
| 2023-12-31 | 2023-09-30 | 2023-06-30 | 2023-03-31 | 2022-12-31 | 2022-09-30 | 2022-06-30 | 2022-03-31 | 2021-12-31 | 2021-09-30 | 2021-06-30 | 2021-03-31 | 2020-12-31 | 2020-09-30 | 2020-06-30 | 2020-03-31 | 2019-12-31 | 2019-09-30 | 2019-06-30 | 2019-03-31 | 2018-12-31 | 2018-09-30 | 2018-06-30 | 2018-03-31 | 2017-12-31 | 2017-09-30 | 2017-06-30 | 2017-03-31 | 2016-12-31 | 2016-09-30 | 2016-06-30 | 2016-03-31 | 2015-12-31 | 2015-09-30 | 2015-06-30 | 2015-03-31 | 2014-12-31 | 2014-09-30 | 2014-06-30 | 2014-03-31 | 2013-12-31 | 2013-09-30 | 2013-06-30 | 2013-03-31 | 2012-12-31 | 2012-09-30 | 2012-06-30 | 2012-03-31 | 2011-12-31 | 2011-09-30 | 2011-06-30 | 2011-03-31 | 2010-12-31 | 2010-09-30 | 2010-06-30 | 2010-03-31 | ||
|---|---|---|---|---|---|---|---|---|---|---|---|---|---|---|---|---|---|---|---|---|---|---|---|---|---|---|---|---|---|---|---|---|---|---|---|---|---|---|---|---|---|---|---|---|---|---|---|---|---|---|---|---|---|---|---|---|---|
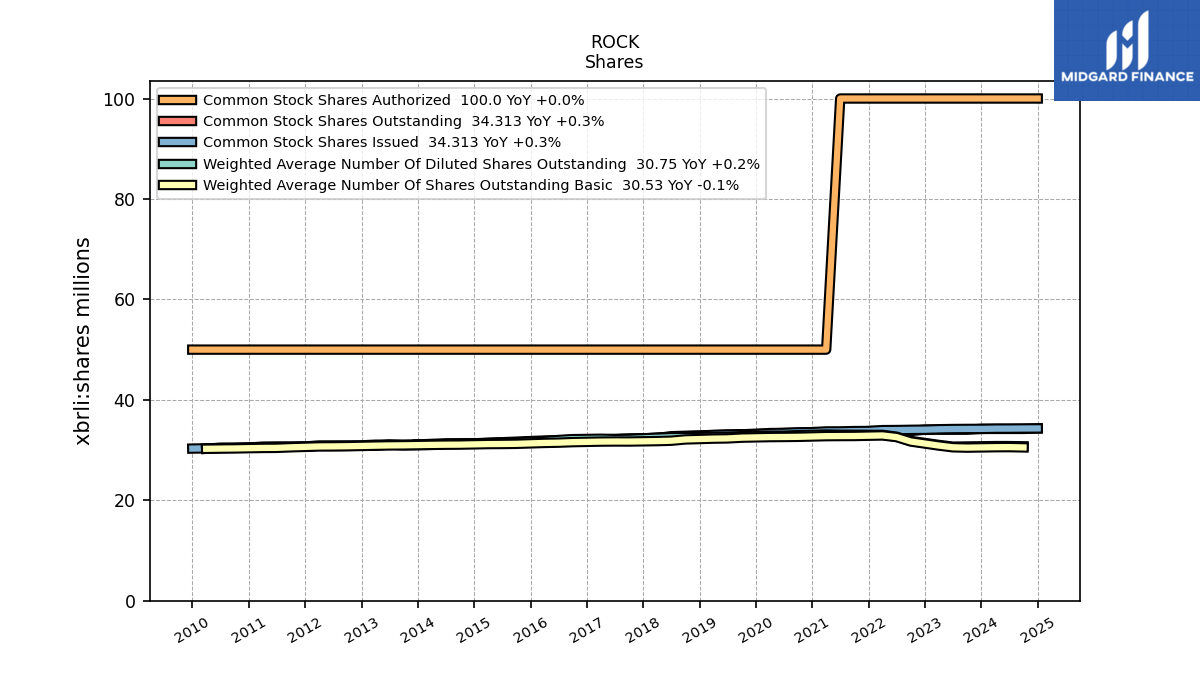
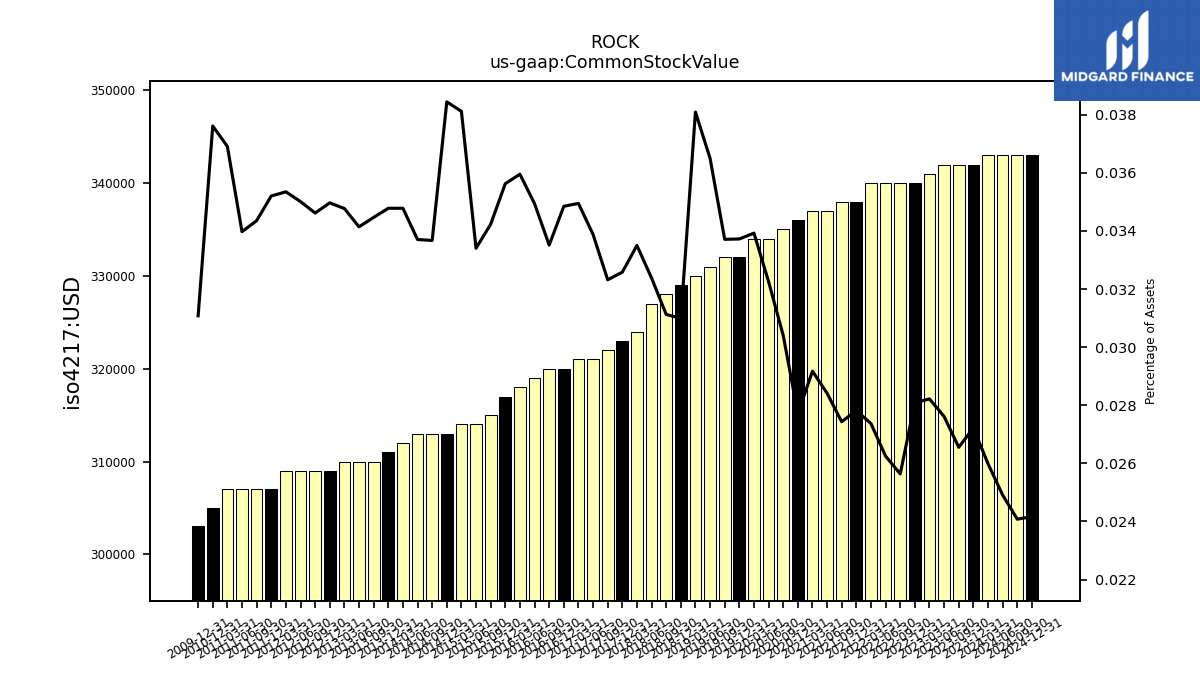
| Common Stock Value | 0.34 | 0.34 | 0.34 | 0.34 | 0.34 | 0.34 | 0.34 | 0.34 | 0.34 | 0.34 | 0.34 | 0.34 | 0.34 | 0.34 | 0.33 | 0.33 | 0.33 | 0.33 | 0.33 | 0.33 | 0.33 | 0.33 | 0.33 | 0.32 | 0.32 | 0.32 | 0.32 | 0.32 | 0.32 | 0.32 | 0.32 | 0.32 | 0.32 | 0.32 | 0.31 | 0.31 | 0.31 | 0.31 | 0.31 | 0.31 | 0.31 | 0.31 | 0.31 | 0.31 | 0.31 | 0.31 | 0.31 | 0.31 | 0.31 | 0.31 | 0.31 | 0.31 | 0.30 | NA | NA | NA | |
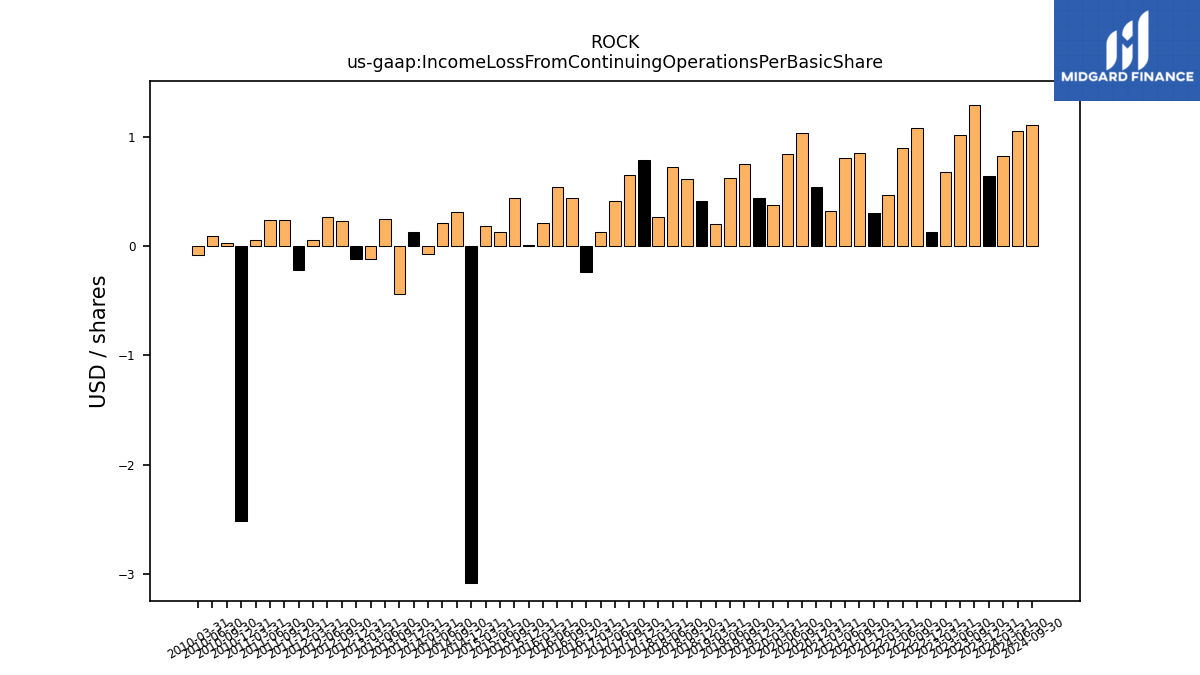
| Income Loss From Continuing Operations Per Basic Share | 0.00 | 0.00 | 0.00 | 0.00 | 0.00 | 0.00 | 0.00 | 0.00 | 0.00 | 0.00 | 0.00 | 0.00 | 0.00 | 0.00 | 0.00 | 0.00 | 0.00 | 0.00 | 0.00 | 0.00 | 0.00 | 0.00 | 0.00 | 0.00 | 0.00 | 0.00 | 0.00 | 0.00 | -0.00 | 0.00 | 0.00 | 0.00 | 0.00 | 0.00 | 0.00 | 0.00 | -0.00 | 0.00 | 0.00 | -0.00 | 0.00 | -0.00 | 0.00 | -0.00 | -0.00 | 0.00 | 0.00 | 0.00 | -0.00 | 0.00 | 0.00 | 0.00 | -0.00 | 0.00 | 0.00 | -0.00 | |
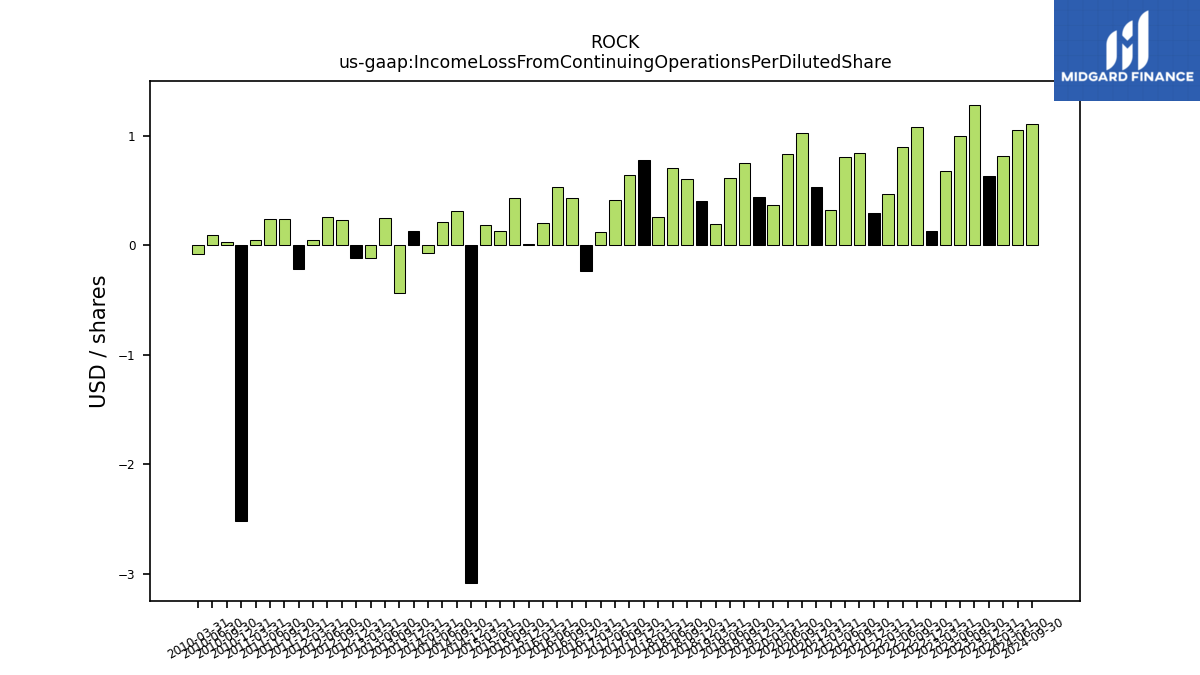
| Income Loss From Continuing Operations Per Diluted Share | 0.00 | 0.00 | 0.00 | 0.00 | 0.00 | 0.00 | 0.00 | 0.00 | 0.00 | 0.00 | 0.00 | 0.00 | 0.00 | 0.00 | 0.00 | 0.00 | 0.00 | 0.00 | 0.00 | 0.00 | 0.00 | 0.00 | 0.00 | 0.00 | 0.00 | 0.00 | 0.00 | 0.00 | -0.00 | 0.00 | 0.00 | 0.00 | 0.00 | 0.00 | 0.00 | 0.00 | -0.00 | 0.00 | 0.00 | -0.00 | 0.00 | -0.00 | 0.00 | -0.00 | -0.00 | 0.00 | 0.00 | 0.00 | -0.00 | 0.00 | 0.00 | 0.00 | -0.00 | 0.00 | 0.00 | -0.00 |
| 2023-12-31 | 2023-09-30 | 2023-06-30 | 2023-03-31 | 2022-12-31 | 2022-09-30 | 2022-06-30 | 2022-03-31 | 2021-12-31 | 2021-09-30 | 2021-06-30 | 2021-03-31 | 2020-12-31 | 2020-09-30 | 2020-06-30 | 2020-03-31 | 2019-12-31 | 2019-09-30 | 2019-06-30 | 2019-03-31 | 2018-12-31 | 2018-09-30 | 2018-06-30 | 2018-03-31 | 2017-12-31 | 2017-09-30 | 2017-06-30 | 2017-03-31 | 2016-12-31 | 2016-09-30 | 2016-06-30 | 2016-03-31 | 2015-12-31 | 2015-09-30 | 2015-06-30 | 2015-03-31 | 2014-12-31 | 2014-09-30 | 2014-06-30 | 2014-03-31 | 2013-12-31 | 2013-09-30 | 2013-06-30 | 2013-03-31 | 2012-12-31 | 2012-09-30 | 2012-06-30 | 2012-03-31 | 2011-12-31 | 2011-09-30 | 2011-06-30 | 2011-03-31 | 2010-12-31 | 2010-09-30 | 2010-06-30 | 2010-03-31 | ||
|---|---|---|---|---|---|---|---|---|---|---|---|---|---|---|---|---|---|---|---|---|---|---|---|---|---|---|---|---|---|---|---|---|---|---|---|---|---|---|---|---|---|---|---|---|---|---|---|---|---|---|---|---|---|---|---|---|---|
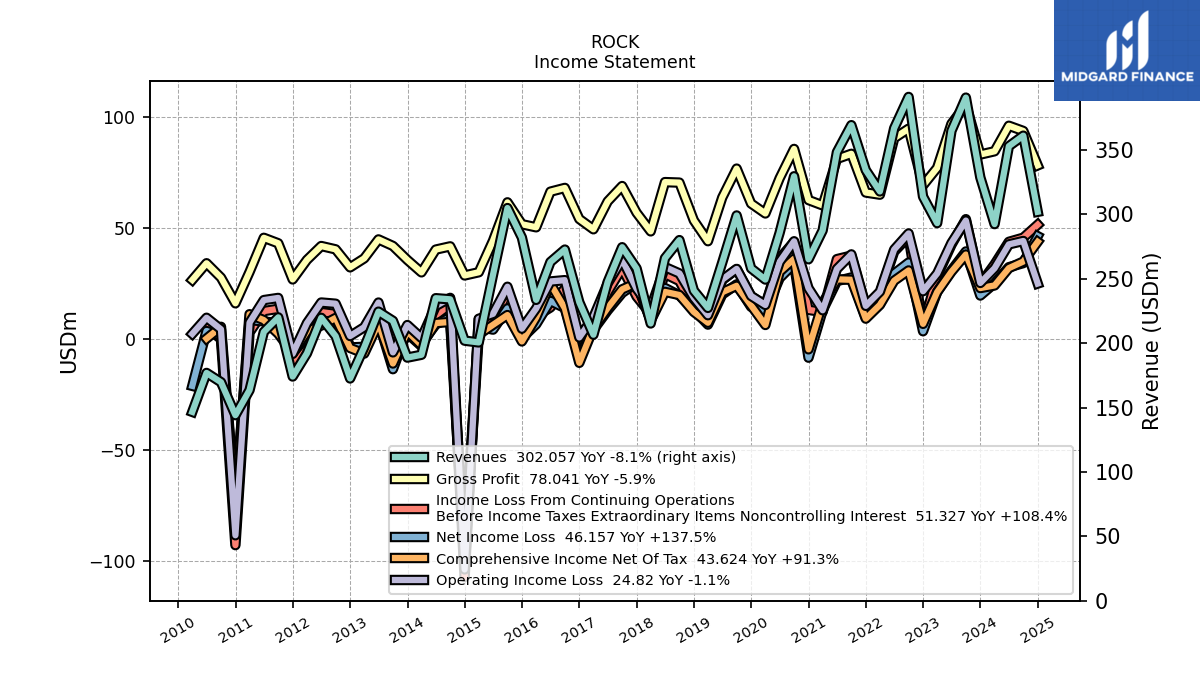
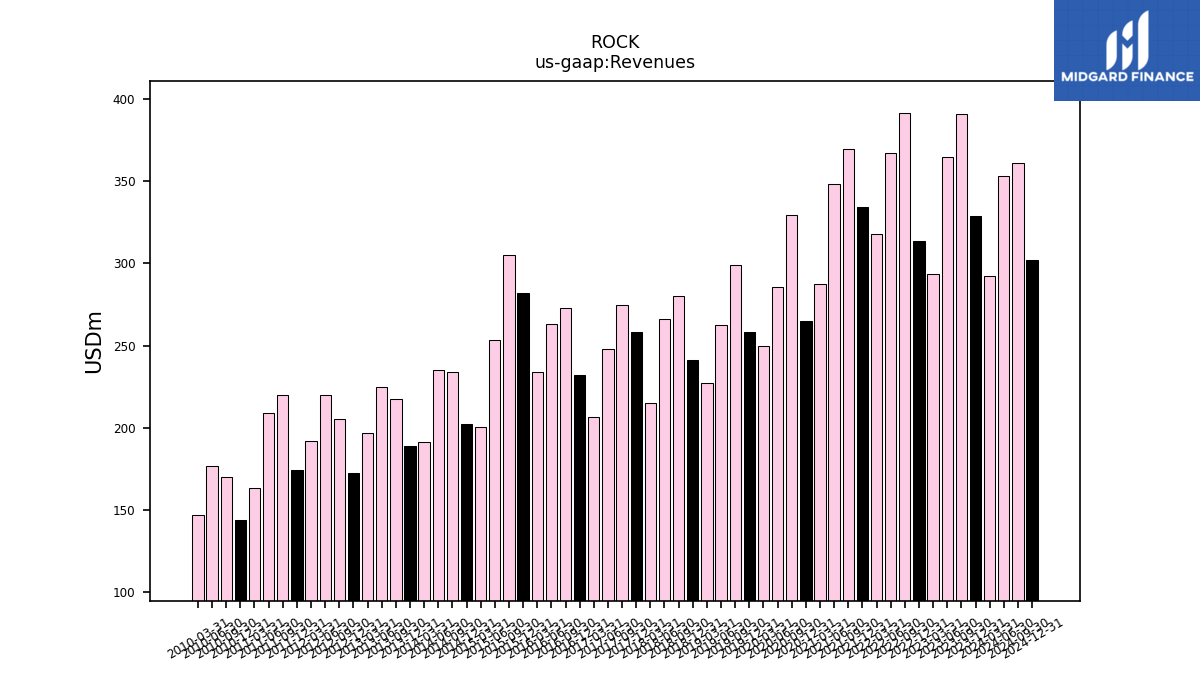
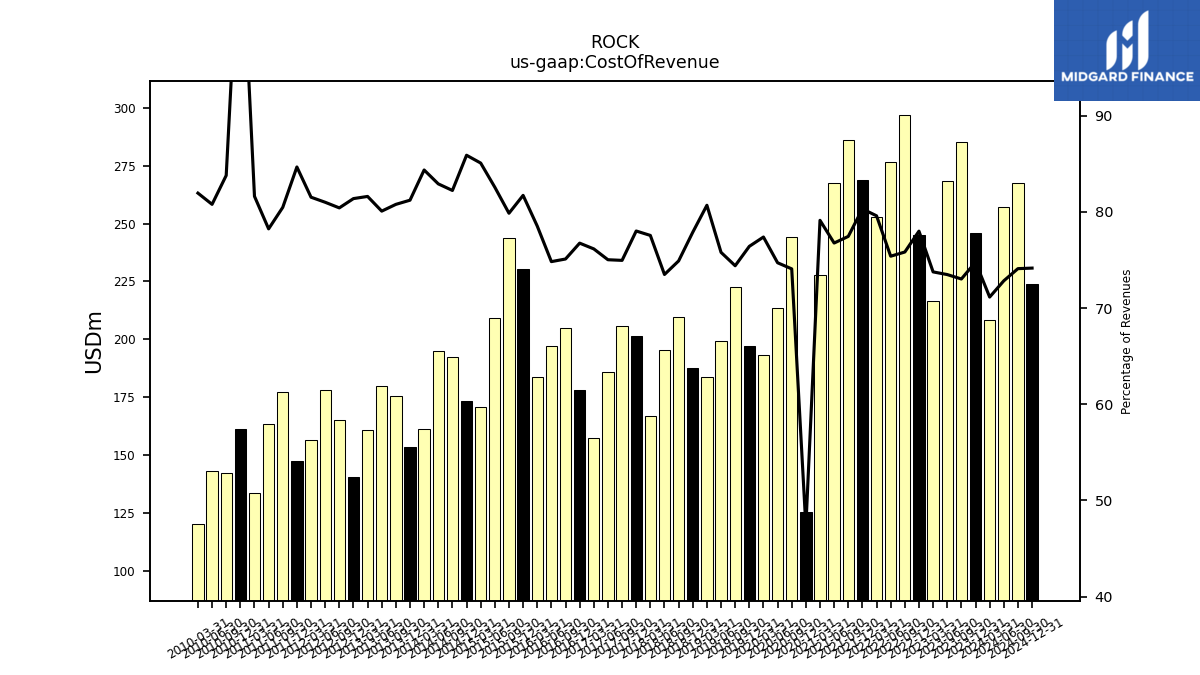
| Revenues | 328.81 | 390.74 | 364.91 | 293.27 | 313.86 | 391.29 | 366.95 | 317.87 | 334.45 | 369.35 | 348.39 | 287.59 | 265.20 | 329.67 | 285.81 | 249.44 | 258.13 | 299.24 | 262.65 | 227.42 | 240.91 | 280.09 | 266.04 | 215.34 | 258.11 | 274.57 | 247.63 | 206.60 | 231.84 | 272.73 | 263.10 | 233.68 | 282.09 | 304.99 | 253.17 | 200.62 | 201.99 | 234.10 | 234.96 | 191.03 | 188.84 | 217.41 | 224.52 | 196.80 | 172.64 | 205.51 | 219.73 | 192.17 | 174.14 | 220.10 | 208.81 | 163.56 | 144.12 | 169.74 | 176.92 | 146.67 | |
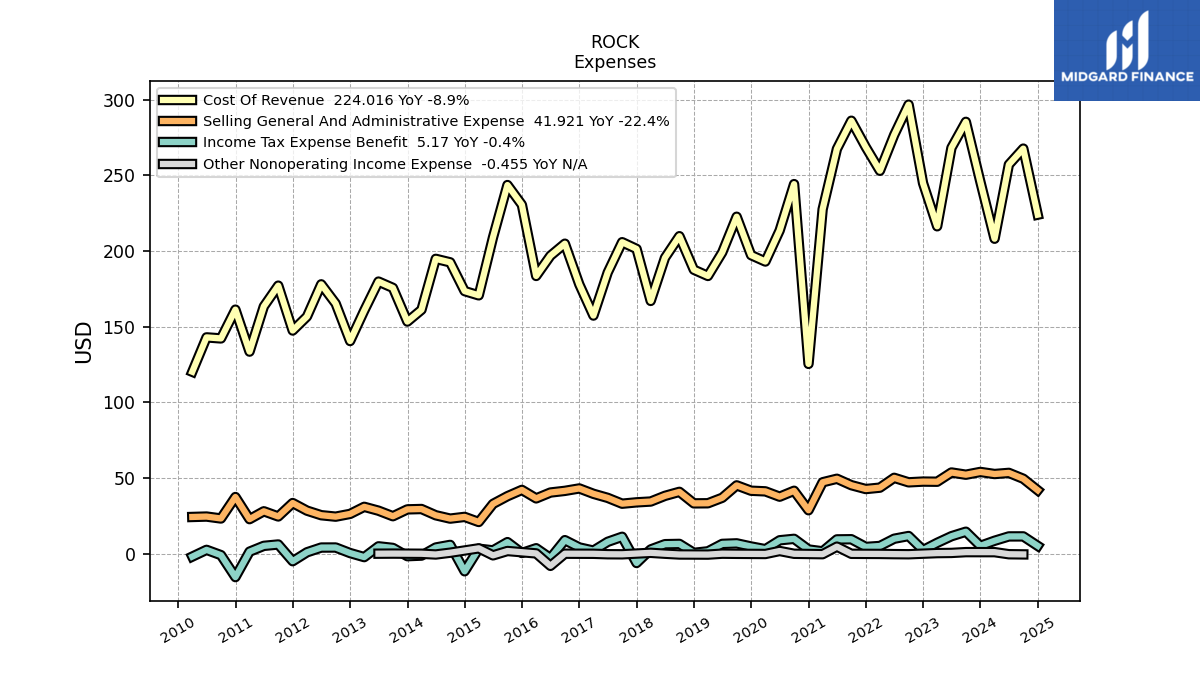
| Cost Of Revenue | 245.90 | 285.36 | 268.18 | 216.34 | 244.84 | 296.74 | 276.68 | 253.02 | 268.64 | 286.10 | 267.46 | 227.57 | 125.41 | 244.22 | 213.56 | 193.05 | 197.28 | 222.66 | 199.10 | 183.52 | 187.65 | 209.81 | 195.53 | 167.02 | 201.38 | 205.84 | 185.80 | 157.35 | 177.96 | 204.85 | 196.90 | 183.52 | 230.55 | 243.60 | 209.05 | 170.70 | 173.51 | 192.52 | 194.84 | 161.17 | 153.38 | 175.65 | 179.81 | 160.62 | 140.51 | 165.29 | 178.01 | 156.69 | 147.46 | 177.13 | 163.38 | 133.52 | 161.27 | 142.24 | 142.94 | 120.22 | |
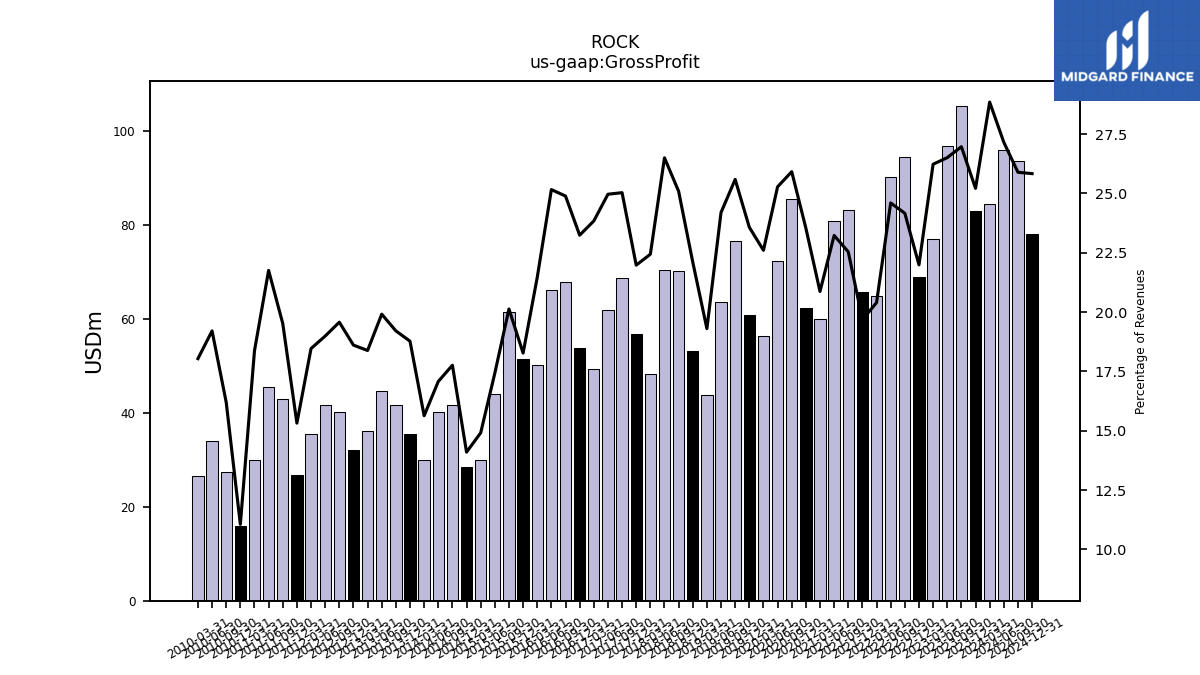
| Gross Profit | 82.91 | 105.38 | 96.74 | 76.93 | 69.02 | 94.56 | 90.27 | 64.84 | 65.81 | 83.25 | 80.93 | 60.02 | 62.43 | 85.44 | 72.26 | 56.39 | 60.85 | 76.58 | 63.56 | 43.90 | 53.26 | 70.28 | 70.50 | 48.32 | 56.73 | 68.73 | 61.83 | 49.26 | 53.88 | 67.89 | 66.20 | 50.16 | 51.55 | 61.40 | 44.12 | 29.91 | 28.48 | 41.58 | 40.12 | 29.86 | 35.45 | 41.76 | 44.71 | 36.18 | 32.12 | 40.23 | 41.73 | 35.48 | 26.68 | 42.96 | 45.43 | 30.05 | 15.93 | 27.50 | 33.98 | 26.46 | |
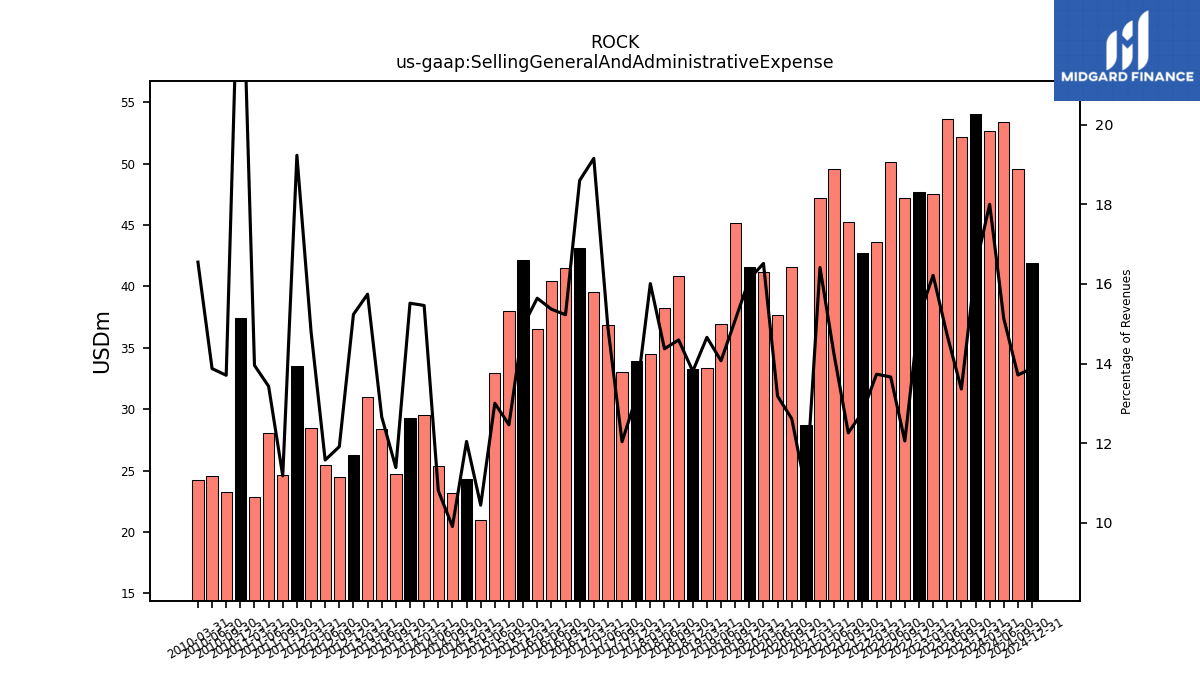
| Selling General And Administrative Expense | 54.02 | 52.19 | 53.66 | 47.56 | 47.65 | 47.16 | 50.13 | 43.65 | 42.72 | 45.27 | 49.52 | 47.20 | 28.70 | 41.58 | 37.67 | 41.20 | 41.61 | 45.16 | 36.95 | 33.33 | 33.26 | 40.88 | 38.23 | 34.48 | 33.94 | 33.04 | 36.90 | 39.58 | 43.12 | 41.52 | 40.43 | 36.55 | 42.16 | 38.00 | 32.92 | 20.95 | 24.32 | 23.19 | 25.39 | 29.53 | 29.30 | 24.75 | 28.42 | 30.98 | 26.30 | 24.48 | 25.43 | 28.46 | 33.49 | 24.60 | 28.04 | 22.82 | 37.46 | 23.26 | 24.54 | 24.27 | |
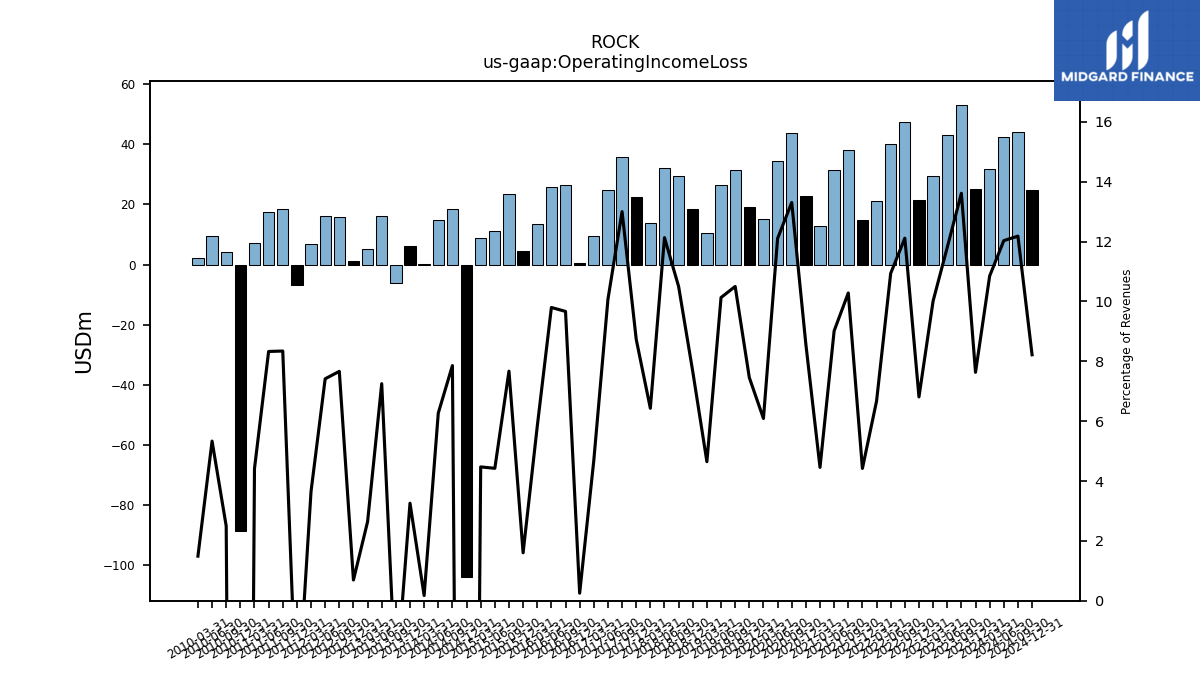
| Operating Income Loss | 25.09 | 53.19 | 43.08 | 29.37 | 21.37 | 47.40 | 40.14 | 21.20 | 14.79 | 37.98 | 31.41 | 12.81 | 22.72 | 43.86 | 34.59 | 15.19 | 19.25 | 31.42 | 26.61 | 10.57 | 18.45 | 29.40 | 32.27 | 13.84 | 22.55 | 35.69 | 24.93 | 9.68 | 0.58 | 26.36 | 25.78 | 13.61 | 4.52 | 23.39 | 11.20 | 8.97 | -103.87 | 18.39 | 14.73 | 0.33 | 6.15 | -6.15 | 16.28 | 5.20 | 1.20 | 15.75 | 16.29 | 7.02 | -6.82 | 18.36 | 17.39 | 7.22 | -88.50 | 4.24 | 9.44 | 2.19 | |
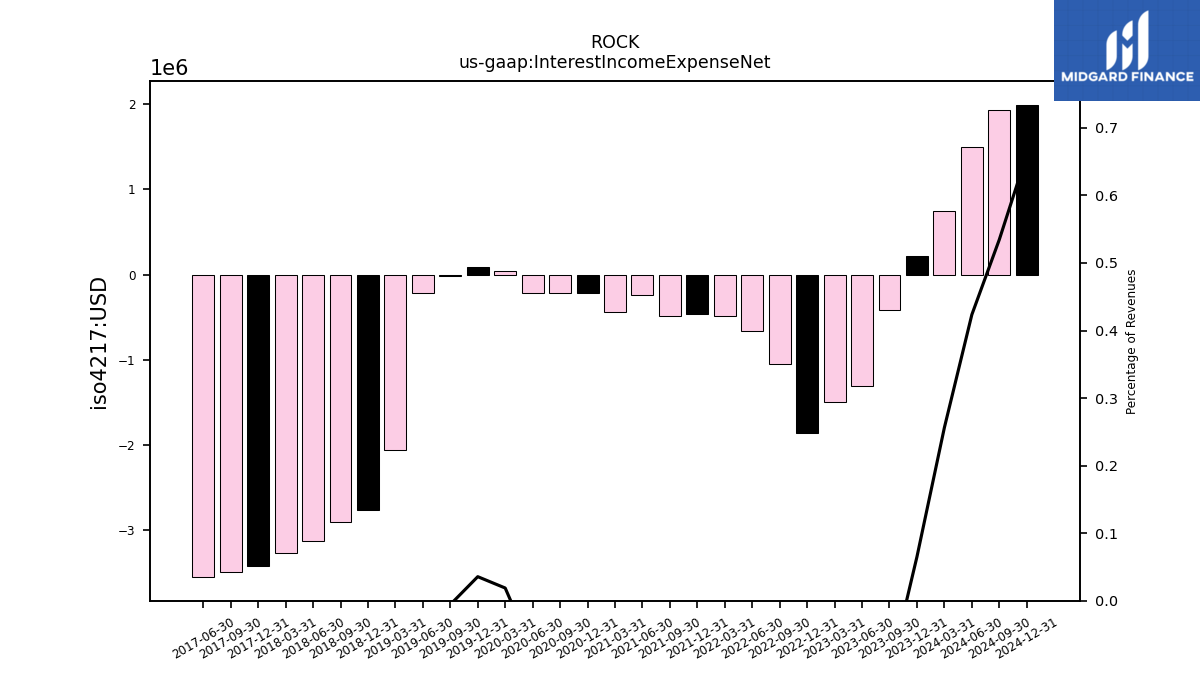
| Interest Income Expense Net | 0.21 | -0.42 | -1.31 | -1.49 | -1.86 | -1.05 | -0.66 | -0.48 | -0.46 | -0.49 | -0.24 | -0.44 | -0.22 | -0.22 | -0.21 | 0.05 | 0.09 | -0.02 | -0.22 | -2.06 | -2.76 | -2.91 | -3.13 | -3.27 | -3.42 | -3.49 | -3.55 | NA | NA | NA | NA | NA | NA | NA | NA | NA | NA | NA | NA | NA | NA | NA | NA | NA | NA | NA | NA | NA | NA | NA | NA | NA | NA | NA | NA | NA | |
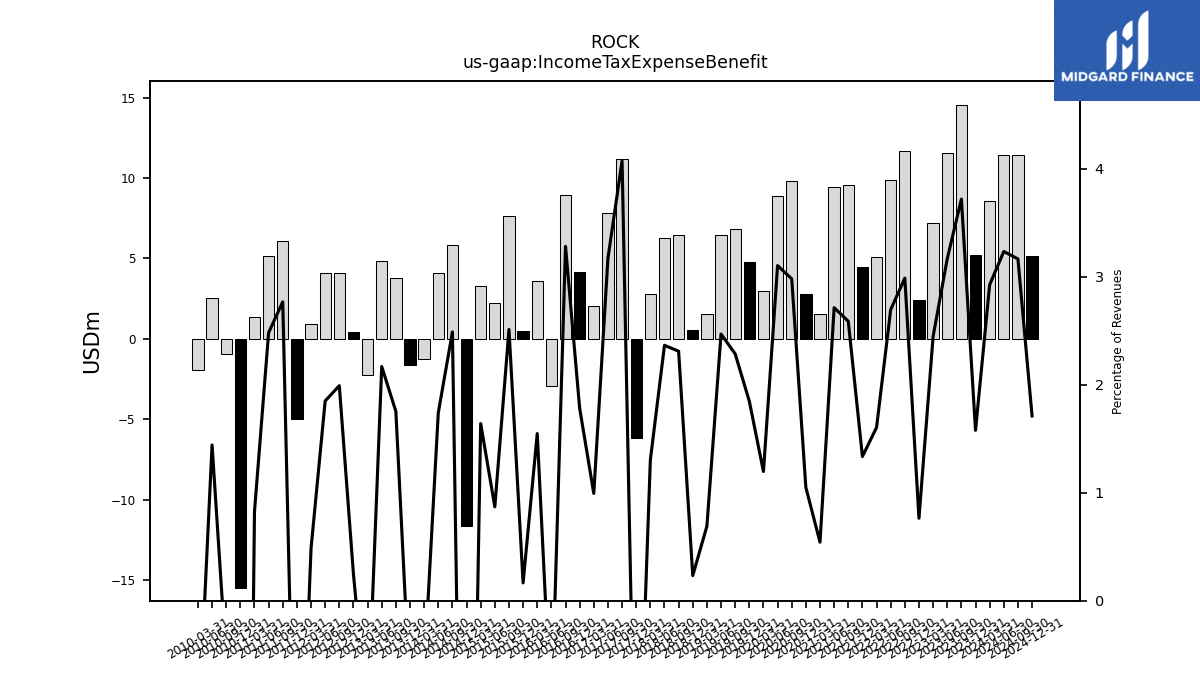
| Income Tax Expense Benefit | 5.19 | 14.54 | 11.55 | 7.18 | 2.40 | 11.69 | 9.89 | 5.10 | 4.47 | 9.56 | 9.46 | 1.56 | 2.78 | 9.83 | 8.87 | 2.99 | 4.77 | 6.84 | 6.49 | 1.57 | 0.56 | 6.47 | 6.29 | 2.81 | -6.15 | 11.18 | 7.85 | 2.05 | 4.13 | 8.95 | -2.91 | 3.62 | 0.47 | 7.66 | 2.20 | 3.29 | -11.62 | 5.83 | 4.09 | -1.25 | -1.63 | 3.81 | 4.87 | -2.25 | 0.43 | 4.09 | 4.07 | 0.93 | -4.96 | 6.09 | 5.18 | 1.35 | -15.47 | -0.94 | 2.55 | -1.92 | |
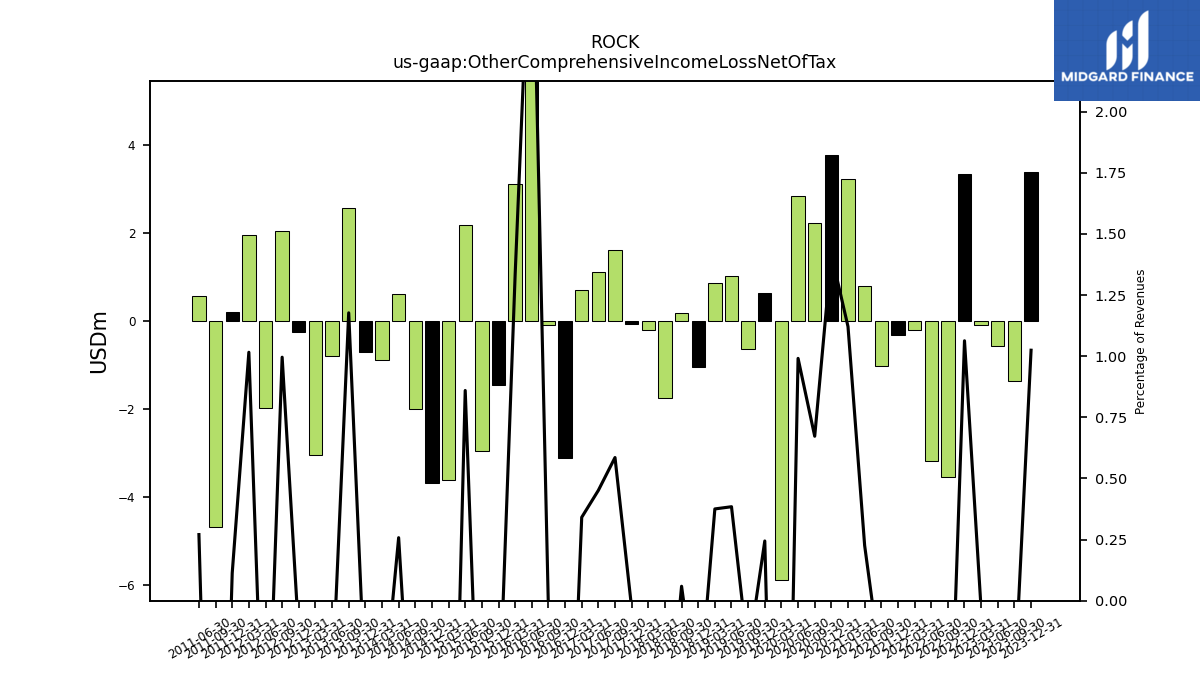
| Other Comprehensive Income Loss Net Of Tax | 3.37 | -1.37 | -0.58 | -0.11 | 3.34 | -3.56 | -3.20 | -0.20 | -0.34 | -1.03 | 0.79 | 3.23 | 3.76 | 2.22 | 2.83 | -5.88 | 0.63 | -0.65 | 1.01 | 0.85 | -1.06 | 0.17 | -1.76 | -0.21 | -0.08 | 1.61 | 1.12 | 0.70 | -3.12 | -0.09 | 7.79 | 3.12 | -1.46 | -2.97 | 2.18 | -3.62 | -3.69 | -2.00 | 0.61 | -0.88 | -0.71 | 2.56 | -0.80 | -3.06 | -0.25 | 2.05 | -1.98 | 1.95 | 0.20 | -4.67 | 0.56 | NA | NA | NA | NA | NA | |
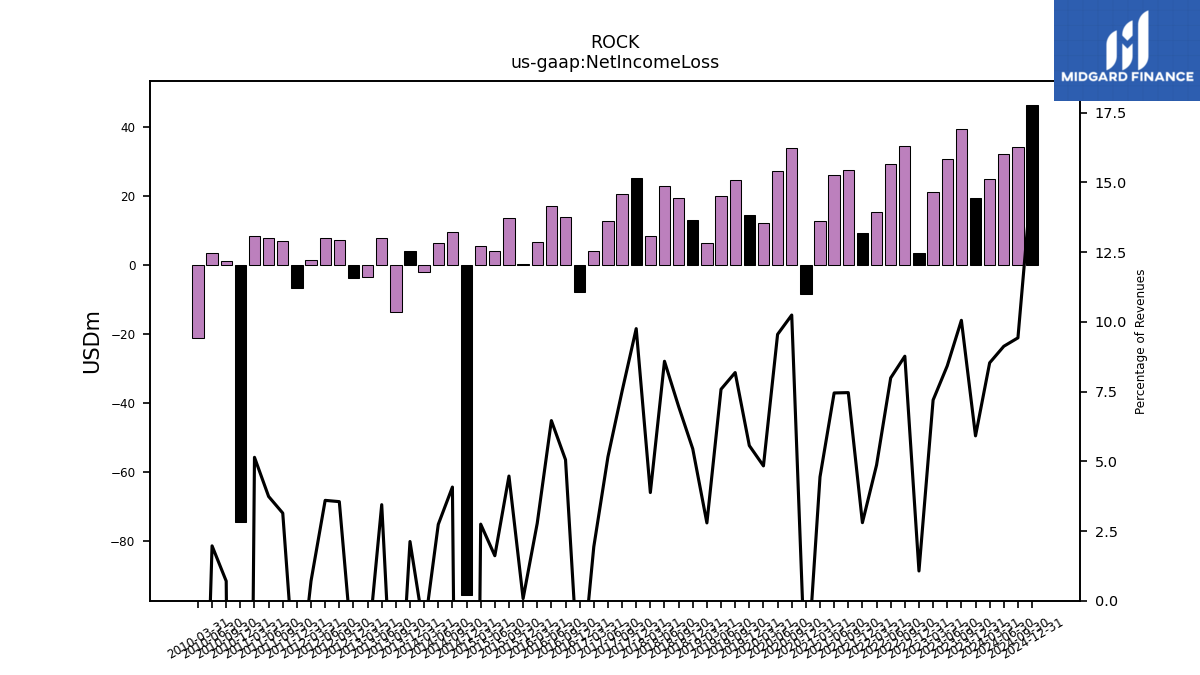
| Net Income Loss | 19.43 | 39.28 | 30.72 | 21.10 | 3.35 | 34.30 | 29.31 | 15.46 | 9.36 | 27.56 | 25.95 | 12.76 | -8.54 | 33.76 | 27.29 | 12.06 | 14.36 | 24.48 | 19.91 | 6.34 | 13.12 | 19.50 | 22.84 | 8.35 | 25.18 | 20.62 | 12.77 | 4.00 | -7.75 | 13.79 | 16.99 | 6.49 | 0.22 | 13.63 | 4.09 | 5.51 | -95.71 | 9.54 | 6.43 | -2.09 | 4.01 | -13.73 | 7.73 | -3.65 | -3.92 | 7.30 | 7.91 | 1.36 | -6.61 | 6.91 | 7.80 | 8.41 | -74.52 | 1.20 | 3.48 | -21.23 | |
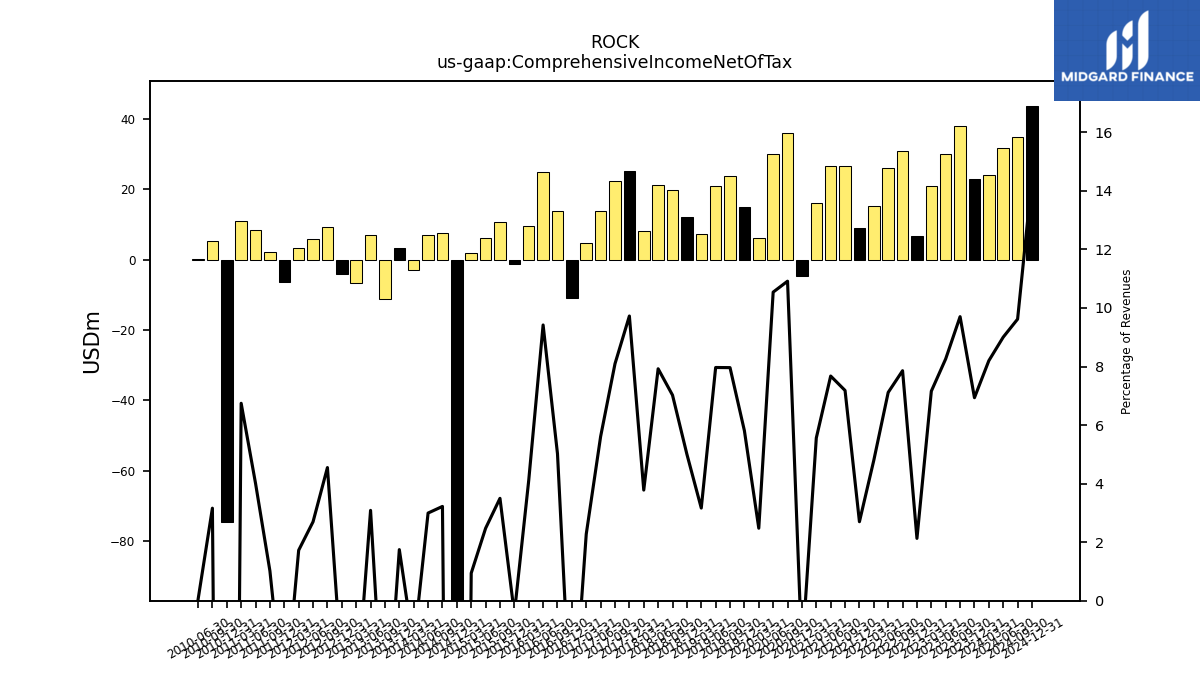
| Comprehensive Income Net Of Tax | 22.80 | 37.91 | 30.15 | 20.99 | 6.68 | 30.74 | 26.11 | 15.25 | 9.03 | 26.53 | 26.74 | 15.99 | -4.79 | 35.98 | 30.12 | 6.18 | 14.99 | 23.82 | 20.92 | 7.20 | 12.06 | 19.67 | 21.08 | 8.14 | 25.10 | 22.23 | 13.89 | 4.70 | -10.87 | 13.69 | 24.78 | 9.61 | -1.24 | 10.67 | 6.26 | 1.89 | -99.40 | 7.54 | 7.04 | -2.97 | 3.30 | -11.17 | 6.93 | -6.70 | -4.17 | 9.35 | 5.93 | 3.31 | -6.41 | 2.24 | 8.37 | 11.03 | -74.54 | 5.37 | 0.06 | NA |
| 2023-12-31 | 2023-09-30 | 2023-06-30 | 2023-03-31 | 2022-12-31 | 2022-09-30 | 2022-06-30 | 2022-03-31 | 2021-12-31 | 2021-09-30 | 2021-06-30 | 2021-03-31 | 2020-12-31 | 2020-09-30 | 2020-06-30 | 2020-03-31 | 2019-12-31 | 2019-09-30 | 2019-06-30 | 2019-03-31 | 2018-12-31 | 2018-09-30 | 2018-06-30 | 2018-03-31 | 2017-12-31 | 2017-09-30 | 2017-06-30 | 2017-03-31 | 2016-12-31 | 2016-09-30 | 2016-06-30 | 2016-03-31 | 2015-12-31 | 2015-09-30 | 2015-06-30 | 2015-03-31 | 2014-12-31 | 2014-09-30 | 2014-06-30 | 2014-03-31 | 2013-12-31 | 2013-09-30 | 2013-06-30 | 2013-03-31 | 2012-12-31 | 2012-09-30 | 2012-06-30 | 2012-03-31 | 2011-12-31 | 2011-09-30 | 2011-06-30 | 2011-03-31 | 2010-12-31 | 2010-09-30 | 2010-06-30 | 2010-03-31 | ||
|---|---|---|---|---|---|---|---|---|---|---|---|---|---|---|---|---|---|---|---|---|---|---|---|---|---|---|---|---|---|---|---|---|---|---|---|---|---|---|---|---|---|---|---|---|---|---|---|---|---|---|---|---|---|---|---|---|---|
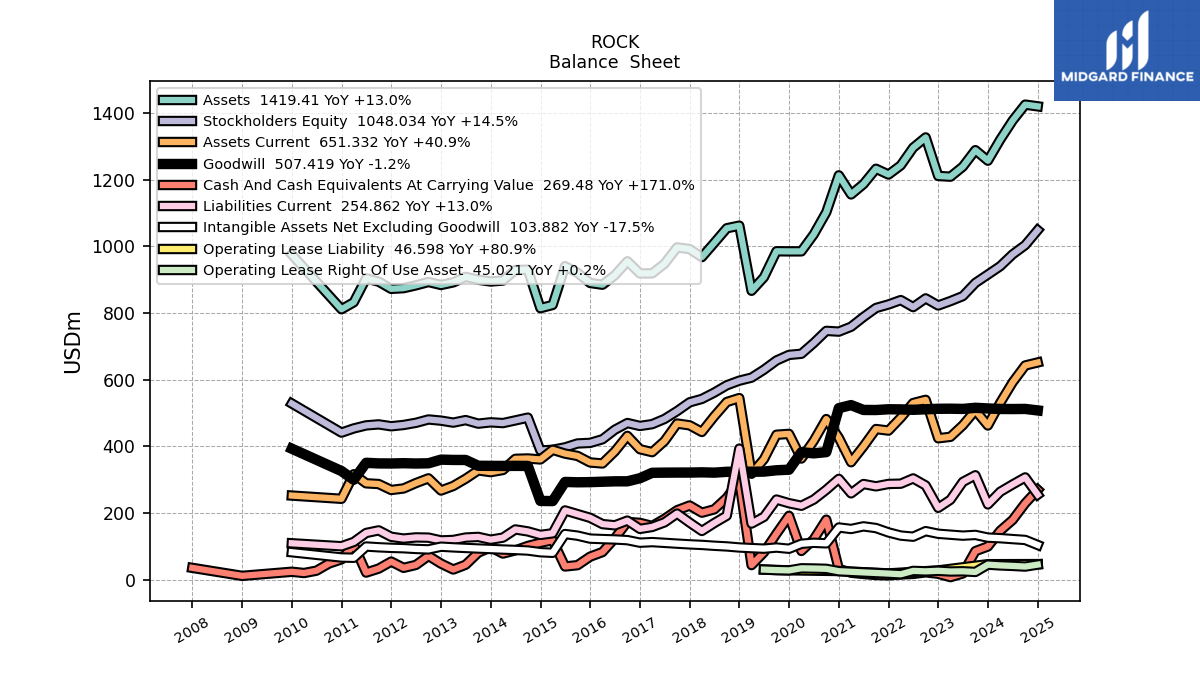
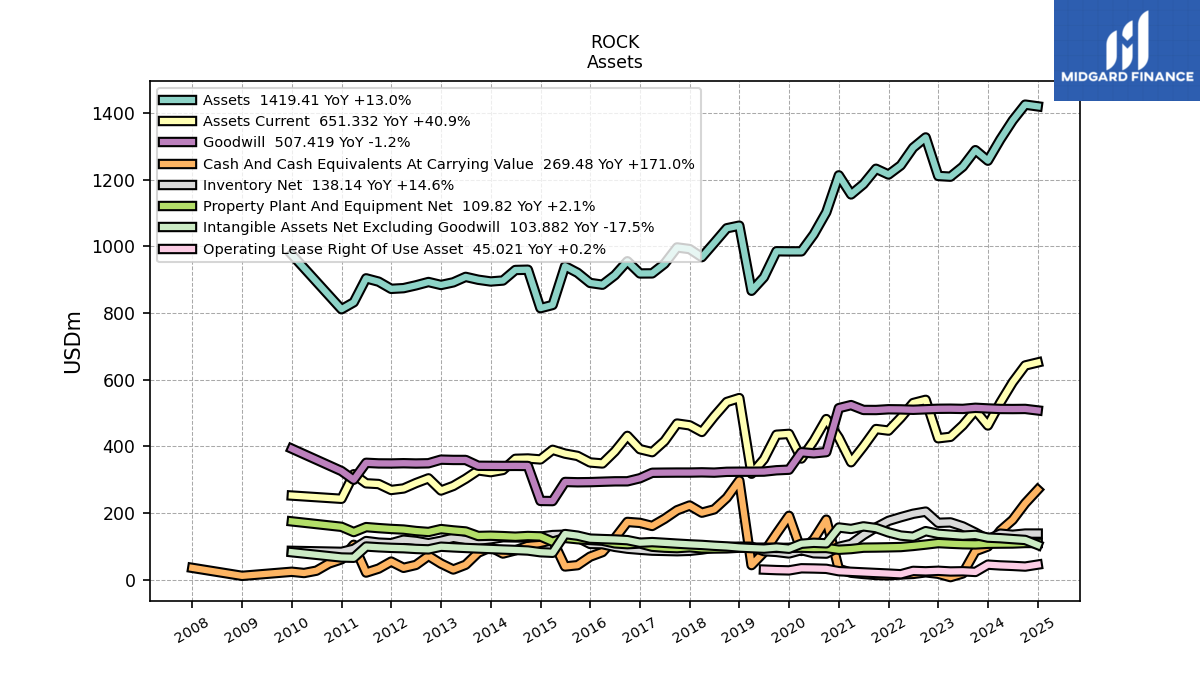
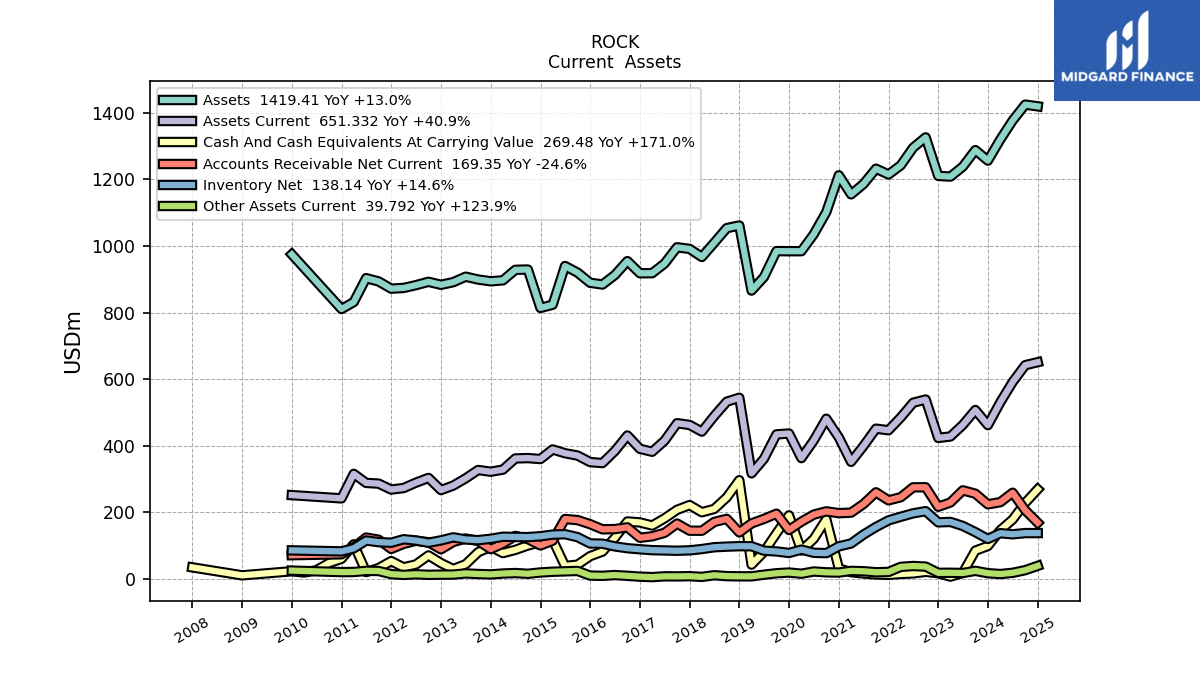
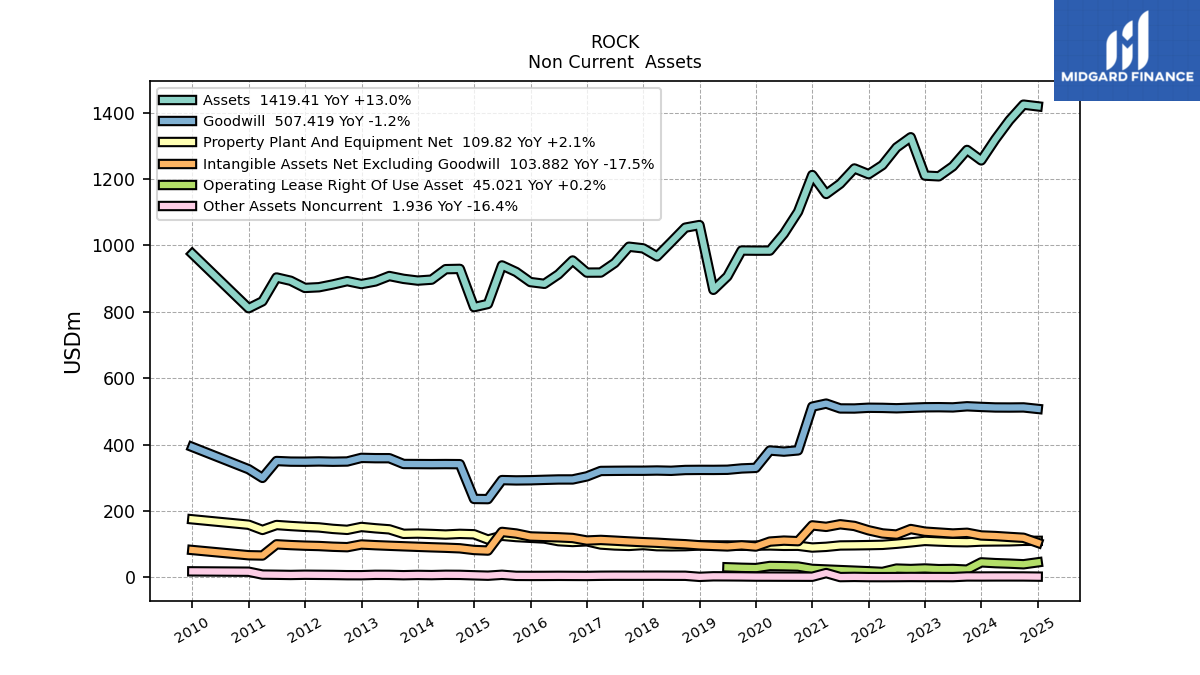
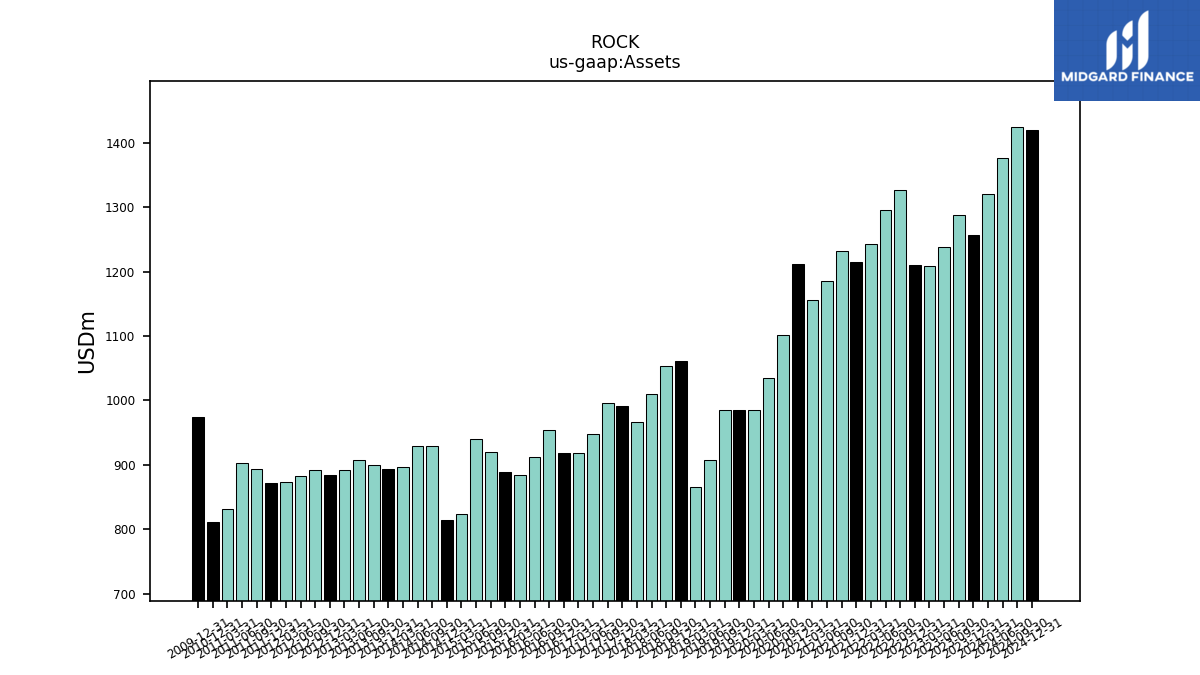
| Assets | 1256.45 | 1288.05 | 1238.58 | 1208.49 | 1210.61 | 1326.26 | 1295.41 | 1242.34 | 1214.90 | 1232.21 | 1186.13 | 1155.19 | 1212.49 | 1101.85 | 1035.50 | 984.52 | 984.45 | 984.82 | 906.86 | 866.26 | 1061.64 | 1053.79 | 1009.92 | 967.14 | 991.38 | 996.30 | 947.46 | 918.47 | 918.25 | 954.83 | 913.00 | 884.45 | 889.77 | 920.20 | 940.00 | 823.76 | 814.16 | 929.51 | 928.63 | 897.03 | 894.16 | 899.43 | 907.99 | 891.53 | 883.67 | 892.60 | 882.60 | 874.18 | 872.05 | 893.64 | 903.61 | 831.74 | 810.89 | NA | NA | NA | |
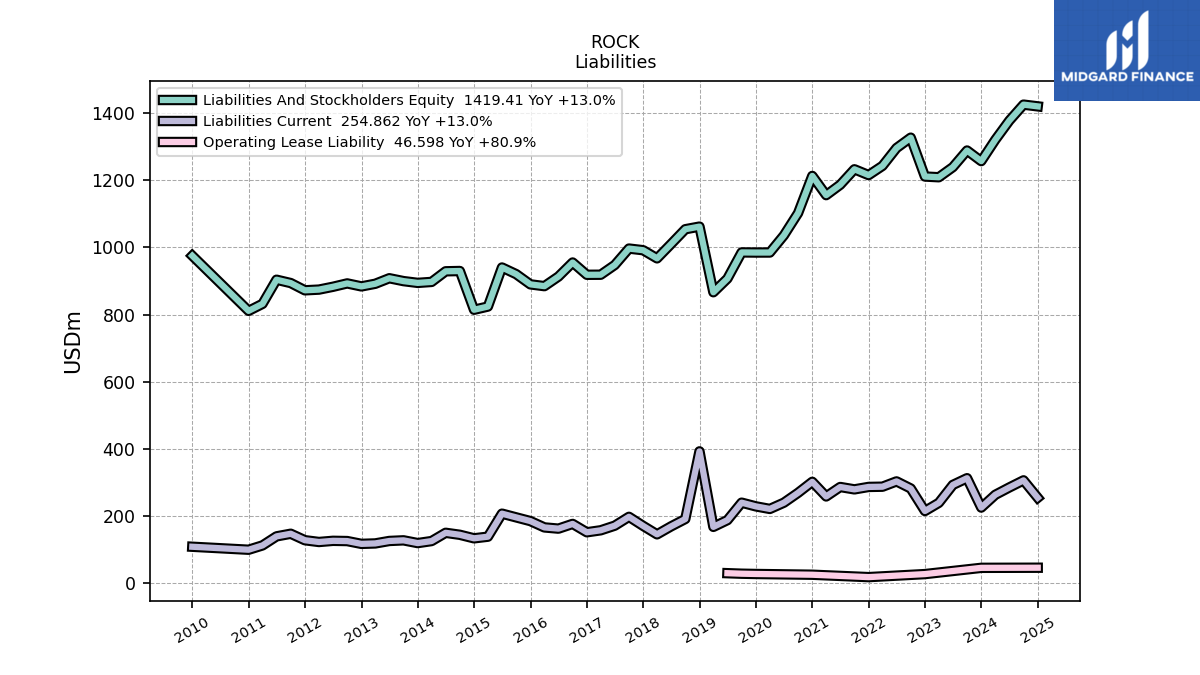
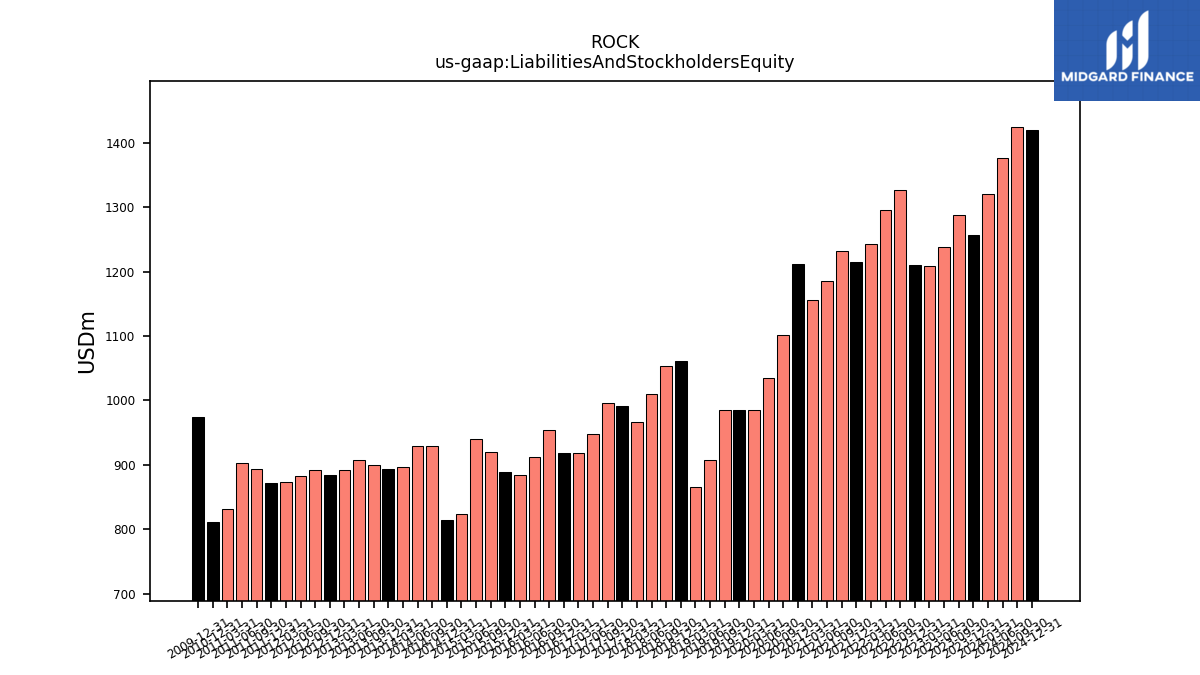
| Liabilities And Stockholders Equity | 1256.45 | 1288.05 | 1238.58 | 1208.49 | 1210.61 | 1326.26 | 1295.41 | 1242.34 | 1214.90 | 1232.21 | 1186.13 | 1155.19 | 1212.49 | 1101.85 | 1035.50 | 984.52 | 984.45 | 984.82 | 906.86 | 866.26 | 1061.64 | 1053.79 | 1009.92 | 967.14 | 991.38 | 996.30 | 947.46 | 918.47 | 918.25 | 954.83 | 913.00 | 884.45 | 889.77 | 920.20 | 940.00 | 823.76 | 814.16 | 929.51 | 928.63 | 897.03 | 894.16 | 899.43 | 907.99 | 891.53 | 883.67 | 892.60 | 882.60 | 874.18 | 872.05 | 893.64 | 903.61 | 831.74 | 810.89 | NA | NA | NA | |
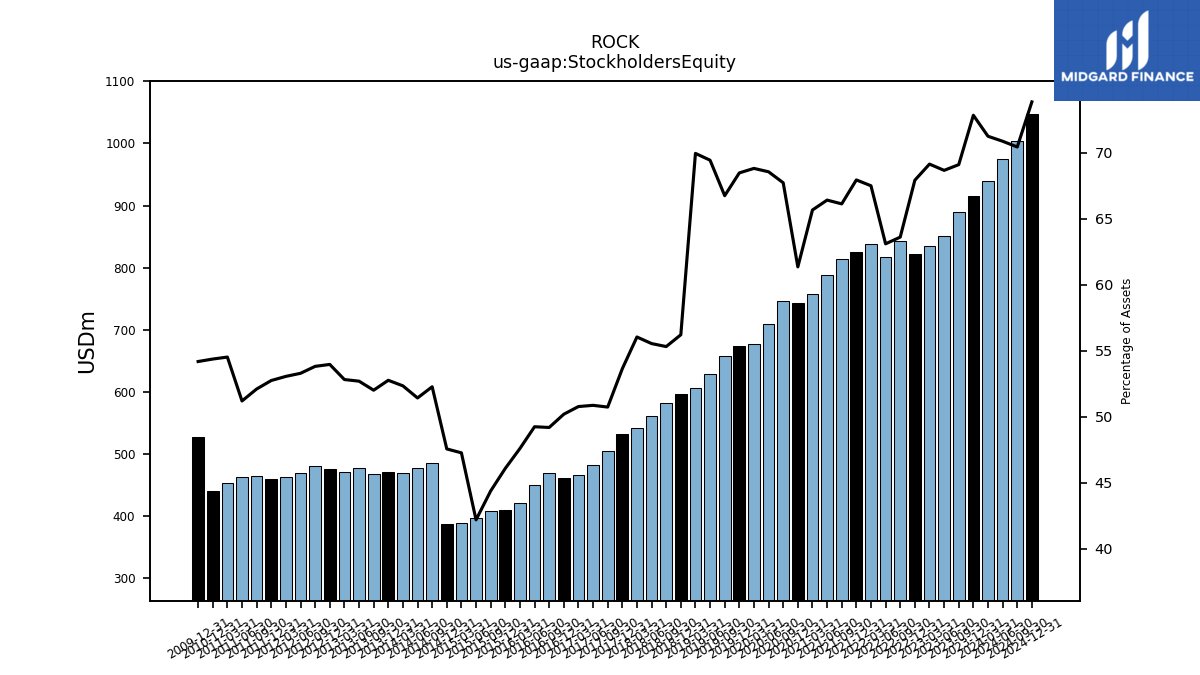
| Stockholders Equity | 915.00 | 889.85 | 850.31 | 835.39 | 822.10 | 843.49 | 817.28 | 838.40 | 825.26 | 814.68 | 787.61 | 758.41 | 743.80 | 746.08 | 709.76 | 677.36 | 673.96 | 657.21 | 629.55 | 605.83 | 596.69 | 582.88 | 560.90 | 541.96 | 531.72 | 505.43 | 481.90 | 466.31 | 460.88 | 469.64 | 449.58 | 420.95 | 410.09 | 408.38 | 396.62 | 389.36 | 387.23 | 485.84 | 477.51 | 469.49 | 471.75 | 467.78 | 478.43 | 470.87 | 476.82 | 480.33 | 470.32 | 463.79 | 459.94 | 465.57 | 462.58 | 453.44 | 440.85 | NA | NA | NA |
| 2023-12-31 | 2023-09-30 | 2023-06-30 | 2023-03-31 | 2022-12-31 | 2022-09-30 | 2022-06-30 | 2022-03-31 | 2021-12-31 | 2021-09-30 | 2021-06-30 | 2021-03-31 | 2020-12-31 | 2020-09-30 | 2020-06-30 | 2020-03-31 | 2019-12-31 | 2019-09-30 | 2019-06-30 | 2019-03-31 | 2018-12-31 | 2018-09-30 | 2018-06-30 | 2018-03-31 | 2017-12-31 | 2017-09-30 | 2017-06-30 | 2017-03-31 | 2016-12-31 | 2016-09-30 | 2016-06-30 | 2016-03-31 | 2015-12-31 | 2015-09-30 | 2015-06-30 | 2015-03-31 | 2014-12-31 | 2014-09-30 | 2014-06-30 | 2014-03-31 | 2013-12-31 | 2013-09-30 | 2013-06-30 | 2013-03-31 | 2012-12-31 | 2012-09-30 | 2012-06-30 | 2012-03-31 | 2011-12-31 | 2011-09-30 | 2011-06-30 | 2011-03-31 | 2010-12-31 | 2010-09-30 | 2010-06-30 | 2010-03-31 | ||
|---|---|---|---|---|---|---|---|---|---|---|---|---|---|---|---|---|---|---|---|---|---|---|---|---|---|---|---|---|---|---|---|---|---|---|---|---|---|---|---|---|---|---|---|---|---|---|---|---|---|---|---|---|---|---|---|---|---|
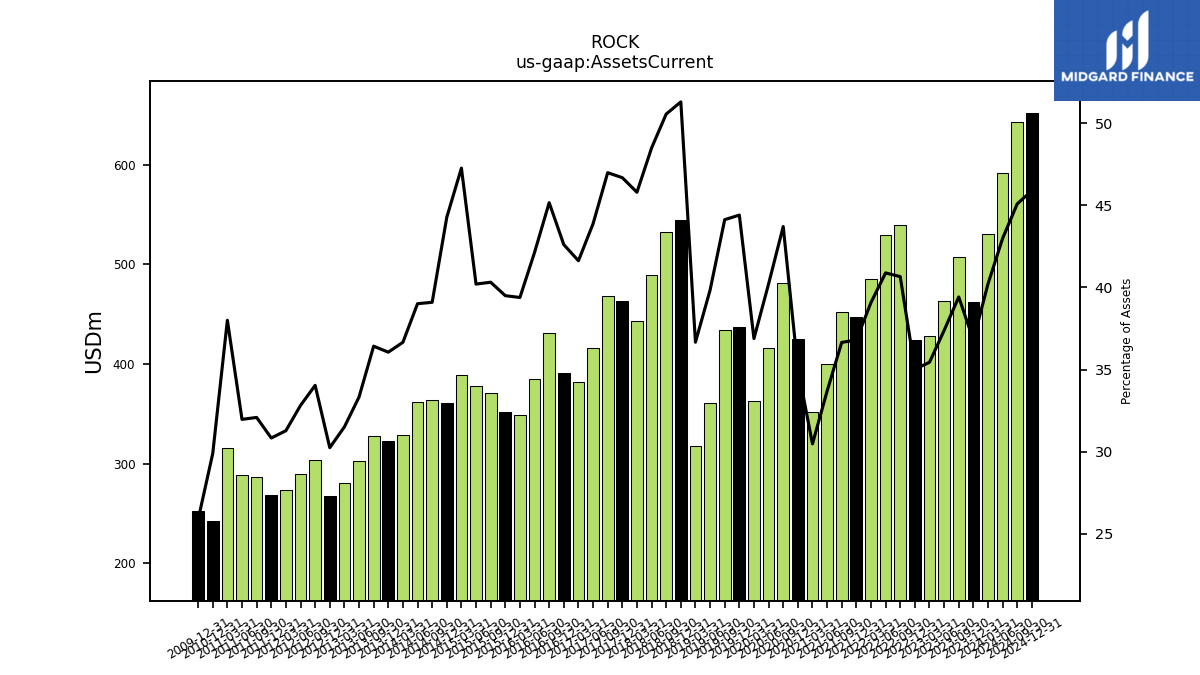
| Assets Current | 462.25 | 507.69 | 462.97 | 428.28 | 423.94 | 539.20 | 529.58 | 485.47 | 446.97 | 451.64 | 399.54 | 352.02 | 425.46 | 481.55 | 416.38 | 363.15 | 437.10 | 434.53 | 361.25 | 317.59 | 544.55 | 532.72 | 489.67 | 442.87 | 462.76 | 468.10 | 415.67 | 382.28 | 391.20 | 431.17 | 384.62 | 348.34 | 351.42 | 370.97 | 377.89 | 389.32 | 360.43 | 363.35 | 362.25 | 328.83 | 322.40 | 327.58 | 302.56 | 280.88 | 267.24 | 303.80 | 289.60 | 273.39 | 268.85 | 286.70 | 288.83 | 316.04 | 242.38 | NA | NA | NA | |
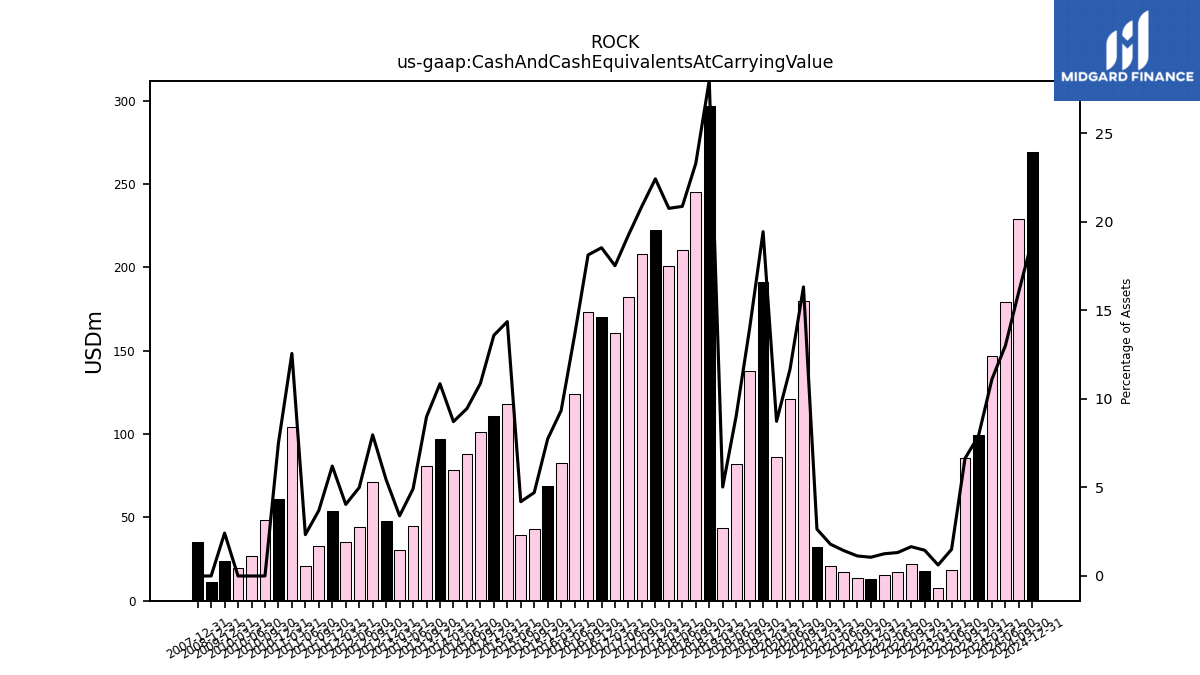
| Cash And Cash Equivalents At Carrying Value | 99.43 | 85.47 | 18.62 | 7.50 | 17.61 | 21.92 | 17.15 | 15.57 | 12.85 | 13.93 | 16.96 | 20.73 | 32.05 | 179.82 | 120.86 | 85.97 | 191.36 | 137.62 | 81.88 | 43.51 | 297.01 | 245.41 | 210.74 | 200.74 | 222.28 | 208.03 | 182.38 | 160.90 | 170.18 | 173.06 | 124.11 | 82.63 | 68.86 | 43.33 | 39.42 | 118.30 | 110.61 | 101.01 | 87.76 | 78.19 | 97.04 | 80.85 | 44.64 | 30.29 | 48.03 | 71.13 | 44.06 | 35.33 | 54.12 | 33.05 | 21.09 | 104.50 | 60.87 | 48.31 | 26.82 | 19.80 | |
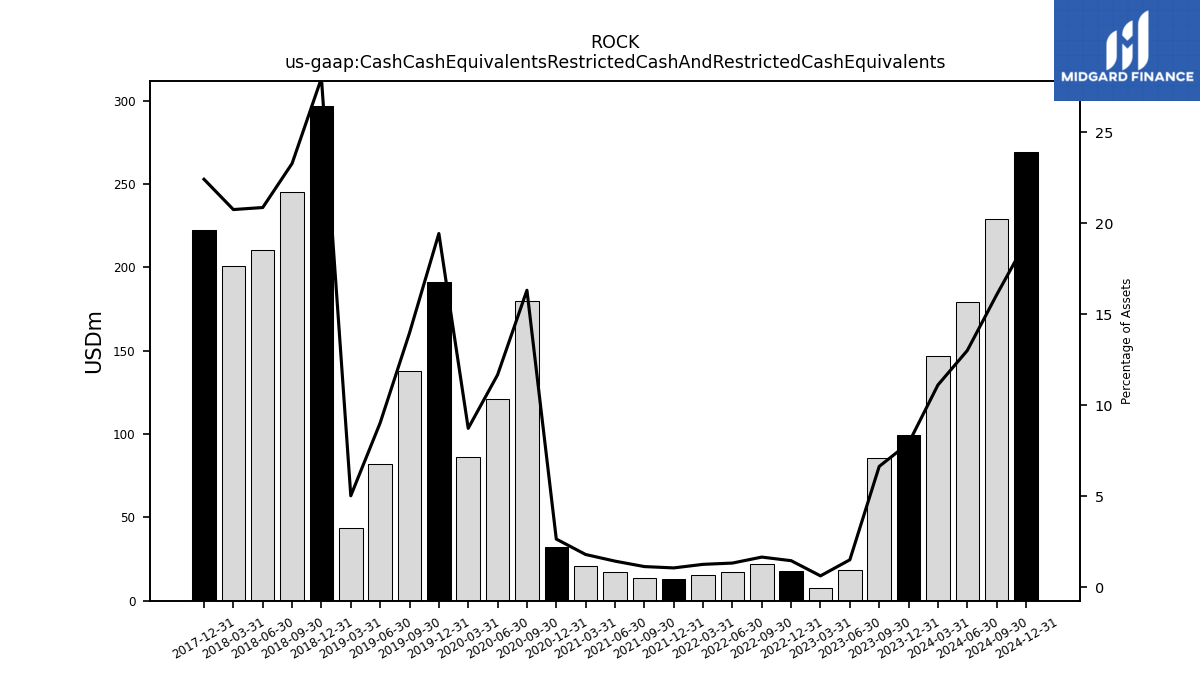
| Cash Cash Equivalents Restricted Cash And Restricted Cash Equivalents | 99.43 | 85.47 | 18.62 | 7.50 | 17.61 | 21.92 | 17.15 | 15.57 | 12.85 | 13.93 | 16.96 | 20.73 | 32.05 | 179.82 | 120.86 | 85.97 | 191.36 | 137.62 | 81.88 | 43.51 | 297.01 | 245.41 | 210.74 | 200.74 | 222.28 | NA | NA | NA | NA | NA | NA | NA | NA | NA | NA | NA | NA | NA | NA | NA | NA | NA | NA | NA | NA | NA | NA | NA | NA | NA | NA | NA | NA | NA | NA | NA | |
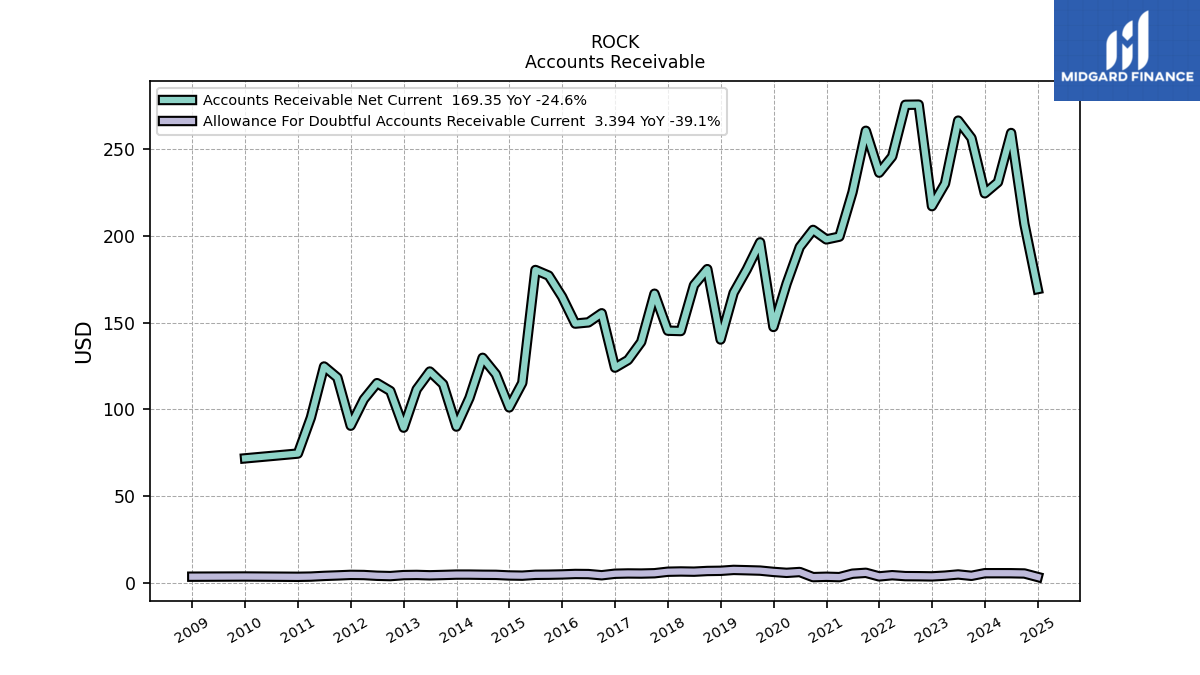
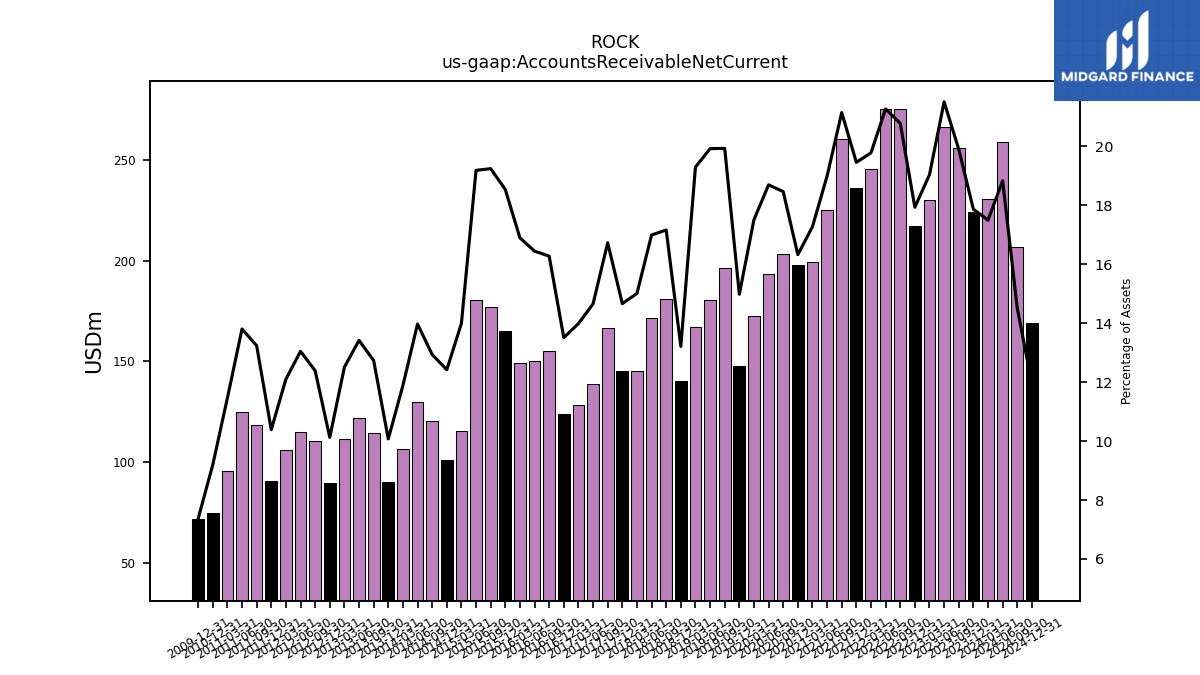
| Accounts Receivable Net Current | 224.55 | 256.40 | 266.49 | 230.13 | 217.16 | 275.70 | 275.60 | 245.81 | 236.44 | 260.62 | 225.31 | 199.60 | 197.99 | 203.49 | 193.61 | 172.45 | 147.51 | 196.33 | 180.70 | 167.20 | 140.28 | 180.88 | 171.64 | 145.18 | 145.38 | 166.72 | 138.87 | 128.48 | 124.07 | 155.43 | 150.17 | 149.46 | 164.97 | 177.12 | 180.38 | 115.28 | 101.14 | 120.26 | 129.76 | 106.64 | 90.08 | 114.54 | 121.85 | 111.53 | 89.47 | 110.61 | 115.15 | 105.78 | 90.59 | 118.33 | 124.75 | 95.31 | 74.54 | NA | NA | NA | |
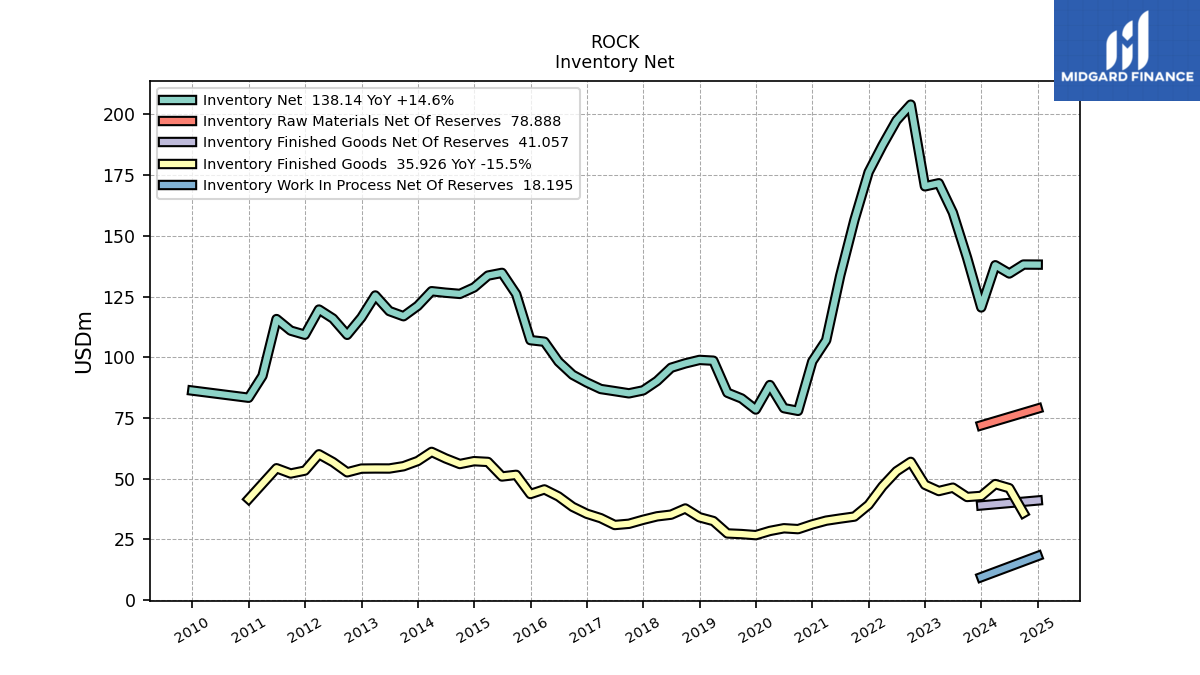
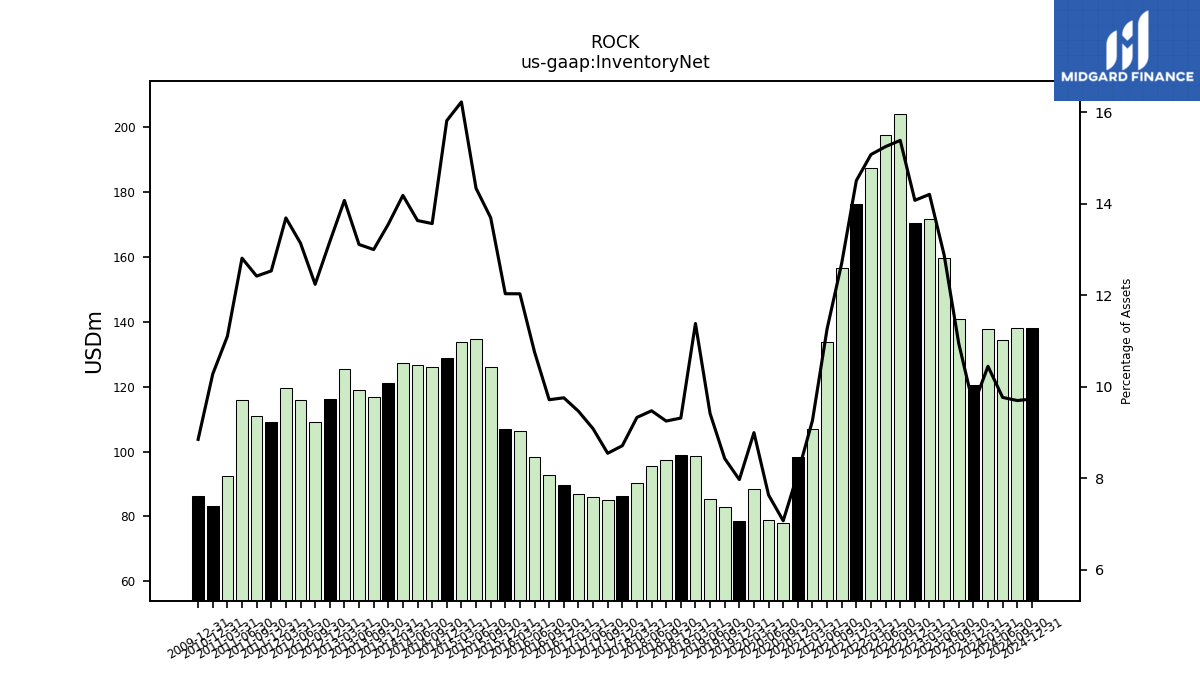
| Inventory Net | 120.50 | 141.01 | 159.54 | 171.63 | 170.36 | 204.00 | 197.50 | 187.25 | 176.21 | 156.49 | 133.62 | 107.00 | 98.31 | 77.94 | 79.06 | 88.58 | 78.48 | 83.05 | 85.40 | 98.59 | 98.91 | 97.49 | 95.69 | 90.24 | 86.37 | 85.16 | 86.06 | 86.94 | 89.61 | 92.78 | 98.22 | 106.41 | 107.06 | 126.01 | 134.75 | 133.62 | 128.74 | 126.08 | 126.58 | 127.20 | 121.15 | 116.90 | 119.02 | 125.44 | 116.36 | 109.24 | 115.94 | 119.66 | 109.27 | 110.97 | 115.74 | 92.35 | 83.34 | NA | NA | NA | |
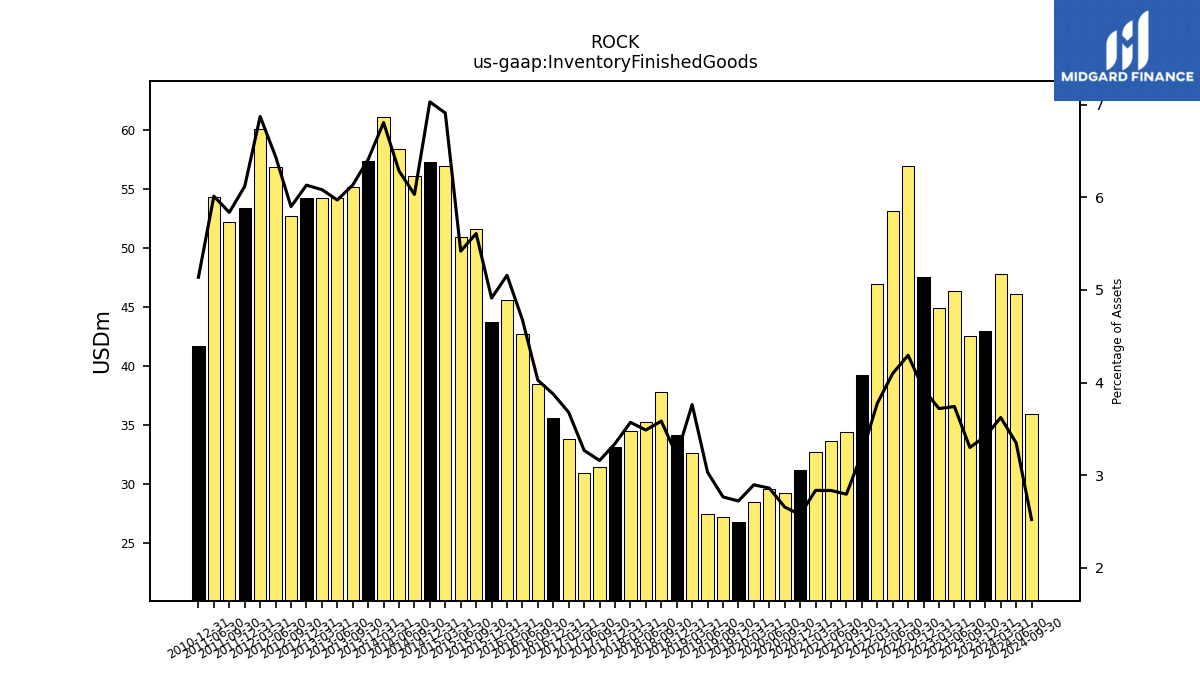
| Inventory Finished Goods | 42.94 | 42.50 | 46.34 | 44.94 | 47.52 | 56.95 | 53.09 | 46.90 | 39.26 | 34.43 | 33.62 | 32.76 | 31.20 | 29.26 | 29.62 | 28.51 | 26.79 | 27.23 | 27.49 | 32.59 | 34.14 | 37.77 | 35.22 | 34.53 | 33.11 | 31.46 | 30.96 | 33.78 | 35.59 | 38.43 | 42.72 | 45.62 | 43.70 | 51.61 | 50.94 | 56.92 | 57.24 | 56.06 | 58.36 | 61.06 | 57.30 | 55.16 | 54.22 | 54.23 | 54.18 | 52.65 | 56.85 | 60.07 | 53.36 | 52.16 | 54.33 | NA | 41.65 | NA | NA | NA | |
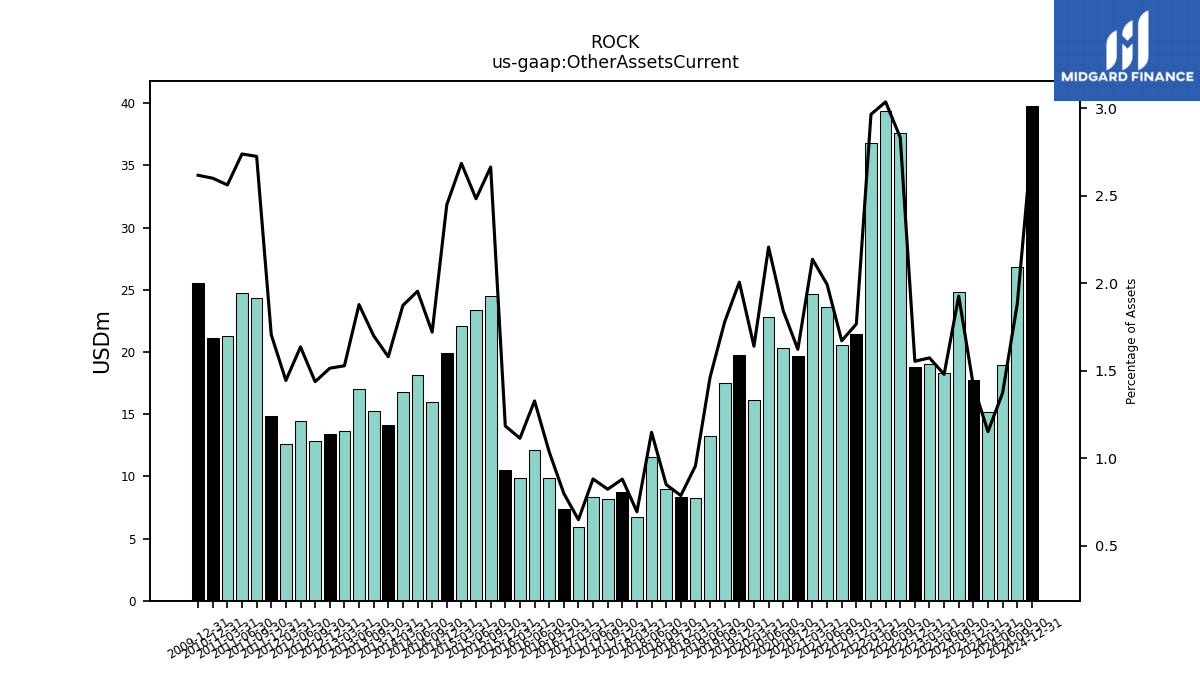
| Other Assets Current | 17.77 | 24.82 | 18.32 | 19.02 | 18.81 | 37.58 | 39.33 | 36.84 | 21.47 | 20.59 | 23.64 | 24.68 | 19.67 | 20.31 | 22.85 | 16.15 | 19.75 | 17.53 | 13.26 | 8.28 | 8.35 | 8.95 | 11.59 | 6.71 | 8.73 | 8.20 | 8.35 | 5.96 | 7.34 | 9.90 | 12.12 | 9.85 | 10.54 | 24.51 | 23.34 | 22.12 | 19.94 | 15.99 | 18.15 | 16.80 | 14.13 | 15.29 | 17.05 | 13.62 | 13.38 | 12.83 | 14.44 | 12.63 | 14.87 | 24.35 | 24.75 | 21.31 | 21.08 | NA | NA | NA | |
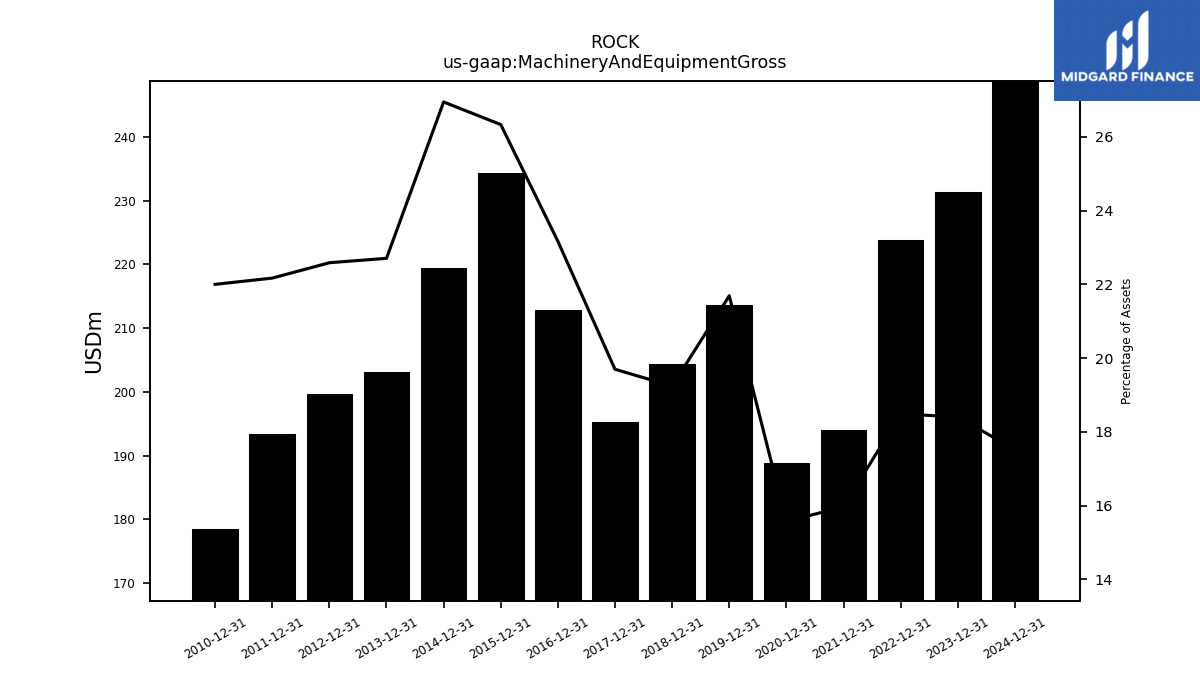
| Machinery And Equipment Gross | 231.28 | NA | NA | NA | 223.84 | NA | NA | NA | 194.01 | NA | NA | NA | 188.85 | NA | NA | NA | 213.55 | NA | NA | NA | 204.33 | NA | NA | NA | 195.30 | NA | NA | NA | 212.77 | NA | NA | NA | 234.34 | NA | NA | NA | 219.41 | NA | NA | NA | 203.05 | NA | NA | NA | 199.62 | NA | NA | NA | 193.35 | NA | NA | NA | 178.43 | NA | NA | NA |
| 2023-12-31 | 2023-09-30 | 2023-06-30 | 2023-03-31 | 2022-12-31 | 2022-09-30 | 2022-06-30 | 2022-03-31 | 2021-12-31 | 2021-09-30 | 2021-06-30 | 2021-03-31 | 2020-12-31 | 2020-09-30 | 2020-06-30 | 2020-03-31 | 2019-12-31 | 2019-09-30 | 2019-06-30 | 2019-03-31 | 2018-12-31 | 2018-09-30 | 2018-06-30 | 2018-03-31 | 2017-12-31 | 2017-09-30 | 2017-06-30 | 2017-03-31 | 2016-12-31 | 2016-09-30 | 2016-06-30 | 2016-03-31 | 2015-12-31 | 2015-09-30 | 2015-06-30 | 2015-03-31 | 2014-12-31 | 2014-09-30 | 2014-06-30 | 2014-03-31 | 2013-12-31 | 2013-09-30 | 2013-06-30 | 2013-03-31 | 2012-12-31 | 2012-09-30 | 2012-06-30 | 2012-03-31 | 2011-12-31 | 2011-09-30 | 2011-06-30 | 2011-03-31 | 2010-12-31 | 2010-09-30 | 2010-06-30 | 2010-03-31 | ||
|---|---|---|---|---|---|---|---|---|---|---|---|---|---|---|---|---|---|---|---|---|---|---|---|---|---|---|---|---|---|---|---|---|---|---|---|---|---|---|---|---|---|---|---|---|---|---|---|---|---|---|---|---|---|---|---|---|---|
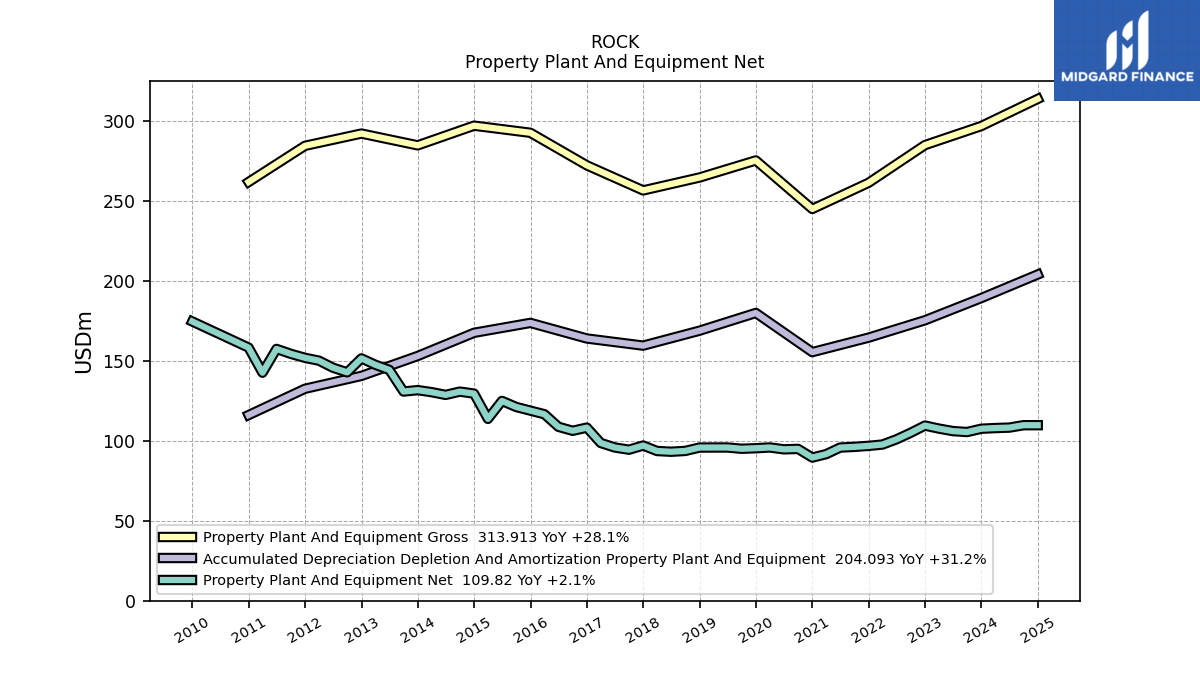
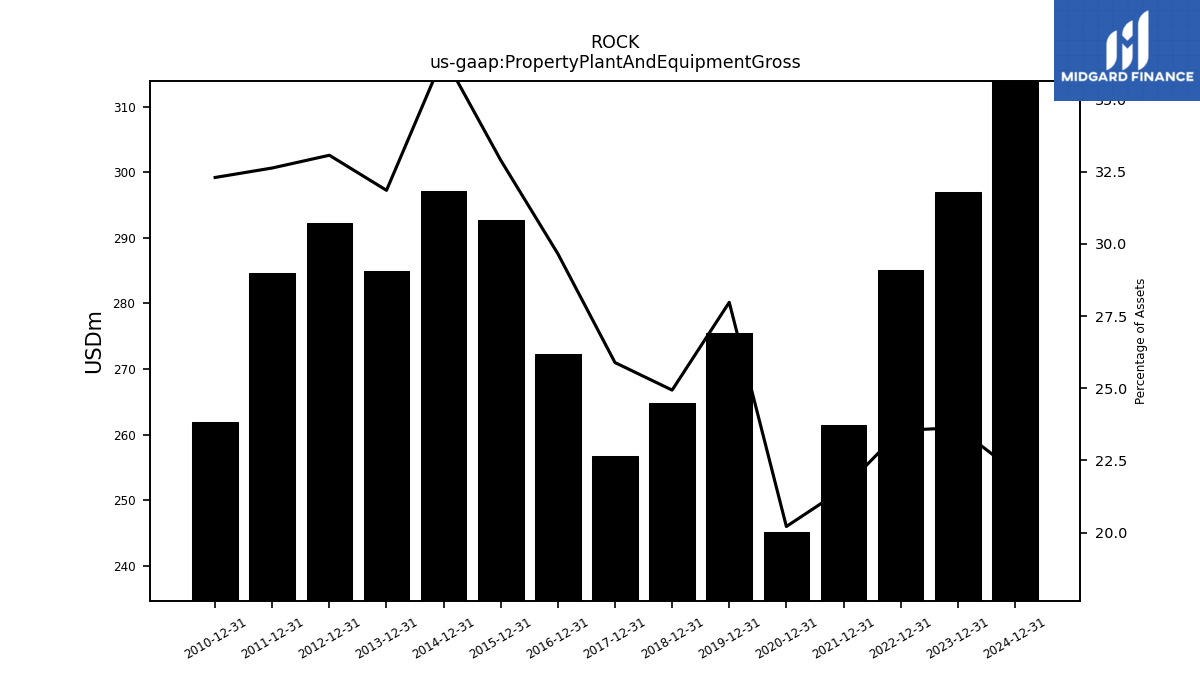
| Property Plant And Equipment Gross | 296.94 | NA | NA | NA | 285.03 | NA | NA | NA | 261.47 | NA | NA | NA | 245.08 | NA | NA | NA | 275.44 | NA | NA | NA | 264.75 | NA | NA | NA | 256.69 | NA | NA | NA | 272.36 | NA | NA | NA | 292.74 | NA | NA | NA | 297.18 | NA | NA | NA | 284.87 | NA | NA | NA | 292.26 | NA | NA | NA | 284.57 | NA | NA | NA | 261.94 | NA | NA | NA | |
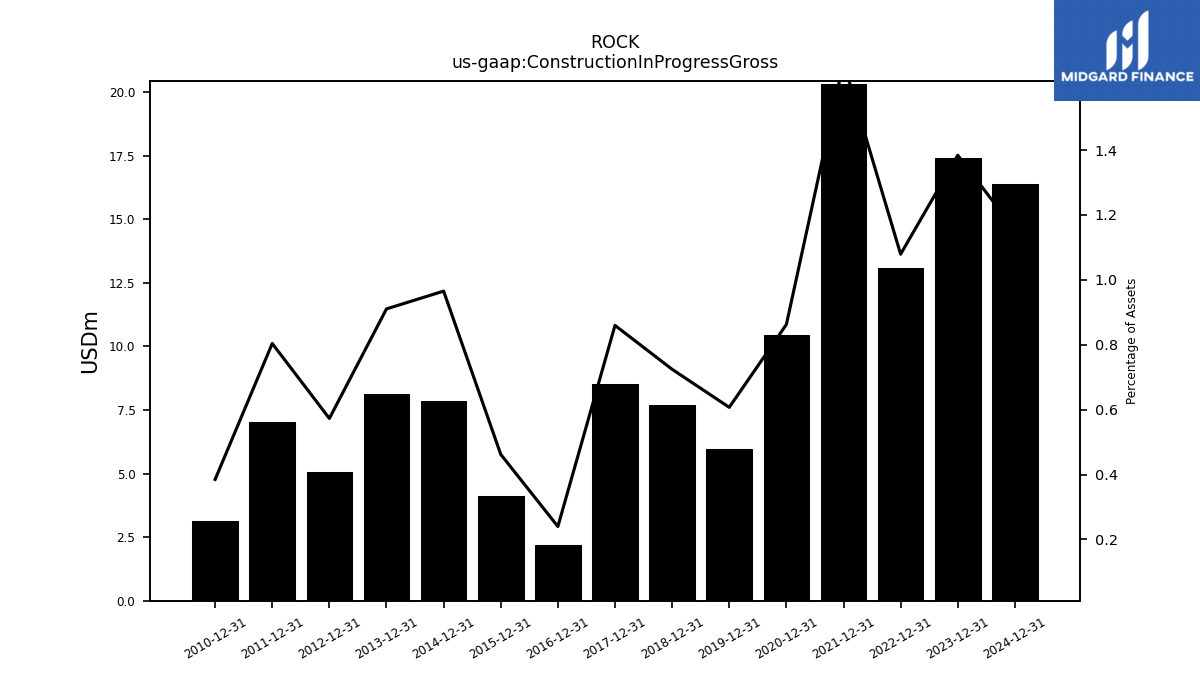
| Construction In Progress Gross | 17.39 | NA | NA | NA | 13.06 | NA | NA | NA | 20.29 | NA | NA | NA | 10.46 | NA | NA | NA | 5.98 | NA | NA | NA | 7.69 | NA | NA | NA | 8.52 | NA | NA | NA | 2.20 | NA | NA | NA | 4.11 | NA | NA | NA | 7.86 | NA | NA | NA | 8.14 | NA | NA | NA | 5.06 | NA | NA | NA | 7.01 | NA | NA | NA | 3.12 | NA | NA | NA | |
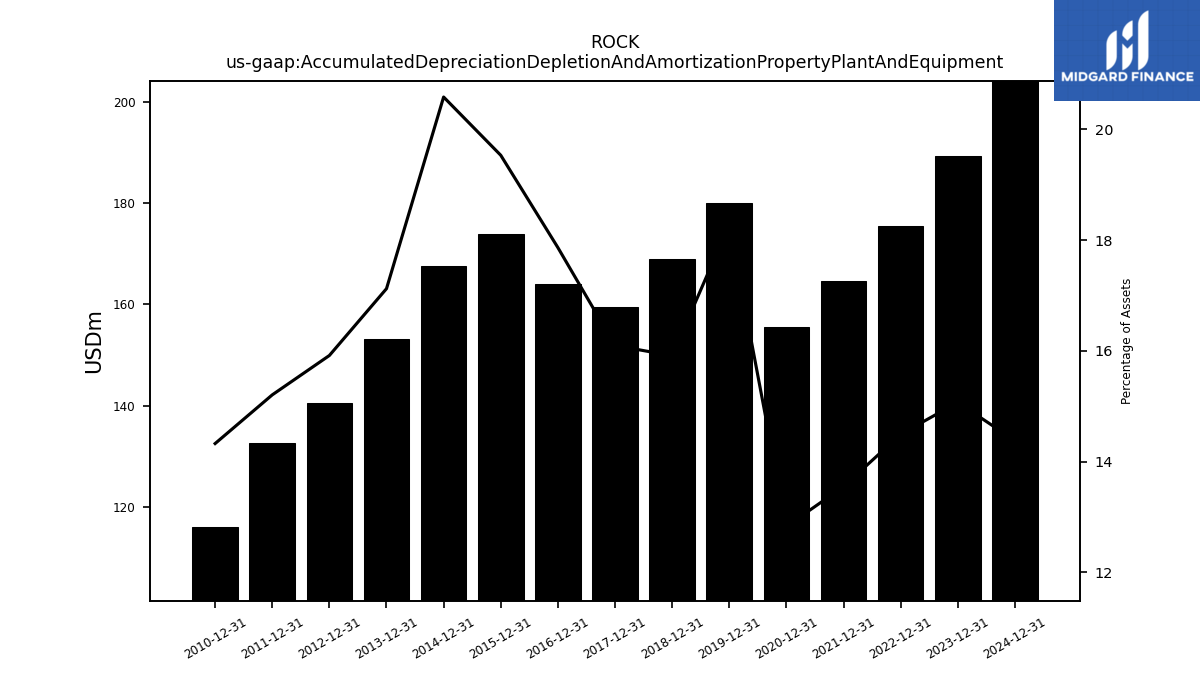
| Accumulated Depreciation Depletion And Amortization Property Plant And Equipment | 189.34 | NA | NA | NA | 175.44 | NA | NA | NA | 164.58 | NA | NA | NA | 155.52 | NA | NA | NA | 180.03 | NA | NA | NA | 168.93 | NA | NA | NA | 159.59 | NA | NA | NA | 164.06 | NA | NA | NA | 173.81 | NA | NA | NA | 167.61 | NA | NA | NA | 153.12 | NA | NA | NA | 140.65 | NA | NA | NA | 132.59 | NA | NA | NA | 116.16 | NA | NA | NA | |
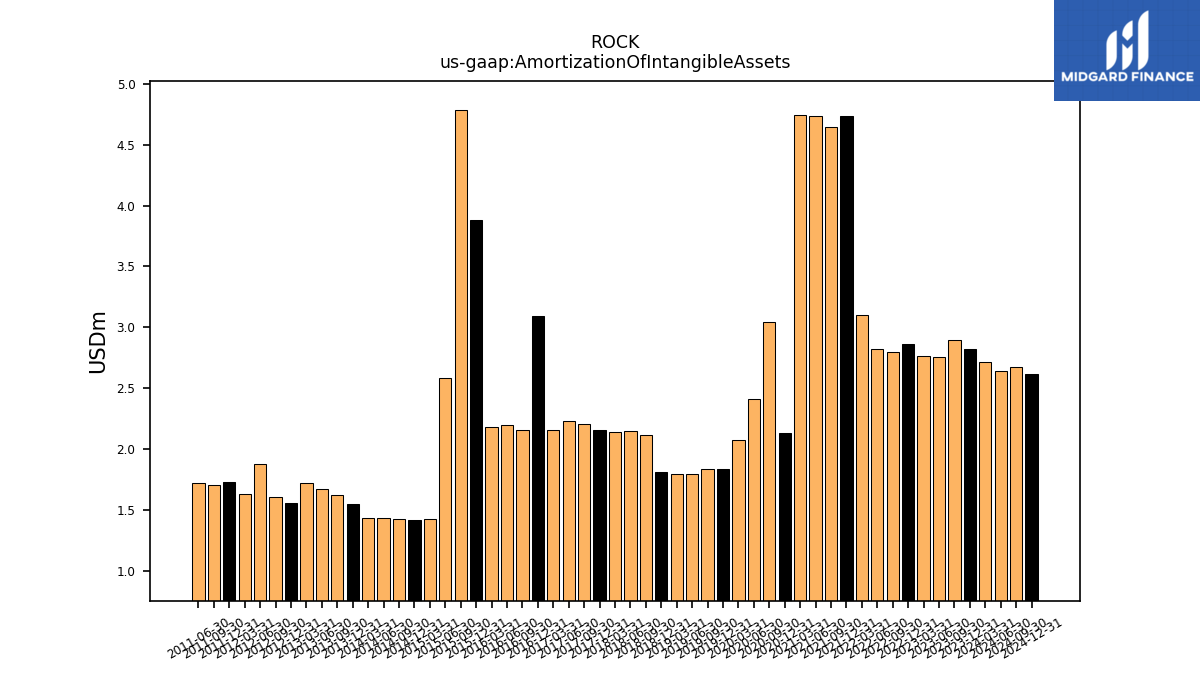
| Amortization Of Intangible Assets | 2.82 | 2.89 | 2.76 | 2.77 | 2.87 | 2.80 | 2.82 | 3.10 | 4.73 | 4.65 | 4.74 | 4.74 | 2.13 | 3.04 | 2.41 | 2.08 | 1.84 | 1.84 | 1.80 | 1.80 | 1.81 | 2.12 | 2.15 | 2.14 | 2.16 | 2.21 | 2.23 | 2.16 | 3.10 | 2.16 | 2.20 | 2.18 | 3.88 | 4.78 | 2.58 | 1.43 | 1.42 | 1.43 | 1.44 | 1.44 | 1.55 | 1.62 | 1.68 | 1.72 | 1.55 | 1.61 | 1.88 | 1.63 | 1.73 | 1.71 | 1.73 | NA | NA | NA | NA | NA | |
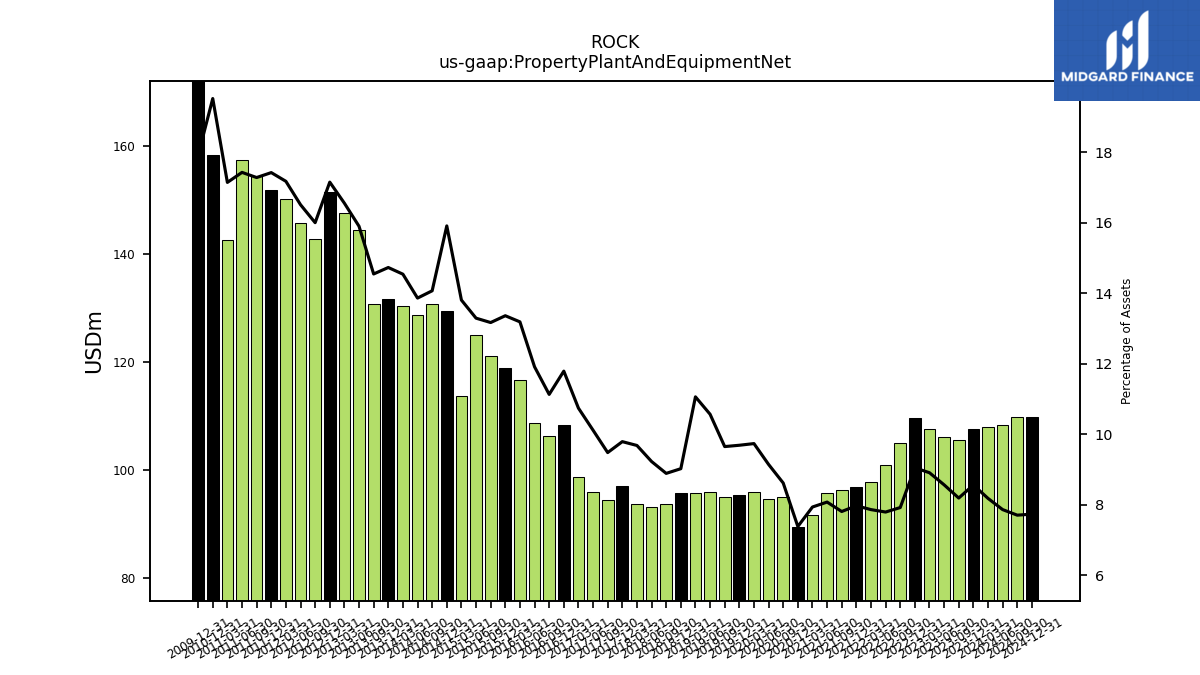
| Property Plant And Equipment Net | 107.60 | 105.54 | 106.13 | 107.70 | 109.58 | 105.10 | 101.00 | 97.72 | 96.89 | 96.26 | 95.84 | 91.72 | 89.56 | 94.98 | 94.72 | 95.88 | 95.41 | 95.08 | 95.87 | 95.86 | 95.83 | 93.72 | 93.22 | 93.67 | 97.10 | 94.49 | 95.87 | 98.69 | 108.30 | 106.31 | 108.81 | 116.68 | 118.93 | 121.22 | 125.00 | 113.77 | 129.57 | 130.82 | 128.77 | 130.48 | 131.75 | 130.88 | 144.41 | 147.63 | 151.61 | 142.88 | 145.77 | 150.19 | 151.97 | 154.48 | 157.53 | 142.63 | 158.35 | NA | NA | NA | |
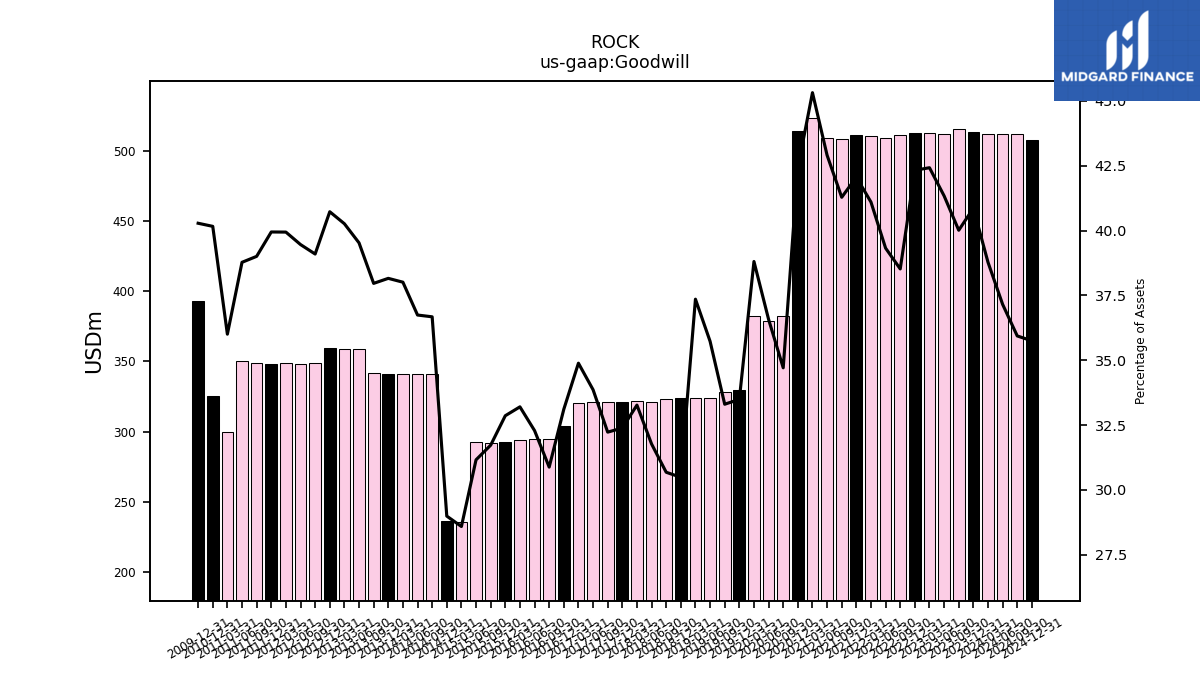
| Goodwill | 513.38 | 515.34 | 511.96 | 512.64 | 512.36 | 510.87 | 509.36 | 510.54 | 510.94 | 508.66 | 508.86 | 523.45 | 514.28 | 382.43 | 378.74 | 382.05 | 329.70 | 327.98 | 324.02 | 323.57 | 323.67 | 323.32 | 320.88 | 321.77 | 321.07 | 321.09 | 320.85 | 320.41 | 304.03 | 294.86 | 294.80 | 293.66 | 292.39 | 291.94 | 292.92 | 235.52 | 236.04 | 340.88 | 341.20 | 340.94 | 341.17 | 341.44 | 358.87 | 358.93 | 359.86 | 348.94 | 348.26 | 349.14 | 348.33 | 348.55 | 350.36 | 299.46 | 325.65 | NA | NA | NA | |
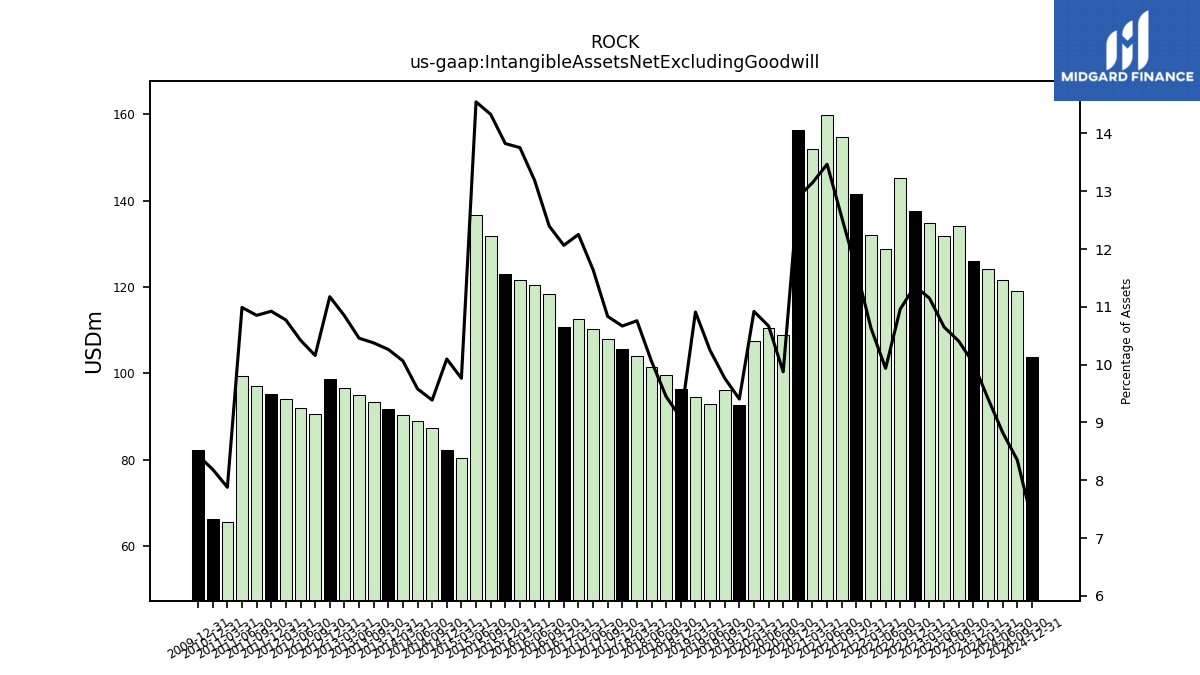
| Intangible Assets Net Excluding Goodwill | 125.98 | 134.05 | 131.93 | 134.74 | 137.53 | 145.37 | 128.72 | 132.11 | 141.50 | 154.66 | 159.73 | 151.88 | 156.37 | 108.82 | 110.48 | 107.53 | 92.59 | 96.19 | 92.93 | 94.52 | 96.38 | 99.55 | 101.55 | 104.06 | 105.77 | 107.94 | 110.33 | 112.53 | 110.79 | 118.39 | 120.44 | 121.65 | 123.01 | 131.87 | 136.73 | 80.44 | 82.22 | 87.26 | 88.97 | 90.29 | 91.78 | 93.33 | 94.97 | 96.71 | 98.76 | 90.68 | 92.00 | 94.17 | 95.27 | 96.99 | 99.31 | 65.54 | 66.39 | NA | NA | NA | |
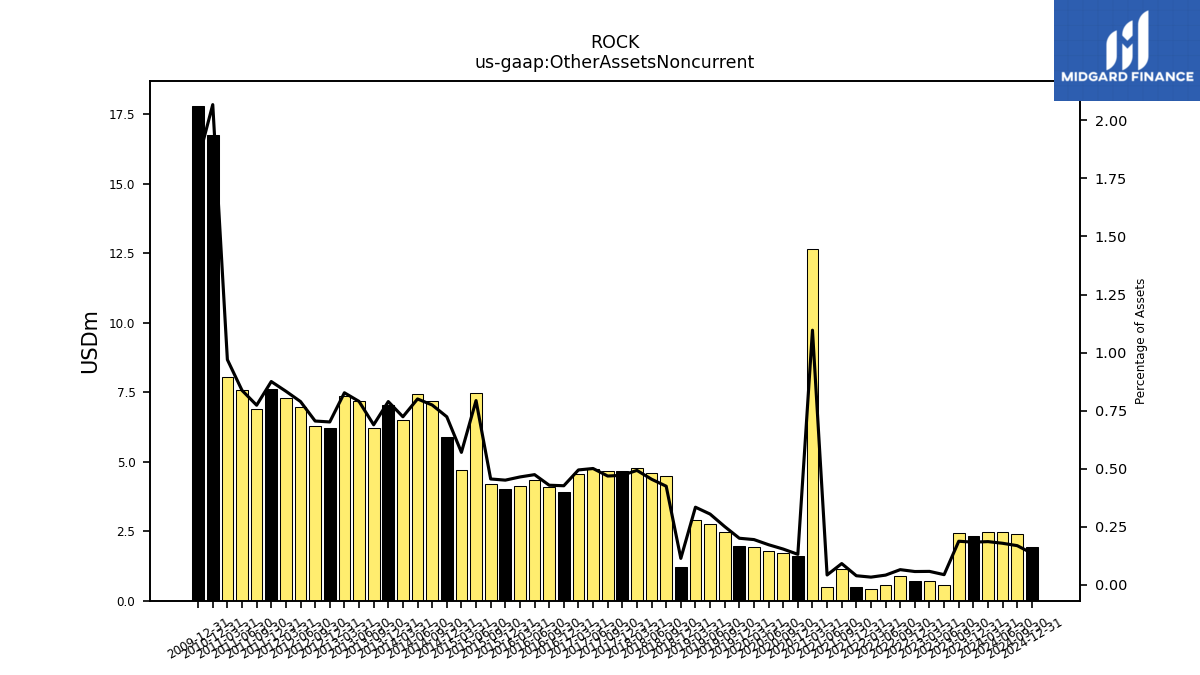
| Other Assets Noncurrent | 2.32 | 2.42 | 0.55 | 0.71 | 0.70 | 0.88 | 0.55 | 0.42 | 0.48 | 1.14 | 0.51 | 12.67 | 1.60 | 1.70 | 1.79 | 1.92 | 1.98 | 2.48 | 2.77 | 2.90 | 1.22 | 4.48 | 4.60 | 4.77 | 4.68 | 4.67 | 4.75 | 4.55 | 3.92 | 4.10 | 4.34 | 4.11 | 4.01 | 4.20 | 7.46 | 4.70 | 5.89 | 7.20 | 7.44 | 6.50 | 7.06 | 6.20 | 7.17 | 7.38 | 6.20 | 6.30 | 6.97 | 7.29 | 7.64 | 6.92 | 7.57 | 8.07 | 16.77 | NA | NA | NA |
| 2023-12-31 | 2023-09-30 | 2023-06-30 | 2023-03-31 | 2022-12-31 | 2022-09-30 | 2022-06-30 | 2022-03-31 | 2021-12-31 | 2021-09-30 | 2021-06-30 | 2021-03-31 | 2020-12-31 | 2020-09-30 | 2020-06-30 | 2020-03-31 | 2019-12-31 | 2019-09-30 | 2019-06-30 | 2019-03-31 | 2018-12-31 | 2018-09-30 | 2018-06-30 | 2018-03-31 | 2017-12-31 | 2017-09-30 | 2017-06-30 | 2017-03-31 | 2016-12-31 | 2016-09-30 | 2016-06-30 | 2016-03-31 | 2015-12-31 | 2015-09-30 | 2015-06-30 | 2015-03-31 | 2014-12-31 | 2014-09-30 | 2014-06-30 | 2014-03-31 | 2013-12-31 | 2013-09-30 | 2013-06-30 | 2013-03-31 | 2012-12-31 | 2012-09-30 | 2012-06-30 | 2012-03-31 | 2011-12-31 | 2011-09-30 | 2011-06-30 | 2011-03-31 | 2010-12-31 | 2010-09-30 | 2010-06-30 | 2010-03-31 | ||
|---|---|---|---|---|---|---|---|---|---|---|---|---|---|---|---|---|---|---|---|---|---|---|---|---|---|---|---|---|---|---|---|---|---|---|---|---|---|---|---|---|---|---|---|---|---|---|---|---|---|---|---|---|---|---|---|---|---|
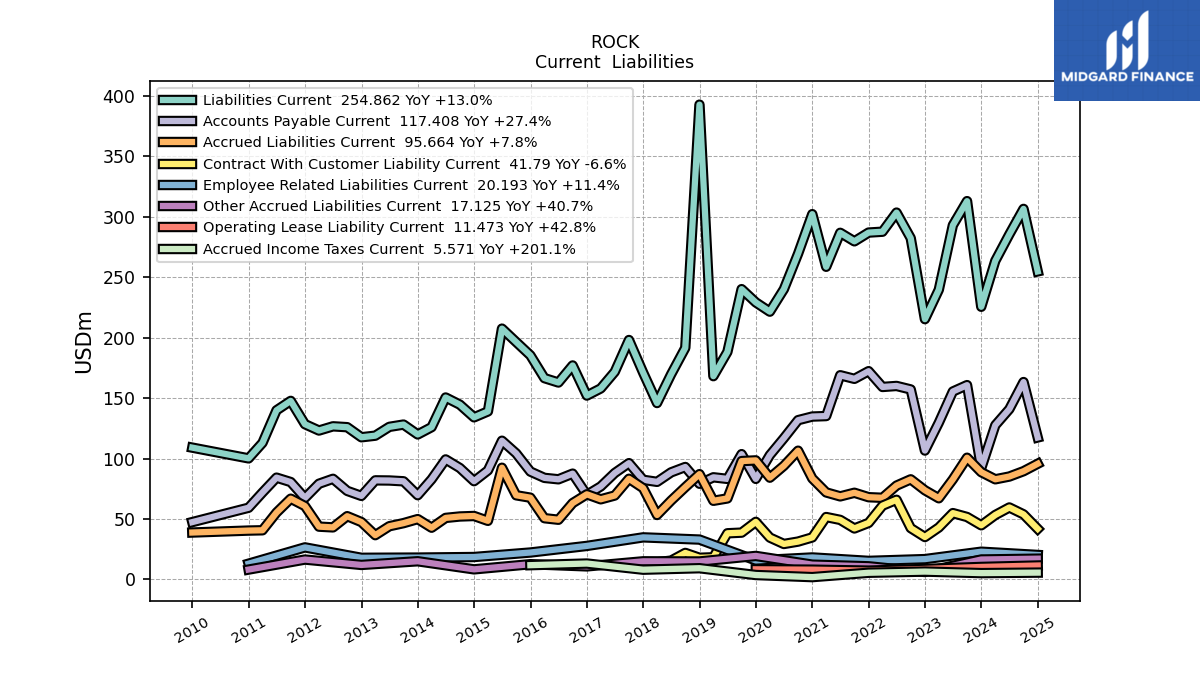
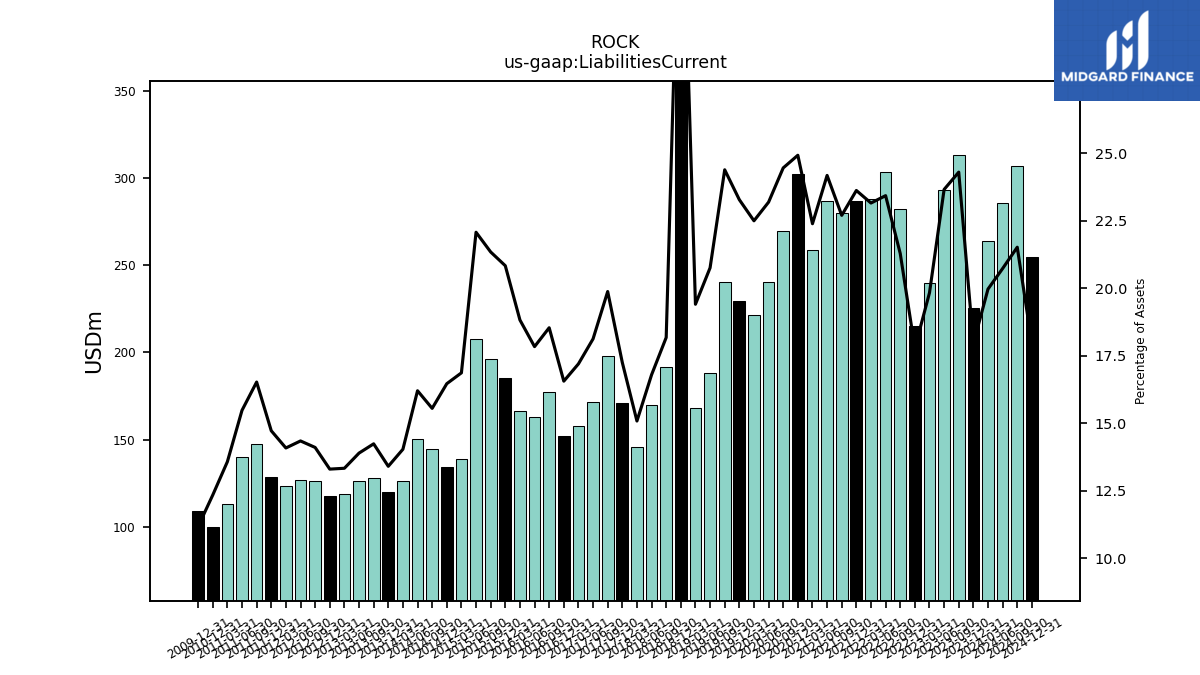
| Liabilities Current | 225.58 | 313.01 | 293.05 | 239.69 | 215.32 | 282.37 | 303.53 | 287.70 | 286.99 | 279.74 | 286.81 | 258.67 | 302.24 | 269.49 | 240.14 | 221.52 | 229.20 | 240.19 | 188.25 | 168.14 | 392.87 | 191.56 | 169.65 | 145.92 | 171.03 | 198.08 | 171.76 | 158.00 | 152.09 | 177.03 | 162.89 | 166.53 | 185.40 | 196.43 | 207.51 | 138.97 | 134.09 | 144.59 | 150.51 | 125.96 | 119.91 | 128.10 | 126.20 | 118.91 | 117.58 | 125.93 | 126.65 | 123.16 | 128.42 | 147.72 | 139.90 | 112.96 | 100.12 | NA | NA | NA | |
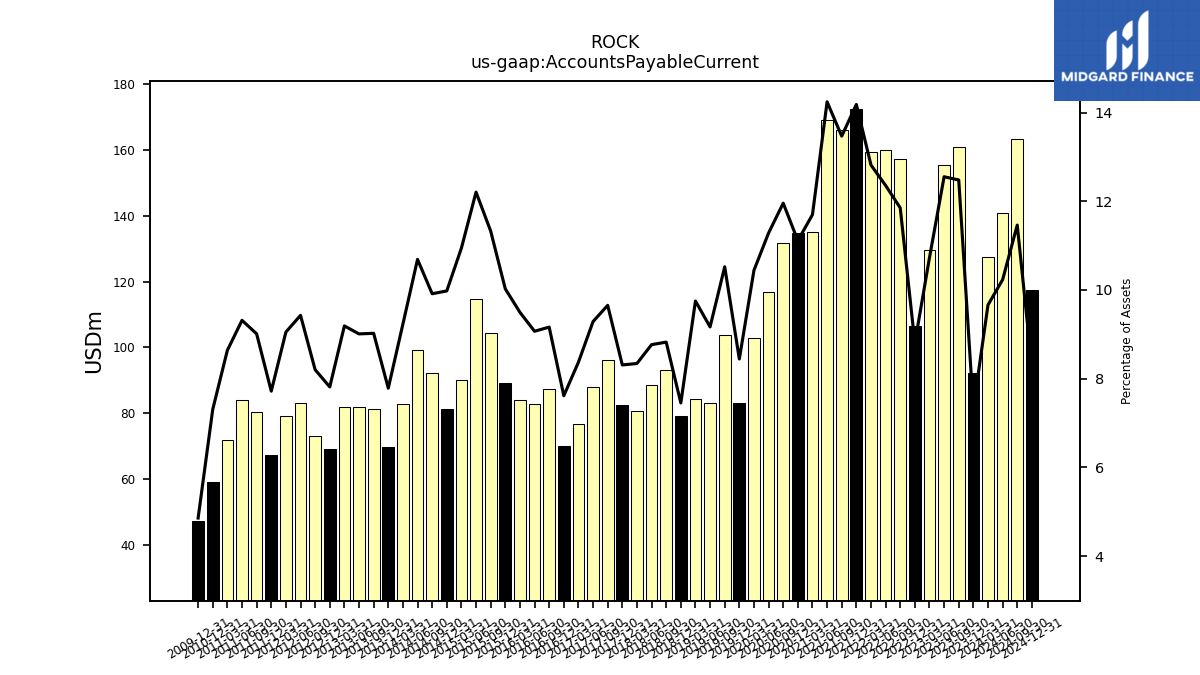
| Accounts Payable Current | 92.12 | 160.74 | 155.46 | 129.66 | 106.58 | 157.17 | 160.06 | 159.21 | 172.29 | 165.94 | 168.92 | 135.13 | 134.74 | 131.75 | 116.85 | 102.82 | 83.14 | 103.63 | 83.14 | 84.46 | 79.14 | 93.00 | 88.55 | 80.69 | 82.39 | 96.18 | 88.01 | 76.89 | 69.94 | 87.50 | 82.81 | 83.99 | 89.20 | 104.24 | 114.73 | 90.16 | 81.25 | 92.16 | 99.26 | 82.81 | 69.62 | 81.16 | 81.81 | 81.93 | 69.06 | 73.22 | 83.22 | 79.12 | 67.32 | 80.53 | 84.18 | 71.87 | 59.28 | NA | NA | NA | |
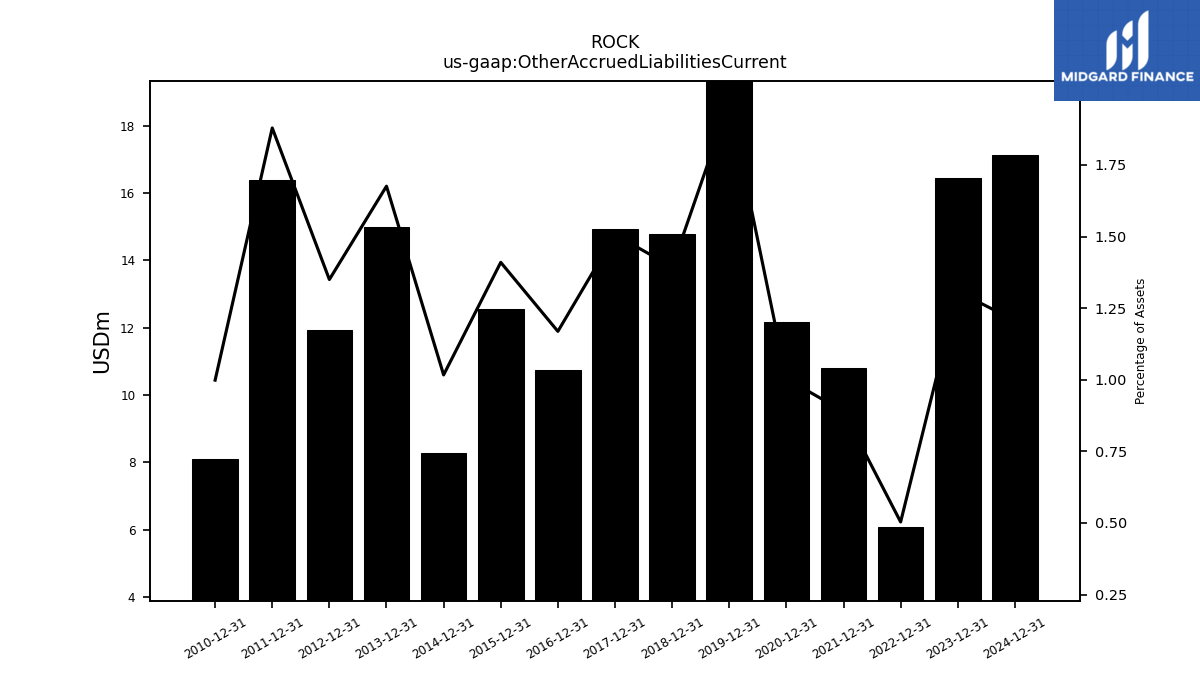
| Other Accrued Liabilities Current | 16.44 | NA | NA | NA | 6.10 | NA | NA | NA | 10.81 | NA | NA | NA | 12.17 | NA | NA | NA | 19.39 | NA | NA | NA | 14.80 | NA | NA | NA | 14.94 | NA | NA | NA | 10.73 | NA | NA | NA | 12.54 | NA | NA | NA | 8.28 | NA | NA | NA | 14.98 | NA | NA | NA | 11.93 | NA | NA | NA | 16.39 | NA | NA | NA | 8.10 | NA | NA | NA | |
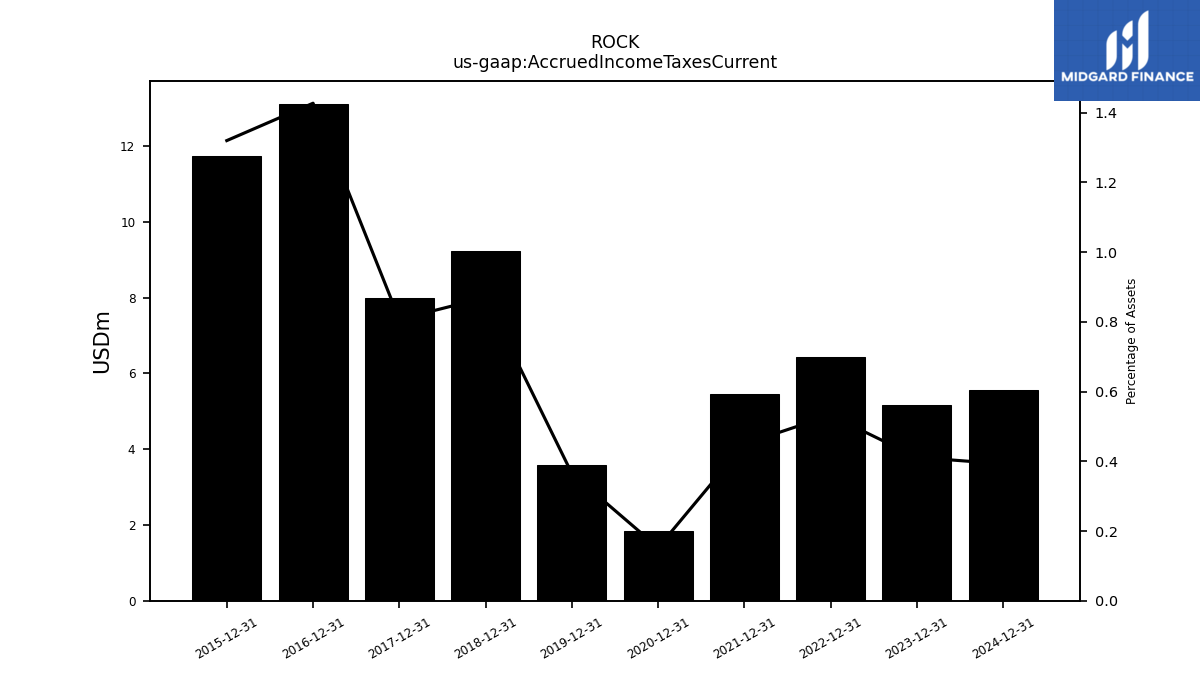
| Accrued Income Taxes Current | 5.17 | NA | NA | NA | 6.44 | NA | NA | NA | 5.46 | NA | NA | NA | 1.85 | NA | NA | NA | 3.59 | NA | NA | NA | 9.23 | NA | NA | NA | 8.00 | NA | NA | NA | 13.10 | NA | NA | NA | 11.74 | NA | NA | NA | NA | NA | NA | NA | NA | NA | NA | NA | NA | NA | NA | NA | NA | NA | NA | NA | NA | NA | NA | NA | |
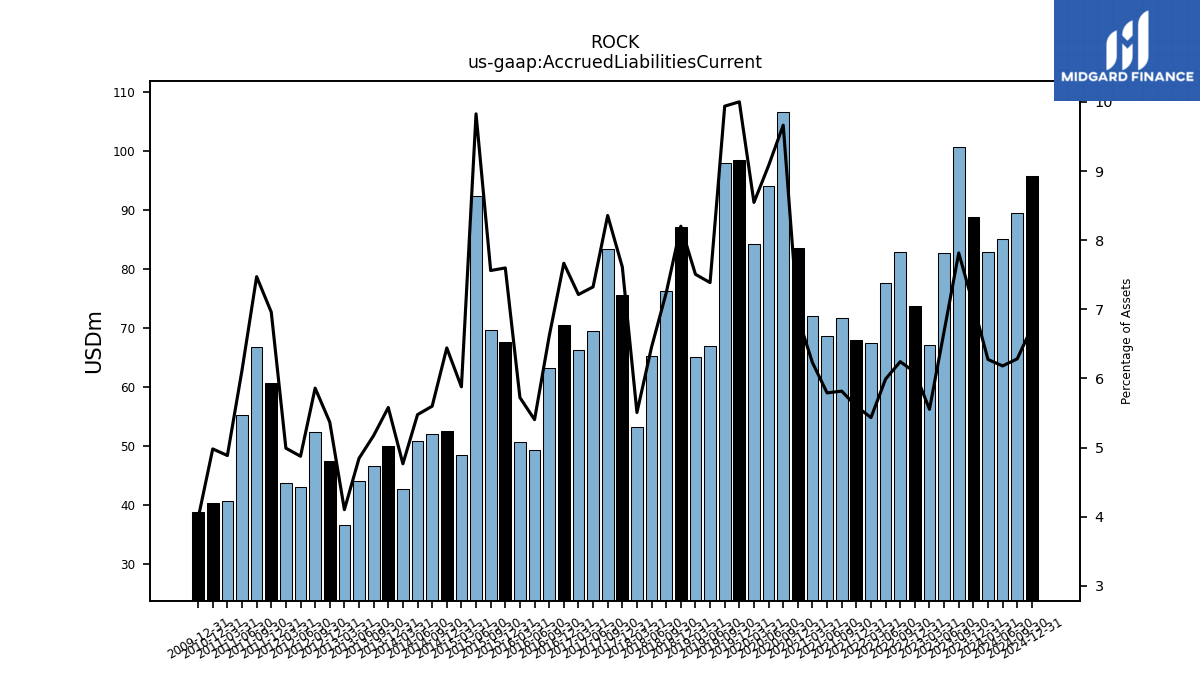
| Accrued Liabilities Current | 88.72 | 100.66 | 82.75 | 67.10 | 73.72 | 82.79 | 77.61 | 67.50 | 67.99 | 71.66 | 68.68 | 71.95 | 83.50 | 106.48 | 94.01 | 84.14 | 98.46 | 97.88 | 66.98 | 65.02 | 87.07 | 76.27 | 65.17 | 53.25 | 75.47 | 83.26 | 69.39 | 66.25 | 70.39 | 63.11 | 49.33 | 50.62 | 67.61 | 69.58 | 92.38 | 48.42 | 52.44 | 52.03 | 50.85 | 42.74 | 49.88 | 46.53 | 43.98 | 36.56 | 47.43 | 52.30 | 43.01 | 43.62 | 60.69 | 66.77 | 55.28 | 40.62 | 40.38 | NA | NA | NA | |
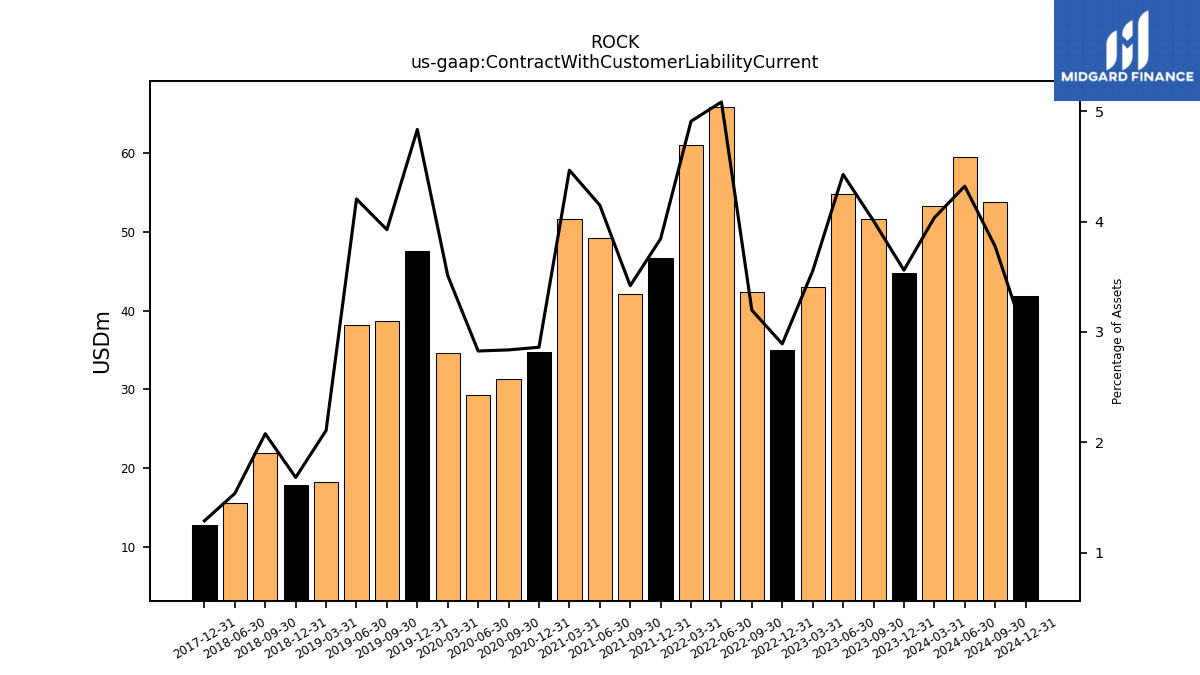
| Contract With Customer Liability Current | 44.73 | 51.62 | 54.84 | 42.93 | 35.02 | 42.41 | 65.86 | 60.99 | 46.71 | 42.13 | 49.22 | 51.59 | 34.70 | 31.27 | 29.28 | 34.57 | 47.60 | 38.67 | 38.13 | 18.26 | 17.86 | 21.90 | 15.53 | NA | 12.78 | NA | NA | NA | NA | NA | NA | NA | NA | NA | NA | NA | NA | NA | NA | NA | NA | NA | NA | NA | NA | NA | NA | NA | NA | NA | NA | NA | NA | NA | NA | NA |
| 2023-12-31 | 2023-09-30 | 2023-06-30 | 2023-03-31 | 2022-12-31 | 2022-09-30 | 2022-06-30 | 2022-03-31 | 2021-12-31 | 2021-09-30 | 2021-06-30 | 2021-03-31 | 2020-12-31 | 2020-09-30 | 2020-06-30 | 2020-03-31 | 2019-12-31 | 2019-09-30 | 2019-06-30 | 2019-03-31 | 2018-12-31 | 2018-09-30 | 2018-06-30 | 2018-03-31 | 2017-12-31 | 2017-09-30 | 2017-06-30 | 2017-03-31 | 2016-12-31 | 2016-09-30 | 2016-06-30 | 2016-03-31 | 2015-12-31 | 2015-09-30 | 2015-06-30 | 2015-03-31 | 2014-12-31 | 2014-09-30 | 2014-06-30 | 2014-03-31 | 2013-12-31 | 2013-09-30 | 2013-06-30 | 2013-03-31 | 2012-12-31 | 2012-09-30 | 2012-06-30 | 2012-03-31 | 2011-12-31 | 2011-09-30 | 2011-06-30 | 2011-03-31 | 2010-12-31 | 2010-09-30 | 2010-06-30 | 2010-03-31 | ||
|---|---|---|---|---|---|---|---|---|---|---|---|---|---|---|---|---|---|---|---|---|---|---|---|---|---|---|---|---|---|---|---|---|---|---|---|---|---|---|---|---|---|---|---|---|---|---|---|---|---|---|---|---|---|---|---|---|---|
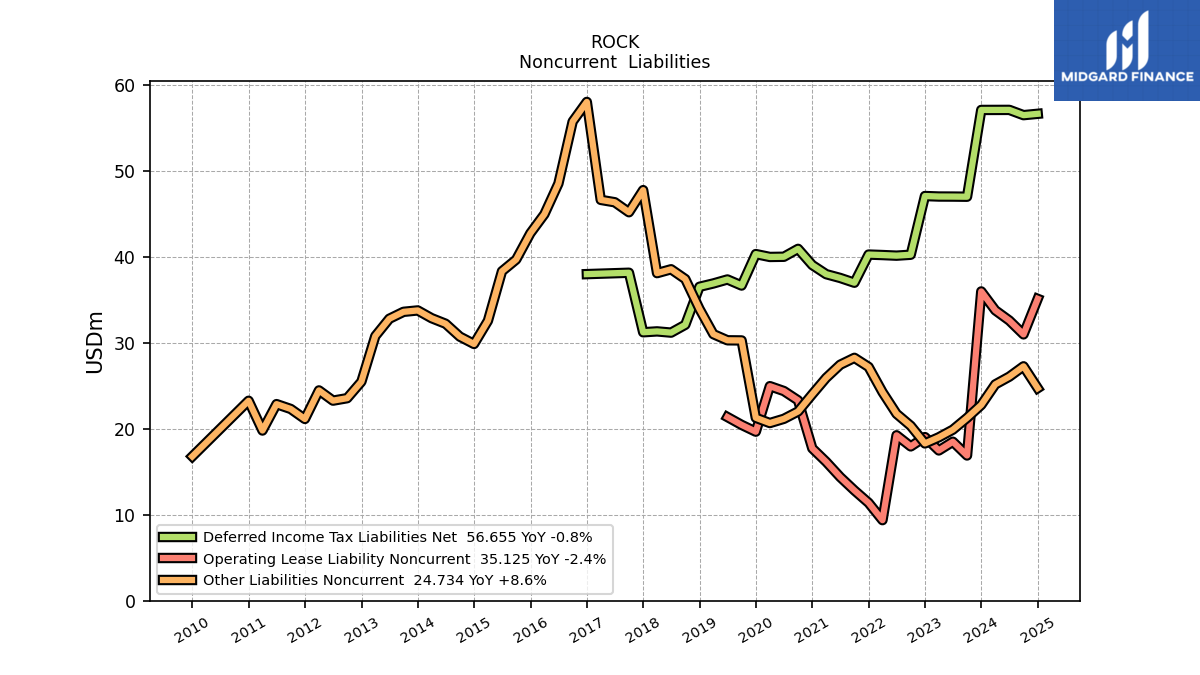
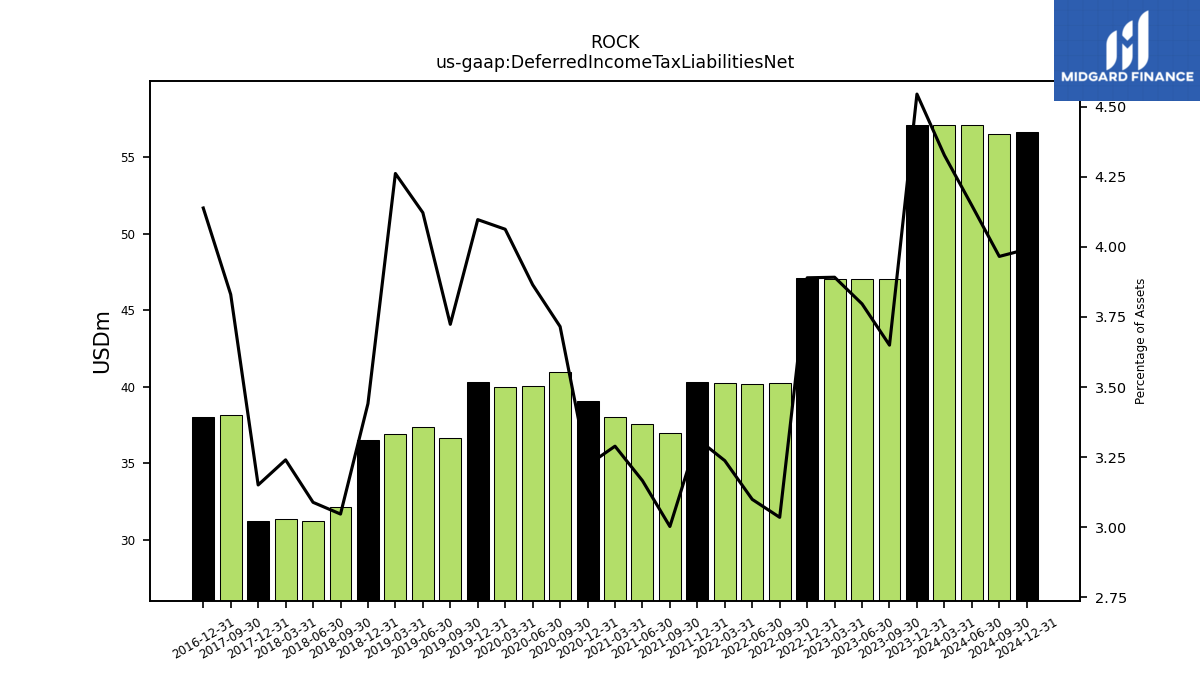
| Deferred Income Tax Liabilities Net | 57.10 | 47.01 | 47.02 | 47.03 | 47.09 | 40.26 | 40.15 | 40.22 | 40.28 | 37.00 | 37.55 | 38.00 | 39.06 | 40.94 | 40.02 | 40.00 | 40.33 | 36.67 | 37.38 | 36.92 | 36.53 | 32.11 | 31.20 | 31.34 | 31.24 | 38.16 | NA | NA | 38.00 | NA | NA | NA | NA | NA | NA | NA | NA | NA | NA | NA | NA | NA | NA | NA | NA | NA | NA | NA | NA | NA | NA | NA | NA | NA | NA | NA | |
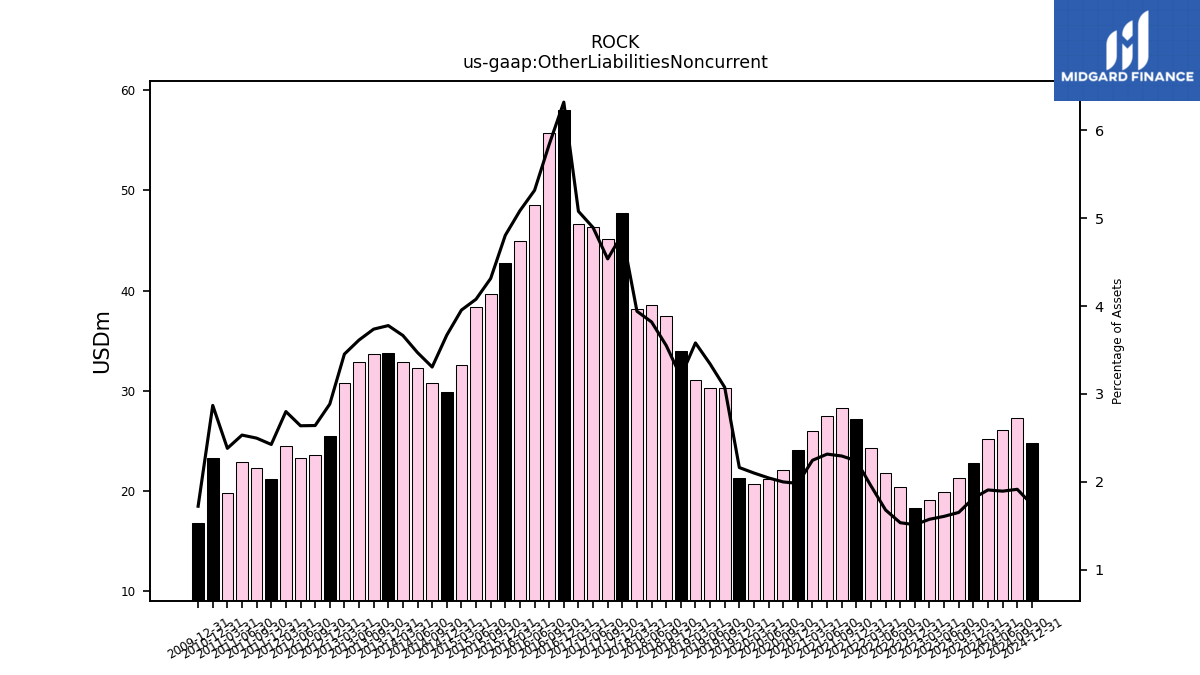
| Other Liabilities Noncurrent | 22.78 | 21.27 | 19.90 | 19.02 | 18.30 | 20.35 | 21.75 | 24.27 | 27.20 | 28.26 | 27.46 | 25.93 | 24.03 | 22.02 | 21.17 | 20.68 | 21.29 | 30.29 | 30.30 | 31.02 | 33.95 | 37.43 | 38.57 | 38.12 | 47.77 | 45.20 | 46.36 | 46.64 | 58.04 | 55.75 | 48.54 | 44.97 | 42.76 | 39.70 | 38.33 | 32.57 | 29.87 | 30.73 | 32.23 | 32.88 | 33.78 | 33.62 | 32.81 | 30.79 | 25.49 | 23.57 | 23.28 | 24.47 | 21.15 | 22.31 | 22.88 | 19.80 | 23.27 | NA | NA | NA | |
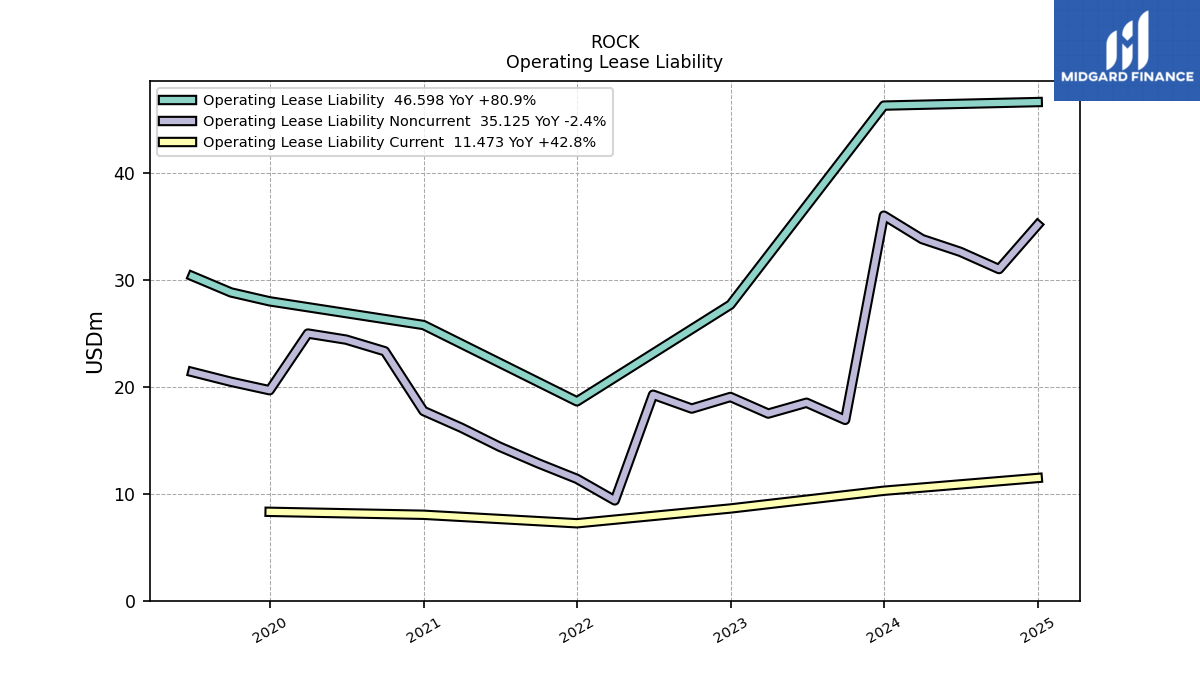
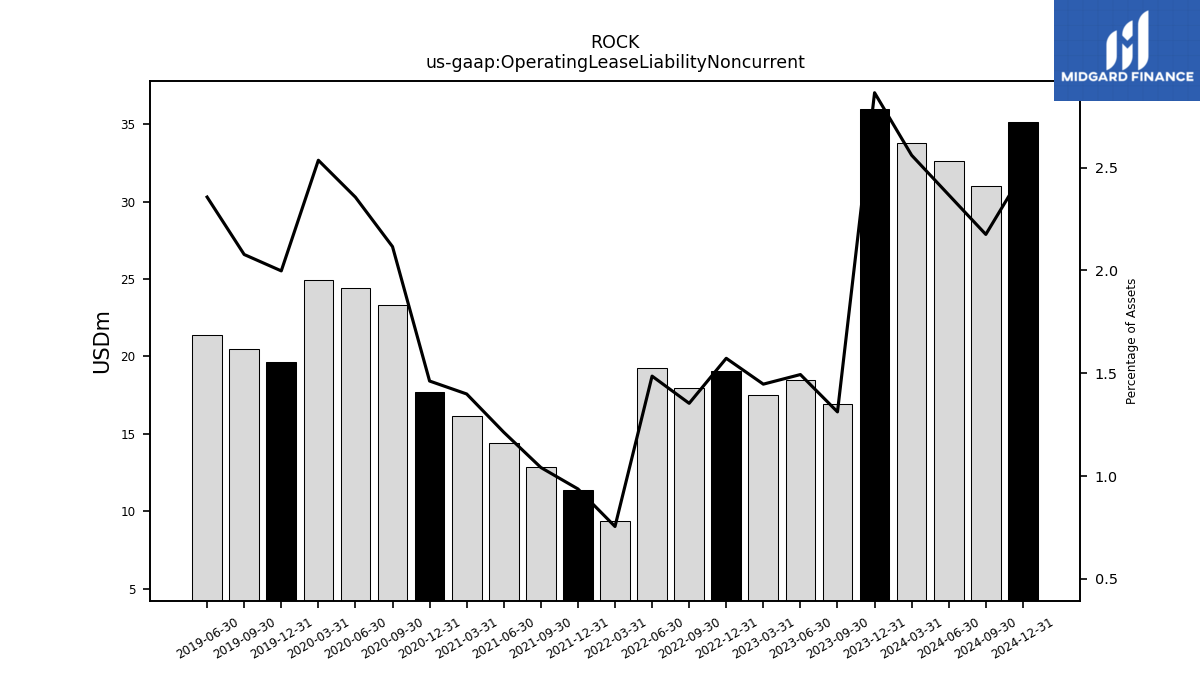
| Operating Lease Liability Noncurrent | 35.99 | 16.90 | 18.50 | 17.49 | 19.04 | 17.96 | 19.25 | 9.38 | 11.39 | 12.84 | 14.39 | 16.16 | 17.73 | 23.31 | 24.40 | 24.97 | 19.67 | 20.46 | 21.38 | NA | NA | NA | NA | NA | NA | NA | NA | NA | NA | NA | NA | NA | NA | NA | NA | NA | NA | NA | NA | NA | NA | NA | NA | NA | NA | NA | NA | NA | NA | NA | NA | NA | NA | NA | NA | NA |
| 2023-12-31 | 2023-09-30 | 2023-06-30 | 2023-03-31 | 2022-12-31 | 2022-09-30 | 2022-06-30 | 2022-03-31 | 2021-12-31 | 2021-09-30 | 2021-06-30 | 2021-03-31 | 2020-12-31 | 2020-09-30 | 2020-06-30 | 2020-03-31 | 2019-12-31 | 2019-09-30 | 2019-06-30 | 2019-03-31 | 2018-12-31 | 2018-09-30 | 2018-06-30 | 2018-03-31 | 2017-12-31 | 2017-09-30 | 2017-06-30 | 2017-03-31 | 2016-12-31 | 2016-09-30 | 2016-06-30 | 2016-03-31 | 2015-12-31 | 2015-09-30 | 2015-06-30 | 2015-03-31 | 2014-12-31 | 2014-09-30 | 2014-06-30 | 2014-03-31 | 2013-12-31 | 2013-09-30 | 2013-06-30 | 2013-03-31 | 2012-12-31 | 2012-09-30 | 2012-06-30 | 2012-03-31 | 2011-12-31 | 2011-09-30 | 2011-06-30 | 2011-03-31 | 2010-12-31 | 2010-09-30 | 2010-06-30 | 2010-03-31 | ||
|---|---|---|---|---|---|---|---|---|---|---|---|---|---|---|---|---|---|---|---|---|---|---|---|---|---|---|---|---|---|---|---|---|---|---|---|---|---|---|---|---|---|---|---|---|---|---|---|---|---|---|---|---|---|---|---|---|---|
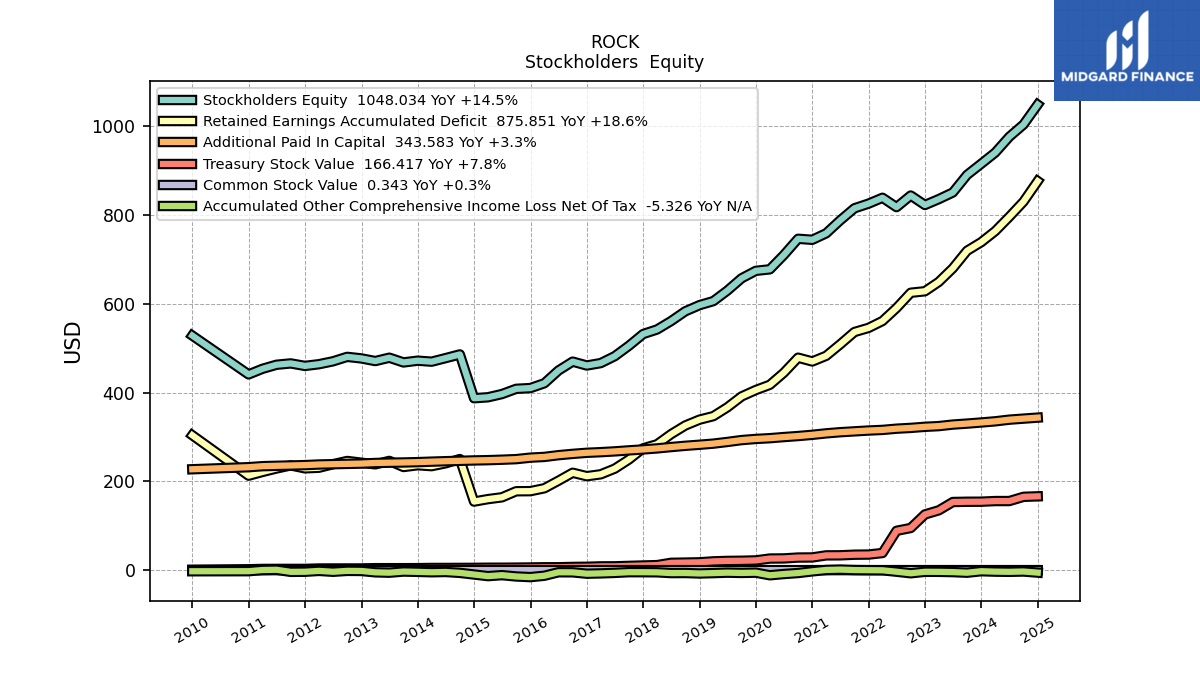
| Stockholders Equity | 915.00 | 889.85 | 850.31 | 835.39 | 822.10 | 843.49 | 817.28 | 838.40 | 825.26 | 814.68 | 787.61 | 758.41 | 743.80 | 746.08 | 709.76 | 677.36 | 673.96 | 657.21 | 629.55 | 605.83 | 596.69 | 582.88 | 560.90 | 541.96 | 531.72 | 505.43 | 481.90 | 466.31 | 460.88 | 469.64 | 449.58 | 420.95 | 410.09 | 408.38 | 396.62 | 389.36 | 387.23 | 485.84 | 477.51 | 469.49 | 471.75 | 467.78 | 478.43 | 470.87 | 476.82 | 480.33 | 470.32 | 463.79 | 459.94 | 465.57 | 462.58 | 453.44 | 440.85 | NA | NA | NA | |
| Common Stock Value | 0.34 | 0.34 | 0.34 | 0.34 | 0.34 | 0.34 | 0.34 | 0.34 | 0.34 | 0.34 | 0.34 | 0.34 | 0.34 | 0.34 | 0.33 | 0.33 | 0.33 | 0.33 | 0.33 | 0.33 | 0.33 | 0.33 | 0.33 | 0.32 | 0.32 | 0.32 | 0.32 | 0.32 | 0.32 | 0.32 | 0.32 | 0.32 | 0.32 | 0.32 | 0.31 | 0.31 | 0.31 | 0.31 | 0.31 | 0.31 | 0.31 | 0.31 | 0.31 | 0.31 | 0.31 | 0.31 | 0.31 | 0.31 | 0.31 | 0.31 | 0.31 | 0.31 | 0.30 | NA | NA | NA | |
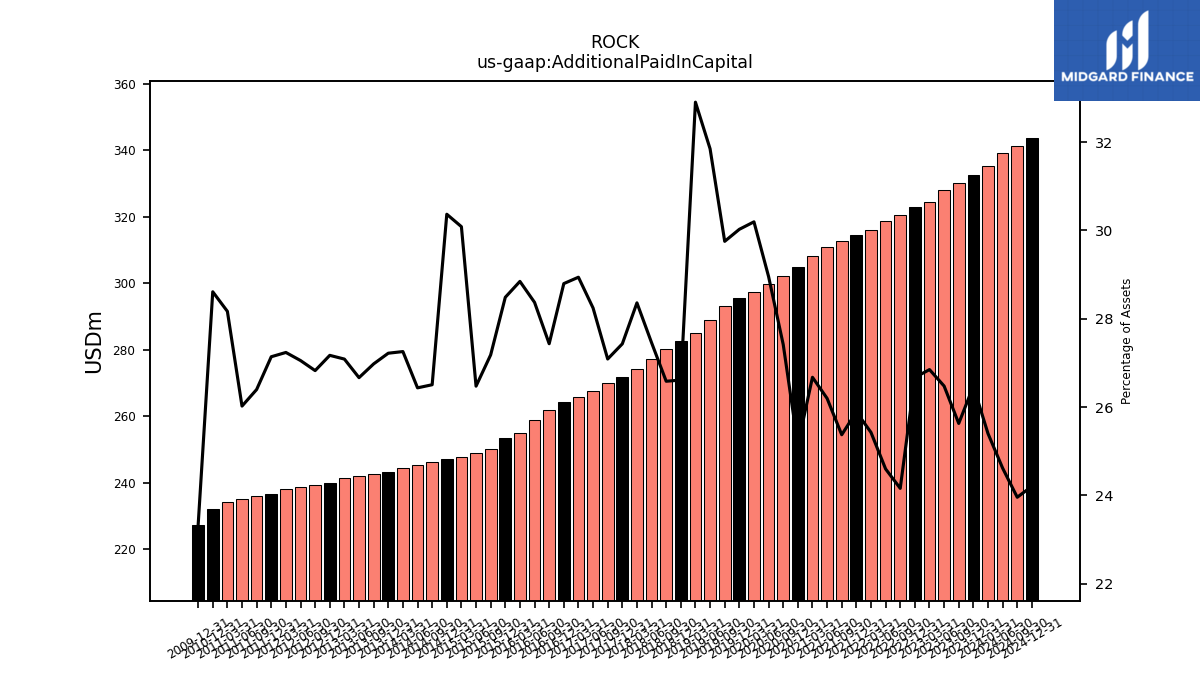
| Additional Paid In Capital | 332.62 | 330.13 | 327.93 | 324.47 | 322.87 | 320.43 | 318.66 | 315.89 | 314.54 | 312.66 | 310.73 | 308.15 | 304.87 | 302.11 | 299.83 | 297.27 | 295.58 | 293.01 | 288.82 | 285.03 | 282.52 | 280.15 | 277.31 | 274.28 | 271.96 | 269.88 | 267.60 | 265.81 | 264.42 | 261.95 | 259.02 | 255.12 | 253.46 | 250.13 | 248.85 | 247.83 | 247.23 | 246.37 | 245.49 | 244.50 | 243.39 | 242.65 | 242.13 | 241.49 | 240.11 | 239.45 | 238.78 | 238.10 | 236.67 | 235.90 | 235.14 | 234.28 | 232.00 | NA | NA | NA | |
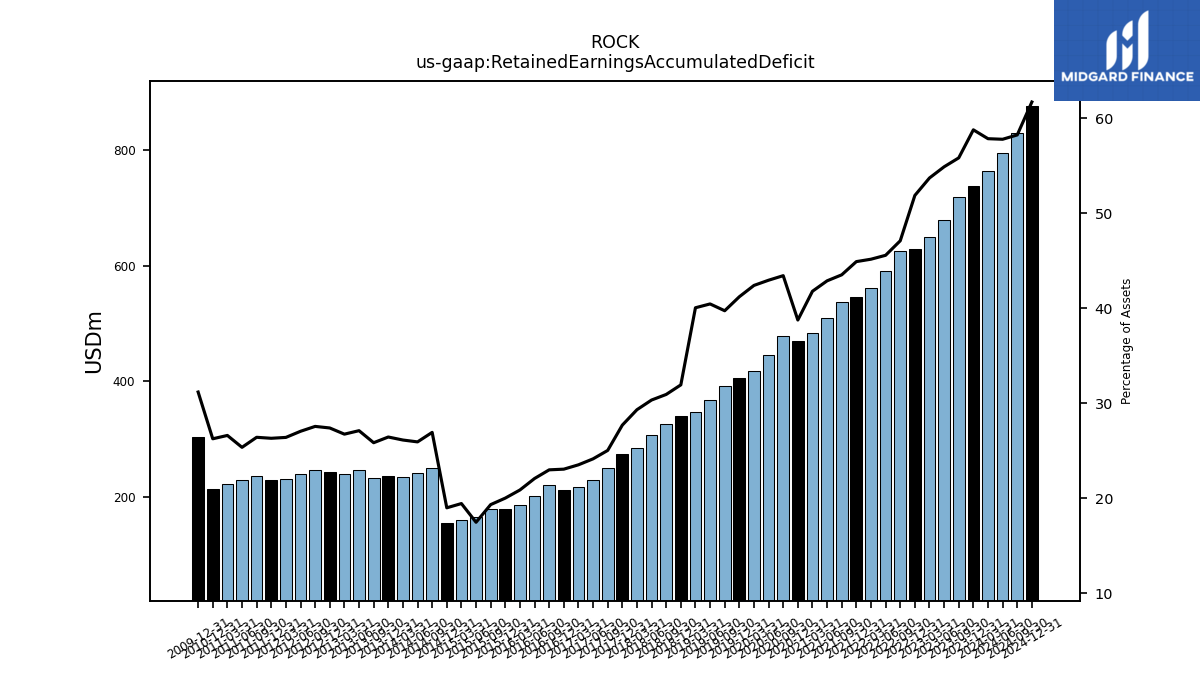
| Retained Earnings Accumulated Deficit | 738.51 | 719.08 | 679.80 | 649.08 | 627.98 | 624.63 | 590.34 | 561.03 | 545.57 | 536.21 | 508.65 | 482.70 | 469.94 | 478.49 | 444.73 | 417.44 | 405.67 | 391.31 | 366.83 | 346.92 | 339.00 | 325.88 | 306.38 | 283.54 | 274.56 | 249.39 | 228.77 | 216.00 | 211.75 | 219.50 | 201.56 | 184.57 | 178.07 | 177.85 | 164.22 | 160.13 | 154.62 | 250.33 | 240.79 | 234.36 | 236.45 | 232.44 | 246.17 | 238.44 | 242.08 | 246.01 | 238.71 | 230.80 | 229.44 | 236.04 | 229.13 | 221.32 | 212.91 | NA | NA | NA | |
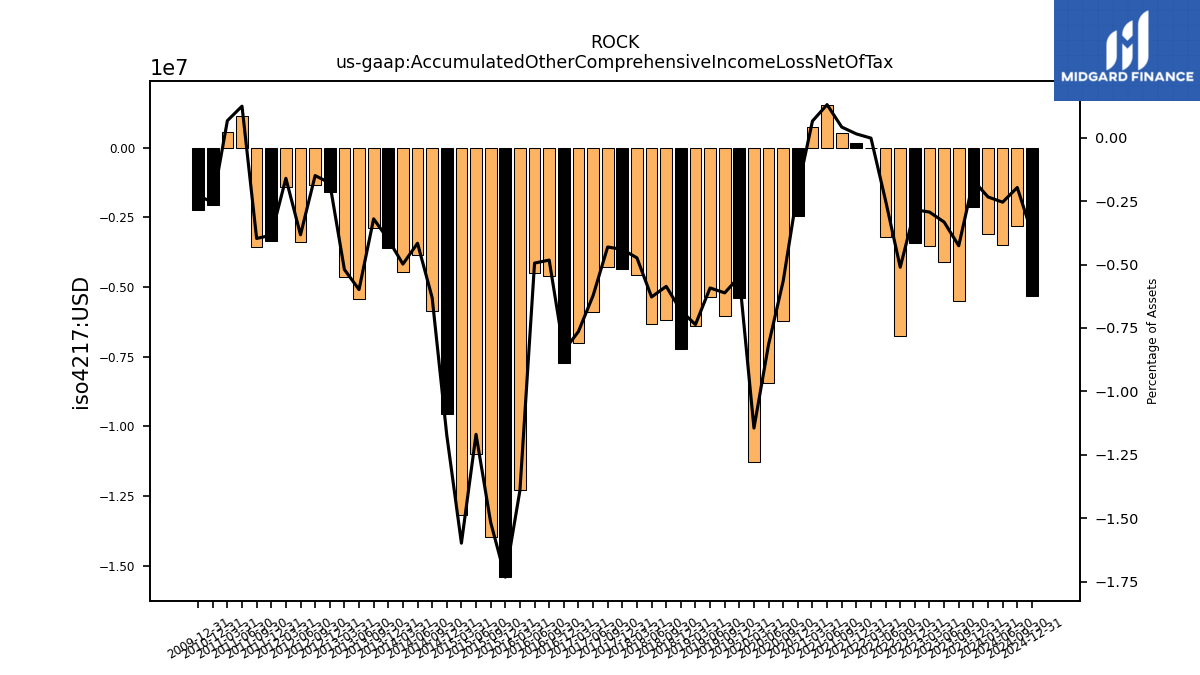
| Accumulated Other Comprehensive Income Loss Net Of Tax | -2.11 | -5.48 | -4.12 | -3.54 | -3.43 | -6.77 | -3.21 | -0.02 | 0.19 | 0.52 | 1.55 | 0.76 | -2.46 | -6.22 | -8.44 | -11.27 | -5.39 | -6.02 | -5.37 | -6.38 | -7.23 | -6.17 | -6.34 | -4.58 | -4.37 | -4.29 | -5.90 | -7.02 | -7.72 | -4.61 | -4.51 | -12.30 | -15.42 | -13.96 | -10.99 | -13.17 | -9.55 | -5.86 | -3.86 | -4.47 | -3.58 | -2.87 | -5.43 | -4.63 | -1.57 | -1.33 | -3.38 | -1.40 | -3.35 | -3.55 | 1.13 | 0.56 | -2.06 | NA | NA | NA | |
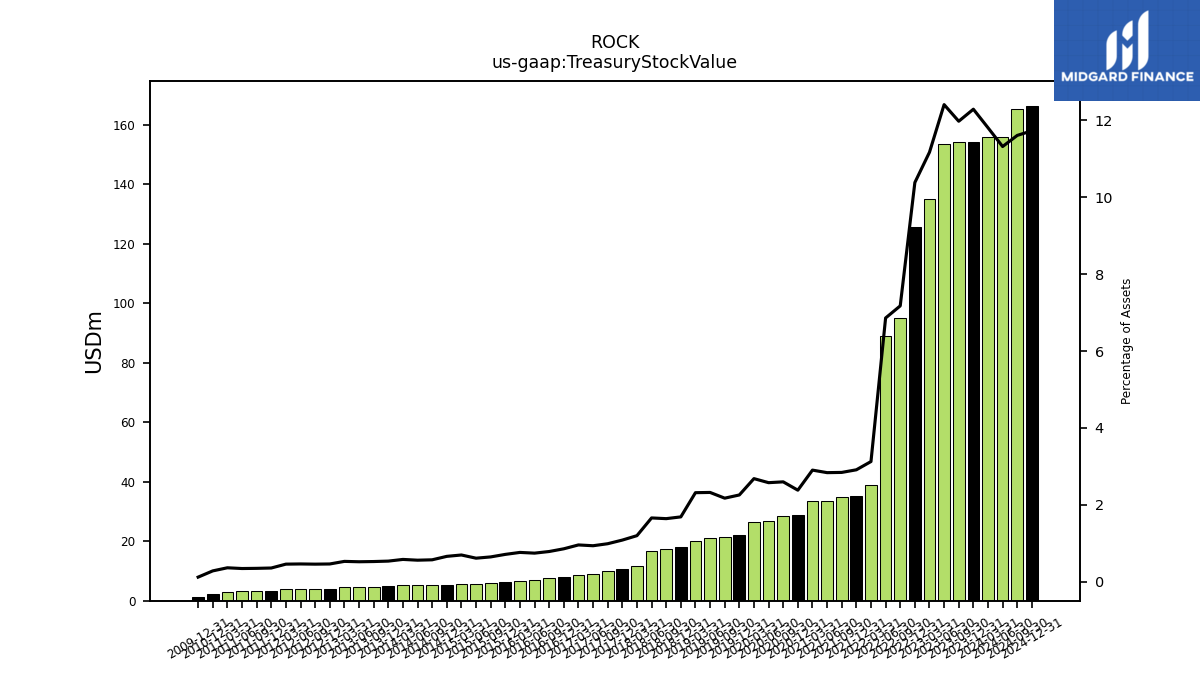
| Treasury Stock Value | 154.36 | 154.22 | 153.64 | 134.96 | 125.66 | 95.14 | 88.85 | 38.84 | 35.38 | 35.04 | 33.66 | 33.55 | 28.88 | 28.64 | 26.69 | 26.41 | 22.23 | 21.42 | 21.07 | 20.07 | 17.92 | 17.31 | 16.77 | 11.61 | 10.76 | 9.87 | 8.89 | 8.81 | 7.88 | 7.52 | 6.81 | 6.76 | 6.35 | 5.96 | 5.78 | 5.75 | 5.39 | 5.32 | 5.22 | 5.22 | 4.82 | 4.74 | 4.74 | 4.74 | 4.10 | 4.10 | 4.10 | 4.02 | 3.13 | 3.13 | 3.12 | 3.04 | 2.31 | NA | NA | NA | |
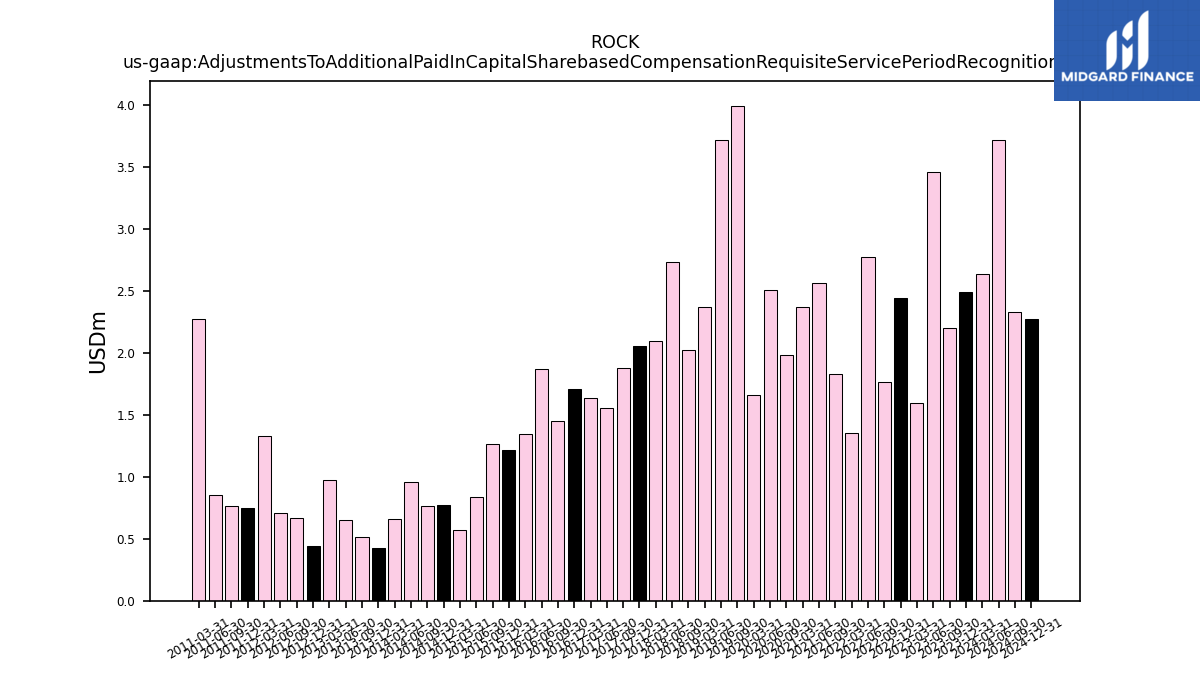
| Adjustments To Additional Paid In Capital Sharebased Compensation Requisite Service Period Recognition Value | 2.49 | 2.20 | 3.46 | 1.59 | 2.44 | 1.76 | 2.77 | 1.35 | NA | 1.83 | 2.57 | 2.37 | NA | 1.98 | 2.51 | 1.67 | NA | 4.00 | 3.72 | 2.37 | NA | 2.03 | 2.73 | 2.10 | 2.05 | 1.88 | 1.56 | 1.64 | 1.71 | 1.45 | 1.87 | 1.35 | 1.22 | 1.27 | 0.84 | 0.57 | 0.77 | 0.76 | 0.96 | 0.66 | 0.43 | 0.52 | 0.65 | 0.97 | 0.44 | 0.67 | 0.71 | 1.33 | 0.75 | 0.76 | 0.86 | 2.28 | NA | NA | NA | NA |
| 2023-12-31 | 2023-09-30 | 2023-06-30 | 2023-03-31 | 2022-12-31 | 2022-09-30 | 2022-06-30 | 2022-03-31 | 2021-12-31 | 2021-09-30 | 2021-06-30 | 2021-03-31 | 2020-12-31 | 2020-09-30 | 2020-06-30 | 2020-03-31 | 2019-12-31 | 2019-09-30 | 2019-06-30 | 2019-03-31 | 2018-12-31 | 2018-09-30 | 2018-06-30 | 2018-03-31 | 2017-12-31 | 2017-09-30 | 2017-06-30 | 2017-03-31 | 2016-12-31 | 2016-09-30 | 2016-06-30 | 2016-03-31 | 2015-12-31 | 2015-09-30 | 2015-06-30 | 2015-03-31 | 2014-12-31 | 2014-09-30 | 2014-06-30 | 2014-03-31 | 2013-12-31 | 2013-09-30 | 2013-06-30 | 2013-03-31 | 2012-12-31 | 2012-09-30 | 2012-06-30 | 2012-03-31 | 2011-12-31 | 2011-09-30 | 2011-06-30 | 2011-03-31 | 2010-12-31 | 2010-09-30 | 2010-06-30 | 2010-03-31 | ||
|---|---|---|---|---|---|---|---|---|---|---|---|---|---|---|---|---|---|---|---|---|---|---|---|---|---|---|---|---|---|---|---|---|---|---|---|---|---|---|---|---|---|---|---|---|---|---|---|---|---|---|---|---|---|---|---|---|---|
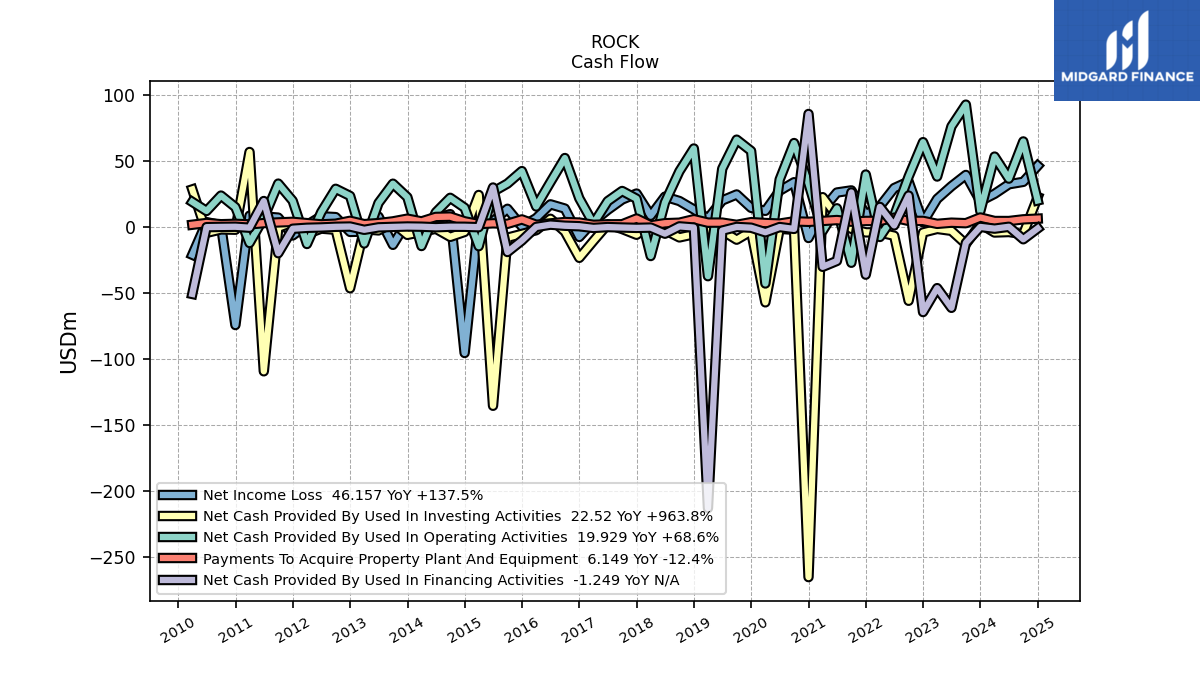
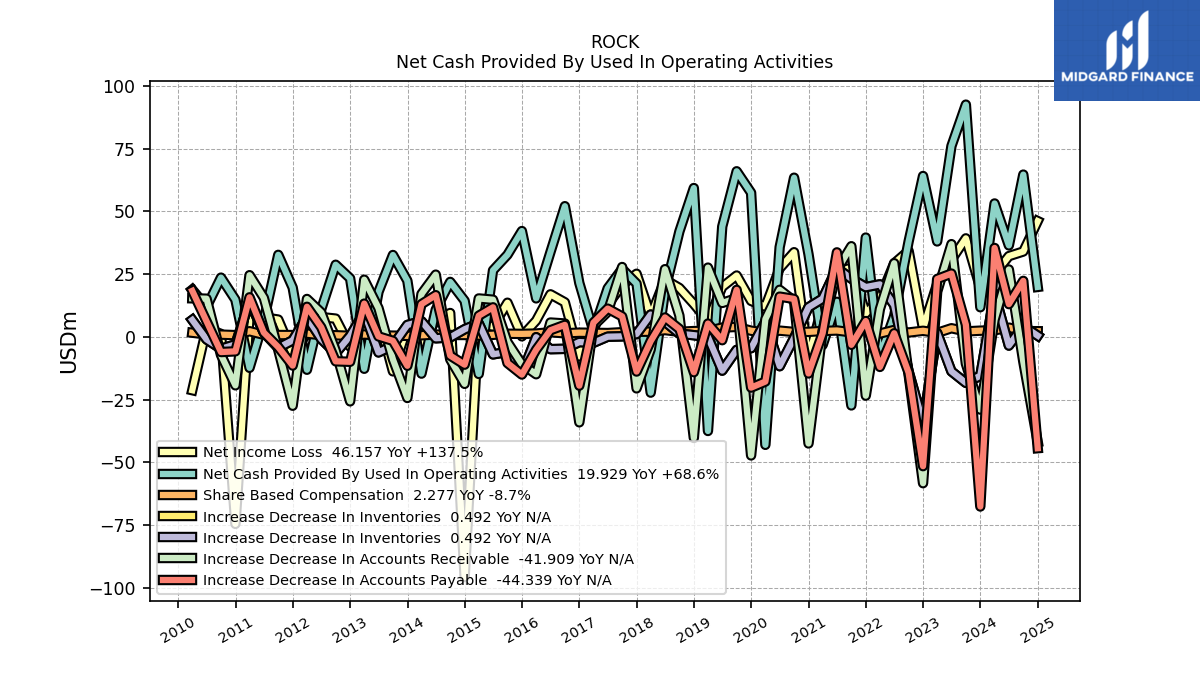
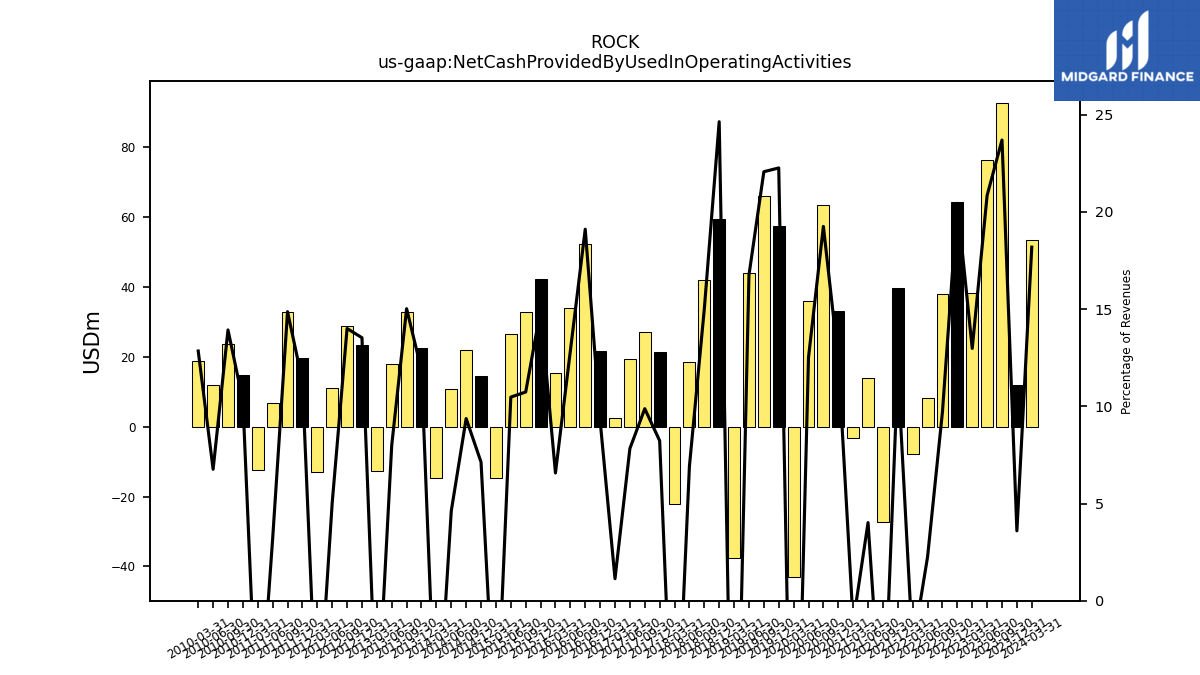
| Net Cash Provided By Used In Operating Activities | 11.82 | 92.56 | 76.05 | 38.05 | 64.13 | 38.02 | 8.30 | -7.75 | 39.59 | -27.30 | 14.00 | -3.23 | 32.91 | 63.45 | 35.76 | -43.01 | 57.44 | 66.01 | 43.97 | -37.49 | 59.34 | 42.01 | 18.40 | -22.21 | 21.24 | 27.11 | 19.38 | 2.34 | 21.49 | 52.10 | 33.80 | 15.35 | 42.20 | 32.73 | 26.51 | -14.75 | 14.40 | 21.93 | 10.84 | -14.63 | 22.39 | 32.65 | 17.96 | -12.69 | 23.35 | 28.77 | 11.05 | -13.08 | 19.65 | 32.71 | 6.66 | -12.32 | 14.81 | 23.64 | 11.96 | 18.83 | |
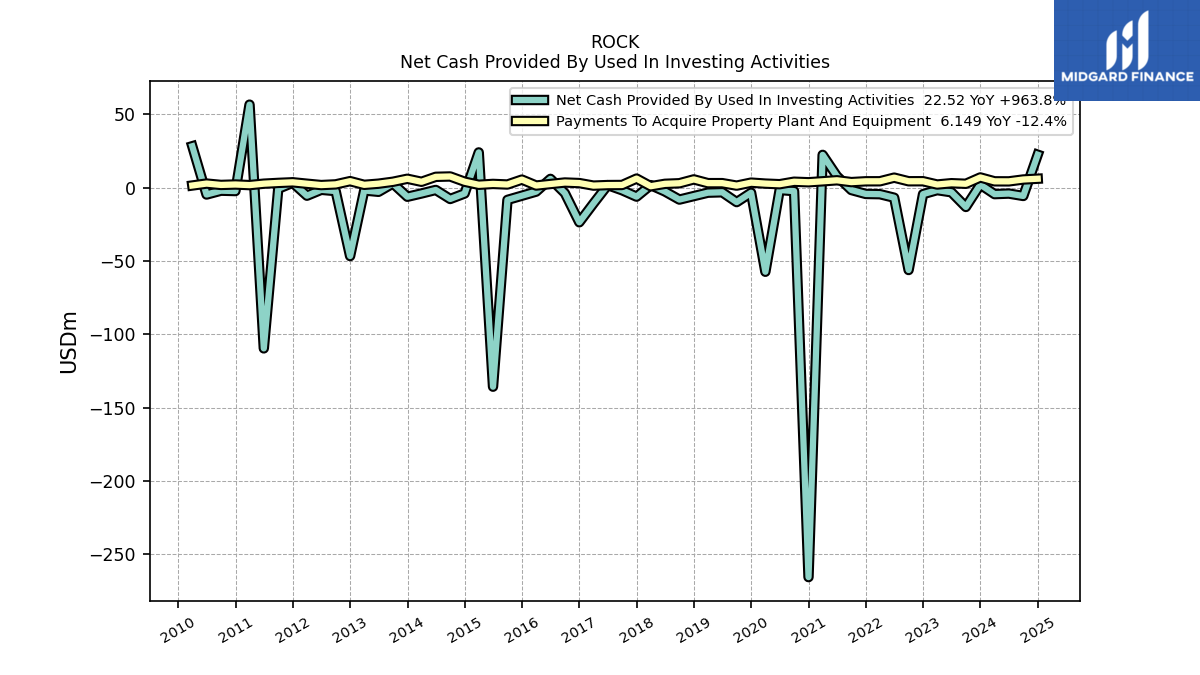
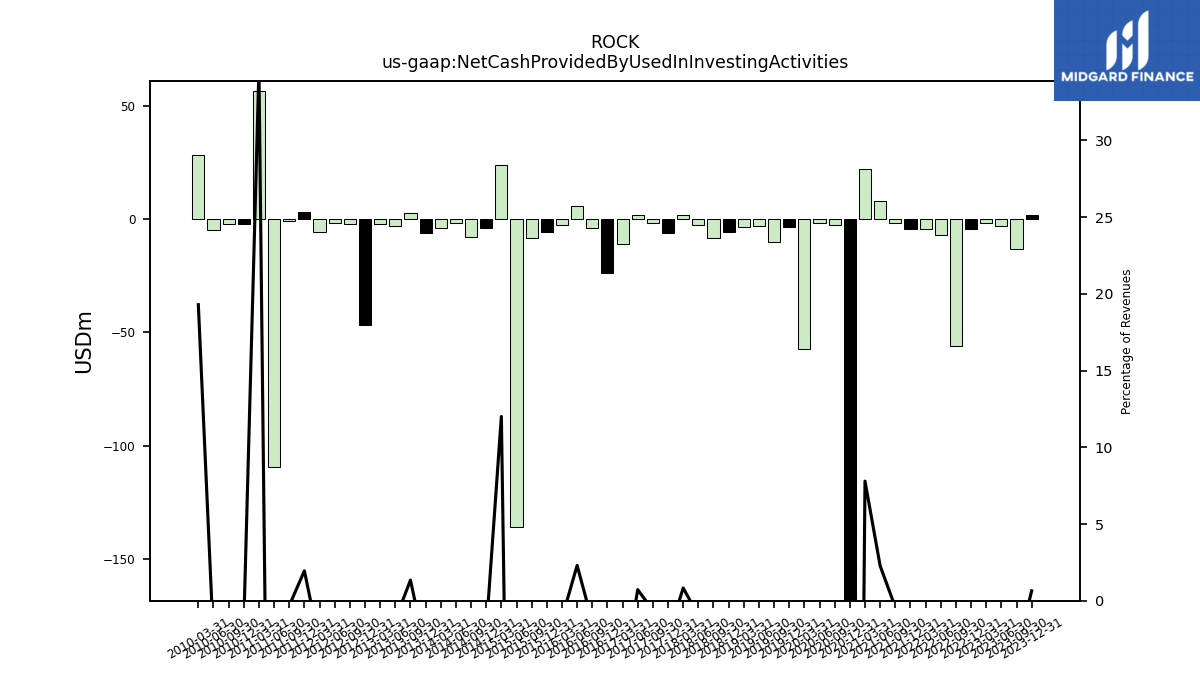
| Net Cash Provided By Used In Investing Activities | 2.12 | -13.11 | -3.09 | -1.64 | -4.36 | -56.12 | -6.80 | -4.40 | -4.24 | -1.56 | 7.92 | 22.42 | -265.56 | -2.30 | -1.54 | -57.31 | -3.39 | -9.81 | -3.10 | -3.37 | -5.69 | -8.09 | -2.56 | 1.79 | -6.09 | -1.72 | 1.79 | -10.78 | -23.57 | -3.71 | 6.05 | -2.64 | -5.44 | -8.29 | -135.71 | 24.10 | -3.92 | -7.67 | -1.51 | -3.92 | -6.15 | 2.93 | -2.79 | -1.85 | -46.62 | -2.29 | -1.41 | -5.44 | 3.39 | -0.70 | -109.58 | 56.68 | -2.26 | -2.02 | -4.63 | 28.30 | |
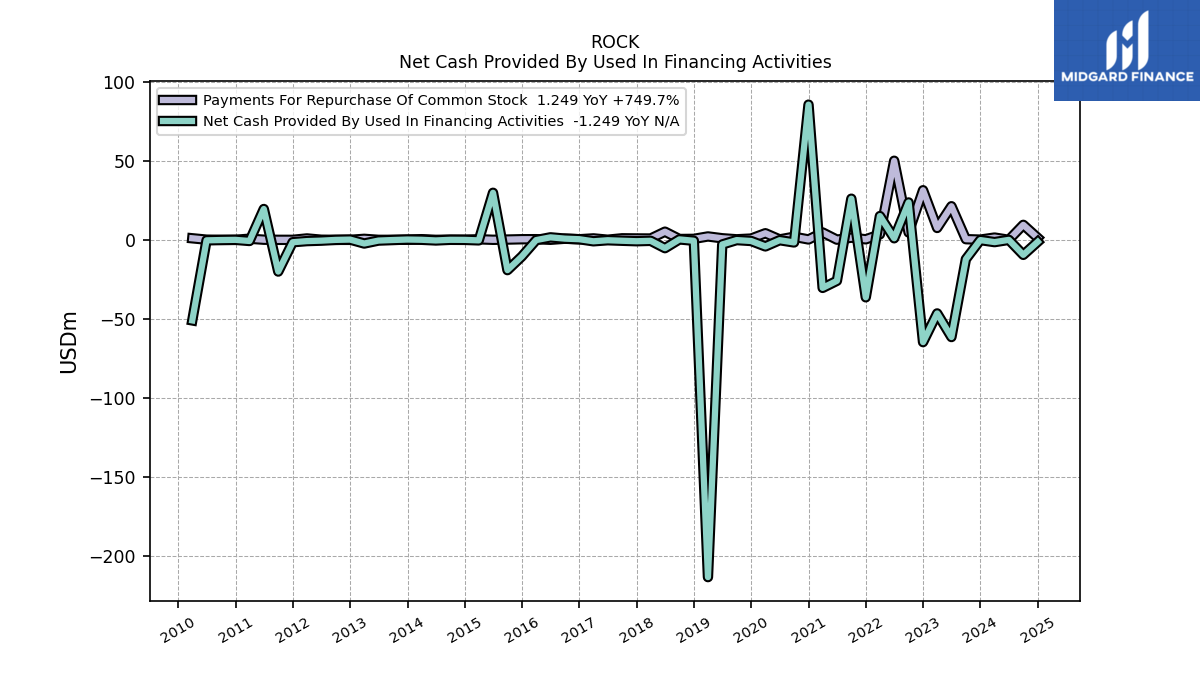
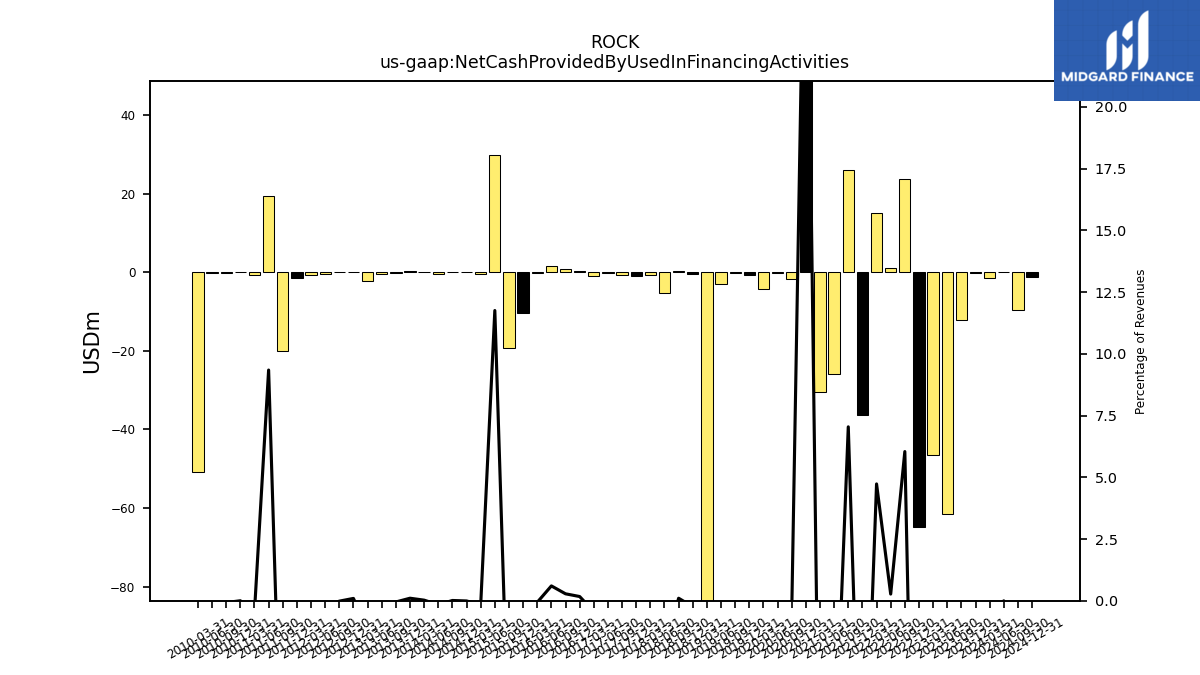
| Net Cash Provided By Used In Financing Activities | -0.15 | -12.21 | -61.46 | -46.51 | -64.68 | 23.64 | 0.99 | 15.04 | -36.34 | 26.02 | -25.90 | -30.39 | 85.49 | -1.65 | -0.22 | -4.16 | -0.72 | -0.15 | -2.93 | -213.25 | -0.57 | 0.28 | -5.27 | -0.62 | -0.86 | -0.58 | -0.24 | -0.91 | 0.40 | 0.77 | 1.58 | -0.15 | -10.45 | -19.16 | 29.76 | -0.33 | -0.02 | 0.03 | -0.38 | 0.05 | 0.19 | -0.11 | -0.46 | -2.32 | 0.16 | -0.03 | -0.51 | -0.79 | -1.51 | -20.05 | 19.51 | -0.72 | -0.00 | -0.12 | -0.31 | -50.93 |
| 2023-12-31 | 2023-09-30 | 2023-06-30 | 2023-03-31 | 2022-12-31 | 2022-09-30 | 2022-06-30 | 2022-03-31 | 2021-12-31 | 2021-09-30 | 2021-06-30 | 2021-03-31 | 2020-12-31 | 2020-09-30 | 2020-06-30 | 2020-03-31 | 2019-12-31 | 2019-09-30 | 2019-06-30 | 2019-03-31 | 2018-12-31 | 2018-09-30 | 2018-06-30 | 2018-03-31 | 2017-12-31 | 2017-09-30 | 2017-06-30 | 2017-03-31 | 2016-12-31 | 2016-09-30 | 2016-06-30 | 2016-03-31 | 2015-12-31 | 2015-09-30 | 2015-06-30 | 2015-03-31 | 2014-12-31 | 2014-09-30 | 2014-06-30 | 2014-03-31 | 2013-12-31 | 2013-09-30 | 2013-06-30 | 2013-03-31 | 2012-12-31 | 2012-09-30 | 2012-06-30 | 2012-03-31 | 2011-12-31 | 2011-09-30 | 2011-06-30 | 2011-03-31 | 2010-12-31 | 2010-09-30 | 2010-06-30 | 2010-03-31 | ||
|---|---|---|---|---|---|---|---|---|---|---|---|---|---|---|---|---|---|---|---|---|---|---|---|---|---|---|---|---|---|---|---|---|---|---|---|---|---|---|---|---|---|---|---|---|---|---|---|---|---|---|---|---|---|---|---|---|---|
| Net Cash Provided By Used In Operating Activities | 11.82 | 92.56 | 76.05 | 38.05 | 64.13 | 38.02 | 8.30 | -7.75 | 39.59 | -27.30 | 14.00 | -3.23 | 32.91 | 63.45 | 35.76 | -43.01 | 57.44 | 66.01 | 43.97 | -37.49 | 59.34 | 42.01 | 18.40 | -22.21 | 21.24 | 27.11 | 19.38 | 2.34 | 21.49 | 52.10 | 33.80 | 15.35 | 42.20 | 32.73 | 26.51 | -14.75 | 14.40 | 21.93 | 10.84 | -14.63 | 22.39 | 32.65 | 17.96 | -12.69 | 23.35 | 28.77 | 11.05 | -13.08 | 19.65 | 32.71 | 6.66 | -12.32 | 14.81 | 23.64 | 11.96 | 18.83 | |
| Net Income Loss | 19.43 | 39.28 | 30.72 | 21.10 | 3.35 | 34.30 | 29.31 | 15.46 | 9.36 | 27.56 | 25.95 | 12.76 | -8.54 | 33.76 | 27.29 | 12.06 | 14.36 | 24.48 | 19.91 | 6.34 | 13.12 | 19.50 | 22.84 | 8.35 | 25.18 | 20.62 | 12.77 | 4.00 | -7.75 | 13.79 | 16.99 | 6.49 | 0.22 | 13.63 | 4.09 | 5.51 | -95.71 | 9.54 | 6.43 | -2.09 | 4.01 | -13.73 | 7.73 | -3.65 | -3.92 | 7.30 | 7.91 | 1.36 | -6.61 | 6.91 | 7.80 | 8.41 | -74.52 | 1.20 | 3.48 | -21.23 | |
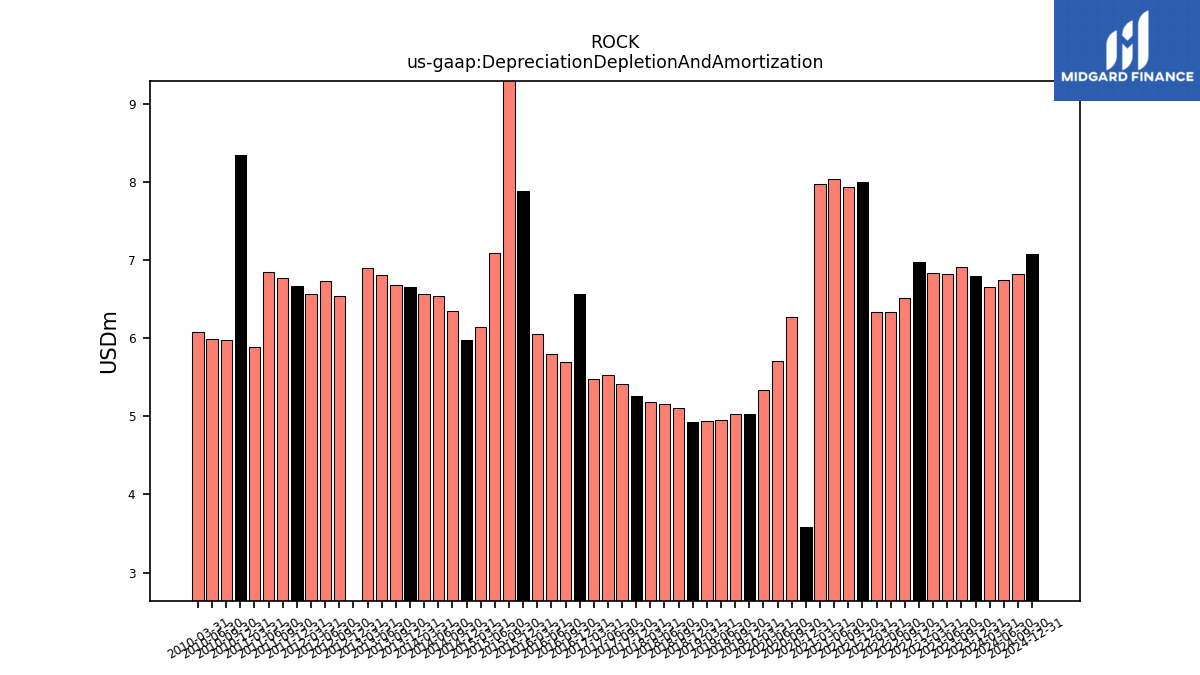
| Depreciation Depletion And Amortization | 6.80 | 6.91 | 6.83 | 6.83 | 6.97 | 6.51 | 6.34 | 6.34 | 8.01 | 7.94 | 8.04 | 7.97 | 3.59 | 6.27 | 5.72 | 5.34 | 5.03 | 5.03 | 4.95 | 4.94 | 4.92 | 5.10 | 5.16 | 5.19 | 5.26 | 5.42 | 5.53 | 5.48 | 6.56 | 5.70 | 5.80 | 6.05 | 7.89 | 9.42 | 7.09 | 6.15 | 5.98 | 6.35 | 6.54 | 6.57 | 6.65 | 6.68 | 6.81 | 6.90 | -46.18 | 6.55 | 6.73 | 6.56 | 6.67 | 6.78 | 6.85 | 5.89 | 8.35 | 5.98 | 5.99 | 6.08 | |
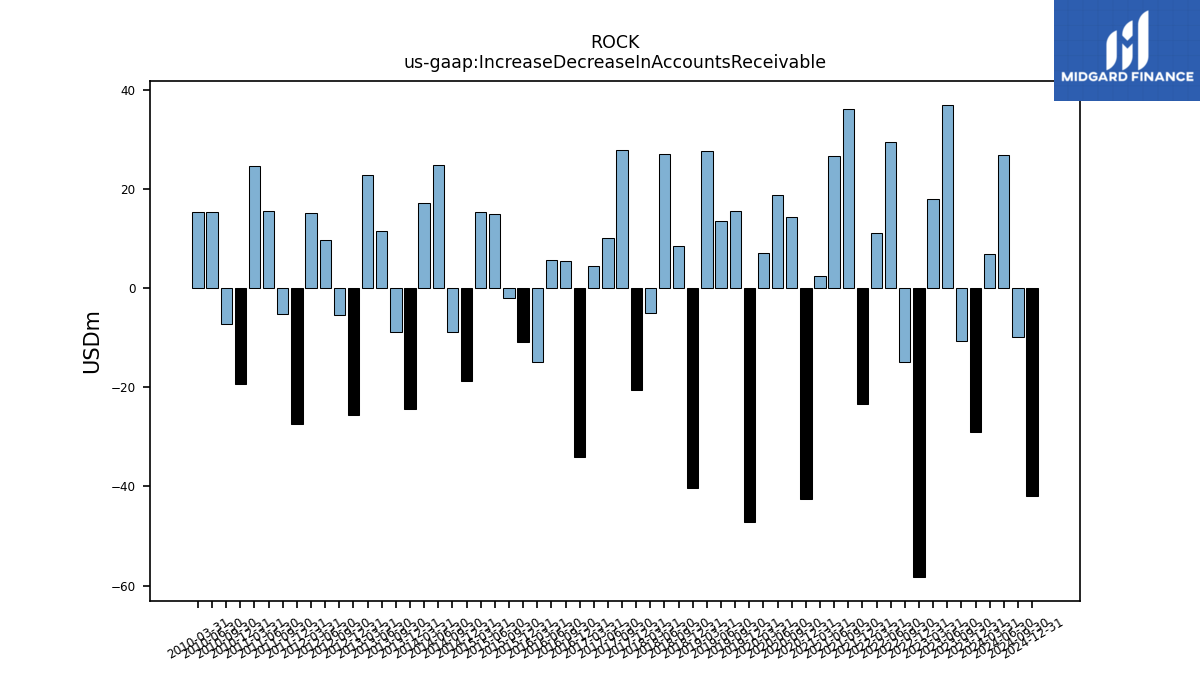
| Increase Decrease In Accounts Receivable | -28.96 | -10.65 | 36.98 | 18.00 | -58.29 | -14.94 | 29.37 | 11.10 | -23.41 | 36.15 | 26.63 | 2.52 | -42.45 | 14.33 | 18.78 | 7.06 | -47.23 | 15.49 | 13.53 | 27.62 | -40.27 | 8.49 | 27.00 | -4.95 | -20.50 | 27.86 | 9.98 | 4.46 | -34.03 | 5.35 | 5.74 | -14.88 | -10.87 | -2.08 | 14.83 | 15.33 | -18.71 | -8.90 | 24.82 | 17.11 | -24.33 | -8.94 | 11.48 | 22.81 | -25.68 | -5.45 | 9.73 | 15.13 | -27.43 | -5.14 | 15.58 | 24.61 | -19.30 | -7.19 | 15.23 | 15.38 | |
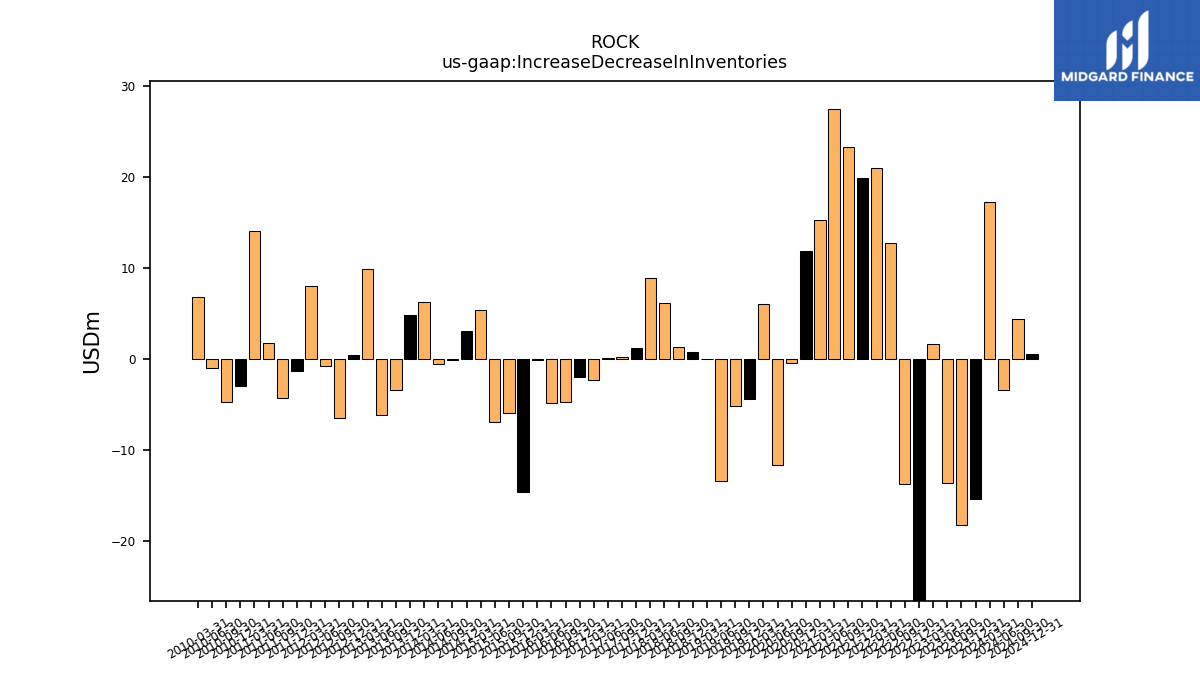
| Increase Decrease In Inventories | -15.48 | -18.30 | -13.72 | 1.59 | -34.22 | -13.78 | 12.68 | 20.94 | 19.86 | 23.22 | 27.42 | 15.26 | 11.82 | -0.44 | -11.66 | 6.00 | -4.49 | -5.15 | -13.43 | -0.04 | 0.69 | 1.28 | 6.08 | 8.91 | 1.15 | 0.23 | 0.09 | -2.34 | -2.04 | -4.75 | -4.87 | -0.12 | -14.71 | -5.97 | -6.96 | 5.36 | 3.07 | -0.20 | -0.54 | 6.27 | 4.76 | -3.42 | -6.17 | 9.80 | 0.38 | -6.50 | -0.82 | 7.96 | -1.35 | -4.34 | 1.74 | 14.05 | -2.97 | -4.75 | -0.98 | 6.76 | |
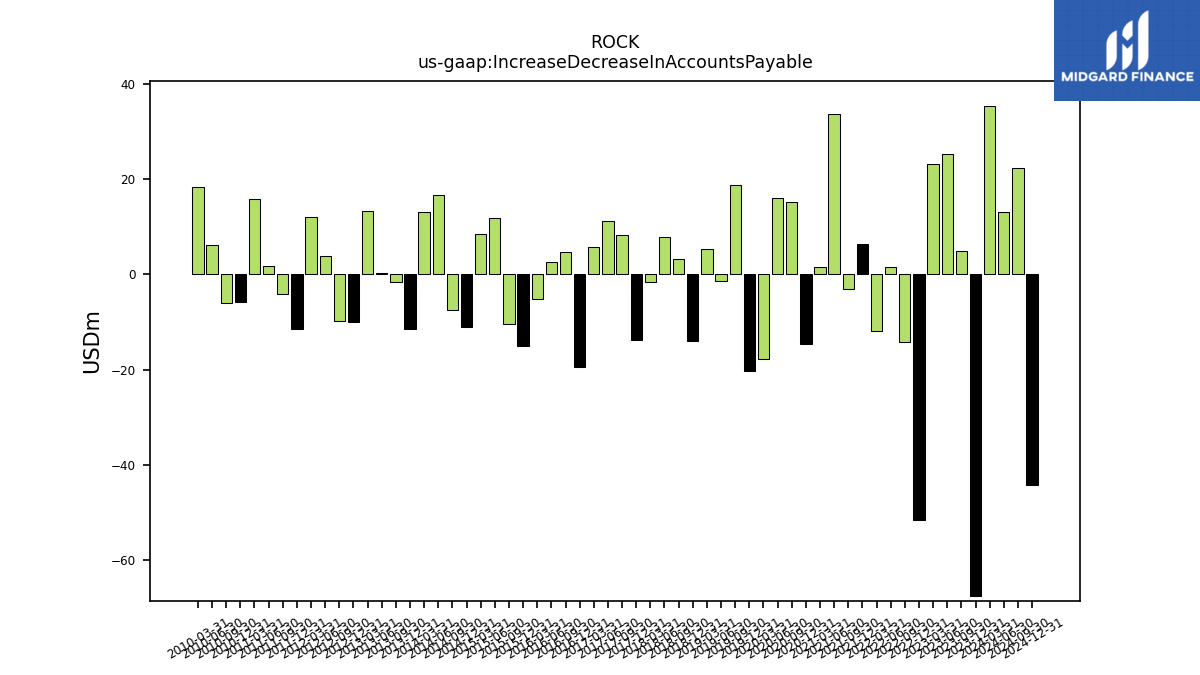
| Increase Decrease In Accounts Payable | -67.58 | 4.87 | 25.25 | 23.08 | -51.50 | -14.26 | 1.46 | -11.96 | 6.34 | -3.15 | 33.70 | 1.47 | -14.57 | 15.14 | 16.06 | -17.79 | -20.20 | 18.76 | -1.32 | 5.33 | -14.06 | 3.17 | 7.76 | -1.69 | -13.80 | 8.17 | 11.29 | 5.67 | -19.43 | 4.79 | 2.67 | -5.10 | -15.00 | -10.41 | 11.80 | 8.45 | -11.05 | -7.44 | 16.64 | 13.06 | -11.50 | -1.57 | 0.21 | 13.28 | -9.90 | -9.72 | 3.84 | 12.01 | -11.41 | -4.05 | 1.74 | 15.79 | -5.74 | -6.03 | 6.24 | 18.36 | |
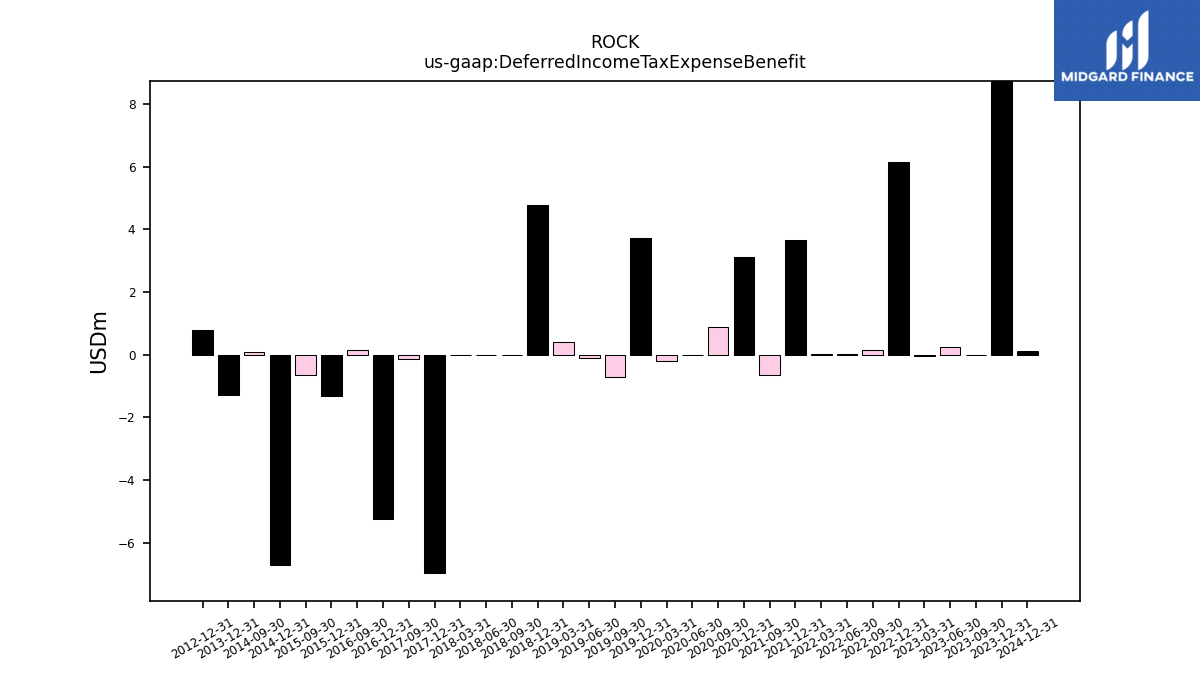
| Deferred Income Tax Expense Benefit | 10.62 | 0.00 | 0.23 | -0.05 | 6.16 | 0.15 | 0.01 | 0.02 | 3.66 | -0.65 | NA | NA | 3.12 | 0.88 | 0.00 | -0.22 | 3.73 | -0.71 | -0.12 | 0.39 | 4.78 | 0.00 | 0.00 | 0.00 | -6.97 | -0.14 | NA | NA | -5.25 | 0.16 | NA | NA | -1.33 | -0.65 | NA | NA | -6.72 | 0.08 | NA | NA | -1.27 | NA | NA | NA | 0.78 | NA | NA | NA | NA | NA | NA | NA | NA | NA | NA | NA | |
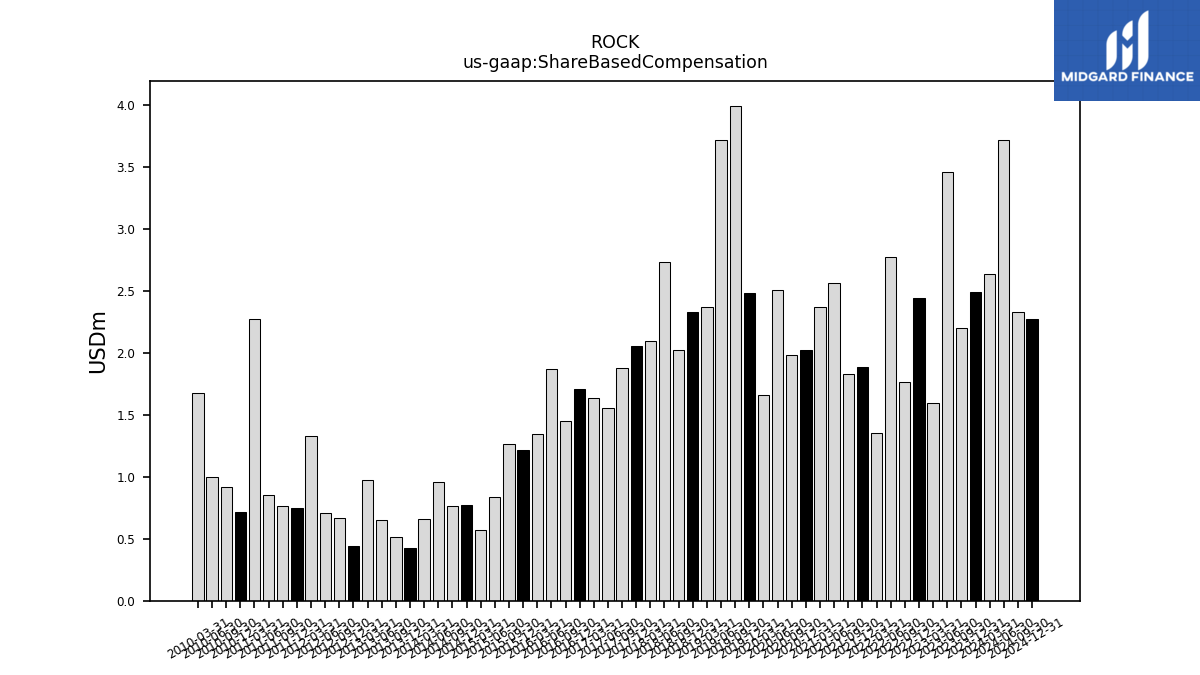
| Share Based Compensation | 2.49 | 2.20 | 3.46 | 1.59 | 2.44 | 1.76 | 2.77 | 1.35 | 1.88 | 1.83 | 2.57 | 2.37 | 2.02 | 1.98 | 2.51 | 1.67 | 2.48 | 4.00 | 3.72 | 2.37 | 2.33 | 2.03 | 2.73 | 2.10 | 2.05 | 1.88 | 1.56 | 1.64 | 1.71 | 1.45 | 1.87 | 1.35 | 1.22 | 1.27 | 0.84 | 0.57 | 0.77 | 0.76 | 0.96 | 0.66 | 0.43 | 0.52 | 0.65 | 0.97 | 0.44 | 0.67 | 0.71 | 1.33 | 0.75 | 0.76 | 0.86 | 2.28 | 0.72 | 0.92 | 1.00 | 1.68 |
| 2023-12-31 | 2023-09-30 | 2023-06-30 | 2023-03-31 | 2022-12-31 | 2022-09-30 | 2022-06-30 | 2022-03-31 | 2021-12-31 | 2021-09-30 | 2021-06-30 | 2021-03-31 | 2020-12-31 | 2020-09-30 | 2020-06-30 | 2020-03-31 | 2019-12-31 | 2019-09-30 | 2019-06-30 | 2019-03-31 | 2018-12-31 | 2018-09-30 | 2018-06-30 | 2018-03-31 | 2017-12-31 | 2017-09-30 | 2017-06-30 | 2017-03-31 | 2016-12-31 | 2016-09-30 | 2016-06-30 | 2016-03-31 | 2015-12-31 | 2015-09-30 | 2015-06-30 | 2015-03-31 | 2014-12-31 | 2014-09-30 | 2014-06-30 | 2014-03-31 | 2013-12-31 | 2013-09-30 | 2013-06-30 | 2013-03-31 | 2012-12-31 | 2012-09-30 | 2012-06-30 | 2012-03-31 | 2011-12-31 | 2011-09-30 | 2011-06-30 | 2011-03-31 | 2010-12-31 | 2010-09-30 | 2010-06-30 | 2010-03-31 | ||
|---|---|---|---|---|---|---|---|---|---|---|---|---|---|---|---|---|---|---|---|---|---|---|---|---|---|---|---|---|---|---|---|---|---|---|---|---|---|---|---|---|---|---|---|---|---|---|---|---|---|---|---|---|---|---|---|---|---|
| Net Cash Provided By Used In Investing Activities | 2.12 | -13.11 | -3.09 | -1.64 | -4.36 | -56.12 | -6.80 | -4.40 | -4.24 | -1.56 | 7.92 | 22.42 | -265.56 | -2.30 | -1.54 | -57.31 | -3.39 | -9.81 | -3.10 | -3.37 | -5.69 | -8.09 | -2.56 | 1.79 | -6.09 | -1.72 | 1.79 | -10.78 | -23.57 | -3.71 | 6.05 | -2.64 | -5.44 | -8.29 | -135.71 | 24.10 | -3.92 | -7.67 | -1.51 | -3.92 | -6.15 | 2.93 | -2.79 | -1.85 | -46.62 | -2.29 | -1.41 | -5.44 | 3.39 | -0.70 | -109.58 | 56.68 | -2.26 | -2.02 | -4.63 | 28.30 | |
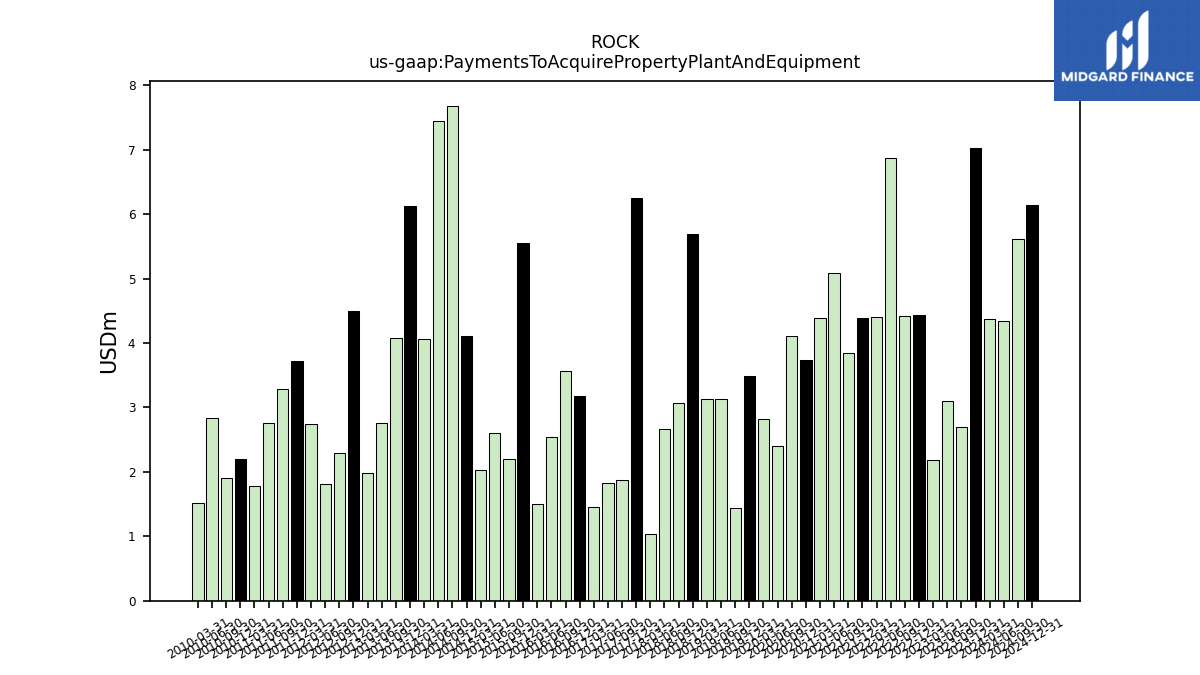
| Payments To Acquire Property Plant And Equipment | 7.02 | 2.69 | 3.09 | 2.19 | 4.43 | 4.42 | 6.88 | 4.41 | 4.39 | 3.84 | 5.08 | 4.39 | 3.73 | 4.10 | 2.41 | 2.82 | 3.48 | 1.44 | 3.13 | 3.13 | 5.69 | 3.06 | 2.67 | 1.03 | 6.25 | 1.88 | 1.82 | 1.45 | 3.18 | 3.56 | 2.53 | 1.50 | 5.55 | 2.20 | 2.60 | 2.02 | 4.11 | 7.68 | 7.44 | 4.06 | 6.12 | 4.08 | 2.76 | 1.98 | 4.50 | 2.29 | 1.82 | 2.74 | 3.71 | 3.29 | 2.76 | 1.78 | 2.21 | 1.91 | 2.84 | 1.52 |
| 2023-12-31 | 2023-09-30 | 2023-06-30 | 2023-03-31 | 2022-12-31 | 2022-09-30 | 2022-06-30 | 2022-03-31 | 2021-12-31 | 2021-09-30 | 2021-06-30 | 2021-03-31 | 2020-12-31 | 2020-09-30 | 2020-06-30 | 2020-03-31 | 2019-12-31 | 2019-09-30 | 2019-06-30 | 2019-03-31 | 2018-12-31 | 2018-09-30 | 2018-06-30 | 2018-03-31 | 2017-12-31 | 2017-09-30 | 2017-06-30 | 2017-03-31 | 2016-12-31 | 2016-09-30 | 2016-06-30 | 2016-03-31 | 2015-12-31 | 2015-09-30 | 2015-06-30 | 2015-03-31 | 2014-12-31 | 2014-09-30 | 2014-06-30 | 2014-03-31 | 2013-12-31 | 2013-09-30 | 2013-06-30 | 2013-03-31 | 2012-12-31 | 2012-09-30 | 2012-06-30 | 2012-03-31 | 2011-12-31 | 2011-09-30 | 2011-06-30 | 2011-03-31 | 2010-12-31 | 2010-09-30 | 2010-06-30 | 2010-03-31 | ||
|---|---|---|---|---|---|---|---|---|---|---|---|---|---|---|---|---|---|---|---|---|---|---|---|---|---|---|---|---|---|---|---|---|---|---|---|---|---|---|---|---|---|---|---|---|---|---|---|---|---|---|---|---|---|---|---|---|---|
| Net Cash Provided By Used In Financing Activities | -0.15 | -12.21 | -61.46 | -46.51 | -64.68 | 23.64 | 0.99 | 15.04 | -36.34 | 26.02 | -25.90 | -30.39 | 85.49 | -1.65 | -0.22 | -4.16 | -0.72 | -0.15 | -2.93 | -213.25 | -0.57 | 0.28 | -5.27 | -0.62 | -0.86 | -0.58 | -0.24 | -0.91 | 0.40 | 0.77 | 1.58 | -0.15 | -10.45 | -19.16 | 29.76 | -0.33 | -0.02 | 0.03 | -0.38 | 0.05 | 0.19 | -0.11 | -0.46 | -2.32 | 0.16 | -0.03 | -0.51 | -0.79 | -1.51 | -20.05 | 19.51 | -0.72 | -0.00 | -0.12 | -0.31 | -50.93 | |
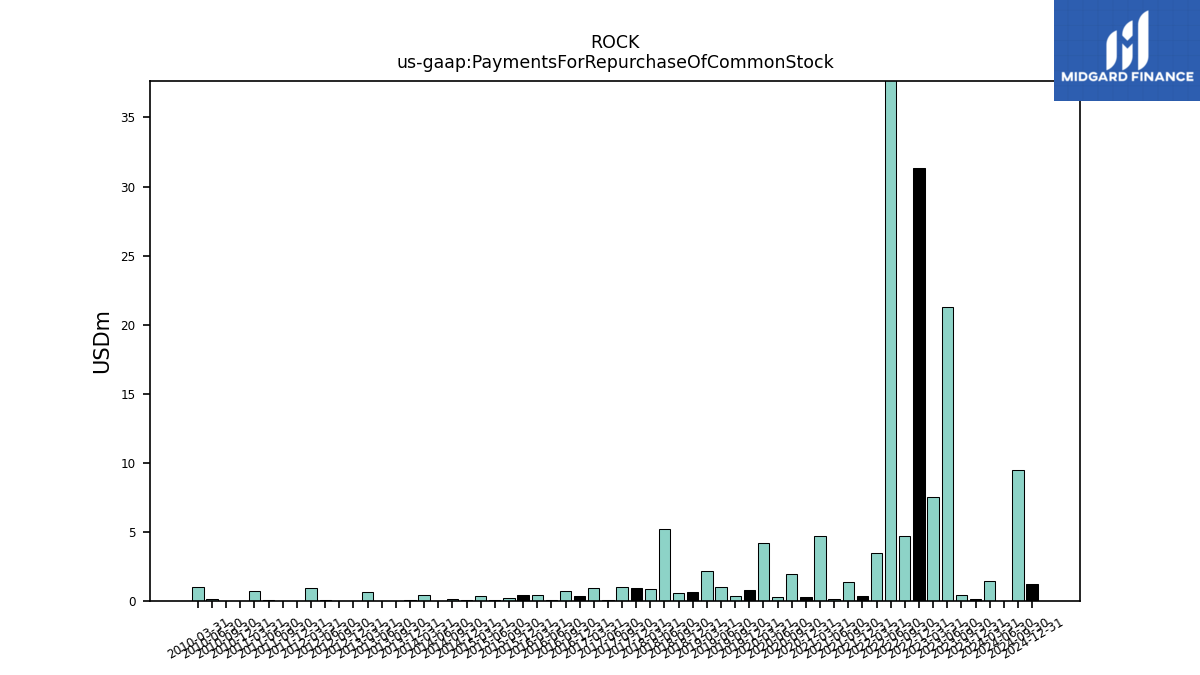
| Payments For Repurchase Of Common Stock | 0.15 | 0.41 | 21.26 | 7.51 | 31.37 | 4.66 | 50.01 | 3.46 | 0.34 | 1.38 | 0.12 | 4.66 | 0.25 | 1.95 | 0.28 | 4.18 | 0.81 | 0.35 | 1.00 | 2.15 | 0.62 | 0.53 | 5.17 | 0.85 | 0.89 | 0.98 | 0.08 | 0.92 | 0.36 | 0.72 | 0.05 | 0.41 | 0.39 | 0.18 | 0.03 | 0.36 | 0.07 | 0.10 | 0.00 | 0.41 | 0.07 | 0.01 | 0.00 | 0.64 | 0.00 | 0.00 | 0.08 | 0.89 | 0.00 | 0.01 | 0.09 | 0.73 | 0.00 | 0.01 | 0.12 | 0.99 |
| 2023-12-31 | 2023-09-30 | 2023-06-30 | 2023-03-31 | 2022-12-31 | 2022-09-30 | 2022-06-30 | 2022-03-31 | 2021-12-31 | 2021-09-30 | 2021-06-30 | 2021-03-31 | 2020-12-31 | 2020-09-30 | 2020-06-30 | 2020-03-31 | 2019-12-31 | 2019-09-30 | 2019-06-30 | 2019-03-31 | 2018-12-31 | 2018-09-30 | 2018-06-30 | 2018-03-31 | 2017-12-31 | 2017-09-30 | 2017-06-30 | 2017-03-31 | 2016-12-31 | 2016-09-30 | 2016-06-30 | 2016-03-31 | 2015-12-31 | 2015-09-30 | 2015-06-30 | 2015-03-31 | 2014-12-31 | 2014-09-30 | 2014-06-30 | 2014-03-31 | 2013-12-31 | 2013-09-30 | 2013-06-30 | 2013-03-31 | 2012-12-31 | 2012-09-30 | 2012-06-30 | 2012-03-31 | 2011-12-31 | 2011-09-30 | 2011-06-30 | 2011-03-31 | 2010-12-31 | 2010-09-30 | 2010-06-30 | 2010-03-31 | ||
|---|---|---|---|---|---|---|---|---|---|---|---|---|---|---|---|---|---|---|---|---|---|---|---|---|---|---|---|---|---|---|---|---|---|---|---|---|---|---|---|---|---|---|---|---|---|---|---|---|---|---|---|---|---|---|---|---|---|
| Revenues | 328.81 | 390.74 | 364.91 | 293.27 | 313.86 | 391.29 | 366.95 | 317.87 | 334.45 | 369.35 | 348.39 | 287.59 | 265.20 | 329.67 | 285.81 | 249.44 | 258.13 | 299.24 | 262.65 | 227.42 | 240.91 | 280.09 | 266.04 | 215.34 | 258.11 | 274.57 | 247.63 | 206.60 | 231.84 | 272.73 | 263.10 | 233.68 | 282.09 | 304.99 | 253.17 | 200.62 | 201.99 | 234.10 | 234.96 | 191.03 | 188.84 | 217.41 | 224.52 | 196.80 | 172.64 | 205.51 | 219.73 | 192.17 | 174.14 | 220.10 | 208.81 | 163.56 | 144.12 | 169.74 | 176.92 | 146.67 | |
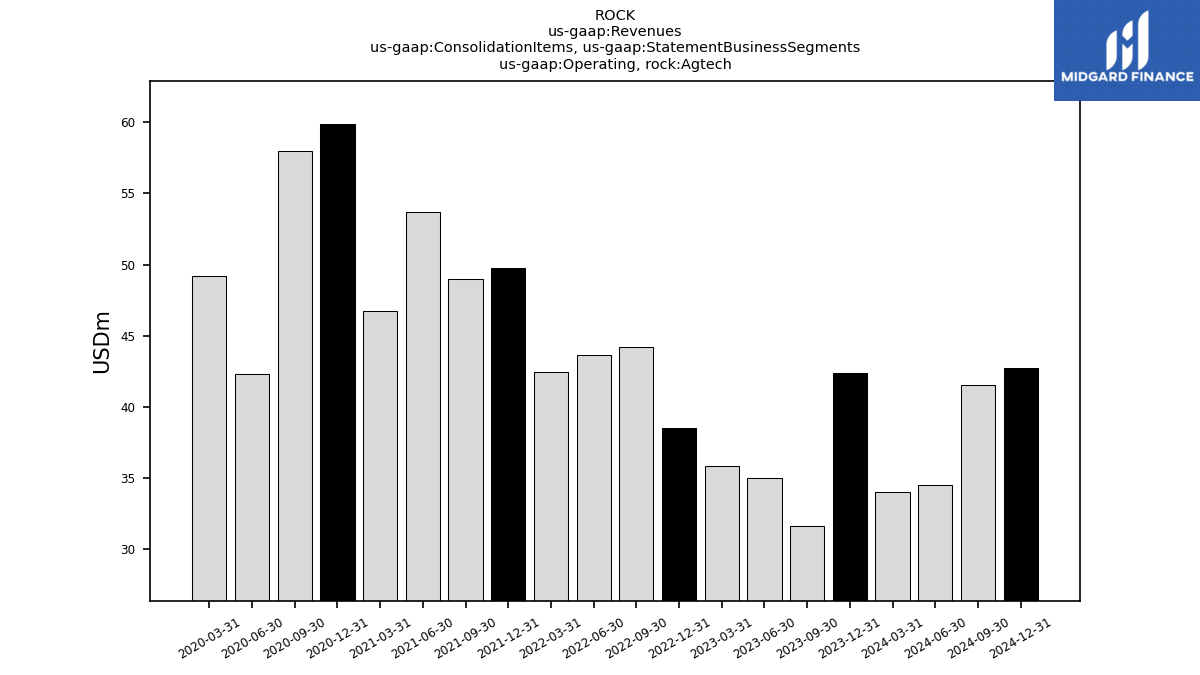
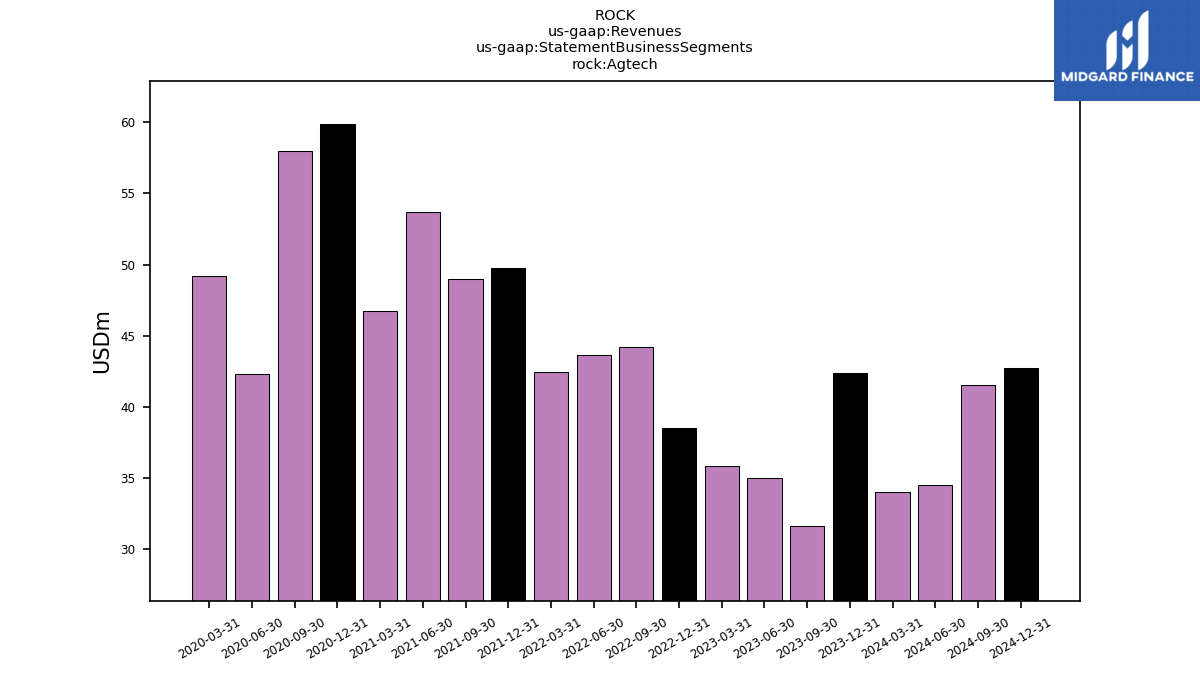
| Operating, Agtech | 42.42 | 31.67 | 35.03 | 35.85 | 38.54 | 44.22 | 43.68 | 42.43 | 49.75 | 48.98 | 53.70 | 46.74 | 59.91 | 58.01 | 42.31 | 49.23 | NA | NA | NA | NA | NA | NA | NA | NA | NA | NA | NA | NA | NA | NA | NA | NA | NA | NA | NA | NA | NA | NA | NA | NA | NA | NA | NA | NA | NA | NA | NA | NA | NA | NA | NA | NA | NA | NA | NA | NA | |
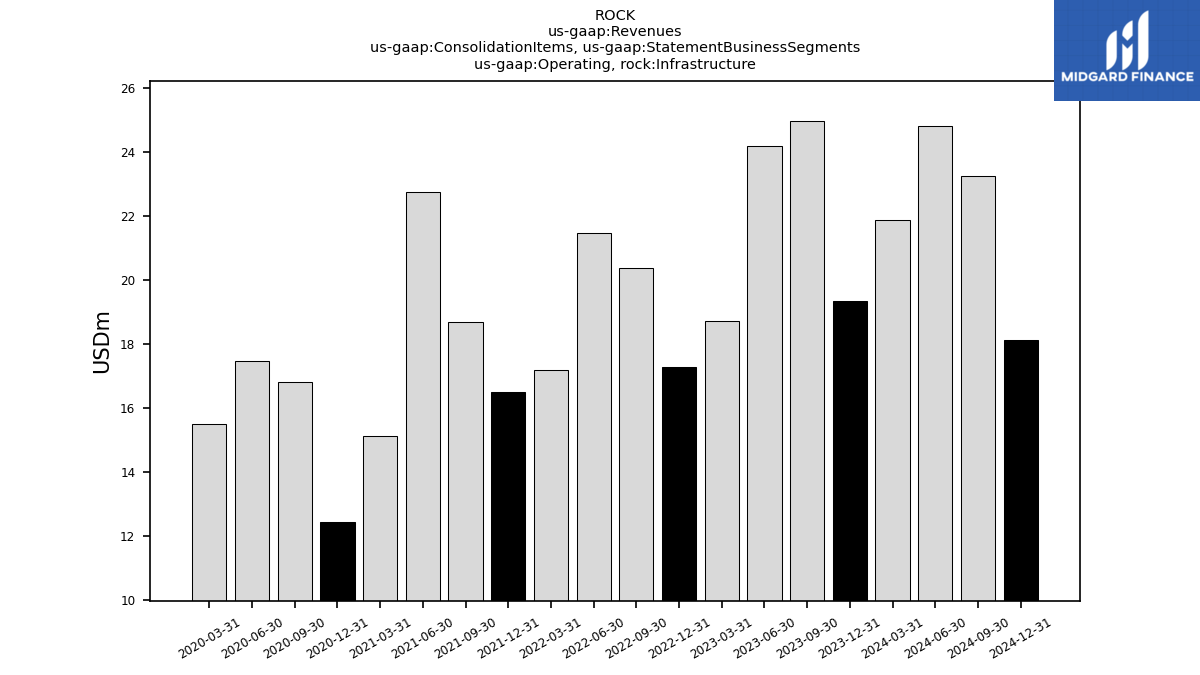
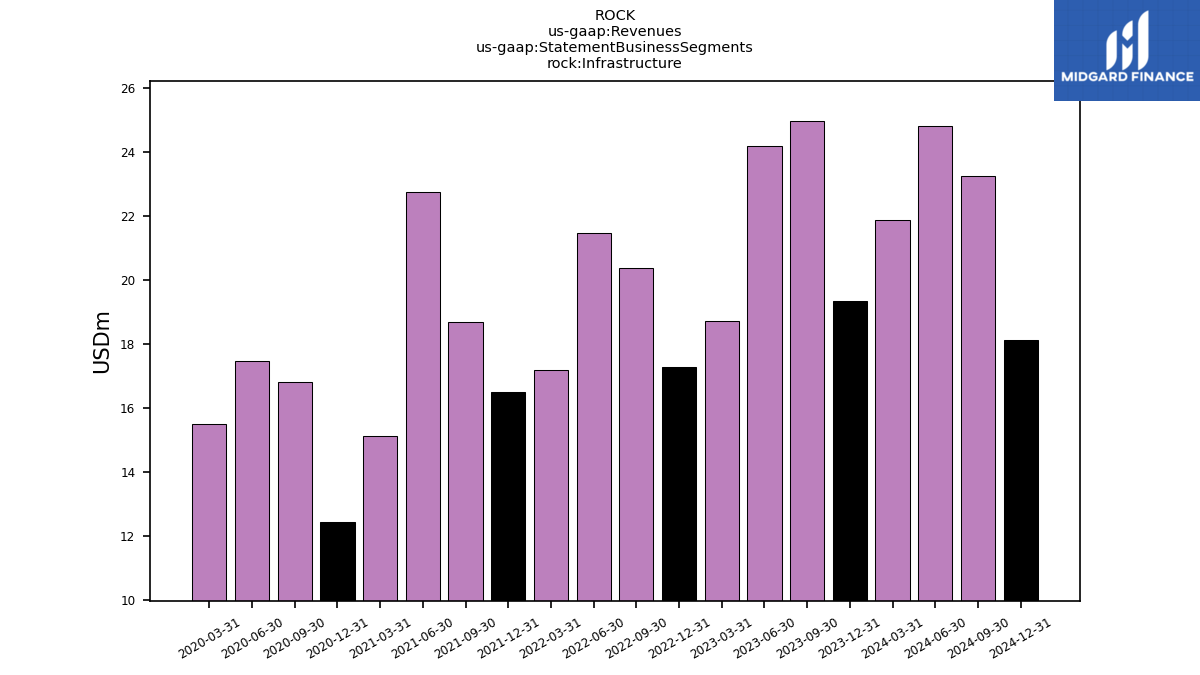
| Operating, Infrastructure | 19.35 | 24.97 | 24.19 | 18.71 | 17.28 | 20.36 | 21.48 | 17.17 | 16.49 | 18.67 | 22.73 | 15.12 | 12.44 | 16.82 | 17.45 | 15.48 | NA | NA | NA | NA | NA | NA | NA | NA | NA | NA | NA | NA | NA | NA | NA | NA | NA | NA | NA | NA | NA | NA | NA | NA | NA | NA | NA | NA | NA | NA | NA | NA | NA | NA | NA | NA | NA | NA | NA | NA | |
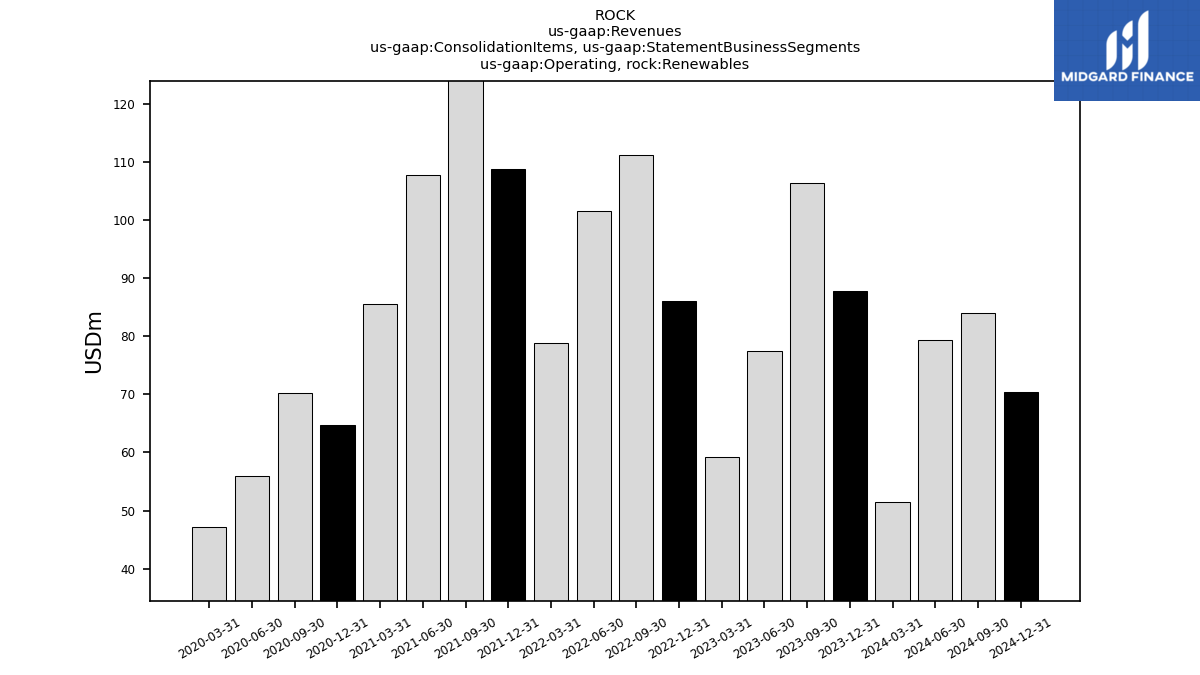
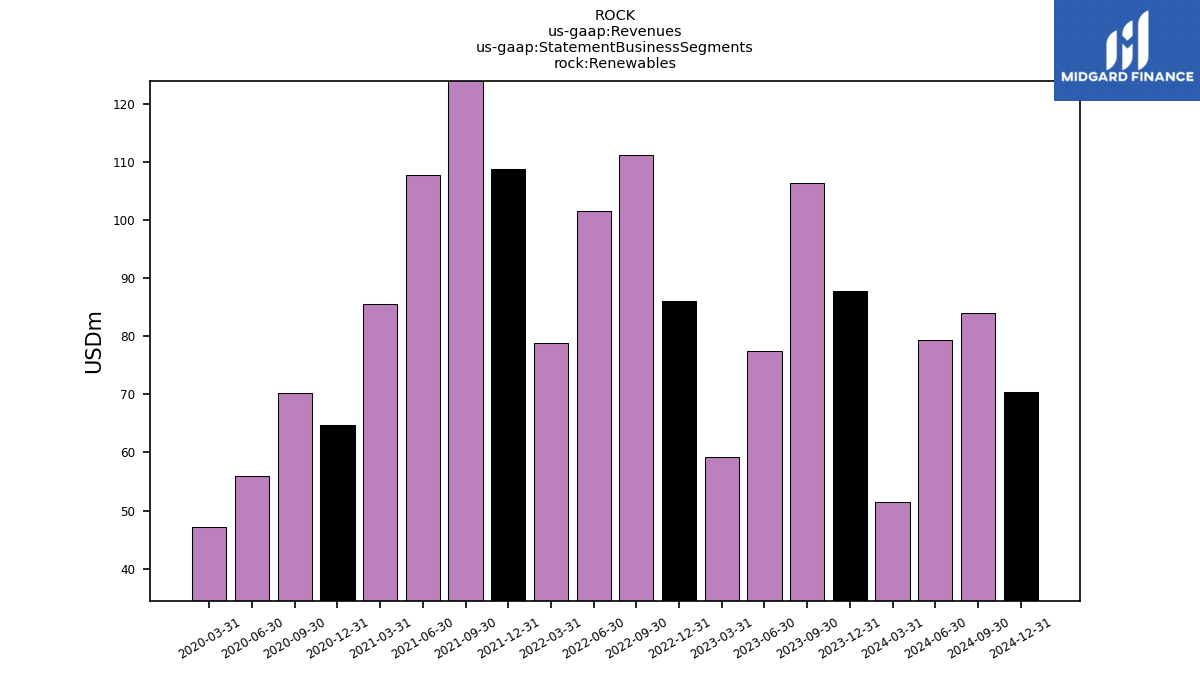
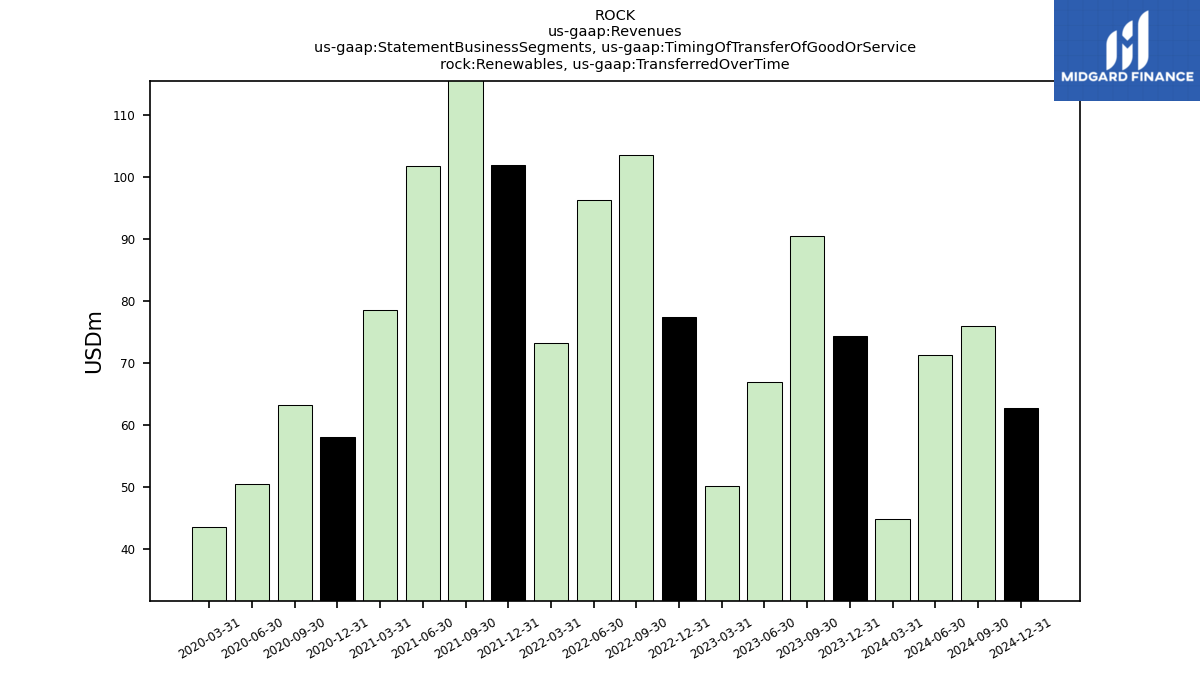
| Operating, Renewables | 87.71 | 106.36 | 77.46 | 59.20 | 86.12 | 111.12 | 101.55 | 78.78 | 108.67 | 130.16 | 107.75 | 85.51 | 64.65 | 70.25 | 55.95 | 47.26 | NA | NA | NA | NA | NA | NA | NA | NA | NA | NA | NA | NA | NA | NA | NA | NA | NA | NA | NA | NA | NA | NA | NA | NA | NA | NA | NA | NA | NA | NA | NA | NA | NA | NA | NA | NA | NA | NA | NA | NA | |
| Agtech | 42.42 | 31.67 | 35.03 | 35.85 | 38.54 | 44.22 | 43.68 | 42.43 | 49.75 | 48.98 | 53.70 | 46.74 | 59.91 | 58.01 | 42.31 | 49.23 | NA | NA | NA | NA | NA | NA | NA | NA | NA | NA | NA | NA | NA | NA | NA | NA | NA | NA | NA | NA | NA | NA | NA | NA | NA | NA | NA | NA | NA | NA | NA | NA | NA | NA | NA | NA | NA | NA | NA | NA | |
| Infrastructure | 19.35 | 24.97 | 24.19 | 18.71 | 17.28 | 20.36 | 21.48 | 17.17 | 16.49 | 18.67 | 22.73 | 15.12 | 12.44 | 16.82 | 17.45 | 15.48 | NA | NA | NA | NA | NA | NA | NA | NA | NA | NA | NA | NA | NA | NA | NA | NA | NA | NA | NA | NA | NA | NA | NA | NA | NA | NA | NA | NA | NA | NA | NA | NA | NA | NA | NA | NA | NA | NA | NA | NA | |
| Renewables | 87.71 | 106.36 | 77.46 | 59.20 | 86.12 | 111.12 | 101.55 | 78.78 | 108.67 | 130.16 | 107.75 | 85.51 | 64.65 | 70.25 | 55.95 | 47.26 | NA | NA | NA | NA | NA | NA | NA | NA | NA | NA | NA | NA | NA | NA | NA | NA | NA | NA | NA | NA | NA | NA | NA | NA | NA | NA | NA | NA | NA | NA | NA | NA | NA | NA | NA | NA | NA | NA | NA | NA | |
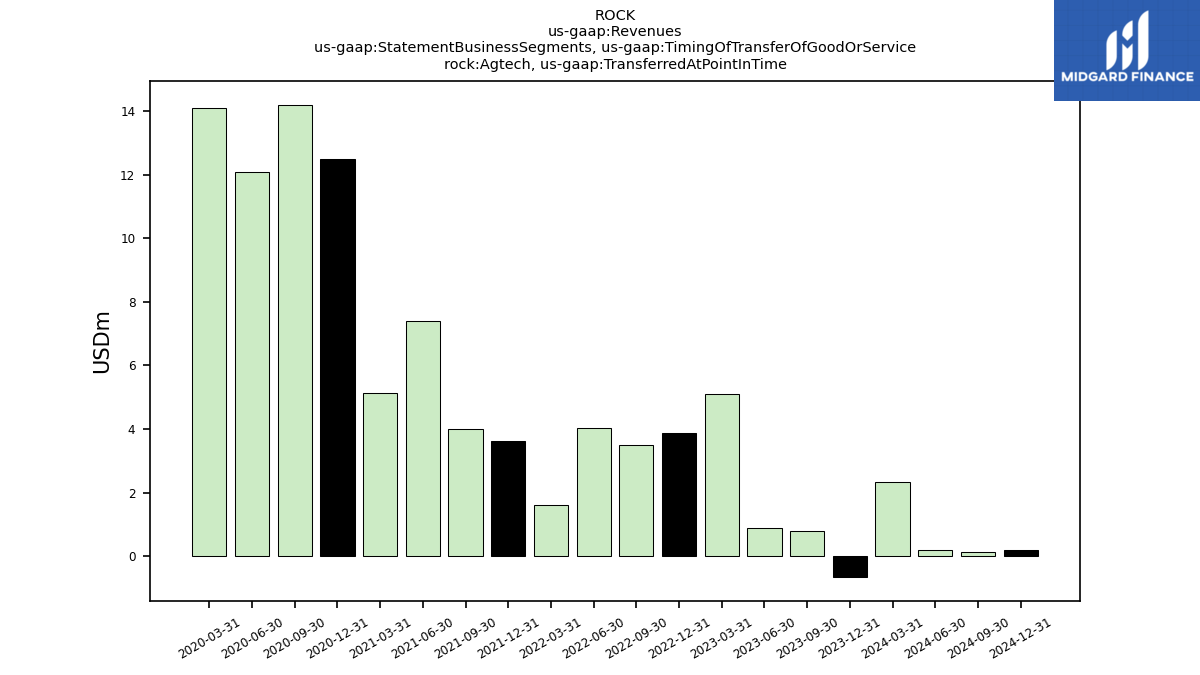
| Agtech, Transferred At Point In Time | -0.66 | 0.78 | 0.88 | 5.11 | 3.86 | 3.51 | 4.03 | 1.61 | 3.62 | 4.01 | 7.39 | 5.14 | 12.50 | 14.21 | 12.09 | 14.10 | NA | NA | NA | NA | NA | NA | NA | NA | NA | NA | NA | NA | NA | NA | NA | NA | NA | NA | NA | NA | NA | NA | NA | NA | NA | NA | NA | NA | NA | NA | NA | NA | NA | NA | NA | NA | NA | NA | NA | NA | |
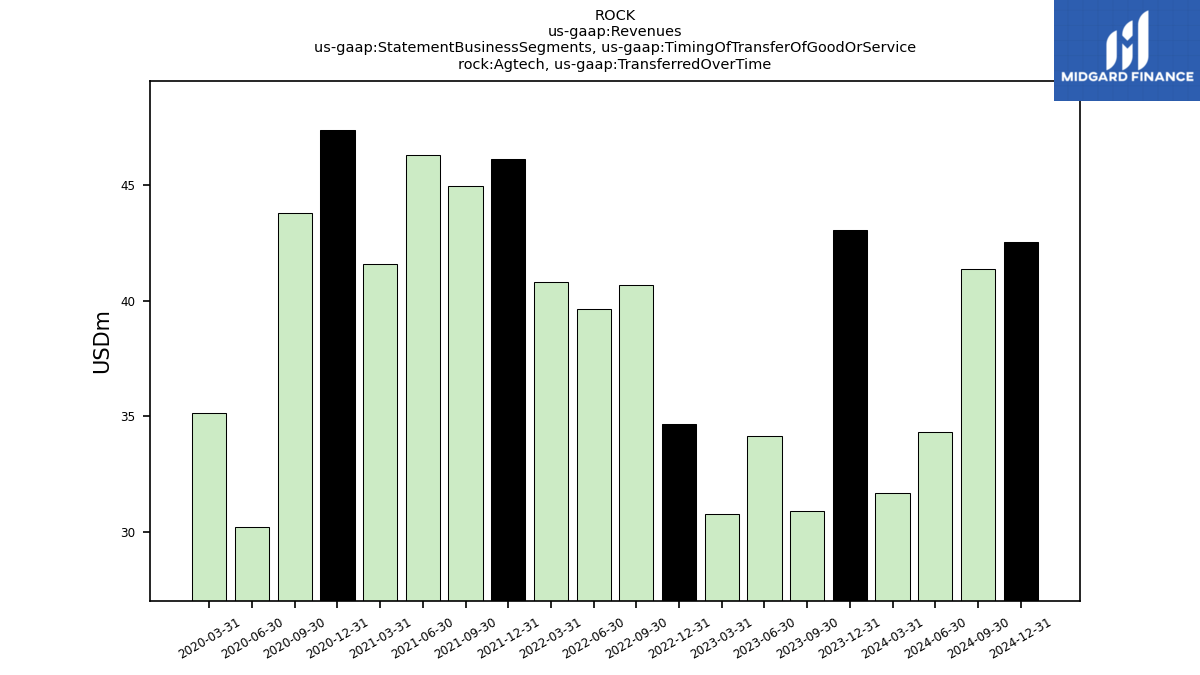
| Agtech, Transferred Over Time | 43.08 | 30.89 | 34.15 | 30.75 | 34.68 | 40.71 | 39.65 | 40.81 | 46.13 | 44.97 | 46.31 | 41.60 | 47.40 | 43.81 | 30.22 | 35.14 | NA | NA | NA | NA | NA | NA | NA | NA | NA | NA | NA | NA | NA | NA | NA | NA | NA | NA | NA | NA | NA | NA | NA | NA | NA | NA | NA | NA | NA | NA | NA | NA | NA | NA | NA | NA | NA | NA | NA | NA | |
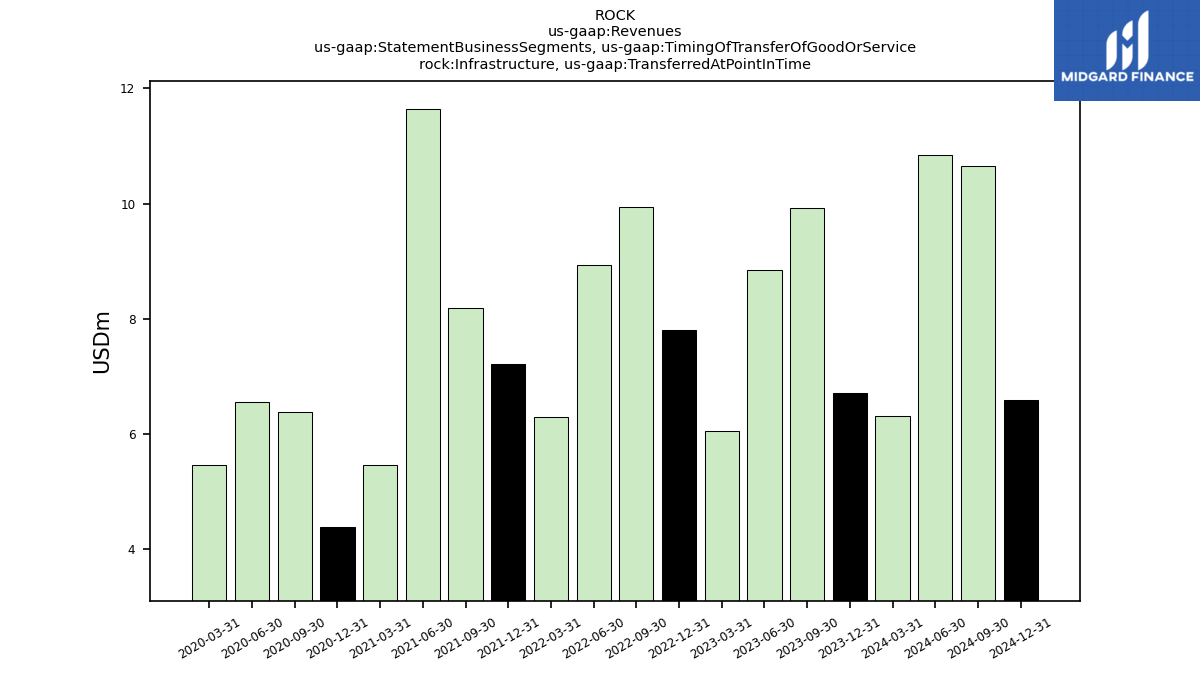
| Infrastructure, Transferred At Point In Time | 6.72 | 9.92 | 8.85 | 6.06 | 7.81 | 9.94 | 8.94 | 6.30 | 7.21 | 8.19 | 11.64 | 5.47 | 4.40 | 6.38 | 6.55 | 5.46 | NA | NA | NA | NA | NA | NA | NA | NA | NA | NA | NA | NA | NA | NA | NA | NA | NA | NA | NA | NA | NA | NA | NA | NA | NA | NA | NA | NA | NA | NA | NA | NA | NA | NA | NA | NA | NA | NA | NA | NA | |
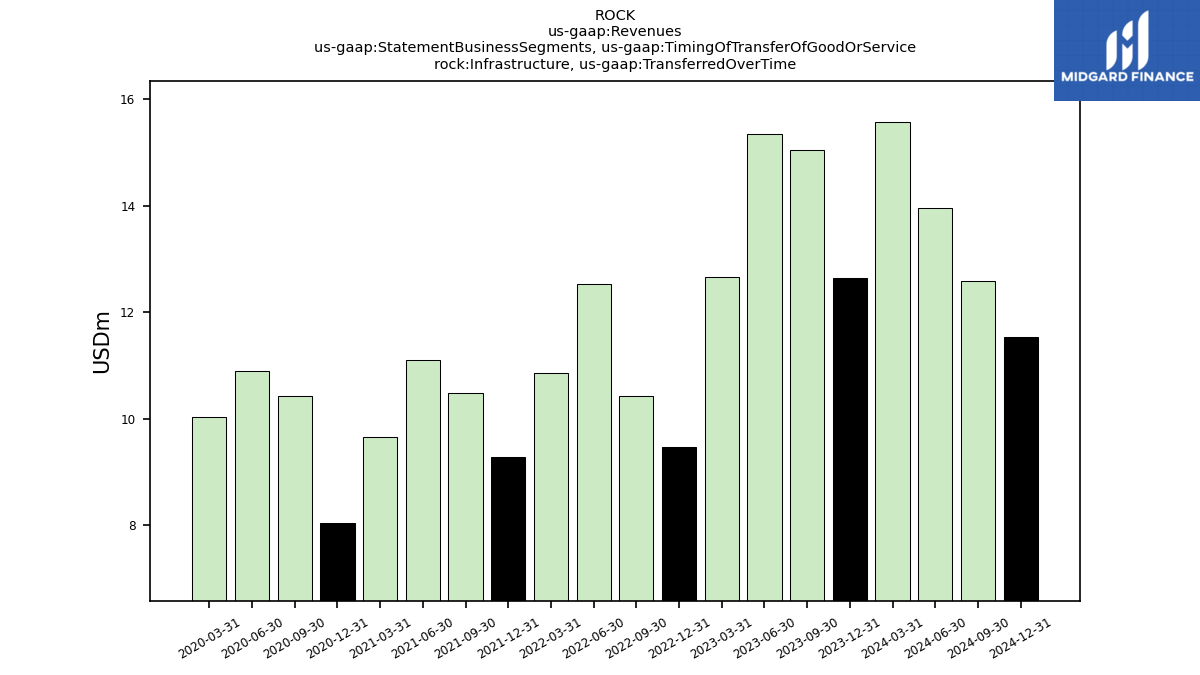
| Infrastructure, Transferred Over Time | 12.63 | 15.05 | 15.35 | 12.65 | 9.47 | 10.43 | 12.54 | 10.87 | 9.28 | 10.48 | 11.10 | 9.65 | 8.05 | 10.44 | 10.90 | 10.03 | NA | NA | NA | NA | NA | NA | NA | NA | NA | NA | NA | NA | NA | NA | NA | NA | NA | NA | NA | NA | NA | NA | NA | NA | NA | NA | NA | NA | NA | NA | NA | NA | NA | NA | NA | NA | NA | NA | NA | NA | |
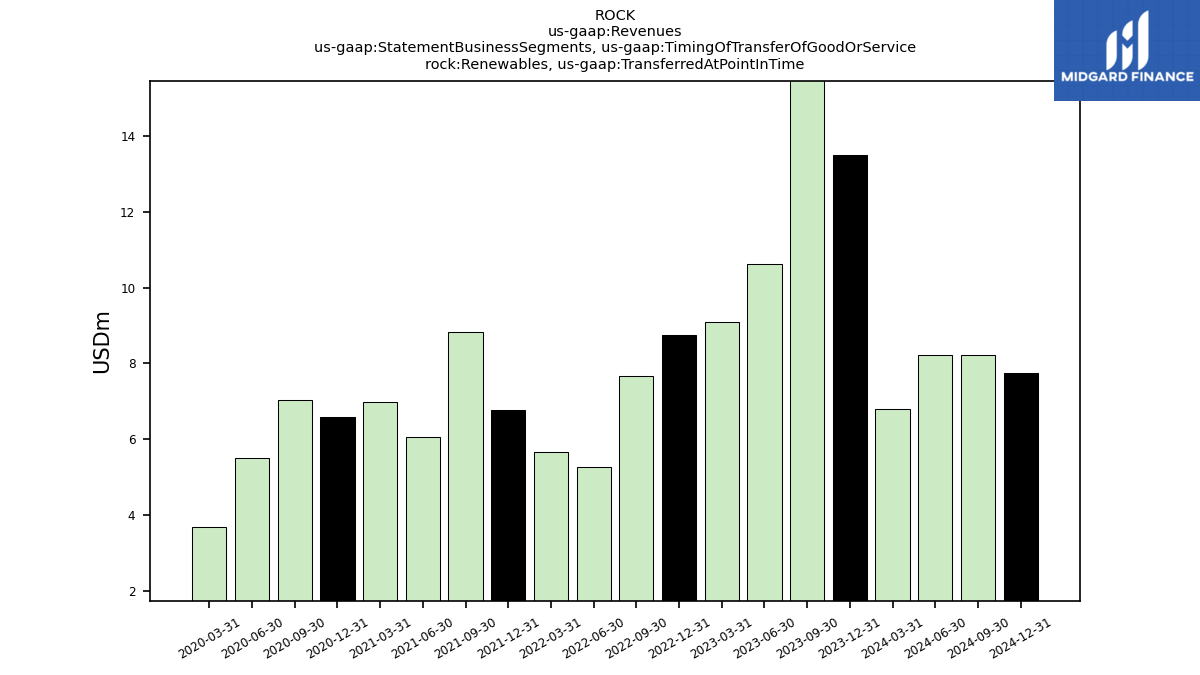
| Renewables, Transferred At Point In Time | 13.49 | 15.90 | 10.63 | 9.09 | 8.75 | 7.66 | 5.26 | 5.65 | 6.78 | 8.84 | 6.05 | 6.97 | 6.59 | 7.04 | 5.51 | 3.70 | NA | NA | NA | NA | NA | NA | NA | NA | NA | NA | NA | NA | NA | NA | NA | NA | NA | NA | NA | NA | NA | NA | NA | NA | NA | NA | NA | NA | NA | NA | NA | NA | NA | NA | NA | NA | NA | NA | NA | NA | |
| Renewables, Transferred Over Time | 74.22 | 90.46 | 66.83 | 50.11 | 77.37 | 103.46 | 96.29 | 73.13 | 101.90 | 121.33 | 101.70 | 78.54 | 58.06 | 63.21 | 50.44 | 43.57 | NA | NA | NA | NA | NA | NA | NA | NA | NA | NA | NA | NA | NA | NA | NA | NA | NA | NA | NA | NA | NA | NA | NA | NA | NA | NA | NA | NA | NA | NA | NA | NA | NA | NA | NA | NA | NA | NA | NA | NA | |
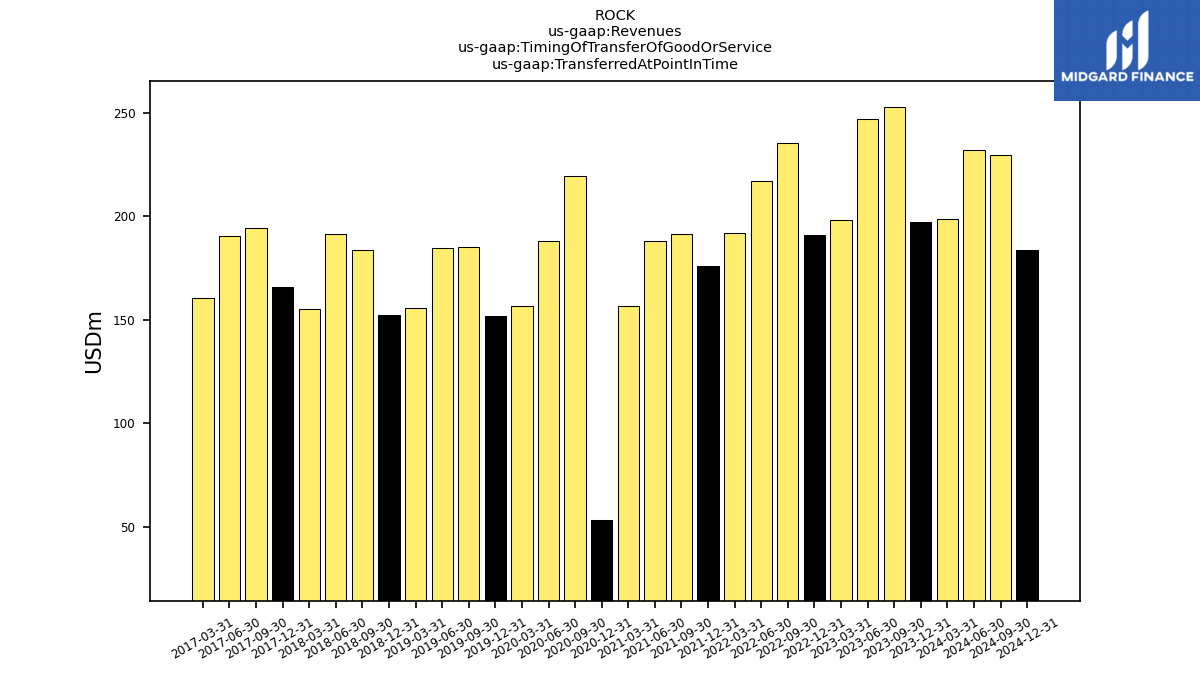
| Transferred At Point In Time | 197.23 | 252.59 | 246.98 | 198.20 | 190.83 | 235.28 | 217.08 | 191.70 | 175.82 | 191.32 | 188.05 | 156.60 | 53.00 | 219.49 | 187.88 | 156.41 | 151.67 | 184.81 | 184.35 | 155.47 | 152.28 | 183.59 | 191.11 | 155.05 | 165.75 | 194.10 | 190.25 | 160.61 | NA | NA | NA | NA | NA | NA | NA | NA | NA | NA | NA | NA | NA | NA | NA | NA | NA | NA | NA | NA | NA | NA | NA | NA | NA | NA | NA | NA | |
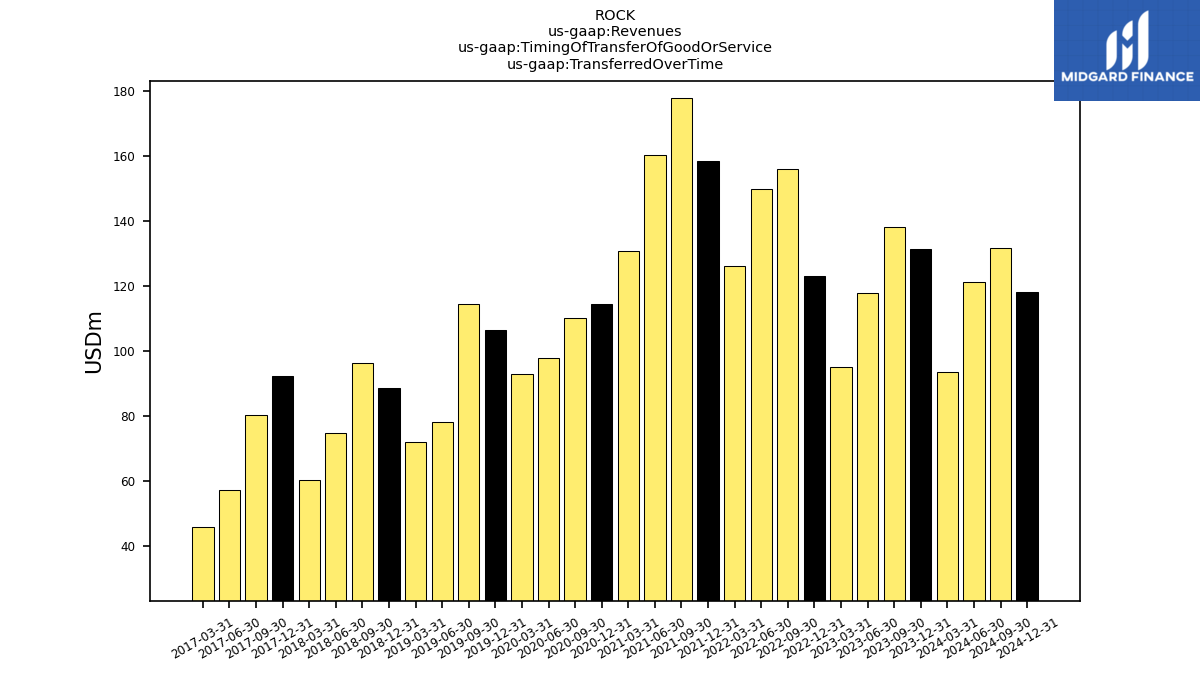
| Transferred Over Time | 131.58 | 138.16 | 117.94 | 95.06 | 123.03 | 156.01 | 149.87 | 126.17 | 158.63 | 178.03 | 160.34 | 130.99 | 114.66 | 110.17 | 97.93 | 93.03 | 106.47 | 114.42 | 78.31 | 71.95 | 88.64 | 96.50 | 74.93 | 60.29 | 92.36 | 80.48 | 57.38 | 46.00 | NA | NA | NA | NA | NA | NA | NA | NA | NA | NA | NA | NA | NA | NA | NA | NA | NA | NA | NA | NA | NA | NA | NA | NA | NA | NA | NA | NA |