
| 2023-12-31 | 2023-09-30 | 2023-06-30 | 2023-03-31 | 2022-12-31 | 2022-09-30 | 2022-06-30 | 2022-03-31 | 2021-12-31 | 2021-09-30 | 2021-06-30 | 2021-03-31 | 2020-12-31 | 2020-09-30 | 2020-06-30 | 2020-03-31 | 2019-12-31 | 2019-09-30 | 2019-06-30 | 2019-03-31 | 2018-12-31 | 2018-09-30 | 2018-06-30 | 2018-03-31 | 2017-12-31 | 2017-09-30 | 2017-06-30 | 2017-03-31 | 2016-12-31 | 2016-09-30 | 2016-06-30 | 2016-03-31 | 2015-12-31 | 2015-09-30 | 2015-06-30 | 2015-03-31 | 2014-12-31 | 2014-09-30 | 2014-06-30 | 2014-03-31 | 2013-12-31 | 2013-09-30 | 2013-06-30 | 2013-03-31 | 2012-12-31 | 2012-09-30 | 2012-06-30 | 2012-03-31 | 2011-12-31 | 2011-09-30 | 2011-06-30 | 2011-03-31 | 2010-12-31 | 2010-09-30 | 2010-06-30 | 2010-03-31 | 2009-12-31 | 2009-09-30 | ||
|---|---|---|---|---|---|---|---|---|---|---|---|---|---|---|---|---|---|---|---|---|---|---|---|---|---|---|---|---|---|---|---|---|---|---|---|---|---|---|---|---|---|---|---|---|---|---|---|---|---|---|---|---|---|---|---|---|---|---|---|
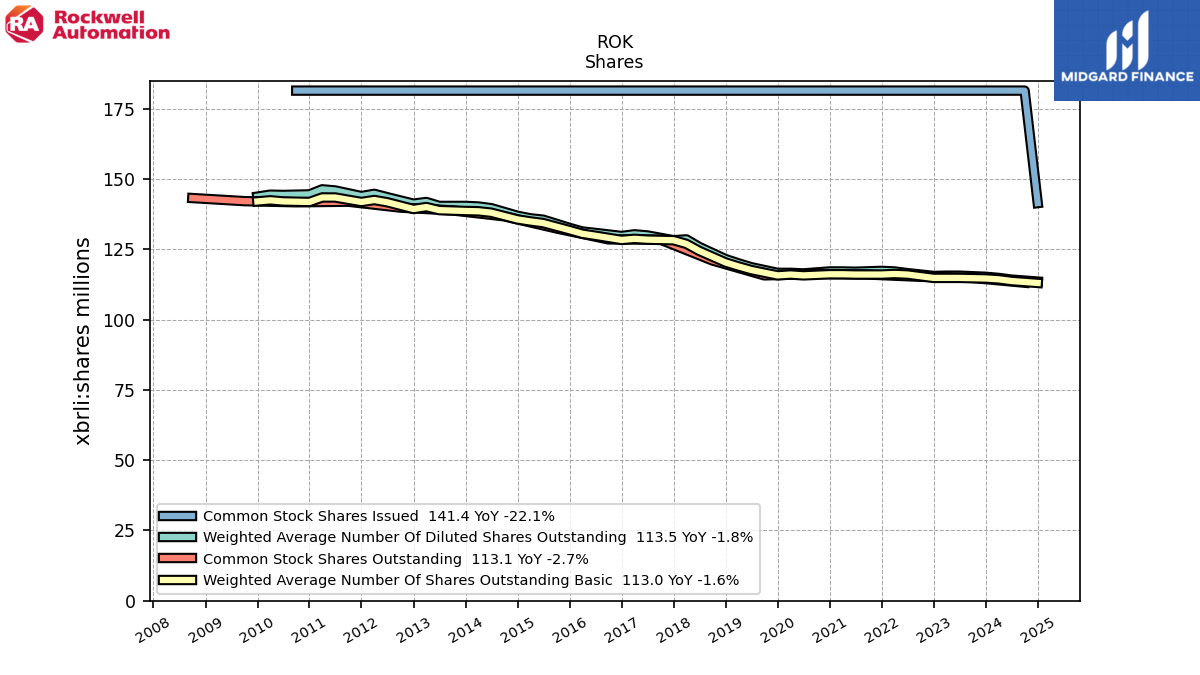
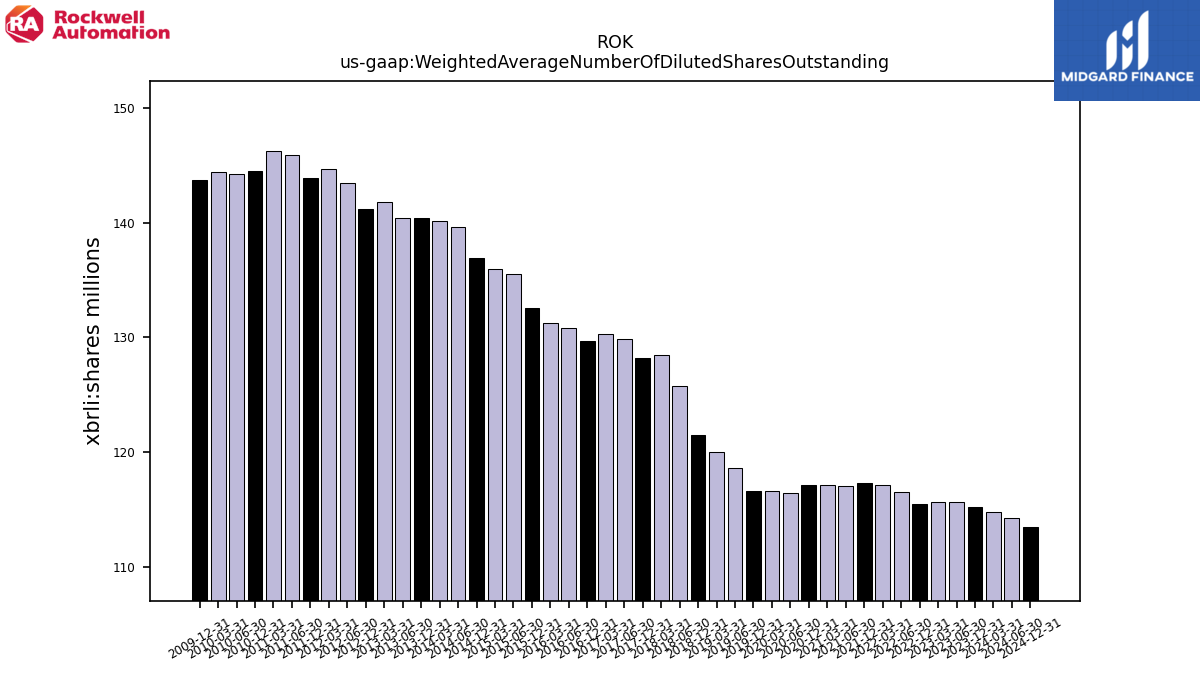
| Weighted Average Number Of Diluted Shares Outstanding | 115.20 | NA | 115.60 | 115.60 | 115.50 | NA | 116.50 | 117.10 | 117.30 | NA | 117.00 | 117.10 | 117.10 | NA | 116.40 | 116.60 | 116.60 | NA | 118.60 | 120.00 | 121.50 | NA | 125.80 | 128.50 | 128.20 | NA | 129.90 | 130.30 | 129.70 | NA | 130.80 | 131.30 | 132.60 | NA | 135.50 | 136.00 | 136.90 | NA | 139.60 | 140.20 | 140.40 | NA | 140.40 | 141.80 | 141.20 | NA | 143.50 | 144.70 | 143.90 | NA | 145.90 | 146.30 | 144.50 | NA | 144.30 | 144.40 | 143.70 | NA | |
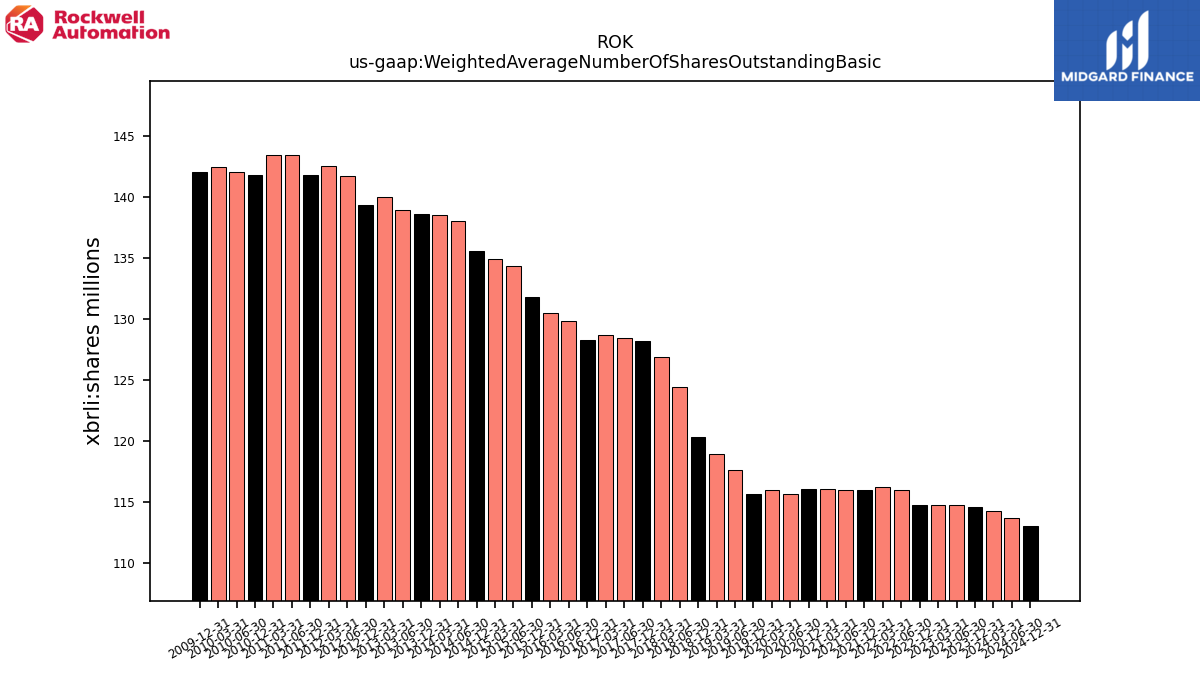
| Weighted Average Number Of Shares Outstanding Basic | 114.60 | NA | 114.80 | 114.80 | 114.80 | NA | 116.00 | 116.20 | 116.00 | NA | 116.00 | 116.10 | 116.10 | NA | 115.70 | 116.00 | 115.70 | NA | 117.60 | 118.90 | 120.30 | NA | 124.40 | 126.90 | 128.20 | NA | 128.40 | 128.70 | 128.30 | NA | 129.80 | 130.50 | 131.80 | NA | 134.30 | 134.90 | 135.60 | NA | 138.00 | 138.50 | 138.60 | NA | 138.90 | 140.00 | 139.30 | NA | 141.70 | 142.50 | 141.80 | NA | 143.40 | 143.40 | 141.80 | NA | 142.00 | 142.40 | 142.00 | NA | |
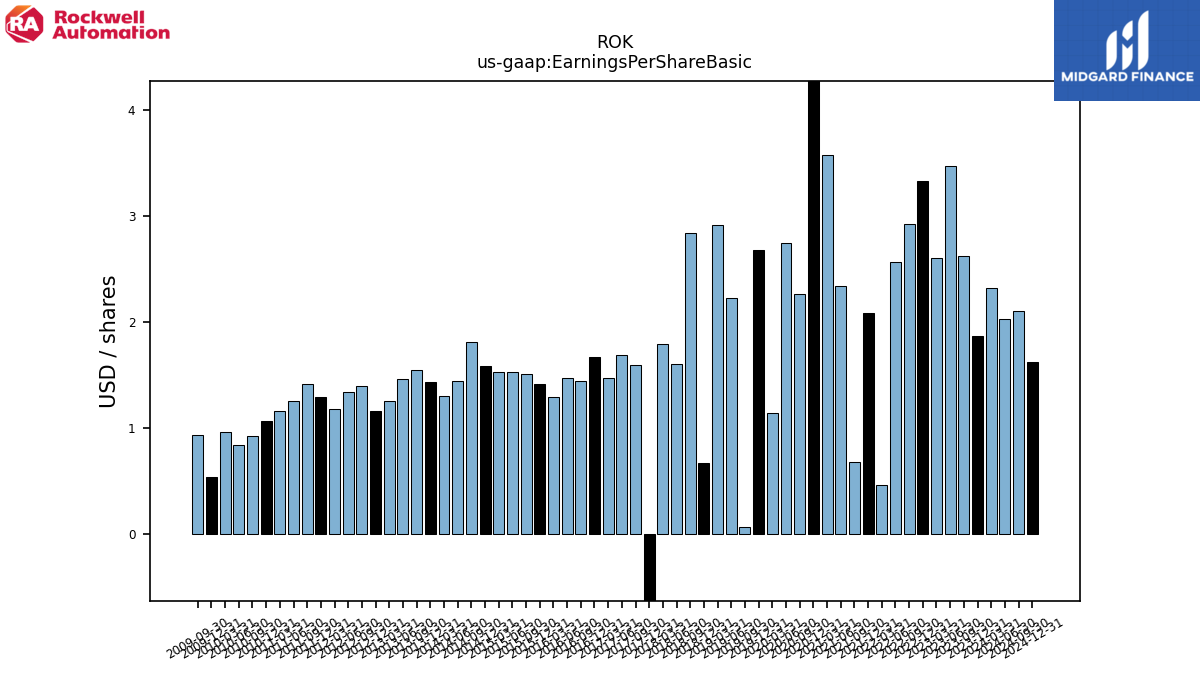
| Earnings Per Share Basic | 1.87 | 2.62 | 3.47 | 2.60 | 3.33 | 2.92 | 2.56 | 0.46 | 2.08 | 0.68 | 2.34 | 3.57 | 5.11 | 2.26 | 2.74 | 1.14 | 2.68 | 0.07 | 2.22 | 2.91 | 0.67 | 2.84 | 1.60 | 1.79 | -1.84 | 1.59 | 1.69 | 1.47 | 1.67 | 1.44 | 1.47 | 1.29 | 1.41 | 1.51 | 1.53 | 1.53 | 1.58 | 1.81 | 1.44 | 1.30 | 1.43 | 1.55 | 1.46 | 1.25 | 1.16 | 1.39 | 1.34 | 1.18 | 1.29 | 1.41 | 1.25 | 1.16 | 1.06 | 0.92 | 0.84 | 0.96 | 0.54 | 0.93 | |
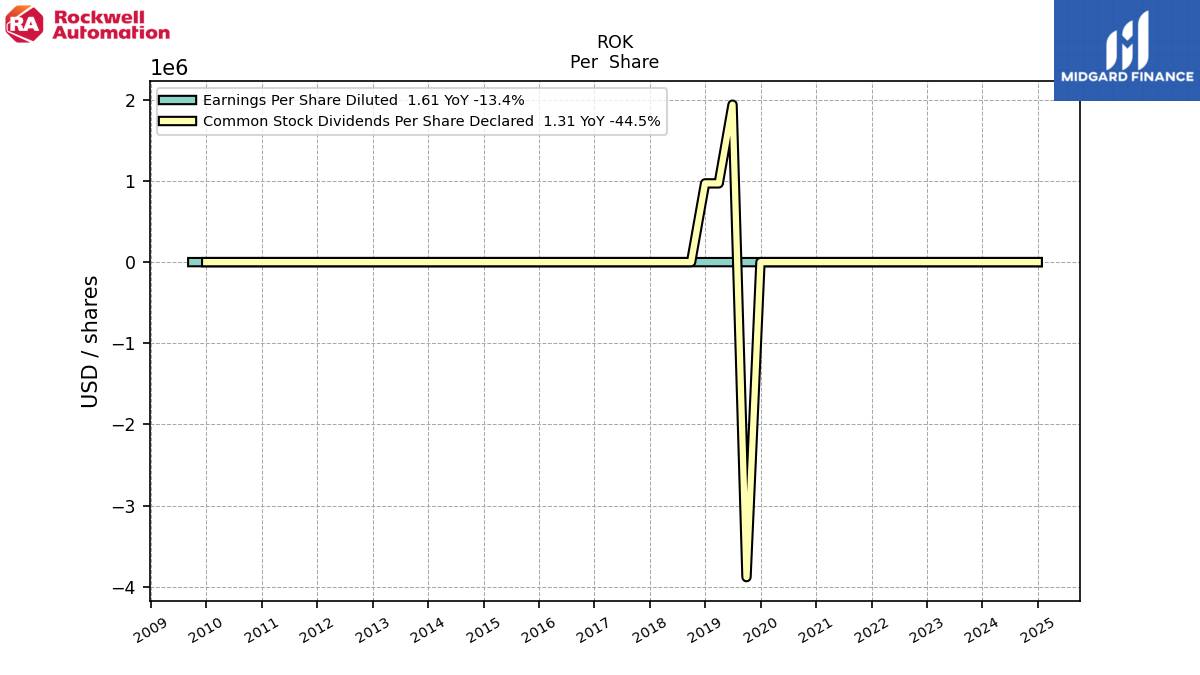
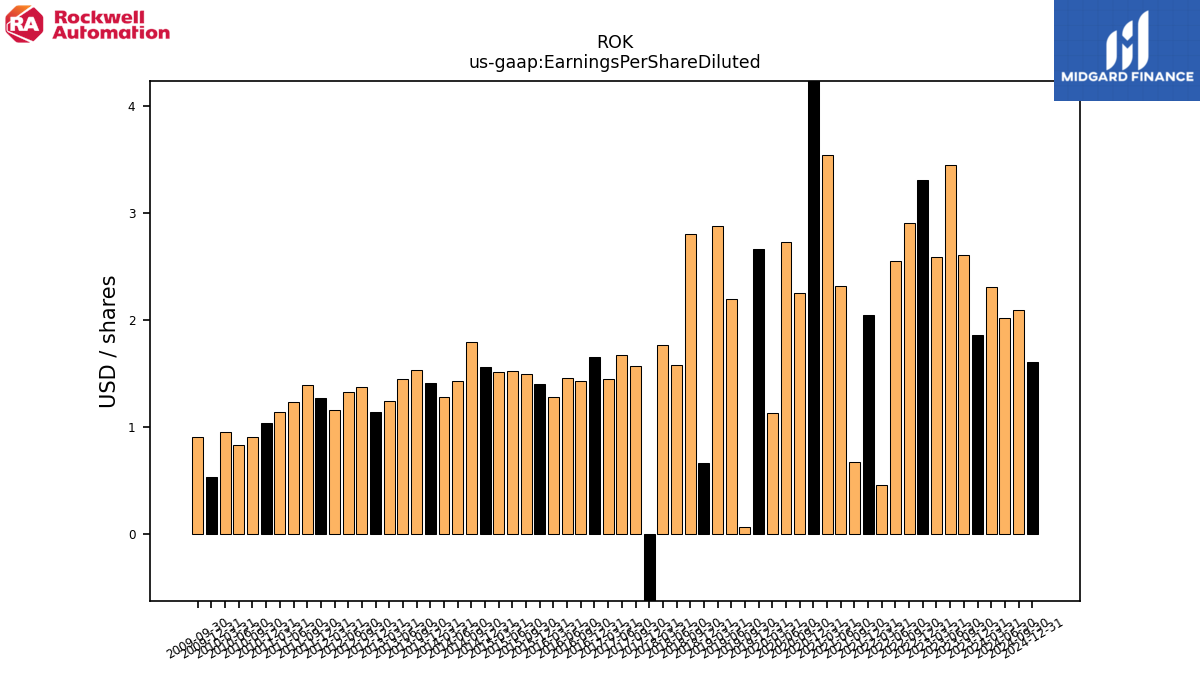
| Earnings Per Share Diluted | 1.86 | 2.61 | 3.45 | 2.59 | 3.31 | 2.91 | 2.55 | 0.46 | 2.05 | 0.67 | 2.32 | 3.54 | 5.06 | 2.25 | 2.73 | 1.13 | 2.66 | 0.07 | 2.20 | 2.88 | 0.66 | 2.80 | 1.58 | 1.77 | -1.84 | 1.57 | 1.67 | 1.45 | 1.65 | 1.43 | 1.46 | 1.28 | 1.40 | 1.50 | 1.52 | 1.51 | 1.56 | 1.79 | 1.43 | 1.28 | 1.41 | 1.53 | 1.45 | 1.24 | 1.14 | 1.37 | 1.33 | 1.16 | 1.27 | 1.39 | 1.23 | 1.14 | 1.04 | 0.91 | 0.83 | 0.95 | 0.53 | 0.91 |
| 2023-12-31 | 2023-09-30 | 2023-06-30 | 2023-03-31 | 2022-12-31 | 2022-09-30 | 2022-06-30 | 2022-03-31 | 2021-12-31 | 2021-09-30 | 2021-06-30 | 2021-03-31 | 2020-12-31 | 2020-09-30 | 2020-06-30 | 2020-03-31 | 2019-12-31 | 2019-09-30 | 2019-06-30 | 2019-03-31 | 2018-12-31 | 2018-09-30 | 2018-06-30 | 2018-03-31 | 2017-12-31 | 2017-09-30 | 2017-06-30 | 2017-03-31 | 2016-12-31 | 2016-09-30 | 2016-06-30 | 2016-03-31 | 2015-12-31 | 2015-09-30 | 2015-06-30 | 2015-03-31 | 2014-12-31 | 2014-09-30 | 2014-06-30 | 2014-03-31 | 2013-12-31 | 2013-09-30 | 2013-06-30 | 2013-03-31 | 2012-12-31 | 2012-09-30 | 2012-06-30 | 2012-03-31 | 2011-12-31 | 2011-09-30 | 2011-06-30 | 2011-03-31 | 2010-12-31 | 2010-09-30 | 2010-06-30 | 2010-03-31 | 2009-12-31 | 2009-09-30 | ||
|---|---|---|---|---|---|---|---|---|---|---|---|---|---|---|---|---|---|---|---|---|---|---|---|---|---|---|---|---|---|---|---|---|---|---|---|---|---|---|---|---|---|---|---|---|---|---|---|---|---|---|---|---|---|---|---|---|---|---|---|
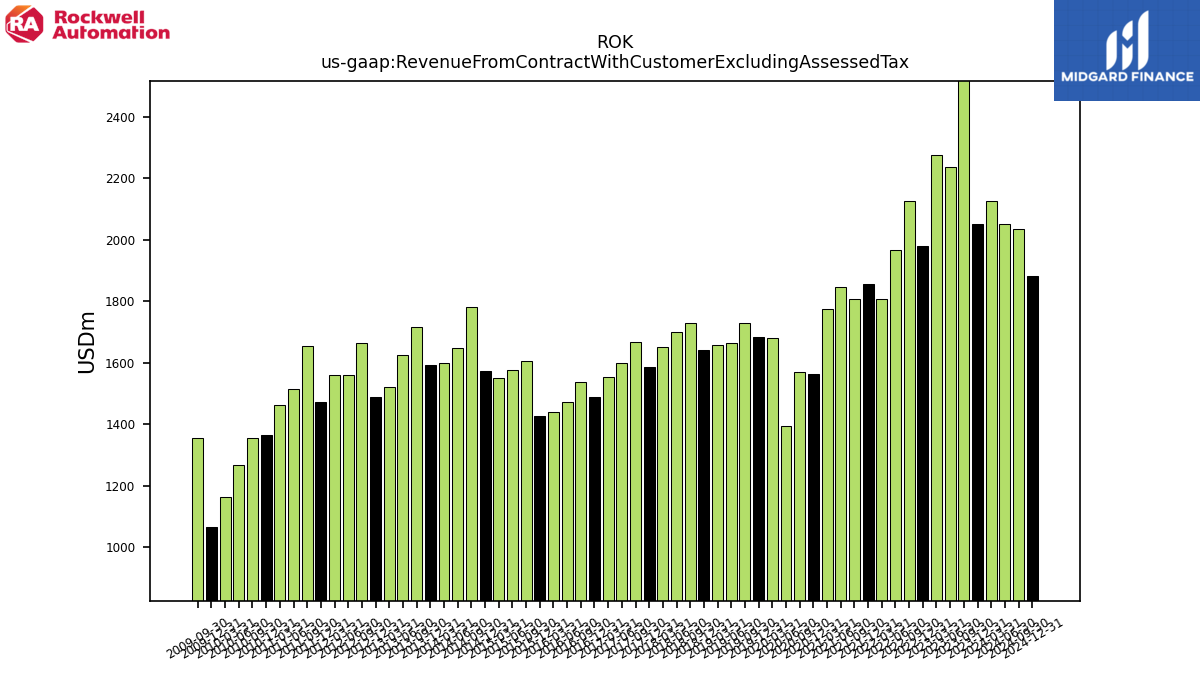
| Revenue From Contract With Customer Excluding Assessed Tax | 2052.10 | 2562.90 | 2238.70 | 2275.40 | 1981.00 | 2126.30 | 1968.70 | 1808.10 | 1857.30 | 1807.80 | 1848.20 | 1776.10 | 1565.30 | 1570.00 | 1394.00 | 1681.30 | 1684.50 | 1730.20 | 1665.10 | 1657.20 | 1642.30 | 1729.50 | 1698.70 | 1651.20 | 1586.60 | 1667.50 | 1599.20 | 1554.30 | 1490.30 | 1538.60 | 1474.00 | 1440.30 | 1426.60 | 1607.50 | 1575.20 | 1550.80 | 1574.40 | 1781.80 | 1649.50 | 1600.50 | 1591.70 | 1715.70 | 1624.20 | 1522.80 | 1489.20 | 1664.00 | 1560.40 | 1561.10 | 1473.90 | 1654.30 | 1516.20 | 1464.10 | 1365.80 | 1356.90 | 1268.10 | 1164.50 | 1067.50 | 1356.90 | |
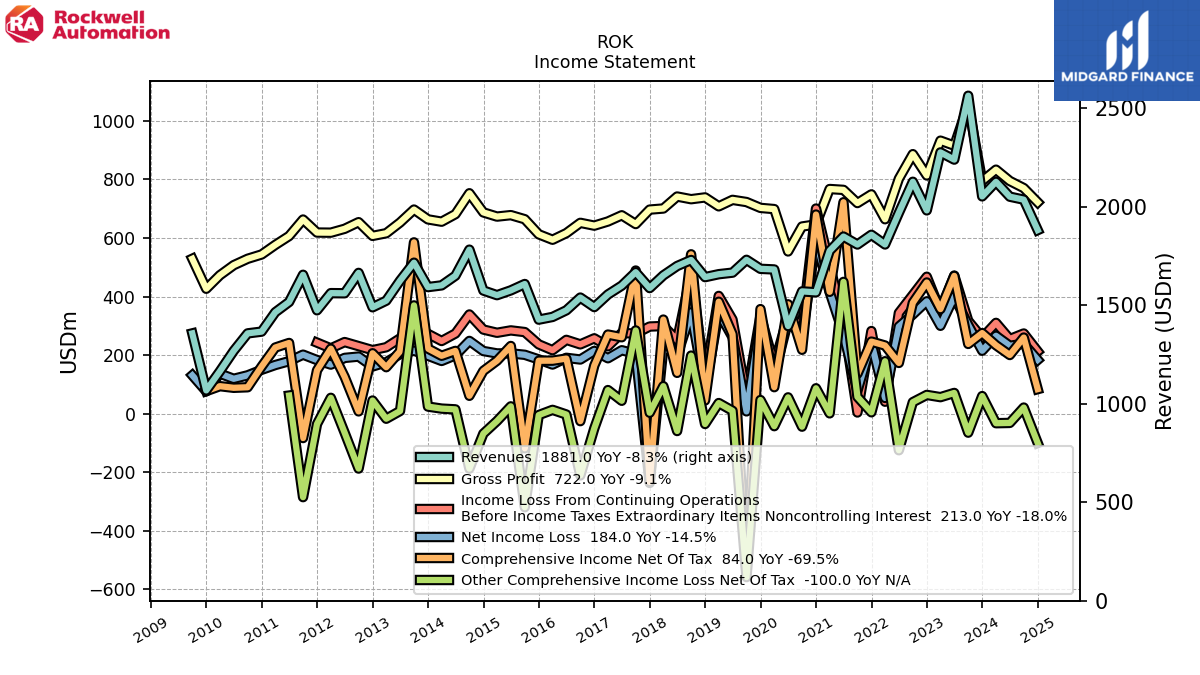
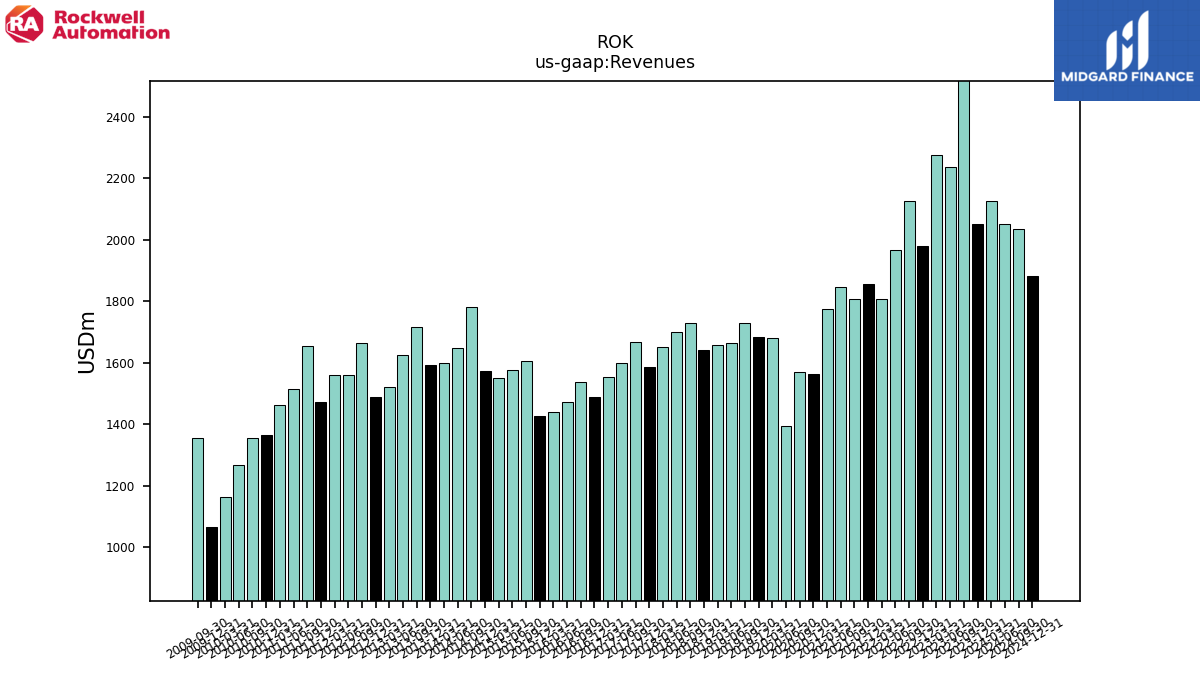
| Revenues | 2052.10 | 2562.90 | 2238.70 | 2275.40 | 1981.00 | 2126.30 | 1968.70 | 1808.10 | 1857.30 | 1807.80 | 1848.20 | 1776.10 | 1565.30 | 1570.00 | 1394.00 | 1681.30 | 1684.50 | 1730.20 | 1665.10 | 1657.20 | 1642.30 | 1729.50 | 1698.70 | 1651.20 | 1586.60 | 1667.50 | 1599.20 | 1554.30 | 1490.30 | 1538.60 | 1474.00 | 1440.30 | 1426.60 | 1607.50 | 1575.20 | 1550.80 | 1574.40 | 1781.80 | 1649.50 | 1600.50 | 1591.70 | 1715.70 | 1624.20 | 1522.80 | 1489.20 | 1664.00 | 1560.40 | 1561.10 | 1473.90 | 1654.30 | 1516.20 | 1464.10 | 1365.80 | 1356.90 | 1268.10 | 1164.50 | 1067.50 | 1356.90 | |
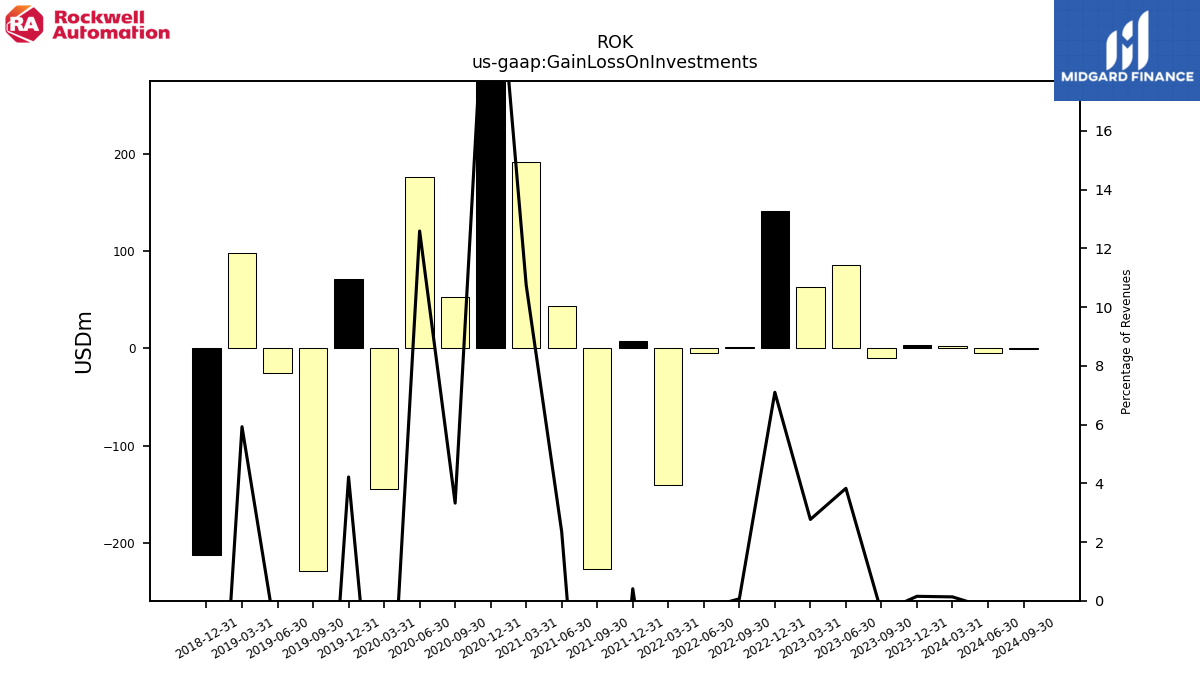
| Gain Loss On Investments | 3.10 | -10.00 | 85.70 | 63.00 | 140.60 | 1.40 | -5.20 | -140.70 | 7.60 | -227.20 | 43.30 | 190.90 | 390.40 | 52.20 | 175.50 | -144.80 | 71.00 | -228.40 | -25.60 | 98.20 | -212.70 | NA | NA | NA | NA | NA | NA | NA | NA | NA | NA | NA | NA | NA | NA | NA | NA | NA | NA | NA | NA | NA | NA | NA | NA | NA | NA | NA | NA | NA | NA | NA | NA | NA | NA | NA | NA | NA | |
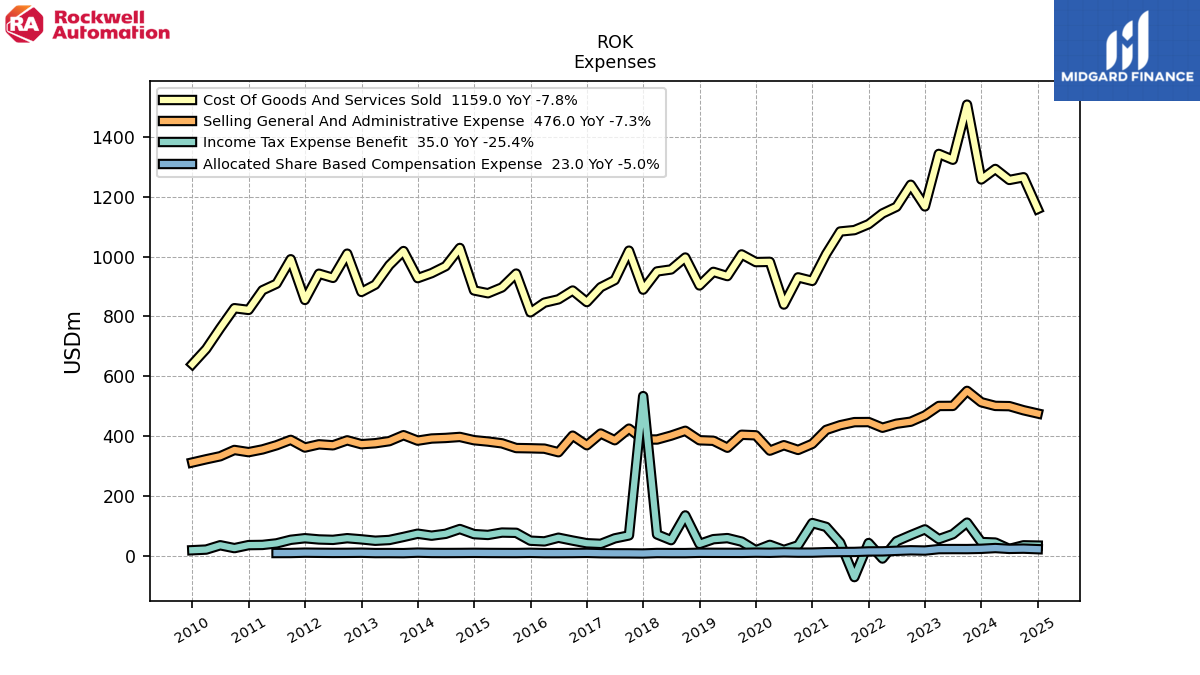
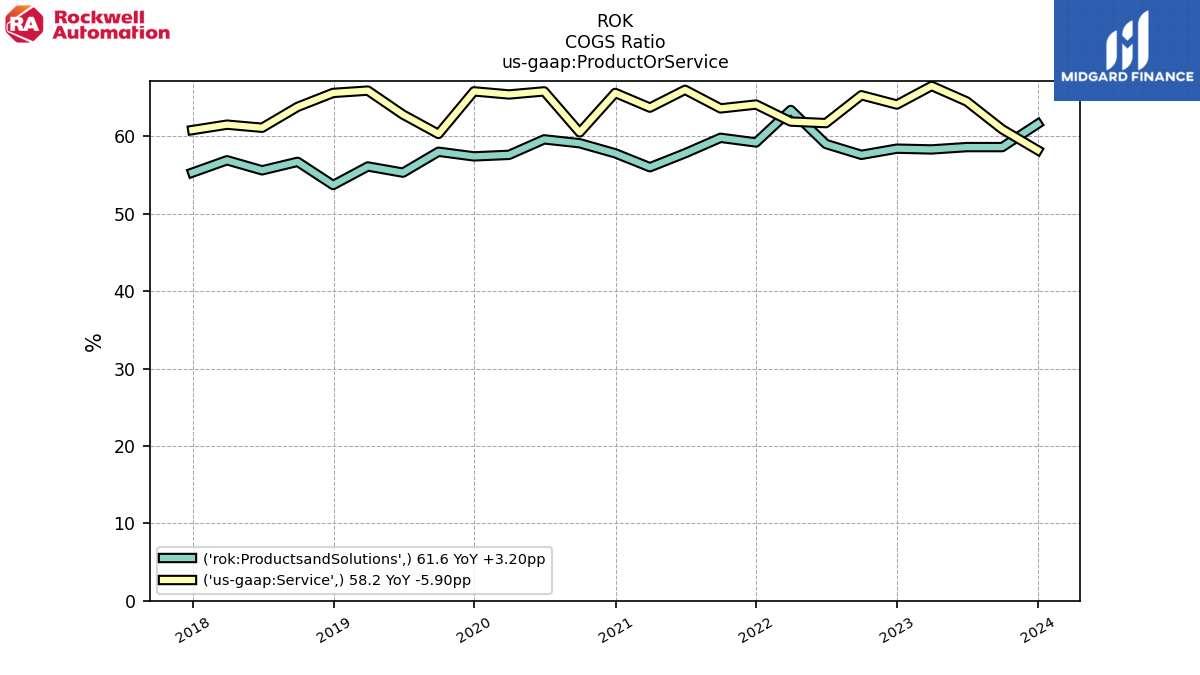
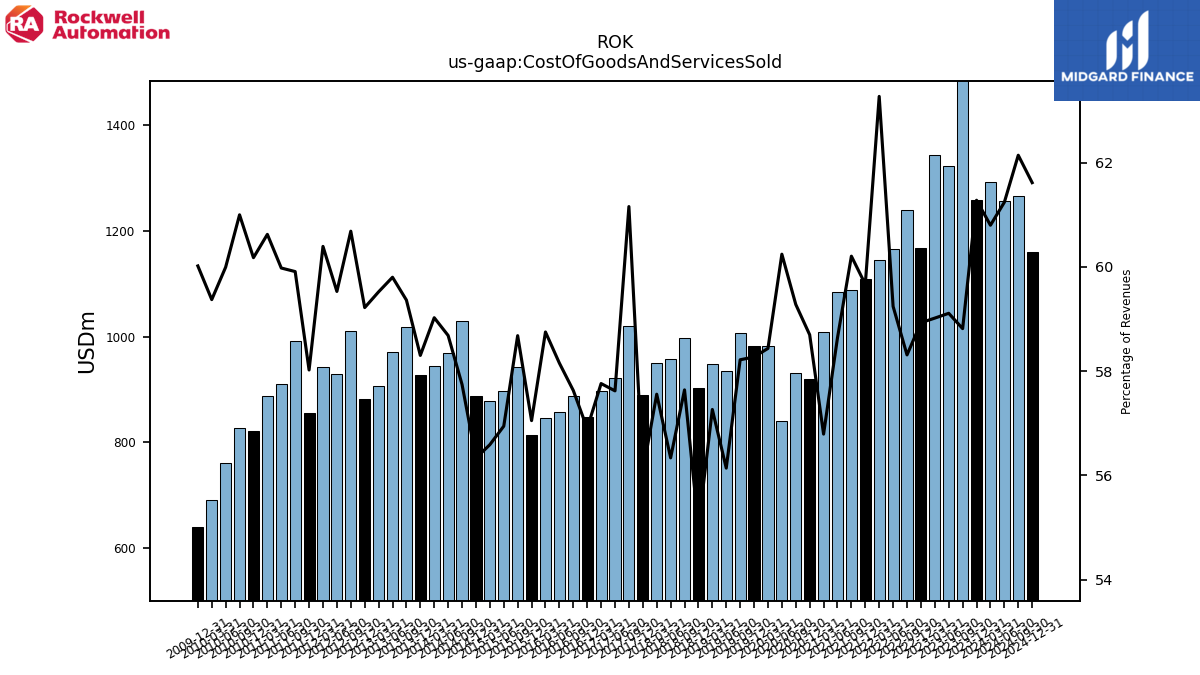
| Cost Of Goods And Services Sold | 1257.50 | 1507.40 | 1323.30 | 1342.90 | 1167.40 | 1239.90 | 1166.30 | 1144.00 | 1108.20 | 1088.40 | 1083.80 | 1008.70 | 918.80 | 930.70 | 839.80 | 982.50 | 981.60 | 1007.30 | 934.80 | 949.00 | 903.60 | 996.90 | 957.00 | 950.40 | 889.50 | 1019.80 | 921.50 | 897.80 | 848.00 | 886.70 | 857.20 | 846.20 | 813.90 | 943.30 | 897.00 | 877.60 | 886.90 | 1028.90 | 968.00 | 944.70 | 928.00 | 1018.50 | 971.30 | 906.40 | 881.90 | 1009.80 | 928.90 | 942.80 | 855.20 | 991.10 | 909.40 | 887.60 | 821.90 | 827.70 | 760.80 | 691.40 | 640.70 | NA | |
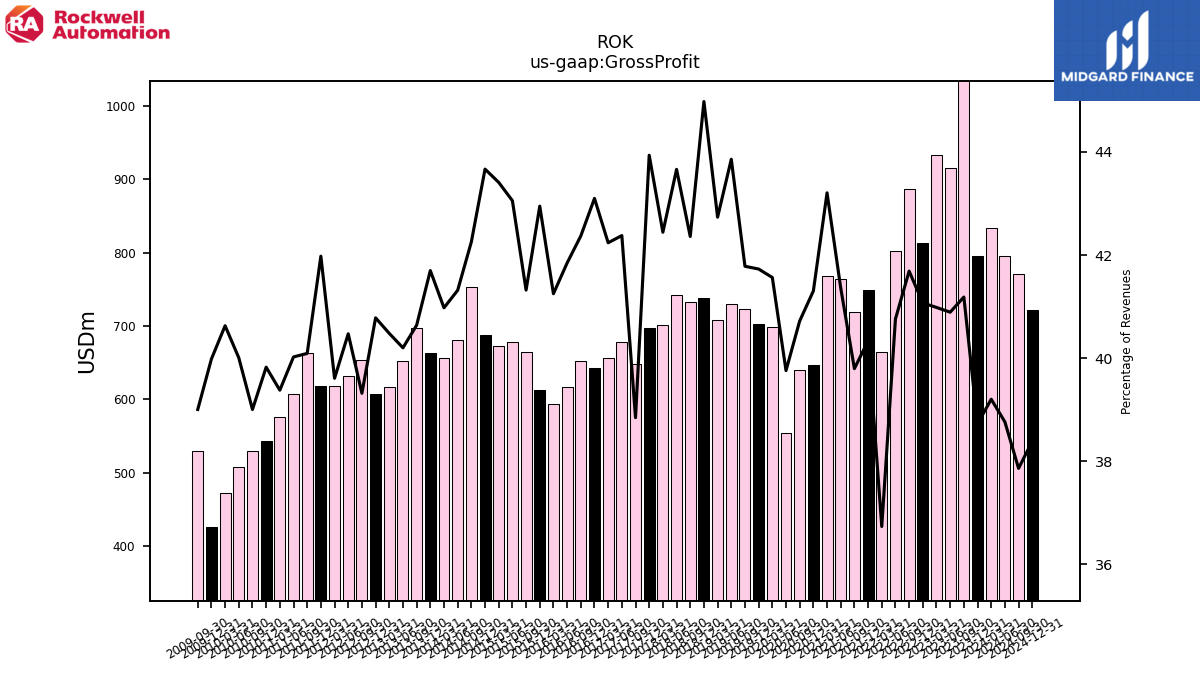
| Gross Profit | 794.60 | 1055.50 | 915.40 | 932.50 | 813.60 | 886.40 | 802.40 | 664.10 | 749.10 | 719.40 | 764.40 | 767.40 | 646.50 | 639.30 | 554.20 | 698.80 | 702.90 | 722.90 | 730.30 | 708.20 | 738.70 | 732.60 | 741.70 | 700.80 | 697.10 | 647.70 | 677.70 | 656.50 | 642.30 | 651.90 | 616.80 | 594.10 | 612.70 | 664.20 | 678.20 | 673.20 | 687.50 | 752.90 | 681.50 | 655.80 | 663.70 | 697.20 | 652.90 | 616.40 | 607.30 | 654.20 | 631.50 | 618.30 | 618.70 | 663.20 | 606.80 | 576.50 | 543.90 | 529.20 | 507.30 | 473.10 | 426.80 | 529.20 | |
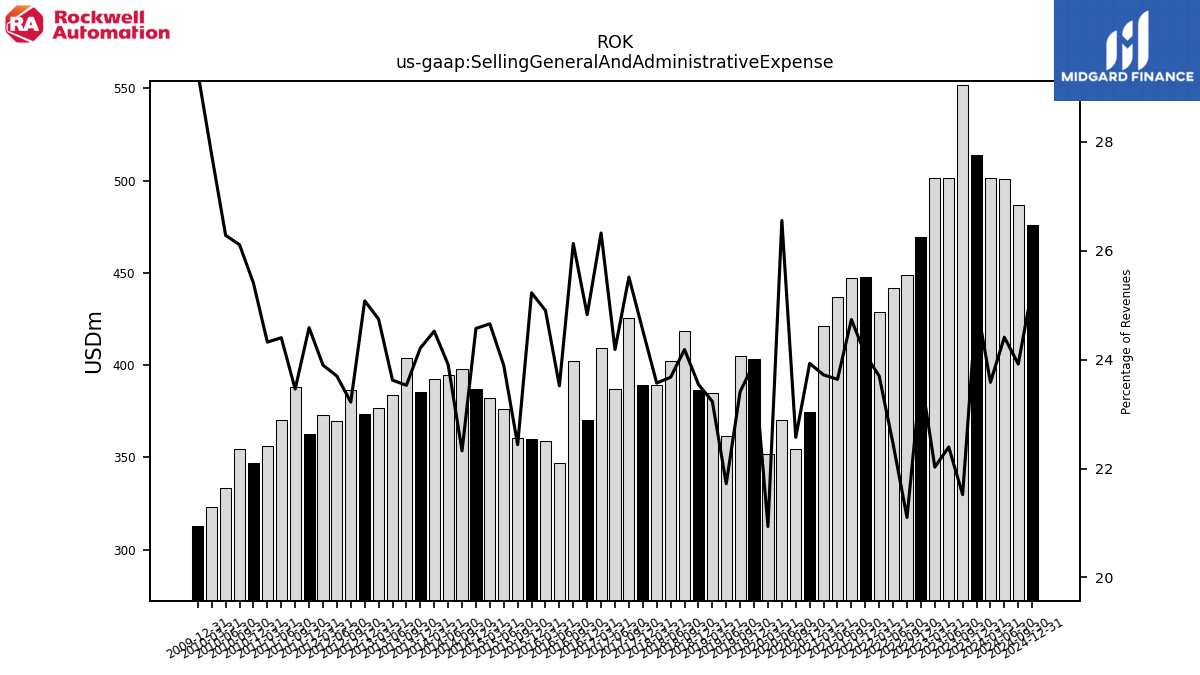
| Selling General And Administrative Expense | 513.70 | 551.60 | 501.40 | 501.20 | 469.50 | 448.70 | 442.00 | 428.50 | 447.50 | 447.20 | 436.90 | 421.30 | 374.60 | 354.40 | 370.20 | 352.00 | 403.20 | 405.10 | 361.70 | 385.00 | 386.70 | 418.30 | 402.20 | 389.20 | 389.30 | 425.50 | 386.80 | 409.20 | 370.00 | 402.10 | 346.70 | 358.70 | 359.90 | 360.70 | 376.40 | 382.40 | 386.90 | 397.80 | 394.40 | 392.50 | 385.40 | 403.70 | 383.70 | 376.80 | 373.50 | 386.40 | 369.80 | 373.10 | 362.40 | 388.10 | 370.00 | 356.10 | 347.00 | 354.30 | 333.30 | 323.20 | 312.50 | NA | |
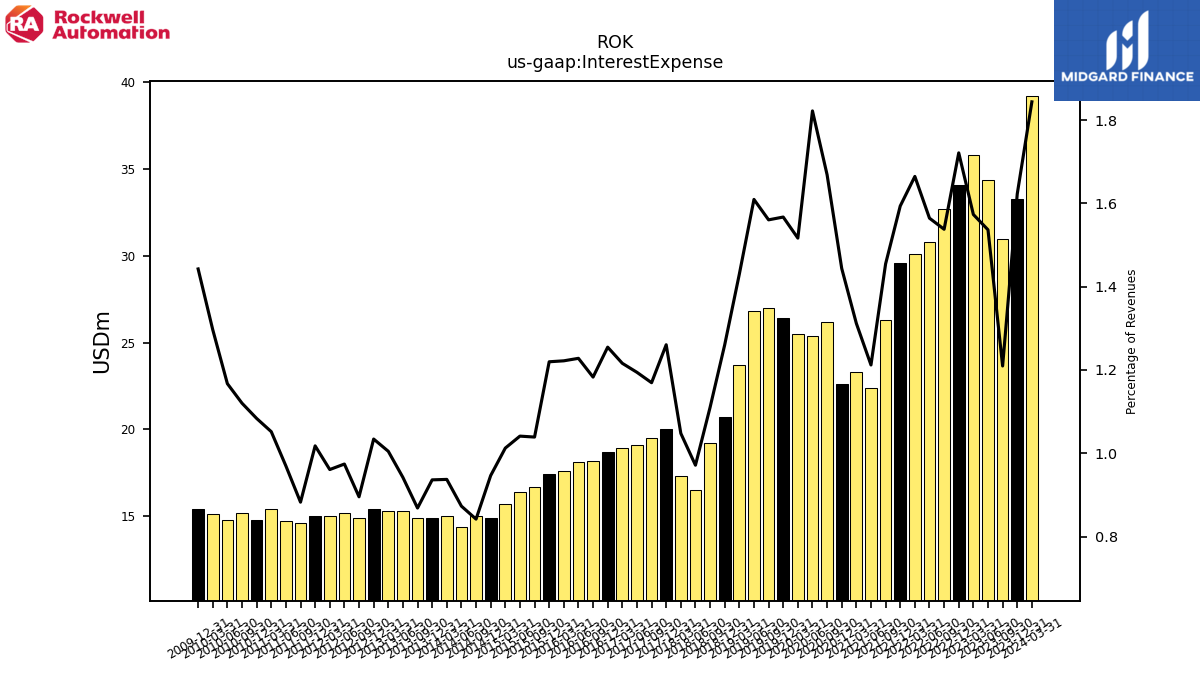
| Interest Expense | 33.30 | 31.00 | 34.40 | 35.80 | 34.10 | 32.70 | 30.80 | 30.10 | 29.60 | 26.30 | 22.40 | 23.30 | 22.60 | 26.20 | 25.40 | 25.50 | 26.40 | 27.00 | 26.80 | 23.70 | 20.70 | 19.20 | 16.50 | 17.30 | 20.00 | 19.50 | 19.10 | 18.90 | 18.70 | 18.20 | 18.10 | 17.60 | 17.40 | 16.70 | 16.40 | 15.70 | 14.90 | 15.00 | 14.40 | 15.00 | 14.90 | 14.90 | 15.30 | 15.30 | 15.40 | 14.90 | 15.20 | 15.00 | 15.00 | 14.60 | 14.70 | 15.40 | 14.80 | 15.20 | 14.80 | 15.10 | 15.40 | NA | |
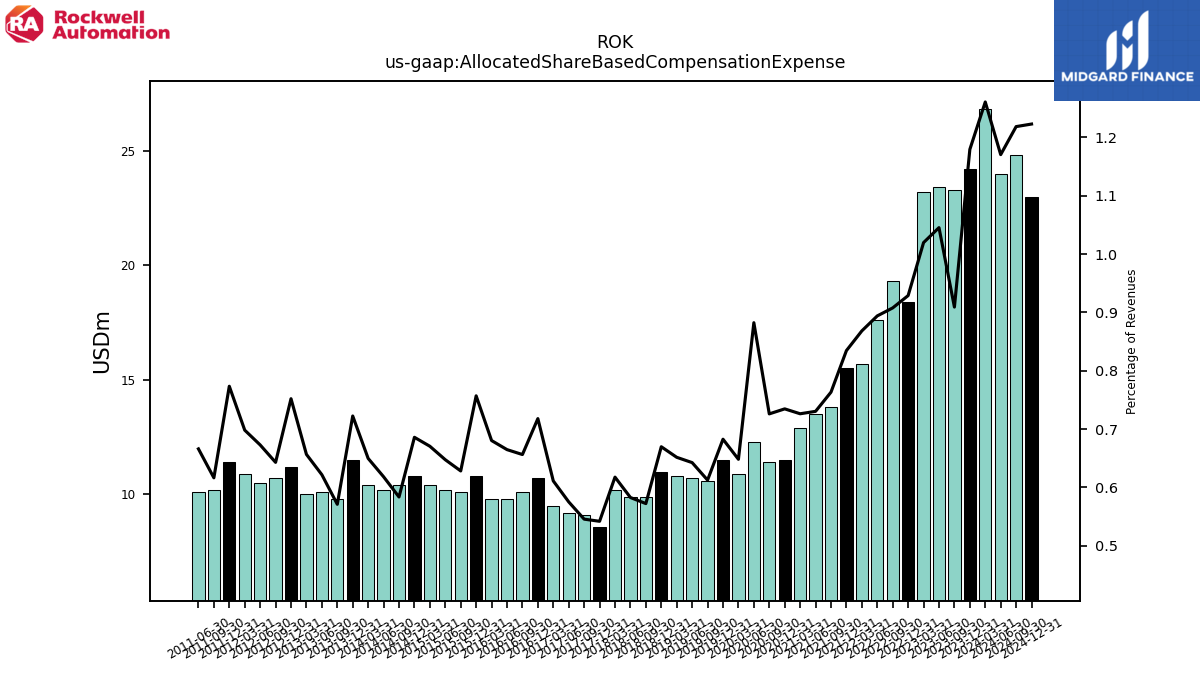
| Allocated Share Based Compensation Expense | 24.20 | 23.30 | 23.40 | 23.20 | 18.40 | 19.30 | 17.60 | 15.70 | 15.50 | 13.80 | 13.50 | 12.90 | 11.50 | 11.40 | 12.30 | 10.90 | 11.50 | 10.60 | 10.70 | 10.80 | 11.00 | 9.90 | 9.90 | 10.20 | 8.60 | 9.10 | 9.20 | 9.50 | 10.70 | 10.10 | 9.80 | 9.80 | 10.80 | 10.10 | 10.20 | 10.40 | 10.80 | 10.40 | 10.20 | 10.40 | 11.50 | 9.80 | 10.10 | 10.00 | 11.20 | 10.70 | 10.50 | 10.90 | 11.40 | 10.20 | 10.10 | NA | NA | NA | NA | NA | NA | NA | |
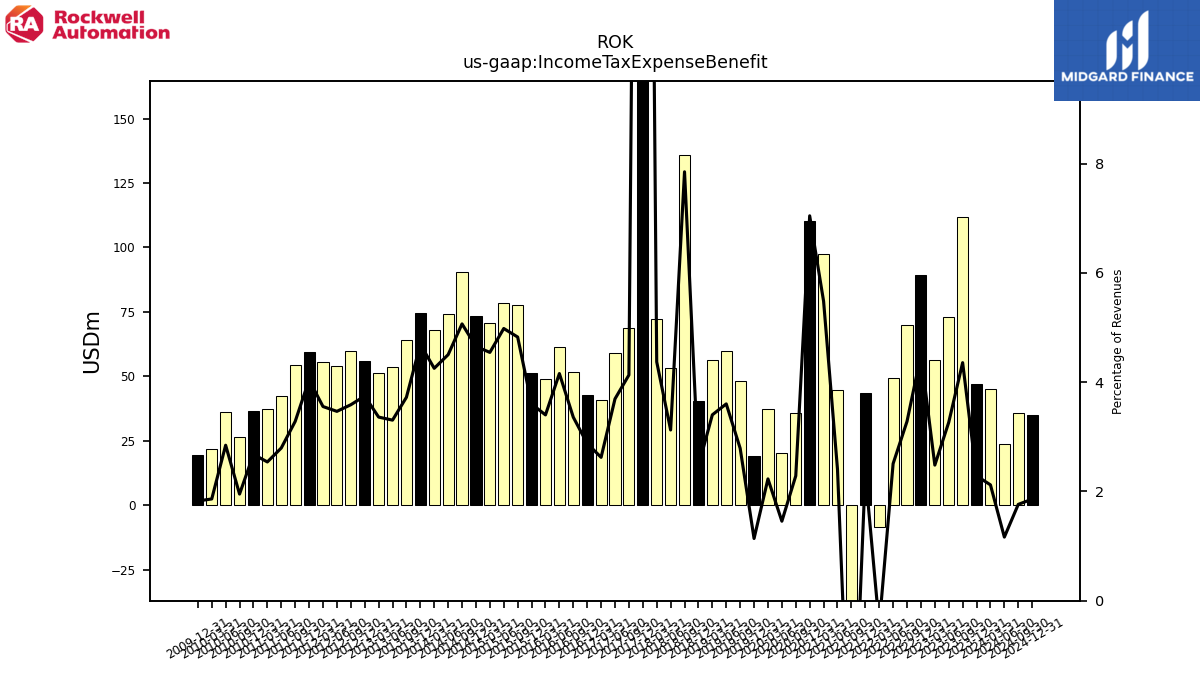
| Income Tax Expense Benefit | 46.90 | 111.70 | 73.10 | 56.50 | 89.20 | 69.80 | 49.40 | -8.30 | 43.60 | -70.30 | 44.50 | 97.40 | 110.30 | 35.90 | 20.30 | 37.50 | 19.20 | 48.30 | 60.00 | 56.40 | 40.50 | 135.80 | 53.10 | 72.20 | 534.20 | 68.90 | 59.10 | 40.80 | 42.90 | 51.70 | 61.30 | 49.00 | 51.40 | 77.60 | 78.50 | 70.50 | 73.30 | 90.30 | 74.30 | 68.10 | 74.70 | 63.90 | 53.70 | 51.20 | 55.80 | 59.70 | 54.10 | 55.50 | 59.60 | 54.30 | 42.40 | 37.20 | 36.60 | 26.50 | 36.10 | 21.70 | 19.50 | NA | |
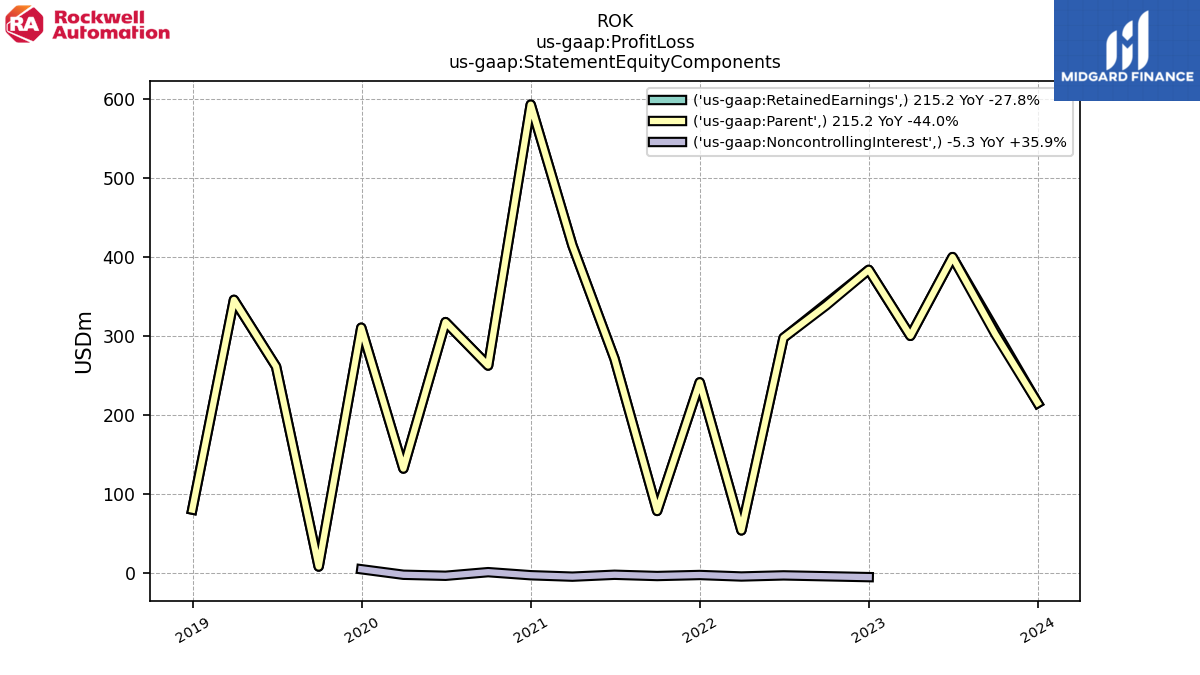
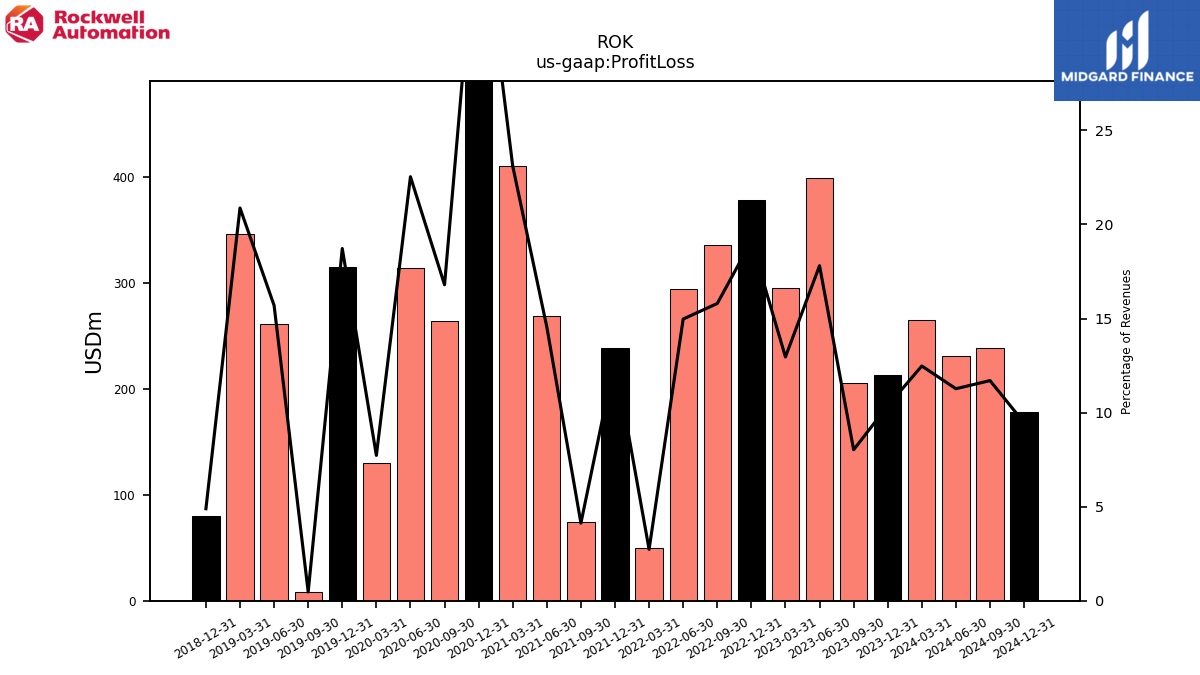
| Profit Loss | 212.70 | 205.70 | 398.70 | 294.90 | 378.70 | 336.00 | 294.80 | 49.40 | 238.90 | 74.60 | 269.00 | 410.30 | 590.40 | 263.70 | 314.20 | 129.90 | 315.40 | 8.10 | 261.40 | 346.00 | 80.30 | NA | NA | NA | NA | NA | NA | NA | NA | NA | NA | NA | NA | NA | NA | NA | NA | NA | NA | NA | NA | NA | NA | NA | NA | NA | NA | NA | NA | NA | NA | NA | NA | NA | NA | NA | NA | NA | |
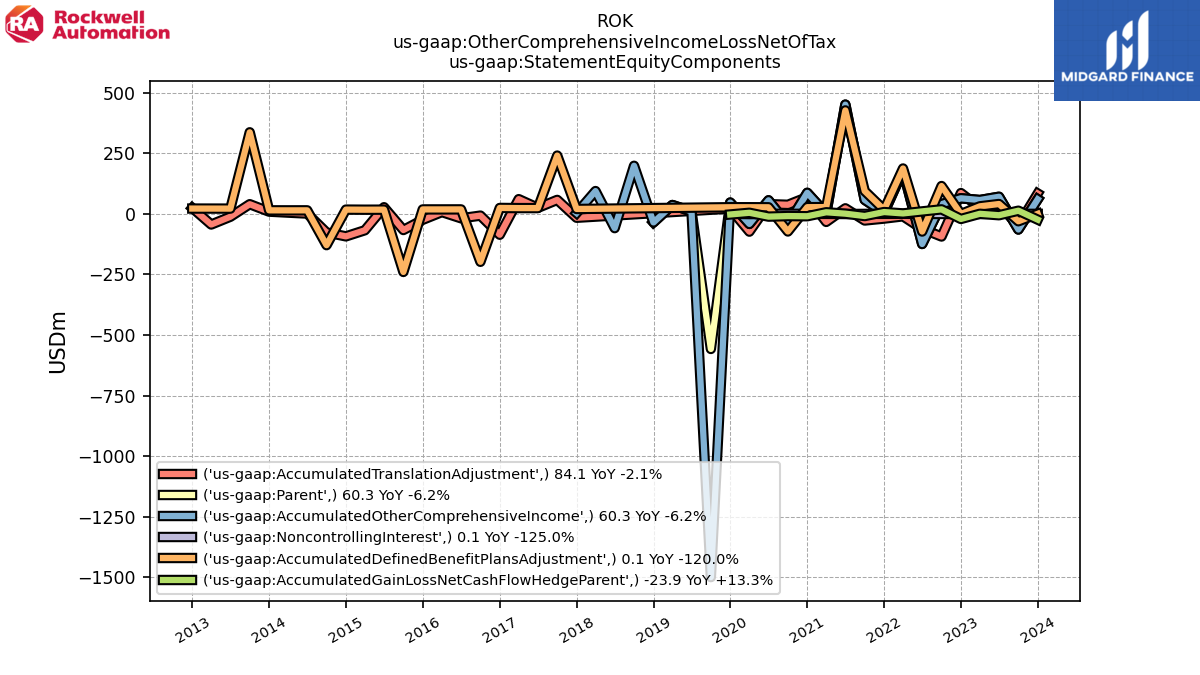
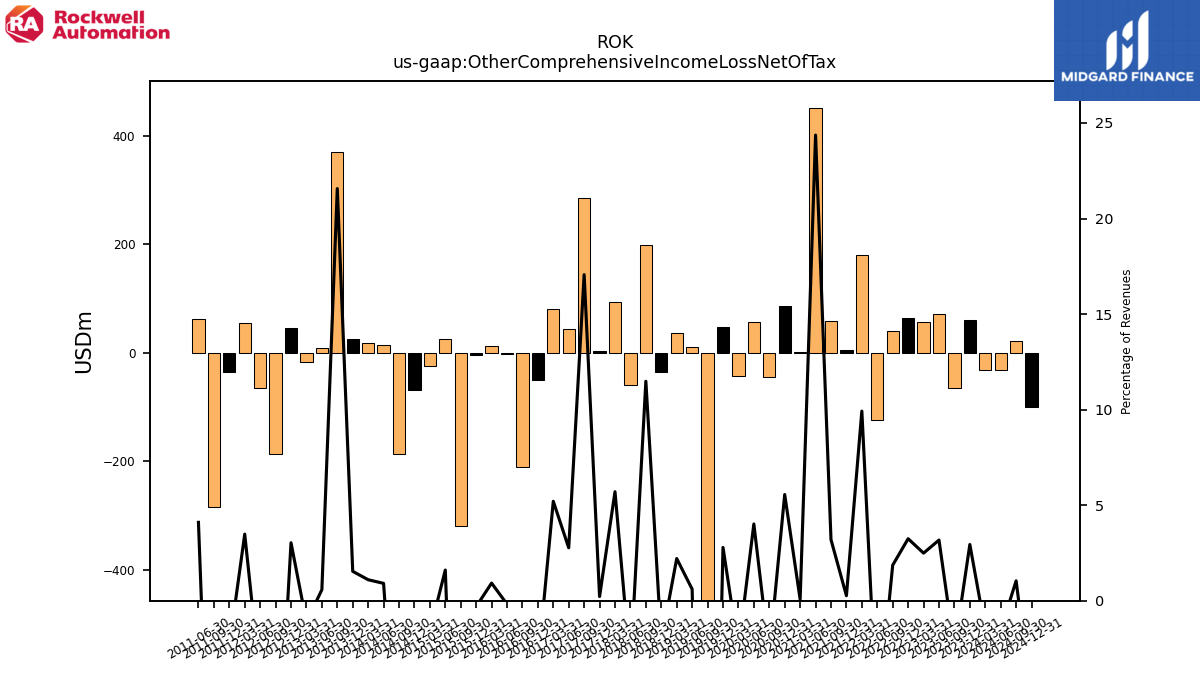
| Other Comprehensive Income Loss Net Of Tax | 60.40 | -64.60 | 71.10 | 56.70 | 64.30 | 39.60 | -124.60 | 179.40 | 4.90 | 57.80 | 450.30 | 1.30 | 87.00 | -44.10 | 56.00 | -42.40 | 47.00 | -557.80 | 10.10 | 36.60 | -35.00 | 198.60 | -59.00 | 94.20 | 3.50 | 284.50 | 44.30 | 80.90 | -50.10 | -210.50 | -2.60 | 13.30 | -4.40 | -319.20 | 25.30 | -24.80 | -67.90 | -187.40 | 15.00 | 17.60 | 24.50 | 370.00 | 9.40 | -17.00 | 45.20 | -187.20 | -64.60 | 54.40 | -35.00 | -284.80 | 62.20 | NA | NA | NA | NA | NA | NA | NA | |
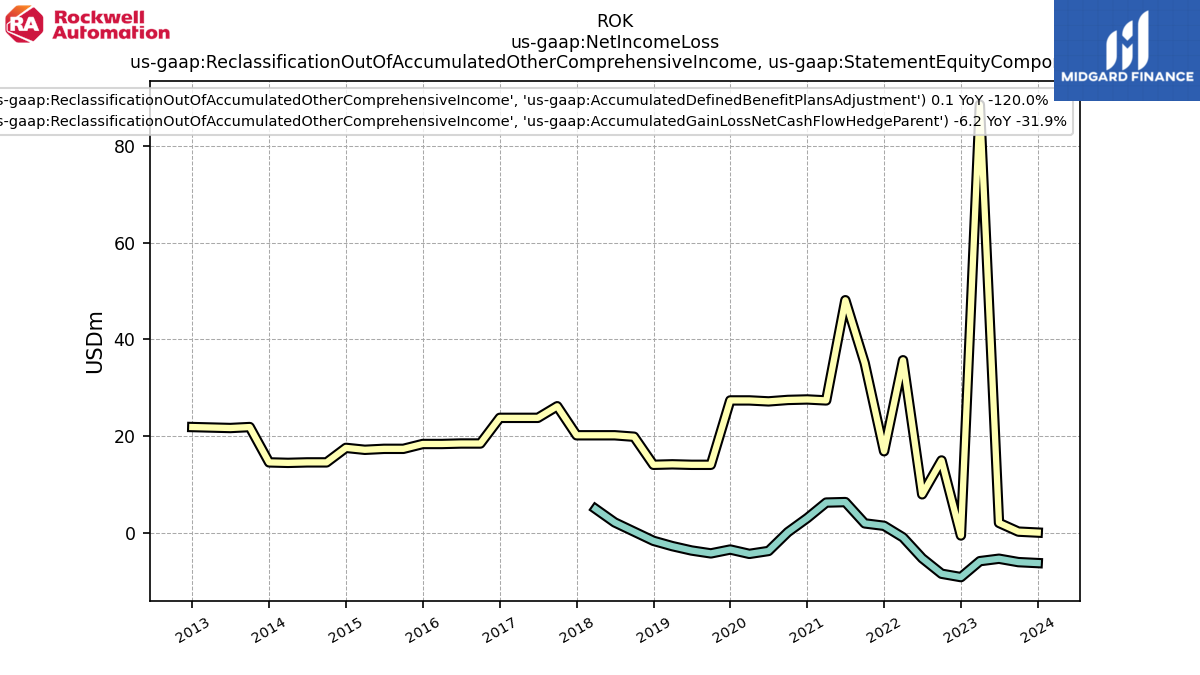
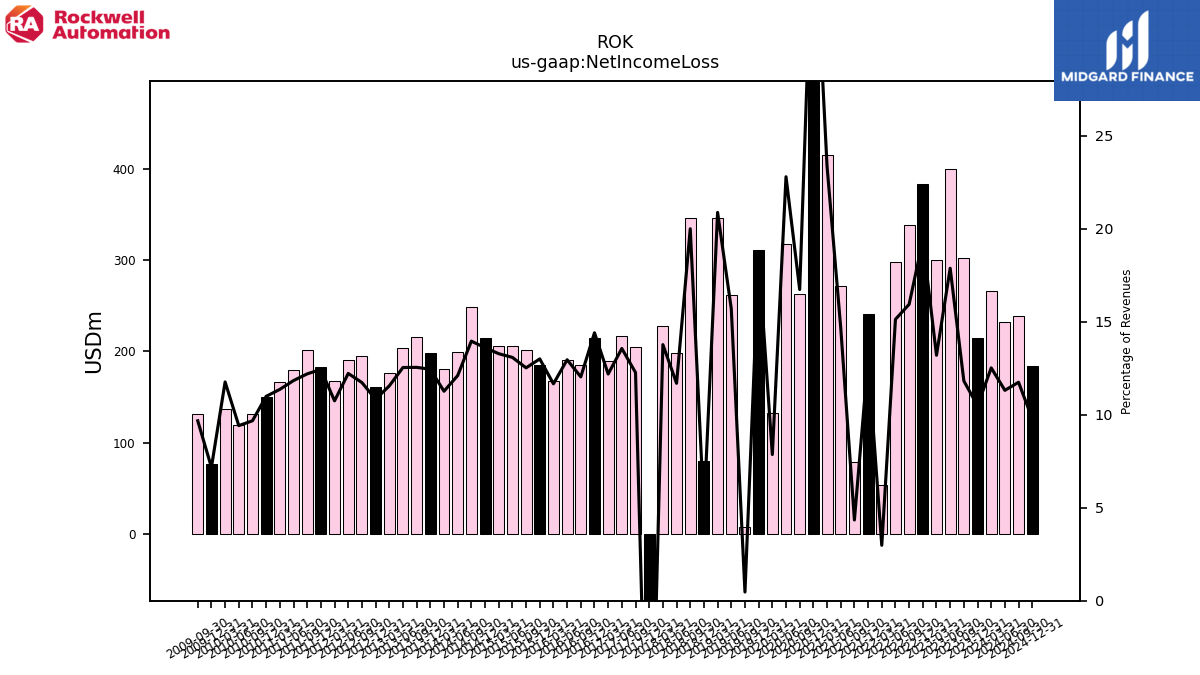
| Net Income Loss | 215.20 | 302.90 | 400.20 | 300.30 | 384.00 | 338.90 | 297.90 | 53.90 | 241.50 | 78.50 | 271.30 | 415.00 | 593.30 | 262.70 | 317.80 | 132.20 | 310.70 | 8.10 | 261.40 | 346.00 | 80.30 | 345.90 | 198.60 | 227.40 | -236.40 | 204.60 | 216.90 | 189.50 | 214.70 | 185.20 | 191.00 | 168.00 | 185.50 | 201.30 | 206.10 | 206.00 | 214.20 | 248.70 | 199.70 | 180.30 | 198.10 | 215.30 | 203.70 | 175.90 | 161.40 | 195.20 | 190.70 | 167.80 | 183.30 | 201.80 | 179.50 | 166.40 | 150.10 | 131.30 | 119.40 | 137.00 | 76.60 | 131.30 | |
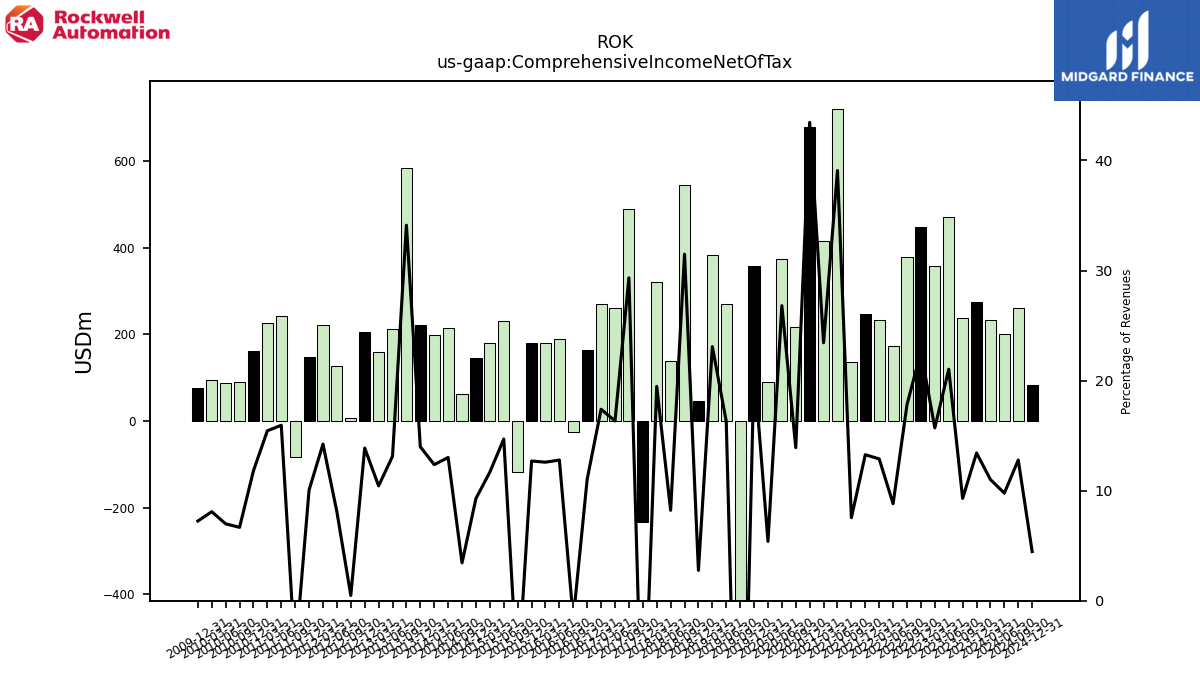
| Comprehensive Income Net Of Tax | 275.50 | 238.30 | 470.80 | 357.40 | 448.30 | 378.90 | 173.50 | 233.00 | 246.40 | 136.40 | 722.30 | 416.30 | 680.20 | 218.40 | 373.70 | 90.70 | 357.40 | -549.70 | 271.50 | 382.60 | 45.30 | 544.50 | 139.60 | 321.60 | -232.90 | 489.10 | 261.20 | 270.40 | 164.60 | -25.30 | 188.40 | 181.30 | 181.10 | -117.90 | 231.40 | 181.20 | 146.30 | 61.30 | 214.70 | 197.90 | 222.60 | 585.30 | 213.10 | 158.90 | 206.60 | 8.00 | 126.10 | 222.20 | 148.30 | -83.00 | 241.70 | 226.10 | 161.30 | 90.50 | 88.60 | 94.20 | 77.30 | NA | |
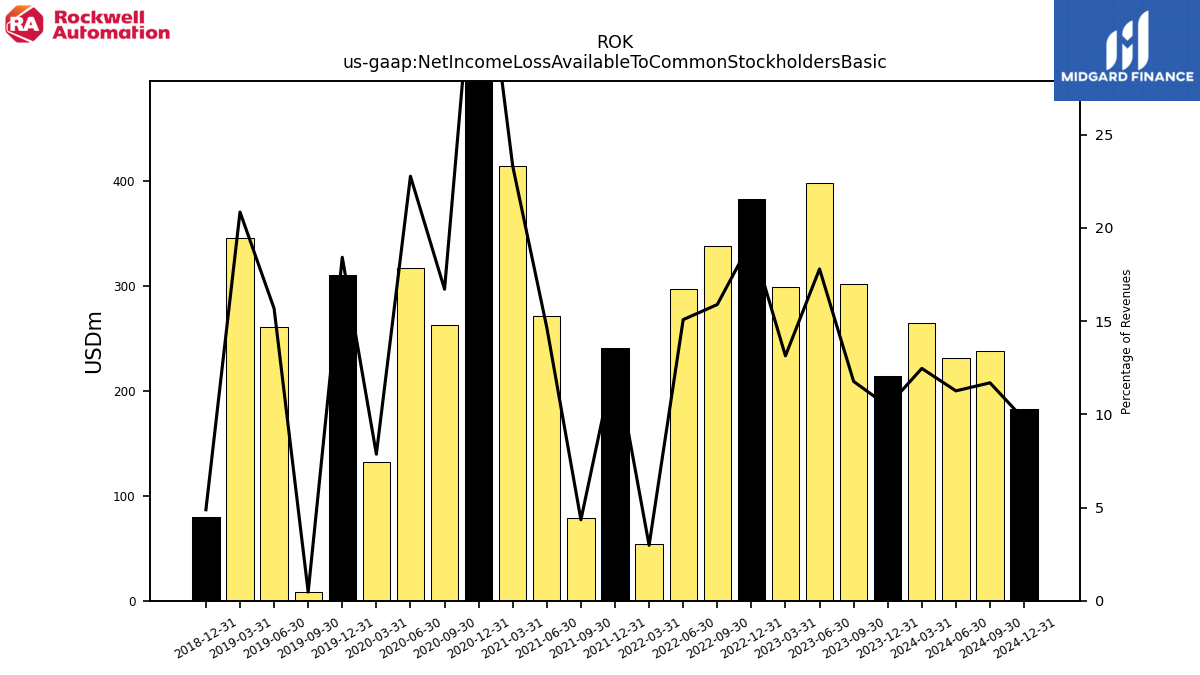
| Net Income Loss Available To Common Stockholders Basic | 214.20 | 301.60 | 398.50 | 299.00 | 382.50 | 337.90 | 296.90 | 53.80 | 240.80 | 78.50 | 270.90 | 414.10 | 592.60 | 262.40 | 317.50 | 132.20 | 310.40 | 8.10 | 261.10 | 345.60 | 80.20 | NA | NA | NA | NA | NA | NA | NA | NA | NA | NA | NA | NA | NA | NA | NA | NA | NA | NA | NA | NA | NA | NA | NA | NA | NA | NA | NA | NA | NA | NA | NA | NA | NA | NA | NA | NA | NA |
| 2023-12-31 | 2023-09-30 | 2023-06-30 | 2023-03-31 | 2022-12-31 | 2022-09-30 | 2022-06-30 | 2022-03-31 | 2021-12-31 | 2021-09-30 | 2021-06-30 | 2021-03-31 | 2020-12-31 | 2020-09-30 | 2020-06-30 | 2020-03-31 | 2019-12-31 | 2019-09-30 | 2019-06-30 | 2019-03-31 | 2018-12-31 | 2018-09-30 | 2018-06-30 | 2018-03-31 | 2017-12-31 | 2017-09-30 | 2017-06-30 | 2017-03-31 | 2016-12-31 | 2016-09-30 | 2016-06-30 | 2016-03-31 | 2015-12-31 | 2015-09-30 | 2015-06-30 | 2015-03-31 | 2014-12-31 | 2014-09-30 | 2014-06-30 | 2014-03-31 | 2013-12-31 | 2013-09-30 | 2013-06-30 | 2013-03-31 | 2012-12-31 | 2012-09-30 | 2012-06-30 | 2012-03-31 | 2011-12-31 | 2011-09-30 | 2011-06-30 | 2011-03-31 | 2010-12-31 | 2010-09-30 | 2010-06-30 | 2010-03-31 | 2009-12-31 | 2009-09-30 | ||
|---|---|---|---|---|---|---|---|---|---|---|---|---|---|---|---|---|---|---|---|---|---|---|---|---|---|---|---|---|---|---|---|---|---|---|---|---|---|---|---|---|---|---|---|---|---|---|---|---|---|---|---|---|---|---|---|---|---|---|---|
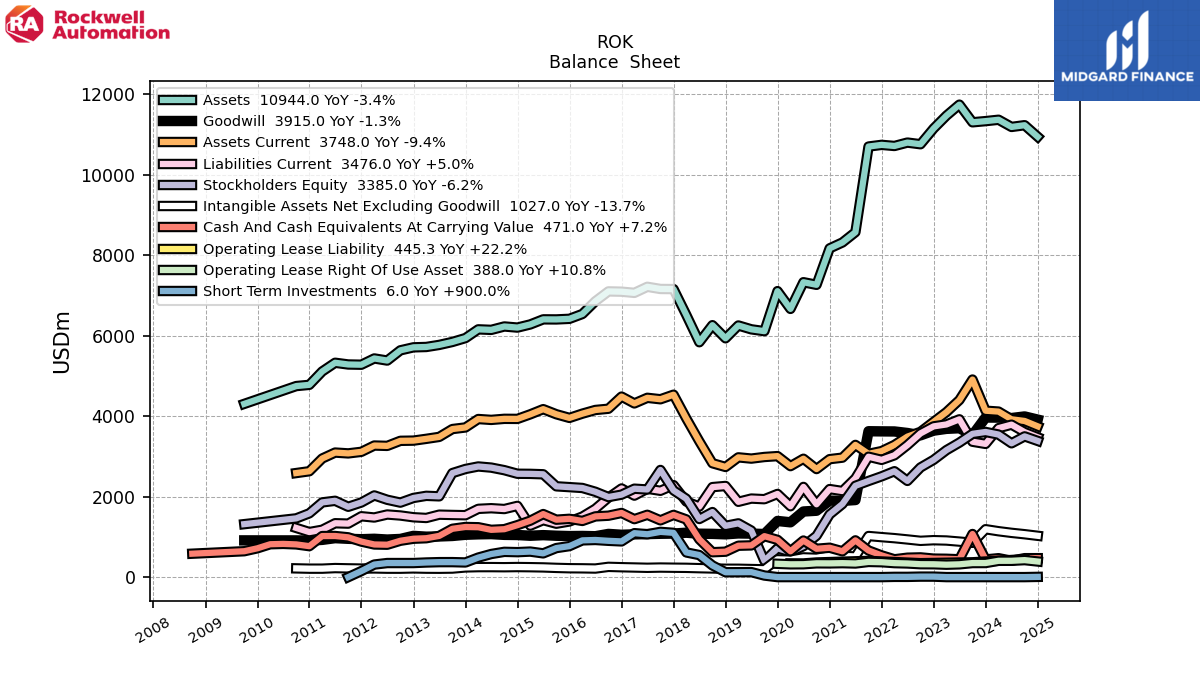
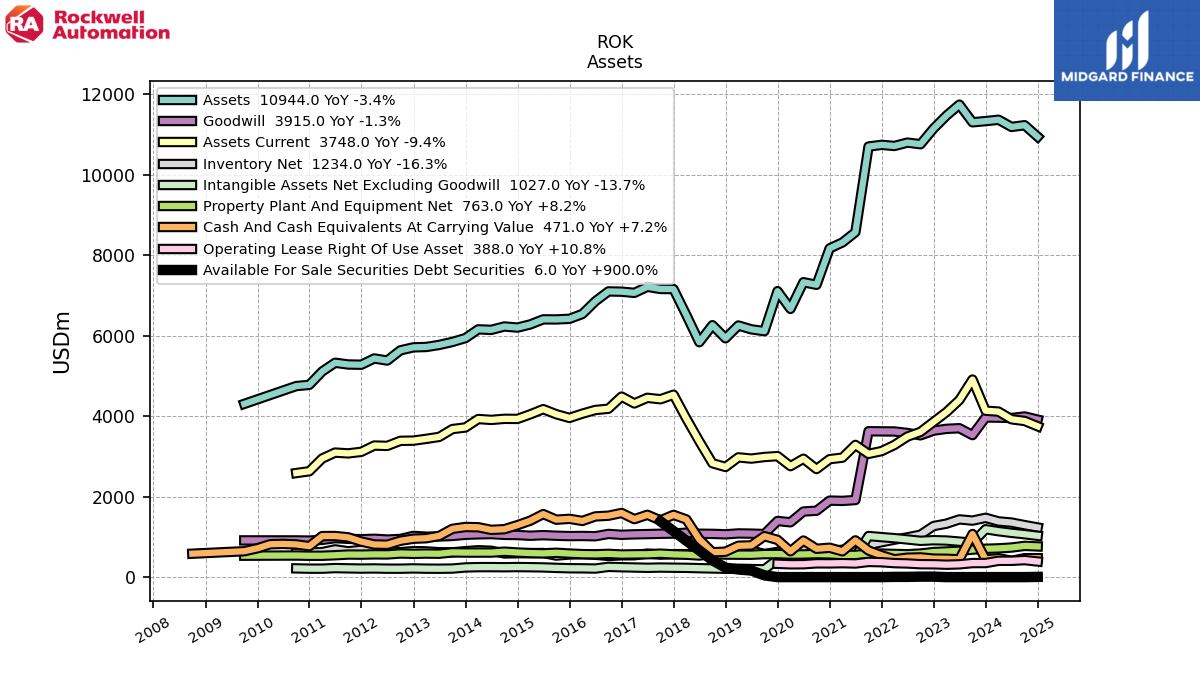
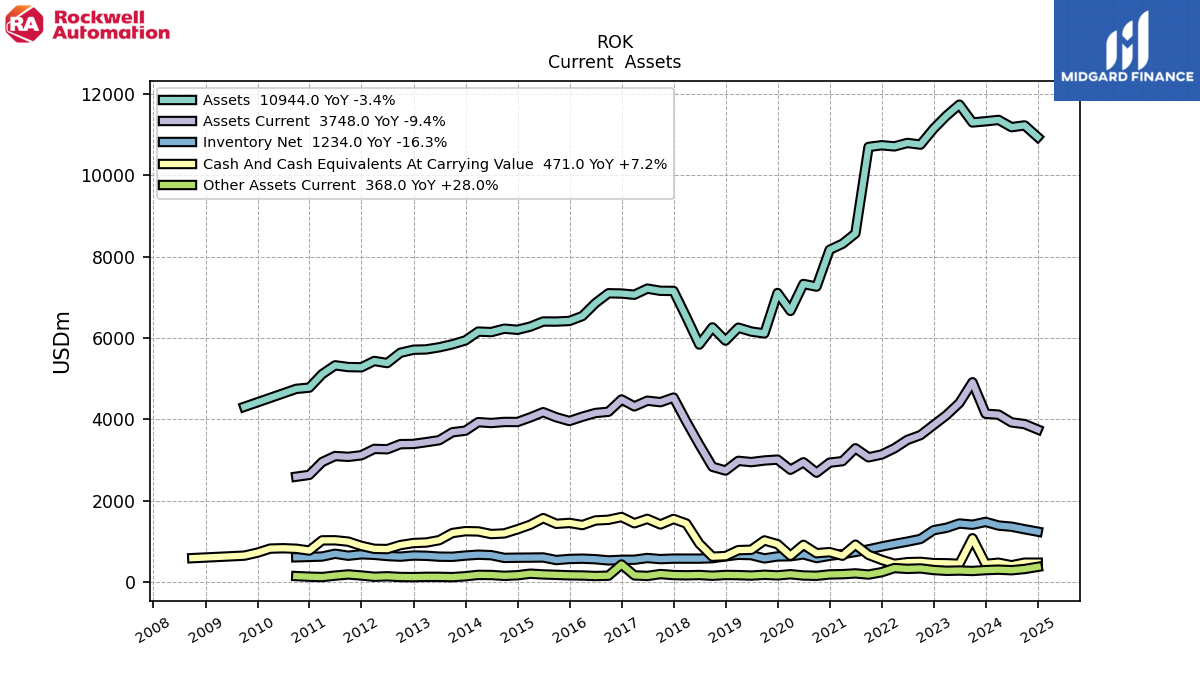
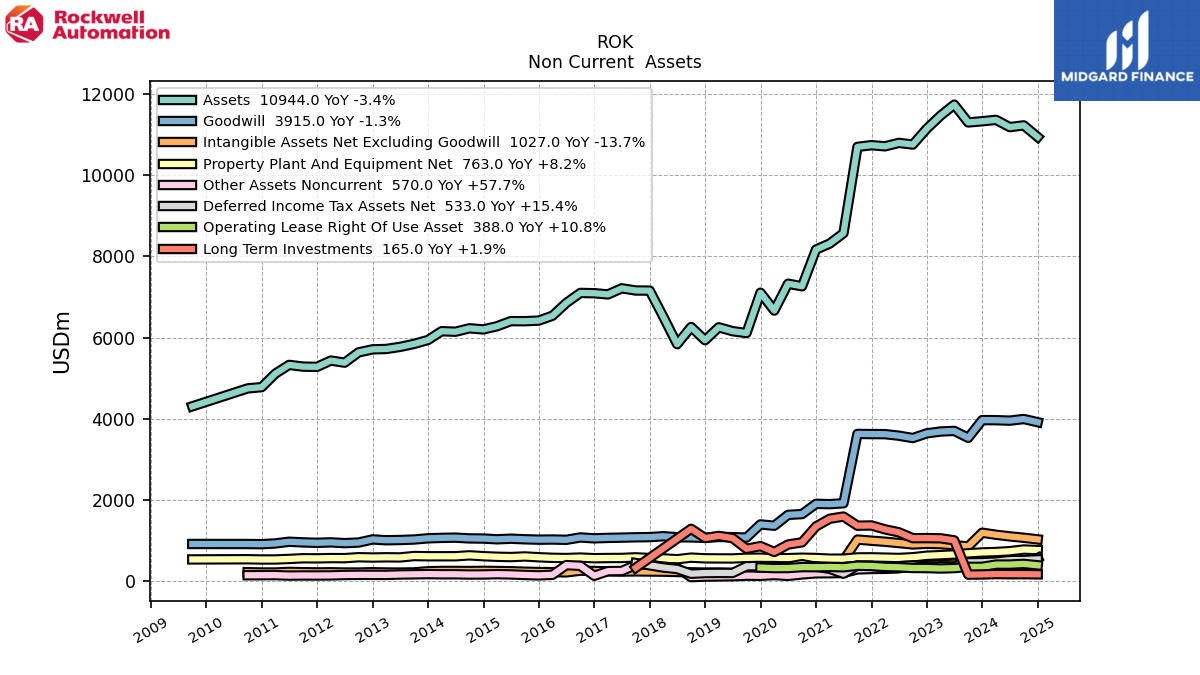
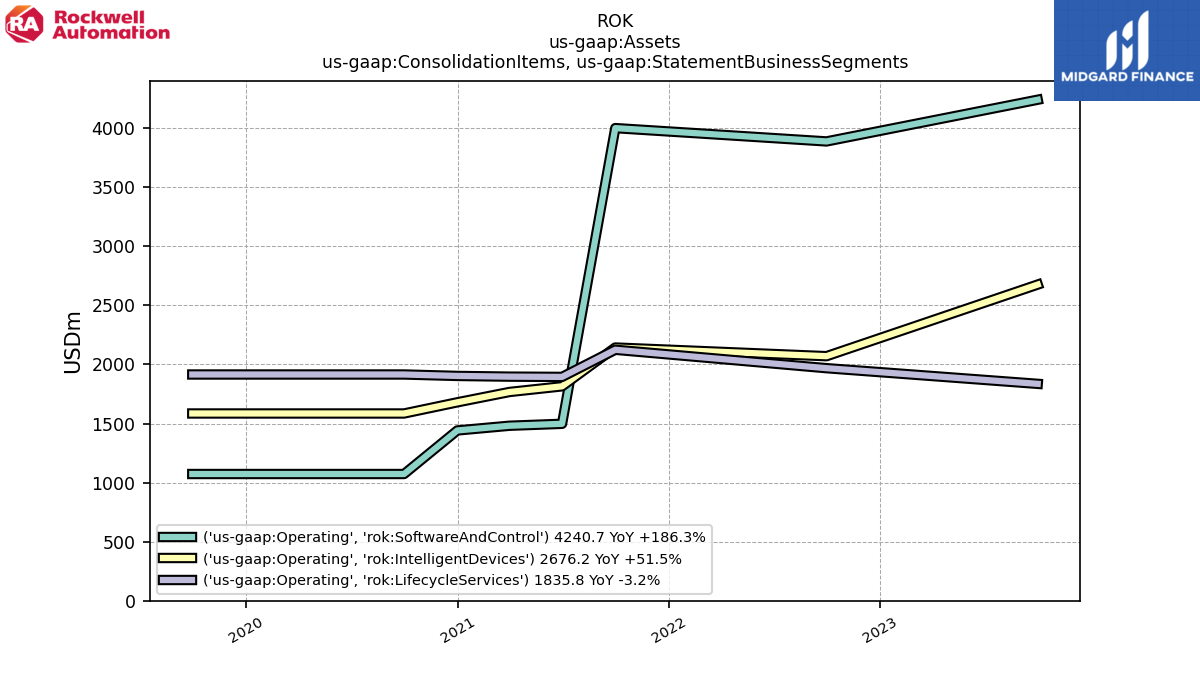
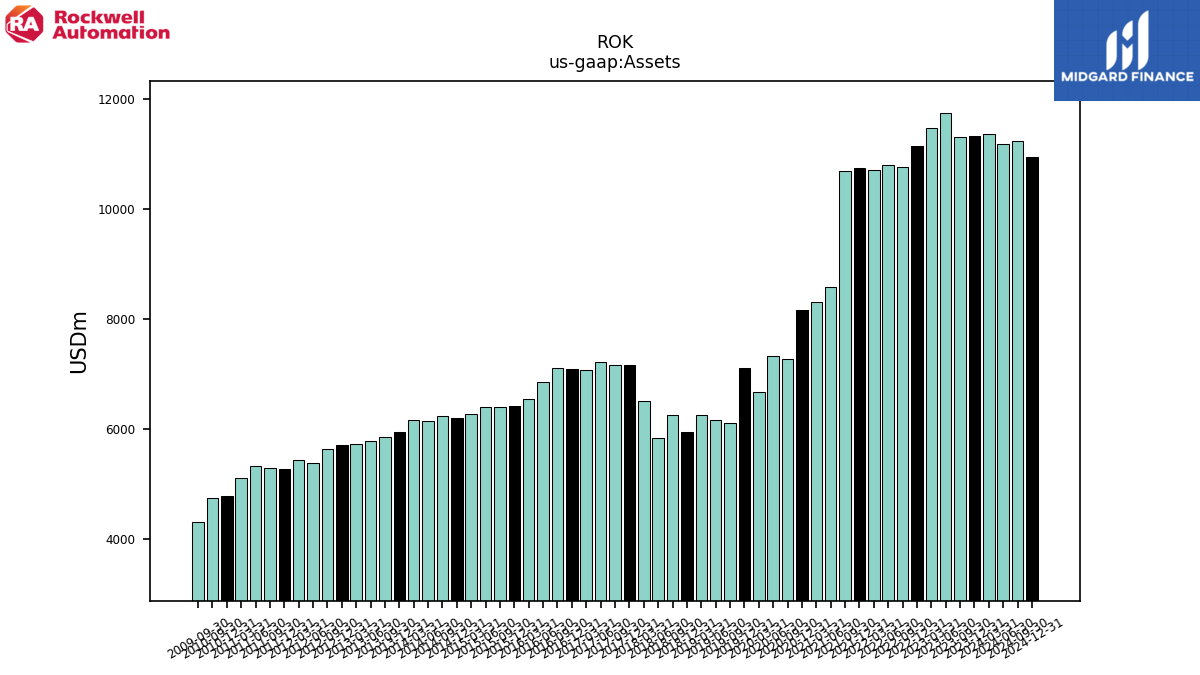
| Assets | 11333.30 | 11304.00 | 11743.30 | 11469.10 | 11149.80 | 10758.70 | 10799.90 | 10715.50 | 10743.30 | 10701.60 | 8573.10 | 8317.70 | 8171.00 | 7264.70 | 7329.50 | 6665.90 | 7107.90 | 6113.00 | 6158.80 | 6254.20 | 5935.40 | 6262.00 | 5837.60 | 6513.60 | 7158.70 | 7161.70 | 7215.50 | 7065.00 | 7094.30 | 7101.20 | 6855.70 | 6539.60 | 6419.70 | 6404.70 | 6406.50 | 6280.20 | 6202.00 | 6229.50 | 6145.10 | 6158.10 | 5940.80 | 5844.60 | 5771.30 | 5719.90 | 5711.10 | 5636.50 | 5382.40 | 5434.60 | 5279.10 | 5284.90 | 5327.70 | 5111.10 | 4778.90 | 4748.30 | NA | NA | NA | 4305.70 | |
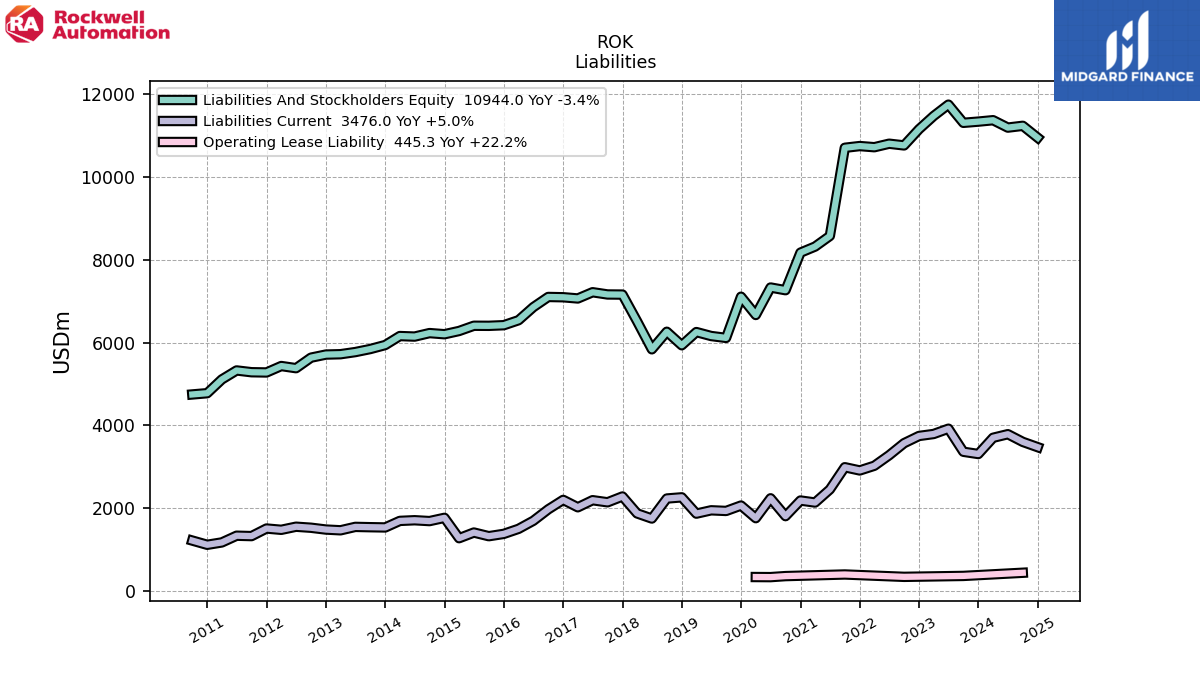
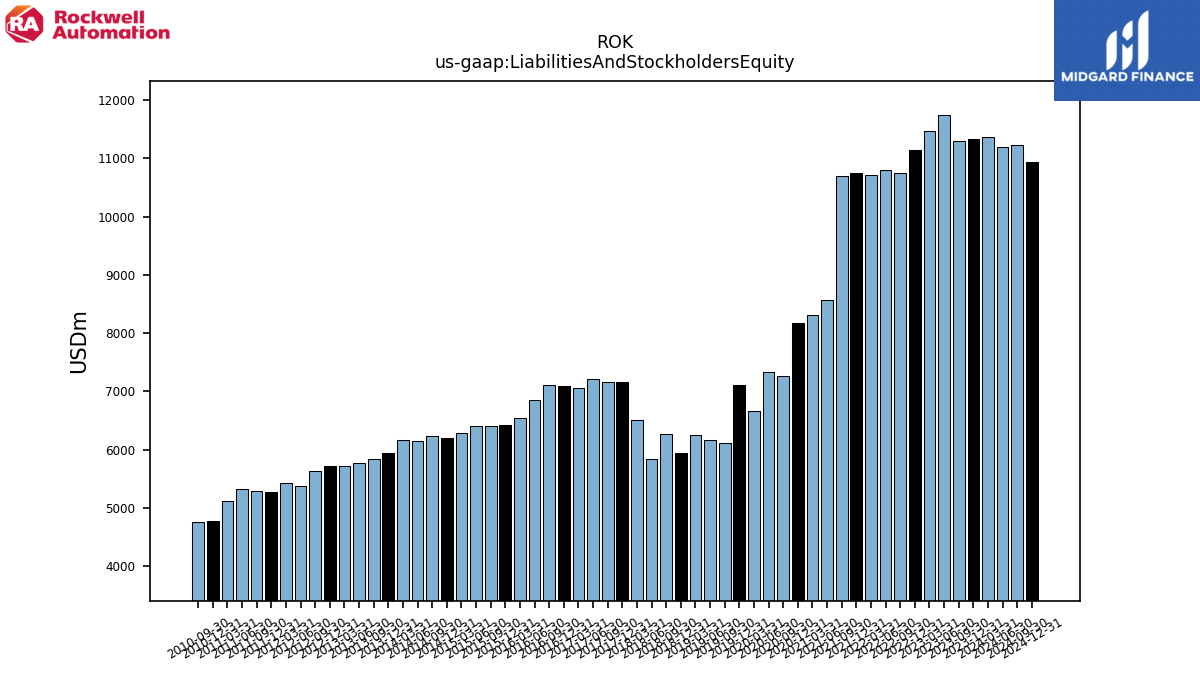
| Liabilities And Stockholders Equity | 11333.30 | 11304.00 | 11743.30 | 11469.10 | 11149.80 | 10758.70 | 10799.90 | 10715.50 | 10743.30 | 10701.60 | 8573.10 | 8317.70 | 8171.00 | 7264.70 | 7329.50 | 6665.90 | 7107.90 | 6113.00 | 6158.80 | 6254.20 | 5935.40 | 6262.00 | 5837.60 | 6513.60 | 7158.70 | 7161.70 | 7215.50 | 7065.00 | 7094.30 | 7101.20 | 6855.70 | 6539.60 | 6419.70 | 6404.70 | 6406.50 | 6280.20 | 6202.00 | 6229.50 | 6145.10 | 6158.10 | 5940.80 | 5844.60 | 5771.30 | 5719.90 | 5711.10 | 5636.50 | 5382.40 | 5434.60 | 5279.10 | 5284.90 | 5327.70 | 5111.10 | 4778.90 | 4748.30 | NA | NA | NA | NA | |
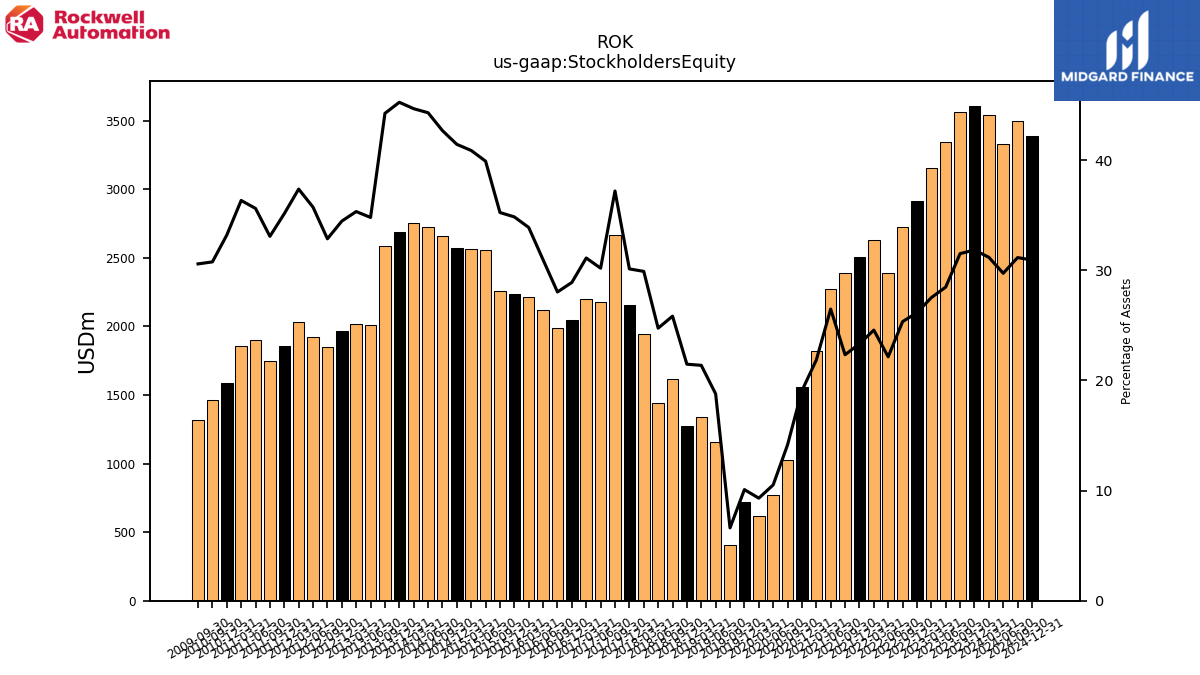
| Stockholders Equity | 3607.70 | 3561.60 | 3343.20 | 3155.50 | 2914.80 | 2725.60 | 2391.20 | 2632.20 | 2504.90 | 2389.60 | 2269.60 | 1817.20 | 1557.60 | 1027.80 | 770.50 | 620.80 | 717.00 | 404.20 | 1156.50 | 1336.30 | 1274.30 | 1617.50 | 1444.20 | 1947.20 | 2156.20 | 2663.60 | 2178.00 | 2197.80 | 2049.70 | 1990.10 | 2121.30 | 2215.60 | 2236.50 | 2256.80 | 2556.00 | 2566.50 | 2569.10 | 2658.10 | 2721.90 | 2750.20 | 2687.80 | 2585.50 | 2007.80 | 2020.50 | 1967.80 | 1851.70 | 1922.50 | 2030.60 | 1854.80 | 1748.00 | 1897.10 | 1856.90 | 1586.10 | 1460.40 | NA | NA | NA | 1316.40 |
| 2023-12-31 | 2023-09-30 | 2023-06-30 | 2023-03-31 | 2022-12-31 | 2022-09-30 | 2022-06-30 | 2022-03-31 | 2021-12-31 | 2021-09-30 | 2021-06-30 | 2021-03-31 | 2020-12-31 | 2020-09-30 | 2020-06-30 | 2020-03-31 | 2019-12-31 | 2019-09-30 | 2019-06-30 | 2019-03-31 | 2018-12-31 | 2018-09-30 | 2018-06-30 | 2018-03-31 | 2017-12-31 | 2017-09-30 | 2017-06-30 | 2017-03-31 | 2016-12-31 | 2016-09-30 | 2016-06-30 | 2016-03-31 | 2015-12-31 | 2015-09-30 | 2015-06-30 | 2015-03-31 | 2014-12-31 | 2014-09-30 | 2014-06-30 | 2014-03-31 | 2013-12-31 | 2013-09-30 | 2013-06-30 | 2013-03-31 | 2012-12-31 | 2012-09-30 | 2012-06-30 | 2012-03-31 | 2011-12-31 | 2011-09-30 | 2011-06-30 | 2011-03-31 | 2010-12-31 | 2010-09-30 | 2010-06-30 | 2010-03-31 | 2009-12-31 | 2009-09-30 | ||
|---|---|---|---|---|---|---|---|---|---|---|---|---|---|---|---|---|---|---|---|---|---|---|---|---|---|---|---|---|---|---|---|---|---|---|---|---|---|---|---|---|---|---|---|---|---|---|---|---|---|---|---|---|---|---|---|---|---|---|---|
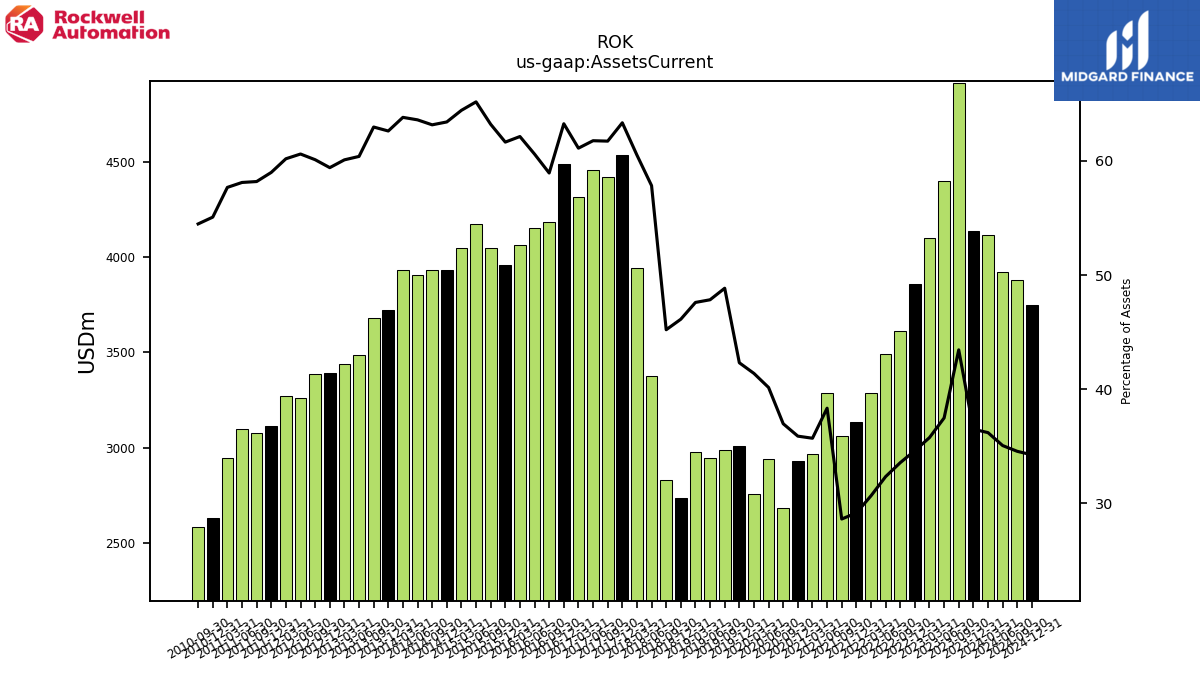
| Assets Current | 4135.90 | 4910.80 | 4401.10 | 4101.00 | 3859.50 | 3610.70 | 3492.30 | 3284.90 | 3132.30 | 3063.40 | 3286.20 | 2969.50 | 2932.10 | 2685.80 | 2942.50 | 2758.20 | 3007.50 | 2985.70 | 2945.80 | 2976.80 | 2737.90 | 2830.70 | 3375.80 | 3940.90 | 4533.90 | 4420.70 | 4456.50 | 4317.40 | 4487.20 | 4185.00 | 4153.90 | 4063.00 | 3957.20 | 4048.00 | 4174.90 | 4046.00 | 3932.50 | 3934.20 | 3907.70 | 3929.40 | 3719.80 | 3679.90 | 3485.10 | 3436.90 | 3392.60 | 3387.50 | 3261.60 | 3270.60 | 3114.00 | 3075.10 | 3095.70 | 2947.80 | 2631.70 | 2586.60 | NA | NA | NA | NA | |
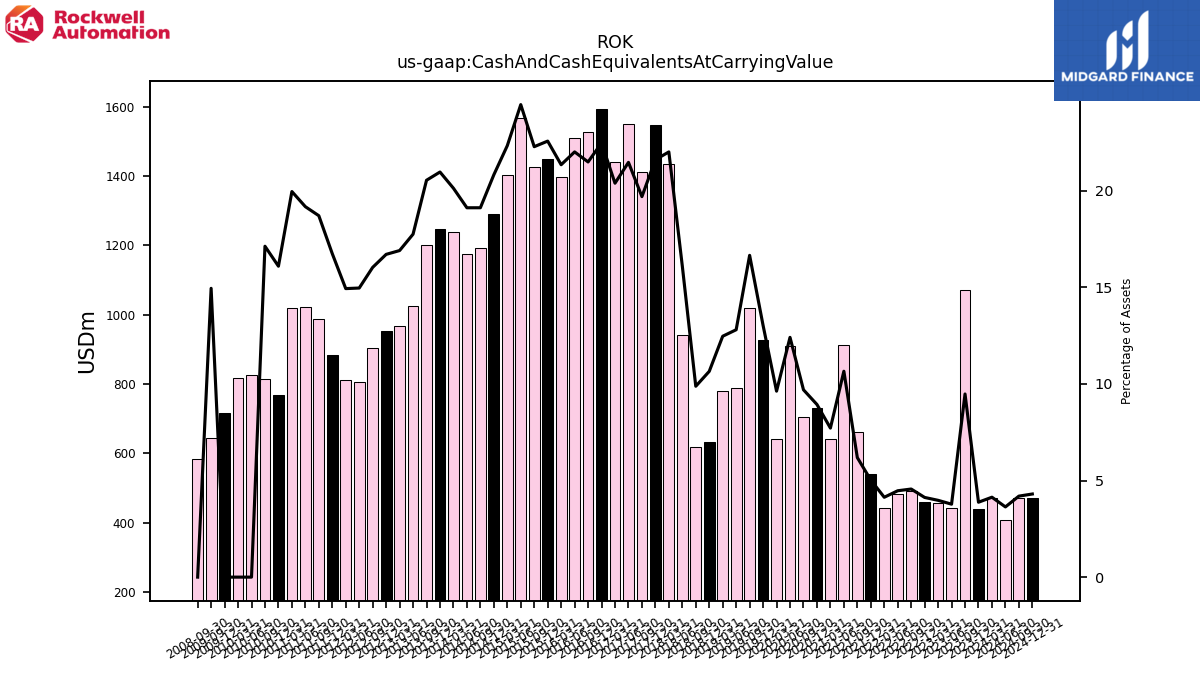
| Cash And Cash Equivalents At Carrying Value | 439.50 | 1071.80 | 443.50 | 456.00 | 460.00 | 490.70 | 482.90 | 443.00 | 540.00 | 662.20 | 913.80 | 641.90 | 730.40 | 704.60 | 909.80 | 641.80 | 926.20 | 1018.40 | 788.80 | 780.00 | 632.30 | 618.80 | 940.10 | 1433.90 | 1547.00 | 1410.90 | 1549.40 | 1440.80 | 1594.60 | 1526.40 | 1509.30 | 1396.30 | 1449.20 | 1427.30 | 1567.20 | 1402.90 | 1291.90 | 1191.30 | 1175.10 | 1239.80 | 1246.00 | 1200.90 | 1024.70 | 967.10 | 954.30 | 903.90 | 805.60 | 811.80 | 884.00 | 988.90 | 1021.80 | 1020.30 | 769.30 | 813.40 | 826.00 | 817.20 | 716.30 | 643.80 | |
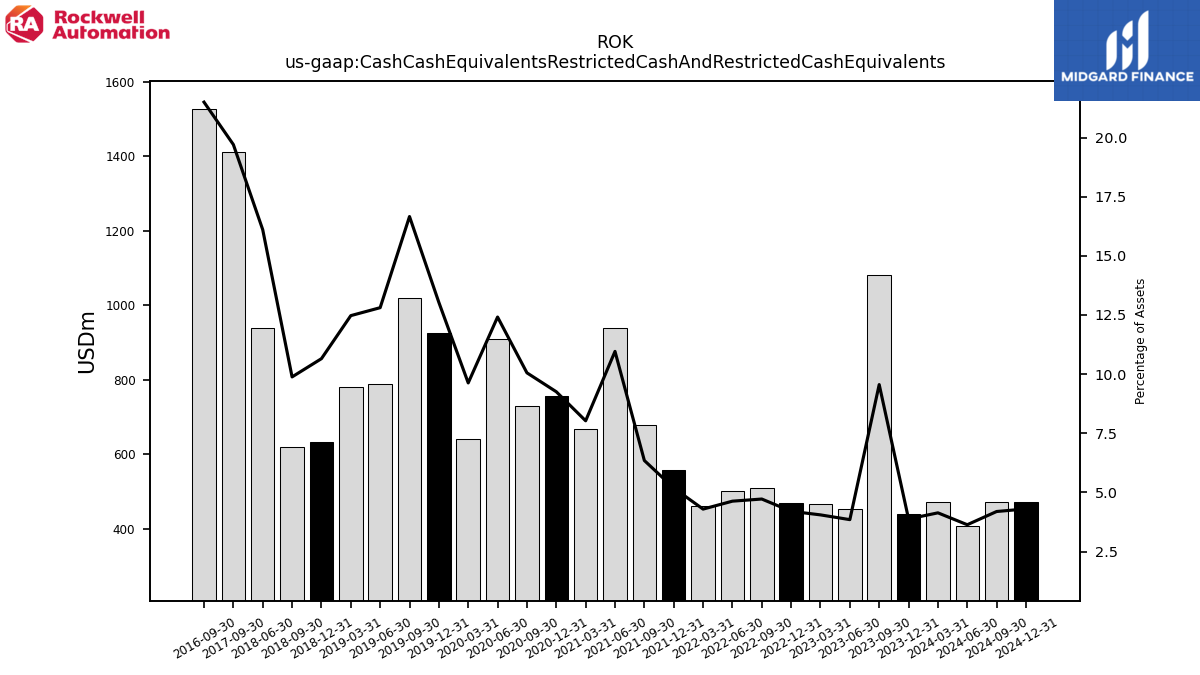
| Cash Cash Equivalents Restricted Cash And Restricted Cash Equivalents | 439.50 | 1080.40 | 452.10 | 464.60 | 468.60 | 507.90 | 500.10 | 460.20 | 557.20 | 679.40 | 939.60 | 667.70 | 756.20 | 730.40 | 909.80 | 641.80 | 926.20 | 1018.40 | 788.80 | 780.00 | 632.30 | 618.80 | 940.10 | NA | NA | 1410.90 | NA | NA | NA | 1526.40 | NA | NA | NA | NA | NA | NA | NA | NA | NA | NA | NA | NA | NA | NA | NA | NA | NA | NA | NA | NA | NA | NA | NA | NA | NA | NA | NA | NA | |
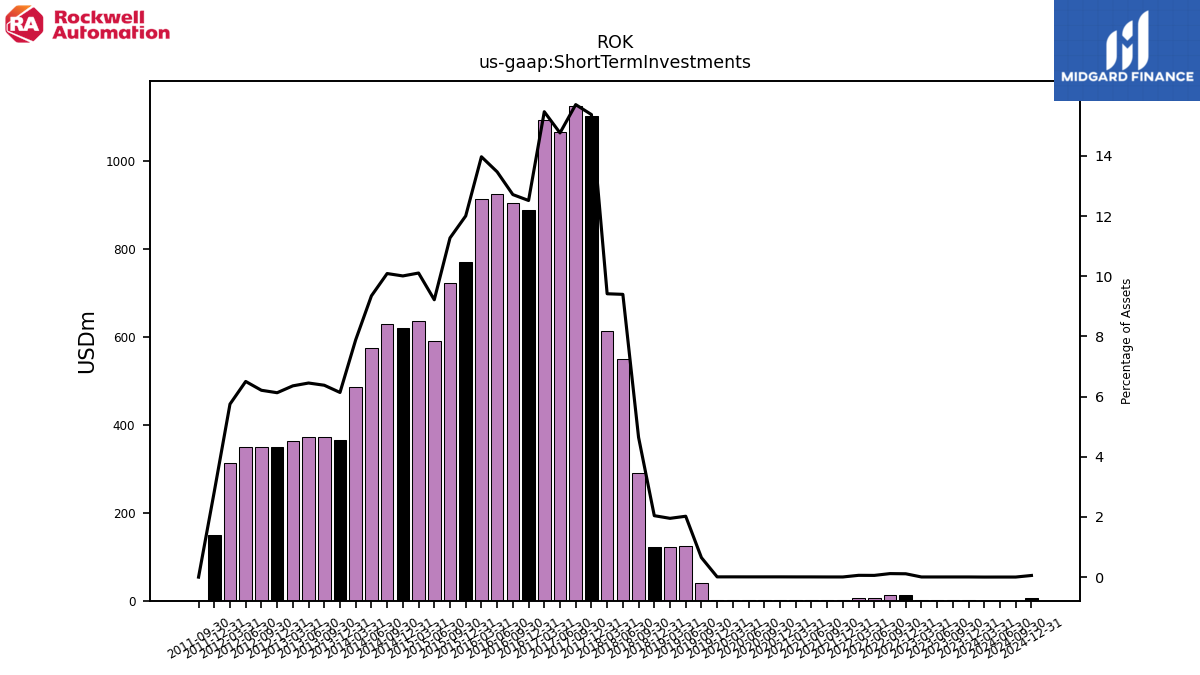
| Short Term Investments | 0.60 | 0.60 | 0.60 | 0.60 | 12.40 | 12.60 | 6.20 | 6.40 | 0.60 | 0.60 | 0.60 | 0.60 | 0.70 | 0.60 | 0.60 | 0.60 | 0.60 | 39.60 | 124.60 | 122.20 | 121.20 | 290.90 | 548.60 | 613.40 | 1100.50 | 1124.60 | 1065.20 | 1092.70 | 888.00 | 902.80 | 923.40 | 913.60 | 770.60 | 721.90 | 590.60 | 634.70 | 620.80 | 628.50 | 574.40 | 485.80 | 364.60 | 372.70 | 372.30 | 363.60 | 350.00 | 350.00 | 350.00 | 312.50 | 150.00 | 0.00 | NA | NA | NA | NA | NA | NA | NA | NA | |
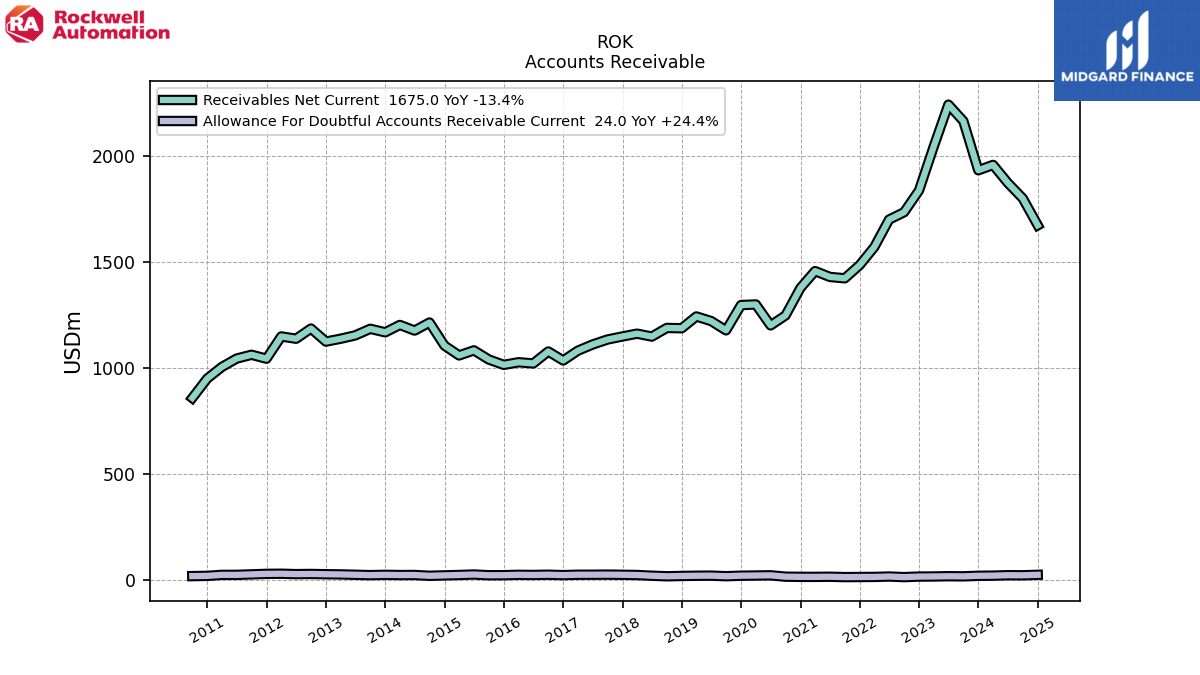
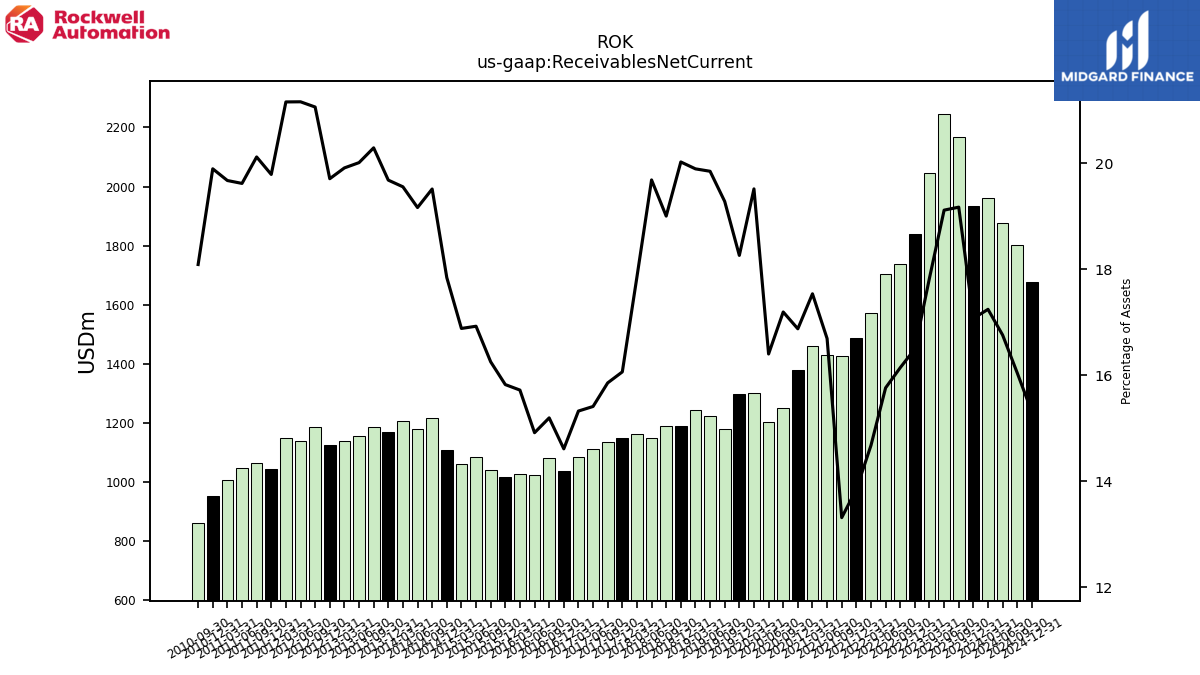
| Receivables Net Current | 1934.90 | 2167.40 | 2245.00 | 2045.60 | 1839.40 | 1736.70 | 1702.20 | 1572.50 | 1487.40 | 1424.50 | 1431.10 | 1458.70 | 1379.00 | 1249.10 | 1202.10 | 1301.10 | 1298.10 | 1178.70 | 1222.60 | 1244.40 | 1188.70 | 1190.10 | 1149.30 | 1163.10 | 1149.90 | 1135.50 | 1111.90 | 1082.60 | 1036.50 | 1079.00 | 1022.50 | 1028.00 | 1015.80 | 1041.00 | 1084.30 | 1060.30 | 1106.70 | 1215.80 | 1177.80 | 1204.40 | 1169.40 | 1186.10 | 1155.10 | 1139.10 | 1125.70 | 1187.30 | 1139.10 | 1150.00 | 1044.80 | 1063.40 | 1045.40 | 1005.70 | 950.90 | 859.00 | NA | NA | NA | NA | |
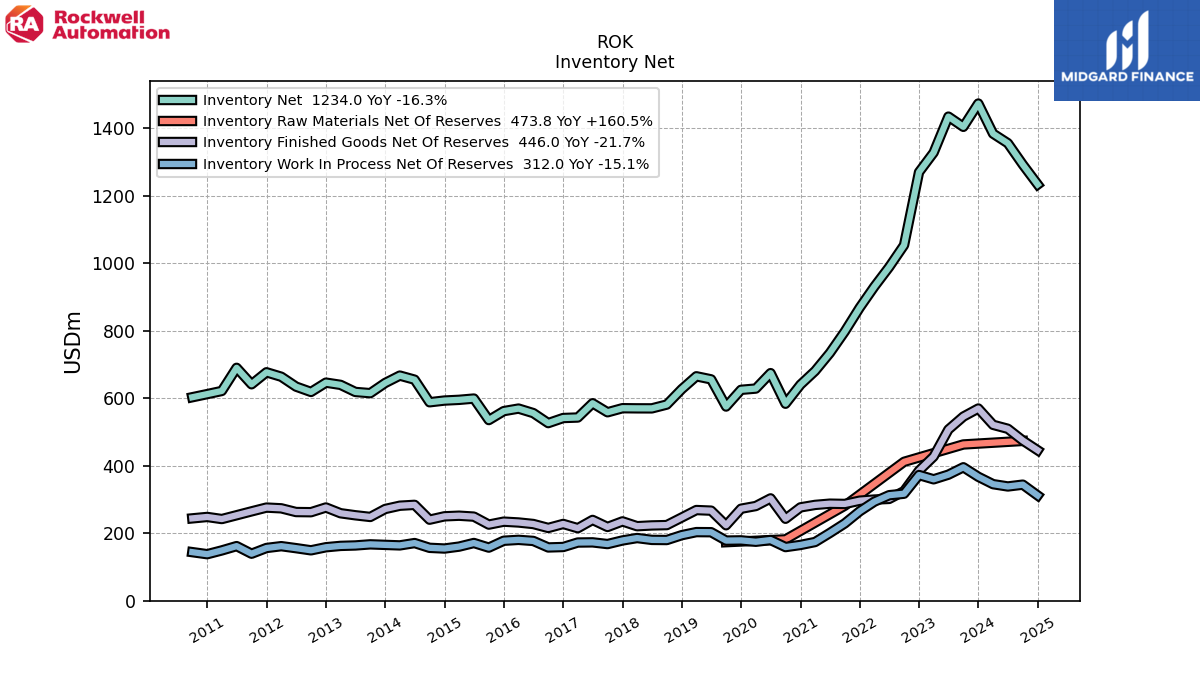
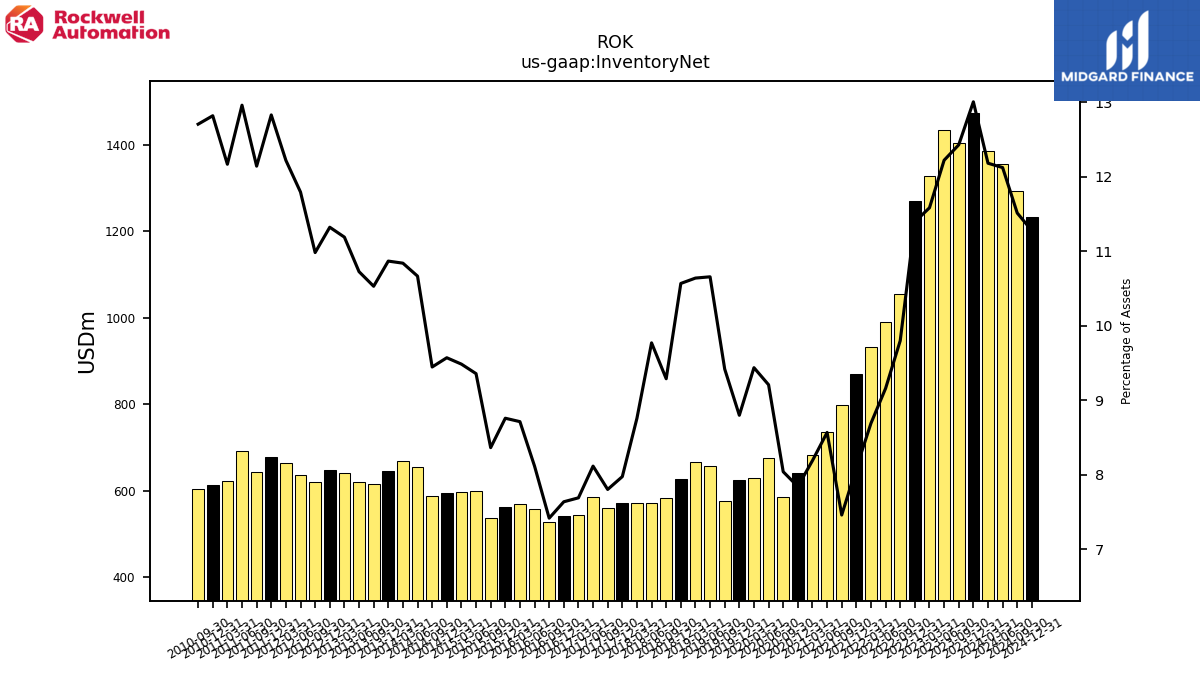
| Inventory Net | 1474.00 | 1404.90 | 1435.20 | 1328.50 | 1270.50 | 1054.20 | 989.10 | 931.20 | 868.90 | 798.10 | 734.40 | 681.10 | 640.60 | 584.00 | 674.80 | 629.00 | 625.30 | 575.70 | 656.30 | 665.40 | 627.20 | 581.60 | 570.30 | 570.40 | 570.80 | 558.70 | 585.50 | 543.20 | 541.70 | 526.60 | 556.30 | 569.70 | 562.20 | 535.60 | 599.40 | 595.60 | 593.50 | 588.40 | 655.40 | 667.50 | 645.60 | 615.40 | 619.00 | 640.00 | 646.60 | 619.00 | 634.80 | 664.10 | 677.30 | 641.70 | 690.50 | 621.90 | 612.60 | 603.30 | NA | NA | NA | NA | |
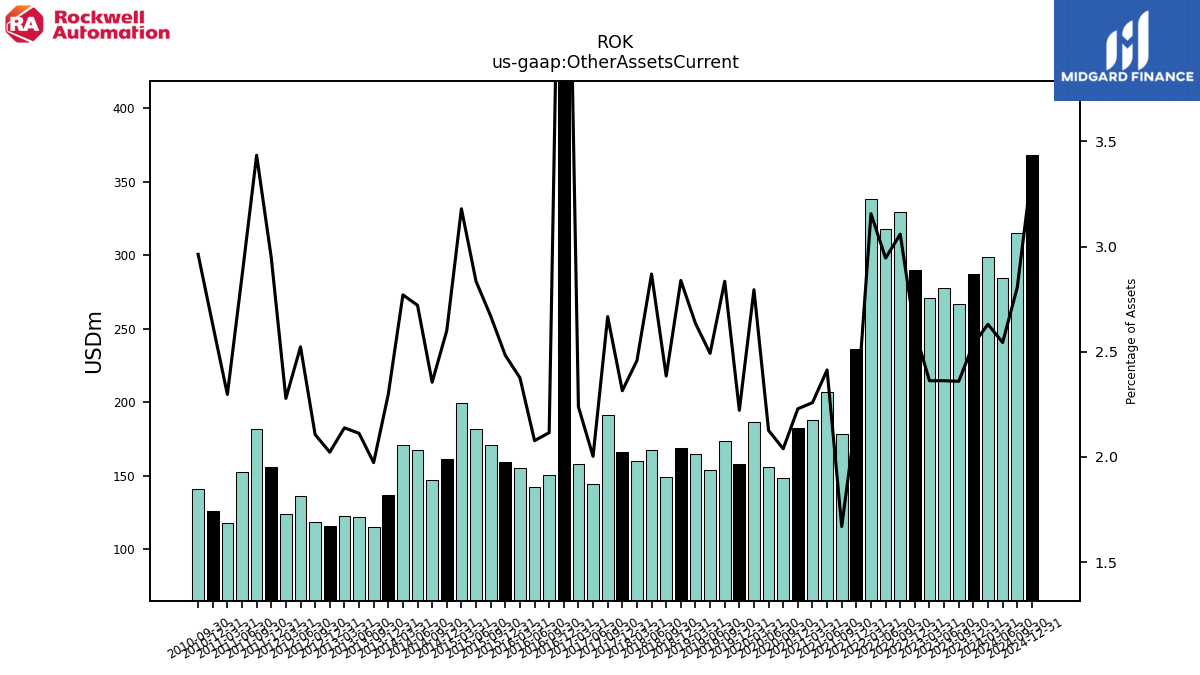
| Other Assets Current | 287.50 | 266.70 | 277.40 | 270.90 | 289.60 | 329.10 | 318.10 | 338.20 | 236.00 | 178.60 | 206.90 | 187.80 | 182.10 | 148.10 | 155.80 | 186.30 | 157.90 | 173.30 | 153.50 | 164.80 | 168.50 | 149.30 | 167.50 | 160.10 | 165.70 | 191.00 | 144.50 | 158.10 | 426.40 | 150.20 | 142.40 | 155.40 | 159.40 | 171.00 | 181.60 | 199.70 | 161.30 | 146.70 | 167.20 | 170.60 | 136.50 | 115.30 | 121.90 | 122.30 | 115.50 | 118.70 | 135.80 | 123.80 | 155.60 | 181.50 | 152.30 | 117.40 | 125.60 | 140.70 | NA | NA | NA | NA | |
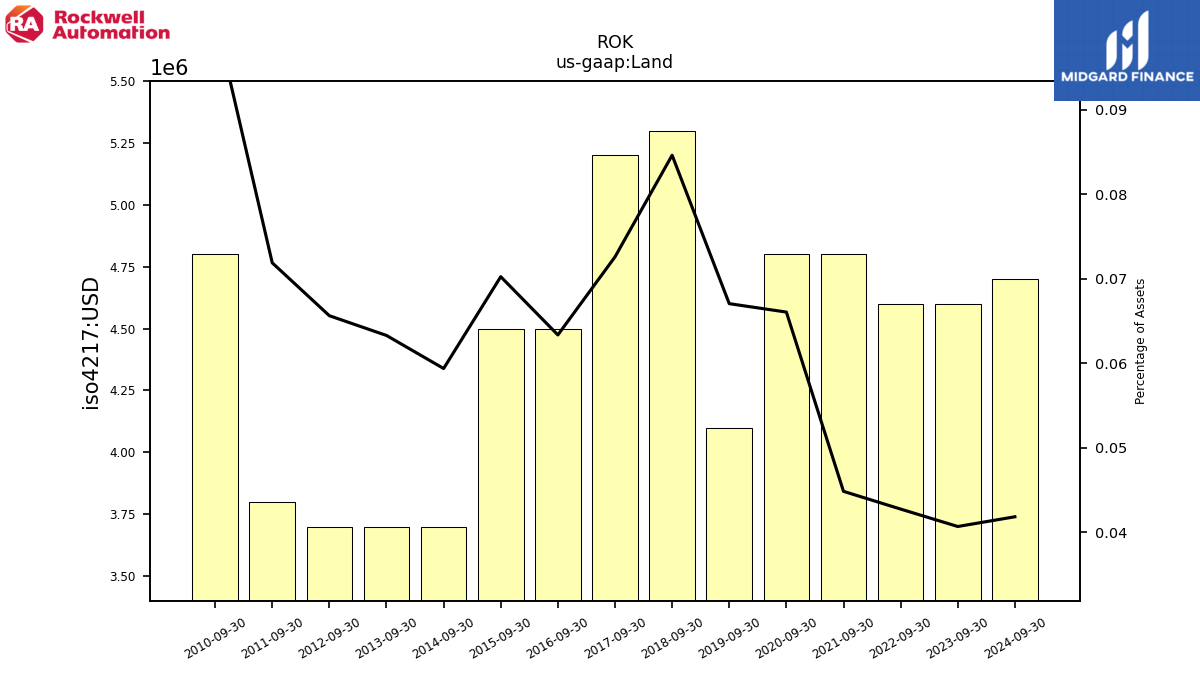
| Land | NA | 4.60 | NA | NA | NA | 4.60 | NA | NA | NA | 4.80 | NA | NA | NA | 4.80 | NA | NA | NA | 4.10 | NA | NA | NA | 5.30 | NA | NA | NA | 5.20 | NA | NA | NA | 4.50 | NA | NA | NA | 4.50 | NA | NA | NA | 3.70 | NA | NA | NA | 3.70 | NA | NA | NA | 3.70 | NA | NA | NA | 3.80 | NA | NA | NA | 4.80 | NA | NA | NA | NA | |
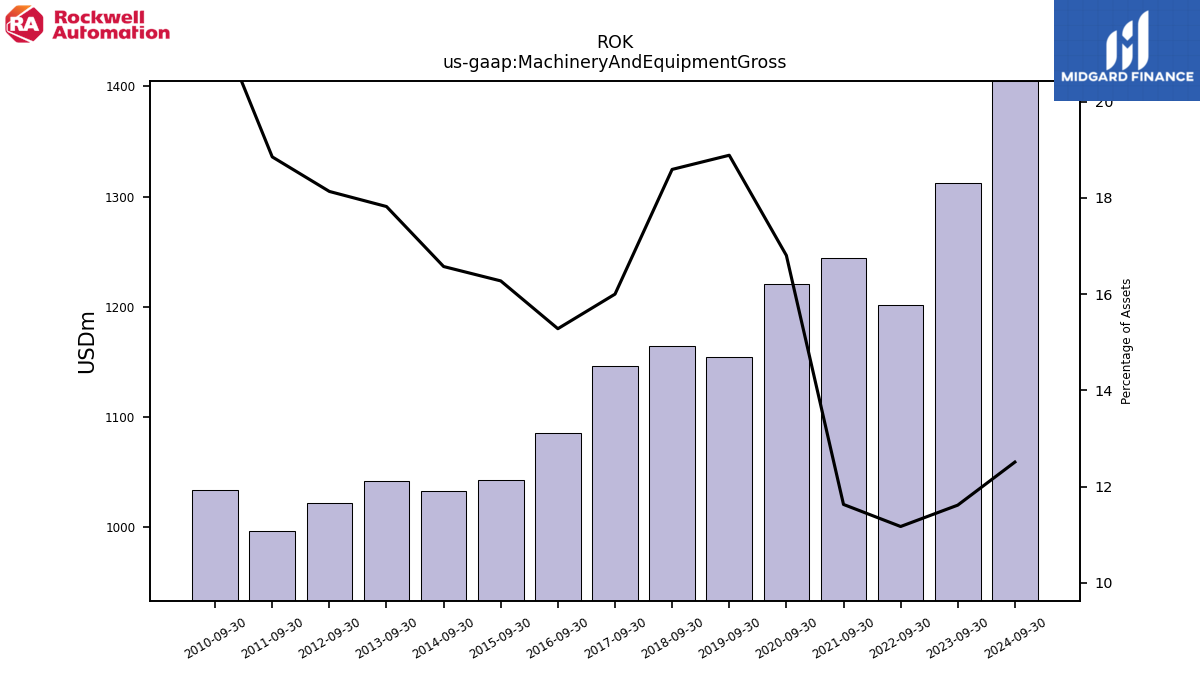
| Machinery And Equipment Gross | NA | 1312.70 | NA | NA | NA | 1201.60 | NA | NA | NA | 1244.30 | NA | NA | NA | 1220.70 | NA | NA | NA | 1154.50 | NA | NA | NA | 1164.20 | NA | NA | NA | 1145.80 | NA | NA | NA | 1085.10 | NA | NA | NA | 1042.30 | NA | NA | NA | 1032.40 | NA | NA | NA | 1041.50 | NA | NA | NA | 1022.10 | NA | NA | NA | 996.30 | NA | NA | NA | 1034.00 | NA | NA | NA | NA | |
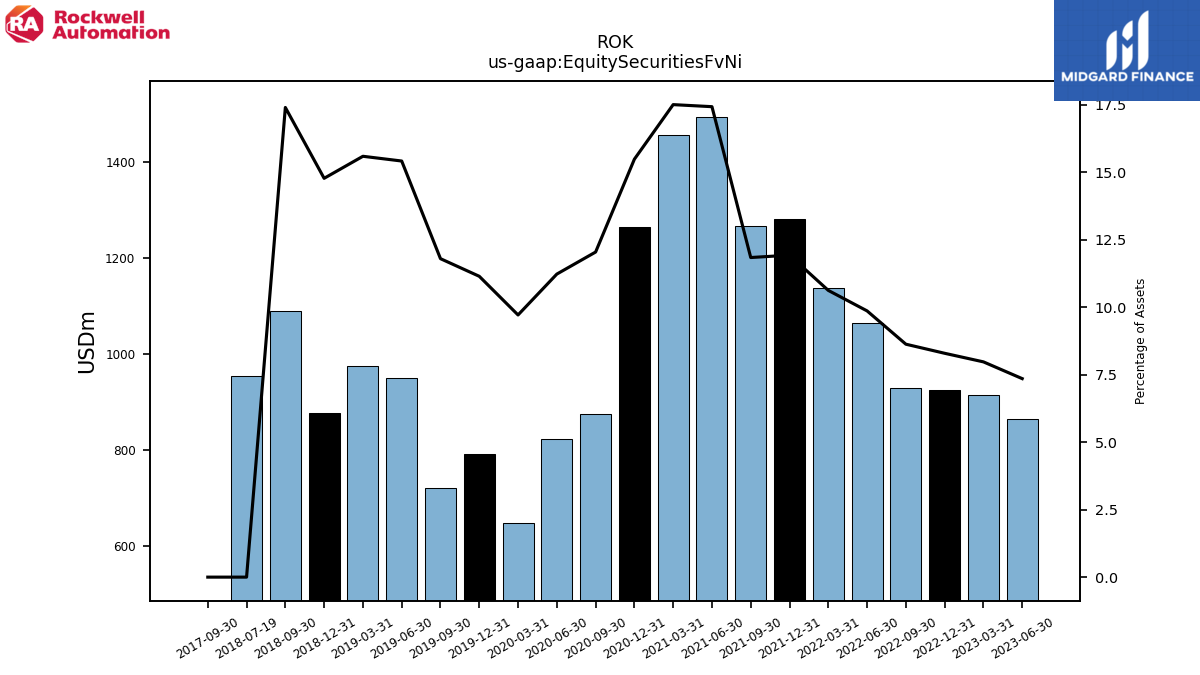
| Equity Securities Fv Ni | NA | NA | 863.90 | 915.00 | 925.00 | 928.80 | 1065.60 | 1138.70 | 1282.00 | 1267.60 | 1494.80 | 1456.60 | 1265.70 | 875.30 | 823.20 | 647.70 | 792.50 | 721.50 | 949.80 | 975.50 | 877.30 | 1090.00 | NA | NA | NA | 0.00 | NA | NA | NA | NA | NA | NA | NA | NA | NA | NA | NA | NA | NA | NA | NA | NA | NA | NA | NA | NA | NA | NA | NA | NA | NA | NA | NA | NA | NA | NA | NA | NA | |
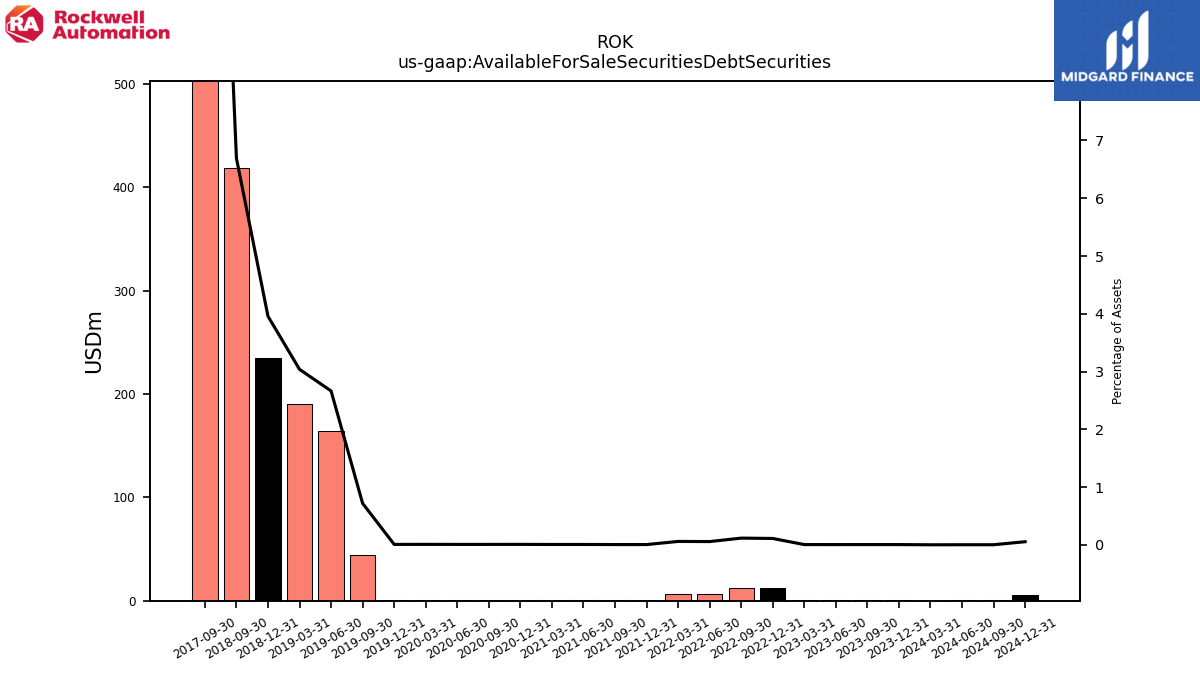
| Available For Sale Securities Debt Securities | 0.60 | 0.60 | 0.60 | 0.60 | 12.40 | 12.60 | 6.20 | 6.40 | 0.60 | 0.60 | 0.60 | 0.60 | 0.70 | 0.60 | 0.60 | 0.60 | 0.60 | 43.90 | 164.10 | 190.00 | 234.90 | 419.00 | NA | NA | NA | 1387.60 | NA | NA | NA | NA | NA | NA | NA | NA | NA | NA | NA | NA | NA | NA | NA | NA | NA | NA | NA | NA | NA | NA | NA | NA | NA | NA | NA | NA | NA | NA | NA | NA |
| 2023-12-31 | 2023-09-30 | 2023-06-30 | 2023-03-31 | 2022-12-31 | 2022-09-30 | 2022-06-30 | 2022-03-31 | 2021-12-31 | 2021-09-30 | 2021-06-30 | 2021-03-31 | 2020-12-31 | 2020-09-30 | 2020-06-30 | 2020-03-31 | 2019-12-31 | 2019-09-30 | 2019-06-30 | 2019-03-31 | 2018-12-31 | 2018-09-30 | 2018-06-30 | 2018-03-31 | 2017-12-31 | 2017-09-30 | 2017-06-30 | 2017-03-31 | 2016-12-31 | 2016-09-30 | 2016-06-30 | 2016-03-31 | 2015-12-31 | 2015-09-30 | 2015-06-30 | 2015-03-31 | 2014-12-31 | 2014-09-30 | 2014-06-30 | 2014-03-31 | 2013-12-31 | 2013-09-30 | 2013-06-30 | 2013-03-31 | 2012-12-31 | 2012-09-30 | 2012-06-30 | 2012-03-31 | 2011-12-31 | 2011-09-30 | 2011-06-30 | 2011-03-31 | 2010-12-31 | 2010-09-30 | 2010-06-30 | 2010-03-31 | 2009-12-31 | 2009-09-30 | ||
|---|---|---|---|---|---|---|---|---|---|---|---|---|---|---|---|---|---|---|---|---|---|---|---|---|---|---|---|---|---|---|---|---|---|---|---|---|---|---|---|---|---|---|---|---|---|---|---|---|---|---|---|---|---|---|---|---|---|---|---|
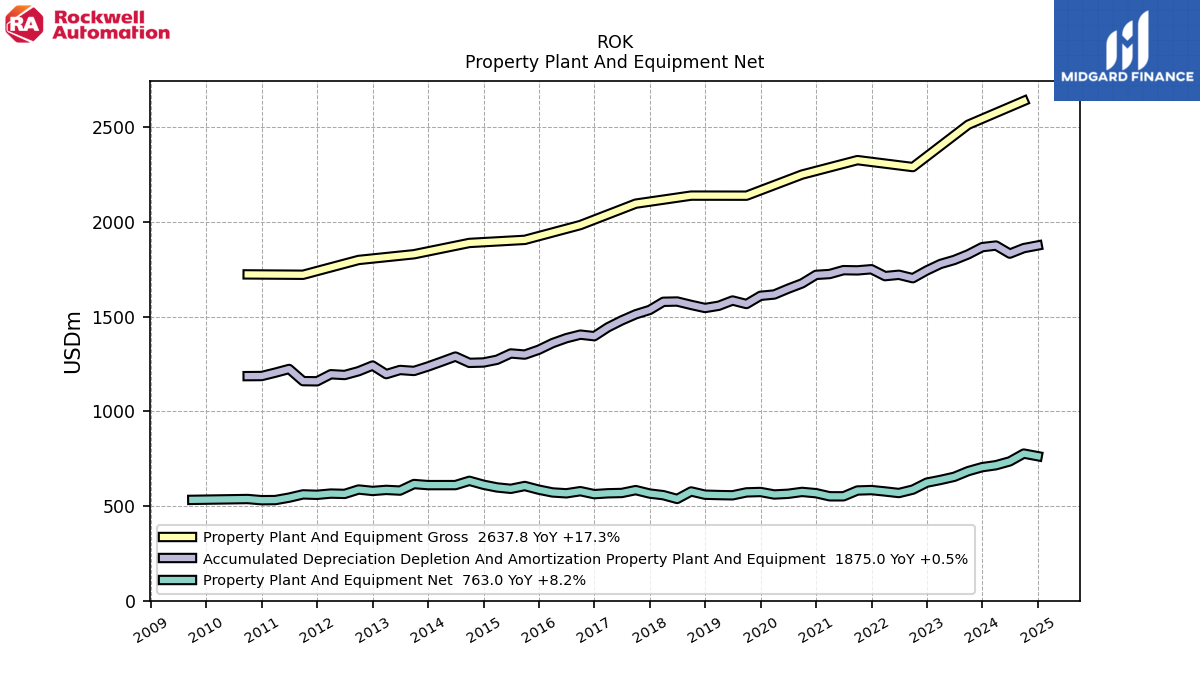
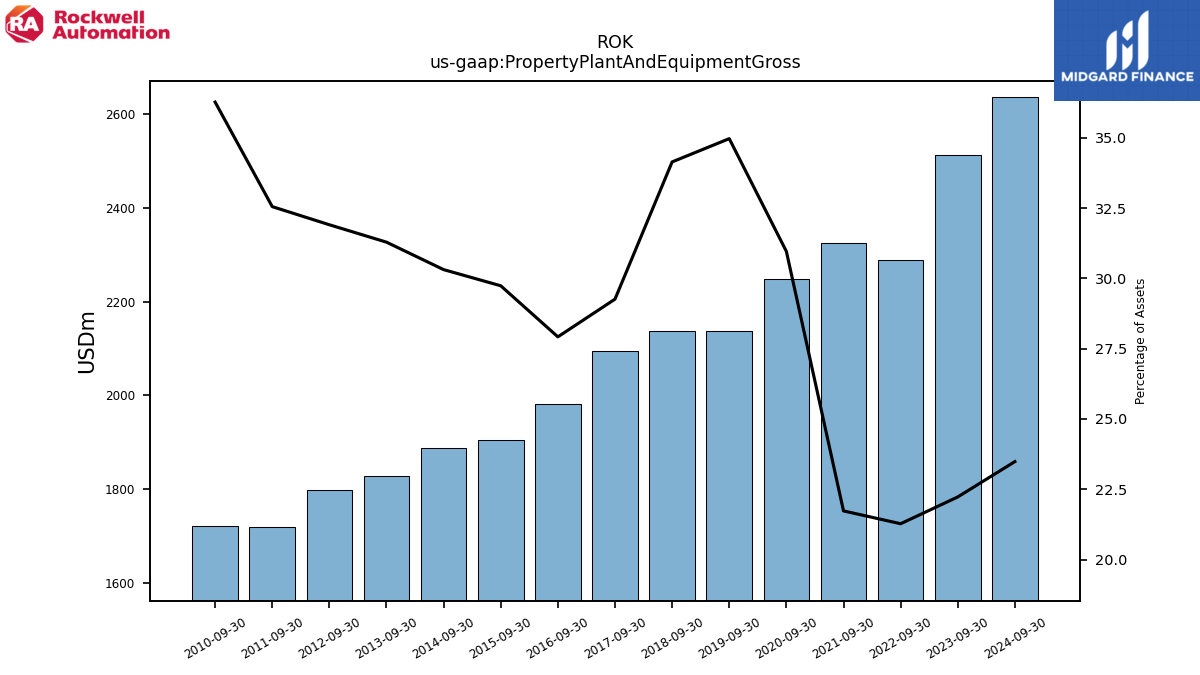
| Property Plant And Equipment Gross | NA | 2512.50 | NA | NA | NA | 2288.80 | NA | NA | NA | 2325.50 | NA | NA | NA | 2249.30 | NA | NA | NA | 2137.90 | NA | NA | NA | 2138.20 | NA | NA | NA | 2095.80 | NA | NA | NA | 1982.80 | NA | NA | NA | 1904.70 | NA | NA | NA | 1888.40 | NA | NA | NA | 1828.80 | NA | NA | NA | 1798.60 | NA | NA | NA | 1720.50 | NA | NA | NA | 1722.40 | NA | NA | NA | NA | |
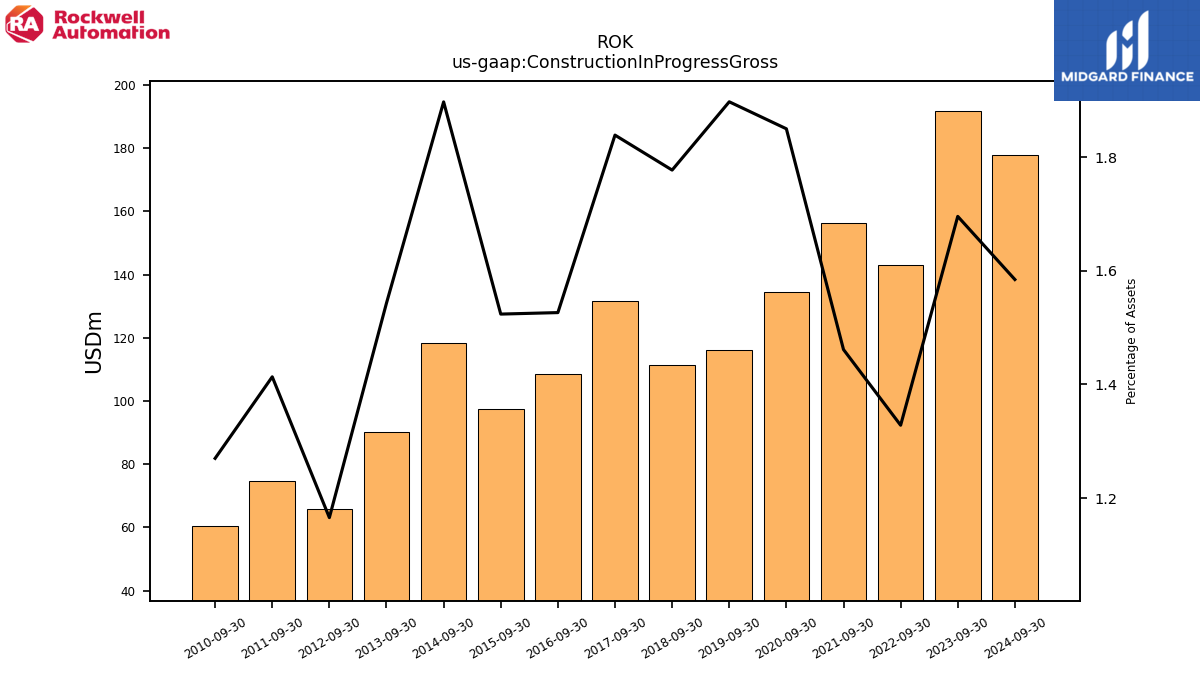
| Construction In Progress Gross | NA | 191.70 | NA | NA | NA | 142.90 | NA | NA | NA | 156.40 | NA | NA | NA | 134.40 | NA | NA | NA | 116.00 | NA | NA | NA | 111.30 | NA | NA | NA | 131.70 | NA | NA | NA | 108.40 | NA | NA | NA | 97.60 | NA | NA | NA | 118.20 | NA | NA | NA | 90.20 | NA | NA | NA | 65.70 | NA | NA | NA | 74.70 | NA | NA | NA | 60.30 | NA | NA | NA | NA | |
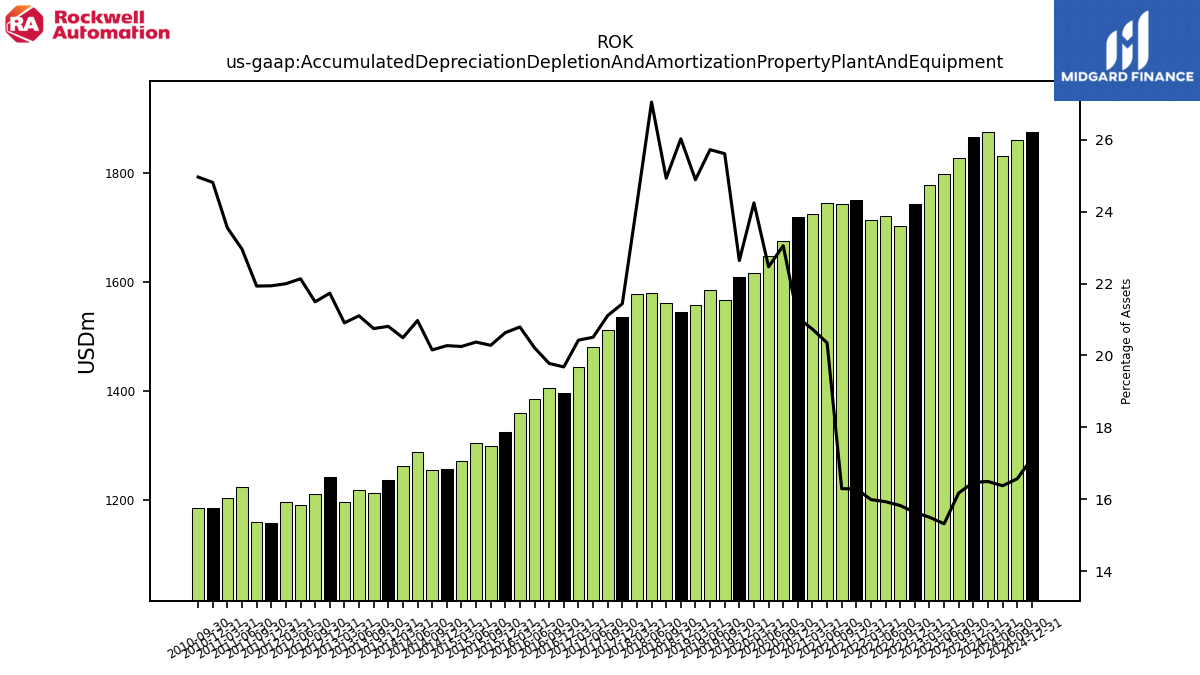
| Accumulated Depreciation Depletion And Amortization Property Plant And Equipment | 1866.30 | 1828.30 | 1798.60 | 1777.40 | 1743.30 | 1702.30 | 1720.40 | 1713.30 | 1749.70 | 1743.60 | 1744.80 | 1724.40 | 1719.90 | 1674.90 | 1646.80 | 1616.30 | 1609.40 | 1566.00 | 1584.60 | 1556.90 | 1545.10 | 1561.40 | 1579.30 | 1577.80 | 1534.80 | 1511.90 | 1479.70 | 1443.20 | 1396.30 | 1404.50 | 1385.80 | 1359.80 | 1324.70 | 1299.10 | 1305.20 | 1271.80 | 1257.40 | 1255.50 | 1288.80 | 1262.10 | 1236.30 | 1212.80 | 1218.00 | 1196.00 | 1241.30 | 1211.50 | 1191.40 | 1195.50 | 1158.20 | 1159.10 | 1223.30 | 1203.80 | 1186.00 | 1185.50 | NA | NA | NA | NA | |
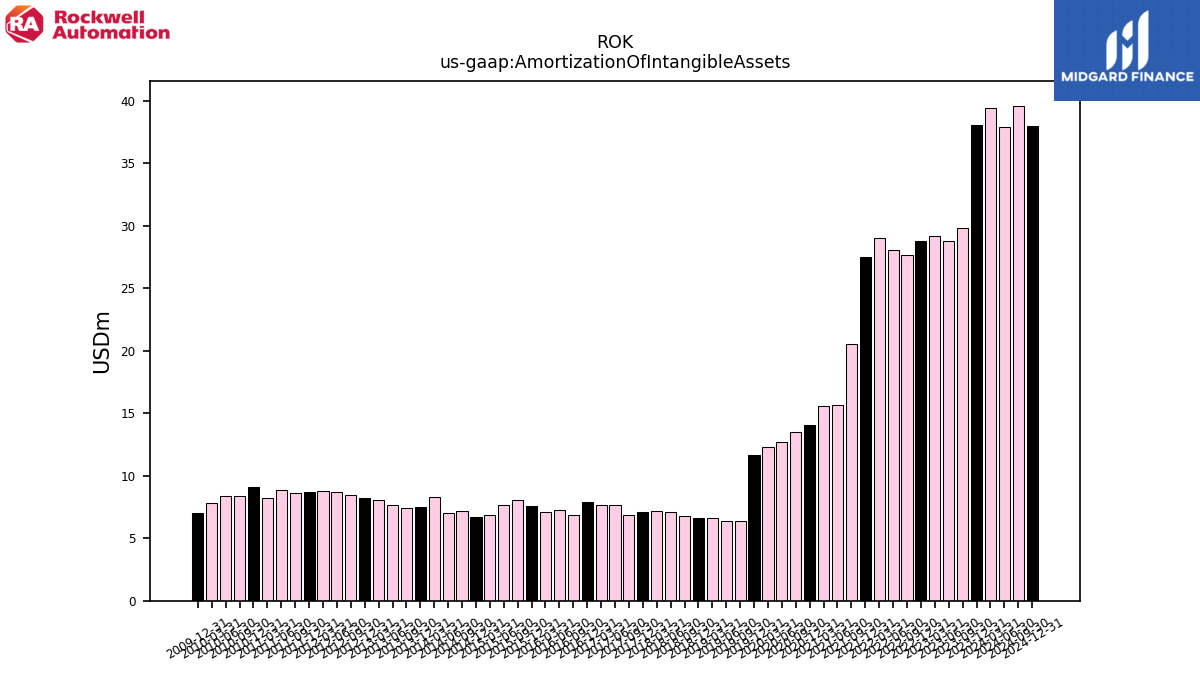
| Amortization Of Intangible Assets | 38.10 | 29.80 | 28.80 | 29.20 | 28.80 | 27.70 | 28.10 | 29.00 | 27.50 | 20.50 | 15.70 | 15.60 | 14.10 | 13.50 | 12.70 | 12.30 | 11.70 | 6.40 | 6.40 | 6.60 | 6.60 | 6.80 | 7.10 | 7.20 | 7.10 | 6.90 | 7.70 | 7.70 | 7.90 | 6.90 | 7.30 | 7.10 | 7.60 | 8.10 | 7.70 | 6.90 | 6.70 | 7.20 | 7.00 | 8.30 | 7.50 | 7.40 | 7.70 | 8.10 | 8.20 | 8.50 | 8.70 | 8.80 | 8.70 | 8.60 | 8.90 | 8.20 | 9.10 | 8.40 | 8.40 | 7.80 | 7.00 | NA | |
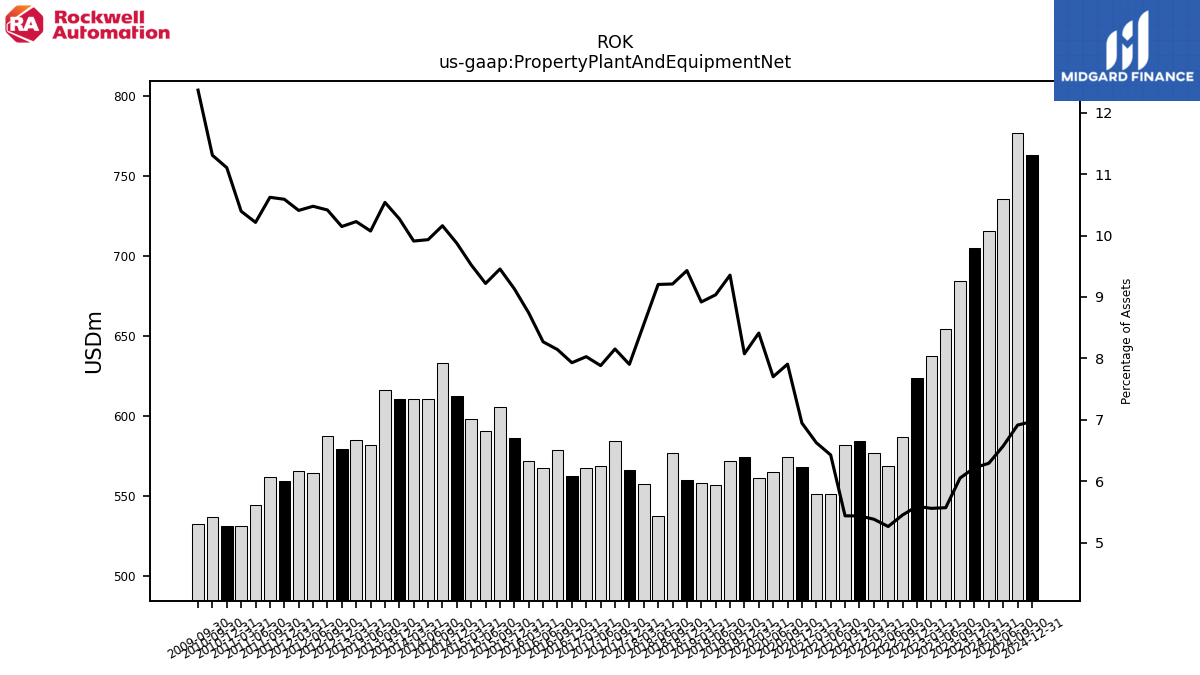
| Property Plant And Equipment Net | 705.00 | 684.20 | 654.10 | 637.60 | 623.40 | 586.50 | 568.50 | 576.80 | 584.10 | 581.90 | 551.10 | 551.30 | 567.70 | 574.40 | 564.50 | 560.80 | 574.00 | 571.90 | 556.50 | 557.80 | 559.70 | 576.80 | 537.30 | 557.20 | 565.80 | 583.90 | 568.80 | 567.20 | 562.60 | 578.30 | 567.00 | 571.60 | 586.30 | 605.60 | 590.70 | 598.00 | 612.40 | 632.90 | 610.40 | 610.30 | 610.30 | 616.00 | 581.40 | 585.00 | 579.50 | 587.10 | 563.90 | 565.70 | 559.10 | 561.40 | 544.20 | 531.30 | 530.70 | 536.90 | NA | NA | NA | 532.50 | |
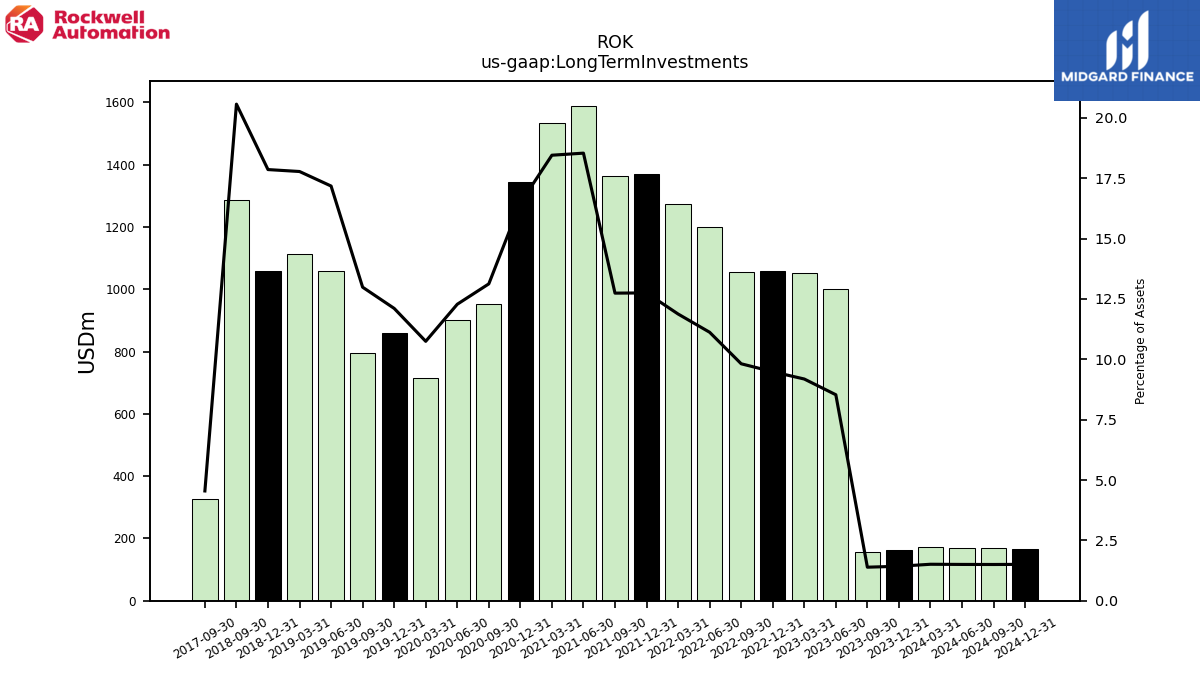
| Long Term Investments | 161.90 | 157.10 | 1002.00 | 1053.30 | 1057.60 | 1056.00 | 1201.00 | 1272.60 | 1369.80 | 1363.50 | 1589.40 | 1534.90 | 1345.90 | 953.50 | 900.10 | 716.30 | 860.70 | 793.90 | 1057.90 | 1111.90 | 1060.00 | 1288.00 | NA | NA | NA | 325.70 | NA | NA | NA | NA | NA | NA | NA | NA | NA | NA | NA | NA | NA | NA | NA | NA | NA | NA | NA | NA | NA | NA | NA | NA | NA | NA | NA | NA | NA | NA | NA | NA | |
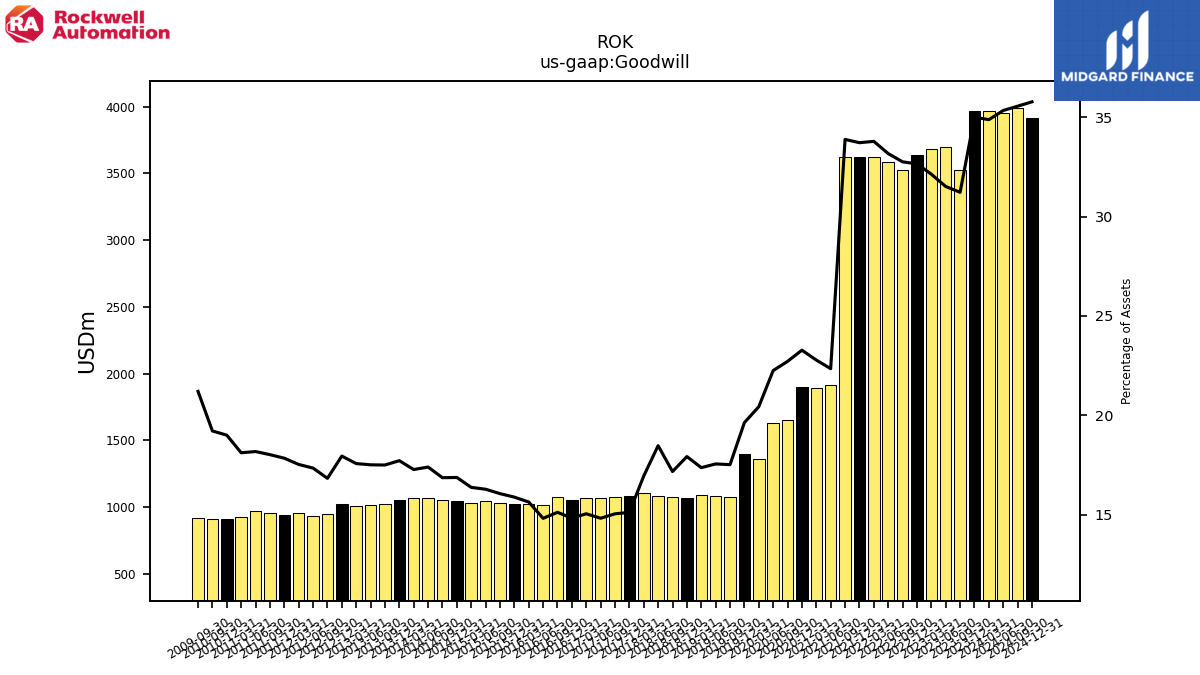
| Goodwill | 3966.70 | 3529.20 | 3700.90 | 3685.20 | 3640.60 | 3524.00 | 3582.20 | 3620.20 | 3622.30 | 3625.90 | 1916.00 | 1895.00 | 1902.20 | 1650.30 | 1631.00 | 1362.30 | 1395.80 | 1071.10 | 1081.30 | 1086.40 | 1064.10 | 1075.50 | 1078.50 | 1104.30 | 1082.30 | 1077.70 | 1069.70 | 1063.30 | 1052.20 | 1073.90 | 1016.10 | 1022.90 | 1019.90 | 1028.80 | 1043.30 | 1028.60 | 1046.70 | 1050.60 | 1069.30 | 1063.80 | 1052.80 | 1023.00 | 1010.70 | 1005.30 | 1025.30 | 948.80 | 933.80 | 952.80 | 942.10 | 952.60 | 968.60 | 926.10 | 908.20 | 912.50 | NA | NA | NA | 913.20 | |
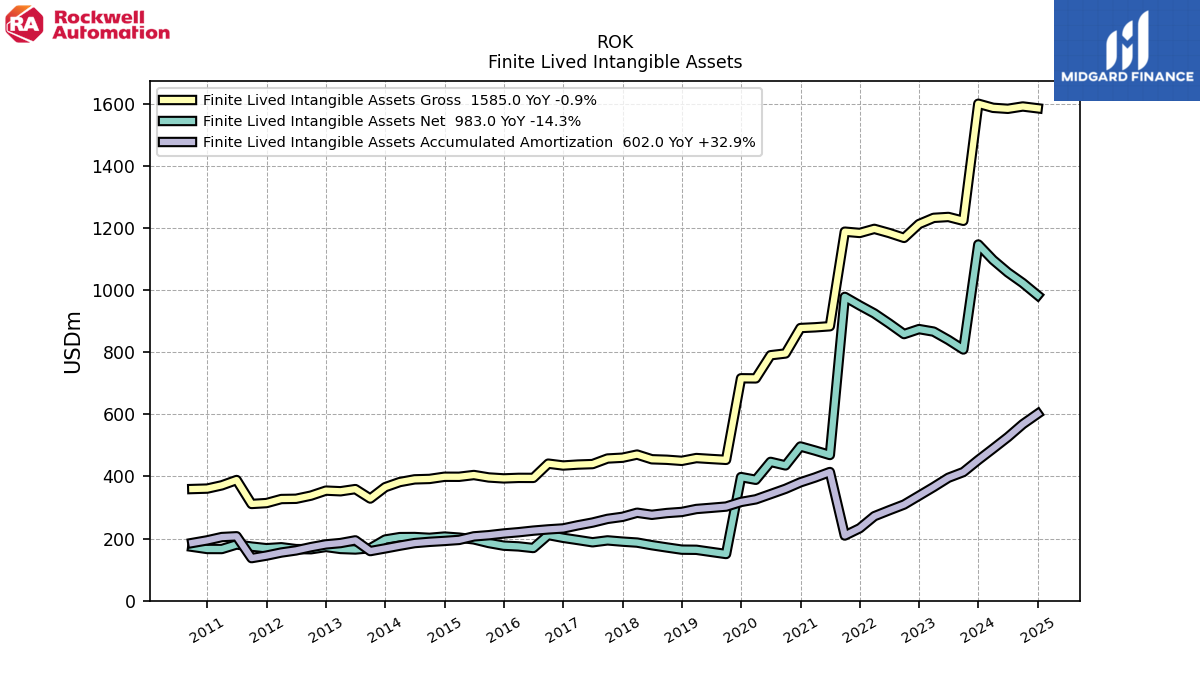
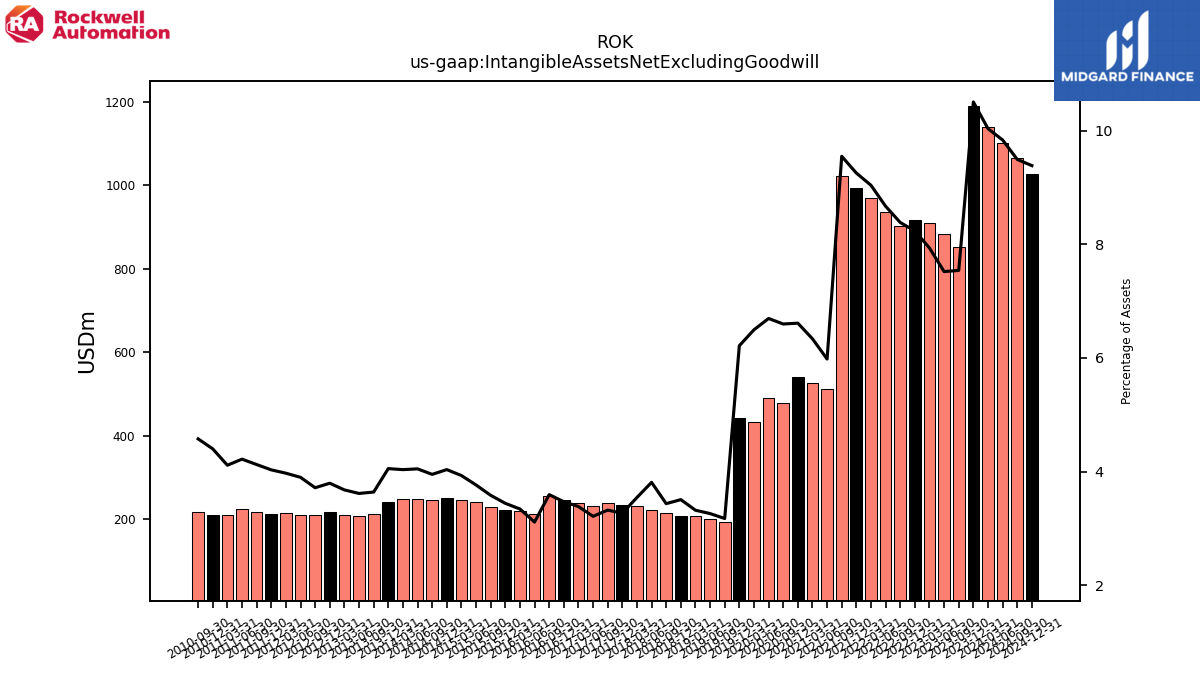
| Intangible Assets Net Excluding Goodwill | 1190.40 | 852.40 | 883.10 | 910.00 | 918.10 | 902.00 | 936.30 | 968.50 | 994.10 | 1021.80 | 512.80 | 527.10 | 540.30 | 479.30 | 490.70 | 433.00 | 441.80 | 194.10 | 200.90 | 207.70 | 208.20 | 215.20 | 222.50 | 230.90 | 234.00 | 238.00 | 231.90 | 239.20 | 246.20 | 255.30 | 213.40 | 218.60 | 221.00 | 229.50 | 241.20 | 246.90 | 250.30 | 246.20 | 248.80 | 248.50 | 240.80 | 212.80 | 208.70 | 210.40 | 216.80 | 209.50 | 209.90 | 215.90 | 212.80 | 218.00 | 224.80 | 210.20 | 210.30 | 217.30 | NA | NA | NA | NA | |
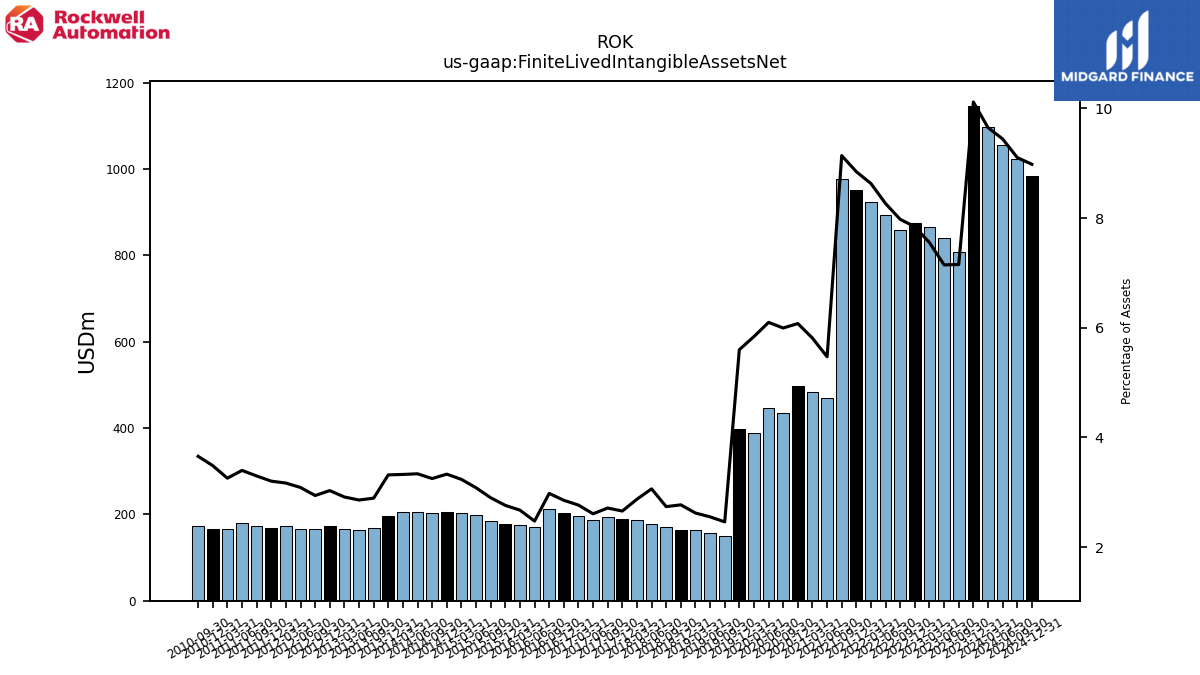
| Finite Lived Intangible Assets Net | 1146.70 | 808.70 | 839.40 | 866.30 | 874.40 | 858.30 | 892.60 | 924.80 | 950.40 | 978.10 | 469.10 | 483.40 | 496.60 | 435.60 | 447.00 | 389.30 | 398.10 | 150.40 | 157.20 | 164.00 | 164.50 | 171.50 | 178.80 | 187.20 | 190.30 | 194.30 | 188.20 | 195.50 | 202.50 | 211.60 | 169.70 | 174.90 | 177.30 | 185.80 | 197.50 | 203.20 | 206.60 | 202.50 | 205.10 | 204.80 | 197.10 | 169.10 | 165.00 | 166.70 | 173.10 | 165.80 | 166.20 | 172.20 | 169.10 | 174.30 | 181.10 | 166.50 | 166.60 | 173.60 | NA | NA | NA | NA | |
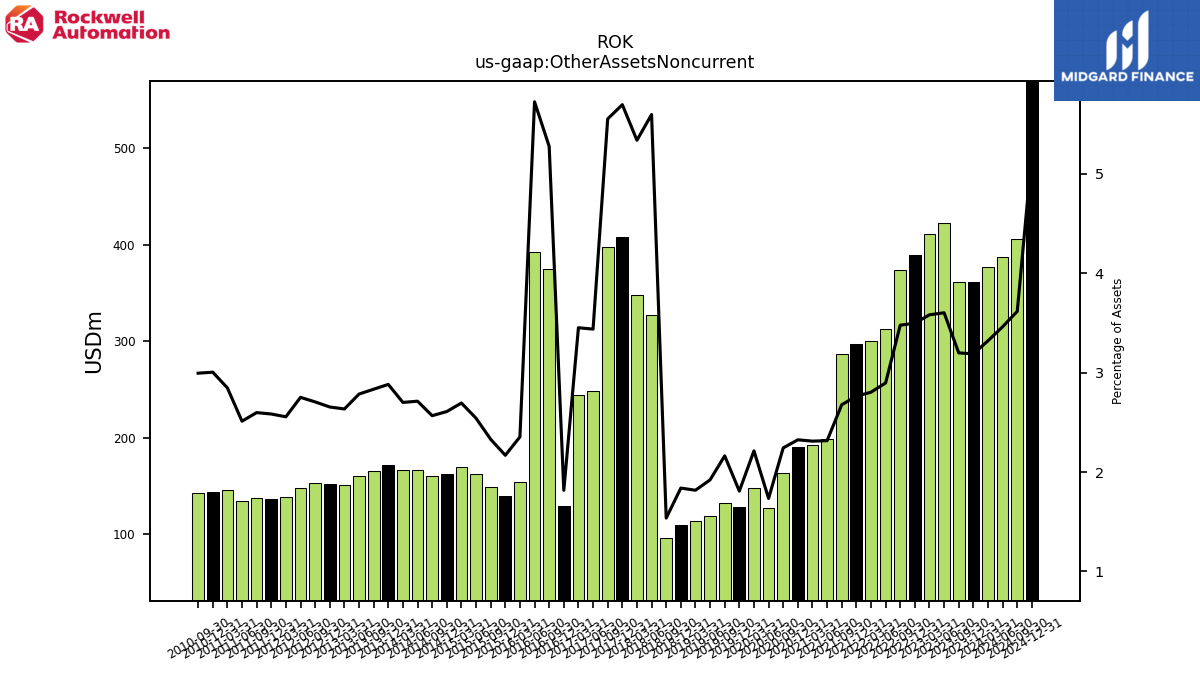
| Other Assets Noncurrent | 361.50 | 361.60 | 423.10 | 410.90 | 390.00 | 374.20 | 312.80 | 300.40 | 296.80 | 286.50 | 198.50 | 192.20 | 189.90 | 162.90 | 127.10 | 147.50 | 128.50 | 132.20 | 118.30 | 113.60 | 109.10 | 96.20 | 326.80 | 347.80 | 407.90 | 397.80 | 248.10 | 243.90 | 128.80 | 374.80 | 392.60 | 153.90 | 139.20 | 149.20 | 162.80 | 169.20 | 161.80 | 159.90 | 166.70 | 166.30 | 171.20 | 165.60 | 160.70 | 150.70 | 151.60 | 152.50 | 148.10 | 138.90 | 136.40 | 137.30 | 133.80 | 145.50 | 143.60 | 142.20 | NA | NA | NA | NA | |
| Equity Securities Fv Ni | NA | NA | 863.90 | 915.00 | 925.00 | 928.80 | 1065.60 | 1138.70 | 1282.00 | 1267.60 | 1494.80 | 1456.60 | 1265.70 | 875.30 | 823.20 | 647.70 | 792.50 | 721.50 | 949.80 | 975.50 | 877.30 | 1090.00 | NA | NA | NA | 0.00 | NA | NA | NA | NA | NA | NA | NA | NA | NA | NA | NA | NA | NA | NA | NA | NA | NA | NA | NA | NA | NA | NA | NA | NA | NA | NA | NA | NA | NA | NA | NA | NA |
| 2023-12-31 | 2023-09-30 | 2023-06-30 | 2023-03-31 | 2022-12-31 | 2022-09-30 | 2022-06-30 | 2022-03-31 | 2021-12-31 | 2021-09-30 | 2021-06-30 | 2021-03-31 | 2020-12-31 | 2020-09-30 | 2020-06-30 | 2020-03-31 | 2019-12-31 | 2019-09-30 | 2019-06-30 | 2019-03-31 | 2018-12-31 | 2018-09-30 | 2018-06-30 | 2018-03-31 | 2017-12-31 | 2017-09-30 | 2017-06-30 | 2017-03-31 | 2016-12-31 | 2016-09-30 | 2016-06-30 | 2016-03-31 | 2015-12-31 | 2015-09-30 | 2015-06-30 | 2015-03-31 | 2014-12-31 | 2014-09-30 | 2014-06-30 | 2014-03-31 | 2013-12-31 | 2013-09-30 | 2013-06-30 | 2013-03-31 | 2012-12-31 | 2012-09-30 | 2012-06-30 | 2012-03-31 | 2011-12-31 | 2011-09-30 | 2011-06-30 | 2011-03-31 | 2010-12-31 | 2010-09-30 | 2010-06-30 | 2010-03-31 | 2009-12-31 | 2009-09-30 | ||
|---|---|---|---|---|---|---|---|---|---|---|---|---|---|---|---|---|---|---|---|---|---|---|---|---|---|---|---|---|---|---|---|---|---|---|---|---|---|---|---|---|---|---|---|---|---|---|---|---|---|---|---|---|---|---|---|---|---|---|---|
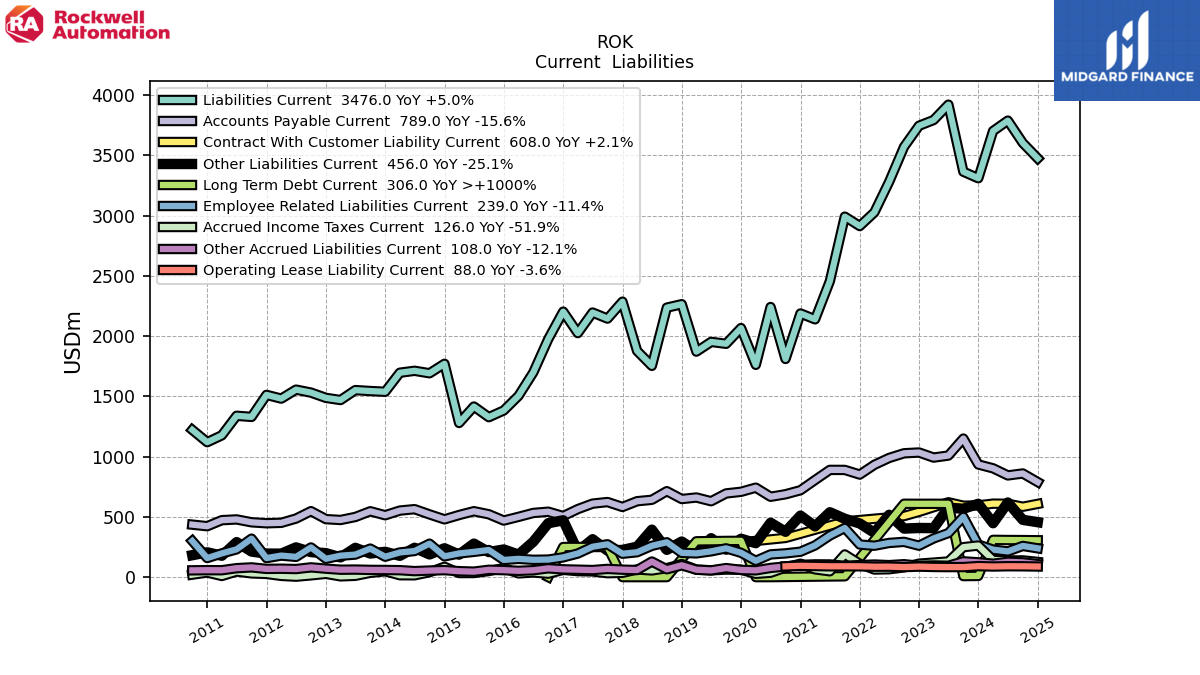
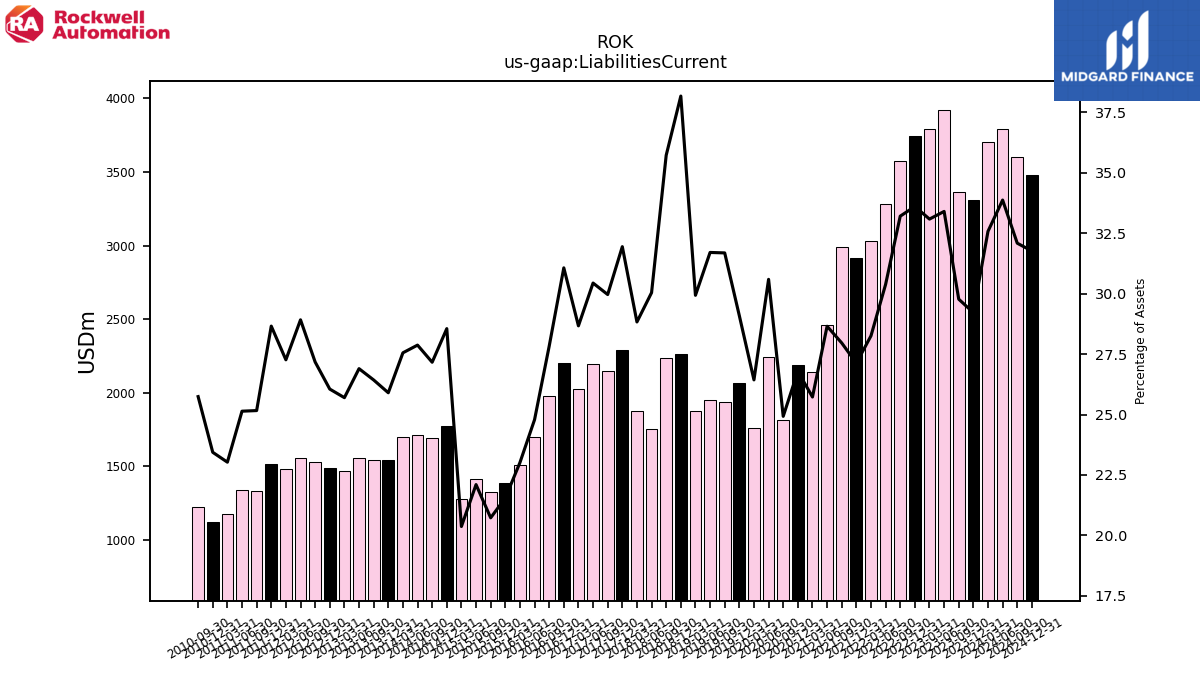
| Liabilities Current | 3310.90 | 3365.30 | 3922.10 | 3794.20 | 3746.70 | 3572.20 | 3281.20 | 3027.60 | 2914.10 | 2992.20 | 2456.30 | 2139.80 | 2188.60 | 1810.80 | 2242.10 | 1762.00 | 2067.50 | 1936.80 | 1952.50 | 1871.90 | 2265.50 | 2236.90 | 1753.60 | 1877.80 | 2286.60 | 2145.80 | 2196.20 | 2025.40 | 2203.90 | 1975.90 | 1699.30 | 1504.90 | 1383.40 | 1327.70 | 1416.00 | 1279.30 | 1770.80 | 1692.10 | 1712.70 | 1696.70 | 1538.70 | 1544.70 | 1552.30 | 1469.90 | 1487.90 | 1531.60 | 1556.40 | 1481.70 | 1512.80 | 1329.90 | 1339.30 | 1177.10 | 1120.10 | 1222.30 | NA | NA | NA | NA | |
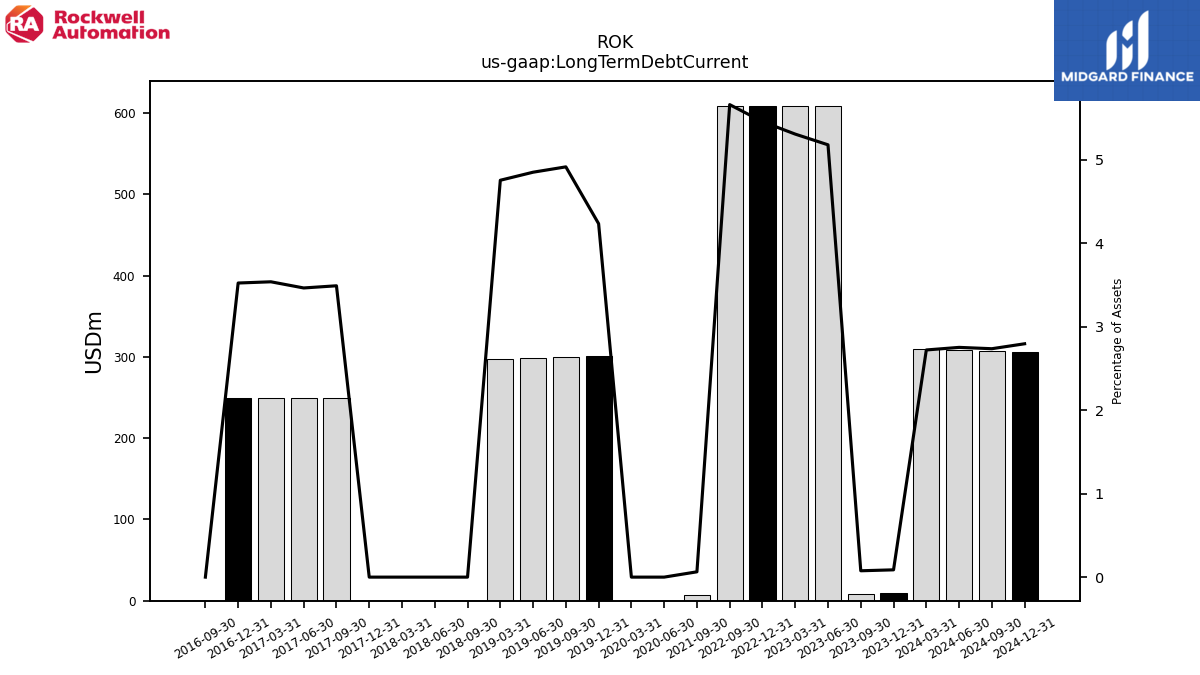
| Long Term Debt Current | 9.90 | 8.60 | 608.30 | 608.80 | 608.50 | 609.10 | NA | NA | NA | 6.80 | NA | NA | NA | NA | 0.00 | 0.00 | 301.00 | 300.50 | 298.80 | 297.40 | NA | 0.00 | 0.00 | 0.00 | 0.00 | 250.00 | 250.00 | 250.00 | 250.00 | 0.00 | NA | NA | NA | NA | NA | NA | NA | NA | NA | NA | NA | NA | NA | NA | NA | NA | NA | NA | NA | NA | NA | NA | NA | NA | NA | NA | NA | NA | |
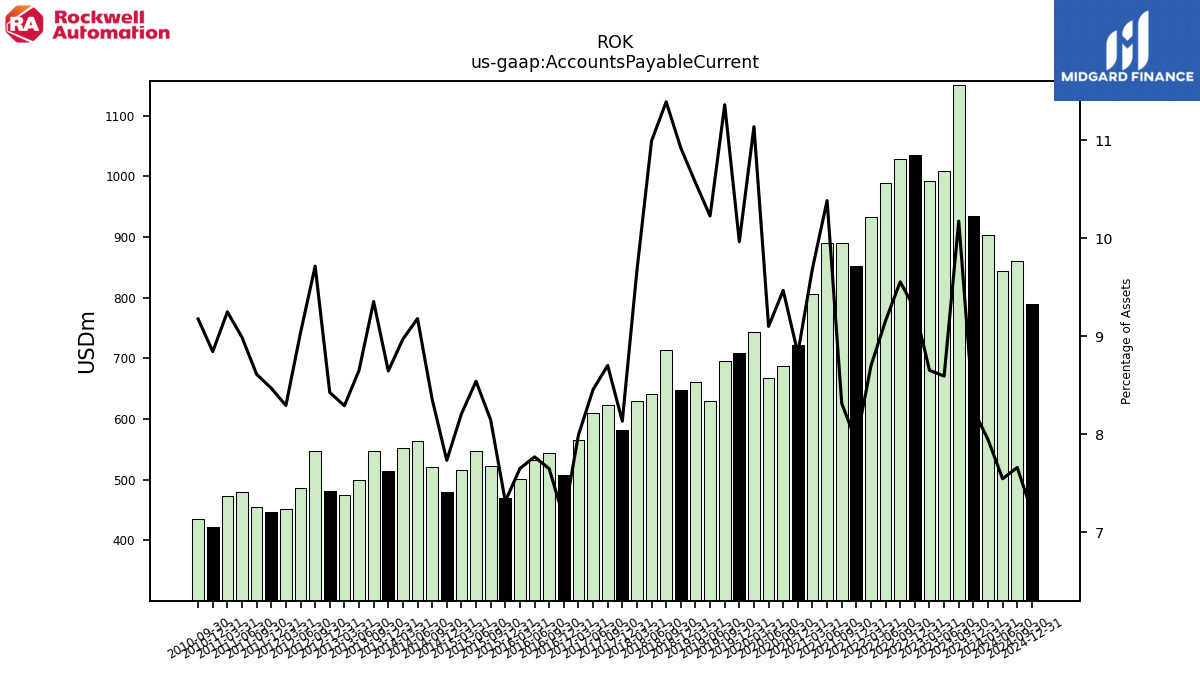
| Accounts Payable Current | 935.00 | 1150.20 | 1009.10 | 992.40 | 1034.50 | 1028.00 | 989.20 | 932.10 | 851.30 | 889.80 | 890.20 | 806.20 | 721.10 | 687.80 | 667.00 | 742.50 | 708.30 | 694.60 | 629.90 | 660.90 | 648.20 | 713.40 | 641.80 | 630.00 | 582.20 | 623.20 | 610.10 | 564.60 | 506.80 | 543.10 | 532.60 | 500.30 | 469.60 | 521.70 | 547.10 | 515.40 | 479.60 | 520.60 | 564.10 | 552.40 | 513.60 | 546.70 | 499.30 | 474.20 | 481.20 | 547.60 | 486.30 | 450.70 | 447.10 | 455.10 | 478.90 | 472.70 | 422.60 | 435.70 | NA | NA | NA | NA | |
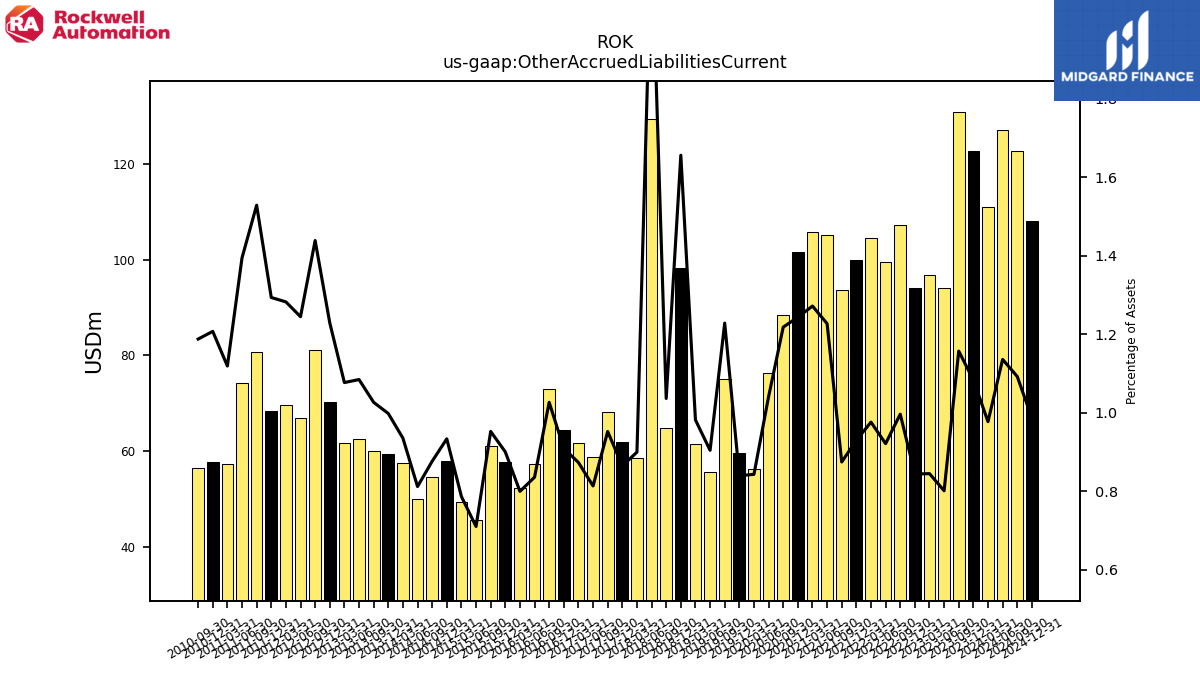
| Other Accrued Liabilities Current | 122.80 | 130.80 | 94.10 | 96.90 | 94.10 | 107.20 | 99.50 | 104.60 | 99.90 | 93.60 | 105.20 | 105.80 | 101.60 | 88.50 | 76.30 | 56.20 | 59.70 | 75.10 | 55.70 | 61.40 | 98.30 | 64.90 | 129.40 | 58.60 | 61.90 | 68.20 | 58.70 | 61.70 | 64.50 | 72.90 | 57.30 | 52.30 | 57.80 | 61.00 | 45.50 | 49.40 | 57.90 | 54.60 | 49.90 | 57.60 | 59.30 | 60.00 | 62.60 | 61.60 | 70.20 | 81.10 | 67.00 | 69.70 | 68.30 | 80.80 | 74.30 | 57.20 | 57.70 | 56.40 | NA | NA | NA | NA | |
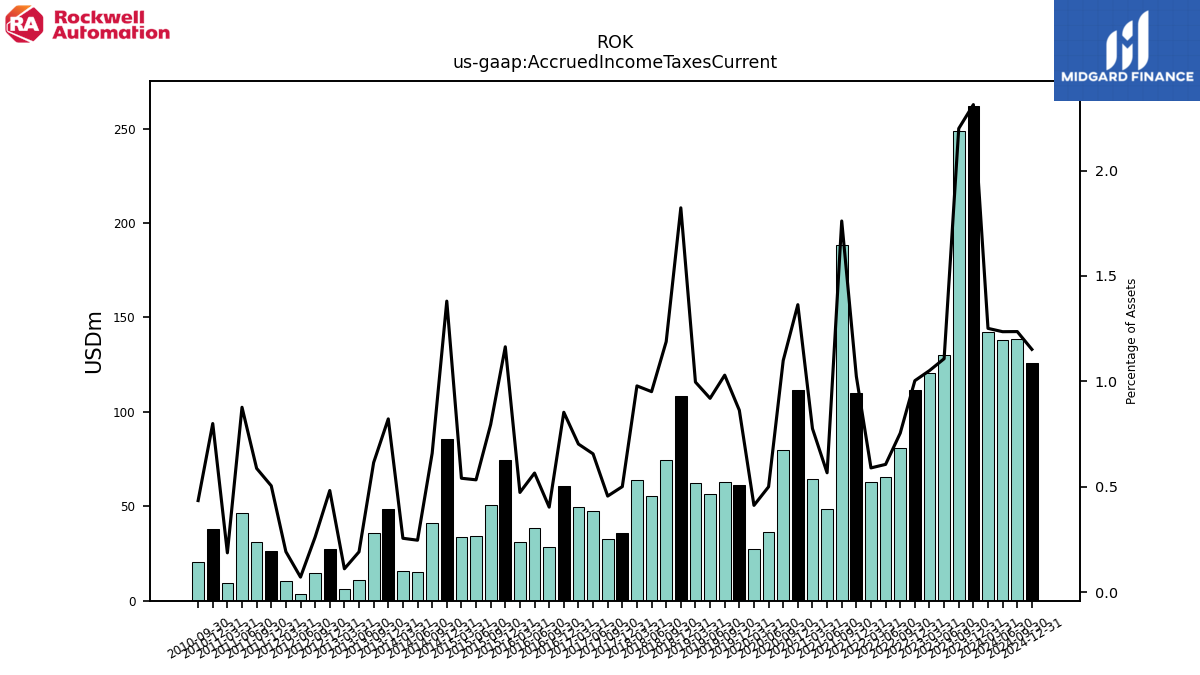
| Accrued Income Taxes Current | 262.10 | 248.60 | 130.00 | 120.50 | 111.80 | 81.10 | 65.40 | 63.10 | 109.90 | 188.40 | 48.50 | 64.50 | 111.40 | 79.80 | 36.60 | 27.40 | 61.30 | 62.90 | 56.60 | 62.30 | 108.20 | 74.40 | 55.50 | 63.70 | 35.80 | 32.60 | 47.30 | 49.60 | 60.50 | 28.60 | 38.70 | 30.90 | 74.70 | 50.90 | 34.10 | 33.90 | 85.60 | 41.00 | 15.10 | 15.70 | 48.80 | 35.90 | 11.00 | 6.30 | 27.50 | 14.70 | 3.80 | 10.40 | 26.60 | 31.00 | 46.70 | 9.50 | 38.20 | 20.60 | NA | NA | NA | NA | |
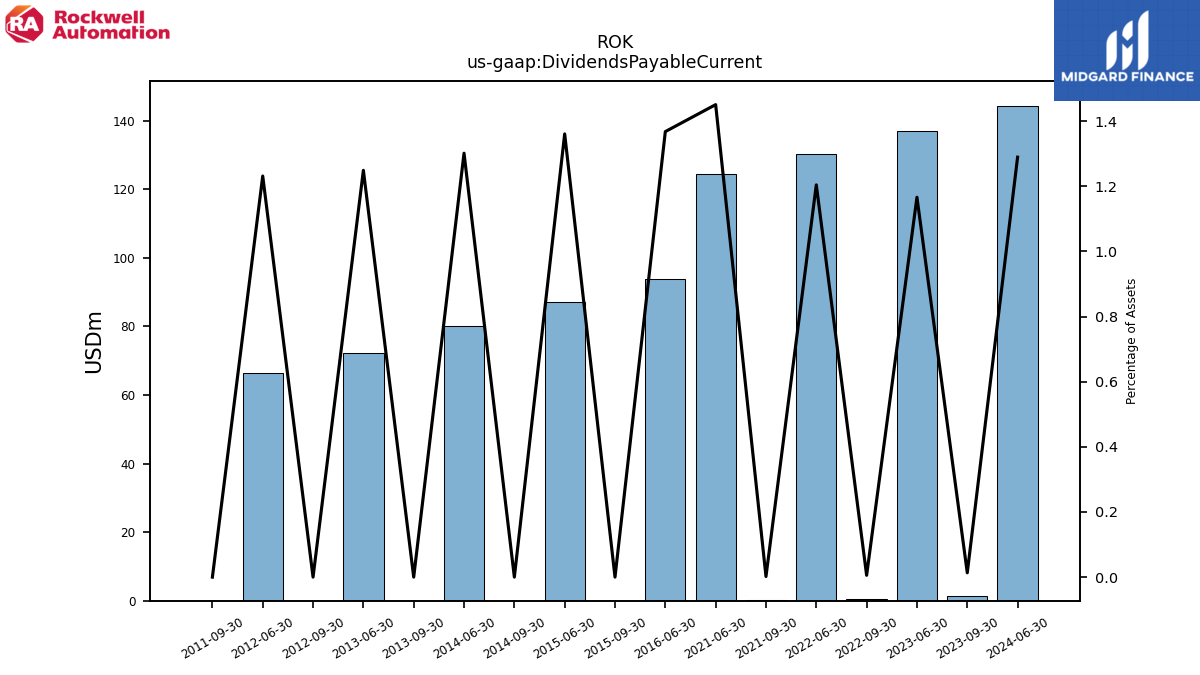
| Dividends Payable Current | NA | NA | 137.00 | NA | NA | 0.60 | 130.10 | NA | NA | 0.20 | 124.40 | NA | NA | NA | NA | NA | NA | NA | NA | NA | NA | NA | NA | NA | NA | NA | NA | NA | NA | NA | 93.80 | NA | NA | 0.00 | 87.20 | NA | NA | 0.00 | 80.00 | NA | NA | 0.00 | 72.10 | NA | NA | 0.00 | 66.30 | NA | NA | 0.00 | NA | NA | NA | NA | NA | NA | NA | NA | |
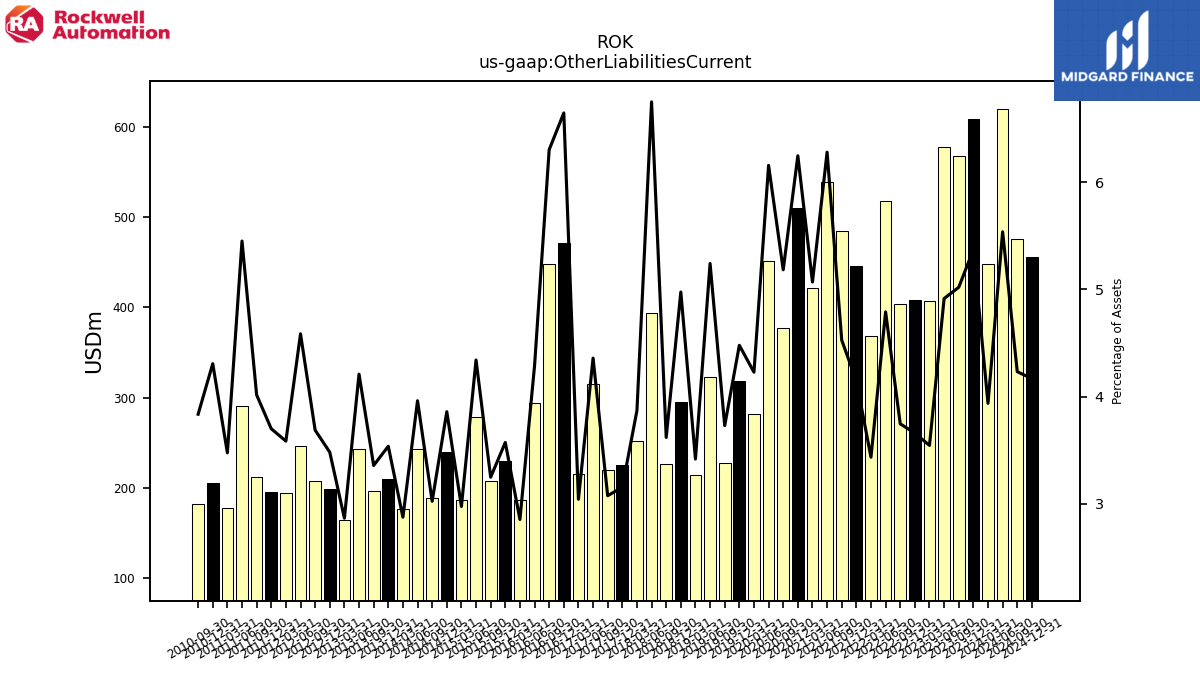
| Other Liabilities Current | 608.60 | 567.40 | 577.10 | 406.50 | 407.90 | 403.00 | 517.30 | 368.00 | 445.50 | 484.40 | 538.40 | 421.60 | 510.40 | 376.50 | 451.30 | 281.80 | 318.30 | 227.90 | 322.80 | 213.70 | 295.30 | 226.60 | 394.00 | 252.00 | 225.80 | 220.20 | 314.50 | 214.90 | 471.50 | 447.60 | 293.90 | 186.60 | 229.30 | 208.00 | 278.10 | 186.80 | 239.30 | 188.30 | 243.40 | 177.00 | 210.10 | 196.20 | 242.90 | 163.90 | 198.80 | 207.80 | 246.80 | 194.80 | 195.30 | 212.20 | 290.40 | 177.60 | 205.80 | 182.10 | NA | NA | NA | NA | |
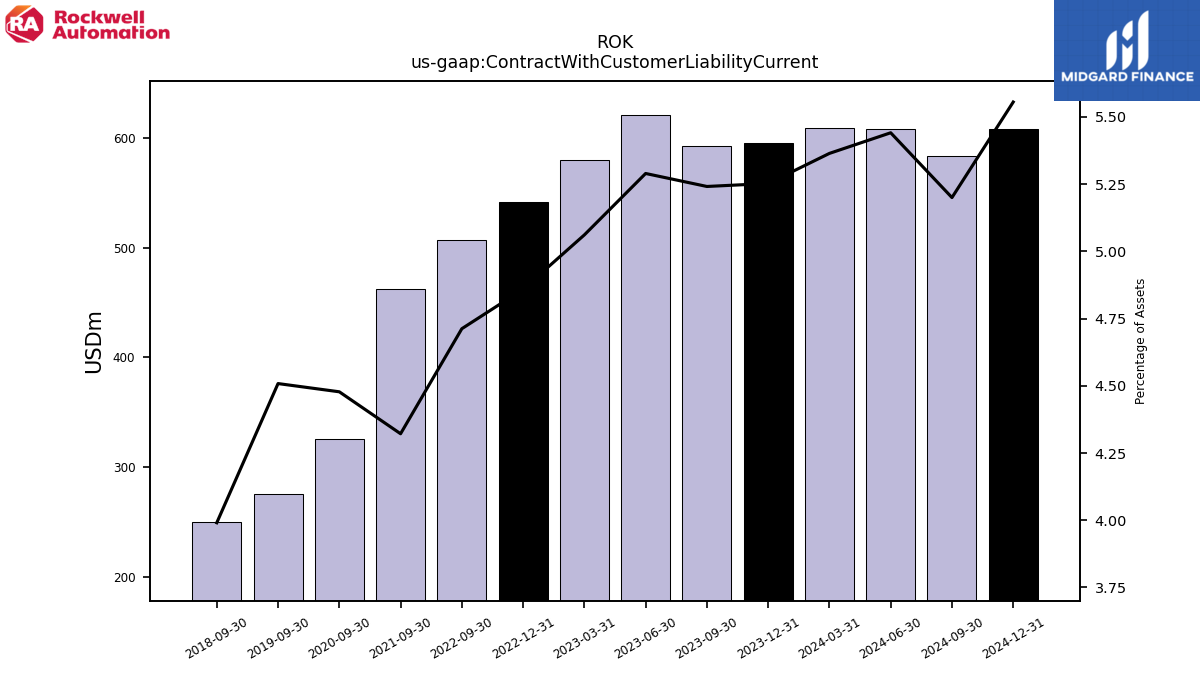
| Contract With Customer Liability Current | 595.30 | 592.50 | 621.20 | 580.50 | 541.80 | 507.00 | NA | NA | NA | 462.50 | NA | NA | NA | 325.30 | NA | NA | NA | 275.60 | NA | NA | NA | 249.90 | NA | NA | NA | NA | NA | NA | NA | NA | NA | NA | NA | NA | NA | NA | NA | NA | NA | NA | NA | NA | NA | NA | NA | NA | NA | NA | NA | NA | NA | NA | NA | NA | NA | NA | NA | NA |
| 2023-12-31 | 2023-09-30 | 2023-06-30 | 2023-03-31 | 2022-12-31 | 2022-09-30 | 2022-06-30 | 2022-03-31 | 2021-12-31 | 2021-09-30 | 2021-06-30 | 2021-03-31 | 2020-12-31 | 2020-09-30 | 2020-06-30 | 2020-03-31 | 2019-12-31 | 2019-09-30 | 2019-06-30 | 2019-03-31 | 2018-12-31 | 2018-09-30 | 2018-06-30 | 2018-03-31 | 2017-12-31 | 2017-09-30 | 2017-06-30 | 2017-03-31 | 2016-12-31 | 2016-09-30 | 2016-06-30 | 2016-03-31 | 2015-12-31 | 2015-09-30 | 2015-06-30 | 2015-03-31 | 2014-12-31 | 2014-09-30 | 2014-06-30 | 2014-03-31 | 2013-12-31 | 2013-09-30 | 2013-06-30 | 2013-03-31 | 2012-12-31 | 2012-09-30 | 2012-06-30 | 2012-03-31 | 2011-12-31 | 2011-09-30 | 2011-06-30 | 2011-03-31 | 2010-12-31 | 2010-09-30 | 2010-06-30 | 2010-03-31 | 2009-12-31 | 2009-09-30 | ||
|---|---|---|---|---|---|---|---|---|---|---|---|---|---|---|---|---|---|---|---|---|---|---|---|---|---|---|---|---|---|---|---|---|---|---|---|---|---|---|---|---|---|---|---|---|---|---|---|---|---|---|---|---|---|---|---|---|---|---|---|
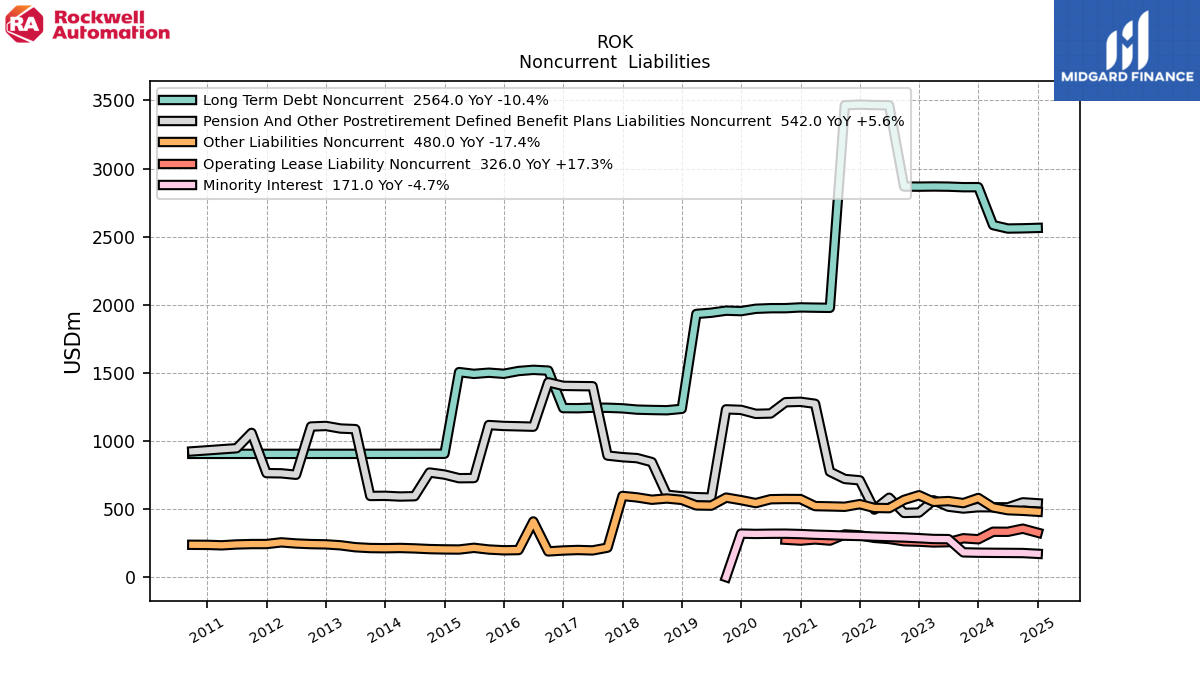
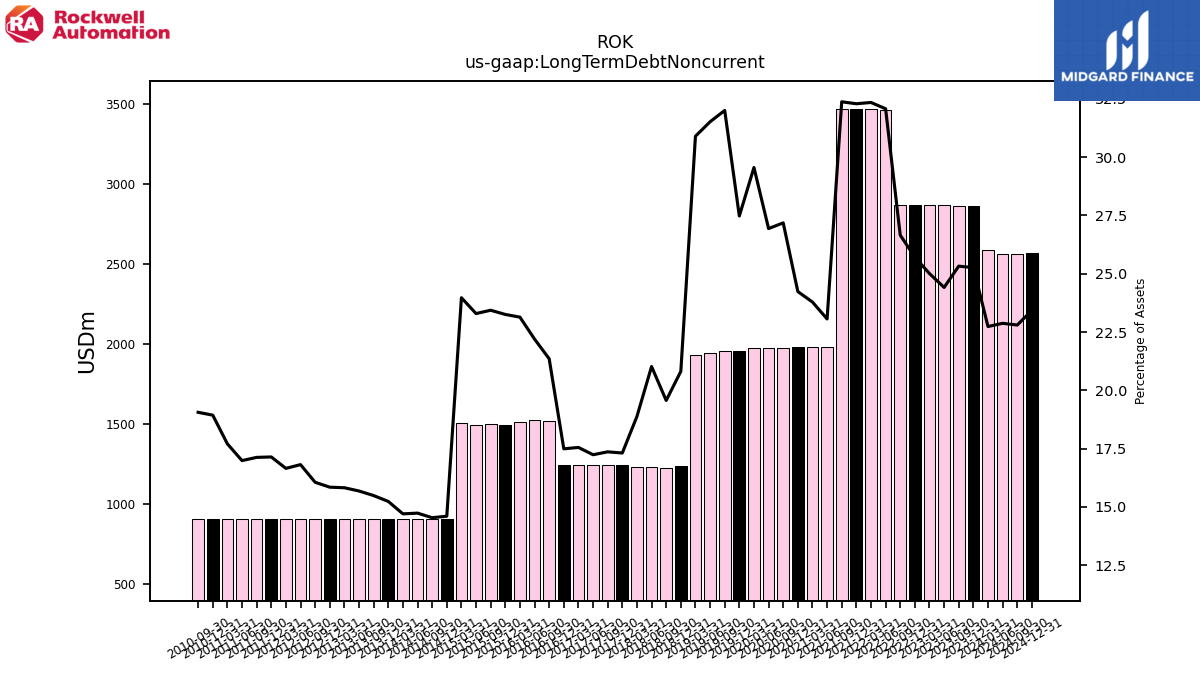
| Long Term Debt Noncurrent | 2863.00 | 2862.90 | 2866.90 | 2868.10 | 2866.90 | 2867.80 | 3464.10 | 3466.00 | 3469.10 | 3464.60 | 1977.10 | 1978.40 | 1980.30 | 1974.70 | 1974.40 | 1970.20 | 1953.00 | 1956.40 | 1941.10 | 1932.40 | 1235.40 | 1225.20 | 1227.10 | 1229.80 | 1239.30 | 1243.40 | 1243.80 | 1240.00 | 1240.90 | 1516.30 | 1521.80 | 1513.20 | 1492.90 | 1500.90 | 1492.20 | 1505.40 | 905.60 | 905.60 | 905.40 | 905.40 | 905.10 | 905.10 | 905.10 | 905.00 | 905.00 | 905.00 | 905.00 | 905.00 | 905.00 | 905.00 | 905.00 | 904.90 | 904.90 | 904.90 | NA | NA | NA | NA | |
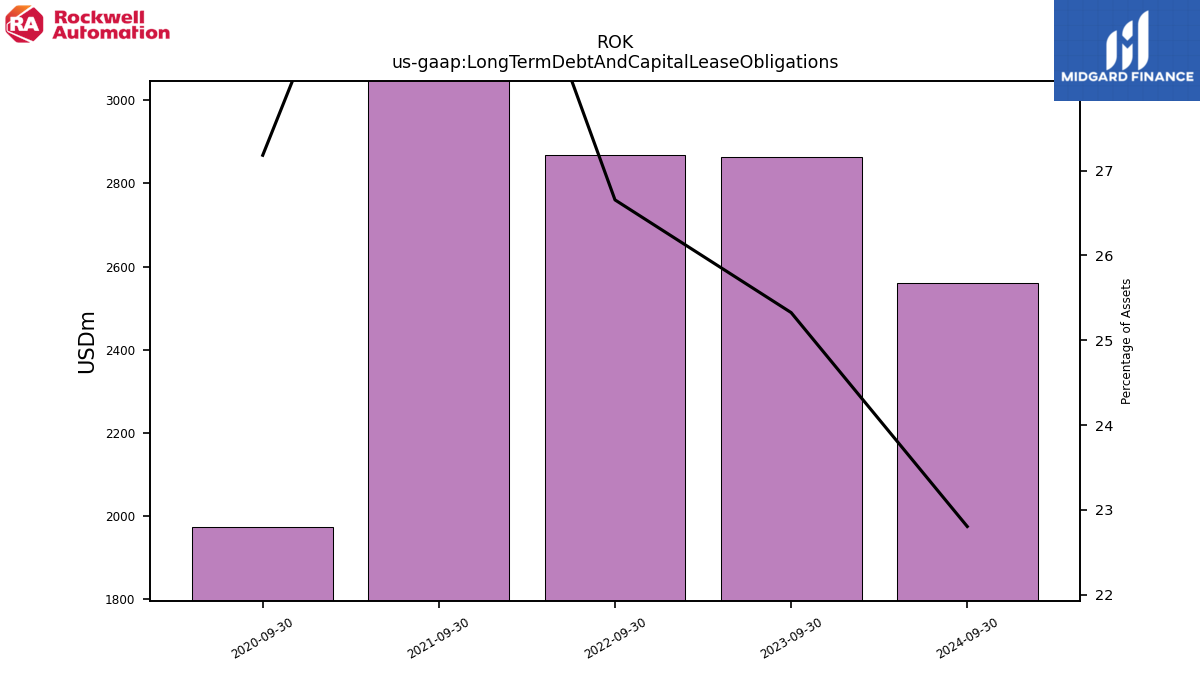
| Long Term Debt And Capital Lease Obligations | NA | 2862.90 | NA | NA | NA | 2867.80 | NA | NA | NA | 3464.60 | NA | NA | NA | 1974.70 | NA | NA | NA | NA | NA | NA | NA | NA | NA | NA | NA | NA | NA | NA | NA | NA | NA | NA | NA | NA | NA | NA | NA | NA | NA | NA | NA | NA | NA | NA | NA | NA | NA | NA | NA | NA | NA | NA | NA | NA | NA | NA | NA | NA | |
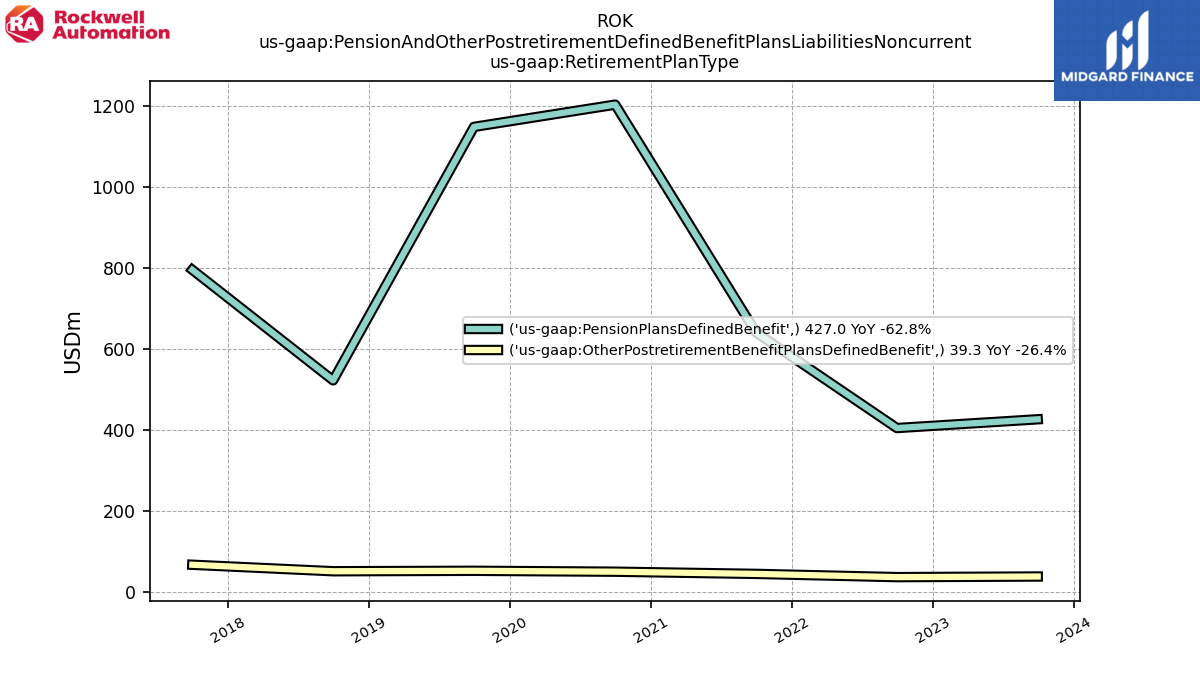
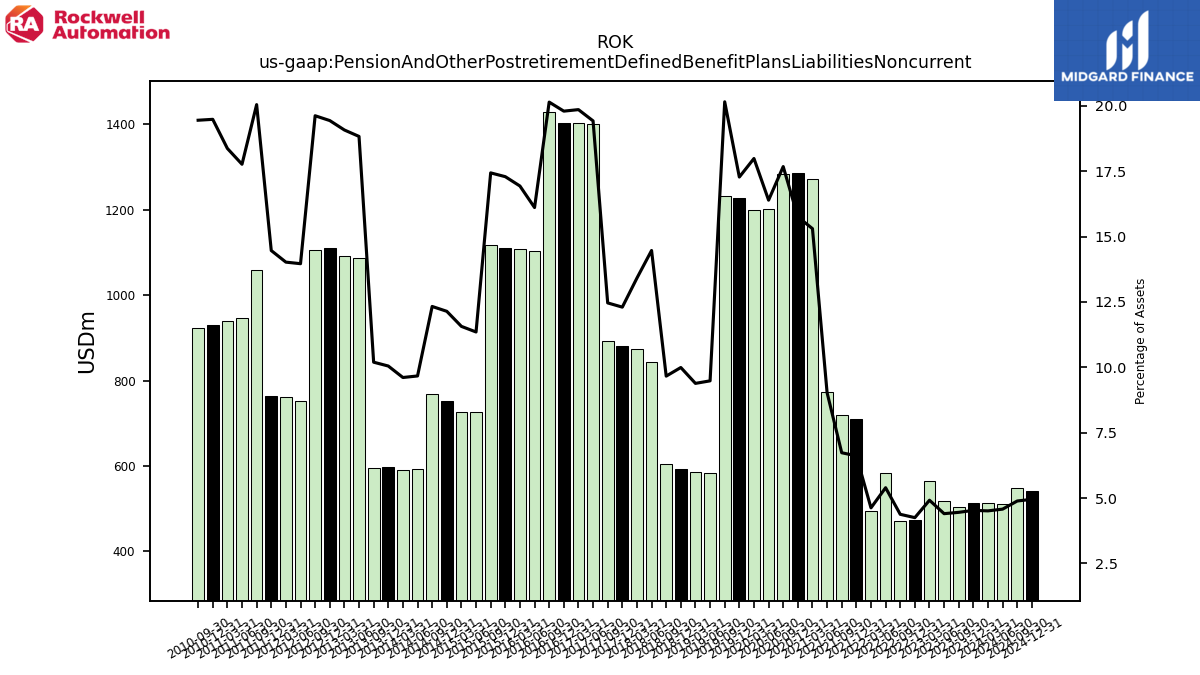
| Pension And Other Postretirement Defined Benefit Plans Liabilities Noncurrent | 513.40 | 503.60 | 517.20 | 564.00 | 474.10 | 471.20 | 582.80 | 495.80 | 710.80 | 720.60 | 774.10 | 1272.70 | 1287.20 | 1284.00 | 1201.40 | 1198.80 | 1227.90 | 1231.90 | 584.00 | 587.00 | 593.10 | 605.10 | 844.50 | 873.60 | 880.60 | 892.50 | 1401.40 | 1402.60 | 1404.30 | 1430.20 | 1104.40 | 1107.30 | 1109.90 | 1116.60 | 727.20 | 726.30 | 753.00 | 767.90 | 594.20 | 591.80 | 597.00 | 595.90 | 1086.60 | 1091.00 | 1109.90 | 1105.80 | 751.50 | 762.00 | 763.60 | 1059.30 | 946.40 | 938.80 | 931.00 | 923.40 | NA | NA | NA | NA | |
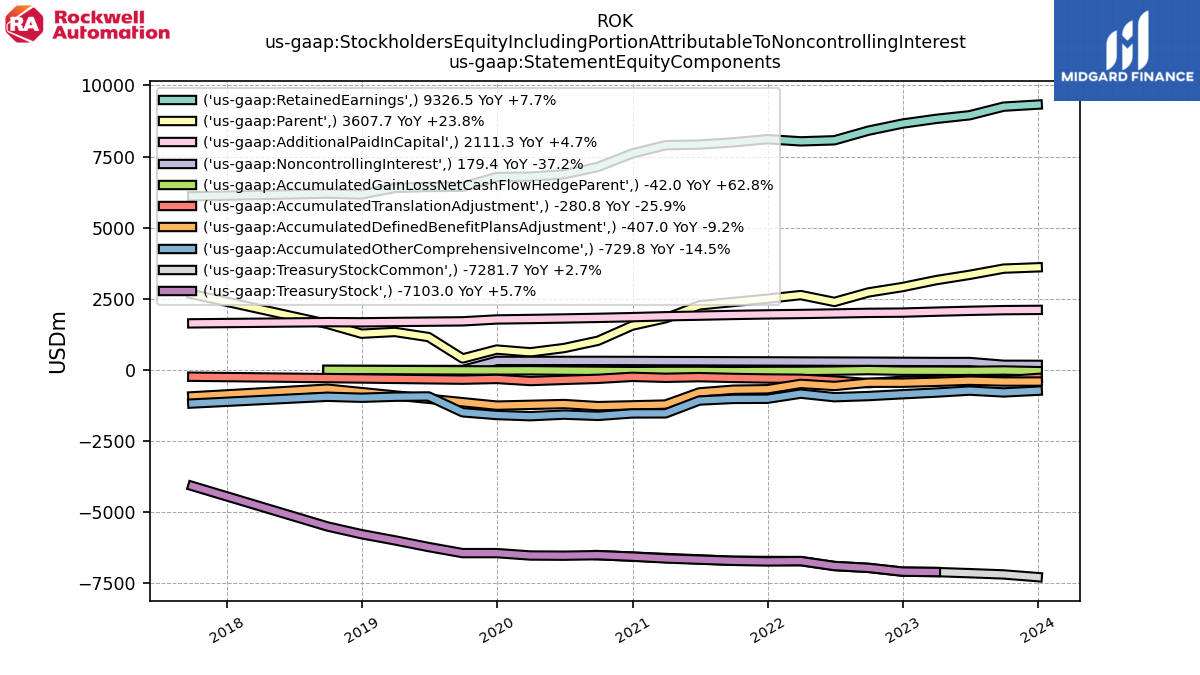
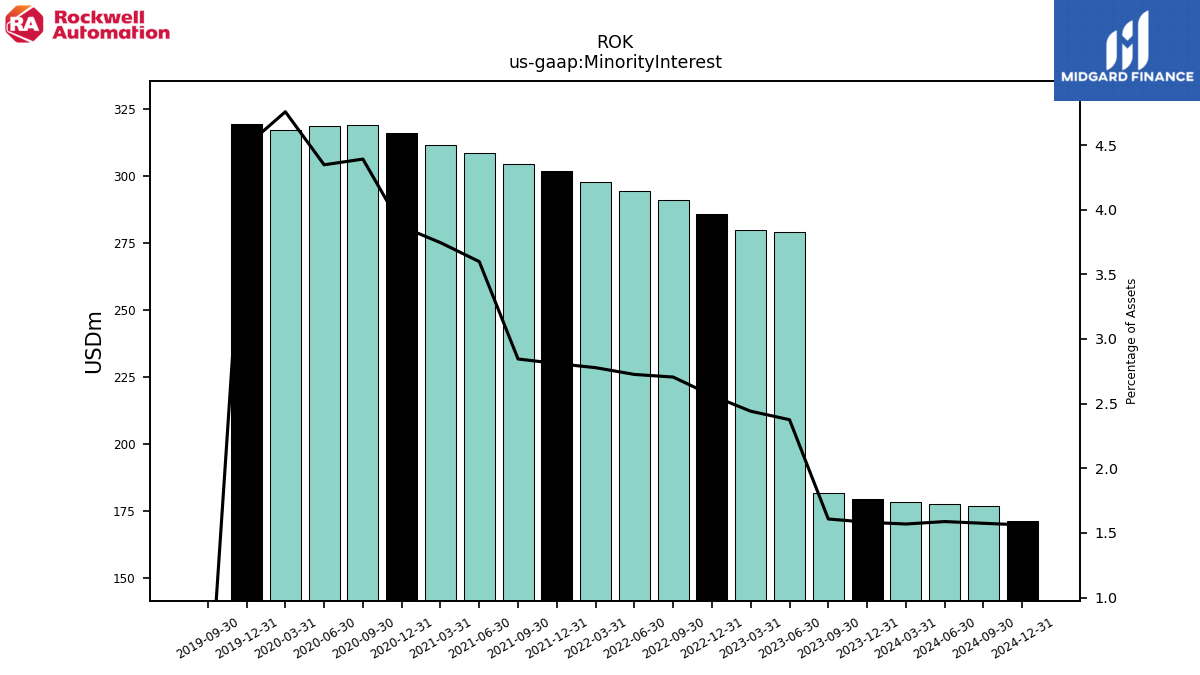
| Minority Interest | 179.40 | 181.80 | 279.00 | 280.00 | 285.80 | 291.10 | 294.40 | 297.70 | 301.90 | 304.50 | 308.50 | 311.50 | 316.20 | 319.00 | 318.60 | 317.10 | 319.50 | 0.00 | NA | NA | NA | NA | NA | NA | NA | NA | NA | NA | NA | NA | NA | NA | NA | NA | NA | NA | NA | NA | NA | NA | NA | NA | NA | NA | NA | NA | NA | NA | NA | NA | NA | NA | NA | NA | NA | NA | NA | NA | |
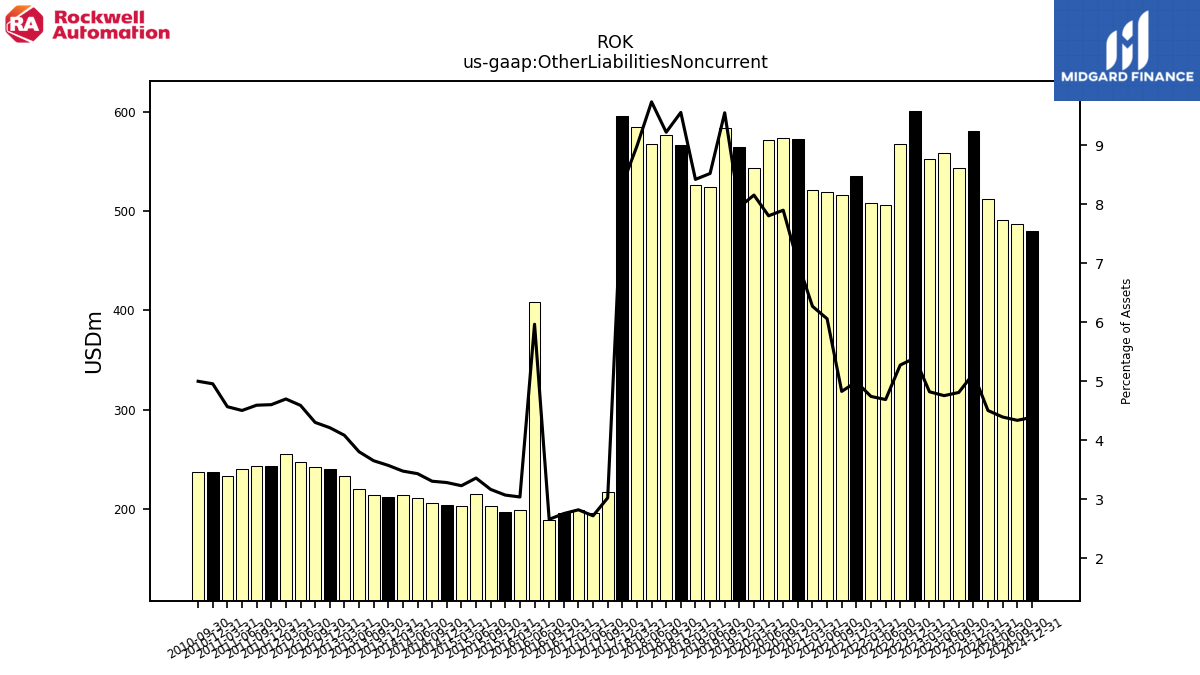
| Other Liabilities Noncurrent | 581.00 | 543.50 | 558.30 | 552.80 | 601.20 | 567.30 | 506.30 | 508.00 | 535.80 | 516.50 | 519.30 | 521.40 | 572.90 | 573.70 | 571.90 | 543.50 | 565.20 | 583.70 | 524.70 | 526.60 | 567.10 | 577.30 | 568.20 | 585.20 | 596.00 | 216.40 | 196.10 | 199.20 | 195.50 | 188.70 | 408.90 | 198.60 | 197.00 | 202.70 | 215.10 | 202.70 | 203.50 | 205.80 | 210.90 | 214.00 | 212.20 | 213.40 | 219.50 | 233.50 | 240.50 | 242.40 | 247.00 | 255.30 | 242.90 | 242.70 | 239.90 | 233.40 | 236.80 | 237.30 | NA | NA | NA | NA | |
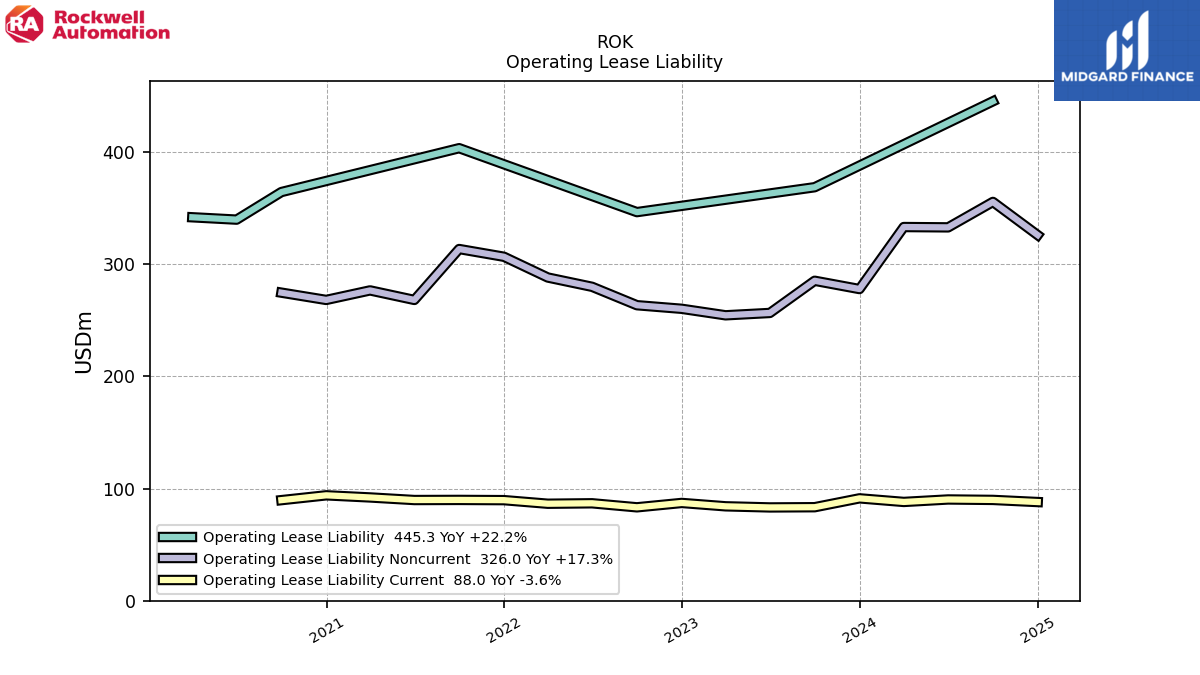
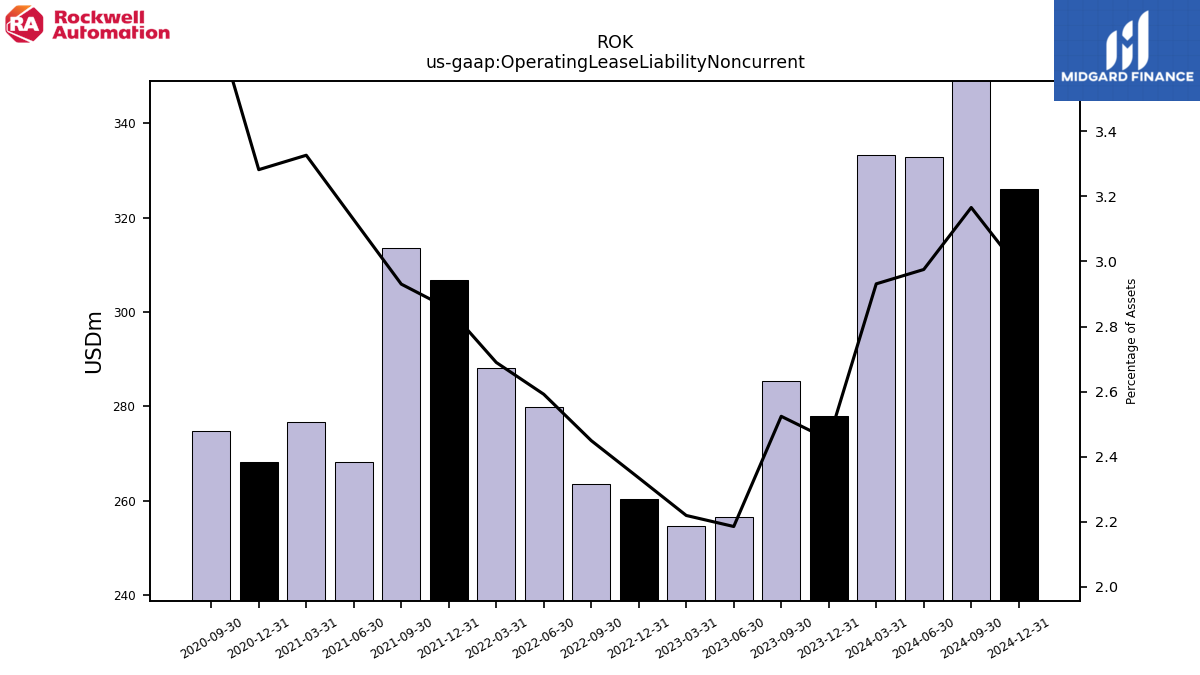
| Operating Lease Liability Noncurrent | 277.90 | 285.30 | 256.60 | 254.50 | 260.30 | 263.50 | 279.90 | 288.20 | 306.70 | 313.60 | 268.20 | 276.70 | 268.20 | 274.70 | NA | NA | NA | NA | NA | NA | NA | NA | NA | NA | NA | NA | NA | NA | NA | NA | NA | NA | NA | NA | NA | NA | NA | NA | NA | NA | NA | NA | NA | NA | NA | NA | NA | NA | NA | NA | NA | NA | NA | NA | NA | NA | NA | NA |
| 2023-12-31 | 2023-09-30 | 2023-06-30 | 2023-03-31 | 2022-12-31 | 2022-09-30 | 2022-06-30 | 2022-03-31 | 2021-12-31 | 2021-09-30 | 2021-06-30 | 2021-03-31 | 2020-12-31 | 2020-09-30 | 2020-06-30 | 2020-03-31 | 2019-12-31 | 2019-09-30 | 2019-06-30 | 2019-03-31 | 2018-12-31 | 2018-09-30 | 2018-06-30 | 2018-03-31 | 2017-12-31 | 2017-09-30 | 2017-06-30 | 2017-03-31 | 2016-12-31 | 2016-09-30 | 2016-06-30 | 2016-03-31 | 2015-12-31 | 2015-09-30 | 2015-06-30 | 2015-03-31 | 2014-12-31 | 2014-09-30 | 2014-06-30 | 2014-03-31 | 2013-12-31 | 2013-09-30 | 2013-06-30 | 2013-03-31 | 2012-12-31 | 2012-09-30 | 2012-06-30 | 2012-03-31 | 2011-12-31 | 2011-09-30 | 2011-06-30 | 2011-03-31 | 2010-12-31 | 2010-09-30 | 2010-06-30 | 2010-03-31 | 2009-12-31 | 2009-09-30 | ||
|---|---|---|---|---|---|---|---|---|---|---|---|---|---|---|---|---|---|---|---|---|---|---|---|---|---|---|---|---|---|---|---|---|---|---|---|---|---|---|---|---|---|---|---|---|---|---|---|---|---|---|---|---|---|---|---|---|---|---|---|
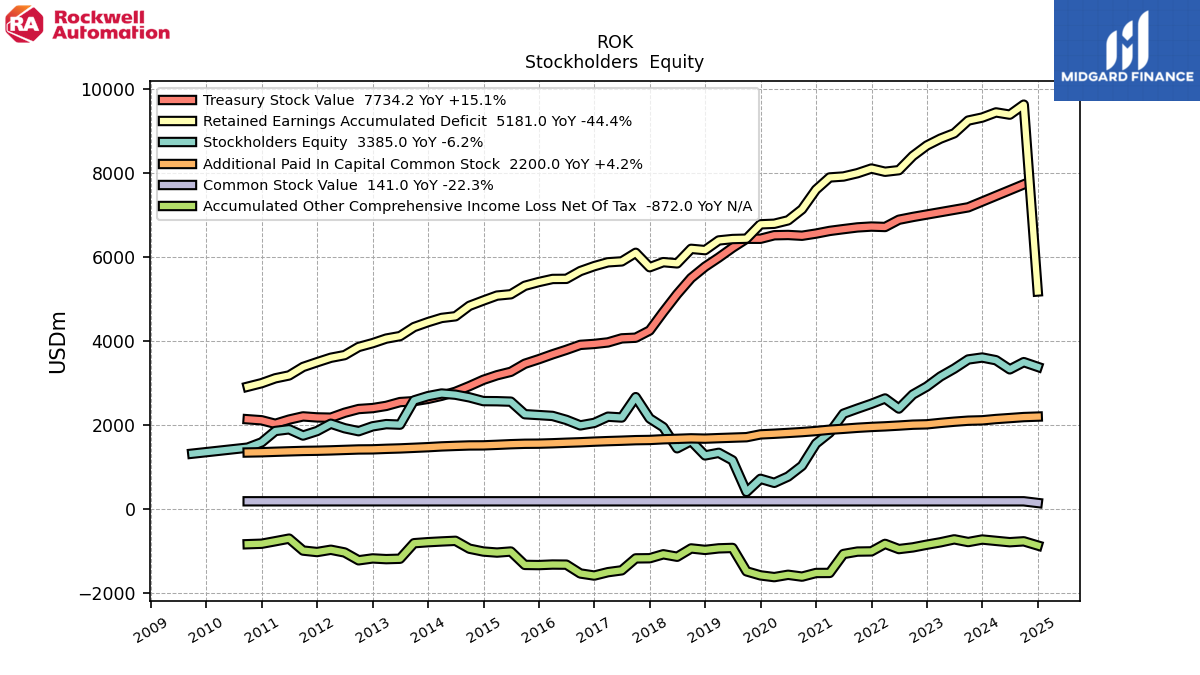
| Stockholders Equity | 3607.70 | 3561.60 | 3343.20 | 3155.50 | 2914.80 | 2725.60 | 2391.20 | 2632.20 | 2504.90 | 2389.60 | 2269.60 | 1817.20 | 1557.60 | 1027.80 | 770.50 | 620.80 | 717.00 | 404.20 | 1156.50 | 1336.30 | 1274.30 | 1617.50 | 1444.20 | 1947.20 | 2156.20 | 2663.60 | 2178.00 | 2197.80 | 2049.70 | 1990.10 | 2121.30 | 2215.60 | 2236.50 | 2256.80 | 2556.00 | 2566.50 | 2569.10 | 2658.10 | 2721.90 | 2750.20 | 2687.80 | 2585.50 | 2007.80 | 2020.50 | 1967.80 | 1851.70 | 1922.50 | 2030.60 | 1854.80 | 1748.00 | 1897.10 | 1856.90 | 1586.10 | 1460.40 | NA | NA | NA | 1316.40 | |
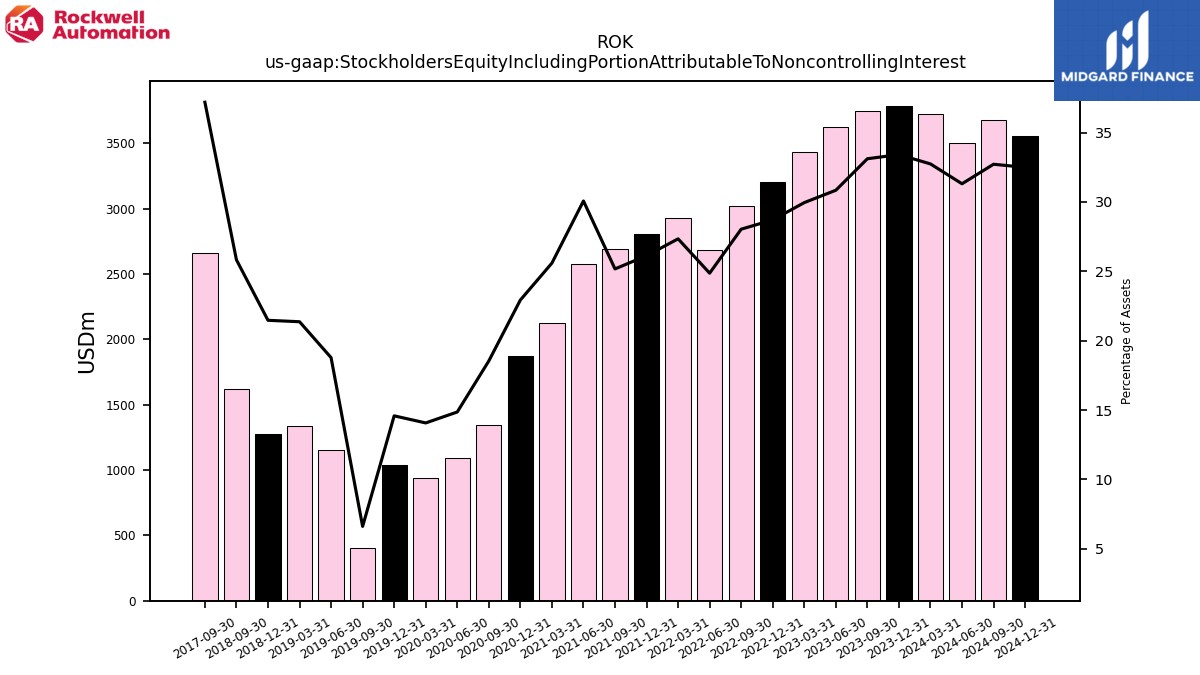
| Stockholders Equity Including Portion Attributable To Noncontrolling Interest | 3787.10 | 3743.40 | 3622.20 | 3435.50 | 3200.60 | 3016.70 | 2685.60 | 2929.90 | 2806.80 | 2694.10 | 2578.10 | 2128.70 | 1873.80 | 1346.80 | 1089.10 | 937.90 | 1036.50 | 404.20 | 1156.50 | 1336.30 | 1274.30 | 1617.50 | NA | NA | NA | 2663.60 | NA | NA | NA | NA | NA | NA | NA | NA | NA | NA | NA | NA | NA | NA | NA | NA | NA | NA | NA | NA | NA | NA | NA | NA | NA | NA | NA | NA | NA | NA | NA | NA | |
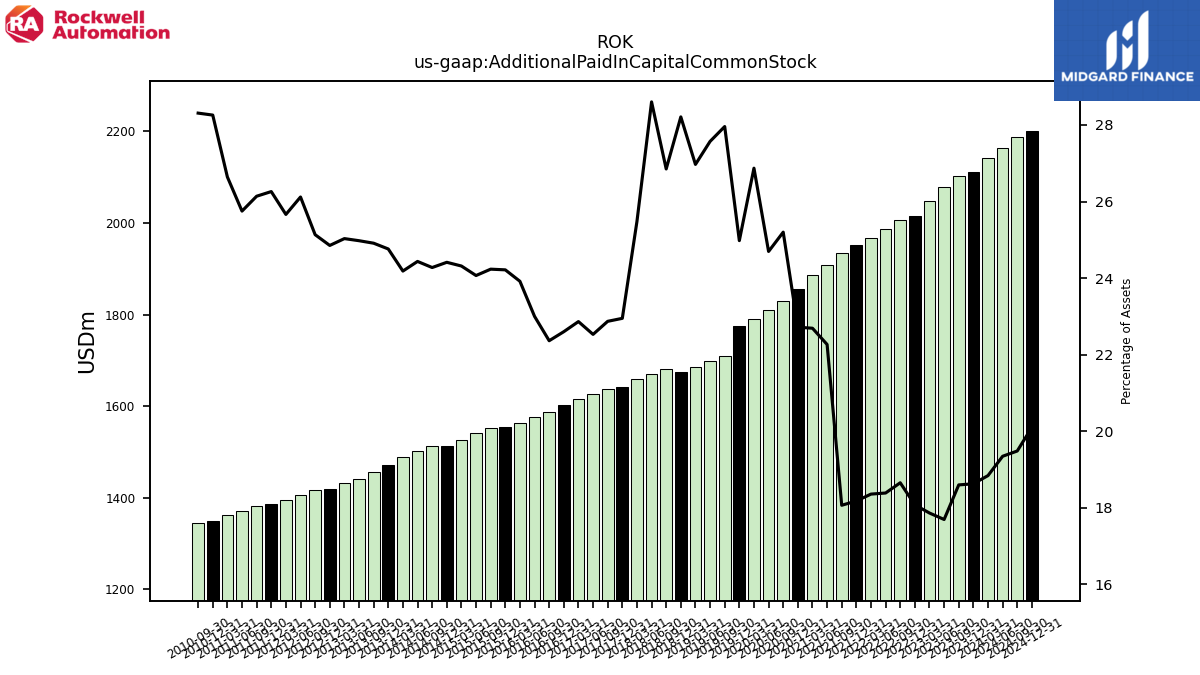
| Additional Paid In Capital Common Stock | 2111.30 | 2102.50 | 2078.20 | 2049.00 | 2015.70 | 2007.10 | 1985.90 | 1967.30 | 1953.00 | 1933.60 | 1909.00 | 1887.40 | 1856.30 | 1830.70 | 1810.10 | 1791.20 | 1775.50 | 1709.10 | 1698.00 | 1686.70 | 1674.40 | 1681.40 | 1669.70 | 1659.60 | 1642.90 | 1638.00 | 1625.70 | 1615.40 | 1603.40 | 1588.20 | 1576.90 | 1564.10 | 1554.60 | 1552.10 | 1541.90 | 1527.10 | 1514.10 | 1512.30 | 1501.60 | 1489.30 | 1471.00 | 1456.00 | 1441.50 | 1431.80 | 1419.40 | 1416.70 | 1405.80 | 1394.70 | 1386.30 | 1381.40 | 1371.90 | 1361.70 | 1350.40 | 1344.20 | NA | NA | NA | NA | |
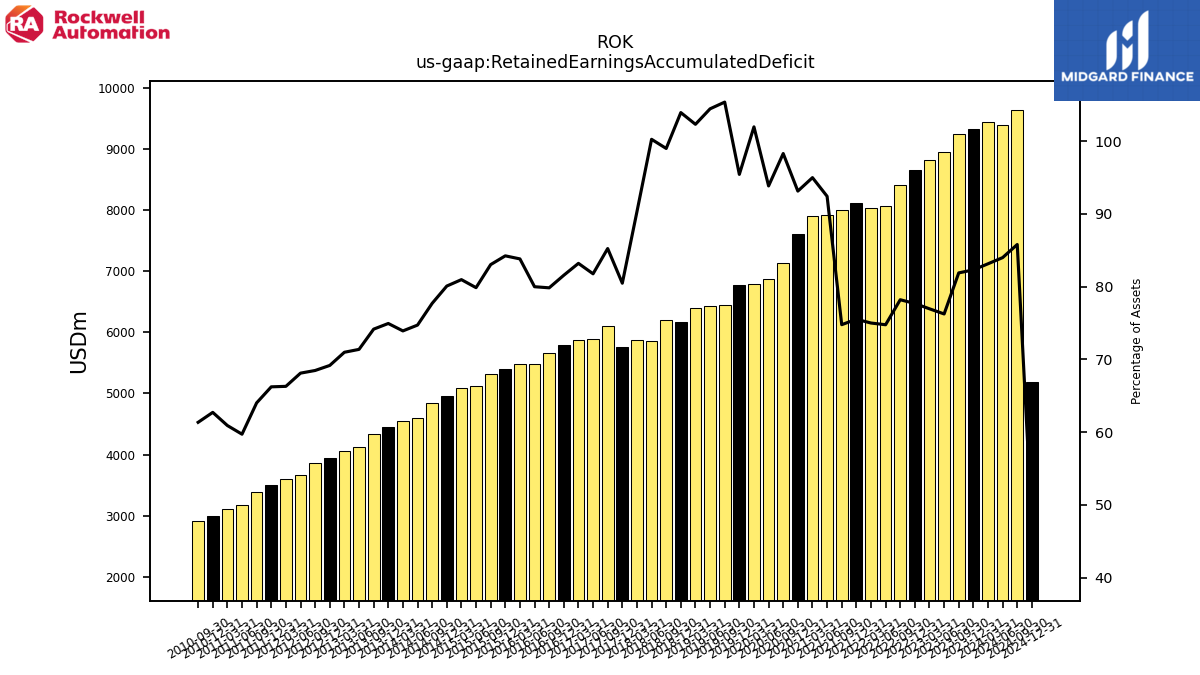
| Retained Earnings Accumulated Deficit | 9326.50 | 9255.20 | 8952.20 | 8824.20 | 8659.90 | 8411.80 | 8072.80 | 8035.10 | 8111.70 | 8000.40 | 7921.90 | 7899.30 | 7608.80 | 7139.80 | 6877.20 | 6795.80 | 6782.00 | 6440.20 | 6431.60 | 6398.00 | 6167.60 | 6198.10 | 5851.50 | 5880.90 | 5759.70 | 6103.40 | 5898.70 | 5877.10 | 5785.60 | 5668.40 | 5482.80 | 5480.10 | 5406.70 | 5316.90 | 5115.30 | 5083.80 | 4965.70 | 4839.60 | 4590.50 | 4550.90 | 4451.00 | 4333.40 | 4118.50 | 4059.20 | 3949.50 | 3858.80 | 3665.20 | 3602.10 | 3495.50 | 3382.80 | 3180.80 | 3112.40 | 2996.50 | 2912.40 | NA | NA | NA | NA | |
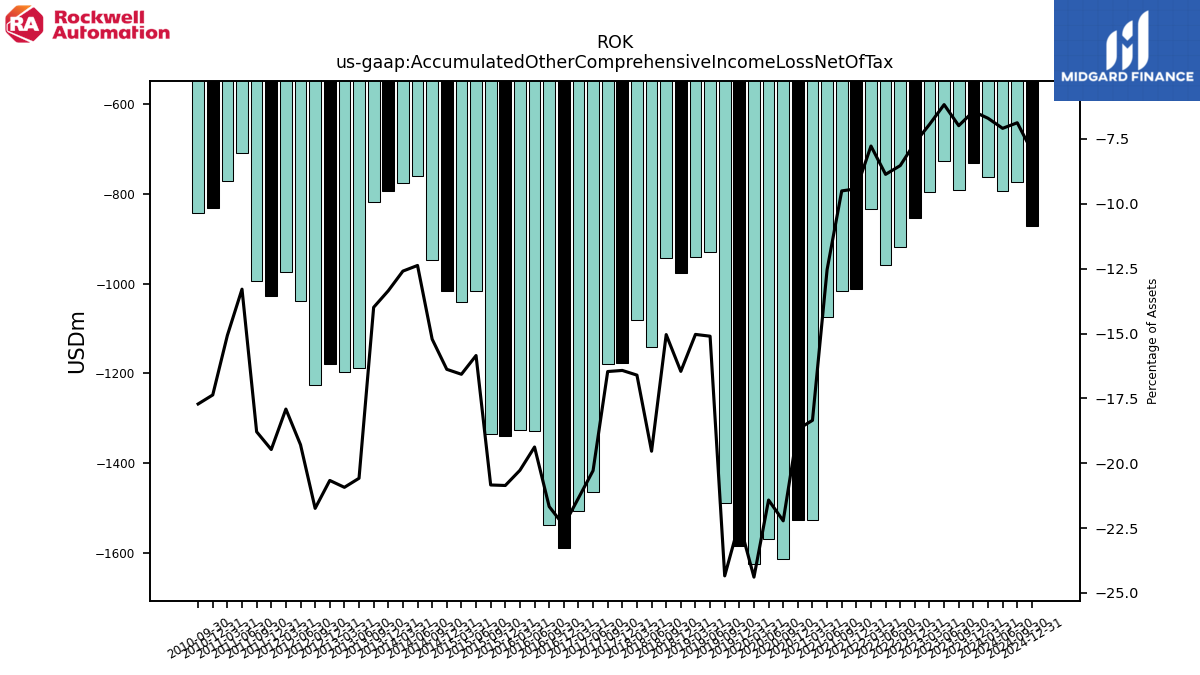
| Accumulated Other Comprehensive Income Loss Net Of Tax | -729.80 | -790.10 | -725.50 | -796.10 | -853.20 | -917.50 | -957.50 | -833.10 | -1012.20 | -1017.10 | -1075.00 | -1526.00 | -1527.30 | -1614.20 | -1569.90 | -1625.80 | -1584.30 | -1488.00 | -930.20 | -940.30 | -976.90 | -941.90 | -1140.50 | -1081.50 | -1175.70 | -1179.20 | -1463.70 | -1508.00 | -1588.90 | -1538.80 | -1328.30 | -1325.70 | -1339.00 | -1334.60 | -1015.40 | -1040.70 | -1015.90 | -948.00 | -760.60 | -775.60 | -793.20 | -817.70 | -1187.70 | -1197.10 | -1180.10 | -1225.30 | -1038.10 | -973.50 | -1027.90 | -992.90 | -708.10 | -770.30 | -830.00 | -841.20 | NA | NA | NA | NA | |
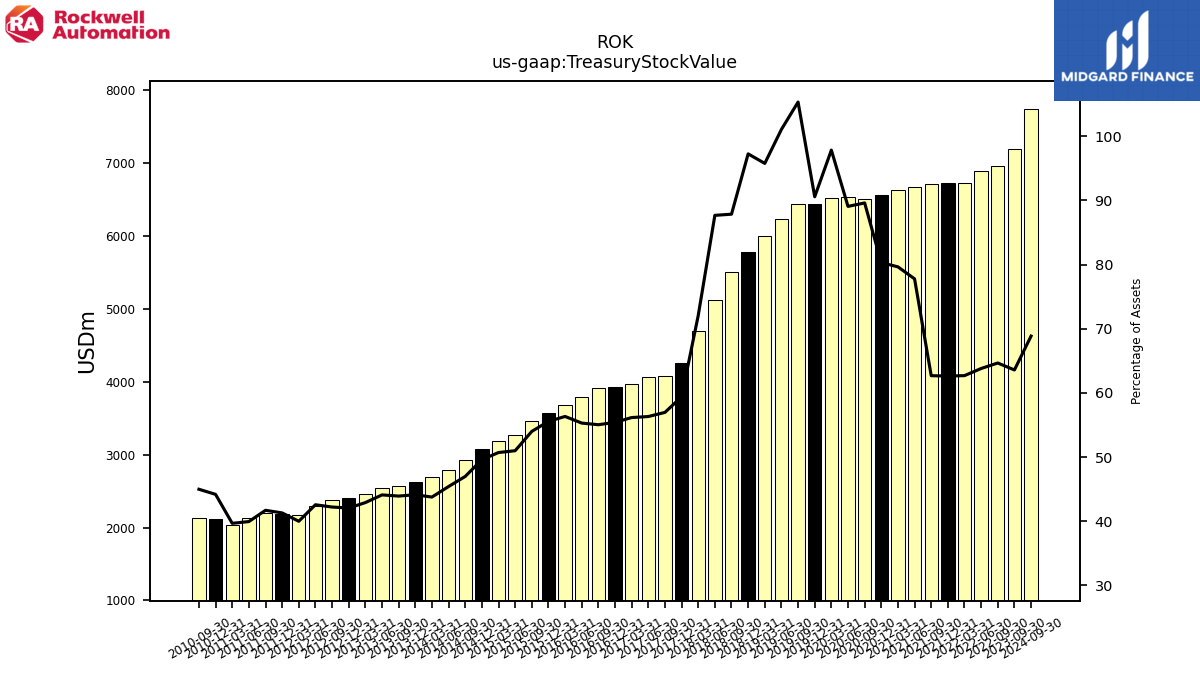
| Treasury Stock Value | NA | 7187.40 | NA | NA | NA | 6957.20 | 6891.40 | 6718.50 | 6729.00 | 6708.70 | 6667.70 | 6624.90 | 6561.60 | 6509.90 | 6528.30 | 6521.80 | 6437.60 | 6438.50 | 6224.30 | 5989.50 | 5772.20 | 5501.50 | 5117.90 | 4693.20 | 4252.10 | 4080.00 | 4064.10 | 3968.10 | 3931.80 | 3909.10 | 3791.50 | 3684.30 | 3567.20 | 3459.00 | 3267.20 | 3185.10 | 3076.20 | 2927.20 | 2791.00 | 2695.80 | 2622.40 | 2567.60 | 2545.90 | 2454.80 | 2402.40 | 2379.90 | 2291.80 | 2174.10 | 2180.50 | 2204.70 | 2128.90 | 2028.30 | 2112.20 | 2136.40 | NA | NA | NA | NA | |
| Minority Interest | 179.40 | 181.80 | 279.00 | 280.00 | 285.80 | 291.10 | 294.40 | 297.70 | 301.90 | 304.50 | 308.50 | 311.50 | 316.20 | 319.00 | 318.60 | 317.10 | 319.50 | 0.00 | NA | NA | NA | NA | NA | NA | NA | NA | NA | NA | NA | NA | NA | NA | NA | NA | NA | NA | NA | NA | NA | NA | NA | NA | NA | NA | NA | NA | NA | NA | NA | NA | NA | NA | NA | NA | NA | NA | NA | NA |
| 2023-12-31 | 2023-09-30 | 2023-06-30 | 2023-03-31 | 2022-12-31 | 2022-09-30 | 2022-06-30 | 2022-03-31 | 2021-12-31 | 2021-09-30 | 2021-06-30 | 2021-03-31 | 2020-12-31 | 2020-09-30 | 2020-06-30 | 2020-03-31 | 2019-12-31 | 2019-09-30 | 2019-06-30 | 2019-03-31 | 2018-12-31 | 2018-09-30 | 2018-06-30 | 2018-03-31 | 2017-12-31 | 2017-09-30 | 2017-06-30 | 2017-03-31 | 2016-12-31 | 2016-09-30 | 2016-06-30 | 2016-03-31 | 2015-12-31 | 2015-09-30 | 2015-06-30 | 2015-03-31 | 2014-12-31 | 2014-09-30 | 2014-06-30 | 2014-03-31 | 2013-12-31 | 2013-09-30 | 2013-06-30 | 2013-03-31 | 2012-12-31 | 2012-09-30 | 2012-06-30 | 2012-03-31 | 2011-12-31 | 2011-09-30 | 2011-06-30 | 2011-03-31 | 2010-12-31 | 2010-09-30 | 2010-06-30 | 2010-03-31 | 2009-12-31 | 2009-09-30 | ||
|---|---|---|---|---|---|---|---|---|---|---|---|---|---|---|---|---|---|---|---|---|---|---|---|---|---|---|---|---|---|---|---|---|---|---|---|---|---|---|---|---|---|---|---|---|---|---|---|---|---|---|---|---|---|---|---|---|---|---|---|
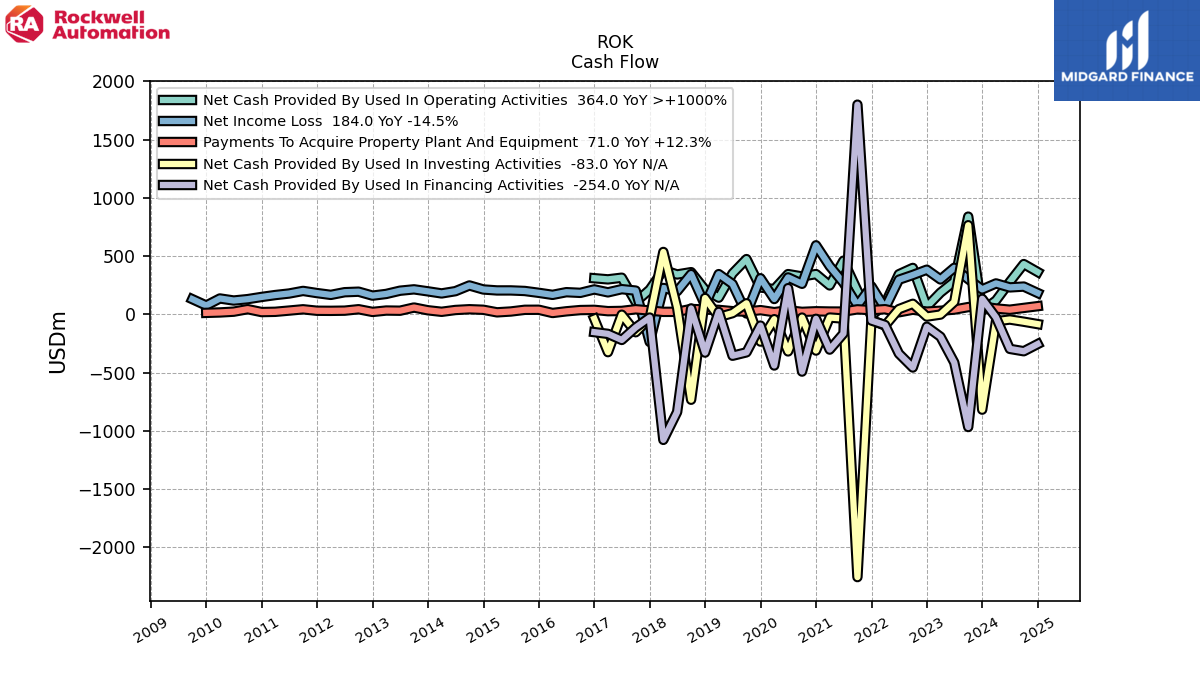
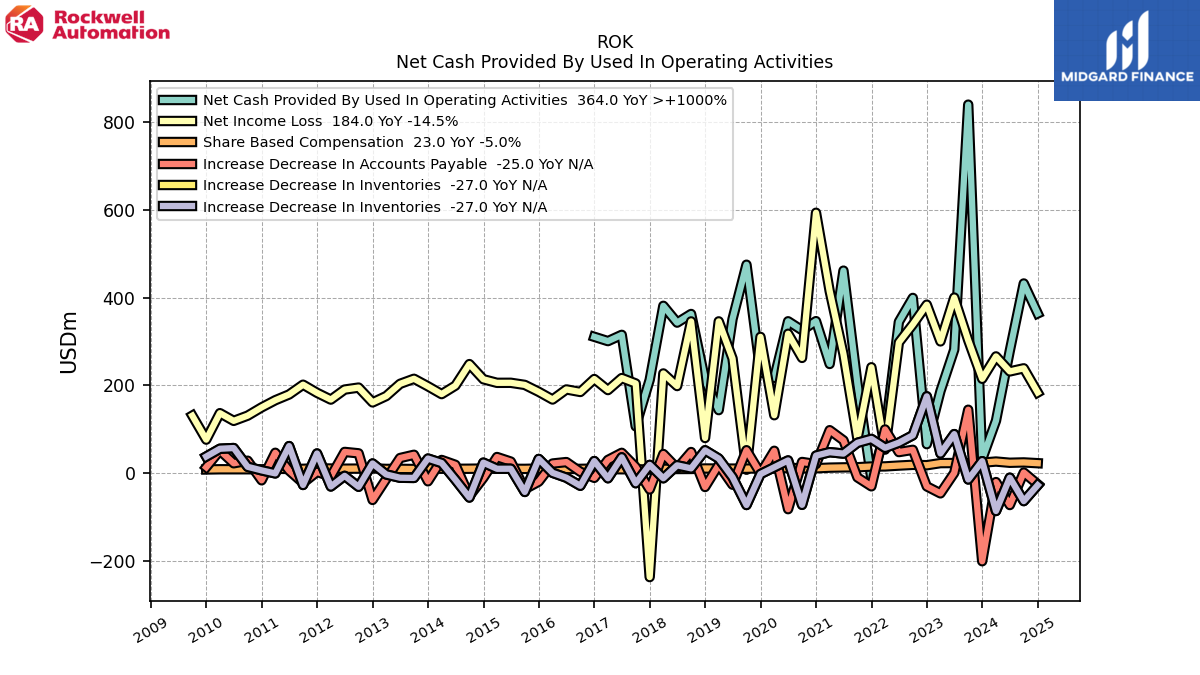
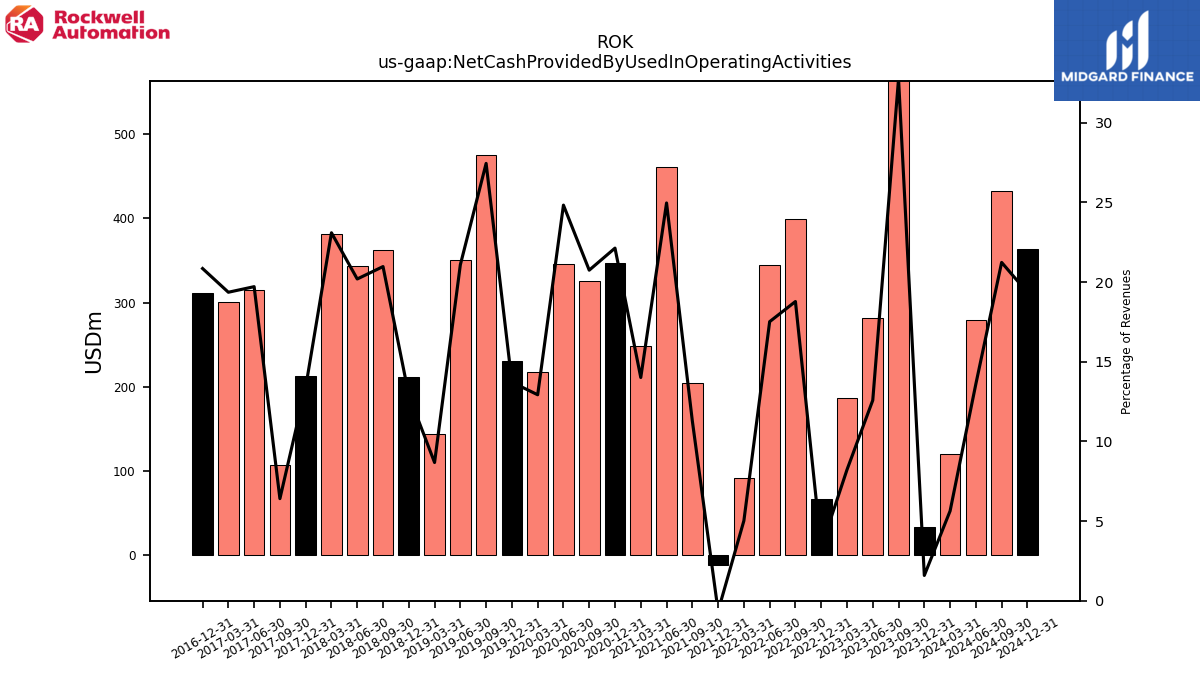
| Net Cash Provided By Used In Operating Activities | 32.60 | 839.50 | 281.70 | 187.10 | 66.30 | 399.40 | 344.90 | 90.80 | -12.00 | 204.10 | 461.50 | 248.90 | 346.50 | 325.80 | 346.20 | 217.40 | 231.10 | 475.00 | 351.20 | 143.80 | 212.00 | 362.80 | 343.10 | 381.40 | 212.70 | 106.90 | 315.30 | 301.00 | 310.80 | NA | NA | NA | NA | NA | NA | NA | NA | NA | NA | NA | NA | NA | NA | NA | NA | NA | NA | NA | NA | NA | NA | NA | NA | NA | NA | NA | NA | NA | |
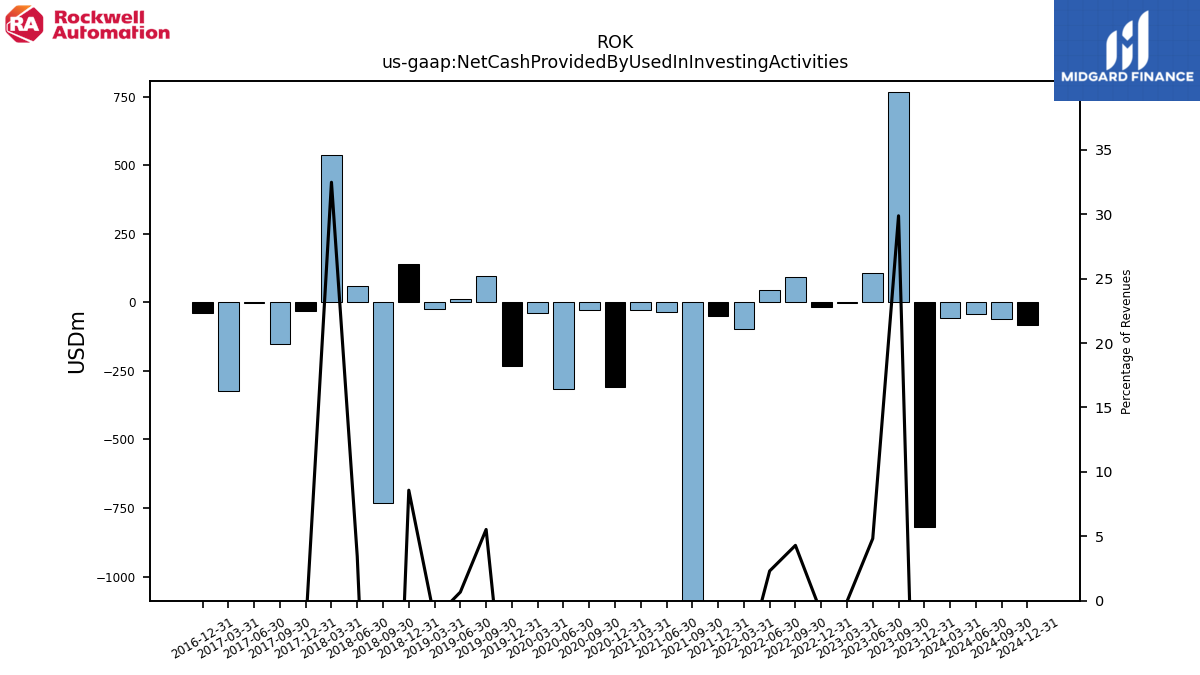
| Net Cash Provided By Used In Investing Activities | -817.40 | 765.70 | 108.10 | -1.20 | -18.30 | 91.40 | 45.50 | -96.00 | -48.70 | -2254.40 | -35.50 | -26.60 | -310.10 | -26.90 | -317.50 | -40.60 | -233.00 | 95.70 | 11.20 | -22.80 | 140.90 | -732.30 | 58.60 | 536.30 | -33.00 | -153.00 | -2.20 | -323.90 | -37.60 | NA | NA | NA | NA | NA | NA | NA | NA | NA | NA | NA | NA | NA | NA | NA | NA | NA | NA | NA | NA | NA | NA | NA | NA | NA | NA | NA | NA | NA | |
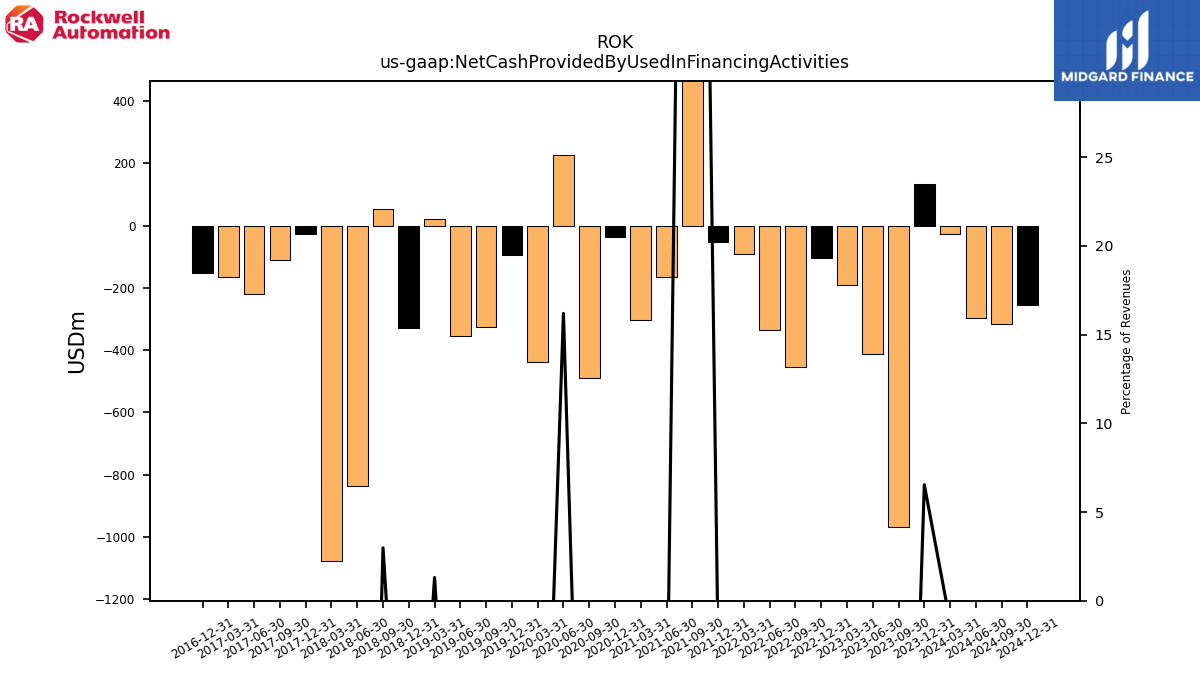
| Net Cash Provided By Used In Financing Activities | 134.20 | -966.40 | -412.70 | -191.20 | -105.30 | -455.70 | -336.00 | -90.50 | -52.00 | 1800.60 | -163.70 | -301.90 | -37.20 | -490.60 | 225.70 | -438.40 | -95.60 | -325.30 | -354.60 | 21.70 | -327.70 | 51.60 | -837.10 | -1076.80 | -26.60 | -111.90 | -219.00 | -166.80 | -151.90 | NA | NA | NA | NA | NA | NA | NA | NA | NA | NA | NA | NA | NA | NA | NA | NA | NA | NA | NA | NA | NA | NA | NA | NA | NA | NA | NA | NA | NA |
| 2023-12-31 | 2023-09-30 | 2023-06-30 | 2023-03-31 | 2022-12-31 | 2022-09-30 | 2022-06-30 | 2022-03-31 | 2021-12-31 | 2021-09-30 | 2021-06-30 | 2021-03-31 | 2020-12-31 | 2020-09-30 | 2020-06-30 | 2020-03-31 | 2019-12-31 | 2019-09-30 | 2019-06-30 | 2019-03-31 | 2018-12-31 | 2018-09-30 | 2018-06-30 | 2018-03-31 | 2017-12-31 | 2017-09-30 | 2017-06-30 | 2017-03-31 | 2016-12-31 | 2016-09-30 | 2016-06-30 | 2016-03-31 | 2015-12-31 | 2015-09-30 | 2015-06-30 | 2015-03-31 | 2014-12-31 | 2014-09-30 | 2014-06-30 | 2014-03-31 | 2013-12-31 | 2013-09-30 | 2013-06-30 | 2013-03-31 | 2012-12-31 | 2012-09-30 | 2012-06-30 | 2012-03-31 | 2011-12-31 | 2011-09-30 | 2011-06-30 | 2011-03-31 | 2010-12-31 | 2010-09-30 | 2010-06-30 | 2010-03-31 | 2009-12-31 | 2009-09-30 | ||
|---|---|---|---|---|---|---|---|---|---|---|---|---|---|---|---|---|---|---|---|---|---|---|---|---|---|---|---|---|---|---|---|---|---|---|---|---|---|---|---|---|---|---|---|---|---|---|---|---|---|---|---|---|---|---|---|---|---|---|---|
| Net Cash Provided By Used In Operating Activities | 32.60 | 839.50 | 281.70 | 187.10 | 66.30 | 399.40 | 344.90 | 90.80 | -12.00 | 204.10 | 461.50 | 248.90 | 346.50 | 325.80 | 346.20 | 217.40 | 231.10 | 475.00 | 351.20 | 143.80 | 212.00 | 362.80 | 343.10 | 381.40 | 212.70 | 106.90 | 315.30 | 301.00 | 310.80 | NA | NA | NA | NA | NA | NA | NA | NA | NA | NA | NA | NA | NA | NA | NA | NA | NA | NA | NA | NA | NA | NA | NA | NA | NA | NA | NA | NA | NA | |
| Net Income Loss | 215.20 | 302.90 | 400.20 | 300.30 | 384.00 | 338.90 | 297.90 | 53.90 | 241.50 | 78.50 | 271.30 | 415.00 | 593.30 | 262.70 | 317.80 | 132.20 | 310.70 | 8.10 | 261.40 | 346.00 | 80.30 | 345.90 | 198.60 | 227.40 | -236.40 | 204.60 | 216.90 | 189.50 | 214.70 | 185.20 | 191.00 | 168.00 | 185.50 | 201.30 | 206.10 | 206.00 | 214.20 | 248.70 | 199.70 | 180.30 | 198.10 | 215.30 | 203.70 | 175.90 | 161.40 | 195.20 | 190.70 | 167.80 | 183.30 | 201.80 | 179.50 | 166.40 | 150.10 | 131.30 | 119.40 | 137.00 | 76.60 | 131.30 | |
| Profit Loss | 212.70 | 205.70 | 398.70 | 294.90 | 378.70 | 336.00 | 294.80 | 49.40 | 238.90 | 74.60 | 269.00 | 410.30 | 590.40 | 263.70 | 314.20 | 129.90 | 315.40 | 8.10 | 261.40 | 346.00 | 80.30 | NA | NA | NA | NA | NA | NA | NA | NA | NA | NA | NA | NA | NA | NA | NA | NA | NA | NA | NA | NA | NA | NA | NA | NA | NA | NA | NA | NA | NA | NA | NA | NA | NA | NA | NA | NA | NA | |
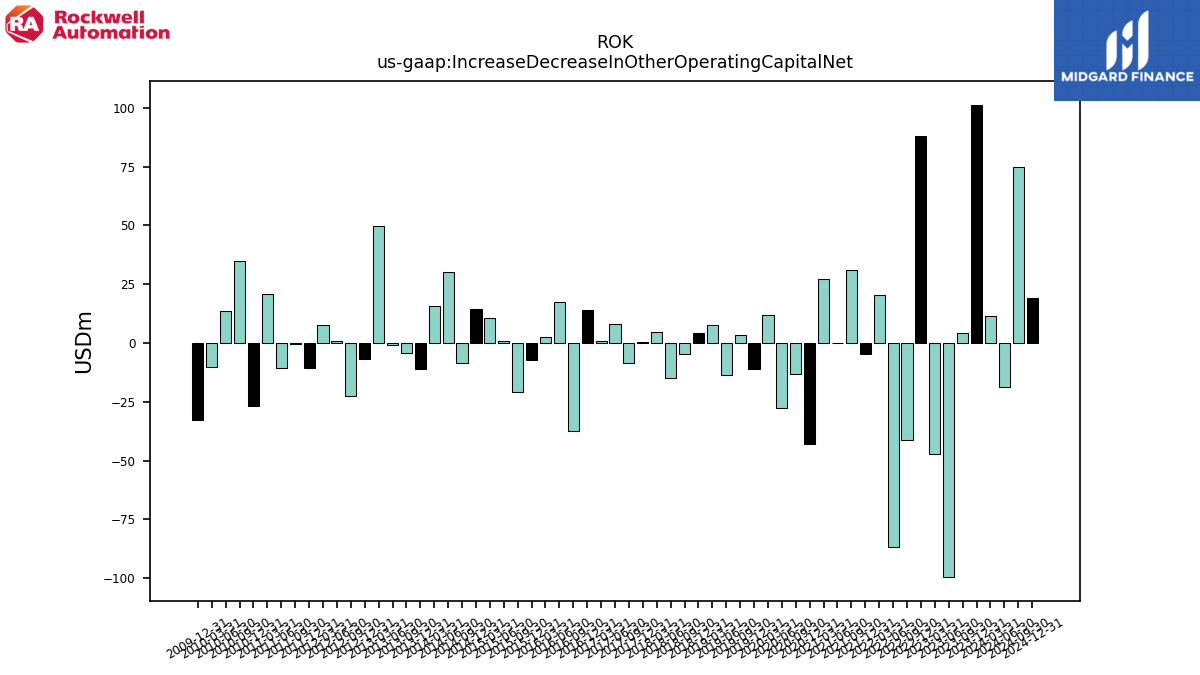
| Increase Decrease In Other Operating Capital Net | 101.30 | 4.20 | -99.50 | -47.10 | 88.10 | -41.40 | -86.70 | 20.60 | -4.70 | 30.90 | 0.00 | 27.40 | -43.10 | -13.00 | -27.60 | 11.70 | -10.90 | 3.60 | -13.60 | 7.50 | 4.30 | -4.70 | -14.80 | 4.60 | 0.30 | -8.30 | 8.10 | 1.00 | 14.00 | -37.40 | 17.60 | 2.40 | -7.10 | -21.00 | 0.80 | 10.50 | 14.40 | -8.40 | 30.30 | 15.70 | -11.10 | -4.20 | -0.70 | 49.80 | -6.70 | -22.50 | 0.80 | 7.60 | -10.70 | -0.30 | -10.60 | 20.70 | -26.80 | 34.70 | 13.80 | -10.00 | -32.80 | NA | |
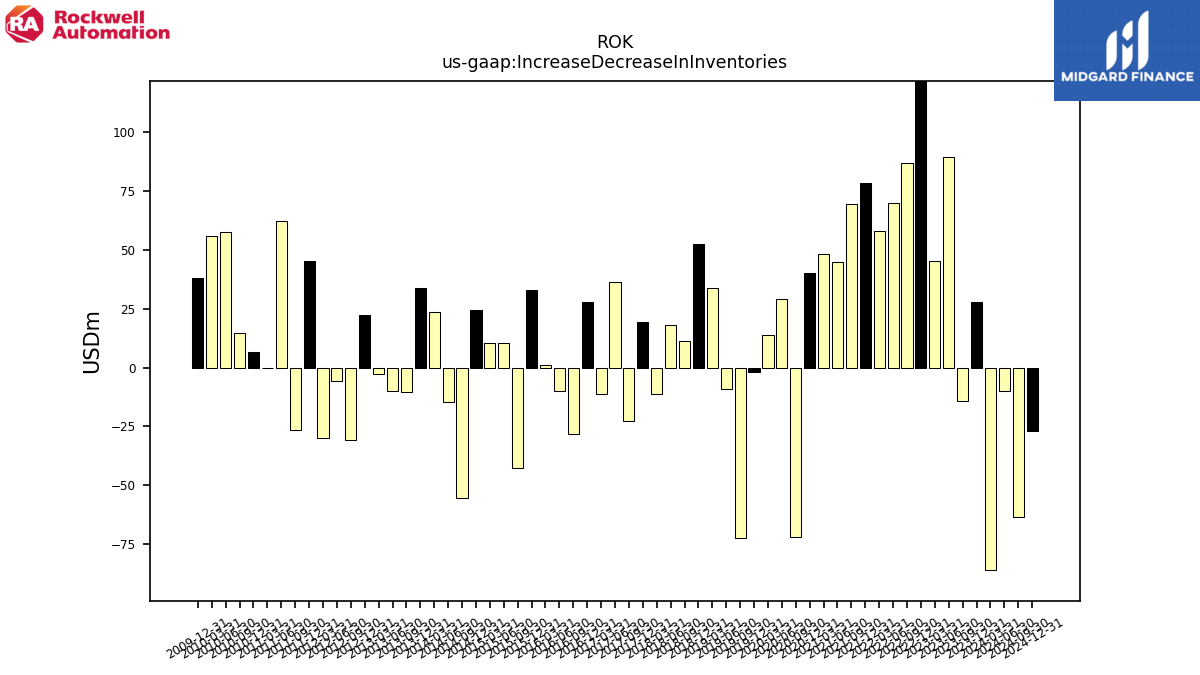
| Increase Decrease In Inventories | 27.70 | -14.00 | 89.30 | 45.30 | 175.30 | 86.60 | 69.80 | 58.10 | 78.30 | 69.50 | 44.90 | 48.10 | 40.30 | -71.80 | 29.30 | 13.80 | -1.70 | -72.20 | -8.90 | 33.60 | 52.40 | 11.30 | 18.20 | -11.30 | 19.20 | -22.60 | 36.40 | -11.30 | 27.90 | -28.40 | -10.00 | 1.10 | 32.70 | -42.50 | 10.40 | 10.30 | 24.30 | -55.20 | -14.80 | 23.50 | 33.60 | -10.50 | -10.10 | -2.60 | 22.40 | -30.70 | -5.80 | -30.00 | 45.10 | -26.60 | 62.00 | -0.20 | 6.70 | 14.80 | 57.50 | 55.90 | 38.20 | NA | |
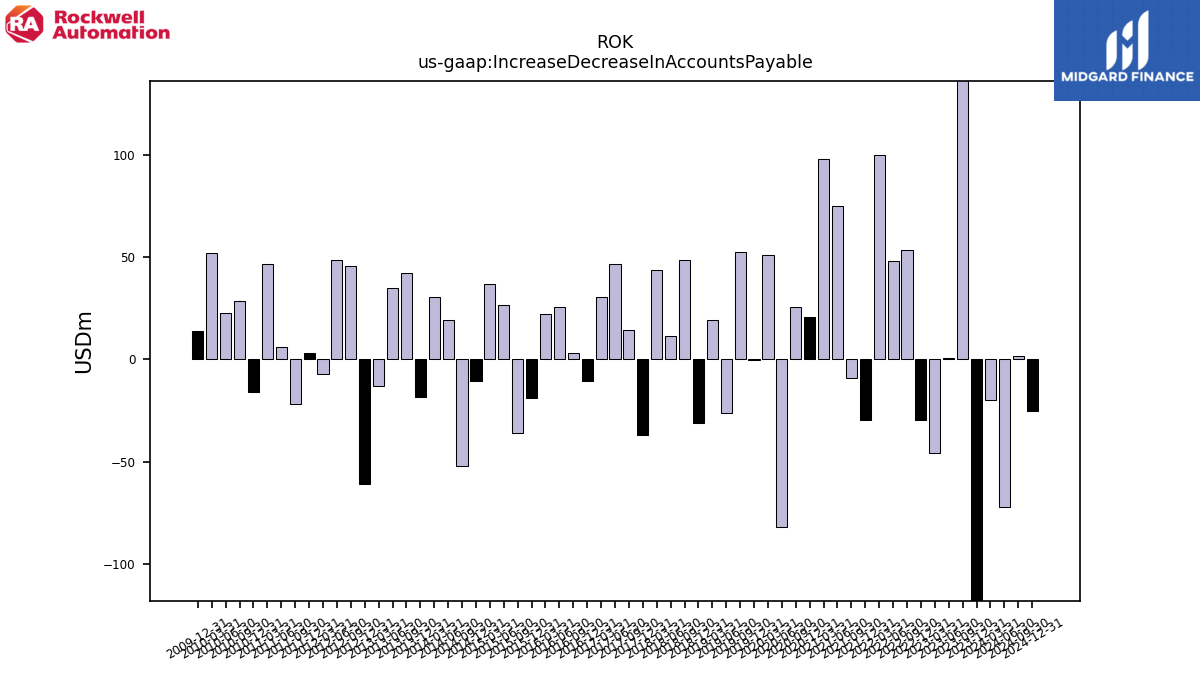
| Increase Decrease In Accounts Payable | -200.30 | 144.80 | 0.90 | -45.70 | -29.80 | 53.50 | 48.30 | 99.90 | -29.70 | -9.30 | 75.00 | 98.20 | 20.90 | 25.80 | -81.70 | 51.30 | -0.40 | 52.60 | -26.00 | 19.10 | -31.20 | 48.50 | 11.50 | 44.00 | -36.80 | 14.40 | 46.70 | 30.40 | -10.40 | 3.40 | 25.60 | 22.30 | -19.00 | -36.10 | 26.70 | 37.10 | -10.40 | -52.10 | 19.30 | 30.40 | -18.30 | 42.20 | 34.80 | -13.00 | -60.70 | 45.50 | 48.70 | -7.10 | 3.10 | -22.00 | 6.20 | 46.80 | -16.00 | 28.70 | 22.80 | 51.90 | 13.80 | NA | |
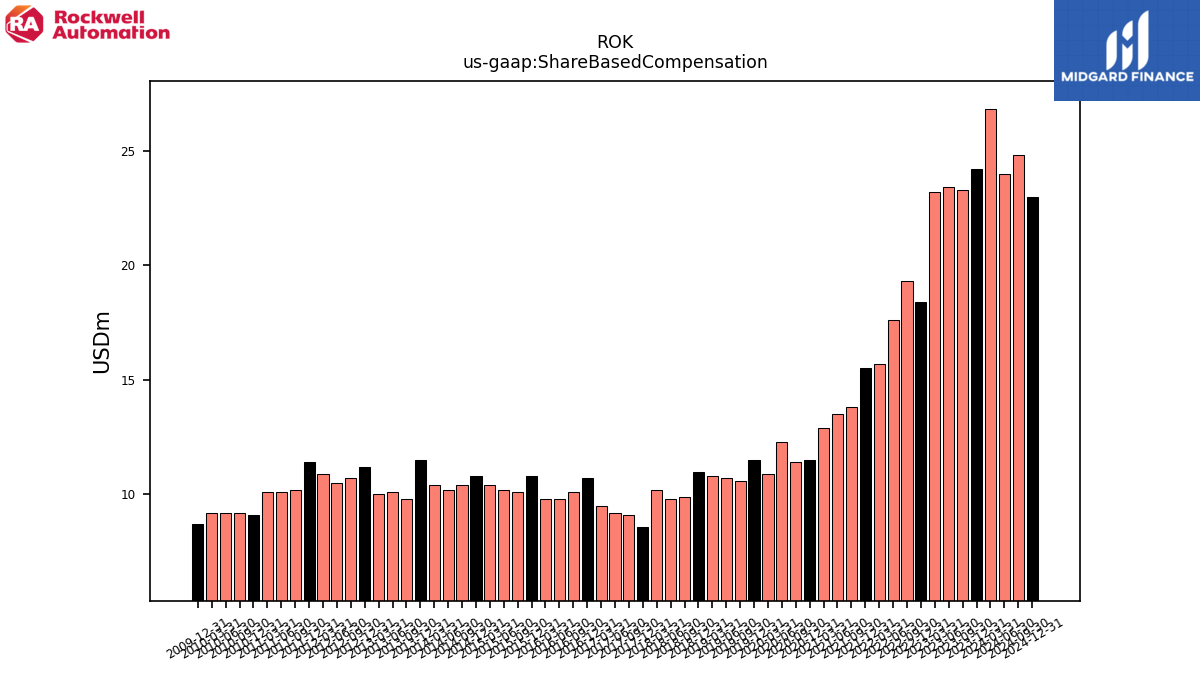
| Share Based Compensation | 24.20 | 23.30 | 23.40 | 23.20 | 18.40 | 19.30 | 17.60 | 15.70 | 15.50 | 13.80 | 13.50 | 12.90 | 11.50 | 11.40 | 12.30 | 10.90 | 11.50 | 10.60 | 10.70 | 10.80 | 11.00 | 9.90 | 9.80 | 10.20 | 8.60 | 9.10 | 9.20 | 9.50 | 10.70 | 10.10 | 9.80 | 9.80 | 10.80 | 10.10 | 10.20 | 10.40 | 10.80 | 10.40 | 10.20 | 10.40 | 11.50 | 9.80 | 10.10 | 10.00 | 11.20 | 10.70 | 10.50 | 10.90 | 11.40 | 10.20 | 10.10 | 10.10 | 9.10 | 9.20 | 9.20 | 9.20 | 8.70 | NA |
| 2023-12-31 | 2023-09-30 | 2023-06-30 | 2023-03-31 | 2022-12-31 | 2022-09-30 | 2022-06-30 | 2022-03-31 | 2021-12-31 | 2021-09-30 | 2021-06-30 | 2021-03-31 | 2020-12-31 | 2020-09-30 | 2020-06-30 | 2020-03-31 | 2019-12-31 | 2019-09-30 | 2019-06-30 | 2019-03-31 | 2018-12-31 | 2018-09-30 | 2018-06-30 | 2018-03-31 | 2017-12-31 | 2017-09-30 | 2017-06-30 | 2017-03-31 | 2016-12-31 | 2016-09-30 | 2016-06-30 | 2016-03-31 | 2015-12-31 | 2015-09-30 | 2015-06-30 | 2015-03-31 | 2014-12-31 | 2014-09-30 | 2014-06-30 | 2014-03-31 | 2013-12-31 | 2013-09-30 | 2013-06-30 | 2013-03-31 | 2012-12-31 | 2012-09-30 | 2012-06-30 | 2012-03-31 | 2011-12-31 | 2011-09-30 | 2011-06-30 | 2011-03-31 | 2010-12-31 | 2010-09-30 | 2010-06-30 | 2010-03-31 | 2009-12-31 | 2009-09-30 | ||
|---|---|---|---|---|---|---|---|---|---|---|---|---|---|---|---|---|---|---|---|---|---|---|---|---|---|---|---|---|---|---|---|---|---|---|---|---|---|---|---|---|---|---|---|---|---|---|---|---|---|---|---|---|---|---|---|---|---|---|---|
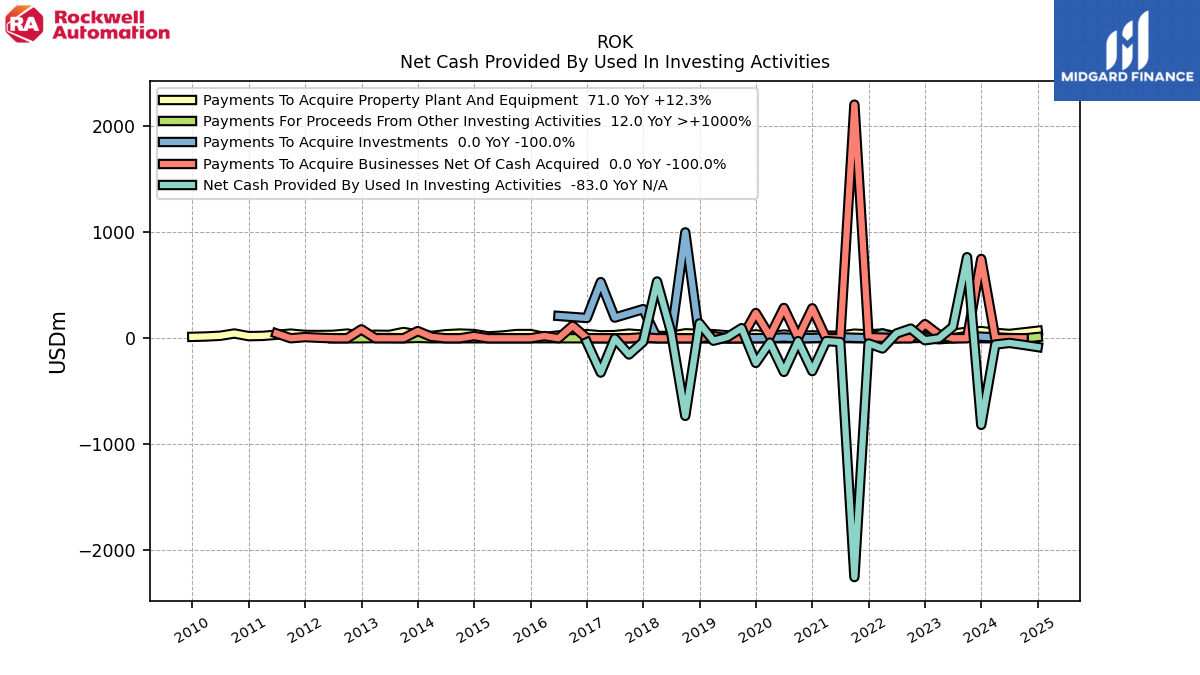
| Net Cash Provided By Used In Investing Activities | -817.40 | 765.70 | 108.10 | -1.20 | -18.30 | 91.40 | 45.50 | -96.00 | -48.70 | -2254.40 | -35.50 | -26.60 | -310.10 | -26.90 | -317.50 | -40.60 | -233.00 | 95.70 | 11.20 | -22.80 | 140.90 | -732.30 | 58.60 | 536.30 | -33.00 | -153.00 | -2.20 | -323.90 | -37.60 | NA | NA | NA | NA | NA | NA | NA | NA | NA | NA | NA | NA | NA | NA | NA | NA | NA | NA | NA | NA | NA | NA | NA | NA | NA | NA | NA | NA | NA | |
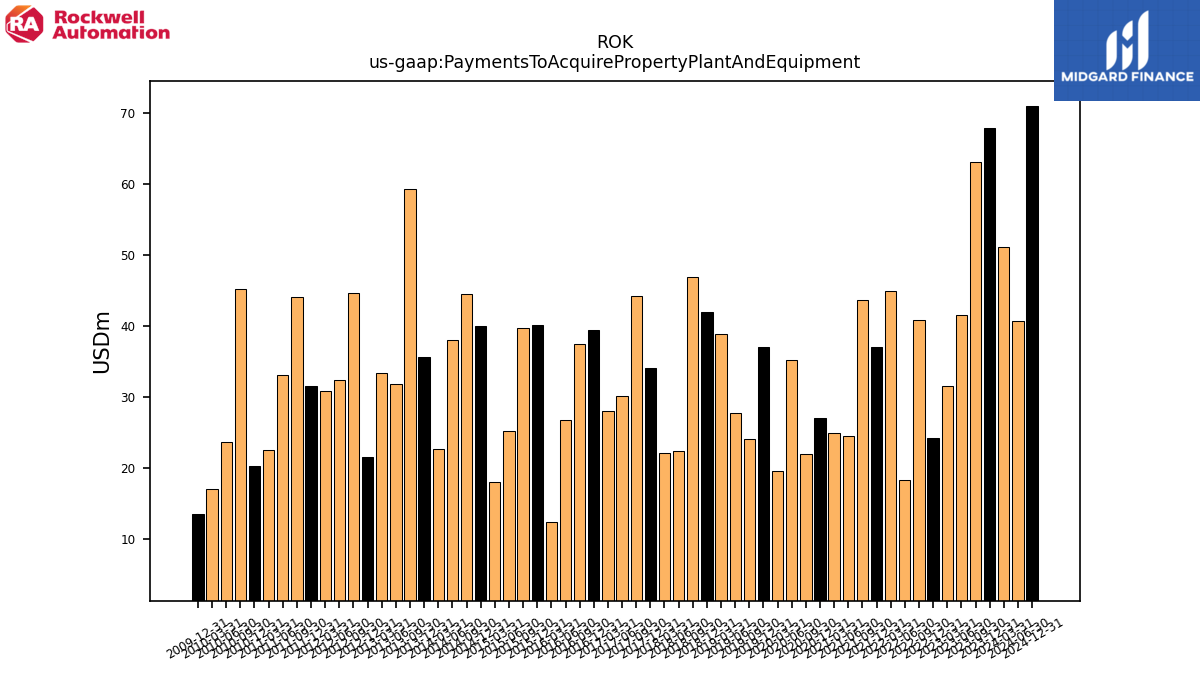
| Payments To Acquire Property Plant And Equipment | 67.90 | 63.20 | 41.60 | 31.50 | 24.20 | 40.80 | 18.30 | 44.90 | 37.10 | 43.70 | 24.50 | 25.00 | 27.10 | 22.00 | 35.30 | 19.60 | 37.00 | 24.10 | 27.80 | 38.90 | 42.00 | 46.90 | 22.40 | 22.10 | 34.10 | 44.20 | 30.10 | 28.00 | 39.40 | 37.50 | 26.80 | 12.40 | 40.20 | 39.70 | 25.20 | 18.00 | 40.00 | 44.60 | 38.10 | 22.70 | 35.60 | 59.30 | 31.90 | 33.40 | 21.60 | 44.70 | 32.40 | 30.90 | 31.60 | 44.10 | 33.10 | 22.60 | 20.30 | 45.20 | 23.70 | 17.00 | 13.50 | NA | |
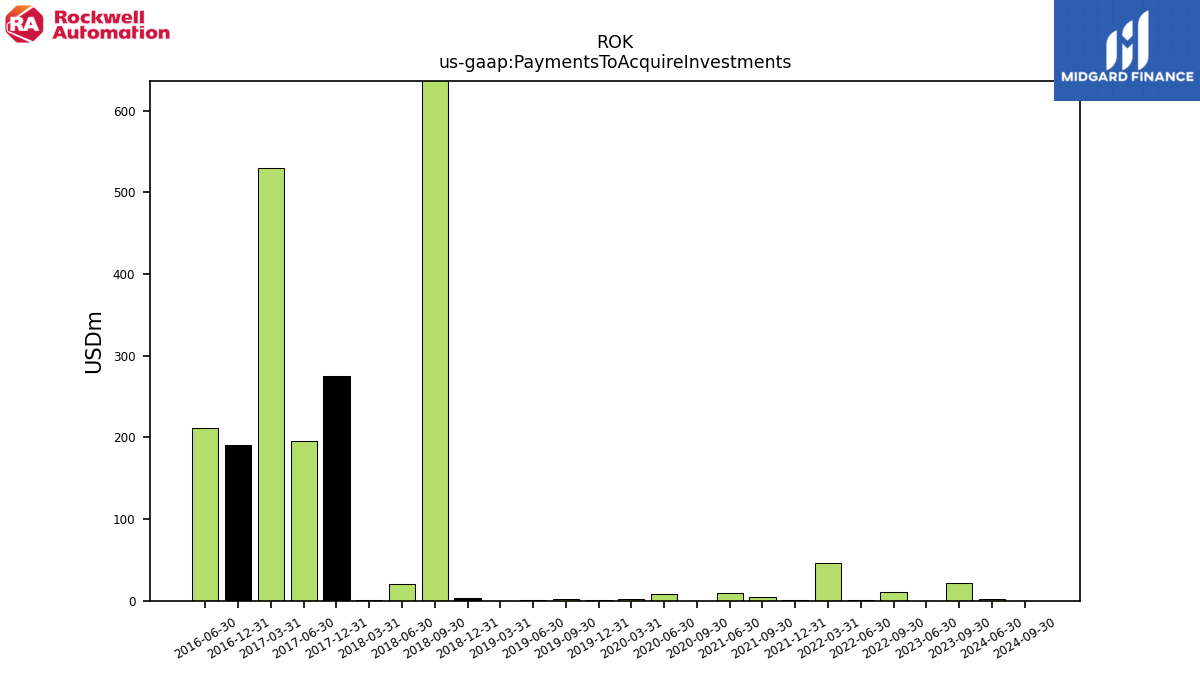
| Payments To Acquire Investments | NA | 21.90 | 0.00 | NA | NA | 11.30 | 0.90 | 46.10 | 1.50 | 4.50 | 8.90 | NA | NA | 0.00 | 8.10 | 1.60 | 1.00 | 1.80 | 0.50 | 0.00 | 2.80 | 1000.00 | 20.30 | 1.40 | 275.20 | NA | 195.20 | 530.30 | 191.30 | NA | 210.90 | NA | NA | NA | NA | NA | NA | NA | NA | NA | NA | NA | NA | NA | NA | NA | NA | NA | NA | NA | NA | NA | NA | NA | NA | NA | NA | NA |
| 2023-12-31 | 2023-09-30 | 2023-06-30 | 2023-03-31 | 2022-12-31 | 2022-09-30 | 2022-06-30 | 2022-03-31 | 2021-12-31 | 2021-09-30 | 2021-06-30 | 2021-03-31 | 2020-12-31 | 2020-09-30 | 2020-06-30 | 2020-03-31 | 2019-12-31 | 2019-09-30 | 2019-06-30 | 2019-03-31 | 2018-12-31 | 2018-09-30 | 2018-06-30 | 2018-03-31 | 2017-12-31 | 2017-09-30 | 2017-06-30 | 2017-03-31 | 2016-12-31 | 2016-09-30 | 2016-06-30 | 2016-03-31 | 2015-12-31 | 2015-09-30 | 2015-06-30 | 2015-03-31 | 2014-12-31 | 2014-09-30 | 2014-06-30 | 2014-03-31 | 2013-12-31 | 2013-09-30 | 2013-06-30 | 2013-03-31 | 2012-12-31 | 2012-09-30 | 2012-06-30 | 2012-03-31 | 2011-12-31 | 2011-09-30 | 2011-06-30 | 2011-03-31 | 2010-12-31 | 2010-09-30 | 2010-06-30 | 2010-03-31 | 2009-12-31 | 2009-09-30 | ||
|---|---|---|---|---|---|---|---|---|---|---|---|---|---|---|---|---|---|---|---|---|---|---|---|---|---|---|---|---|---|---|---|---|---|---|---|---|---|---|---|---|---|---|---|---|---|---|---|---|---|---|---|---|---|---|---|---|---|---|---|
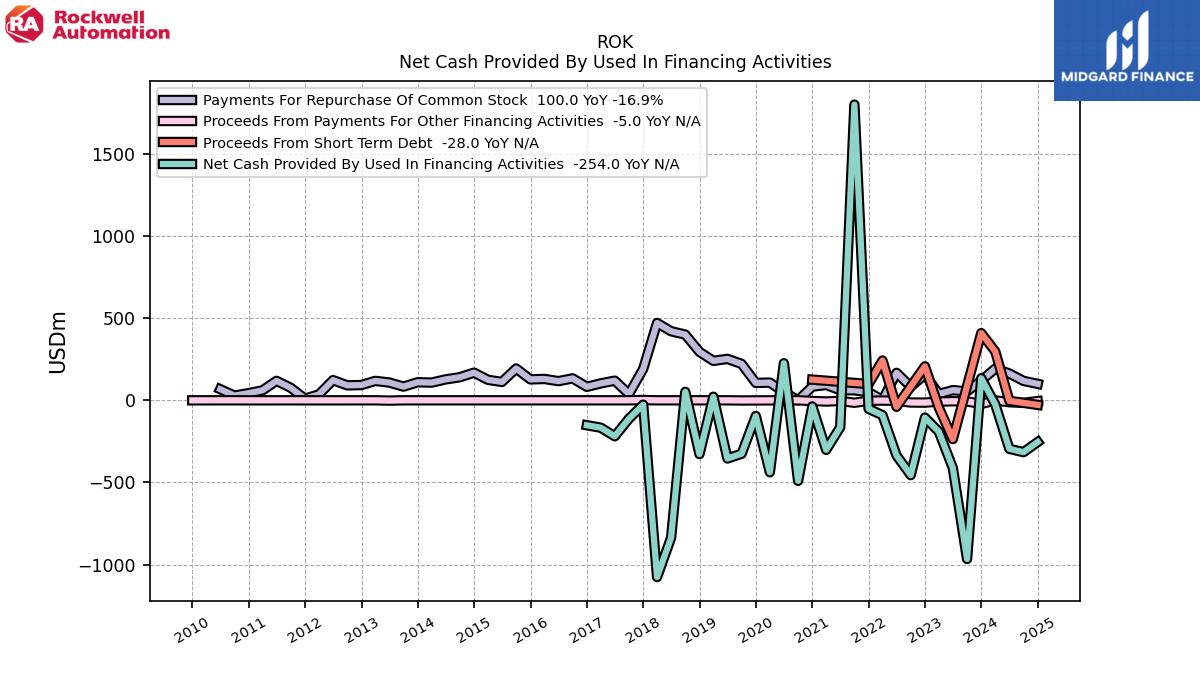
| Net Cash Provided By Used In Financing Activities | 134.20 | -966.40 | -412.70 | -191.20 | -105.30 | -455.70 | -336.00 | -90.50 | -52.00 | 1800.60 | -163.70 | -301.90 | -37.20 | -490.60 | 225.70 | -438.40 | -95.60 | -325.30 | -354.60 | 21.70 | -327.70 | 51.60 | -837.10 | -1076.80 | -26.60 | -111.90 | -219.00 | -166.80 | -151.90 | NA | NA | NA | NA | NA | NA | NA | NA | NA | NA | NA | NA | NA | NA | NA | NA | NA | NA | NA | NA | NA | NA | NA | NA | NA | NA | NA | NA | NA | |
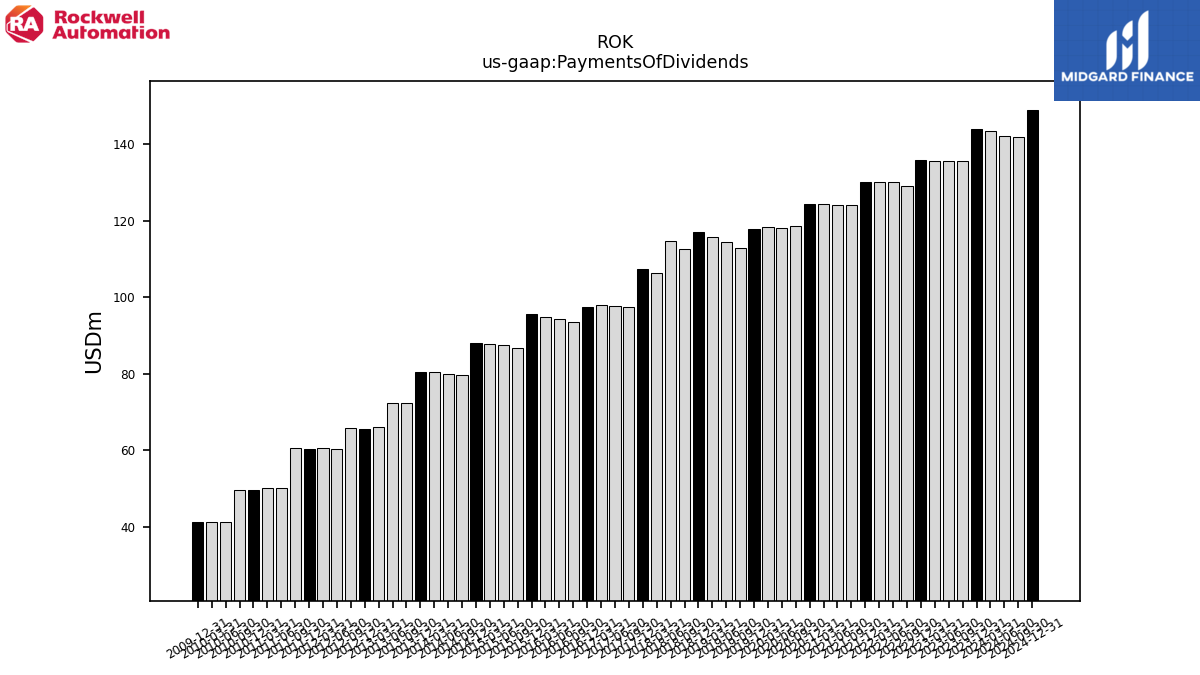
| Payments Of Dividends | 144.00 | 135.50 | 135.50 | 135.50 | 135.90 | 129.00 | 130.20 | 130.10 | 130.10 | 124.20 | 124.20 | 124.40 | 124.30 | 118.50 | 118.00 | 118.40 | 117.90 | 112.90 | 114.40 | 115.60 | 116.90 | 112.50 | 114.80 | 106.20 | 107.30 | 97.50 | 97.70 | 98.00 | 97.50 | 93.50 | 94.30 | 94.80 | 95.60 | 86.80 | 87.40 | 87.80 | 88.10 | 79.60 | 80.00 | 80.40 | 80.50 | 72.40 | 72.30 | 66.10 | 65.50 | 65.90 | 60.50 | 60.70 | 60.30 | 60.70 | 50.30 | 50.30 | 49.70 | 49.60 | 41.30 | 41.40 | 41.30 | NA | |
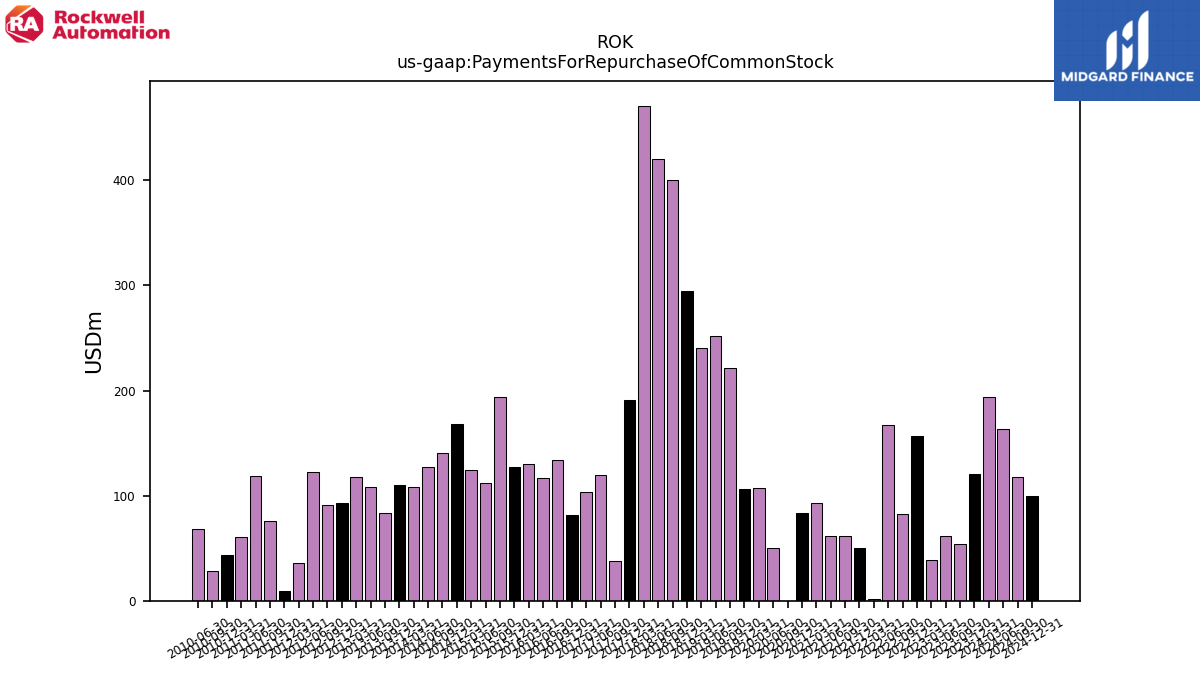
| Payments For Repurchase Of Common Stock | 120.30 | 54.40 | 61.90 | 38.40 | 156.80 | 82.80 | 167.30 | 1.40 | 49.80 | 61.20 | 61.60 | 93.40 | 83.50 | 0.00 | 50.50 | 107.70 | 106.00 | 221.60 | 252.20 | 240.10 | 295.10 | 400.10 | 420.50 | 470.90 | 190.80 | 38.00 | 119.60 | 103.00 | 82.00 | 133.50 | 116.70 | 130.00 | 127.40 | 193.60 | 111.80 | 124.60 | 168.40 | 140.50 | 127.40 | 107.80 | 110.00 | 83.40 | 108.20 | 118.20 | 92.90 | 91.10 | 122.80 | 35.80 | 9.70 | 76.00 | 118.50 | 60.60 | 43.60 | 28.40 | 67.80 | NA | NA | NA |
| 2023-12-31 | 2023-09-30 | 2023-06-30 | 2023-03-31 | 2022-12-31 | 2022-09-30 | 2022-06-30 | 2022-03-31 | 2021-12-31 | 2021-09-30 | 2021-06-30 | 2021-03-31 | 2020-12-31 | 2020-09-30 | 2020-06-30 | 2020-03-31 | 2019-12-31 | 2019-09-30 | 2019-06-30 | 2019-03-31 | 2018-12-31 | 2018-09-30 | 2018-06-30 | 2018-03-31 | 2017-12-31 | 2017-09-30 | 2017-06-30 | 2017-03-31 | 2016-12-31 | 2016-09-30 | 2016-06-30 | 2016-03-31 | 2015-12-31 | 2015-09-30 | 2015-06-30 | 2015-03-31 | 2014-12-31 | 2014-09-30 | 2014-06-30 | 2014-03-31 | 2013-12-31 | 2013-09-30 | 2013-06-30 | 2013-03-31 | 2012-12-31 | 2012-09-30 | 2012-06-30 | 2012-03-31 | 2011-12-31 | 2011-09-30 | 2011-06-30 | 2011-03-31 | 2010-12-31 | 2010-09-30 | 2010-06-30 | 2010-03-31 | 2009-12-31 | 2009-09-30 | ||
|---|---|---|---|---|---|---|---|---|---|---|---|---|---|---|---|---|---|---|---|---|---|---|---|---|---|---|---|---|---|---|---|---|---|---|---|---|---|---|---|---|---|---|---|---|---|---|---|---|---|---|---|---|---|---|---|---|---|---|---|
| Revenues | 2052.10 | 2562.90 | 2238.70 | 2275.40 | 1981.00 | 2126.30 | 1968.70 | 1808.10 | 1857.30 | 1807.80 | 1848.20 | 1776.10 | 1565.30 | 1570.00 | 1394.00 | 1681.30 | 1684.50 | 1730.20 | 1665.10 | 1657.20 | 1642.30 | 1729.50 | 1698.70 | 1651.20 | 1586.60 | 1667.50 | 1599.20 | 1554.30 | 1490.30 | 1538.60 | 1474.00 | 1440.30 | 1426.60 | 1607.50 | 1575.20 | 1550.80 | 1574.40 | 1781.80 | 1649.50 | 1600.50 | 1591.70 | 1715.70 | 1624.20 | 1522.80 | 1489.20 | 1664.00 | 1560.40 | 1561.10 | 1473.90 | 1654.30 | 1516.20 | 1464.10 | 1365.80 | 1356.90 | 1268.10 | 1164.50 | 1067.50 | 1356.90 | |
| Revenue From Contract With Customer Excluding Assessed Tax | 2052.10 | 2562.90 | 2238.70 | 2275.40 | 1981.00 | 2126.30 | 1968.70 | 1808.10 | 1857.30 | 1807.80 | 1848.20 | 1776.10 | 1565.30 | 1570.00 | 1394.00 | 1681.30 | 1684.50 | 1730.20 | 1665.10 | 1657.20 | 1642.30 | 1729.50 | 1698.70 | 1651.20 | 1586.60 | 1667.50 | 1599.20 | 1554.30 | 1490.30 | 1538.60 | 1474.00 | 1440.30 | 1426.60 | 1607.50 | 1575.20 | 1550.80 | 1574.40 | 1781.80 | 1649.50 | 1600.50 | 1591.70 | 1715.70 | 1624.20 | 1522.80 | 1489.20 | 1664.00 | 1560.40 | 1561.10 | 1473.90 | 1654.30 | 1516.20 | 1464.10 | 1365.80 | 1356.90 | 1268.10 | 1164.50 | 1067.50 | 1356.90 | |
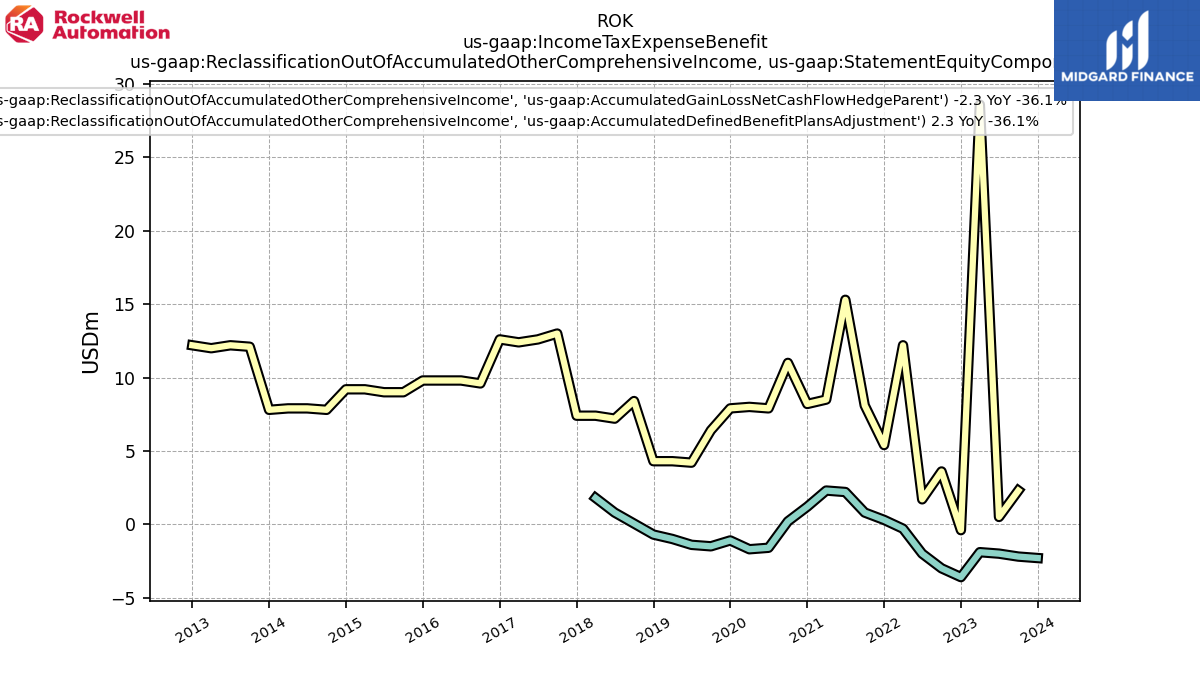
| Foreign Exchange Forward, Reclassification Out Of Accumulated Other Comprehensive Income, Accumulated Gain Loss Net Cash Flow Hedge Parent | -1.30 | NA | -1.90 | -1.70 | -1.00 | NA | -0.50 | 0.10 | 0.20 | NA | -0.10 | -0.70 | -0.50 | NA | 1.00 | -0.10 | -0.10 | NA | -0.10 | -0.60 | 0.40 | NA | -0.20 | -0.80 | NA | NA | NA | NA | NA | NA | NA | NA | NA | NA | NA | NA | NA | NA | NA | NA | NA | NA | NA | NA | NA | NA | NA | NA | NA | NA | NA | NA | NA | NA | NA | NA | NA | NA | |
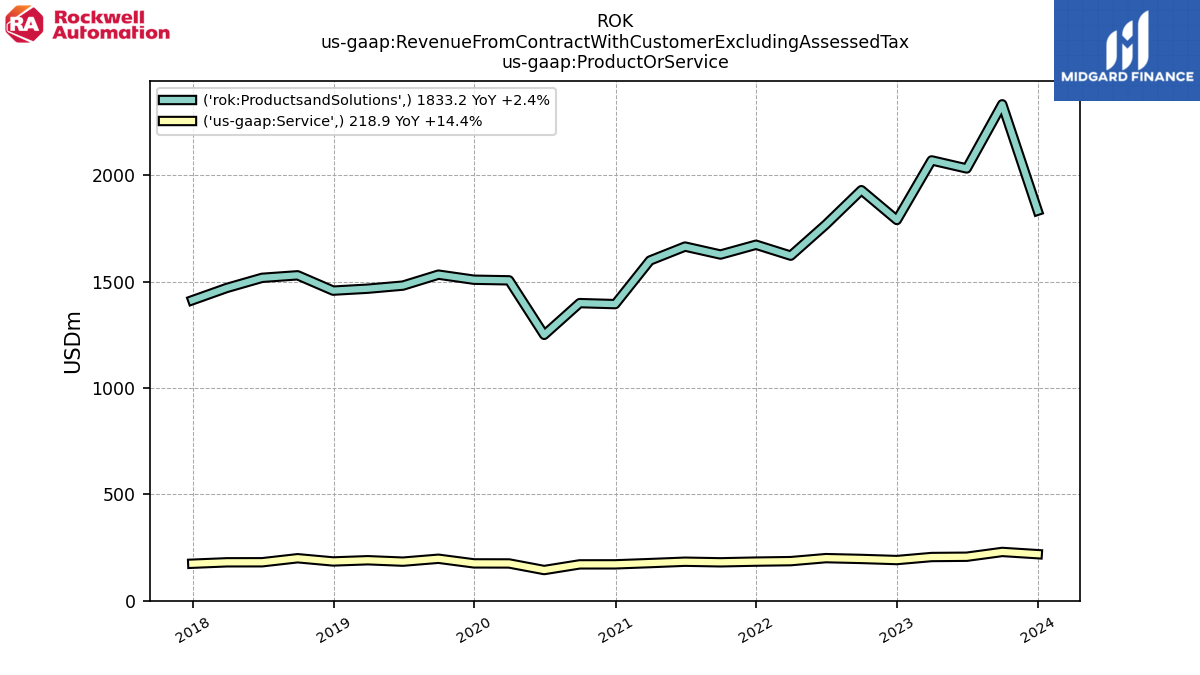
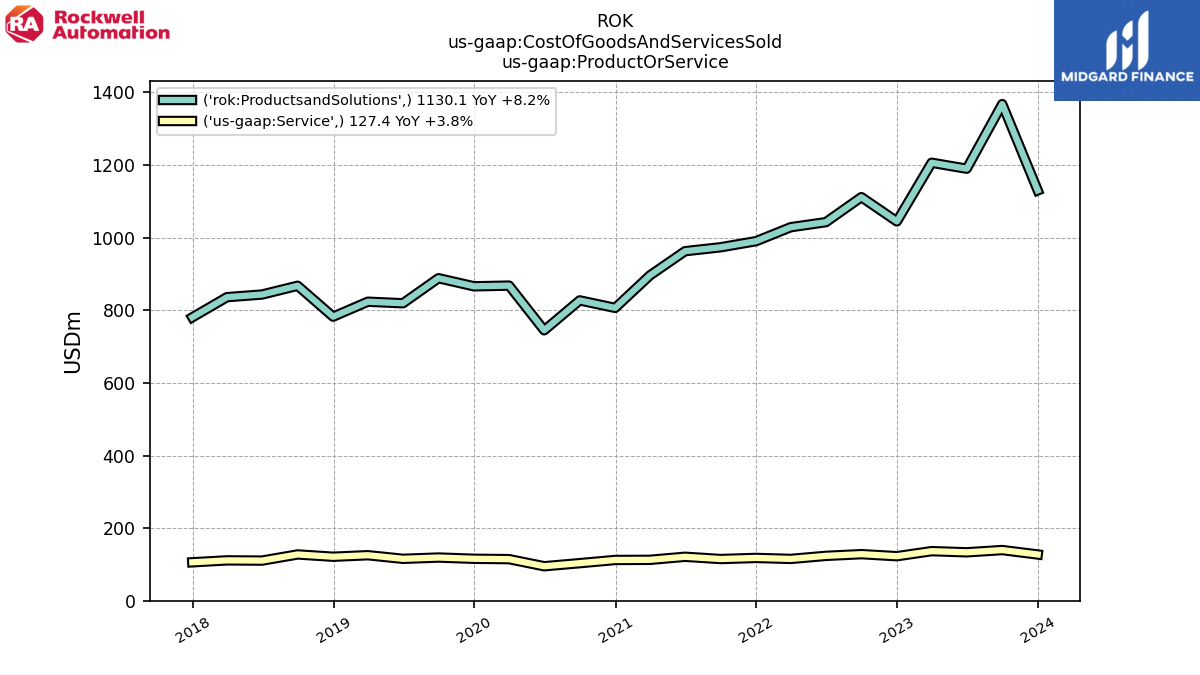
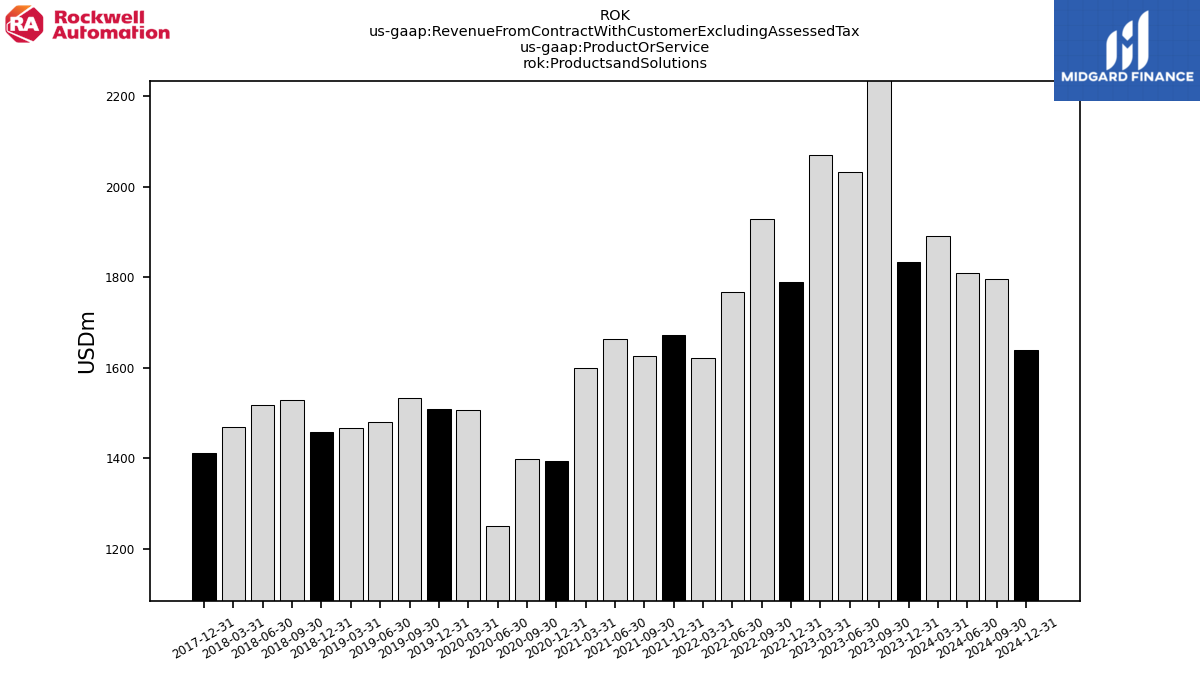
| Productsand Solutions | 1833.20 | 2333.50 | 2031.80 | 2069.90 | 1789.70 | 1929.80 | 1768.40 | 1621.90 | 1673.30 | 1627.20 | 1664.70 | 1599.10 | 1394.20 | 1399.00 | 1249.70 | 1506.00 | 1508.90 | 1532.80 | 1481.30 | 1466.80 | 1457.60 | 1529.70 | 1517.80 | 1470.50 | 1412.50 | NA | NA | NA | NA | NA | NA | NA | NA | NA | NA | NA | NA | NA | NA | NA | NA | NA | NA | NA | NA | NA | NA | NA | NA | NA | NA | NA | NA | NA | NA | NA | NA | NA | |
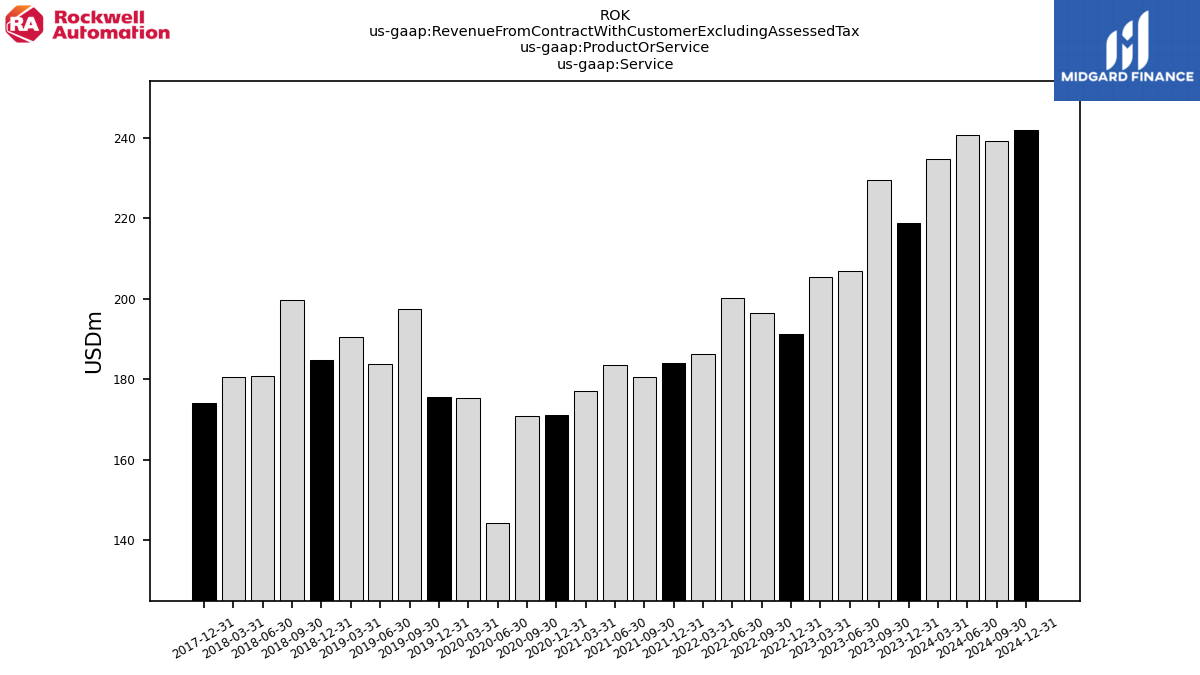
| Service | 218.90 | 229.40 | 206.90 | 205.50 | 191.30 | 196.50 | 200.30 | 186.20 | 184.00 | 180.60 | 183.50 | 177.00 | 171.10 | 171.00 | 144.30 | 175.30 | 175.60 | 197.40 | 183.80 | 190.40 | 184.70 | 199.80 | 180.90 | 180.70 | 174.10 | NA | NA | NA | NA | NA | NA | NA | NA | NA | NA | NA | NA | NA | NA | NA | NA | NA | NA | NA | NA | NA | NA | NA | NA | NA | NA | NA | NA | NA | NA | NA | NA | NA | |
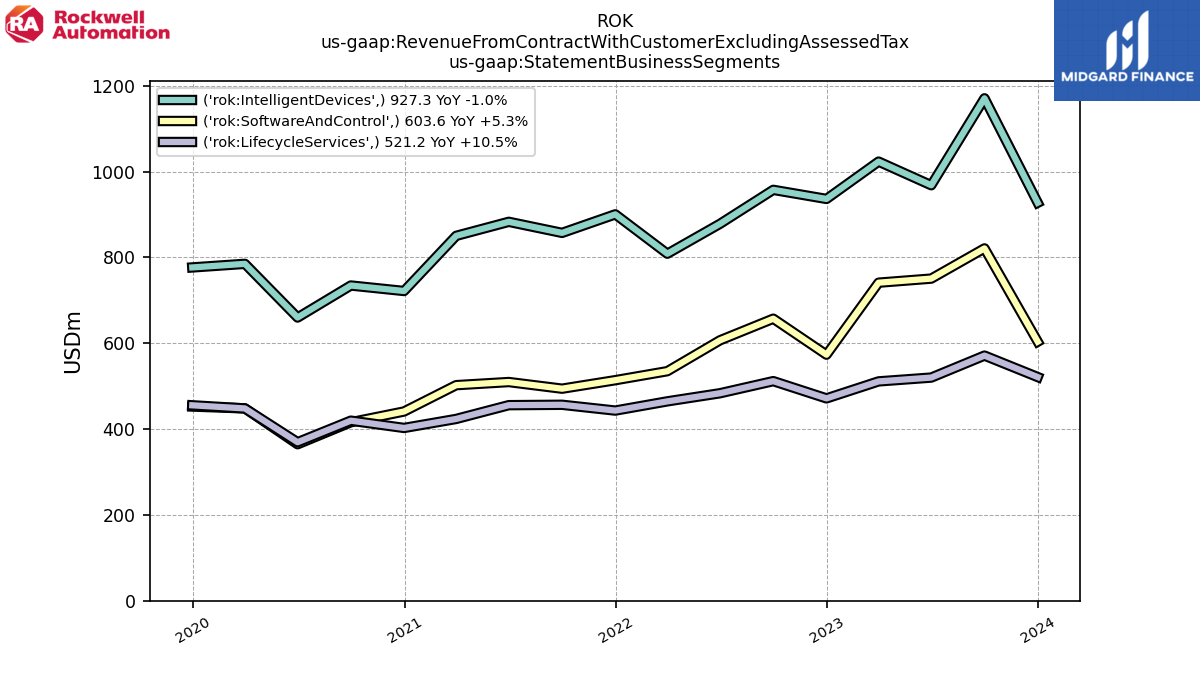
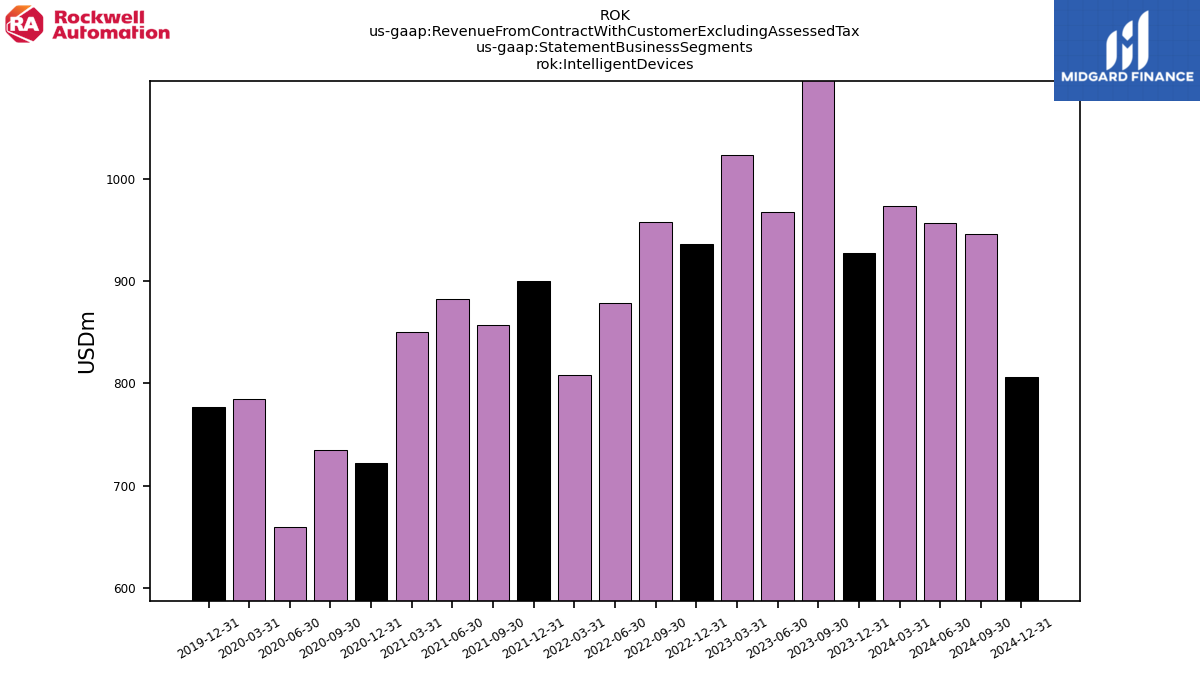
| Intelligent Devices | 927.30 | 1170.70 | 968.10 | 1023.20 | 936.20 | 957.40 | 878.30 | 808.60 | 900.30 | 857.10 | 882.90 | 850.20 | 721.70 | 734.50 | 659.90 | 785.00 | 776.60 | NA | NA | NA | NA | NA | NA | NA | NA | NA | NA | NA | NA | NA | NA | NA | NA | NA | NA | NA | NA | NA | NA | NA | NA | NA | NA | NA | NA | NA | NA | NA | NA | NA | NA | NA | NA | NA | NA | NA | NA | NA | |
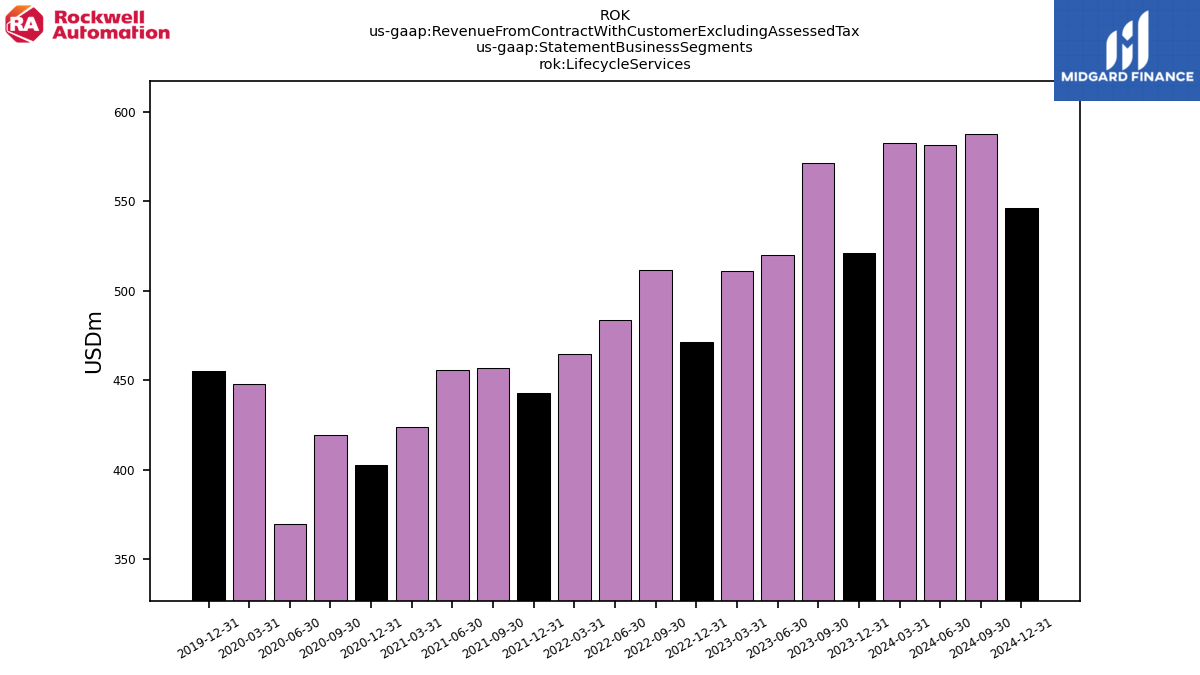
| Lifecycle Services | 521.20 | 571.20 | 520.00 | 511.10 | 471.50 | 511.70 | 483.50 | 464.60 | 443.10 | 456.60 | 455.70 | 423.60 | 402.60 | 419.60 | 369.40 | 448.10 | 455.40 | NA | NA | NA | NA | NA | NA | NA | NA | NA | NA | NA | NA | NA | NA | NA | NA | NA | NA | NA | NA | NA | NA | NA | NA | NA | NA | NA | NA | NA | NA | NA | NA | NA | NA | NA | NA | NA | NA | NA | NA | NA | |
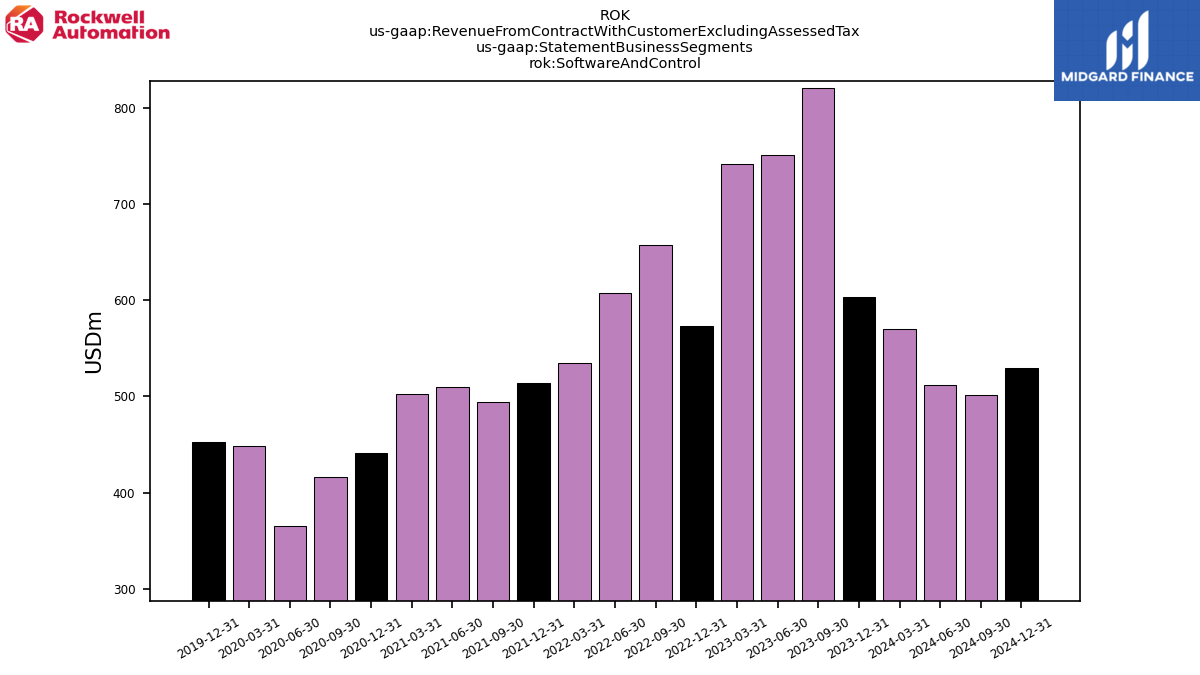
| Software And Control | 603.60 | 821.00 | 750.60 | 741.10 | 573.30 | 657.20 | 606.90 | 534.90 | 513.90 | 494.10 | 509.60 | 502.30 | 441.00 | 415.90 | 364.70 | 448.20 | 452.50 | NA | NA | NA | NA | NA | NA | NA | NA | NA | NA | NA | NA | NA | NA | NA | NA | NA | NA | NA | NA | NA | NA | NA | NA | NA | NA | NA | NA | NA | NA | NA | NA | NA | NA | NA | NA | NA | NA | NA | NA | NA | |
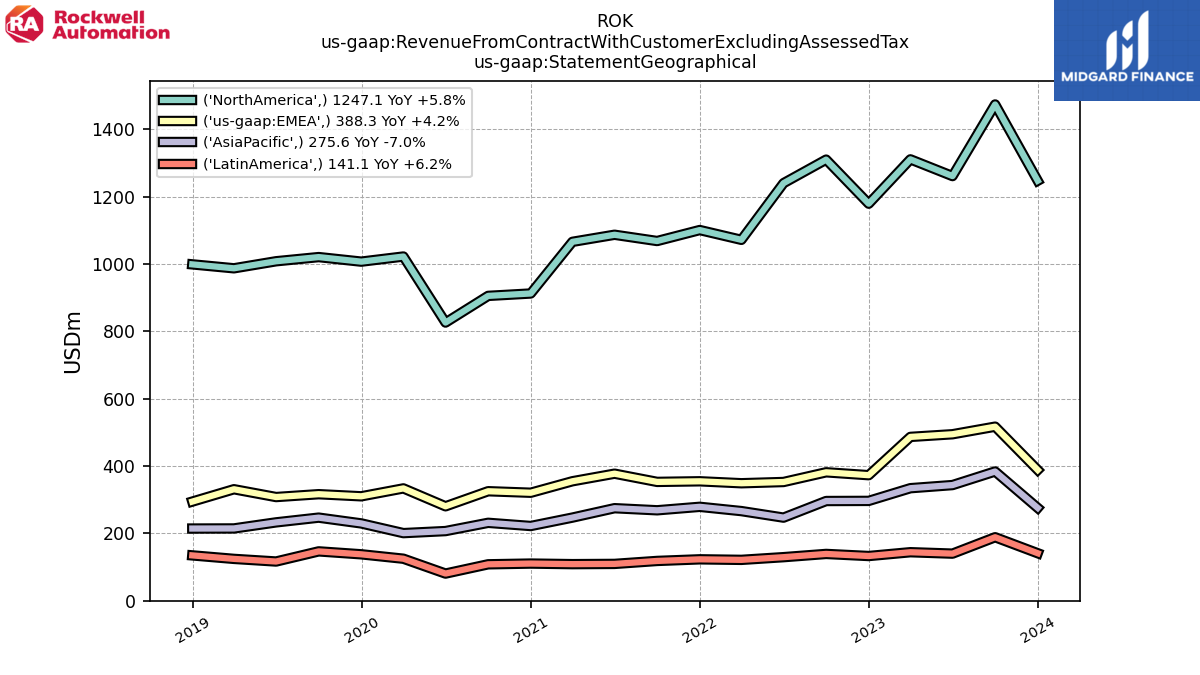
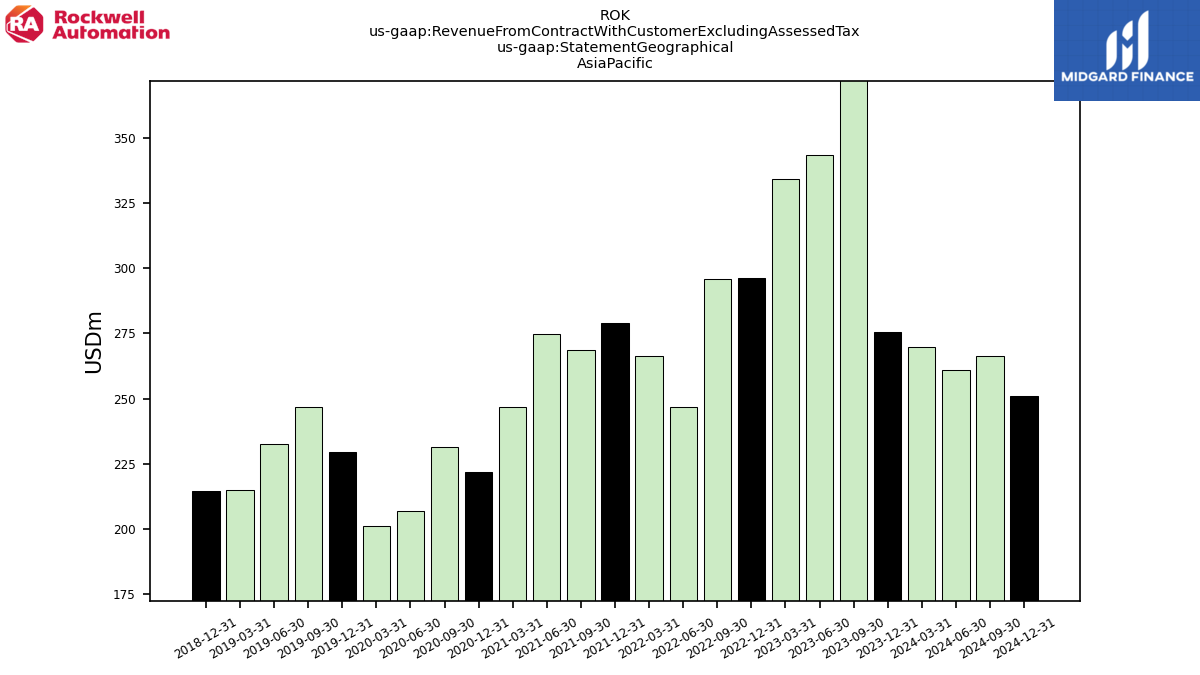
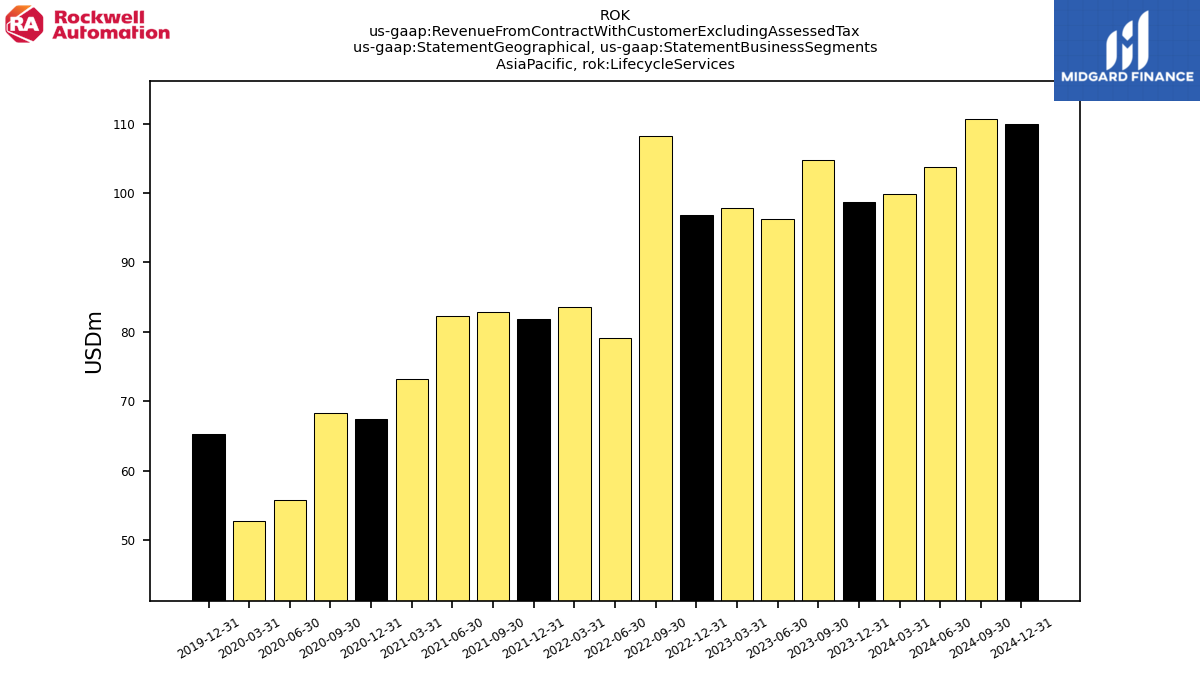
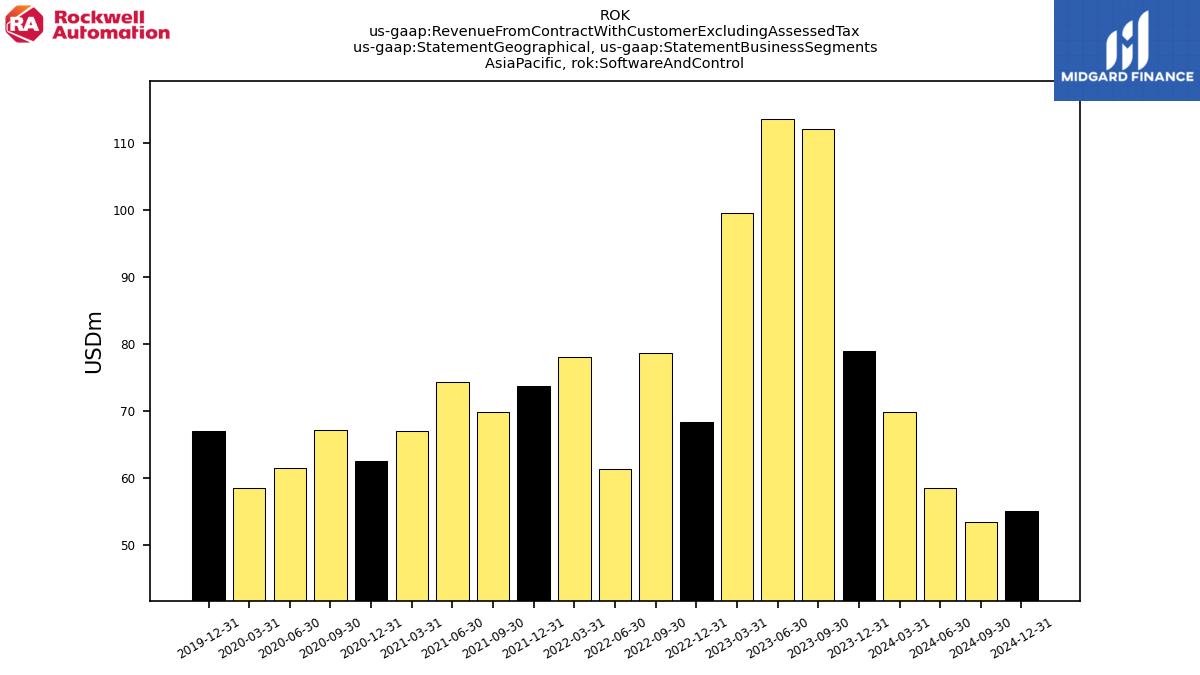
| 275.60 | 383.80 | 343.50 | 334.20 | 296.50 | 296.10 | 246.80 | 266.20 | 278.90 | 268.60 | 274.80 | 246.90 | 221.90 | 231.40 | 206.90 | 200.80 | 229.60 | 246.80 | 232.70 | 214.70 | 214.40 | NA | NA | NA | NA | NA | NA | NA | NA | NA | NA | NA | NA | NA | NA | NA | NA | NA | NA | NA | NA | NA | NA | NA | NA | NA | NA | NA | NA | NA | NA | NA | NA | NA | NA | NA | NA | NA | ||
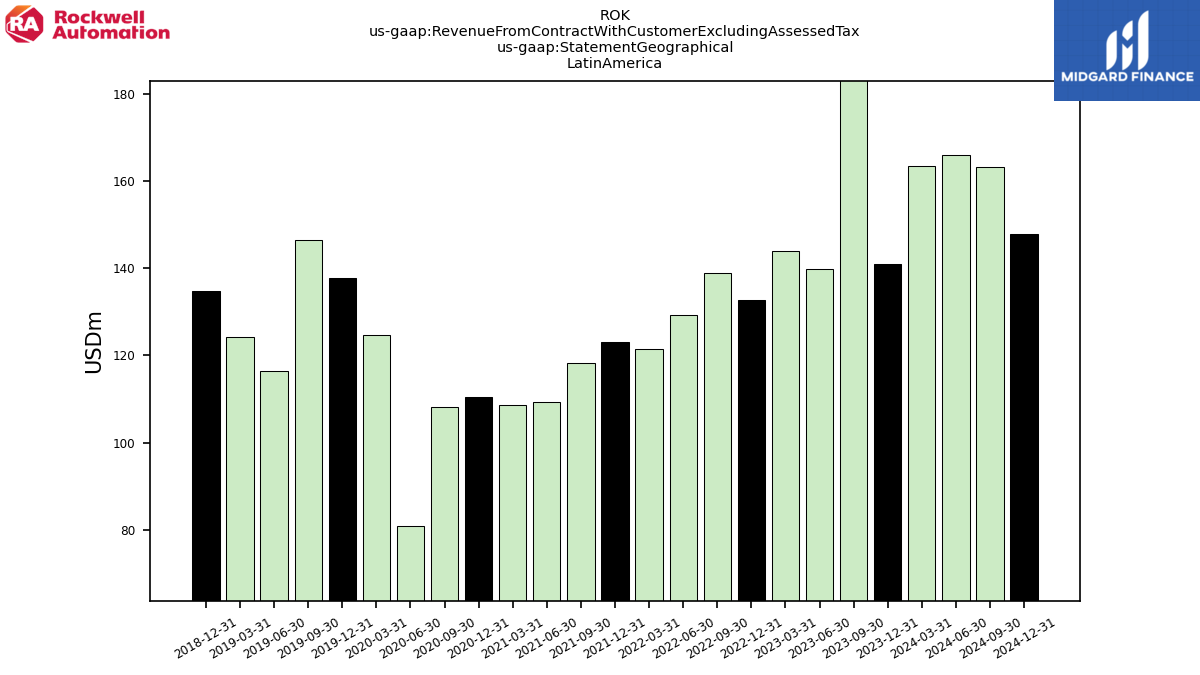
| 141.10 | 188.60 | 139.90 | 144.10 | 132.80 | 139.00 | 129.40 | 121.40 | 123.00 | 118.20 | 109.40 | 108.70 | 110.40 | 108.20 | 80.70 | 124.80 | 137.90 | 146.60 | 116.50 | 124.30 | 134.70 | NA | NA | NA | NA | NA | NA | NA | NA | NA | NA | NA | NA | NA | NA | NA | NA | NA | NA | NA | NA | NA | NA | NA | NA | NA | NA | NA | NA | NA | NA | NA | NA | NA | NA | NA | NA | NA | ||
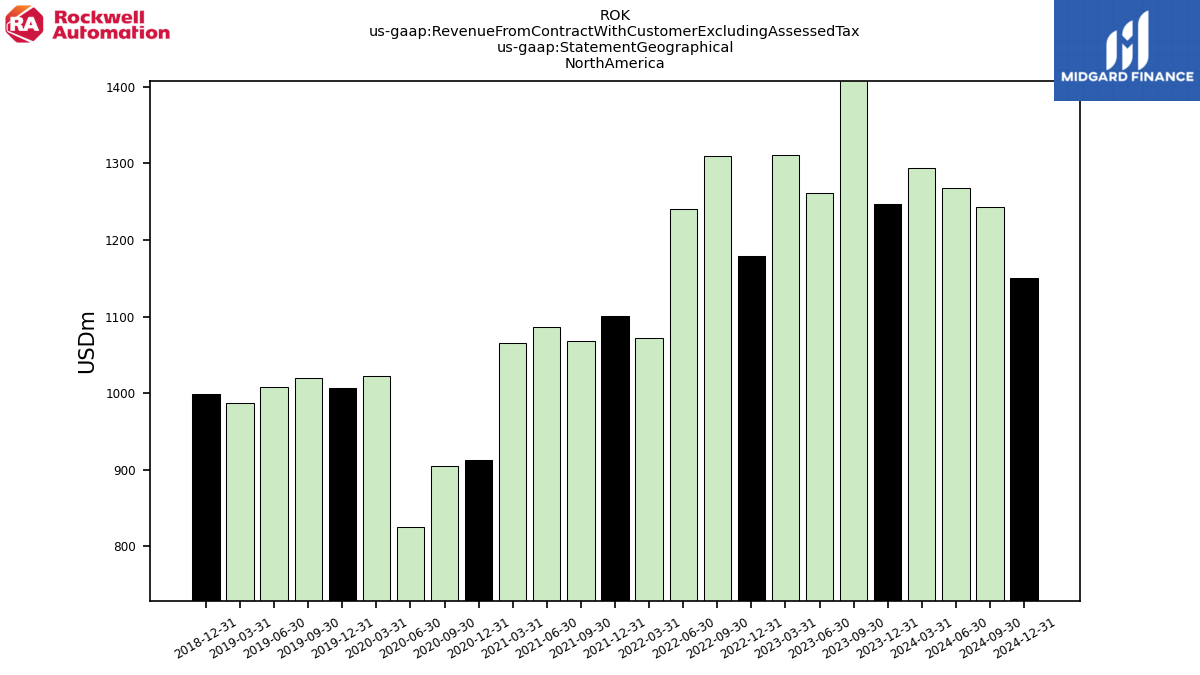
| 1247.10 | 1473.60 | 1260.90 | 1310.60 | 1178.90 | 1309.80 | 1239.90 | 1071.60 | 1100.70 | 1068.10 | 1086.70 | 1065.70 | 912.30 | 905.20 | 826.00 | 1022.10 | 1006.90 | 1020.40 | 1008.00 | 987.10 | 998.80 | NA | NA | NA | NA | NA | NA | NA | NA | NA | NA | NA | NA | NA | NA | NA | NA | NA | NA | NA | NA | NA | NA | NA | NA | NA | NA | NA | NA | NA | NA | NA | NA | NA | NA | NA | NA | NA | ||
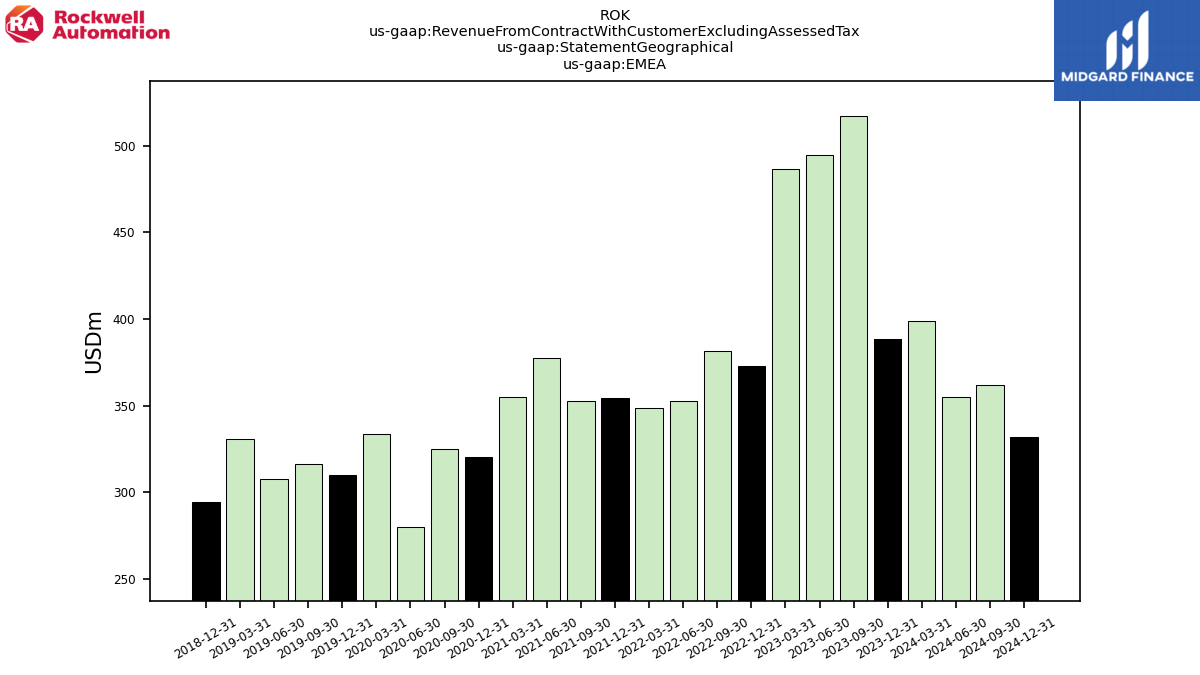
| EMEA | 388.30 | 516.90 | 494.40 | 486.50 | 372.80 | 381.40 | 352.60 | 348.90 | 354.70 | 352.90 | 377.30 | 354.80 | 320.70 | 325.20 | 280.40 | 333.60 | 310.10 | 316.40 | 307.90 | 331.10 | 294.40 | NA | NA | NA | NA | NA | NA | NA | NA | NA | NA | NA | NA | NA | NA | NA | NA | NA | NA | NA | NA | NA | NA | NA | NA | NA | NA | NA | NA | NA | NA | NA | NA | NA | NA | NA | NA | NA | |
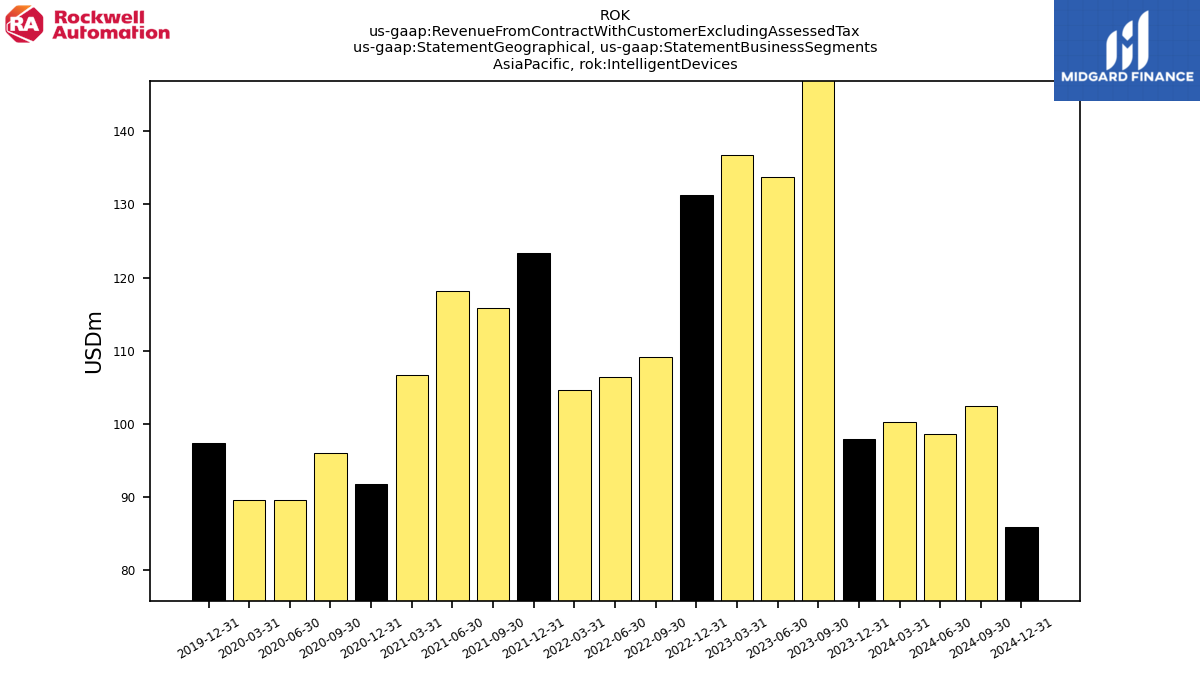
| , Intelligent Devices | 97.90 | 166.90 | 133.70 | 136.70 | 131.30 | 109.20 | 106.40 | 104.60 | 123.30 | 115.90 | 118.10 | 106.70 | 91.80 | 96.00 | 89.60 | 89.60 | 97.40 | NA | NA | NA | NA | NA | NA | NA | NA | NA | NA | NA | NA | NA | NA | NA | NA | NA | NA | NA | NA | NA | NA | NA | NA | NA | NA | NA | NA | NA | NA | NA | NA | NA | NA | NA | NA | NA | NA | NA | NA | NA | |
| , Lifecycle Services | 98.70 | 104.80 | 96.20 | 97.90 | 96.80 | 108.20 | 79.10 | 83.50 | 81.90 | 82.80 | 82.30 | 73.20 | 67.50 | 68.30 | 55.80 | 52.70 | 65.20 | NA | NA | NA | NA | NA | NA | NA | NA | NA | NA | NA | NA | NA | NA | NA | NA | NA | NA | NA | NA | NA | NA | NA | NA | NA | NA | NA | NA | NA | NA | NA | NA | NA | NA | NA | NA | NA | NA | NA | NA | NA | |
| , Software And Control | 79.00 | 112.10 | 113.60 | 99.60 | 68.40 | 78.70 | 61.30 | 78.10 | 73.70 | 69.90 | 74.40 | 67.00 | 62.60 | 67.10 | 61.50 | 58.50 | 67.00 | NA | NA | NA | NA | NA | NA | NA | NA | NA | NA | NA | NA | NA | NA | NA | NA | NA | NA | NA | NA | NA | NA | NA | NA | NA | NA | NA | NA | NA | NA | NA | NA | NA | NA | NA | NA | NA | NA | NA | NA | NA | |
| , Intelligent Devices | 58.50 | 88.30 | 65.50 | 71.20 | 66.30 | 67.30 | 59.80 | 60.70 | 60.30 | 51.70 | 53.50 | 52.60 | 50.30 | 50.00 | 33.20 | 56.80 | 64.70 | NA | NA | NA | NA | NA | NA | NA | NA | NA | NA | NA | NA | NA | NA | NA | NA | NA | NA | NA | NA | NA | NA | NA | NA | NA | NA | NA | NA | NA | NA | NA | NA | NA | NA | NA | NA | NA | NA | NA | NA | NA | |
| , Lifecycle Services | 44.40 | 45.50 | 35.60 | 32.00 | 31.50 | 34.80 | 34.10 | 32.30 | 35.00 | 38.90 | 26.90 | 28.10 | 32.90 | 34.50 | 33.00 | 38.60 | 41.60 | NA | NA | NA | NA | NA | NA | NA | NA | NA | NA | NA | NA | NA | NA | NA | NA | NA | NA | NA | NA | NA | NA | NA | NA | NA | NA | NA | NA | NA | NA | NA | NA | NA | NA | NA | NA | NA | NA | NA | NA | NA | |
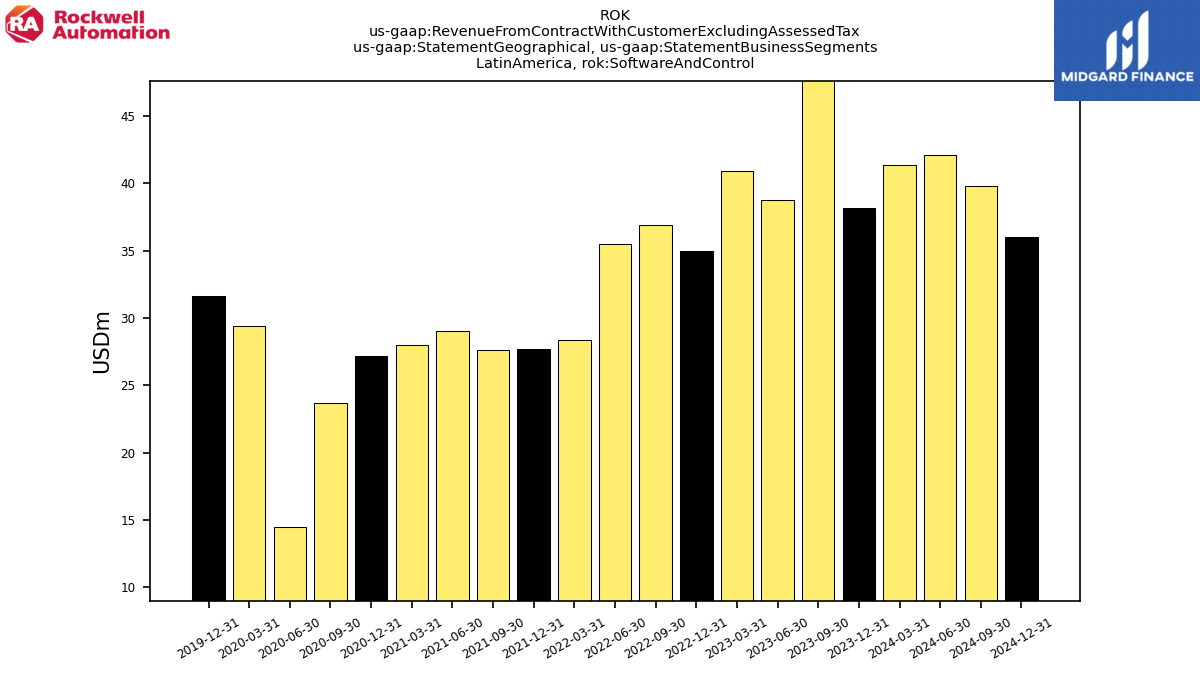
| , Software And Control | 38.20 | 54.80 | 38.80 | 40.90 | 35.00 | 36.90 | 35.50 | 28.40 | 27.70 | 27.60 | 29.00 | 28.00 | 27.20 | 23.70 | 14.50 | 29.40 | 31.60 | NA | NA | NA | NA | NA | NA | NA | NA | NA | NA | NA | NA | NA | NA | NA | NA | NA | NA | NA | NA | NA | NA | NA | NA | NA | NA | NA | NA | NA | NA | NA | NA | NA | NA | NA | NA | NA | NA | NA | NA | NA | |
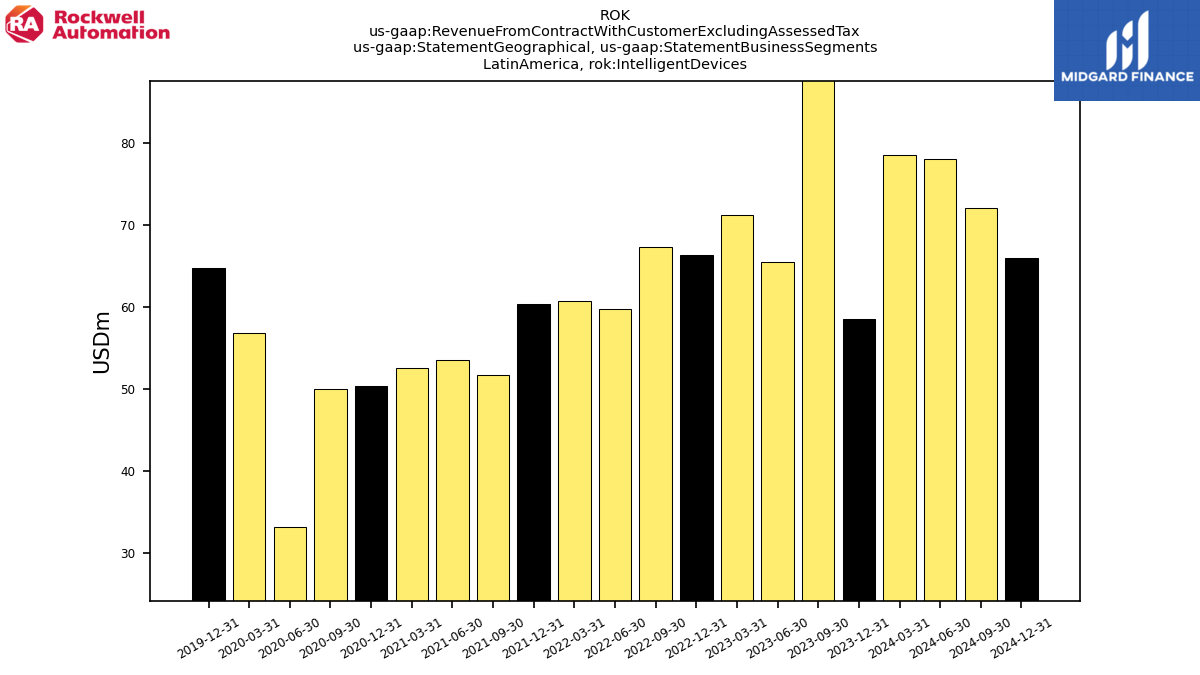
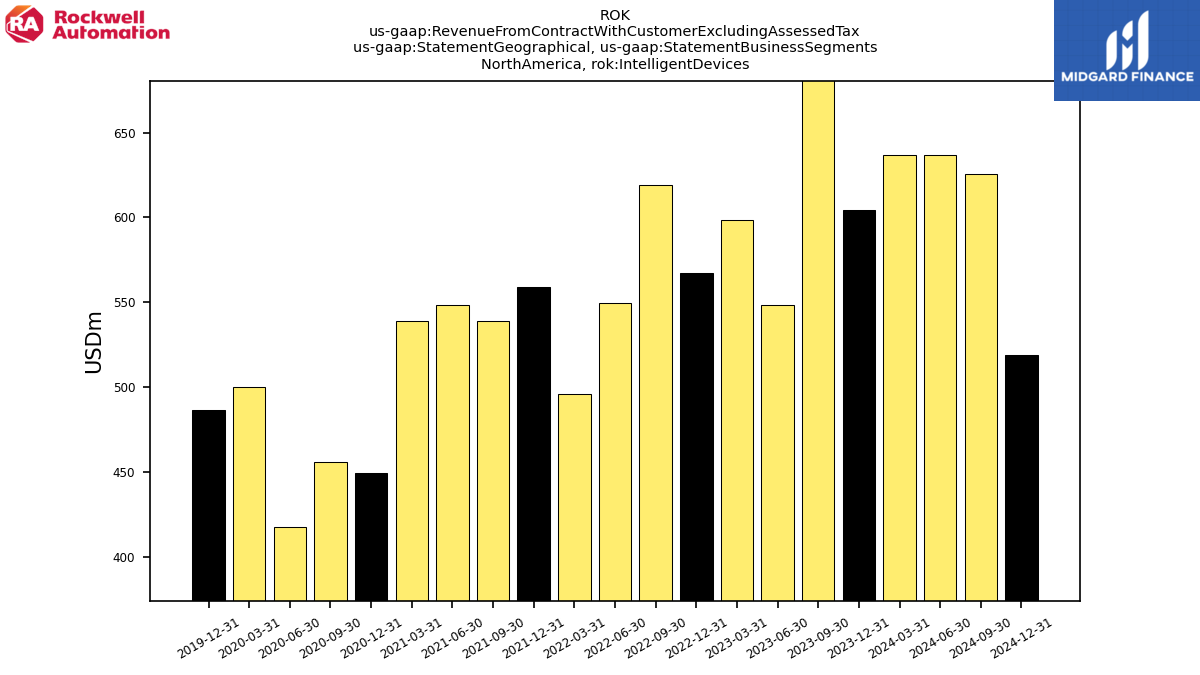
| , Intelligent Devices | 604.30 | 694.60 | 548.50 | 598.70 | 567.40 | 619.30 | 549.60 | 495.90 | 558.90 | 538.70 | 548.50 | 538.90 | 449.30 | 455.60 | 417.80 | 500.10 | 486.70 | NA | NA | NA | NA | NA | NA | NA | NA | NA | NA | NA | NA | NA | NA | NA | NA | NA | NA | NA | NA | NA | NA | NA | NA | NA | NA | NA | NA | NA | NA | NA | NA | NA | NA | NA | NA | NA | NA | NA | NA | NA | |
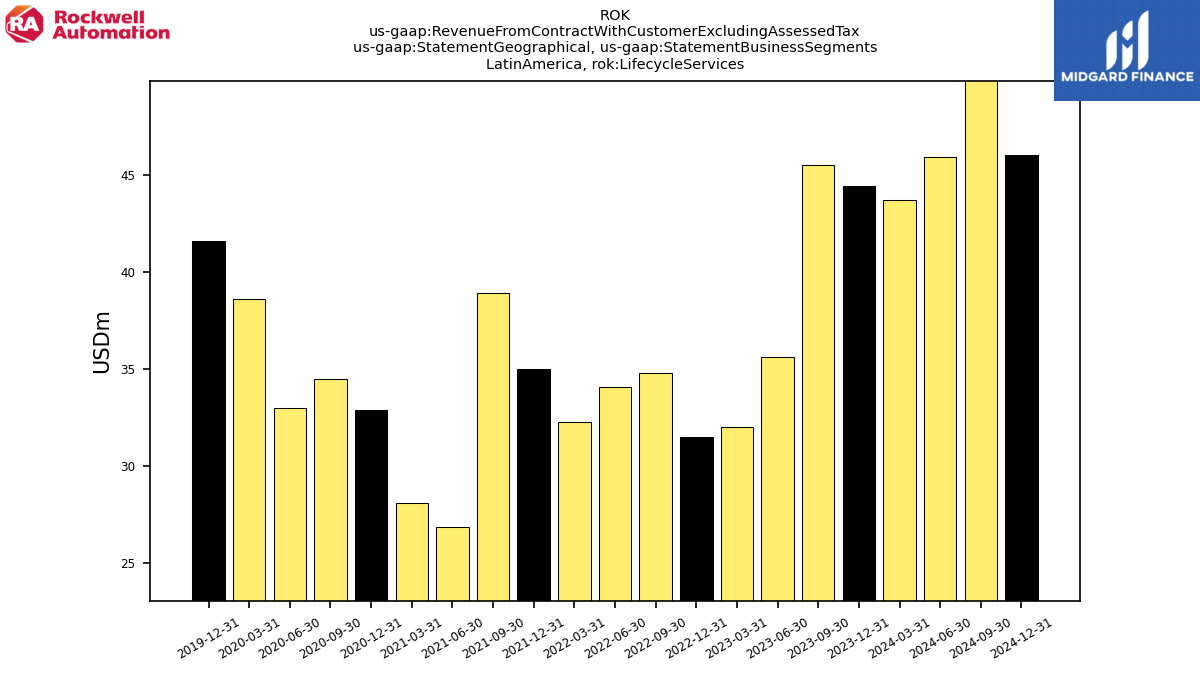
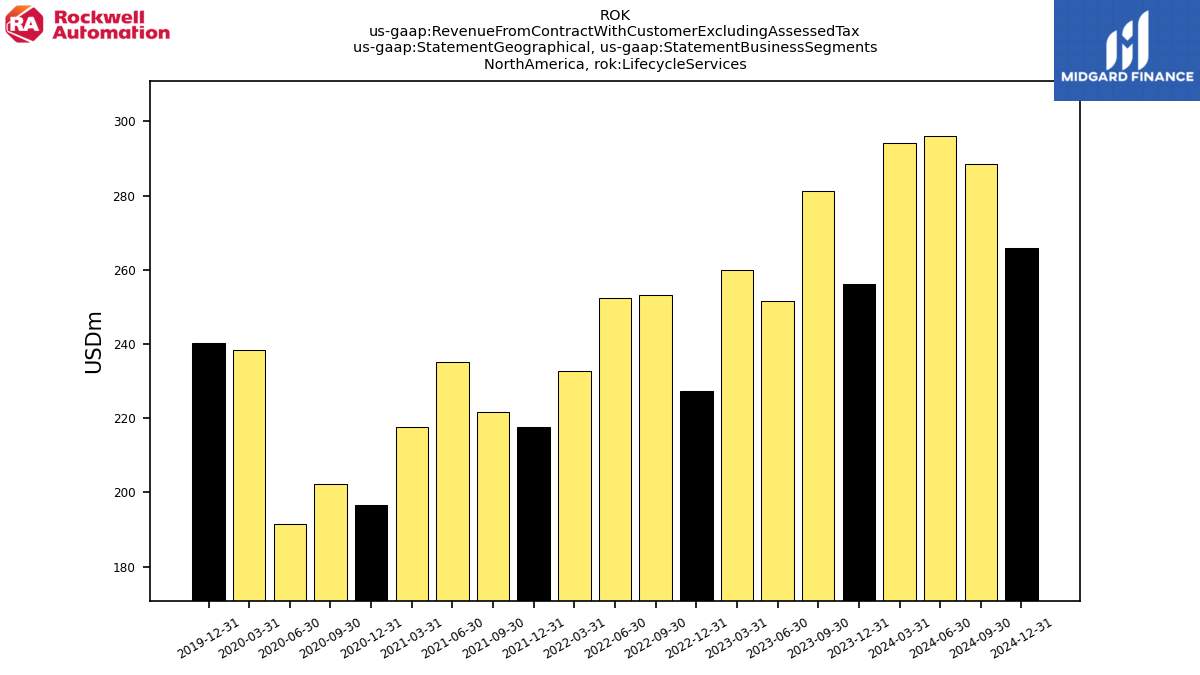
| , Lifecycle Services | 256.20 | 281.20 | 251.50 | 259.90 | 227.40 | 253.20 | 252.50 | 232.70 | 217.70 | 221.60 | 235.30 | 217.60 | 196.60 | 202.20 | 191.40 | 238.50 | 240.40 | NA | NA | NA | NA | NA | NA | NA | NA | NA | NA | NA | NA | NA | NA | NA | NA | NA | NA | NA | NA | NA | NA | NA | NA | NA | NA | NA | NA | NA | NA | NA | NA | NA | NA | NA | NA | NA | NA | NA | NA | NA | |
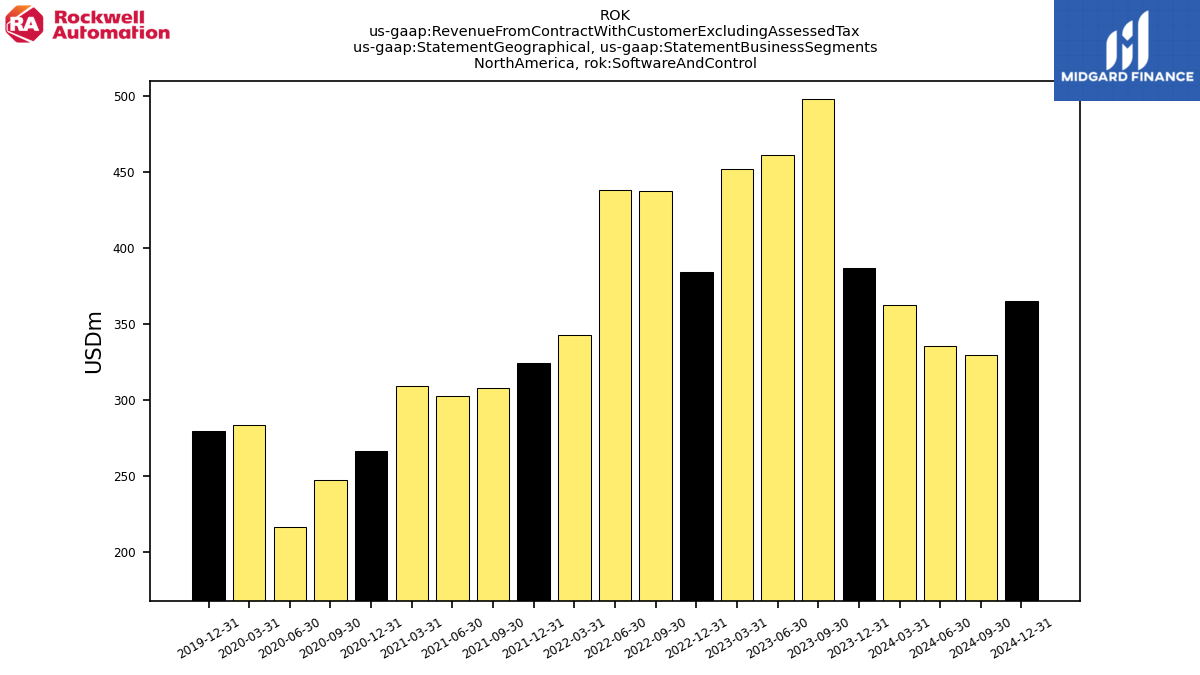
| , Software And Control | 386.60 | 497.80 | 460.90 | 452.00 | 384.10 | 437.30 | 437.80 | 343.00 | 324.10 | 307.80 | 302.90 | 309.20 | 266.40 | 247.40 | 216.80 | 283.50 | 279.80 | NA | NA | NA | NA | NA | NA | NA | NA | NA | NA | NA | NA | NA | NA | NA | NA | NA | NA | NA | NA | NA | NA | NA | NA | NA | NA | NA | NA | NA | NA | NA | NA | NA | NA | NA | NA | NA | NA | NA | NA | NA | |
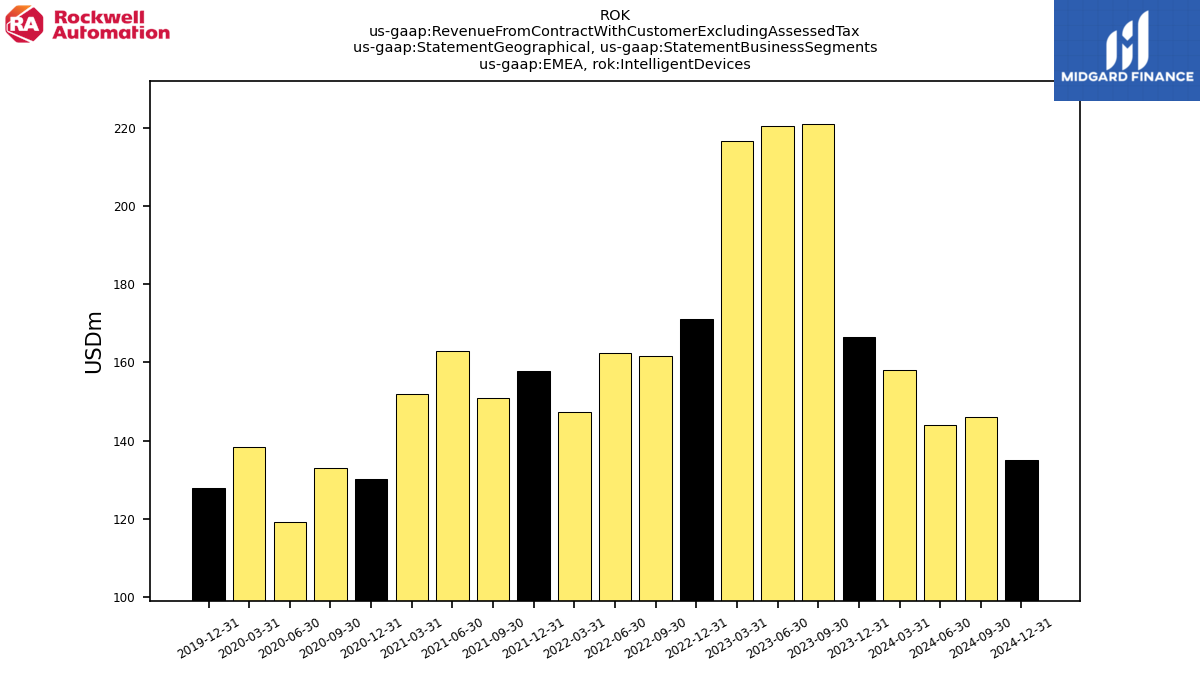
| EMEA, Intelligent Devices | 166.60 | 220.90 | 220.40 | 216.60 | 171.20 | 161.60 | 162.50 | 147.40 | 157.80 | 150.80 | 162.80 | 152.00 | 130.30 | 132.90 | 119.30 | 138.50 | 127.80 | NA | NA | NA | NA | NA | NA | NA | NA | NA | NA | NA | NA | NA | NA | NA | NA | NA | NA | NA | NA | NA | NA | NA | NA | NA | NA | NA | NA | NA | NA | NA | NA | NA | NA | NA | NA | NA | NA | NA | NA | NA | |
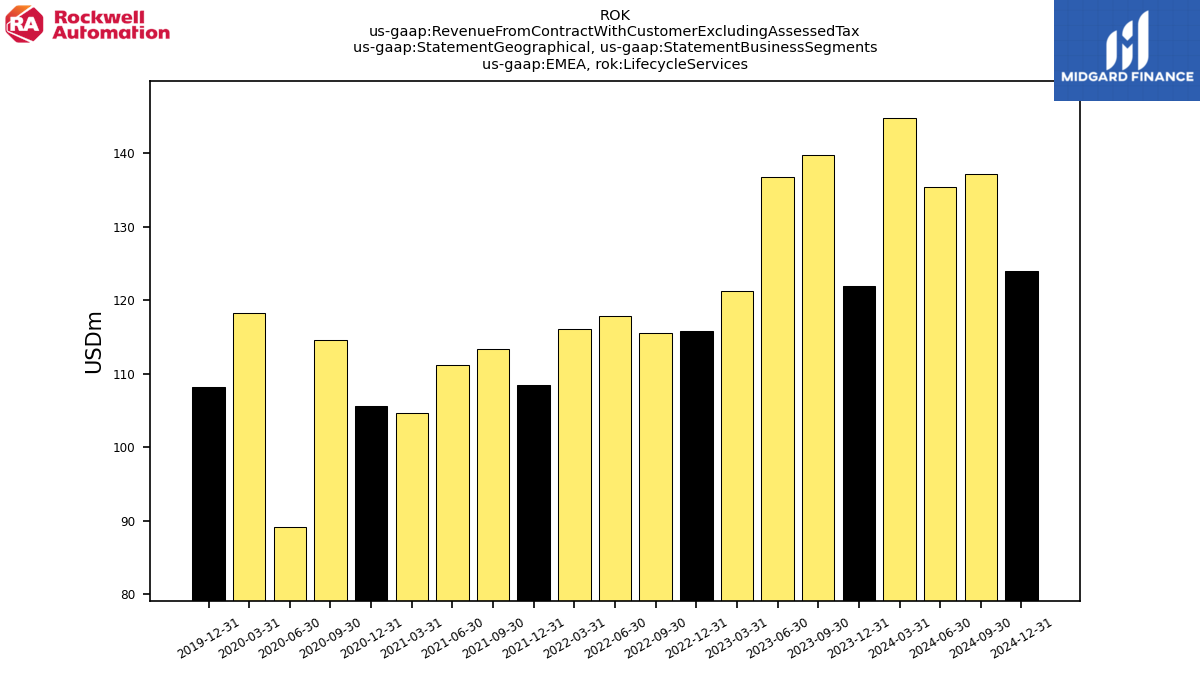
| EMEA, Lifecycle Services | 121.90 | 139.70 | 136.70 | 121.30 | 115.80 | 115.50 | 117.80 | 116.10 | 108.50 | 113.30 | 111.20 | 104.70 | 105.60 | 114.60 | 89.20 | 118.30 | 108.20 | NA | NA | NA | NA | NA | NA | NA | NA | NA | NA | NA | NA | NA | NA | NA | NA | NA | NA | NA | NA | NA | NA | NA | NA | NA | NA | NA | NA | NA | NA | NA | NA | NA | NA | NA | NA | NA | NA | NA | NA | NA | |
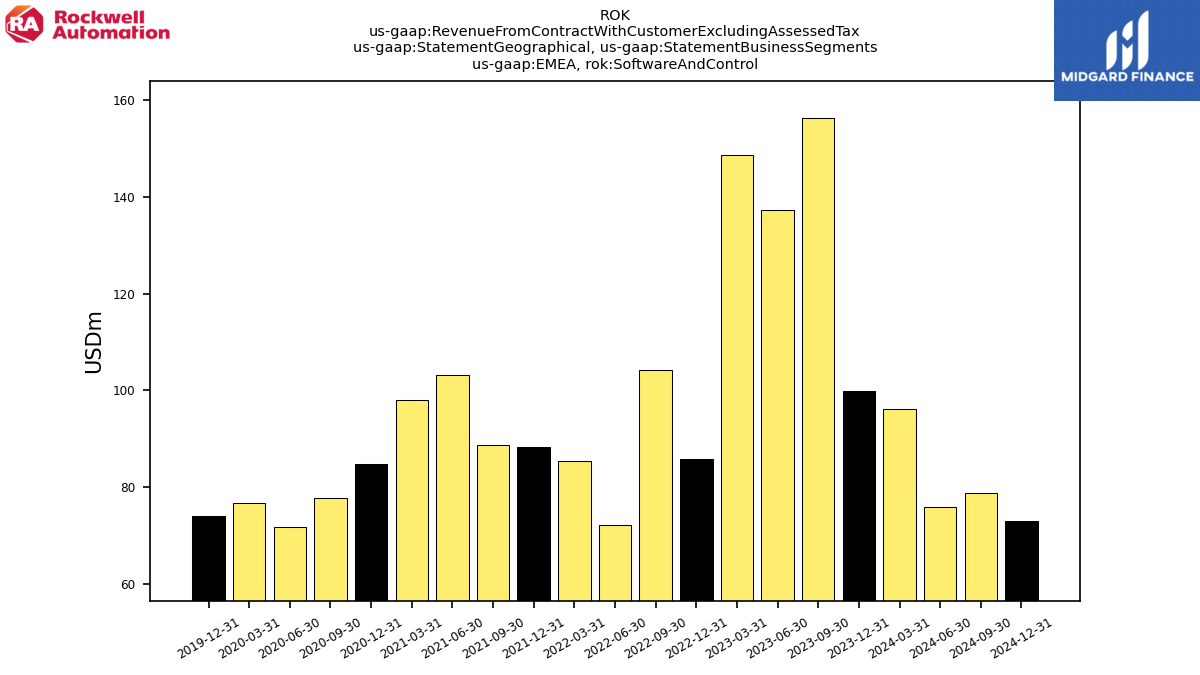
| EMEA, Software And Control | 99.80 | 156.30 | 137.30 | 148.60 | 85.80 | 104.30 | 72.30 | 85.40 | 88.40 | 88.80 | 103.30 | 98.10 | 84.80 | 77.70 | 71.90 | 76.80 | 74.10 | NA | NA | NA | NA | NA | NA | NA | NA | NA | NA | NA | NA | NA | NA | NA | NA | NA | NA | NA | NA | NA | NA | NA | NA | NA | NA | NA | NA | NA | NA | NA | NA | NA | NA | NA | NA | NA | NA | NA | NA | NA |
