
| 2023-06-30 | 2023-03-31 | 2022-06-30 | 2022-03-31 | 2021-12-31 | 2021-09-30 | 2021-06-30 | 2021-03-31 | ||
|---|---|---|---|---|---|---|---|---|---|
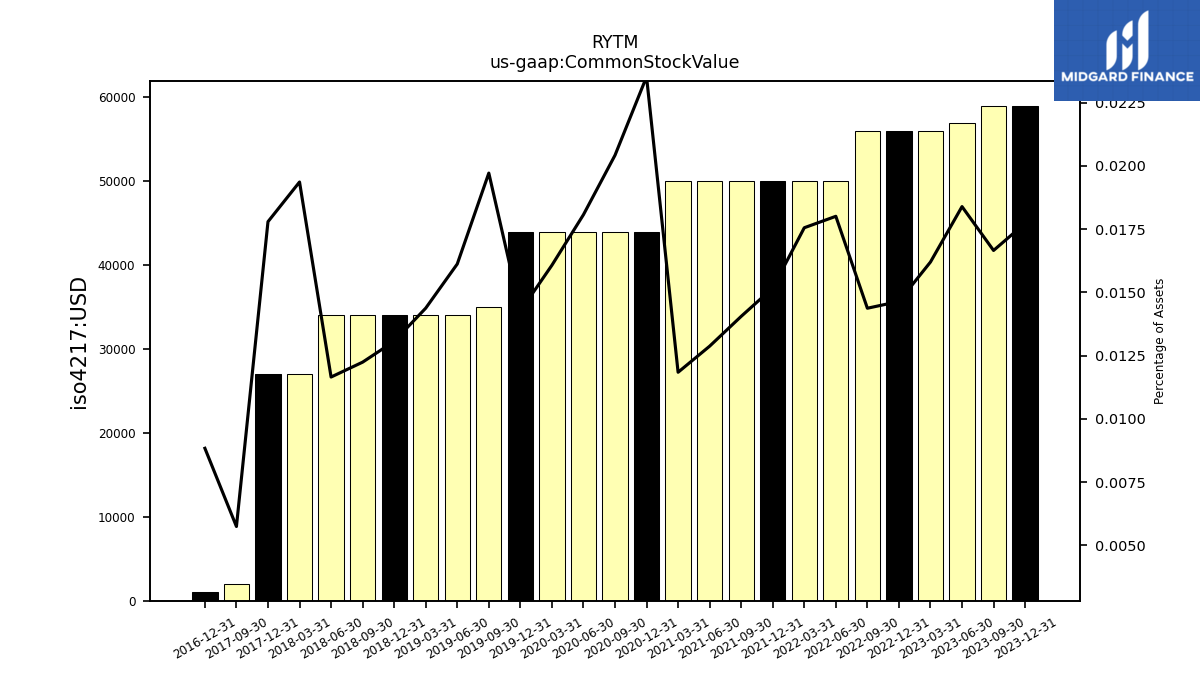
| Common Stock Value | 0.06 | 0.06 | 0.05 | 0.05 | 0.05 | 0.05 | 0.05 | 0.05 | |
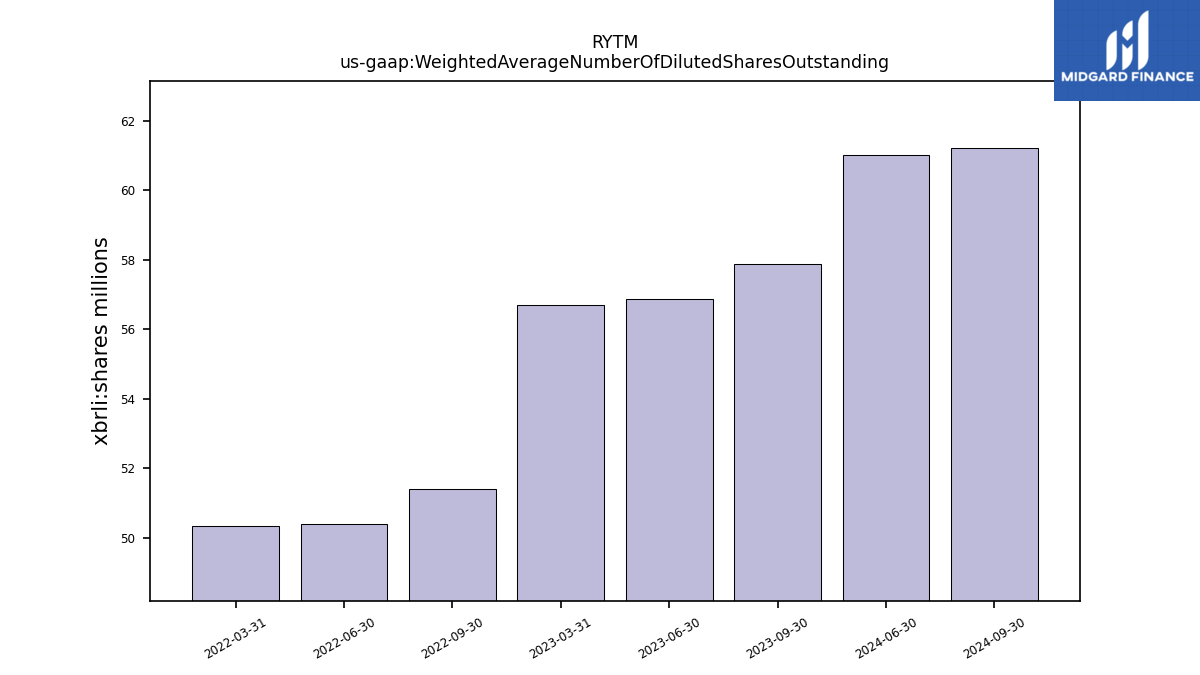
| Weighted Average Number Of Diluted Shares Outstanding | 56.87 | 56.71 | 50.40 | 50.33 | NA | NA | NA | NA | |
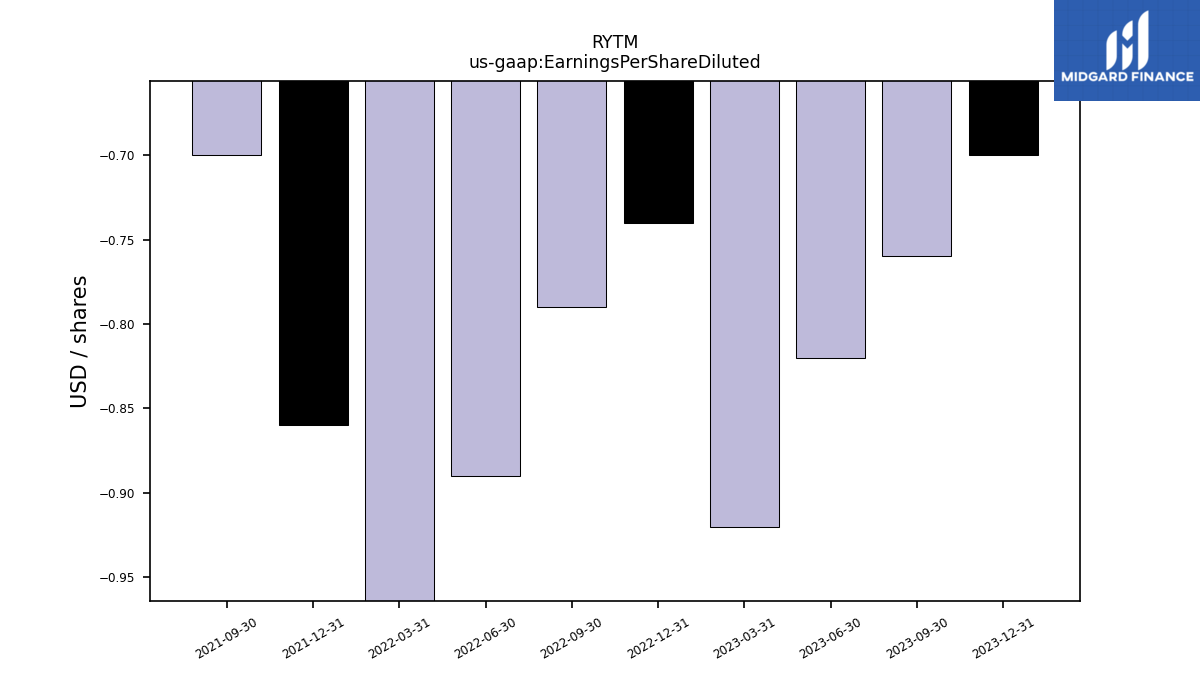
| Earnings Per Share Diluted | -0.82 | -0.92 | -0.89 | -1.05 | -0.86 | -0.70 | NA | NA |
| 2023-06-30 | 2023-03-31 | 2022-06-30 | 2022-03-31 | 2021-12-31 | 2021-09-30 | 2021-06-30 | 2021-03-31 | ||
|---|---|---|---|---|---|---|---|---|---|
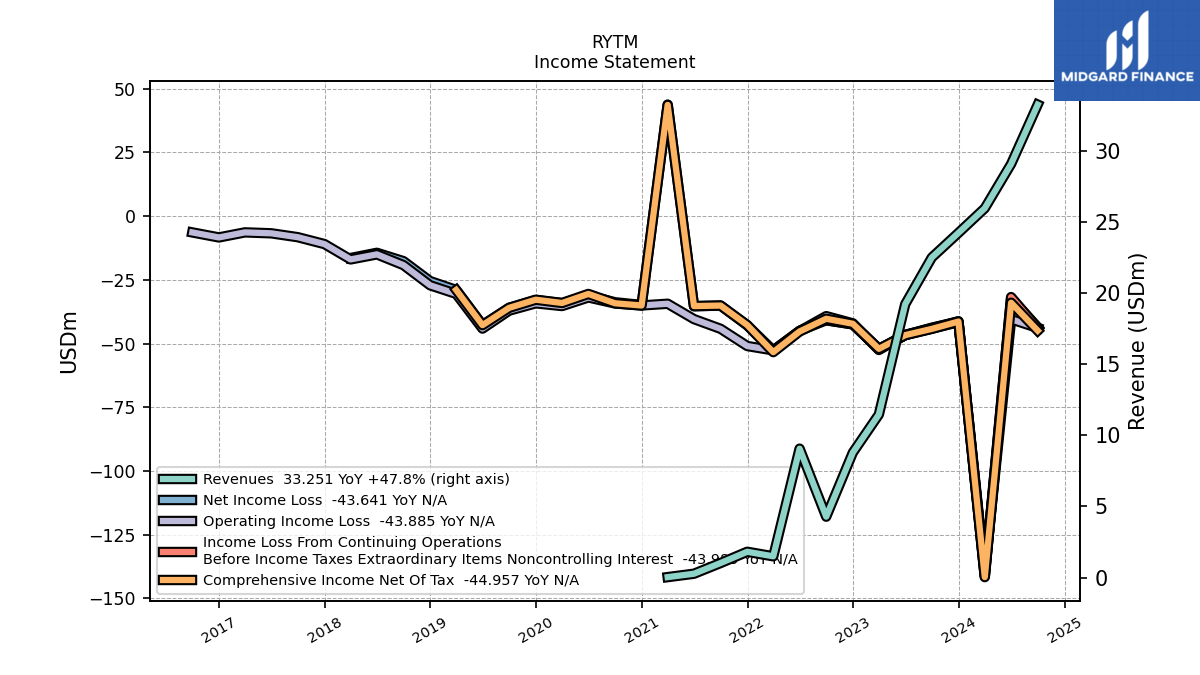
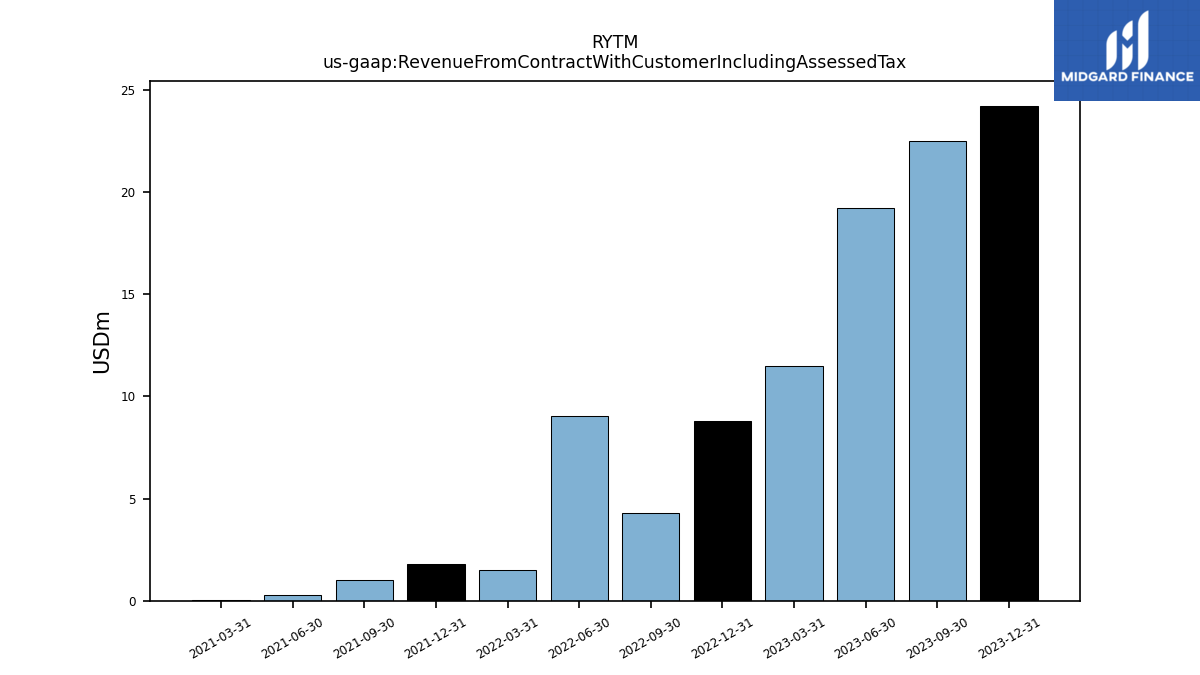
| Revenue From Contract With Customer Including Assessed Tax | 19.22 | 11.47 | 9.07 | 1.50 | 1.82 | 1.03 | 0.27 | 0.04 | |
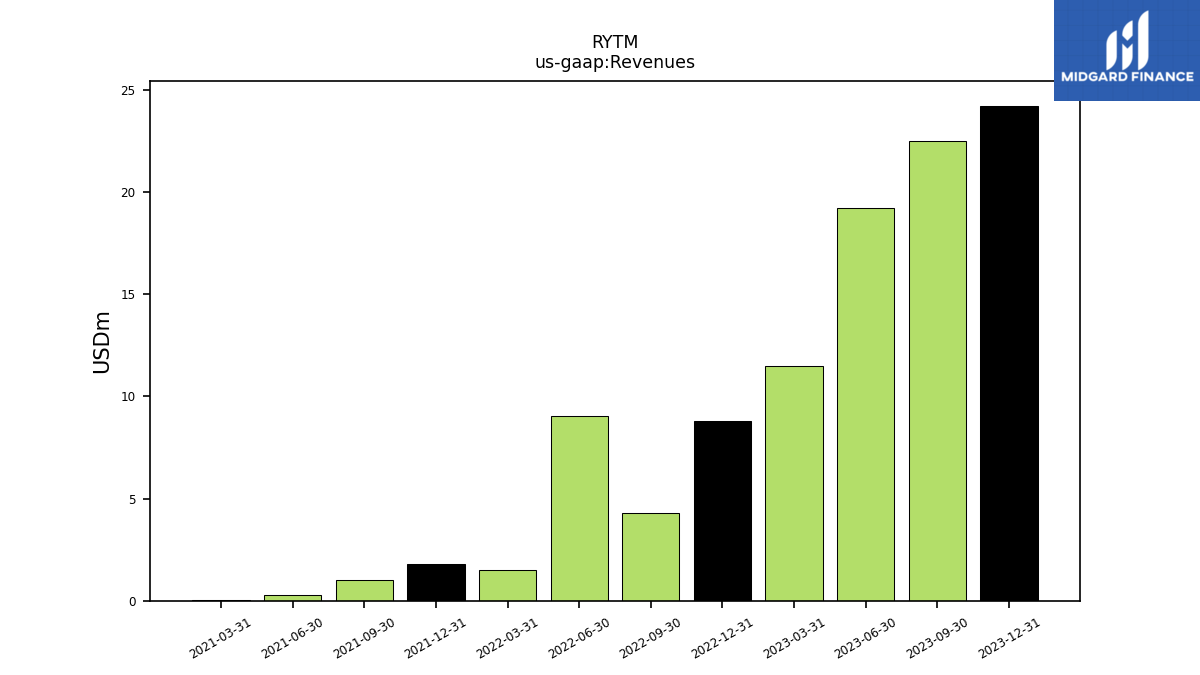
| Revenues | 19.22 | 11.47 | 9.07 | 1.50 | 1.82 | 1.03 | 0.27 | 0.04 | |
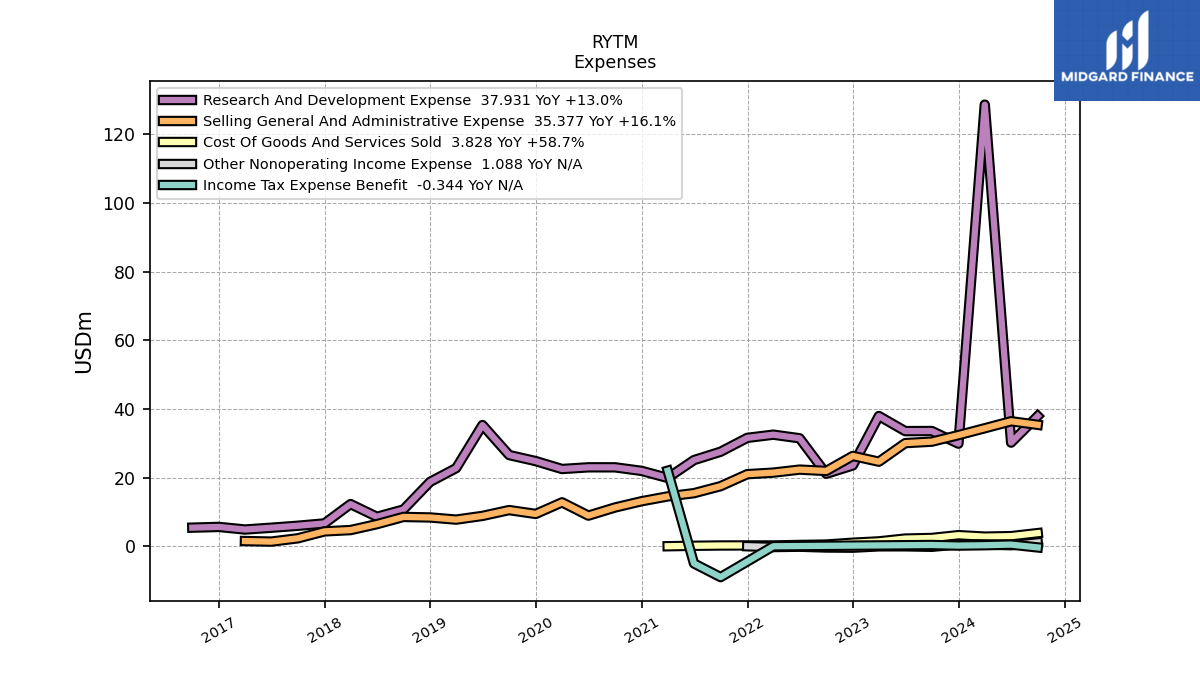
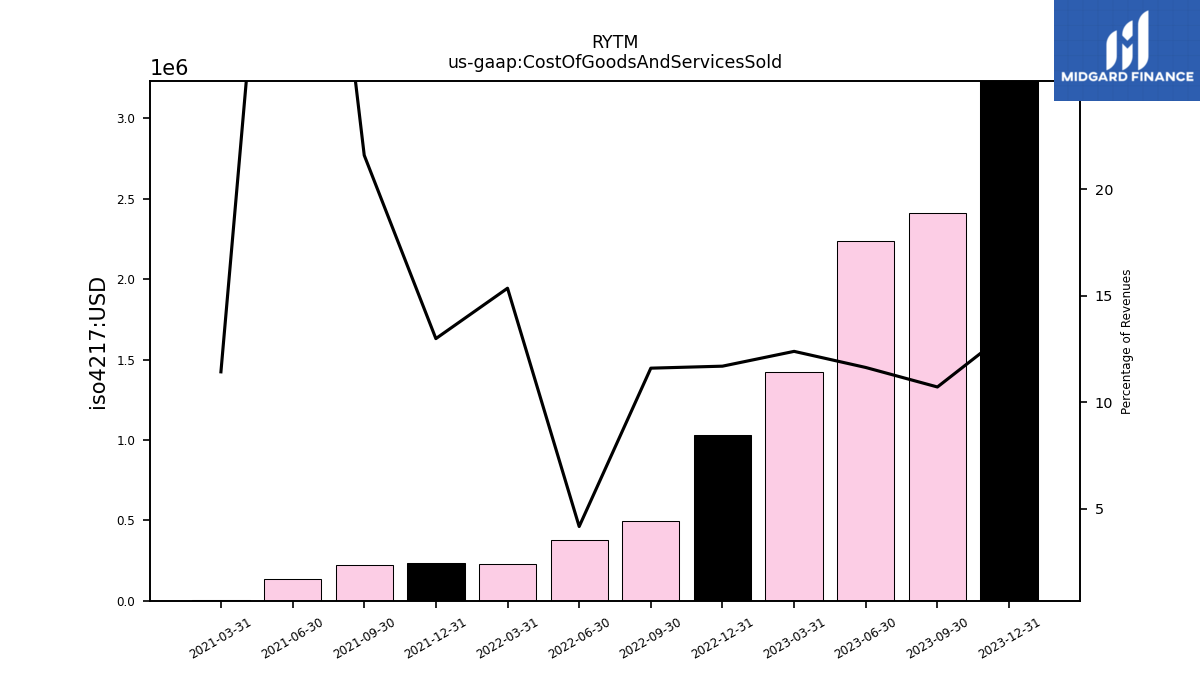
| Cost Of Goods And Services Sold | 2.24 | 1.42 | 0.38 | 0.23 | 0.24 | 0.22 | 0.14 | 0.00 | |
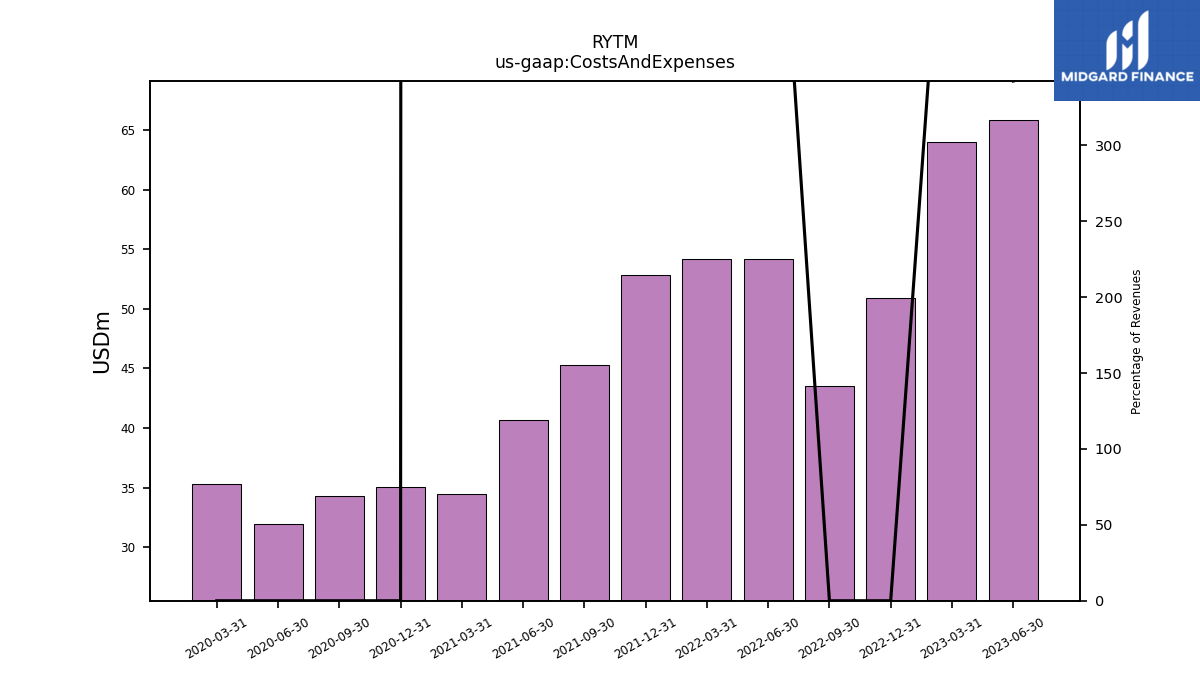
| Costs And Expenses | 65.83 | 64.00 | 54.16 | 54.19 | 52.81 | 45.27 | 40.71 | 34.43 | |
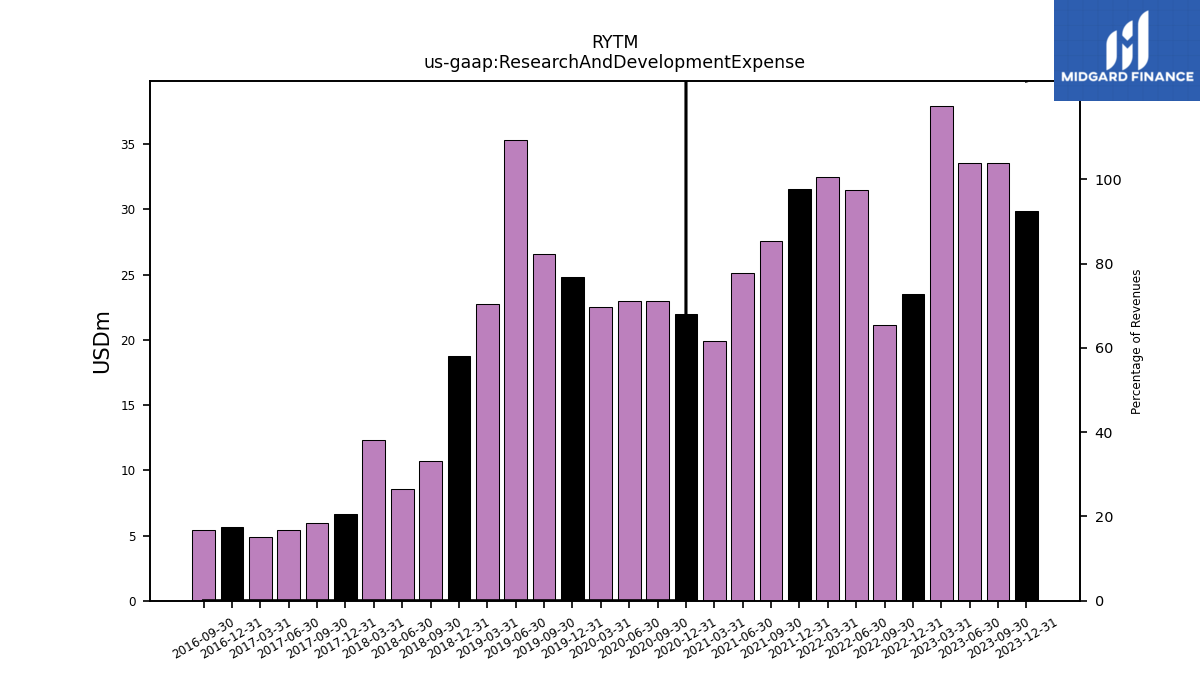
| Research And Development Expense | 33.54 | 37.95 | 31.46 | 32.51 | 31.57 | 27.54 | 25.10 | 19.91 | |
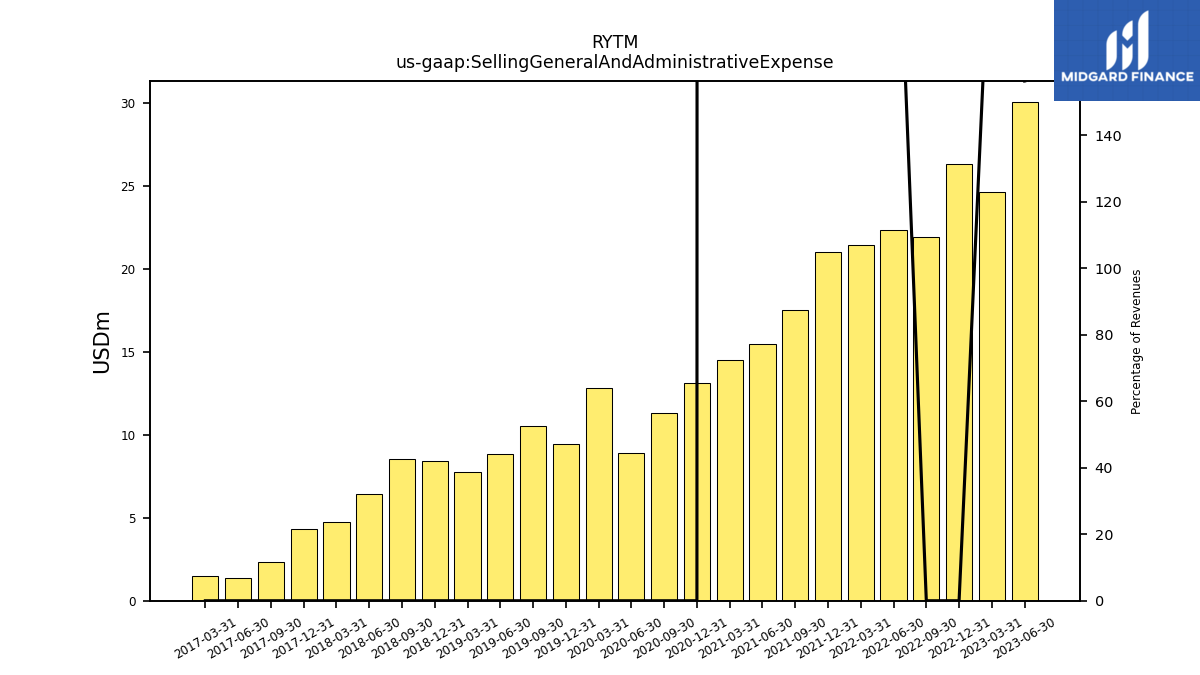
| Selling General And Administrative Expense | 30.05 | 24.63 | 22.33 | 21.45 | 21.00 | 17.51 | 15.46 | 14.52 | |
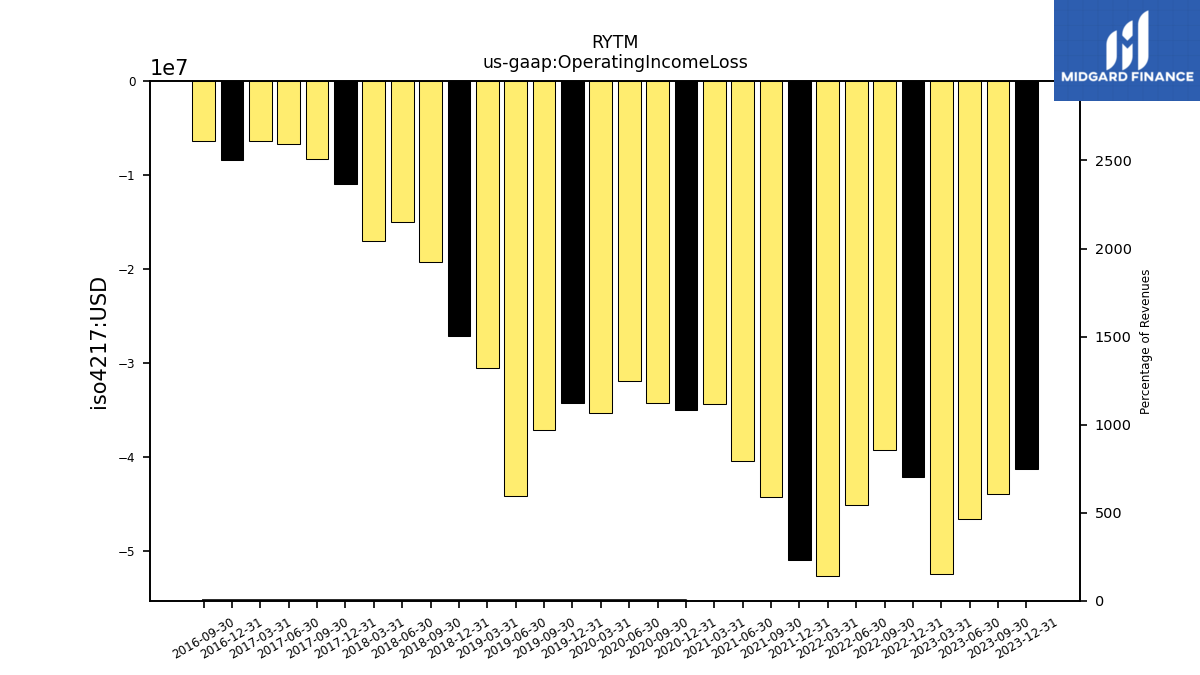
| Operating Income Loss | -46.60 | -52.53 | -45.10 | -52.69 | -50.99 | -44.24 | -40.43 | -34.40 | |
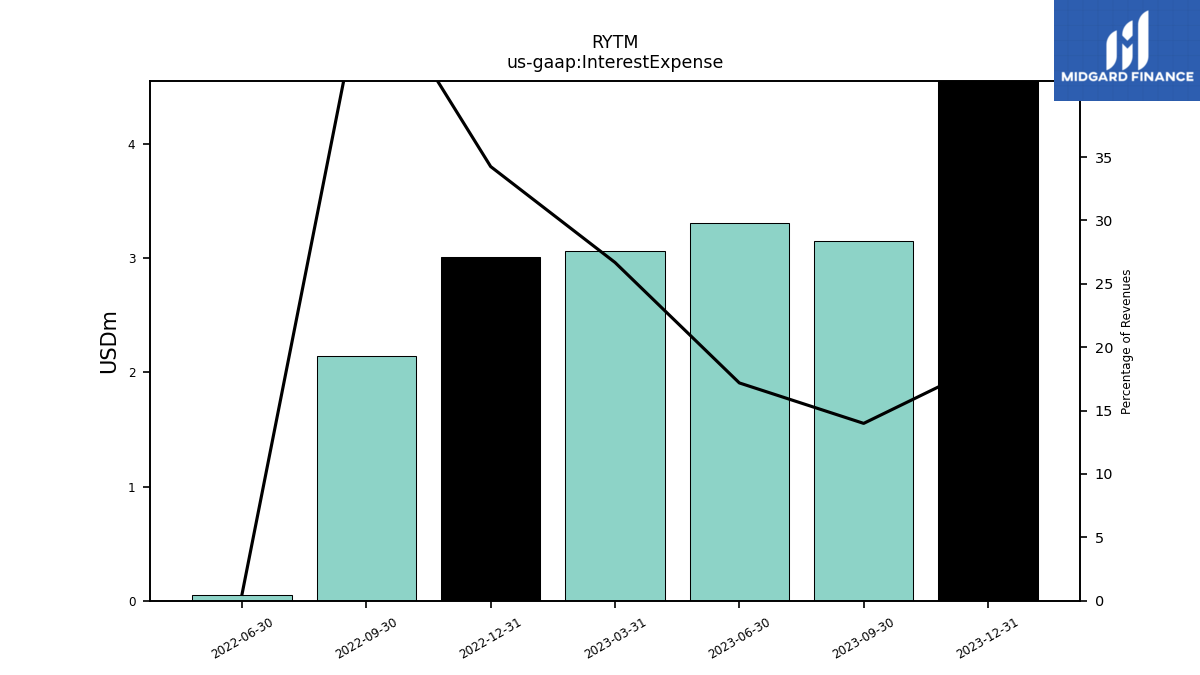
| Interest Expense | 3.30 | 3.06 | 0.05 | NA | NA | NA | NA | NA | |
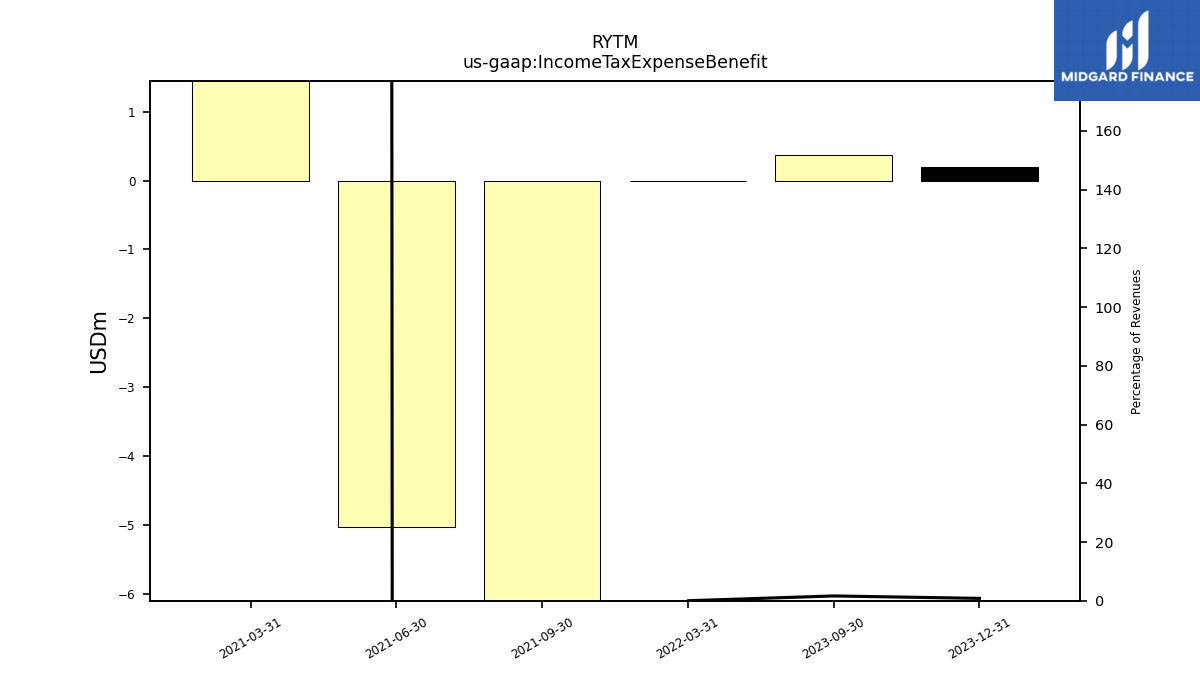
| Income Tax Expense Benefit | NA | NA | NA | 0.00 | NA | -8.99 | -5.02 | 22.01 | |
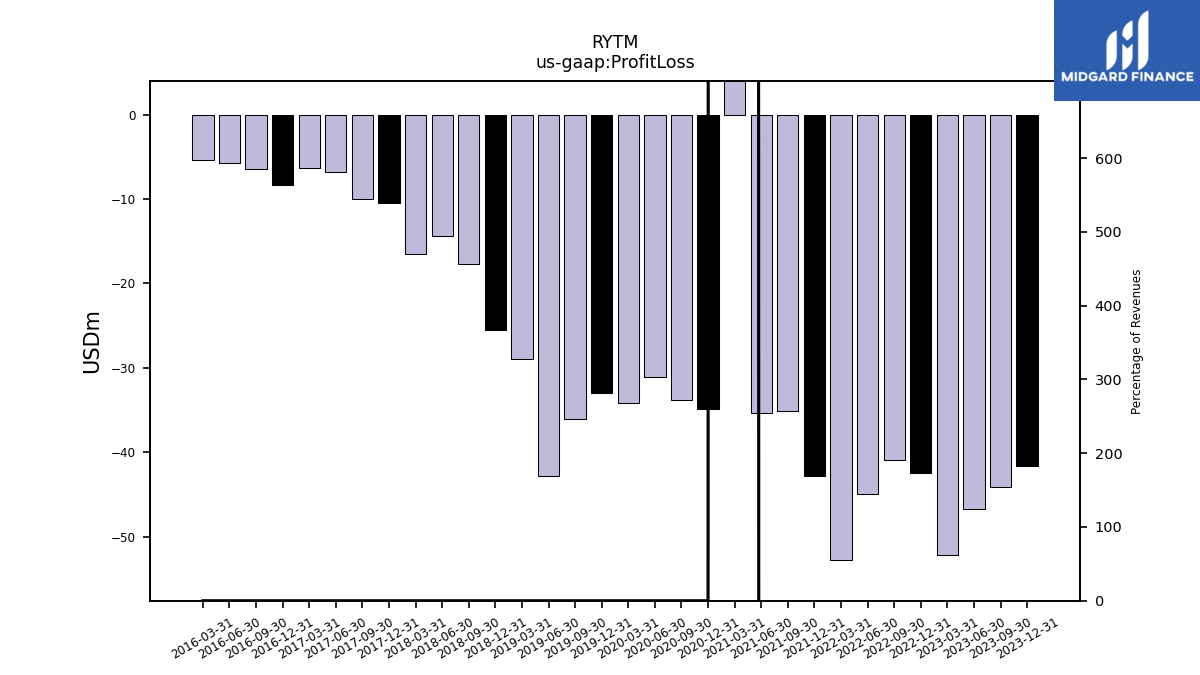
| Profit Loss | -46.70 | -52.18 | -45.00 | -52.76 | -42.87 | -35.11 | -35.39 | 43.75 | |
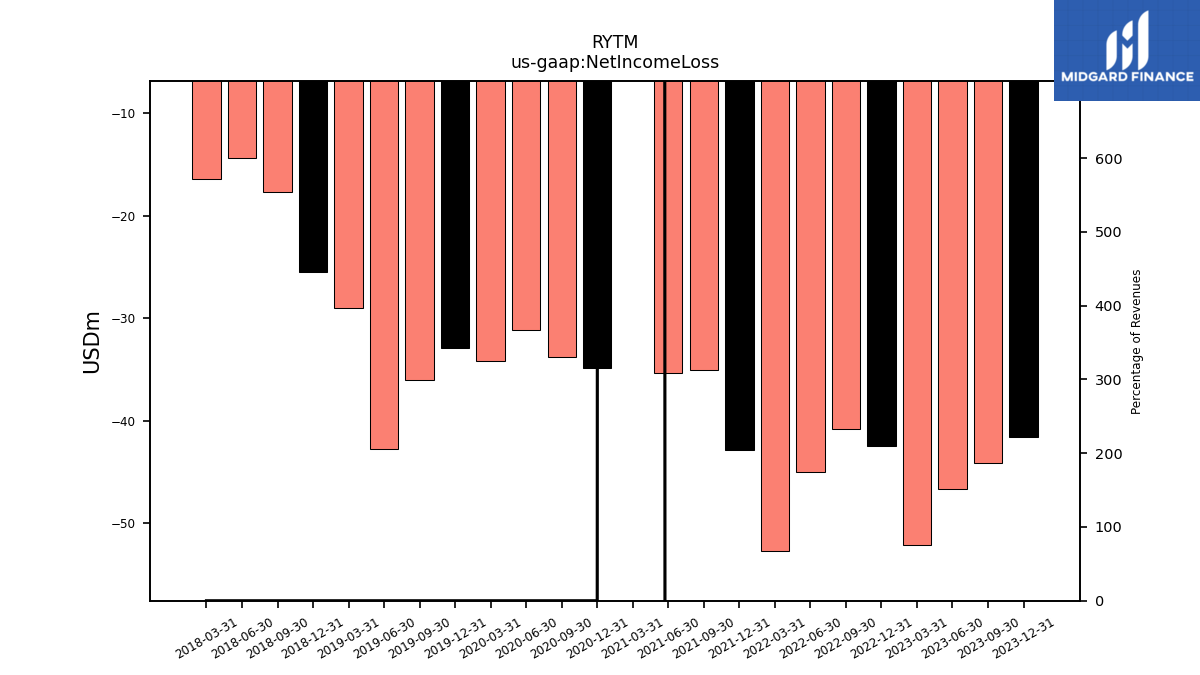
| Net Income Loss | -46.70 | -52.18 | -45.00 | -52.76 | -42.87 | -35.11 | -35.39 | 43.75 | |
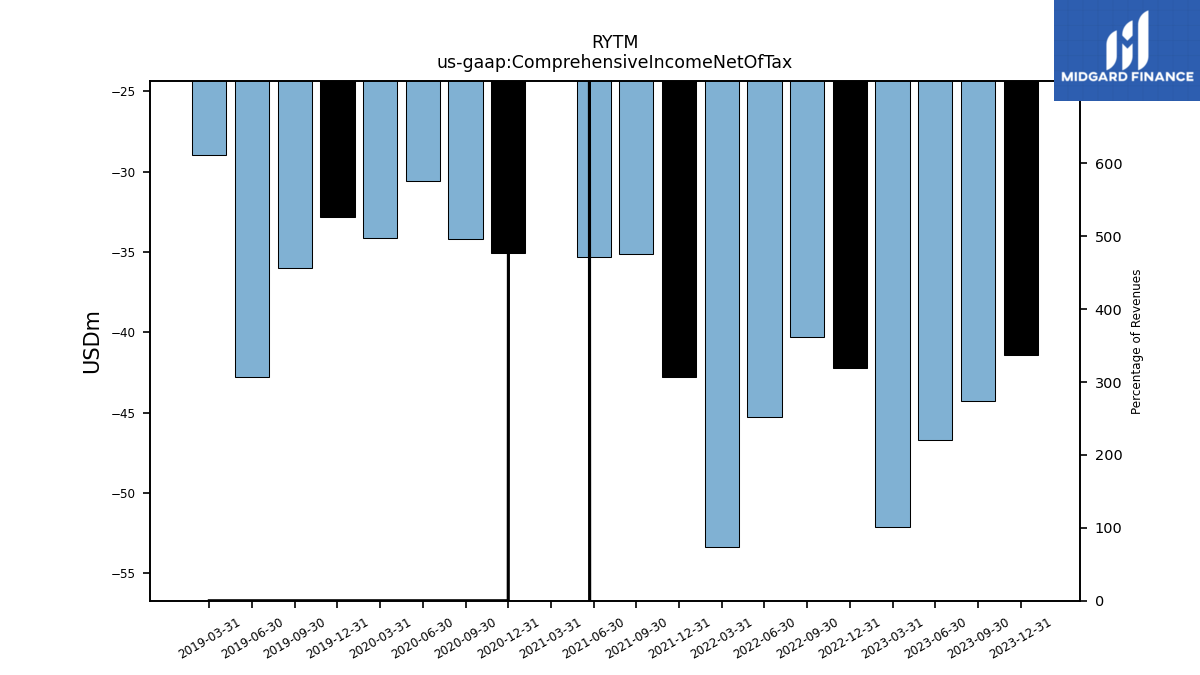
| Comprehensive Income Net Of Tax | -46.71 | -52.09 | -45.28 | -53.39 | -42.76 | -35.11 | -35.31 | 43.64 |
| 2023-06-30 | 2023-03-31 | 2022-06-30 | 2022-03-31 | 2021-12-31 | 2021-09-30 | 2021-06-30 | 2021-03-31 | ||
|---|---|---|---|---|---|---|---|---|---|
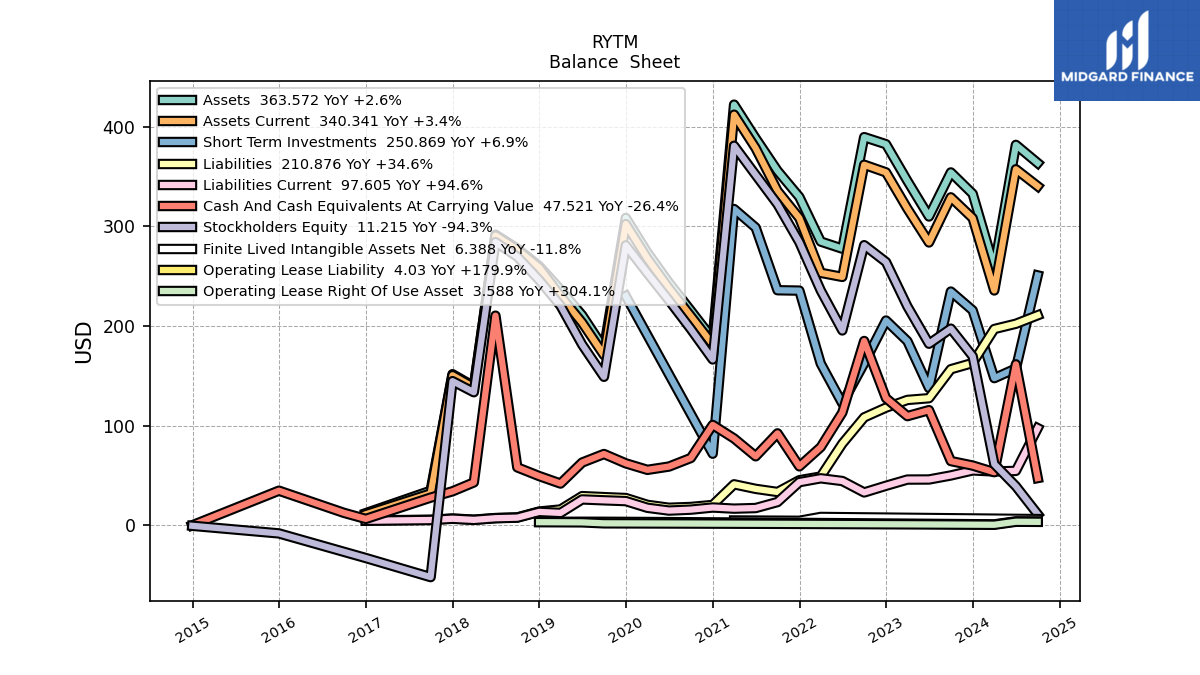
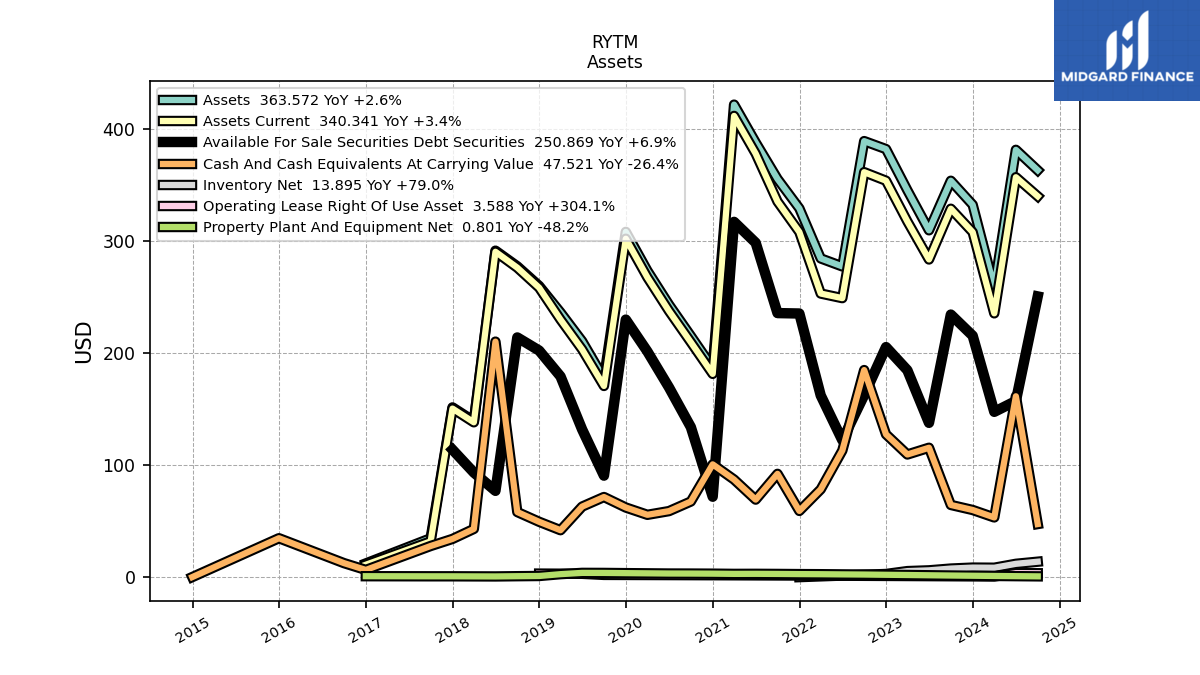
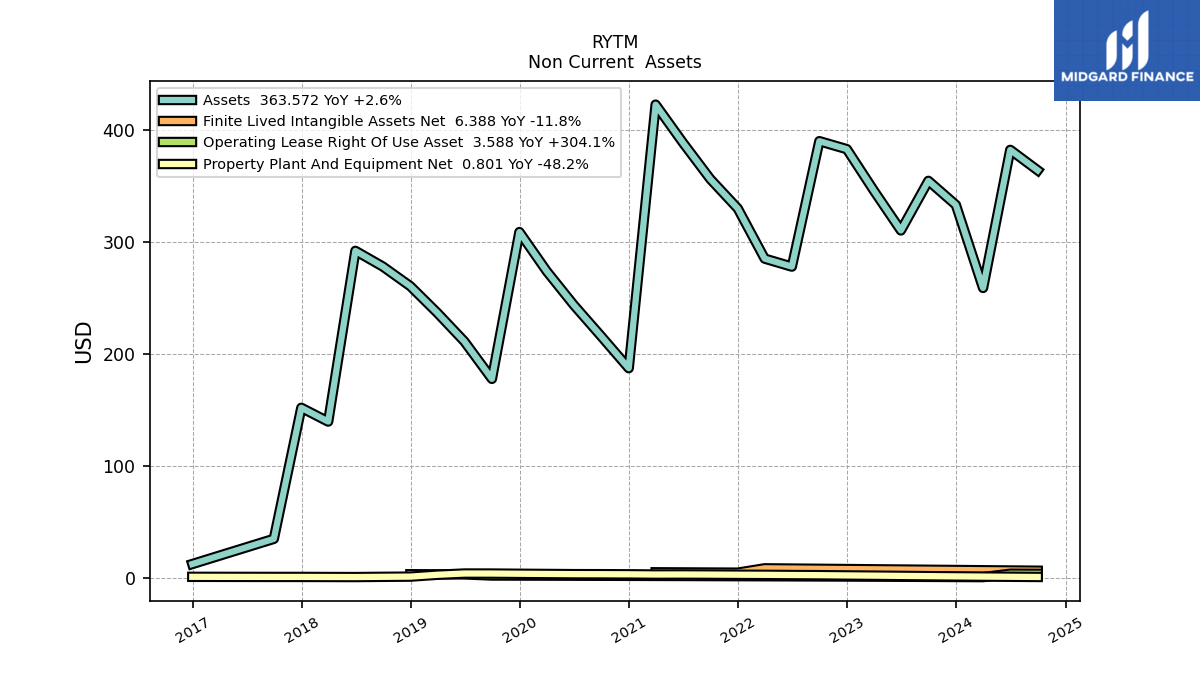
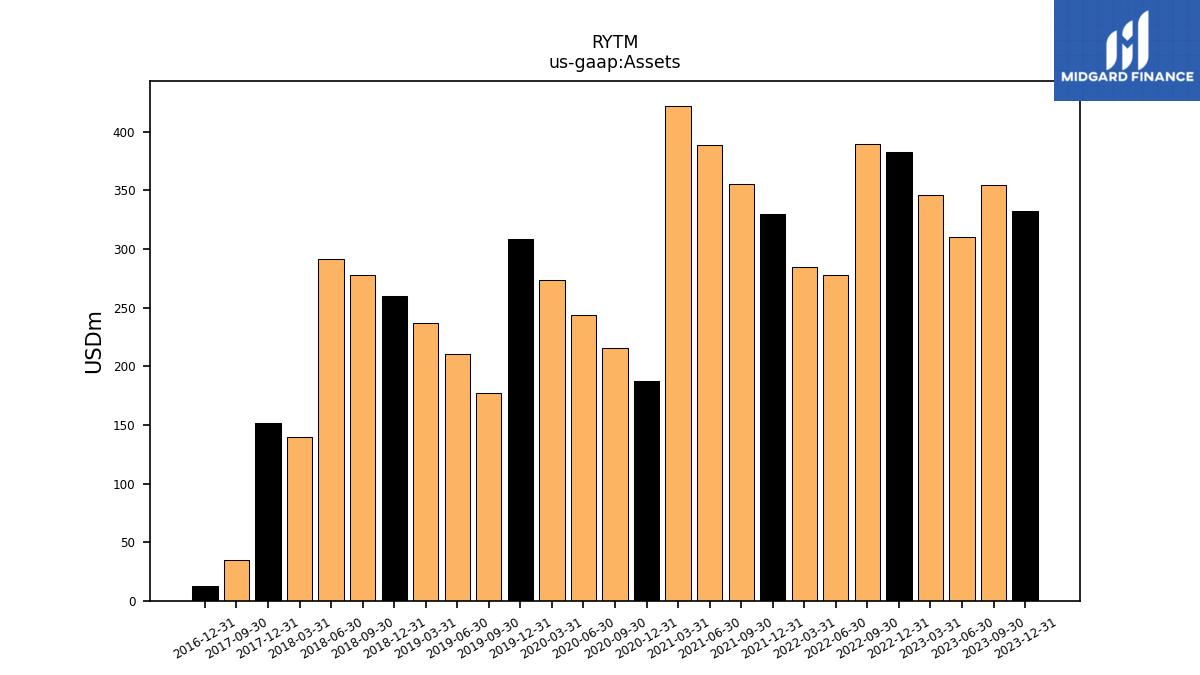
| Assets | 309.94 | 345.68 | 277.68 | 284.82 | 329.52 | 355.82 | 388.39 | 422.21 | |
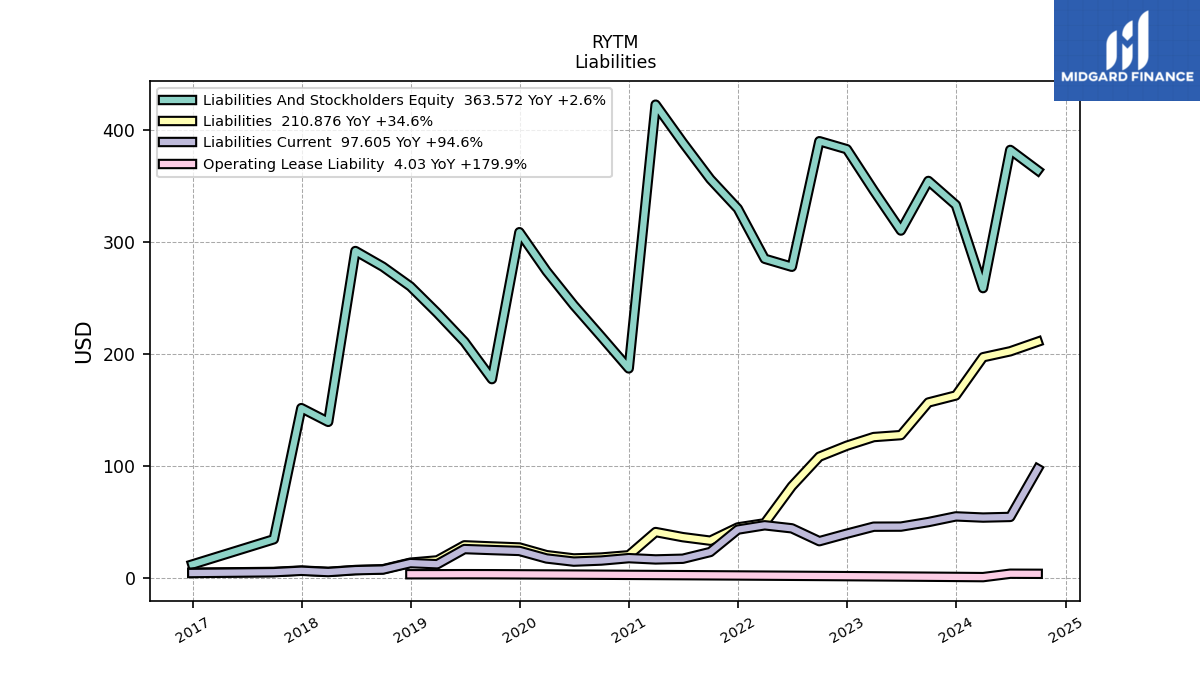
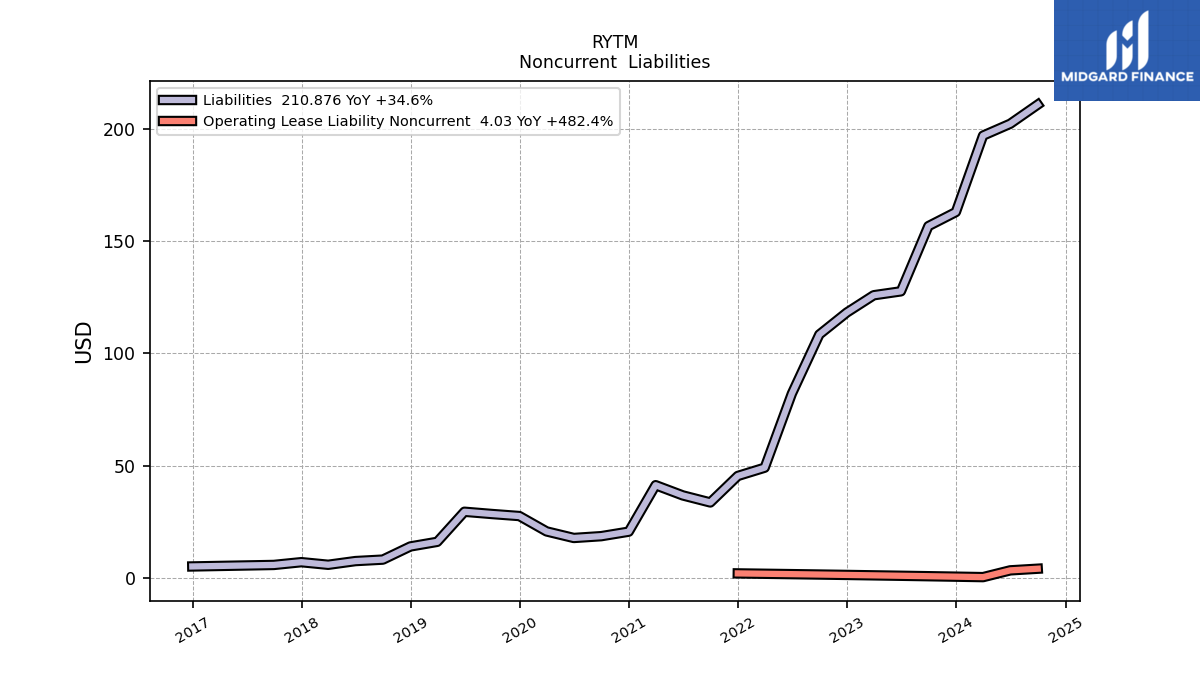
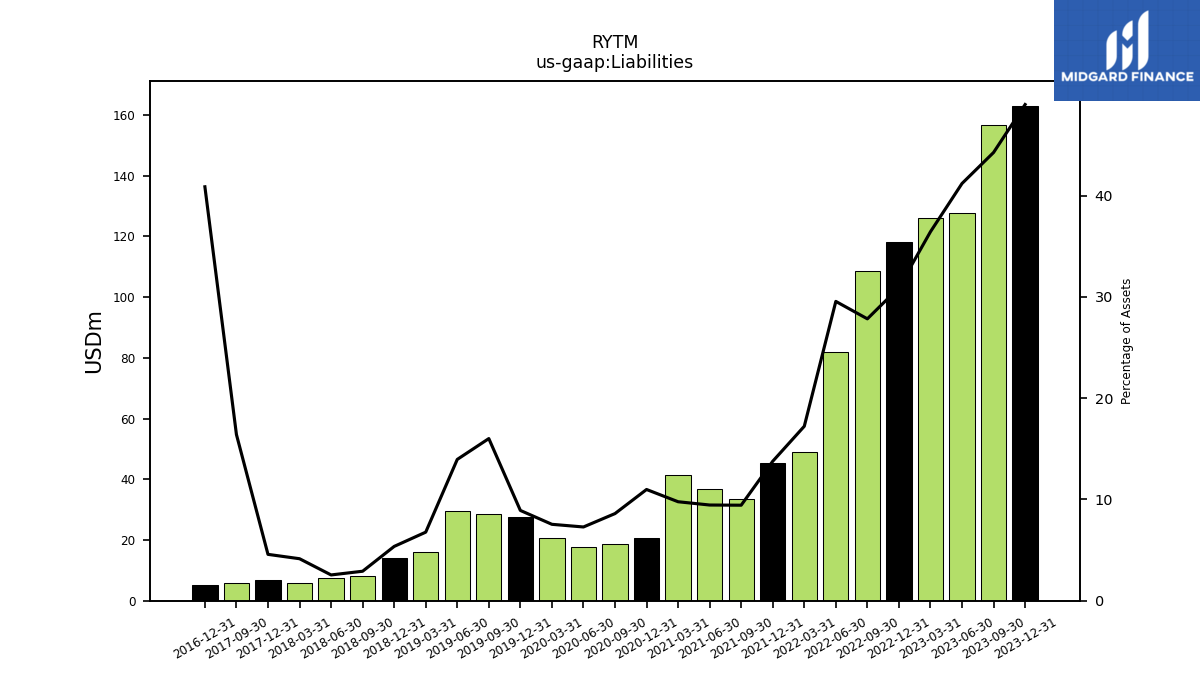
| Liabilities | 127.66 | 125.92 | 82.05 | 49.05 | 45.37 | 33.56 | 36.70 | 41.26 | |
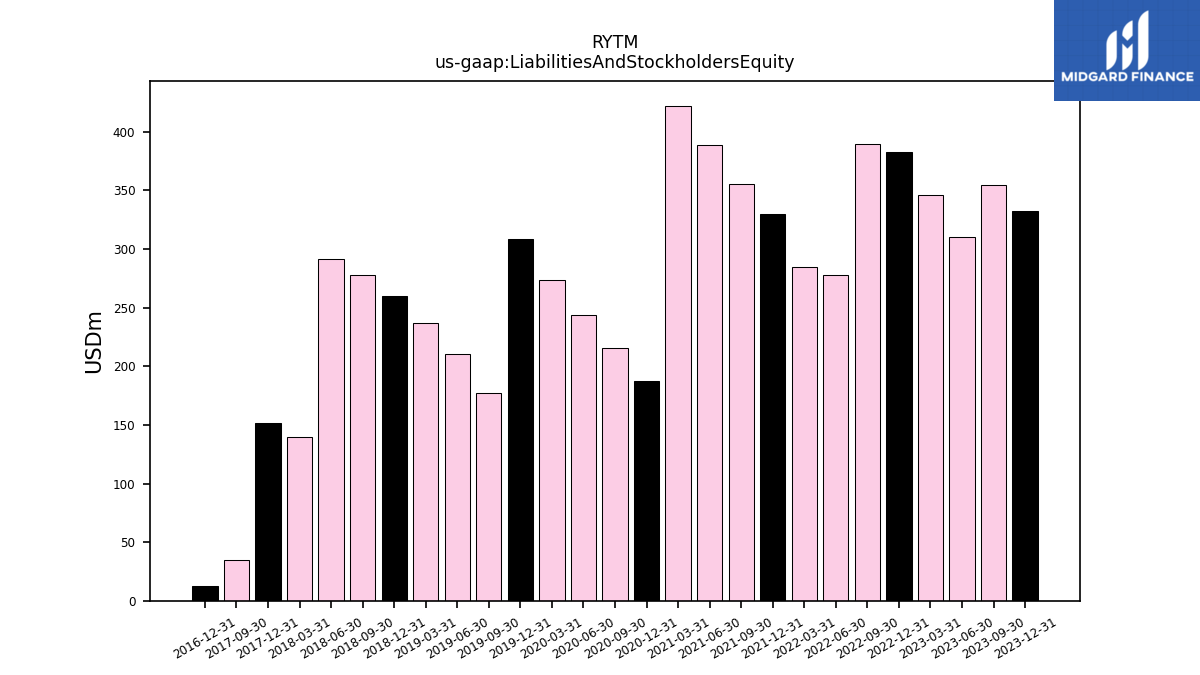
| Liabilities And Stockholders Equity | 309.94 | 345.68 | 277.68 | 284.82 | 329.52 | 355.82 | 388.39 | 422.21 | |
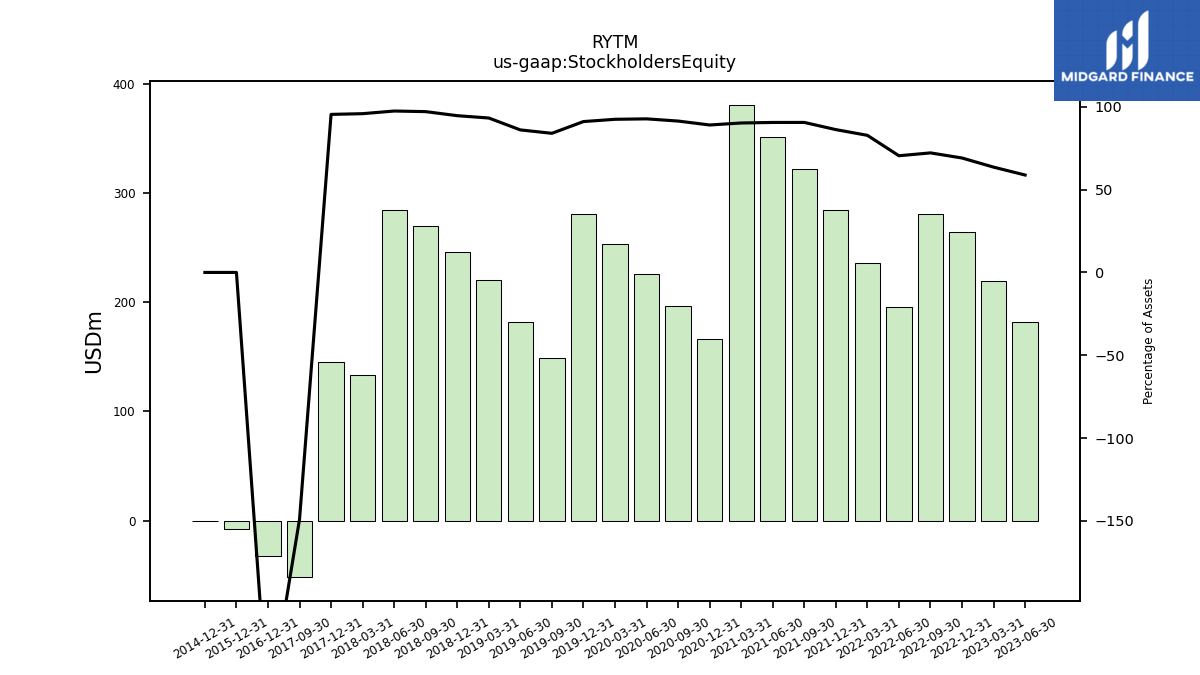
| Stockholders Equity | 182.28 | 219.76 | 195.63 | 235.77 | 284.15 | 322.26 | 351.69 | 380.95 |
| 2023-06-30 | 2023-03-31 | 2022-06-30 | 2022-03-31 | 2021-12-31 | 2021-09-30 | 2021-06-30 | 2021-03-31 | ||
|---|---|---|---|---|---|---|---|---|---|
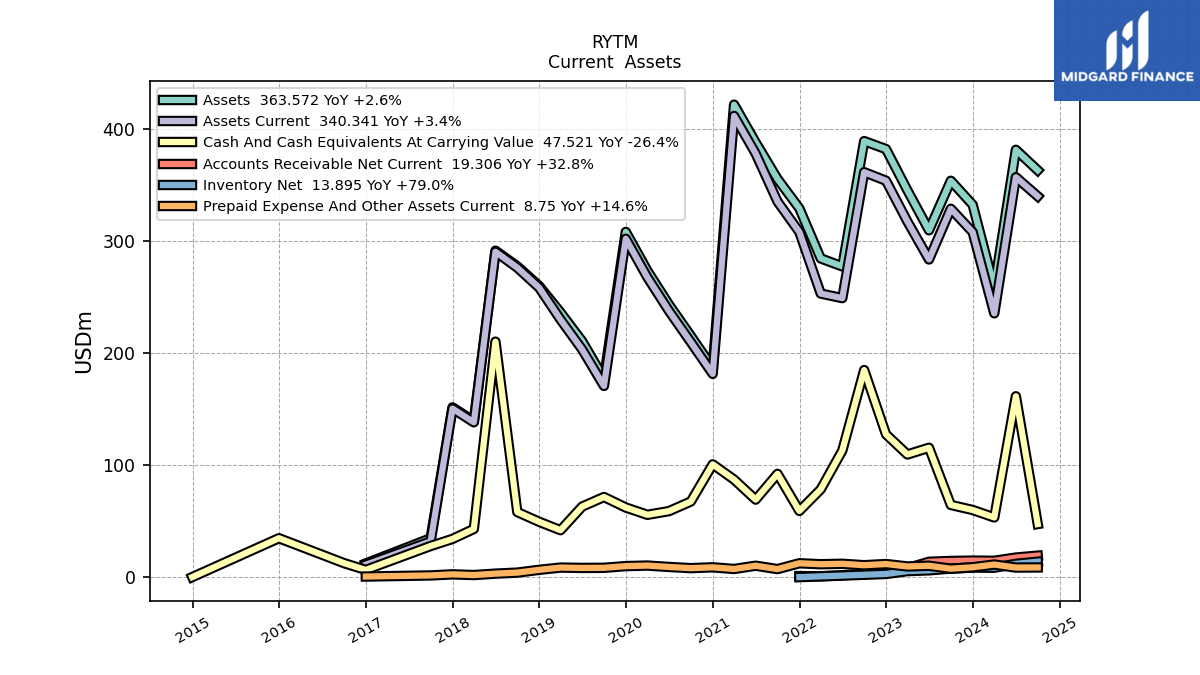
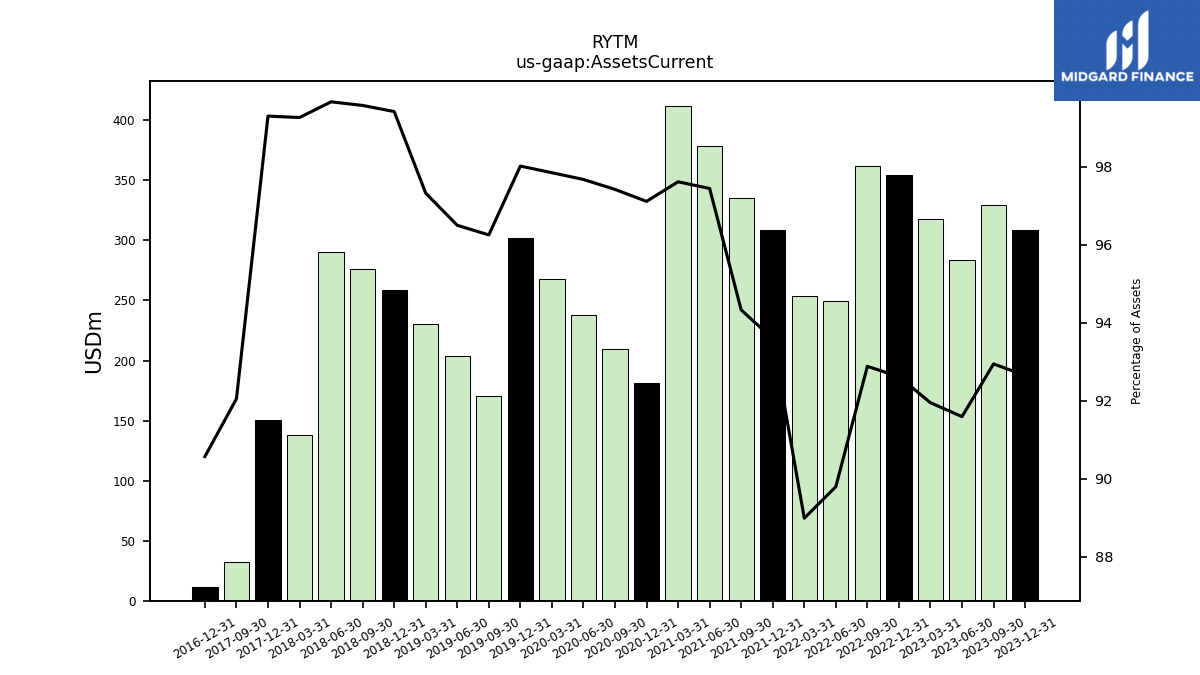
| Assets Current | 283.88 | 317.84 | 249.33 | 253.45 | 308.39 | 335.64 | 378.45 | 412.13 | |
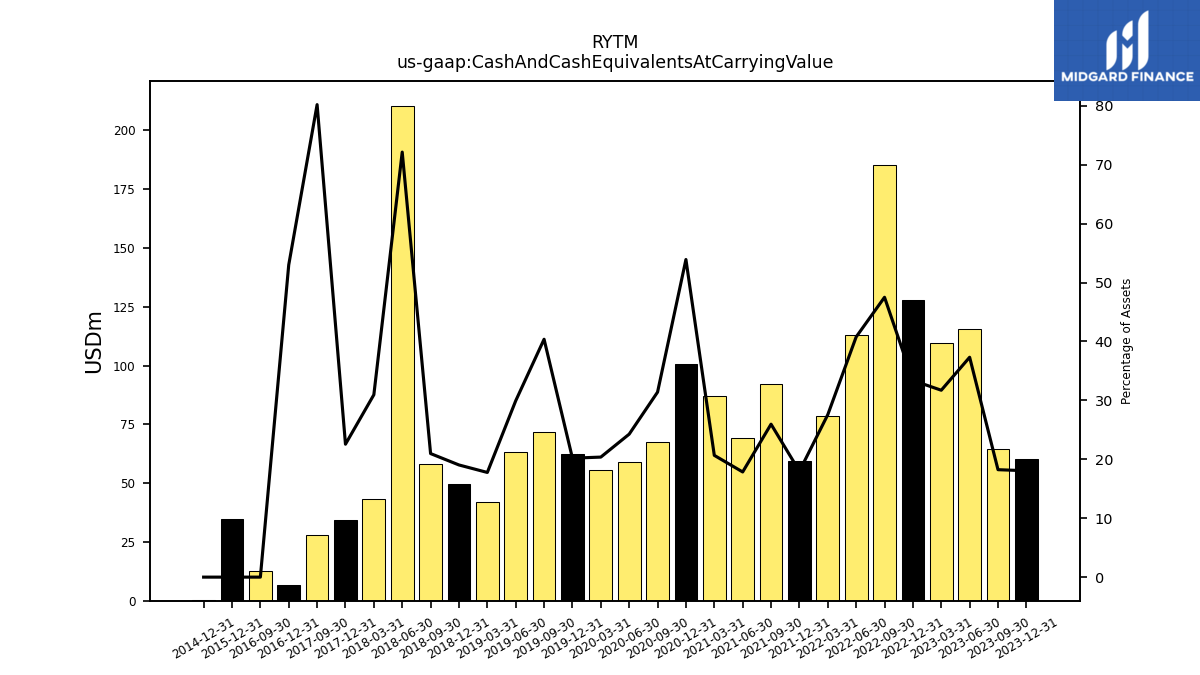
| Cash And Cash Equivalents At Carrying Value | 115.68 | 109.66 | 113.21 | 78.54 | 59.25 | 92.37 | 69.34 | 87.27 | |
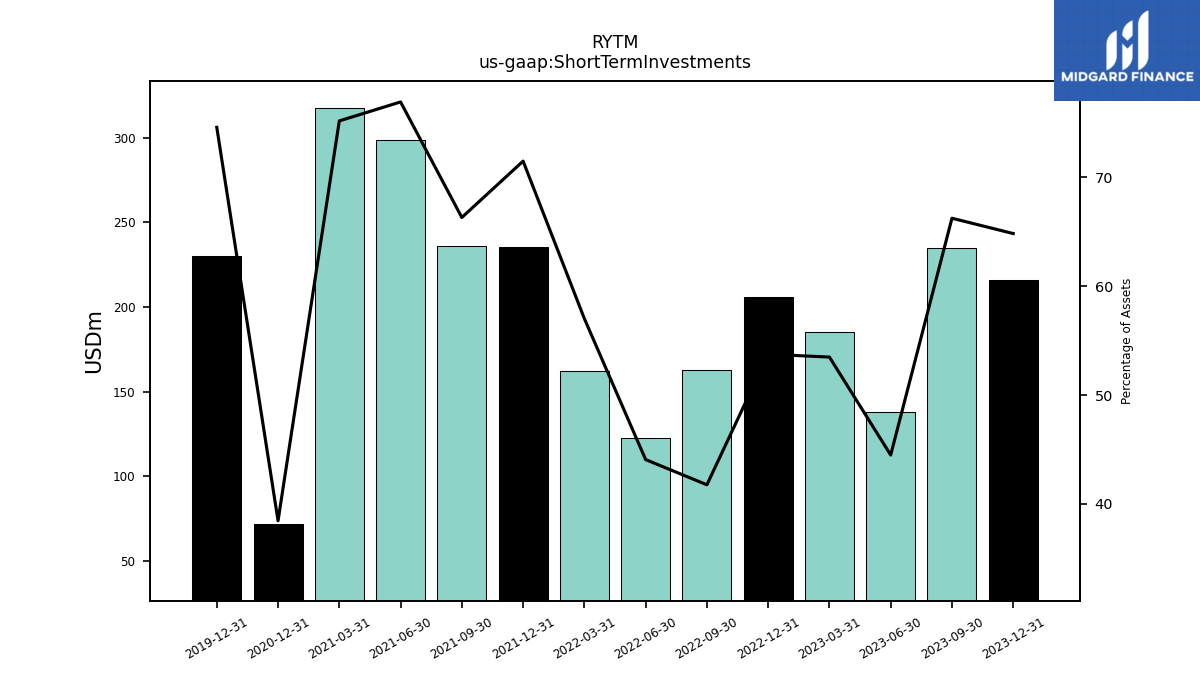
| Short Term Investments | 137.92 | 184.92 | 122.39 | 162.43 | 235.61 | 235.98 | 298.81 | 317.48 | |
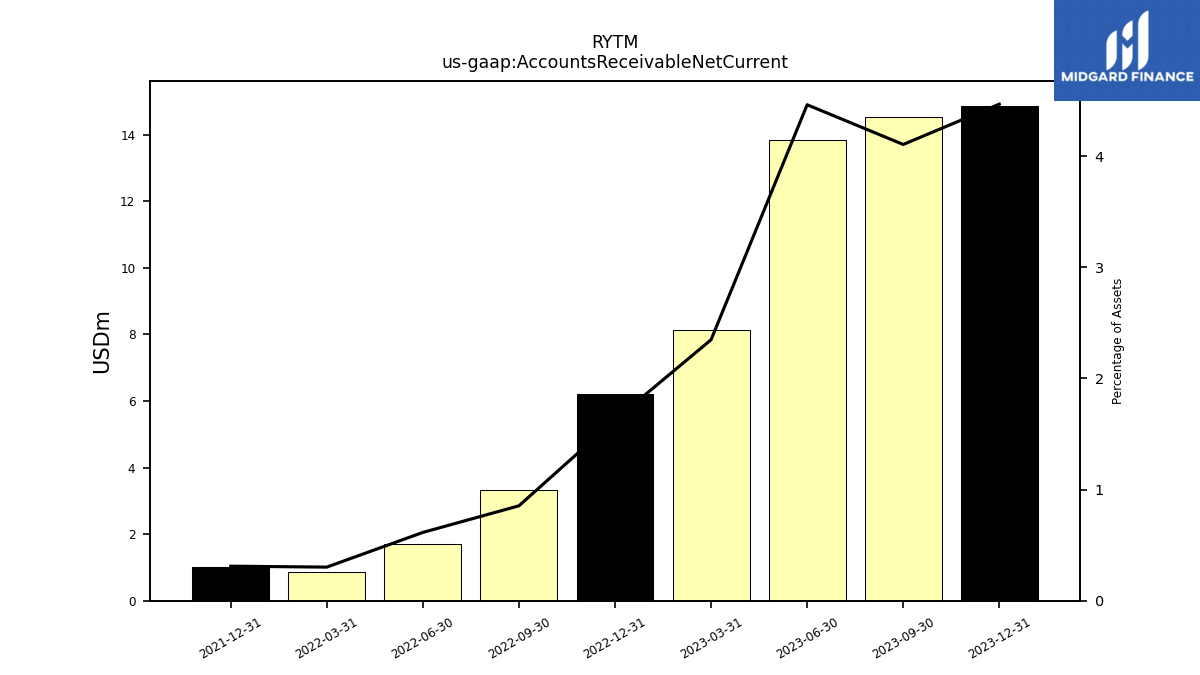
| Accounts Receivable Net Current | 13.83 | 8.12 | 1.71 | 0.86 | 1.02 | NA | NA | NA | |
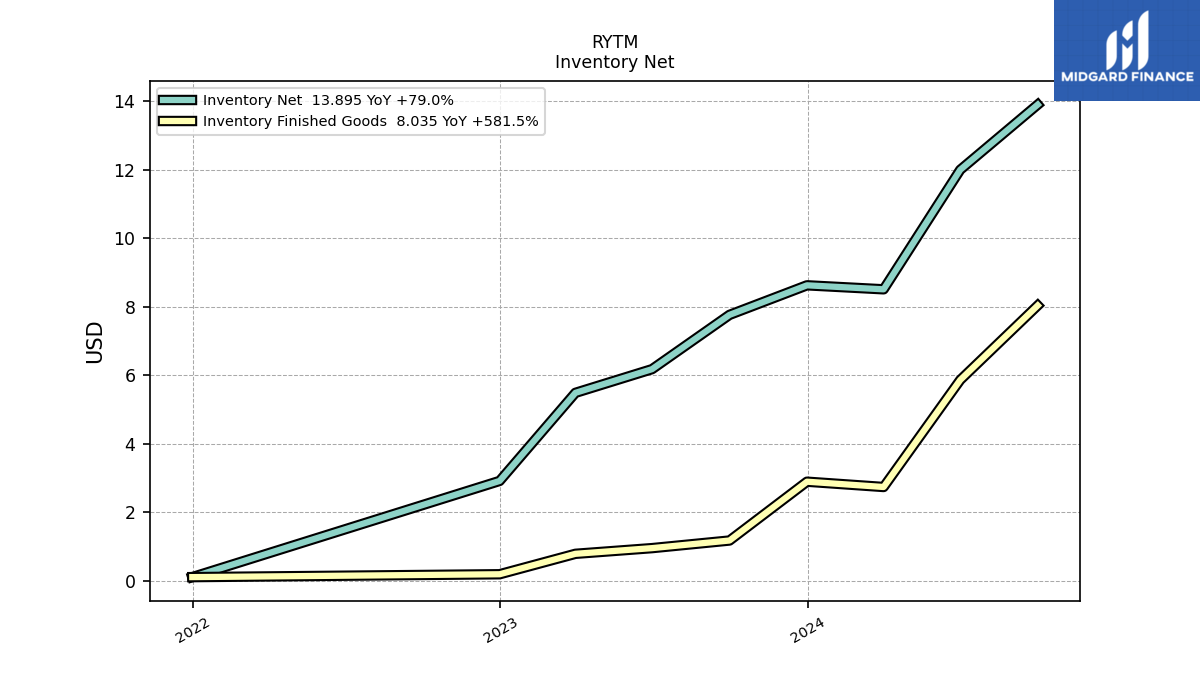
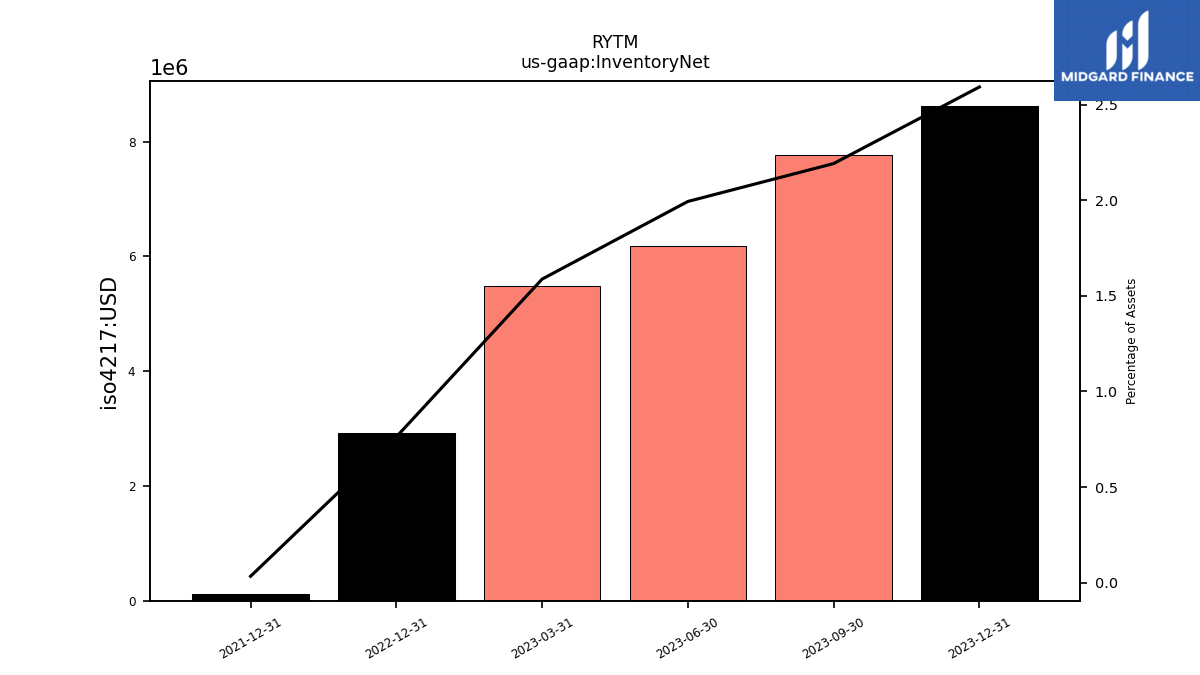
| Inventory Net | 6.18 | 5.49 | NA | NA | 0.11 | NA | NA | NA | |
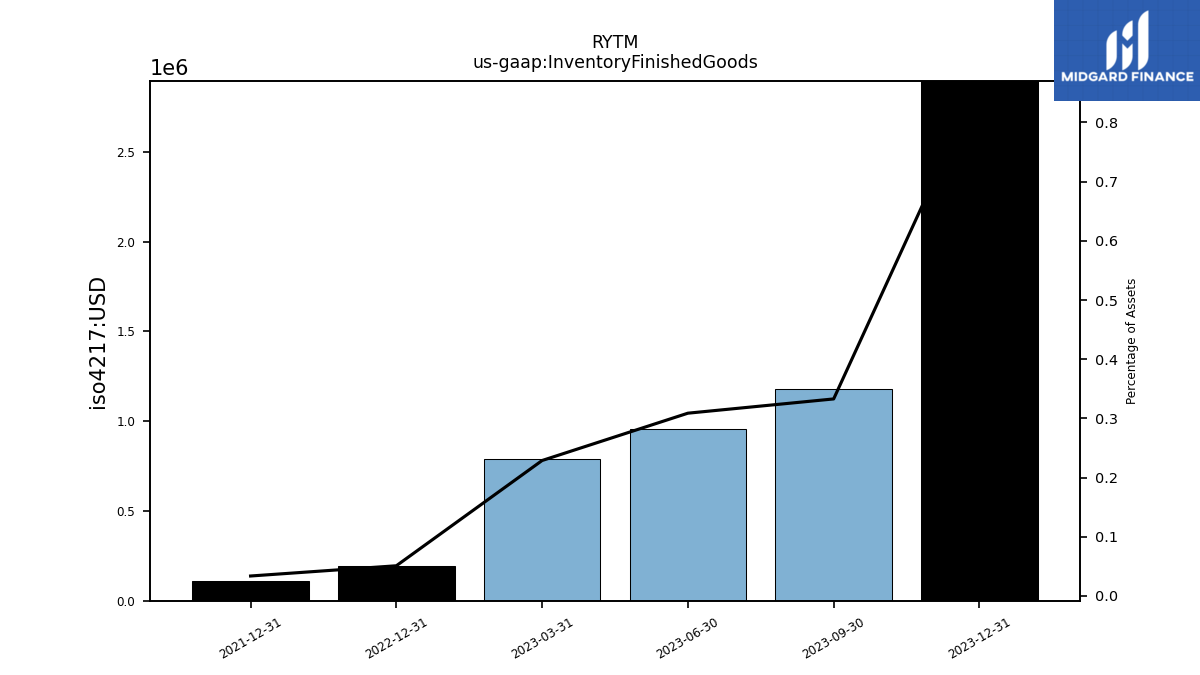
| Inventory Finished Goods | 0.96 | 0.79 | NA | NA | 0.11 | NA | NA | NA | |
| Inventory Raw Materials And Supplies | 2.27 | 4.70 | NA | NA | NA | NA | NA | NA | |
| Other Assets Current | NA | NA | NA | NA | 4.10 | NA | NA | NA | |
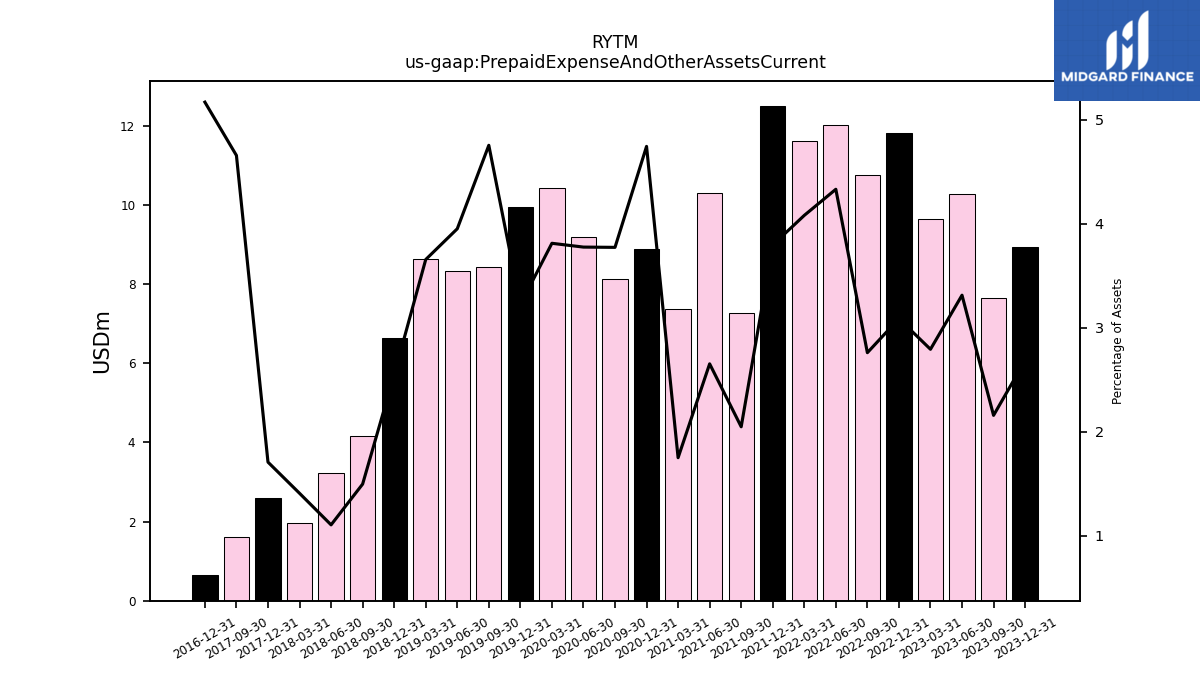
| Prepaid Expense And Other Assets Current | 10.27 | 9.65 | 12.03 | 11.62 | 12.51 | 7.28 | 10.30 | 7.38 | |
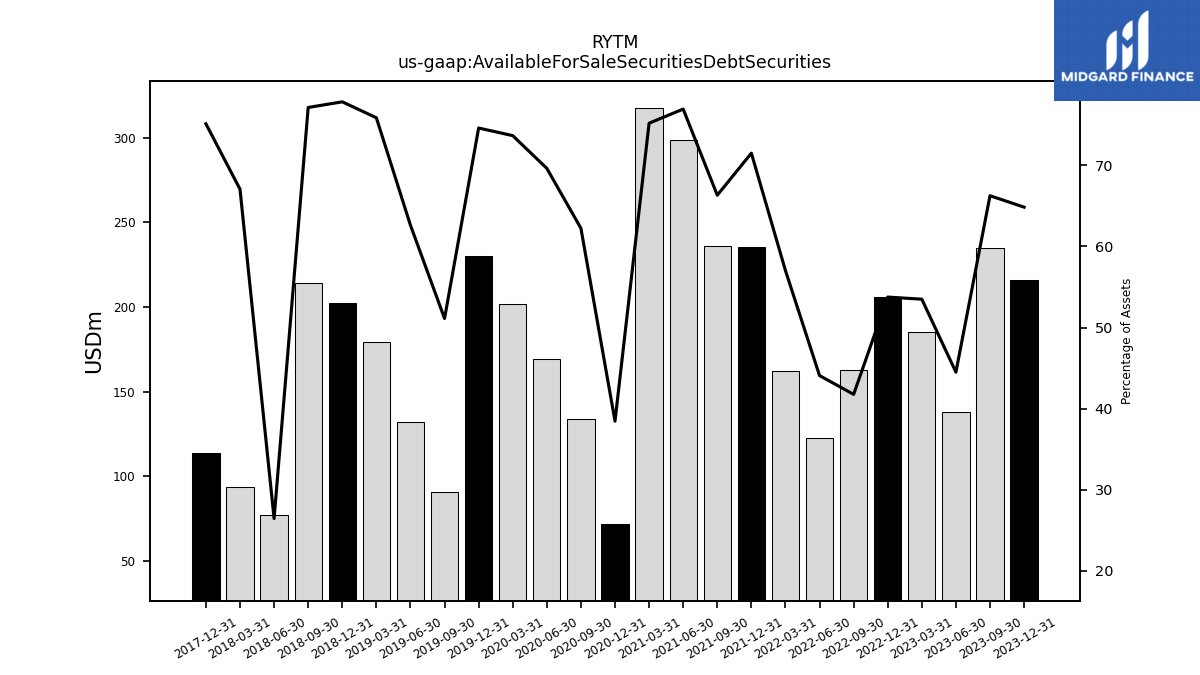
| Available For Sale Securities Debt Securities | 137.92 | 184.92 | 122.39 | 162.43 | 235.61 | 235.98 | 298.81 | 317.48 |
| 2023-06-30 | 2023-03-31 | 2022-06-30 | 2022-03-31 | 2021-12-31 | 2021-09-30 | 2021-06-30 | 2021-03-31 | ||
|---|---|---|---|---|---|---|---|---|---|
| Property Plant And Equipment Gross | NA | NA | NA | NA | 5.07 | NA | NA | NA | |
| Accumulated Depreciation Depletion And Amortization Property Plant And Equipment | NA | NA | NA | NA | 2.26 | NA | NA | NA | |
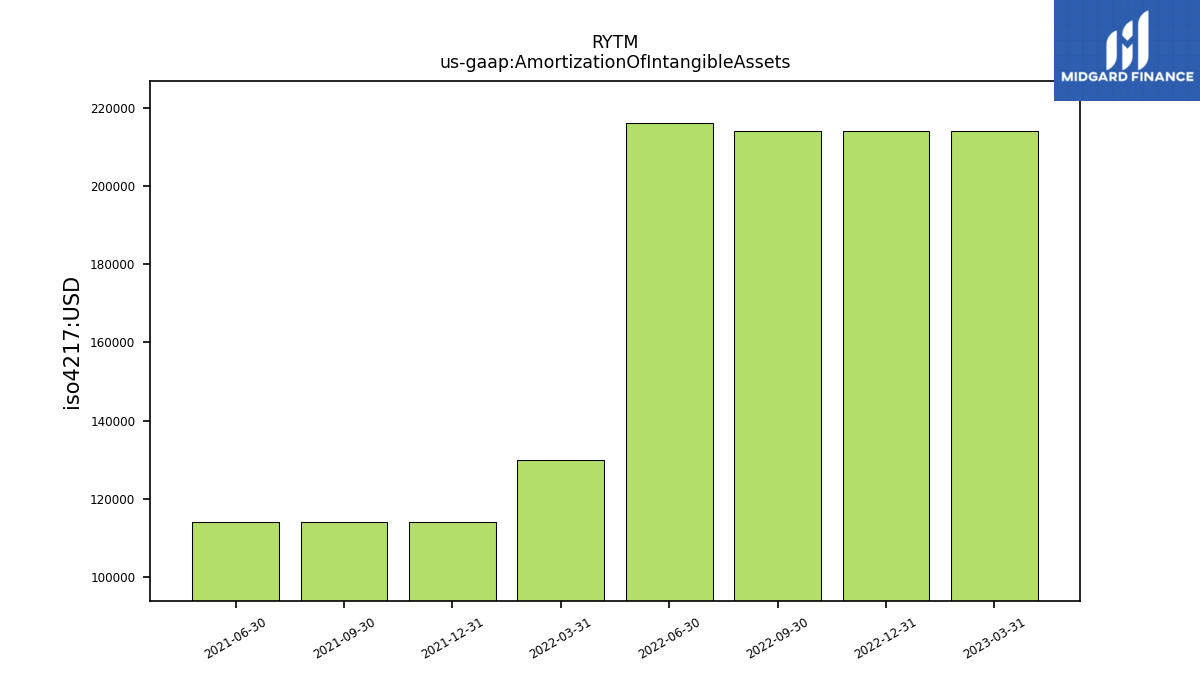
| Amortization Of Intangible Assets | NA | 0.21 | 0.22 | 0.13 | 0.11 | 0.11 | 0.11 | NA | |
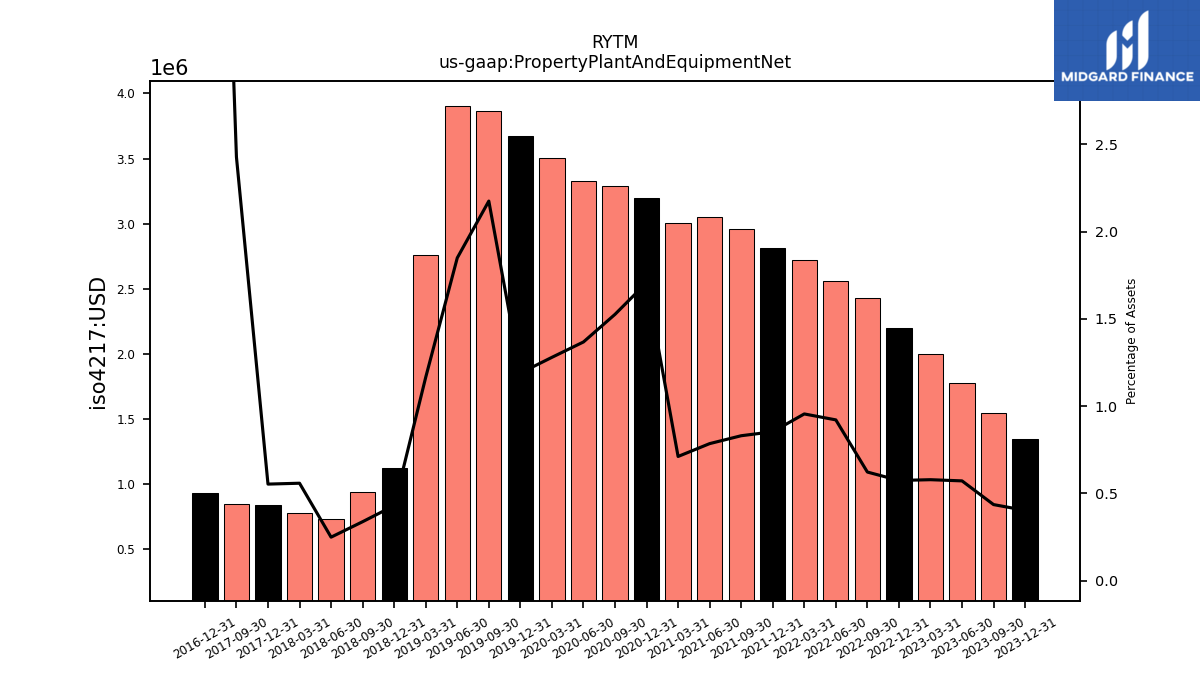
| Property Plant And Equipment Net | 1.77 | 2.00 | 2.56 | 2.72 | 2.81 | 2.96 | 3.05 | 3.01 | |
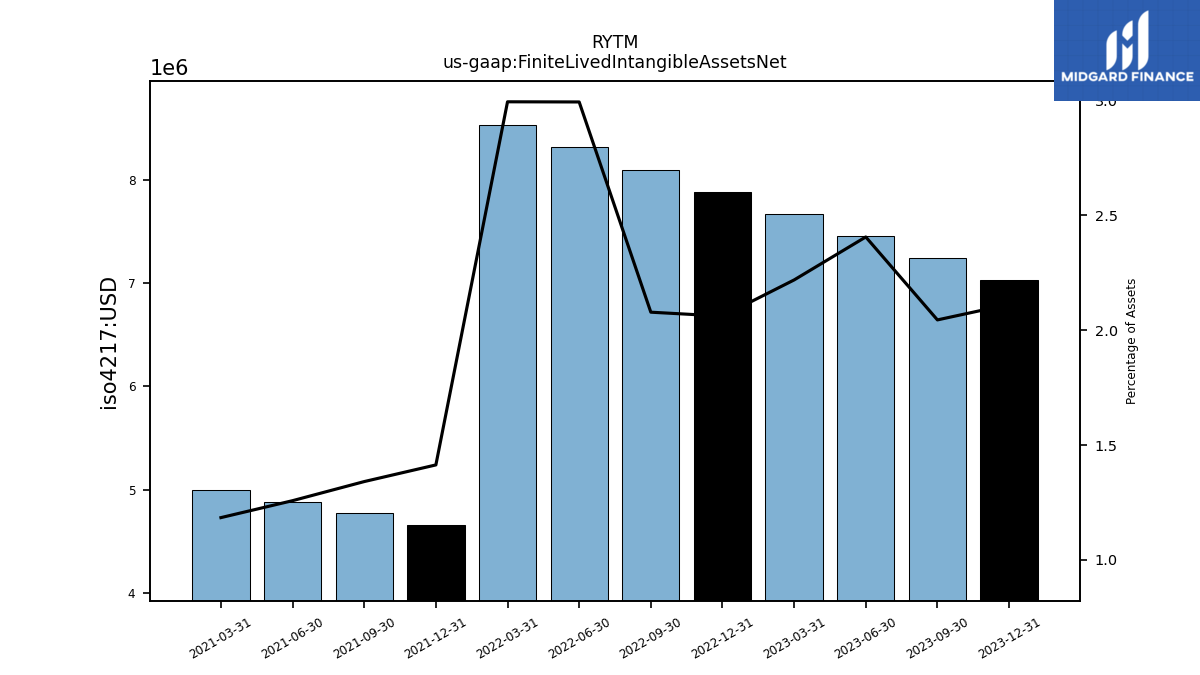
| Finite Lived Intangible Assets Net | 7.46 | 7.67 | 8.31 | 8.53 | 4.66 | 4.77 | 4.89 | 5.00 | |
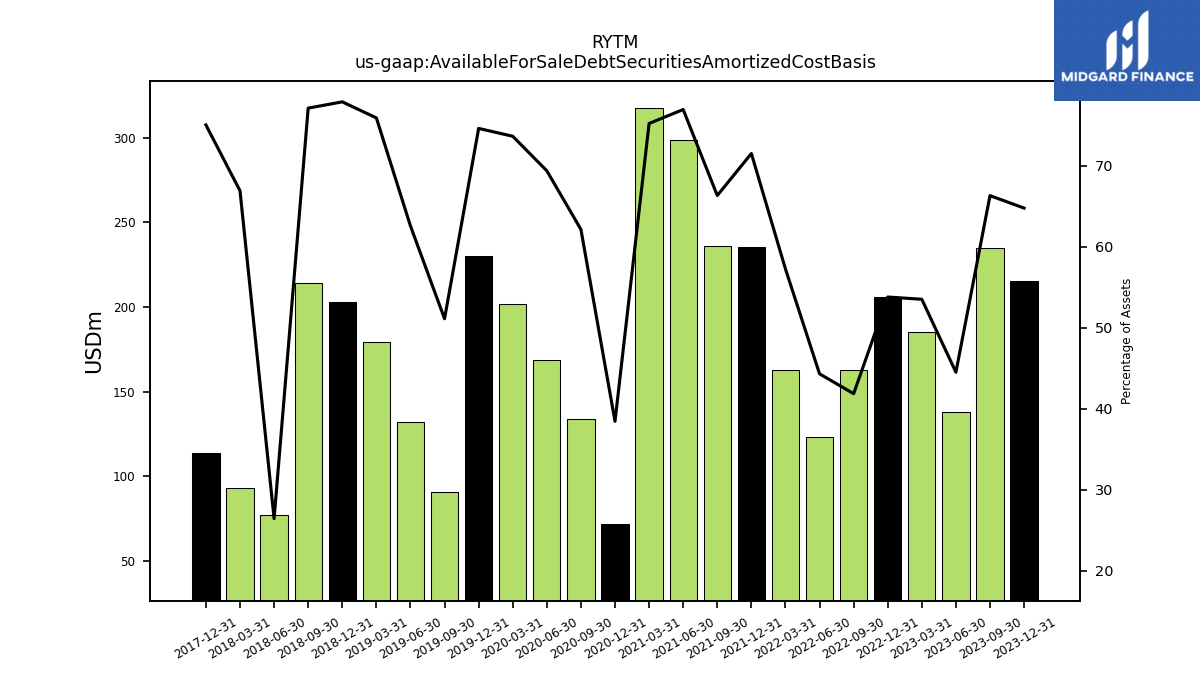
| Available For Sale Debt Securities Amortized Cost Basis | 137.91 | 184.95 | 122.99 | 163.06 | 235.61 | 235.96 | 298.79 | 317.54 |
| 2023-06-30 | 2023-03-31 | 2022-06-30 | 2022-03-31 | 2021-12-31 | 2021-09-30 | 2021-06-30 | 2021-03-31 | ||
|---|---|---|---|---|---|---|---|---|---|
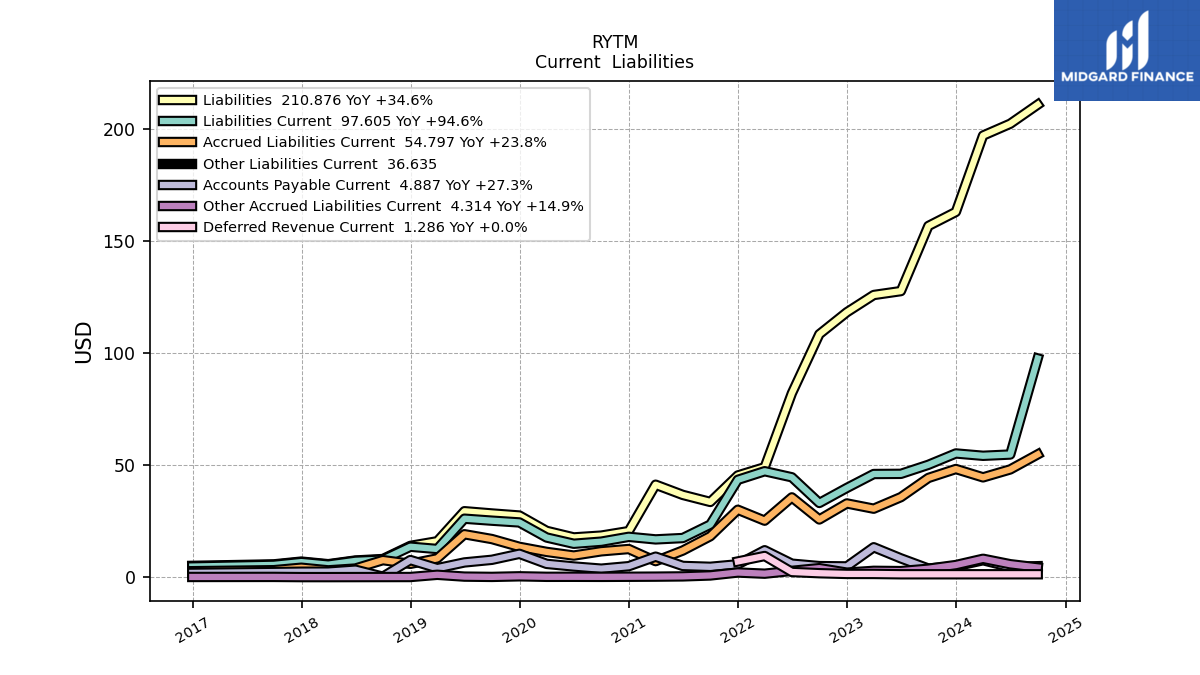
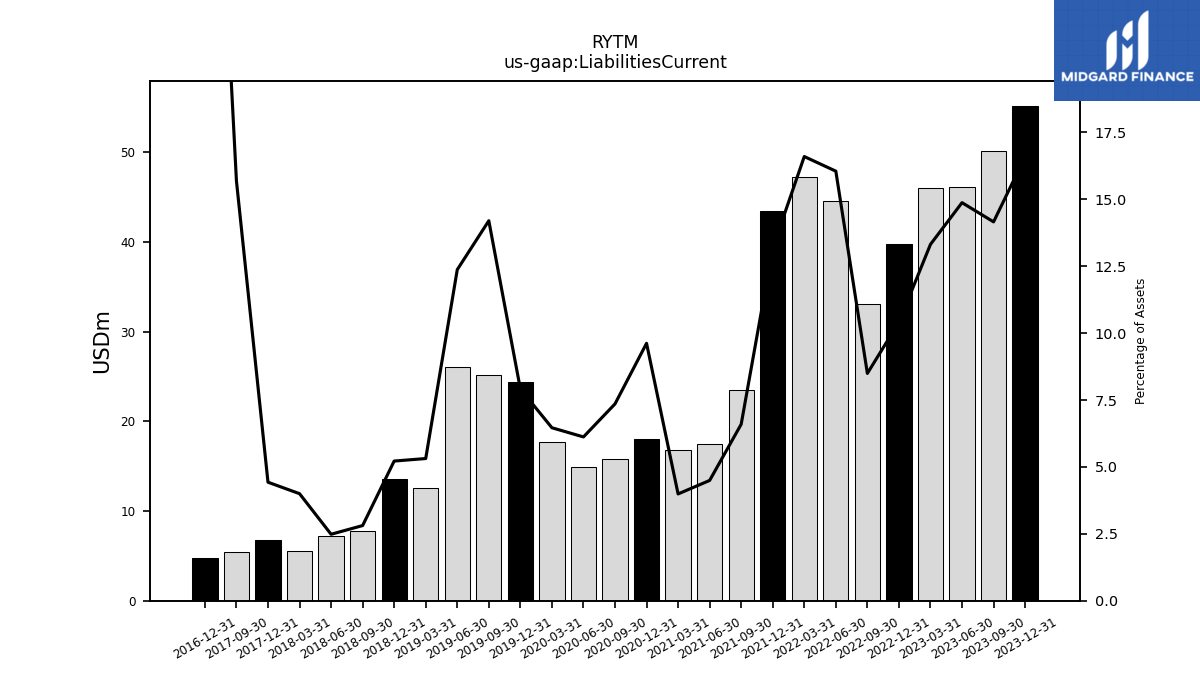
| Liabilities Current | 46.10 | 46.03 | 44.57 | 47.27 | 43.43 | 23.47 | 17.46 | 16.85 | |
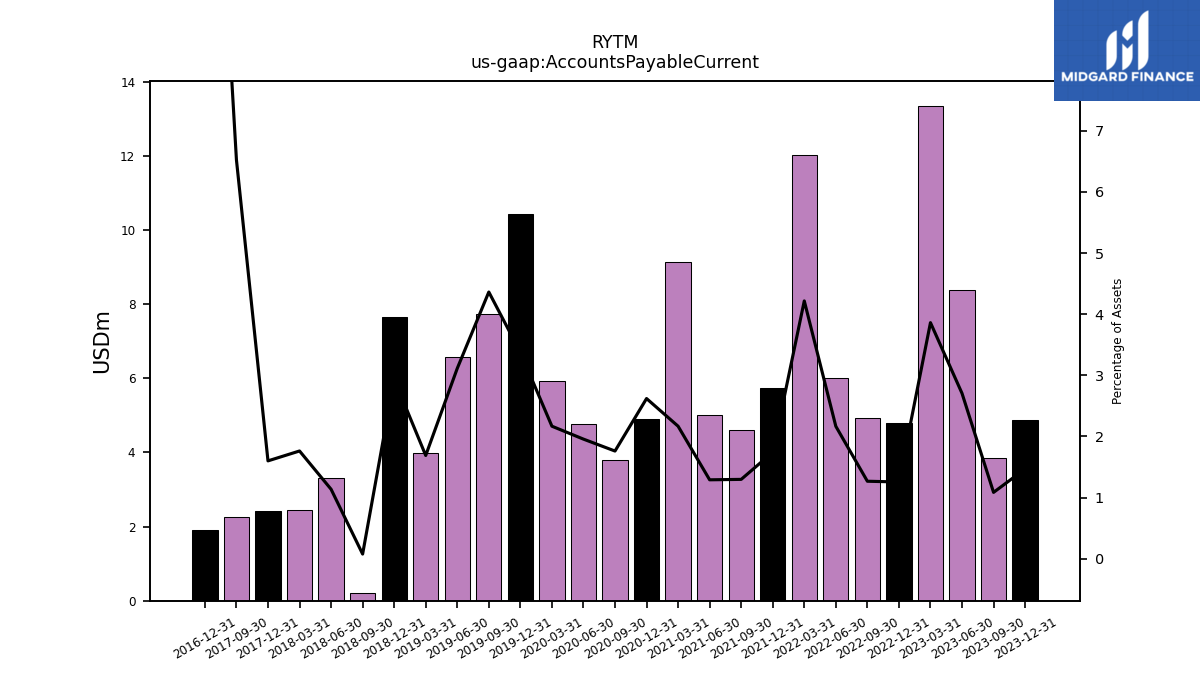
| Accounts Payable Current | 8.38 | 13.35 | 6.01 | 12.01 | 5.74 | 4.61 | 5.01 | 9.15 | |
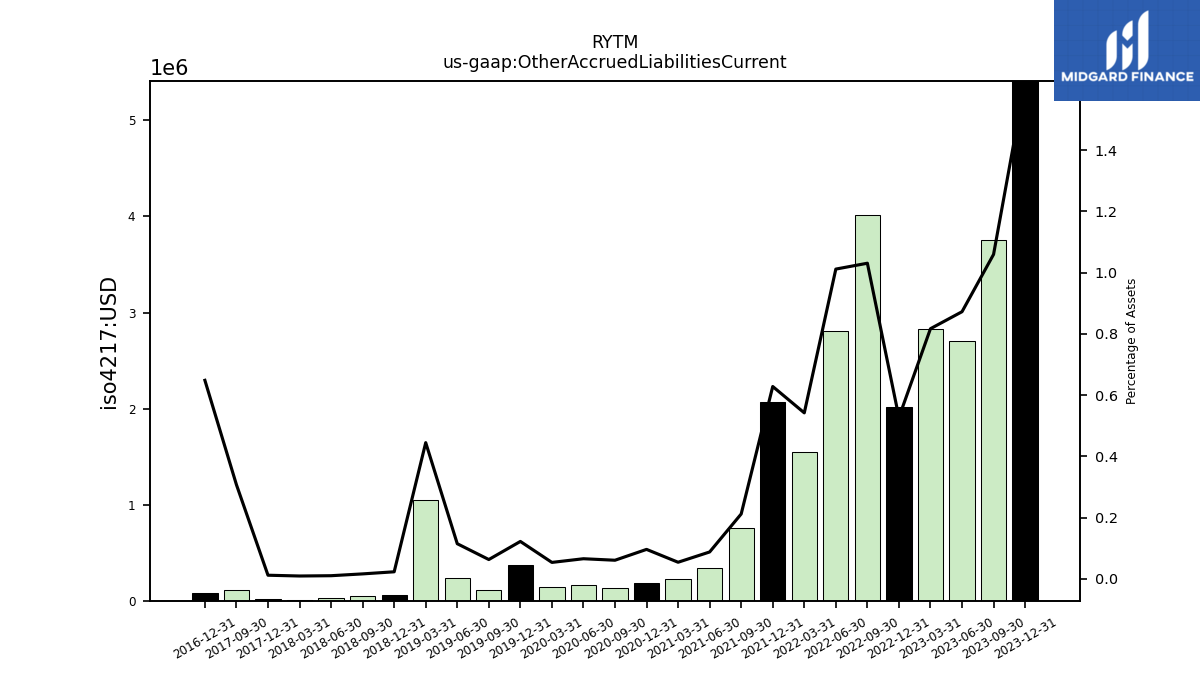
| Other Accrued Liabilities Current | 2.70 | 2.82 | 2.81 | 1.54 | 2.07 | 0.75 | 0.34 | 0.23 | |
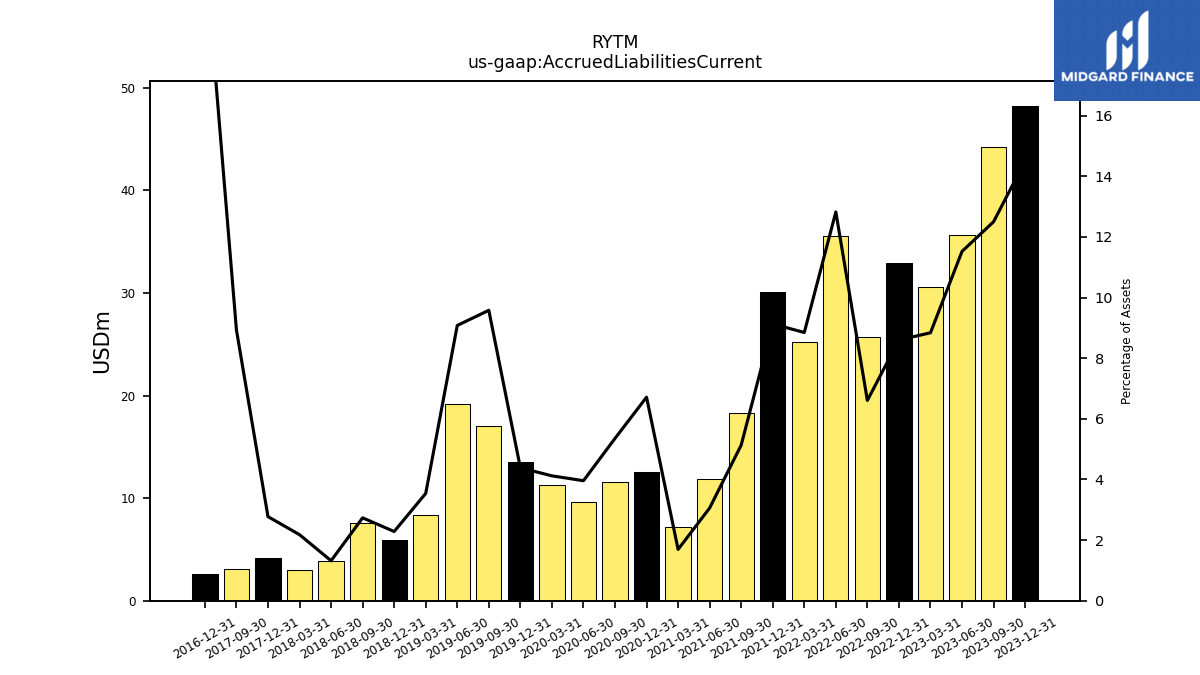
| Accrued Liabilities Current | 35.71 | 30.55 | 35.60 | 25.20 | 30.08 | 18.27 | 11.88 | 7.15 |
| 2023-06-30 | 2023-03-31 | 2022-06-30 | 2022-03-31 | 2021-12-31 | 2021-09-30 | 2021-06-30 | 2021-03-31 | ||
|---|---|---|---|---|---|---|---|---|---|
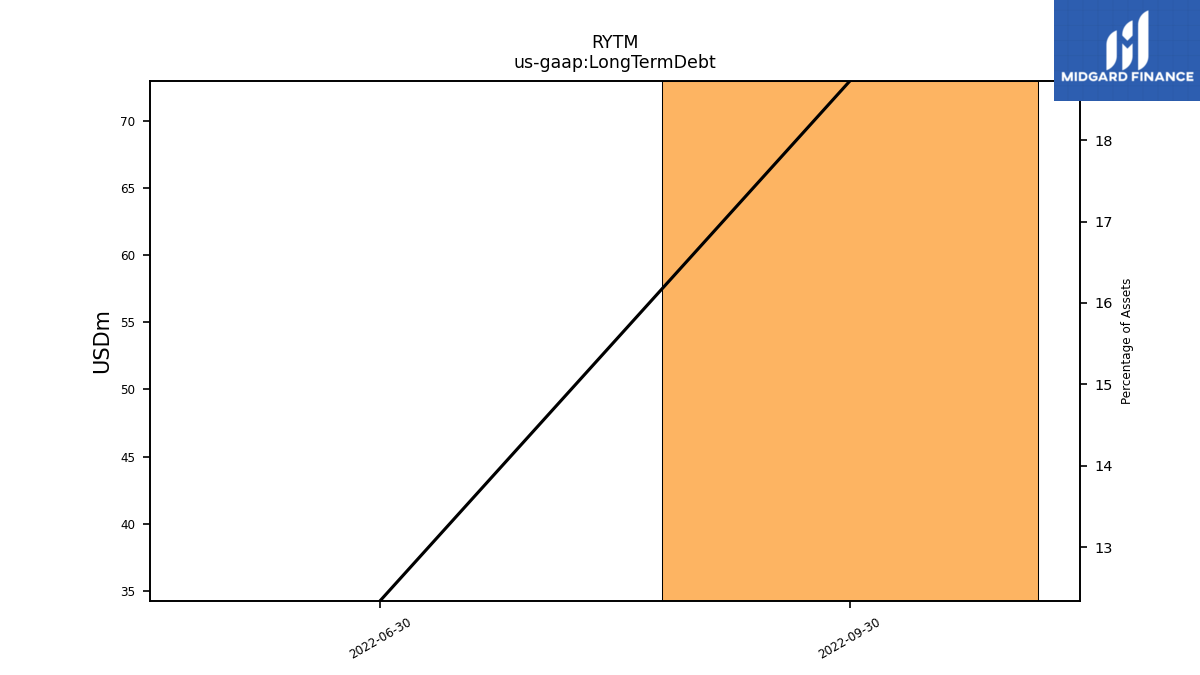
| Long Term Debt | NA | NA | 34.27 | NA | NA | NA | NA | NA | |
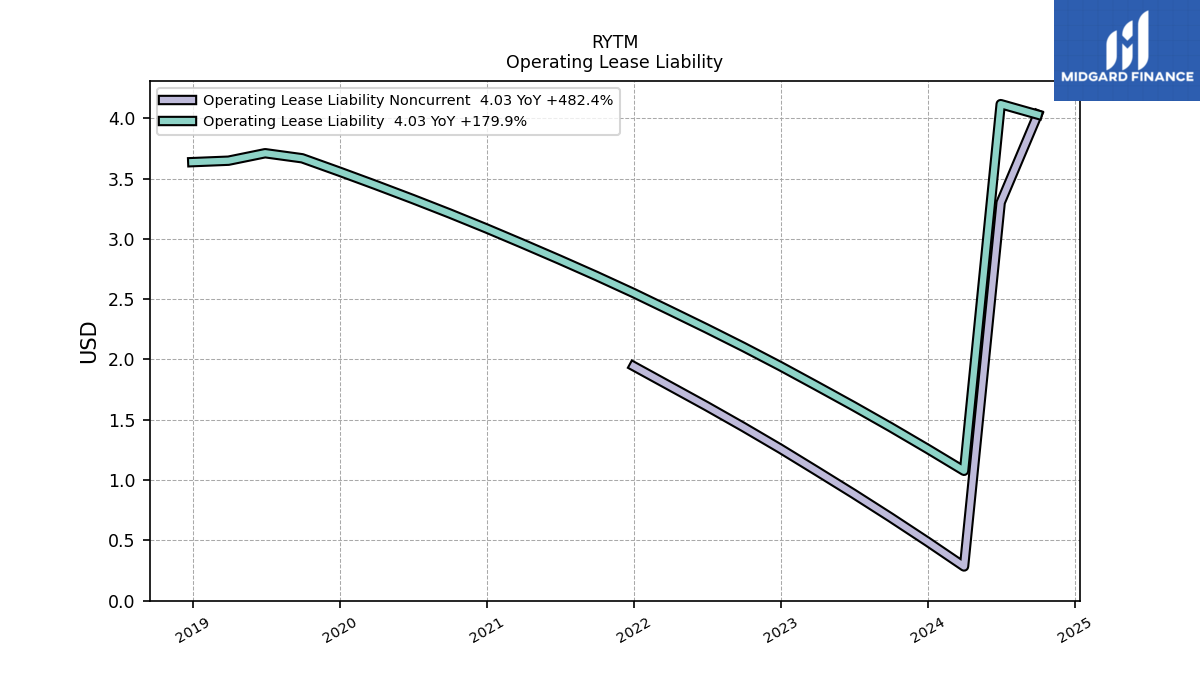
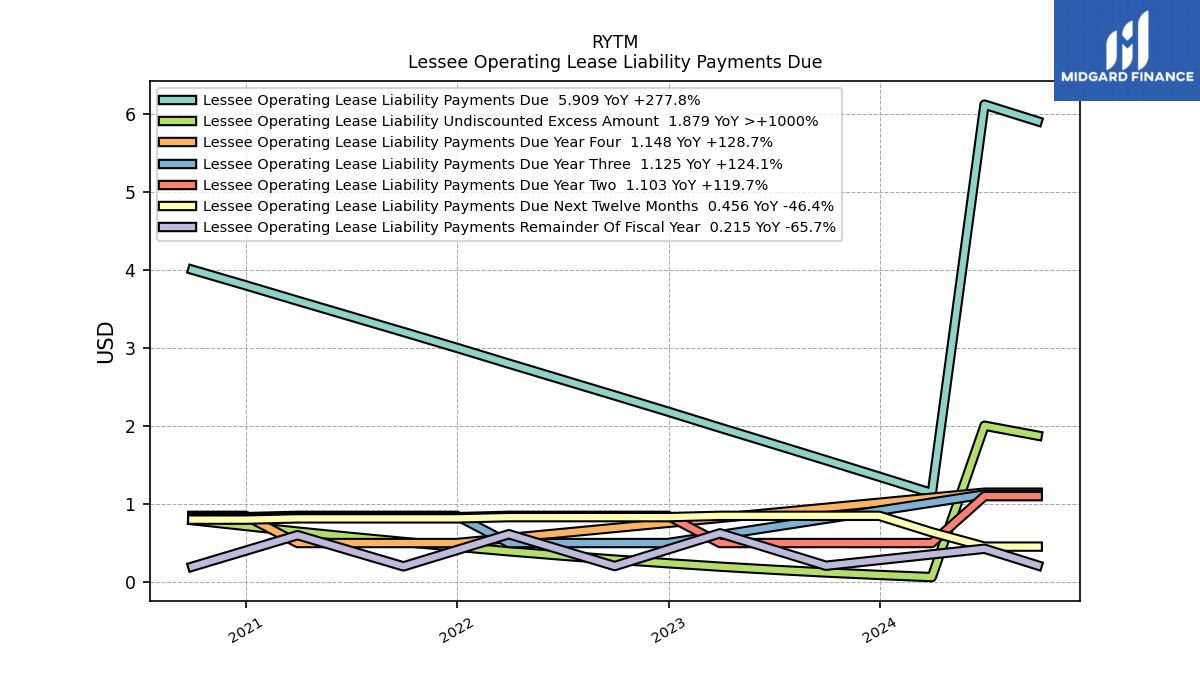
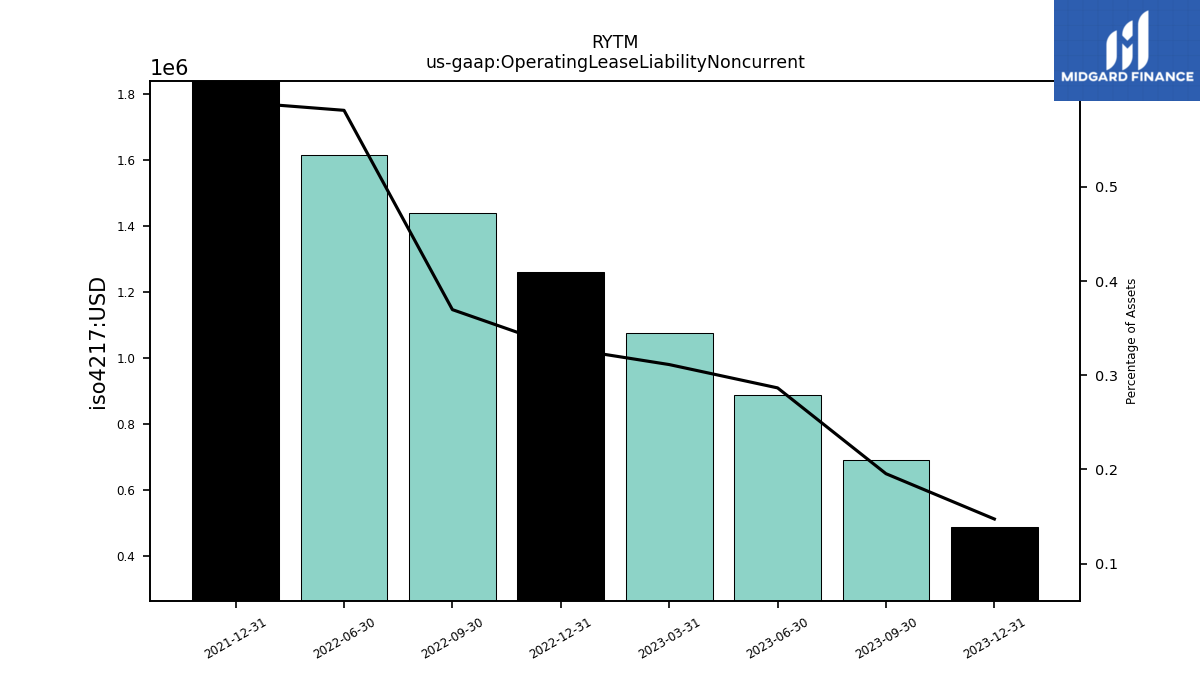
| Operating Lease Liability Noncurrent | 0.89 | 1.08 | 1.61 | NA | 1.95 | NA | NA | NA |
| 2023-06-30 | 2023-03-31 | 2022-06-30 | 2022-03-31 | 2021-12-31 | 2021-09-30 | 2021-06-30 | 2021-03-31 | ||
|---|---|---|---|---|---|---|---|---|---|
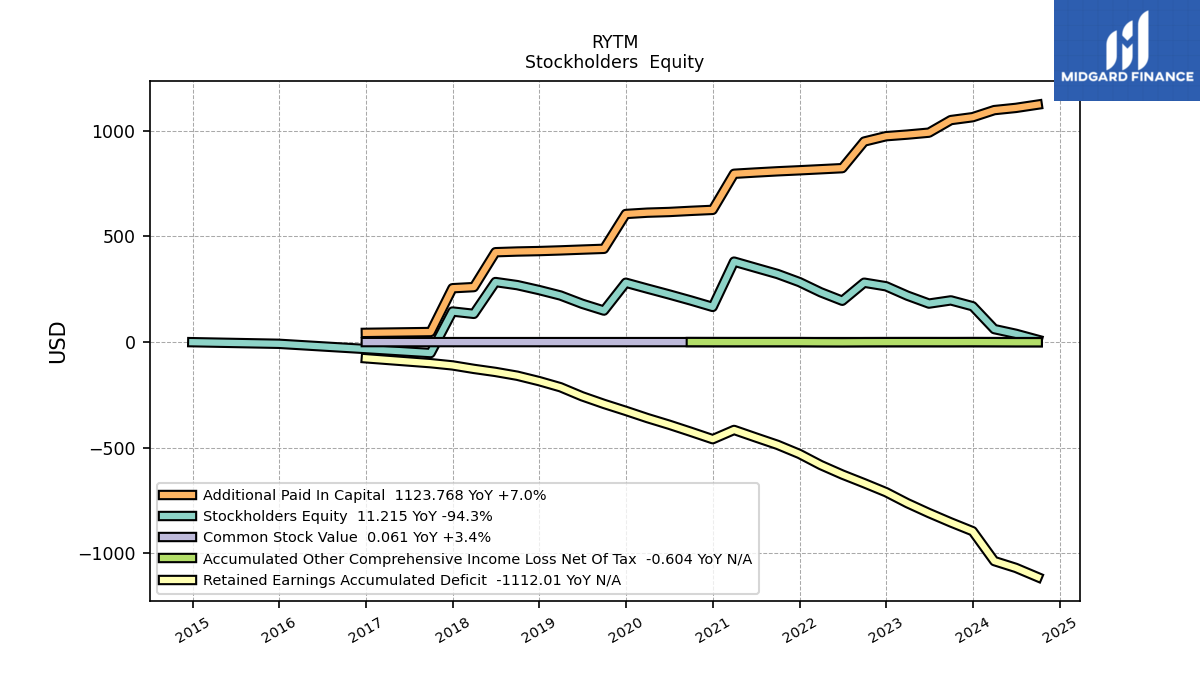
| Stockholders Equity | 182.28 | 219.76 | 195.63 | 235.77 | 284.15 | 322.26 | 351.69 | 380.95 | |
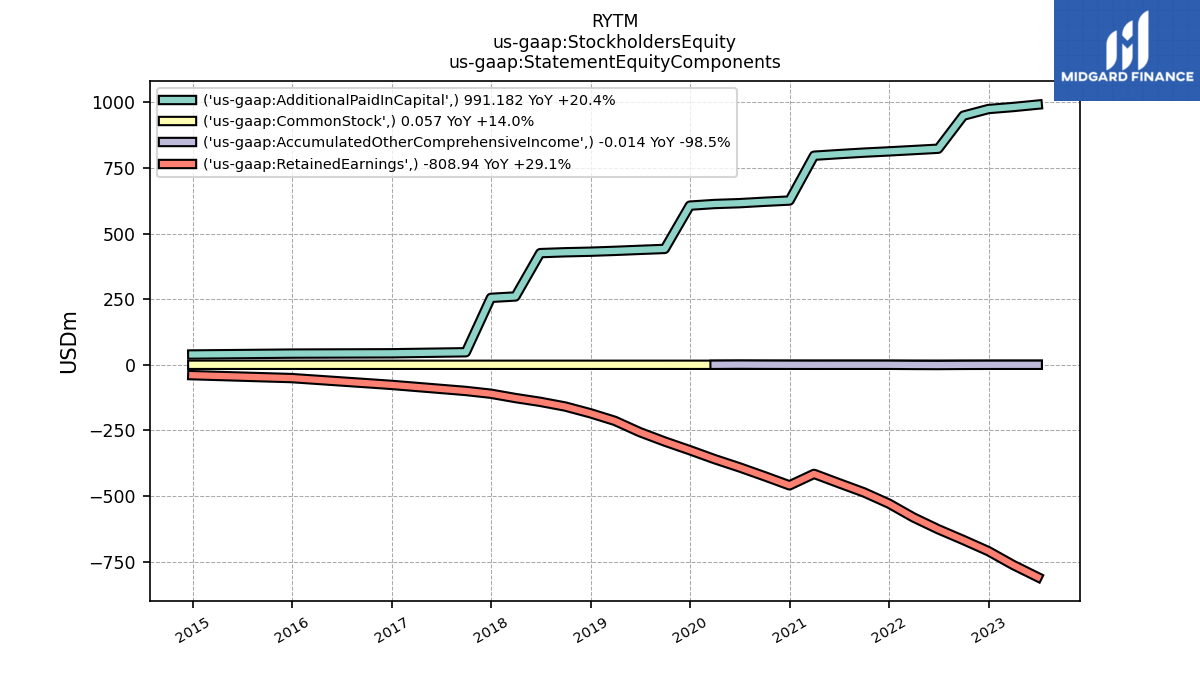
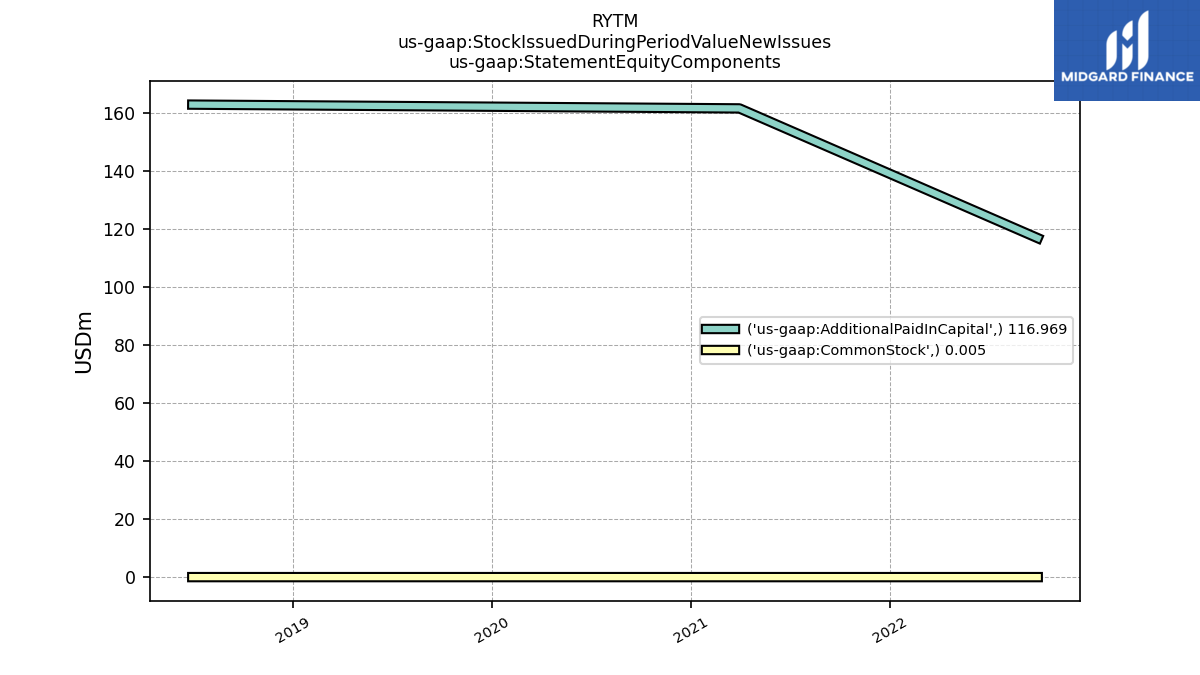
| Common Stock Value | 0.06 | 0.06 | 0.05 | 0.05 | 0.05 | 0.05 | 0.05 | 0.05 | |
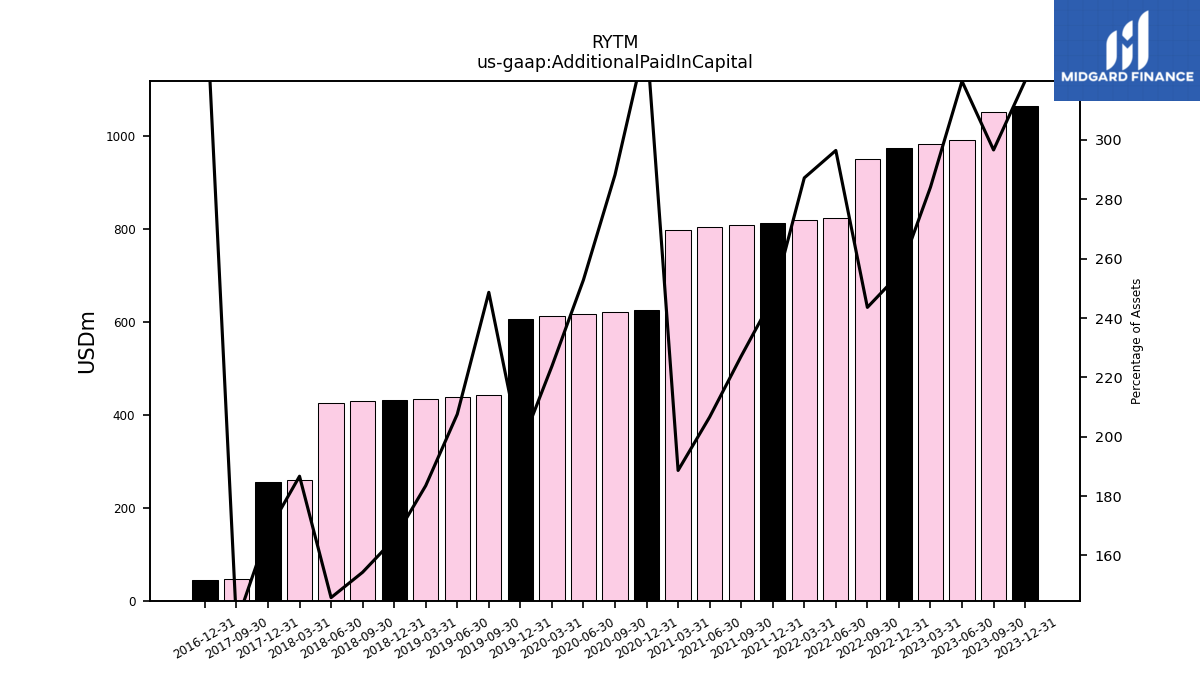
| Additional Paid In Capital | 991.18 | 981.95 | 823.19 | 818.05 | 813.04 | 808.26 | 802.58 | 796.53 | |
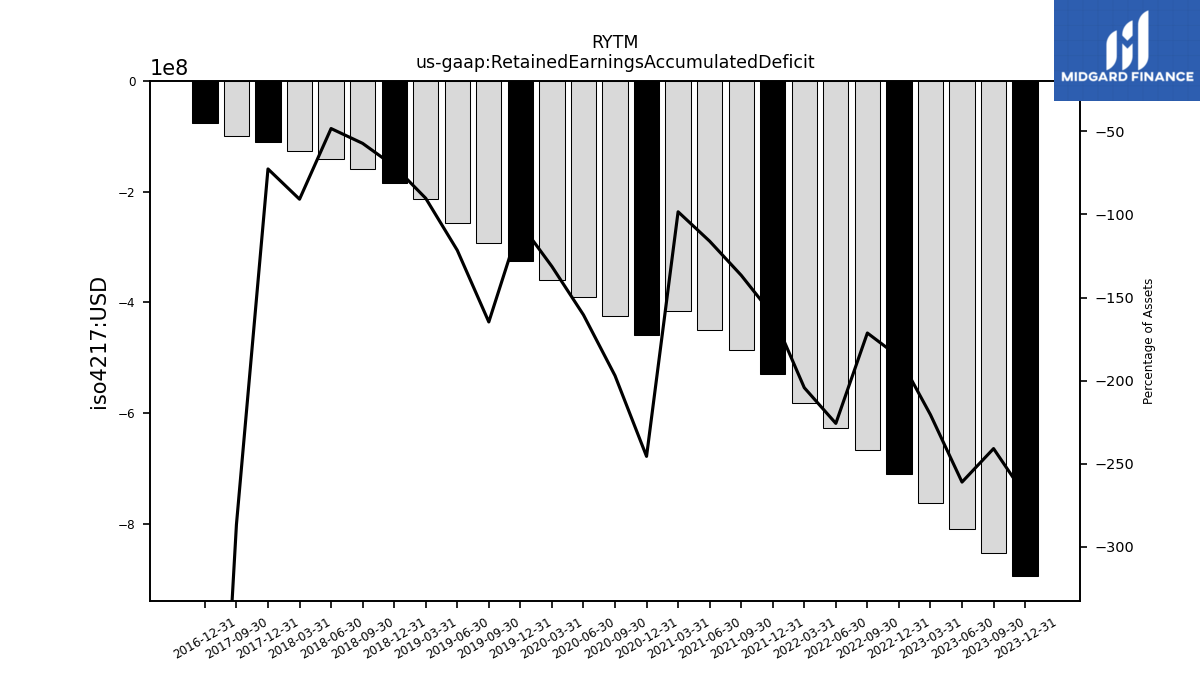
| Retained Earnings Accumulated Deficit | -808.94 | -762.24 | -626.70 | -581.70 | -528.94 | -486.07 | -450.97 | -415.58 | |
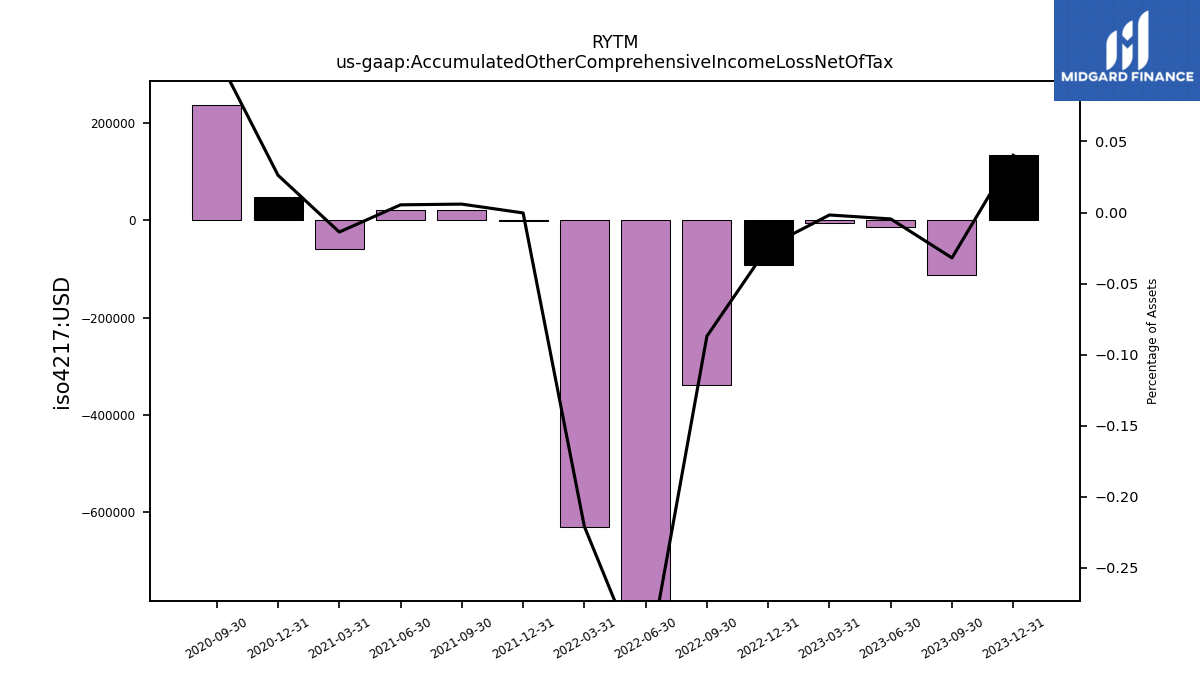
| Accumulated Other Comprehensive Income Loss Net Of Tax | -0.01 | -0.01 | -0.91 | -0.63 | -0.00 | 0.02 | 0.02 | -0.06 | |
| Stock Issued During Period Value New Issues | NA | NA | NA | NA | NA | NA | NA | 161.73 | |
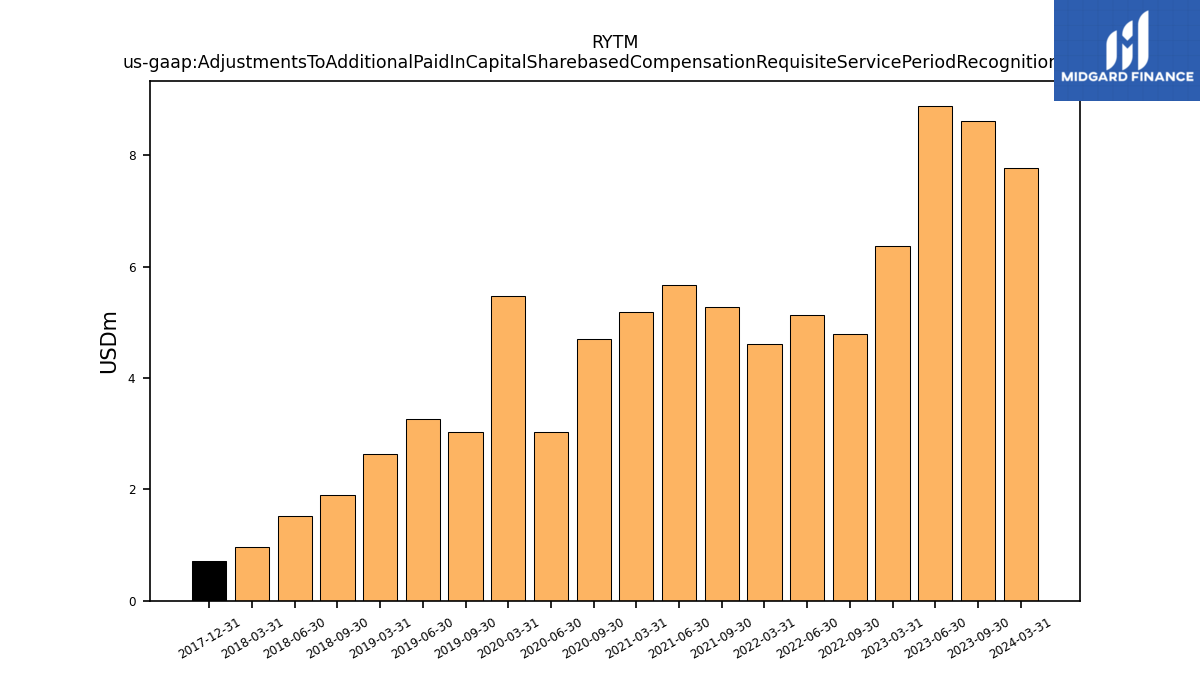
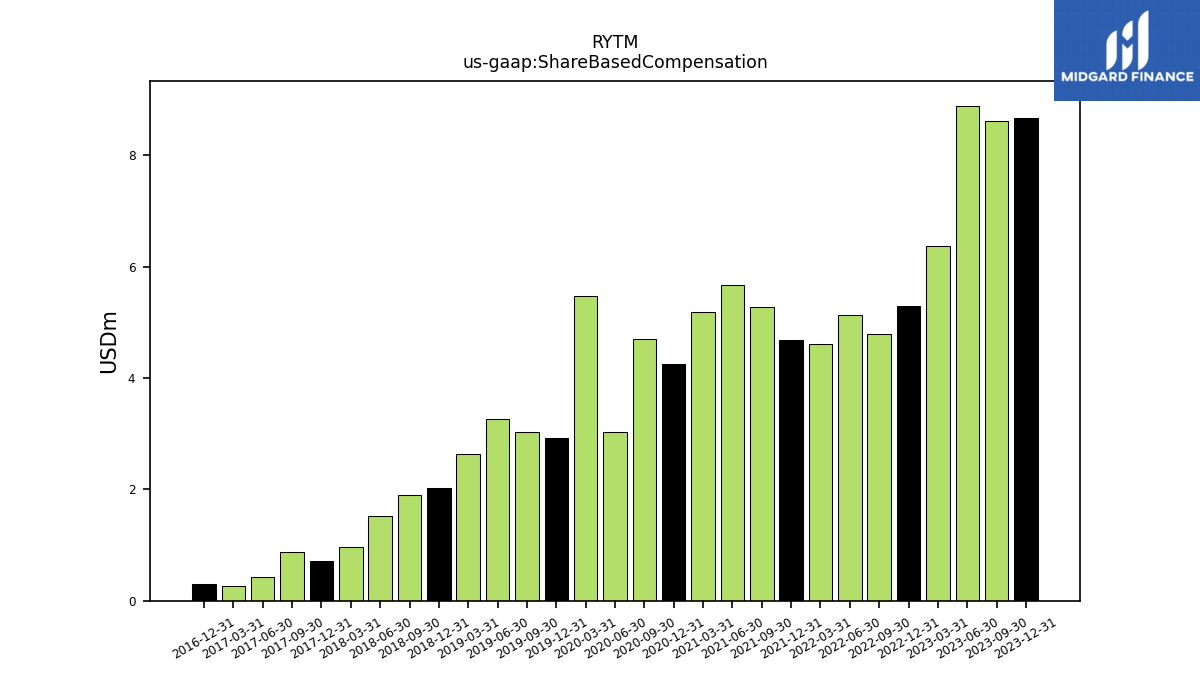
| Adjustments To Additional Paid In Capital Sharebased Compensation Requisite Service Period Recognition Value | 8.89 | 6.38 | 5.14 | 4.61 | NA | 5.27 | 5.67 | 5.19 |
| 2023-06-30 | 2023-03-31 | 2022-06-30 | 2022-03-31 | 2021-12-31 | 2021-09-30 | 2021-06-30 | 2021-03-31 | ||
|---|---|---|---|---|---|---|---|---|---|
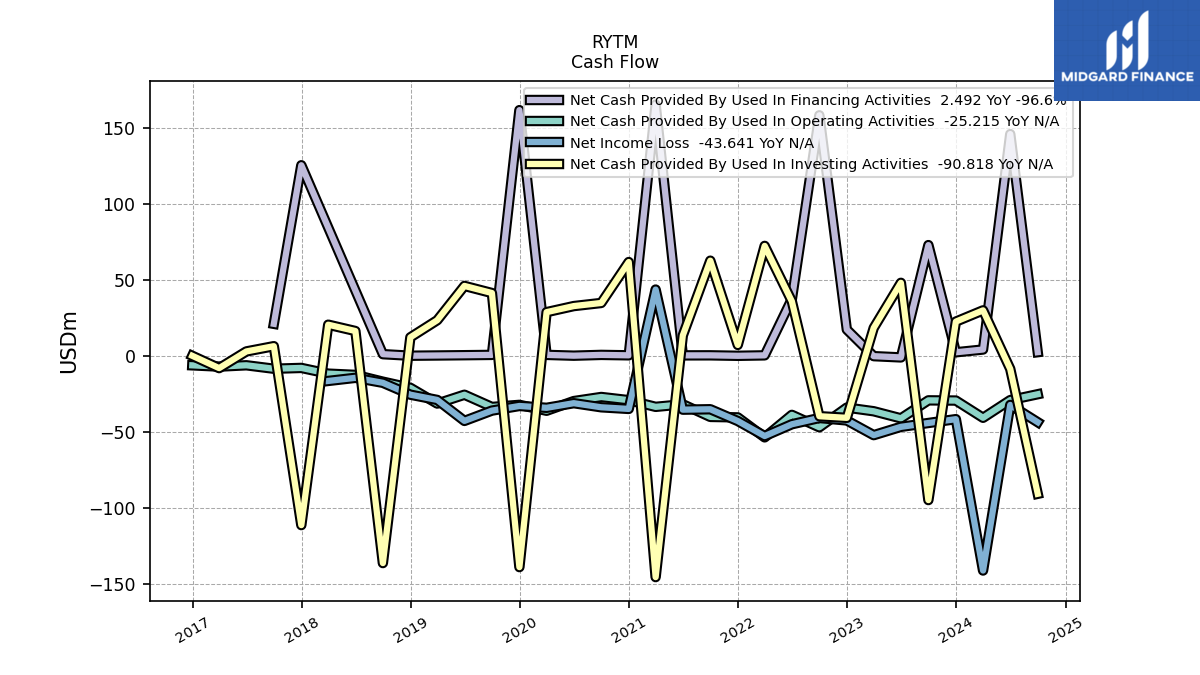
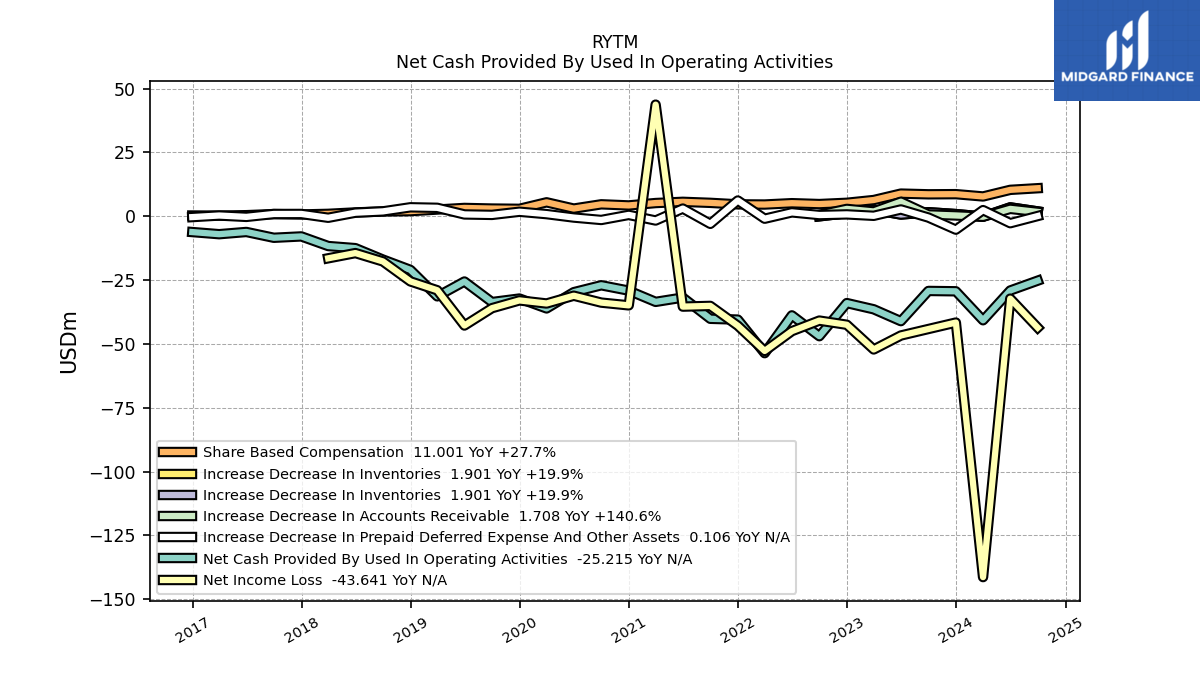
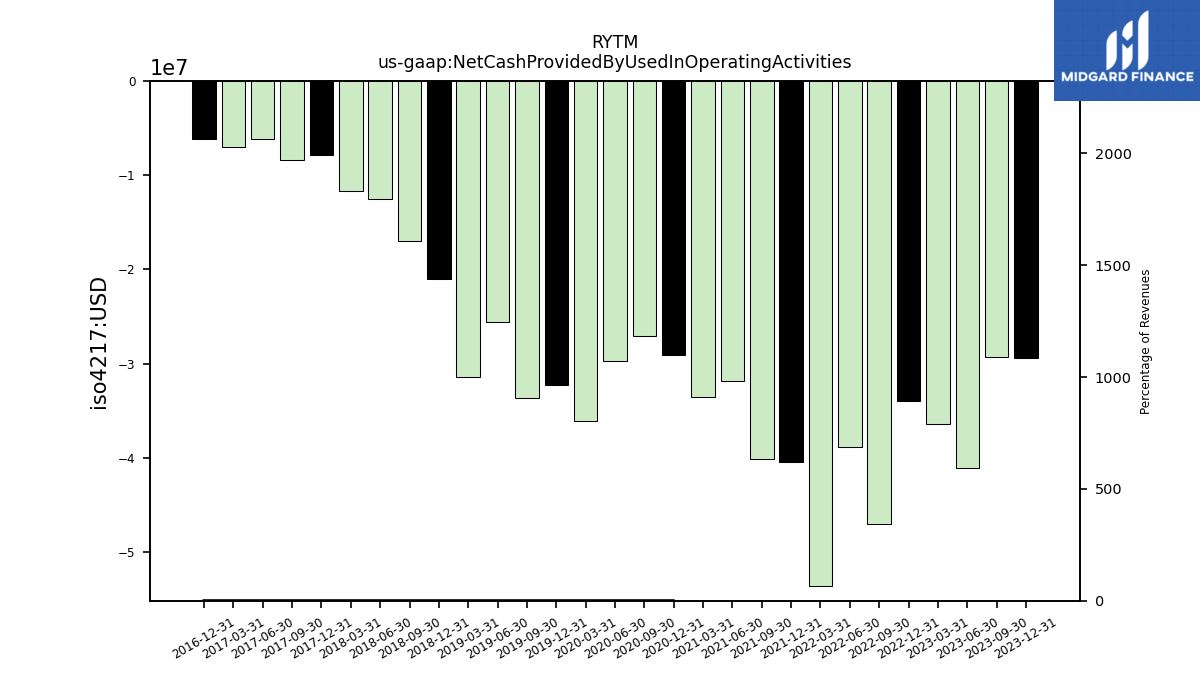
| Net Cash Provided By Used In Operating Activities | -41.09 | -36.43 | -38.81 | -53.63 | -40.47 | -40.16 | -31.84 | -33.53 | |
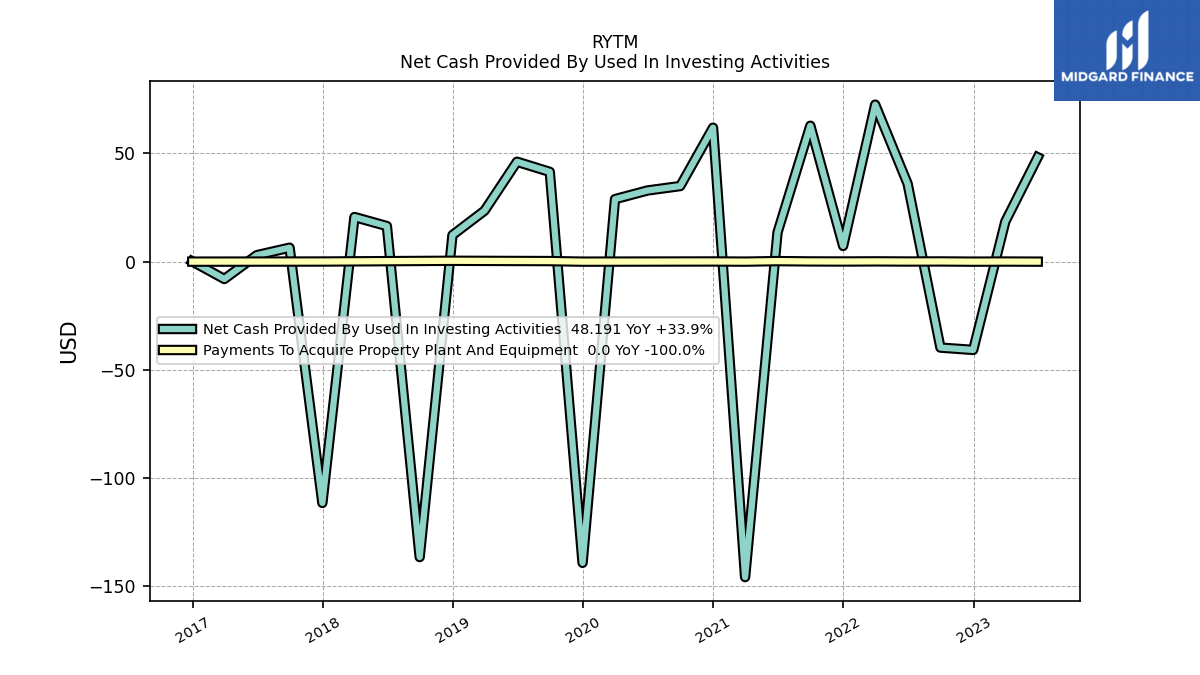
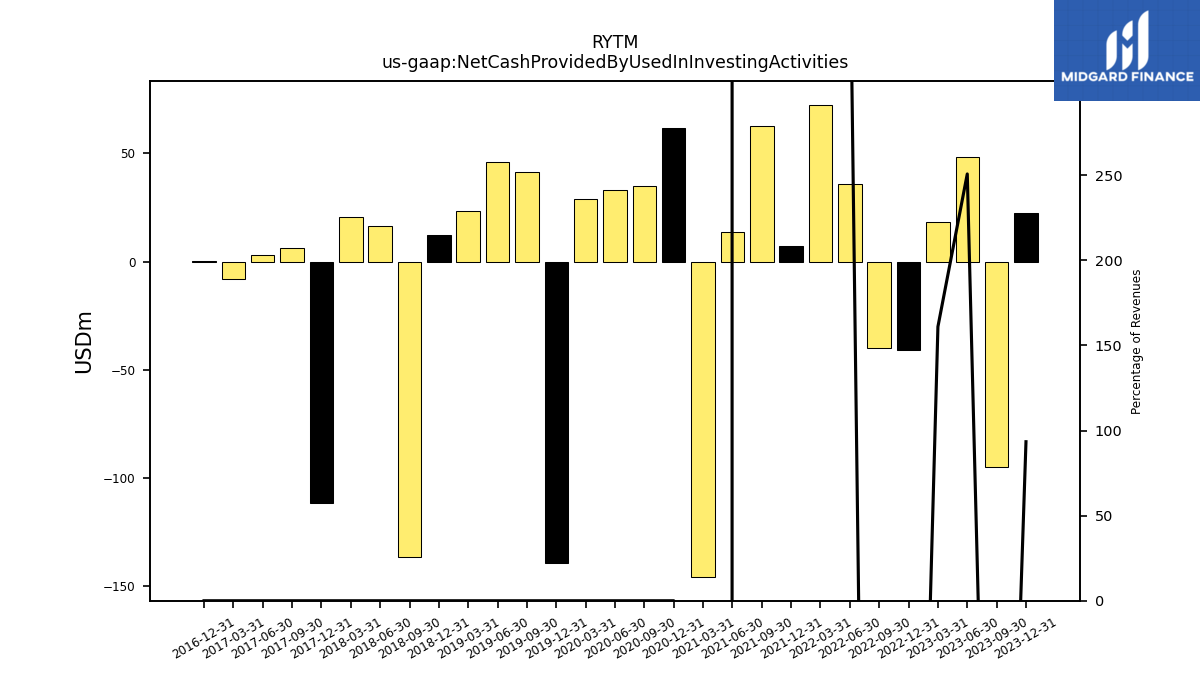
| Net Cash Provided By Used In Investing Activities | 48.19 | 18.46 | 35.98 | 72.52 | 7.25 | 62.78 | 13.53 | -145.71 | |
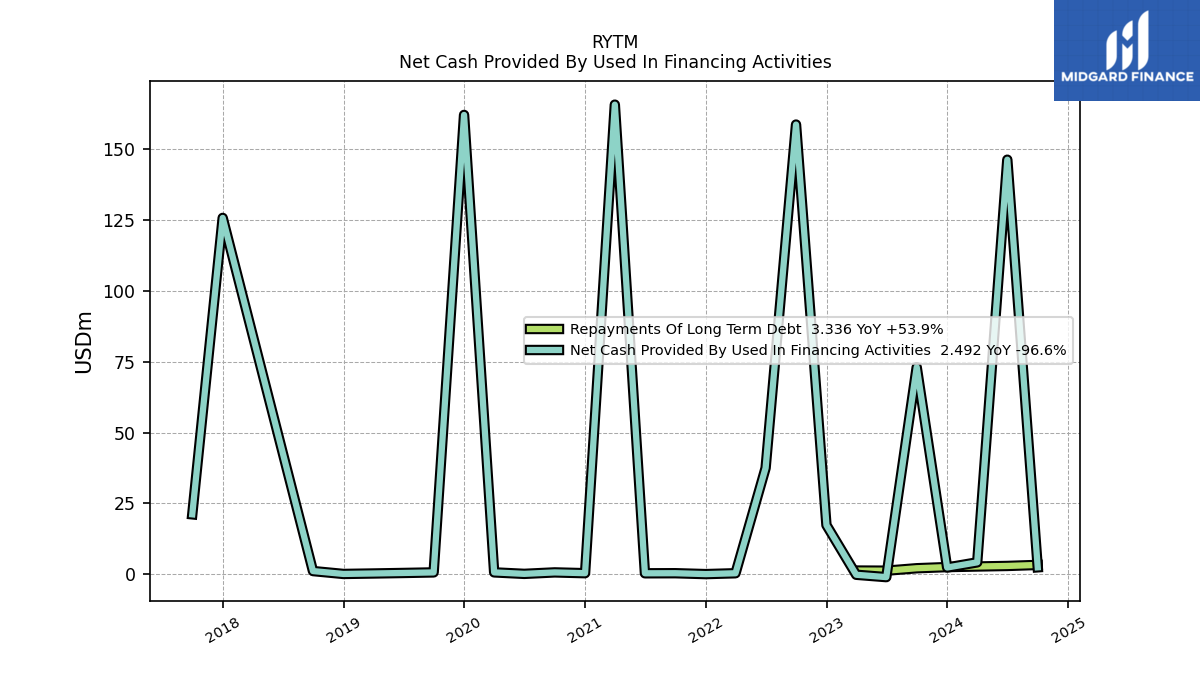
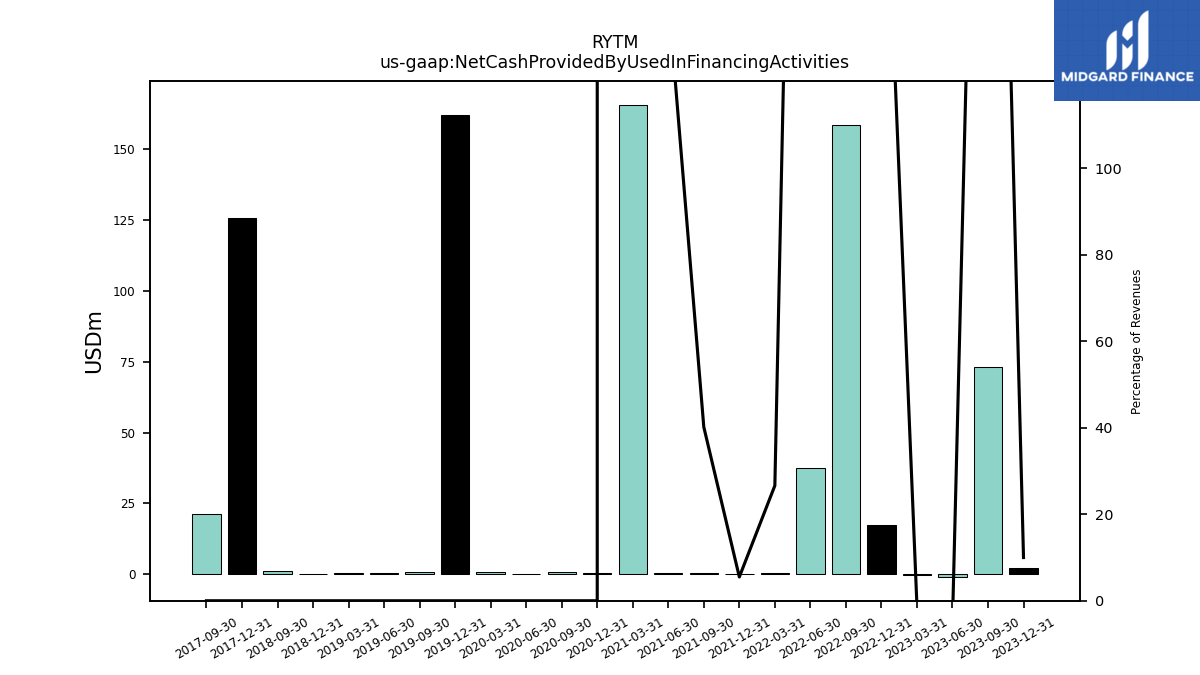
| Net Cash Provided By Used In Financing Activities | -0.96 | -0.13 | 37.50 | 0.40 | 0.10 | 0.41 | 0.38 | 165.59 |
| 2023-06-30 | 2023-03-31 | 2022-06-30 | 2022-03-31 | 2021-12-31 | 2021-09-30 | 2021-06-30 | 2021-03-31 | ||
|---|---|---|---|---|---|---|---|---|---|
| Net Cash Provided By Used In Operating Activities | -41.09 | -36.43 | -38.81 | -53.63 | -40.47 | -40.16 | -31.84 | -33.53 | |
| Net Income Loss | -46.70 | -52.18 | -45.00 | -52.76 | -42.87 | -35.11 | -35.39 | 43.75 | |
| Profit Loss | -46.70 | -52.18 | -45.00 | -52.76 | -42.87 | -35.11 | -35.39 | 43.75 | |
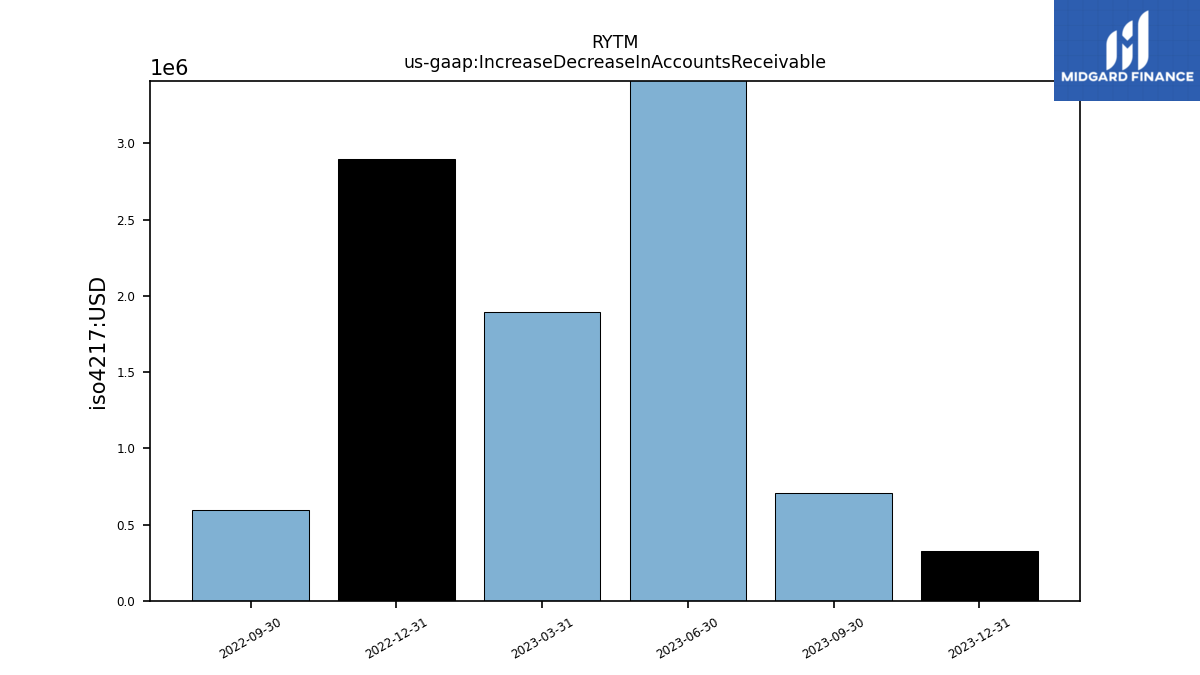
| Increase Decrease In Accounts Receivable | 5.71 | 1.89 | NA | NA | NA | NA | NA | NA | |
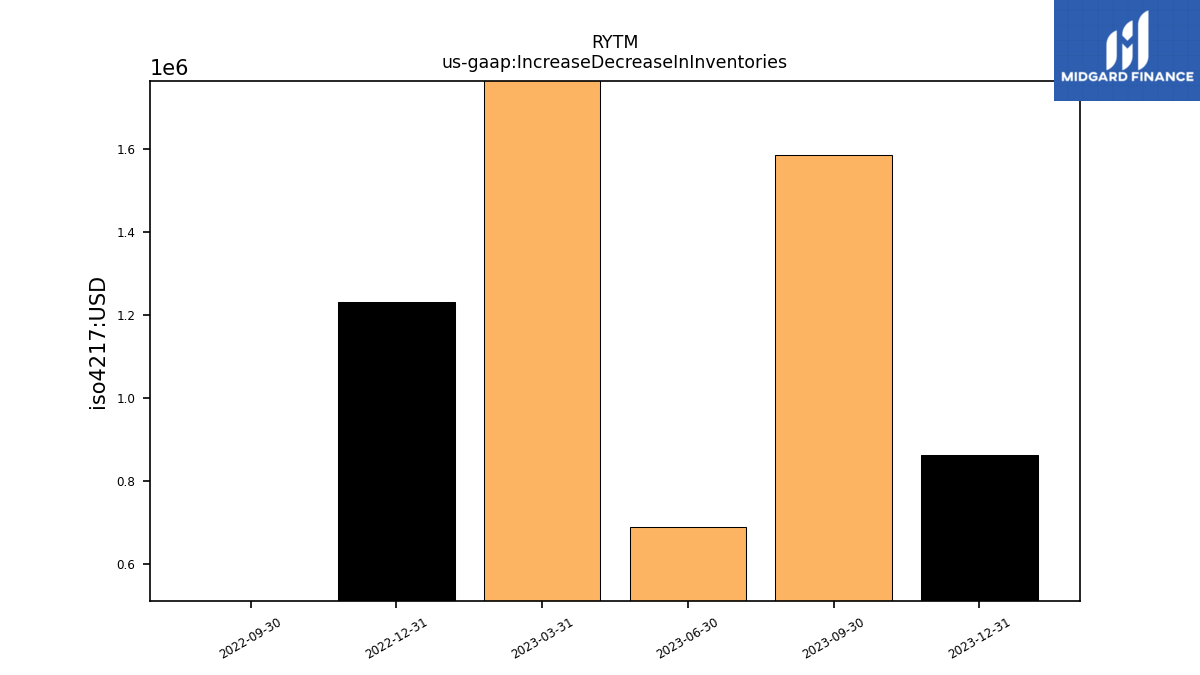
| Increase Decrease In Inventories | 0.69 | 2.57 | NA | NA | NA | NA | NA | NA | |
| Share Based Compensation | 8.89 | 6.38 | 5.14 | 4.61 | 4.68 | 5.27 | 5.67 | 5.19 |
| 2023-06-30 | 2023-03-31 | 2022-06-30 | 2022-03-31 | 2021-12-31 | 2021-09-30 | 2021-06-30 | 2021-03-31 | ||
|---|---|---|---|---|---|---|---|---|---|
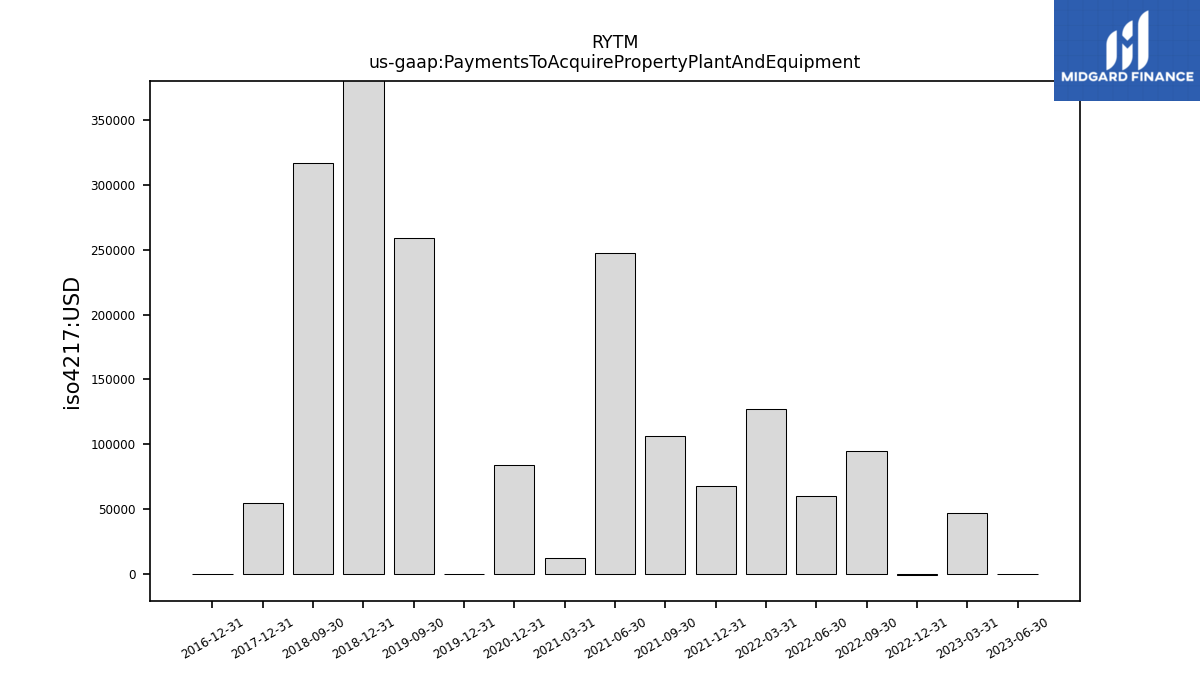
| Net Cash Provided By Used In Investing Activities | 48.19 | 18.46 | 35.98 | 72.52 | 7.25 | 62.78 | 13.53 | -145.71 | |
| Payments To Acquire Property Plant And Equipment | 0.00 | 0.05 | 0.06 | 0.13 | 0.07 | 0.11 | 0.25 | 0.01 |
| 2023-06-30 | 2023-03-31 | 2022-06-30 | 2022-03-31 | 2021-12-31 | 2021-09-30 | 2021-06-30 | 2021-03-31 | ||
|---|---|---|---|---|---|---|---|---|---|
| Net Cash Provided By Used In Financing Activities | -0.96 | -0.13 | 37.50 | 0.40 | 0.10 | 0.41 | 0.38 | 165.59 |
| 2023-06-30 | 2023-03-31 | 2022-06-30 | 2022-03-31 | 2021-12-31 | 2021-09-30 | 2021-06-30 | 2021-03-31 | ||
|---|---|---|---|---|---|---|---|---|---|
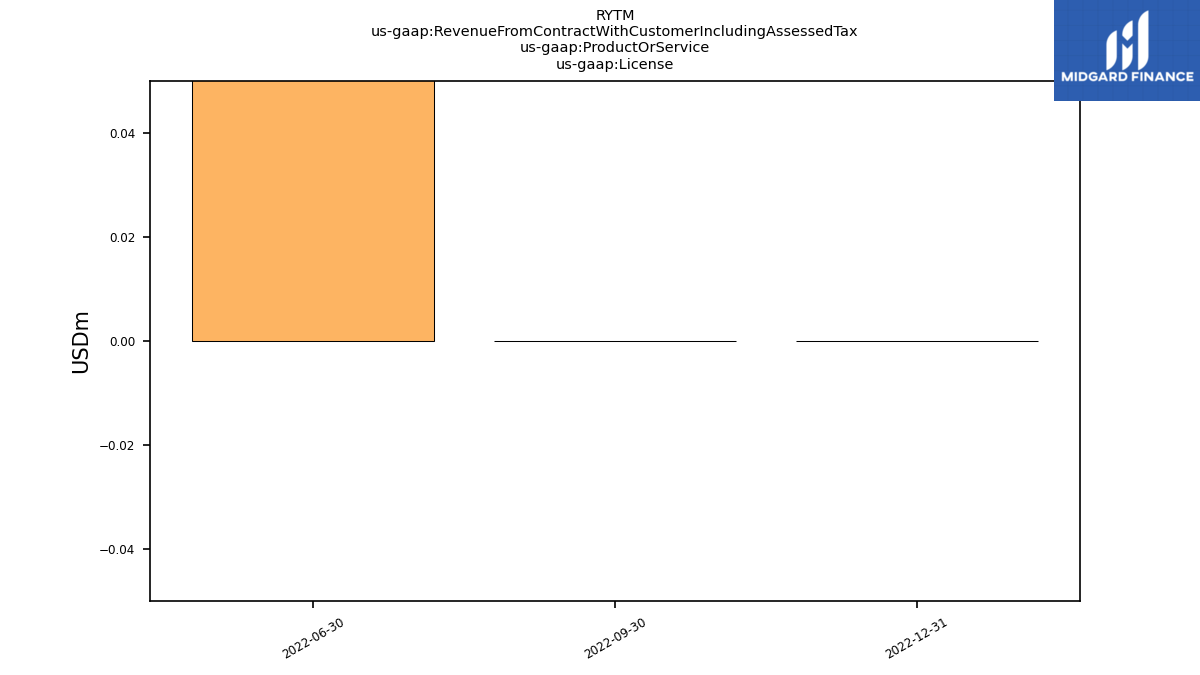
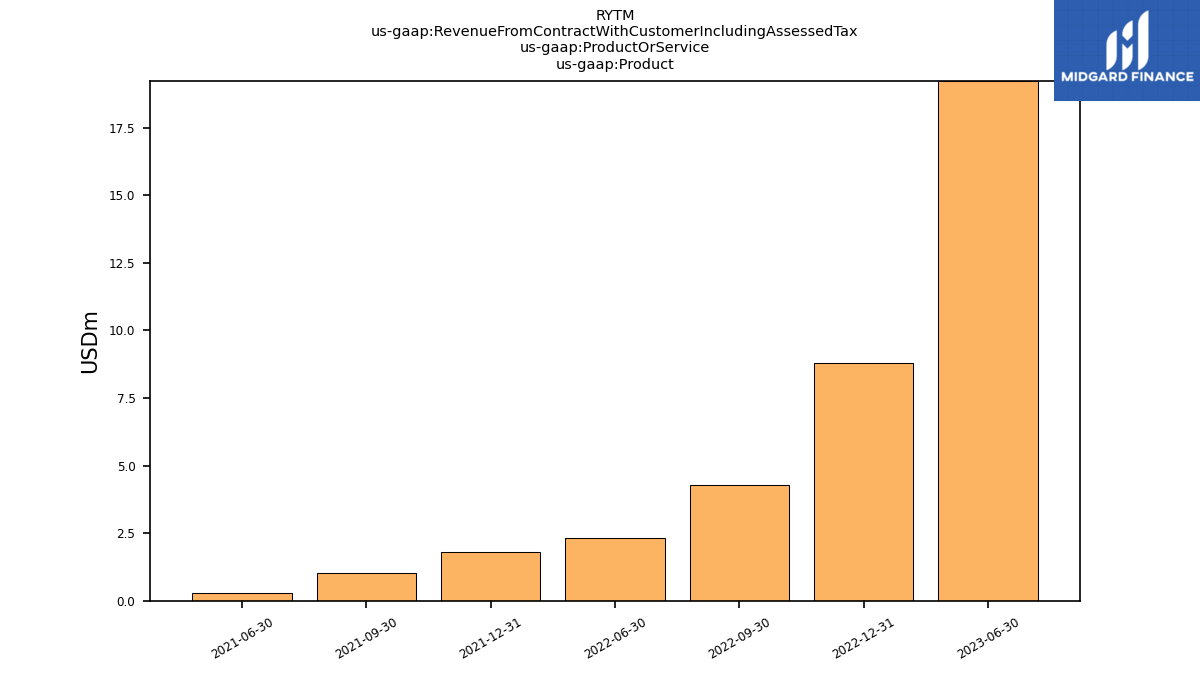
| Revenues | 19.22 | 11.47 | 9.07 | 1.50 | 1.82 | 1.03 | 0.27 | 0.04 | |
| Revenue From Contract With Customer Including Assessed Tax | 19.22 | 11.47 | 9.07 | 1.50 | 1.82 | 1.03 | 0.27 | 0.04 | |
| License | NA | NA | 6.75 | NA | NA | NA | NA | NA | |
| Product | 19.22 | NA | 2.31 | NA | 1.82 | 1.03 | 0.27 | NA |

