
| 2023-12-31 | 2023-09-30 | 2023-06-30 | 2023-03-31 | 2022-12-31 | 2022-09-30 | 2022-06-30 | 2022-03-31 | 2021-12-31 | 2021-09-30 | 2021-06-30 | 2021-03-31 | 2020-12-31 | 2020-09-30 | 2020-06-30 | 2020-03-31 | 2019-12-31 | 2019-09-30 | 2019-06-30 | 2019-03-31 | 2018-12-31 | 2018-09-30 | 2018-06-30 | 2018-03-31 | 2017-12-31 | 2017-09-30 | 2017-06-30 | 2017-03-31 | 2016-12-31 | 2016-09-30 | 2016-06-30 | 2016-03-31 | 2015-12-31 | 2015-09-30 | 2015-06-30 | 2015-03-31 | 2014-12-31 | 2014-09-30 | 2014-06-30 | 2014-03-31 | 2013-12-31 | 2013-09-30 | 2013-06-30 | 2013-03-31 | ||
|---|---|---|---|---|---|---|---|---|---|---|---|---|---|---|---|---|---|---|---|---|---|---|---|---|---|---|---|---|---|---|---|---|---|---|---|---|---|---|---|---|---|---|---|---|---|
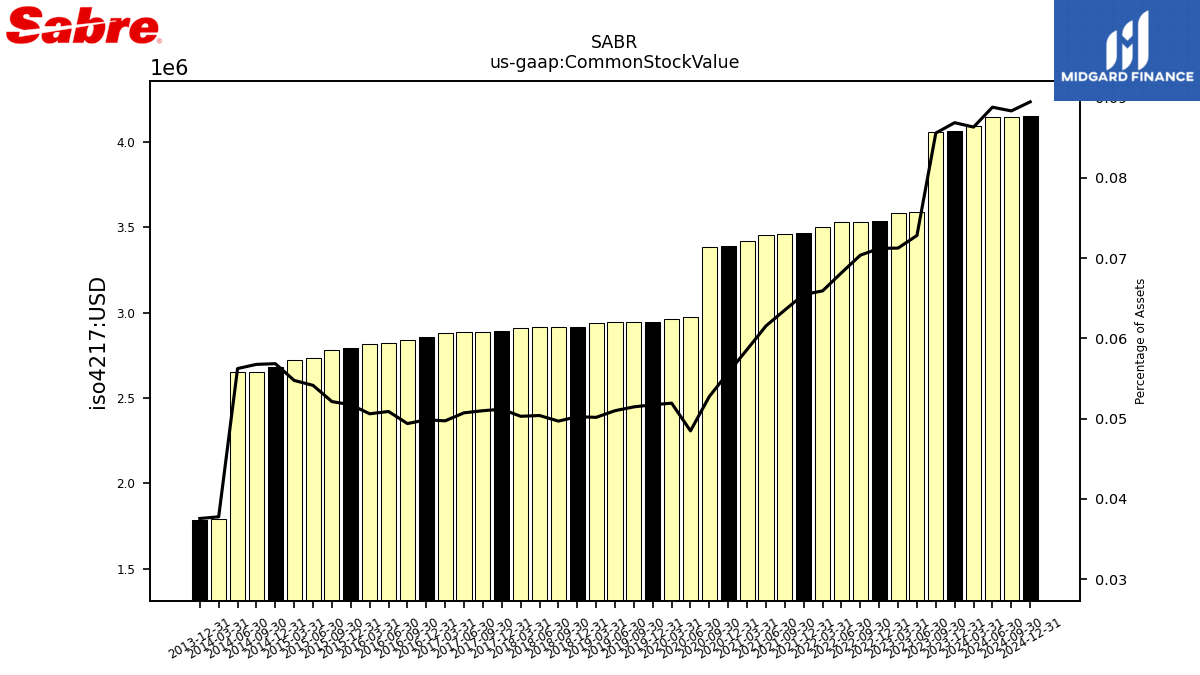
| Common Stock Value | 4.06 | 4.06 | 3.59 | 3.58 | 3.53 | 3.53 | 3.53 | 3.50 | 3.46 | 3.46 | 3.45 | 3.42 | 3.39 | 3.38 | 2.97 | 2.96 | 2.94 | 2.94 | 2.94 | 2.94 | 2.92 | 2.92 | 2.91 | 2.91 | 2.89 | 2.89 | 2.89 | 2.88 | 2.85 | 2.84 | 2.82 | 2.81 | 2.79 | 2.78 | 2.73 | 2.72 | 2.68 | 2.65 | 2.65 | 1.79 | 1.79 | NA | NA | NA | |
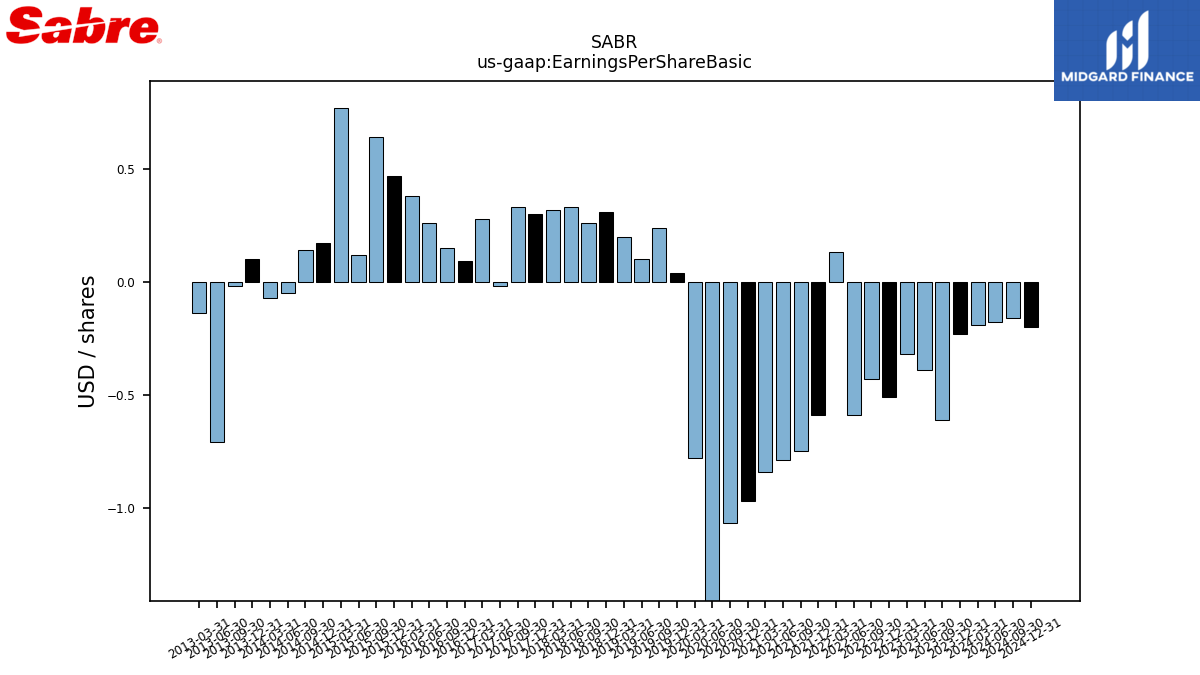
| Earnings Per Share Basic | -0.23 | -0.61 | -0.39 | -0.32 | -0.51 | -0.43 | -0.59 | 0.13 | -0.59 | -0.75 | -0.79 | -0.84 | -0.97 | -1.07 | -1.61 | -0.78 | 0.04 | 0.24 | 0.10 | 0.20 | 0.31 | 0.26 | 0.33 | 0.32 | 0.30 | 0.33 | -0.02 | 0.28 | 0.09 | 0.15 | 0.26 | 0.38 | 0.47 | 0.64 | 0.12 | 0.77 | 0.17 | 0.14 | -0.05 | -0.07 | 0.10 | -0.02 | -0.71 | -0.14 | |
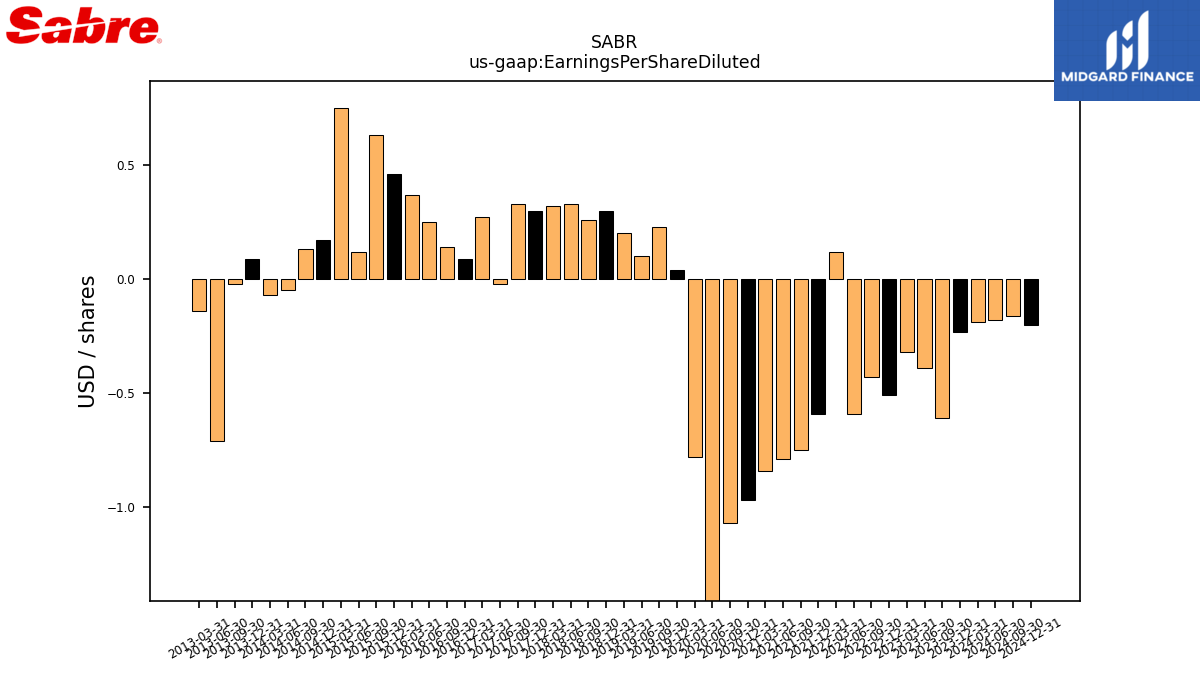
| Earnings Per Share Diluted | -0.23 | -0.61 | -0.39 | -0.32 | -0.51 | -0.43 | -0.59 | 0.12 | -0.59 | -0.75 | -0.79 | -0.84 | -0.97 | -1.07 | -1.61 | -0.78 | 0.04 | 0.23 | 0.10 | 0.20 | 0.30 | 0.26 | 0.33 | 0.32 | 0.30 | 0.33 | -0.02 | 0.27 | 0.09 | 0.14 | 0.25 | 0.37 | 0.46 | 0.63 | 0.12 | 0.75 | 0.17 | 0.13 | -0.05 | -0.07 | 0.09 | -0.02 | -0.71 | -0.14 | |
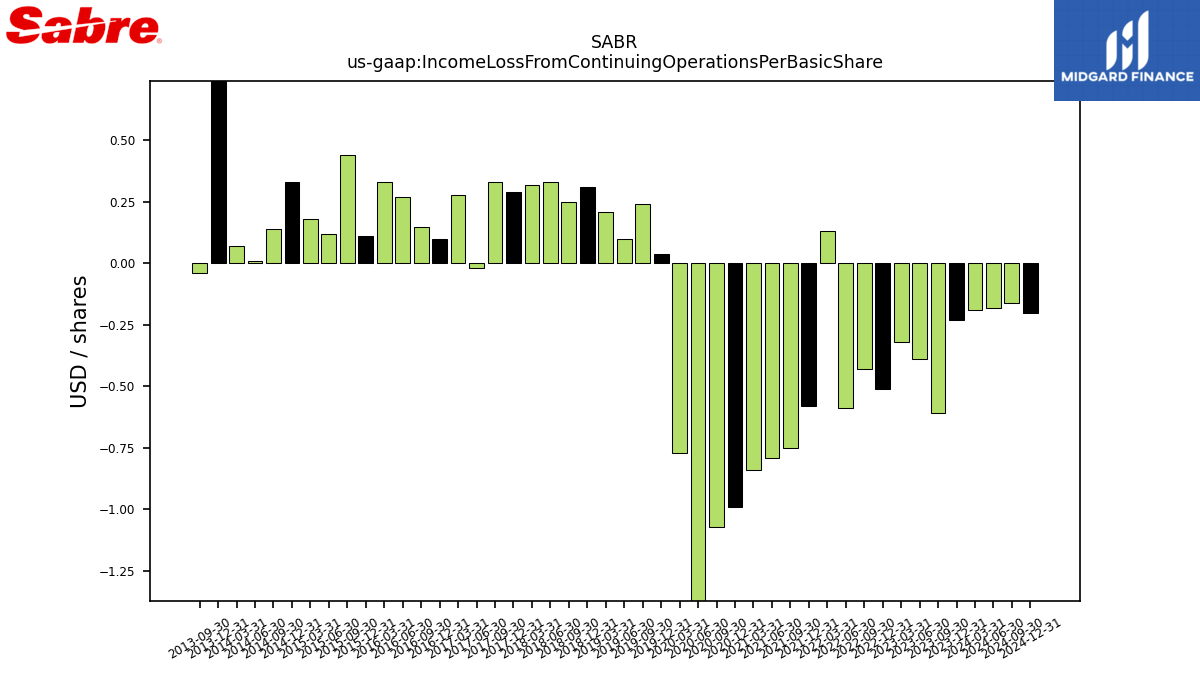
| Income Loss From Continuing Operations Per Basic Share | -0.00 | -0.00 | -0.00 | -0.00 | -0.00 | -0.00 | -0.00 | 0.00 | -0.00 | -0.00 | -0.00 | -0.00 | -0.00 | -0.00 | -0.00 | -0.00 | 0.00 | 0.00 | 0.00 | 0.00 | 0.00 | 0.00 | 0.00 | 0.00 | 0.00 | 0.00 | -0.00 | 0.00 | 0.00 | 0.00 | 0.00 | 0.00 | 0.00 | 0.00 | 0.00 | 0.00 | 0.00 | 0.00 | 0.00 | 0.00 | 0.00 | -0.00 | NA | NA | |
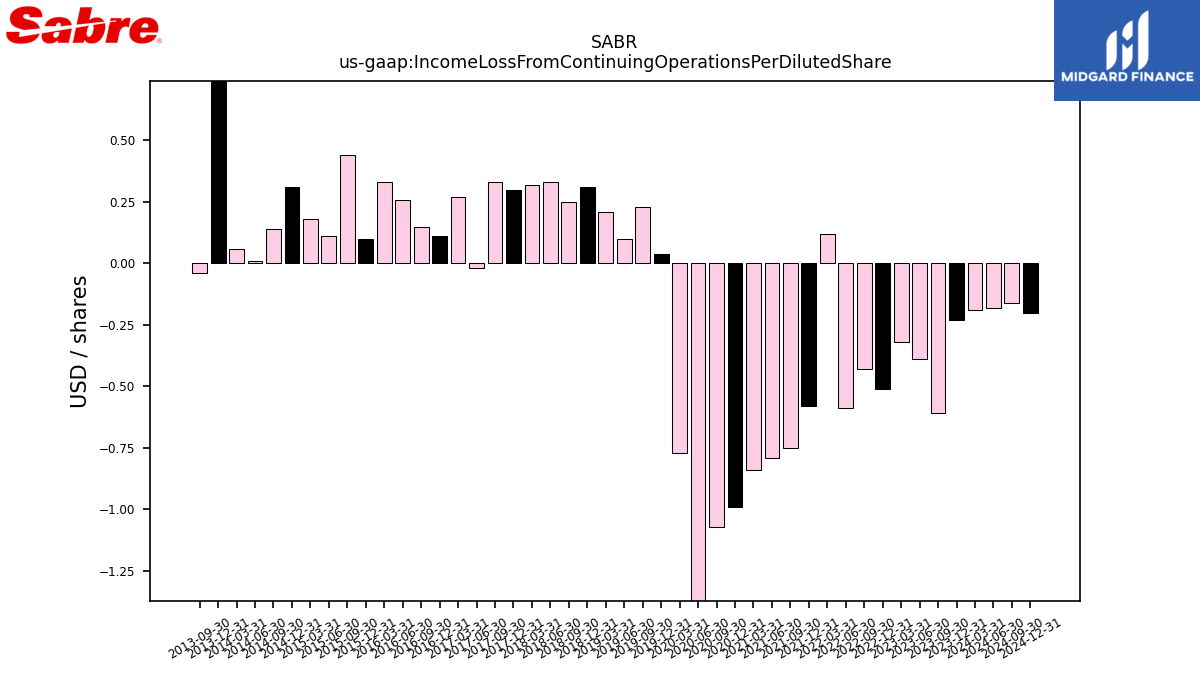
| Income Loss From Continuing Operations Per Diluted Share | -0.00 | -0.00 | -0.00 | -0.00 | -0.00 | -0.00 | -0.00 | 0.00 | -0.00 | -0.00 | -0.00 | -0.00 | -0.00 | -0.00 | -0.00 | -0.00 | 0.00 | 0.00 | 0.00 | 0.00 | 0.00 | 0.00 | 0.00 | 0.00 | 0.00 | 0.00 | -0.00 | 0.00 | 0.00 | 0.00 | 0.00 | 0.00 | 0.00 | 0.00 | 0.00 | 0.00 | 0.00 | 0.00 | 0.00 | 0.00 | 0.00 | -0.00 | NA | NA |
| 2023-12-31 | 2023-09-30 | 2023-06-30 | 2023-03-31 | 2022-12-31 | 2022-09-30 | 2022-06-30 | 2022-03-31 | 2021-12-31 | 2021-09-30 | 2021-06-30 | 2021-03-31 | 2020-12-31 | 2020-09-30 | 2020-06-30 | 2020-03-31 | 2019-12-31 | 2019-09-30 | 2019-06-30 | 2019-03-31 | 2018-12-31 | 2018-09-30 | 2018-06-30 | 2018-03-31 | 2017-12-31 | 2017-09-30 | 2017-06-30 | 2017-03-31 | 2016-12-31 | 2016-09-30 | 2016-06-30 | 2016-03-31 | 2015-12-31 | 2015-09-30 | 2015-06-30 | 2015-03-31 | 2014-12-31 | 2014-09-30 | 2014-06-30 | 2014-03-31 | 2013-12-31 | 2013-09-30 | 2013-06-30 | 2013-03-31 | ||
|---|---|---|---|---|---|---|---|---|---|---|---|---|---|---|---|---|---|---|---|---|---|---|---|---|---|---|---|---|---|---|---|---|---|---|---|---|---|---|---|---|---|---|---|---|---|
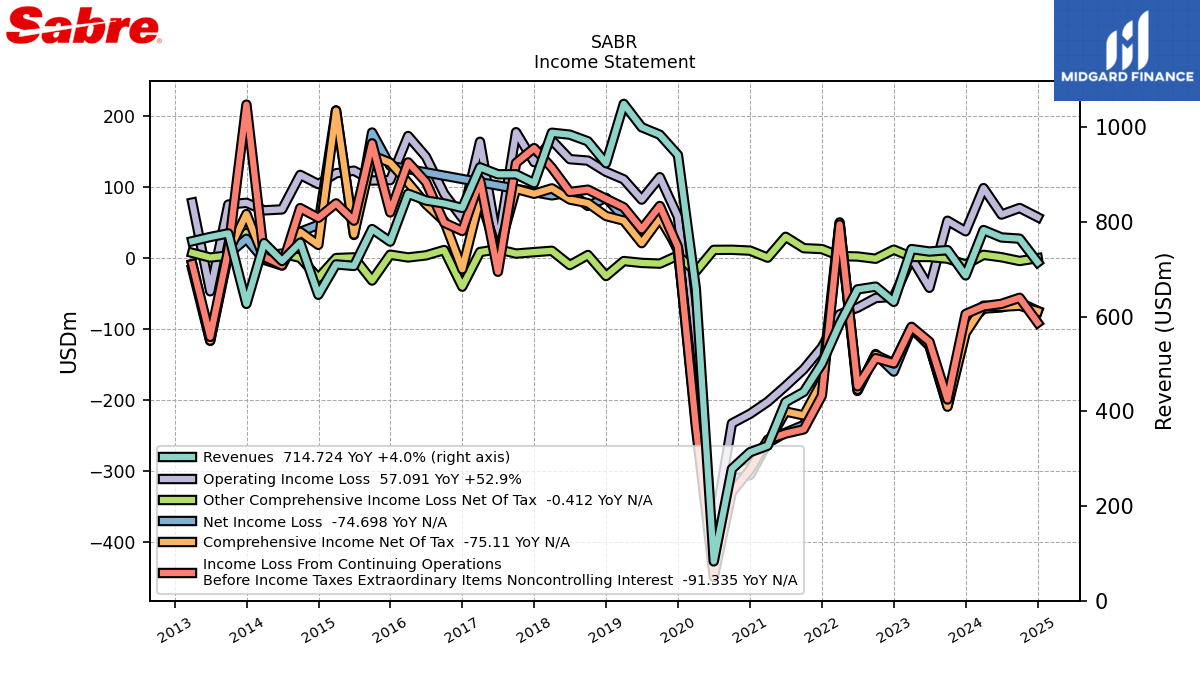
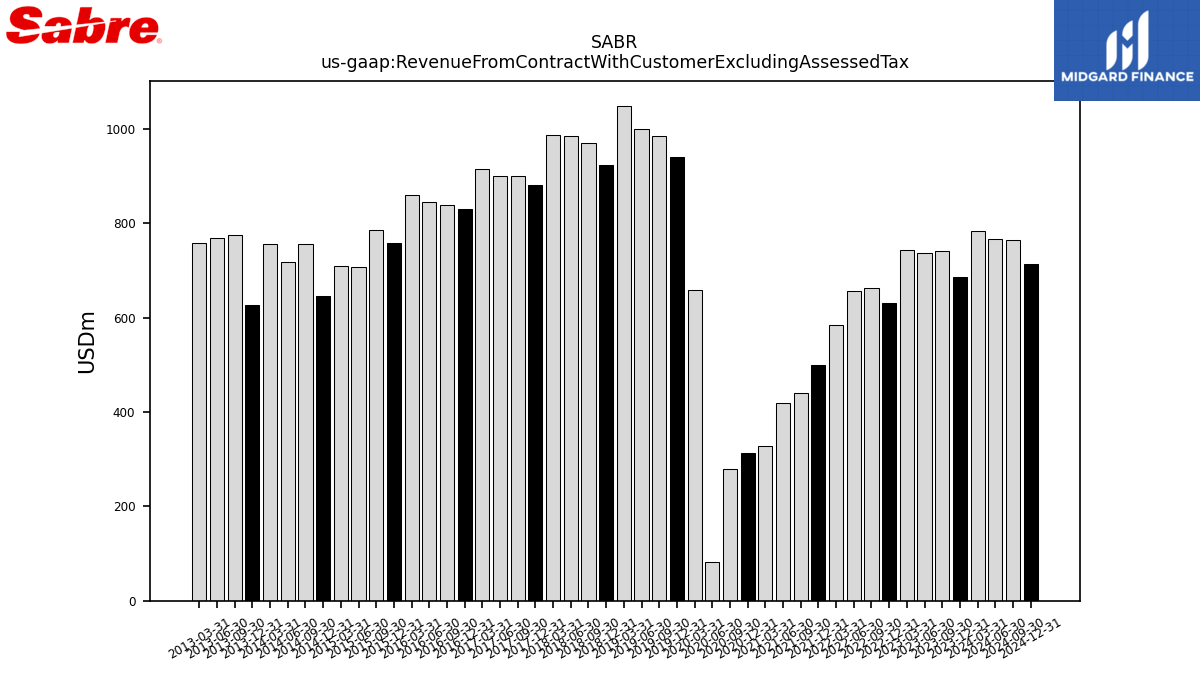
| Revenue From Contract With Customer Excluding Assessed Tax | 687.05 | 740.46 | 737.53 | 742.70 | 631.18 | 663.39 | 657.53 | 584.91 | 500.64 | 441.09 | 419.67 | 327.48 | 313.71 | 278.37 | 83.04 | 658.98 | 941.42 | 984.20 | 1000.01 | 1049.36 | 923.93 | 970.28 | 984.38 | 988.37 | 881.86 | 900.61 | 900.66 | 915.35 | 829.62 | 838.98 | 845.24 | 859.54 | 758.46 | 785.00 | 707.09 | 710.35 | 646.14 | 756.30 | 717.57 | 755.41 | 626.92 | 775.82 | 768.23 | 759.34 | |
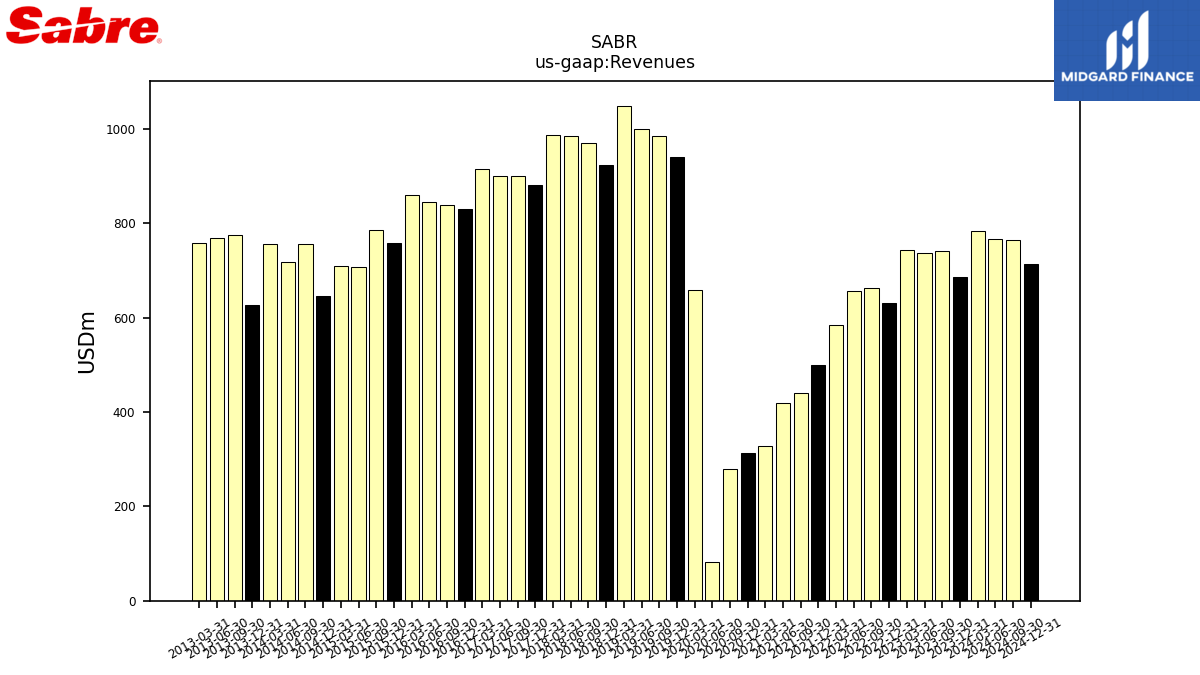
| Revenues | 687.05 | 740.46 | 737.53 | 742.70 | 631.18 | 663.39 | 657.53 | 584.91 | 500.64 | 441.09 | 419.67 | 327.48 | 313.71 | 278.37 | 83.04 | 658.98 | 941.42 | 984.20 | 1000.01 | 1049.36 | 923.93 | 970.28 | 984.38 | 988.37 | 881.86 | 900.61 | 900.66 | 915.35 | 829.62 | 838.98 | 845.24 | 859.54 | 758.46 | 785.00 | 707.09 | 710.35 | 646.14 | 756.30 | 717.57 | 755.41 | 626.92 | 775.82 | 768.23 | 759.34 | |
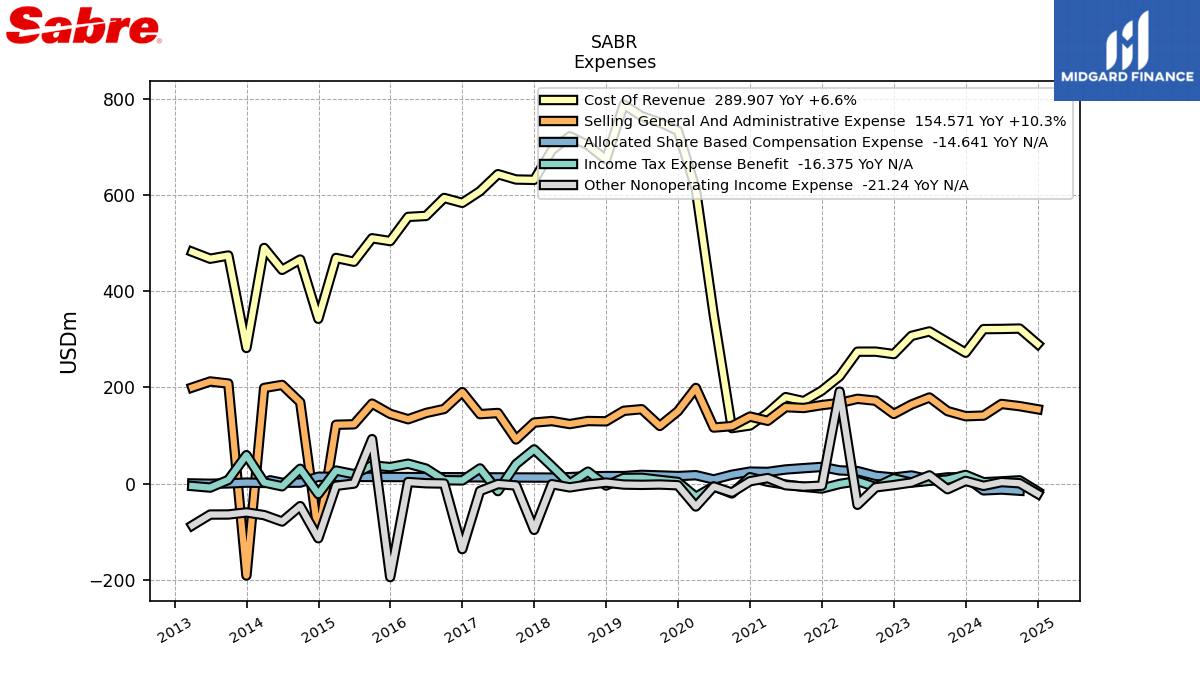
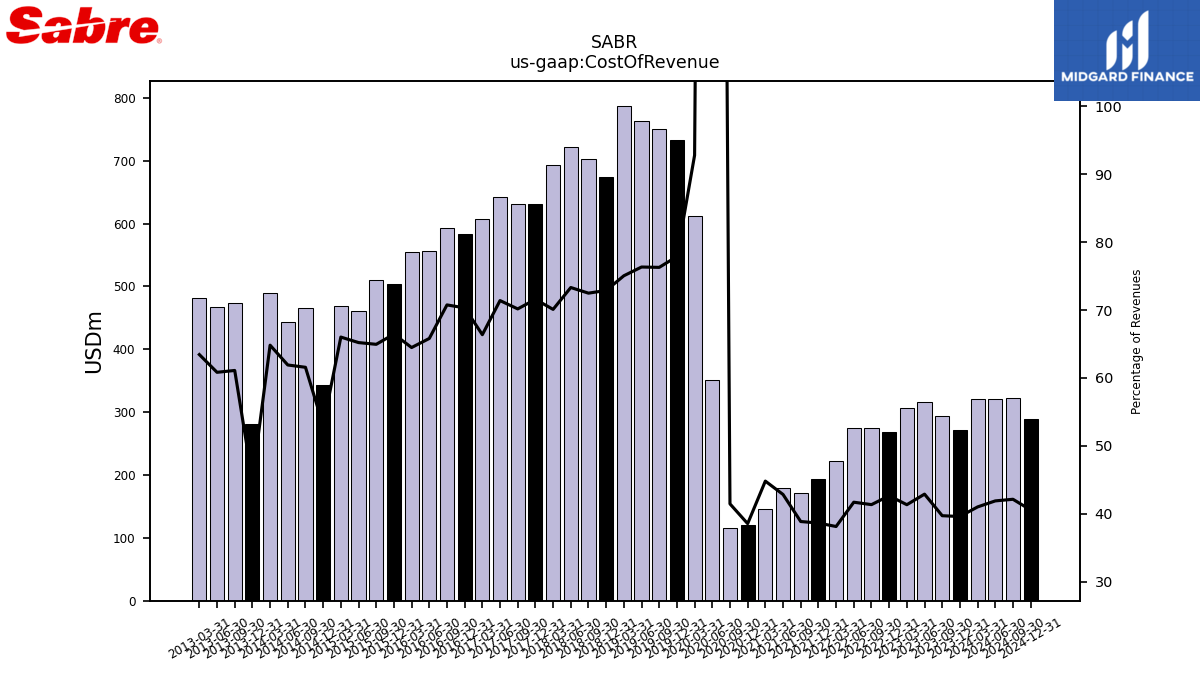
| Cost Of Revenue | 272.07 | 294.12 | 316.37 | 307.04 | 269.21 | 274.33 | 274.25 | 223.03 | 193.44 | 171.43 | 179.82 | 146.76 | 120.94 | 115.43 | 350.55 | 611.51 | 733.23 | 750.82 | 763.39 | 787.56 | 673.43 | 703.37 | 721.76 | 692.86 | 631.23 | 631.97 | 643.07 | 607.59 | 583.43 | 593.65 | 556.32 | 554.26 | 504.02 | 509.91 | 461.13 | 469.00 | 342.56 | 465.69 | 444.28 | 489.75 | 281.92 | 474.09 | 467.37 | 481.79 | |
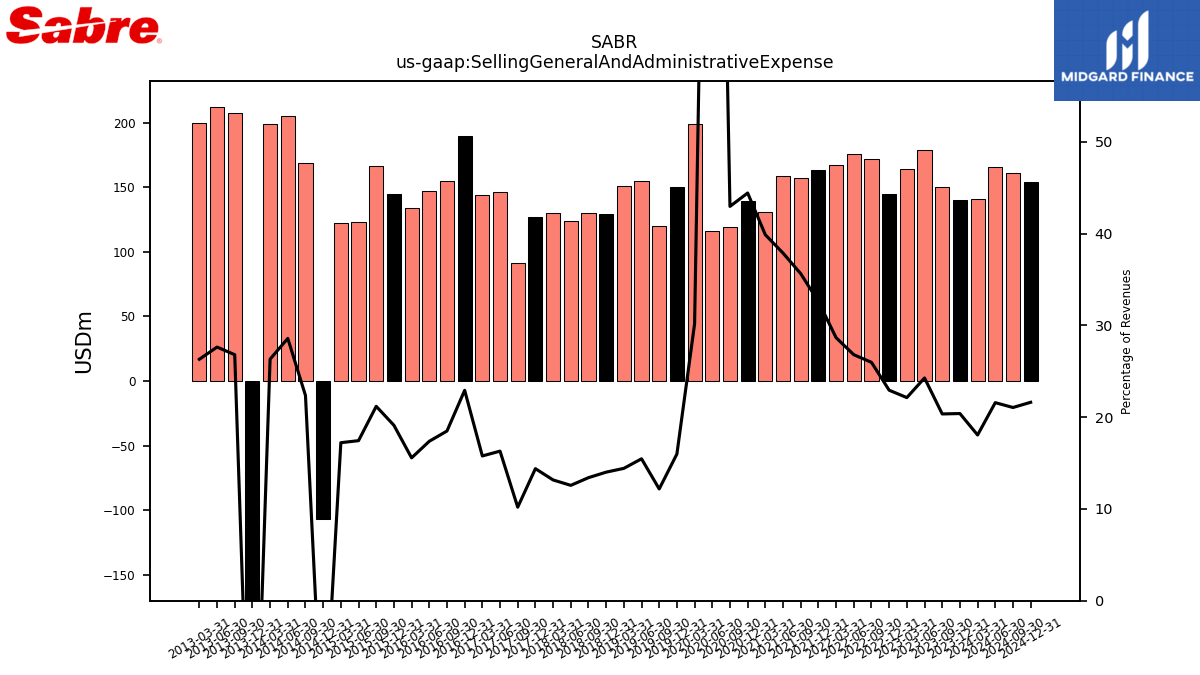
| Selling General And Administrative Expense | 140.17 | 150.74 | 179.06 | 164.43 | 144.81 | 172.36 | 176.31 | 167.68 | 163.23 | 157.23 | 159.00 | 130.61 | 139.40 | 119.63 | 116.56 | 198.87 | 150.55 | 119.92 | 154.71 | 151.39 | 129.48 | 130.15 | 123.78 | 130.11 | 126.94 | 91.84 | 146.86 | 144.44 | 190.23 | 155.18 | 146.89 | 133.86 | 145.03 | 166.32 | 123.36 | 122.36 | -107.26 | 169.18 | 205.15 | 198.88 | -190.94 | 208.03 | 212.36 | 199.83 | |
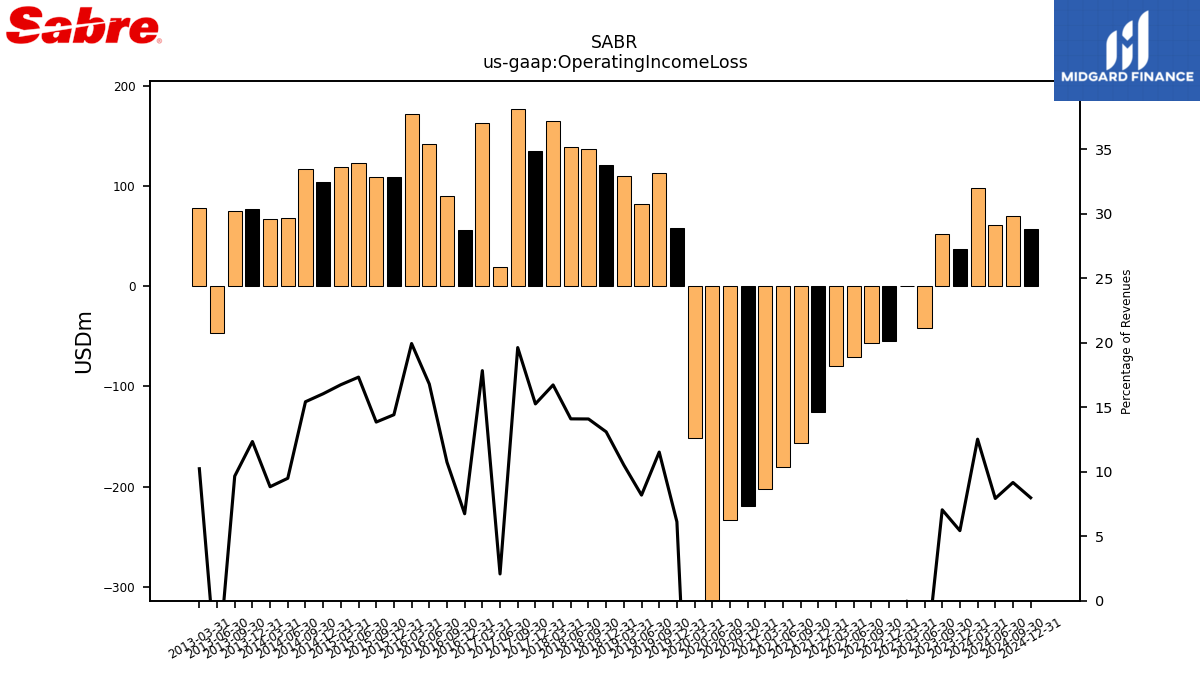
| Operating Income Loss | 37.34 | 52.20 | -42.18 | -0.21 | -54.80 | -56.53 | -70.19 | -79.53 | -125.88 | -156.69 | -180.37 | -202.55 | -219.51 | -233.05 | -384.07 | -151.41 | 57.64 | 113.46 | 81.91 | 110.41 | 121.02 | 136.76 | 138.83 | 165.40 | 134.60 | 176.80 | 18.72 | 163.33 | 55.96 | 90.15 | 142.04 | 171.42 | 109.40 | 108.77 | 122.61 | 118.99 | 103.71 | 116.70 | 68.14 | 66.79 | 77.41 | 74.97 | -47.09 | 77.73 | |
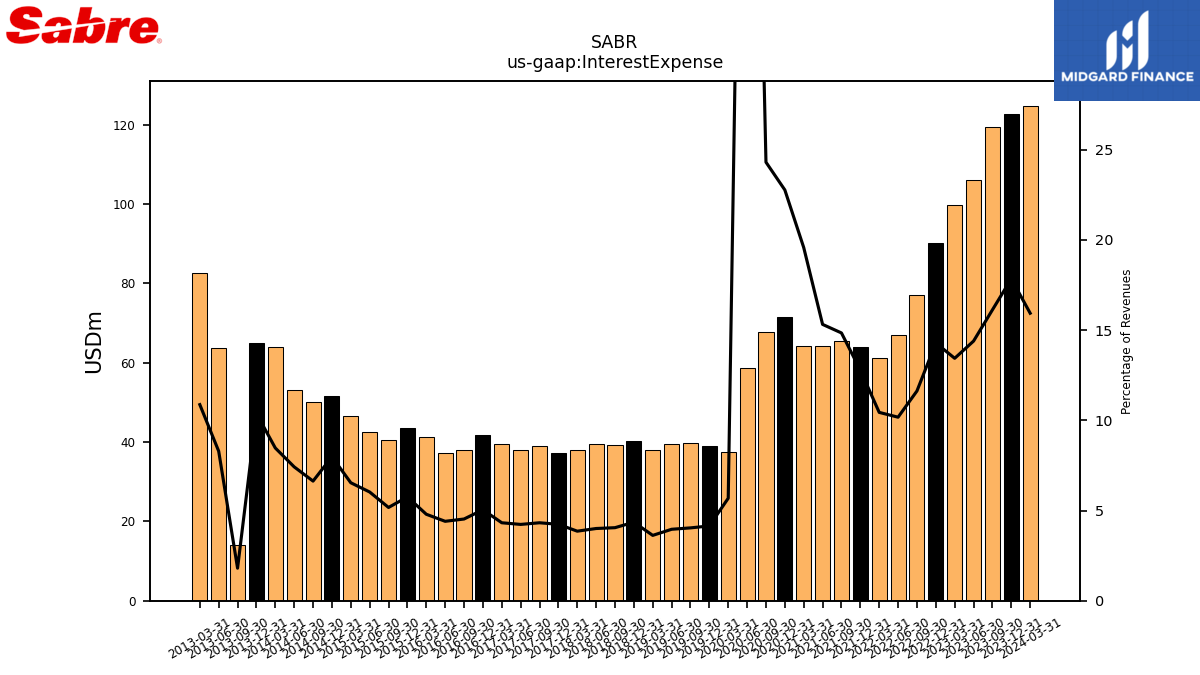
| Interest Expense | 122.59 | 119.37 | 106.13 | 99.78 | 90.17 | 77.12 | 66.88 | 61.06 | 63.98 | 65.46 | 64.27 | 64.10 | 71.42 | 67.65 | 58.58 | 37.44 | 39.03 | 39.74 | 39.61 | 38.01 | 40.21 | 39.29 | 39.41 | 38.11 | 37.35 | 38.92 | 38.10 | 39.56 | 41.84 | 38.00 | 37.21 | 41.20 | 43.66 | 40.58 | 42.61 | 46.45 | 51.55 | 50.15 | 53.23 | 63.94 | 65.04 | 14.00 | 63.67 | 82.53 | |
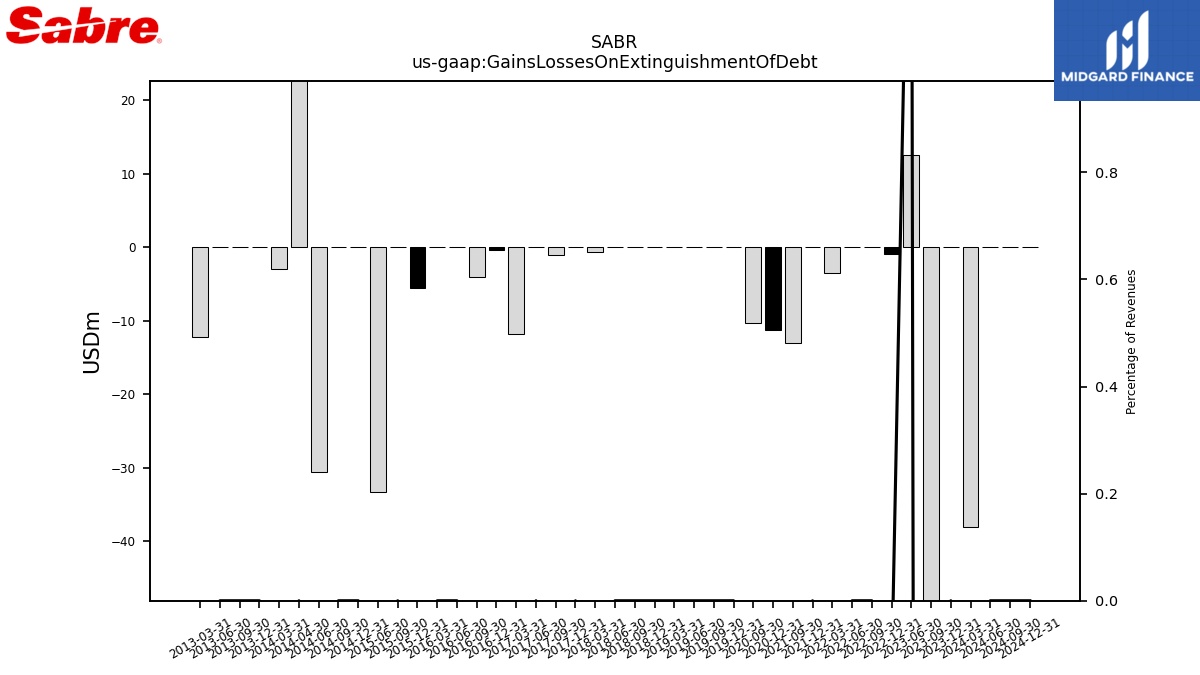
| Gains Losses On Extinguishment Of Debt | 0.00 | -121.12 | 12.54 | NA | -0.94 | 0.00 | 0.00 | -3.53 | 0.00 | -13.07 | NA | NA | -11.29 | -10.33 | NA | NA | 0.00 | 0.00 | 0.00 | 0.00 | 0.00 | 0.00 | 0.00 | -0.63 | 0.00 | -1.01 | 0.00 | -11.73 | -0.32 | -4.00 | 0.00 | 0.00 | -5.55 | 0.00 | -33.23 | NA | 0.00 | 0.00 | -30.56 | -2.98 | 0.00 | 0.00 | 0.00 | -12.18 | |
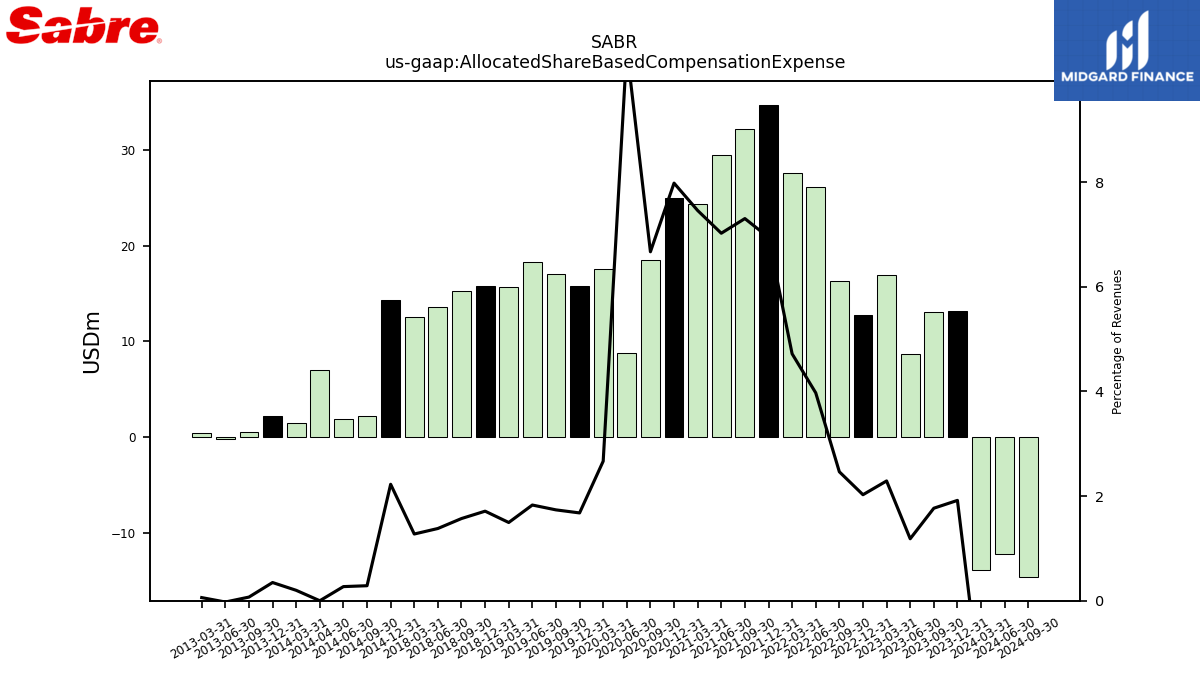
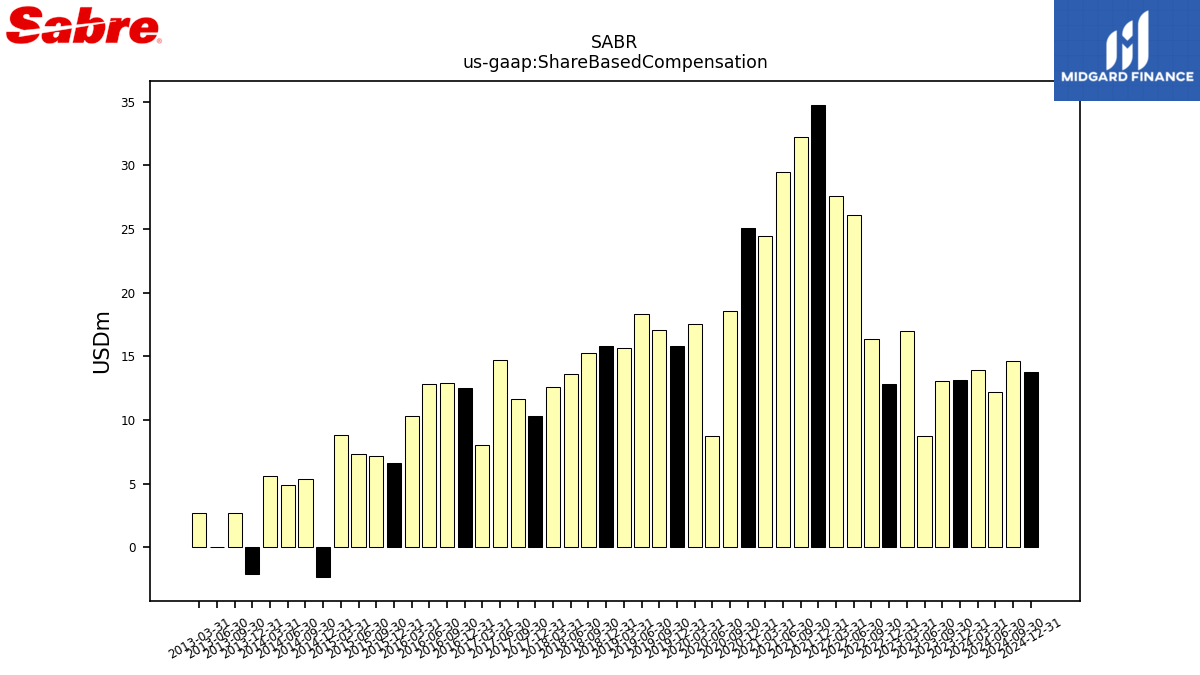
| Allocated Share Based Compensation Expense | 13.18 | 13.09 | 8.74 | 17.00 | 12.79 | 16.35 | 26.13 | 27.61 | 34.77 | 32.22 | 29.48 | 24.43 | 25.04 | 18.57 | 8.76 | 17.58 | 15.80 | 17.09 | 18.30 | 15.69 | 15.82 | 15.24 | 13.59 | 12.61 | NA | NA | NA | NA | NA | NA | NA | NA | NA | NA | NA | NA | 14.38 | 2.17 | 1.94 | 1.51 | 2.18 | 0.54 | -0.19 | 0.46 | |
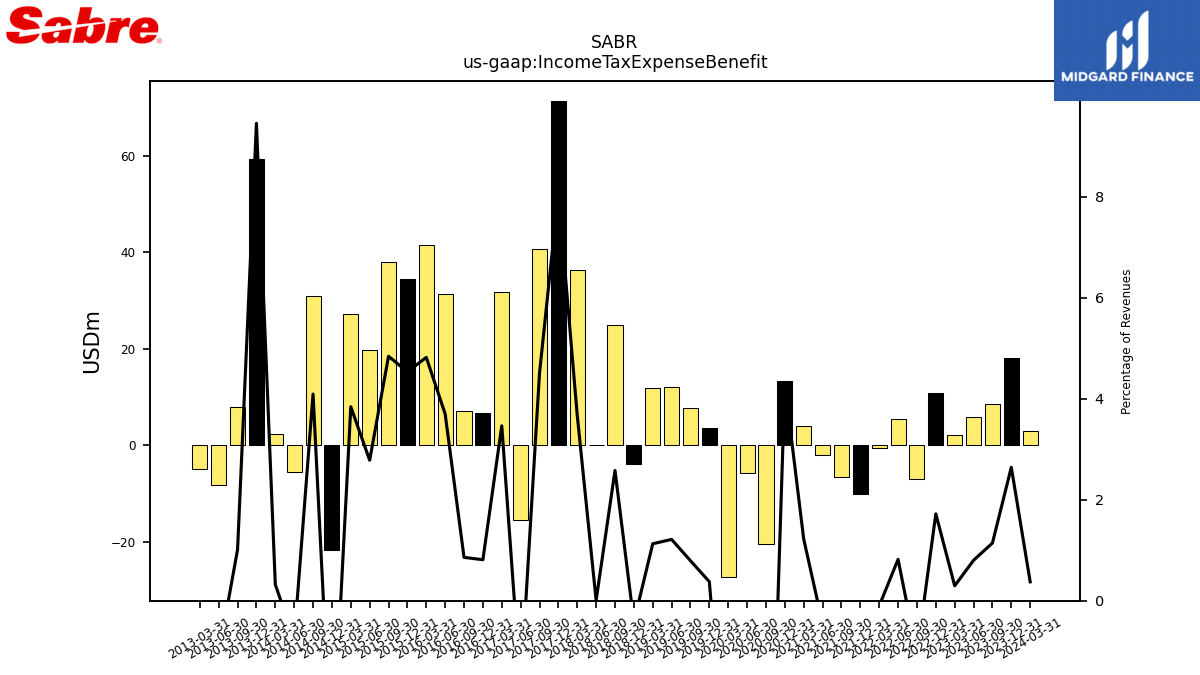
| Income Tax Expense Benefit | 18.16 | 8.46 | 5.91 | 2.20 | 10.86 | -6.99 | 5.39 | -0.60 | -10.10 | -6.61 | -1.90 | 4.00 | 13.42 | -20.36 | -5.72 | -27.25 | 3.54 | 7.79 | 12.14 | 11.84 | -3.88 | 25.02 | 0.07 | 36.27 | 71.20 | 40.59 | -15.47 | 31.71 | 6.74 | 7.21 | 31.27 | 41.42 | 34.39 | 38.01 | 19.68 | 27.28 | -21.60 | 30.96 | -5.50 | 2.42 | 59.27 | 7.86 | -8.14 | -4.95 | |
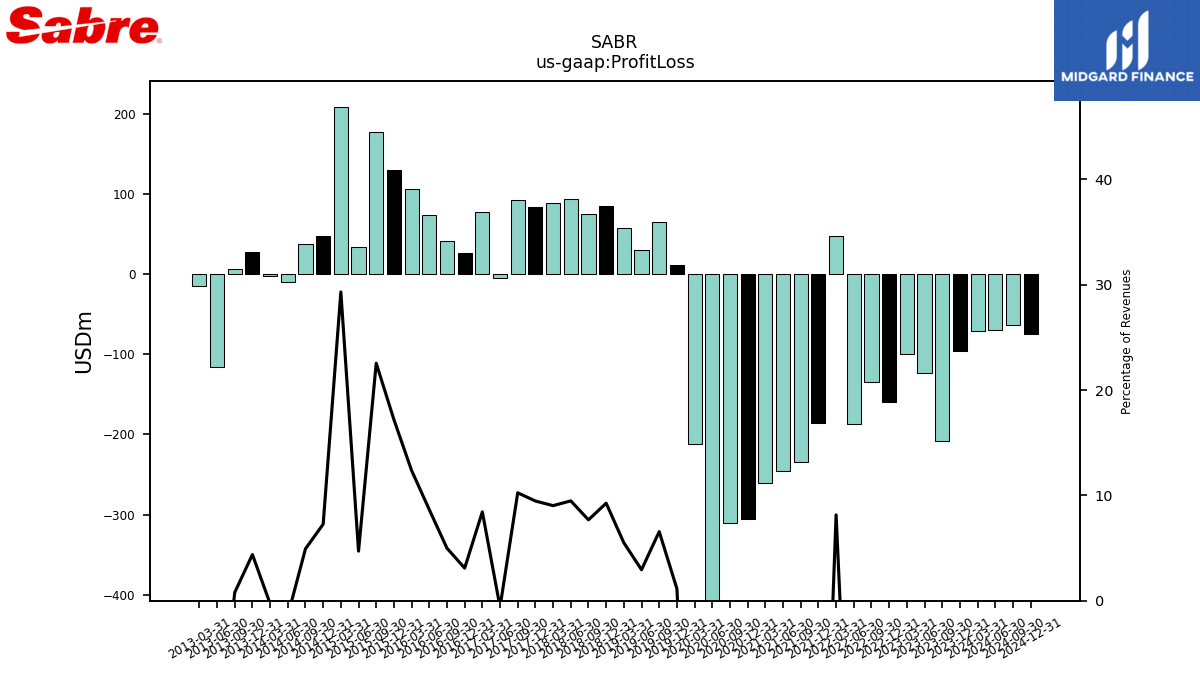
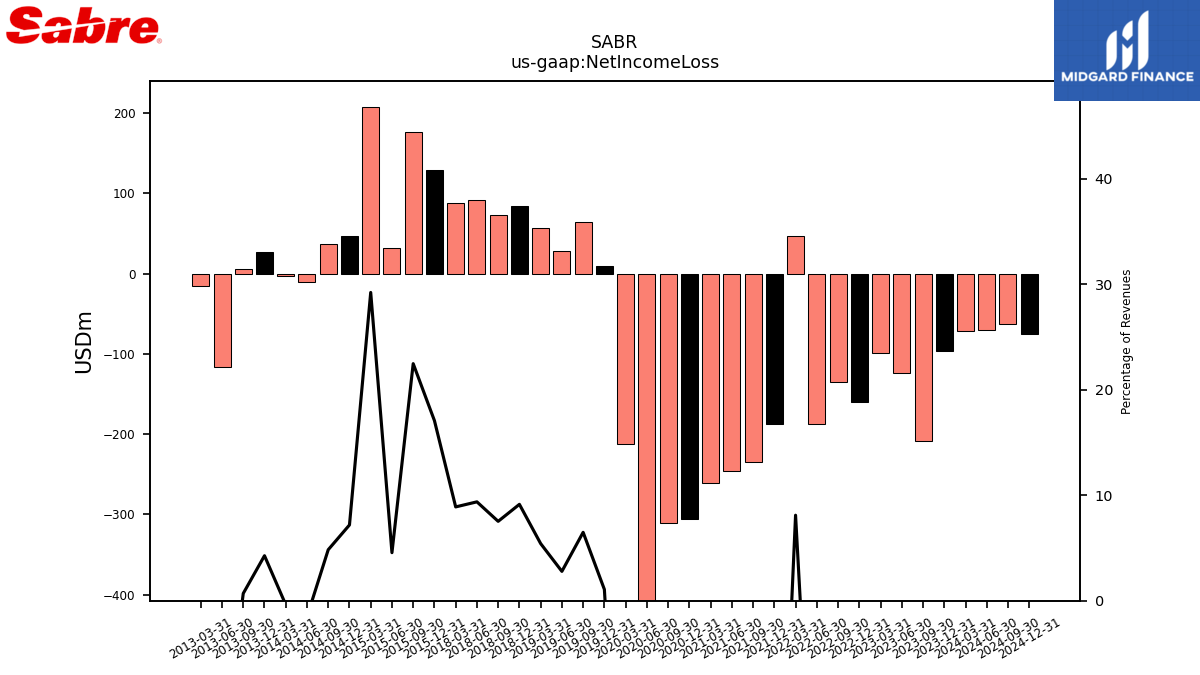
| Profit Loss | -96.27 | -207.91 | -124.00 | -99.77 | -159.35 | -134.60 | -186.50 | 47.68 | -186.19 | -234.53 | -245.40 | -260.19 | -305.35 | -310.09 | -444.20 | -211.90 | 10.76 | 64.58 | 29.44 | 57.76 | 85.55 | 74.54 | 93.33 | 89.24 | 83.48 | 92.30 | -5.37 | 77.25 | 25.71 | 41.86 | 73.10 | 106.27 | 130.42 | 177.02 | 33.28 | 208.24 | 46.96 | 37.28 | -10.20 | -2.10 | 27.49 | 6.09 | -116.03 | -15.18 | |
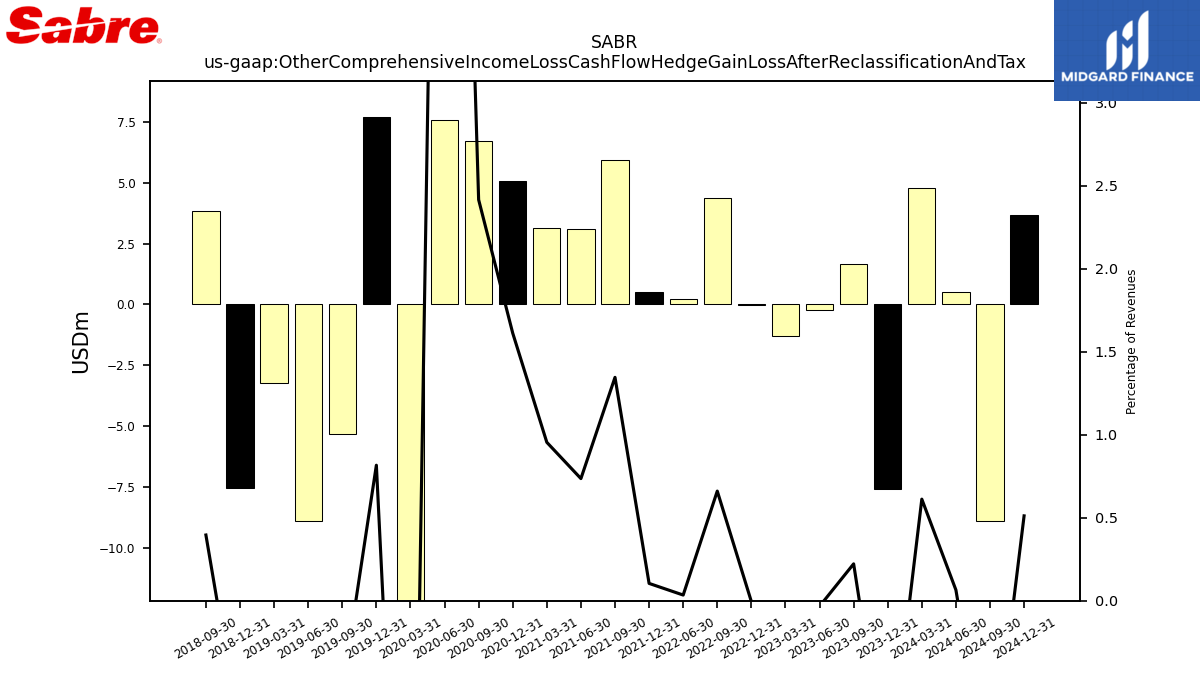
| Other Comprehensive Income Loss Cash Flow Hedge Gain Loss After Reclassification And Tax | -7.56 | 1.65 | -0.25 | -1.28 | -0.03 | 4.38 | 0.23 | NA | 0.52 | 5.93 | 3.09 | 3.12 | 5.06 | 6.72 | 7.57 | -21.98 | 7.68 | -5.32 | -8.87 | -3.21 | -7.51 | 3.84 | NA | NA | NA | NA | NA | NA | NA | NA | NA | NA | NA | NA | NA | NA | NA | NA | NA | NA | NA | NA | NA | NA | |
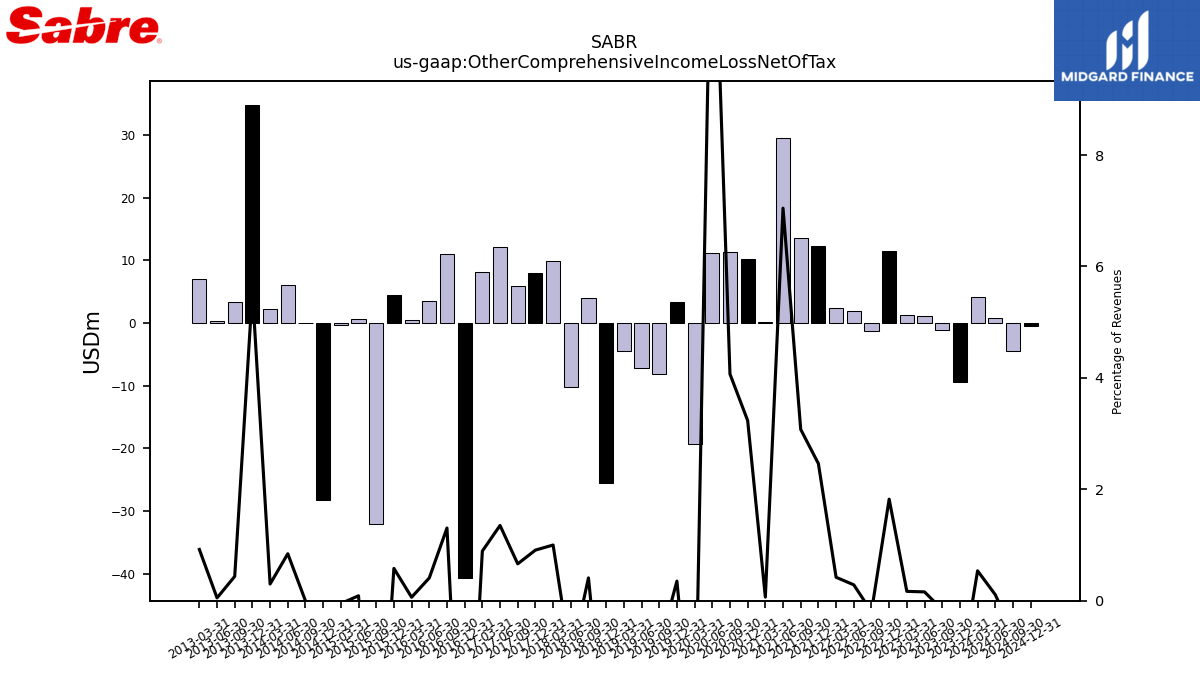
| Other Comprehensive Income Loss Net Of Tax | -9.44 | -1.18 | 1.17 | 1.25 | 11.51 | -1.29 | 1.88 | 2.46 | 12.32 | 13.57 | 29.57 | 0.21 | 10.15 | 11.33 | 11.18 | -19.30 | 3.32 | -8.21 | -7.16 | -4.53 | -25.60 | 3.98 | -10.23 | 9.89 | 8.02 | 5.96 | 12.17 | 8.16 | -40.62 | 10.95 | 3.46 | 0.54 | 4.40 | -32.00 | 0.63 | -0.36 | -28.21 | -0.02 | 6.05 | 2.27 | 34.85 | 3.39 | 0.39 | 6.99 | |
| Net Income Loss | -96.46 | -208.28 | -123.93 | -98.93 | -160.09 | -135.38 | -187.39 | 47.41 | -186.70 | -235.24 | -245.85 | -260.68 | -305.71 | -310.22 | -444.13 | -212.68 | 10.09 | 63.81 | 27.84 | 56.85 | 84.40 | 73.00 | 92.25 | 87.88 | NA | NA | NA | NA | NA | NA | NA | NA | 129.44 | 176.34 | 32.21 | 207.49 | 46.40 | 36.56 | -10.90 | -2.84 | 26.76 | 5.37 | -116.86 | -15.76 | |
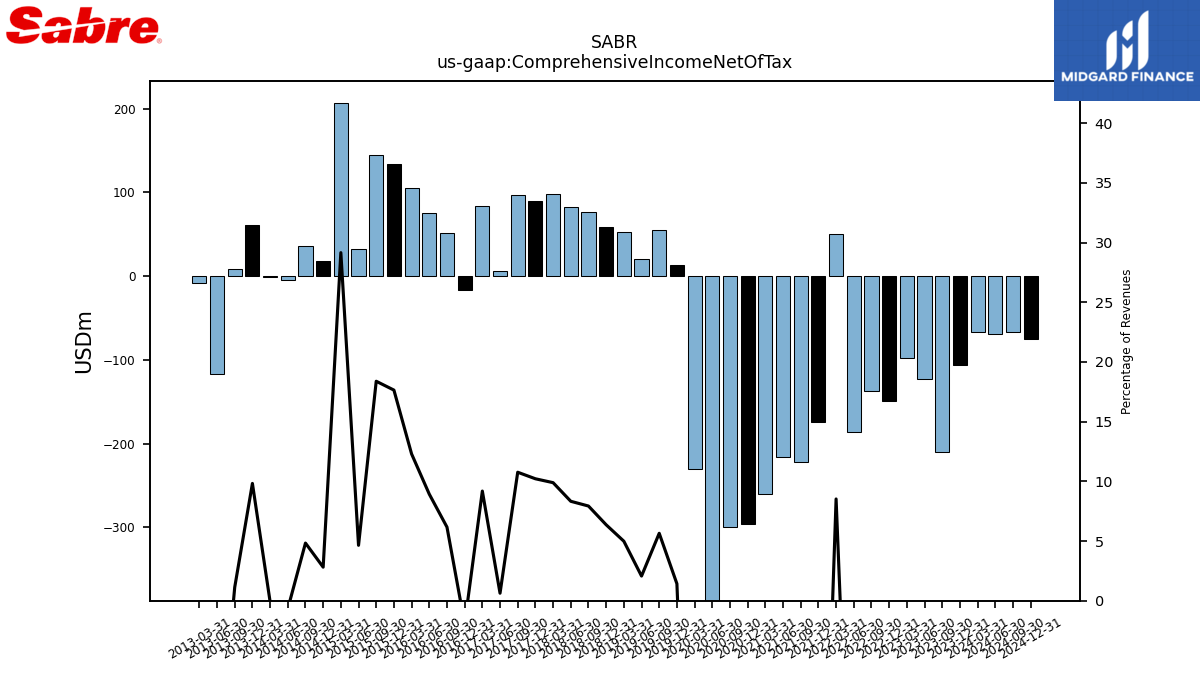
| Comprehensive Income Net Of Tax | -105.89 | -209.47 | -122.76 | -97.68 | -148.58 | -136.67 | -185.51 | 49.87 | -174.38 | -221.68 | -216.28 | -260.46 | -295.57 | -298.89 | -432.95 | -230.42 | 13.41 | 55.60 | 20.67 | 52.32 | 58.80 | 76.98 | 82.02 | 97.77 | 90.11 | 96.95 | 5.69 | 84.10 | -16.06 | 51.77 | 75.48 | 105.71 | 133.84 | 144.34 | 32.84 | 207.13 | 18.19 | 36.54 | -4.84 | -0.58 | 61.61 | 8.77 | -116.47 | -8.77 | |
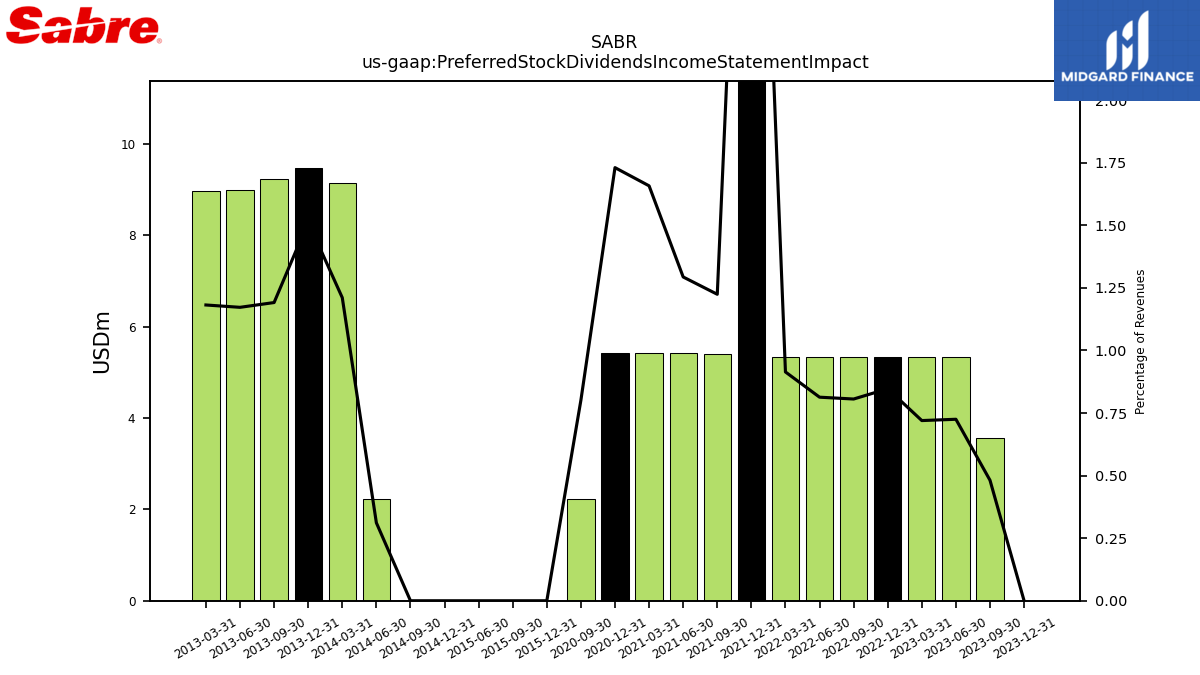
| Preferred Stock Dividends Income Statement Impact | 0.00 | 3.56 | 5.35 | 5.35 | 5.35 | 5.35 | 5.35 | 5.35 | 21.60 | 5.40 | 5.43 | 5.43 | 5.43 | 2.23 | NA | NA | NA | NA | NA | NA | NA | NA | NA | NA | NA | NA | NA | NA | NA | NA | NA | NA | 0.00 | 0.00 | 0.00 | NA | 0.00 | 0.00 | 2.23 | 9.15 | 9.48 | 9.24 | 9.01 | 8.97 | |
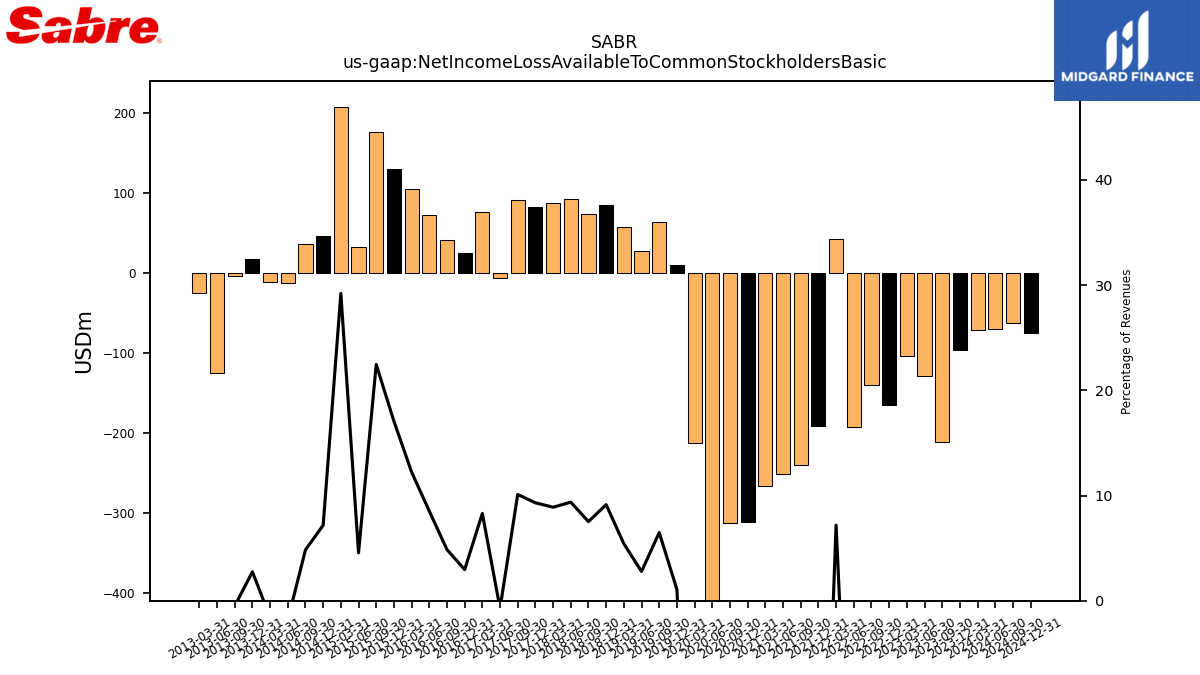
| Net Income Loss Available To Common Stockholders Basic | -96.46 | -211.85 | -129.28 | -104.28 | -165.44 | -140.72 | -192.73 | 42.06 | -192.04 | -240.64 | -251.28 | -266.11 | -311.14 | -312.45 | -442.57 | -212.68 | 10.09 | 63.81 | 27.84 | 56.85 | 84.40 | 73.00 | 92.25 | 87.88 | 82.09 | 90.99 | -6.49 | 75.94 | 24.56 | 40.81 | 72.02 | 105.17 | 129.44 | 176.34 | 32.21 | 207.49 | 46.40 | 36.56 | -13.13 | -11.99 | 17.27 | -3.87 | -125.87 | -24.74 |
| 2023-12-31 | 2023-09-30 | 2023-06-30 | 2023-03-31 | 2022-12-31 | 2022-09-30 | 2022-06-30 | 2022-03-31 | 2021-12-31 | 2021-09-30 | 2021-06-30 | 2021-03-31 | 2020-12-31 | 2020-09-30 | 2020-06-30 | 2020-03-31 | 2019-12-31 | 2019-09-30 | 2019-06-30 | 2019-03-31 | 2018-12-31 | 2018-09-30 | 2018-06-30 | 2018-03-31 | 2017-12-31 | 2017-09-30 | 2017-06-30 | 2017-03-31 | 2016-12-31 | 2016-09-30 | 2016-06-30 | 2016-03-31 | 2015-12-31 | 2015-09-30 | 2015-06-30 | 2015-03-31 | 2014-12-31 | 2014-09-30 | 2014-06-30 | 2014-03-31 | 2013-12-31 | 2013-09-30 | 2013-06-30 | 2013-03-31 | ||
|---|---|---|---|---|---|---|---|---|---|---|---|---|---|---|---|---|---|---|---|---|---|---|---|---|---|---|---|---|---|---|---|---|---|---|---|---|---|---|---|---|---|---|---|---|---|
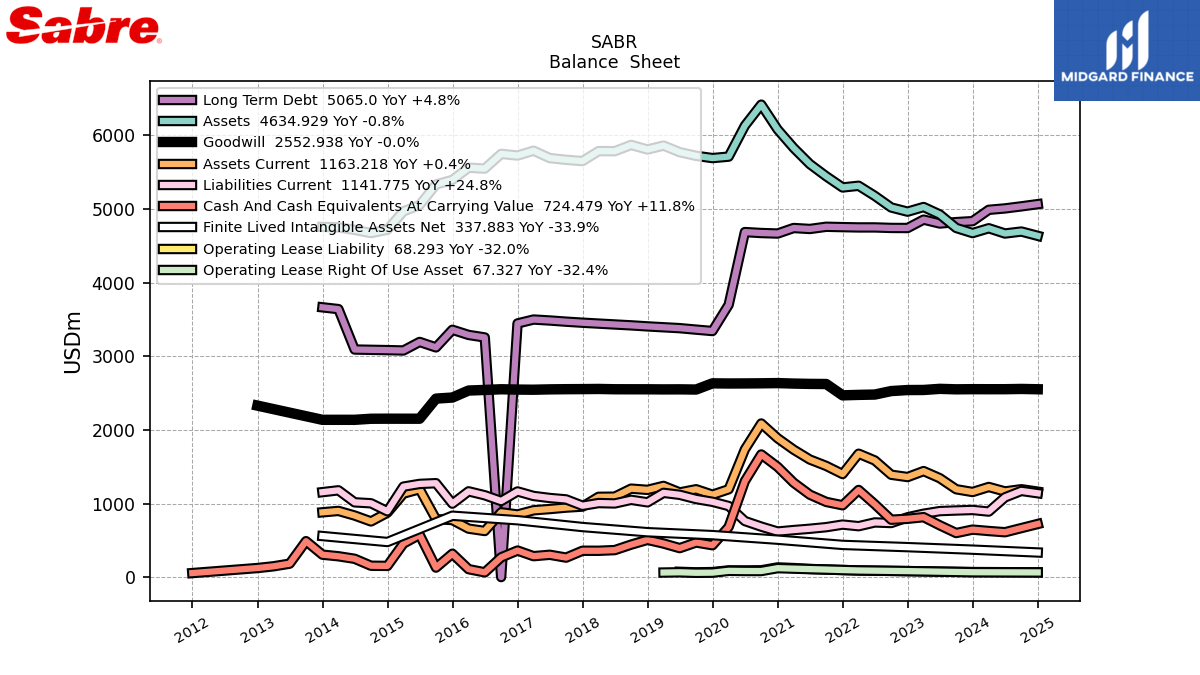
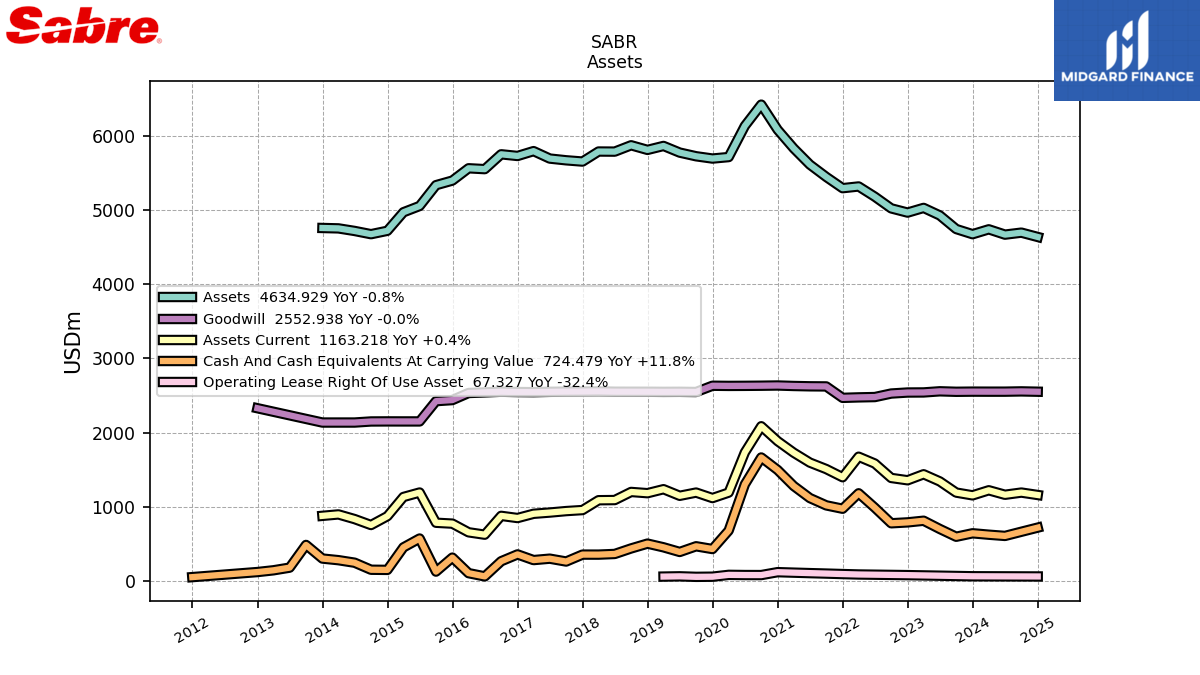
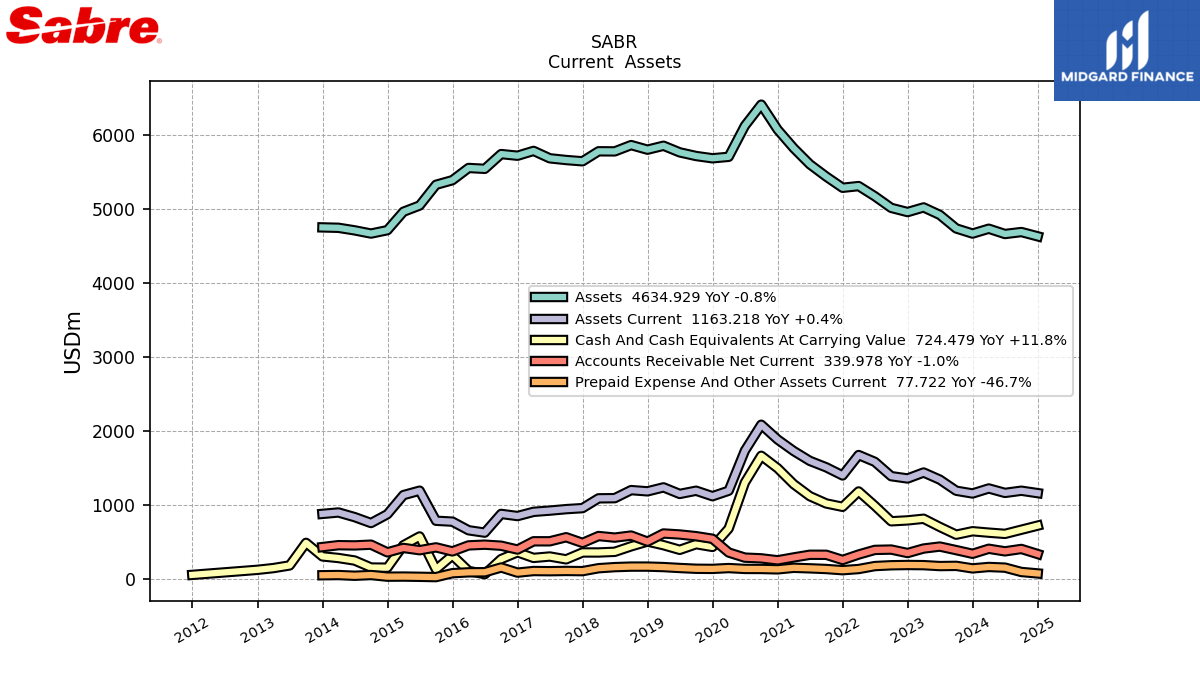
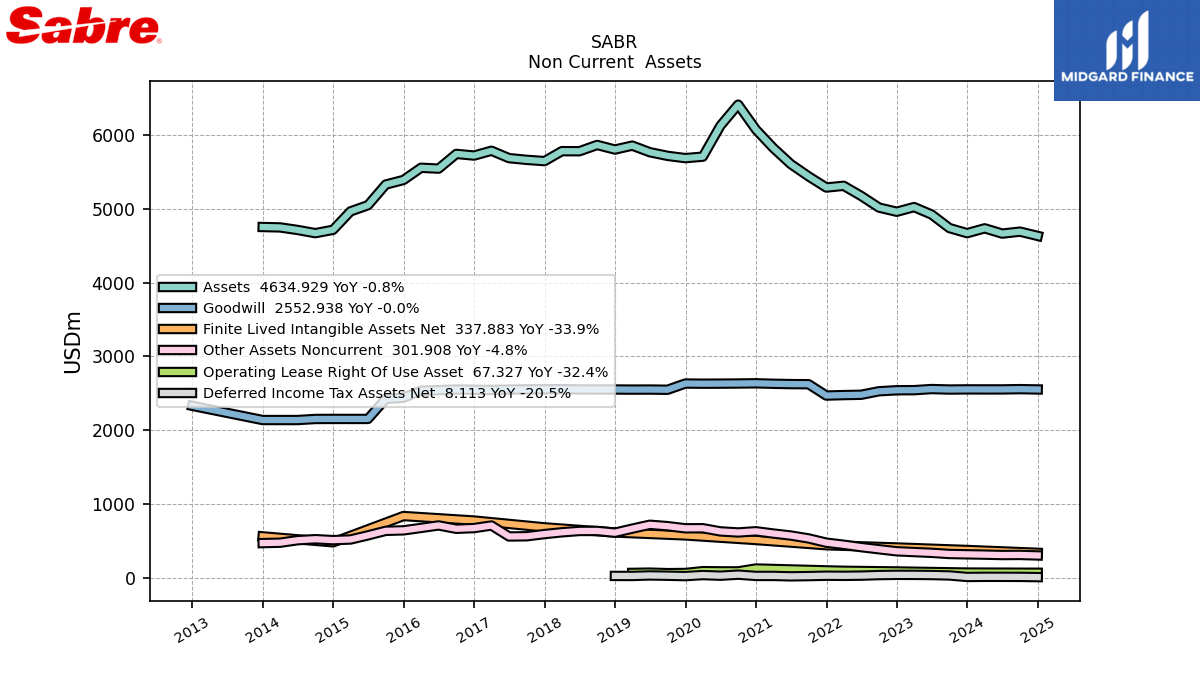
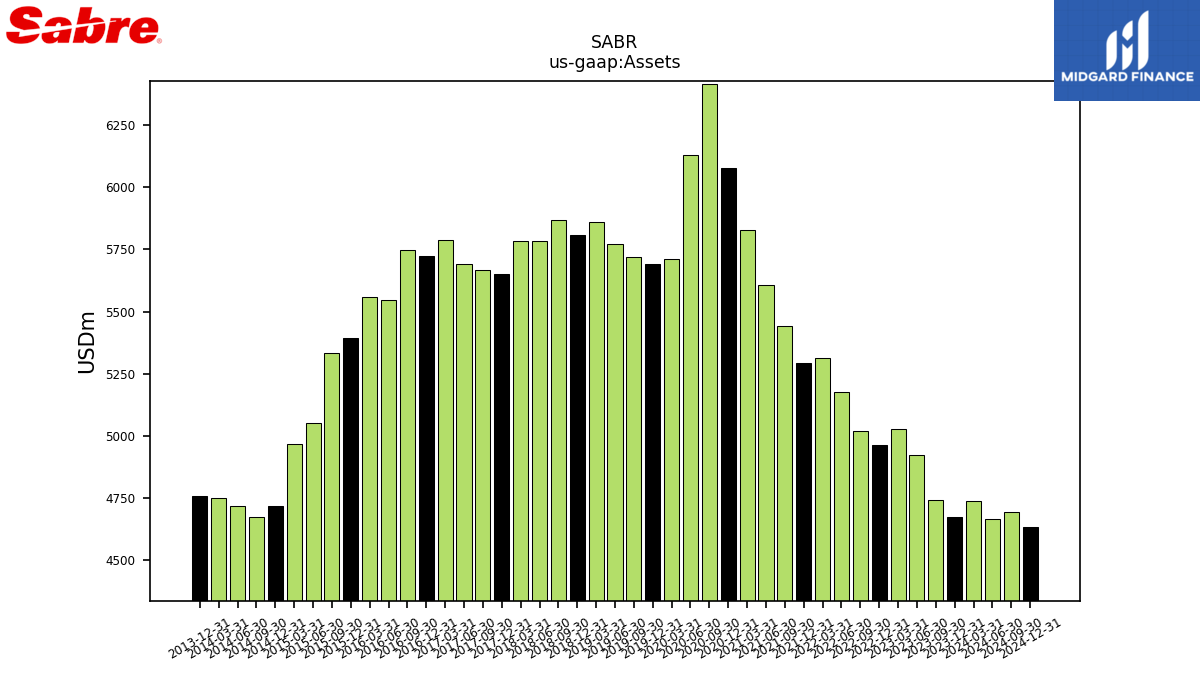
| Assets | 4672.19 | 4741.70 | 4924.56 | 5026.01 | 4962.88 | 5019.62 | 5176.74 | 5314.48 | 5291.33 | 5442.91 | 5608.45 | 5827.84 | 6077.72 | 6415.50 | 6129.21 | 5709.86 | 5689.96 | 5720.73 | 5770.07 | 5859.56 | 5806.38 | 5868.48 | 5783.28 | 5784.55 | 5649.36 | 5666.49 | 5689.88 | 5790.00 | 5724.57 | 5747.19 | 5547.42 | 5559.12 | 5393.63 | 5331.72 | 5051.58 | 4967.48 | 4718.00 | 4672.39 | 4715.70 | 4750.41 | 4755.71 | NA | NA | NA | |
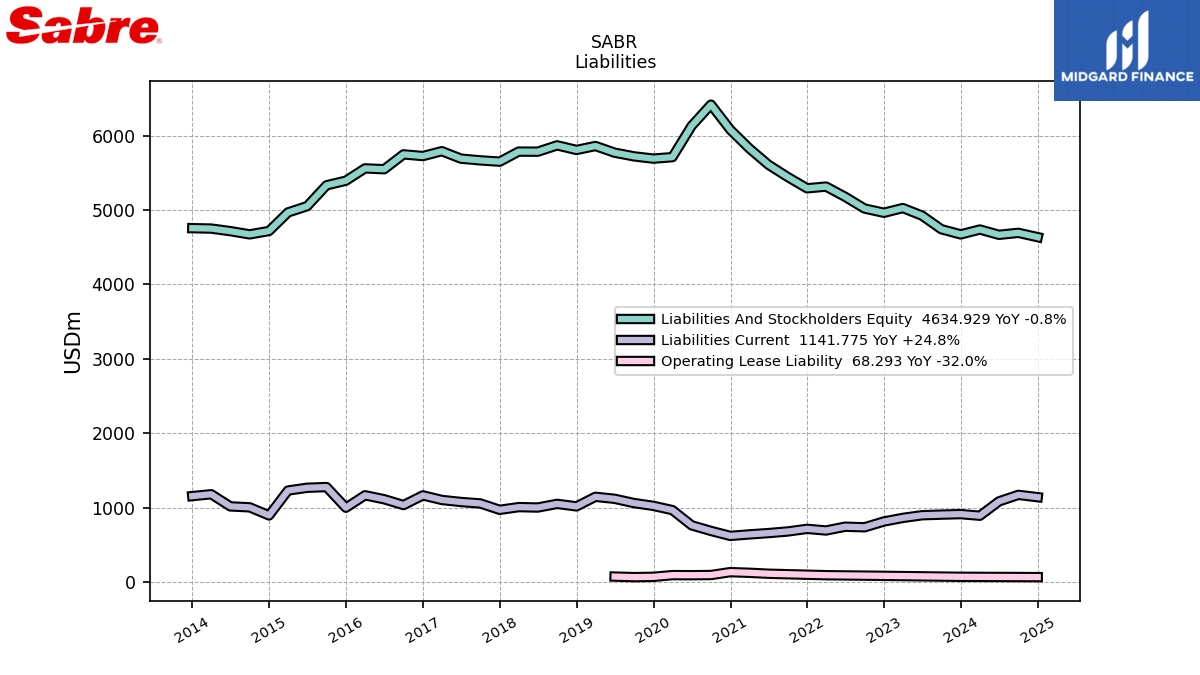
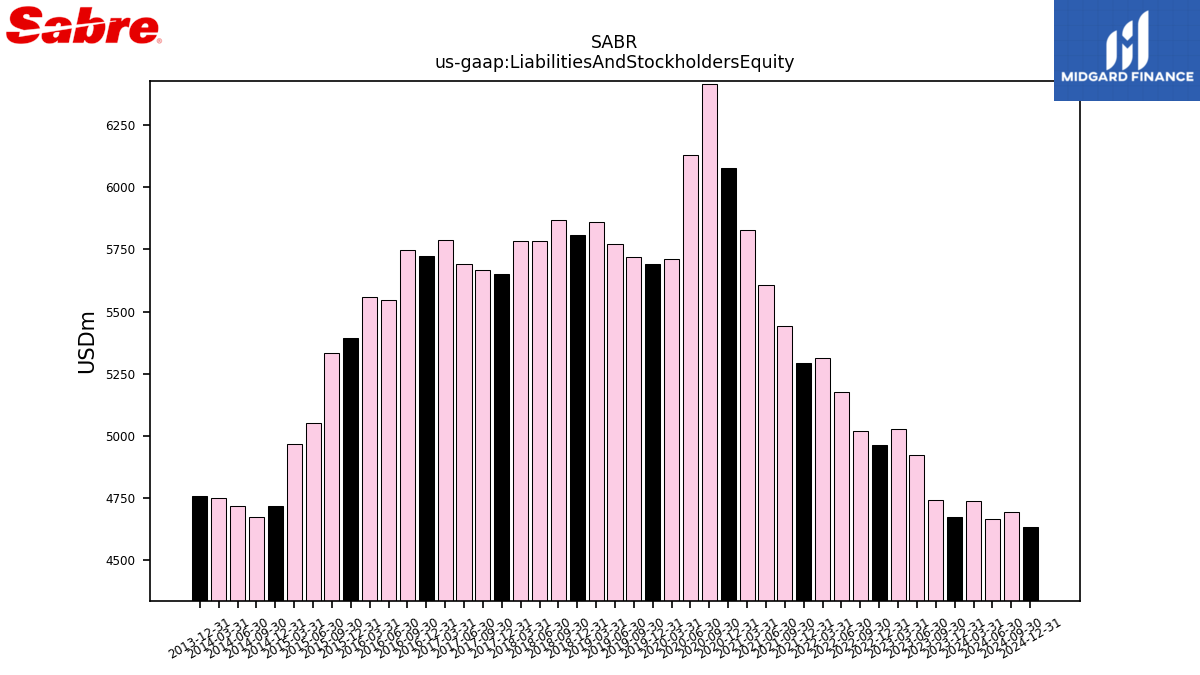
| Liabilities And Stockholders Equity | 4672.19 | 4741.70 | 4924.56 | 5026.01 | 4962.88 | 5019.62 | 5176.74 | 5314.48 | 5291.33 | 5442.91 | 5608.45 | 5827.84 | 6077.72 | 6415.50 | 6129.21 | 5709.86 | 5689.96 | 5720.73 | 5770.07 | 5859.56 | 5806.38 | 5868.48 | 5783.28 | 5784.55 | 5649.36 | 5666.49 | 5689.88 | 5790.00 | 5724.57 | 5747.19 | 5547.42 | 5559.12 | 5393.63 | 5331.72 | 5051.58 | 4967.48 | 4718.00 | 4672.39 | 4715.70 | 4750.41 | 4755.71 | NA | NA | NA |
| 2023-12-31 | 2023-09-30 | 2023-06-30 | 2023-03-31 | 2022-12-31 | 2022-09-30 | 2022-06-30 | 2022-03-31 | 2021-12-31 | 2021-09-30 | 2021-06-30 | 2021-03-31 | 2020-12-31 | 2020-09-30 | 2020-06-30 | 2020-03-31 | 2019-12-31 | 2019-09-30 | 2019-06-30 | 2019-03-31 | 2018-12-31 | 2018-09-30 | 2018-06-30 | 2018-03-31 | 2017-12-31 | 2017-09-30 | 2017-06-30 | 2017-03-31 | 2016-12-31 | 2016-09-30 | 2016-06-30 | 2016-03-31 | 2015-12-31 | 2015-09-30 | 2015-06-30 | 2015-03-31 | 2014-12-31 | 2014-09-30 | 2014-06-30 | 2014-03-31 | 2013-12-31 | 2013-09-30 | 2013-06-30 | 2013-03-31 | ||
|---|---|---|---|---|---|---|---|---|---|---|---|---|---|---|---|---|---|---|---|---|---|---|---|---|---|---|---|---|---|---|---|---|---|---|---|---|---|---|---|---|---|---|---|---|---|
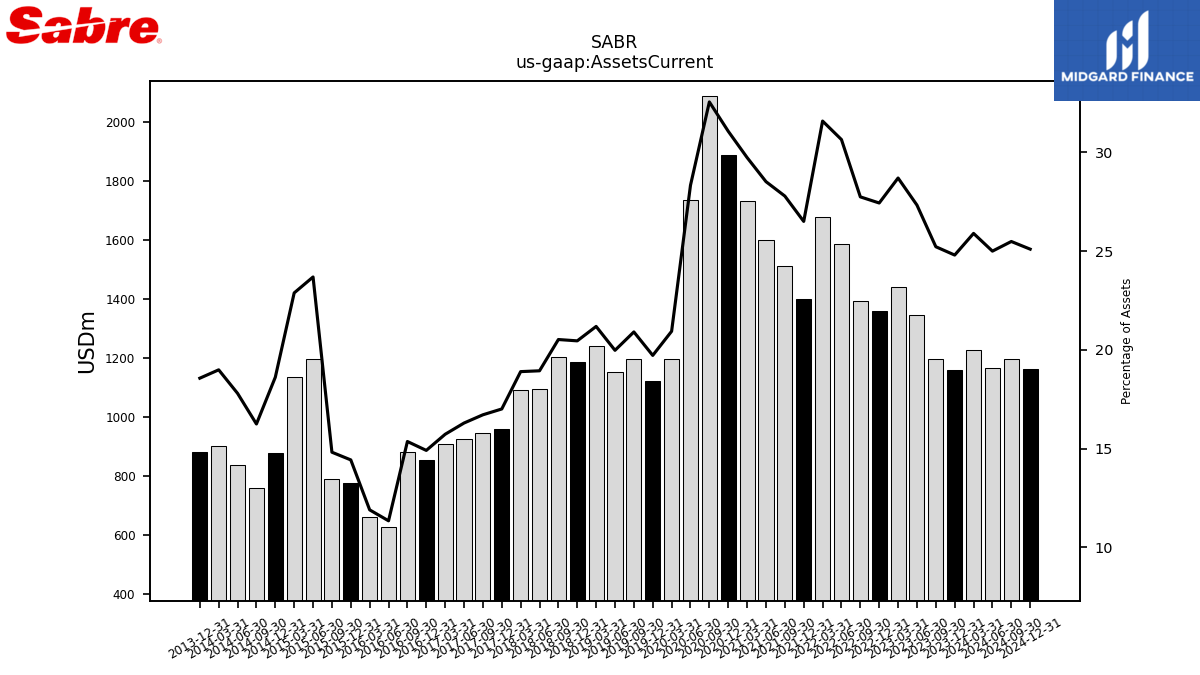
| Assets Current | 1158.59 | 1195.83 | 1345.76 | 1442.38 | 1361.49 | 1392.66 | 1586.38 | 1678.42 | 1402.27 | 1512.29 | 1599.23 | 1732.84 | 1888.11 | 2088.25 | 1736.46 | 1195.62 | 1121.92 | 1195.95 | 1152.58 | 1241.29 | 1187.63 | 1204.29 | 1095.24 | 1093.06 | 960.69 | 946.89 | 927.08 | 910.43 | 853.38 | 882.66 | 629.26 | 661.36 | 778.09 | 789.95 | 1196.64 | 1136.62 | 878.16 | 759.02 | 839.20 | 901.94 | 882.83 | NA | NA | NA | |
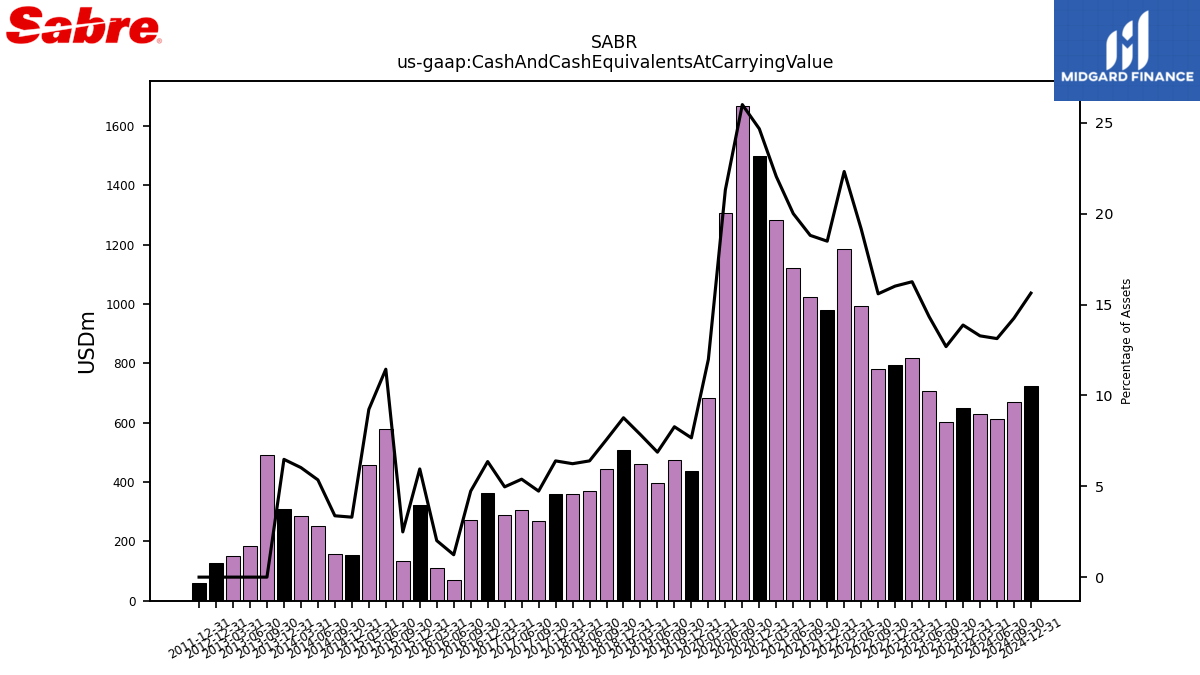
| Cash And Cash Equivalents At Carrying Value | 648.21 | 601.60 | 706.15 | 817.08 | 794.89 | 782.76 | 992.18 | 1186.41 | 978.35 | 1023.77 | 1122.11 | 1284.92 | 1499.66 | 1668.35 | 1306.29 | 684.47 | 436.18 | 473.43 | 396.85 | 459.49 | 509.26 | 444.32 | 370.00 | 361.10 | 361.38 | 268.27 | 306.70 | 287.64 | 364.11 | 272.00 | 68.31 | 111.70 | 321.13 | 132.69 | 578.03 | 458.56 | 155.68 | 157.75 | 252.38 | 286.36 | 308.24 | 491.59 | 186.01 | 150.23 | |
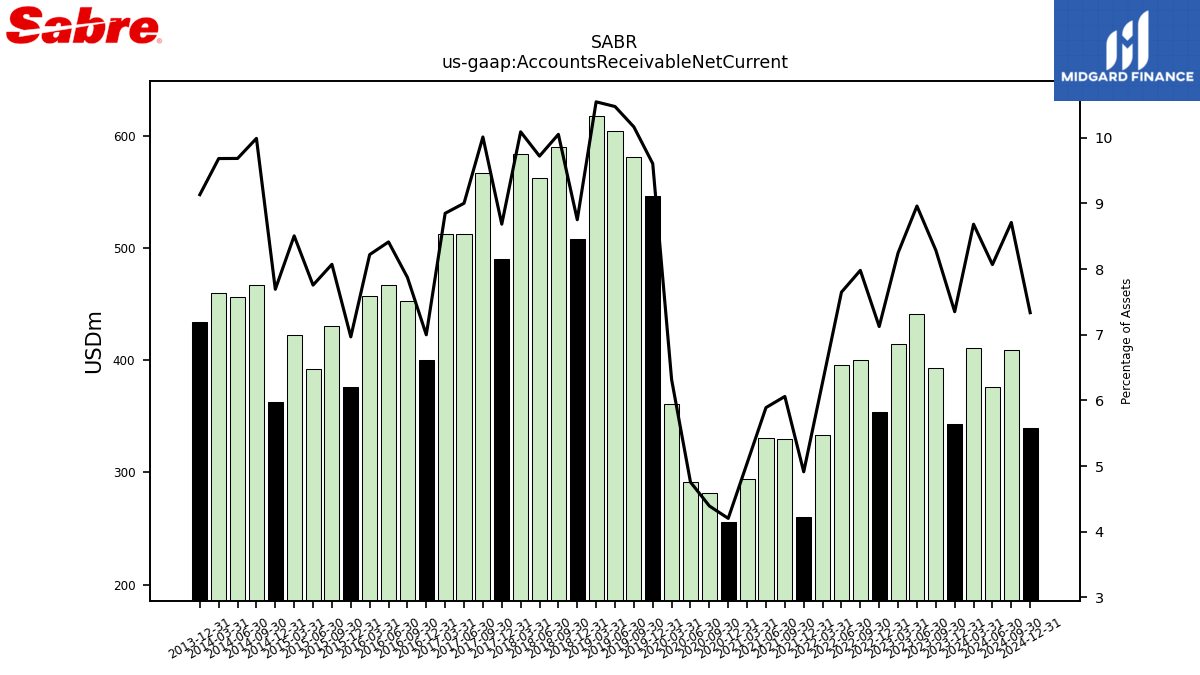
| Accounts Receivable Net Current | 343.44 | 392.94 | 441.21 | 414.46 | 353.59 | 400.56 | 395.92 | 333.58 | 259.93 | 329.84 | 330.36 | 293.95 | 255.47 | 281.79 | 291.48 | 360.68 | 546.53 | 581.48 | 604.40 | 617.96 | 508.12 | 589.86 | 562.15 | 583.62 | 490.56 | 567.27 | 512.17 | 512.34 | 400.67 | 452.49 | 466.69 | 456.94 | 375.79 | 430.36 | 391.78 | 422.49 | 362.91 | 466.75 | 456.67 | 459.96 | 434.29 | NA | NA | NA | |
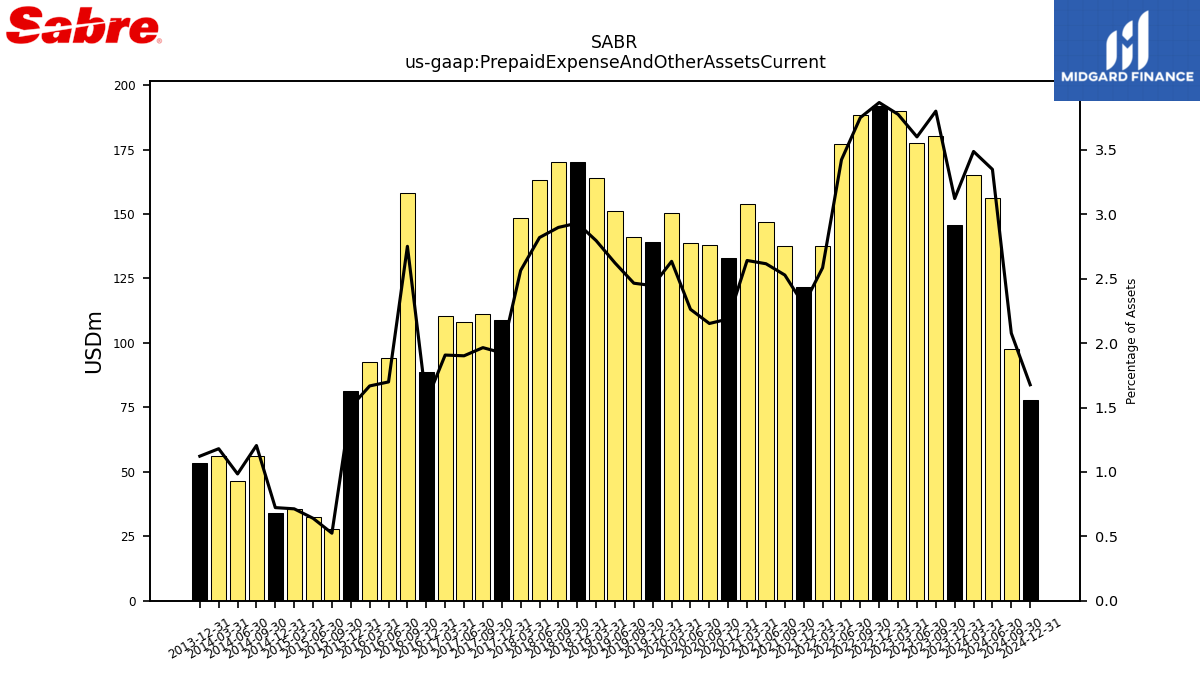
| Prepaid Expense And Other Assets Current | 145.91 | 180.25 | 177.37 | 189.81 | 191.98 | 188.30 | 177.24 | 137.39 | 121.59 | 137.64 | 146.76 | 153.96 | 132.97 | 138.11 | 138.69 | 150.47 | 139.21 | 141.04 | 151.33 | 163.84 | 170.24 | 170.11 | 163.09 | 148.33 | 108.75 | 111.36 | 108.22 | 110.45 | 88.60 | 158.16 | 94.25 | 92.72 | 81.17 | 27.97 | 32.35 | 35.45 | 34.12 | 56.31 | 46.44 | 56.08 | 53.38 | NA | NA | NA |
| 2023-12-31 | 2023-09-30 | 2023-06-30 | 2023-03-31 | 2022-12-31 | 2022-09-30 | 2022-06-30 | 2022-03-31 | 2021-12-31 | 2021-09-30 | 2021-06-30 | 2021-03-31 | 2020-12-31 | 2020-09-30 | 2020-06-30 | 2020-03-31 | 2019-12-31 | 2019-09-30 | 2019-06-30 | 2019-03-31 | 2018-12-31 | 2018-09-30 | 2018-06-30 | 2018-03-31 | 2017-12-31 | 2017-09-30 | 2017-06-30 | 2017-03-31 | 2016-12-31 | 2016-09-30 | 2016-06-30 | 2016-03-31 | 2015-12-31 | 2015-09-30 | 2015-06-30 | 2015-03-31 | 2014-12-31 | 2014-09-30 | 2014-06-30 | 2014-03-31 | 2013-12-31 | 2013-09-30 | 2013-06-30 | 2013-03-31 | ||
|---|---|---|---|---|---|---|---|---|---|---|---|---|---|---|---|---|---|---|---|---|---|---|---|---|---|---|---|---|---|---|---|---|---|---|---|---|---|---|---|---|---|---|---|---|---|
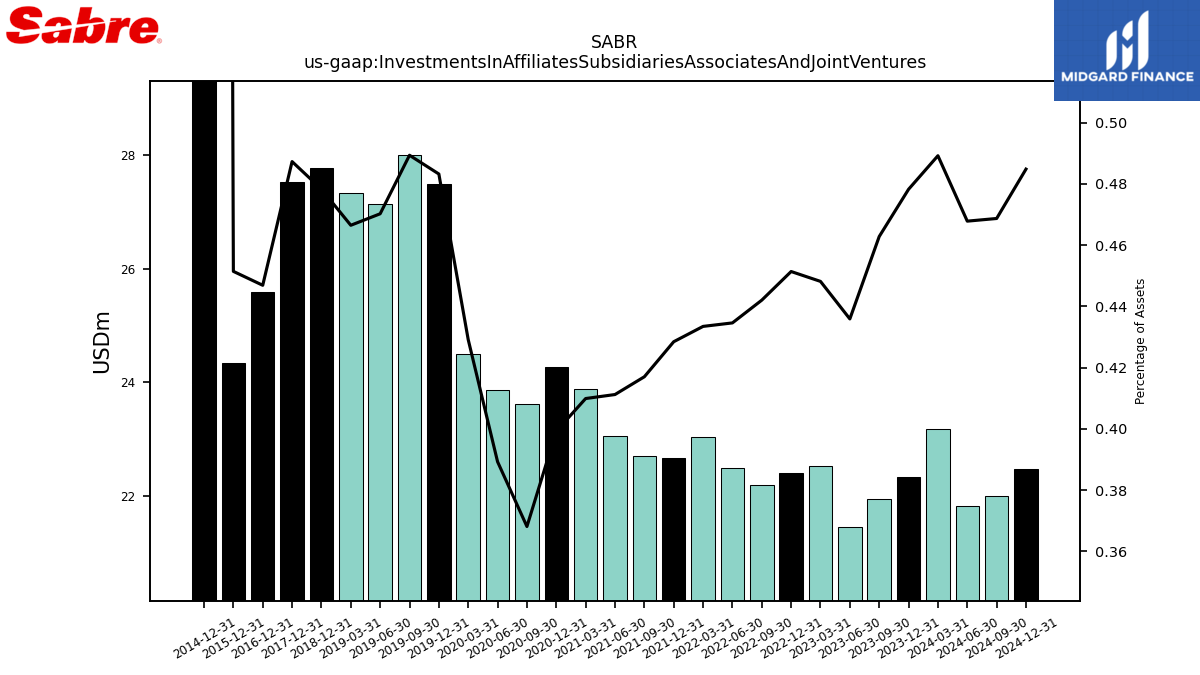
| Investments In Affiliates Subsidiaries Associates And Joint Ventures | 22.34 | 21.94 | 21.47 | 22.52 | 22.40 | 22.19 | 22.50 | 23.04 | 22.67 | 22.70 | 23.06 | 23.89 | 24.27 | 23.62 | 23.86 | 24.50 | 27.49 | 27.99 | 27.13 | 27.33 | 27.77 | NA | NA | NA | 27.53 | NA | NA | NA | 25.58 | NA | NA | NA | 24.35 | NA | NA | NA | 145.32 | NA | NA | NA | NA | NA | NA | NA | |
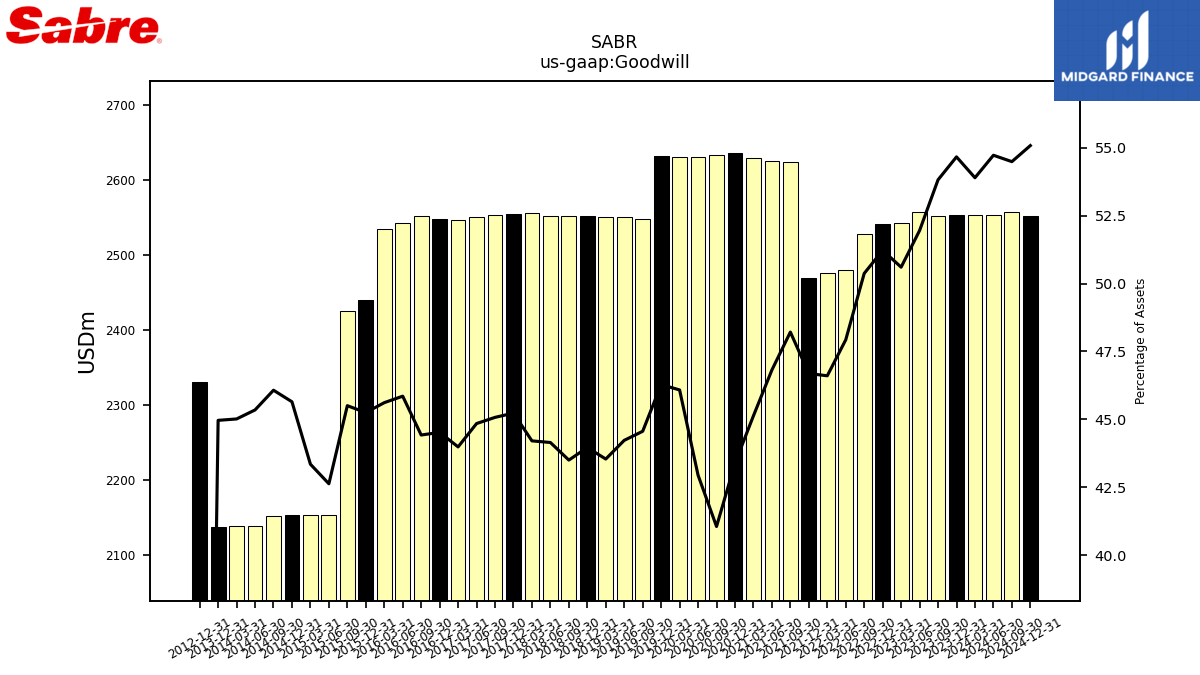
| Goodwill | 2554.04 | 2552.00 | 2558.42 | 2543.25 | 2542.09 | 2528.43 | 2481.07 | 2476.63 | 2470.21 | 2624.11 | 2625.63 | 2630.01 | 2636.55 | 2633.59 | 2631.90 | 2631.08 | 2633.25 | 2549.00 | 2551.74 | 2550.98 | 2552.37 | 2552.57 | 2553.00 | 2557.03 | 2554.99 | 2553.87 | 2551.45 | 2546.61 | 2548.45 | 2552.87 | 2543.51 | 2535.59 | 2440.43 | 2425.96 | 2153.21 | 2153.15 | 2153.50 | 2152.59 | 2138.26 | 2138.22 | 2138.18 | NA | NA | NA | |
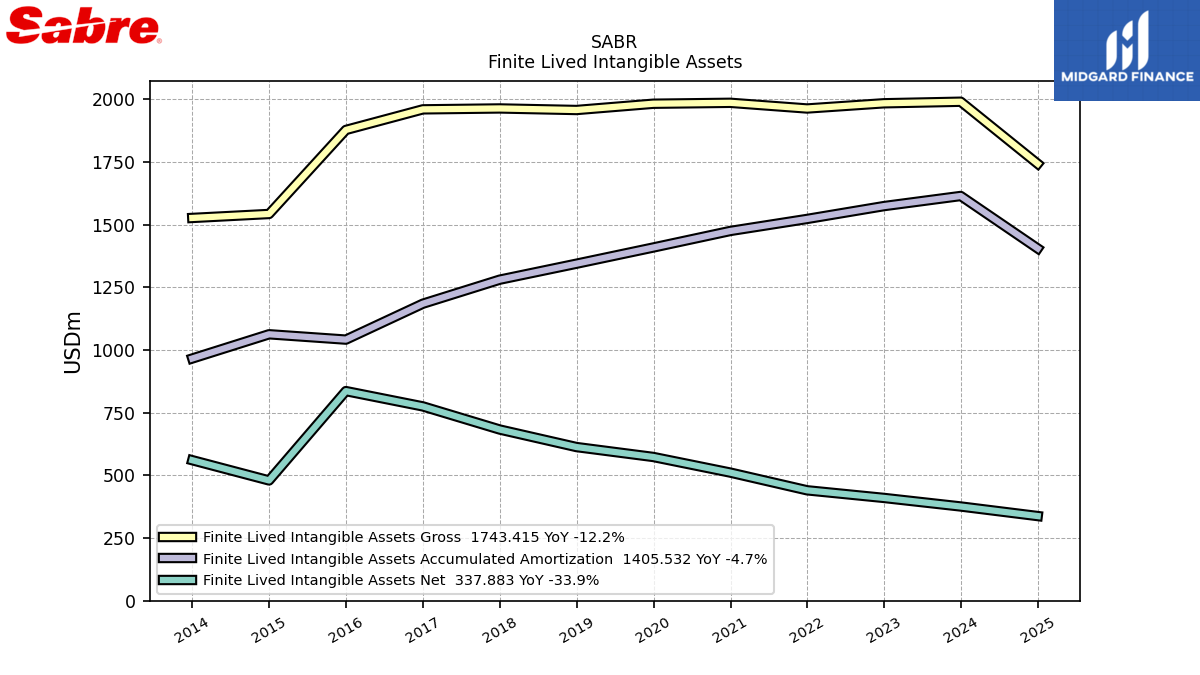
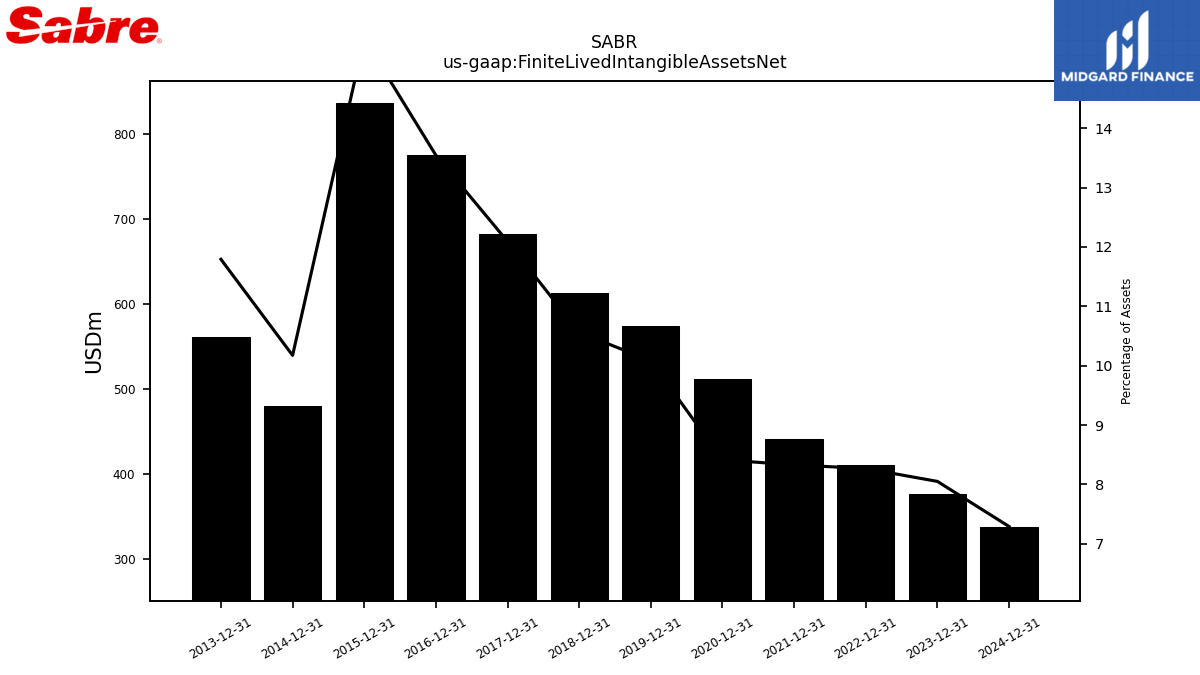
| Finite Lived Intangible Assets Net | 376.10 | NA | NA | NA | 410.25 | NA | NA | NA | 440.68 | NA | NA | NA | 511.37 | NA | NA | NA | 573.65 | NA | NA | NA | 613.25 | NA | NA | NA | 683.21 | NA | NA | NA | 775.44 | NA | NA | NA | 836.55 | NA | NA | NA | 479.99 | NA | NA | NA | 560.81 | NA | NA | NA | |
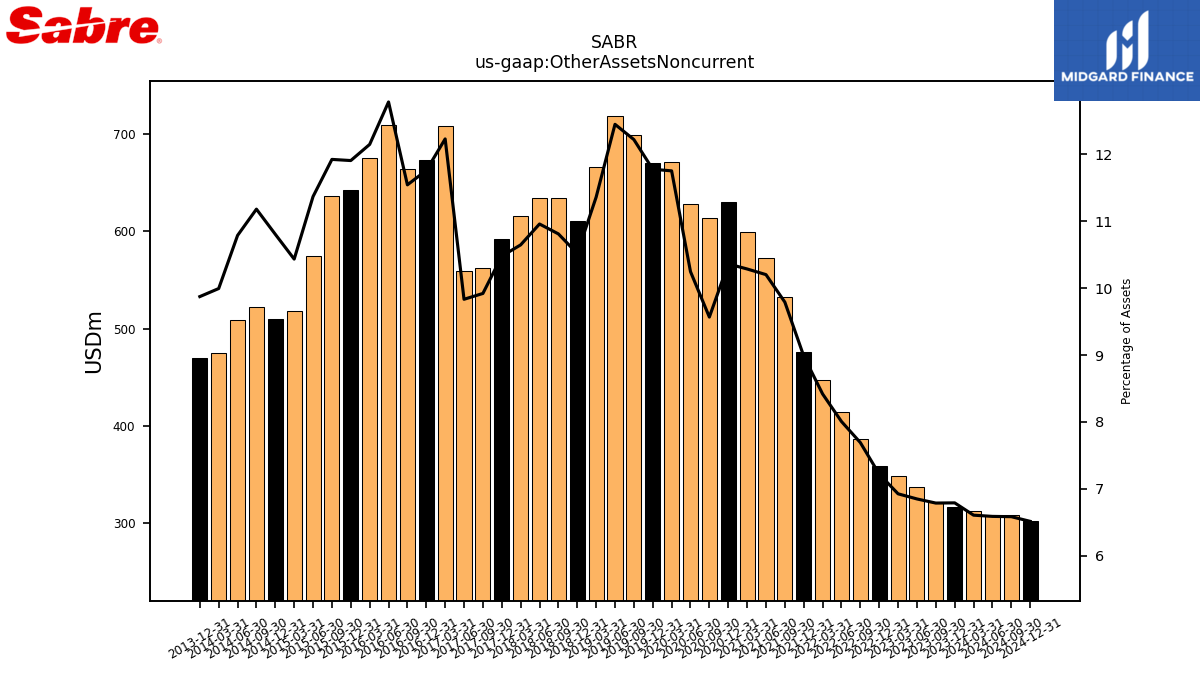
| Other Assets Noncurrent | 317.24 | 321.82 | 337.27 | 348.06 | 358.33 | 386.07 | 414.46 | 447.39 | 475.42 | 532.89 | 572.17 | 599.46 | 629.77 | 613.78 | 628.05 | 671.07 | 670.11 | 699.10 | 718.29 | 665.63 | 610.67 | 634.42 | 633.76 | 615.84 | 591.94 | 562.13 | 559.50 | 708.12 | 673.16 | 663.45 | 709.10 | 675.33 | 642.21 | 635.75 | 574.32 | 518.29 | 509.76 | 522.40 | 508.71 | 474.75 | 469.54 | NA | NA | NA |
| 2023-12-31 | 2023-09-30 | 2023-06-30 | 2023-03-31 | 2022-12-31 | 2022-09-30 | 2022-06-30 | 2022-03-31 | 2021-12-31 | 2021-09-30 | 2021-06-30 | 2021-03-31 | 2020-12-31 | 2020-09-30 | 2020-06-30 | 2020-03-31 | 2019-12-31 | 2019-09-30 | 2019-06-30 | 2019-03-31 | 2018-12-31 | 2018-09-30 | 2018-06-30 | 2018-03-31 | 2017-12-31 | 2017-09-30 | 2017-06-30 | 2017-03-31 | 2016-12-31 | 2016-09-30 | 2016-06-30 | 2016-03-31 | 2015-12-31 | 2015-09-30 | 2015-06-30 | 2015-03-31 | 2014-12-31 | 2014-09-30 | 2014-06-30 | 2014-03-31 | 2013-12-31 | 2013-09-30 | 2013-06-30 | 2013-03-31 | ||
|---|---|---|---|---|---|---|---|---|---|---|---|---|---|---|---|---|---|---|---|---|---|---|---|---|---|---|---|---|---|---|---|---|---|---|---|---|---|---|---|---|---|---|---|---|---|
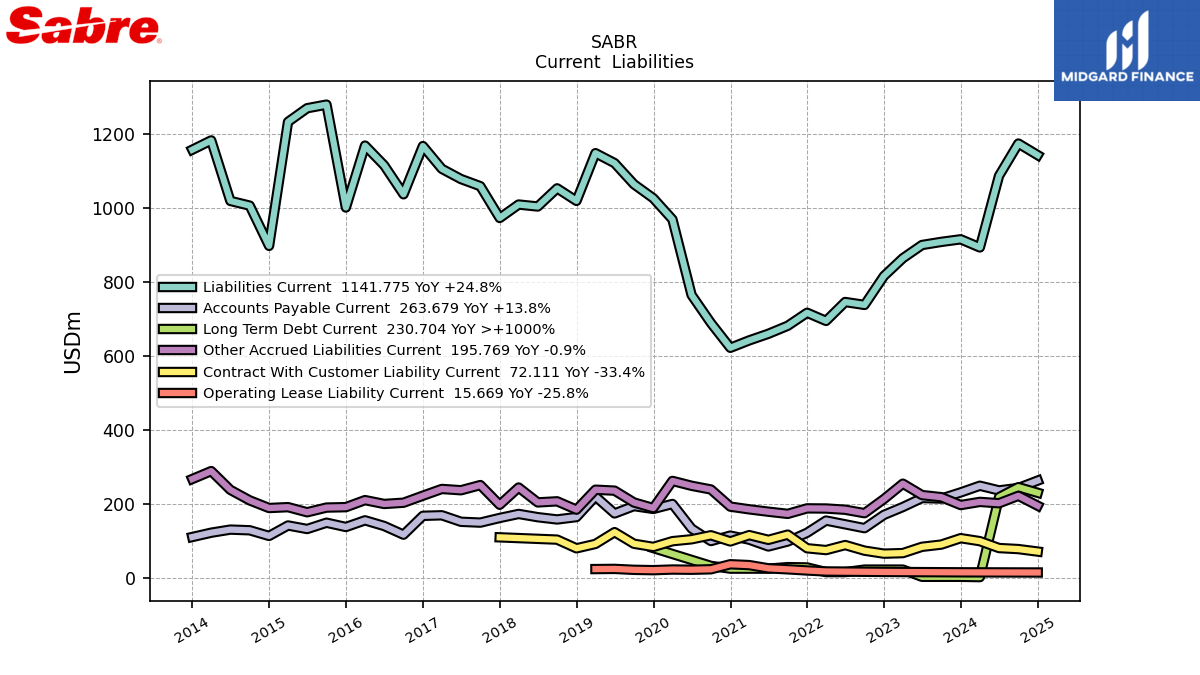
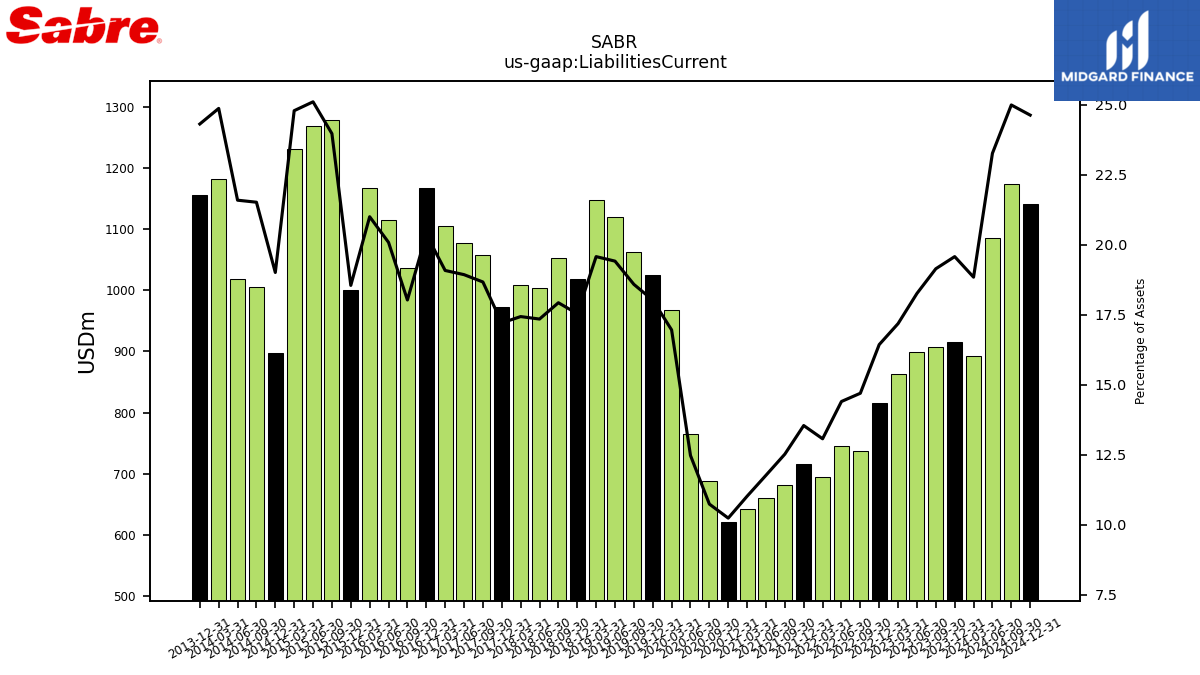
| Liabilities Current | 914.71 | 907.76 | 899.31 | 863.66 | 815.57 | 737.65 | 745.49 | 694.53 | 716.50 | 681.42 | 659.79 | 641.97 | 621.94 | 688.72 | 764.41 | 968.33 | 1025.54 | 1063.27 | 1120.35 | 1147.16 | 1018.39 | 1052.18 | 1003.20 | 1008.54 | 972.15 | 1058.01 | 1077.29 | 1104.89 | 1166.36 | 1036.13 | 1114.27 | 1167.62 | 1000.49 | 1278.12 | 1268.42 | 1231.56 | 896.93 | 1005.58 | 1018.31 | 1181.59 | 1156.42 | NA | NA | NA | |
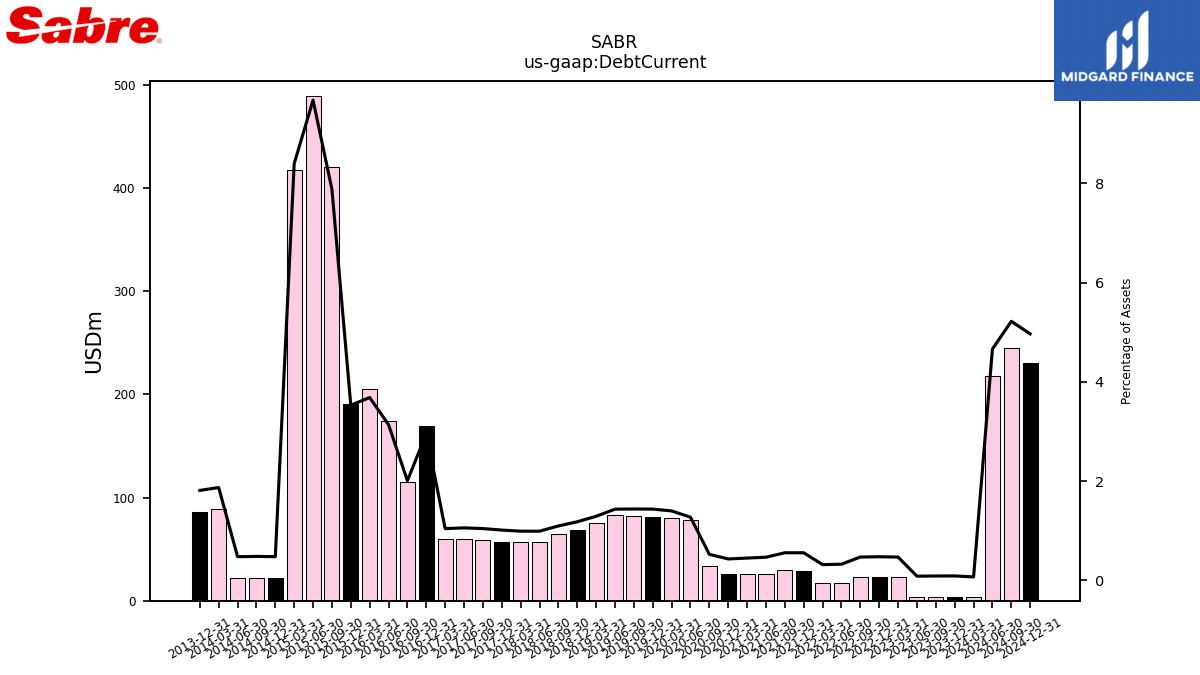
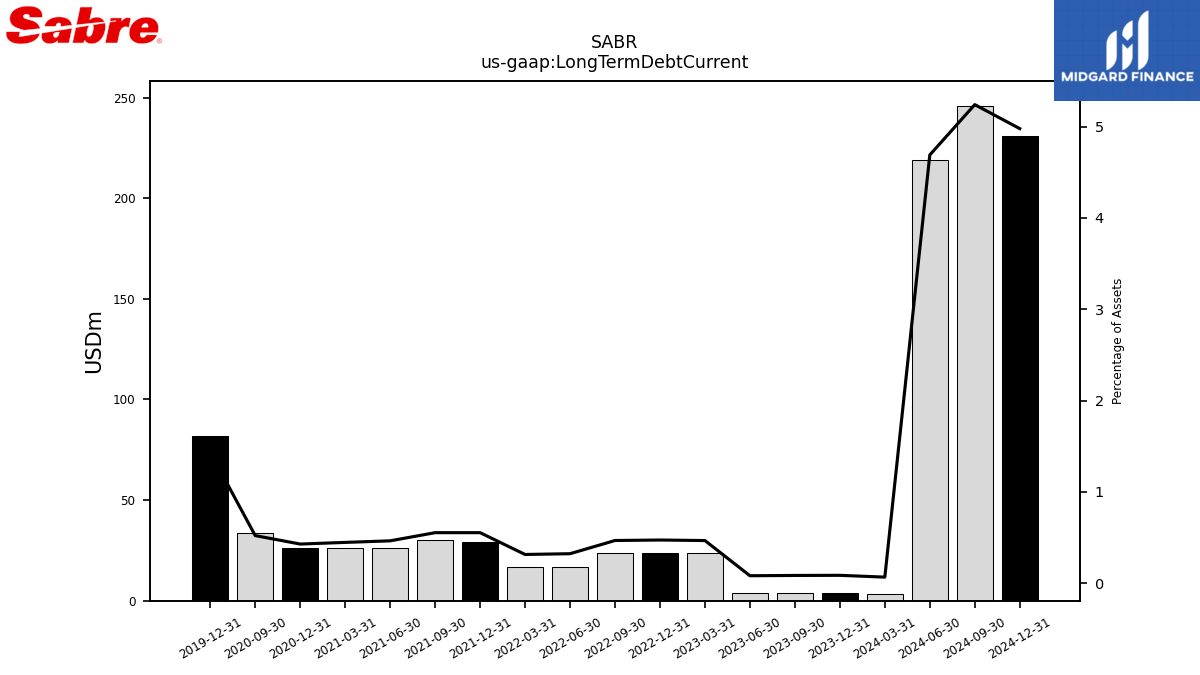
| Debt Current | 4.04 | 4.04 | 4.04 | 23.48 | 23.48 | 23.48 | 16.73 | 16.73 | 29.29 | 30.12 | 26.03 | 26.05 | 26.07 | 33.45 | 77.88 | 79.77 | 81.61 | 82.17 | 82.66 | 75.55 | 68.44 | 64.22 | 57.17 | 57.20 | 57.14 | 59.02 | 60.05 | 60.25 | 169.25 | 115.34 | 174.05 | 204.82 | 190.31 | 420.24 | 488.93 | 417.23 | 22.43 | 22.42 | 22.40 | 88.79 | 86.12 | NA | NA | NA | |
| Long Term Debt Current | 4.04 | 4.04 | 4.04 | 23.48 | 23.48 | 23.48 | 16.73 | 16.73 | 29.29 | 30.12 | 26.03 | 26.05 | 26.07 | 33.45 | NA | NA | 81.61 | NA | NA | NA | NA | NA | NA | NA | NA | NA | NA | NA | NA | NA | NA | NA | NA | NA | NA | NA | NA | NA | NA | NA | NA | NA | NA | NA | |
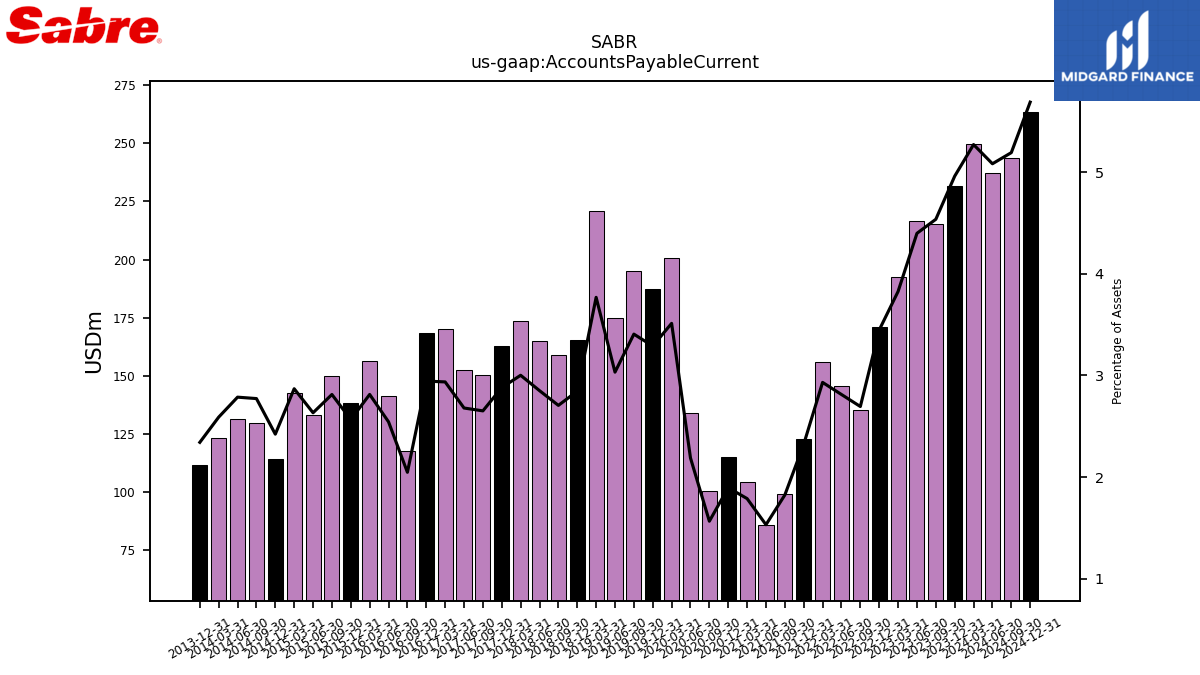
| Accounts Payable Current | 231.77 | 215.11 | 216.60 | 192.31 | 171.07 | 135.26 | 145.62 | 155.81 | 122.93 | 99.31 | 85.91 | 104.24 | 115.23 | 100.50 | 134.13 | 200.56 | 187.19 | 194.88 | 175.00 | 220.82 | 165.23 | 158.79 | 164.87 | 173.64 | 162.75 | 150.26 | 152.49 | 170.03 | 168.58 | 117.68 | 141.12 | 156.40 | 138.42 | 149.98 | 133.01 | 142.54 | 114.30 | 129.56 | 131.41 | 123.05 | 111.39 | NA | NA | NA | |
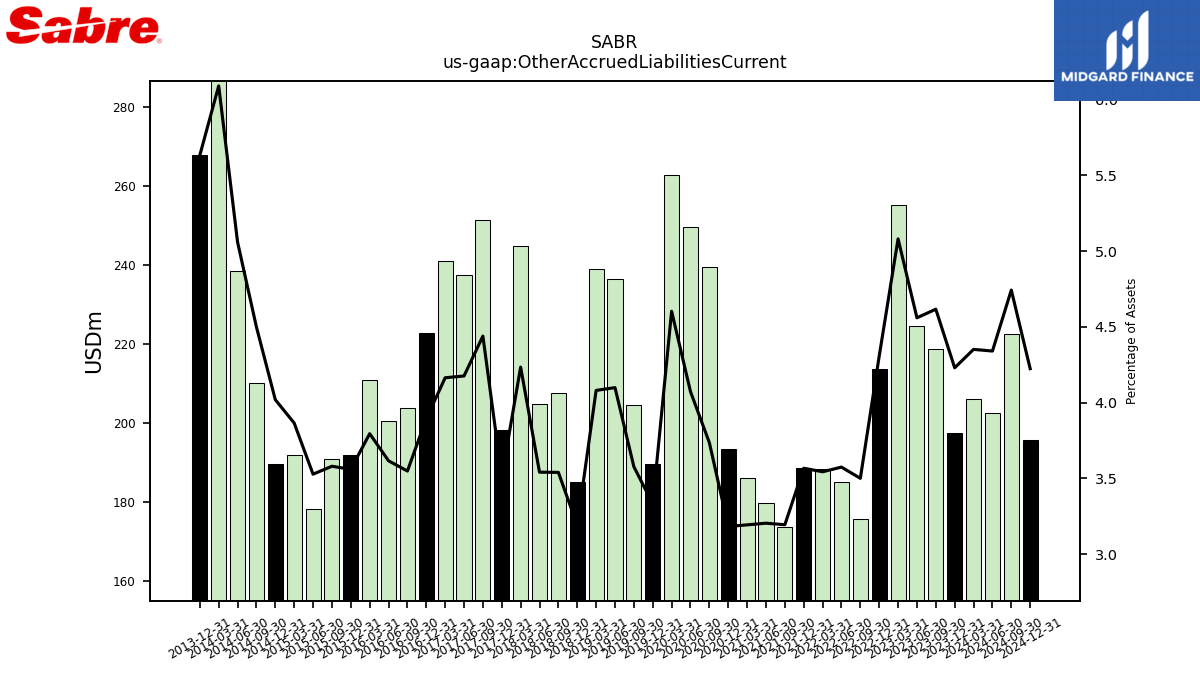
| Other Accrued Liabilities Current | 197.61 | 218.89 | 224.54 | 255.34 | 213.74 | 175.68 | 185.01 | 188.30 | 188.71 | 173.82 | 179.68 | 186.06 | 193.38 | 239.64 | 249.61 | 262.82 | 189.55 | 204.60 | 236.49 | 239.07 | 185.18 | 207.69 | 204.75 | 244.92 | 198.35 | 251.53 | 237.58 | 241.07 | 222.88 | 203.91 | 200.57 | 210.95 | 191.96 | 190.85 | 178.18 | 191.98 | 189.61 | 210.20 | 238.59 | 289.31 | 267.87 | NA | NA | NA | |
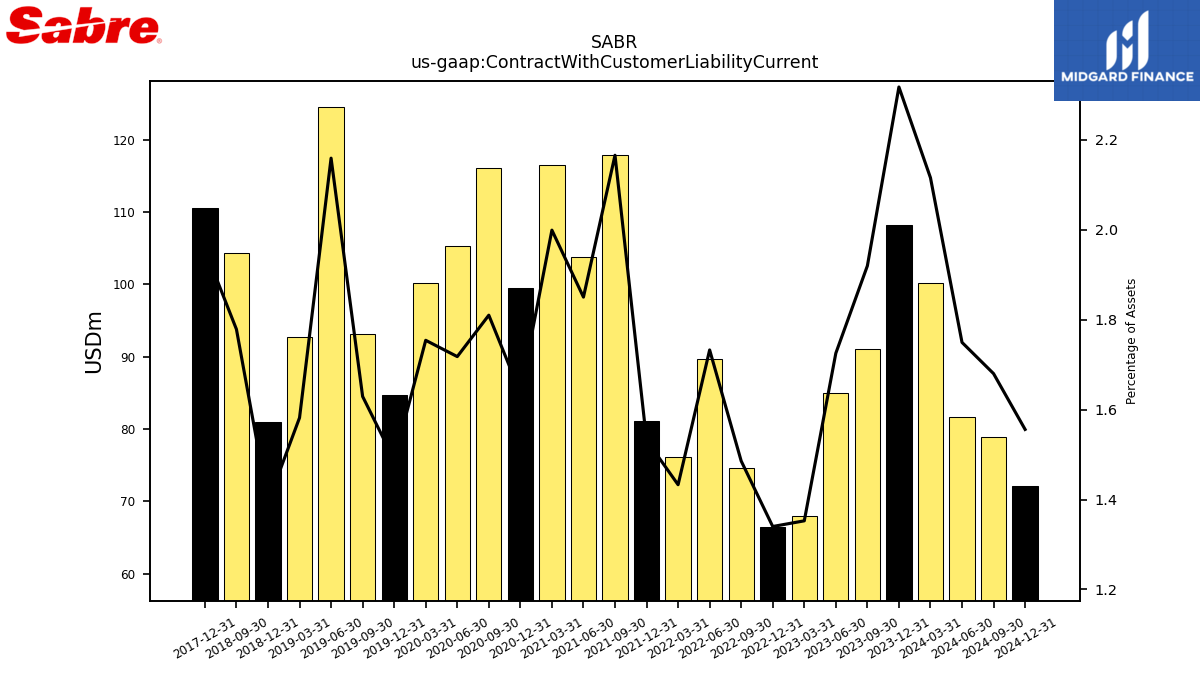
| Contract With Customer Liability Current | 108.26 | 91.02 | 84.96 | 67.98 | 66.50 | 74.57 | 89.69 | 76.15 | 81.06 | 117.86 | 103.75 | 116.49 | 99.47 | 116.11 | 105.28 | 100.15 | 84.66 | 93.20 | 124.57 | 92.68 | 80.90 | 104.37 | NA | NA | 110.53 | NA | NA | NA | NA | NA | NA | NA | NA | NA | NA | NA | NA | NA | NA | NA | NA | NA | NA | NA |
| 2023-12-31 | 2023-09-30 | 2023-06-30 | 2023-03-31 | 2022-12-31 | 2022-09-30 | 2022-06-30 | 2022-03-31 | 2021-12-31 | 2021-09-30 | 2021-06-30 | 2021-03-31 | 2020-12-31 | 2020-09-30 | 2020-06-30 | 2020-03-31 | 2019-12-31 | 2019-09-30 | 2019-06-30 | 2019-03-31 | 2018-12-31 | 2018-09-30 | 2018-06-30 | 2018-03-31 | 2017-12-31 | 2017-09-30 | 2017-06-30 | 2017-03-31 | 2016-12-31 | 2016-09-30 | 2016-06-30 | 2016-03-31 | 2015-12-31 | 2015-09-30 | 2015-06-30 | 2015-03-31 | 2014-12-31 | 2014-09-30 | 2014-06-30 | 2014-03-31 | 2013-12-31 | 2013-09-30 | 2013-06-30 | 2013-03-31 | ||
|---|---|---|---|---|---|---|---|---|---|---|---|---|---|---|---|---|---|---|---|---|---|---|---|---|---|---|---|---|---|---|---|---|---|---|---|---|---|---|---|---|---|---|---|---|---|
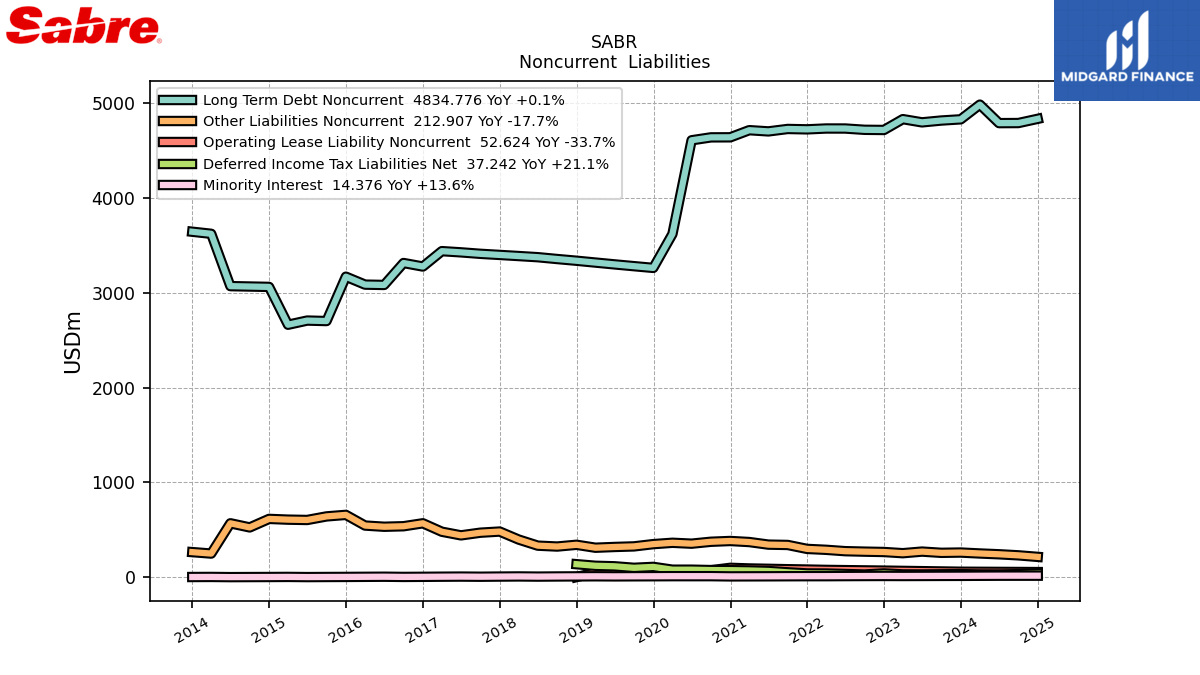
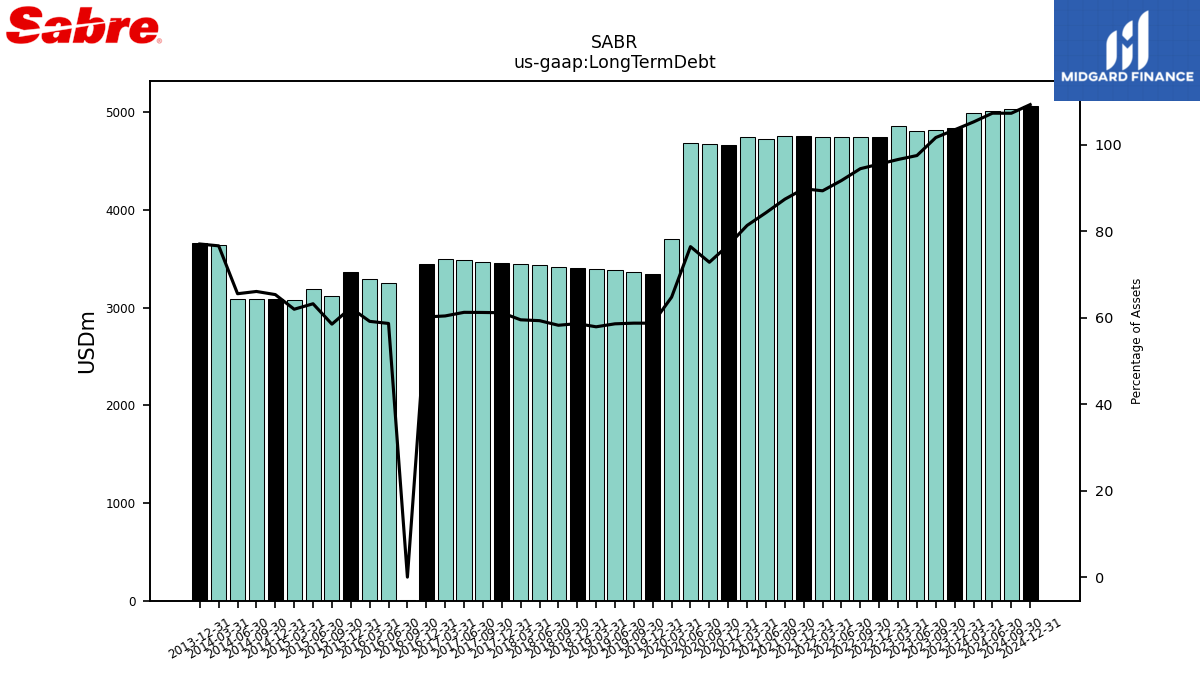
| Long Term Debt | 4834.00 | 4821.00 | 4802.00 | 4855.00 | 4741.00 | 4742.00 | 4749.00 | 4749.00 | 4753.00 | 4758.00 | 4728.00 | 4741.00 | 4666.00 | 4673.00 | 4686.00 | 3699.00 | 3343.00 | 3362.00 | 3382.00 | 3394.00 | 3406.00 | 3420.00 | 3432.00 | 3444.00 | 3456.00 | 3470.00 | 3486.00 | 3499.00 | 3446.00 | 3.43 | 3256.00 | 3290.00 | 3360.00 | 3121.00 | 3195.00 | 3079.00 | 3084.00 | 3088.00 | 3092.00 | 3640.58 | 3664.79 | NA | NA | NA | |
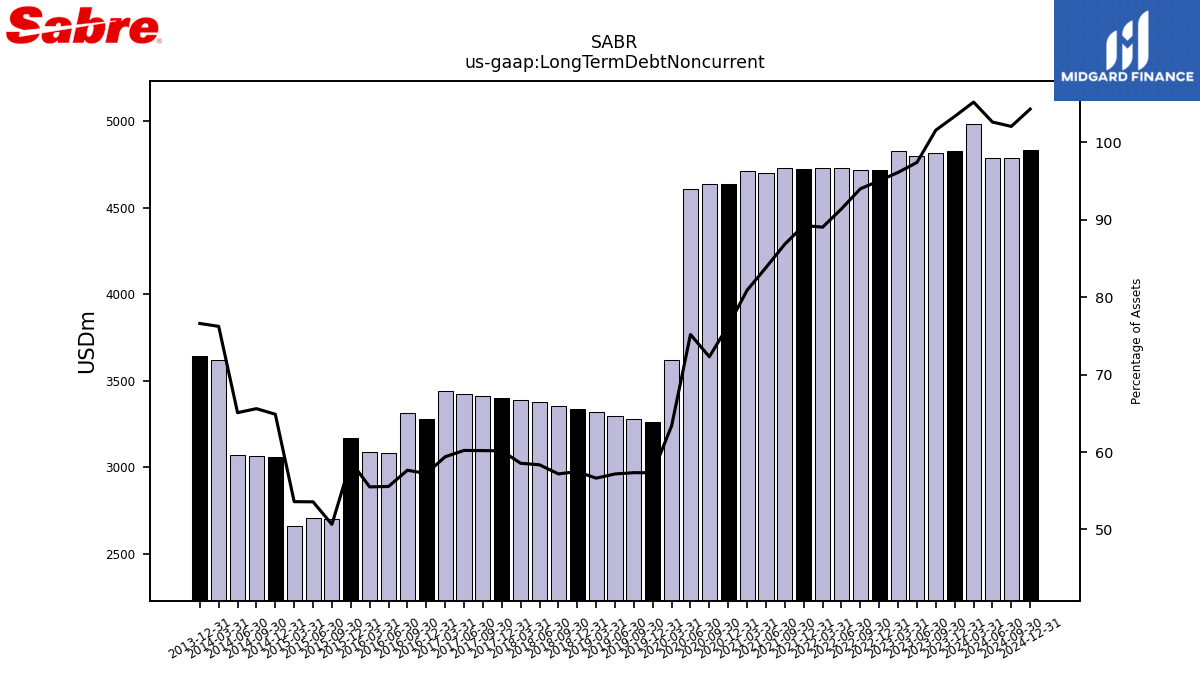
| Long Term Debt Noncurrent | 4829.46 | 4816.89 | 4797.55 | 4831.43 | 4717.09 | 4718.97 | 4732.53 | 4732.71 | 4723.69 | 4727.84 | 4702.17 | 4714.99 | 4639.78 | 4639.12 | 4608.48 | 3619.31 | 3261.82 | 3280.20 | 3298.92 | 3318.20 | 3337.47 | 3355.60 | 3374.83 | 3387.01 | 3398.73 | 3410.53 | 3425.95 | 3438.76 | 3276.28 | 3313.54 | 3081.92 | 3085.49 | 3169.34 | 2701.09 | 2706.27 | 2662.17 | 3061.40 | 3065.44 | 3069.50 | 3621.68 | 3643.55 | NA | NA | NA | |
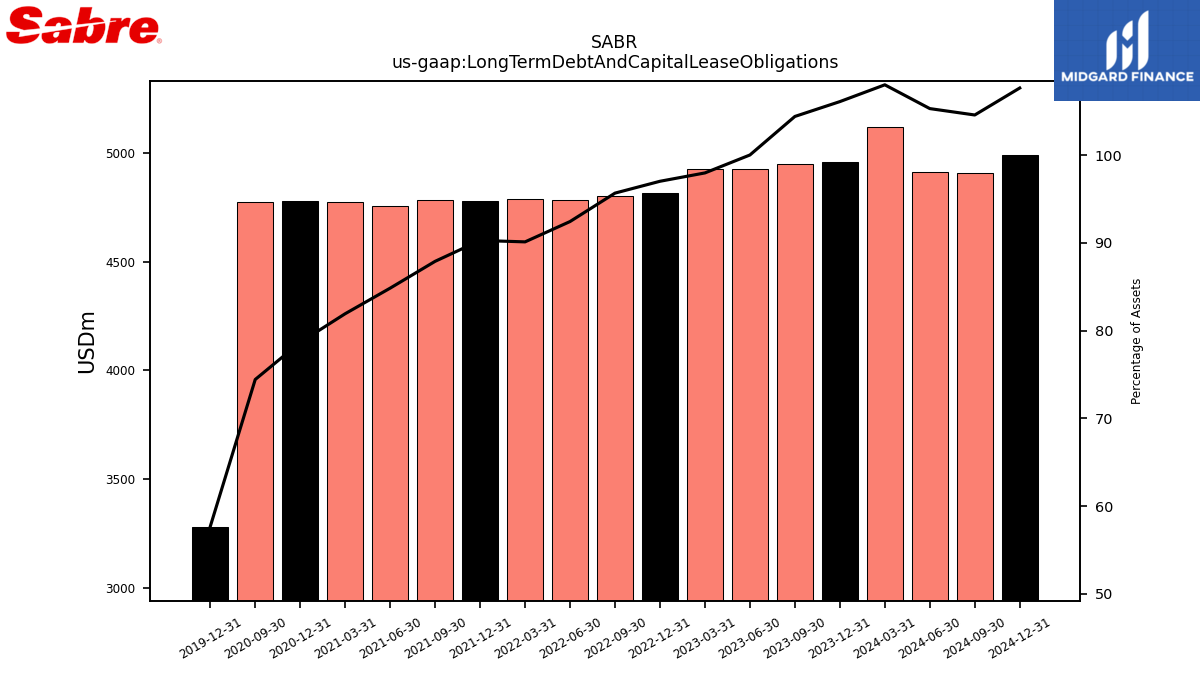
| Long Term Debt And Capital Lease Obligations | 4957.86 | 4951.40 | 4926.02 | 4924.77 | 4815.65 | 4802.97 | 4785.58 | 4789.76 | 4777.50 | 4784.82 | 4758.85 | 4775.14 | 4781.44 | 4775.76 | NA | NA | 3282.20 | NA | NA | NA | NA | NA | NA | NA | NA | NA | NA | NA | NA | NA | NA | NA | NA | NA | NA | NA | NA | NA | NA | NA | NA | NA | NA | NA | |
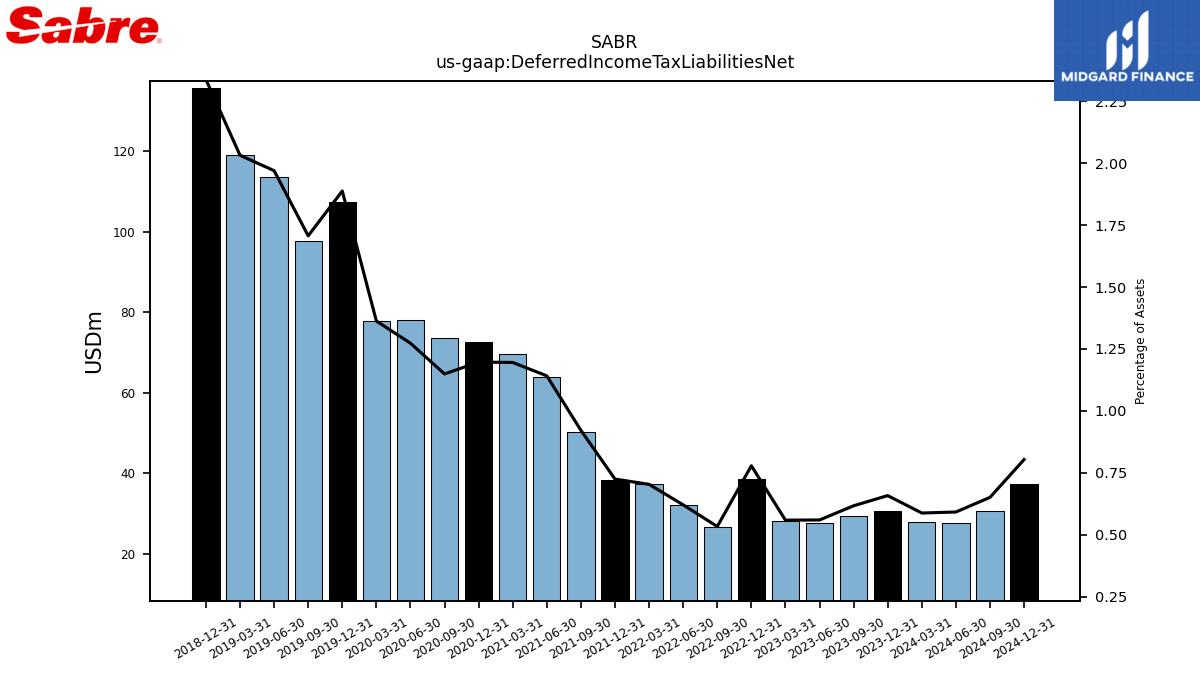
| Deferred Income Tax Liabilities Net | 30.75 | 29.26 | 27.56 | 28.09 | 38.63 | 26.77 | 32.13 | 37.38 | 38.34 | 50.16 | 64.01 | 69.67 | 72.74 | 73.72 | 78.03 | 77.82 | 107.40 | 97.63 | 113.65 | 119.06 | 135.75 | NA | NA | NA | NA | NA | NA | NA | NA | NA | NA | NA | NA | NA | NA | NA | NA | NA | NA | NA | NA | NA | NA | NA | |
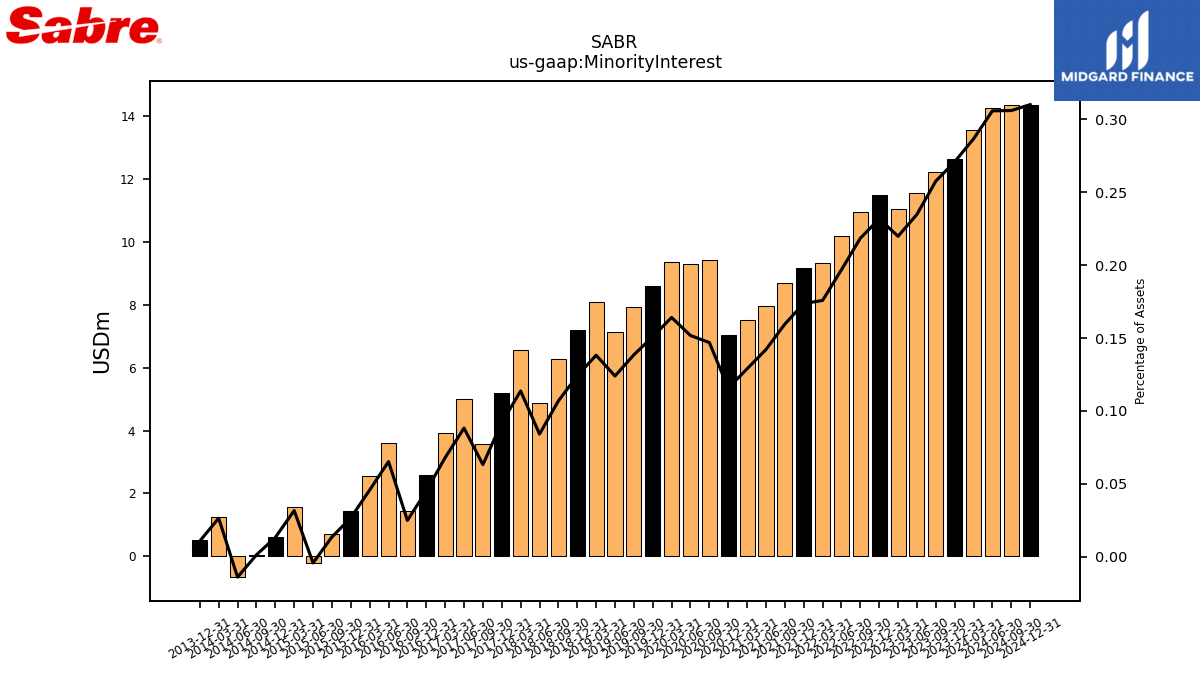
| Minority Interest | 12.66 | 12.22 | 11.56 | 11.05 | 11.50 | 10.97 | 10.19 | 9.34 | 9.19 | 8.69 | 7.97 | 7.51 | 7.03 | 9.43 | 9.30 | 9.37 | 8.59 | 7.92 | 7.15 | 8.10 | 7.21 | 6.27 | 4.86 | 6.58 | 5.20 | 3.58 | 5.02 | 3.93 | 2.58 | 1.43 | 3.62 | 2.54 | 1.44 | 0.72 | -0.22 | 1.57 | 0.62 | 0.06 | -0.66 | 1.25 | 0.51 | NA | NA | NA | |
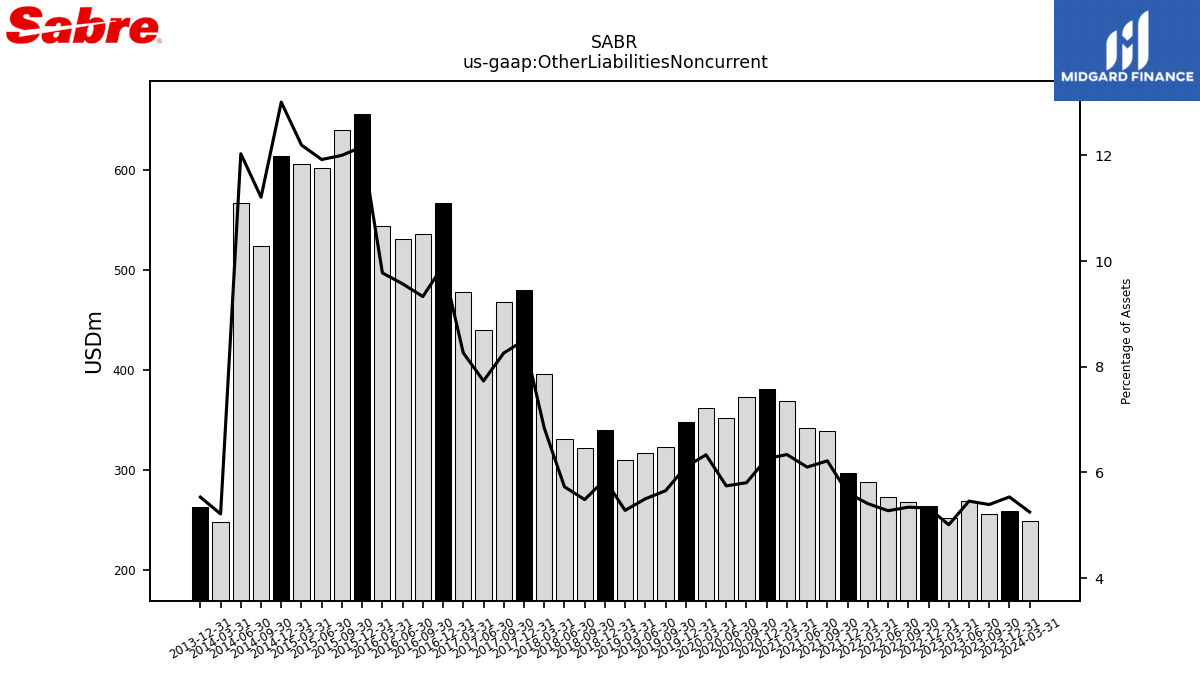
| Other Liabilities Noncurrent | 258.72 | 255.74 | 268.78 | 251.81 | 264.41 | 268.23 | 273.17 | 287.56 | 297.04 | 338.57 | 342.27 | 369.46 | 380.62 | 372.51 | 352.26 | 361.69 | 347.52 | 323.52 | 317.46 | 309.54 | 340.50 | 322.00 | 331.39 | 395.88 | 480.19 | 468.07 | 439.97 | 478.41 | 567.36 | 536.16 | 530.87 | 543.50 | 656.09 | 639.89 | 602.24 | 605.80 | 613.71 | 523.73 | 567.33 | 247.76 | 263.18 | NA | NA | NA | |
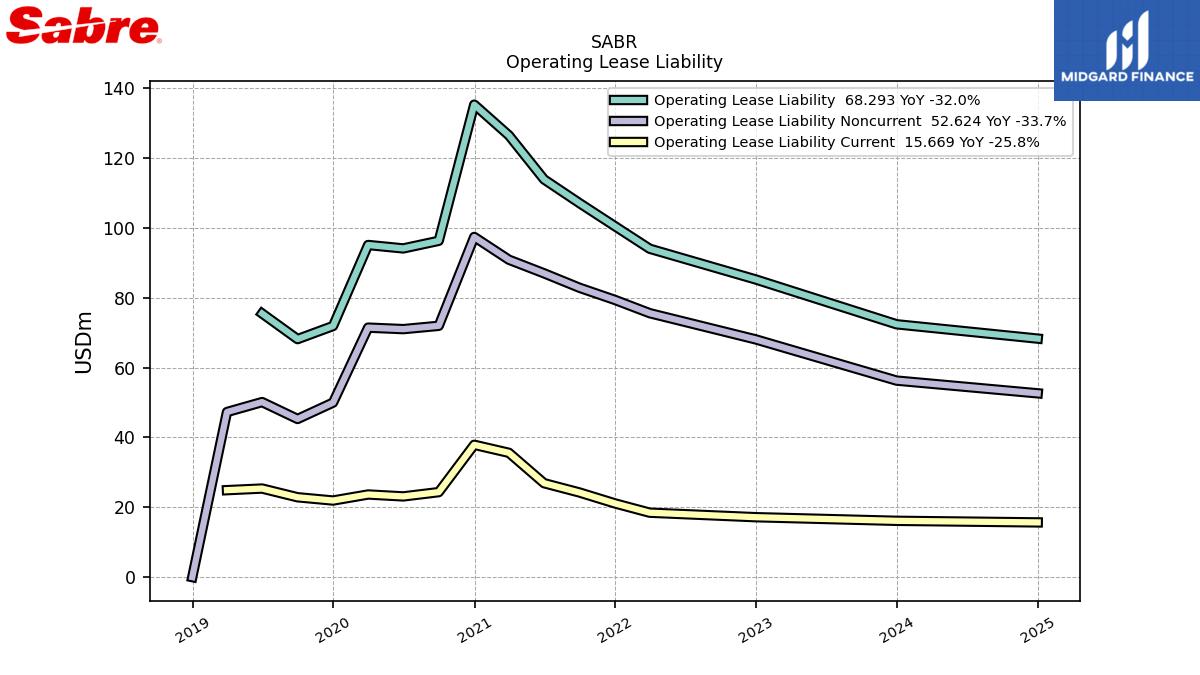
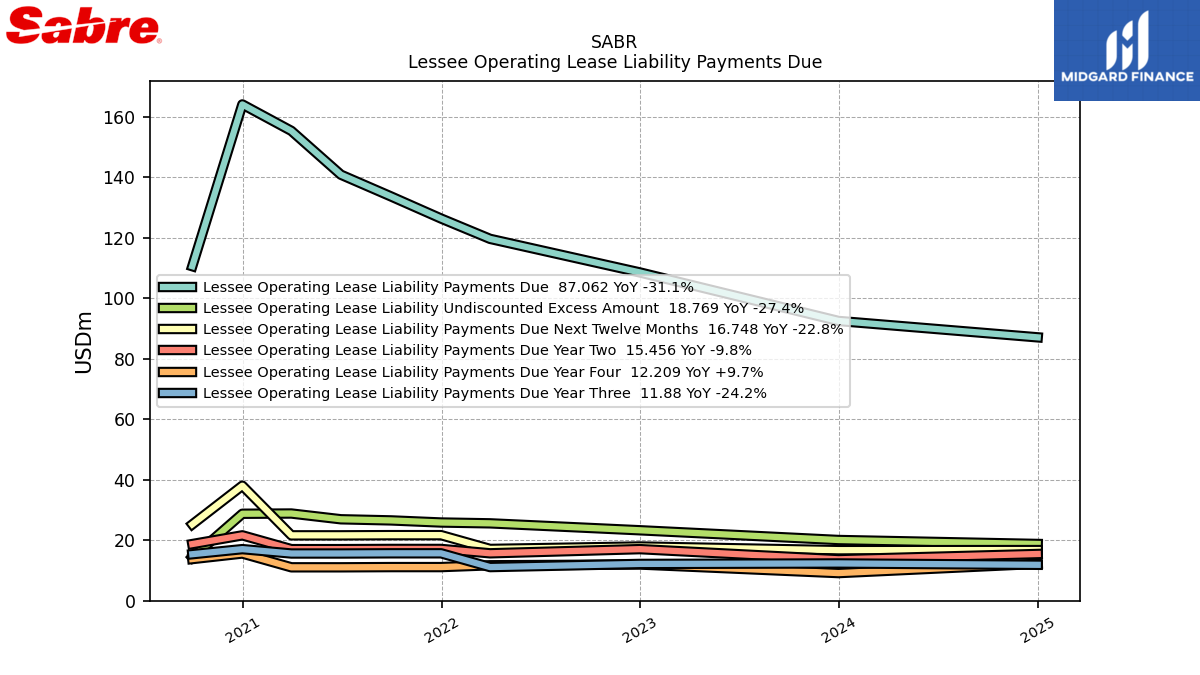
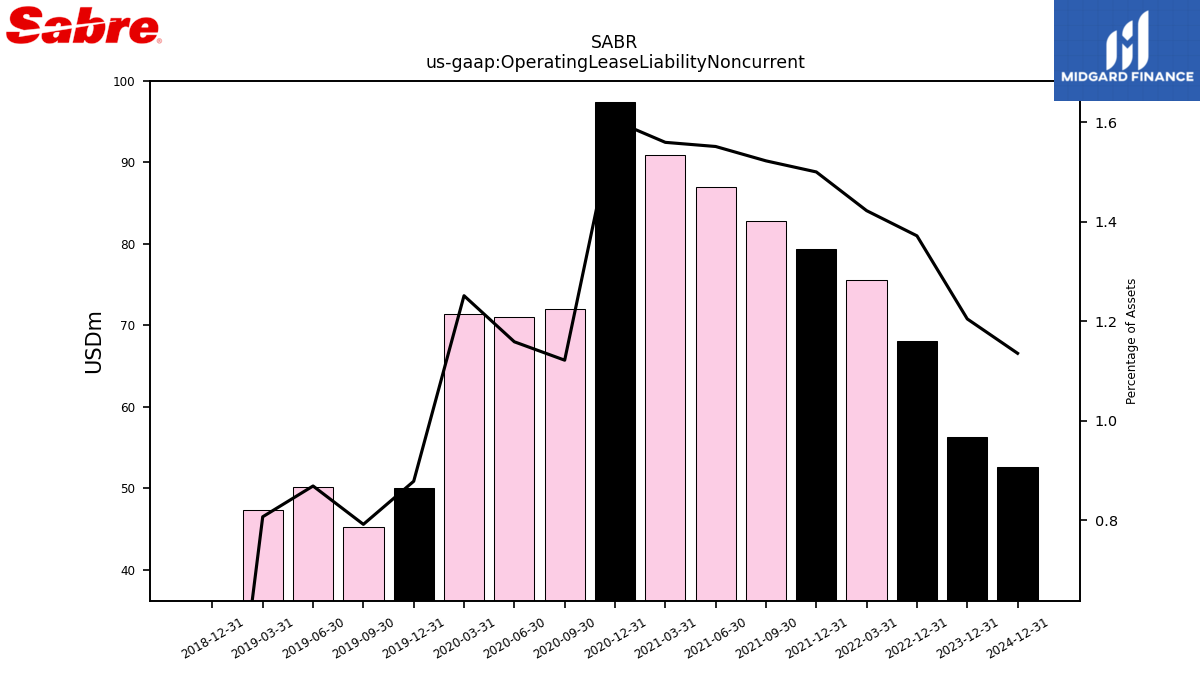
| Operating Lease Liability Noncurrent | 56.28 | NA | NA | NA | 68.07 | NA | NA | 75.58 | 79.37 | 82.85 | 86.99 | 90.88 | 97.40 | 71.96 | 71.01 | 71.44 | 49.97 | 45.29 | 50.12 | 47.28 | 0.00 | NA | NA | NA | NA | NA | NA | NA | NA | NA | NA | NA | NA | NA | NA | NA | NA | NA | NA | NA | NA | NA | NA | NA |
| 2023-12-31 | 2023-09-30 | 2023-06-30 | 2023-03-31 | 2022-12-31 | 2022-09-30 | 2022-06-30 | 2022-03-31 | 2021-12-31 | 2021-09-30 | 2021-06-30 | 2021-03-31 | 2020-12-31 | 2020-09-30 | 2020-06-30 | 2020-03-31 | 2019-12-31 | 2019-09-30 | 2019-06-30 | 2019-03-31 | 2018-12-31 | 2018-09-30 | 2018-06-30 | 2018-03-31 | 2017-12-31 | 2017-09-30 | 2017-06-30 | 2017-03-31 | 2016-12-31 | 2016-09-30 | 2016-06-30 | 2016-03-31 | 2015-12-31 | 2015-09-30 | 2015-06-30 | 2015-03-31 | 2014-12-31 | 2014-09-30 | 2014-06-30 | 2014-03-31 | 2013-12-31 | 2013-09-30 | 2013-06-30 | 2013-03-31 | ||
|---|---|---|---|---|---|---|---|---|---|---|---|---|---|---|---|---|---|---|---|---|---|---|---|---|---|---|---|---|---|---|---|---|---|---|---|---|---|---|---|---|---|---|---|---|---|
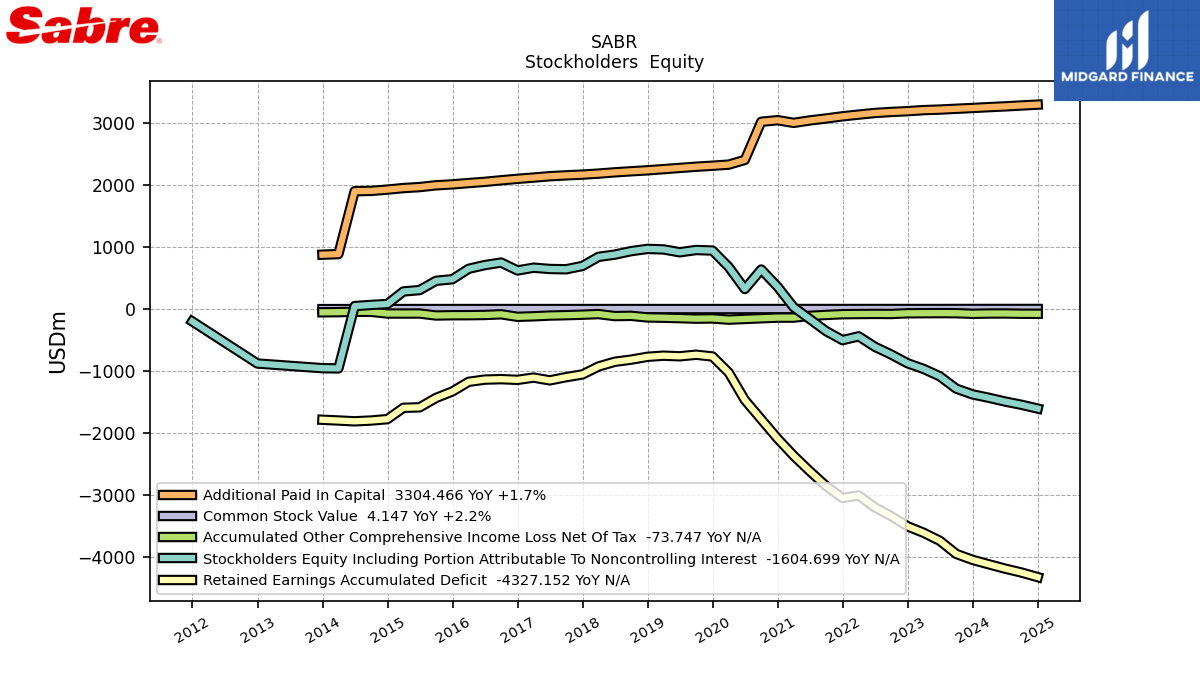
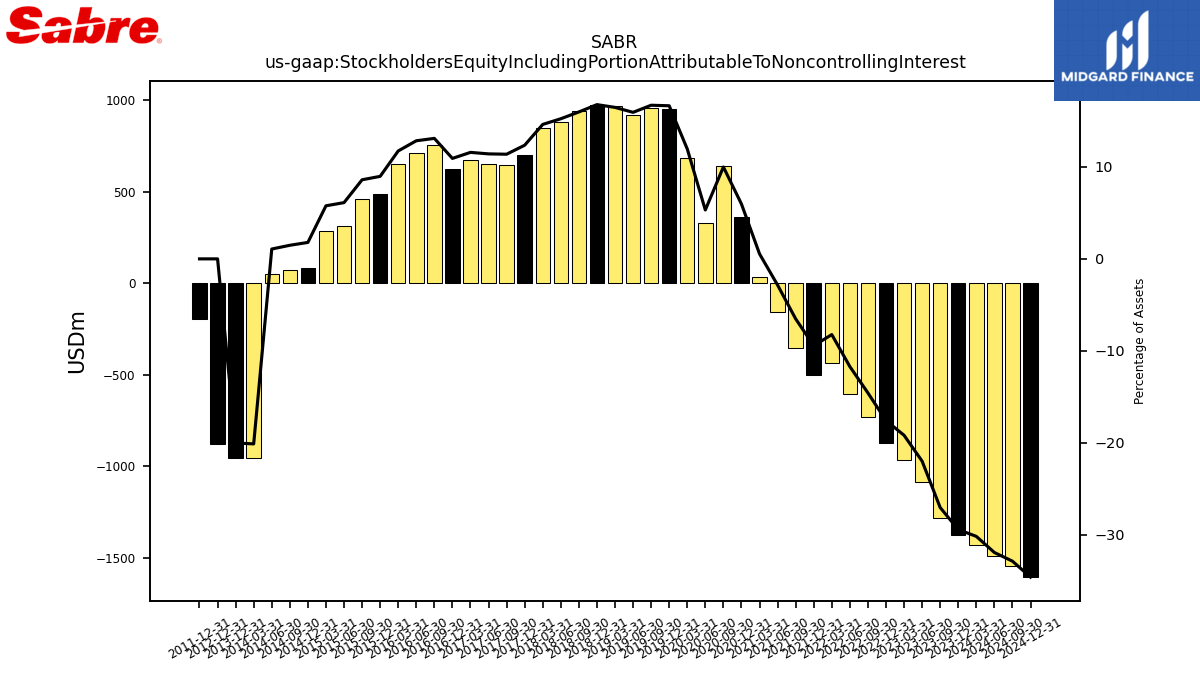
| Stockholders Equity Including Portion Attributable To Noncontrolling Interest | -1375.82 | -1282.66 | -1083.66 | -964.55 | -872.83 | -732.00 | -606.58 | -437.70 | -499.72 | -355.08 | -159.79 | 31.74 | 362.63 | 641.42 | 326.02 | 682.71 | 947.67 | 956.11 | 919.69 | 965.60 | 974.27 | 937.93 | 881.52 | 846.00 | 698.50 | 645.09 | 649.83 | 670.72 | 625.62 | 753.29 | 712.69 | 652.59 | 484.14 | 458.74 | 309.09 | 286.78 | 84.38 | 69.05 | 50.48 | -956.19 | -952.54 | NA | NA | NA | |
| Common Stock Value | 4.06 | 4.06 | 3.59 | 3.58 | 3.53 | 3.53 | 3.53 | 3.50 | 3.46 | 3.46 | 3.45 | 3.42 | 3.39 | 3.38 | 2.97 | 2.96 | 2.94 | 2.94 | 2.94 | 2.94 | 2.92 | 2.92 | 2.91 | 2.91 | 2.89 | 2.89 | 2.89 | 2.88 | 2.85 | 2.84 | 2.82 | 2.81 | 2.79 | 2.78 | 2.73 | 2.72 | 2.68 | 2.65 | 2.65 | 1.79 | 1.79 | NA | NA | NA | |
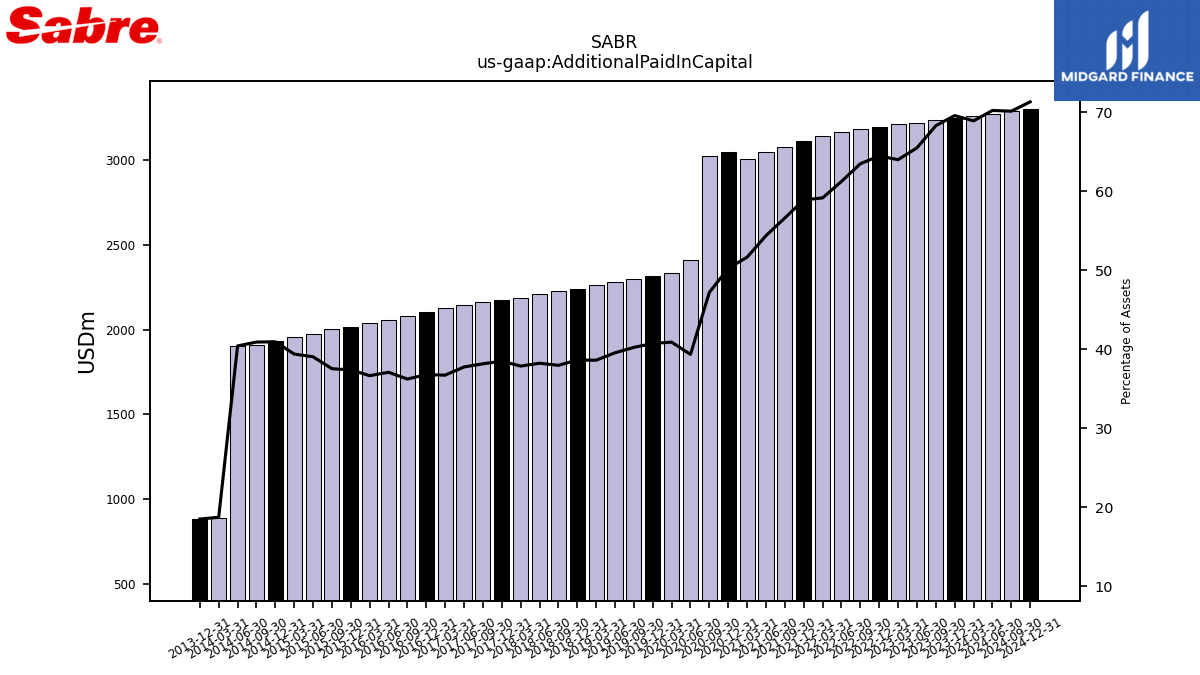
| Additional Paid In Capital | 3249.90 | 3237.53 | 3224.32 | 3215.58 | 3198.58 | 3185.79 | 3169.44 | 3143.32 | 3115.72 | 3080.95 | 3049.16 | 3009.65 | 3052.95 | 3027.73 | 2411.72 | 2335.17 | 2317.54 | 2301.49 | 2281.99 | 2262.42 | 2243.42 | 2227.68 | 2210.82 | 2190.40 | 2174.19 | 2162.13 | 2148.15 | 2126.01 | 2105.84 | 2082.17 | 2057.34 | 2037.69 | 2016.33 | 2001.44 | 1972.40 | 1956.59 | 1931.80 | 1911.17 | 1906.03 | 890.31 | 880.62 | NA | NA | NA | |
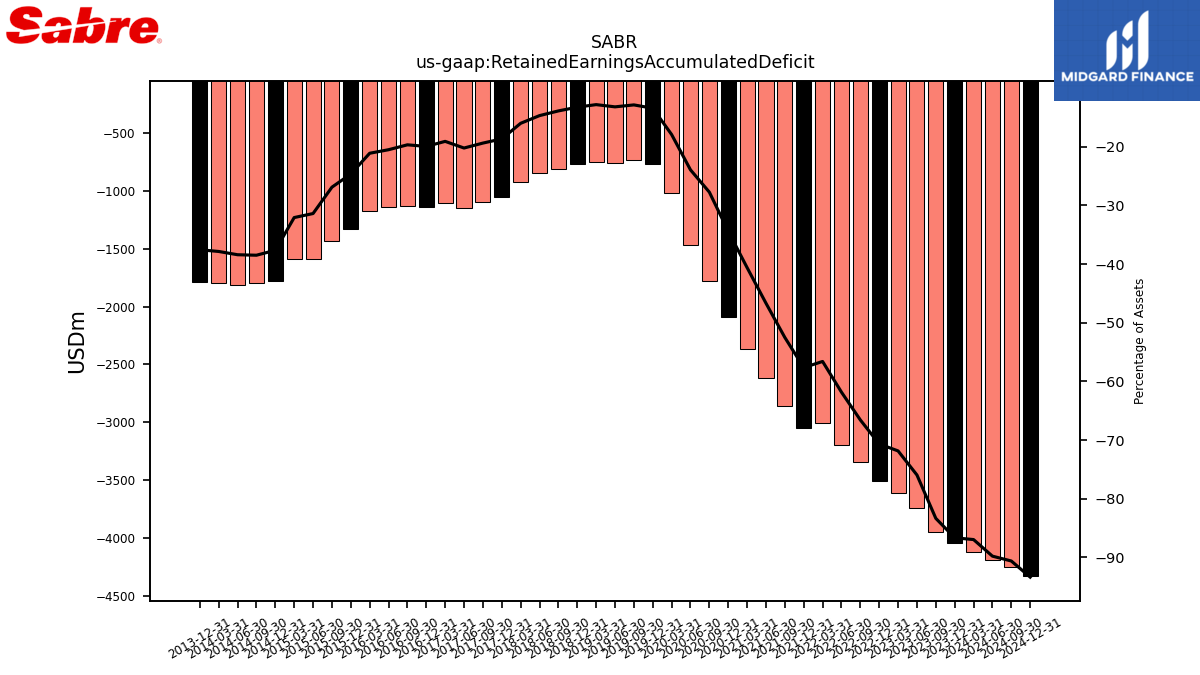
| Retained Earnings Accumulated Deficit | -4048.39 | -3951.93 | -3740.09 | -3610.81 | -3506.53 | -3341.09 | -3200.37 | -3007.64 | -3049.70 | -2857.65 | -2617.01 | -2365.73 | -2090.02 | -1778.88 | -1466.43 | -1022.30 | -763.48 | -735.25 | -760.75 | -750.31 | -768.57 | -814.45 | -848.95 | -924.97 | -1053.45 | -1097.15 | -1149.60 | -1104.12 | -1141.12 | -1129.68 | -1136.83 | -1172.75 | -1328.73 | -1433.13 | -1584.83 | -1592.51 | -1775.62 | -1797.94 | -1810.67 | -1797.54 | -1785.55 | NA | NA | NA | |
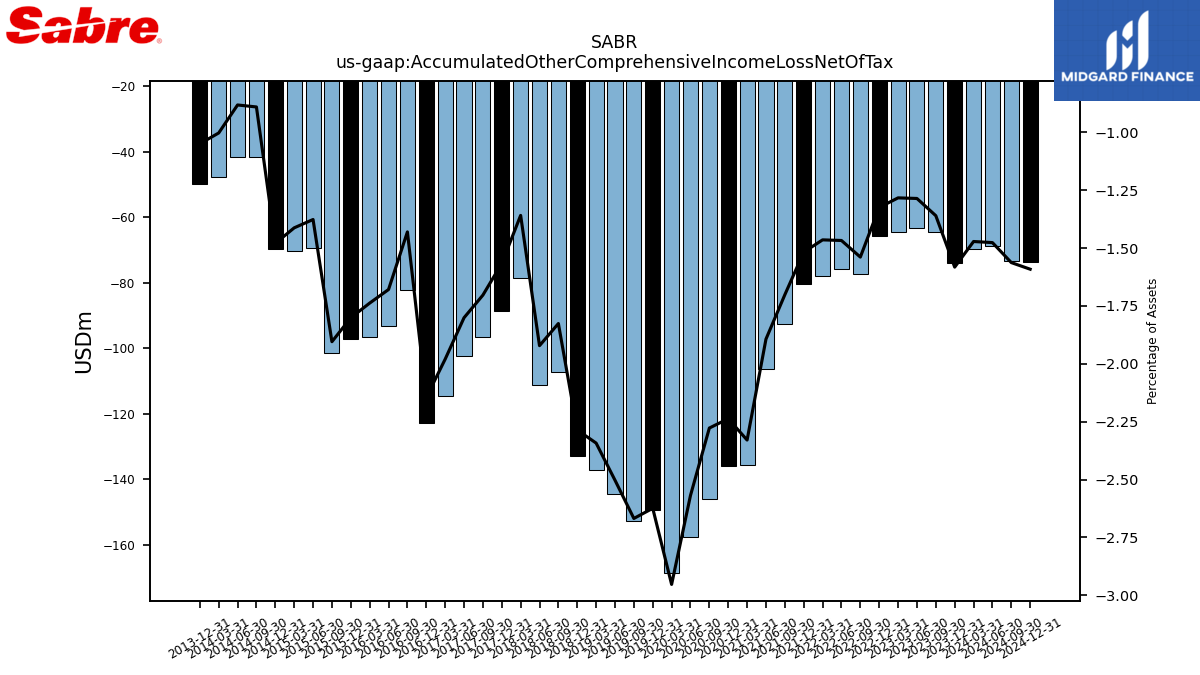
| Accumulated Other Comprehensive Income Loss Net Of Tax | -73.92 | -64.49 | -63.31 | -64.48 | -65.73 | -77.24 | -75.94 | -77.82 | -80.29 | -92.61 | -106.17 | -135.74 | -135.96 | -146.10 | -157.43 | -168.61 | -149.31 | -152.63 | -144.42 | -137.25 | -132.72 | -107.15 | -111.12 | -78.60 | -88.48 | -96.50 | -102.47 | -114.64 | -122.80 | -82.18 | -93.14 | -96.59 | -97.14 | -101.54 | -69.53 | -70.16 | -69.80 | -41.59 | -41.57 | -47.63 | -49.90 | NA | NA | NA | |
| Minority Interest | 12.66 | 12.22 | 11.56 | 11.05 | 11.50 | 10.97 | 10.19 | 9.34 | 9.19 | 8.69 | 7.97 | 7.51 | 7.03 | 9.43 | 9.30 | 9.37 | 8.59 | 7.92 | 7.15 | 8.10 | 7.21 | 6.27 | 4.86 | 6.58 | 5.20 | 3.58 | 5.02 | 3.93 | 2.58 | 1.43 | 3.62 | 2.54 | 1.44 | 0.72 | -0.22 | 1.57 | 0.62 | 0.06 | -0.66 | 1.25 | 0.51 | NA | NA | NA |
| 2023-12-31 | 2023-09-30 | 2023-06-30 | 2023-03-31 | 2022-12-31 | 2022-09-30 | 2022-06-30 | 2022-03-31 | 2021-12-31 | 2021-09-30 | 2021-06-30 | 2021-03-31 | 2020-12-31 | 2020-09-30 | 2020-06-30 | 2020-03-31 | 2019-12-31 | 2019-09-30 | 2019-06-30 | 2019-03-31 | 2018-12-31 | 2018-09-30 | 2018-06-30 | 2018-03-31 | 2017-12-31 | 2017-09-30 | 2017-06-30 | 2017-03-31 | 2016-12-31 | 2016-09-30 | 2016-06-30 | 2016-03-31 | 2015-12-31 | 2015-09-30 | 2015-06-30 | 2015-03-31 | 2014-12-31 | 2014-09-30 | 2014-06-30 | 2014-03-31 | 2013-12-31 | 2013-09-30 | 2013-06-30 | 2013-03-31 | ||
|---|---|---|---|---|---|---|---|---|---|---|---|---|---|---|---|---|---|---|---|---|---|---|---|---|---|---|---|---|---|---|---|---|---|---|---|---|---|---|---|---|---|---|---|---|---|
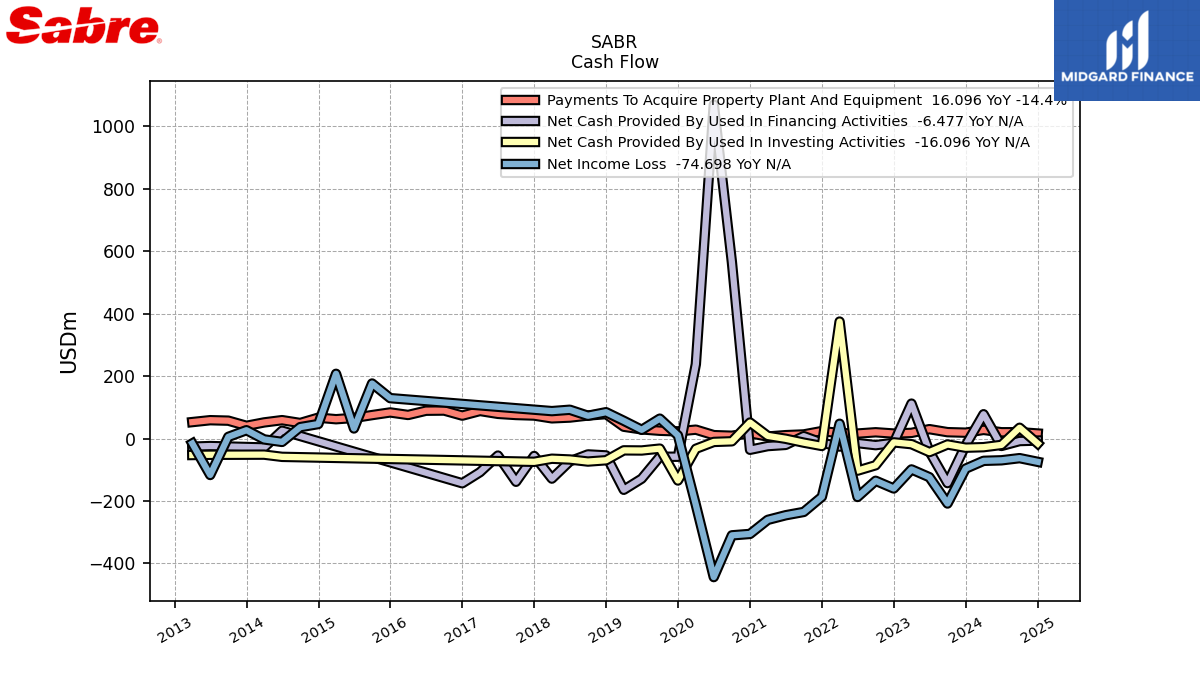
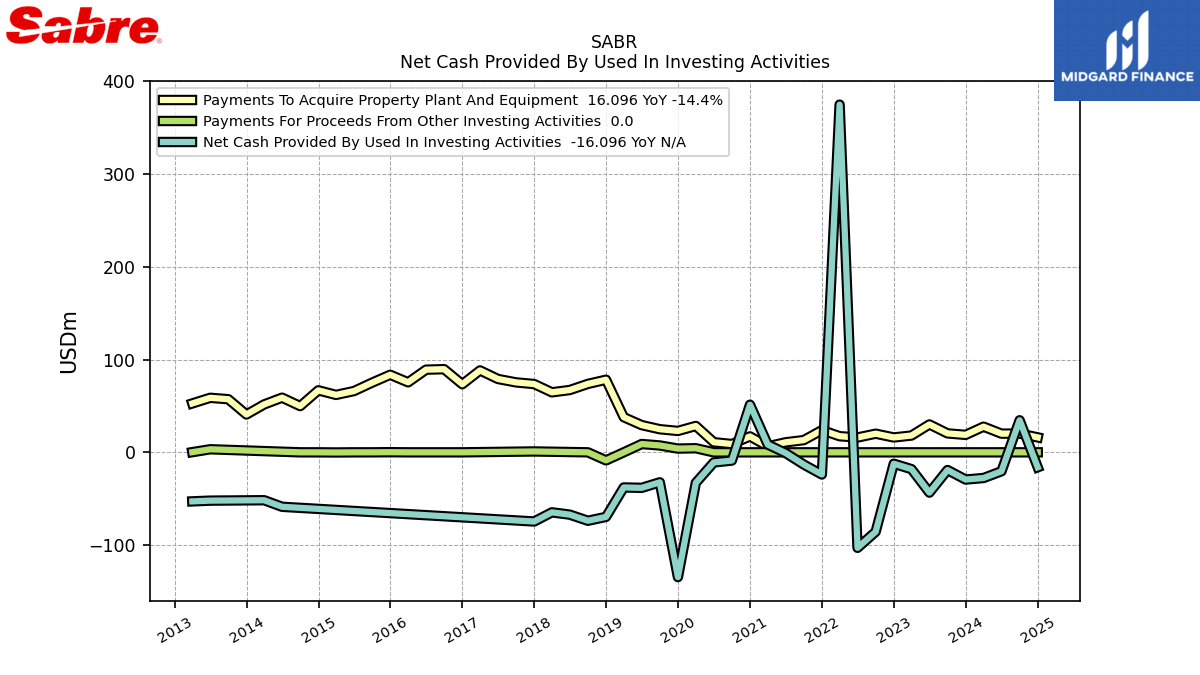
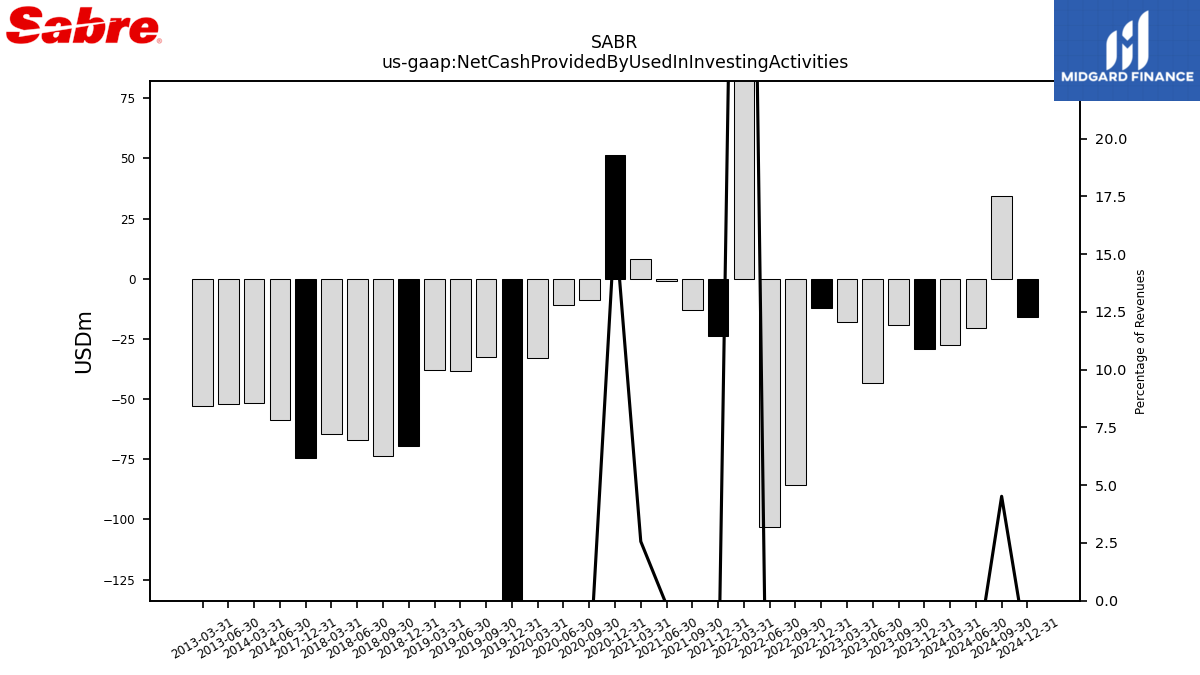
| Net Cash Provided By Used In Investing Activities | -29.35 | -19.09 | -43.44 | -18.11 | -12.27 | -85.65 | -102.97 | 374.87 | -23.89 | -13.17 | -0.77 | 8.40 | 51.34 | -8.89 | -10.90 | -32.85 | -134.54 | -32.32 | -38.30 | -37.86 | -69.59 | -73.78 | -67.19 | -64.70 | -74.57 | NA | NA | NA | NA | NA | NA | NA | NA | NA | NA | NA | NA | NA | -58.71 | -51.64 | NA | NA | -52.08 | -52.88 | |
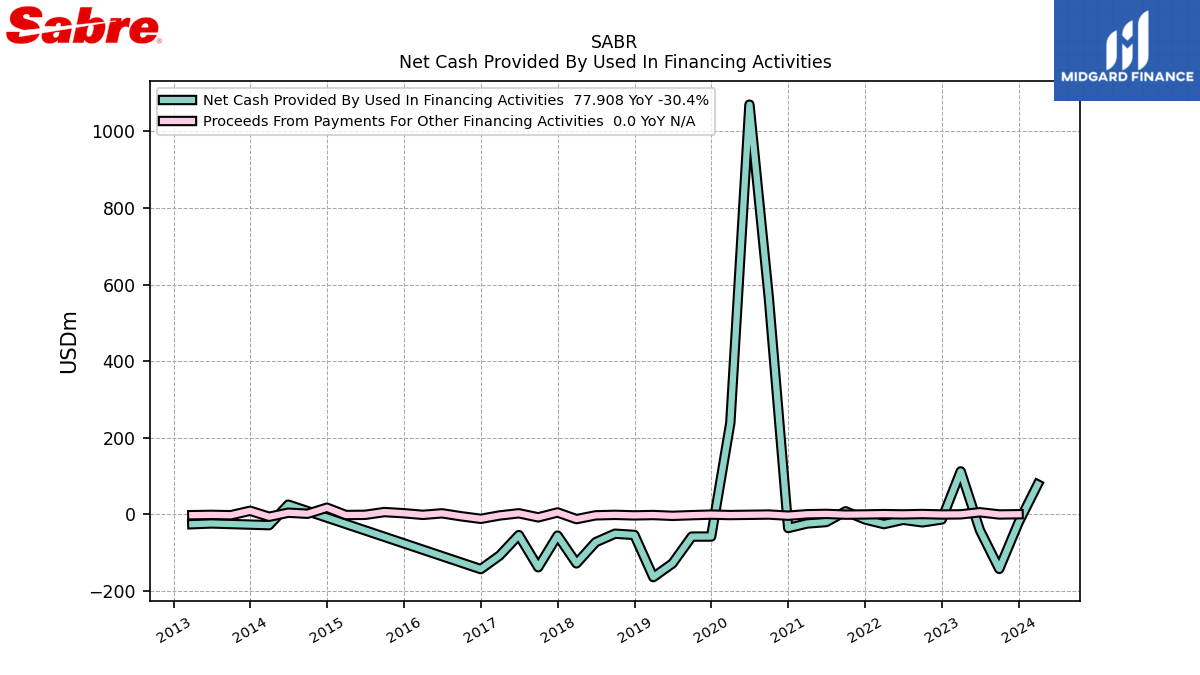
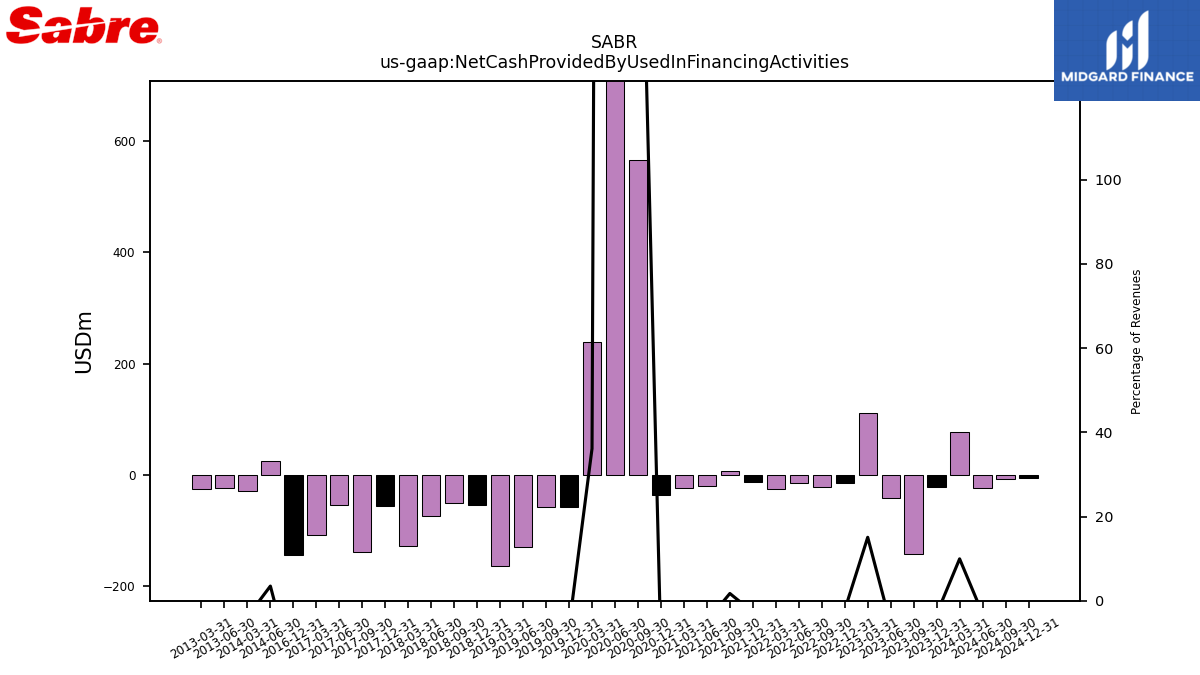
| Net Cash Provided By Used In Financing Activities | -21.70 | -142.88 | -41.58 | 111.94 | -13.72 | -21.24 | -14.57 | -25.84 | -13.54 | 7.61 | -20.40 | -24.22 | -36.06 | 565.61 | 1070.05 | 238.15 | -58.30 | -58.45 | -128.66 | -164.31 | -54.10 | -50.88 | -73.05 | -128.47 | -55.84 | -138.62 | -54.52 | -107.79 | -143.38 | NA | NA | NA | NA | NA | NA | NA | NA | NA | 25.02 | -28.60 | NA | NA | -24.10 | -26.07 |
| 2023-12-31 | 2023-09-30 | 2023-06-30 | 2023-03-31 | 2022-12-31 | 2022-09-30 | 2022-06-30 | 2022-03-31 | 2021-12-31 | 2021-09-30 | 2021-06-30 | 2021-03-31 | 2020-12-31 | 2020-09-30 | 2020-06-30 | 2020-03-31 | 2019-12-31 | 2019-09-30 | 2019-06-30 | 2019-03-31 | 2018-12-31 | 2018-09-30 | 2018-06-30 | 2018-03-31 | 2017-12-31 | 2017-09-30 | 2017-06-30 | 2017-03-31 | 2016-12-31 | 2016-09-30 | 2016-06-30 | 2016-03-31 | 2015-12-31 | 2015-09-30 | 2015-06-30 | 2015-03-31 | 2014-12-31 | 2014-09-30 | 2014-06-30 | 2014-03-31 | 2013-12-31 | 2013-09-30 | 2013-06-30 | 2013-03-31 | ||
|---|---|---|---|---|---|---|---|---|---|---|---|---|---|---|---|---|---|---|---|---|---|---|---|---|---|---|---|---|---|---|---|---|---|---|---|---|---|---|---|---|---|---|---|---|---|
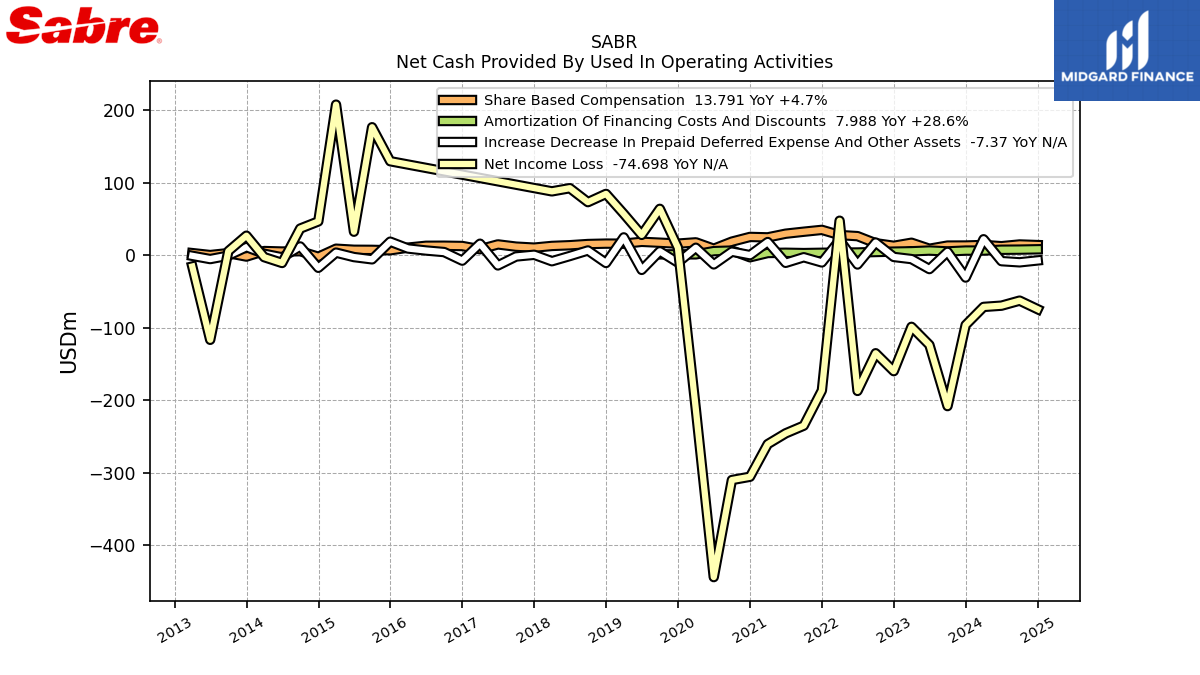
| Net Income Loss | -96.46 | -208.28 | -123.93 | -98.93 | -160.09 | -135.38 | -187.39 | 47.41 | -186.70 | -235.24 | -245.85 | -260.68 | -305.71 | -310.22 | -444.13 | -212.68 | 10.09 | 63.81 | 27.84 | 56.85 | 84.40 | 73.00 | 92.25 | 87.88 | NA | NA | NA | NA | NA | NA | NA | NA | 129.44 | 176.34 | 32.21 | 207.49 | 46.40 | 36.56 | -10.90 | -2.84 | 26.76 | 5.37 | -116.86 | -15.76 | |
| Profit Loss | -96.27 | -207.91 | -124.00 | -99.77 | -159.35 | -134.60 | -186.50 | 47.68 | -186.19 | -234.53 | -245.40 | -260.19 | -305.35 | -310.09 | -444.20 | -211.90 | 10.76 | 64.58 | 29.44 | 57.76 | 85.55 | 74.54 | 93.33 | 89.24 | 83.48 | 92.30 | -5.37 | 77.25 | 25.71 | 41.86 | 73.10 | 106.27 | 130.42 | 177.02 | 33.28 | 208.24 | 46.96 | 37.28 | -10.20 | -2.10 | 27.49 | 6.09 | -116.03 | -15.18 | |
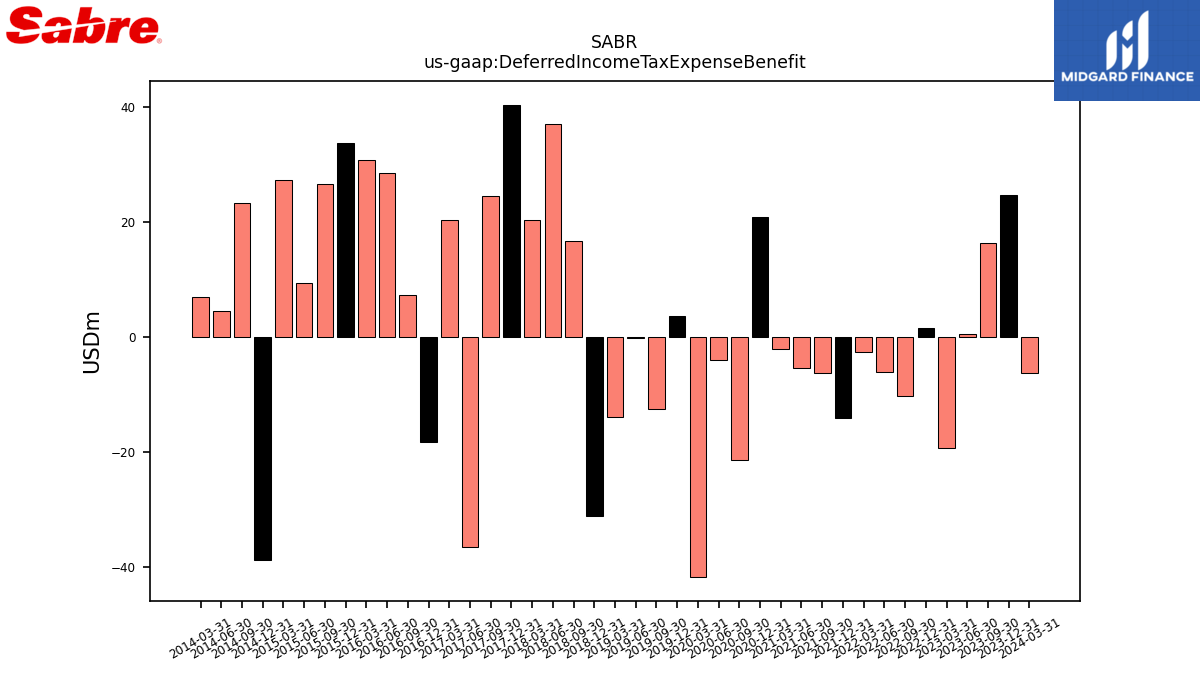
| Deferred Income Tax Expense Benefit | 24.69 | 16.33 | 0.48 | -19.22 | 1.56 | -10.27 | -6.03 | -2.57 | -14.03 | -6.20 | -5.29 | -2.00 | 20.90 | -21.34 | -4.06 | -41.73 | 3.70 | -12.48 | -0.21 | -13.93 | -31.16 | 16.73 | 37.12 | 20.41 | 40.42 | 24.46 | -36.42 | 20.30 | -18.22 | 7.36 | 28.56 | 30.76 | 33.82 | 26.64 | 9.37 | 27.39 | -38.78 | 23.37 | 4.62 | 6.97 | NA | NA | NA | NA | |
| Share Based Compensation | 13.18 | 13.09 | 8.74 | 17.00 | 12.79 | 16.35 | 26.13 | 27.61 | 34.77 | 32.22 | 29.48 | 24.43 | 25.04 | 18.57 | 8.76 | 17.58 | 15.80 | 17.09 | 18.30 | 15.69 | 15.82 | 15.24 | 13.59 | 12.61 | 10.28 | 11.65 | 14.72 | 8.03 | 12.51 | 12.91 | 12.81 | 10.29 | 6.64 | 7.20 | 7.33 | 8.79 | -2.34 | 5.37 | 4.88 | 5.58 | -2.06 | 2.69 | 0.04 | 2.72 |
| 2023-12-31 | 2023-09-30 | 2023-06-30 | 2023-03-31 | 2022-12-31 | 2022-09-30 | 2022-06-30 | 2022-03-31 | 2021-12-31 | 2021-09-30 | 2021-06-30 | 2021-03-31 | 2020-12-31 | 2020-09-30 | 2020-06-30 | 2020-03-31 | 2019-12-31 | 2019-09-30 | 2019-06-30 | 2019-03-31 | 2018-12-31 | 2018-09-30 | 2018-06-30 | 2018-03-31 | 2017-12-31 | 2017-09-30 | 2017-06-30 | 2017-03-31 | 2016-12-31 | 2016-09-30 | 2016-06-30 | 2016-03-31 | 2015-12-31 | 2015-09-30 | 2015-06-30 | 2015-03-31 | 2014-12-31 | 2014-09-30 | 2014-06-30 | 2014-03-31 | 2013-12-31 | 2013-09-30 | 2013-06-30 | 2013-03-31 | ||
|---|---|---|---|---|---|---|---|---|---|---|---|---|---|---|---|---|---|---|---|---|---|---|---|---|---|---|---|---|---|---|---|---|---|---|---|---|---|---|---|---|---|---|---|---|---|
| Net Cash Provided By Used In Investing Activities | -29.35 | -19.09 | -43.44 | -18.11 | -12.27 | -85.65 | -102.97 | 374.87 | -23.89 | -13.17 | -0.77 | 8.40 | 51.34 | -8.89 | -10.90 | -32.85 | -134.54 | -32.32 | -38.30 | -37.86 | -69.59 | -73.78 | -67.19 | -64.70 | -74.57 | NA | NA | NA | NA | NA | NA | NA | NA | NA | NA | NA | NA | NA | -58.71 | -51.64 | NA | NA | -52.08 | -52.88 | |
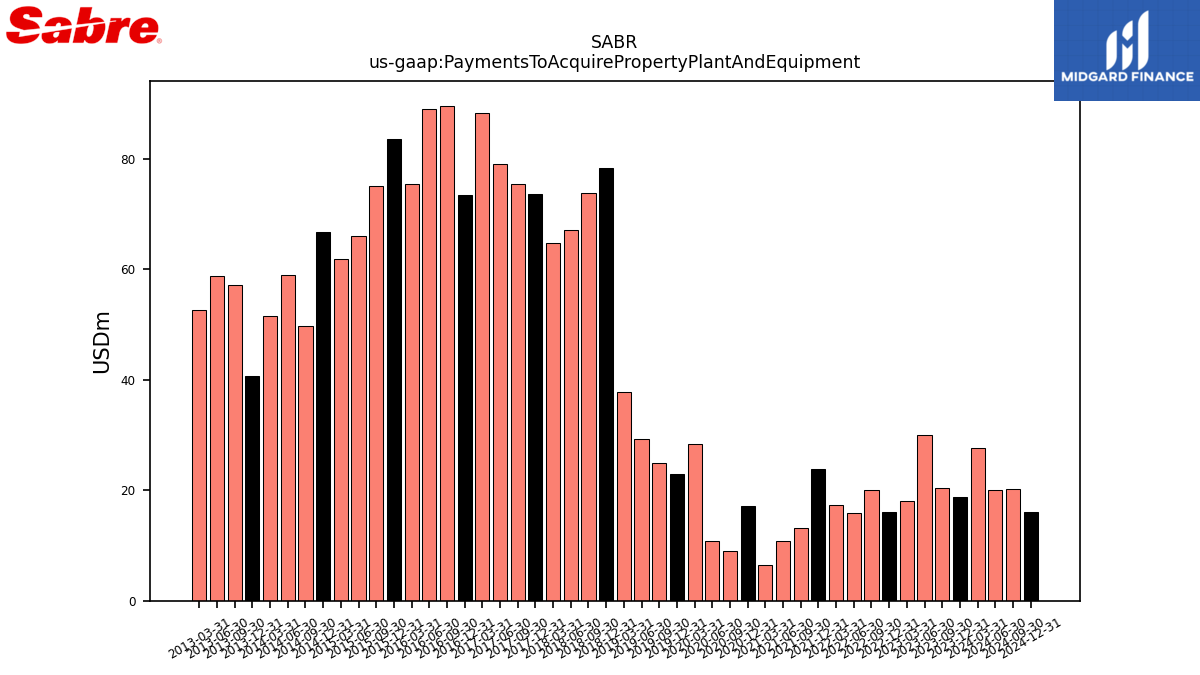
| Payments To Acquire Property Plant And Equipment | 18.81 | 20.42 | 30.08 | 18.11 | 16.02 | 20.09 | 15.98 | 17.40 | 23.89 | 13.17 | 10.80 | 6.43 | 17.16 | 8.93 | 10.90 | 28.44 | 23.04 | 24.93 | 29.33 | 37.86 | 78.28 | 73.78 | 67.19 | 64.70 | 73.62 | 75.40 | 79.09 | 88.32 | 73.42 | 89.64 | 89.12 | 75.47 | 83.63 | 75.11 | 66.05 | 61.91 | 66.84 | 49.80 | 58.94 | 51.64 | 40.78 | 57.26 | 58.79 | 52.70 |
| 2023-12-31 | 2023-09-30 | 2023-06-30 | 2023-03-31 | 2022-12-31 | 2022-09-30 | 2022-06-30 | 2022-03-31 | 2021-12-31 | 2021-09-30 | 2021-06-30 | 2021-03-31 | 2020-12-31 | 2020-09-30 | 2020-06-30 | 2020-03-31 | 2019-12-31 | 2019-09-30 | 2019-06-30 | 2019-03-31 | 2018-12-31 | 2018-09-30 | 2018-06-30 | 2018-03-31 | 2017-12-31 | 2017-09-30 | 2017-06-30 | 2017-03-31 | 2016-12-31 | 2016-09-30 | 2016-06-30 | 2016-03-31 | 2015-12-31 | 2015-09-30 | 2015-06-30 | 2015-03-31 | 2014-12-31 | 2014-09-30 | 2014-06-30 | 2014-03-31 | 2013-12-31 | 2013-09-30 | 2013-06-30 | 2013-03-31 | ||
|---|---|---|---|---|---|---|---|---|---|---|---|---|---|---|---|---|---|---|---|---|---|---|---|---|---|---|---|---|---|---|---|---|---|---|---|---|---|---|---|---|---|---|---|---|---|
| Net Cash Provided By Used In Financing Activities | -21.70 | -142.88 | -41.58 | 111.94 | -13.72 | -21.24 | -14.57 | -25.84 | -13.54 | 7.61 | -20.40 | -24.22 | -36.06 | 565.61 | 1070.05 | 238.15 | -58.30 | -58.45 | -128.66 | -164.31 | -54.10 | -50.88 | -73.05 | -128.47 | -55.84 | -138.62 | -54.52 | -107.79 | -143.38 | NA | NA | NA | NA | NA | NA | NA | NA | NA | 25.02 | -28.60 | NA | NA | -24.10 | -26.07 |
| 2023-12-31 | 2023-09-30 | 2023-06-30 | 2023-03-31 | 2022-12-31 | 2022-09-30 | 2022-06-30 | 2022-03-31 | 2021-12-31 | 2021-09-30 | 2021-06-30 | 2021-03-31 | 2020-12-31 | 2020-09-30 | 2020-06-30 | 2020-03-31 | 2019-12-31 | 2019-09-30 | 2019-06-30 | 2019-03-31 | 2018-12-31 | 2018-09-30 | 2018-06-30 | 2018-03-31 | 2017-12-31 | 2017-09-30 | 2017-06-30 | 2017-03-31 | 2016-12-31 | 2016-09-30 | 2016-06-30 | 2016-03-31 | 2015-12-31 | 2015-09-30 | 2015-06-30 | 2015-03-31 | 2014-12-31 | 2014-09-30 | 2014-06-30 | 2014-03-31 | 2013-12-31 | 2013-09-30 | 2013-06-30 | 2013-03-31 | ||
|---|---|---|---|---|---|---|---|---|---|---|---|---|---|---|---|---|---|---|---|---|---|---|---|---|---|---|---|---|---|---|---|---|---|---|---|---|---|---|---|---|---|---|---|---|---|
| Revenues | 687.05 | 740.46 | 737.53 | 742.70 | 631.18 | 663.39 | 657.53 | 584.91 | 500.64 | 441.09 | 419.67 | 327.48 | 313.71 | 278.37 | 83.04 | 658.98 | 941.42 | 984.20 | 1000.01 | 1049.36 | 923.93 | 970.28 | 984.38 | 988.37 | 881.86 | 900.61 | 900.66 | 915.35 | 829.62 | 838.98 | 845.24 | 859.54 | 758.46 | 785.00 | 707.09 | 710.35 | 646.14 | 756.30 | 717.57 | 755.41 | 626.92 | 775.82 | 768.23 | 759.34 | |
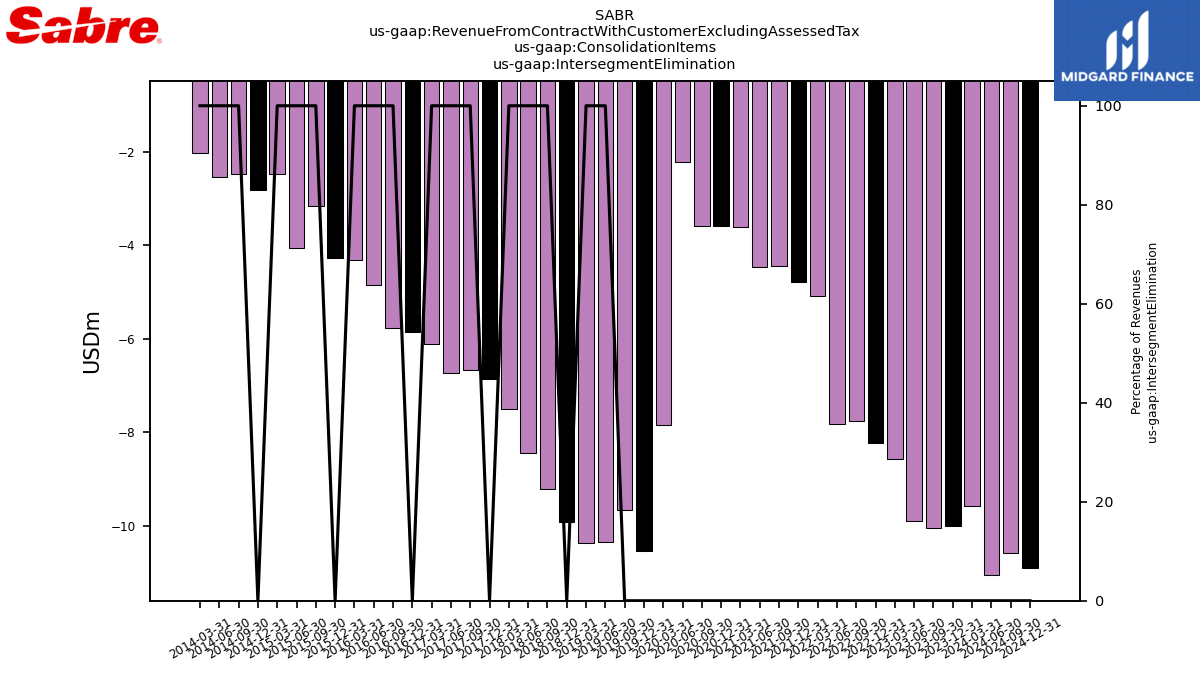
| Revenue From Contract With Customer Excluding Assessed Tax | 687.05 | 740.46 | 737.53 | 742.70 | 631.18 | 663.39 | 657.53 | 584.91 | 500.64 | 441.09 | 419.67 | 327.48 | 313.71 | 278.37 | 83.04 | 658.98 | 941.42 | 984.20 | 1000.01 | 1049.36 | 923.93 | 970.28 | 984.38 | 988.37 | 881.86 | 900.61 | 900.66 | 915.35 | 829.62 | 838.98 | 845.24 | 859.54 | 758.46 | 785.00 | 707.09 | 710.35 | 646.14 | 756.30 | 717.57 | 755.41 | 626.92 | 775.82 | 768.23 | 759.34 | |
| Intersegment Elimination | -10.00 | -10.05 | -9.90 | -8.56 | -8.22 | -7.75 | -7.82 | -5.09 | -4.77 | -4.45 | -4.47 | -3.61 | -3.58 | -3.58 | -2.22 | -7.85 | -10.54 | -9.65 | -10.34 | -10.37 | -9.91 | -9.21 | -8.45 | -7.50 | -6.85 | -6.67 | -6.73 | -6.10 | -5.84 | -5.77 | -4.84 | -4.31 | -4.28 | -3.17 | -4.06 | -2.48 | -2.81 | -2.48 | -2.53 | -2.03 | NA | NA | NA | NA | |
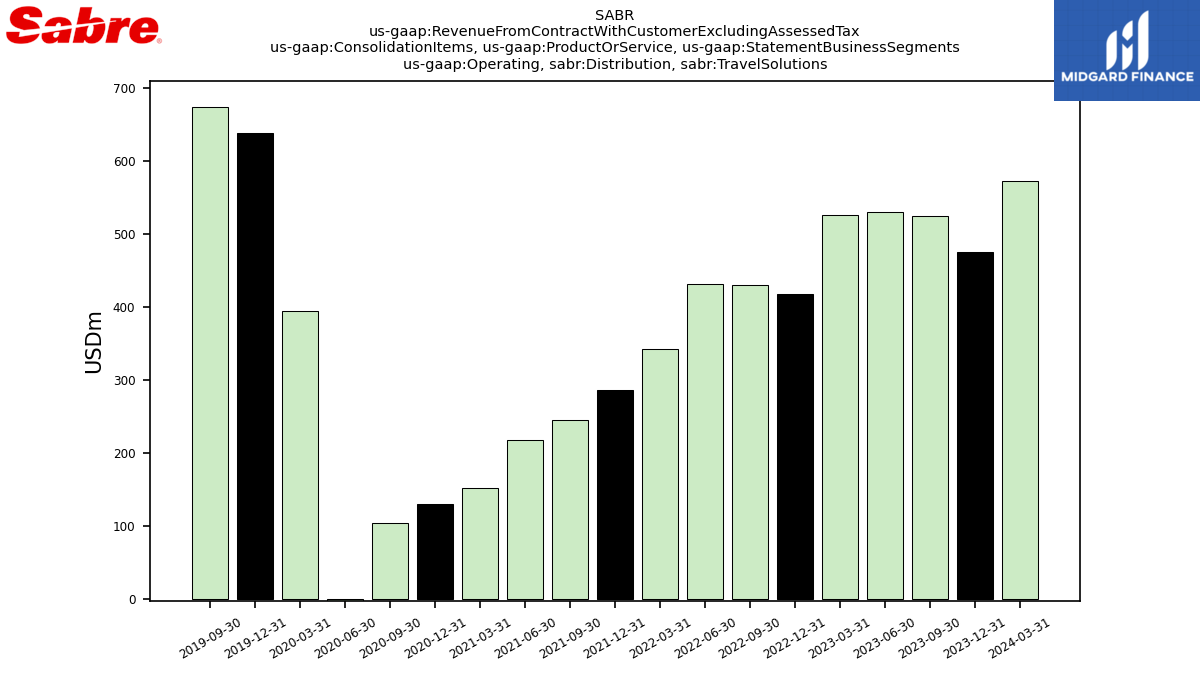
| Operating, Distribution, Travel Solutions | 475.95 | 524.80 | 530.40 | 525.89 | 417.29 | 430.83 | 431.54 | 342.89 | 286.03 | 245.42 | 218.25 | 151.78 | 130.93 | 104.59 | -47.95 | 394.54 | 638.48 | 673.40 | NA | NA | NA | NA | NA | NA | NA | NA | NA | NA | NA | NA | NA | NA | NA | NA | NA | NA | NA | NA | NA | NA | NA | NA | NA | NA | |
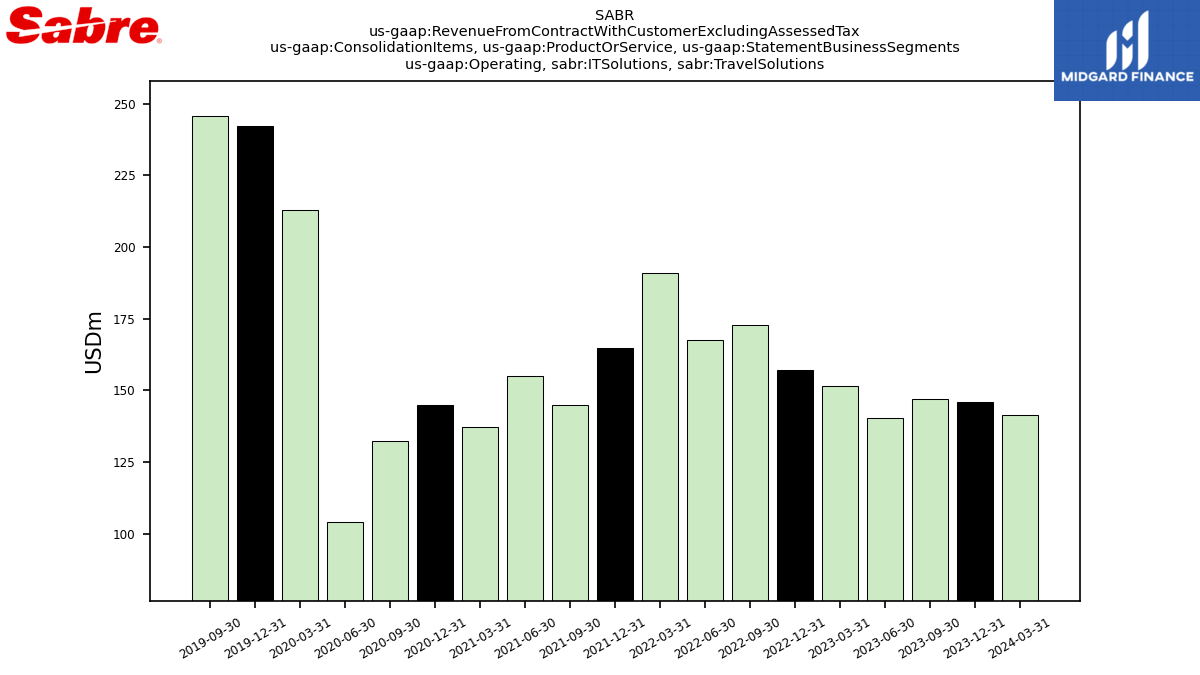
| Operating, I T Solutions, Travel Solutions | 145.99 | 147.13 | 140.36 | 151.56 | 157.19 | 172.82 | 167.61 | 191.11 | 164.90 | 144.93 | 155.14 | 137.09 | 144.89 | 132.42 | 104.21 | 213.05 | 242.13 | 245.63 | NA | NA | NA | NA | NA | NA | NA | NA | NA | NA | NA | NA | NA | NA | NA | NA | NA | NA | NA | NA | NA | NA | NA | NA | NA | NA | |
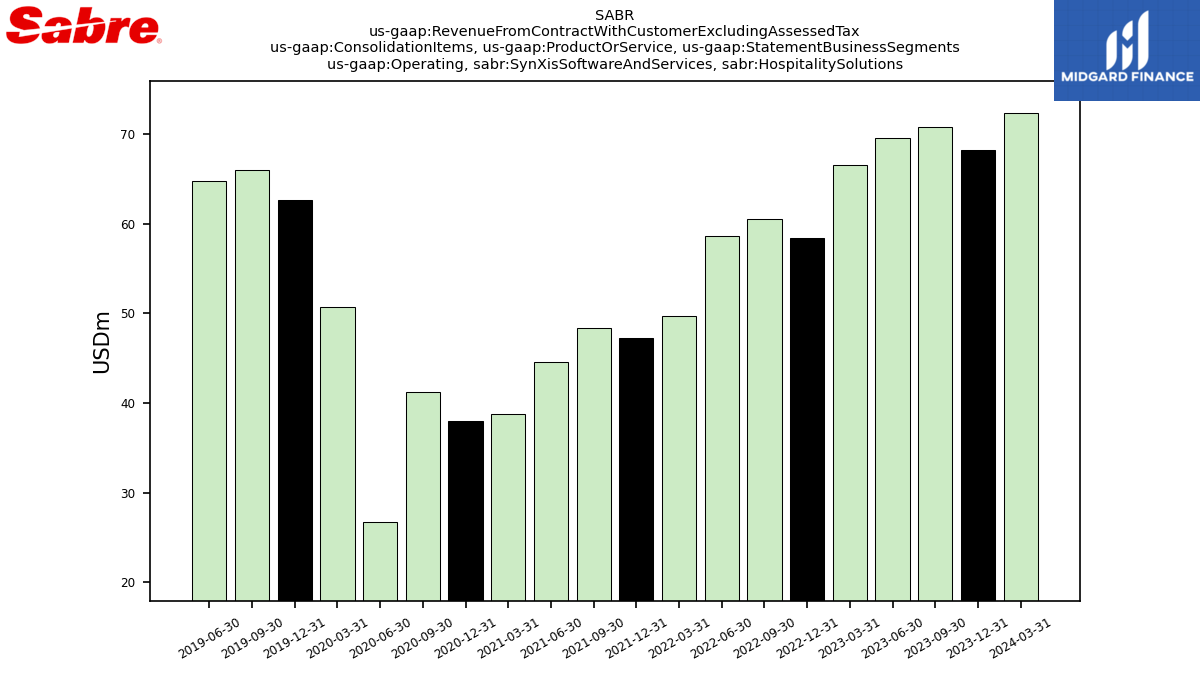
| Operating, Syn Xis Software And Services, Hospitality Solutions | 68.19 | 70.80 | 69.52 | 66.51 | 58.42 | 60.52 | 58.62 | 49.73 | 47.29 | 48.39 | 44.53 | 38.73 | 37.98 | 41.29 | 26.75 | 50.73 | 62.64 | 65.96 | 64.80 | NA | NA | NA | NA | NA | NA | NA | NA | NA | NA | NA | NA | NA | NA | NA | NA | NA | NA | NA | NA | NA | NA | NA | NA | NA | |
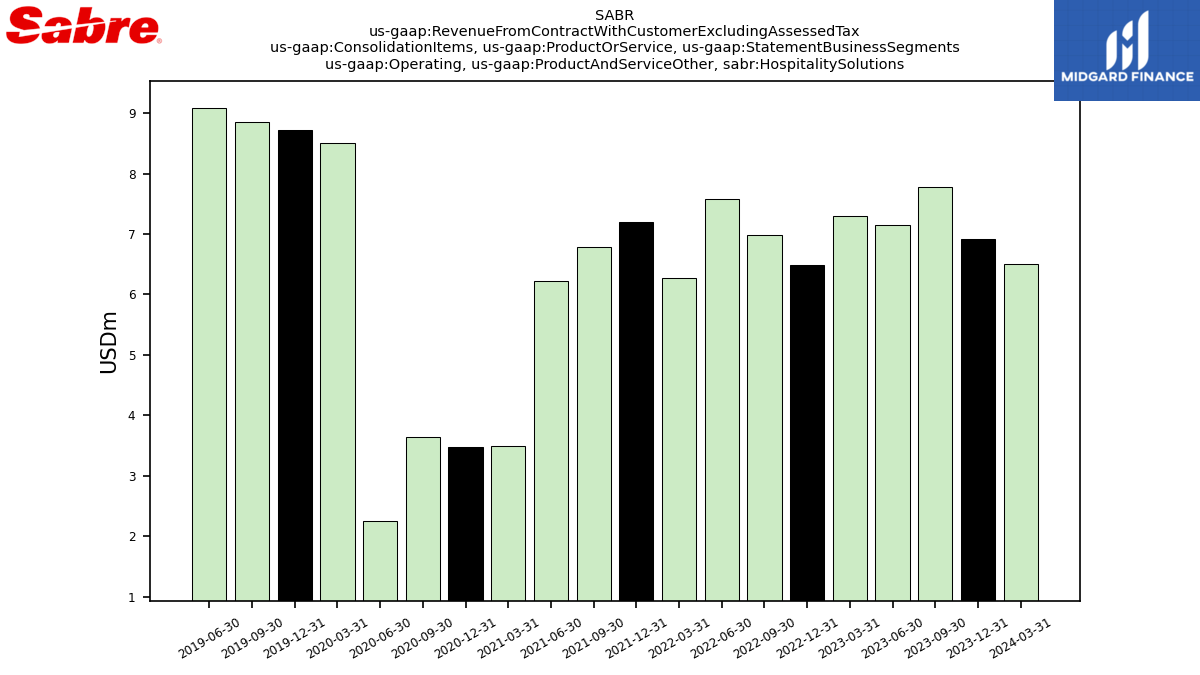
| Operating, Product And Service Other, Hospitality Solutions | 6.92 | 7.79 | 7.15 | 7.30 | 6.49 | 6.98 | 7.58 | 6.27 | 7.19 | 6.79 | 6.22 | 3.48 | 3.48 | 3.64 | 2.25 | 8.51 | 8.72 | 8.86 | 9.08 | NA | NA | NA | NA | NA | NA | NA | NA | NA | NA | NA | NA | NA | NA | NA | NA | NA | NA | NA | NA | NA | NA | NA | NA | NA | |
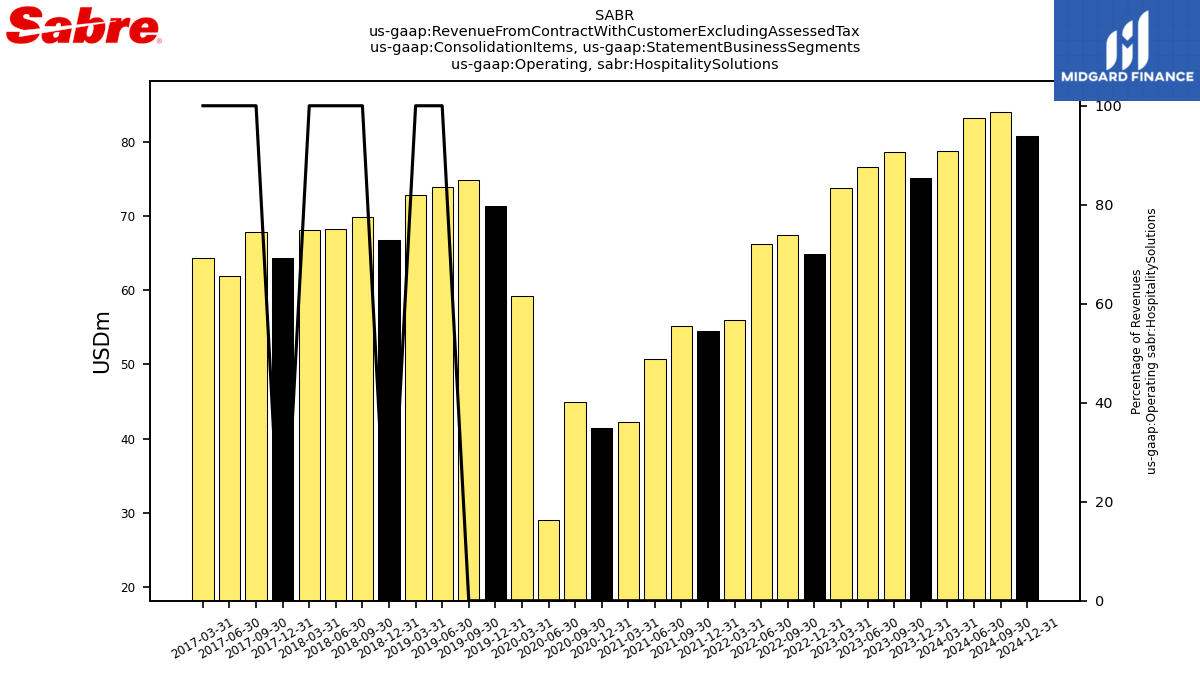
| Operating, Hospitality Solutions | 75.11 | 78.58 | 76.67 | 73.81 | 64.92 | 67.50 | 66.20 | 56.00 | 54.48 | 55.18 | 50.75 | 42.22 | 41.47 | 44.92 | 29.00 | 59.24 | 71.36 | 74.82 | 73.88 | 72.83 | 66.73 | 69.91 | 68.31 | 68.13 | 64.28 | 67.80 | 61.91 | 64.36 | NA | NA | NA | NA | NA | NA | NA | NA | NA | NA | NA | NA | NA | NA | NA | NA | |
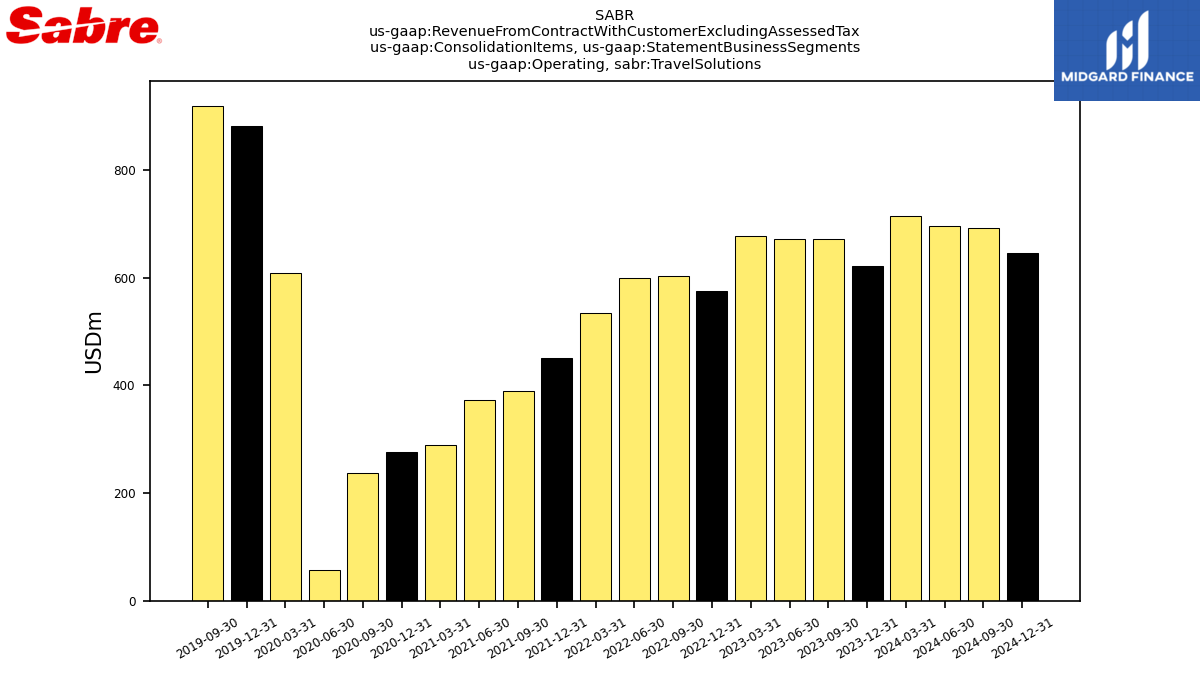
| Operating, Travel Solutions | 621.95 | 671.93 | 670.76 | 677.44 | 574.48 | 603.65 | 599.15 | 534.00 | 450.93 | 390.35 | 373.38 | 288.88 | 275.83 | 237.02 | 56.26 | 607.59 | 880.61 | 919.03 | NA | NA | NA | NA | NA | NA | NA | NA | NA | NA | NA | NA | NA | NA | NA | NA | NA | NA | NA | NA | NA | NA | NA | NA | NA | NA |