
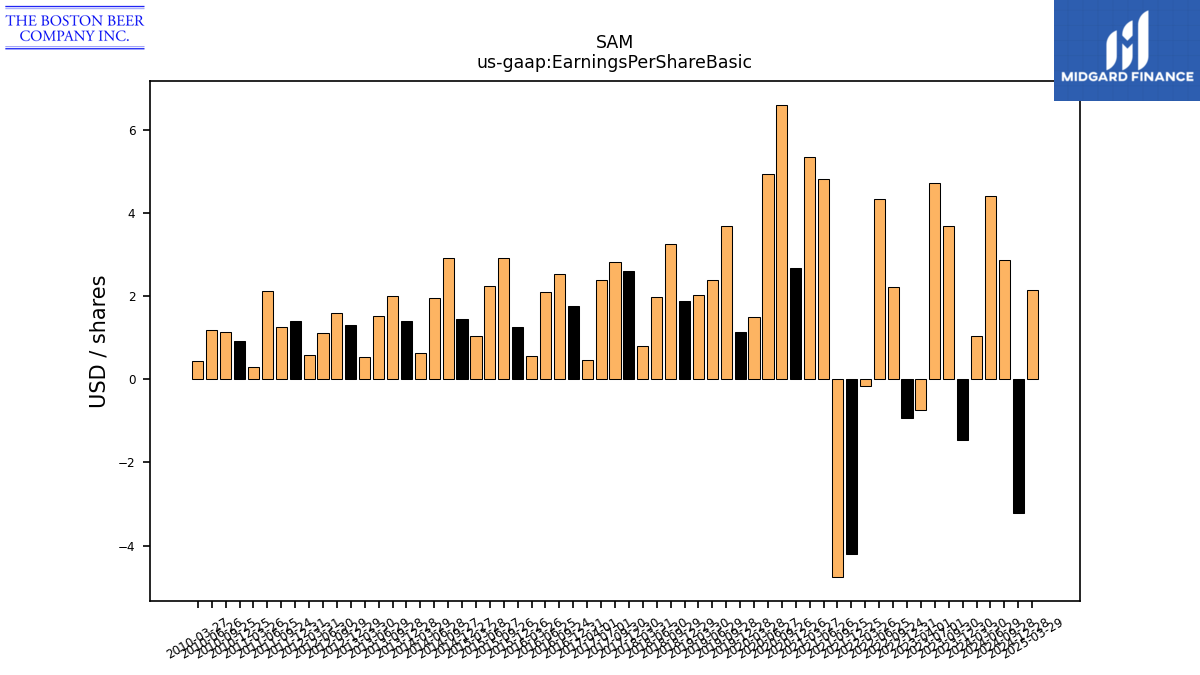
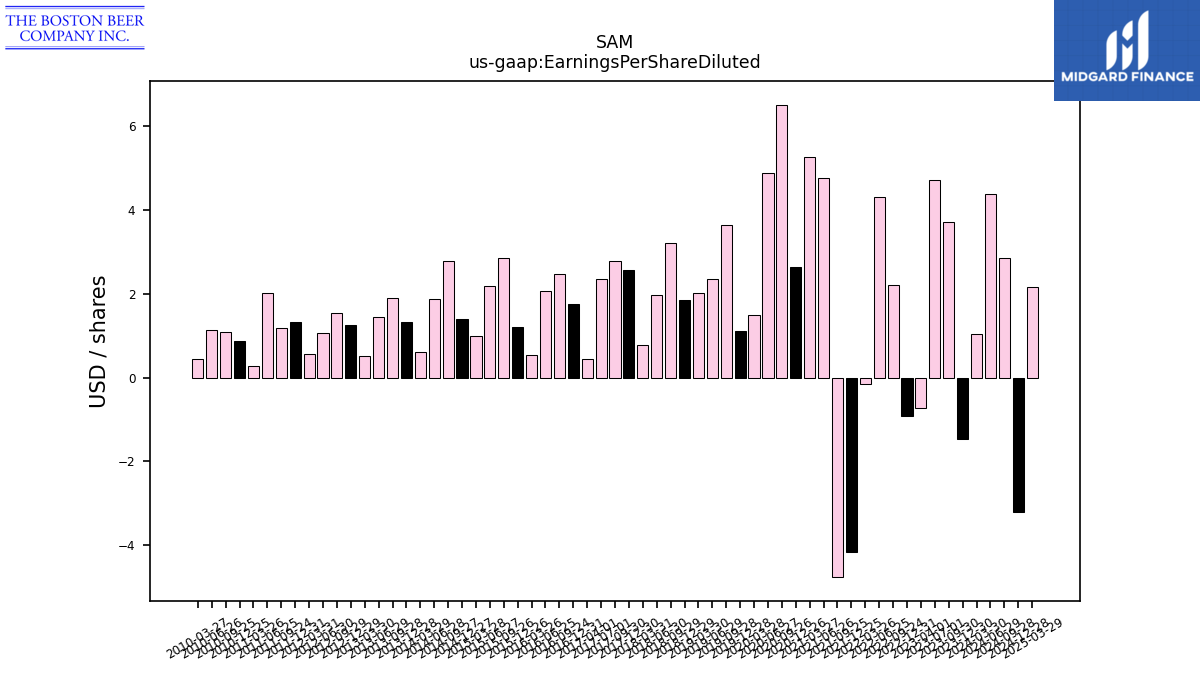
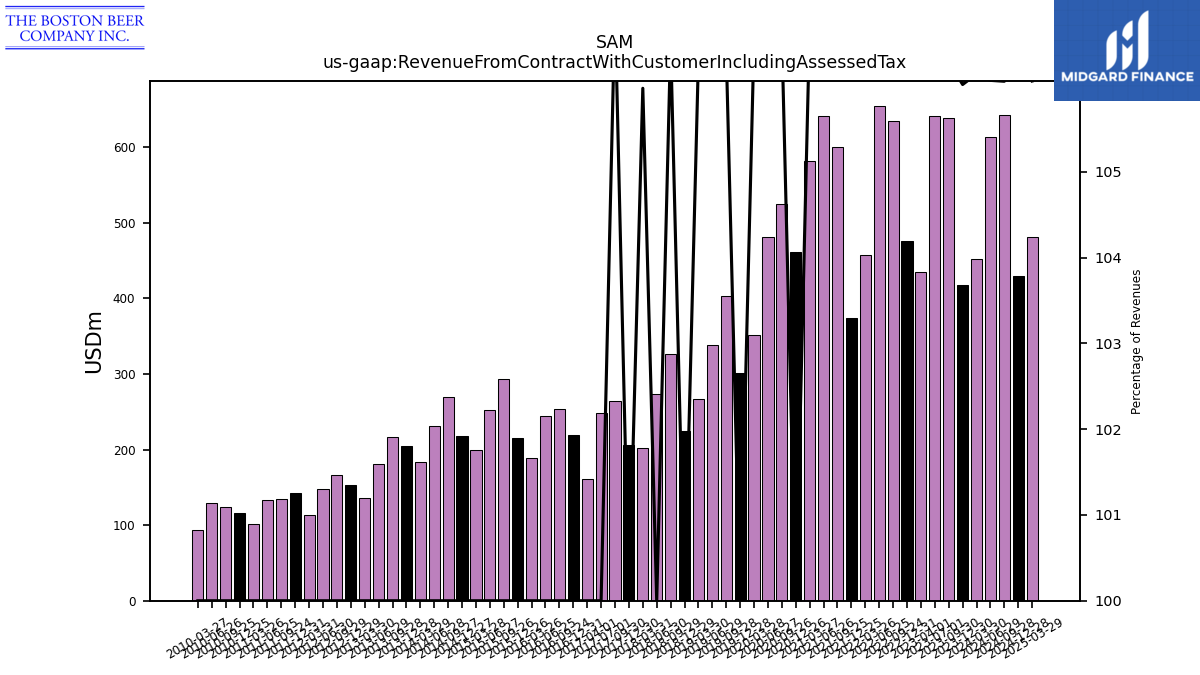
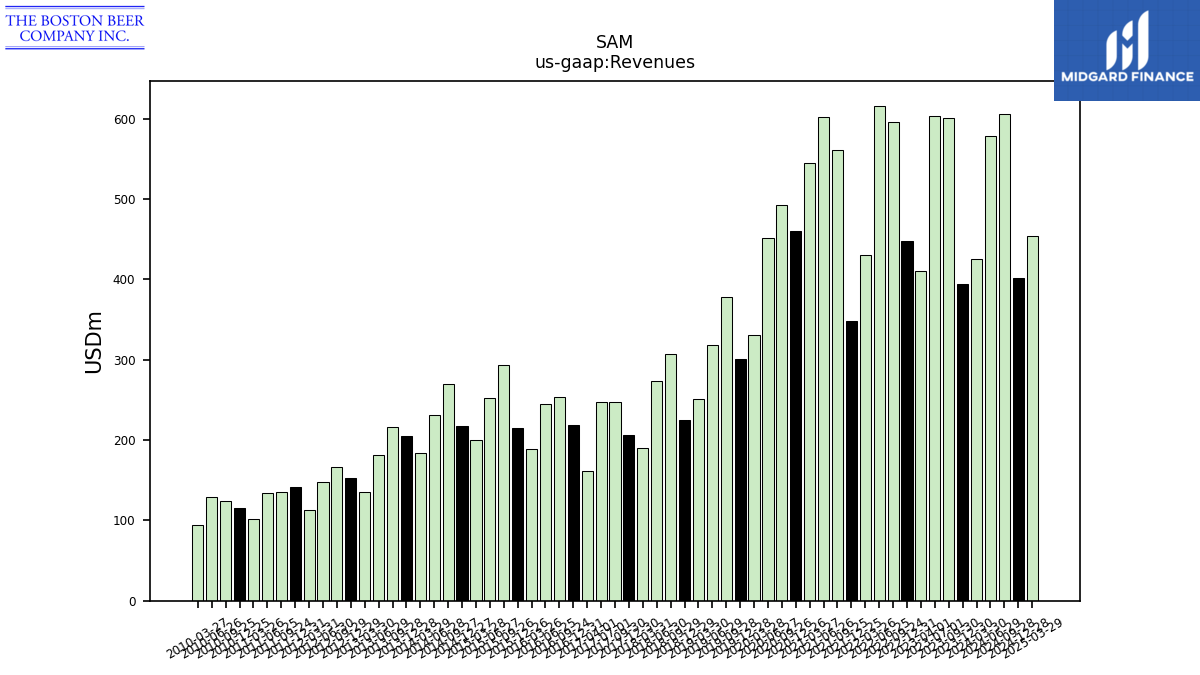
| 2023-12-30 | 2023-09-30 | 2023-07-01 | 2023-04-01 | 2022-12-31 | 2022-09-24 | 2022-06-25 | 2022-03-26 | 2021-12-25 | 2021-09-25 | 2021-06-26 | 2021-03-27 | 2020-12-26 | 2020-09-26 | 2020-06-27 | 2020-03-28 | 2019-12-28 | 2019-09-28 | 2019-06-29 | 2019-03-30 | 2018-12-29 | 2018-09-29 | 2018-06-30 | 2018-03-31 | 2017-12-30 | 2017-09-30 | 2017-07-01 | 2017-04-01 | 2016-12-31 | 2016-09-24 | 2016-06-25 | 2016-03-26 | 2015-12-26 | 2015-09-26 | 2015-06-27 | 2015-03-28 | 2014-12-27 | 2014-09-27 | 2014-06-28 | 2014-03-29 | 2013-12-28 | 2013-09-28 | 2013-06-29 | 2013-03-30 | 2012-12-29 | 2012-09-29 | 2012-06-30 | 2012-03-31 | 2011-12-31 | 2011-09-24 | 2011-06-25 | 2011-03-26 | 2010-12-25 | 2010-09-25 | 2010-06-26 | 2010-03-27 | ||
|---|---|---|---|---|---|---|---|---|---|---|---|---|---|---|---|---|---|---|---|---|---|---|---|---|---|---|---|---|---|---|---|---|---|---|---|---|---|---|---|---|---|---|---|---|---|---|---|---|---|---|---|---|---|---|---|---|---|
| Earnings Per Share Basic | -1.46 | 3.70 | 4.73 | -0.73 | -0.93 | 2.21 | 4.33 | -0.16 | -4.21 | -4.76 | 4.82 | 5.34 | 2.68 | 6.61 | 4.93 | 1.50 | 1.13 | 3.70 | 2.39 | 2.04 | 1.88 | 3.25 | 1.99 | 0.79 | 2.60 | 2.82 | 2.38 | 0.46 | 1.77 | 2.53 | 2.11 | 0.55 | 1.25 | 2.93 | 2.24 | 1.04 | 1.46 | 2.91 | 1.95 | 0.64 | 1.40 | 2.00 | 1.53 | 0.54 | 1.31 | 1.60 | 1.11 | 0.59 | 1.41 | 1.26 | 2.12 | 0.30 | 0.92 | 1.14 | 1.18 | 0.45 | |
| Earnings Per Share Diluted | -1.46 | 3.70 | 4.72 | -0.73 | -0.92 | 2.21 | 4.31 | -0.16 | -4.16 | -4.76 | 4.75 | 5.26 | 2.64 | 6.51 | 4.88 | 1.49 | 1.12 | 3.65 | 2.36 | 2.02 | 1.86 | 3.21 | 1.98 | 0.78 | 2.57 | 2.78 | 2.35 | 0.45 | 1.75 | 2.48 | 2.06 | 0.53 | 1.21 | 2.85 | 2.18 | 1.00 | 1.40 | 2.79 | 1.88 | 0.62 | 1.33 | 1.89 | 1.45 | 0.51 | 1.25 | 1.53 | 1.06 | 0.56 | 1.33 | 1.19 | 2.01 | 0.28 | 0.87 | 1.09 | 1.13 | 0.44 |
| 2023-12-30 | 2023-09-30 | 2023-07-01 | 2023-04-01 | 2022-12-31 | 2022-09-24 | 2022-06-25 | 2022-03-26 | 2021-12-25 | 2021-09-25 | 2021-06-26 | 2021-03-27 | 2020-12-26 | 2020-09-26 | 2020-06-27 | 2020-03-28 | 2019-12-28 | 2019-09-28 | 2019-06-29 | 2019-03-30 | 2018-12-29 | 2018-09-29 | 2018-06-30 | 2018-03-31 | 2017-12-30 | 2017-09-30 | 2017-07-01 | 2017-04-01 | 2016-12-31 | 2016-09-24 | 2016-06-25 | 2016-03-26 | 2015-12-26 | 2015-09-26 | 2015-06-27 | 2015-03-28 | 2014-12-27 | 2014-09-27 | 2014-06-28 | 2014-03-29 | 2013-12-28 | 2013-09-28 | 2013-06-29 | 2013-03-30 | 2012-12-29 | 2012-09-29 | 2012-06-30 | 2012-03-31 | 2011-12-31 | 2011-09-24 | 2011-06-25 | 2011-03-26 | 2010-12-25 | 2010-09-25 | 2010-06-26 | 2010-03-27 | ||
|---|---|---|---|---|---|---|---|---|---|---|---|---|---|---|---|---|---|---|---|---|---|---|---|---|---|---|---|---|---|---|---|---|---|---|---|---|---|---|---|---|---|---|---|---|---|---|---|---|---|---|---|---|---|---|---|---|---|
| Revenue From Contract With Customer Including Assessed Tax | 417.41 | 639.39 | 641.33 | 435.16 | 476.02 | 634.33 | 655.02 | 457.29 | 373.66 | 599.97 | 641.31 | 581.71 | 460.94 | 525.25 | 481.09 | 352.23 | 301.30 | 402.69 | 338.64 | 267.56 | 225.22 | 326.85 | 273.10 | 201.83 | 206.32 | 264.15 | 247.93 | 161.69 | 219.37 | 253.43 | 244.82 | 188.83 | 215.13 | 293.09 | 252.20 | 199.50 | 217.82 | 269.73 | 231.61 | 183.84 | 205.38 | 216.41 | 181.33 | 135.93 | 153.00 | 166.45 | 147.50 | 113.27 | 142.05 | 134.81 | 133.96 | 102.18 | 115.74 | 124.47 | 129.56 | 94.03 | |
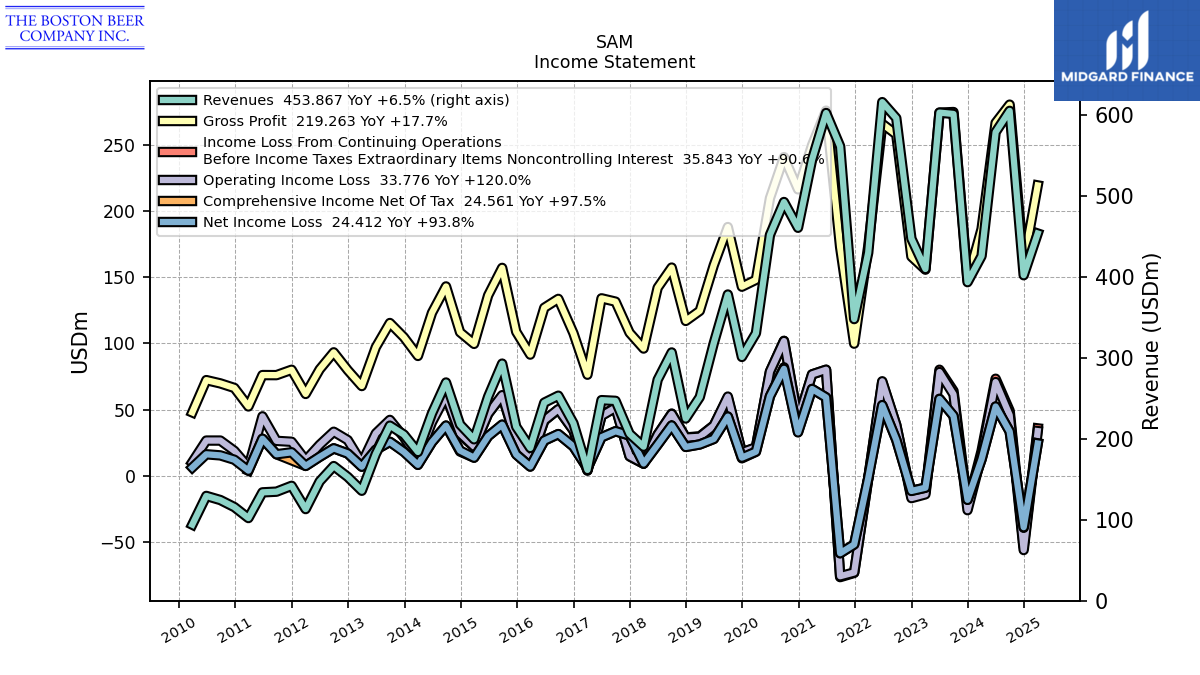
| Revenues | 393.72 | 601.60 | 603.30 | 410.00 | 447.52 | 596.45 | 616.24 | 430.11 | 348.09 | 561.64 | 602.80 | 545.08 | 460.94 | 492.79 | 452.14 | 330.56 | 301.30 | 378.47 | 318.41 | 251.65 | 225.22 | 306.87 | 273.10 | 190.46 | 206.32 | 247.05 | 247.93 | 161.69 | 219.37 | 253.43 | 244.82 | 188.83 | 215.13 | 293.09 | 252.20 | 199.50 | 217.82 | 269.73 | 231.61 | 183.84 | 205.38 | 216.41 | 181.33 | 135.93 | 153.00 | 166.45 | 147.50 | 113.27 | 142.05 | 134.81 | 133.96 | 102.18 | 115.74 | 124.47 | 129.56 | 94.03 | |
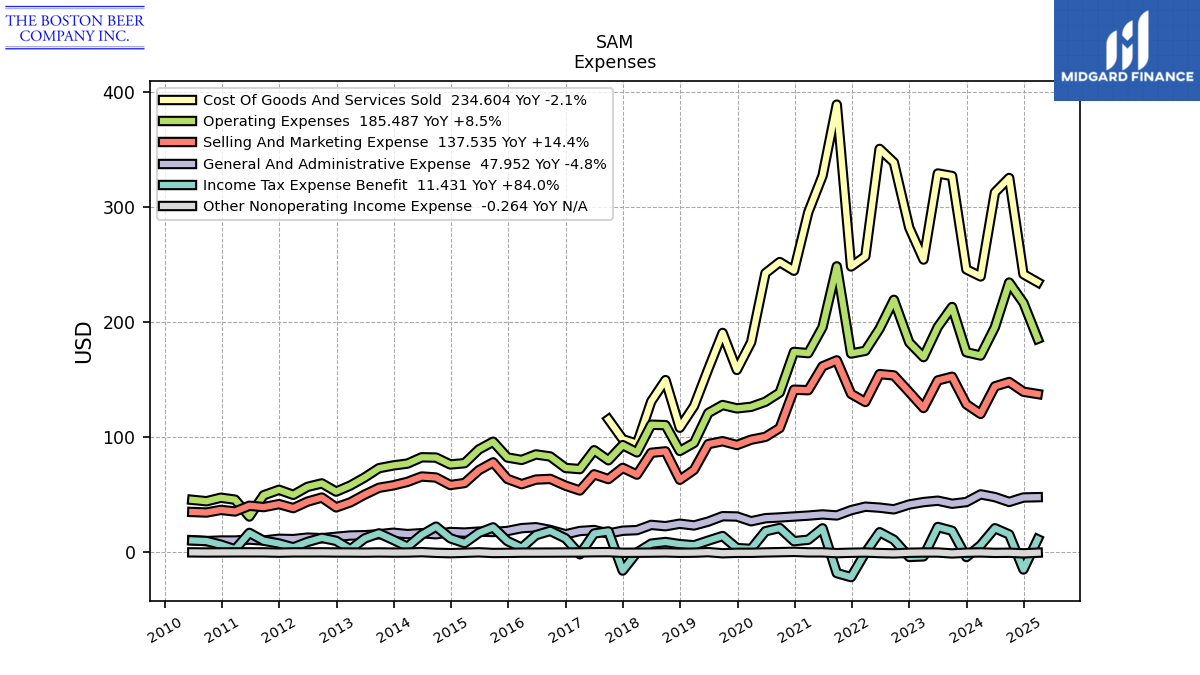
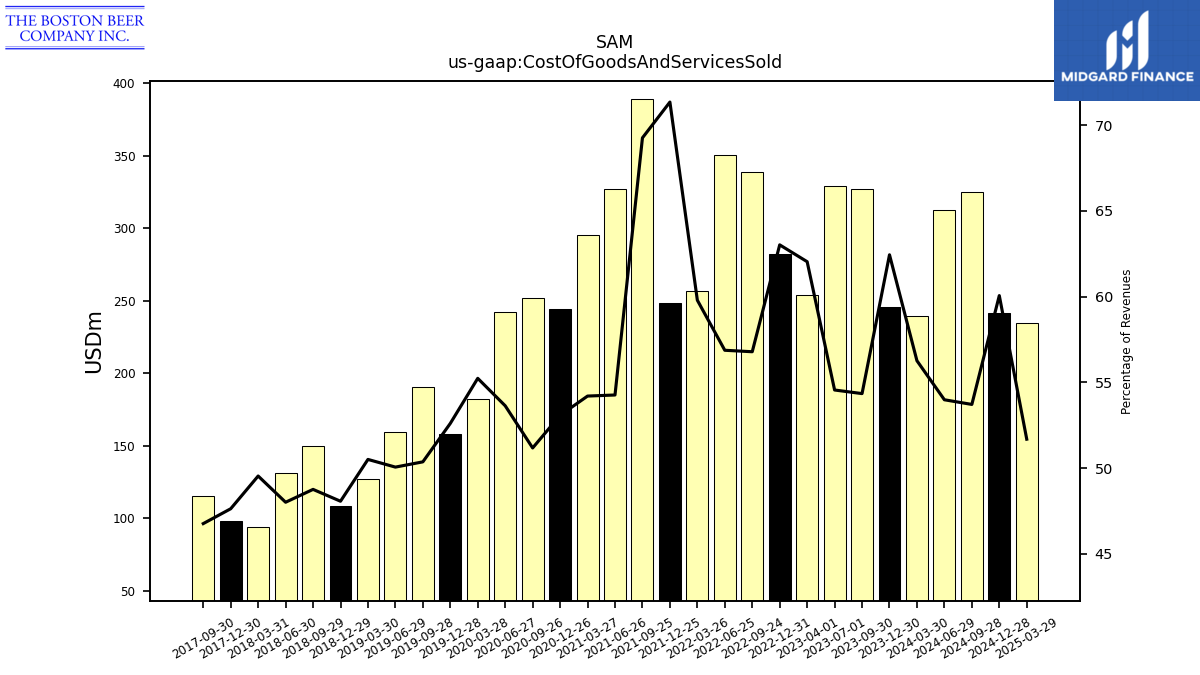
| Cost Of Goods And Services Sold | 245.83 | 326.95 | 329.14 | 254.34 | 282.01 | 338.71 | 350.47 | 257.16 | 248.32 | 388.95 | 327.12 | 295.45 | 244.67 | 252.21 | 242.51 | 182.59 | 158.51 | 190.63 | 159.41 | 127.11 | 108.27 | 149.64 | 131.13 | 94.36 | 98.28 | 115.55 | NA | NA | NA | NA | NA | NA | NA | NA | NA | NA | NA | NA | NA | NA | NA | NA | NA | NA | NA | NA | NA | NA | NA | NA | NA | NA | NA | NA | NA | NA | |
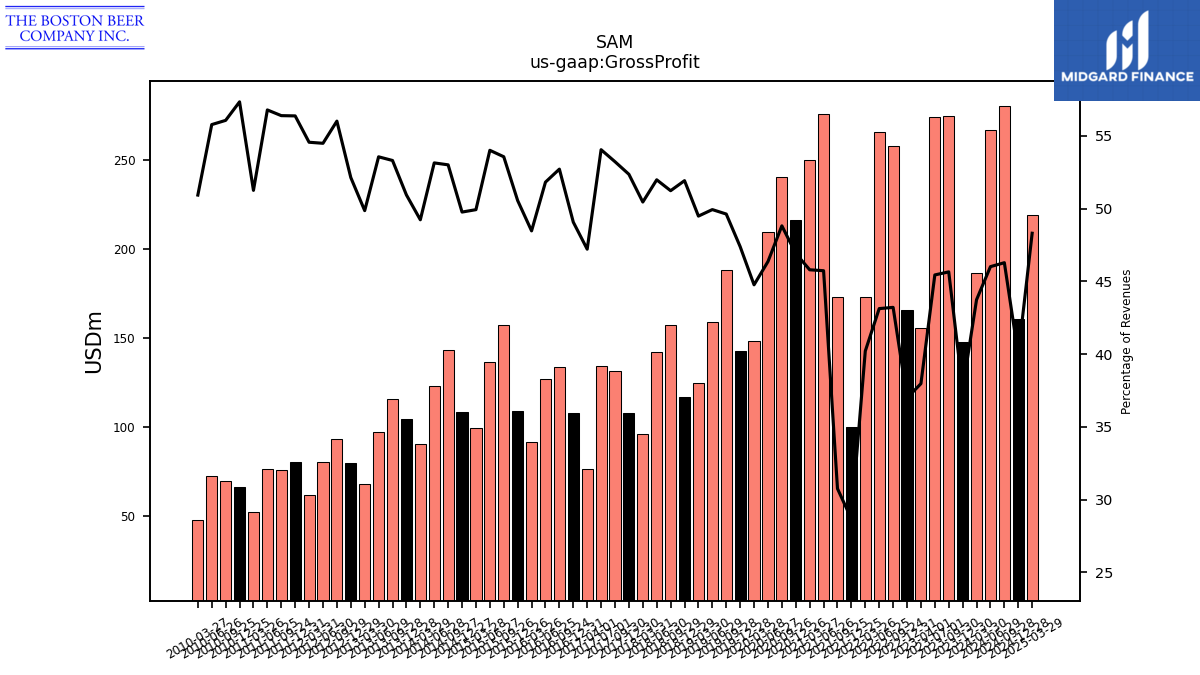
| Gross Profit | 147.90 | 274.65 | 274.16 | 155.66 | 165.51 | 257.75 | 265.77 | 172.95 | 99.78 | 172.70 | 275.69 | 249.63 | 216.27 | 240.59 | 209.62 | 147.97 | 142.79 | 187.84 | 159.00 | 124.54 | 116.95 | 157.23 | 141.97 | 96.10 | 108.04 | 131.50 | 134.02 | 76.34 | 107.66 | 133.61 | 126.88 | 91.53 | 108.77 | 157.01 | 136.22 | 99.61 | 108.40 | 143.00 | 123.10 | 90.52 | 104.63 | 115.38 | 97.13 | 67.78 | 79.78 | 93.24 | 80.38 | 61.81 | 80.09 | 76.03 | 76.07 | 52.37 | 66.37 | 69.79 | 72.27 | 47.89 | |
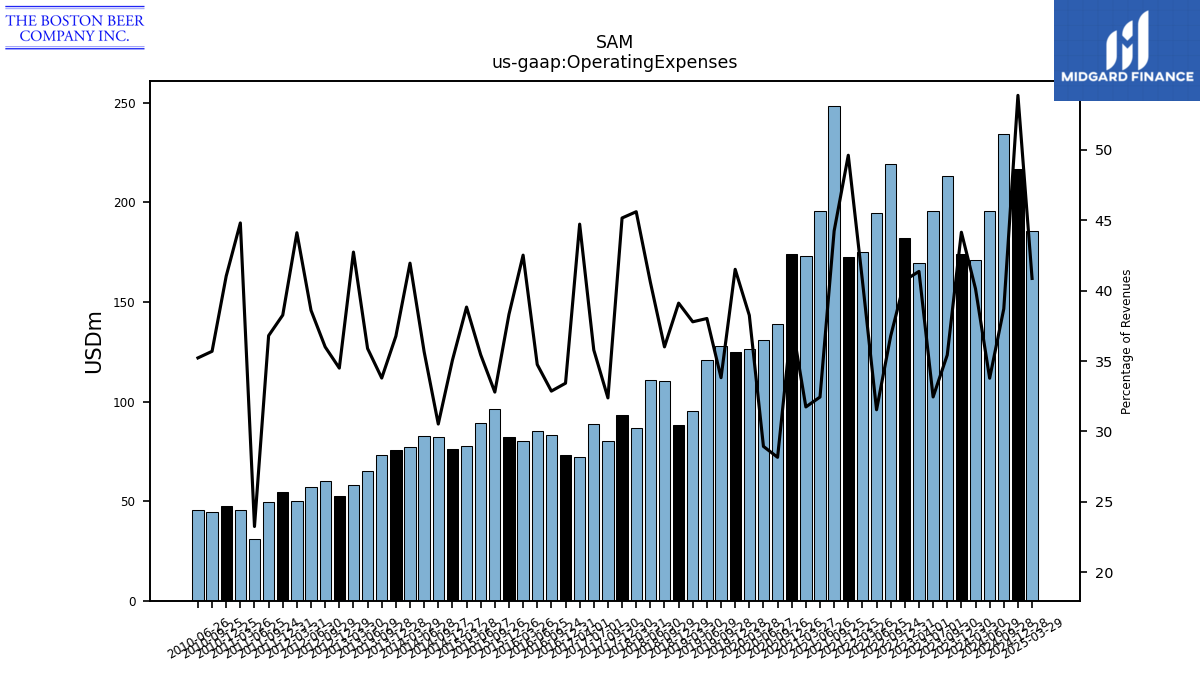
| Operating Expenses | 173.82 | 213.15 | 195.79 | 169.61 | 182.32 | 219.38 | 194.39 | 175.11 | 172.71 | 248.47 | 195.58 | 173.03 | 174.15 | 138.80 | 130.85 | 126.44 | 125.09 | 128.00 | 121.07 | 95.10 | 88.10 | 110.50 | 110.91 | 86.86 | 93.17 | 80.00 | 88.73 | 72.32 | 73.33 | 83.30 | 85.09 | 80.29 | 82.43 | 96.13 | 89.41 | 77.48 | 76.36 | 82.35 | 82.60 | 77.13 | 75.51 | 73.14 | 65.08 | 58.10 | 52.79 | 59.93 | 56.94 | 49.97 | 54.36 | 49.62 | 31.15 | 45.78 | 47.49 | 44.43 | 45.64 | NA | |
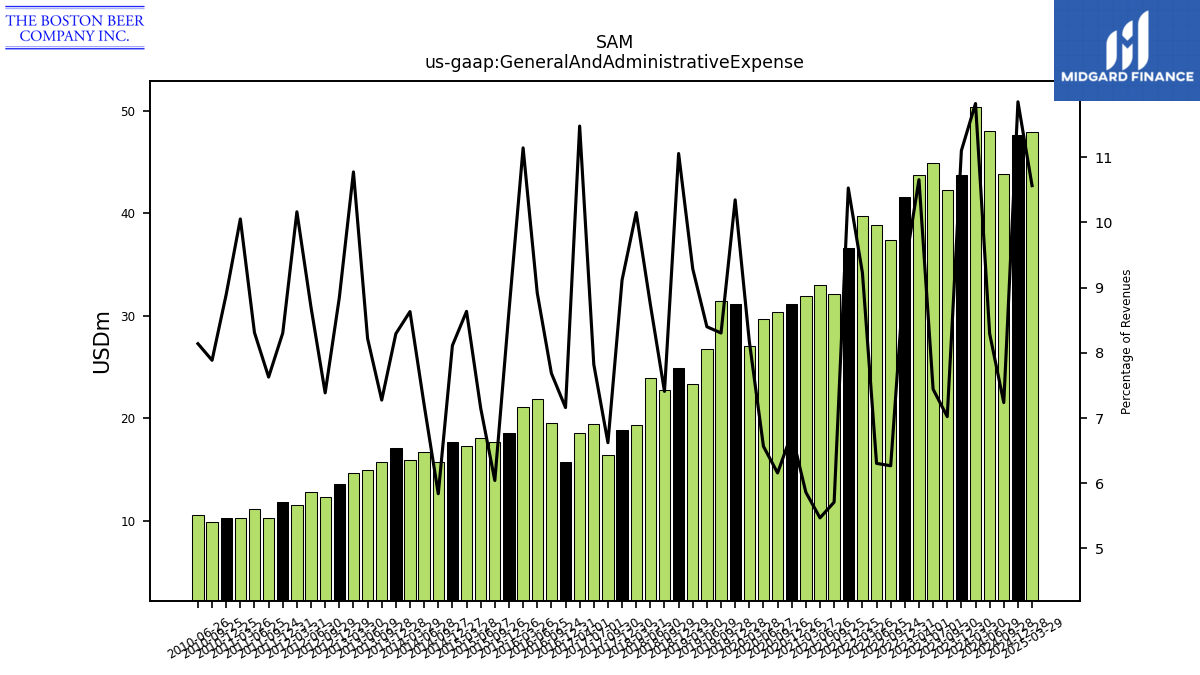
| General And Administrative Expense | 43.71 | 42.24 | 44.90 | 43.69 | 41.60 | 37.38 | 38.85 | 39.70 | 36.65 | 32.07 | 32.96 | 31.95 | 31.16 | 30.34 | 29.68 | 27.03 | 31.18 | 31.43 | 26.75 | 23.37 | 24.91 | 22.73 | 23.88 | 19.34 | 18.81 | 16.36 | 19.39 | 18.56 | 15.71 | 19.48 | 21.84 | 21.05 | 18.58 | 17.71 | 18.04 | 17.23 | 17.67 | 15.75 | 16.68 | 15.87 | 17.03 | 15.74 | 14.91 | 14.65 | 13.54 | 12.29 | 12.83 | 11.51 | 11.80 | 10.28 | 11.13 | 10.27 | 10.30 | 9.81 | 10.55 | NA | |
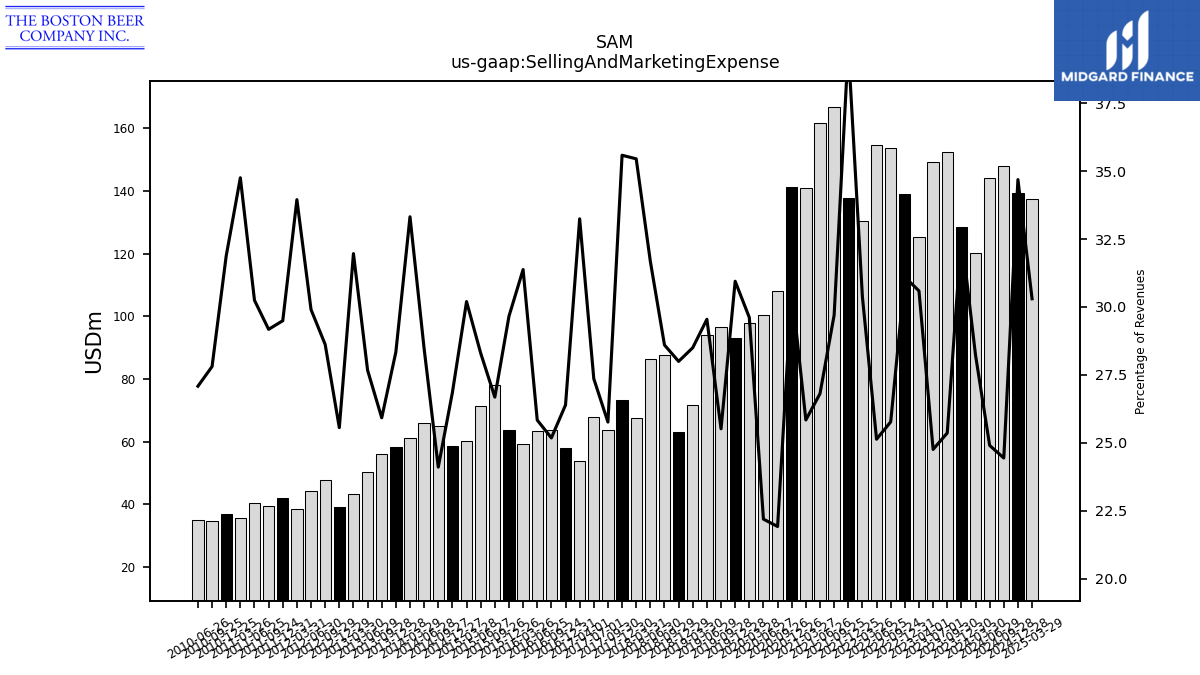
| Selling And Marketing Expense | 128.63 | 152.58 | 149.36 | 125.43 | 139.19 | 153.72 | 154.88 | 130.62 | 137.70 | 166.82 | 161.62 | 140.86 | 141.32 | 108.02 | 100.34 | 97.89 | 93.24 | 96.57 | 94.08 | 71.72 | 63.06 | 87.77 | 86.51 | 67.52 | 73.42 | 63.65 | 67.83 | 53.75 | 57.90 | 63.82 | 63.25 | 59.25 | 63.81 | 78.20 | 71.37 | 60.25 | 58.49 | 65.02 | 65.92 | 61.26 | 58.21 | 56.10 | 50.18 | 43.45 | 39.10 | 47.64 | 44.11 | 38.45 | 41.90 | 39.33 | 40.52 | 35.51 | 36.90 | 34.61 | 35.09 | NA | |
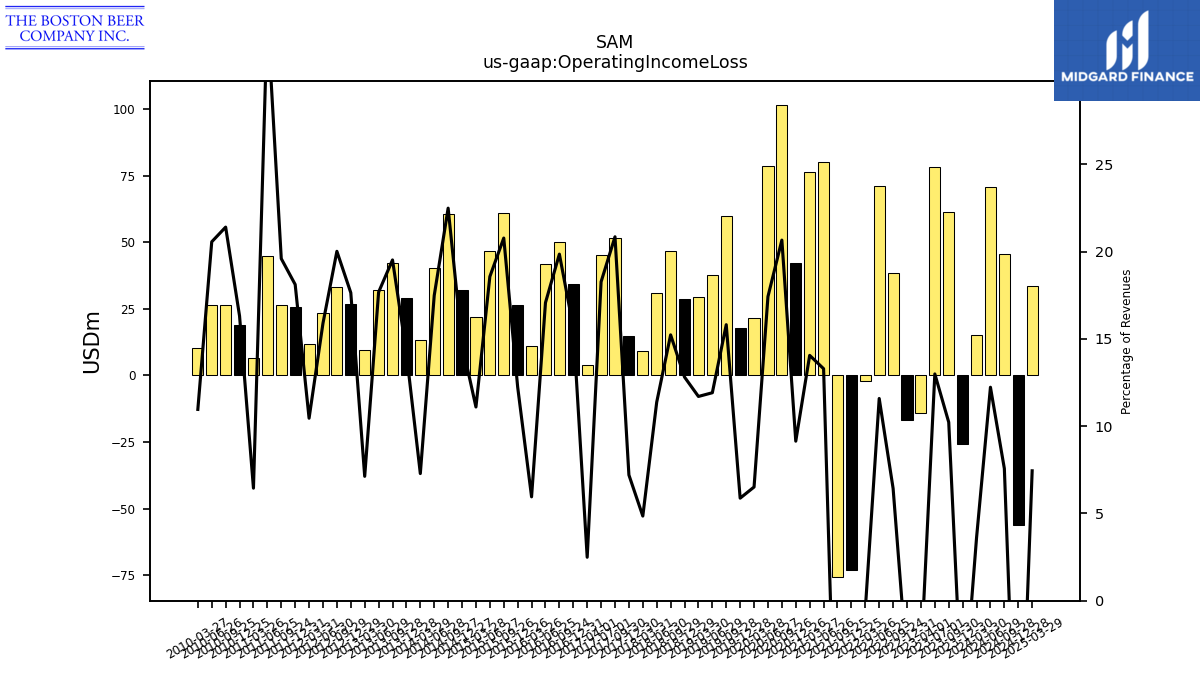
| Operating Income Loss | -25.93 | 61.50 | 78.37 | -13.94 | -16.81 | 38.37 | 71.39 | -2.15 | -72.93 | -75.77 | 80.11 | 76.60 | 42.12 | 101.78 | 78.77 | 21.53 | 17.70 | 59.84 | 37.93 | 29.44 | 28.85 | 46.73 | 31.06 | 9.24 | 14.86 | 51.50 | 45.29 | 4.03 | 34.33 | 50.31 | 41.79 | 11.24 | 26.34 | 60.88 | 46.82 | 22.14 | 32.04 | 60.65 | 40.49 | 13.39 | 29.12 | 42.24 | 32.05 | 9.69 | 26.99 | 33.31 | 23.45 | 11.84 | 25.73 | 26.41 | 44.92 | 6.59 | 18.88 | 26.63 | 26.63 | 10.30 | |
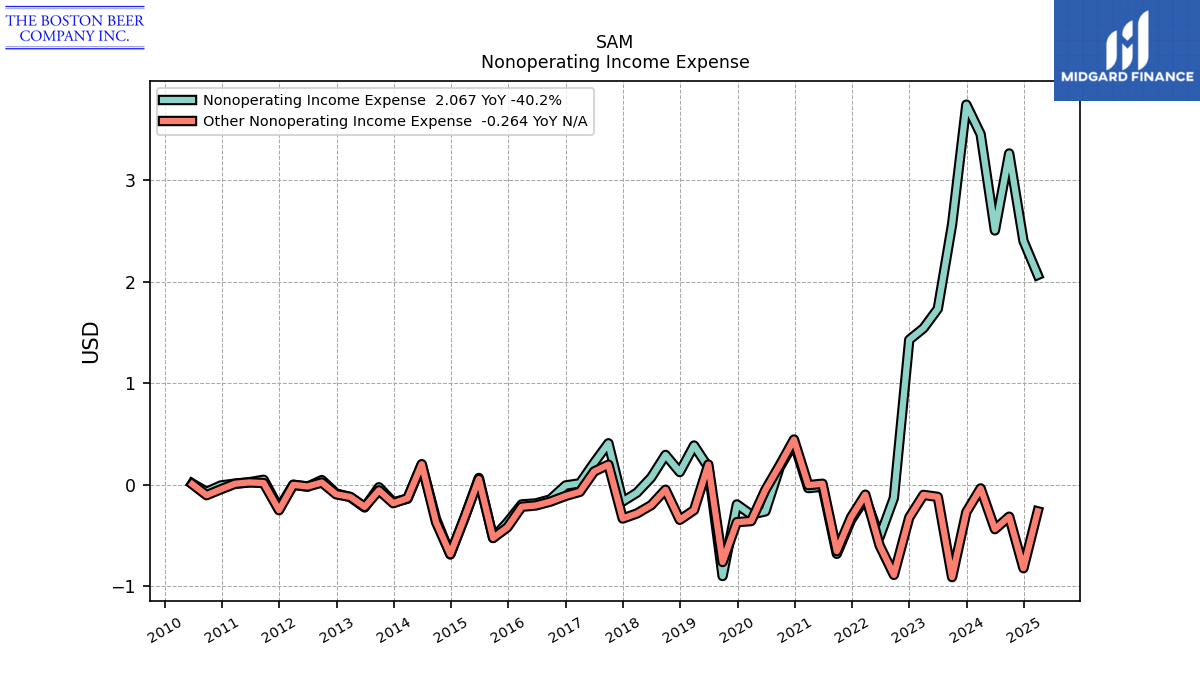
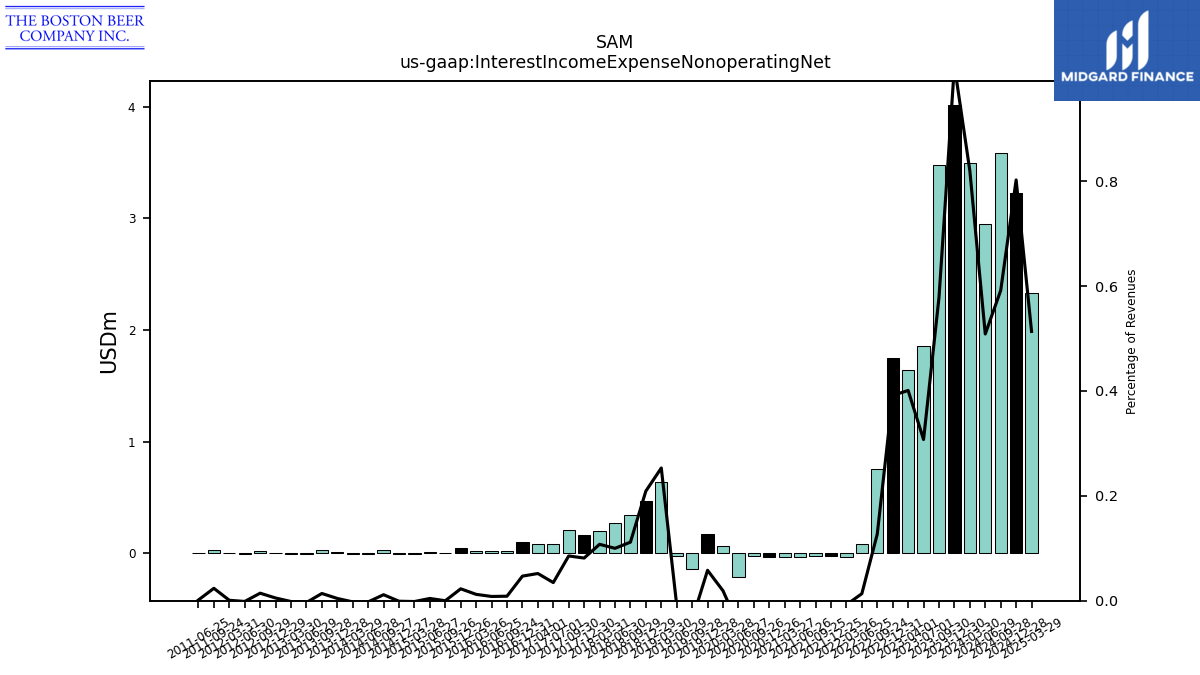
| Interest Income Expense Nonoperating Net | 4.02 | 3.48 | 1.85 | 1.64 | 1.75 | 0.76 | 0.08 | -0.03 | -0.03 | -0.03 | -0.03 | -0.03 | -0.03 | -0.02 | -0.21 | 0.06 | 0.17 | -0.14 | -0.03 | 0.64 | 0.47 | 0.34 | 0.27 | 0.20 | 0.17 | 0.21 | 0.09 | 0.08 | 0.10 | 0.02 | 0.02 | 0.02 | 0.05 | 0.00 | 0.01 | -0.00 | -0.00 | 0.03 | -0.01 | -0.00 | 0.01 | 0.03 | -0.01 | -0.00 | 0.01 | 0.02 | -0.00 | 0.00 | NA | 0.03 | 0.00 | NA | NA | NA | NA | NA | |
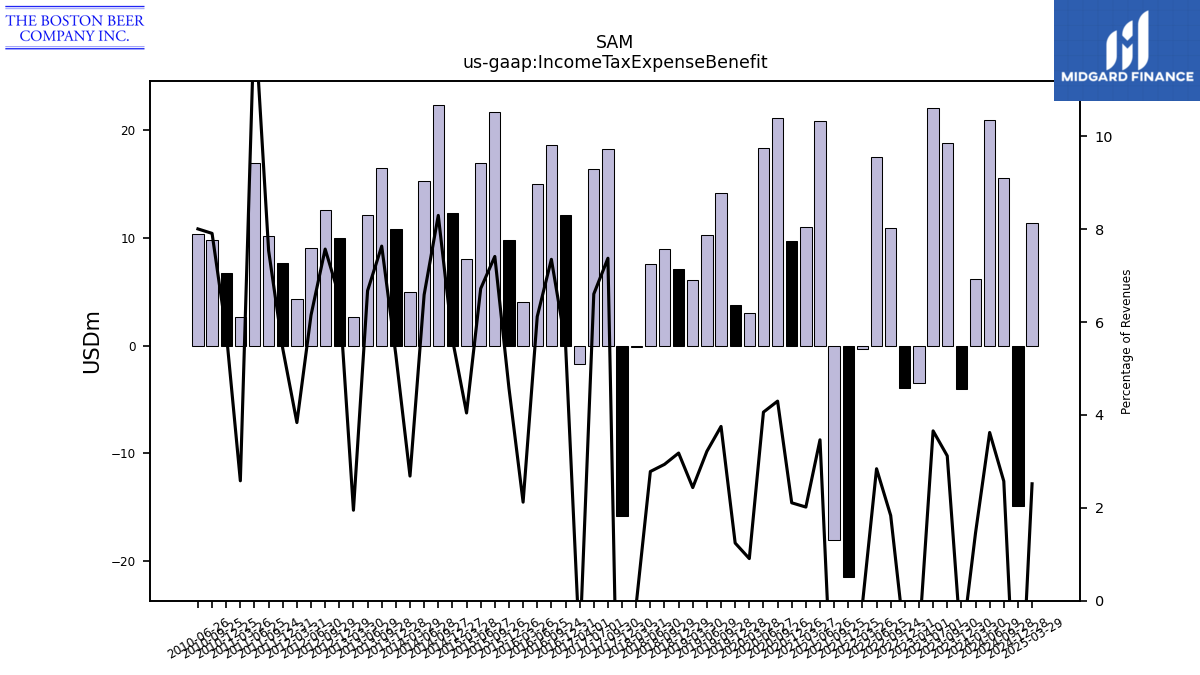
| Income Tax Expense Benefit | -4.06 | 18.77 | 22.07 | -3.45 | -3.96 | 10.95 | 17.52 | -0.33 | -21.50 | -18.04 | 20.89 | 11.00 | 9.72 | 21.18 | 18.36 | 3.00 | 3.74 | 14.21 | 10.25 | 6.13 | 7.16 | 9.01 | 7.60 | -0.15 | -15.83 | 18.22 | 16.38 | -1.67 | 12.15 | 18.63 | 14.98 | 4.01 | 9.85 | 21.73 | 16.95 | 8.07 | 12.27 | 22.38 | 15.26 | 4.94 | 10.87 | 16.53 | 12.11 | 2.65 | 10.03 | 12.60 | 9.07 | 4.35 | 7.71 | 10.16 | 16.93 | 2.64 | 6.70 | 9.85 | 10.37 | NA | |
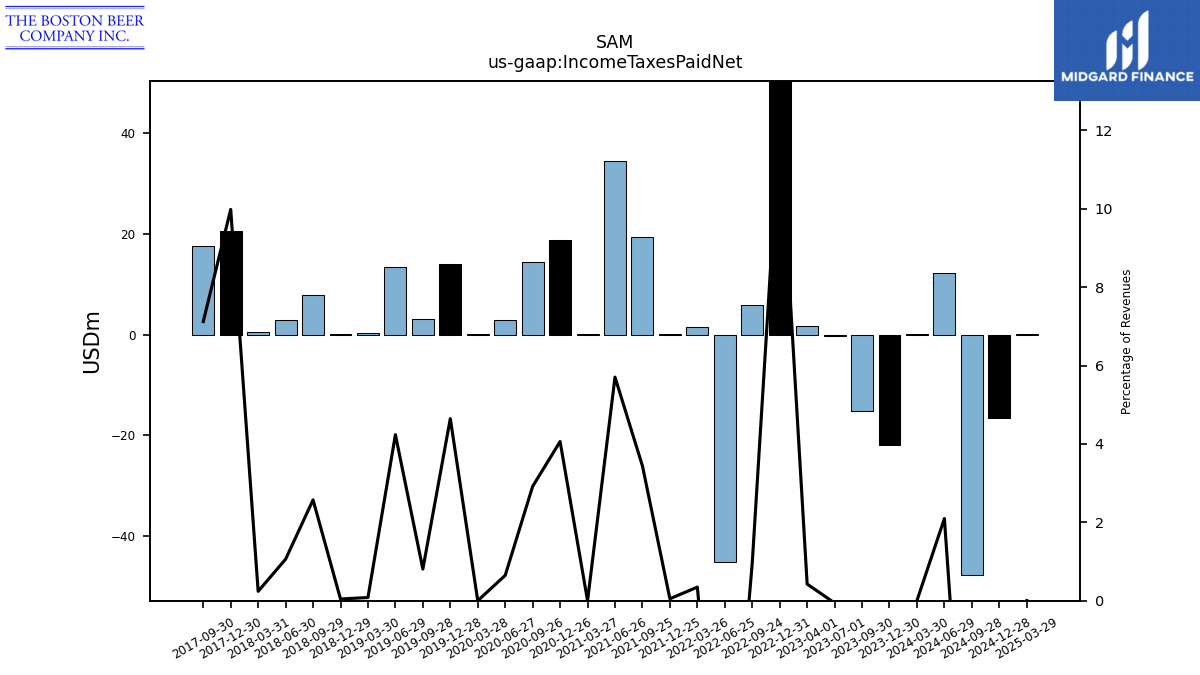
| Income Taxes Paid Net | -21.95 | -15.17 | -0.35 | 1.74 | 54.84 | 5.76 | -45.12 | 1.50 | 0.18 | 19.32 | 34.39 | 0.00 | 18.72 | 14.38 | 2.92 | 0.01 | 14.00 | 3.06 | 13.49 | 0.21 | 0.10 | 7.90 | 2.90 | 0.46 | 20.60 | 17.60 | NA | NA | NA | NA | NA | NA | NA | NA | NA | NA | NA | NA | NA | NA | NA | NA | NA | NA | NA | NA | NA | NA | NA | NA | NA | NA | NA | NA | NA | NA | |
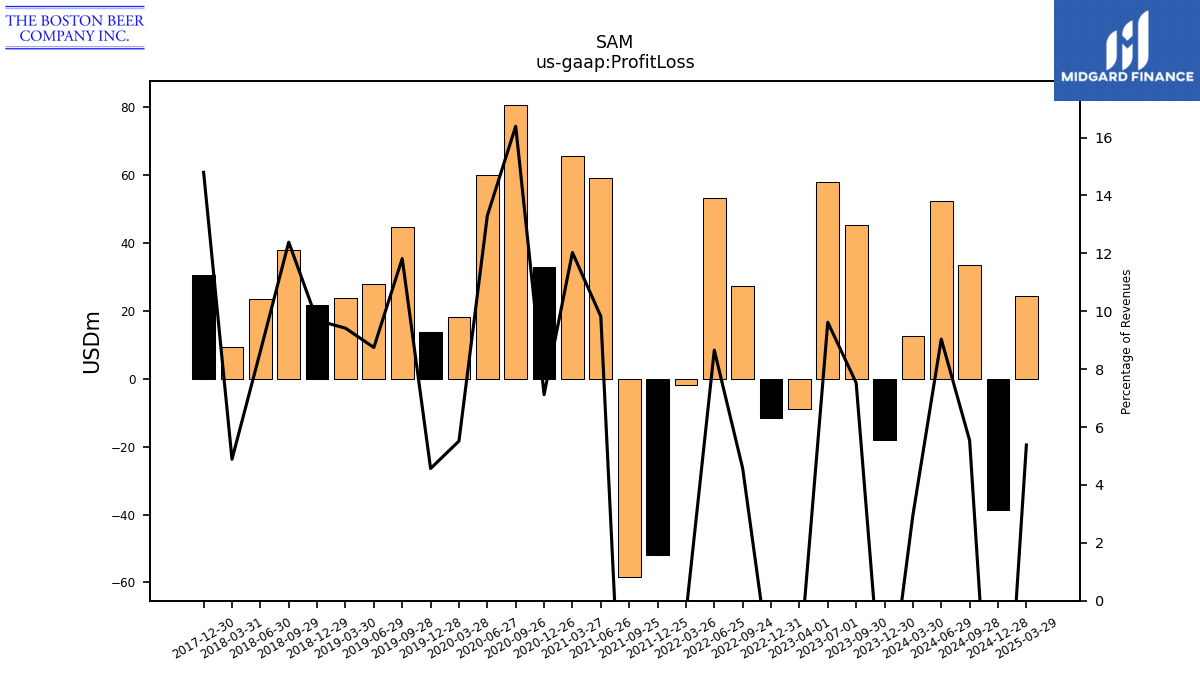
| Profit Loss | -18.12 | 45.30 | 58.03 | -8.96 | -11.42 | 27.29 | 53.35 | -1.96 | -51.78 | -58.42 | 59.20 | 65.56 | 32.82 | 80.77 | 60.14 | 18.23 | 13.76 | 44.73 | 27.86 | 23.69 | 21.81 | 38.01 | 23.54 | 9.31 | 30.53 | NA | NA | NA | NA | NA | NA | NA | NA | NA | NA | NA | NA | NA | NA | NA | NA | NA | NA | NA | NA | NA | NA | NA | NA | NA | NA | NA | NA | NA | NA | NA | |
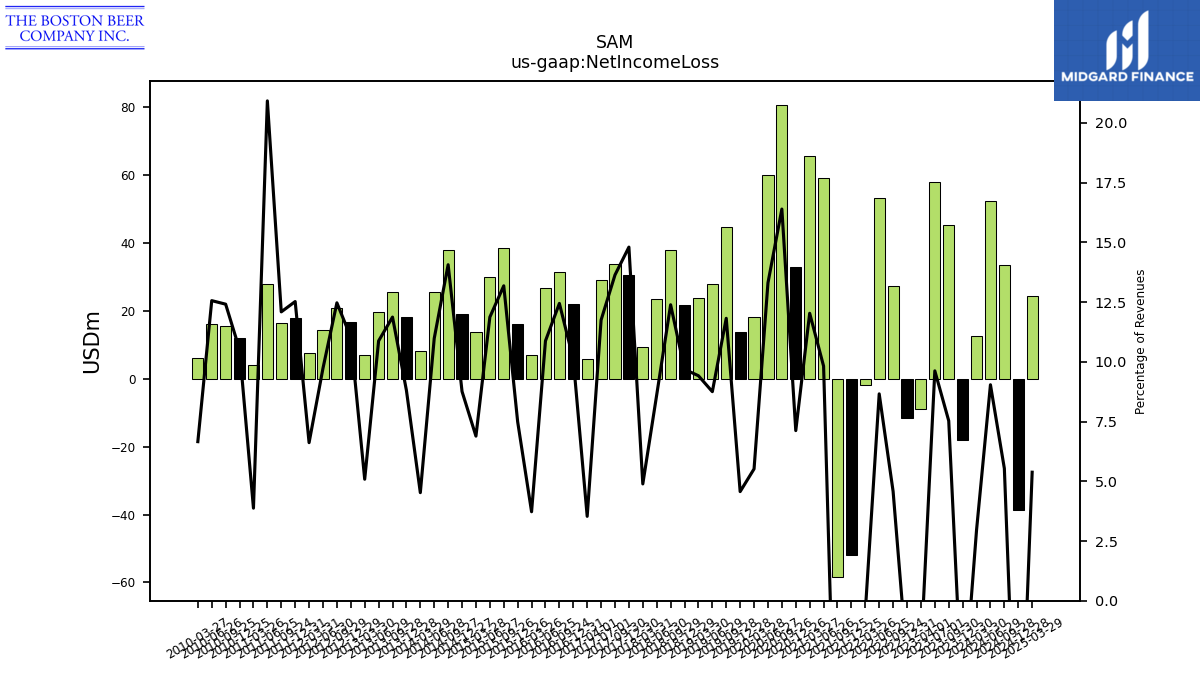
| Net Income Loss | -18.12 | 45.30 | 58.03 | -8.96 | -11.42 | 27.29 | 53.35 | -1.96 | -51.78 | -58.42 | 59.20 | 65.56 | 32.82 | 80.77 | 60.14 | 18.23 | 13.76 | 44.73 | 27.86 | 23.69 | 21.81 | 38.01 | 23.54 | 9.31 | 30.53 | 33.68 | 29.12 | 5.71 | 22.17 | 31.53 | 26.62 | 7.03 | 16.11 | 38.62 | 29.93 | 13.74 | 19.07 | 37.93 | 25.43 | 8.31 | 18.08 | 25.69 | 19.71 | 6.91 | 16.87 | 20.75 | 14.35 | 7.49 | 17.79 | 16.30 | 28.02 | 3.96 | 12.17 | 15.45 | 16.27 | 6.26 | |
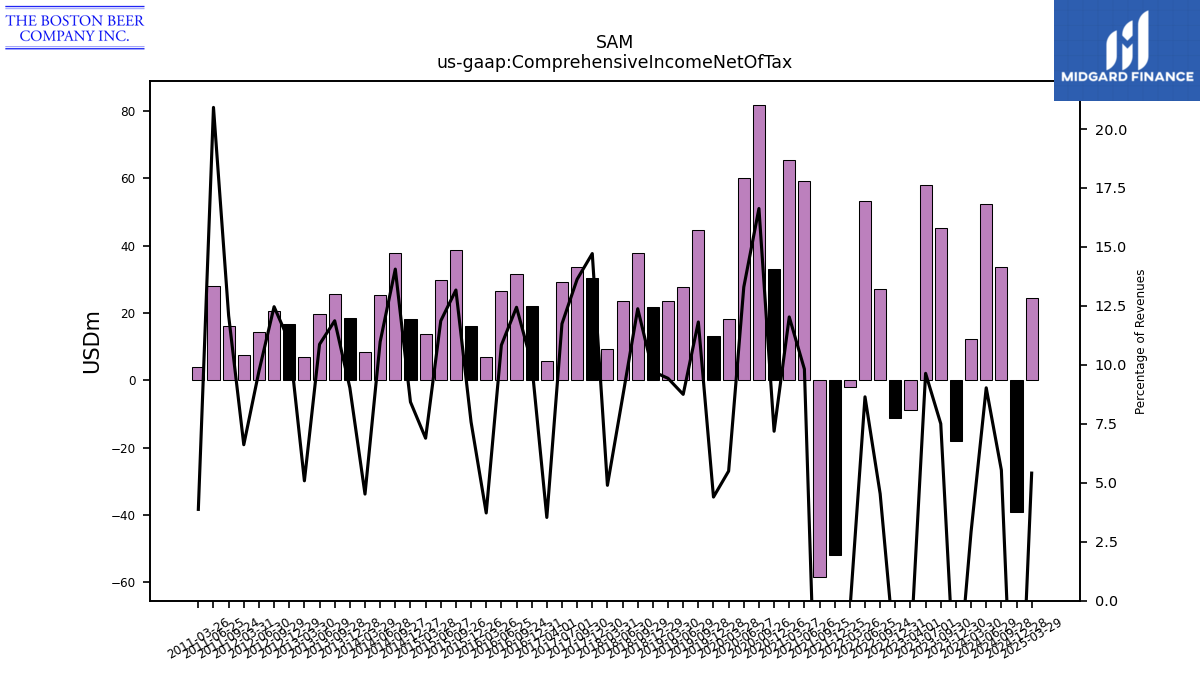
| Comprehensive Income Net Of Tax | -17.97 | 45.15 | 58.16 | -8.94 | -11.17 | 27.04 | 53.28 | -1.91 | -51.74 | -58.45 | 59.21 | 65.58 | 33.13 | 81.95 | 60.13 | 18.18 | 13.25 | 44.73 | 27.86 | 23.73 | 21.90 | 37.99 | 23.54 | 9.32 | 30.37 | 33.67 | 29.11 | 5.71 | 22.10 | 31.53 | 26.53 | 7.03 | 16.31 | 38.61 | 29.93 | 13.75 | 18.36 | 37.93 | 25.43 | 8.31 | 18.55 | 25.69 | 19.71 | 6.91 | 16.83 | 20.75 | 14.35 | 7.49 | NA | 16.30 | 28.02 | 3.96 | NA | NA | NA | NA | |
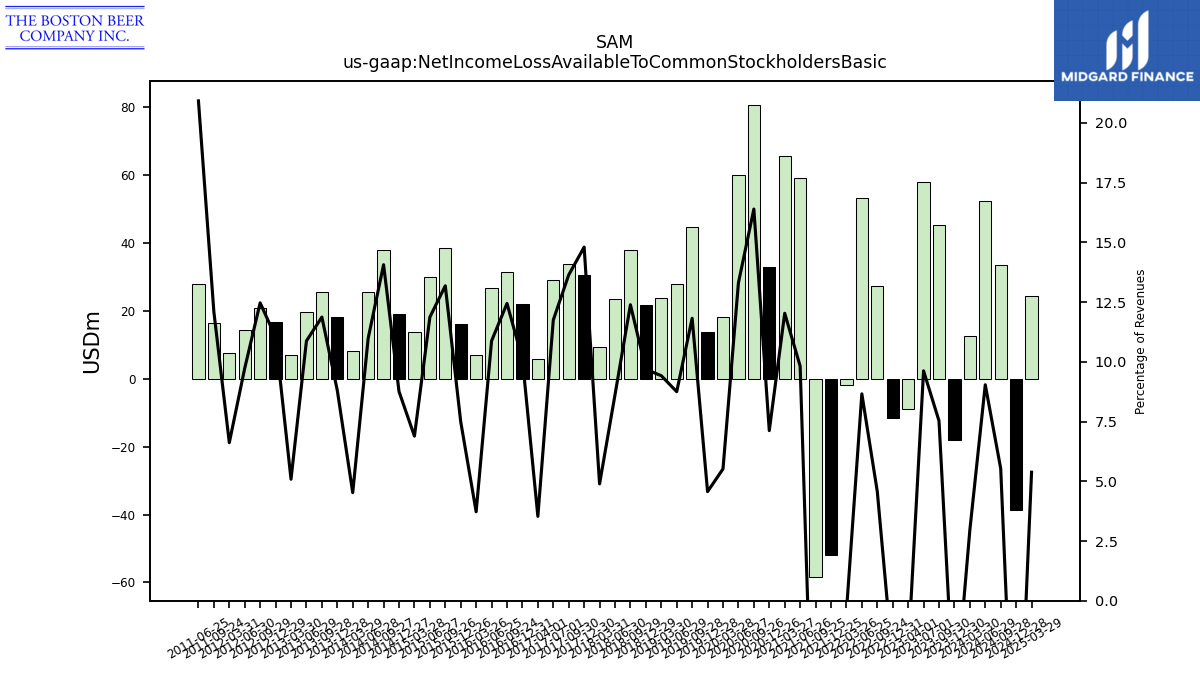
| Net Income Loss Available To Common Stockholders Basic | -18.12 | 45.30 | 58.03 | -8.96 | -11.42 | 27.29 | 53.35 | -1.96 | -51.78 | -58.42 | 59.20 | 65.56 | 32.82 | 80.77 | 60.14 | 18.23 | 13.76 | 44.73 | 27.86 | 23.69 | 21.81 | 38.01 | 23.54 | 9.31 | 30.53 | 33.68 | 29.12 | 5.71 | 22.17 | 31.53 | 26.62 | 7.03 | 16.11 | 38.62 | 29.93 | 13.74 | 19.07 | 37.93 | 25.43 | 8.31 | 18.08 | 25.69 | 19.71 | 6.91 | 16.87 | 20.75 | 14.35 | 7.49 | NA | 16.30 | 28.02 | NA | NA | NA | NA | NA | |
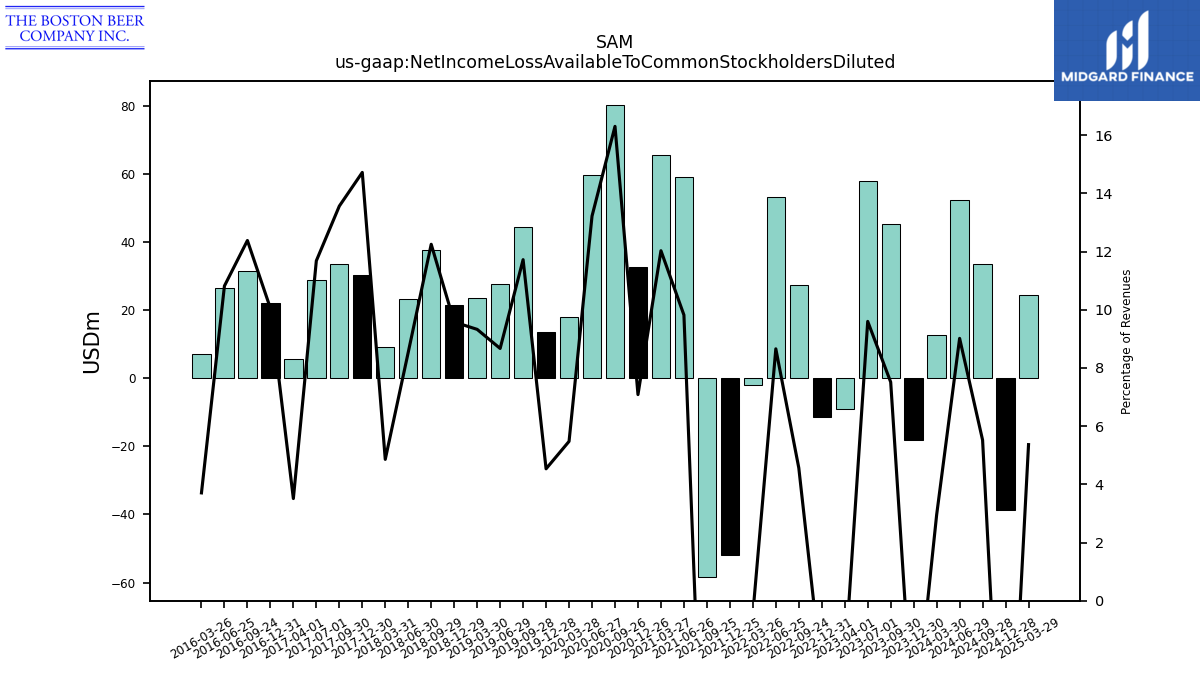
| Net Income Loss Available To Common Stockholders Diluted | -18.09 | 45.20 | 57.91 | -8.96 | -11.39 | 27.23 | 53.35 | -1.96 | -51.78 | -58.42 | 59.20 | 65.56 | 32.66 | 80.33 | 59.77 | 18.10 | 13.66 | 44.36 | 27.61 | 23.47 | 21.57 | 37.59 | 23.31 | 9.25 | 30.37 | 33.50 | 28.96 | 5.68 | 22.05 | 31.37 | 26.48 | 7.00 | NA | NA | NA | NA | NA | NA | NA | NA | NA | NA | NA | NA | NA | NA | NA | NA | NA | NA | NA | NA | NA | NA | NA | NA |
| 2023-12-30 | 2023-09-30 | 2023-07-01 | 2023-04-01 | 2022-12-31 | 2022-09-24 | 2022-06-25 | 2022-03-26 | 2021-12-25 | 2021-09-25 | 2021-06-26 | 2021-03-27 | 2020-12-26 | 2020-09-26 | 2020-06-27 | 2020-03-28 | 2019-12-28 | 2019-09-28 | 2019-06-29 | 2019-03-30 | 2018-12-29 | 2018-09-29 | 2018-06-30 | 2018-03-31 | 2017-12-30 | 2017-09-30 | 2017-07-01 | 2017-04-01 | 2016-12-31 | 2016-09-24 | 2016-06-25 | 2016-03-26 | 2015-12-26 | 2015-09-26 | 2015-06-27 | 2015-03-28 | 2014-12-27 | 2014-09-27 | 2014-06-28 | 2014-03-29 | 2013-12-28 | 2013-09-28 | 2013-06-29 | 2013-03-30 | 2012-12-29 | 2012-09-29 | 2012-06-30 | 2012-03-31 | 2011-12-31 | 2011-09-24 | 2011-06-25 | 2011-03-26 | 2010-12-25 | 2010-09-25 | 2010-06-26 | 2010-03-27 | ||
|---|---|---|---|---|---|---|---|---|---|---|---|---|---|---|---|---|---|---|---|---|---|---|---|---|---|---|---|---|---|---|---|---|---|---|---|---|---|---|---|---|---|---|---|---|---|---|---|---|---|---|---|---|---|---|---|---|---|
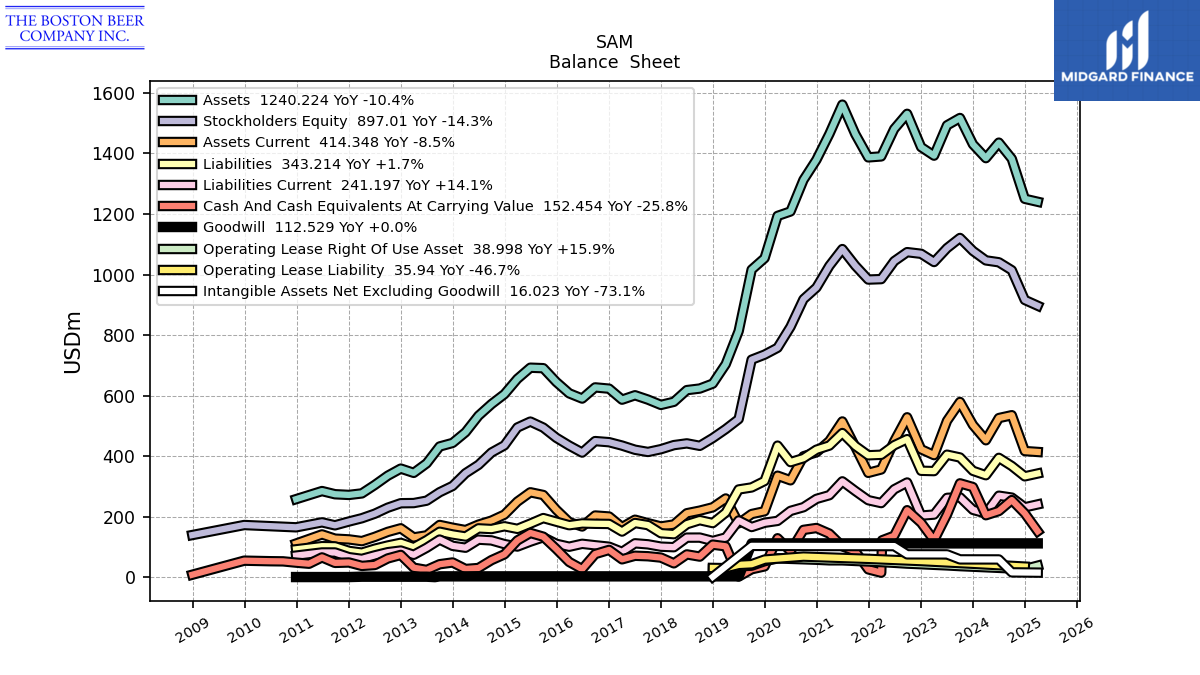
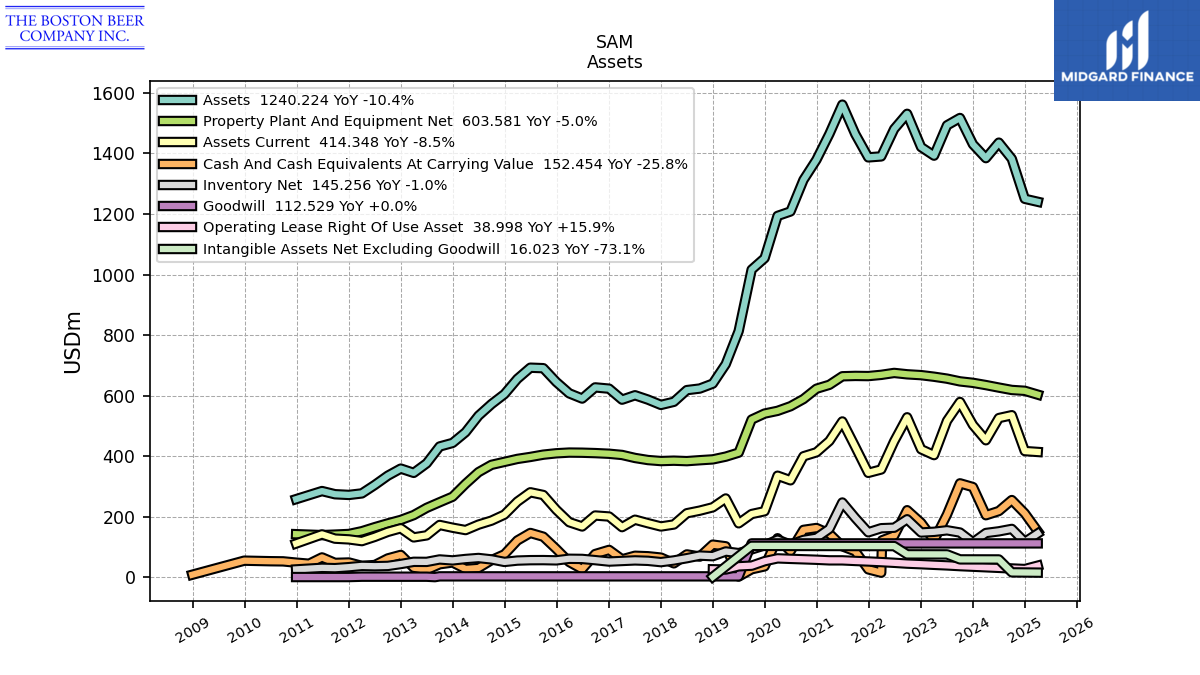
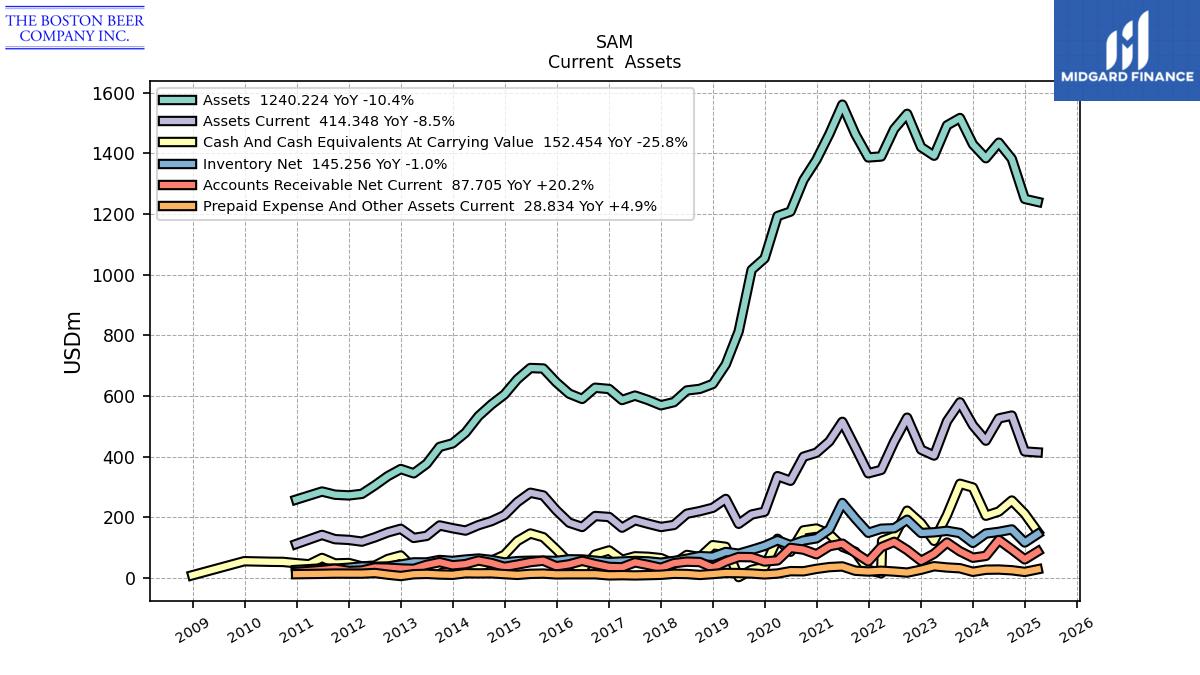
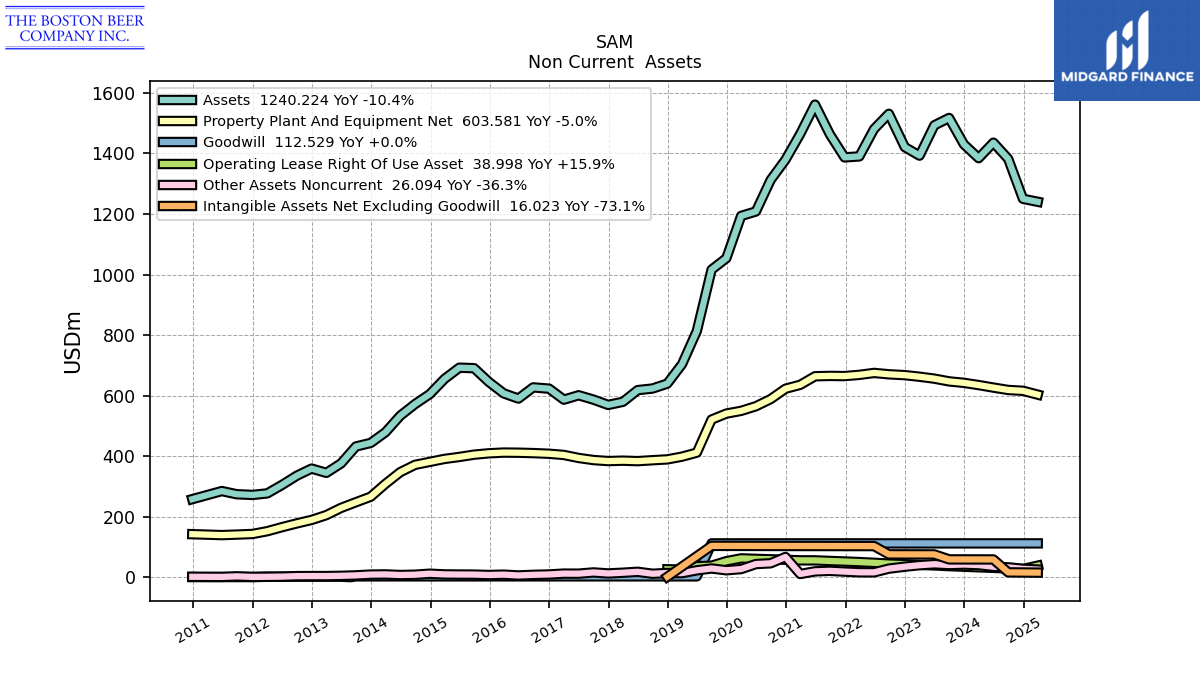
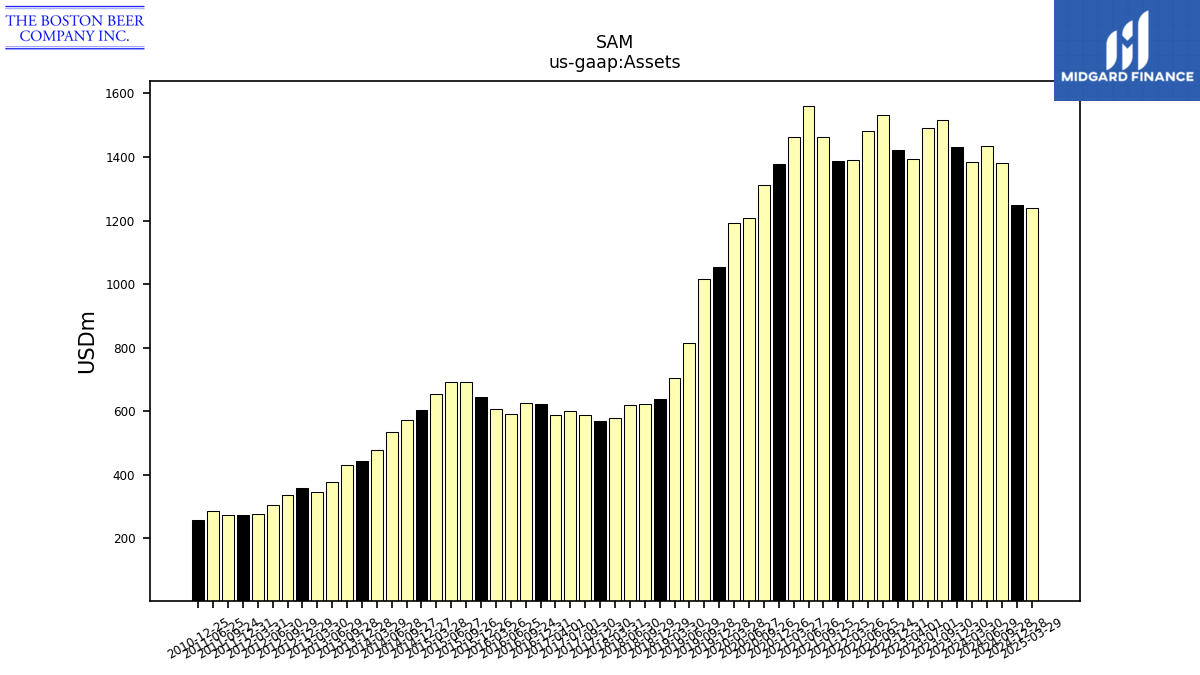
| Assets | 1429.99 | 1516.89 | 1492.55 | 1392.51 | 1420.77 | 1530.70 | 1480.47 | 1390.00 | 1386.78 | 1463.53 | 1560.95 | 1464.17 | 1378.83 | 1312.34 | 1208.25 | 1193.56 | 1054.06 | 1016.18 | 813.33 | 704.02 | 639.85 | 623.70 | 618.50 | 579.89 | 569.62 | 587.11 | 601.51 | 586.96 | 623.30 | 627.50 | 590.57 | 607.83 | 645.40 | 690.92 | 692.51 | 655.62 | 605.16 | 572.30 | 533.87 | 479.36 | 444.07 | 432.43 | 376.77 | 345.33 | 359.48 | 335.99 | 305.58 | 277.53 | 272.49 | 274.81 | 285.26 | NA | 258.53 | NA | NA | NA | |
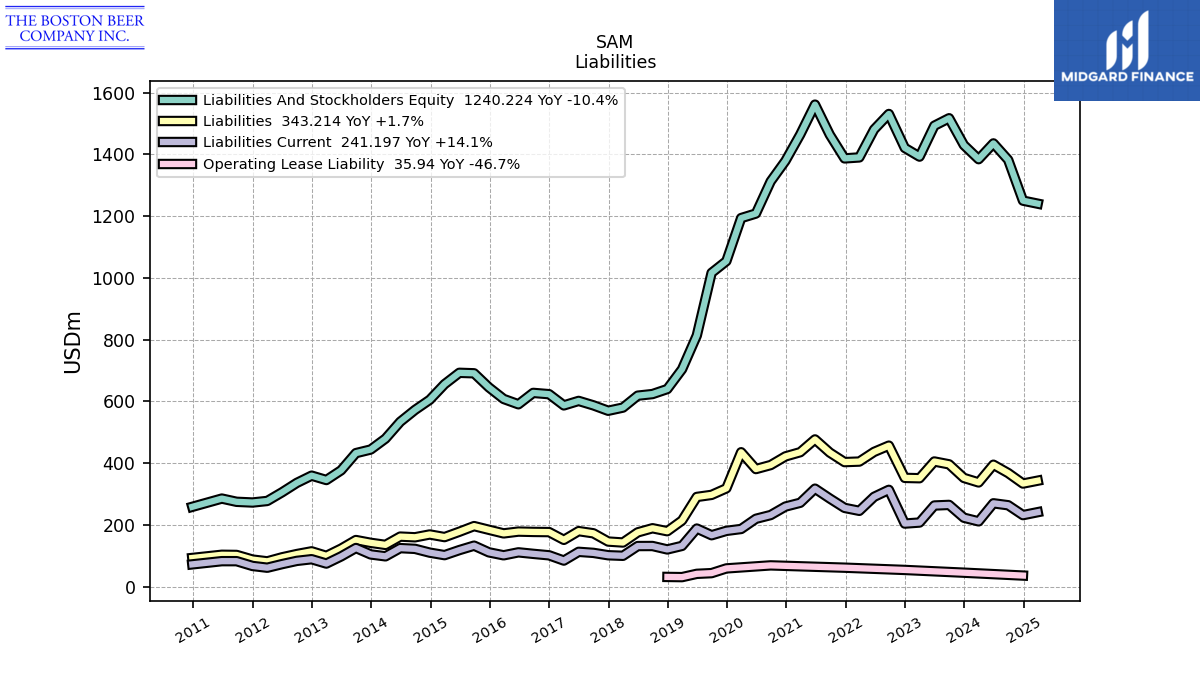
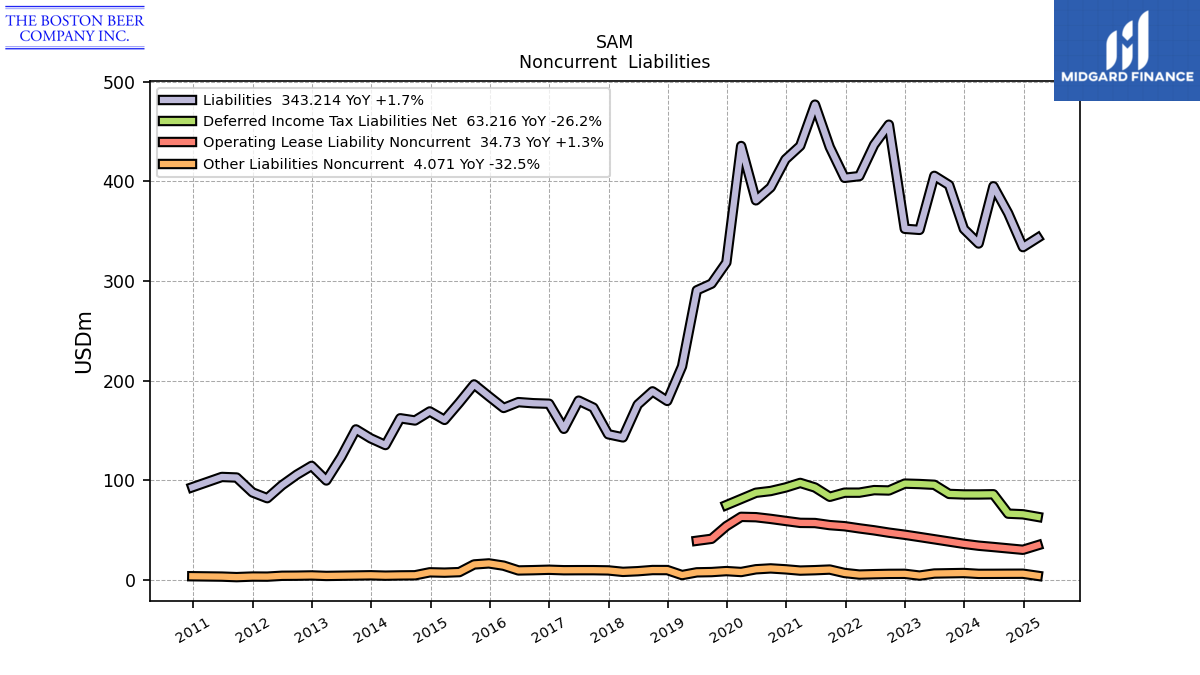
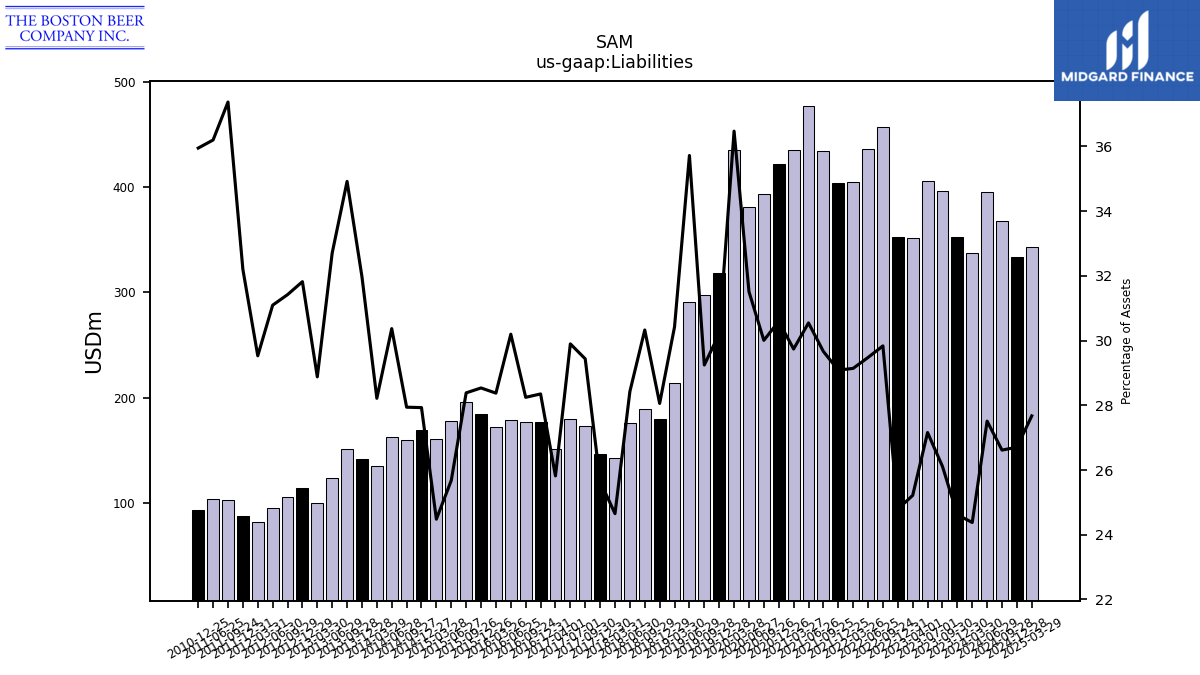
| Liabilities | 352.06 | 396.11 | 405.36 | 351.15 | 352.22 | 456.71 | 436.43 | 405.07 | 403.38 | 434.15 | 476.82 | 435.45 | 421.86 | 393.81 | 380.77 | 435.33 | 318.42 | 297.20 | 290.53 | 214.20 | 179.53 | 189.16 | 175.82 | 142.96 | 146.10 | 172.82 | 179.84 | 151.54 | 176.72 | 177.25 | 178.34 | 172.48 | 184.18 | 196.12 | 177.83 | 160.50 | 169.02 | 159.91 | 162.14 | 135.26 | 141.99 | 151.01 | 123.23 | 99.73 | 114.39 | 105.57 | 95.02 | 81.96 | 87.74 | 102.70 | 103.26 | NA | 92.94 | NA | NA | NA | |
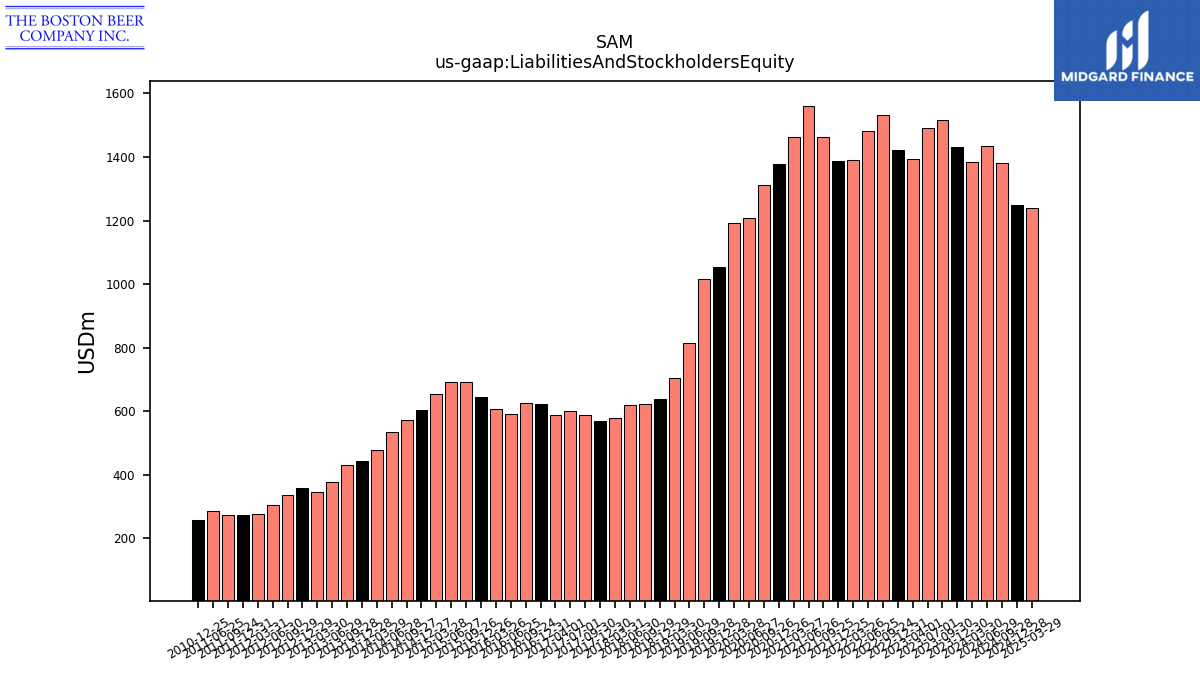
| Liabilities And Stockholders Equity | 1429.99 | 1516.89 | 1492.55 | 1392.51 | 1420.77 | 1530.70 | 1480.47 | 1390.00 | 1386.78 | 1463.53 | 1560.95 | 1464.17 | 1378.83 | 1312.34 | 1208.25 | 1193.56 | 1054.06 | 1016.18 | 813.33 | 704.02 | 639.85 | 623.70 | 618.50 | 579.89 | 569.62 | 587.11 | 601.51 | 586.96 | 623.30 | 627.50 | 590.57 | 607.83 | 645.40 | 690.92 | 692.51 | 655.62 | 605.16 | 572.30 | 533.87 | 479.36 | 444.07 | 432.43 | 376.77 | 345.33 | 359.48 | 335.99 | 305.58 | 277.53 | 272.49 | 274.81 | 285.26 | NA | 258.53 | NA | NA | NA | |
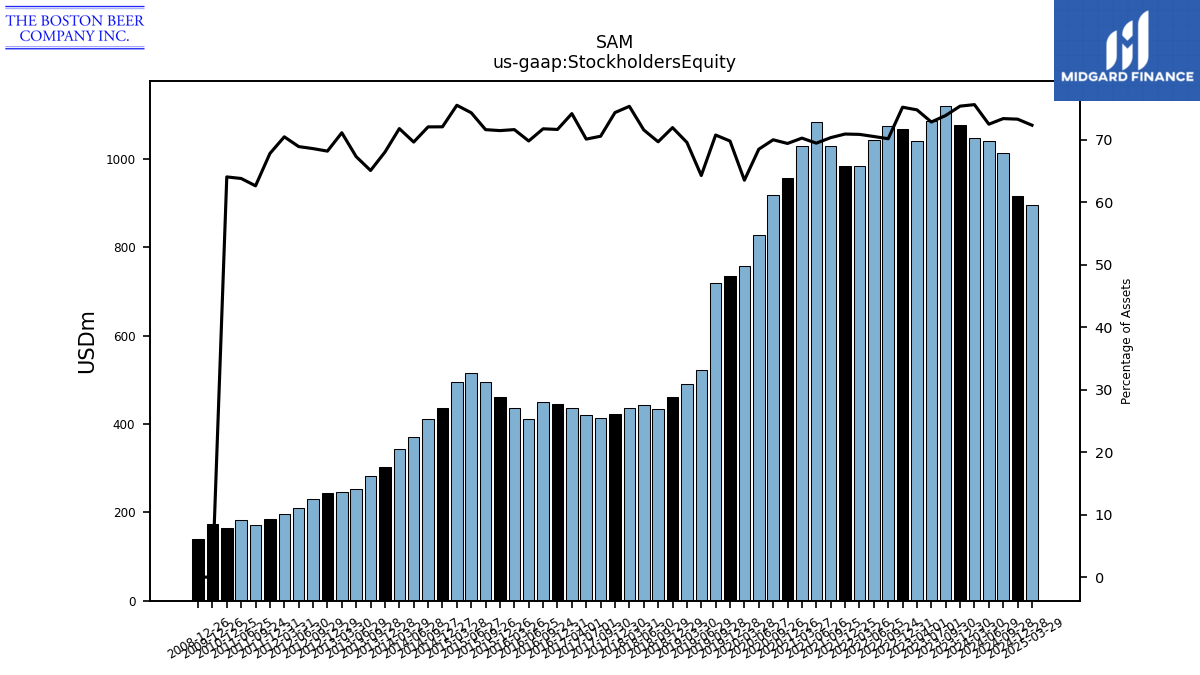
| Stockholders Equity | 1077.93 | 1120.78 | 1087.19 | 1041.36 | 1068.55 | 1073.99 | 1044.04 | 984.92 | 983.41 | 1029.38 | 1084.13 | 1028.72 | 956.97 | 918.53 | 827.48 | 758.24 | 735.64 | 718.98 | 522.80 | 489.82 | 460.32 | 434.55 | 442.67 | 436.93 | 423.52 | 414.29 | 421.66 | 435.41 | 446.58 | 450.24 | 412.23 | 435.35 | 461.22 | 494.80 | 514.68 | 495.12 | 436.14 | 412.38 | 371.73 | 344.10 | 302.08 | 281.42 | 253.54 | 245.60 | 245.09 | 230.42 | 210.56 | 195.58 | 184.75 | 172.10 | 181.99 | NA | 165.59 | NA | NA | NA |
| 2023-12-30 | 2023-09-30 | 2023-07-01 | 2023-04-01 | 2022-12-31 | 2022-09-24 | 2022-06-25 | 2022-03-26 | 2021-12-25 | 2021-09-25 | 2021-06-26 | 2021-03-27 | 2020-12-26 | 2020-09-26 | 2020-06-27 | 2020-03-28 | 2019-12-28 | 2019-09-28 | 2019-06-29 | 2019-03-30 | 2018-12-29 | 2018-09-29 | 2018-06-30 | 2018-03-31 | 2017-12-30 | 2017-09-30 | 2017-07-01 | 2017-04-01 | 2016-12-31 | 2016-09-24 | 2016-06-25 | 2016-03-26 | 2015-12-26 | 2015-09-26 | 2015-06-27 | 2015-03-28 | 2014-12-27 | 2014-09-27 | 2014-06-28 | 2014-03-29 | 2013-12-28 | 2013-09-28 | 2013-06-29 | 2013-03-30 | 2012-12-29 | 2012-09-29 | 2012-06-30 | 2012-03-31 | 2011-12-31 | 2011-09-24 | 2011-06-25 | 2011-03-26 | 2010-12-25 | 2010-09-25 | 2010-06-26 | 2010-03-27 | ||
|---|---|---|---|---|---|---|---|---|---|---|---|---|---|---|---|---|---|---|---|---|---|---|---|---|---|---|---|---|---|---|---|---|---|---|---|---|---|---|---|---|---|---|---|---|---|---|---|---|---|---|---|---|---|---|---|---|---|
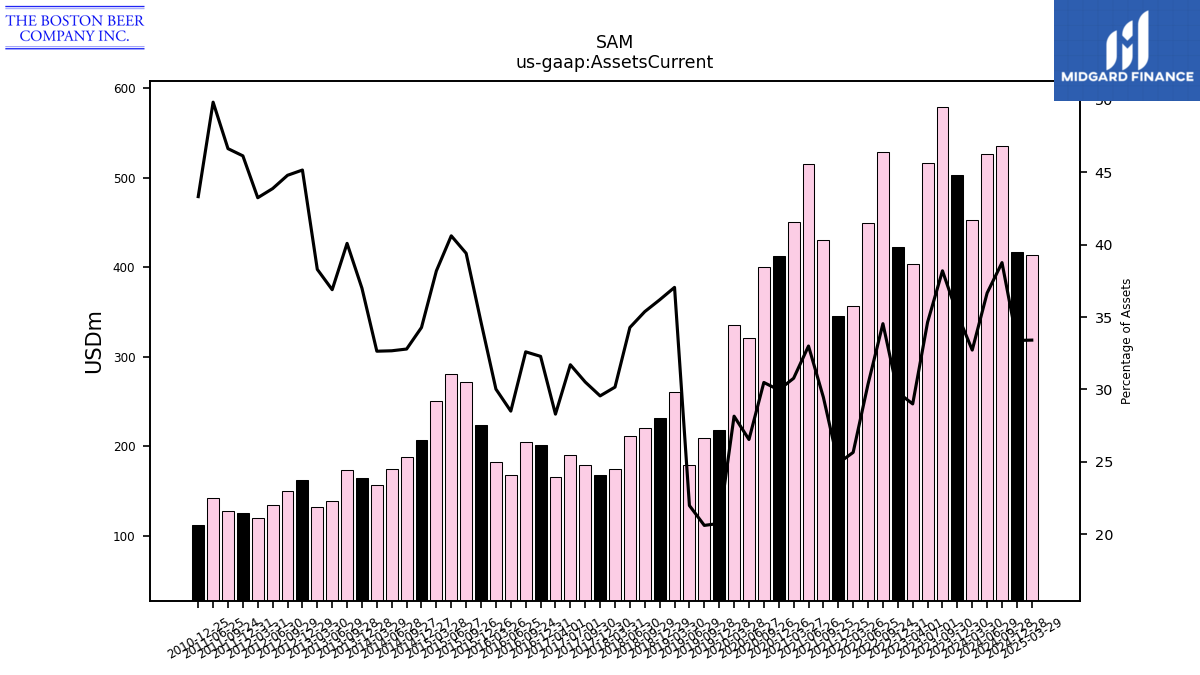
| Assets Current | 503.51 | 579.40 | 517.07 | 403.82 | 423.27 | 528.77 | 449.58 | 356.53 | 345.34 | 431.13 | 515.10 | 450.55 | 413.17 | 400.02 | 320.69 | 336.00 | 218.65 | 209.39 | 178.76 | 260.86 | 231.57 | 220.64 | 212.02 | 174.90 | 168.35 | 179.14 | 190.71 | 166.07 | 201.24 | 204.55 | 168.32 | 182.50 | 223.60 | 272.27 | 281.26 | 250.41 | 207.46 | 187.67 | 174.42 | 156.47 | 164.28 | 173.37 | 139.00 | 132.25 | 162.34 | 150.51 | 134.09 | 120.02 | 125.72 | 128.16 | 142.20 | NA | 112.00 | NA | NA | NA | |
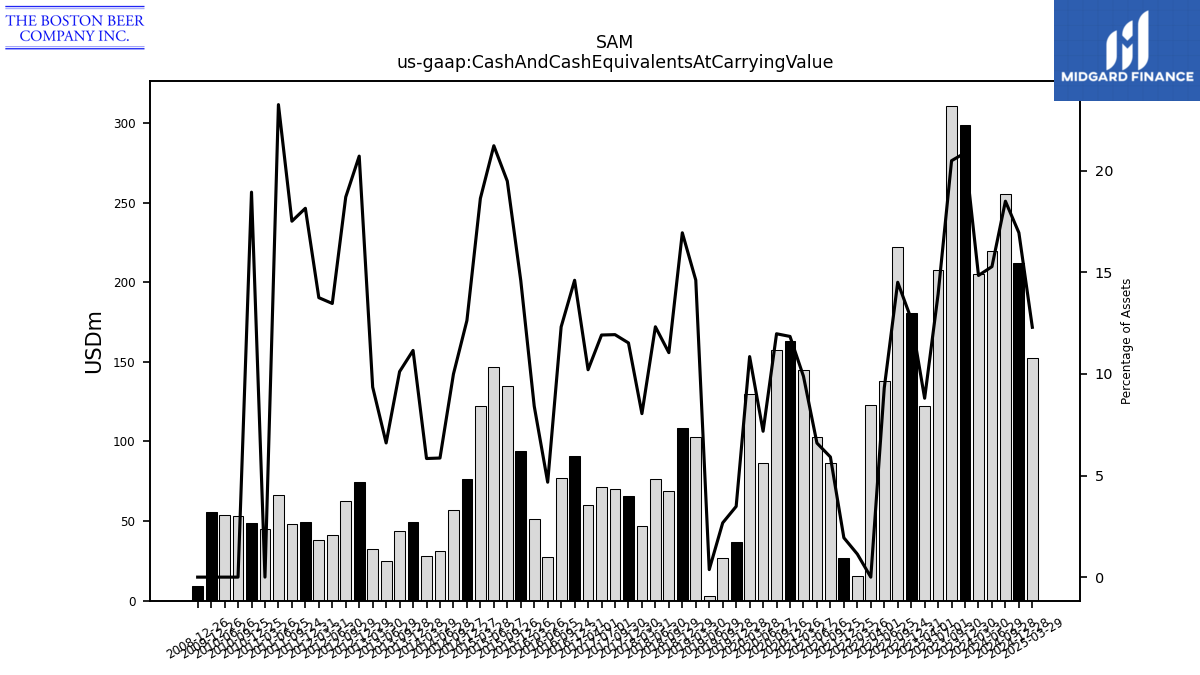
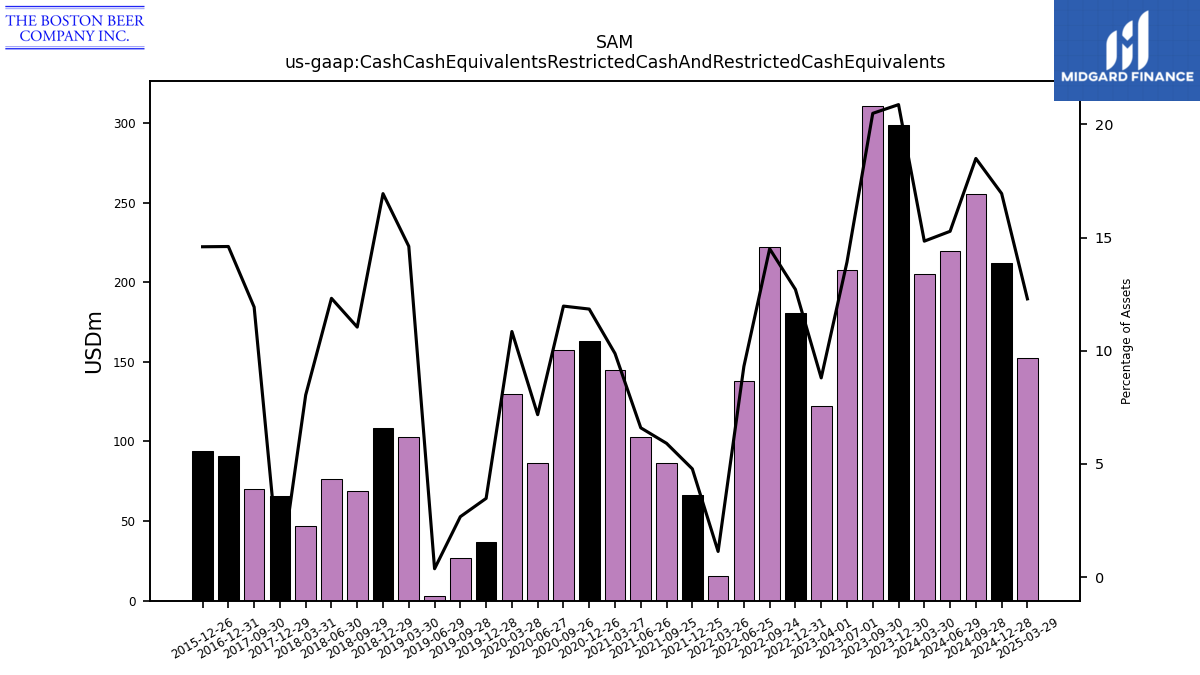
| Cash And Cash Equivalents At Carrying Value | 298.49 | 310.78 | 207.75 | 122.56 | 180.56 | 222.05 | 137.80 | 15.77 | 26.85 | 86.50 | 102.95 | 144.66 | 163.28 | 157.13 | 86.72 | 129.50 | 36.67 | 27.13 | 3.02 | 102.89 | 108.40 | 68.89 | 76.18 | 46.65 | 65.64 | 70.05 | 71.65 | 59.89 | 91.03 | 77.27 | 27.58 | 51.13 | 94.19 | 134.61 | 146.98 | 122.16 | 76.40 | 57.18 | 31.28 | 27.98 | 49.52 | 43.73 | 24.87 | 32.29 | 74.46 | 62.84 | 41.14 | 38.16 | 49.45 | 48.12 | 66.31 | 45.32 | 48.97 | 53.19 | 53.68 | NA | |
| Cash Cash Equivalents Restricted Cash And Restricted Cash Equivalents | 298.49 | 310.78 | 207.75 | 122.56 | 180.56 | 222.05 | 137.80 | 15.77 | 66.32 | 86.50 | 102.95 | 144.66 | 163.28 | 157.13 | 86.72 | 129.50 | 36.67 | 27.13 | 3.02 | 102.89 | 108.40 | 68.89 | 76.18 | 46.65 | NA | 70.05 | NA | NA | 91.03 | NA | NA | NA | 94.19 | NA | NA | NA | NA | NA | NA | NA | NA | NA | NA | NA | NA | NA | NA | NA | NA | NA | NA | NA | NA | NA | NA | NA | |
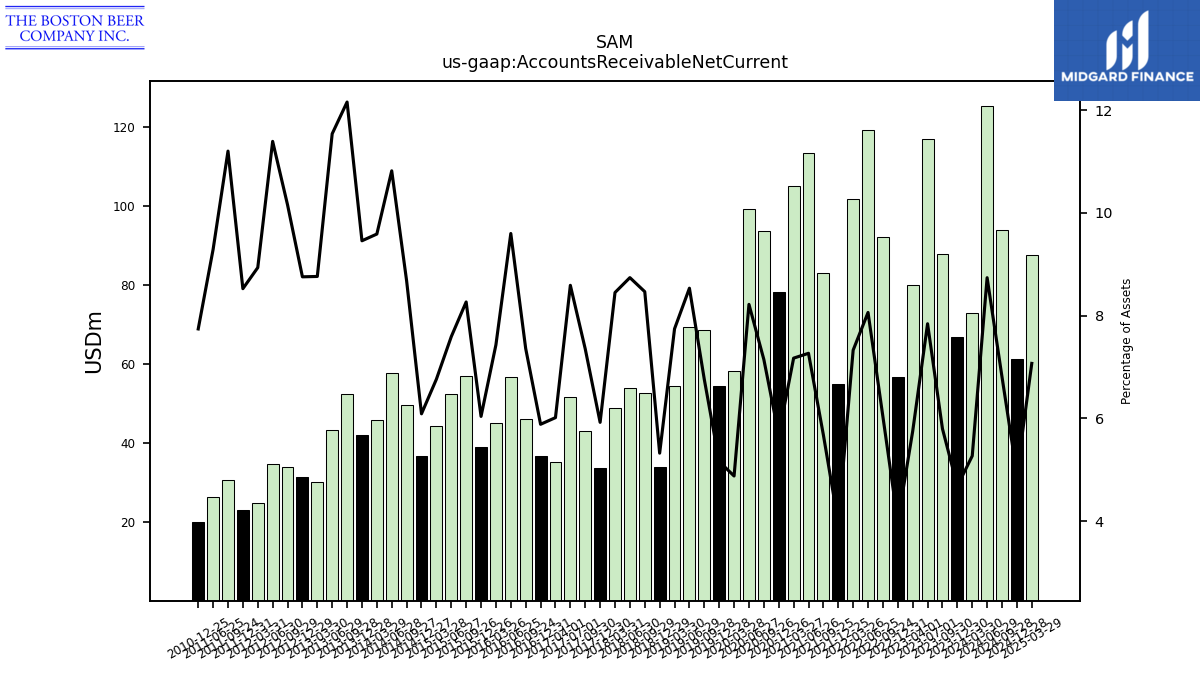
| Accounts Receivable Net Current | 67.00 | 87.98 | 117.07 | 80.10 | 56.67 | 92.35 | 119.37 | 101.88 | 55.02 | 83.12 | 113.46 | 105.04 | 78.36 | 93.81 | 99.32 | 58.25 | 54.40 | 68.69 | 69.42 | 54.52 | 34.07 | 52.81 | 54.06 | 49.01 | 33.75 | 43.18 | 51.68 | 35.31 | 36.69 | 46.19 | 56.69 | 45.18 | 38.98 | 57.12 | 52.58 | 44.35 | 36.86 | 49.67 | 57.76 | 45.97 | 42.00 | 52.57 | 43.48 | 30.26 | 31.48 | 34.13 | 34.81 | 24.80 | 23.23 | 30.79 | 26.50 | NA | 20.02 | NA | NA | NA | |
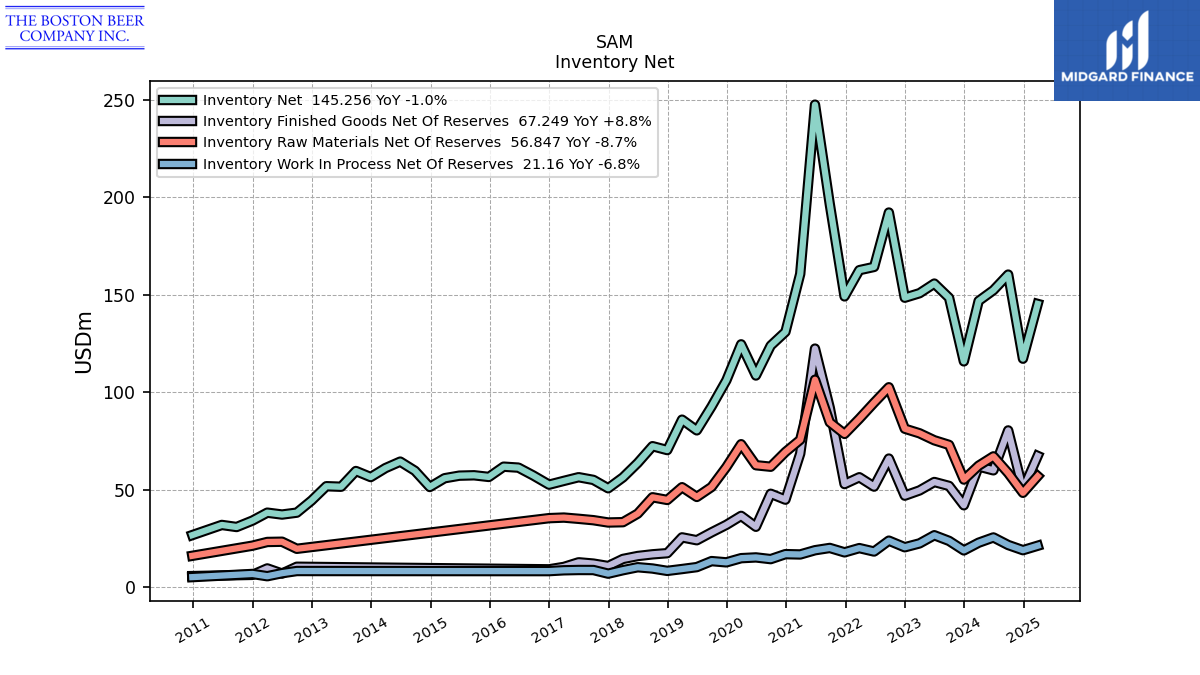
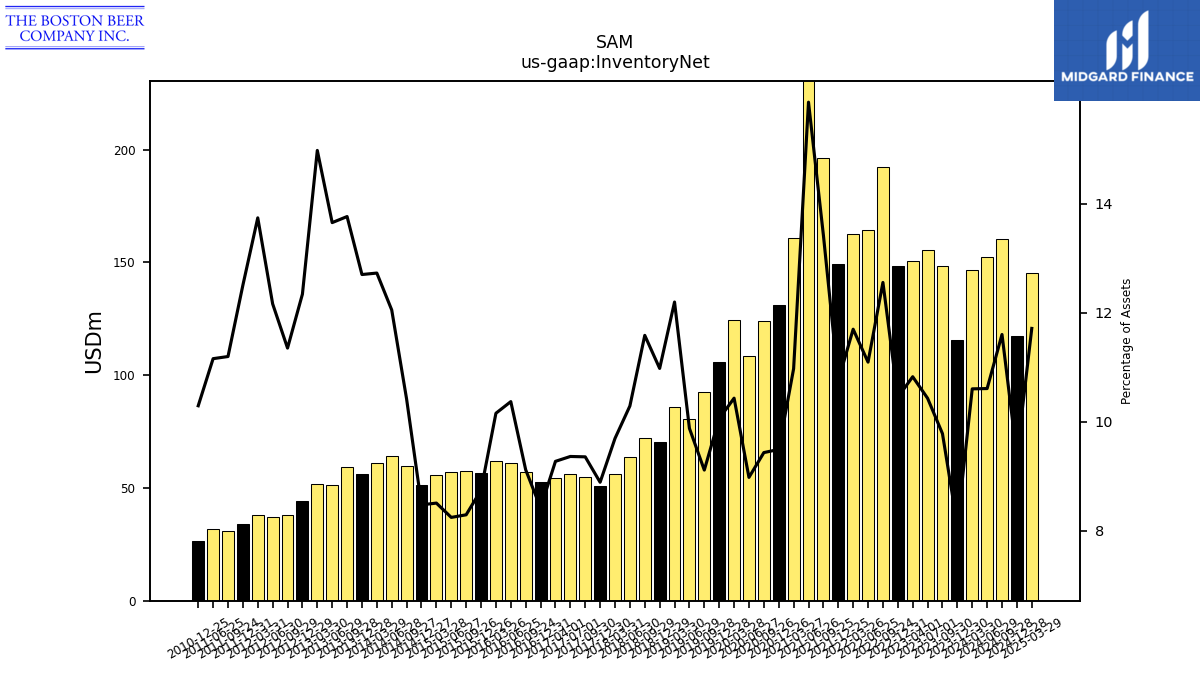
| Inventory Net | 115.77 | 148.40 | 155.70 | 150.76 | 148.45 | 192.17 | 164.25 | 162.59 | 149.12 | 196.46 | 247.55 | 160.67 | 130.91 | 123.83 | 108.52 | 124.53 | 106.04 | 92.63 | 80.36 | 85.86 | 70.25 | 72.25 | 63.65 | 56.23 | 50.65 | 54.94 | 56.33 | 54.44 | 52.50 | 57.23 | 61.24 | 61.74 | 56.46 | 57.32 | 57.12 | 55.80 | 51.31 | 59.61 | 64.33 | 61.01 | 56.40 | 59.51 | 51.43 | 51.71 | 44.36 | 38.14 | 37.17 | 38.13 | 34.07 | 30.77 | 31.83 | NA | 26.61 | NA | NA | NA | |
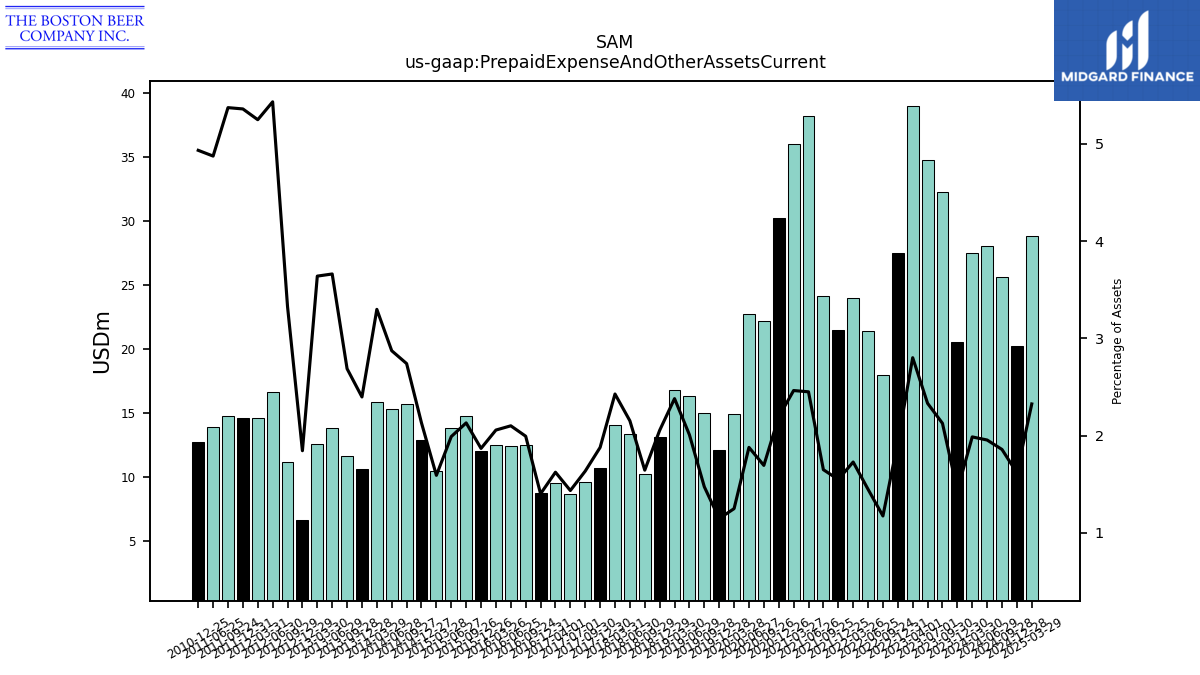
| Prepaid Expense And Other Assets Current | 20.54 | 32.24 | 34.80 | 39.00 | 27.46 | 17.95 | 21.42 | 24.01 | 21.46 | 24.13 | 38.24 | 36.06 | 30.23 | 22.21 | 22.69 | 14.89 | 12.08 | 14.96 | 16.33 | 16.75 | 13.14 | 10.25 | 13.31 | 14.07 | 10.70 | 9.59 | 8.63 | 9.52 | 8.73 | 12.51 | 12.40 | 12.50 | 12.05 | 14.72 | 13.78 | 10.43 | 12.89 | 15.68 | 15.33 | 15.81 | 10.64 | 11.62 | 13.80 | 12.57 | 6.63 | 11.18 | 16.60 | 14.57 | 14.61 | 14.77 | 13.91 | NA | 12.76 | NA | NA | NA | |
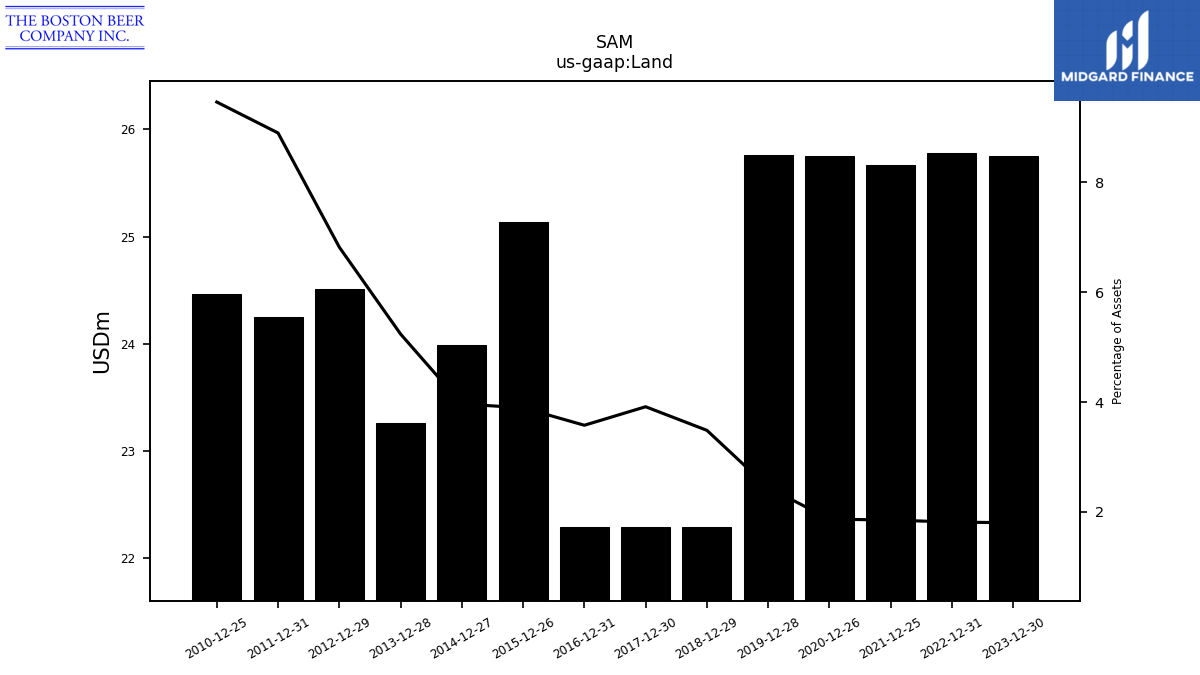
| Land | 25.75 | NA | NA | NA | 25.78 | NA | NA | NA | 25.67 | NA | NA | NA | 25.75 | NA | NA | NA | 25.76 | NA | NA | NA | 22.30 | NA | NA | NA | 22.30 | NA | NA | NA | 22.30 | NA | NA | NA | 25.14 | NA | NA | NA | 23.99 | NA | NA | NA | 23.26 | NA | NA | NA | 24.52 | NA | NA | NA | 24.25 | NA | NA | NA | 24.46 | NA | NA | NA | |
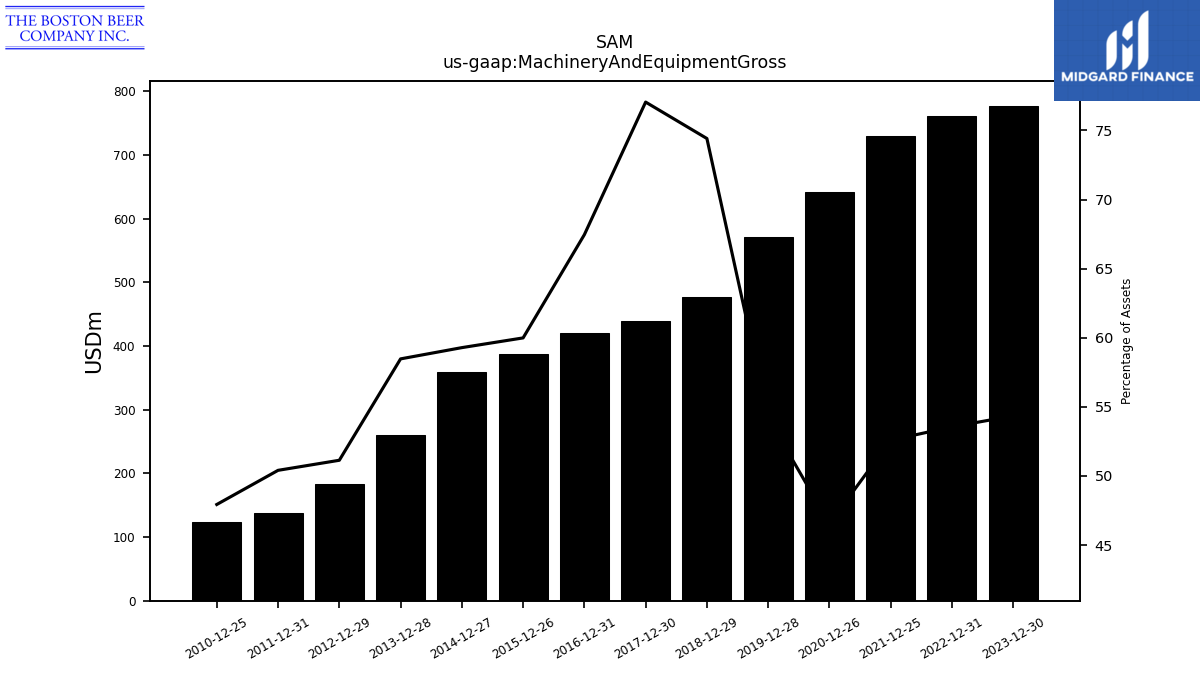
| Machinery And Equipment Gross | 777.18 | NA | NA | NA | 760.89 | NA | NA | NA | 729.25 | NA | NA | NA | 641.79 | NA | NA | NA | 571.51 | NA | NA | NA | 476.17 | NA | NA | NA | 438.93 | NA | NA | NA | 420.49 | NA | NA | NA | 387.18 | NA | NA | NA | 358.78 | NA | NA | NA | 259.66 | NA | NA | NA | 183.83 | NA | NA | NA | 137.36 | NA | NA | NA | 123.93 | NA | NA | NA |
| 2023-12-30 | 2023-09-30 | 2023-07-01 | 2023-04-01 | 2022-12-31 | 2022-09-24 | 2022-06-25 | 2022-03-26 | 2021-12-25 | 2021-09-25 | 2021-06-26 | 2021-03-27 | 2020-12-26 | 2020-09-26 | 2020-06-27 | 2020-03-28 | 2019-12-28 | 2019-09-28 | 2019-06-29 | 2019-03-30 | 2018-12-29 | 2018-09-29 | 2018-06-30 | 2018-03-31 | 2017-12-30 | 2017-09-30 | 2017-07-01 | 2017-04-01 | 2016-12-31 | 2016-09-24 | 2016-06-25 | 2016-03-26 | 2015-12-26 | 2015-09-26 | 2015-06-27 | 2015-03-28 | 2014-12-27 | 2014-09-27 | 2014-06-28 | 2014-03-29 | 2013-12-28 | 2013-09-28 | 2013-06-29 | 2013-03-30 | 2012-12-29 | 2012-09-29 | 2012-06-30 | 2012-03-31 | 2011-12-31 | 2011-09-24 | 2011-06-25 | 2011-03-26 | 2010-12-25 | 2010-09-25 | 2010-06-26 | 2010-03-27 | ||
|---|---|---|---|---|---|---|---|---|---|---|---|---|---|---|---|---|---|---|---|---|---|---|---|---|---|---|---|---|---|---|---|---|---|---|---|---|---|---|---|---|---|---|---|---|---|---|---|---|---|---|---|---|---|---|---|---|---|
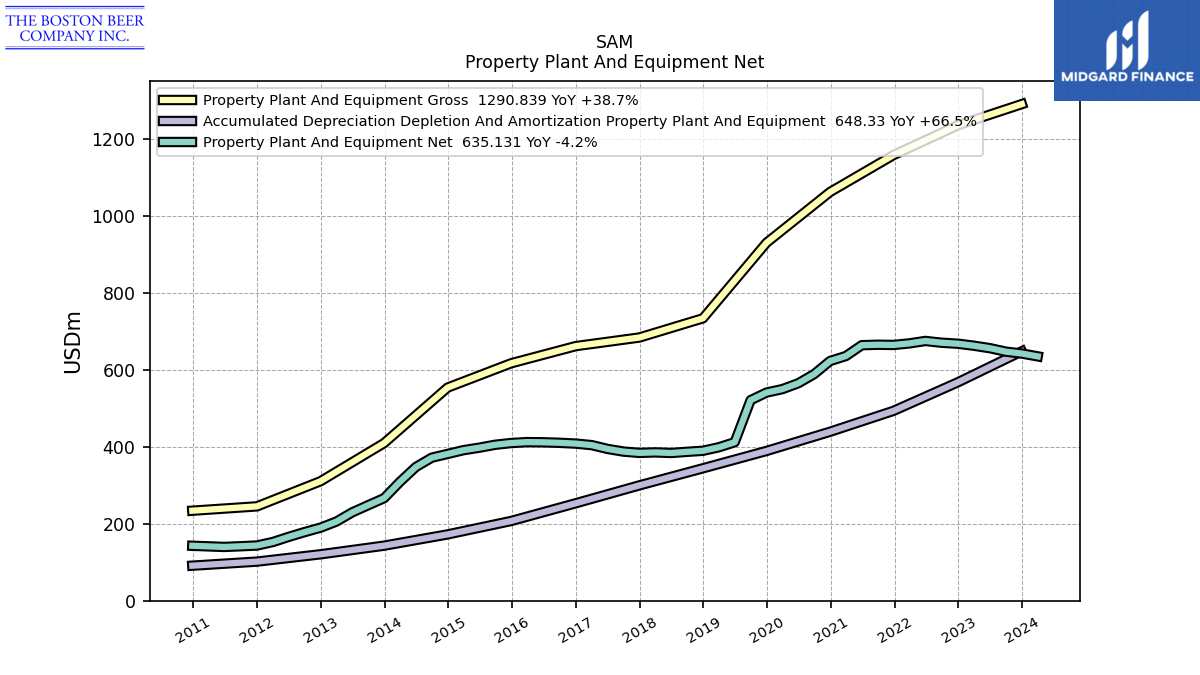
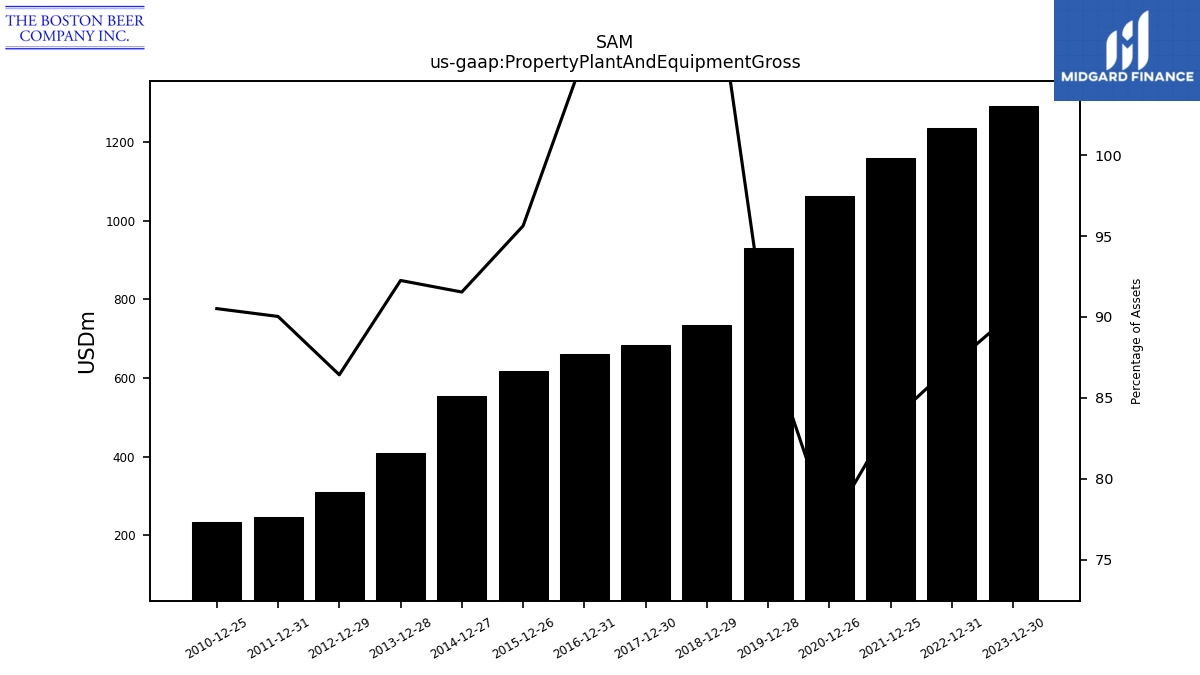
| Property Plant And Equipment Gross | 1290.84 | NA | NA | NA | 1236.24 | NA | NA | NA | 1158.40 | NA | NA | NA | 1062.29 | NA | NA | NA | 930.34 | NA | NA | NA | 734.05 | NA | NA | NA | 684.15 | NA | NA | NA | 661.87 | NA | NA | NA | 617.21 | NA | NA | NA | 553.98 | NA | NA | NA | 409.69 | NA | NA | NA | 310.68 | NA | NA | NA | 245.33 | NA | NA | NA | 234.01 | NA | NA | NA | |
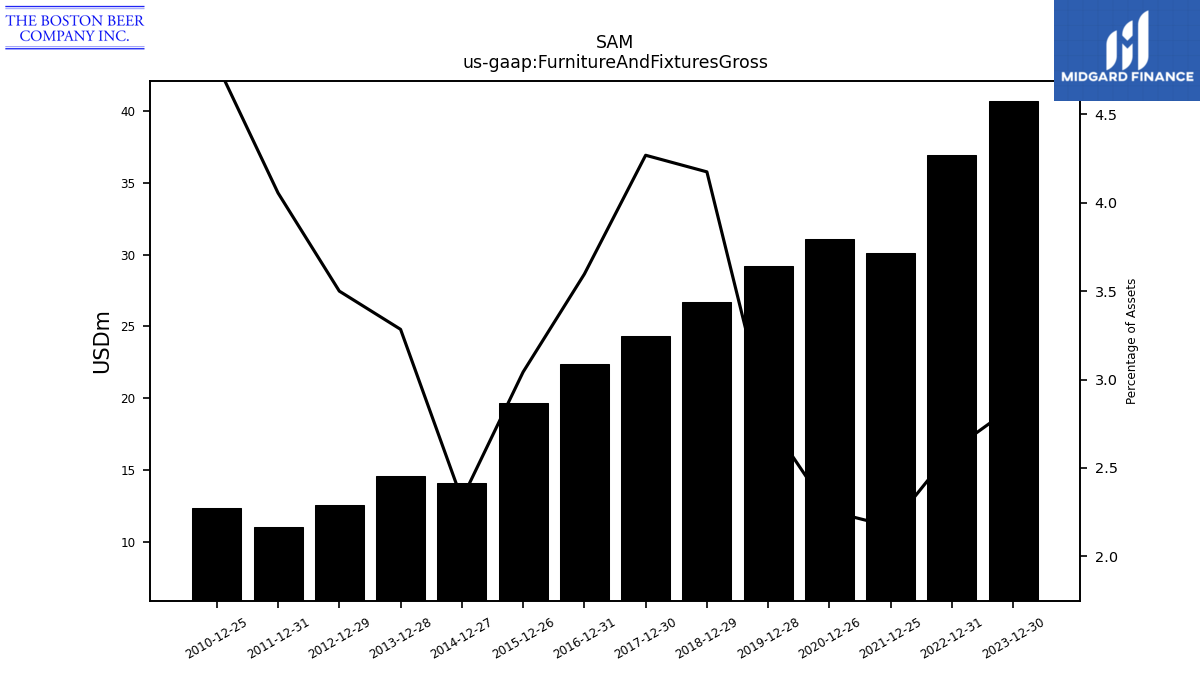
| Furniture And Fixtures Gross | 40.72 | NA | NA | NA | 36.94 | NA | NA | NA | 30.09 | NA | NA | NA | 31.11 | NA | NA | NA | 29.20 | NA | NA | NA | 26.70 | NA | NA | NA | 24.31 | NA | NA | NA | 22.41 | NA | NA | NA | 19.64 | NA | NA | NA | 14.06 | NA | NA | NA | 14.58 | NA | NA | NA | 12.58 | NA | NA | NA | 11.05 | NA | NA | NA | 12.37 | NA | NA | NA | |
| Leasehold Improvements Gross | 74.60 | NA | NA | NA | 75.26 | NA | NA | NA | 70.42 | NA | NA | NA | 43.16 | NA | NA | NA | 48.53 | NA | NA | NA | 20.83 | NA | NA | NA | 16.66 | NA | NA | NA | 14.15 | NA | NA | NA | 12.04 | NA | NA | NA | 7.89 | NA | NA | NA | 7.60 | NA | NA | NA | 6.19 | NA | NA | NA | 3.72 | NA | NA | NA | 3.90 | NA | NA | NA | |
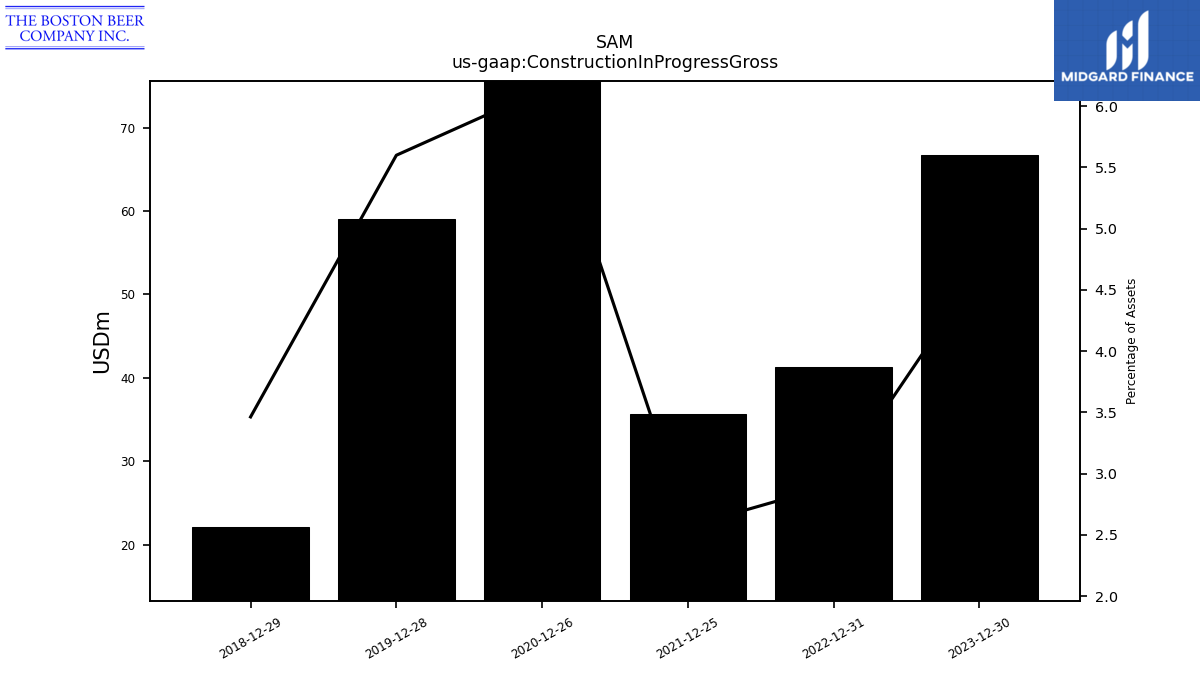
| Construction In Progress Gross | 66.70 | NA | NA | NA | 41.32 | NA | NA | NA | 35.62 | NA | NA | NA | 84.56 | NA | NA | NA | 59.03 | NA | NA | NA | 22.16 | NA | NA | NA | NA | NA | NA | NA | NA | NA | NA | NA | NA | NA | NA | NA | NA | NA | NA | NA | NA | NA | NA | NA | NA | NA | NA | NA | NA | NA | NA | NA | NA | NA | NA | NA | |
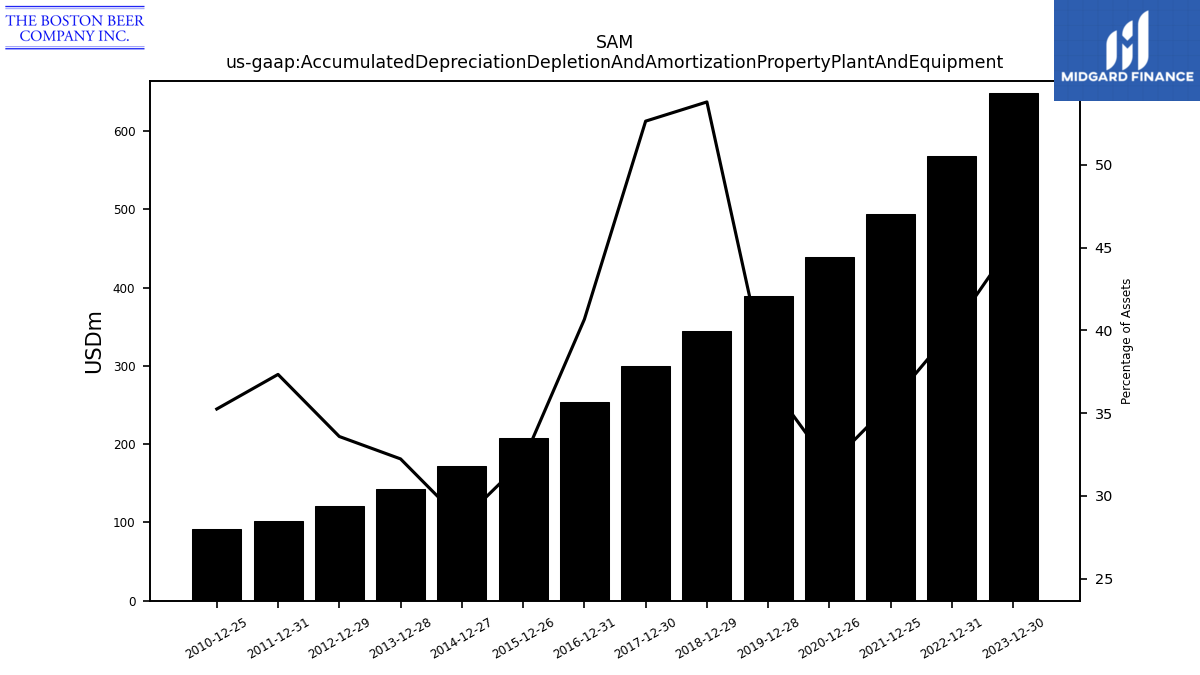
| Accumulated Depreciation Depletion And Amortization Property Plant And Equipment | 648.33 | NA | NA | NA | 568.33 | NA | NA | NA | 493.59 | NA | NA | NA | 439.21 | NA | NA | NA | 389.28 | NA | NA | NA | 344.26 | NA | NA | NA | 299.87 | NA | NA | NA | 253.46 | NA | NA | NA | 207.29 | NA | NA | NA | 172.41 | NA | NA | NA | 143.13 | NA | NA | NA | 120.73 | NA | NA | NA | 101.74 | NA | NA | NA | 91.12 | NA | NA | NA | |
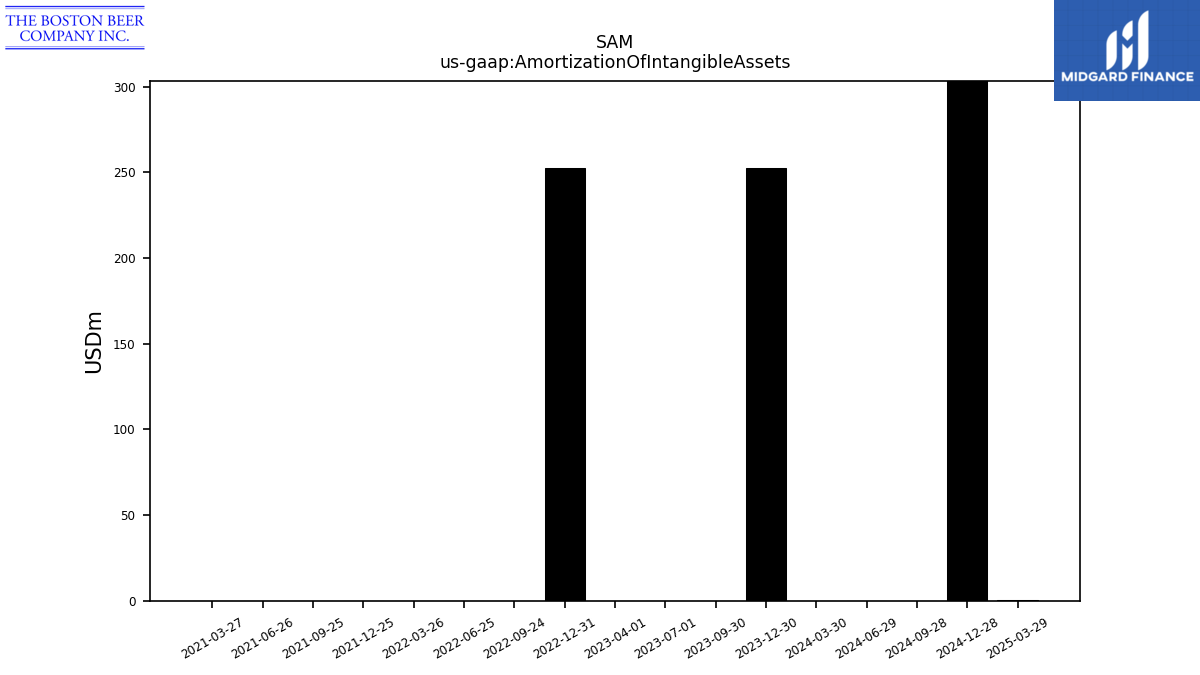
| Amortization Of Intangible Assets | 252.81 | 0.06 | 0.06 | 0.06 | 252.81 | 0.06 | 0.06 | 0.06 | 0.06 | 0.06 | 0.06 | 0.06 | NA | NA | NA | NA | NA | NA | NA | NA | NA | NA | NA | NA | NA | NA | NA | NA | NA | NA | NA | NA | NA | NA | NA | NA | NA | NA | NA | NA | NA | NA | NA | NA | NA | NA | NA | NA | NA | NA | NA | NA | NA | NA | NA | NA | |
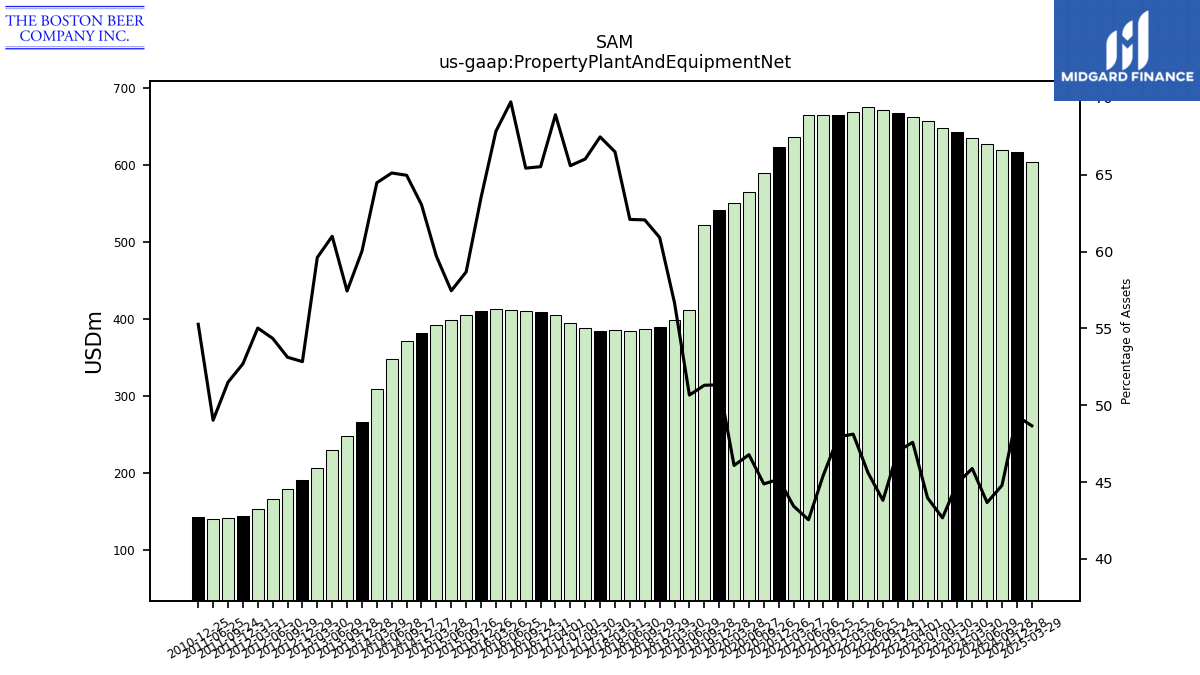
| Property Plant And Equipment Net | 642.51 | 647.32 | 656.36 | 662.70 | 667.91 | 670.69 | 675.21 | 668.88 | 664.82 | 665.37 | 664.20 | 636.01 | 623.08 | 588.98 | 565.26 | 550.03 | 541.07 | 521.32 | 412.06 | 398.88 | 389.79 | 387.07 | 384.05 | 385.57 | 384.28 | 387.64 | 394.52 | 404.43 | 408.41 | 410.57 | 411.87 | 412.30 | 409.93 | 405.42 | 397.85 | 391.37 | 381.57 | 371.80 | 347.62 | 309.08 | 266.56 | 248.36 | 229.81 | 205.87 | 189.95 | 178.49 | 166.10 | 152.71 | 143.59 | 141.53 | 139.84 | NA | 142.89 | NA | NA | NA | |
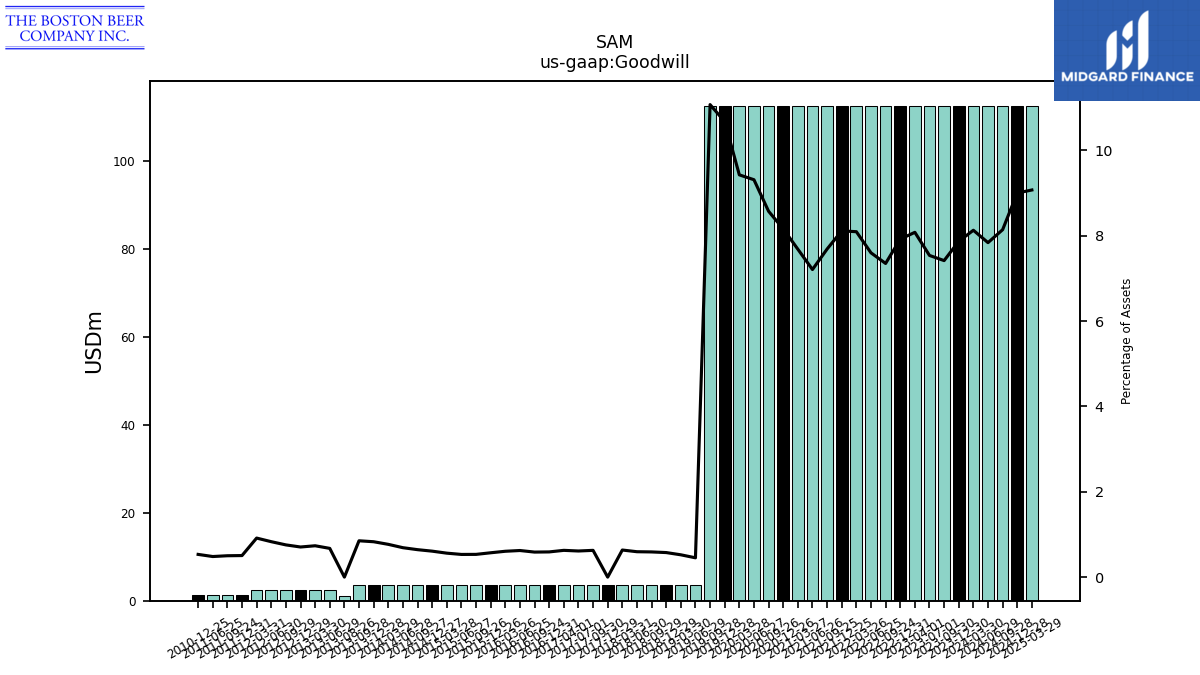
| Goodwill | 112.53 | 112.53 | 112.53 | 112.53 | 112.53 | 112.53 | 112.53 | 112.53 | 112.53 | 112.53 | 112.53 | 112.53 | 112.53 | 112.53 | 112.53 | 112.53 | 112.53 | 112.53 | 3.68 | 3.68 | 3.68 | 3.68 | 3.68 | 3.68 | NA | 3.68 | 3.68 | 3.68 | 3.68 | 3.68 | 3.68 | 3.68 | 3.68 | 3.68 | 3.68 | 3.68 | 3.68 | 3.68 | 3.68 | 3.68 | 3.68 | 3.68 | 2.54 | 2.54 | 2.54 | 2.54 | 2.54 | 2.54 | 1.38 | 1.38 | 1.38 | NA | 1.38 | NA | NA | NA | |
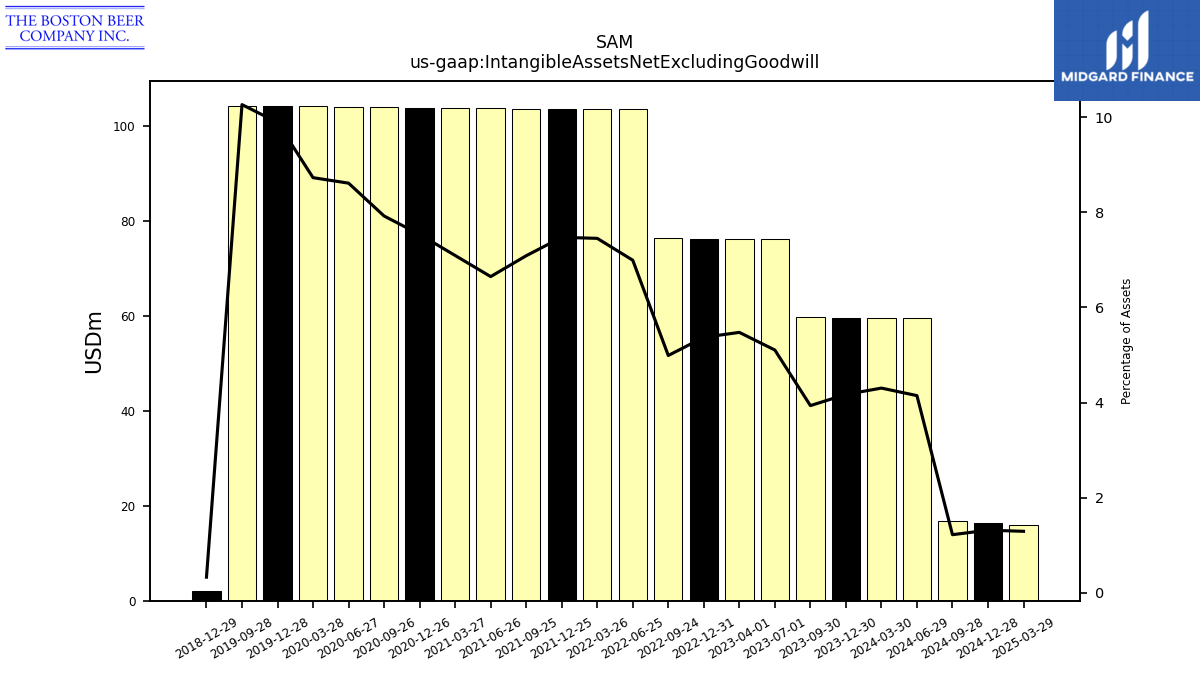
| Intangible Assets Net Excluding Goodwill | 59.64 | 59.71 | 76.20 | 76.26 | 76.32 | 76.39 | 103.55 | 103.61 | 103.68 | 103.74 | 103.80 | 103.87 | 103.93 | 103.99 | 104.10 | 104.21 | 104.27 | 104.33 | NA | NA | 2.10 | NA | NA | NA | NA | NA | NA | NA | NA | NA | NA | NA | NA | NA | NA | NA | NA | NA | NA | NA | NA | NA | NA | NA | NA | NA | NA | NA | NA | NA | NA | NA | NA | NA | NA | NA | |
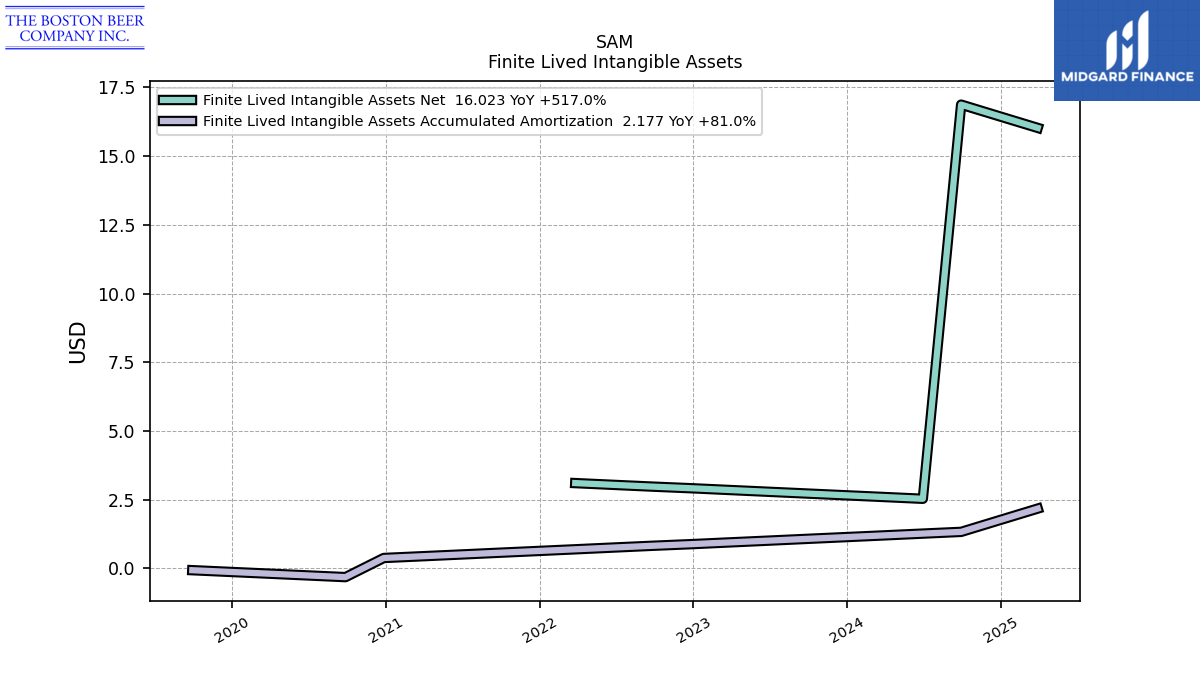
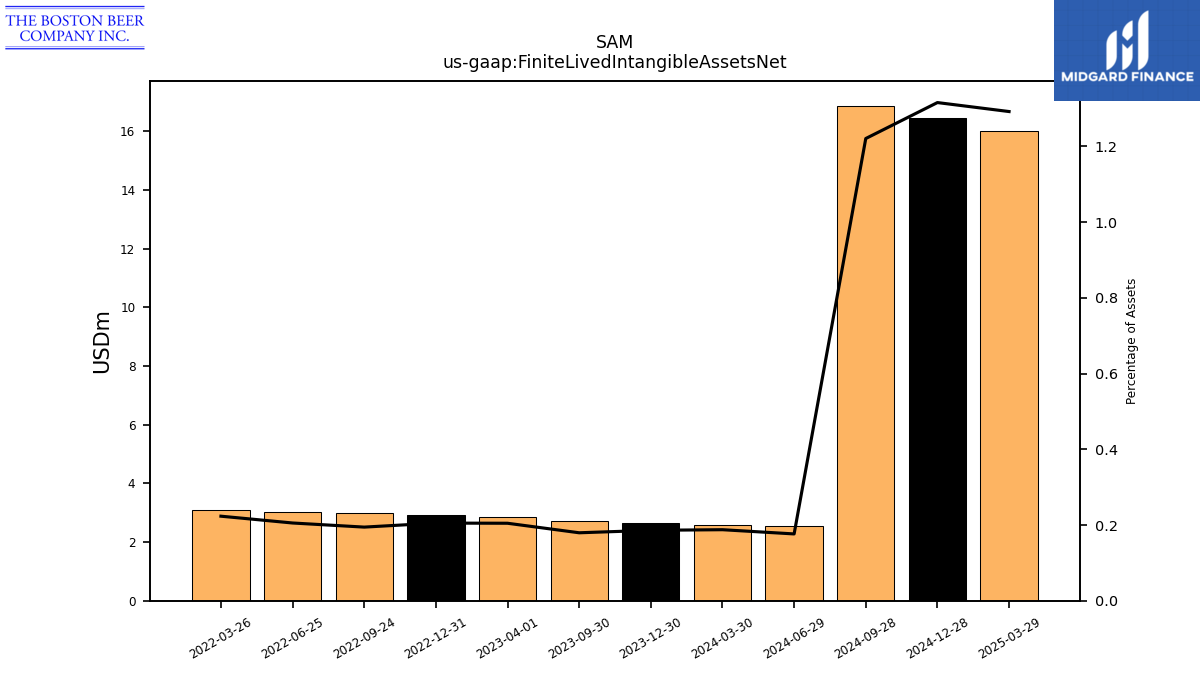
| Finite Lived Intangible Assets Net | 2.66 | 2.72 | NA | 2.85 | 2.91 | 2.98 | 3.04 | 3.10 | NA | NA | NA | NA | NA | NA | NA | NA | NA | NA | NA | NA | NA | NA | NA | NA | NA | NA | NA | NA | NA | NA | NA | NA | NA | NA | NA | NA | NA | NA | NA | NA | NA | NA | NA | NA | NA | NA | NA | NA | NA | NA | NA | NA | NA | NA | NA | NA | |
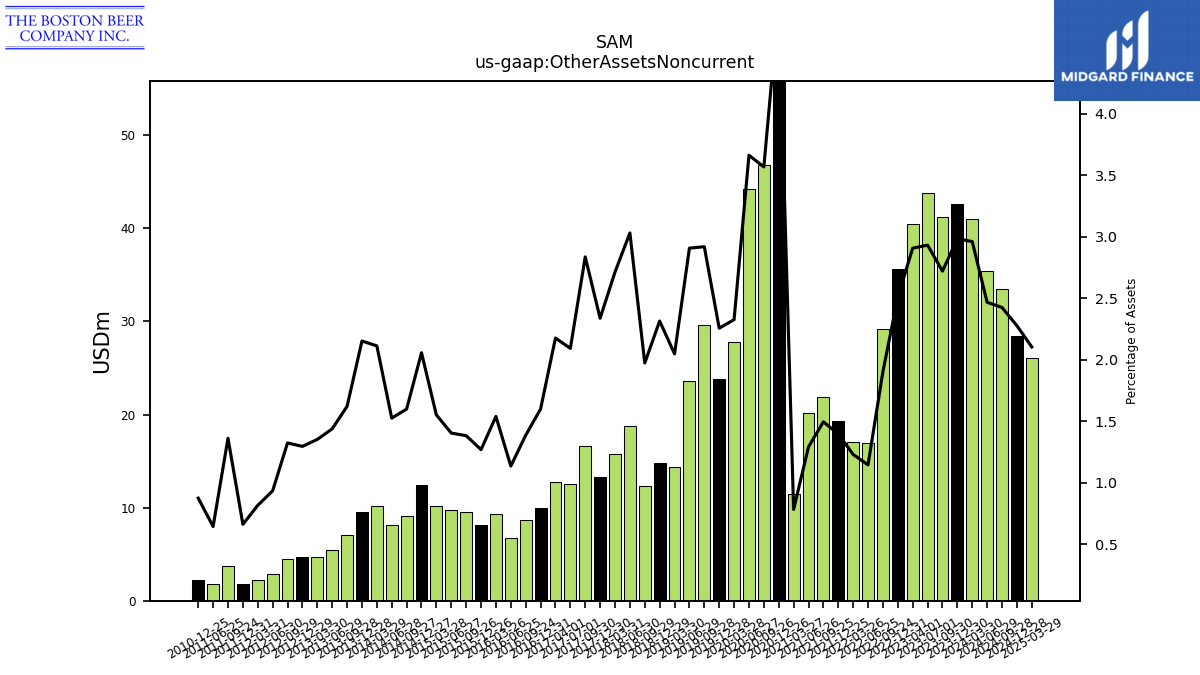
| Other Assets Noncurrent | 42.66 | 41.27 | 43.75 | 40.48 | 35.63 | 29.15 | 16.94 | 17.09 | 19.35 | 21.88 | 20.15 | 11.46 | 67.63 | 46.82 | 44.26 | 27.75 | 23.78 | 29.66 | 23.65 | 14.42 | 14.81 | 12.31 | 18.75 | 15.73 | 13.31 | 16.65 | 12.59 | 12.77 | 9.96 | 8.69 | 6.70 | 9.35 | 8.19 | 9.55 | 9.72 | 10.17 | 12.45 | 9.15 | 8.14 | 10.13 | 9.56 | 7.01 | 5.42 | 4.67 | 4.66 | 4.45 | 2.85 | 2.26 | 1.80 | 3.74 | 1.84 | NA | 2.26 | NA | NA | NA |
| 2023-12-30 | 2023-09-30 | 2023-07-01 | 2023-04-01 | 2022-12-31 | 2022-09-24 | 2022-06-25 | 2022-03-26 | 2021-12-25 | 2021-09-25 | 2021-06-26 | 2021-03-27 | 2020-12-26 | 2020-09-26 | 2020-06-27 | 2020-03-28 | 2019-12-28 | 2019-09-28 | 2019-06-29 | 2019-03-30 | 2018-12-29 | 2018-09-29 | 2018-06-30 | 2018-03-31 | 2017-12-30 | 2017-09-30 | 2017-07-01 | 2017-04-01 | 2016-12-31 | 2016-09-24 | 2016-06-25 | 2016-03-26 | 2015-12-26 | 2015-09-26 | 2015-06-27 | 2015-03-28 | 2014-12-27 | 2014-09-27 | 2014-06-28 | 2014-03-29 | 2013-12-28 | 2013-09-28 | 2013-06-29 | 2013-03-30 | 2012-12-29 | 2012-09-29 | 2012-06-30 | 2012-03-31 | 2011-12-31 | 2011-09-24 | 2011-06-25 | 2011-03-26 | 2010-12-25 | 2010-09-25 | 2010-06-26 | 2010-03-27 | ||
|---|---|---|---|---|---|---|---|---|---|---|---|---|---|---|---|---|---|---|---|---|---|---|---|---|---|---|---|---|---|---|---|---|---|---|---|---|---|---|---|---|---|---|---|---|---|---|---|---|---|---|---|---|---|---|---|---|---|
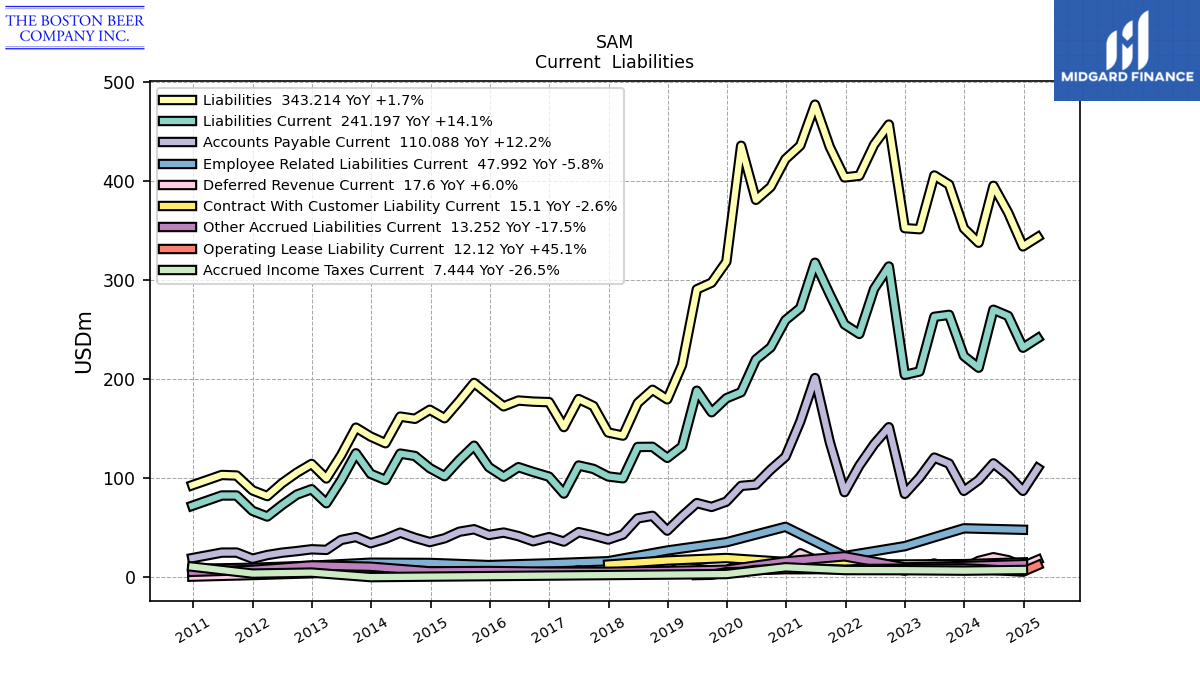
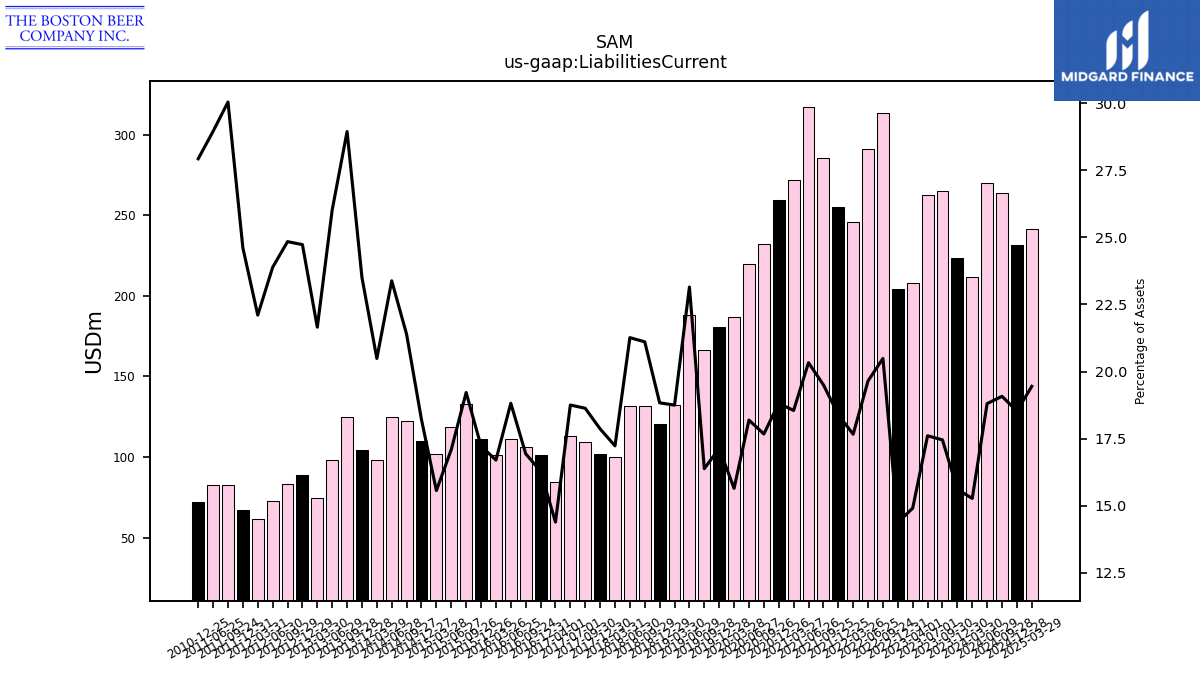
| Liabilities Current | 223.29 | 264.75 | 262.81 | 207.64 | 204.27 | 313.60 | 290.93 | 245.53 | 255.11 | 285.49 | 317.35 | 271.63 | 259.42 | 231.94 | 219.81 | 186.78 | 180.65 | 166.48 | 188.27 | 132.00 | 120.51 | 131.65 | 131.51 | 99.92 | 101.76 | 109.39 | 112.81 | 84.48 | 101.52 | 106.29 | 111.14 | 101.52 | 111.16 | 132.79 | 118.37 | 102.06 | 110.17 | 122.39 | 124.82 | 98.21 | 104.38 | 125.15 | 98.03 | 74.77 | 88.89 | 83.46 | 72.98 | 61.34 | 67.05 | 82.55 | 82.58 | NA | 72.20 | NA | NA | NA | |
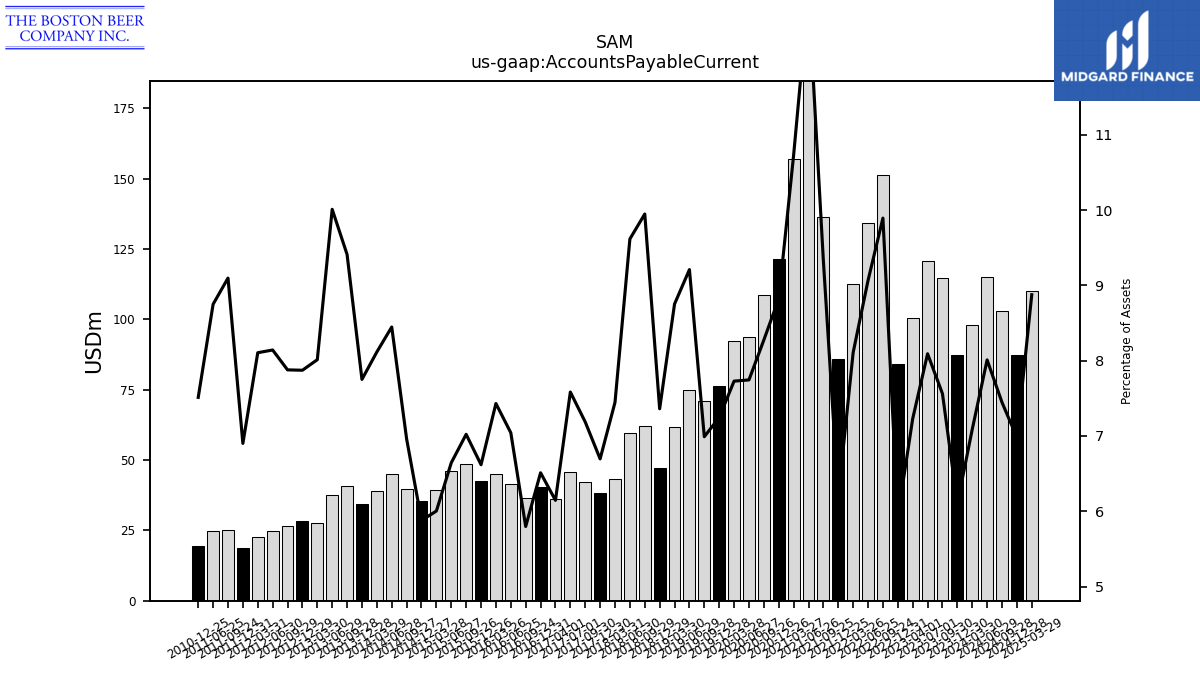
| Accounts Payable Current | 87.25 | 114.70 | 120.78 | 100.67 | 84.25 | 151.44 | 134.22 | 112.71 | 85.92 | 136.46 | 201.04 | 157.09 | 121.65 | 108.60 | 93.58 | 92.25 | 76.37 | 71.03 | 74.91 | 61.62 | 47.10 | 62.05 | 59.48 | 43.18 | 38.14 | 42.19 | 45.62 | 36.07 | 40.59 | 36.38 | 41.59 | 45.17 | 42.72 | 48.52 | 46.01 | 39.36 | 35.58 | 39.84 | 45.10 | 38.91 | 34.42 | 40.70 | 37.72 | 27.67 | 28.30 | 26.47 | 24.88 | 22.50 | 18.81 | 25.00 | 24.96 | NA | 19.42 | NA | NA | NA | |
| Other Accrued Liabilities Current | 11.44 | NA | NA | NA | 10.06 | NA | NA | NA | 21.20 | NA | NA | NA | 16.06 | NA | NA | NA | 7.69 | NA | NA | NA | 6.44 | NA | NA | NA | 5.61 | NA | NA | NA | 5.68 | NA | NA | NA | 6.39 | NA | NA | NA | 6.06 | NA | NA | NA | 10.72 | NA | NA | NA | 11.99 | NA | NA | NA | 7.51 | NA | NA | NA | 5.57 | NA | NA | NA | |
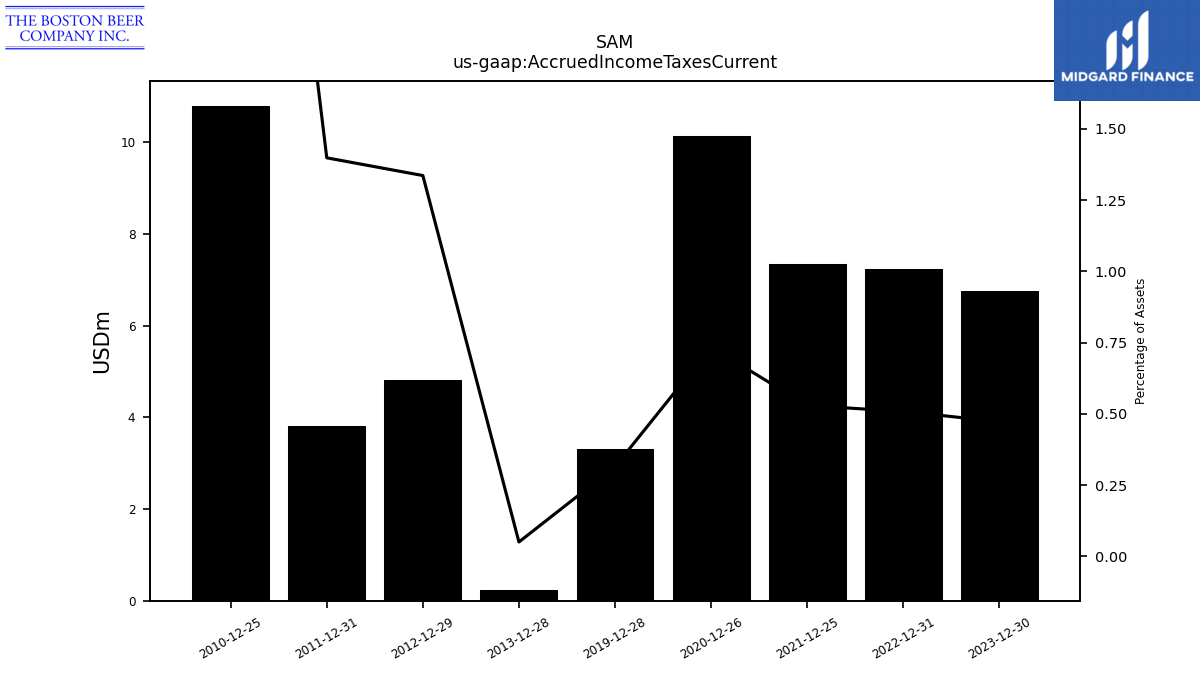
| Accrued Income Taxes Current | 6.76 | NA | NA | NA | 7.23 | NA | NA | NA | 7.34 | NA | NA | NA | 10.13 | NA | NA | NA | 3.32 | NA | NA | NA | NA | NA | NA | NA | NA | NA | NA | NA | NA | NA | NA | NA | NA | NA | NA | NA | NA | NA | NA | NA | 0.23 | NA | NA | NA | 4.80 | NA | NA | NA | 3.81 | NA | NA | NA | 10.79 | NA | NA | NA | |
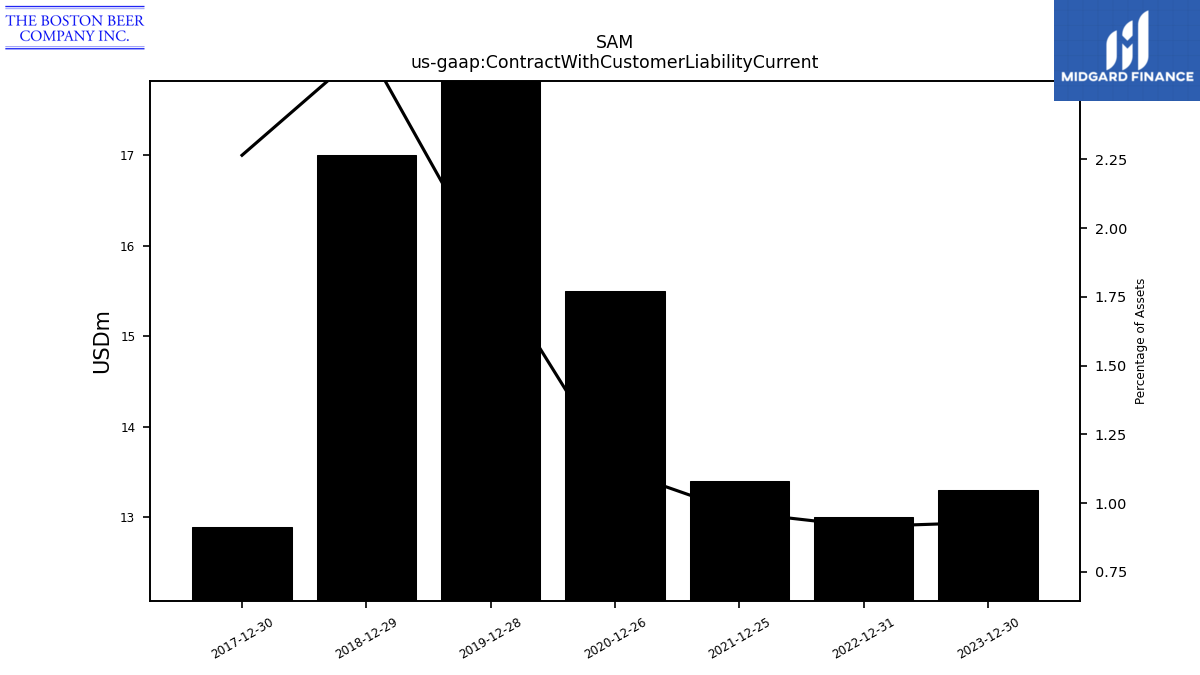
| Contract With Customer Liability Current | 13.30 | NA | NA | NA | 13.00 | NA | NA | NA | 13.40 | NA | NA | NA | 15.50 | NA | NA | NA | 19.50 | NA | NA | NA | 17.00 | NA | NA | NA | 12.90 | NA | NA | NA | NA | NA | NA | NA | NA | NA | NA | NA | NA | NA | NA | NA | NA | NA | NA | NA | NA | NA | NA | NA | NA | NA | NA | NA | NA | NA | NA | NA |
| 2023-12-30 | 2023-09-30 | 2023-07-01 | 2023-04-01 | 2022-12-31 | 2022-09-24 | 2022-06-25 | 2022-03-26 | 2021-12-25 | 2021-09-25 | 2021-06-26 | 2021-03-27 | 2020-12-26 | 2020-09-26 | 2020-06-27 | 2020-03-28 | 2019-12-28 | 2019-09-28 | 2019-06-29 | 2019-03-30 | 2018-12-29 | 2018-09-29 | 2018-06-30 | 2018-03-31 | 2017-12-30 | 2017-09-30 | 2017-07-01 | 2017-04-01 | 2016-12-31 | 2016-09-24 | 2016-06-25 | 2016-03-26 | 2015-12-26 | 2015-09-26 | 2015-06-27 | 2015-03-28 | 2014-12-27 | 2014-09-27 | 2014-06-28 | 2014-03-29 | 2013-12-28 | 2013-09-28 | 2013-06-29 | 2013-03-30 | 2012-12-29 | 2012-09-29 | 2012-06-30 | 2012-03-31 | 2011-12-31 | 2011-09-24 | 2011-06-25 | 2011-03-26 | 2010-12-25 | 2010-09-25 | 2010-06-26 | 2010-03-27 | ||
|---|---|---|---|---|---|---|---|---|---|---|---|---|---|---|---|---|---|---|---|---|---|---|---|---|---|---|---|---|---|---|---|---|---|---|---|---|---|---|---|---|---|---|---|---|---|---|---|---|---|---|---|---|---|---|---|---|---|
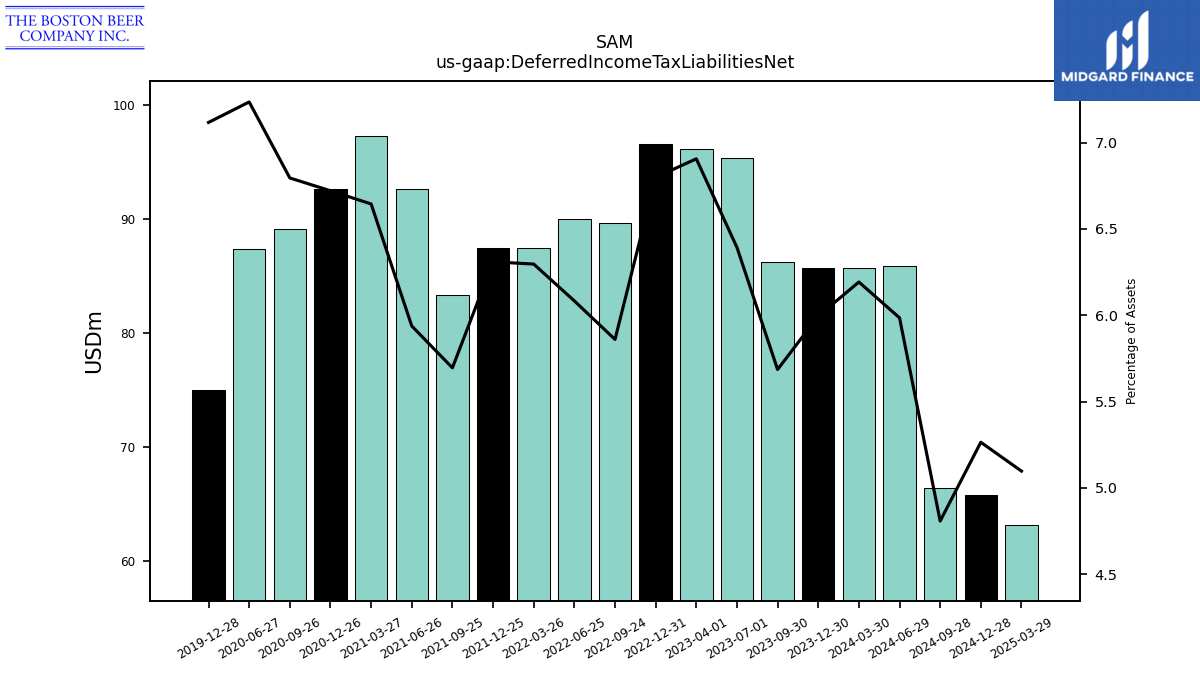
| Deferred Income Tax Liabilities Net | 85.72 | 86.24 | 95.42 | 96.16 | 96.59 | 89.69 | 90.05 | 87.52 | 87.50 | 83.35 | 92.68 | 97.28 | 92.67 | 89.17 | 87.42 | NA | 75.01 | NA | NA | NA | NA | NA | NA | NA | NA | NA | NA | NA | NA | NA | NA | NA | NA | NA | NA | NA | NA | NA | NA | NA | NA | NA | NA | NA | NA | NA | NA | NA | NA | NA | NA | NA | NA | NA | NA | NA | |
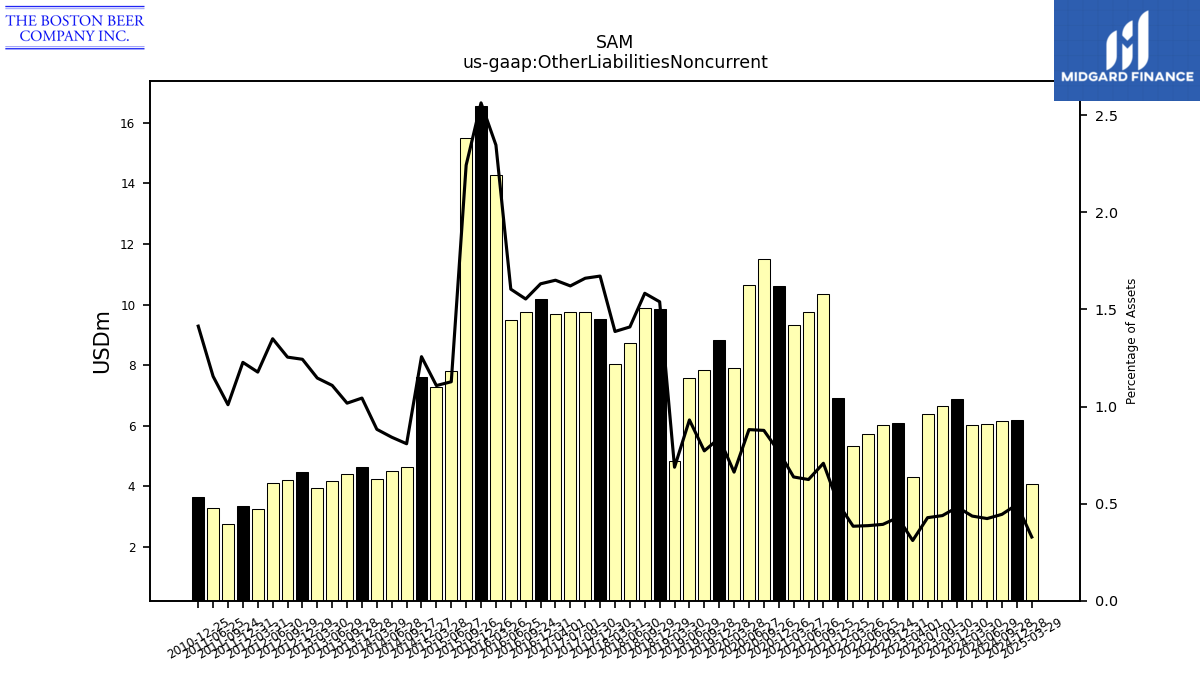
| Other Liabilities Noncurrent | 6.89 | 6.65 | 6.39 | 4.32 | 6.09 | 6.02 | 5.73 | 5.33 | 6.92 | 10.36 | 9.74 | 9.33 | 10.60 | 11.51 | 10.65 | 7.91 | 8.82 | 7.84 | 7.57 | 4.84 | 9.85 | 9.88 | 8.72 | 8.04 | 9.52 | 9.75 | 9.75 | 9.69 | 10.17 | 9.75 | 9.48 | 14.26 | 16.55 | 15.50 | 7.81 | 7.26 | 7.61 | 4.63 | 4.50 | 4.23 | 4.63 | 4.40 | 4.18 | 3.96 | 4.47 | 4.21 | 4.12 | 3.27 | 3.35 | 2.77 | 3.30 | NA | 3.66 | NA | NA | NA | |
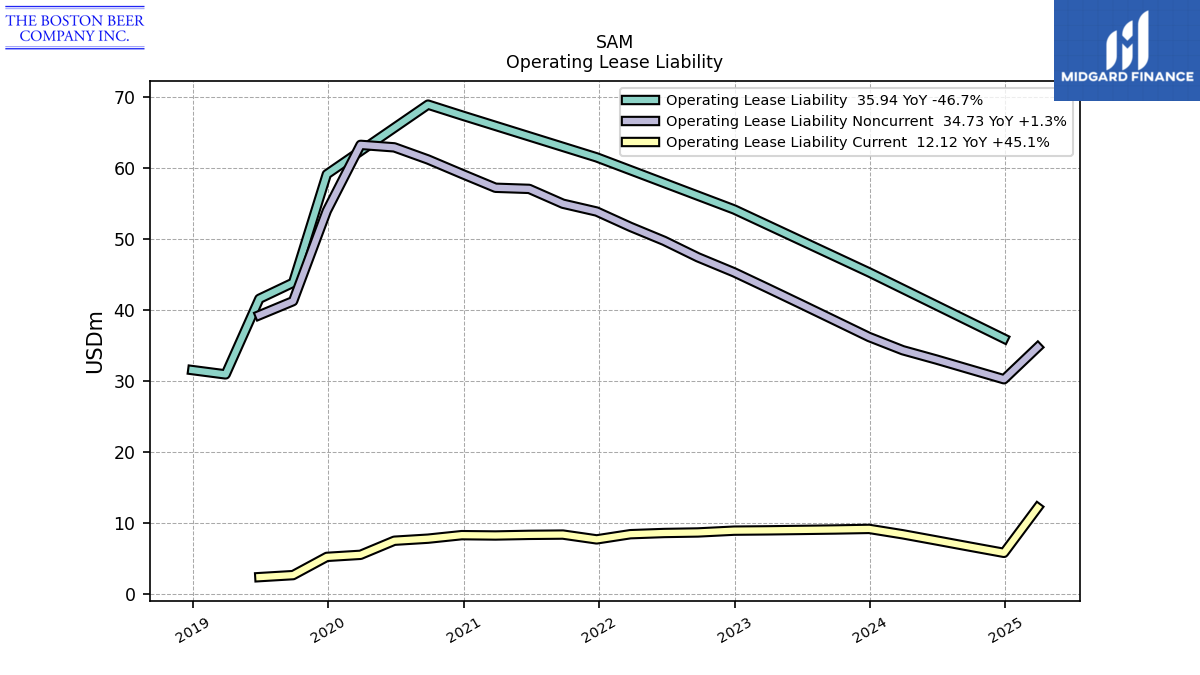
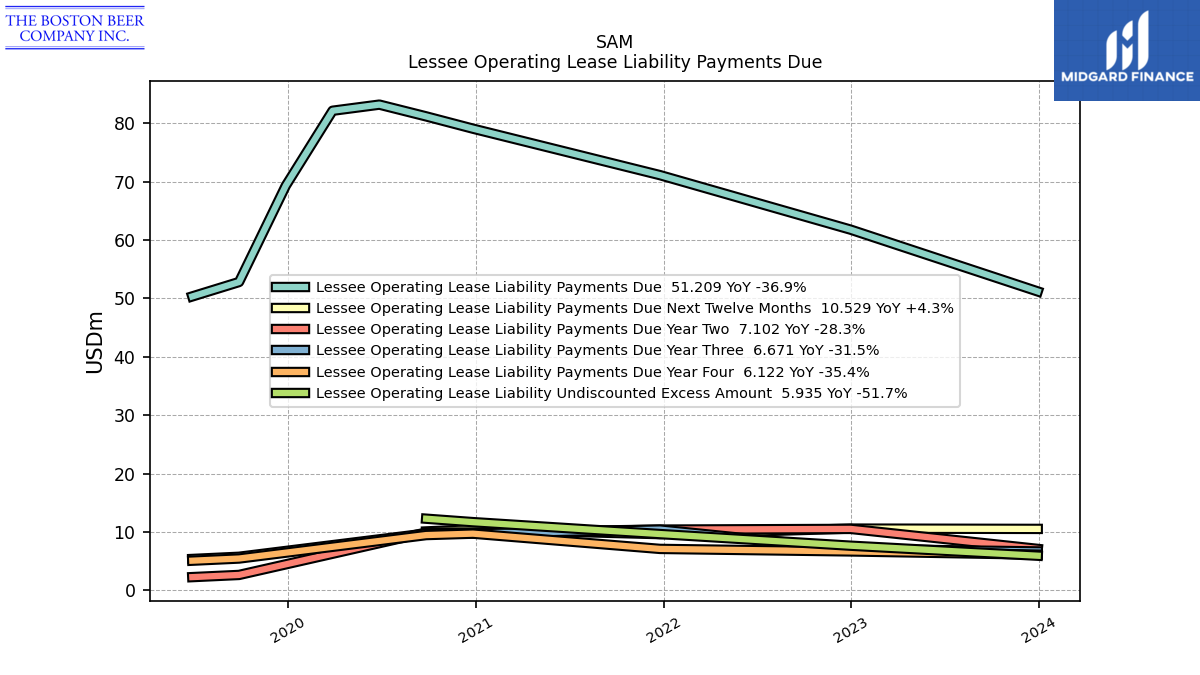
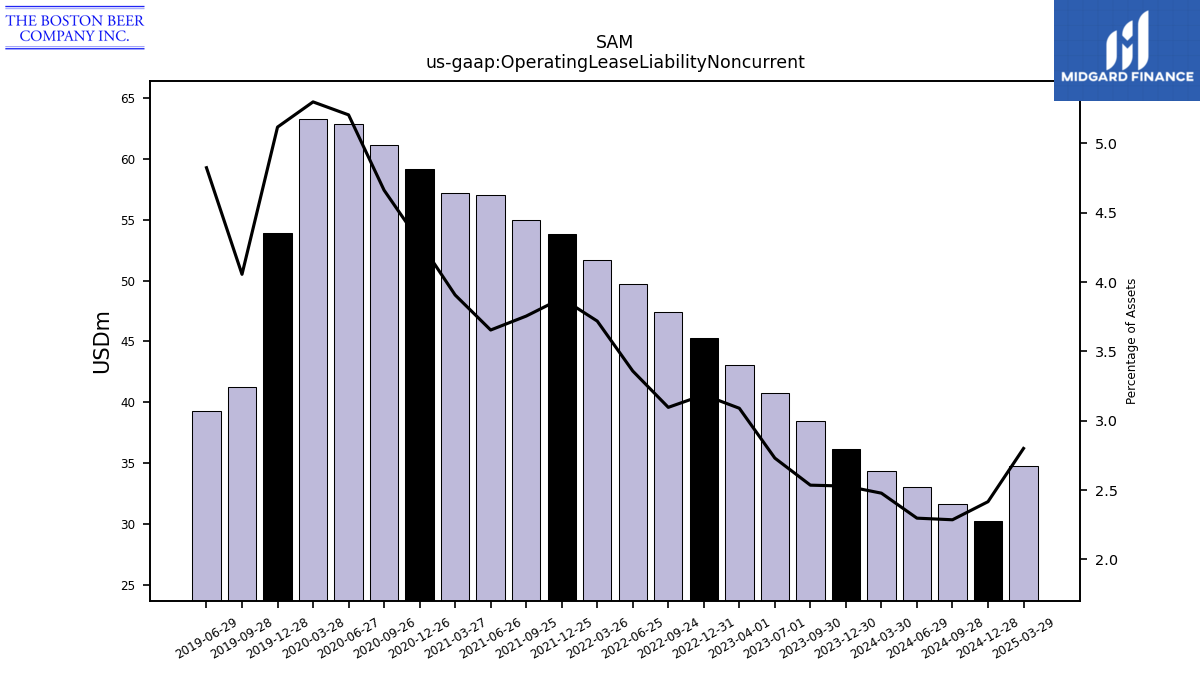
| Operating Lease Liability Noncurrent | 36.16 | 38.46 | 40.76 | 43.03 | 45.27 | 47.40 | 49.72 | 51.69 | 53.85 | 54.95 | 57.04 | 57.20 | 59.17 | 61.18 | 62.90 | 63.25 | 53.94 | 41.22 | 39.24 | NA | NA | NA | NA | NA | NA | NA | NA | NA | NA | NA | NA | NA | NA | NA | NA | NA | NA | NA | NA | NA | NA | NA | NA | NA | NA | NA | NA | NA | NA | NA | NA | NA | NA | NA | NA | NA |
| 2023-12-30 | 2023-09-30 | 2023-07-01 | 2023-04-01 | 2022-12-31 | 2022-09-24 | 2022-06-25 | 2022-03-26 | 2021-12-25 | 2021-09-25 | 2021-06-26 | 2021-03-27 | 2020-12-26 | 2020-09-26 | 2020-06-27 | 2020-03-28 | 2019-12-28 | 2019-09-28 | 2019-06-29 | 2019-03-30 | 2018-12-29 | 2018-09-29 | 2018-06-30 | 2018-03-31 | 2017-12-30 | 2017-09-30 | 2017-07-01 | 2017-04-01 | 2016-12-31 | 2016-09-24 | 2016-06-25 | 2016-03-26 | 2015-12-26 | 2015-09-26 | 2015-06-27 | 2015-03-28 | 2014-12-27 | 2014-09-27 | 2014-06-28 | 2014-03-29 | 2013-12-28 | 2013-09-28 | 2013-06-29 | 2013-03-30 | 2012-12-29 | 2012-09-29 | 2012-06-30 | 2012-03-31 | 2011-12-31 | 2011-09-24 | 2011-06-25 | 2011-03-26 | 2010-12-25 | 2010-09-25 | 2010-06-26 | 2010-03-27 | ||
|---|---|---|---|---|---|---|---|---|---|---|---|---|---|---|---|---|---|---|---|---|---|---|---|---|---|---|---|---|---|---|---|---|---|---|---|---|---|---|---|---|---|---|---|---|---|---|---|---|---|---|---|---|---|---|---|---|---|
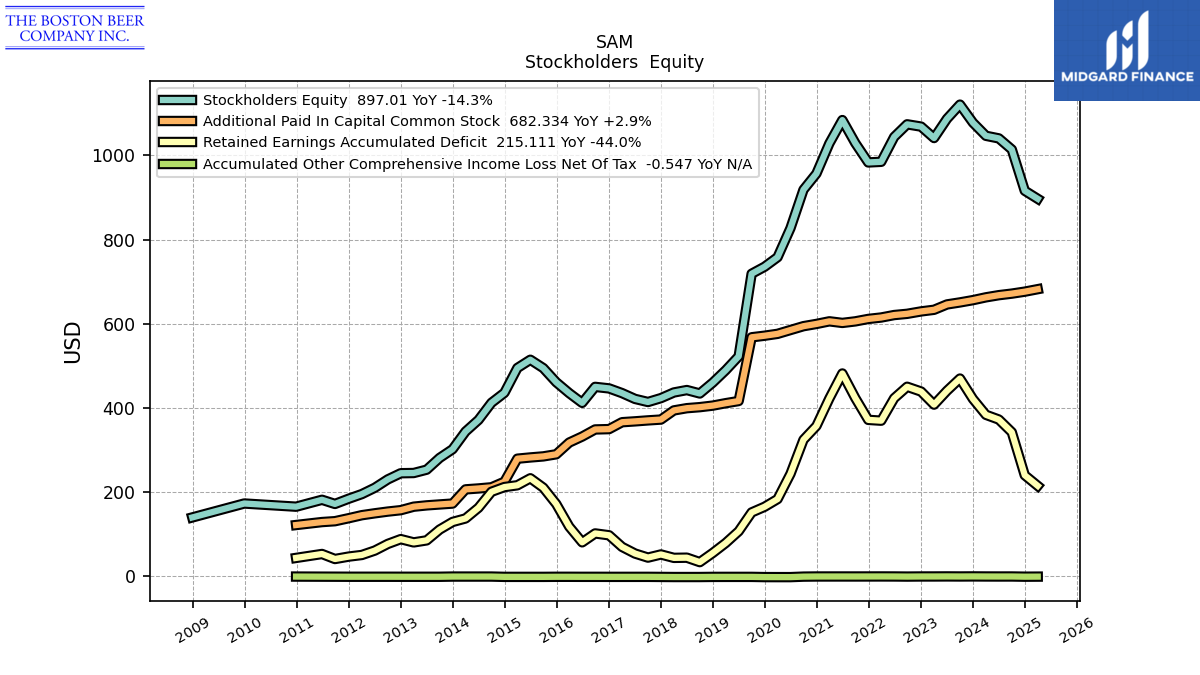
| Stockholders Equity | 1077.93 | 1120.78 | 1087.19 | 1041.36 | 1068.55 | 1073.99 | 1044.04 | 984.92 | 983.41 | 1029.38 | 1084.13 | 1028.72 | 956.97 | 918.53 | 827.48 | 758.24 | 735.64 | 718.98 | 522.80 | 489.82 | 460.32 | 434.55 | 442.67 | 436.93 | 423.52 | 414.29 | 421.66 | 435.41 | 446.58 | 450.24 | 412.23 | 435.35 | 461.22 | 494.80 | 514.68 | 495.12 | 436.14 | 412.38 | 371.73 | 344.10 | 302.08 | 281.42 | 253.54 | 245.60 | 245.09 | 230.42 | 210.56 | 195.58 | 184.75 | 172.10 | 181.99 | NA | 165.59 | NA | NA | NA | |
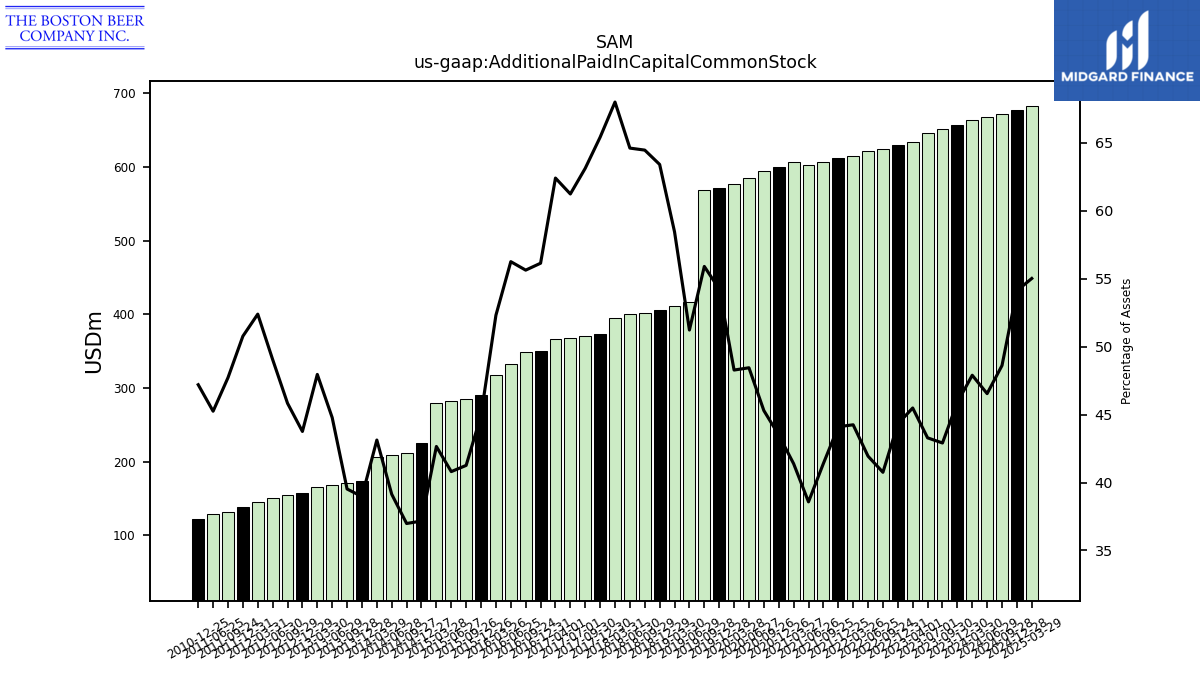
| Additional Paid In Capital Common Stock | 656.30 | 650.87 | 646.09 | 633.38 | 629.51 | 623.78 | 620.88 | 615.04 | 611.62 | 605.85 | 602.16 | 605.96 | 599.74 | 594.43 | 585.33 | 576.21 | 571.78 | 568.05 | 416.60 | 411.48 | 405.71 | 402.06 | 399.62 | 394.31 | 372.59 | 370.61 | 368.33 | 366.30 | 349.91 | 349.07 | 332.22 | 317.97 | 290.10 | 285.07 | 282.55 | 279.63 | 224.91 | 211.65 | 208.93 | 206.72 | 173.03 | 170.91 | 168.71 | 165.59 | 157.31 | 153.99 | 149.89 | 145.40 | 138.34 | 131.13 | 129.07 | NA | 122.02 | NA | NA | NA | |
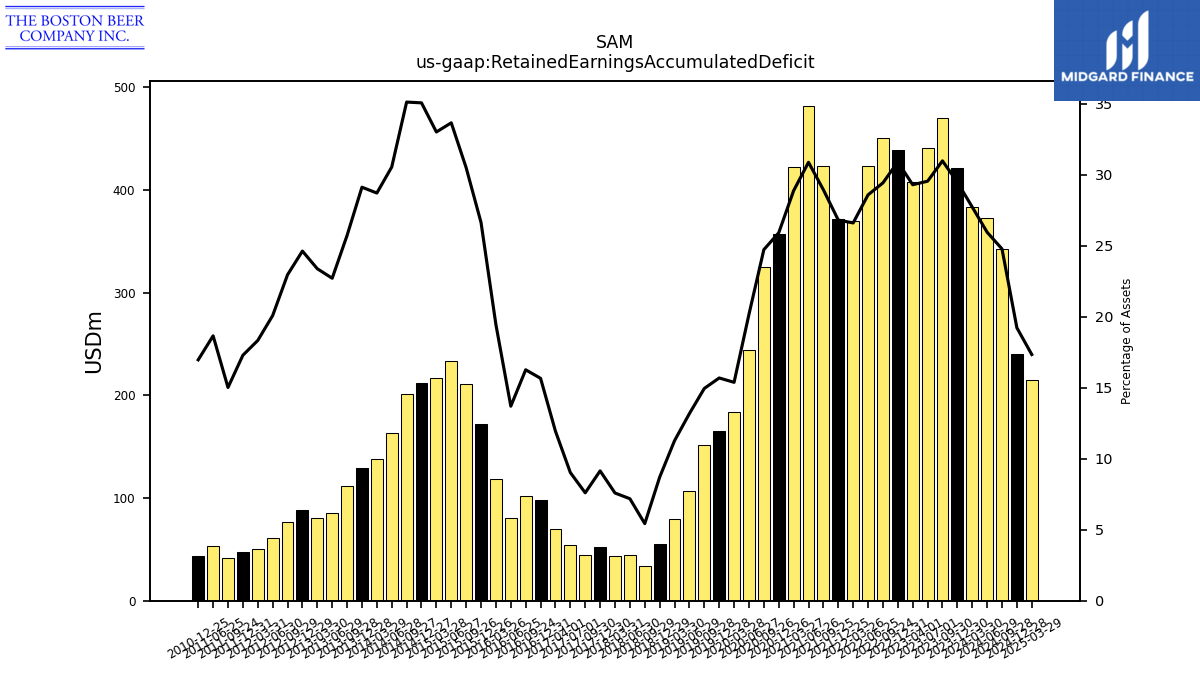
| Retained Earnings Accumulated Deficit | 421.57 | 469.99 | 441.05 | 408.05 | 439.12 | 450.54 | 423.25 | 369.90 | 371.86 | 423.64 | 482.07 | 422.87 | 357.36 | 324.54 | 243.78 | 183.63 | 165.40 | 151.97 | 107.24 | 79.38 | 55.69 | 33.88 | 44.46 | 44.01 | 52.10 | 44.64 | 54.31 | 70.09 | 97.65 | 102.08 | 80.93 | 118.21 | 171.95 | 210.74 | 233.13 | 216.49 | 212.23 | 201.02 | 163.09 | 137.66 | 129.35 | 111.27 | 85.58 | 80.76 | 88.54 | 77.14 | 61.38 | 50.88 | 47.12 | 41.28 | 53.23 | NA | 43.88 | NA | NA | NA | |
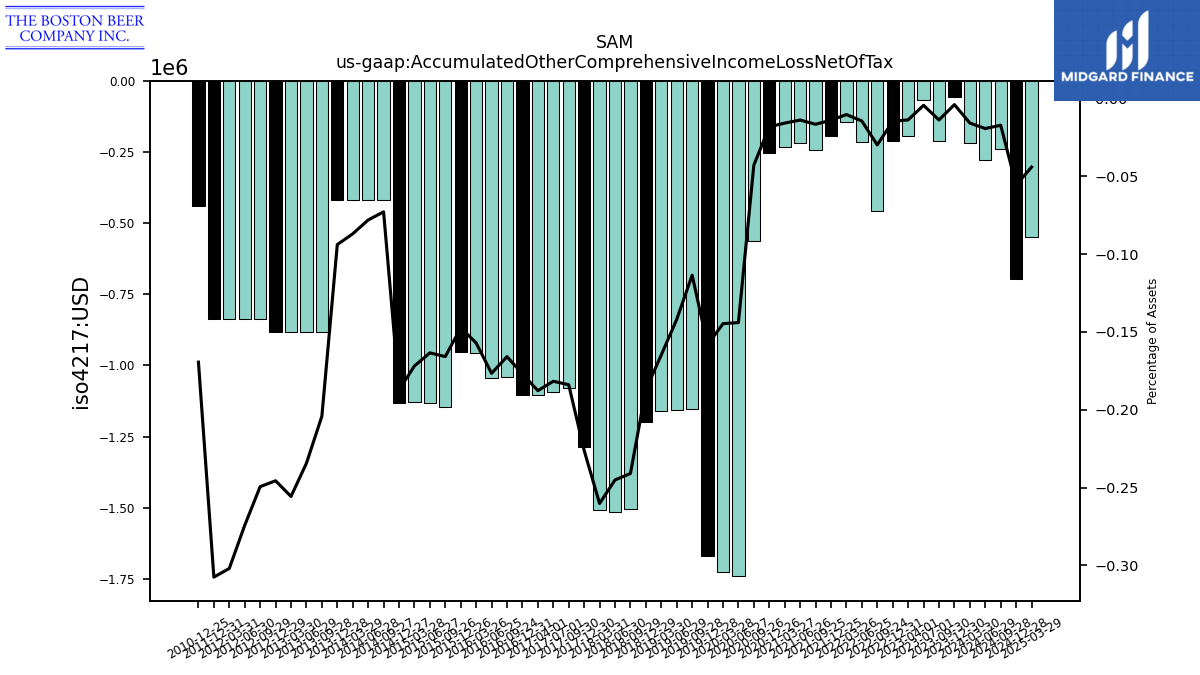
| Accumulated Other Comprehensive Income Loss Net Of Tax | -0.06 | -0.21 | -0.07 | -0.19 | -0.21 | -0.46 | -0.21 | -0.14 | -0.19 | -0.24 | -0.22 | -0.23 | -0.25 | -0.56 | -1.74 | -1.73 | -1.67 | -1.15 | -1.16 | -1.16 | -1.20 | -1.50 | -1.52 | -1.51 | -1.29 | -1.08 | -1.09 | -1.10 | -1.10 | -1.04 | -1.04 | -0.95 | -0.95 | -1.15 | -1.13 | -1.13 | -1.13 | -0.42 | -0.42 | -0.42 | -0.42 | -0.88 | -0.88 | -0.88 | -0.88 | -0.84 | -0.84 | -0.84 | -0.84 | NA | NA | NA | -0.44 | NA | NA | NA |
| 2023-12-30 | 2023-09-30 | 2023-07-01 | 2023-04-01 | 2022-12-31 | 2022-09-24 | 2022-06-25 | 2022-03-26 | 2021-12-25 | 2021-09-25 | 2021-06-26 | 2021-03-27 | 2020-12-26 | 2020-09-26 | 2020-06-27 | 2020-03-28 | 2019-12-28 | 2019-09-28 | 2019-06-29 | 2019-03-30 | 2018-12-29 | 2018-09-29 | 2018-06-30 | 2018-03-31 | 2017-12-30 | 2017-09-30 | 2017-07-01 | 2017-04-01 | 2016-12-31 | 2016-09-24 | 2016-06-25 | 2016-03-26 | 2015-12-26 | 2015-09-26 | 2015-06-27 | 2015-03-28 | 2014-12-27 | 2014-09-27 | 2014-06-28 | 2014-03-29 | 2013-12-28 | 2013-09-28 | 2013-06-29 | 2013-03-30 | 2012-12-29 | 2012-09-29 | 2012-06-30 | 2012-03-31 | 2011-12-31 | 2011-09-24 | 2011-06-25 | 2011-03-26 | 2010-12-25 | 2010-09-25 | 2010-06-26 | 2010-03-27 | ||
|---|---|---|---|---|---|---|---|---|---|---|---|---|---|---|---|---|---|---|---|---|---|---|---|---|---|---|---|---|---|---|---|---|---|---|---|---|---|---|---|---|---|---|---|---|---|---|---|---|---|---|---|---|---|---|---|---|---|
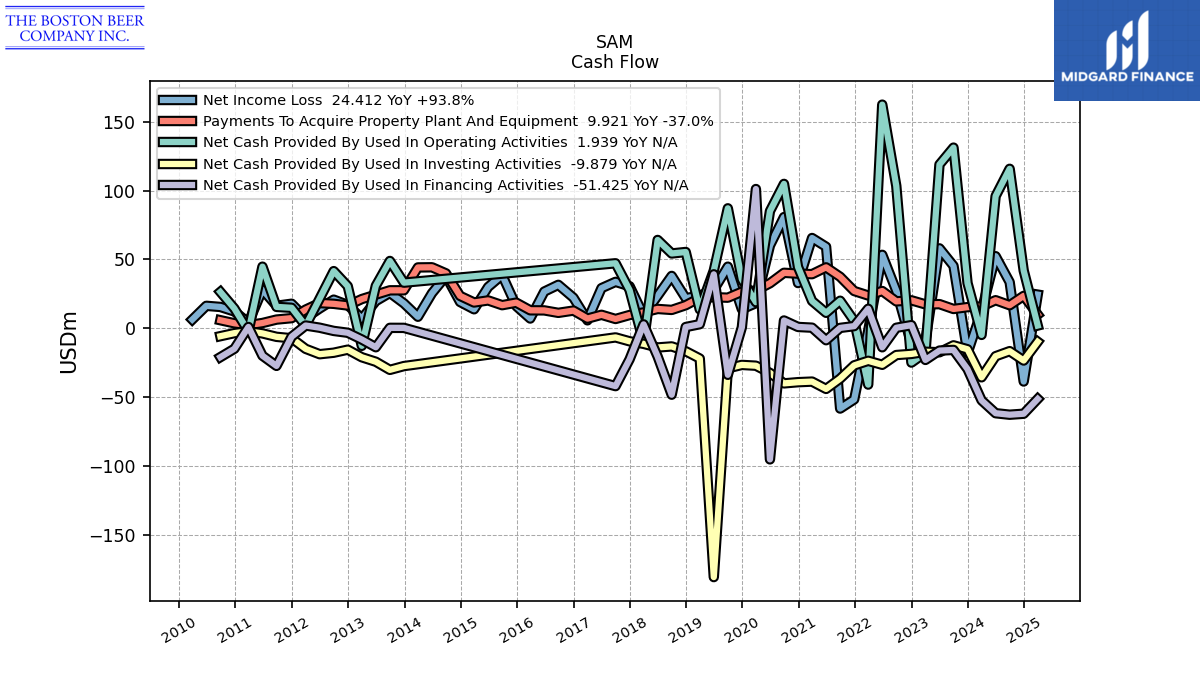
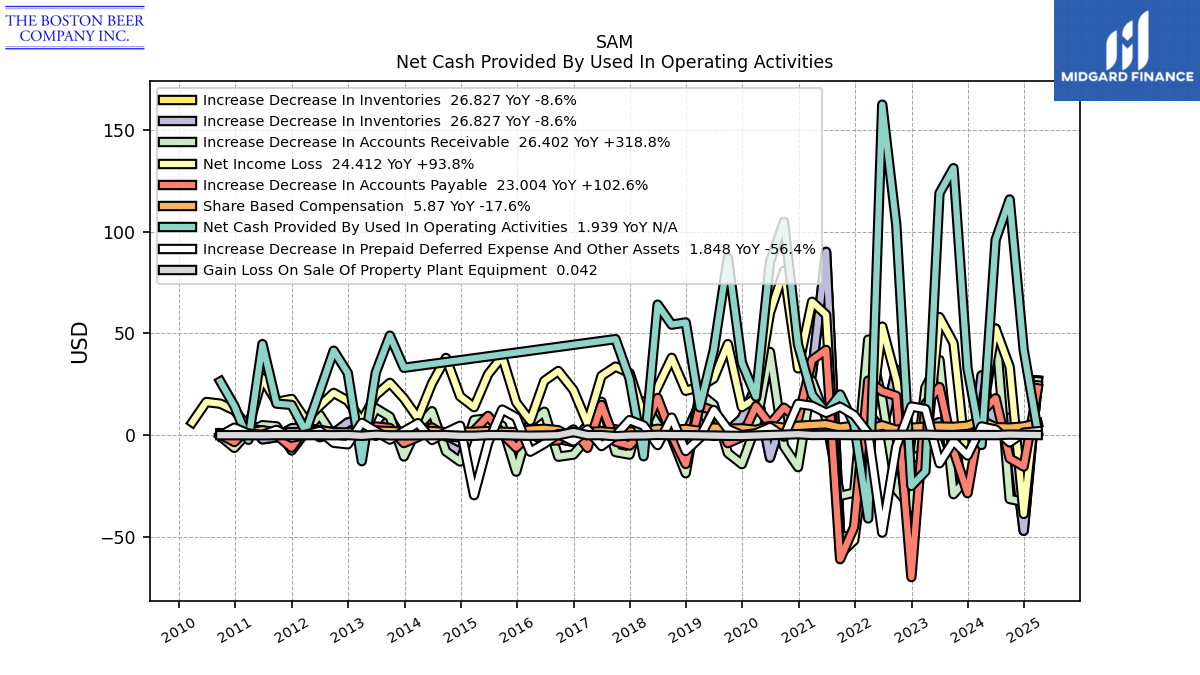
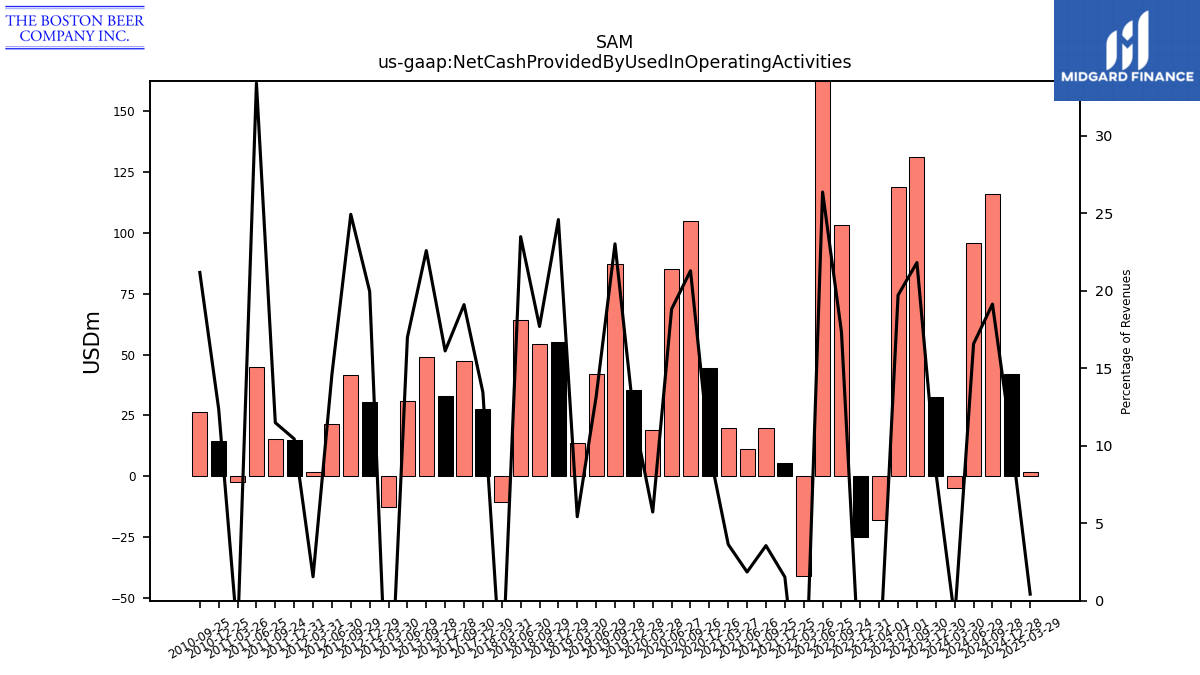
| Net Cash Provided By Used In Operating Activities | 32.75 | 131.26 | 118.96 | -17.82 | -25.01 | 103.45 | 162.51 | -41.01 | 5.33 | 19.98 | 11.18 | 19.81 | 44.49 | 104.91 | 85.09 | 18.92 | 35.56 | 87.15 | 41.89 | 13.64 | 55.39 | 54.31 | 64.16 | -10.41 | 27.74 | 47.20 | NA | NA | NA | NA | NA | NA | NA | NA | NA | NA | NA | NA | NA | NA | 33.10 | 48.89 | 30.82 | -12.83 | 30.54 | 41.50 | 21.54 | 1.75 | 14.84 | 15.49 | 44.75 | -2.31 | 14.31 | 26.36 | NA | NA | |
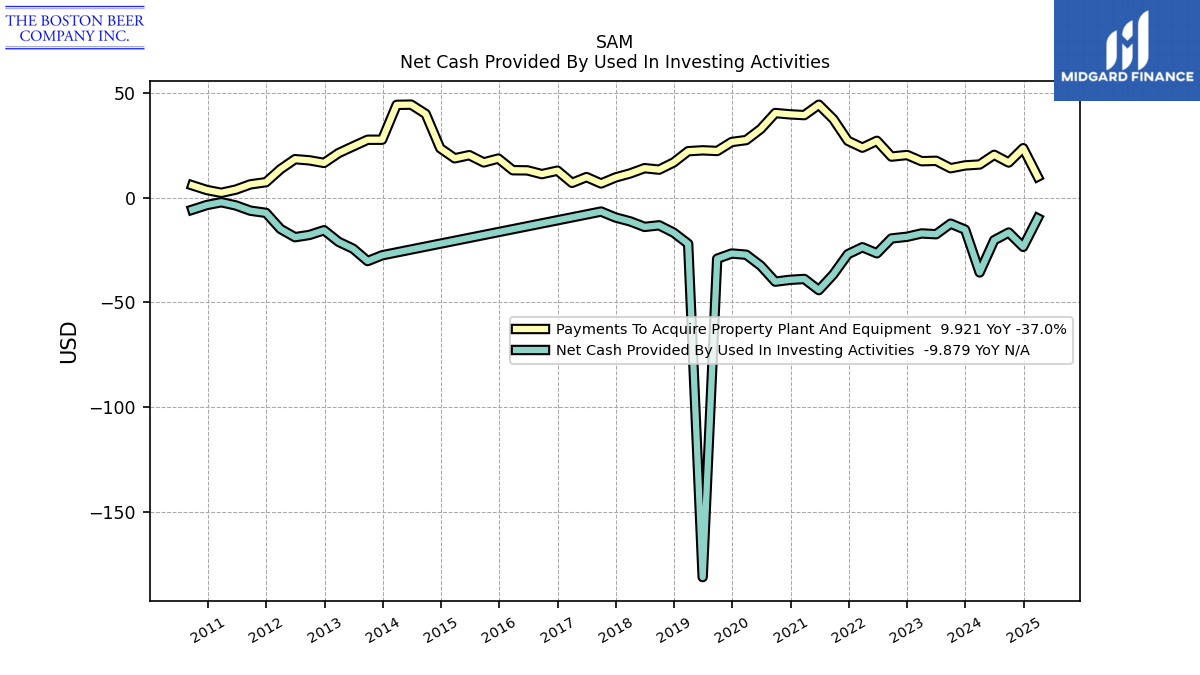
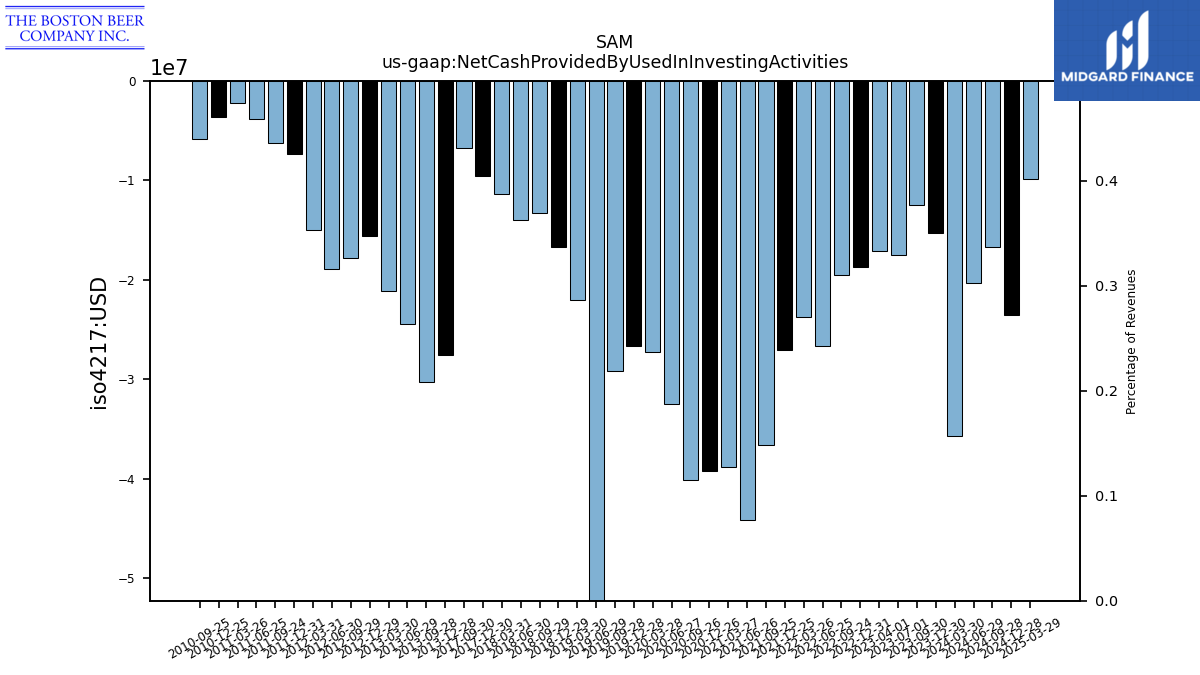
| Net Cash Provided By Used In Investing Activities | -15.31 | -12.46 | -17.50 | -17.12 | -18.70 | -19.51 | -26.60 | -23.70 | -27.02 | -36.64 | -44.14 | -38.81 | -39.24 | -40.11 | -32.50 | -27.26 | -26.69 | -29.15 | -180.94 | -22.05 | -16.73 | -13.24 | -14.01 | -11.36 | -9.53 | -6.69 | NA | NA | NA | NA | NA | NA | NA | NA | NA | NA | NA | NA | NA | NA | -27.54 | -30.29 | -24.39 | -21.11 | -15.60 | -17.82 | -18.91 | -14.99 | -7.31 | -6.27 | -3.77 | -2.25 | -3.58 | -5.81 | NA | NA | |
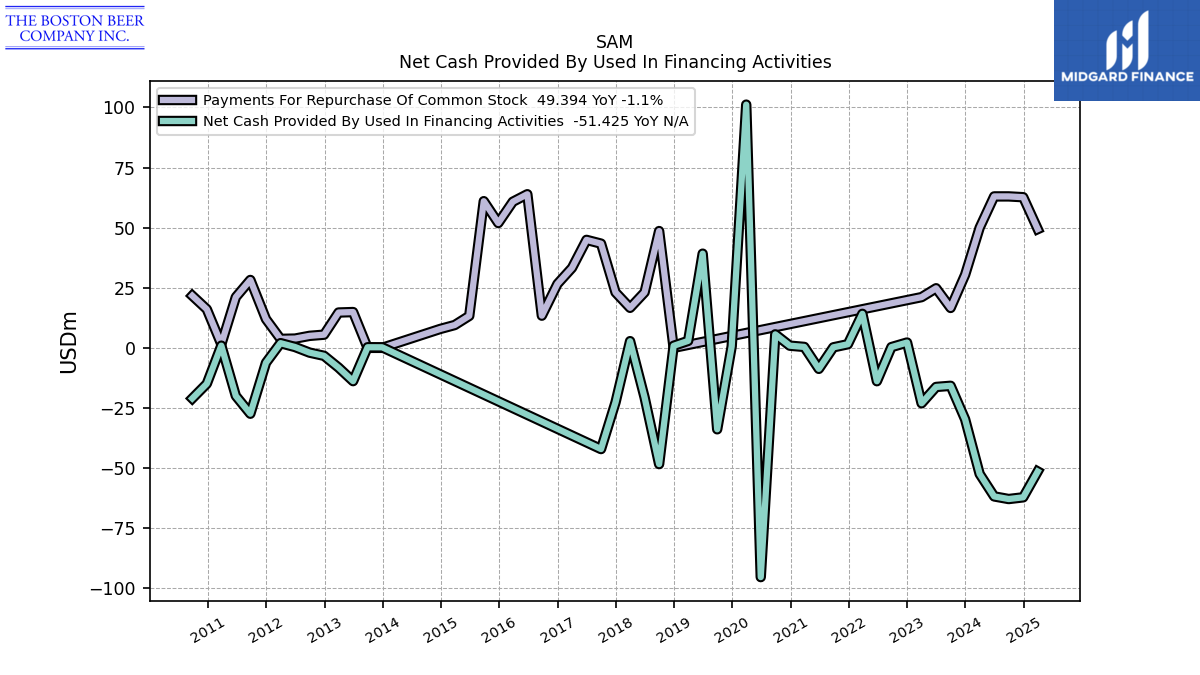
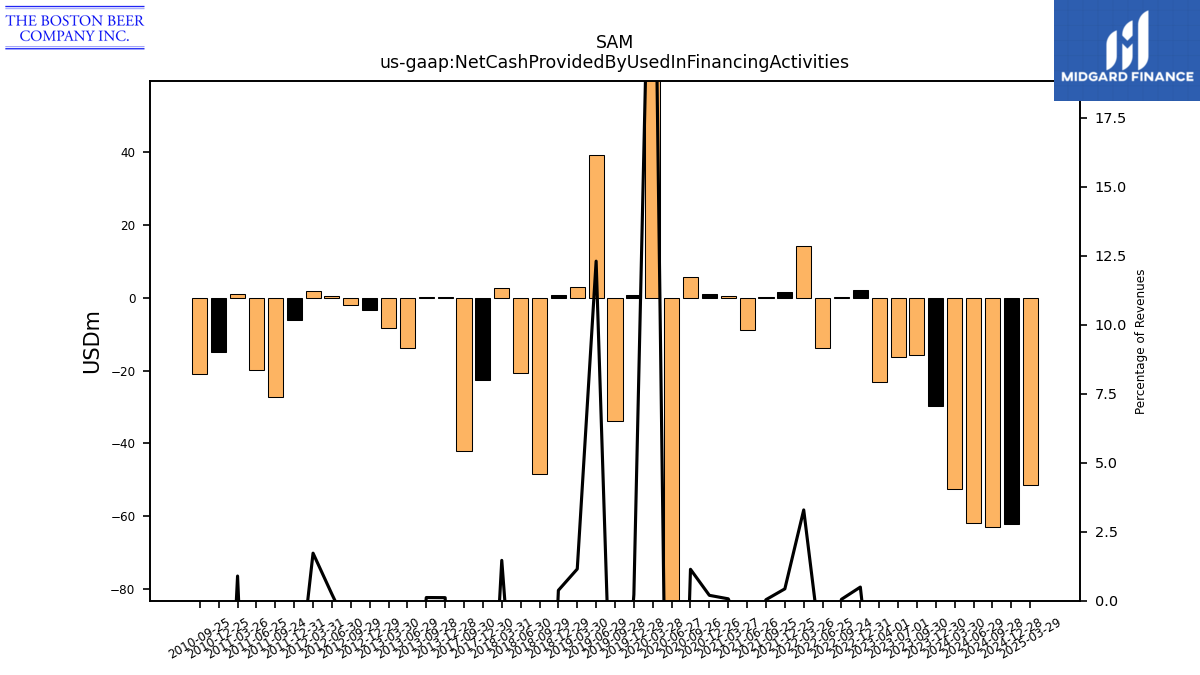
| Net Cash Provided By Used In Financing Activities | -29.73 | -15.79 | -16.27 | -23.06 | 2.22 | 0.31 | -13.88 | 14.15 | 1.50 | 0.22 | -8.74 | 0.38 | 0.91 | 5.62 | -95.37 | 101.17 | 0.67 | -33.89 | 39.18 | 2.90 | 0.85 | -48.36 | -20.62 | 2.79 | -22.63 | -42.11 | NA | NA | NA | NA | NA | NA | NA | NA | NA | NA | NA | NA | NA | NA | 0.23 | 0.25 | -13.85 | -8.22 | -3.31 | -1.98 | 0.35 | 1.95 | -6.20 | -27.41 | -19.98 | 0.92 | -14.94 | -21.04 | NA | NA |
| 2023-12-30 | 2023-09-30 | 2023-07-01 | 2023-04-01 | 2022-12-31 | 2022-09-24 | 2022-06-25 | 2022-03-26 | 2021-12-25 | 2021-09-25 | 2021-06-26 | 2021-03-27 | 2020-12-26 | 2020-09-26 | 2020-06-27 | 2020-03-28 | 2019-12-28 | 2019-09-28 | 2019-06-29 | 2019-03-30 | 2018-12-29 | 2018-09-29 | 2018-06-30 | 2018-03-31 | 2017-12-30 | 2017-09-30 | 2017-07-01 | 2017-04-01 | 2016-12-31 | 2016-09-24 | 2016-06-25 | 2016-03-26 | 2015-12-26 | 2015-09-26 | 2015-06-27 | 2015-03-28 | 2014-12-27 | 2014-09-27 | 2014-06-28 | 2014-03-29 | 2013-12-28 | 2013-09-28 | 2013-06-29 | 2013-03-30 | 2012-12-29 | 2012-09-29 | 2012-06-30 | 2012-03-31 | 2011-12-31 | 2011-09-24 | 2011-06-25 | 2011-03-26 | 2010-12-25 | 2010-09-25 | 2010-06-26 | 2010-03-27 | ||
|---|---|---|---|---|---|---|---|---|---|---|---|---|---|---|---|---|---|---|---|---|---|---|---|---|---|---|---|---|---|---|---|---|---|---|---|---|---|---|---|---|---|---|---|---|---|---|---|---|---|---|---|---|---|---|---|---|---|
| Net Cash Provided By Used In Operating Activities | 32.75 | 131.26 | 118.96 | -17.82 | -25.01 | 103.45 | 162.51 | -41.01 | 5.33 | 19.98 | 11.18 | 19.81 | 44.49 | 104.91 | 85.09 | 18.92 | 35.56 | 87.15 | 41.89 | 13.64 | 55.39 | 54.31 | 64.16 | -10.41 | 27.74 | 47.20 | NA | NA | NA | NA | NA | NA | NA | NA | NA | NA | NA | NA | NA | NA | 33.10 | 48.89 | 30.82 | -12.83 | 30.54 | 41.50 | 21.54 | 1.75 | 14.84 | 15.49 | 44.75 | -2.31 | 14.31 | 26.36 | NA | NA | |
| Net Income Loss | -18.12 | 45.30 | 58.03 | -8.96 | -11.42 | 27.29 | 53.35 | -1.96 | -51.78 | -58.42 | 59.20 | 65.56 | 32.82 | 80.77 | 60.14 | 18.23 | 13.76 | 44.73 | 27.86 | 23.69 | 21.81 | 38.01 | 23.54 | 9.31 | 30.53 | 33.68 | 29.12 | 5.71 | 22.17 | 31.53 | 26.62 | 7.03 | 16.11 | 38.62 | 29.93 | 13.74 | 19.07 | 37.93 | 25.43 | 8.31 | 18.08 | 25.69 | 19.71 | 6.91 | 16.87 | 20.75 | 14.35 | 7.49 | 17.79 | 16.30 | 28.02 | 3.96 | 12.17 | 15.45 | 16.27 | 6.26 | |
| Profit Loss | -18.12 | 45.30 | 58.03 | -8.96 | -11.42 | 27.29 | 53.35 | -1.96 | -51.78 | -58.42 | 59.20 | 65.56 | 32.82 | 80.77 | 60.14 | 18.23 | 13.76 | 44.73 | 27.86 | 23.69 | 21.81 | 38.01 | 23.54 | 9.31 | 30.53 | NA | NA | NA | NA | NA | NA | NA | NA | NA | NA | NA | NA | NA | NA | NA | NA | NA | NA | NA | NA | NA | NA | NA | NA | NA | NA | NA | NA | NA | NA | NA | |
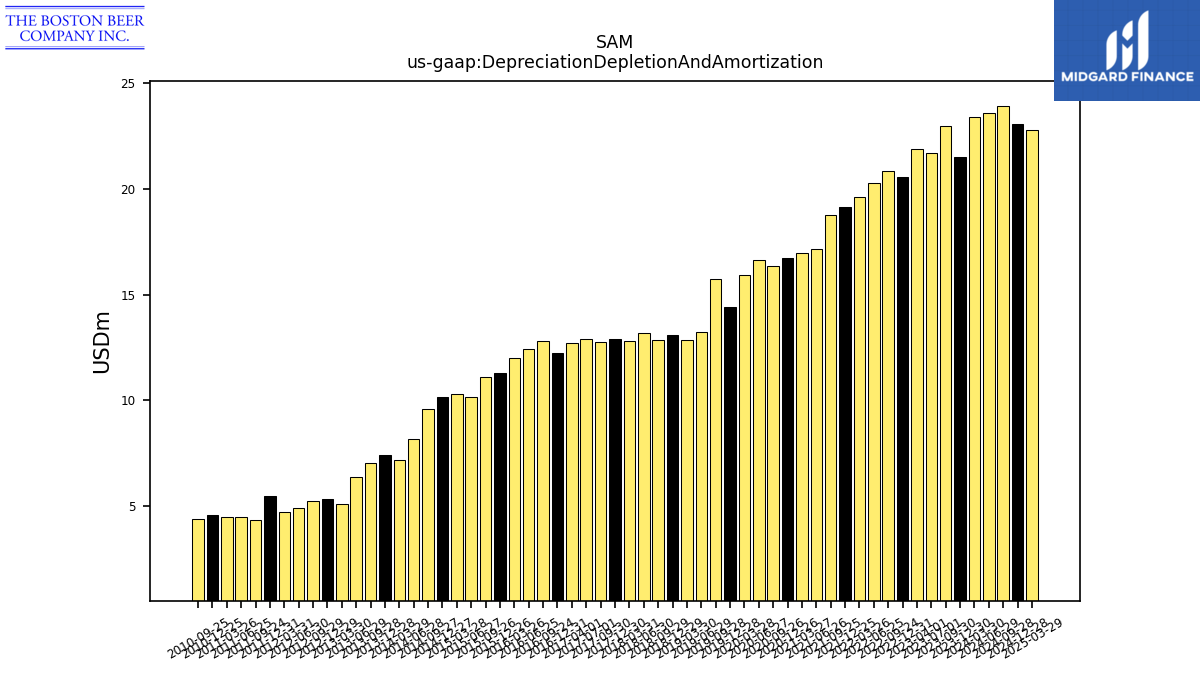
| Depreciation Depletion And Amortization | 21.54 | 23.00 | 21.69 | 21.91 | 20.59 | 20.86 | 20.27 | 19.63 | 19.14 | 18.78 | 17.18 | 17.00 | 16.72 | 16.35 | 16.64 | 15.95 | 14.43 | 15.75 | 13.23 | 12.86 | 13.11 | 12.85 | 13.19 | 12.82 | 12.88 | 12.76 | 12.89 | 12.72 | 12.25 | 12.83 | 12.44 | 12.03 | 11.31 | 11.12 | 10.14 | 10.31 | 10.15 | 9.60 | 8.20 | 7.20 | 7.42 | 7.02 | 6.37 | 5.10 | 5.32 | 5.25 | 4.90 | 4.73 | 5.46 | 4.36 | 4.50 | 4.46 | 4.59 | 4.37 | NA | NA | |
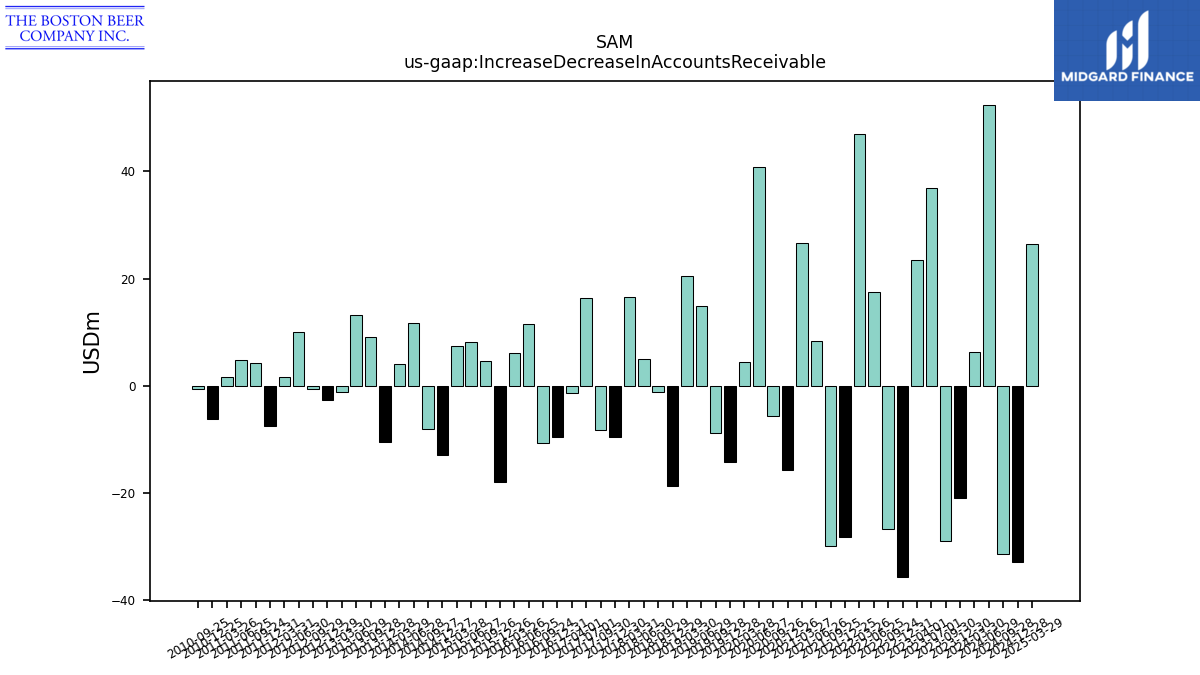
| Increase Decrease In Accounts Receivable | -20.91 | -29.05 | 36.94 | 23.37 | -35.70 | -26.72 | 17.50 | 46.97 | -28.25 | -29.89 | 8.35 | 26.72 | -15.76 | -5.55 | 40.89 | 4.44 | -14.27 | -8.81 | 14.89 | 20.45 | -18.78 | -1.24 | 5.04 | 16.61 | -9.60 | -8.34 | 16.38 | -1.38 | -9.57 | -10.62 | 11.49 | 6.17 | -17.98 | 4.61 | 8.22 | 7.44 | -12.99 | -8.05 | 11.74 | 4.14 | -10.51 | 9.03 | 13.21 | -1.18 | -2.60 | -0.67 | 9.98 | 1.59 | -7.55 | 4.28 | 4.87 | 1.56 | -6.28 | -0.54 | NA | NA | |
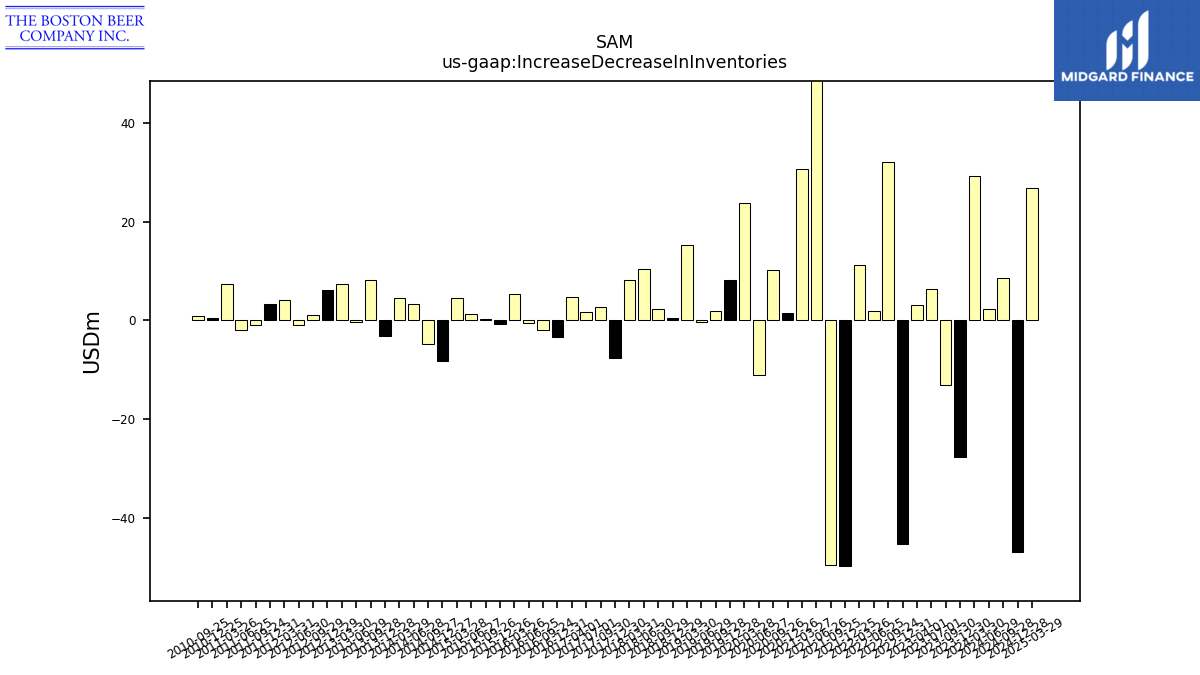
| Increase Decrease In Inventories | -27.71 | -13.16 | 6.37 | 3.00 | -45.32 | 32.17 | 1.81 | 11.21 | -49.88 | -49.57 | 90.09 | 30.58 | 1.39 | 10.28 | -11.06 | 23.86 | 8.09 | 1.91 | -0.41 | 15.35 | 0.48 | 2.20 | 10.47 | 8.17 | -7.59 | 2.78 | 1.75 | 4.80 | -3.34 | -1.89 | -0.49 | 5.28 | -0.85 | 0.20 | 1.32 | 4.49 | -8.30 | -4.72 | 3.33 | 4.61 | -3.12 | 8.08 | -0.28 | 7.35 | 6.22 | 0.97 | -0.96 | 4.06 | 3.30 | -1.06 | -2.07 | 7.28 | 0.48 | 0.80 | NA | NA | |
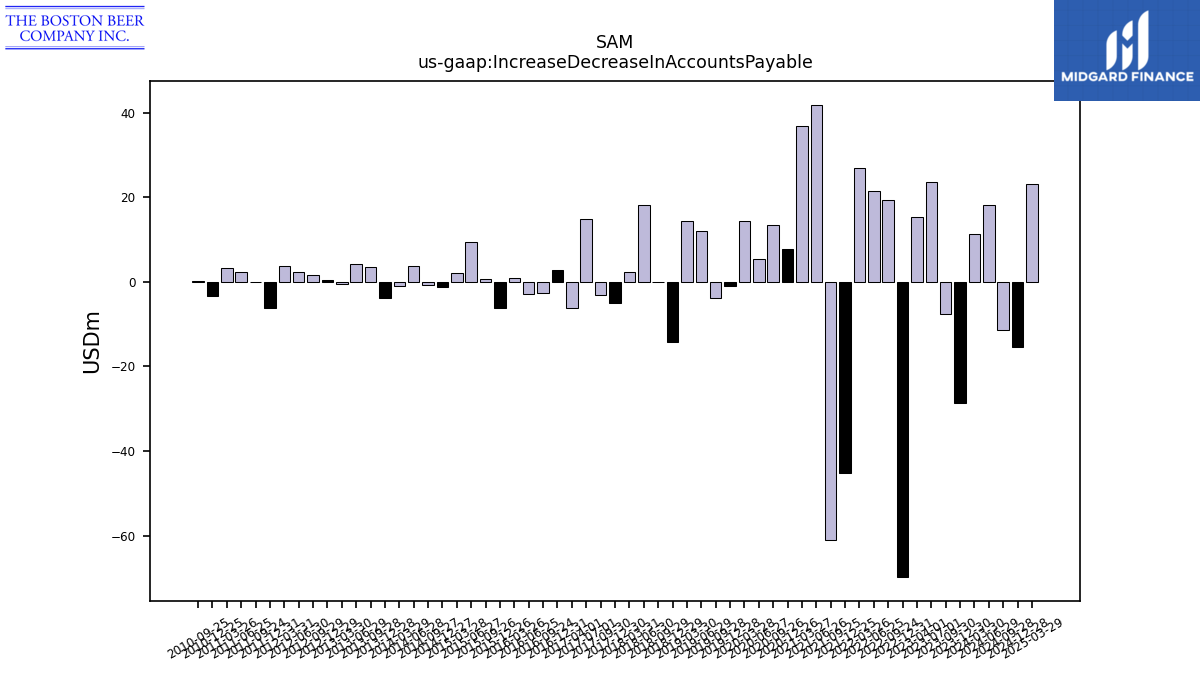
| Increase Decrease In Accounts Payable | -28.58 | -7.53 | 23.61 | 15.26 | -69.84 | 19.28 | 21.54 | 26.80 | -45.14 | -61.02 | 41.89 | 36.91 | 7.75 | 13.46 | 5.30 | 14.26 | -0.97 | -3.93 | 11.92 | 14.40 | -14.21 | -0.00 | 18.26 | 2.30 | -5.13 | -3.21 | 14.83 | -6.25 | 2.76 | -2.58 | -2.82 | 0.82 | -6.18 | 0.60 | 9.43 | 2.14 | -1.15 | -0.69 | 3.73 | -1.01 | -3.90 | 3.49 | 4.21 | -0.63 | 0.34 | 1.59 | 2.38 | 3.69 | -6.19 | 0.04 | 2.23 | 3.31 | -3.41 | 0.29 | NA | NA | |
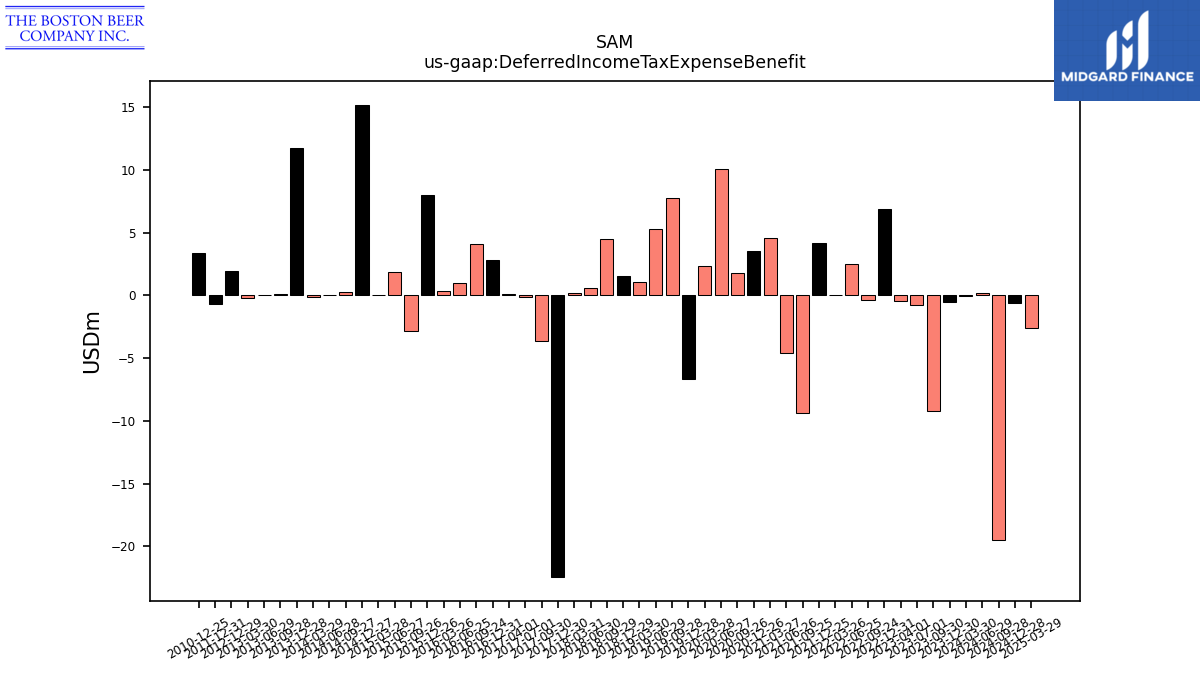
| Deferred Income Tax Expense Benefit | -0.52 | -9.17 | -0.75 | -0.43 | 6.90 | -0.36 | 2.54 | 0.02 | 4.14 | -9.33 | -4.60 | 4.57 | 3.50 | 1.75 | 10.03 | 2.38 | -6.64 | 7.76 | 5.25 | 1.03 | 1.53 | 4.50 | 0.60 | 0.18 | -22.44 | -3.61 | -0.09 | 0.12 | 2.78 | 4.09 | 1.02 | 0.35 | 8.00 | -2.87 | 1.87 | -0.01 | 15.19 | 0.26 | -0.00 | -0.10 | 11.74 | 0.10 | 0.00 | -0.21 | 1.95 | NA | NA | NA | -0.67 | NA | NA | NA | 3.39 | NA | NA | NA | |
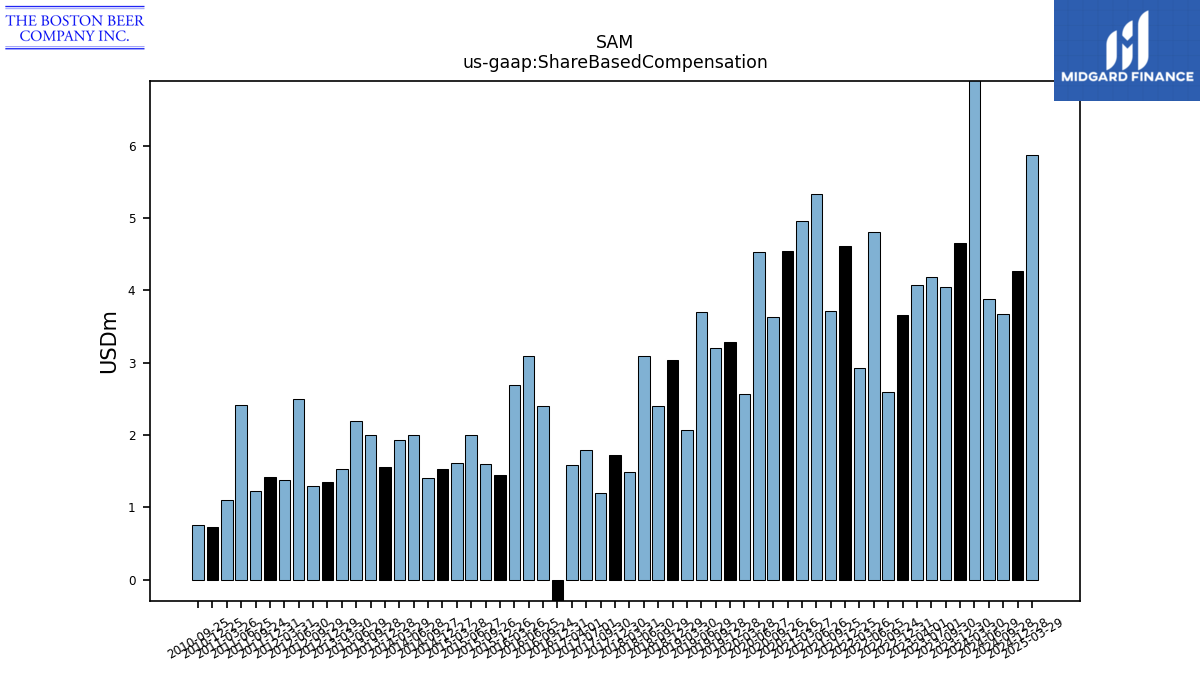
| Share Based Compensation | 4.66 | 4.05 | 4.19 | 4.07 | 3.66 | 2.60 | 4.81 | 2.92 | 4.61 | 3.71 | 5.33 | 4.96 | 4.55 | 3.63 | 4.54 | 2.57 | 3.29 | 3.20 | 3.70 | 2.07 | 3.04 | 2.40 | 3.10 | 1.49 | 1.72 | 1.20 | 1.80 | 1.58 | -1.97 | 2.40 | 3.10 | 2.69 | 1.45 | 1.60 | 2.00 | 1.62 | 1.53 | 1.40 | 2.00 | 1.94 | 1.55 | 2.00 | 2.20 | 1.54 | 1.35 | 1.30 | 2.50 | 1.39 | 1.43 | 1.23 | 2.42 | 1.10 | 0.74 | 0.75 | NA | NA |
| 2023-12-30 | 2023-09-30 | 2023-07-01 | 2023-04-01 | 2022-12-31 | 2022-09-24 | 2022-06-25 | 2022-03-26 | 2021-12-25 | 2021-09-25 | 2021-06-26 | 2021-03-27 | 2020-12-26 | 2020-09-26 | 2020-06-27 | 2020-03-28 | 2019-12-28 | 2019-09-28 | 2019-06-29 | 2019-03-30 | 2018-12-29 | 2018-09-29 | 2018-06-30 | 2018-03-31 | 2017-12-30 | 2017-09-30 | 2017-07-01 | 2017-04-01 | 2016-12-31 | 2016-09-24 | 2016-06-25 | 2016-03-26 | 2015-12-26 | 2015-09-26 | 2015-06-27 | 2015-03-28 | 2014-12-27 | 2014-09-27 | 2014-06-28 | 2014-03-29 | 2013-12-28 | 2013-09-28 | 2013-06-29 | 2013-03-30 | 2012-12-29 | 2012-09-29 | 2012-06-30 | 2012-03-31 | 2011-12-31 | 2011-09-24 | 2011-06-25 | 2011-03-26 | 2010-12-25 | 2010-09-25 | 2010-06-26 | 2010-03-27 | ||
|---|---|---|---|---|---|---|---|---|---|---|---|---|---|---|---|---|---|---|---|---|---|---|---|---|---|---|---|---|---|---|---|---|---|---|---|---|---|---|---|---|---|---|---|---|---|---|---|---|---|---|---|---|---|---|---|---|---|
| Net Cash Provided By Used In Investing Activities | -15.31 | -12.46 | -17.50 | -17.12 | -18.70 | -19.51 | -26.60 | -23.70 | -27.02 | -36.64 | -44.14 | -38.81 | -39.24 | -40.11 | -32.50 | -27.26 | -26.69 | -29.15 | -180.94 | -22.05 | -16.73 | -13.24 | -14.01 | -11.36 | -9.53 | -6.69 | NA | NA | NA | NA | NA | NA | NA | NA | NA | NA | NA | NA | NA | NA | -27.54 | -30.29 | -24.39 | -21.11 | -15.60 | -17.82 | -18.91 | -14.99 | -7.31 | -6.27 | -3.77 | -2.25 | -3.58 | -5.81 | NA | NA | |
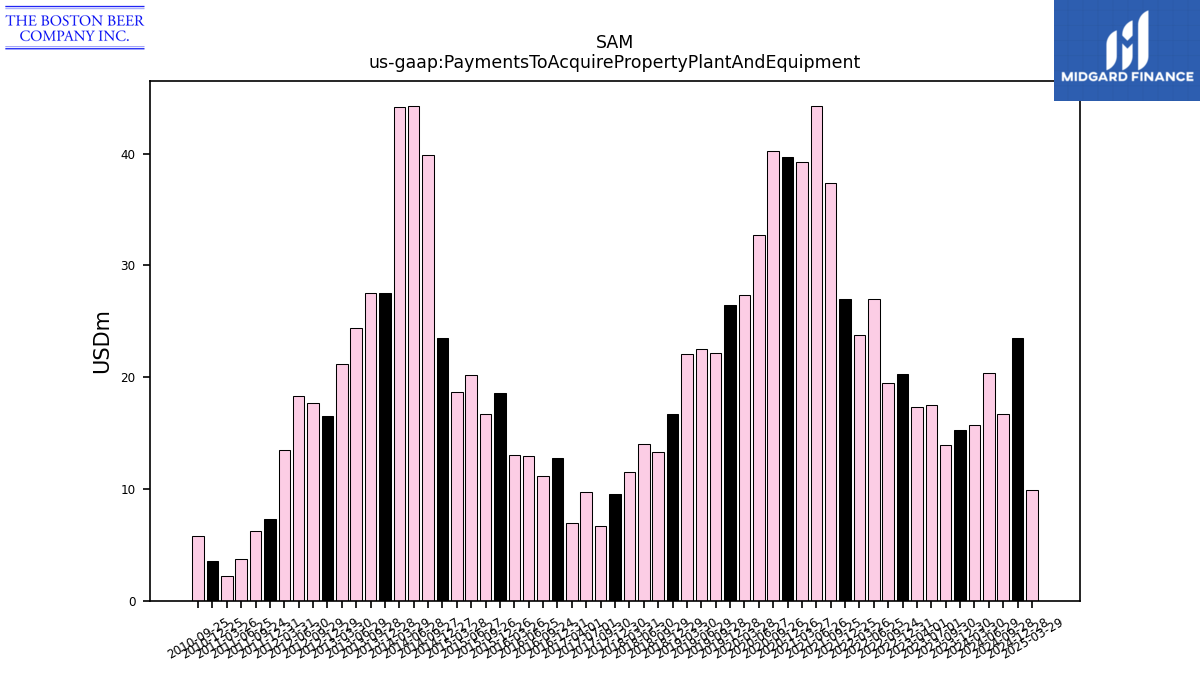
| Payments To Acquire Property Plant And Equipment | 15.31 | 13.97 | 17.50 | 17.31 | 20.27 | 19.51 | 27.04 | 23.77 | 27.03 | 37.37 | 44.24 | 39.28 | 39.66 | 40.27 | 32.68 | 27.39 | 26.47 | 22.18 | 22.50 | 22.08 | 16.71 | 13.28 | 13.99 | 11.48 | 9.57 | 6.69 | 9.74 | 6.98 | 12.80 | 11.15 | 12.94 | 13.01 | 18.58 | 16.73 | 20.19 | 18.69 | 23.49 | 39.84 | 44.28 | 44.17 | 27.55 | 27.54 | 24.39 | 21.18 | 16.50 | 17.71 | 18.28 | 13.52 | 7.31 | 6.27 | 3.77 | 2.25 | 3.58 | 5.81 | NA | NA |
| 2023-12-30 | 2023-09-30 | 2023-07-01 | 2023-04-01 | 2022-12-31 | 2022-09-24 | 2022-06-25 | 2022-03-26 | 2021-12-25 | 2021-09-25 | 2021-06-26 | 2021-03-27 | 2020-12-26 | 2020-09-26 | 2020-06-27 | 2020-03-28 | 2019-12-28 | 2019-09-28 | 2019-06-29 | 2019-03-30 | 2018-12-29 | 2018-09-29 | 2018-06-30 | 2018-03-31 | 2017-12-30 | 2017-09-30 | 2017-07-01 | 2017-04-01 | 2016-12-31 | 2016-09-24 | 2016-06-25 | 2016-03-26 | 2015-12-26 | 2015-09-26 | 2015-06-27 | 2015-03-28 | 2014-12-27 | 2014-09-27 | 2014-06-28 | 2014-03-29 | 2013-12-28 | 2013-09-28 | 2013-06-29 | 2013-03-30 | 2012-12-29 | 2012-09-29 | 2012-06-30 | 2012-03-31 | 2011-12-31 | 2011-09-24 | 2011-06-25 | 2011-03-26 | 2010-12-25 | 2010-09-25 | 2010-06-26 | 2010-03-27 | ||
|---|---|---|---|---|---|---|---|---|---|---|---|---|---|---|---|---|---|---|---|---|---|---|---|---|---|---|---|---|---|---|---|---|---|---|---|---|---|---|---|---|---|---|---|---|---|---|---|---|---|---|---|---|---|---|---|---|---|
| Net Cash Provided By Used In Financing Activities | -29.73 | -15.79 | -16.27 | -23.06 | 2.22 | 0.31 | -13.88 | 14.15 | 1.50 | 0.22 | -8.74 | 0.38 | 0.91 | 5.62 | -95.37 | 101.17 | 0.67 | -33.89 | 39.18 | 2.90 | 0.85 | -48.36 | -20.62 | 2.79 | -22.63 | -42.11 | NA | NA | NA | NA | NA | NA | NA | NA | NA | NA | NA | NA | NA | NA | 0.23 | 0.25 | -13.85 | -8.22 | -3.31 | -1.98 | 0.35 | 1.95 | -6.20 | -27.41 | -19.98 | 0.92 | -14.94 | -21.04 | NA | NA | |
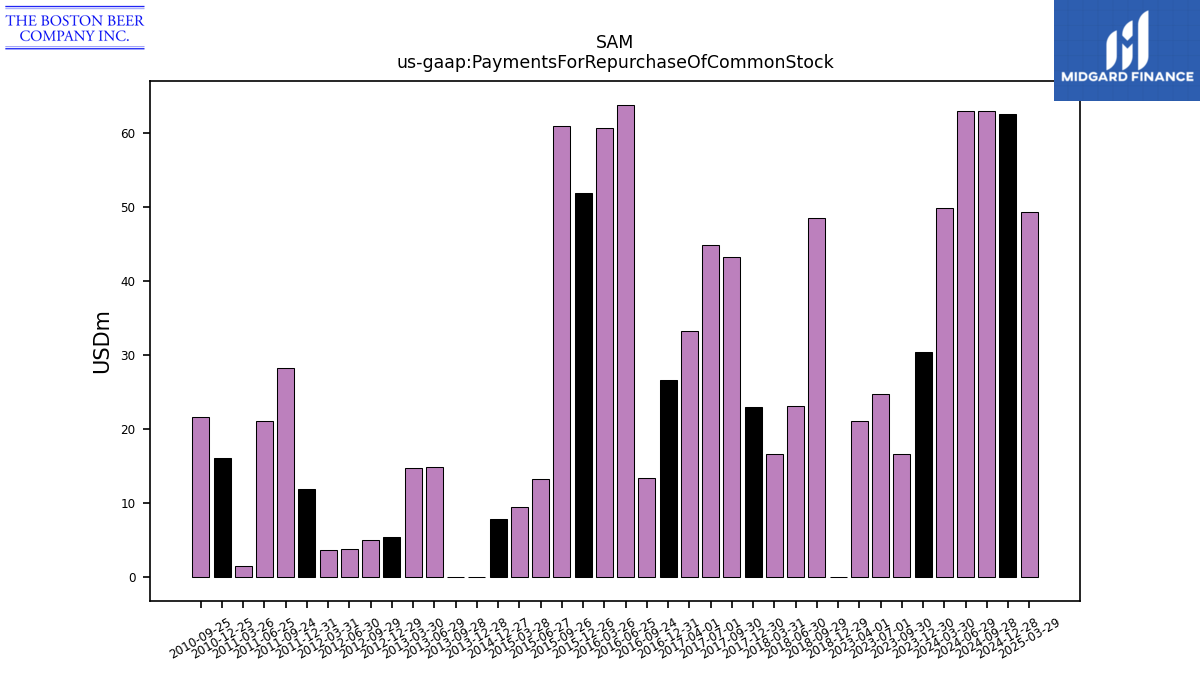
| Payments For Repurchase Of Common Stock | 30.40 | 16.59 | 24.79 | 21.10 | NA | NA | NA | NA | NA | NA | NA | NA | NA | NA | NA | NA | NA | NA | NA | NA | 0.00 | 48.59 | 23.09 | 16.64 | 23.07 | 43.35 | 44.91 | 33.27 | 26.60 | 13.38 | 63.90 | 60.77 | 51.91 | 61.01 | 13.29 | 9.49 | 7.86 | NA | NA | NA | -0.00 | 0.00 | 14.89 | 14.70 | 5.48 | 4.99 | 3.85 | 3.73 | 11.95 | 28.24 | 21.10 | 1.53 | 16.07 | 21.69 | NA | NA |
| 2023-12-30 | 2023-09-30 | 2023-07-01 | 2023-04-01 | 2022-12-31 | 2022-09-24 | 2022-06-25 | 2022-03-26 | 2021-12-25 | 2021-09-25 | 2021-06-26 | 2021-03-27 | 2020-12-26 | 2020-09-26 | 2020-06-27 | 2020-03-28 | 2019-12-28 | 2019-09-28 | 2019-06-29 | 2019-03-30 | 2018-12-29 | 2018-09-29 | 2018-06-30 | 2018-03-31 | 2017-12-30 | 2017-09-30 | 2017-07-01 | 2017-04-01 | 2016-12-31 | 2016-09-24 | 2016-06-25 | 2016-03-26 | 2015-12-26 | 2015-09-26 | 2015-06-27 | 2015-03-28 | 2014-12-27 | 2014-09-27 | 2014-06-28 | 2014-03-29 | 2013-12-28 | 2013-09-28 | 2013-06-29 | 2013-03-30 | 2012-12-29 | 2012-09-29 | 2012-06-30 | 2012-03-31 | 2011-12-31 | 2011-09-24 | 2011-06-25 | 2011-03-26 | 2010-12-25 | 2010-09-25 | 2010-06-26 | 2010-03-27 | ||
|---|---|---|---|---|---|---|---|---|---|---|---|---|---|---|---|---|---|---|---|---|---|---|---|---|---|---|---|---|---|---|---|---|---|---|---|---|---|---|---|---|---|---|---|---|---|---|---|---|---|---|---|---|---|---|---|---|---|
| Revenues | 393.72 | 601.60 | 603.30 | 410.00 | 447.52 | 596.45 | 616.24 | 430.11 | 348.09 | 561.64 | 602.80 | 545.08 | 460.94 | 492.79 | 452.14 | 330.56 | 301.30 | 378.47 | 318.41 | 251.65 | 225.22 | 306.87 | 273.10 | 190.46 | 206.32 | 247.05 | 247.93 | 161.69 | 219.37 | 253.43 | 244.82 | 188.83 | 215.13 | 293.09 | 252.20 | 199.50 | 217.82 | 269.73 | 231.61 | 183.84 | 205.38 | 216.41 | 181.33 | 135.93 | 153.00 | 166.45 | 147.50 | 113.27 | 142.05 | 134.81 | 133.96 | 102.18 | 115.74 | 124.47 | 129.56 | 94.03 | |
| Revenue From Contract With Customer Including Assessed Tax | 417.41 | 639.39 | 641.33 | 435.16 | 476.02 | 634.33 | 655.02 | 457.29 | 373.66 | 599.97 | 641.31 | 581.71 | 460.94 | 525.25 | 481.09 | 352.23 | 301.30 | 402.69 | 338.64 | 267.56 | 225.22 | 326.85 | 273.10 | 201.83 | 206.32 | 264.15 | 247.93 | 161.69 | 219.37 | 253.43 | 244.82 | 188.83 | 215.13 | 293.09 | 252.20 | 199.50 | 217.82 | 269.73 | 231.61 | 183.84 | 205.38 | 216.41 | 181.33 | 135.93 | 153.00 | 166.45 | 147.50 | 113.27 | 142.05 | 134.81 | 133.96 | 102.18 | 115.74 | 124.47 | 129.56 | 94.03 |