
| 2023-05-31 | 2023-02-28 | 2022-11-30 | 2022-08-31 | 2022-05-31 | 2022-02-28 | 2021-11-30 | 2021-08-31 | 2021-05-31 | 2021-02-28 | 2020-11-30 | 2020-08-31 | 2020-05-31 | 2020-02-29 | 2019-11-30 | 2019-08-31 | 2019-05-31 | 2019-02-28 | 2018-11-30 | 2018-08-31 | 2018-05-31 | 2018-02-28 | 2017-11-30 | 2017-08-31 | 2017-05-31 | 2017-02-28 | 2016-11-30 | 2016-08-31 | 2016-05-31 | 2016-02-29 | 2015-11-30 | 2015-08-31 | 2015-05-31 | 2015-02-28 | 2014-11-30 | 2014-08-31 | 2014-05-31 | 2014-02-28 | 2013-11-30 | 2013-08-31 | 2013-05-31 | 2013-02-28 | 2012-11-30 | 2012-08-31 | 2012-05-31 | 2012-02-29 | 2011-11-30 | 2011-08-31 | 2011-05-31 | 2011-02-28 | 2010-11-30 | 2010-08-31 | 2010-05-31 | 2010-02-28 | 2009-11-30 | ||
|---|---|---|---|---|---|---|---|---|---|---|---|---|---|---|---|---|---|---|---|---|---|---|---|---|---|---|---|---|---|---|---|---|---|---|---|---|---|---|---|---|---|---|---|---|---|---|---|---|---|---|---|---|---|---|---|---|
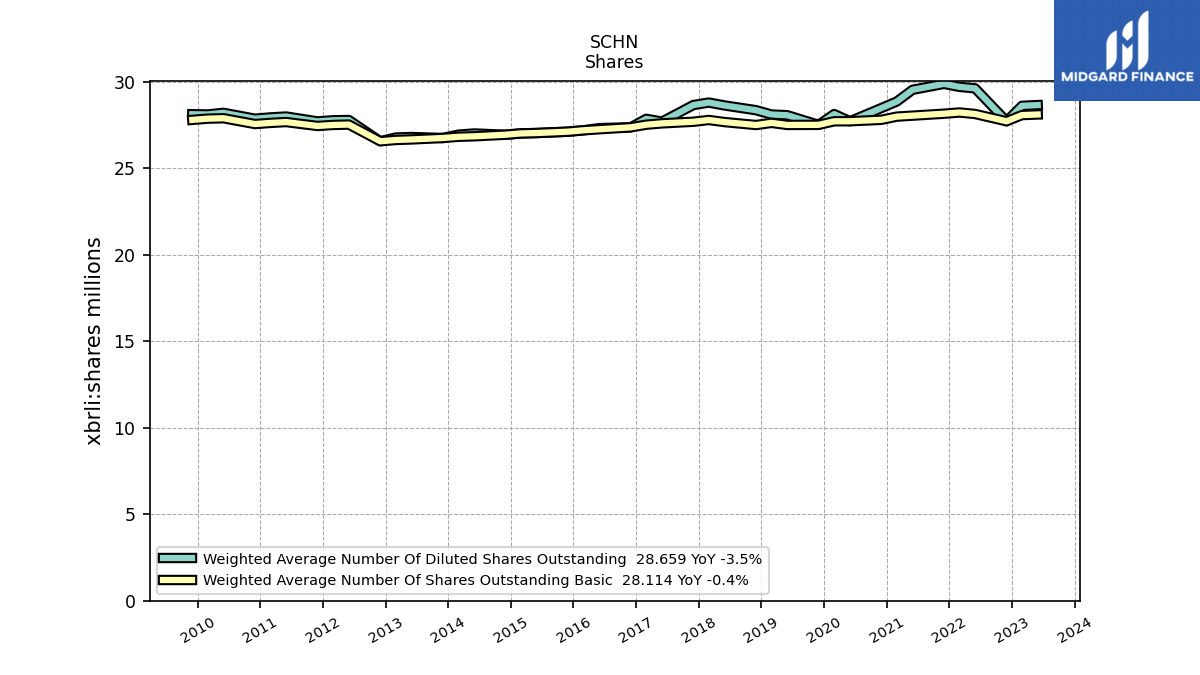
| Weighted Average Number Of Diluted Shares Outstanding | 28.66 | 28.62 | 27.72 | NA | 29.62 | 29.71 | 29.89 | NA | 29.54 | 28.86 | 28.48 | NA | 27.72 | 28.14 | 27.52 | NA | 28.07 | 28.11 | 28.36 | NA | 28.64 | 28.80 | 28.66 | NA | 27.70 | 27.86 | 27.37 | NA | 27.33 | 27.20 | 27.12 | NA | 27.04 | 27.02 | 26.94 | NA | 27.02 | 26.95 | 26.75 | NA | 26.81 | 26.78 | 26.57 | NA | 27.80 | 27.78 | 27.71 | NA | 28.00 | 27.94 | 27.87 | NA | 28.21 | 28.12 | 28.13 | |
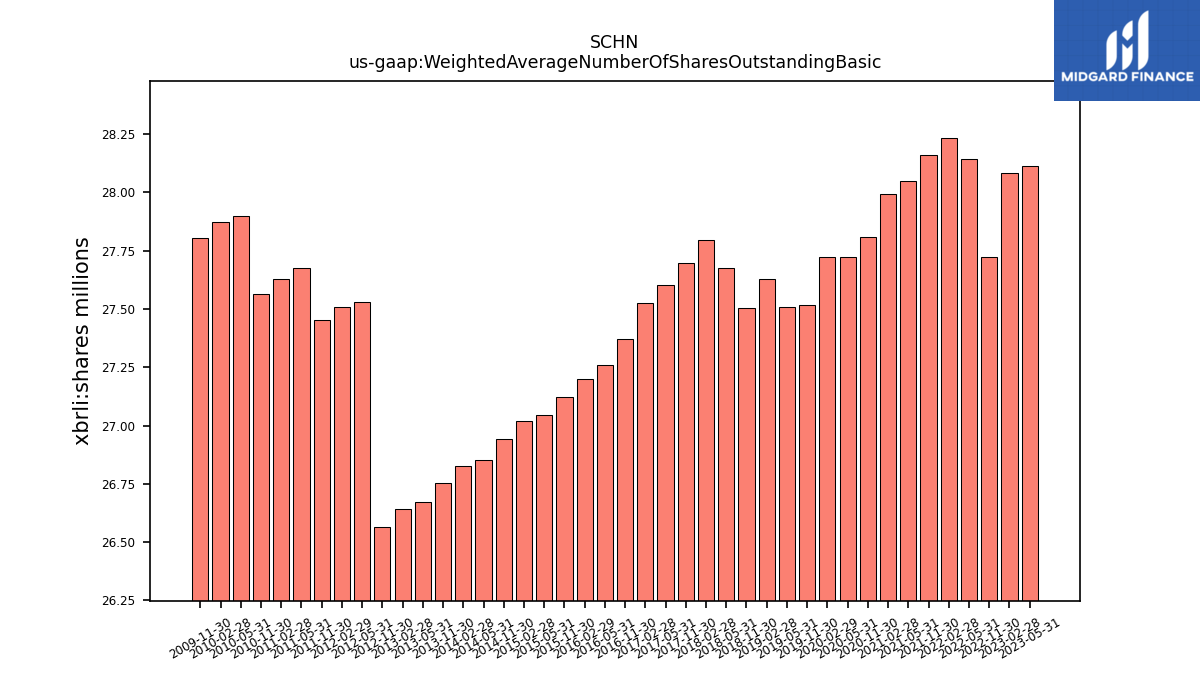
| Weighted Average Number Of Shares Outstanding Basic | 28.11 | 28.08 | 27.72 | NA | 28.14 | 28.23 | 28.16 | NA | 28.05 | 27.99 | 27.81 | NA | 27.72 | 27.72 | 27.52 | NA | 27.51 | 27.63 | 27.50 | NA | 27.68 | 27.80 | 27.70 | NA | 27.60 | 27.52 | 27.37 | NA | 27.26 | 27.20 | 27.12 | NA | 27.04 | 27.02 | 26.94 | NA | 26.85 | 26.82 | 26.75 | NA | 26.67 | 26.64 | 26.57 | NA | 27.53 | 27.51 | 27.45 | NA | 27.68 | 27.63 | 27.56 | NA | 27.90 | 27.87 | 27.80 | |
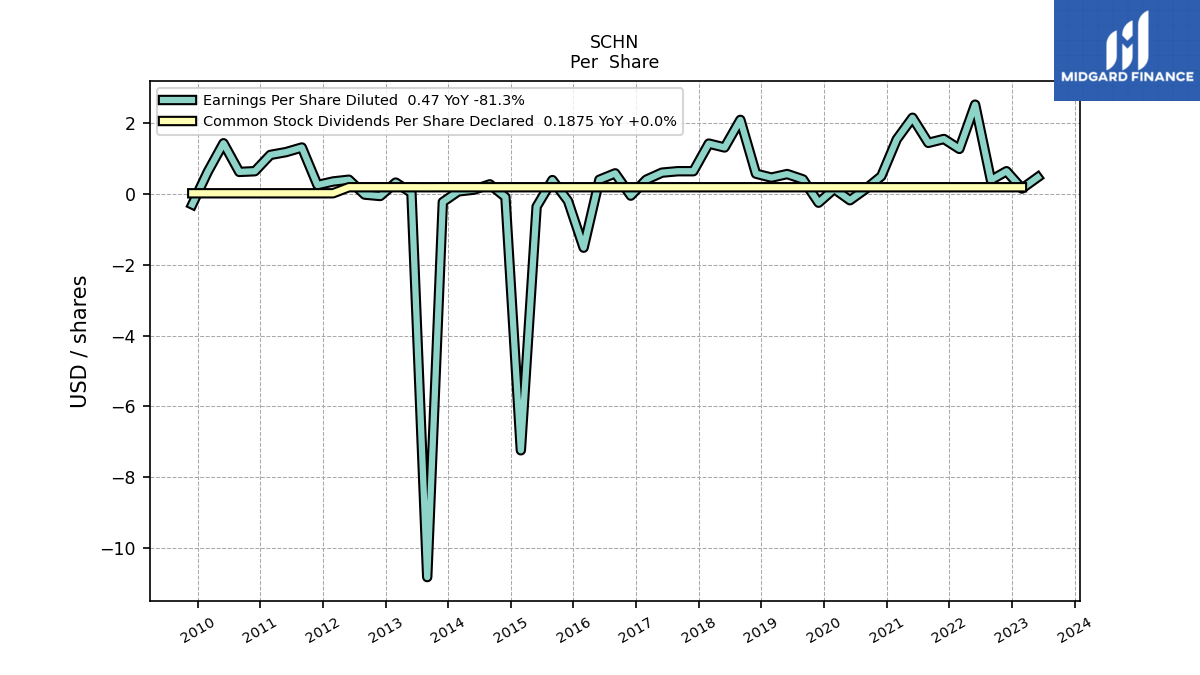
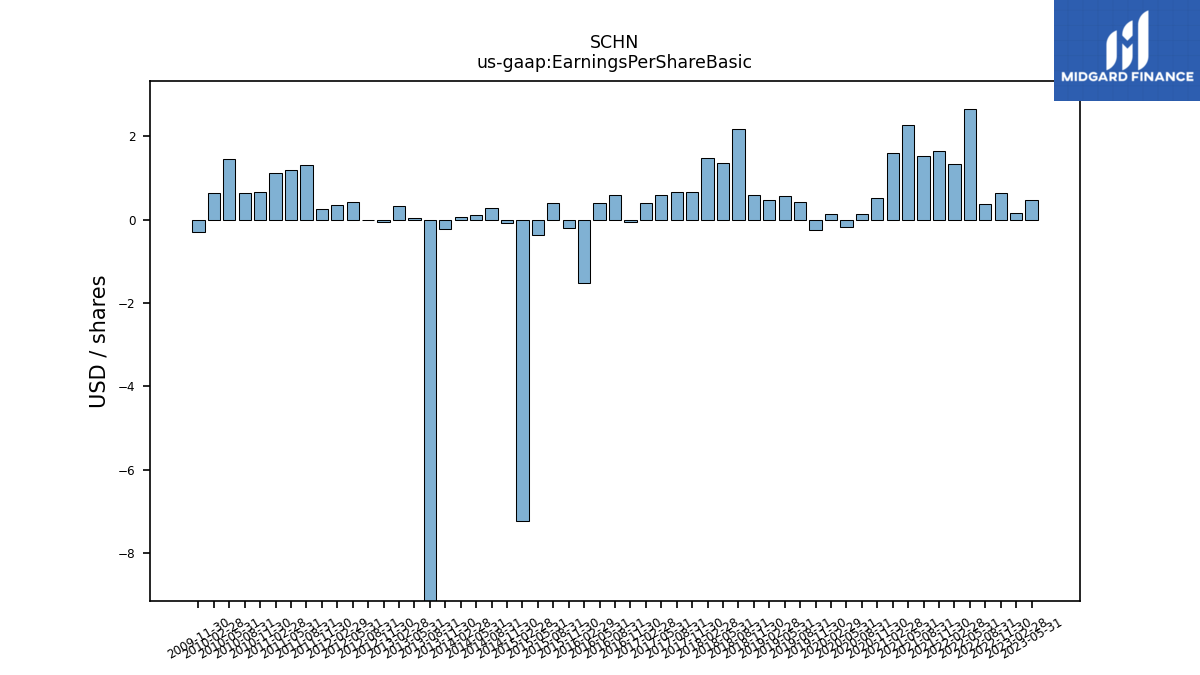
| Earnings Per Share Basic | 0.48 | 0.16 | 0.64 | 0.38 | 2.65 | 1.33 | 1.64 | 1.52 | 2.27 | 1.59 | 0.51 | 0.14 | -0.18 | 0.14 | -0.25 | 0.42 | 0.57 | 0.47 | 0.59 | 2.18 | 1.35 | 1.48 | 0.66 | 0.66 | 0.60 | 0.40 | -0.05 | 0.59 | 0.40 | -1.52 | -0.20 | 0.40 | -0.36 | -7.24 | -0.09 | 0.27 | 0.12 | 0.07 | -0.23 | -10.82 | 0.03 | 0.32 | -0.06 | -0.02 | 0.41 | 0.35 | 0.26 | 1.32 | 1.19 | 1.12 | 0.65 | 0.63 | 1.45 | 0.63 | -0.31 | |
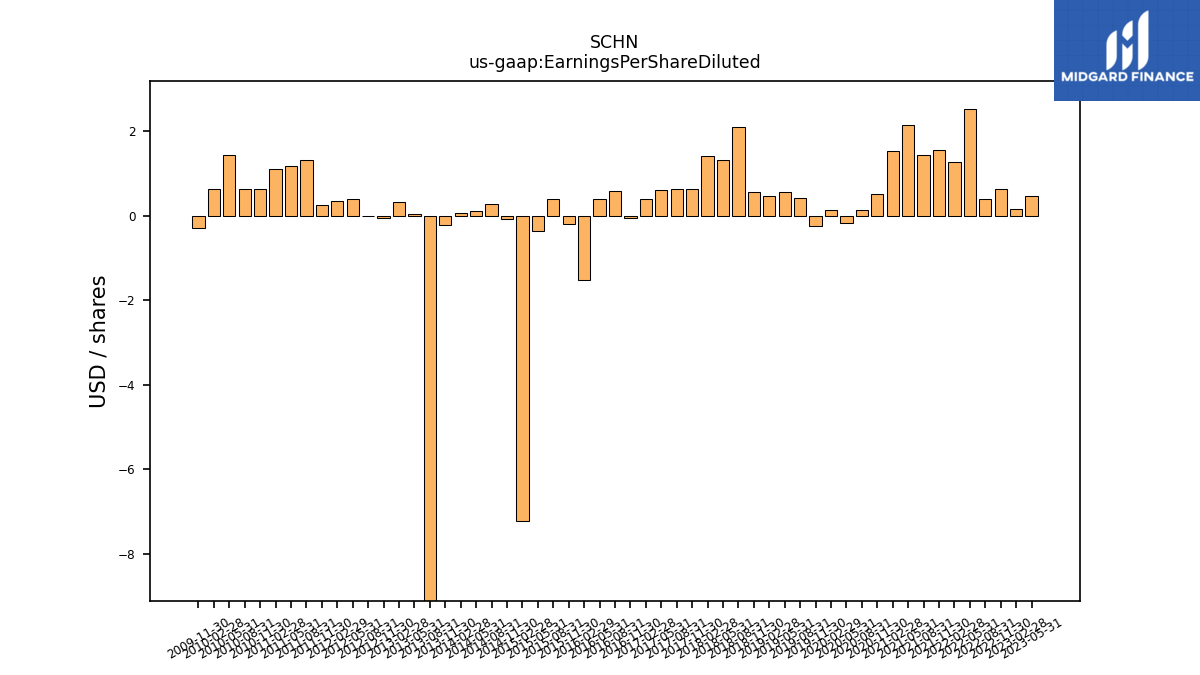
| Earnings Per Share Diluted | 0.47 | 0.15 | 0.64 | 0.39 | 2.52 | 1.27 | 1.55 | 1.44 | 2.15 | 1.54 | 0.50 | 0.14 | -0.18 | 0.14 | -0.25 | 0.41 | 0.56 | 0.46 | 0.57 | 2.09 | 1.31 | 1.42 | 0.64 | 0.64 | 0.60 | 0.40 | -0.05 | 0.58 | 0.40 | -1.52 | -0.20 | 0.39 | -0.36 | -7.24 | -0.09 | 0.27 | 0.12 | 0.07 | -0.23 | -10.82 | 0.03 | 0.32 | -0.06 | -0.02 | 0.40 | 0.35 | 0.25 | 1.31 | 1.18 | 1.10 | 0.64 | 0.62 | 1.43 | 0.62 | -0.30 | |
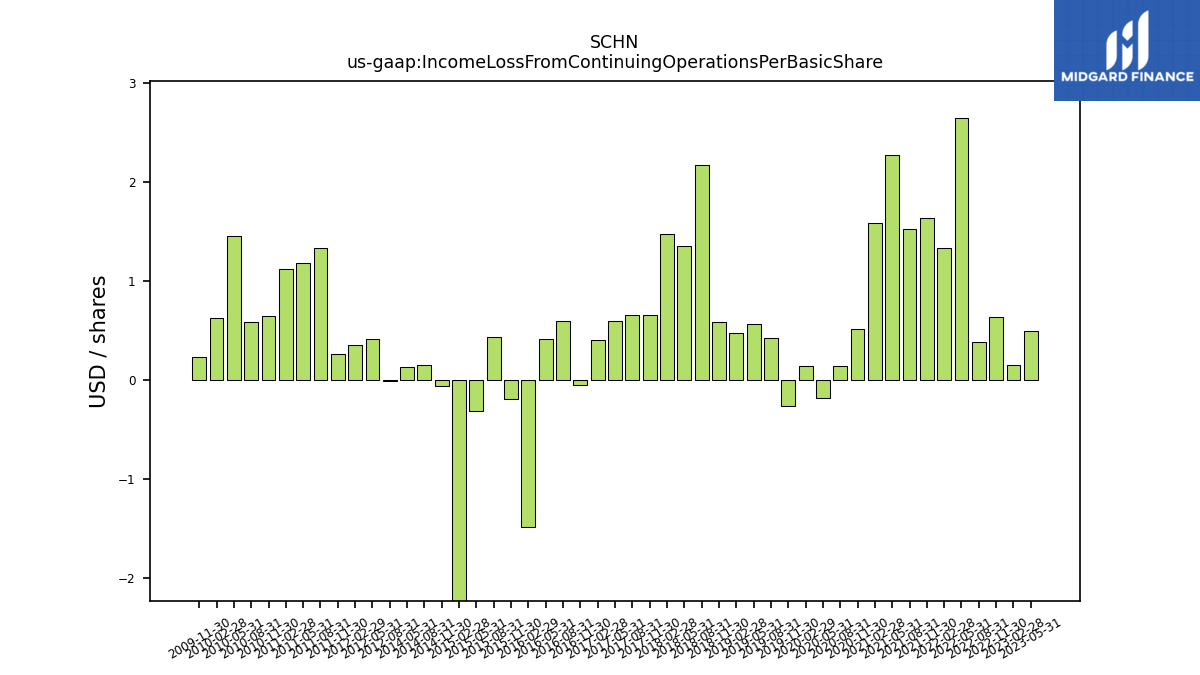
| Income Loss From Continuing Operations Per Basic Share | 0.00 | 0.00 | 0.00 | 0.00 | 0.00 | 0.00 | 0.00 | 0.00 | 0.00 | 0.00 | 0.00 | 0.00 | -0.00 | 0.00 | -0.00 | 0.00 | 0.00 | 0.00 | 0.00 | 0.00 | 0.00 | 0.00 | 0.00 | 0.00 | 0.00 | 0.00 | -0.00 | 0.00 | 0.00 | -0.00 | -0.00 | 0.00 | -0.00 | -0.00 | -0.00 | 0.00 | 0.00 | NA | NA | NA | NA | NA | NA | -0.00 | 0.00 | 0.00 | 0.00 | 0.00 | 0.00 | 0.00 | 0.00 | 0.00 | 0.00 | 0.00 | 0.00 | |
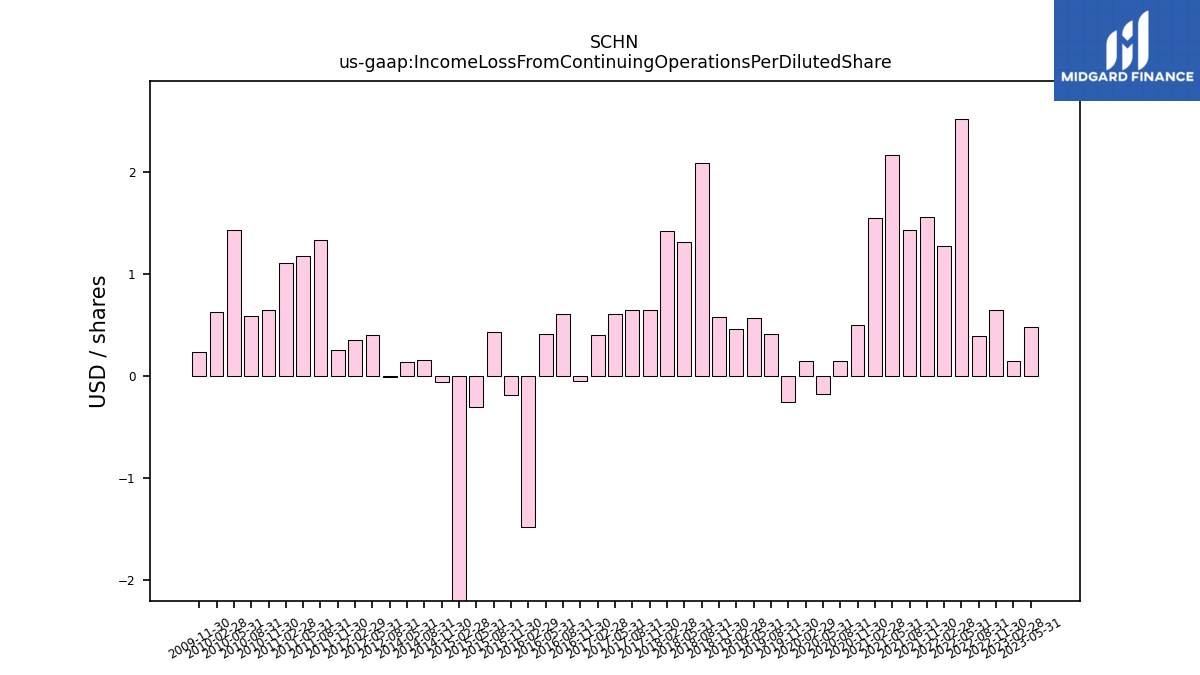
| Income Loss From Continuing Operations Per Diluted Share | 0.00 | 0.00 | 0.00 | 0.00 | 0.00 | 0.00 | 0.00 | 0.00 | 0.00 | 0.00 | 0.00 | 0.00 | -0.00 | 0.00 | -0.00 | 0.00 | 0.00 | 0.00 | 0.00 | 0.00 | 0.00 | 0.00 | 0.00 | 0.00 | 0.00 | 0.00 | -0.00 | 0.00 | 0.00 | -0.00 | -0.00 | 0.00 | -0.00 | -0.00 | -0.00 | 0.00 | 0.00 | NA | NA | NA | NA | NA | NA | -0.00 | 0.00 | 0.00 | 0.00 | 0.00 | 0.00 | 0.00 | 0.00 | 0.00 | 0.00 | 0.00 | 0.00 |
| 2023-05-31 | 2023-02-28 | 2022-11-30 | 2022-08-31 | 2022-05-31 | 2022-02-28 | 2021-11-30 | 2021-08-31 | 2021-05-31 | 2021-02-28 | 2020-11-30 | 2020-08-31 | 2020-05-31 | 2020-02-29 | 2019-11-30 | 2019-08-31 | 2019-05-31 | 2019-02-28 | 2018-11-30 | 2018-08-31 | 2018-05-31 | 2018-02-28 | 2017-11-30 | 2017-08-31 | 2017-05-31 | 2017-02-28 | 2016-11-30 | 2016-08-31 | 2016-05-31 | 2016-02-29 | 2015-11-30 | 2015-08-31 | 2015-05-31 | 2015-02-28 | 2014-11-30 | 2014-08-31 | 2014-05-31 | 2014-02-28 | 2013-11-30 | 2013-08-31 | 2013-05-31 | 2013-02-28 | 2012-11-30 | 2012-08-31 | 2012-05-31 | 2012-02-29 | 2011-11-30 | 2011-08-31 | 2011-05-31 | 2011-02-28 | 2010-11-30 | 2010-08-31 | 2010-05-31 | 2010-02-28 | 2009-11-30 | ||
|---|---|---|---|---|---|---|---|---|---|---|---|---|---|---|---|---|---|---|---|---|---|---|---|---|---|---|---|---|---|---|---|---|---|---|---|---|---|---|---|---|---|---|---|---|---|---|---|---|---|---|---|---|---|---|---|---|
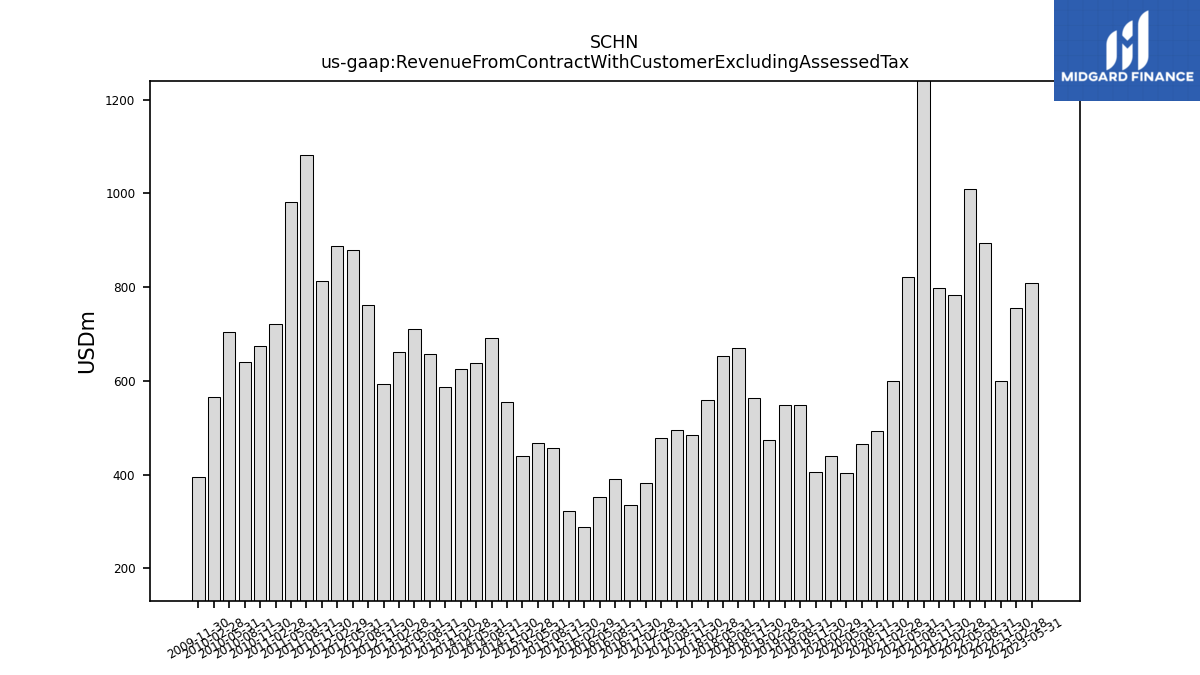
| Revenue From Contract With Customer Excluding Assessed Tax | 809.61 | 755.95 | 598.73 | 894.41 | 1010.09 | 783.20 | 798.12 | 2758.55 | 820.72 | 600.11 | 492.11 | 464.59 | 402.68 | 439.48 | 405.58 | 547.80 | 547.40 | 473.56 | 564.02 | 669.58 | 652.42 | 559.44 | 483.28 | 494.26 | 477.09 | 382.08 | 334.16 | 390.66 | 351.60 | 289.08 | 321.20 | 457.02 | 467.31 | 439.23 | 555.59 | 691.90 | 637.79 | 626.15 | 587.75 | 656.59 | 710.29 | 662.21 | 592.82 | 762.28 | 879.87 | 886.61 | 812.18 | 1081.19 | 981.06 | 721.84 | 675.10 | 639.09 | 703.54 | 564.33 | 394.28 | |
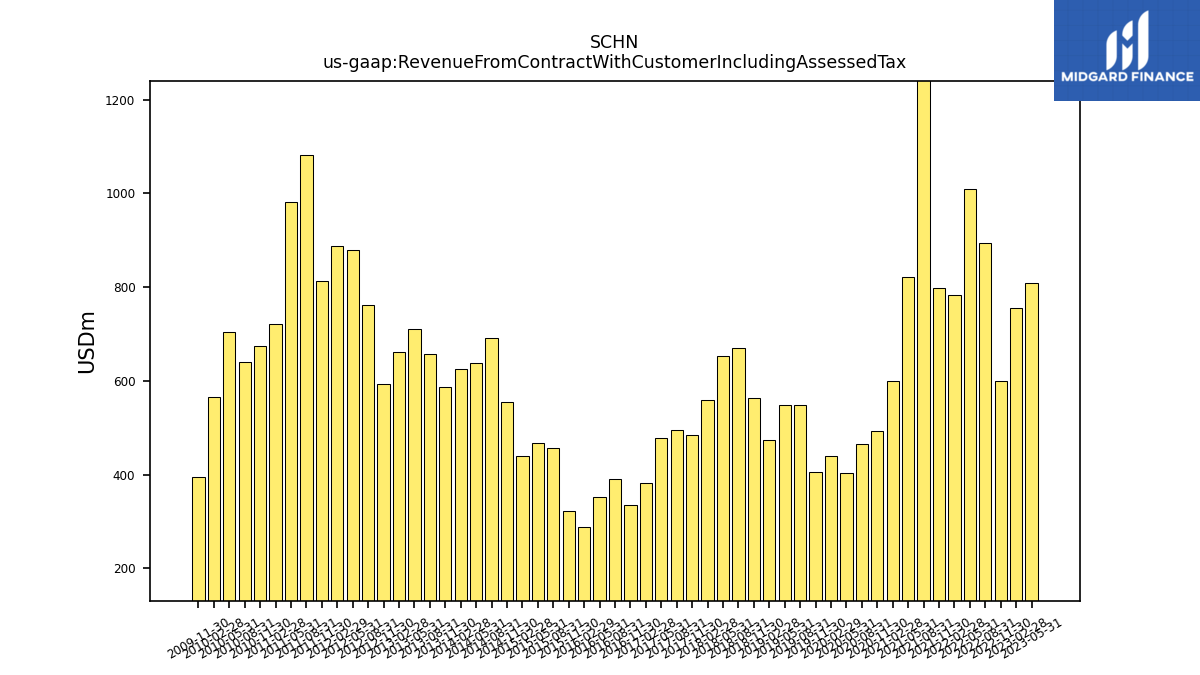
| Revenue From Contract With Customer Including Assessed Tax | 809.61 | 755.95 | 598.73 | 894.41 | 1010.09 | 783.20 | 798.12 | 2758.55 | 820.72 | 600.11 | 492.11 | 464.59 | 402.68 | 439.48 | 405.58 | 547.80 | 547.40 | 473.56 | 564.02 | 669.58 | 652.42 | 559.44 | 483.28 | 494.26 | 477.09 | 382.08 | 334.16 | 390.66 | 351.60 | 289.08 | 321.20 | 457.02 | 467.31 | 439.23 | 555.59 | 691.90 | 637.79 | 626.15 | 587.75 | 656.59 | 710.29 | 662.21 | 592.82 | 762.28 | 879.87 | 886.61 | 812.18 | 1081.19 | 981.06 | 721.84 | 675.10 | 639.09 | 703.54 | 564.33 | 394.28 | |
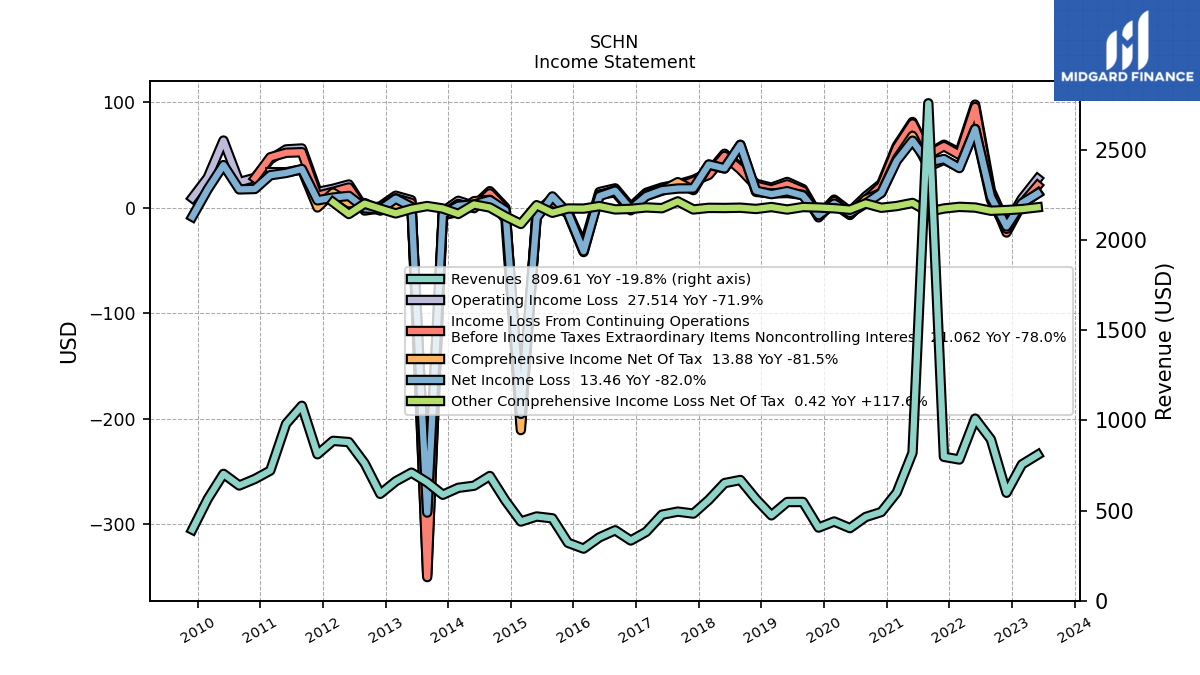
| Revenues | 809.61 | 755.95 | 598.73 | 894.41 | 1010.09 | 783.20 | 798.12 | 2758.55 | 820.72 | 600.11 | 492.11 | 464.59 | 402.68 | 439.48 | 405.58 | 547.80 | 547.40 | 473.56 | 564.02 | 669.58 | 652.42 | 559.44 | 483.28 | 494.26 | 477.09 | 382.08 | 334.16 | 390.66 | 351.60 | 289.08 | 321.20 | 457.02 | 467.31 | 439.23 | 555.59 | 691.90 | 637.79 | 626.15 | 587.75 | 656.59 | 710.29 | 662.21 | 592.82 | 762.28 | 879.87 | 886.61 | 812.18 | 1081.19 | 981.06 | 721.84 | 675.10 | 639.09 | 703.54 | 564.33 | 394.28 | |
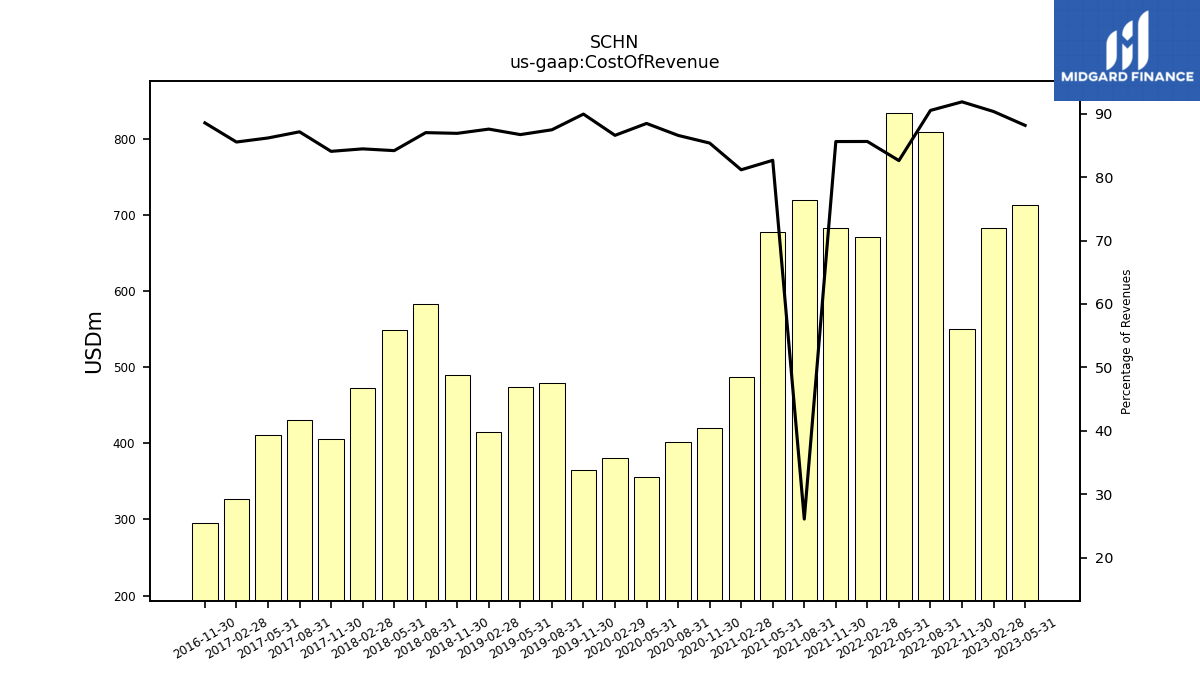
| Cost Of Revenue | 713.68 | 682.94 | 550.01 | 809.59 | 834.38 | 670.54 | 683.24 | 719.94 | 678.30 | 487.02 | 420.09 | 402.23 | 356.22 | 380.52 | 364.76 | 479.12 | 474.60 | 414.69 | 490.13 | 582.61 | 549.16 | 472.46 | 406.25 | 430.70 | 411.11 | 326.80 | 295.89 | NA | NA | NA | NA | NA | NA | NA | NA | NA | NA | NA | NA | NA | NA | NA | NA | NA | NA | NA | NA | NA | NA | NA | NA | NA | NA | NA | NA | |
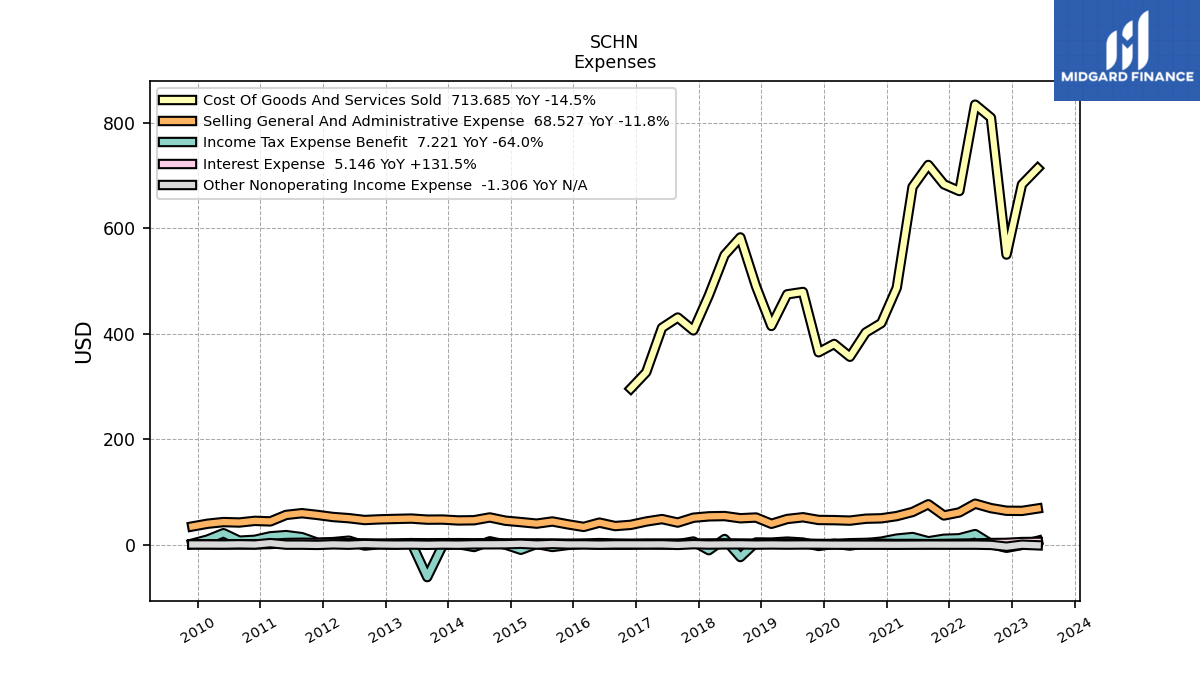
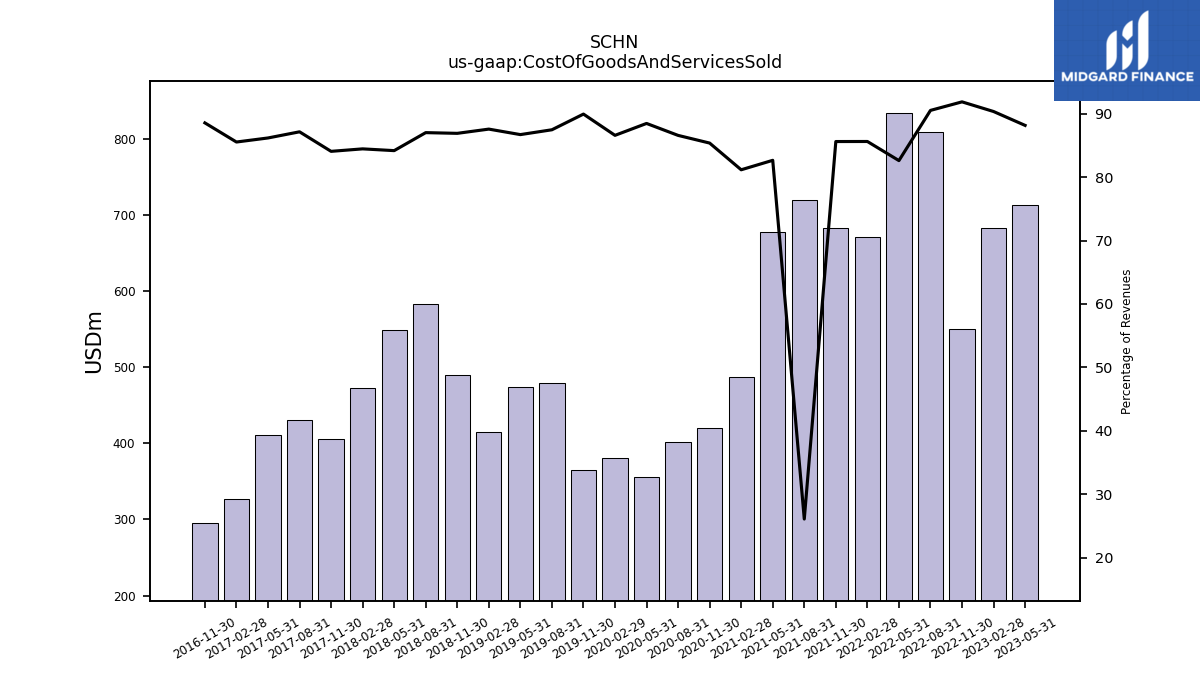
| Cost Of Goods And Services Sold | 713.68 | 682.94 | 550.01 | 809.59 | 834.38 | 670.54 | 683.24 | 719.94 | 678.30 | 487.02 | 420.09 | 402.23 | 356.22 | 380.52 | 364.76 | 479.12 | 474.60 | 414.69 | 490.13 | 582.61 | 549.16 | 472.46 | 406.25 | 430.70 | 411.11 | 326.80 | 295.89 | NA | NA | NA | NA | NA | NA | NA | NA | NA | NA | NA | NA | NA | NA | NA | NA | NA | NA | NA | NA | NA | NA | NA | NA | NA | NA | NA | NA | |
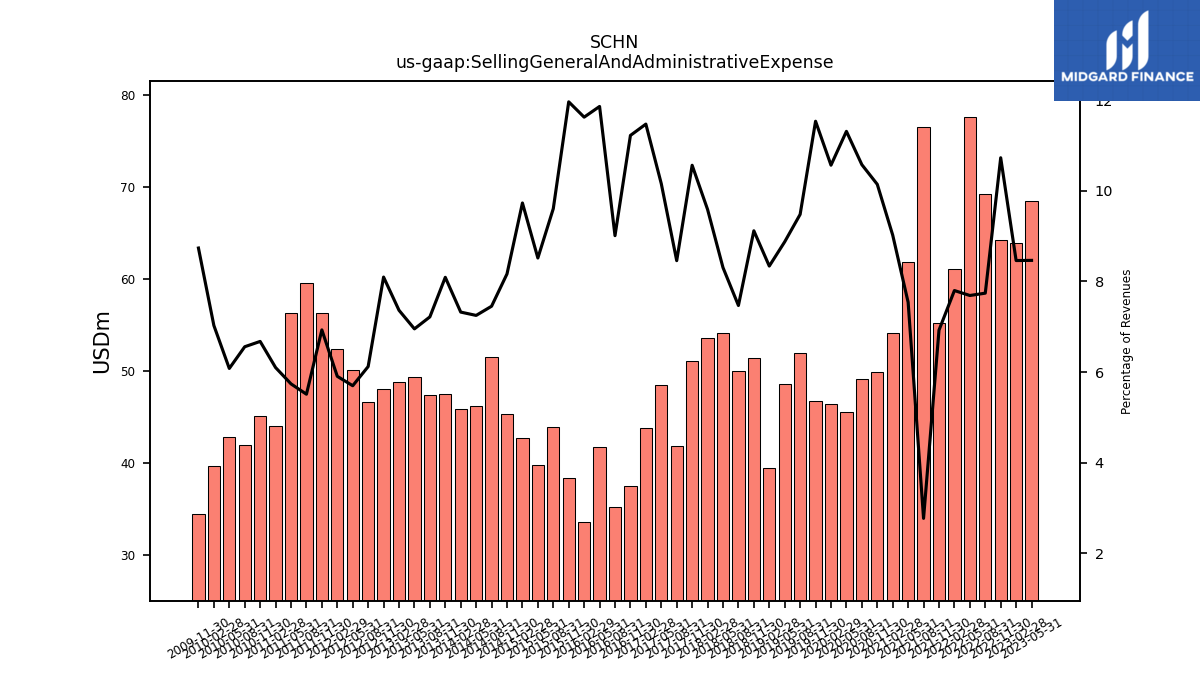
| Selling General And Administrative Expense | 68.53 | 63.96 | 64.23 | 69.24 | 77.67 | 61.08 | 55.27 | 76.53 | 61.89 | 54.14 | 49.91 | 49.13 | 45.54 | 46.43 | 46.77 | 51.92 | 48.58 | 39.49 | 51.42 | 50.01 | 54.19 | 53.64 | 51.04 | 41.80 | 48.45 | 43.82 | 37.49 | 35.20 | 41.70 | 33.60 | 38.42 | 43.90 | 39.80 | 42.74 | 45.37 | 51.57 | 46.24 | 45.86 | 47.55 | 47.39 | 49.39 | 48.76 | 47.99 | 46.67 | 50.15 | 52.37 | 56.29 | 59.60 | 56.32 | 44.03 | 45.08 | 41.92 | 42.78 | 39.66 | 34.45 | |
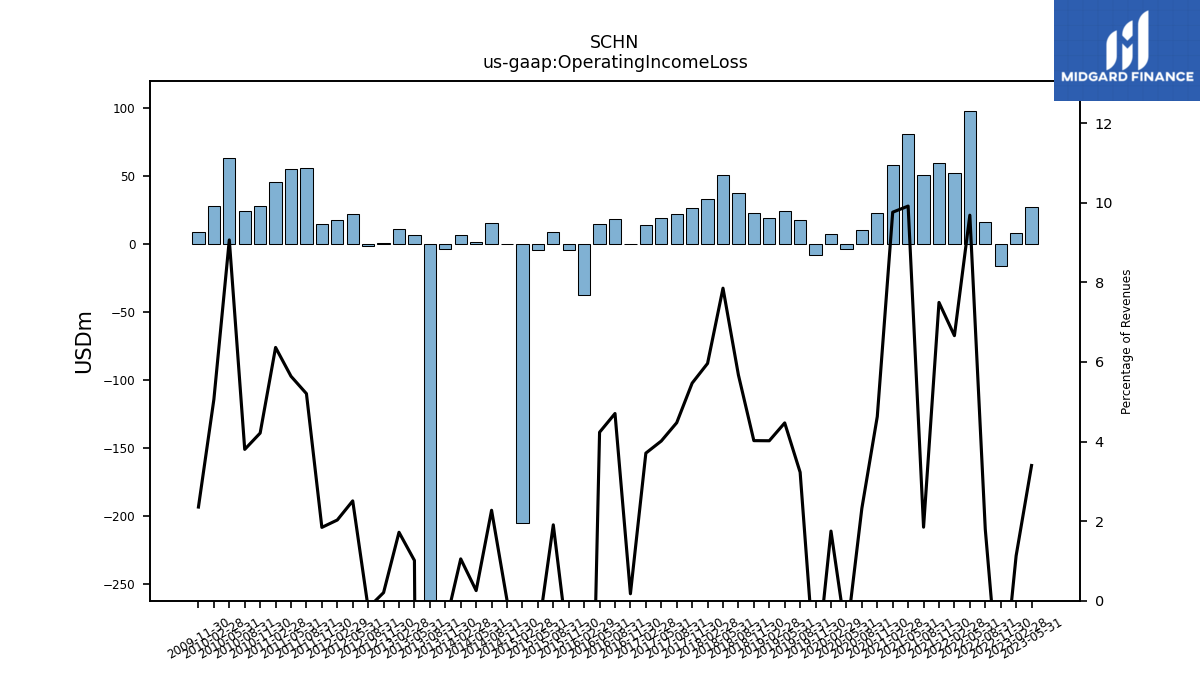
| Operating Income Loss | 27.51 | 8.54 | -16.31 | 16.08 | 97.84 | 52.16 | 59.82 | 50.99 | 81.38 | 58.58 | 22.77 | 10.78 | -3.71 | 7.69 | -7.91 | 17.68 | 24.46 | 19.04 | 22.69 | 37.97 | 51.23 | 33.36 | 26.42 | 22.11 | 19.15 | 14.17 | 0.59 | 18.38 | 14.89 | -37.08 | -4.03 | 8.72 | -4.02 | -204.91 | 0.08 | 15.73 | 1.63 | 6.58 | -3.62 | -347.58 | 7.19 | 11.39 | 1.21 | -1.37 | 22.08 | 17.99 | 14.97 | 56.26 | 55.33 | 45.94 | 28.44 | 24.30 | 63.77 | 28.54 | 9.28 | |
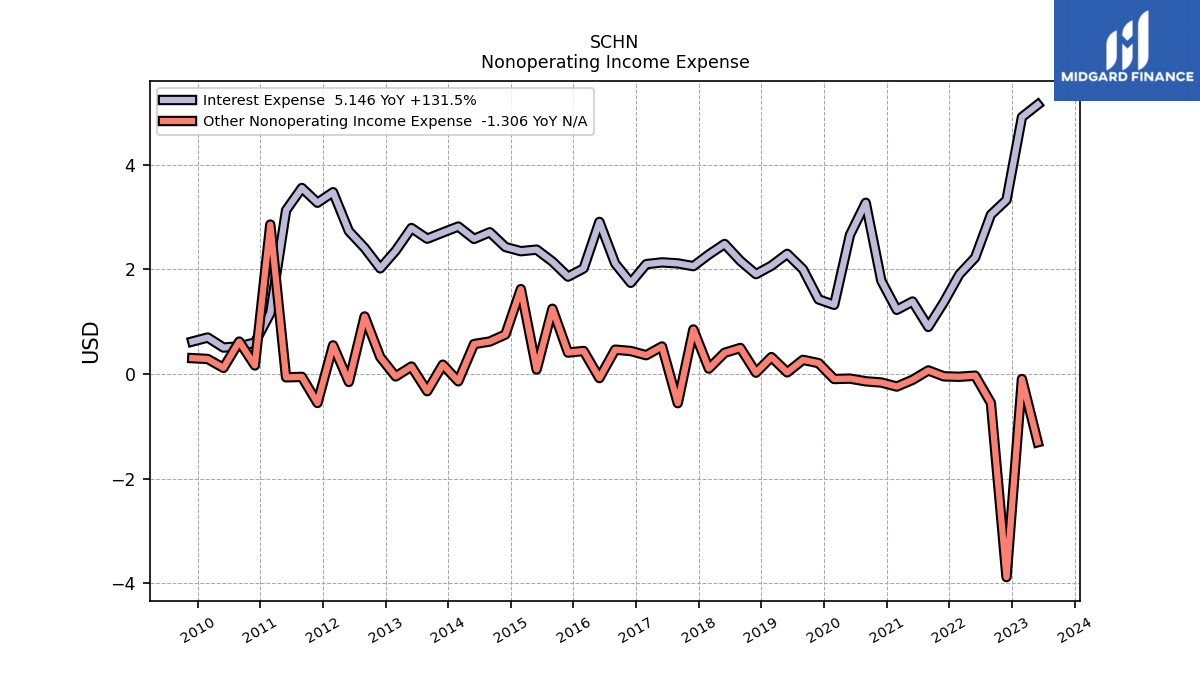
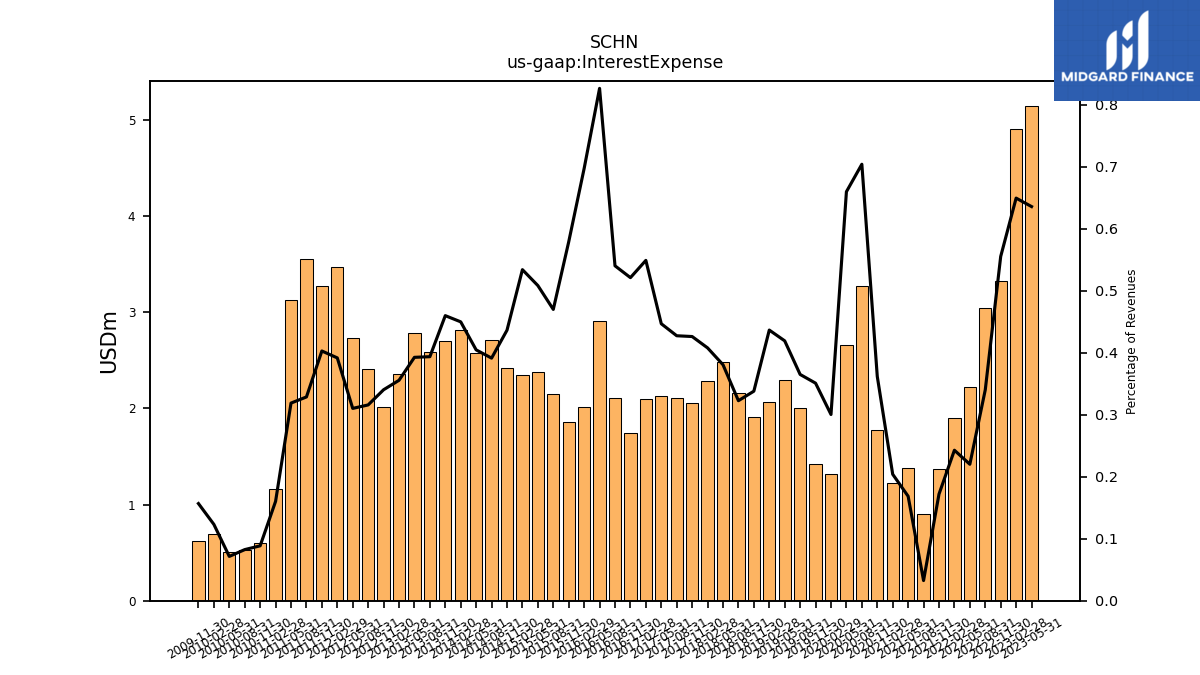
| Interest Expense | 5.15 | 4.91 | 3.32 | 3.04 | 2.22 | 1.90 | 1.37 | 0.90 | 1.38 | 1.22 | 1.78 | 3.27 | 2.66 | 1.32 | 1.42 | 2.00 | 2.29 | 2.07 | 1.91 | 2.16 | 2.48 | 2.28 | 2.06 | 2.11 | 2.13 | 2.10 | 1.74 | 2.11 | 2.90 | 2.02 | 1.86 | 2.15 | 2.38 | 2.35 | 2.42 | 2.71 | 2.58 | 2.82 | 2.70 | 2.58 | 2.79 | 2.35 | 2.02 | 2.41 | 2.73 | 3.47 | 3.27 | 3.55 | 3.13 | 1.16 | 0.60 | 0.53 | 0.50 | 0.69 | 0.62 | |
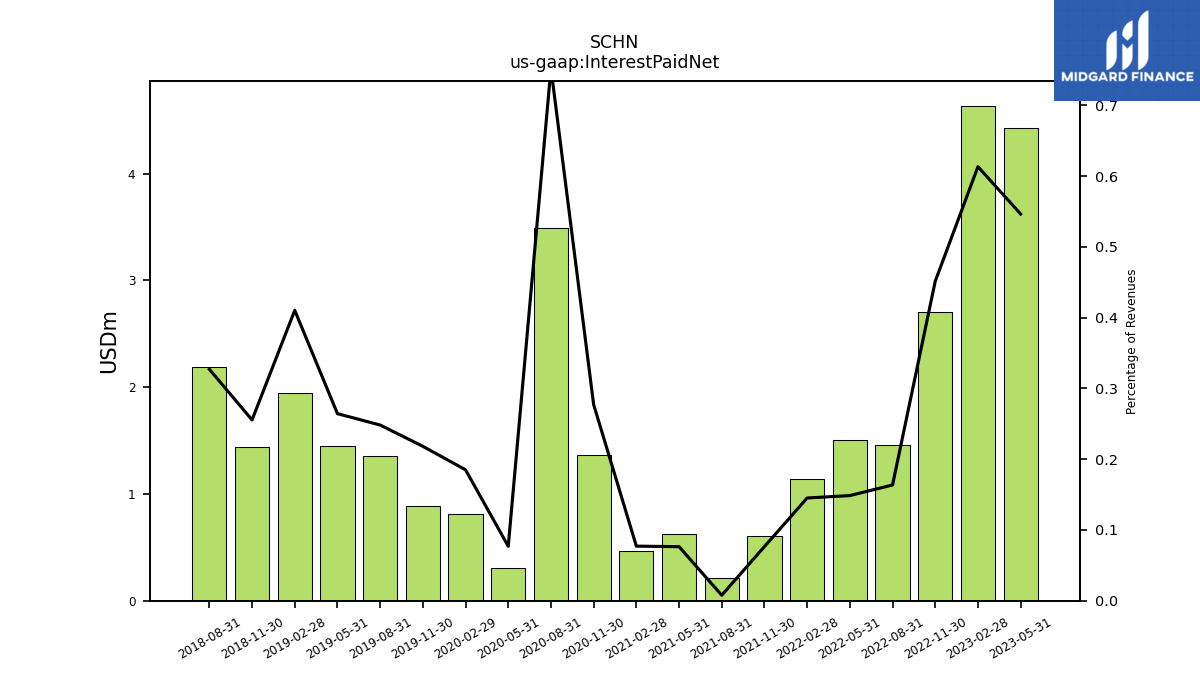
| Interest Paid Net | 4.42 | 4.64 | 2.70 | 1.46 | 1.50 | 1.14 | 0.61 | 0.21 | 0.63 | 0.46 | 1.36 | 3.50 | 0.31 | 0.81 | 0.89 | 1.36 | 1.45 | 1.94 | 1.44 | 2.19 | NA | NA | NA | NA | NA | NA | NA | NA | NA | NA | NA | NA | NA | NA | NA | NA | NA | NA | NA | NA | NA | NA | NA | NA | NA | NA | NA | NA | NA | NA | NA | NA | NA | NA | NA | |
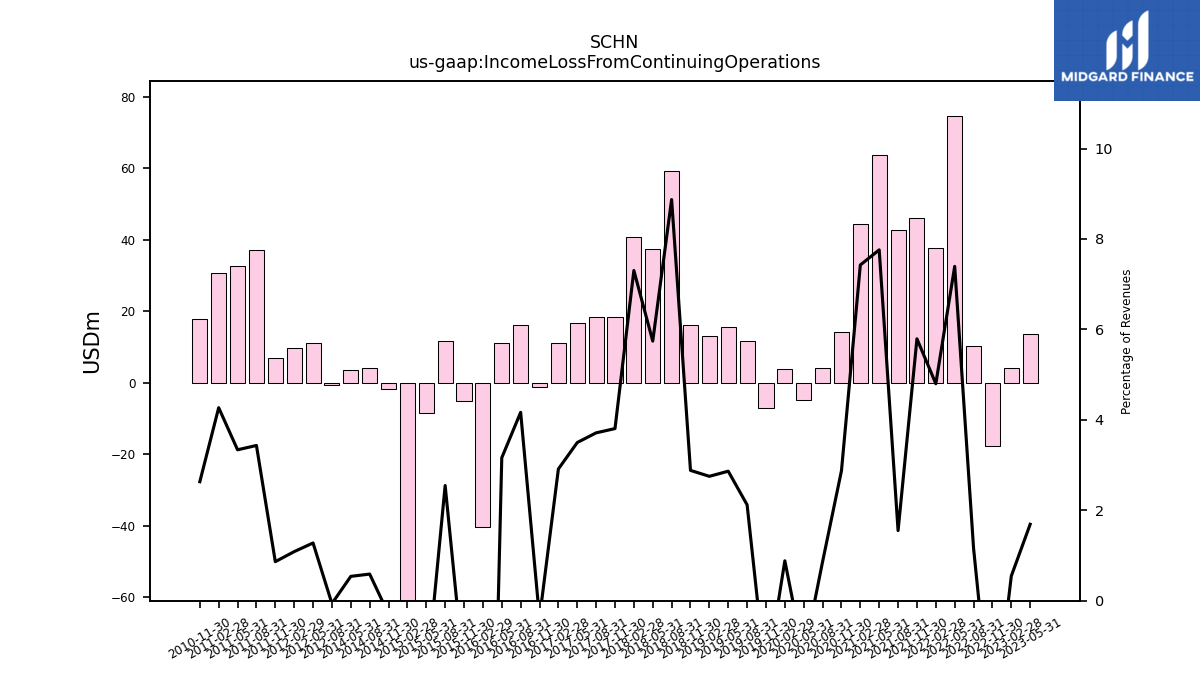
| Income Loss From Continuing Operations | 13.69 | 4.13 | -17.72 | 10.39 | 74.68 | 37.59 | 46.23 | 42.81 | 63.68 | 44.56 | 14.15 | 4.02 | -4.93 | 3.88 | -7.02 | 11.62 | 15.68 | 13.03 | 16.26 | 59.40 | 37.46 | 40.85 | 18.40 | 18.35 | 16.69 | 11.13 | -1.27 | 16.28 | 11.12 | -40.22 | -5.23 | 11.64 | -8.39 | -191.40 | -1.63 | 4.08 | 3.44 | NA | NA | NA | NA | NA | NA | -0.48 | 11.24 | 9.63 | 7.02 | 37.13 | 32.75 | 30.81 | 17.77 | NA | NA | NA | NA | |
| Income Tax Expense Benefit | 7.22 | -0.51 | -6.03 | 1.39 | 20.04 | 12.07 | 11.10 | 6.35 | 14.40 | 11.47 | 5.72 | 2.73 | -1.80 | 1.77 | -2.53 | 3.94 | 5.76 | 3.85 | 4.12 | -23.62 | 10.65 | -10.58 | 5.96 | 0.59 | 0.16 | 0.64 | -0.06 | -0.07 | 0.10 | 1.29 | -0.58 | -4.44 | 1.40 | -9.75 | 0.01 | 6.30 | -4.50 | 0.99 | -0.78 | -61.62 | 2.99 | 0.24 | 0.96 | -1.83 | 7.54 | 4.77 | 3.56 | 14.20 | 18.06 | 15.74 | 9.16 | 7.51 | 21.71 | 9.74 | 1.86 | |
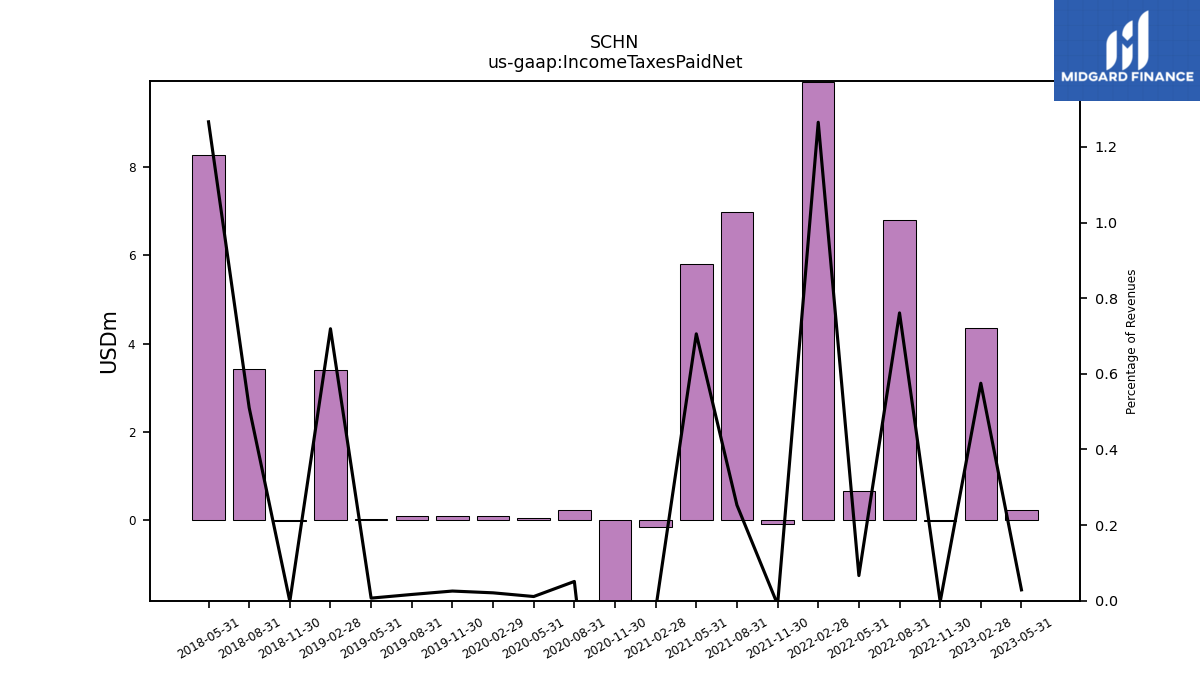
| Income Taxes Paid Net | 0.23 | 4.35 | -0.02 | 6.81 | 0.67 | 9.91 | -0.08 | 6.98 | 5.79 | -0.14 | -4.39 | 0.24 | 0.04 | 0.09 | 0.10 | 0.09 | 0.04 | 3.41 | -0.01 | 3.42 | 8.26 | NA | NA | NA | NA | NA | NA | NA | NA | NA | NA | NA | NA | NA | NA | NA | NA | NA | NA | NA | NA | NA | NA | NA | NA | NA | NA | NA | NA | NA | NA | NA | NA | NA | NA | |
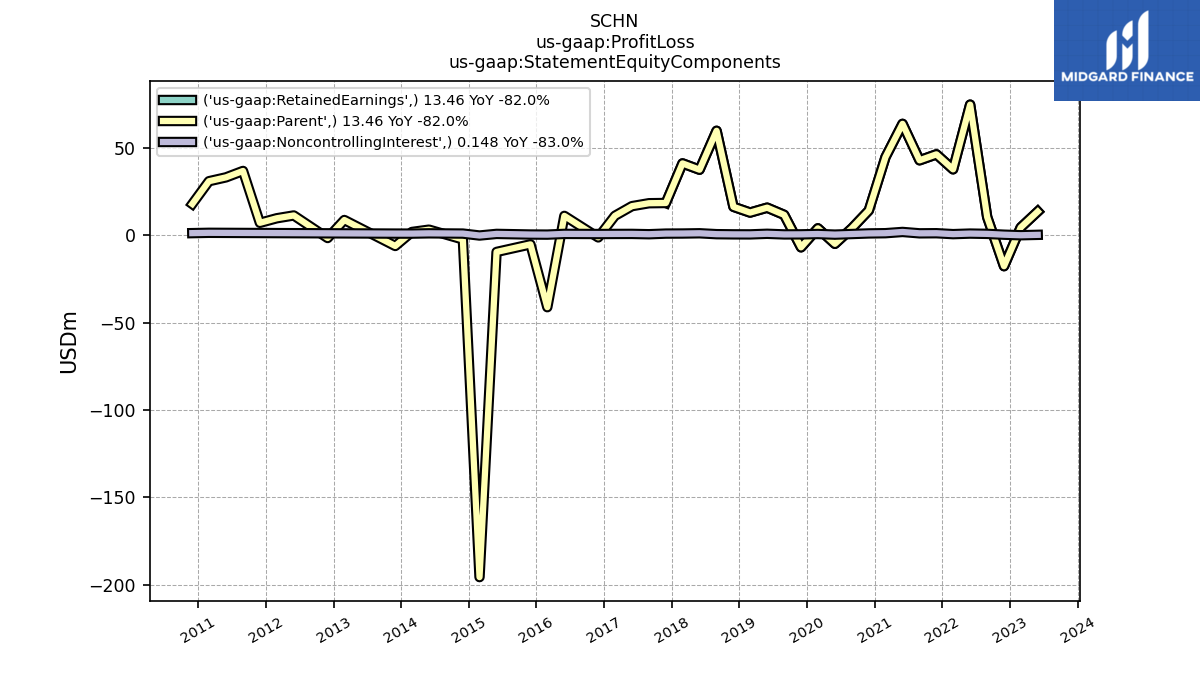
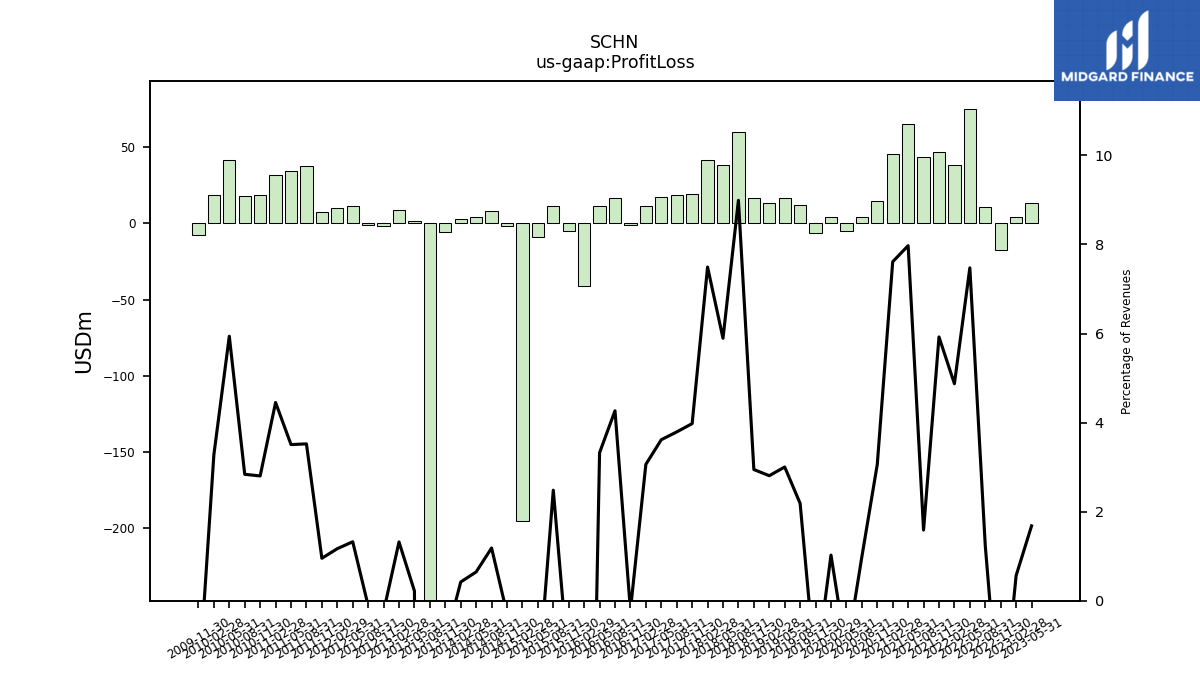
| Profit Loss | 13.61 | 4.27 | -17.56 | 11.05 | 75.50 | 38.16 | 47.28 | 43.80 | 65.44 | 45.68 | 15.06 | 4.58 | -4.72 | 4.50 | -6.57 | 11.97 | 16.44 | 13.30 | 16.62 | 60.20 | 38.45 | 41.92 | 19.22 | 18.73 | 17.25 | 11.70 | -0.71 | 16.66 | 11.69 | -40.97 | -4.97 | 11.35 | -8.94 | -195.88 | -1.60 | 8.19 | 4.12 | 2.64 | -5.37 | -288.88 | 1.55 | 8.74 | -1.44 | -0.84 | 11.65 | 10.37 | 7.75 | 38.09 | 34.40 | 32.13 | 18.92 | 18.14 | 41.78 | 18.50 | -7.75 | |
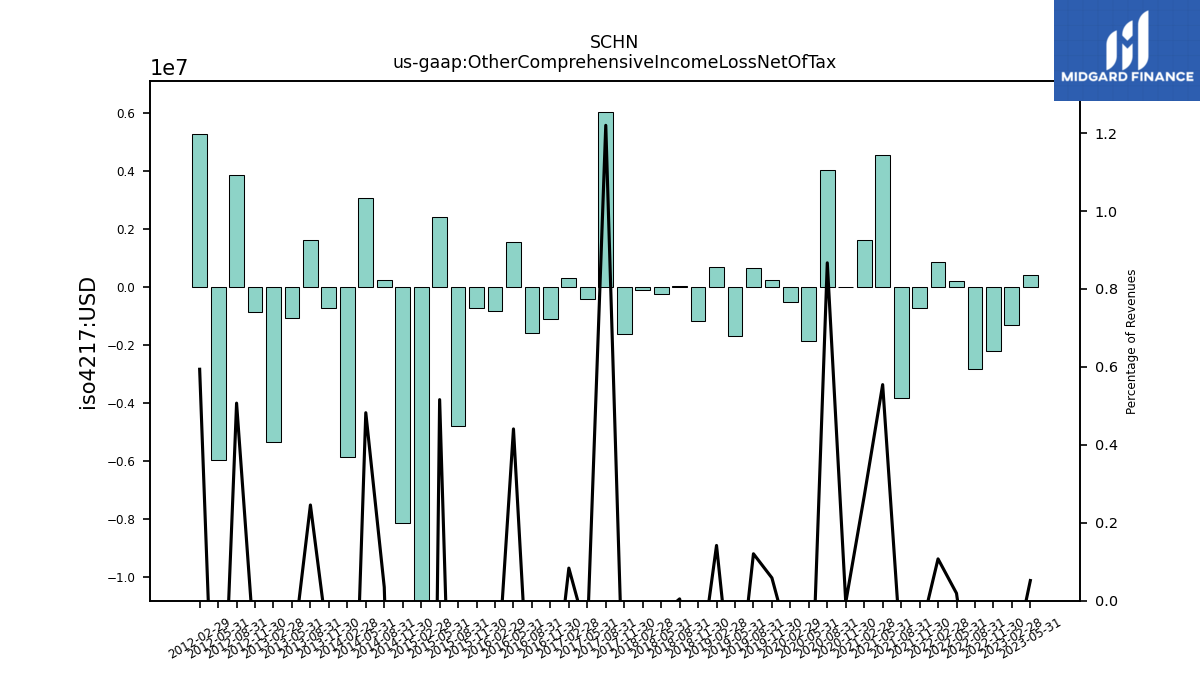
| Other Comprehensive Income Loss Net Of Tax | 0.42 | -1.30 | -2.21 | -2.84 | 0.19 | 0.84 | -0.72 | -3.82 | 4.55 | 1.61 | -0.02 | 4.03 | -1.86 | -0.52 | 0.24 | 0.66 | -1.70 | 0.67 | -1.16 | 0.03 | -0.24 | -0.11 | -1.63 | 6.03 | -0.43 | 0.32 | -1.10 | -1.59 | 1.55 | -0.83 | -0.73 | -4.79 | 2.41 | -15.36 | -8.14 | 0.24 | 3.08 | -5.87 | -0.73 | 1.61 | -1.07 | -5.36 | -0.87 | 3.87 | -5.98 | 5.27 | NA | NA | NA | NA | NA | NA | NA | NA | NA | |
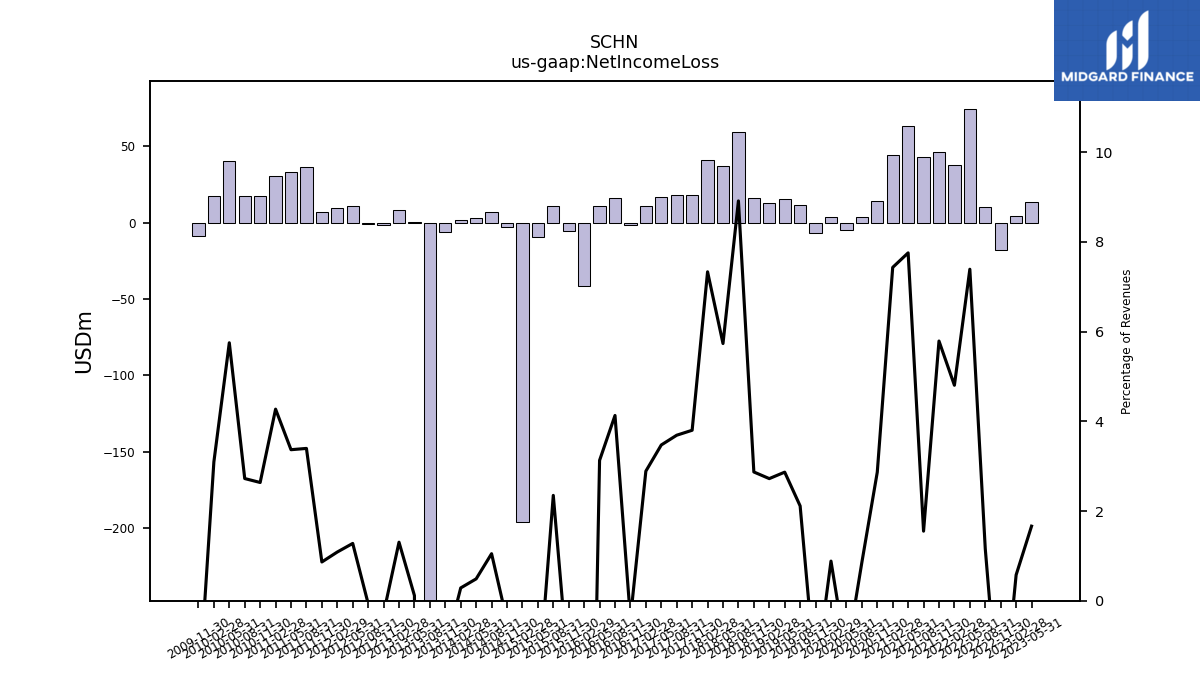
| Net Income Loss | 13.46 | 4.35 | -17.79 | 10.35 | 74.63 | 37.62 | 46.20 | 42.78 | 63.63 | 44.59 | 14.10 | 3.96 | -5.00 | 3.88 | -7.00 | 11.57 | 15.69 | 12.89 | 16.19 | 59.67 | 37.40 | 41.02 | 18.36 | 18.23 | 16.57 | 11.04 | -1.33 | 16.13 | 11.00 | -41.24 | -5.30 | 10.73 | -9.63 | -195.64 | -2.47 | 7.25 | 3.11 | 1.79 | -6.23 | -289.23 | 0.82 | 8.64 | -1.67 | -0.48 | 11.24 | 9.63 | 7.02 | 36.71 | 33.03 | 30.82 | 17.79 | 17.41 | 40.45 | 17.46 | -8.57 | |
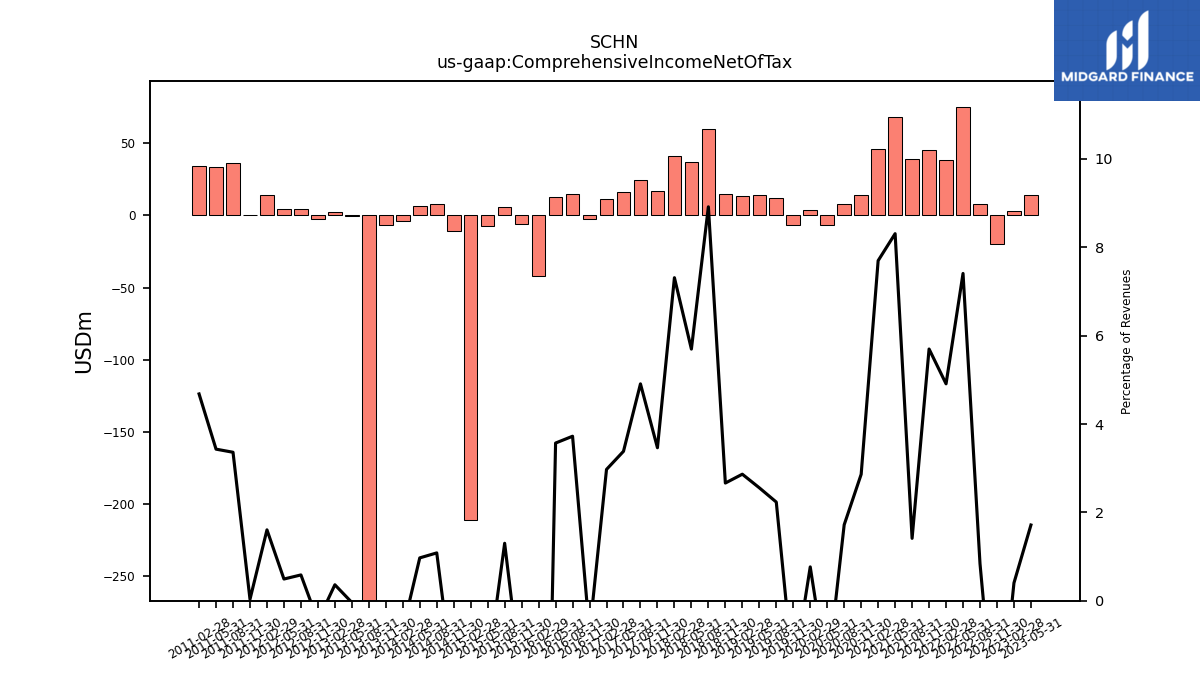
| Comprehensive Income Net Of Tax | 13.88 | 3.05 | -20.00 | 7.51 | 74.83 | 38.46 | 45.47 | 38.96 | 68.19 | 46.20 | 14.08 | 7.99 | -6.85 | 3.37 | -6.76 | 12.23 | 13.99 | 13.56 | 15.03 | 59.70 | 37.16 | 40.91 | 16.74 | 24.26 | 16.14 | 11.36 | -2.42 | 14.55 | 12.55 | -42.07 | -6.02 | 5.95 | -7.22 | -211.00 | -10.62 | 7.49 | 6.19 | -4.08 | -6.95 | -287.62 | -0.28 | 2.40 | -2.71 | 4.46 | 4.33 | 14.23 | 0.27 | 36.34 | 33.66 | 33.79 | NA | NA | NA | NA | NA |
| 2023-05-31 | 2023-02-28 | 2022-11-30 | 2022-08-31 | 2022-05-31 | 2022-02-28 | 2021-11-30 | 2021-08-31 | 2021-05-31 | 2021-02-28 | 2020-11-30 | 2020-08-31 | 2020-05-31 | 2020-02-29 | 2019-11-30 | 2019-08-31 | 2019-05-31 | 2019-02-28 | 2018-11-30 | 2018-08-31 | 2018-05-31 | 2018-02-28 | 2017-11-30 | 2017-08-31 | 2017-05-31 | 2017-02-28 | 2016-11-30 | 2016-08-31 | 2016-05-31 | 2016-02-29 | 2015-11-30 | 2015-08-31 | 2015-05-31 | 2015-02-28 | 2014-11-30 | 2014-08-31 | 2014-05-31 | 2014-02-28 | 2013-11-30 | 2013-08-31 | 2013-05-31 | 2013-02-28 | 2012-11-30 | 2012-08-31 | 2012-05-31 | 2012-02-29 | 2011-11-30 | 2011-08-31 | 2011-05-31 | 2011-02-28 | 2010-11-30 | 2010-08-31 | 2010-05-31 | 2010-02-28 | 2009-11-30 | ||
|---|---|---|---|---|---|---|---|---|---|---|---|---|---|---|---|---|---|---|---|---|---|---|---|---|---|---|---|---|---|---|---|---|---|---|---|---|---|---|---|---|---|---|---|---|---|---|---|---|---|---|---|---|---|---|---|---|
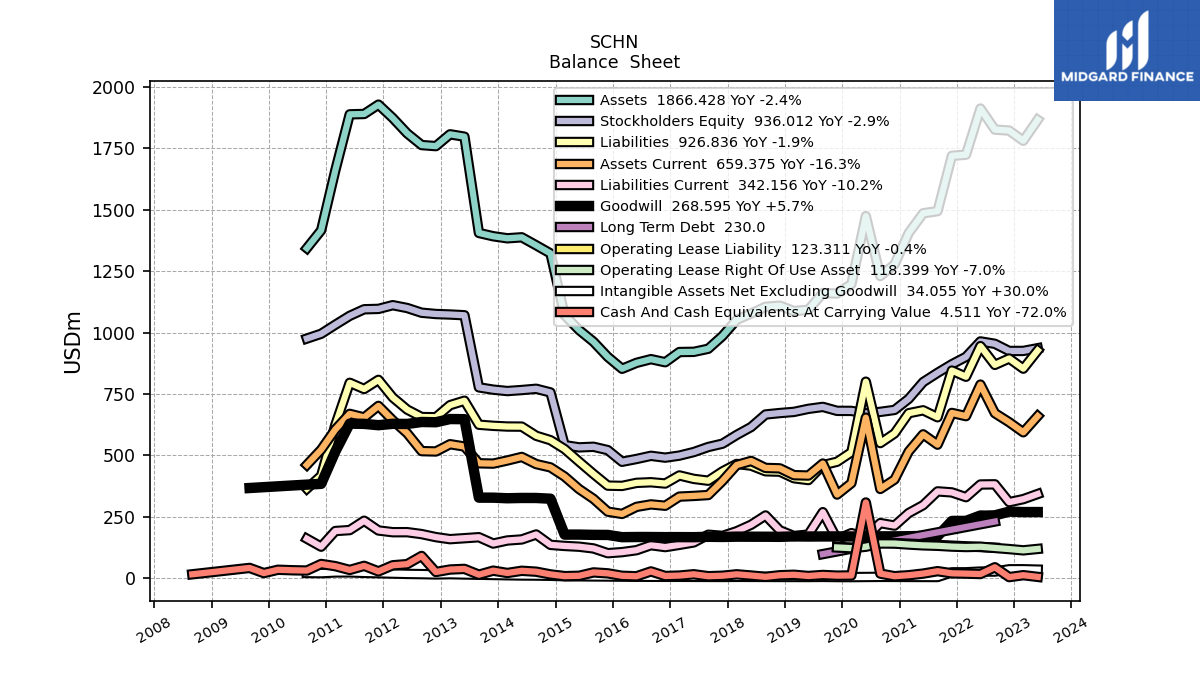
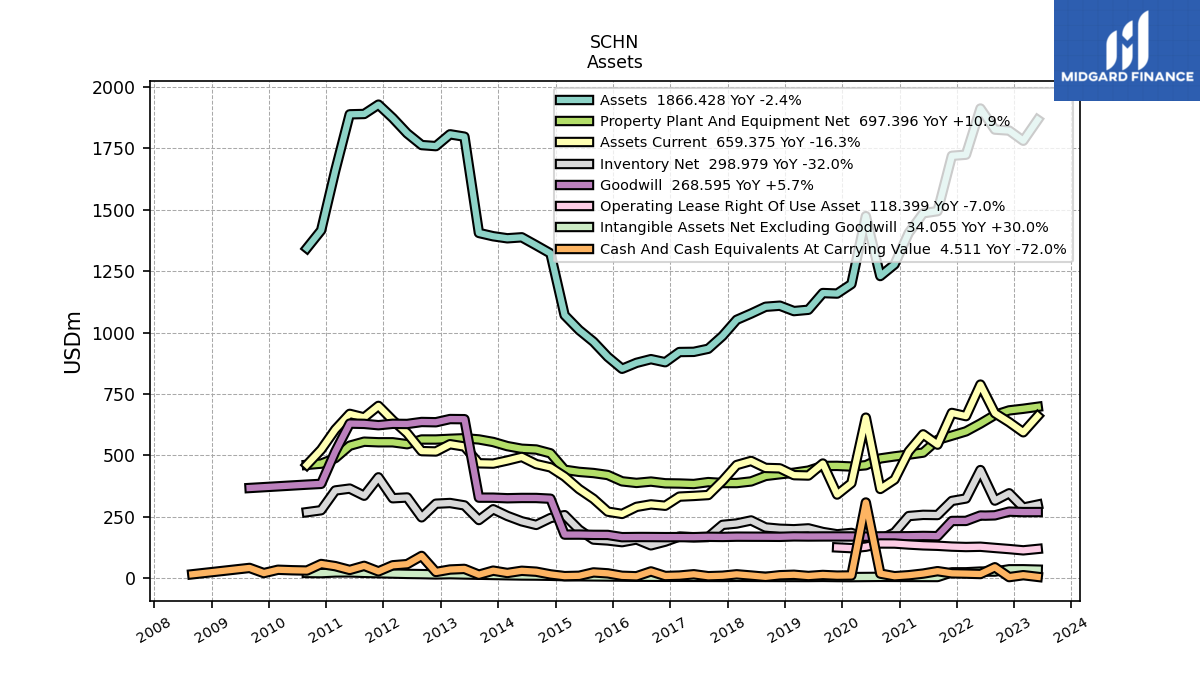
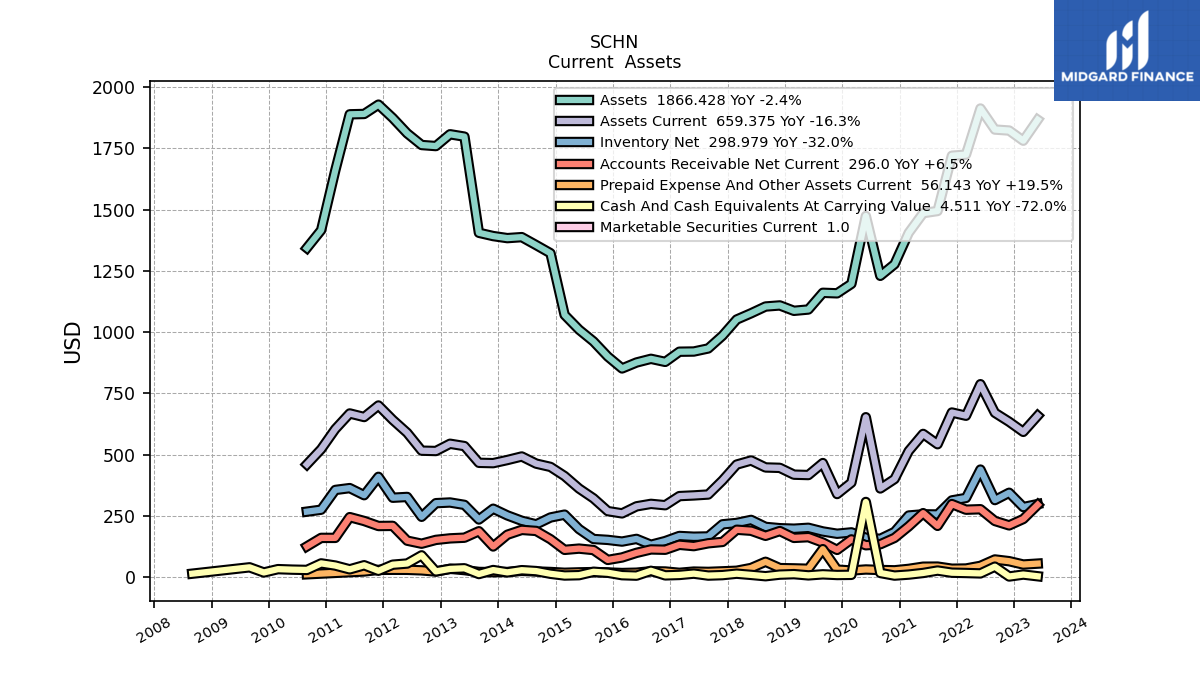
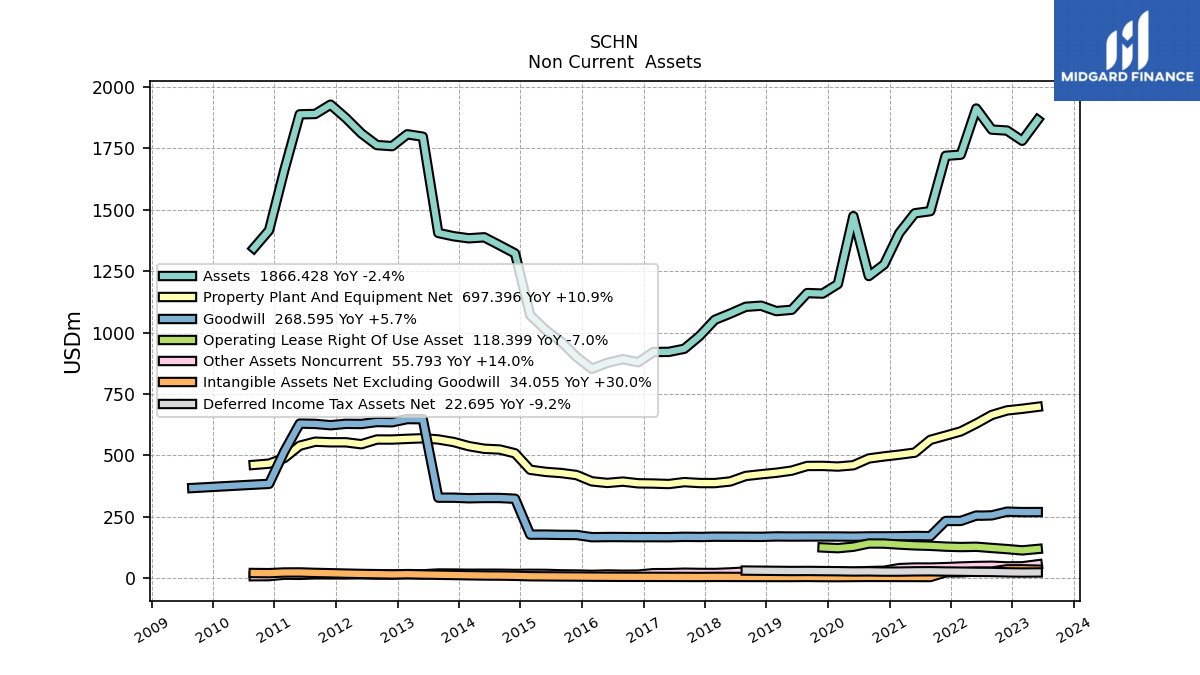
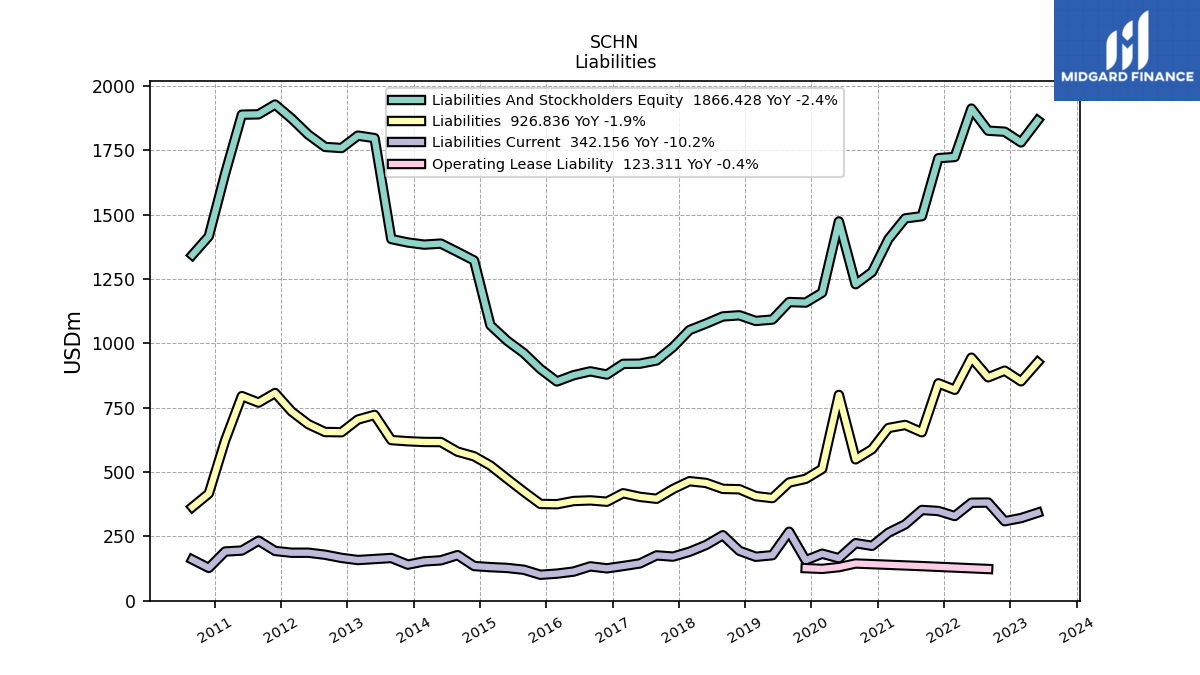
| Assets | 1866.43 | 1781.10 | 1822.62 | 1826.60 | 1912.44 | 1724.33 | 1719.77 | 1494.36 | 1485.74 | 1405.33 | 1277.53 | 1229.93 | 1474.10 | 1197.25 | 1158.59 | 1160.75 | 1092.62 | 1087.25 | 1109.20 | 1104.82 | 1077.27 | 1051.70 | 985.91 | 933.75 | 921.23 | 920.45 | 878.89 | 891.43 | 876.44 | 852.17 | 900.69 | 962.30 | 1010.30 | 1070.61 | 1322.18 | 1355.21 | 1387.84 | 1383.77 | 1392.12 | 1405.51 | 1797.77 | 1807.43 | 1759.20 | 1763.57 | 1811.16 | 1873.79 | 1928.30 | 1890.17 | 1888.79 | 1659.79 | 1416.14 | 1343.42 | NA | NA | NA | |
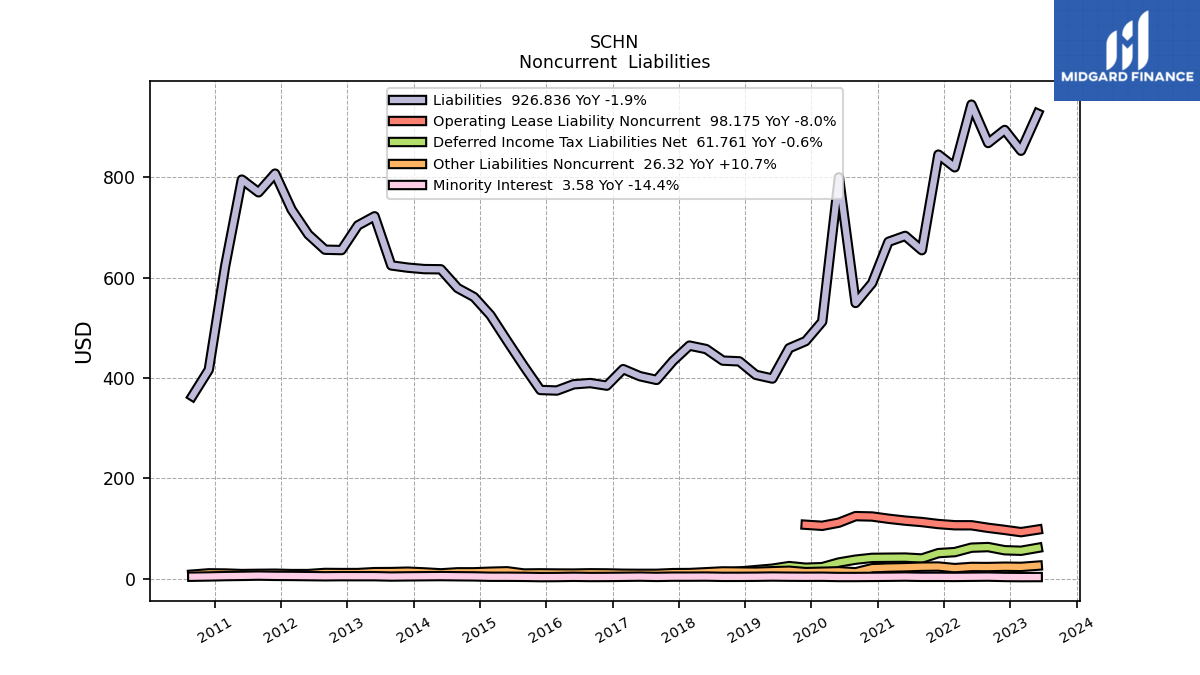
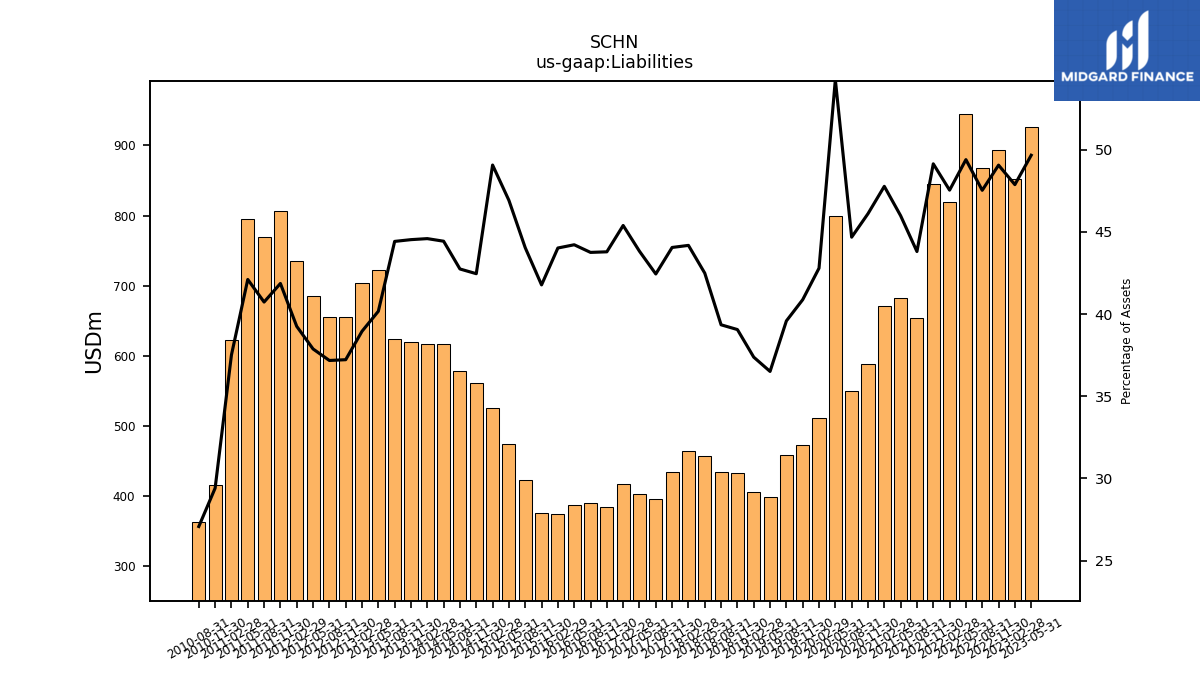
| Liabilities | 926.84 | 852.66 | 894.12 | 868.12 | 944.57 | 819.68 | 845.01 | 654.58 | 683.15 | 671.29 | 588.99 | 549.49 | 799.75 | 512.30 | 473.56 | 459.45 | 398.92 | 406.40 | 433.22 | 434.71 | 457.71 | 464.60 | 434.30 | 396.26 | 403.67 | 417.77 | 384.83 | 390.00 | 387.51 | 375.10 | 376.24 | 423.75 | 473.99 | 525.27 | 561.33 | 579.23 | 616.62 | 616.99 | 619.85 | 624.31 | 722.16 | 704.04 | 654.85 | 655.63 | 686.02 | 735.49 | 807.20 | 769.88 | 795.24 | 622.64 | 416.50 | 363.79 | NA | NA | NA | |
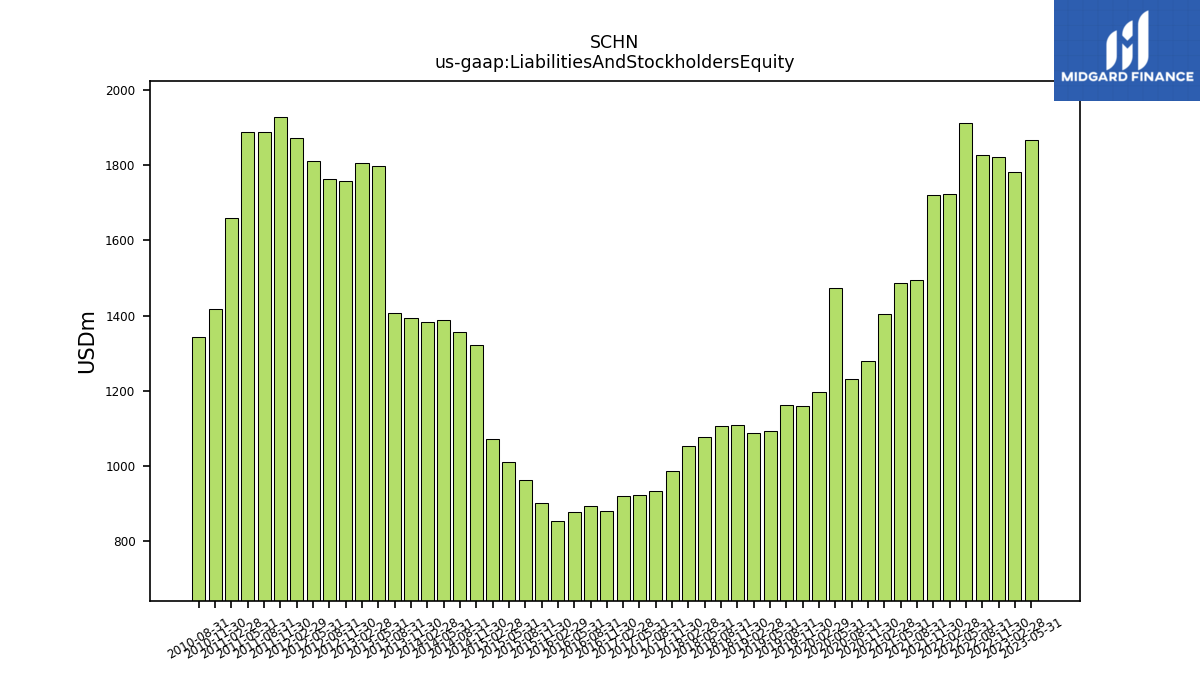
| Liabilities And Stockholders Equity | 1866.43 | 1781.10 | 1822.62 | 1826.60 | 1912.44 | 1724.33 | 1719.77 | 1494.36 | 1485.74 | 1405.33 | 1277.53 | 1229.93 | 1474.10 | 1197.25 | 1158.59 | 1160.75 | 1092.62 | 1087.25 | 1109.20 | 1104.82 | 1077.27 | 1051.70 | 985.91 | 933.75 | 921.23 | 920.45 | 878.89 | 891.43 | 876.44 | 852.17 | 900.69 | 962.30 | 1010.30 | 1070.61 | 1322.18 | 1355.21 | 1387.84 | 1383.77 | 1392.12 | 1405.51 | 1797.77 | 1807.43 | 1759.20 | 1763.57 | 1811.16 | 1873.79 | 1928.30 | 1890.17 | 1888.79 | 1659.79 | 1416.14 | 1343.42 | NA | NA | NA | |
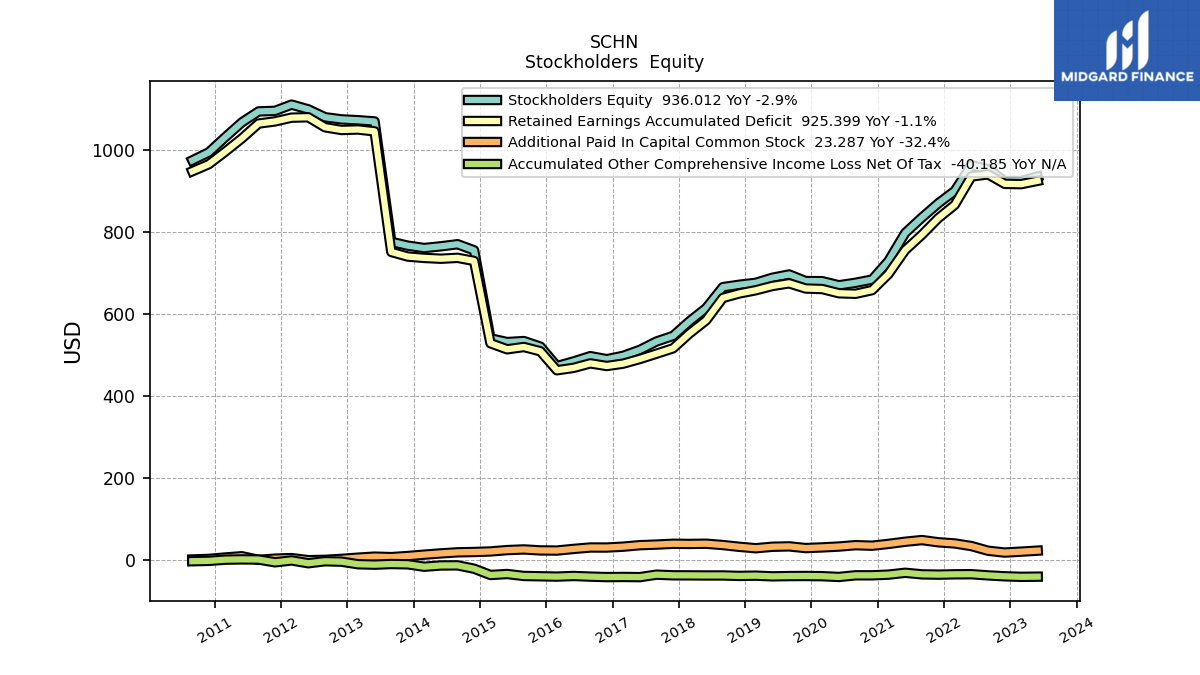
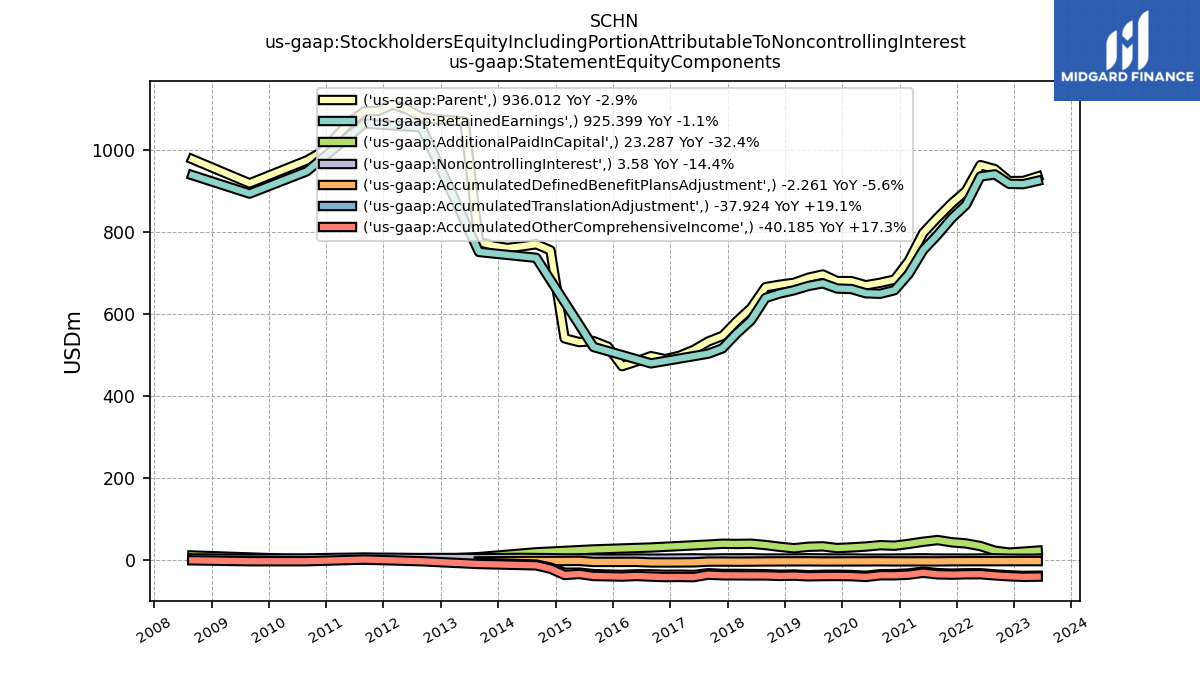
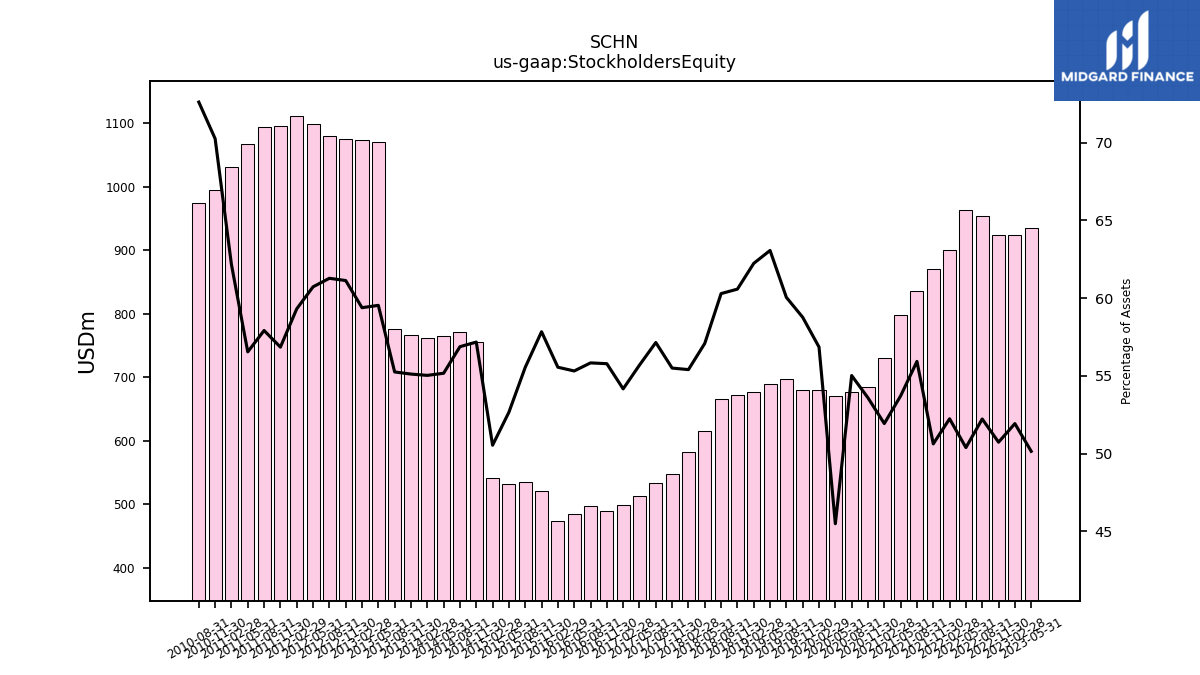
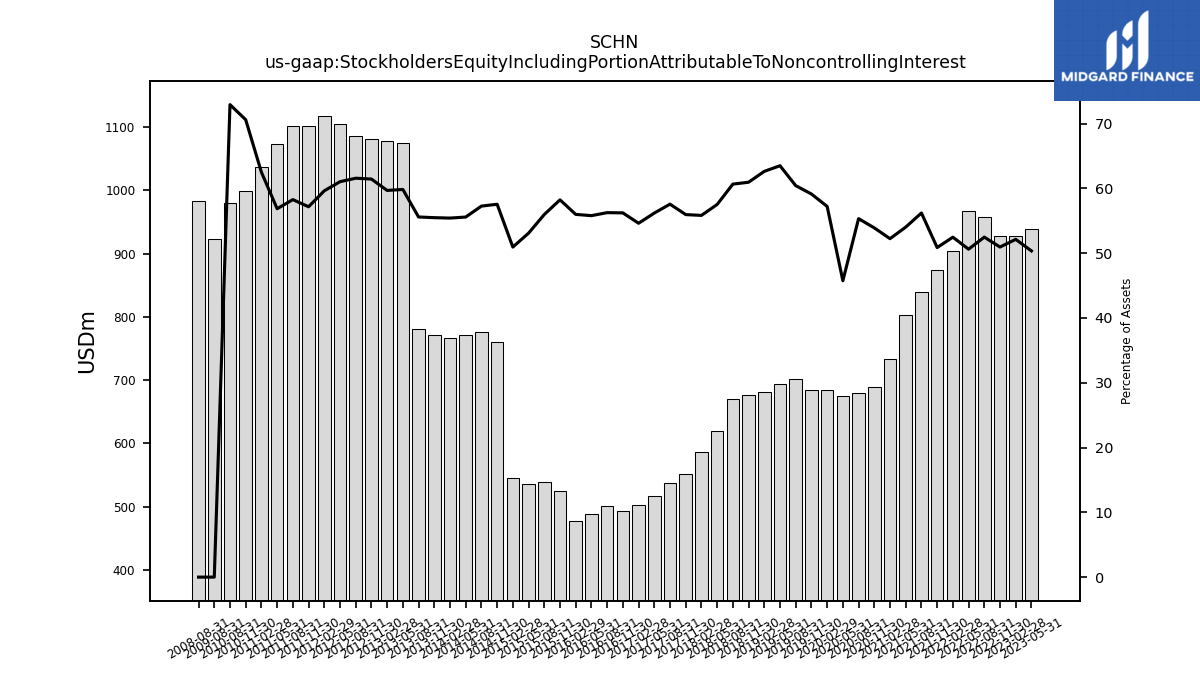
| Stockholders Equity | 936.01 | 924.95 | 924.74 | 953.98 | 963.69 | 900.79 | 870.69 | 835.76 | 798.03 | 729.84 | 684.58 | 676.71 | 670.63 | 680.65 | 680.85 | 696.96 | 689.03 | 676.61 | 671.91 | 666.08 | 614.98 | 582.66 | 547.18 | 533.59 | 513.06 | 498.55 | 490.26 | 497.72 | 484.80 | 473.42 | 520.93 | 534.53 | 532.07 | 541.10 | 755.92 | 770.78 | 765.65 | 761.50 | 767.26 | 776.56 | 1070.27 | 1073.29 | 1075.35 | 1080.58 | 1099.80 | 1111.31 | 1096.18 | 1094.71 | 1067.95 | 1031.63 | 994.84 | 975.33 | NA | NA | NA |
| 2023-05-31 | 2023-02-28 | 2022-11-30 | 2022-08-31 | 2022-05-31 | 2022-02-28 | 2021-11-30 | 2021-08-31 | 2021-05-31 | 2021-02-28 | 2020-11-30 | 2020-08-31 | 2020-05-31 | 2020-02-29 | 2019-11-30 | 2019-08-31 | 2019-05-31 | 2019-02-28 | 2018-11-30 | 2018-08-31 | 2018-05-31 | 2018-02-28 | 2017-11-30 | 2017-08-31 | 2017-05-31 | 2017-02-28 | 2016-11-30 | 2016-08-31 | 2016-05-31 | 2016-02-29 | 2015-11-30 | 2015-08-31 | 2015-05-31 | 2015-02-28 | 2014-11-30 | 2014-08-31 | 2014-05-31 | 2014-02-28 | 2013-11-30 | 2013-08-31 | 2013-05-31 | 2013-02-28 | 2012-11-30 | 2012-08-31 | 2012-05-31 | 2012-02-29 | 2011-11-30 | 2011-08-31 | 2011-05-31 | 2011-02-28 | 2010-11-30 | 2010-08-31 | 2010-05-31 | 2010-02-28 | 2009-11-30 | ||
|---|---|---|---|---|---|---|---|---|---|---|---|---|---|---|---|---|---|---|---|---|---|---|---|---|---|---|---|---|---|---|---|---|---|---|---|---|---|---|---|---|---|---|---|---|---|---|---|---|---|---|---|---|---|---|---|---|
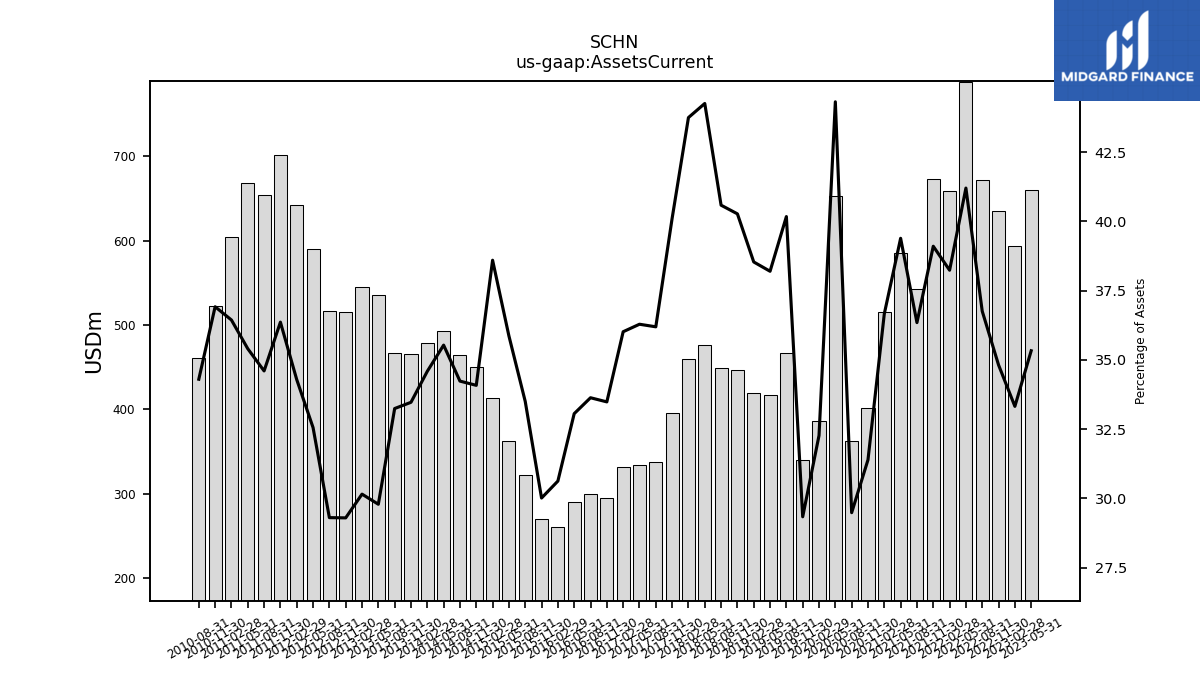
| Assets Current | 659.38 | 593.49 | 634.56 | 671.39 | 787.92 | 659.30 | 672.43 | 543.11 | 585.19 | 515.23 | 401.03 | 362.63 | 653.23 | 386.34 | 339.88 | 466.29 | 417.35 | 418.95 | 446.67 | 448.36 | 476.72 | 460.06 | 395.42 | 337.95 | 334.27 | 331.50 | 294.28 | 299.81 | 289.73 | 260.97 | 270.32 | 322.37 | 362.34 | 413.21 | 450.60 | 463.93 | 493.12 | 478.60 | 465.91 | 467.23 | 535.51 | 545.00 | 515.38 | 516.82 | 589.65 | 642.48 | 701.14 | 654.00 | 668.66 | 604.79 | 522.79 | 460.79 | NA | NA | NA | |
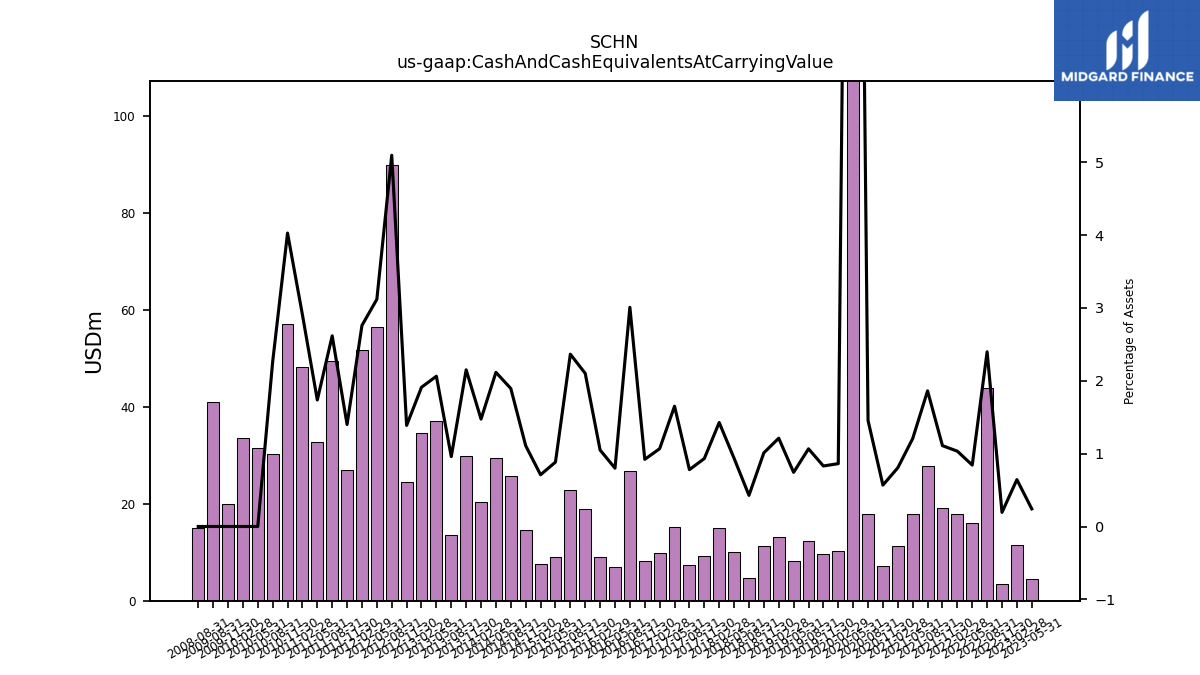
| Cash And Cash Equivalents At Carrying Value | 4.51 | 11.46 | 3.54 | 43.80 | 16.12 | 17.82 | 19.08 | 27.82 | 17.93 | 11.33 | 7.26 | 17.89 | 307.65 | 10.33 | 9.62 | 12.38 | 8.12 | 13.17 | 11.22 | 4.72 | 10.09 | 15.01 | 9.19 | 7.29 | 15.21 | 9.83 | 8.10 | 26.82 | 7.02 | 8.94 | 18.93 | 22.75 | 8.93 | 7.60 | 14.67 | 25.67 | 29.36 | 20.40 | 29.93 | 13.48 | 37.08 | 34.54 | 24.40 | 89.86 | 56.47 | 51.72 | 26.99 | 49.46 | 32.80 | 48.24 | 57.03 | 30.34 | 31.52 | 33.57 | 19.98 | |
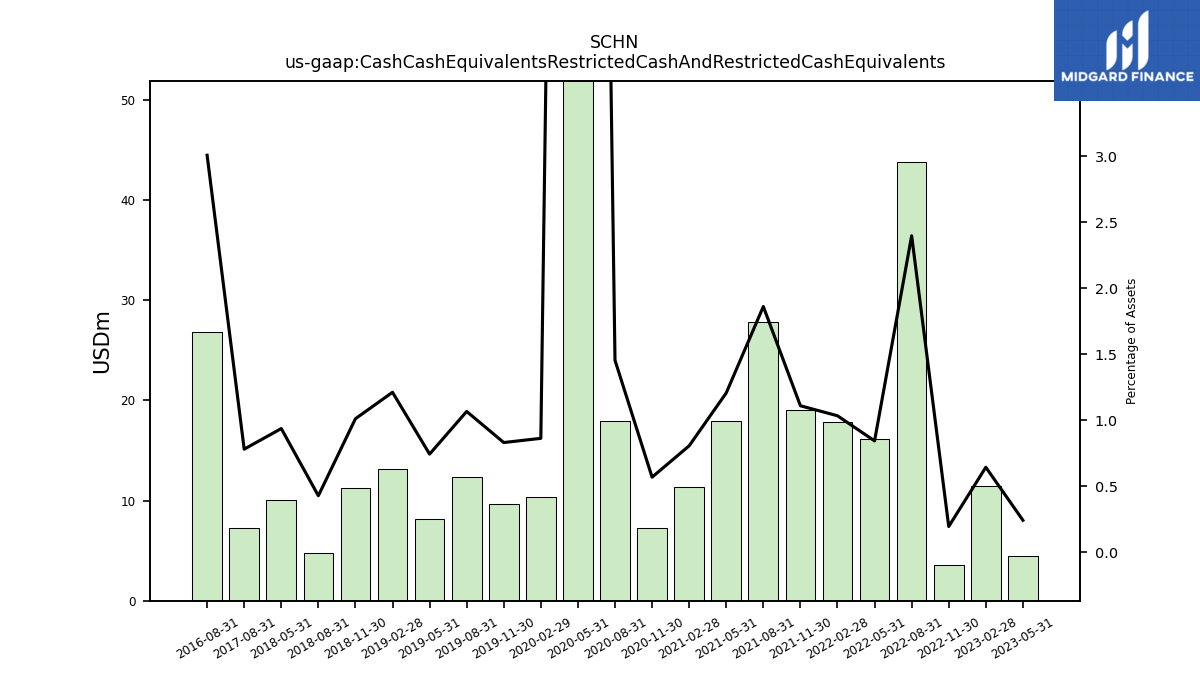
| Cash Cash Equivalents Restricted Cash And Restricted Cash Equivalents | 4.51 | 11.46 | 3.54 | 43.80 | 16.12 | 17.82 | 19.08 | 27.82 | 17.93 | 11.33 | 7.26 | 17.89 | 307.65 | 10.33 | 9.62 | 12.38 | 8.12 | 13.17 | 11.22 | 4.72 | 10.09 | NA | NA | 7.29 | NA | NA | NA | 26.82 | NA | NA | NA | NA | NA | NA | NA | NA | NA | NA | NA | NA | NA | NA | NA | NA | NA | NA | NA | NA | NA | NA | NA | NA | NA | NA | NA | |
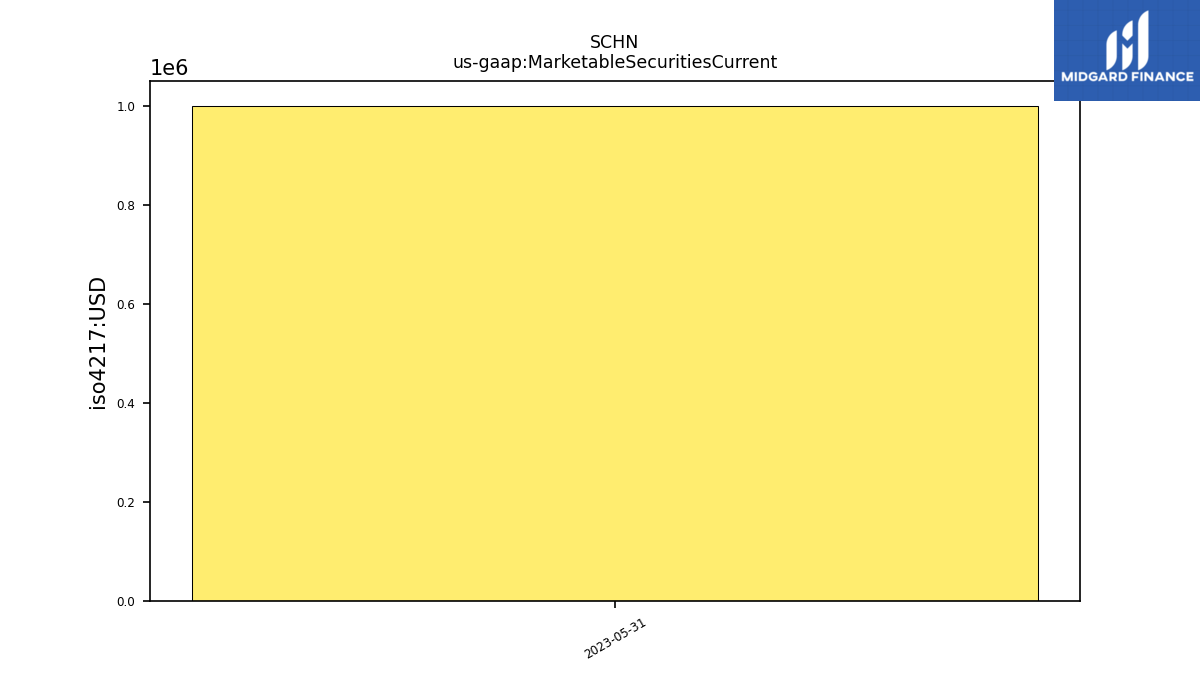
| Marketable Securities Current | 1.00 | NA | NA | NA | NA | NA | NA | NA | NA | NA | NA | NA | NA | NA | NA | NA | NA | NA | NA | NA | NA | NA | NA | NA | NA | NA | NA | NA | NA | NA | NA | NA | NA | NA | NA | NA | NA | NA | NA | NA | NA | NA | NA | NA | NA | NA | NA | NA | NA | NA | NA | NA | NA | NA | NA | |
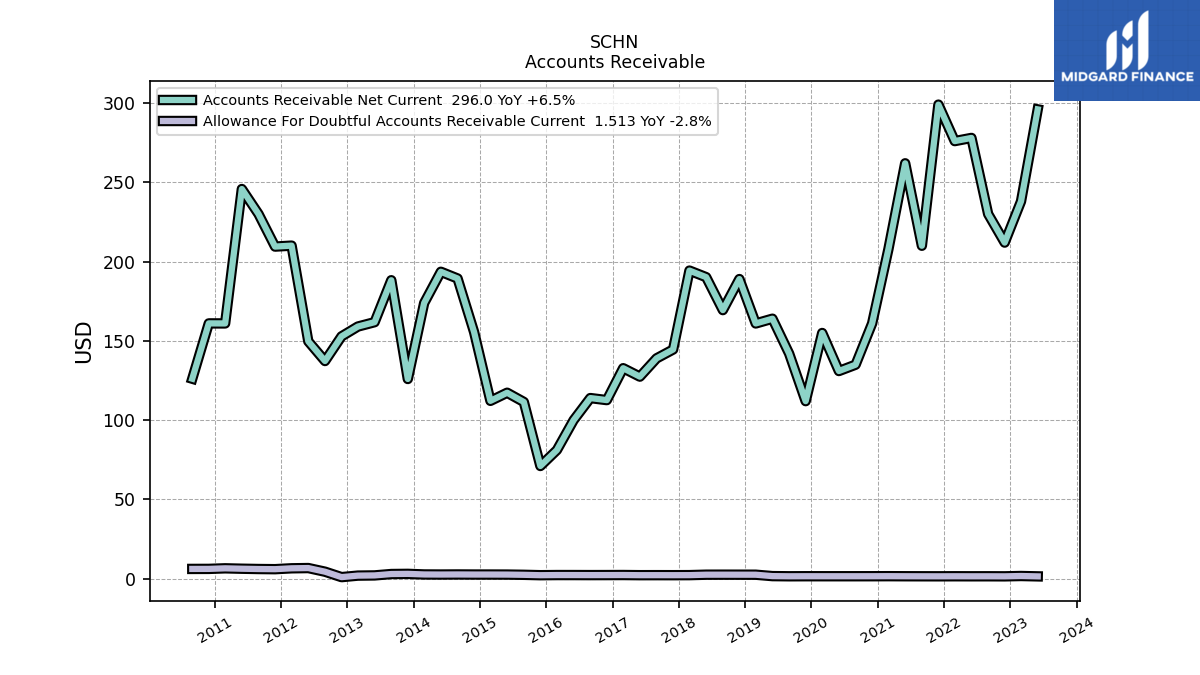
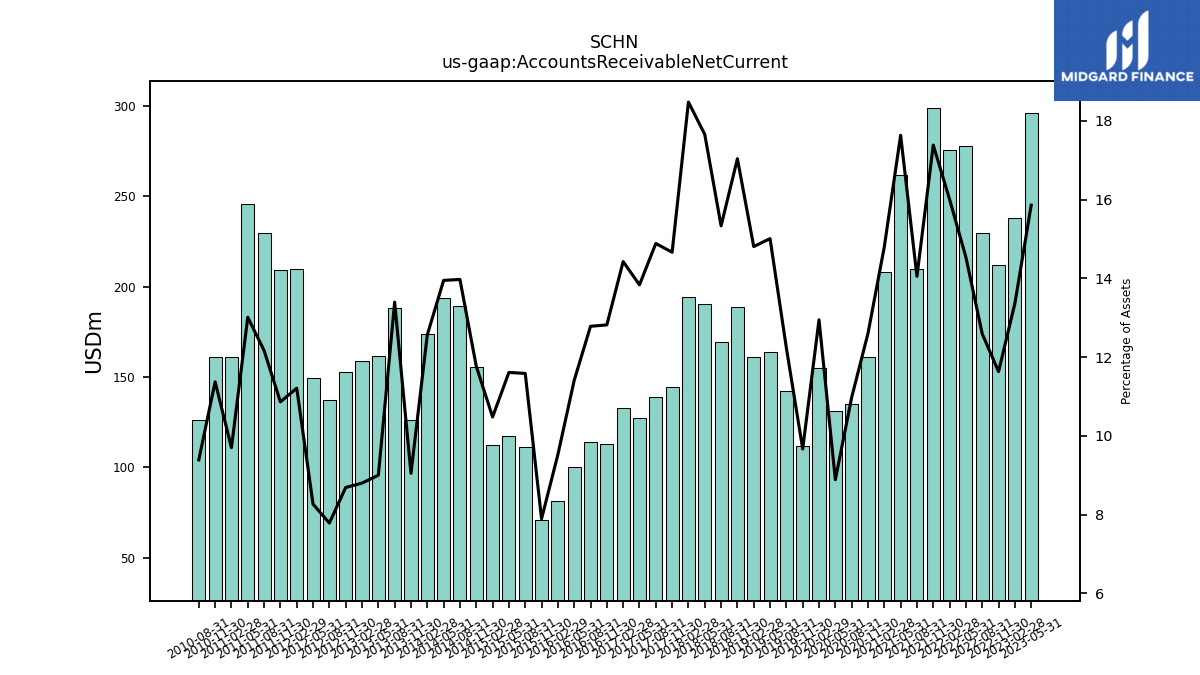
| Accounts Receivable Net Current | 296.00 | 238.00 | 212.00 | 230.00 | 278.00 | 276.00 | 299.00 | 210.00 | 262.00 | 208.00 | 161.00 | 135.00 | 131.00 | 155.00 | 112.00 | 142.00 | 164.00 | 161.00 | 189.00 | 169.42 | 190.19 | 194.34 | 144.58 | 139.00 | 127.46 | 132.79 | 112.67 | 113.95 | 100.00 | 81.16 | 71.10 | 111.49 | 117.31 | 112.20 | 155.60 | 189.36 | 193.59 | 173.88 | 125.97 | 188.27 | 161.81 | 159.06 | 152.86 | 137.31 | 149.72 | 210.08 | 209.47 | 229.97 | 245.78 | 161.01 | 161.04 | 126.16 | NA | NA | NA | |
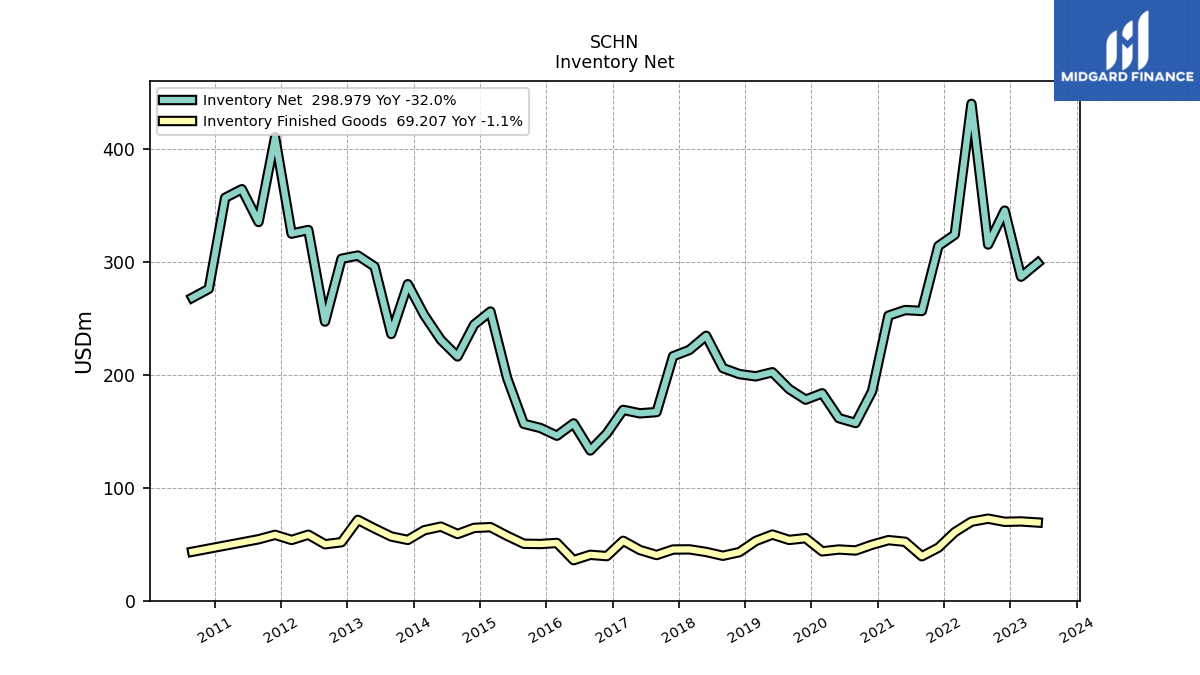
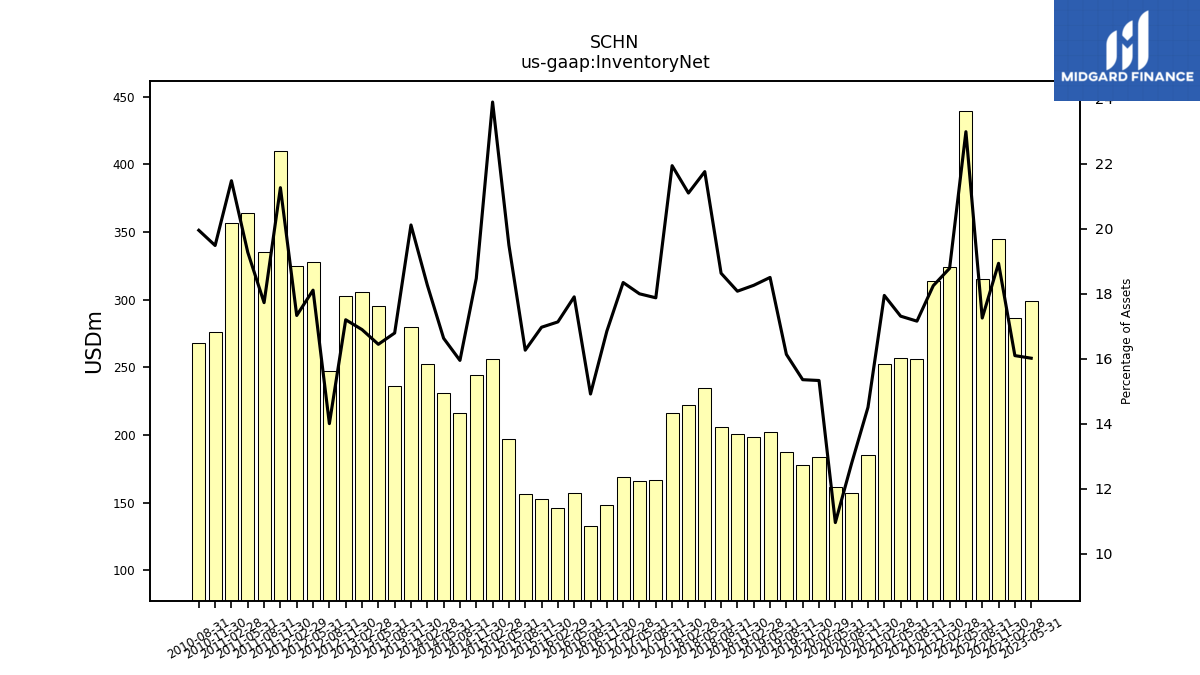
| Inventory Net | 298.98 | 286.73 | 345.20 | 315.19 | 439.70 | 323.93 | 313.87 | 256.43 | 257.23 | 252.27 | 185.35 | 157.27 | 161.54 | 183.57 | 177.93 | 187.32 | 202.19 | 198.56 | 200.56 | 205.88 | 234.44 | 221.94 | 216.37 | 166.94 | 165.83 | 168.89 | 148.09 | 132.97 | 156.95 | 146.03 | 152.87 | 156.53 | 197.01 | 255.93 | 244.27 | 216.17 | 230.83 | 252.85 | 280.10 | 236.05 | 295.68 | 305.45 | 302.63 | 246.99 | 328.06 | 324.82 | 410.12 | 335.12 | 364.16 | 356.56 | 275.99 | 268.10 | NA | NA | NA | |
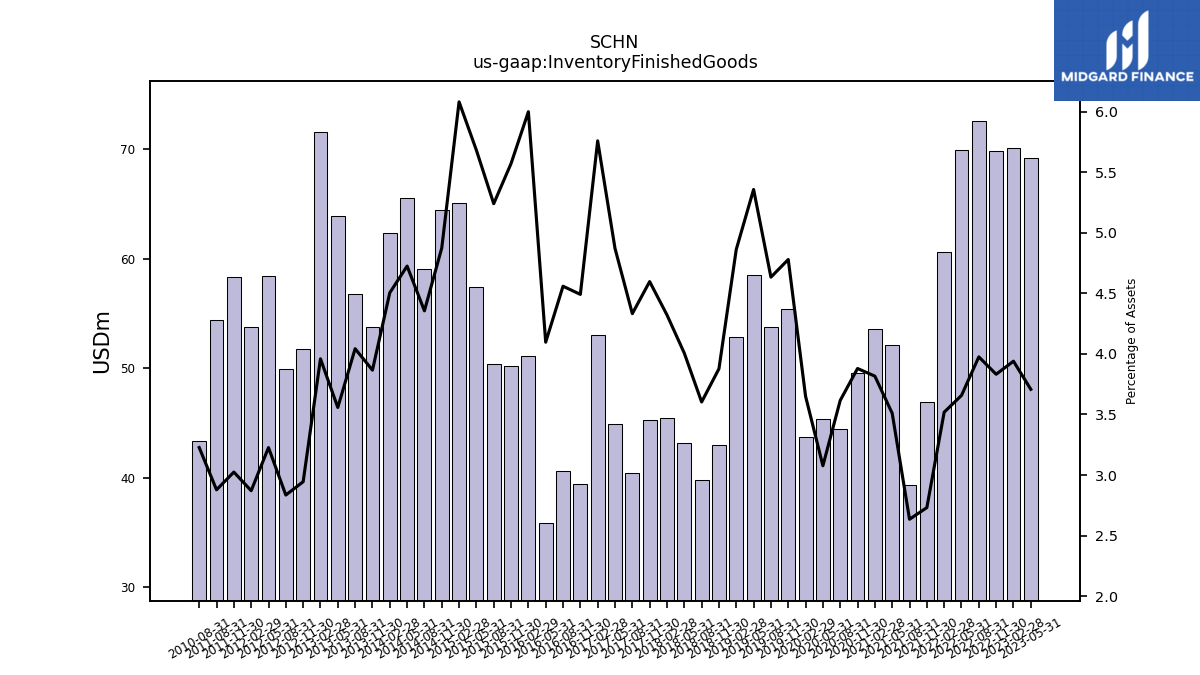
| Inventory Finished Goods | 69.21 | 70.18 | 69.85 | 72.62 | 69.95 | 60.68 | 46.96 | 39.37 | 52.15 | 53.64 | 49.57 | 44.48 | 45.35 | 43.70 | 55.39 | 53.80 | 58.55 | 52.89 | 43.01 | 39.81 | 43.16 | 45.46 | 45.33 | 40.46 | 44.89 | 53.02 | 39.48 | 40.65 | 35.91 | 51.14 | 50.20 | 50.44 | 57.42 | 65.12 | 64.46 | 59.04 | 65.59 | 62.34 | 53.83 | 56.83 | 63.97 | 71.57 | 51.80 | 49.99 | 58.44 | 53.78 | 58.31 | 54.40 | NA | NA | NA | 43.35 | NA | NA | NA | |
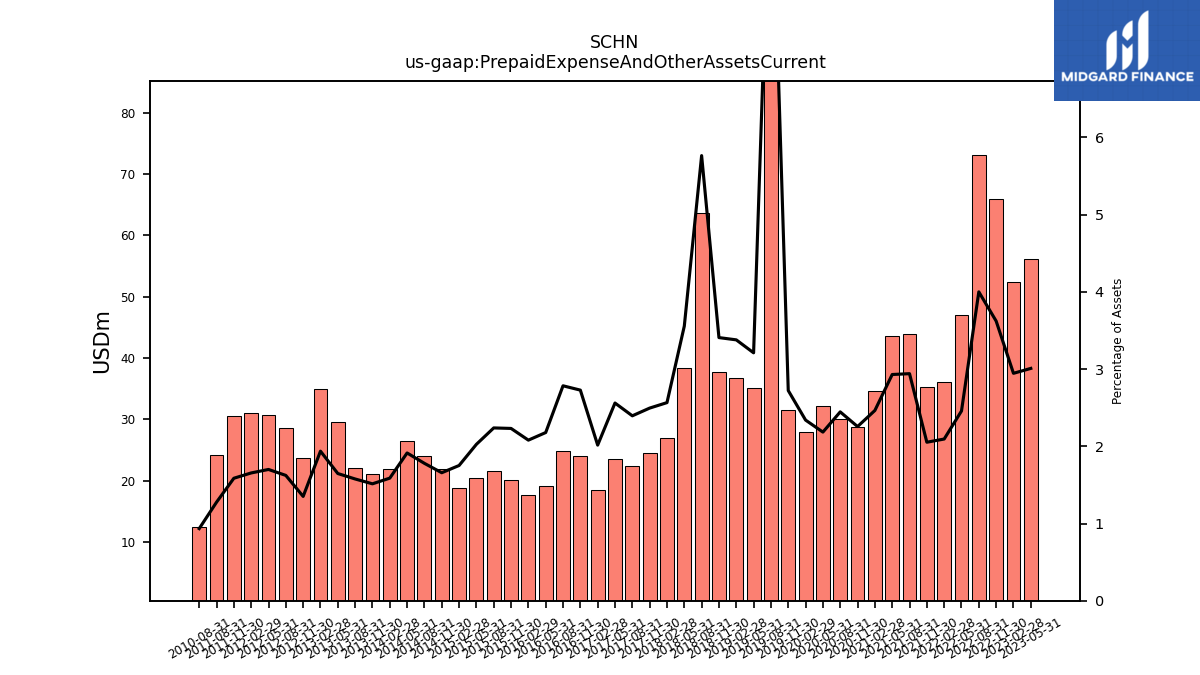
| Prepaid Expense And Other Assets Current | 56.14 | 52.45 | 66.00 | 73.04 | 46.99 | 36.10 | 35.30 | 43.93 | 43.52 | 34.62 | 28.81 | 30.07 | 32.19 | 28.00 | 31.53 | 115.11 | 35.07 | 36.72 | 37.79 | 63.67 | 38.30 | 26.98 | 24.59 | 22.36 | 23.58 | 18.55 | 23.97 | 24.81 | 19.09 | 17.72 | 20.09 | 21.53 | 20.46 | 18.75 | 21.91 | 24.11 | 26.55 | 21.97 | 21.08 | 22.16 | 29.61 | 35.00 | 23.76 | 28.62 | 30.79 | 31.00 | 30.58 | 24.12 | NA | NA | NA | 12.55 | NA | NA | NA |
| 2023-05-31 | 2023-02-28 | 2022-11-30 | 2022-08-31 | 2022-05-31 | 2022-02-28 | 2021-11-30 | 2021-08-31 | 2021-05-31 | 2021-02-28 | 2020-11-30 | 2020-08-31 | 2020-05-31 | 2020-02-29 | 2019-11-30 | 2019-08-31 | 2019-05-31 | 2019-02-28 | 2018-11-30 | 2018-08-31 | 2018-05-31 | 2018-02-28 | 2017-11-30 | 2017-08-31 | 2017-05-31 | 2017-02-28 | 2016-11-30 | 2016-08-31 | 2016-05-31 | 2016-02-29 | 2015-11-30 | 2015-08-31 | 2015-05-31 | 2015-02-28 | 2014-11-30 | 2014-08-31 | 2014-05-31 | 2014-02-28 | 2013-11-30 | 2013-08-31 | 2013-05-31 | 2013-02-28 | 2012-11-30 | 2012-08-31 | 2012-05-31 | 2012-02-29 | 2011-11-30 | 2011-08-31 | 2011-05-31 | 2011-02-28 | 2010-11-30 | 2010-08-31 | 2010-05-31 | 2010-02-28 | 2009-11-30 | ||
|---|---|---|---|---|---|---|---|---|---|---|---|---|---|---|---|---|---|---|---|---|---|---|---|---|---|---|---|---|---|---|---|---|---|---|---|---|---|---|---|---|---|---|---|---|---|---|---|---|---|---|---|---|---|---|---|---|
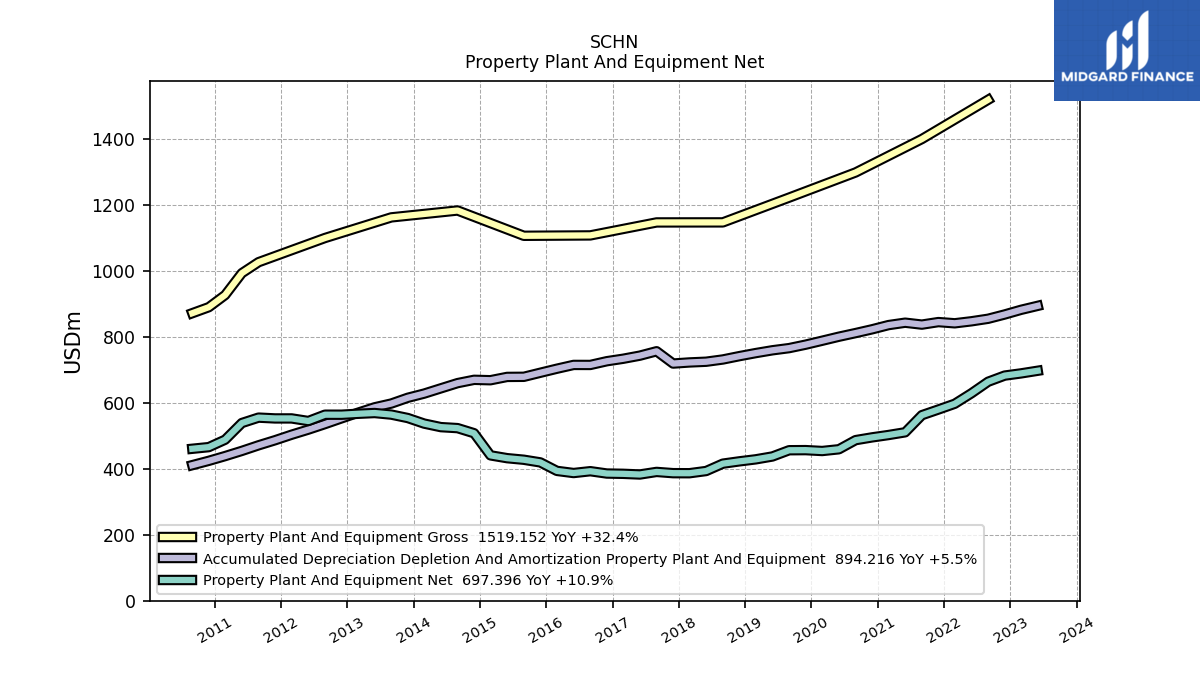
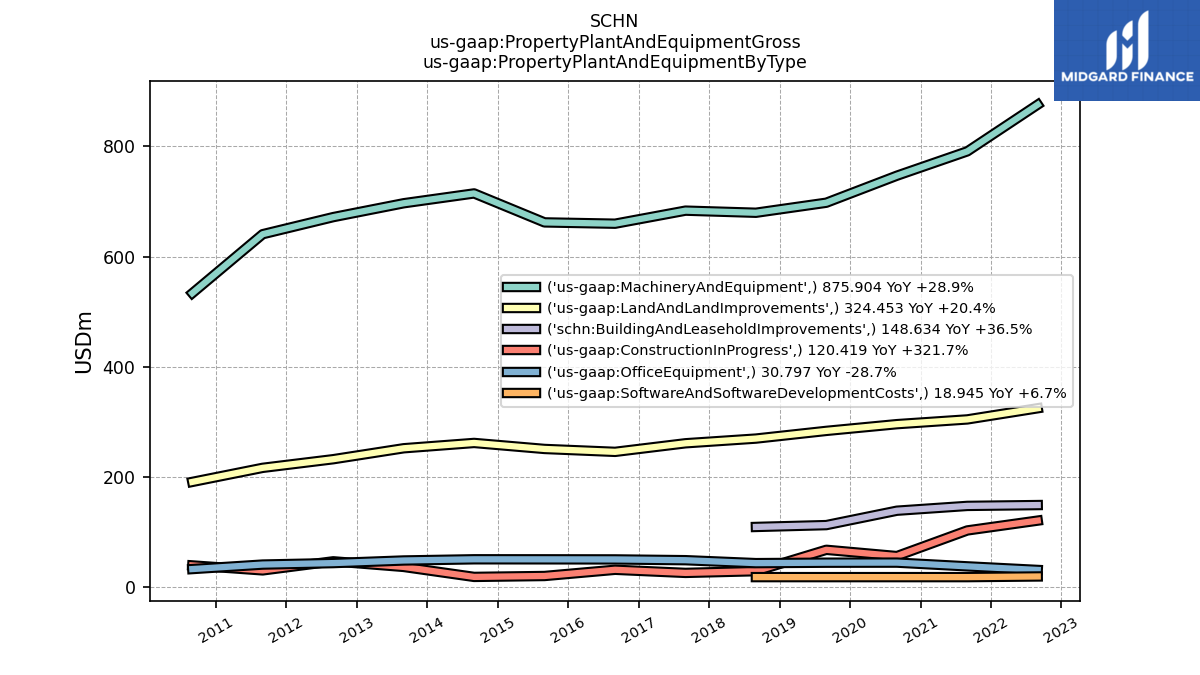
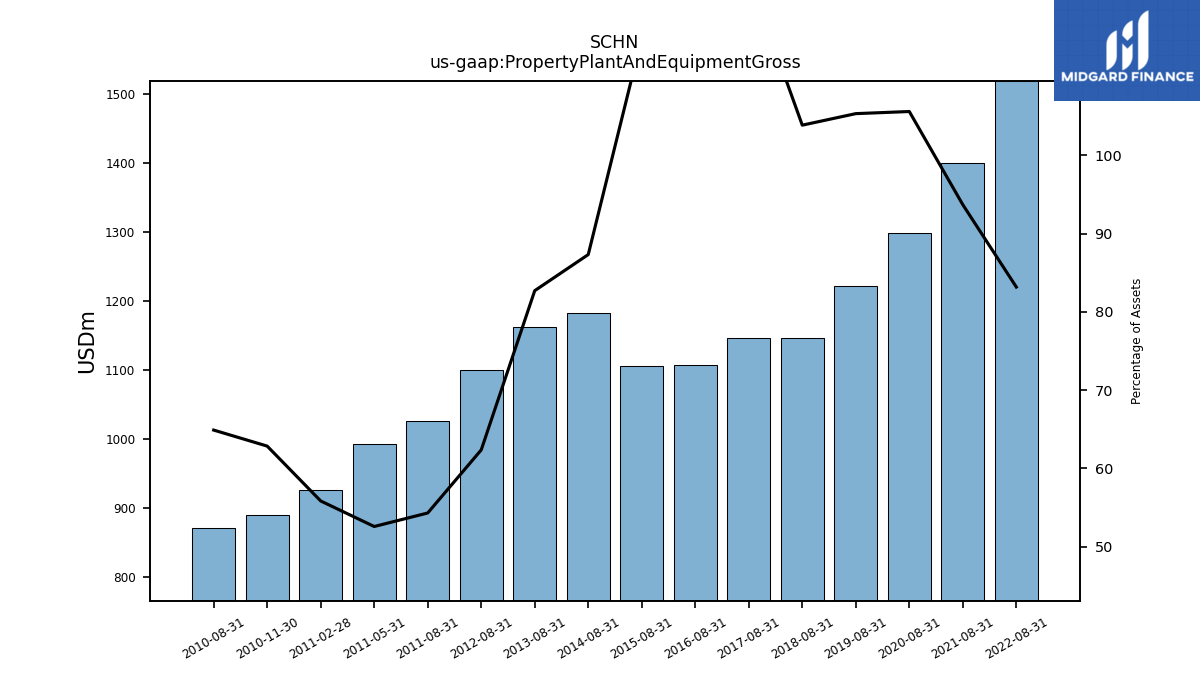
| Property Plant And Equipment Gross | NA | NA | NA | 1519.15 | NA | NA | NA | 1399.97 | NA | NA | NA | 1298.63 | NA | NA | NA | 1222.43 | NA | NA | NA | 1147.27 | NA | NA | NA | 1147.12 | NA | NA | NA | 1107.79 | NA | NA | NA | 1106.59 | NA | NA | NA | 1183.31 | NA | NA | NA | 1162.41 | NA | NA | NA | 1099.91 | NA | NA | NA | 1026.59 | 993.25 | 926.98 | 890.11 | 871.90 | NA | NA | NA | |
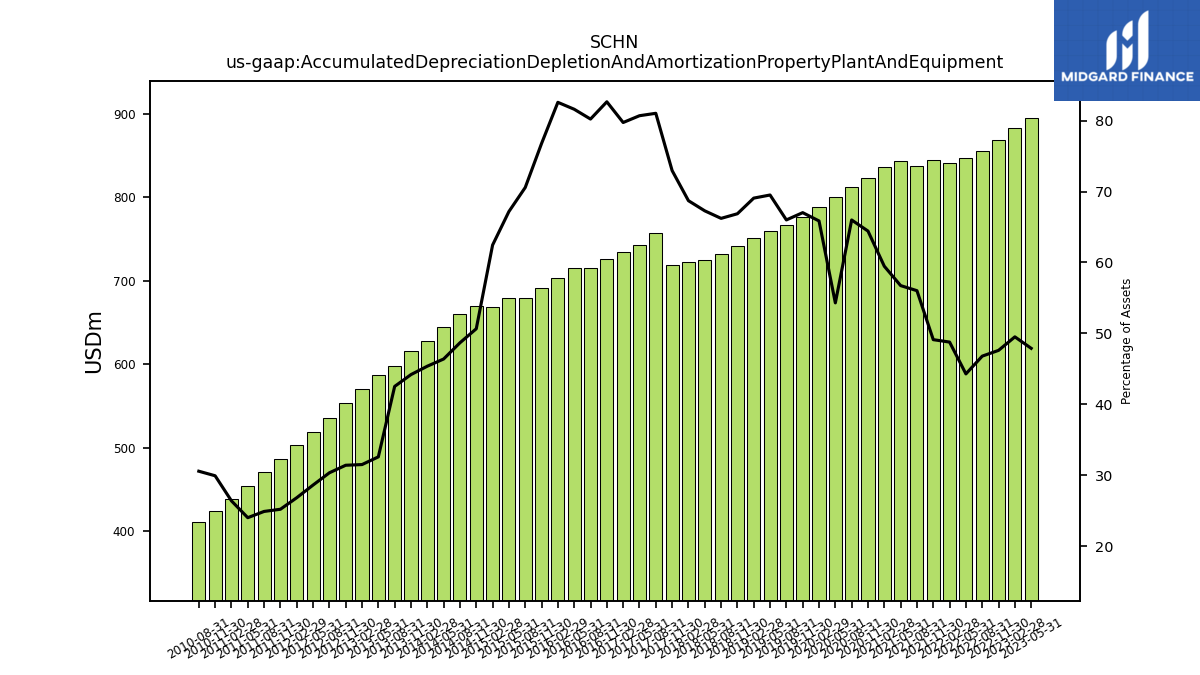
| Accumulated Depreciation Depletion And Amortization Property Plant And Equipment | 894.22 | 882.12 | 867.98 | 855.03 | 847.37 | 841.30 | 844.96 | 837.29 | 843.12 | 835.80 | 823.09 | 811.62 | 800.62 | 788.43 | 776.51 | 766.03 | 759.45 | 750.95 | 741.69 | 731.56 | 724.76 | 722.58 | 719.19 | 756.49 | 743.20 | 733.77 | 726.29 | 714.97 | 715.06 | 703.56 | 691.37 | 679.03 | 678.69 | 668.65 | 669.90 | 659.87 | 644.04 | 628.13 | 615.46 | 597.99 | 586.47 | 570.02 | 553.10 | 535.73 | 518.90 | 503.42 | 486.74 | 471.31 | 454.36 | 438.66 | 424.28 | 411.09 | NA | NA | NA | |
| Property Plant And Equipment Net | 697.40 | 689.37 | 682.74 | 664.12 | 629.10 | 597.26 | 579.87 | 562.67 | 510.76 | 502.48 | 495.38 | 487.00 | 459.31 | 454.02 | 456.71 | 456.40 | 437.46 | 428.78 | 422.69 | 415.71 | 393.39 | 386.68 | 386.85 | 390.63 | 382.82 | 384.88 | 385.75 | 392.82 | 387.27 | 393.77 | 419.49 | 427.55 | 432.31 | 440.87 | 507.97 | 523.43 | 526.45 | 537.19 | 554.01 | 564.43 | 569.22 | 566.89 | 564.11 | 564.18 | 544.97 | 552.85 | 552.83 | 555.28 | 538.89 | 488.33 | 465.83 | 460.81 | NA | NA | NA | |
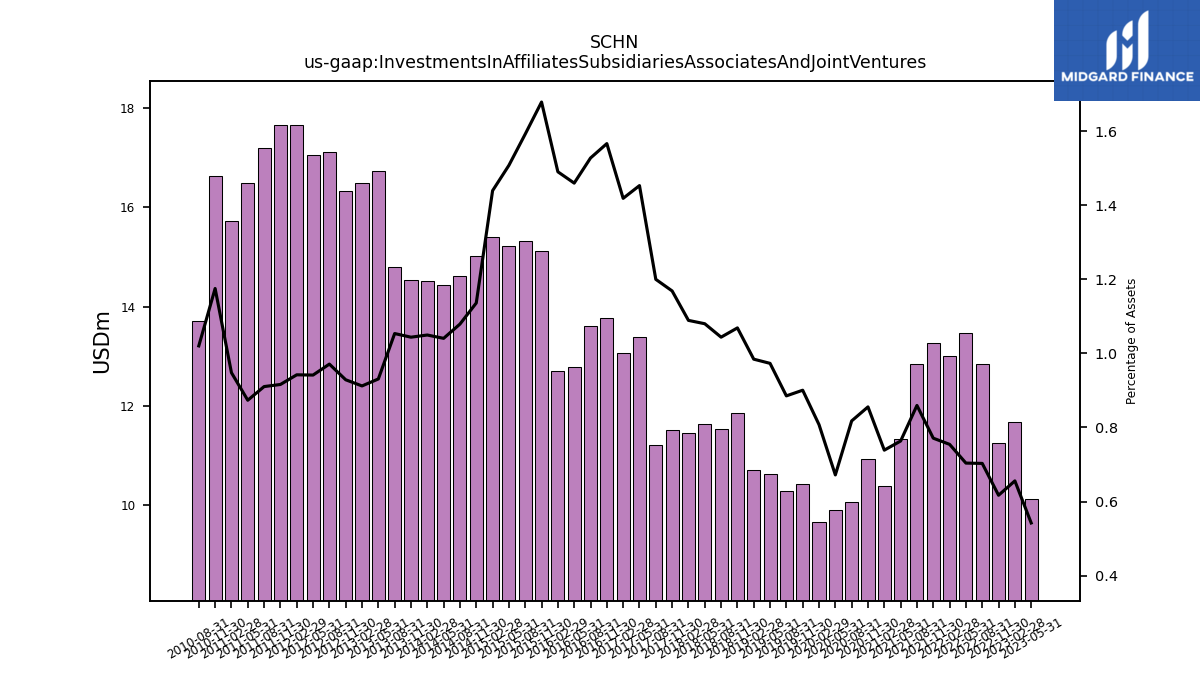
| Investments In Affiliates Subsidiaries Associates And Joint Ventures | 10.12 | 11.68 | 11.25 | 12.84 | 13.46 | 13.01 | 13.26 | 12.84 | 11.34 | 10.38 | 10.93 | 10.06 | 9.90 | 9.67 | 10.43 | 10.28 | 10.63 | 10.70 | 11.86 | 11.53 | 11.63 | 11.45 | 11.52 | 11.20 | 13.38 | 13.06 | 13.77 | 13.62 | 12.79 | 12.70 | 15.12 | 15.32 | 15.23 | 15.41 | 15.02 | 14.62 | 14.44 | 14.52 | 14.53 | 14.81 | 16.74 | 16.49 | 16.34 | 17.13 | 17.05 | 17.65 | 17.66 | 17.21 | 16.50 | 15.73 | 16.64 | 13.71 | NA | NA | NA | |
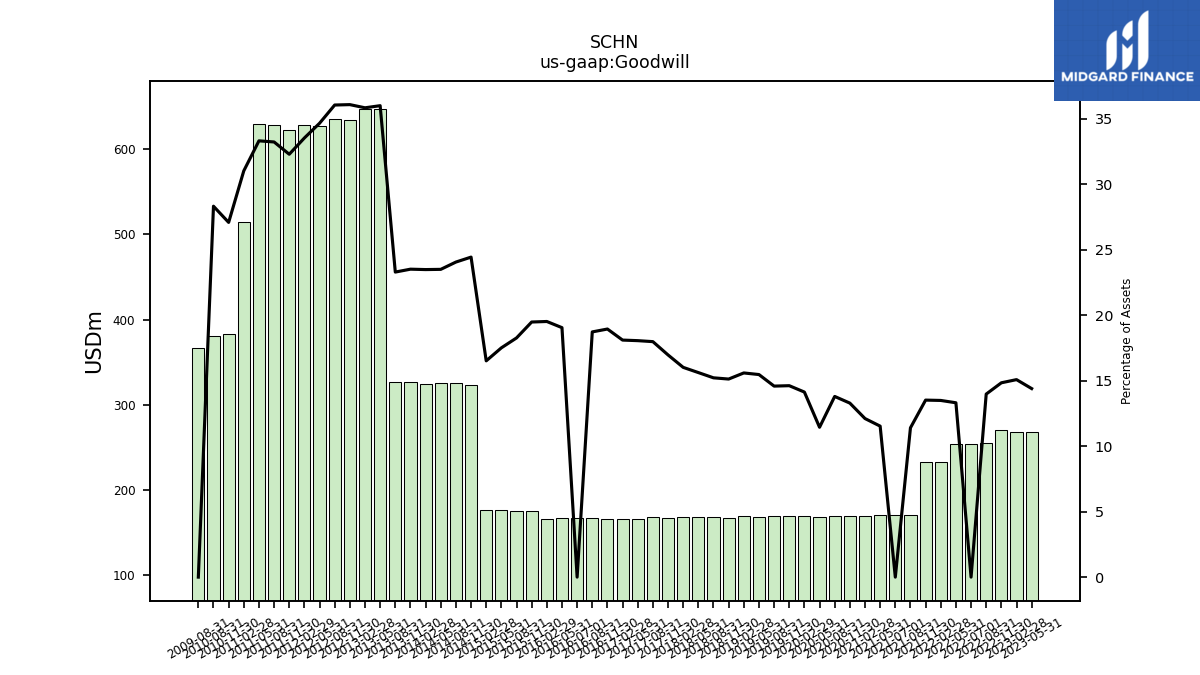
| Goodwill | 268.60 | 268.50 | 270.35 | 255.20 | 254.51 | 232.54 | 232.37 | 170.30 | 171.23 | 170.10 | 169.69 | 169.63 | 168.59 | 169.12 | 169.29 | 169.24 | 168.95 | 169.44 | 167.69 | 168.06 | 168.19 | 168.38 | 167.20 | 167.84 | 166.27 | 166.53 | 166.43 | 166.85 | 166.90 | 166.28 | 175.38 | 175.68 | 176.80 | 176.73 | 322.96 | 325.90 | 326.02 | 324.83 | 327.21 | 327.26 | 646.91 | 647.47 | 634.45 | 635.49 | 627.43 | 628.08 | 622.38 | 627.80 | 628.98 | 514.68 | 383.42 | 380.33 | NA | NA | NA | |
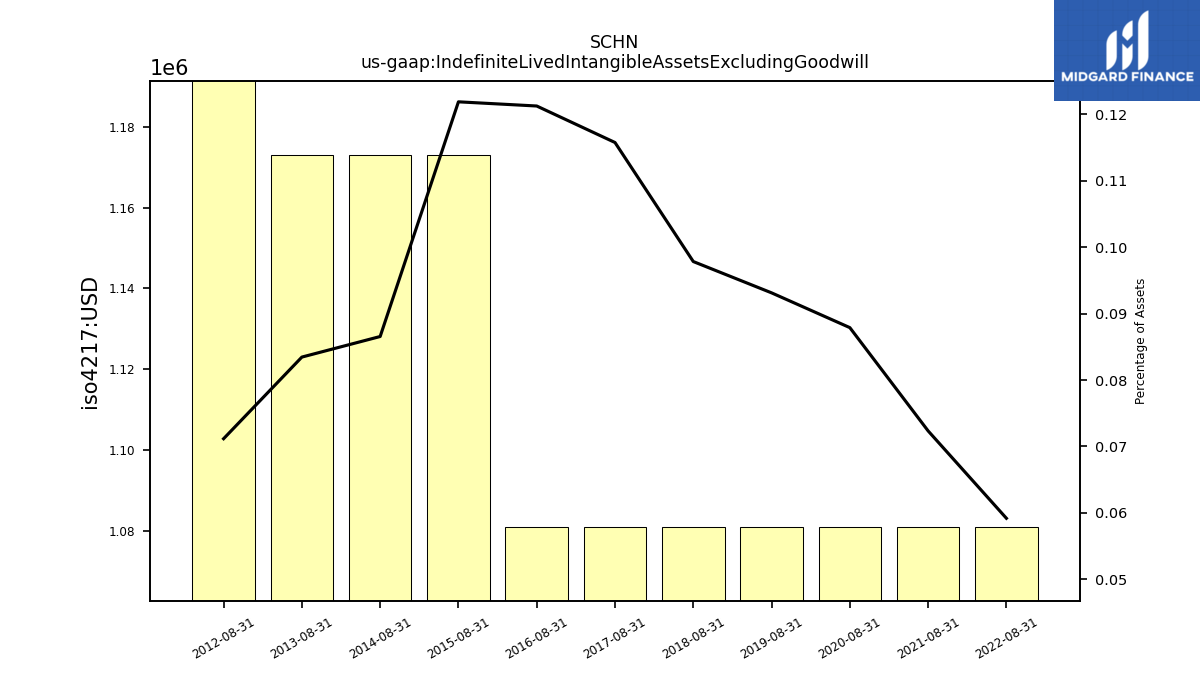
| Indefinite Lived Intangible Assets Excluding Goodwill | NA | NA | NA | 1.08 | NA | NA | NA | 1.08 | NA | NA | NA | 1.08 | NA | NA | NA | 1.08 | NA | NA | NA | 1.08 | NA | NA | NA | 1.08 | NA | NA | NA | 1.08 | NA | NA | NA | 1.17 | NA | NA | NA | 1.17 | NA | NA | NA | 1.17 | NA | NA | NA | 1.25 | NA | NA | NA | NA | NA | NA | NA | NA | NA | NA | NA | |
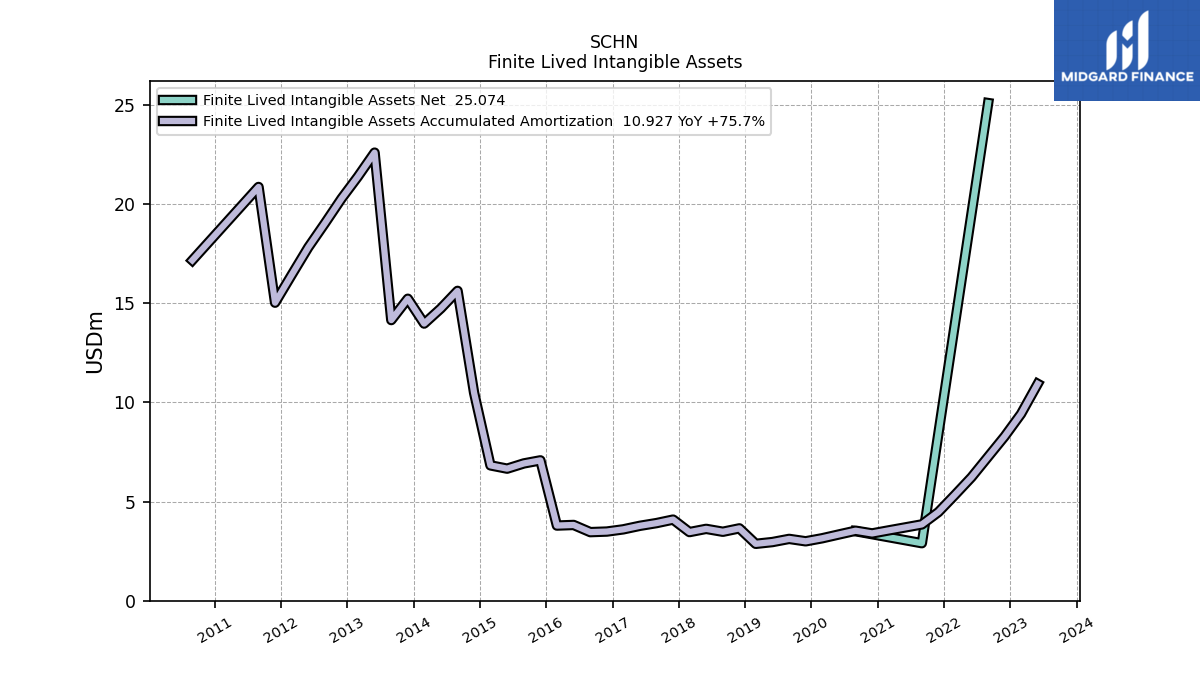
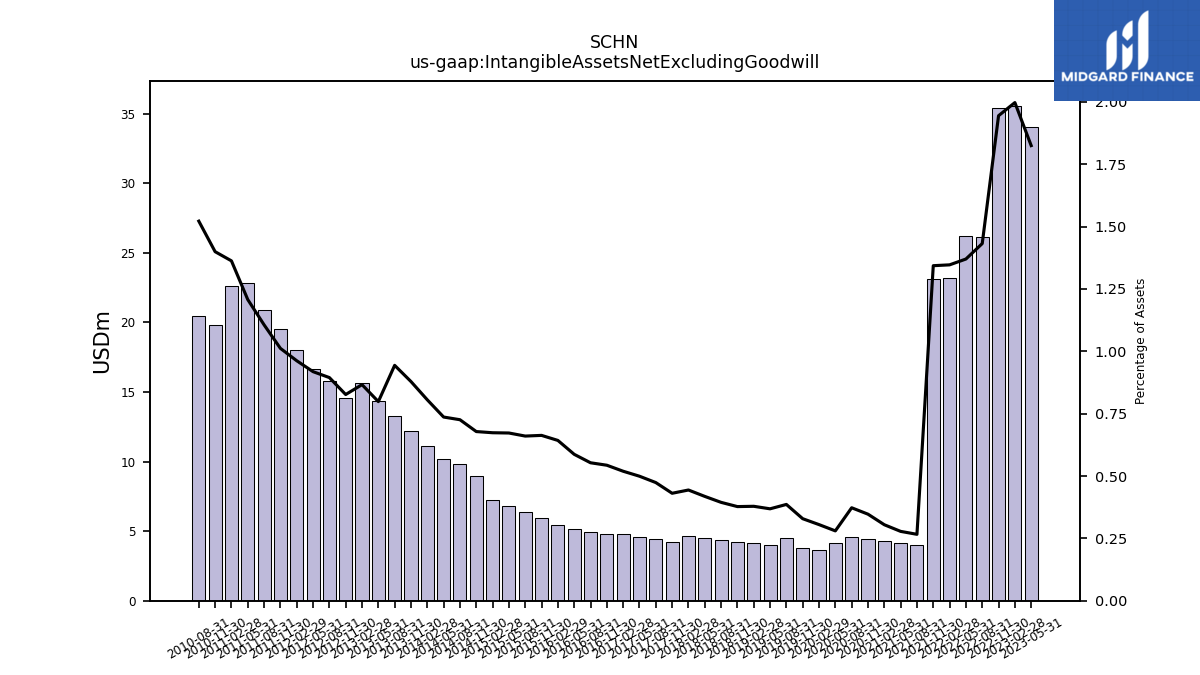
| Intangible Assets Net Excluding Goodwill | 34.05 | 35.57 | 35.44 | 26.16 | 26.20 | 23.22 | 23.10 | 3.98 | 4.13 | 4.28 | 4.43 | 4.58 | 4.13 | 3.65 | 3.81 | 4.48 | 4.03 | 4.12 | 4.19 | 4.36 | 4.51 | 4.67 | 4.25 | 4.42 | 4.60 | 4.78 | 4.78 | 4.93 | 5.14 | 5.48 | 5.97 | 6.35 | 6.79 | 7.21 | 8.97 | 9.84 | 10.22 | 11.15 | 12.23 | 13.26 | 14.35 | 15.66 | 14.54 | 15.78 | 16.63 | 18.03 | 19.51 | 20.91 | 22.81 | 22.62 | 19.82 | 20.44 | NA | NA | NA | |
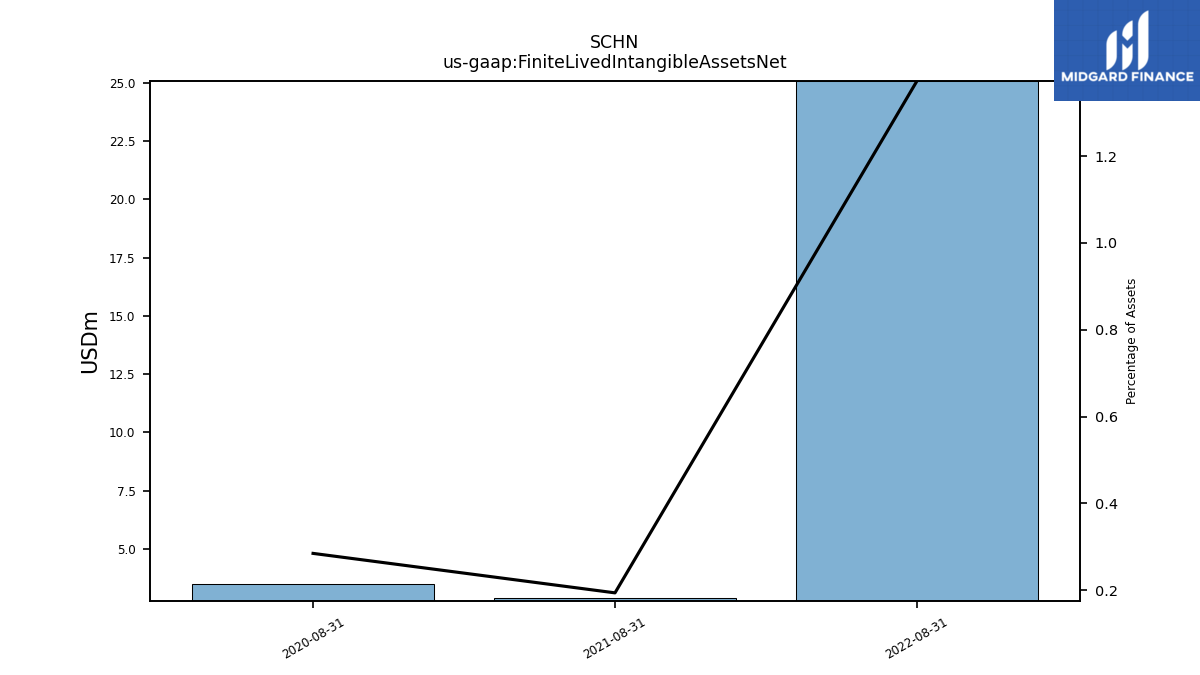
| Finite Lived Intangible Assets Net | NA | NA | NA | 25.07 | NA | NA | NA | 2.90 | NA | NA | NA | 3.50 | NA | NA | NA | NA | NA | NA | NA | NA | NA | NA | NA | NA | NA | NA | NA | NA | NA | NA | NA | NA | NA | NA | NA | NA | NA | NA | NA | NA | NA | NA | NA | NA | NA | NA | NA | NA | NA | NA | NA | NA | NA | NA | NA | |
| Other Assets Noncurrent | 55.79 | 47.63 | 47.37 | 49.89 | 48.94 | 46.86 | 44.30 | 42.66 | 42.89 | 40.37 | 29.67 | 28.29 | 24.82 | 25.13 | 25.71 | 25.21 | 25.68 | 25.71 | 26.64 | 26.46 | 22.82 | 20.45 | 20.67 | 21.71 | 19.87 | 19.70 | 13.89 | 13.41 | 14.60 | 12.98 | 14.42 | 15.03 | 16.82 | 17.17 | 16.66 | 17.48 | 17.58 | 17.48 | 18.22 | 18.52 | 15.05 | 15.93 | 14.38 | 14.17 | 15.43 | 14.69 | 14.77 | 14.97 | 12.95 | 13.64 | 7.64 | 7.33 | NA | NA | NA |
| 2023-05-31 | 2023-02-28 | 2022-11-30 | 2022-08-31 | 2022-05-31 | 2022-02-28 | 2021-11-30 | 2021-08-31 | 2021-05-31 | 2021-02-28 | 2020-11-30 | 2020-08-31 | 2020-05-31 | 2020-02-29 | 2019-11-30 | 2019-08-31 | 2019-05-31 | 2019-02-28 | 2018-11-30 | 2018-08-31 | 2018-05-31 | 2018-02-28 | 2017-11-30 | 2017-08-31 | 2017-05-31 | 2017-02-28 | 2016-11-30 | 2016-08-31 | 2016-05-31 | 2016-02-29 | 2015-11-30 | 2015-08-31 | 2015-05-31 | 2015-02-28 | 2014-11-30 | 2014-08-31 | 2014-05-31 | 2014-02-28 | 2013-11-30 | 2013-08-31 | 2013-05-31 | 2013-02-28 | 2012-11-30 | 2012-08-31 | 2012-05-31 | 2012-02-29 | 2011-11-30 | 2011-08-31 | 2011-05-31 | 2011-02-28 | 2010-11-30 | 2010-08-31 | 2010-05-31 | 2010-02-28 | 2009-11-30 | ||
|---|---|---|---|---|---|---|---|---|---|---|---|---|---|---|---|---|---|---|---|---|---|---|---|---|---|---|---|---|---|---|---|---|---|---|---|---|---|---|---|---|---|---|---|---|---|---|---|---|---|---|---|---|---|---|---|---|
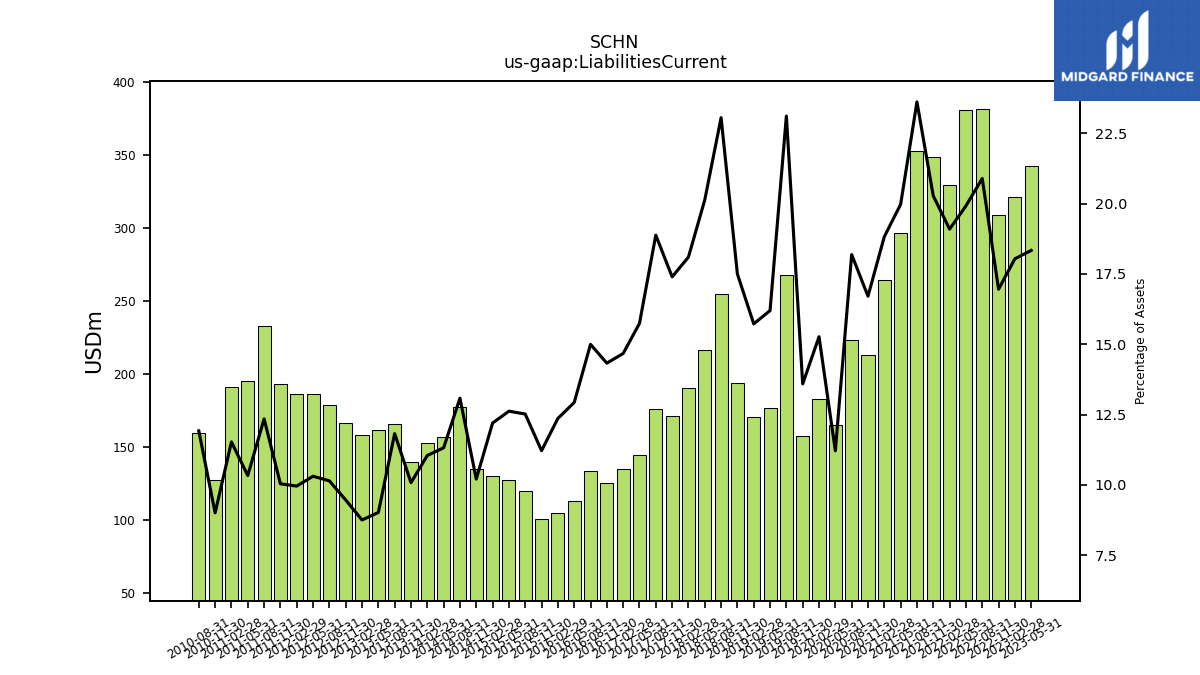
| Liabilities Current | 342.16 | 321.21 | 309.01 | 381.57 | 380.86 | 329.17 | 348.64 | 352.85 | 296.70 | 264.48 | 213.42 | 223.66 | 165.27 | 182.76 | 157.43 | 268.23 | 176.94 | 170.95 | 194.03 | 254.68 | 216.84 | 190.32 | 171.48 | 176.26 | 144.99 | 135.02 | 125.91 | 133.65 | 113.29 | 105.33 | 101.01 | 120.45 | 127.48 | 130.57 | 134.95 | 177.27 | 157.05 | 152.82 | 140.30 | 166.13 | 162.12 | 158.18 | 166.46 | 178.84 | 186.68 | 186.54 | 193.53 | 233.31 | 195.13 | 191.29 | 127.52 | 160.11 | NA | NA | NA | |
| Accounts Payable Current | 209.79 | 212.60 | 185.17 | 217.69 | 223.82 | 191.42 | 196.85 | 179.92 | 153.45 | 142.72 | 116.51 | 106.68 | 68.48 | 92.48 | 72.17 | 110.30 | 100.39 | 95.73 | 110.23 | 128.50 | 118.10 | 106.59 | 97.18 | 94.67 | 69.41 | 72.64 | 68.87 | 58.44 | 56.88 | 53.08 | 49.45 | 57.10 | 67.89 | 74.14 | 73.56 | 103.45 | 91.51 | 91.77 | 85.85 | 96.35 | 99.17 | 96.33 | 97.33 | 115.01 | 115.58 | 115.42 | 111.08 | 141.01 | 123.37 | 119.78 | 76.87 | 91.88 | NA | NA | NA | |
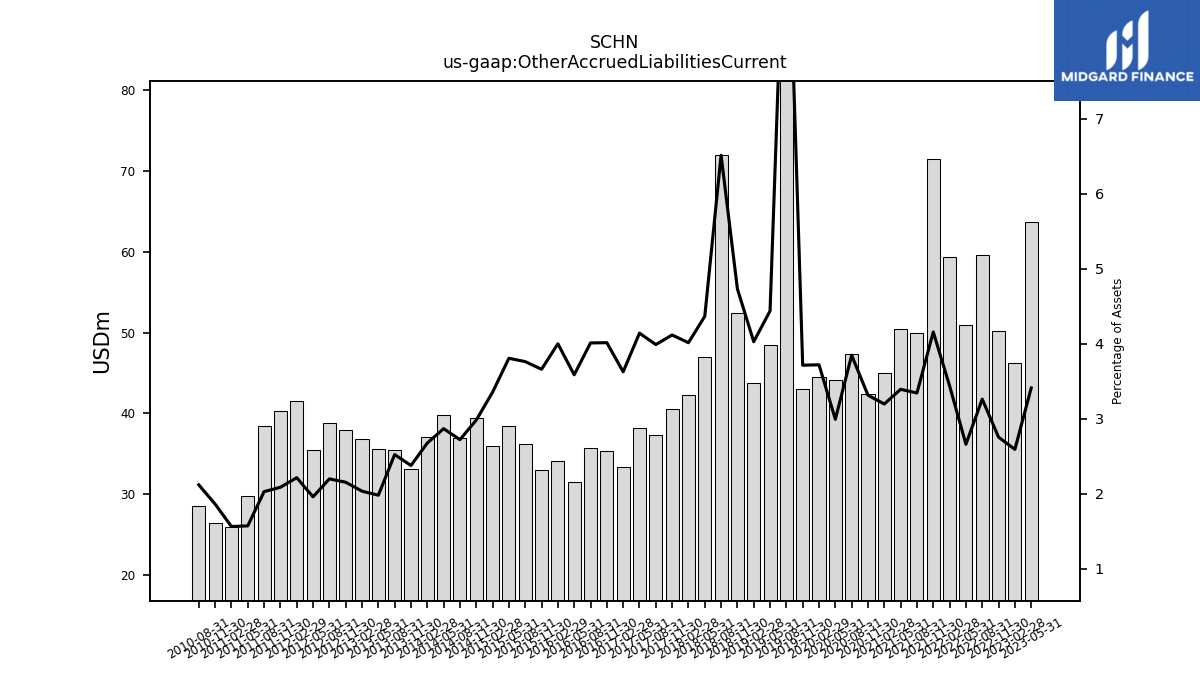
| Other Accrued Liabilities Current | 63.67 | 46.19 | 50.23 | 59.59 | 50.90 | 59.32 | 71.50 | 49.98 | 50.42 | 44.94 | 42.35 | 47.31 | 44.13 | 44.54 | 43.04 | 123.03 | 48.49 | 43.79 | 52.48 | 71.95 | 47.03 | 42.22 | 40.59 | 37.26 | 38.16 | 33.39 | 35.29 | 35.76 | 31.44 | 34.09 | 32.97 | 36.21 | 38.47 | 35.92 | 39.45 | 36.90 | 39.82 | 37.05 | 33.11 | 35.47 | 35.64 | 36.80 | 37.91 | 38.80 | 35.51 | 41.52 | 40.27 | 38.37 | 29.72 | 25.98 | 26.40 | 28.48 | NA | NA | NA | |
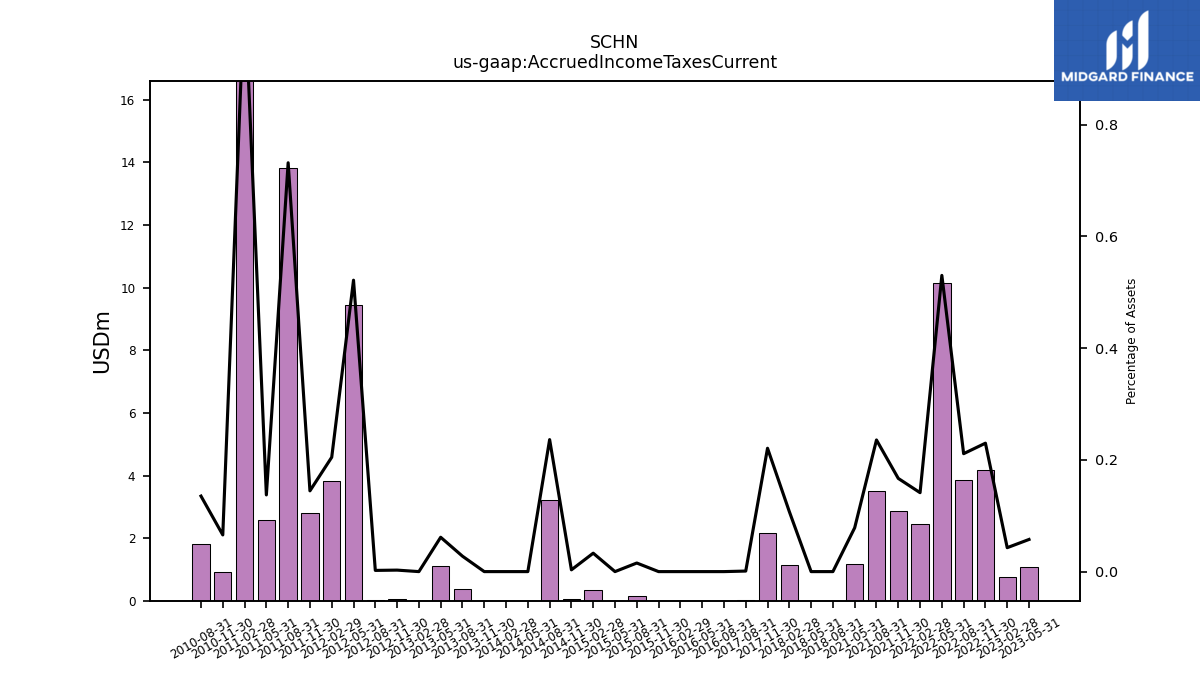
| Accrued Income Taxes Current | 1.07 | 0.76 | 4.19 | 3.86 | 10.14 | 2.44 | 2.87 | 3.52 | 1.17 | NA | NA | NA | NA | NA | NA | NA | NA | NA | NA | 0.00 | 0.00 | 1.13 | 2.18 | 0.01 | NA | NA | NA | 0.00 | 0.00 | 0.00 | 0.00 | 0.15 | 0.00 | 0.35 | 0.04 | 3.20 | 0.00 | 0.00 | 0.00 | 0.39 | 1.10 | 0.00 | 0.05 | 0.04 | 9.45 | 3.84 | 2.79 | 13.83 | 2.59 | 17.32 | 0.93 | 1.82 | NA | NA | NA |
| 2023-05-31 | 2023-02-28 | 2022-11-30 | 2022-08-31 | 2022-05-31 | 2022-02-28 | 2021-11-30 | 2021-08-31 | 2021-05-31 | 2021-02-28 | 2020-11-30 | 2020-08-31 | 2020-05-31 | 2020-02-29 | 2019-11-30 | 2019-08-31 | 2019-05-31 | 2019-02-28 | 2018-11-30 | 2018-08-31 | 2018-05-31 | 2018-02-28 | 2017-11-30 | 2017-08-31 | 2017-05-31 | 2017-02-28 | 2016-11-30 | 2016-08-31 | 2016-05-31 | 2016-02-29 | 2015-11-30 | 2015-08-31 | 2015-05-31 | 2015-02-28 | 2014-11-30 | 2014-08-31 | 2014-05-31 | 2014-02-28 | 2013-11-30 | 2013-08-31 | 2013-05-31 | 2013-02-28 | 2012-11-30 | 2012-08-31 | 2012-05-31 | 2012-02-29 | 2011-11-30 | 2011-08-31 | 2011-05-31 | 2011-02-28 | 2010-11-30 | 2010-08-31 | 2010-05-31 | 2010-02-28 | 2009-11-30 | ||
|---|---|---|---|---|---|---|---|---|---|---|---|---|---|---|---|---|---|---|---|---|---|---|---|---|---|---|---|---|---|---|---|---|---|---|---|---|---|---|---|---|---|---|---|---|---|---|---|---|---|---|---|---|---|---|---|---|
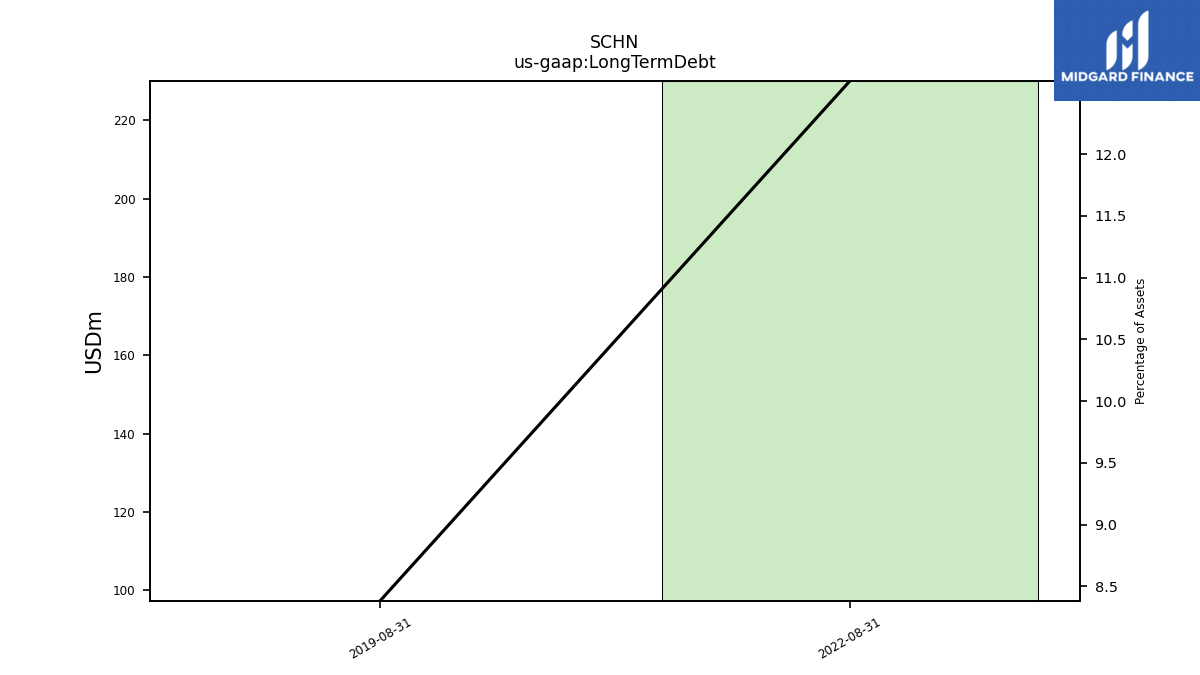
| Long Term Debt | NA | NA | NA | 230.00 | NA | NA | NA | NA | NA | NA | NA | NA | NA | NA | NA | 97.32 | NA | NA | NA | NA | NA | NA | NA | NA | NA | NA | NA | NA | NA | NA | NA | NA | NA | NA | NA | NA | NA | NA | NA | NA | NA | NA | NA | NA | NA | NA | NA | NA | NA | NA | NA | NA | NA | NA | NA | |
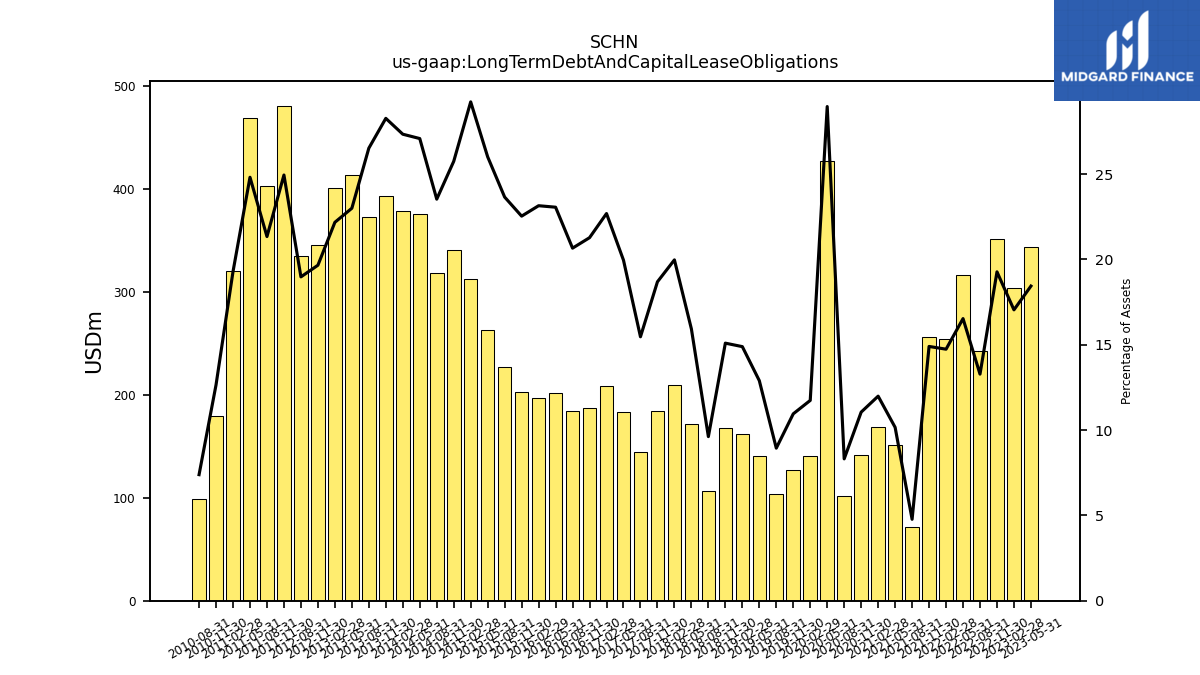
| Long Term Debt And Capital Lease Obligations | 344.08 | 303.55 | 351.20 | 242.52 | 316.11 | 254.13 | 256.21 | 71.30 | 150.94 | 168.44 | 141.17 | 102.23 | 426.79 | 140.52 | 126.88 | 103.78 | 140.90 | 161.87 | 167.39 | 106.24 | 171.54 | 210.03 | 184.22 | 144.40 | 183.80 | 208.80 | 186.94 | 184.14 | 202.07 | 197.22 | 202.95 | 227.57 | 262.75 | 312.90 | 340.36 | 318.84 | 375.80 | 378.22 | 393.43 | 372.66 | 413.40 | 400.72 | 345.80 | 334.63 | NA | NA | 480.94 | 403.29 | 468.61 | 320.11 | 179.14 | 99.24 | NA | NA | NA | |
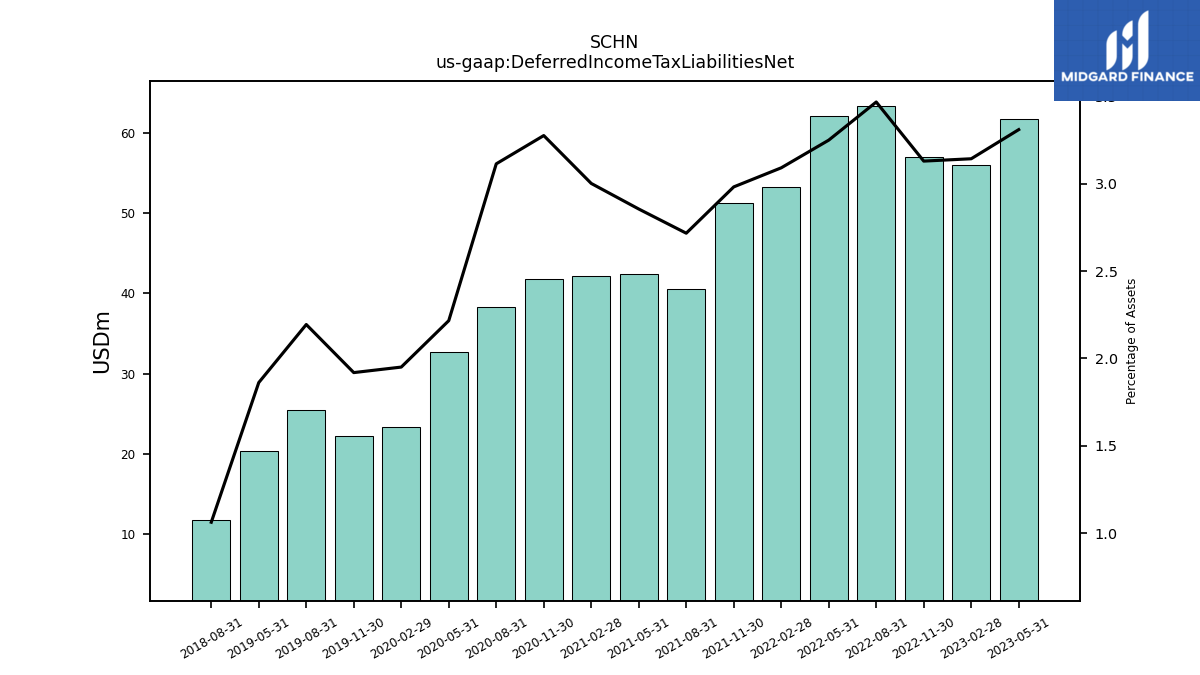
| Deferred Income Tax Liabilities Net | 61.76 | 55.97 | 57.03 | 63.33 | 62.13 | 53.29 | 51.27 | 40.59 | 42.41 | 42.17 | 41.84 | 38.29 | 32.67 | 23.35 | 22.23 | 25.47 | 20.34 | NA | NA | 11.74 | NA | NA | NA | NA | NA | NA | NA | NA | NA | NA | NA | NA | NA | NA | NA | NA | NA | NA | NA | NA | NA | NA | NA | NA | NA | NA | NA | NA | NA | NA | NA | NA | NA | NA | NA | |
| Minority Interest | 3.58 | 3.49 | 3.77 | 4.50 | 4.18 | 3.86 | 4.07 | 4.01 | 4.55 | 4.20 | 3.97 | 3.73 | 3.72 | 4.30 | 4.18 | 4.33 | 4.68 | 4.24 | 4.07 | 4.03 | 4.59 | 4.43 | 4.43 | 3.91 | 4.50 | 4.14 | 3.81 | 3.71 | 4.13 | 3.65 | 3.52 | 4.02 | 4.25 | 4.24 | 4.93 | 5.19 | 5.57 | 5.28 | 5.01 | 4.64 | 5.34 | 5.34 | 5.41 | 5.11 | 5.47 | 5.82 | 5.98 | 6.52 | 5.94 | 5.52 | 4.80 | 4.31 | NA | NA | NA | |
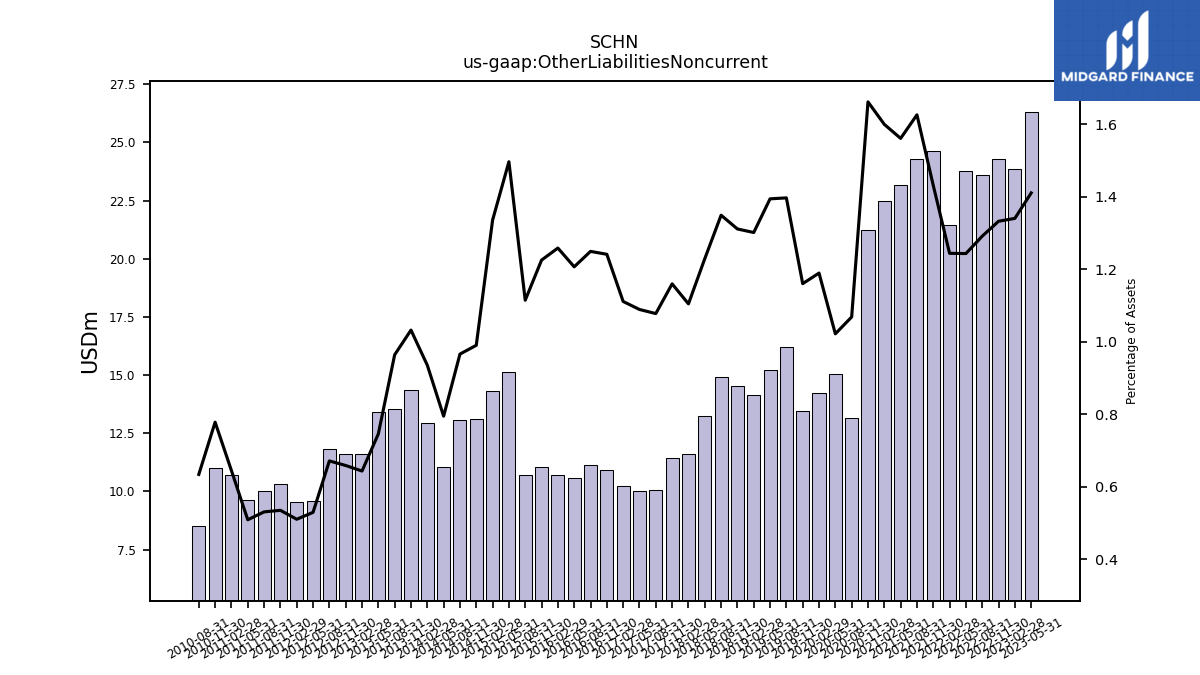
| Other Liabilities Noncurrent | 26.32 | 23.87 | 24.28 | 23.58 | 23.77 | 21.45 | 24.61 | 24.29 | 23.19 | 22.48 | 21.22 | 13.14 | 15.06 | 14.24 | 13.44 | 16.21 | 15.23 | 14.15 | 14.54 | 14.90 | 13.24 | 11.61 | 11.43 | 10.06 | 10.03 | 10.22 | 10.91 | 11.13 | 10.57 | 10.72 | 11.03 | 10.72 | 15.12 | 14.29 | 13.09 | 13.09 | 11.03 | 12.94 | 14.37 | 13.55 | 13.40 | 11.63 | 11.59 | 11.84 | 9.59 | 9.56 | 10.31 | 10.03 | 9.61 | 10.70 | 11.02 | 8.52 | NA | NA | NA | |
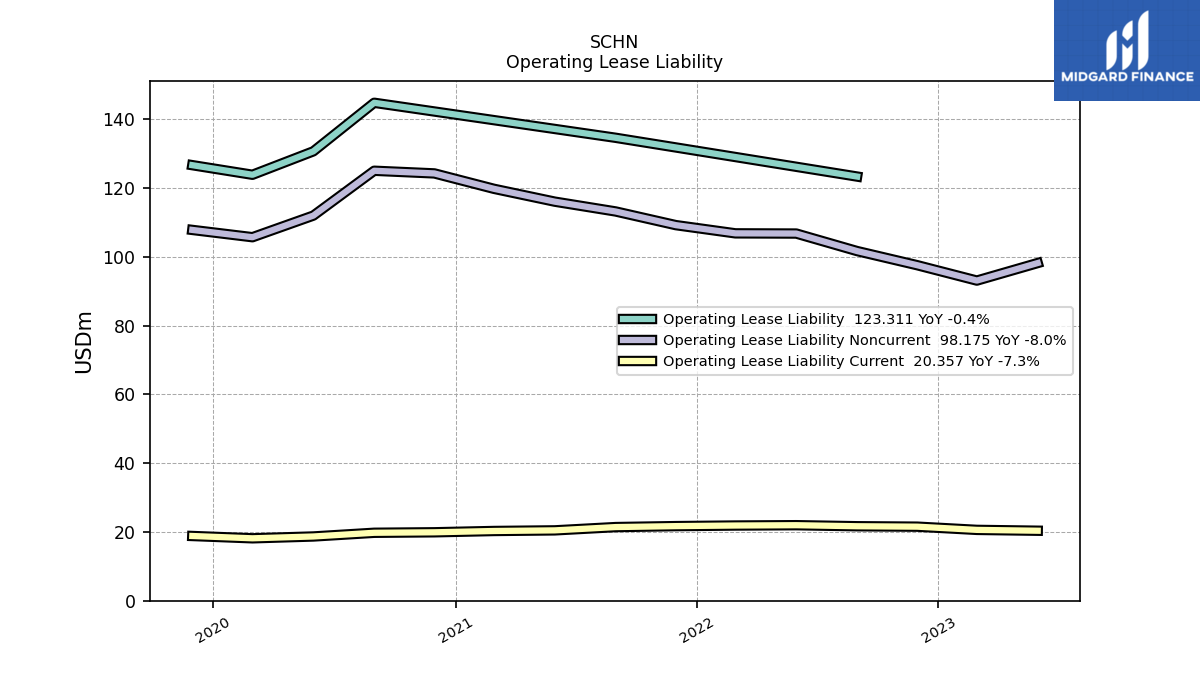
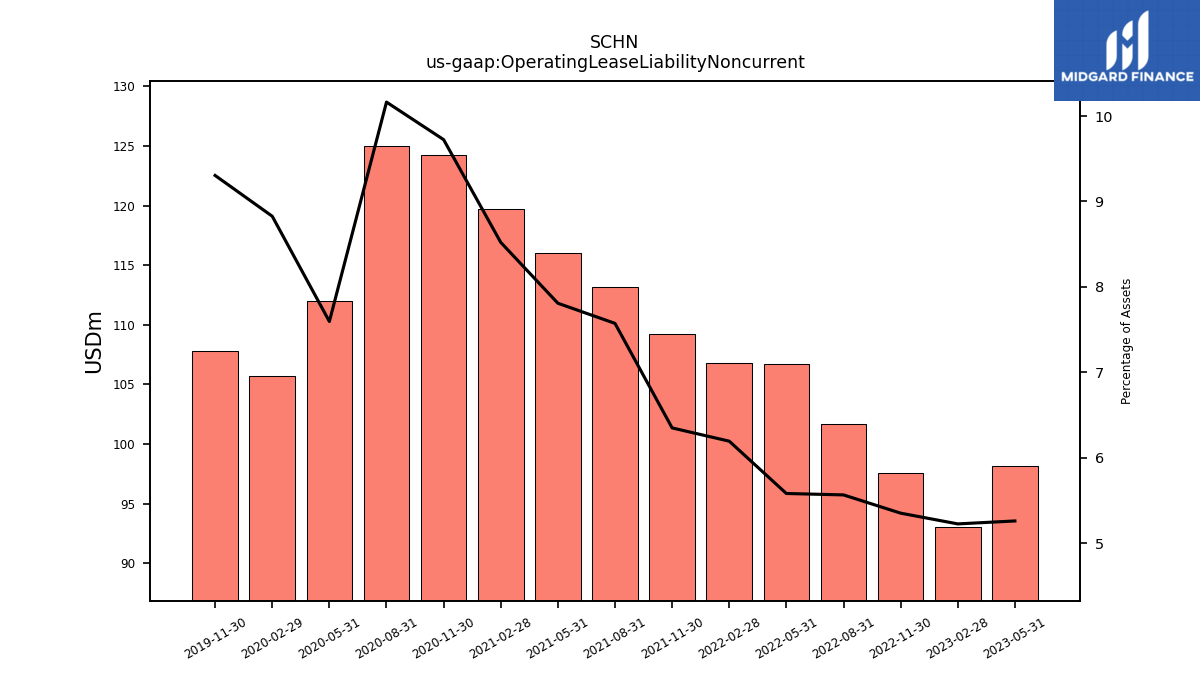
| Operating Lease Liability Noncurrent | 98.17 | 93.07 | 97.54 | 101.65 | 106.75 | 106.80 | 109.19 | 113.17 | 116.02 | 119.75 | 124.22 | 125.00 | 111.96 | 105.68 | 107.80 | NA | NA | NA | NA | NA | NA | NA | NA | NA | NA | NA | NA | NA | NA | NA | NA | NA | NA | NA | NA | NA | NA | NA | NA | NA | NA | NA | NA | NA | NA | NA | NA | NA | NA | NA | NA | NA | NA | NA | NA |
| 2023-05-31 | 2023-02-28 | 2022-11-30 | 2022-08-31 | 2022-05-31 | 2022-02-28 | 2021-11-30 | 2021-08-31 | 2021-05-31 | 2021-02-28 | 2020-11-30 | 2020-08-31 | 2020-05-31 | 2020-02-29 | 2019-11-30 | 2019-08-31 | 2019-05-31 | 2019-02-28 | 2018-11-30 | 2018-08-31 | 2018-05-31 | 2018-02-28 | 2017-11-30 | 2017-08-31 | 2017-05-31 | 2017-02-28 | 2016-11-30 | 2016-08-31 | 2016-05-31 | 2016-02-29 | 2015-11-30 | 2015-08-31 | 2015-05-31 | 2015-02-28 | 2014-11-30 | 2014-08-31 | 2014-05-31 | 2014-02-28 | 2013-11-30 | 2013-08-31 | 2013-05-31 | 2013-02-28 | 2012-11-30 | 2012-08-31 | 2012-05-31 | 2012-02-29 | 2011-11-30 | 2011-08-31 | 2011-05-31 | 2011-02-28 | 2010-11-30 | 2010-08-31 | 2010-05-31 | 2010-02-28 | 2009-11-30 | ||
|---|---|---|---|---|---|---|---|---|---|---|---|---|---|---|---|---|---|---|---|---|---|---|---|---|---|---|---|---|---|---|---|---|---|---|---|---|---|---|---|---|---|---|---|---|---|---|---|---|---|---|---|---|---|---|---|---|
| Stockholders Equity | 936.01 | 924.95 | 924.74 | 953.98 | 963.69 | 900.79 | 870.69 | 835.76 | 798.03 | 729.84 | 684.58 | 676.71 | 670.63 | 680.65 | 680.85 | 696.96 | 689.03 | 676.61 | 671.91 | 666.08 | 614.98 | 582.66 | 547.18 | 533.59 | 513.06 | 498.55 | 490.26 | 497.72 | 484.80 | 473.42 | 520.93 | 534.53 | 532.07 | 541.10 | 755.92 | 770.78 | 765.65 | 761.50 | 767.26 | 776.56 | 1070.27 | 1073.29 | 1075.35 | 1080.58 | 1099.80 | 1111.31 | 1096.18 | 1094.71 | 1067.95 | 1031.63 | 994.84 | 975.33 | NA | NA | NA | |
| Stockholders Equity Including Portion Attributable To Noncontrolling Interest | 939.59 | 928.44 | 928.50 | 958.47 | 967.87 | 904.65 | 874.76 | 839.78 | 802.58 | 734.04 | 688.55 | 680.44 | 674.35 | 684.95 | 685.04 | 701.30 | 693.70 | 680.85 | 675.98 | 670.11 | 619.56 | 587.10 | 551.62 | 537.49 | 517.56 | 502.68 | 494.07 | 501.43 | 488.93 | 477.07 | 524.45 | 538.55 | 536.31 | 545.34 | 760.85 | 775.98 | 771.23 | 766.78 | 772.27 | 781.20 | 1075.61 | 1078.63 | 1080.75 | 1085.70 | 1105.28 | 1117.12 | 1102.17 | 1101.24 | 1073.90 | 1037.15 | 999.64 | 979.63 | NA | NA | NA | |
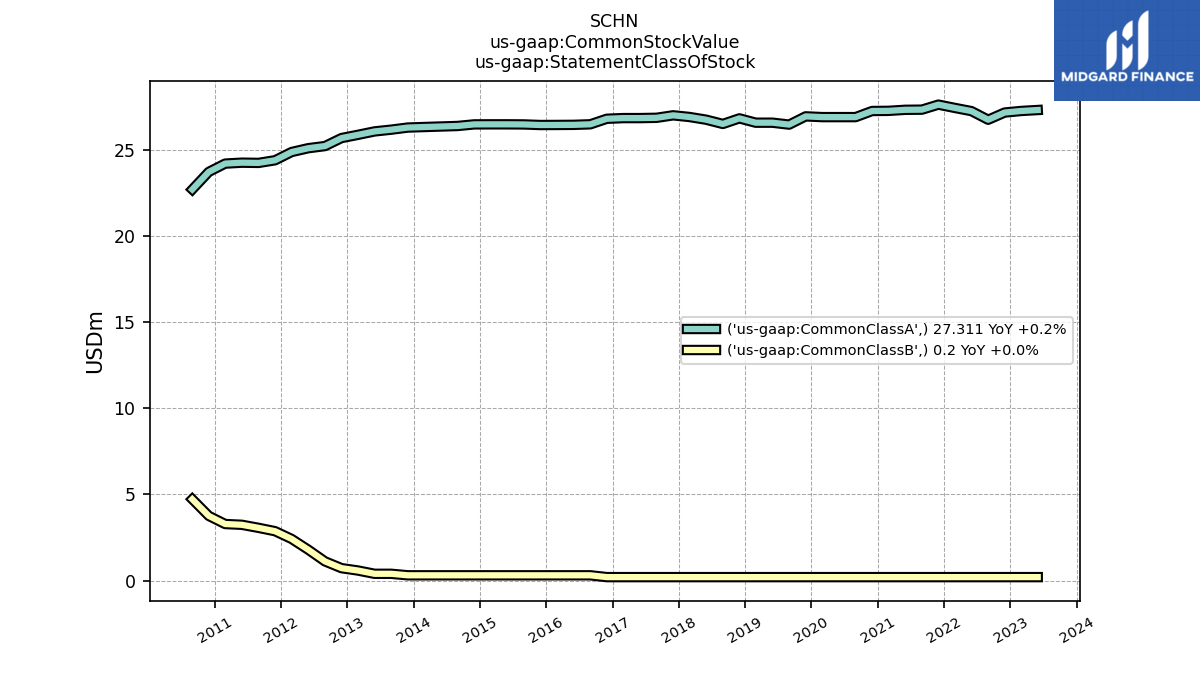
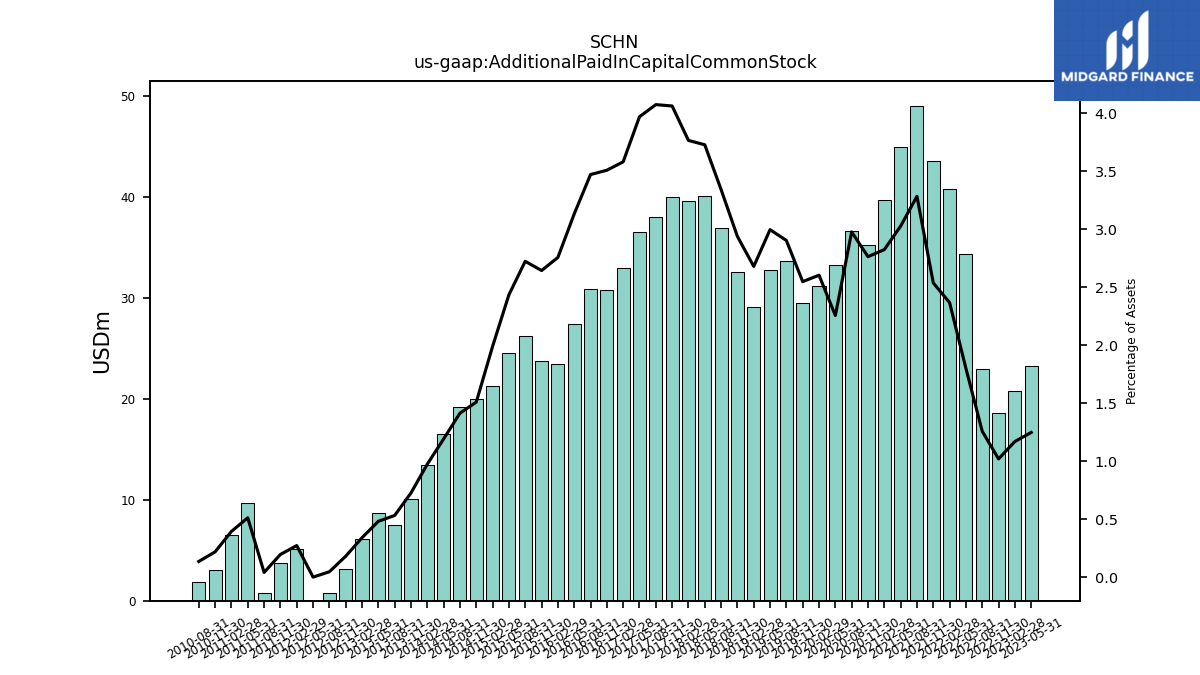
| Additional Paid In Capital Common Stock | 23.29 | 20.83 | 18.58 | 22.98 | 34.43 | 40.82 | 43.64 | 49.07 | 44.98 | 39.70 | 35.31 | 36.62 | 33.26 | 31.17 | 29.53 | 33.70 | 32.74 | 29.14 | 32.59 | 36.93 | 40.17 | 39.61 | 40.06 | 38.05 | 36.58 | 32.97 | 30.84 | 30.95 | 27.45 | 23.49 | 23.81 | 26.21 | 24.60 | 21.30 | 19.95 | 19.16 | 16.54 | 13.48 | 10.10 | 7.48 | 8.65 | 6.14 | 3.17 | 0.82 | 0.00 | 5.10 | 3.77 | 0.76 | 9.66 | 6.54 | 3.09 | 1.81 | NA | NA | NA | |
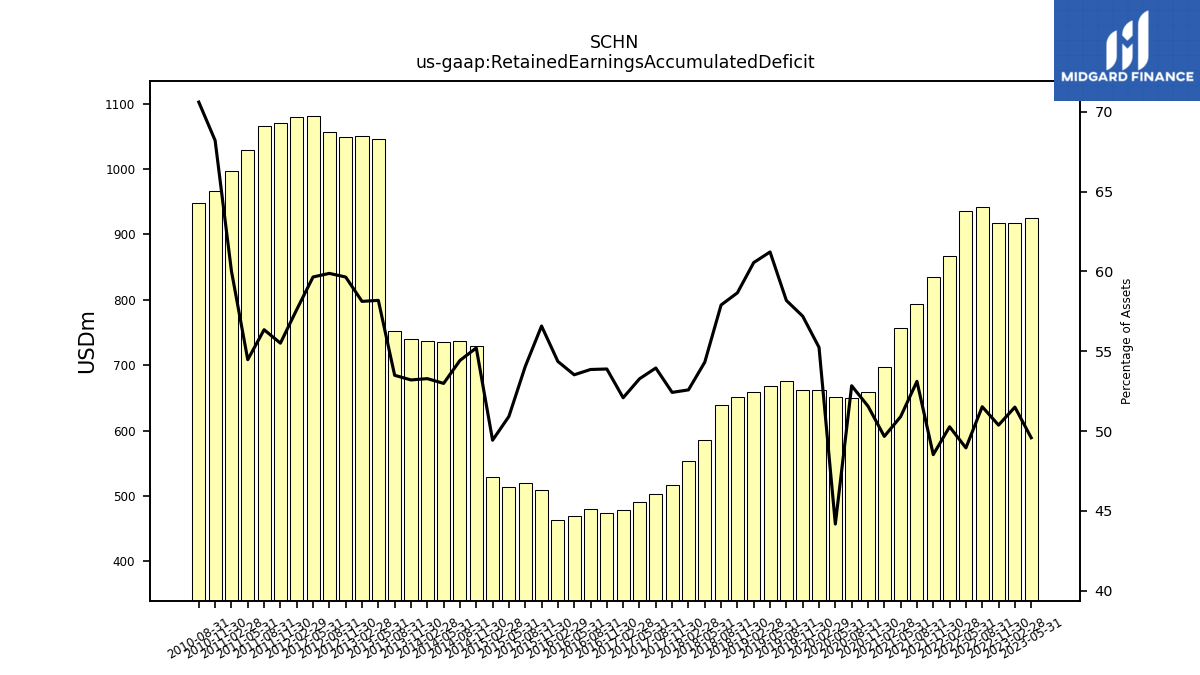
| Retained Earnings Accumulated Deficit | 925.40 | 917.27 | 918.09 | 941.15 | 936.06 | 866.78 | 834.50 | 793.71 | 756.26 | 697.97 | 658.71 | 649.86 | 651.16 | 661.42 | 662.71 | 675.36 | 668.93 | 658.42 | 650.70 | 639.68 | 585.13 | 552.98 | 516.84 | 503.77 | 490.76 | 479.43 | 473.63 | 480.10 | 469.12 | 463.26 | 509.62 | 520.07 | 514.42 | 529.16 | 729.97 | 737.57 | 735.37 | 737.35 | 740.65 | 751.88 | 1046.13 | 1050.58 | 1049.40 | 1056.02 | 1080.44 | 1079.53 | 1070.36 | 1065.11 | 1028.89 | 996.33 | 965.97 | 948.64 | NA | NA | NA | |
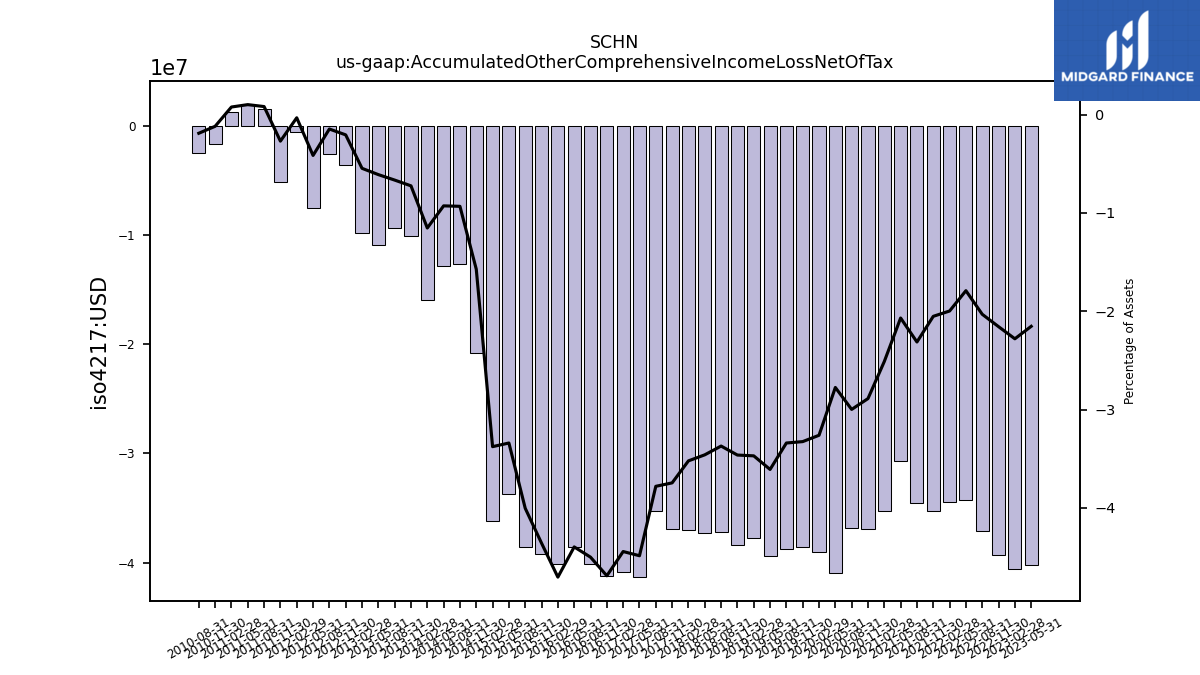
| Accumulated Other Comprehensive Income Loss Net Of Tax | -40.19 | -40.60 | -39.30 | -37.09 | -34.24 | -34.44 | -35.28 | -34.55 | -30.73 | -35.28 | -36.89 | -36.87 | -40.90 | -39.04 | -38.52 | -38.76 | -39.42 | -37.73 | -38.40 | -37.24 | -37.27 | -37.03 | -36.92 | -35.29 | -41.32 | -40.89 | -41.21 | -40.12 | -38.53 | -40.08 | -39.25 | -38.52 | -33.74 | -36.15 | -20.79 | -12.64 | -12.88 | -15.96 | -10.09 | -9.36 | -10.97 | -9.88 | -3.63 | -2.59 | -7.53 | -0.61 | -5.21 | 1.54 | 1.91 | 1.28 | -1.69 | -2.55 | NA | NA | NA | |
| Minority Interest | 3.58 | 3.49 | 3.77 | 4.50 | 4.18 | 3.86 | 4.07 | 4.01 | 4.55 | 4.20 | 3.97 | 3.73 | 3.72 | 4.30 | 4.18 | 4.33 | 4.68 | 4.24 | 4.07 | 4.03 | 4.59 | 4.43 | 4.43 | 3.91 | 4.50 | 4.14 | 3.81 | 3.71 | 4.13 | 3.65 | 3.52 | 4.02 | 4.25 | 4.24 | 4.93 | 5.19 | 5.57 | 5.28 | 5.01 | 4.64 | 5.34 | 5.34 | 5.41 | 5.11 | 5.47 | 5.82 | 5.98 | 6.52 | 5.94 | 5.52 | 4.80 | 4.31 | NA | NA | NA | |
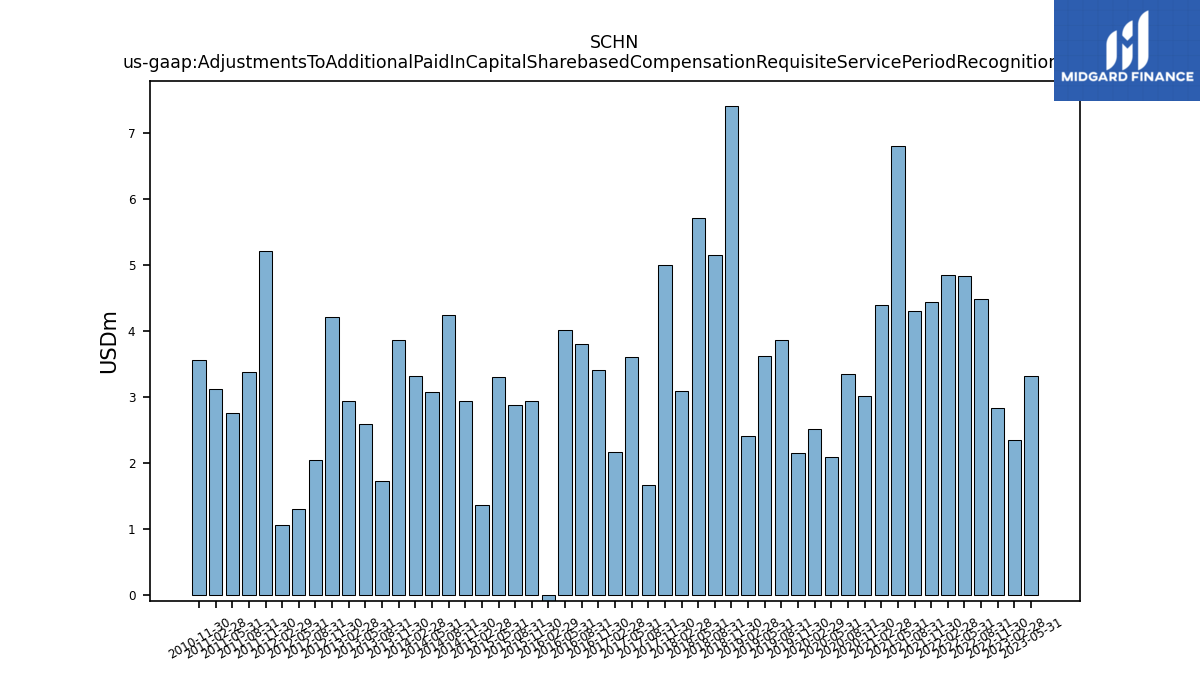
| Adjustments To Additional Paid In Capital Sharebased Compensation Requisite Service Period Recognition Value | 3.31 | 2.34 | 2.83 | 4.49 | 4.84 | 4.85 | 4.44 | 4.31 | 6.81 | 4.39 | 3.02 | 3.35 | 2.09 | 2.52 | 2.15 | 3.86 | 3.63 | 2.40 | 7.40 | 5.15 | 5.72 | 3.09 | 5.00 | 1.67 | 3.61 | 2.16 | 3.41 | 3.80 | 4.01 | -0.31 | 2.94 | 2.88 | 3.30 | 1.37 | 2.93 | 4.25 | 3.08 | 3.31 | 3.87 | 1.72 | 2.60 | 2.95 | 4.21 | 2.04 | 1.30 | 1.06 | 5.21 | 3.38 | 2.76 | 3.12 | 3.57 | NA | NA | NA | NA | |
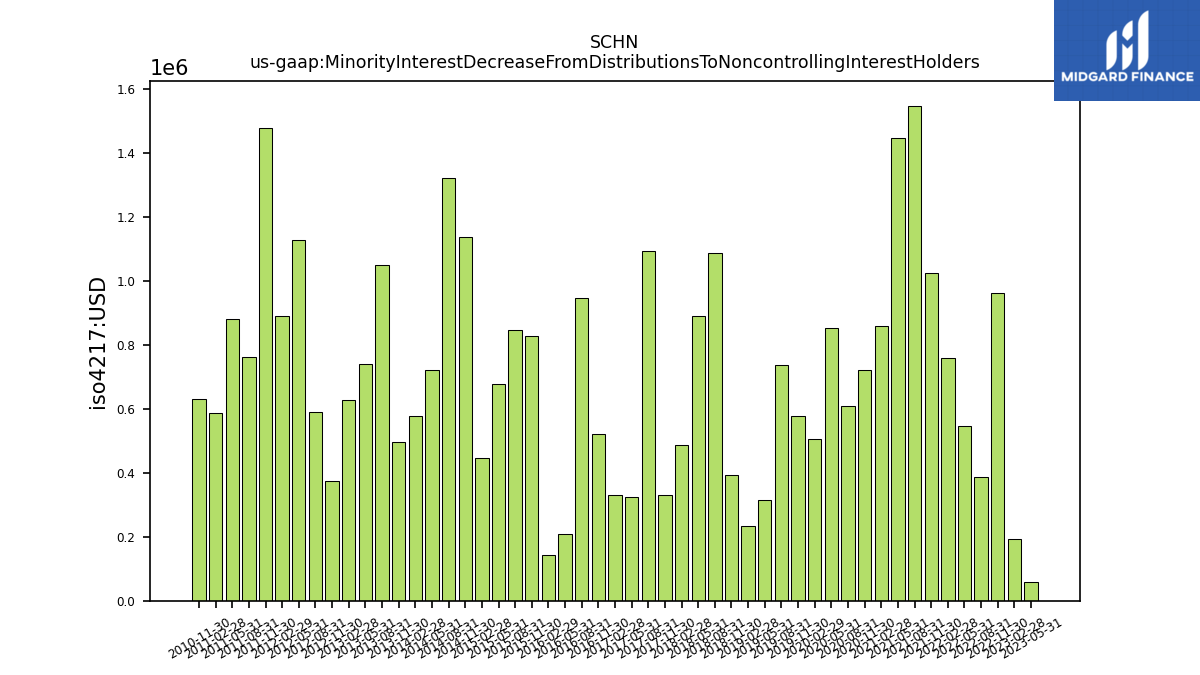
| Minority Interest Decrease From Distributions To Noncontrolling Interest Holders | 0.06 | 0.19 | 0.96 | 0.39 | 0.55 | 0.76 | 1.03 | 1.55 | 1.45 | 0.86 | 0.72 | 0.61 | 0.85 | 0.51 | 0.58 | 0.74 | 0.31 | 0.23 | 0.39 | 1.09 | 0.89 | 0.49 | 0.33 | 1.09 | 0.33 | 0.33 | 0.52 | 0.95 | 0.21 | 0.14 | 0.83 | 0.85 | 0.68 | 0.45 | 1.14 | 1.32 | 0.72 | 0.58 | 0.49 | 1.05 | 0.74 | 0.63 | 0.38 | 0.59 | 1.13 | 0.89 | 1.48 | 0.76 | 0.88 | 0.59 | 0.63 | NA | NA | NA | NA |
| 2023-05-31 | 2023-02-28 | 2022-11-30 | 2022-08-31 | 2022-05-31 | 2022-02-28 | 2021-11-30 | 2021-08-31 | 2021-05-31 | 2021-02-28 | 2020-11-30 | 2020-08-31 | 2020-05-31 | 2020-02-29 | 2019-11-30 | 2019-08-31 | 2019-05-31 | 2019-02-28 | 2018-11-30 | 2018-08-31 | 2018-05-31 | 2018-02-28 | 2017-11-30 | 2017-08-31 | 2017-05-31 | 2017-02-28 | 2016-11-30 | 2016-08-31 | 2016-05-31 | 2016-02-29 | 2015-11-30 | 2015-08-31 | 2015-05-31 | 2015-02-28 | 2014-11-30 | 2014-08-31 | 2014-05-31 | 2014-02-28 | 2013-11-30 | 2013-08-31 | 2013-05-31 | 2013-02-28 | 2012-11-30 | 2012-08-31 | 2012-05-31 | 2012-02-29 | 2011-11-30 | 2011-08-31 | 2011-05-31 | 2011-02-28 | 2010-11-30 | 2010-08-31 | 2010-05-31 | 2010-02-28 | 2009-11-30 | ||
|---|---|---|---|---|---|---|---|---|---|---|---|---|---|---|---|---|---|---|---|---|---|---|---|---|---|---|---|---|---|---|---|---|---|---|---|---|---|---|---|---|---|---|---|---|---|---|---|---|---|---|---|---|---|---|---|---|
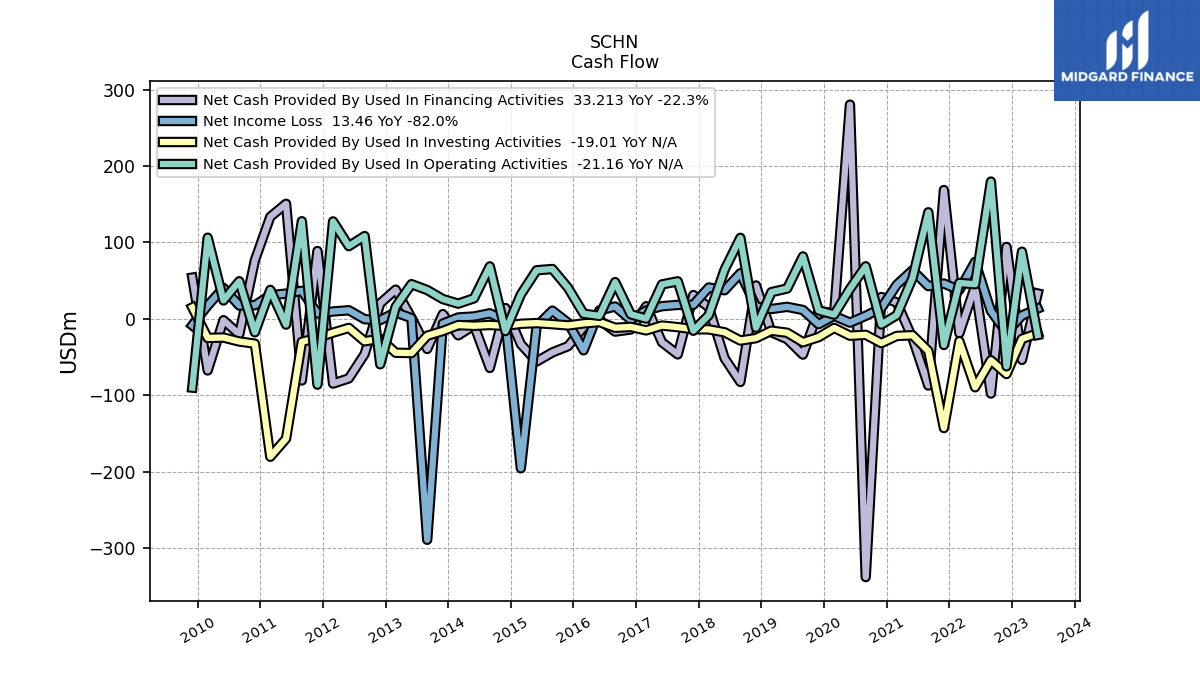
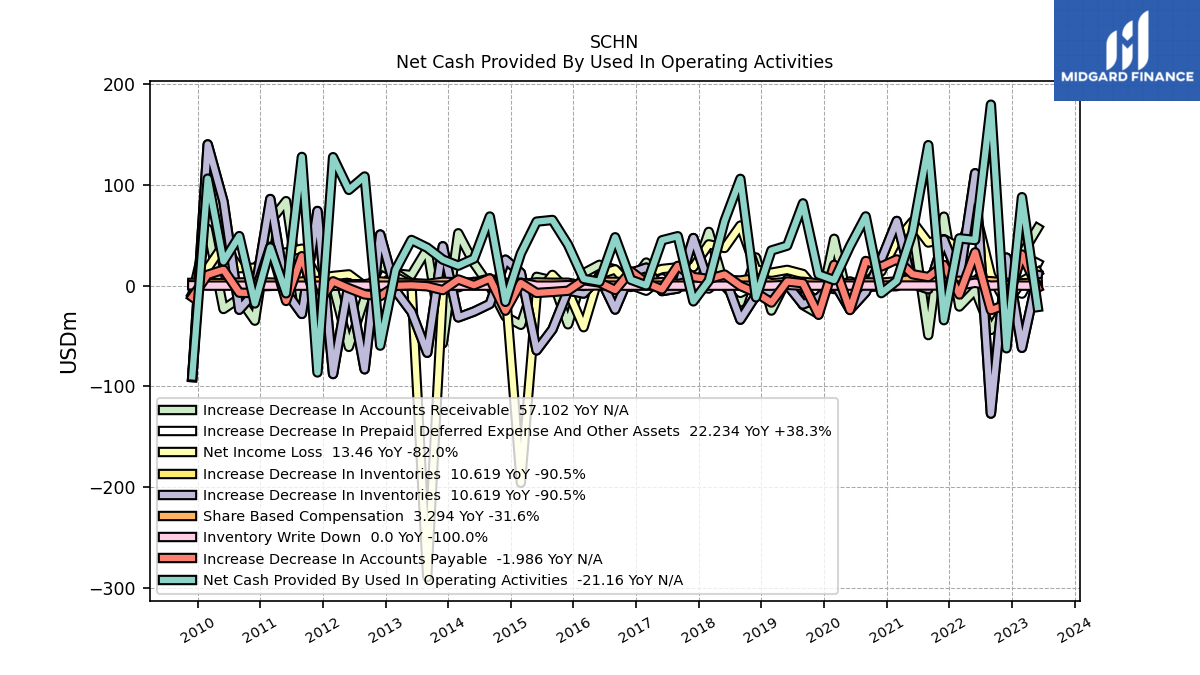
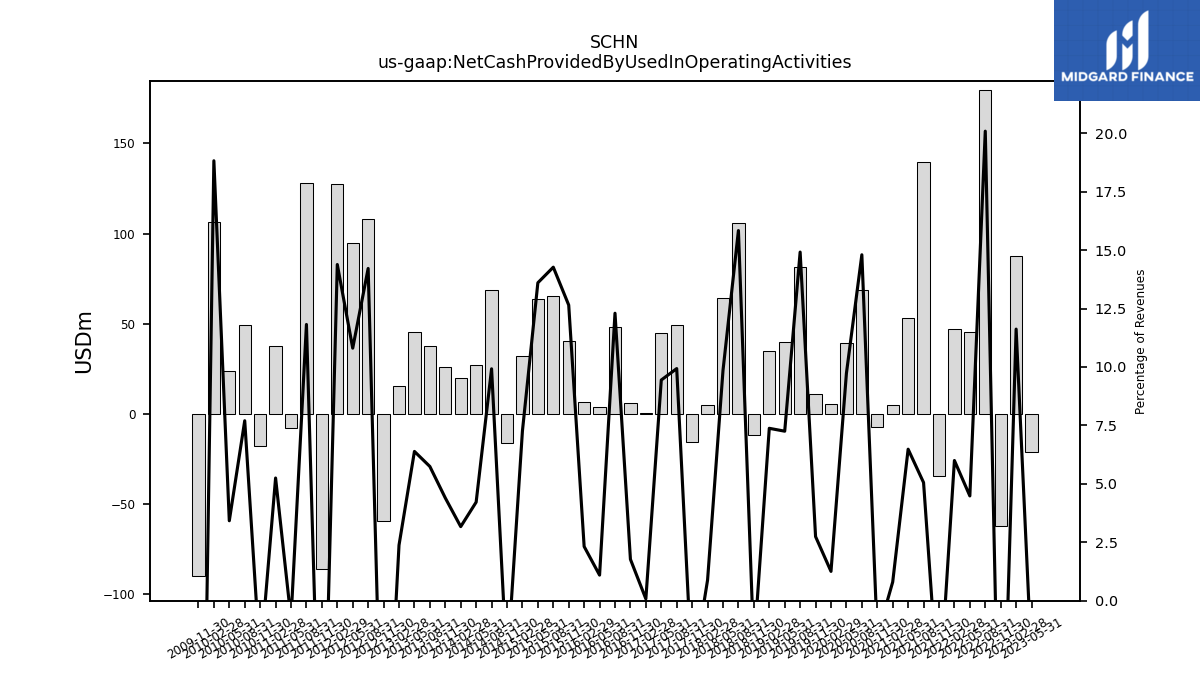
| Net Cash Provided By Used In Operating Activities | -21.16 | 87.84 | -62.15 | 179.67 | 45.29 | 46.98 | -34.27 | 139.47 | 53.20 | 4.82 | -7.43 | 68.76 | 39.18 | 5.52 | 11.13 | 81.71 | 39.70 | 34.93 | -11.61 | 106.03 | 64.27 | 4.96 | -15.59 | 49.09 | 45.05 | 0.30 | 5.93 | 48.05 | 3.86 | 6.71 | 40.63 | 65.21 | 63.57 | 31.90 | -16.05 | 68.65 | 26.90 | 19.86 | 25.84 | 37.71 | 45.37 | 15.74 | -59.53 | 108.35 | 95.07 | 127.53 | -86.16 | 127.79 | -7.60 | 37.90 | -17.62 | 49.22 | 24.07 | 106.22 | -90.02 | |
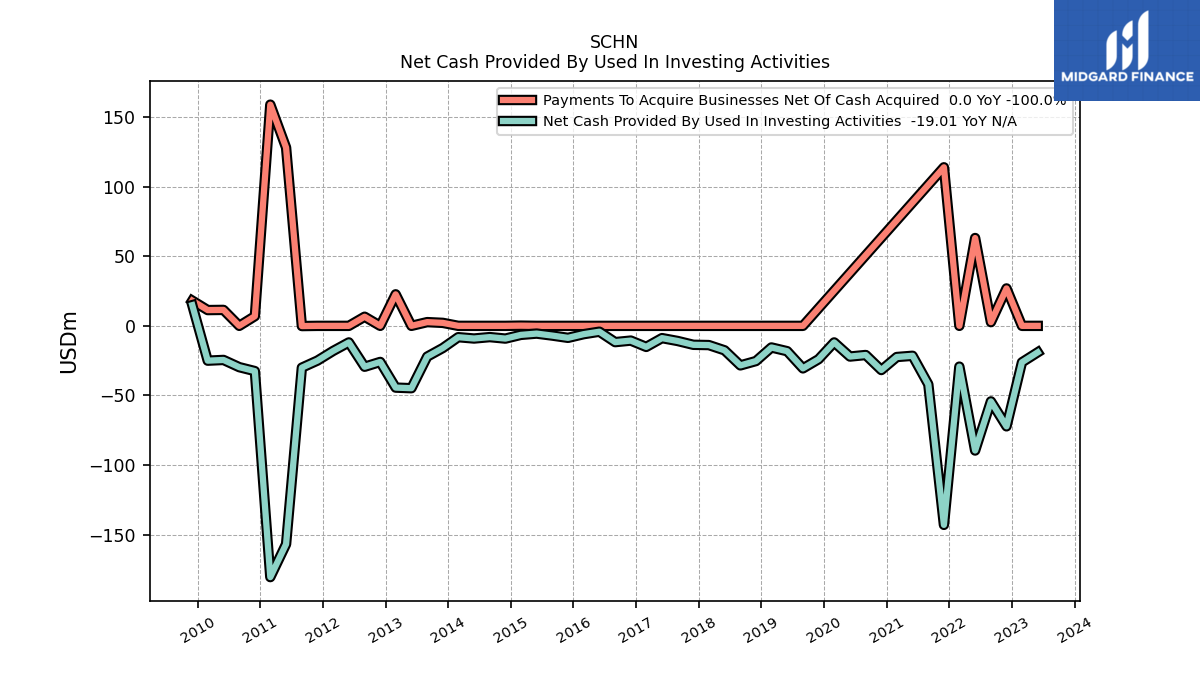
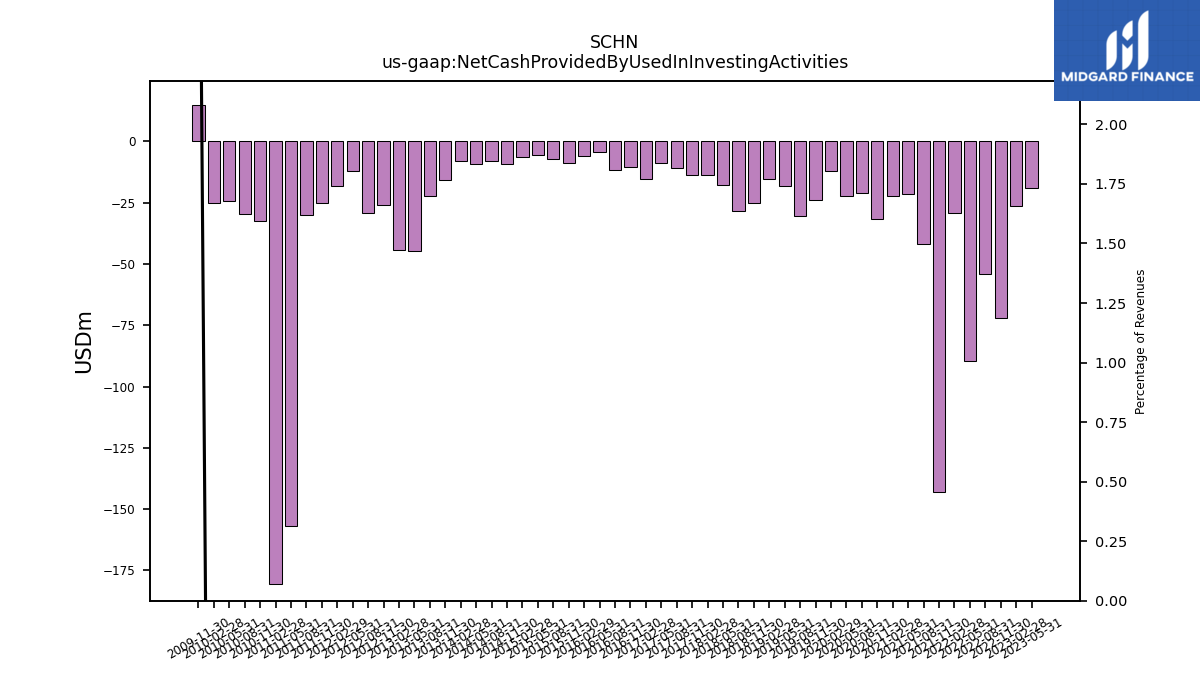
| Net Cash Provided By Used In Investing Activities | -19.01 | -26.18 | -72.20 | -54.27 | -89.58 | -29.28 | -143.01 | -42.01 | -21.50 | -22.39 | -31.75 | -20.94 | -22.06 | -11.89 | -23.97 | -30.55 | -18.20 | -15.52 | -25.29 | -28.40 | -17.57 | -13.81 | -13.61 | -10.89 | -8.80 | -15.12 | -10.59 | -11.69 | -4.19 | -5.98 | -8.62 | -7.00 | -5.56 | -6.48 | -9.14 | -8.08 | -9.09 | -8.14 | -15.92 | -22.09 | -44.80 | -44.37 | -25.92 | -29.39 | -11.89 | -18.05 | -24.95 | -30.02 | -156.85 | -180.54 | -32.49 | -29.68 | -24.49 | -25.01 | 14.88 | |
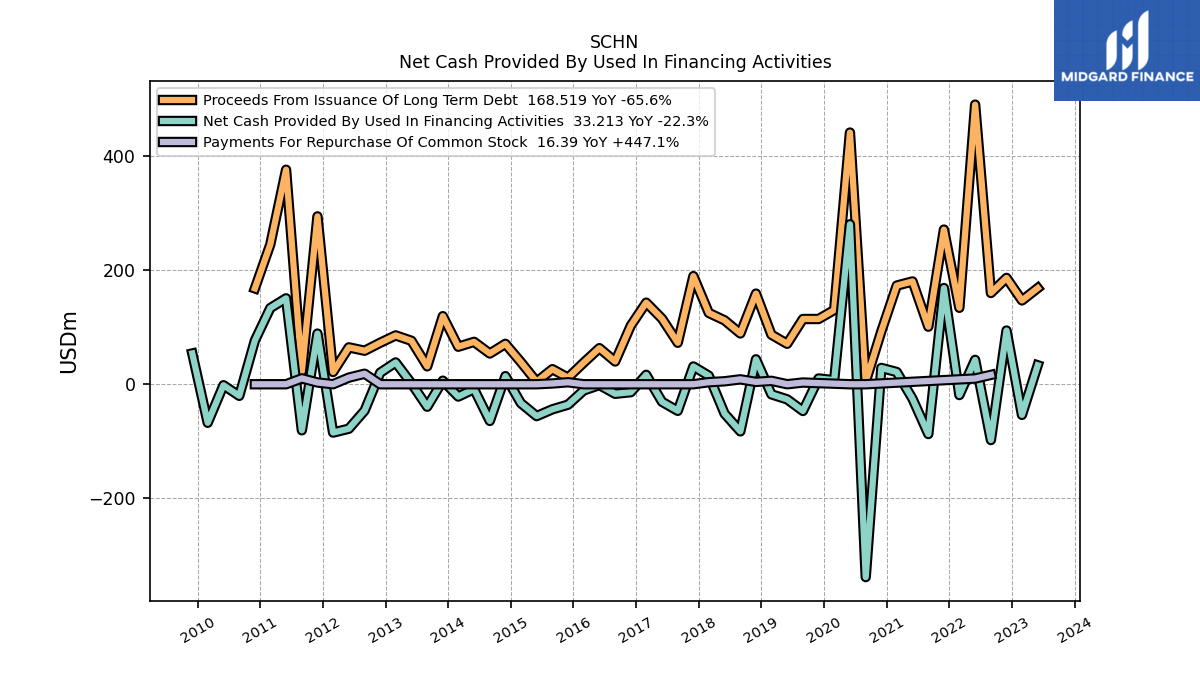
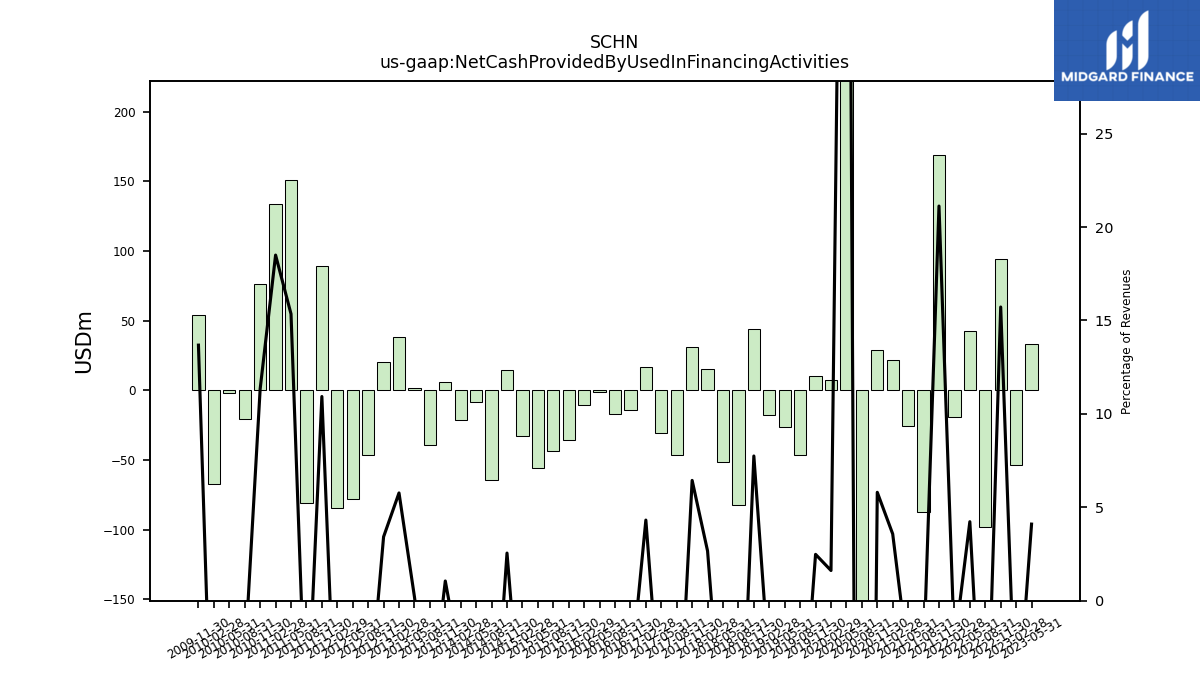
| Net Cash Provided By Used In Financing Activities | 33.21 | -53.72 | 94.13 | -97.80 | 42.74 | -18.98 | 168.61 | -87.29 | -25.55 | 21.45 | 28.56 | -338.06 | 280.37 | 7.12 | 10.07 | -46.82 | -26.50 | -17.65 | 43.70 | -82.63 | -51.54 | 14.90 | 31.13 | -46.55 | -30.70 | 16.50 | -13.92 | -16.72 | -1.43 | -10.93 | -35.83 | -43.94 | -55.84 | -33.15 | 14.18 | -64.31 | -8.48 | -21.60 | 6.21 | -39.44 | 1.53 | 38.21 | 20.28 | -46.17 | -77.93 | -84.73 | 88.78 | -80.72 | 150.61 | 133.55 | 76.52 | -20.30 | -1.76 | -67.57 | 53.94 |
| 2023-05-31 | 2023-02-28 | 2022-11-30 | 2022-08-31 | 2022-05-31 | 2022-02-28 | 2021-11-30 | 2021-08-31 | 2021-05-31 | 2021-02-28 | 2020-11-30 | 2020-08-31 | 2020-05-31 | 2020-02-29 | 2019-11-30 | 2019-08-31 | 2019-05-31 | 2019-02-28 | 2018-11-30 | 2018-08-31 | 2018-05-31 | 2018-02-28 | 2017-11-30 | 2017-08-31 | 2017-05-31 | 2017-02-28 | 2016-11-30 | 2016-08-31 | 2016-05-31 | 2016-02-29 | 2015-11-30 | 2015-08-31 | 2015-05-31 | 2015-02-28 | 2014-11-30 | 2014-08-31 | 2014-05-31 | 2014-02-28 | 2013-11-30 | 2013-08-31 | 2013-05-31 | 2013-02-28 | 2012-11-30 | 2012-08-31 | 2012-05-31 | 2012-02-29 | 2011-11-30 | 2011-08-31 | 2011-05-31 | 2011-02-28 | 2010-11-30 | 2010-08-31 | 2010-05-31 | 2010-02-28 | 2009-11-30 | ||
|---|---|---|---|---|---|---|---|---|---|---|---|---|---|---|---|---|---|---|---|---|---|---|---|---|---|---|---|---|---|---|---|---|---|---|---|---|---|---|---|---|---|---|---|---|---|---|---|---|---|---|---|---|---|---|---|---|
| Net Cash Provided By Used In Operating Activities | -21.16 | 87.84 | -62.15 | 179.67 | 45.29 | 46.98 | -34.27 | 139.47 | 53.20 | 4.82 | -7.43 | 68.76 | 39.18 | 5.52 | 11.13 | 81.71 | 39.70 | 34.93 | -11.61 | 106.03 | 64.27 | 4.96 | -15.59 | 49.09 | 45.05 | 0.30 | 5.93 | 48.05 | 3.86 | 6.71 | 40.63 | 65.21 | 63.57 | 31.90 | -16.05 | 68.65 | 26.90 | 19.86 | 25.84 | 37.71 | 45.37 | 15.74 | -59.53 | 108.35 | 95.07 | 127.53 | -86.16 | 127.79 | -7.60 | 37.90 | -17.62 | 49.22 | 24.07 | 106.22 | -90.02 | |
| Net Income Loss | 13.46 | 4.35 | -17.79 | 10.35 | 74.63 | 37.62 | 46.20 | 42.78 | 63.63 | 44.59 | 14.10 | 3.96 | -5.00 | 3.88 | -7.00 | 11.57 | 15.69 | 12.89 | 16.19 | 59.67 | 37.40 | 41.02 | 18.36 | 18.23 | 16.57 | 11.04 | -1.33 | 16.13 | 11.00 | -41.24 | -5.30 | 10.73 | -9.63 | -195.64 | -2.47 | 7.25 | 3.11 | 1.79 | -6.23 | -289.23 | 0.82 | 8.64 | -1.67 | -0.48 | 11.24 | 9.63 | 7.02 | 36.71 | 33.03 | 30.82 | 17.79 | 17.41 | 40.45 | 17.46 | -8.57 | |
| Profit Loss | 13.61 | 4.27 | -17.56 | 11.05 | 75.50 | 38.16 | 47.28 | 43.80 | 65.44 | 45.68 | 15.06 | 4.58 | -4.72 | 4.50 | -6.57 | 11.97 | 16.44 | 13.30 | 16.62 | 60.20 | 38.45 | 41.92 | 19.22 | 18.73 | 17.25 | 11.70 | -0.71 | 16.66 | 11.69 | -40.97 | -4.97 | 11.35 | -8.94 | -195.88 | -1.60 | 8.19 | 4.12 | 2.64 | -5.37 | -288.88 | 1.55 | 8.74 | -1.44 | -0.84 | 11.65 | 10.37 | 7.75 | 38.09 | 34.40 | 32.13 | 18.92 | 18.14 | 41.78 | 18.50 | -7.75 | |
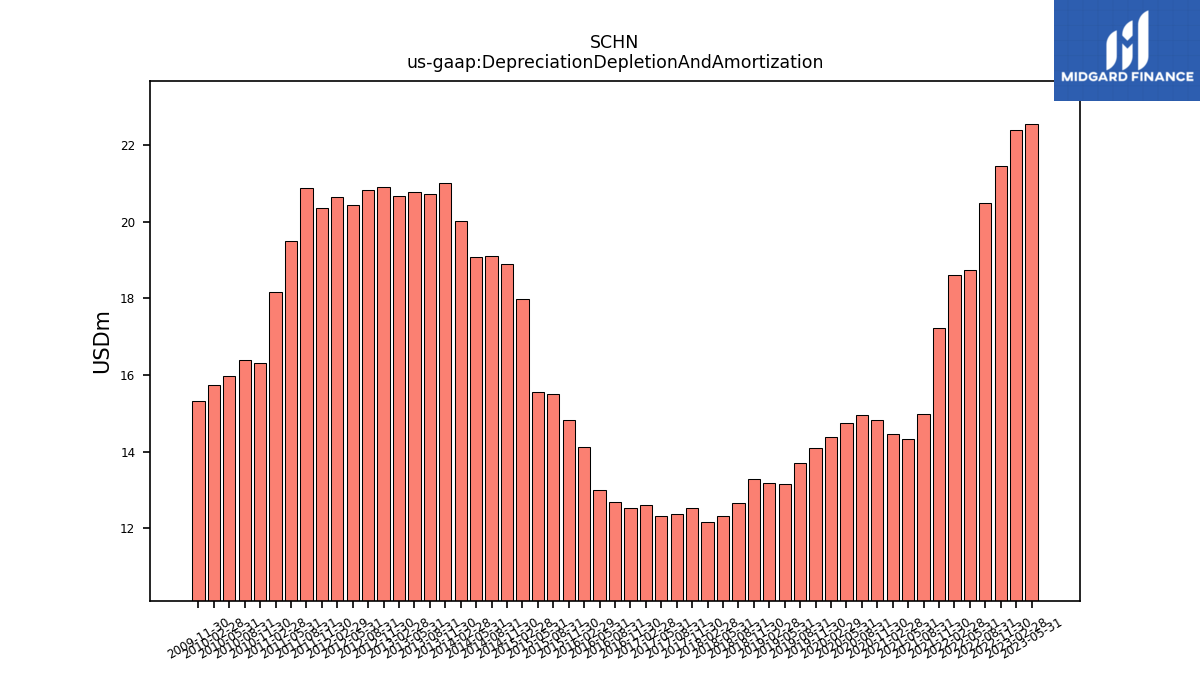
| Depreciation Depletion And Amortization | 22.54 | 22.40 | 21.45 | 20.49 | 18.75 | 18.60 | 17.22 | 14.98 | 14.33 | 14.47 | 14.83 | 14.96 | 14.74 | 14.38 | 14.09 | 13.69 | 13.15 | 13.19 | 13.30 | 12.66 | 12.33 | 12.16 | 12.52 | 12.38 | 12.32 | 12.60 | 12.54 | 12.69 | 12.99 | 14.12 | 14.83 | 15.52 | 15.55 | 17.99 | 18.88 | 19.09 | 19.07 | 20.03 | 21.02 | 20.72 | 20.78 | 20.67 | 20.90 | 20.82 | 20.45 | 20.64 | 20.35 | 20.88 | 19.51 | 18.16 | 16.32 | 16.39 | 15.97 | 15.73 | 15.33 | |
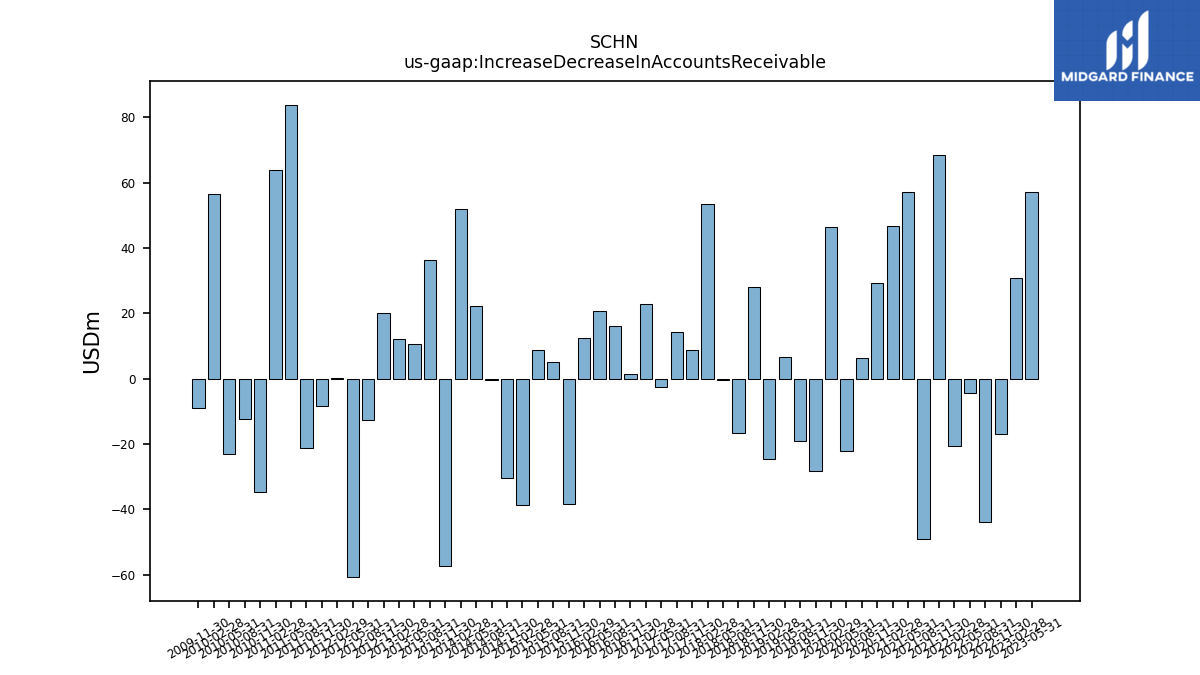
| Increase Decrease In Accounts Receivable | 57.10 | 30.84 | -16.93 | -43.97 | -4.42 | -20.73 | 68.49 | -49.08 | 57.20 | 46.84 | 29.12 | 6.17 | -22.25 | 46.54 | -28.20 | -19.26 | 6.46 | -24.72 | 28.05 | -16.62 | -0.49 | 53.41 | 8.64 | 14.24 | -2.56 | 22.96 | 1.55 | 16.00 | 20.72 | 12.34 | -38.37 | 5.04 | 8.79 | -38.86 | -30.58 | -0.49 | 22.19 | 52.03 | -57.38 | 36.43 | 10.52 | 12.16 | 20.01 | -12.66 | -60.80 | 0.04 | -8.28 | -21.19 | 83.89 | 63.76 | -34.74 | -12.51 | -23.18 | 56.40 | -9.14 | |
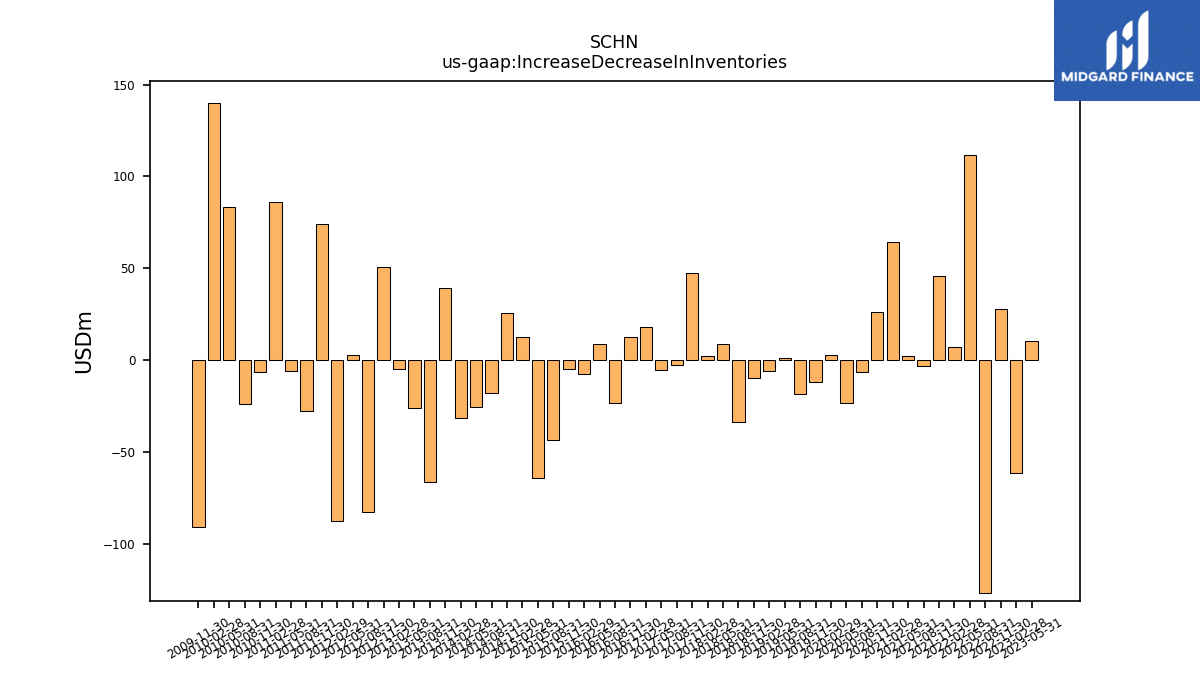
| Increase Decrease In Inventories | 10.62 | -61.68 | 27.85 | -126.96 | 111.57 | 7.04 | 45.58 | -3.49 | 1.96 | 64.22 | 25.93 | -6.47 | -23.69 | 2.80 | -11.87 | -18.63 | 0.96 | -6.17 | -9.63 | -33.77 | 8.62 | 2.17 | 47.27 | -2.83 | -5.39 | 17.84 | 12.59 | -23.69 | 8.77 | -7.78 | -4.80 | -43.42 | -64.24 | 12.63 | 25.77 | -18.16 | -25.69 | -31.50 | 39.08 | -66.58 | -25.98 | -5.04 | 50.78 | -82.99 | 2.48 | -87.70 | 74.12 | -28.04 | -6.24 | 86.00 | -6.46 | -23.88 | 83.55 | 140.20 | -90.73 | |
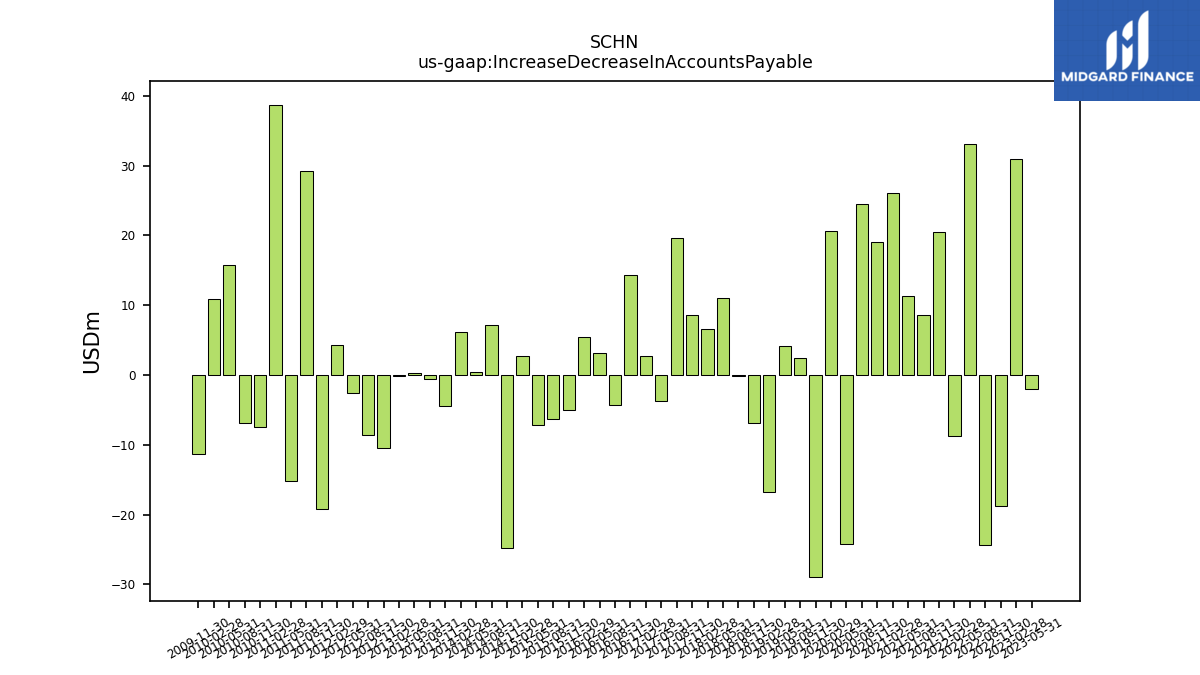
| Increase Decrease In Accounts Payable | -1.99 | 30.94 | -18.69 | -24.30 | 33.11 | -8.75 | 20.51 | 8.56 | 11.34 | 26.04 | 19.02 | 24.52 | -24.19 | 20.66 | -28.95 | 2.41 | 4.13 | -16.74 | -6.88 | -0.21 | 11.07 | 6.64 | 8.55 | 19.70 | -3.69 | 2.71 | 14.34 | -4.29 | 3.10 | 5.45 | -5.03 | -6.23 | -7.21 | 2.66 | -24.85 | 7.16 | 0.49 | 6.16 | -4.40 | -0.61 | 0.31 | -0.17 | -10.43 | -8.64 | -2.55 | 4.31 | -19.19 | 29.28 | -15.18 | 38.74 | -7.39 | -6.94 | 15.82 | 10.85 | -11.26 | |
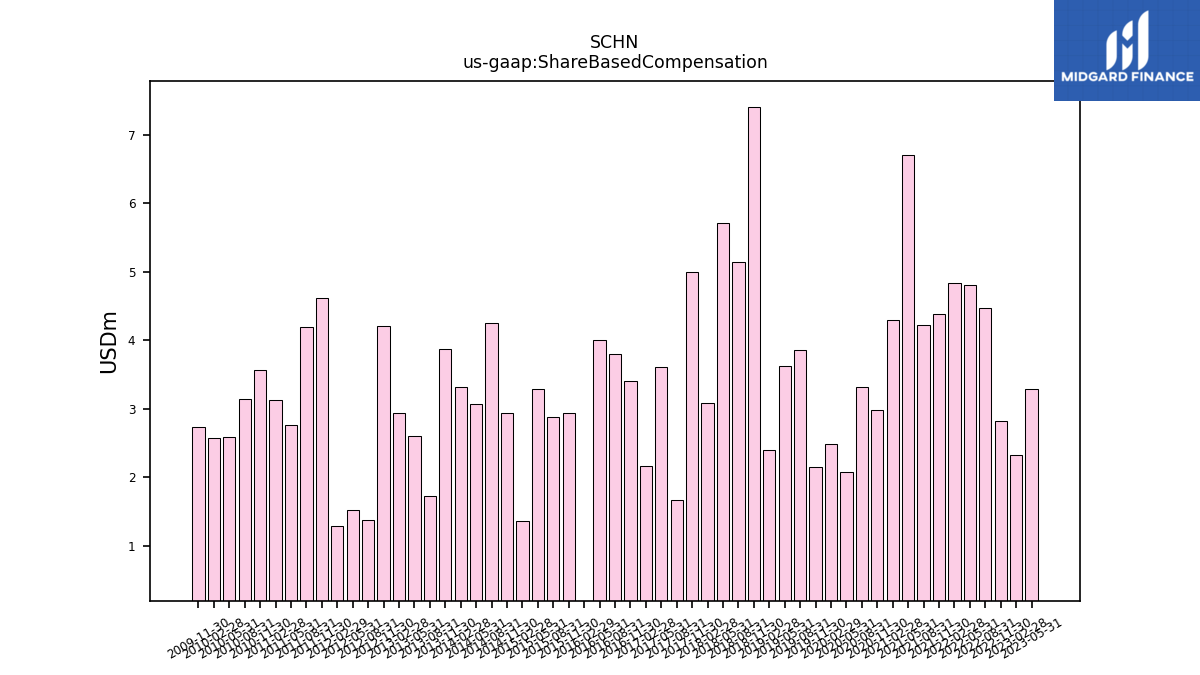
| Share Based Compensation | 3.29 | 2.33 | 2.82 | 4.47 | 4.82 | 4.84 | 4.39 | 4.23 | 6.71 | 4.29 | 2.98 | 3.32 | 2.07 | 2.49 | 2.15 | 3.86 | 3.63 | 2.40 | 7.40 | 5.15 | 5.72 | 3.09 | 5.00 | 1.67 | 3.61 | 2.16 | 3.41 | 3.80 | 4.01 | -0.31 | 2.94 | 2.88 | 3.30 | 1.37 | 2.93 | 4.25 | 3.08 | 3.31 | 3.87 | 1.72 | 2.60 | 2.95 | 4.21 | 1.37 | 1.53 | 1.28 | 4.61 | 4.20 | 2.76 | 3.12 | 3.57 | 3.15 | 2.58 | 2.57 | 2.73 |
| 2023-05-31 | 2023-02-28 | 2022-11-30 | 2022-08-31 | 2022-05-31 | 2022-02-28 | 2021-11-30 | 2021-08-31 | 2021-05-31 | 2021-02-28 | 2020-11-30 | 2020-08-31 | 2020-05-31 | 2020-02-29 | 2019-11-30 | 2019-08-31 | 2019-05-31 | 2019-02-28 | 2018-11-30 | 2018-08-31 | 2018-05-31 | 2018-02-28 | 2017-11-30 | 2017-08-31 | 2017-05-31 | 2017-02-28 | 2016-11-30 | 2016-08-31 | 2016-05-31 | 2016-02-29 | 2015-11-30 | 2015-08-31 | 2015-05-31 | 2015-02-28 | 2014-11-30 | 2014-08-31 | 2014-05-31 | 2014-02-28 | 2013-11-30 | 2013-08-31 | 2013-05-31 | 2013-02-28 | 2012-11-30 | 2012-08-31 | 2012-05-31 | 2012-02-29 | 2011-11-30 | 2011-08-31 | 2011-05-31 | 2011-02-28 | 2010-11-30 | 2010-08-31 | 2010-05-31 | 2010-02-28 | 2009-11-30 | ||
|---|---|---|---|---|---|---|---|---|---|---|---|---|---|---|---|---|---|---|---|---|---|---|---|---|---|---|---|---|---|---|---|---|---|---|---|---|---|---|---|---|---|---|---|---|---|---|---|---|---|---|---|---|---|---|---|---|
| Net Cash Provided By Used In Investing Activities | -19.01 | -26.18 | -72.20 | -54.27 | -89.58 | -29.28 | -143.01 | -42.01 | -21.50 | -22.39 | -31.75 | -20.94 | -22.06 | -11.89 | -23.97 | -30.55 | -18.20 | -15.52 | -25.29 | -28.40 | -17.57 | -13.81 | -13.61 | -10.89 | -8.80 | -15.12 | -10.59 | -11.69 | -4.19 | -5.98 | -8.62 | -7.00 | -5.56 | -6.48 | -9.14 | -8.08 | -9.09 | -8.14 | -15.92 | -22.09 | -44.80 | -44.37 | -25.92 | -29.39 | -11.89 | -18.05 | -24.95 | -30.02 | -156.85 | -180.54 | -32.49 | -29.68 | -24.49 | -25.01 | 14.88 | |
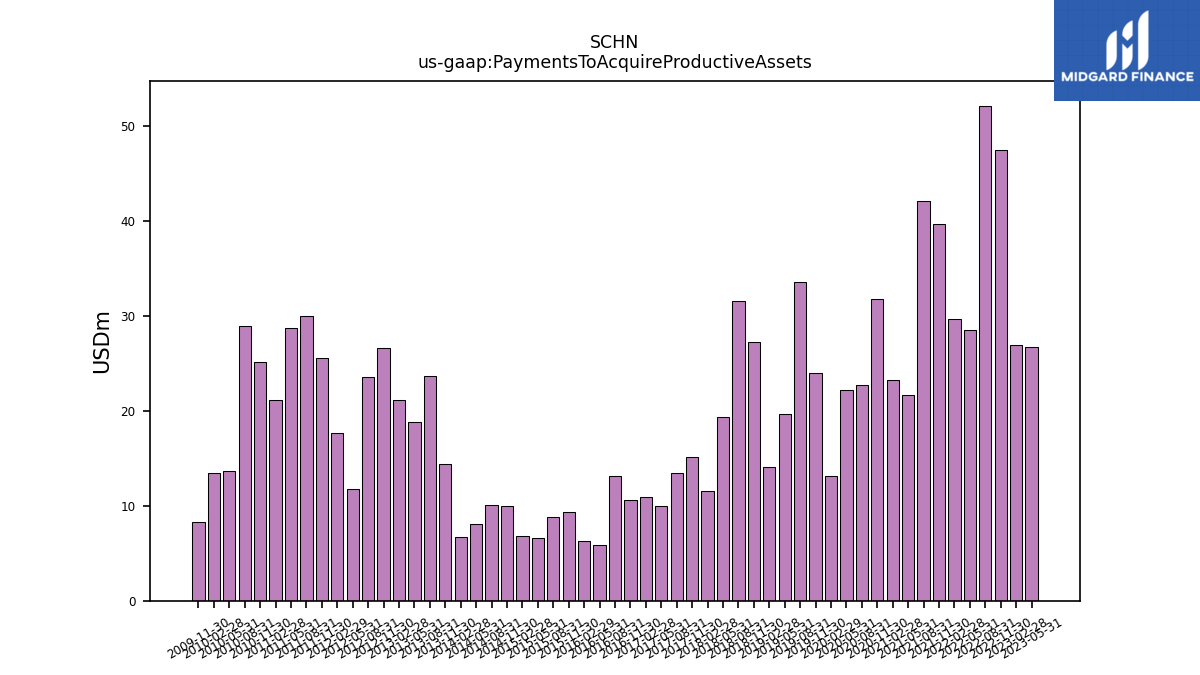
| Payments To Acquire Productive Assets | 26.76 | 26.99 | 47.52 | 52.15 | 28.56 | 29.69 | 39.72 | 42.14 | 21.65 | 23.26 | 31.83 | 22.72 | 22.19 | 13.13 | 23.97 | 33.61 | 19.70 | 14.09 | 27.21 | 31.53 | 19.33 | 11.61 | 15.16 | 13.43 | 9.97 | 10.94 | 10.60 | 13.13 | 5.83 | 6.27 | 9.34 | 8.86 | 6.61 | 6.80 | 10.03 | 10.05 | 8.04 | 6.68 | 14.38 | 23.70 | 18.86 | 21.15 | 26.68 | 23.61 | 11.77 | 17.63 | 25.55 | 30.00 | 28.68 | 21.12 | 25.17 | 28.95 | 13.71 | 13.41 | 8.25 |
| 2023-05-31 | 2023-02-28 | 2022-11-30 | 2022-08-31 | 2022-05-31 | 2022-02-28 | 2021-11-30 | 2021-08-31 | 2021-05-31 | 2021-02-28 | 2020-11-30 | 2020-08-31 | 2020-05-31 | 2020-02-29 | 2019-11-30 | 2019-08-31 | 2019-05-31 | 2019-02-28 | 2018-11-30 | 2018-08-31 | 2018-05-31 | 2018-02-28 | 2017-11-30 | 2017-08-31 | 2017-05-31 | 2017-02-28 | 2016-11-30 | 2016-08-31 | 2016-05-31 | 2016-02-29 | 2015-11-30 | 2015-08-31 | 2015-05-31 | 2015-02-28 | 2014-11-30 | 2014-08-31 | 2014-05-31 | 2014-02-28 | 2013-11-30 | 2013-08-31 | 2013-05-31 | 2013-02-28 | 2012-11-30 | 2012-08-31 | 2012-05-31 | 2012-02-29 | 2011-11-30 | 2011-08-31 | 2011-05-31 | 2011-02-28 | 2010-11-30 | 2010-08-31 | 2010-05-31 | 2010-02-28 | 2009-11-30 | ||
|---|---|---|---|---|---|---|---|---|---|---|---|---|---|---|---|---|---|---|---|---|---|---|---|---|---|---|---|---|---|---|---|---|---|---|---|---|---|---|---|---|---|---|---|---|---|---|---|---|---|---|---|---|---|---|---|---|
| Net Cash Provided By Used In Financing Activities | 33.21 | -53.72 | 94.13 | -97.80 | 42.74 | -18.98 | 168.61 | -87.29 | -25.55 | 21.45 | 28.56 | -338.06 | 280.37 | 7.12 | 10.07 | -46.82 | -26.50 | -17.65 | 43.70 | -82.63 | -51.54 | 14.90 | 31.13 | -46.55 | -30.70 | 16.50 | -13.92 | -16.72 | -1.43 | -10.93 | -35.83 | -43.94 | -55.84 | -33.15 | 14.18 | -64.31 | -8.48 | -21.60 | 6.21 | -39.44 | 1.53 | 38.21 | 20.28 | -46.17 | -77.93 | -84.73 | 88.78 | -80.72 | 150.61 | 133.55 | 76.52 | -20.30 | -1.76 | -67.57 | 53.94 | |
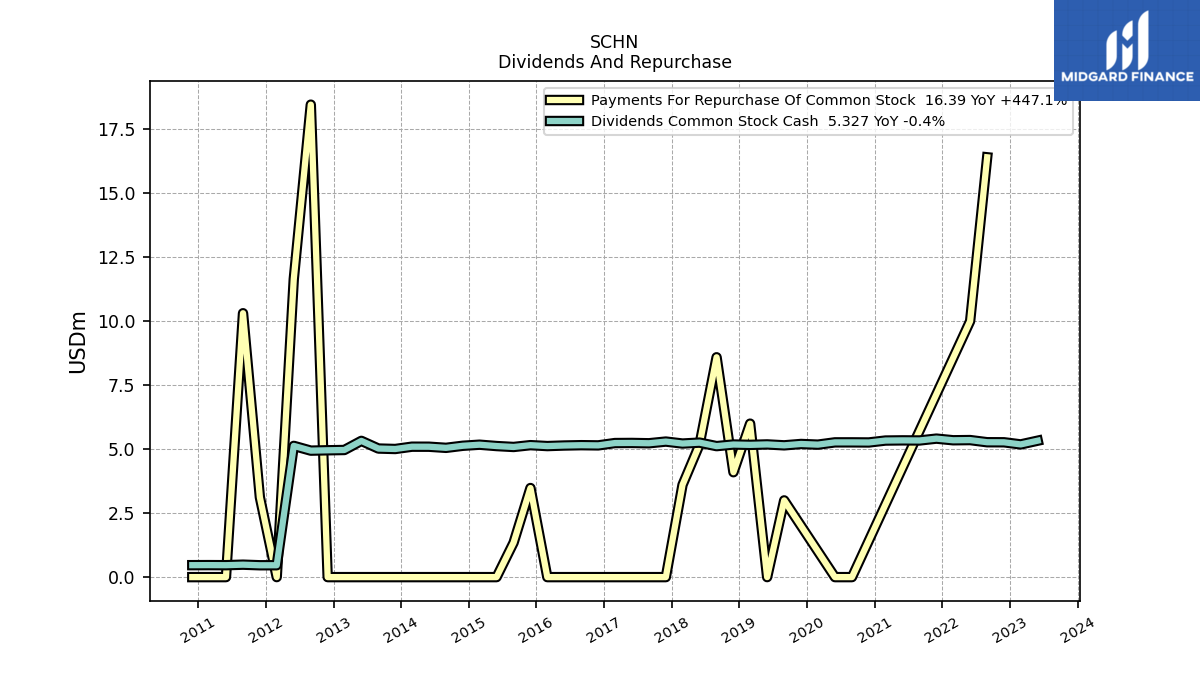
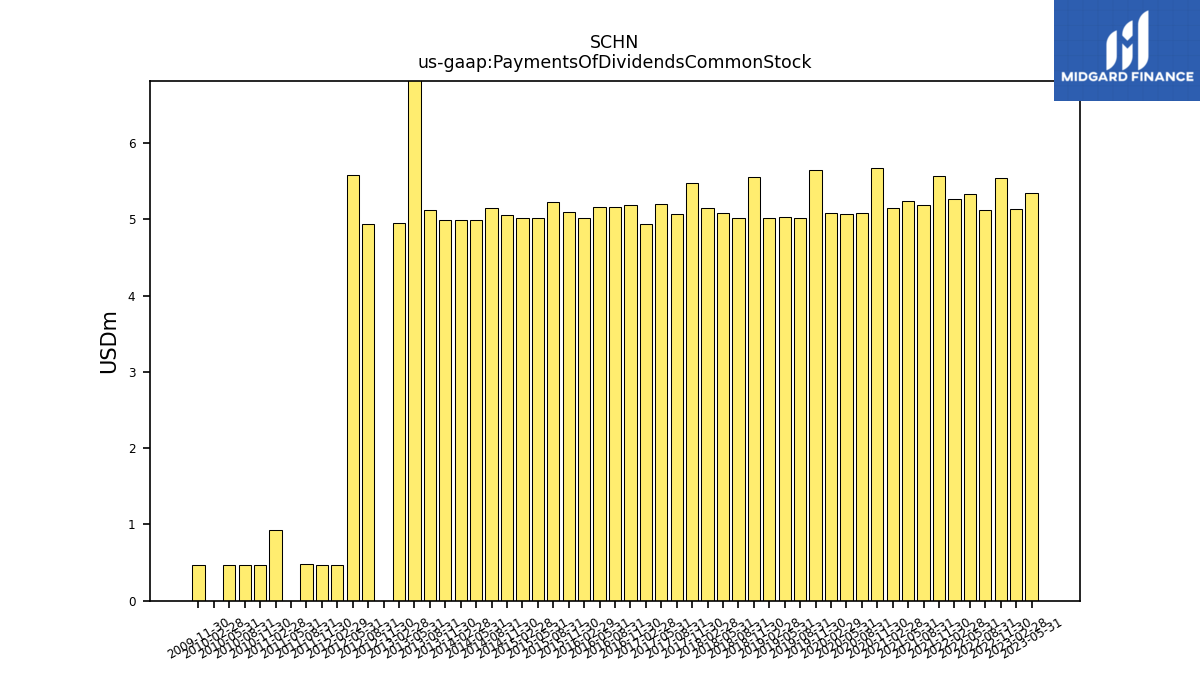
| Payments Of Dividends Common Stock | 5.35 | 5.13 | 5.54 | 5.12 | 5.33 | 5.27 | 5.57 | 5.19 | 5.24 | 5.15 | 5.68 | 5.08 | 5.07 | 5.08 | 5.65 | 5.01 | 5.03 | 5.02 | 5.55 | 5.01 | 5.09 | 5.16 | 5.48 | 5.07 | 5.20 | 4.94 | 5.18 | 5.17 | 5.16 | 5.02 | 5.10 | 5.23 | 5.02 | 5.02 | 5.06 | 5.15 | 4.99 | 4.99 | 4.99 | 5.12 | 9.93 | 4.95 | 0.00 | 4.93 | 5.59 | 0.46 | 0.47 | 0.48 | 0.00 | 0.93 | 0.47 | 0.47 | 0.47 | 0.00 | 0.47 | |
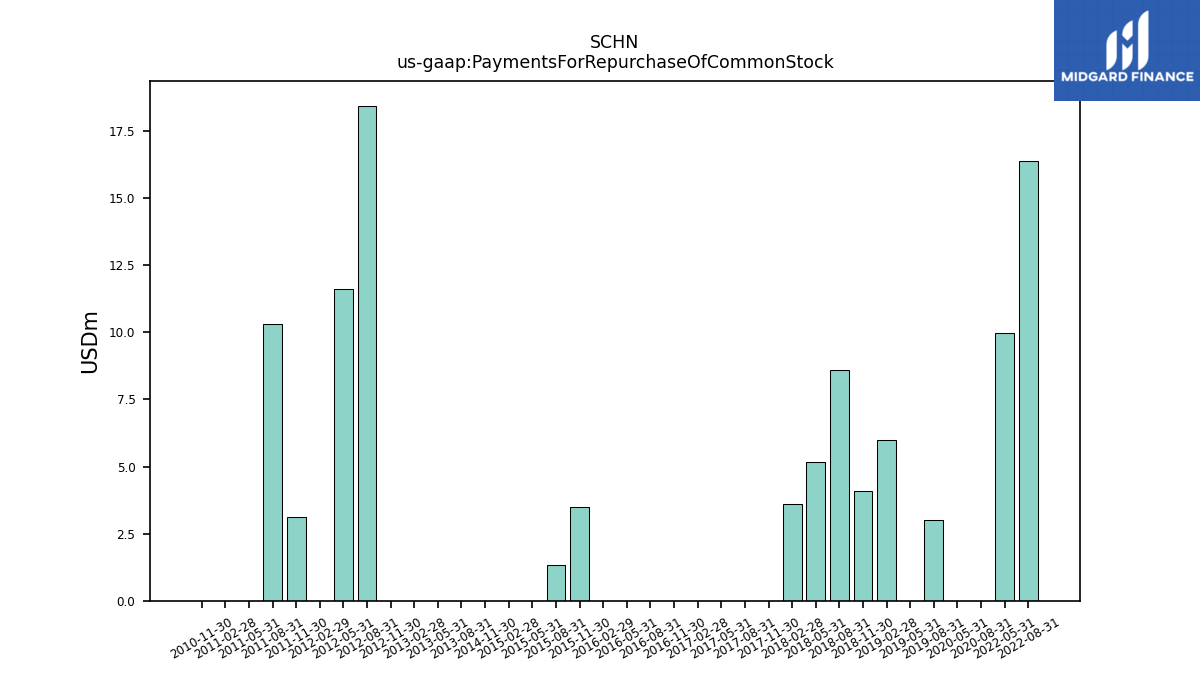
| Payments For Repurchase Of Common Stock | NA | NA | NA | 16.39 | 9.99 | NA | NA | NA | NA | NA | NA | 0.00 | 0.00 | NA | NA | 3.00 | 0.00 | 5.99 | 4.09 | 8.58 | 5.18 | 3.60 | 0.00 | 0.00 | 0.00 | 0.00 | 0.00 | 0.00 | 0.00 | 0.00 | 3.48 | 1.35 | 0.00 | 0.00 | 0.00 | NA | NA | NA | NA | 0.00 | 0.00 | 0.00 | 0.00 | 18.45 | 11.63 | 0.00 | 3.12 | 10.30 | 0.00 | 0.00 | 0.00 | NA | NA | NA | NA |
| 2023-05-31 | 2023-02-28 | 2022-11-30 | 2022-08-31 | 2022-05-31 | 2022-02-28 | 2021-11-30 | 2021-08-31 | 2021-05-31 | 2021-02-28 | 2020-11-30 | 2020-08-31 | 2020-05-31 | 2020-02-29 | 2019-11-30 | 2019-08-31 | 2019-05-31 | 2019-02-28 | 2018-11-30 | 2018-08-31 | 2018-05-31 | 2018-02-28 | 2017-11-30 | 2017-08-31 | 2017-05-31 | 2017-02-28 | 2016-11-30 | 2016-08-31 | 2016-05-31 | 2016-02-29 | 2015-11-30 | 2015-08-31 | 2015-05-31 | 2015-02-28 | 2014-11-30 | 2014-08-31 | 2014-05-31 | 2014-02-28 | 2013-11-30 | 2013-08-31 | 2013-05-31 | 2013-02-28 | 2012-11-30 | 2012-08-31 | 2012-05-31 | 2012-02-29 | 2011-11-30 | 2011-08-31 | 2011-05-31 | 2011-02-28 | 2010-11-30 | 2010-08-31 | 2010-05-31 | 2010-02-28 | 2009-11-30 | ||
|---|---|---|---|---|---|---|---|---|---|---|---|---|---|---|---|---|---|---|---|---|---|---|---|---|---|---|---|---|---|---|---|---|---|---|---|---|---|---|---|---|---|---|---|---|---|---|---|---|---|---|---|---|---|---|---|---|
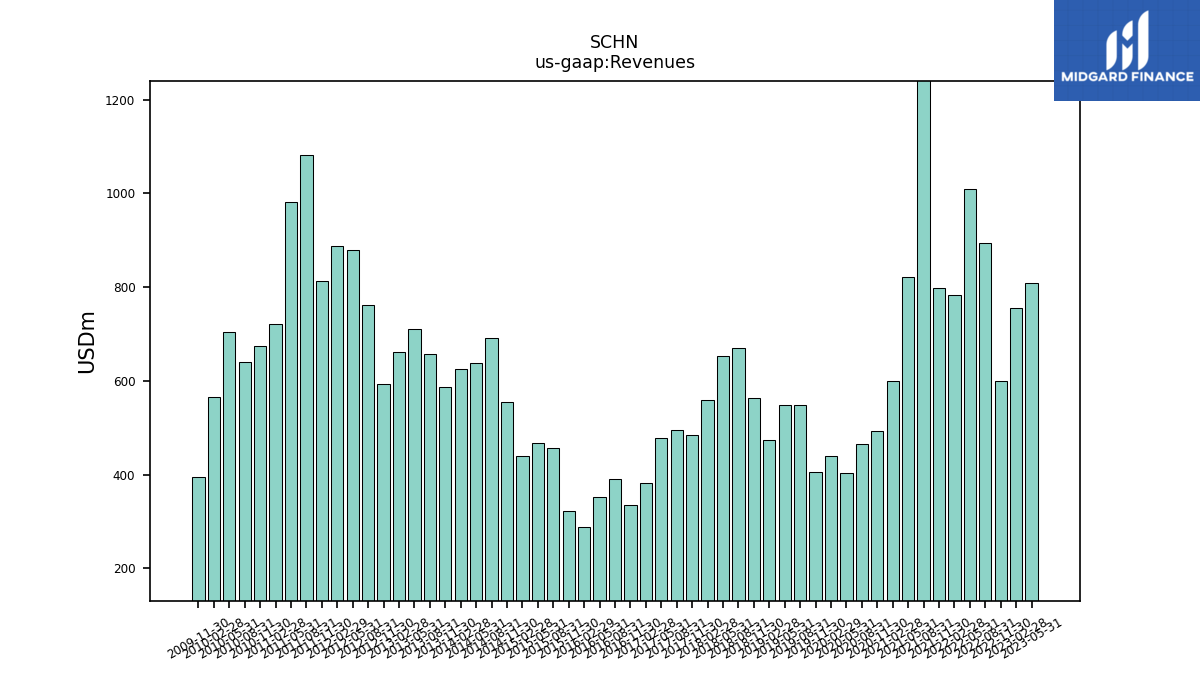
| Revenues | 809.61 | 755.95 | 598.73 | 894.41 | 1010.09 | 783.20 | 798.12 | 2758.55 | 820.72 | 600.11 | 492.11 | 464.59 | 402.68 | 439.48 | 405.58 | 547.80 | 547.40 | 473.56 | 564.02 | 669.58 | 652.42 | 559.44 | 483.28 | 494.26 | 477.09 | 382.08 | 334.16 | 390.66 | 351.60 | 289.08 | 321.20 | 457.02 | 467.31 | 439.23 | 555.59 | 691.90 | 637.79 | 626.15 | 587.75 | 656.59 | 710.29 | 662.21 | 592.82 | 762.28 | 879.87 | 886.61 | 812.18 | 1081.19 | 981.06 | 721.84 | 675.10 | 639.09 | 703.54 | 564.33 | 394.28 | |
| Revenue From Contract With Customer Excluding Assessed Tax | 809.61 | 755.95 | 598.73 | 894.41 | 1010.09 | 783.20 | 798.12 | 2758.55 | 820.72 | 600.11 | 492.11 | 464.59 | 402.68 | 439.48 | 405.58 | 547.80 | 547.40 | 473.56 | 564.02 | 669.58 | 652.42 | 559.44 | 483.28 | 494.26 | 477.09 | 382.08 | 334.16 | 390.66 | 351.60 | 289.08 | 321.20 | 457.02 | 467.31 | 439.23 | 555.59 | 691.90 | 637.79 | 626.15 | 587.75 | 656.59 | 710.29 | 662.21 | 592.82 | 762.28 | 879.87 | 886.61 | 812.18 | 1081.19 | 981.06 | 721.84 | 675.10 | 639.09 | 703.54 | 564.33 | 394.28 | |
| Geographic Distribution Domestic | 395.80 | 319.73 | 326.05 | 408.91 | 477.00 | 347.73 | 326.94 | 300.21 | 353.98 | 267.91 | 223.71 | 210.20 | 189.28 | 214.98 | 187.10 | 229.81 | 249.03 | 240.49 | 272.38 | NA | NA | NA | NA | NA | NA | NA | NA | NA | NA | NA | NA | NA | NA | NA | NA | NA | NA | NA | NA | NA | NA | NA | NA | NA | NA | NA | NA | NA | NA | NA | NA | NA | NA | NA | NA | |
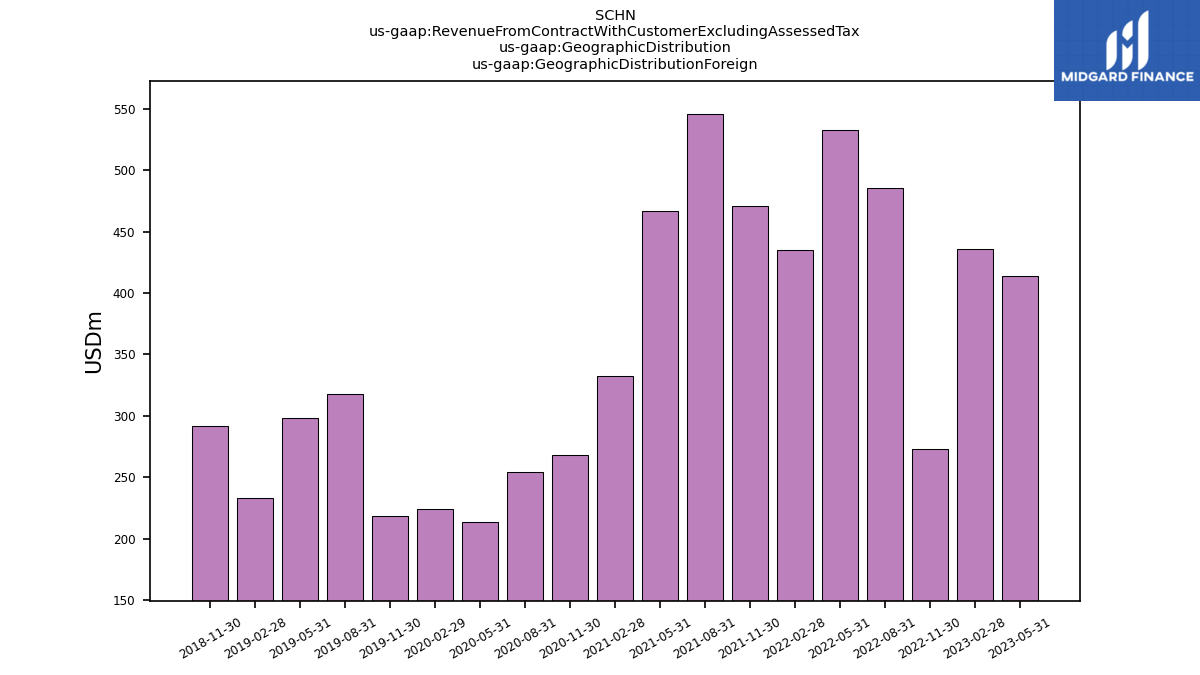
| Geographic Distribution Foreign | 413.81 | 436.22 | 272.68 | 485.50 | 533.09 | 435.47 | 471.17 | 545.41 | 466.74 | 332.20 | 268.40 | 254.40 | 213.40 | 224.50 | 218.48 | 317.99 | 298.37 | 233.08 | 291.64 | NA | NA | NA | NA | NA | NA | NA | NA | NA | NA | NA | NA | NA | NA | NA | NA | NA | NA | NA | NA | NA | NA | NA | NA | NA | NA | NA | NA | NA | NA | NA | NA | NA | NA | NA | NA | |
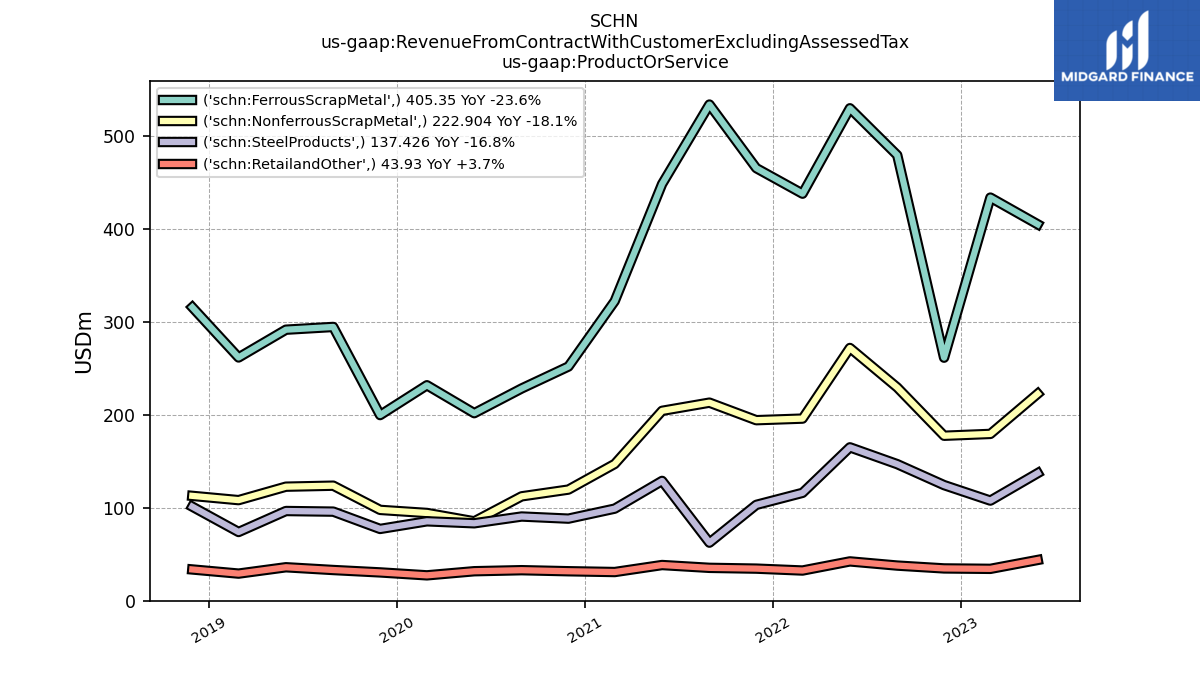
| Ferrous Scrap Metal | 405.35 | 434.12 | 261.73 | 479.78 | 530.30 | 438.31 | 465.86 | 534.32 | 448.68 | 322.68 | 252.21 | 228.55 | 201.97 | 232.07 | 199.90 | 294.83 | 291.87 | 261.97 | 316.05 | NA | NA | NA | NA | NA | NA | NA | NA | NA | NA | NA | NA | NA | NA | NA | NA | NA | NA | NA | NA | NA | NA | NA | NA | NA | NA | NA | NA | NA | NA | NA | NA | NA | NA | NA | NA | |
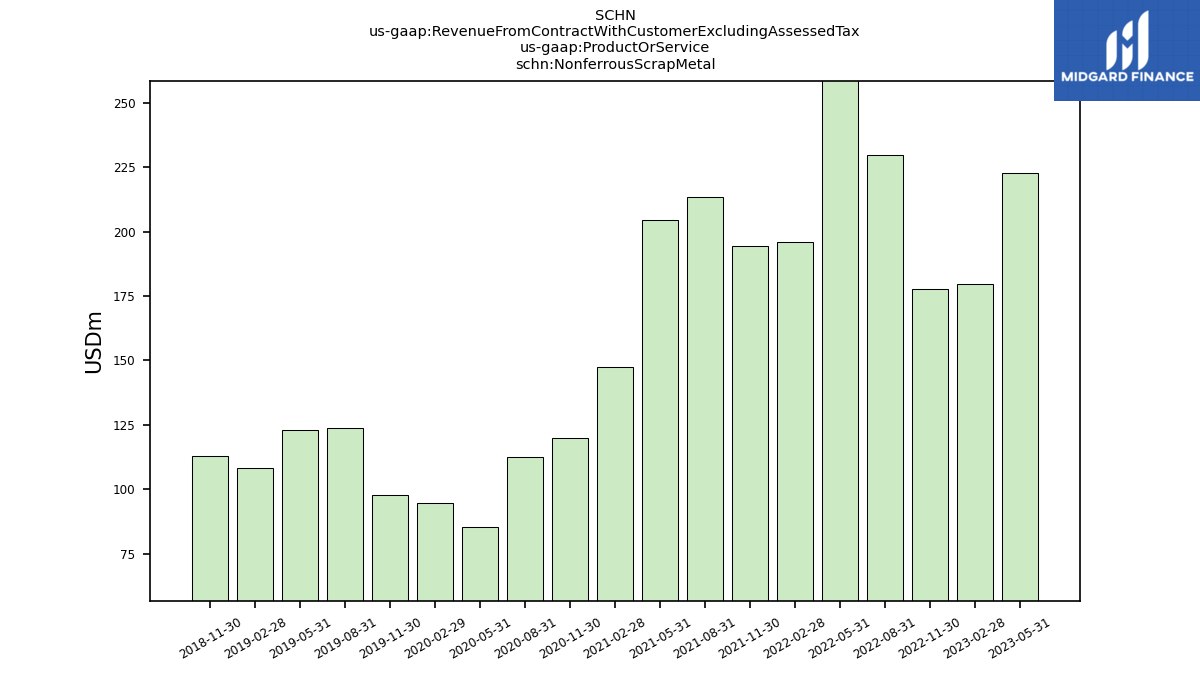
| Nonferrous Scrap Metal | 222.90 | 179.66 | 177.68 | 229.66 | 272.21 | 196.14 | 194.43 | 213.32 | 204.51 | 147.32 | 119.71 | 112.43 | 85.51 | 94.52 | 97.84 | 123.91 | 122.83 | 108.34 | 112.94 | NA | NA | NA | NA | NA | NA | NA | NA | NA | NA | NA | NA | NA | NA | NA | NA | NA | NA | NA | NA | NA | NA | NA | NA | NA | NA | NA | NA | NA | NA | NA | NA | NA | NA | NA | NA | |
| Retailand Other | 43.93 | 34.35 | 34.81 | 37.88 | 42.37 | 32.55 | 34.59 | 35.43 | 38.47 | 30.92 | 31.78 | 32.91 | 31.79 | 27.36 | 30.52 | 33.09 | 36.06 | 29.23 | 33.69 | NA | NA | NA | NA | NA | NA | NA | NA | NA | NA | NA | NA | NA | NA | NA | NA | NA | NA | NA | NA | NA | NA | NA | NA | NA | NA | NA | NA | NA | NA | NA | NA | NA | NA | NA | NA | |
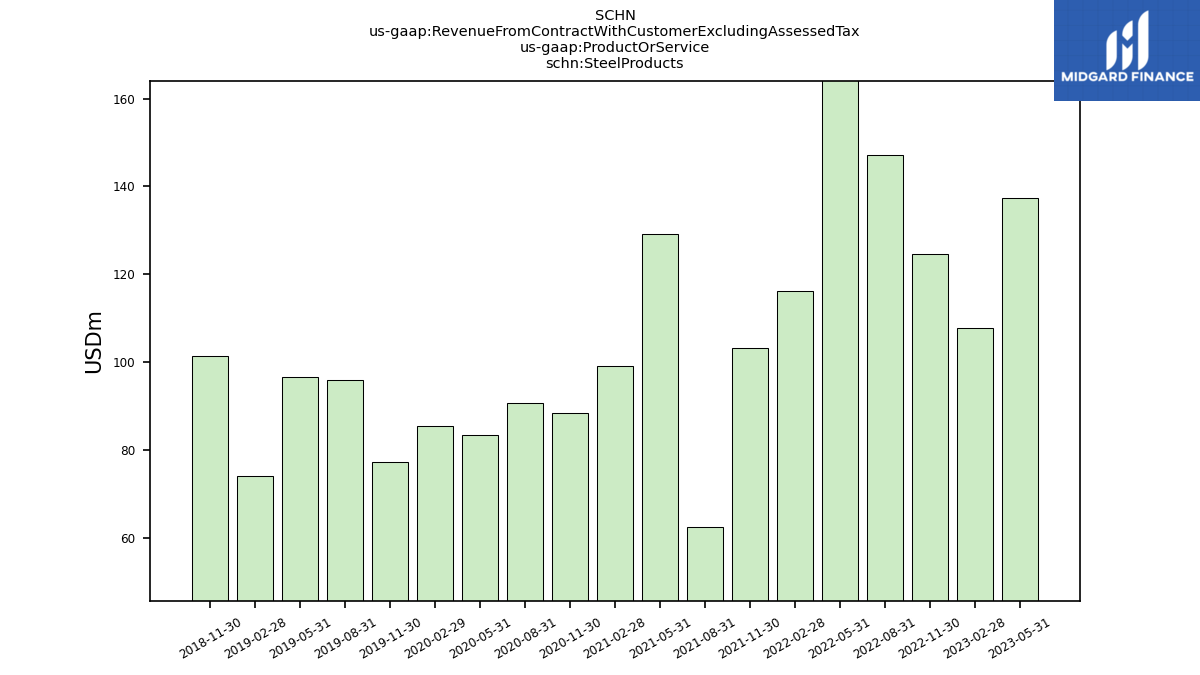
| Steel Products | 137.43 | 107.83 | 124.52 | 147.09 | 165.21 | 116.20 | 103.24 | 62.54 | 129.06 | 99.19 | 88.41 | 90.70 | 83.41 | 85.54 | 77.33 | 95.97 | 96.63 | 74.03 | 101.34 | NA | NA | NA | NA | NA | NA | NA | NA | NA | NA | NA | NA | NA | NA | NA | NA | NA | NA | NA | NA | NA | NA | NA | NA | NA | NA | NA | NA | NA | NA | NA | NA | NA | NA | NA | NA | |
| Revenue From Contract With Customer Including Assessed Tax | 809.61 | 755.95 | 598.73 | 894.41 | 1010.09 | 783.20 | 798.12 | 2758.55 | 820.72 | 600.11 | 492.11 | 464.59 | 402.68 | 439.48 | 405.58 | 547.80 | 547.40 | 473.56 | 564.02 | 669.58 | 652.42 | 559.44 | 483.28 | 494.26 | 477.09 | 382.08 | 334.16 | 390.66 | 351.60 | 289.08 | 321.20 | 457.02 | 467.31 | 439.23 | 555.59 | 691.90 | 637.79 | 626.15 | 587.75 | 656.59 | 710.29 | 662.21 | 592.82 | 762.28 | 879.87 | 886.61 | 812.18 | 1081.19 | 981.06 | 721.84 | 675.10 | 639.09 | 703.54 | 564.33 | 394.28 |


