
| 2023-09-30 | 2023-07-01 | 2023-04-01 | 2022-12-31 | 2022-10-01 | 2022-07-02 | 2022-04-02 | 2021-12-31 | 2021-10-02 | 2021-07-03 | 2021-04-03 | 2020-12-31 | 2020-09-26 | 2020-06-27 | 2020-03-28 | 2019-12-31 | 2019-09-28 | 2019-06-29 | 2019-03-30 | 2018-12-31 | 2018-09-29 | 2018-06-30 | 2018-03-31 | 2017-12-31 | 2017-09-30 | 2017-07-01 | 2017-04-01 | 2016-12-31 | 2016-10-01 | 2016-07-02 | 2016-04-02 | 2015-12-31 | 2015-10-03 | 2015-07-04 | 2015-04-04 | 2014-12-31 | 2014-09-27 | 2014-06-28 | 2014-03-29 | 2013-12-31 | 2013-09-28 | 2013-06-29 | 2013-03-30 | 2012-12-31 | 2012-09-29 | 2012-06-30 | 2012-03-31 | 2011-12-31 | 2011-10-01 | 2011-07-02 | 2011-04-02 | 2010-12-31 | 2010-10-02 | 2010-07-03 | ||
|---|---|---|---|---|---|---|---|---|---|---|---|---|---|---|---|---|---|---|---|---|---|---|---|---|---|---|---|---|---|---|---|---|---|---|---|---|---|---|---|---|---|---|---|---|---|---|---|---|---|---|---|---|---|---|---|
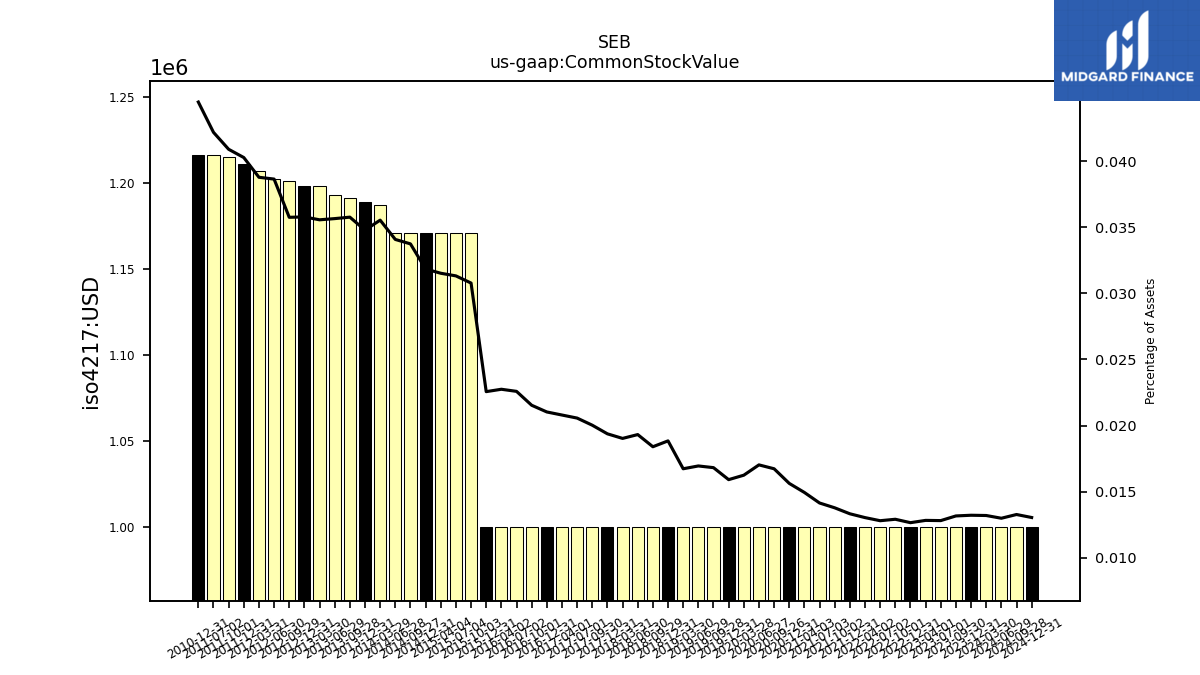
| Common Stock Value | 1.00 | 1.00 | 1.00 | 1.00 | 1.00 | 1.00 | 1.00 | 1.00 | 1.00 | 1.00 | 1.00 | 1.00 | 1.00 | 1.00 | 1.00 | 1.00 | 1.00 | 1.00 | 1.00 | 1.00 | 1.00 | 1.00 | 1.00 | 1.00 | 1.00 | 1.00 | 1.00 | 1.00 | 1.00 | 1.00 | 1.00 | 1.00 | 1.17 | 1.17 | 1.17 | 1.17 | 1.17 | 1.17 | 1.19 | 1.19 | 1.19 | 1.19 | 1.20 | 1.20 | 1.20 | 1.20 | 1.21 | 1.21 | 1.22 | 1.22 | NA | 1.22 | NA | NA | |
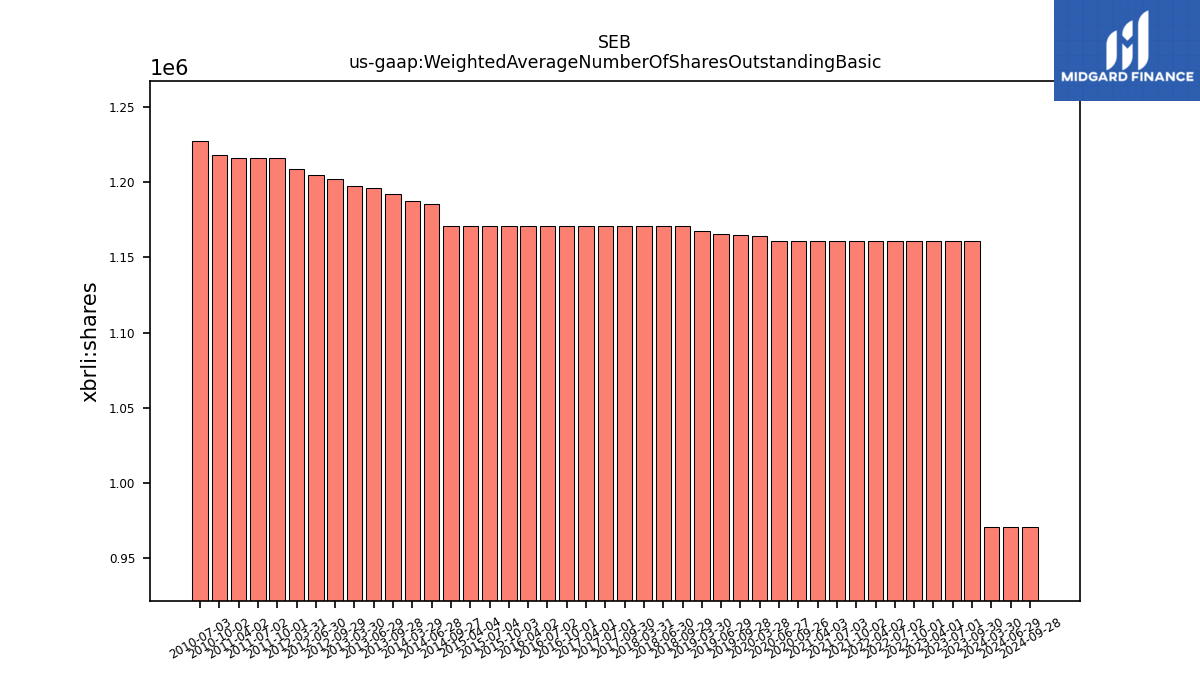
| Weighted Average Number Of Shares Outstanding Basic | 1.16 | 1.16 | 1.16 | NA | 1.16 | 1.16 | 1.16 | NA | 1.16 | 1.16 | 1.16 | NA | 1.16 | 1.16 | 1.16 | NA | 1.17 | 1.17 | 1.17 | NA | 1.17 | 1.17 | 1.17 | NA | 1.17 | 1.17 | 1.17 | NA | 1.17 | 1.17 | 1.17 | NA | 1.17 | 1.17 | 1.17 | NA | 1.17 | 1.19 | 1.19 | NA | 1.19 | 1.20 | 1.20 | NA | 1.20 | 1.20 | 1.21 | NA | 1.22 | 1.22 | 1.22 | NA | 1.22 | 1.23 | |
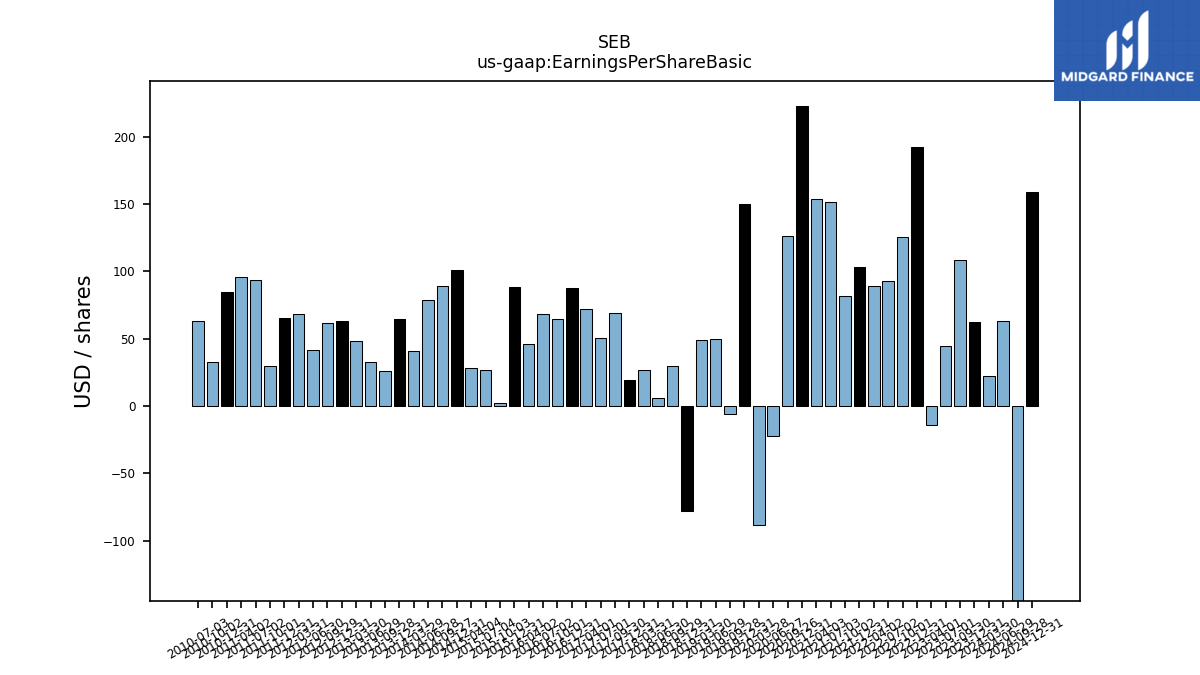
| Earnings Per Share Basic | 108.55 | 44.80 | -13.78 | 192.11 | 125.78 | 92.53 | 89.28 | 103.27 | 81.50 | 151.56 | 154.03 | 222.52 | 126.17 | -22.35 | -88.43 | 149.91 | -6.00 | 50.13 | 48.79 | -77.58 | 29.93 | 6.28 | 26.75 | 19.38 | 69.28 | 50.51 | 71.84 | 87.83 | 64.42 | 68.34 | 45.91 | 88.71 | 2.59 | 27.04 | 28.49 | 101.20 | 89.49 | 79.01 | 40.55 | 64.83 | 25.99 | 33.07 | 47.98 | 63.02 | 61.92 | 41.58 | 68.00 | 65.14 | 30.07 | 93.34 | 96.11 | 84.76 | 32.74 | 63.21 |
| 2023-09-30 | 2023-07-01 | 2023-04-01 | 2022-12-31 | 2022-10-01 | 2022-07-02 | 2022-04-02 | 2021-12-31 | 2021-10-02 | 2021-07-03 | 2021-04-03 | 2020-12-31 | 2020-09-26 | 2020-06-27 | 2020-03-28 | 2019-12-31 | 2019-09-28 | 2019-06-29 | 2019-03-30 | 2018-12-31 | 2018-09-29 | 2018-06-30 | 2018-03-31 | 2017-12-31 | 2017-09-30 | 2017-07-01 | 2017-04-01 | 2016-12-31 | 2016-10-01 | 2016-07-02 | 2016-04-02 | 2015-12-31 | 2015-10-03 | 2015-07-04 | 2015-04-04 | 2014-12-31 | 2014-09-27 | 2014-06-28 | 2014-03-29 | 2013-12-31 | 2013-09-28 | 2013-06-29 | 2013-03-30 | 2012-12-31 | 2012-09-29 | 2012-06-30 | 2012-03-31 | 2011-12-31 | 2011-10-01 | 2011-07-02 | 2011-04-02 | 2010-12-31 | 2010-10-02 | 2010-07-03 | ||
|---|---|---|---|---|---|---|---|---|---|---|---|---|---|---|---|---|---|---|---|---|---|---|---|---|---|---|---|---|---|---|---|---|---|---|---|---|---|---|---|---|---|---|---|---|---|---|---|---|---|---|---|---|---|---|---|
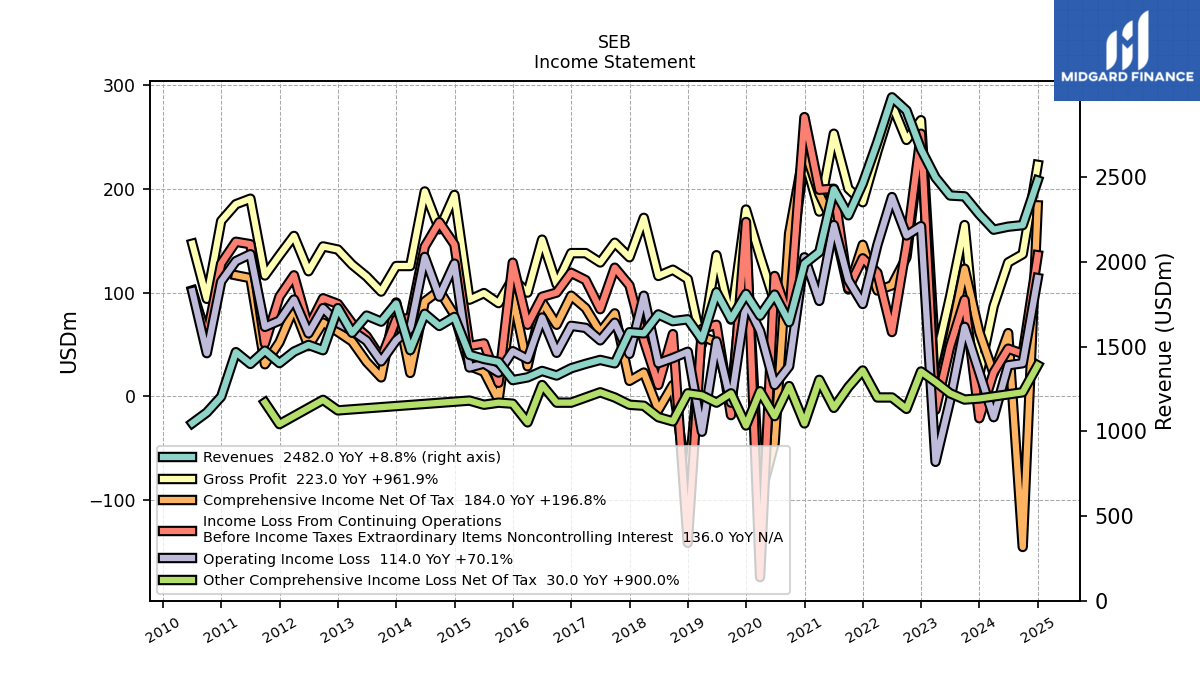
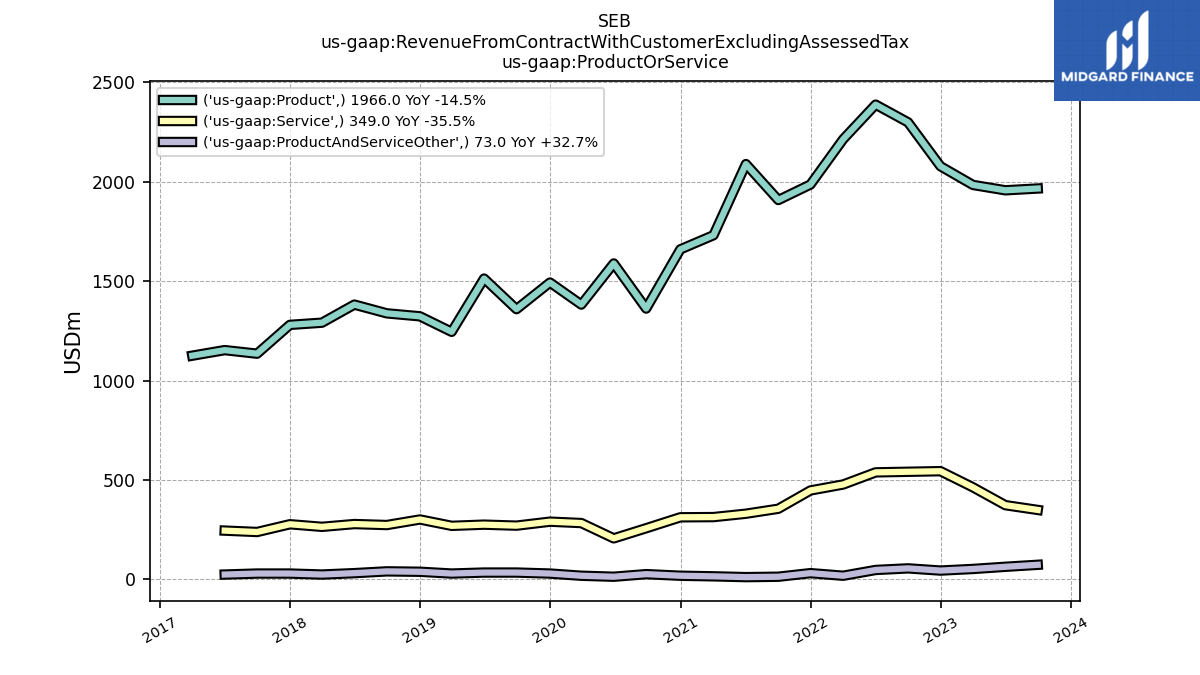
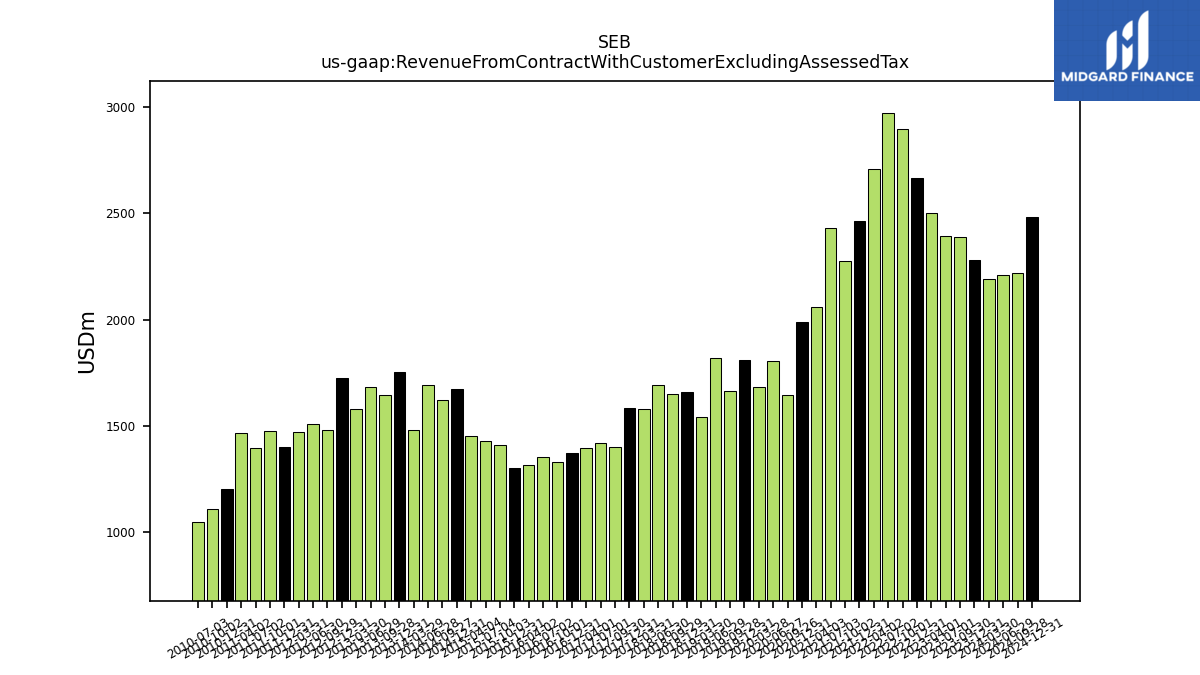
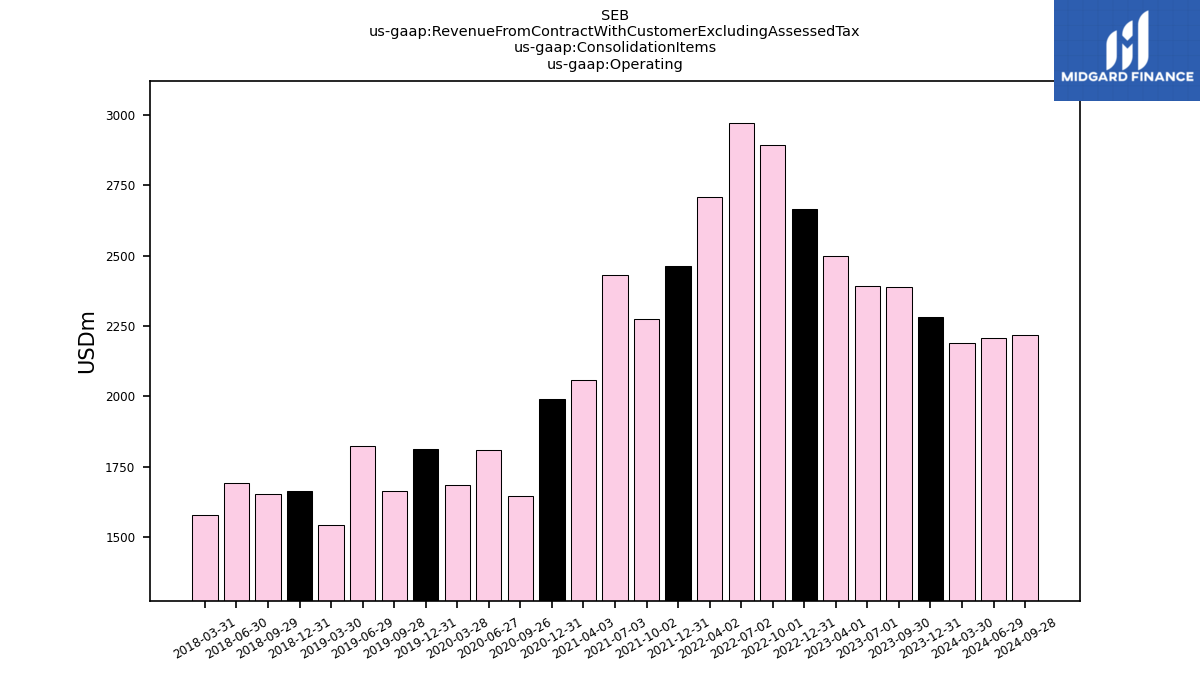
| Revenue From Contract With Customer Excluding Assessed Tax | 2388.00 | 2393.00 | 2499.00 | 2666.00 | 2895.00 | 2973.00 | 2709.00 | 2464.00 | 2276.00 | 2430.00 | 2059.00 | 1990.00 | 1645.00 | 1808.00 | 1683.00 | 1812.00 | 1663.00 | 1822.00 | 1543.00 | 1662.00 | 1651.00 | 1691.00 | 1579.00 | 1586.00 | 1402.00 | 1422.00 | 1399.00 | 1373.00 | 1330.00 | 1357.00 | 1319.00 | 1302.98 | 1410.77 | 1427.89 | 1452.36 | 1676.21 | 1622.64 | 1694.59 | 1479.64 | 1755.97 | 1648.11 | 1684.04 | 1582.30 | 1728.01 | 1479.42 | 1510.59 | 1471.11 | 1403.42 | 1476.72 | 1398.59 | 1468.18 | 1205.15 | 1111.81 | 1048.46 | |
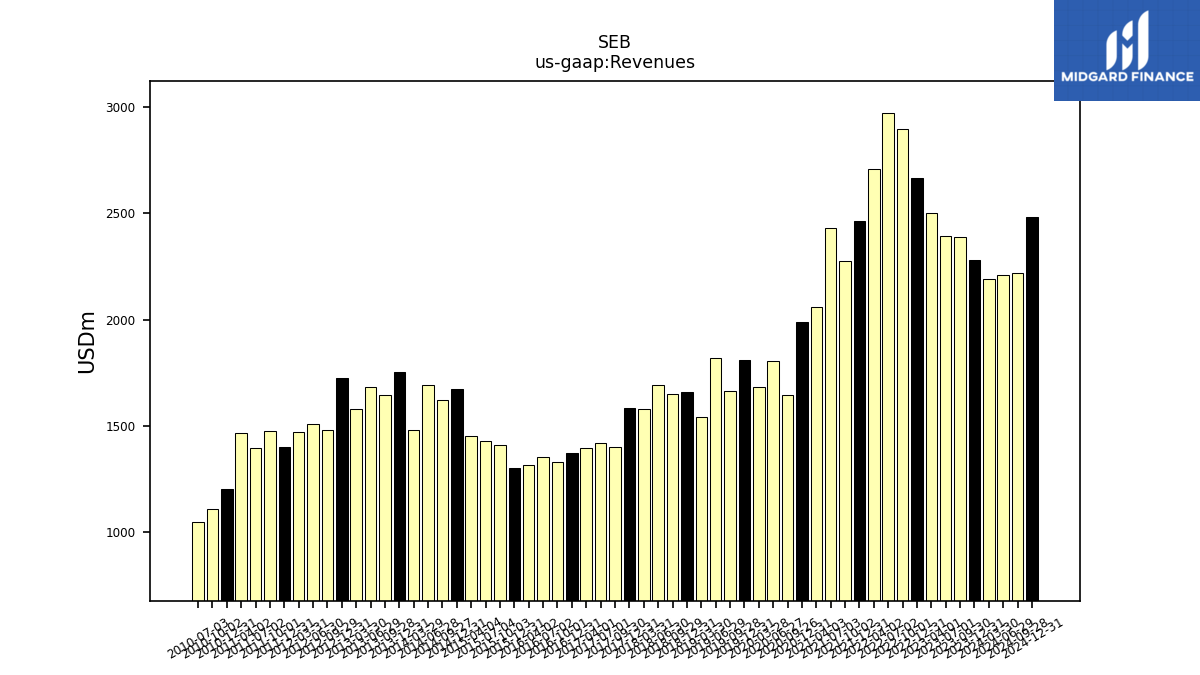
| Revenues | 2388.00 | 2393.00 | 2499.00 | 2666.00 | 2895.00 | 2973.00 | 2709.00 | 2464.00 | 2276.00 | 2430.00 | 2059.00 | 1990.00 | 1645.00 | 1808.00 | 1683.00 | 1812.00 | 1663.00 | 1822.00 | 1543.00 | 1662.00 | 1651.00 | 1691.00 | 1579.00 | 1586.00 | 1402.00 | 1422.00 | 1399.00 | 1373.00 | 1330.00 | 1357.00 | 1319.00 | 1302.98 | 1410.77 | 1427.89 | 1452.36 | 1676.21 | 1622.64 | 1694.59 | 1479.64 | 1755.97 | 1648.11 | 1684.04 | 1582.30 | 1728.01 | 1479.42 | 1510.59 | 1471.11 | 1403.42 | 1476.72 | 1398.59 | 1468.18 | 1205.15 | 1111.81 | 1048.46 | |
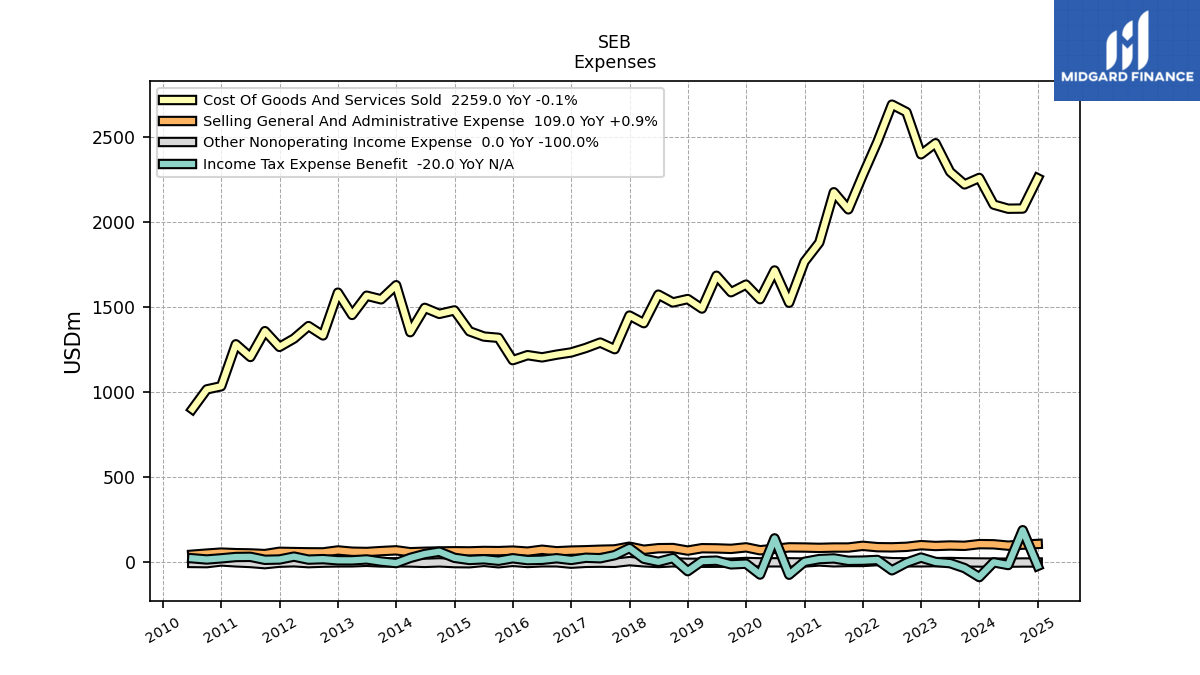
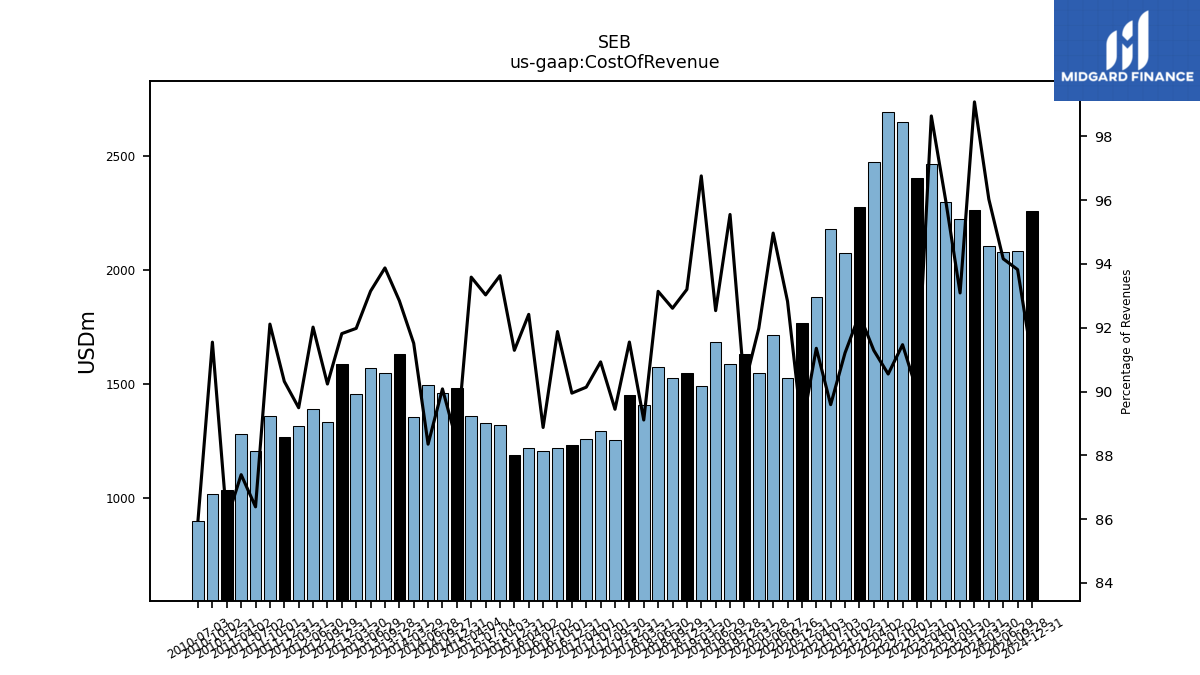
| Cost Of Revenue | 2223.00 | 2297.00 | 2465.00 | 2400.00 | 2648.00 | 2692.00 | 2473.00 | 2277.00 | 2076.00 | 2177.00 | 1881.00 | 1768.00 | 1527.00 | 1717.00 | 1548.00 | 1634.00 | 1589.00 | 1686.00 | 1493.00 | 1549.00 | 1529.00 | 1575.00 | 1407.00 | 1452.00 | 1254.00 | 1293.00 | 1261.00 | 1235.00 | 1222.00 | 1206.00 | 1219.00 | 1189.52 | 1320.93 | 1328.36 | 1359.19 | 1482.14 | 1461.70 | 1497.16 | 1354.05 | 1630.39 | 1547.15 | 1568.63 | 1455.39 | 1586.58 | 1334.95 | 1390.03 | 1316.52 | 1267.53 | 1360.25 | 1208.16 | 1283.07 | 1036.21 | 1017.84 | 901.40 | |
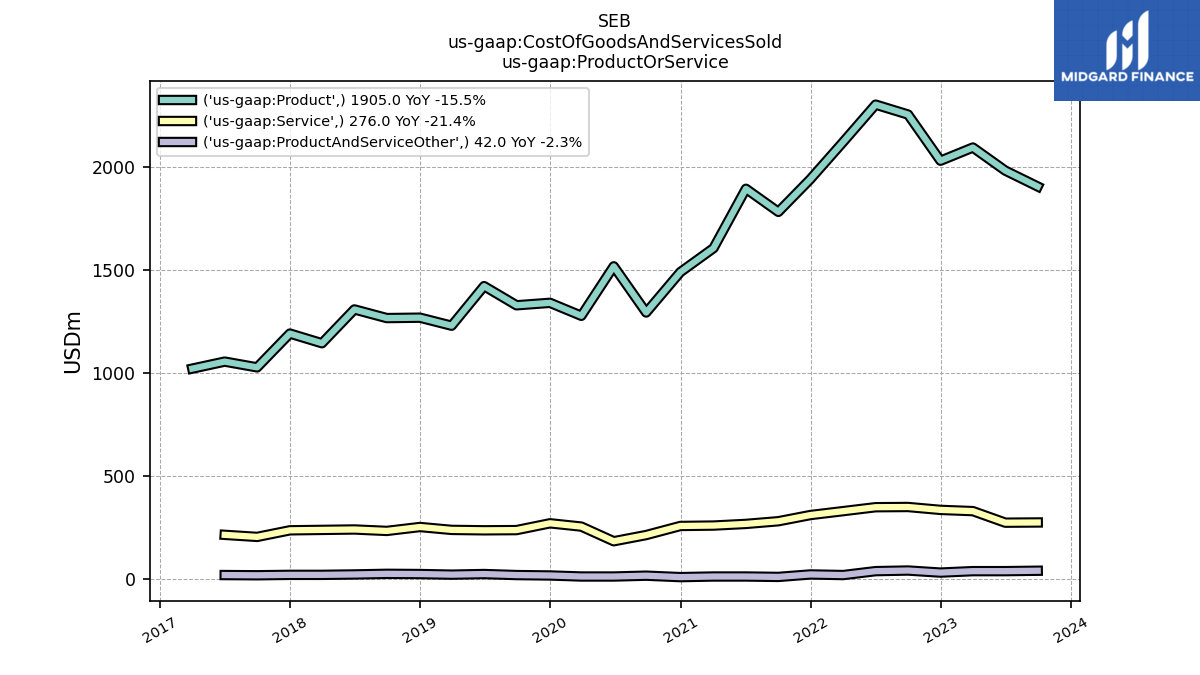
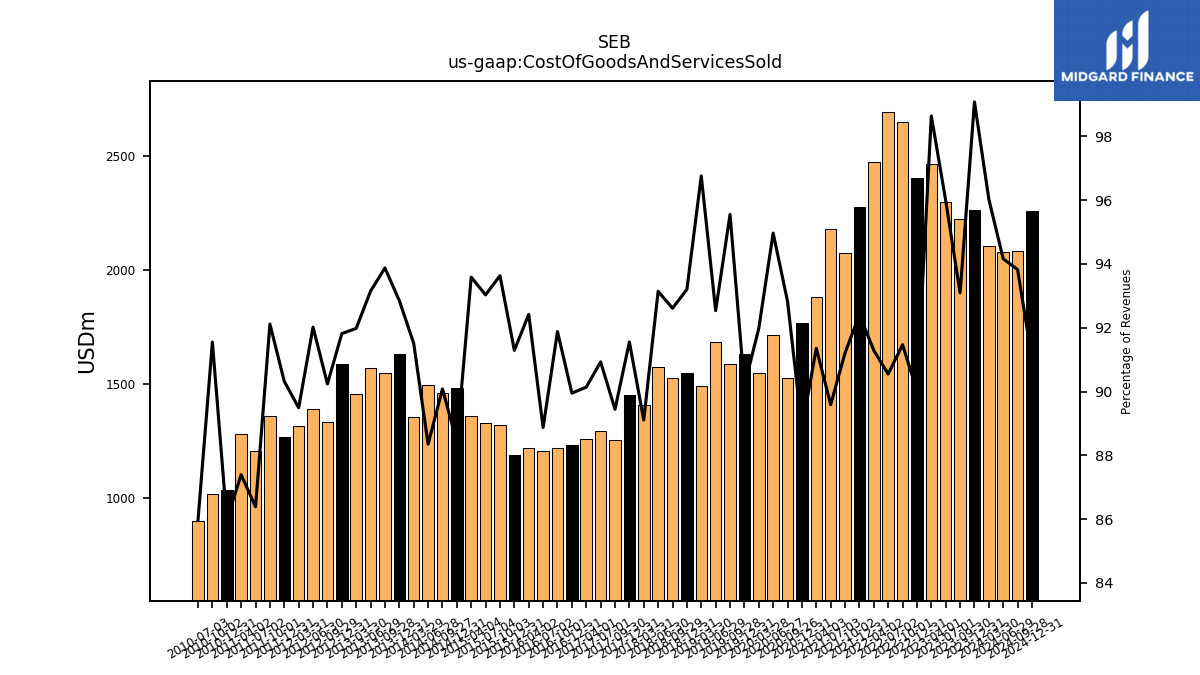
| Cost Of Goods And Services Sold | 2223.00 | 2297.00 | 2465.00 | 2400.00 | 2648.00 | 2692.00 | 2473.00 | 2277.00 | 2076.00 | 2177.00 | 1881.00 | 1768.00 | 1527.00 | 1717.00 | 1548.00 | 1634.00 | 1589.00 | 1686.00 | 1493.00 | 1549.00 | 1529.00 | 1575.00 | 1407.00 | 1452.00 | 1254.00 | 1293.00 | 1261.00 | 1235.00 | 1222.00 | 1206.00 | 1219.00 | 1189.52 | 1320.93 | 1328.36 | 1359.19 | 1482.14 | 1461.70 | 1497.16 | 1354.05 | 1630.39 | 1547.15 | 1568.63 | 1455.39 | 1586.58 | 1334.95 | 1390.03 | 1316.52 | 1267.53 | 1360.25 | 1208.16 | 1283.07 | 1036.21 | 1017.84 | 901.40 | |
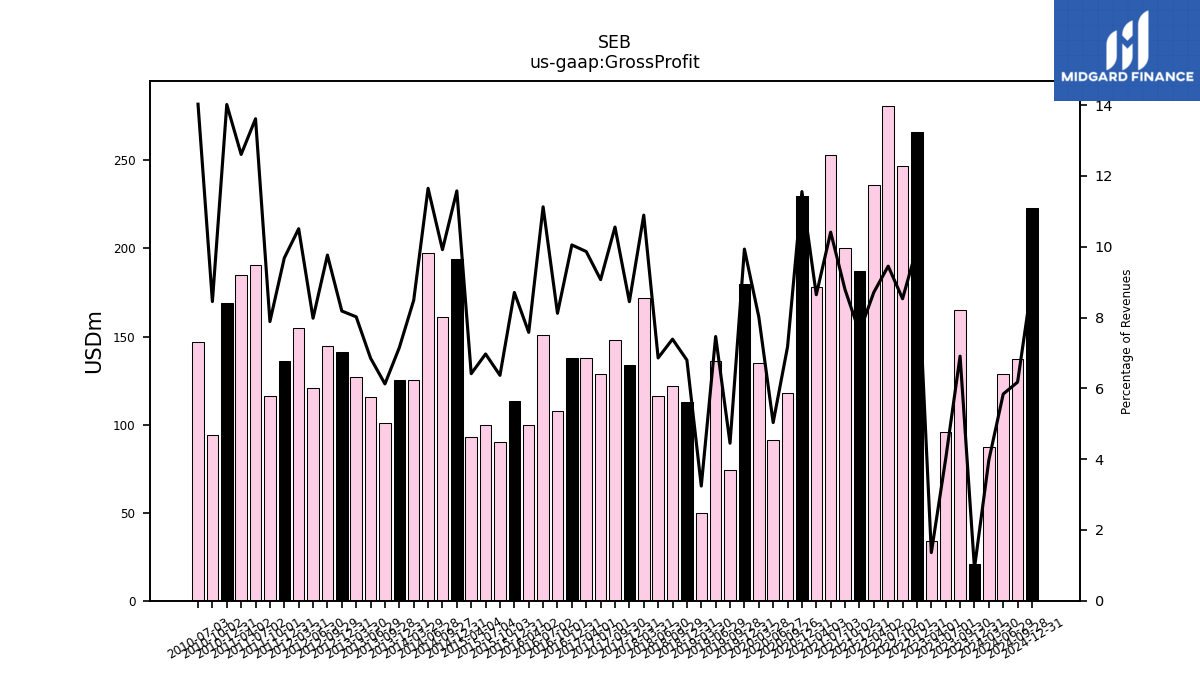
| Gross Profit | 165.00 | 96.00 | 34.00 | 266.00 | 247.00 | 281.00 | 236.00 | 187.00 | 200.00 | 253.00 | 178.00 | 230.00 | 118.00 | 91.00 | 135.00 | 180.00 | 74.00 | 136.00 | 50.00 | 113.00 | 122.00 | 116.00 | 172.00 | 134.00 | 148.00 | 129.00 | 138.00 | 138.00 | 108.00 | 151.00 | 100.00 | 113.46 | 89.84 | 99.53 | 93.16 | 194.06 | 160.94 | 197.43 | 125.59 | 125.58 | 100.95 | 115.41 | 126.91 | 141.44 | 144.46 | 120.57 | 154.59 | 135.89 | 116.47 | 190.42 | 185.11 | 168.94 | 93.97 | 147.06 | |
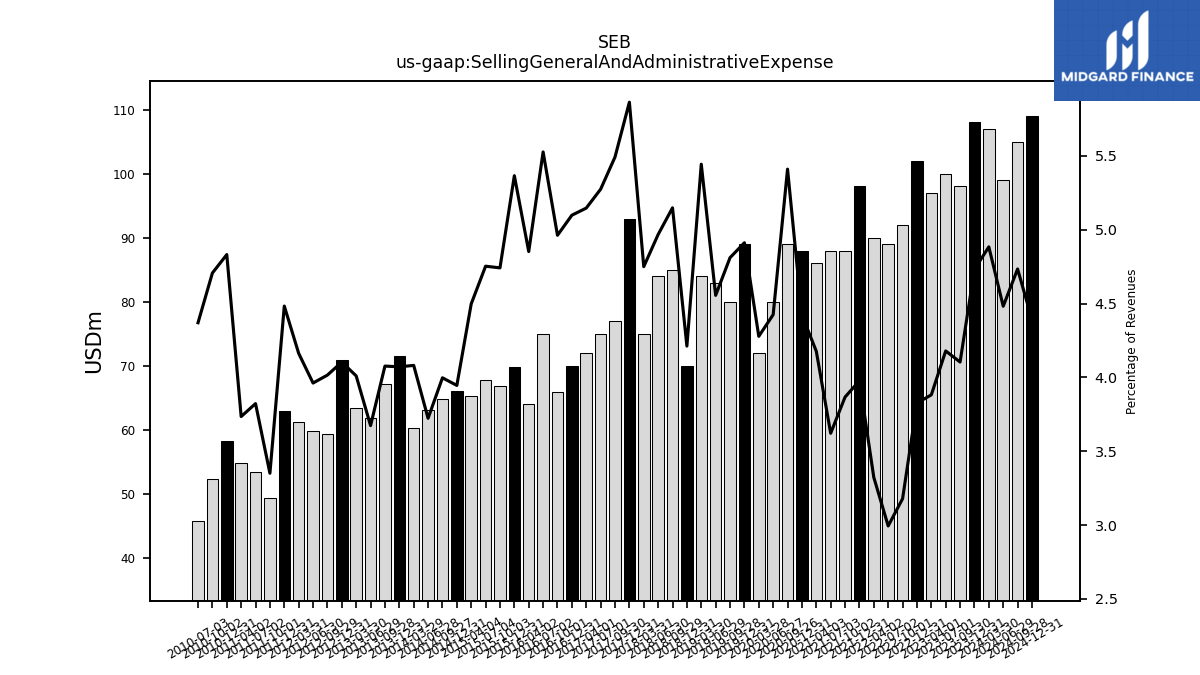
| Selling General And Administrative Expense | 98.00 | 100.00 | 97.00 | 102.00 | 92.00 | 89.00 | 90.00 | 98.00 | 88.00 | 88.00 | 86.00 | 88.00 | 89.00 | 80.00 | 72.00 | 89.00 | 80.00 | 83.00 | 84.00 | 70.00 | 85.00 | 84.00 | 75.00 | 93.00 | 77.00 | 75.00 | 72.00 | 70.00 | 66.00 | 75.00 | 64.00 | 69.92 | 66.89 | 67.87 | 65.33 | 66.13 | 64.86 | 63.09 | 60.38 | 71.49 | 67.18 | 61.86 | 63.45 | 70.91 | 59.41 | 59.84 | 61.24 | 62.91 | 49.48 | 53.46 | 54.83 | 58.23 | 52.33 | 45.82 | |
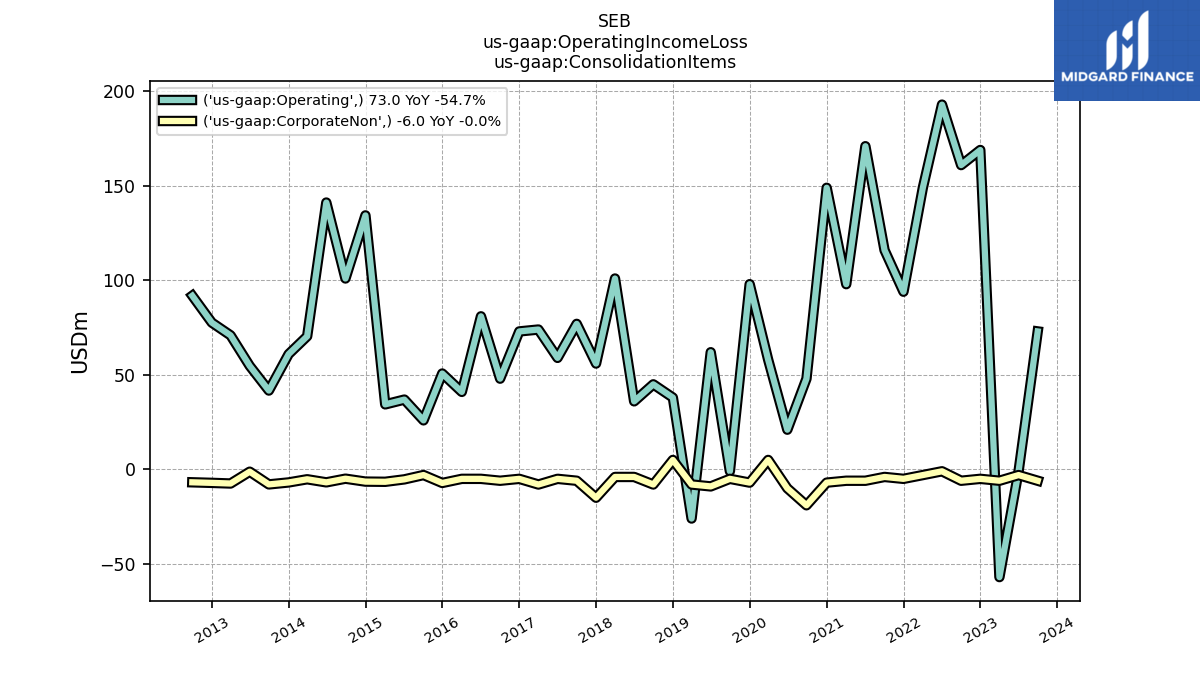
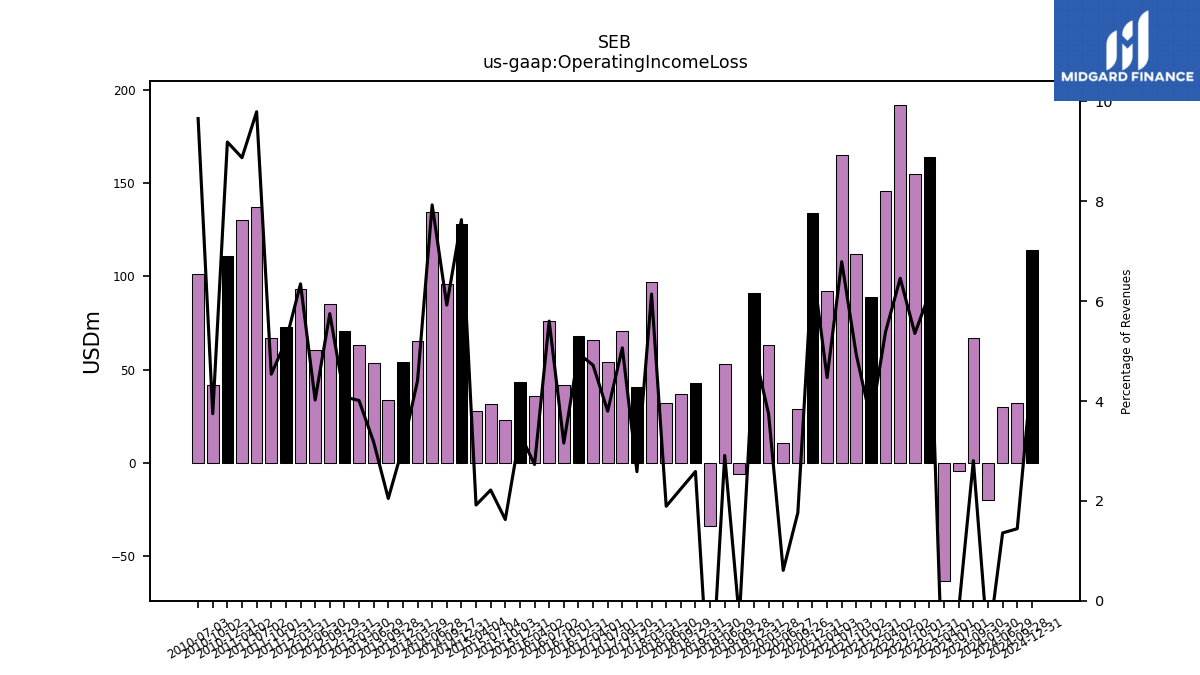
| Operating Income Loss | 67.00 | -4.00 | -63.00 | 164.00 | 155.00 | 192.00 | 146.00 | 89.00 | 112.00 | 165.00 | 92.00 | 134.00 | 29.00 | 11.00 | 63.00 | 91.00 | -6.00 | 53.00 | -34.00 | 43.00 | 37.00 | 32.00 | 97.00 | 41.00 | 71.00 | 54.00 | 66.00 | 68.00 | 42.00 | 76.00 | 36.00 | 43.55 | 22.95 | 31.66 | 27.84 | 127.93 | 96.09 | 134.34 | 65.20 | 54.09 | 33.77 | 53.55 | 63.46 | 70.53 | 85.06 | 60.72 | 93.36 | 72.97 | 66.99 | 136.97 | 130.28 | 110.71 | 41.64 | 101.25 | |
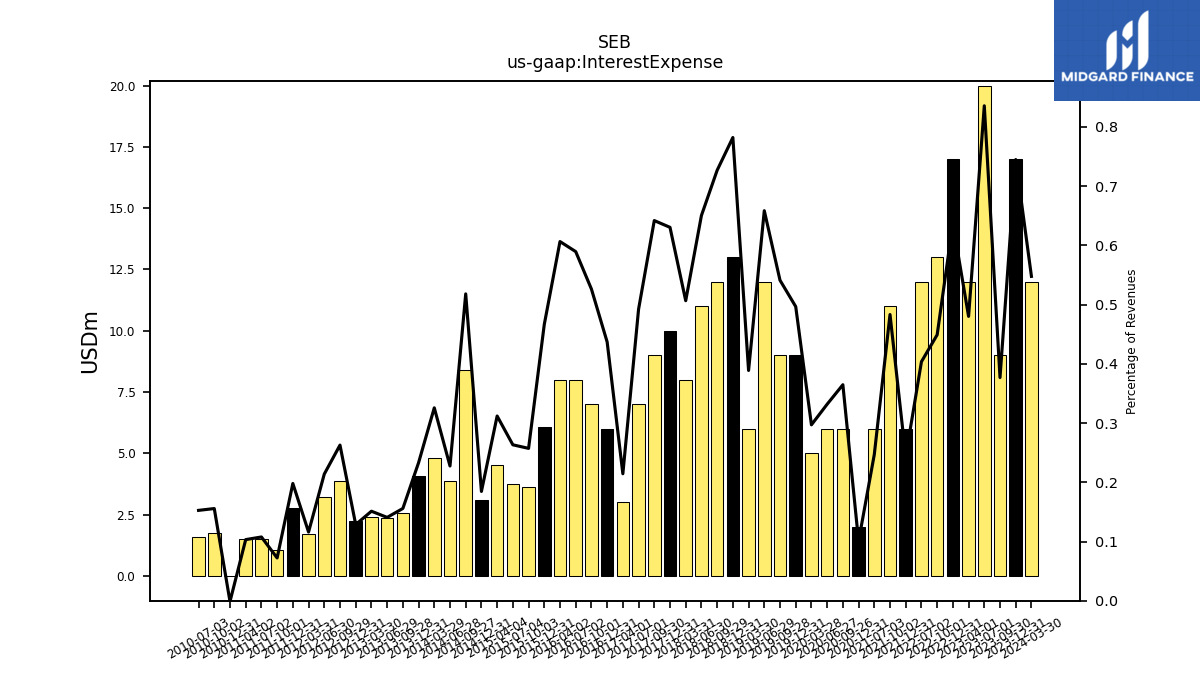
| Interest Expense | 9.00 | 20.00 | NA | 17.00 | 13.00 | 12.00 | NA | 6.00 | 11.00 | 6.00 | NA | 2.00 | 6.00 | 6.00 | 5.00 | 9.00 | 9.00 | 12.00 | 6.00 | 13.00 | 12.00 | 11.00 | 8.00 | 10.00 | 9.00 | 7.00 | 3.00 | 6.00 | 7.00 | 8.00 | 8.00 | 6.08 | 3.63 | 3.76 | 4.53 | 3.09 | 8.41 | 3.86 | 4.82 | 4.09 | 2.57 | 2.37 | 2.39 | 2.22 | 3.89 | 3.23 | 1.71 | 2.78 | 1.07 | 1.51 | 1.52 | -0.01 | 1.73 | 1.60 | |
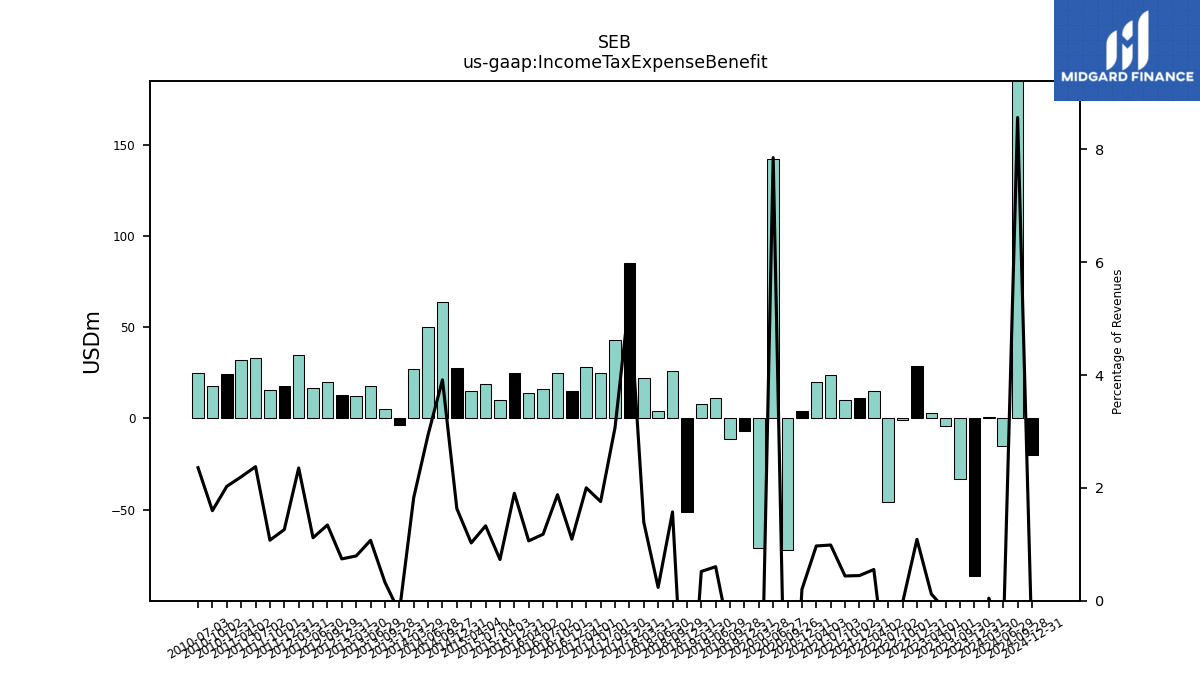
| Income Tax Expense Benefit | -33.00 | -4.00 | 3.00 | 29.00 | -1.00 | -46.00 | 15.00 | 11.00 | 10.00 | 24.00 | 20.00 | 4.00 | -72.00 | 142.00 | -71.00 | -7.00 | -11.00 | 11.00 | 8.00 | -51.00 | 26.00 | 4.00 | 22.00 | 85.00 | 43.00 | 25.00 | 28.00 | 15.00 | 25.00 | 16.00 | 14.00 | 24.83 | 10.32 | 18.97 | 14.88 | 27.38 | 63.54 | 49.85 | 27.03 | -3.56 | 5.39 | 18.05 | 12.57 | 12.82 | 19.87 | 16.87 | 34.63 | 17.71 | 15.85 | 33.24 | 32.25 | 24.44 | 17.75 | 24.73 | |
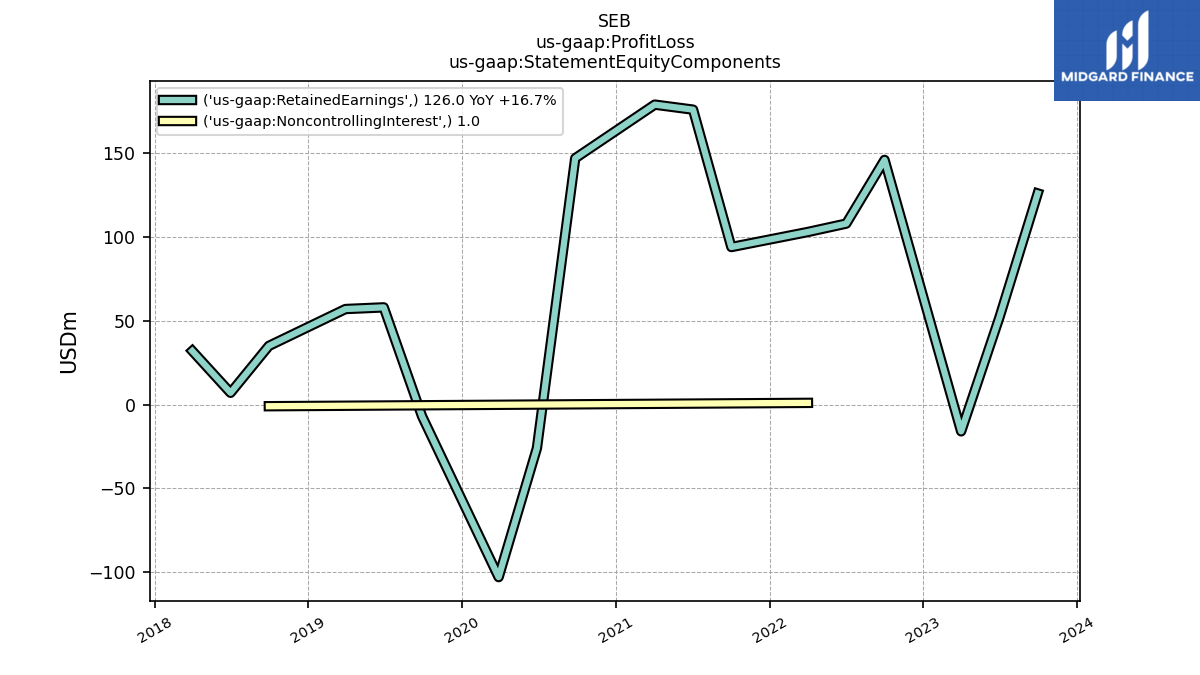
| Profit Loss | 126.00 | 52.00 | -16.00 | 224.00 | 146.00 | 108.00 | 104.00 | 122.00 | 94.00 | 176.00 | 179.00 | 265.00 | 147.00 | -26.00 | -103.00 | 175.00 | -7.00 | 58.00 | 57.00 | -90.00 | 34.00 | 7.00 | 32.00 | 22.00 | 81.00 | 59.00 | 84.00 | 104.00 | 75.00 | 80.00 | 55.00 | 103.96 | 2.80 | 32.11 | 33.58 | 118.83 | 104.28 | 94.44 | 48.45 | 77.62 | 31.36 | 40.03 | 57.76 | 76.26 | 74.63 | 49.69 | 82.00 | 78.41 | 35.09 | 113.36 | 116.69 | 103.51 | 39.48 | 77.36 | |
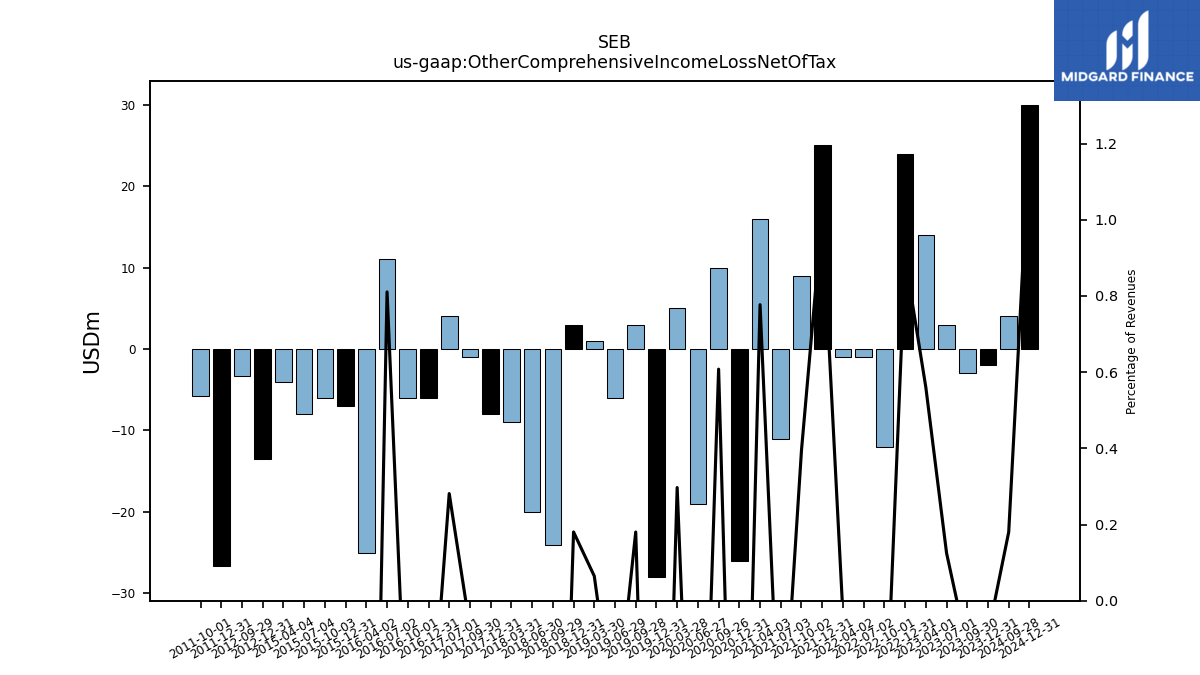
| Other Comprehensive Income Loss Net Of Tax | -3.00 | 3.00 | 14.00 | 24.00 | -12.00 | -1.00 | -1.00 | 25.00 | 9.00 | -11.00 | 16.00 | -26.00 | 10.00 | -19.00 | 5.00 | -28.00 | 3.00 | -6.00 | 1.00 | 3.00 | -24.00 | -20.00 | -9.00 | -8.00 | -1.00 | 4.00 | NA | -6.00 | -6.00 | 11.00 | -25.00 | -7.00 | -6.00 | -8.00 | -4.00 | NA | NA | NA | NA | NA | NA | NA | NA | -13.45 | -3.28 | NA | NA | -26.67 | -5.83 | NA | NA | NA | NA | NA | |
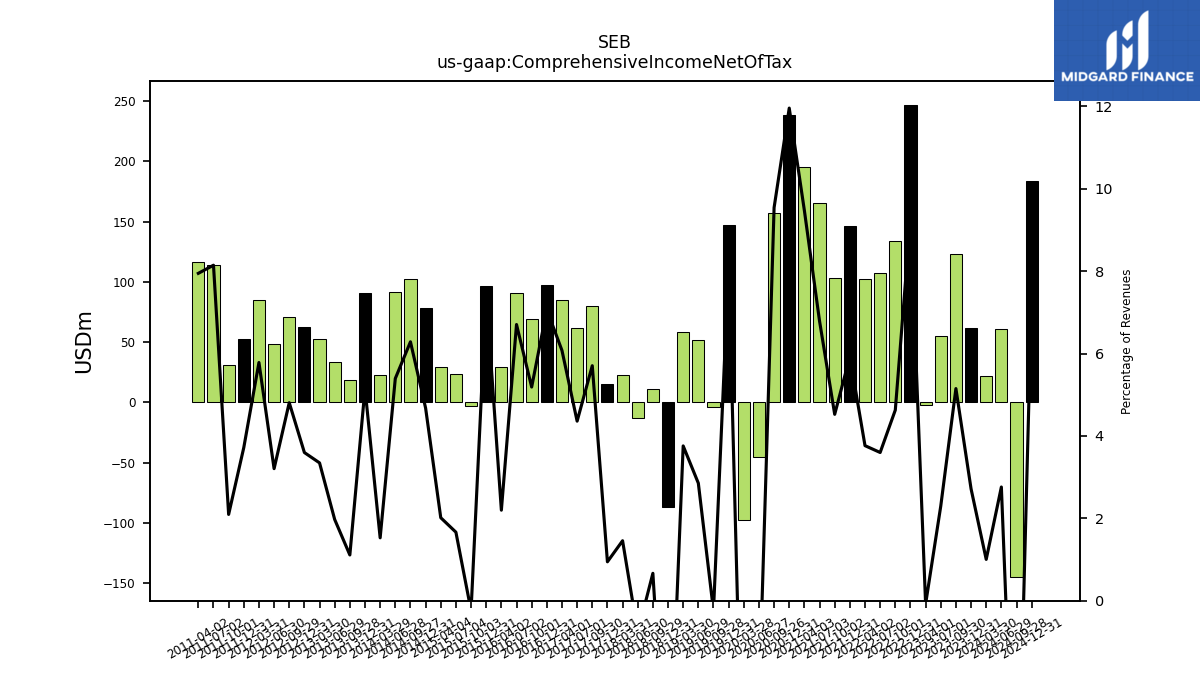
| Comprehensive Income Net Of Tax | 123.00 | 55.00 | -2.00 | 247.00 | 134.00 | 107.00 | 102.00 | 146.00 | 103.00 | 165.00 | 195.00 | 238.00 | 157.00 | -45.00 | -98.00 | 147.00 | -4.00 | 52.00 | 58.00 | -87.00 | 11.00 | -13.00 | 23.00 | 15.00 | 80.00 | 62.00 | 85.00 | 97.00 | 69.00 | 91.00 | 29.00 | 96.79 | -3.38 | 23.77 | 29.27 | 78.41 | 102.00 | 91.43 | 22.60 | 90.46 | 18.32 | 33.21 | 52.96 | 62.17 | 71.13 | 48.44 | 85.08 | 52.19 | 30.94 | 113.92 | 116.70 | NA | NA | NA | |
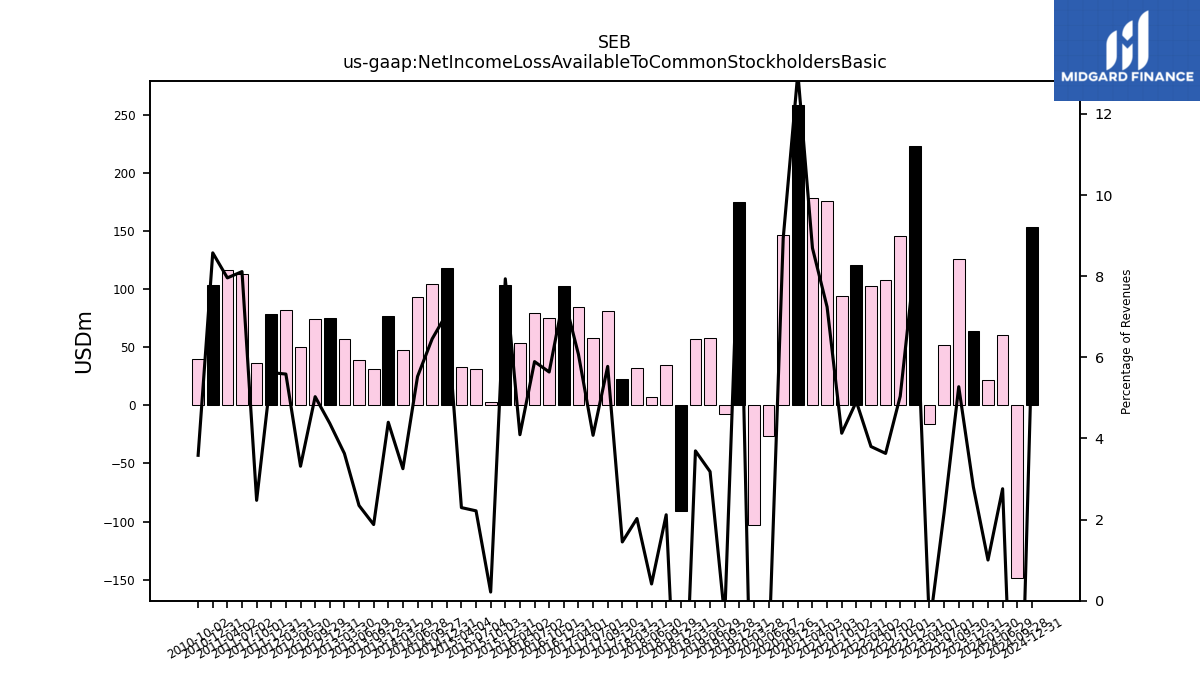
| Net Income Loss Available To Common Stockholders Basic | 126.00 | 52.00 | -16.00 | 223.00 | 146.00 | 108.00 | 103.00 | 121.00 | 94.00 | 176.00 | 179.00 | 259.00 | 147.00 | -26.00 | -103.00 | 175.00 | -7.00 | 58.00 | 57.00 | -91.00 | 35.00 | 7.00 | 32.00 | 23.00 | 81.00 | 58.00 | 85.00 | 103.00 | 75.00 | 80.00 | 54.00 | 103.42 | 3.03 | 31.65 | 33.35 | 118.68 | 104.75 | 93.68 | 48.17 | 77.27 | 30.97 | 39.55 | 57.45 | 75.58 | 74.42 | 50.10 | 82.21 | 78.94 | 36.56 | 113.49 | 116.86 | 103.36 | 39.87 | NA |
| 2023-09-30 | 2023-07-01 | 2023-04-01 | 2022-12-31 | 2022-10-01 | 2022-07-02 | 2022-04-02 | 2021-12-31 | 2021-10-02 | 2021-07-03 | 2021-04-03 | 2020-12-31 | 2020-09-26 | 2020-06-27 | 2020-03-28 | 2019-12-31 | 2019-09-28 | 2019-06-29 | 2019-03-30 | 2018-12-31 | 2018-09-29 | 2018-06-30 | 2018-03-31 | 2017-12-31 | 2017-09-30 | 2017-07-01 | 2017-04-01 | 2016-12-31 | 2016-10-01 | 2016-07-02 | 2016-04-02 | 2015-12-31 | 2015-10-03 | 2015-07-04 | 2015-04-04 | 2014-12-31 | 2014-09-27 | 2014-06-28 | 2014-03-29 | 2013-12-31 | 2013-09-28 | 2013-06-29 | 2013-03-30 | 2012-12-31 | 2012-09-29 | 2012-06-30 | 2012-03-31 | 2011-12-31 | 2011-10-01 | 2011-07-02 | 2011-04-02 | 2010-12-31 | 2010-10-02 | 2010-07-03 | ||
|---|---|---|---|---|---|---|---|---|---|---|---|---|---|---|---|---|---|---|---|---|---|---|---|---|---|---|---|---|---|---|---|---|---|---|---|---|---|---|---|---|---|---|---|---|---|---|---|---|---|---|---|---|---|---|---|
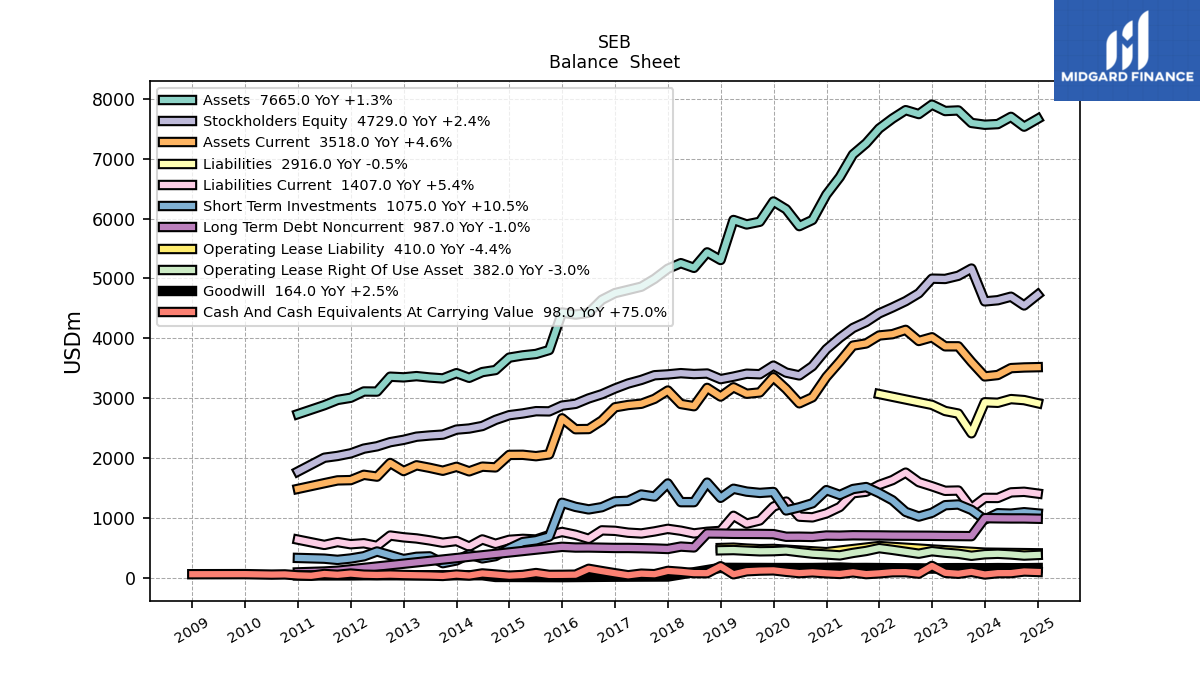
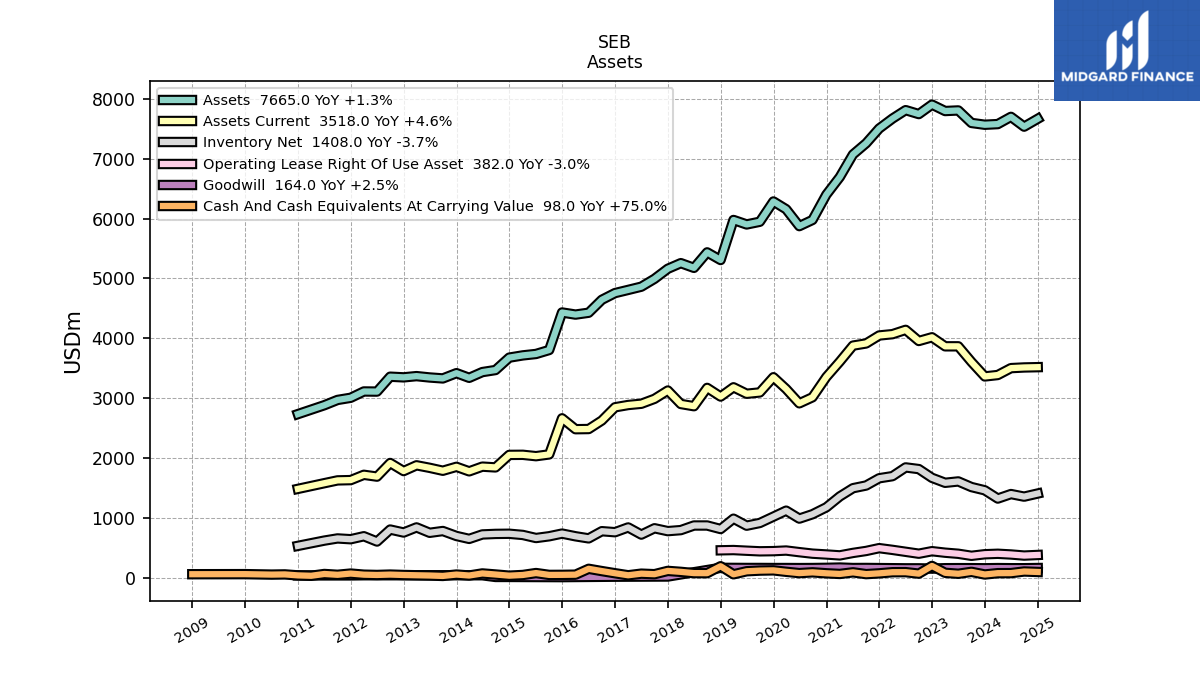
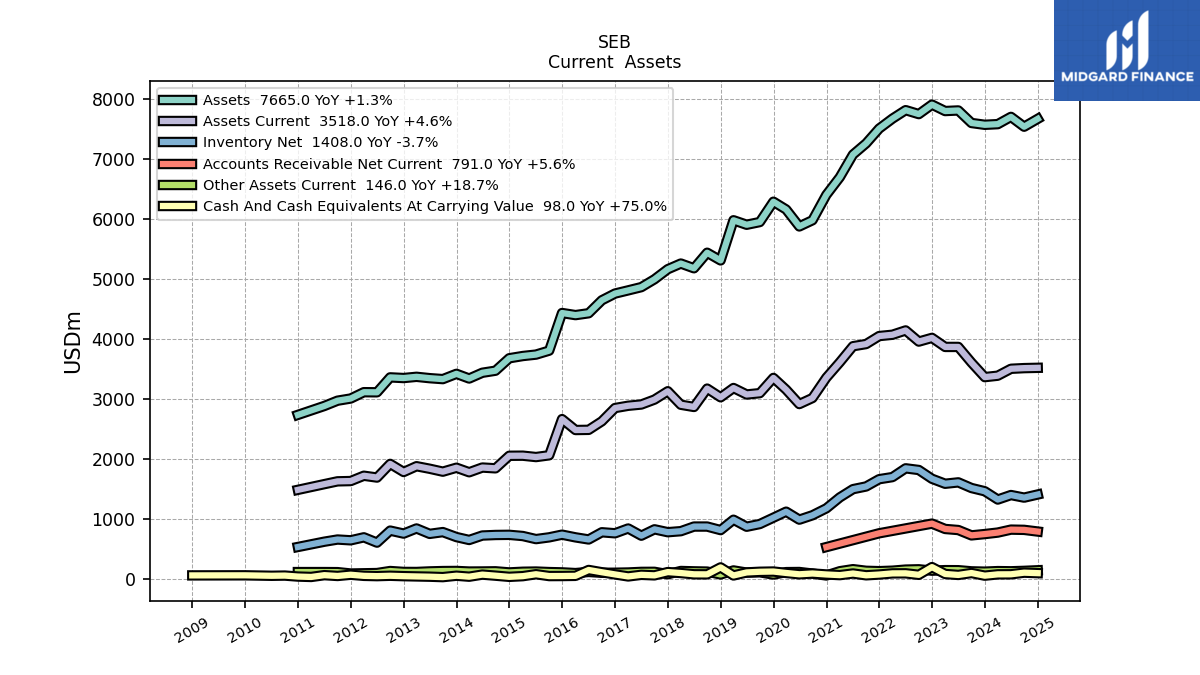
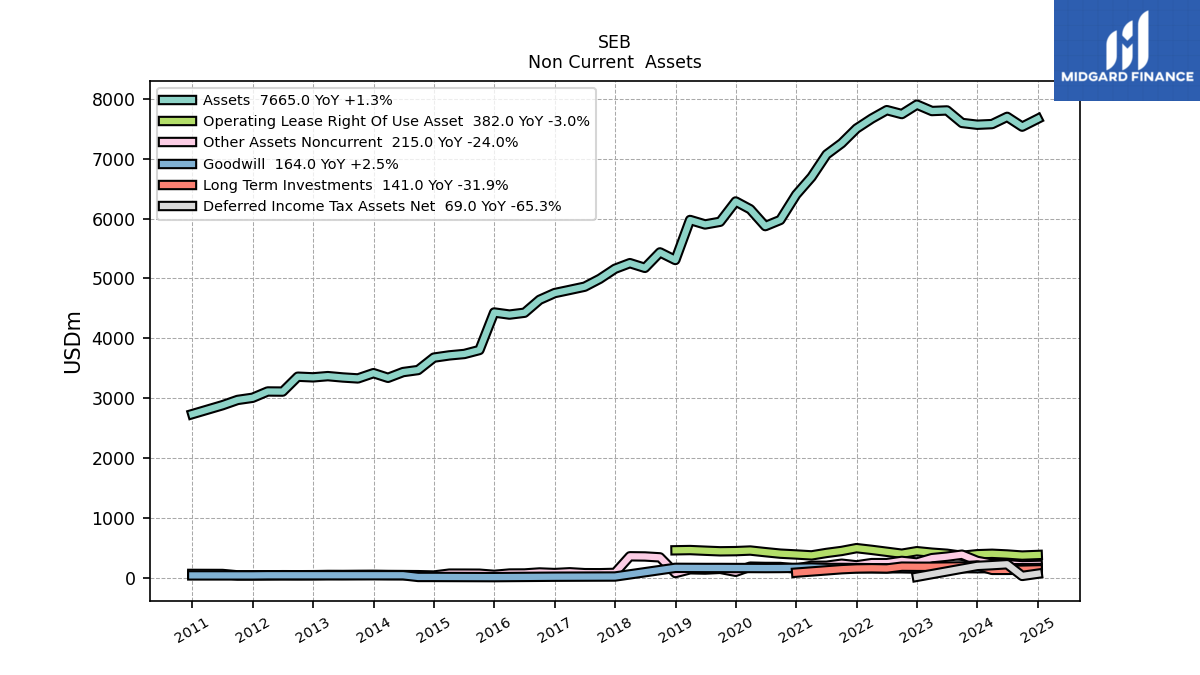
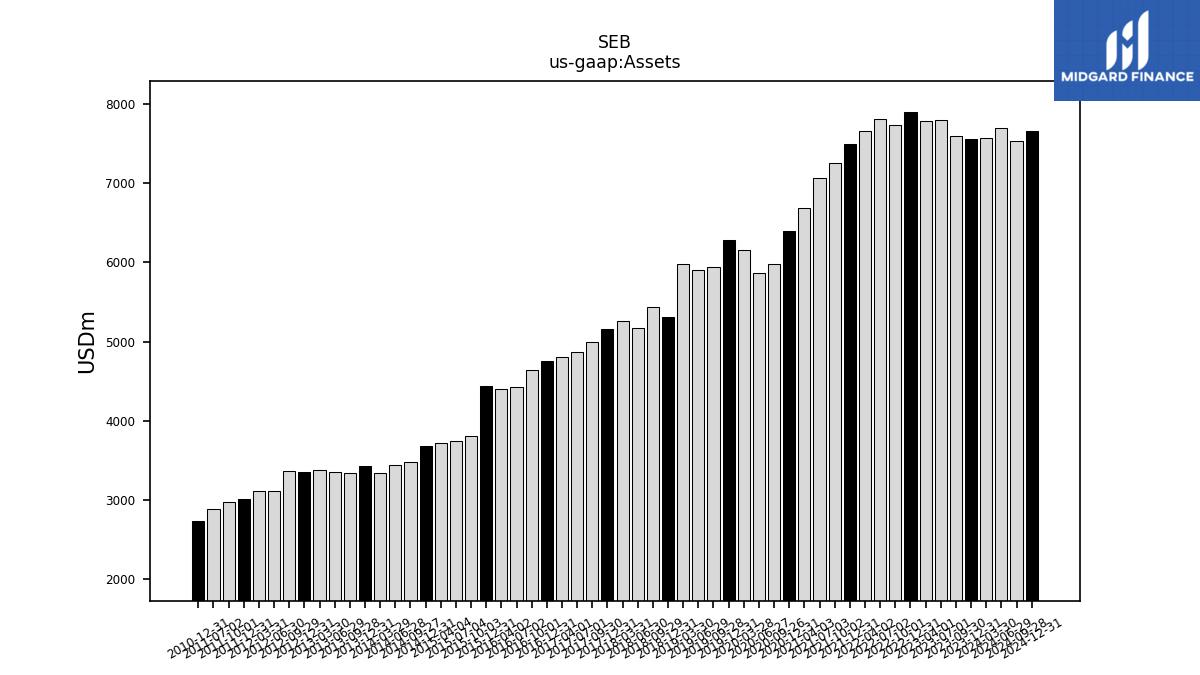
| Assets | 7596.00 | 7805.00 | 7795.00 | 7902.00 | 7744.00 | 7810.00 | 7669.00 | 7503.00 | 7257.00 | 7070.00 | 6693.00 | 6399.00 | 5976.00 | 5873.00 | 6155.00 | 6285.00 | 5946.00 | 5901.00 | 5976.00 | 5307.00 | 5435.00 | 5176.00 | 5255.00 | 5161.00 | 4993.00 | 4862.00 | 4808.00 | 4755.00 | 4643.00 | 4427.00 | 4396.00 | 4431.00 | 3804.23 | 3738.35 | 3714.66 | 3677.32 | 3470.07 | 3435.88 | 3339.81 | 3418.05 | 3329.89 | 3345.76 | 3368.33 | 3347.78 | 3358.91 | 3110.17 | 3112.14 | 3006.73 | 2970.56 | 2882.62 | NA | 2734.09 | NA | NA | |
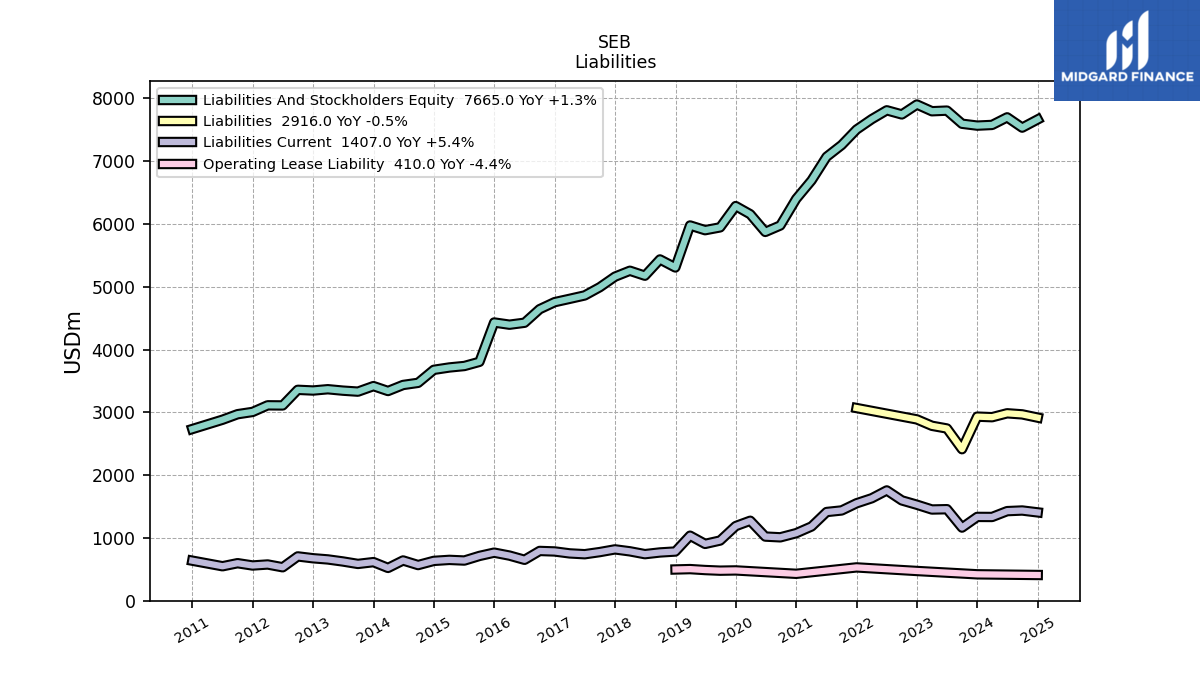
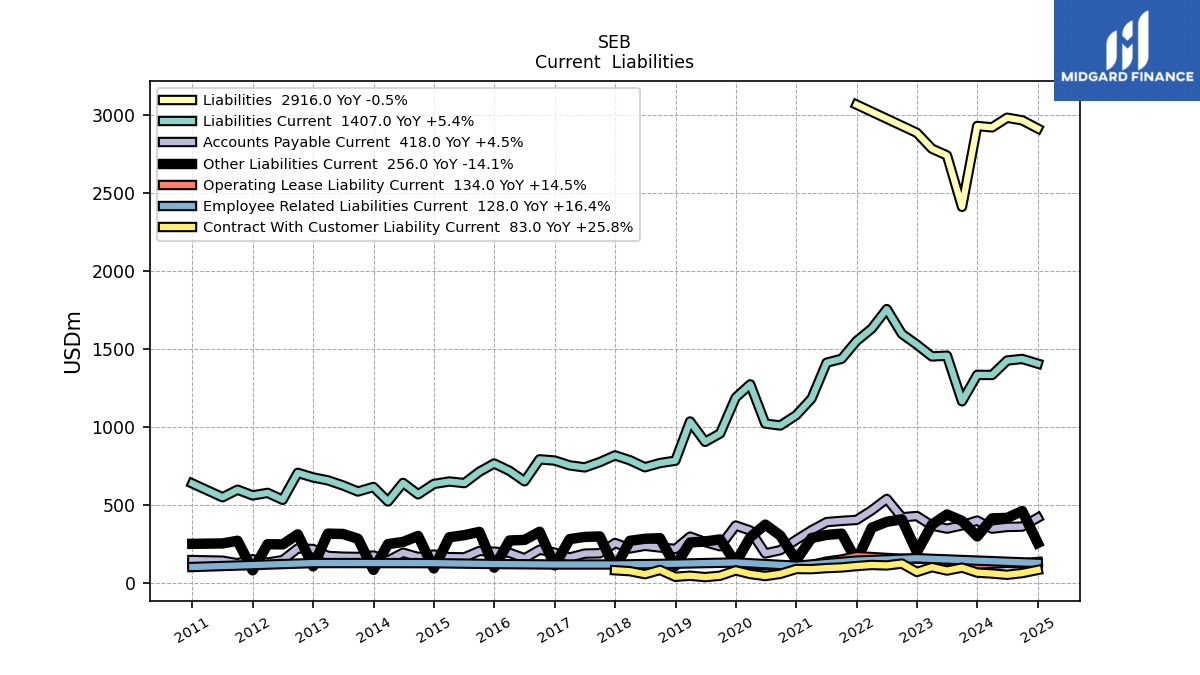
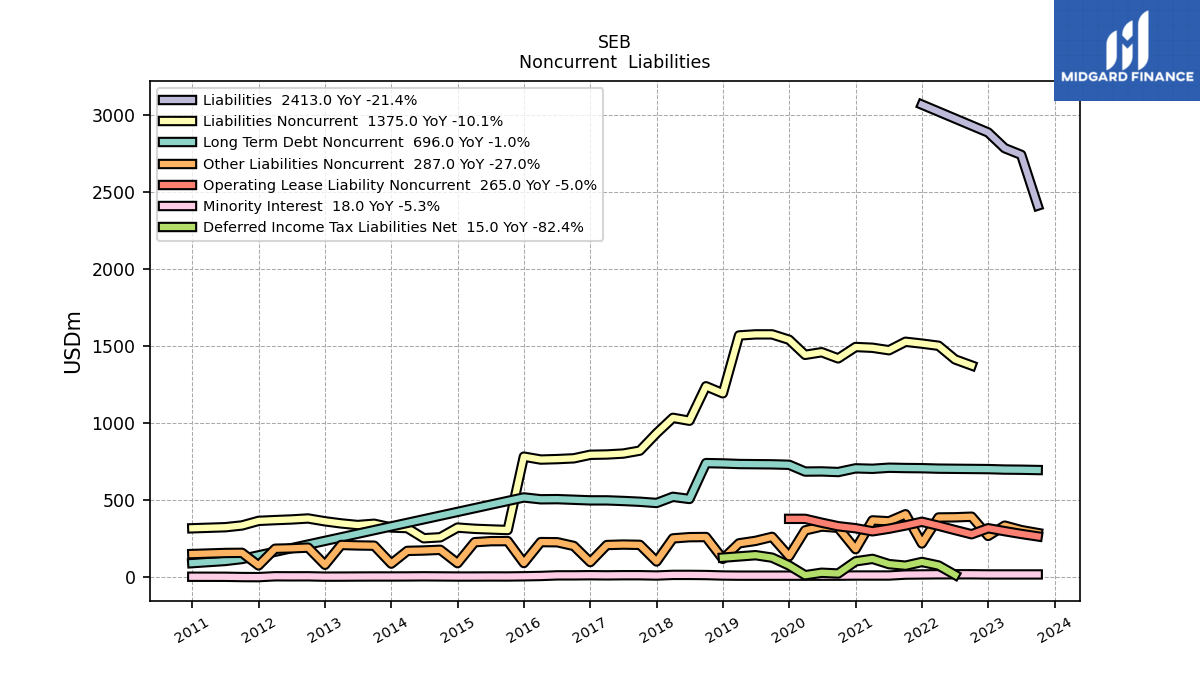
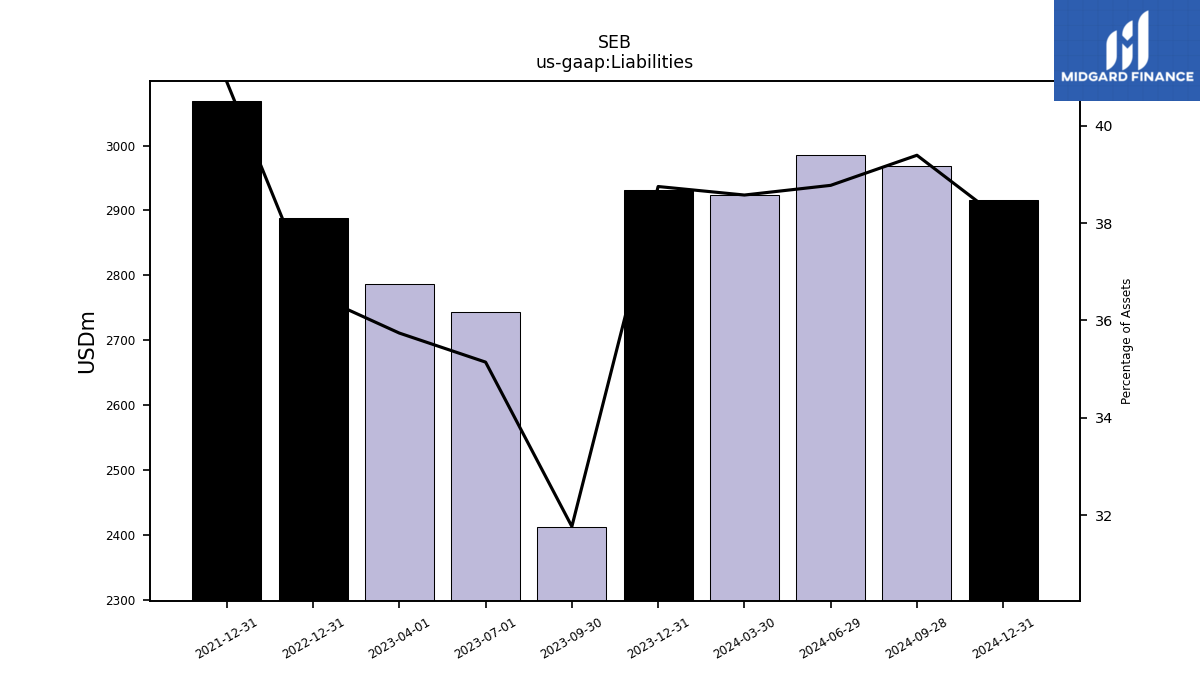
| Liabilities | 2413.00 | 2743.00 | 2786.00 | 2888.00 | NA | NA | NA | 3069.00 | NA | NA | NA | NA | NA | NA | NA | NA | NA | NA | NA | NA | NA | NA | NA | NA | NA | NA | NA | NA | NA | NA | NA | NA | NA | NA | NA | NA | NA | NA | NA | NA | NA | NA | NA | NA | NA | NA | NA | NA | NA | NA | NA | NA | NA | NA | |
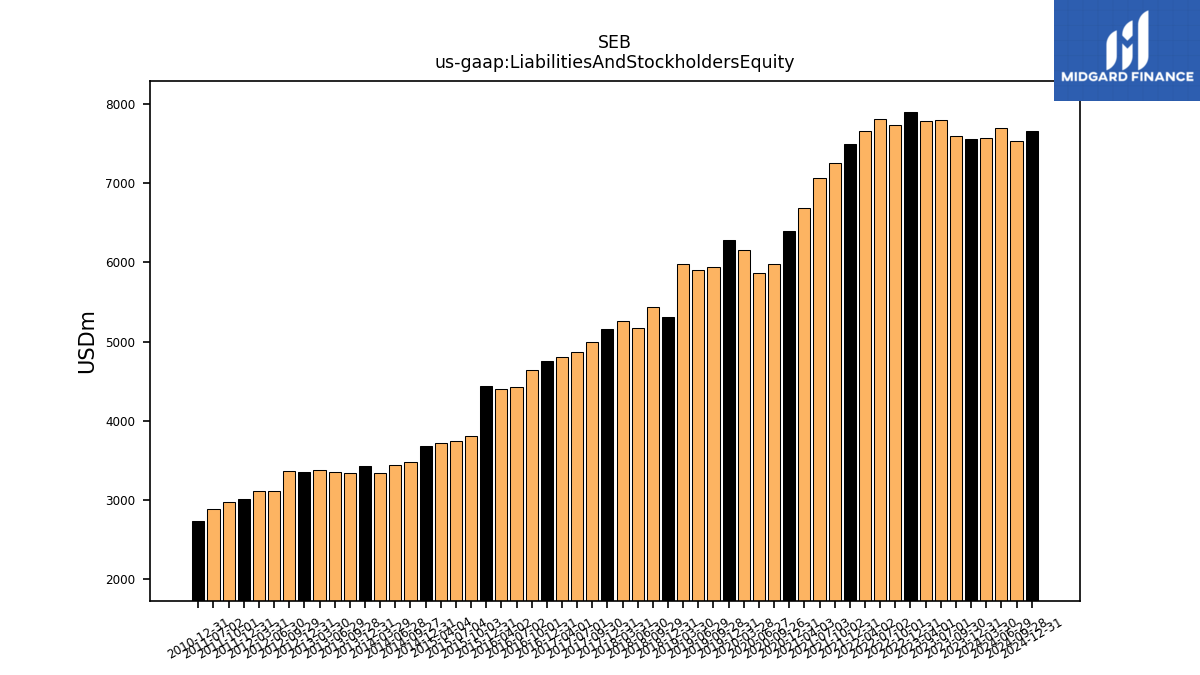
| Liabilities And Stockholders Equity | 7596.00 | 7805.00 | 7795.00 | 7902.00 | 7744.00 | 7810.00 | 7669.00 | 7503.00 | 7257.00 | 7070.00 | 6693.00 | 6399.00 | 5976.00 | 5873.00 | 6155.00 | 6285.00 | 5946.00 | 5901.00 | 5976.00 | 5307.00 | 5435.00 | 5176.00 | 5255.00 | 5161.00 | 4993.00 | 4862.00 | 4808.00 | 4755.00 | 4643.00 | 4427.00 | 4396.00 | 4431.00 | 3804.23 | 3738.35 | 3714.66 | 3677.32 | 3470.07 | 3435.88 | 3339.81 | 3418.05 | 3329.89 | 3345.76 | 3368.33 | 3347.78 | 3358.91 | 3110.17 | 3112.14 | 3006.73 | 2970.56 | 2882.62 | NA | 2734.09 | NA | NA | |
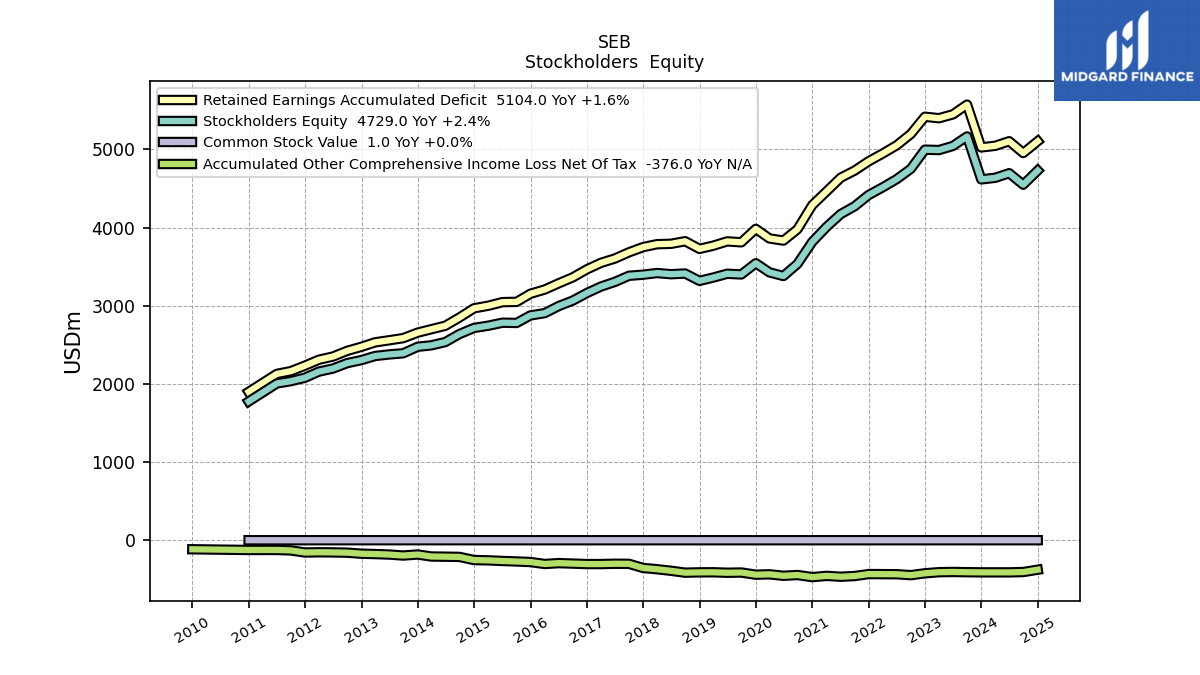
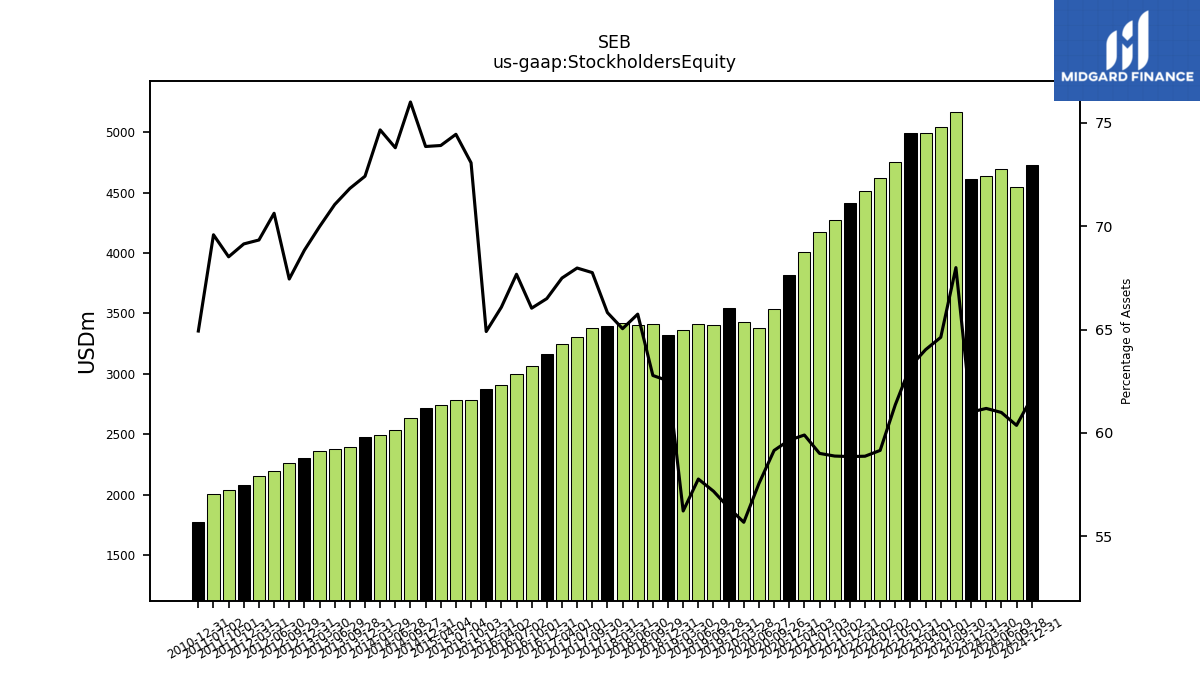
| Stockholders Equity | 5165.00 | 5044.00 | 4991.00 | 4996.00 | 4752.00 | 4620.00 | 4515.00 | 4416.00 | 4273.00 | 4172.00 | 4009.00 | 3817.00 | 3535.00 | 3380.00 | 3427.00 | 3544.00 | 3400.00 | 3409.00 | 3360.00 | 3318.00 | 3412.00 | 3403.00 | 3418.00 | 3397.00 | 3383.00 | 3305.00 | 3245.00 | 3162.00 | 3066.00 | 2996.00 | 2905.00 | 2876.00 | 2779.62 | 2783.00 | 2745.25 | 2715.90 | 2637.49 | 2535.50 | 2493.44 | 2475.25 | 2391.73 | 2377.07 | 2357.14 | 2304.55 | 2265.43 | 2196.54 | 2157.73 | 2078.92 | 2035.41 | 2005.84 | NA | 1775.21 | NA | NA |
| 2023-09-30 | 2023-07-01 | 2023-04-01 | 2022-12-31 | 2022-10-01 | 2022-07-02 | 2022-04-02 | 2021-12-31 | 2021-10-02 | 2021-07-03 | 2021-04-03 | 2020-12-31 | 2020-09-26 | 2020-06-27 | 2020-03-28 | 2019-12-31 | 2019-09-28 | 2019-06-29 | 2019-03-30 | 2018-12-31 | 2018-09-29 | 2018-06-30 | 2018-03-31 | 2017-12-31 | 2017-09-30 | 2017-07-01 | 2017-04-01 | 2016-12-31 | 2016-10-01 | 2016-07-02 | 2016-04-02 | 2015-12-31 | 2015-10-03 | 2015-07-04 | 2015-04-04 | 2014-12-31 | 2014-09-27 | 2014-06-28 | 2014-03-29 | 2013-12-31 | 2013-09-28 | 2013-06-29 | 2013-03-30 | 2012-12-31 | 2012-09-29 | 2012-06-30 | 2012-03-31 | 2011-12-31 | 2011-10-01 | 2011-07-02 | 2011-04-02 | 2010-12-31 | 2010-10-02 | 2010-07-03 | ||
|---|---|---|---|---|---|---|---|---|---|---|---|---|---|---|---|---|---|---|---|---|---|---|---|---|---|---|---|---|---|---|---|---|---|---|---|---|---|---|---|---|---|---|---|---|---|---|---|---|---|---|---|---|---|---|---|
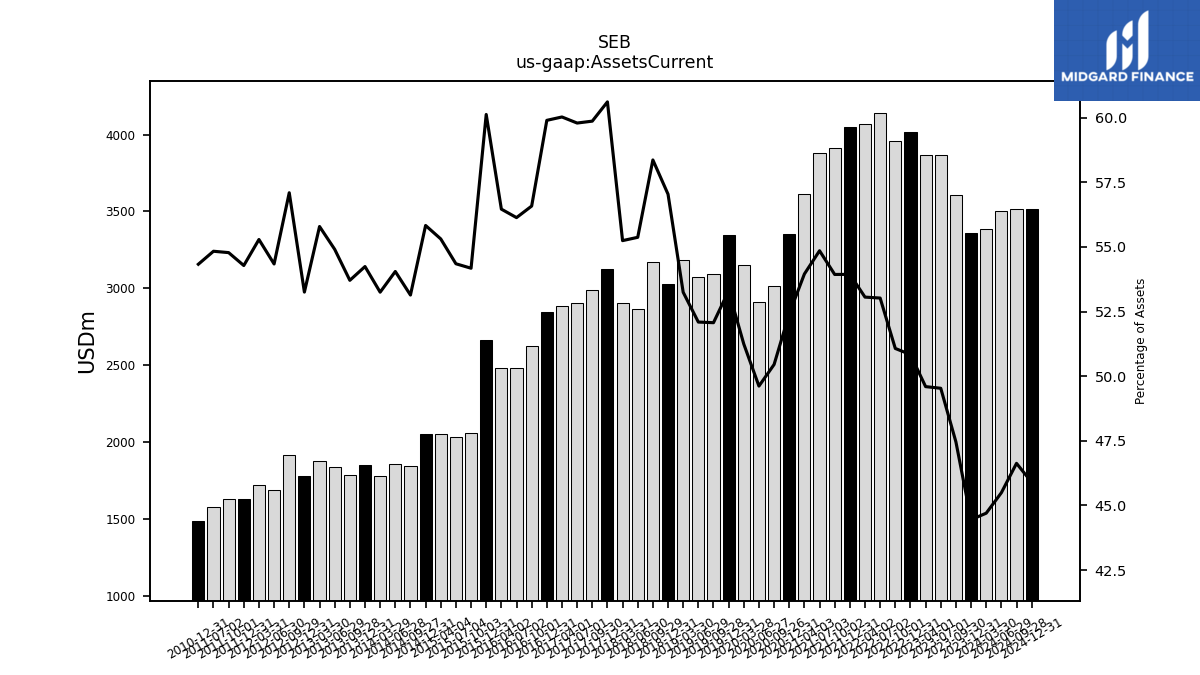
| Assets Current | 3605.00 | 3866.00 | 3866.00 | 4017.00 | 3955.00 | 4141.00 | 4069.00 | 4047.00 | 3914.00 | 3878.00 | 3611.00 | 3354.00 | 3015.00 | 2914.00 | 3154.00 | 3350.00 | 3096.00 | 3074.00 | 3182.00 | 3027.00 | 3172.00 | 2866.00 | 2903.00 | 3128.00 | 2989.00 | 2907.00 | 2886.00 | 2848.00 | 2627.00 | 2485.00 | 2482.00 | 2664.00 | 2060.94 | 2031.70 | 2054.50 | 2052.99 | 1843.94 | 1857.06 | 1778.42 | 1853.95 | 1788.39 | 1837.02 | 1879.13 | 1782.76 | 1917.76 | 1690.07 | 1720.59 | 1632.04 | 1627.24 | 1580.58 | NA | 1485.41 | NA | NA | |
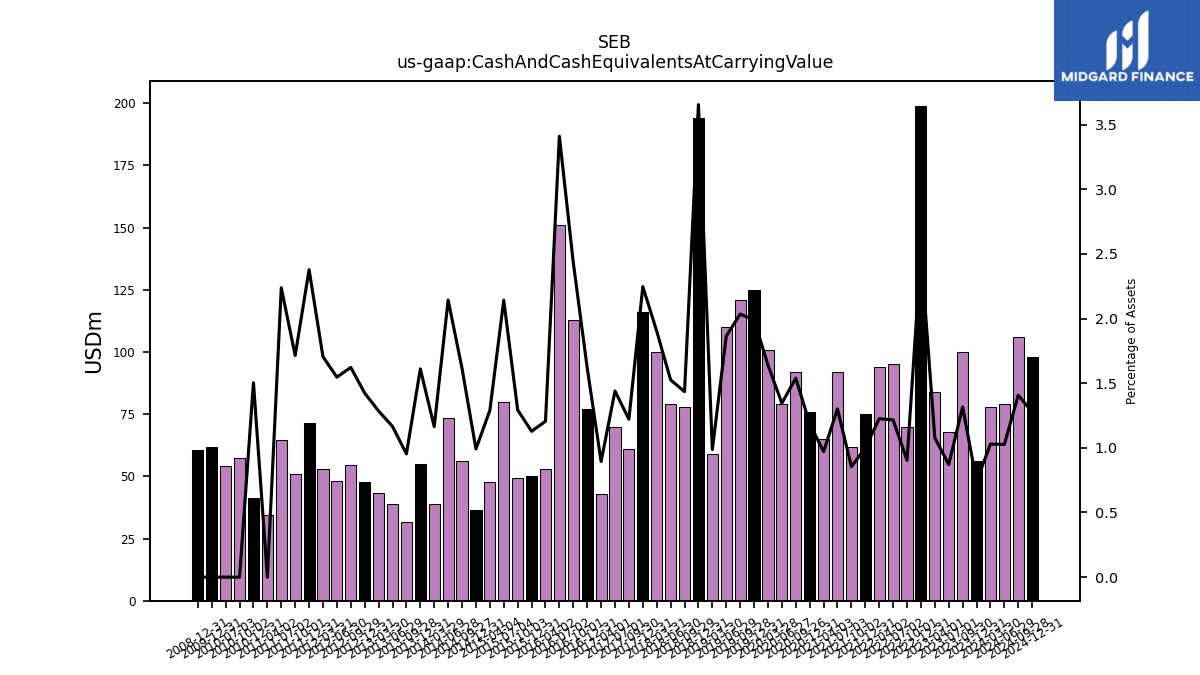
| Cash And Cash Equivalents At Carrying Value | 100.00 | 68.00 | 84.00 | 199.00 | 70.00 | 95.00 | 94.00 | 75.00 | 62.00 | 92.00 | 65.00 | 76.00 | 92.00 | 79.00 | 101.00 | 125.00 | 121.00 | 110.00 | 59.00 | 194.00 | 78.00 | 79.00 | 100.00 | 116.00 | 61.00 | 70.00 | 43.00 | 77.00 | 113.00 | 151.00 | 53.00 | 50.00 | 49.21 | 80.09 | 47.92 | 36.46 | 56.03 | 73.65 | 38.88 | 55.05 | 31.75 | 39.01 | 43.28 | 47.65 | 54.51 | 48.13 | 53.05 | 71.51 | 50.94 | 64.53 | 34.46 | 41.12 | 57.42 | 54.14 | |
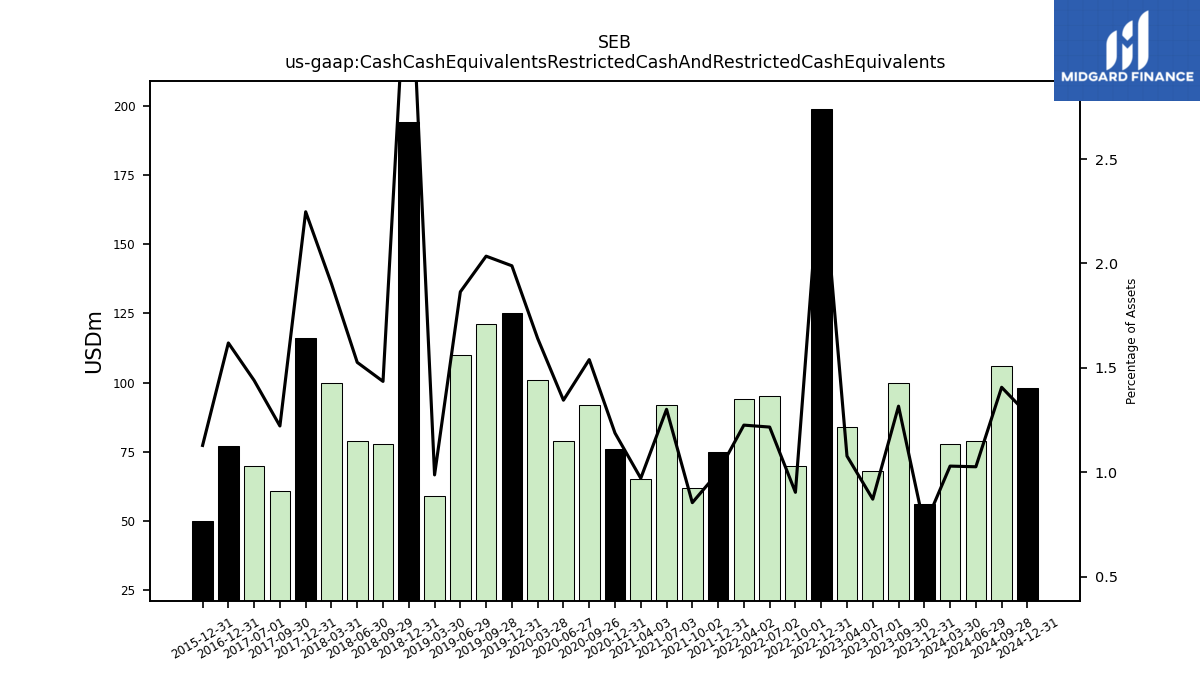
| Cash Cash Equivalents Restricted Cash And Restricted Cash Equivalents | 100.00 | 68.00 | 84.00 | 199.00 | 70.00 | 95.00 | 94.00 | 75.00 | 62.00 | 92.00 | 65.00 | 76.00 | 92.00 | 79.00 | 101.00 | 125.00 | 121.00 | 110.00 | 59.00 | 194.00 | 78.00 | 79.00 | 100.00 | 116.00 | 61.00 | 70.00 | NA | 77.00 | NA | NA | NA | 50.00 | NA | NA | NA | NA | NA | NA | NA | NA | NA | NA | NA | NA | NA | NA | NA | NA | NA | NA | NA | NA | NA | NA | |
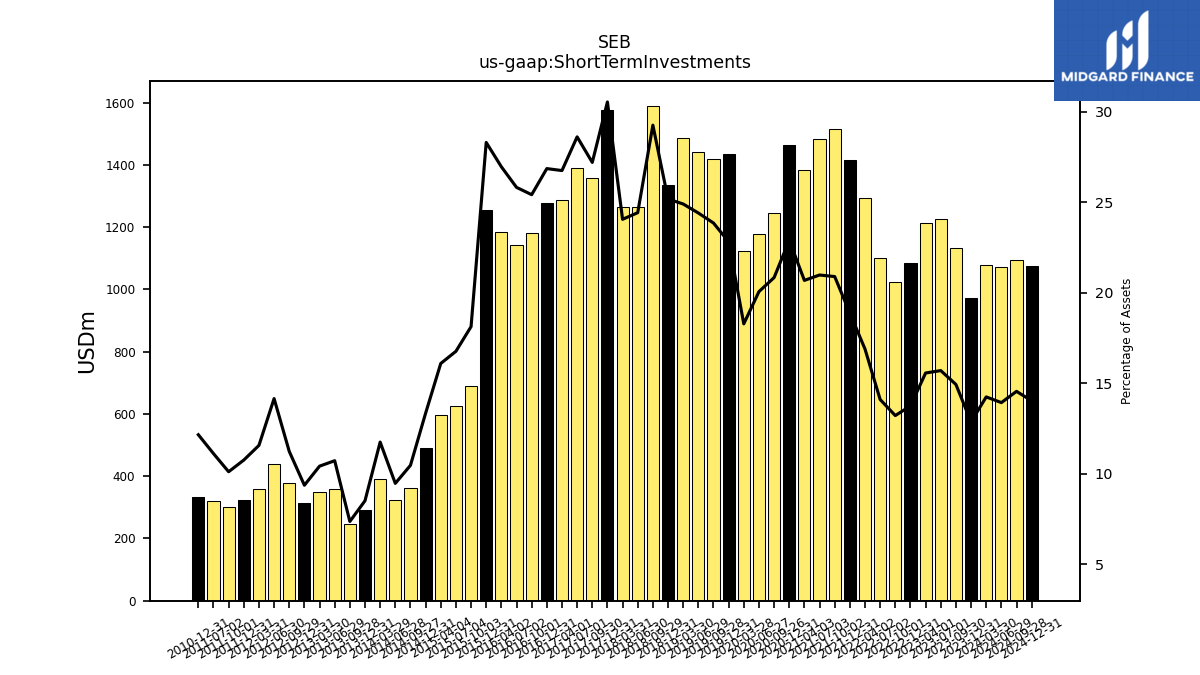
| Short Term Investments | 1134.00 | 1225.00 | 1213.00 | 1086.00 | 1023.00 | 1101.00 | 1295.00 | 1416.00 | 1516.00 | 1483.00 | 1384.00 | 1465.00 | 1245.00 | 1178.00 | 1125.00 | 1434.00 | 1418.00 | 1440.00 | 1488.00 | 1336.00 | 1590.00 | 1264.00 | 1264.00 | 1576.00 | 1358.00 | 1391.00 | 1286.00 | 1277.00 | 1180.00 | 1143.00 | 1185.00 | 1254.00 | 689.44 | 626.54 | 597.62 | 490.57 | 362.96 | 325.13 | 392.22 | 290.65 | 245.00 | 358.51 | 350.80 | 313.38 | 377.21 | 440.04 | 359.83 | 323.26 | 300.20 | 320.22 | NA | 332.20 | NA | NA | |
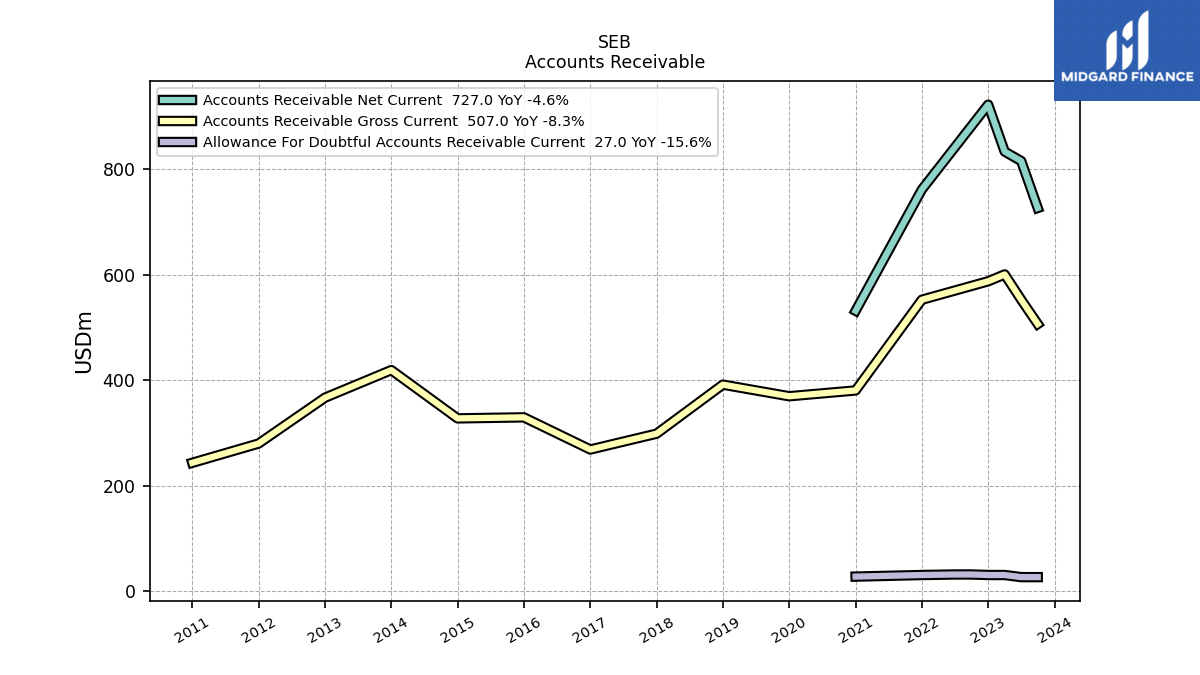
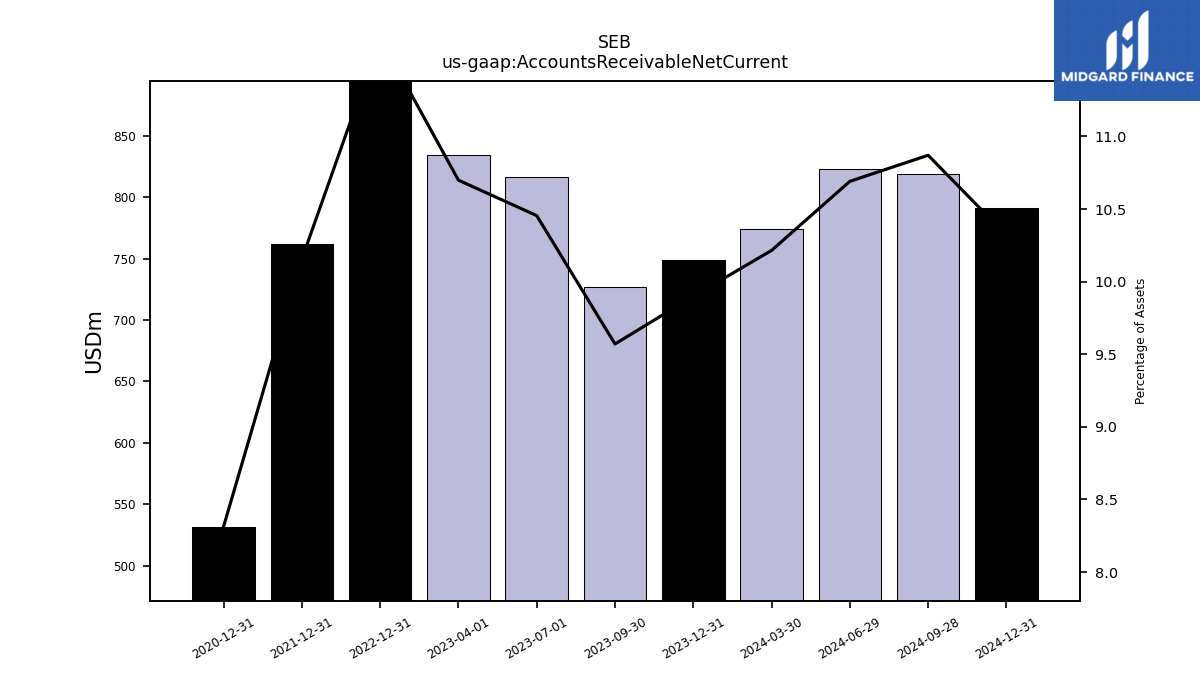
| Accounts Receivable Net Current | 727.00 | 816.00 | 834.00 | 923.00 | NA | NA | NA | 762.00 | NA | NA | NA | 532.00 | NA | NA | NA | NA | NA | NA | NA | NA | NA | NA | NA | NA | NA | NA | NA | NA | NA | NA | NA | NA | NA | NA | NA | NA | NA | NA | NA | NA | NA | NA | NA | NA | NA | NA | NA | NA | NA | NA | NA | NA | NA | NA | |
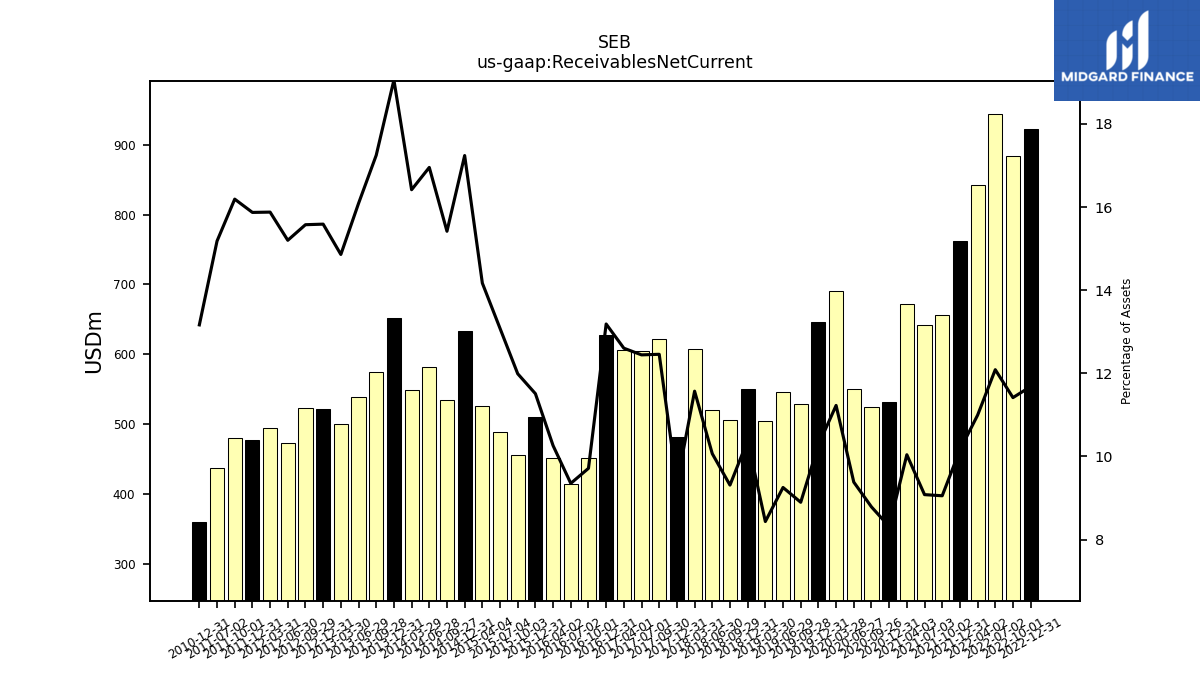
| Receivables Net Current | NA | NA | NA | 923.00 | 884.00 | 944.00 | 843.00 | 762.00 | 657.00 | 642.00 | 672.00 | 532.00 | 525.00 | 551.00 | 691.00 | 646.00 | 529.00 | 546.00 | 504.00 | 551.00 | 506.00 | 521.00 | 608.00 | 482.00 | 622.00 | 605.00 | 606.00 | 627.00 | 451.00 | 414.00 | 451.00 | 510.00 | 456.10 | 488.99 | 526.37 | 633.97 | 535.01 | 582.52 | 548.31 | 651.40 | 574.30 | 538.25 | 500.52 | 521.89 | 523.17 | 472.77 | 494.17 | 477.21 | 480.96 | 437.64 | NA | 359.94 | NA | NA | |
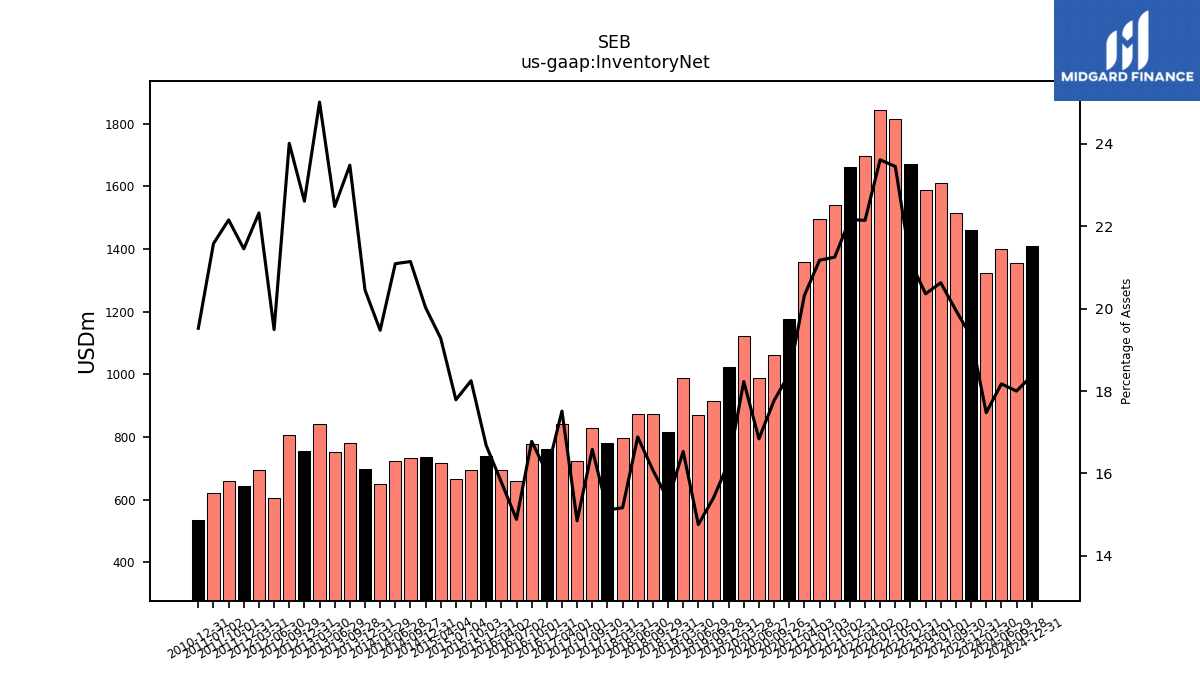
| Inventory Net | 1516.00 | 1610.00 | 1587.00 | 1670.00 | 1816.00 | 1844.00 | 1698.00 | 1663.00 | 1542.00 | 1497.00 | 1360.00 | 1178.00 | 1062.00 | 989.00 | 1122.00 | 1022.00 | 916.00 | 871.00 | 988.00 | 815.00 | 874.00 | 874.00 | 797.00 | 780.00 | 828.00 | 722.00 | 842.00 | 762.00 | 779.00 | 659.00 | 694.00 | 739.00 | 694.25 | 664.97 | 716.08 | 736.30 | 733.64 | 724.64 | 650.44 | 699.00 | 781.85 | 752.10 | 842.46 | 756.86 | 806.52 | 606.21 | 694.69 | 644.93 | 658.05 | 622.01 | NA | 533.76 | NA | NA | |
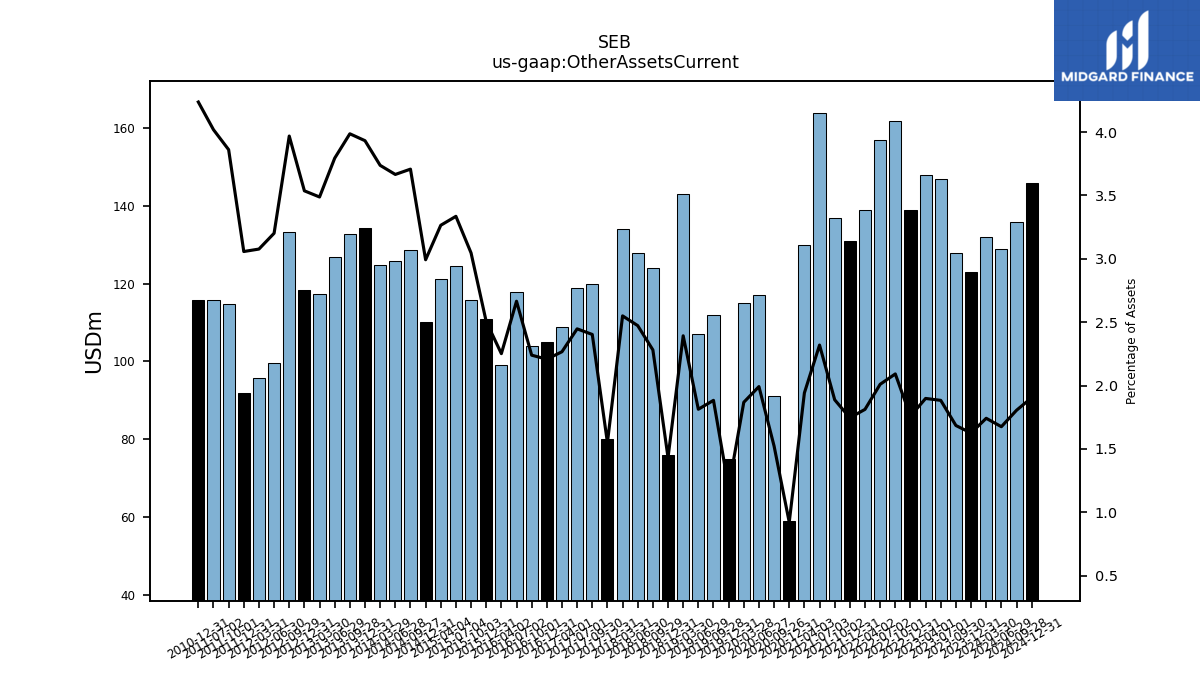
| Other Assets Current | 128.00 | 147.00 | 148.00 | 139.00 | 162.00 | 157.00 | 139.00 | 131.00 | 137.00 | 164.00 | 130.00 | 59.00 | 91.00 | 117.00 | 115.00 | 75.00 | 112.00 | 107.00 | 143.00 | 76.00 | 124.00 | 128.00 | 134.00 | 80.00 | 120.00 | 119.00 | 109.00 | 105.00 | 104.00 | 118.00 | 99.00 | 111.00 | 115.89 | 124.68 | 121.27 | 110.05 | 128.65 | 125.95 | 124.82 | 134.39 | 132.74 | 126.94 | 117.48 | 118.39 | 133.30 | 99.58 | 95.76 | 91.93 | 114.69 | 115.84 | NA | 115.84 | NA | NA |
| 2023-09-30 | 2023-07-01 | 2023-04-01 | 2022-12-31 | 2022-10-01 | 2022-07-02 | 2022-04-02 | 2021-12-31 | 2021-10-02 | 2021-07-03 | 2021-04-03 | 2020-12-31 | 2020-09-26 | 2020-06-27 | 2020-03-28 | 2019-12-31 | 2019-09-28 | 2019-06-29 | 2019-03-30 | 2018-12-31 | 2018-09-29 | 2018-06-30 | 2018-03-31 | 2017-12-31 | 2017-09-30 | 2017-07-01 | 2017-04-01 | 2016-12-31 | 2016-10-01 | 2016-07-02 | 2016-04-02 | 2015-12-31 | 2015-10-03 | 2015-07-04 | 2015-04-04 | 2014-12-31 | 2014-09-27 | 2014-06-28 | 2014-03-29 | 2013-12-31 | 2013-09-28 | 2013-06-29 | 2013-03-30 | 2012-12-31 | 2012-09-29 | 2012-06-30 | 2012-03-31 | 2011-12-31 | 2011-10-01 | 2011-07-02 | 2011-04-02 | 2010-12-31 | 2010-10-02 | 2010-07-03 | ||
|---|---|---|---|---|---|---|---|---|---|---|---|---|---|---|---|---|---|---|---|---|---|---|---|---|---|---|---|---|---|---|---|---|---|---|---|---|---|---|---|---|---|---|---|---|---|---|---|---|---|---|---|---|---|---|---|
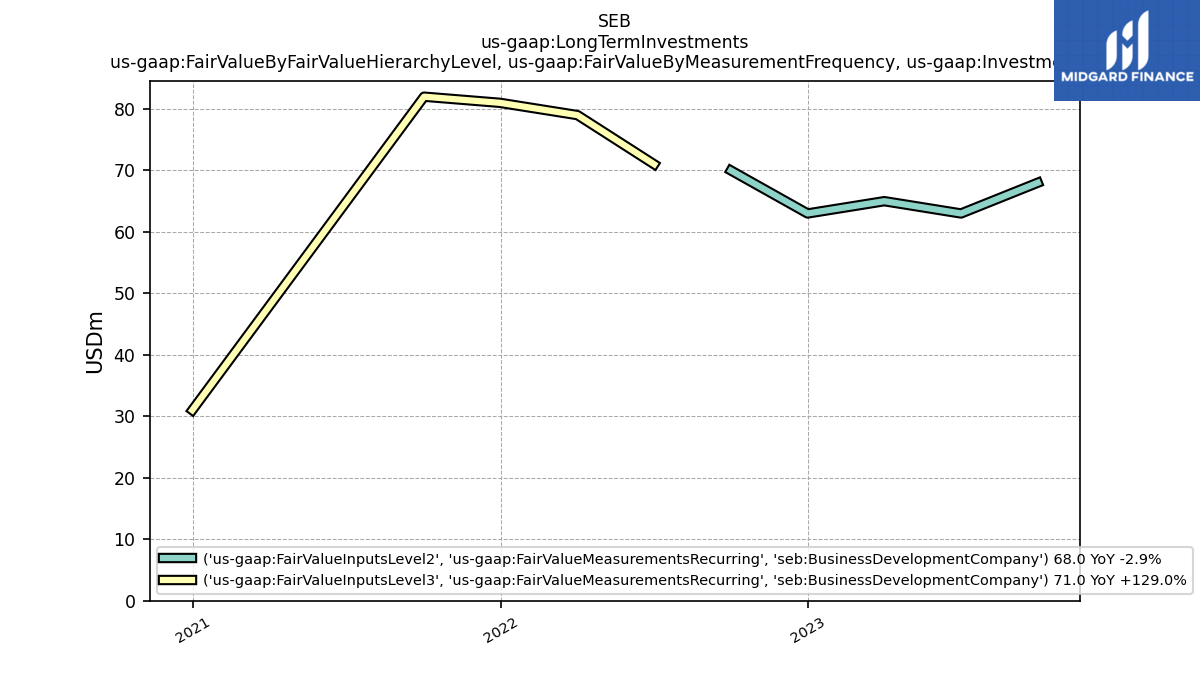
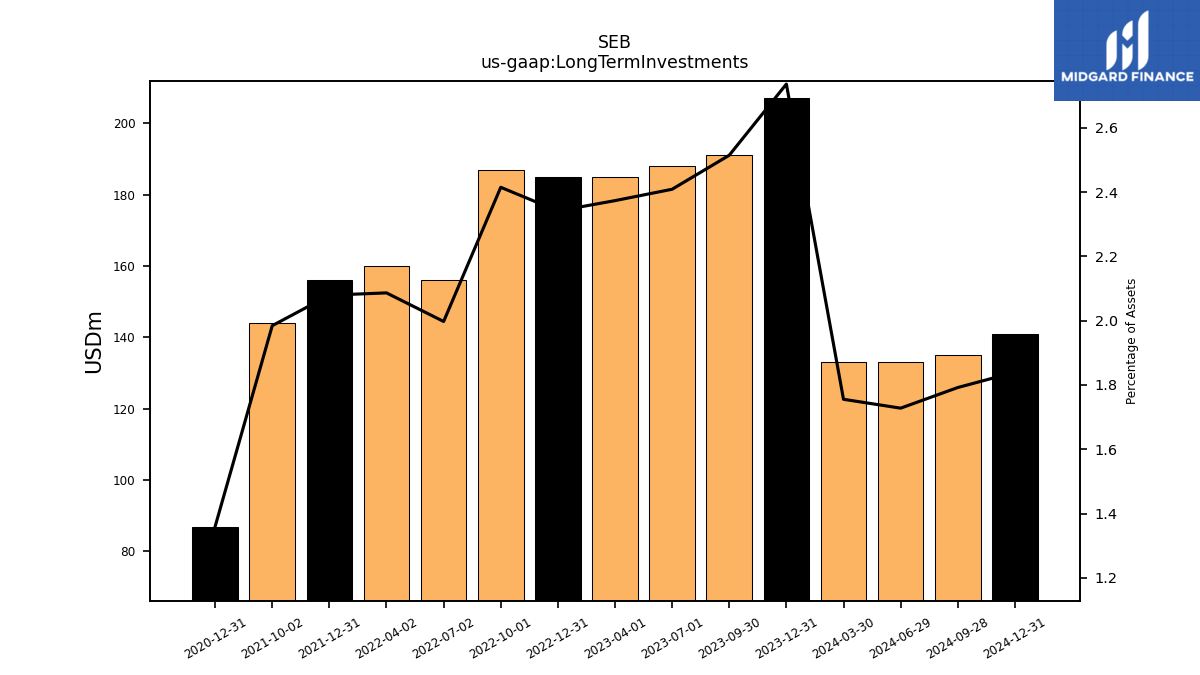
| Long Term Investments | 191.00 | 188.00 | 185.00 | 185.00 | 187.00 | 156.00 | 160.00 | 156.00 | 144.00 | NA | NA | 87.00 | NA | NA | NA | NA | NA | NA | NA | NA | NA | NA | NA | NA | NA | NA | NA | NA | NA | NA | NA | NA | NA | NA | NA | NA | NA | NA | NA | NA | NA | NA | NA | NA | NA | NA | NA | NA | NA | NA | NA | NA | NA | NA | |
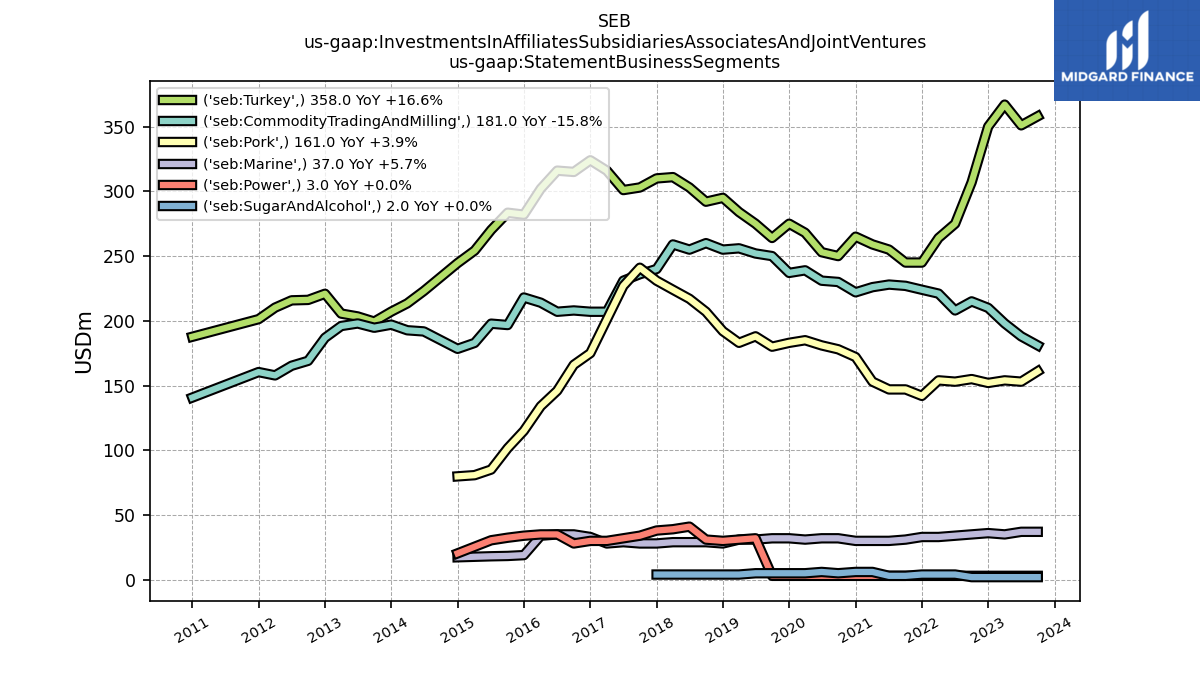
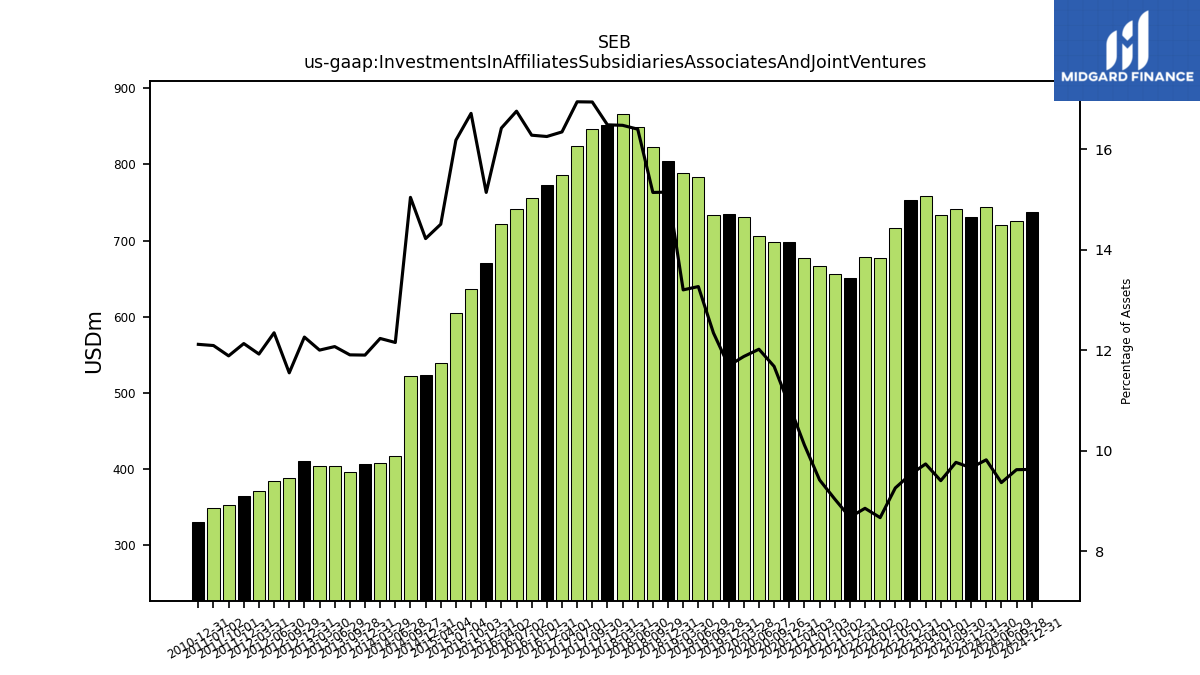
| Investments In Affiliates Subsidiaries Associates And Joint Ventures | 742.00 | 734.00 | 759.00 | 753.00 | 717.00 | 677.00 | 679.00 | 651.00 | 656.00 | 666.00 | 677.00 | 698.00 | 698.00 | 706.00 | 731.00 | 735.00 | 734.00 | 783.00 | 789.00 | 804.00 | 823.00 | 849.00 | 866.00 | 851.00 | 846.00 | 824.00 | 786.00 | 773.00 | 756.00 | 742.00 | 722.00 | 671.00 | 635.95 | 605.01 | 539.00 | 523.06 | 522.07 | 417.65 | 408.64 | 406.90 | 396.56 | 403.97 | 404.32 | 410.54 | 388.00 | 384.07 | 371.13 | 364.84 | 353.17 | 348.65 | NA | 331.32 | NA | NA | |
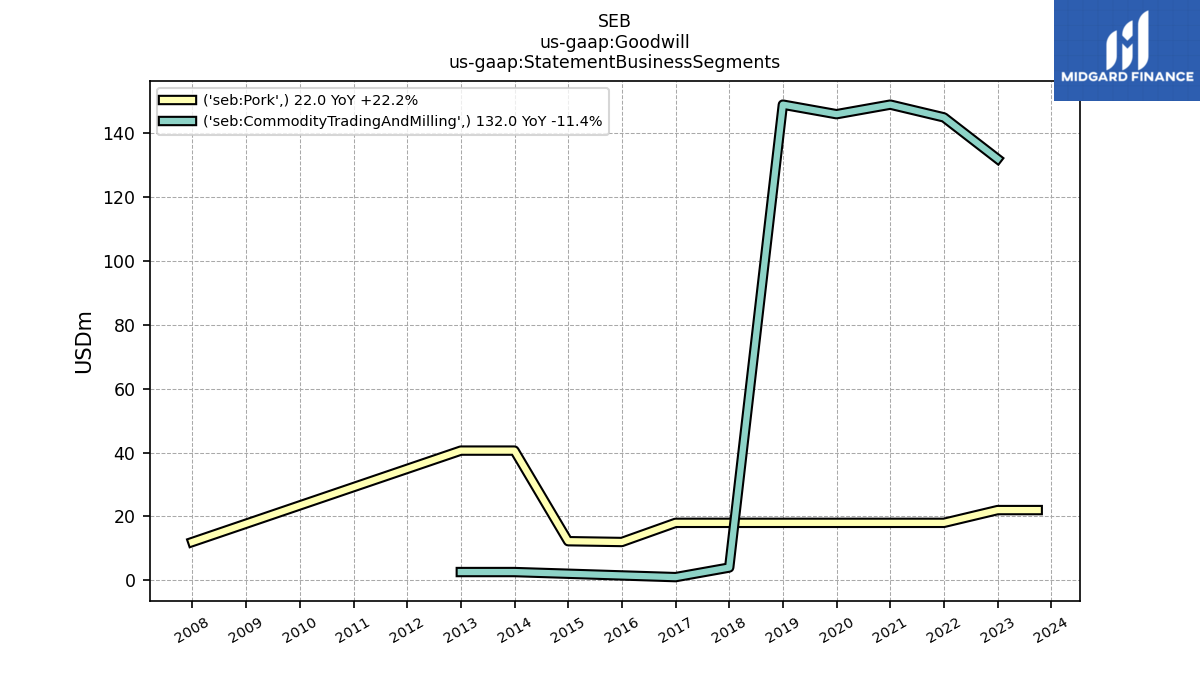
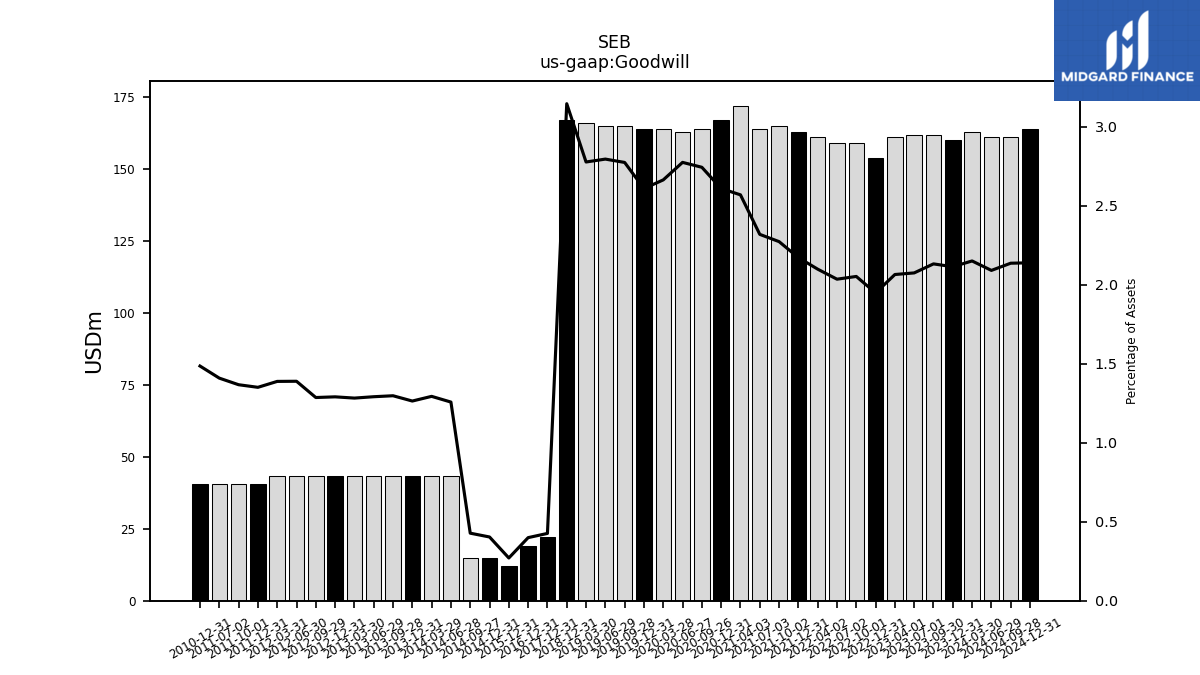
| Goodwill | 162.00 | 162.00 | 161.00 | 154.00 | 159.00 | 159.00 | 161.00 | 163.00 | 165.00 | 164.00 | 172.00 | 167.00 | 164.00 | 163.00 | 164.00 | 164.00 | 165.00 | 165.00 | 166.00 | 167.00 | NA | NA | NA | 22.00 | NA | NA | NA | 19.00 | NA | NA | NA | 12.00 | NA | NA | NA | 14.85 | 14.85 | 43.22 | 43.22 | 43.22 | 43.22 | 43.22 | 43.22 | 43.22 | 43.22 | 43.22 | 43.22 | 40.63 | 40.63 | 40.63 | NA | 40.63 | NA | NA | |
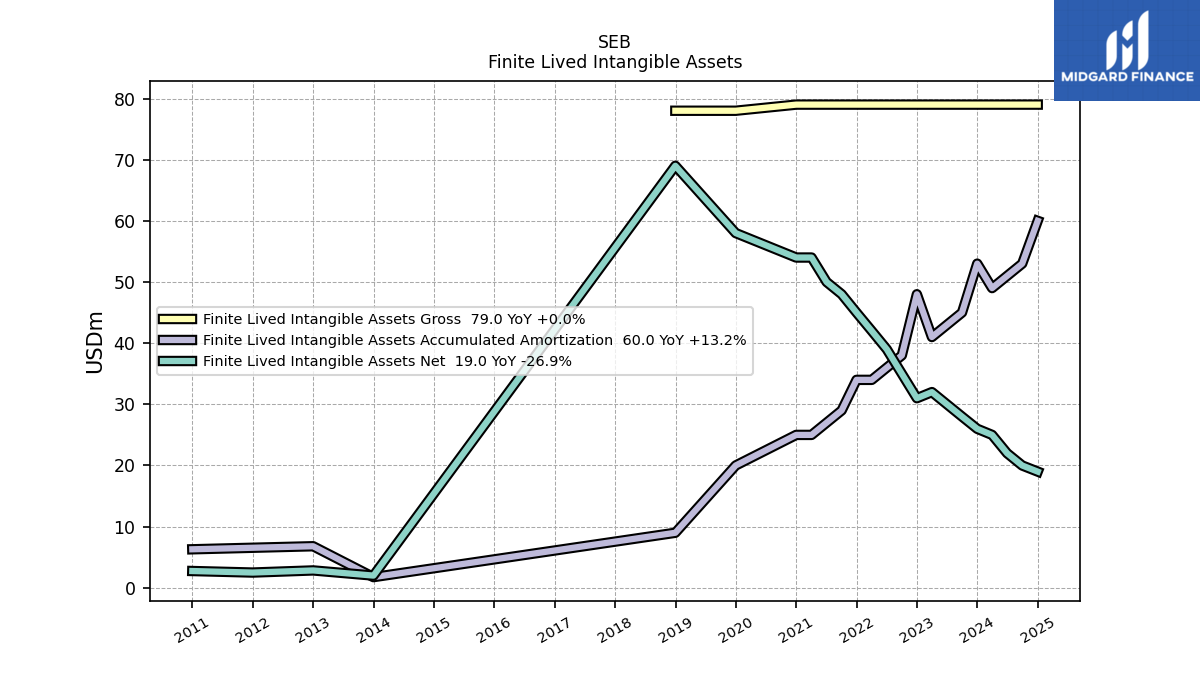
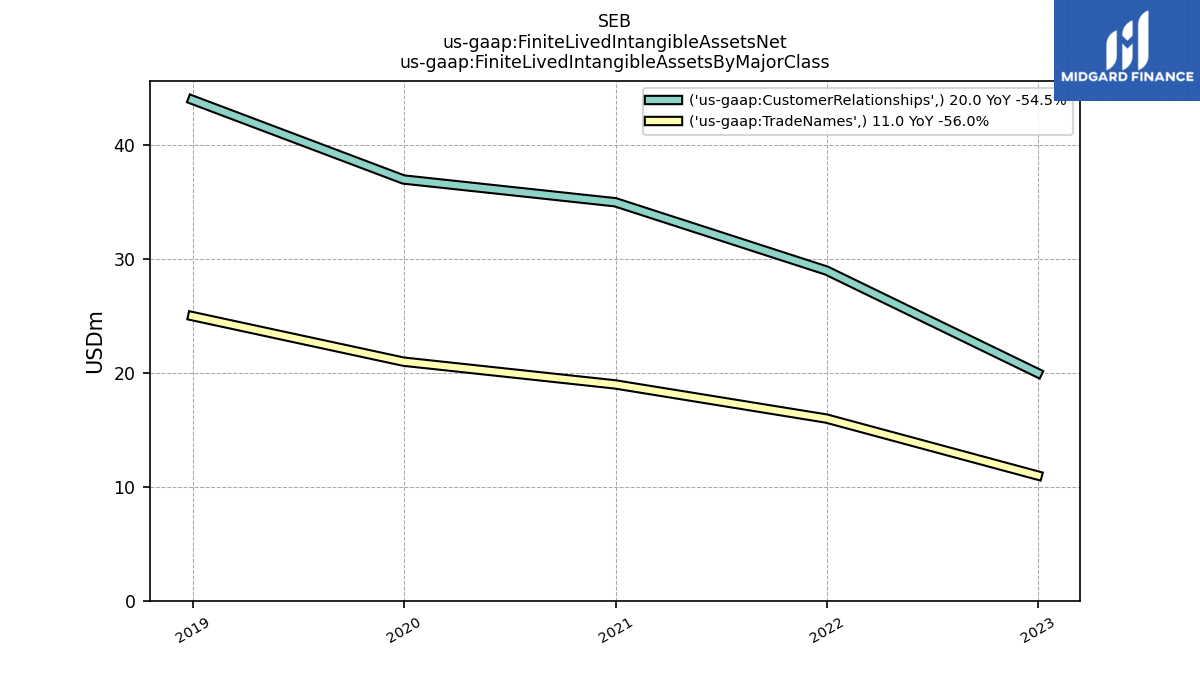
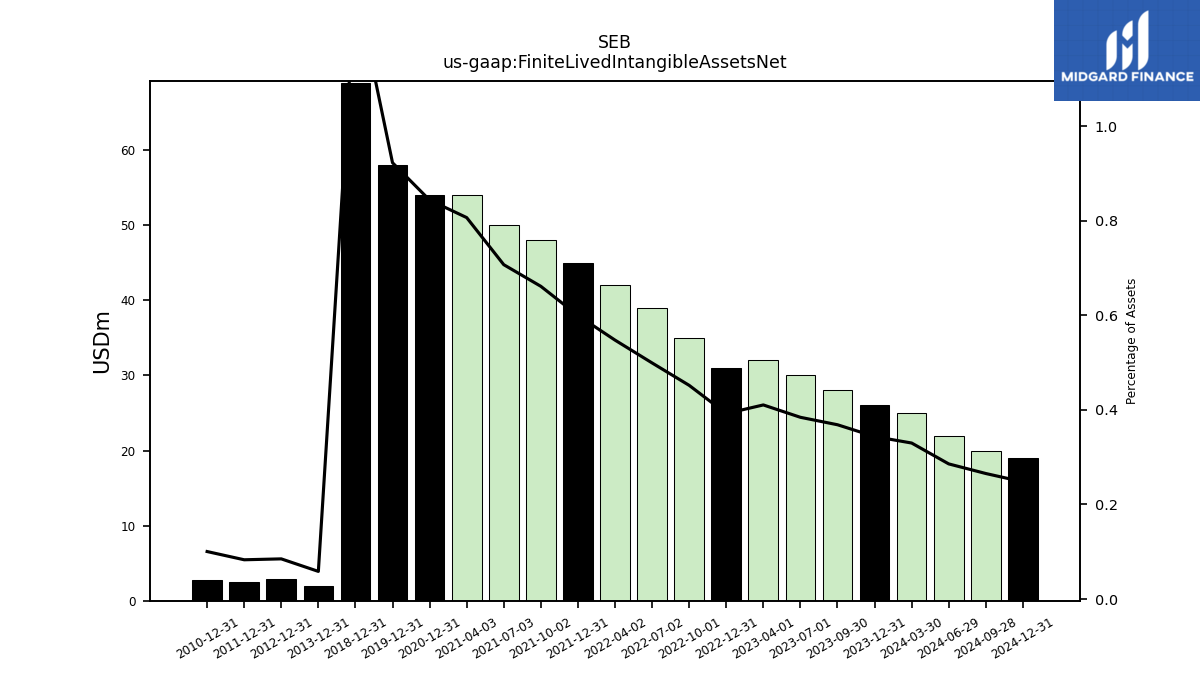
| Finite Lived Intangible Assets Net | 28.00 | 30.00 | 32.00 | 31.00 | 35.00 | 39.00 | 42.00 | 45.00 | 48.00 | 50.00 | 54.00 | 54.00 | NA | NA | NA | 58.00 | NA | NA | NA | 69.00 | NA | NA | NA | NA | NA | NA | NA | NA | NA | NA | NA | NA | NA | NA | NA | NA | NA | NA | NA | 2.00 | NA | NA | NA | 2.84 | NA | NA | NA | 2.50 | NA | NA | NA | 2.75 | NA | NA | |
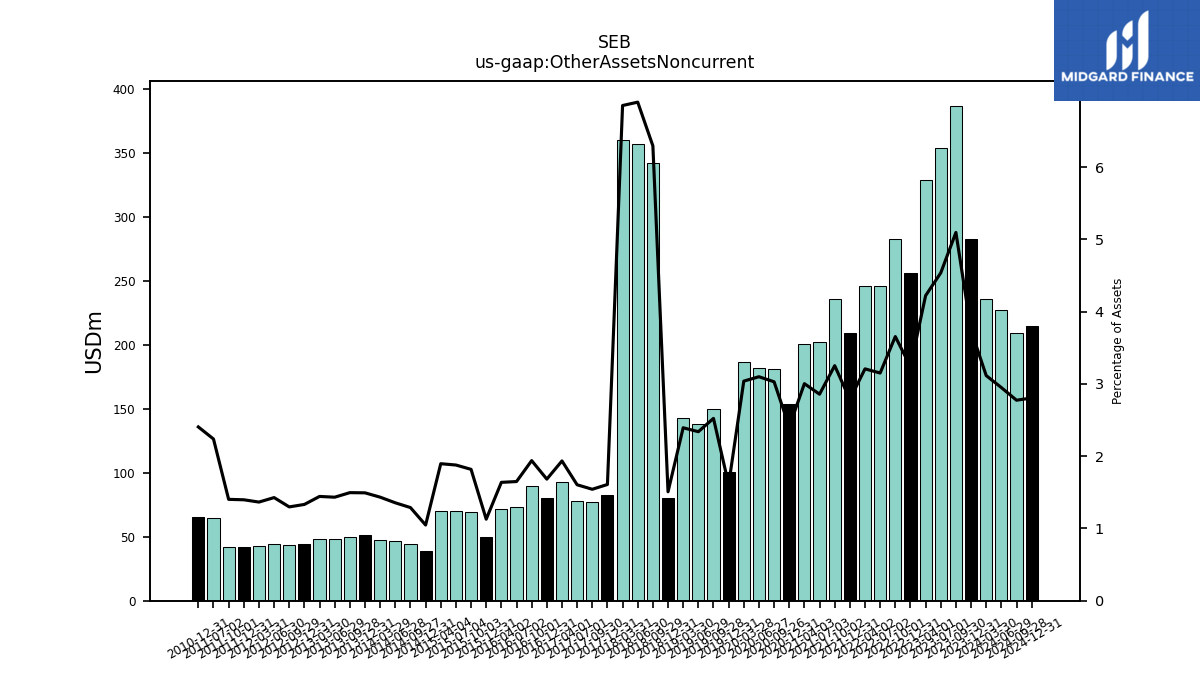
| Other Assets Noncurrent | 387.00 | 354.00 | 329.00 | 256.00 | 283.00 | 246.00 | 246.00 | 209.00 | 236.00 | 202.00 | 201.00 | 154.00 | 181.00 | 182.00 | 187.00 | 101.00 | 150.00 | 138.00 | 143.00 | 80.00 | 342.00 | 357.00 | 360.00 | 83.00 | 77.00 | 78.00 | 93.00 | 80.00 | 90.00 | 73.00 | 72.00 | 50.00 | 69.15 | 70.19 | 70.42 | 38.52 | 44.73 | 46.55 | 47.85 | 51.02 | 49.79 | 47.92 | 48.60 | 44.60 | 43.60 | 44.38 | 42.48 | 42.00 | 41.66 | 64.49 | NA | 65.74 | NA | NA |
| 2023-09-30 | 2023-07-01 | 2023-04-01 | 2022-12-31 | 2022-10-01 | 2022-07-02 | 2022-04-02 | 2021-12-31 | 2021-10-02 | 2021-07-03 | 2021-04-03 | 2020-12-31 | 2020-09-26 | 2020-06-27 | 2020-03-28 | 2019-12-31 | 2019-09-28 | 2019-06-29 | 2019-03-30 | 2018-12-31 | 2018-09-29 | 2018-06-30 | 2018-03-31 | 2017-12-31 | 2017-09-30 | 2017-07-01 | 2017-04-01 | 2016-12-31 | 2016-10-01 | 2016-07-02 | 2016-04-02 | 2015-12-31 | 2015-10-03 | 2015-07-04 | 2015-04-04 | 2014-12-31 | 2014-09-27 | 2014-06-28 | 2014-03-29 | 2013-12-31 | 2013-09-28 | 2013-06-29 | 2013-03-30 | 2012-12-31 | 2012-09-29 | 2012-06-30 | 2012-03-31 | 2011-12-31 | 2011-10-01 | 2011-07-02 | 2011-04-02 | 2010-12-31 | 2010-10-02 | 2010-07-03 | ||
|---|---|---|---|---|---|---|---|---|---|---|---|---|---|---|---|---|---|---|---|---|---|---|---|---|---|---|---|---|---|---|---|---|---|---|---|---|---|---|---|---|---|---|---|---|---|---|---|---|---|---|---|---|---|---|---|
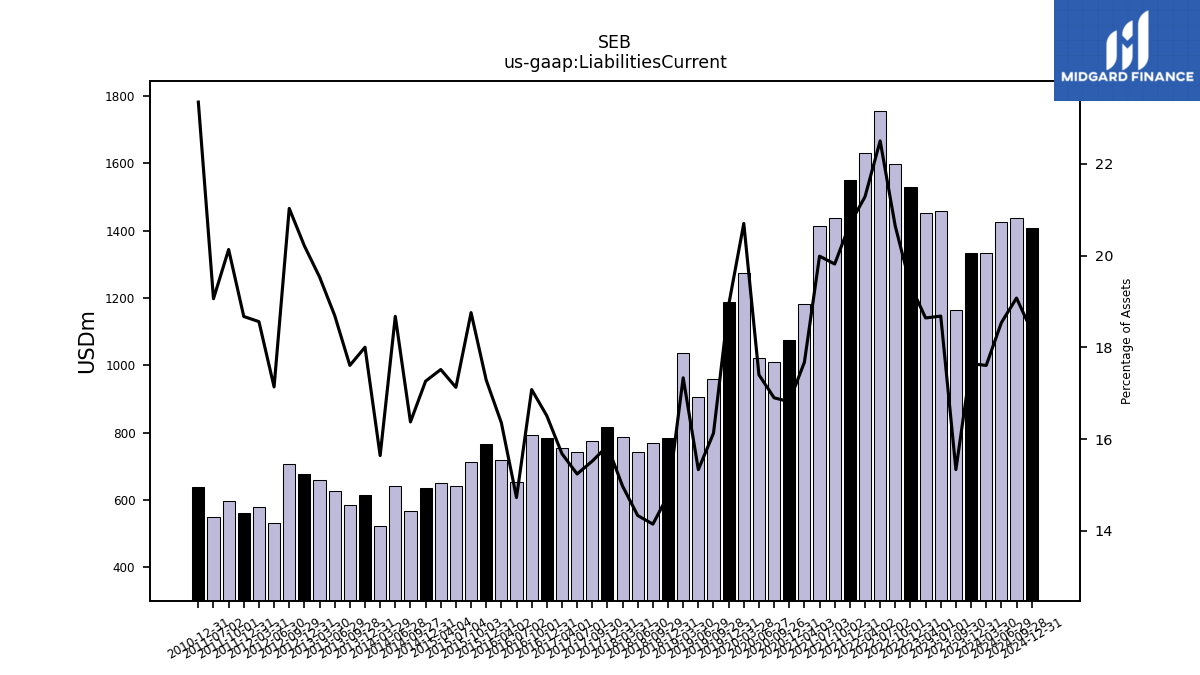
| Liabilities Current | 1165.00 | 1458.00 | 1453.00 | 1529.00 | 1598.00 | 1757.00 | 1632.00 | 1552.00 | 1438.00 | 1413.00 | 1183.00 | 1076.00 | 1010.00 | 1022.00 | 1274.00 | 1189.00 | 959.00 | 905.00 | 1036.00 | 784.00 | 769.00 | 742.00 | 787.00 | 818.00 | 775.00 | 741.00 | 754.00 | 785.00 | 793.00 | 652.00 | 719.00 | 766.00 | 713.53 | 640.31 | 650.69 | 634.83 | 568.22 | 641.65 | 522.41 | 615.33 | 586.28 | 625.45 | 657.96 | 676.58 | 706.26 | 533.00 | 577.60 | 561.41 | 598.01 | 549.40 | NA | 638.20 | NA | NA | |
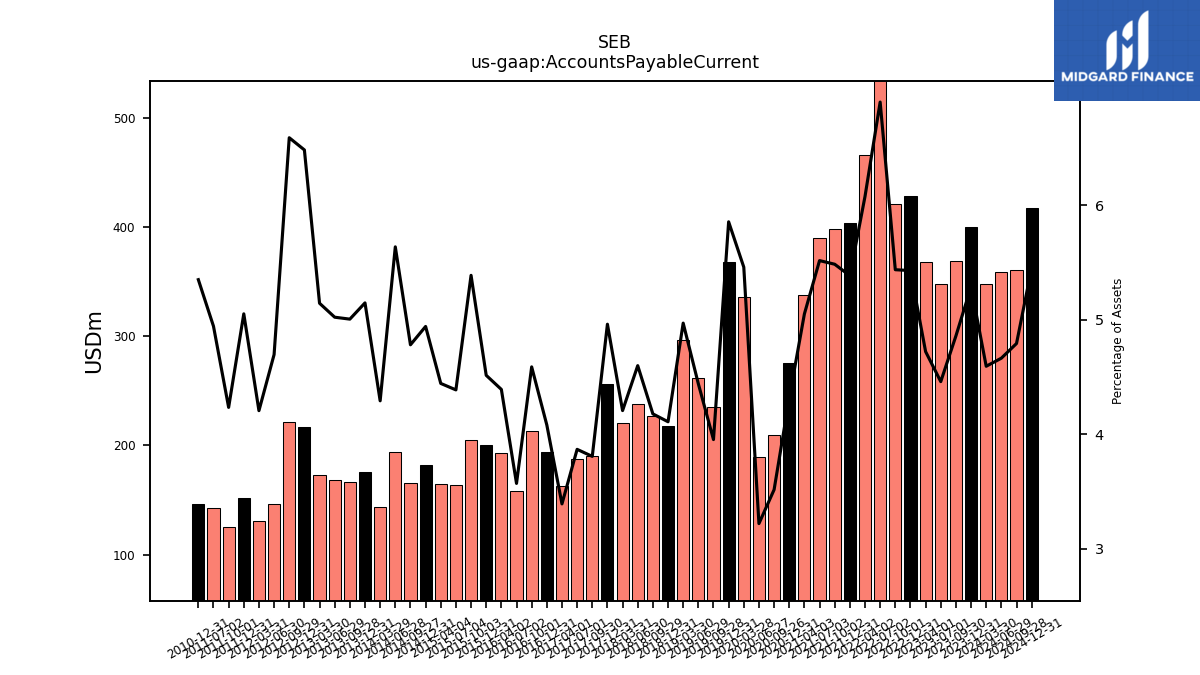
| Accounts Payable Current | 369.00 | 348.00 | 368.00 | 429.00 | 421.00 | 539.00 | 466.00 | 404.00 | 398.00 | 390.00 | 338.00 | 276.00 | 210.00 | 189.00 | 336.00 | 368.00 | 235.00 | 262.00 | 297.00 | 218.00 | 227.00 | 238.00 | 221.00 | 256.00 | 190.00 | 188.00 | 163.00 | 194.00 | 213.00 | 158.00 | 193.00 | 200.00 | 204.95 | 163.98 | 165.04 | 181.69 | 165.88 | 193.66 | 143.31 | 175.92 | 166.65 | 168.01 | 173.25 | 217.04 | 221.35 | 146.02 | 130.86 | 151.87 | 125.75 | 142.48 | NA | 146.26 | NA | NA | |
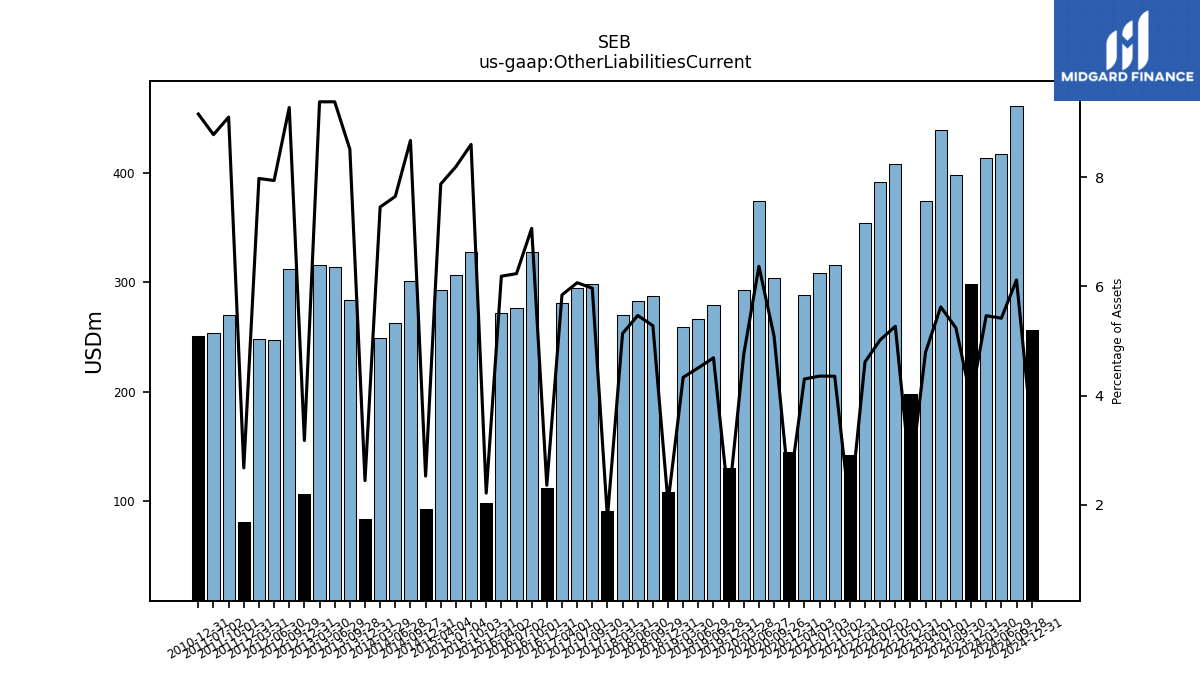
| Other Liabilities Current | 398.00 | 439.00 | 374.00 | 198.00 | 408.00 | 392.00 | 354.00 | 142.00 | 316.00 | 308.00 | 288.00 | 145.00 | 304.00 | 374.00 | 293.00 | 130.00 | 279.00 | 266.00 | 259.00 | 108.00 | 287.00 | 283.00 | 270.00 | 91.00 | 298.00 | 295.00 | 281.00 | 112.00 | 328.00 | 276.00 | 272.00 | 98.00 | 327.21 | 306.37 | 292.62 | 92.80 | 301.04 | 262.83 | 248.99 | 83.42 | 283.55 | 313.96 | 316.08 | 106.34 | 311.69 | 246.98 | 248.29 | 80.40 | 270.40 | 253.15 | NA | 250.44 | NA | NA | |
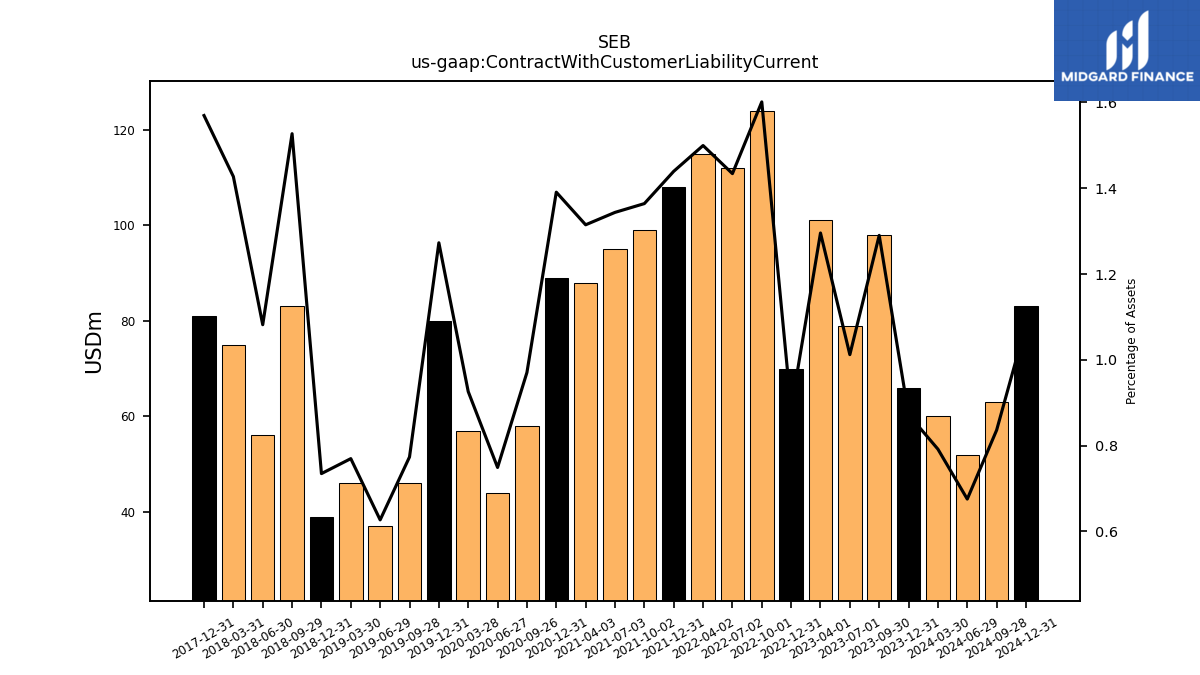
| Contract With Customer Liability Current | 98.00 | 79.00 | 101.00 | 70.00 | 124.00 | 112.00 | 115.00 | 108.00 | 99.00 | 95.00 | 88.00 | 89.00 | 58.00 | 44.00 | 57.00 | 80.00 | 46.00 | 37.00 | 46.00 | 39.00 | 83.00 | 56.00 | 75.00 | 81.00 | NA | NA | NA | NA | NA | NA | NA | NA | NA | NA | NA | NA | NA | NA | NA | NA | NA | NA | NA | NA | NA | NA | NA | NA | NA | NA | NA | NA | NA | NA |
| 2023-09-30 | 2023-07-01 | 2023-04-01 | 2022-12-31 | 2022-10-01 | 2022-07-02 | 2022-04-02 | 2021-12-31 | 2021-10-02 | 2021-07-03 | 2021-04-03 | 2020-12-31 | 2020-09-26 | 2020-06-27 | 2020-03-28 | 2019-12-31 | 2019-09-28 | 2019-06-29 | 2019-03-30 | 2018-12-31 | 2018-09-29 | 2018-06-30 | 2018-03-31 | 2017-12-31 | 2017-09-30 | 2017-07-01 | 2017-04-01 | 2016-12-31 | 2016-10-01 | 2016-07-02 | 2016-04-02 | 2015-12-31 | 2015-10-03 | 2015-07-04 | 2015-04-04 | 2014-12-31 | 2014-09-27 | 2014-06-28 | 2014-03-29 | 2013-12-31 | 2013-09-28 | 2013-06-29 | 2013-03-30 | 2012-12-31 | 2012-09-29 | 2012-06-30 | 2012-03-31 | 2011-12-31 | 2011-10-01 | 2011-07-02 | 2011-04-02 | 2010-12-31 | 2010-10-02 | 2010-07-03 | ||
|---|---|---|---|---|---|---|---|---|---|---|---|---|---|---|---|---|---|---|---|---|---|---|---|---|---|---|---|---|---|---|---|---|---|---|---|---|---|---|---|---|---|---|---|---|---|---|---|---|---|---|---|---|---|---|---|
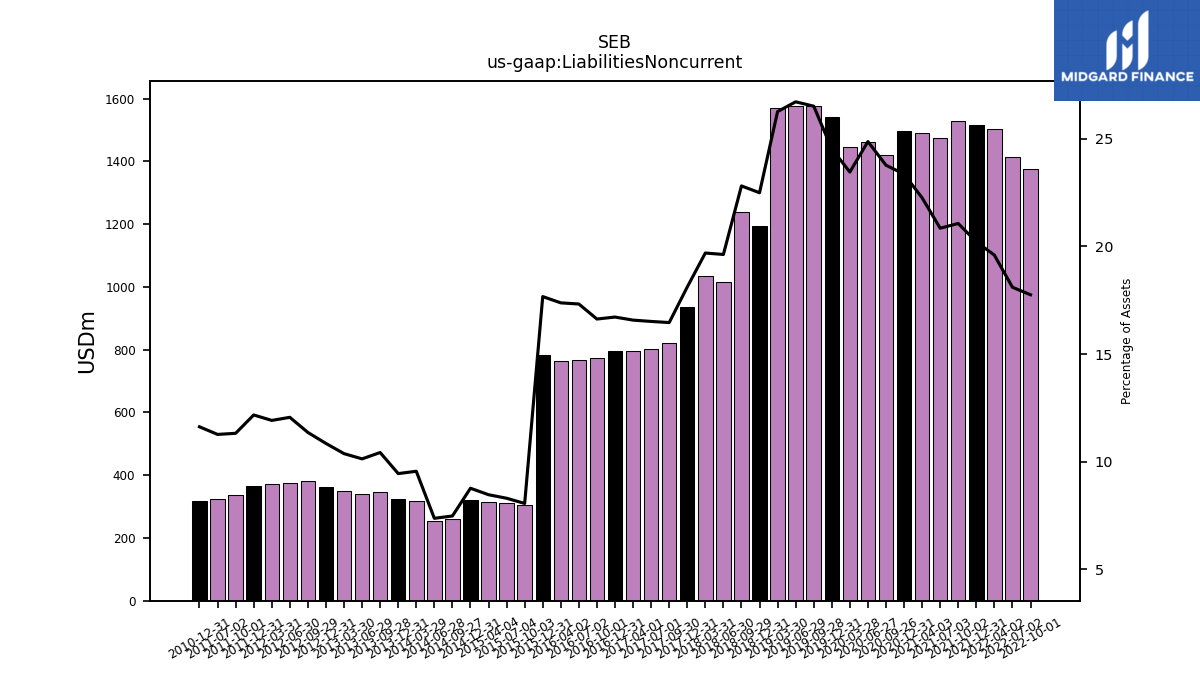
| Liabilities Noncurrent | NA | NA | NA | NA | 1375.00 | 1414.00 | 1503.00 | 1517.00 | 1529.00 | 1474.00 | 1490.00 | 1495.00 | 1421.00 | 1461.00 | 1444.00 | 1542.00 | 1577.00 | 1577.00 | 1570.00 | 1194.00 | 1240.00 | 1016.00 | 1035.00 | 935.00 | 822.00 | 803.00 | 797.00 | 795.00 | 772.00 | 767.00 | 764.00 | 783.00 | 306.41 | 310.14 | 314.27 | 322.21 | 259.27 | 252.99 | 318.96 | 322.75 | 347.05 | 338.81 | 349.31 | 363.02 | 381.41 | 375.03 | 370.79 | 365.85 | 336.13 | 324.68 | NA | 317.64 | NA | NA | |
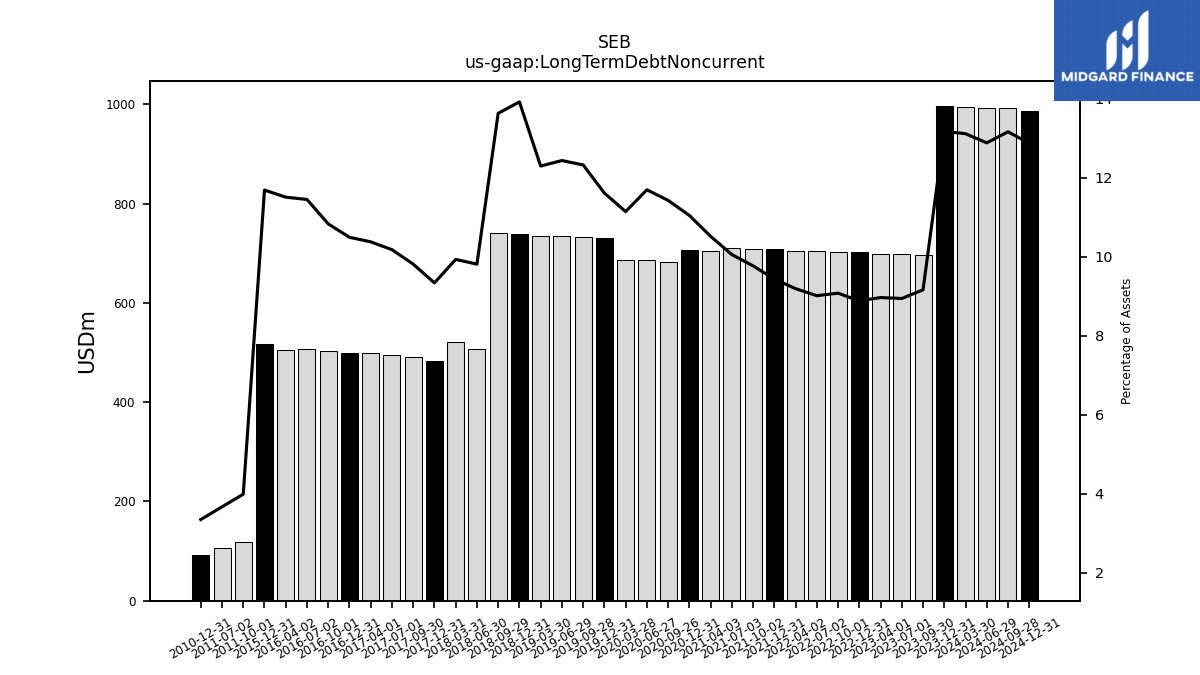
| Long Term Debt Noncurrent | 696.00 | 698.00 | 699.00 | 702.00 | 703.00 | 704.00 | 705.00 | 708.00 | 709.00 | 711.00 | 704.00 | 707.00 | 683.00 | 687.00 | 686.00 | 730.00 | 733.00 | 734.00 | 735.00 | 739.00 | 741.00 | 508.00 | 522.00 | 482.00 | 490.00 | 495.00 | 499.00 | 499.00 | 503.00 | 507.00 | 506.00 | 518.00 | NA | NA | NA | NA | NA | NA | NA | NA | NA | NA | NA | NA | NA | NA | NA | NA | 118.38 | 105.61 | NA | 91.41 | NA | NA | |
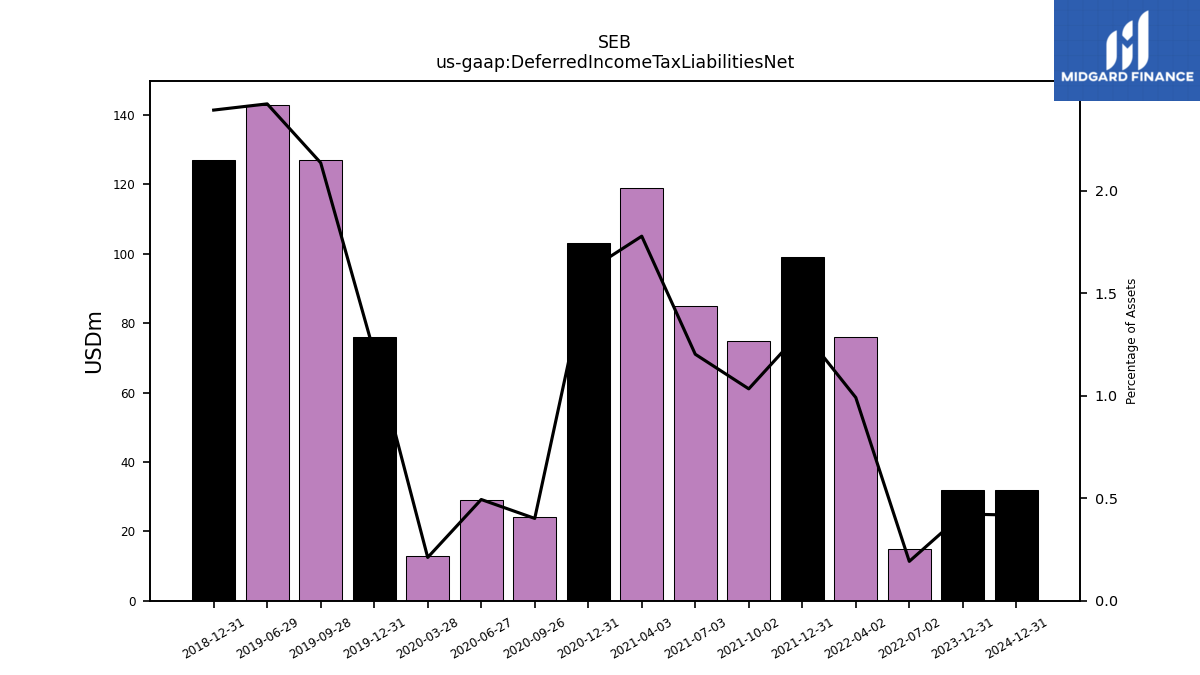
| Deferred Income Tax Liabilities Net | NA | NA | NA | NA | NA | 15.00 | 76.00 | 99.00 | 75.00 | 85.00 | 119.00 | 103.00 | 24.00 | 29.00 | 13.00 | 76.00 | 127.00 | 143.00 | NA | 127.00 | NA | NA | NA | NA | NA | NA | NA | NA | NA | NA | NA | NA | NA | NA | NA | NA | NA | NA | NA | NA | NA | NA | NA | NA | NA | NA | NA | NA | NA | NA | NA | NA | NA | NA | |
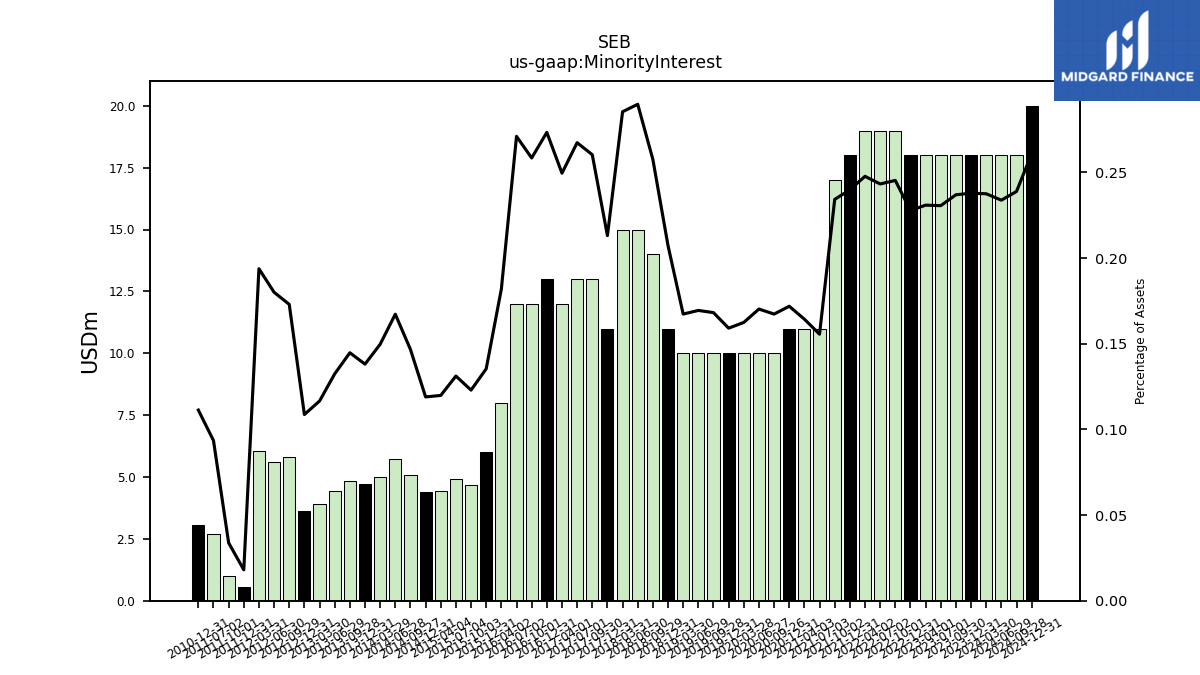
| Minority Interest | 18.00 | 18.00 | 18.00 | 18.00 | 19.00 | 19.00 | 19.00 | 18.00 | 17.00 | 11.00 | 11.00 | 11.00 | 10.00 | 10.00 | 10.00 | 10.00 | 10.00 | 10.00 | 10.00 | 11.00 | 14.00 | 15.00 | 15.00 | 11.00 | 13.00 | 13.00 | 12.00 | 13.00 | 12.00 | 12.00 | 8.00 | 6.00 | 4.68 | 4.90 | 4.45 | 4.38 | 5.09 | 5.75 | 5.00 | 4.72 | 4.82 | 4.43 | 3.93 | 3.64 | 5.81 | 5.60 | 6.03 | 0.54 | 1.00 | 2.70 | NA | 3.04 | NA | NA | |
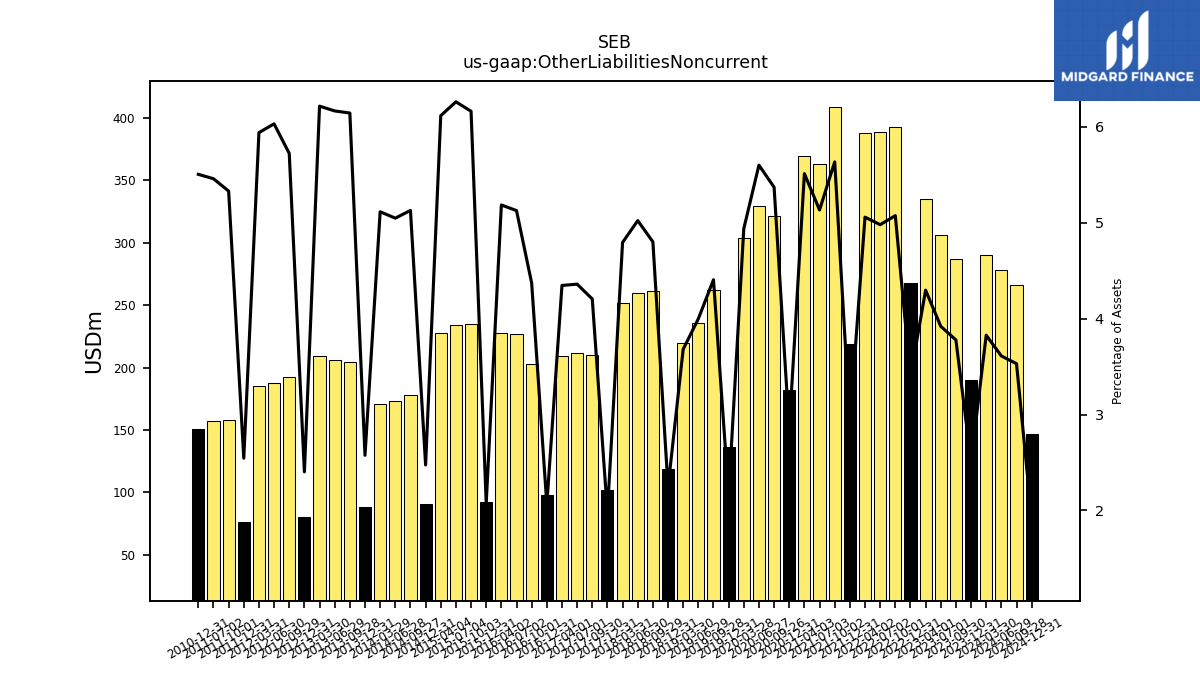
| Other Liabilities Noncurrent | 287.00 | 306.00 | 335.00 | 268.00 | 393.00 | 389.00 | 388.00 | 219.00 | 409.00 | 363.00 | 369.00 | 182.00 | 321.00 | 329.00 | 304.00 | 136.00 | 262.00 | 236.00 | 220.00 | 119.00 | 261.00 | 260.00 | 252.00 | 102.00 | 210.00 | 212.00 | 209.00 | 98.00 | 203.00 | 227.00 | 228.00 | 92.00 | 234.49 | 234.11 | 227.26 | 91.00 | 177.99 | 173.47 | 170.84 | 88.02 | 204.64 | 206.34 | 209.42 | 80.43 | 192.26 | 187.62 | 184.90 | 76.51 | 158.36 | 157.39 | NA | 150.54 | NA | NA | |
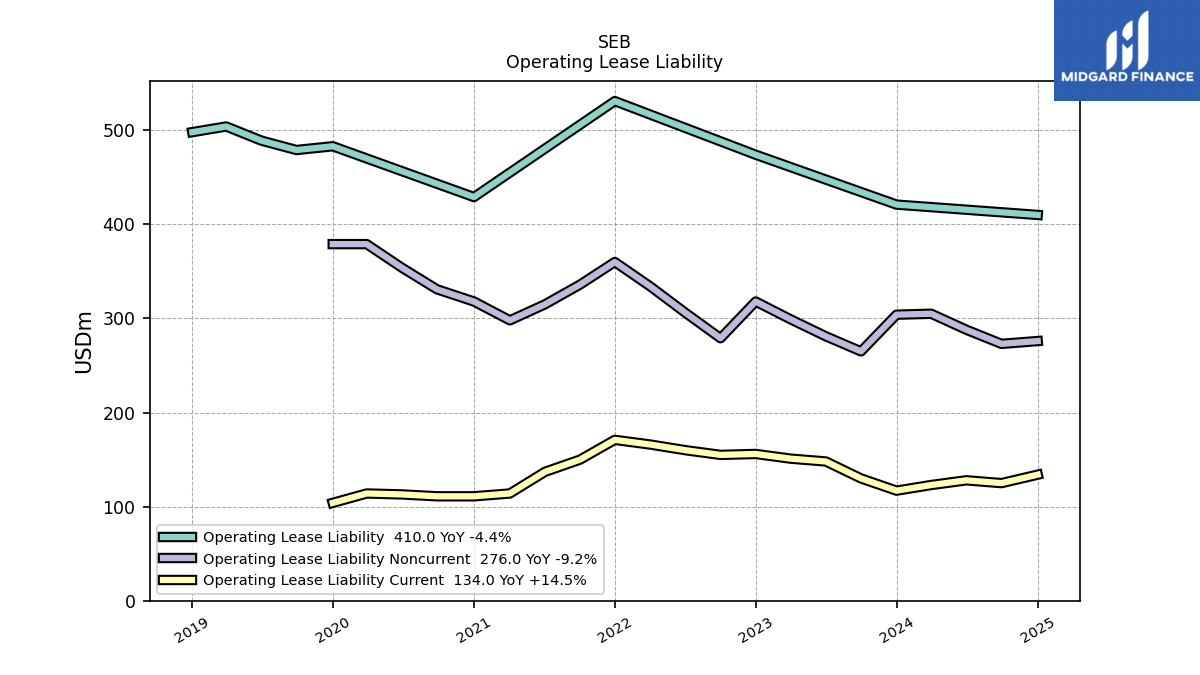
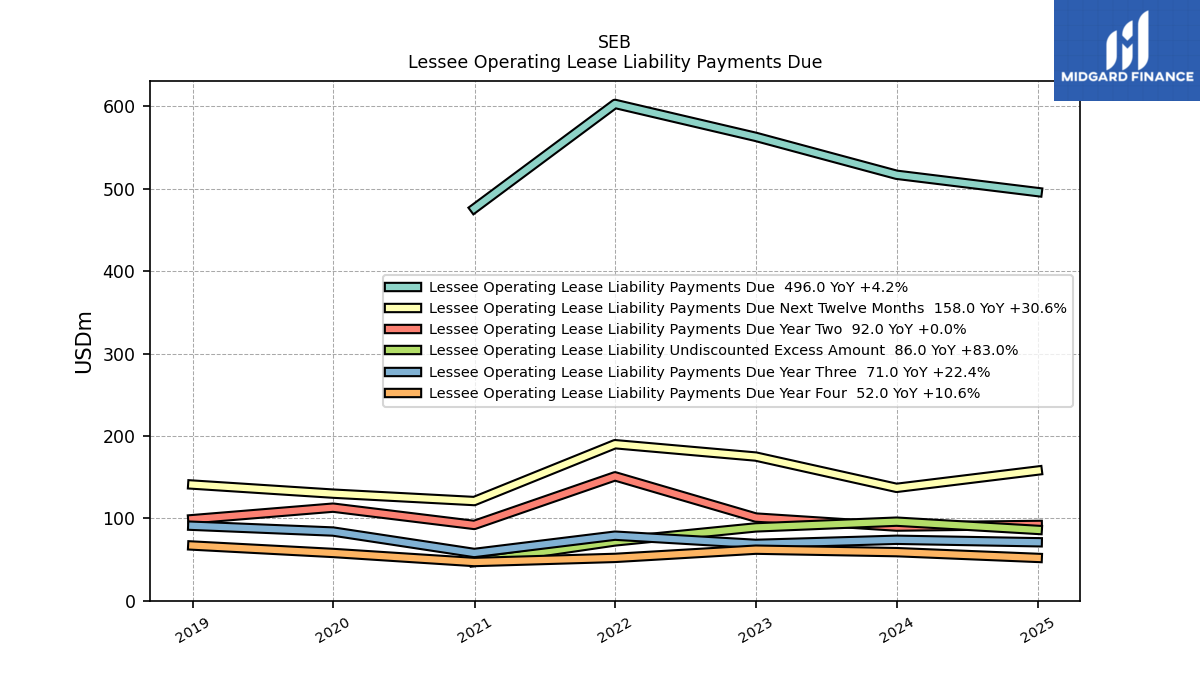
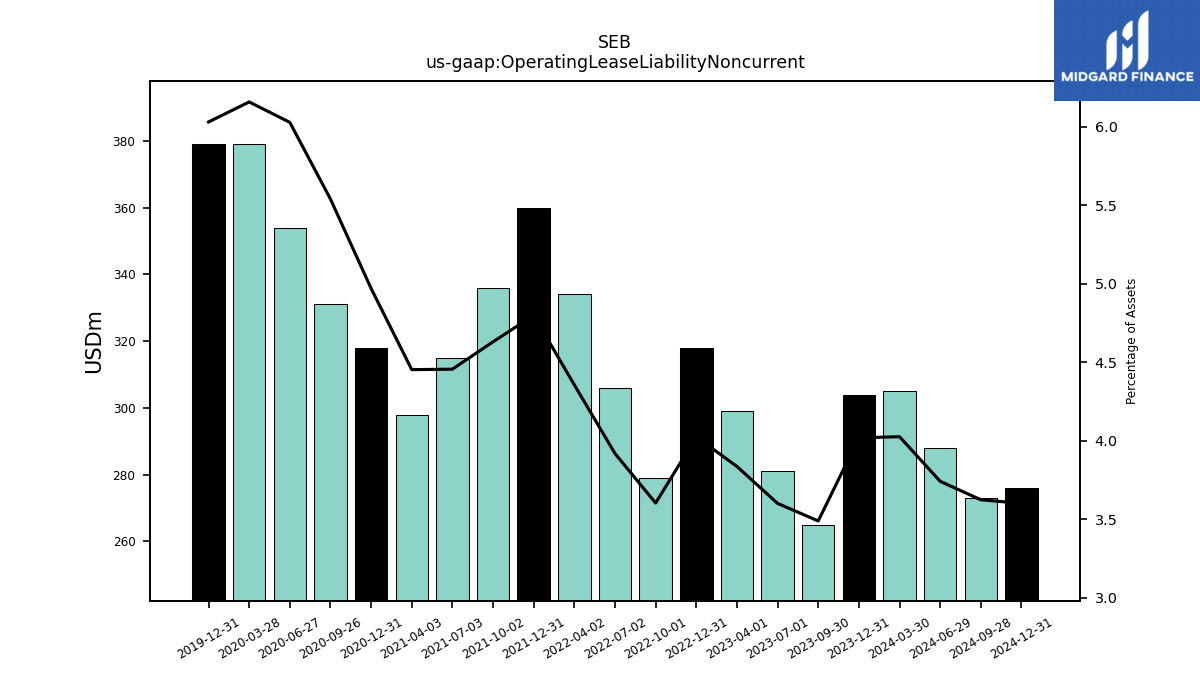
| Operating Lease Liability Noncurrent | 265.00 | 281.00 | 299.00 | 318.00 | 279.00 | 306.00 | 334.00 | 360.00 | 336.00 | 315.00 | 298.00 | 318.00 | 331.00 | 354.00 | 379.00 | 379.00 | NA | NA | NA | NA | NA | NA | NA | NA | NA | NA | NA | NA | NA | NA | NA | NA | NA | NA | NA | NA | NA | NA | NA | NA | NA | NA | NA | NA | NA | NA | NA | NA | NA | NA | NA | NA | NA | NA |
| 2023-09-30 | 2023-07-01 | 2023-04-01 | 2022-12-31 | 2022-10-01 | 2022-07-02 | 2022-04-02 | 2021-12-31 | 2021-10-02 | 2021-07-03 | 2021-04-03 | 2020-12-31 | 2020-09-26 | 2020-06-27 | 2020-03-28 | 2019-12-31 | 2019-09-28 | 2019-06-29 | 2019-03-30 | 2018-12-31 | 2018-09-29 | 2018-06-30 | 2018-03-31 | 2017-12-31 | 2017-09-30 | 2017-07-01 | 2017-04-01 | 2016-12-31 | 2016-10-01 | 2016-07-02 | 2016-04-02 | 2015-12-31 | 2015-10-03 | 2015-07-04 | 2015-04-04 | 2014-12-31 | 2014-09-27 | 2014-06-28 | 2014-03-29 | 2013-12-31 | 2013-09-28 | 2013-06-29 | 2013-03-30 | 2012-12-31 | 2012-09-29 | 2012-06-30 | 2012-03-31 | 2011-12-31 | 2011-10-01 | 2011-07-02 | 2011-04-02 | 2010-12-31 | 2010-10-02 | 2010-07-03 | ||
|---|---|---|---|---|---|---|---|---|---|---|---|---|---|---|---|---|---|---|---|---|---|---|---|---|---|---|---|---|---|---|---|---|---|---|---|---|---|---|---|---|---|---|---|---|---|---|---|---|---|---|---|---|---|---|---|
| Stockholders Equity | 5165.00 | 5044.00 | 4991.00 | 4996.00 | 4752.00 | 4620.00 | 4515.00 | 4416.00 | 4273.00 | 4172.00 | 4009.00 | 3817.00 | 3535.00 | 3380.00 | 3427.00 | 3544.00 | 3400.00 | 3409.00 | 3360.00 | 3318.00 | 3412.00 | 3403.00 | 3418.00 | 3397.00 | 3383.00 | 3305.00 | 3245.00 | 3162.00 | 3066.00 | 2996.00 | 2905.00 | 2876.00 | 2779.62 | 2783.00 | 2745.25 | 2715.90 | 2637.49 | 2535.50 | 2493.44 | 2475.25 | 2391.73 | 2377.07 | 2357.14 | 2304.55 | 2265.43 | 2196.54 | 2157.73 | 2078.92 | 2035.41 | 2005.84 | NA | 1775.21 | NA | NA | |
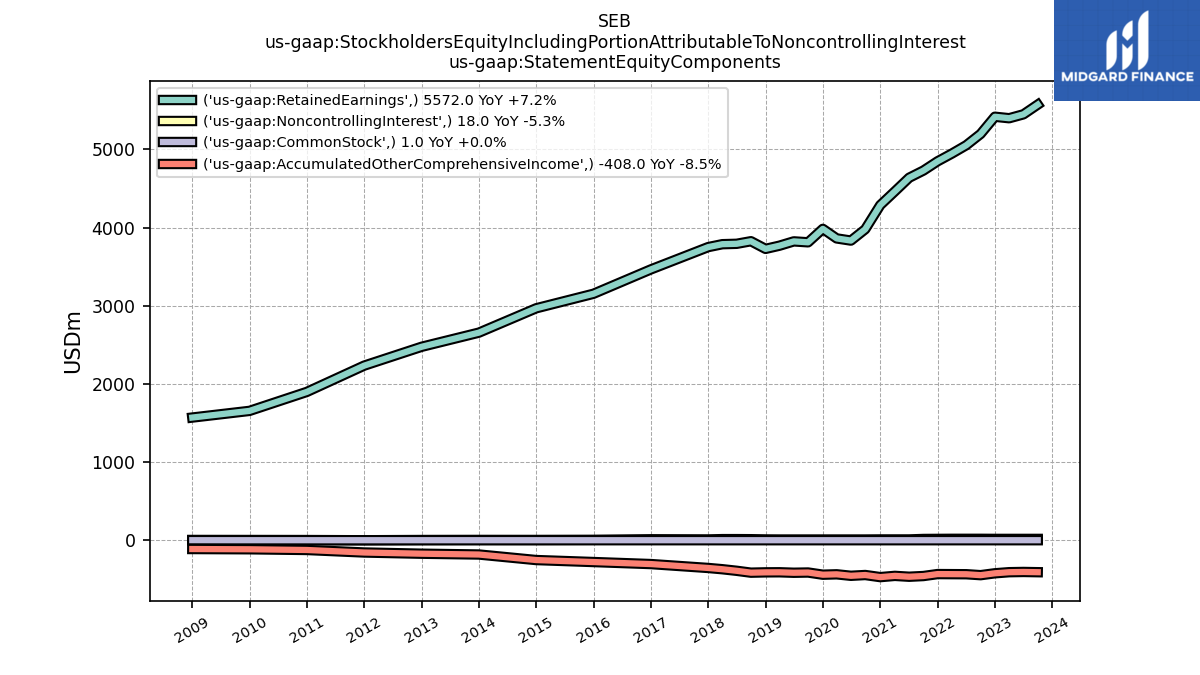
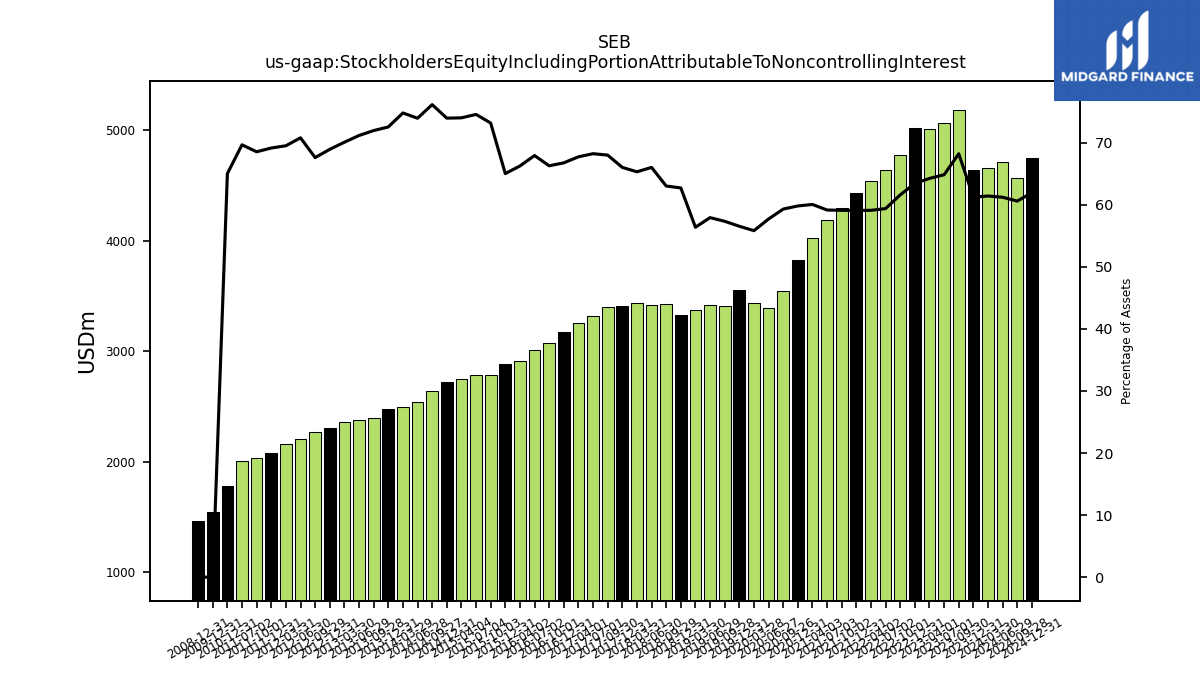
| Stockholders Equity Including Portion Attributable To Noncontrolling Interest | 5183.00 | 5062.00 | 5009.00 | 5014.00 | 4771.00 | 4639.00 | 4534.00 | 4434.00 | 4290.00 | 4183.00 | 4020.00 | 3828.00 | 3545.00 | 3390.00 | 3437.00 | 3554.00 | 3410.00 | 3419.00 | 3370.00 | 3329.00 | 3426.00 | 3418.00 | 3433.00 | 3408.00 | 3396.00 | 3318.00 | 3257.00 | 3175.00 | 3078.00 | 3008.00 | 2913.00 | 2882.00 | 2784.30 | 2787.90 | 2749.70 | 2720.27 | 2642.58 | 2541.24 | 2498.44 | 2479.97 | 2396.55 | 2381.50 | 2361.06 | 2308.19 | 2271.24 | 2202.14 | 2163.76 | 2079.47 | 2036.42 | 2008.54 | NA | 1778.25 | NA | NA | |
| Common Stock Value | 1.00 | 1.00 | 1.00 | 1.00 | 1.00 | 1.00 | 1.00 | 1.00 | 1.00 | 1.00 | 1.00 | 1.00 | 1.00 | 1.00 | 1.00 | 1.00 | 1.00 | 1.00 | 1.00 | 1.00 | 1.00 | 1.00 | 1.00 | 1.00 | 1.00 | 1.00 | 1.00 | 1.00 | 1.00 | 1.00 | 1.00 | 1.00 | 1.17 | 1.17 | 1.17 | 1.17 | 1.17 | 1.17 | 1.19 | 1.19 | 1.19 | 1.19 | 1.20 | 1.20 | 1.20 | 1.20 | 1.21 | 1.21 | 1.22 | 1.22 | NA | 1.22 | NA | NA | |
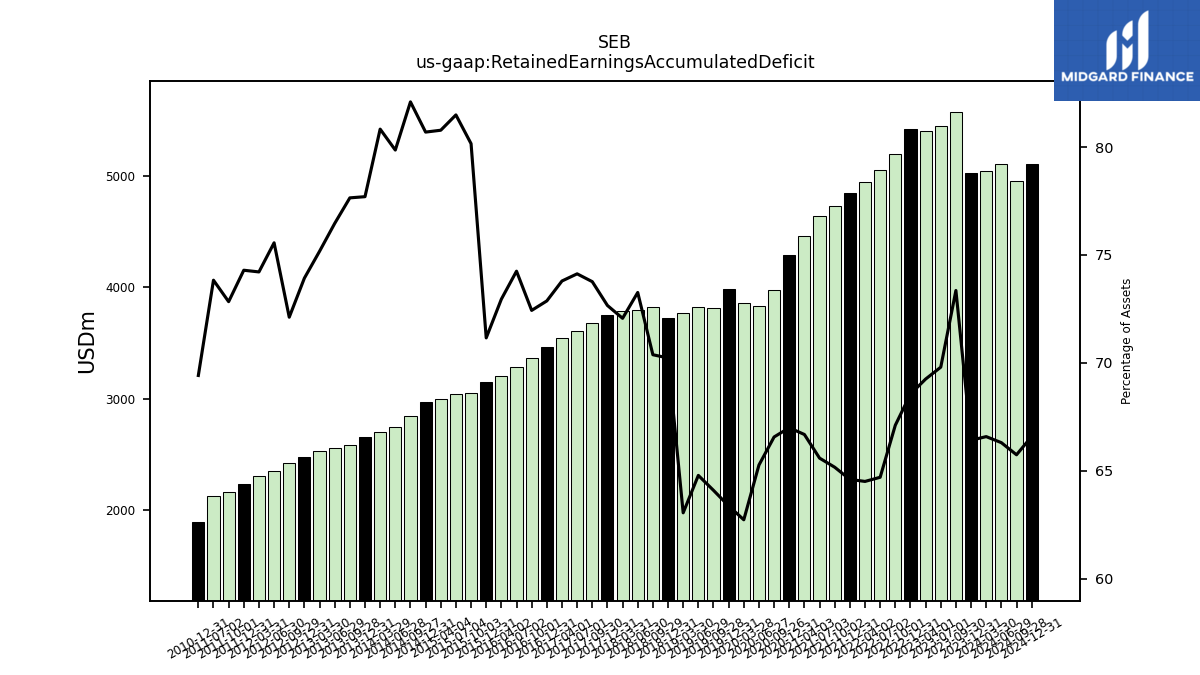
| Retained Earnings Accumulated Deficit | 5572.00 | 5448.00 | 5398.00 | 5417.00 | 5197.00 | 5053.00 | 4947.00 | 4847.00 | 4729.00 | 4637.00 | 4463.00 | 4287.00 | 3978.00 | 3833.00 | 3861.00 | 3983.00 | 3811.00 | 3823.00 | 3768.00 | 3727.00 | 3825.00 | 3792.00 | 3787.00 | 3750.00 | 3683.00 | 3604.00 | 3548.00 | 3465.00 | 3363.00 | 3287.00 | 3207.00 | 3153.00 | 3049.38 | 3046.36 | 3000.71 | 2967.36 | 2848.69 | 2743.94 | 2699.62 | 2655.86 | 2585.52 | 2558.21 | 2531.98 | 2474.90 | 2422.32 | 2350.14 | 2309.65 | 2233.78 | 2163.65 | 2128.25 | NA | 1897.90 | NA | NA | |
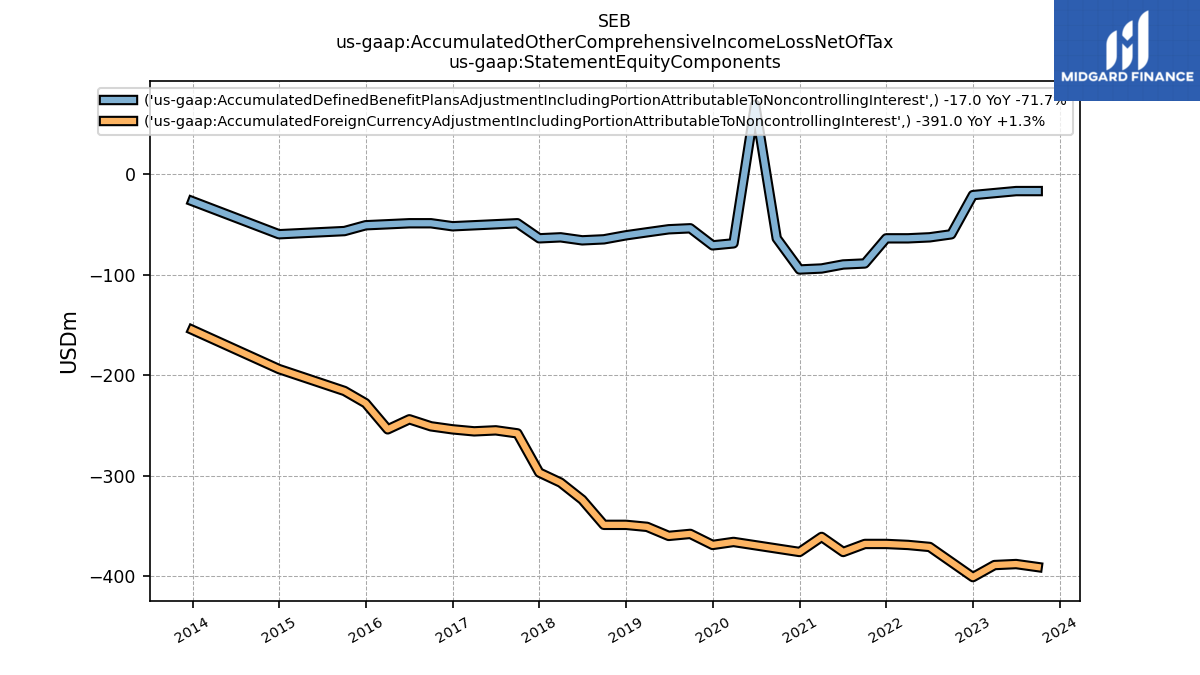
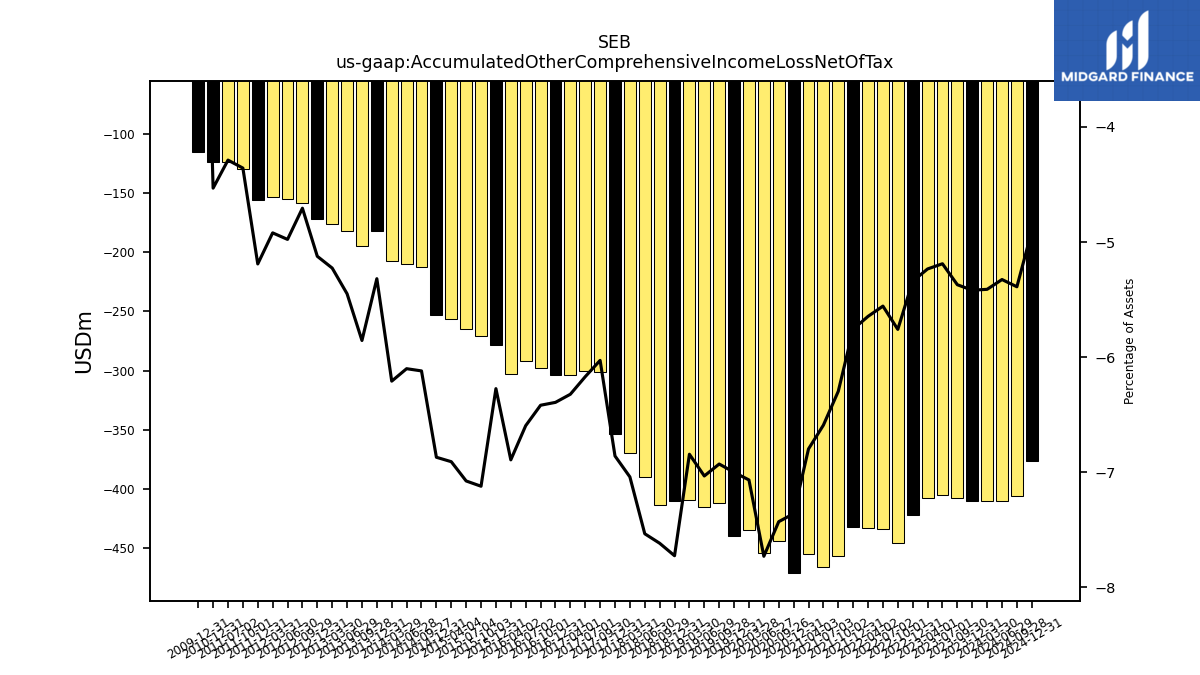
| Accumulated Other Comprehensive Income Loss Net Of Tax | -408.00 | -405.00 | -408.00 | -422.00 | -446.00 | -434.00 | -433.00 | -432.00 | -457.00 | -466.00 | -455.00 | -471.00 | -444.00 | -454.00 | -435.00 | -440.00 | -412.00 | -415.00 | -409.00 | -410.00 | -414.00 | -390.00 | -370.00 | -354.00 | -301.00 | -300.00 | -304.00 | -304.00 | -298.00 | -292.00 | -303.00 | -278.00 | -270.94 | -264.53 | -256.64 | -252.64 | -212.37 | -209.61 | -207.37 | -181.80 | -194.98 | -182.34 | -176.04 | -171.54 | -158.09 | -154.81 | -153.13 | -156.06 | -129.45 | -123.62 | NA | -123.91 | NA | NA | |
| Minority Interest | 18.00 | 18.00 | 18.00 | 18.00 | 19.00 | 19.00 | 19.00 | 18.00 | 17.00 | 11.00 | 11.00 | 11.00 | 10.00 | 10.00 | 10.00 | 10.00 | 10.00 | 10.00 | 10.00 | 11.00 | 14.00 | 15.00 | 15.00 | 11.00 | 13.00 | 13.00 | 12.00 | 13.00 | 12.00 | 12.00 | 8.00 | 6.00 | 4.68 | 4.90 | 4.45 | 4.38 | 5.09 | 5.75 | 5.00 | 4.72 | 4.82 | 4.43 | 3.93 | 3.64 | 5.81 | 5.60 | 6.03 | 0.54 | 1.00 | 2.70 | NA | 3.04 | NA | NA |
| 2023-09-30 | 2023-07-01 | 2023-04-01 | 2022-12-31 | 2022-10-01 | 2022-07-02 | 2022-04-02 | 2021-12-31 | 2021-10-02 | 2021-07-03 | 2021-04-03 | 2020-12-31 | 2020-09-26 | 2020-06-27 | 2020-03-28 | 2019-12-31 | 2019-09-28 | 2019-06-29 | 2019-03-30 | 2018-12-31 | 2018-09-29 | 2018-06-30 | 2018-03-31 | 2017-12-31 | 2017-09-30 | 2017-07-01 | 2017-04-01 | 2016-12-31 | 2016-10-01 | 2016-07-02 | 2016-04-02 | 2015-12-31 | 2015-10-03 | 2015-07-04 | 2015-04-04 | 2014-12-31 | 2014-09-27 | 2014-06-28 | 2014-03-29 | 2013-12-31 | 2013-09-28 | 2013-06-29 | 2013-03-30 | 2012-12-31 | 2012-09-29 | 2012-06-30 | 2012-03-31 | 2011-12-31 | 2011-10-01 | 2011-07-02 | 2011-04-02 | 2010-12-31 | 2010-10-02 | 2010-07-03 | ||
|---|---|---|---|---|---|---|---|---|---|---|---|---|---|---|---|---|---|---|---|---|---|---|---|---|---|---|---|---|---|---|---|---|---|---|---|---|---|---|---|---|---|---|---|---|---|---|---|---|---|---|---|---|---|---|---|
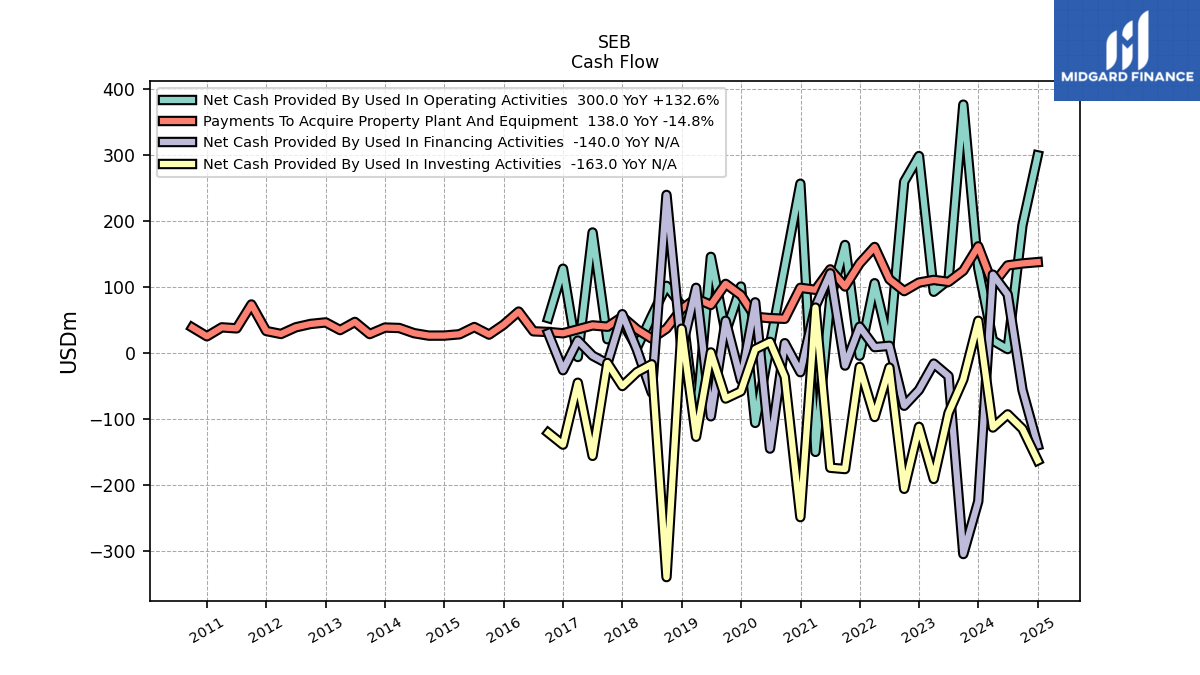
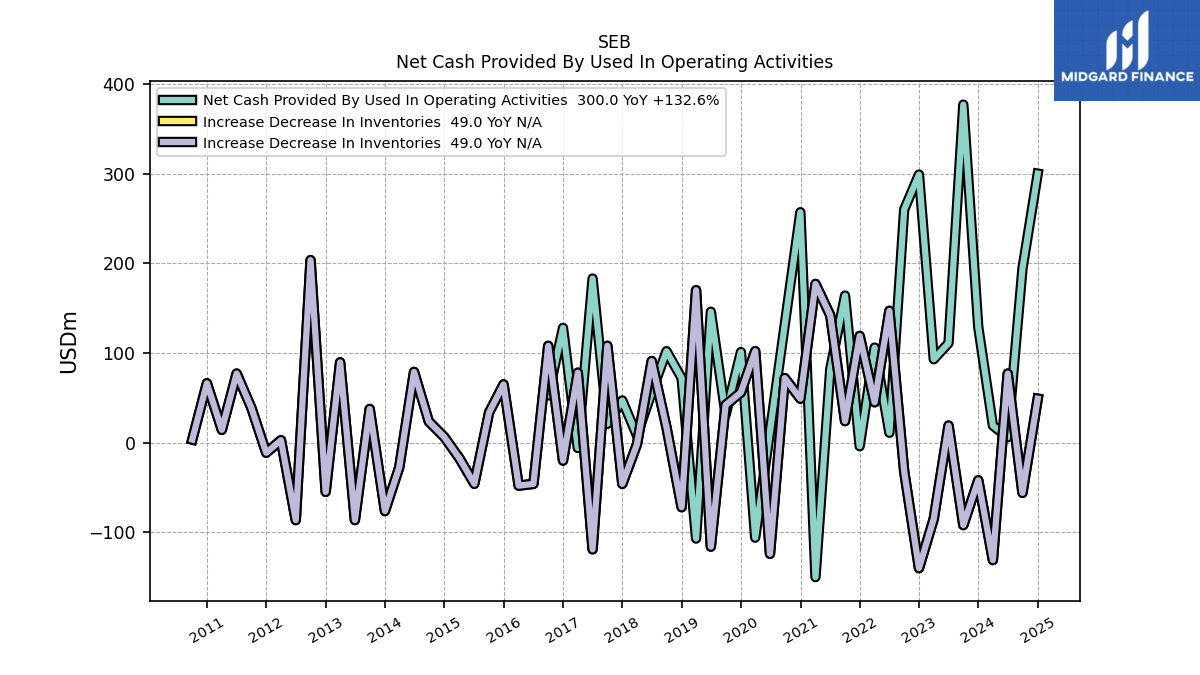
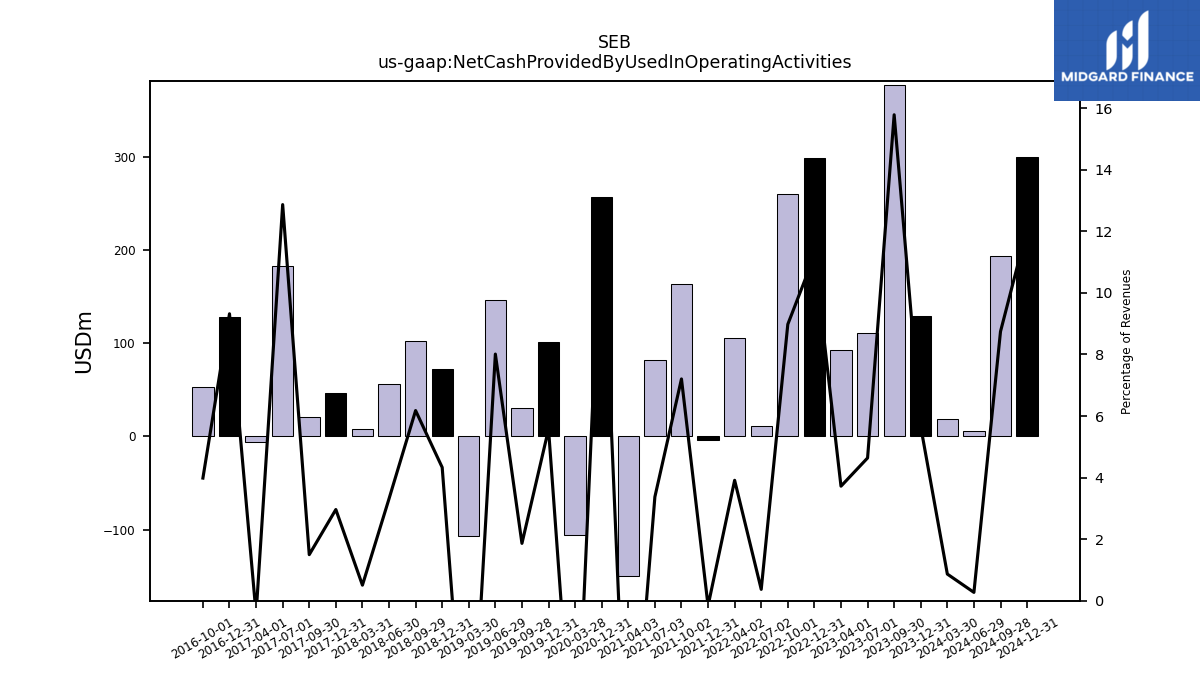
| Net Cash Provided By Used In Operating Activities | 377.00 | 111.00 | 93.00 | 299.00 | 260.00 | 11.00 | 106.00 | -4.00 | 164.00 | 82.00 | -150.00 | 257.00 | NA | NA | -106.00 | 101.00 | 31.00 | 146.00 | -107.00 | 72.00 | 102.00 | 56.00 | 8.00 | 47.00 | 21.00 | 183.00 | -6.00 | 128.00 | 53.00 | NA | NA | NA | NA | NA | NA | NA | NA | NA | NA | NA | NA | NA | NA | NA | NA | NA | NA | NA | NA | NA | NA | NA | NA | NA | |
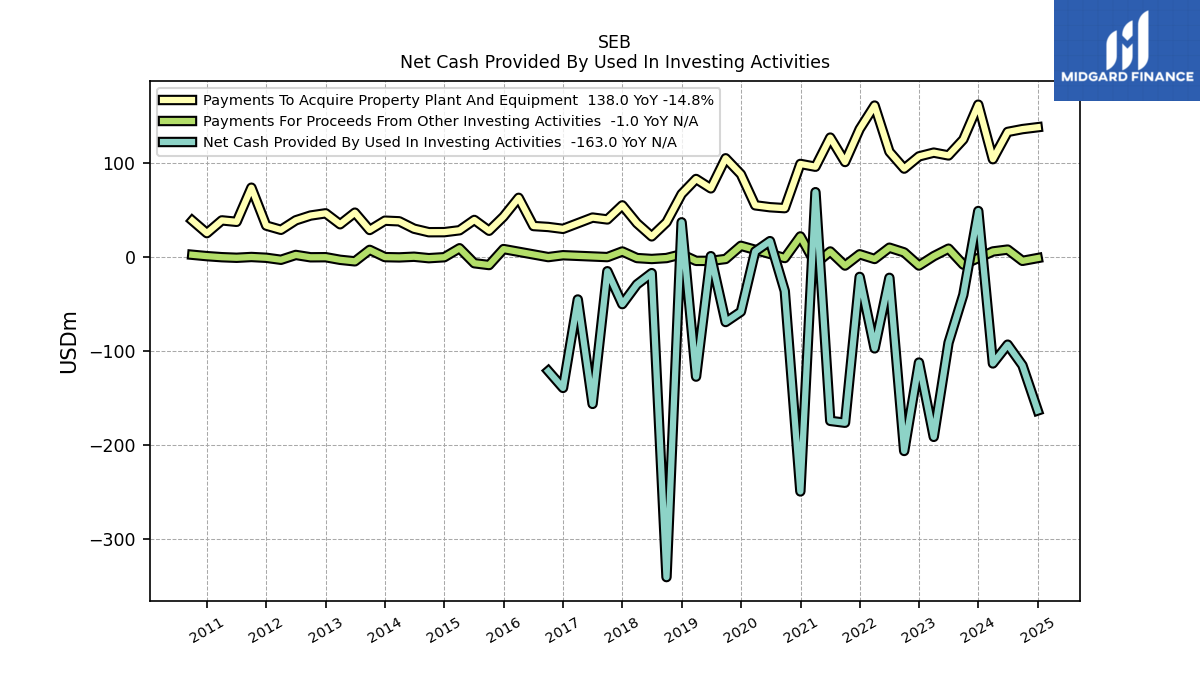
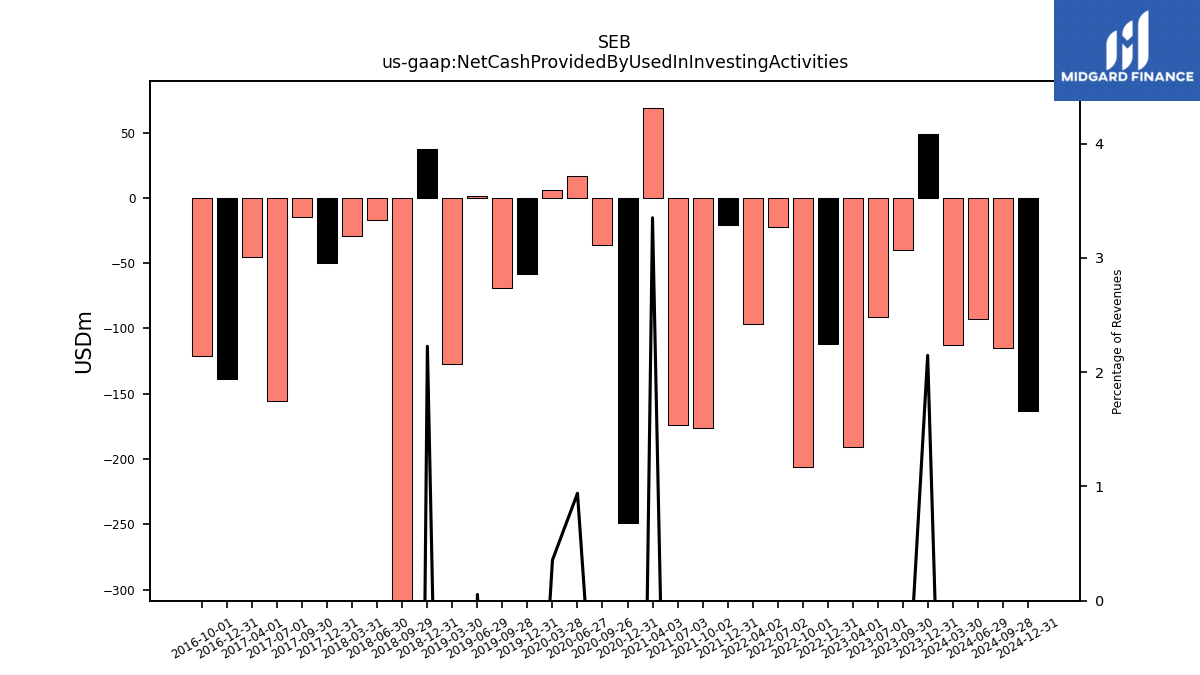
| Net Cash Provided By Used In Investing Activities | -40.00 | -91.00 | -191.00 | -112.00 | -206.00 | -22.00 | -97.00 | -21.00 | -176.00 | -174.00 | 69.00 | -249.00 | -36.00 | 17.00 | 6.00 | -58.00 | -69.00 | 1.00 | -127.00 | 37.00 | -340.00 | -17.00 | -29.00 | -50.00 | -15.00 | -156.00 | -45.00 | -139.00 | -121.00 | NA | NA | NA | NA | NA | NA | NA | NA | NA | NA | NA | NA | NA | NA | NA | NA | NA | NA | NA | NA | NA | NA | NA | NA | NA | |
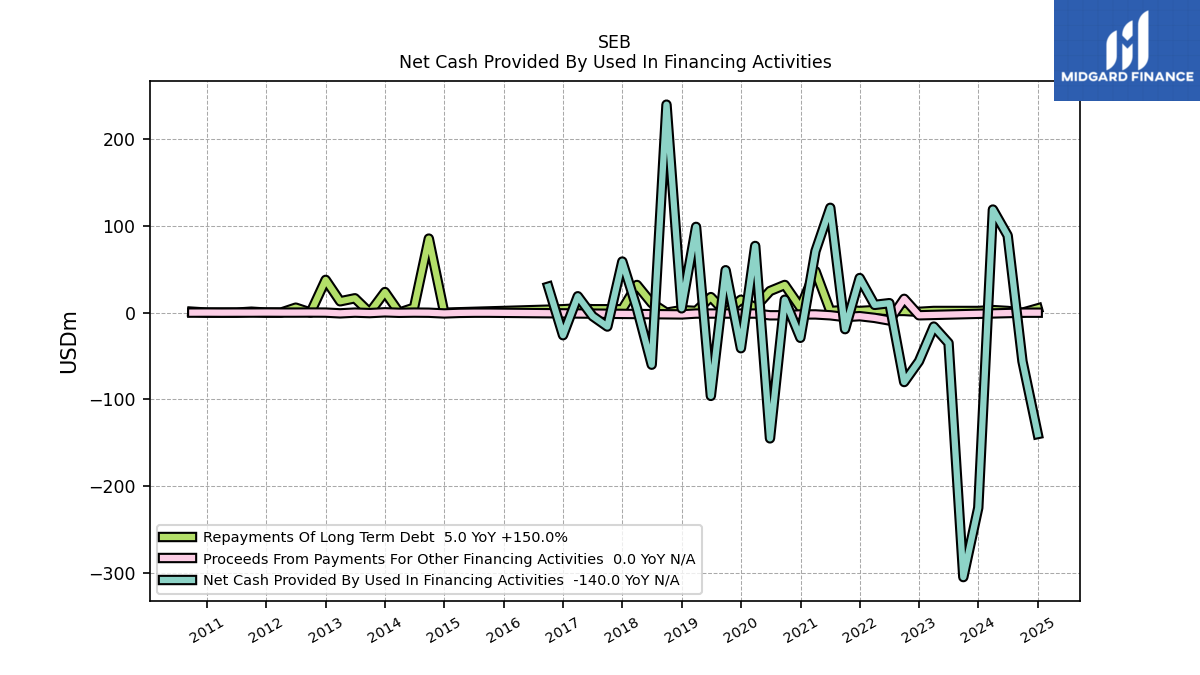
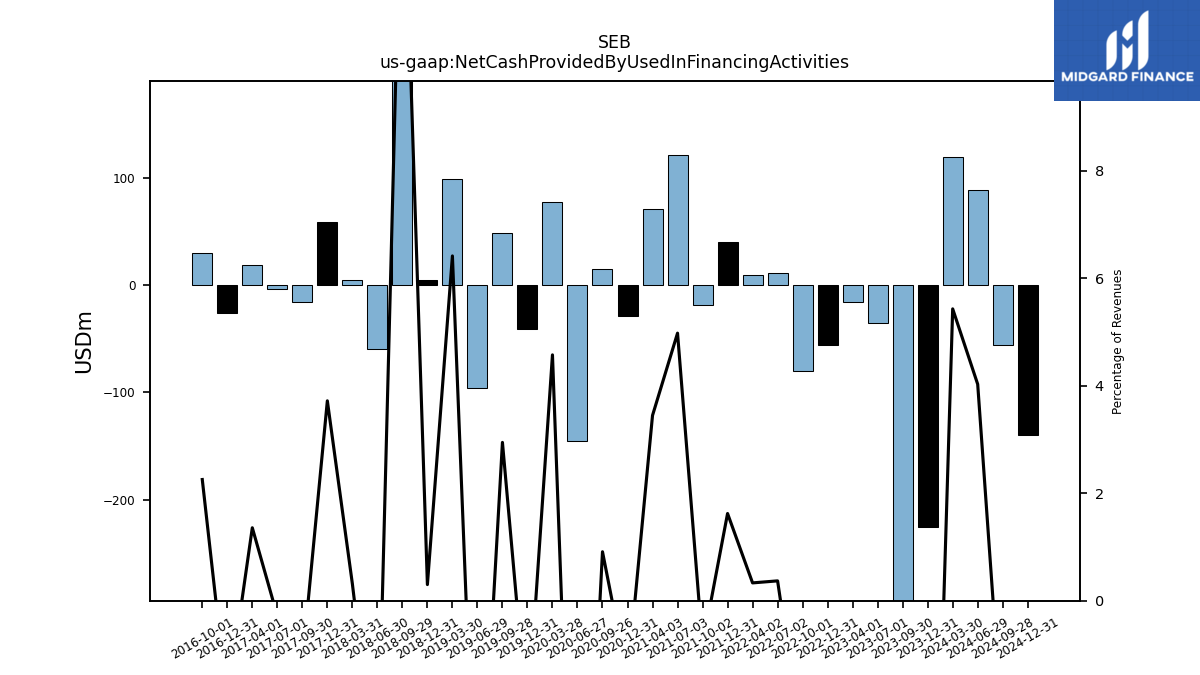
| Net Cash Provided By Used In Financing Activities | -305.00 | -35.00 | -16.00 | -56.00 | -80.00 | 11.00 | 9.00 | 40.00 | -19.00 | 121.00 | 71.00 | -29.00 | 15.00 | -145.00 | 77.00 | -41.00 | 49.00 | -96.00 | 99.00 | 5.00 | 240.00 | -60.00 | 5.00 | 59.00 | -16.00 | -4.00 | 19.00 | -26.00 | 30.00 | NA | NA | NA | NA | NA | NA | NA | NA | NA | NA | NA | NA | NA | NA | NA | NA | NA | NA | NA | NA | NA | NA | NA | NA | NA |
| 2023-09-30 | 2023-07-01 | 2023-04-01 | 2022-12-31 | 2022-10-01 | 2022-07-02 | 2022-04-02 | 2021-12-31 | 2021-10-02 | 2021-07-03 | 2021-04-03 | 2020-12-31 | 2020-09-26 | 2020-06-27 | 2020-03-28 | 2019-12-31 | 2019-09-28 | 2019-06-29 | 2019-03-30 | 2018-12-31 | 2018-09-29 | 2018-06-30 | 2018-03-31 | 2017-12-31 | 2017-09-30 | 2017-07-01 | 2017-04-01 | 2016-12-31 | 2016-10-01 | 2016-07-02 | 2016-04-02 | 2015-12-31 | 2015-10-03 | 2015-07-04 | 2015-04-04 | 2014-12-31 | 2014-09-27 | 2014-06-28 | 2014-03-29 | 2013-12-31 | 2013-09-28 | 2013-06-29 | 2013-03-30 | 2012-12-31 | 2012-09-29 | 2012-06-30 | 2012-03-31 | 2011-12-31 | 2011-10-01 | 2011-07-02 | 2011-04-02 | 2010-12-31 | 2010-10-02 | 2010-07-03 | ||
|---|---|---|---|---|---|---|---|---|---|---|---|---|---|---|---|---|---|---|---|---|---|---|---|---|---|---|---|---|---|---|---|---|---|---|---|---|---|---|---|---|---|---|---|---|---|---|---|---|---|---|---|---|---|---|---|
| Net Cash Provided By Used In Operating Activities | 377.00 | 111.00 | 93.00 | 299.00 | 260.00 | 11.00 | 106.00 | -4.00 | 164.00 | 82.00 | -150.00 | 257.00 | NA | NA | -106.00 | 101.00 | 31.00 | 146.00 | -107.00 | 72.00 | 102.00 | 56.00 | 8.00 | 47.00 | 21.00 | 183.00 | -6.00 | 128.00 | 53.00 | NA | NA | NA | NA | NA | NA | NA | NA | NA | NA | NA | NA | NA | NA | NA | NA | NA | NA | NA | NA | NA | NA | NA | NA | NA | |
| Profit Loss | 126.00 | 52.00 | -16.00 | 224.00 | 146.00 | 108.00 | 104.00 | 122.00 | 94.00 | 176.00 | 179.00 | 265.00 | 147.00 | -26.00 | -103.00 | 175.00 | -7.00 | 58.00 | 57.00 | -90.00 | 34.00 | 7.00 | 32.00 | 22.00 | 81.00 | 59.00 | 84.00 | 104.00 | 75.00 | 80.00 | 55.00 | 103.96 | 2.80 | 32.11 | 33.58 | 118.83 | 104.28 | 94.44 | 48.45 | 77.62 | 31.36 | 40.03 | 57.76 | 76.26 | 74.63 | 49.69 | 82.00 | 78.41 | 35.09 | 113.36 | 116.69 | 103.51 | 39.48 | 77.36 | |
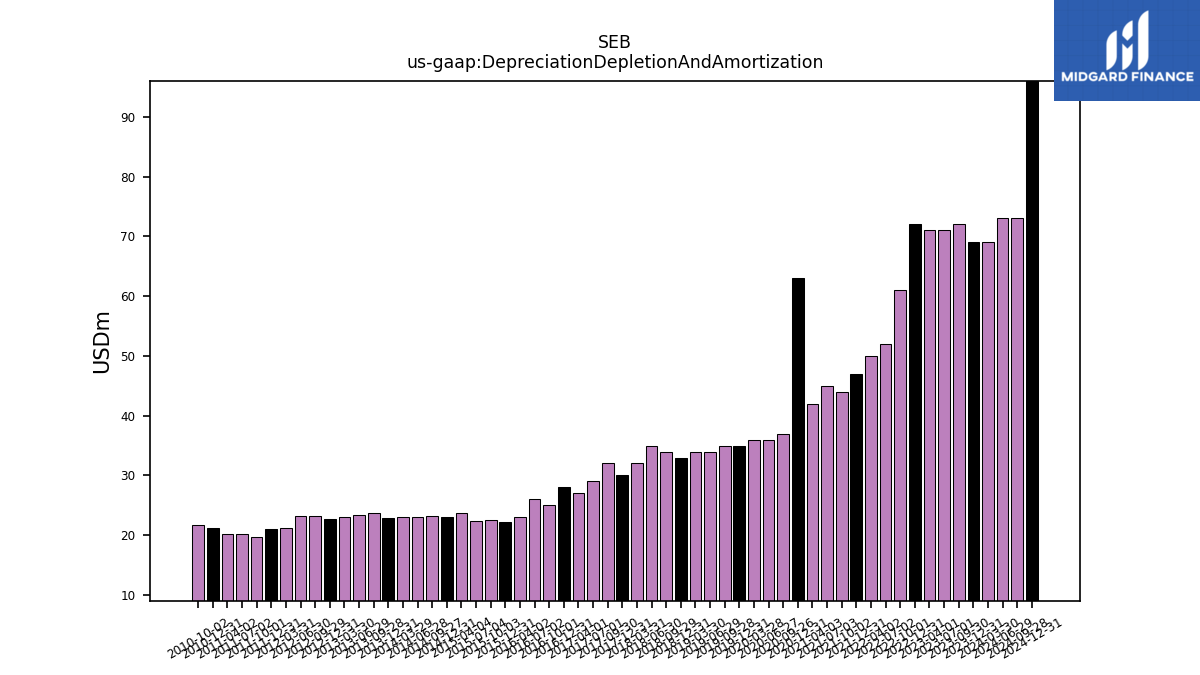
| Depreciation Depletion And Amortization | 72.00 | 71.00 | 71.00 | 72.00 | 61.00 | 52.00 | 50.00 | 47.00 | 44.00 | 45.00 | 42.00 | 63.00 | 37.00 | 36.00 | 36.00 | 35.00 | 35.00 | 34.00 | 34.00 | 33.00 | 34.00 | 35.00 | 32.00 | 30.00 | 32.00 | 29.00 | 27.00 | 28.00 | 25.00 | 26.00 | 23.00 | 22.26 | 22.62 | 22.42 | 23.71 | 23.06 | 23.27 | 23.09 | 22.96 | 22.89 | 23.67 | 23.44 | 23.07 | 22.70 | 23.18 | 23.20 | 21.14 | 21.11 | 19.69 | 20.14 | 20.27 | 21.15 | 21.71 | NA | |
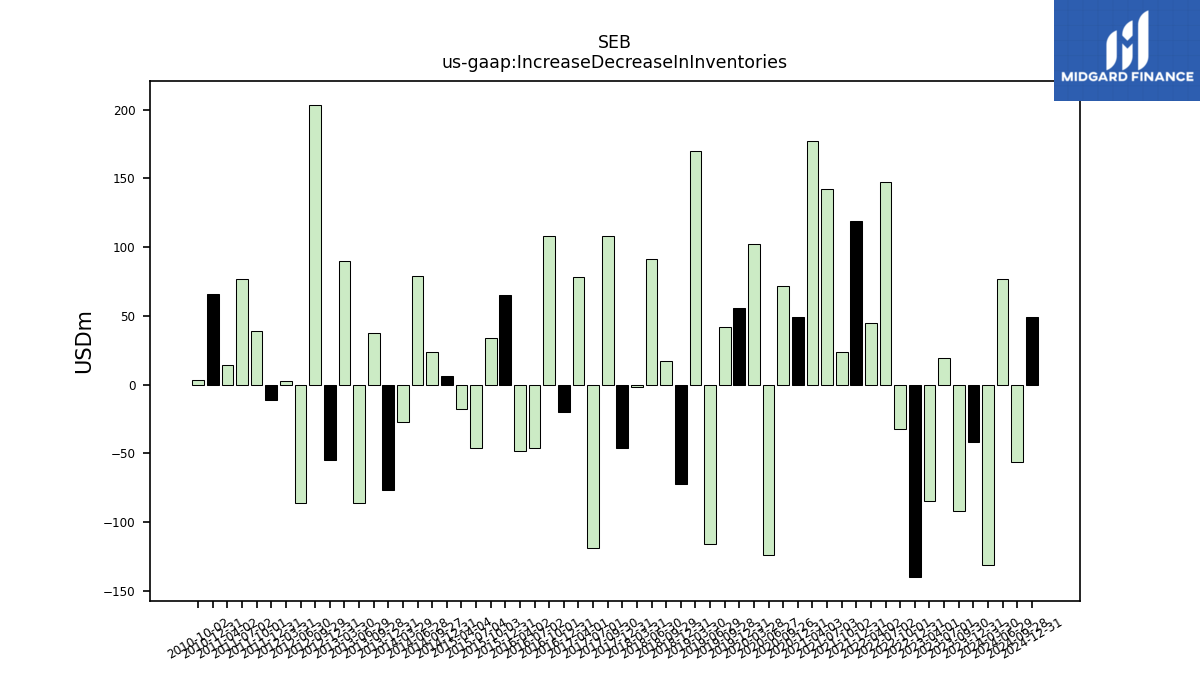
| Increase Decrease In Inventories | -92.00 | 19.00 | -85.00 | -140.00 | -32.00 | 147.00 | 45.00 | 119.00 | 24.00 | 142.00 | 177.00 | 49.00 | 72.00 | -124.00 | 102.00 | 56.00 | 42.00 | -116.00 | 170.00 | -72.00 | 17.00 | 91.00 | -2.00 | -46.00 | 108.00 | -119.00 | 78.00 | -20.00 | 108.00 | -46.00 | -48.00 | 64.96 | 33.60 | -45.90 | -17.66 | 6.31 | 23.61 | 78.89 | -27.52 | -76.34 | 37.55 | -86.36 | 89.55 | -54.93 | 203.56 | -86.40 | 2.71 | -11.29 | 38.70 | 77.06 | 14.26 | 66.20 | 3.43 | NA | |
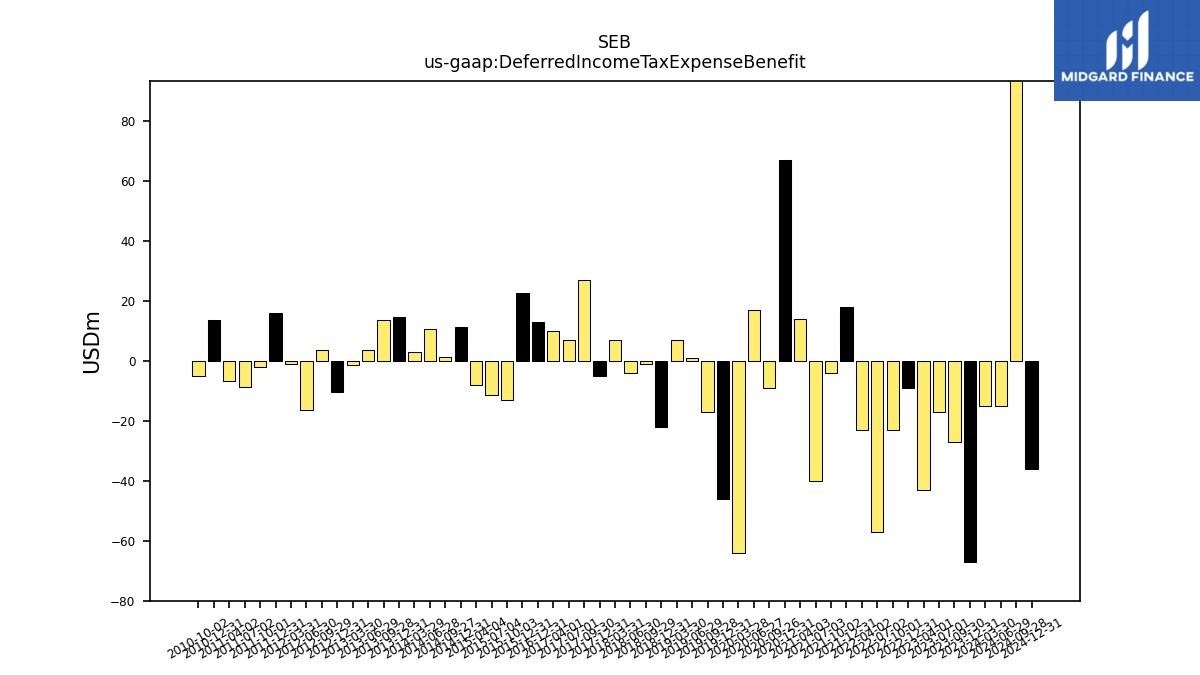
| Deferred Income Tax Expense Benefit | -27.00 | -17.00 | -43.00 | -9.00 | -23.00 | -57.00 | -23.00 | 18.00 | -4.00 | -40.00 | 14.00 | 67.00 | -9.00 | 17.00 | -64.00 | -46.00 | -17.00 | 1.00 | 7.00 | -22.00 | -1.00 | -4.00 | 7.00 | -5.00 | 27.00 | 7.00 | 10.00 | 13.00 | NA | NA | NA | 22.54 | -13.00 | -11.54 | -8.00 | 11.21 | 1.33 | 10.49 | 2.87 | 14.53 | 13.42 | 3.61 | -1.34 | -10.46 | 3.58 | -16.40 | -1.29 | 16.00 | -1.99 | -8.67 | -6.90 | 13.65 | -5.25 | NA |
| 2023-09-30 | 2023-07-01 | 2023-04-01 | 2022-12-31 | 2022-10-01 | 2022-07-02 | 2022-04-02 | 2021-12-31 | 2021-10-02 | 2021-07-03 | 2021-04-03 | 2020-12-31 | 2020-09-26 | 2020-06-27 | 2020-03-28 | 2019-12-31 | 2019-09-28 | 2019-06-29 | 2019-03-30 | 2018-12-31 | 2018-09-29 | 2018-06-30 | 2018-03-31 | 2017-12-31 | 2017-09-30 | 2017-07-01 | 2017-04-01 | 2016-12-31 | 2016-10-01 | 2016-07-02 | 2016-04-02 | 2015-12-31 | 2015-10-03 | 2015-07-04 | 2015-04-04 | 2014-12-31 | 2014-09-27 | 2014-06-28 | 2014-03-29 | 2013-12-31 | 2013-09-28 | 2013-06-29 | 2013-03-30 | 2012-12-31 | 2012-09-29 | 2012-06-30 | 2012-03-31 | 2011-12-31 | 2011-10-01 | 2011-07-02 | 2011-04-02 | 2010-12-31 | 2010-10-02 | 2010-07-03 | ||
|---|---|---|---|---|---|---|---|---|---|---|---|---|---|---|---|---|---|---|---|---|---|---|---|---|---|---|---|---|---|---|---|---|---|---|---|---|---|---|---|---|---|---|---|---|---|---|---|---|---|---|---|---|---|---|---|
| Net Cash Provided By Used In Investing Activities | -40.00 | -91.00 | -191.00 | -112.00 | -206.00 | -22.00 | -97.00 | -21.00 | -176.00 | -174.00 | 69.00 | -249.00 | -36.00 | 17.00 | 6.00 | -58.00 | -69.00 | 1.00 | -127.00 | 37.00 | -340.00 | -17.00 | -29.00 | -50.00 | -15.00 | -156.00 | -45.00 | -139.00 | -121.00 | NA | NA | NA | NA | NA | NA | NA | NA | NA | NA | NA | NA | NA | NA | NA | NA | NA | NA | NA | NA | NA | NA | NA | NA | NA | |
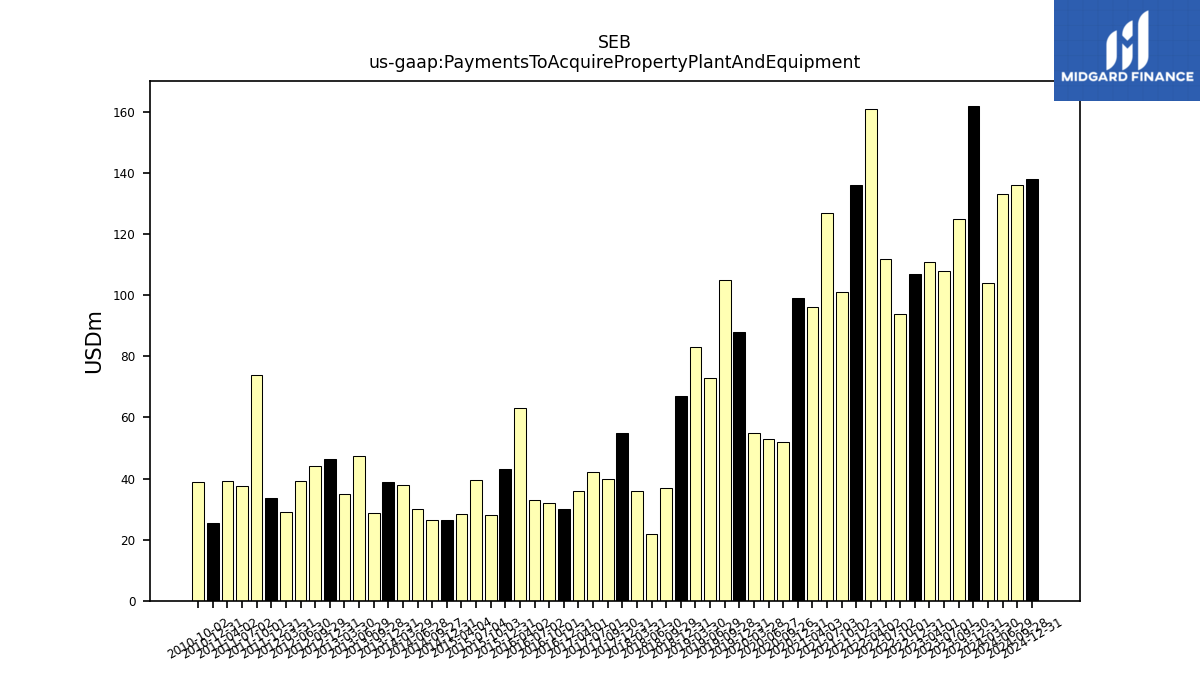
| Payments To Acquire Property Plant And Equipment | 125.00 | 108.00 | 111.00 | 107.00 | 94.00 | 112.00 | 161.00 | 136.00 | 101.00 | 127.00 | 96.00 | 99.00 | 52.00 | 53.00 | 55.00 | 88.00 | 105.00 | 73.00 | 83.00 | 67.00 | 37.00 | 22.00 | 36.00 | 55.00 | 40.00 | 42.00 | 36.00 | 30.00 | 32.00 | 33.00 | 63.00 | 43.01 | 27.99 | 39.49 | 28.52 | 26.51 | 26.45 | 30.18 | 38.03 | 38.71 | 28.81 | 47.25 | 34.89 | 46.54 | 44.16 | 39.09 | 28.97 | 33.48 | 73.77 | 37.46 | 39.03 | 25.44 | 38.85 | NA |
| 2023-09-30 | 2023-07-01 | 2023-04-01 | 2022-12-31 | 2022-10-01 | 2022-07-02 | 2022-04-02 | 2021-12-31 | 2021-10-02 | 2021-07-03 | 2021-04-03 | 2020-12-31 | 2020-09-26 | 2020-06-27 | 2020-03-28 | 2019-12-31 | 2019-09-28 | 2019-06-29 | 2019-03-30 | 2018-12-31 | 2018-09-29 | 2018-06-30 | 2018-03-31 | 2017-12-31 | 2017-09-30 | 2017-07-01 | 2017-04-01 | 2016-12-31 | 2016-10-01 | 2016-07-02 | 2016-04-02 | 2015-12-31 | 2015-10-03 | 2015-07-04 | 2015-04-04 | 2014-12-31 | 2014-09-27 | 2014-06-28 | 2014-03-29 | 2013-12-31 | 2013-09-28 | 2013-06-29 | 2013-03-30 | 2012-12-31 | 2012-09-29 | 2012-06-30 | 2012-03-31 | 2011-12-31 | 2011-10-01 | 2011-07-02 | 2011-04-02 | 2010-12-31 | 2010-10-02 | 2010-07-03 | ||
|---|---|---|---|---|---|---|---|---|---|---|---|---|---|---|---|---|---|---|---|---|---|---|---|---|---|---|---|---|---|---|---|---|---|---|---|---|---|---|---|---|---|---|---|---|---|---|---|---|---|---|---|---|---|---|---|
| Net Cash Provided By Used In Financing Activities | -305.00 | -35.00 | -16.00 | -56.00 | -80.00 | 11.00 | 9.00 | 40.00 | -19.00 | 121.00 | 71.00 | -29.00 | 15.00 | -145.00 | 77.00 | -41.00 | 49.00 | -96.00 | 99.00 | 5.00 | 240.00 | -60.00 | 5.00 | 59.00 | -16.00 | -4.00 | 19.00 | -26.00 | 30.00 | NA | NA | NA | NA | NA | NA | NA | NA | NA | NA | NA | NA | NA | NA | NA | NA | NA | NA | NA | NA | NA | NA | NA | NA | NA | |
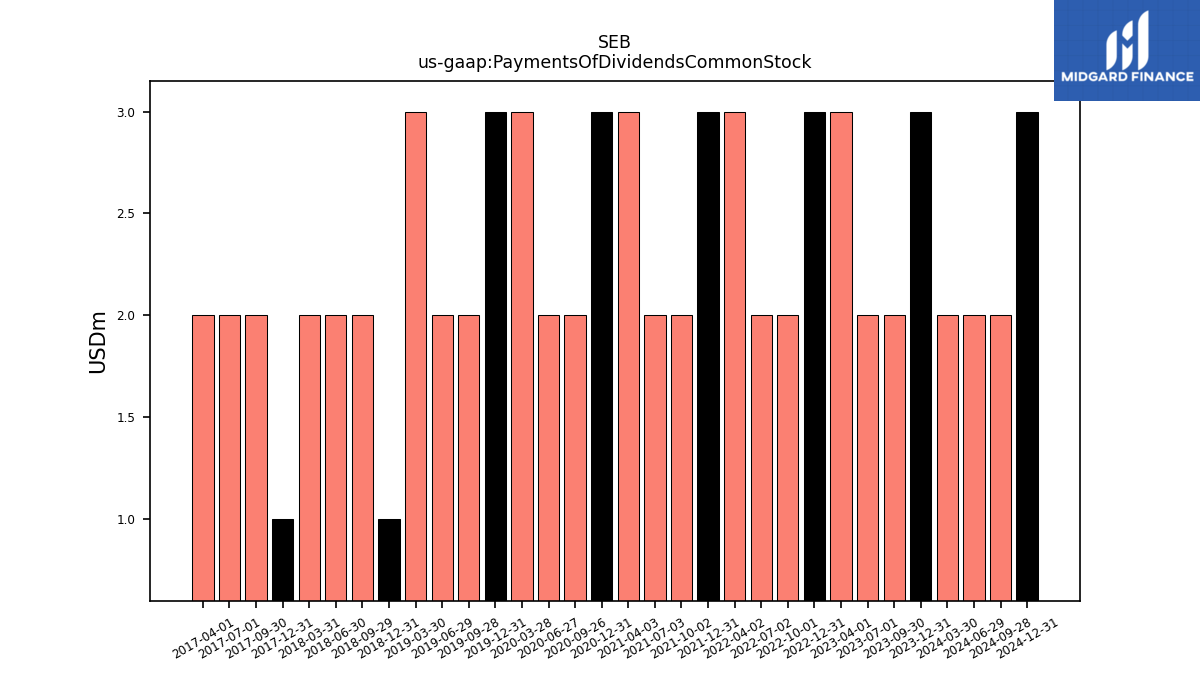
| Payments Of Dividends Common Stock | 2.00 | 2.00 | 3.00 | 3.00 | 2.00 | 2.00 | 3.00 | 3.00 | 2.00 | 2.00 | 3.00 | 3.00 | 2.00 | 2.00 | 3.00 | 3.00 | 2.00 | 2.00 | 3.00 | 1.00 | 2.00 | 2.00 | 2.00 | 1.00 | 2.00 | 2.00 | 2.00 | NA | NA | NA | NA | NA | NA | NA | NA | NA | NA | NA | NA | NA | NA | NA | NA | NA | NA | NA | NA | NA | NA | NA | NA | NA | NA | NA |
| 2023-09-30 | 2023-07-01 | 2023-04-01 | 2022-12-31 | 2022-10-01 | 2022-07-02 | 2022-04-02 | 2021-12-31 | 2021-10-02 | 2021-07-03 | 2021-04-03 | 2020-12-31 | 2020-09-26 | 2020-06-27 | 2020-03-28 | 2019-12-31 | 2019-09-28 | 2019-06-29 | 2019-03-30 | 2018-12-31 | 2018-09-29 | 2018-06-30 | 2018-03-31 | 2017-12-31 | 2017-09-30 | 2017-07-01 | 2017-04-01 | 2016-12-31 | 2016-10-01 | 2016-07-02 | 2016-04-02 | 2015-12-31 | 2015-10-03 | 2015-07-04 | 2015-04-04 | 2014-12-31 | 2014-09-27 | 2014-06-28 | 2014-03-29 | 2013-12-31 | 2013-09-28 | 2013-06-29 | 2013-03-30 | 2012-12-31 | 2012-09-29 | 2012-06-30 | 2012-03-31 | 2011-12-31 | 2011-10-01 | 2011-07-02 | 2011-04-02 | 2010-12-31 | 2010-10-02 | 2010-07-03 | ||
|---|---|---|---|---|---|---|---|---|---|---|---|---|---|---|---|---|---|---|---|---|---|---|---|---|---|---|---|---|---|---|---|---|---|---|---|---|---|---|---|---|---|---|---|---|---|---|---|---|---|---|---|---|---|---|---|
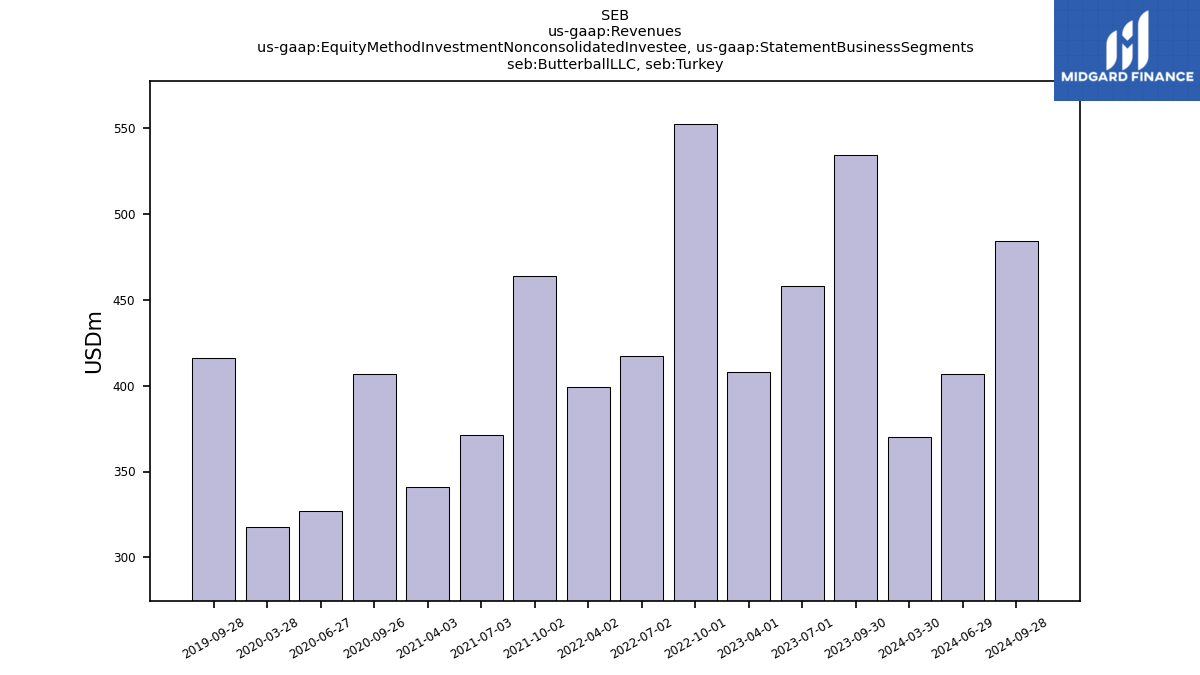
| Revenues | 2388.00 | 2393.00 | 2499.00 | 2666.00 | 2895.00 | 2973.00 | 2709.00 | 2464.00 | 2276.00 | 2430.00 | 2059.00 | 1990.00 | 1645.00 | 1808.00 | 1683.00 | 1812.00 | 1663.00 | 1822.00 | 1543.00 | 1662.00 | 1651.00 | 1691.00 | 1579.00 | 1586.00 | 1402.00 | 1422.00 | 1399.00 | 1373.00 | 1330.00 | 1357.00 | 1319.00 | 1302.98 | 1410.77 | 1427.89 | 1452.36 | 1676.21 | 1622.64 | 1694.59 | 1479.64 | 1755.97 | 1648.11 | 1684.04 | 1582.30 | 1728.01 | 1479.42 | 1510.59 | 1471.11 | 1403.42 | 1476.72 | 1398.59 | 1468.18 | 1205.15 | 1111.81 | 1048.46 | |
| Butterball L L C, Turkey | 534.00 | 458.00 | 408.00 | NA | 552.00 | 417.00 | 399.00 | NA | 464.00 | 371.00 | 341.00 | NA | 407.00 | 327.00 | 318.00 | NA | 416.00 | NA | NA | NA | NA | NA | NA | NA | NA | NA | NA | NA | NA | NA | NA | NA | NA | NA | NA | NA | NA | NA | NA | NA | NA | NA | NA | NA | NA | NA | NA | NA | NA | NA | NA | NA | NA | NA | |
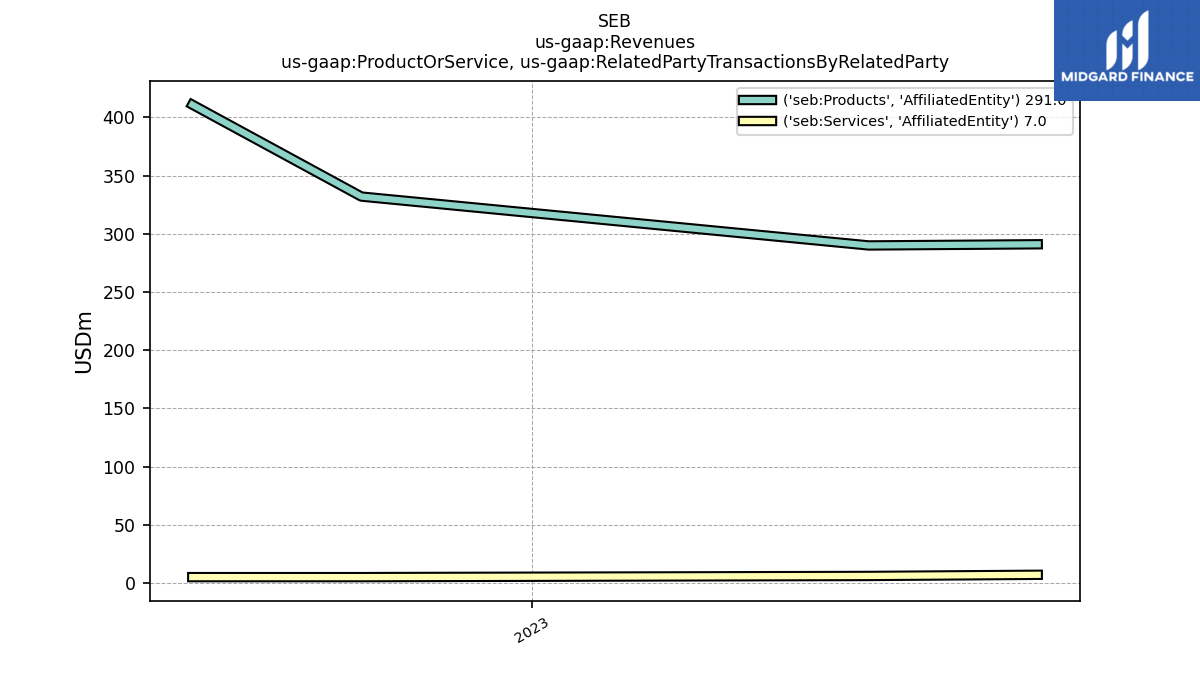
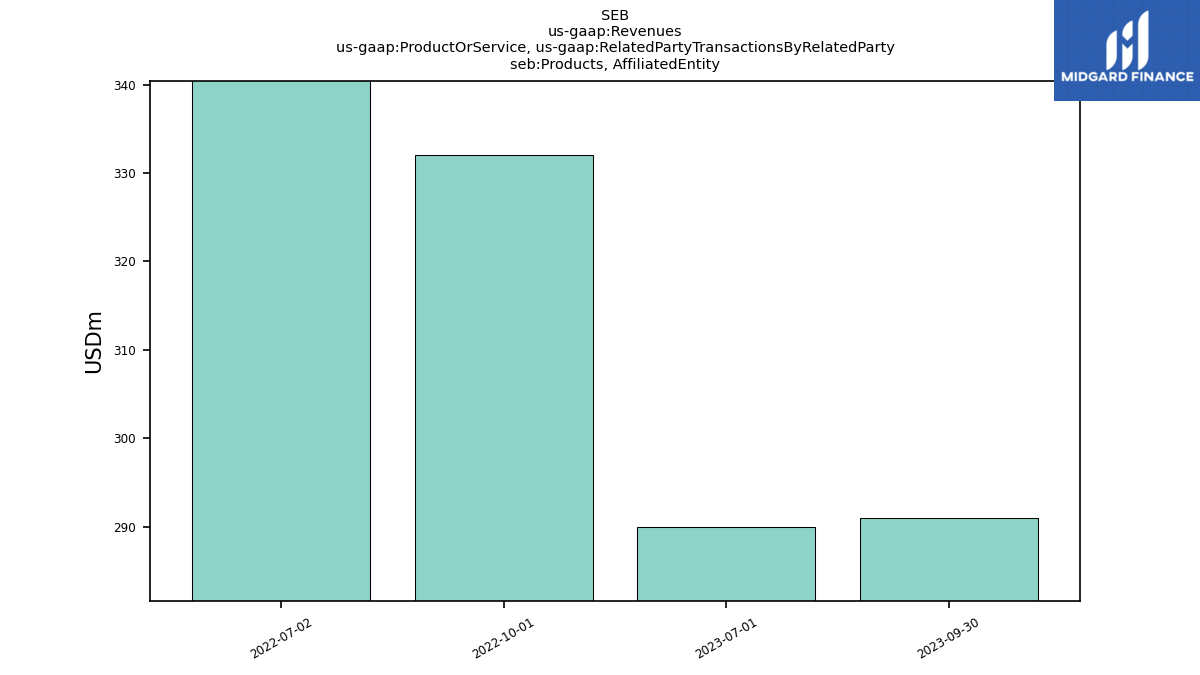
| Products, | 291.00 | 290.00 | NA | NA | 332.00 | 411.00 | NA | NA | NA | NA | NA | NA | NA | NA | NA | NA | NA | NA | NA | NA | NA | NA | NA | NA | NA | NA | NA | NA | NA | NA | NA | NA | NA | NA | NA | NA | NA | NA | NA | NA | NA | NA | NA | NA | NA | NA | NA | NA | NA | NA | NA | NA | NA | NA | |
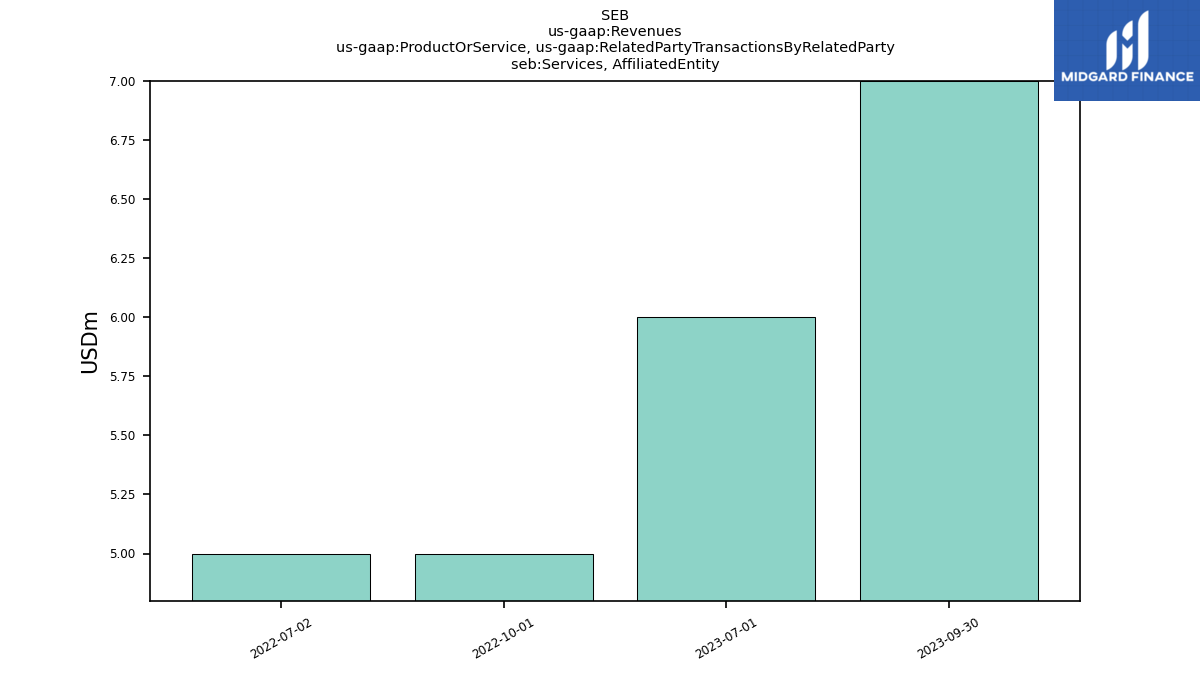
| Services, | 7.00 | 6.00 | NA | NA | 5.00 | 5.00 | NA | NA | NA | NA | NA | NA | NA | NA | NA | NA | NA | NA | NA | NA | NA | NA | NA | NA | NA | NA | NA | NA | NA | NA | NA | NA | NA | NA | NA | NA | NA | NA | NA | NA | NA | NA | NA | NA | NA | NA | NA | NA | NA | NA | NA | NA | NA | NA | |
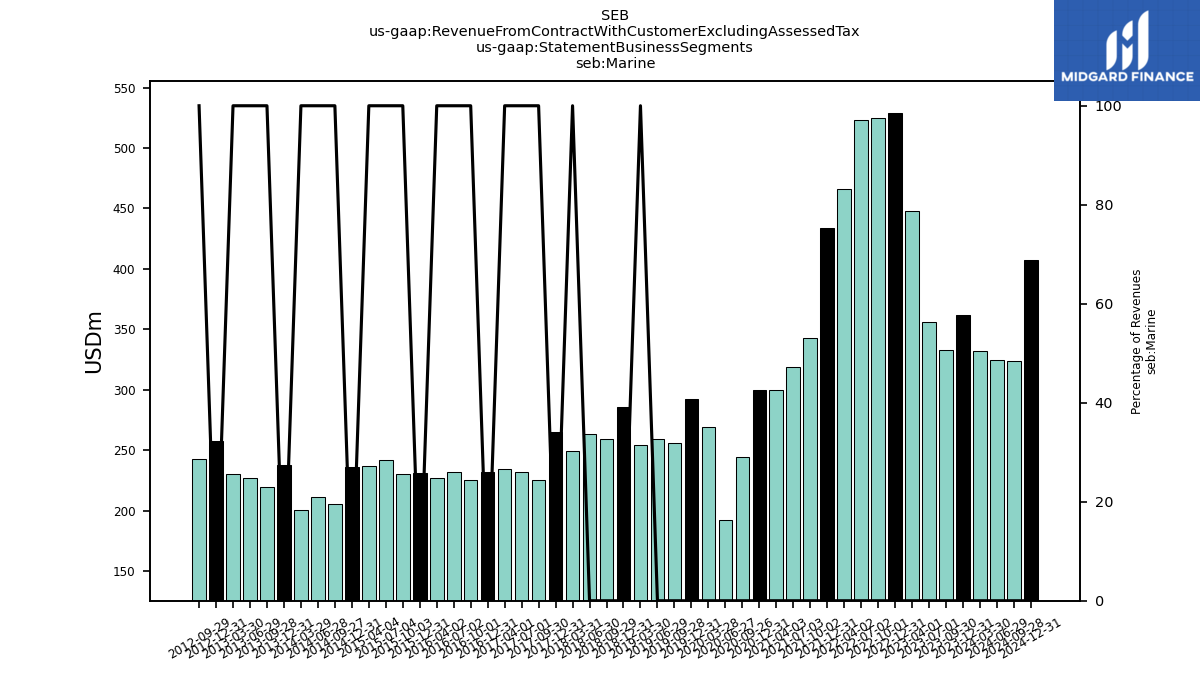
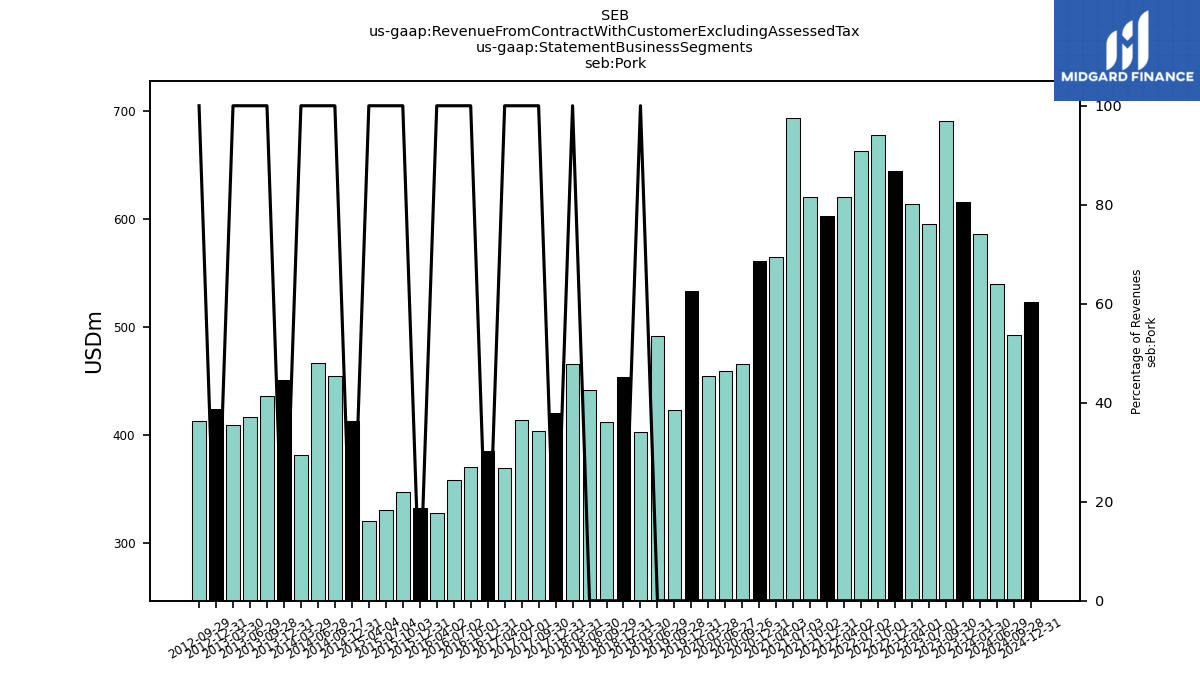
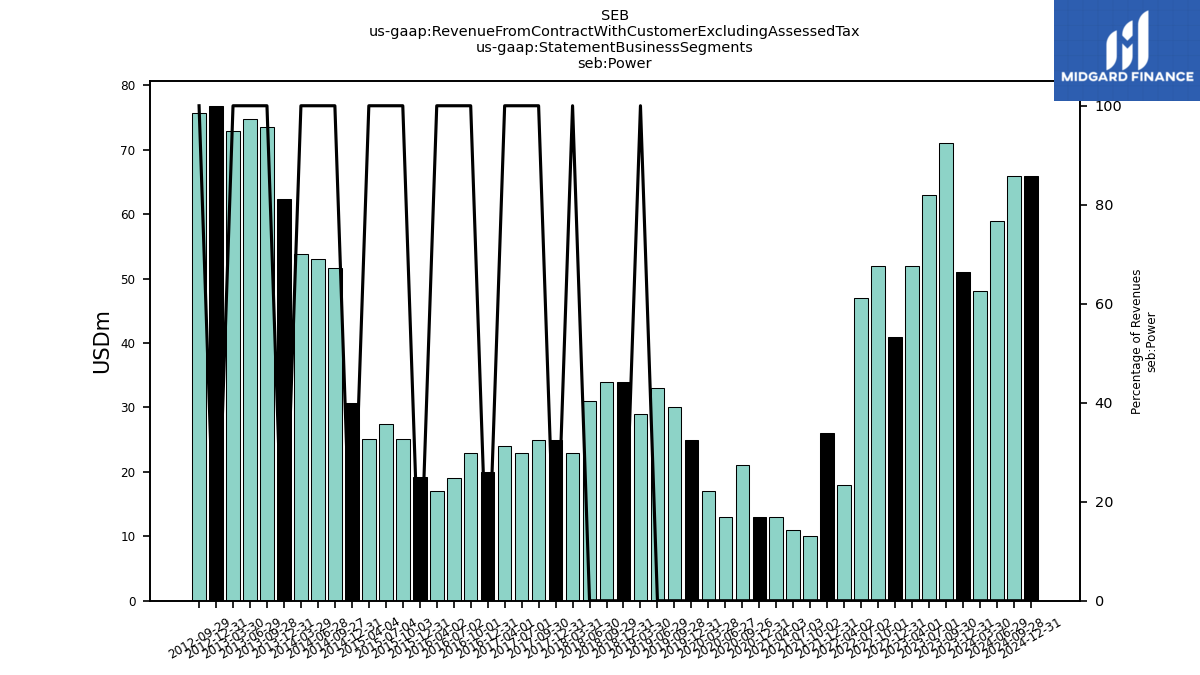
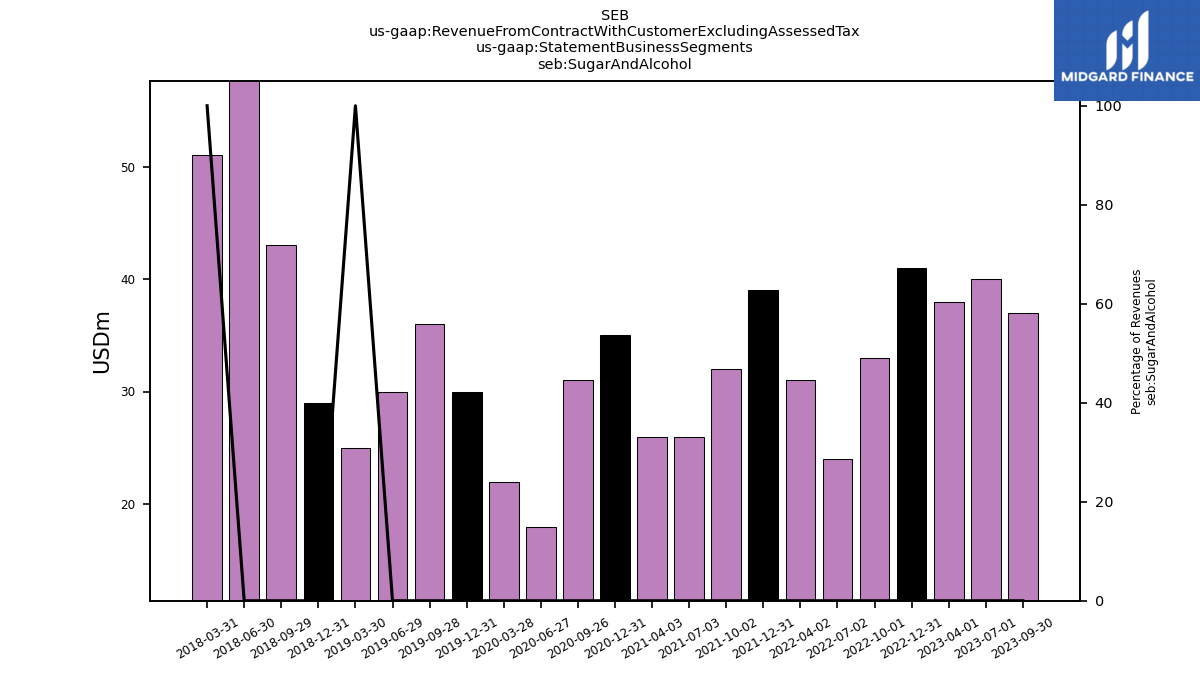
| Revenue From Contract With Customer Excluding Assessed Tax | 2388.00 | 2393.00 | 2499.00 | 2666.00 | 2895.00 | 2973.00 | 2709.00 | 2464.00 | 2276.00 | 2430.00 | 2059.00 | 1990.00 | 1645.00 | 1808.00 | 1683.00 | 1812.00 | 1663.00 | 1822.00 | 1543.00 | 1662.00 | 1651.00 | 1691.00 | 1579.00 | 1586.00 | 1402.00 | 1422.00 | 1399.00 | 1373.00 | 1330.00 | 1357.00 | 1319.00 | 1302.98 | 1410.77 | 1427.89 | 1452.36 | 1676.21 | 1622.64 | 1694.59 | 1479.64 | 1755.97 | 1648.11 | 1684.04 | 1582.30 | 1728.01 | 1479.42 | 1510.59 | 1471.11 | 1403.42 | 1476.72 | 1398.59 | 1468.18 | 1205.15 | 1111.81 | 1048.46 | |
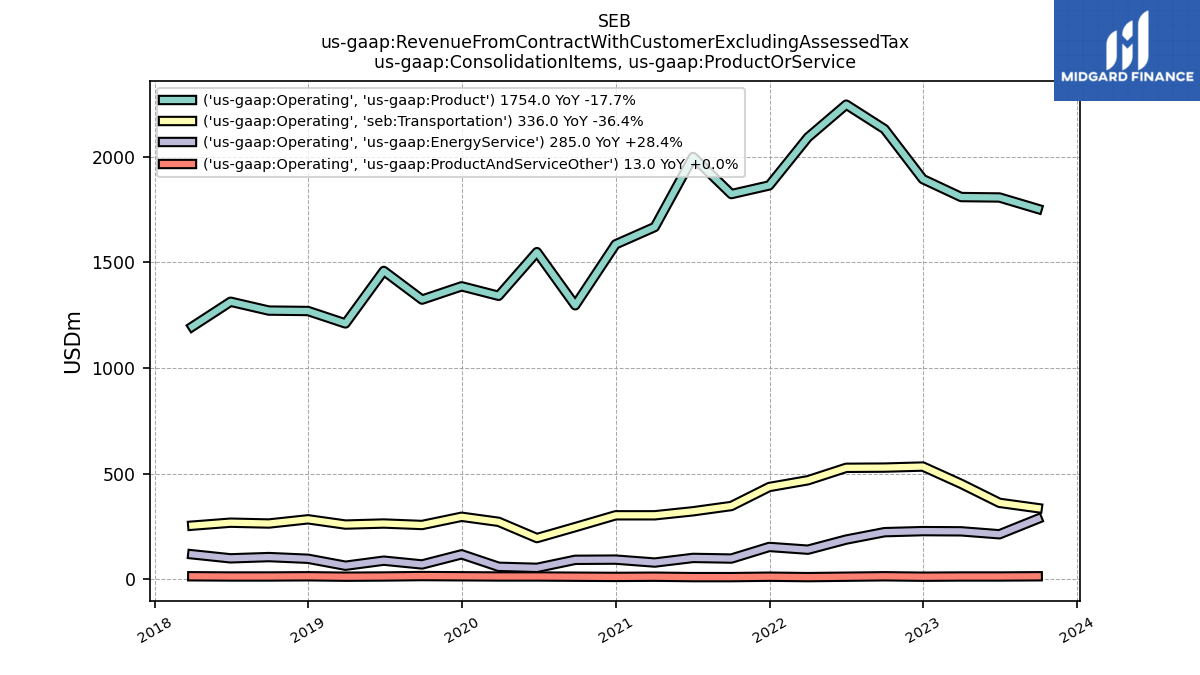
| Operating | 2388.00 | 2393.00 | 2499.00 | 2666.00 | 2895.00 | 2973.00 | 2709.00 | 2464.00 | 2276.00 | 2430.00 | 2059.00 | 1990.00 | 1645.00 | 1808.00 | 1683.00 | 1812.00 | 1663.00 | 1822.00 | 1543.00 | 1662.00 | 1651.00 | 1691.00 | 1579.00 | NA | NA | NA | NA | NA | NA | NA | NA | NA | NA | NA | NA | NA | NA | NA | NA | NA | NA | NA | NA | NA | NA | NA | NA | NA | NA | NA | NA | NA | NA | NA | |
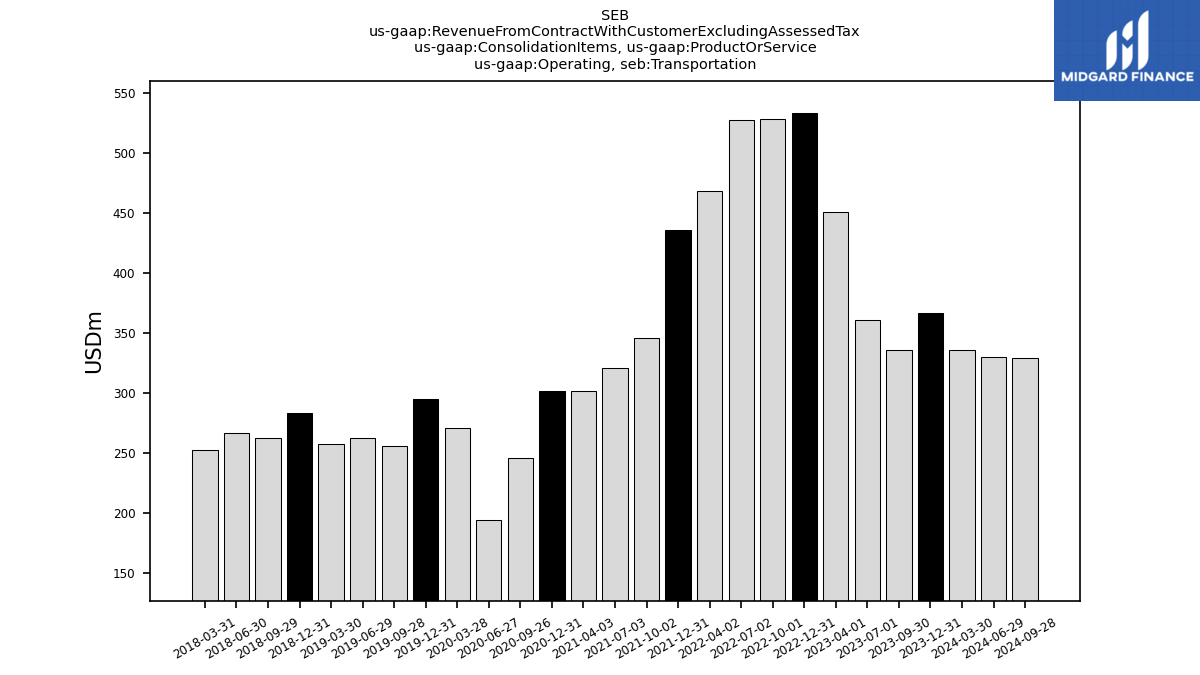
| Operating, Transportation | 336.00 | 361.00 | 451.00 | 533.00 | 528.00 | 527.00 | 468.00 | 436.00 | 346.00 | 321.00 | 302.00 | 302.00 | 246.00 | 194.00 | 271.00 | 295.00 | 256.00 | 263.00 | 258.00 | 283.00 | 263.00 | 267.00 | 253.00 | NA | NA | NA | NA | NA | NA | NA | NA | NA | NA | NA | NA | NA | NA | NA | NA | NA | NA | NA | NA | NA | NA | NA | NA | NA | NA | NA | NA | NA | NA | NA | |
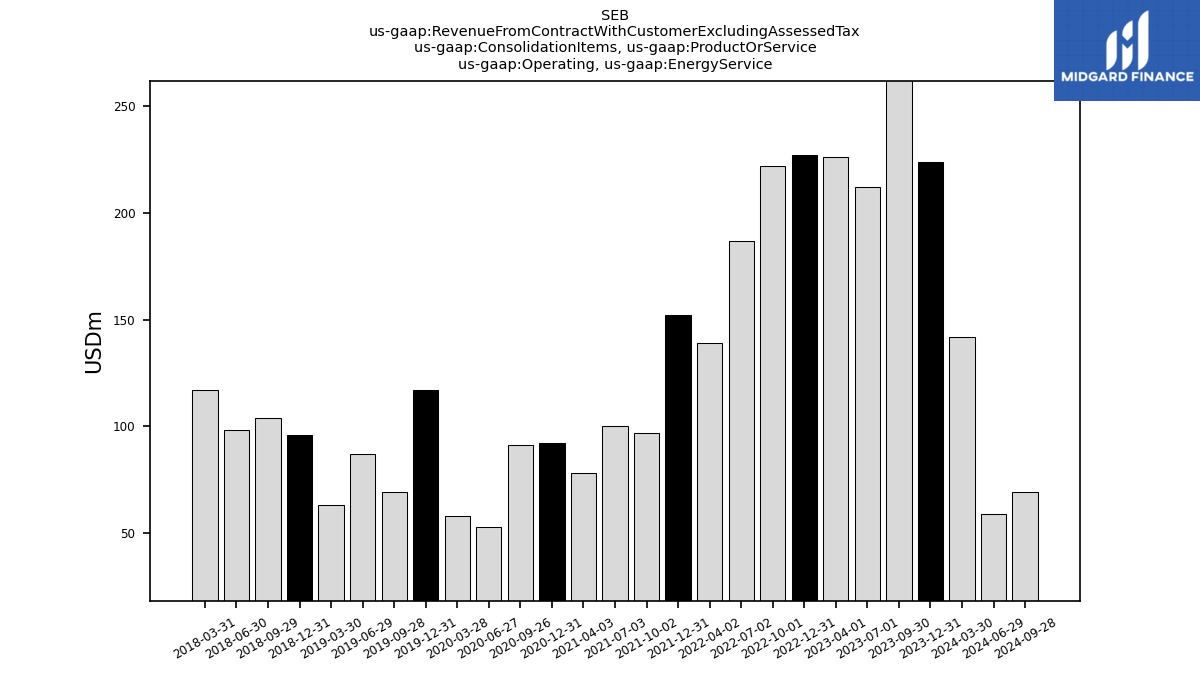
| Operating, Energy Service | 285.00 | 212.00 | 226.00 | 227.00 | 222.00 | 187.00 | 139.00 | 152.00 | 97.00 | 100.00 | 78.00 | 92.00 | 91.00 | 53.00 | 58.00 | 117.00 | 69.00 | 87.00 | 63.00 | 96.00 | 104.00 | 98.00 | 117.00 | NA | NA | NA | NA | NA | NA | NA | NA | NA | NA | NA | NA | NA | NA | NA | NA | NA | NA | NA | NA | NA | NA | NA | NA | NA | NA | NA | NA | NA | NA | NA | |
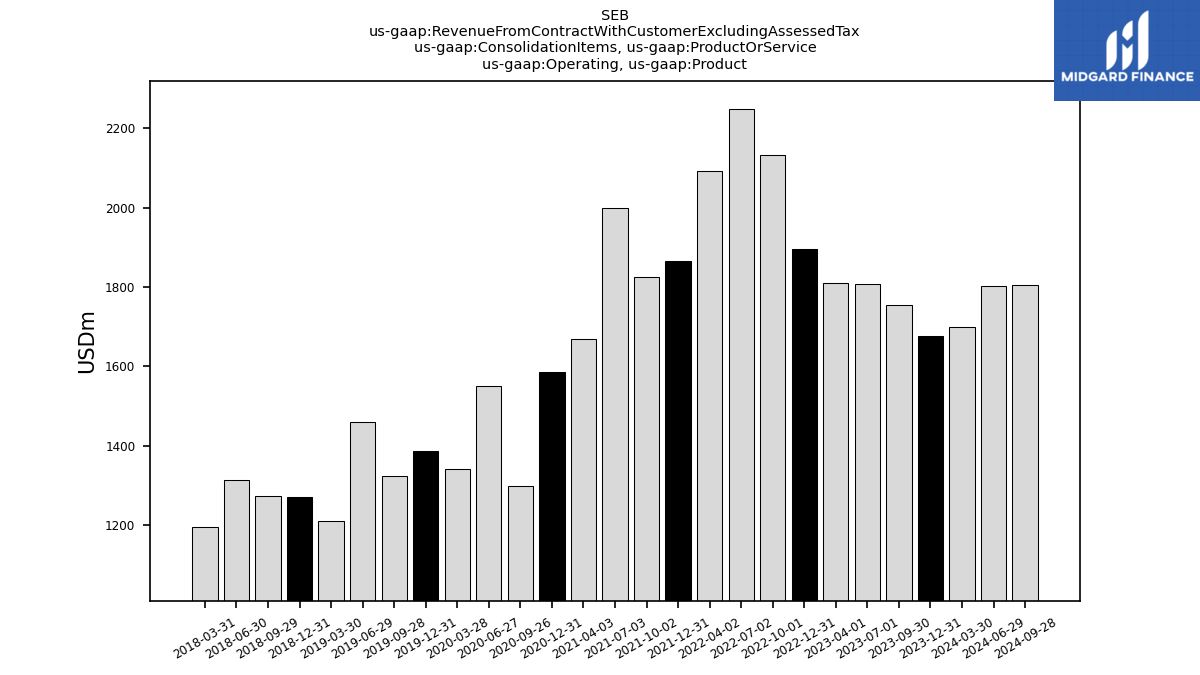
| Operating, Product | 1754.00 | 1808.00 | 1810.00 | 1895.00 | 2132.00 | 2248.00 | 2093.00 | 1865.00 | 1824.00 | 2000.00 | 1668.00 | 1586.00 | 1297.00 | 1549.00 | 1342.00 | 1387.00 | 1324.00 | 1460.00 | 1211.00 | 1270.00 | 1272.00 | 1314.00 | 1196.00 | NA | NA | NA | NA | NA | NA | NA | NA | NA | NA | NA | NA | NA | NA | NA | NA | NA | NA | NA | NA | NA | NA | NA | NA | NA | NA | NA | NA | NA | NA | NA | |
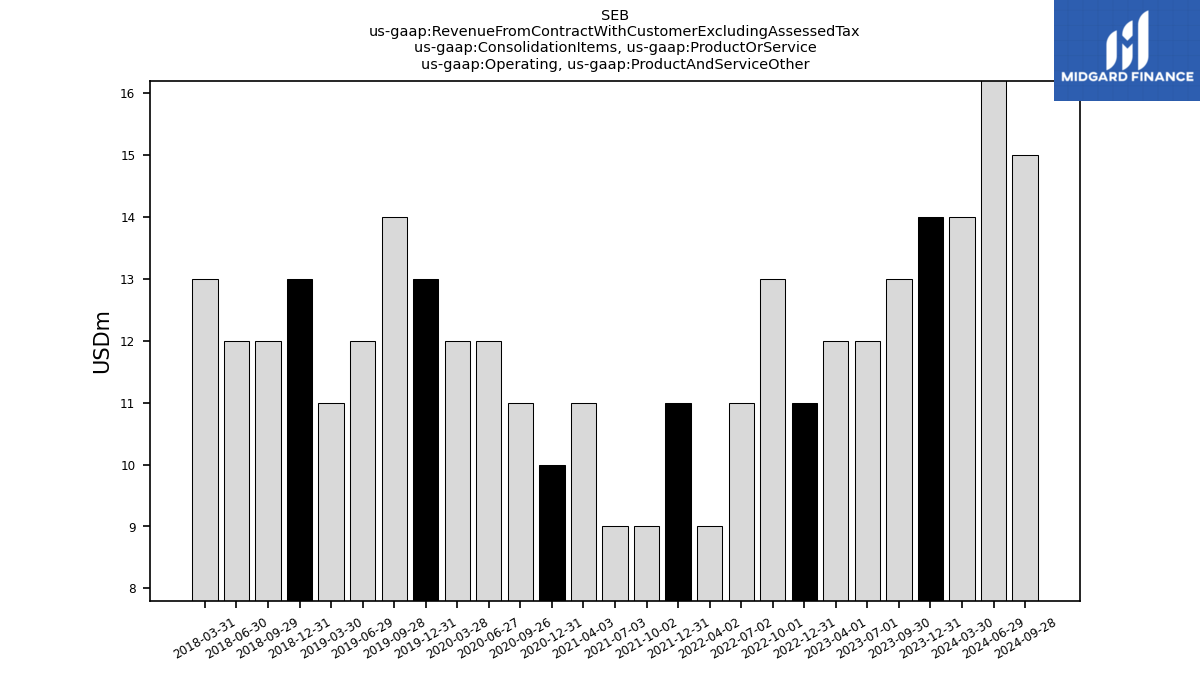
| Operating, Product And Service Other | 13.00 | 12.00 | 12.00 | 11.00 | 13.00 | 11.00 | 9.00 | 11.00 | 9.00 | 9.00 | 11.00 | 10.00 | 11.00 | 12.00 | 12.00 | 13.00 | 14.00 | 12.00 | 11.00 | 13.00 | 12.00 | 12.00 | 13.00 | NA | NA | NA | NA | NA | NA | NA | NA | NA | NA | NA | NA | NA | NA | NA | NA | NA | NA | NA | NA | NA | NA | NA | NA | NA | NA | NA | NA | NA | NA | NA | |
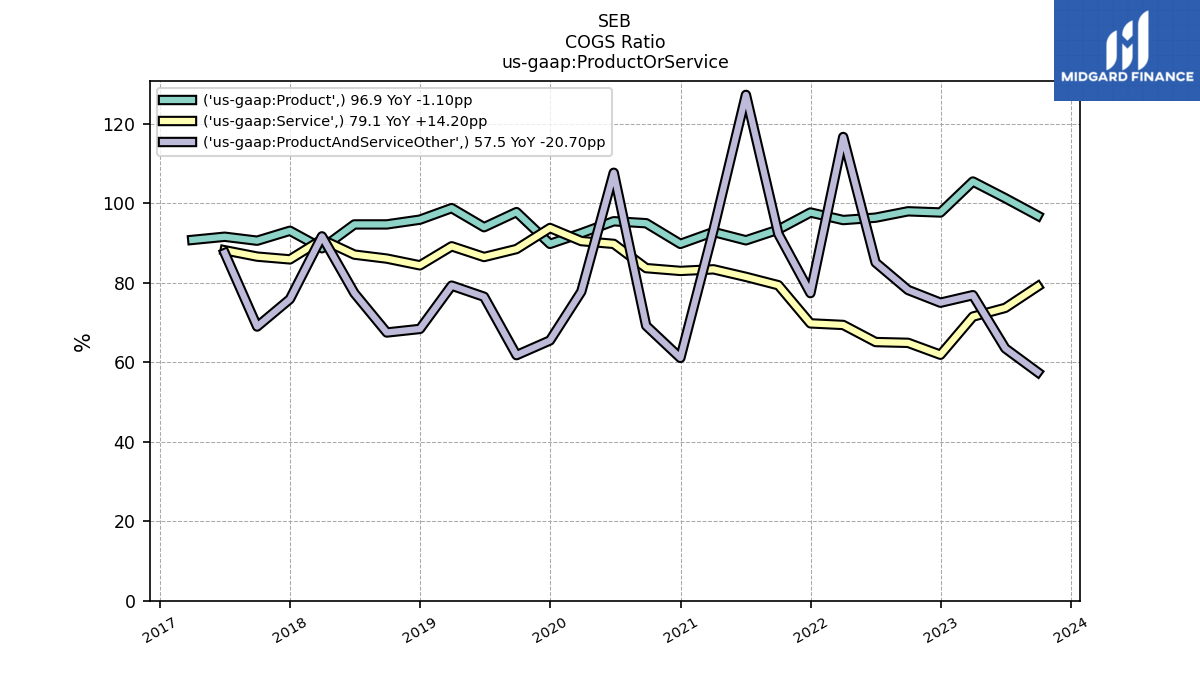
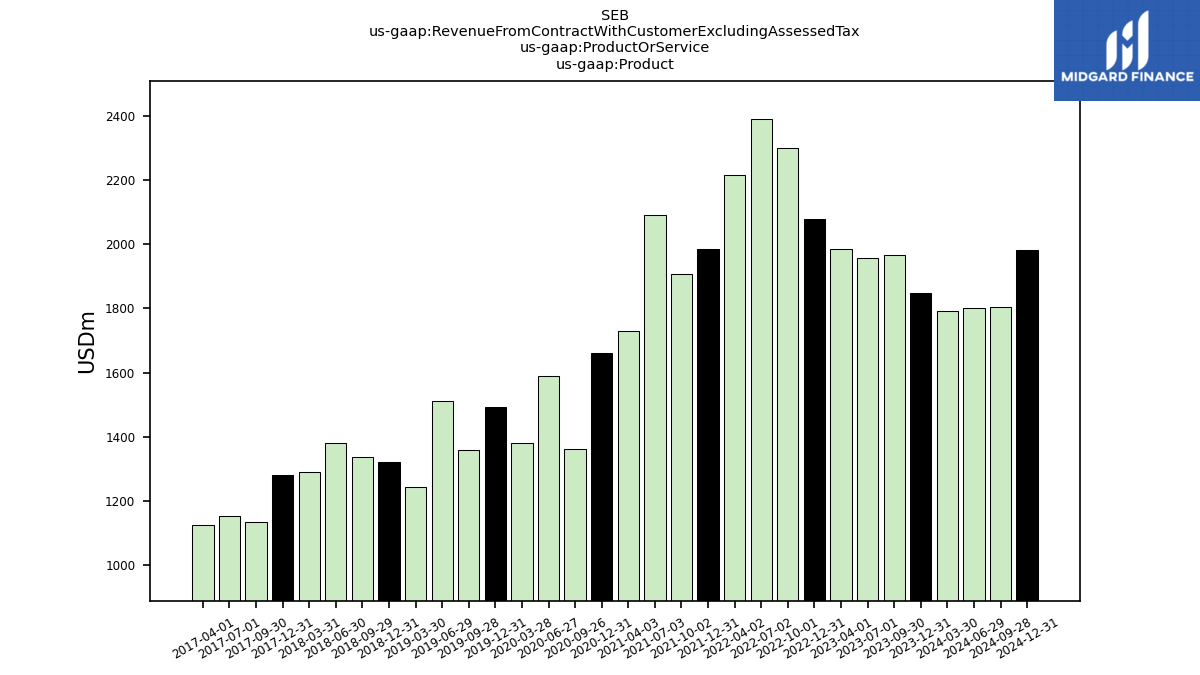
| Product | 1966.00 | 1957.00 | 1984.00 | 2078.00 | 2299.00 | 2388.00 | 2214.00 | 1986.00 | 1908.00 | 2089.00 | 1731.00 | 1660.00 | 1362.00 | 1589.00 | 1382.00 | 1493.00 | 1359.00 | 1513.00 | 1245.00 | 1323.00 | 1338.00 | 1382.00 | 1291.00 | 1280.00 | 1135.00 | 1153.00 | 1125.00 | NA | NA | NA | NA | NA | NA | NA | NA | NA | NA | NA | NA | NA | NA | NA | NA | NA | NA | NA | NA | NA | NA | NA | NA | NA | NA | NA | |
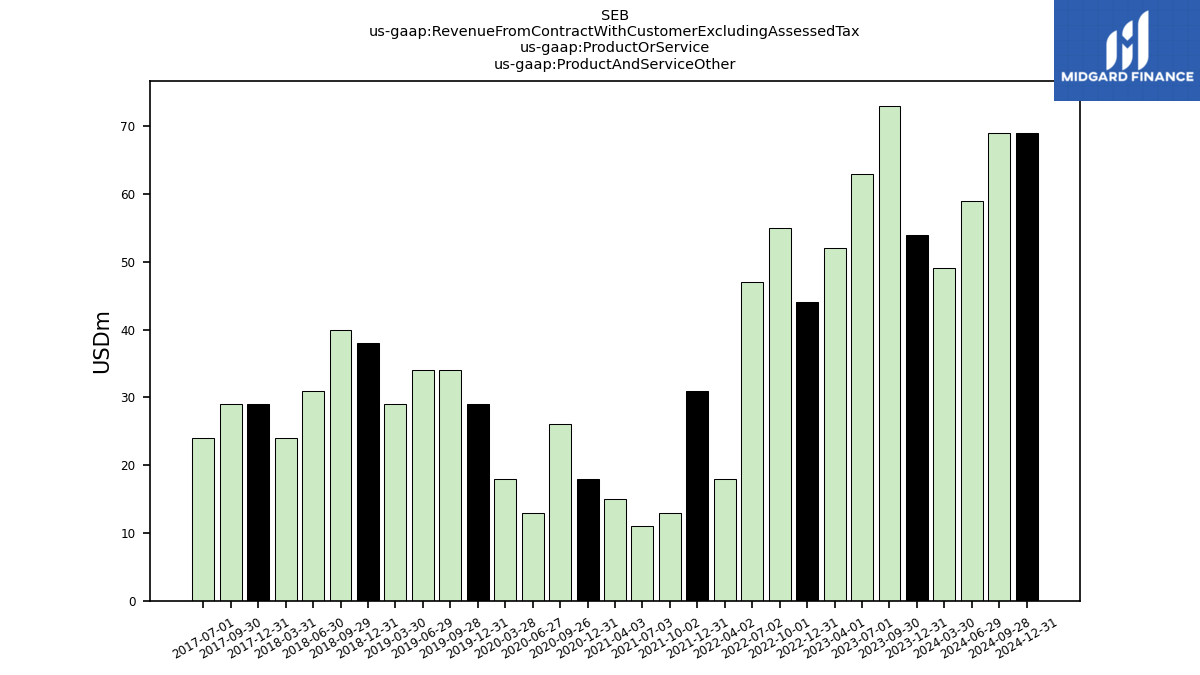
| Product And Service Other | 73.00 | 63.00 | 52.00 | 44.00 | 55.00 | 47.00 | 18.00 | 31.00 | 13.00 | 11.00 | 15.00 | 18.00 | 26.00 | 13.00 | 18.00 | 29.00 | 34.00 | 34.00 | 29.00 | 38.00 | 40.00 | 31.00 | 24.00 | 29.00 | 29.00 | 24.00 | NA | NA | NA | NA | NA | NA | NA | NA | NA | NA | NA | NA | NA | NA | NA | NA | NA | NA | NA | NA | NA | NA | NA | NA | NA | NA | NA | NA | |
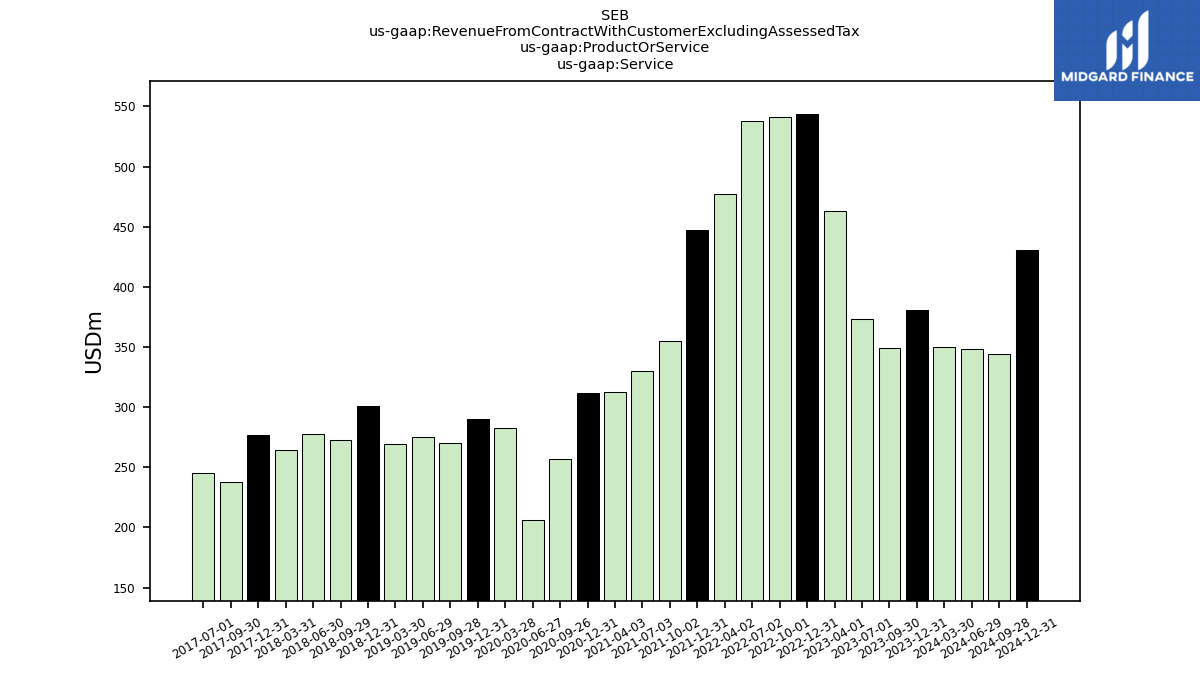
| Service | 349.00 | 373.00 | 463.00 | 544.00 | 541.00 | 538.00 | 477.00 | 447.00 | 355.00 | 330.00 | 313.00 | 312.00 | 257.00 | 206.00 | 283.00 | 290.00 | 270.00 | 275.00 | 269.00 | 301.00 | 273.00 | 278.00 | 264.00 | 277.00 | 238.00 | 245.00 | NA | NA | NA | NA | NA | NA | NA | NA | NA | NA | NA | NA | NA | NA | NA | NA | NA | NA | NA | NA | NA | NA | NA | NA | NA | NA | NA | NA | |
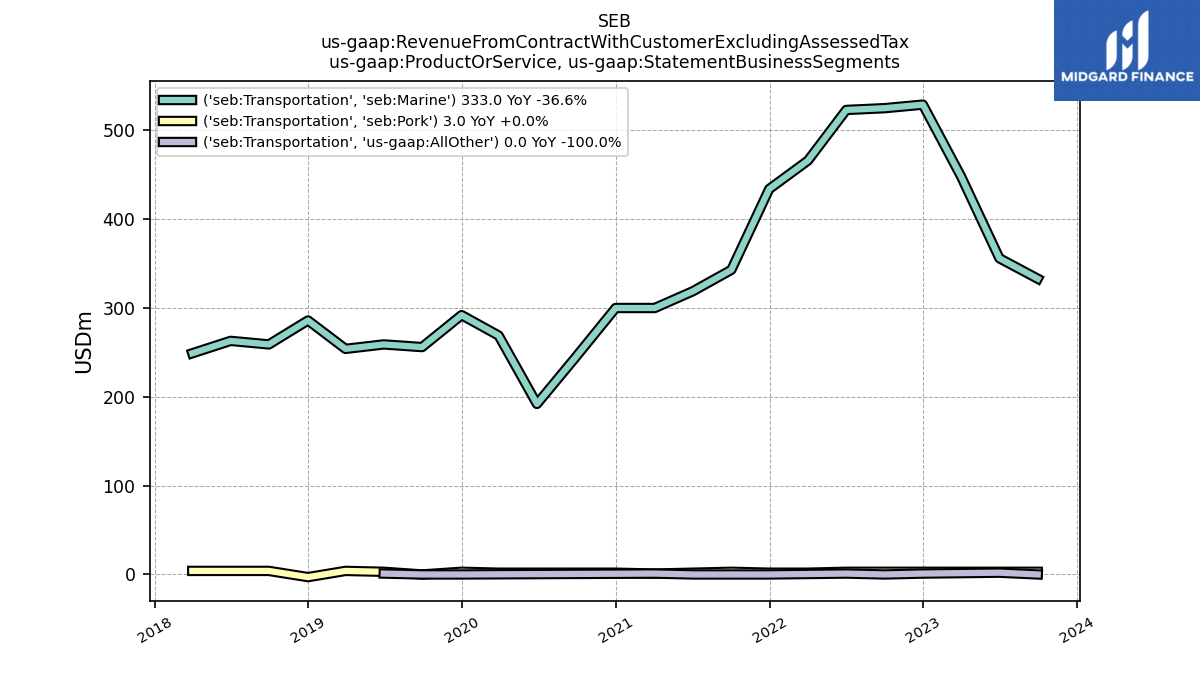
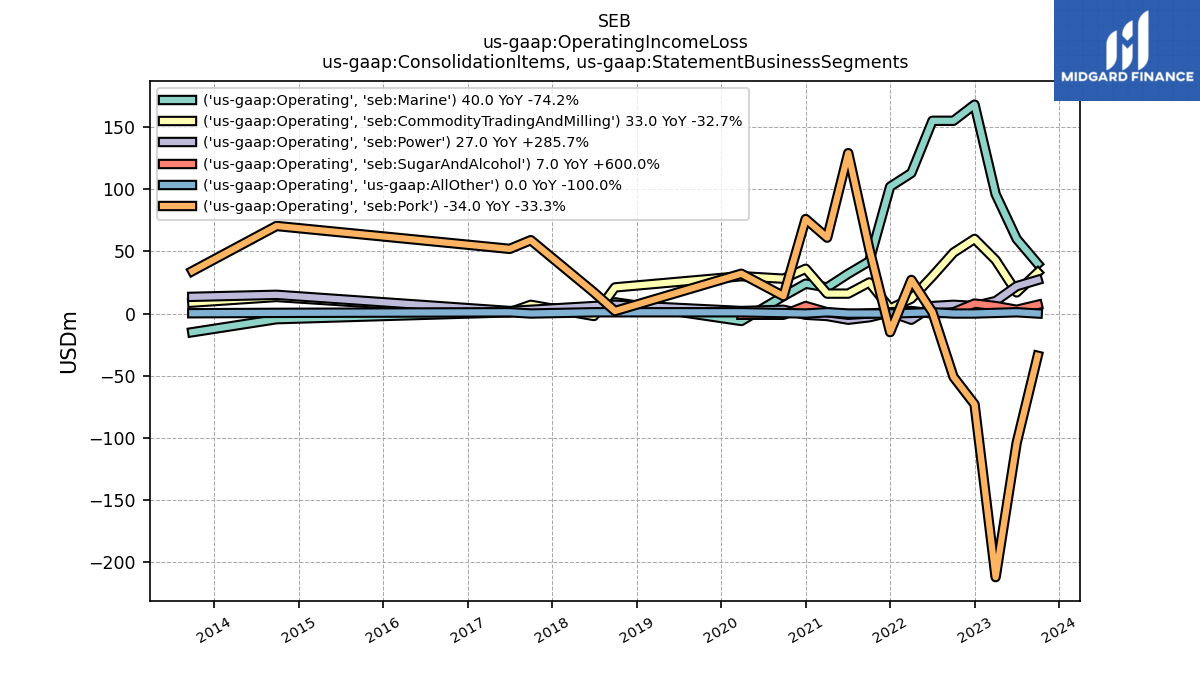
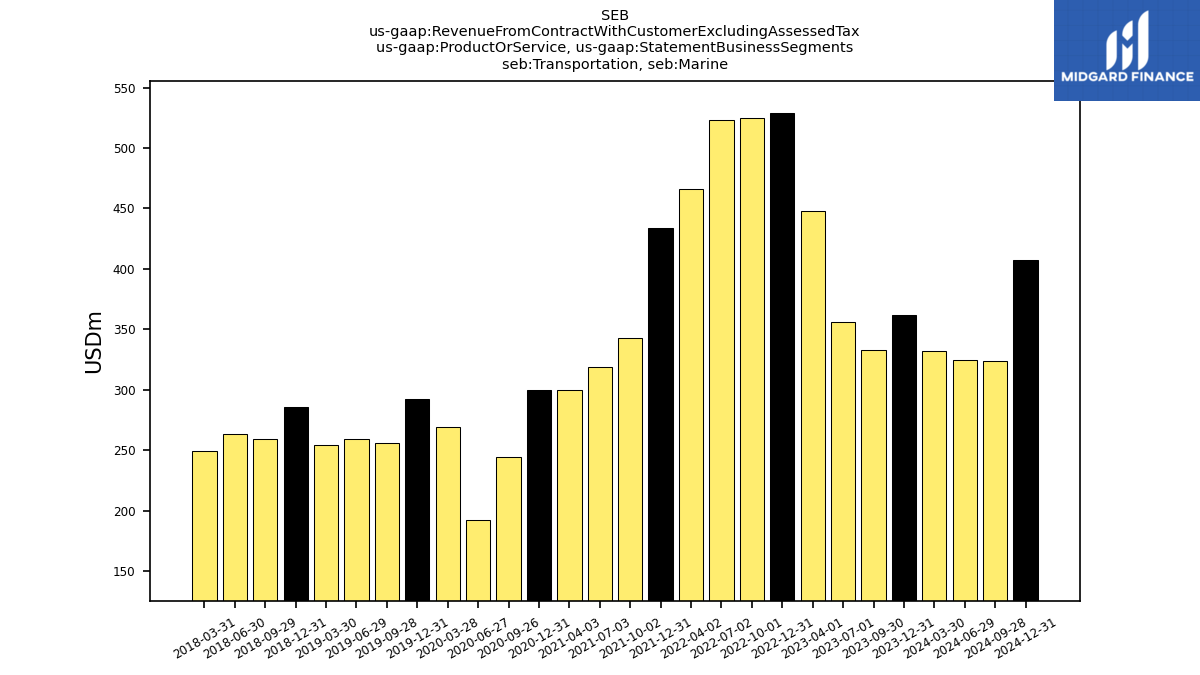
| Transportation, Marine | 333.00 | 356.00 | 448.00 | 529.00 | 525.00 | 523.00 | 466.00 | 434.00 | 343.00 | 319.00 | 300.00 | 300.00 | 244.00 | 192.00 | 269.00 | 292.00 | 256.00 | 259.00 | 254.00 | 286.00 | 259.00 | 263.00 | 249.00 | NA | NA | NA | NA | NA | NA | NA | NA | NA | NA | NA | NA | NA | NA | NA | NA | NA | NA | NA | NA | NA | NA | NA | NA | NA | NA | NA | NA | NA | NA | NA | |
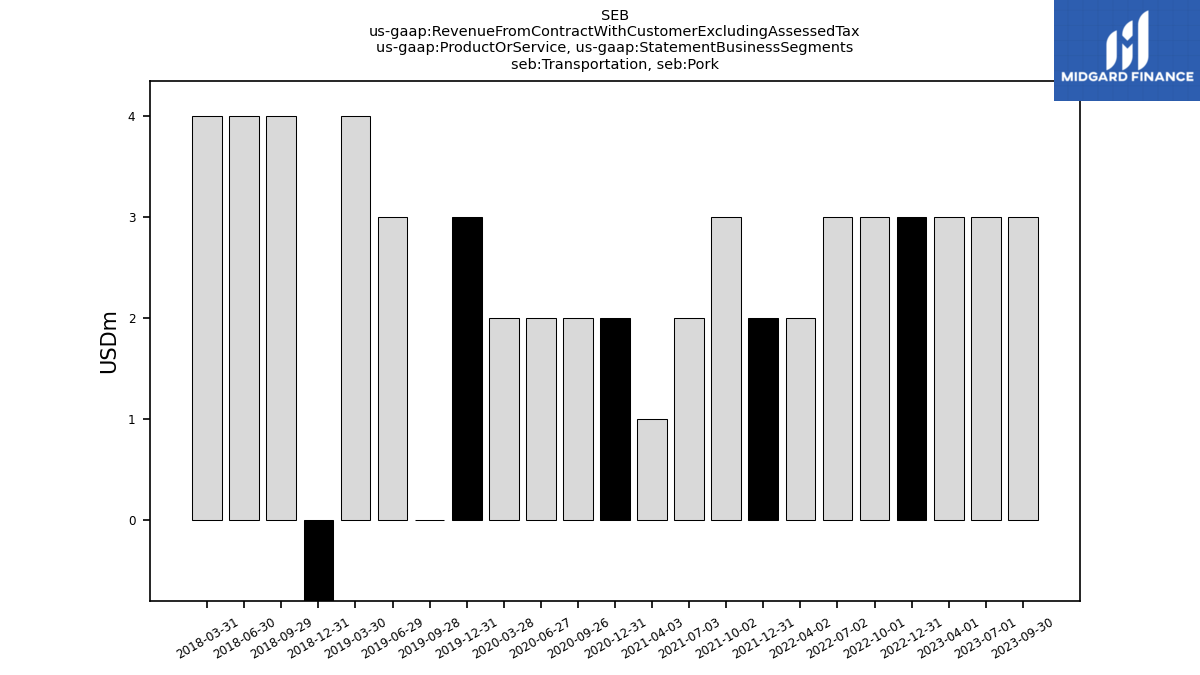
| Transportation, Pork | 3.00 | 3.00 | 3.00 | 3.00 | 3.00 | 3.00 | 2.00 | 2.00 | 3.00 | 2.00 | 1.00 | 2.00 | 2.00 | 2.00 | 2.00 | 3.00 | 0.00 | 3.00 | 4.00 | -3.00 | 4.00 | 4.00 | 4.00 | NA | NA | NA | NA | NA | NA | NA | NA | NA | NA | NA | NA | NA | NA | NA | NA | NA | NA | NA | NA | NA | NA | NA | NA | NA | NA | NA | NA | NA | NA | NA | |
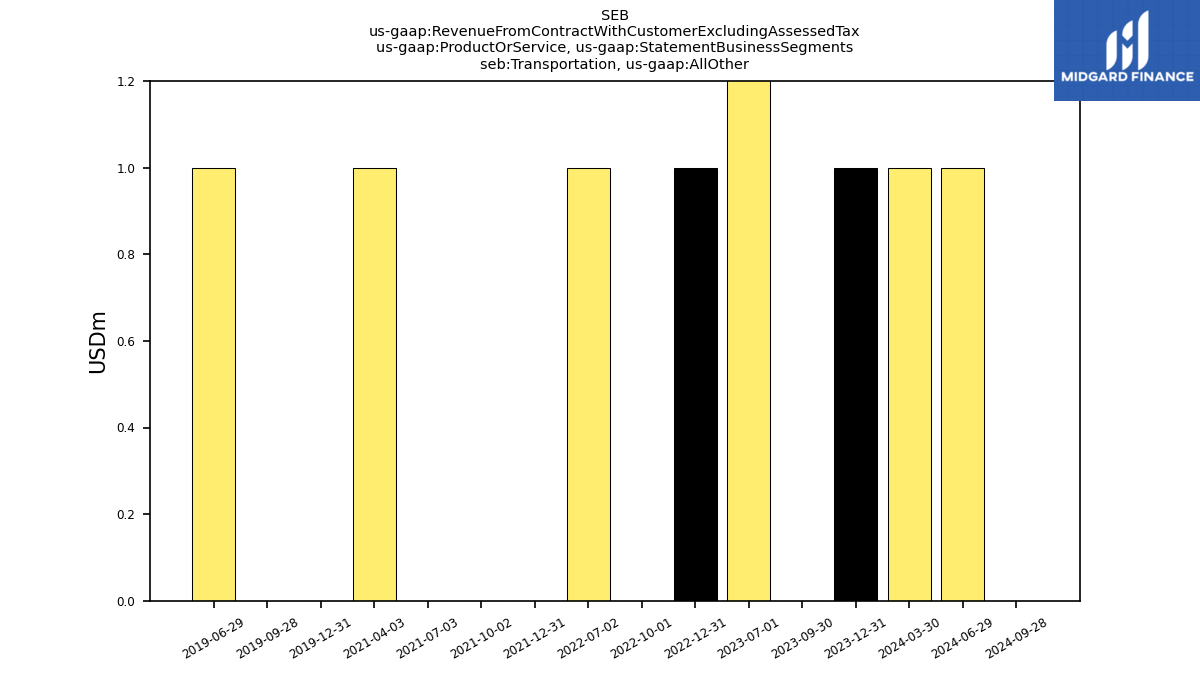
| Transportation, All Other | 0.00 | 2.00 | NA | 1.00 | 0.00 | 1.00 | NA | 0.00 | 0.00 | 0.00 | 1.00 | NA | NA | NA | NA | 0.00 | 0.00 | 1.00 | NA | NA | NA | NA | NA | NA | NA | NA | NA | NA | NA | NA | NA | NA | NA | NA | NA | NA | NA | NA | NA | NA | NA | NA | NA | NA | NA | NA | NA | NA | NA | NA | NA | NA | NA | NA | |
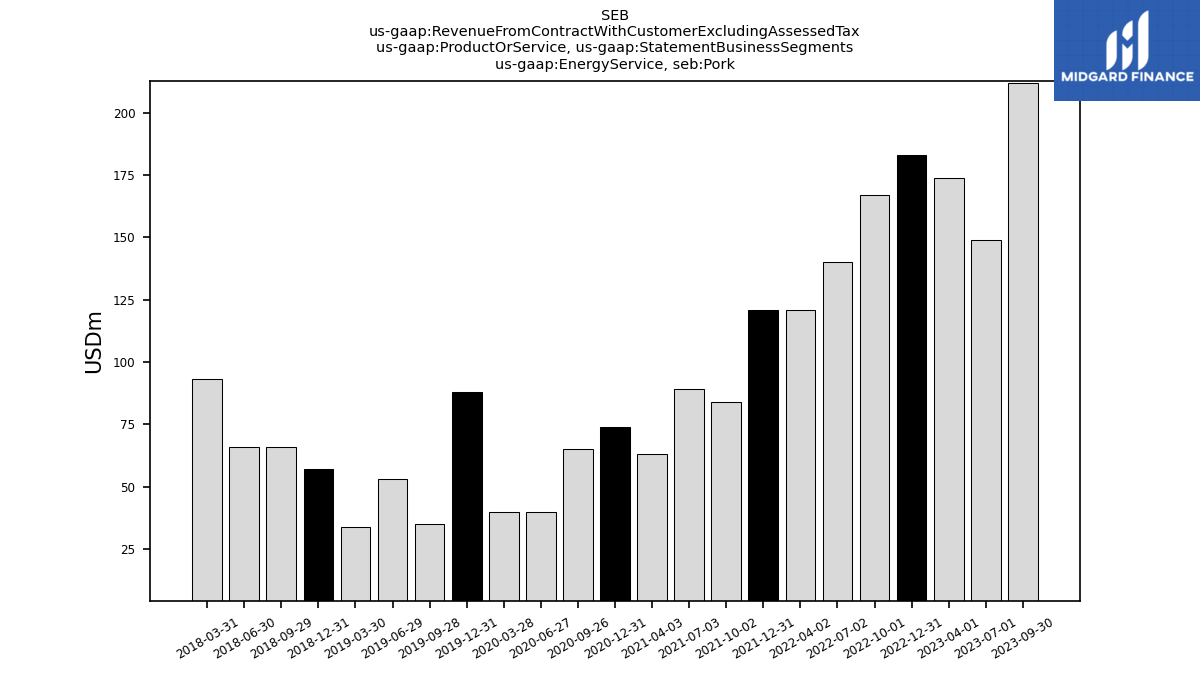
| Energy Service, Pork | 212.00 | 149.00 | 174.00 | 183.00 | 167.00 | 140.00 | 121.00 | 121.00 | 84.00 | 89.00 | 63.00 | 74.00 | 65.00 | 40.00 | 40.00 | 88.00 | 35.00 | 53.00 | 34.00 | 57.00 | 66.00 | 66.00 | 93.00 | NA | NA | NA | NA | NA | NA | NA | NA | NA | NA | NA | NA | NA | NA | NA | NA | NA | NA | NA | NA | NA | NA | NA | NA | NA | NA | NA | NA | NA | NA | NA | |
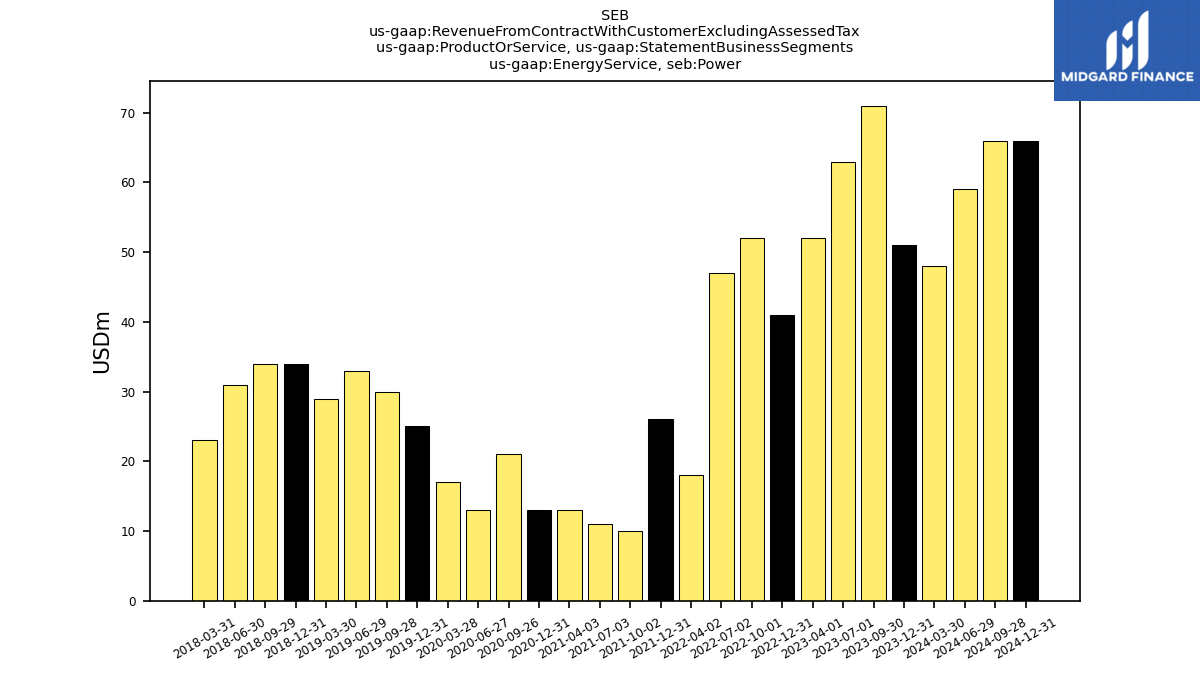
| Energy Service, Power | 71.00 | 63.00 | 52.00 | 41.00 | 52.00 | 47.00 | 18.00 | 26.00 | 10.00 | 11.00 | 13.00 | 13.00 | 21.00 | 13.00 | 17.00 | 25.00 | 30.00 | 33.00 | 29.00 | 34.00 | 34.00 | 31.00 | 23.00 | NA | NA | NA | NA | NA | NA | NA | NA | NA | NA | NA | NA | NA | NA | NA | NA | NA | NA | NA | NA | NA | NA | NA | NA | NA | NA | NA | NA | NA | NA | NA | |
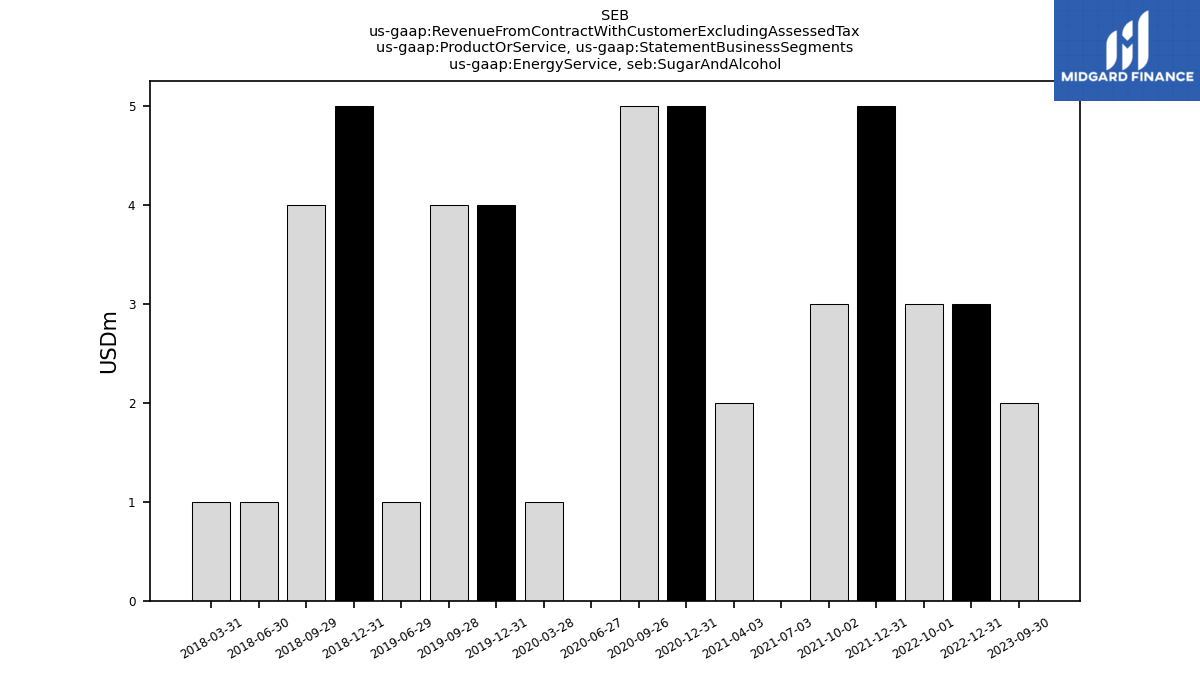
| Energy Service, Sugar And Alcohol | 2.00 | NA | NA | 3.00 | 3.00 | NA | NA | 5.00 | 3.00 | 0.00 | 2.00 | 5.00 | 5.00 | 0.00 | 1.00 | 4.00 | 4.00 | 1.00 | NA | 5.00 | 4.00 | 1.00 | 1.00 | NA | NA | NA | NA | NA | NA | NA | NA | NA | NA | NA | NA | NA | NA | NA | NA | NA | NA | NA | NA | NA | NA | NA | NA | NA | NA | NA | NA | NA | NA | NA | |
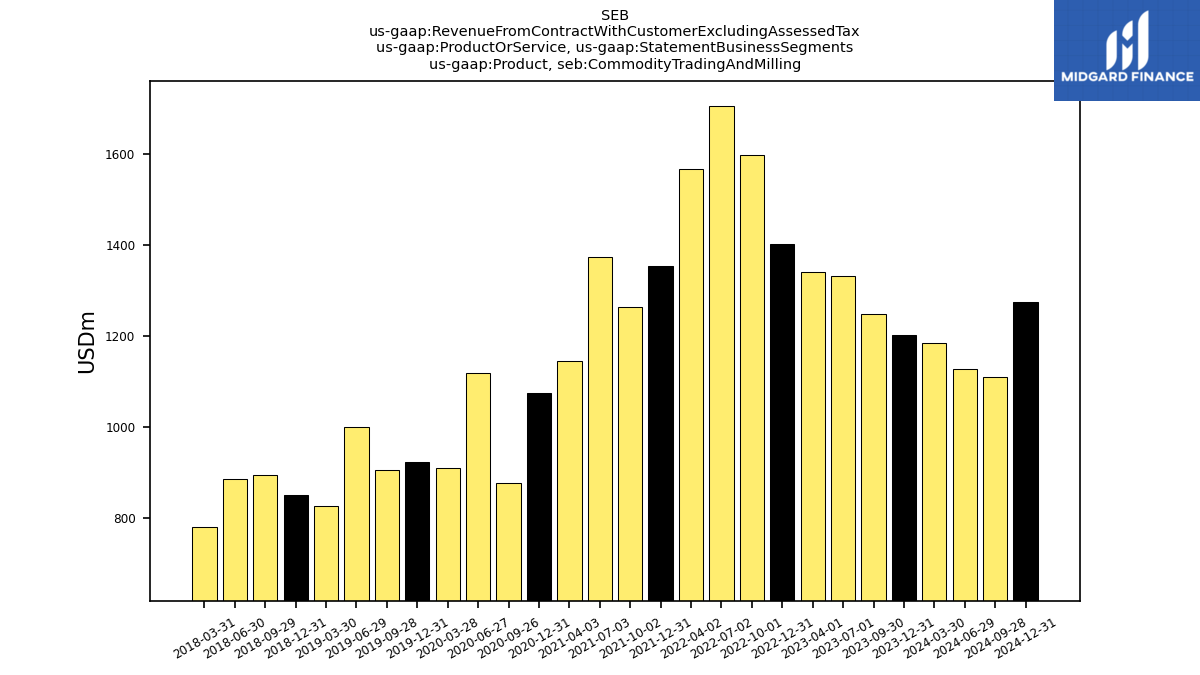
| Product, Commodity Trading And Milling | 1249.00 | 1332.00 | 1341.00 | 1403.00 | 1598.00 | 1707.00 | 1567.00 | 1355.00 | 1264.00 | 1374.00 | 1146.00 | 1075.00 | 877.00 | 1119.00 | 910.00 | 923.00 | 906.00 | 999.00 | 826.00 | 850.00 | 894.00 | 885.00 | 781.00 | NA | NA | NA | NA | NA | NA | NA | NA | NA | NA | NA | NA | NA | NA | NA | NA | NA | NA | NA | NA | NA | NA | NA | NA | NA | NA | NA | NA | NA | NA | NA | |
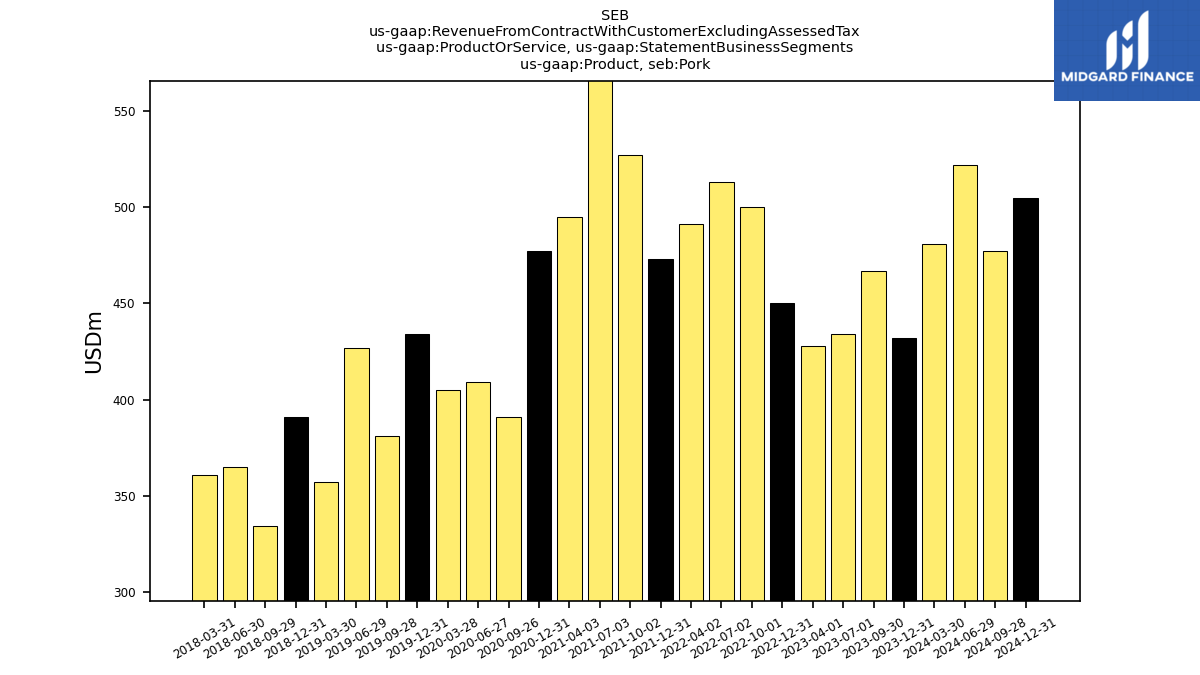
| Product, Pork | 467.00 | 434.00 | 428.00 | 450.00 | 500.00 | 513.00 | 491.00 | 473.00 | 527.00 | 596.00 | 495.00 | 477.00 | 391.00 | 409.00 | 405.00 | 434.00 | 381.00 | 427.00 | 357.00 | 391.00 | 334.00 | 365.00 | 361.00 | NA | NA | NA | NA | NA | NA | NA | NA | NA | NA | NA | NA | NA | NA | NA | NA | NA | NA | NA | NA | NA | NA | NA | NA | NA | NA | NA | NA | NA | NA | NA | |
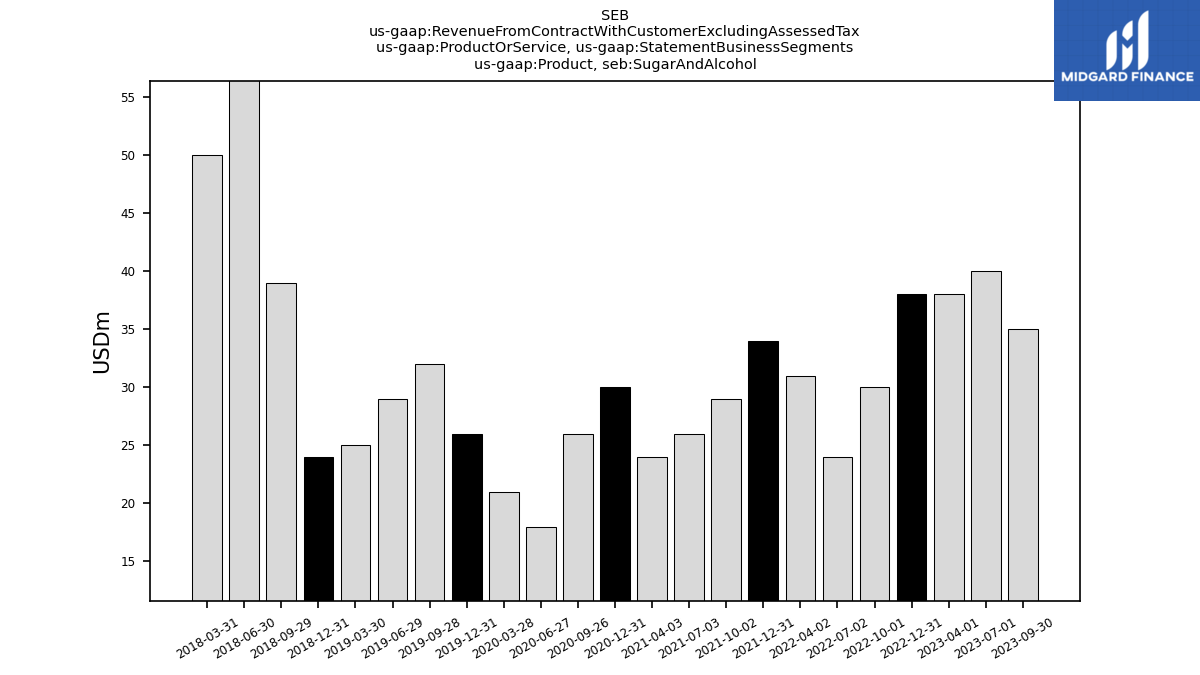
| Product, Sugar And Alcohol | 35.00 | 40.00 | 38.00 | 38.00 | 30.00 | 24.00 | 31.00 | 34.00 | 29.00 | 26.00 | 24.00 | 30.00 | 26.00 | 18.00 | 21.00 | 26.00 | 32.00 | 29.00 | 25.00 | 24.00 | 39.00 | 60.00 | 50.00 | NA | NA | NA | NA | NA | NA | NA | NA | NA | NA | NA | NA | NA | NA | NA | NA | NA | NA | NA | NA | NA | NA | NA | NA | NA | NA | NA | NA | NA | NA | NA | |
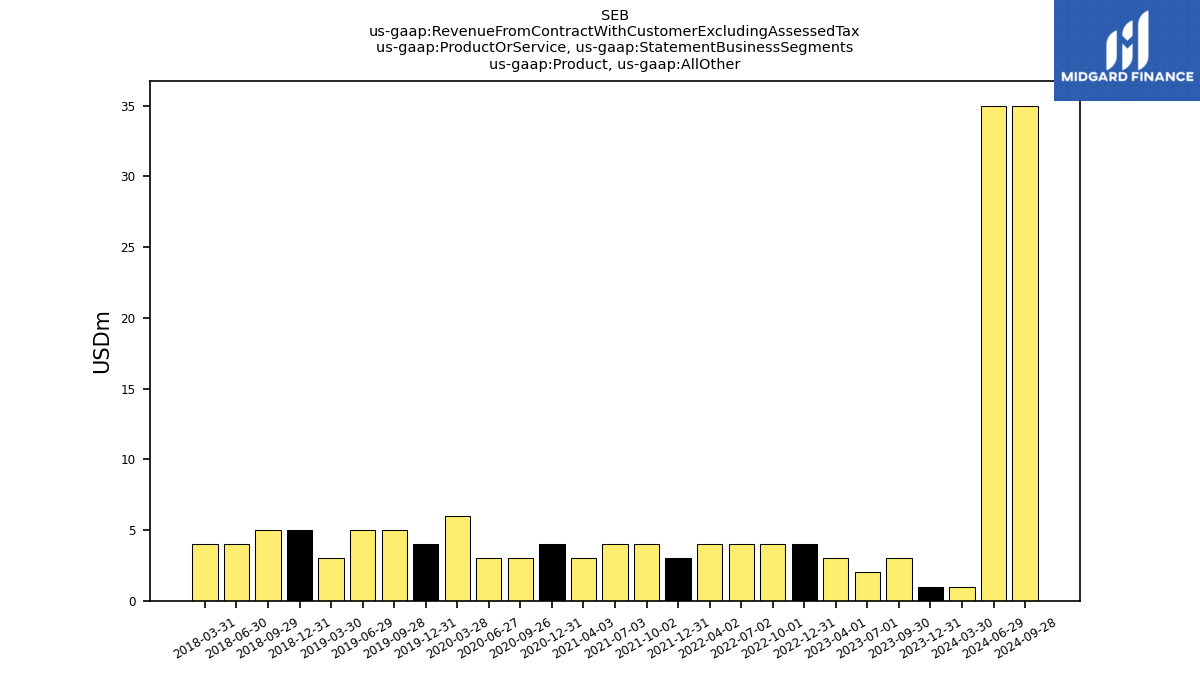
| Product, All Other | 3.00 | 2.00 | 3.00 | 4.00 | 4.00 | 4.00 | 4.00 | 3.00 | 4.00 | 4.00 | 3.00 | 4.00 | 3.00 | 3.00 | 6.00 | 4.00 | 5.00 | 5.00 | 3.00 | 5.00 | 5.00 | 4.00 | 4.00 | NA | NA | NA | NA | NA | NA | NA | NA | NA | NA | NA | NA | NA | NA | NA | NA | NA | NA | NA | NA | NA | NA | NA | NA | NA | NA | NA | NA | NA | NA | NA | |
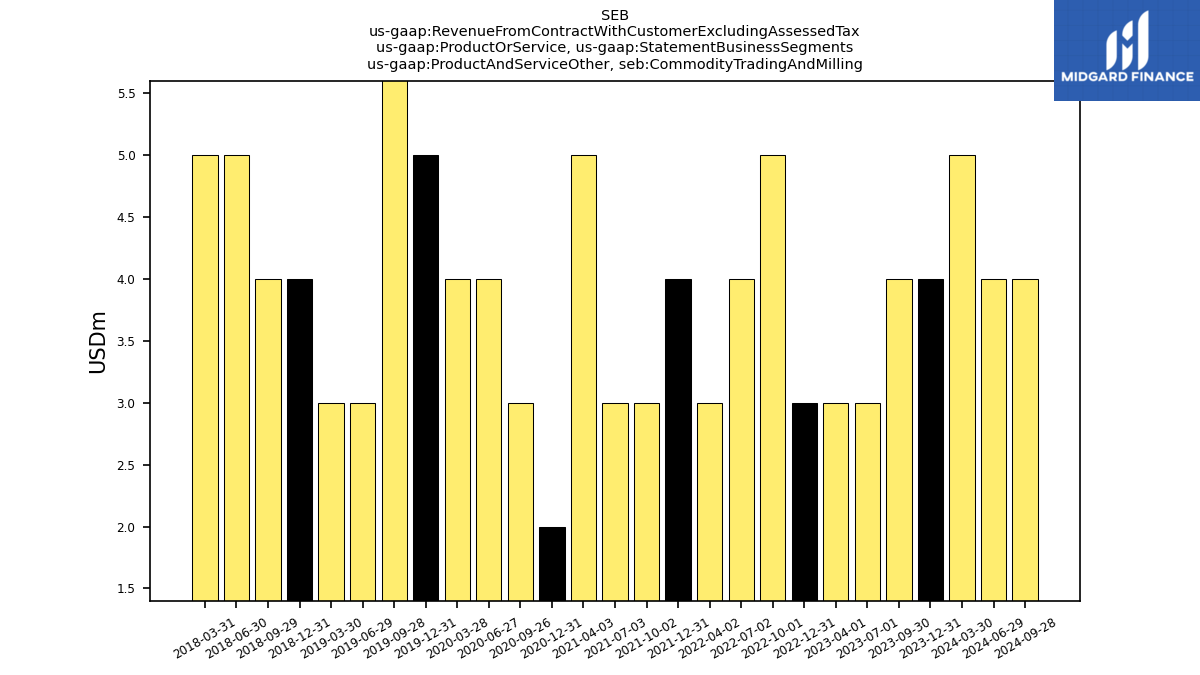
| Product And Service Other, Commodity Trading And Milling | 4.00 | 3.00 | 3.00 | 3.00 | 5.00 | 4.00 | 3.00 | 4.00 | 3.00 | 3.00 | 5.00 | 2.00 | 3.00 | 4.00 | 4.00 | 5.00 | 7.00 | 3.00 | 3.00 | 4.00 | 4.00 | 5.00 | 5.00 | NA | NA | NA | NA | NA | NA | NA | NA | NA | NA | NA | NA | NA | NA | NA | NA | NA | NA | NA | NA | NA | NA | NA | NA | NA | NA | NA | NA | NA | NA | NA | |
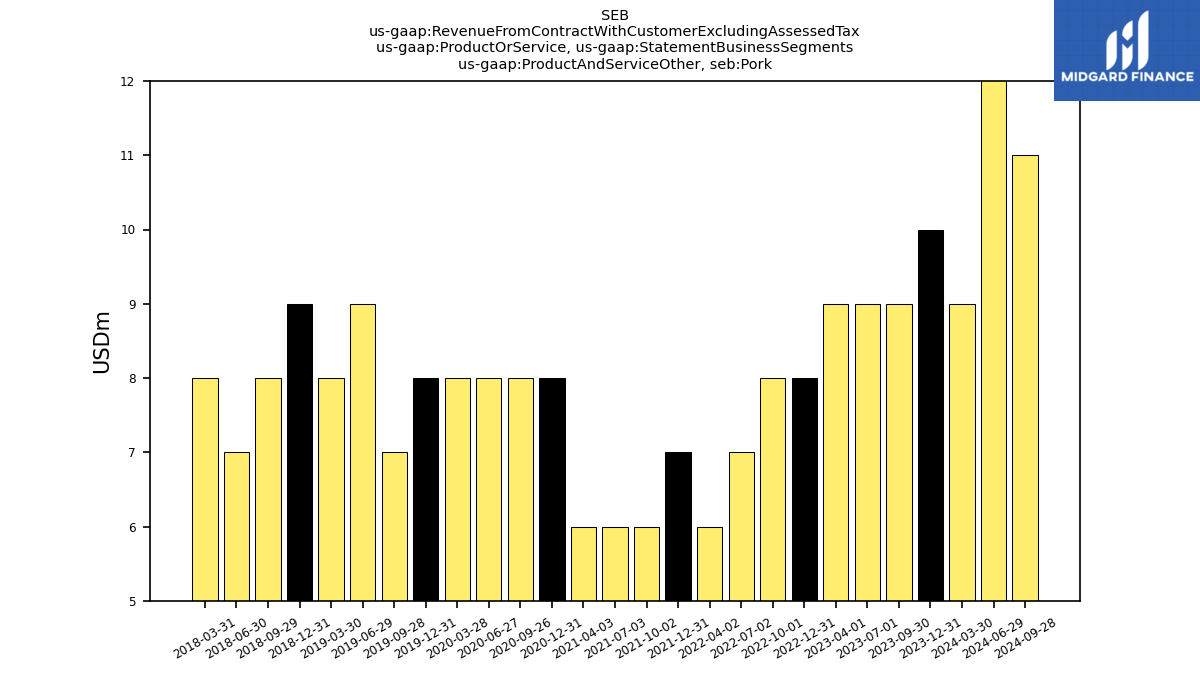
| Product And Service Other, Pork | 9.00 | 9.00 | 9.00 | 8.00 | 8.00 | 7.00 | 6.00 | 7.00 | 6.00 | 6.00 | 6.00 | 8.00 | 8.00 | 8.00 | 8.00 | 8.00 | 7.00 | 9.00 | 8.00 | 9.00 | 8.00 | 7.00 | 8.00 | NA | NA | NA | NA | NA | NA | NA | NA | NA | NA | NA | NA | NA | NA | NA | NA | NA | NA | NA | NA | NA | NA | NA | NA | NA | NA | NA | NA | NA | NA | NA | |
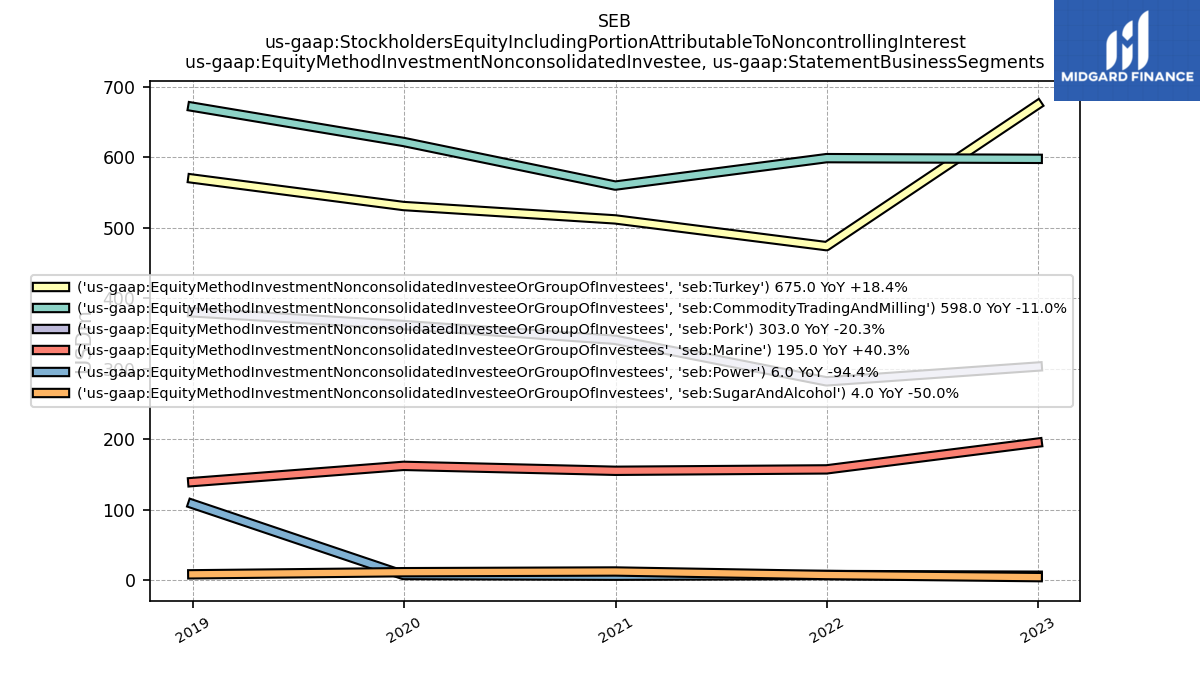
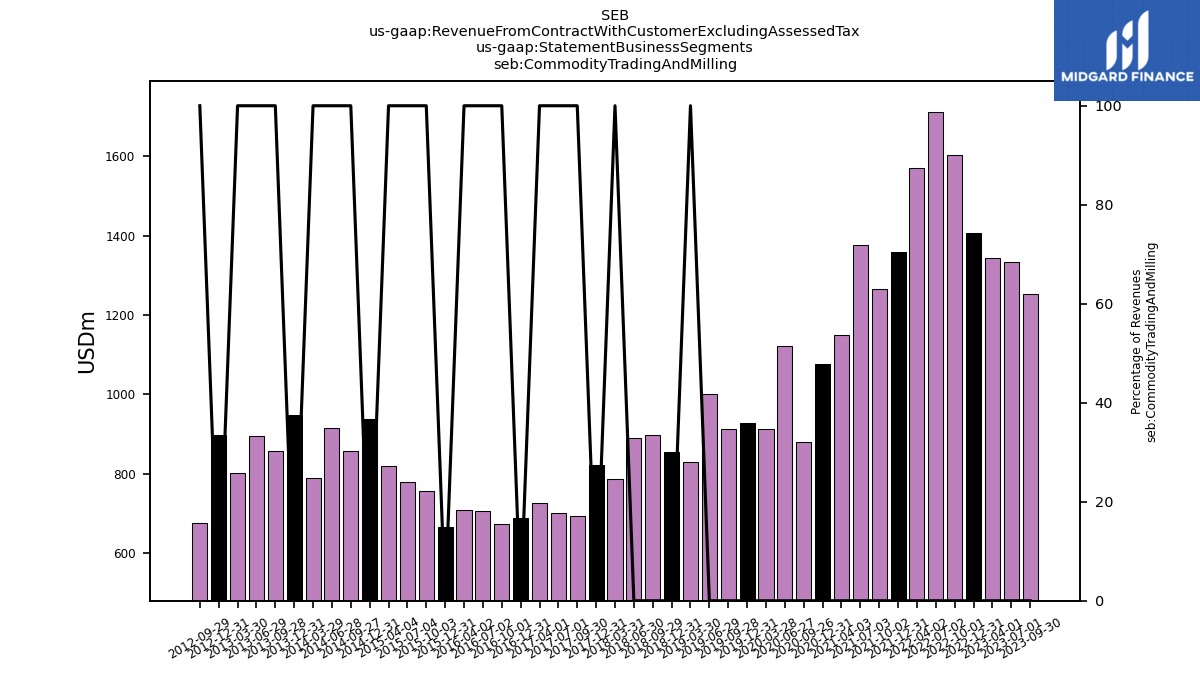
| Commodity Trading And Milling | 1253.00 | 1335.00 | 1344.00 | 1406.00 | 1603.00 | 1711.00 | 1570.00 | 1359.00 | 1267.00 | 1377.00 | 1151.00 | 1077.00 | 880.00 | 1123.00 | 914.00 | 928.00 | 913.00 | 1002.00 | 829.00 | 854.00 | 898.00 | 890.00 | 786.00 | 823.00 | 694.00 | 701.00 | 727.00 | 689.00 | 673.00 | 707.00 | 709.00 | 666.97 | 755.75 | 778.69 | 820.59 | 937.29 | 858.50 | 914.11 | 789.39 | 947.99 | 857.99 | 894.76 | 800.75 | 898.27 | 675.65 | NA | NA | NA | NA | NA | NA | NA | NA | NA | |
| Marine | 333.00 | 356.00 | 448.00 | 529.00 | 525.00 | 523.00 | 466.00 | 434.00 | 343.00 | 319.00 | 300.00 | 300.00 | 244.00 | 192.00 | 269.00 | 292.00 | 256.00 | 259.00 | 254.00 | 286.00 | 259.00 | 263.00 | 249.00 | 265.00 | 225.00 | 232.00 | 234.00 | 232.00 | 225.00 | 232.00 | 227.00 | 231.33 | 230.33 | 241.68 | 236.66 | 236.06 | 205.26 | 210.96 | 200.46 | 237.43 | 219.47 | 226.72 | 230.16 | 257.43 | 242.33 | NA | NA | NA | NA | NA | NA | NA | NA | NA | |
| Pork | 691.00 | 595.00 | 614.00 | 644.00 | 678.00 | 663.00 | 620.00 | 603.00 | 620.00 | 693.00 | 565.00 | 561.00 | 466.00 | 459.00 | 455.00 | 533.00 | 423.00 | 492.00 | 403.00 | 454.00 | 412.00 | 442.00 | 466.00 | 421.00 | 404.00 | 414.00 | 370.00 | 385.00 | 371.00 | 359.00 | 328.00 | 332.72 | 347.14 | 331.26 | 320.89 | 413.58 | 454.93 | 466.74 | 382.09 | 450.99 | 435.98 | 416.85 | 409.25 | 424.00 | 413.08 | NA | NA | NA | NA | NA | NA | NA | NA | NA | |
| Power | 71.00 | 63.00 | 52.00 | 41.00 | 52.00 | 47.00 | 18.00 | 26.00 | 10.00 | 11.00 | 13.00 | 13.00 | 21.00 | 13.00 | 17.00 | 25.00 | 30.00 | 33.00 | 29.00 | 34.00 | 34.00 | 31.00 | 23.00 | 25.00 | 25.00 | 23.00 | 24.00 | 20.00 | 23.00 | 19.00 | 17.00 | 19.28 | 25.08 | 27.51 | 25.13 | 30.62 | 51.62 | 53.03 | 53.85 | 62.41 | 73.61 | 74.81 | 72.97 | 76.83 | 75.78 | NA | NA | NA | NA | NA | NA | NA | NA | NA | |
| Sugar And Alcohol | 37.00 | 40.00 | 38.00 | 41.00 | 33.00 | 24.00 | 31.00 | 39.00 | 32.00 | 26.00 | 26.00 | 35.00 | 31.00 | 18.00 | 22.00 | 30.00 | 36.00 | 30.00 | 25.00 | 29.00 | 43.00 | 61.00 | 51.00 | NA | NA | NA | NA | NA | NA | NA | NA | NA | NA | NA | NA | NA | NA | NA | NA | NA | NA | NA | NA | NA | NA | NA | NA | NA | NA | NA | NA | NA | NA | NA | |
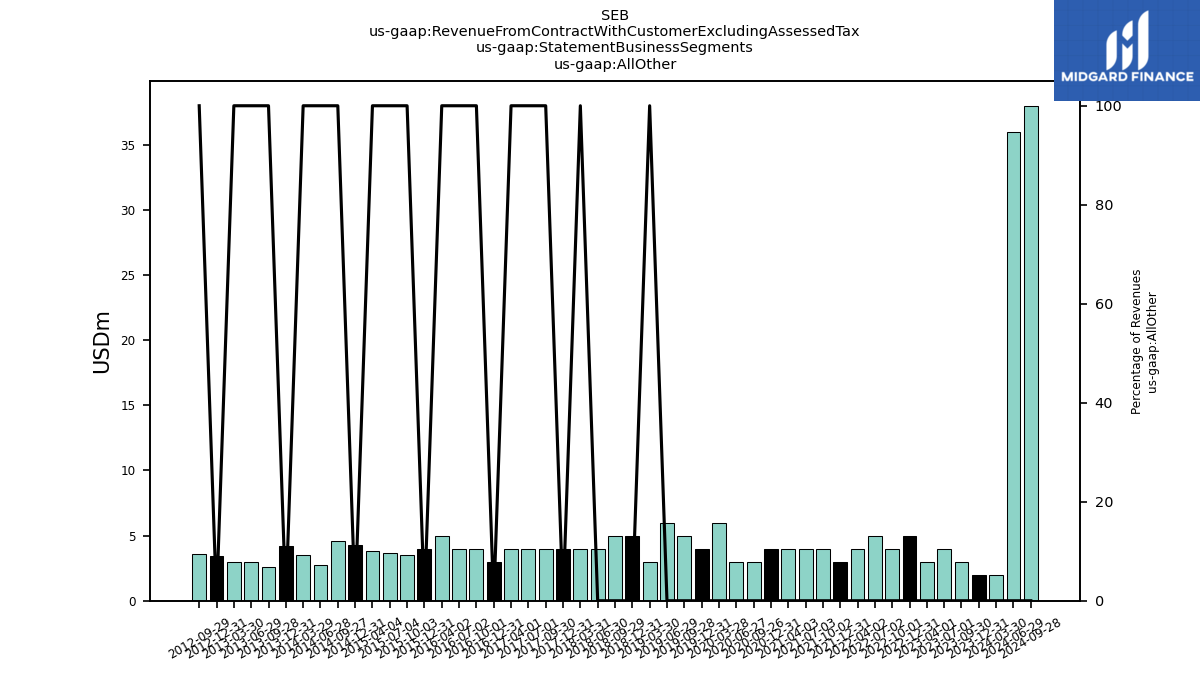
| All Other | 3.00 | 4.00 | 3.00 | 5.00 | 4.00 | 5.00 | 4.00 | 3.00 | 4.00 | 4.00 | 4.00 | 4.00 | 3.00 | 3.00 | 6.00 | 4.00 | 5.00 | 6.00 | 3.00 | 5.00 | 5.00 | 4.00 | 4.00 | 4.00 | 4.00 | 4.00 | 4.00 | 3.00 | 4.00 | 4.00 | 5.00 | 3.98 | 3.54 | 3.64 | 3.83 | 4.29 | 4.55 | 2.76 | 3.49 | 4.17 | 2.56 | 3.00 | 3.00 | 3.44 | 3.56 | NA | NA | NA | NA | NA | NA | NA | NA | NA |
