
| 2023-12-31 | 2023-09-30 | 2023-06-30 | 2023-03-31 | 2022-12-31 | 2022-09-30 | 2022-06-30 | 2022-03-31 | 2021-12-31 | 2021-09-30 | 2021-06-30 | 2021-03-31 | 2020-12-31 | 2020-09-30 | 2020-06-30 | 2020-03-31 | 2019-12-31 | 2019-09-30 | 2019-06-30 | 2019-03-31 | 2018-12-31 | 2018-09-30 | 2018-06-30 | 2018-03-31 | 2017-12-31 | 2017-09-30 | 2017-06-30 | 2017-03-31 | 2016-12-31 | 2016-09-30 | 2016-06-30 | 2016-03-31 | 2015-12-31 | 2015-09-30 | 2015-06-30 | 2015-03-31 | 2014-12-31 | 2014-09-30 | 2014-06-30 | 2014-03-31 | 2013-12-31 | 2013-09-30 | 2013-06-30 | 2013-03-31 | 2012-12-31 | 2012-09-30 | 2012-06-30 | 2012-03-31 | 2011-12-31 | 2011-09-30 | 2011-06-30 | 2010-12-31 | ||
|---|---|---|---|---|---|---|---|---|---|---|---|---|---|---|---|---|---|---|---|---|---|---|---|---|---|---|---|---|---|---|---|---|---|---|---|---|---|---|---|---|---|---|---|---|---|---|---|---|---|---|---|---|---|
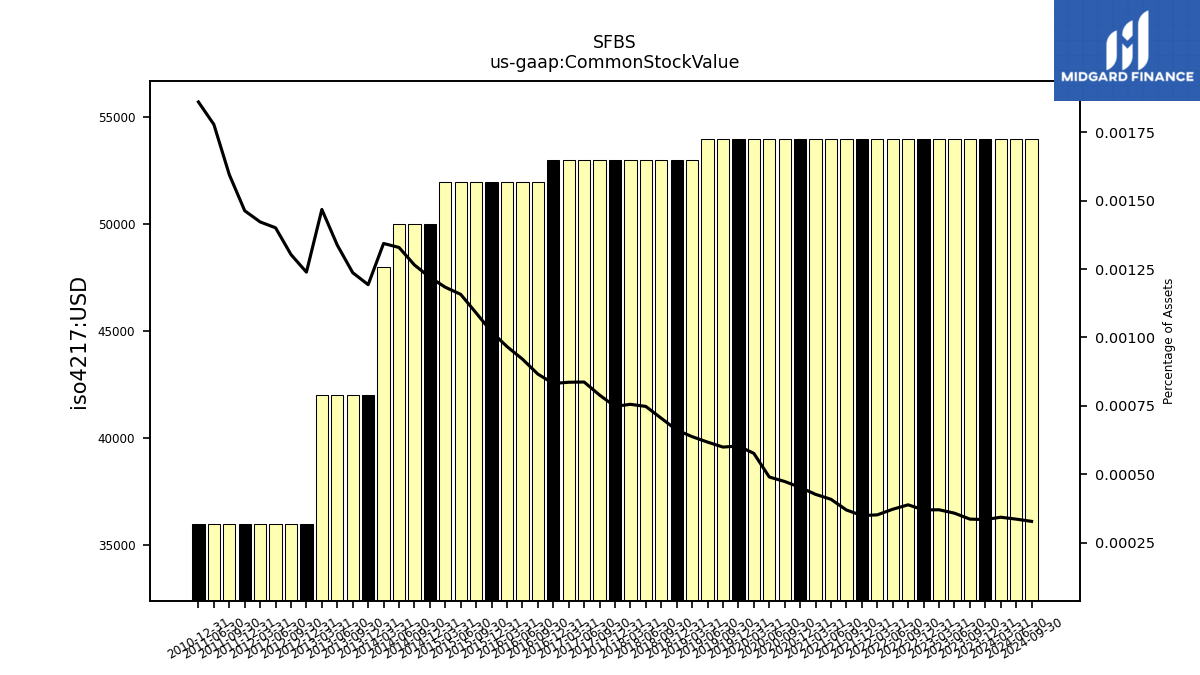
| Common Stock Value | 0.05 | 0.05 | 0.05 | 0.05 | 0.05 | 0.05 | 0.05 | 0.05 | 0.05 | 0.05 | 0.05 | 0.05 | 0.05 | 0.05 | 0.05 | 0.05 | 0.05 | 0.05 | 0.05 | 0.05 | 0.05 | 0.05 | 0.05 | 0.05 | 0.05 | 0.05 | 0.05 | 0.05 | 0.05 | 0.05 | 0.05 | 0.05 | 0.05 | 0.05 | 0.05 | 0.05 | 0.05 | 0.05 | 0.05 | 0.05 | 0.04 | 0.04 | 0.04 | 0.04 | 0.04 | 0.04 | 0.04 | 0.04 | 0.04 | 0.04 | 0.04 | 0.04 | |
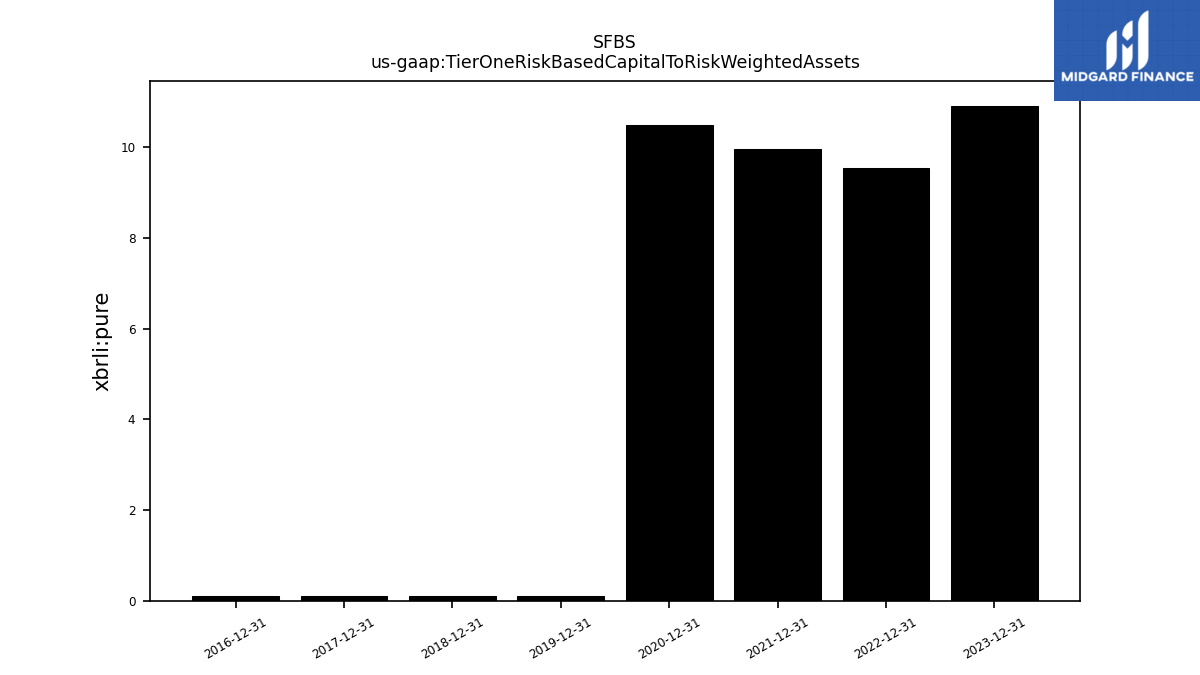
| Tier One Risk Based Capital To Risk Weighted Assets | 0.00 | NA | NA | NA | 0.00 | NA | NA | NA | 0.00 | NA | NA | NA | 0.00 | NA | NA | NA | 0.00 | NA | NA | NA | 0.00 | NA | NA | NA | 0.00 | NA | NA | NA | 0.00 | NA | NA | NA | NA | NA | NA | NA | NA | NA | NA | NA | NA | NA | NA | NA | NA | NA | NA | NA | NA | NA | NA | NA | |
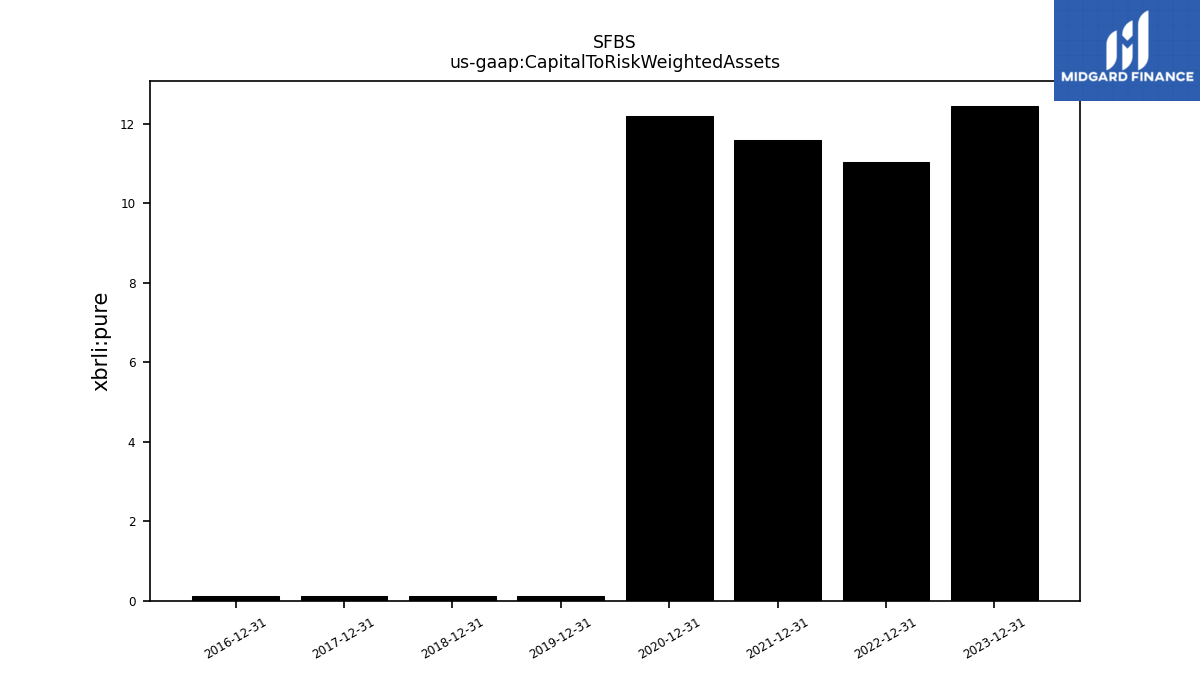
| Capital To Risk Weighted Assets | 0.00 | NA | NA | NA | 0.00 | NA | NA | NA | 0.00 | NA | NA | NA | 0.00 | NA | NA | NA | 0.00 | NA | NA | NA | 0.00 | NA | NA | NA | 0.00 | NA | NA | NA | 0.00 | NA | NA | NA | NA | NA | NA | NA | NA | NA | NA | NA | NA | NA | NA | NA | NA | NA | NA | NA | NA | NA | NA | NA |
| 2023-12-31 | 2023-09-30 | 2023-06-30 | 2023-03-31 | 2022-12-31 | 2022-09-30 | 2022-06-30 | 2022-03-31 | 2021-12-31 | 2021-09-30 | 2021-06-30 | 2021-03-31 | 2020-12-31 | 2020-09-30 | 2020-06-30 | 2020-03-31 | 2019-12-31 | 2019-09-30 | 2019-06-30 | 2019-03-31 | 2018-12-31 | 2018-09-30 | 2018-06-30 | 2018-03-31 | 2017-12-31 | 2017-09-30 | 2017-06-30 | 2017-03-31 | 2016-12-31 | 2016-09-30 | 2016-06-30 | 2016-03-31 | 2015-12-31 | 2015-09-30 | 2015-06-30 | 2015-03-31 | 2014-12-31 | 2014-09-30 | 2014-06-30 | 2014-03-31 | 2013-12-31 | 2013-09-30 | 2013-06-30 | 2013-03-31 | 2012-12-31 | 2012-09-30 | 2012-06-30 | 2012-03-31 | 2011-12-31 | 2011-09-30 | 2011-06-30 | 2010-12-31 | ||
|---|---|---|---|---|---|---|---|---|---|---|---|---|---|---|---|---|---|---|---|---|---|---|---|---|---|---|---|---|---|---|---|---|---|---|---|---|---|---|---|---|---|---|---|---|---|---|---|---|---|---|---|---|---|
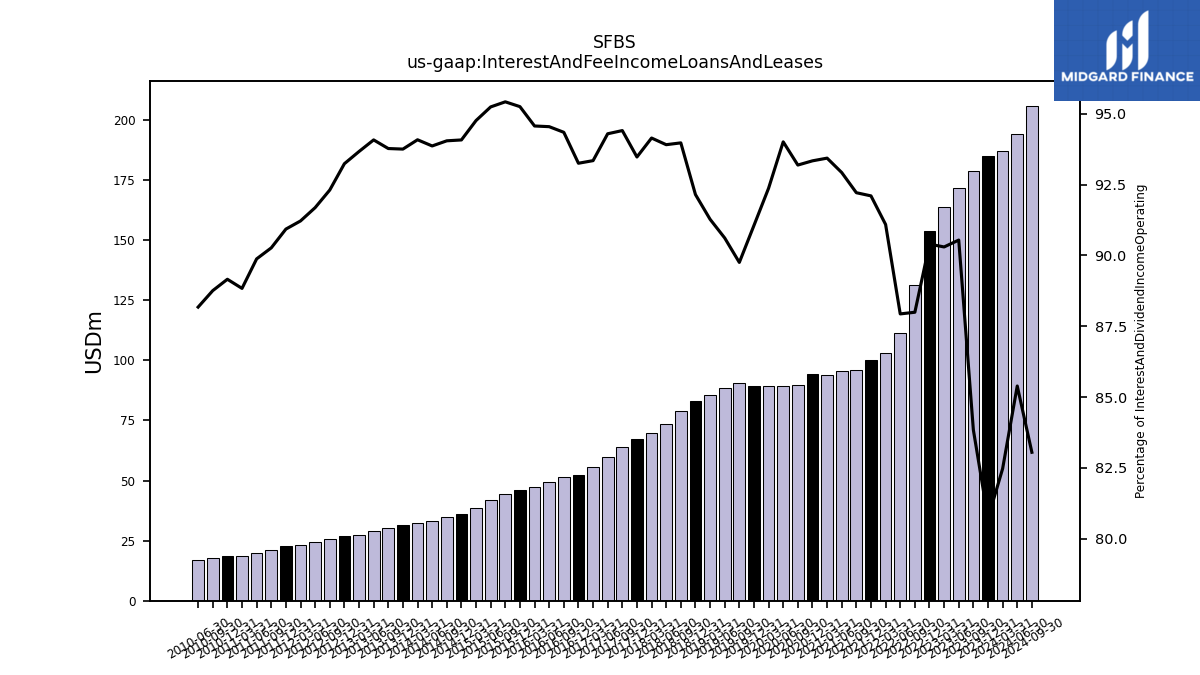
| Interest And Fee Income Loans And Leases | 184.90 | 178.75 | 171.72 | 163.73 | 153.92 | 131.38 | 111.29 | 103.11 | 100.35 | 96.12 | 95.45 | 93.80 | 94.33 | 89.56 | 89.38 | 89.39 | 89.41 | 90.77 | 88.61 | 85.52 | 83.08 | 78.99 | 73.62 | 69.67 | 67.36 | 63.86 | 59.91 | 55.56 | 52.41 | 51.60 | 49.21 | 47.25 | 46.15 | 44.40 | 42.10 | 38.65 | 35.90 | 34.66 | 33.25 | 32.25 | 31.62 | 30.48 | 28.87 | 27.32 | 27.09 | 25.61 | 24.44 | 23.32 | 22.79 | 21.04 | 19.84 | 18.45 | |
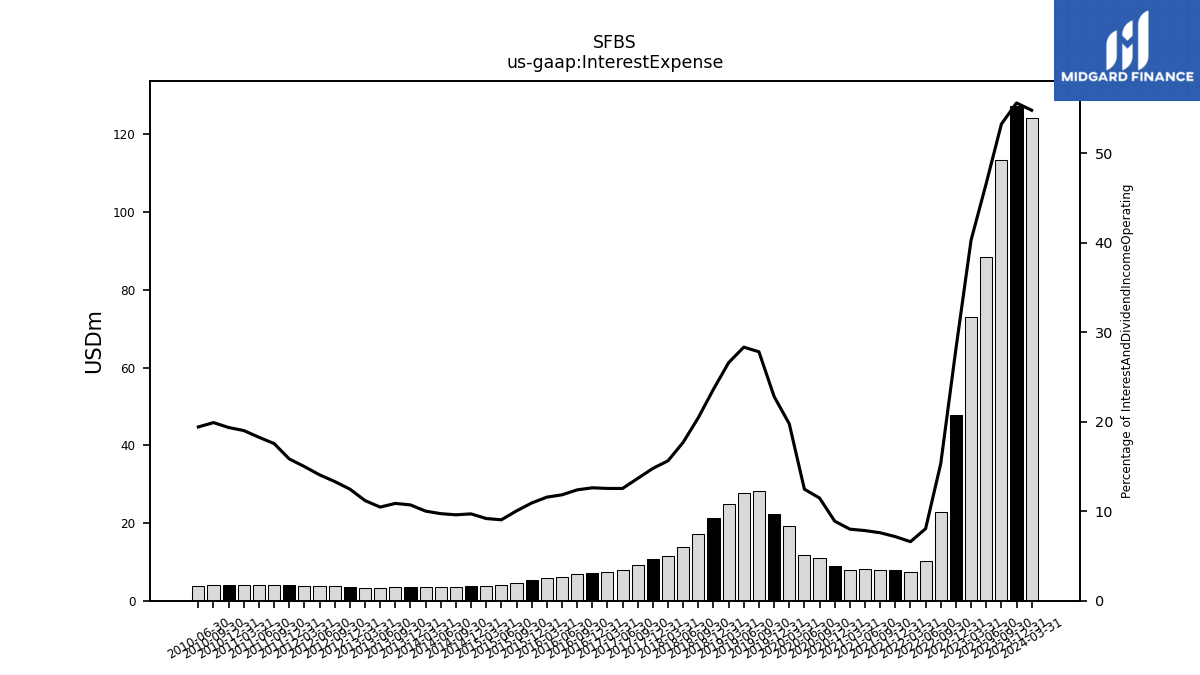
| Interest Expense | 127.38 | 113.51 | 88.41 | 73.02 | 47.89 | 22.88 | 10.19 | 7.47 | 7.80 | 7.92 | 8.05 | 8.03 | 8.98 | 11.03 | 11.85 | 19.13 | 22.41 | 28.12 | 27.70 | 24.92 | 21.31 | 17.20 | 13.87 | 11.57 | 10.65 | 9.24 | 7.97 | 7.46 | 7.09 | 6.77 | 6.16 | 5.78 | 5.29 | 4.67 | 4.00 | 3.75 | 3.70 | 3.54 | 3.45 | 3.43 | 3.61 | 3.53 | 3.21 | 3.26 | 3.62 | 3.69 | 3.75 | 3.83 | 3.97 | 4.09 | 4.03 | 4.00 | |
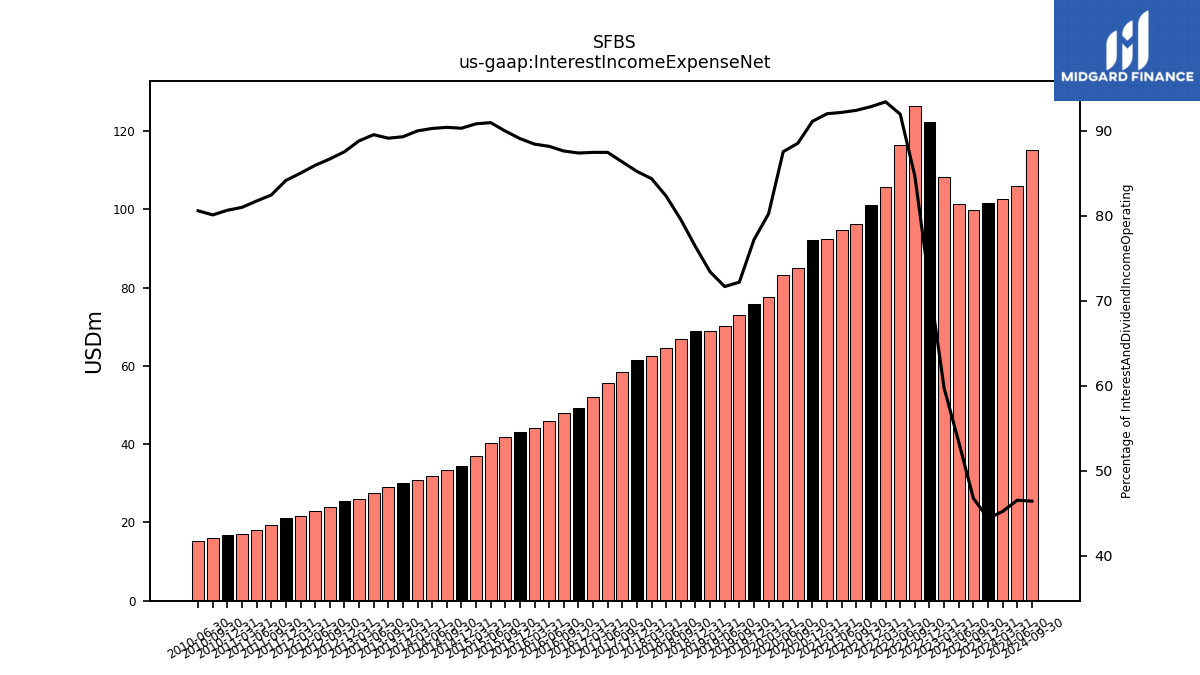
| Interest Income Expense Net | 101.69 | 99.70 | 101.25 | 108.30 | 122.38 | 126.42 | 116.37 | 105.72 | 101.15 | 96.32 | 94.67 | 92.36 | 92.08 | 85.08 | 83.23 | 77.64 | 75.78 | 73.00 | 70.08 | 68.78 | 68.86 | 66.86 | 64.52 | 62.44 | 61.41 | 58.40 | 55.57 | 52.05 | 49.11 | 47.92 | 45.89 | 44.18 | 43.16 | 41.86 | 40.21 | 37.04 | 34.46 | 33.32 | 31.98 | 30.85 | 30.11 | 28.96 | 27.48 | 25.90 | 25.43 | 24.05 | 22.91 | 21.74 | 21.09 | 19.22 | 18.05 | 16.68 | |
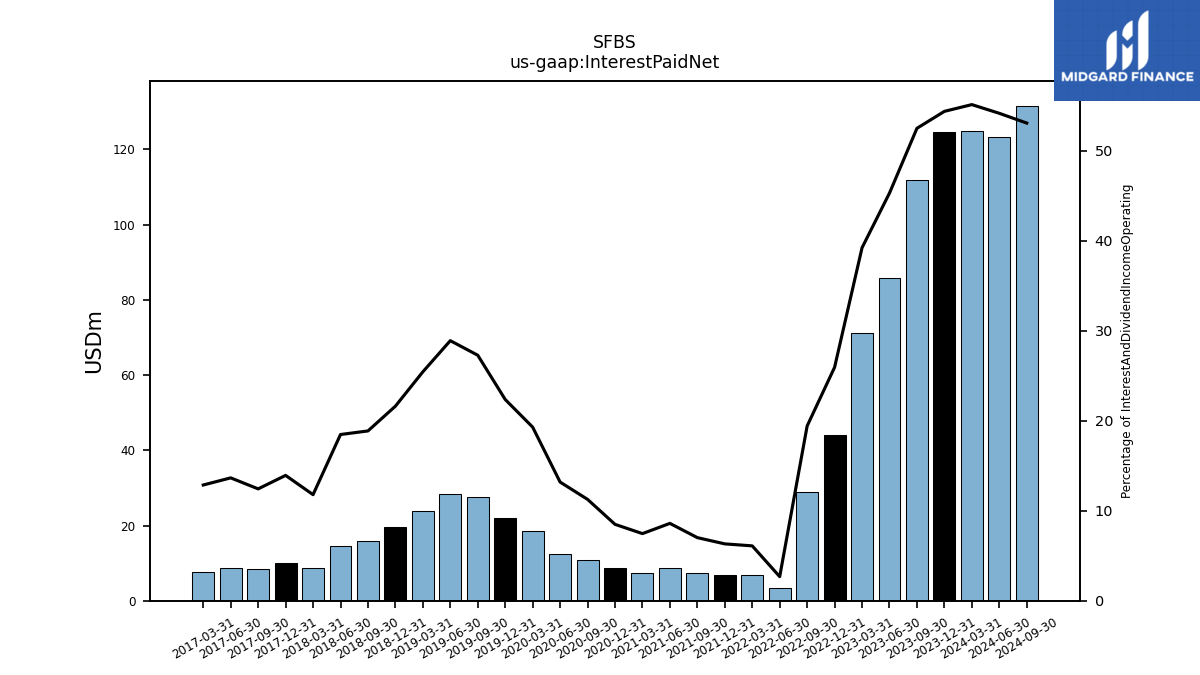
| Interest Paid Net | 124.51 | 111.89 | 85.89 | 71.09 | 44.16 | 28.98 | 3.39 | 6.90 | 6.88 | 7.31 | 8.83 | 7.49 | 8.58 | 10.82 | 12.54 | 18.66 | 21.95 | 27.58 | 28.25 | 23.83 | 19.49 | 15.86 | 14.47 | 8.72 | 10.03 | 8.40 | 8.67 | 7.65 | NA | NA | NA | NA | NA | NA | NA | NA | NA | NA | NA | NA | NA | NA | NA | NA | NA | NA | NA | NA | NA | NA | NA | NA | |
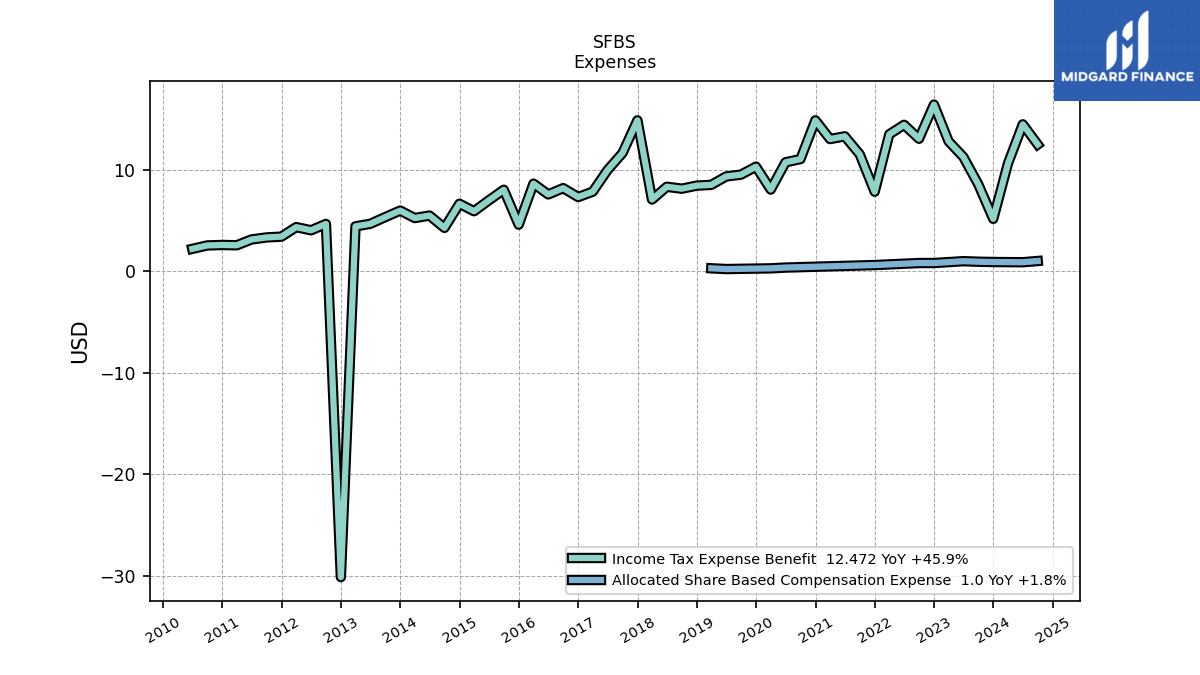
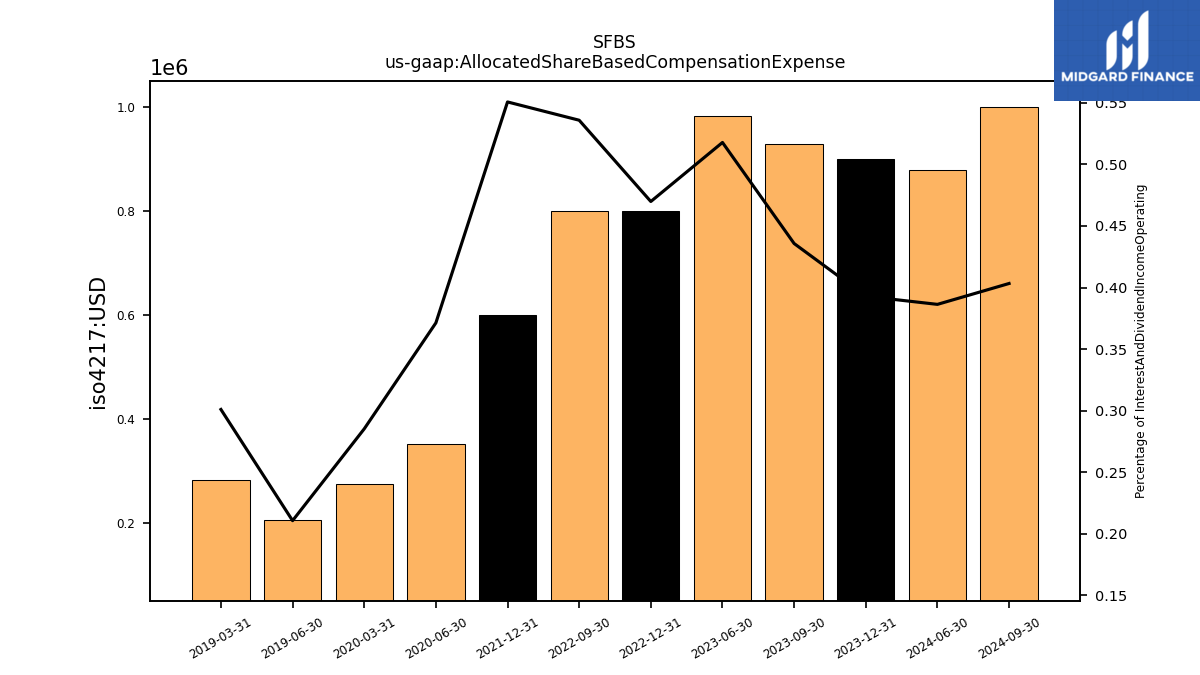
| Allocated Share Based Compensation Expense | 0.90 | 0.90 | NA | NA | 0.80 | 0.80 | NA | NA | 0.60 | NA | NA | NA | NA | NA | 0.35 | 0.28 | NA | NA | 0.21 | 0.28 | NA | NA | NA | NA | NA | NA | NA | NA | NA | NA | NA | NA | NA | NA | NA | NA | NA | NA | NA | NA | NA | NA | NA | NA | NA | NA | NA | NA | NA | NA | NA | NA | |
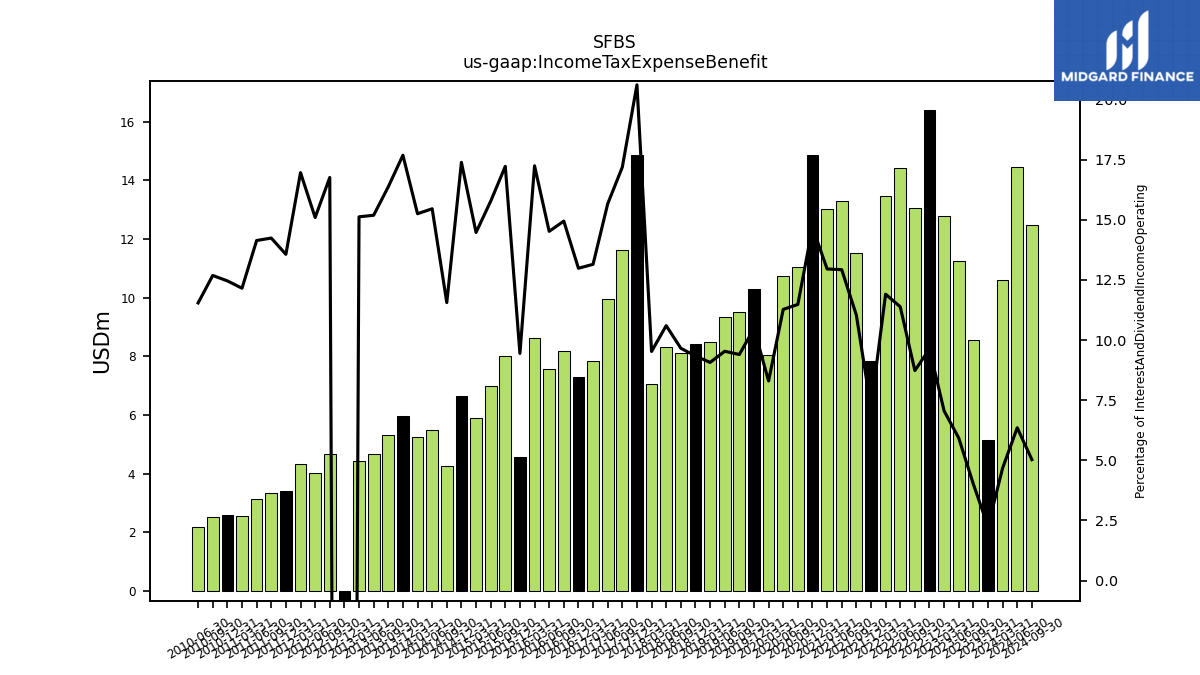
| Income Tax Expense Benefit | 5.15 | 8.55 | 11.24 | 12.79 | 16.40 | 13.04 | 14.41 | 13.48 | 7.82 | 11.51 | 13.28 | 13.01 | 14.85 | 11.04 | 10.72 | 8.03 | 10.29 | 9.51 | 9.32 | 8.50 | 8.42 | 8.12 | 8.31 | 7.05 | 14.85 | 11.63 | 9.95 | 7.83 | 7.30 | 8.17 | 7.56 | 8.62 | 4.58 | 8.01 | 6.97 | 5.90 | 6.64 | 4.26 | 5.48 | 5.23 | 5.96 | 5.32 | 4.66 | 4.41 | -30.13 | 4.65 | 4.02 | 4.34 | 3.40 | 3.32 | 3.12 | 2.58 | |
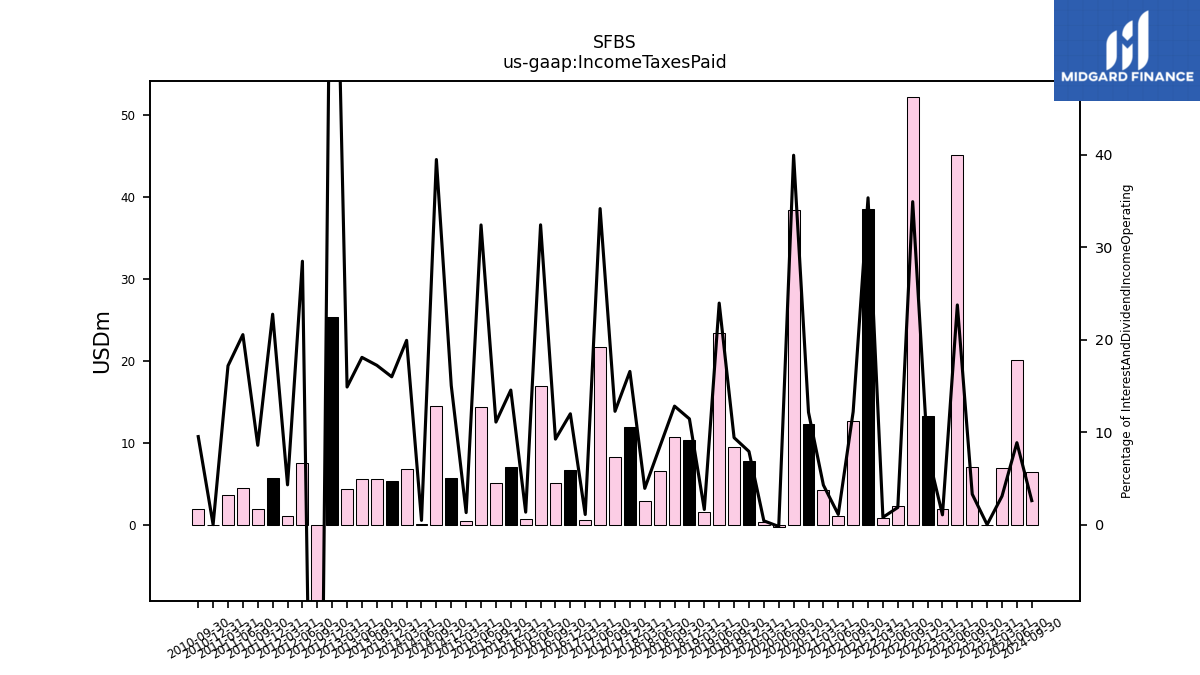
| Income Taxes Paid | 0.00 | 7.02 | 45.05 | 1.92 | 13.29 | 52.13 | 2.35 | 0.89 | 38.50 | 12.72 | 1.13 | 4.29 | 12.27 | 38.39 | -0.19 | 0.40 | 7.77 | 9.51 | 23.42 | 1.53 | 10.31 | 10.77 | 6.56 | 2.90 | 11.94 | 8.29 | 21.71 | 0.65 | 6.74 | 5.06 | 16.87 | 0.67 | 7.05 | 5.16 | 14.32 | 0.53 | 5.74 | 14.55 | 0.16 | 6.83 | 5.39 | 5.60 | 5.55 | 4.34 | 25.34 | -20.89 | 7.59 | 1.10 | 5.70 | 2.00 | 4.54 | 0.00 | |
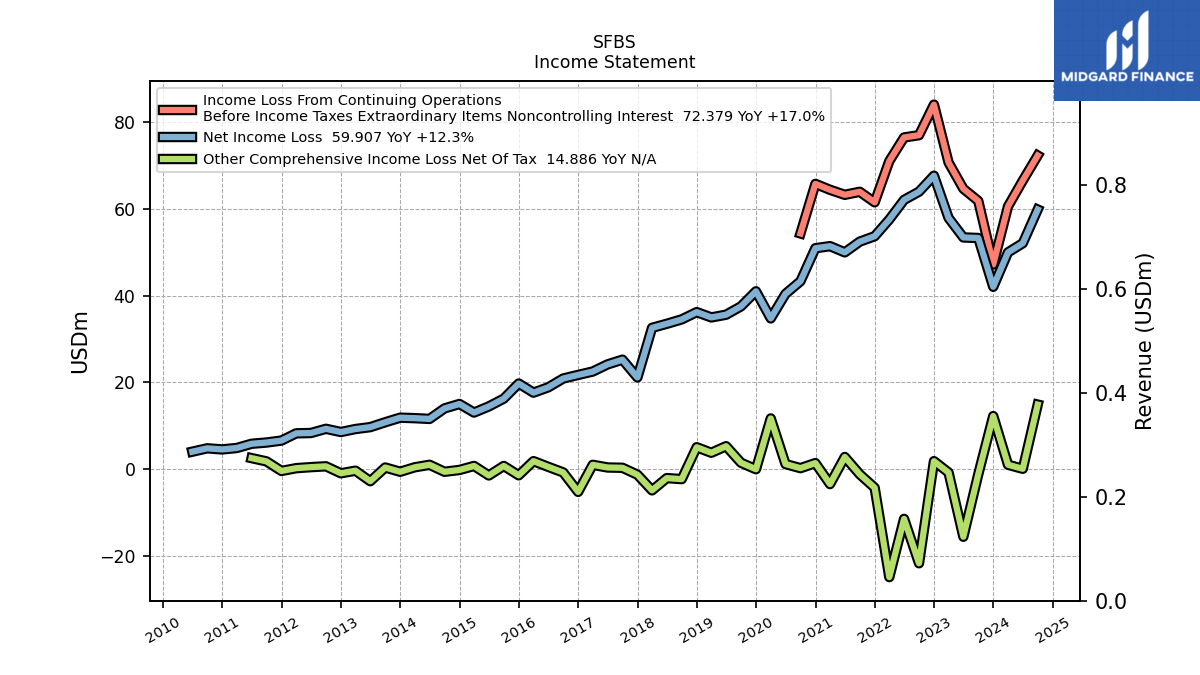
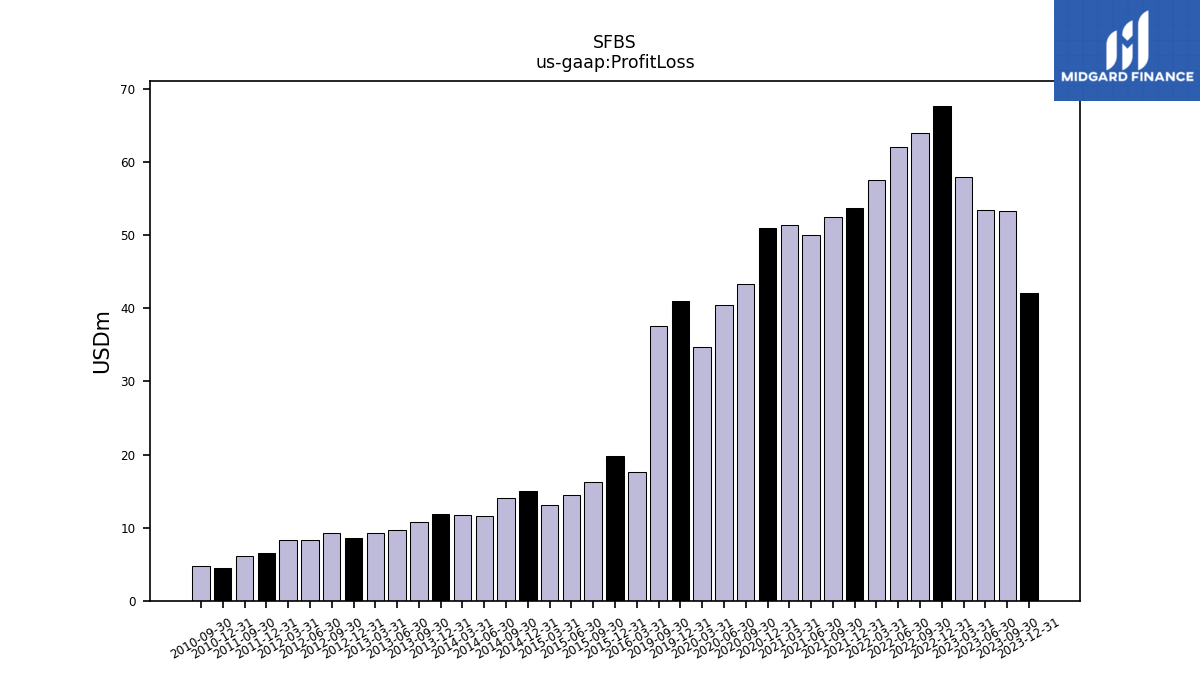
| Profit Loss | 42.07 | 53.34 | 53.47 | 57.97 | 67.72 | 64.03 | 62.14 | 57.61 | 53.75 | 52.50 | 50.03 | 51.45 | 50.98 | 43.36 | 40.45 | 34.78 | 41.04 | 37.56 | NA | NA | NA | NA | NA | NA | NA | NA | NA | NA | NA | NA | NA | 17.65 | 19.75 | 16.27 | 14.47 | 13.05 | 15.03 | 14.00 | 11.59 | 11.76 | 11.87 | 10.81 | 9.69 | 9.25 | 8.56 | 9.30 | 8.33 | 8.26 | 6.59 | 6.13 | NA | 4.54 | |
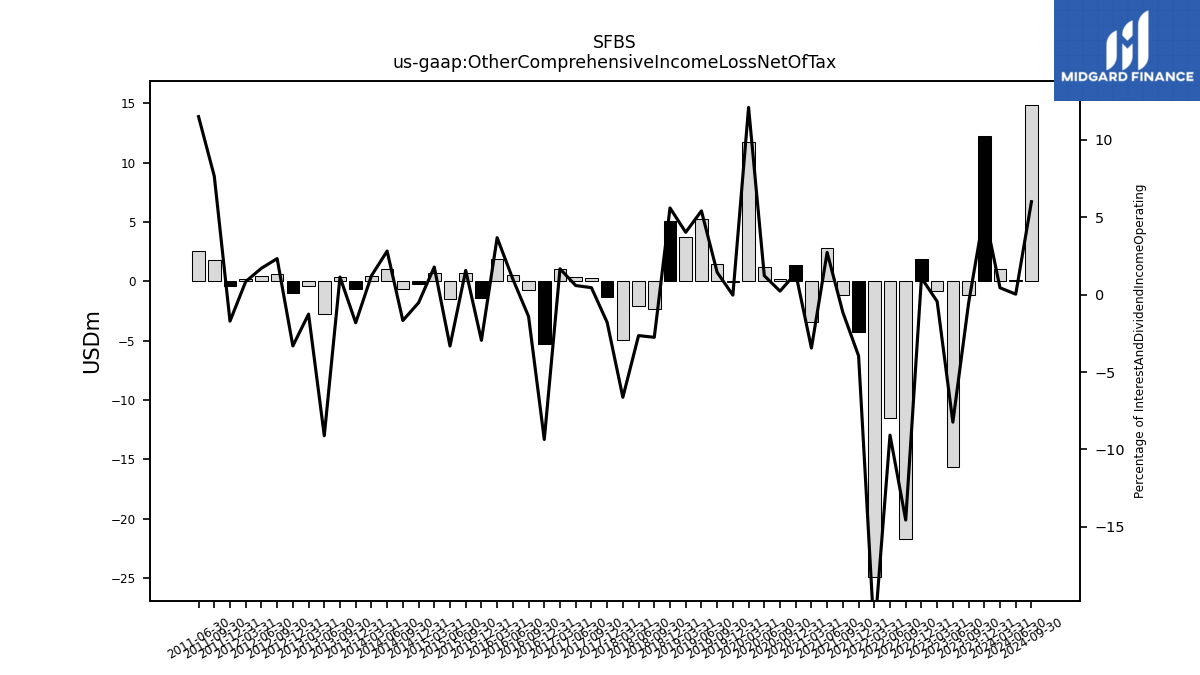
| Other Comprehensive Income Loss Net Of Tax | 12.24 | -1.18 | -15.61 | -0.80 | 1.84 | -21.73 | -11.48 | -24.93 | -4.30 | -1.20 | 2.80 | -3.46 | 1.39 | 0.22 | 1.16 | 11.70 | -0.03 | 1.46 | 5.29 | 3.77 | 5.05 | -2.32 | -2.07 | -4.91 | -1.29 | 0.30 | 0.37 | 0.99 | -5.26 | -0.77 | 0.52 | 1.84 | -1.43 | 0.73 | -1.47 | 0.73 | -0.20 | -0.62 | 1.00 | 0.42 | -0.61 | 0.37 | -2.80 | -0.37 | -0.96 | 0.65 | 0.45 | 0.22 | -0.43 | 1.78 | 2.54 | NA | |
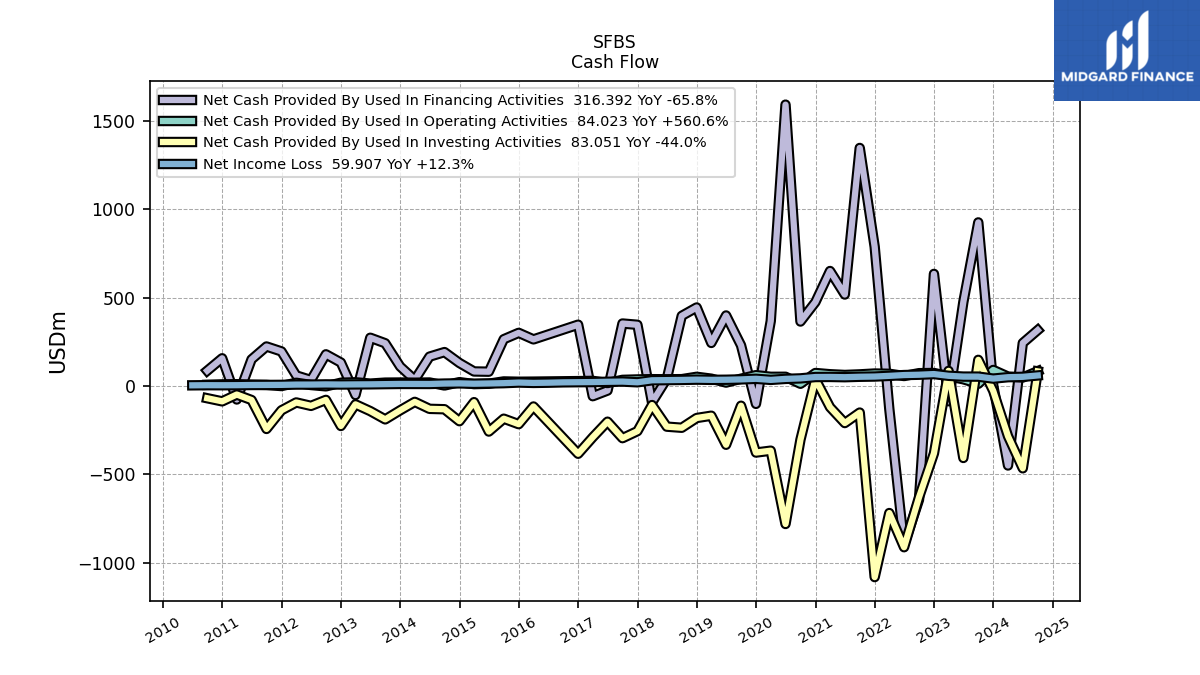
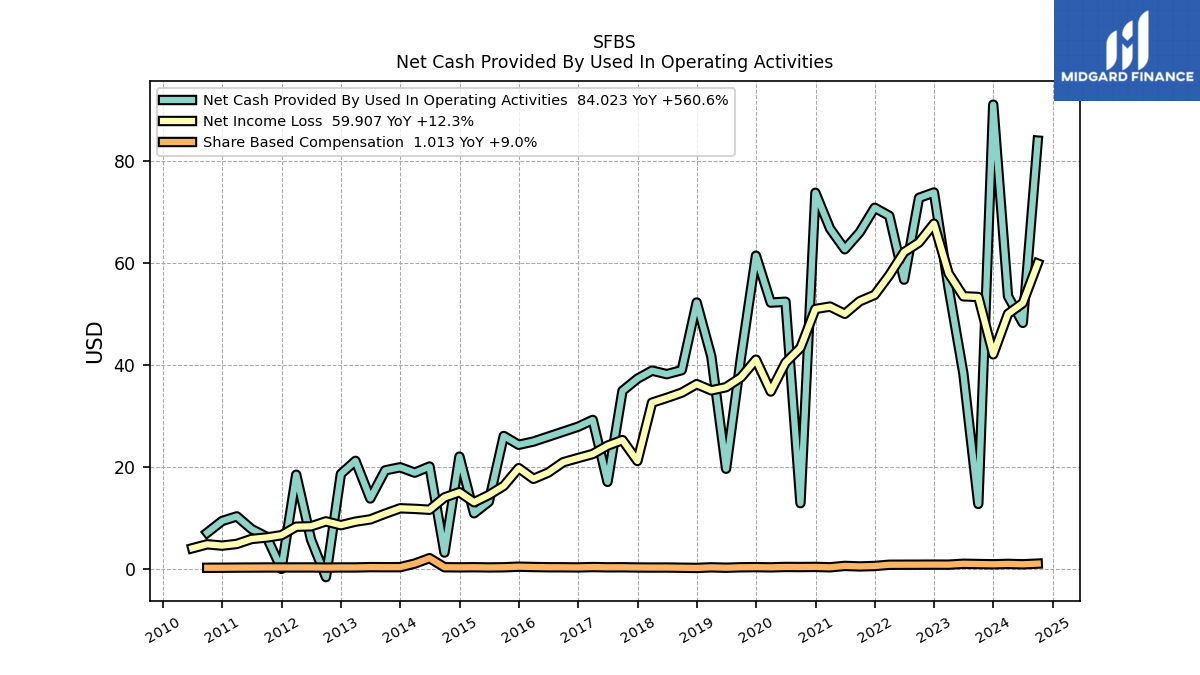
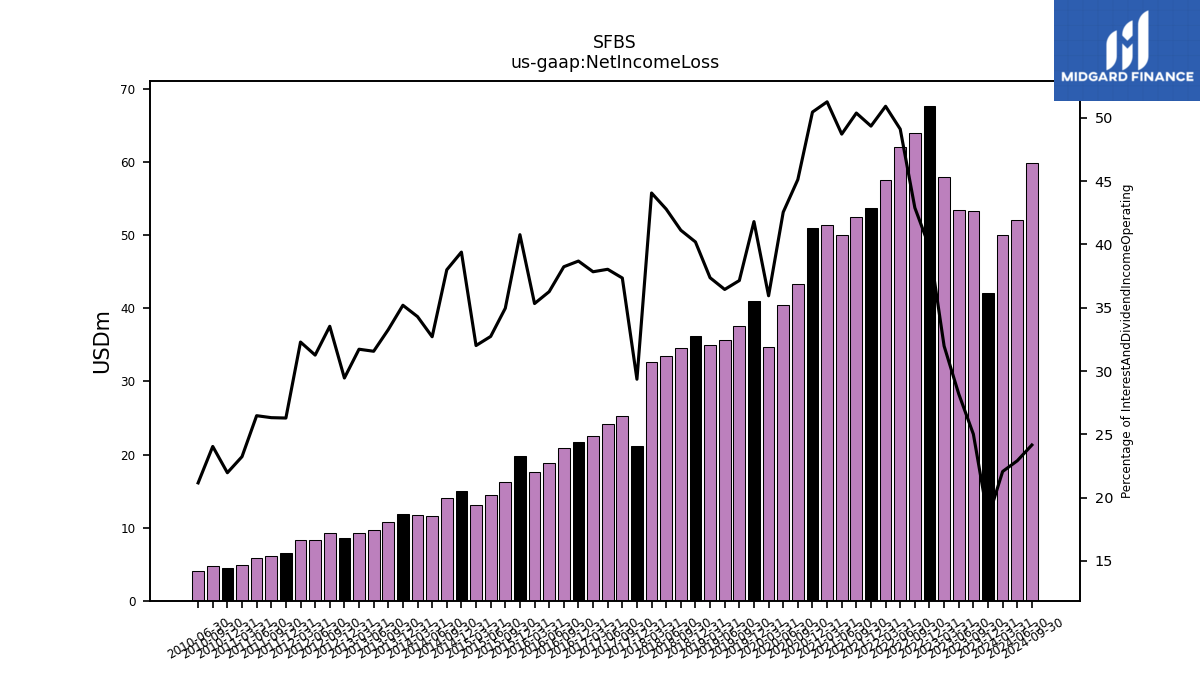
| Net Income Loss | 42.07 | 53.34 | 53.47 | 57.97 | 67.72 | 64.03 | 62.14 | 57.61 | 53.75 | 52.50 | 50.03 | 51.45 | 50.98 | 43.36 | 40.45 | 34.78 | 41.04 | 37.56 | 35.63 | 35.01 | 36.24 | 34.56 | 33.54 | 32.60 | 21.15 | 25.26 | 24.16 | 22.52 | 21.74 | 20.91 | 18.88 | 17.65 | 19.75 | 16.27 | 14.47 | 13.05 | 15.03 | 14.00 | 11.59 | 11.76 | 11.87 | 10.81 | 9.69 | 9.25 | 8.56 | 9.30 | 8.33 | 8.26 | 6.59 | 6.13 | 5.84 | 4.54 | |
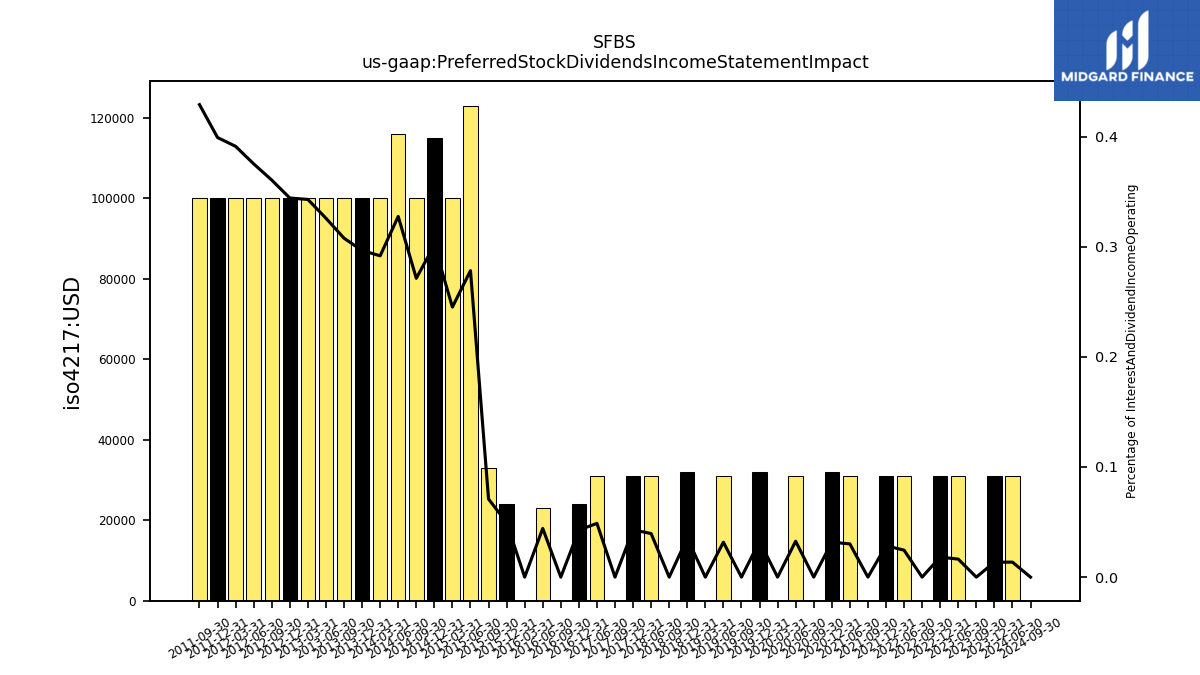
| Preferred Stock Dividends Income Statement Impact | 0.03 | 0.00 | 0.03 | NA | 0.03 | 0.00 | 0.03 | NA | 0.03 | 0.00 | 0.03 | NA | 0.03 | 0.00 | 0.03 | 0.00 | 0.03 | 0.00 | 0.03 | 0.00 | 0.03 | 0.00 | 0.03 | NA | 0.03 | 0.00 | 0.03 | NA | 0.02 | 0.00 | 0.02 | 0.00 | 0.02 | 0.03 | 0.12 | 0.10 | 0.12 | 0.10 | 0.12 | 0.10 | 0.10 | 0.10 | 0.10 | 0.10 | 0.10 | 0.10 | 0.10 | 0.10 | 0.10 | 0.10 | NA | NA | |
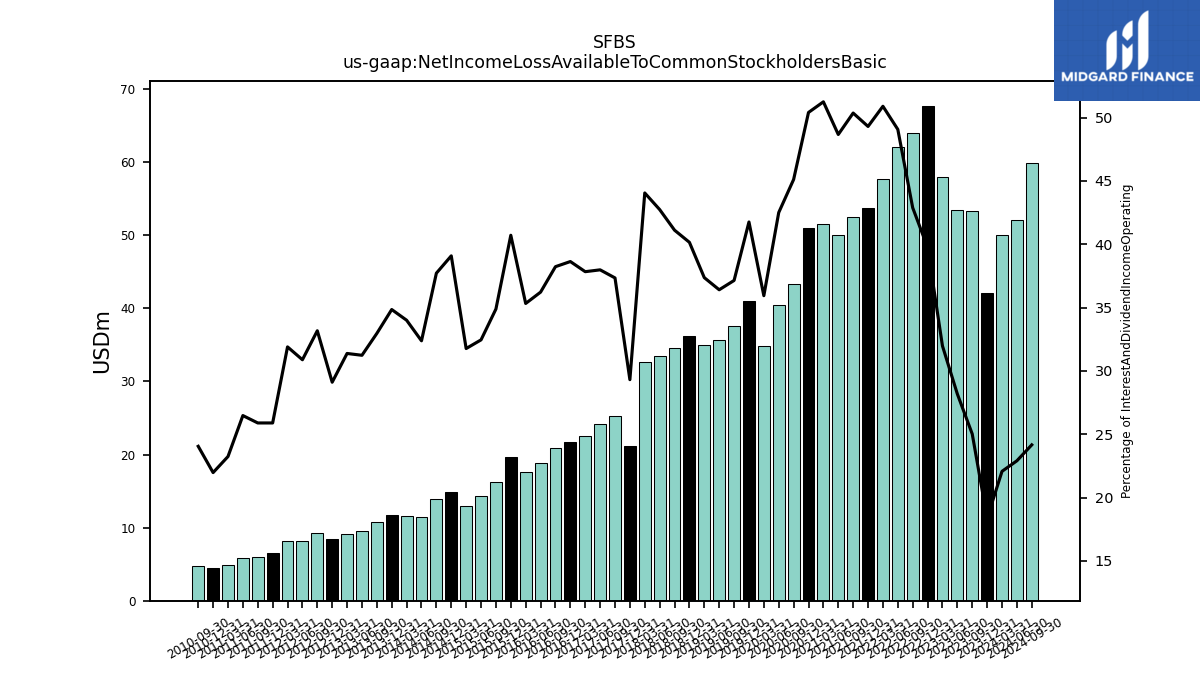
| Net Income Loss Available To Common Stockholders Basic | 42.04 | 53.34 | 53.44 | 57.97 | 67.69 | 64.03 | 62.10 | 57.61 | 53.72 | 52.50 | 50.00 | 51.45 | 50.95 | 43.36 | 40.42 | 34.78 | 41.01 | 37.56 | 35.60 | 35.01 | 36.20 | 34.56 | 33.51 | 32.60 | 21.12 | 25.26 | 24.13 | 22.52 | 21.71 | 20.91 | 18.85 | 17.65 | 19.73 | 16.23 | 14.35 | 12.96 | 14.92 | 13.90 | 11.47 | 11.66 | 11.75 | 10.71 | 9.59 | 9.15 | 8.46 | 9.20 | 8.23 | 8.16 | 6.49 | 6.04 | 5.84 | 4.54 | |
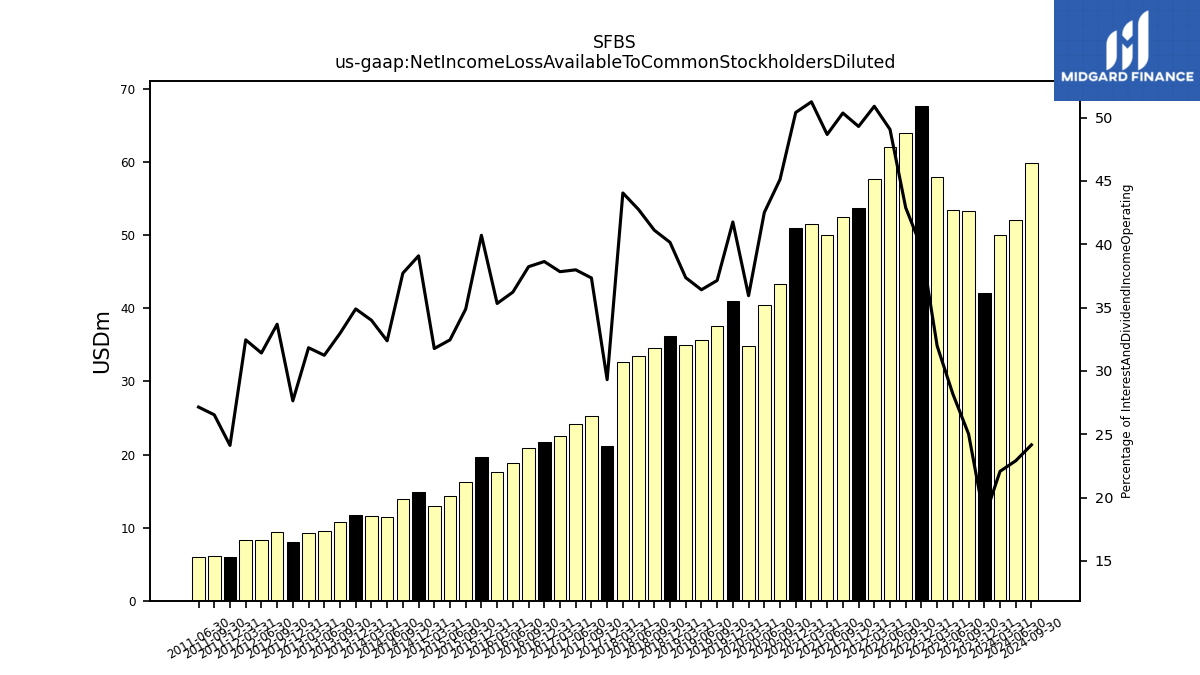
| Net Income Loss Available To Common Stockholders Diluted | 42.04 | 53.34 | 53.44 | 57.97 | 67.69 | 64.03 | 62.10 | 57.61 | 53.72 | 52.50 | 50.00 | 51.45 | 50.95 | 43.36 | 40.42 | 34.78 | 41.01 | 37.56 | 35.60 | 35.01 | 36.20 | 34.56 | 33.51 | 32.60 | 21.12 | 25.26 | 24.13 | 22.52 | 21.71 | 20.91 | 18.85 | 17.65 | 19.73 | 16.23 | 14.35 | 12.96 | 14.92 | 13.90 | 11.47 | 11.66 | 11.77 | 10.71 | 9.59 | 9.28 | 8.03 | 9.35 | 8.37 | 8.30 | 6.04 | 6.18 | 5.99 | NA | |
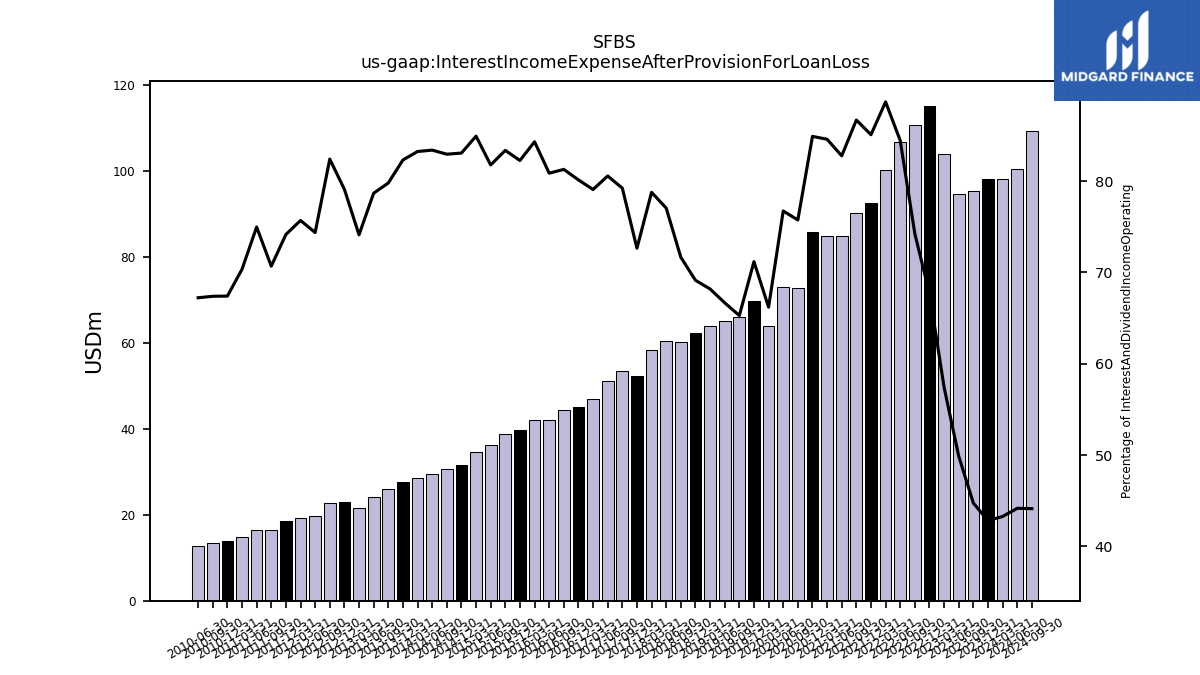
| Interest Income Expense After Provision For Loan Loss | 98.11 | 95.42 | 94.60 | 104.10 | 115.25 | 110.81 | 106.86 | 100.36 | 92.70 | 90.36 | 85.02 | 84.91 | 85.80 | 72.80 | 72.95 | 64.06 | 69.89 | 66.02 | 65.20 | 63.89 | 62.34 | 60.24 | 60.40 | 58.30 | 52.35 | 53.59 | 51.19 | 47.07 | 45.03 | 44.45 | 42.09 | 42.12 | 39.85 | 38.79 | 36.15 | 34.63 | 31.70 | 30.57 | 29.54 | 28.54 | 27.76 | 25.93 | 24.15 | 21.62 | 22.98 | 22.86 | 19.82 | 19.36 | 18.58 | 16.48 | 16.55 | 13.95 | |
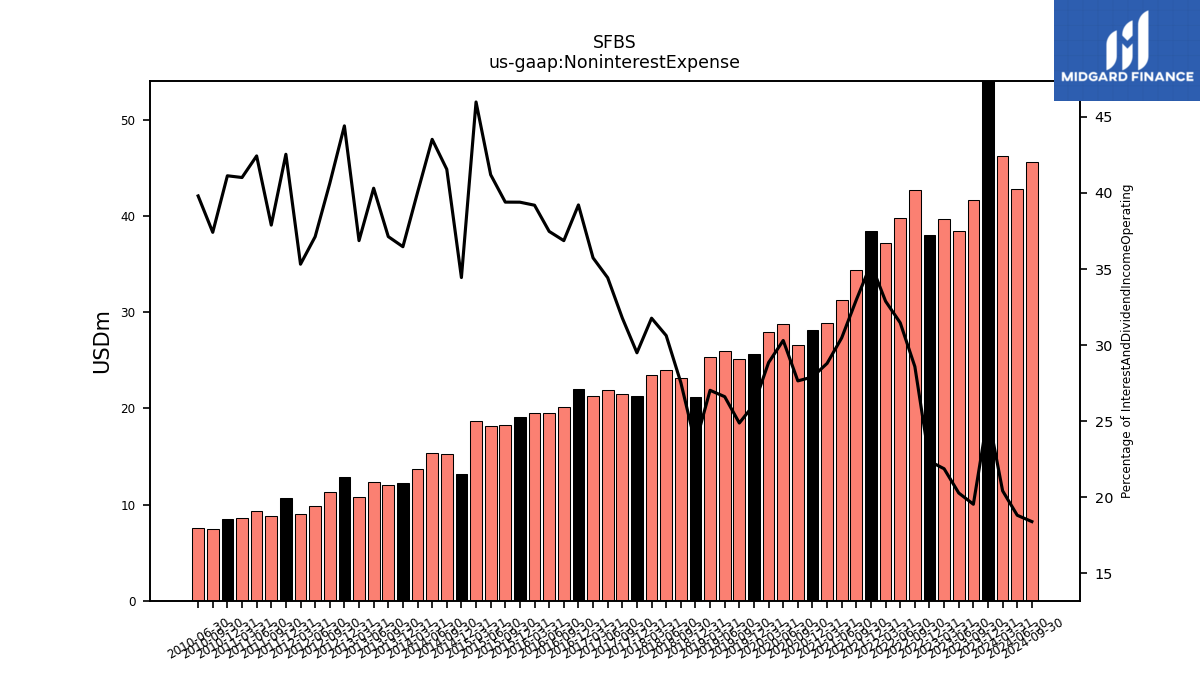
| Noninterest Expense | 58.26 | 41.66 | 38.47 | 39.66 | 38.09 | 42.69 | 39.82 | 37.22 | 38.49 | 34.38 | 31.31 | 28.91 | 28.20 | 26.57 | 28.82 | 27.92 | 25.62 | 25.16 | 26.02 | 25.33 | 21.20 | 23.15 | 24.01 | 23.51 | 21.25 | 21.50 | 21.88 | 21.27 | 22.04 | 20.16 | 19.50 | 19.58 | 19.09 | 18.33 | 18.21 | 18.75 | 13.14 | 15.31 | 15.42 | 13.72 | 12.30 | 12.07 | 12.37 | 10.75 | 12.90 | 11.27 | 9.89 | 9.03 | 10.66 | 8.83 | 9.37 | 8.51 | |
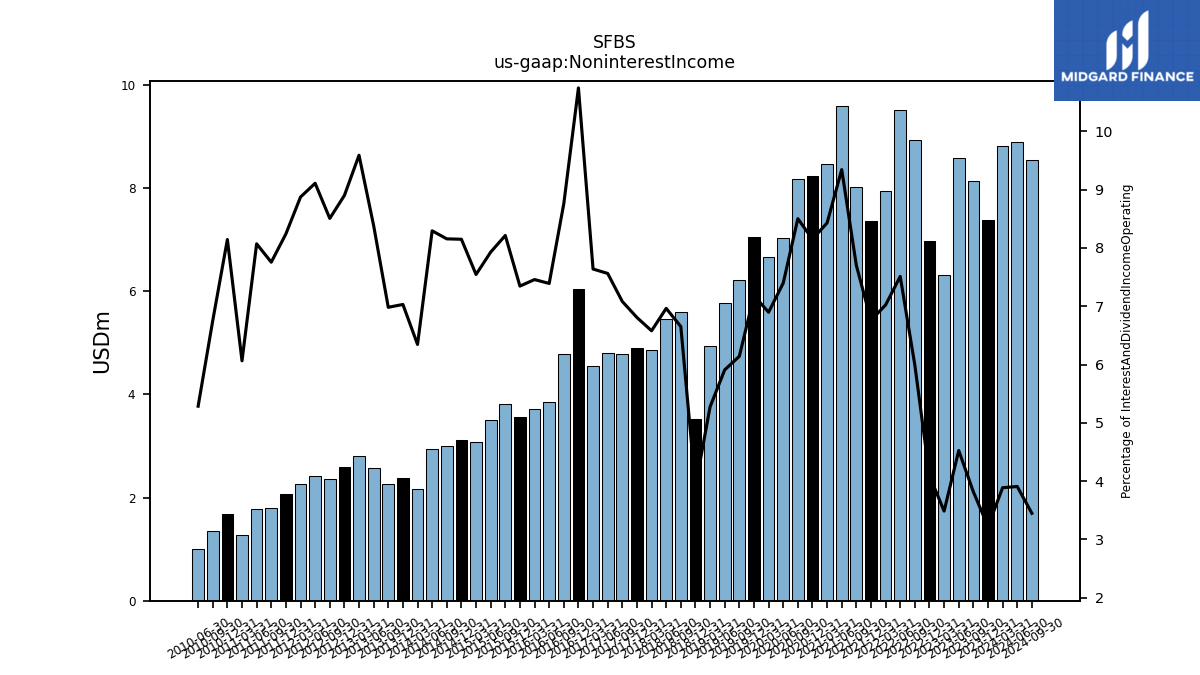
| Noninterest Income | 7.38 | 8.13 | 8.58 | 6.32 | 6.97 | 8.94 | 9.51 | 7.95 | 7.37 | 8.03 | 9.60 | 8.46 | 8.24 | 8.17 | 7.03 | 6.67 | 7.05 | 6.21 | 5.78 | 4.94 | 3.52 | 5.59 | 5.46 | 4.87 | 4.91 | 4.79 | 4.80 | 4.55 | 6.04 | 4.79 | 3.85 | 3.73 | 3.56 | 3.82 | 3.50 | 3.08 | 3.11 | 3.01 | 2.94 | 2.17 | 2.37 | 2.27 | 2.57 | 2.80 | 2.59 | 2.36 | 2.43 | 2.27 | 2.06 | 1.81 | 1.78 | 1.69 |
| 2023-12-31 | 2023-09-30 | 2023-06-30 | 2023-03-31 | 2022-12-31 | 2022-09-30 | 2022-06-30 | 2022-03-31 | 2021-12-31 | 2021-09-30 | 2021-06-30 | 2021-03-31 | 2020-12-31 | 2020-09-30 | 2020-06-30 | 2020-03-31 | 2019-12-31 | 2019-09-30 | 2019-06-30 | 2019-03-31 | 2018-12-31 | 2018-09-30 | 2018-06-30 | 2018-03-31 | 2017-12-31 | 2017-09-30 | 2017-06-30 | 2017-03-31 | 2016-12-31 | 2016-09-30 | 2016-06-30 | 2016-03-31 | 2015-12-31 | 2015-09-30 | 2015-06-30 | 2015-03-31 | 2014-12-31 | 2014-09-30 | 2014-06-30 | 2014-03-31 | 2013-12-31 | 2013-09-30 | 2013-06-30 | 2013-03-31 | 2012-12-31 | 2012-09-30 | 2012-06-30 | 2012-03-31 | 2011-12-31 | 2011-09-30 | 2011-06-30 | 2010-12-31 | ||
|---|---|---|---|---|---|---|---|---|---|---|---|---|---|---|---|---|---|---|---|---|---|---|---|---|---|---|---|---|---|---|---|---|---|---|---|---|---|---|---|---|---|---|---|---|---|---|---|---|---|---|---|---|---|
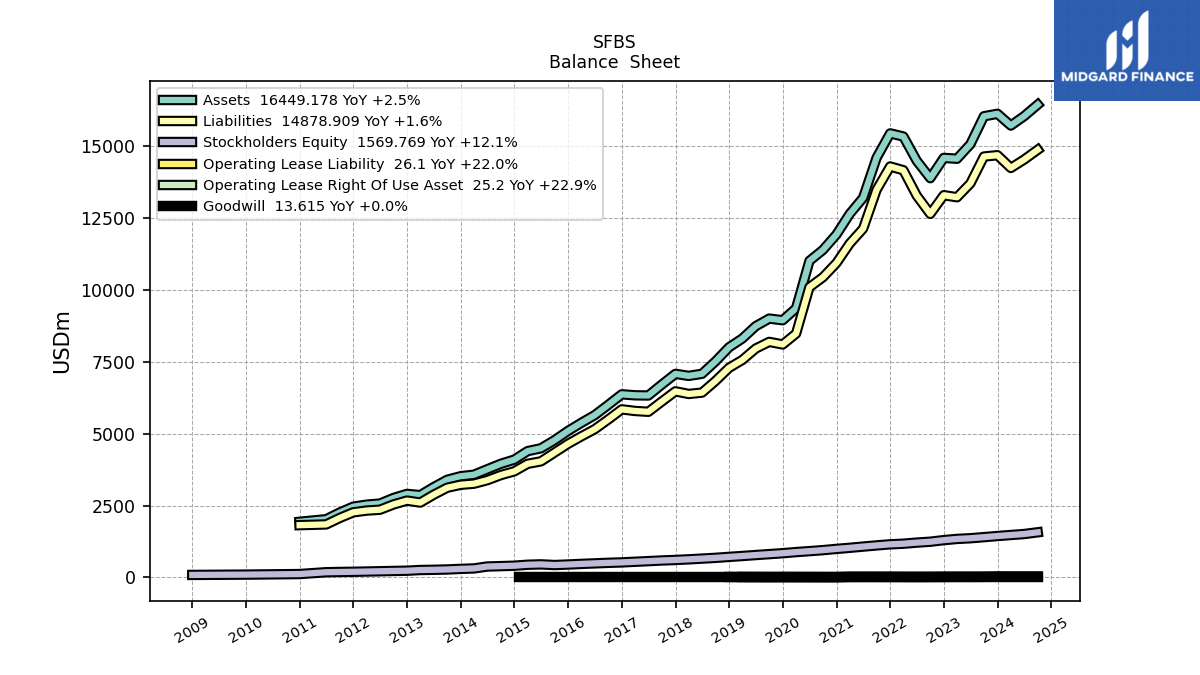
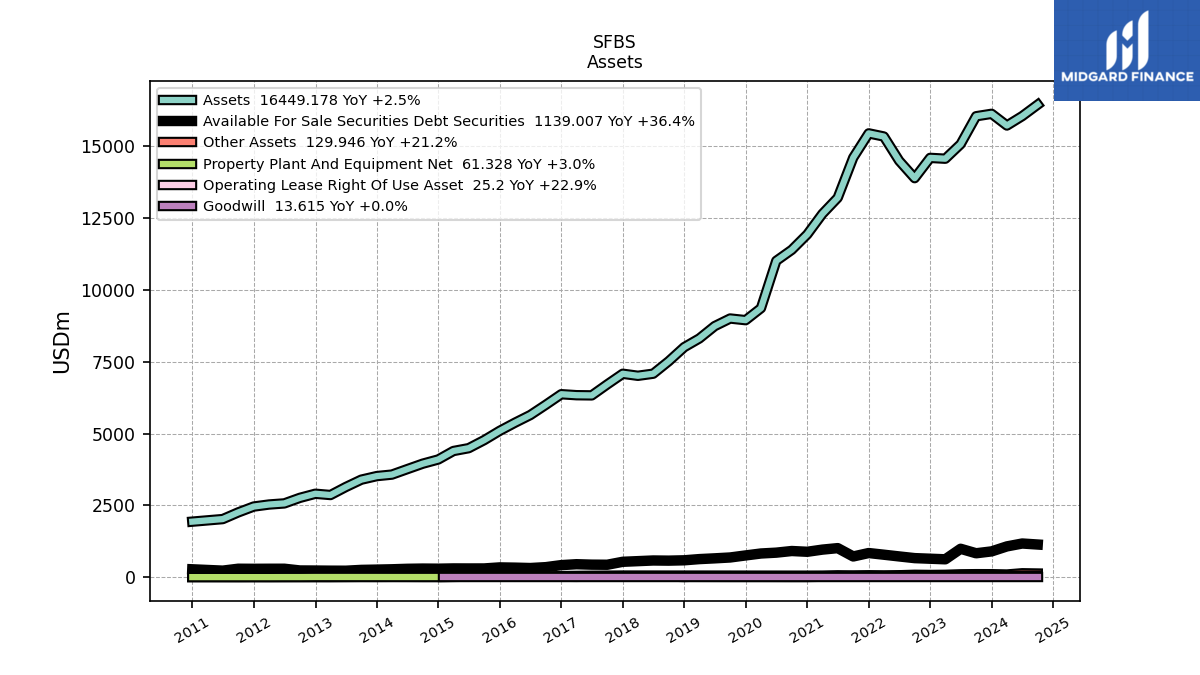
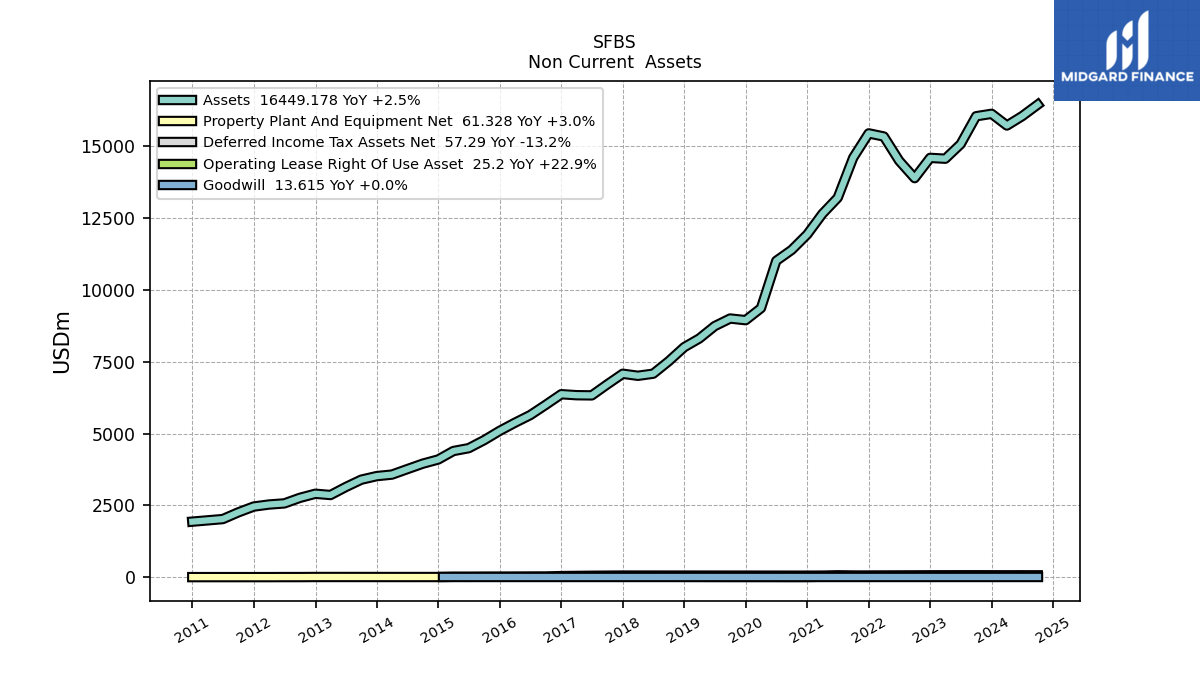
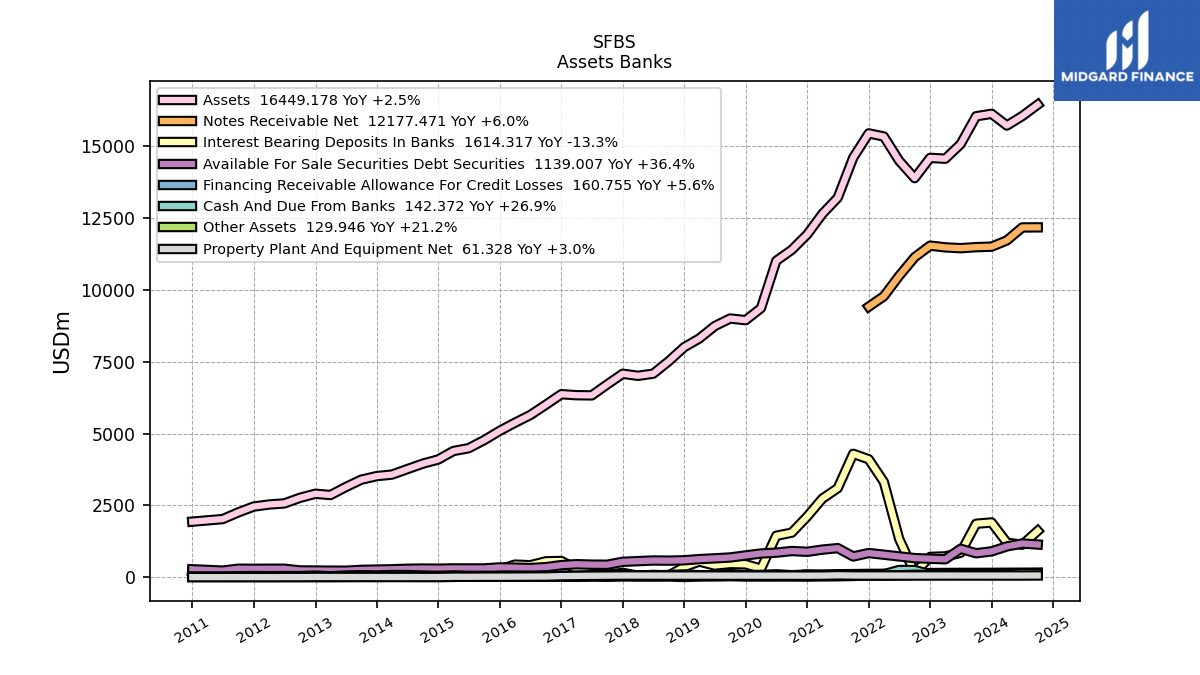
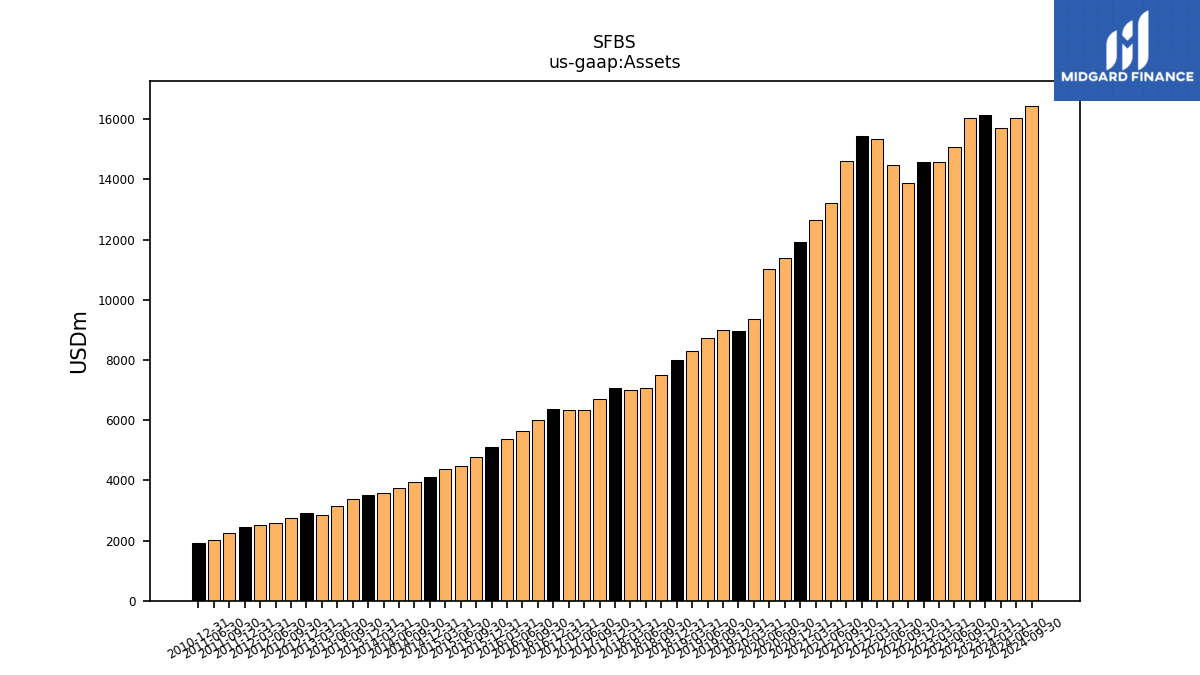
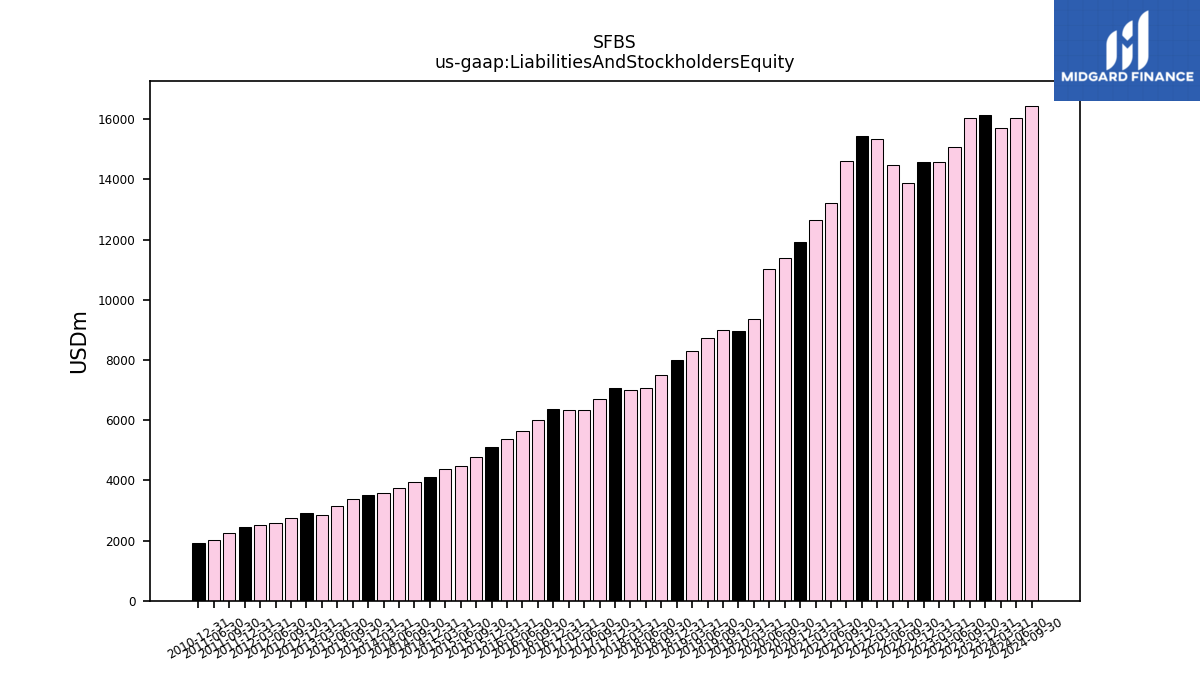
| Assets | 16129.67 | 16044.33 | 15072.81 | 14566.56 | 14595.75 | 13890.03 | 14494.32 | 15339.42 | 15448.81 | 14602.23 | 13207.32 | 12647.37 | 11932.65 | 11394.87 | 11012.19 | 9364.88 | 8947.65 | 9005.11 | 8740.24 | 8310.84 | 8007.38 | 7517.83 | 7084.56 | 7011.73 | 7082.38 | 6712.10 | 6329.60 | 6336.16 | 6370.45 | 6002.62 | 5646.06 | 5378.60 | 5095.51 | 4772.60 | 4492.54 | 4393.34 | 4098.68 | 3952.80 | 3762.68 | 3572.91 | 3520.70 | 3396.15 | 3140.63 | 2861.76 | 2906.31 | 2763.23 | 2570.24 | 2531.48 | 2460.78 | 2257.33 | 2024.60 | 1935.17 | |
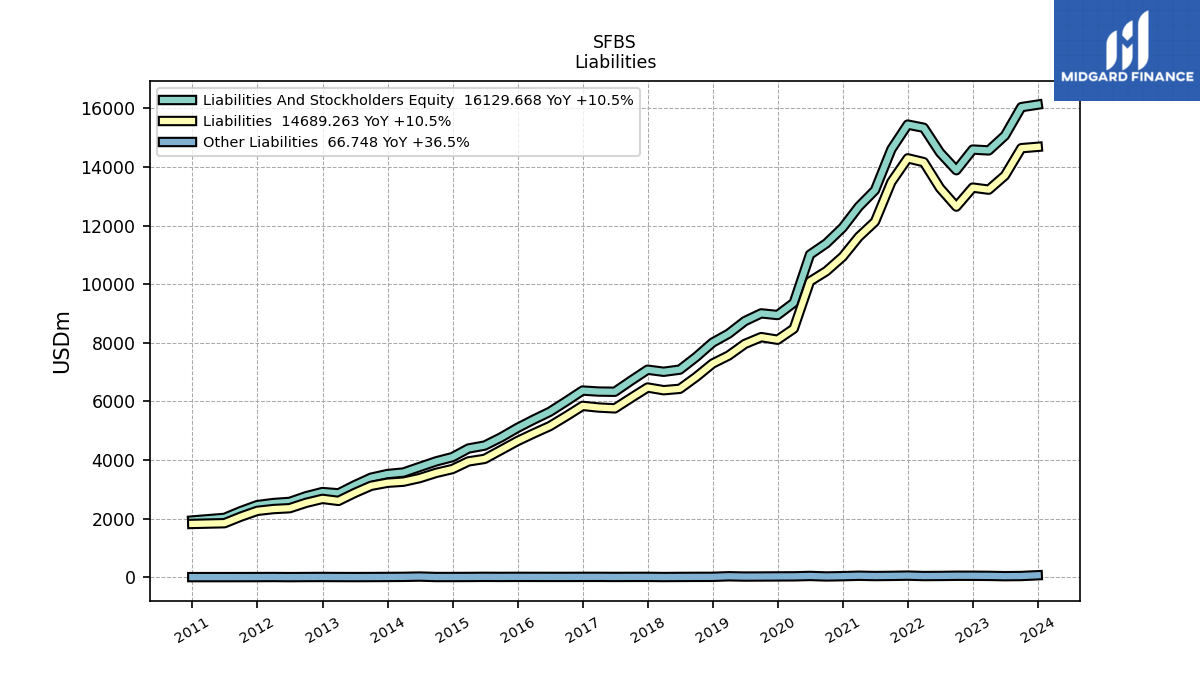
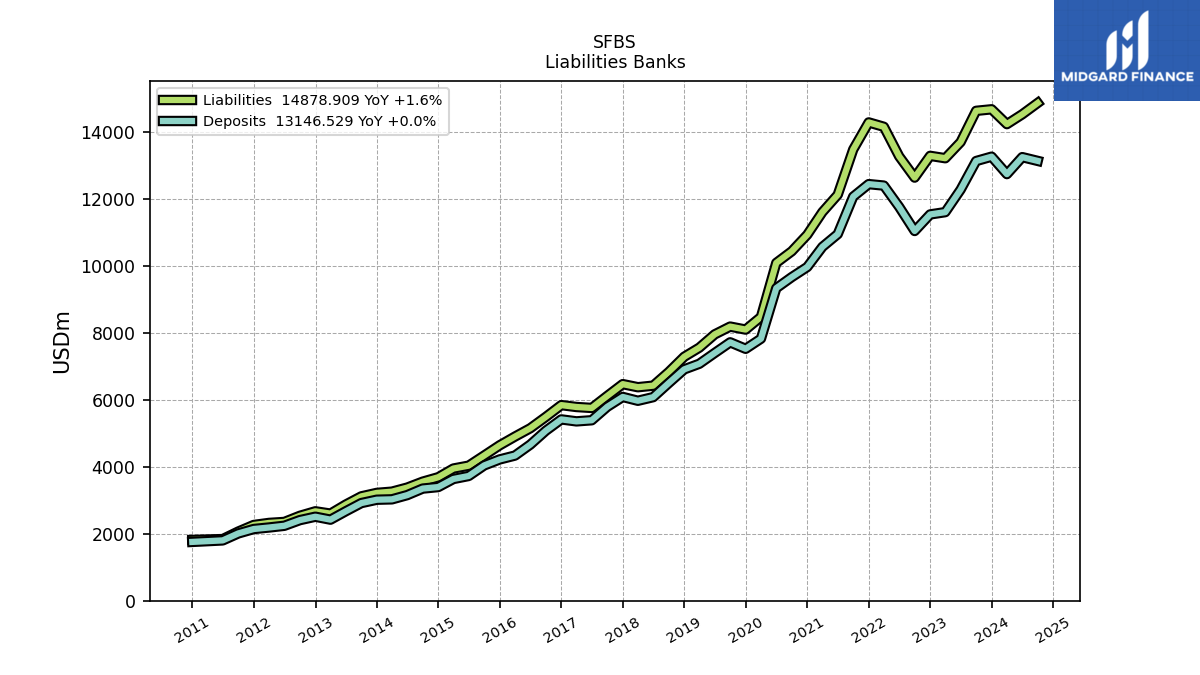
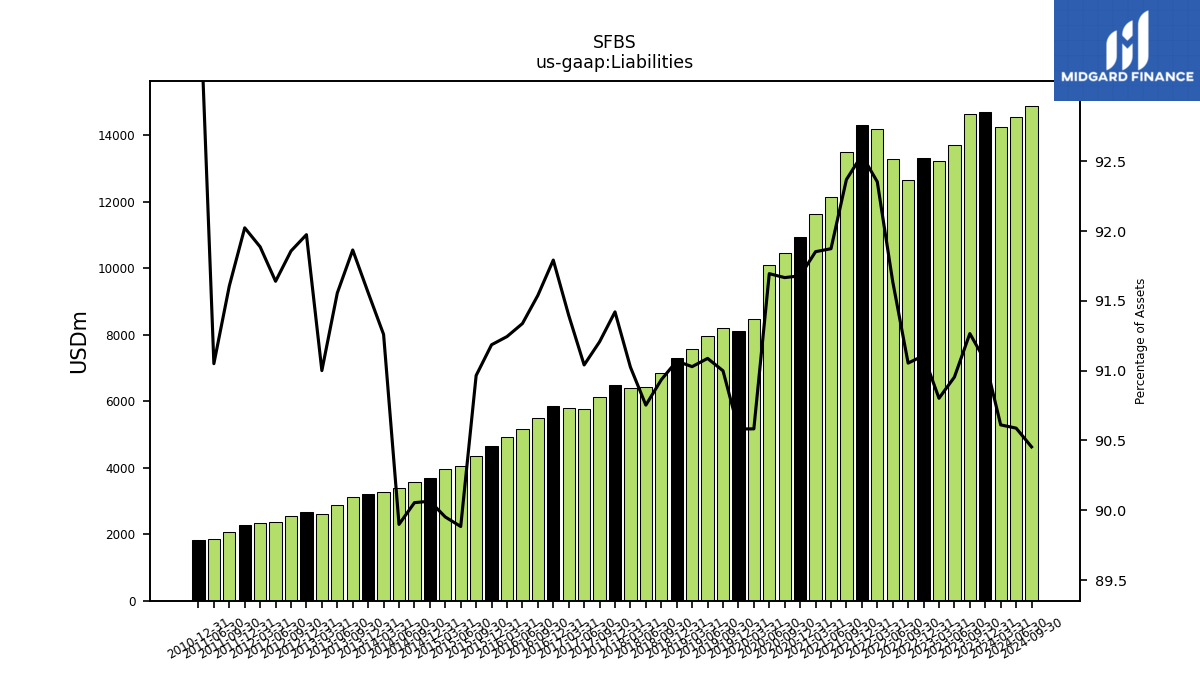
| Liabilities | 14689.26 | 14642.95 | 13709.34 | 13226.74 | 13297.86 | 12647.44 | 13282.40 | 14166.44 | 14296.79 | 13487.93 | 12134.03 | 11616.89 | 10939.80 | 10445.28 | 10097.61 | 8483.00 | 8104.97 | 8194.58 | 7961.28 | 7565.25 | 7292.18 | 6836.32 | 6429.45 | 6382.44 | 6474.78 | 6121.89 | 5762.51 | 5791.02 | 5847.56 | 5494.76 | 5156.96 | 4907.66 | 4646.36 | 4341.41 | 4038.05 | 3951.88 | 3691.47 | 3559.66 | 3382.61 | 3260.63 | 3223.51 | 3119.85 | 2875.44 | 2604.21 | 2673.06 | 2538.23 | 2355.38 | 2326.10 | 2264.49 | 2067.86 | 1843.40 | 1818.07 | |
| Liabilities And Stockholders Equity | 16129.67 | 16044.33 | 15072.81 | 14566.56 | 14595.75 | 13890.03 | 14494.32 | 15339.42 | 15448.81 | 14602.23 | 13207.32 | 12647.37 | 11932.65 | 11394.87 | 11012.19 | 9364.88 | 8947.65 | 9005.11 | 8740.24 | 8310.84 | 8007.38 | 7517.83 | 7084.56 | 7011.73 | 7082.38 | 6712.10 | 6329.60 | 6336.16 | 6370.45 | 6002.62 | 5646.06 | 5378.60 | 5095.51 | 4772.60 | 4492.54 | 4393.34 | 4098.68 | 3952.80 | 3762.68 | 3572.91 | 3520.70 | 3396.15 | 3140.63 | 2861.76 | 2906.31 | 2763.23 | 2570.24 | 2531.48 | 2460.78 | 2257.33 | 2024.60 | 1935.17 | |
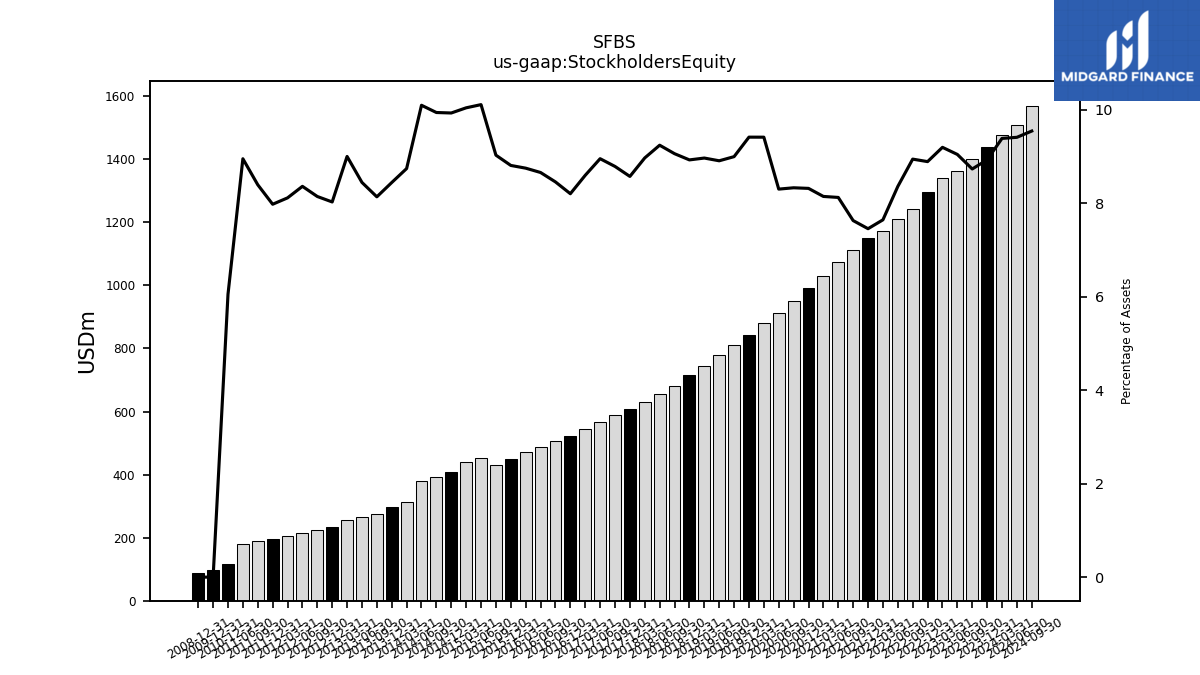
| Stockholders Equity | 1439.90 | 1400.88 | 1362.97 | 1339.32 | 1297.40 | 1242.09 | 1211.42 | 1172.47 | 1151.52 | 1113.79 | 1072.78 | 1029.98 | 992.35 | 949.09 | 914.09 | 881.38 | 842.18 | 810.03 | 778.46 | 745.08 | 714.70 | 681.01 | 654.61 | 628.79 | 607.10 | 589.71 | 566.58 | 544.65 | 522.51 | 507.49 | 488.72 | 470.56 | 448.77 | 430.82 | 454.11 | 441.08 | 406.96 | 392.88 | 379.82 | 312.28 | 297.19 | 276.30 | 265.19 | 257.55 | 233.26 | 225.01 | 214.87 | 205.38 | 196.29 | 189.47 | 181.20 | 117.10 | |
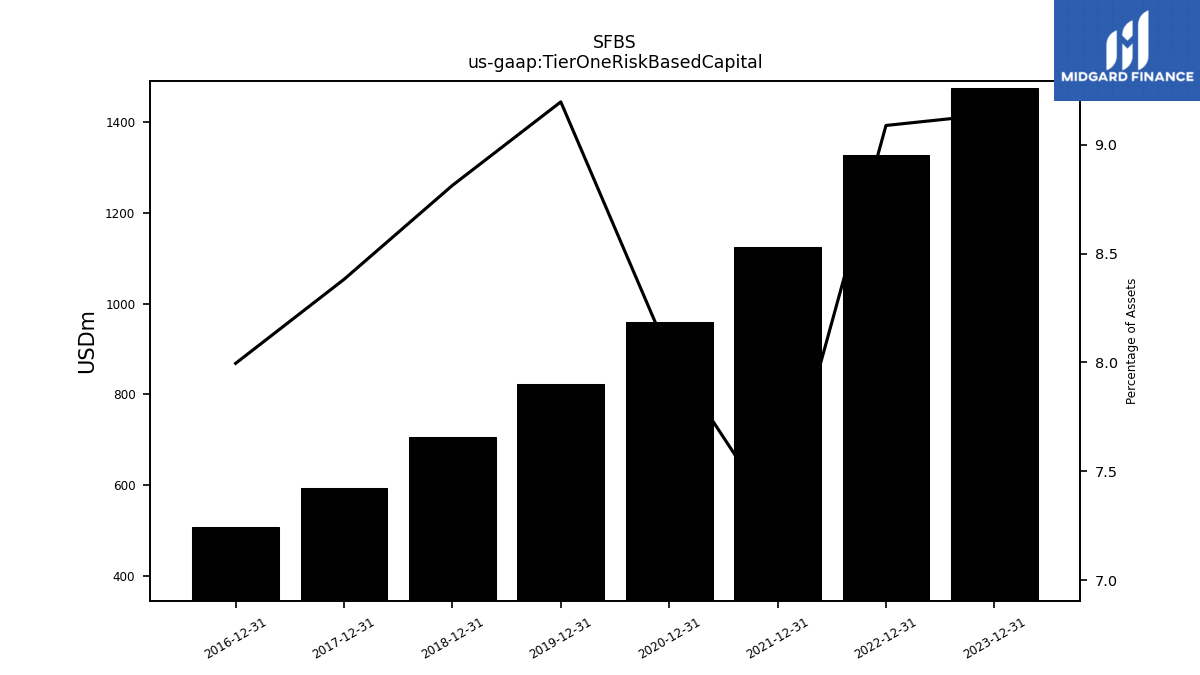
| Tier One Risk Based Capital | 1474.38 | NA | NA | NA | 1326.54 | NA | NA | NA | 1124.33 | NA | NA | NA | 958.80 | NA | NA | NA | 822.90 | NA | NA | NA | 705.71 | NA | NA | NA | 593.61 | NA | NA | NA | 509.36 | NA | NA | NA | NA | NA | NA | NA | NA | NA | NA | NA | NA | NA | NA | NA | NA | NA | NA | NA | NA | NA | NA | NA |
| 2023-12-31 | 2023-09-30 | 2023-06-30 | 2023-03-31 | 2022-12-31 | 2022-09-30 | 2022-06-30 | 2022-03-31 | 2021-12-31 | 2021-09-30 | 2021-06-30 | 2021-03-31 | 2020-12-31 | 2020-09-30 | 2020-06-30 | 2020-03-31 | 2019-12-31 | 2019-09-30 | 2019-06-30 | 2019-03-31 | 2018-12-31 | 2018-09-30 | 2018-06-30 | 2018-03-31 | 2017-12-31 | 2017-09-30 | 2017-06-30 | 2017-03-31 | 2016-12-31 | 2016-09-30 | 2016-06-30 | 2016-03-31 | 2015-12-31 | 2015-09-30 | 2015-06-30 | 2015-03-31 | 2014-12-31 | 2014-09-30 | 2014-06-30 | 2014-03-31 | 2013-12-31 | 2013-09-30 | 2013-06-30 | 2013-03-31 | 2012-12-31 | 2012-09-30 | 2012-06-30 | 2012-03-31 | 2011-12-31 | 2011-09-30 | 2011-06-30 | 2010-12-31 | ||
|---|---|---|---|---|---|---|---|---|---|---|---|---|---|---|---|---|---|---|---|---|---|---|---|---|---|---|---|---|---|---|---|---|---|---|---|---|---|---|---|---|---|---|---|---|---|---|---|---|---|---|---|---|---|
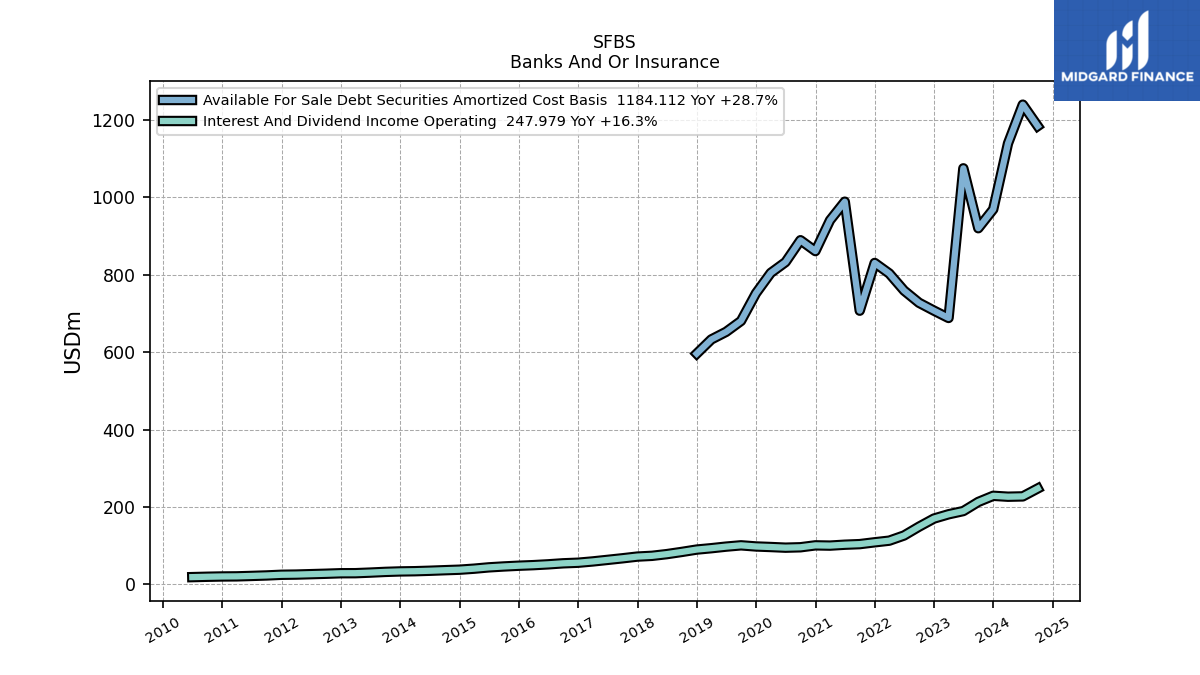
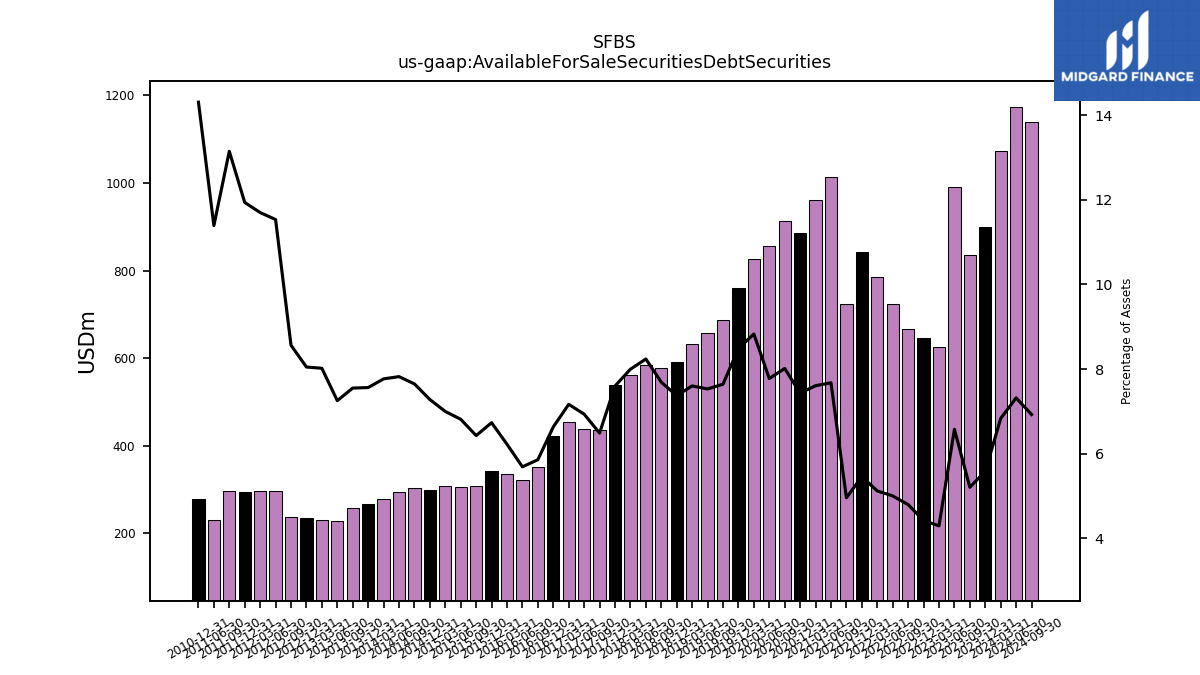
| Available For Sale Securities Debt Securities | 900.18 | 834.80 | 990.92 | 624.95 | 644.82 | 665.76 | 724.46 | 784.67 | 842.57 | 723.32 | 1013.53 | 961.88 | 886.69 | 913.05 | 856.13 | 826.78 | 759.40 | 688.02 | 657.97 | 631.70 | 590.18 | 578.02 | 583.55 | 560.63 | 538.08 | 435.32 | 438.81 | 453.96 | 422.38 | 351.42 | 321.04 | 334.57 | 342.94 | 306.67 | 305.99 | 307.38 | 298.31 | 302.30 | 294.25 | 277.50 | 266.22 | 256.38 | 227.77 | 229.43 | 233.88 | 236.58 | 296.51 | 296.22 | 293.81 | 296.83 | 230.67 | 276.96 |
| 2023-12-31 | 2023-09-30 | 2023-06-30 | 2023-03-31 | 2022-12-31 | 2022-09-30 | 2022-06-30 | 2022-03-31 | 2021-12-31 | 2021-09-30 | 2021-06-30 | 2021-03-31 | 2020-12-31 | 2020-09-30 | 2020-06-30 | 2020-03-31 | 2019-12-31 | 2019-09-30 | 2019-06-30 | 2019-03-31 | 2018-12-31 | 2018-09-30 | 2018-06-30 | 2018-03-31 | 2017-12-31 | 2017-09-30 | 2017-06-30 | 2017-03-31 | 2016-12-31 | 2016-09-30 | 2016-06-30 | 2016-03-31 | 2015-12-31 | 2015-09-30 | 2015-06-30 | 2015-03-31 | 2014-12-31 | 2014-09-30 | 2014-06-30 | 2014-03-31 | 2013-12-31 | 2013-09-30 | 2013-06-30 | 2013-03-31 | 2012-12-31 | 2012-09-30 | 2012-06-30 | 2012-03-31 | 2011-12-31 | 2011-09-30 | 2011-06-30 | 2010-12-31 | ||
|---|---|---|---|---|---|---|---|---|---|---|---|---|---|---|---|---|---|---|---|---|---|---|---|---|---|---|---|---|---|---|---|---|---|---|---|---|---|---|---|---|---|---|---|---|---|---|---|---|---|---|---|---|---|
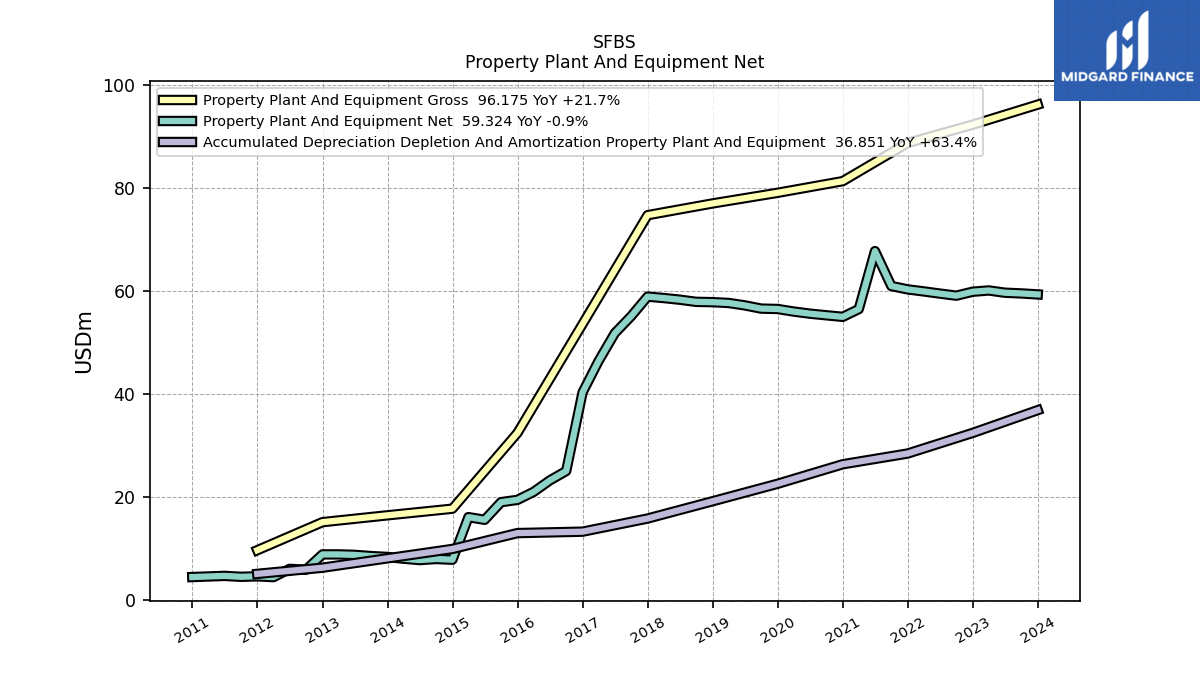
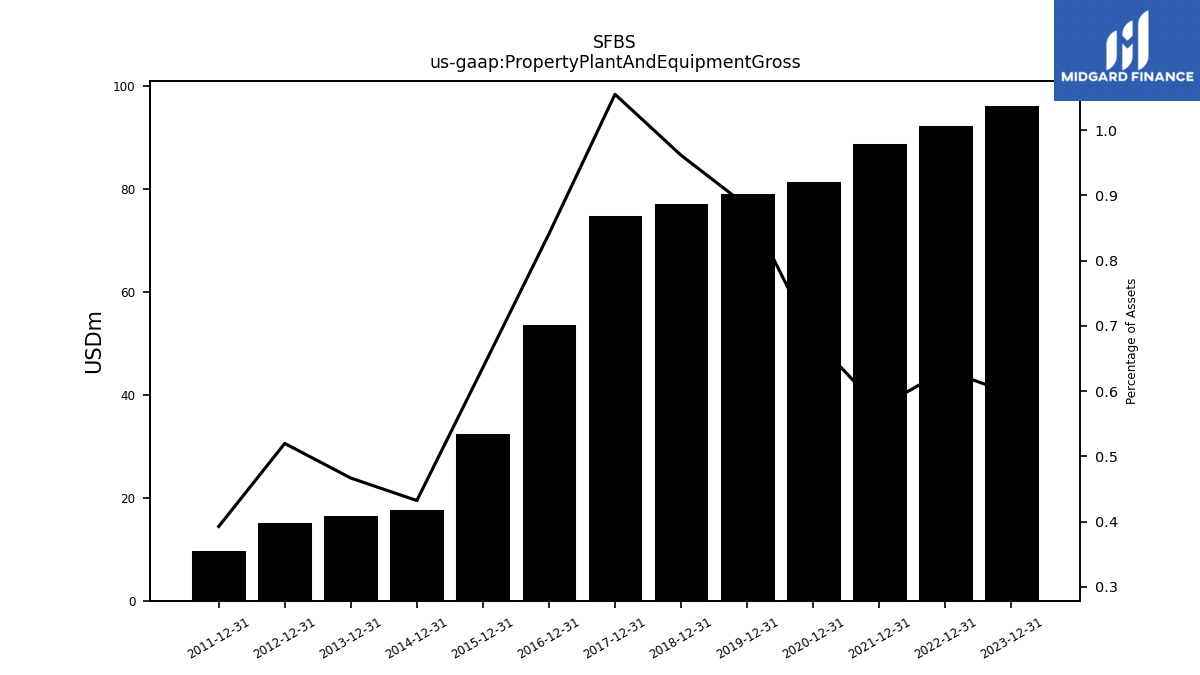
| Property Plant And Equipment Gross | 96.17 | NA | NA | NA | 92.29 | NA | NA | NA | 88.74 | NA | NA | NA | 81.32 | NA | NA | NA | 79.05 | NA | NA | NA | 76.99 | NA | NA | NA | 74.71 | NA | NA | NA | 53.58 | NA | NA | NA | 32.42 | NA | NA | NA | 17.72 | NA | NA | NA | 16.43 | NA | NA | NA | 15.11 | NA | NA | NA | 9.66 | NA | NA | NA | |
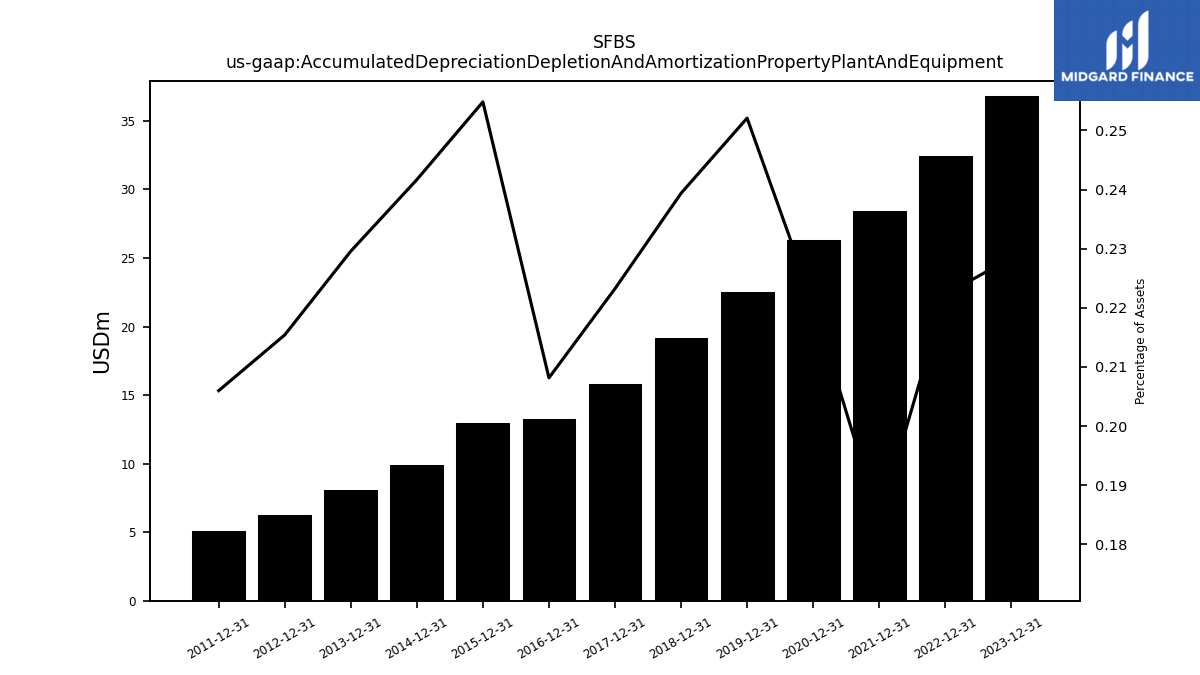
| Accumulated Depreciation Depletion And Amortization Property Plant And Equipment | 36.85 | NA | NA | NA | 32.44 | NA | NA | NA | 28.44 | NA | NA | NA | 26.35 | NA | NA | NA | 22.56 | NA | NA | NA | 19.17 | NA | NA | NA | 15.81 | NA | NA | NA | 13.26 | NA | NA | NA | 12.98 | NA | NA | NA | 9.91 | NA | NA | NA | 8.08 | NA | NA | NA | 6.26 | NA | NA | NA | 5.07 | NA | NA | NA | |
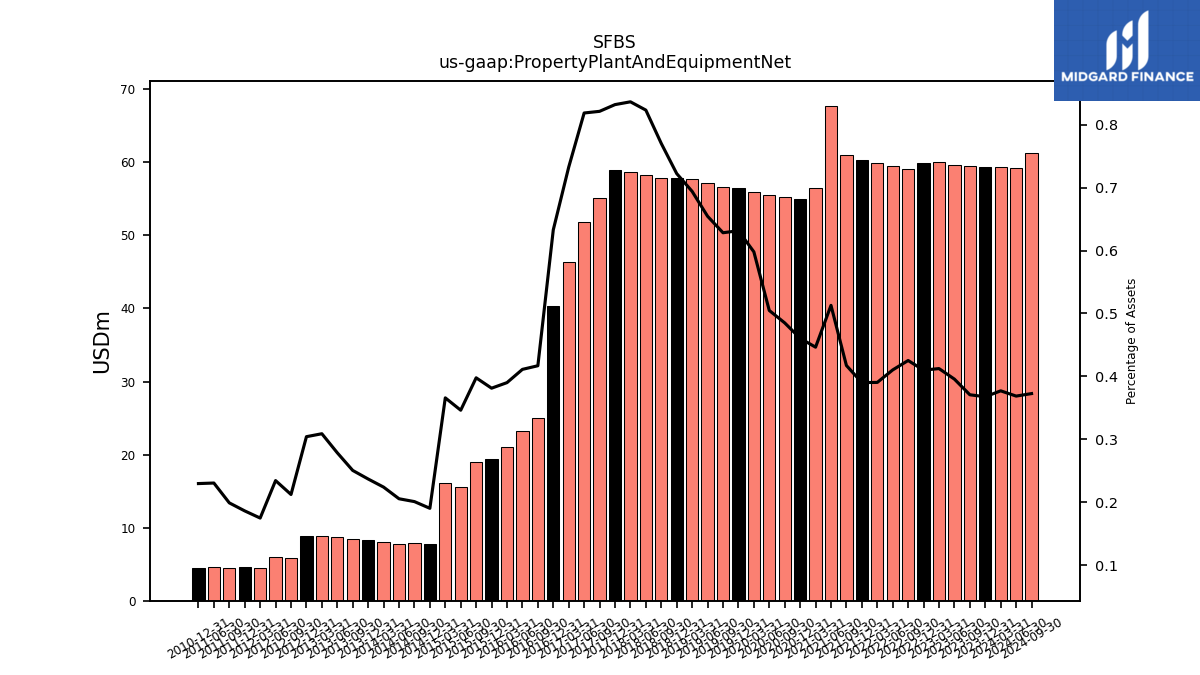
| Property Plant And Equipment Net | 59.32 | 59.52 | 59.66 | 60.09 | 59.85 | 59.08 | 59.48 | 59.91 | 60.30 | 60.95 | 67.74 | 56.47 | 54.97 | 55.27 | 55.59 | 55.99 | 56.50 | 56.57 | 57.20 | 57.66 | 57.82 | 57.88 | 58.30 | 58.62 | 58.90 | 55.10 | 51.80 | 46.41 | 40.31 | 25.03 | 23.22 | 20.99 | 19.43 | 18.99 | 15.56 | 16.08 | 7.82 | 7.96 | 7.75 | 8.02 | 8.35 | 8.52 | 8.76 | 8.85 | 8.85 | 5.88 | 6.03 | 4.43 | 4.59 | 4.50 | 4.67 | 4.45 | |
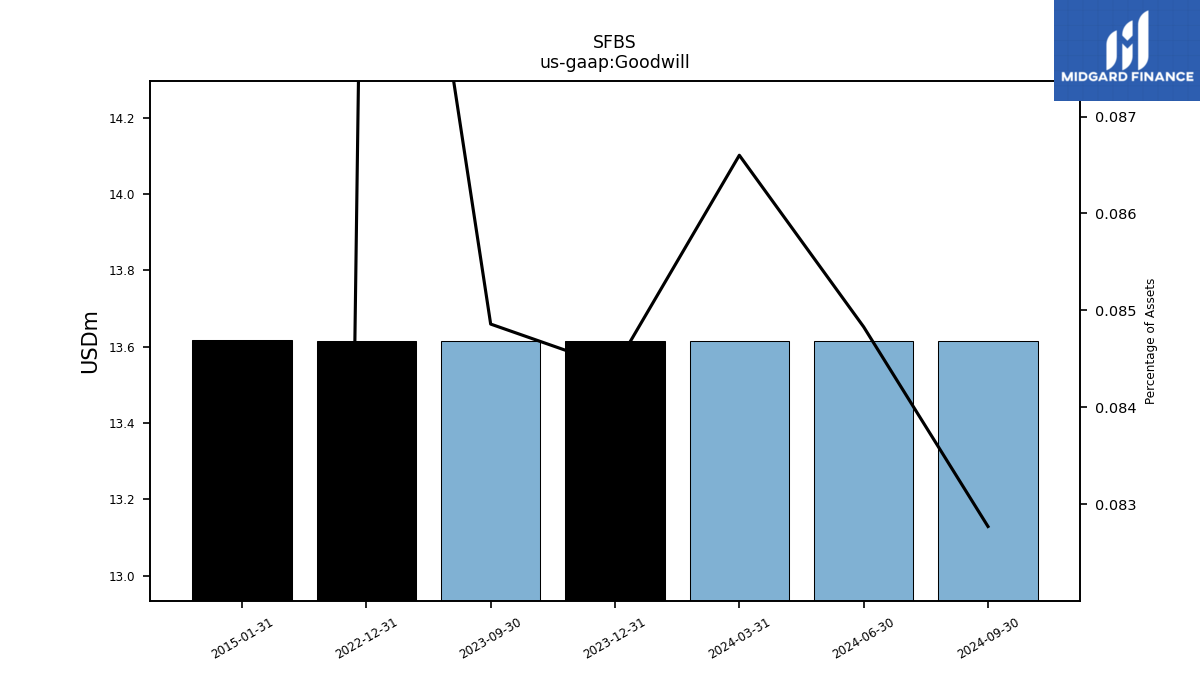
| Goodwill | 13.62 | 13.62 | NA | NA | 13.62 | NA | NA | NA | NA | NA | NA | NA | NA | NA | NA | NA | NA | NA | NA | NA | NA | NA | NA | NA | NA | NA | NA | NA | NA | NA | NA | NA | NA | NA | NA | NA | NA | NA | NA | NA | NA | NA | NA | NA | NA | NA | NA | NA | NA | NA | NA | NA | |
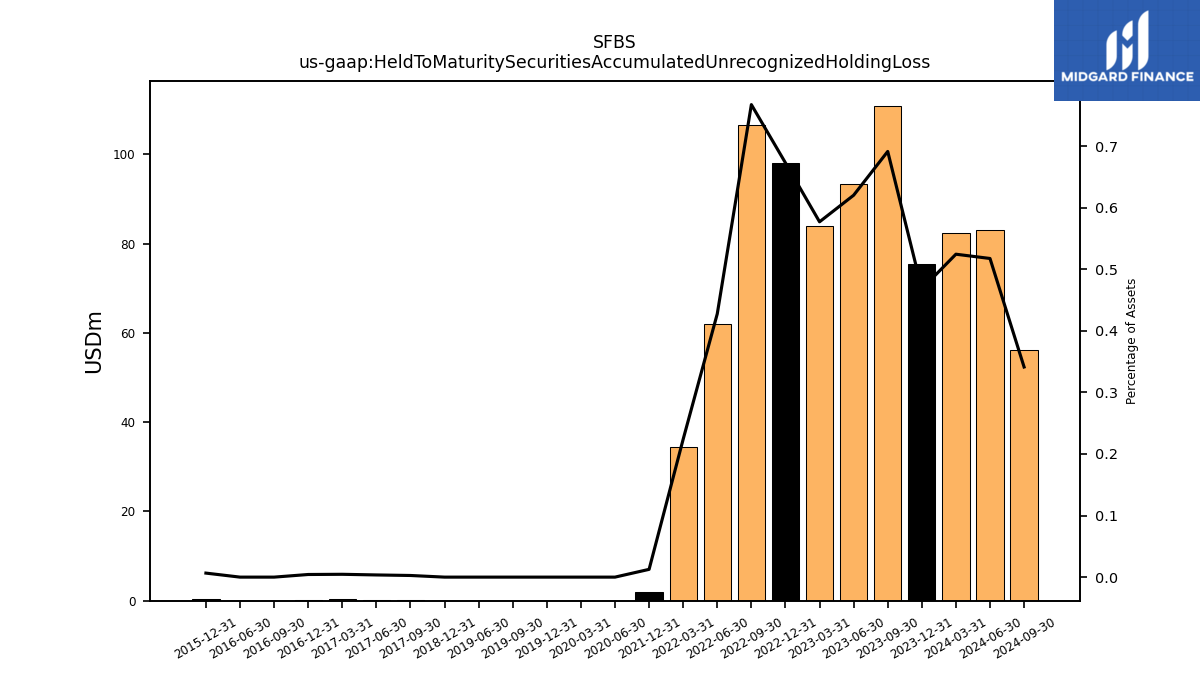
| Held To Maturity Securities Accumulated Unrecognized Holding Loss | 75.47 | 110.89 | 93.46 | 84.04 | 98.17 | 106.56 | 61.97 | 34.36 | 1.95 | NA | NA | NA | NA | NA | -0.00 | -0.00 | -0.00 | -0.00 | -0.00 | NA | -0.00 | NA | NA | NA | NA | 0.18 | 0.22 | 0.29 | 0.27 | 0.00 | 0.00 | NA | 0.33 | NA | NA | NA | NA | NA | NA | NA | NA | NA | NA | NA | NA | NA | NA | NA | NA | NA | NA | NA | |
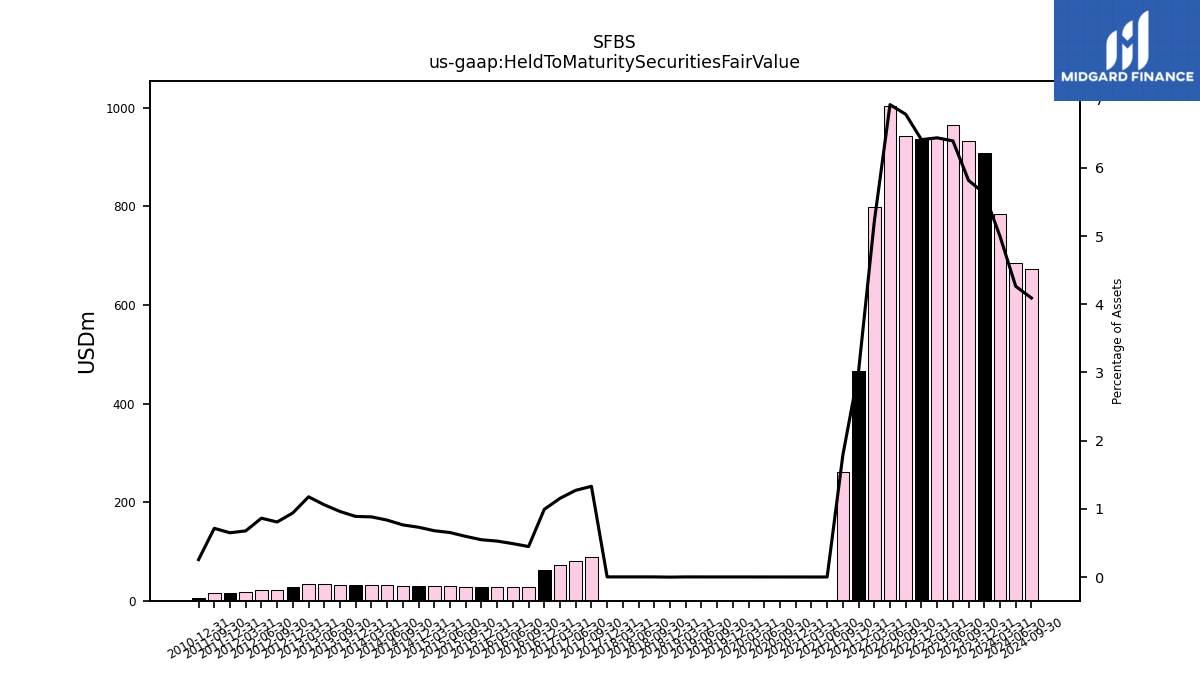
| Held To Maturity Securities Fair Value | 907.19 | 933.01 | 963.84 | 937.96 | 935.95 | 942.28 | 1003.84 | 799.35 | 466.29 | 261.28 | 0.25 | 0.25 | 0.25 | 0.25 | 0.25 | 0.25 | 0.25 | 0.25 | 0.25 | 0.25 | 0.00 | 0.25 | 0.25 | 0.25 | 0.25 | 89.33 | 80.53 | 73.18 | 63.30 | 26.91 | 27.72 | 28.41 | 27.91 | 28.51 | 29.35 | 29.89 | 29.97 | 30.25 | 31.45 | 31.56 | 31.32 | 32.67 | 33.29 | 33.69 | 27.35 | 22.33 | 22.19 | 17.16 | 16.00 | 16.14 | NA | 4.96 | |
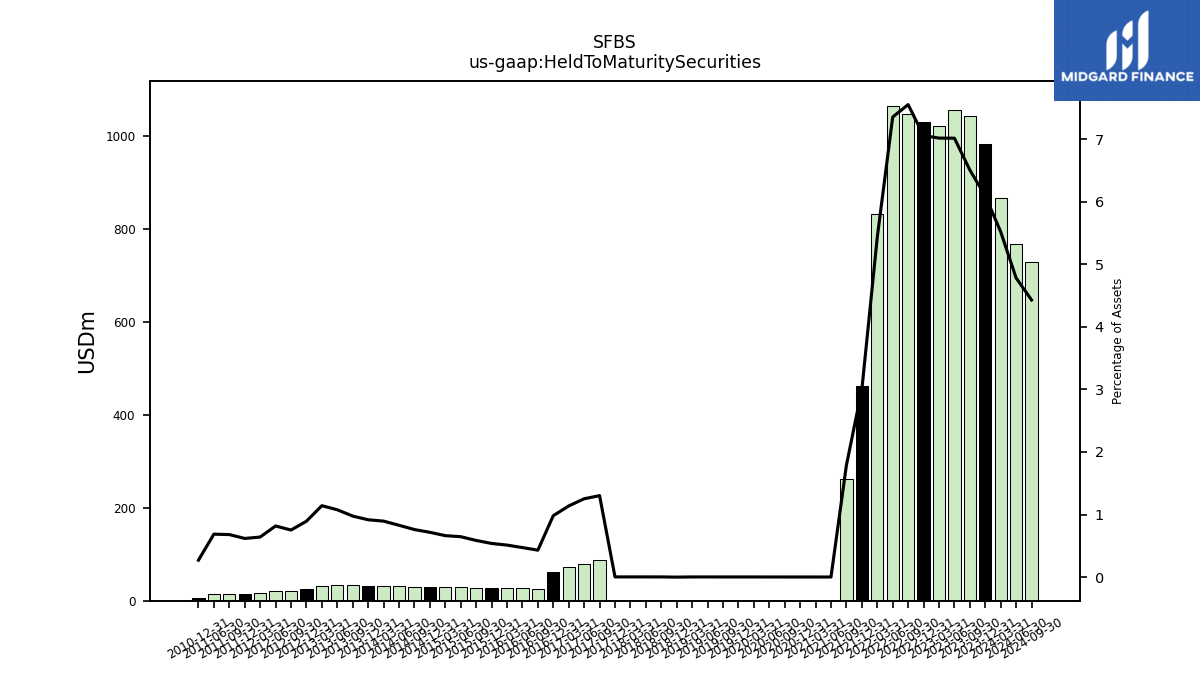
| Held To Maturity Securities | 982.66 | 1043.90 | 1057.31 | 1021.99 | 1030.00 | 1048.84 | 1065.76 | 833.30 | 463.00 | 261.28 | 0.25 | 0.25 | 0.25 | 0.25 | 0.25 | 0.25 | 0.25 | 0.25 | 0.25 | 0.25 | 0.00 | 0.25 | 0.25 | 0.25 | 0.25 | 87.40 | 79.26 | 72.06 | 62.56 | 25.85 | 26.66 | 27.54 | 27.43 | 27.97 | 29.02 | 29.13 | 29.36 | 30.05 | 31.18 | 31.97 | 32.27 | 33.13 | 33.81 | 32.67 | 25.97 | 20.79 | 21.01 | 16.21 | 15.21 | 15.36 | 13.89 | 5.23 | |
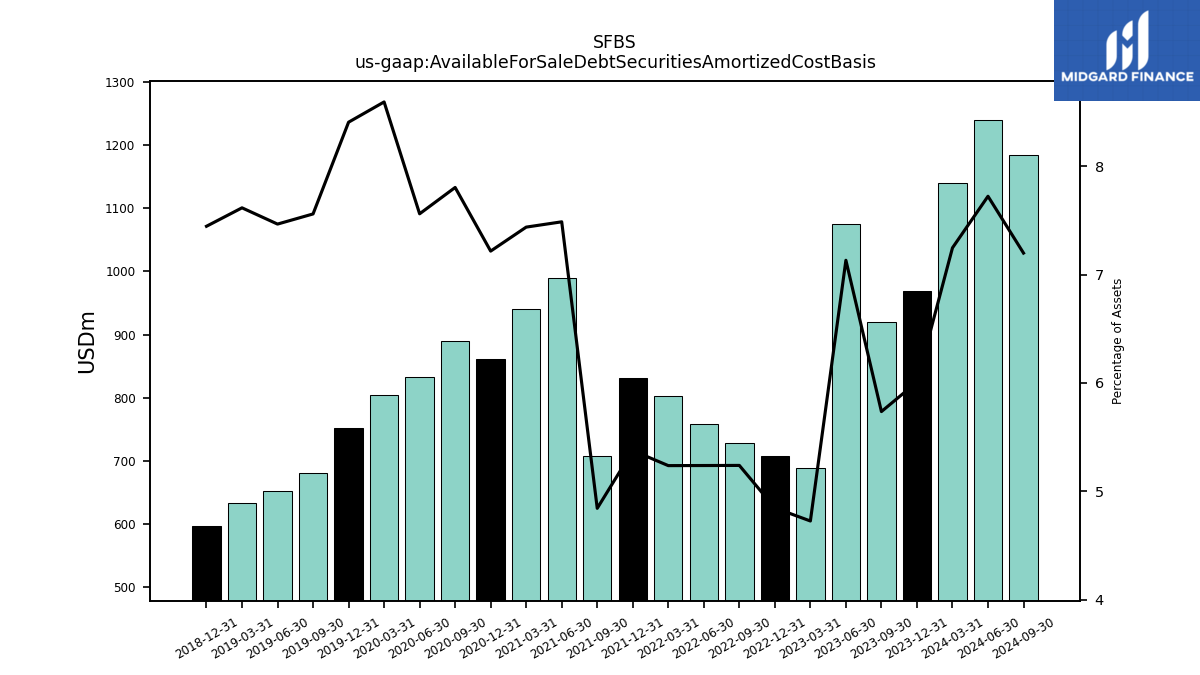
| Available For Sale Debt Securities Amortized Cost Basis | 969.09 | 920.24 | 1075.01 | 688.40 | 707.38 | 727.66 | 759.18 | 803.31 | 830.55 | 707.19 | 988.84 | 940.73 | 861.16 | 889.27 | 832.63 | 804.75 | 752.18 | 680.76 | 652.56 | 632.97 | 596.23 | NA | NA | NA | NA | NA | NA | NA | NA | NA | NA | NA | NA | NA | NA | NA | NA | NA | NA | NA | NA | NA | NA | NA | NA | NA | NA | NA | NA | NA | NA | NA | |
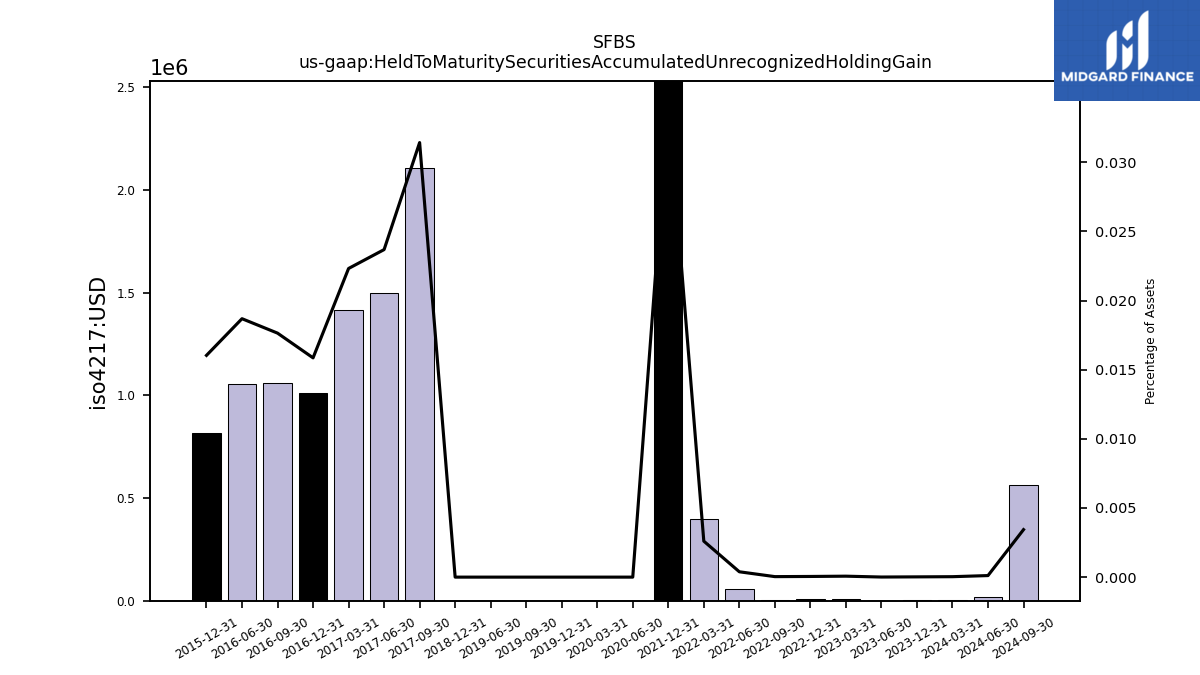
| Held To Maturity Securities Accumulated Unrecognized Holding Gain | 0.00 | NA | 0.00 | 0.01 | 0.01 | 0.01 | 0.06 | 0.40 | 5.28 | NA | NA | NA | NA | NA | 0.00 | 0.00 | 0.00 | 0.00 | 0.00 | NA | 0.00 | NA | NA | NA | NA | 2.11 | 1.50 | 1.41 | 1.01 | 1.06 | 1.05 | NA | 0.82 | NA | NA | NA | NA | NA | NA | NA | NA | NA | NA | NA | NA | NA | NA | NA | NA | NA | NA | NA | |
| Held To Maturity Securities Accumulated Unrecognized Holding Loss | 75.47 | 110.89 | 93.46 | 84.04 | 98.17 | 106.56 | 61.97 | 34.36 | 1.95 | NA | NA | NA | NA | NA | -0.00 | -0.00 | -0.00 | -0.00 | -0.00 | NA | -0.00 | NA | NA | NA | NA | 0.18 | 0.22 | 0.29 | 0.27 | 0.00 | 0.00 | NA | 0.33 | NA | NA | NA | NA | NA | NA | NA | NA | NA | NA | NA | NA | NA | NA | NA | NA | NA | NA | NA | |
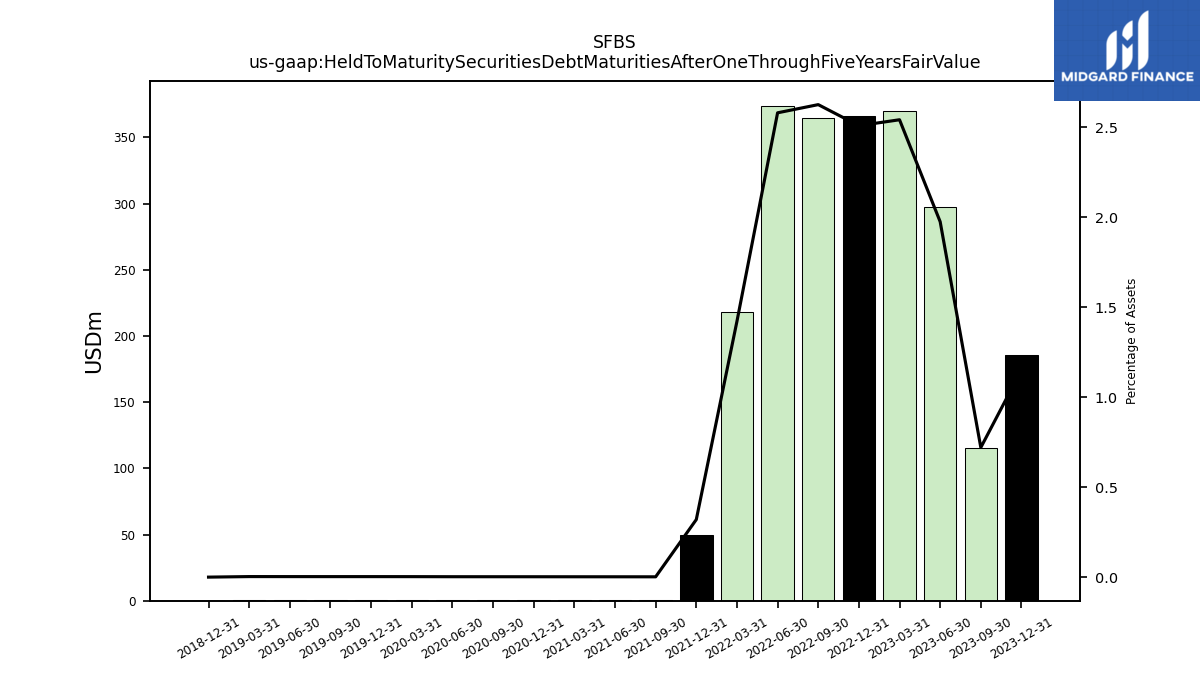
| Held To Maturity Securities Debt Maturities After One Through Five Years Fair Value | 185.74 | 115.56 | 297.63 | 370.17 | 366.10 | 364.65 | 373.93 | 217.99 | 49.42 | 0.25 | 0.25 | 0.25 | 0.25 | 0.25 | 0.25 | 0.25 | 0.25 | 0.25 | 0.25 | 0.25 | 0.00 | NA | NA | NA | NA | NA | NA | NA | NA | NA | NA | NA | NA | NA | NA | NA | NA | NA | NA | NA | NA | NA | NA | NA | NA | NA | NA | NA | NA | NA | NA | NA | |
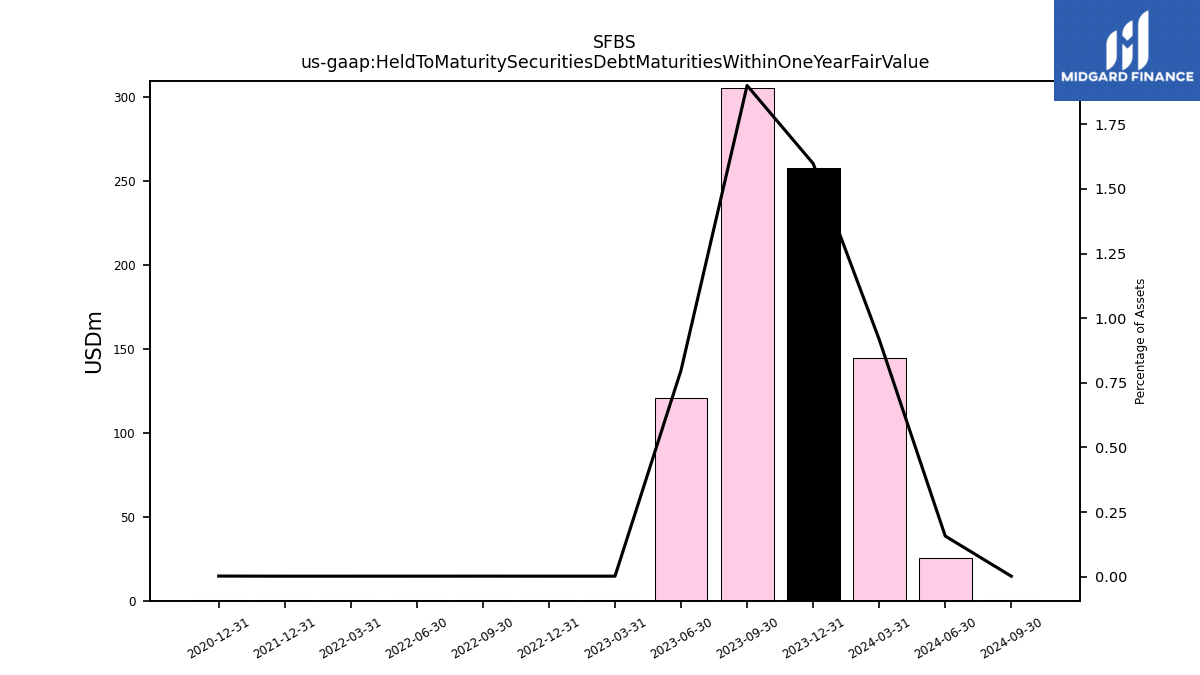
| Held To Maturity Securities Debt Maturities Within One Year Fair Value | 257.83 | 304.93 | 120.40 | 0.25 | 0.25 | 0.25 | 0.25 | 0.25 | 0.25 | NA | NA | NA | 0.25 | NA | NA | NA | NA | NA | NA | NA | NA | NA | NA | NA | NA | NA | NA | NA | NA | NA | NA | NA | NA | NA | NA | NA | NA | NA | NA | NA | NA | NA | NA | NA | NA | NA | NA | NA | NA | NA | NA | NA | |
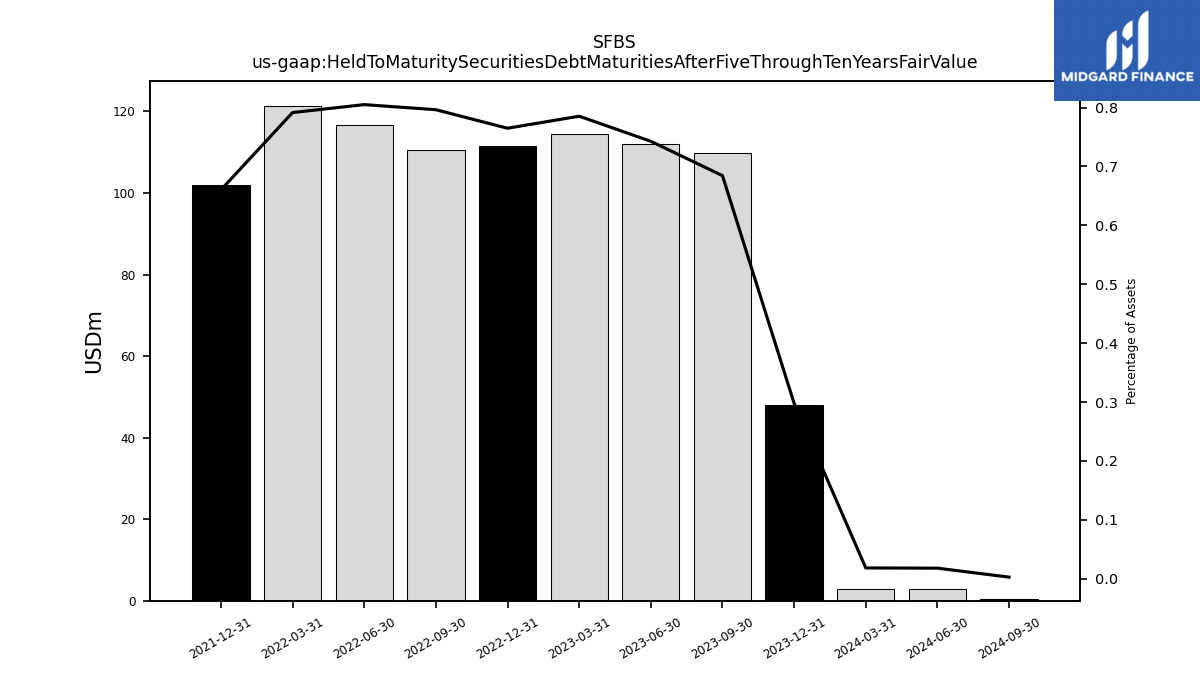
| Held To Maturity Securities Debt Maturities After Five Through Ten Years Fair Value | 48.02 | 109.80 | 111.94 | 114.38 | 111.63 | 110.60 | 116.67 | 121.40 | 102.00 | NA | NA | NA | NA | NA | NA | NA | NA | NA | NA | NA | NA | NA | NA | NA | NA | NA | NA | NA | NA | NA | NA | NA | NA | NA | NA | NA | NA | NA | NA | NA | NA | NA | NA | NA | NA | NA | NA | NA | NA | NA | NA | NA |
| 2023-12-31 | 2023-09-30 | 2023-06-30 | 2023-03-31 | 2022-12-31 | 2022-09-30 | 2022-06-30 | 2022-03-31 | 2021-12-31 | 2021-09-30 | 2021-06-30 | 2021-03-31 | 2020-12-31 | 2020-09-30 | 2020-06-30 | 2020-03-31 | 2019-12-31 | 2019-09-30 | 2019-06-30 | 2019-03-31 | 2018-12-31 | 2018-09-30 | 2018-06-30 | 2018-03-31 | 2017-12-31 | 2017-09-30 | 2017-06-30 | 2017-03-31 | 2016-12-31 | 2016-09-30 | 2016-06-30 | 2016-03-31 | 2015-12-31 | 2015-09-30 | 2015-06-30 | 2015-03-31 | 2014-12-31 | 2014-09-30 | 2014-06-30 | 2014-03-31 | 2013-12-31 | 2013-09-30 | 2013-06-30 | 2013-03-31 | 2012-12-31 | 2012-09-30 | 2012-06-30 | 2012-03-31 | 2011-12-31 | 2011-09-30 | 2011-06-30 | 2010-12-31 | ||
|---|---|---|---|---|---|---|---|---|---|---|---|---|---|---|---|---|---|---|---|---|---|---|---|---|---|---|---|---|---|---|---|---|---|---|---|---|---|---|---|---|---|---|---|---|---|---|---|---|---|---|---|---|---|
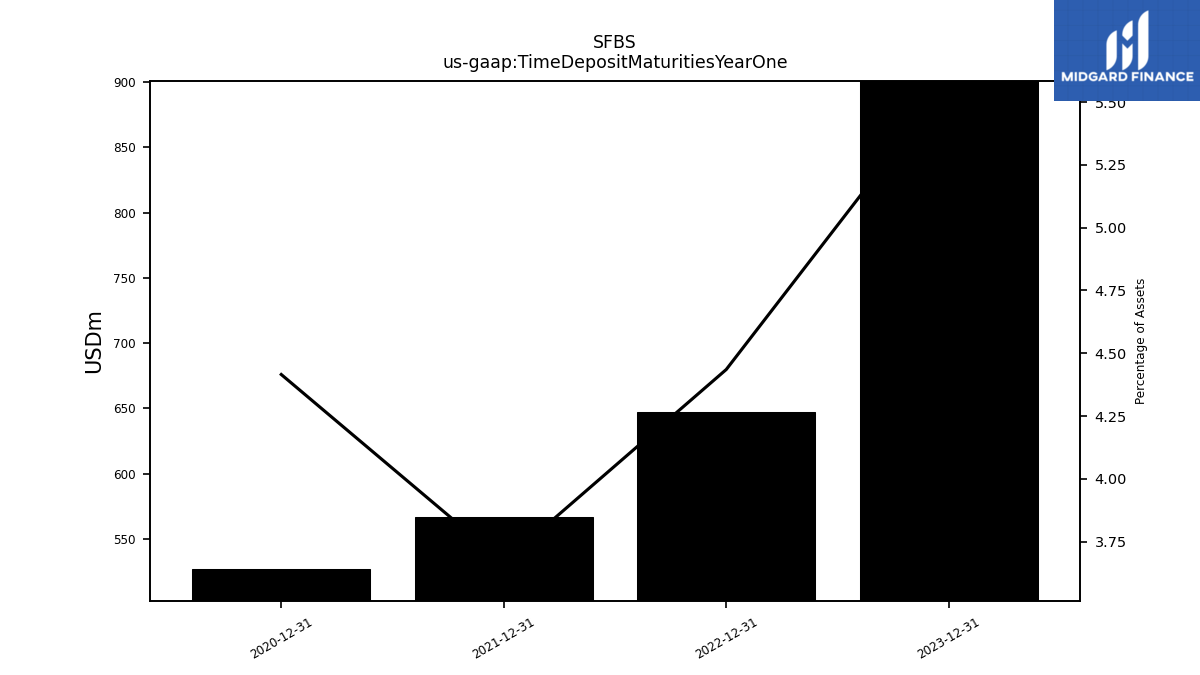
| Time Deposit Maturities Year One | 900.68 | NA | NA | NA | 647.38 | NA | NA | NA | 566.70 | NA | NA | NA | 526.89 | NA | NA | NA | NA | NA | NA | NA | NA | NA | NA | NA | NA | NA | NA | NA | NA | NA | NA | NA | NA | NA | NA | NA | NA | NA | NA | NA | NA | NA | NA | NA | NA | NA | NA | NA | NA | NA | NA | NA | |
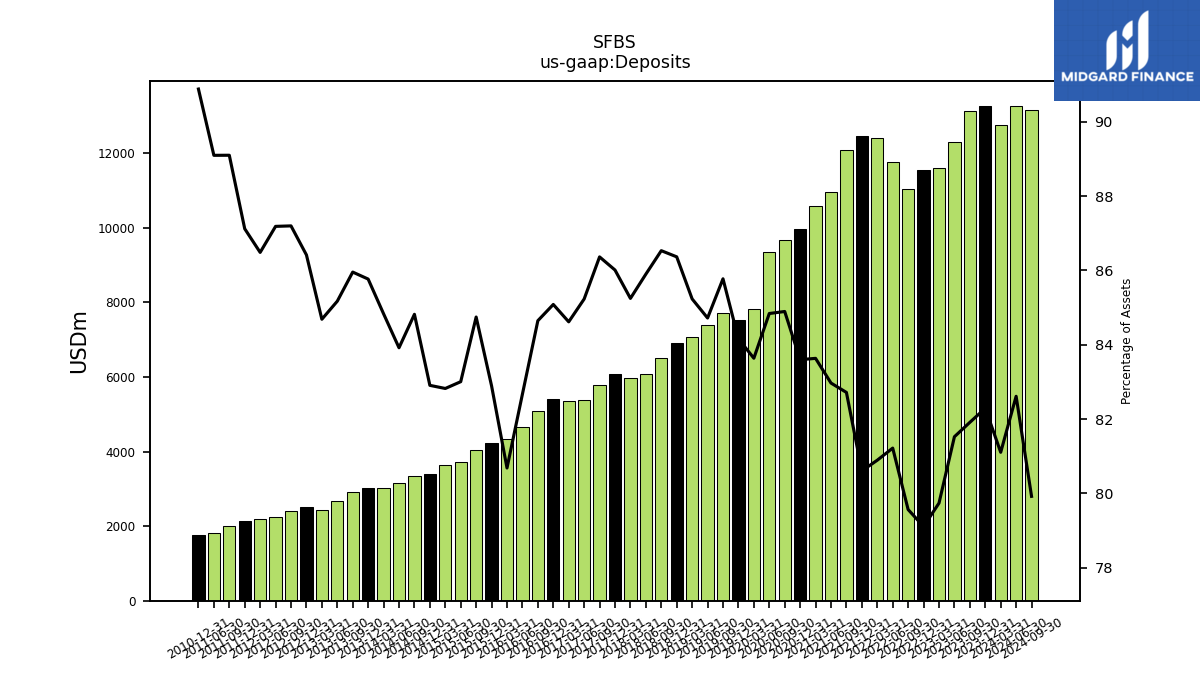
| Deposits | 13273.51 | 13142.38 | 12288.22 | 11615.32 | 11546.81 | 11051.92 | 11772.34 | 12408.75 | 12452.84 | 12078.67 | 10958.24 | 10577.61 | 9975.72 | 9673.78 | 9342.92 | 7832.65 | 7530.43 | 7724.16 | 7404.79 | 7083.67 | 6915.71 | 6505.35 | 6085.68 | 5977.39 | 6091.67 | 5796.90 | 5394.81 | 5361.53 | 5420.31 | 5081.13 | 4667.80 | 4339.75 | 4223.89 | 4044.63 | 3729.13 | 3638.76 | 3398.16 | 3352.77 | 3157.64 | 3031.04 | 3019.64 | 2919.22 | 2674.98 | 2423.53 | 2511.57 | 2409.52 | 2240.90 | 2189.38 | 2143.89 | 2011.28 | 1803.87 | 1758.72 |
| 2023-12-31 | 2023-09-30 | 2023-06-30 | 2023-03-31 | 2022-12-31 | 2022-09-30 | 2022-06-30 | 2022-03-31 | 2021-12-31 | 2021-09-30 | 2021-06-30 | 2021-03-31 | 2020-12-31 | 2020-09-30 | 2020-06-30 | 2020-03-31 | 2019-12-31 | 2019-09-30 | 2019-06-30 | 2019-03-31 | 2018-12-31 | 2018-09-30 | 2018-06-30 | 2018-03-31 | 2017-12-31 | 2017-09-30 | 2017-06-30 | 2017-03-31 | 2016-12-31 | 2016-09-30 | 2016-06-30 | 2016-03-31 | 2015-12-31 | 2015-09-30 | 2015-06-30 | 2015-03-31 | 2014-12-31 | 2014-09-30 | 2014-06-30 | 2014-03-31 | 2013-12-31 | 2013-09-30 | 2013-06-30 | 2013-03-31 | 2012-12-31 | 2012-09-30 | 2012-06-30 | 2012-03-31 | 2011-12-31 | 2011-09-30 | 2011-06-30 | 2010-12-31 | ||
|---|---|---|---|---|---|---|---|---|---|---|---|---|---|---|---|---|---|---|---|---|---|---|---|---|---|---|---|---|---|---|---|---|---|---|---|---|---|---|---|---|---|---|---|---|---|---|---|---|---|---|---|---|---|
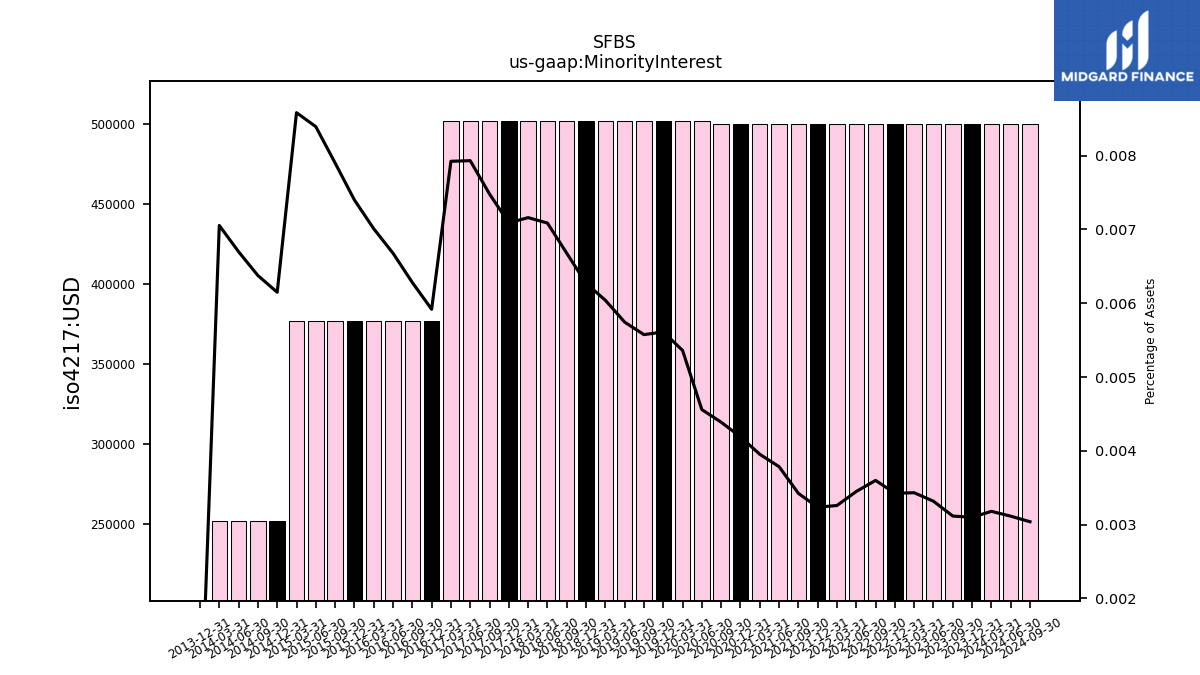
| Minority Interest | 0.50 | 0.50 | 0.50 | 0.50 | 0.50 | 0.50 | 0.50 | 0.50 | 0.50 | 0.50 | 0.50 | 0.50 | 0.50 | 0.50 | 0.50 | 0.50 | 0.50 | 0.50 | 0.50 | 0.50 | 0.50 | 0.50 | 0.50 | 0.50 | 0.50 | 0.50 | 0.50 | 0.50 | 0.38 | 0.38 | 0.38 | 0.38 | 0.38 | 0.38 | 0.38 | 0.38 | 0.25 | 0.25 | 0.25 | 0.25 | 0.00 | NA | NA | NA | NA | NA | NA | NA | NA | NA | NA | NA |
| 2023-12-31 | 2023-09-30 | 2023-06-30 | 2023-03-31 | 2022-12-31 | 2022-09-30 | 2022-06-30 | 2022-03-31 | 2021-12-31 | 2021-09-30 | 2021-06-30 | 2021-03-31 | 2020-12-31 | 2020-09-30 | 2020-06-30 | 2020-03-31 | 2019-12-31 | 2019-09-30 | 2019-06-30 | 2019-03-31 | 2018-12-31 | 2018-09-30 | 2018-06-30 | 2018-03-31 | 2017-12-31 | 2017-09-30 | 2017-06-30 | 2017-03-31 | 2016-12-31 | 2016-09-30 | 2016-06-30 | 2016-03-31 | 2015-12-31 | 2015-09-30 | 2015-06-30 | 2015-03-31 | 2014-12-31 | 2014-09-30 | 2014-06-30 | 2014-03-31 | 2013-12-31 | 2013-09-30 | 2013-06-30 | 2013-03-31 | 2012-12-31 | 2012-09-30 | 2012-06-30 | 2012-03-31 | 2011-12-31 | 2011-09-30 | 2011-06-30 | 2010-12-31 | ||
|---|---|---|---|---|---|---|---|---|---|---|---|---|---|---|---|---|---|---|---|---|---|---|---|---|---|---|---|---|---|---|---|---|---|---|---|---|---|---|---|---|---|---|---|---|---|---|---|---|---|---|---|---|---|
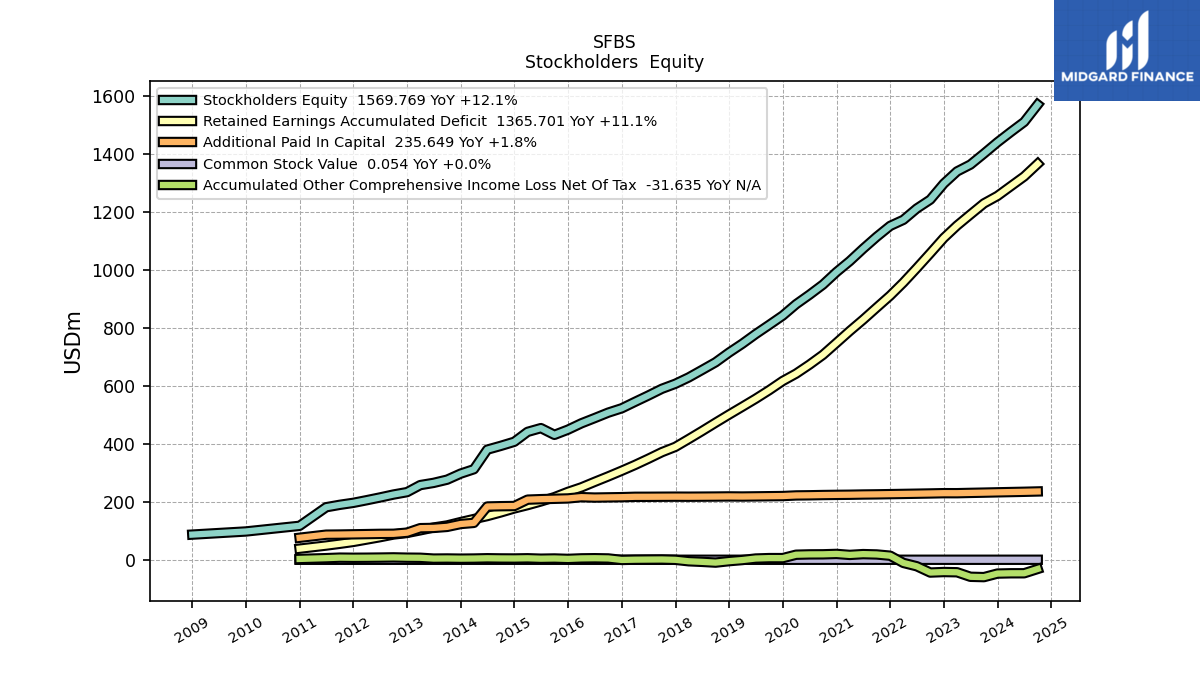
| Stockholders Equity | 1439.90 | 1400.88 | 1362.97 | 1339.32 | 1297.40 | 1242.09 | 1211.42 | 1172.47 | 1151.52 | 1113.79 | 1072.78 | 1029.98 | 992.35 | 949.09 | 914.09 | 881.38 | 842.18 | 810.03 | 778.46 | 745.08 | 714.70 | 681.01 | 654.61 | 628.79 | 607.10 | 589.71 | 566.58 | 544.65 | 522.51 | 507.49 | 488.72 | 470.56 | 448.77 | 430.82 | 454.11 | 441.08 | 406.96 | 392.88 | 379.82 | 312.28 | 297.19 | 276.30 | 265.19 | 257.55 | 233.26 | 225.01 | 214.87 | 205.38 | 196.29 | 189.47 | 181.20 | 117.10 | |
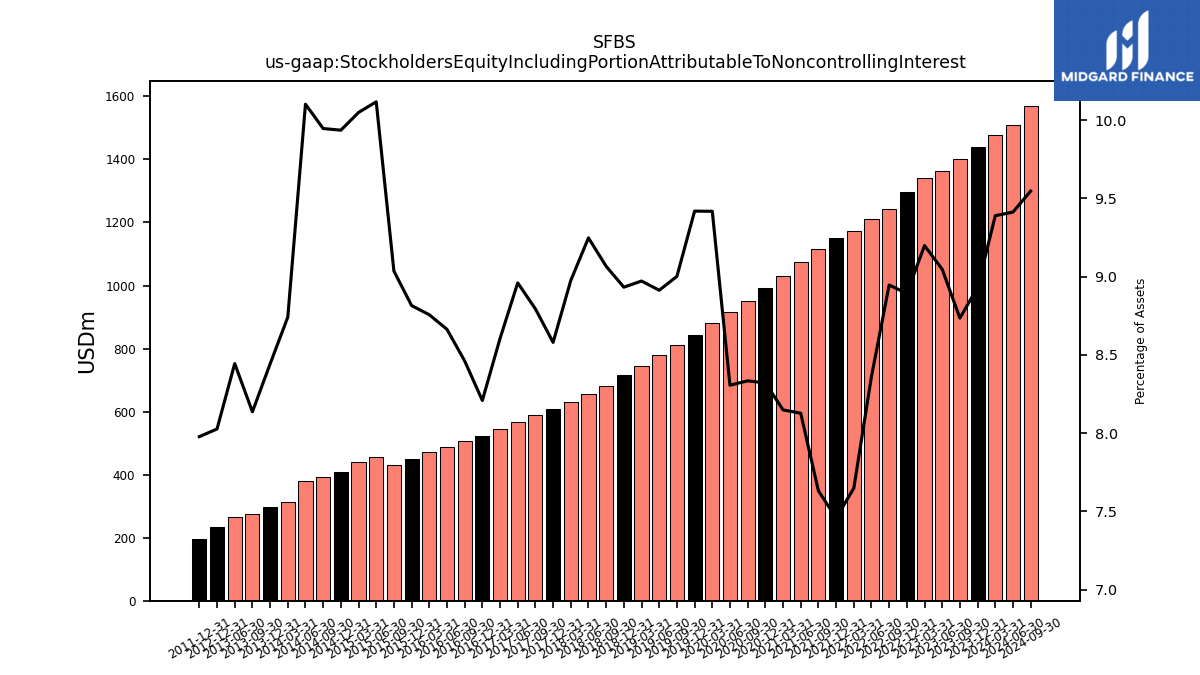
| Stockholders Equity Including Portion Attributable To Noncontrolling Interest | 1440.40 | 1401.38 | 1363.47 | 1339.82 | 1297.90 | 1242.59 | 1211.92 | 1172.97 | 1152.02 | 1114.29 | 1073.28 | 1030.48 | 992.85 | 949.59 | 914.59 | 881.88 | 842.68 | 810.54 | 778.96 | 745.59 | 715.20 | 681.51 | 655.11 | 629.30 | 607.60 | 590.21 | 567.09 | 545.15 | 522.89 | 507.87 | 489.10 | 470.94 | 449.15 | 431.19 | 454.49 | 441.46 | 407.21 | 393.14 | 380.07 | 312.28 | 297.19 | 276.30 | 265.19 | NA | 233.26 | NA | NA | NA | 196.29 | NA | NA | NA | |
| Common Stock Value | 0.05 | 0.05 | 0.05 | 0.05 | 0.05 | 0.05 | 0.05 | 0.05 | 0.05 | 0.05 | 0.05 | 0.05 | 0.05 | 0.05 | 0.05 | 0.05 | 0.05 | 0.05 | 0.05 | 0.05 | 0.05 | 0.05 | 0.05 | 0.05 | 0.05 | 0.05 | 0.05 | 0.05 | 0.05 | 0.05 | 0.05 | 0.05 | 0.05 | 0.05 | 0.05 | 0.05 | 0.05 | 0.05 | 0.05 | 0.05 | 0.04 | 0.04 | 0.04 | 0.04 | 0.04 | 0.04 | 0.04 | 0.04 | 0.04 | 0.04 | 0.04 | 0.04 | |
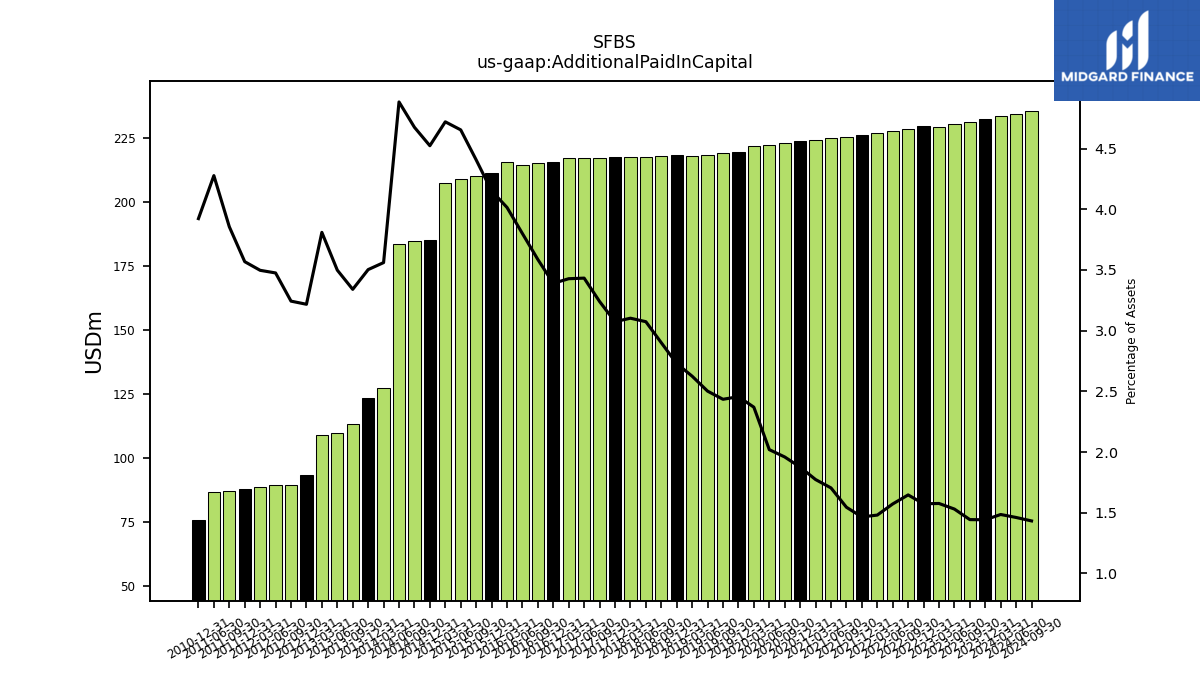
| Additional Paid In Capital | 232.60 | 231.59 | 230.66 | 229.63 | 229.69 | 228.74 | 227.91 | 227.13 | 226.40 | 225.65 | 225.13 | 224.30 | 223.86 | 223.28 | 222.44 | 221.90 | 219.77 | 219.23 | 218.66 | 218.15 | 218.52 | 218.06 | 217.76 | 217.54 | 217.69 | 217.48 | 217.27 | 217.19 | 215.93 | 215.26 | 214.53 | 215.95 | 211.55 | 210.33 | 209.07 | 207.37 | 185.40 | 184.80 | 183.76 | 127.22 | 123.33 | 113.44 | 109.87 | 109.02 | 93.50 | 89.61 | 89.32 | 88.53 | 87.81 | 87.04 | 86.59 | 75.91 | |
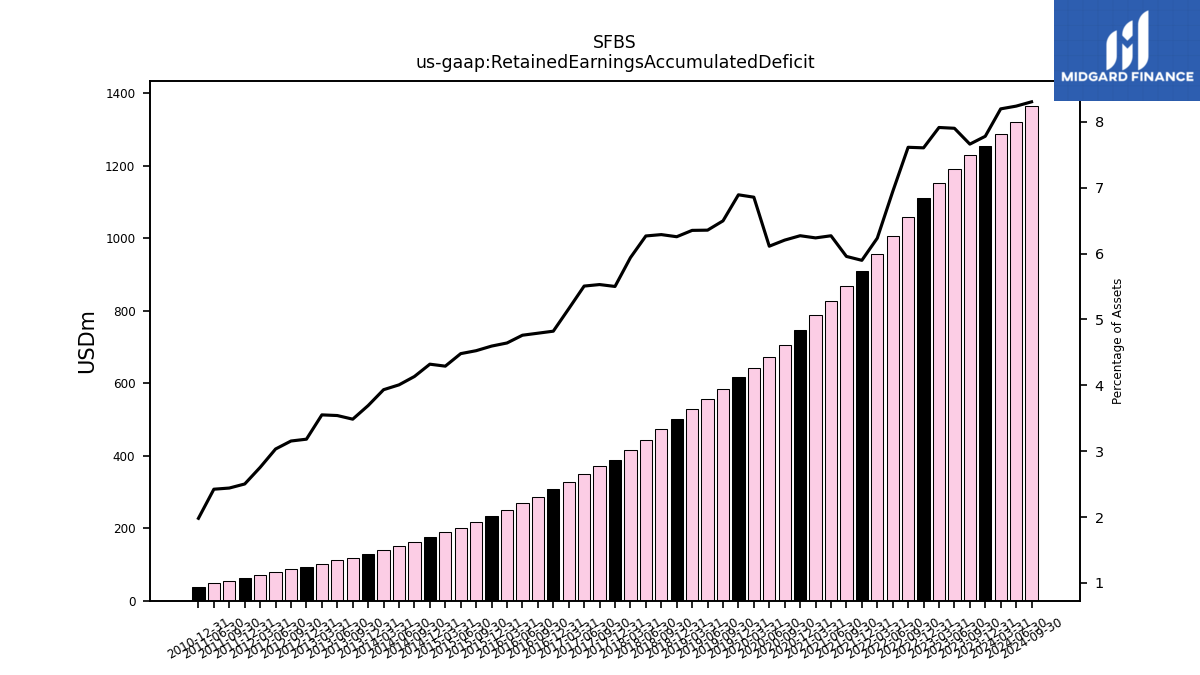
| Retained Earnings Accumulated Deficit | 1254.84 | 1229.08 | 1190.92 | 1152.68 | 1109.90 | 1057.39 | 1005.82 | 956.17 | 911.01 | 869.73 | 828.05 | 788.88 | 748.22 | 706.92 | 672.98 | 641.98 | 616.61 | 584.97 | 555.42 | 527.85 | 500.87 | 472.68 | 443.97 | 416.31 | 389.55 | 371.13 | 348.52 | 327.03 | 307.15 | 287.57 | 268.76 | 249.70 | 234.15 | 215.98 | 201.30 | 188.51 | 177.09 | 163.41 | 150.77 | 140.54 | 130.01 | 118.39 | 111.22 | 101.63 | 92.49 | 87.17 | 77.97 | 69.74 | 61.58 | 55.09 | 49.06 | 38.34 | |
| Accumulated Other Comprehensive Income Loss Net Of Tax | -47.59 | -59.84 | -58.66 | -43.05 | -42.25 | -44.09 | -22.36 | -10.88 | 14.06 | 18.36 | 19.55 | 16.75 | 20.22 | 18.83 | 18.61 | 17.45 | 5.75 | 5.78 | 4.32 | -0.97 | -4.74 | -9.79 | -7.18 | -5.11 | -0.20 | 1.05 | 0.74 | 0.37 | -0.62 | 4.63 | 5.40 | 4.88 | 3.05 | 4.48 | 3.75 | 5.22 | 4.49 | 4.69 | 5.30 | 4.31 | 3.89 | 4.50 | 4.13 | 6.93 | 7.30 | 8.26 | 7.61 | 7.16 | 6.94 | 7.37 | 5.59 | 2.84 | |
| Minority Interest | 0.50 | 0.50 | 0.50 | 0.50 | 0.50 | 0.50 | 0.50 | 0.50 | 0.50 | 0.50 | 0.50 | 0.50 | 0.50 | 0.50 | 0.50 | 0.50 | 0.50 | 0.50 | 0.50 | 0.50 | 0.50 | 0.50 | 0.50 | 0.50 | 0.50 | 0.50 | 0.50 | 0.50 | 0.38 | 0.38 | 0.38 | 0.38 | 0.38 | 0.38 | 0.38 | 0.38 | 0.25 | 0.25 | 0.25 | 0.25 | 0.00 | NA | NA | NA | NA | NA | NA | NA | NA | NA | NA | NA | |
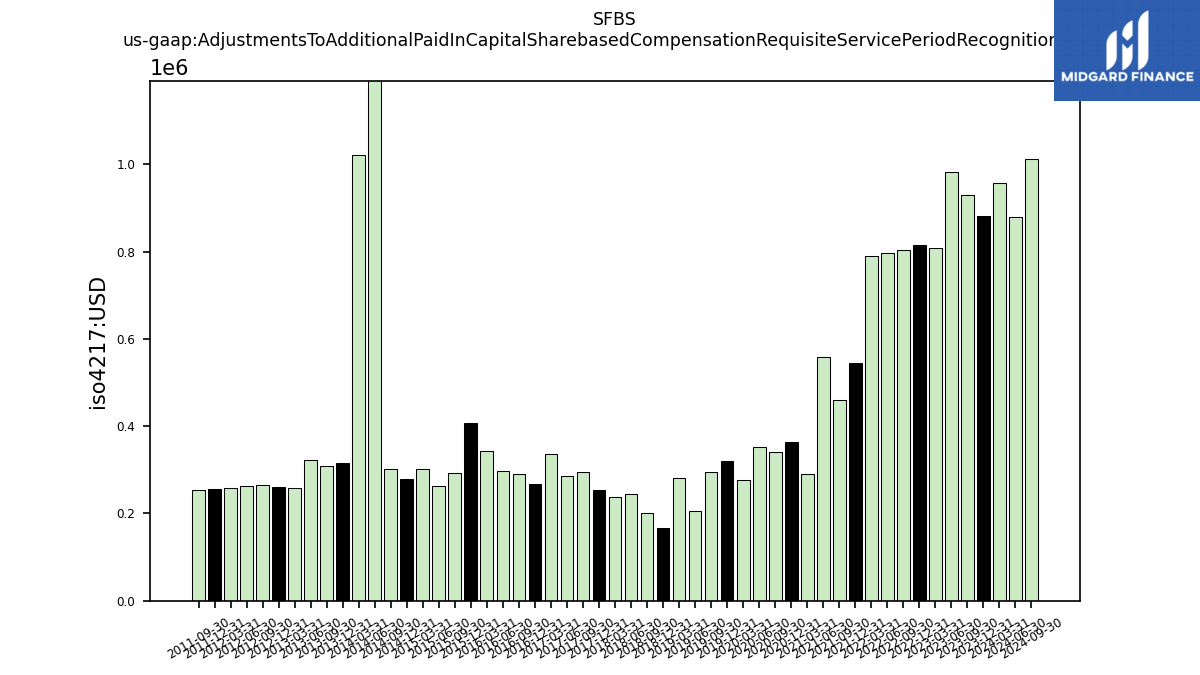
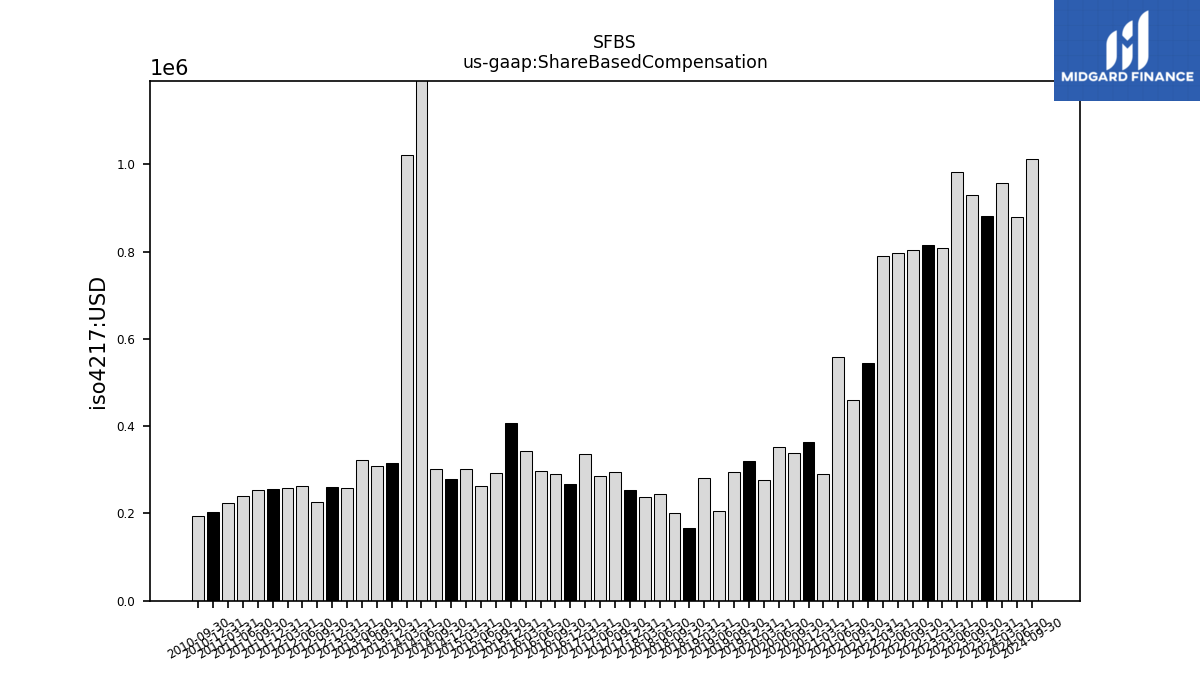
| Adjustments To Additional Paid In Capital Sharebased Compensation Requisite Service Period Recognition Value | 0.88 | 0.93 | 0.98 | 0.81 | 0.82 | 0.80 | 0.80 | 0.79 | 0.55 | 0.46 | 0.56 | 0.29 | 0.36 | 0.34 | 0.35 | 0.28 | 0.32 | 0.29 | 0.21 | 0.28 | 0.17 | 0.20 | 0.24 | 0.24 | 0.25 | 0.29 | 0.28 | 0.34 | 0.27 | 0.29 | 0.30 | 0.34 | 0.41 | 0.29 | 0.26 | 0.30 | 0.28 | 0.30 | 2.08 | 1.02 | 0.32 | 0.31 | 0.32 | 0.26 | 0.26 | 0.27 | 0.26 | 0.26 | 0.26 | 0.25 | NA | NA |
| 2023-12-31 | 2023-09-30 | 2023-06-30 | 2023-03-31 | 2022-12-31 | 2022-09-30 | 2022-06-30 | 2022-03-31 | 2021-12-31 | 2021-09-30 | 2021-06-30 | 2021-03-31 | 2020-12-31 | 2020-09-30 | 2020-06-30 | 2020-03-31 | 2019-12-31 | 2019-09-30 | 2019-06-30 | 2019-03-31 | 2018-12-31 | 2018-09-30 | 2018-06-30 | 2018-03-31 | 2017-12-31 | 2017-09-30 | 2017-06-30 | 2017-03-31 | 2016-12-31 | 2016-09-30 | 2016-06-30 | 2016-03-31 | 2015-12-31 | 2015-09-30 | 2015-06-30 | 2015-03-31 | 2014-12-31 | 2014-09-30 | 2014-06-30 | 2014-03-31 | 2013-12-31 | 2013-09-30 | 2013-06-30 | 2013-03-31 | 2012-12-31 | 2012-09-30 | 2012-06-30 | 2012-03-31 | 2011-12-31 | 2011-09-30 | 2011-06-30 | 2010-12-31 | ||
|---|---|---|---|---|---|---|---|---|---|---|---|---|---|---|---|---|---|---|---|---|---|---|---|---|---|---|---|---|---|---|---|---|---|---|---|---|---|---|---|---|---|---|---|---|---|---|---|---|---|---|---|---|---|
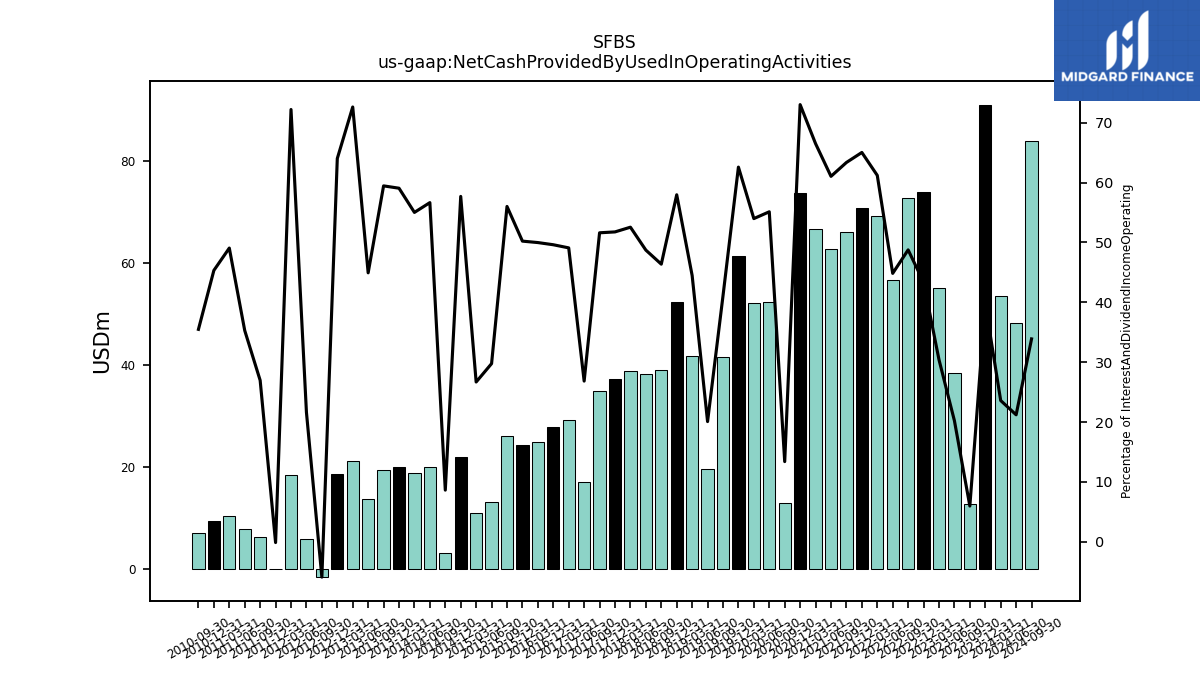
| Net Cash Provided By Used In Operating Activities | 91.08 | 12.72 | 38.34 | 55.15 | 73.84 | 72.79 | 56.73 | 69.27 | 70.84 | 66.03 | 62.69 | 66.76 | 73.79 | 12.87 | 52.40 | 52.23 | 61.44 | 41.53 | 19.63 | 41.67 | 52.26 | 38.97 | 38.19 | 38.88 | 37.29 | 34.91 | 17.05 | 29.21 | 27.88 | NA | NA | 24.97 | 24.33 | 26.06 | 13.15 | 10.88 | 22.01 | 3.18 | 20.07 | 18.86 | 19.91 | 19.32 | 13.79 | 21.18 | 18.60 | -1.64 | 5.76 | 18.46 | -0.03 | 6.28 | 7.79 | 9.38 | |
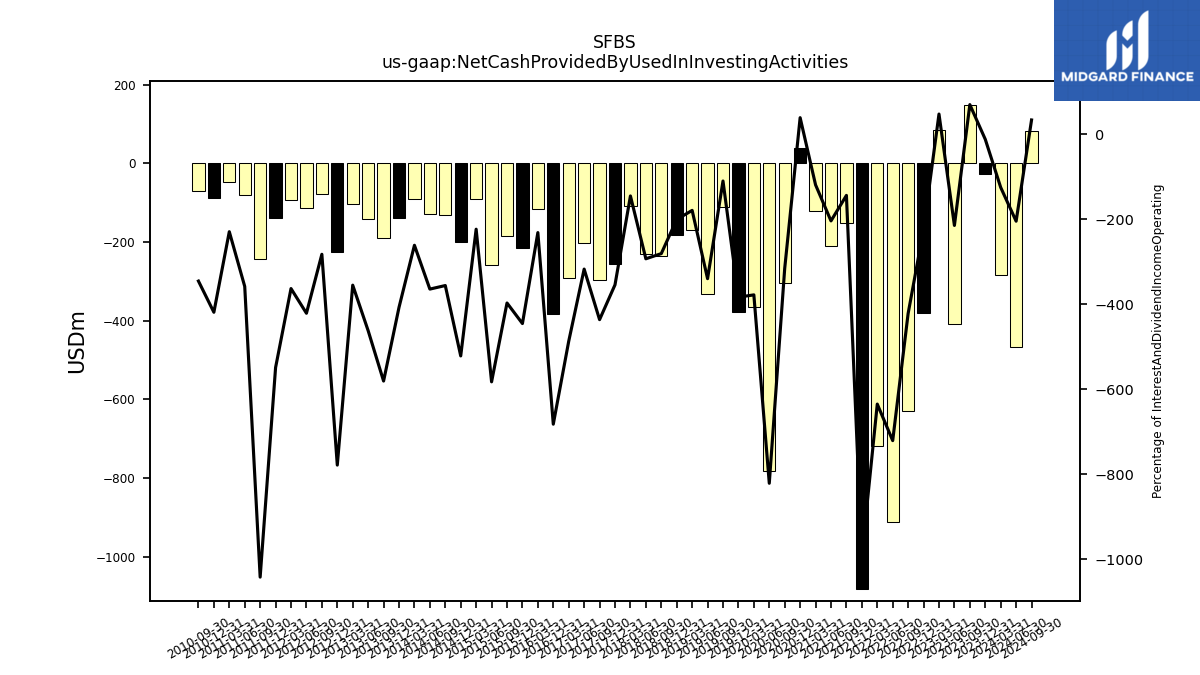
| Net Cash Provided By Used In Investing Activities | -27.54 | 148.35 | -407.21 | 85.98 | -381.00 | -629.90 | -912.50 | -718.82 | -1081.68 | -150.12 | -209.59 | -119.71 | 39.30 | -303.51 | -781.00 | -365.87 | -376.53 | -111.39 | -332.45 | -167.98 | -180.93 | -236.17 | -229.84 | -107.54 | -255.40 | -295.15 | -201.68 | -290.01 | -383.49 | NA | NA | -115.67 | -215.87 | -184.82 | -257.62 | -91.17 | -199.12 | -131.26 | -129.12 | -89.60 | -137.42 | -188.77 | -141.90 | -103.60 | -226.23 | -78.39 | -112.30 | -92.89 | -137.59 | -242.97 | -79.10 | -86.69 | |
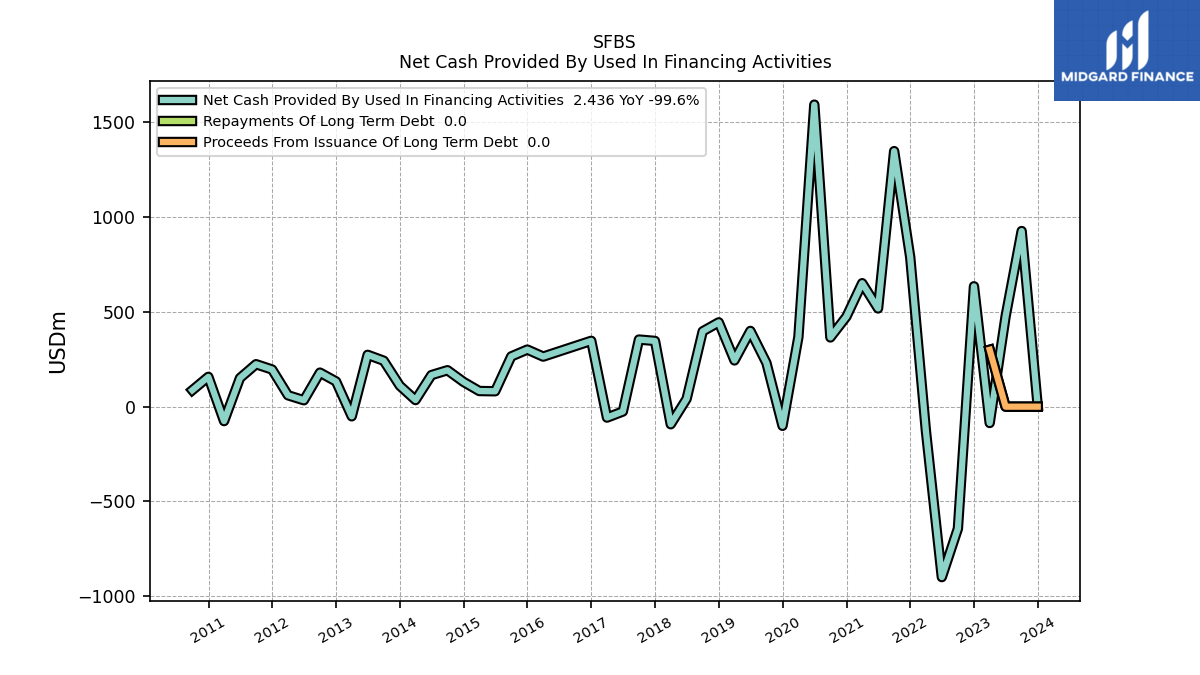
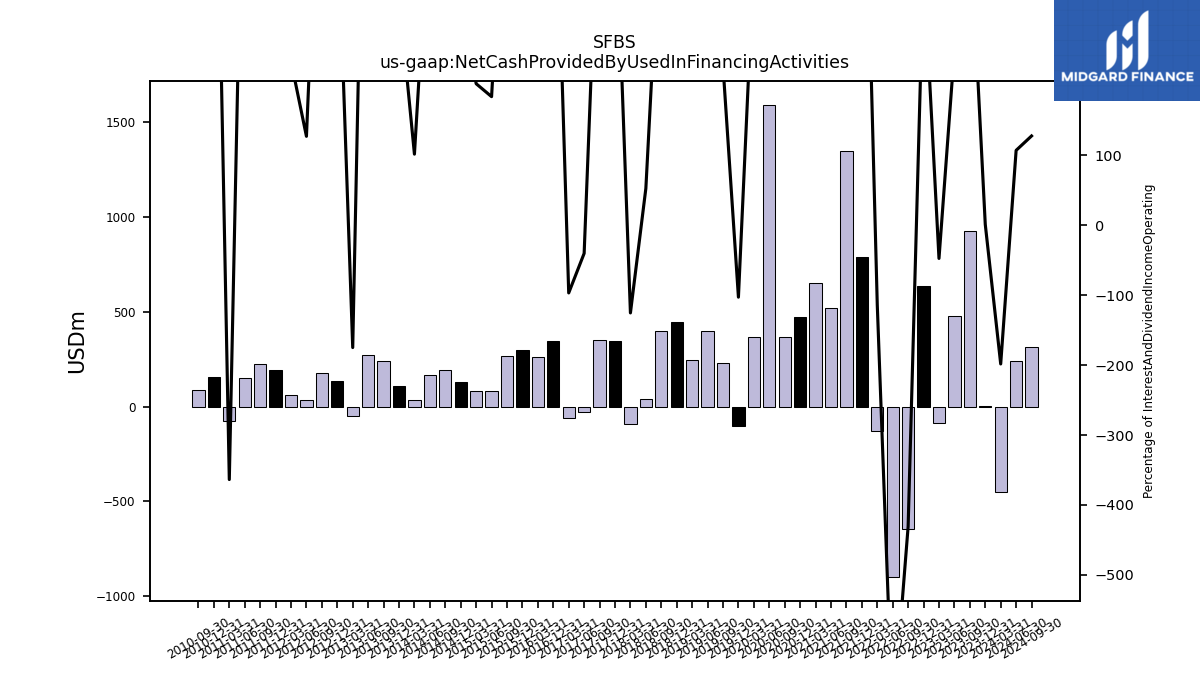
| Net Cash Provided By Used In Financing Activities | 2.44 | 926.35 | 475.59 | -86.21 | 634.88 | -643.16 | -899.02 | -129.15 | 788.44 | 1347.80 | 517.94 | 651.27 | 474.95 | 365.08 | 1592.99 | 367.57 | -101.04 | 230.44 | 399.45 | 243.94 | 444.75 | 397.35 | 41.21 | -92.83 | 346.70 | 353.92 | -25.61 | -57.64 | 347.35 | NA | NA | 264.10 | 301.09 | 265.00 | 81.24 | 82.50 | 130.54 | 192.19 | 166.48 | 34.82 | 110.51 | 242.26 | 273.42 | -51.02 | 133.03 | 179.57 | 33.86 | 59.97 | 196.00 | 223.91 | 150.81 | 157.23 |
| 2023-12-31 | 2023-09-30 | 2023-06-30 | 2023-03-31 | 2022-12-31 | 2022-09-30 | 2022-06-30 | 2022-03-31 | 2021-12-31 | 2021-09-30 | 2021-06-30 | 2021-03-31 | 2020-12-31 | 2020-09-30 | 2020-06-30 | 2020-03-31 | 2019-12-31 | 2019-09-30 | 2019-06-30 | 2019-03-31 | 2018-12-31 | 2018-09-30 | 2018-06-30 | 2018-03-31 | 2017-12-31 | 2017-09-30 | 2017-06-30 | 2017-03-31 | 2016-12-31 | 2016-09-30 | 2016-06-30 | 2016-03-31 | 2015-12-31 | 2015-09-30 | 2015-06-30 | 2015-03-31 | 2014-12-31 | 2014-09-30 | 2014-06-30 | 2014-03-31 | 2013-12-31 | 2013-09-30 | 2013-06-30 | 2013-03-31 | 2012-12-31 | 2012-09-30 | 2012-06-30 | 2012-03-31 | 2011-12-31 | 2011-09-30 | 2011-06-30 | 2010-12-31 | ||
|---|---|---|---|---|---|---|---|---|---|---|---|---|---|---|---|---|---|---|---|---|---|---|---|---|---|---|---|---|---|---|---|---|---|---|---|---|---|---|---|---|---|---|---|---|---|---|---|---|---|---|---|---|---|
| Net Cash Provided By Used In Operating Activities | 91.08 | 12.72 | 38.34 | 55.15 | 73.84 | 72.79 | 56.73 | 69.27 | 70.84 | 66.03 | 62.69 | 66.76 | 73.79 | 12.87 | 52.40 | 52.23 | 61.44 | 41.53 | 19.63 | 41.67 | 52.26 | 38.97 | 38.19 | 38.88 | 37.29 | 34.91 | 17.05 | 29.21 | 27.88 | NA | NA | 24.97 | 24.33 | 26.06 | 13.15 | 10.88 | 22.01 | 3.18 | 20.07 | 18.86 | 19.91 | 19.32 | 13.79 | 21.18 | 18.60 | -1.64 | 5.76 | 18.46 | -0.03 | 6.28 | 7.79 | 9.38 | |
| Net Income Loss | 42.07 | 53.34 | 53.47 | 57.97 | 67.72 | 64.03 | 62.14 | 57.61 | 53.75 | 52.50 | 50.03 | 51.45 | 50.98 | 43.36 | 40.45 | 34.78 | 41.04 | 37.56 | 35.63 | 35.01 | 36.24 | 34.56 | 33.54 | 32.60 | 21.15 | 25.26 | 24.16 | 22.52 | 21.74 | 20.91 | 18.88 | 17.65 | 19.75 | 16.27 | 14.47 | 13.05 | 15.03 | 14.00 | 11.59 | 11.76 | 11.87 | 10.81 | 9.69 | 9.25 | 8.56 | 9.30 | 8.33 | 8.26 | 6.59 | 6.13 | 5.84 | 4.54 | |
| Profit Loss | 42.07 | 53.34 | 53.47 | 57.97 | 67.72 | 64.03 | 62.14 | 57.61 | 53.75 | 52.50 | 50.03 | 51.45 | 50.98 | 43.36 | 40.45 | 34.78 | 41.04 | 37.56 | NA | NA | NA | NA | NA | NA | NA | NA | NA | NA | NA | NA | NA | 17.65 | 19.75 | 16.27 | 14.47 | 13.05 | 15.03 | 14.00 | 11.59 | 11.76 | 11.87 | 10.81 | 9.69 | 9.25 | 8.56 | 9.30 | 8.33 | 8.26 | 6.59 | 6.13 | NA | 4.54 | |
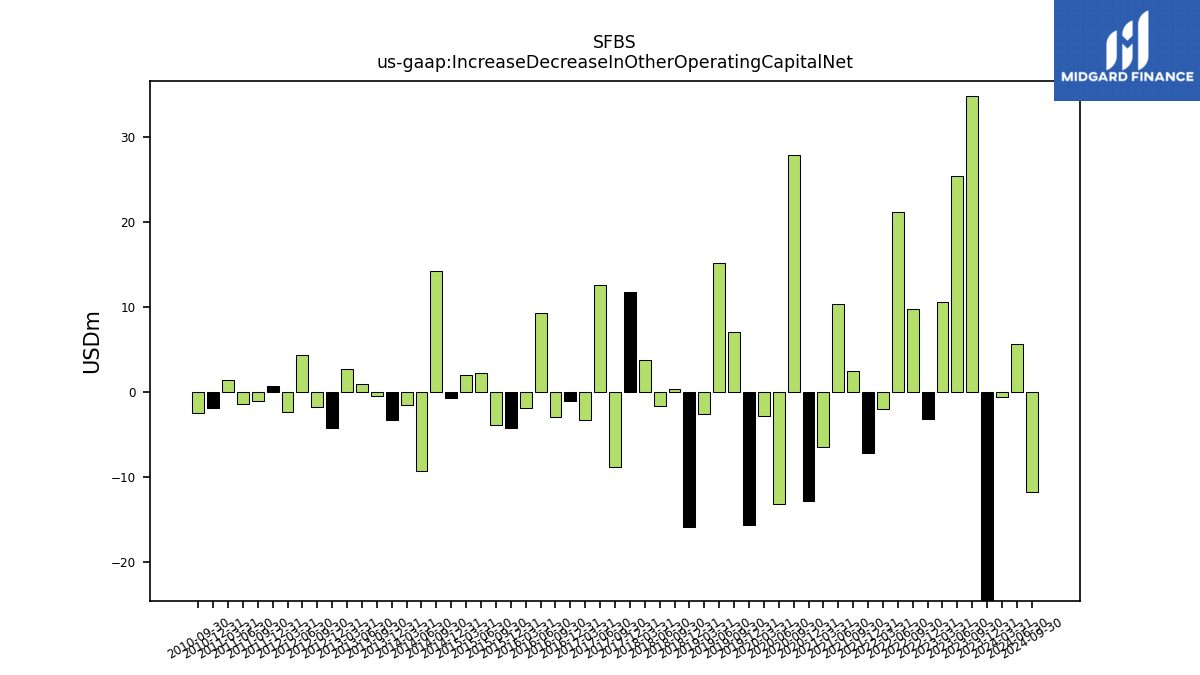
| Increase Decrease In Other Operating Capital Net | -33.86 | 34.83 | 25.44 | 10.65 | -3.09 | 9.81 | 21.19 | -1.92 | -7.13 | 2.52 | 10.34 | -6.46 | -12.75 | 27.90 | -13.17 | -2.81 | -15.61 | 7.13 | 15.19 | -2.55 | -15.78 | 0.37 | -1.55 | 3.79 | 11.78 | -8.83 | 12.58 | -3.20 | -1.03 | -2.93 | 9.36 | -1.79 | -4.21 | -3.84 | 2.25 | 2.02 | -0.65 | 14.31 | -9.30 | -1.54 | -3.28 | -0.47 | 0.93 | 2.72 | -4.19 | -1.71 | 4.39 | -2.28 | 0.77 | -1.01 | -1.39 | -1.88 | |
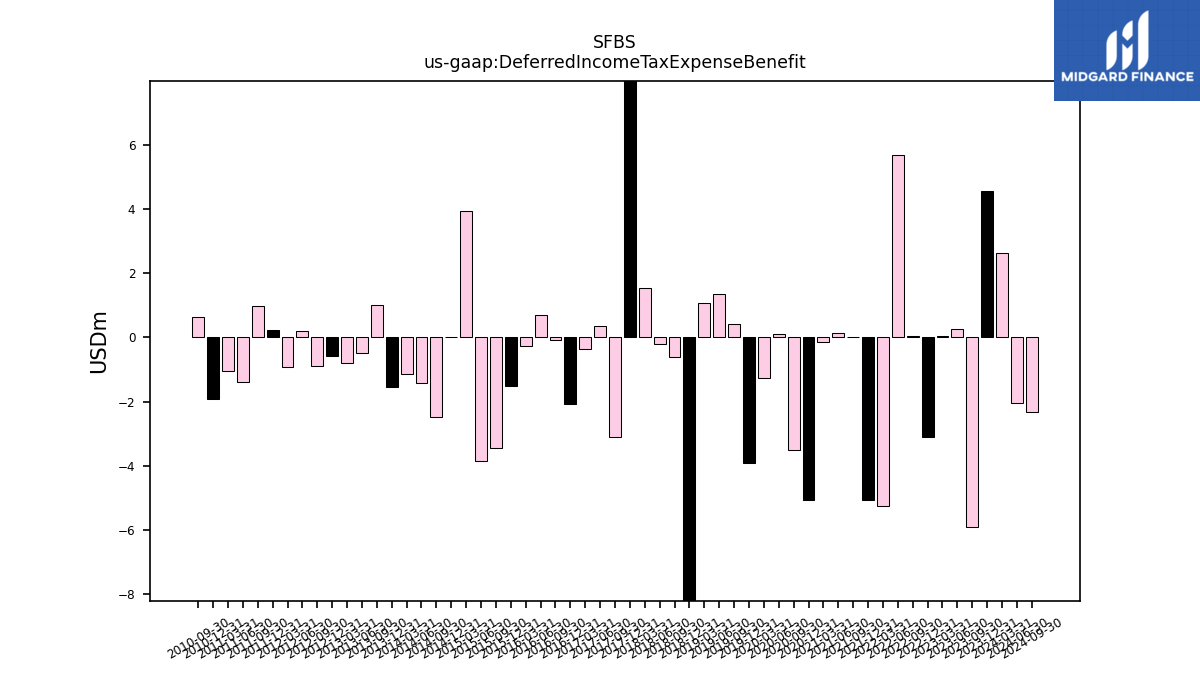
| Deferred Income Tax Expense Benefit | 4.58 | -5.89 | 0.26 | 0.05 | -3.09 | 0.05 | 5.68 | -5.26 | -5.07 | 0.00 | 0.15 | -0.14 | -5.05 | -3.52 | 0.11 | -1.27 | -3.93 | 0.42 | 1.36 | 1.07 | -15.01 | -0.61 | -0.19 | 1.55 | 17.15 | -3.10 | 0.37 | -0.37 | -2.08 | -0.09 | 0.69 | -0.26 | -1.51 | -3.46 | -3.85 | 3.94 | 0.01 | -2.47 | -1.42 | -1.14 | -1.53 | 1.02 | -0.49 | -0.80 | -0.58 | -0.90 | 0.20 | -0.91 | 0.24 | 0.98 | -1.40 | -1.92 | |
| Share Based Compensation | 0.88 | 0.93 | 0.98 | 0.81 | 0.82 | 0.80 | 0.80 | 0.79 | 0.55 | 0.46 | 0.56 | 0.29 | 0.36 | 0.34 | 0.35 | 0.28 | 0.32 | 0.29 | 0.21 | 0.28 | 0.17 | 0.20 | 0.24 | 0.24 | 0.25 | 0.29 | 0.28 | 0.34 | 0.27 | 0.29 | 0.30 | 0.34 | 0.41 | 0.29 | 0.26 | 0.30 | 0.28 | 0.30 | 2.08 | 1.02 | 0.32 | 0.31 | 0.32 | 0.26 | 0.26 | 0.23 | 0.26 | 0.26 | 0.26 | 0.25 | 0.24 | 0.20 |
| 2023-12-31 | 2023-09-30 | 2023-06-30 | 2023-03-31 | 2022-12-31 | 2022-09-30 | 2022-06-30 | 2022-03-31 | 2021-12-31 | 2021-09-30 | 2021-06-30 | 2021-03-31 | 2020-12-31 | 2020-09-30 | 2020-06-30 | 2020-03-31 | 2019-12-31 | 2019-09-30 | 2019-06-30 | 2019-03-31 | 2018-12-31 | 2018-09-30 | 2018-06-30 | 2018-03-31 | 2017-12-31 | 2017-09-30 | 2017-06-30 | 2017-03-31 | 2016-12-31 | 2016-09-30 | 2016-06-30 | 2016-03-31 | 2015-12-31 | 2015-09-30 | 2015-06-30 | 2015-03-31 | 2014-12-31 | 2014-09-30 | 2014-06-30 | 2014-03-31 | 2013-12-31 | 2013-09-30 | 2013-06-30 | 2013-03-31 | 2012-12-31 | 2012-09-30 | 2012-06-30 | 2012-03-31 | 2011-12-31 | 2011-09-30 | 2011-06-30 | 2010-12-31 | ||
|---|---|---|---|---|---|---|---|---|---|---|---|---|---|---|---|---|---|---|---|---|---|---|---|---|---|---|---|---|---|---|---|---|---|---|---|---|---|---|---|---|---|---|---|---|---|---|---|---|---|---|---|---|---|
| Net Cash Provided By Used In Investing Activities | -27.54 | 148.35 | -407.21 | 85.98 | -381.00 | -629.90 | -912.50 | -718.82 | -1081.68 | -150.12 | -209.59 | -119.71 | 39.30 | -303.51 | -781.00 | -365.87 | -376.53 | -111.39 | -332.45 | -167.98 | -180.93 | -236.17 | -229.84 | -107.54 | -255.40 | -295.15 | -201.68 | -290.01 | -383.49 | NA | NA | -115.67 | -215.87 | -184.82 | -257.62 | -91.17 | -199.12 | -131.26 | -129.12 | -89.60 | -137.42 | -188.77 | -141.90 | -103.60 | -226.23 | -78.39 | -112.30 | -92.89 | -137.59 | -242.97 | -79.10 | -86.69 |
| 2023-12-31 | 2023-09-30 | 2023-06-30 | 2023-03-31 | 2022-12-31 | 2022-09-30 | 2022-06-30 | 2022-03-31 | 2021-12-31 | 2021-09-30 | 2021-06-30 | 2021-03-31 | 2020-12-31 | 2020-09-30 | 2020-06-30 | 2020-03-31 | 2019-12-31 | 2019-09-30 | 2019-06-30 | 2019-03-31 | 2018-12-31 | 2018-09-30 | 2018-06-30 | 2018-03-31 | 2017-12-31 | 2017-09-30 | 2017-06-30 | 2017-03-31 | 2016-12-31 | 2016-09-30 | 2016-06-30 | 2016-03-31 | 2015-12-31 | 2015-09-30 | 2015-06-30 | 2015-03-31 | 2014-12-31 | 2014-09-30 | 2014-06-30 | 2014-03-31 | 2013-12-31 | 2013-09-30 | 2013-06-30 | 2013-03-31 | 2012-12-31 | 2012-09-30 | 2012-06-30 | 2012-03-31 | 2011-12-31 | 2011-09-30 | 2011-06-30 | 2010-12-31 | ||
|---|---|---|---|---|---|---|---|---|---|---|---|---|---|---|---|---|---|---|---|---|---|---|---|---|---|---|---|---|---|---|---|---|---|---|---|---|---|---|---|---|---|---|---|---|---|---|---|---|---|---|---|---|---|
| Net Cash Provided By Used In Financing Activities | 2.44 | 926.35 | 475.59 | -86.21 | 634.88 | -643.16 | -899.02 | -129.15 | 788.44 | 1347.80 | 517.94 | 651.27 | 474.95 | 365.08 | 1592.99 | 367.57 | -101.04 | 230.44 | 399.45 | 243.94 | 444.75 | 397.35 | 41.21 | -92.83 | 346.70 | 353.92 | -25.61 | -57.64 | 347.35 | NA | NA | 264.10 | 301.09 | 265.00 | 81.24 | 82.50 | 130.54 | 192.19 | 166.48 | 34.82 | 110.51 | 242.26 | 273.42 | -51.02 | 133.03 | 179.57 | 33.86 | 59.97 | 196.00 | 223.91 | 150.81 | 157.23 | |
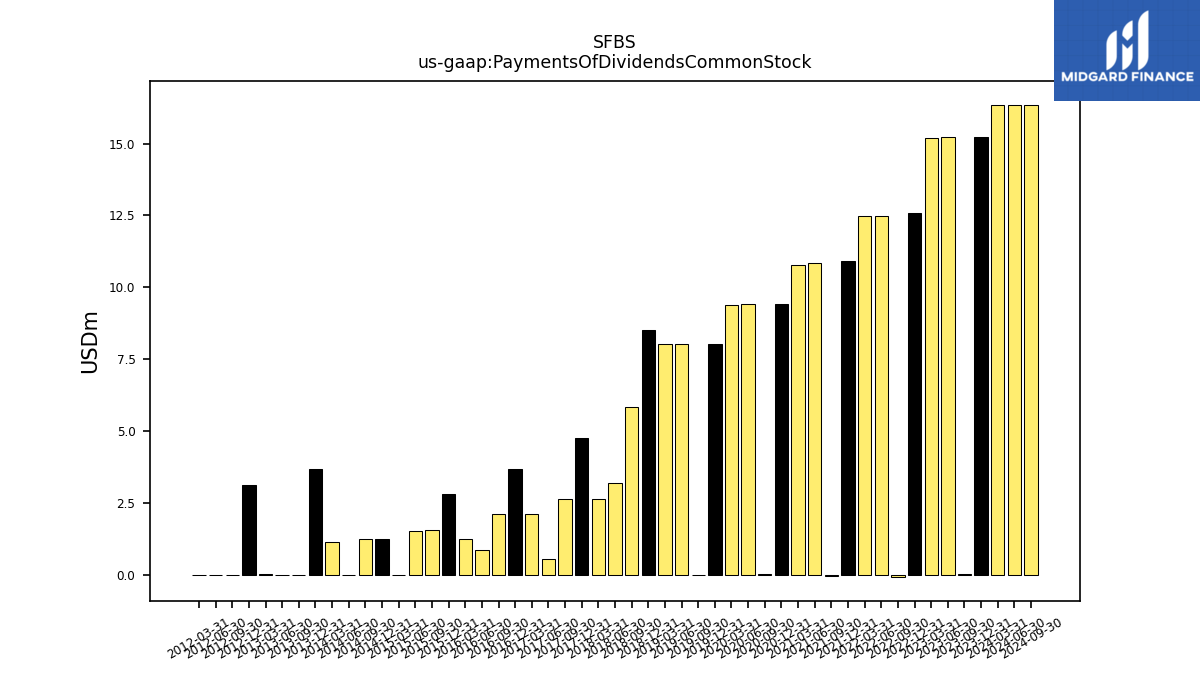
| Payments Of Dividends Common Stock | 15.24 | 0.03 | 15.23 | 15.21 | 12.59 | -0.08 | 12.48 | 12.47 | 10.92 | -0.03 | 10.84 | 10.79 | 9.41 | 0.03 | 9.41 | 9.38 | 8.02 | -0.01 | 8.03 | 8.02 | 8.50 | 5.85 | 3.20 | 2.65 | 4.75 | 2.65 | 0.54 | 2.10 | 3.66 | 2.10 | 0.85 | 1.24 | 2.79 | 1.55 | 1.54 | 0.00 | 1.24 | 1.24 | 0.00 | 1.13 | 3.67 | 0.00 | 0.00 | 0.01 | 3.13 | 0.00 | 0.00 | 0.00 | NA | NA | NA | NA |