
| 2023-10-28 | 2023-07-29 | 2023-04-29 | 2023-01-28 | 2022-10-29 | 2022-07-30 | 2022-04-30 | 2022-01-29 | 2021-10-30 | 2021-07-31 | 2021-05-01 | 2021-01-30 | 2020-10-31 | 2020-08-01 | 2020-05-02 | 2020-02-01 | 2019-11-02 | 2019-04-27 | 2019-01-26 | 2018-10-27 | 2018-07-28 | 2018-04-28 | 2018-01-27 | 2017-10-28 | 2017-07-29 | 2017-04-29 | 2017-01-28 | 2016-10-29 | ||
|---|---|---|---|---|---|---|---|---|---|---|---|---|---|---|---|---|---|---|---|---|---|---|---|---|---|---|---|---|---|
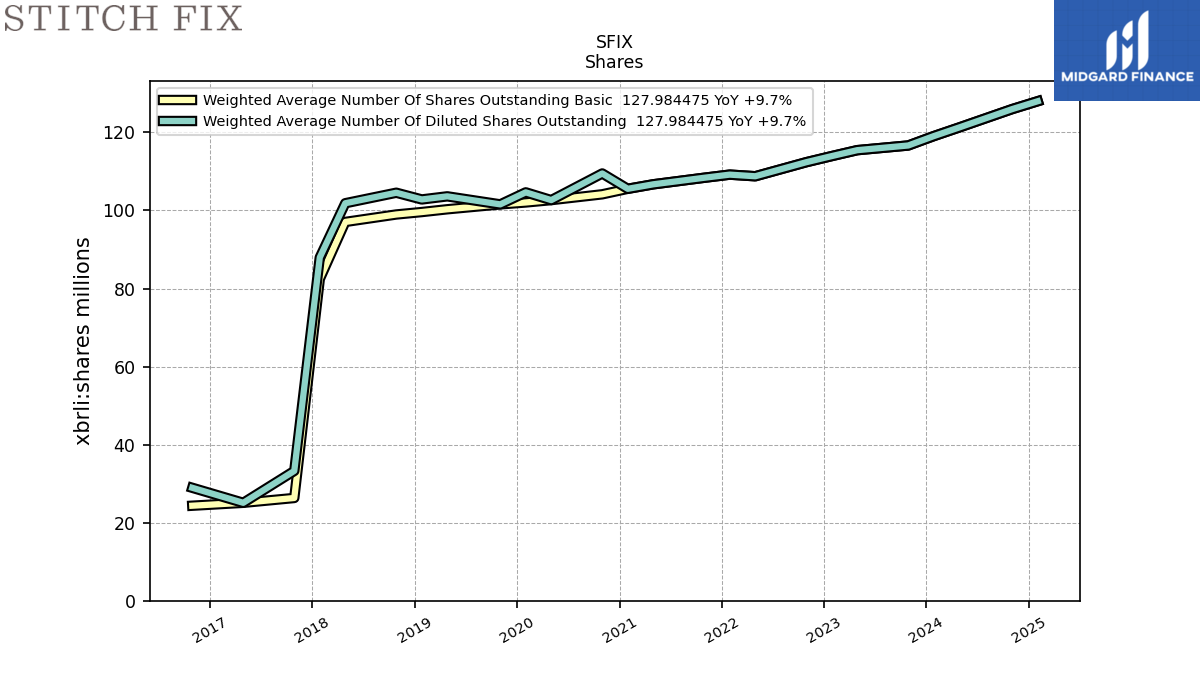
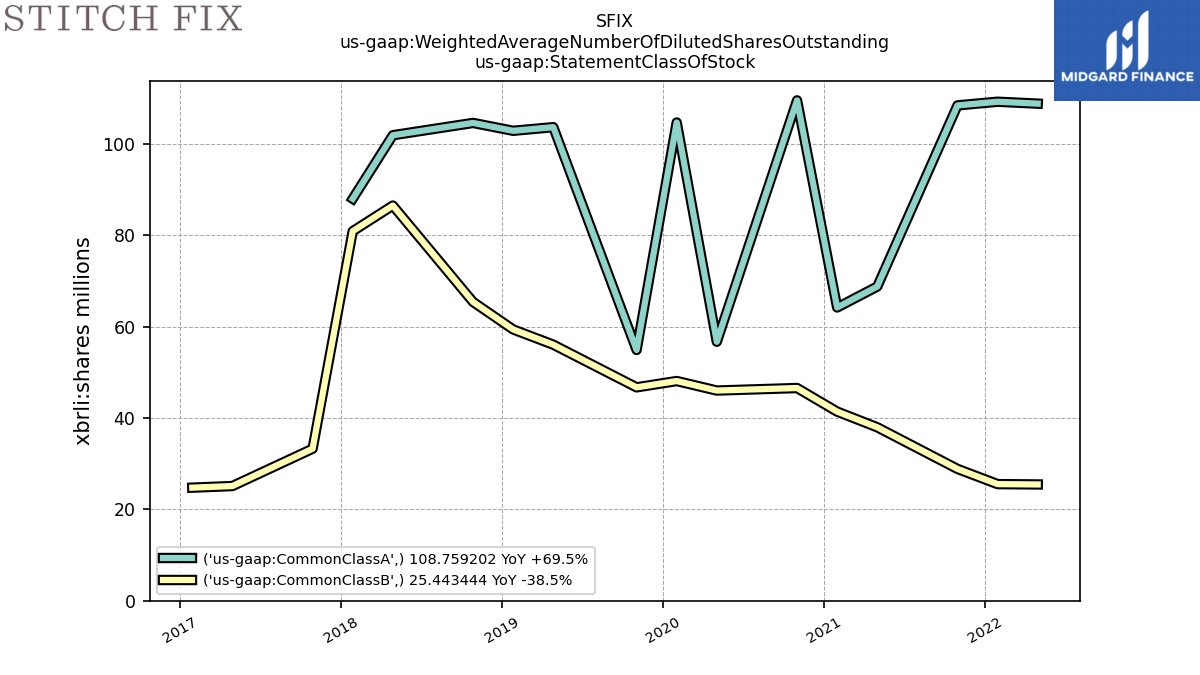
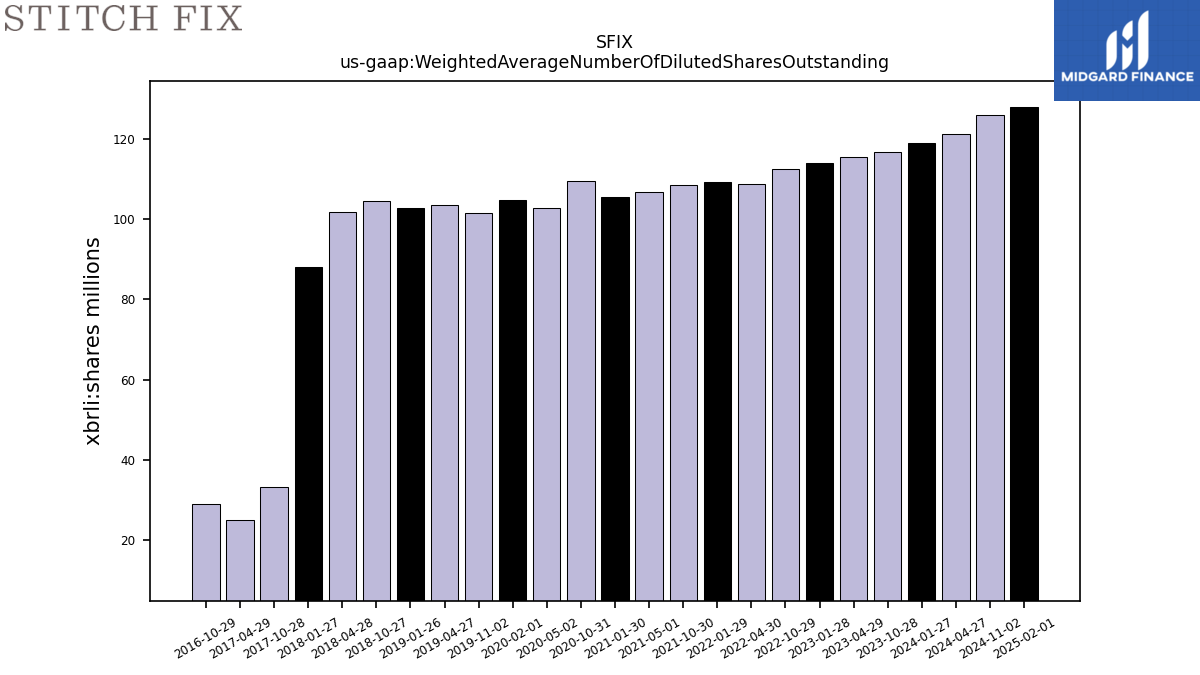
| Weighted Average Number Of Diluted Shares Outstanding | 116.65 | NA | 115.45 | 113.93 | 112.36 | NA | 108.76 | 109.18 | 108.38 | NA | 106.70 | 105.54 | 109.48 | NA | 102.65 | 104.64 | 101.56 | 103.62 | 102.82 | 104.54 | NA | 101.85 | 87.95 | 33.26 | NA | 25.09 | NA | 28.94 | |
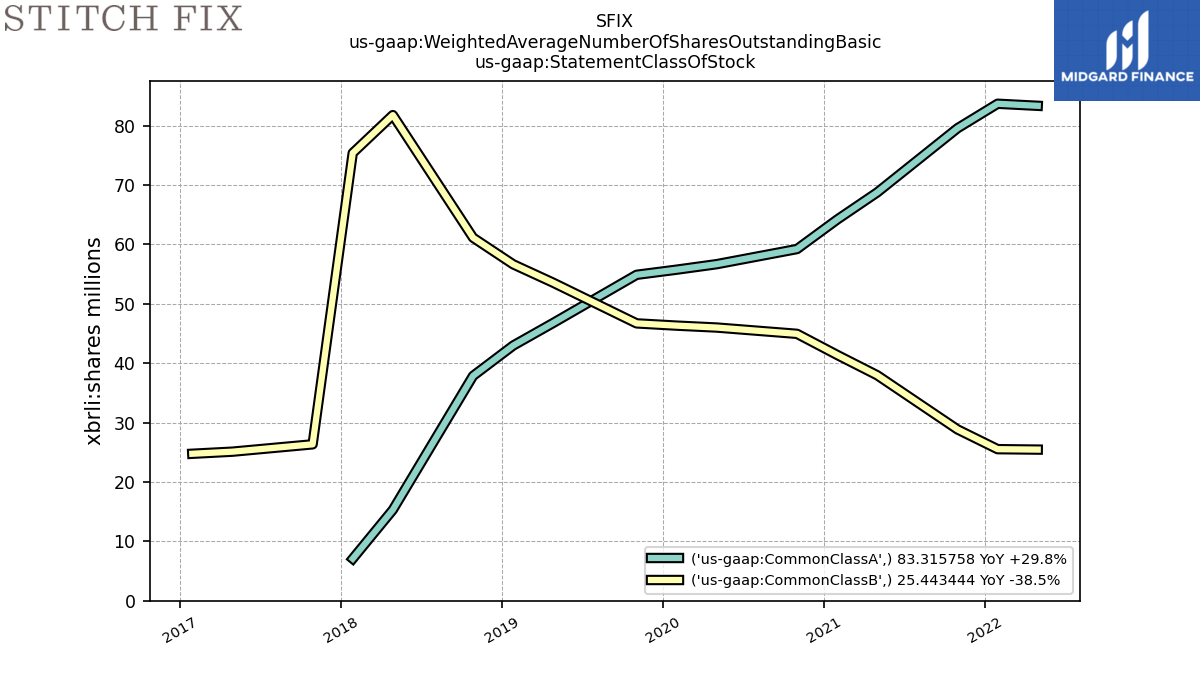
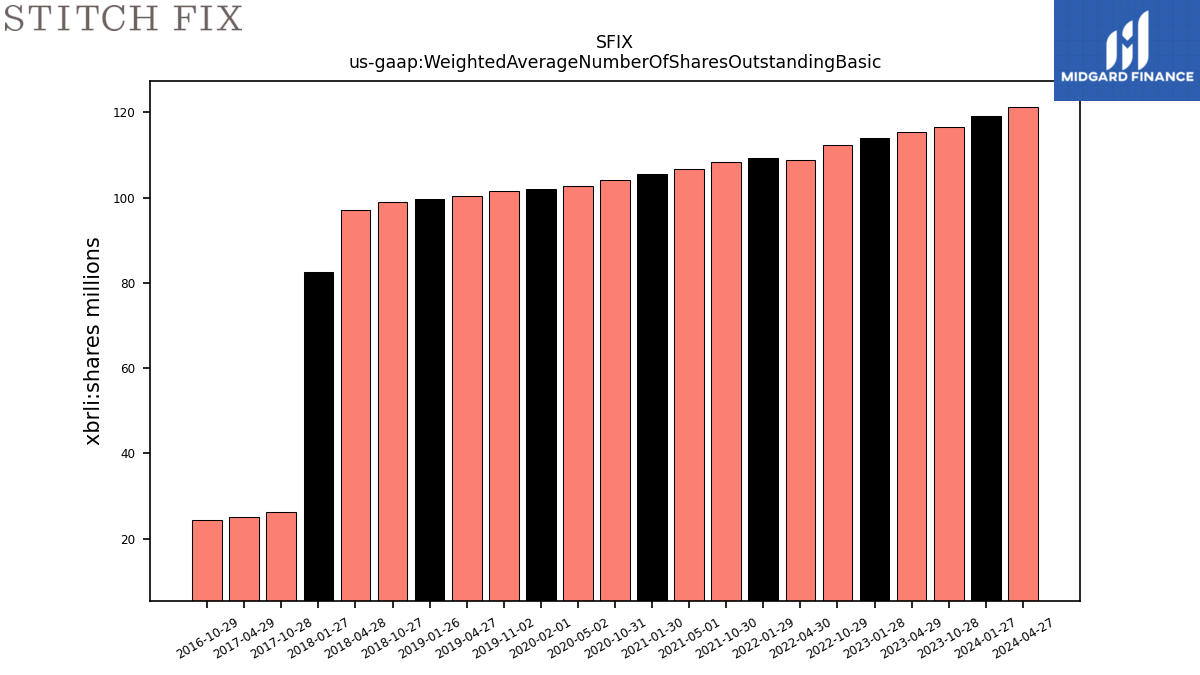
| Weighted Average Number Of Shares Outstanding Basic | 116.65 | NA | 115.45 | 113.93 | 112.36 | NA | 108.76 | 109.18 | 108.38 | NA | 106.70 | 105.54 | 104.13 | NA | 102.65 | 102.05 | 101.56 | 100.30 | 99.59 | 98.97 | NA | 97.06 | 82.44 | 26.33 | NA | 25.09 | NA | 24.35 | |
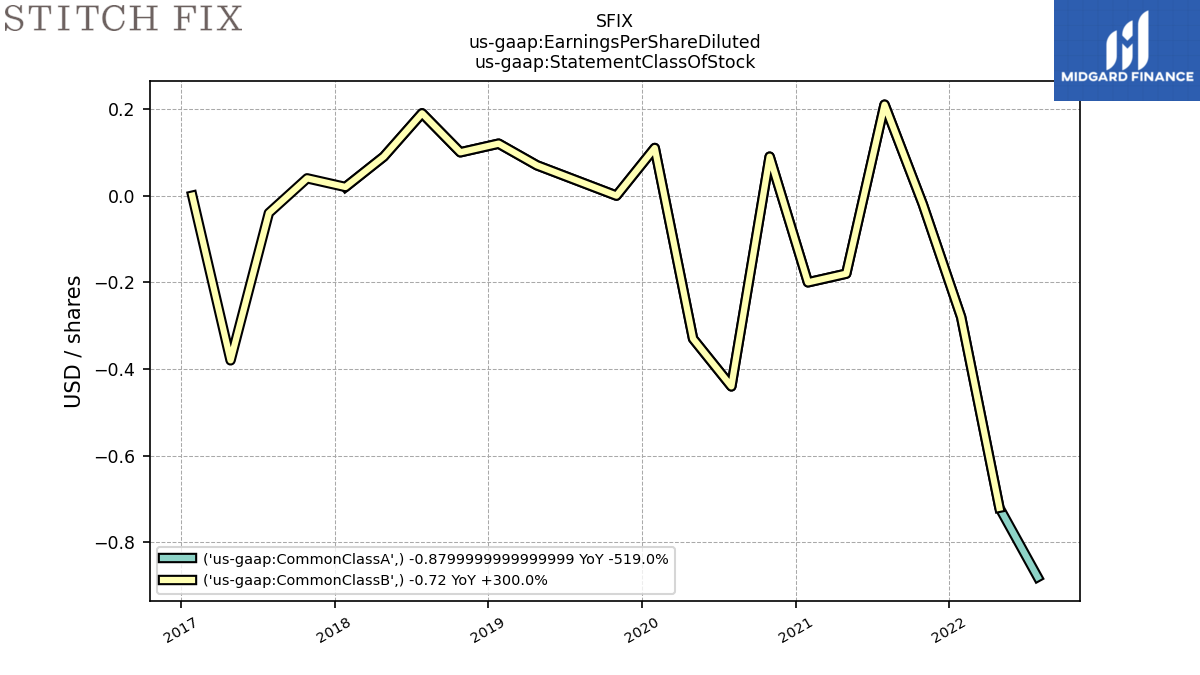
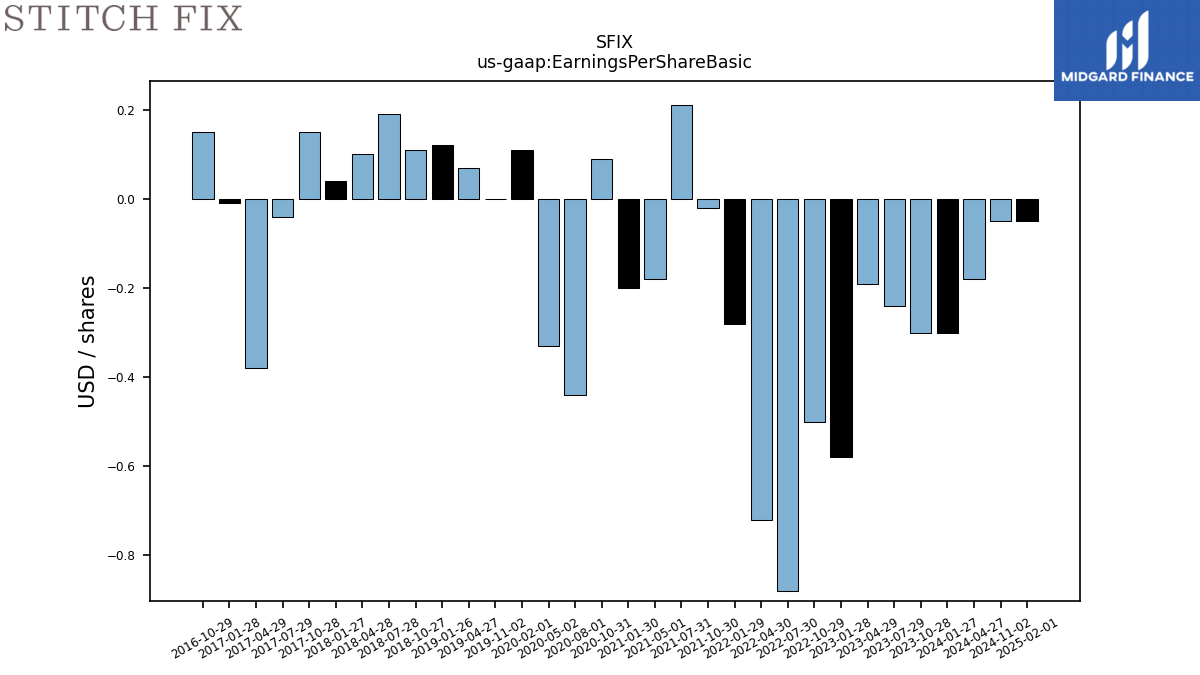
| Earnings Per Share Basic | -0.30 | -0.24 | -0.19 | -0.58 | -0.50 | -0.88 | -0.72 | -0.28 | -0.02 | 0.21 | -0.18 | -0.20 | 0.09 | -0.44 | -0.33 | 0.11 | 0.00 | 0.07 | 0.12 | 0.11 | 0.19 | 0.10 | 0.04 | 0.15 | -0.04 | -0.38 | -0.01 | 0.15 | |
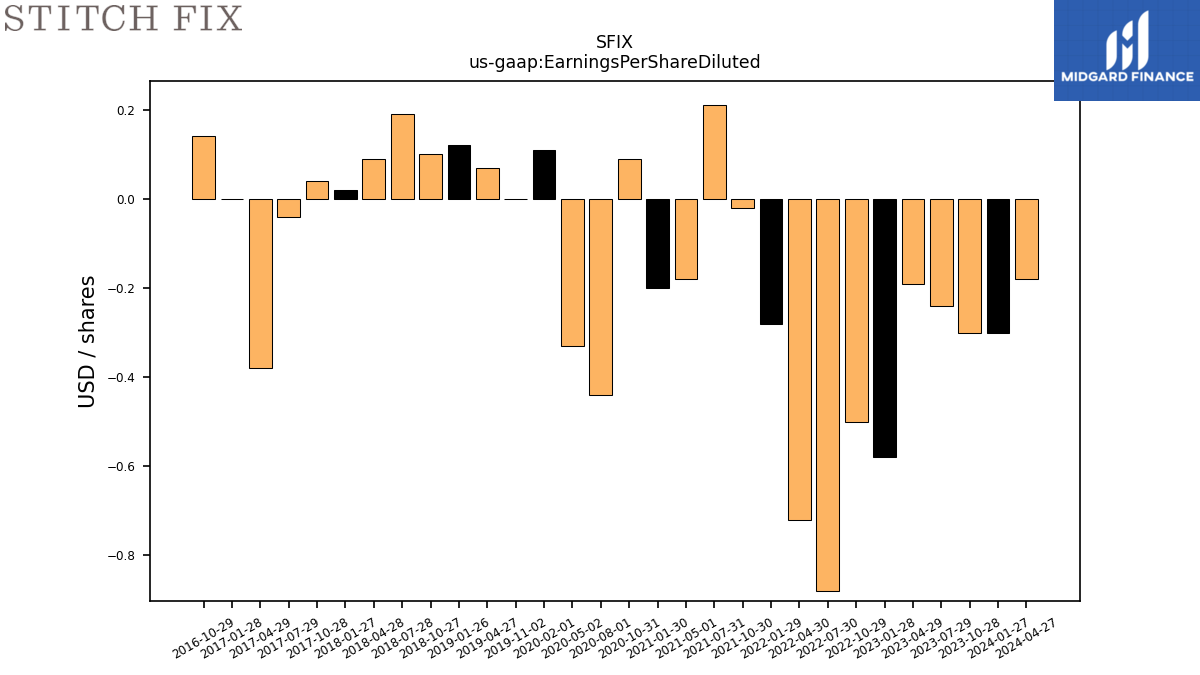
| Earnings Per Share Diluted | -0.30 | -0.24 | -0.19 | -0.58 | -0.50 | -0.88 | -0.72 | -0.28 | -0.02 | 0.21 | -0.18 | -0.20 | 0.09 | -0.44 | -0.33 | 0.11 | 0.00 | 0.07 | 0.12 | 0.10 | 0.19 | 0.09 | 0.02 | 0.04 | -0.04 | -0.38 | 0.00 | 0.14 | |
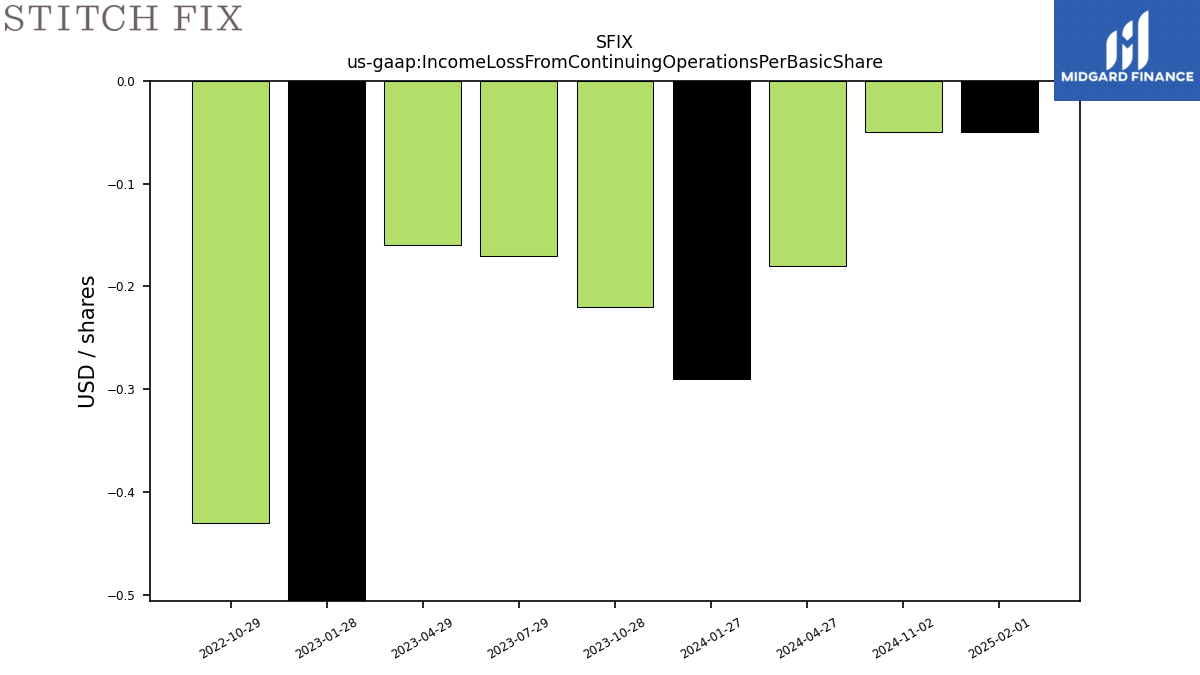
| Income Loss From Continuing Operations Per Basic Share | -0.00 | NA | NA | NA | -0.00 | NA | NA | NA | NA | NA | NA | NA | NA | NA | NA | NA | NA | NA | NA | NA | NA | NA | NA | NA | NA | NA | NA | NA | |
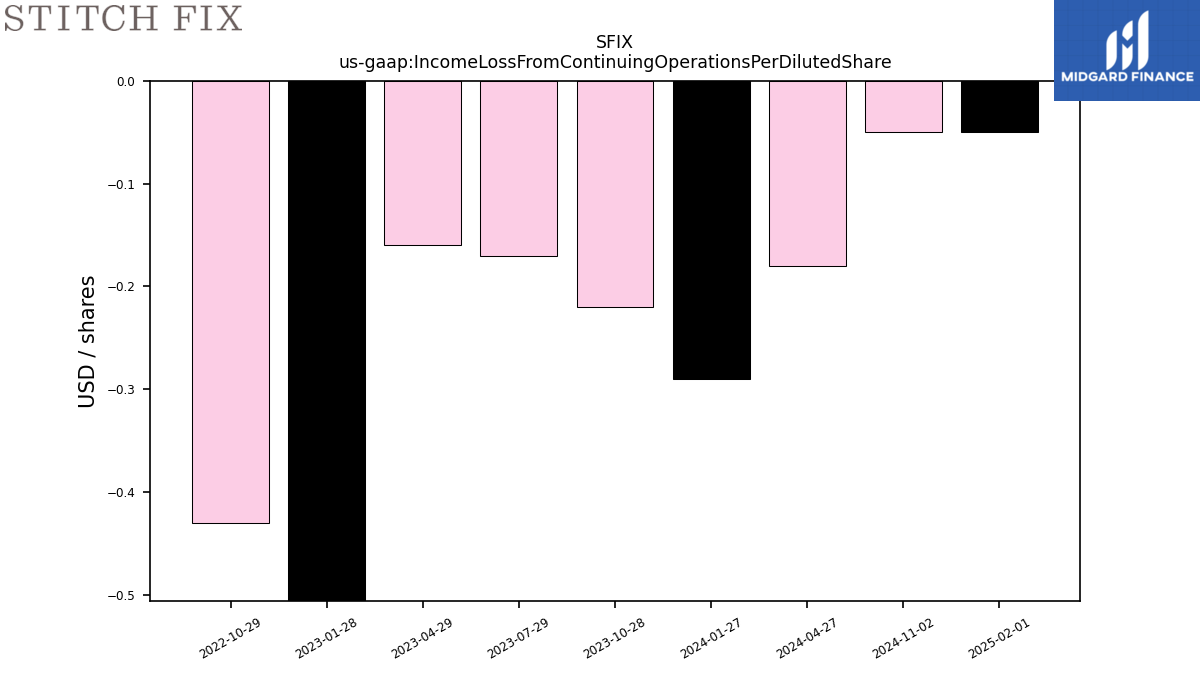
| Income Loss From Continuing Operations Per Diluted Share | -0.00 | NA | NA | NA | -0.00 | NA | NA | NA | NA | NA | NA | NA | NA | NA | NA | NA | NA | NA | NA | NA | NA | NA | NA | NA | NA | NA | NA | NA |
| 2023-10-28 | 2023-07-29 | 2023-04-29 | 2023-01-28 | 2022-10-29 | 2022-07-30 | 2022-04-30 | 2022-01-29 | 2021-10-30 | 2021-07-31 | 2021-05-01 | 2021-01-30 | 2020-10-31 | 2020-08-01 | 2020-05-02 | 2020-02-01 | 2019-11-02 | 2019-04-27 | 2019-01-26 | 2018-10-27 | 2018-07-28 | 2018-04-28 | 2018-01-27 | 2017-10-28 | 2017-07-29 | 2017-04-29 | 2017-01-28 | 2016-10-29 | ||
|---|---|---|---|---|---|---|---|---|---|---|---|---|---|---|---|---|---|---|---|---|---|---|---|---|---|---|---|---|---|
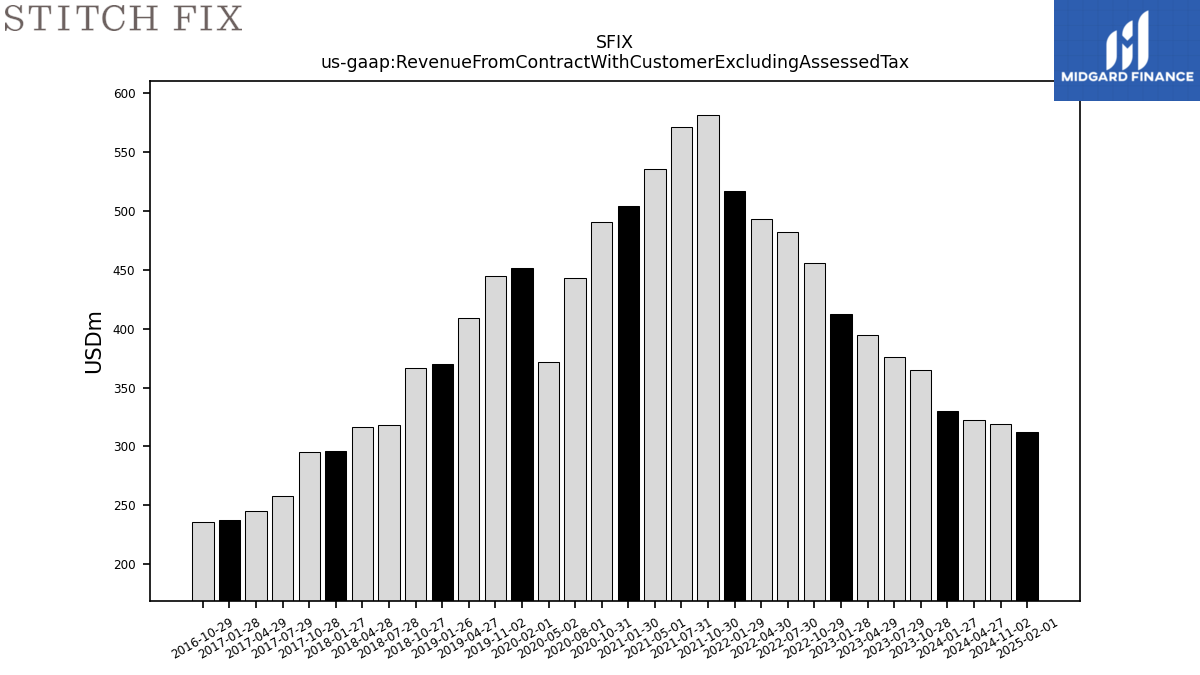
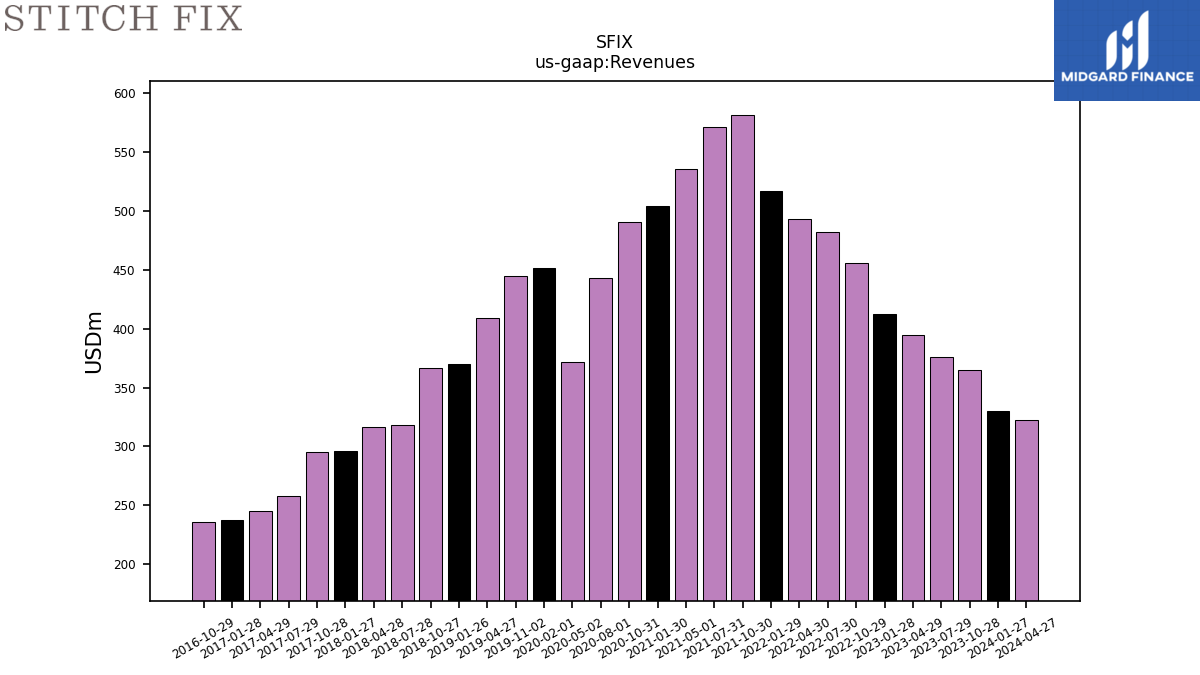
| Revenue From Contract With Customer Excluding Assessed Tax | 364.79 | 375.80 | 394.91 | 412.12 | 455.59 | 481.90 | 492.94 | 516.72 | 581.24 | 571.16 | 535.59 | 504.09 | 490.42 | 443.41 | 371.73 | 451.78 | 444.81 | 408.89 | 370.28 | 366.24 | 318.30 | 316.74 | 295.91 | 295.56 | 258.29 | 245.07 | 237.78 | 236.00 | |
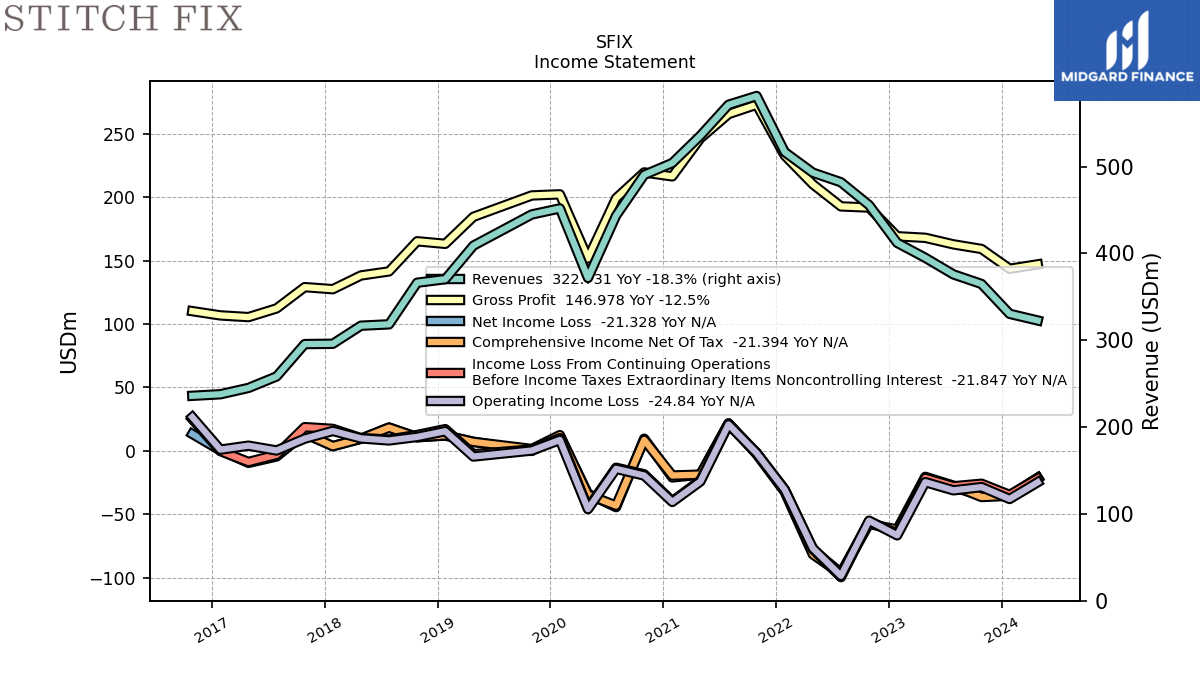
| Revenues | 364.79 | 375.80 | 394.91 | 412.12 | 455.59 | 481.90 | 492.94 | 516.72 | 581.24 | 571.16 | 535.59 | 504.09 | 490.42 | 443.41 | 371.73 | 451.78 | 444.81 | 408.89 | 370.28 | 366.24 | 318.30 | 316.74 | 295.91 | 295.56 | 258.29 | 245.07 | 237.78 | 236.00 | |
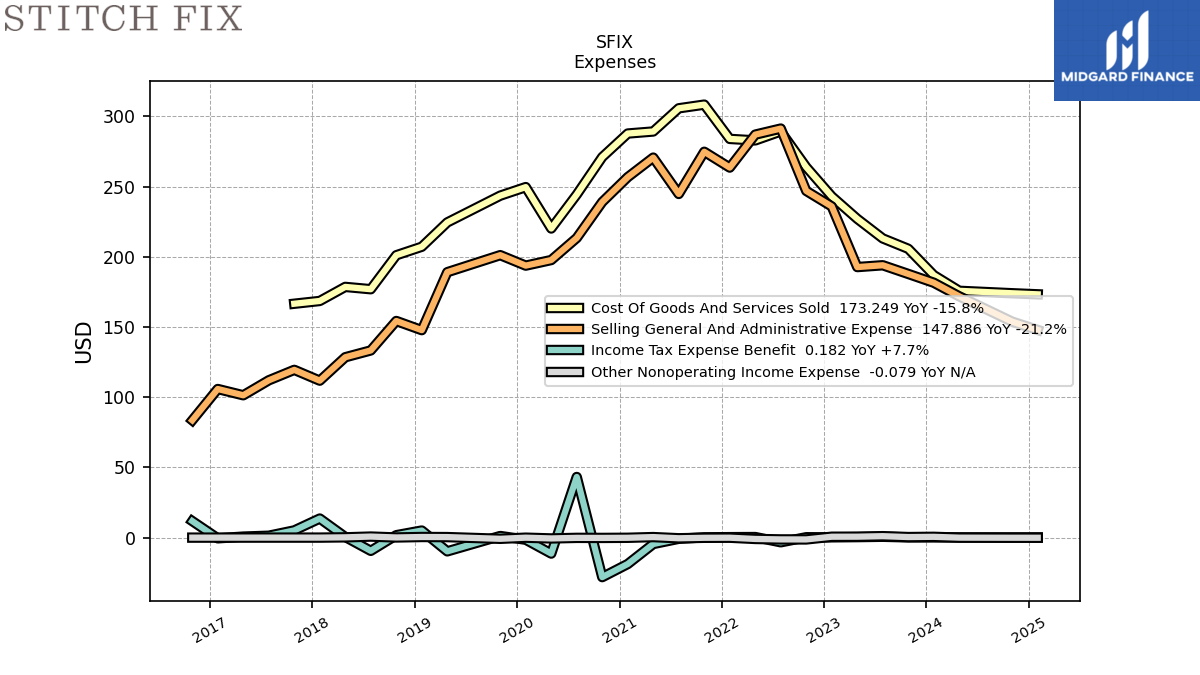
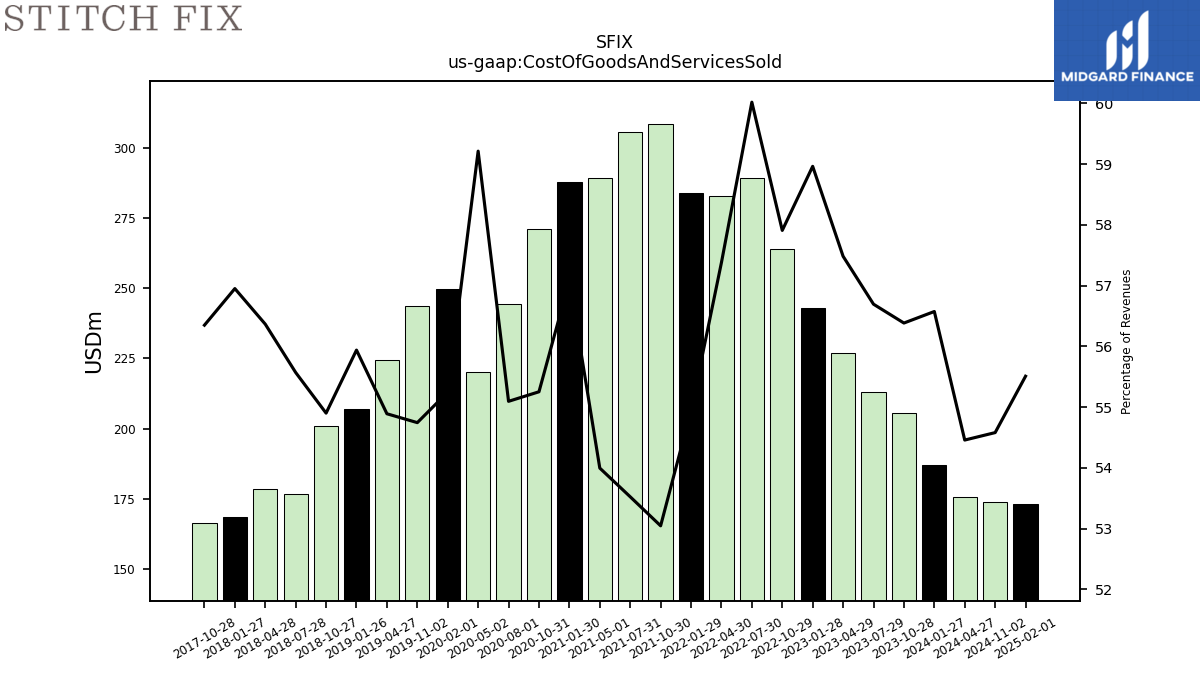
| Cost Of Goods And Services Sold | 205.68 | 213.06 | 227.01 | 243.00 | 263.83 | 289.24 | 282.85 | 283.92 | 308.33 | 305.71 | 289.20 | 287.74 | 270.97 | 244.30 | 220.12 | 249.60 | 243.51 | 224.44 | 207.13 | 201.07 | 176.88 | 178.53 | 168.52 | 166.55 | NA | NA | NA | NA | |
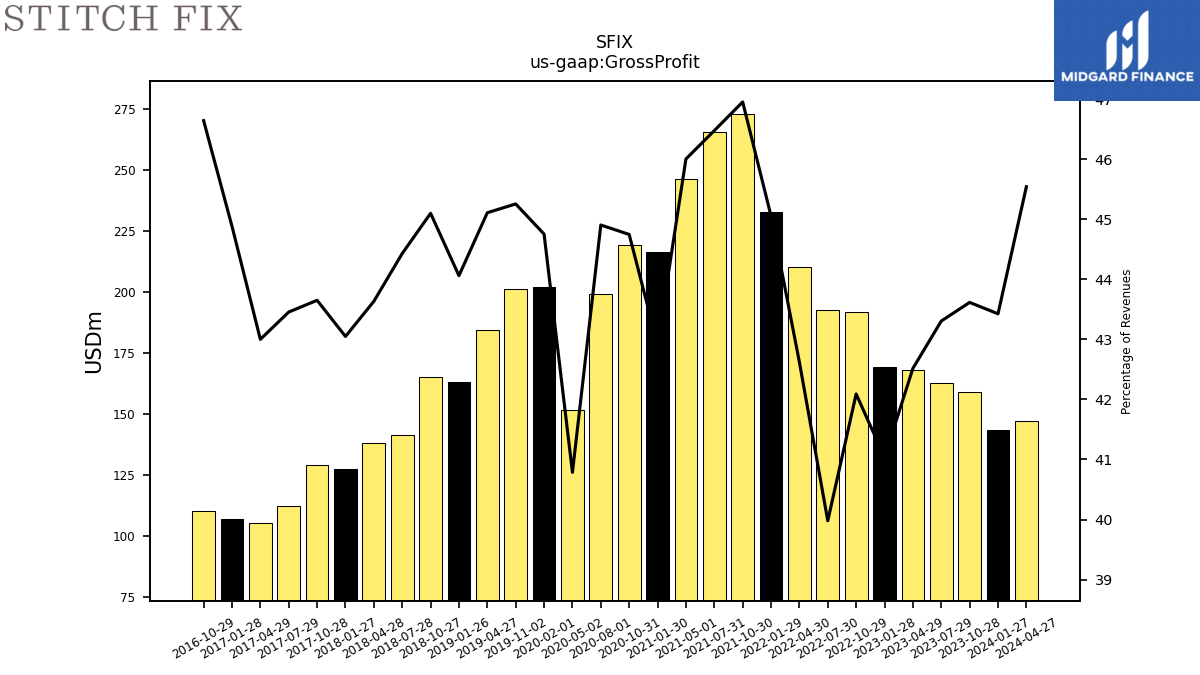
| Gross Profit | 159.10 | 162.74 | 167.90 | 169.12 | 191.76 | 192.66 | 210.09 | 232.80 | 272.92 | 265.45 | 246.39 | 216.34 | 219.45 | 199.11 | 151.61 | 202.19 | 201.30 | 184.45 | 163.15 | 165.17 | 141.42 | 138.21 | 127.38 | 129.01 | 112.24 | 105.38 | 106.72 | 110.08 | |
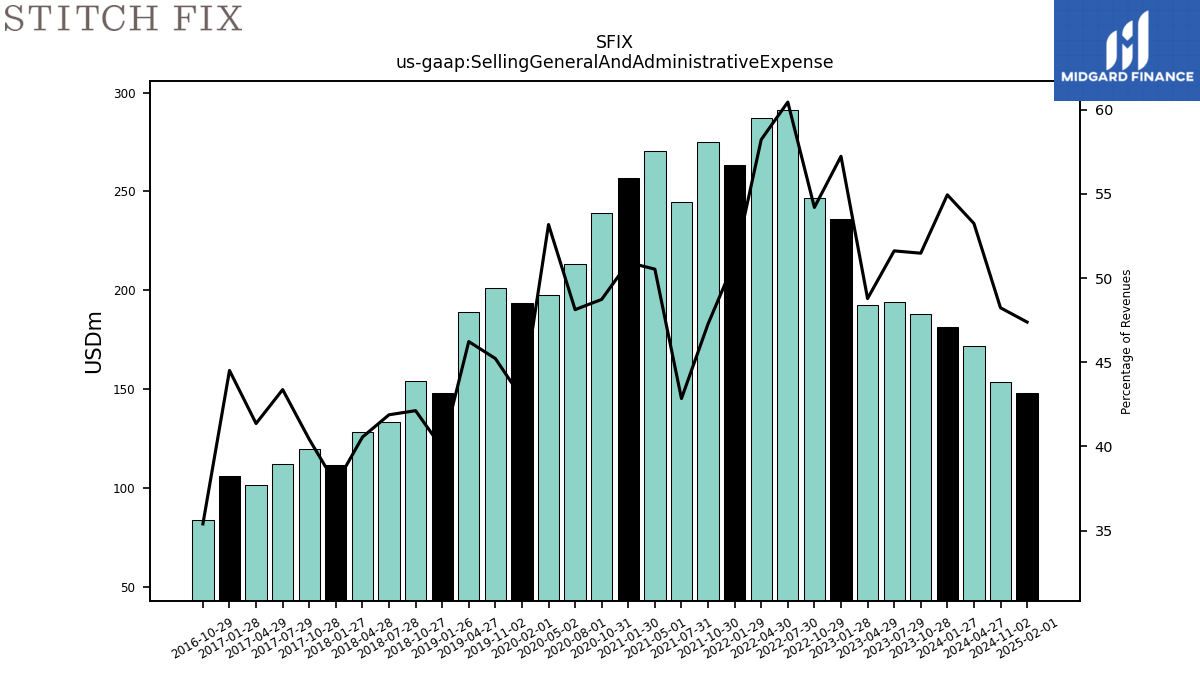
| Selling General And Administrative Expense | 187.76 | 193.95 | 192.65 | 235.83 | 246.89 | 291.28 | 286.97 | 263.50 | 274.77 | 244.71 | 270.61 | 256.69 | 238.98 | 213.38 | 197.67 | 193.69 | 201.14 | 189.01 | 147.74 | 154.27 | 133.30 | 128.45 | 111.77 | 119.47 | 112.03 | 101.37 | 105.83 | 83.55 | |
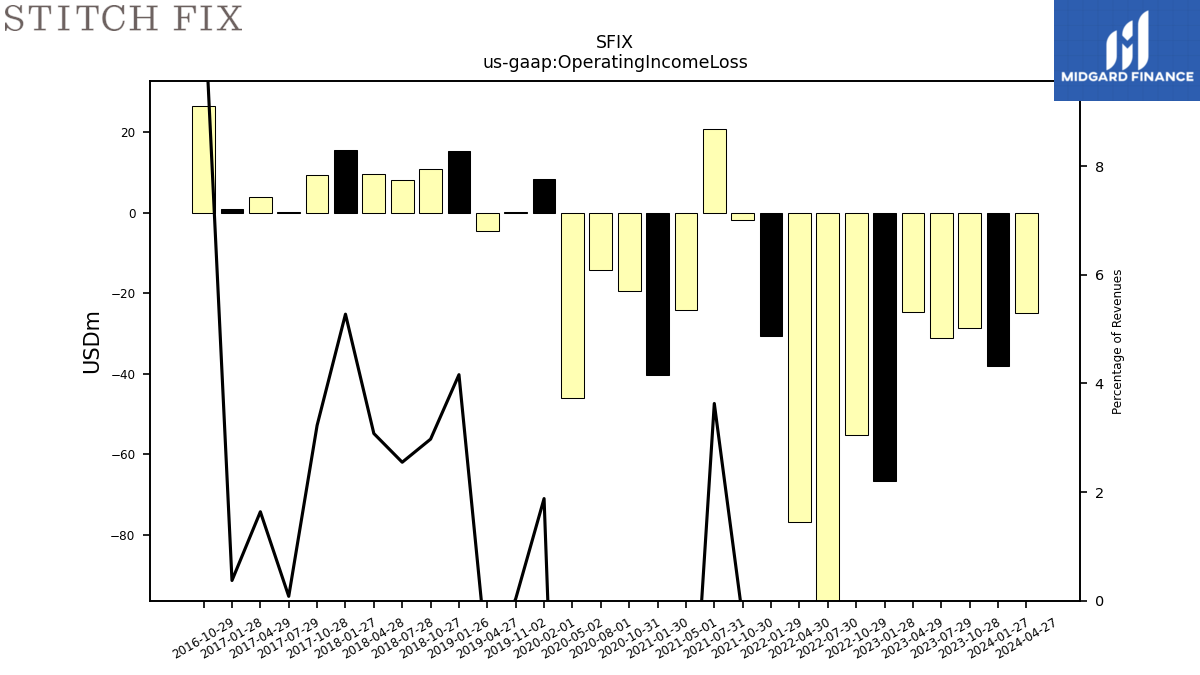
| Operating Income Loss | -28.66 | -31.21 | -24.75 | -66.71 | -55.13 | -98.62 | -76.88 | -30.70 | -1.85 | 20.74 | -24.22 | -40.35 | -19.53 | -14.27 | -46.05 | 8.50 | 0.16 | -4.57 | 15.41 | 10.90 | 8.12 | 9.75 | 15.61 | 9.54 | 0.21 | 4.01 | 0.89 | 26.53 | |
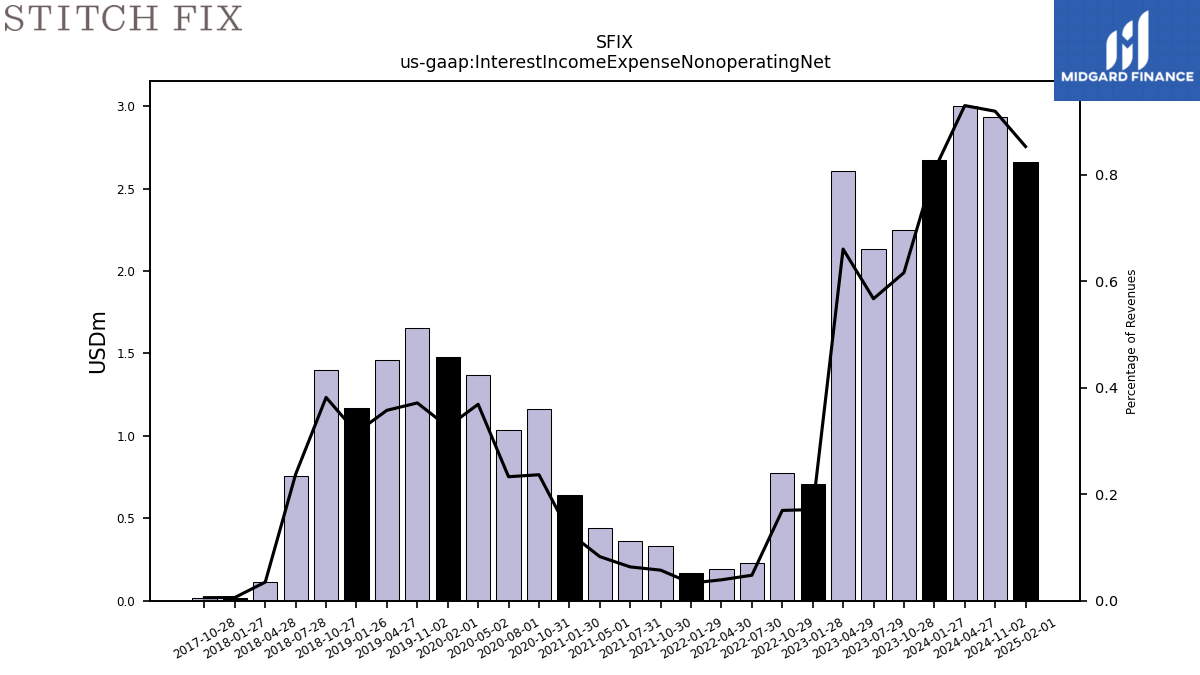
| Interest Income Expense Nonoperating Net | 2.25 | 2.13 | 2.61 | 0.71 | 0.77 | 0.23 | 0.19 | 0.17 | 0.33 | 0.36 | 0.44 | 0.64 | 1.16 | 1.03 | 1.37 | 1.48 | 1.65 | 1.46 | 1.17 | 1.40 | 0.76 | 0.11 | 0.02 | 0.02 | NA | NA | NA | NA | |
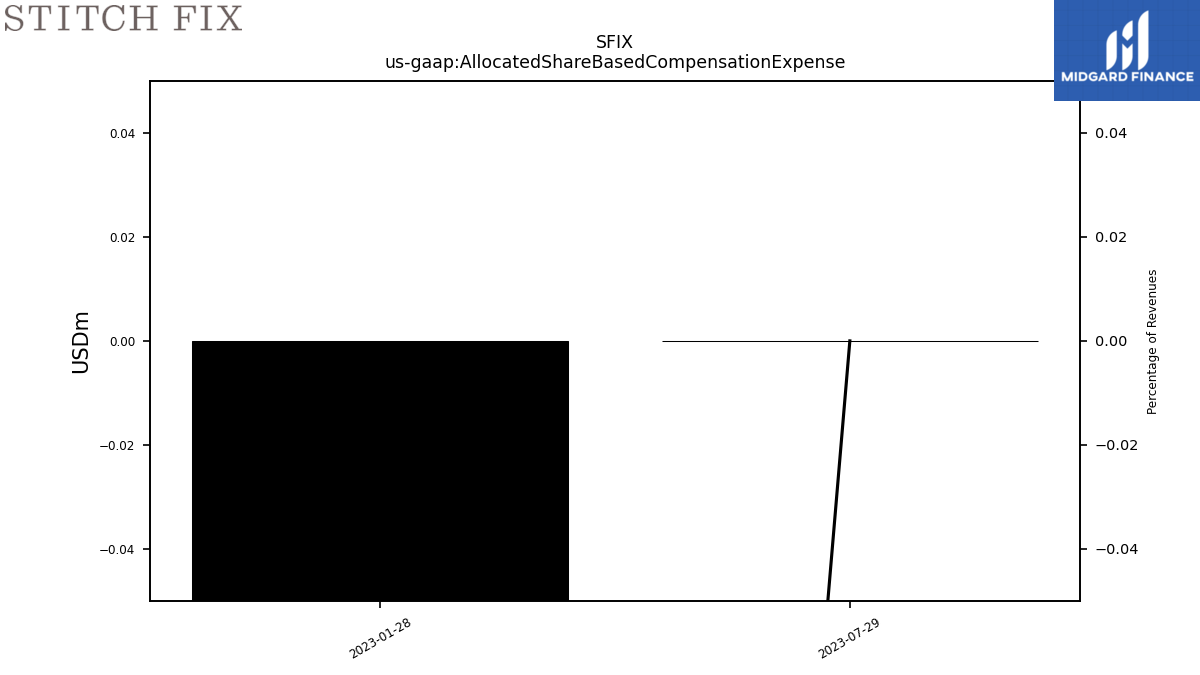
| Allocated Share Based Compensation Expense | NA | 0.00 | NA | -4.40 | NA | NA | NA | NA | NA | NA | NA | NA | NA | NA | NA | NA | NA | NA | NA | NA | NA | NA | NA | NA | NA | NA | NA | NA | |
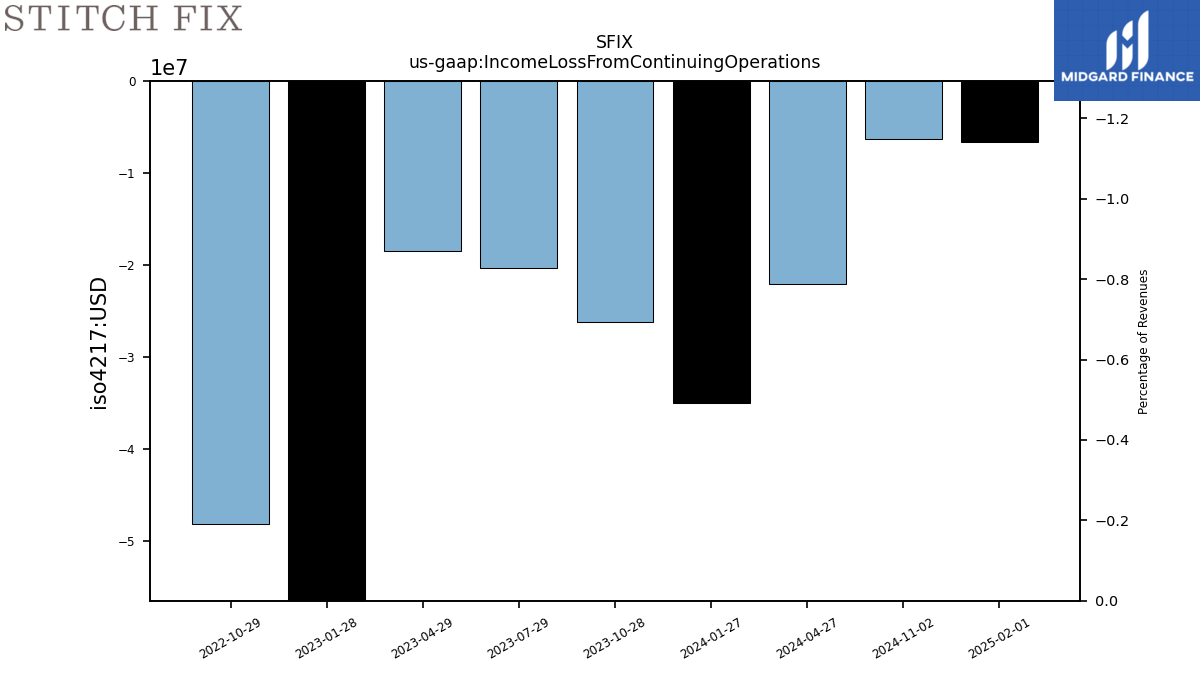
| Income Loss From Continuing Operations | -26.17 | NA | NA | NA | -48.15 | NA | NA | NA | NA | NA | NA | NA | NA | NA | NA | NA | NA | NA | NA | NA | NA | NA | NA | NA | NA | NA | NA | NA | |
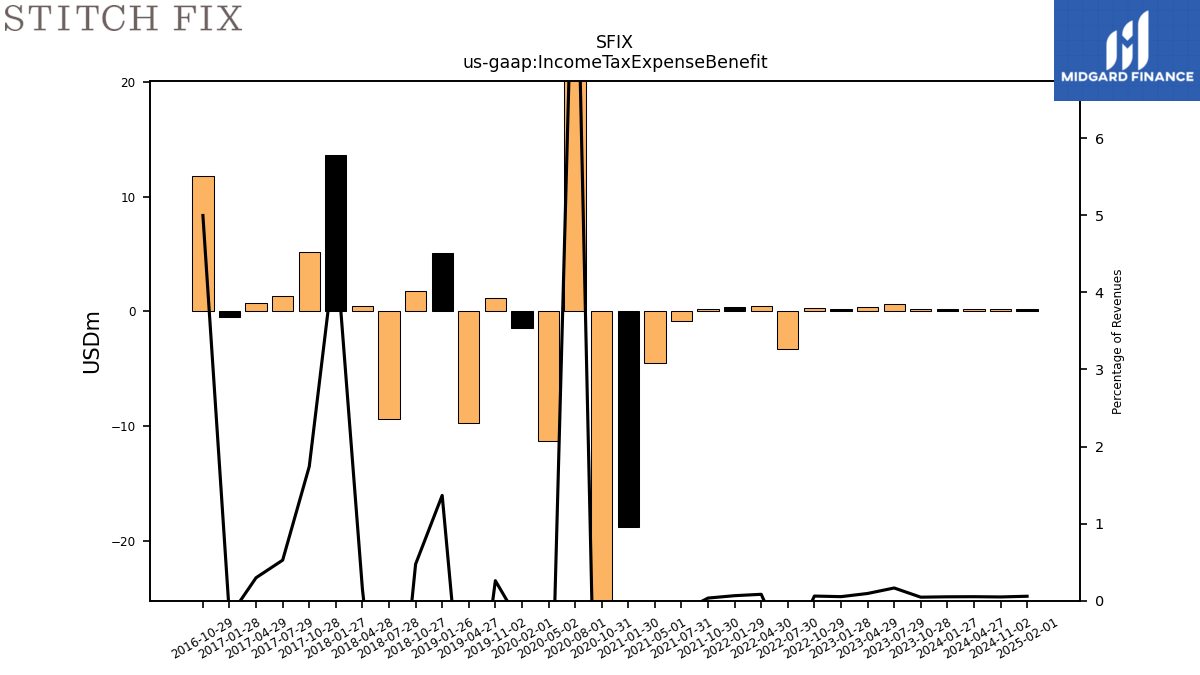
| Income Tax Expense Benefit | 0.17 | 0.62 | 0.37 | 0.22 | 0.28 | -3.30 | 0.41 | 0.34 | 0.20 | -0.81 | -4.53 | -18.78 | -28.12 | 43.20 | -11.35 | -1.48 | 1.16 | -9.76 | 5.06 | 1.74 | -9.41 | 0.47 | 13.60 | 5.14 | 1.36 | 0.73 | -0.49 | 11.79 | |
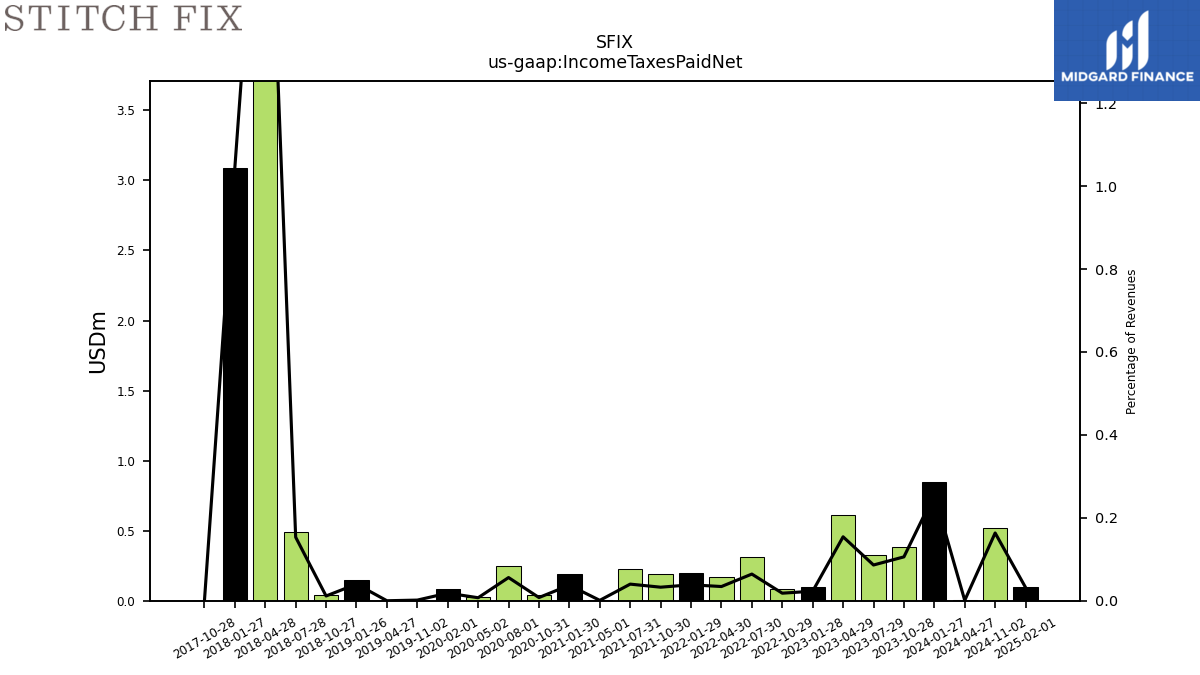
| Income Taxes Paid Net | 0.39 | 0.32 | 0.61 | 0.10 | 0.08 | 0.31 | 0.17 | 0.20 | 0.19 | 0.23 | 0.01 | 0.19 | 0.04 | 0.25 | 0.03 | 0.08 | 0.01 | 0.00 | 0.15 | 0.04 | 0.49 | 6.49 | 3.09 | 0.00 | NA | NA | NA | NA | |
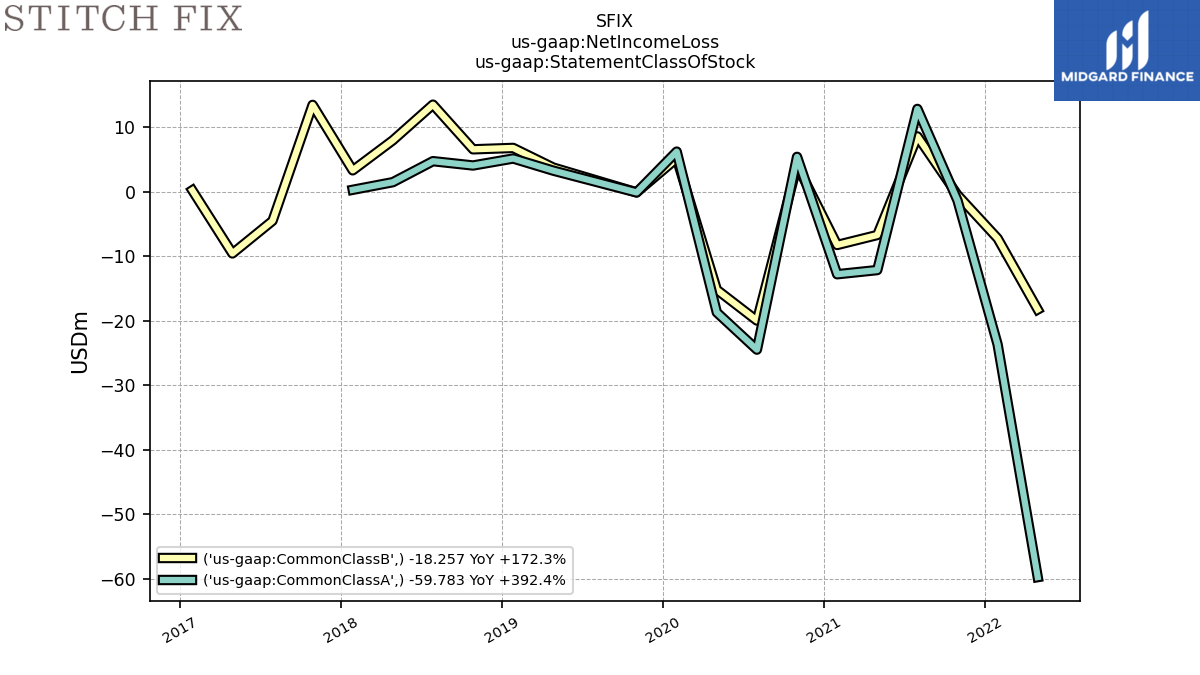
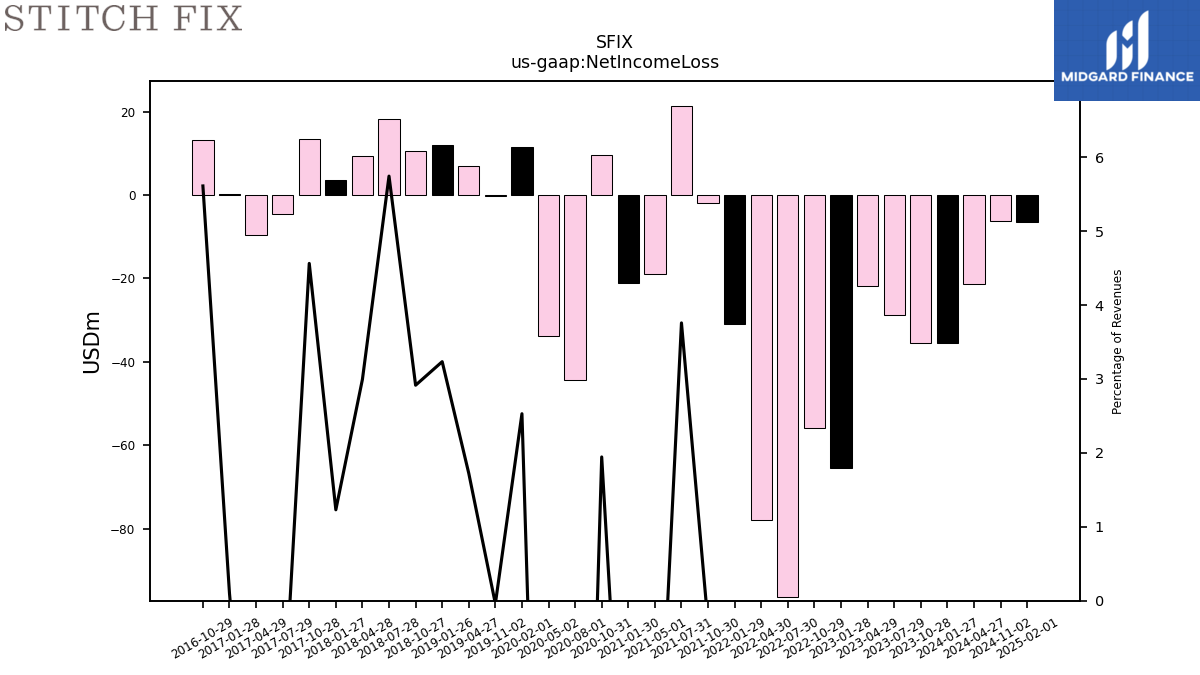
| Net Income Loss | -35.49 | -28.66 | -21.82 | -65.57 | -55.92 | -96.34 | -78.04 | -30.91 | -1.83 | 21.47 | -18.85 | -21.04 | 9.54 | -44.47 | -33.90 | 11.43 | -0.18 | 7.05 | 11.98 | 10.68 | 18.28 | 9.49 | 3.64 | 13.49 | -4.51 | -9.56 | 0.23 | 13.24 | |
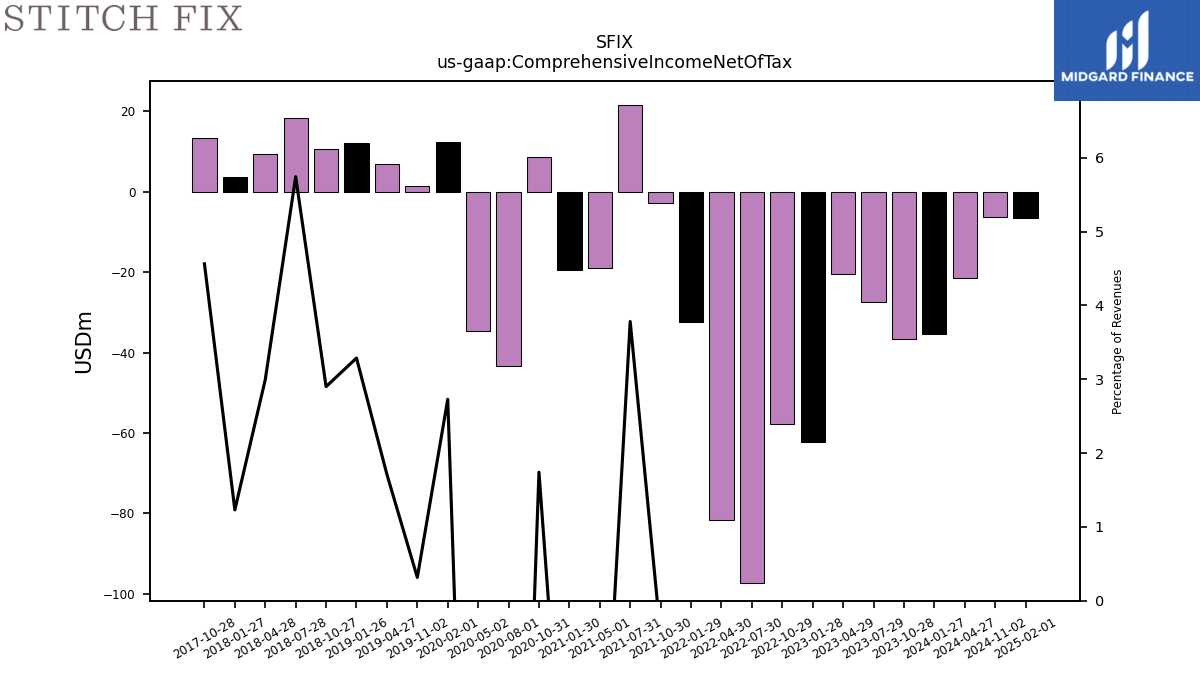
| Comprehensive Income Net Of Tax | -36.50 | -27.50 | -20.57 | -62.13 | -57.72 | -97.19 | -81.71 | -32.41 | -2.75 | 21.60 | -18.84 | -19.50 | 8.54 | -43.25 | -34.68 | 12.33 | 1.41 | 7.00 | 12.17 | 10.62 | 18.28 | 9.49 | 3.64 | 13.49 | NA | NA | NA | NA | |
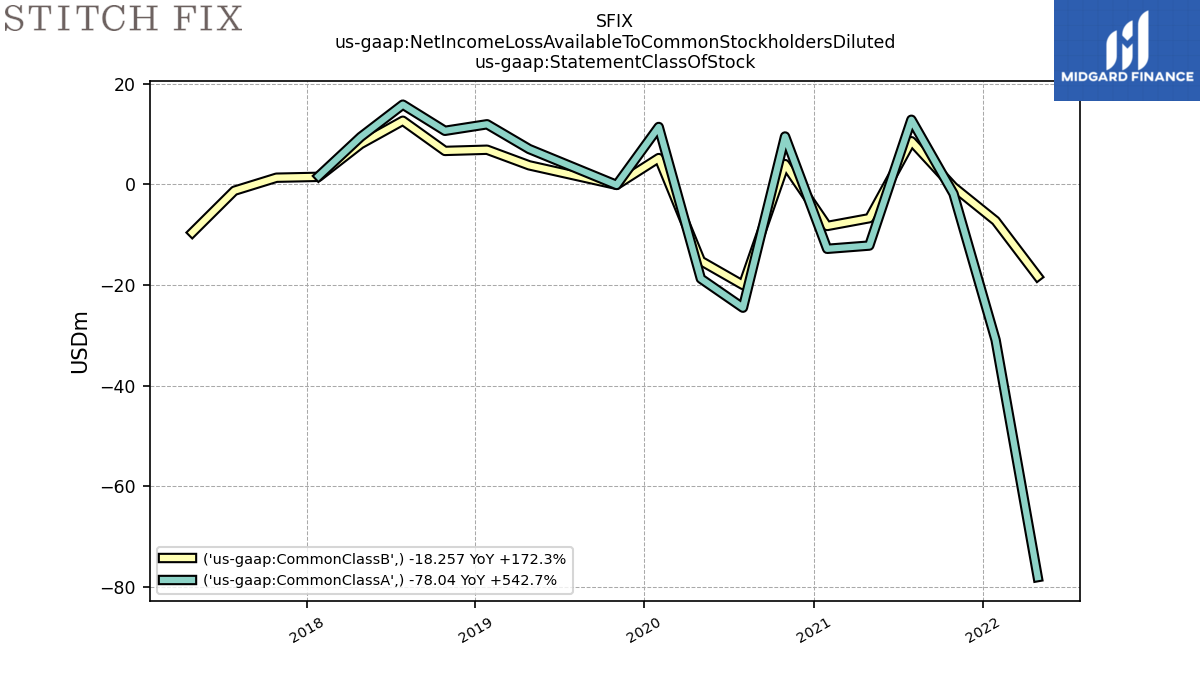
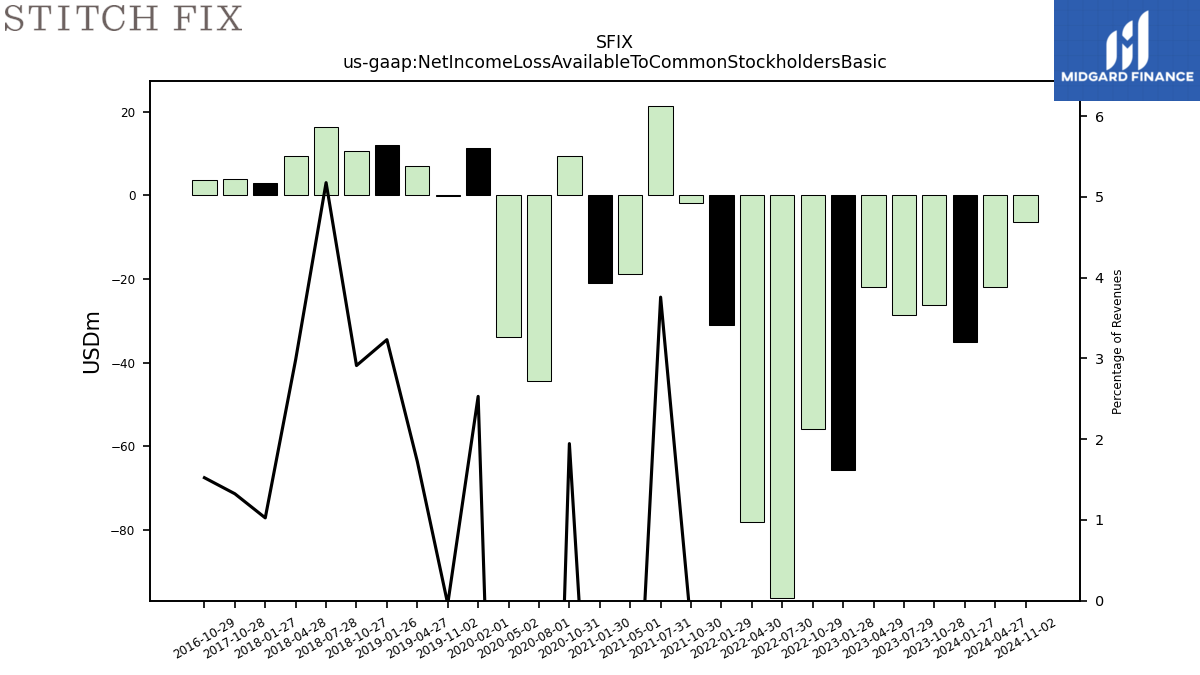
| Net Income Loss Available To Common Stockholders Basic | -26.17 | -28.66 | -21.82 | -65.57 | -55.92 | -96.34 | -78.04 | -30.91 | -1.83 | 21.47 | -18.85 | -21.04 | 9.54 | -44.47 | -33.90 | 11.43 | -0.18 | 7.05 | 11.97 | 10.66 | 16.48 | 9.46 | 3.04 | 3.92 | NA | NA | NA | 3.60 | |
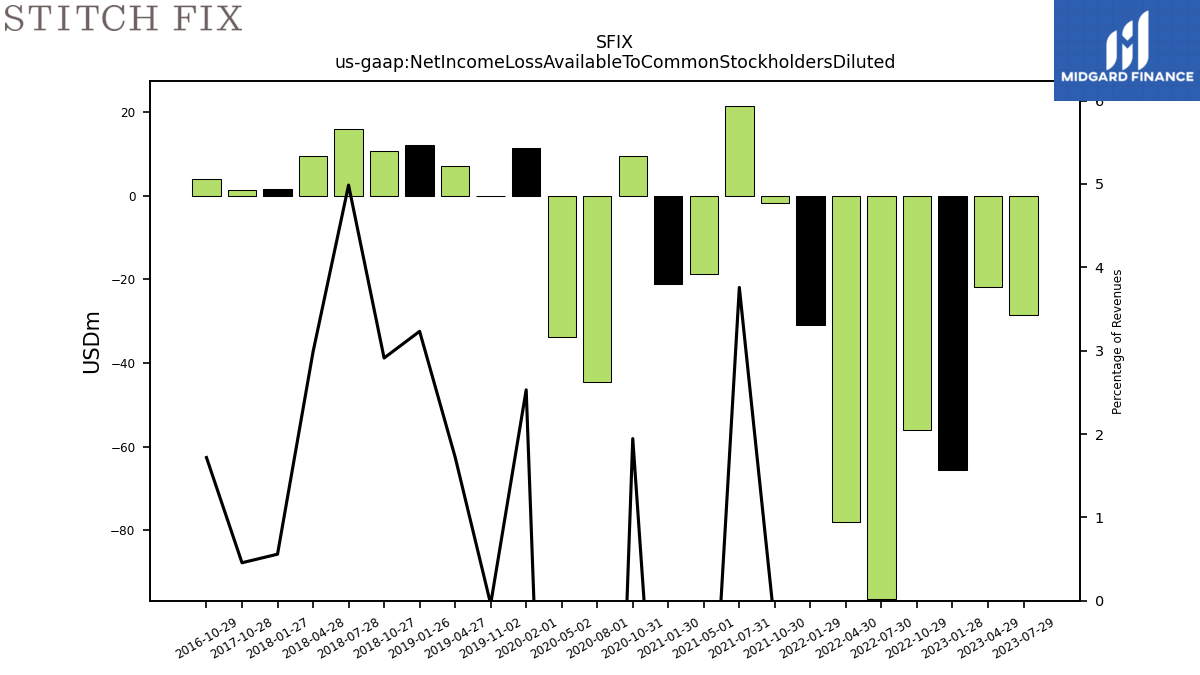
| Net Income Loss Available To Common Stockholders Diluted | NA | -28.66 | -21.82 | -65.57 | -55.92 | -96.34 | -78.04 | -30.91 | -1.83 | 21.47 | -18.85 | -21.04 | 9.54 | -44.47 | -33.90 | 11.43 | -0.18 | 7.05 | 11.97 | 10.66 | 15.87 | 9.46 | 1.65 | 1.35 | NA | NA | NA | 4.05 |
| 2023-10-28 | 2023-07-29 | 2023-04-29 | 2023-01-28 | 2022-10-29 | 2022-07-30 | 2022-04-30 | 2022-01-29 | 2021-10-30 | 2021-07-31 | 2021-05-01 | 2021-01-30 | 2020-10-31 | 2020-08-01 | 2020-05-02 | 2020-02-01 | 2019-11-02 | 2019-04-27 | 2019-01-26 | 2018-10-27 | 2018-07-28 | 2018-04-28 | 2018-01-27 | 2017-10-28 | 2017-07-29 | 2017-04-29 | 2017-01-28 | 2016-10-29 | ||
|---|---|---|---|---|---|---|---|---|---|---|---|---|---|---|---|---|---|---|---|---|---|---|---|---|---|---|---|---|---|
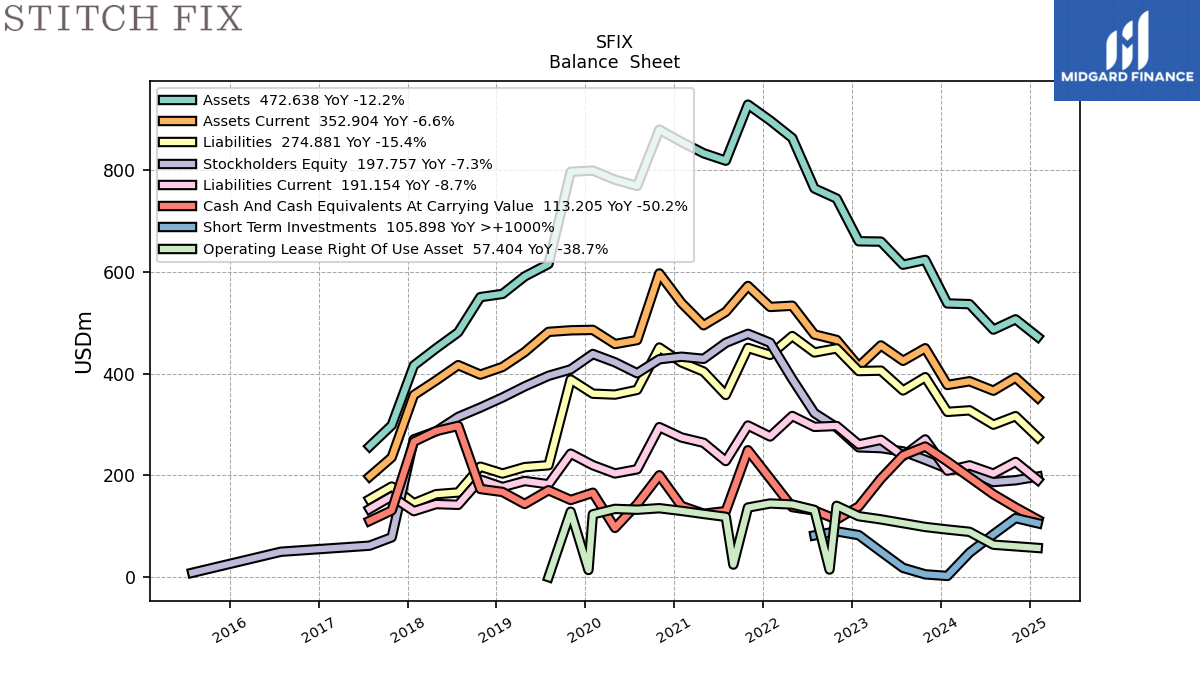
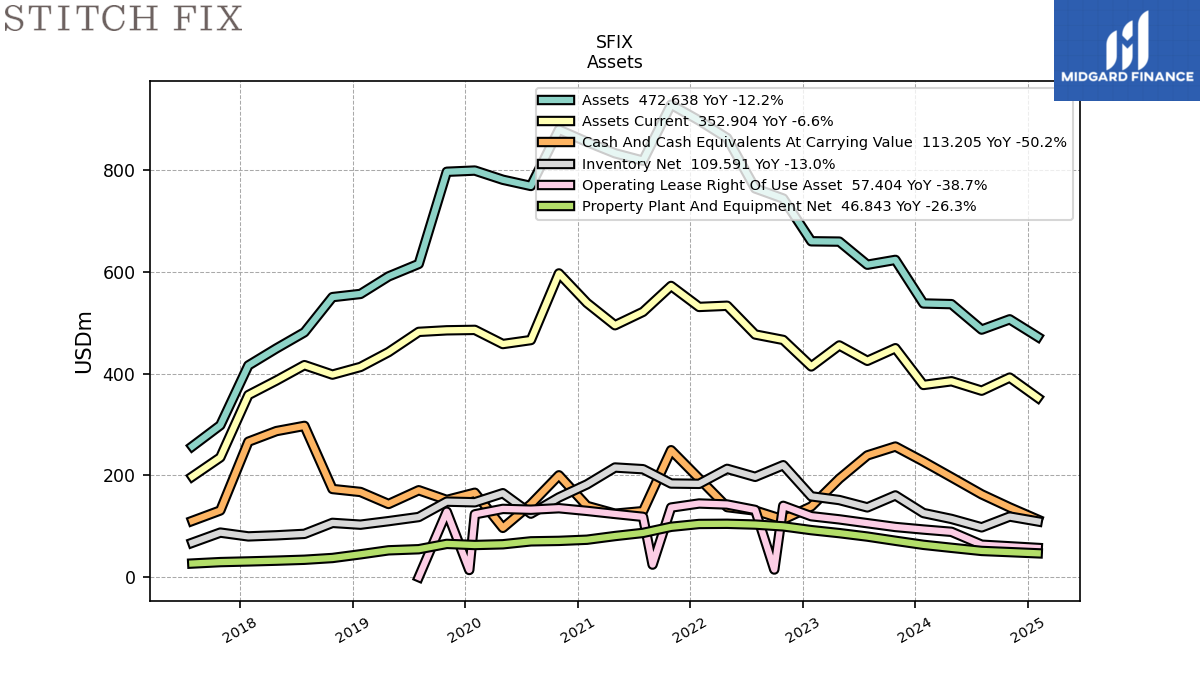
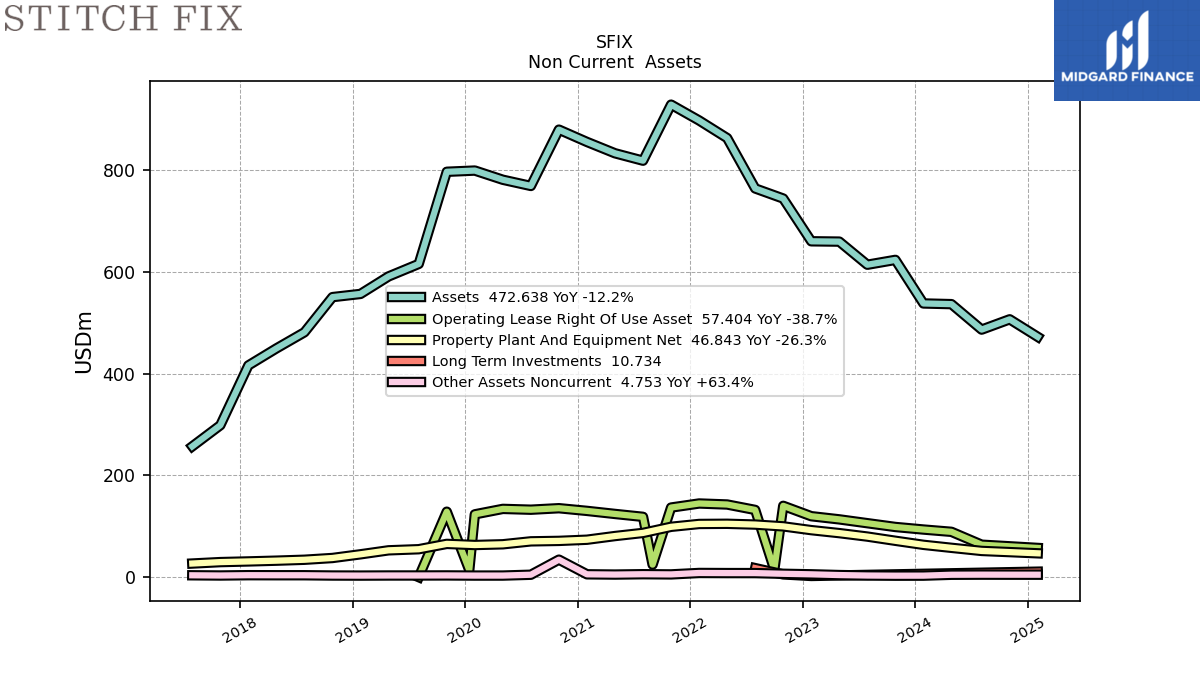
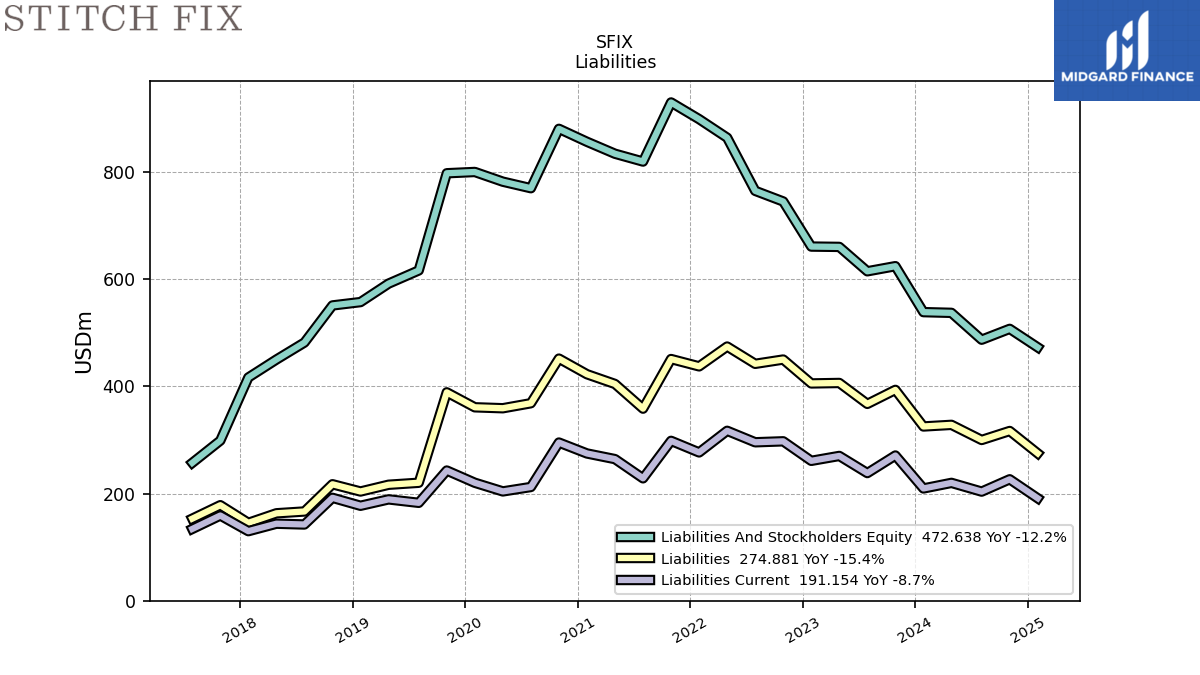
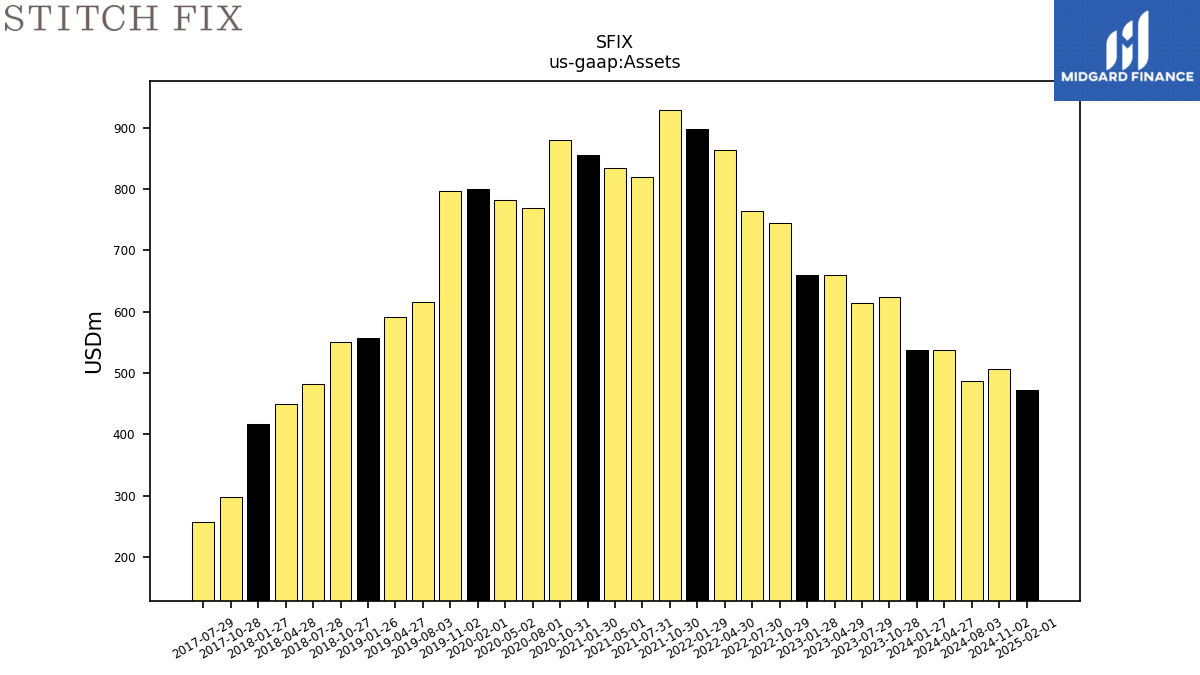
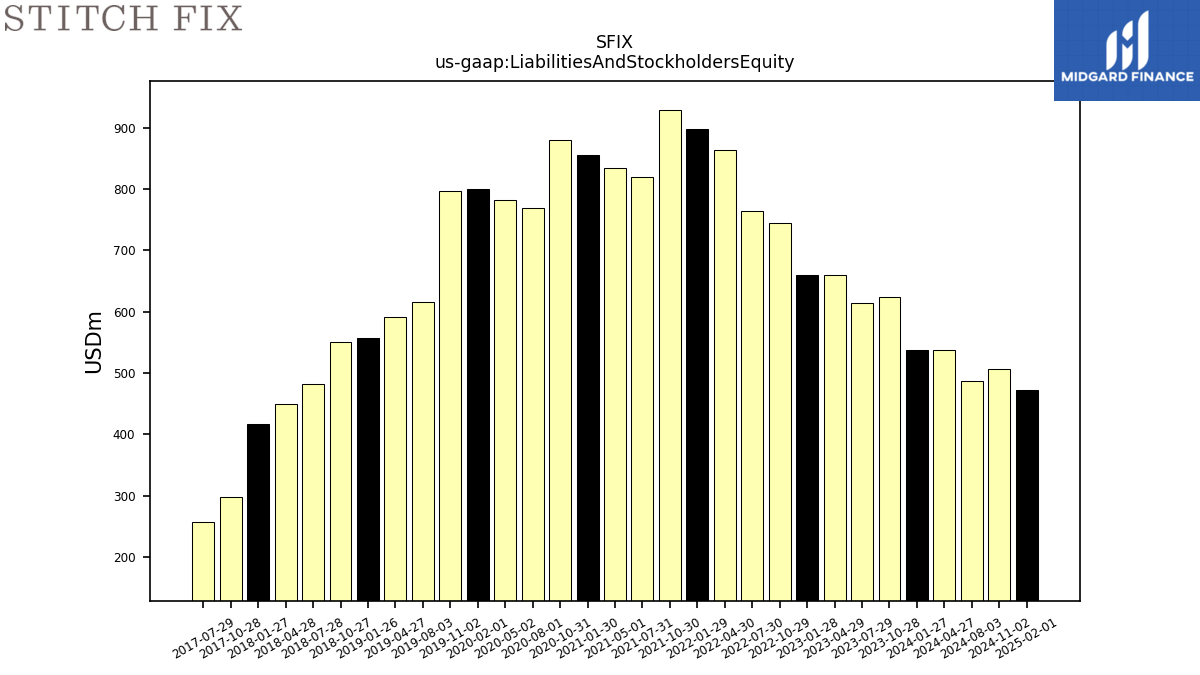
| Assets | 624.04 | 614.48 | 659.97 | 660.60 | 744.69 | 764.53 | 863.65 | 898.25 | 929.42 | 819.15 | 833.72 | 856.02 | 880.22 | 769.43 | 781.63 | 799.73 | 797.33 | 591.48 | 557.05 | 550.79 | 481.58 | 449.87 | 416.40 | 298.71 | 257.20 | NA | NA | NA | |
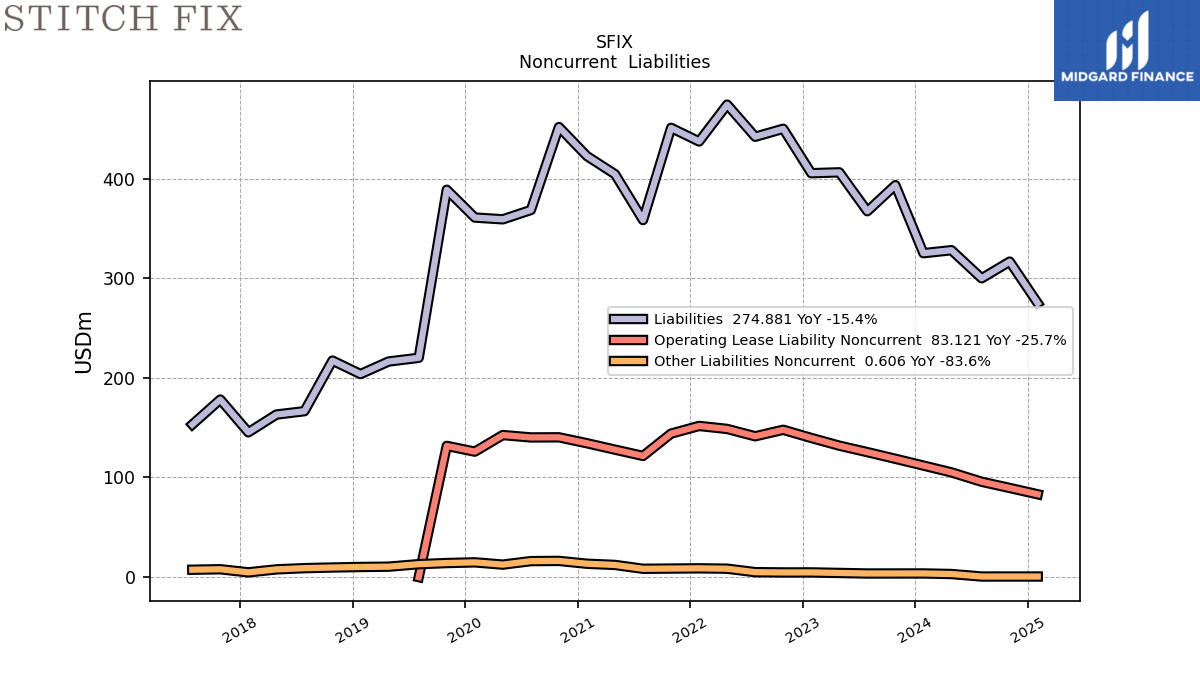
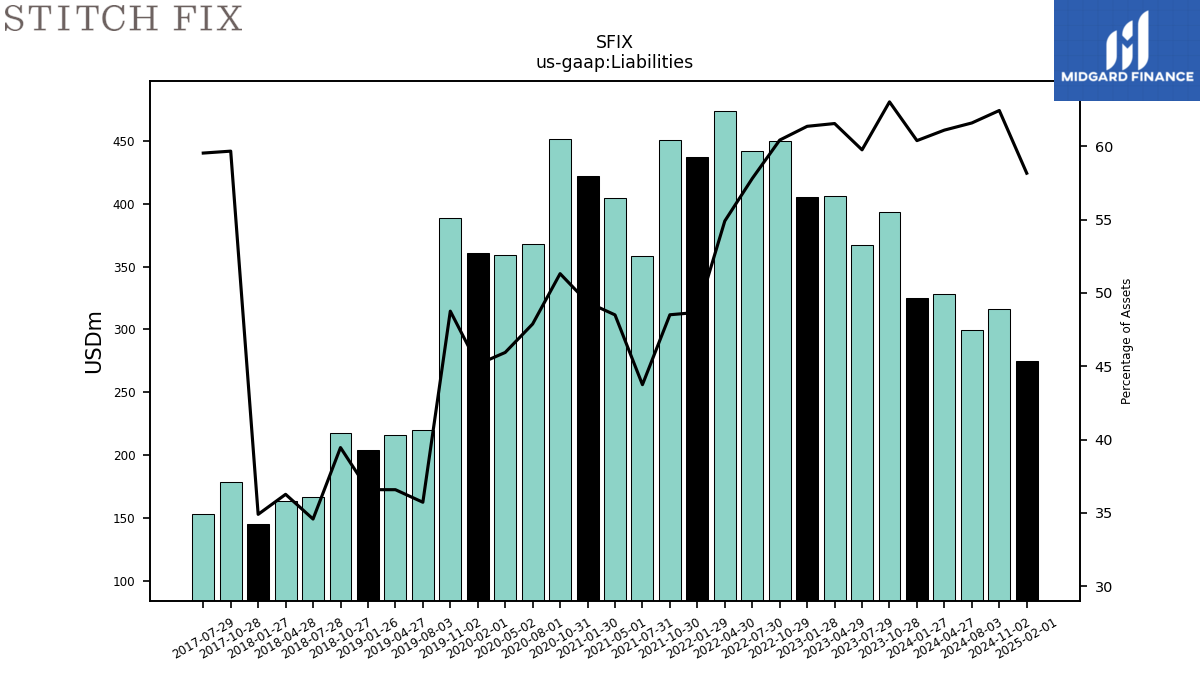
| Liabilities | 393.30 | 367.17 | 406.19 | 405.32 | 449.92 | 441.88 | 474.14 | 437.17 | 450.83 | 358.30 | 404.34 | 422.49 | 451.64 | 368.39 | 359.05 | 360.82 | 388.71 | 216.35 | 203.76 | 217.29 | 166.51 | 163.13 | 145.31 | 178.22 | 153.12 | NA | NA | NA | |
| Liabilities And Stockholders Equity | 624.04 | 614.48 | 659.97 | 660.60 | 744.69 | 764.53 | 863.65 | 898.25 | 929.42 | 819.15 | 833.72 | 856.02 | 880.22 | 769.43 | 781.63 | 799.73 | 797.33 | 591.48 | 557.05 | 550.79 | 481.58 | 449.87 | 416.40 | 298.71 | 257.20 | NA | NA | NA | |
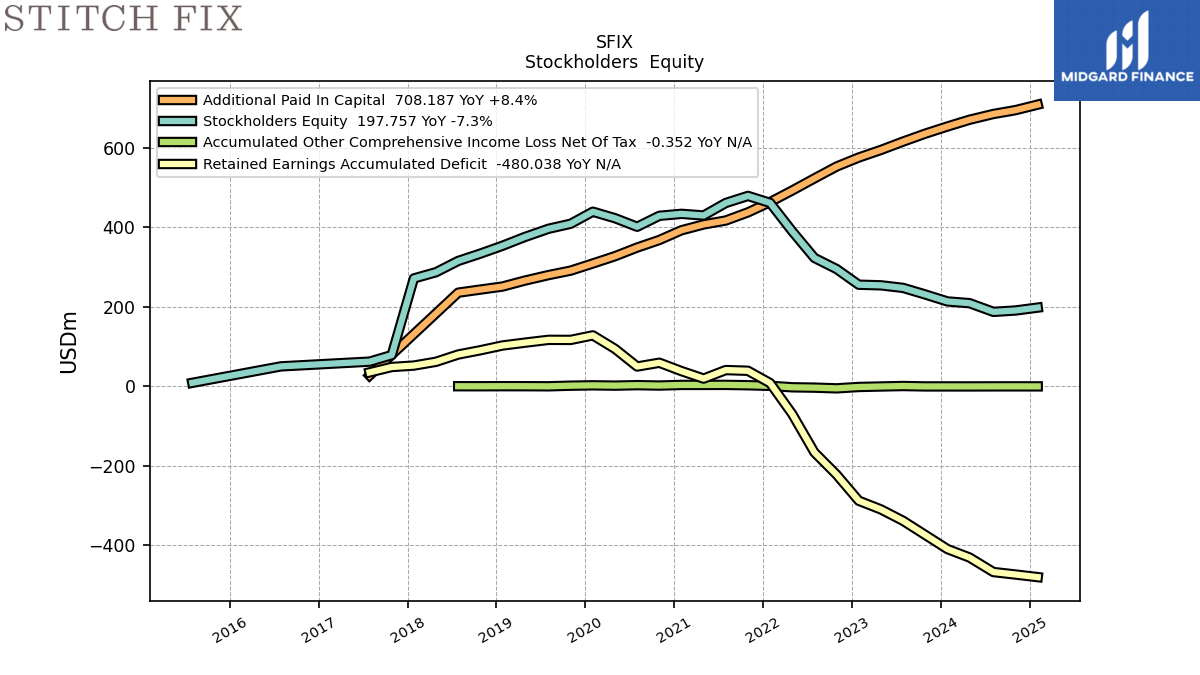
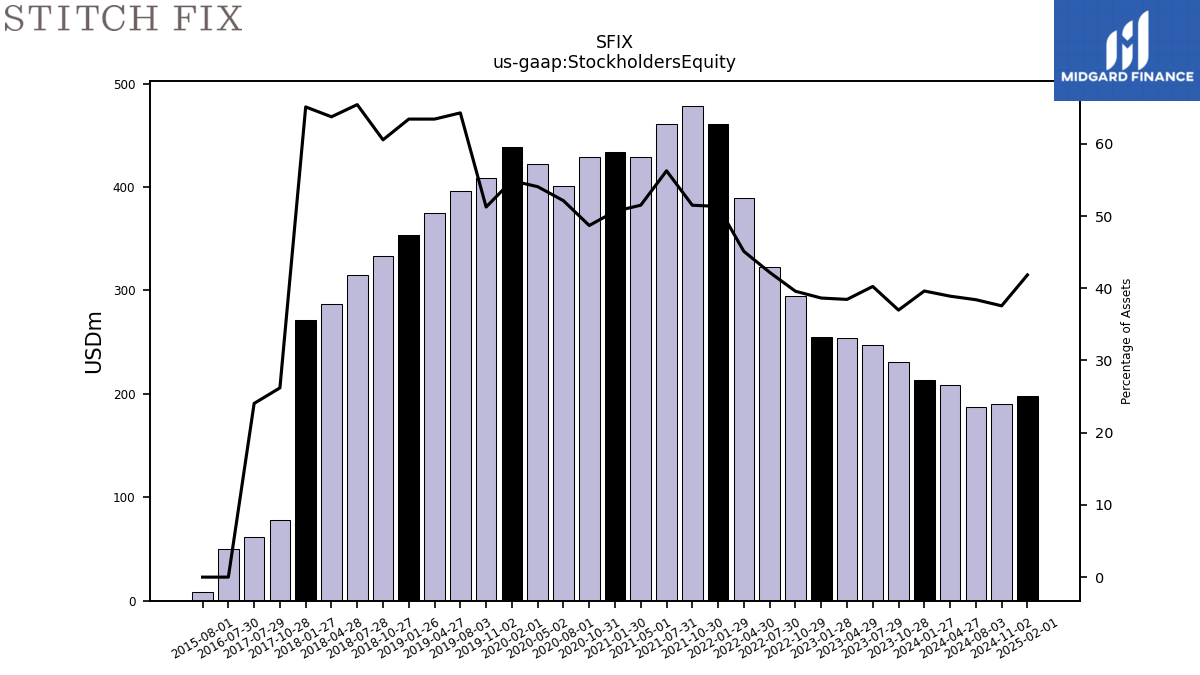
| Stockholders Equity | 230.74 | 247.31 | 253.78 | 255.28 | 294.77 | 322.65 | 389.51 | 461.08 | 478.60 | 460.85 | 429.38 | 433.53 | 428.59 | 401.04 | 422.58 | 438.91 | 408.61 | 375.13 | 353.29 | 333.50 | 315.07 | 286.74 | 271.10 | 78.27 | 61.86 | NA | NA | NA |
| 2023-10-28 | 2023-07-29 | 2023-04-29 | 2023-01-28 | 2022-10-29 | 2022-07-30 | 2022-04-30 | 2022-01-29 | 2021-10-30 | 2021-07-31 | 2021-05-01 | 2021-01-30 | 2020-10-31 | 2020-08-01 | 2020-05-02 | 2020-02-01 | 2019-11-02 | 2019-04-27 | 2019-01-26 | 2018-10-27 | 2018-07-28 | 2018-04-28 | 2018-01-27 | 2017-10-28 | 2017-07-29 | 2017-04-29 | 2017-01-28 | 2016-10-29 | ||
|---|---|---|---|---|---|---|---|---|---|---|---|---|---|---|---|---|---|---|---|---|---|---|---|---|---|---|---|---|---|
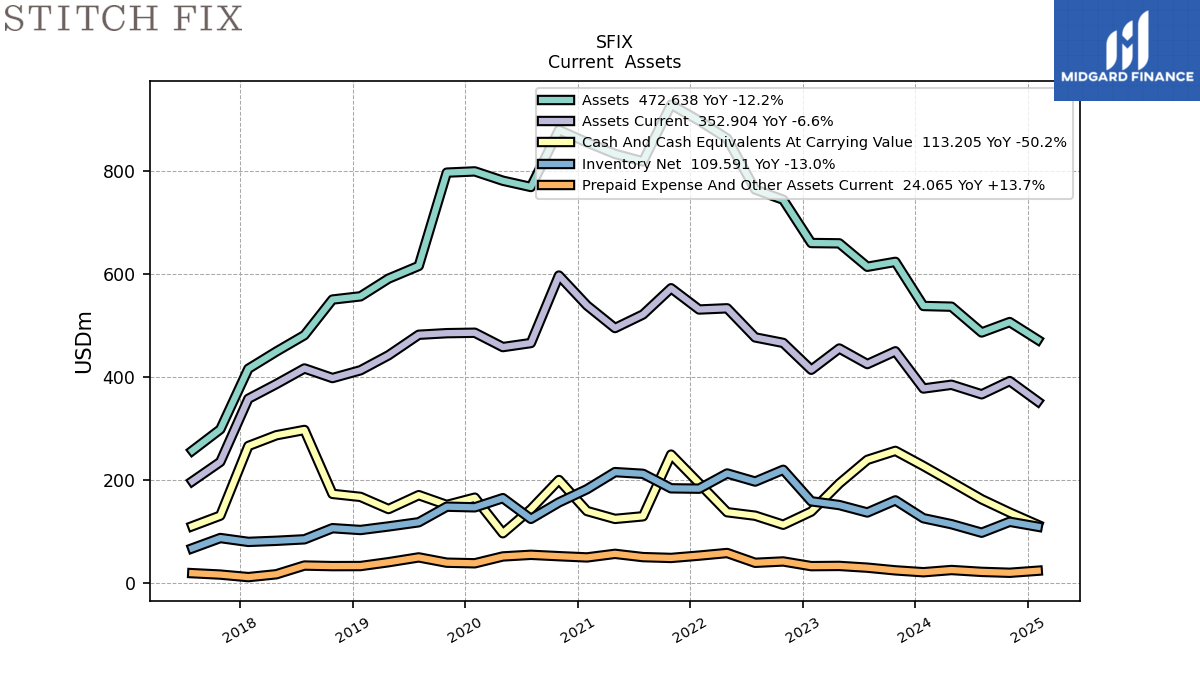
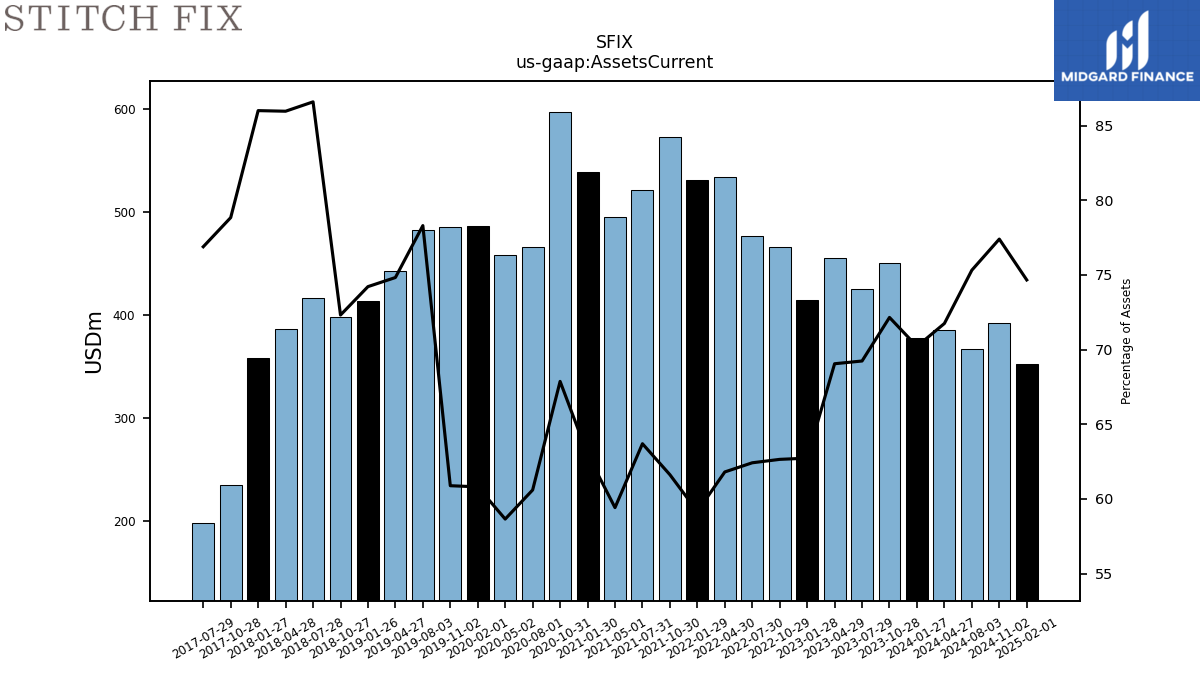
| Assets Current | 450.29 | 425.46 | 455.74 | 414.43 | 466.57 | 477.25 | 533.82 | 531.45 | 572.77 | 521.80 | 495.42 | 539.32 | 597.43 | 466.31 | 458.47 | 486.33 | 485.49 | 442.60 | 413.44 | 398.31 | 417.01 | 386.72 | 358.12 | 235.51 | 197.76 | NA | NA | NA | |
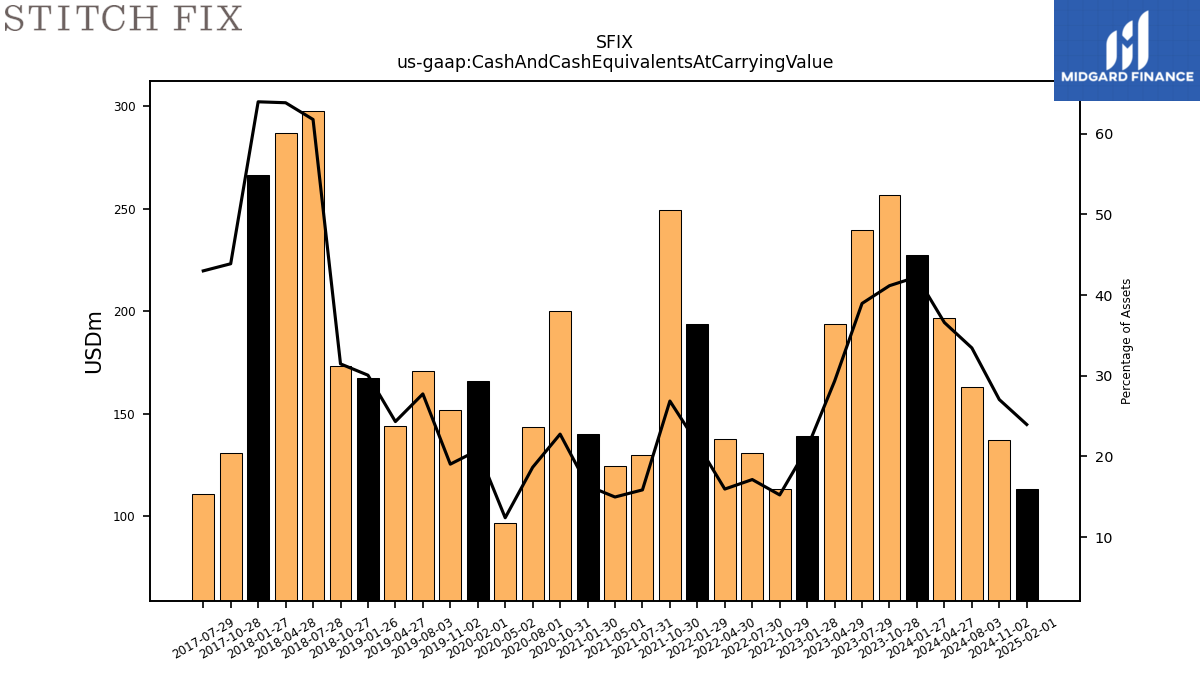
| Cash And Cash Equivalents At Carrying Value | 256.90 | 239.44 | 193.57 | 138.98 | 113.35 | 130.94 | 137.72 | 193.88 | 249.68 | 129.78 | 124.74 | 140.03 | 200.35 | 143.46 | 96.84 | 165.99 | 151.78 | 143.83 | 167.50 | 173.34 | 297.52 | 287.26 | 266.37 | 131.10 | 110.61 | NA | NA | NA | |
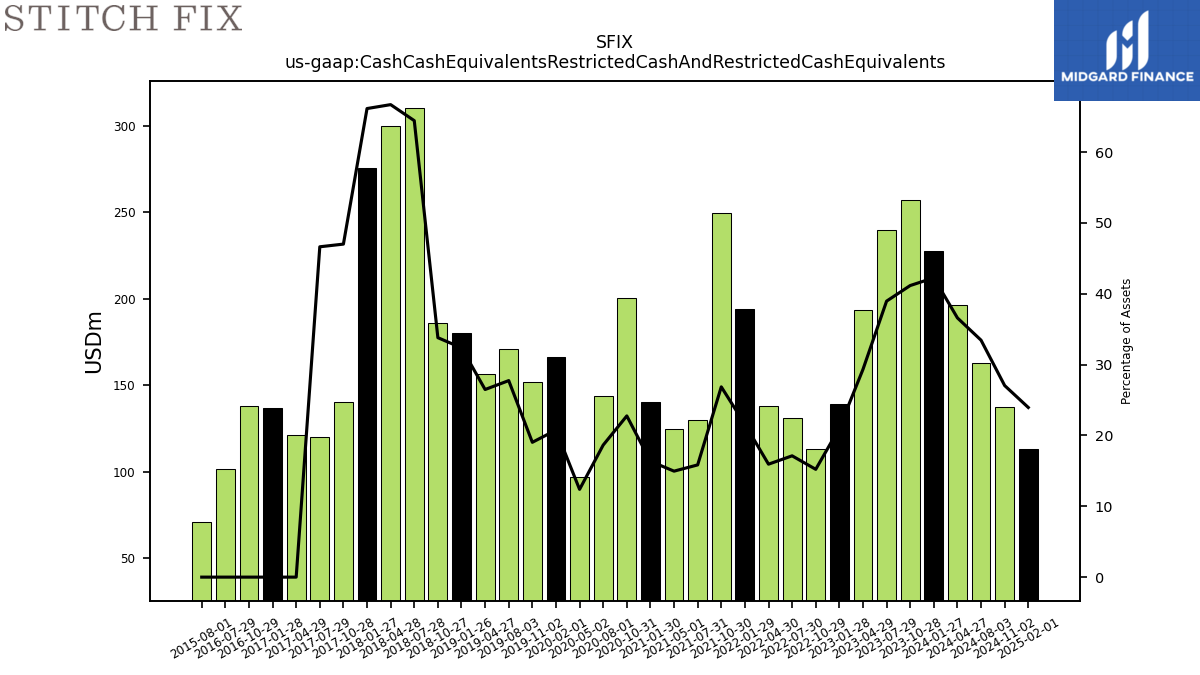
| Cash Cash Equivalents Restricted Cash And Restricted Cash Equivalents | 256.90 | 239.44 | 193.57 | 138.98 | 113.35 | 130.94 | 137.72 | 193.88 | 249.68 | 129.78 | 124.74 | 140.03 | 200.35 | 143.46 | 96.84 | 165.99 | 151.78 | 156.68 | 180.35 | 186.19 | 310.37 | 300.11 | 275.47 | 140.45 | 119.96 | 121.39 | 137.02 | 137.85 | |
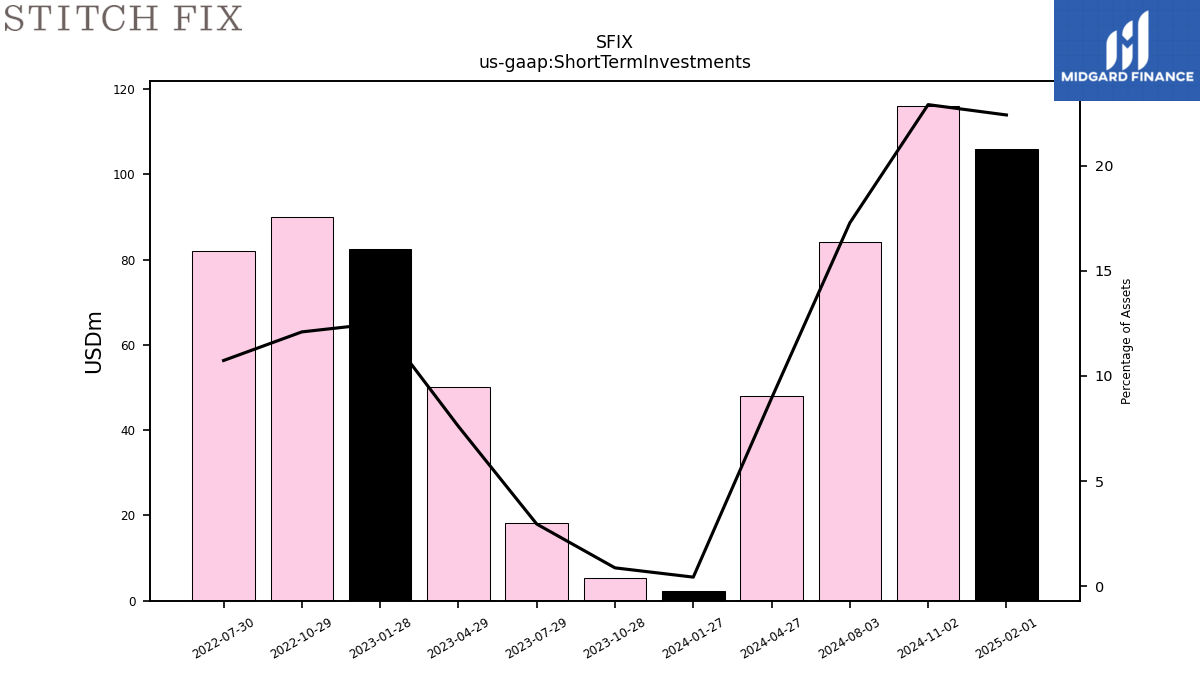
| Short Term Investments | 5.44 | 18.16 | 50.14 | 82.62 | 90.04 | 82.05 | NA | NA | NA | NA | NA | NA | NA | NA | NA | NA | NA | NA | NA | NA | NA | NA | NA | NA | NA | NA | NA | NA | |
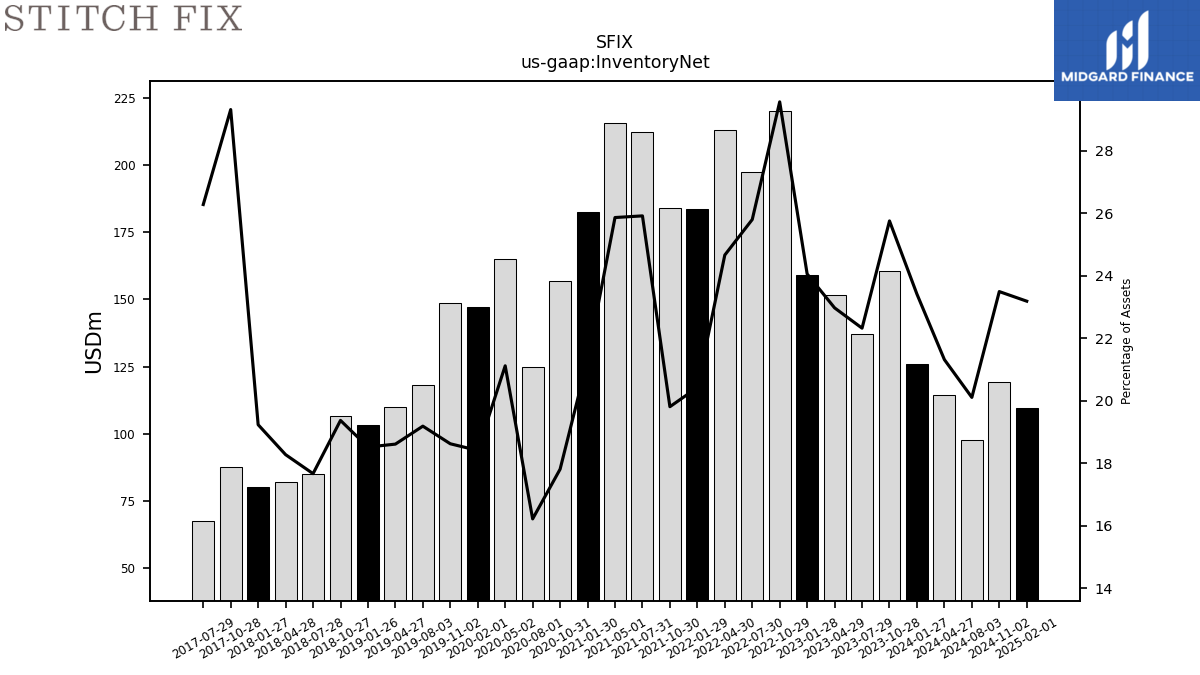
| Inventory Net | 160.72 | 137.18 | 151.61 | 158.93 | 220.16 | 197.25 | 213.00 | 183.46 | 184.13 | 212.29 | 215.63 | 182.42 | 156.79 | 124.82 | 165.08 | 147.24 | 148.50 | 110.10 | 103.17 | 106.70 | 85.09 | 82.22 | 80.09 | 87.58 | 67.59 | NA | NA | NA | |
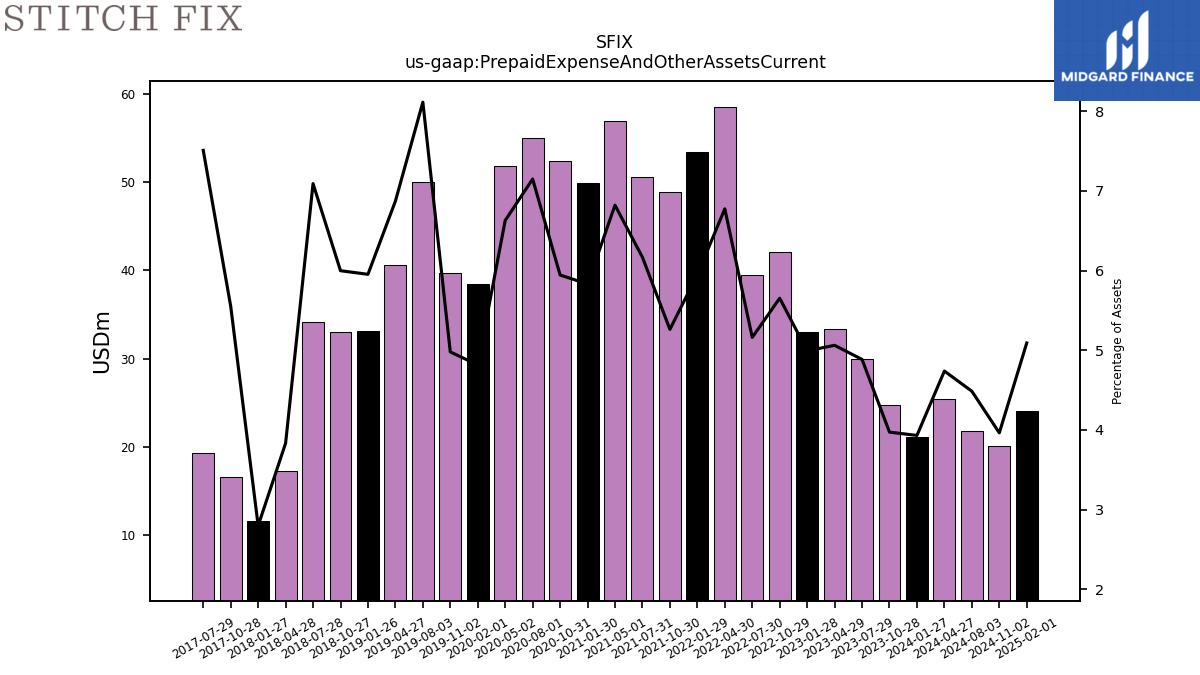
| Prepaid Expense And Other Assets Current | 24.79 | 30.01 | 33.41 | 32.98 | 42.09 | 39.46 | 58.50 | 53.44 | 48.90 | 50.51 | 56.86 | 49.91 | 52.32 | 55.00 | 51.81 | 38.51 | 39.70 | 40.64 | 33.16 | 33.04 | 34.15 | 17.24 | 11.65 | 16.58 | 19.31 | NA | NA | NA |
| 2023-10-28 | 2023-07-29 | 2023-04-29 | 2023-01-28 | 2022-10-29 | 2022-07-30 | 2022-04-30 | 2022-01-29 | 2021-10-30 | 2021-07-31 | 2021-05-01 | 2021-01-30 | 2020-10-31 | 2020-08-01 | 2020-05-02 | 2020-02-01 | 2019-11-02 | 2019-04-27 | 2019-01-26 | 2018-10-27 | 2018-07-28 | 2018-04-28 | 2018-01-27 | 2017-10-28 | 2017-07-29 | 2017-04-29 | 2017-01-28 | 2016-10-29 | ||
|---|---|---|---|---|---|---|---|---|---|---|---|---|---|---|---|---|---|---|---|---|---|---|---|---|---|---|---|---|---|
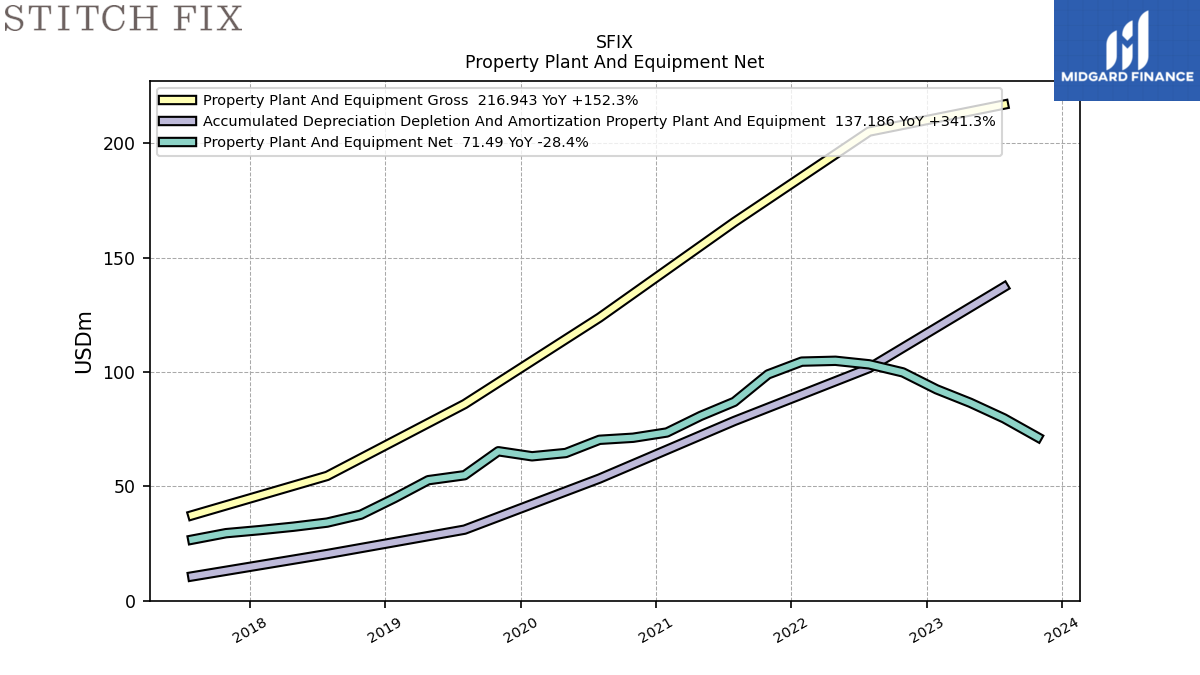
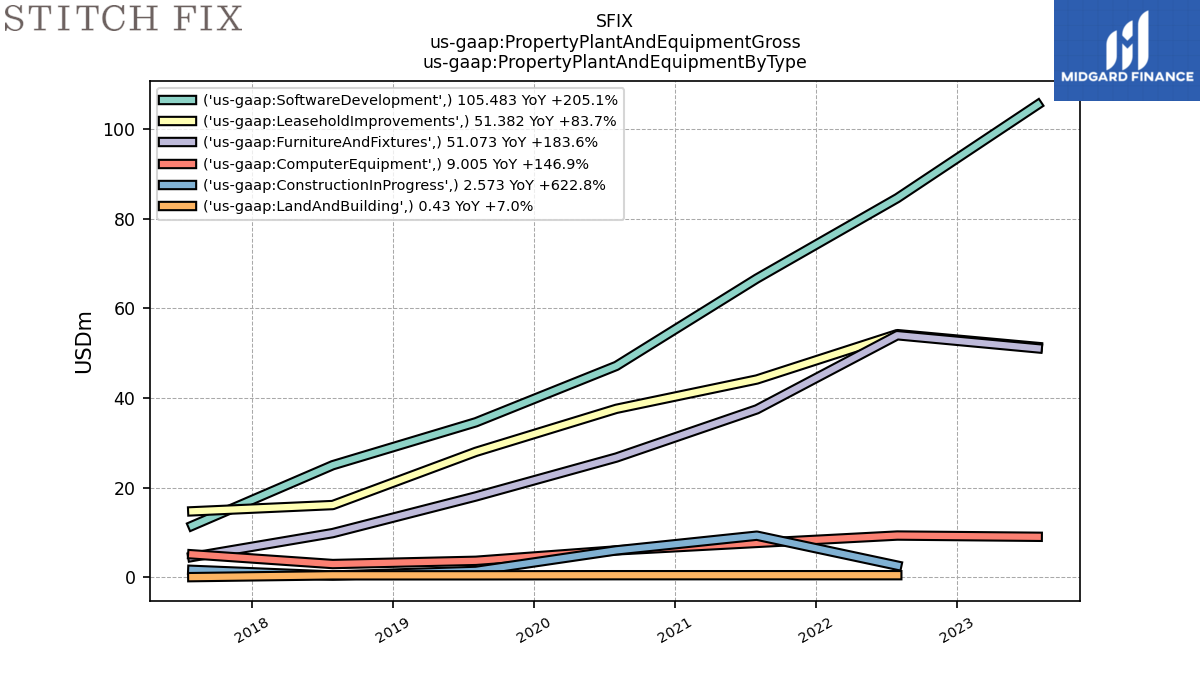
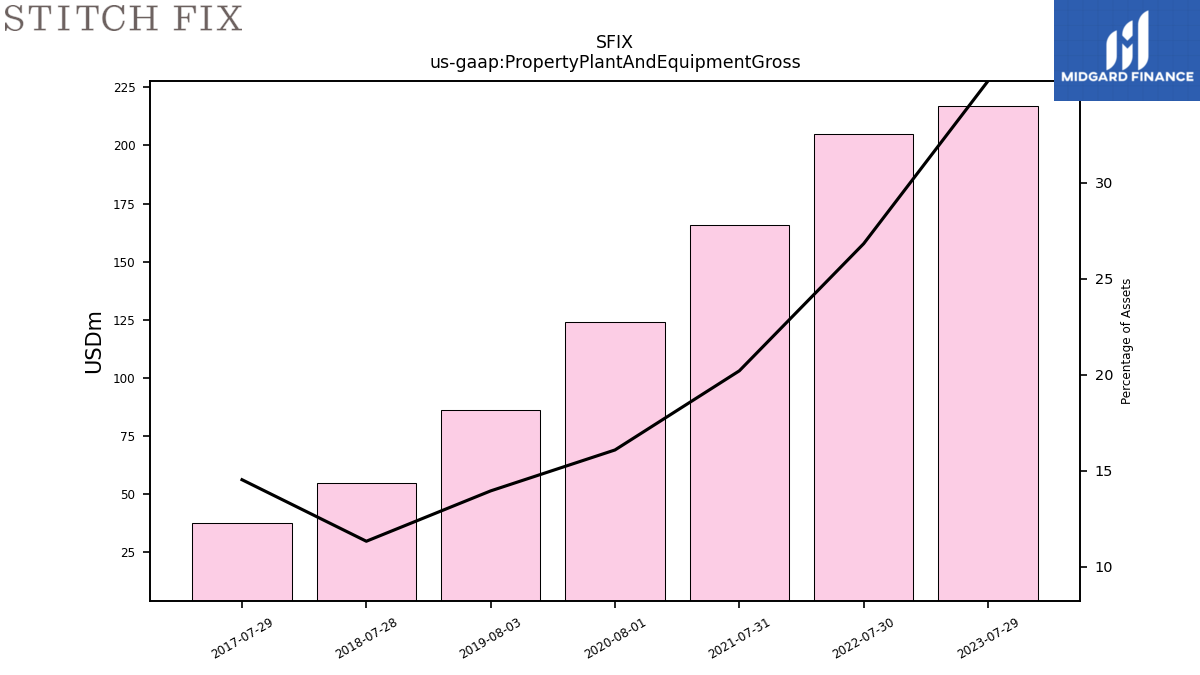
| Property Plant And Equipment Gross | NA | 216.94 | NA | NA | NA | 205.13 | NA | NA | NA | 165.55 | NA | NA | NA | 123.79 | NA | NA | NA | NA | NA | NA | 54.58 | NA | NA | NA | 37.39 | NA | NA | NA | |
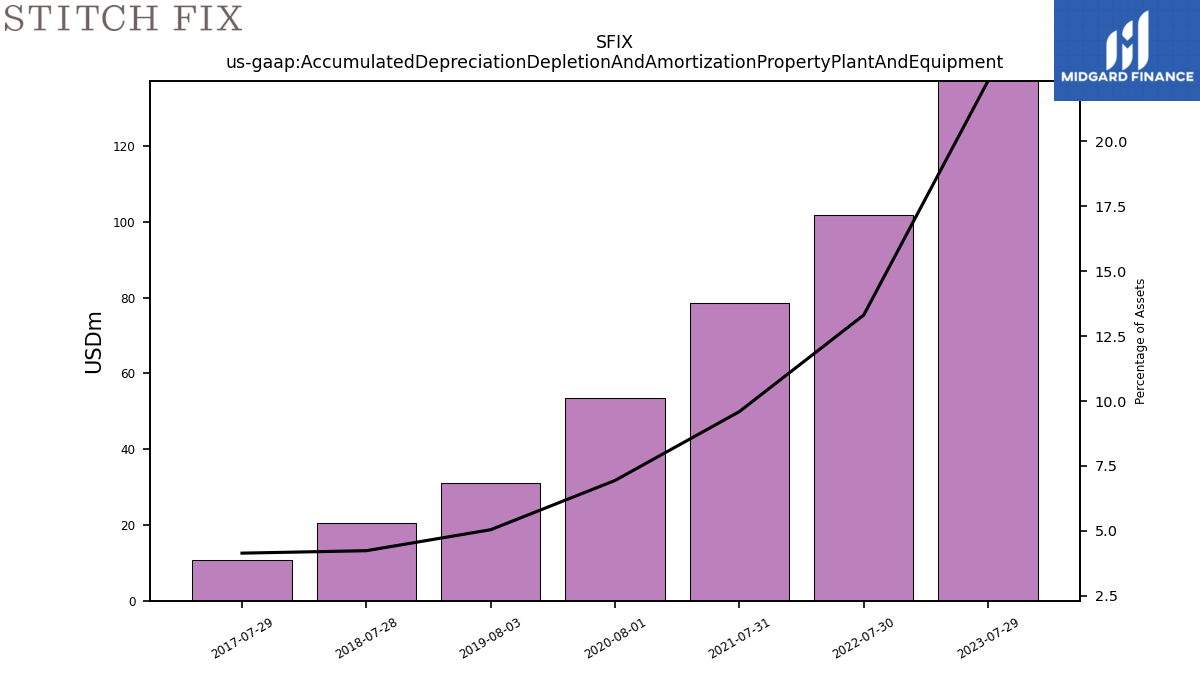
| Accumulated Depreciation Depletion And Amortization Property Plant And Equipment | NA | 137.19 | NA | NA | NA | 101.76 | NA | NA | NA | 78.59 | NA | NA | NA | 53.42 | NA | NA | NA | NA | NA | NA | 20.41 | NA | NA | NA | 10.66 | NA | NA | NA | |
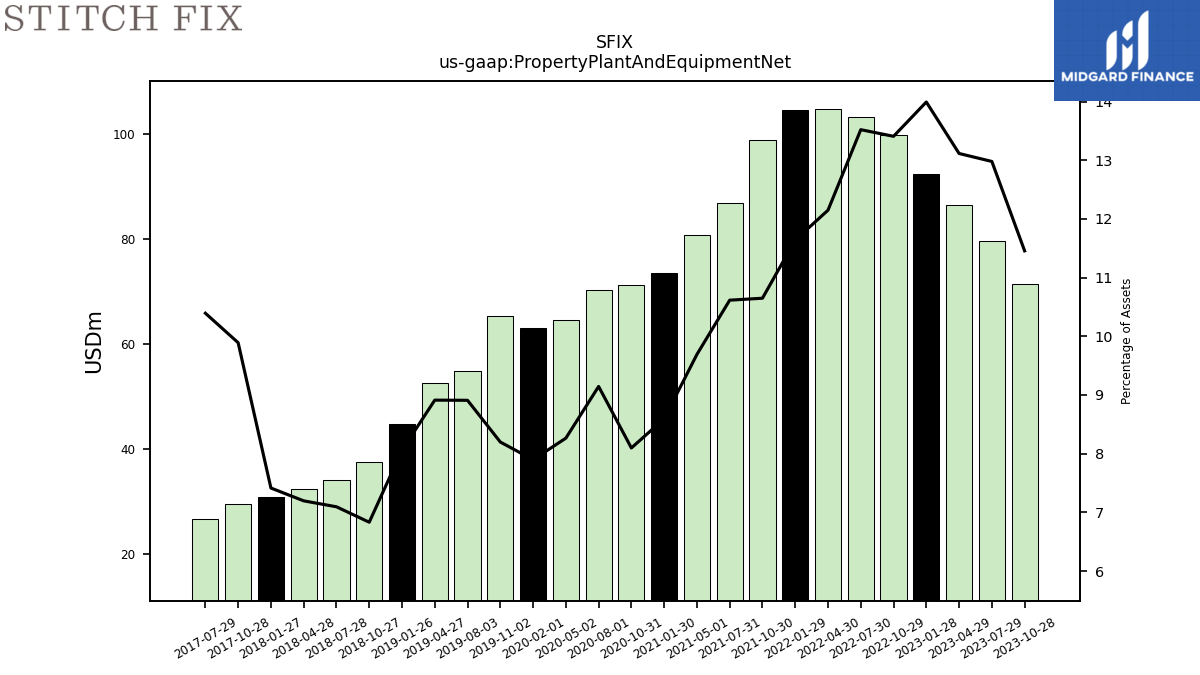
| Property Plant And Equipment Net | 71.49 | 79.76 | 86.56 | 92.43 | 99.85 | 103.38 | 104.92 | 104.56 | 98.97 | 86.96 | 80.80 | 73.58 | 71.28 | 70.37 | 64.60 | 63.16 | 65.37 | 52.72 | 44.89 | 37.63 | 34.17 | 32.37 | 30.88 | 29.55 | 26.73 | NA | NA | NA | |
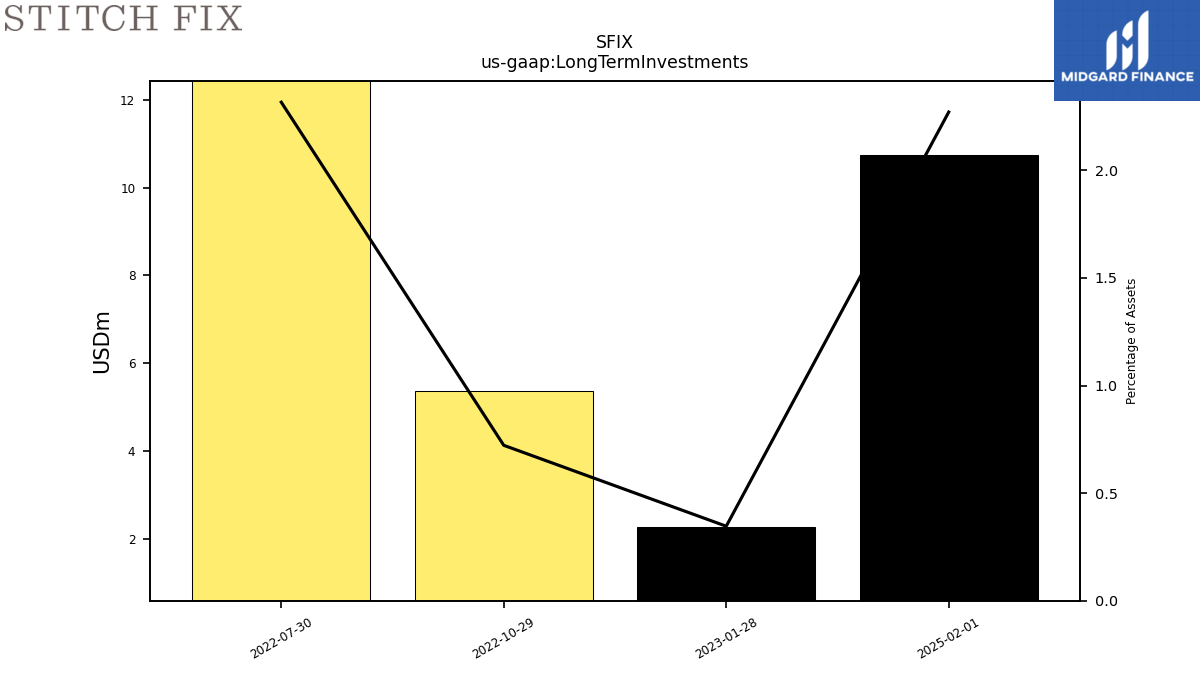
| Long Term Investments | NA | NA | NA | 2.29 | 5.38 | 17.71 | NA | NA | NA | NA | NA | NA | NA | NA | NA | NA | NA | NA | NA | NA | NA | NA | NA | NA | NA | NA | NA | NA | |
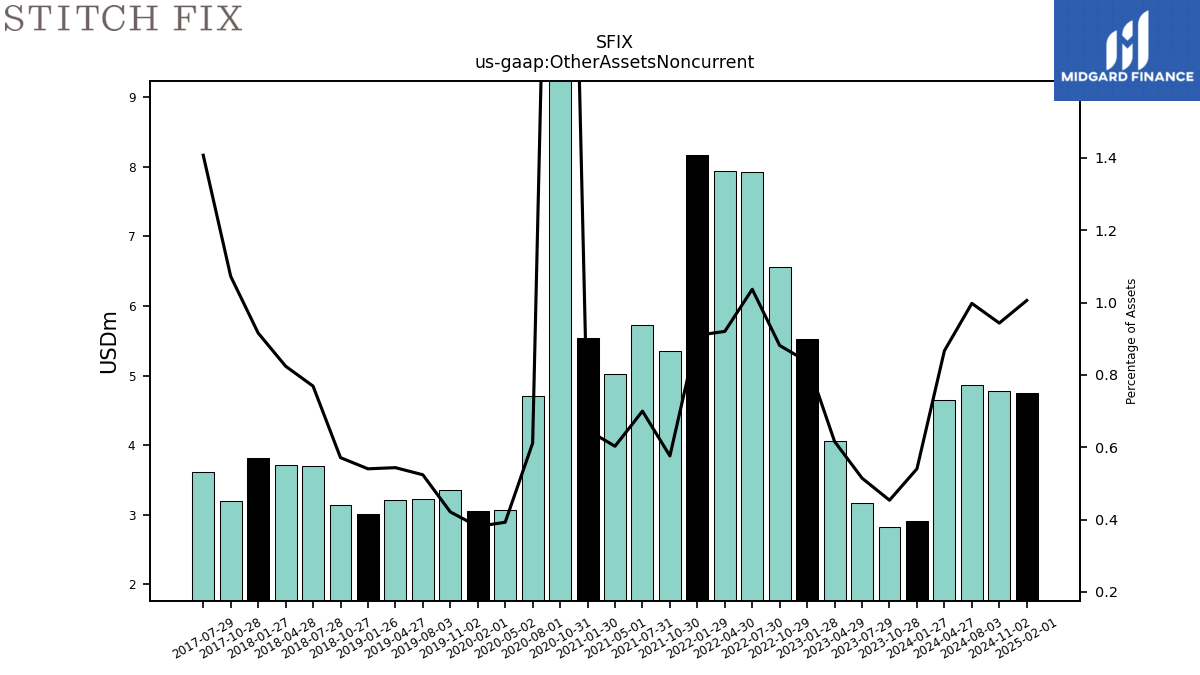
| Other Assets Noncurrent | 2.83 | 3.16 | 4.06 | 5.53 | 6.56 | 7.92 | 7.95 | 8.17 | 5.35 | 5.73 | 5.03 | 5.54 | 34.36 | 4.71 | 3.07 | 3.05 | 3.36 | 3.21 | 3.01 | 3.15 | 3.70 | 3.71 | 3.81 | 3.20 | 3.62 | NA | NA | NA |
| 2023-10-28 | 2023-07-29 | 2023-04-29 | 2023-01-28 | 2022-10-29 | 2022-07-30 | 2022-04-30 | 2022-01-29 | 2021-10-30 | 2021-07-31 | 2021-05-01 | 2021-01-30 | 2020-10-31 | 2020-08-01 | 2020-05-02 | 2020-02-01 | 2019-11-02 | 2019-04-27 | 2019-01-26 | 2018-10-27 | 2018-07-28 | 2018-04-28 | 2018-01-27 | 2017-10-28 | 2017-07-29 | 2017-04-29 | 2017-01-28 | 2016-10-29 | ||
|---|---|---|---|---|---|---|---|---|---|---|---|---|---|---|---|---|---|---|---|---|---|---|---|---|---|---|---|---|---|
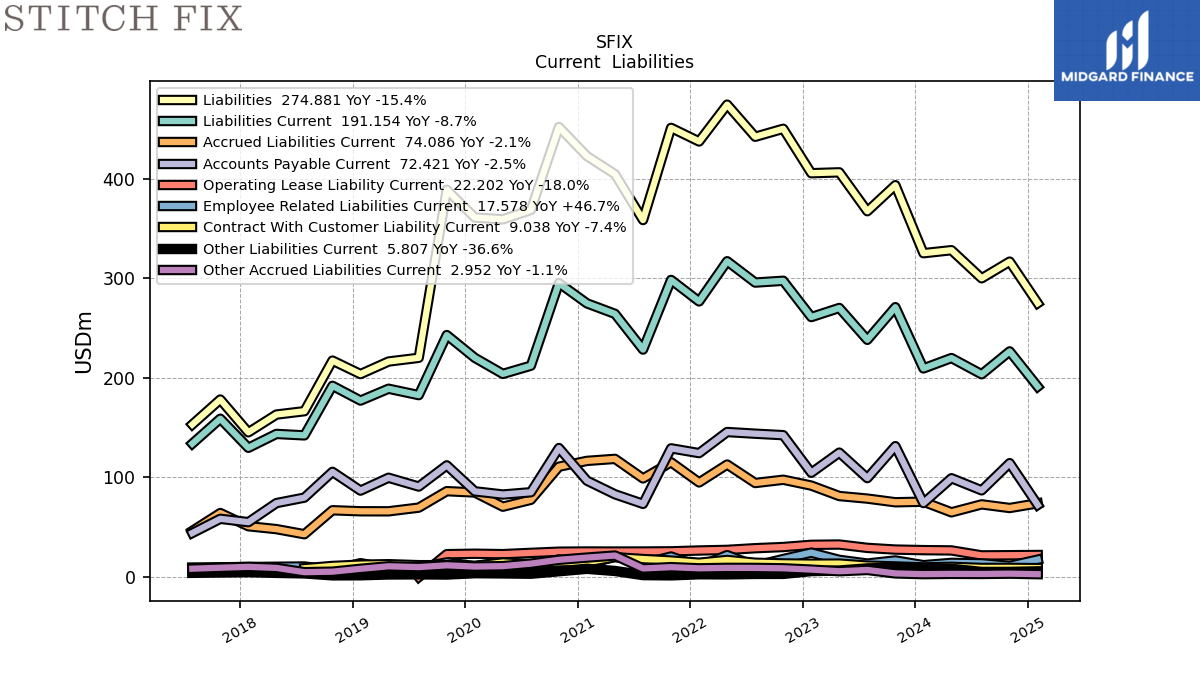
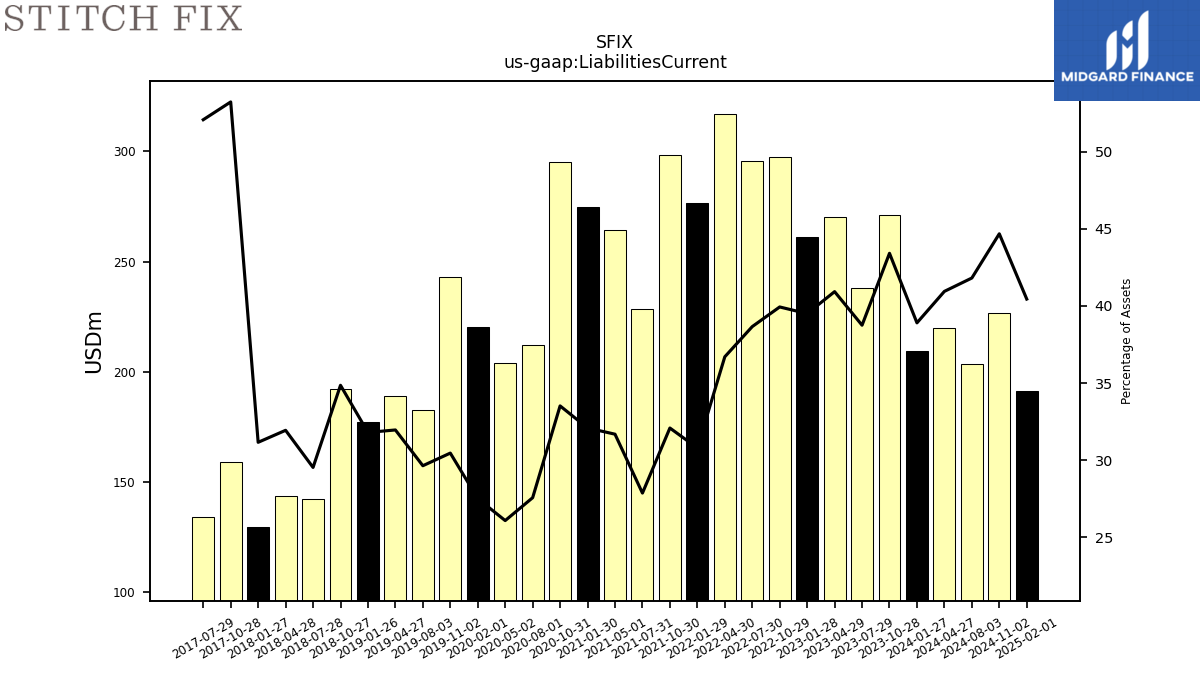
| Liabilities Current | 270.89 | 238.11 | 270.09 | 260.95 | 297.38 | 295.57 | 316.99 | 276.64 | 298.23 | 228.31 | 264.19 | 274.71 | 295.06 | 212.16 | 203.93 | 220.07 | 242.89 | 189.05 | 177.16 | 192.00 | 142.23 | 143.69 | 129.76 | 158.97 | 133.92 | NA | NA | NA | |
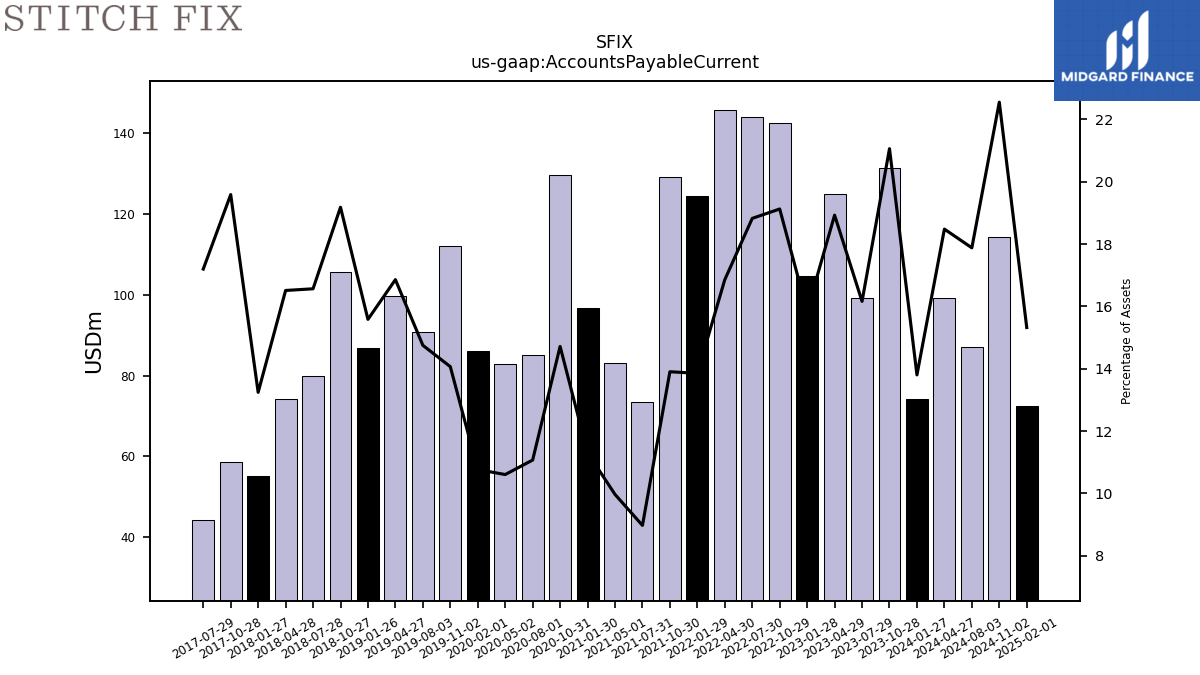
| Accounts Payable Current | 131.44 | 99.32 | 124.93 | 104.72 | 142.44 | 143.93 | 145.60 | 124.43 | 129.23 | 73.50 | 83.10 | 96.79 | 129.55 | 85.18 | 82.89 | 86.09 | 112.16 | 99.73 | 86.81 | 105.66 | 79.78 | 74.29 | 55.15 | 58.52 | 44.24 | NA | NA | NA | |
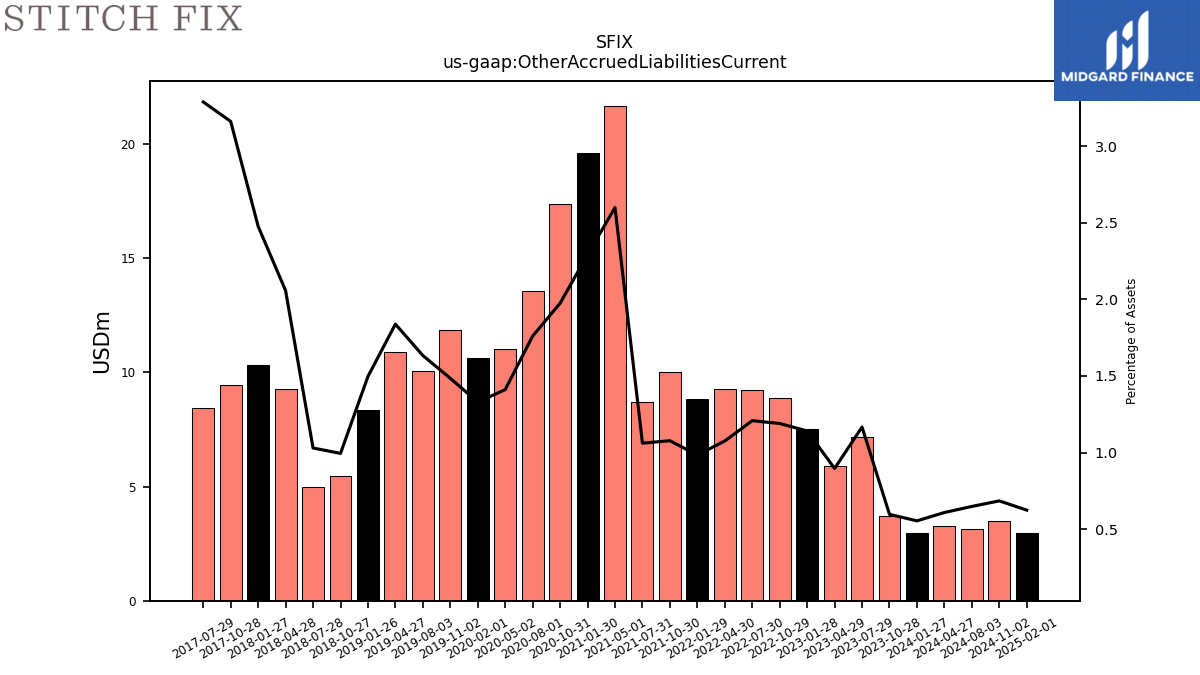
| Other Accrued Liabilities Current | 3.73 | 7.17 | 5.92 | 7.54 | 8.86 | 9.24 | 9.29 | 8.84 | 10.02 | 8.70 | 21.67 | 19.62 | 17.38 | 13.55 | 11.03 | 10.63 | 11.84 | 10.87 | 8.34 | 5.48 | 4.96 | 9.25 | 10.31 | 9.44 | 8.46 | NA | NA | NA | |
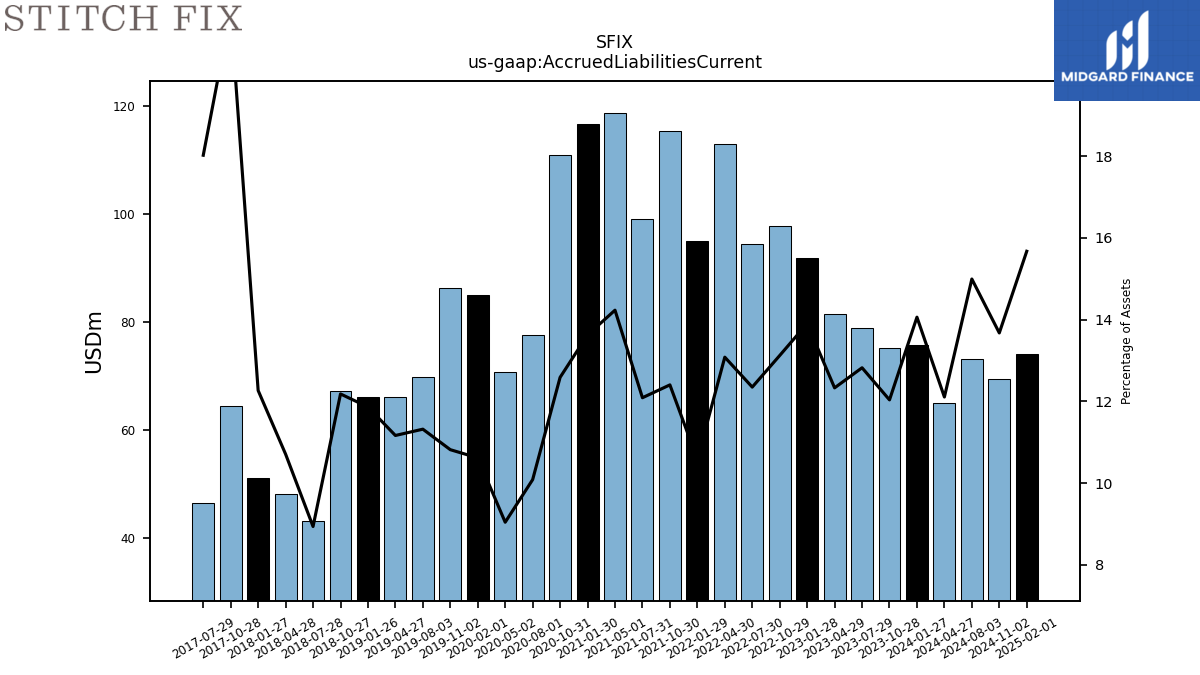
| Accrued Liabilities Current | 75.11 | 78.80 | 81.38 | 91.86 | 97.72 | 94.42 | 112.98 | 95.02 | 115.28 | 99.03 | 118.66 | 116.65 | 110.80 | 77.59 | 70.67 | 84.90 | 86.25 | 66.04 | 66.08 | 67.10 | 43.04 | 48.17 | 51.08 | 64.31 | 46.36 | NA | NA | NA | |
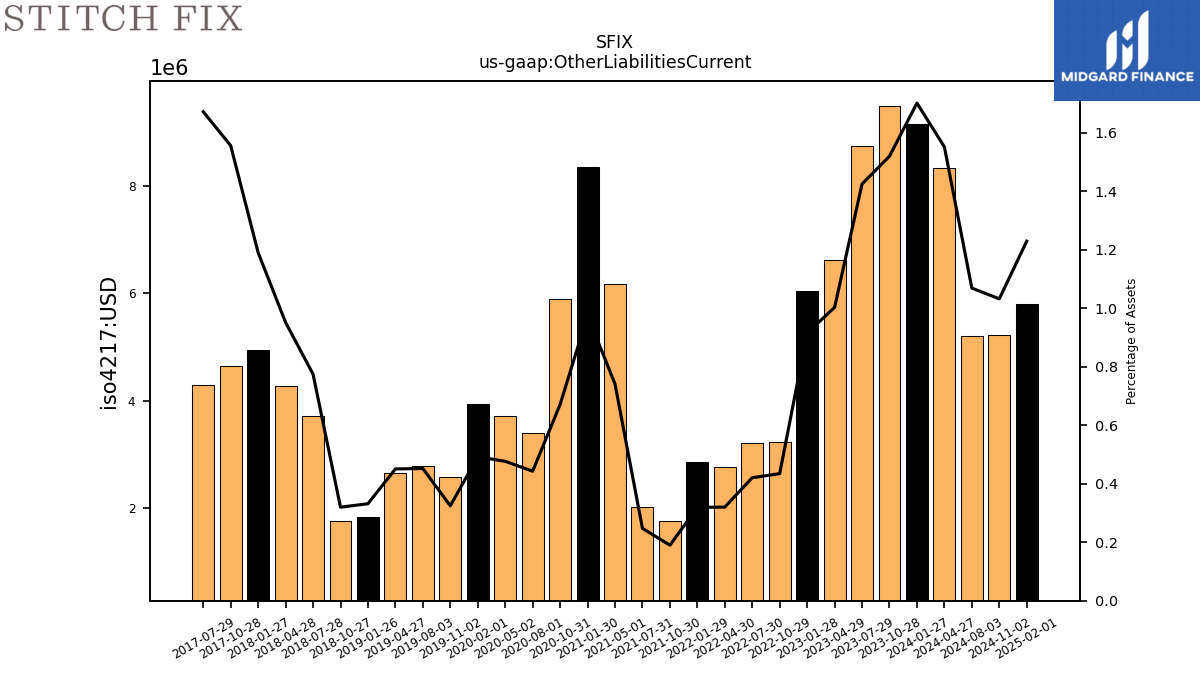
| Other Liabilities Current | 9.48 | 8.75 | 6.62 | 6.04 | 3.23 | 3.21 | 2.76 | 2.86 | 1.76 | 2.03 | 6.18 | 8.34 | 5.90 | 3.41 | 3.72 | 3.93 | 2.59 | 2.66 | 1.85 | 1.76 | 3.73 | 4.28 | 4.95 | 4.64 | 4.30 | NA | NA | NA | |
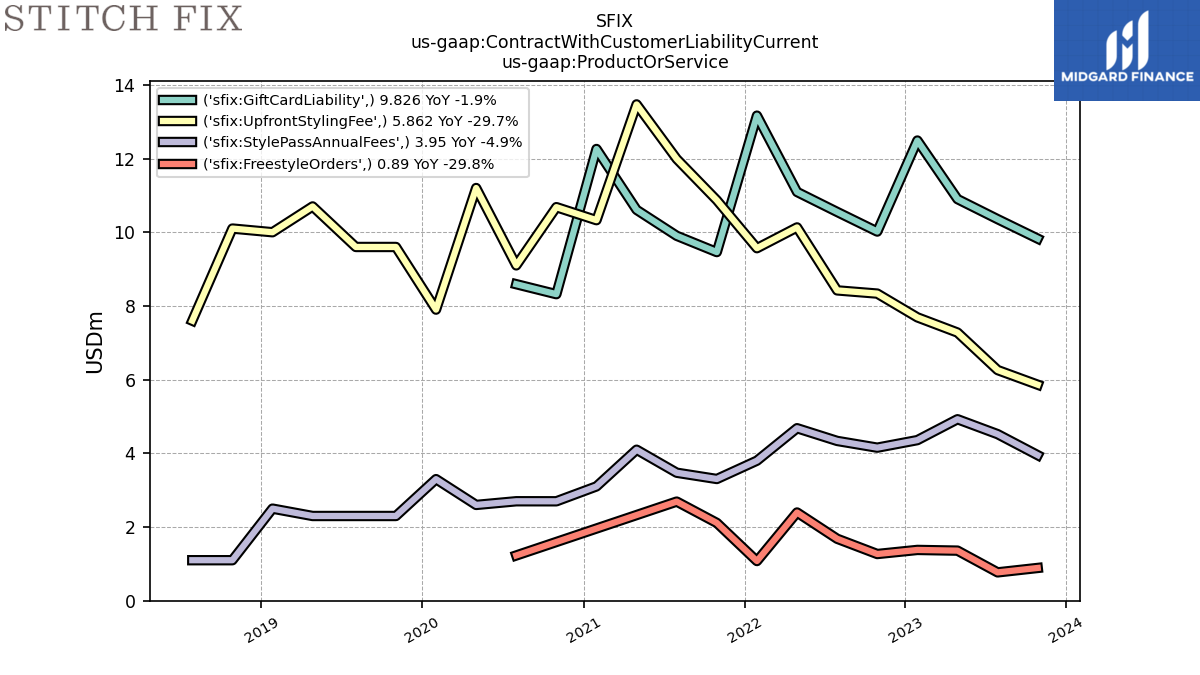
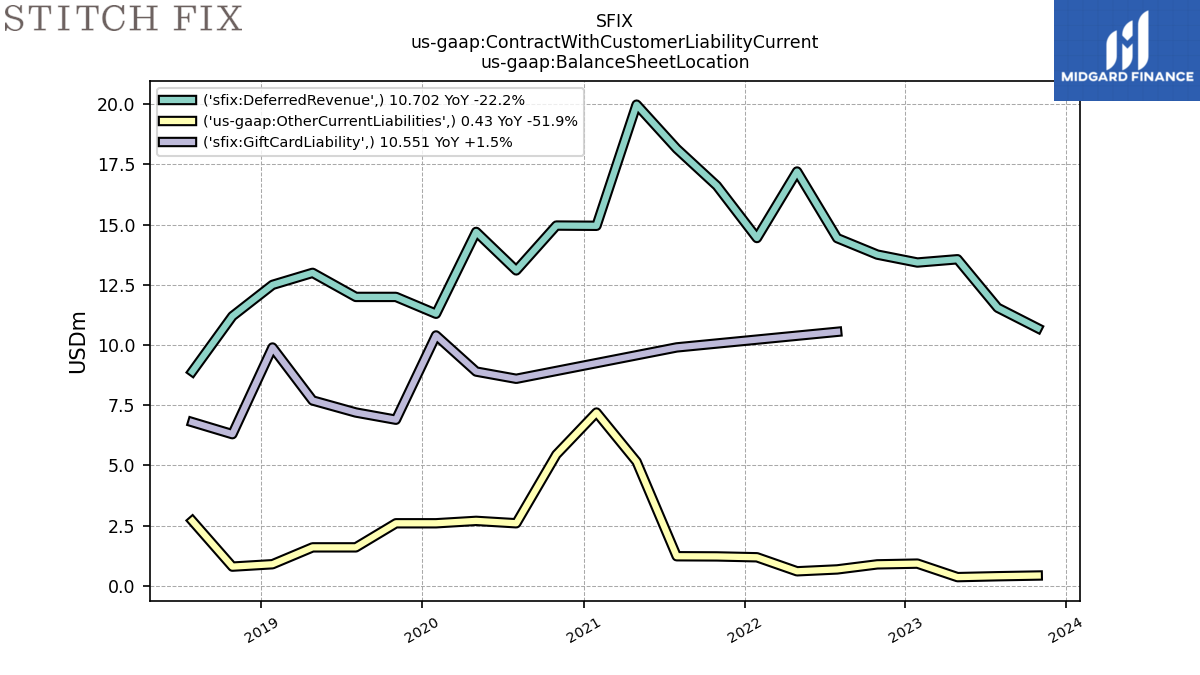
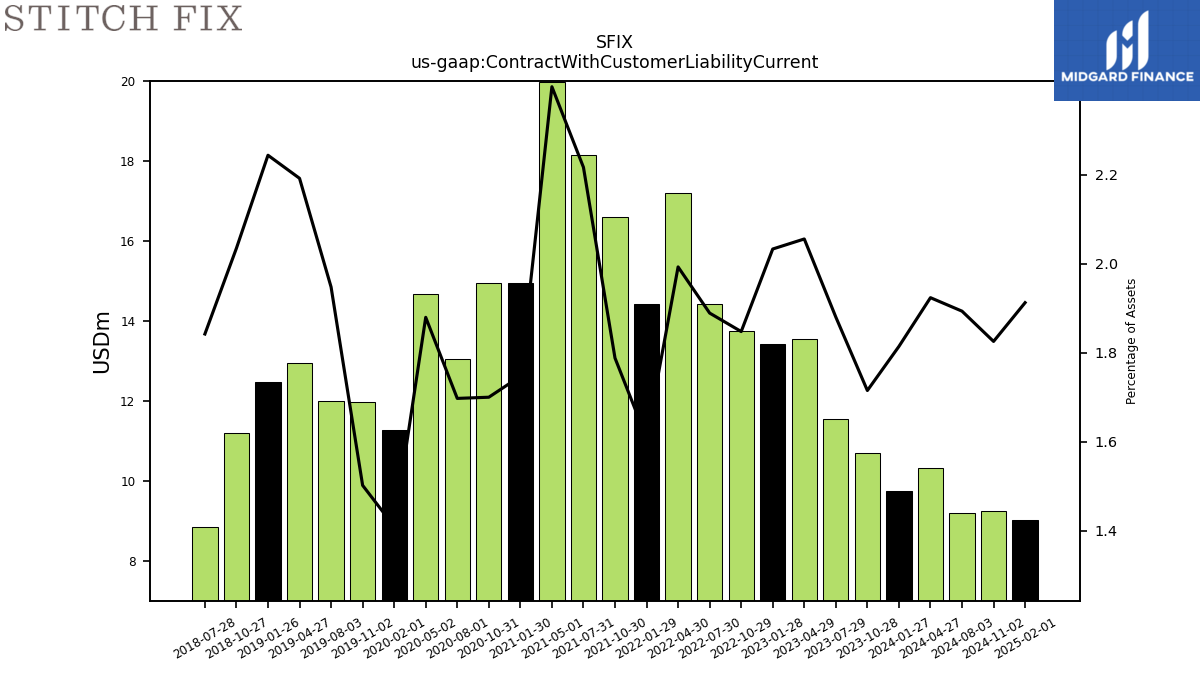
| Contract With Customer Liability Current | 10.70 | 11.55 | 13.56 | 13.43 | 13.76 | 14.44 | 17.21 | 14.45 | 16.62 | 18.15 | 19.98 | 14.95 | 14.96 | 13.06 | 14.69 | 11.27 | 11.98 | 12.96 | 12.50 | 11.21 | 8.87 | NA | NA | NA | NA | NA | NA | NA |
| 2023-10-28 | 2023-07-29 | 2023-04-29 | 2023-01-28 | 2022-10-29 | 2022-07-30 | 2022-04-30 | 2022-01-29 | 2021-10-30 | 2021-07-31 | 2021-05-01 | 2021-01-30 | 2020-10-31 | 2020-08-01 | 2020-05-02 | 2020-02-01 | 2019-11-02 | 2019-04-27 | 2019-01-26 | 2018-10-27 | 2018-07-28 | 2018-04-28 | 2018-01-27 | 2017-10-28 | 2017-07-29 | 2017-04-29 | 2017-01-28 | 2016-10-29 | ||
|---|---|---|---|---|---|---|---|---|---|---|---|---|---|---|---|---|---|---|---|---|---|---|---|---|---|---|---|---|---|
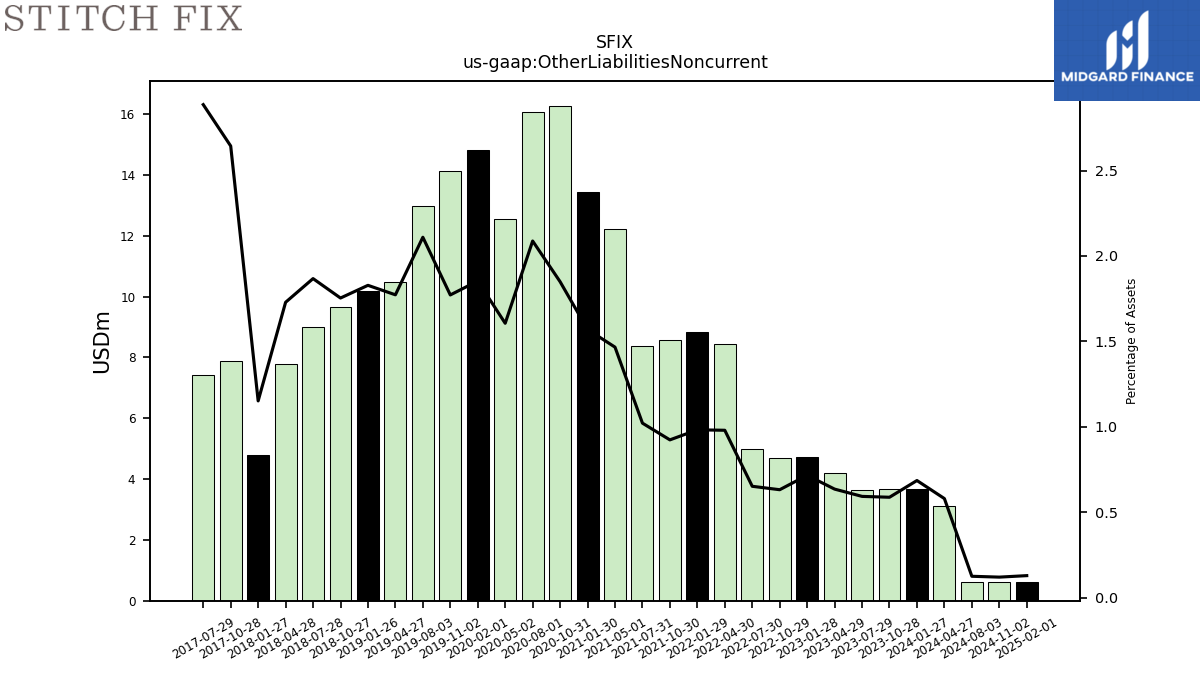
| Other Liabilities Noncurrent | 3.66 | 3.64 | 4.19 | 4.73 | 4.70 | 4.98 | 8.46 | 8.82 | 8.58 | 8.36 | 12.22 | 13.44 | 16.28 | 16.06 | 12.55 | 14.82 | 14.13 | 10.48 | 10.18 | 9.66 | 8.99 | 7.78 | 4.79 | 7.90 | 7.42 | NA | NA | NA | |
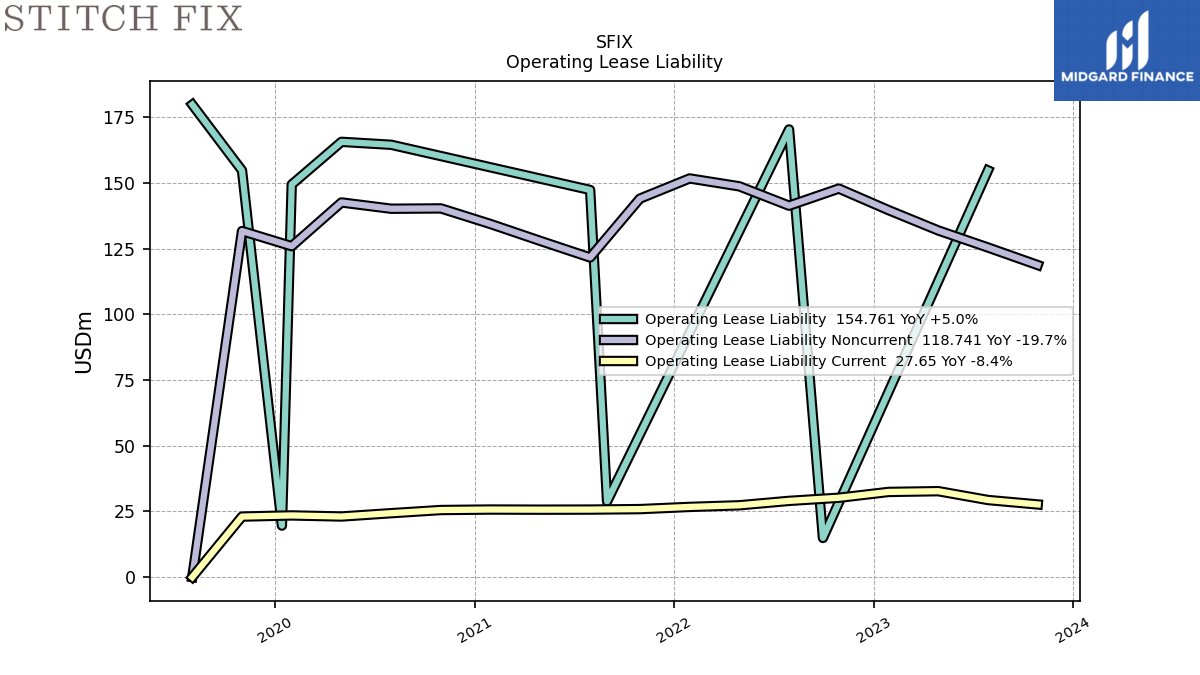
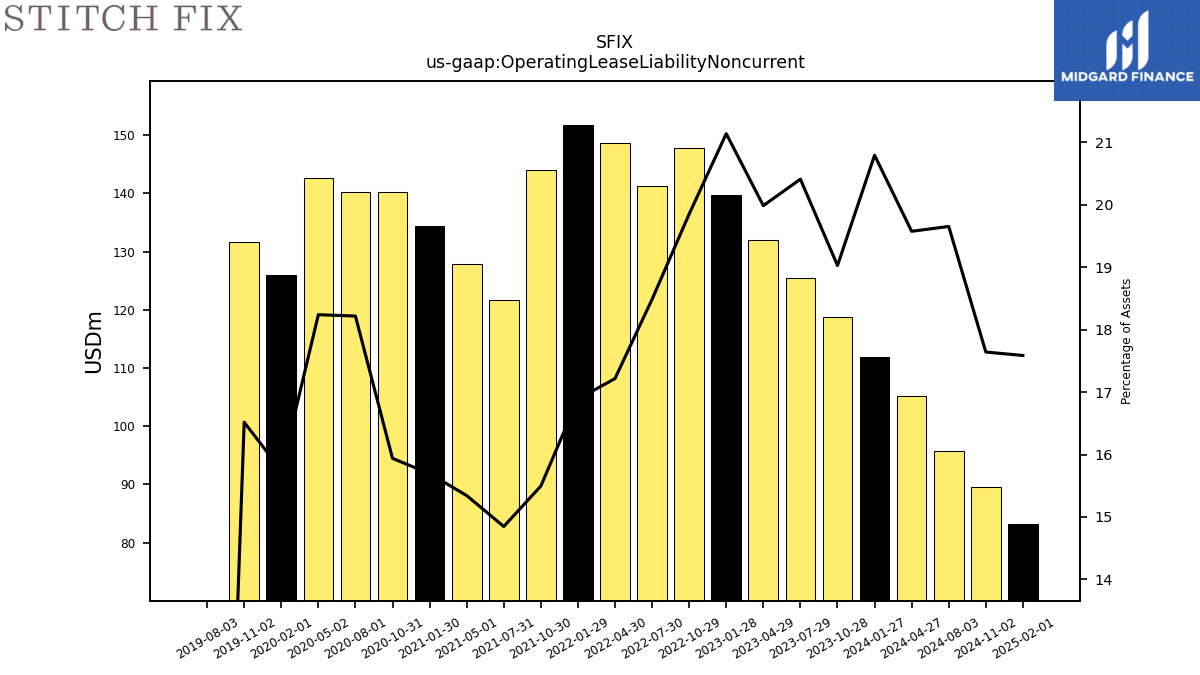
| Operating Lease Liability Noncurrent | 118.74 | 125.42 | 131.91 | 139.64 | 147.84 | 141.33 | 148.69 | 151.70 | 144.01 | 121.62 | 127.92 | 134.34 | 140.30 | 140.18 | 142.57 | 125.92 | 131.69 | NA | NA | NA | NA | NA | NA | NA | NA | NA | NA | NA |
| 2023-10-28 | 2023-07-29 | 2023-04-29 | 2023-01-28 | 2022-10-29 | 2022-07-30 | 2022-04-30 | 2022-01-29 | 2021-10-30 | 2021-07-31 | 2021-05-01 | 2021-01-30 | 2020-10-31 | 2020-08-01 | 2020-05-02 | 2020-02-01 | 2019-11-02 | 2019-04-27 | 2019-01-26 | 2018-10-27 | 2018-07-28 | 2018-04-28 | 2018-01-27 | 2017-10-28 | 2017-07-29 | 2017-04-29 | 2017-01-28 | 2016-10-29 | ||
|---|---|---|---|---|---|---|---|---|---|---|---|---|---|---|---|---|---|---|---|---|---|---|---|---|---|---|---|---|---|
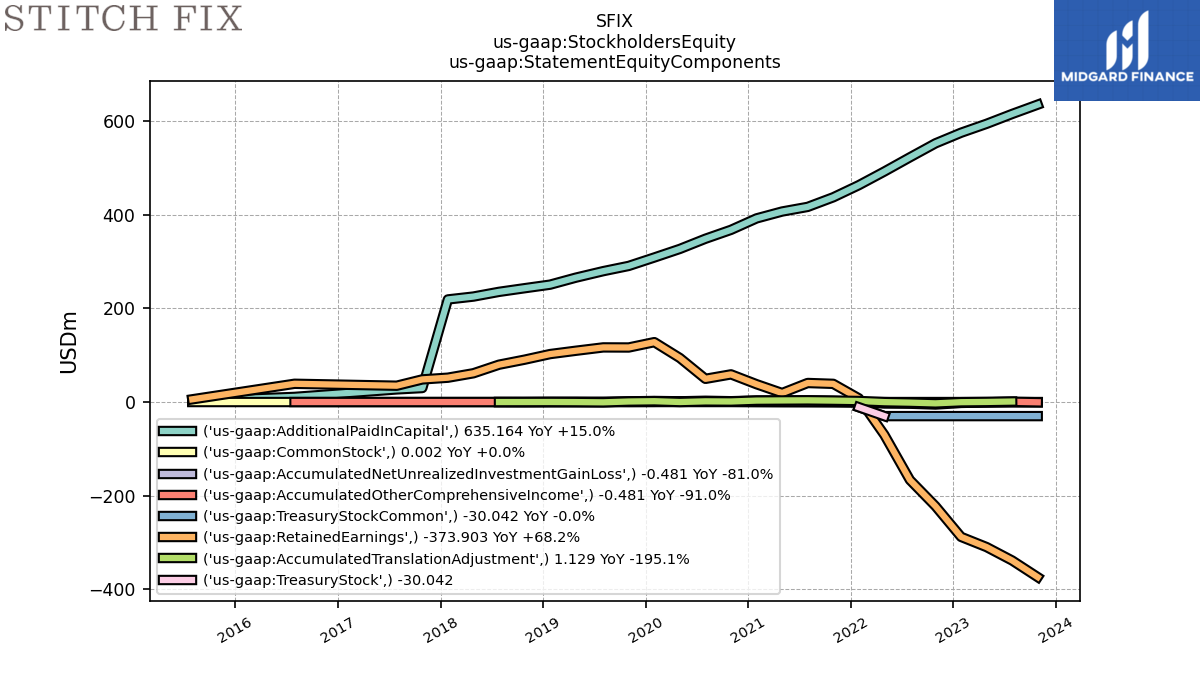
| Stockholders Equity | 230.74 | 247.31 | 253.78 | 255.28 | 294.77 | 322.65 | 389.51 | 461.08 | 478.60 | 460.85 | 429.38 | 433.53 | 428.59 | 401.04 | 422.58 | 438.91 | 408.61 | 375.13 | 353.29 | 333.50 | 315.07 | 286.74 | 271.10 | 78.27 | 61.86 | NA | NA | NA | |
| Additional Paid In Capital | 635.16 | 615.24 | 594.21 | 575.13 | 552.49 | 522.66 | 492.32 | 463.14 | 437.25 | 416.75 | 406.89 | 392.20 | 367.76 | 348.75 | 327.04 | 308.69 | 290.72 | 265.55 | 250.70 | 243.09 | 235.31 | NA | NA | NA | 27.00 | NA | NA | NA | |
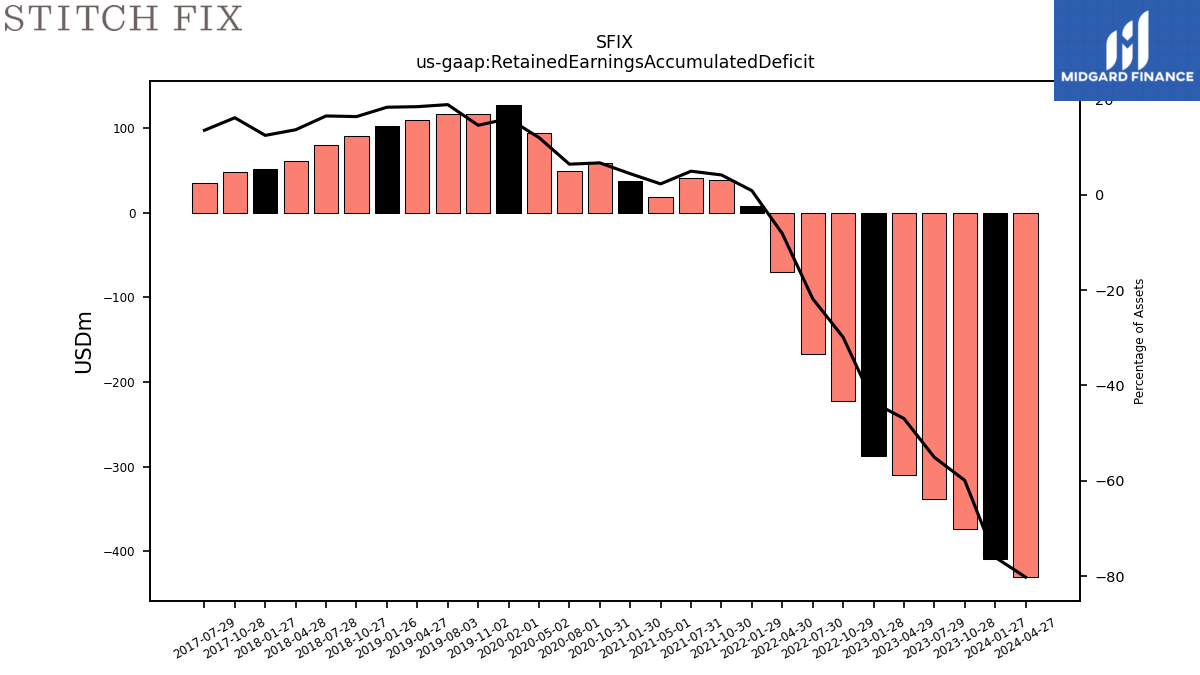
| Retained Earnings Accumulated Deficit | -373.90 | -338.41 | -309.75 | -287.93 | -222.36 | -166.44 | -70.10 | 7.94 | 38.85 | 40.68 | 19.21 | 38.06 | 59.10 | 49.56 | 94.02 | 127.93 | 116.50 | 109.50 | 102.45 | 90.47 | 79.76 | 61.47 | 51.99 | 48.35 | 34.86 | NA | NA | NA | |
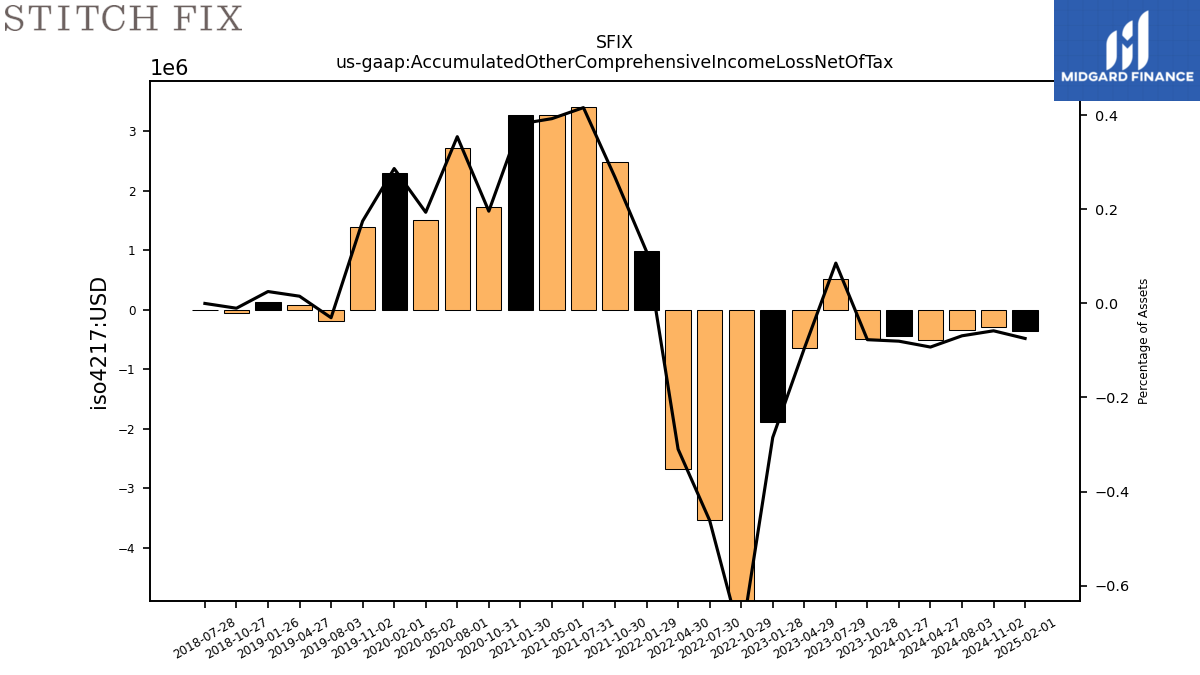
| Accumulated Other Comprehensive Income Loss Net Of Tax | -0.48 | 0.53 | -0.63 | -1.88 | -5.33 | -3.53 | -2.68 | 0.99 | 2.49 | 3.41 | 3.28 | 3.27 | 1.73 | 2.73 | 1.51 | 2.29 | 1.40 | 0.09 | 0.14 | -0.06 | 0.00 | NA | NA | NA | NA | NA | NA | NA | |
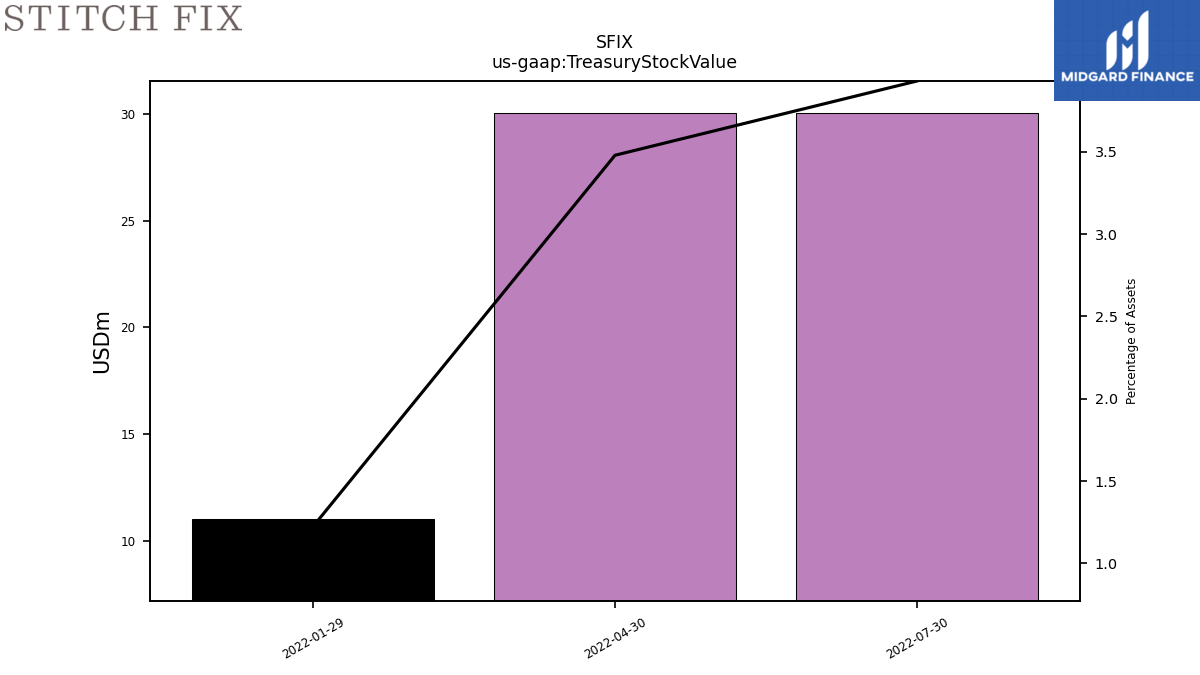
| Treasury Stock Value | NA | NA | NA | NA | NA | 30.04 | 30.04 | 11.00 | NA | NA | NA | NA | NA | NA | NA | NA | NA | NA | NA | NA | NA | NA | NA | NA | NA | NA | NA | NA | |
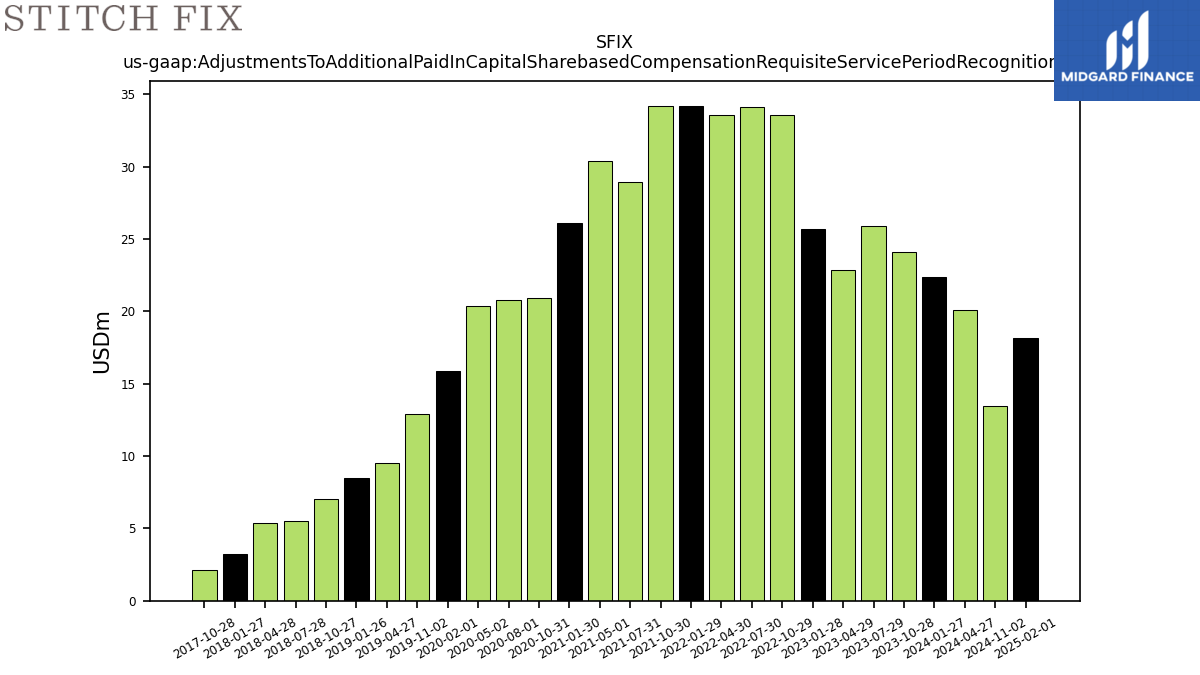
| Adjustments To Additional Paid In Capital Sharebased Compensation Requisite Service Period Recognition Value | 24.10 | 25.89 | 22.82 | 25.70 | 33.59 | 34.14 | 33.57 | 34.21 | 34.19 | 28.96 | 30.40 | 26.13 | 20.91 | 20.80 | 20.40 | 15.87 | 12.90 | 9.53 | 8.51 | 7.05 | 5.49 | 5.40 | 3.24 | 2.16 | NA | NA | NA | NA |
| 2023-10-28 | 2023-07-29 | 2023-04-29 | 2023-01-28 | 2022-10-29 | 2022-07-30 | 2022-04-30 | 2022-01-29 | 2021-10-30 | 2021-07-31 | 2021-05-01 | 2021-01-30 | 2020-10-31 | 2020-08-01 | 2020-05-02 | 2020-02-01 | 2019-11-02 | 2019-04-27 | 2019-01-26 | 2018-10-27 | 2018-07-28 | 2018-04-28 | 2018-01-27 | 2017-10-28 | 2017-07-29 | 2017-04-29 | 2017-01-28 | 2016-10-29 | ||
|---|---|---|---|---|---|---|---|---|---|---|---|---|---|---|---|---|---|---|---|---|---|---|---|---|---|---|---|---|---|
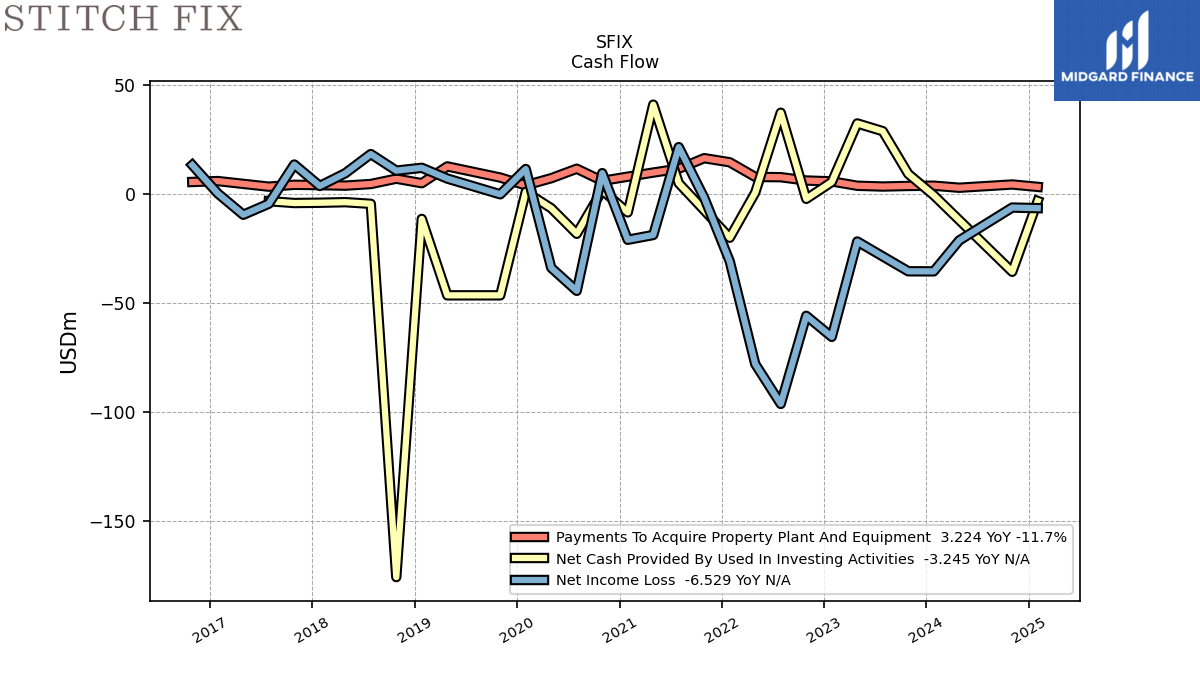
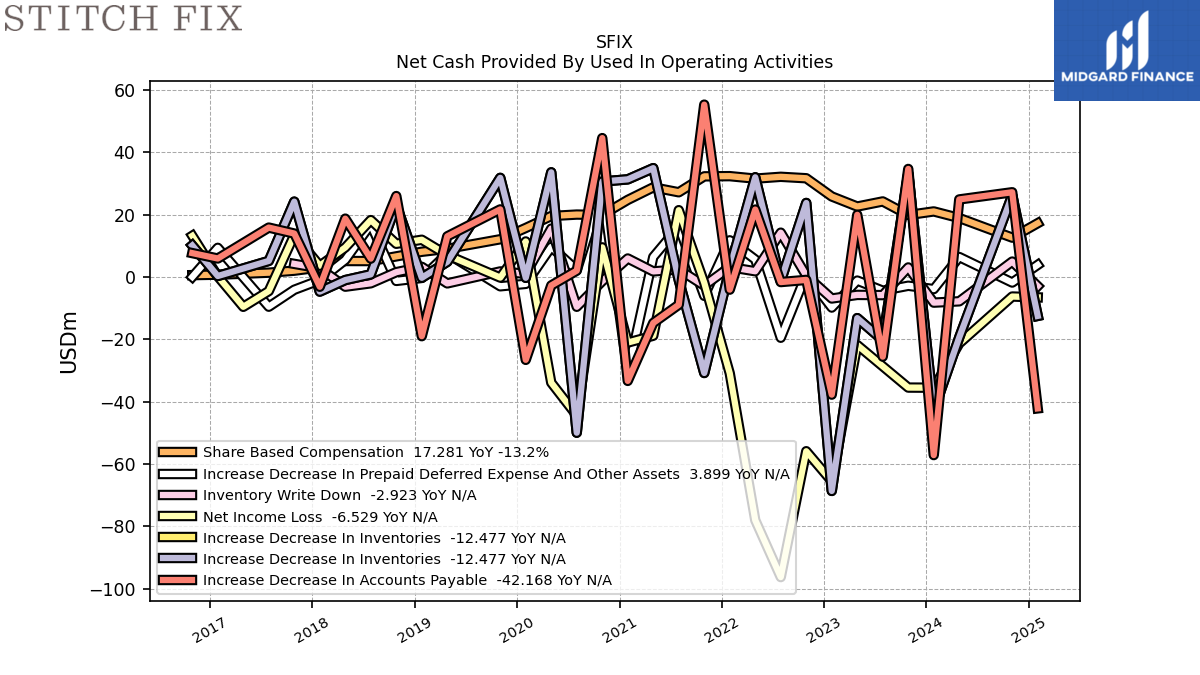
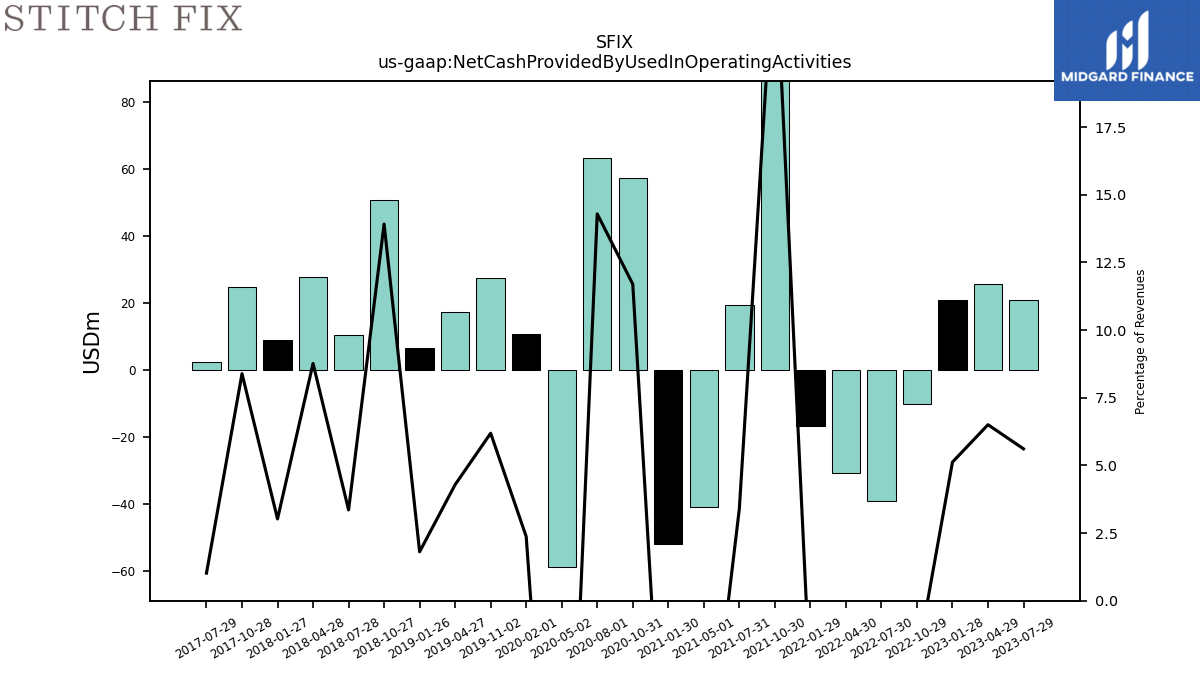
| Net Cash Provided By Used In Operating Activities | NA | 21.09 | 25.68 | 21.11 | -10.05 | -39.06 | -30.48 | -16.72 | 141.66 | 19.39 | -40.73 | -51.69 | 57.36 | 63.37 | -58.73 | 10.72 | 27.52 | 17.54 | 6.70 | 50.97 | 10.68 | 27.76 | 8.94 | 24.79 | 2.63 | NA | NA | NA | |
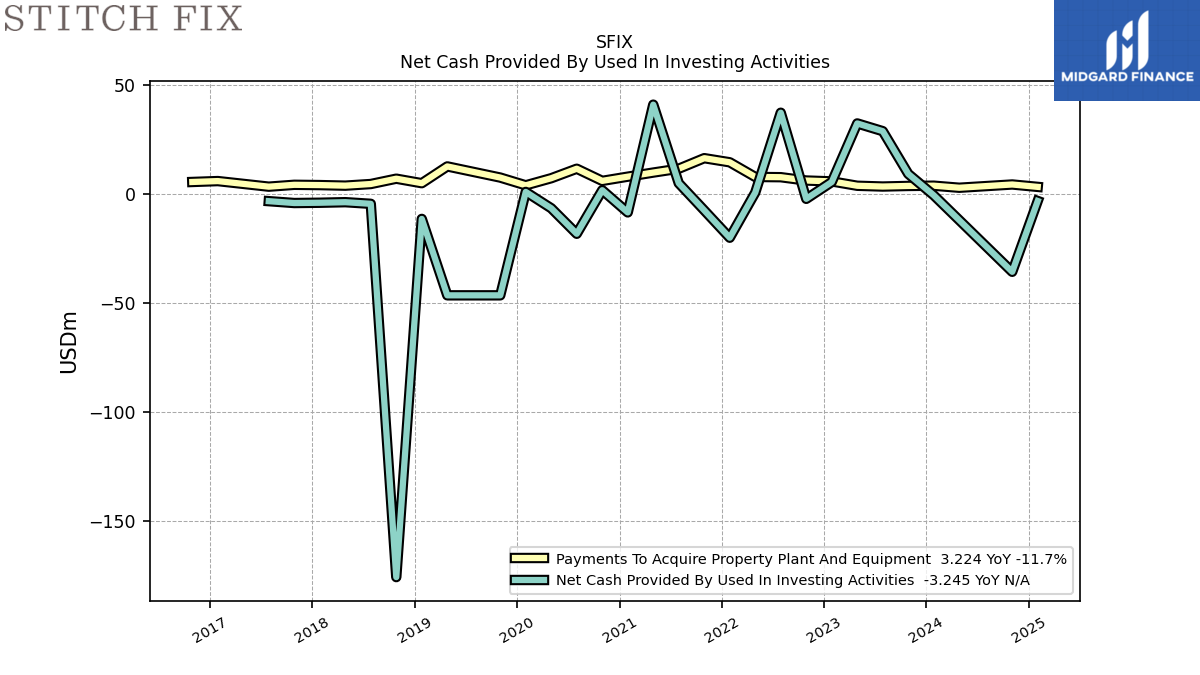
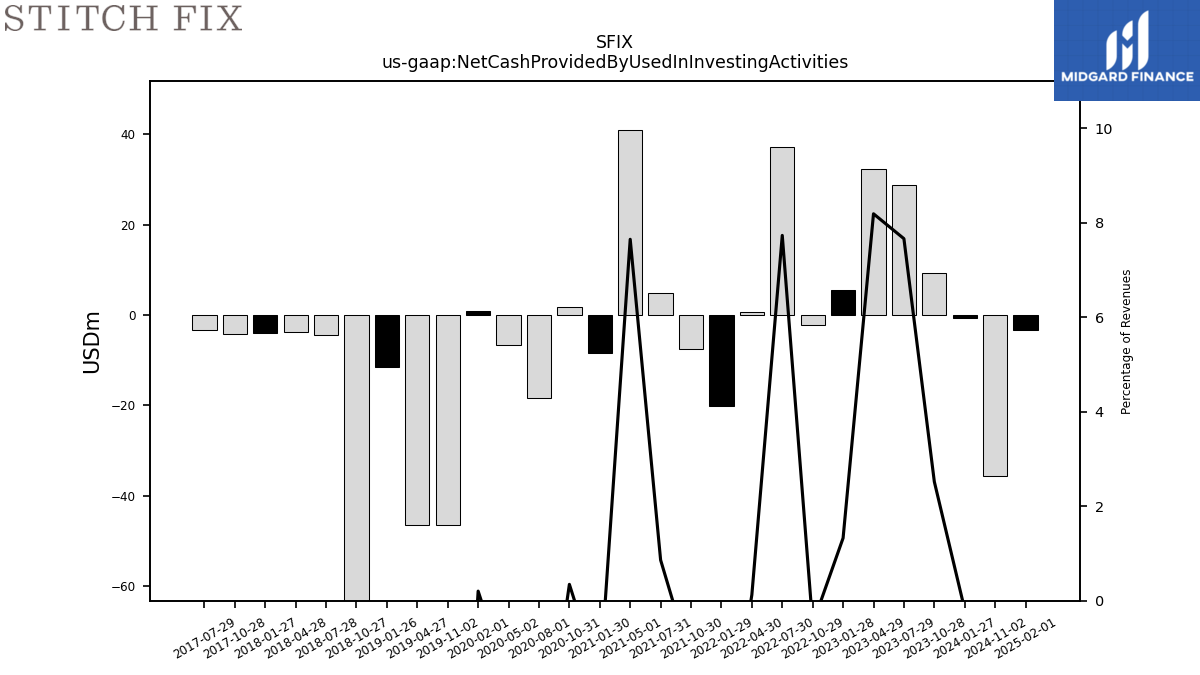
| Net Cash Provided By Used In Investing Activities | NA | 28.79 | 32.33 | 5.47 | -2.26 | 37.25 | 0.62 | -20.10 | -7.54 | 4.92 | 40.96 | -8.48 | 1.70 | -18.28 | -6.58 | 0.92 | -46.52 | -46.52 | -11.46 | -175.78 | -4.54 | -3.79 | -4.05 | -4.18 | -3.32 | NA | NA | NA | |
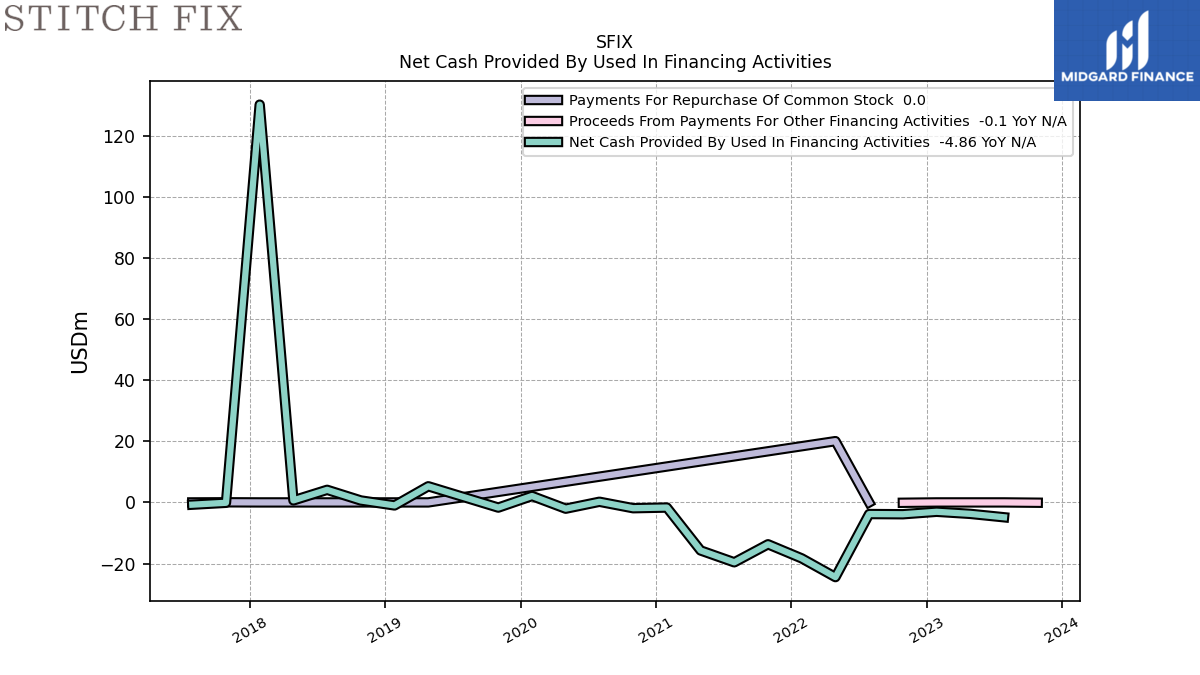
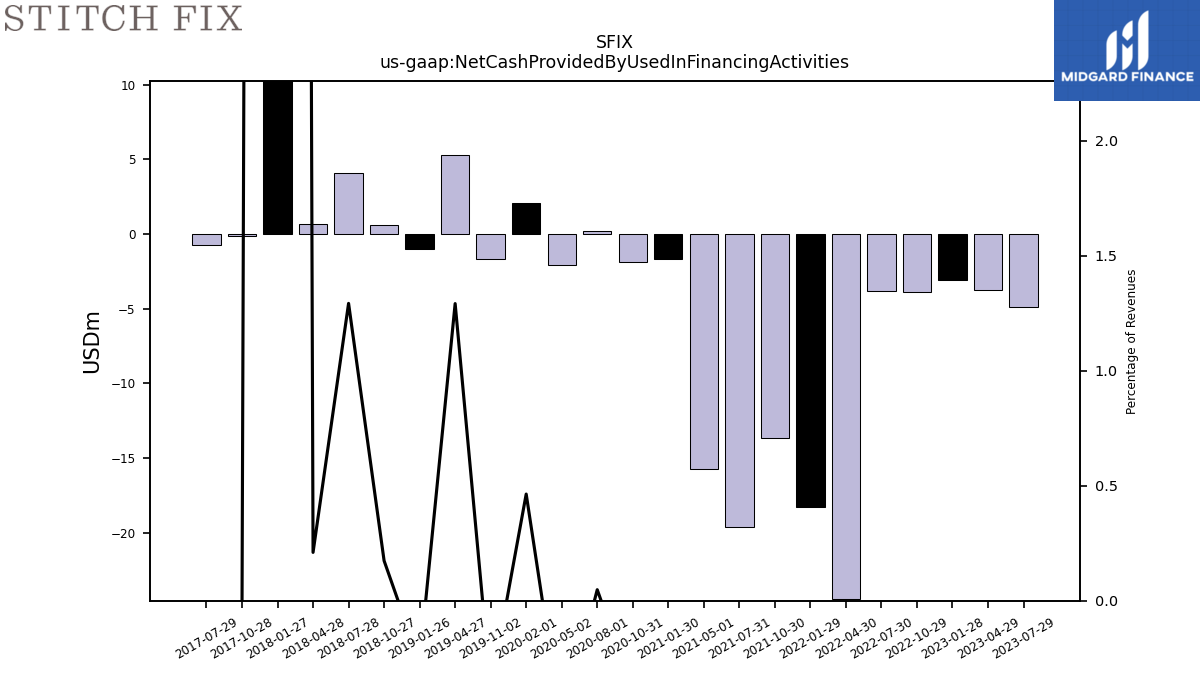
| Net Cash Provided By Used In Financing Activities | NA | -4.86 | -3.75 | -3.06 | -3.87 | -3.81 | -24.44 | -18.30 | -13.70 | -19.60 | -15.71 | -1.68 | -1.90 | 0.21 | -2.05 | 2.10 | -1.69 | 5.28 | -0.99 | 0.64 | 4.12 | 0.67 | 130.14 | -0.12 | -0.74 | NA | NA | NA |
| 2023-10-28 | 2023-07-29 | 2023-04-29 | 2023-01-28 | 2022-10-29 | 2022-07-30 | 2022-04-30 | 2022-01-29 | 2021-10-30 | 2021-07-31 | 2021-05-01 | 2021-01-30 | 2020-10-31 | 2020-08-01 | 2020-05-02 | 2020-02-01 | 2019-11-02 | 2019-04-27 | 2019-01-26 | 2018-10-27 | 2018-07-28 | 2018-04-28 | 2018-01-27 | 2017-10-28 | 2017-07-29 | 2017-04-29 | 2017-01-28 | 2016-10-29 | ||
|---|---|---|---|---|---|---|---|---|---|---|---|---|---|---|---|---|---|---|---|---|---|---|---|---|---|---|---|---|---|
| Net Cash Provided By Used In Operating Activities | NA | 21.09 | 25.68 | 21.11 | -10.05 | -39.06 | -30.48 | -16.72 | 141.66 | 19.39 | -40.73 | -51.69 | 57.36 | 63.37 | -58.73 | 10.72 | 27.52 | 17.54 | 6.70 | 50.97 | 10.68 | 27.76 | 8.94 | 24.79 | 2.63 | NA | NA | NA | |
| Net Income Loss | -35.49 | -28.66 | -21.82 | -65.57 | -55.92 | -96.34 | -78.04 | -30.91 | -1.83 | 21.47 | -18.85 | -21.04 | 9.54 | -44.47 | -33.90 | 11.43 | -0.18 | 7.05 | 11.98 | 10.68 | 18.28 | 9.49 | 3.64 | 13.49 | -4.51 | -9.56 | 0.23 | 13.24 | |
| Depreciation Depletion And Amortization | 13.78 | 10.03 | 10.18 | 11.94 | 10.16 | 7.82 | 9.81 | 9.04 | 8.34 | 5.67 | 7.73 | 7.25 | 6.96 | 6.34 | 5.92 | 5.70 | 4.65 | 3.73 | 3.28 | 3.17 | 2.96 | 2.65 | 2.62 | 2.27 | NA | NA | NA | NA | |
| Increase Decrease In Inventories | 33.26 | -20.28 | -13.18 | -68.68 | 23.78 | -1.33 | 32.02 | 2.71 | -30.81 | -0.93 | 34.96 | 31.36 | 30.66 | -49.98 | 33.61 | -0.25 | 31.84 | 4.89 | -0.24 | 23.17 | 0.86 | -0.97 | -4.68 | 24.21 | 5.17 | NA | 0.33 | 10.14 | |
| Increase Decrease In Accounts Payable | 34.71 | -25.56 | 19.98 | -37.76 | -0.92 | -1.62 | 21.67 | -4.06 | 55.35 | -8.90 | -14.74 | -33.35 | 44.61 | 2.05 | -2.70 | -26.59 | 21.72 | 13.07 | -19.00 | 26.01 | 5.91 | 18.75 | -3.12 | 13.97 | 15.88 | NA | 5.95 | 7.68 | |
| Share Based Compensation | 19.90 | 24.27 | 22.64 | 25.87 | 31.71 | 32.18 | 31.59 | 32.39 | 32.32 | 27.21 | 28.80 | 24.76 | 19.93 | 20.05 | 19.59 | 15.76 | 12.13 | 9.07 | 8.11 | 6.64 | 5.13 | 5.14 | 3.10 | 2.04 | 1.40 | NA | 0.75 | 0.61 |
| 2023-10-28 | 2023-07-29 | 2023-04-29 | 2023-01-28 | 2022-10-29 | 2022-07-30 | 2022-04-30 | 2022-01-29 | 2021-10-30 | 2021-07-31 | 2021-05-01 | 2021-01-30 | 2020-10-31 | 2020-08-01 | 2020-05-02 | 2020-02-01 | 2019-11-02 | 2019-04-27 | 2019-01-26 | 2018-10-27 | 2018-07-28 | 2018-04-28 | 2018-01-27 | 2017-10-28 | 2017-07-29 | 2017-04-29 | 2017-01-28 | 2016-10-29 | ||
|---|---|---|---|---|---|---|---|---|---|---|---|---|---|---|---|---|---|---|---|---|---|---|---|---|---|---|---|---|---|
| Net Cash Provided By Used In Investing Activities | NA | 28.79 | 32.33 | 5.47 | -2.26 | 37.25 | 0.62 | -20.10 | -7.54 | 4.92 | 40.96 | -8.48 | 1.70 | -18.28 | -6.58 | 0.92 | -46.52 | -46.52 | -11.46 | -175.78 | -4.54 | -3.79 | -4.05 | -4.18 | -3.32 | NA | NA | NA | |
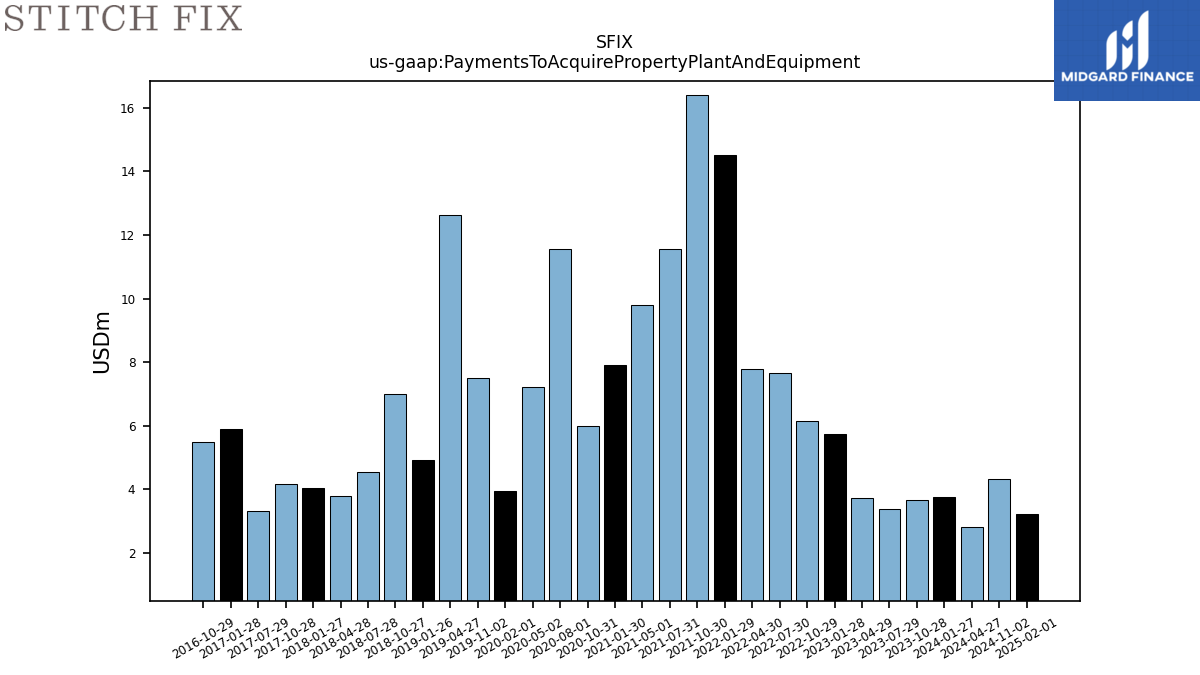
| Payments To Acquire Property Plant And Equipment | 3.65 | 3.39 | 3.74 | 5.74 | 6.14 | 7.67 | 7.78 | 14.51 | 16.39 | 11.57 | 9.80 | 7.91 | 5.99 | 11.56 | 7.21 | 3.94 | 7.50 | 12.61 | 4.92 | 6.99 | 4.54 | 3.79 | 4.05 | 4.18 | 3.32 | NA | 5.89 | 5.48 |
| 2023-10-28 | 2023-07-29 | 2023-04-29 | 2023-01-28 | 2022-10-29 | 2022-07-30 | 2022-04-30 | 2022-01-29 | 2021-10-30 | 2021-07-31 | 2021-05-01 | 2021-01-30 | 2020-10-31 | 2020-08-01 | 2020-05-02 | 2020-02-01 | 2019-11-02 | 2019-04-27 | 2019-01-26 | 2018-10-27 | 2018-07-28 | 2018-04-28 | 2018-01-27 | 2017-10-28 | 2017-07-29 | 2017-04-29 | 2017-01-28 | 2016-10-29 | ||
|---|---|---|---|---|---|---|---|---|---|---|---|---|---|---|---|---|---|---|---|---|---|---|---|---|---|---|---|---|---|
| Net Cash Provided By Used In Financing Activities | NA | -4.86 | -3.75 | -3.06 | -3.87 | -3.81 | -24.44 | -18.30 | -13.70 | -19.60 | -15.71 | -1.68 | -1.90 | 0.21 | -2.05 | 2.10 | -1.69 | 5.28 | -0.99 | 0.64 | 4.12 | 0.67 | 130.14 | -0.12 | -0.74 | NA | NA | NA | |
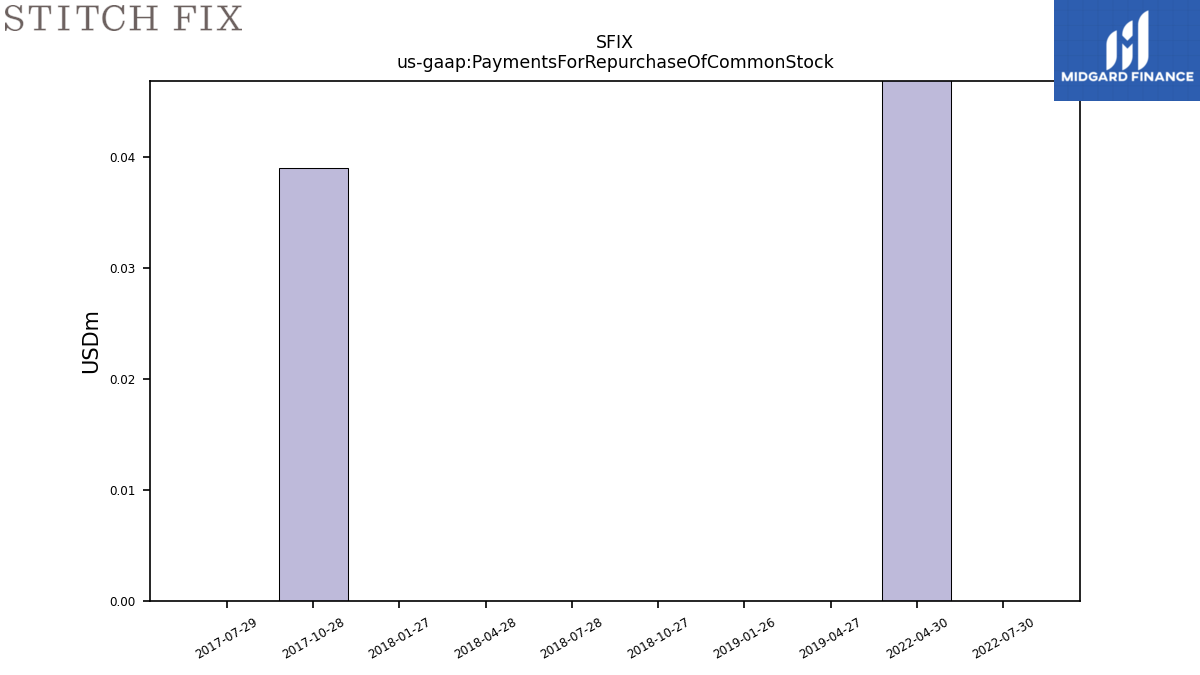
| Payments For Repurchase Of Common Stock | NA | NA | NA | NA | NA | 0.00 | 20.05 | NA | NA | NA | NA | NA | NA | NA | NA | NA | NA | 0.00 | 0.00 | 0.00 | 0.00 | 0.00 | 0.00 | 0.04 | 0.00 | NA | NA | NA |
| 2023-10-28 | 2023-07-29 | 2023-04-29 | 2023-01-28 | 2022-10-29 | 2022-07-30 | 2022-04-30 | 2022-01-29 | 2021-10-30 | 2021-07-31 | 2021-05-01 | 2021-01-30 | 2020-10-31 | 2020-08-01 | 2020-05-02 | 2020-02-01 | 2019-11-02 | 2019-04-27 | 2019-01-26 | 2018-10-27 | 2018-07-28 | 2018-04-28 | 2018-01-27 | 2017-10-28 | 2017-07-29 | 2017-04-29 | 2017-01-28 | 2016-10-29 | ||
|---|---|---|---|---|---|---|---|---|---|---|---|---|---|---|---|---|---|---|---|---|---|---|---|---|---|---|---|---|---|
| Revenues | 364.79 | 375.80 | 394.91 | 412.12 | 455.59 | 481.90 | 492.94 | 516.72 | 581.24 | 571.16 | 535.59 | 504.09 | 490.42 | 443.41 | 371.73 | 451.78 | 444.81 | 408.89 | 370.28 | 366.24 | 318.30 | 316.74 | 295.91 | 295.56 | 258.29 | 245.07 | 237.78 | 236.00 | |
| Revenue From Contract With Customer Excluding Assessed Tax | 364.79 | 375.80 | 394.91 | 412.12 | 455.59 | 481.90 | 492.94 | 516.72 | 581.24 | 571.16 | 535.59 | 504.09 | 490.42 | 443.41 | 371.73 | 451.78 | 444.81 | 408.89 | 370.28 | 366.24 | 318.30 | 316.74 | 295.91 | 295.56 | 258.29 | 245.07 | 237.78 | 236.00 |

