
| 2023-12-31 | 2023-09-30 | 2023-06-30 | 2023-03-31 | 2022-12-31 | 2022-09-30 | 2022-06-30 | 2022-03-31 | 2021-12-31 | 2021-09-30 | 2021-06-30 | 2021-03-31 | 2020-12-31 | 2020-09-30 | 2020-06-30 | 2020-03-31 | 2019-12-31 | 2019-09-30 | 2019-06-30 | 2019-03-31 | 2018-12-31 | 2018-09-30 | 2018-06-30 | 2018-03-31 | 2017-12-31 | 2017-09-30 | 2017-06-30 | 2017-03-31 | 2016-12-31 | 2016-09-30 | 2016-06-30 | 2016-03-31 | 2015-12-31 | 2015-09-30 | 2015-06-30 | 2015-03-31 | 2014-12-31 | 2014-09-30 | 2014-06-30 | 2014-03-31 | ||
|---|---|---|---|---|---|---|---|---|---|---|---|---|---|---|---|---|---|---|---|---|---|---|---|---|---|---|---|---|---|---|---|---|---|---|---|---|---|---|---|---|---|
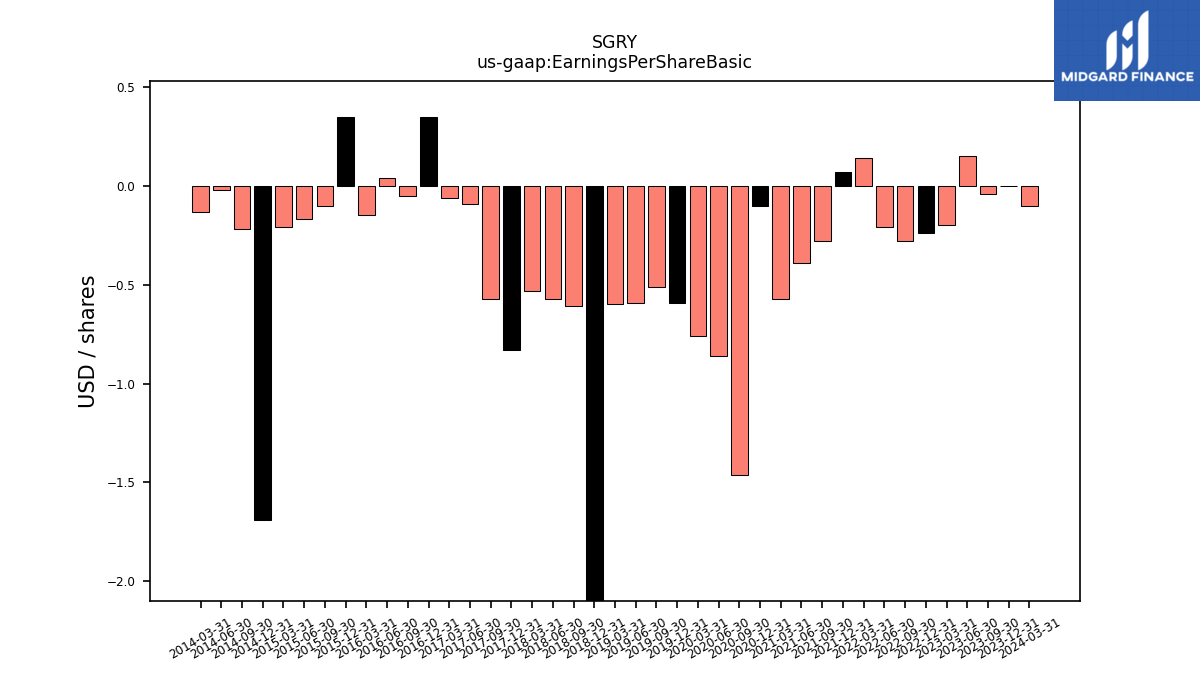
| Earnings Per Share Basic | 0.00 | -0.04 | 0.15 | -0.20 | -0.24 | -0.28 | -0.21 | 0.14 | 0.07 | -0.28 | -0.39 | -0.57 | -0.10 | -1.46 | -0.86 | -0.76 | -0.59 | -0.51 | -0.59 | -0.60 | -3.25 | -0.61 | -0.57 | -0.53 | -0.83 | -0.57 | -0.09 | -0.06 | 0.35 | -0.05 | 0.04 | -0.15 | 0.35 | -0.10 | -0.17 | -0.21 | -1.69 | -0.22 | -0.02 | -0.13 | |
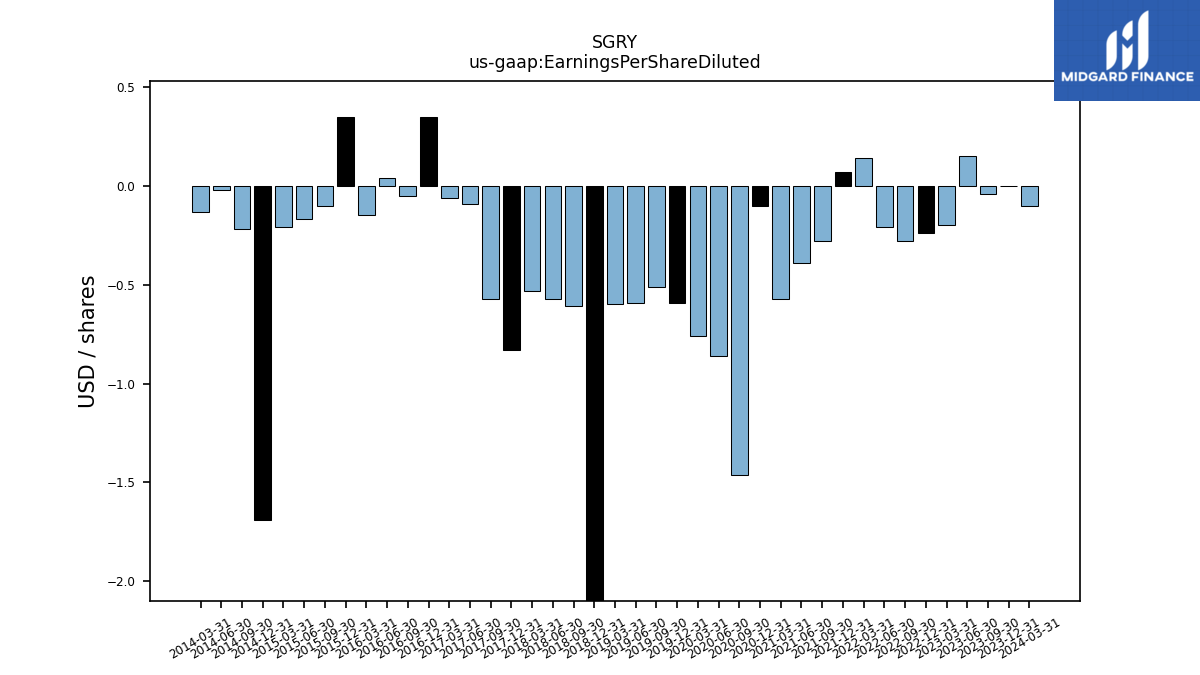
| Earnings Per Share Diluted | 0.00 | -0.04 | 0.15 | -0.20 | -0.24 | -0.28 | -0.21 | 0.14 | 0.07 | -0.28 | -0.39 | -0.57 | -0.10 | -1.46 | -0.86 | -0.76 | -0.59 | -0.51 | -0.59 | -0.60 | -3.25 | -0.61 | -0.57 | -0.53 | -0.83 | -0.57 | -0.09 | -0.06 | 0.35 | -0.05 | 0.04 | -0.15 | 0.35 | -0.10 | -0.17 | -0.21 | -1.69 | -0.22 | -0.02 | -0.13 |
| 2023-12-31 | 2023-09-30 | 2023-06-30 | 2023-03-31 | 2022-12-31 | 2022-09-30 | 2022-06-30 | 2022-03-31 | 2021-12-31 | 2021-09-30 | 2021-06-30 | 2021-03-31 | 2020-12-31 | 2020-09-30 | 2020-06-30 | 2020-03-31 | 2019-12-31 | 2019-09-30 | 2019-06-30 | 2019-03-31 | 2018-12-31 | 2018-09-30 | 2018-06-30 | 2018-03-31 | 2017-12-31 | 2017-09-30 | 2017-06-30 | 2017-03-31 | 2016-12-31 | 2016-09-30 | 2016-06-30 | 2016-03-31 | 2015-12-31 | 2015-09-30 | 2015-06-30 | 2015-03-31 | 2014-12-31 | 2014-09-30 | 2014-06-30 | 2014-03-31 | ||
|---|---|---|---|---|---|---|---|---|---|---|---|---|---|---|---|---|---|---|---|---|---|---|---|---|---|---|---|---|---|---|---|---|---|---|---|---|---|---|---|---|---|
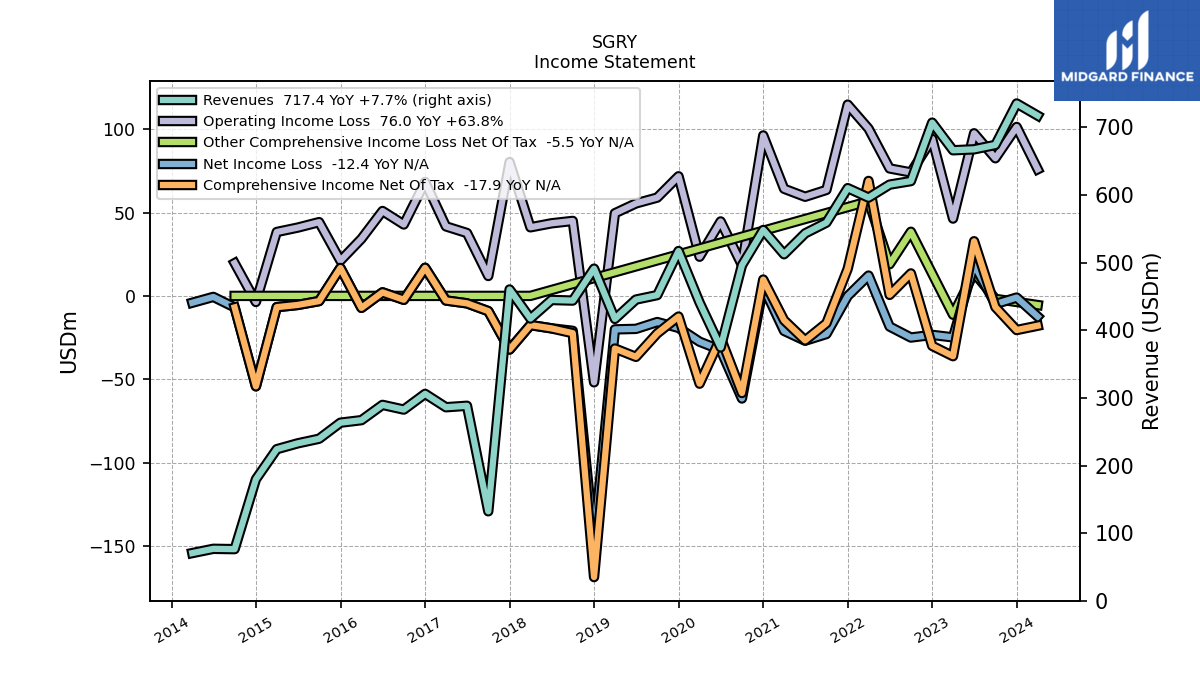
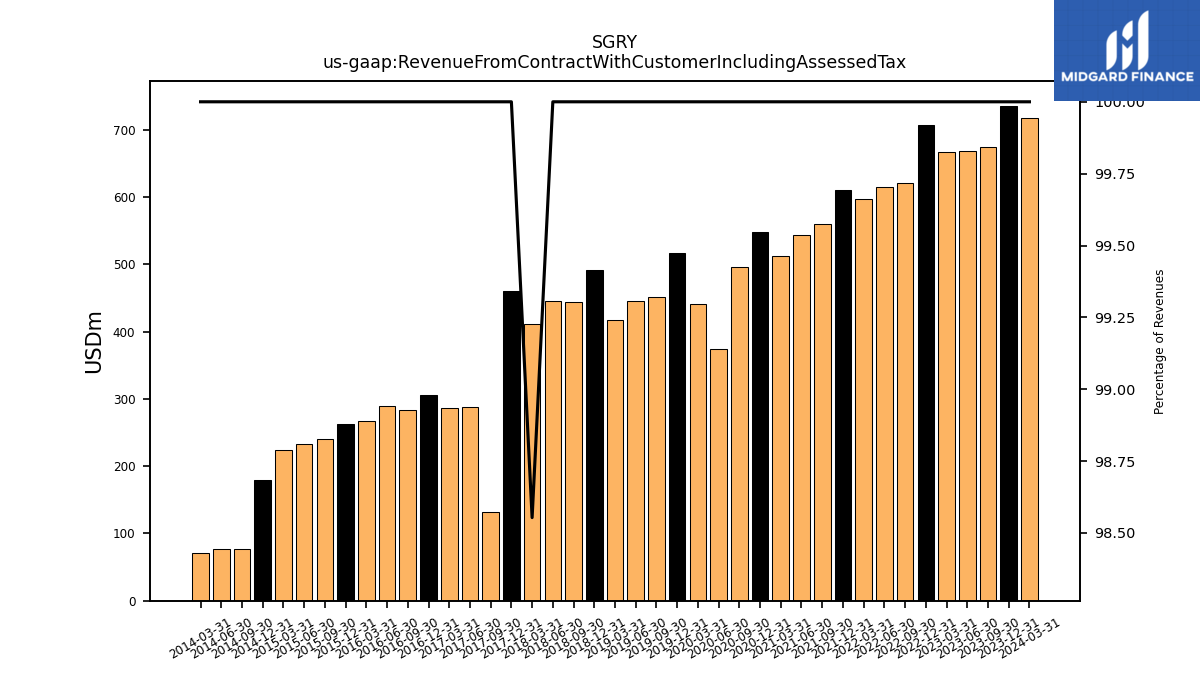
| Revenue From Contract With Customer Including Assessed Tax | 735.40 | 674.10 | 667.60 | 666.20 | 707.10 | 620.60 | 615.40 | 596.20 | 610.20 | 559.20 | 543.30 | 512.40 | 548.30 | 496.10 | 374.70 | 441.00 | 517.20 | 452.00 | 445.40 | 416.80 | 491.17 | 443.93 | 444.77 | 411.33 | 460.35 | 132.26 | 288.35 | 286.18 | 306.00 | 282.68 | 289.68 | 267.07 | 263.32 | 239.60 | 232.83 | 224.14 | 179.69 | 76.30 | 76.81 | 70.48 | |
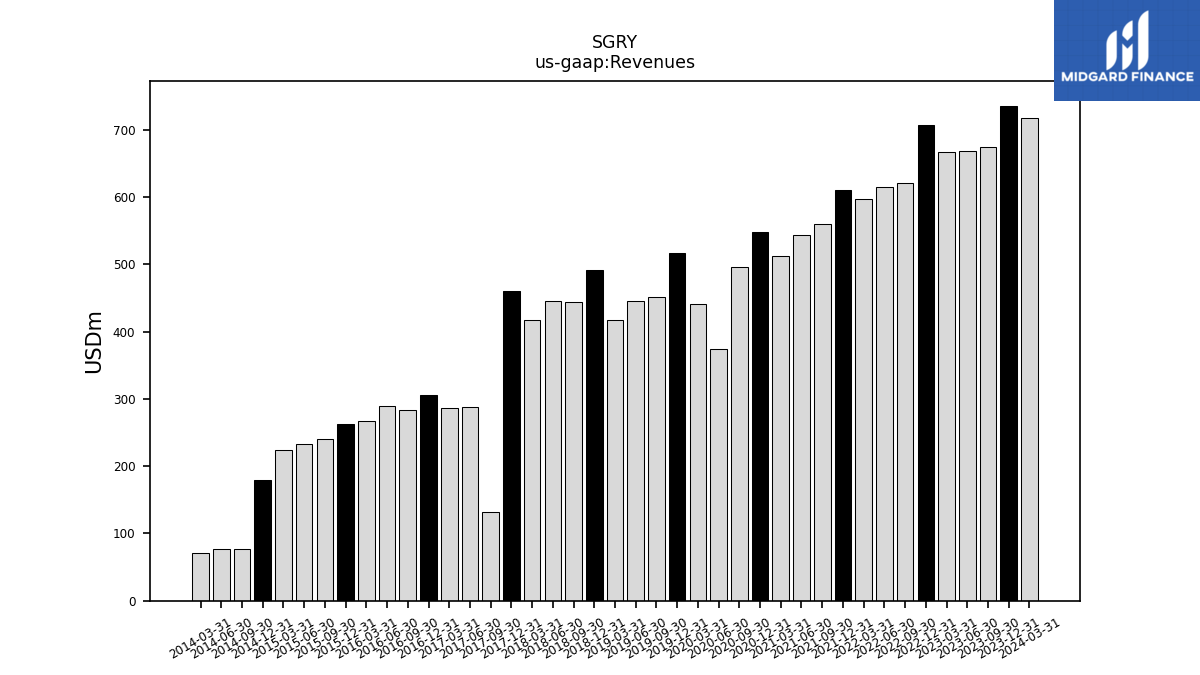
| Revenues | 735.40 | 674.10 | 667.60 | 666.20 | 707.10 | 620.60 | 615.40 | 596.20 | 610.20 | 559.20 | 543.30 | 512.40 | 548.30 | 496.10 | 374.70 | 441.00 | 517.20 | 452.00 | 445.40 | 416.80 | 491.17 | 443.93 | 444.77 | 417.37 | 460.35 | 132.26 | 288.35 | 286.18 | 306.00 | 282.68 | 289.68 | 267.07 | 263.32 | 239.60 | 232.83 | 224.14 | 179.69 | 76.30 | 76.81 | 70.48 | |
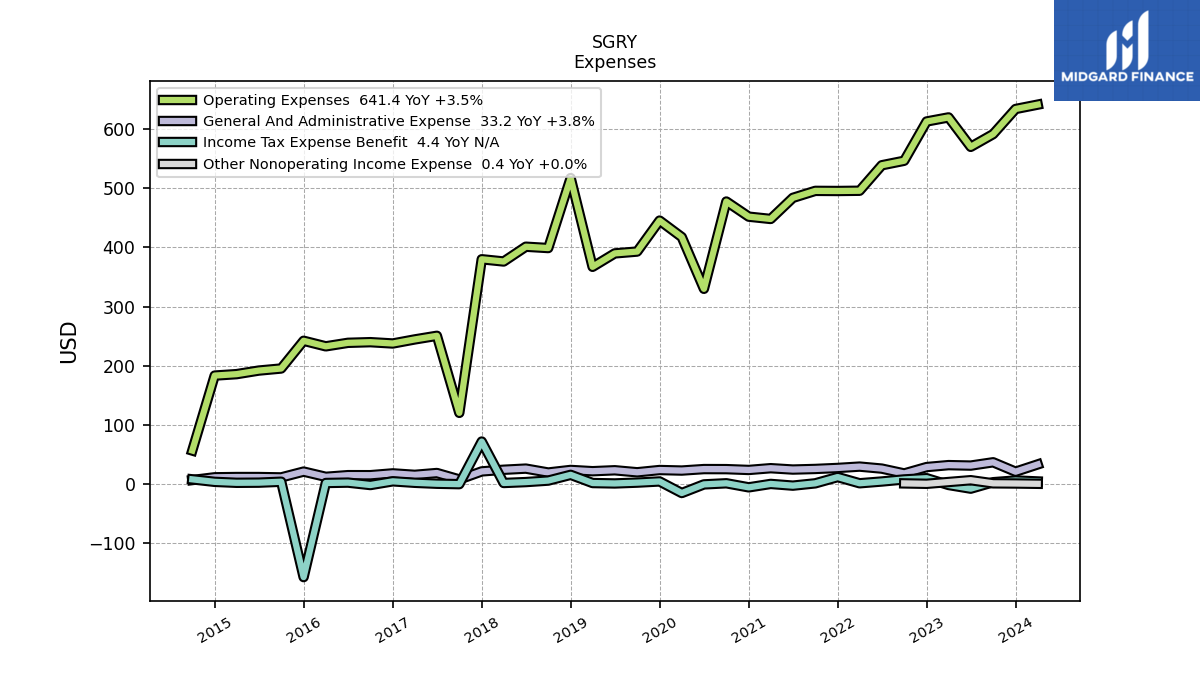
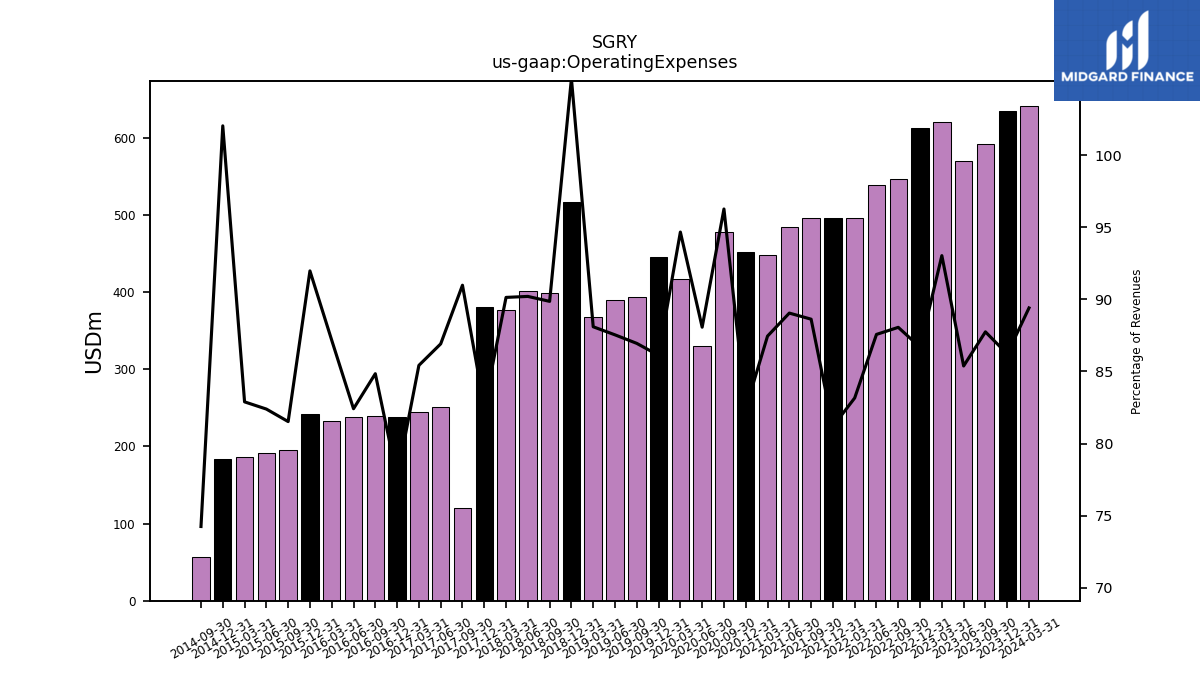
| Operating Expenses | 634.00 | 591.50 | 570.00 | 619.80 | 612.90 | 546.50 | 538.90 | 495.80 | 495.40 | 495.60 | 483.80 | 448.10 | 452.00 | 477.60 | 330.00 | 417.50 | 445.40 | 393.00 | 389.90 | 367.20 | 517.27 | 398.93 | 401.21 | 376.21 | 380.00 | 120.33 | 250.61 | 244.46 | 237.59 | 239.83 | 238.73 | 232.79 | 242.19 | 195.32 | 191.83 | 185.79 | 183.36 | 56.65 | NA | NA | |
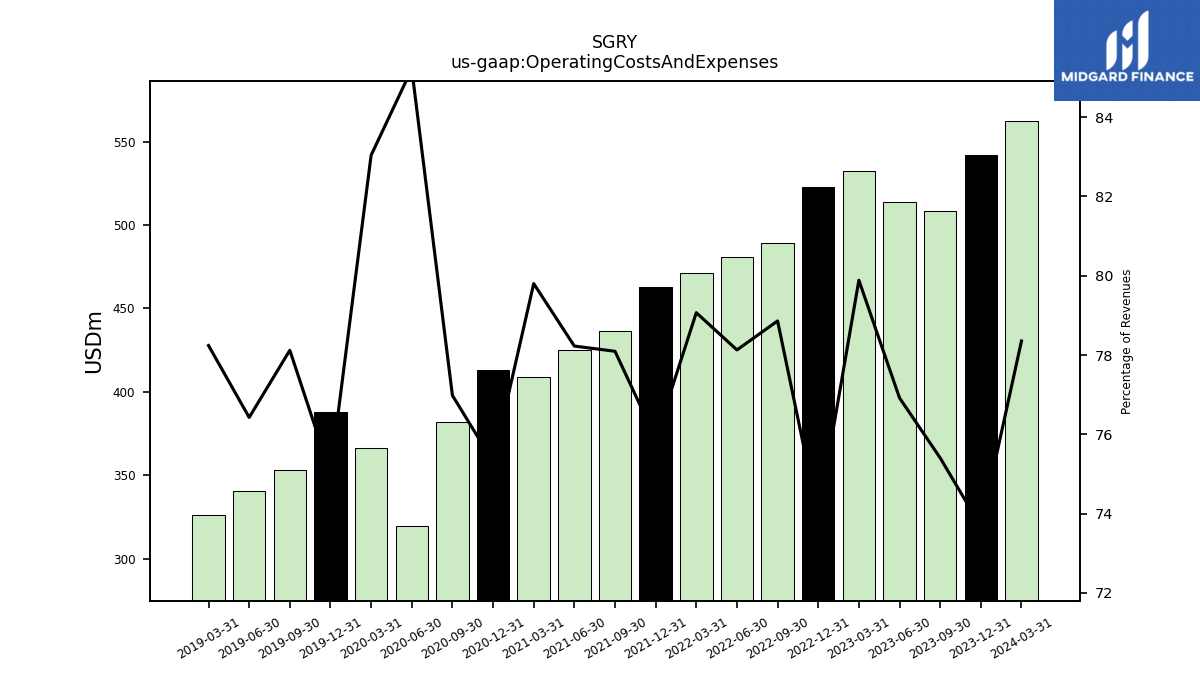
| Operating Costs And Expenses | 541.80 | 508.30 | 513.50 | 532.20 | 522.80 | 489.40 | 480.80 | 471.40 | 463.10 | 436.70 | 425.00 | 408.90 | 412.90 | 381.90 | 319.30 | 366.20 | 388.00 | 353.10 | 340.40 | 326.10 | NA | NA | NA | NA | NA | NA | NA | NA | NA | NA | NA | NA | NA | NA | NA | NA | NA | NA | NA | NA | |
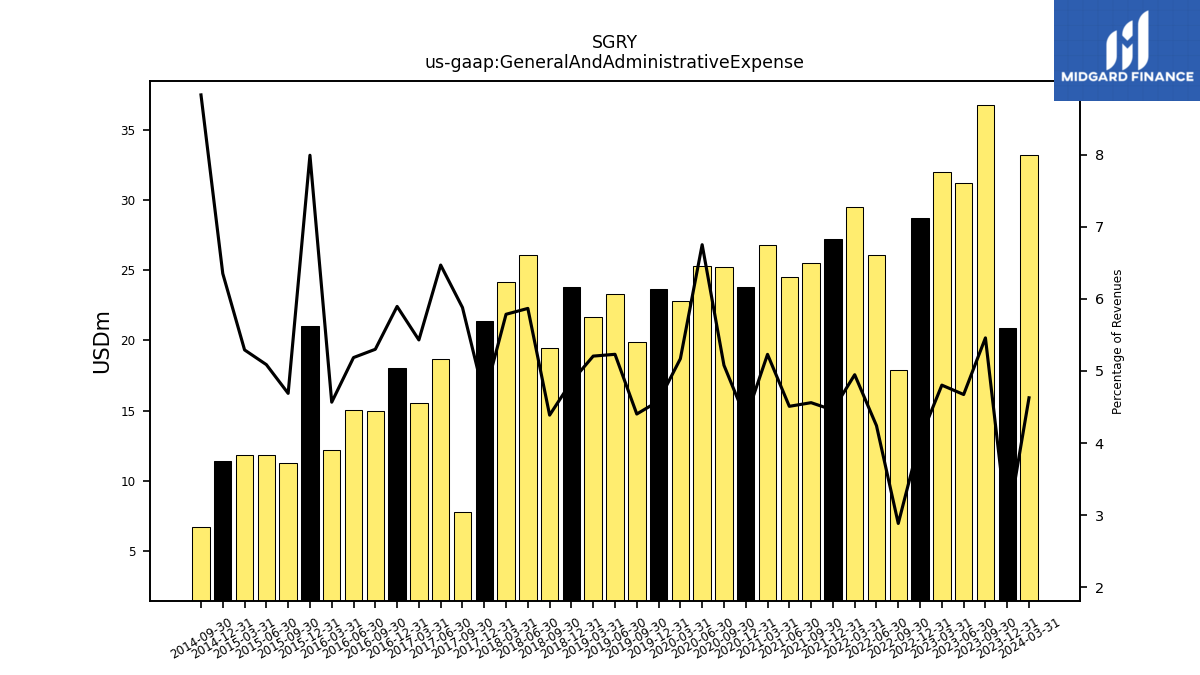
| General And Administrative Expense | 20.90 | 36.80 | 31.20 | 32.00 | 28.70 | 17.90 | 26.10 | 29.50 | 27.20 | 25.50 | 24.50 | 26.80 | 23.80 | 25.20 | 25.30 | 22.80 | 23.70 | 19.90 | 23.30 | 21.70 | 23.83 | 19.48 | 26.10 | 24.15 | 21.38 | 7.78 | 18.66 | 15.54 | 18.04 | 14.98 | 15.02 | 12.20 | 21.05 | 11.24 | 11.85 | 11.86 | 11.41 | 6.74 | NA | NA | |
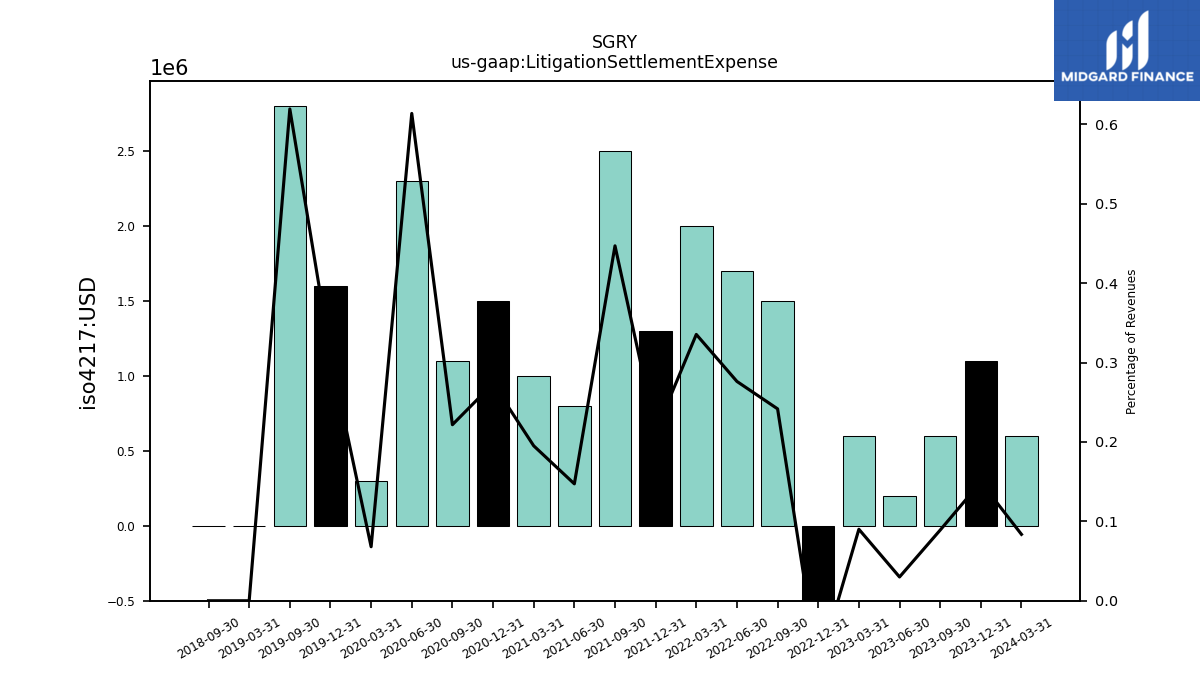
| Litigation Settlement Expense | 1.10 | 0.60 | 0.20 | 0.60 | -0.60 | 1.50 | 1.70 | 2.00 | 1.30 | 2.50 | 0.80 | 1.00 | 1.50 | 1.10 | 2.30 | 0.30 | 1.60 | 2.80 | NA | 0.00 | NA | 0.00 | NA | NA | NA | NA | NA | NA | NA | NA | NA | NA | NA | NA | NA | NA | NA | NA | NA | NA | |
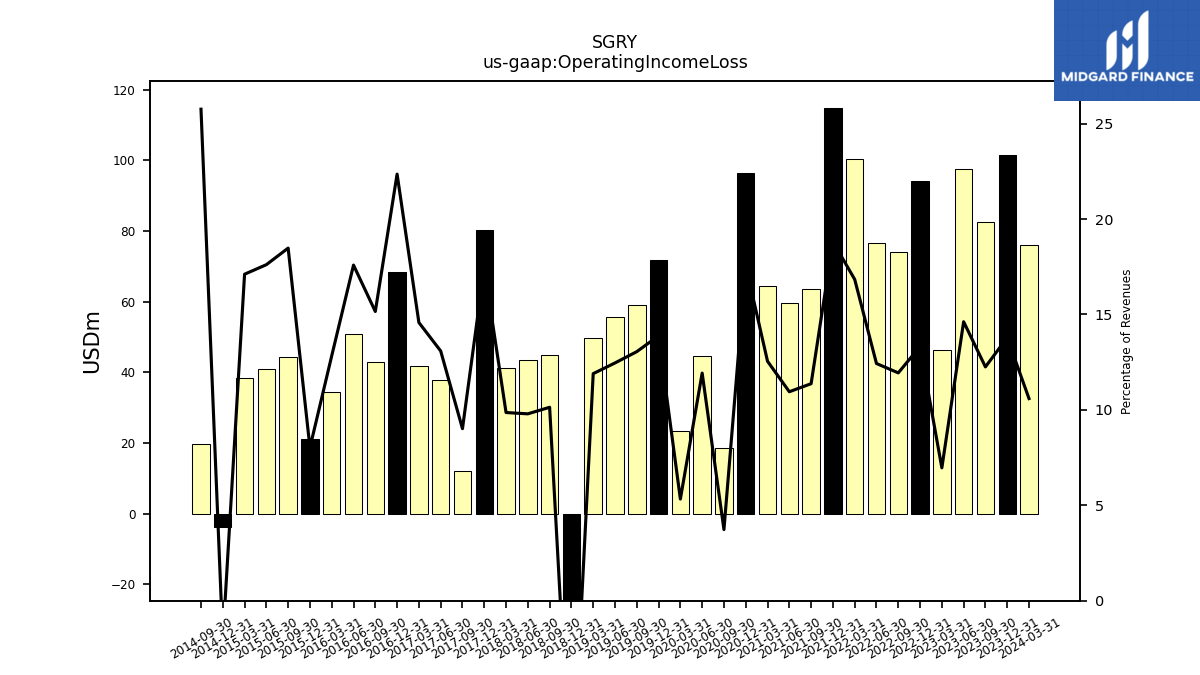
| Operating Income Loss | 101.40 | 82.60 | 97.60 | 46.40 | 94.20 | 74.10 | 76.50 | 100.40 | 114.80 | 63.60 | 59.50 | 64.30 | 96.30 | 18.50 | 44.70 | 23.50 | 71.80 | 59.00 | 55.50 | 49.60 | -51.89 | 45.00 | 43.56 | 41.16 | 80.34 | 11.93 | 37.74 | 41.72 | 68.41 | 42.85 | 50.95 | 34.28 | 21.13 | 44.27 | 41.00 | 38.35 | -3.67 | 19.65 | NA | NA | |
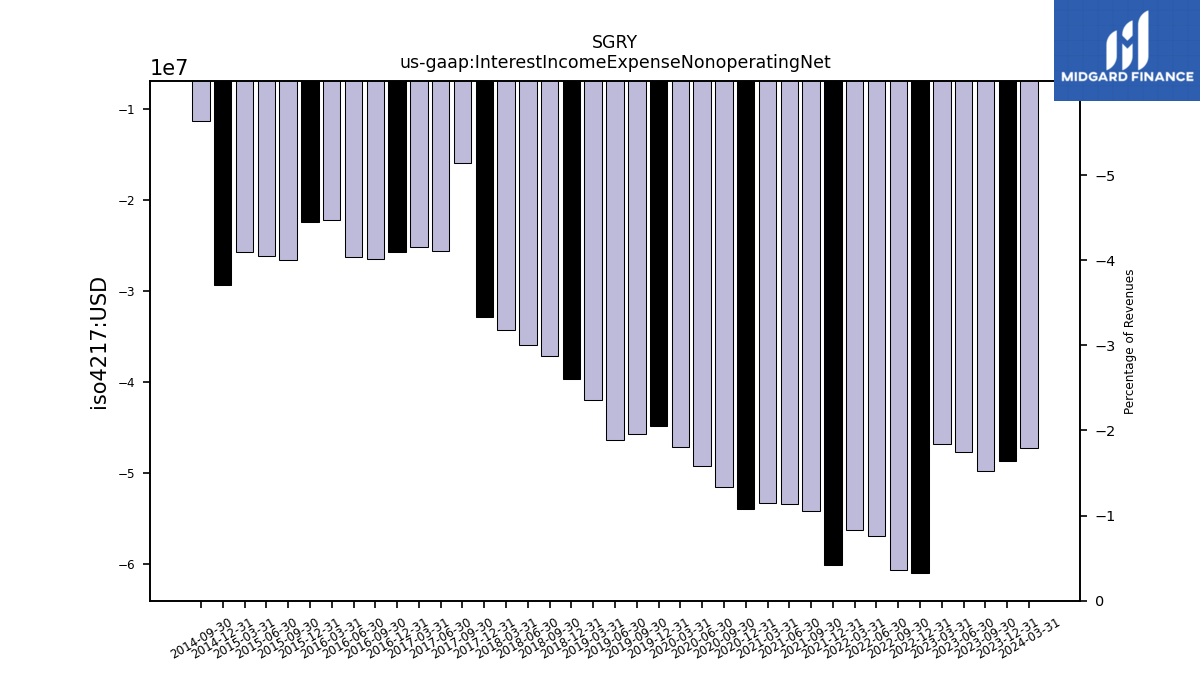
| Interest Income Expense Nonoperating Net | -48.70 | -49.80 | -47.70 | -46.80 | -61.00 | -60.70 | -56.90 | -56.30 | -60.10 | -54.20 | -53.40 | -53.30 | -54.00 | -51.50 | -49.20 | -47.10 | -44.80 | -45.70 | -46.40 | -42.00 | -39.63 | -37.16 | -35.93 | -34.28 | -32.86 | -15.88 | -25.60 | -25.18 | -25.71 | -26.48 | -26.23 | -22.15 | -22.47 | -26.57 | -26.18 | -25.76 | -29.38 | -11.26 | NA | NA | |
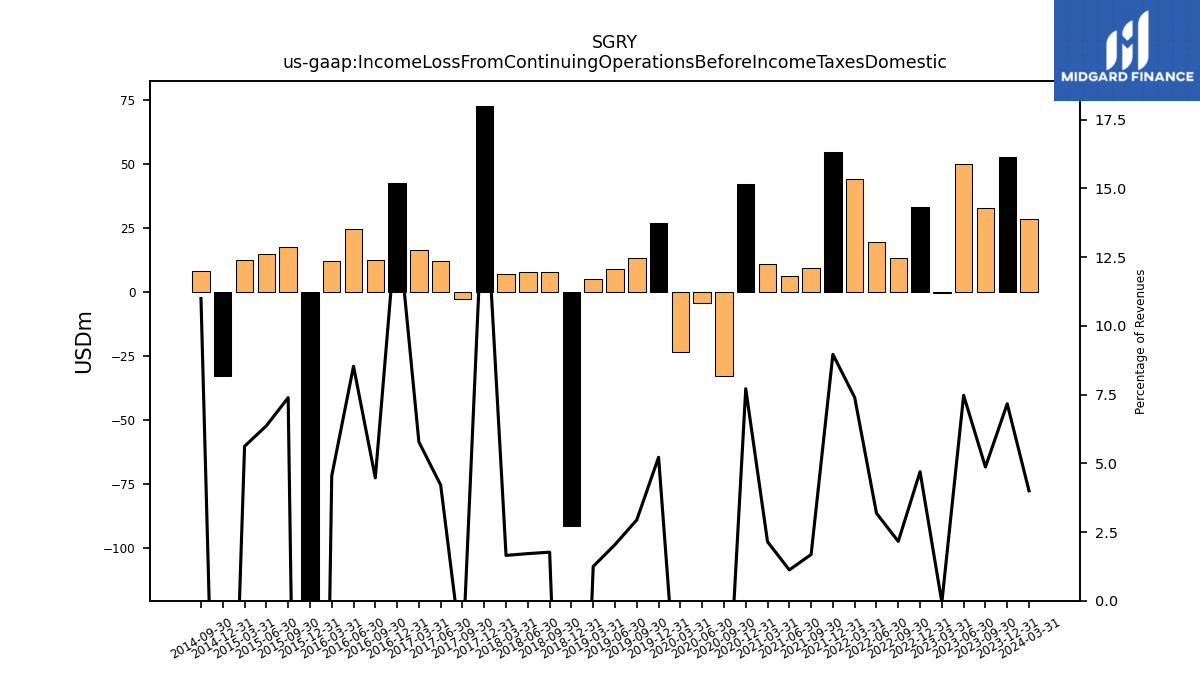
| Income Loss From Continuing Operations Before Income Taxes Domestic | 52.70 | 32.80 | 49.90 | -0.40 | 33.20 | 13.40 | 19.60 | 44.10 | 54.70 | 9.40 | 6.10 | 11.00 | 42.30 | -33.00 | -4.50 | -23.60 | 27.00 | 13.30 | 9.10 | 5.20 | -91.52 | 7.84 | 7.63 | 6.89 | 72.82 | -2.86 | 12.14 | 16.54 | 42.70 | 12.64 | 24.71 | 12.13 | -121.26 | 17.70 | 14.82 | 12.60 | -33.05 | 8.39 | NA | NA | |
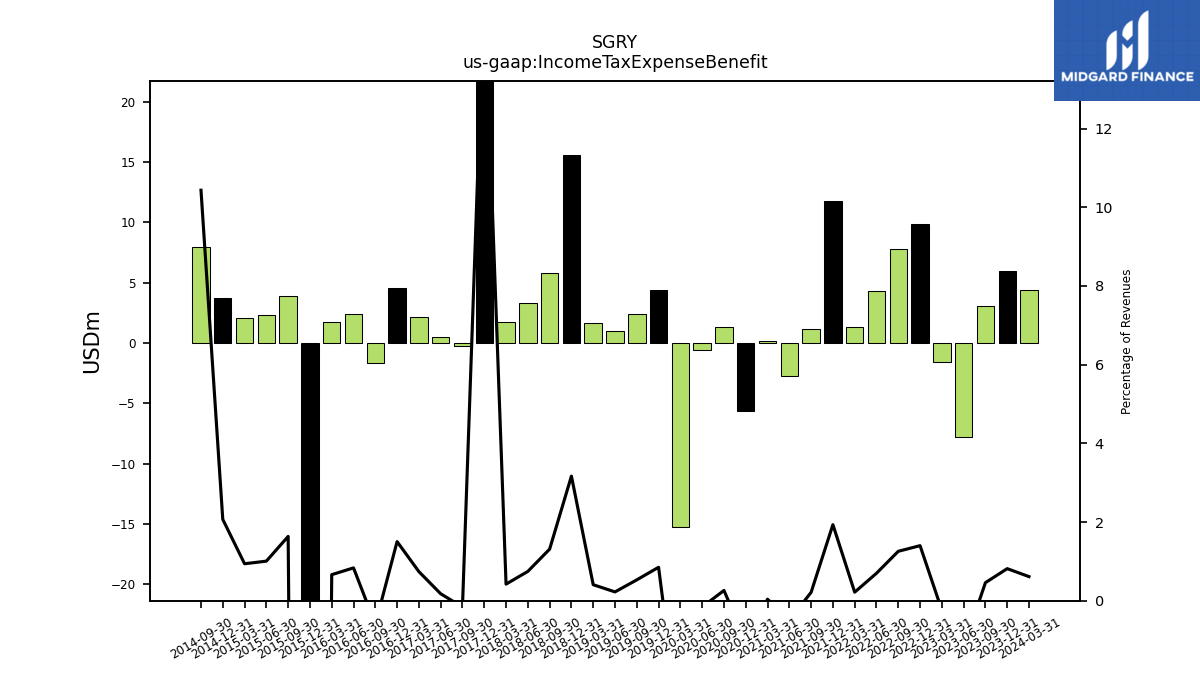
| Income Tax Expense Benefit | 6.00 | 3.10 | -7.80 | -1.60 | 9.90 | 7.80 | 4.30 | 1.30 | 11.80 | 1.20 | -2.70 | 0.20 | -5.60 | 1.30 | -0.60 | -15.20 | 4.40 | 2.40 | 1.00 | 1.70 | 15.56 | 5.83 | 3.32 | 1.76 | 71.85 | -0.21 | 0.51 | 2.12 | 4.60 | -1.69 | 2.42 | 1.77 | -157.35 | 3.92 | 2.34 | 2.11 | 3.71 | 7.96 | NA | NA | |
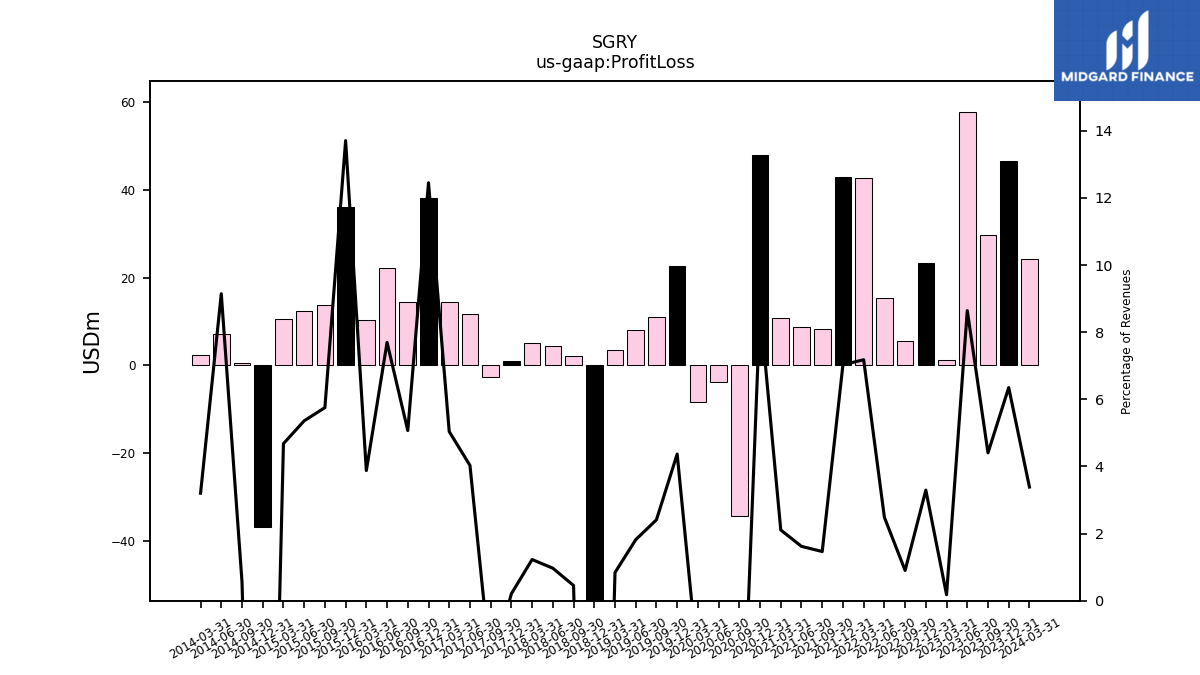
| Profit Loss | 46.70 | 29.70 | 57.70 | 1.20 | 23.30 | 5.60 | 15.30 | 42.80 | 42.90 | 8.20 | 8.80 | 10.80 | 47.90 | -34.30 | -3.90 | -8.40 | 22.60 | 10.90 | 8.10 | 3.50 | -107.08 | 2.02 | 4.31 | 5.12 | 0.97 | -2.65 | 11.63 | 14.42 | 38.10 | 14.33 | 22.29 | 10.36 | 36.09 | 13.78 | 12.48 | 10.49 | -36.77 | 0.43 | 7.03 | 2.26 | |
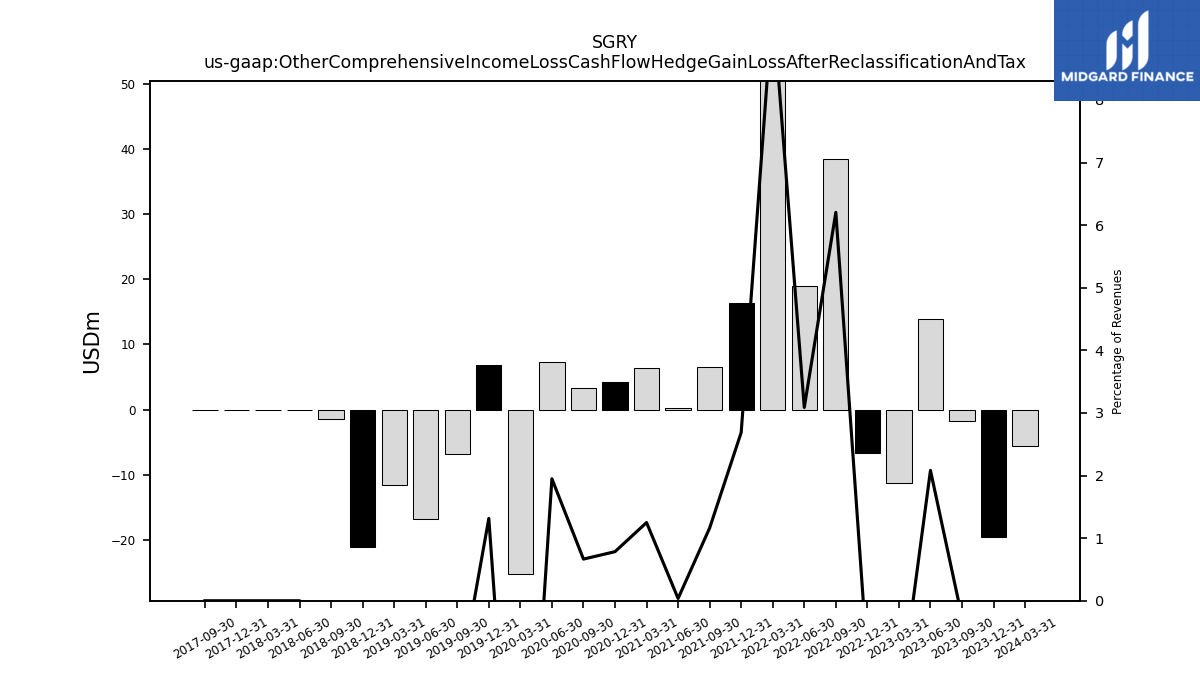
| Other Comprehensive Income Loss Cash Flow Hedge Gain Loss After Reclassification And Tax | -19.50 | -1.80 | 13.90 | -11.30 | -6.60 | 38.50 | 19.00 | 56.80 | 16.40 | 6.50 | 0.20 | 6.40 | 4.30 | 3.30 | 7.30 | -25.20 | 6.80 | -6.80 | -16.80 | -11.50 | -21.06 | -1.39 | 0.00 | 0.00 | 0.00 | 0.00 | NA | NA | NA | NA | NA | NA | NA | NA | NA | NA | NA | NA | NA | NA | |
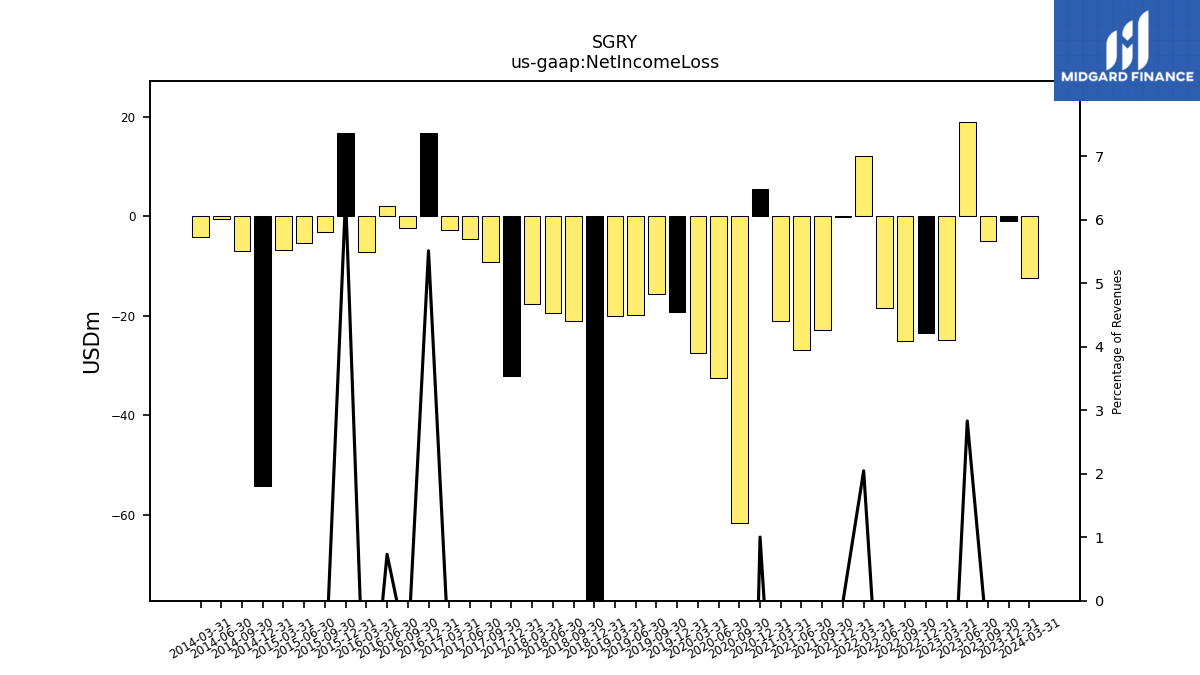
| Net Income Loss | -1.00 | -4.90 | 18.90 | -24.90 | -23.40 | -25.00 | -18.40 | 12.20 | -0.10 | -22.90 | -26.90 | -21.00 | 5.50 | -61.60 | -32.50 | -27.50 | -19.20 | -15.70 | -19.80 | -20.10 | -147.74 | -20.98 | -19.46 | -17.52 | -32.18 | -9.14 | -4.47 | -2.75 | 16.86 | -2.34 | 2.12 | -7.19 | 16.74 | -3.12 | -5.43 | -6.76 | -54.26 | -6.91 | -0.61 | -4.12 | |
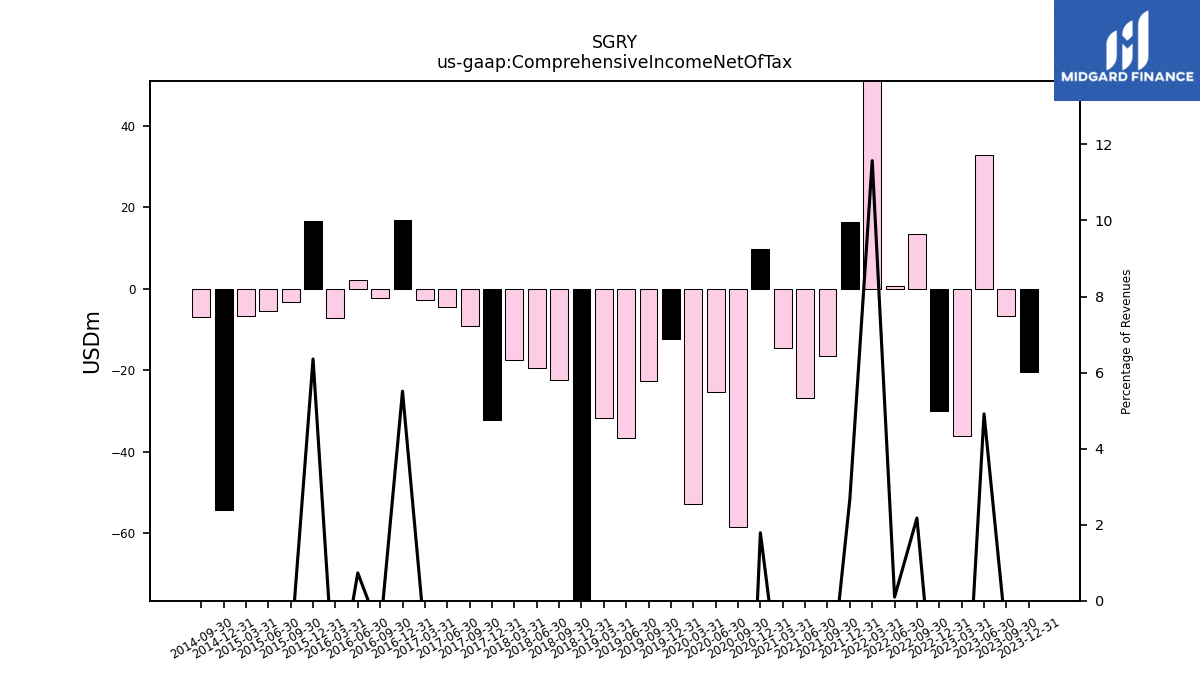
| Comprehensive Income Net Of Tax | -20.50 | -6.70 | 32.80 | -36.20 | -30.00 | 13.50 | 0.60 | 69.00 | 16.30 | -16.40 | -26.70 | -14.60 | 9.80 | -58.30 | -25.20 | -52.70 | -12.40 | -22.50 | -36.60 | -31.60 | -168.80 | -22.37 | -19.50 | -17.52 | -32.18 | -9.14 | -4.47 | -2.75 | 16.86 | -2.34 | 2.12 | -7.19 | 16.74 | -3.12 | -5.43 | -6.76 | -54.26 | -6.91 | NA | NA |
| 2023-12-31 | 2023-09-30 | 2023-06-30 | 2023-03-31 | 2022-12-31 | 2022-09-30 | 2022-06-30 | 2022-03-31 | 2021-12-31 | 2021-09-30 | 2021-06-30 | 2021-03-31 | 2020-12-31 | 2020-09-30 | 2020-06-30 | 2020-03-31 | 2019-12-31 | 2019-09-30 | 2019-06-30 | 2019-03-31 | 2018-12-31 | 2018-09-30 | 2018-06-30 | 2018-03-31 | 2017-12-31 | 2017-09-30 | 2017-06-30 | 2017-03-31 | 2016-12-31 | 2016-09-30 | 2016-06-30 | 2016-03-31 | 2015-12-31 | 2015-09-30 | 2015-06-30 | 2015-03-31 | 2014-12-31 | 2014-09-30 | 2014-06-30 | 2014-03-31 | ||
|---|---|---|---|---|---|---|---|---|---|---|---|---|---|---|---|---|---|---|---|---|---|---|---|---|---|---|---|---|---|---|---|---|---|---|---|---|---|---|---|---|---|
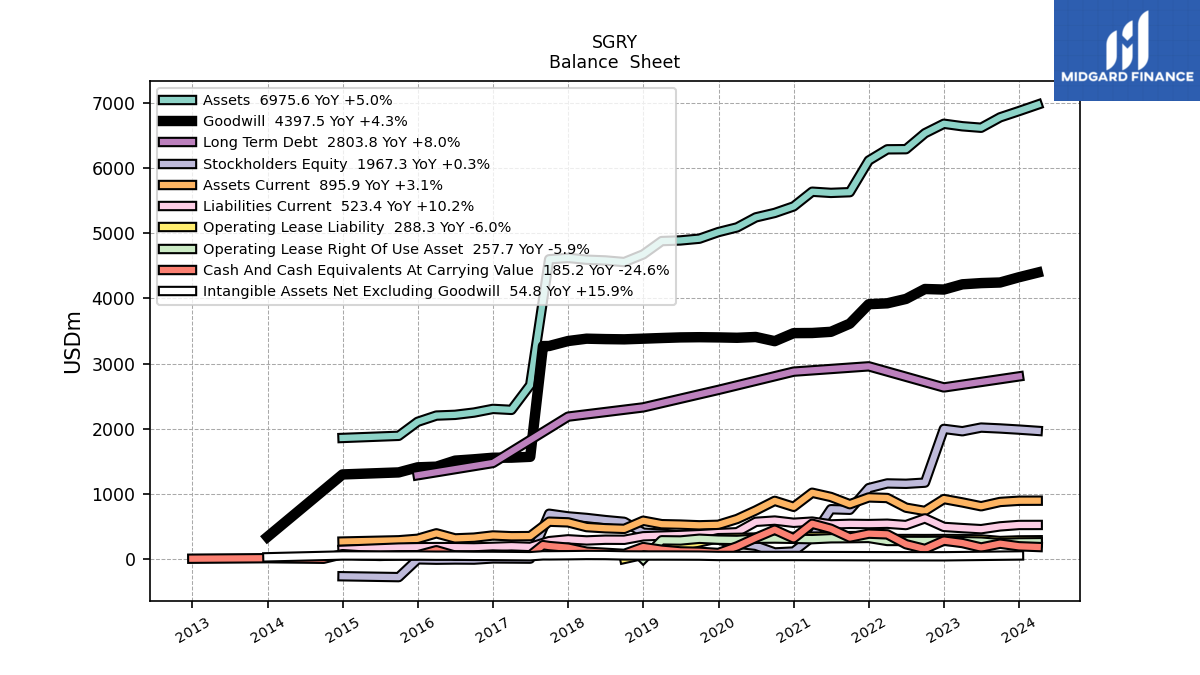
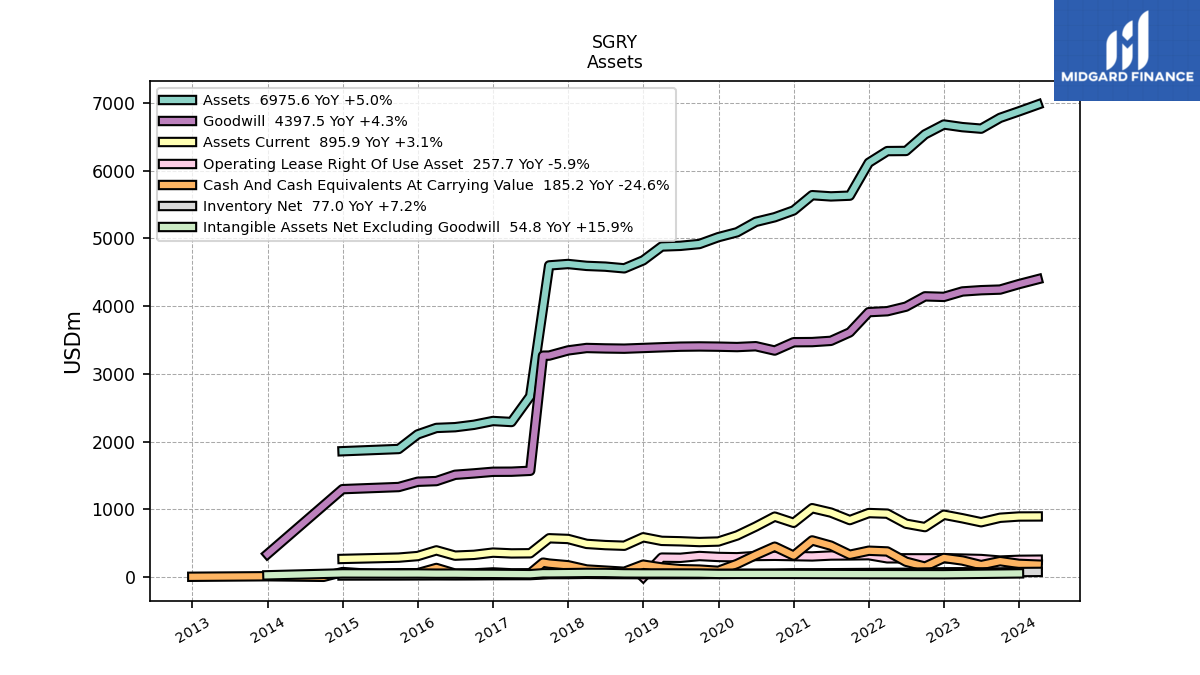
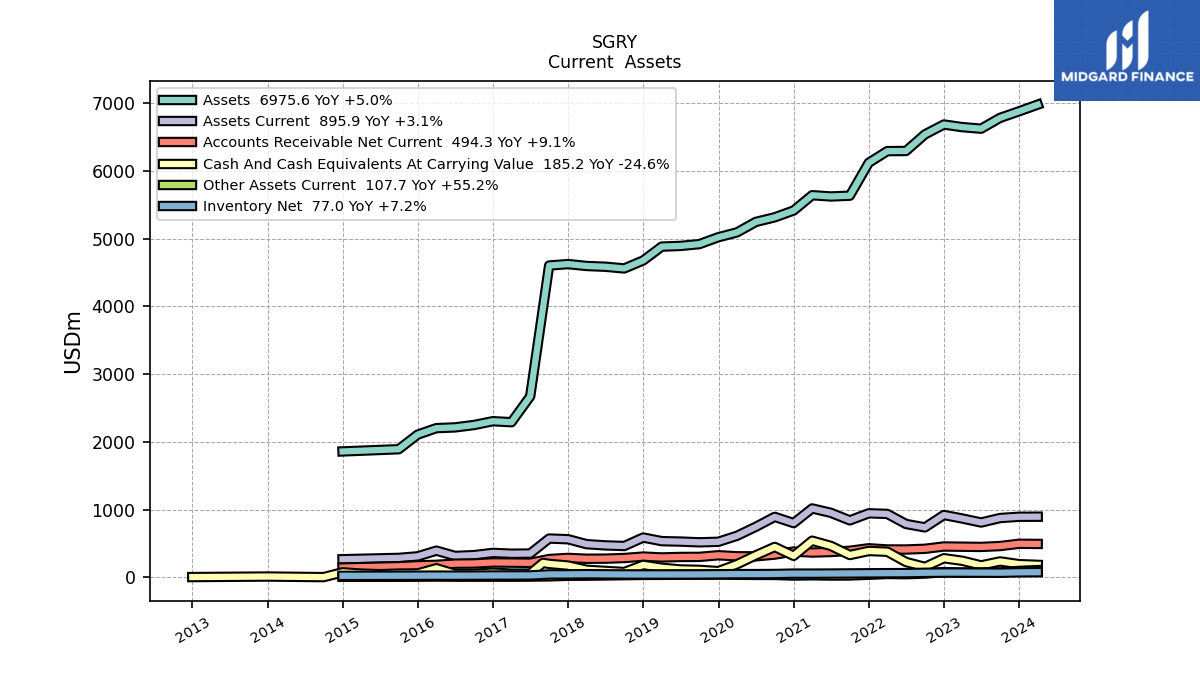
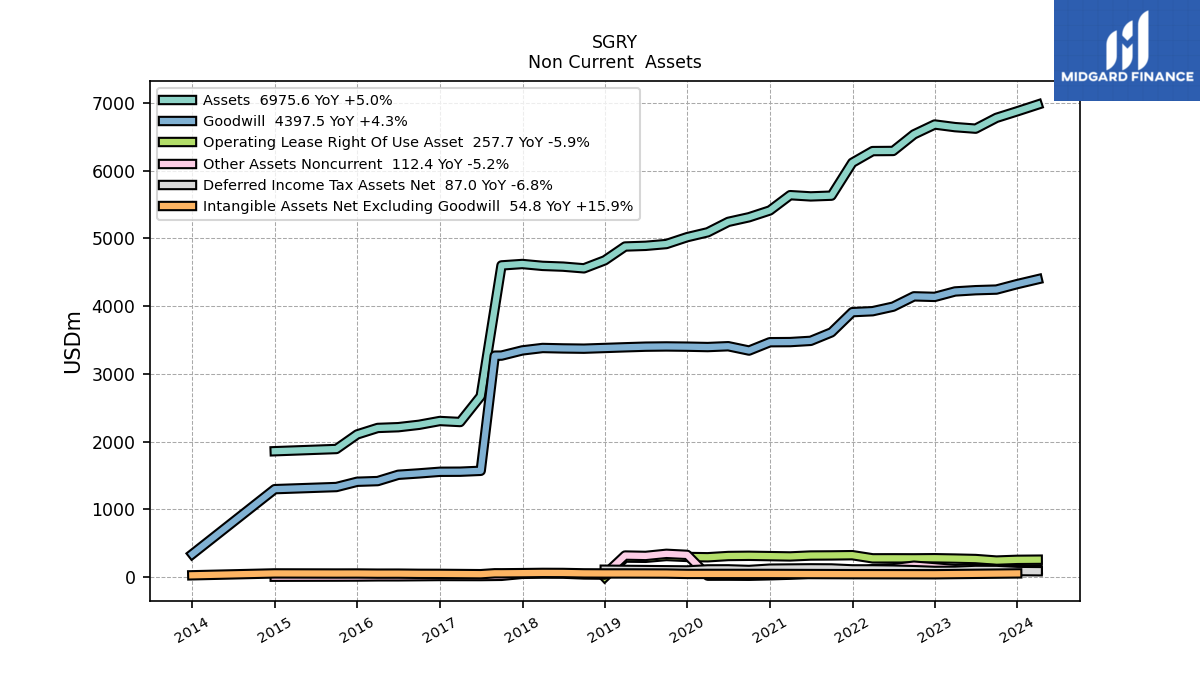
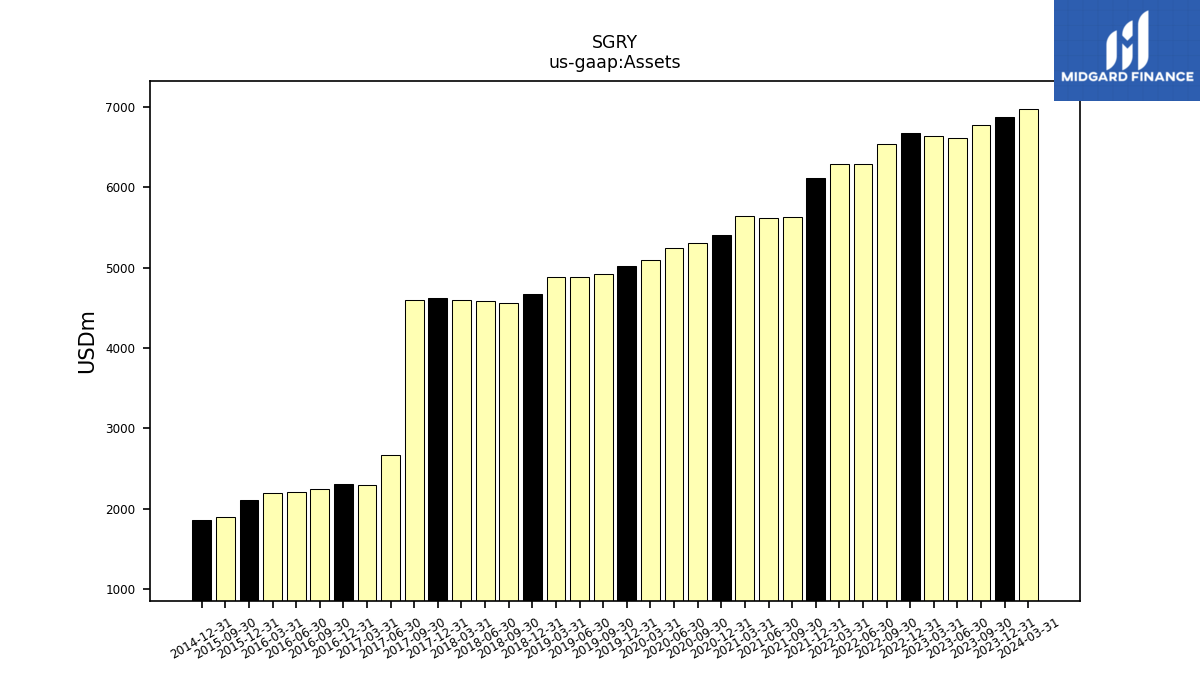
| Assets | 6876.70 | 6780.10 | 6620.60 | 6643.30 | 6682.10 | 6536.50 | 6291.60 | 6289.50 | 6117.60 | 5631.60 | 5620.60 | 5639.00 | 5413.20 | 5312.90 | 5244.70 | 5090.90 | 5018.90 | 4917.50 | 4890.90 | 4880.90 | 4676.27 | 4558.66 | 4583.73 | 4594.88 | 4622.77 | 4601.85 | 2671.49 | 2289.73 | 2304.96 | 2248.72 | 2213.52 | 2202.34 | 2106.68 | 1891.52 | NA | NA | 1858.79 | NA | NA | NA | |
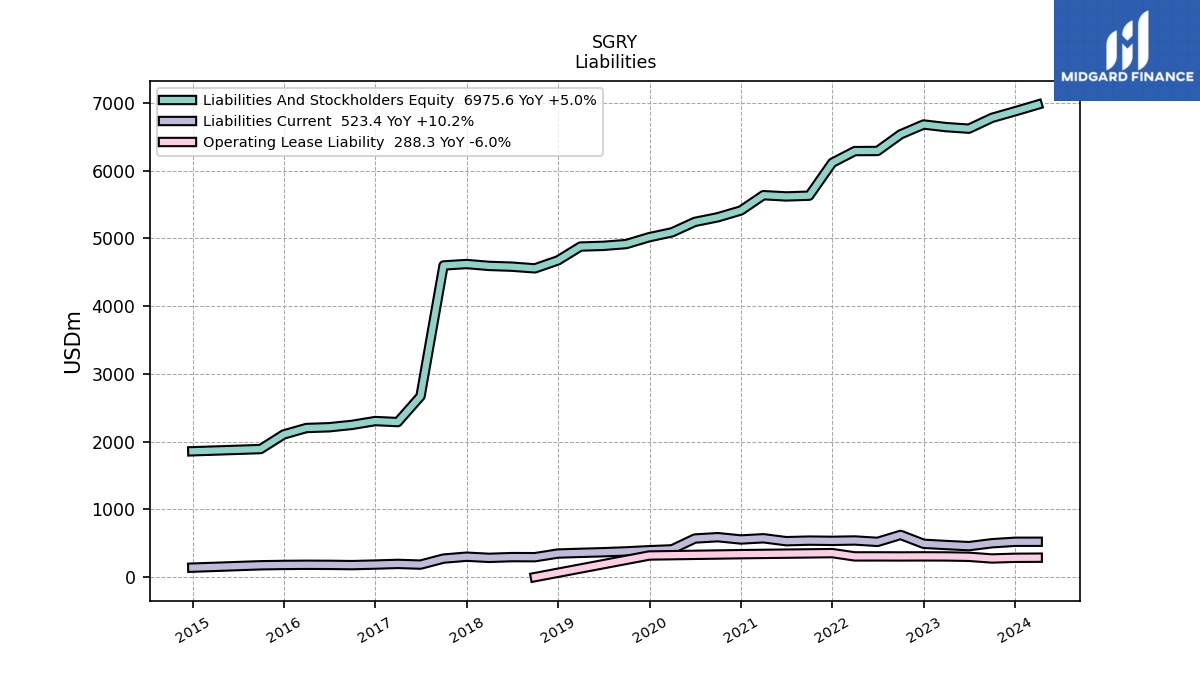
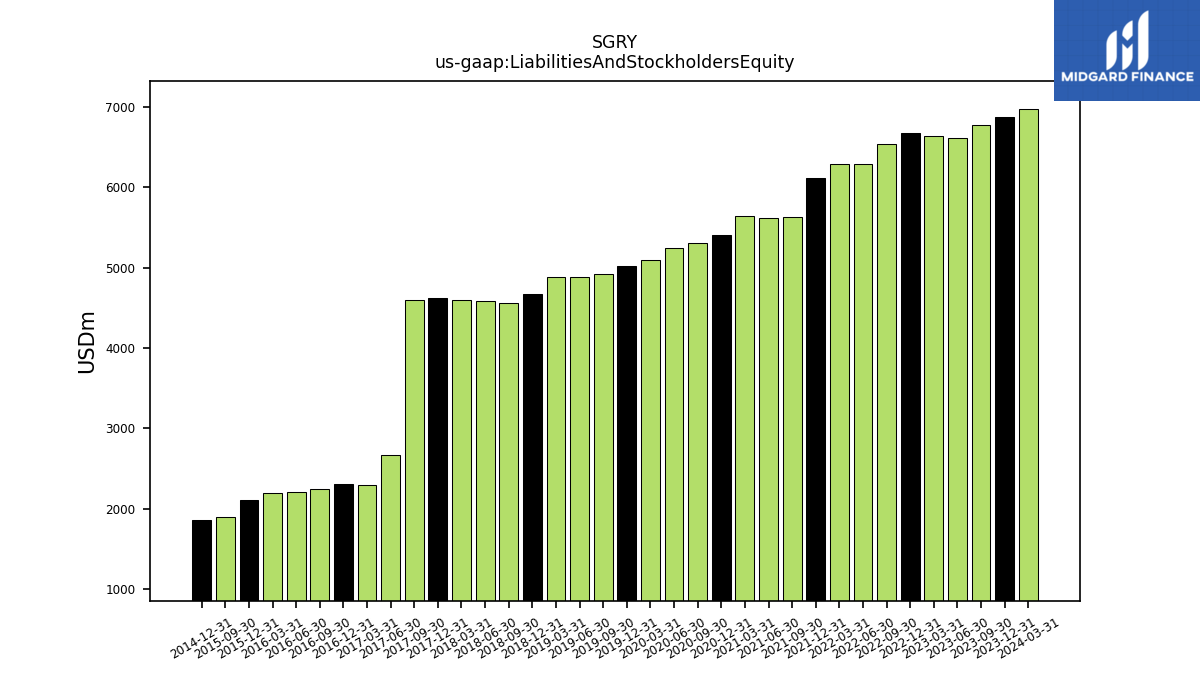
| Liabilities And Stockholders Equity | 6876.70 | 6780.10 | 6620.60 | 6643.30 | 6682.10 | 6536.50 | 6291.60 | 6289.50 | 6117.60 | 5631.60 | 5620.60 | 5639.00 | 5413.20 | 5312.90 | 5244.70 | 5090.90 | 5018.90 | 4917.50 | 4890.90 | 4880.90 | 4676.27 | 4558.66 | 4583.73 | 4594.88 | 4622.77 | 4601.85 | 2671.49 | 2289.73 | 2304.96 | 2248.72 | 2213.52 | 2202.34 | 2106.68 | 1891.52 | NA | NA | 1858.79 | NA | NA | NA | |
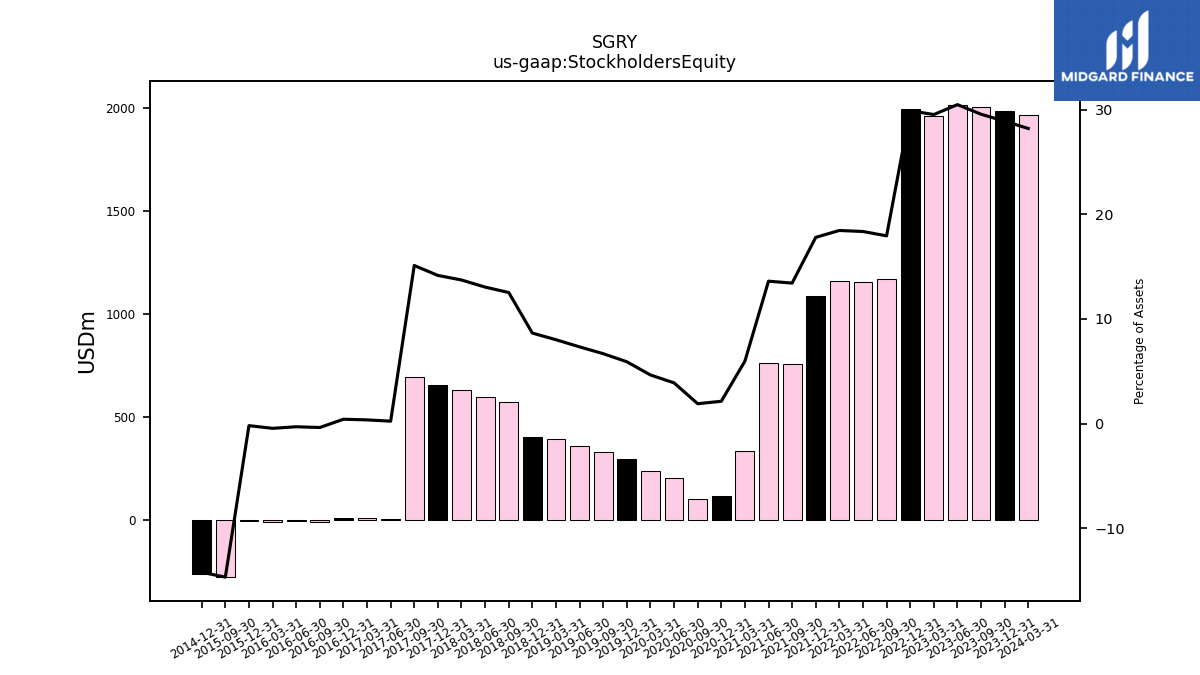
| Stockholders Equity | 1987.20 | 2004.60 | 2018.20 | 1962.00 | 1998.20 | 1172.90 | 1155.10 | 1160.90 | 1089.00 | 756.30 | 765.10 | 336.50 | 115.60 | 101.20 | 204.40 | 236.70 | 296.80 | 328.70 | 358.70 | 391.40 | 404.64 | 571.07 | 598.05 | 630.66 | 654.73 | 695.40 | 6.25 | 8.20 | 9.68 | -8.33 | -6.63 | -9.89 | -4.03 | -277.44 | NA | NA | -264.08 | NA | NA | NA |
| 2023-12-31 | 2023-09-30 | 2023-06-30 | 2023-03-31 | 2022-12-31 | 2022-09-30 | 2022-06-30 | 2022-03-31 | 2021-12-31 | 2021-09-30 | 2021-06-30 | 2021-03-31 | 2020-12-31 | 2020-09-30 | 2020-06-30 | 2020-03-31 | 2019-12-31 | 2019-09-30 | 2019-06-30 | 2019-03-31 | 2018-12-31 | 2018-09-30 | 2018-06-30 | 2018-03-31 | 2017-12-31 | 2017-09-30 | 2017-06-30 | 2017-03-31 | 2016-12-31 | 2016-09-30 | 2016-06-30 | 2016-03-31 | 2015-12-31 | 2015-09-30 | 2015-06-30 | 2015-03-31 | 2014-12-31 | 2014-09-30 | 2014-06-30 | 2014-03-31 | ||
|---|---|---|---|---|---|---|---|---|---|---|---|---|---|---|---|---|---|---|---|---|---|---|---|---|---|---|---|---|---|---|---|---|---|---|---|---|---|---|---|---|---|
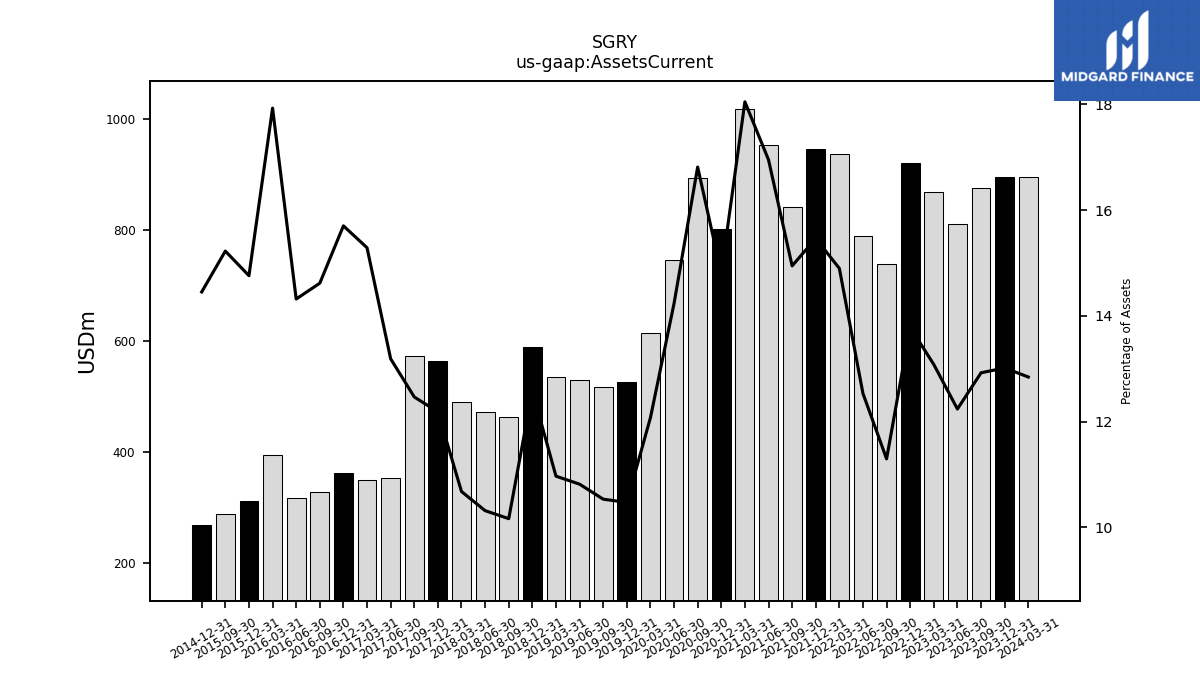
| Assets Current | 895.00 | 876.20 | 810.20 | 868.90 | 921.00 | 738.30 | 788.40 | 937.00 | 946.10 | 841.70 | 952.90 | 1017.80 | 801.50 | 893.40 | 746.50 | 614.60 | 525.50 | 517.90 | 529.00 | 535.30 | 588.32 | 463.32 | 472.80 | 490.58 | 563.23 | 573.66 | 352.31 | 350.08 | 361.95 | 328.73 | 316.95 | 394.89 | 310.96 | 288.00 | NA | NA | 268.65 | NA | NA | NA | |
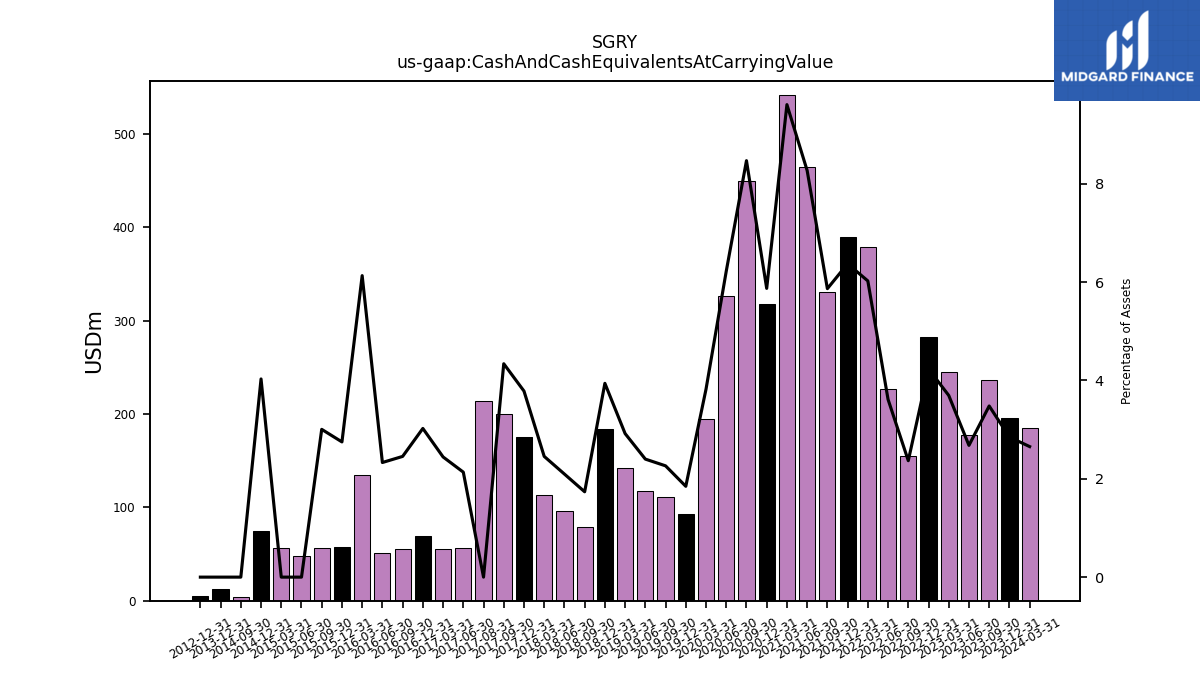
| Cash And Cash Equivalents At Carrying Value | 195.90 | 236.00 | 177.40 | 245.50 | 282.90 | 154.80 | 227.40 | 378.90 | 389.90 | 330.40 | 464.80 | 541.90 | 317.90 | 450.00 | 326.30 | 194.60 | 92.70 | 111.30 | 117.40 | 142.50 | 184.31 | 79.12 | 96.07 | 112.82 | 174.91 | 199.70 | 57.03 | 55.97 | 69.70 | 55.21 | 51.60 | 135.05 | 57.93 | 56.85 | 47.91 | 56.44 | 74.92 | 4.39 | NA | NA | |
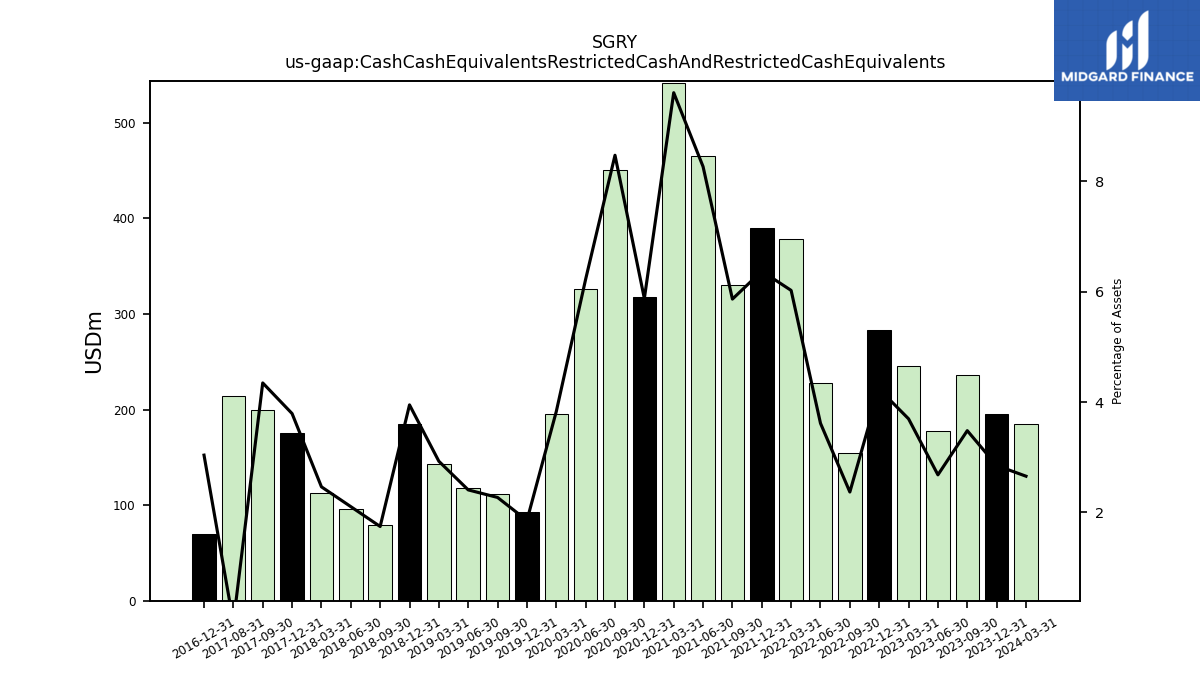
| Cash Cash Equivalents Restricted Cash And Restricted Cash Equivalents | 195.90 | 236.00 | 177.40 | 245.50 | 282.90 | 154.80 | 227.40 | 378.90 | 389.90 | 330.40 | 464.80 | 541.90 | 318.20 | 450.30 | 326.60 | 194.90 | 93.00 | 111.60 | 117.70 | 142.80 | 184.62 | 79.44 | 96.38 | 113.13 | 175.23 | 200.02 | NA | NA | 70.00 | NA | NA | NA | NA | NA | NA | NA | NA | NA | NA | NA | |
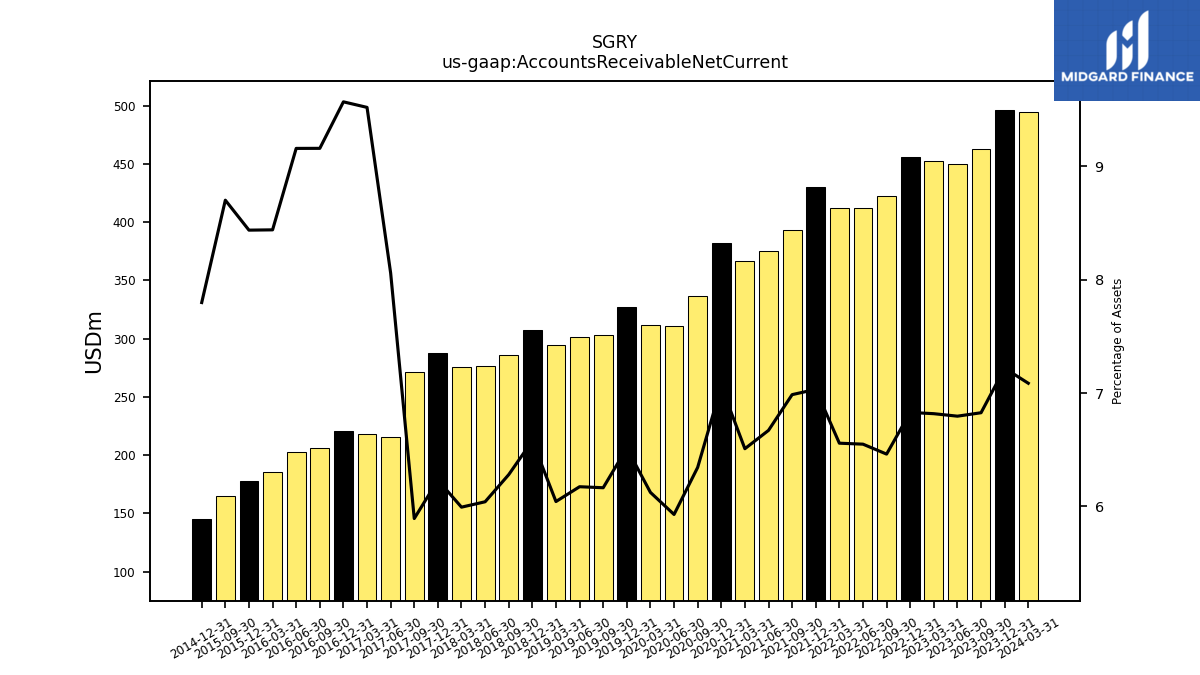
| Accounts Receivable Net Current | 496.40 | 462.80 | 449.90 | 452.90 | 456.30 | 422.30 | 412.00 | 412.40 | 430.20 | 393.40 | 374.90 | 367.00 | 382.20 | 337.00 | 310.90 | 311.70 | 326.90 | 303.10 | 301.90 | 294.90 | 307.64 | 286.26 | 276.85 | 275.34 | 288.02 | 271.14 | 215.29 | 218.01 | 220.59 | 205.98 | 202.74 | 185.88 | 177.76 | 164.60 | NA | NA | 144.96 | NA | NA | NA | |
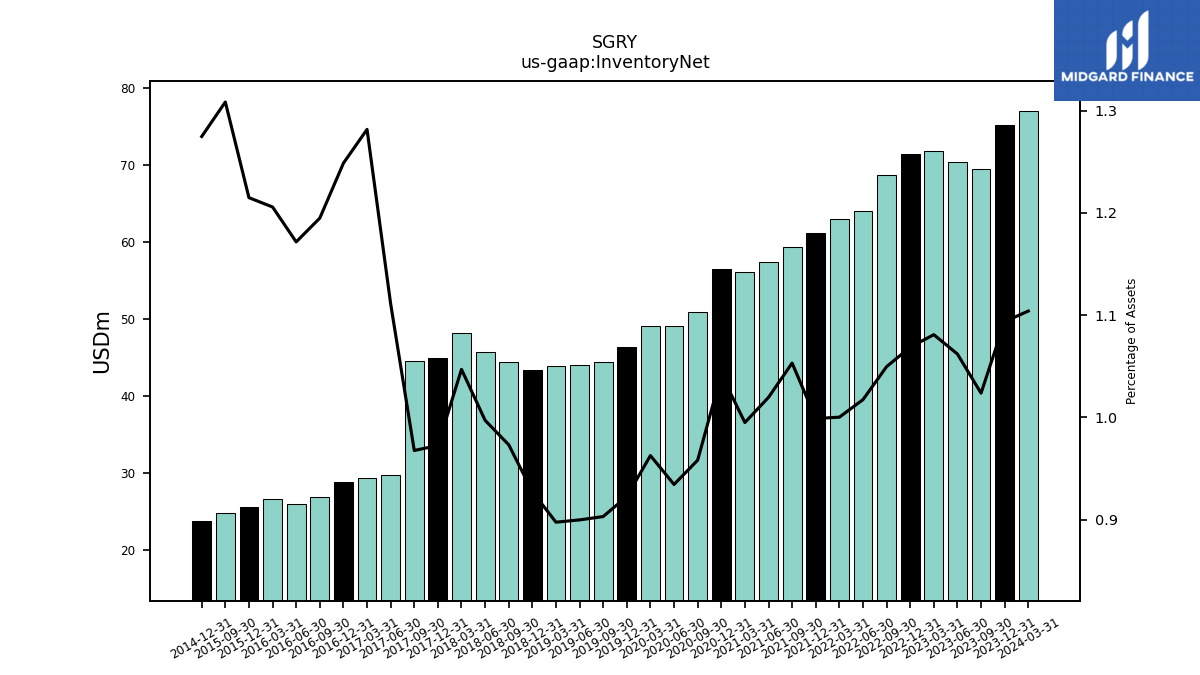
| Inventory Net | 75.20 | 69.40 | 70.30 | 71.80 | 71.40 | 68.60 | 64.00 | 62.90 | 61.10 | 59.30 | 57.30 | 56.10 | 56.40 | 50.90 | 49.00 | 49.00 | 46.30 | 44.40 | 44.00 | 43.80 | 43.36 | 44.36 | 45.70 | 48.10 | 44.95 | 44.52 | 29.68 | 29.34 | 28.78 | 26.87 | 25.93 | 26.55 | 25.59 | 24.75 | NA | NA | 23.69 | NA | NA | NA | |
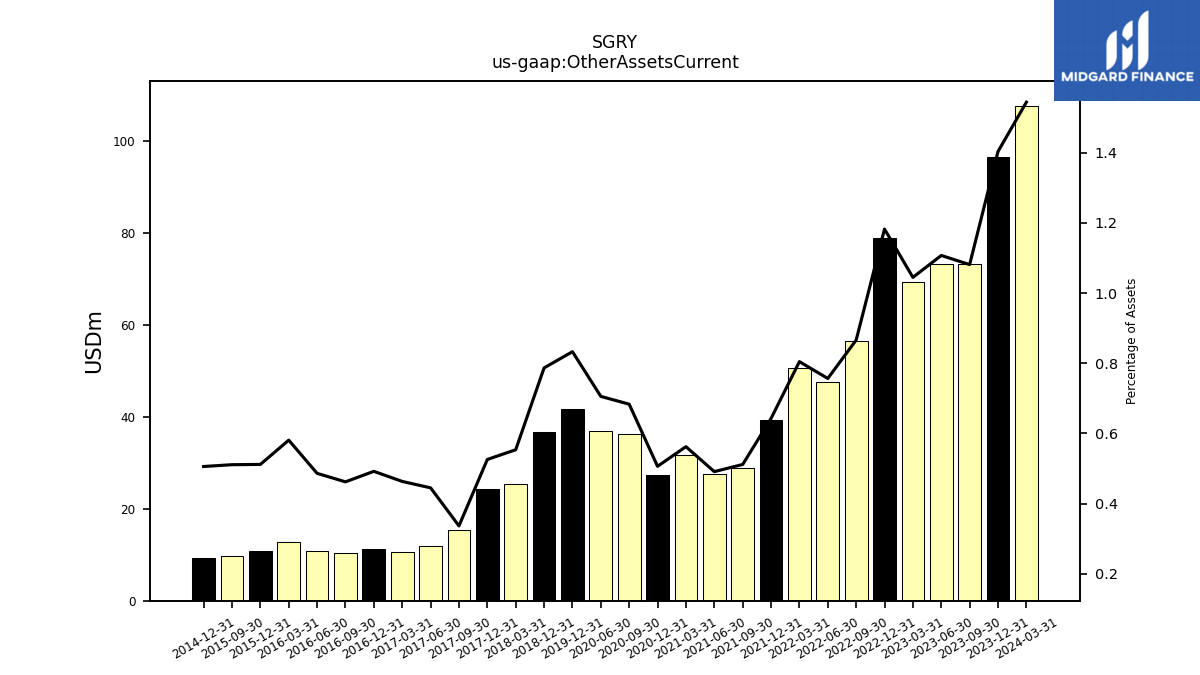
| Other Assets Current | 96.50 | 73.30 | 73.30 | 69.40 | 79.00 | 56.60 | 47.60 | 50.60 | 39.30 | 28.80 | 27.60 | 31.70 | 27.40 | 36.30 | 37.00 | NA | 41.80 | NA | NA | NA | 36.78 | NA | NA | 25.43 | 24.30 | 15.48 | 11.88 | 10.60 | 11.34 | 10.39 | 10.76 | 12.79 | 10.78 | 9.66 | NA | NA | 9.40 | NA | NA | NA |
| 2023-12-31 | 2023-09-30 | 2023-06-30 | 2023-03-31 | 2022-12-31 | 2022-09-30 | 2022-06-30 | 2022-03-31 | 2021-12-31 | 2021-09-30 | 2021-06-30 | 2021-03-31 | 2020-12-31 | 2020-09-30 | 2020-06-30 | 2020-03-31 | 2019-12-31 | 2019-09-30 | 2019-06-30 | 2019-03-31 | 2018-12-31 | 2018-09-30 | 2018-06-30 | 2018-03-31 | 2017-12-31 | 2017-09-30 | 2017-06-30 | 2017-03-31 | 2016-12-31 | 2016-09-30 | 2016-06-30 | 2016-03-31 | 2015-12-31 | 2015-09-30 | 2015-06-30 | 2015-03-31 | 2014-12-31 | 2014-09-30 | 2014-06-30 | 2014-03-31 | ||
|---|---|---|---|---|---|---|---|---|---|---|---|---|---|---|---|---|---|---|---|---|---|---|---|---|---|---|---|---|---|---|---|---|---|---|---|---|---|---|---|---|---|
| Investments In Affiliates Subsidiaries Associates And Joint Ventures | 184.10 | 196.30 | 192.20 | 191.60 | 190.30 | 189.10 | 159.70 | 94.50 | 88.70 | 89.60 | 90.20 | 90.40 | 90.30 | 91.80 | 91.10 | 90.60 | 93.20 | 93.00 | 93.40 | 78.50 | 78.48 | 80.78 | 78.13 | 75.19 | 74.28 | 64.43 | 34.49 | 35.11 | 34.98 | 34.27 | 34.72 | 34.48 | 34.10 | 33.88 | NA | NA | 33.44 | NA | NA | NA | |
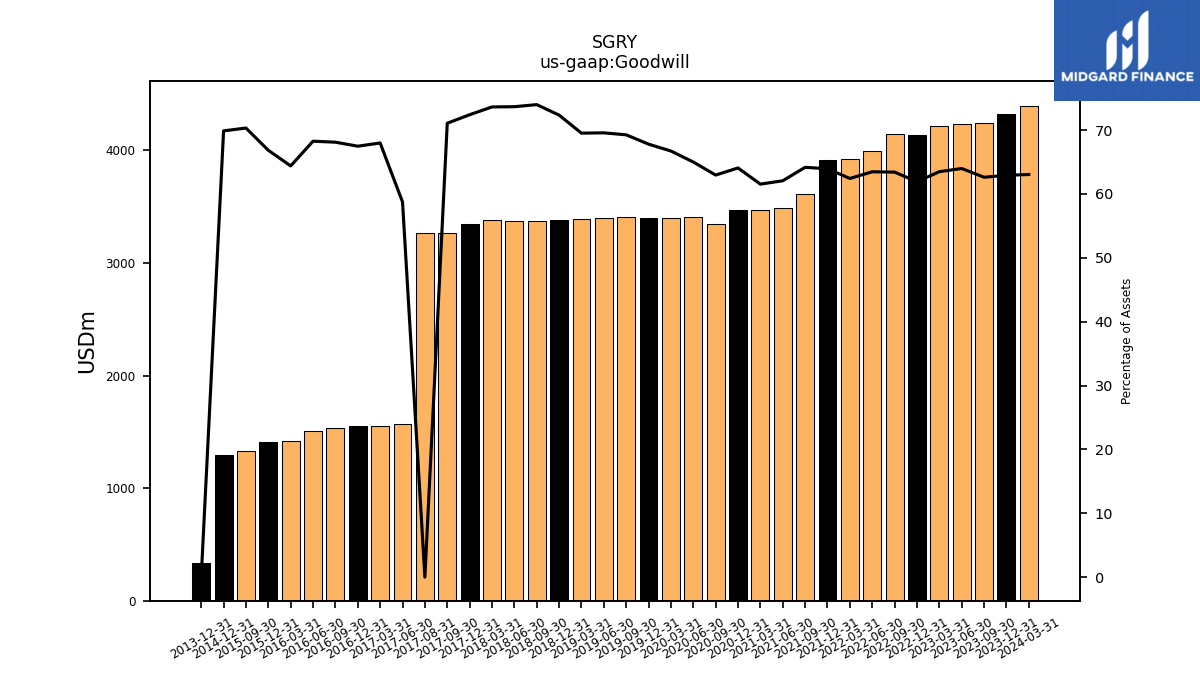
| Goodwill | 4326.00 | 4245.10 | 4235.90 | 4217.30 | 4137.10 | 4145.30 | 3993.10 | 3925.80 | 3911.80 | 3613.60 | 3488.10 | 3470.00 | 3468.00 | 3344.60 | 3408.90 | 3396.50 | 3402.40 | 3405.60 | 3402.30 | 3393.00 | 3382.85 | 3372.61 | 3376.30 | 3382.80 | 3346.84 | 3270.31 | 1569.41 | 1556.50 | 1555.20 | 1531.37 | 1510.85 | 1417.99 | 1407.93 | 1330.05 | NA | NA | 1298.75 | NA | NA | NA | |
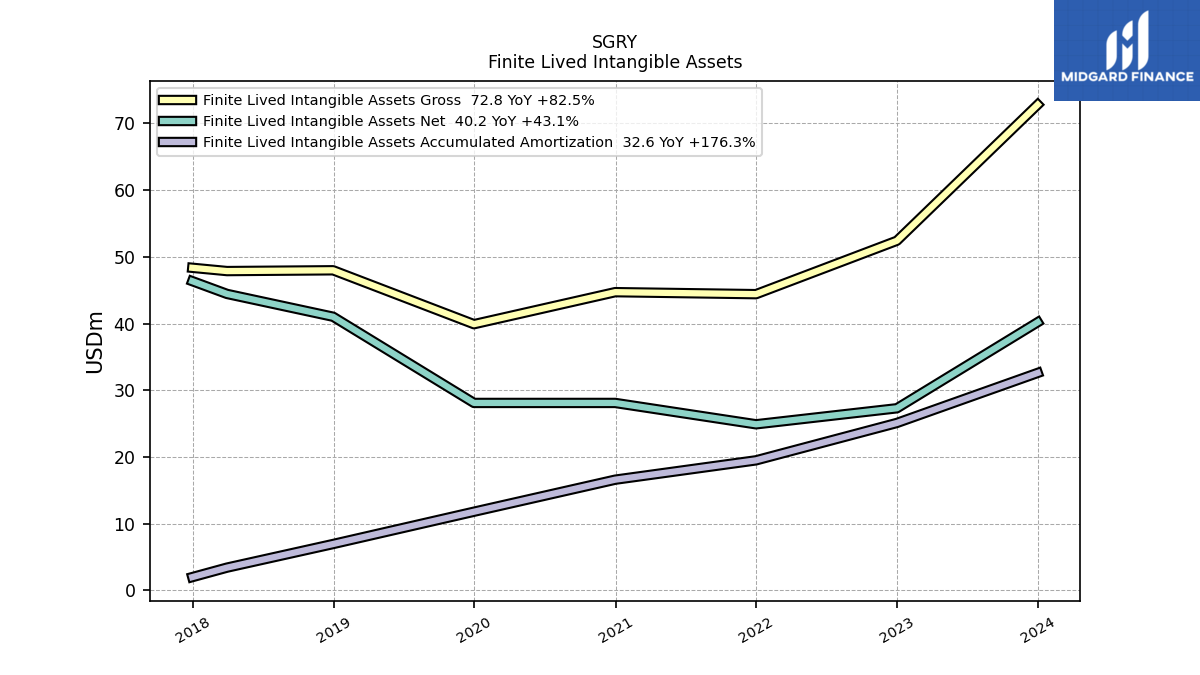
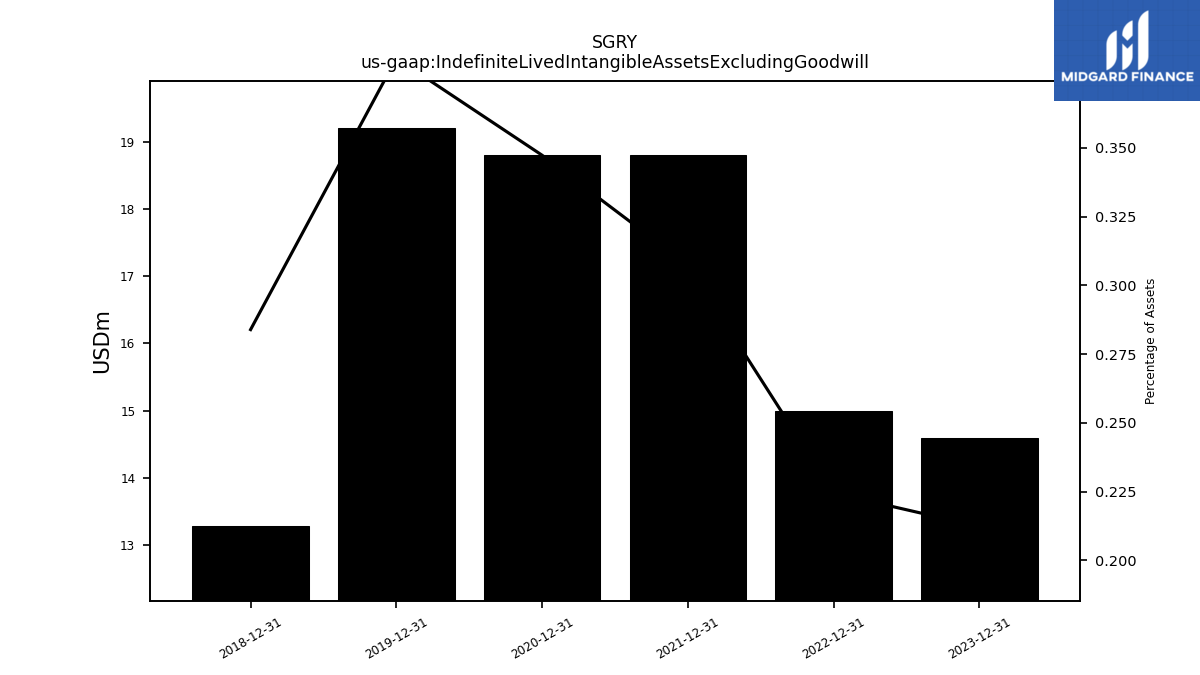
| Indefinite Lived Intangible Assets Excluding Goodwill | 14.60 | NA | NA | NA | 15.00 | NA | NA | NA | 18.80 | NA | NA | NA | 18.80 | NA | NA | NA | 19.20 | NA | NA | NA | 13.28 | NA | NA | NA | NA | NA | NA | NA | NA | NA | NA | NA | NA | NA | NA | NA | NA | NA | NA | NA | |
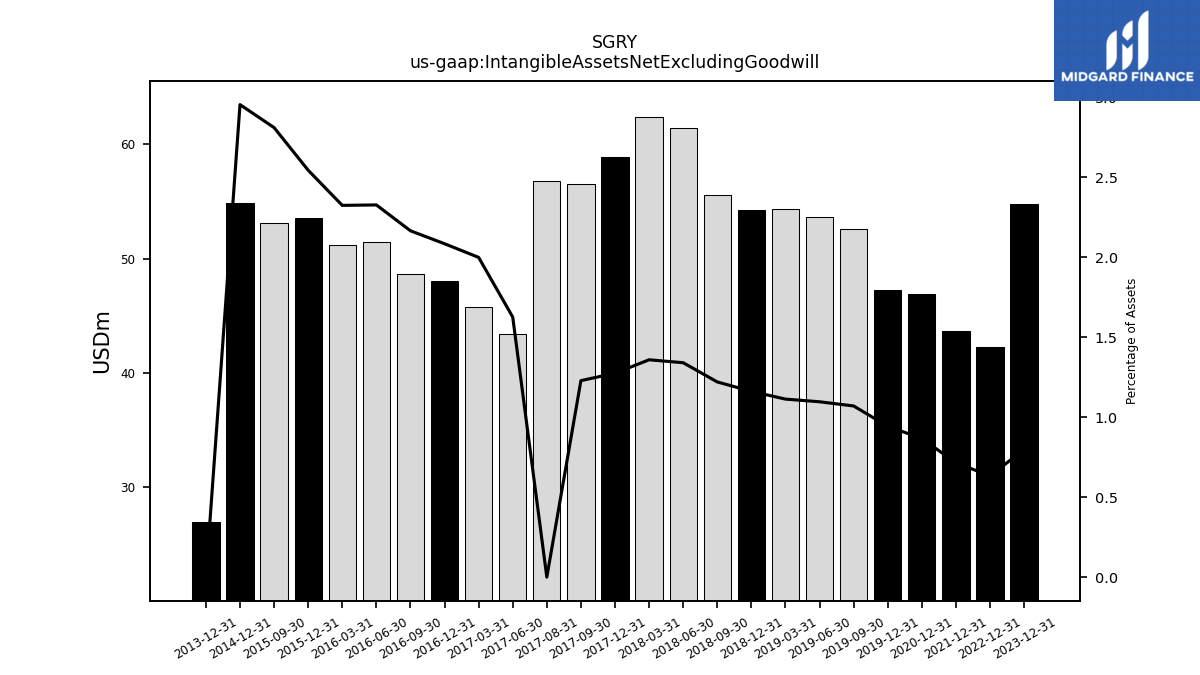
| Intangible Assets Net Excluding Goodwill | 54.80 | NA | NA | NA | 42.30 | NA | NA | NA | 43.70 | NA | NA | NA | 46.90 | NA | NA | NA | 47.30 | 52.60 | 53.60 | 54.30 | 54.29 | 55.61 | 61.42 | 62.41 | 58.91 | 56.51 | 43.42 | 45.75 | 48.02 | 48.67 | 51.49 | 51.17 | 53.57 | 53.14 | NA | NA | 54.89 | NA | NA | NA | |
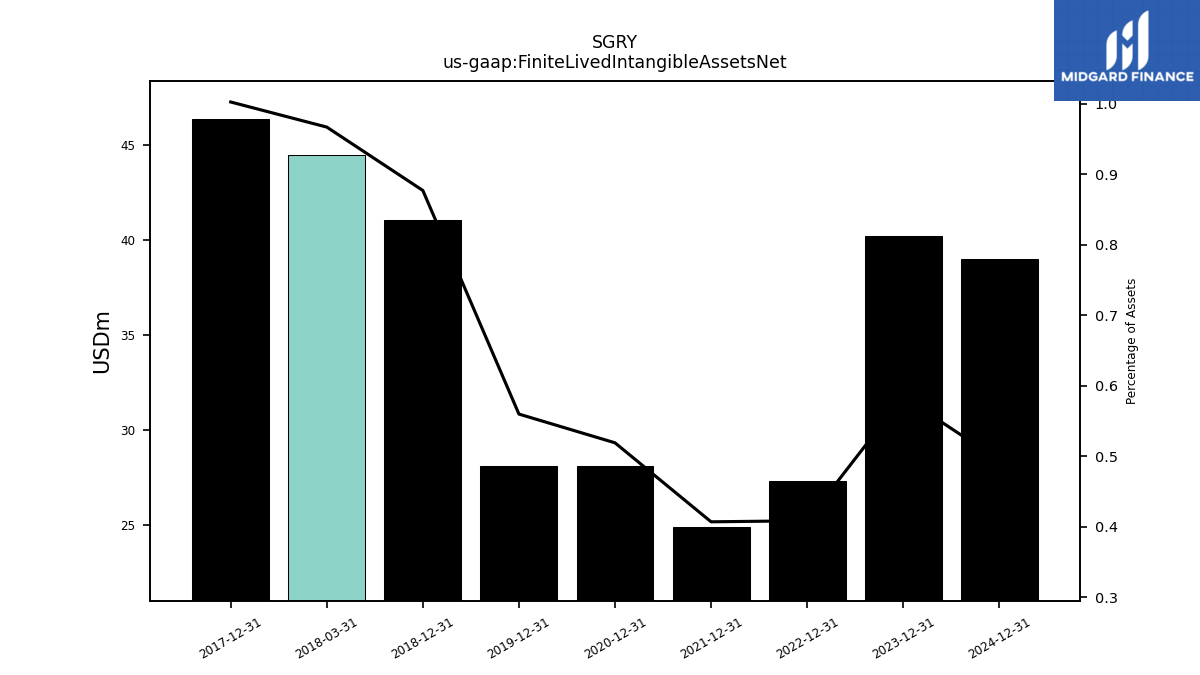
| Finite Lived Intangible Assets Net | 40.20 | NA | NA | NA | 27.30 | NA | NA | NA | 24.90 | NA | NA | NA | 28.10 | NA | NA | NA | 28.10 | NA | NA | NA | 41.02 | NA | NA | 44.44 | 46.35 | NA | NA | NA | NA | NA | NA | NA | NA | NA | NA | NA | NA | NA | NA | NA | |
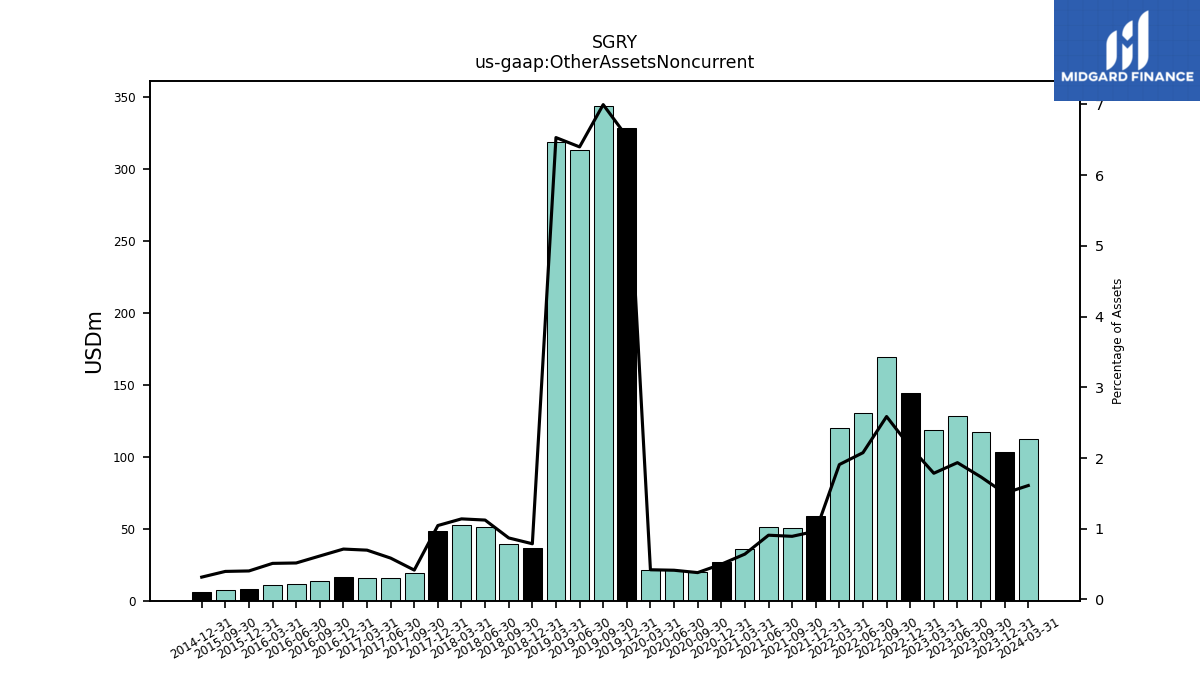
| Other Assets Noncurrent | 103.30 | 117.40 | 128.10 | 118.60 | 144.20 | 169.10 | 130.60 | 120.00 | 59.10 | 50.30 | 51.10 | 36.20 | 27.00 | 20.20 | 21.70 | 21.40 | 328.50 | 344.10 | 313.00 | 318.80 | 36.85 | 39.67 | 51.48 | 52.38 | 48.35 | 19.13 | 15.63 | 15.97 | 16.43 | 13.83 | 11.43 | 11.25 | 8.50 | 7.51 | NA | NA | 5.88 | NA | NA | NA |
| 2023-12-31 | 2023-09-30 | 2023-06-30 | 2023-03-31 | 2022-12-31 | 2022-09-30 | 2022-06-30 | 2022-03-31 | 2021-12-31 | 2021-09-30 | 2021-06-30 | 2021-03-31 | 2020-12-31 | 2020-09-30 | 2020-06-30 | 2020-03-31 | 2019-12-31 | 2019-09-30 | 2019-06-30 | 2019-03-31 | 2018-12-31 | 2018-09-30 | 2018-06-30 | 2018-03-31 | 2017-12-31 | 2017-09-30 | 2017-06-30 | 2017-03-31 | 2016-12-31 | 2016-09-30 | 2016-06-30 | 2016-03-31 | 2015-12-31 | 2015-09-30 | 2015-06-30 | 2015-03-31 | 2014-12-31 | 2014-09-30 | 2014-06-30 | 2014-03-31 | ||
|---|---|---|---|---|---|---|---|---|---|---|---|---|---|---|---|---|---|---|---|---|---|---|---|---|---|---|---|---|---|---|---|---|---|---|---|---|---|---|---|---|---|
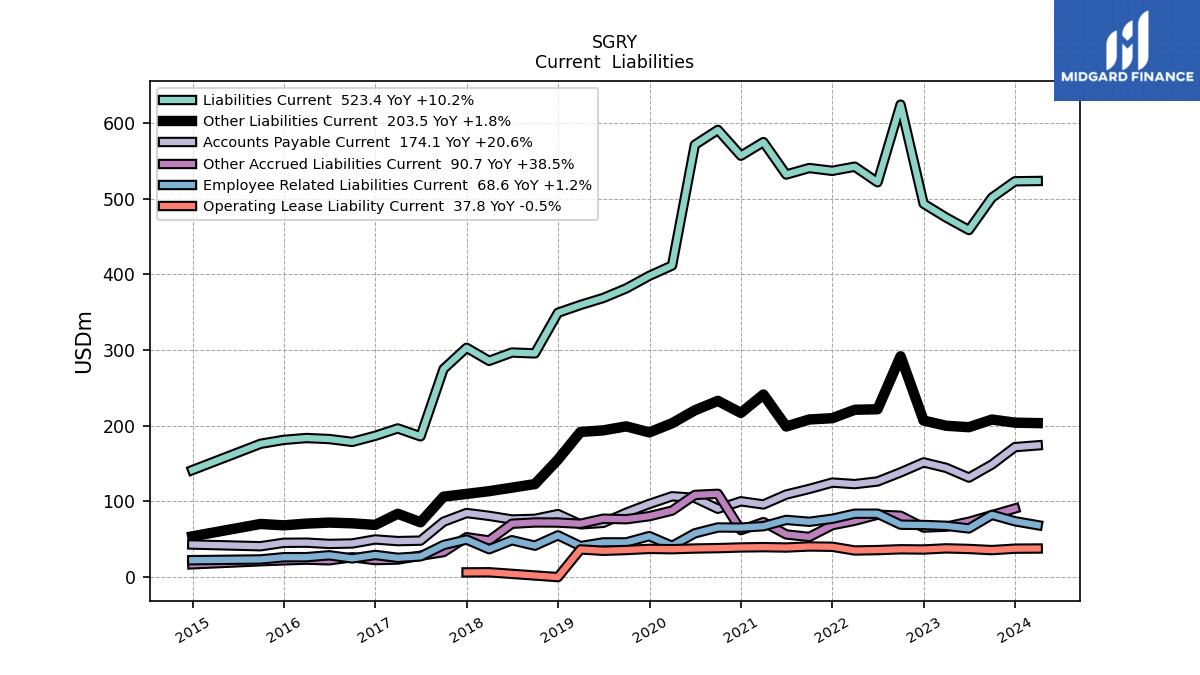
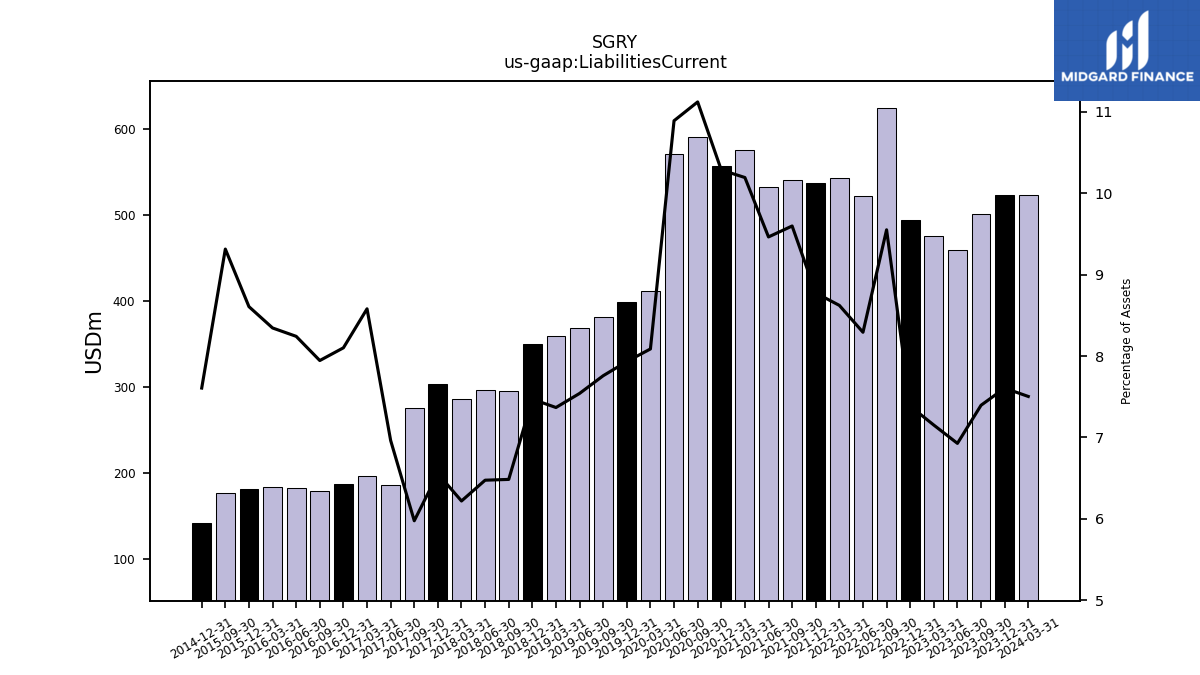
| Liabilities Current | 523.00 | 501.40 | 458.60 | 475.10 | 493.40 | 624.30 | 521.70 | 542.30 | 536.80 | 540.50 | 531.90 | 574.80 | 556.80 | 590.90 | 571.20 | 411.70 | 398.10 | 381.50 | 368.80 | 359.60 | 349.30 | 295.59 | 296.77 | 285.75 | 303.00 | 275.01 | 186.00 | 196.46 | 186.72 | 178.65 | 182.44 | 183.78 | 181.31 | 176.18 | NA | NA | 141.39 | NA | NA | NA | |
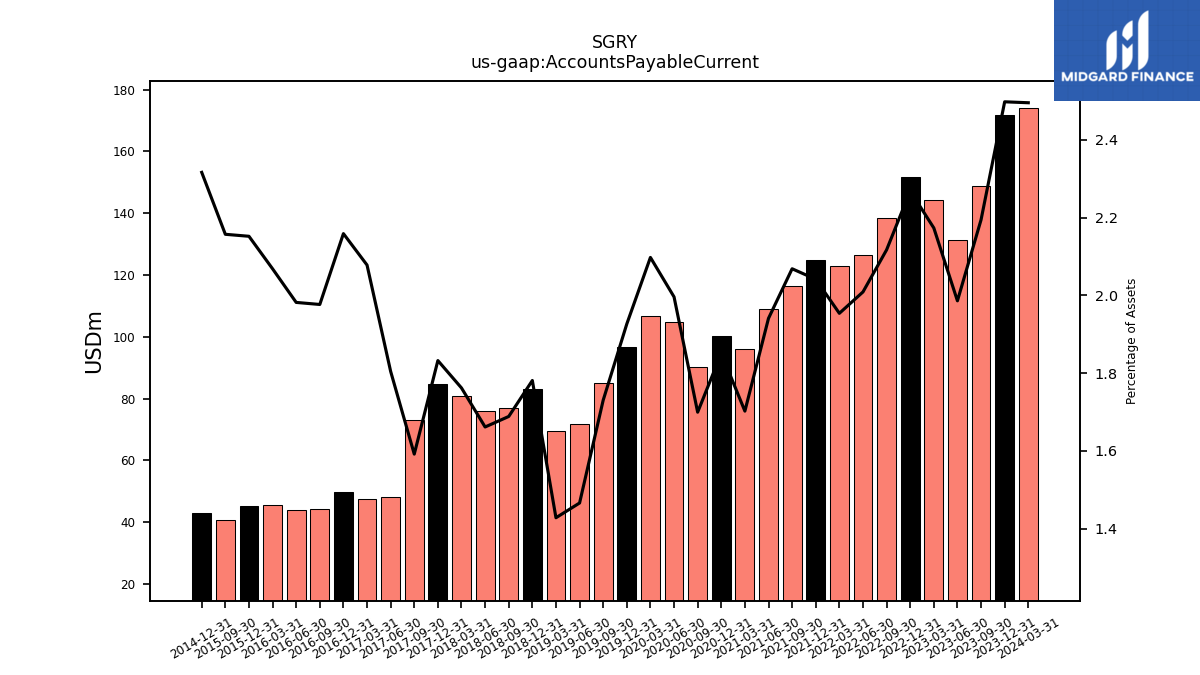
| Accounts Payable Current | 171.80 | 148.80 | 131.50 | 144.40 | 151.60 | 138.40 | 126.40 | 122.90 | 124.90 | 116.50 | 109.10 | 96.00 | 100.20 | 90.30 | 104.70 | 106.80 | 96.70 | 85.10 | 71.70 | 69.70 | 83.29 | 76.98 | 76.16 | 80.96 | 84.71 | 73.25 | 48.21 | 47.59 | 49.77 | 44.45 | 43.87 | 45.56 | 45.34 | 40.81 | NA | NA | 43.06 | NA | NA | NA | |
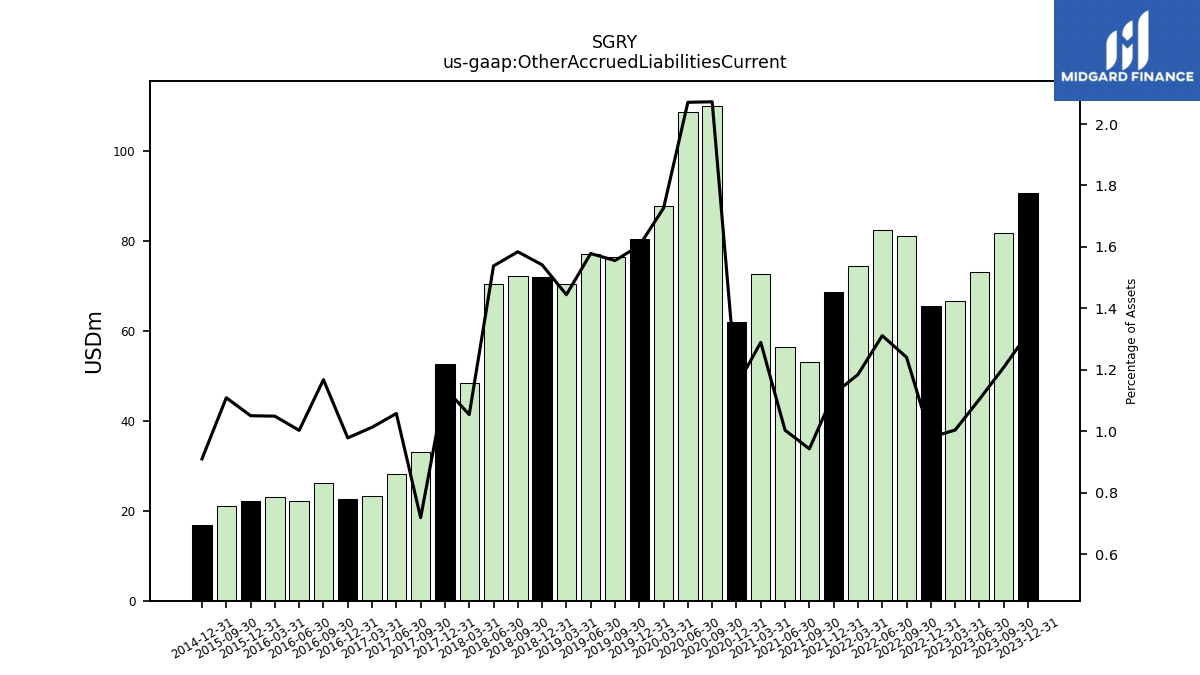
| Other Accrued Liabilities Current | 90.70 | 81.90 | 73.10 | 66.70 | 65.50 | 81.10 | 82.50 | 74.50 | 68.60 | 53.10 | 56.40 | 72.70 | 62.10 | 110.10 | 108.60 | 87.90 | 80.50 | 76.50 | 77.20 | 70.50 | 72.09 | 72.22 | 70.50 | 48.45 | 52.72 | 33.08 | 28.26 | 23.19 | 22.55 | 26.26 | 22.20 | 23.11 | 22.13 | 20.98 | NA | NA | 16.92 | NA | NA | NA | |
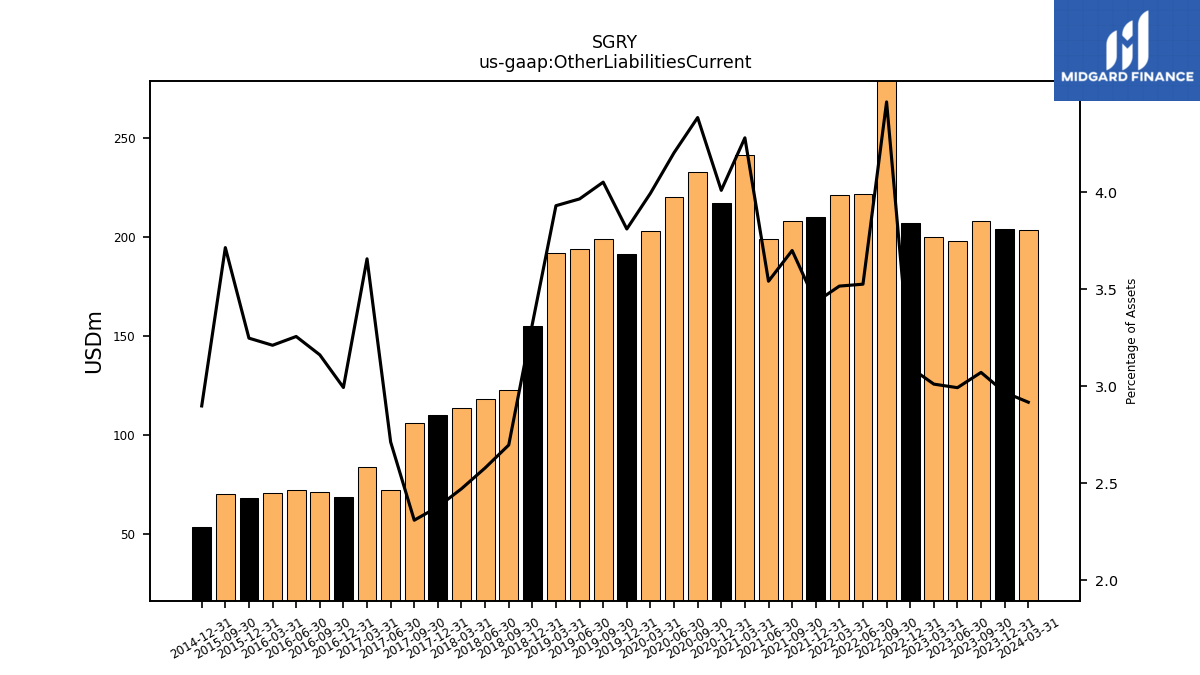
| Other Liabilities Current | 204.10 | 208.20 | 198.10 | 200.00 | 206.90 | 291.80 | 221.80 | 221.10 | 210.00 | 208.30 | 199.00 | 241.30 | 217.00 | 232.90 | 220.40 | 203.30 | 191.20 | 199.20 | 193.90 | 191.80 | 155.24 | 122.94 | 118.21 | 113.57 | 109.94 | 106.28 | 72.47 | 83.71 | 68.99 | 71.09 | 72.07 | 70.71 | 68.41 | 70.25 | NA | NA | 53.87 | NA | NA | NA |
| 2023-12-31 | 2023-09-30 | 2023-06-30 | 2023-03-31 | 2022-12-31 | 2022-09-30 | 2022-06-30 | 2022-03-31 | 2021-12-31 | 2021-09-30 | 2021-06-30 | 2021-03-31 | 2020-12-31 | 2020-09-30 | 2020-06-30 | 2020-03-31 | 2019-12-31 | 2019-09-30 | 2019-06-30 | 2019-03-31 | 2018-12-31 | 2018-09-30 | 2018-06-30 | 2018-03-31 | 2017-12-31 | 2017-09-30 | 2017-06-30 | 2017-03-31 | 2016-12-31 | 2016-09-30 | 2016-06-30 | 2016-03-31 | 2015-12-31 | 2015-09-30 | 2015-06-30 | 2015-03-31 | 2014-12-31 | 2014-09-30 | 2014-06-30 | 2014-03-31 | ||
|---|---|---|---|---|---|---|---|---|---|---|---|---|---|---|---|---|---|---|---|---|---|---|---|---|---|---|---|---|---|---|---|---|---|---|---|---|---|---|---|---|---|
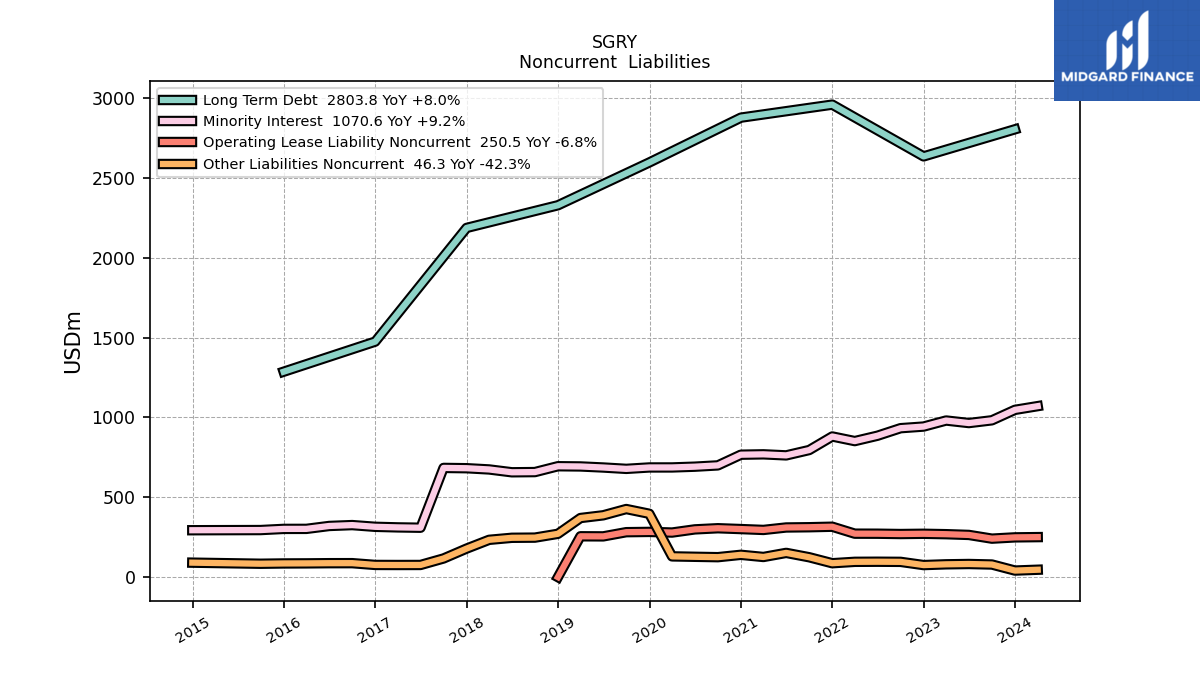
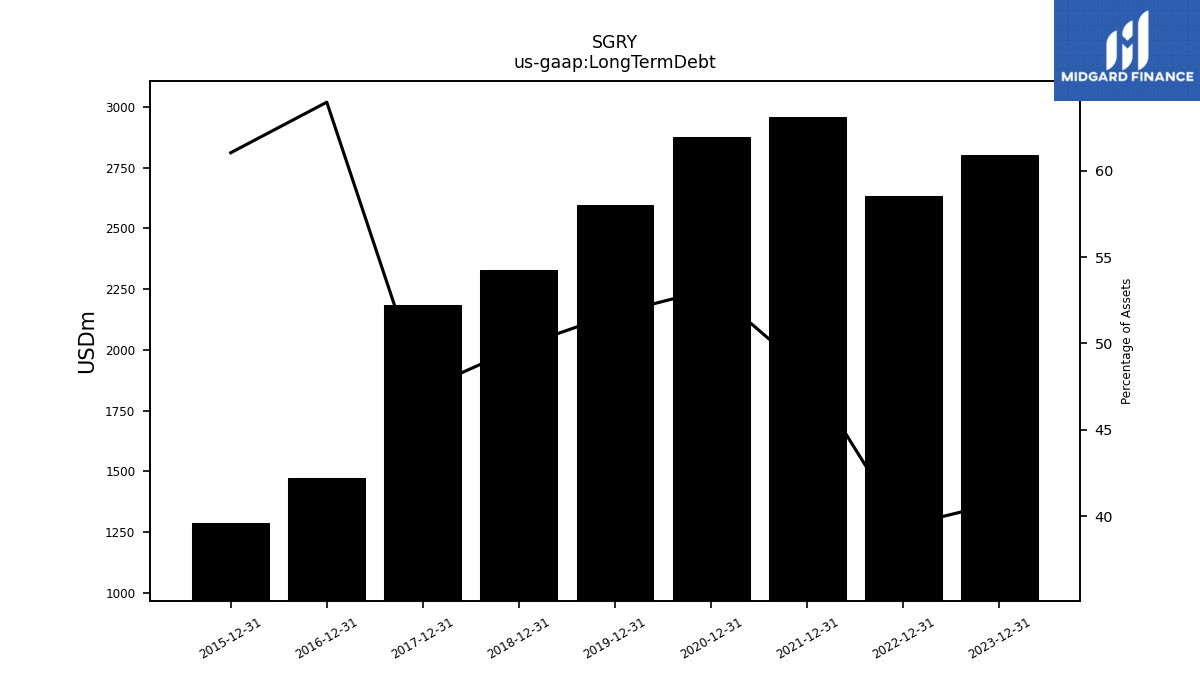
| Long Term Debt | 2803.80 | NA | NA | NA | 2634.10 | NA | NA | NA | 2958.30 | NA | NA | NA | 2876.80 | NA | NA | NA | 2596.10 | NA | NA | NA | 2328.14 | NA | NA | NA | 2186.29 | NA | NA | NA | 1474.52 | NA | NA | NA | 1285.98 | NA | NA | NA | NA | NA | NA | NA | |
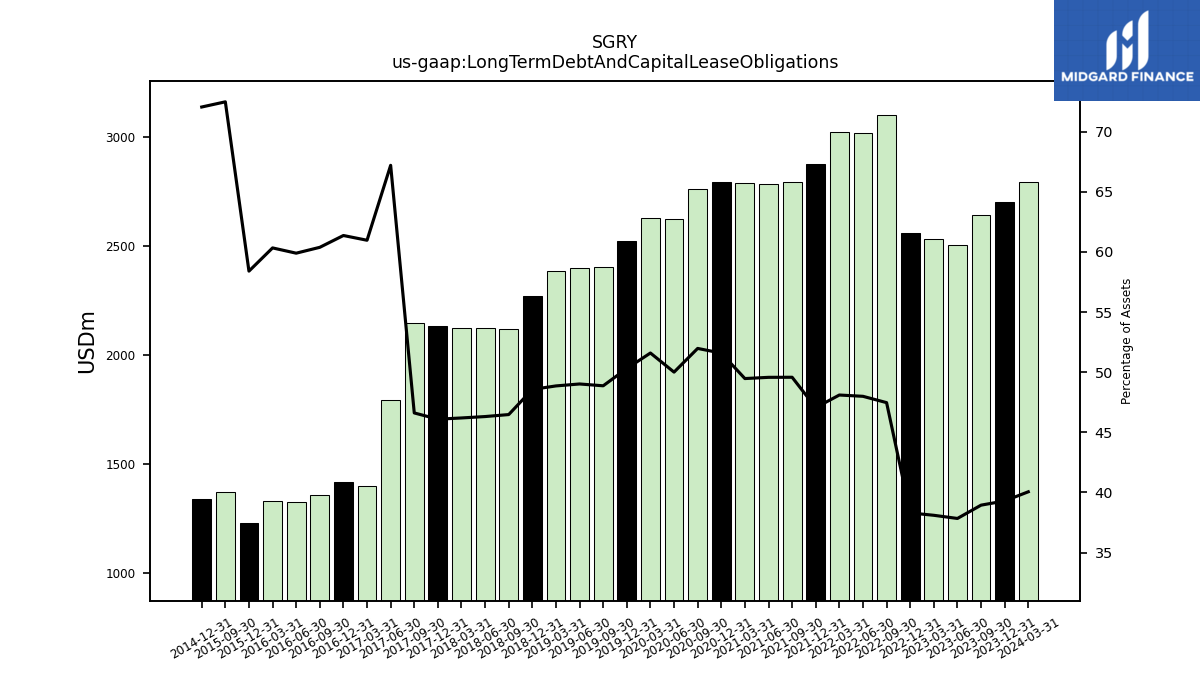
| Long Term Debt And Capital Lease Obligations | 2701.80 | 2640.20 | 2504.80 | 2530.90 | 2559.00 | 3102.60 | 3019.40 | 3025.20 | 2878.40 | 2791.90 | 2786.10 | 2789.50 | 2792.40 | 2761.30 | 2622.50 | 2626.50 | 2524.70 | 2403.00 | 2397.40 | 2384.60 | 2270.90 | 2118.57 | 2122.63 | 2122.45 | 2130.56 | 2144.86 | 1795.27 | 1396.04 | 1414.42 | 1357.82 | 1325.78 | 1328.74 | 1230.33 | 1370.99 | NA | NA | 1339.27 | NA | NA | NA | |
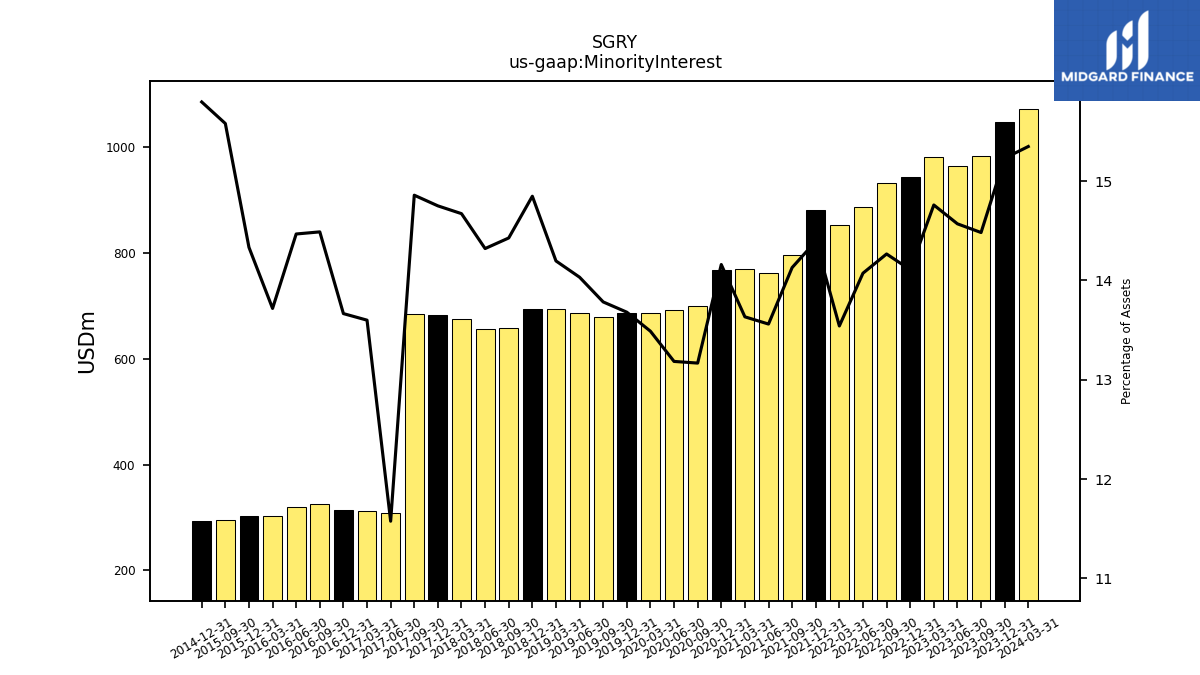
| Minority Interest | 1047.30 | 981.90 | 964.60 | 980.50 | 942.70 | 932.50 | 885.40 | 851.70 | 880.60 | 795.70 | 762.20 | 768.80 | 766.50 | 699.60 | 691.50 | 686.70 | 686.60 | 677.80 | 686.30 | 692.90 | 694.30 | 657.69 | 656.42 | 674.16 | 681.88 | 683.73 | 309.26 | 311.40 | 315.00 | 325.81 | 320.24 | 302.12 | 301.95 | 294.68 | NA | NA | 293.62 | NA | NA | NA | |
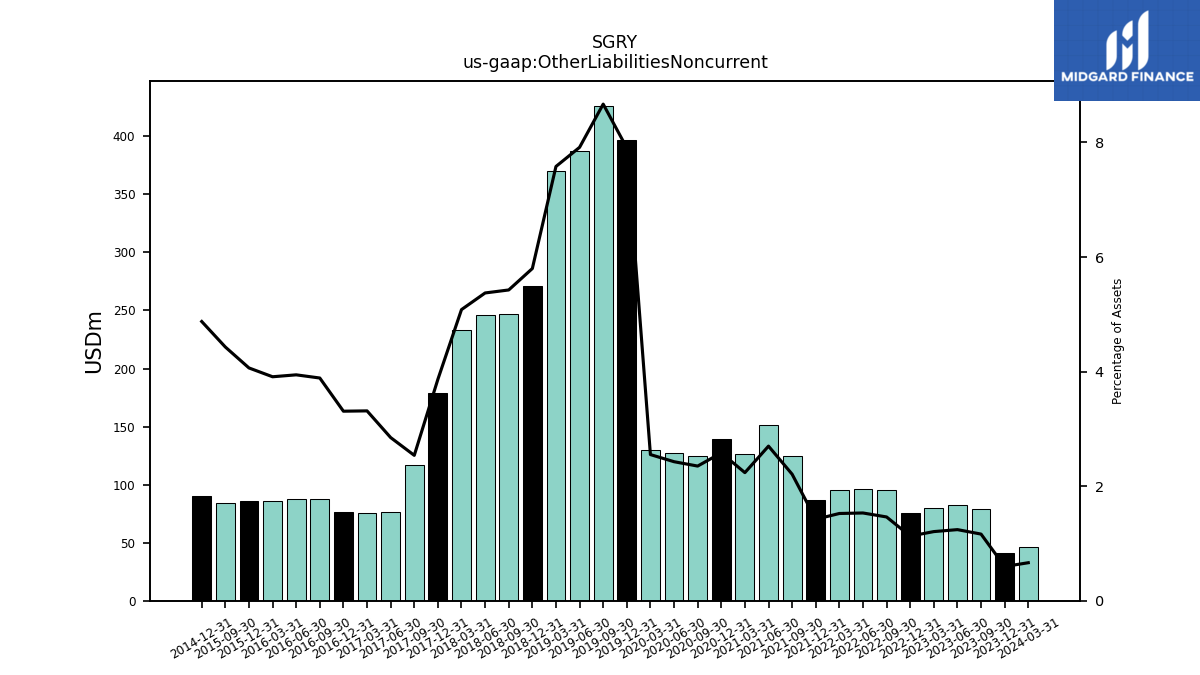
| Other Liabilities Noncurrent | 41.10 | 78.90 | 82.20 | 80.20 | 75.40 | 95.60 | 96.40 | 95.80 | 87.00 | 124.40 | 151.70 | 126.10 | 139.70 | 124.90 | 127.30 | 129.90 | 396.70 | 426.30 | 387.10 | 370.00 | 271.19 | 247.31 | 246.27 | 233.52 | 178.69 | 116.80 | 76.10 | 75.89 | 76.27 | 87.43 | 87.29 | 86.11 | 85.61 | 83.78 | NA | NA | 90.61 | NA | NA | NA | |
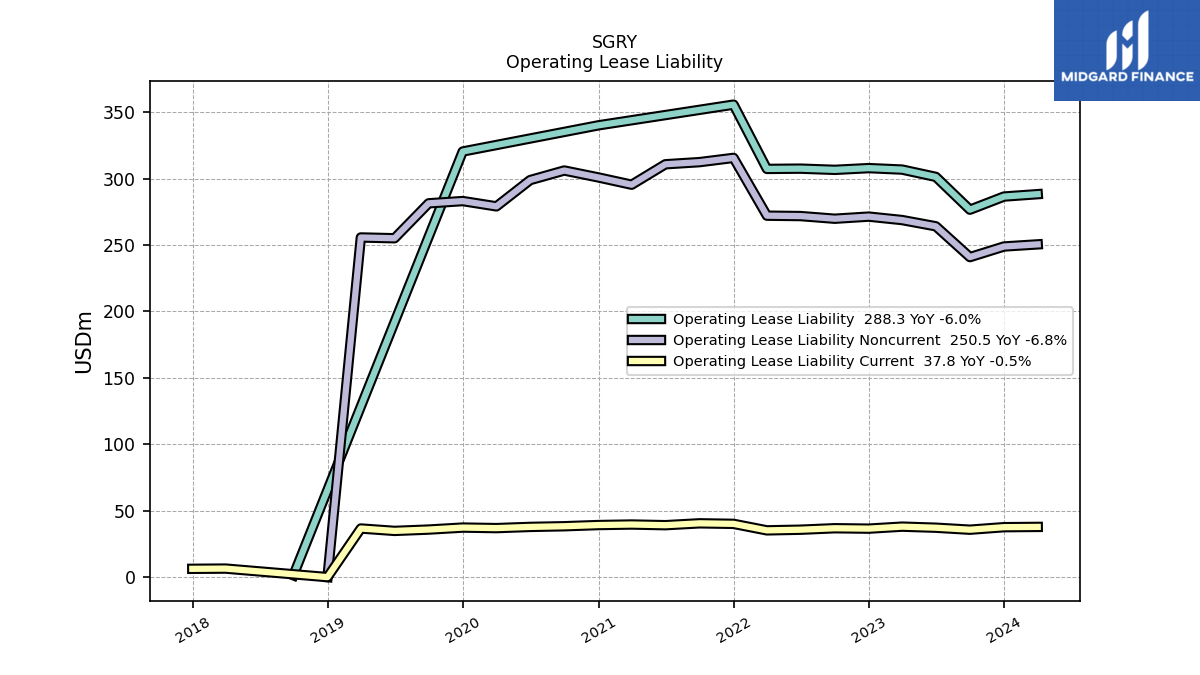
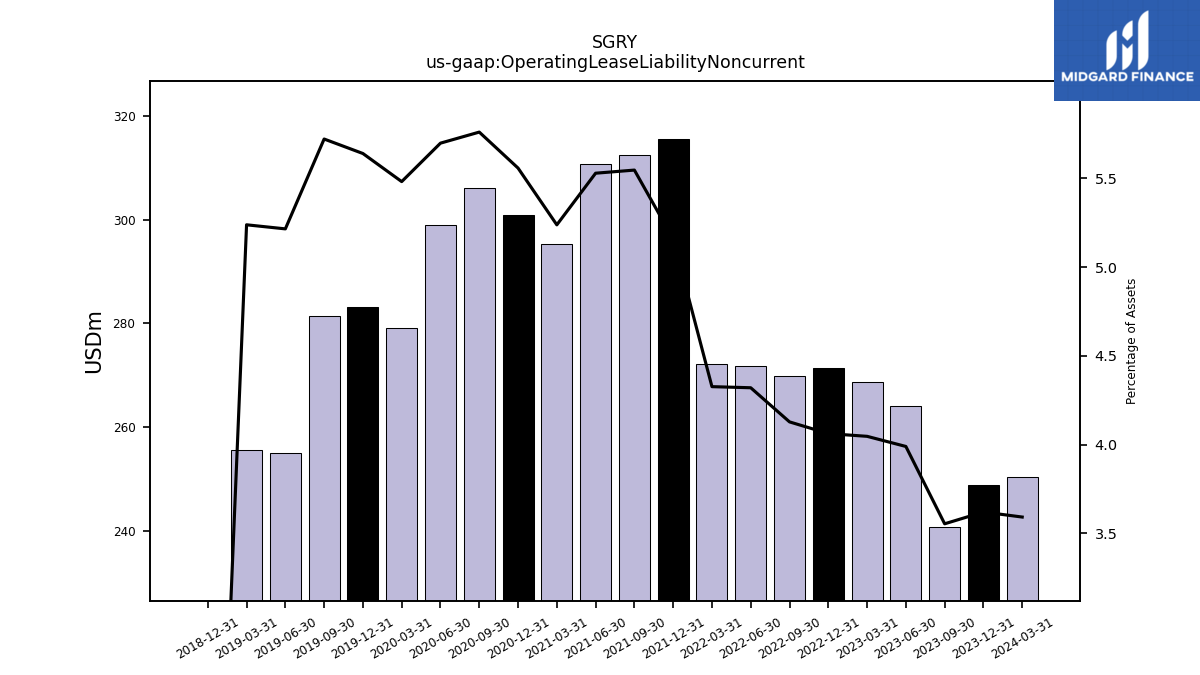
| Operating Lease Liability Noncurrent | 248.90 | 240.90 | 264.10 | 268.80 | 271.40 | 269.80 | 271.80 | 272.10 | 315.60 | 312.40 | 310.80 | 295.40 | 300.90 | 306.10 | 298.90 | 279.10 | 283.10 | 281.40 | 255.10 | 255.70 | 0.00 | NA | NA | NA | NA | NA | NA | NA | NA | NA | NA | NA | NA | NA | NA | NA | NA | NA | NA | NA |
| 2023-12-31 | 2023-09-30 | 2023-06-30 | 2023-03-31 | 2022-12-31 | 2022-09-30 | 2022-06-30 | 2022-03-31 | 2021-12-31 | 2021-09-30 | 2021-06-30 | 2021-03-31 | 2020-12-31 | 2020-09-30 | 2020-06-30 | 2020-03-31 | 2019-12-31 | 2019-09-30 | 2019-06-30 | 2019-03-31 | 2018-12-31 | 2018-09-30 | 2018-06-30 | 2018-03-31 | 2017-12-31 | 2017-09-30 | 2017-06-30 | 2017-03-31 | 2016-12-31 | 2016-09-30 | 2016-06-30 | 2016-03-31 | 2015-12-31 | 2015-09-30 | 2015-06-30 | 2015-03-31 | 2014-12-31 | 2014-09-30 | 2014-06-30 | 2014-03-31 | ||
|---|---|---|---|---|---|---|---|---|---|---|---|---|---|---|---|---|---|---|---|---|---|---|---|---|---|---|---|---|---|---|---|---|---|---|---|---|---|---|---|---|---|
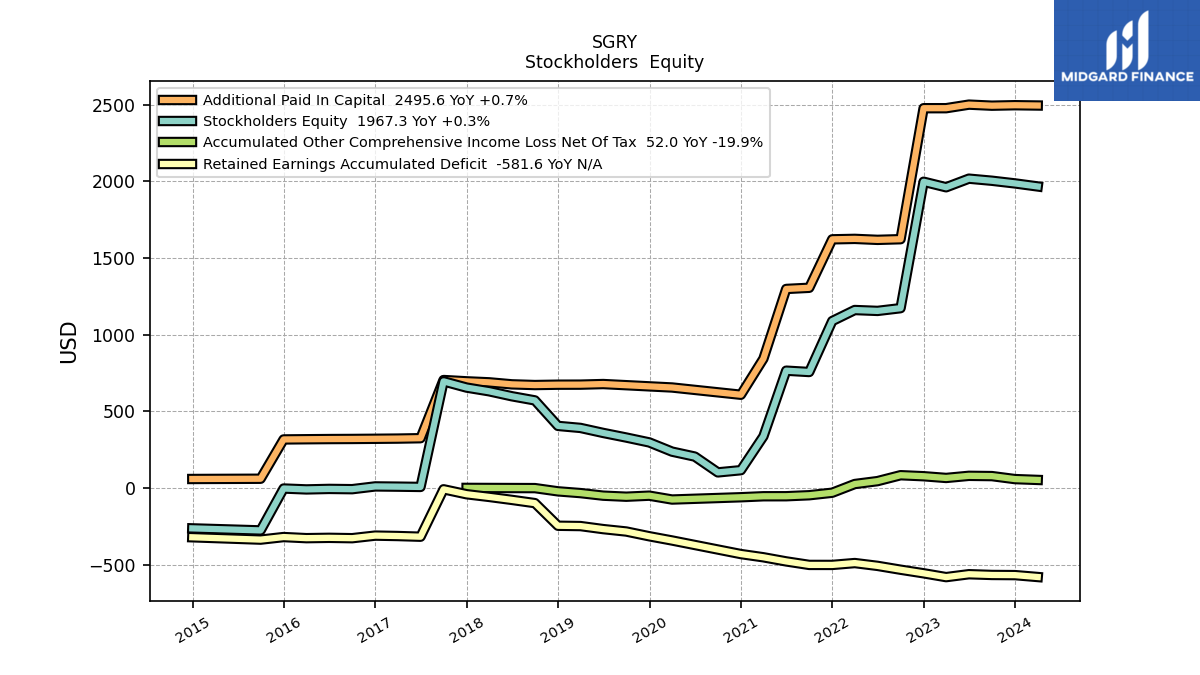
| Stockholders Equity | 1987.20 | 2004.60 | 2018.20 | 1962.00 | 1998.20 | 1172.90 | 1155.10 | 1160.90 | 1089.00 | 756.30 | 765.10 | 336.50 | 115.60 | 101.20 | 204.40 | 236.70 | 296.80 | 328.70 | 358.70 | 391.40 | 404.64 | 571.07 | 598.05 | 630.66 | 654.73 | 695.40 | 6.25 | 8.20 | 9.68 | -8.33 | -6.63 | -9.89 | -4.03 | -277.44 | NA | NA | -264.08 | NA | NA | NA | |
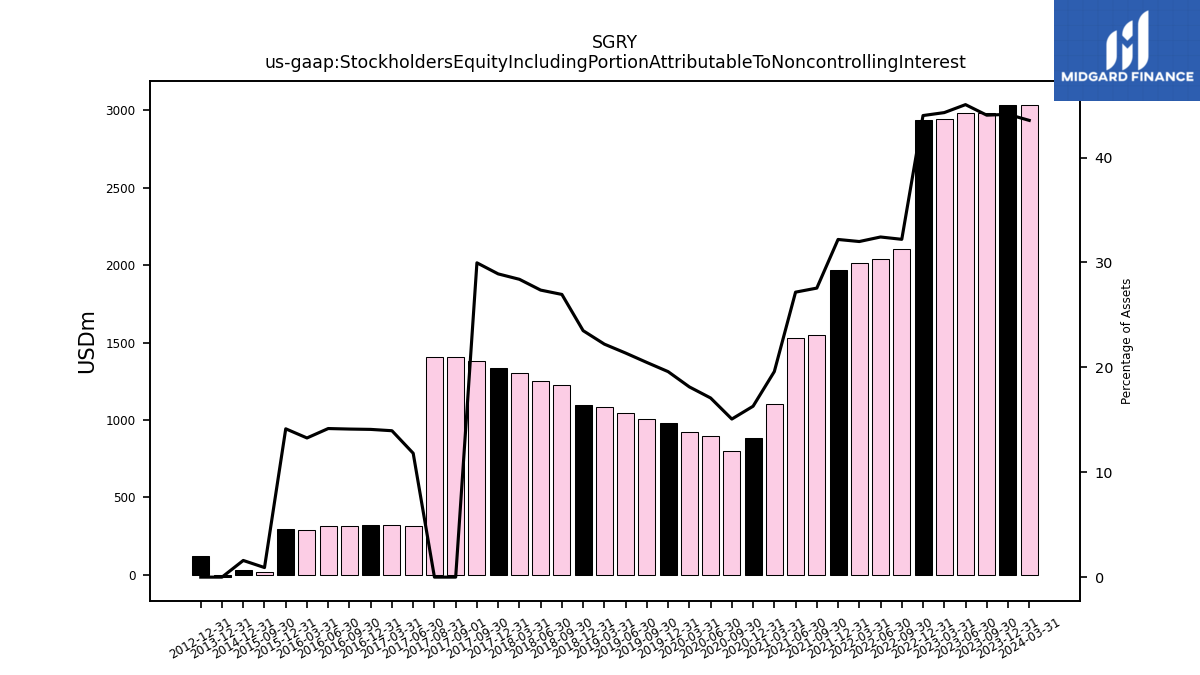
| Stockholders Equity Including Portion Attributable To Noncontrolling Interest | 3034.50 | 2986.50 | 2982.80 | 2942.50 | 2940.90 | 2105.40 | 2040.50 | 2012.60 | 1969.60 | 1552.00 | 1527.30 | 1105.30 | 882.10 | 800.80 | 895.90 | 923.40 | 983.40 | 1006.50 | 1045.00 | 1084.30 | 1098.94 | 1228.77 | 1254.47 | 1304.83 | 1336.61 | 1379.13 | 315.52 | 319.61 | 324.67 | 317.48 | 313.61 | 292.23 | 297.93 | 17.25 | NA | NA | 29.54 | NA | NA | NA | |
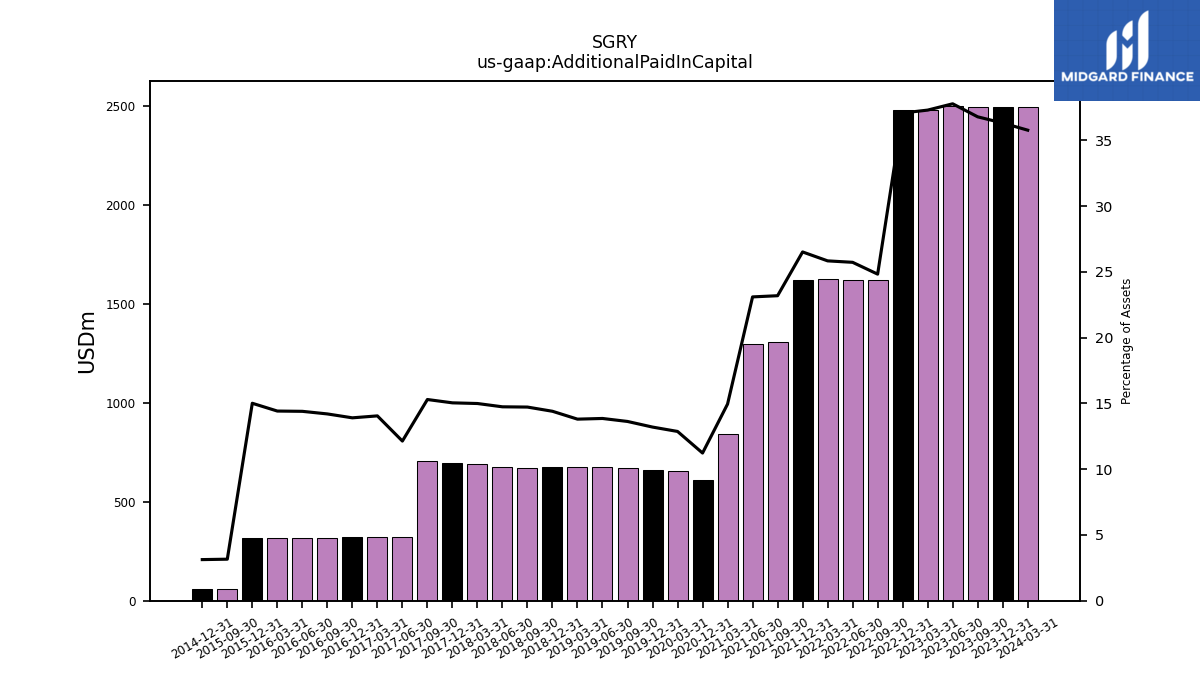
| Additional Paid In Capital | 2497.60 | 2494.50 | 2501.40 | 2478.10 | 2478.00 | 1623.10 | 1618.80 | 1625.20 | 1622.30 | 1306.00 | 1298.40 | 843.30 | 607.90 | NA | NA | 655.30 | 662.70 | 670.30 | 677.80 | 673.90 | 673.62 | 671.25 | 675.86 | 689.01 | 695.56 | 704.05 | 324.34 | 321.82 | 320.54 | 319.40 | 318.76 | 317.62 | 316.29 | 59.77 | NA | NA | 58.15 | NA | NA | NA | |
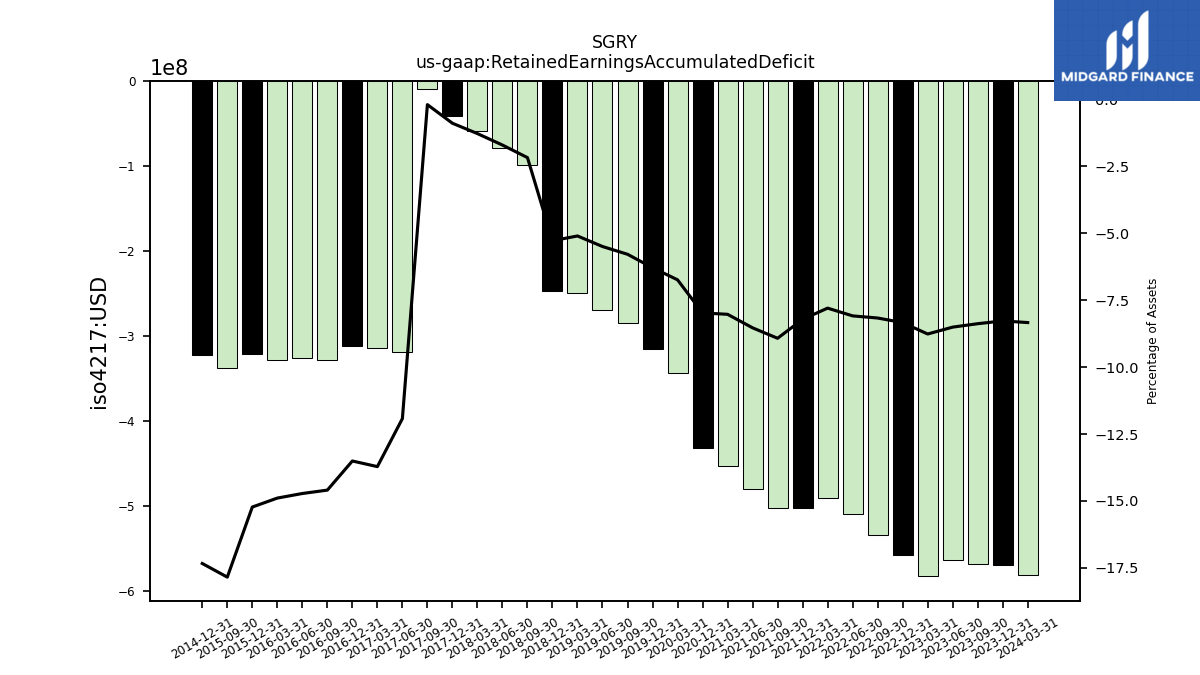
| Retained Earnings Accumulated Deficit | -569.20 | -568.20 | -563.30 | -582.30 | -557.30 | -533.90 | -508.90 | -490.50 | -502.70 | -502.60 | -479.70 | -452.80 | -431.80 | NA | NA | -343.20 | -315.70 | -284.60 | -268.90 | -249.10 | -247.02 | -99.28 | -78.30 | -58.84 | -41.32 | -9.14 | -318.58 | -314.11 | -311.35 | -328.21 | -325.88 | -327.99 | -320.80 | -337.54 | NA | NA | -322.23 | NA | NA | NA | |
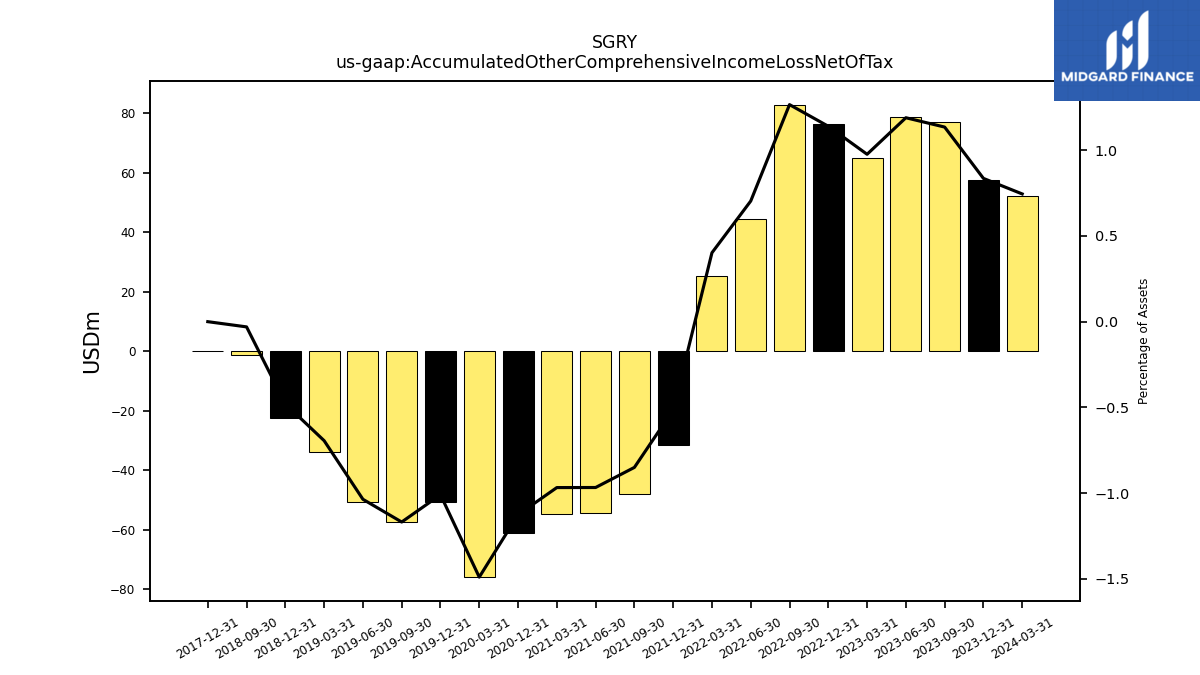
| Accumulated Other Comprehensive Income Loss Net Of Tax | 57.50 | 77.00 | 78.80 | 64.90 | 76.20 | 82.80 | 44.30 | 25.30 | -31.50 | -47.90 | -54.40 | -54.60 | -61.00 | NA | NA | -75.90 | -50.70 | -57.50 | -50.70 | -33.90 | -22.45 | -1.39 | NA | NA | 0.00 | NA | NA | NA | NA | NA | NA | NA | NA | NA | NA | NA | NA | NA | NA | NA | |
| Minority Interest | 1047.30 | 981.90 | 964.60 | 980.50 | 942.70 | 932.50 | 885.40 | 851.70 | 880.60 | 795.70 | 762.20 | 768.80 | 766.50 | 699.60 | 691.50 | 686.70 | 686.60 | 677.80 | 686.30 | 692.90 | 694.30 | 657.69 | 656.42 | 674.16 | 681.88 | 683.73 | 309.26 | 311.40 | 315.00 | 325.81 | 320.24 | 302.12 | 301.95 | 294.68 | NA | NA | 293.62 | NA | NA | NA |
| 2023-12-31 | 2023-09-30 | 2023-06-30 | 2023-03-31 | 2022-12-31 | 2022-09-30 | 2022-06-30 | 2022-03-31 | 2021-12-31 | 2021-09-30 | 2021-06-30 | 2021-03-31 | 2020-12-31 | 2020-09-30 | 2020-06-30 | 2020-03-31 | 2019-12-31 | 2019-09-30 | 2019-06-30 | 2019-03-31 | 2018-12-31 | 2018-09-30 | 2018-06-30 | 2018-03-31 | 2017-12-31 | 2017-09-30 | 2017-06-30 | 2017-03-31 | 2016-12-31 | 2016-09-30 | 2016-06-30 | 2016-03-31 | 2015-12-31 | 2015-09-30 | 2015-06-30 | 2015-03-31 | 2014-12-31 | 2014-09-30 | 2014-06-30 | 2014-03-31 | ||
|---|---|---|---|---|---|---|---|---|---|---|---|---|---|---|---|---|---|---|---|---|---|---|---|---|---|---|---|---|---|---|---|---|---|---|---|---|---|---|---|---|---|
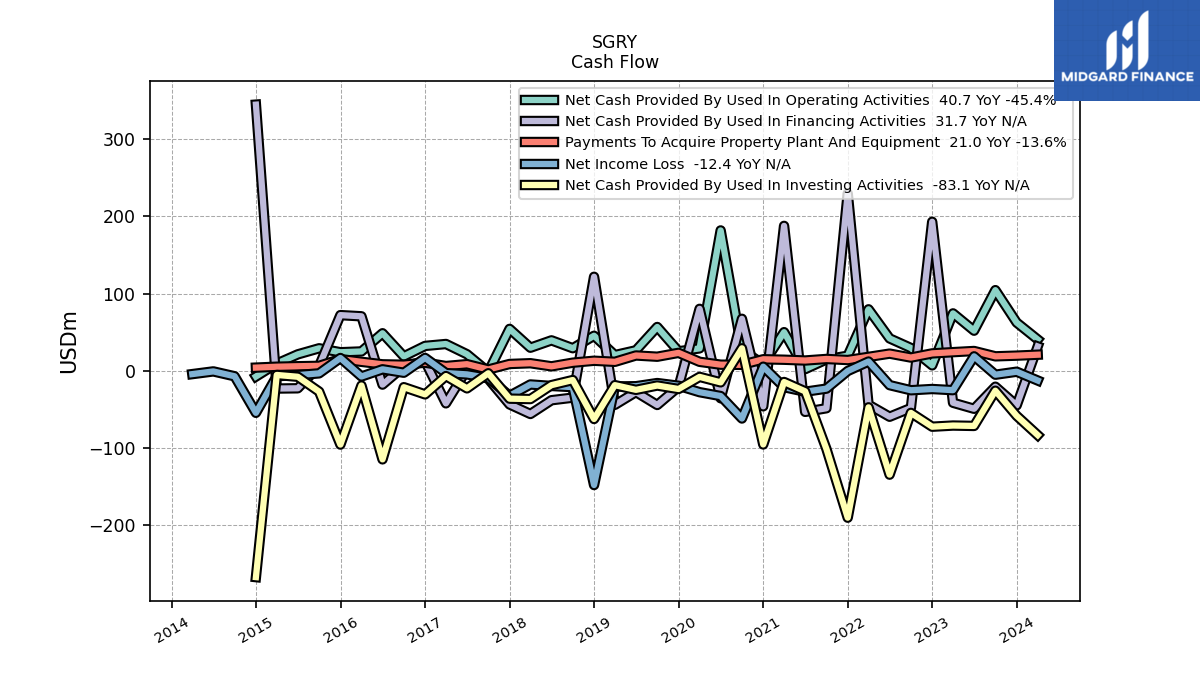
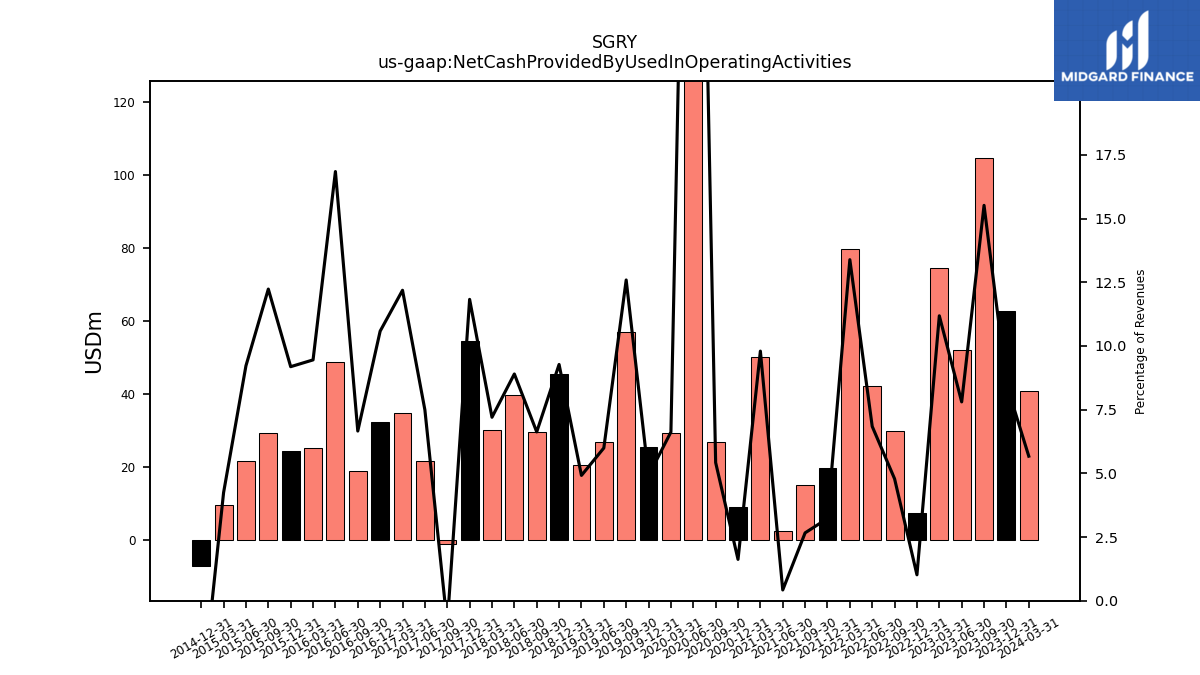
| Net Cash Provided By Used In Operating Activities | 62.60 | 104.60 | 52.10 | 74.50 | 7.20 | 29.70 | 42.10 | 79.80 | 19.70 | 14.90 | 2.30 | 50.20 | 8.90 | 26.90 | 181.90 | 29.20 | 25.40 | 56.90 | 26.70 | 20.50 | 45.55 | 29.41 | 39.58 | 30.06 | 54.45 | -1.22 | 21.60 | 34.87 | 32.38 | 18.83 | 48.79 | 25.24 | 24.19 | 29.31 | 21.47 | 9.51 | -7.29 | NA | NA | NA | |
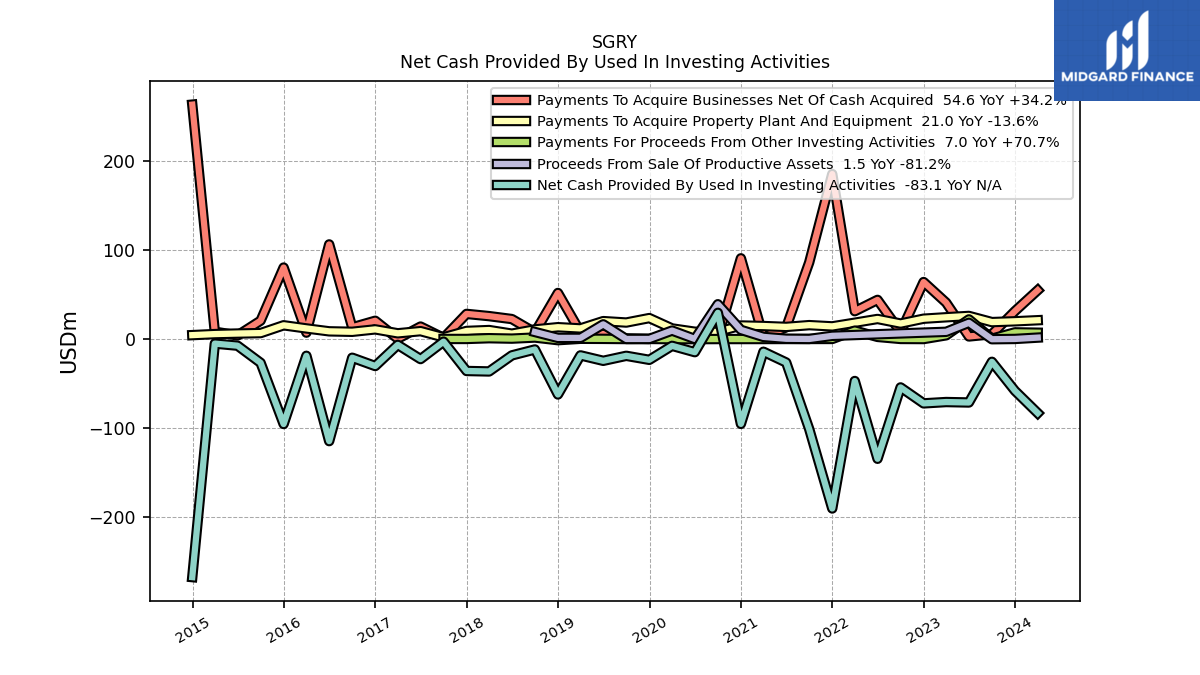
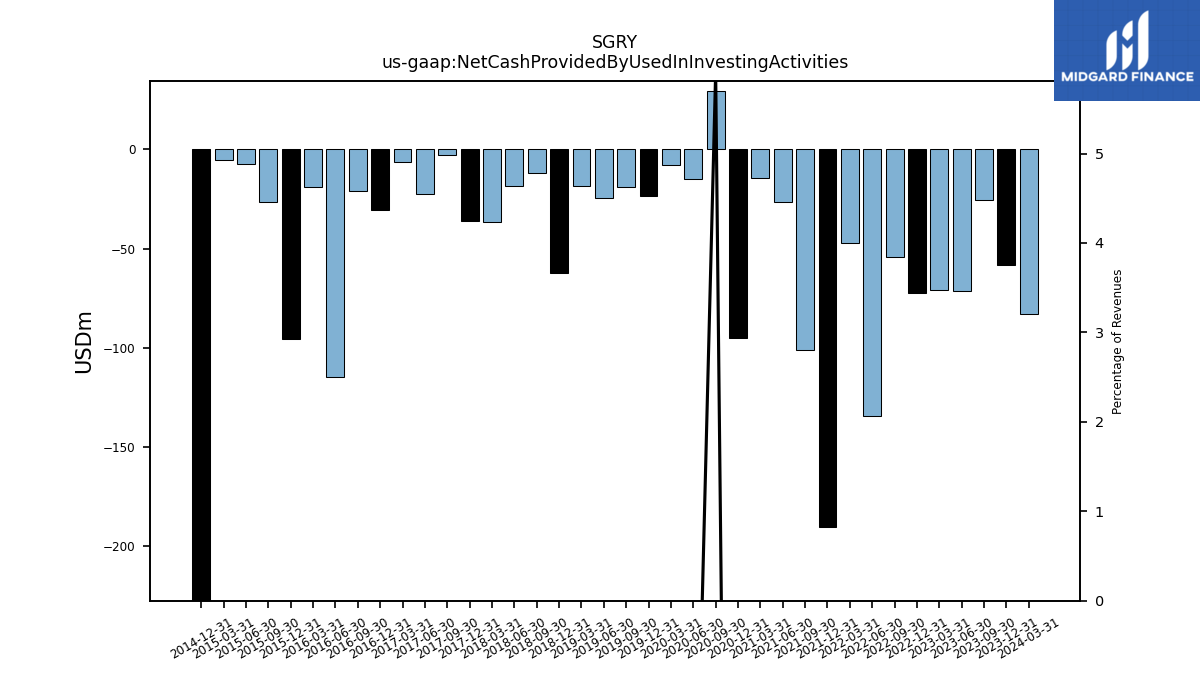
| Net Cash Provided By Used In Investing Activities | -58.10 | -25.60 | -71.20 | -70.70 | -72.20 | -54.30 | -134.30 | -47.10 | -190.00 | -101.00 | -26.40 | -14.30 | -95.20 | 29.30 | -14.80 | -7.70 | -23.40 | -18.90 | -24.50 | -18.40 | -62.25 | -11.79 | -18.41 | -36.41 | -35.89 | -3.00 | -22.57 | -6.62 | -30.35 | -21.03 | -114.51 | -18.85 | -95.36 | -26.74 | -7.55 | -5.20 | -266.92 | NA | NA | NA | |
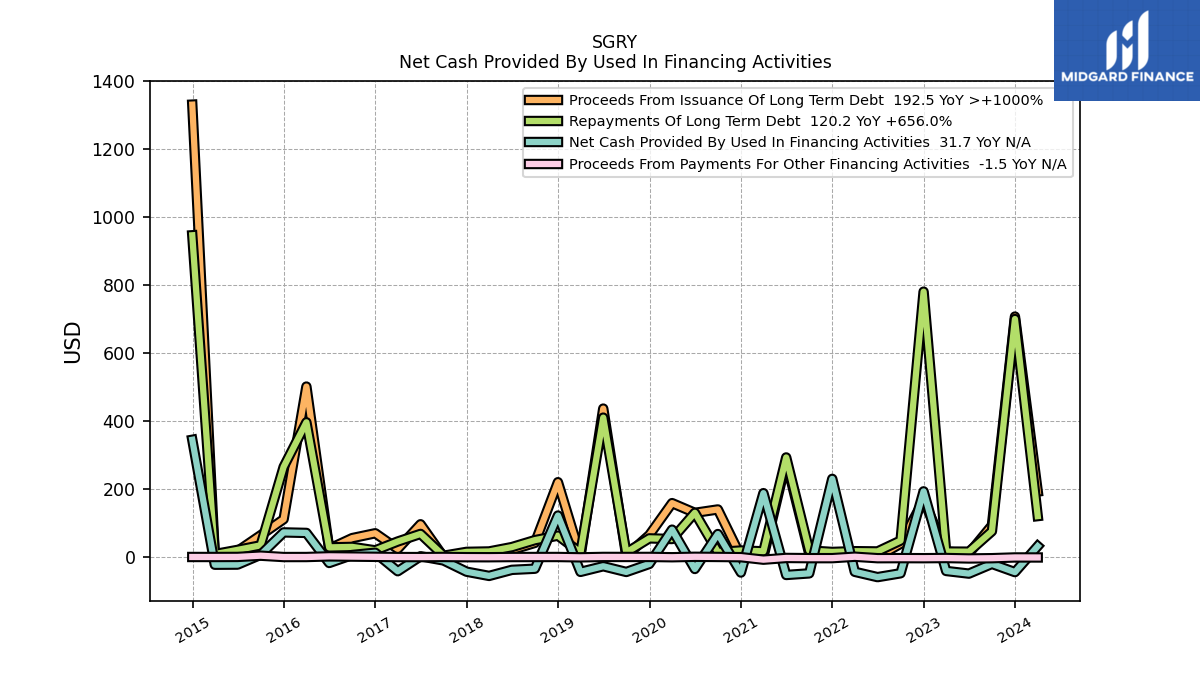
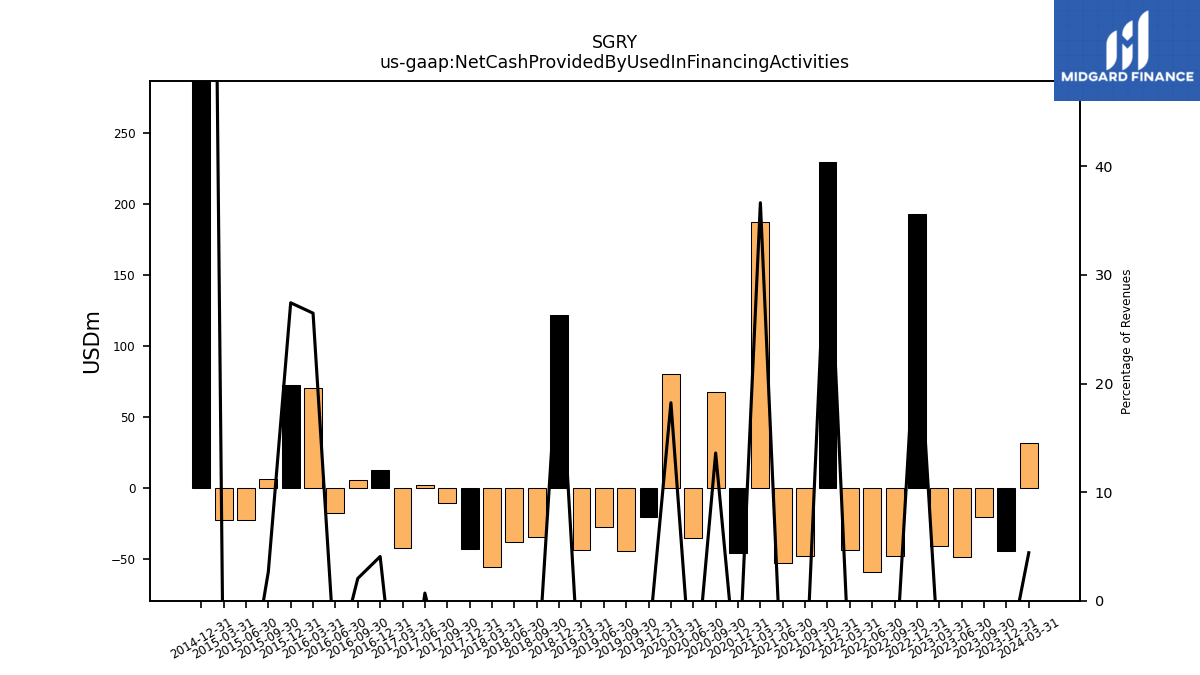
| Net Cash Provided By Used In Financing Activities | -44.60 | -20.40 | -49.00 | -41.20 | 193.10 | -48.00 | -59.30 | -43.70 | 229.80 | -48.30 | -53.00 | 187.80 | -45.80 | 67.50 | -35.40 | 80.40 | -20.60 | -44.10 | -27.30 | -43.90 | 121.89 | -34.57 | -37.92 | -55.74 | -43.34 | -10.28 | 2.04 | -41.98 | 12.47 | 5.81 | -17.73 | 70.72 | 72.25 | 6.38 | -22.46 | -22.79 | 344.74 | NA | NA | NA |
| 2023-12-31 | 2023-09-30 | 2023-06-30 | 2023-03-31 | 2022-12-31 | 2022-09-30 | 2022-06-30 | 2022-03-31 | 2021-12-31 | 2021-09-30 | 2021-06-30 | 2021-03-31 | 2020-12-31 | 2020-09-30 | 2020-06-30 | 2020-03-31 | 2019-12-31 | 2019-09-30 | 2019-06-30 | 2019-03-31 | 2018-12-31 | 2018-09-30 | 2018-06-30 | 2018-03-31 | 2017-12-31 | 2017-09-30 | 2017-06-30 | 2017-03-31 | 2016-12-31 | 2016-09-30 | 2016-06-30 | 2016-03-31 | 2015-12-31 | 2015-09-30 | 2015-06-30 | 2015-03-31 | 2014-12-31 | 2014-09-30 | 2014-06-30 | 2014-03-31 | ||
|---|---|---|---|---|---|---|---|---|---|---|---|---|---|---|---|---|---|---|---|---|---|---|---|---|---|---|---|---|---|---|---|---|---|---|---|---|---|---|---|---|---|
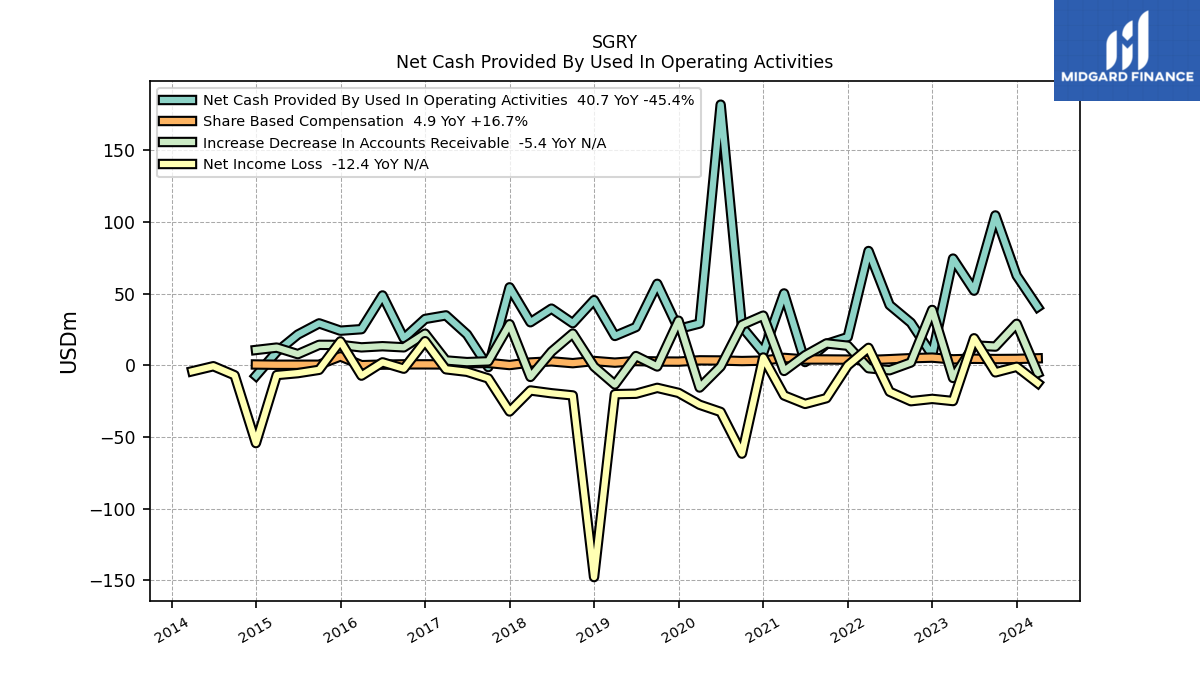
| Net Cash Provided By Used In Operating Activities | 62.60 | 104.60 | 52.10 | 74.50 | 7.20 | 29.70 | 42.10 | 79.80 | 19.70 | 14.90 | 2.30 | 50.20 | 8.90 | 26.90 | 181.90 | 29.20 | 25.40 | 56.90 | 26.70 | 20.50 | 45.55 | 29.41 | 39.58 | 30.06 | 54.45 | -1.22 | 21.60 | 34.87 | 32.38 | 18.83 | 48.79 | 25.24 | 24.19 | 29.31 | 21.47 | 9.51 | -7.29 | NA | NA | NA | |
| Net Income Loss | -1.00 | -4.90 | 18.90 | -24.90 | -23.40 | -25.00 | -18.40 | 12.20 | -0.10 | -22.90 | -26.90 | -21.00 | 5.50 | -61.60 | -32.50 | -27.50 | -19.20 | -15.70 | -19.80 | -20.10 | -147.74 | -20.98 | -19.46 | -17.52 | -32.18 | -9.14 | -4.47 | -2.75 | 16.86 | -2.34 | 2.12 | -7.19 | 16.74 | -3.12 | -5.43 | -6.76 | -54.26 | -6.91 | -0.61 | -4.12 | |
| Profit Loss | 46.70 | 29.70 | 57.70 | 1.20 | 23.30 | 5.60 | 15.30 | 42.80 | 42.90 | 8.20 | 8.80 | 10.80 | 47.90 | -34.30 | -3.90 | -8.40 | 22.60 | 10.90 | 8.10 | 3.50 | -107.08 | 2.02 | 4.31 | 5.12 | 0.97 | -2.65 | 11.63 | 14.42 | 38.10 | 14.33 | 22.29 | 10.36 | 36.09 | 13.78 | 12.48 | 10.49 | -36.77 | 0.43 | 7.03 | 2.26 | |
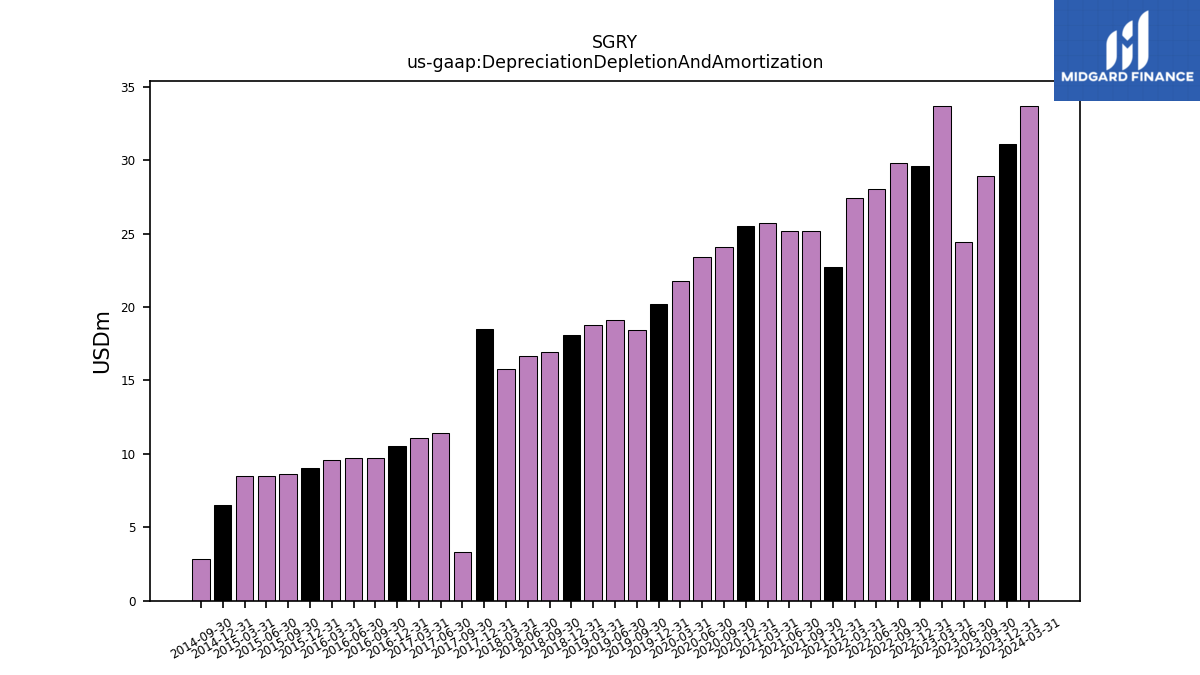
| Depreciation Depletion And Amortization | 31.10 | 28.90 | 24.40 | 33.70 | 29.60 | 29.80 | 28.00 | 27.40 | 22.70 | 25.20 | 25.20 | 25.70 | 25.50 | 24.10 | 23.40 | 21.80 | 20.20 | 18.40 | 19.10 | 18.80 | 18.06 | 16.95 | 16.68 | 15.75 | 18.47 | 3.33 | 11.42 | 11.11 | 10.57 | 9.71 | 9.70 | 9.57 | 9.01 | 8.61 | 8.46 | 8.46 | 6.50 | 2.83 | NA | NA | |
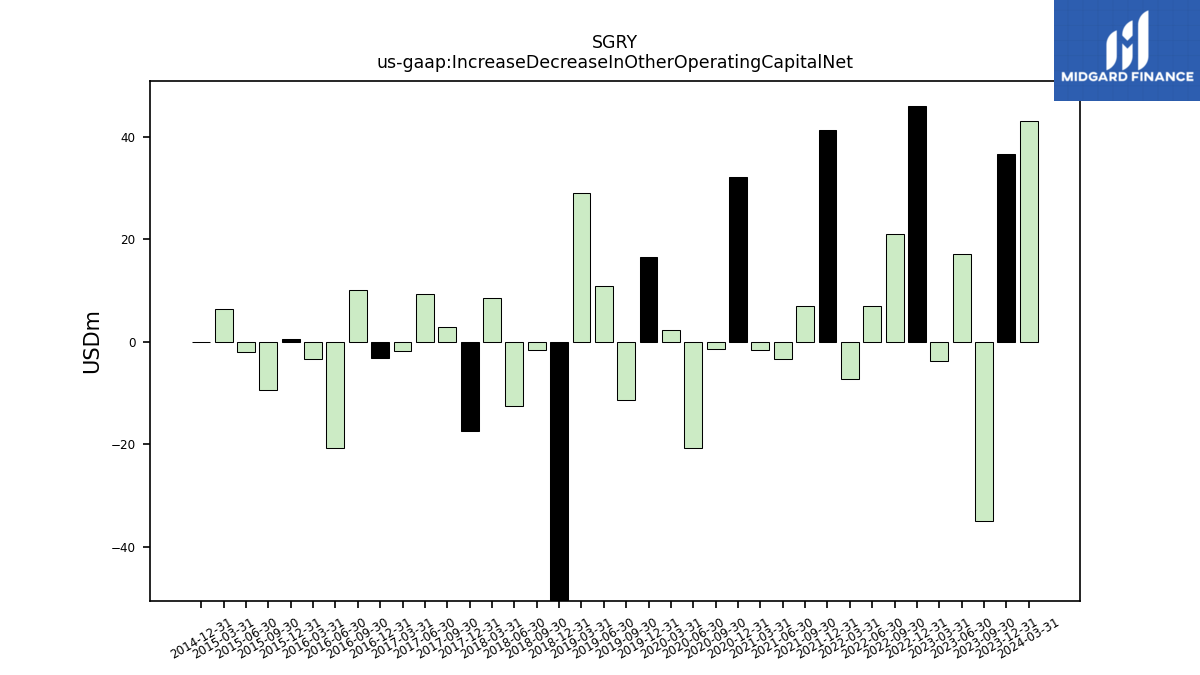
| Increase Decrease In Other Operating Capital Net | 36.70 | -34.90 | 17.10 | -3.80 | 46.10 | 21.10 | 7.00 | -7.20 | 41.30 | 7.10 | -3.40 | -1.60 | 32.20 | -1.30 | -20.60 | 2.40 | 16.60 | -11.30 | 11.00 | 29.00 | -50.30 | -1.64 | -12.57 | 8.53 | -17.41 | 2.92 | 9.37 | -1.84 | -3.13 | 10.07 | -20.79 | -3.36 | 0.55 | -9.40 | -1.95 | 6.36 | 0.01 | NA | NA | NA | |
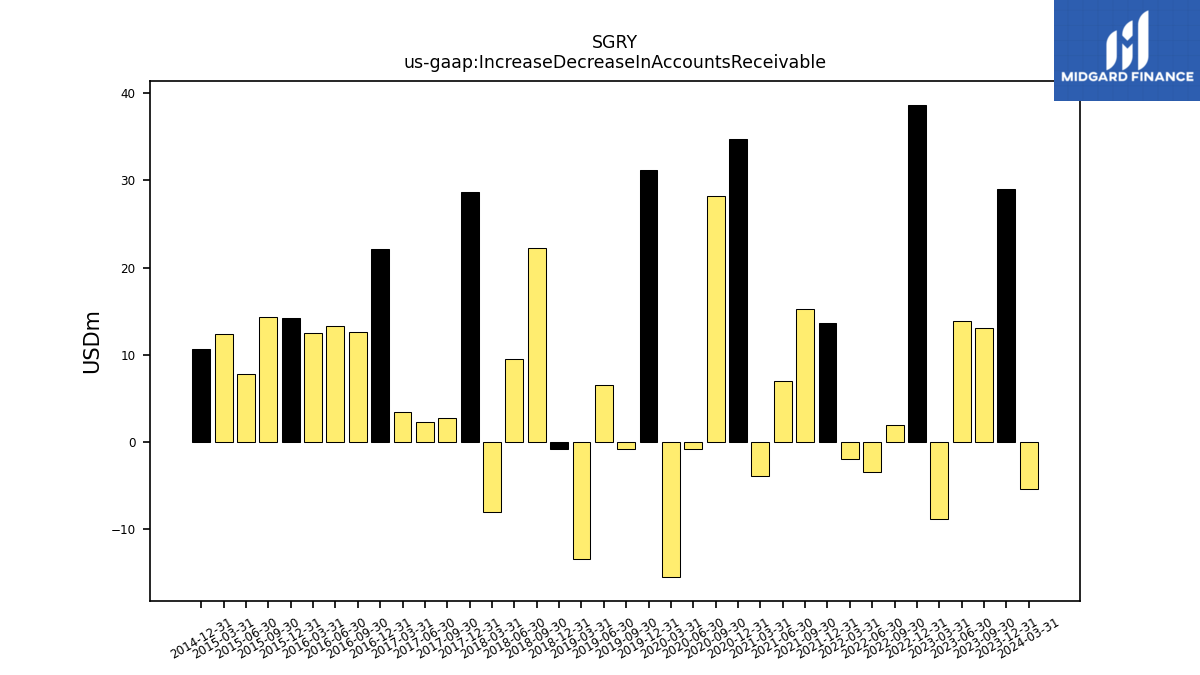
| Increase Decrease In Accounts Receivable | 29.00 | 13.10 | 13.90 | -8.80 | 38.70 | 2.00 | -3.40 | -2.00 | 13.70 | 15.30 | 7.00 | -3.90 | 34.70 | 28.20 | -0.80 | -15.50 | 31.20 | -0.80 | 6.50 | -13.40 | -0.85 | 22.20 | 9.54 | -8.08 | 28.70 | 2.79 | 2.27 | 3.43 | 22.14 | 12.58 | 13.36 | 12.55 | 14.24 | 14.31 | 7.83 | 12.40 | 10.72 | NA | NA | NA | |
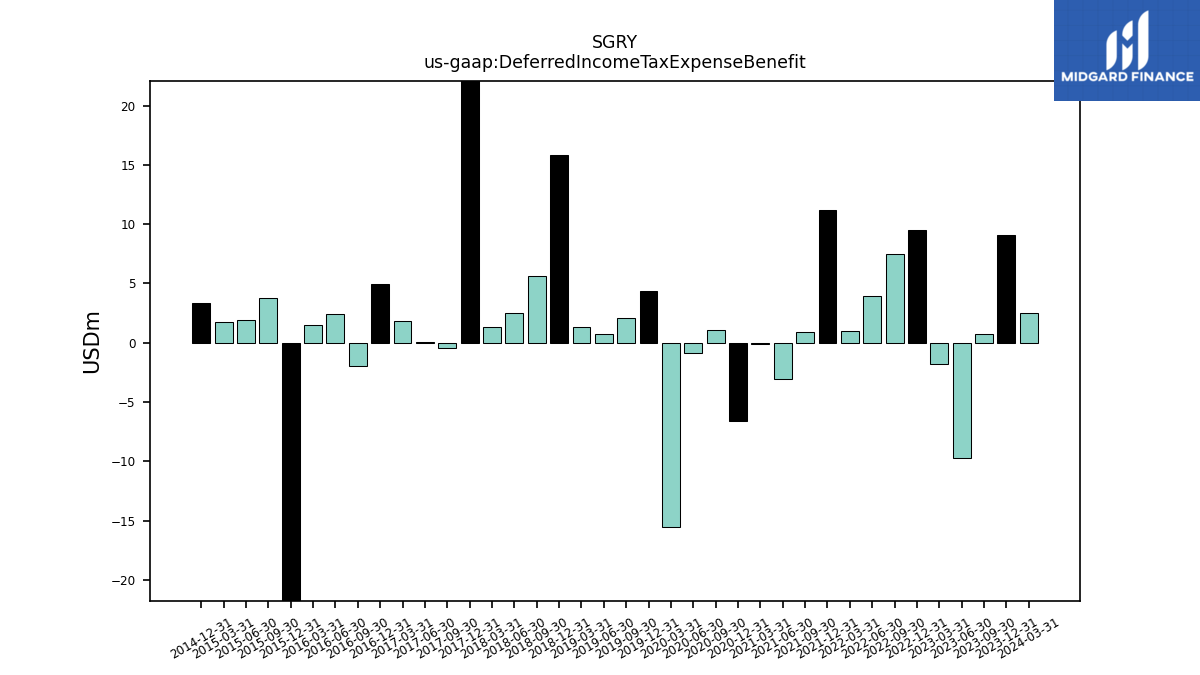
| Deferred Income Tax Expense Benefit | 9.10 | 0.70 | -9.70 | -1.80 | 9.50 | 7.50 | 3.90 | 1.00 | 11.20 | 0.90 | -3.10 | -0.10 | -6.60 | 1.10 | -0.90 | -15.50 | 4.40 | 2.10 | 0.70 | 1.30 | 15.81 | 5.64 | 2.48 | 1.35 | 71.50 | -0.47 | 0.09 | 1.81 | 4.98 | -1.99 | 2.40 | 1.49 | -157.31 | 3.79 | 1.91 | 1.72 | 3.35 | NA | NA | NA | |
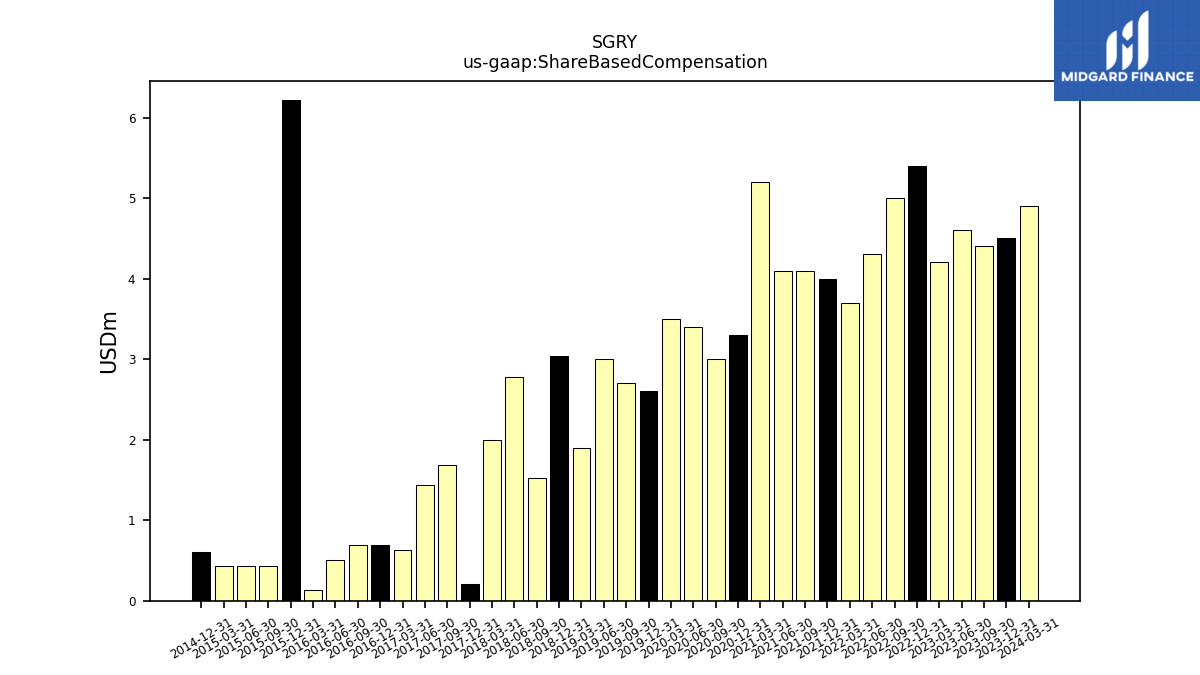
| Share Based Compensation | 4.50 | 4.40 | 4.60 | 4.20 | 5.40 | 5.00 | 4.30 | 3.70 | 4.00 | 4.10 | 4.10 | 5.20 | 3.30 | 3.00 | 3.40 | 3.50 | 2.60 | 2.70 | 3.00 | 1.90 | 3.04 | 1.53 | 2.78 | 2.00 | 0.20 | 1.68 | 1.44 | 0.63 | 0.69 | 0.69 | 0.50 | 0.13 | 6.22 | 0.43 | 0.43 | 0.43 | 0.60 | NA | NA | NA |
| 2023-12-31 | 2023-09-30 | 2023-06-30 | 2023-03-31 | 2022-12-31 | 2022-09-30 | 2022-06-30 | 2022-03-31 | 2021-12-31 | 2021-09-30 | 2021-06-30 | 2021-03-31 | 2020-12-31 | 2020-09-30 | 2020-06-30 | 2020-03-31 | 2019-12-31 | 2019-09-30 | 2019-06-30 | 2019-03-31 | 2018-12-31 | 2018-09-30 | 2018-06-30 | 2018-03-31 | 2017-12-31 | 2017-09-30 | 2017-06-30 | 2017-03-31 | 2016-12-31 | 2016-09-30 | 2016-06-30 | 2016-03-31 | 2015-12-31 | 2015-09-30 | 2015-06-30 | 2015-03-31 | 2014-12-31 | 2014-09-30 | 2014-06-30 | 2014-03-31 | ||
|---|---|---|---|---|---|---|---|---|---|---|---|---|---|---|---|---|---|---|---|---|---|---|---|---|---|---|---|---|---|---|---|---|---|---|---|---|---|---|---|---|---|
| Net Cash Provided By Used In Investing Activities | -58.10 | -25.60 | -71.20 | -70.70 | -72.20 | -54.30 | -134.30 | -47.10 | -190.00 | -101.00 | -26.40 | -14.30 | -95.20 | 29.30 | -14.80 | -7.70 | -23.40 | -18.90 | -24.50 | -18.40 | -62.25 | -11.79 | -18.41 | -36.41 | -35.89 | -3.00 | -22.57 | -6.62 | -30.35 | -21.03 | -114.51 | -18.85 | -95.36 | -26.74 | -7.55 | -5.20 | -266.92 | NA | NA | NA | |
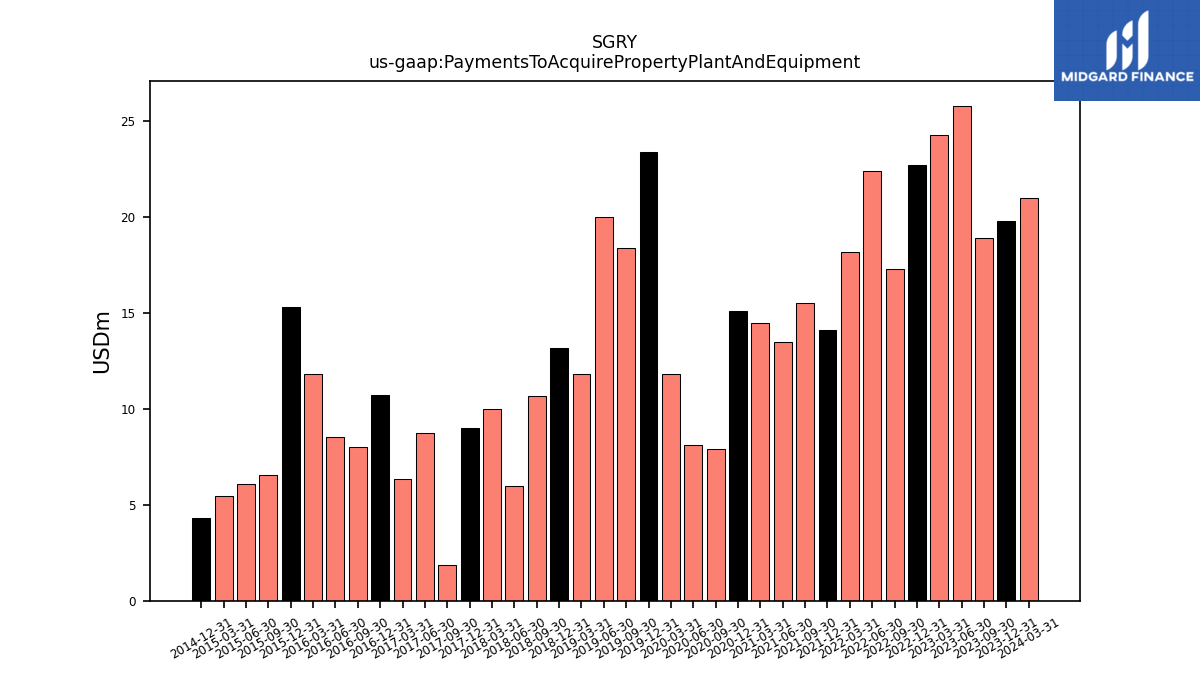
| Payments To Acquire Property Plant And Equipment | 19.80 | 18.90 | 25.80 | 24.30 | 22.70 | 17.30 | 22.40 | 18.20 | 14.10 | 15.50 | 13.50 | 14.50 | 15.10 | 7.90 | 8.10 | 11.80 | 23.40 | 18.40 | 20.00 | 11.80 | 13.19 | 10.68 | 5.96 | 9.98 | 8.99 | 1.84 | 8.75 | 6.35 | 10.73 | 8.03 | 8.55 | 11.80 | 15.32 | 6.57 | 6.08 | 5.46 | 4.30 | NA | NA | NA |
| 2023-12-31 | 2023-09-30 | 2023-06-30 | 2023-03-31 | 2022-12-31 | 2022-09-30 | 2022-06-30 | 2022-03-31 | 2021-12-31 | 2021-09-30 | 2021-06-30 | 2021-03-31 | 2020-12-31 | 2020-09-30 | 2020-06-30 | 2020-03-31 | 2019-12-31 | 2019-09-30 | 2019-06-30 | 2019-03-31 | 2018-12-31 | 2018-09-30 | 2018-06-30 | 2018-03-31 | 2017-12-31 | 2017-09-30 | 2017-06-30 | 2017-03-31 | 2016-12-31 | 2016-09-30 | 2016-06-30 | 2016-03-31 | 2015-12-31 | 2015-09-30 | 2015-06-30 | 2015-03-31 | 2014-12-31 | 2014-09-30 | 2014-06-30 | 2014-03-31 | ||
|---|---|---|---|---|---|---|---|---|---|---|---|---|---|---|---|---|---|---|---|---|---|---|---|---|---|---|---|---|---|---|---|---|---|---|---|---|---|---|---|---|---|
| Net Cash Provided By Used In Financing Activities | -44.60 | -20.40 | -49.00 | -41.20 | 193.10 | -48.00 | -59.30 | -43.70 | 229.80 | -48.30 | -53.00 | 187.80 | -45.80 | 67.50 | -35.40 | 80.40 | -20.60 | -44.10 | -27.30 | -43.90 | 121.89 | -34.57 | -37.92 | -55.74 | -43.34 | -10.28 | 2.04 | -41.98 | 12.47 | 5.81 | -17.73 | 70.72 | 72.25 | 6.38 | -22.46 | -22.79 | 344.74 | NA | NA | NA |
| 2023-12-31 | 2023-09-30 | 2023-06-30 | 2023-03-31 | 2022-12-31 | 2022-09-30 | 2022-06-30 | 2022-03-31 | 2021-12-31 | 2021-09-30 | 2021-06-30 | 2021-03-31 | 2020-12-31 | 2020-09-30 | 2020-06-30 | 2020-03-31 | 2019-12-31 | 2019-09-30 | 2019-06-30 | 2019-03-31 | 2018-12-31 | 2018-09-30 | 2018-06-30 | 2018-03-31 | 2017-12-31 | 2017-09-30 | 2017-06-30 | 2017-03-31 | 2016-12-31 | 2016-09-30 | 2016-06-30 | 2016-03-31 | 2015-12-31 | 2015-09-30 | 2015-06-30 | 2015-03-31 | 2014-12-31 | 2014-09-30 | 2014-06-30 | 2014-03-31 | ||
|---|---|---|---|---|---|---|---|---|---|---|---|---|---|---|---|---|---|---|---|---|---|---|---|---|---|---|---|---|---|---|---|---|---|---|---|---|---|---|---|---|---|
| Revenues | 735.40 | 674.10 | 667.60 | 666.20 | 707.10 | 620.60 | 615.40 | 596.20 | 610.20 | 559.20 | 543.30 | 512.40 | 548.30 | 496.10 | 374.70 | 441.00 | 517.20 | 452.00 | 445.40 | 416.80 | 491.17 | 443.93 | 444.77 | 417.37 | 460.35 | 132.26 | 288.35 | 286.18 | 306.00 | 282.68 | 289.68 | 267.07 | 263.32 | 239.60 | 232.83 | 224.14 | 179.69 | 76.30 | 76.81 | 70.48 | |
| Revenue From Contract With Customer Including Assessed Tax | 735.40 | 674.10 | 667.60 | 666.20 | 707.10 | 620.60 | 615.40 | 596.20 | 610.20 | 559.20 | 543.30 | 512.40 | 548.30 | 496.10 | 374.70 | 441.00 | 517.20 | 452.00 | 445.40 | 416.80 | 491.17 | 443.93 | 444.77 | 411.33 | 460.35 | 132.26 | 288.35 | 286.18 | 306.00 | 282.68 | 289.68 | 267.07 | 263.32 | 239.60 | 232.83 | 224.14 | 179.69 | 76.30 | 76.81 | 70.48 | |
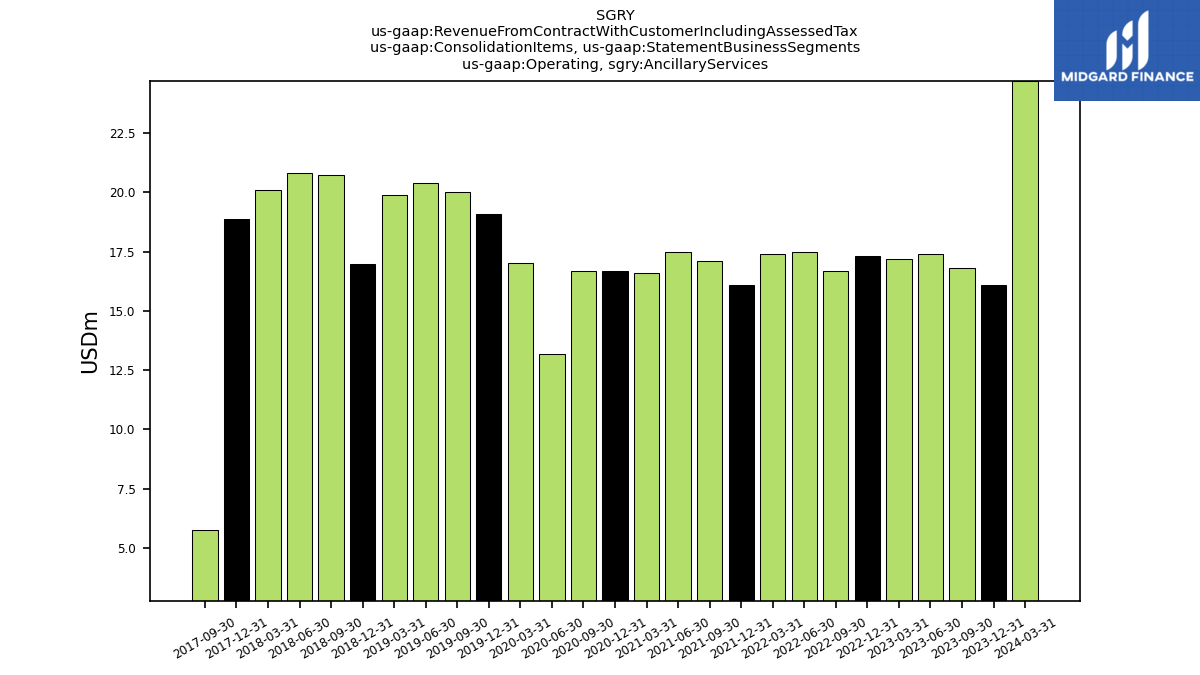
| Operating, Ancillary Services | 16.10 | 16.80 | 17.40 | 17.20 | 17.30 | 16.70 | 17.50 | 17.40 | 16.10 | 17.10 | 17.50 | 16.60 | 16.70 | 16.70 | 13.20 | 17.00 | 19.10 | 20.00 | 20.40 | 19.90 | 16.98 | 20.72 | 20.80 | 20.10 | 18.89 | 5.78 | NA | NA | NA | NA | NA | NA | NA | NA | NA | NA | NA | NA | NA | NA | |
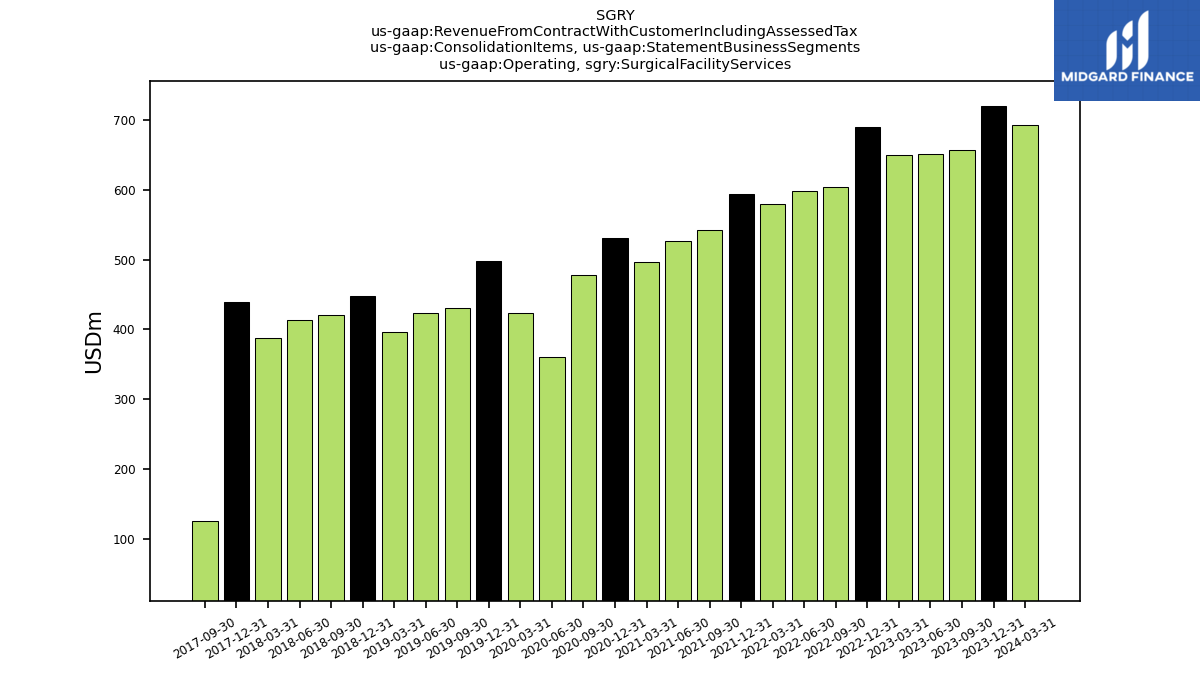
| Operating, Surgical Facility Services | 719.30 | 657.30 | 650.20 | 649.00 | 689.80 | 603.90 | 597.90 | 578.80 | 594.10 | 542.10 | 525.80 | 495.80 | 530.60 | 478.60 | 361.00 | 423.20 | 497.30 | 431.10 | 424.00 | 395.80 | 447.29 | 420.51 | 413.00 | 388.20 | 438.86 | 125.59 | NA | NA | NA | NA | NA | NA | NA | NA | NA | NA | NA | NA | NA | NA | |
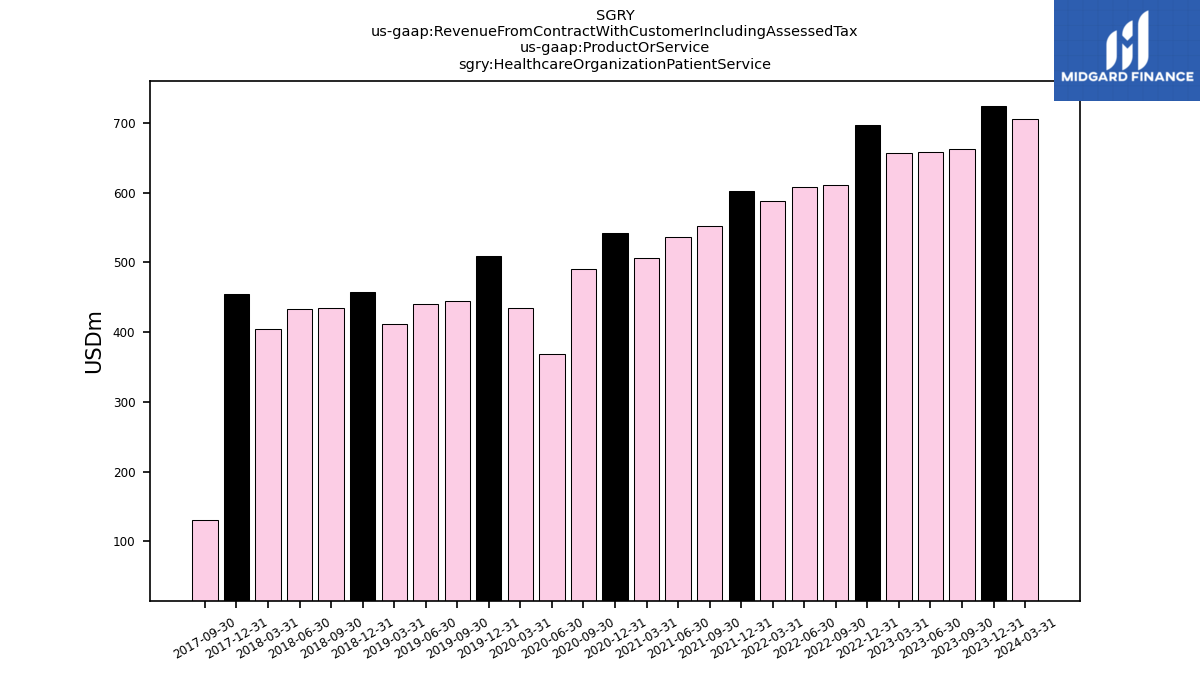
| Healthcare Organization Patient Service | 723.70 | 662.30 | 658.00 | 656.40 | 697.00 | 610.10 | 607.30 | 587.70 | 602.00 | 551.40 | 535.90 | 505.70 | 542.60 | 489.80 | 369.10 | 434.60 | 508.30 | 444.50 | 439.50 | 410.80 | 458.01 | 434.69 | 433.54 | 404.70 | 453.97 | 129.84 | NA | NA | NA | NA | NA | NA | NA | NA | NA | NA | NA | NA | NA | NA | |
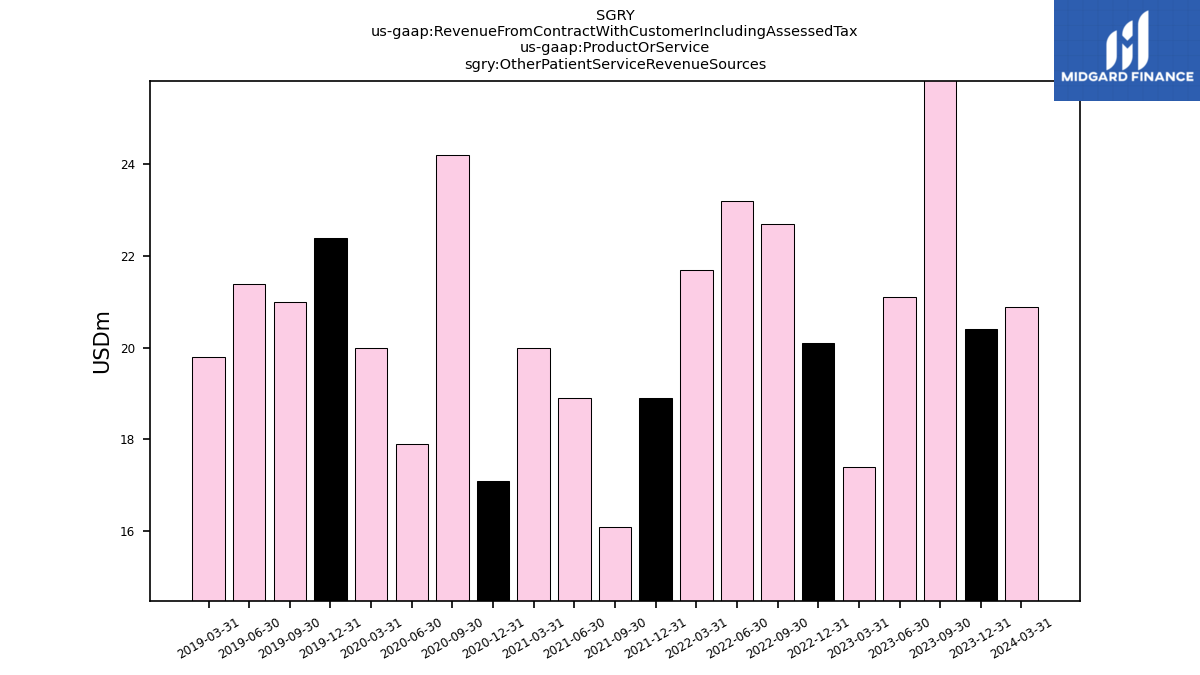
| Other Patient Service Revenue Sources | 20.40 | 26.70 | 21.10 | 17.40 | 20.10 | 22.70 | 23.20 | 21.70 | 18.90 | 16.10 | 18.90 | 20.00 | 17.10 | 24.20 | 17.90 | 20.00 | 22.40 | 21.00 | 21.40 | 19.80 | NA | NA | NA | NA | NA | NA | NA | NA | NA | NA | NA | NA | NA | NA | NA | NA | NA | NA | NA | NA | |
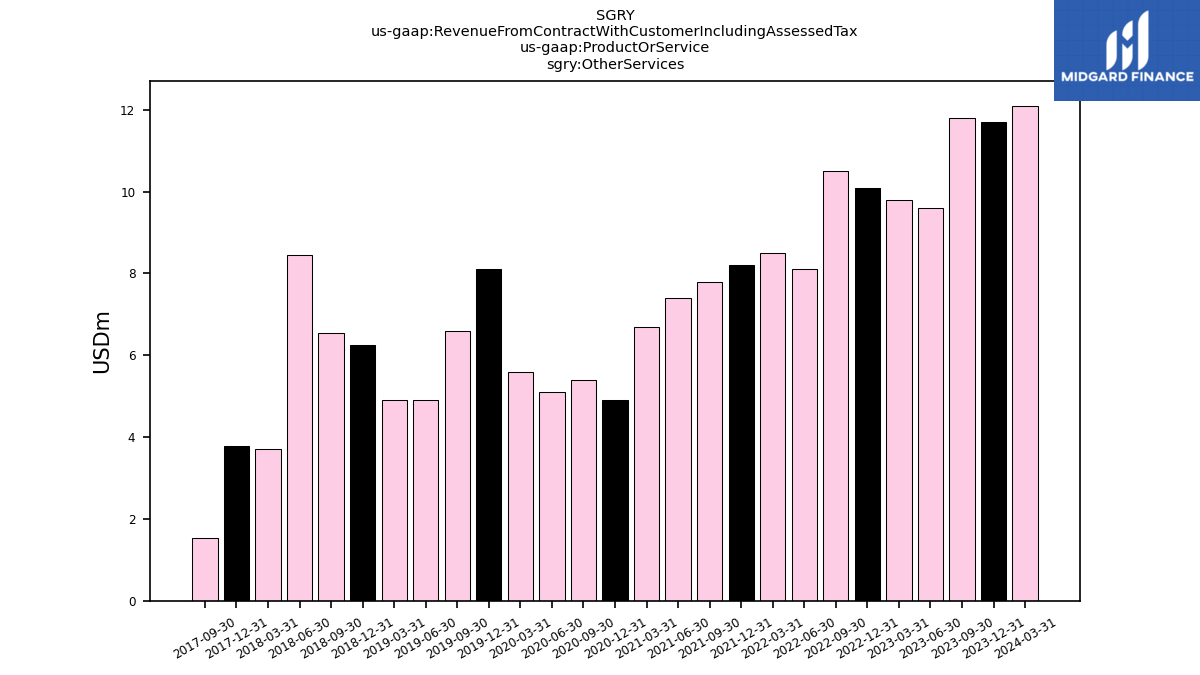
| Other Services | 11.70 | 11.80 | 9.60 | 9.80 | 10.10 | 10.50 | 8.10 | 8.50 | 8.20 | 7.80 | 7.40 | 6.70 | 4.90 | 5.40 | 5.10 | 5.60 | 8.10 | 6.60 | 4.90 | 4.90 | 6.26 | 6.55 | 8.46 | 3.70 | 3.78 | 1.53 | NA | NA | NA | NA | NA | NA | NA | NA | NA | NA | NA | NA | NA | NA | |
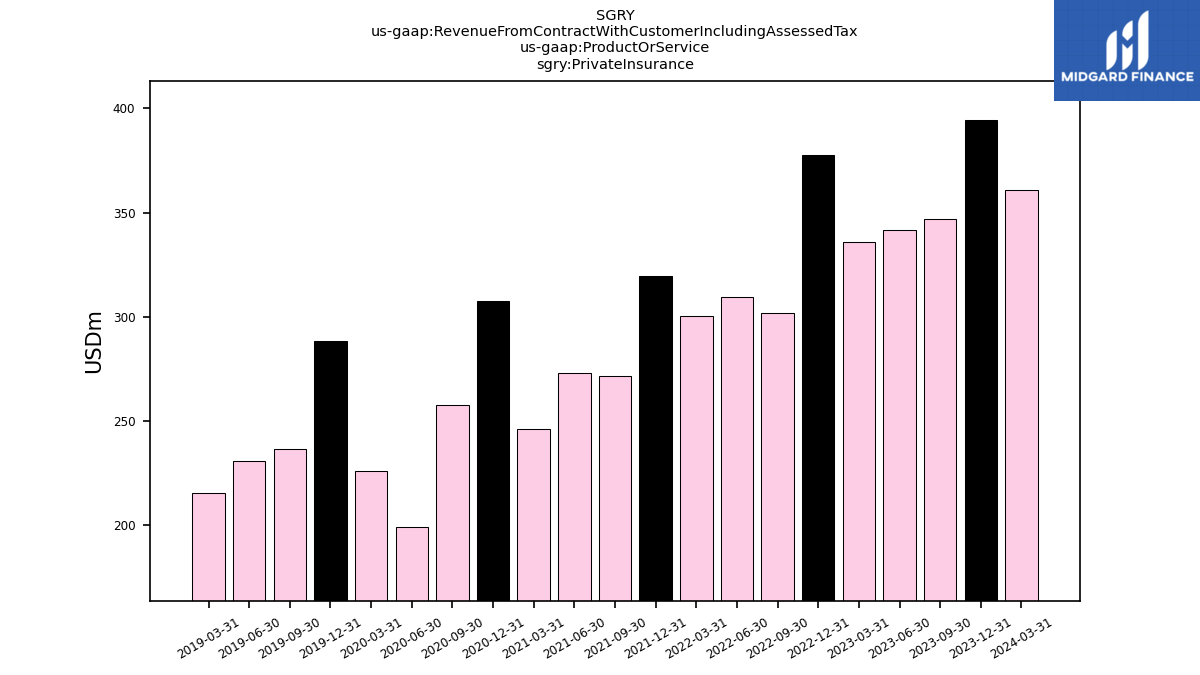
| Private Insurance | 394.30 | 347.10 | 341.60 | 335.60 | 377.50 | 301.90 | 309.50 | 300.20 | 319.60 | 271.40 | 273.00 | 246.10 | 307.30 | 257.40 | 199.20 | 226.00 | 288.40 | 236.30 | 230.50 | 215.30 | NA | NA | NA | NA | NA | NA | NA | NA | NA | NA | NA | NA | NA | NA | NA | NA | NA | NA | NA | NA | |
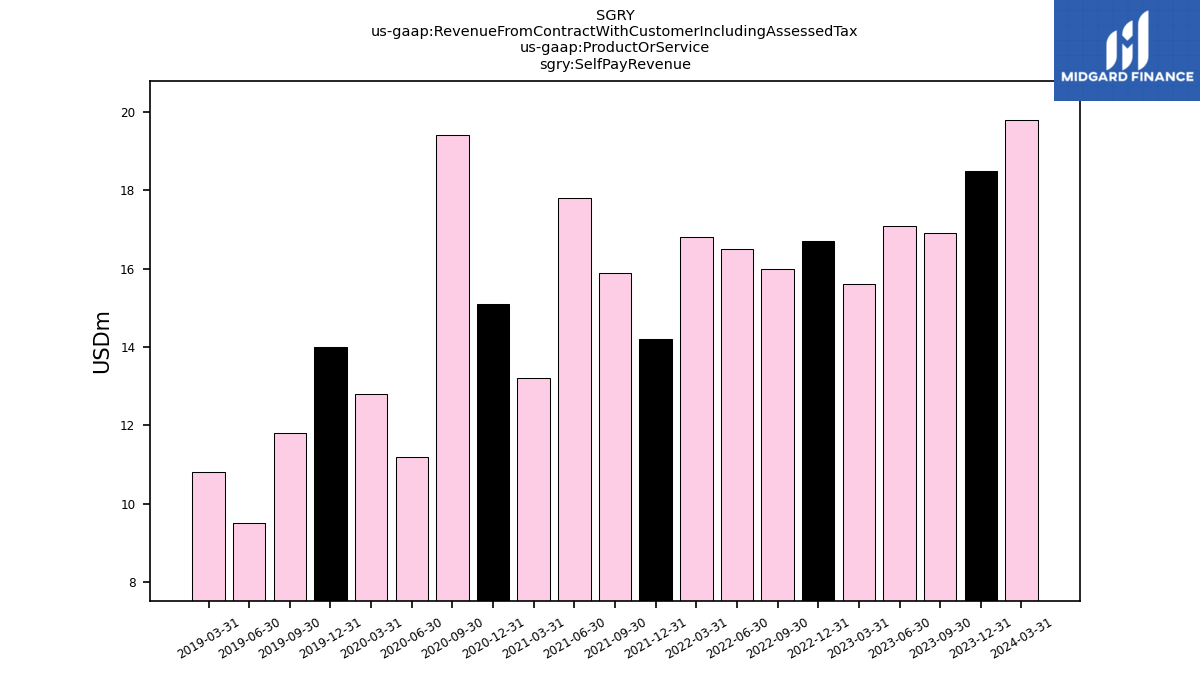
| Self Pay Revenue | 18.50 | 16.90 | 17.10 | 15.60 | 16.70 | 16.00 | 16.50 | 16.80 | 14.20 | 15.90 | 17.80 | 13.20 | 15.10 | 19.40 | 11.20 | 12.80 | 14.00 | 11.80 | 9.50 | 10.80 | NA | NA | NA | NA | NA | NA | NA | NA | NA | NA | NA | NA | NA | NA | NA | NA | NA | NA | NA | NA |