
| 2023-12-31 | 2023-09-30 | 2023-06-30 | 2023-03-31 | 2022-12-31 | 2022-09-30 | 2022-06-30 | 2022-03-31 | 2021-12-31 | 2021-09-30 | 2021-06-30 | 2021-03-31 | 2020-12-31 | 2020-09-30 | 2020-06-30 | 2020-03-31 | 2019-12-31 | 2019-09-30 | 2019-06-30 | 2019-03-31 | 2018-12-31 | 2018-09-30 | 2018-06-30 | 2018-03-31 | 2017-12-31 | 2017-09-30 | 2017-06-30 | 2017-03-31 | 2016-12-31 | 2016-09-30 | 2016-06-30 | 2016-03-31 | 2015-12-31 | 2015-09-30 | 2015-06-30 | 2015-03-31 | 2014-12-31 | 2014-09-30 | 2014-06-30 | 2014-03-31 | 2013-12-31 | 2013-09-30 | 2013-06-30 | 2013-03-31 | 2012-12-31 | 2012-09-30 | 2012-06-30 | 2012-03-31 | 2011-12-31 | 2011-09-30 | 2011-06-30 | 2011-03-31 | ||
|---|---|---|---|---|---|---|---|---|---|---|---|---|---|---|---|---|---|---|---|---|---|---|---|---|---|---|---|---|---|---|---|---|---|---|---|---|---|---|---|---|---|---|---|---|---|---|---|---|---|---|---|---|---|
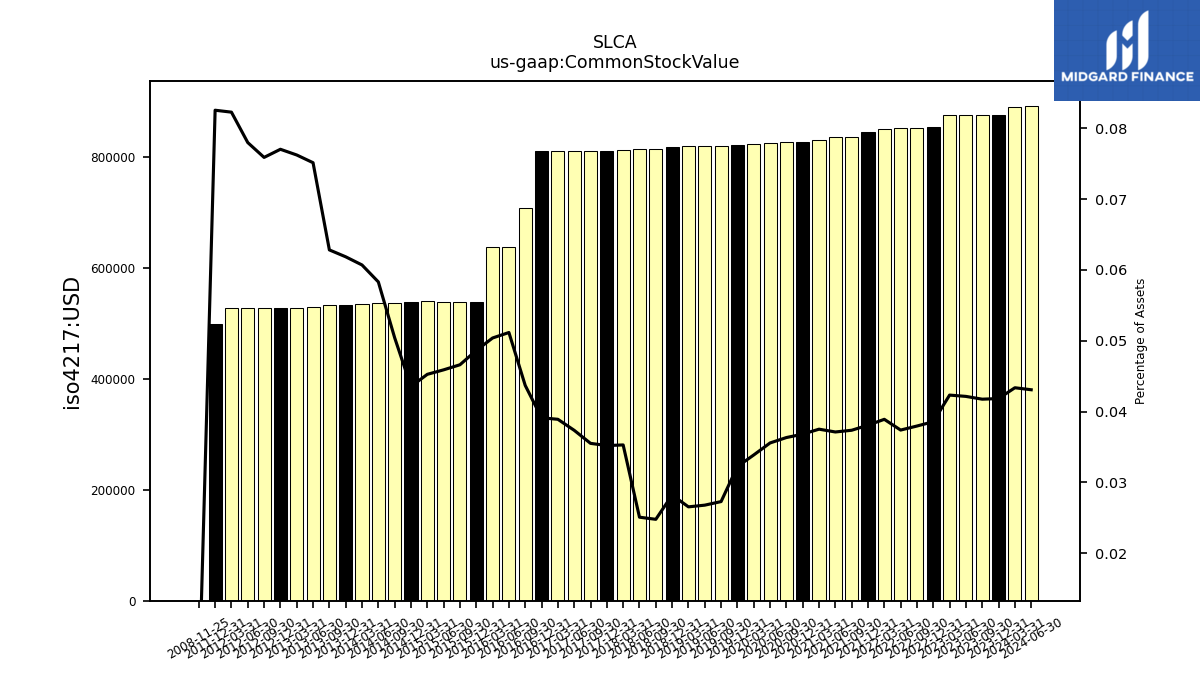
| Common Stock Value | 0.88 | 0.88 | 0.88 | 0.88 | 0.85 | 0.85 | 0.85 | 0.85 | 0.84 | 0.84 | 0.84 | 0.83 | 0.83 | 0.83 | 0.83 | 0.82 | 0.82 | 0.82 | 0.82 | 0.82 | 0.82 | 0.81 | 0.81 | 0.81 | 0.81 | 0.81 | 0.81 | 0.81 | 0.81 | 0.71 | 0.64 | 0.64 | 0.54 | 0.54 | 0.54 | 0.54 | 0.54 | 0.54 | 0.54 | 0.54 | 0.53 | 0.53 | 0.53 | 0.53 | 0.53 | 0.53 | 0.53 | 0.53 | 0.50 | NA | NA | NA | |
| Earnings Per Share Basic | 0.38 | 0.35 | 0.60 | 0.58 | 0.42 | 0.42 | 0.30 | -0.11 | -0.25 | -0.27 | 0.35 | -0.28 | 0.06 | -0.19 | -0.44 | -0.98 | -4.00 | -0.31 | 0.08 | -0.26 | -3.44 | 0.08 | 0.23 | 0.39 | 0.89 | 0.51 | 0.36 | 0.03 | -0.09 | -0.17 | -0.19 | -0.20 | -0.29 | 0.05 | 0.19 | 0.28 | 0.62 | 0.77 | 0.53 | 0.34 | 0.31 | 0.40 | 0.38 | 0.33 | 0.41 | 0.36 | 0.37 | 0.37 | 0.21 | 0.21 | 0.13 | 0.07 | |
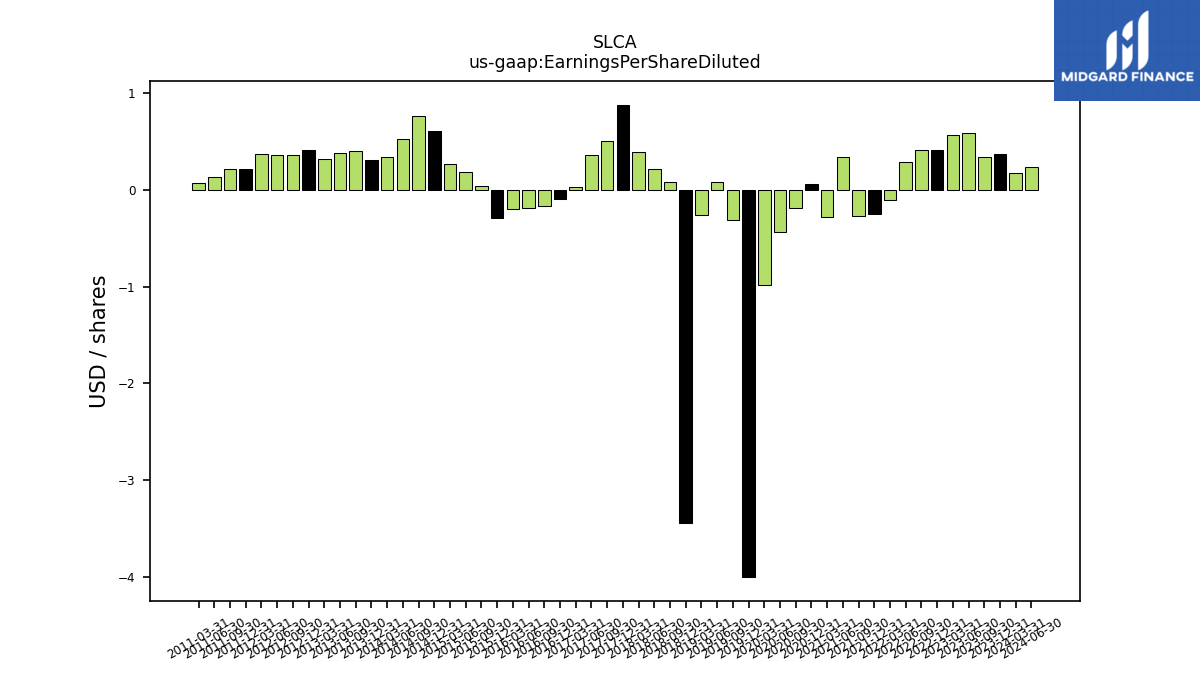
| Earnings Per Share Diluted | 0.37 | 0.34 | 0.59 | 0.57 | 0.41 | 0.41 | 0.29 | -0.11 | -0.25 | -0.27 | 0.34 | -0.28 | 0.06 | -0.19 | -0.44 | -0.98 | -4.00 | -0.31 | 0.08 | -0.26 | -3.44 | 0.08 | 0.22 | 0.39 | 0.88 | 0.50 | 0.36 | 0.03 | -0.09 | -0.17 | -0.19 | -0.20 | -0.29 | 0.04 | 0.18 | 0.27 | 0.61 | 0.76 | 0.53 | 0.34 | 0.31 | 0.40 | 0.38 | 0.32 | 0.41 | 0.36 | 0.36 | 0.37 | 0.21 | 0.21 | 0.13 | 0.07 |
| 2023-12-31 | 2023-09-30 | 2023-06-30 | 2023-03-31 | 2022-12-31 | 2022-09-30 | 2022-06-30 | 2022-03-31 | 2021-12-31 | 2021-09-30 | 2021-06-30 | 2021-03-31 | 2020-12-31 | 2020-09-30 | 2020-06-30 | 2020-03-31 | 2019-12-31 | 2019-09-30 | 2019-06-30 | 2019-03-31 | 2018-12-31 | 2018-09-30 | 2018-06-30 | 2018-03-31 | 2017-12-31 | 2017-09-30 | 2017-06-30 | 2017-03-31 | 2016-12-31 | 2016-09-30 | 2016-06-30 | 2016-03-31 | 2015-12-31 | 2015-09-30 | 2015-06-30 | 2015-03-31 | 2014-12-31 | 2014-09-30 | 2014-06-30 | 2014-03-31 | 2013-12-31 | 2013-09-30 | 2013-06-30 | 2013-03-31 | 2012-12-31 | 2012-09-30 | 2012-06-30 | 2012-03-31 | 2011-12-31 | 2011-09-30 | 2011-06-30 | 2011-03-31 | ||
|---|---|---|---|---|---|---|---|---|---|---|---|---|---|---|---|---|---|---|---|---|---|---|---|---|---|---|---|---|---|---|---|---|---|---|---|---|---|---|---|---|---|---|---|---|---|---|---|---|---|---|---|---|---|
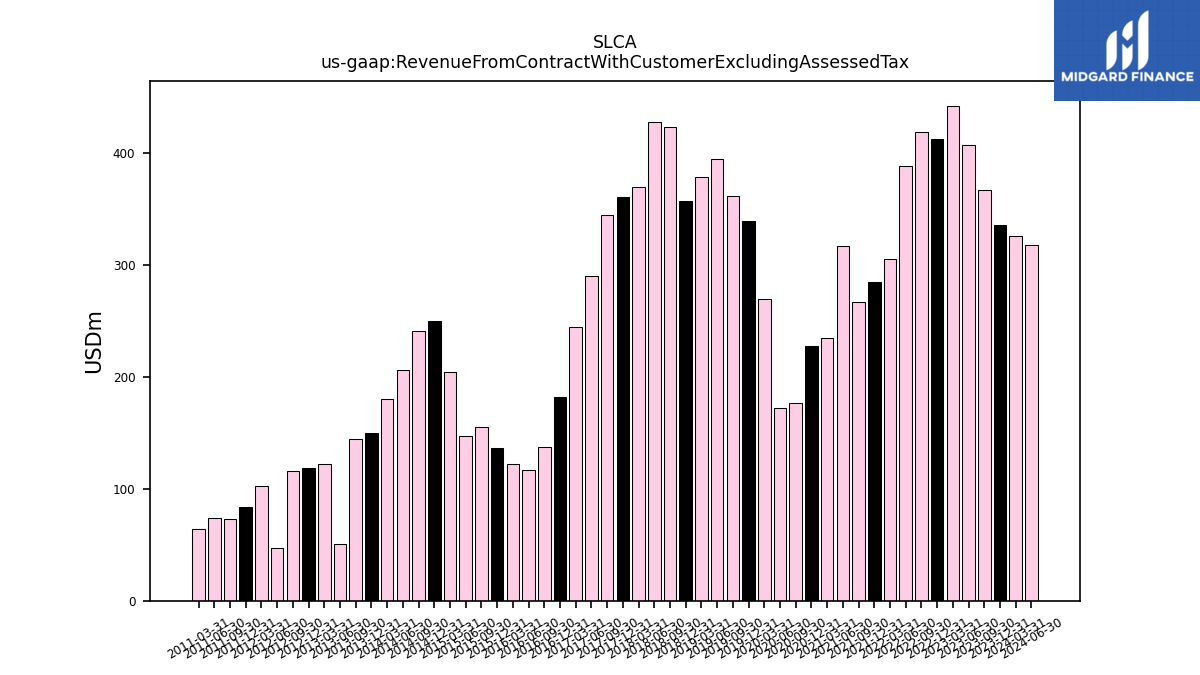
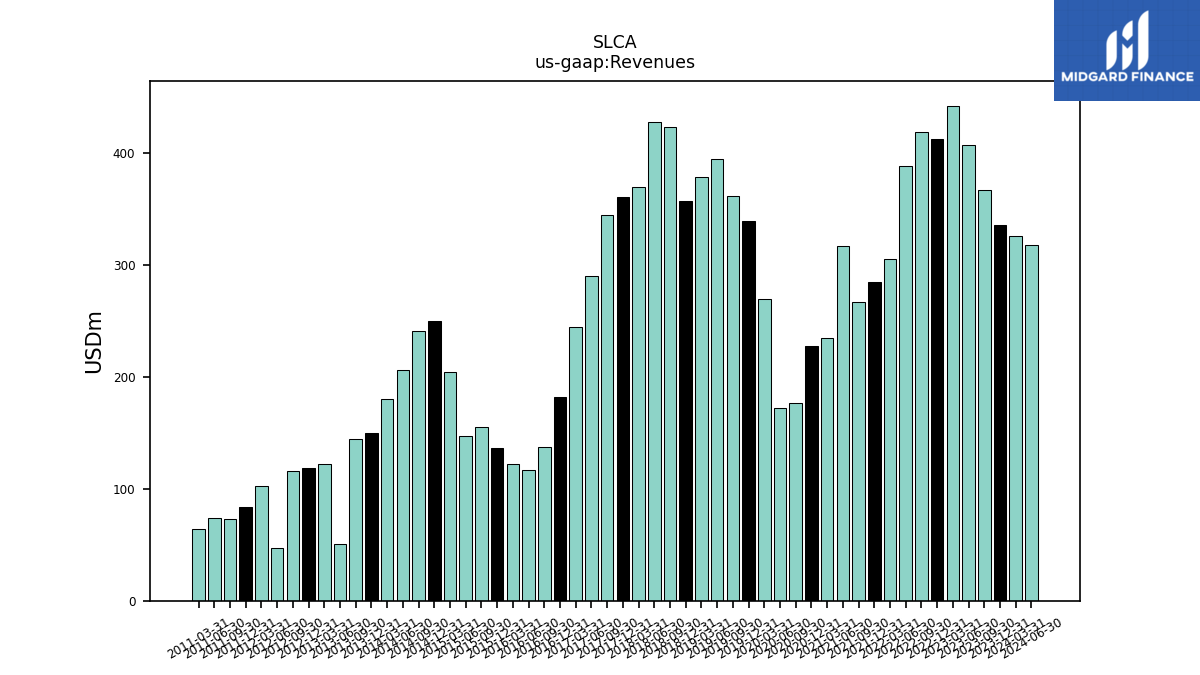
| Revenue From Contract With Customer Excluding Assessed Tax | 336.04 | 366.96 | 406.78 | 442.24 | 412.93 | 418.81 | 388.51 | 304.89 | 284.86 | 267.30 | 317.30 | 234.42 | 227.28 | 176.47 | 172.54 | 269.60 | 339.06 | 361.81 | 394.85 | 378.75 | 357.38 | 423.17 | 427.43 | 369.31 | 360.57 | 345.02 | 290.46 | 244.80 | 182.37 | 137.75 | 116.99 | 122.51 | 136.11 | 155.41 | 147.51 | 203.96 | 249.59 | 241.26 | 205.80 | 180.09 | 149.47 | 144.37 | 50.83 | 122.31 | 118.85 | 115.89 | 47.29 | 102.59 | 83.63 | 73.45 | 74.08 | 64.43 | |
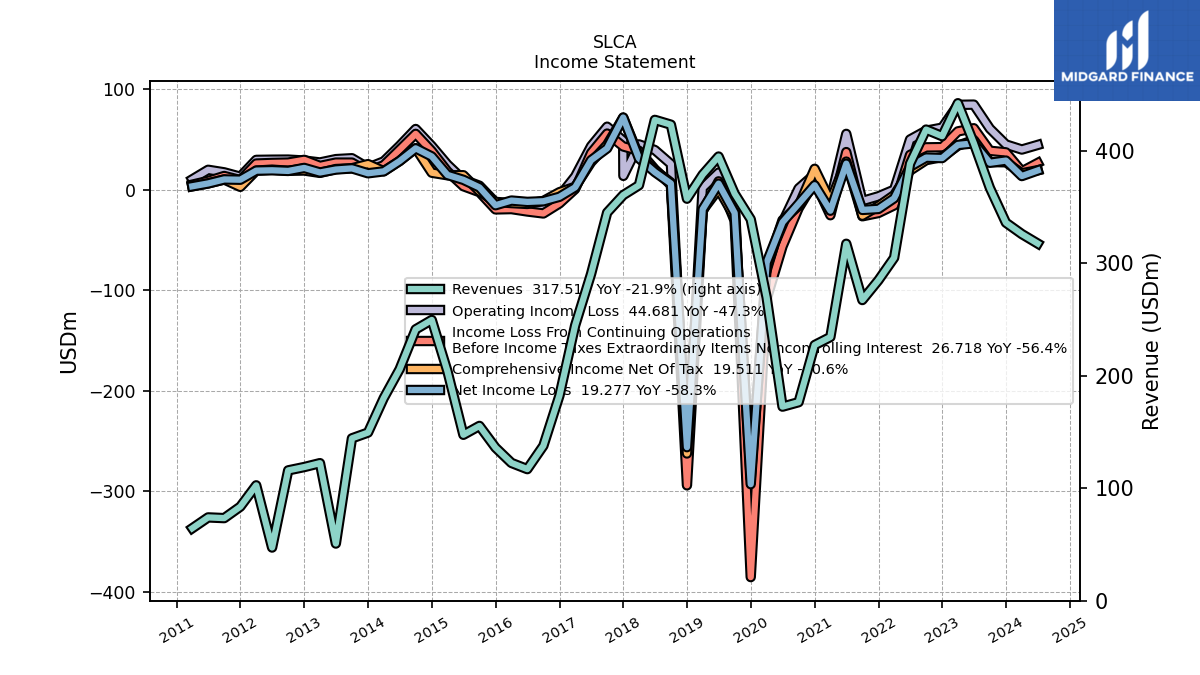
| Revenues | 336.04 | 366.96 | 406.78 | 442.24 | 412.93 | 418.81 | 388.51 | 304.89 | 284.86 | 267.30 | 317.30 | 234.42 | 227.28 | 176.47 | 172.54 | 269.60 | 339.06 | 361.81 | 394.85 | 378.75 | 357.38 | 423.17 | 427.43 | 369.31 | 360.57 | 345.02 | 290.46 | 244.80 | 182.37 | 137.75 | 116.99 | 122.51 | 136.11 | 155.41 | 147.51 | 203.96 | 249.59 | 241.26 | 205.80 | 180.09 | 149.47 | 144.37 | 50.83 | 122.31 | 118.85 | 115.89 | 47.29 | 102.59 | 83.63 | 73.45 | 74.08 | 64.43 | |
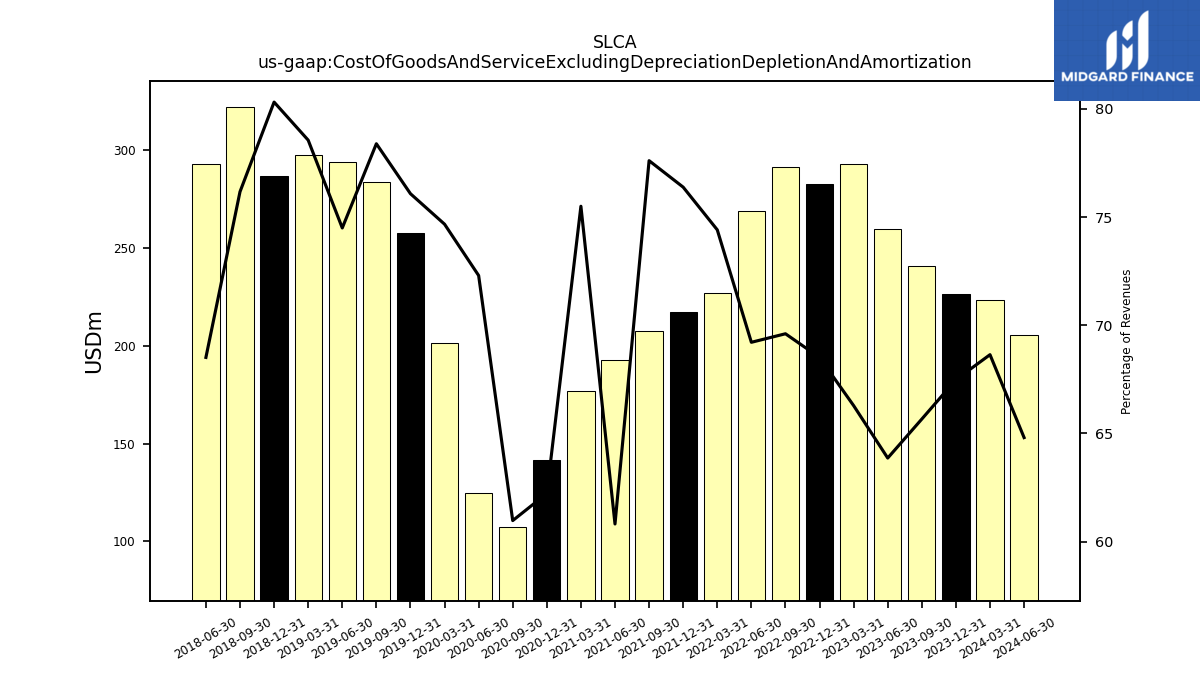
| Cost Of Goods And Service Excluding Depreciation Depletion And Amortization | 226.76 | 240.96 | 259.77 | 293.13 | 282.90 | 291.52 | 268.90 | 226.87 | 217.59 | 207.45 | 192.96 | 176.99 | 141.42 | 107.59 | 124.74 | 201.32 | 257.96 | 283.63 | 294.16 | 297.54 | 287.04 | 322.34 | 292.85 | NA | NA | NA | NA | NA | NA | NA | NA | NA | NA | NA | NA | NA | NA | NA | NA | NA | NA | NA | NA | NA | NA | NA | NA | NA | NA | NA | NA | NA | |
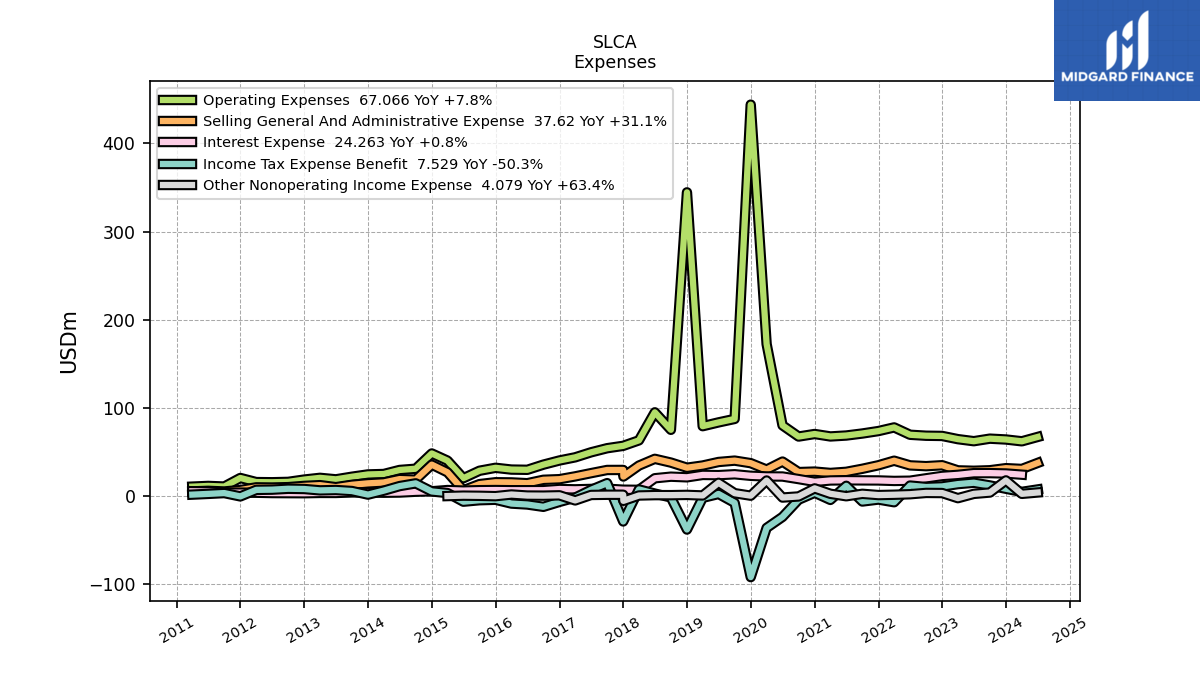
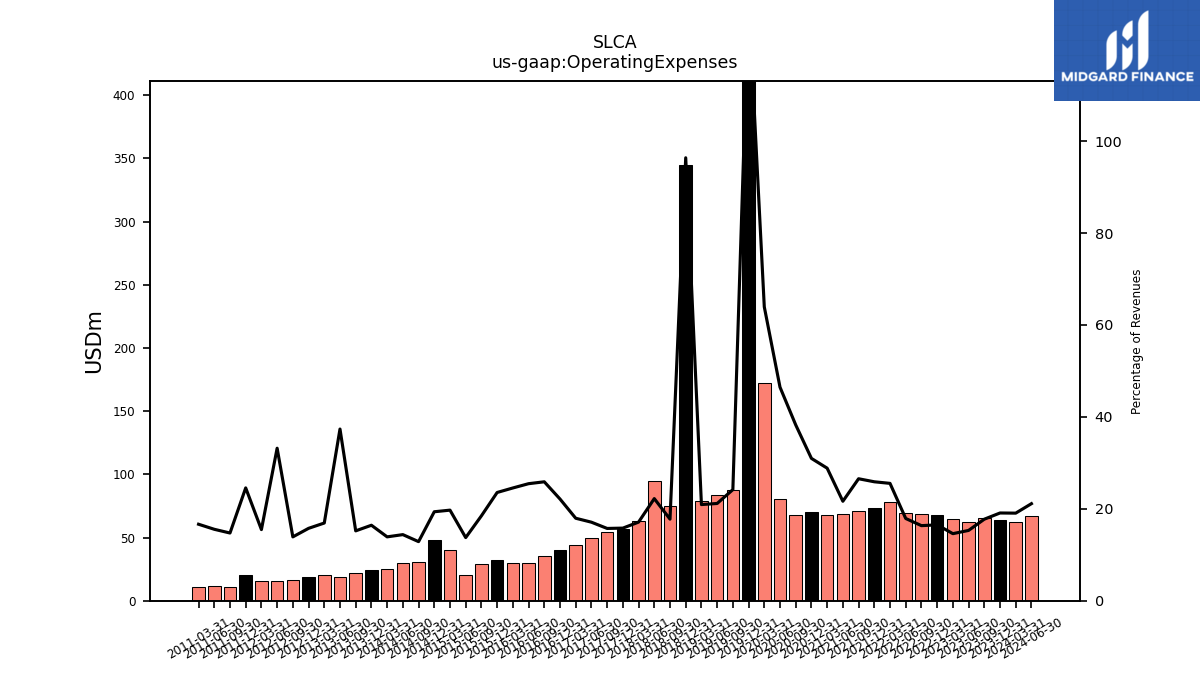
| Operating Expenses | 64.16 | 65.11 | 62.24 | 64.55 | 68.18 | 68.43 | 69.53 | 77.86 | 73.73 | 70.95 | 68.67 | 67.61 | 70.39 | 67.51 | 80.17 | 172.37 | 443.86 | 87.46 | 83.56 | 79.26 | 344.41 | 75.13 | 94.98 | 63.18 | 56.97 | 54.27 | 49.64 | 43.94 | 40.36 | 35.65 | 29.79 | 30.06 | 32.06 | 28.72 | 20.27 | 40.20 | 48.32 | 31.02 | 29.61 | 25.03 | 24.55 | 21.95 | 18.99 | 20.68 | 18.72 | 16.10 | 15.69 | 15.88 | 20.53 | 10.82 | 11.52 | 10.72 | |
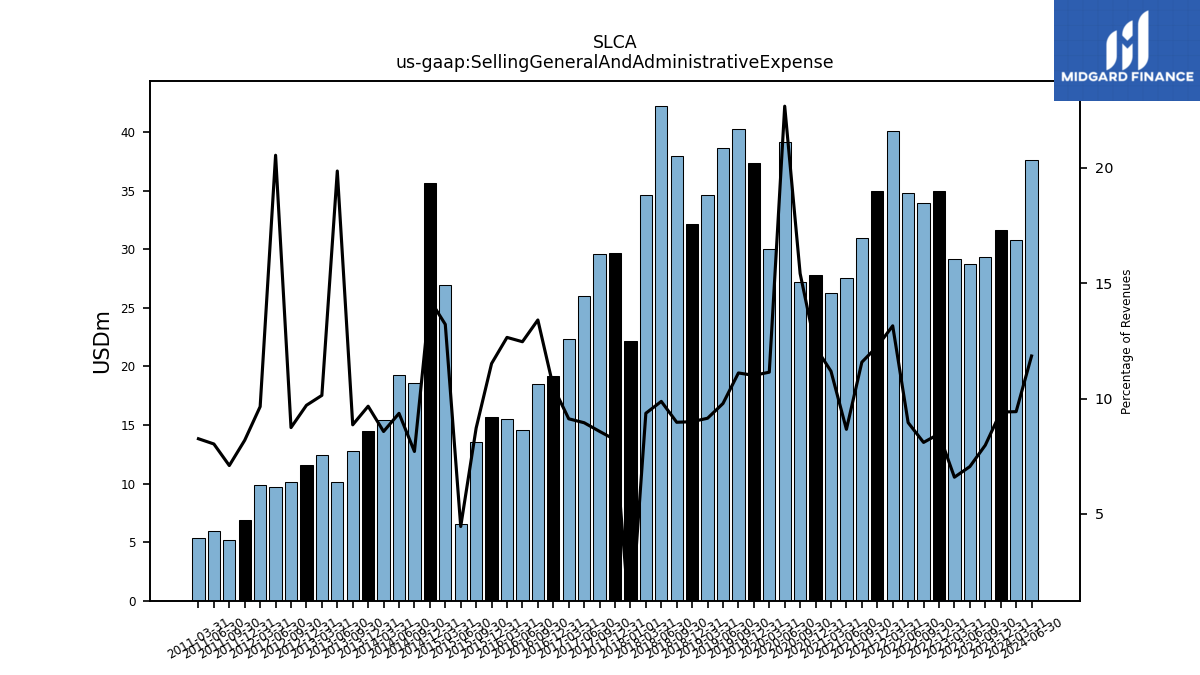
| Selling General And Administrative Expense | 31.65 | 29.29 | 28.69 | 29.16 | 34.98 | 33.93 | 34.82 | 40.11 | 34.94 | 30.96 | 27.51 | 26.22 | 27.78 | 27.22 | 39.13 | 30.05 | 37.33 | 40.21 | 38.66 | 34.66 | 32.17 | 37.98 | 42.23 | 34.59 | 29.64 | 29.60 | 26.01 | 22.34 | 19.17 | 18.47 | 14.59 | 15.50 | 15.68 | 13.56 | 6.58 | 26.96 | 35.66 | 18.60 | 19.27 | 15.45 | 14.46 | 12.80 | 10.10 | 12.40 | 11.54 | 10.13 | 9.72 | 9.90 | 6.86 | 5.21 | 5.95 | 5.32 | |
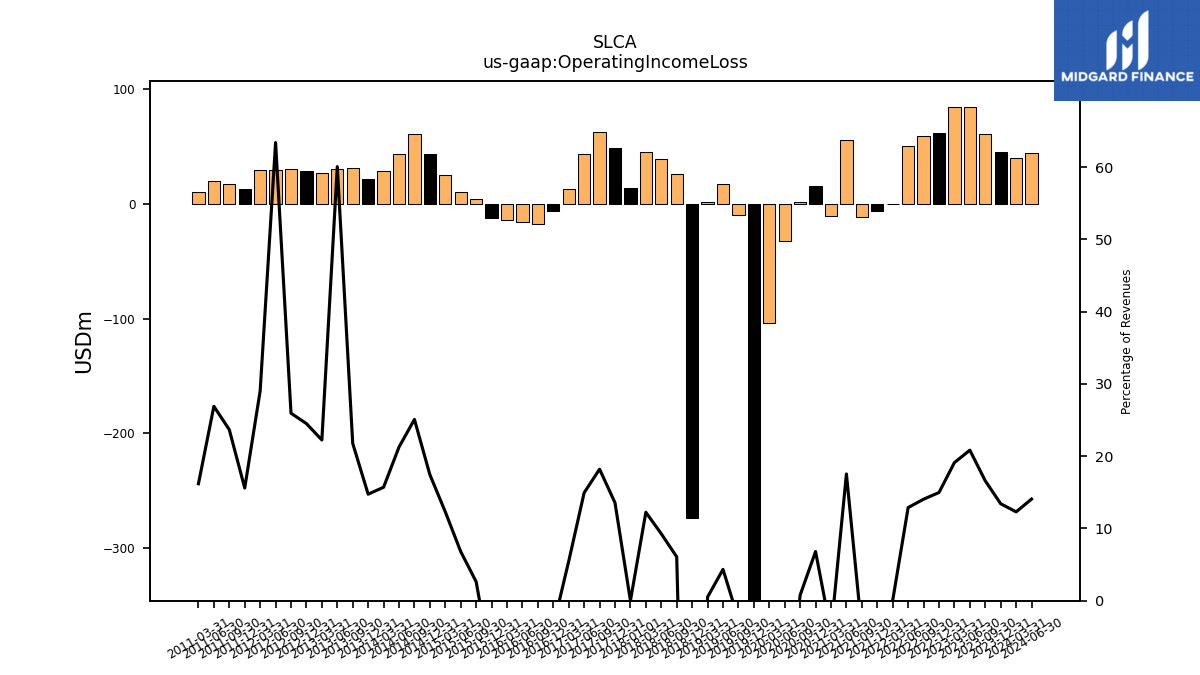
| Operating Income Loss | 45.12 | 60.90 | 84.77 | 84.56 | 61.85 | 58.86 | 50.09 | 0.16 | -6.46 | -11.10 | 55.67 | -10.18 | 15.47 | 1.37 | -32.37 | -104.08 | -362.76 | -9.28 | 17.14 | 1.96 | -274.07 | 25.71 | 39.61 | 45.22 | 48.89 | 62.83 | 43.42 | 13.38 | -6.40 | -17.32 | -15.51 | -14.30 | -12.56 | 4.09 | 10.04 | 25.10 | 43.57 | 60.53 | 43.78 | 28.29 | 22.05 | 31.44 | 30.54 | 27.22 | 29.14 | 30.08 | 29.99 | 29.79 | 13.05 | 17.39 | 19.93 | 10.43 | |
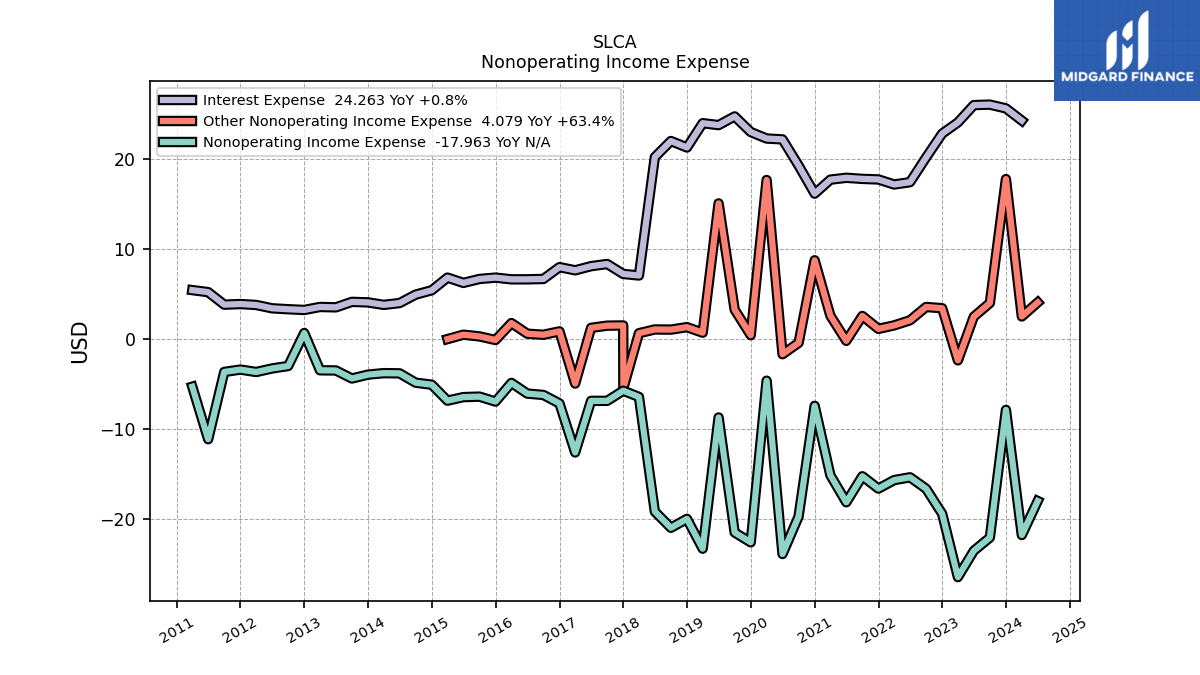
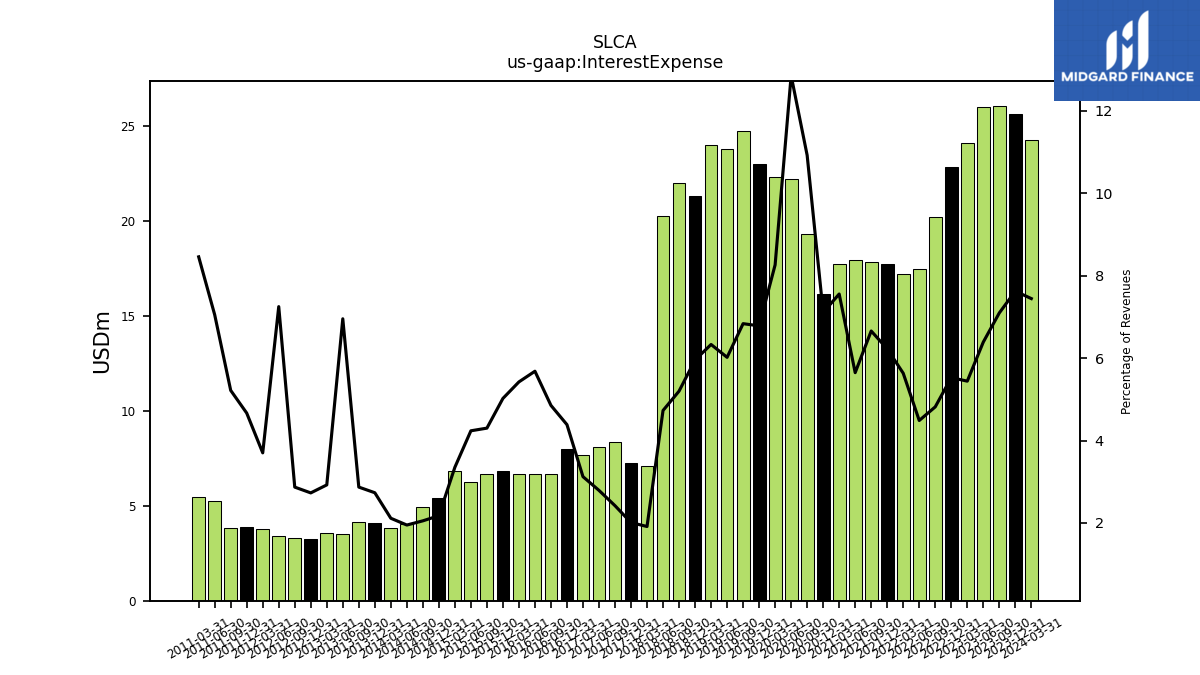
| Interest Expense | 25.62 | 26.04 | 25.99 | 24.06 | 22.82 | 20.17 | 17.43 | 17.17 | 17.73 | 17.80 | 17.92 | 17.71 | 16.16 | 19.27 | 22.18 | 22.28 | 23.00 | 24.73 | 23.77 | 23.98 | 21.28 | 22.00 | 20.21 | 7.07 | 7.24 | 8.35 | 8.11 | 7.65 | 8.00 | 6.68 | 6.65 | 6.64 | 6.83 | 6.68 | 6.25 | 6.84 | 5.43 | 4.95 | 4.01 | 3.81 | 4.09 | 4.14 | 3.54 | 3.58 | 3.24 | 3.33 | 3.43 | 3.80 | 3.90 | 3.83 | 5.22 | 5.45 | |
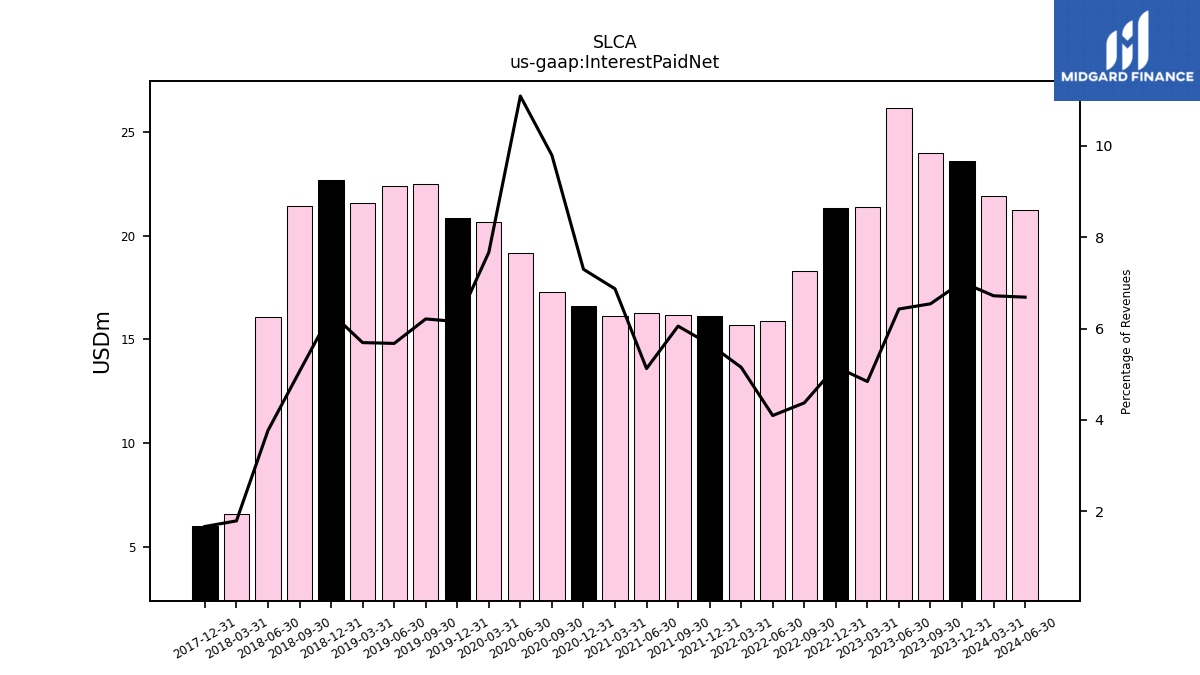
| Interest Paid Net | 23.58 | 24.00 | 26.15 | 21.40 | 21.32 | 18.31 | 15.90 | 15.70 | 16.11 | 16.18 | 16.25 | 16.10 | 16.59 | 17.29 | 19.14 | 20.68 | 20.86 | 22.47 | 22.40 | 21.56 | 22.66 | 21.42 | 16.10 | 6.59 | 5.99 | NA | NA | NA | NA | NA | NA | NA | NA | NA | NA | NA | NA | NA | NA | NA | NA | NA | NA | NA | NA | NA | NA | NA | NA | NA | NA | NA | |
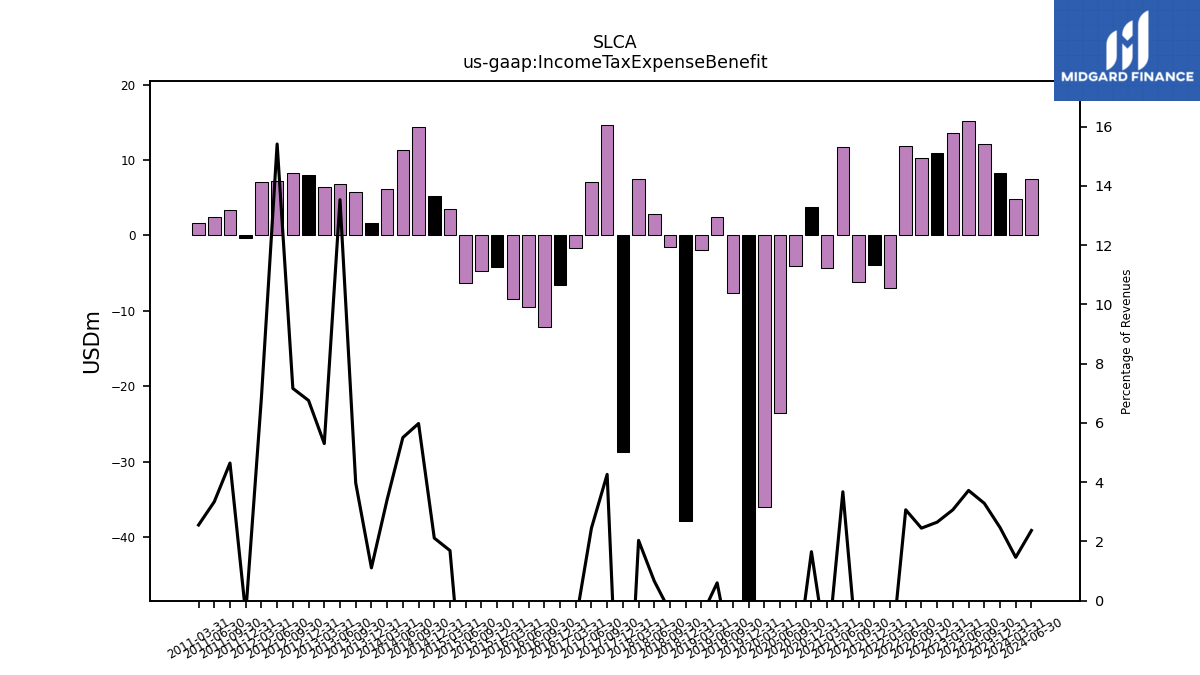
| Income Tax Expense Benefit | 8.31 | 12.06 | 15.14 | 13.57 | 10.95 | 10.26 | 11.92 | -6.97 | -3.93 | -6.14 | 11.67 | -4.35 | 3.76 | -4.09 | -23.61 | -36.09 | -91.89 | -7.67 | 2.38 | -1.97 | -37.94 | -1.55 | 2.83 | 7.52 | -28.78 | 14.71 | 7.11 | -1.71 | -6.59 | -12.18 | -9.55 | -8.49 | -4.17 | -4.70 | -6.34 | 3.45 | 5.28 | 14.43 | 11.33 | 6.15 | 1.66 | 5.74 | 6.88 | 6.49 | 8.03 | 8.30 | 7.29 | 7.03 | -0.37 | 3.41 | 2.47 | 1.65 | |
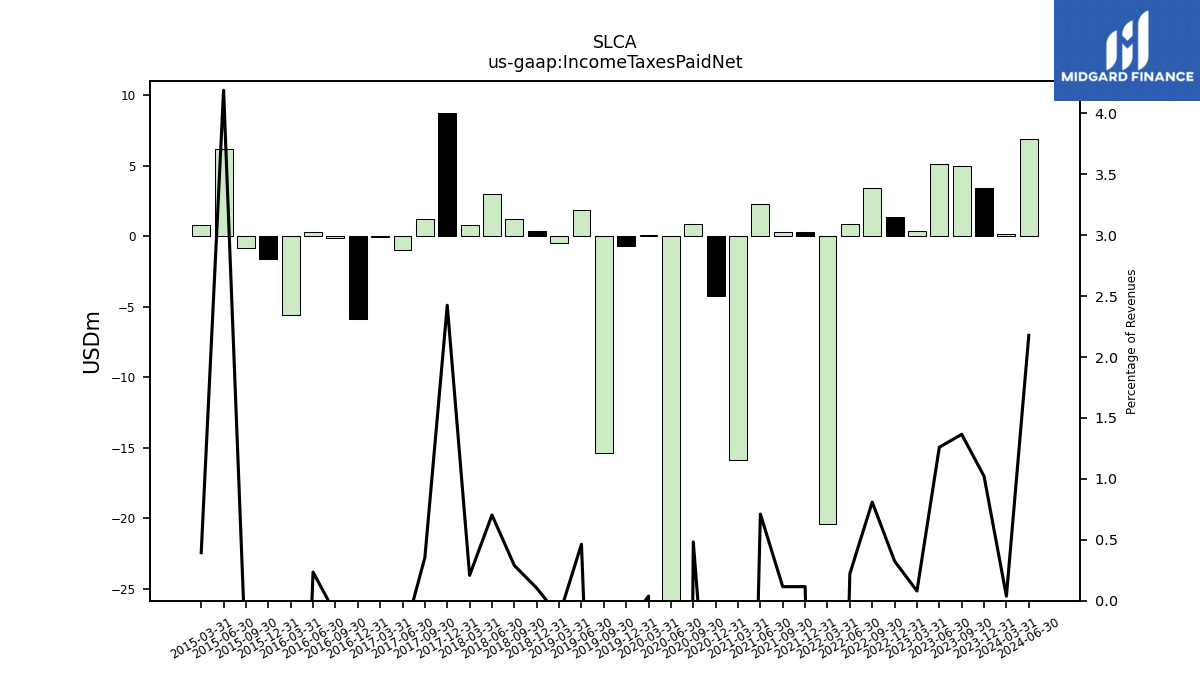
| Income Taxes Paid Net | 3.43 | 5.01 | 5.12 | 0.35 | 1.34 | 3.39 | 0.86 | -20.40 | 0.33 | 0.31 | 2.26 | -15.89 | -4.23 | 0.85 | -36.63 | 0.10 | -0.71 | -15.39 | 1.83 | -0.47 | 0.37 | 1.23 | 3.01 | 0.77 | 8.74 | 1.23 | -0.95 | -0.06 | -5.88 | -0.15 | 0.28 | -5.57 | -1.61 | -0.81 | 6.18 | 0.81 | NA | NA | NA | NA | NA | NA | NA | NA | NA | NA | NA | NA | NA | NA | NA | NA | |
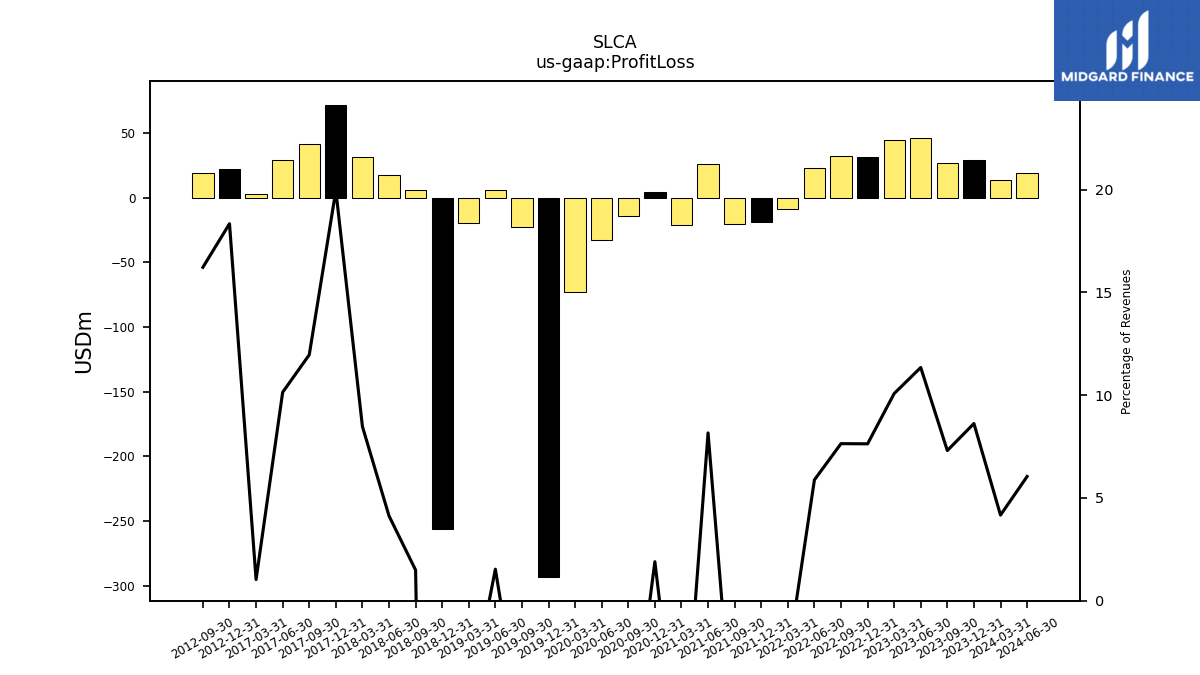
| Profit Loss | 28.96 | 26.81 | 46.14 | 44.57 | 31.52 | 32.00 | 22.84 | -8.51 | -19.11 | -20.17 | 25.90 | -20.93 | 4.32 | -14.22 | -32.62 | -72.61 | -293.43 | -23.07 | 6.06 | -19.33 | -256.07 | 6.32 | 17.64 | 31.29 | 71.95 | 41.27 | 29.46 | 2.52 | NA | NA | NA | NA | NA | NA | NA | NA | NA | NA | NA | NA | NA | NA | NA | NA | 21.79 | 18.80 | NA | NA | NA | NA | NA | NA | |
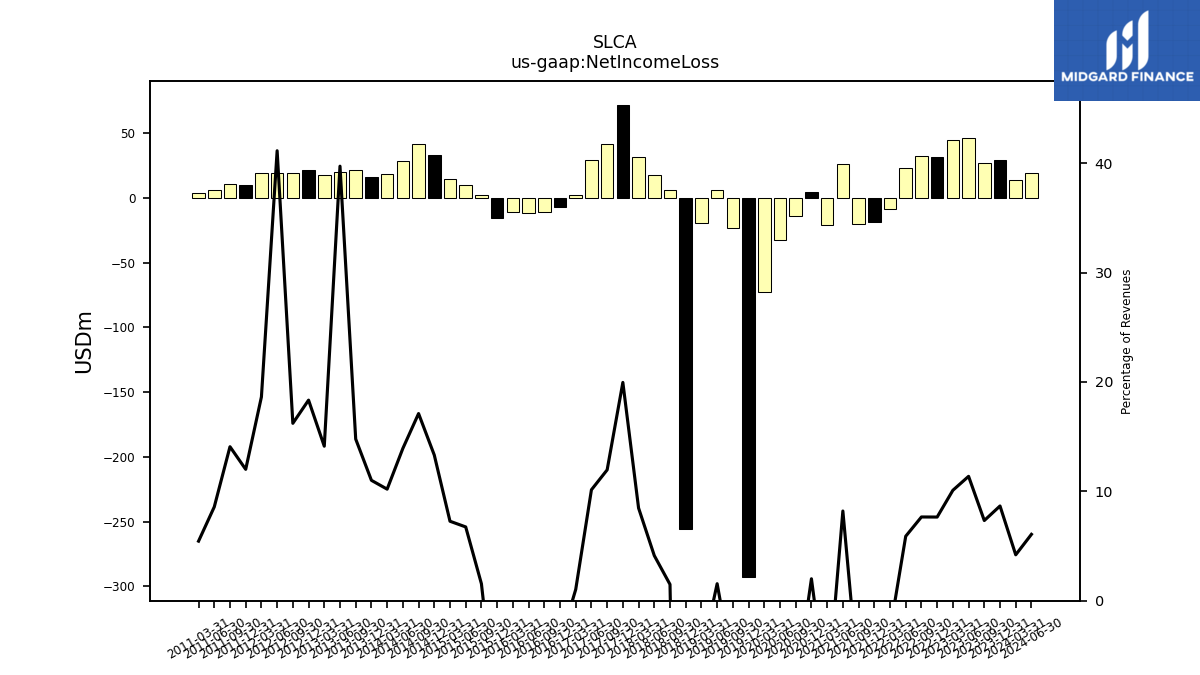
| Net Income Loss | 29.11 | 26.91 | 46.26 | 44.65 | 31.59 | 32.07 | 22.91 | -8.39 | -19.02 | -20.00 | 26.03 | -20.78 | 4.57 | -13.96 | -32.35 | -72.34 | -292.87 | -23.04 | 6.15 | -19.32 | -256.06 | 6.32 | 17.64 | 31.29 | 71.95 | 41.27 | 29.46 | 2.52 | -6.94 | -11.34 | -11.99 | -10.66 | -15.32 | 2.41 | 9.95 | 14.82 | 33.24 | 41.28 | 28.65 | 18.37 | 16.45 | 21.33 | 20.19 | 17.28 | 21.79 | 18.80 | 19.45 | 19.11 | 10.04 | 10.34 | 6.36 | 3.51 | |
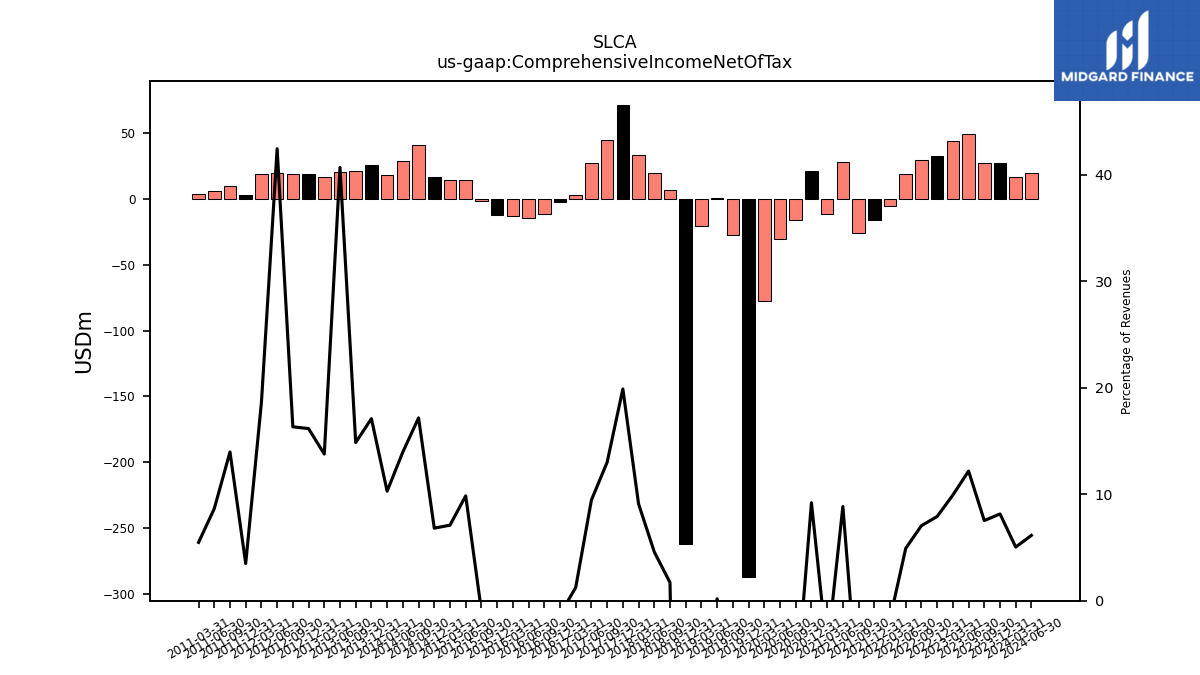
| Comprehensive Income Net Of Tax | 27.41 | 27.63 | 49.56 | 43.92 | 32.68 | 29.54 | 19.12 | -5.24 | -16.11 | -25.72 | 28.09 | -11.20 | 20.93 | -15.89 | -30.20 | -77.55 | -287.30 | -27.08 | 0.75 | -20.29 | -262.33 | 7.23 | 19.61 | 33.59 | 71.73 | 44.89 | 27.49 | 3.05 | -2.35 | -11.05 | -14.05 | -13.19 | -12.01 | -1.49 | 14.53 | 14.48 | 17.02 | 41.43 | 28.76 | 18.53 | 25.57 | 21.46 | 20.69 | 16.86 | 19.22 | 18.93 | 20.08 | 19.11 | 2.93 | 10.27 | 6.41 | 3.53 | |
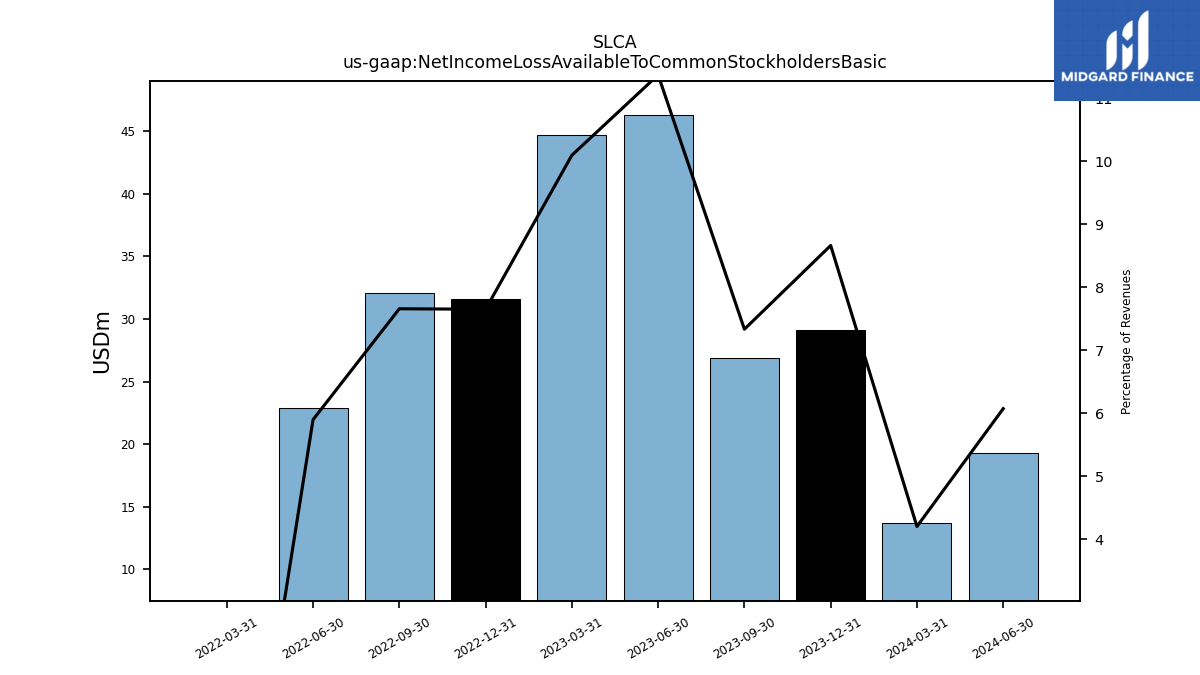
| Net Income Loss Available To Common Stockholders Basic | 29.11 | 26.91 | 46.26 | 44.65 | 31.59 | 32.07 | 22.91 | -8.39 | NA | NA | NA | NA | NA | NA | NA | NA | NA | NA | NA | NA | NA | NA | NA | NA | NA | NA | NA | NA | NA | NA | NA | NA | NA | NA | NA | NA | NA | NA | NA | NA | NA | NA | NA | NA | NA | NA | NA | NA | NA | NA | NA | NA | |
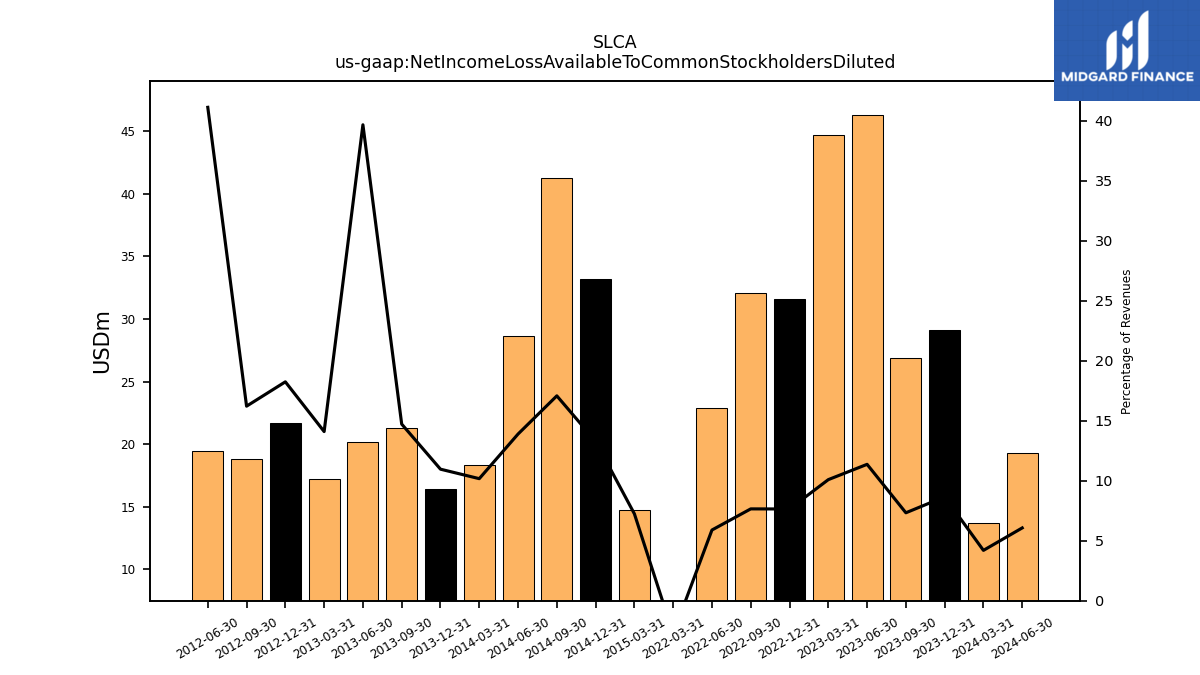
| Net Income Loss Available To Common Stockholders Diluted | 29.11 | 26.91 | 46.26 | 44.65 | 31.59 | 32.07 | 22.91 | -8.39 | NA | NA | NA | NA | NA | NA | NA | NA | NA | NA | NA | NA | NA | NA | NA | NA | NA | NA | NA | NA | NA | NA | NA | NA | NA | NA | NA | 14.78 | 33.18 | 41.21 | 28.60 | 18.33 | 16.39 | 21.26 | 20.17 | 17.25 | 21.69 | 18.80 | 19.45 | NA | NA | NA | NA | NA |
| 2023-12-31 | 2023-09-30 | 2023-06-30 | 2023-03-31 | 2022-12-31 | 2022-09-30 | 2022-06-30 | 2022-03-31 | 2021-12-31 | 2021-09-30 | 2021-06-30 | 2021-03-31 | 2020-12-31 | 2020-09-30 | 2020-06-30 | 2020-03-31 | 2019-12-31 | 2019-09-30 | 2019-06-30 | 2019-03-31 | 2018-12-31 | 2018-09-30 | 2018-06-30 | 2018-03-31 | 2017-12-31 | 2017-09-30 | 2017-06-30 | 2017-03-31 | 2016-12-31 | 2016-09-30 | 2016-06-30 | 2016-03-31 | 2015-12-31 | 2015-09-30 | 2015-06-30 | 2015-03-31 | 2014-12-31 | 2014-09-30 | 2014-06-30 | 2014-03-31 | 2013-12-31 | 2013-09-30 | 2013-06-30 | 2013-03-31 | 2012-12-31 | 2012-09-30 | 2012-06-30 | 2012-03-31 | 2011-12-31 | 2011-09-30 | 2011-06-30 | 2011-03-31 | ||
|---|---|---|---|---|---|---|---|---|---|---|---|---|---|---|---|---|---|---|---|---|---|---|---|---|---|---|---|---|---|---|---|---|---|---|---|---|---|---|---|---|---|---|---|---|---|---|---|---|---|---|---|---|---|
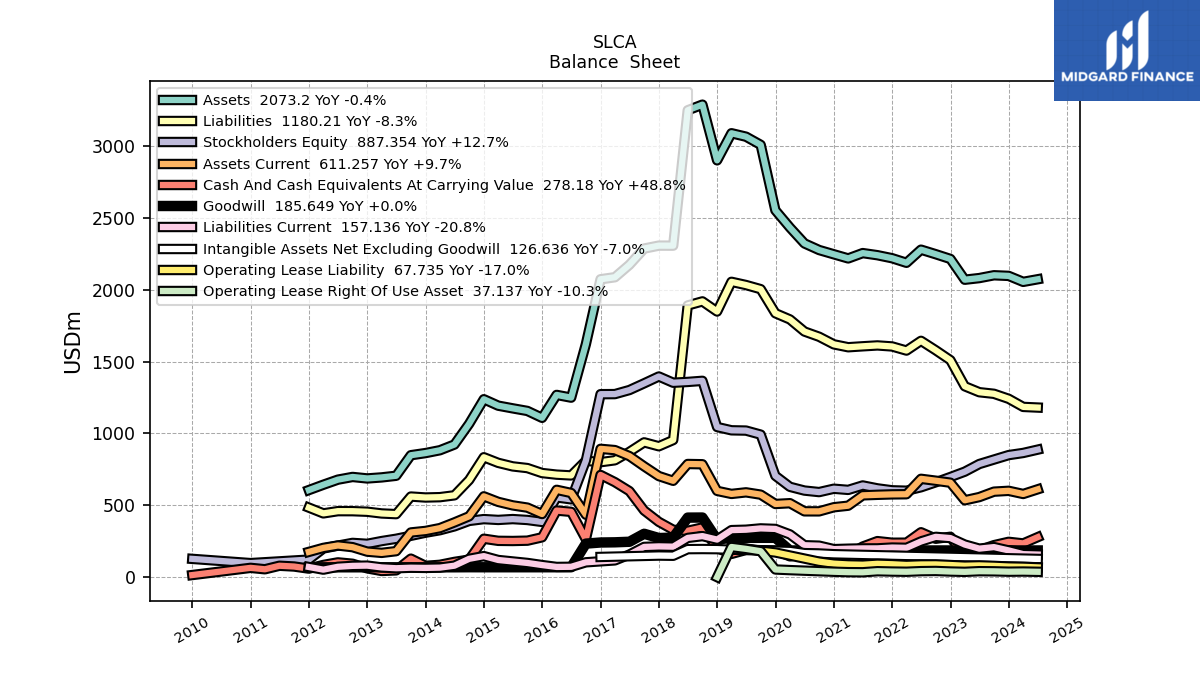
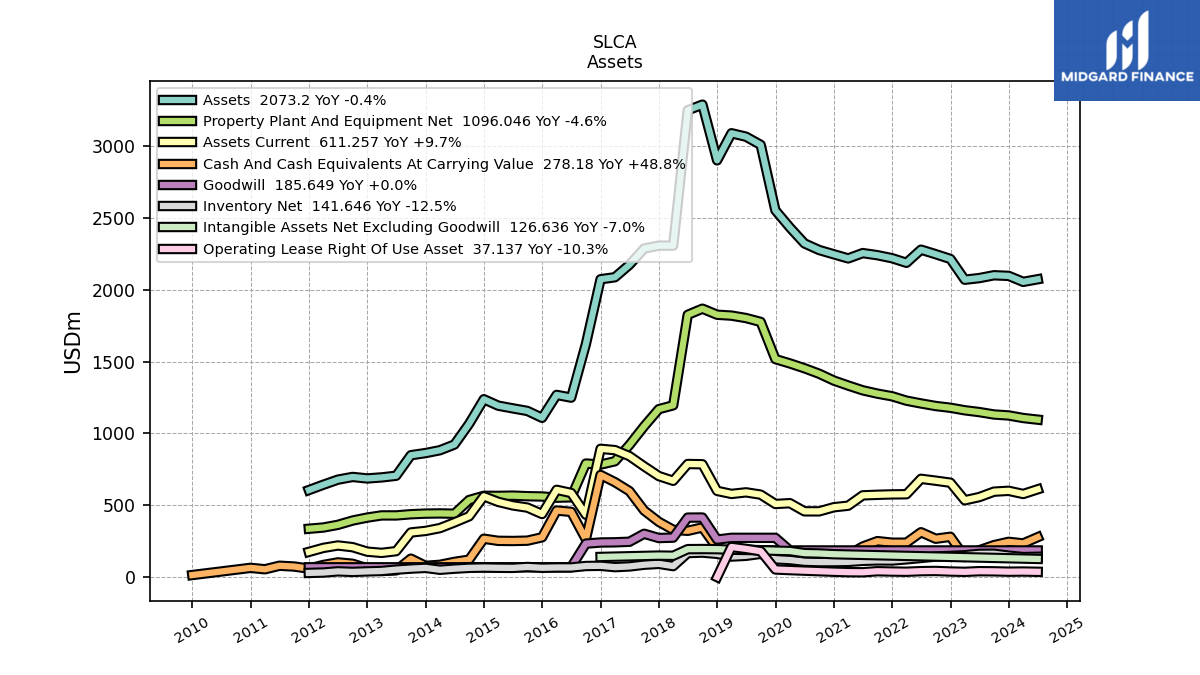
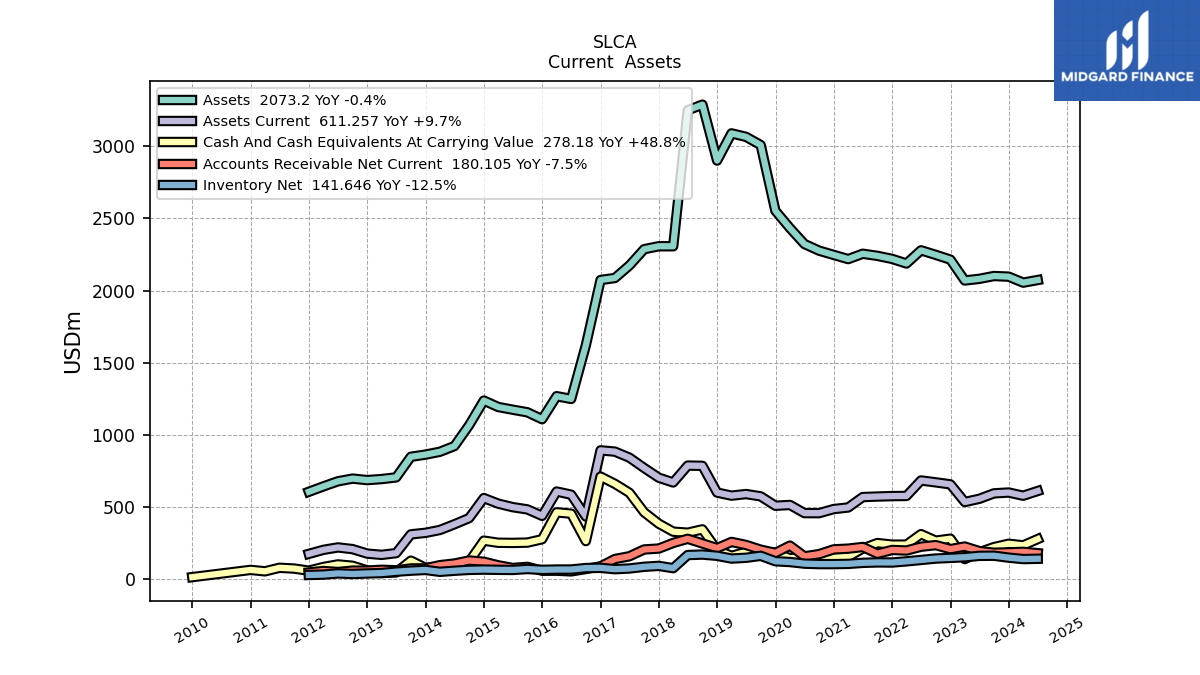
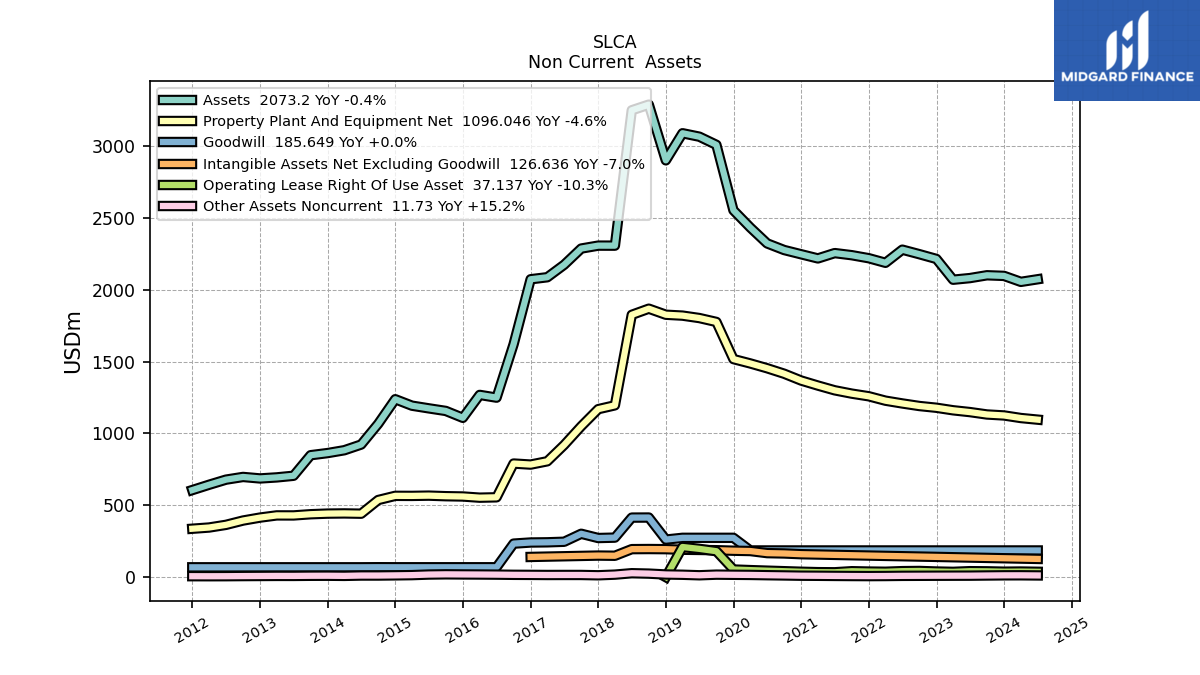
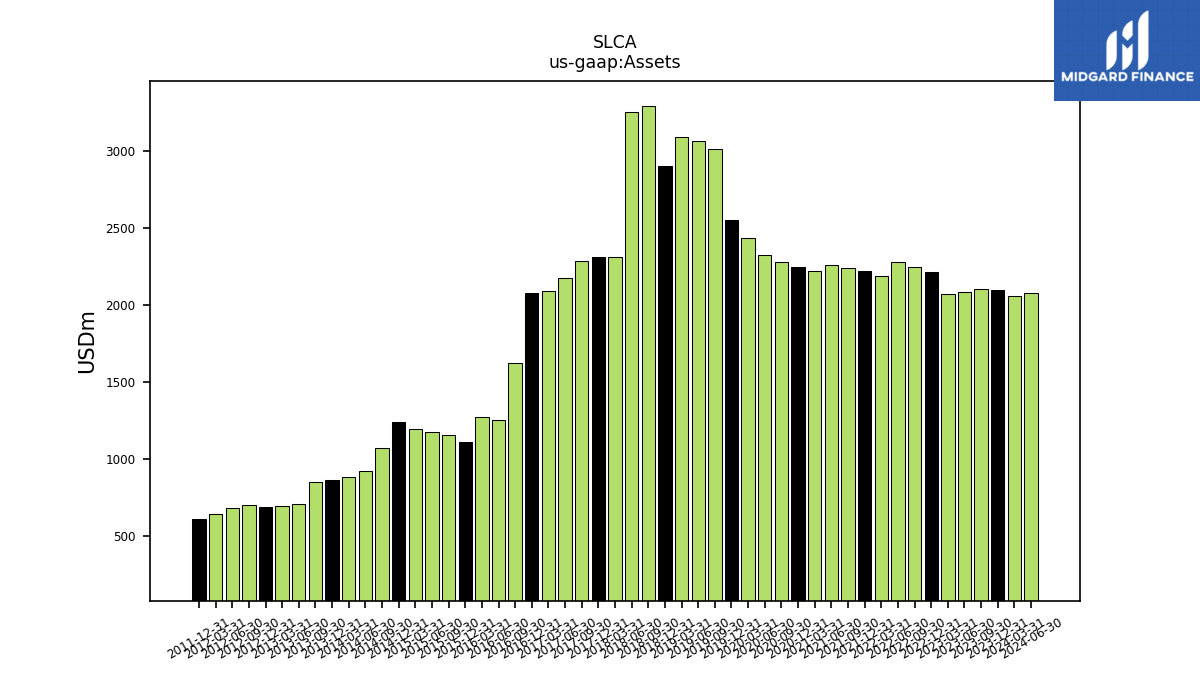
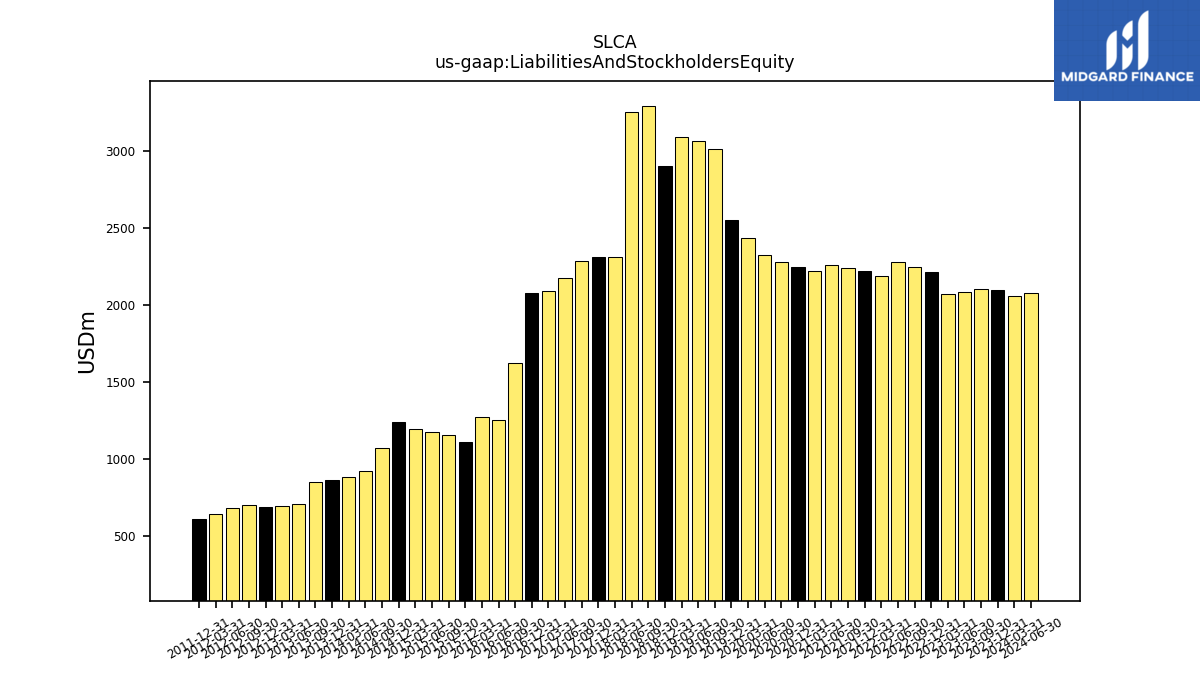
| Assets | 2096.59 | 2100.97 | 2081.37 | 2069.92 | 2214.58 | 2247.59 | 2279.11 | 2187.70 | 2219.60 | 2240.61 | 2255.28 | 2218.23 | 2246.95 | 2276.65 | 2322.71 | 2433.12 | 2553.23 | 3008.69 | 3065.51 | 3089.44 | 2900.84 | 3288.66 | 3249.34 | 2307.04 | 2307.28 | 2286.91 | 2174.17 | 2087.24 | 2073.22 | 1620.83 | 1249.15 | 1268.30 | 1108.62 | 1156.59 | 1174.67 | 1193.35 | 1238.15 | 1067.09 | 922.86 | 883.18 | 863.46 | 848.50 | 705.48 | 694.06 | 686.81 | 697.19 | 678.46 | 643.05 | 605.80 | NA | NA | NA | |
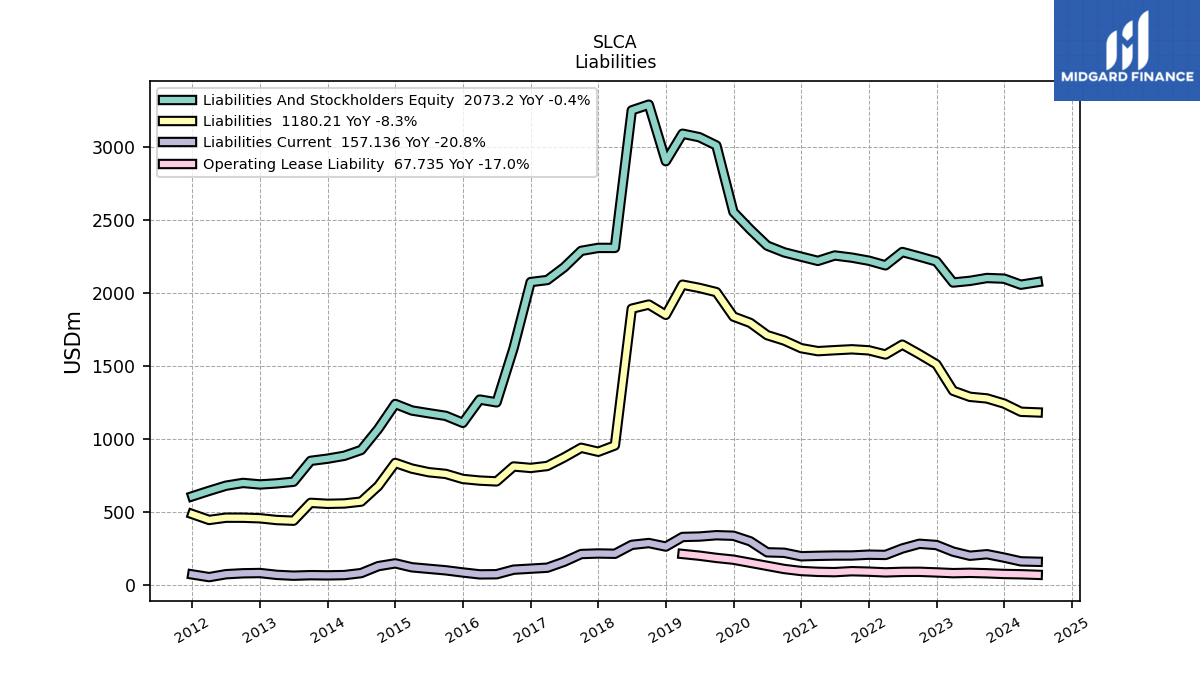
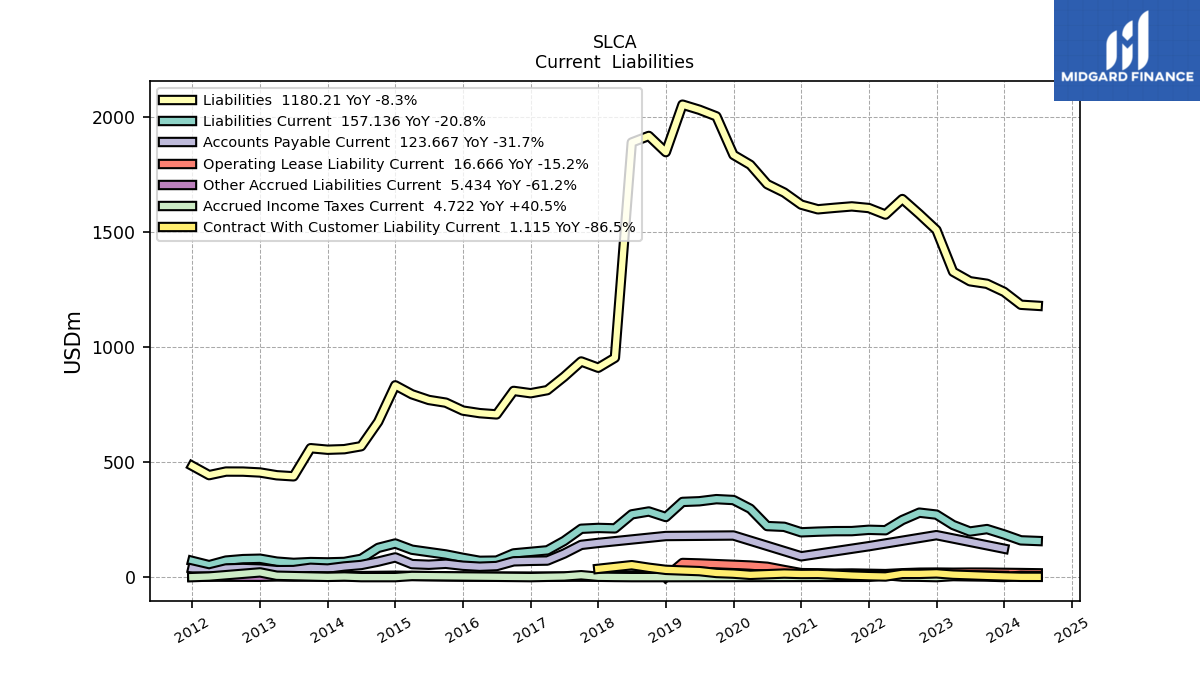
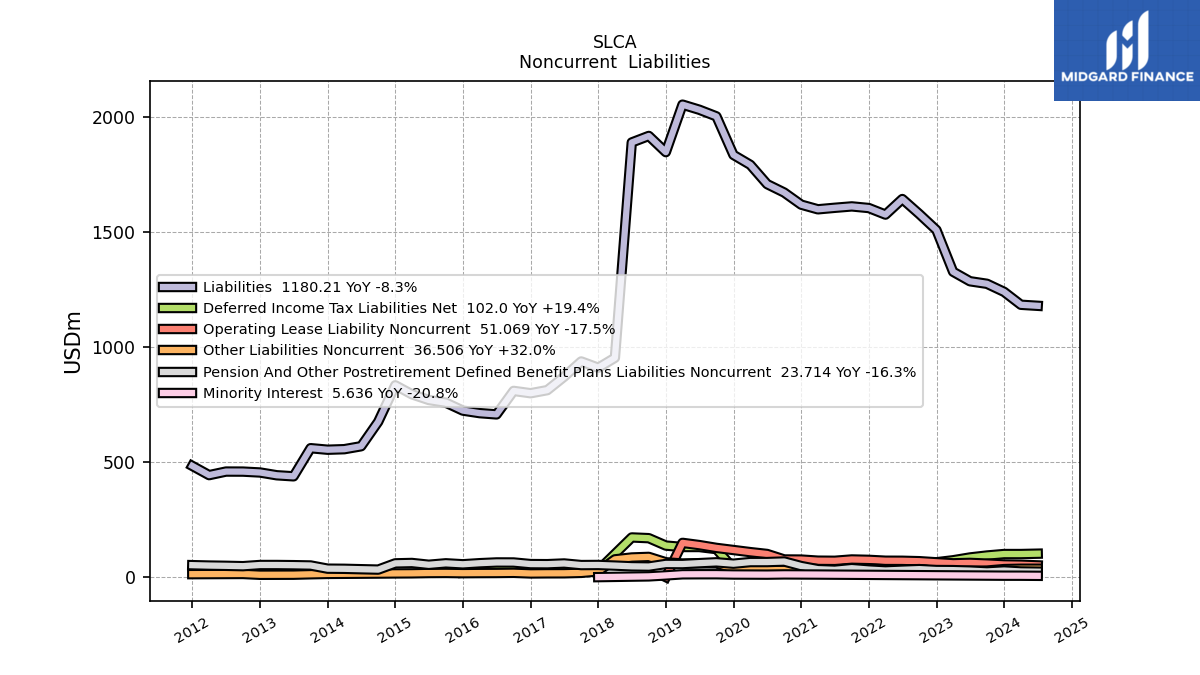
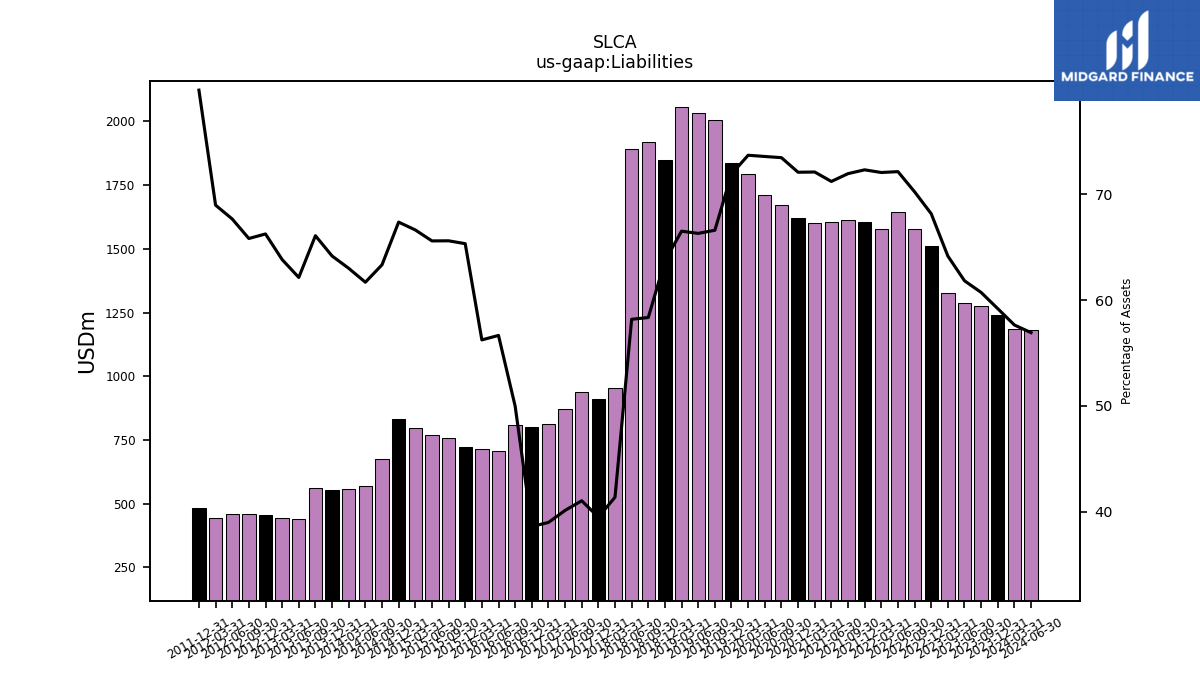
| Liabilities | 1241.07 | 1275.95 | 1287.03 | 1328.37 | 1509.89 | 1579.10 | 1644.68 | 1576.90 | 1605.52 | 1612.61 | 1606.54 | 1599.96 | 1620.16 | 1672.98 | 1709.44 | 1793.53 | 1836.65 | 2004.29 | 2033.05 | 2055.34 | 1848.54 | 1919.17 | 1890.84 | 954.05 | 910.78 | 938.11 | 871.96 | 813.34 | 799.93 | 810.04 | 707.81 | 713.31 | 724.45 | 758.93 | 770.67 | 795.30 | 834.34 | 675.95 | 569.38 | 556.53 | 554.17 | 560.86 | 438.44 | 443.11 | 455.12 | 459.00 | 459.20 | 443.64 | 483.86 | NA | NA | NA | |
| Liabilities And Stockholders Equity | 2096.59 | 2100.97 | 2081.37 | 2069.92 | 2214.58 | 2247.59 | 2279.11 | 2187.70 | 2219.60 | 2240.61 | 2255.28 | 2218.23 | 2246.95 | 2276.65 | 2322.71 | 2433.12 | 2553.23 | 3008.69 | 3065.51 | 3089.44 | 2900.84 | 3288.66 | 3249.34 | 2307.04 | 2307.28 | 2286.91 | 2174.17 | 2087.24 | 2073.22 | 1620.83 | 1249.15 | 1268.30 | 1108.62 | 1156.59 | 1174.67 | 1193.35 | 1238.15 | 1067.09 | 922.86 | 883.18 | 863.46 | 848.50 | 705.48 | 694.06 | 686.81 | 697.19 | 678.46 | 643.05 | 605.80 | NA | NA | NA | |
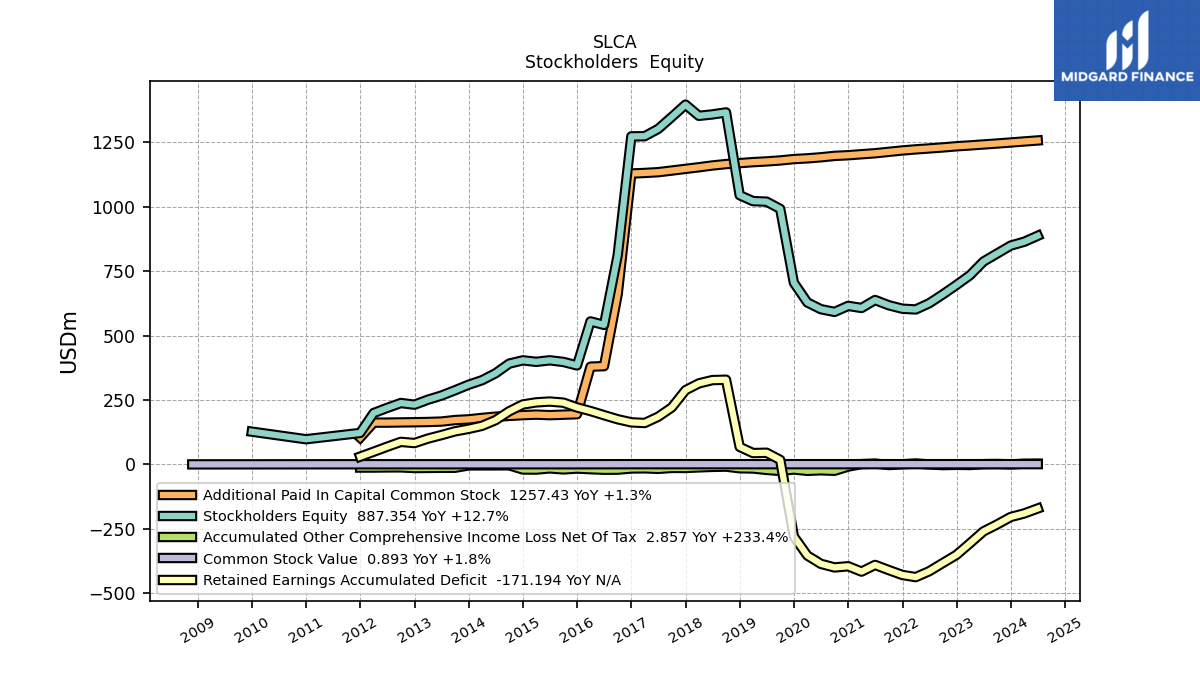
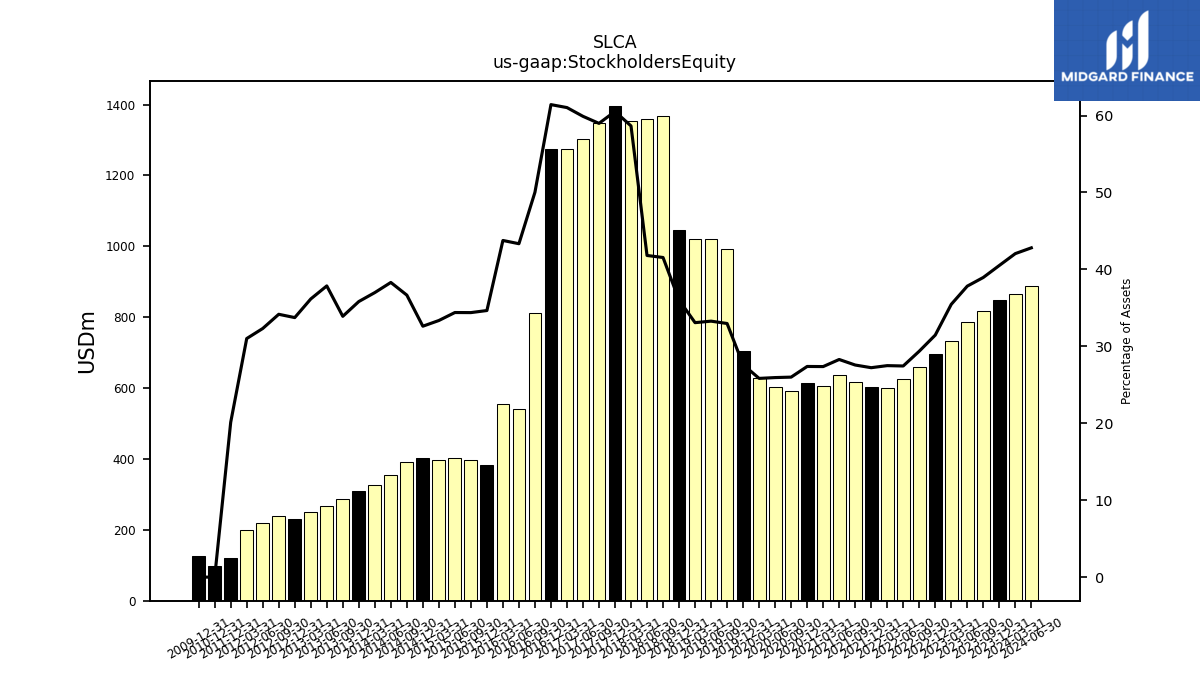
| Stockholders Equity | 849.31 | 818.33 | 787.22 | 733.97 | 696.68 | 660.00 | 625.48 | 601.40 | 604.22 | 617.72 | 638.01 | 607.08 | 615.26 | 591.85 | 602.46 | 628.50 | 705.22 | 991.85 | 1019.95 | 1021.89 | 1044.82 | 1366.27 | 1358.50 | 1352.98 | 1396.51 | 1348.80 | 1302.21 | 1273.90 | 1273.29 | 810.79 | 541.35 | 554.99 | 384.17 | 397.67 | 404.00 | 398.05 | 403.82 | 391.14 | 353.48 | 326.65 | 309.29 | 287.65 | 267.04 | 250.96 | 231.69 | 238.19 | 219.26 | 199.41 | 121.93 | NA | NA | NA |
| 2023-12-31 | 2023-09-30 | 2023-06-30 | 2023-03-31 | 2022-12-31 | 2022-09-30 | 2022-06-30 | 2022-03-31 | 2021-12-31 | 2021-09-30 | 2021-06-30 | 2021-03-31 | 2020-12-31 | 2020-09-30 | 2020-06-30 | 2020-03-31 | 2019-12-31 | 2019-09-30 | 2019-06-30 | 2019-03-31 | 2018-12-31 | 2018-09-30 | 2018-06-30 | 2018-03-31 | 2017-12-31 | 2017-09-30 | 2017-06-30 | 2017-03-31 | 2016-12-31 | 2016-09-30 | 2016-06-30 | 2016-03-31 | 2015-12-31 | 2015-09-30 | 2015-06-30 | 2015-03-31 | 2014-12-31 | 2014-09-30 | 2014-06-30 | 2014-03-31 | 2013-12-31 | 2013-09-30 | 2013-06-30 | 2013-03-31 | 2012-12-31 | 2012-09-30 | 2012-06-30 | 2012-03-31 | 2011-12-31 | 2011-09-30 | 2011-06-30 | 2011-03-31 | ||
|---|---|---|---|---|---|---|---|---|---|---|---|---|---|---|---|---|---|---|---|---|---|---|---|---|---|---|---|---|---|---|---|---|---|---|---|---|---|---|---|---|---|---|---|---|---|---|---|---|---|---|---|---|---|
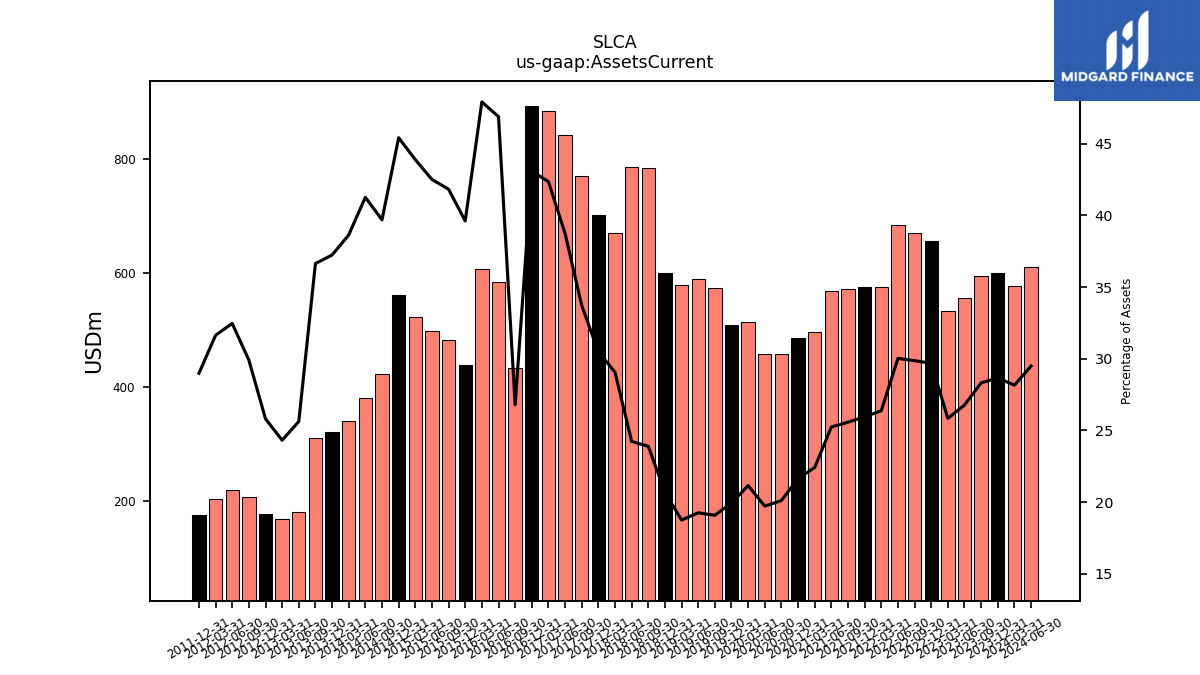
| Assets Current | 600.74 | 594.88 | 557.14 | 534.83 | 657.28 | 671.22 | 684.25 | 576.91 | 575.91 | 572.96 | 569.19 | 497.13 | 486.31 | 457.74 | 457.90 | 514.57 | 509.04 | 574.12 | 590.06 | 579.07 | 600.24 | 785.63 | 787.42 | 670.39 | 703.24 | 771.05 | 842.18 | 884.13 | 892.95 | 434.32 | 585.70 | 607.72 | 439.14 | 483.75 | 499.30 | 523.75 | 562.33 | 423.49 | 380.77 | 341.22 | 321.50 | 310.89 | 180.73 | 168.75 | 177.27 | 208.48 | 220.25 | 203.43 | 175.57 | NA | NA | NA | |
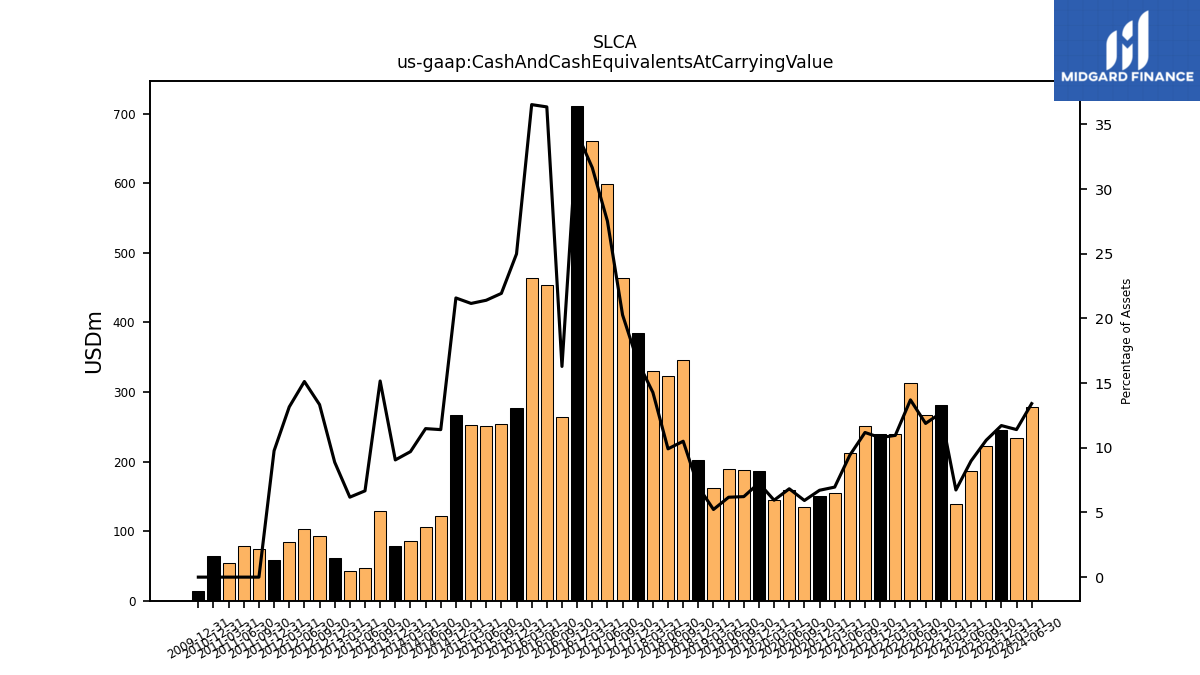
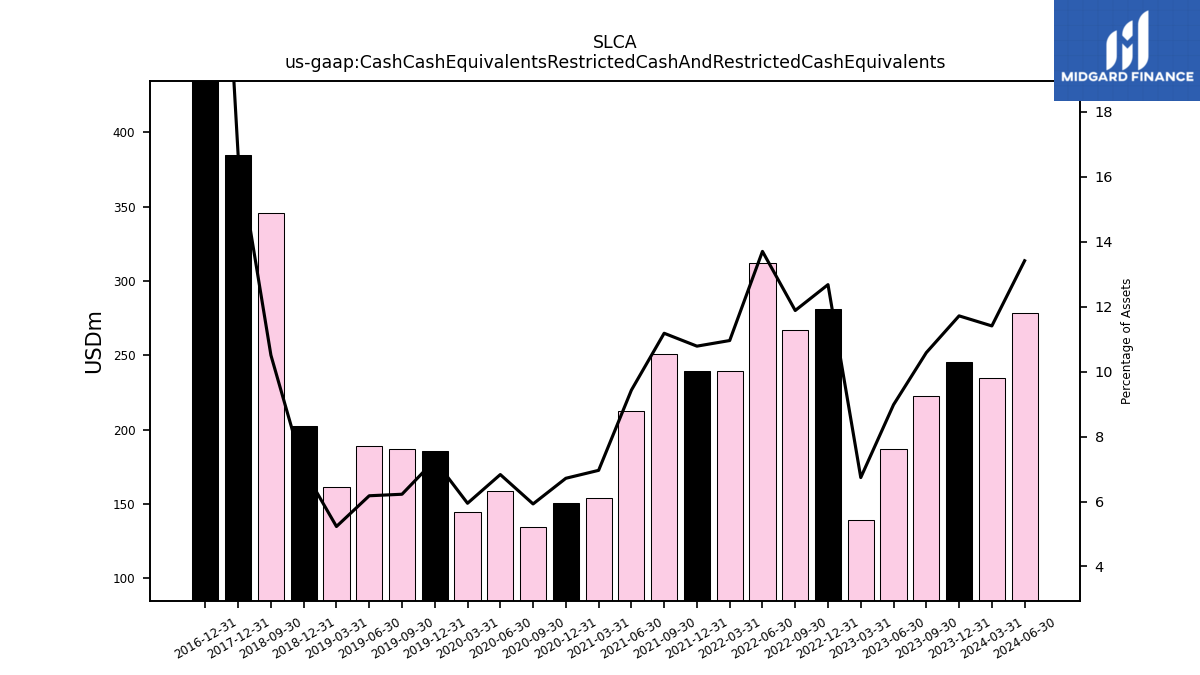
| Cash And Cash Equivalents At Carrying Value | 245.72 | 222.44 | 186.96 | 139.49 | 280.85 | 267.13 | 312.38 | 239.77 | 239.43 | 250.59 | 212.70 | 154.41 | 150.92 | 134.92 | 158.68 | 144.70 | 185.74 | 187.29 | 189.39 | 161.62 | 202.50 | 345.58 | 322.36 | 329.51 | 384.57 | 463.65 | 598.53 | 660.90 | 711.23 | 264.06 | 454.21 | 463.39 | 277.08 | 253.76 | 251.49 | 252.56 | 267.28 | 121.71 | 105.97 | 85.70 | 78.26 | 128.69 | 47.07 | 42.92 | 61.02 | 93.01 | 102.62 | 84.64 | 59.20 | 73.81 | 79.19 | 54.64 | |
| Cash Cash Equivalents Restricted Cash And Restricted Cash Equivalents | 245.72 | 222.44 | 186.96 | 139.49 | 280.85 | 267.13 | 312.38 | 239.77 | 239.43 | 250.59 | 212.70 | 154.41 | 150.92 | 134.92 | 158.68 | 144.70 | 185.74 | 187.29 | 189.39 | 161.62 | 202.50 | 345.58 | NA | NA | 384.57 | NA | NA | NA | 711.23 | NA | NA | NA | NA | NA | NA | NA | NA | NA | NA | NA | NA | NA | NA | NA | NA | NA | NA | NA | NA | NA | NA | NA | |
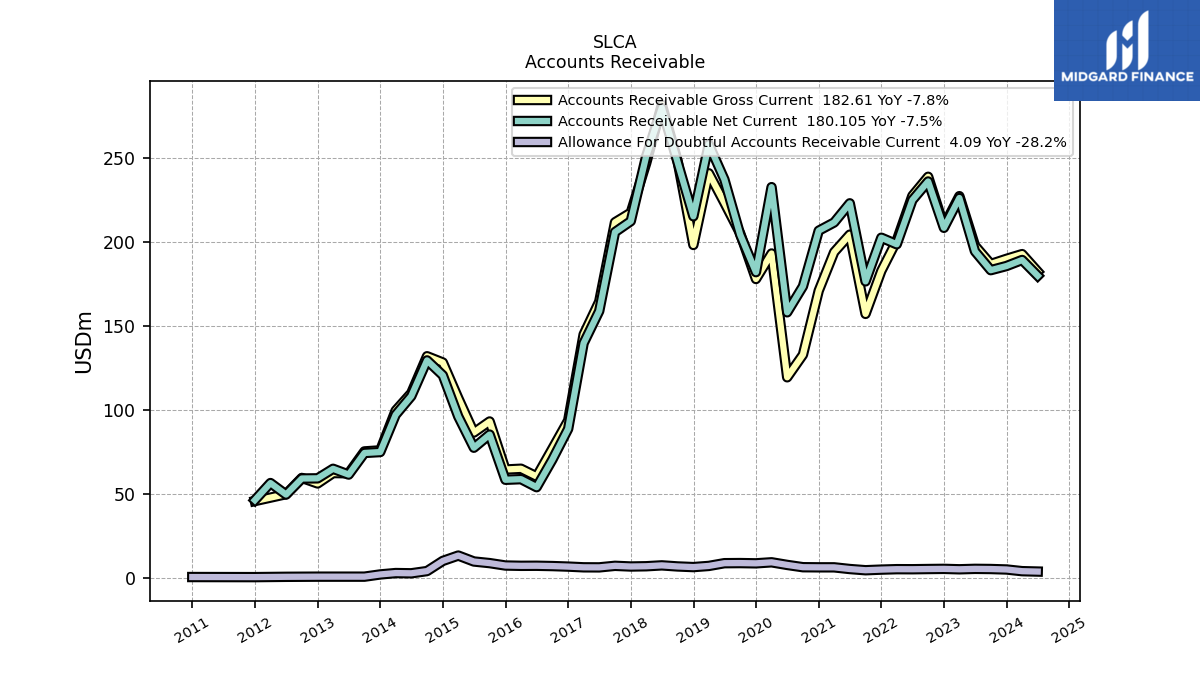
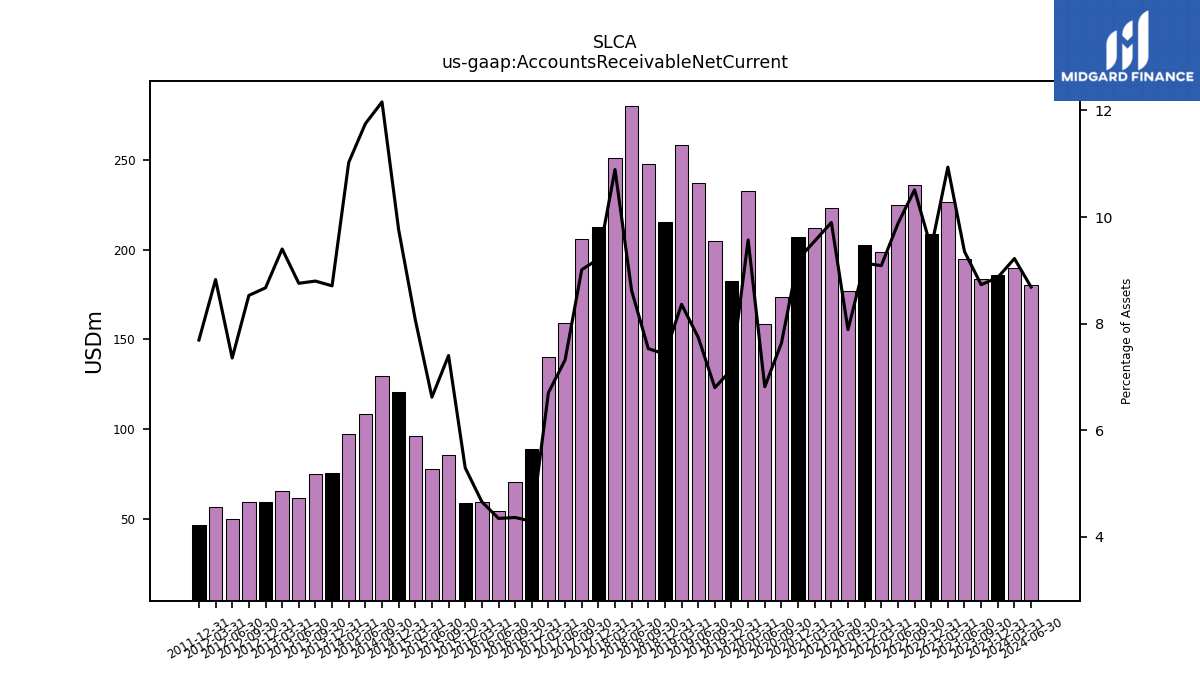
| Accounts Receivable Net Current | 185.92 | 183.43 | 194.68 | 226.40 | 208.63 | 236.23 | 225.11 | 198.84 | 202.76 | 176.76 | 223.23 | 211.84 | 206.93 | 173.83 | 158.35 | 232.85 | 182.24 | 204.59 | 237.39 | 258.35 | 215.49 | 247.69 | 280.02 | 251.28 | 212.59 | 206.10 | 159.11 | 139.97 | 89.01 | 70.72 | 54.29 | 59.08 | 58.71 | 85.61 | 77.78 | 96.36 | 120.88 | 129.75 | 108.45 | 97.37 | 75.21 | 74.66 | 61.78 | 65.25 | 59.56 | 59.47 | 49.90 | 56.77 | 46.60 | NA | NA | NA | |
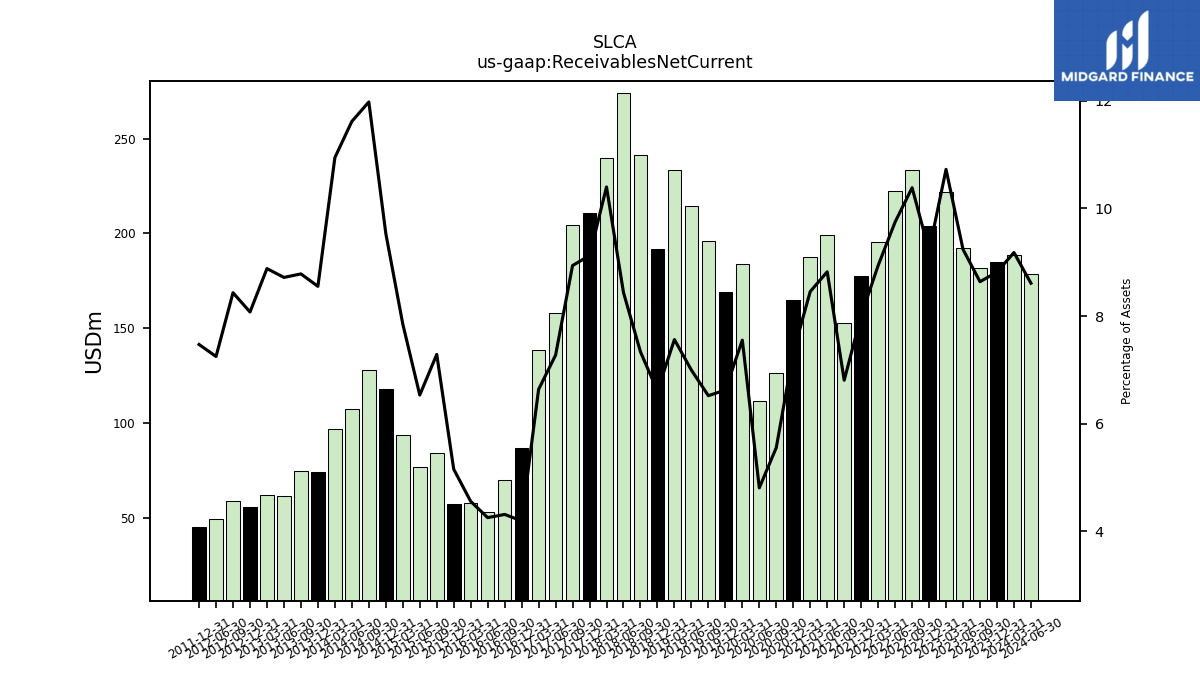
| Receivables Net Current | 184.87 | 181.51 | 192.31 | 222.04 | 203.99 | 233.43 | 222.19 | 195.57 | 177.74 | 152.53 | 198.99 | 187.57 | 164.63 | 126.45 | 111.64 | 183.77 | 169.20 | 196.16 | 214.45 | 233.66 | 191.68 | 241.23 | 274.18 | 239.93 | 210.55 | 204.43 | 158.16 | 138.53 | 86.94 | 69.90 | 53.13 | 57.78 | 57.13 | 84.29 | 76.73 | 93.70 | 118.07 | 127.84 | 107.22 | 96.67 | 73.85 | 74.53 | 61.51 | 61.65 | 55.47 | 58.80 | 49.18 | NA | 45.27 | NA | NA | NA | |
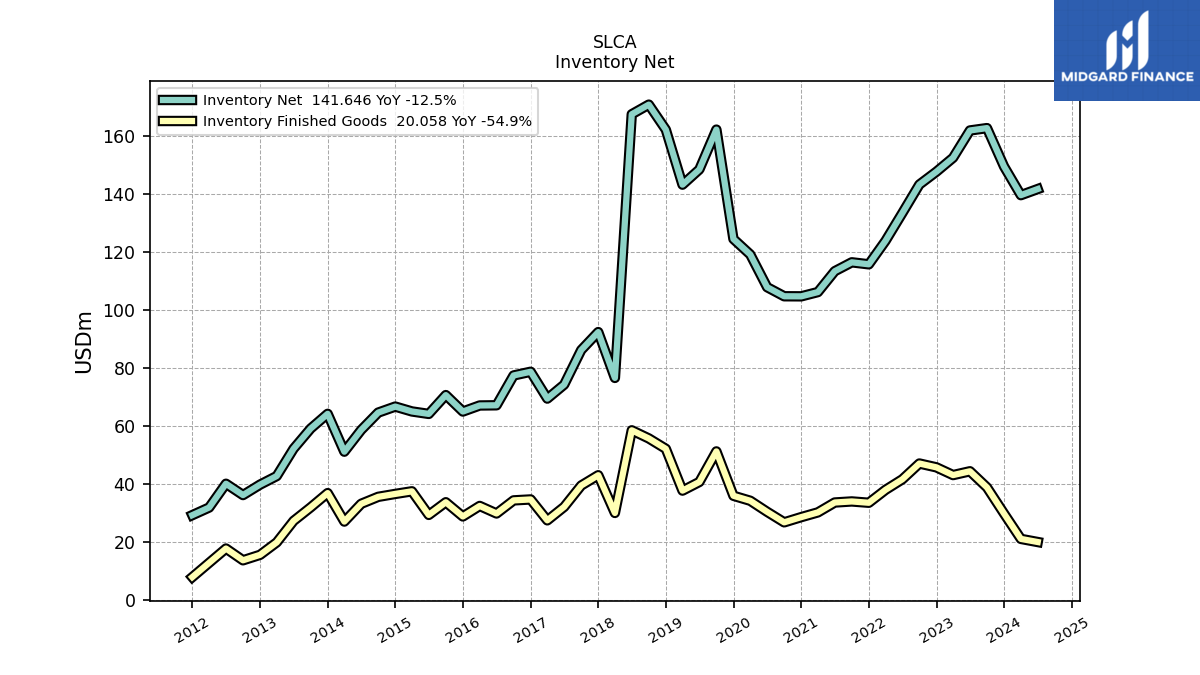
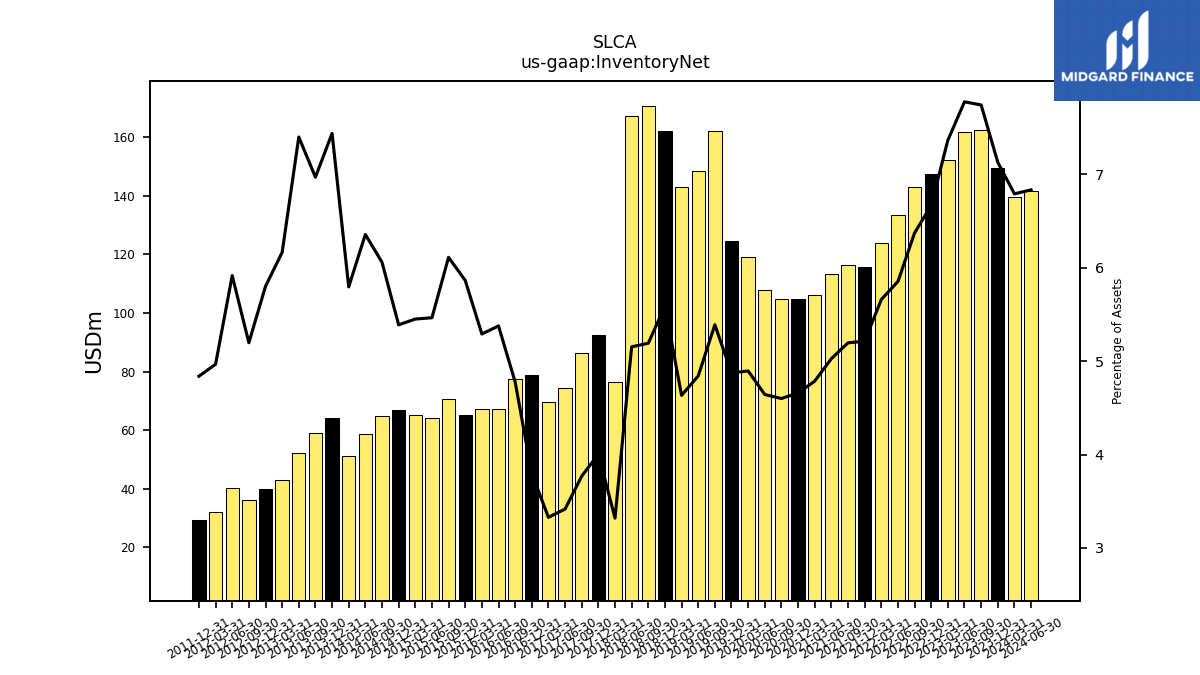
| Inventory Net | 149.43 | 162.64 | 161.82 | 152.42 | 147.63 | 143.20 | 133.37 | 123.78 | 115.71 | 116.41 | 113.35 | 106.15 | 104.68 | 104.71 | 107.83 | 119.08 | 124.43 | 162.12 | 148.40 | 143.15 | 162.09 | 170.72 | 167.41 | 76.58 | 92.38 | 86.17 | 74.28 | 69.46 | 78.71 | 77.43 | 67.16 | 67.09 | 65.00 | 70.67 | 64.18 | 65.03 | 66.71 | 64.64 | 58.65 | 51.17 | 64.21 | 59.13 | 52.19 | 42.78 | 39.84 | 36.23 | 40.13 | 31.94 | 29.31 | NA | NA | NA | |
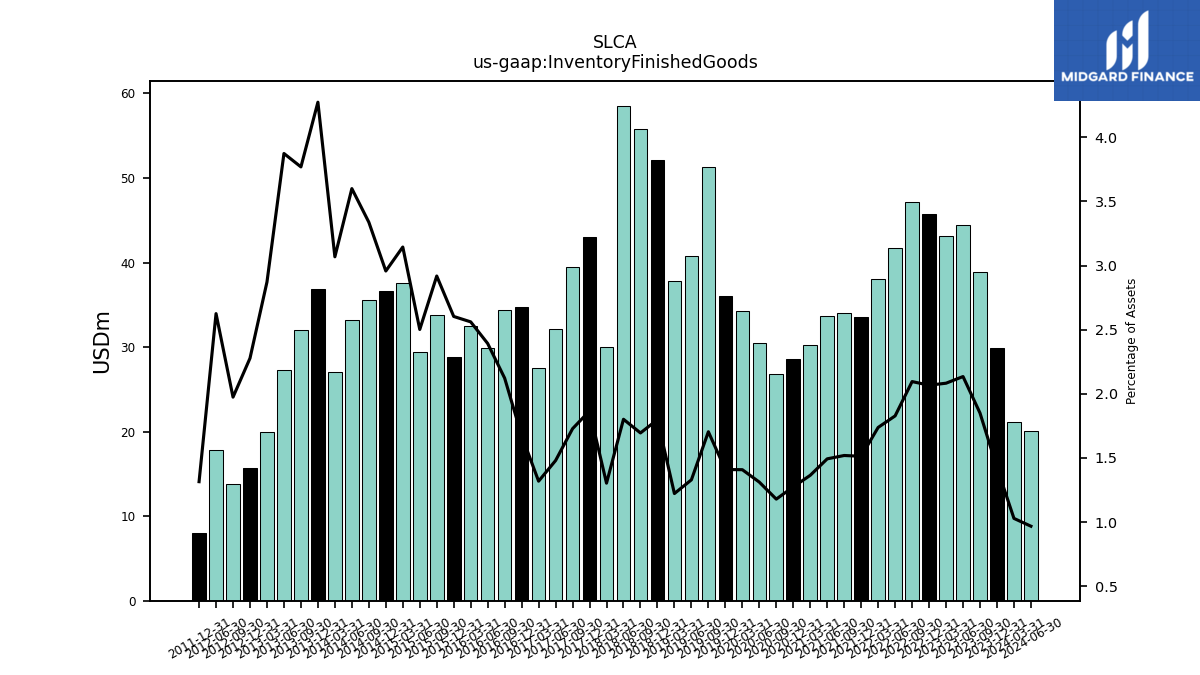
| Inventory Finished Goods | 29.86 | 38.87 | 44.43 | 43.11 | 45.78 | 47.10 | 41.66 | 38.02 | 33.58 | 34.03 | 33.67 | 30.27 | 28.63 | 26.84 | 30.46 | 34.27 | 35.99 | 51.27 | 40.75 | 37.76 | 52.16 | 55.74 | 58.54 | 30.07 | 43.06 | 39.52 | 32.17 | 27.52 | 34.72 | 34.40 | 29.89 | 32.48 | 28.86 | 33.76 | 29.39 | 37.53 | 36.62 | 35.62 | 33.23 | 27.10 | 36.91 | 31.99 | 27.33 | 19.93 | 15.64 | 13.76 | 17.81 | NA | 7.96 | NA | NA | NA |
| 2023-12-31 | 2023-09-30 | 2023-06-30 | 2023-03-31 | 2022-12-31 | 2022-09-30 | 2022-06-30 | 2022-03-31 | 2021-12-31 | 2021-09-30 | 2021-06-30 | 2021-03-31 | 2020-12-31 | 2020-09-30 | 2020-06-30 | 2020-03-31 | 2019-12-31 | 2019-09-30 | 2019-06-30 | 2019-03-31 | 2018-12-31 | 2018-09-30 | 2018-06-30 | 2018-03-31 | 2017-12-31 | 2017-09-30 | 2017-06-30 | 2017-03-31 | 2016-12-31 | 2016-09-30 | 2016-06-30 | 2016-03-31 | 2015-12-31 | 2015-09-30 | 2015-06-30 | 2015-03-31 | 2014-12-31 | 2014-09-30 | 2014-06-30 | 2014-03-31 | 2013-12-31 | 2013-09-30 | 2013-06-30 | 2013-03-31 | 2012-12-31 | 2012-09-30 | 2012-06-30 | 2012-03-31 | 2011-12-31 | 2011-09-30 | 2011-06-30 | 2011-03-31 | ||
|---|---|---|---|---|---|---|---|---|---|---|---|---|---|---|---|---|---|---|---|---|---|---|---|---|---|---|---|---|---|---|---|---|---|---|---|---|---|---|---|---|---|---|---|---|---|---|---|---|---|---|---|---|---|
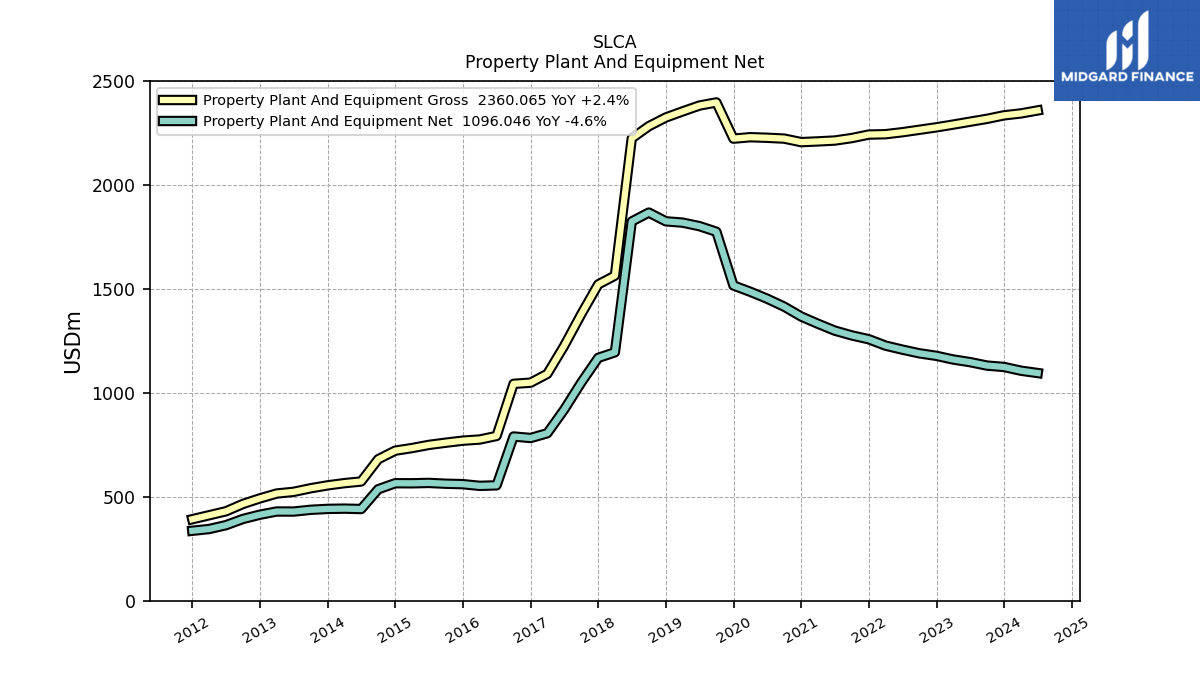
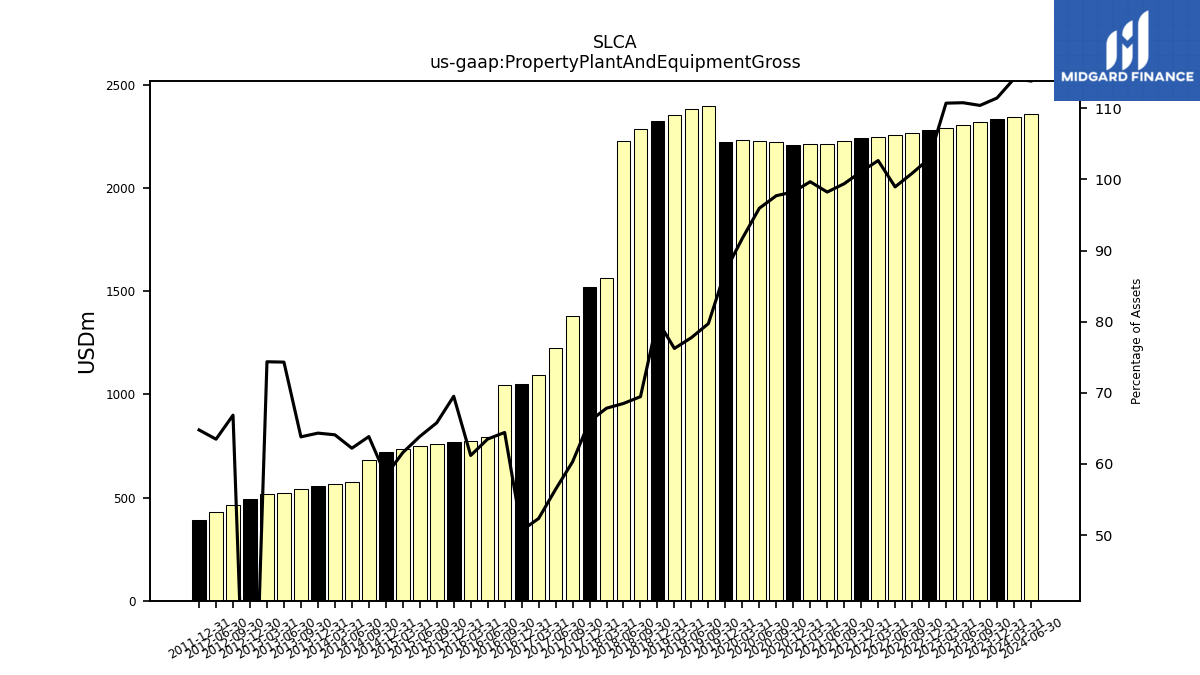
| Property Plant And Equipment Gross | 2336.48 | 2319.56 | 2305.77 | 2291.86 | 2278.76 | 2266.90 | 2255.19 | 2245.65 | 2243.94 | 2227.06 | 2215.17 | 2211.00 | 2207.49 | 2224.48 | 2228.45 | 2231.23 | 2224.20 | 2398.65 | 2383.54 | 2355.16 | 2326.13 | 2284.07 | 2225.74 | 1564.88 | 1522.67 | 1378.72 | 1226.71 | 1092.03 | 1049.70 | 1044.15 | 793.17 | 776.02 | 770.59 | 760.81 | 750.07 | 734.92 | 722.51 | 681.23 | 574.07 | 566.05 | 555.43 | 541.38 | 524.24 | 516.11 | NA | 466.06 | 430.66 | NA | 392.40 | NA | NA | NA | |
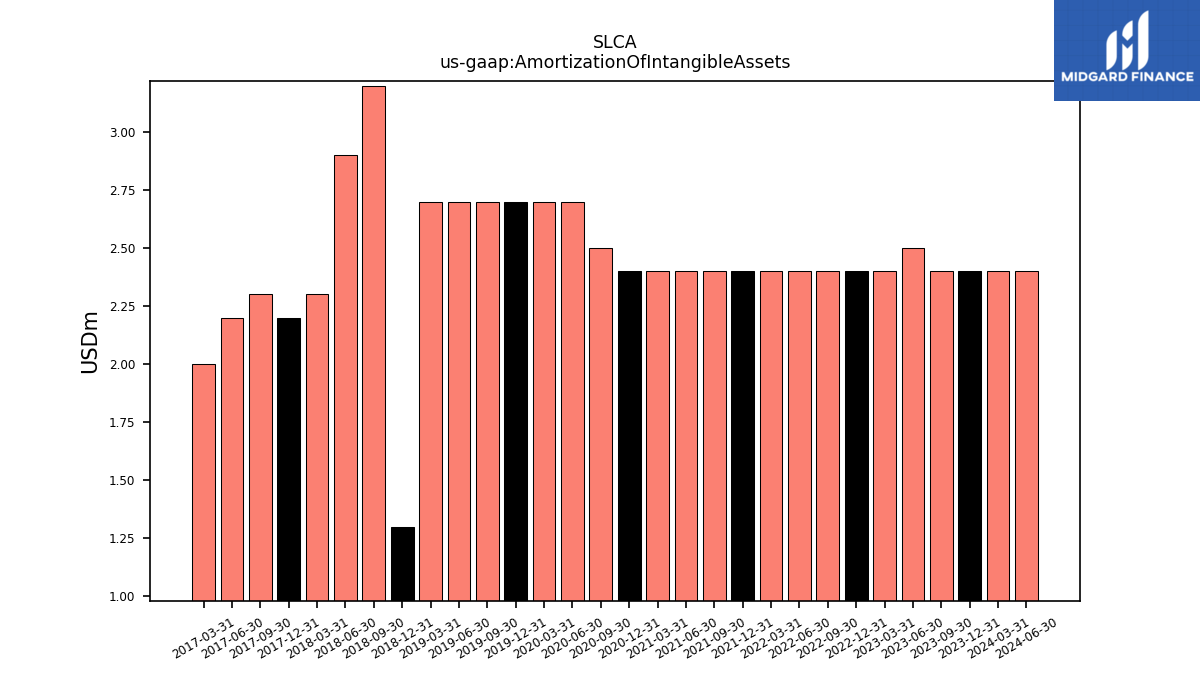
| Amortization Of Intangible Assets | 2.40 | 2.40 | 2.50 | 2.40 | 2.40 | 2.40 | 2.40 | 2.40 | 2.40 | 2.40 | 2.40 | 2.40 | 2.40 | 2.50 | 2.70 | 2.70 | 2.70 | 2.70 | 2.70 | 2.70 | 1.30 | 3.20 | 2.90 | 2.30 | 2.20 | 2.30 | 2.20 | 2.00 | NA | NA | NA | NA | NA | NA | NA | NA | NA | NA | NA | NA | NA | NA | NA | NA | NA | NA | NA | NA | NA | NA | NA | NA | |
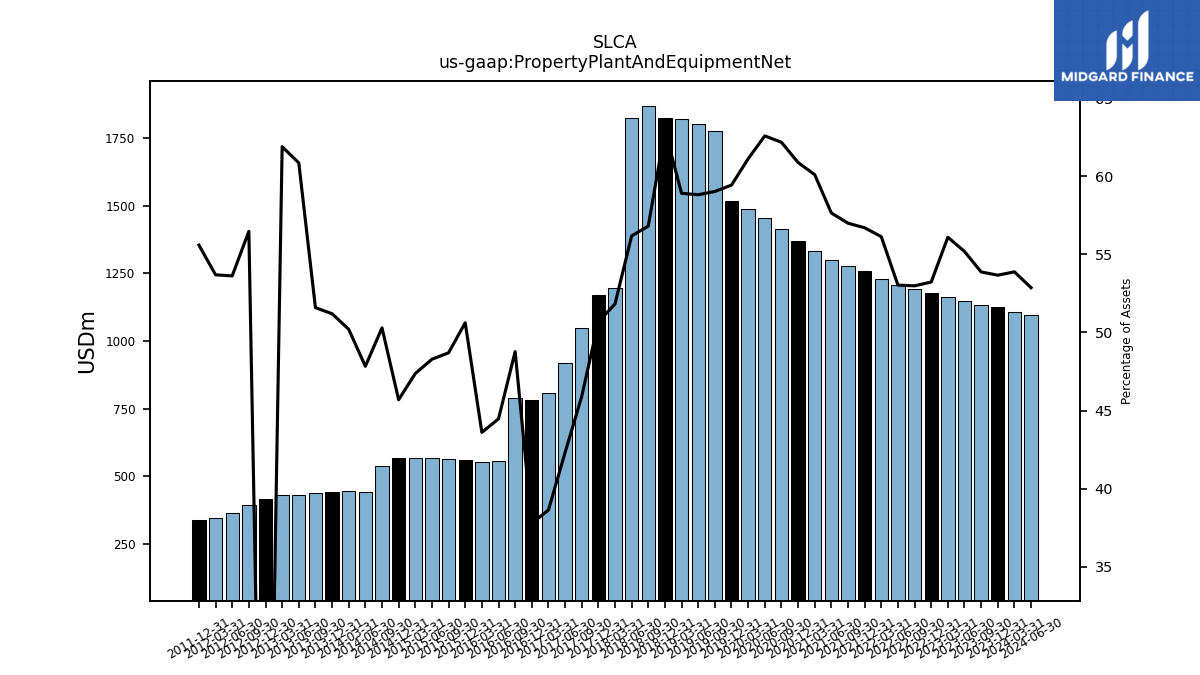
| Property Plant And Equipment Net | 1125.22 | 1131.97 | 1148.68 | 1161.25 | 1178.83 | 1190.96 | 1208.74 | 1228.07 | 1258.65 | 1277.13 | 1300.21 | 1333.32 | 1368.09 | 1415.64 | 1453.78 | 1487.22 | 1517.59 | 1776.08 | 1803.20 | 1820.10 | 1826.30 | 1868.38 | 1825.65 | 1195.72 | 1169.15 | 1049.81 | 919.84 | 806.29 | 783.31 | 790.57 | 555.49 | 553.00 | 561.20 | 563.26 | 567.20 | 565.34 | 565.75 | 536.72 | 441.45 | 443.41 | 442.12 | 437.75 | 429.36 | 429.61 | NA | 393.76 | 363.83 | 345.28 | 336.79 | NA | NA | NA | |
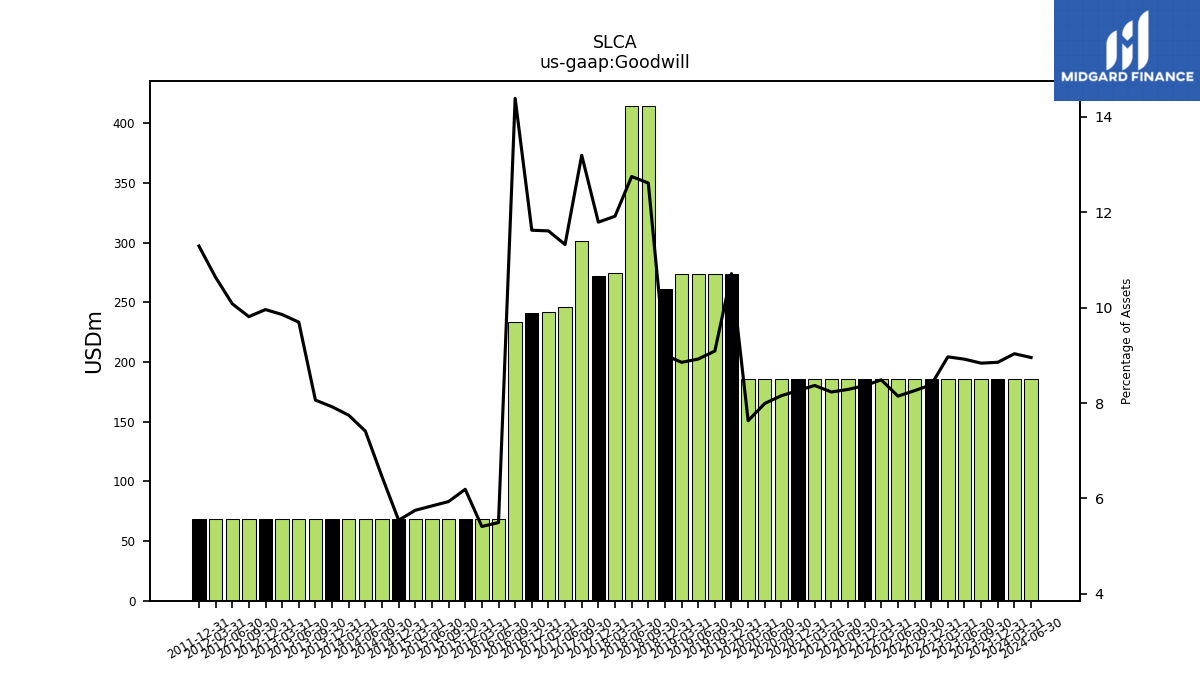
| Goodwill | 185.65 | 185.65 | 185.65 | 185.65 | 185.65 | 185.65 | 185.65 | 185.65 | 185.65 | 185.65 | 185.65 | 185.65 | 185.65 | 185.65 | 185.65 | 185.65 | 273.52 | 273.52 | 273.52 | 273.52 | 261.30 | 414.74 | 414.26 | 274.90 | 272.08 | 301.74 | 246.18 | 242.30 | 240.97 | 233.20 | 68.65 | 68.65 | 68.65 | 68.65 | 68.65 | 68.65 | 68.65 | 68.91 | 68.40 | 68.40 | 68.40 | 68.40 | 68.40 | 68.40 | 68.40 | 68.40 | 68.40 | 68.40 | 68.40 | NA | NA | NA | |
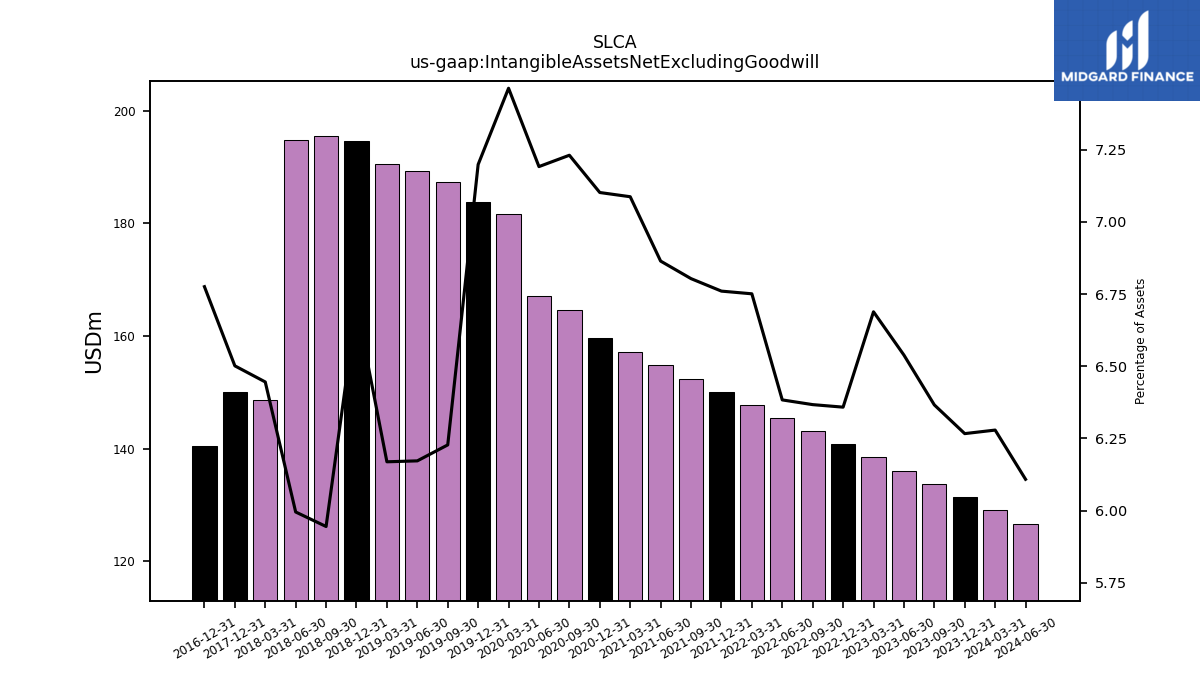
| Intangible Assets Net Excluding Goodwill | 131.38 | 133.75 | 136.10 | 138.45 | 140.81 | 143.10 | 145.48 | 147.69 | 150.05 | 152.44 | 154.81 | 157.22 | 159.58 | 164.63 | 167.05 | 181.60 | 183.81 | 187.36 | 189.21 | 190.58 | 194.63 | 195.50 | 194.79 | 148.70 | 150.01 | NA | NA | NA | 140.48 | NA | NA | NA | NA | NA | NA | NA | NA | NA | NA | NA | NA | NA | NA | NA | NA | NA | NA | NA | NA | NA | NA | NA | |
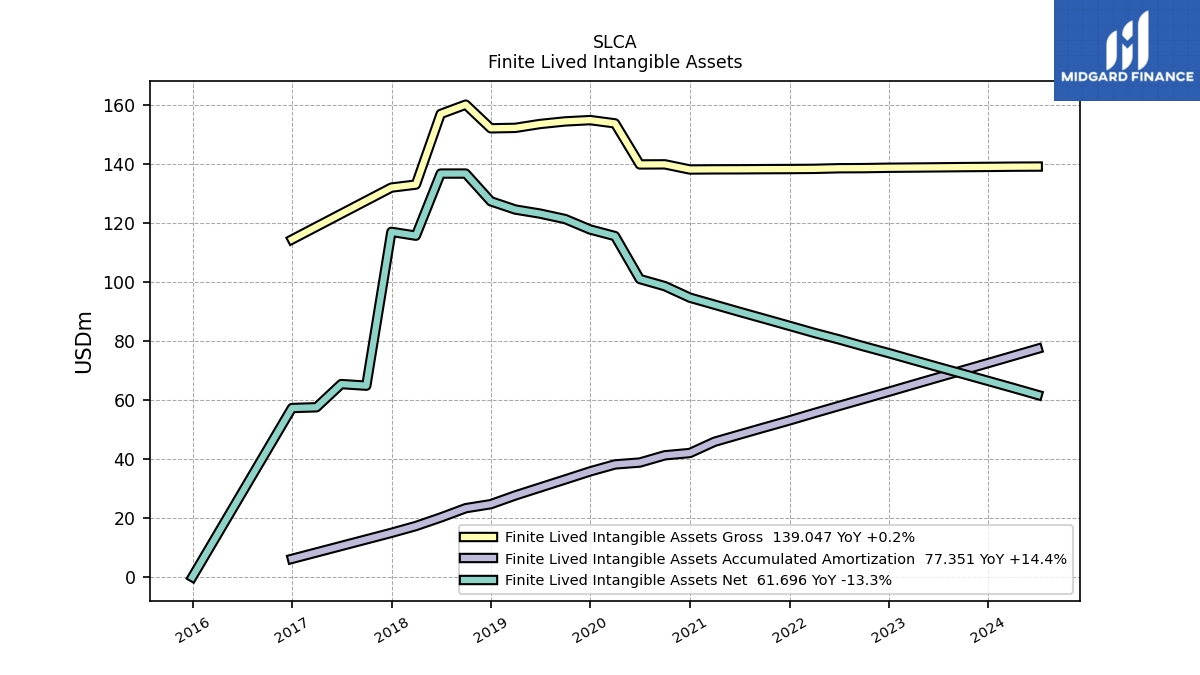
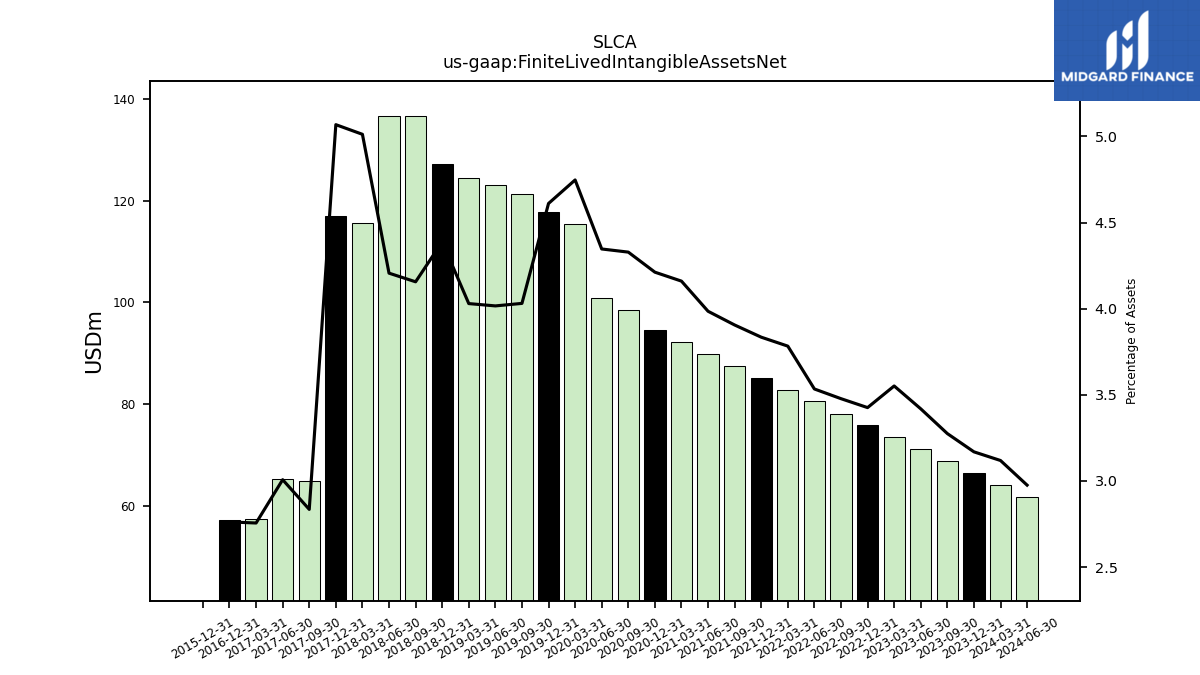
| Finite Lived Intangible Assets Net | 66.44 | 68.81 | 71.16 | 73.51 | 75.87 | 78.17 | 80.54 | 82.75 | 85.11 | 87.50 | 89.88 | 92.28 | 94.64 | 98.54 | 100.96 | 115.51 | 117.72 | 121.27 | 123.12 | 124.49 | 127.29 | 136.68 | 136.68 | 115.63 | 116.94 | 64.84 | 65.38 | 57.52 | 57.27 | NA | NA | NA | 0.00 | NA | NA | NA | NA | NA | NA | NA | NA | NA | NA | NA | NA | NA | NA | NA | NA | NA | NA | NA | |
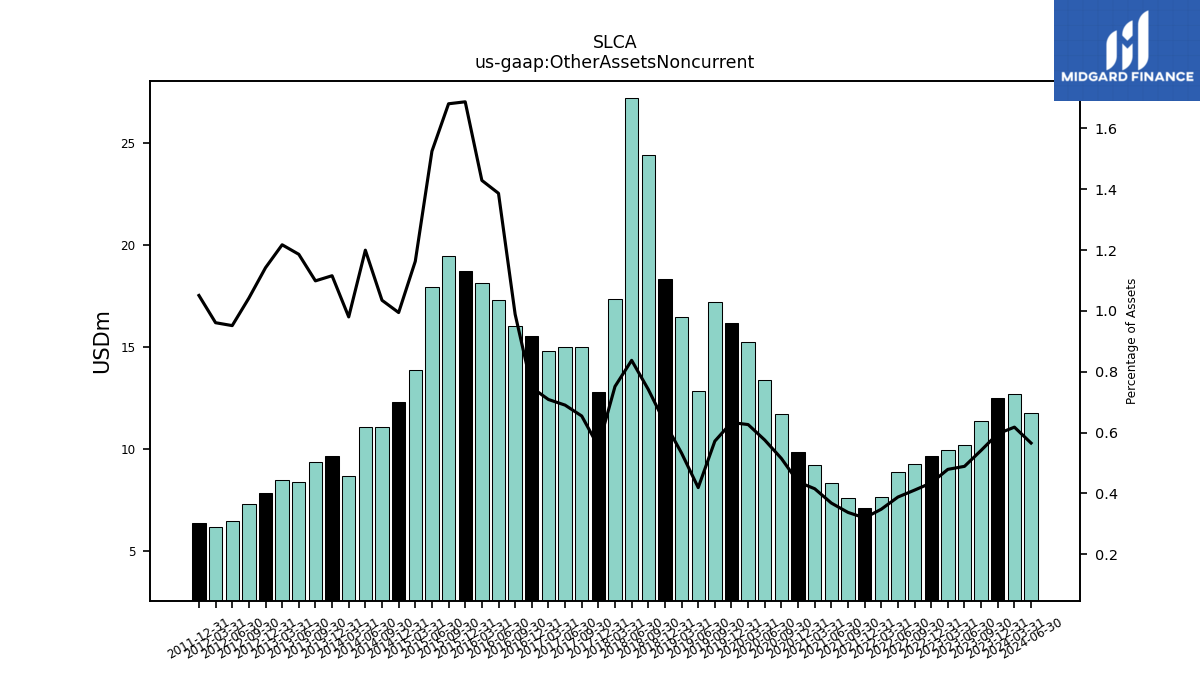
| Other Assets Noncurrent | 12.50 | 11.38 | 10.18 | 9.92 | 9.63 | 9.24 | 8.85 | 7.62 | 7.09 | 7.57 | 8.31 | 9.22 | 9.84 | 11.72 | 13.37 | 15.24 | 16.17 | 17.21 | 12.86 | 16.46 | 18.33 | 24.41 | 27.22 | 17.35 | 12.80 | 14.97 | 15.01 | 14.80 | 15.51 | 16.03 | 17.32 | 18.13 | 18.71 | 19.44 | 17.91 | 13.88 | 12.32 | 11.05 | 11.07 | 8.66 | 9.63 | 9.32 | 8.37 | 8.45 | 7.84 | 7.27 | 6.46 | 6.18 | 6.37 | NA | NA | NA |
| 2023-12-31 | 2023-09-30 | 2023-06-30 | 2023-03-31 | 2022-12-31 | 2022-09-30 | 2022-06-30 | 2022-03-31 | 2021-12-31 | 2021-09-30 | 2021-06-30 | 2021-03-31 | 2020-12-31 | 2020-09-30 | 2020-06-30 | 2020-03-31 | 2019-12-31 | 2019-09-30 | 2019-06-30 | 2019-03-31 | 2018-12-31 | 2018-09-30 | 2018-06-30 | 2018-03-31 | 2017-12-31 | 2017-09-30 | 2017-06-30 | 2017-03-31 | 2016-12-31 | 2016-09-30 | 2016-06-30 | 2016-03-31 | 2015-12-31 | 2015-09-30 | 2015-06-30 | 2015-03-31 | 2014-12-31 | 2014-09-30 | 2014-06-30 | 2014-03-31 | 2013-12-31 | 2013-09-30 | 2013-06-30 | 2013-03-31 | 2012-12-31 | 2012-09-30 | 2012-06-30 | 2012-03-31 | 2011-12-31 | 2011-09-30 | 2011-06-30 | 2011-03-31 | ||
|---|---|---|---|---|---|---|---|---|---|---|---|---|---|---|---|---|---|---|---|---|---|---|---|---|---|---|---|---|---|---|---|---|---|---|---|---|---|---|---|---|---|---|---|---|---|---|---|---|---|---|---|---|---|
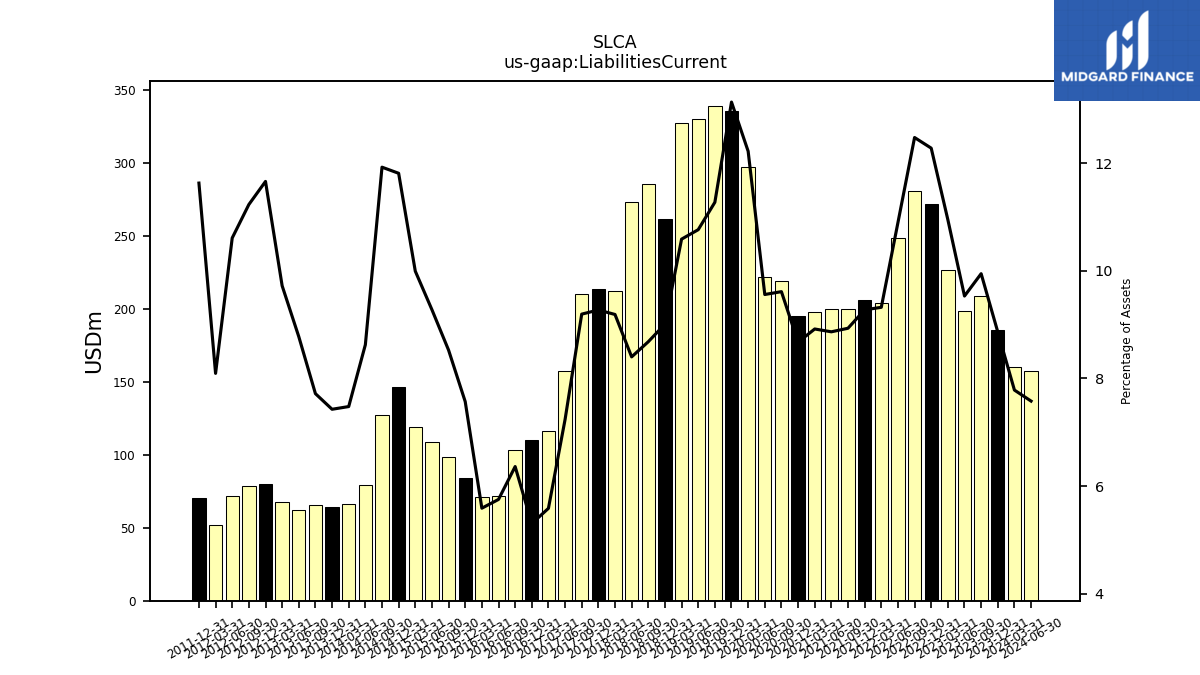
| Liabilities Current | 185.85 | 208.99 | 198.38 | 226.66 | 271.95 | 280.44 | 248.33 | 203.94 | 205.87 | 200.16 | 199.97 | 197.85 | 194.90 | 218.86 | 222.06 | 297.39 | 335.40 | 339.19 | 329.99 | 327.14 | 261.34 | 285.54 | 272.98 | 211.99 | 213.94 | 210.29 | 157.35 | 116.59 | 109.96 | 103.13 | 71.85 | 70.89 | 83.92 | 98.62 | 108.99 | 119.26 | 146.26 | 127.27 | 79.61 | 66.04 | 64.13 | 65.48 | 61.92 | 67.48 | 80.09 | 78.31 | 71.99 | 52.05 | 70.46 | NA | NA | NA | |
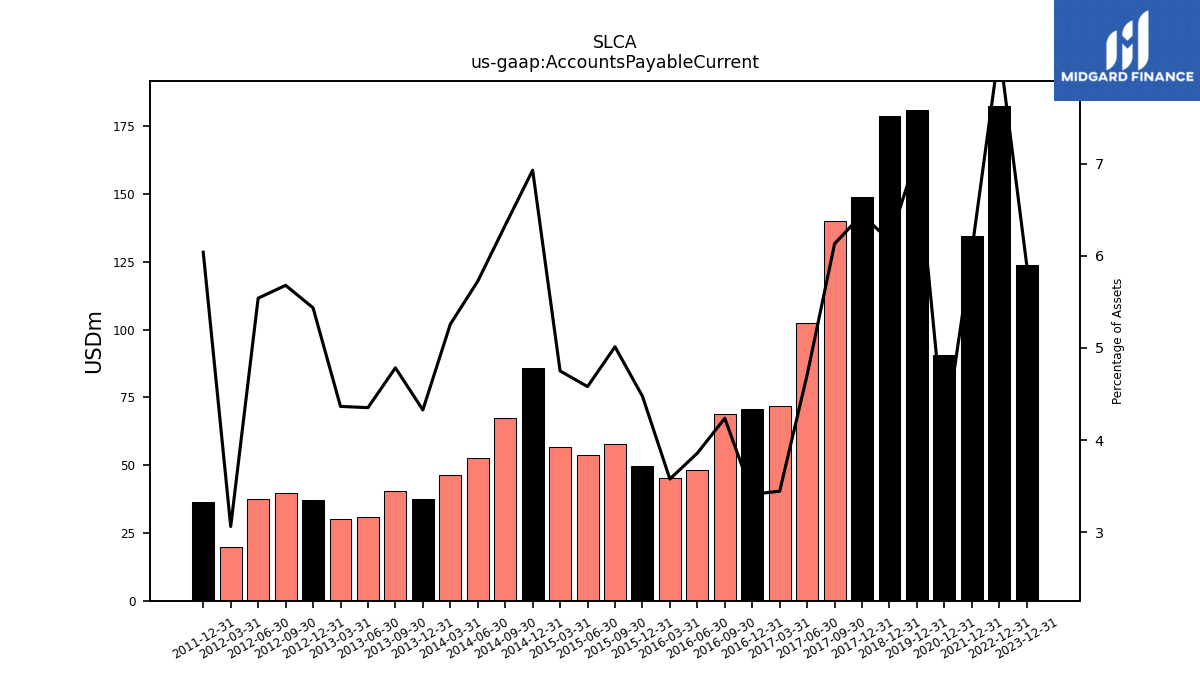
| Accounts Payable Current | 123.67 | NA | NA | NA | 182.56 | NA | NA | NA | 134.49 | NA | NA | NA | 90.56 | NA | NA | NA | 181.03 | NA | NA | NA | 178.80 | NA | NA | NA | 148.77 | 140.19 | 102.38 | 71.95 | 70.78 | 68.69 | 48.22 | 45.39 | 49.63 | 57.98 | 53.81 | 56.70 | 85.78 | 67.55 | 52.83 | 46.43 | 37.38 | 40.60 | 30.71 | 30.31 | 37.33 | 39.60 | 37.59 | 19.70 | 36.58 | NA | NA | NA | |
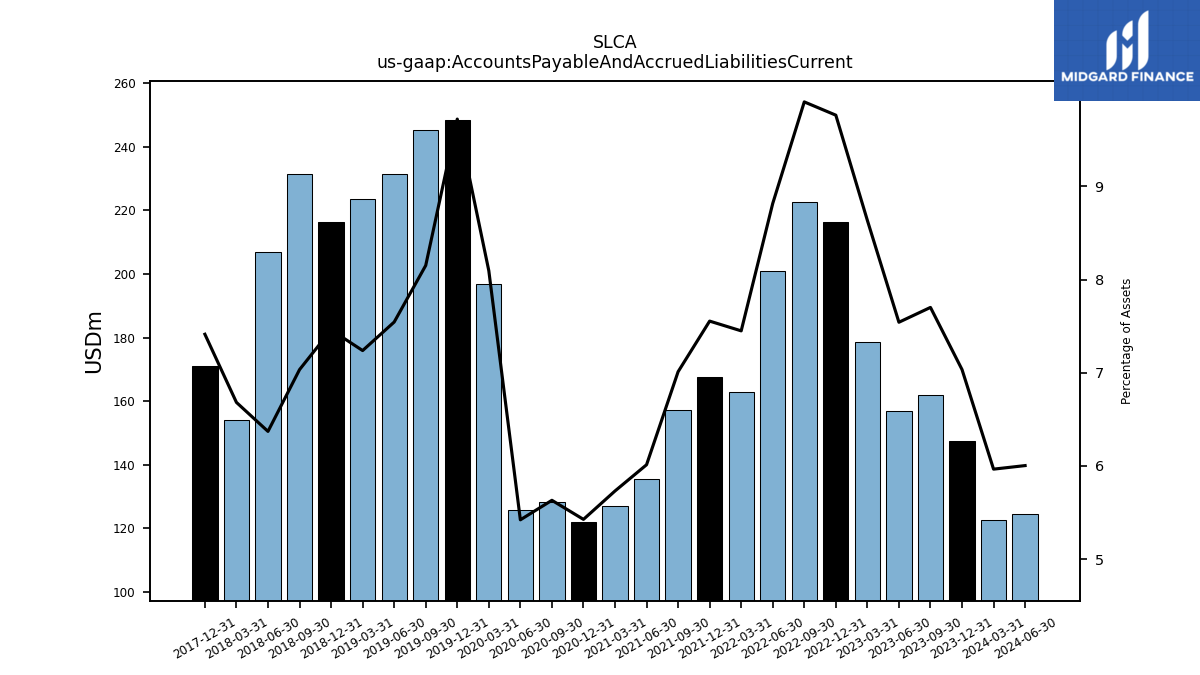
| Accounts Payable And Accrued Liabilities Current | 147.48 | 161.80 | 156.97 | 178.74 | 216.24 | 222.66 | 200.94 | 162.97 | 167.67 | 157.08 | 135.59 | 127.12 | 121.92 | 128.19 | 125.92 | 196.96 | 248.24 | 245.25 | 231.26 | 223.61 | 216.40 | 231.30 | 206.99 | 154.15 | 171.04 | NA | NA | NA | NA | NA | NA | NA | NA | NA | NA | NA | NA | NA | NA | NA | NA | NA | NA | NA | NA | NA | NA | NA | NA | NA | NA | NA | |
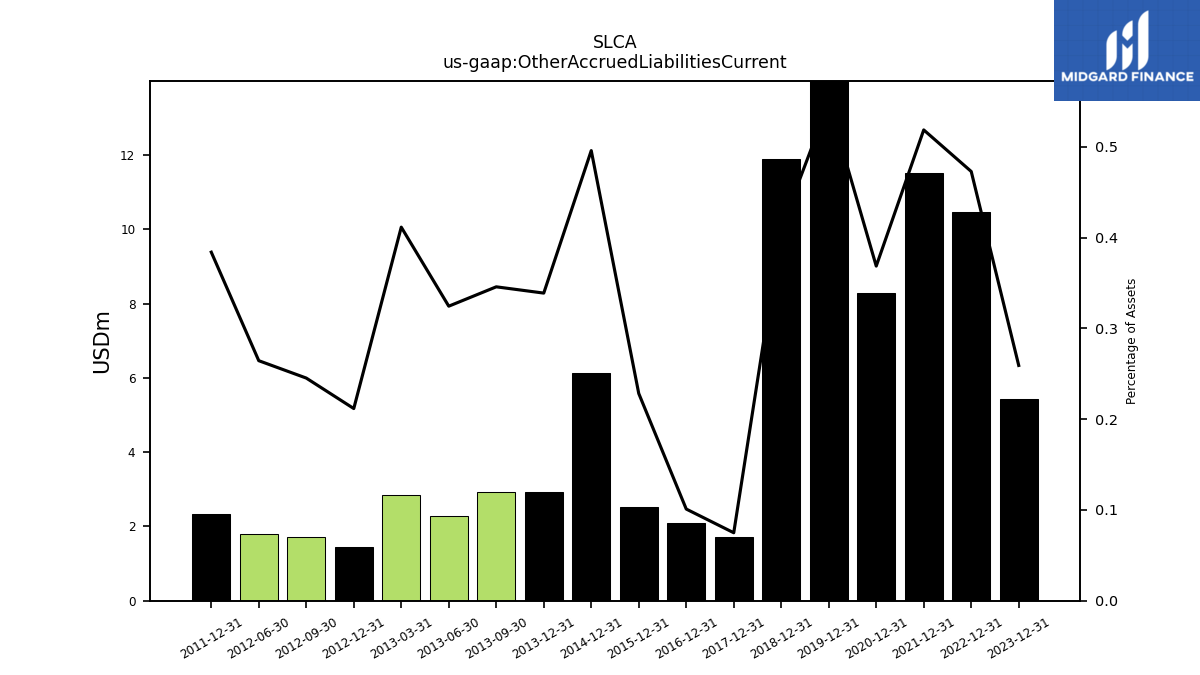
| Other Accrued Liabilities Current | 5.43 | NA | NA | NA | 10.47 | NA | NA | NA | 11.51 | NA | NA | NA | 8.28 | NA | NA | NA | 14.01 | NA | NA | NA | 11.90 | NA | NA | NA | 1.73 | NA | NA | NA | 2.09 | NA | NA | NA | 2.53 | NA | NA | NA | 6.14 | NA | NA | NA | 2.93 | 2.93 | 2.29 | 2.86 | 1.45 | 1.71 | 1.79 | NA | 2.33 | NA | NA | NA | |
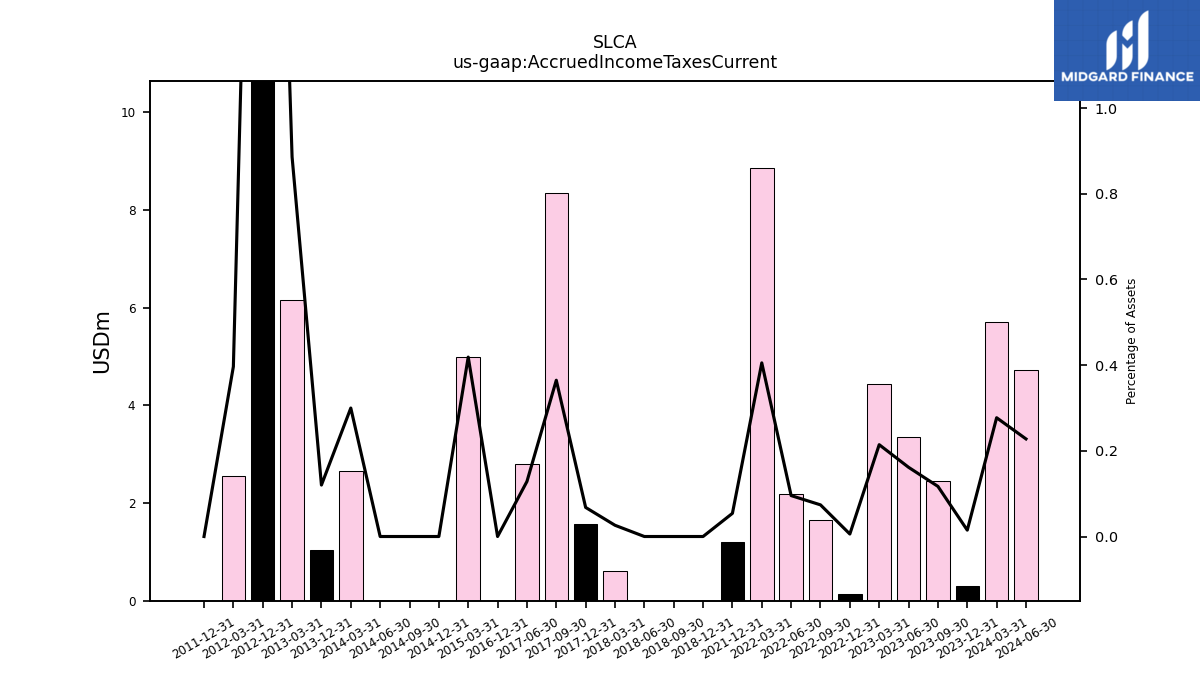
| Accrued Income Taxes Current | 0.31 | 2.46 | 3.36 | 4.44 | 0.13 | 1.66 | 2.18 | 8.87 | 1.20 | NA | NA | NA | NA | NA | NA | NA | NA | NA | NA | NA | 0.00 | 0.00 | 0.00 | 0.60 | 1.57 | 8.34 | 2.79 | NA | 0.00 | NA | NA | NA | NA | NA | NA | 5.00 | 0.00 | 0.00 | 0.00 | 2.65 | 1.04 | NA | NA | 6.15 | 20.60 | NA | NA | 2.55 | 0.00 | NA | NA | NA | |
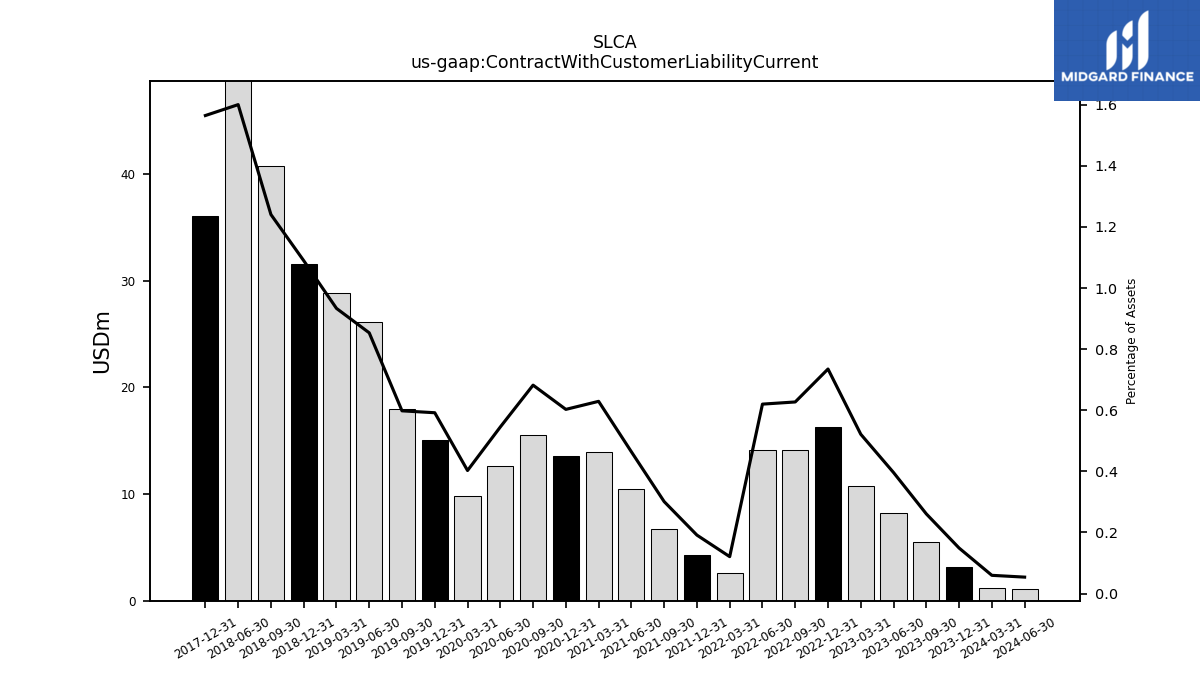
| Contract With Customer Liability Current | 3.12 | 5.48 | 8.24 | 10.79 | 16.27 | 14.10 | 14.13 | 2.64 | 4.25 | 6.74 | 10.46 | 13.96 | 13.54 | 15.53 | 12.66 | 9.80 | 15.11 | 18.00 | 26.16 | 28.84 | 31.61 | 40.80 | 52.00 | NA | 36.10 | NA | NA | NA | NA | NA | NA | NA | NA | NA | NA | NA | NA | NA | NA | NA | NA | NA | NA | NA | NA | NA | NA | NA | NA | NA | NA | NA |
| 2023-12-31 | 2023-09-30 | 2023-06-30 | 2023-03-31 | 2022-12-31 | 2022-09-30 | 2022-06-30 | 2022-03-31 | 2021-12-31 | 2021-09-30 | 2021-06-30 | 2021-03-31 | 2020-12-31 | 2020-09-30 | 2020-06-30 | 2020-03-31 | 2019-12-31 | 2019-09-30 | 2019-06-30 | 2019-03-31 | 2018-12-31 | 2018-09-30 | 2018-06-30 | 2018-03-31 | 2017-12-31 | 2017-09-30 | 2017-06-30 | 2017-03-31 | 2016-12-31 | 2016-09-30 | 2016-06-30 | 2016-03-31 | 2015-12-31 | 2015-09-30 | 2015-06-30 | 2015-03-31 | 2014-12-31 | 2014-09-30 | 2014-06-30 | 2014-03-31 | 2013-12-31 | 2013-09-30 | 2013-06-30 | 2013-03-31 | 2012-12-31 | 2012-09-30 | 2012-06-30 | 2012-03-31 | 2011-12-31 | 2011-09-30 | 2011-06-30 | 2011-03-31 | ||
|---|---|---|---|---|---|---|---|---|---|---|---|---|---|---|---|---|---|---|---|---|---|---|---|---|---|---|---|---|---|---|---|---|---|---|---|---|---|---|---|---|---|---|---|---|---|---|---|---|---|---|---|---|---|
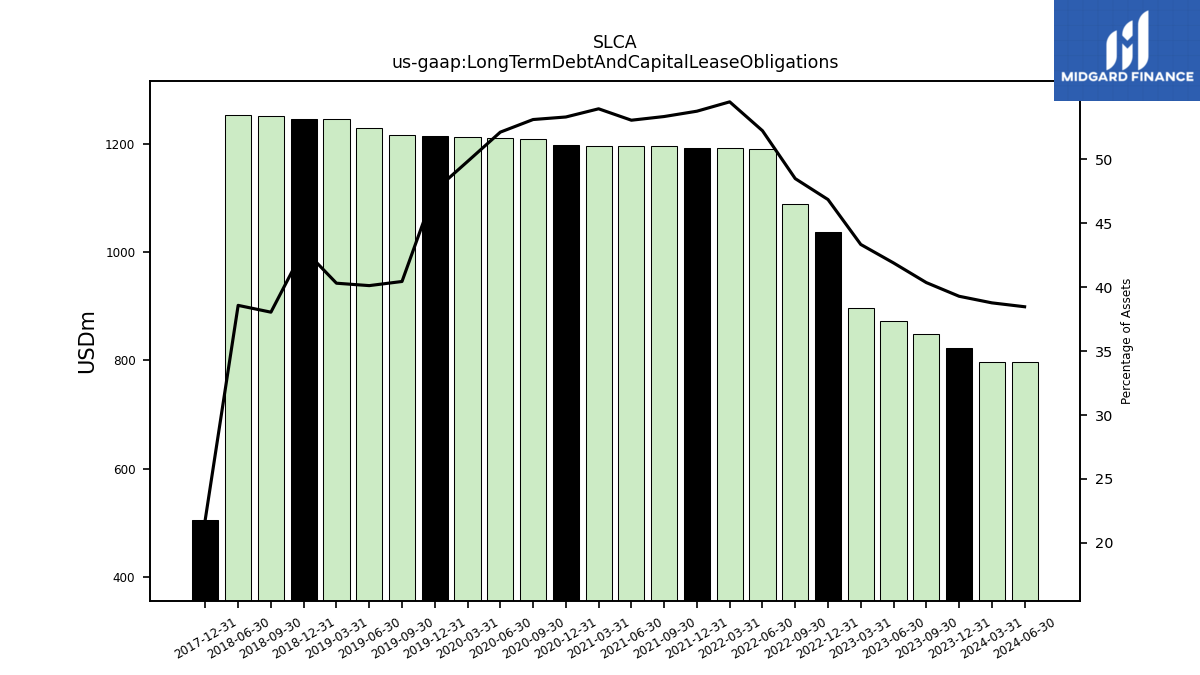
| Long Term Debt And Capital Lease Obligations | 823.67 | 847.85 | 871.91 | 897.01 | 1037.46 | 1089.71 | 1190.33 | 1191.98 | 1193.13 | 1195.09 | 1196.41 | 1196.56 | 1197.66 | 1208.97 | 1210.52 | 1212.26 | 1213.98 | 1216.75 | 1229.82 | 1245.24 | 1246.43 | 1251.05 | 1253.38 | NA | 505.07 | NA | NA | NA | NA | NA | NA | NA | NA | NA | NA | NA | NA | NA | NA | NA | NA | NA | NA | NA | NA | NA | NA | NA | NA | NA | NA | NA | |
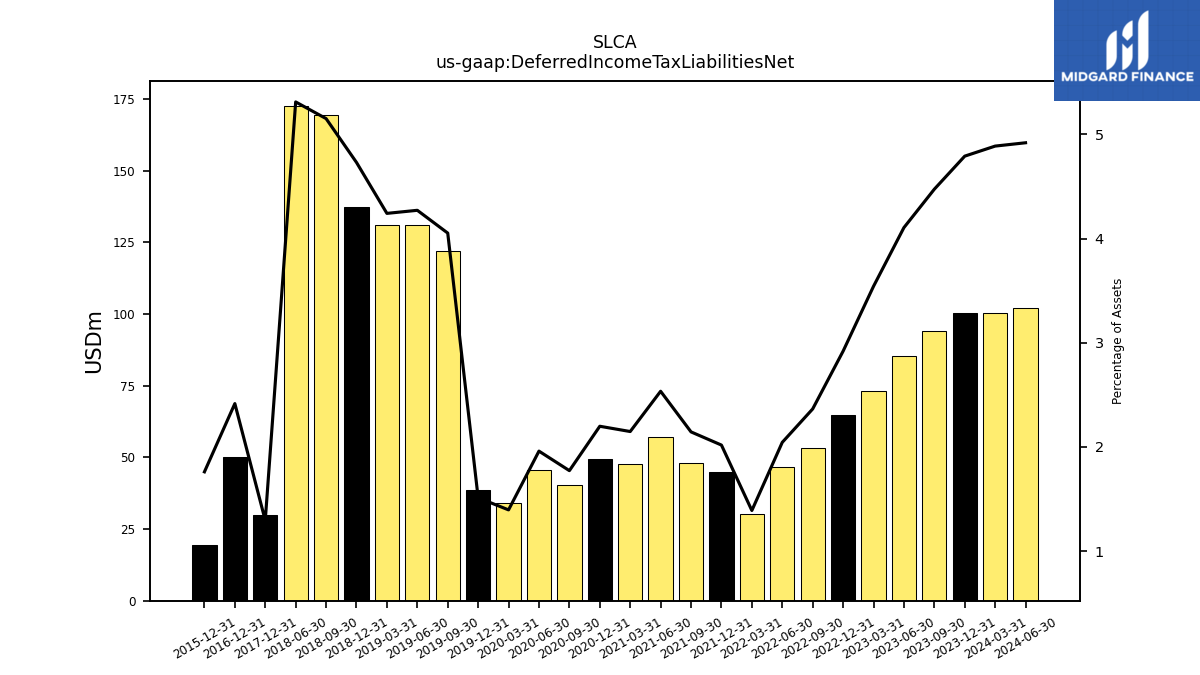
| Deferred Income Tax Liabilities Net | 100.46 | 94.00 | 85.44 | 73.30 | 64.64 | 53.13 | 46.57 | 30.39 | 44.77 | 48.03 | 57.15 | 47.63 | 49.39 | 40.33 | 45.50 | 33.94 | 38.59 | 121.93 | 130.94 | 131.05 | 137.24 | 169.43 | 172.61 | NA | 29.86 | NA | NA | NA | 50.08 | NA | NA | NA | 19.51 | NA | NA | NA | NA | NA | NA | NA | NA | NA | NA | NA | NA | NA | NA | NA | NA | NA | NA | NA | |
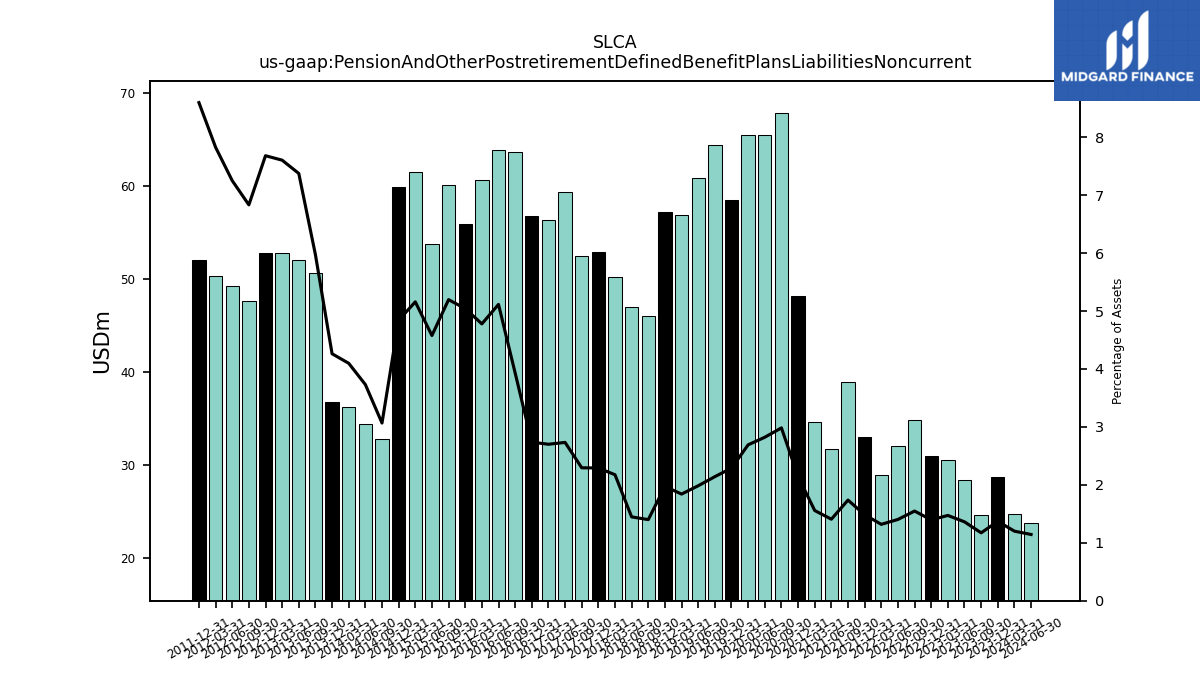
| Pension And Other Postretirement Defined Benefit Plans Liabilities Noncurrent | 28.71 | 24.63 | 28.34 | 30.48 | 30.91 | 34.79 | 31.97 | 28.84 | 32.94 | 38.92 | 31.74 | 34.54 | 48.17 | 67.91 | 65.53 | 65.47 | 58.45 | 64.43 | 60.83 | 56.88 | 57.19 | 46.05 | 47.02 | 50.17 | 52.87 | 52.47 | 59.41 | 56.36 | 56.75 | 63.72 | 63.89 | 60.60 | 55.89 | 60.10 | 53.77 | 61.55 | 59.93 | 32.73 | 34.43 | 36.19 | 36.80 | 50.67 | 52.02 | 52.77 | 52.75 | 47.63 | 49.19 | 50.33 | 52.08 | NA | NA | NA | |
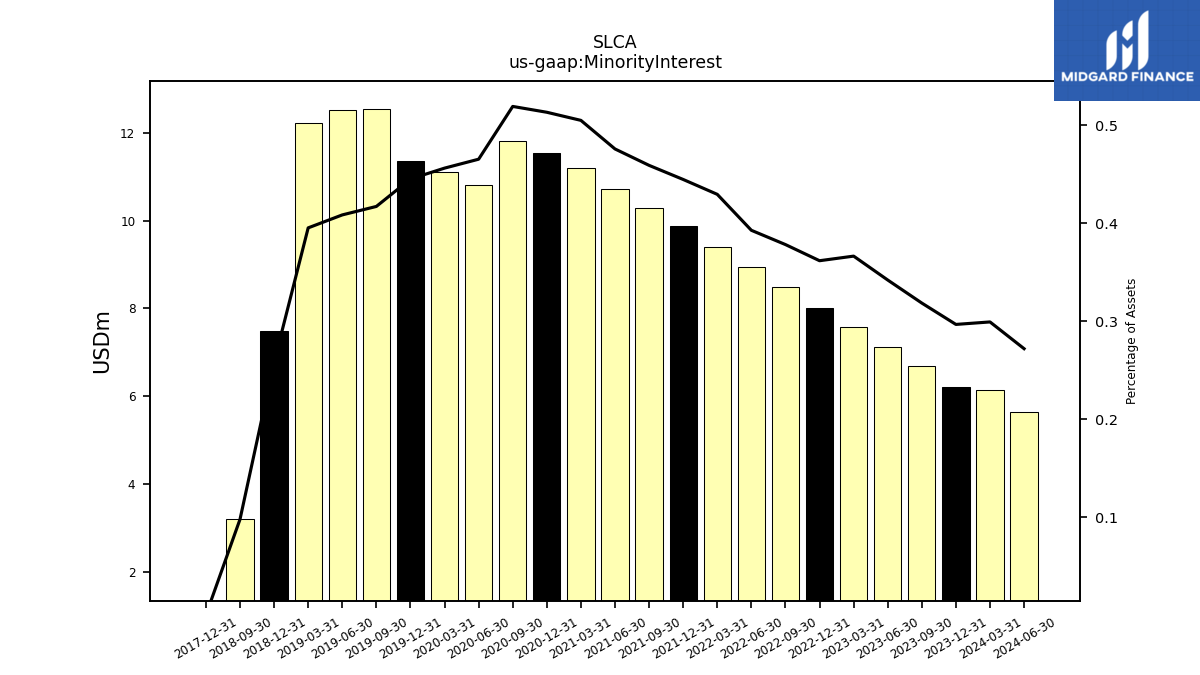
| Minority Interest | 6.22 | 6.69 | 7.12 | 7.58 | 8.01 | 8.50 | 8.95 | 9.39 | 9.87 | 10.28 | 10.73 | 11.20 | 11.53 | 11.82 | 10.81 | 11.10 | 11.36 | 12.55 | 12.52 | 12.21 | 7.48 | 3.21 | NA | NA | 0.00 | NA | NA | NA | NA | NA | NA | NA | NA | NA | NA | NA | NA | NA | NA | NA | NA | NA | NA | NA | NA | NA | NA | NA | NA | NA | NA | NA | |
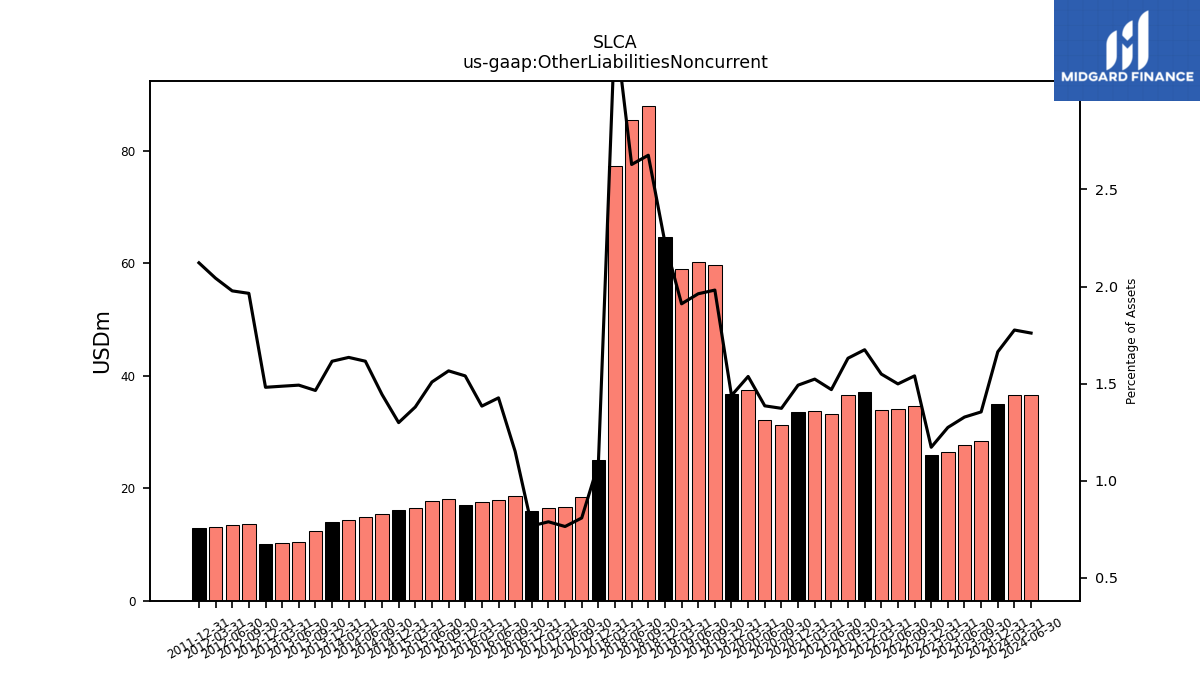
| Other Liabilities Noncurrent | 34.90 | 28.47 | 27.65 | 26.39 | 25.98 | 34.62 | 34.17 | 33.91 | 37.18 | 36.55 | 33.15 | 33.80 | 33.54 | 31.27 | 32.20 | 37.41 | 36.75 | 59.63 | 60.18 | 59.05 | 64.63 | 88.01 | 85.42 | 77.25 | 25.09 | 18.50 | 16.63 | 16.47 | 15.93 | 18.67 | 17.83 | 17.56 | 17.08 | 18.11 | 17.73 | 16.47 | 16.09 | 15.42 | 14.91 | 14.45 | 13.95 | 12.43 | 10.53 | 10.32 | 10.18 | 13.70 | 13.42 | 13.14 | 12.86 | NA | NA | NA | |
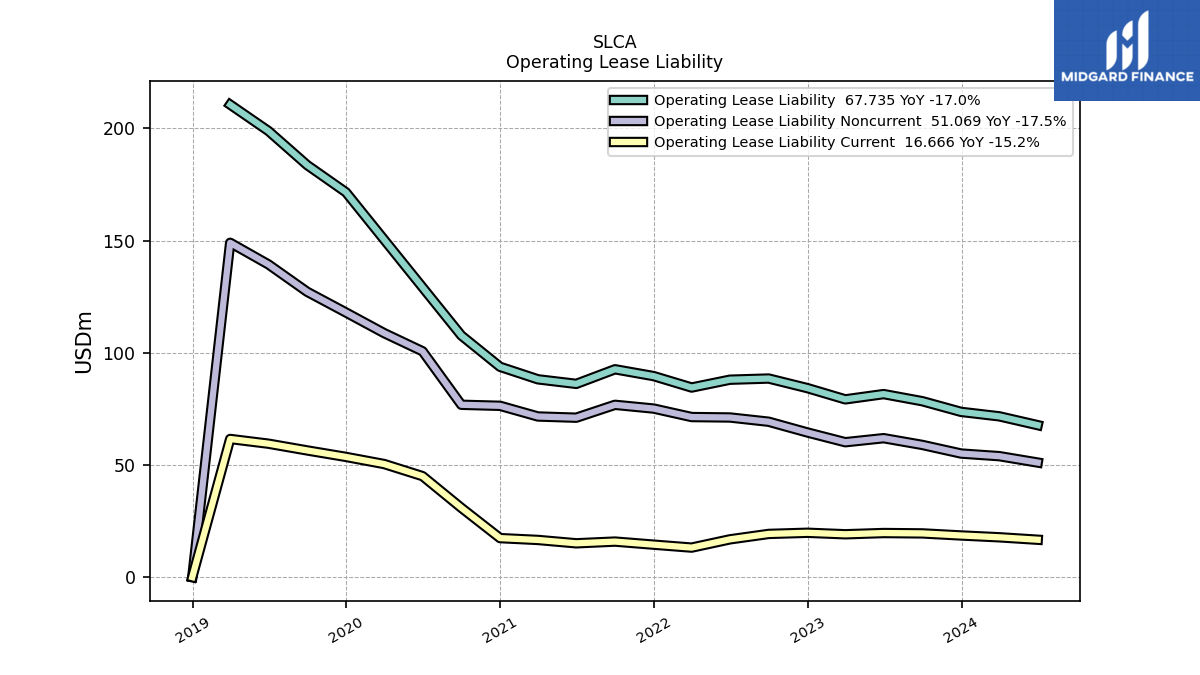
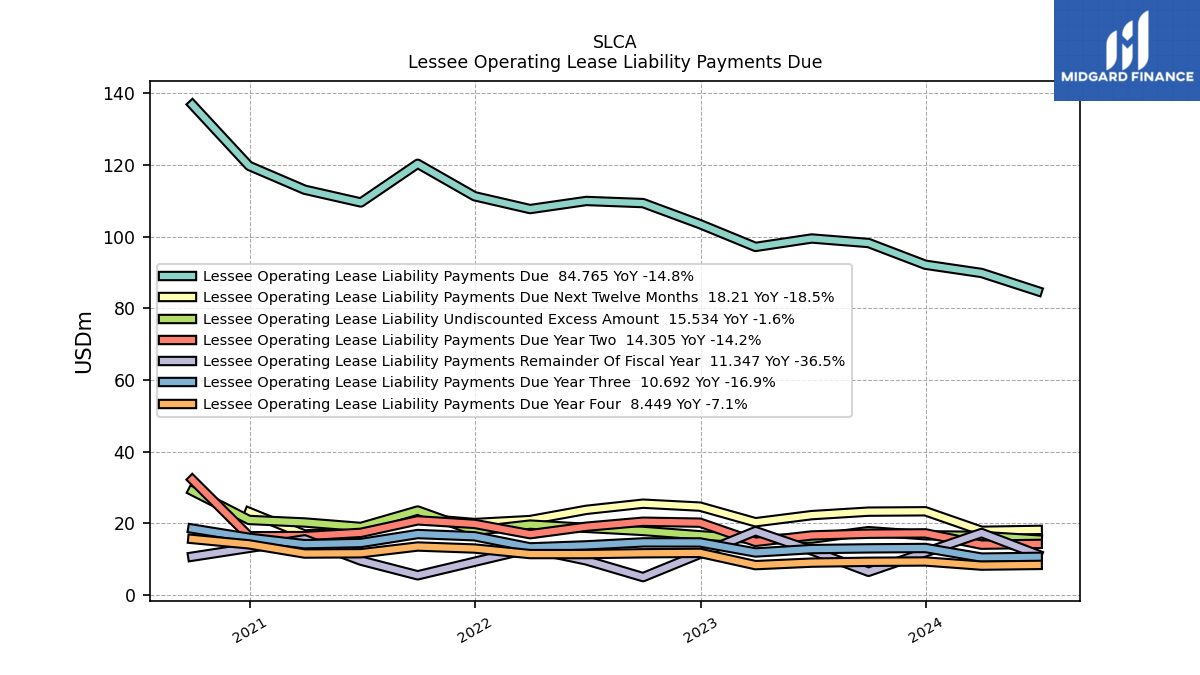
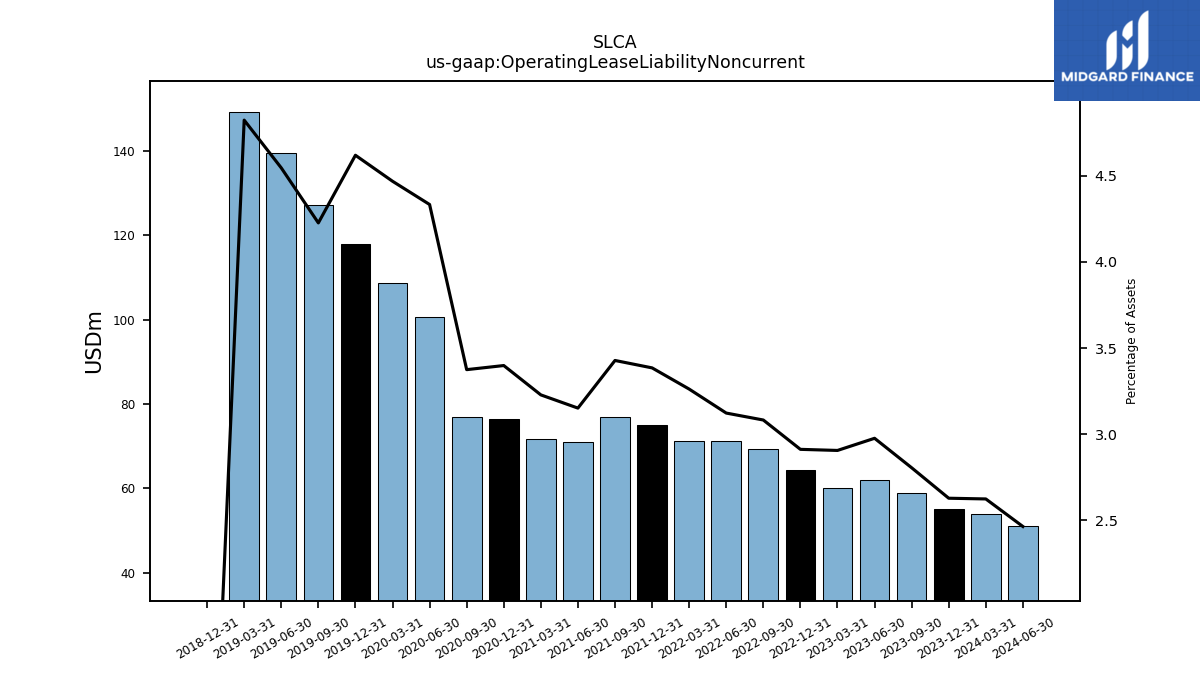
| Operating Lease Liability Noncurrent | 55.09 | 58.92 | 61.94 | 60.13 | 64.48 | 69.27 | 71.16 | 71.36 | 75.13 | 76.81 | 71.07 | 71.60 | 76.36 | 76.83 | 100.67 | 108.74 | 117.96 | 127.18 | 139.38 | 149.04 | 0.00 | NA | NA | NA | NA | NA | NA | NA | NA | NA | NA | NA | NA | NA | NA | NA | NA | NA | NA | NA | NA | NA | NA | NA | NA | NA | NA | NA | NA | NA | NA | NA |
| 2023-12-31 | 2023-09-30 | 2023-06-30 | 2023-03-31 | 2022-12-31 | 2022-09-30 | 2022-06-30 | 2022-03-31 | 2021-12-31 | 2021-09-30 | 2021-06-30 | 2021-03-31 | 2020-12-31 | 2020-09-30 | 2020-06-30 | 2020-03-31 | 2019-12-31 | 2019-09-30 | 2019-06-30 | 2019-03-31 | 2018-12-31 | 2018-09-30 | 2018-06-30 | 2018-03-31 | 2017-12-31 | 2017-09-30 | 2017-06-30 | 2017-03-31 | 2016-12-31 | 2016-09-30 | 2016-06-30 | 2016-03-31 | 2015-12-31 | 2015-09-30 | 2015-06-30 | 2015-03-31 | 2014-12-31 | 2014-09-30 | 2014-06-30 | 2014-03-31 | 2013-12-31 | 2013-09-30 | 2013-06-30 | 2013-03-31 | 2012-12-31 | 2012-09-30 | 2012-06-30 | 2012-03-31 | 2011-12-31 | 2011-09-30 | 2011-06-30 | 2011-03-31 | ||
|---|---|---|---|---|---|---|---|---|---|---|---|---|---|---|---|---|---|---|---|---|---|---|---|---|---|---|---|---|---|---|---|---|---|---|---|---|---|---|---|---|---|---|---|---|---|---|---|---|---|---|---|---|---|
| Stockholders Equity | 849.31 | 818.33 | 787.22 | 733.97 | 696.68 | 660.00 | 625.48 | 601.40 | 604.22 | 617.72 | 638.01 | 607.08 | 615.26 | 591.85 | 602.46 | 628.50 | 705.22 | 991.85 | 1019.95 | 1021.89 | 1044.82 | 1366.27 | 1358.50 | 1352.98 | 1396.51 | 1348.80 | 1302.21 | 1273.90 | 1273.29 | 810.79 | 541.35 | 554.99 | 384.17 | 397.67 | 404.00 | 398.05 | 403.82 | 391.14 | 353.48 | 326.65 | 309.29 | 287.65 | 267.04 | 250.96 | 231.69 | 238.19 | 219.26 | 199.41 | 121.93 | NA | NA | NA | |
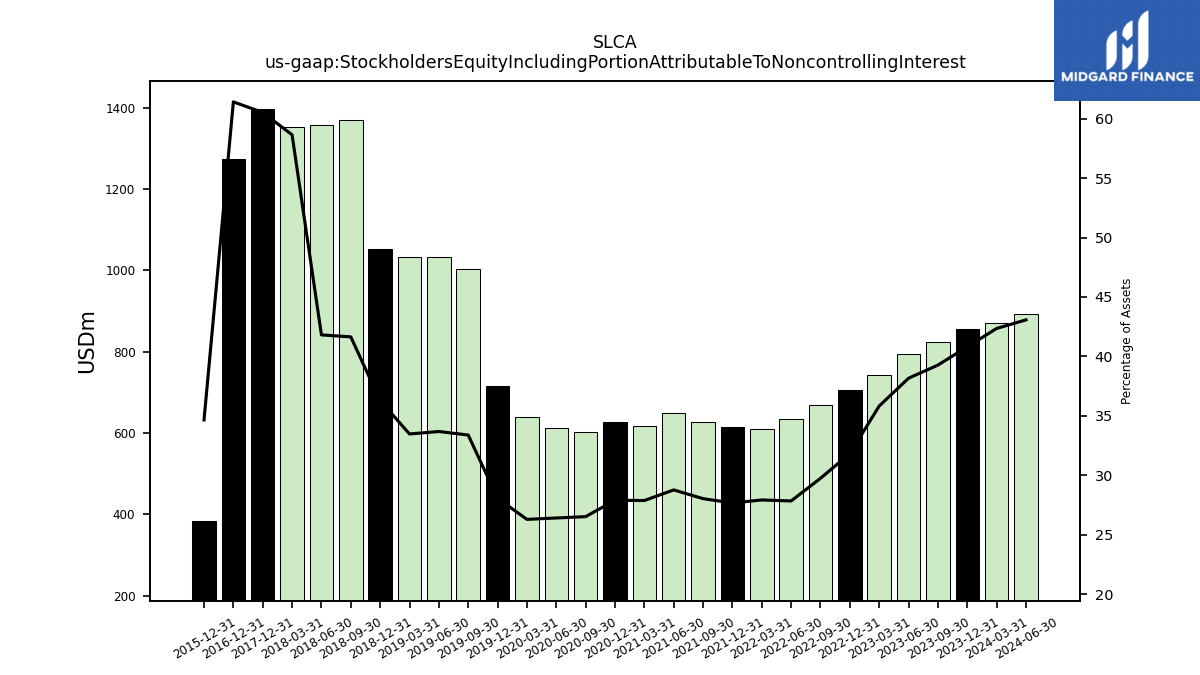
| Stockholders Equity Including Portion Attributable To Noncontrolling Interest | 855.53 | 825.02 | 794.34 | 741.56 | 704.69 | 668.50 | 634.43 | 610.79 | 614.08 | 628.01 | 648.74 | 618.27 | 626.79 | 603.67 | 613.27 | 639.59 | 716.58 | 1004.40 | 1032.46 | 1034.10 | 1052.30 | 1369.48 | 1358.50 | 1352.98 | 1396.51 | NA | NA | NA | 1273.29 | NA | NA | NA | 384.17 | NA | NA | NA | NA | NA | NA | NA | NA | NA | NA | NA | NA | NA | NA | NA | NA | NA | NA | NA | |
| Common Stock Value | 0.88 | 0.88 | 0.88 | 0.88 | 0.85 | 0.85 | 0.85 | 0.85 | 0.84 | 0.84 | 0.84 | 0.83 | 0.83 | 0.83 | 0.83 | 0.82 | 0.82 | 0.82 | 0.82 | 0.82 | 0.82 | 0.81 | 0.81 | 0.81 | 0.81 | 0.81 | 0.81 | 0.81 | 0.81 | 0.71 | 0.64 | 0.64 | 0.54 | 0.54 | 0.54 | 0.54 | 0.54 | 0.54 | 0.54 | 0.54 | 0.53 | 0.53 | 0.53 | 0.53 | 0.53 | 0.53 | 0.53 | 0.53 | 0.50 | NA | NA | NA | |
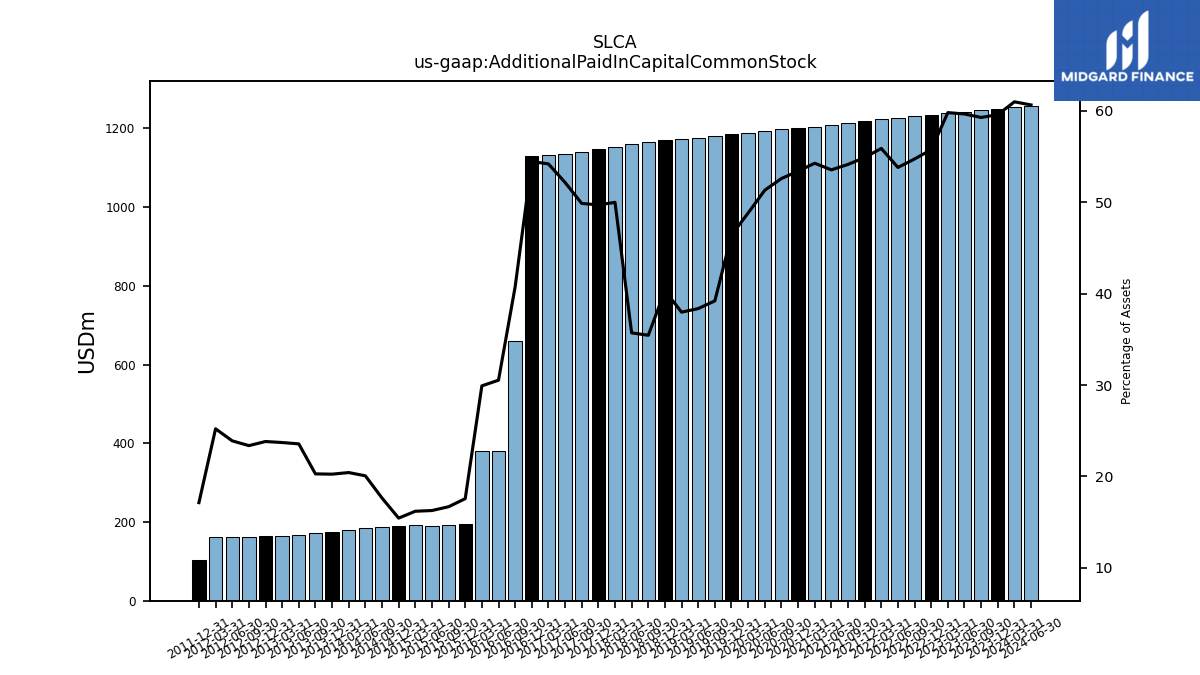
| Additional Paid In Capital Common Stock | 1249.46 | 1245.55 | 1241.83 | 1238.10 | 1234.83 | 1230.29 | 1226.48 | 1222.78 | 1218.58 | 1213.16 | 1207.67 | 1203.92 | 1200.02 | 1197.46 | 1192.07 | 1187.96 | 1185.12 | 1179.78 | 1176.06 | 1173.26 | 1169.38 | 1165.66 | 1160.23 | 1153.34 | 1147.08 | 1140.55 | 1134.24 | 1131.25 | 1129.05 | 660.45 | 381.35 | 379.34 | 194.67 | 192.91 | 191.04 | 193.14 | 191.09 | 188.17 | 185.16 | 180.34 | 174.80 | 172.02 | 166.19 | 164.53 | 163.58 | 162.91 | 162.09 | 162.10 | 103.76 | NA | NA | NA | |
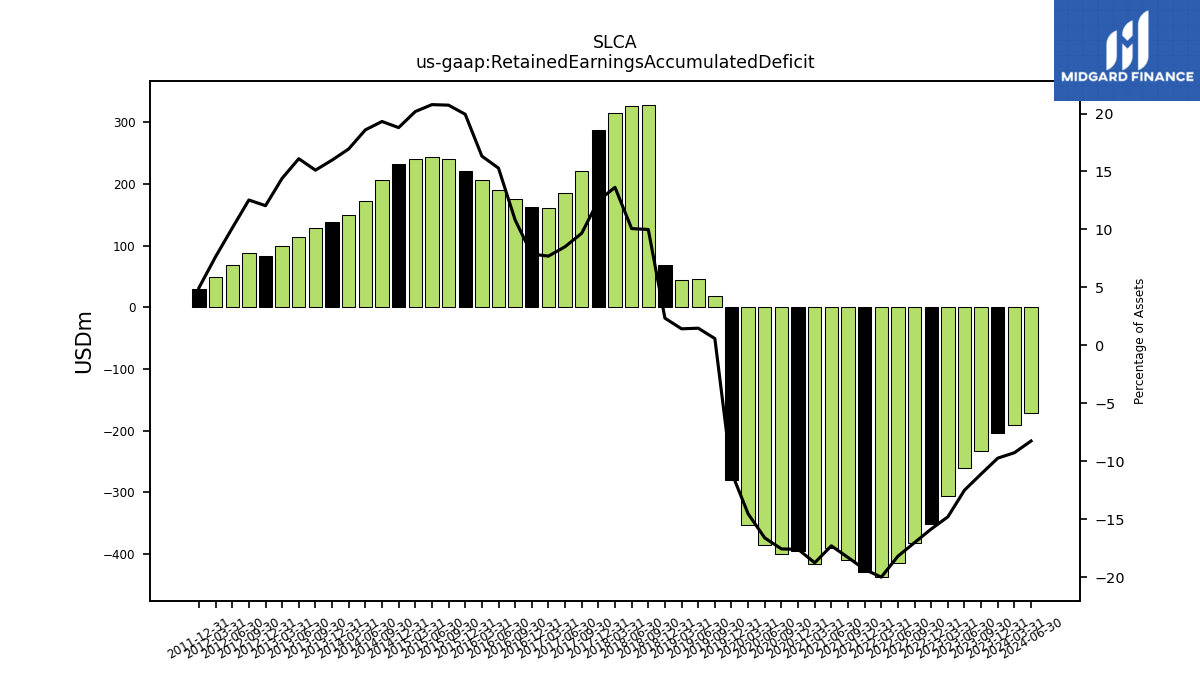
| Retained Earnings Accumulated Deficit | -204.16 | -233.27 | -260.18 | -306.44 | -351.08 | -382.67 | -414.75 | -437.64 | -429.26 | -410.23 | -390.24 | -416.27 | -395.50 | -400.06 | -386.11 | -353.86 | -279.96 | 17.50 | 45.22 | 43.92 | 67.85 | 328.62 | 327.17 | 314.40 | 287.99 | 221.13 | 184.96 | 160.60 | 163.17 | 175.21 | 190.96 | 207.04 | 220.97 | 239.66 | 243.93 | 240.68 | 232.55 | 206.07 | 171.54 | 149.63 | 137.98 | 128.22 | 113.57 | 100.01 | 82.73 | 87.40 | 68.60 | 49.15 | 30.04 | NA | NA | NA | |
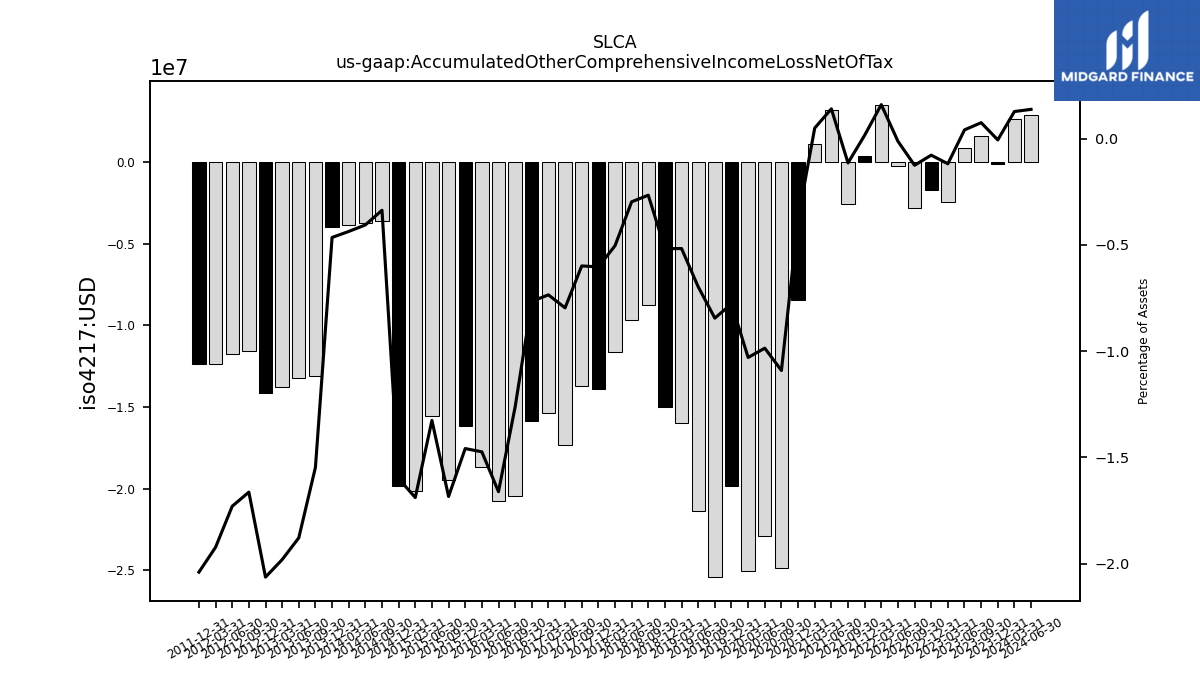
| Accumulated Other Comprehensive Income Loss Net Of Tax | -0.12 | 1.58 | 0.86 | -2.45 | -1.72 | -2.82 | -0.28 | 3.50 | 0.35 | -2.56 | 3.16 | 1.10 | -8.48 | -24.84 | -22.91 | -25.06 | -19.85 | -25.42 | -21.38 | -15.98 | -15.02 | -8.75 | -9.66 | -11.63 | -13.93 | -13.70 | -17.32 | -15.35 | -15.88 | -20.47 | -20.76 | -18.70 | -16.17 | -19.48 | -15.58 | -20.16 | -19.82 | -3.60 | -3.75 | -3.86 | -4.02 | -13.13 | -13.26 | -13.75 | -14.18 | -11.60 | -11.74 | -12.37 | -12.36 | NA | NA | NA | |
| Minority Interest | 6.22 | 6.69 | 7.12 | 7.58 | 8.01 | 8.50 | 8.95 | 9.39 | 9.87 | 10.28 | 10.73 | 11.20 | 11.53 | 11.82 | 10.81 | 11.10 | 11.36 | 12.55 | 12.52 | 12.21 | 7.48 | 3.21 | NA | NA | 0.00 | NA | NA | NA | NA | NA | NA | NA | NA | NA | NA | NA | NA | NA | NA | NA | NA | NA | NA | NA | NA | NA | NA | NA | NA | NA | NA | NA | |
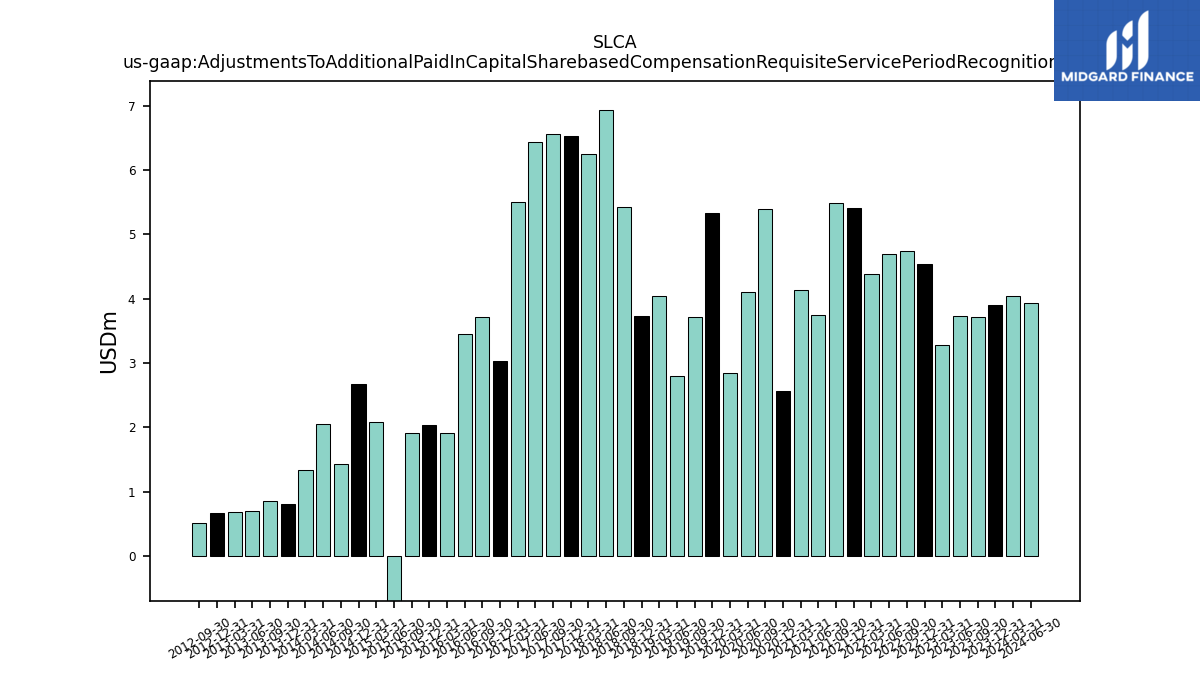
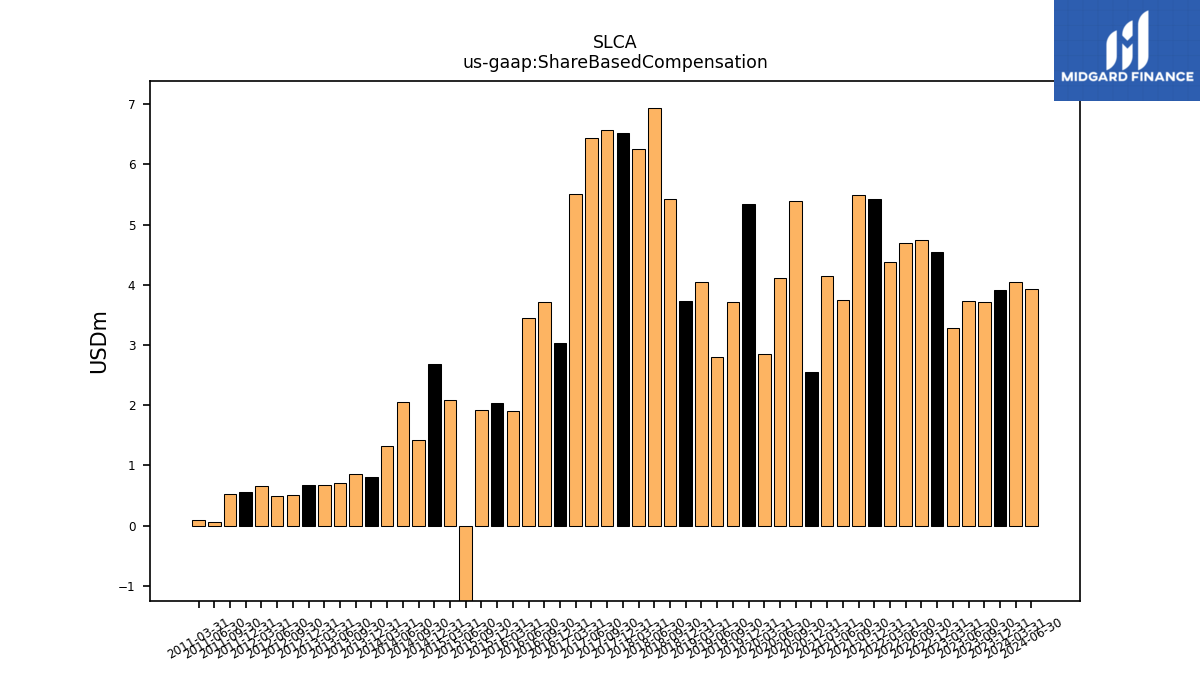
| Adjustments To Additional Paid In Capital Sharebased Compensation Requisite Service Period Recognition Value | 3.91 | 3.72 | 3.73 | 3.29 | 4.54 | 4.74 | 4.70 | 4.38 | 5.42 | 5.50 | 3.75 | 4.14 | 2.56 | 5.40 | 4.11 | 2.85 | 5.34 | 3.72 | 2.80 | 4.04 | 3.73 | 5.43 | 6.93 | 6.25 | 6.53 | 6.57 | 6.44 | 5.51 | 3.03 | 3.72 | 3.45 | 1.91 | 2.03 | 1.91 | -2.18 | 2.09 | 2.68 | 1.42 | 2.05 | 1.33 | 0.80 | 0.85 | 0.70 | 0.68 | 0.67 | 0.52 | NA | NA | NA | NA | NA | NA | |
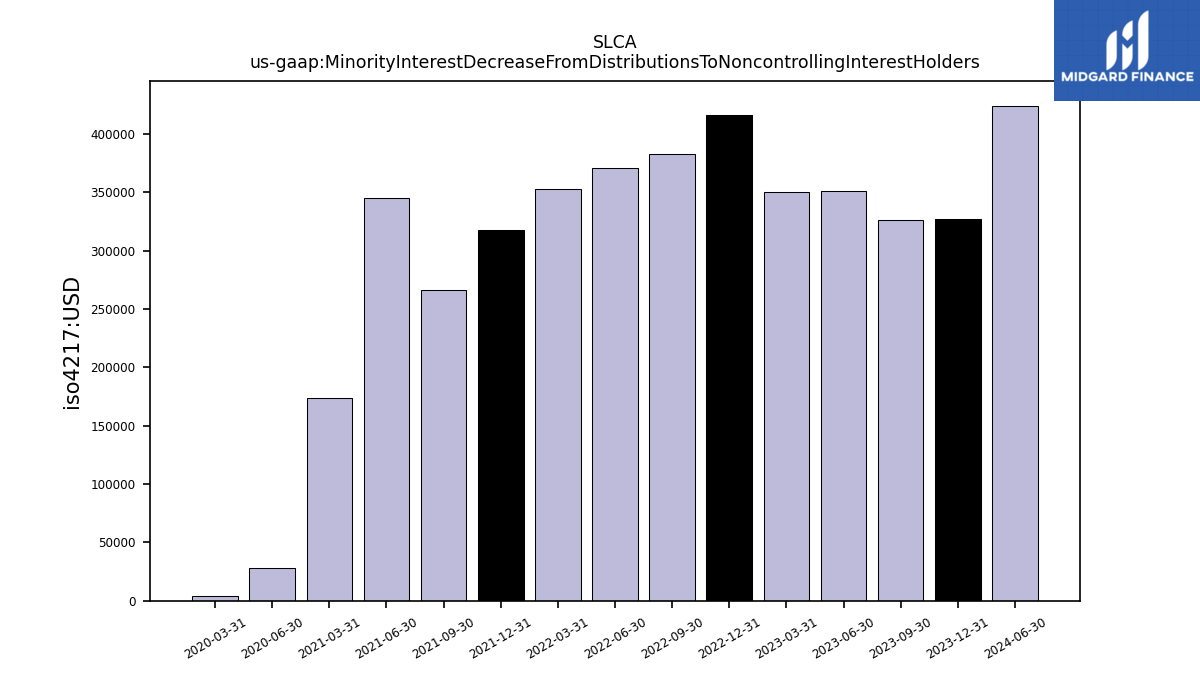
| Minority Interest Decrease From Distributions To Noncontrolling Interest Holders | 0.33 | 0.33 | 0.35 | 0.35 | 0.42 | 0.38 | 0.37 | 0.35 | 0.32 | 0.27 | 0.34 | 0.17 | NA | NA | 0.03 | 0.00 | NA | NA | NA | NA | NA | NA | NA | NA | NA | NA | NA | NA | NA | NA | NA | NA | NA | NA | NA | NA | NA | NA | NA | NA | NA | NA | NA | NA | NA | NA | NA | NA | NA | NA | NA | NA |
| 2023-12-31 | 2023-09-30 | 2023-06-30 | 2023-03-31 | 2022-12-31 | 2022-09-30 | 2022-06-30 | 2022-03-31 | 2021-12-31 | 2021-09-30 | 2021-06-30 | 2021-03-31 | 2020-12-31 | 2020-09-30 | 2020-06-30 | 2020-03-31 | 2019-12-31 | 2019-09-30 | 2019-06-30 | 2019-03-31 | 2018-12-31 | 2018-09-30 | 2018-06-30 | 2018-03-31 | 2017-12-31 | 2017-09-30 | 2017-06-30 | 2017-03-31 | 2016-12-31 | 2016-09-30 | 2016-06-30 | 2016-03-31 | 2015-12-31 | 2015-09-30 | 2015-06-30 | 2015-03-31 | 2014-12-31 | 2014-09-30 | 2014-06-30 | 2014-03-31 | 2013-12-31 | 2013-09-30 | 2013-06-30 | 2013-03-31 | 2012-12-31 | 2012-09-30 | 2012-06-30 | 2012-03-31 | 2011-12-31 | 2011-09-30 | 2011-06-30 | 2011-03-31 | ||
|---|---|---|---|---|---|---|---|---|---|---|---|---|---|---|---|---|---|---|---|---|---|---|---|---|---|---|---|---|---|---|---|---|---|---|---|---|---|---|---|---|---|---|---|---|---|---|---|---|---|---|---|---|---|
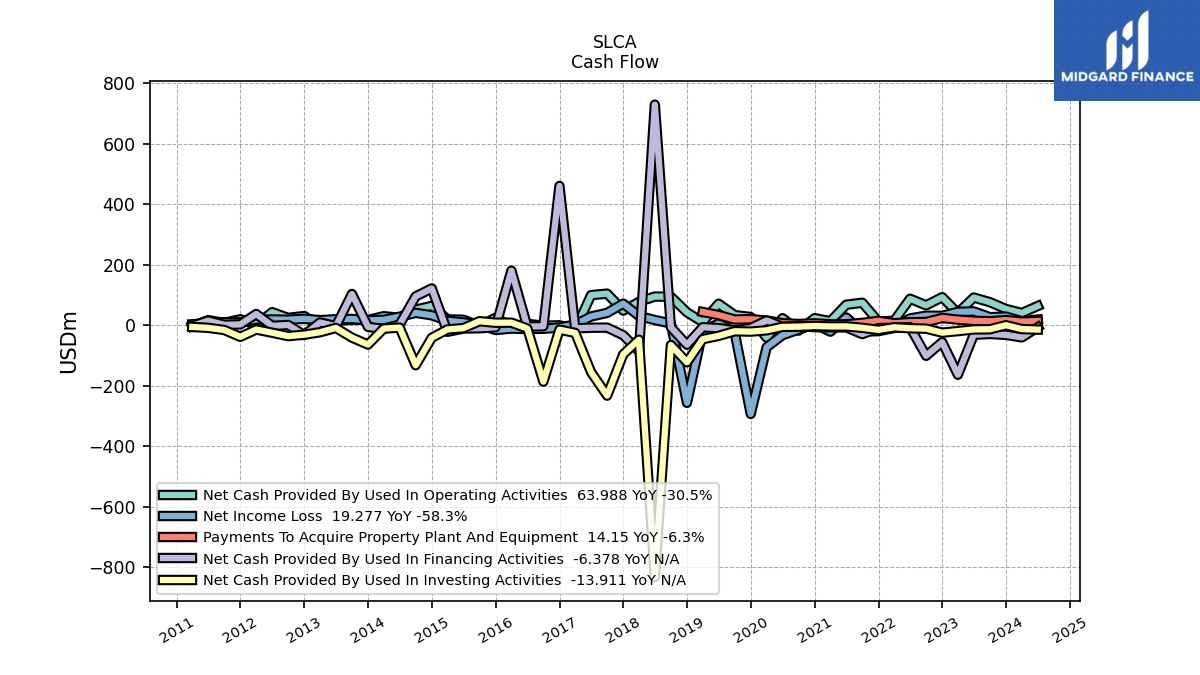
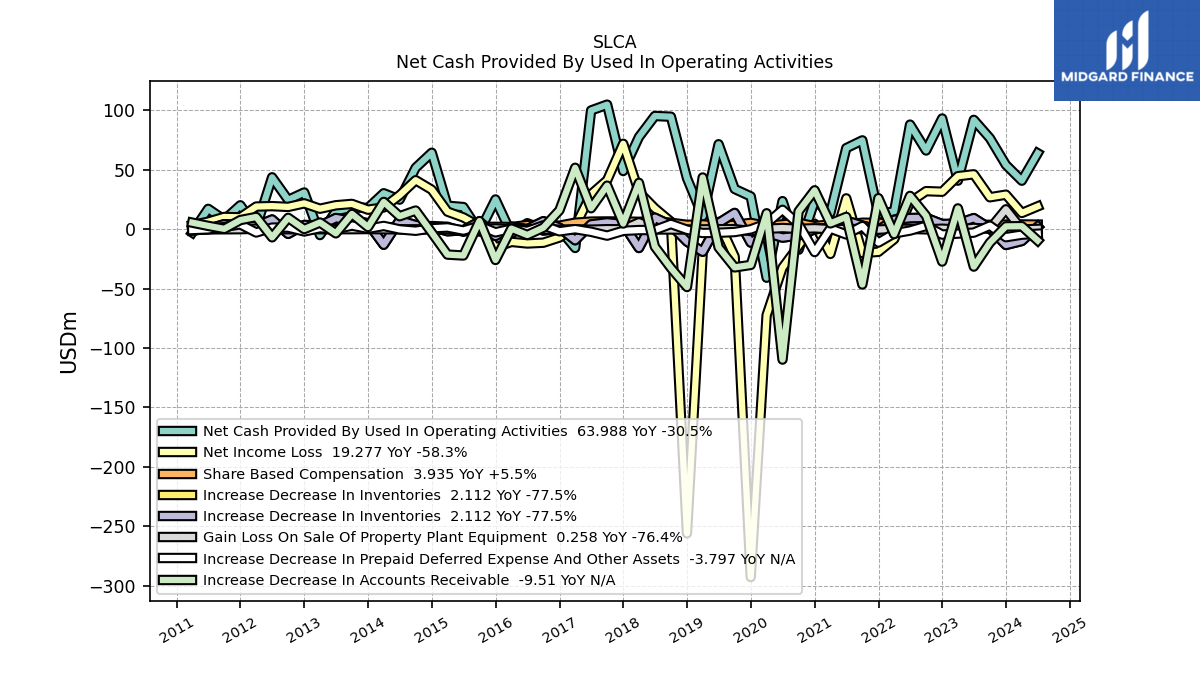
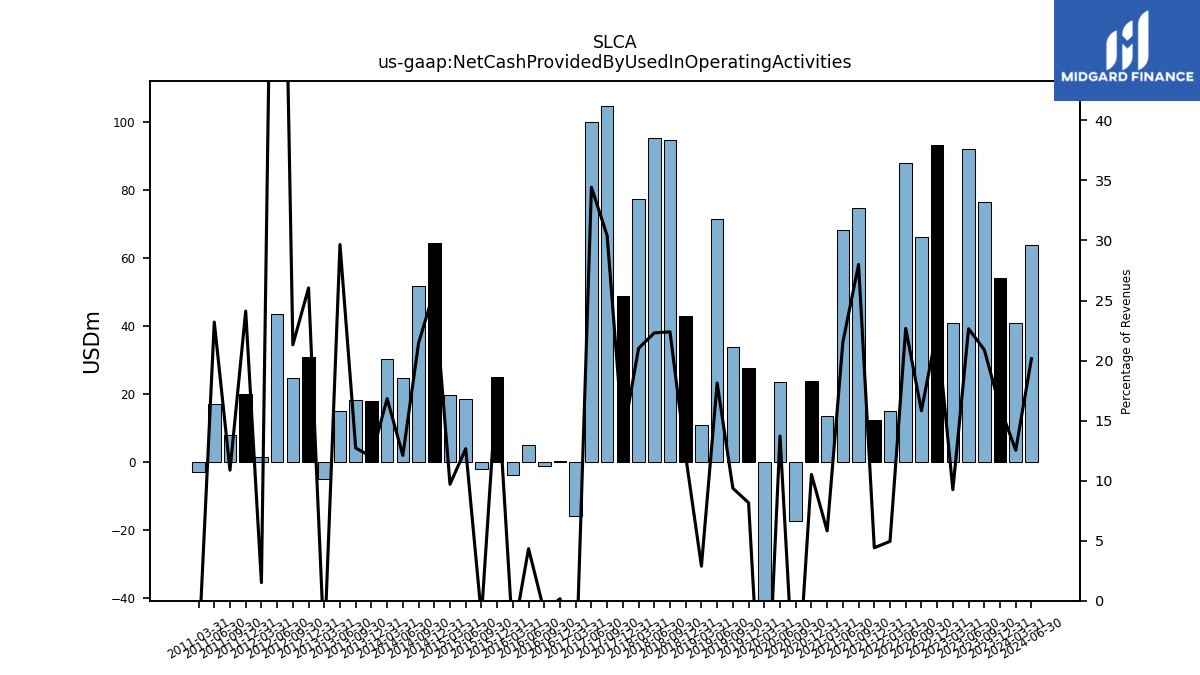
| Net Cash Provided By Used In Operating Activities | 54.16 | 76.69 | 92.11 | 40.90 | 93.26 | 66.28 | 88.10 | 15.08 | 12.56 | 74.83 | 68.31 | 13.64 | 23.91 | -17.30 | 23.66 | -40.80 | 27.66 | 33.89 | 71.59 | 10.90 | 43.02 | 94.75 | 95.33 | 77.61 | 49.00 | 104.91 | 100.01 | -15.77 | 0.31 | -1.25 | 5.08 | -3.75 | 25.08 | -2.04 | 18.67 | 19.78 | 64.42 | 51.77 | 24.91 | 30.31 | 17.92 | 18.36 | 15.08 | -4.91 | 30.96 | 24.70 | 43.74 | 1.55 | 20.17 | 7.99 | 17.19 | -2.78 | |
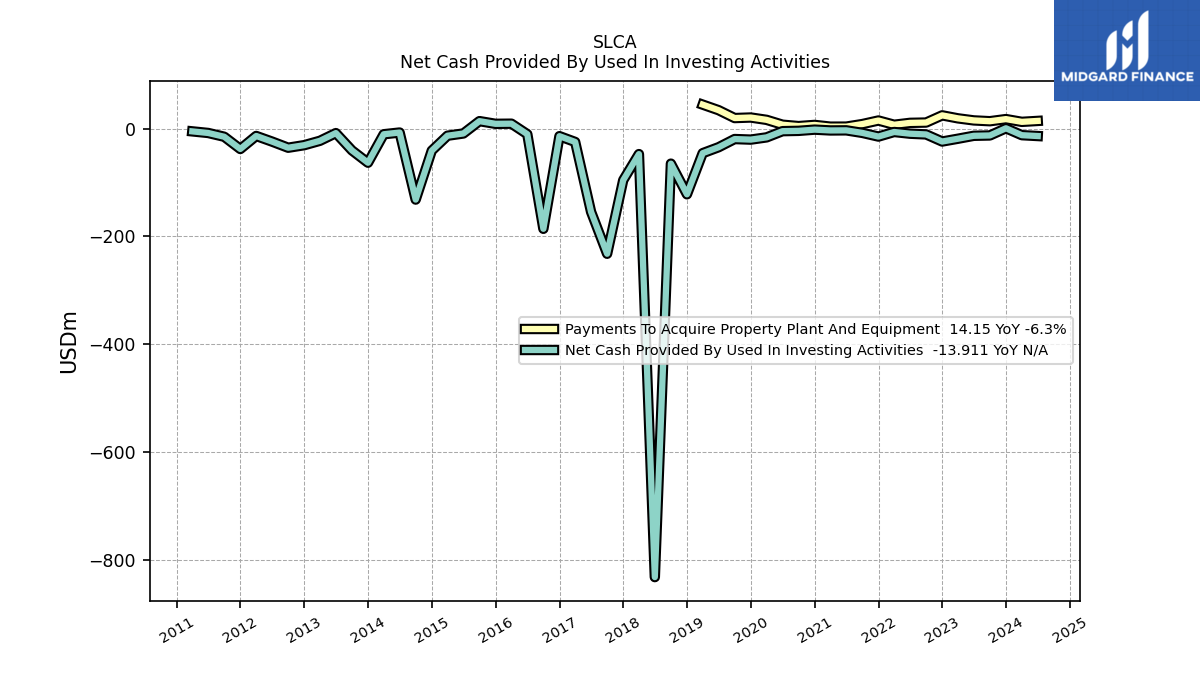
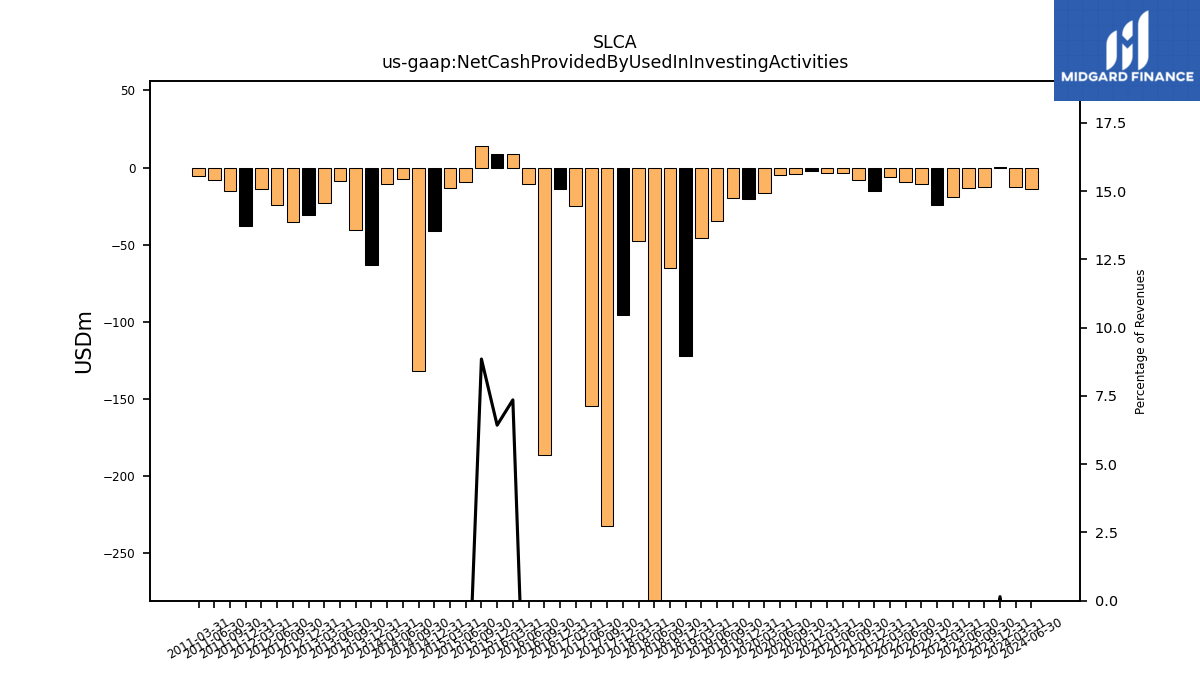
| Net Cash Provided By Used In Investing Activities | 0.50 | -12.83 | -13.46 | -18.93 | -24.09 | -10.91 | -9.57 | -6.38 | -14.90 | -8.08 | -3.35 | -3.53 | -2.03 | -4.28 | -4.86 | -16.39 | -20.54 | -19.49 | -34.68 | -45.68 | -122.03 | -65.13 | -832.34 | -47.38 | -95.83 | -232.38 | -154.58 | -24.88 | -14.15 | -186.06 | -10.46 | 9.01 | 8.75 | 13.76 | -9.15 | -13.30 | -41.03 | -131.87 | -7.41 | -10.61 | -63.45 | -40.54 | -8.43 | -22.71 | -30.85 | -35.59 | -24.26 | -13.76 | -37.95 | -15.22 | -8.23 | -5.24 | |
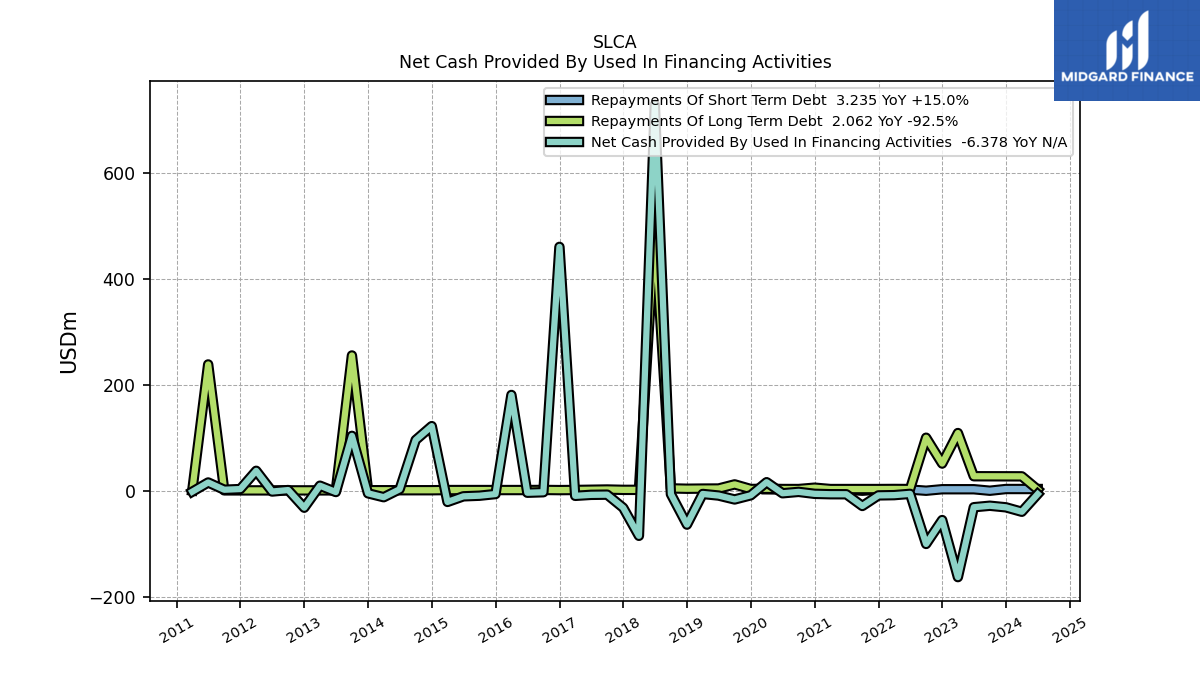
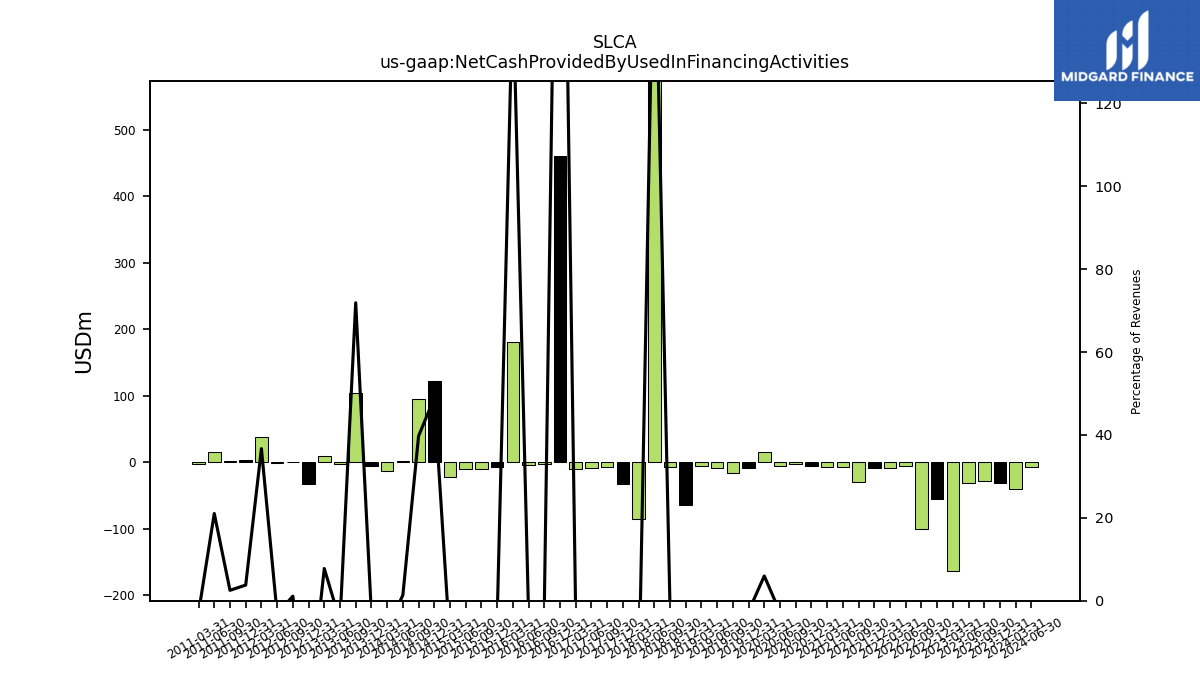
| Net Cash Provided By Used In Financing Activities | -31.38 | -28.38 | -31.19 | -163.32 | -55.45 | -100.62 | -5.92 | -8.35 | -8.83 | -28.87 | -6.67 | -6.62 | -5.88 | -2.17 | -4.82 | 16.15 | -8.67 | -16.50 | -9.13 | -6.10 | -64.07 | -6.39 | 729.85 | -85.29 | -32.26 | -7.42 | -7.79 | -9.68 | 461.00 | -2.84 | -3.80 | 181.06 | -6.30 | -9.44 | -10.59 | -21.20 | 122.17 | 95.84 | 2.76 | -12.26 | -4.91 | 103.79 | -2.50 | 9.52 | -32.10 | 1.28 | -1.50 | 37.65 | 3.17 | 1.85 | 15.60 | -1.84 |
| 2023-12-31 | 2023-09-30 | 2023-06-30 | 2023-03-31 | 2022-12-31 | 2022-09-30 | 2022-06-30 | 2022-03-31 | 2021-12-31 | 2021-09-30 | 2021-06-30 | 2021-03-31 | 2020-12-31 | 2020-09-30 | 2020-06-30 | 2020-03-31 | 2019-12-31 | 2019-09-30 | 2019-06-30 | 2019-03-31 | 2018-12-31 | 2018-09-30 | 2018-06-30 | 2018-03-31 | 2017-12-31 | 2017-09-30 | 2017-06-30 | 2017-03-31 | 2016-12-31 | 2016-09-30 | 2016-06-30 | 2016-03-31 | 2015-12-31 | 2015-09-30 | 2015-06-30 | 2015-03-31 | 2014-12-31 | 2014-09-30 | 2014-06-30 | 2014-03-31 | 2013-12-31 | 2013-09-30 | 2013-06-30 | 2013-03-31 | 2012-12-31 | 2012-09-30 | 2012-06-30 | 2012-03-31 | 2011-12-31 | 2011-09-30 | 2011-06-30 | 2011-03-31 | ||
|---|---|---|---|---|---|---|---|---|---|---|---|---|---|---|---|---|---|---|---|---|---|---|---|---|---|---|---|---|---|---|---|---|---|---|---|---|---|---|---|---|---|---|---|---|---|---|---|---|---|---|---|---|---|
| Net Cash Provided By Used In Operating Activities | 54.16 | 76.69 | 92.11 | 40.90 | 93.26 | 66.28 | 88.10 | 15.08 | 12.56 | 74.83 | 68.31 | 13.64 | 23.91 | -17.30 | 23.66 | -40.80 | 27.66 | 33.89 | 71.59 | 10.90 | 43.02 | 94.75 | 95.33 | 77.61 | 49.00 | 104.91 | 100.01 | -15.77 | 0.31 | -1.25 | 5.08 | -3.75 | 25.08 | -2.04 | 18.67 | 19.78 | 64.42 | 51.77 | 24.91 | 30.31 | 17.92 | 18.36 | 15.08 | -4.91 | 30.96 | 24.70 | 43.74 | 1.55 | 20.17 | 7.99 | 17.19 | -2.78 | |
| Net Income Loss | 29.11 | 26.91 | 46.26 | 44.65 | 31.59 | 32.07 | 22.91 | -8.39 | -19.02 | -20.00 | 26.03 | -20.78 | 4.57 | -13.96 | -32.35 | -72.34 | -292.87 | -23.04 | 6.15 | -19.32 | -256.06 | 6.32 | 17.64 | 31.29 | 71.95 | 41.27 | 29.46 | 2.52 | -6.94 | -11.34 | -11.99 | -10.66 | -15.32 | 2.41 | 9.95 | 14.82 | 33.24 | 41.28 | 28.65 | 18.37 | 16.45 | 21.33 | 20.19 | 17.28 | 21.79 | 18.80 | 19.45 | 19.11 | 10.04 | 10.34 | 6.36 | 3.51 | |
| Profit Loss | 28.96 | 26.81 | 46.14 | 44.57 | 31.52 | 32.00 | 22.84 | -8.51 | -19.11 | -20.17 | 25.90 | -20.93 | 4.32 | -14.22 | -32.62 | -72.61 | -293.43 | -23.07 | 6.06 | -19.33 | -256.07 | 6.32 | 17.64 | 31.29 | 71.95 | 41.27 | 29.46 | 2.52 | NA | NA | NA | NA | NA | NA | NA | NA | NA | NA | NA | NA | NA | NA | NA | NA | 21.79 | 18.80 | NA | NA | NA | NA | NA | NA | |
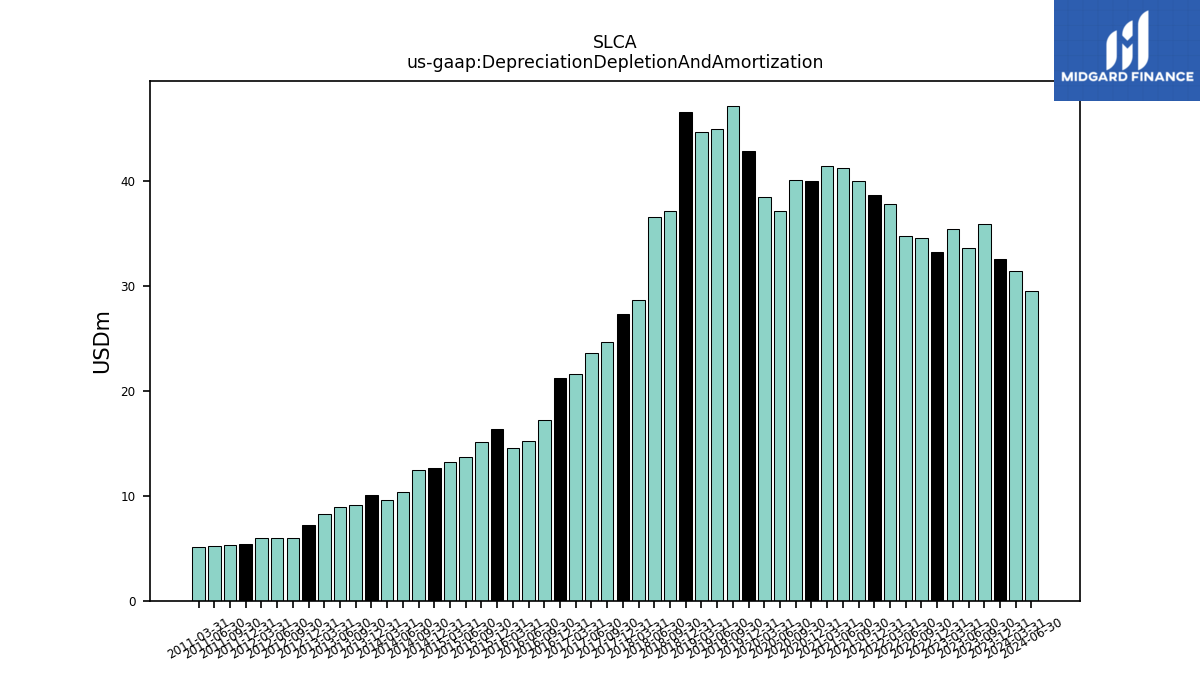
| Depreciation Depletion And Amortization | 32.51 | 35.82 | 33.55 | 35.39 | 33.20 | 34.50 | 34.72 | 37.75 | 38.64 | 39.98 | 41.16 | 41.35 | 39.96 | 40.07 | 37.09 | 38.45 | 42.82 | 47.13 | 44.90 | 44.60 | 46.53 | 37.15 | 36.56 | 28.59 | 27.34 | 24.67 | 23.63 | 21.60 | 21.19 | 17.18 | 15.21 | 14.56 | 16.38 | 15.16 | 13.70 | 13.24 | 12.66 | 12.43 | 10.34 | 9.59 | 10.10 | 9.15 | 8.89 | 8.28 | 7.18 | 5.97 | 5.97 | 5.98 | 5.36 | 5.29 | 5.25 | 5.09 | |
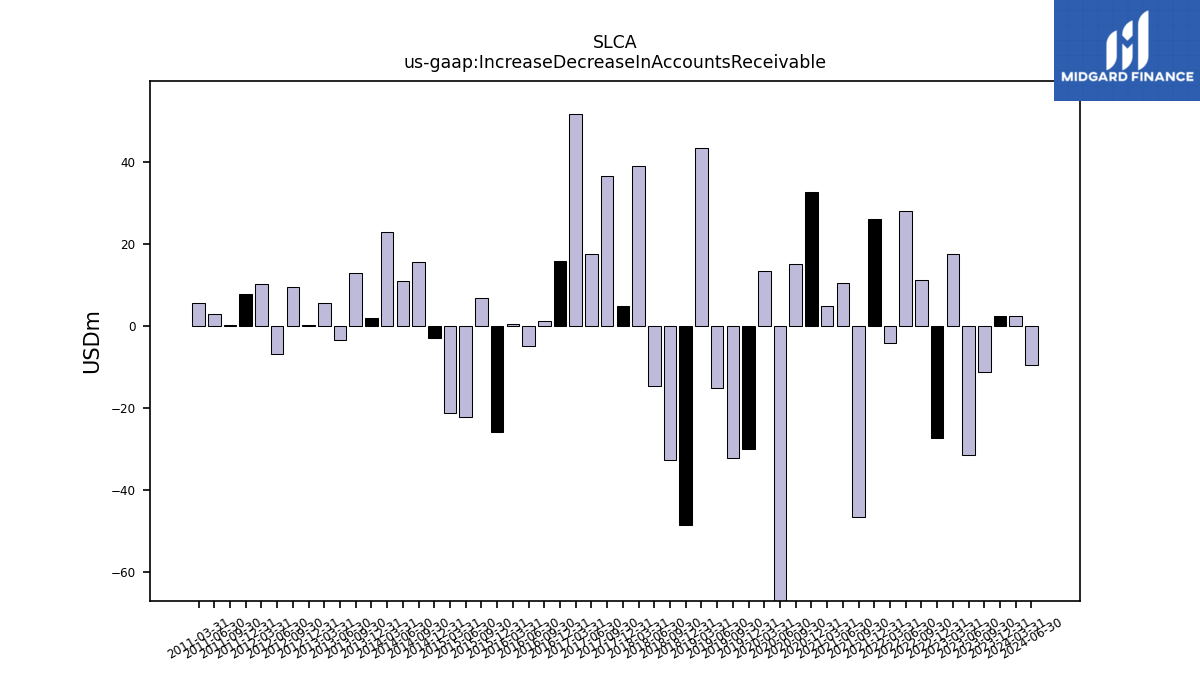
| Increase Decrease In Accounts Receivable | 2.41 | -11.34 | -31.46 | 17.58 | -27.23 | 11.30 | 28.09 | -4.09 | 26.19 | -46.53 | 10.40 | 4.92 | 32.79 | 15.04 | -109.75 | 13.47 | -30.05 | -32.12 | -15.26 | 43.58 | -48.64 | -32.65 | -14.61 | 39.08 | 4.80 | 36.72 | 17.65 | 51.75 | 15.97 | 1.33 | -4.83 | 0.52 | -25.88 | 6.86 | -22.11 | -21.34 | -2.83 | 15.74 | 10.94 | 22.98 | 1.87 | 12.88 | -3.47 | 5.69 | 0.14 | 9.61 | -6.83 | 10.32 | 7.73 | 0.32 | 2.83 | 5.55 | |
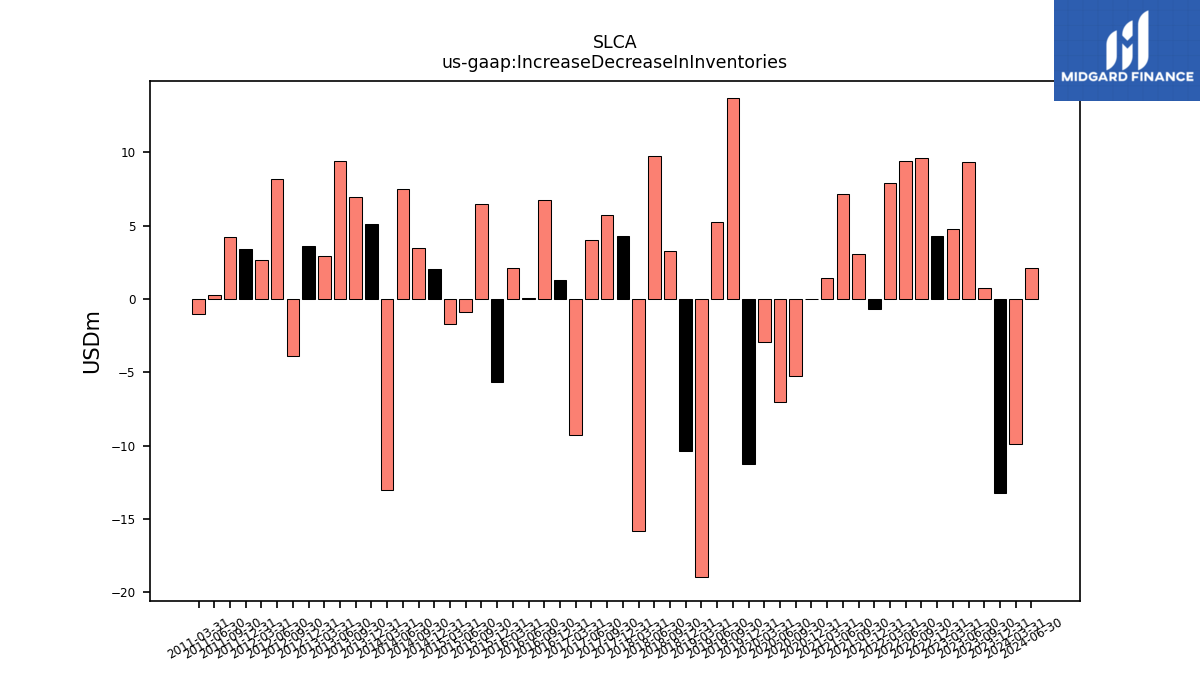
| Increase Decrease In Inventories | -13.22 | 0.78 | 9.37 | 4.76 | 4.29 | 9.64 | 9.40 | 7.88 | -0.69 | 3.06 | 7.20 | 1.47 | -0.03 | -5.28 | -7.02 | -2.92 | -11.22 | 13.72 | 5.25 | -18.94 | -10.35 | 3.31 | 9.76 | -15.80 | 4.30 | 5.73 | 4.04 | -9.25 | 1.28 | 6.78 | 0.07 | 2.09 | -5.67 | 6.49 | -0.85 | -1.68 | 2.07 | 3.46 | 7.48 | -13.04 | 5.08 | 6.94 | 9.41 | 2.94 | 3.61 | -3.90 | 8.20 | 2.63 | 3.43 | 4.25 | 0.26 | -1.05 | |
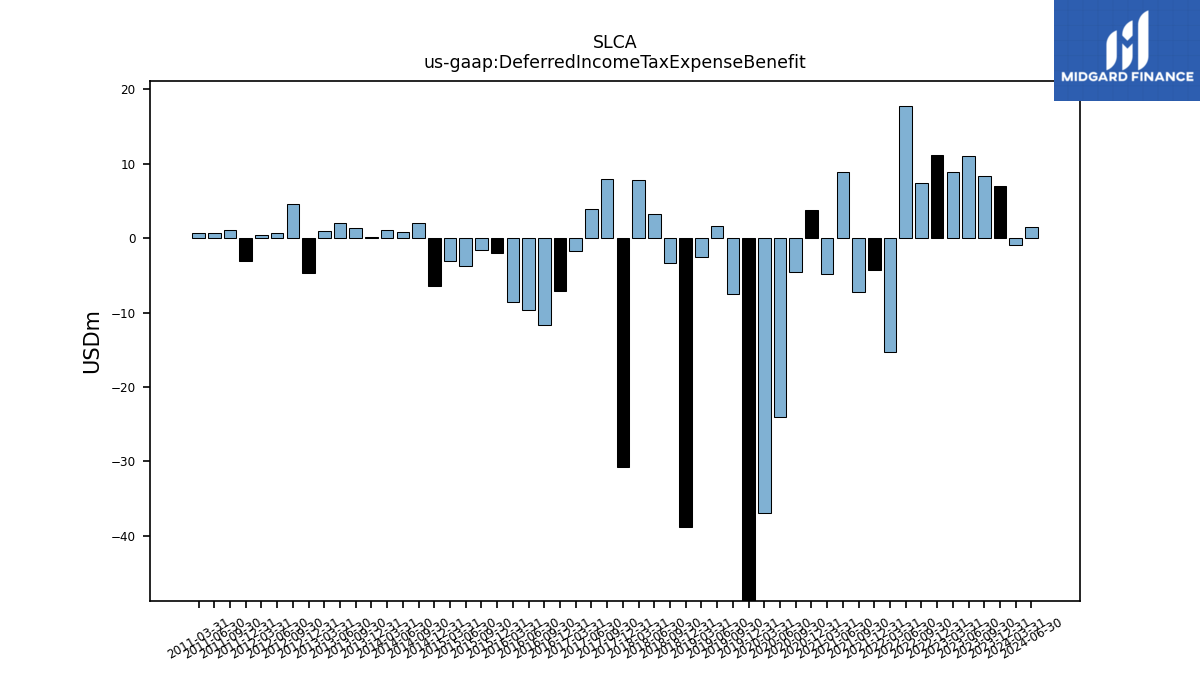
| Deferred Income Tax Expense Benefit | 7.00 | 8.33 | 11.09 | 8.90 | 11.15 | 7.38 | 17.73 | -15.31 | -4.25 | -7.29 | 8.92 | -4.87 | 3.84 | -4.55 | -24.11 | -36.98 | -93.19 | -7.55 | 1.61 | -2.55 | -38.77 | -3.32 | 3.24 | 7.79 | -30.75 | 8.00 | 3.88 | -1.73 | -7.04 | -11.66 | -9.64 | -8.56 | -2.01 | -1.56 | -3.80 | -3.10 | -6.49 | 2.00 | 0.88 | 1.16 | 0.13 | 1.40 | 2.03 | 1.03 | -4.64 | 4.58 | 0.75 | 0.41 | -3.08 | 1.08 | 0.67 | 0.67 | |
| Share Based Compensation | 3.91 | 3.72 | 3.73 | 3.29 | 4.54 | 4.74 | 4.70 | 4.38 | 5.42 | 5.50 | 3.75 | 4.14 | 2.56 | 5.40 | 4.11 | 2.85 | 5.34 | 3.72 | 2.80 | 4.04 | 3.73 | 5.43 | 6.93 | 6.25 | 6.53 | 6.57 | 6.44 | 5.51 | 3.03 | 3.72 | 3.45 | 1.91 | 2.03 | 1.91 | -2.18 | 2.09 | 2.68 | 1.42 | 2.05 | 1.33 | 0.80 | 0.85 | 0.70 | 0.68 | 0.67 | 0.52 | 0.49 | 0.65 | 0.56 | 0.53 | 0.05 | 0.10 |
| 2023-12-31 | 2023-09-30 | 2023-06-30 | 2023-03-31 | 2022-12-31 | 2022-09-30 | 2022-06-30 | 2022-03-31 | 2021-12-31 | 2021-09-30 | 2021-06-30 | 2021-03-31 | 2020-12-31 | 2020-09-30 | 2020-06-30 | 2020-03-31 | 2019-12-31 | 2019-09-30 | 2019-06-30 | 2019-03-31 | 2018-12-31 | 2018-09-30 | 2018-06-30 | 2018-03-31 | 2017-12-31 | 2017-09-30 | 2017-06-30 | 2017-03-31 | 2016-12-31 | 2016-09-30 | 2016-06-30 | 2016-03-31 | 2015-12-31 | 2015-09-30 | 2015-06-30 | 2015-03-31 | 2014-12-31 | 2014-09-30 | 2014-06-30 | 2014-03-31 | 2013-12-31 | 2013-09-30 | 2013-06-30 | 2013-03-31 | 2012-12-31 | 2012-09-30 | 2012-06-30 | 2012-03-31 | 2011-12-31 | 2011-09-30 | 2011-06-30 | 2011-03-31 | ||
|---|---|---|---|---|---|---|---|---|---|---|---|---|---|---|---|---|---|---|---|---|---|---|---|---|---|---|---|---|---|---|---|---|---|---|---|---|---|---|---|---|---|---|---|---|---|---|---|---|---|---|---|---|---|
| Net Cash Provided By Used In Investing Activities | 0.50 | -12.83 | -13.46 | -18.93 | -24.09 | -10.91 | -9.57 | -6.38 | -14.90 | -8.08 | -3.35 | -3.53 | -2.03 | -4.28 | -4.86 | -16.39 | -20.54 | -19.49 | -34.68 | -45.68 | -122.03 | -65.13 | -832.34 | -47.38 | -95.83 | -232.38 | -154.58 | -24.88 | -14.15 | -186.06 | -10.46 | 9.01 | 8.75 | 13.76 | -9.15 | -13.30 | -41.03 | -131.87 | -7.41 | -10.61 | -63.45 | -40.54 | -8.43 | -22.71 | -30.85 | -35.59 | -24.26 | -13.76 | -37.95 | -15.22 | -8.23 | -5.24 | |
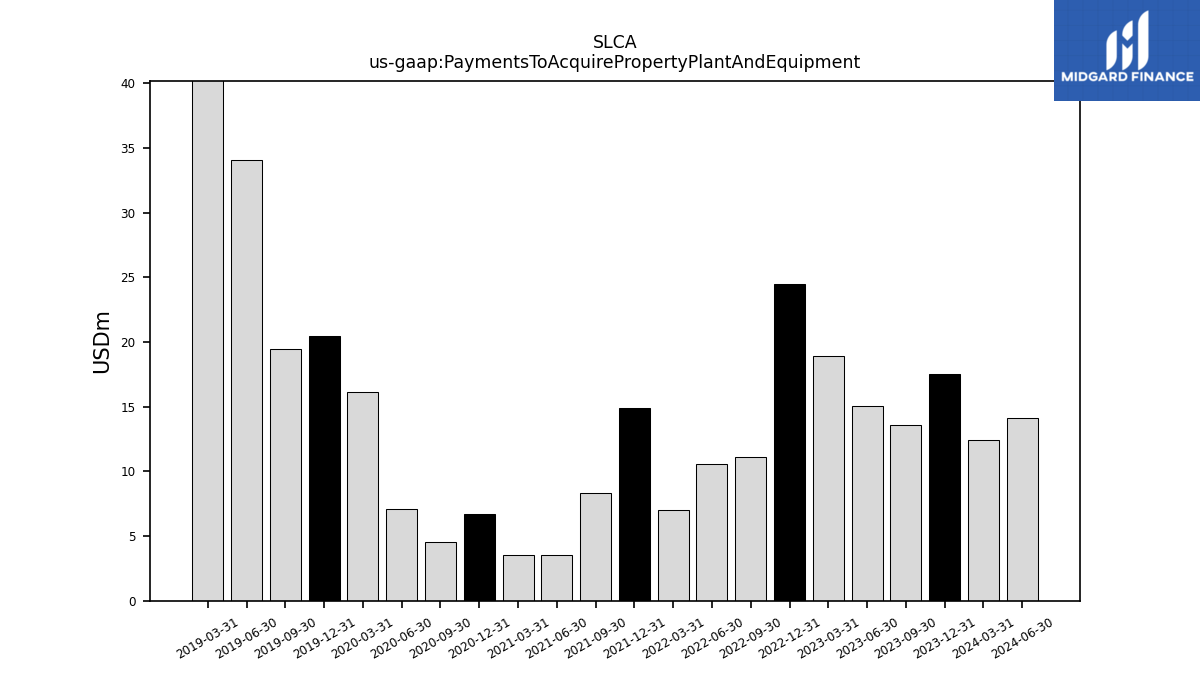
| Payments To Acquire Property Plant And Equipment | 17.53 | 13.60 | 15.09 | 18.93 | 24.48 | 11.12 | 10.54 | 7.03 | 14.91 | 8.32 | 3.57 | 3.51 | 6.71 | 4.52 | 7.11 | 16.12 | 20.45 | 19.45 | 34.08 | 44.38 | NA | NA | NA | NA | NA | NA | NA | NA | NA | NA | NA | NA | NA | NA | NA | NA | NA | NA | NA | NA | NA | NA | NA | NA | NA | NA | NA | NA | NA | NA | NA | NA |
| 2023-12-31 | 2023-09-30 | 2023-06-30 | 2023-03-31 | 2022-12-31 | 2022-09-30 | 2022-06-30 | 2022-03-31 | 2021-12-31 | 2021-09-30 | 2021-06-30 | 2021-03-31 | 2020-12-31 | 2020-09-30 | 2020-06-30 | 2020-03-31 | 2019-12-31 | 2019-09-30 | 2019-06-30 | 2019-03-31 | 2018-12-31 | 2018-09-30 | 2018-06-30 | 2018-03-31 | 2017-12-31 | 2017-09-30 | 2017-06-30 | 2017-03-31 | 2016-12-31 | 2016-09-30 | 2016-06-30 | 2016-03-31 | 2015-12-31 | 2015-09-30 | 2015-06-30 | 2015-03-31 | 2014-12-31 | 2014-09-30 | 2014-06-30 | 2014-03-31 | 2013-12-31 | 2013-09-30 | 2013-06-30 | 2013-03-31 | 2012-12-31 | 2012-09-30 | 2012-06-30 | 2012-03-31 | 2011-12-31 | 2011-09-30 | 2011-06-30 | 2011-03-31 | ||
|---|---|---|---|---|---|---|---|---|---|---|---|---|---|---|---|---|---|---|---|---|---|---|---|---|---|---|---|---|---|---|---|---|---|---|---|---|---|---|---|---|---|---|---|---|---|---|---|---|---|---|---|---|---|
| Net Cash Provided By Used In Financing Activities | -31.38 | -28.38 | -31.19 | -163.32 | -55.45 | -100.62 | -5.92 | -8.35 | -8.83 | -28.87 | -6.67 | -6.62 | -5.88 | -2.17 | -4.82 | 16.15 | -8.67 | -16.50 | -9.13 | -6.10 | -64.07 | -6.39 | 729.85 | -85.29 | -32.26 | -7.42 | -7.79 | -9.68 | 461.00 | -2.84 | -3.80 | 181.06 | -6.30 | -9.44 | -10.59 | -21.20 | 122.17 | 95.84 | 2.76 | -12.26 | -4.91 | 103.79 | -2.50 | 9.52 | -32.10 | 1.28 | -1.50 | 37.65 | 3.17 | 1.85 | 15.60 | -1.84 | |
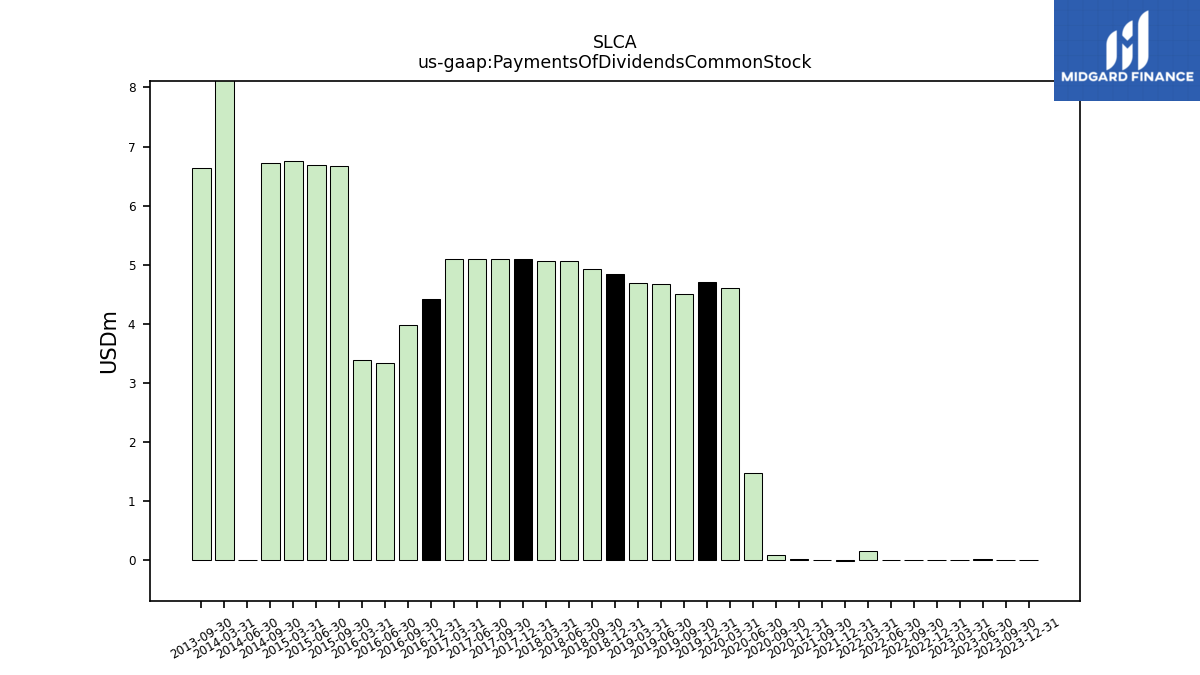
| Payments Of Dividends Common Stock | 0.00 | 0.00 | 0.02 | 0.00 | 0.00 | 0.00 | 0.01 | 0.15 | -0.01 | 0.00 | NA | NA | 0.02 | 0.09 | 1.47 | 4.60 | 4.71 | 4.51 | 4.68 | 4.69 | 4.84 | 4.94 | 5.06 | 5.07 | 5.09 | 5.10 | 5.09 | 5.09 | 4.42 | 3.97 | 3.34 | 3.39 | NA | 6.67 | 6.69 | 6.76 | NA | 6.73 | 0.00 | 13.40 | NA | 6.63 | NA | NA | NA | NA | NA | NA | NA | NA | NA | NA |
| 2023-12-31 | 2023-09-30 | 2023-06-30 | 2023-03-31 | 2022-12-31 | 2022-09-30 | 2022-06-30 | 2022-03-31 | 2021-12-31 | 2021-09-30 | 2021-06-30 | 2021-03-31 | 2020-12-31 | 2020-09-30 | 2020-06-30 | 2020-03-31 | 2019-12-31 | 2019-09-30 | 2019-06-30 | 2019-03-31 | 2018-12-31 | 2018-09-30 | 2018-06-30 | 2018-03-31 | 2017-12-31 | 2017-09-30 | 2017-06-30 | 2017-03-31 | 2016-12-31 | 2016-09-30 | 2016-06-30 | 2016-03-31 | 2015-12-31 | 2015-09-30 | 2015-06-30 | 2015-03-31 | 2014-12-31 | 2014-09-30 | 2014-06-30 | 2014-03-31 | 2013-12-31 | 2013-09-30 | 2013-06-30 | 2013-03-31 | 2012-12-31 | 2012-09-30 | 2012-06-30 | 2012-03-31 | 2011-12-31 | 2011-09-30 | 2011-06-30 | 2011-03-31 | ||
|---|---|---|---|---|---|---|---|---|---|---|---|---|---|---|---|---|---|---|---|---|---|---|---|---|---|---|---|---|---|---|---|---|---|---|---|---|---|---|---|---|---|---|---|---|---|---|---|---|---|---|---|---|---|
| Revenues | 336.04 | 366.96 | 406.78 | 442.24 | 412.93 | 418.81 | 388.51 | 304.89 | 284.86 | 267.30 | 317.30 | 234.42 | 227.28 | 176.47 | 172.54 | 269.60 | 339.06 | 361.81 | 394.85 | 378.75 | 357.38 | 423.17 | 427.43 | 369.31 | 360.57 | 345.02 | 290.46 | 244.80 | 182.37 | 137.75 | 116.99 | 122.51 | 136.11 | 155.41 | 147.51 | 203.96 | 249.59 | 241.26 | 205.80 | 180.09 | 149.47 | 144.37 | 50.83 | 122.31 | 118.85 | 115.89 | 47.29 | 102.59 | 83.63 | 73.45 | 74.08 | 64.43 | |
| Revenue From Contract With Customer Excluding Assessed Tax | 336.04 | 366.96 | 406.78 | 442.24 | 412.93 | 418.81 | 388.51 | 304.89 | 284.86 | 267.30 | 317.30 | 234.42 | 227.28 | 176.47 | 172.54 | 269.60 | 339.06 | 361.81 | 394.85 | 378.75 | 357.38 | 423.17 | 427.43 | 369.31 | 360.57 | 345.02 | 290.46 | 244.80 | 182.37 | 137.75 | 116.99 | 122.51 | 136.11 | 155.41 | 147.51 | 203.96 | 249.59 | 241.26 | 205.80 | 180.09 | 149.47 | 144.37 | 50.83 | 122.31 | 118.85 | 115.89 | 47.29 | 102.59 | 83.63 | 73.45 | 74.08 | 64.43 | |
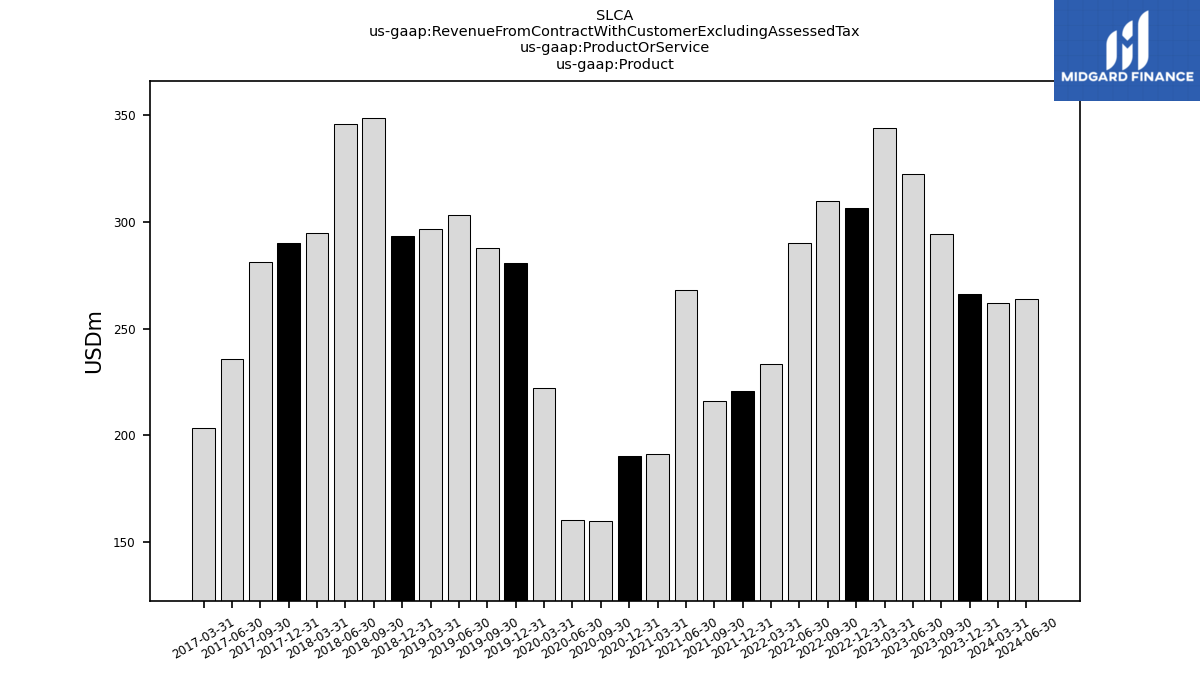
| Product | 266.15 | 294.26 | 322.51 | 344.01 | 306.38 | 309.83 | 290.32 | 233.23 | 220.59 | 216.13 | 268.09 | 191.39 | 190.19 | 159.64 | 160.20 | 222.16 | 280.59 | 287.98 | 303.04 | 296.86 | 293.42 | 348.63 | 345.96 | 294.79 | 290.11 | 281.14 | 235.89 | 203.25 | NA | NA | NA | NA | NA | NA | NA | NA | NA | NA | NA | NA | NA | NA | NA | NA | NA | NA | NA | NA | NA | NA | NA | NA | |
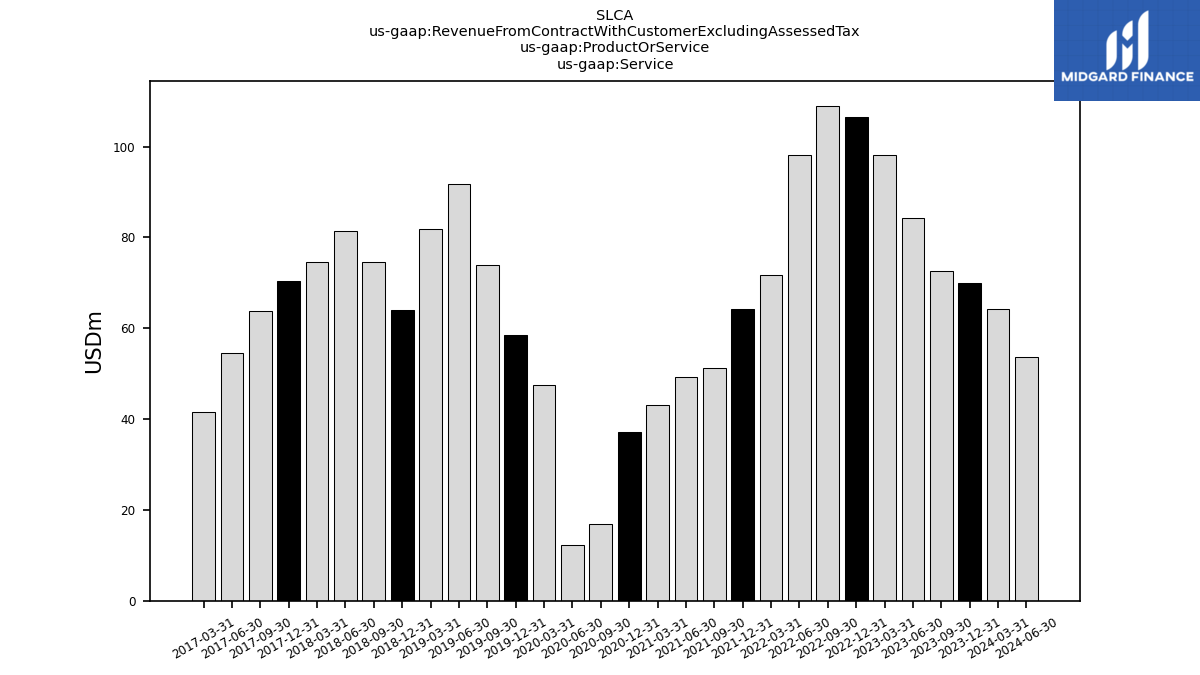
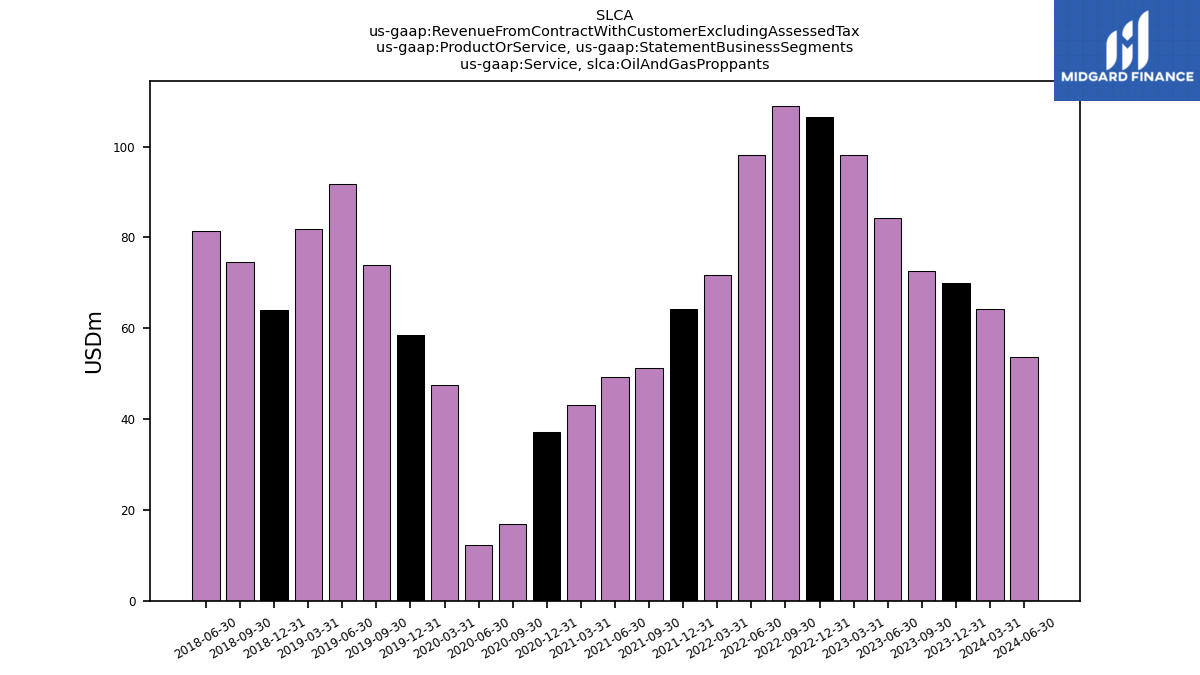
| Service | 69.88 | 72.70 | 84.27 | 98.23 | 106.55 | 108.98 | 98.19 | 71.65 | 64.27 | 51.16 | 49.21 | 43.03 | 37.09 | 16.84 | 12.34 | 47.44 | 58.47 | 73.84 | 91.81 | 81.89 | 63.96 | 74.54 | 81.48 | 74.53 | 70.45 | 63.88 | 54.57 | 41.55 | NA | NA | NA | NA | NA | NA | NA | NA | NA | NA | NA | NA | NA | NA | NA | NA | NA | NA | NA | NA | NA | NA | NA | NA | |
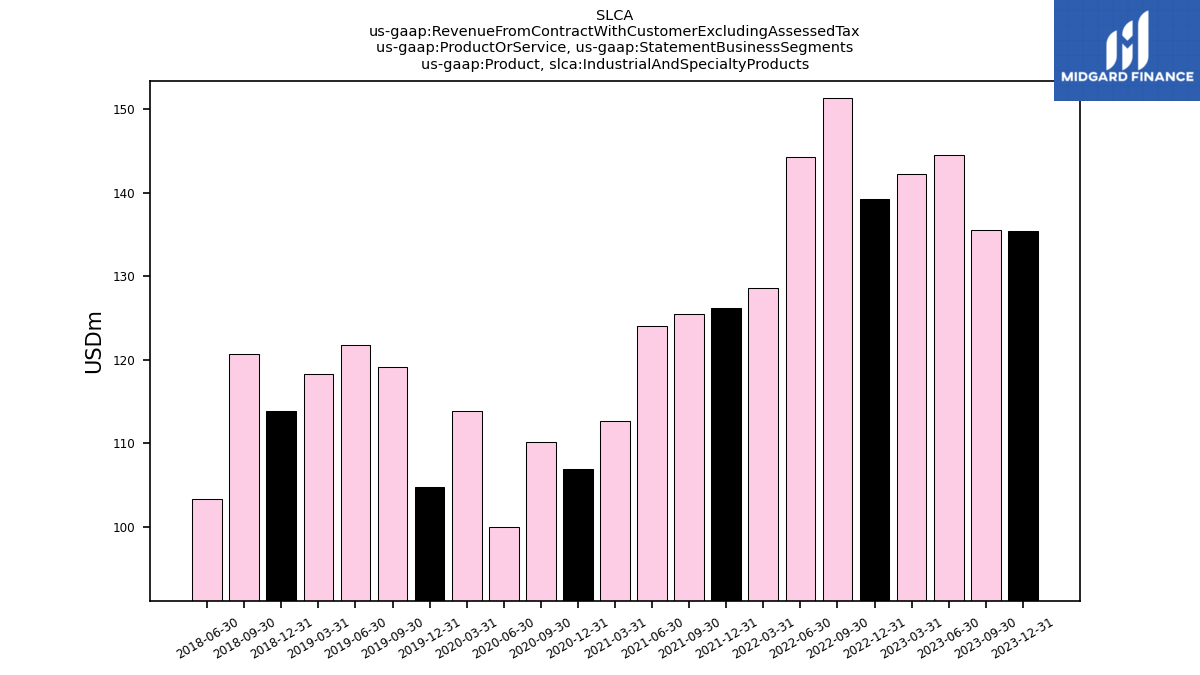
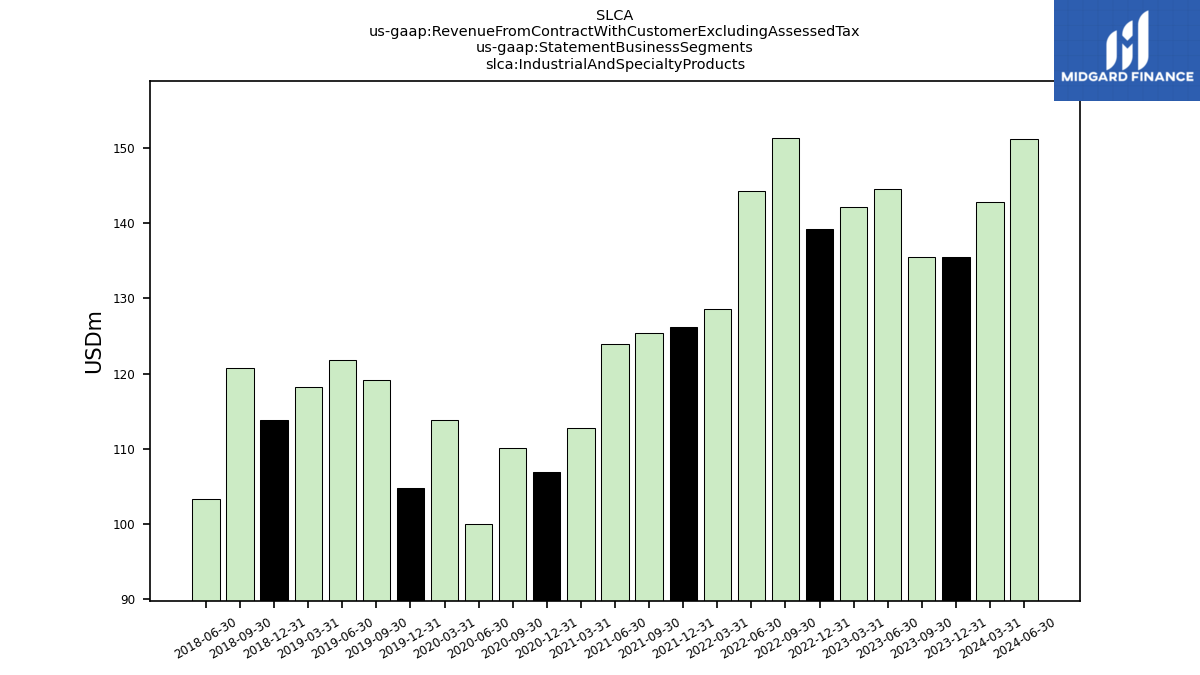
| Product, Industrial And Specialty Products | 135.49 | 135.53 | 144.50 | 142.23 | 139.22 | 151.35 | 144.27 | 128.64 | 126.26 | 125.45 | 124.00 | 112.72 | 106.93 | 110.13 | 100.04 | 113.88 | 104.79 | 119.11 | 121.79 | 118.27 | 113.83 | 120.72 | 103.37 | NA | NA | NA | NA | NA | NA | NA | NA | NA | NA | NA | NA | NA | NA | NA | NA | NA | NA | NA | NA | NA | NA | NA | NA | NA | NA | NA | NA | NA | |
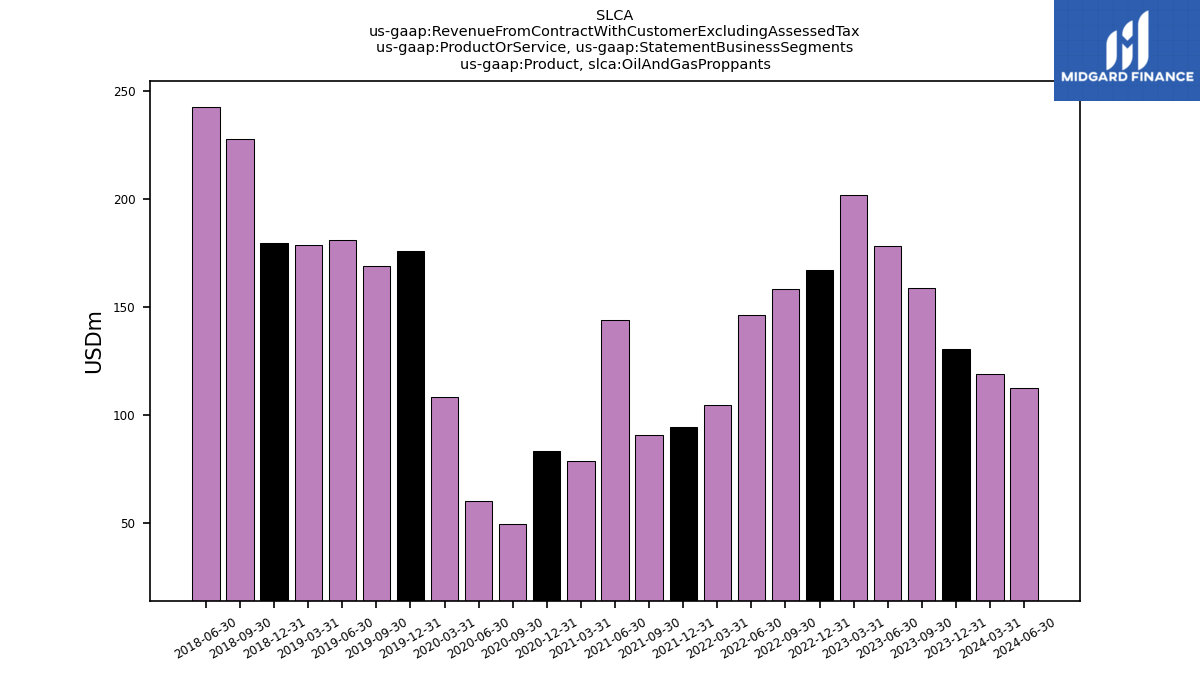
| Product, Oil And Gas Proppants | 130.67 | 158.72 | 178.01 | 201.79 | 167.16 | 158.48 | 146.06 | 104.59 | 94.33 | 90.68 | 144.08 | 78.67 | 83.26 | 49.51 | 60.16 | 108.28 | 175.81 | 168.87 | 181.25 | 178.59 | 179.59 | 227.91 | 242.59 | NA | NA | NA | NA | NA | NA | NA | NA | NA | NA | NA | NA | NA | NA | NA | NA | NA | NA | NA | NA | NA | NA | NA | NA | NA | NA | NA | NA | NA | |
| Service, Oil And Gas Proppants | 69.88 | 72.70 | 84.27 | 98.23 | 106.55 | 108.98 | 98.19 | 71.65 | 64.27 | 51.16 | 49.21 | 43.03 | 37.09 | 16.84 | 12.34 | 47.44 | 58.47 | 73.84 | 91.81 | 81.89 | 63.96 | 74.54 | 81.48 | NA | NA | NA | NA | NA | NA | NA | NA | NA | NA | NA | NA | NA | NA | NA | NA | NA | NA | NA | NA | NA | NA | NA | NA | NA | NA | NA | NA | NA | |
| Industrial And Specialty Products | 135.49 | 135.53 | 144.50 | 142.23 | 139.22 | 151.35 | 144.27 | 128.64 | 126.26 | 125.45 | 124.00 | 112.72 | 106.93 | 110.13 | 100.04 | 113.88 | 104.79 | 119.11 | 121.79 | 118.27 | 113.83 | 120.72 | 103.37 | NA | NA | NA | NA | NA | NA | NA | NA | NA | NA | NA | NA | NA | NA | NA | NA | NA | NA | NA | NA | NA | NA | NA | NA | NA | NA | NA | NA | NA | |
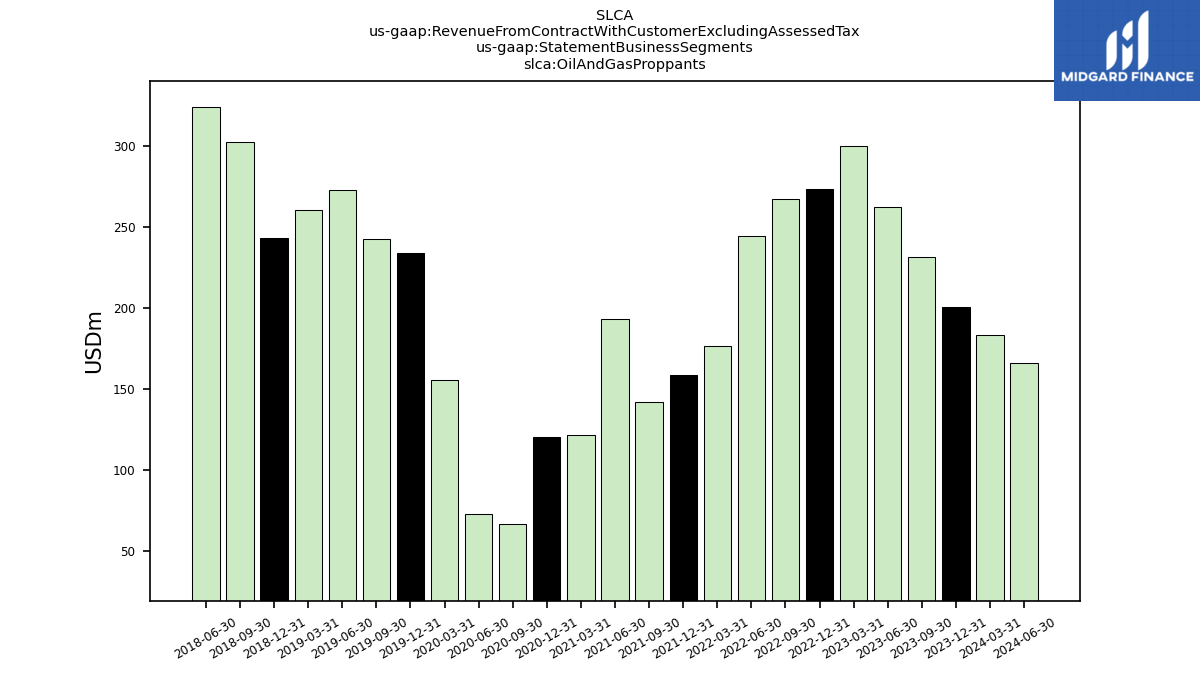
| Oil And Gas Proppants | 200.55 | 231.43 | 262.29 | 300.01 | 273.72 | 267.46 | 244.25 | 176.24 | 158.61 | 141.85 | 193.30 | 121.70 | 120.34 | 66.34 | 72.50 | 155.72 | 234.27 | 242.71 | 273.06 | 260.48 | 243.55 | 302.45 | 324.06 | NA | NA | NA | NA | NA | NA | NA | NA | NA | NA | NA | NA | NA | NA | NA | NA | NA | NA | NA | NA | NA | NA | NA | NA | NA | NA | NA | NA | NA | |
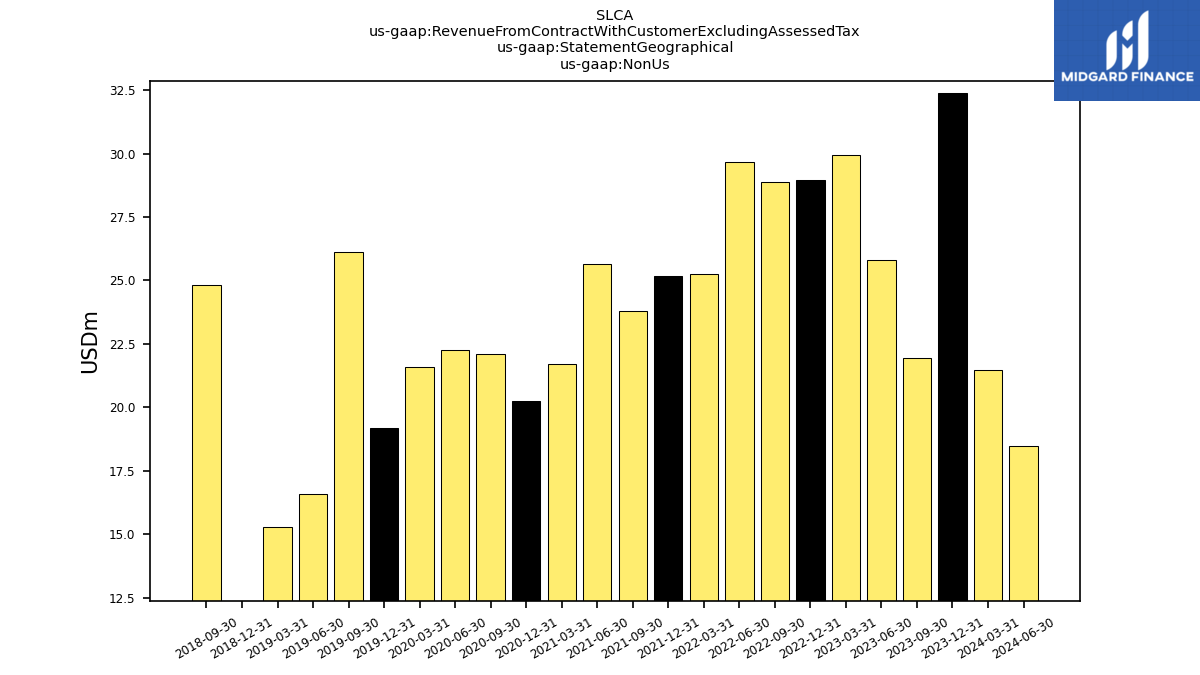
| Non Us | 32.40 | 21.96 | 25.82 | 29.93 | 28.95 | 28.89 | 29.66 | 25.25 | 25.18 | 23.78 | 25.66 | 21.70 | 20.23 | 22.08 | 22.26 | 21.61 | 19.20 | 26.10 | 16.60 | 15.30 | -1.20 | 24.80 | NA | NA | NA | NA | NA | NA | NA | NA | NA | NA | NA | NA | NA | NA | NA | NA | NA | NA | NA | NA | NA | NA | NA | NA | NA | NA | NA | NA | NA | NA |