
| 2023-12-31 | 2023-09-30 | 2023-06-30 | 2023-03-31 | 2022-12-31 | 2022-09-30 | 2022-06-30 | 2022-03-31 | 2021-12-31 | 2021-09-30 | 2021-06-30 | 2021-03-31 | 2020-12-31 | 2020-09-30 | 2020-06-30 | 2020-03-31 | 2019-12-31 | 2019-09-30 | 2019-06-30 | 2019-03-31 | 2018-12-31 | 2018-09-30 | 2018-06-30 | 2018-03-31 | 2017-12-31 | 2017-09-30 | 2017-06-30 | 2017-03-31 | 2016-12-31 | 2016-09-30 | 2016-06-30 | 2016-03-31 | 2015-12-31 | 2015-09-30 | 2015-06-30 | 2015-03-31 | 2014-12-31 | 2014-09-30 | 2014-06-30 | 2014-03-31 | 2013-12-31 | 2013-09-30 | 2013-06-30 | 2013-03-31 | 2012-12-31 | 2012-09-30 | 2012-06-30 | 2012-03-31 | 2011-12-31 | 2011-09-30 | 2011-06-30 | 2011-03-31 | 2010-12-31 | 2009-12-31 | ||
|---|---|---|---|---|---|---|---|---|---|---|---|---|---|---|---|---|---|---|---|---|---|---|---|---|---|---|---|---|---|---|---|---|---|---|---|---|---|---|---|---|---|---|---|---|---|---|---|---|---|---|---|---|---|---|---|
| Common Stock Value | 87.65 | 87.64 | 87.60 | 87.53 | 87.03 | 87.02 | 87.02 | 86.92 | 86.40 | 86.40 | 86.30 | 86.21 | 91.35 | 91.32 | 91.32 | 91.29 | 90.72 | 90.71 | 90.70 | 90.67 | 89.97 | 89.96 | 89.88 | 89.81 | 88.69 | 88.46 | 88.37 | 88.08 | 87.33 | 86.88 | 86.77 | 86.68 | 86.14 | 86.08 | 86.00 | 85.59 | 84.96 | 84.78 | 84.66 | 110.00 | 109.00 | 109.00 | 109.00 | 108.00 | 107.00 | 107.00 | 107.00 | 106.00 | 106.00 | 106.00 | 105.72 | 105.50 | 119.05 | 110.44 | |
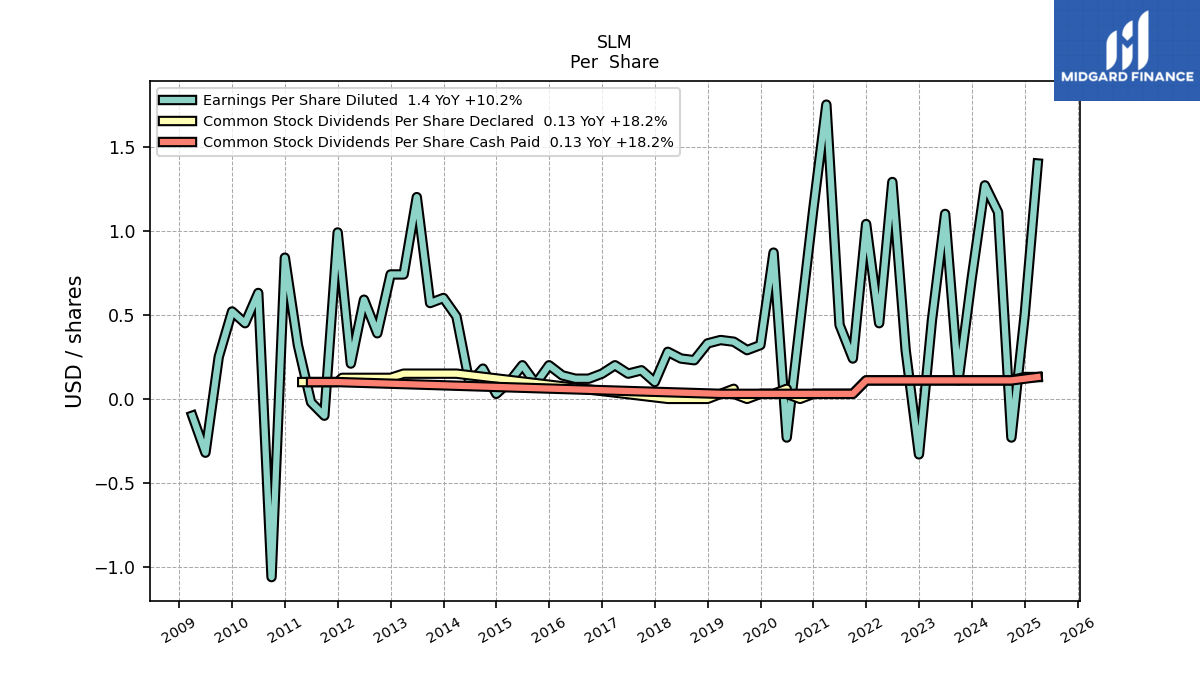
| Earnings Per Share Basic | 0.73 | 0.11 | 1.11 | 0.47 | -0.33 | 0.29 | 1.30 | 0.46 | 1.06 | 0.24 | 0.45 | 1.77 | 1.15 | 0.45 | -0.23 | 0.88 | 0.33 | 0.29 | 0.34 | 0.35 | 0.33 | 0.23 | 0.24 | 0.28 | 0.10 | 0.17 | 0.15 | 0.21 | 0.15 | 0.12 | 0.12 | 0.14 | 0.20 | 0.10 | 0.20 | 0.10 | 0.04 | 0.18 | 0.10 | 0.50 | 0.61 | 0.58 | 1.22 | 0.76 | 0.75 | 0.39 | 0.59 | 0.21 | 1.00 | -0.10 | -0.02 | 0.32 | 0.88 | 0.54 | |
| Earnings Per Share Diluted | 0.72 | 0.11 | 1.10 | 0.47 | -0.33 | 0.29 | 1.29 | 0.45 | 1.04 | 0.24 | 0.44 | 1.75 | 1.13 | 0.45 | -0.23 | 0.87 | 0.32 | 0.29 | 0.34 | 0.35 | 0.33 | 0.23 | 0.24 | 0.28 | 0.10 | 0.17 | 0.15 | 0.20 | 0.15 | 0.12 | 0.12 | 0.14 | 0.20 | 0.09 | 0.20 | 0.10 | 0.03 | 0.18 | 0.09 | 0.49 | 0.60 | 0.57 | 1.20 | 0.74 | 0.74 | 0.39 | 0.59 | 0.21 | 0.99 | -0.10 | -0.02 | 0.32 | 0.84 | 0.52 | |
| Tier One Risk Based Capital To Risk Weighted Assets | 0.00 | 0.00 | 0.00 | 0.00 | 0.00 | 0.00 | 0.00 | 0.00 | 0.00 | 0.00 | 0.00 | 0.00 | 0.00 | 0.00 | 0.00 | 0.00 | 0.00 | 0.00 | 0.00 | 0.00 | 0.00 | 0.00 | 0.00 | 0.00 | 0.00 | 0.00 | 0.00 | 0.00 | 0.00 | 0.00 | 0.00 | 0.00 | 0.00 | 0.00 | 0.00 | 0.00 | 0.00 | 0.00 | 0.00 | NA | 0.00 | NA | NA | NA | NA | NA | NA | NA | NA | NA | NA | NA | NA | NA | |
| Capital To Risk Weighted Assets | 0.00 | 0.00 | 0.00 | 0.00 | 0.00 | 0.00 | 0.00 | 0.00 | 0.00 | 0.00 | 0.00 | 0.00 | 0.00 | 0.00 | 0.00 | 0.00 | 0.00 | 0.00 | 0.00 | 0.00 | 0.00 | 0.00 | 0.00 | 0.00 | 0.00 | 0.00 | 0.00 | 0.00 | 0.00 | 0.00 | 0.00 | 0.00 | 0.00 | 0.00 | 0.00 | 0.00 | 0.00 | 0.00 | 0.00 | NA | 0.00 | NA | NA | NA | NA | NA | NA | NA | NA | NA | NA | NA | NA | NA |
| 2023-12-31 | 2023-09-30 | 2023-06-30 | 2023-03-31 | 2022-12-31 | 2022-09-30 | 2022-06-30 | 2022-03-31 | 2021-12-31 | 2021-09-30 | 2021-06-30 | 2021-03-31 | 2020-12-31 | 2020-09-30 | 2020-06-30 | 2020-03-31 | 2019-12-31 | 2019-09-30 | 2019-06-30 | 2019-03-31 | 2018-12-31 | 2018-09-30 | 2018-06-30 | 2018-03-31 | 2017-12-31 | 2017-09-30 | 2017-06-30 | 2017-03-31 | 2016-12-31 | 2016-09-30 | 2016-06-30 | 2016-03-31 | 2015-12-31 | 2015-09-30 | 2015-06-30 | 2015-03-31 | 2014-12-31 | 2014-09-30 | 2014-06-30 | 2014-03-31 | 2013-12-31 | 2013-09-30 | 2013-06-30 | 2013-03-31 | 2012-12-31 | 2012-09-30 | 2012-06-30 | 2012-03-31 | 2011-12-31 | 2011-09-30 | 2011-06-30 | 2011-03-31 | 2010-12-31 | 2009-12-31 | ||
|---|---|---|---|---|---|---|---|---|---|---|---|---|---|---|---|---|---|---|---|---|---|---|---|---|---|---|---|---|---|---|---|---|---|---|---|---|---|---|---|---|---|---|---|---|---|---|---|---|---|---|---|---|---|---|---|
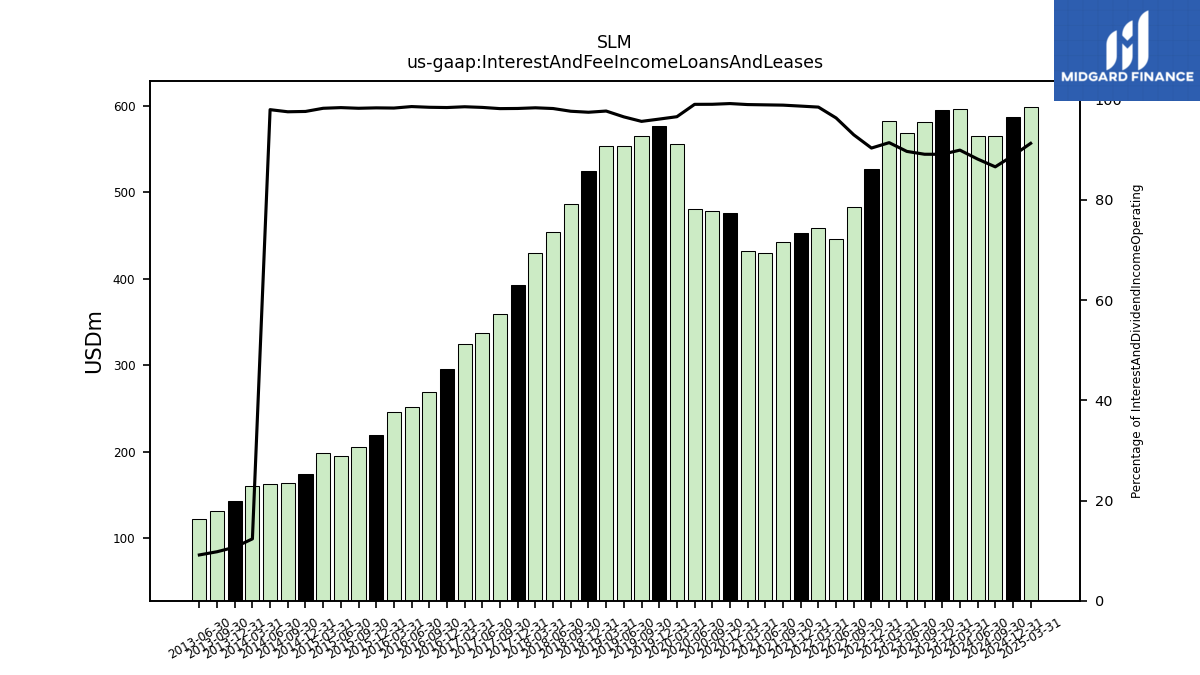
| Interest And Fee Income Loans And Leases | 595.54 | 581.08 | 568.34 | 582.78 | 527.14 | 483.33 | 446.04 | 458.04 | 452.47 | 442.58 | 430.10 | 431.80 | 475.73 | 477.83 | 480.17 | 555.28 | 577.09 | 564.70 | 553.90 | 553.48 | 524.60 | 486.00 | 454.05 | 430.05 | 392.40 | 359.61 | 336.74 | 324.76 | 295.24 | 268.34 | 251.68 | 245.23 | 218.70 | 205.27 | 195.29 | 197.86 | 174.41 | 164.11 | 162.24 | 160.03 | 142.45 | 131.03 | 122.21 | NA | NA | NA | NA | NA | NA | NA | NA | NA | NA | NA | |
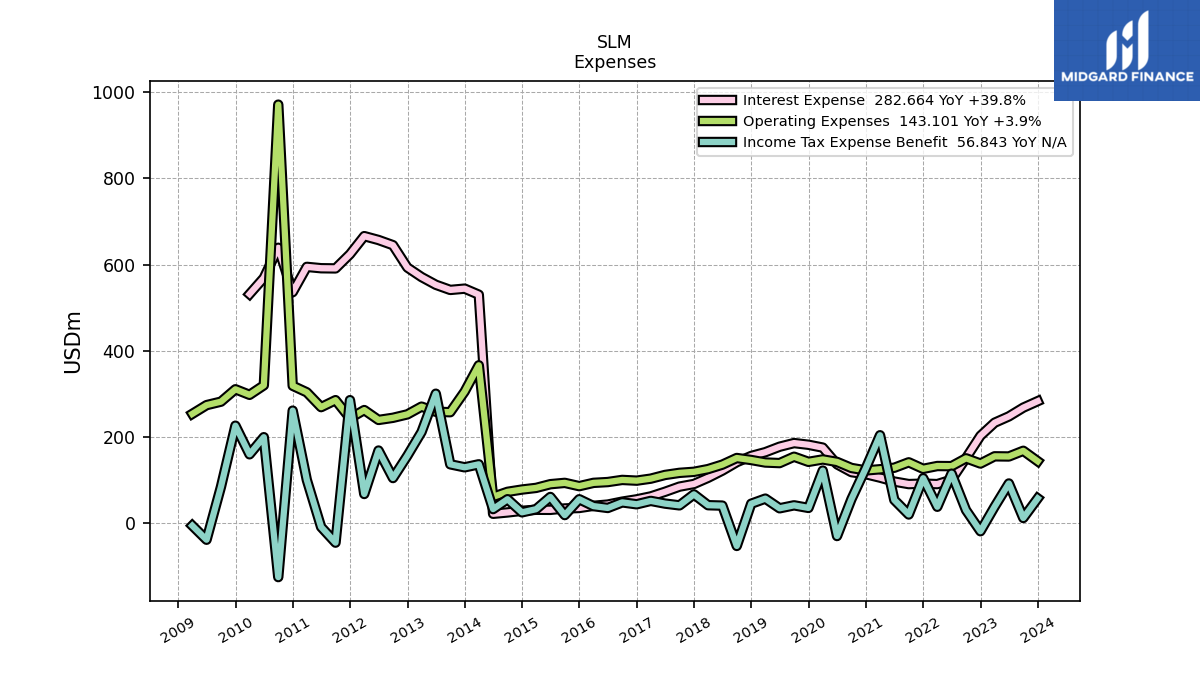
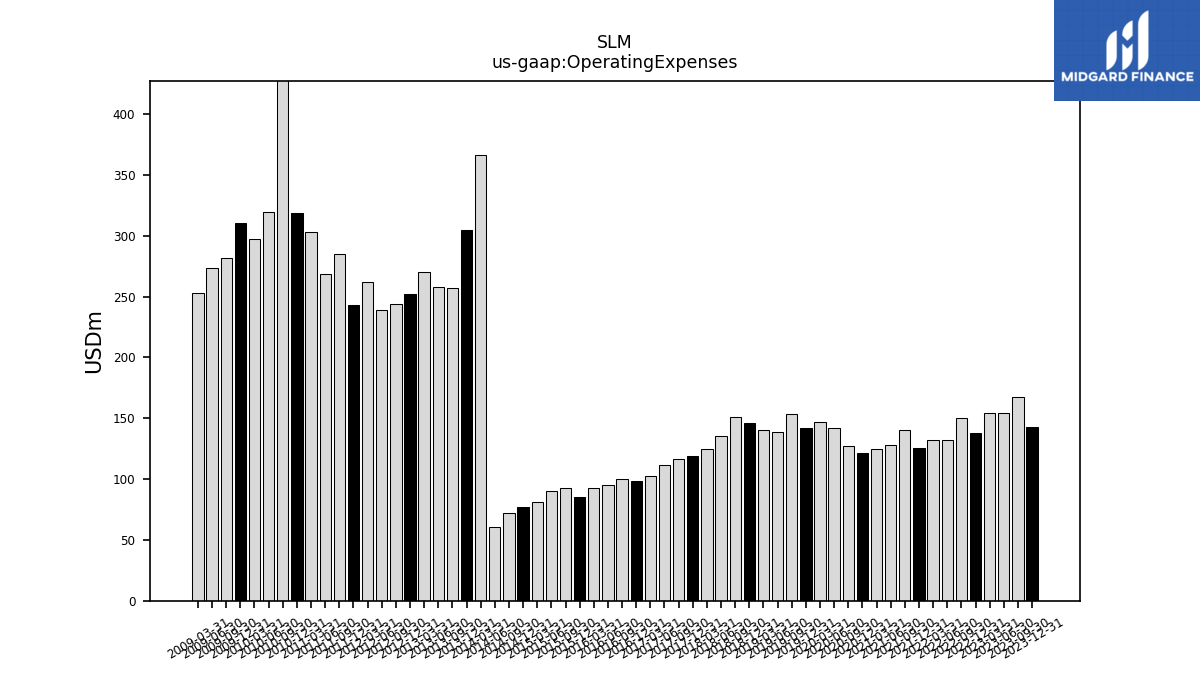
| Operating Expenses | 143.10 | 167.40 | 154.16 | 154.54 | 137.76 | 149.96 | 131.73 | 132.01 | 125.50 | 140.65 | 128.01 | 124.50 | 121.74 | 127.49 | 141.56 | 147.30 | 141.68 | 153.62 | 138.81 | 140.15 | 145.97 | 150.63 | 135.22 | 124.87 | 118.55 | 116.14 | 111.25 | 102.68 | 98.04 | 99.71 | 94.78 | 92.89 | 85.25 | 92.86 | 89.80 | 81.19 | 77.36 | 72.08 | 60.48 | 366.00 | 305.00 | 257.00 | 258.00 | 270.00 | 252.00 | 244.00 | 239.00 | 262.00 | 243.00 | 285.00 | 268.72 | 303.20 | 318.39 | 310.30 | |
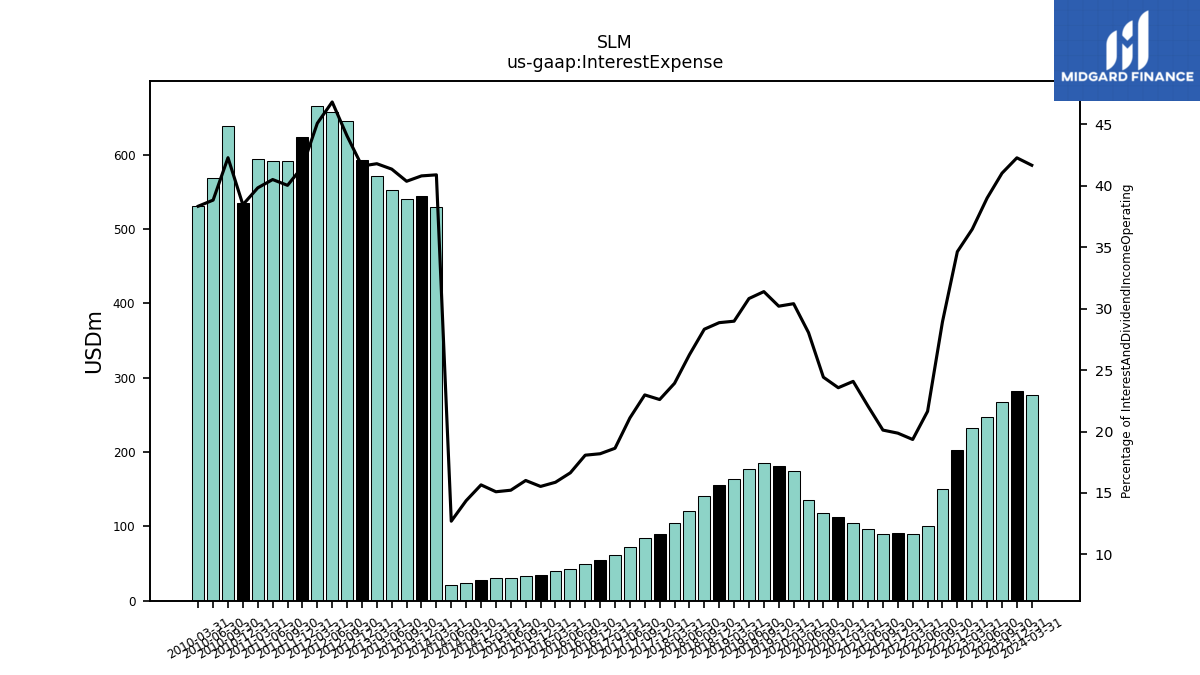
| Interest Expense | 282.66 | 267.62 | 247.27 | 232.53 | 202.17 | 150.40 | 100.22 | 90.01 | 91.09 | 90.04 | 95.91 | 105.04 | 113.02 | 117.81 | 136.02 | 174.82 | 181.37 | 185.33 | 176.85 | 164.17 | 155.35 | 140.96 | 121.36 | 104.62 | 90.31 | 84.16 | 72.20 | 61.41 | 54.58 | 49.26 | 42.48 | 39.59 | 34.54 | 33.46 | 30.22 | 30.40 | 27.97 | 24.18 | 21.03 | 530.00 | 544.00 | 541.00 | 553.00 | 571.00 | 593.00 | 645.00 | 657.00 | 666.00 | 624.00 | 591.00 | 591.43 | 594.60 | 535.77 | NA | |
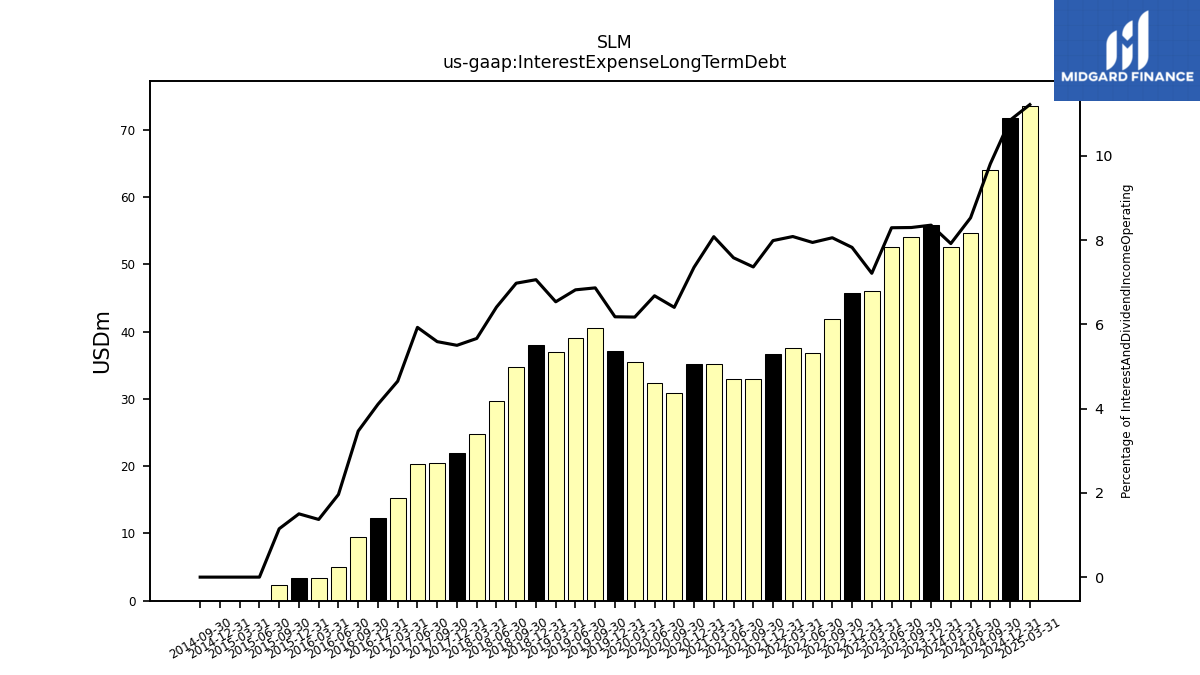
| Interest Expense Long Term Debt | 55.85 | 54.12 | 52.57 | 45.98 | 45.67 | 41.88 | 36.78 | 37.59 | 36.62 | 32.95 | 32.95 | 35.24 | 35.26 | 30.89 | 32.38 | 35.49 | 37.10 | 40.53 | 39.12 | 37.02 | 37.99 | 34.72 | 29.63 | 24.77 | 21.98 | 20.47 | 20.28 | 15.32 | 12.31 | 9.45 | 5.01 | 3.42 | 3.34 | 2.40 | 0.00 | 0.00 | 0.00 | 0.00 | NA | NA | NA | NA | NA | NA | NA | NA | NA | NA | NA | NA | NA | NA | NA | NA | |
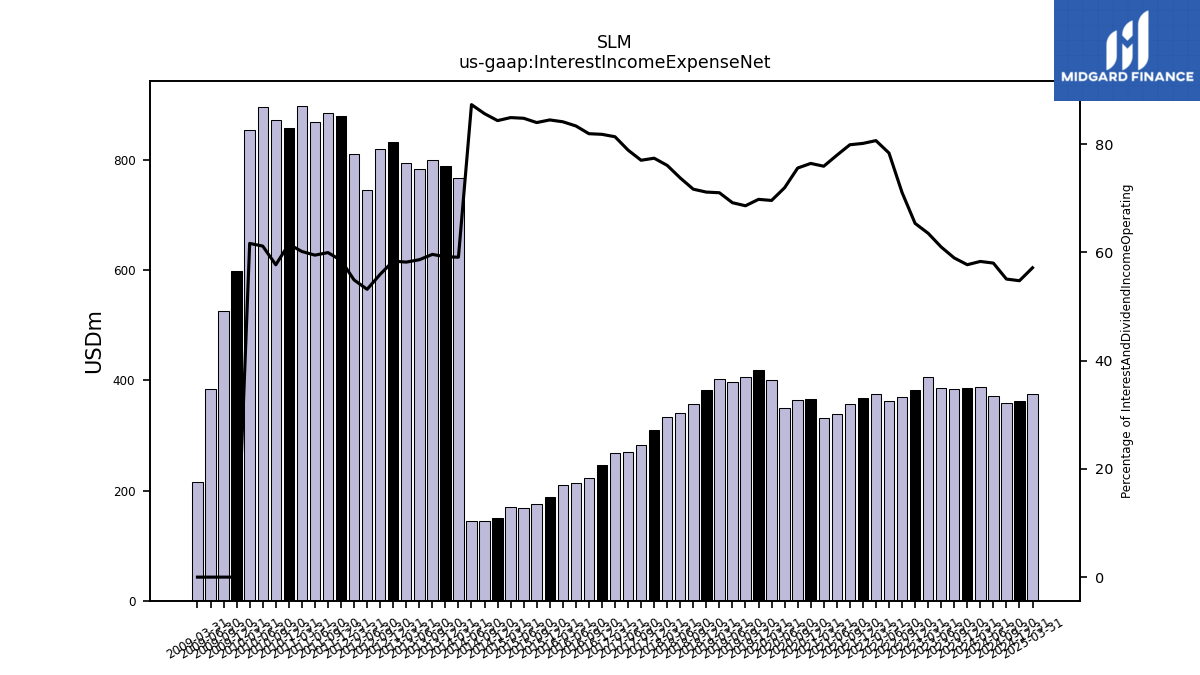
| Interest Income Expense Net | 385.89 | 384.63 | 386.63 | 405.07 | 381.43 | 369.51 | 362.81 | 375.03 | 367.35 | 357.52 | 338.78 | 331.11 | 366.54 | 364.57 | 348.77 | 400.12 | 419.10 | 405.06 | 396.87 | 402.28 | 382.87 | 356.63 | 340.95 | 332.61 | 309.19 | 282.06 | 269.89 | 268.08 | 245.43 | 223.28 | 212.77 | 209.86 | 187.85 | 175.44 | 168.26 | 170.95 | 150.68 | 144.03 | 144.54 | 766.00 | 789.00 | 799.00 | 784.00 | 795.00 | 832.00 | 819.00 | 746.00 | 811.00 | 879.00 | 885.00 | 868.41 | 897.97 | 856.81 | 598.79 | |
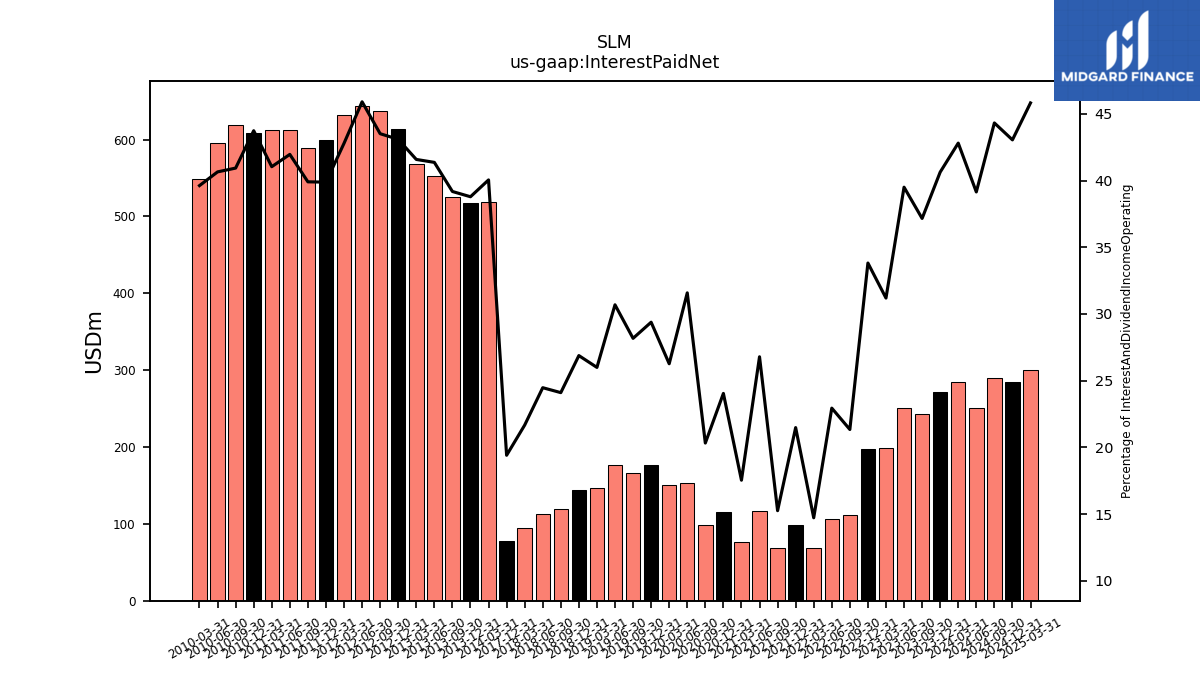
| Interest Paid Net | 271.63 | 242.36 | 250.39 | 198.87 | 197.35 | 110.94 | 106.22 | 68.46 | 98.48 | 68.27 | 116.45 | 76.49 | 115.29 | 98.03 | 153.10 | 151.02 | 176.42 | 166.32 | 176.04 | 147.24 | 144.66 | 119.93 | 113.14 | 94.74 | 77.53 | NA | NA | NA | NA | NA | NA | NA | NA | NA | NA | NA | NA | NA | NA | 519.00 | 517.00 | 525.00 | 553.00 | 568.00 | 614.00 | 637.00 | 644.00 | 632.00 | 599.00 | 588.96 | 612.52 | 612.52 | 609.18 | NA | |
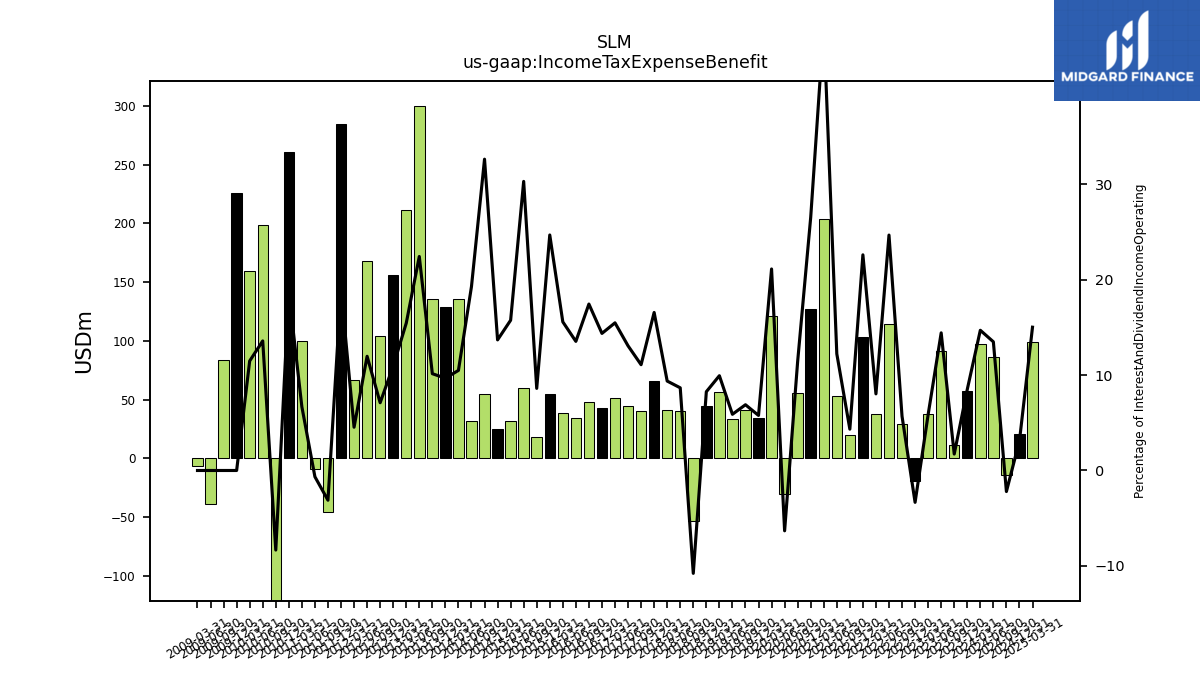
| Income Tax Expense Benefit | 56.84 | 11.24 | 91.48 | 37.34 | -19.49 | 29.55 | 114.30 | 37.36 | 103.66 | 19.39 | 53.17 | 203.53 | 127.31 | 55.19 | -30.66 | 121.48 | 34.67 | 40.70 | 33.80 | 56.30 | 44.45 | -53.67 | 40.07 | 41.00 | 66.19 | 40.62 | 44.71 | 51.01 | 43.12 | 47.56 | 34.55 | 38.88 | 54.91 | 17.98 | 60.16 | 31.72 | 24.46 | 54.90 | 31.94 | 136.00 | 129.00 | 136.00 | 300.00 | 211.00 | 156.00 | 104.00 | 168.00 | 67.00 | 285.00 | -46.00 | -9.59 | 99.71 | 260.69 | 225.72 | |
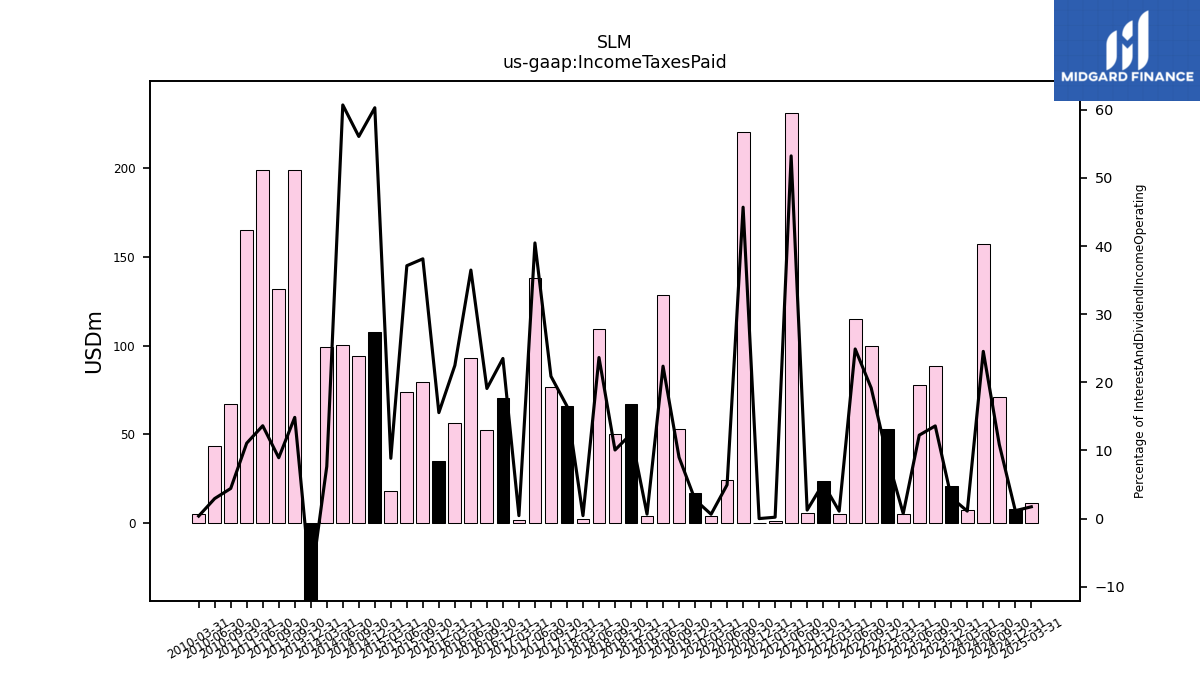
| Income Taxes Paid | 20.67 | 88.72 | 77.61 | 4.70 | 52.97 | 99.64 | 115.26 | 5.07 | 23.59 | 5.60 | 231.40 | 0.89 | 0.00 | 220.46 | 24.03 | 3.63 | 16.65 | 53.10 | 128.34 | 3.70 | 66.83 | 50.08 | 109.28 | 1.89 | 65.96 | 76.49 | 138.40 | 1.43 | 70.50 | 52.05 | 93.10 | 56.08 | 34.58 | 79.64 | 73.66 | 17.81 | 107.72 | 94.33 | 100.52 | 99.27 | -128.17 | 199.05 | NA | NA | NA | NA | NA | NA | NA | 131.83 | 198.93 | 165.24 | NA | NA | |
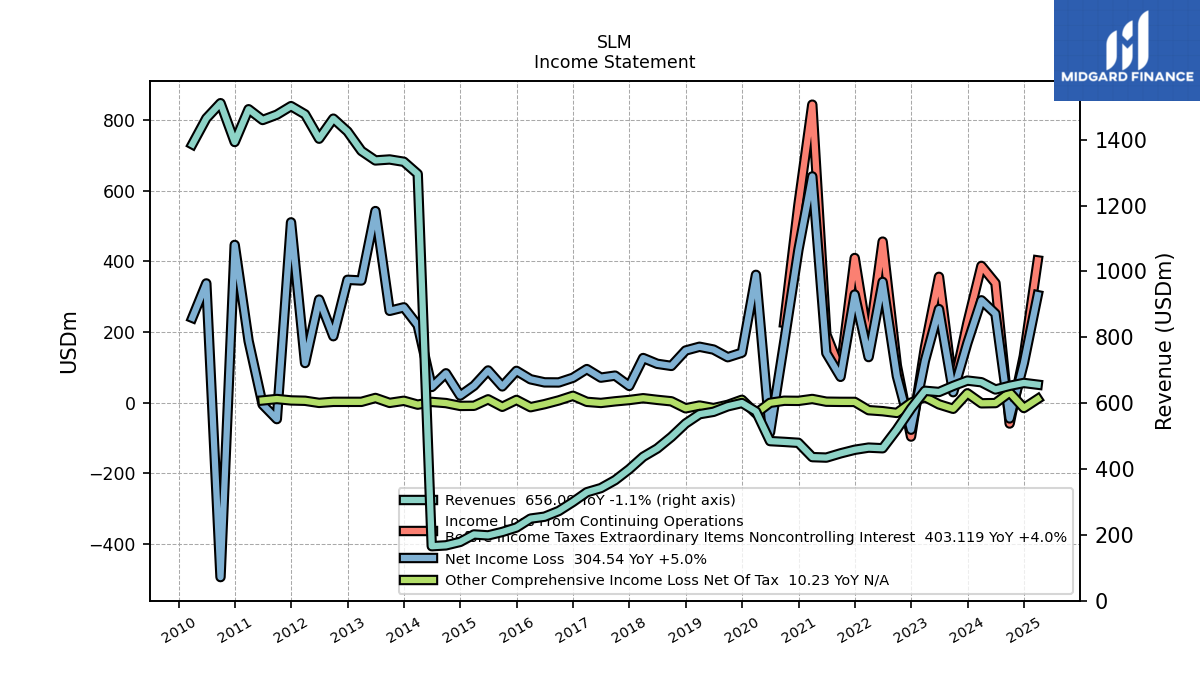
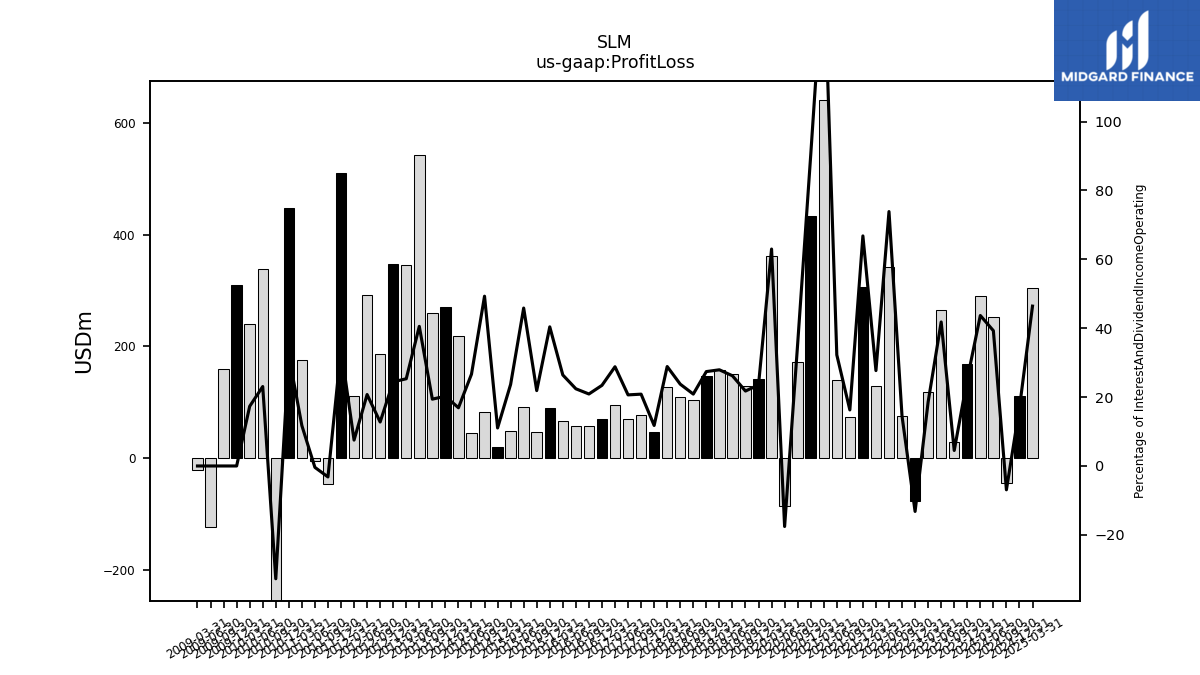
| Profit Loss | 168.44 | 29.36 | 265.06 | 118.52 | -77.04 | 75.17 | 342.07 | 128.81 | 306.26 | 72.84 | 140.20 | 641.21 | 432.70 | 171.03 | -85.21 | 362.17 | 141.35 | 128.46 | 150.28 | 158.19 | 147.51 | 103.88 | 109.83 | 126.25 | 47.00 | 76.37 | 70.62 | 94.94 | 70.24 | 56.97 | 57.20 | 65.92 | 89.84 | 45.72 | 91.02 | 47.70 | 19.72 | 82.93 | 44.13 | 219.00 | 270.00 | 260.00 | 542.00 | 346.00 | 348.00 | 187.00 | 291.00 | 111.00 | 511.00 | -47.00 | -6.00 | 175.00 | 447.37 | 309.13 | |
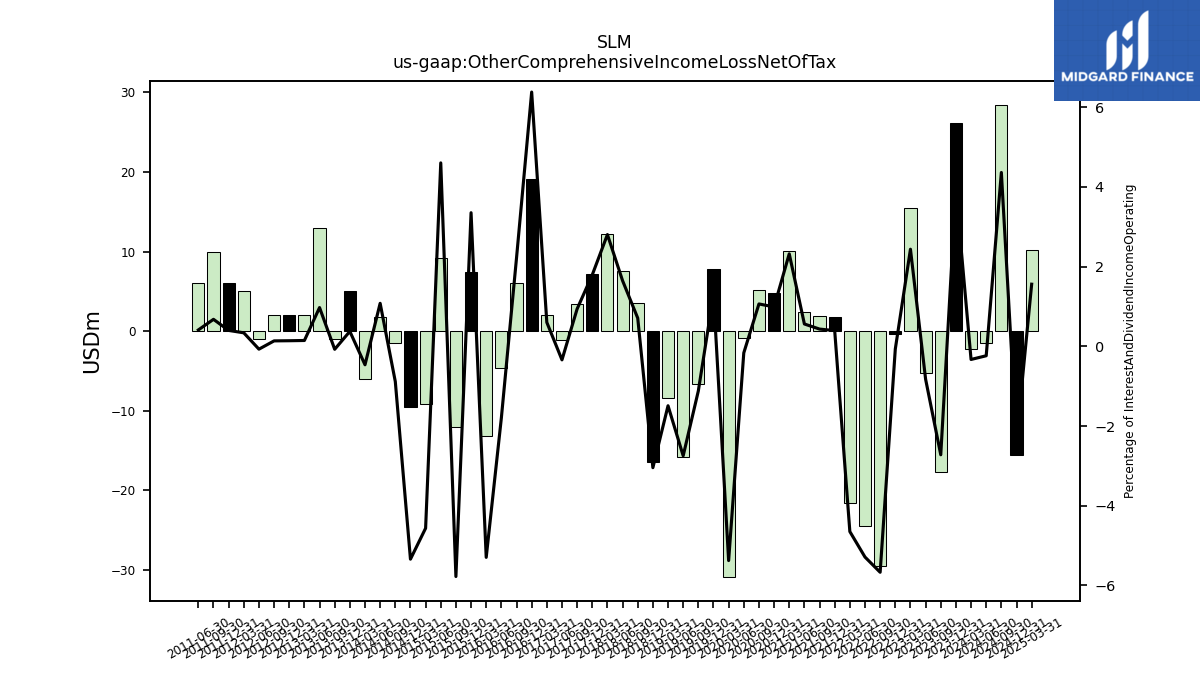
| Other Comprehensive Income Loss Net Of Tax | 26.21 | -17.75 | -5.23 | 15.54 | -0.39 | -29.48 | -24.48 | -21.62 | 1.81 | 1.94 | 2.44 | 10.12 | 4.74 | 5.13 | -0.80 | -30.91 | 7.82 | -6.60 | -15.76 | -8.45 | -16.39 | 3.53 | 7.62 | 12.26 | 7.17 | 3.44 | -1.16 | 1.98 | 19.14 | 6.04 | -4.58 | -13.21 | 7.46 | -12.07 | 9.14 | -9.19 | -9.54 | -1.49 | 1.79 | -6.00 | 5.00 | -1.00 | 13.00 | 2.00 | 2.00 | 2.00 | -1.00 | 5.00 | 6.00 | 10.00 | 6.00 | NA | NA | NA | |
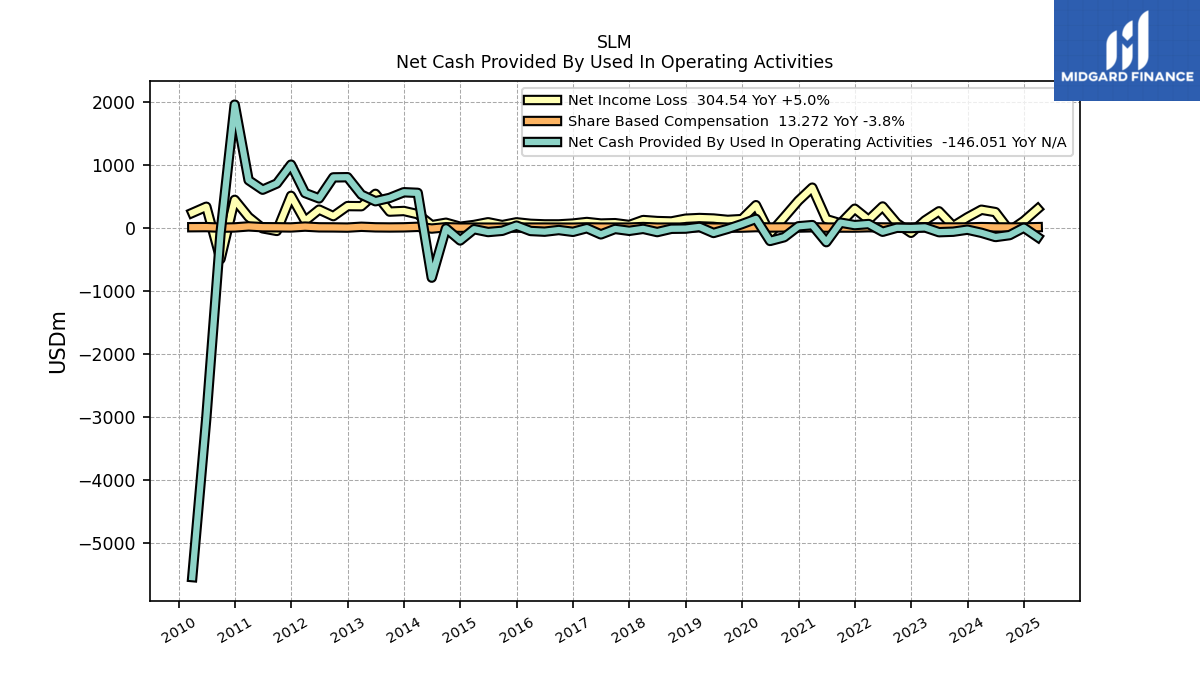
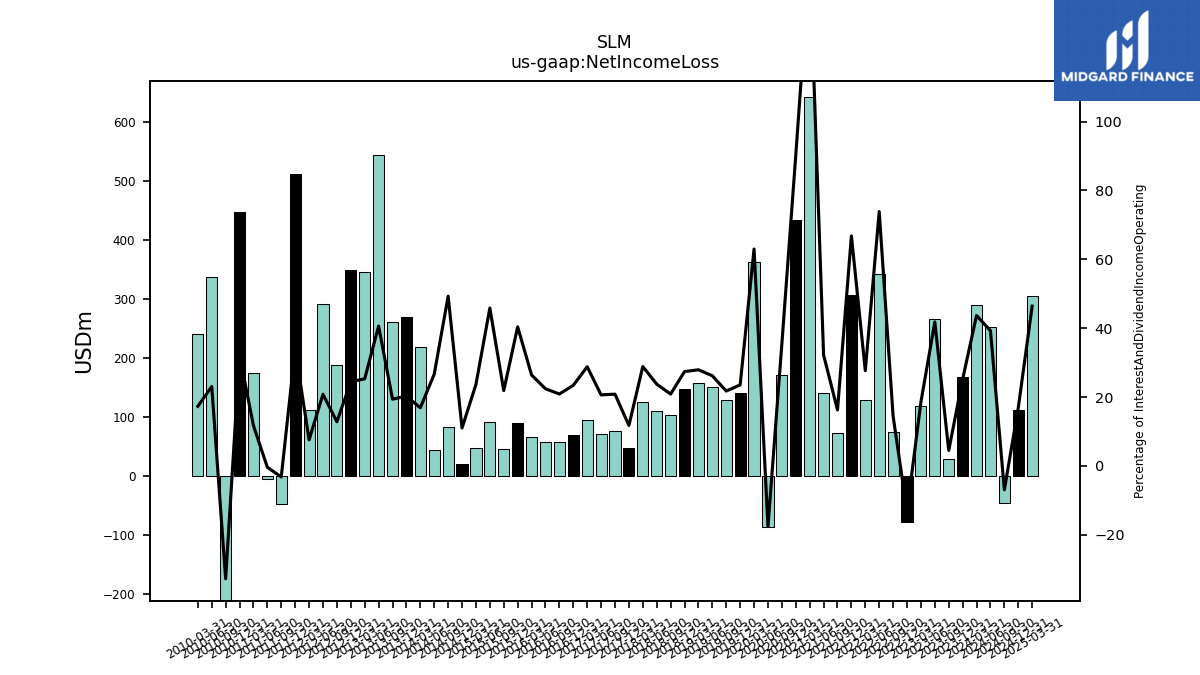
| Net Income Loss | 168.44 | 29.36 | 265.06 | 118.52 | -77.04 | 75.17 | 342.07 | 128.81 | 306.26 | 72.84 | 140.20 | 641.21 | 432.70 | 171.03 | -85.21 | 362.17 | 141.35 | 128.46 | 150.28 | 158.19 | 147.51 | 103.88 | 109.83 | 126.25 | 47.00 | 76.37 | 70.62 | 94.94 | 70.24 | 56.97 | 57.20 | 65.92 | 89.84 | 45.72 | 91.02 | 47.70 | 19.72 | 82.93 | 44.13 | 219.00 | 270.00 | 260.00 | 543.00 | 346.00 | 348.00 | 188.00 | 292.00 | 112.00 | 511.00 | -47.00 | -5.65 | 174.69 | 447.00 | NA | |
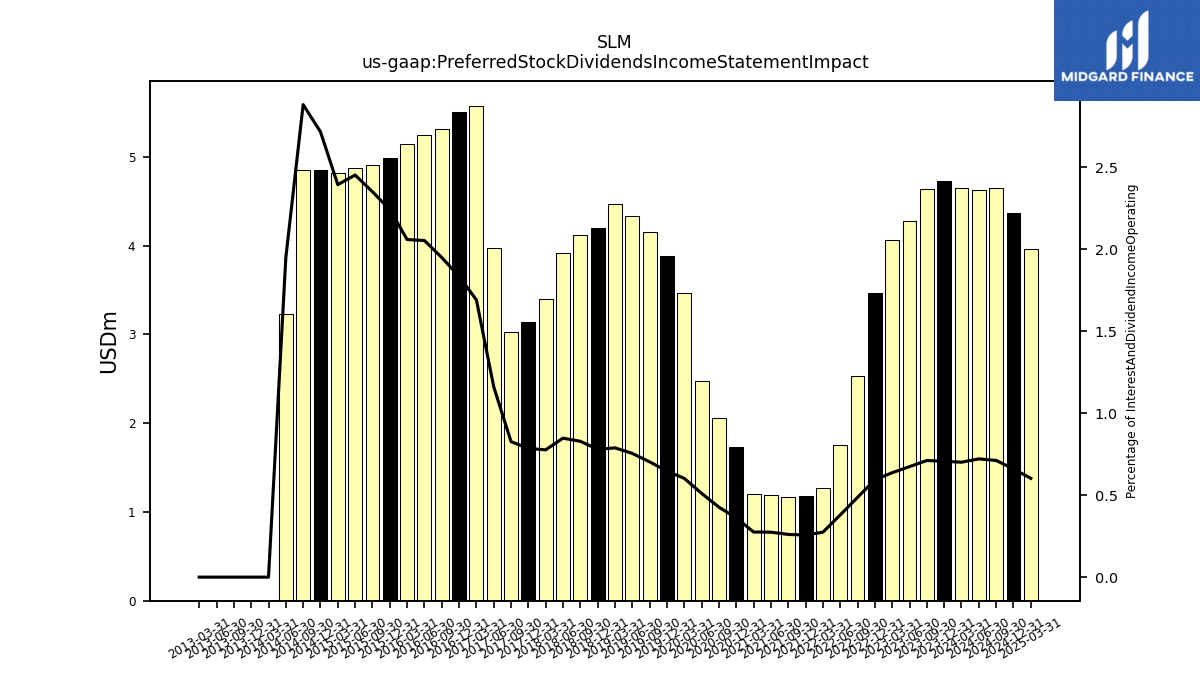
| Preferred Stock Dividends Income Statement Impact | 4.73 | 4.64 | 4.27 | 4.06 | 3.47 | 2.53 | 1.76 | 1.27 | 1.18 | 1.17 | 1.19 | 1.20 | 1.73 | 2.06 | 2.48 | 3.46 | 3.88 | 4.15 | 4.33 | 4.47 | 4.20 | 4.12 | 3.92 | 3.40 | 3.14 | 3.03 | 3.97 | 5.58 | 5.51 | 5.32 | 5.24 | 5.14 | 4.99 | 4.91 | 4.87 | 4.82 | 4.86 | 4.85 | 3.23 | 0.00 | 0.00 | 0.00 | 0.00 | 0.00 | NA | NA | NA | NA | NA | NA | NA | NA | NA | NA | |
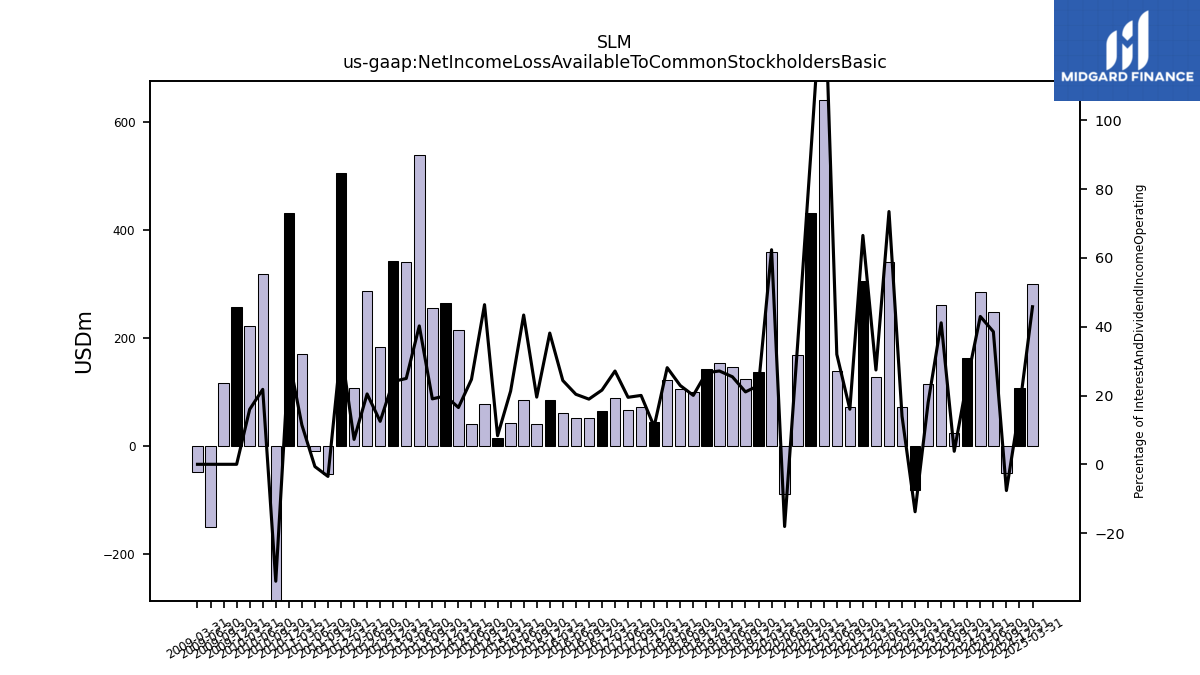
| Net Income Loss Available To Common Stockholders Basic | 163.72 | 24.72 | 260.79 | 114.45 | -80.51 | 72.64 | 340.32 | 127.54 | 305.09 | 71.67 | 139.01 | 640.01 | 430.97 | 168.97 | -87.69 | 358.71 | 137.47 | 124.31 | 145.95 | 153.72 | 143.31 | 99.75 | 105.91 | 122.86 | 43.87 | 73.34 | 66.64 | 89.37 | 64.74 | 51.65 | 51.96 | 60.78 | 84.86 | 40.81 | 86.15 | 42.88 | 14.86 | 78.08 | 40.90 | 214.00 | 265.00 | 255.00 | 538.00 | 341.00 | 343.00 | 183.00 | 287.00 | 107.00 | 506.00 | -52.00 | -9.70 | 170.82 | 431.40 | 258.12 | |
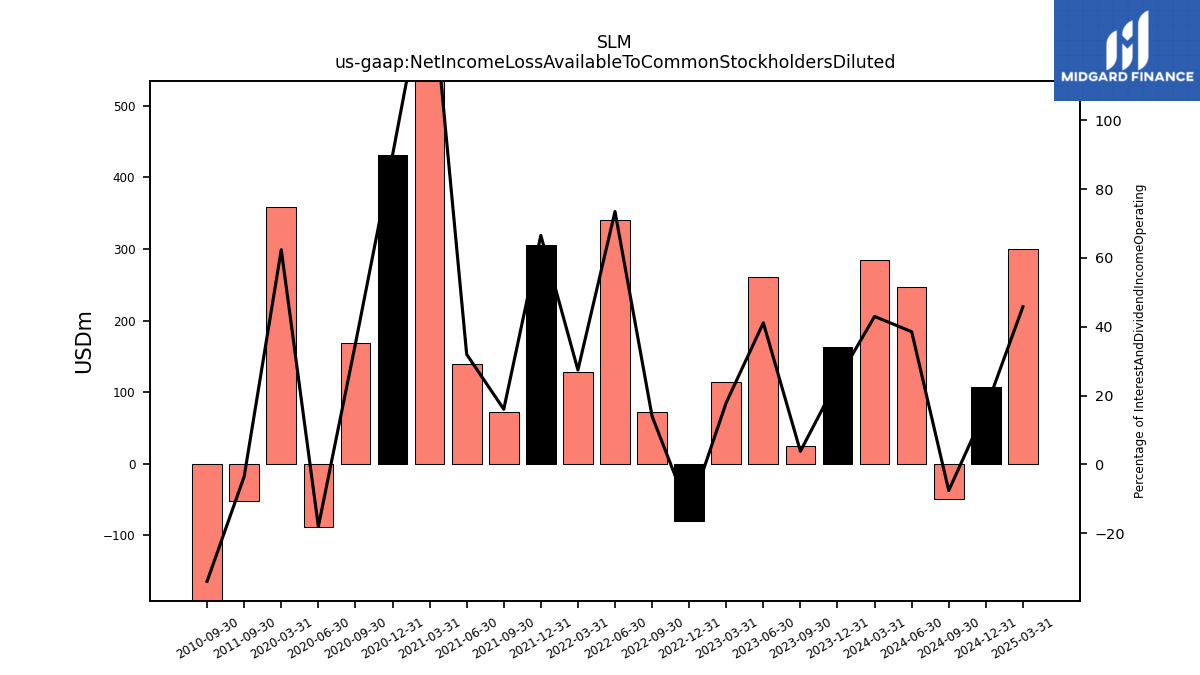
| Net Income Loss Available To Common Stockholders Diluted | 163.72 | 24.72 | 260.79 | 114.45 | -80.51 | 72.64 | 340.32 | 127.54 | 305.09 | 71.67 | 139.01 | 640.01 | 430.97 | 168.97 | -87.69 | 358.71 | NA | NA | NA | NA | NA | NA | NA | NA | NA | NA | NA | NA | NA | NA | NA | NA | NA | NA | NA | NA | NA | NA | NA | NA | NA | NA | NA | NA | NA | NA | NA | NA | NA | -52.00 | NA | NA | NA | NA | |
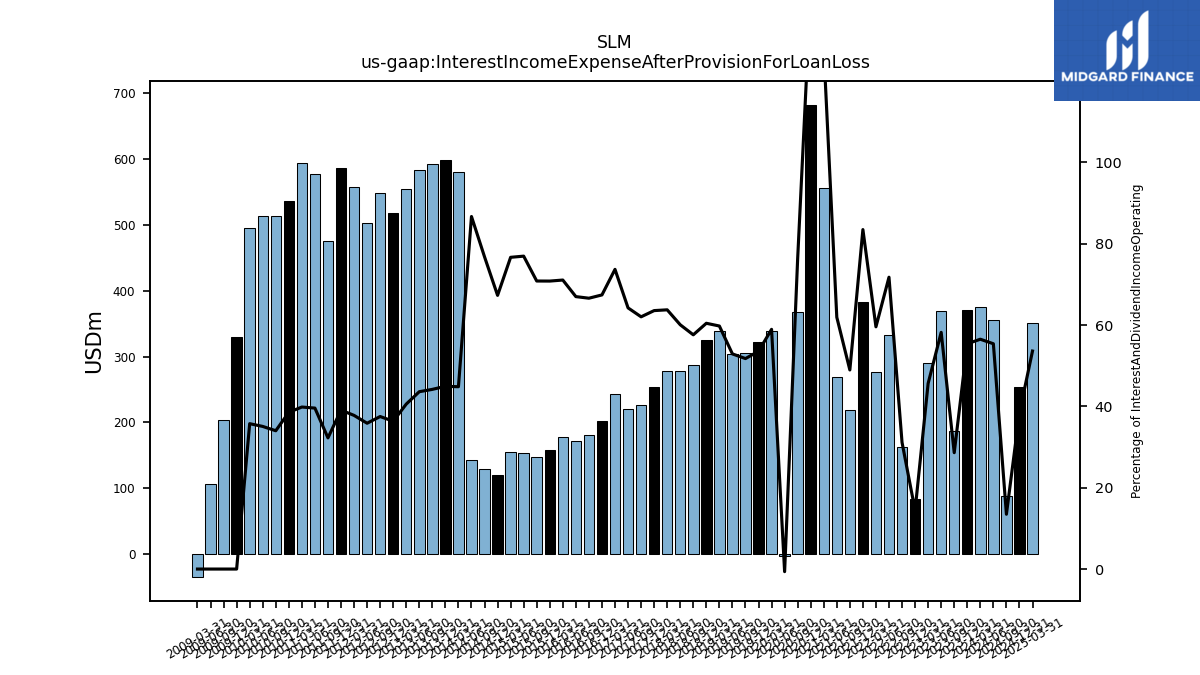
| Interest Income Expense After Provision For Loan Loss | 370.29 | 186.60 | 368.90 | 290.96 | 84.17 | 161.91 | 332.26 | 276.98 | 382.66 | 219.08 | 269.11 | 556.88 | 682.91 | 368.21 | -3.11 | 338.86 | 321.54 | 305.54 | 303.49 | 338.49 | 325.25 | 286.59 | 277.68 | 278.68 | 253.87 | 227.13 | 219.68 | 242.78 | 202.21 | 181.49 | 170.97 | 177.26 | 157.46 | 147.94 | 152.70 | 154.34 | 120.22 | 129.13 | 143.53 | 581.00 | 599.00 | 592.00 | 583.00 | 554.00 | 518.00 | 549.00 | 503.00 | 558.00 | 587.00 | 476.00 | 577.72 | 594.56 | 536.87 | 329.34 | |
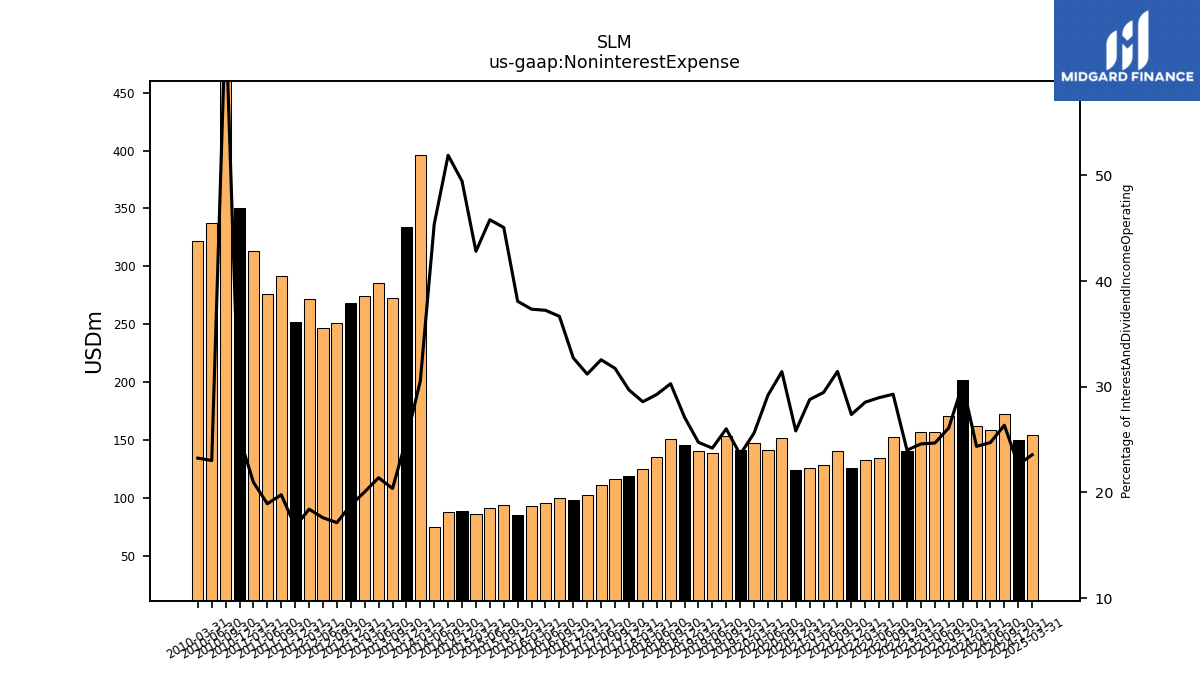
| Noninterest Expense | 202.11 | 170.24 | 156.41 | 156.81 | 140.06 | 152.29 | 134.15 | 132.74 | 125.50 | 140.76 | 128.08 | 125.58 | 123.83 | 151.62 | 141.56 | 147.30 | 141.68 | 153.62 | 138.81 | 140.15 | 145.97 | 150.72 | 135.31 | 124.97 | 118.67 | 116.26 | 111.37 | 102.79 | 98.19 | 99.94 | 95.04 | 93.14 | 84.70 | 94.14 | 90.91 | 86.21 | 88.35 | 87.31 | 75.16 | 396.00 | 334.00 | 273.00 | 286.00 | 274.00 | 268.00 | 251.00 | 247.00 | 272.00 | 252.00 | 292.00 | 276.38 | 312.82 | 350.84 | NA | |
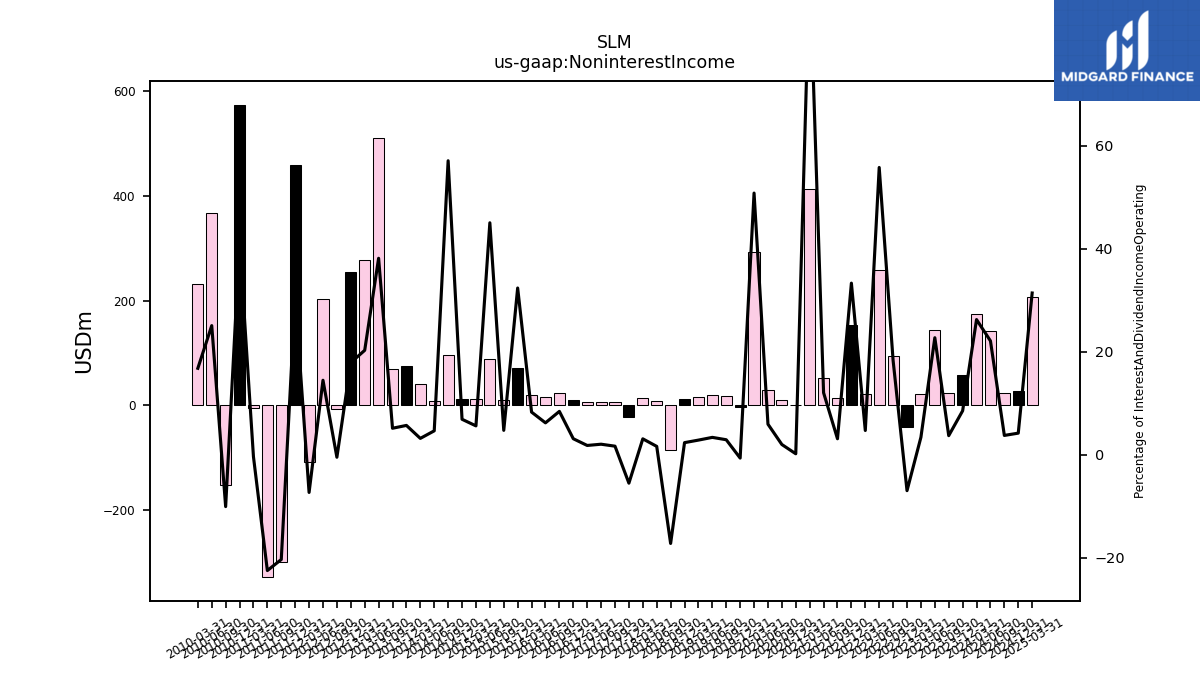
| Noninterest Income | 57.11 | 24.24 | 144.05 | 21.71 | -40.64 | 95.10 | 258.25 | 21.93 | 152.76 | 13.91 | 52.35 | 413.43 | 0.93 | 9.63 | 28.79 | 292.09 | -3.85 | 17.24 | 19.39 | 16.14 | 12.68 | -85.65 | 7.54 | 13.53 | -22.01 | 6.12 | 7.02 | 5.97 | 9.35 | 22.97 | 15.82 | 20.67 | 72.00 | 9.91 | 89.39 | 11.30 | 12.32 | 96.01 | 7.70 | 41.26 | 76.00 | 69.00 | 510.00 | 277.00 | 255.00 | -7.00 | 203.00 | -108.00 | 460.00 | -300.00 | -328.06 | -5.60 | 574.41 | NA |
| 2023-12-31 | 2023-09-30 | 2023-06-30 | 2023-03-31 | 2022-12-31 | 2022-09-30 | 2022-06-30 | 2022-03-31 | 2021-12-31 | 2021-09-30 | 2021-06-30 | 2021-03-31 | 2020-12-31 | 2020-09-30 | 2020-06-30 | 2020-03-31 | 2019-12-31 | 2019-09-30 | 2019-06-30 | 2019-03-31 | 2018-12-31 | 2018-09-30 | 2018-06-30 | 2018-03-31 | 2017-12-31 | 2017-09-30 | 2017-06-30 | 2017-03-31 | 2016-12-31 | 2016-09-30 | 2016-06-30 | 2016-03-31 | 2015-12-31 | 2015-09-30 | 2015-06-30 | 2015-03-31 | 2014-12-31 | 2014-09-30 | 2014-06-30 | 2014-03-31 | 2013-12-31 | 2013-09-30 | 2013-06-30 | 2013-03-31 | 2012-12-31 | 2012-09-30 | 2012-06-30 | 2012-03-31 | 2011-12-31 | 2011-09-30 | 2011-06-30 | 2011-03-31 | 2010-12-31 | 2009-12-31 | ||
|---|---|---|---|---|---|---|---|---|---|---|---|---|---|---|---|---|---|---|---|---|---|---|---|---|---|---|---|---|---|---|---|---|---|---|---|---|---|---|---|---|---|---|---|---|---|---|---|---|---|---|---|---|---|---|---|
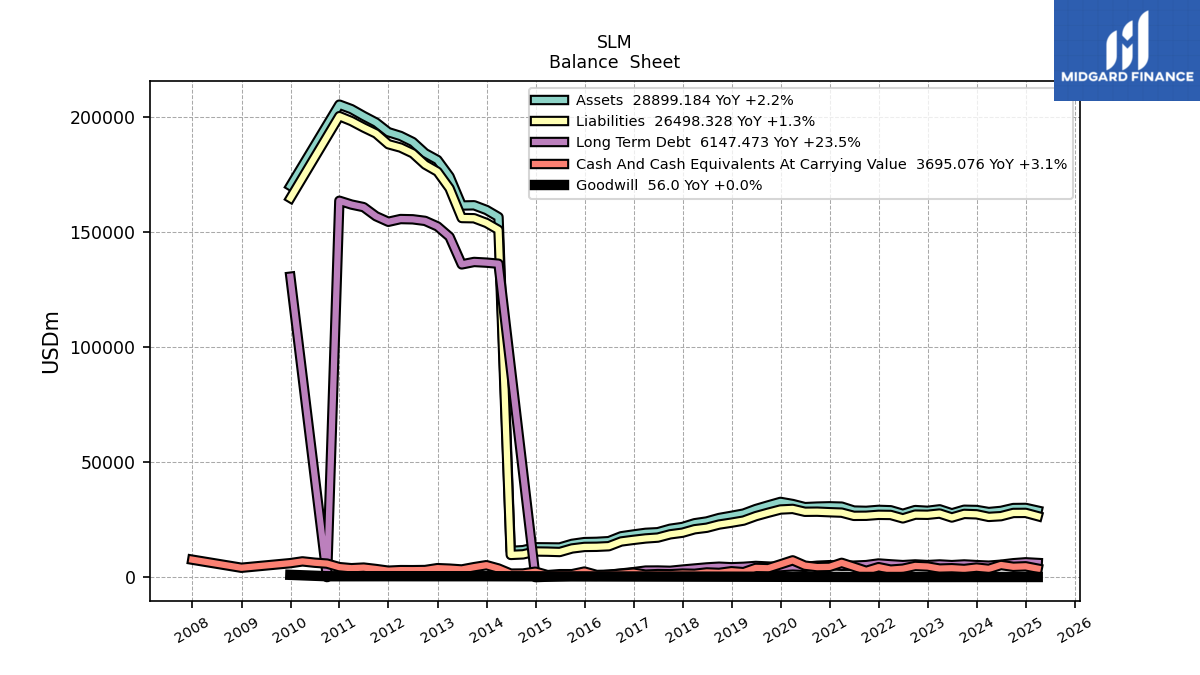
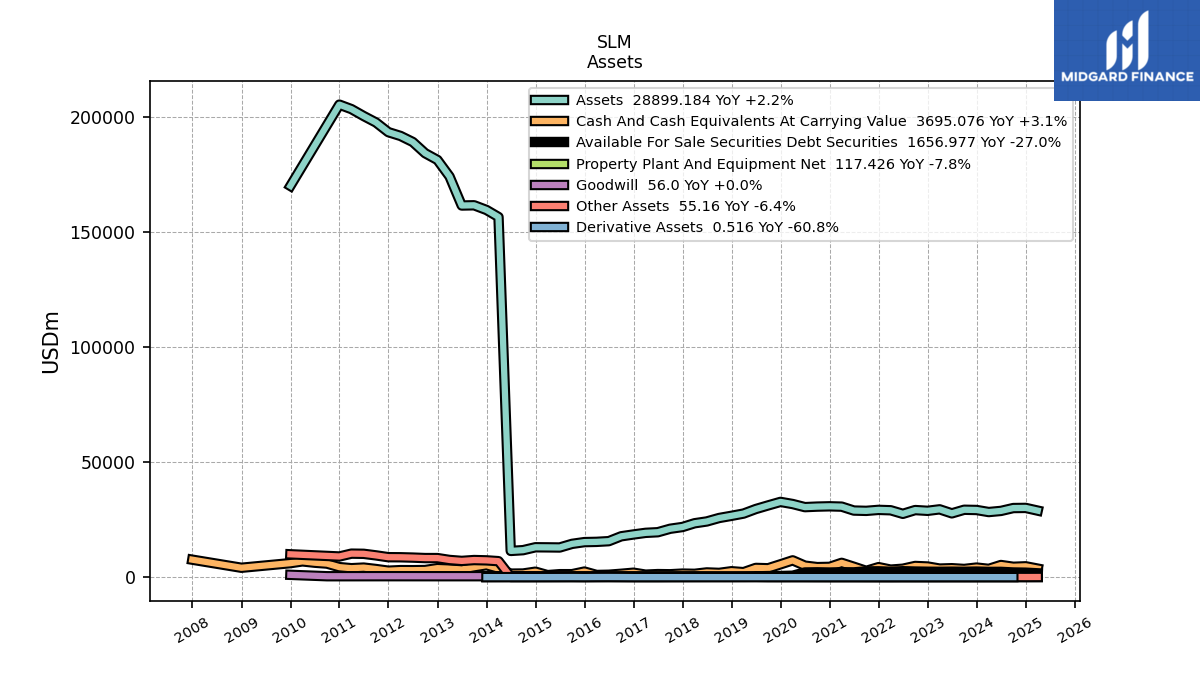
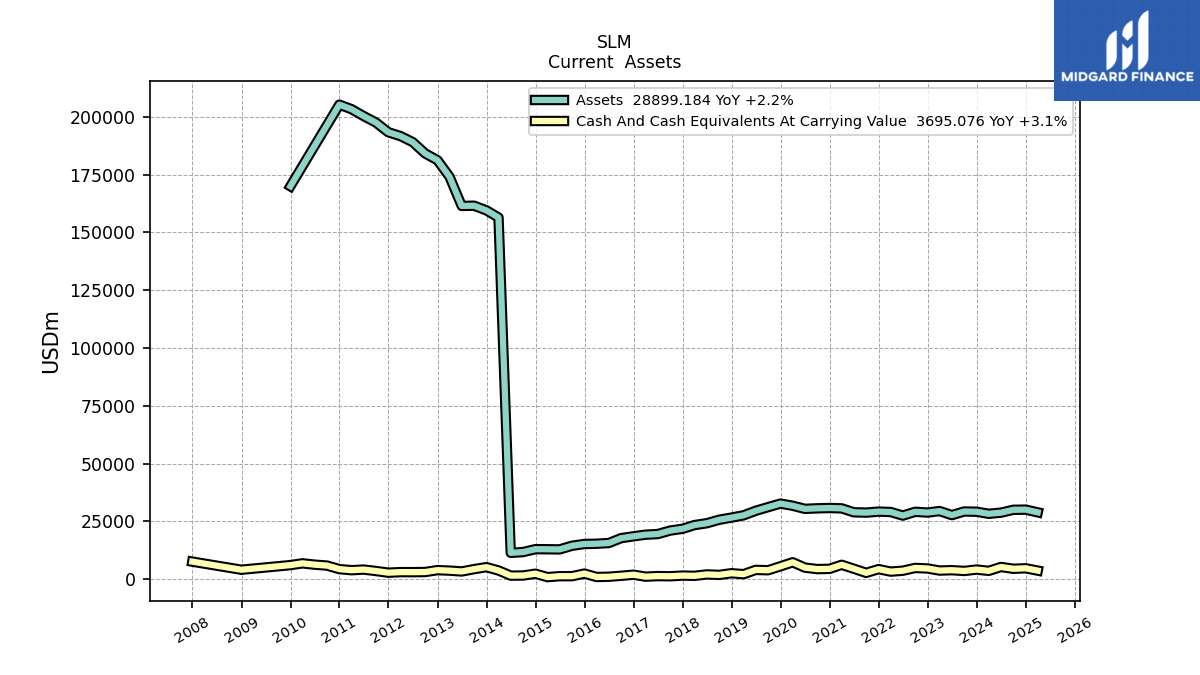
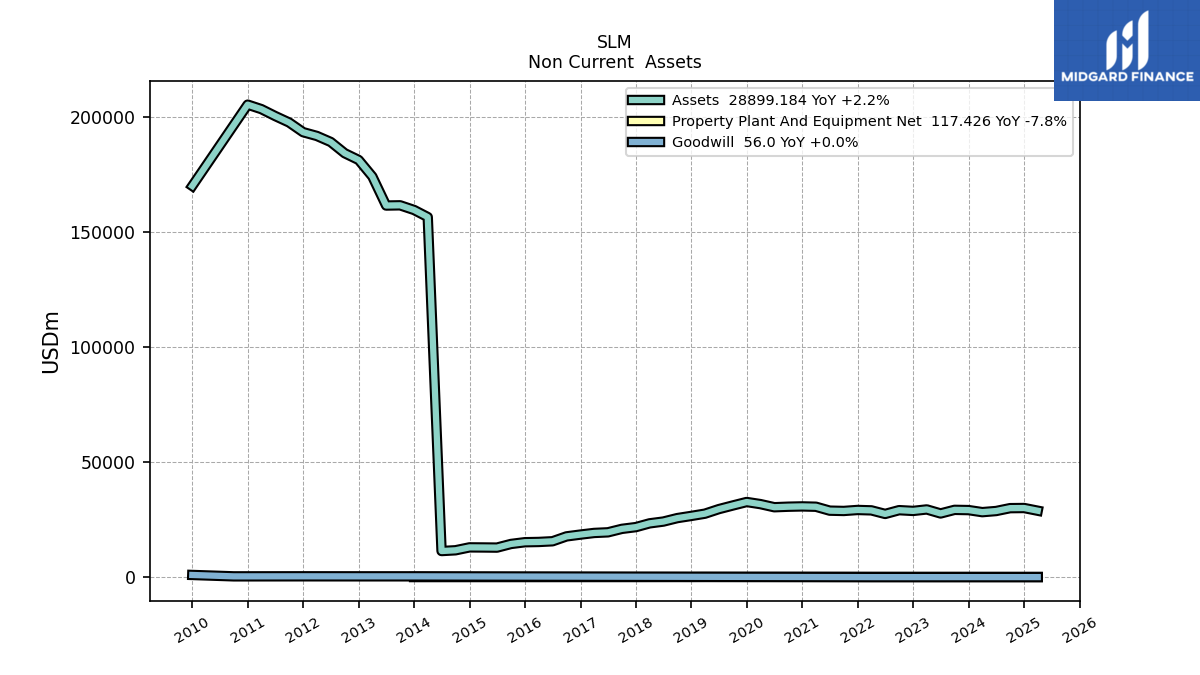
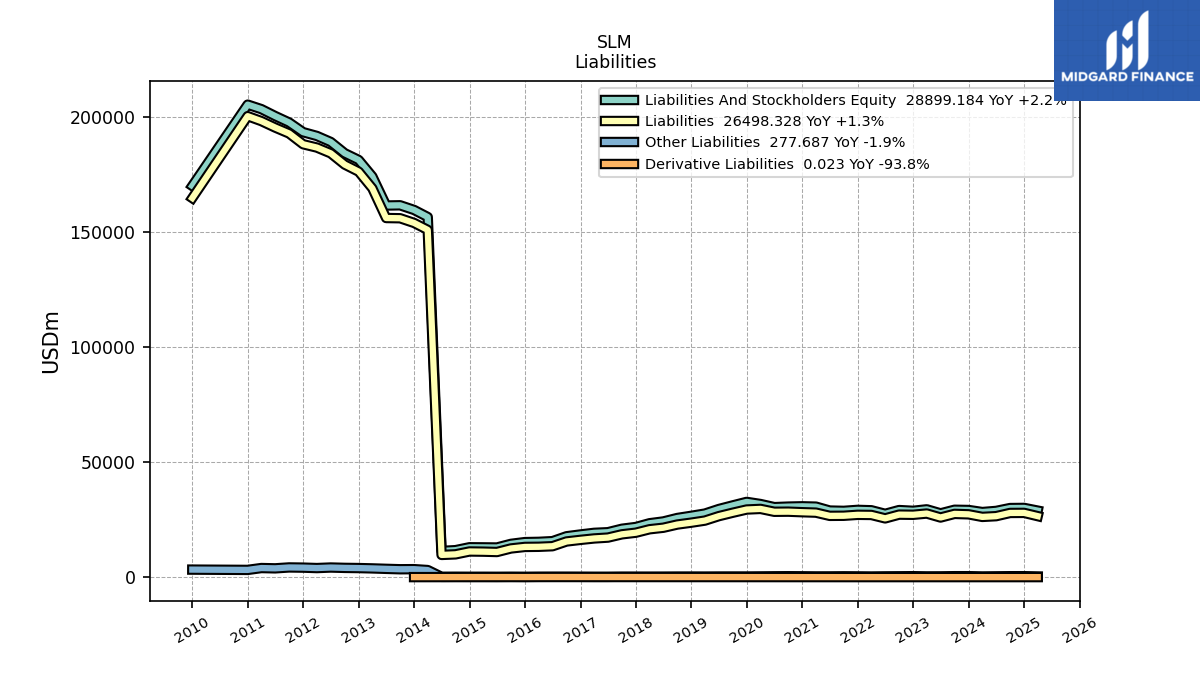
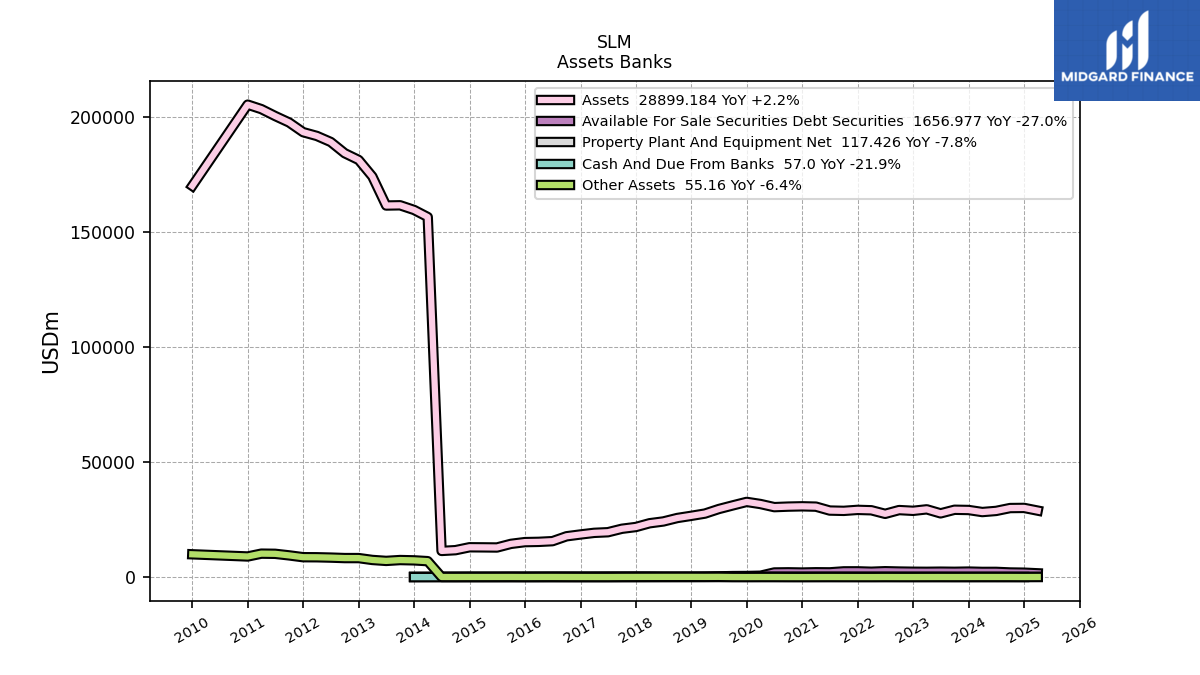
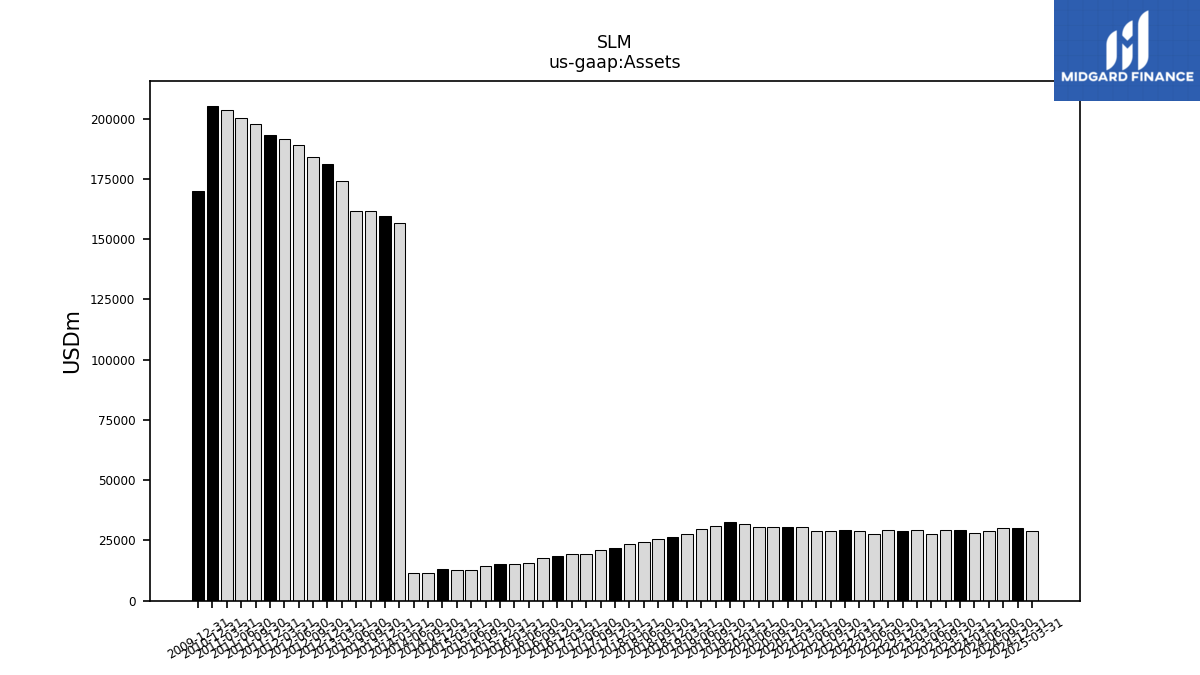
| Assets | 29169.47 | 29273.22 | 27708.40 | 29453.90 | 28811.03 | 29139.09 | 27498.77 | 29051.83 | 29221.90 | 28791.14 | 28925.17 | 30628.01 | 30770.42 | 30642.42 | 30412.11 | 31760.90 | 32686.48 | 31160.22 | 29585.23 | 27613.62 | 26638.17 | 25691.18 | 24189.18 | 23406.32 | 21779.58 | 21016.17 | 19513.30 | 19236.50 | 18533.00 | 17745.61 | 15629.93 | 15324.77 | 15214.10 | 14450.54 | 12874.96 | 12933.52 | 12972.24 | 11714.95 | 11379.34 | 156472.00 | 159543.00 | 161570.00 | 161468.00 | 174086.00 | 181260.00 | 184203.00 | 189079.00 | 191692.00 | 193345.00 | 197544.00 | 200356.60 | 203354.81 | 205307.05 | 169985.30 | |
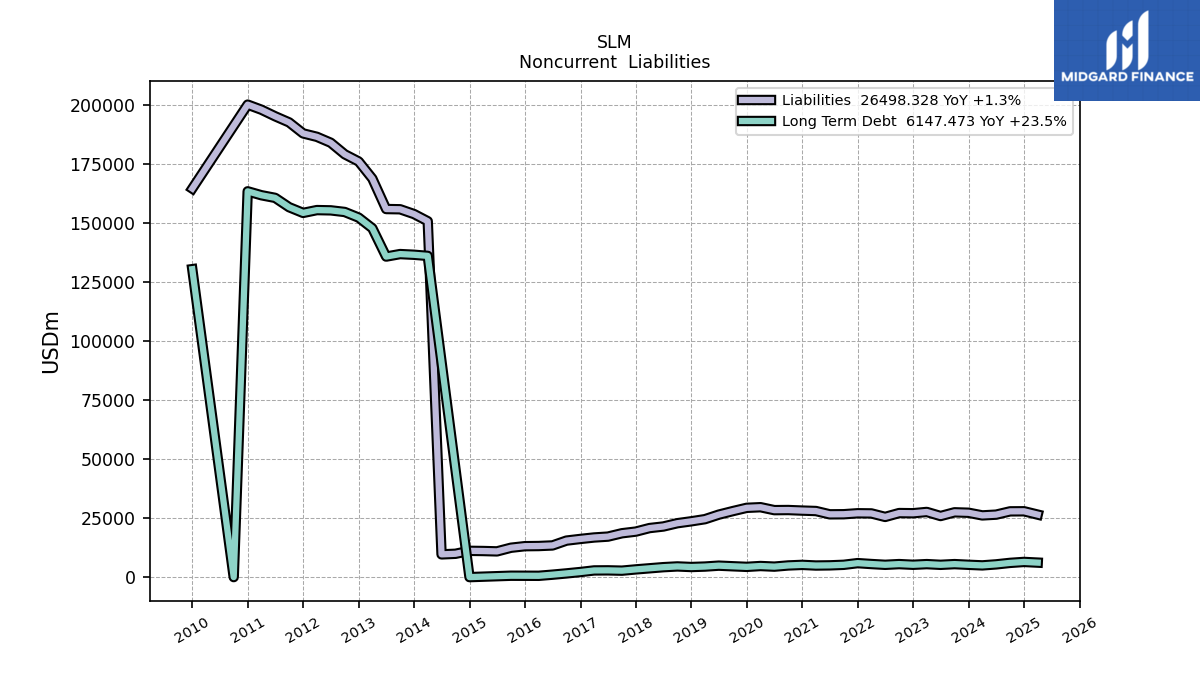
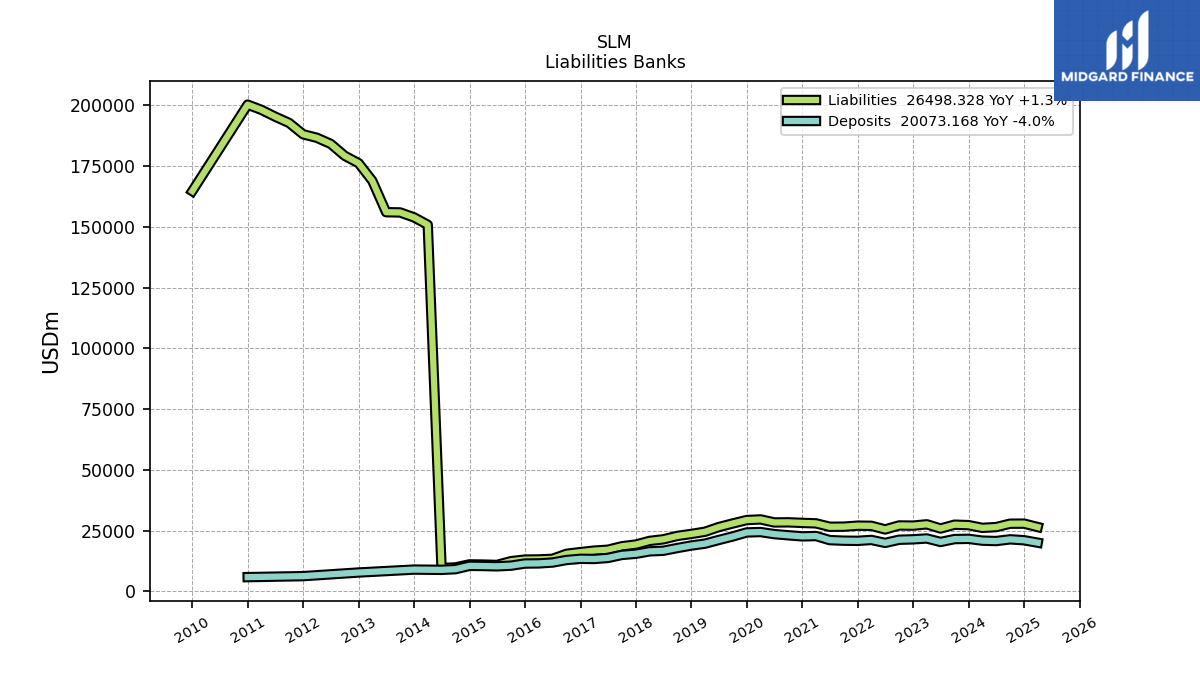
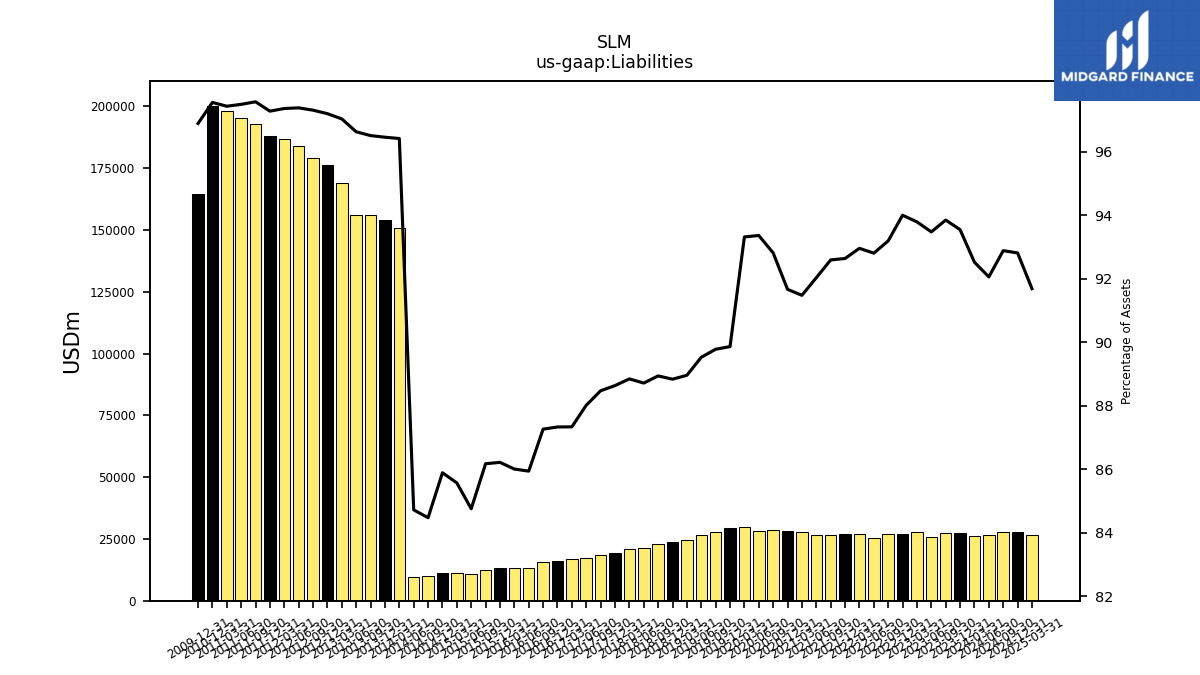
| Liabilities | 27288.67 | 27473.99 | 25902.04 | 27626.81 | 27084.06 | 27156.86 | 25521.96 | 27007.62 | 27072.19 | 26659.88 | 26621.80 | 28019.54 | 28207.59 | 28441.97 | 28395.19 | 29640.31 | 29374.64 | 27977.08 | 26487.91 | 24566.09 | 23665.52 | 22850.85 | 21460.47 | 20796.49 | 19305.33 | 18594.33 | 17175.59 | 16801.15 | 16185.94 | 15486.12 | 13433.02 | 13180.85 | 13117.77 | 12453.21 | 10912.79 | 11067.61 | 11142.28 | 9896.52 | 9641.08 | 150874.00 | 153901.00 | 155938.00 | 156034.00 | 168932.00 | 176194.00 | 179257.00 | 184141.00 | 186647.00 | 188094.00 | 192762.00 | 195345.36 | 198147.72 | 200295.47 | 164706.68 | |
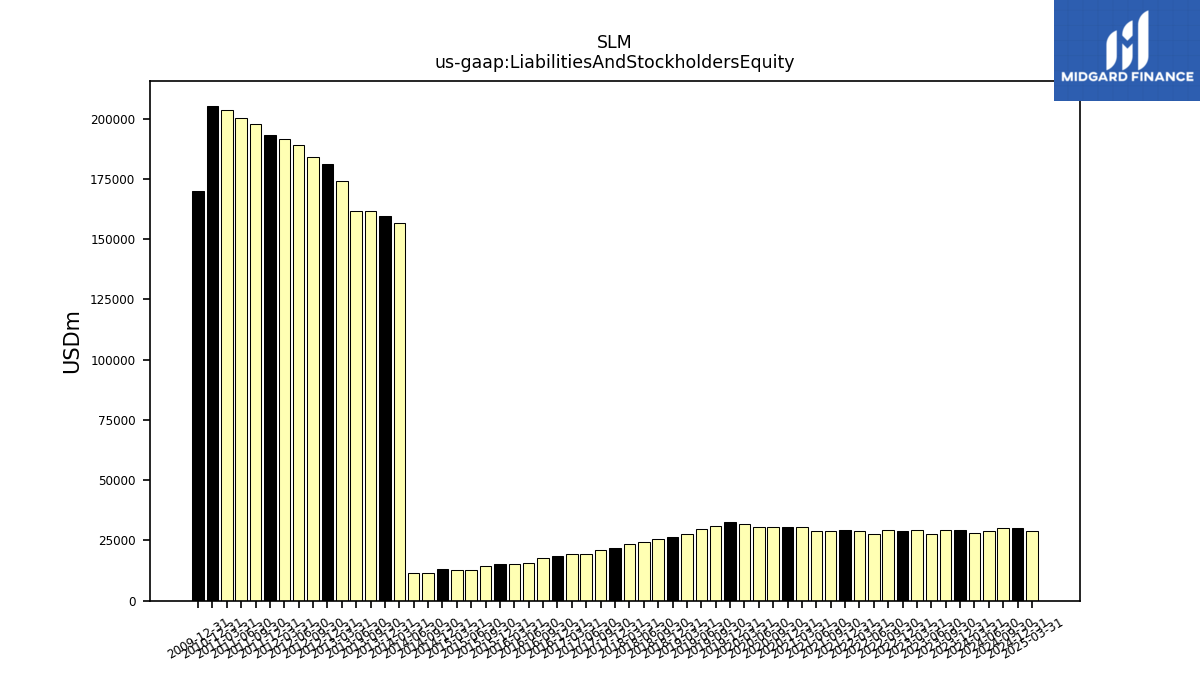
| Liabilities And Stockholders Equity | 29169.47 | 29273.22 | 27708.40 | 29453.90 | 28811.03 | 29139.09 | 27498.77 | 29051.83 | 29221.90 | 28791.14 | 28925.17 | 30628.01 | 30770.42 | 30642.42 | 30412.11 | 31760.90 | 32686.48 | 31160.22 | 29585.23 | 27613.62 | 26638.17 | 25691.18 | 24189.18 | 23406.32 | 21779.58 | 21016.17 | 19513.30 | 19236.50 | 18533.00 | 17745.61 | 15629.93 | 15324.77 | 15214.10 | 14450.54 | 12874.96 | 12933.52 | 12972.24 | 11714.95 | 11379.34 | 156472.00 | 159543.00 | 161570.00 | 161468.00 | 174086.00 | 181260.00 | 184203.00 | 189079.00 | 191692.00 | 193345.00 | 197544.00 | 200356.60 | 203354.81 | 205307.05 | 169985.30 | |
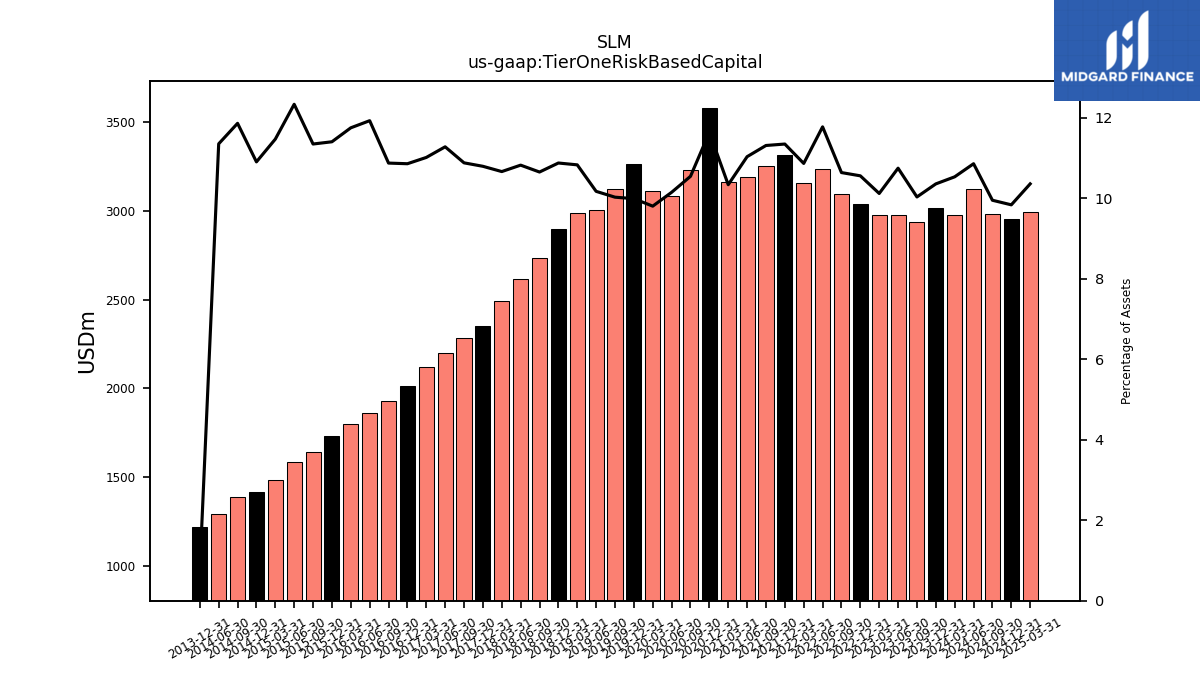
| Tier One Risk Based Capital | 3019.97 | 2935.90 | 2976.88 | 2979.43 | 3040.66 | 3098.80 | 3236.74 | 3155.47 | 3314.66 | 3255.47 | 3190.26 | 3164.96 | 3579.01 | 3230.08 | 3085.13 | 3112.76 | 3264.31 | 3123.26 | 3008.32 | 2989.53 | 2896.09 | 2735.62 | 2617.02 | 2494.96 | 2350.08 | 2285.77 | 2199.98 | 2117.96 | 2011.58 | 1928.98 | 1863.58 | 1800.07 | 1734.32 | 1639.23 | 1587.56 | 1482.86 | 1413.99 | 1389.12 | 1291.39 | NA | 1221.42 | NA | NA | NA | NA | NA | NA | NA | NA | NA | NA | NA | NA | NA |
| 2023-12-31 | 2023-09-30 | 2023-06-30 | 2023-03-31 | 2022-12-31 | 2022-09-30 | 2022-06-30 | 2022-03-31 | 2021-12-31 | 2021-09-30 | 2021-06-30 | 2021-03-31 | 2020-12-31 | 2020-09-30 | 2020-06-30 | 2020-03-31 | 2019-12-31 | 2019-09-30 | 2019-06-30 | 2019-03-31 | 2018-12-31 | 2018-09-30 | 2018-06-30 | 2018-03-31 | 2017-12-31 | 2017-09-30 | 2017-06-30 | 2017-03-31 | 2016-12-31 | 2016-09-30 | 2016-06-30 | 2016-03-31 | 2015-12-31 | 2015-09-30 | 2015-06-30 | 2015-03-31 | 2014-12-31 | 2014-09-30 | 2014-06-30 | 2014-03-31 | 2013-12-31 | 2013-09-30 | 2013-06-30 | 2013-03-31 | 2012-12-31 | 2012-09-30 | 2012-06-30 | 2012-03-31 | 2011-12-31 | 2011-09-30 | 2011-06-30 | 2011-03-31 | 2010-12-31 | 2009-12-31 | ||
|---|---|---|---|---|---|---|---|---|---|---|---|---|---|---|---|---|---|---|---|---|---|---|---|---|---|---|---|---|---|---|---|---|---|---|---|---|---|---|---|---|---|---|---|---|---|---|---|---|---|---|---|---|---|---|---|
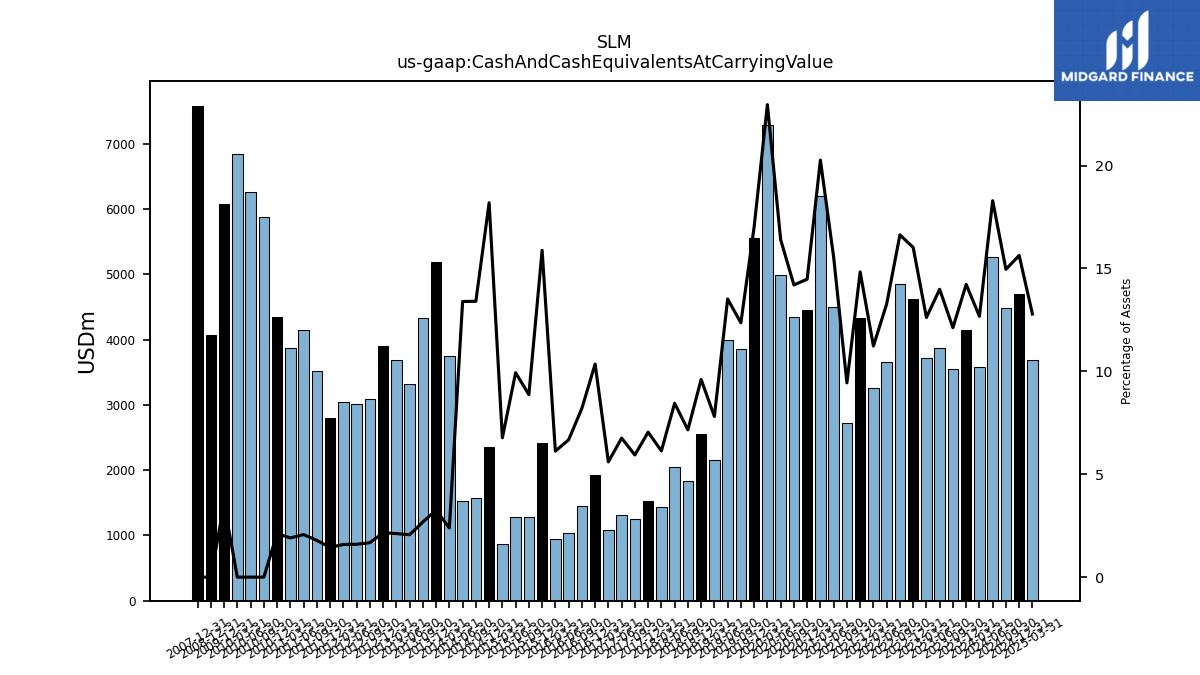
| Cash And Cash Equivalents At Carrying Value | 4149.84 | 3548.22 | 3875.76 | 3716.38 | 4616.12 | 4846.75 | 3649.65 | 3262.59 | 4334.60 | 2717.75 | 4497.31 | 6207.00 | 4455.29 | 4351.05 | 4988.96 | 7292.93 | 5563.88 | 3851.61 | 3998.51 | 2156.26 | 2559.11 | 1839.05 | 2043.79 | 1435.65 | 1534.34 | 1247.76 | 1318.17 | 1077.58 | 1918.79 | 1454.94 | 1042.91 | 938.48 | 2416.22 | 1281.80 | 1278.86 | 875.62 | 2359.78 | 1570.38 | 1524.18 | 3742.00 | 5190.00 | 4329.00 | 3327.00 | 3685.00 | 3900.00 | 3083.00 | 3020.00 | 3043.00 | 2794.00 | 3523.00 | 4144.73 | 3871.48 | 4342.33 | 6070.01 | |
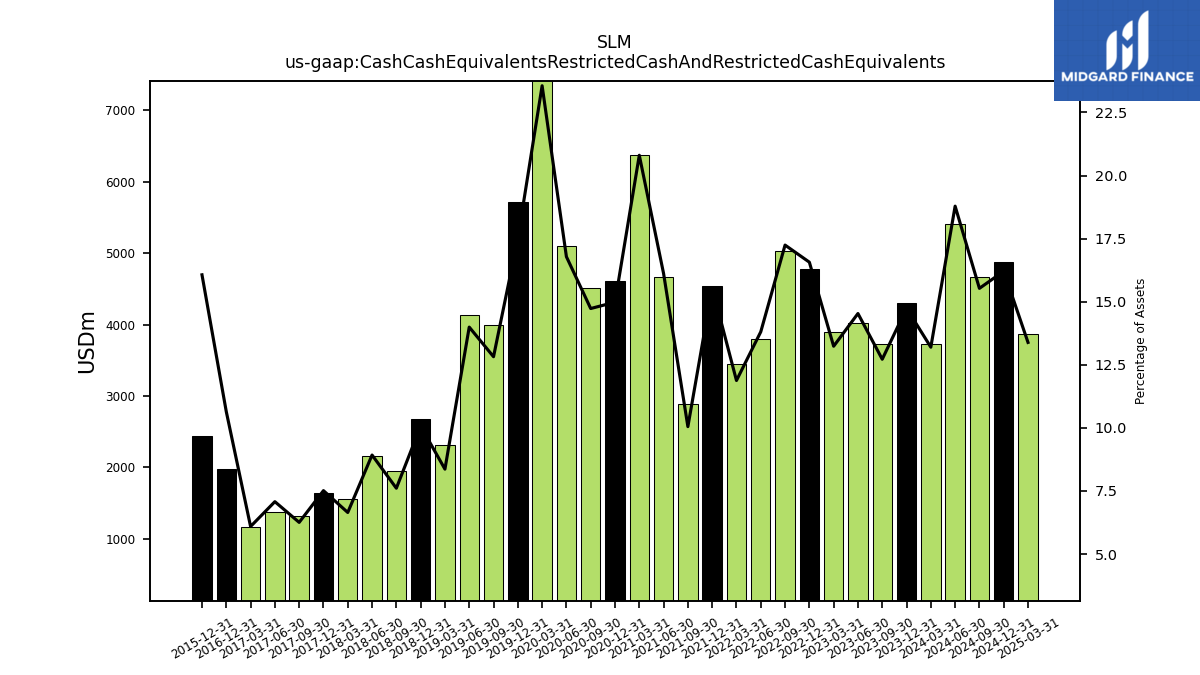
| Cash Cash Equivalents Restricted Cash And Restricted Cash Equivalents | 4299.51 | 3723.29 | 4026.34 | 3898.14 | 4772.84 | 5024.67 | 3796.76 | 3450.55 | 4545.34 | 2893.22 | 4661.27 | 6371.71 | 4609.71 | 4513.49 | 5104.15 | 7482.37 | 5720.76 | 3994.45 | 4139.95 | 2309.81 | 2681.89 | 1954.71 | 2158.45 | 1555.73 | 1636.17 | 1314.39 | 1380.63 | 1171.72 | 1972.51 | NA | NA | NA | 2444.20 | NA | NA | NA | NA | NA | NA | NA | NA | NA | NA | NA | NA | NA | NA | NA | NA | NA | NA | NA | NA | NA | |
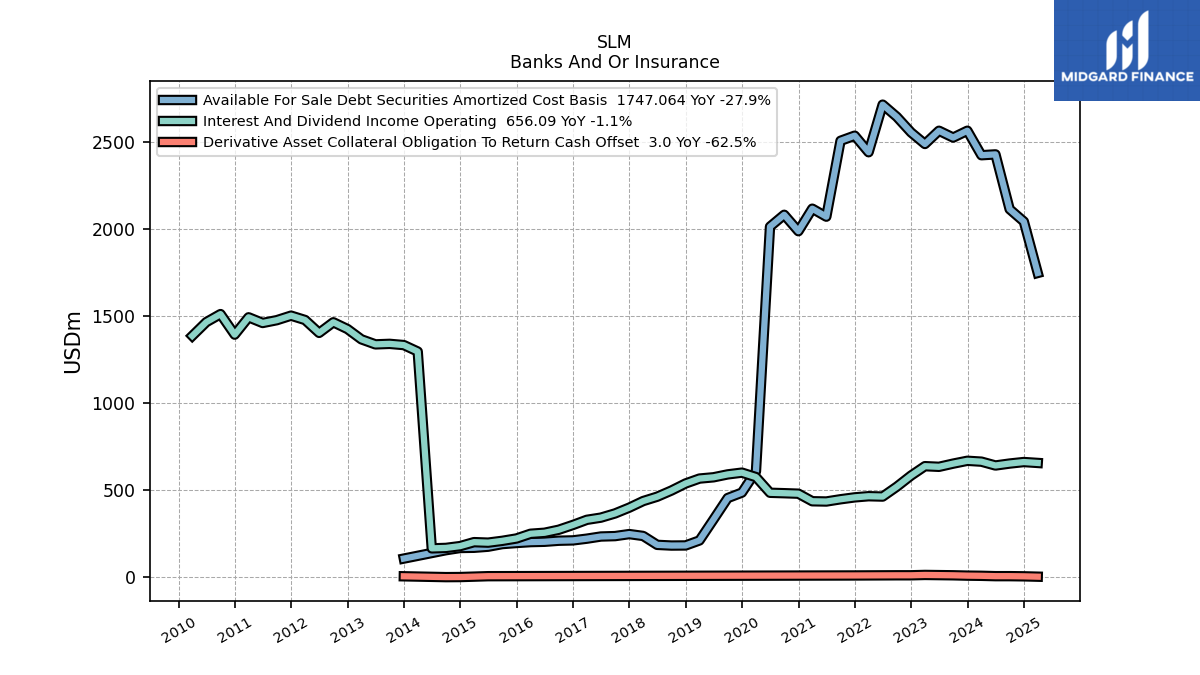
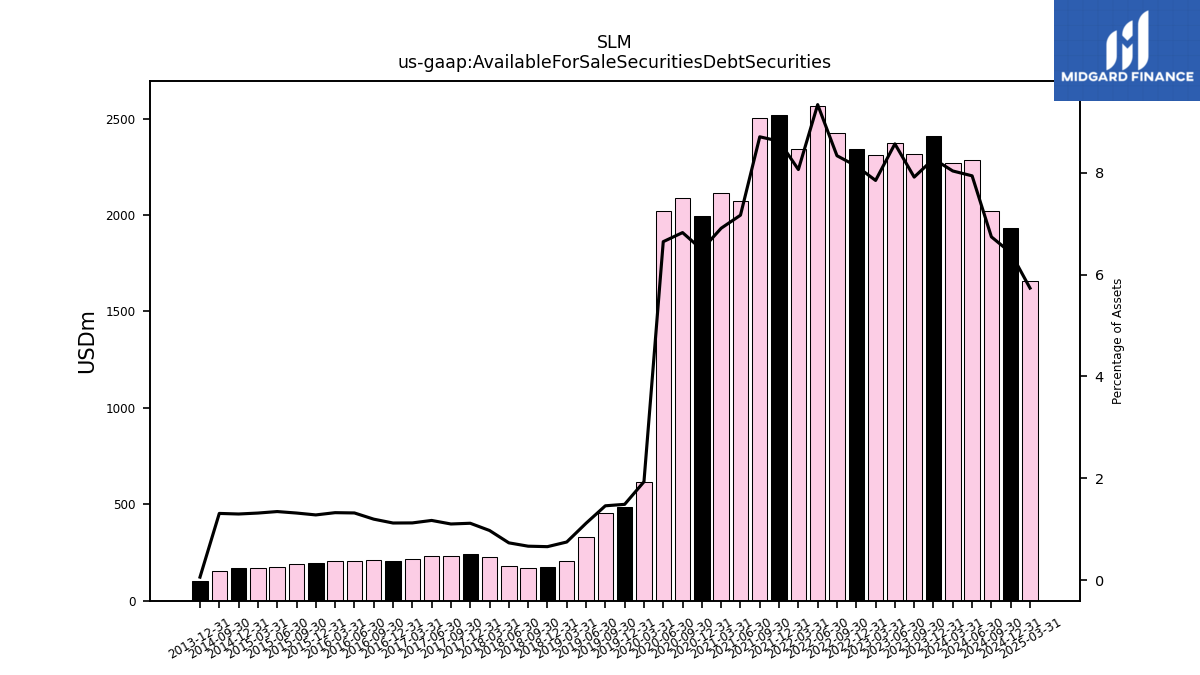
| Available For Sale Securities Debt Securities | 2411.62 | 2315.98 | 2372.85 | 2311.06 | 2342.09 | 2427.54 | 2566.56 | 2341.55 | 2517.96 | 2505.37 | 2072.31 | 2115.89 | 1996.63 | 2090.71 | 2020.95 | 614.58 | 487.67 | 455.97 | 331.54 | 207.91 | 176.25 | 172.37 | 178.15 | 229.11 | 244.09 | 232.55 | 229.48 | 216.90 | 208.60 | 213.18 | 206.78 | 203.60 | 195.39 | 190.94 | 173.84 | 170.83 | 168.93 | 153.89 | NA | NA | 102.11 | NA | NA | NA | NA | NA | NA | NA | NA | NA | NA | NA | NA | NA |
| 2023-12-31 | 2023-09-30 | 2023-06-30 | 2023-03-31 | 2022-12-31 | 2022-09-30 | 2022-06-30 | 2022-03-31 | 2021-12-31 | 2021-09-30 | 2021-06-30 | 2021-03-31 | 2020-12-31 | 2020-09-30 | 2020-06-30 | 2020-03-31 | 2019-12-31 | 2019-09-30 | 2019-06-30 | 2019-03-31 | 2018-12-31 | 2018-09-30 | 2018-06-30 | 2018-03-31 | 2017-12-31 | 2017-09-30 | 2017-06-30 | 2017-03-31 | 2016-12-31 | 2016-09-30 | 2016-06-30 | 2016-03-31 | 2015-12-31 | 2015-09-30 | 2015-06-30 | 2015-03-31 | 2014-12-31 | 2014-09-30 | 2014-06-30 | 2014-03-31 | 2013-12-31 | 2013-09-30 | 2013-06-30 | 2013-03-31 | 2012-12-31 | 2012-09-30 | 2012-06-30 | 2012-03-31 | 2011-12-31 | 2011-09-30 | 2011-06-30 | 2011-03-31 | 2010-12-31 | 2009-12-31 | ||
|---|---|---|---|---|---|---|---|---|---|---|---|---|---|---|---|---|---|---|---|---|---|---|---|---|---|---|---|---|---|---|---|---|---|---|---|---|---|---|---|---|---|---|---|---|---|---|---|---|---|---|---|---|---|---|---|
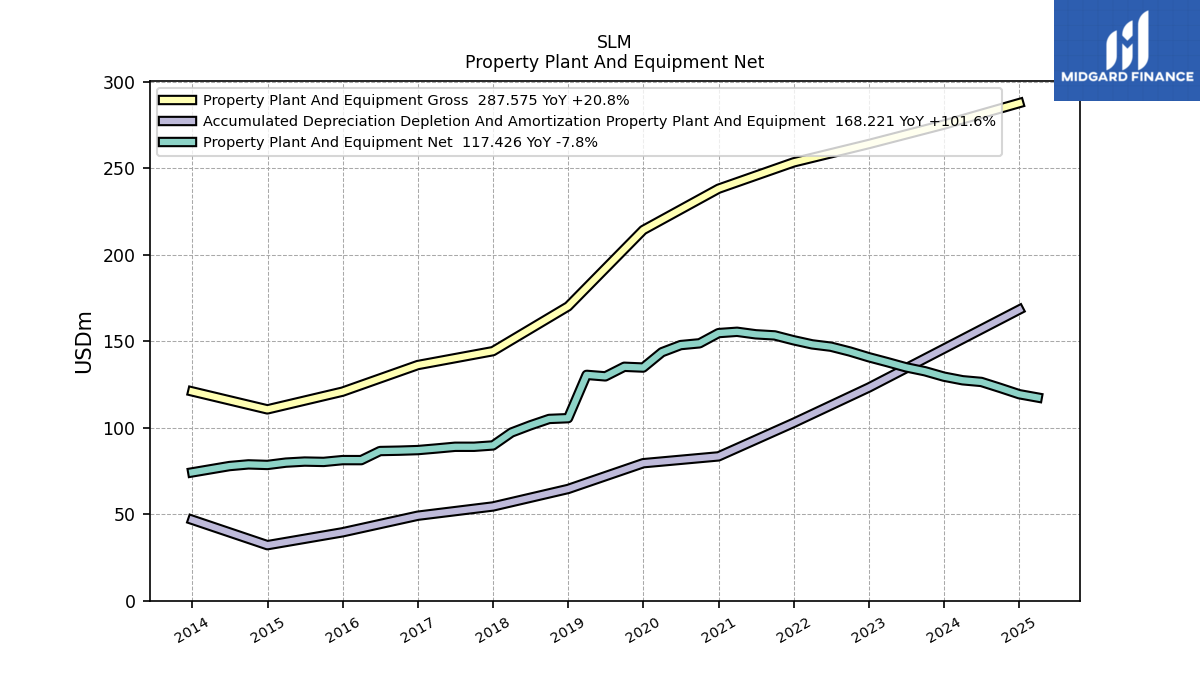
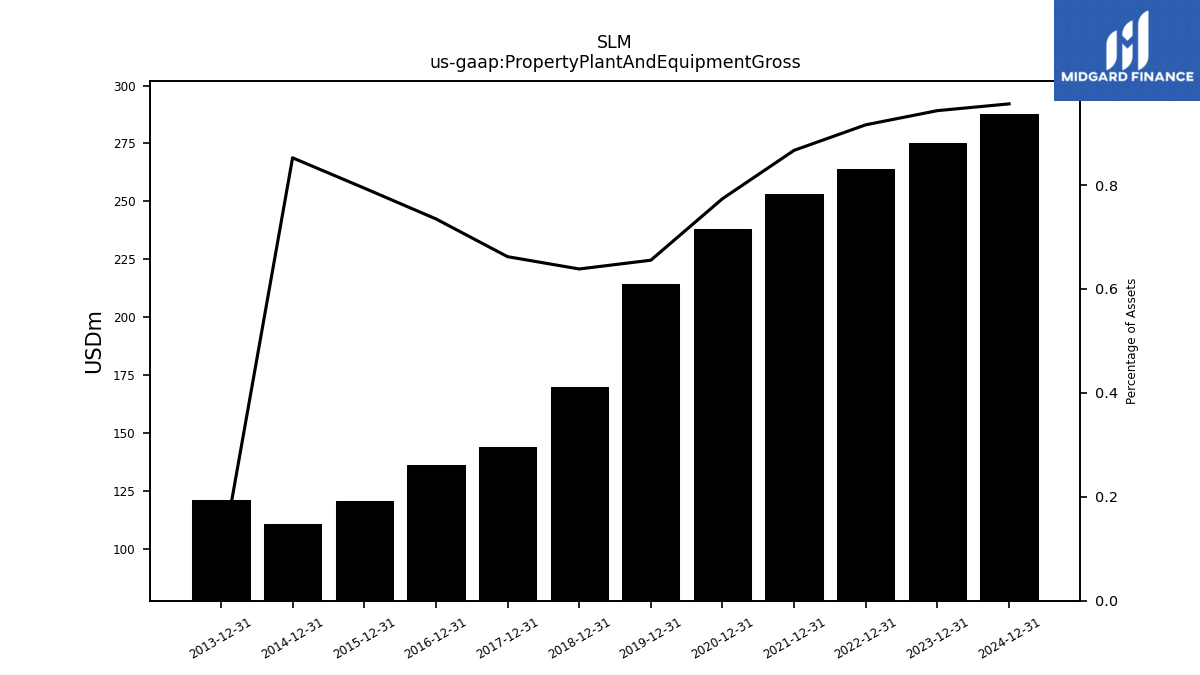
| Property Plant And Equipment Gross | 275.15 | NA | NA | NA | 263.91 | NA | NA | NA | 253.32 | NA | NA | NA | 238.10 | NA | NA | NA | 214.23 | NA | NA | NA | 170.09 | NA | NA | NA | 144.23 | NA | NA | NA | 136.21 | NA | NA | NA | 120.83 | NA | NA | NA | 110.58 | NA | NA | NA | 120.95 | NA | NA | NA | NA | NA | NA | NA | NA | NA | NA | NA | NA | NA | |
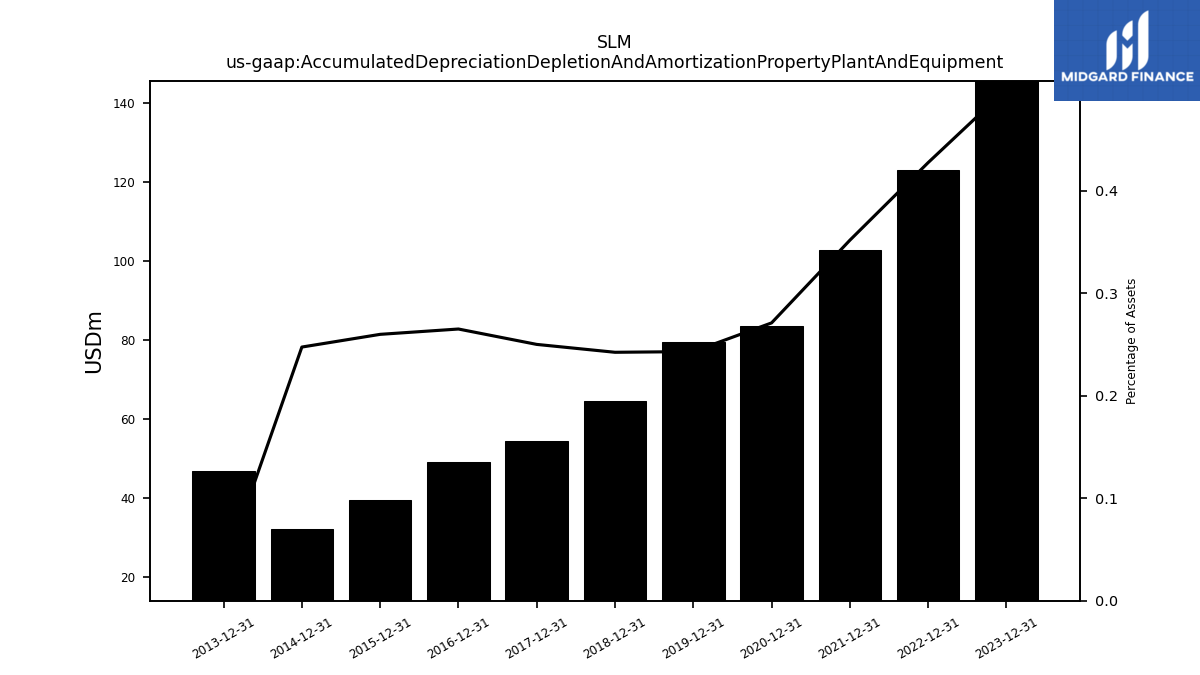
| Accumulated Depreciation Depletion And Amortization Property Plant And Equipment | 145.65 | NA | NA | NA | 123.18 | NA | NA | NA | 102.81 | NA | NA | NA | 83.43 | NA | NA | NA | 79.48 | NA | NA | NA | 64.59 | NA | NA | NA | 54.48 | NA | NA | NA | 49.14 | NA | NA | NA | 39.55 | NA | NA | NA | 32.12 | NA | NA | NA | 46.76 | NA | NA | NA | NA | NA | NA | NA | NA | NA | NA | NA | NA | NA | |
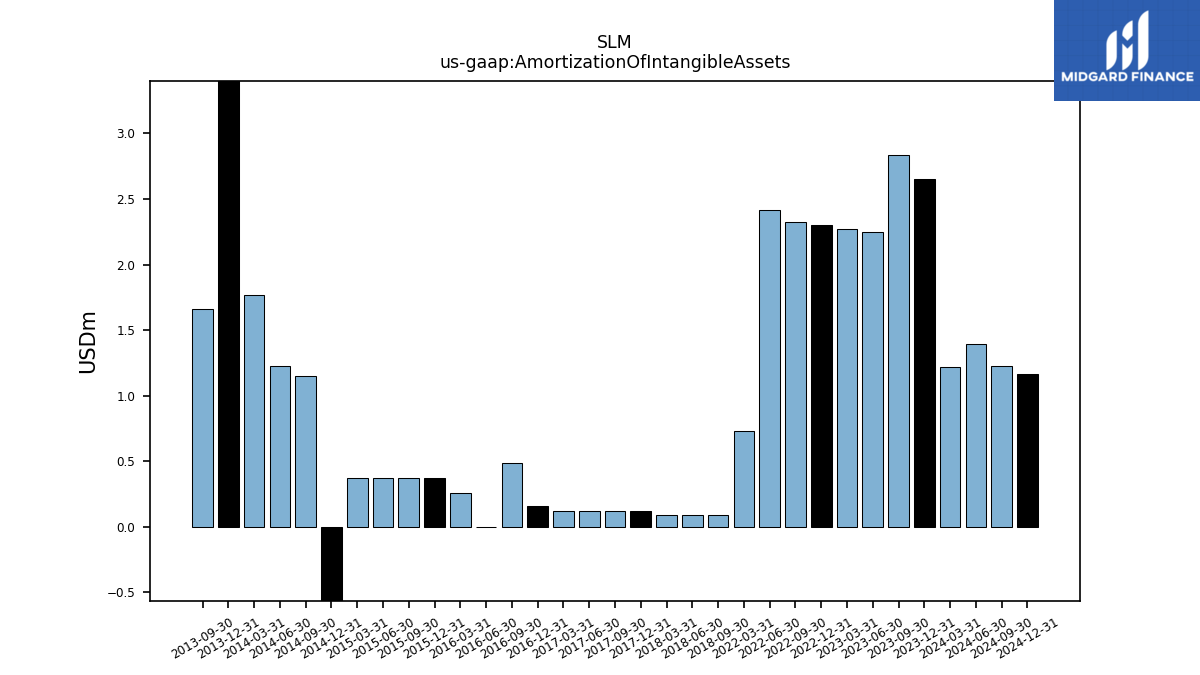
| Amortization Of Intangible Assets | 2.65 | 2.83 | 2.25 | 2.27 | 2.30 | 2.33 | 2.42 | 0.73 | NA | NA | NA | NA | NA | NA | NA | NA | NA | NA | NA | NA | NA | 0.09 | 0.09 | 0.09 | 0.12 | 0.12 | 0.12 | 0.12 | 0.16 | 0.49 | 0.00 | 0.26 | 0.37 | 0.37 | 0.37 | 0.37 | -0.85 | 1.15 | 1.23 | 1.77 | 9.91 | 1.66 | NA | NA | NA | NA | NA | NA | NA | NA | NA | NA | NA | NA | |
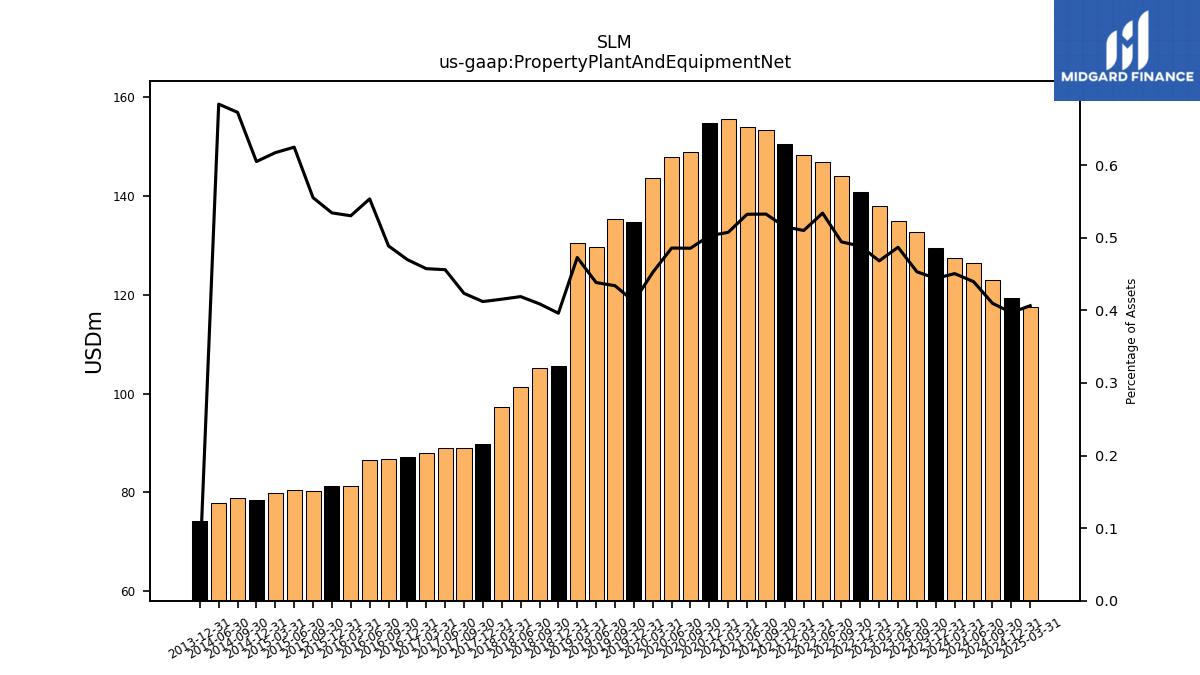
| Property Plant And Equipment Net | 129.50 | 132.62 | 134.90 | 137.89 | 140.73 | 144.03 | 146.81 | 148.15 | 150.52 | 153.33 | 153.97 | 155.43 | 154.67 | 148.77 | 147.74 | 143.62 | 134.75 | 135.21 | 129.66 | 130.54 | 105.50 | 105.06 | 101.33 | 97.21 | 89.75 | 88.97 | 88.98 | 87.98 | 87.06 | 86.72 | 86.51 | 81.26 | 81.27 | 80.22 | 80.43 | 79.82 | 78.47 | 78.81 | 77.83 | NA | 74.19 | NA | NA | NA | NA | NA | NA | NA | NA | NA | NA | NA | NA | NA | |
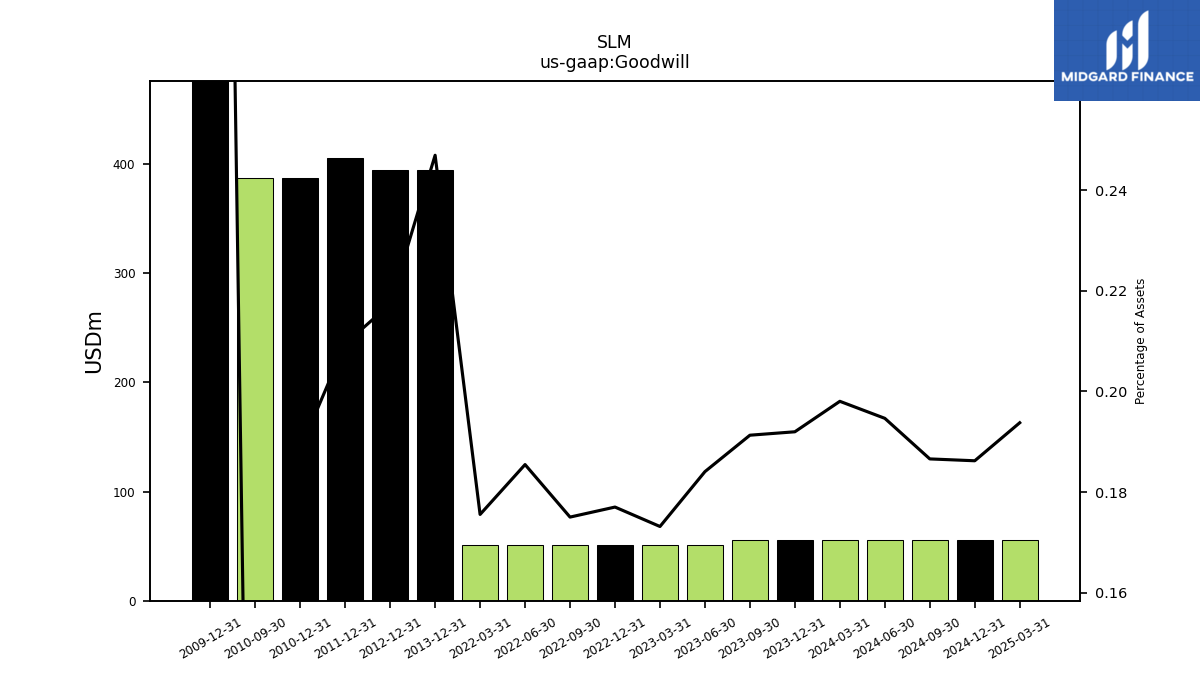
| Goodwill | 56.00 | 56.00 | 51.00 | 51.00 | 51.00 | 51.00 | 51.00 | 51.00 | NA | NA | NA | NA | NA | NA | NA | NA | NA | NA | NA | NA | NA | NA | NA | NA | NA | NA | NA | NA | NA | NA | NA | NA | NA | NA | NA | NA | NA | NA | NA | NA | 394.00 | NA | NA | NA | 394.00 | NA | NA | NA | 405.00 | NA | NA | NA | 387.00 | 991.00 | |
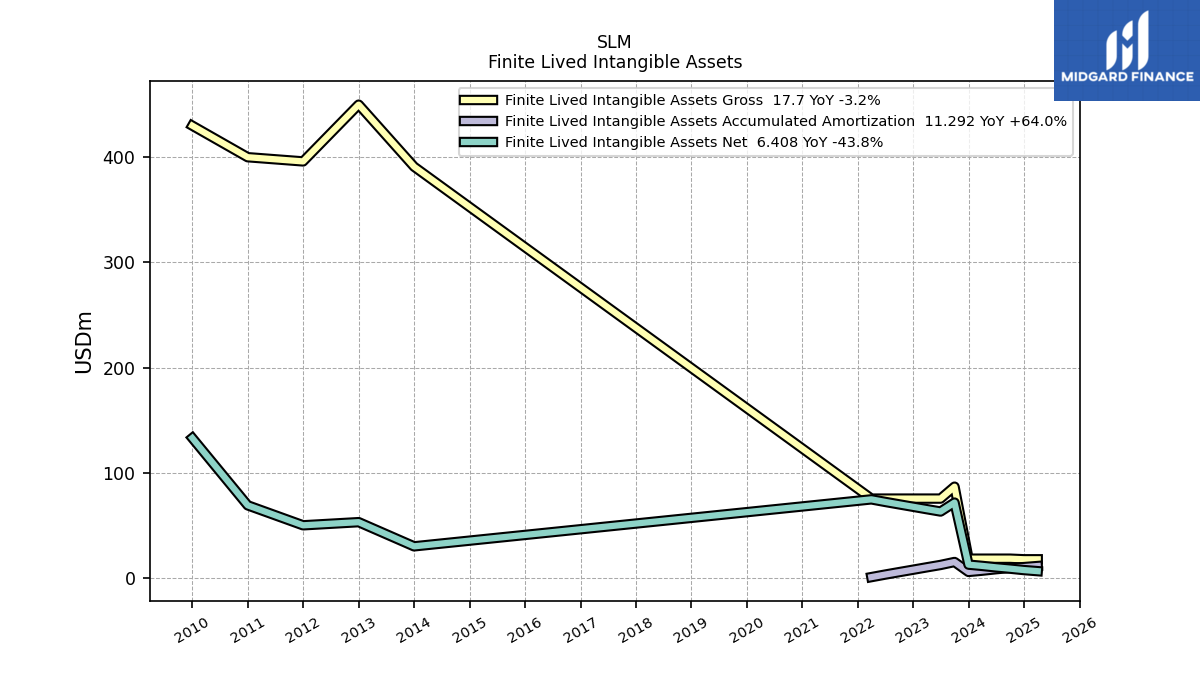
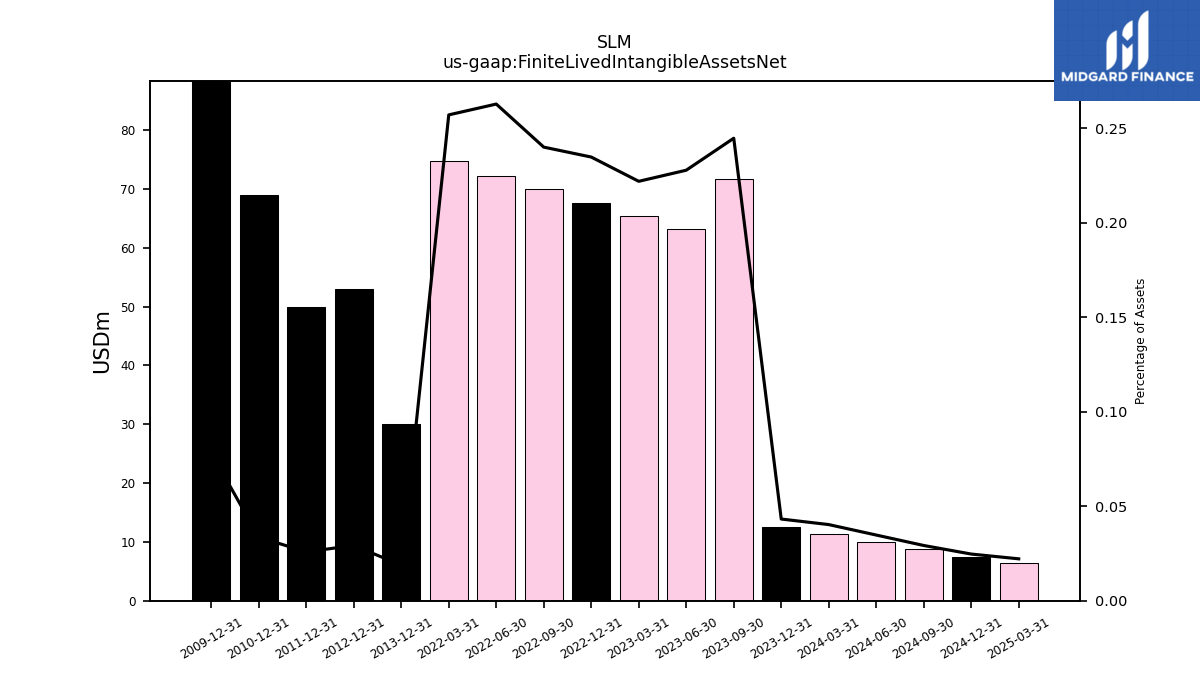
| Finite Lived Intangible Assets Net | 12.61 | 71.62 | 63.10 | 65.35 | 67.62 | 69.92 | 72.25 | 74.67 | NA | NA | NA | NA | NA | NA | NA | NA | NA | NA | NA | NA | NA | NA | NA | NA | NA | NA | NA | NA | NA | NA | NA | NA | NA | NA | NA | NA | NA | NA | NA | NA | 30.00 | NA | NA | NA | 53.00 | NA | NA | NA | 50.00 | NA | NA | NA | 69.00 | 133.00 | |
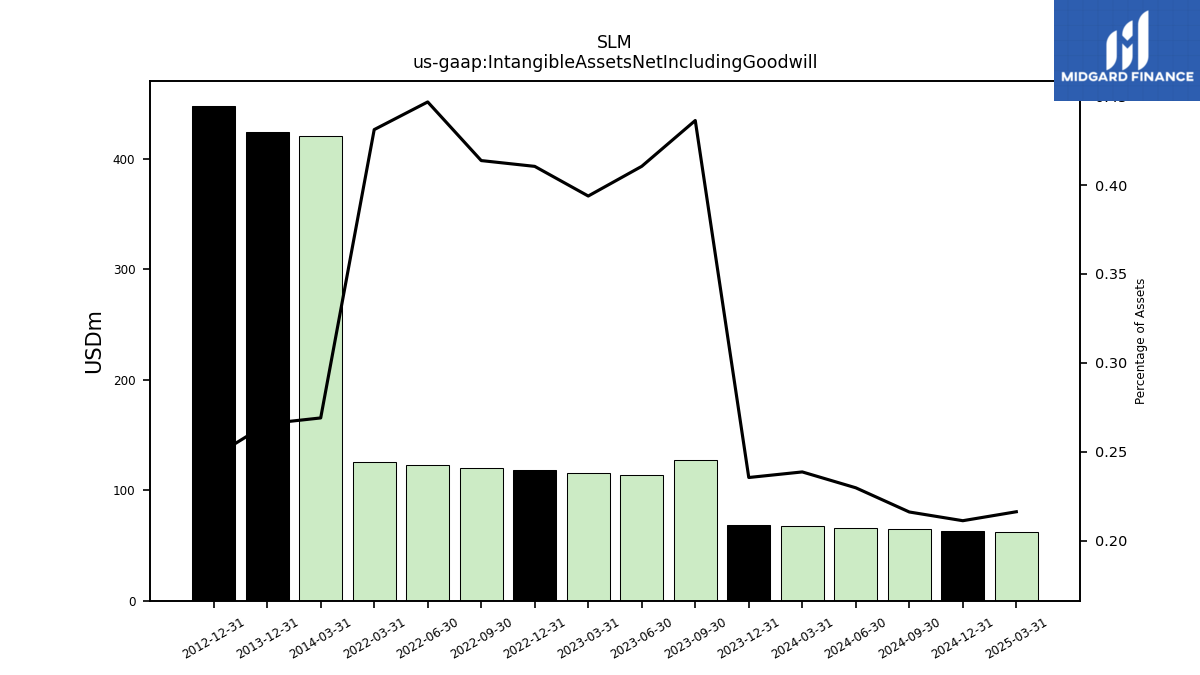
| Intangible Assets Net Including Goodwill | 68.71 | 127.72 | 113.76 | 116.00 | 118.27 | 120.57 | 122.85 | 125.27 | NA | NA | NA | NA | NA | NA | NA | NA | NA | NA | NA | NA | NA | NA | NA | NA | NA | NA | NA | NA | NA | NA | NA | NA | NA | NA | NA | NA | NA | NA | NA | 421.00 | 424.00 | NA | NA | NA | 448.00 | NA | NA | NA | NA | NA | NA | NA | NA | NA | |
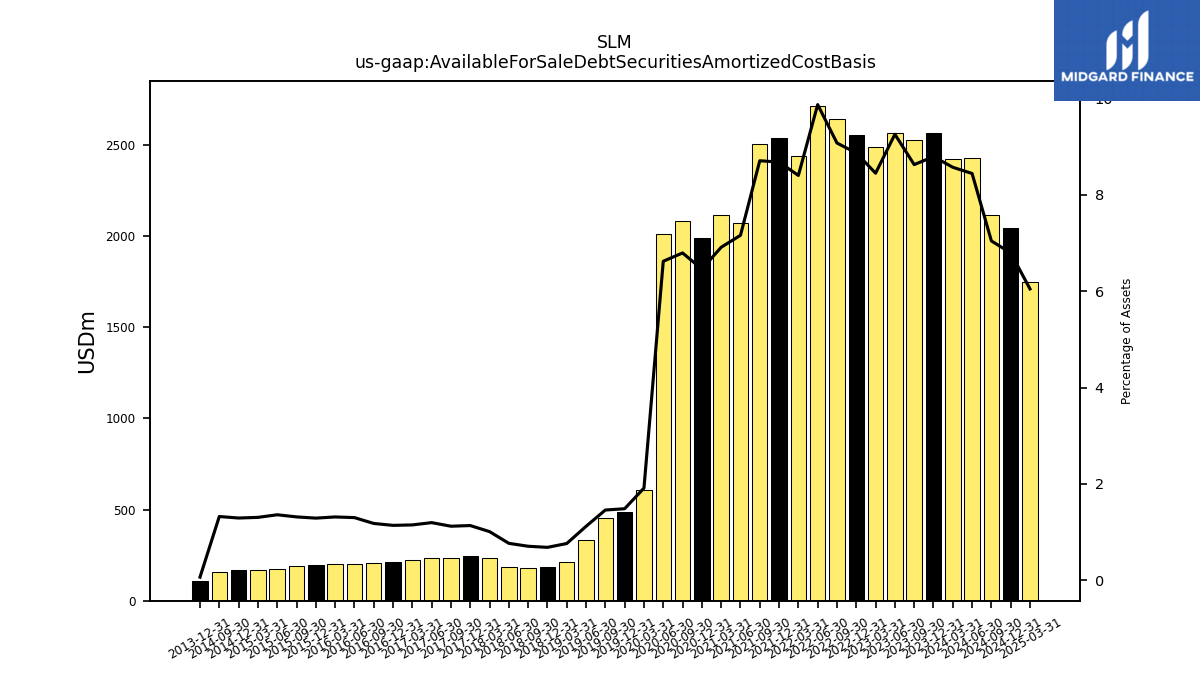
| Available For Sale Debt Securities Amortized Cost Basis | 2563.98 | 2524.63 | 2563.82 | 2487.75 | 2554.33 | 2643.54 | 2713.80 | 2440.20 | 2535.57 | 2506.09 | 2070.35 | 2116.28 | 1986.96 | 2081.24 | 2013.02 | 607.87 | 485.76 | 454.60 | 331.52 | 211.05 | 182.32 | 181.78 | 185.75 | 236.76 | 247.61 | 236.02 | 233.68 | 221.26 | 211.41 | 209.46 | 203.48 | 201.59 | 196.40 | 190.25 | 175.16 | 168.96 | 167.74 | 155.14 | NA | NA | 106.98 | NA | NA | NA | NA | NA | NA | NA | NA | NA | NA | NA | NA | NA |
| 2023-12-31 | 2023-09-30 | 2023-06-30 | 2023-03-31 | 2022-12-31 | 2022-09-30 | 2022-06-30 | 2022-03-31 | 2021-12-31 | 2021-09-30 | 2021-06-30 | 2021-03-31 | 2020-12-31 | 2020-09-30 | 2020-06-30 | 2020-03-31 | 2019-12-31 | 2019-09-30 | 2019-06-30 | 2019-03-31 | 2018-12-31 | 2018-09-30 | 2018-06-30 | 2018-03-31 | 2017-12-31 | 2017-09-30 | 2017-06-30 | 2017-03-31 | 2016-12-31 | 2016-09-30 | 2016-06-30 | 2016-03-31 | 2015-12-31 | 2015-09-30 | 2015-06-30 | 2015-03-31 | 2014-12-31 | 2014-09-30 | 2014-06-30 | 2014-03-31 | 2013-12-31 | 2013-09-30 | 2013-06-30 | 2013-03-31 | 2012-12-31 | 2012-09-30 | 2012-06-30 | 2012-03-31 | 2011-12-31 | 2011-09-30 | 2011-06-30 | 2011-03-31 | 2010-12-31 | 2009-12-31 | ||
|---|---|---|---|---|---|---|---|---|---|---|---|---|---|---|---|---|---|---|---|---|---|---|---|---|---|---|---|---|---|---|---|---|---|---|---|---|---|---|---|---|---|---|---|---|---|---|---|---|---|---|---|---|---|---|---|
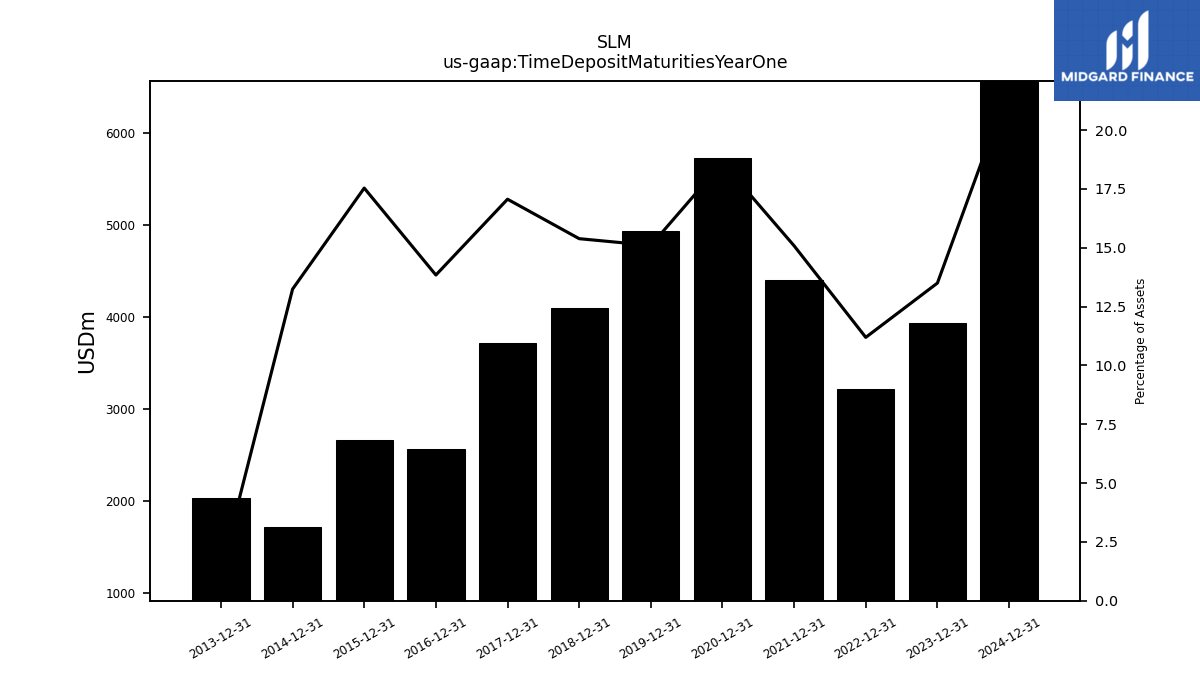
| Time Deposit Maturities Year One | 3937.77 | NA | NA | NA | 3224.57 | NA | NA | NA | 4407.37 | NA | NA | NA | 5728.56 | NA | NA | NA | 4934.93 | NA | NA | NA | 4098.52 | NA | NA | NA | 3716.18 | NA | NA | NA | 2565.25 | NA | NA | NA | 2667.98 | NA | NA | NA | 1717.89 | NA | NA | NA | 2030.19 | NA | NA | NA | NA | NA | NA | NA | NA | NA | NA | NA | NA | NA | |
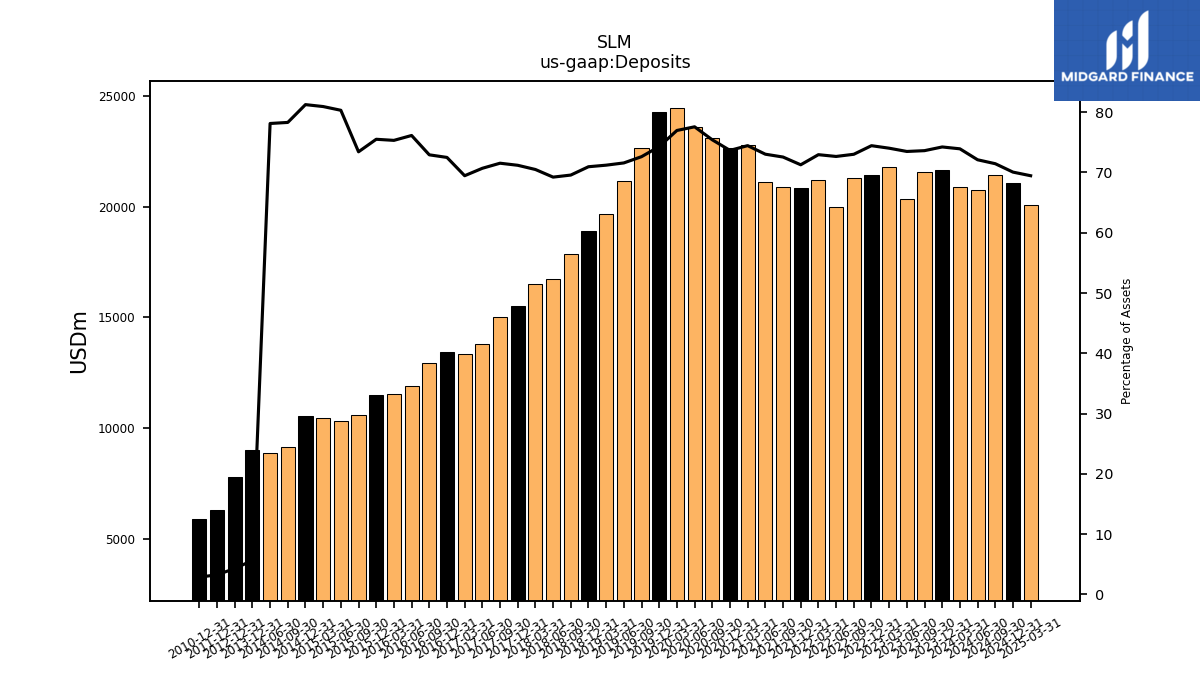
| Deposits | 21653.19 | 21550.74 | 20361.49 | 21803.67 | 21448.07 | 21276.75 | 19979.72 | 21194.03 | 20828.12 | 20890.86 | 21124.38 | 22803.14 | 22666.04 | 23109.92 | 23592.12 | 24445.61 | 24283.98 | 22628.68 | 21178.13 | 19663.99 | 18900.00 | 17873.29 | 16745.96 | 16500.00 | 15505.38 | 15034.05 | 13794.82 | 13361.87 | 13435.67 | 12941.34 | 11900.08 | 11543.35 | 11487.71 | 10610.88 | 10340.60 | 10467.75 | 10540.56 | 9173.02 | 8890.21 | NA | 9001.55 | NA | NA | NA | 7800.00 | NA | NA | NA | 6300.00 | NA | NA | NA | 5900.00 | NA |
| 2023-12-31 | 2023-09-30 | 2023-06-30 | 2023-03-31 | 2022-12-31 | 2022-09-30 | 2022-06-30 | 2022-03-31 | 2021-12-31 | 2021-09-30 | 2021-06-30 | 2021-03-31 | 2020-12-31 | 2020-09-30 | 2020-06-30 | 2020-03-31 | 2019-12-31 | 2019-09-30 | 2019-06-30 | 2019-03-31 | 2018-12-31 | 2018-09-30 | 2018-06-30 | 2018-03-31 | 2017-12-31 | 2017-09-30 | 2017-06-30 | 2017-03-31 | 2016-12-31 | 2016-09-30 | 2016-06-30 | 2016-03-31 | 2015-12-31 | 2015-09-30 | 2015-06-30 | 2015-03-31 | 2014-12-31 | 2014-09-30 | 2014-06-30 | 2014-03-31 | 2013-12-31 | 2013-09-30 | 2013-06-30 | 2013-03-31 | 2012-12-31 | 2012-09-30 | 2012-06-30 | 2012-03-31 | 2011-12-31 | 2011-09-30 | 2011-06-30 | 2011-03-31 | 2010-12-31 | 2009-12-31 | ||
|---|---|---|---|---|---|---|---|---|---|---|---|---|---|---|---|---|---|---|---|---|---|---|---|---|---|---|---|---|---|---|---|---|---|---|---|---|---|---|---|---|---|---|---|---|---|---|---|---|---|---|---|---|---|---|---|
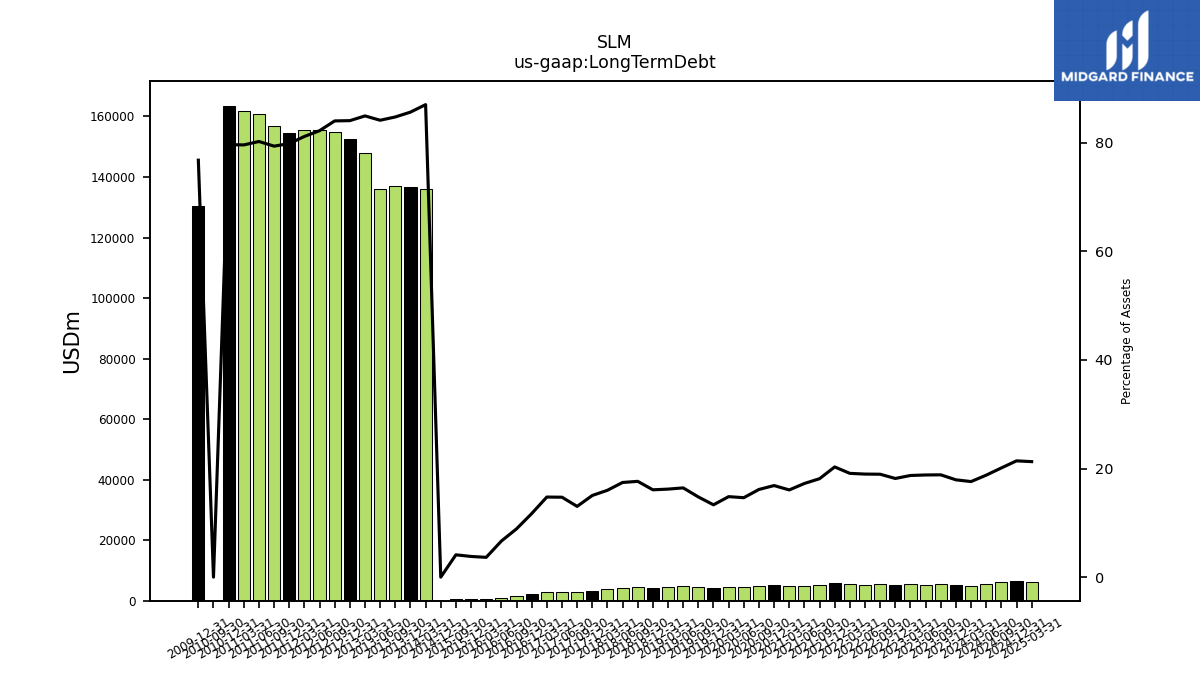
| Long Term Debt | 5227.51 | 5515.53 | 5213.70 | 5513.98 | 5235.11 | 5522.31 | 5219.31 | 5552.50 | 5930.99 | 5219.75 | 4989.06 | 4918.67 | 5189.22 | 4947.65 | 4449.77 | 4708.04 | 4354.04 | 4601.89 | 4862.76 | 4476.41 | 4284.30 | 4532.22 | 4217.12 | 3744.34 | 3275.27 | 2738.66 | 2872.23 | 2837.35 | 2167.98 | 1577.69 | 1038.03 | 558.51 | 579.10 | 593.69 | NA | NA | 0.00 | NA | NA | 136177.00 | 136648.00 | 136944.00 | 135879.00 | 147887.00 | 152401.00 | 154786.00 | 155476.00 | 155588.00 | 154393.00 | 156810.00 | 160765.28 | 161886.31 | 163543.50 | 130546.27 |
| 2023-12-31 | 2023-09-30 | 2023-06-30 | 2023-03-31 | 2022-12-31 | 2022-09-30 | 2022-06-30 | 2022-03-31 | 2021-12-31 | 2021-09-30 | 2021-06-30 | 2021-03-31 | 2020-12-31 | 2020-09-30 | 2020-06-30 | 2020-03-31 | 2019-12-31 | 2019-09-30 | 2019-06-30 | 2019-03-31 | 2018-12-31 | 2018-09-30 | 2018-06-30 | 2018-03-31 | 2017-12-31 | 2017-09-30 | 2017-06-30 | 2017-03-31 | 2016-12-31 | 2016-09-30 | 2016-06-30 | 2016-03-31 | 2015-12-31 | 2015-09-30 | 2015-06-30 | 2015-03-31 | 2014-12-31 | 2014-09-30 | 2014-06-30 | 2014-03-31 | 2013-12-31 | 2013-09-30 | 2013-06-30 | 2013-03-31 | 2012-12-31 | 2012-09-30 | 2012-06-30 | 2012-03-31 | 2011-12-31 | 2011-09-30 | 2011-06-30 | 2011-03-31 | 2010-12-31 | 2009-12-31 | ||
|---|---|---|---|---|---|---|---|---|---|---|---|---|---|---|---|---|---|---|---|---|---|---|---|---|---|---|---|---|---|---|---|---|---|---|---|---|---|---|---|---|---|---|---|---|---|---|---|---|---|---|---|---|---|---|---|
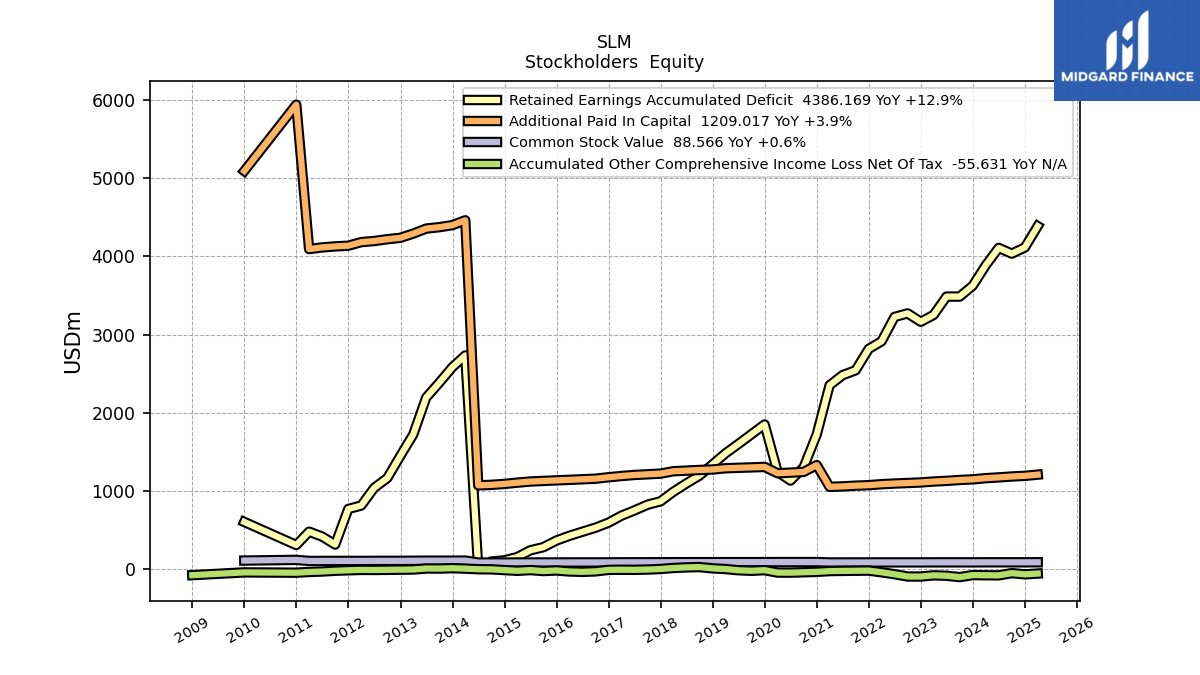
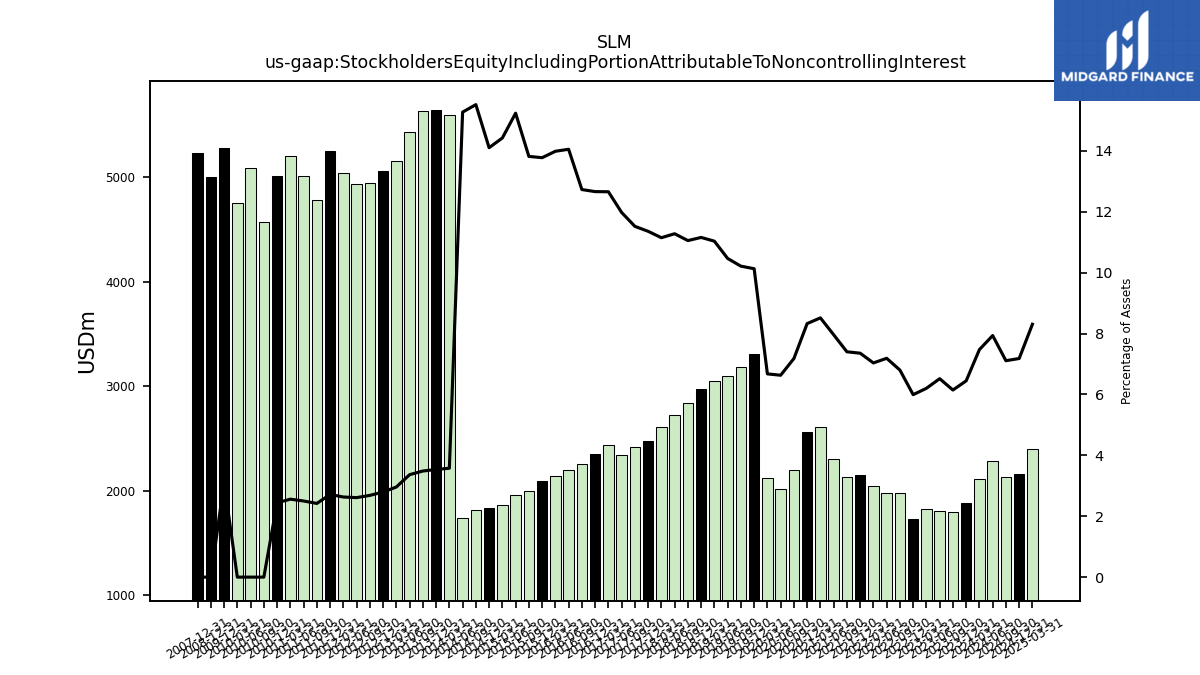
| Stockholders Equity Including Portion Attributable To Noncontrolling Interest | 1880.80 | 1799.22 | 1806.36 | 1827.10 | 1726.97 | 1982.23 | 1976.81 | 2044.21 | 2149.71 | 2131.26 | 2303.38 | 2608.46 | 2562.84 | 2200.45 | 2016.92 | 2120.58 | 3311.84 | 3183.13 | 3097.32 | 3047.53 | 2972.66 | 2840.34 | 2728.70 | 2609.83 | 2474.26 | 2421.84 | 2337.71 | 2435.36 | 2347.06 | 2259.50 | 2196.91 | 2143.93 | 2096.32 | 1997.33 | 1962.17 | 1865.91 | 1829.96 | 1818.43 | 1738.26 | 5598.00 | 5642.00 | 5632.00 | 5434.00 | 5154.00 | 5066.00 | 4946.00 | 4938.00 | 5045.00 | 5251.00 | 4782.00 | 5011.24 | 5207.09 | 5011.58 | 5278.62 | |
| Common Stock Value | 87.65 | 87.64 | 87.60 | 87.53 | 87.03 | 87.02 | 87.02 | 86.92 | 86.40 | 86.40 | 86.30 | 86.21 | 91.35 | 91.32 | 91.32 | 91.29 | 90.72 | 90.71 | 90.70 | 90.67 | 89.97 | 89.96 | 89.88 | 89.81 | 88.69 | 88.46 | 88.37 | 88.08 | 87.33 | 86.88 | 86.77 | 86.68 | 86.14 | 86.08 | 86.00 | 85.59 | 84.96 | 84.78 | 84.66 | 110.00 | 109.00 | 109.00 | 109.00 | 108.00 | 107.00 | 107.00 | 107.00 | 106.00 | 106.00 | 106.00 | 105.72 | 105.50 | 119.05 | 110.44 | |
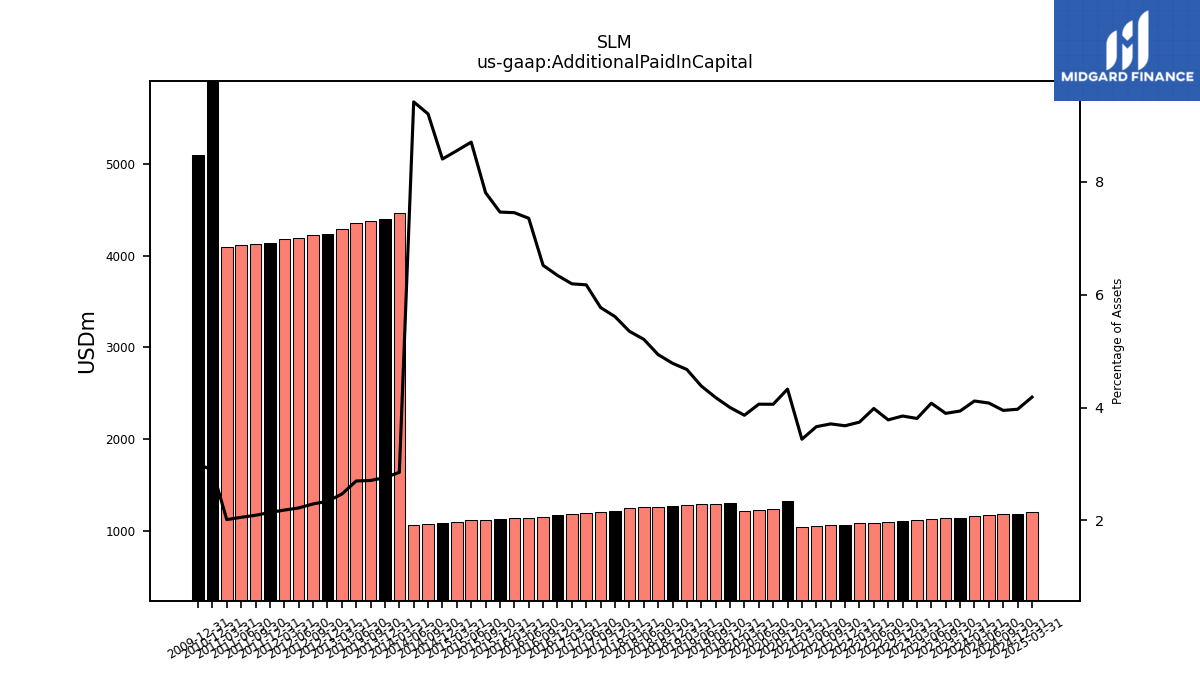
| Additional Paid In Capital | 1148.69 | 1140.60 | 1129.54 | 1121.08 | 1109.07 | 1101.76 | 1095.30 | 1086.85 | 1074.38 | 1068.06 | 1058.70 | 1052.90 | 1331.25 | 1243.48 | 1234.45 | 1226.89 | 1307.63 | 1301.63 | 1296.41 | 1290.68 | 1274.63 | 1268.76 | 1260.20 | 1252.61 | 1222.28 | 1213.20 | 1205.04 | 1191.47 | 1175.56 | 1157.25 | 1149.78 | 1142.50 | 1135.86 | 1128.49 | 1120.92 | 1106.41 | 1090.51 | 1078.50 | 1071.92 | 4461.00 | 4399.00 | 4373.00 | 4355.00 | 4291.00 | 4237.00 | 4219.00 | 4196.00 | 4182.00 | 4136.00 | 4127.00 | 4114.27 | 4092.33 | 5939.84 | 5090.89 | |
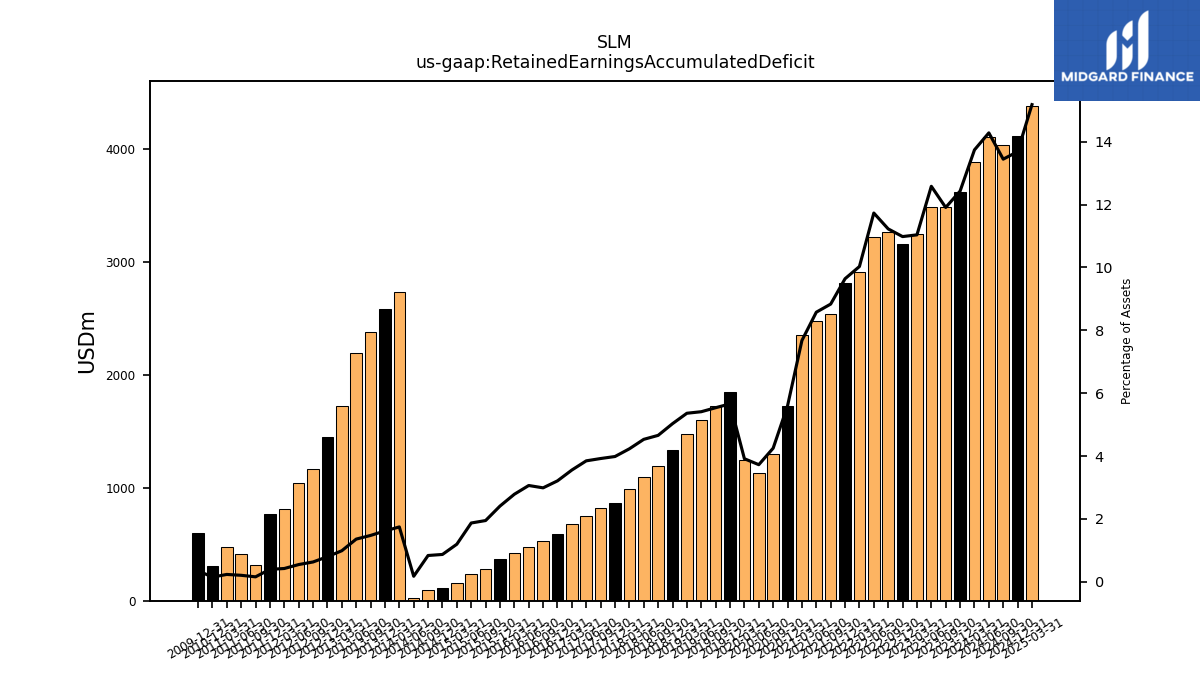
| Retained Earnings Accumulated Deficit | 3624.86 | 3485.57 | 3485.73 | 3250.48 | 3163.64 | 3270.90 | 3225.61 | 2913.54 | 2817.13 | 2543.41 | 2480.67 | 2350.99 | 1722.37 | 1302.65 | 1133.27 | 1243.72 | 1850.51 | 1725.67 | 1600.86 | 1480.72 | 1340.02 | 1196.89 | 1096.36 | 990.45 | 868.18 | 824.32 | 750.97 | 684.16 | 595.32 | 530.59 | 478.95 | 426.99 | 366.61 | 281.76 | 240.97 | 154.82 | 113.07 | 98.21 | 20.17 | 2733.00 | 2584.00 | 2385.00 | 2195.00 | 1723.00 | 1451.00 | 1165.00 | 1040.00 | 814.00 | 770.00 | 315.00 | 417.70 | 479.65 | 308.84 | 604.47 | |
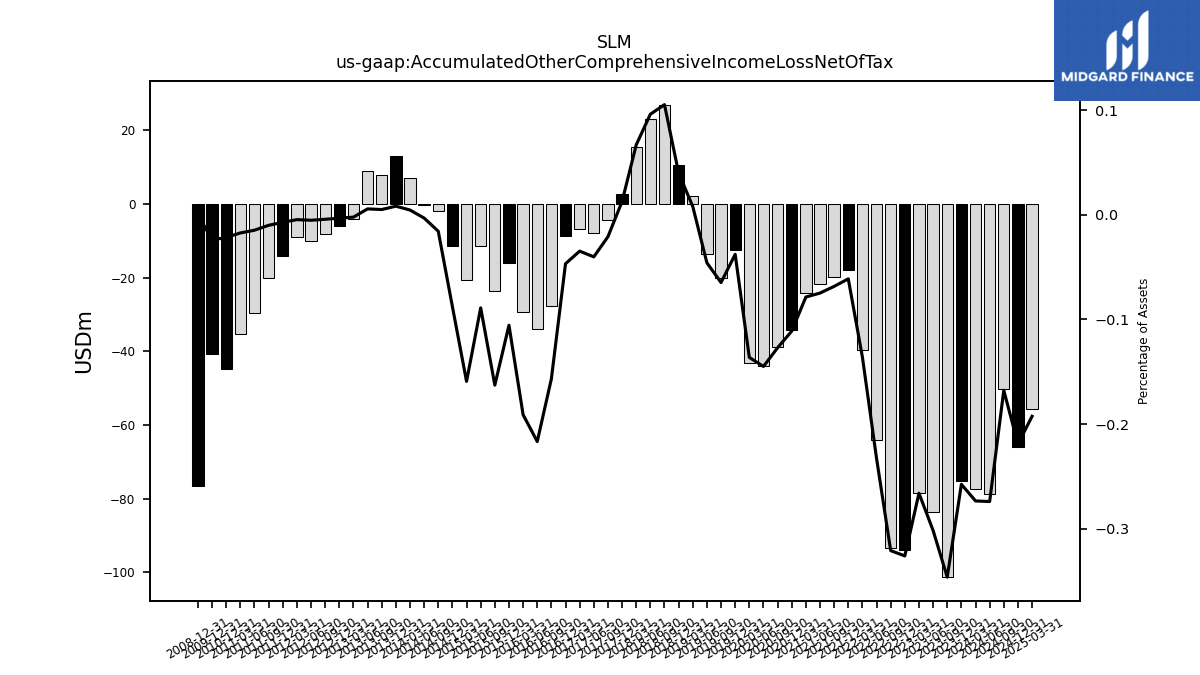
| Accumulated Other Comprehensive Income Loss Net Of Tax | -75.10 | -101.31 | -83.56 | -78.33 | -93.87 | -93.48 | -64.00 | -39.51 | -17.90 | -19.70 | -21.64 | -24.08 | -34.20 | -38.94 | -44.07 | -43.27 | -12.37 | -20.18 | -13.58 | 2.18 | 10.62 | 27.01 | 23.22 | 15.60 | 2.75 | -4.42 | -7.85 | -6.69 | -8.67 | -27.81 | -33.85 | -29.27 | -16.06 | -23.52 | -11.45 | -20.58 | -11.39 | -1.85 | -0.36 | 7.00 | 13.00 | 8.00 | 9.00 | -4.00 | -6.00 | -8.00 | -10.00 | -9.00 | -14.00 | -20.00 | -29.64 | -35.40 | -44.66 | -40.83 | |
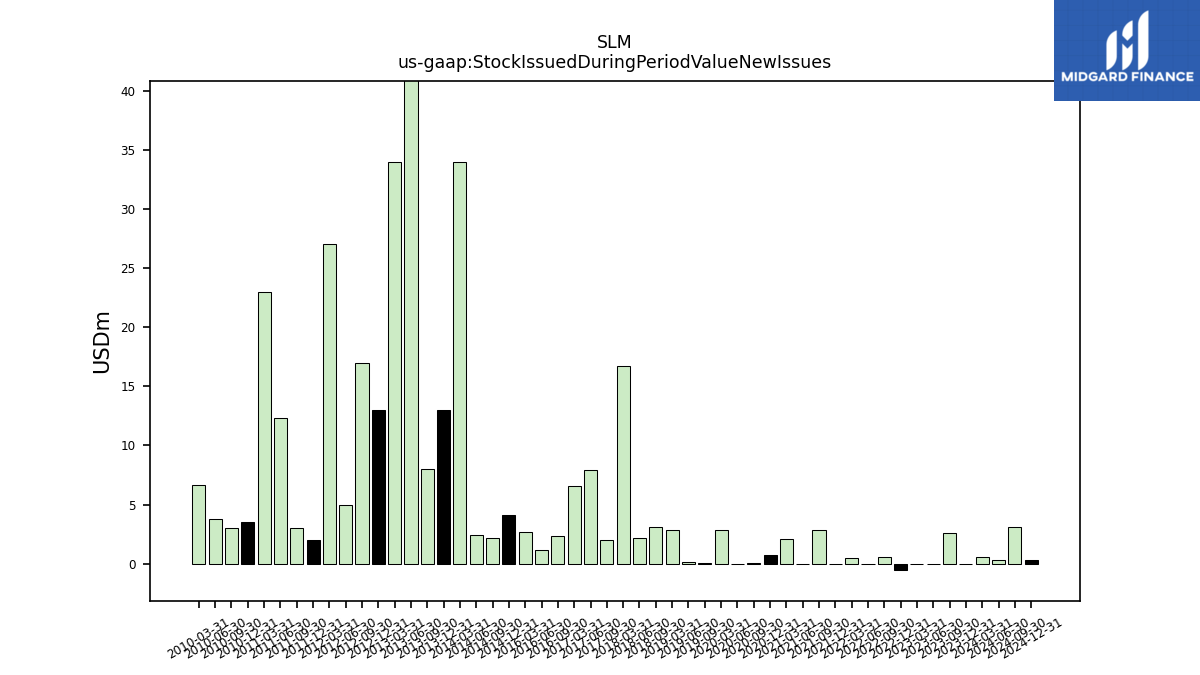
| Stock Issued During Period Value New Issues | 0.00 | 2.63 | -0.00 | -0.00 | -0.56 | 0.54 | 0.00 | 0.45 | 0.00 | 2.87 | -0.04 | 2.06 | 0.70 | 0.02 | -0.00 | 2.87 | NA | 0.09 | 0.17 | 2.85 | NA | 3.08 | 2.15 | 16.70 | NA | 1.97 | 7.96 | 6.54 | NA | 2.38 | 1.15 | 2.71 | NA | NA | NA | NA | 4.07 | 2.17 | 2.44 | 34.00 | 13.00 | 8.00 | 51.00 | 34.00 | 13.00 | 17.00 | 5.00 | 27.00 | 2.00 | 3.00 | 12.30 | 22.93 | 3.54 | NA | |
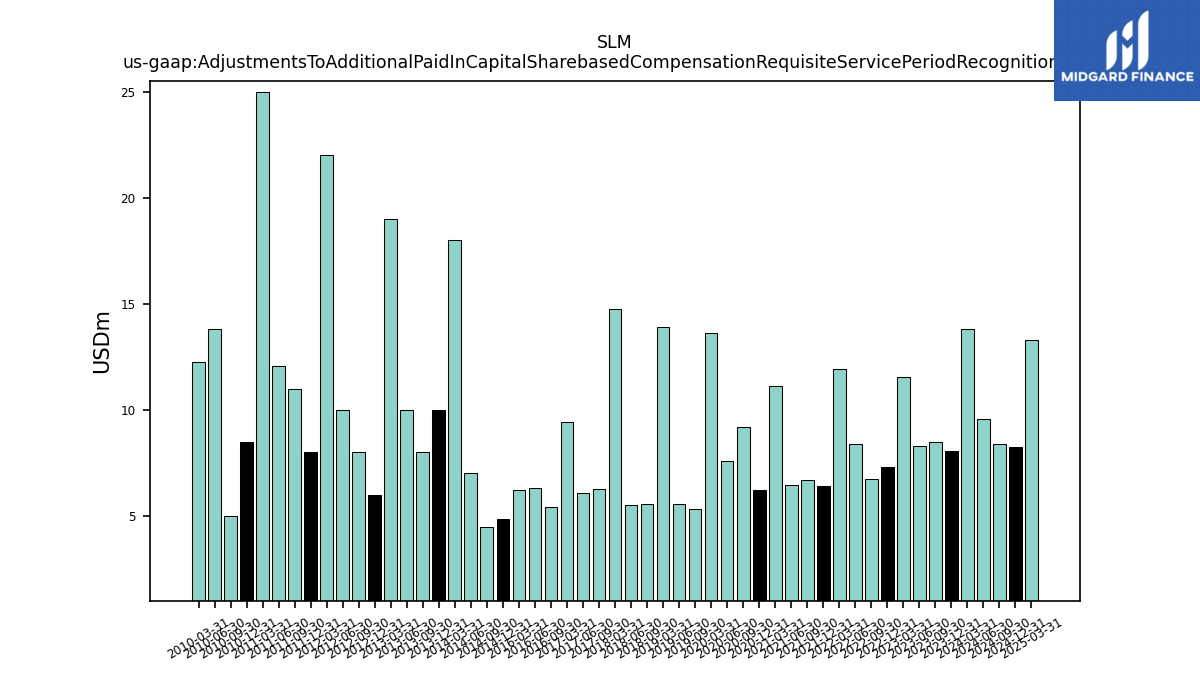
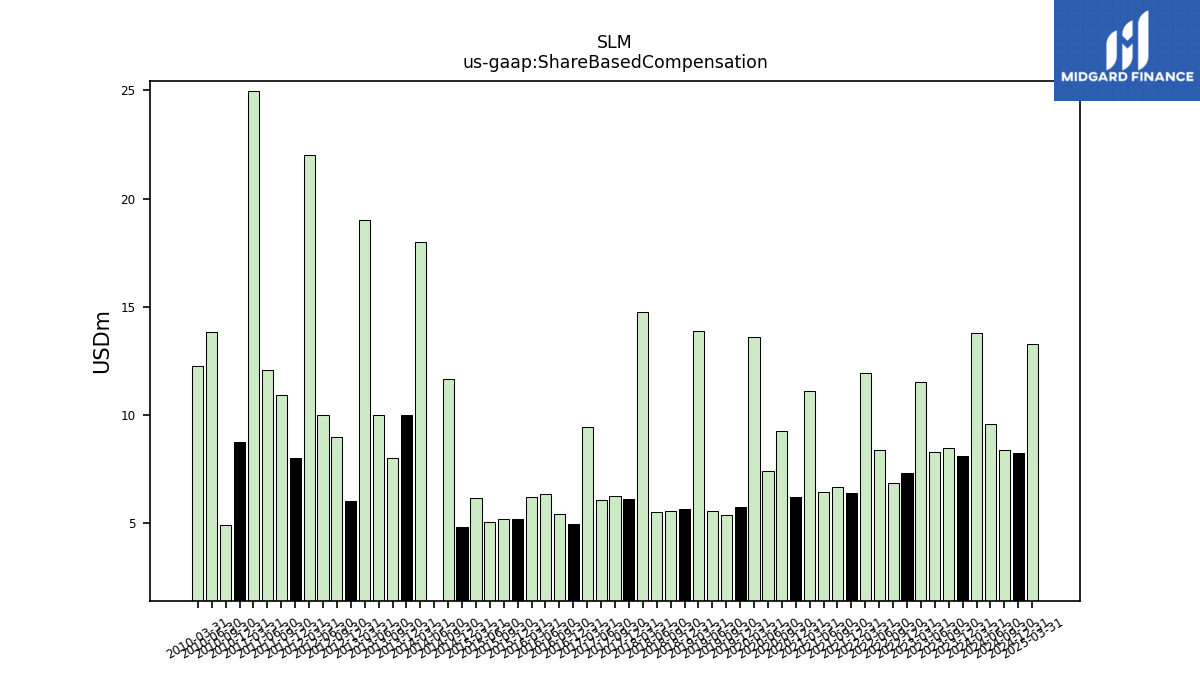
| Adjustments To Additional Paid In Capital Sharebased Compensation Requisite Service Period Recognition Value | 8.08 | 8.47 | 8.29 | 11.54 | 7.31 | 6.75 | 8.38 | 11.92 | 6.39 | 6.69 | 6.44 | 11.12 | 6.21 | 9.19 | 7.58 | 13.61 | NA | 5.31 | 5.58 | 13.89 | NA | 5.57 | 5.52 | 14.74 | NA | 6.27 | 6.08 | 9.43 | NA | 5.40 | 6.33 | 6.22 | NA | NA | NA | NA | 4.84 | 4.50 | 7.04 | 18.00 | 10.00 | 8.00 | 10.00 | 19.00 | 6.00 | 8.00 | 10.00 | 22.00 | 8.00 | 11.00 | 12.07 | 24.99 | 8.49 | NA |
| 2023-12-31 | 2023-09-30 | 2023-06-30 | 2023-03-31 | 2022-12-31 | 2022-09-30 | 2022-06-30 | 2022-03-31 | 2021-12-31 | 2021-09-30 | 2021-06-30 | 2021-03-31 | 2020-12-31 | 2020-09-30 | 2020-06-30 | 2020-03-31 | 2019-12-31 | 2019-09-30 | 2019-06-30 | 2019-03-31 | 2018-12-31 | 2018-09-30 | 2018-06-30 | 2018-03-31 | 2017-12-31 | 2017-09-30 | 2017-06-30 | 2017-03-31 | 2016-12-31 | 2016-09-30 | 2016-06-30 | 2016-03-31 | 2015-12-31 | 2015-09-30 | 2015-06-30 | 2015-03-31 | 2014-12-31 | 2014-09-30 | 2014-06-30 | 2014-03-31 | 2013-12-31 | 2013-09-30 | 2013-06-30 | 2013-03-31 | 2012-12-31 | 2012-09-30 | 2012-06-30 | 2012-03-31 | 2011-12-31 | 2011-09-30 | 2011-06-30 | 2011-03-31 | 2010-12-31 | 2009-12-31 | ||
|---|---|---|---|---|---|---|---|---|---|---|---|---|---|---|---|---|---|---|---|---|---|---|---|---|---|---|---|---|---|---|---|---|---|---|---|---|---|---|---|---|---|---|---|---|---|---|---|---|---|---|---|---|---|---|---|
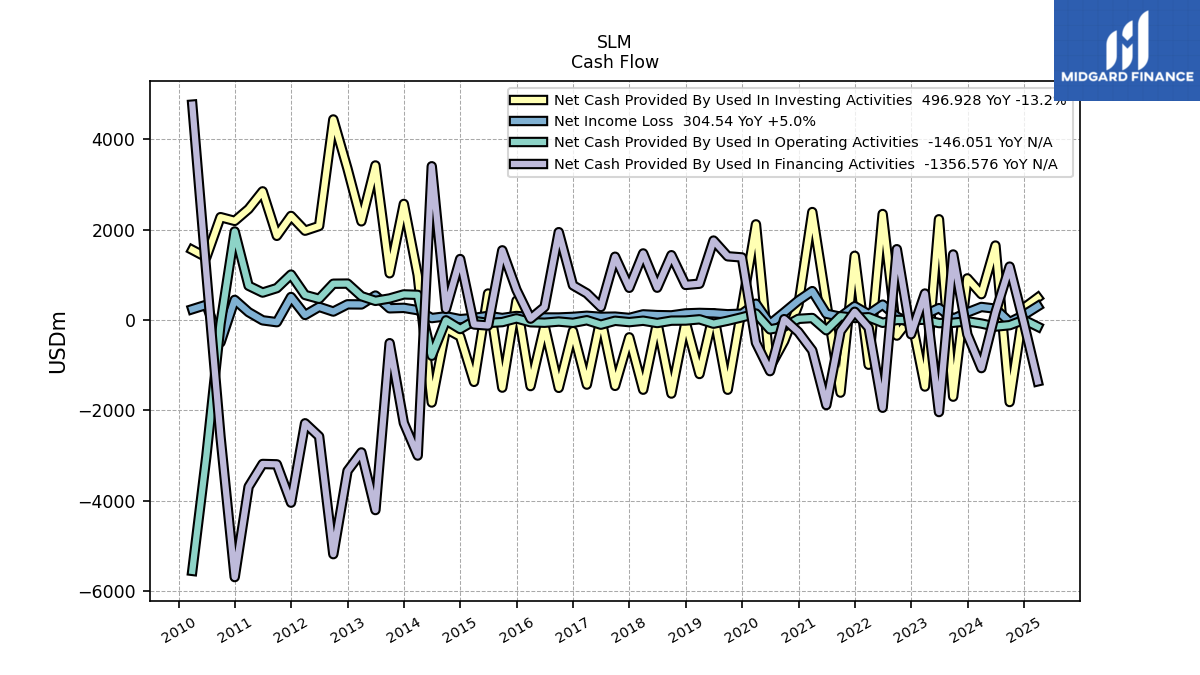
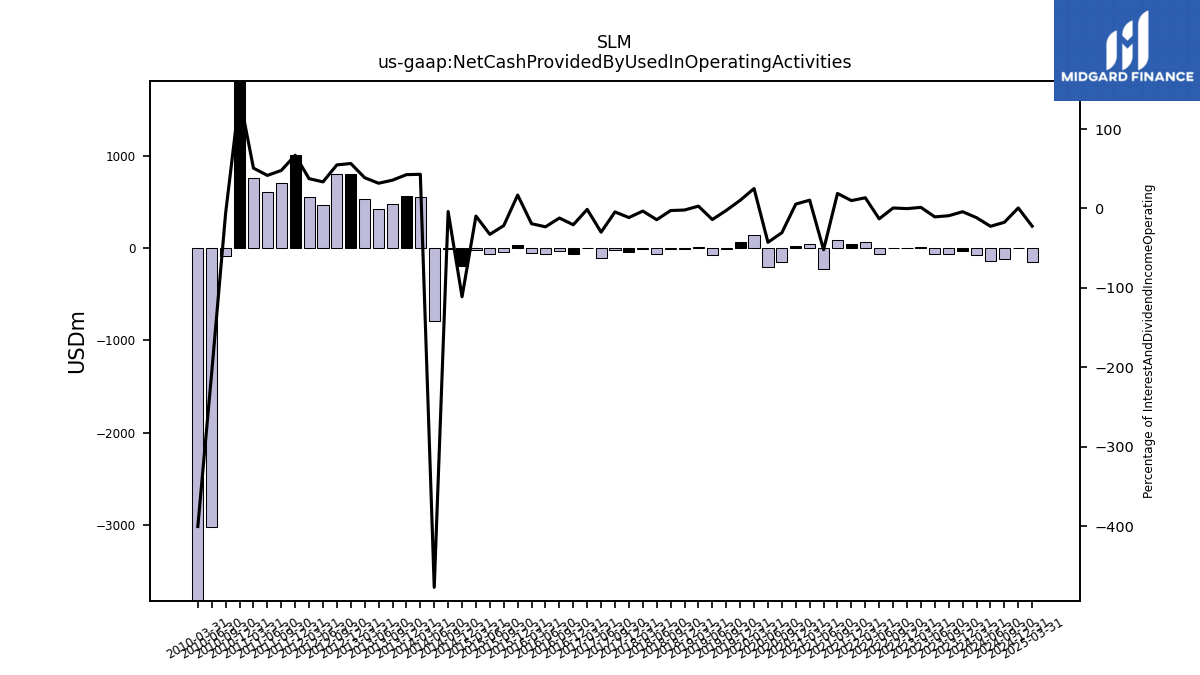
| Net Cash Provided By Used In Operating Activities | -27.14 | -59.35 | -67.03 | 8.89 | -0.88 | 3.37 | -60.29 | 62.79 | 45.60 | 84.81 | -225.69 | 45.75 | 26.48 | -147.01 | -206.56 | 144.41 | 61.76 | -14.36 | -79.76 | 16.71 | -10.34 | -12.91 | -65.34 | -14.16 | -45.59 | -15.70 | -102.01 | -3.61 | -61.56 | -32.70 | -58.89 | -47.78 | 37.63 | -44.94 | -64.71 | -19.18 | -198.55 | -6.36 | -789.86 | 558.00 | 568.00 | 478.00 | 425.00 | 529.00 | 807.00 | 804.00 | 470.00 | 555.00 | 1007.00 | 706.86 | 608.22 | 758.92 | 1960.51 | NA | |
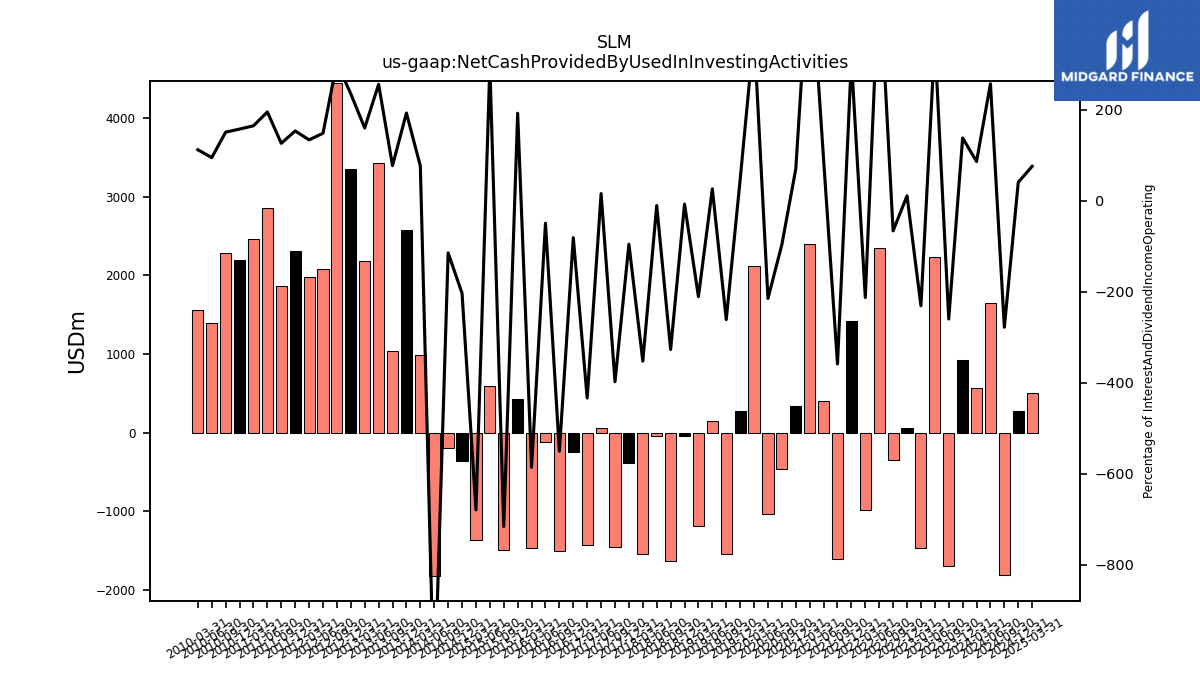
| Net Cash Provided By Used In Investing Activities | 922.78 | -1695.27 | 2231.08 | -1471.05 | 63.19 | -343.80 | 2346.86 | -988.87 | 1422.78 | -1605.30 | 396.83 | 2390.36 | 334.44 | -464.13 | -1041.20 | 2118.22 | 278.54 | -1541.81 | 150.23 | -1193.68 | -39.60 | -1626.28 | -48.02 | -1540.97 | -381.42 | -1456.46 | 53.90 | -1428.53 | -243.49 | -1500.42 | -125.92 | -1461.21 | 427.72 | -1495.42 | 588.06 | -1367.88 | -363.26 | -192.67 | -1824.43 | 992.00 | 2570.00 | 1035.00 | 3421.00 | 2184.00 | 3348.00 | 4439.00 | 2081.00 | 1977.00 | 2304.00 | 1863.05 | 2848.69 | 2458.26 | 2194.11 | NA | |
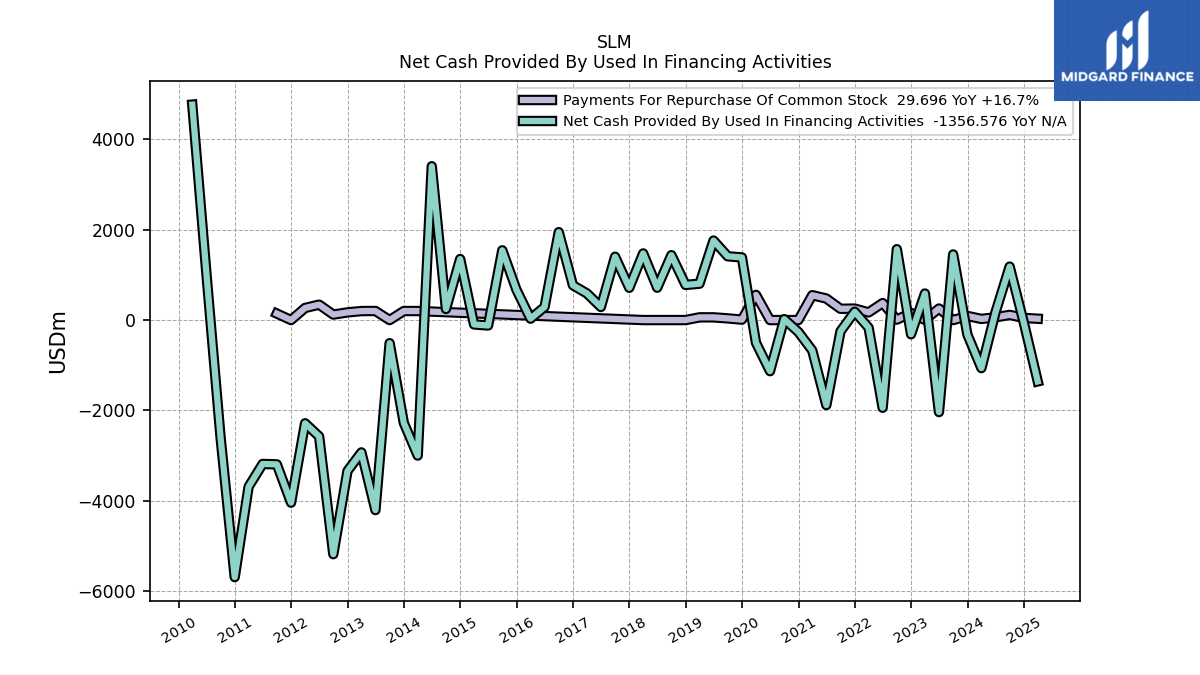
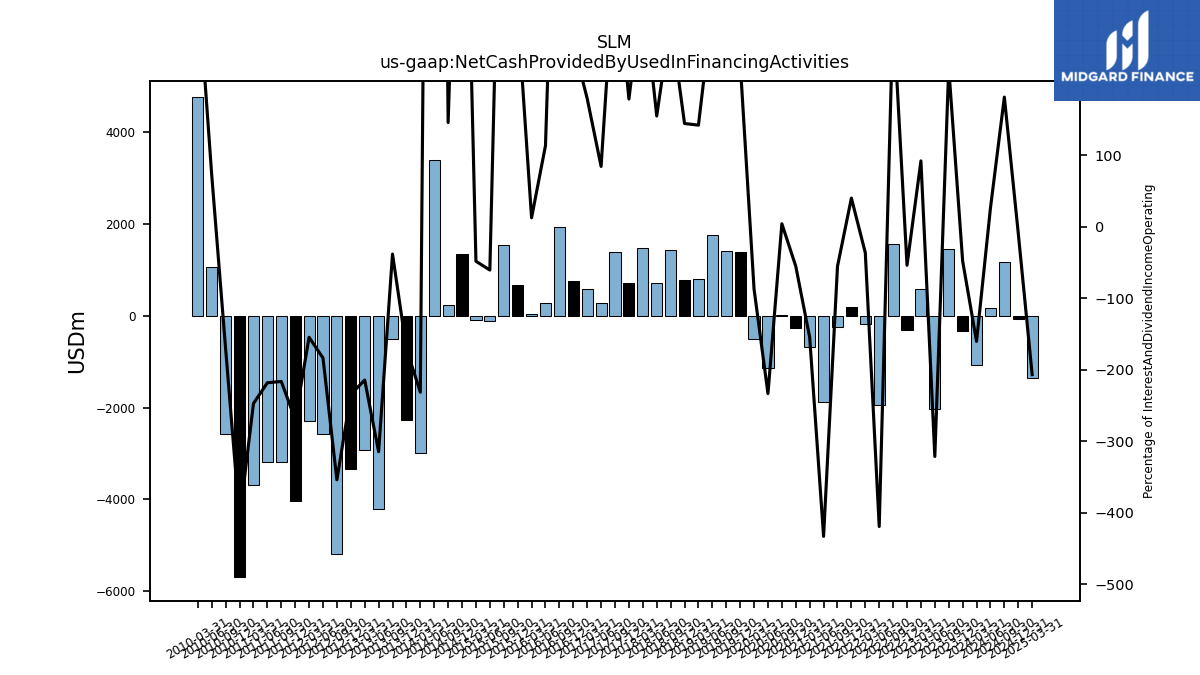
| Net Cash Provided By Used In Financing Activities | -319.42 | 1451.56 | -2035.85 | 587.47 | -314.15 | 1568.34 | -1940.37 | -168.71 | 183.74 | -247.55 | -1881.59 | -674.11 | -264.70 | 20.47 | -1130.45 | -501.03 | 1386.00 | 1410.66 | 1759.68 | 804.88 | 777.13 | 1435.45 | 716.07 | 1474.68 | 713.59 | 1401.75 | 288.70 | 590.93 | 768.90 | 1945.15 | 289.24 | 31.25 | 669.07 | 1543.30 | -120.12 | -97.10 | 1351.22 | 245.24 | 3403.60 | -2998.00 | -2277.00 | -511.00 | -4204.00 | -2928.00 | -3338.00 | -5180.00 | -2574.00 | -2283.00 | -4040.00 | -3192.32 | -3183.65 | -3688.03 | -5687.30 | NA |
| 2023-12-31 | 2023-09-30 | 2023-06-30 | 2023-03-31 | 2022-12-31 | 2022-09-30 | 2022-06-30 | 2022-03-31 | 2021-12-31 | 2021-09-30 | 2021-06-30 | 2021-03-31 | 2020-12-31 | 2020-09-30 | 2020-06-30 | 2020-03-31 | 2019-12-31 | 2019-09-30 | 2019-06-30 | 2019-03-31 | 2018-12-31 | 2018-09-30 | 2018-06-30 | 2018-03-31 | 2017-12-31 | 2017-09-30 | 2017-06-30 | 2017-03-31 | 2016-12-31 | 2016-09-30 | 2016-06-30 | 2016-03-31 | 2015-12-31 | 2015-09-30 | 2015-06-30 | 2015-03-31 | 2014-12-31 | 2014-09-30 | 2014-06-30 | 2014-03-31 | 2013-12-31 | 2013-09-30 | 2013-06-30 | 2013-03-31 | 2012-12-31 | 2012-09-30 | 2012-06-30 | 2012-03-31 | 2011-12-31 | 2011-09-30 | 2011-06-30 | 2011-03-31 | 2010-12-31 | 2009-12-31 | ||
|---|---|---|---|---|---|---|---|---|---|---|---|---|---|---|---|---|---|---|---|---|---|---|---|---|---|---|---|---|---|---|---|---|---|---|---|---|---|---|---|---|---|---|---|---|---|---|---|---|---|---|---|---|---|---|---|
| Net Cash Provided By Used In Operating Activities | -27.14 | -59.35 | -67.03 | 8.89 | -0.88 | 3.37 | -60.29 | 62.79 | 45.60 | 84.81 | -225.69 | 45.75 | 26.48 | -147.01 | -206.56 | 144.41 | 61.76 | -14.36 | -79.76 | 16.71 | -10.34 | -12.91 | -65.34 | -14.16 | -45.59 | -15.70 | -102.01 | -3.61 | -61.56 | -32.70 | -58.89 | -47.78 | 37.63 | -44.94 | -64.71 | -19.18 | -198.55 | -6.36 | -789.86 | 558.00 | 568.00 | 478.00 | 425.00 | 529.00 | 807.00 | 804.00 | 470.00 | 555.00 | 1007.00 | 706.86 | 608.22 | 758.92 | 1960.51 | NA | |
| Net Income Loss | 168.44 | 29.36 | 265.06 | 118.52 | -77.04 | 75.17 | 342.07 | 128.81 | 306.26 | 72.84 | 140.20 | 641.21 | 432.70 | 171.03 | -85.21 | 362.17 | 141.35 | 128.46 | 150.28 | 158.19 | 147.51 | 103.88 | 109.83 | 126.25 | 47.00 | 76.37 | 70.62 | 94.94 | 70.24 | 56.97 | 57.20 | 65.92 | 89.84 | 45.72 | 91.02 | 47.70 | 19.72 | 82.93 | 44.13 | 219.00 | 270.00 | 260.00 | 543.00 | 346.00 | 348.00 | 188.00 | 292.00 | 112.00 | 511.00 | -47.00 | -5.65 | 174.69 | 447.00 | NA | |
| Profit Loss | 168.44 | 29.36 | 265.06 | 118.52 | -77.04 | 75.17 | 342.07 | 128.81 | 306.26 | 72.84 | 140.20 | 641.21 | 432.70 | 171.03 | -85.21 | 362.17 | 141.35 | 128.46 | 150.28 | 158.19 | 147.51 | 103.88 | 109.83 | 126.25 | 47.00 | 76.37 | 70.62 | 94.94 | 70.24 | 56.97 | 57.20 | 65.92 | 89.84 | 45.72 | 91.02 | 47.70 | 19.72 | 82.93 | 44.13 | 219.00 | 270.00 | 260.00 | 542.00 | 346.00 | 348.00 | 187.00 | 291.00 | 111.00 | 511.00 | -47.00 | -6.00 | 175.00 | 447.37 | 309.13 | |
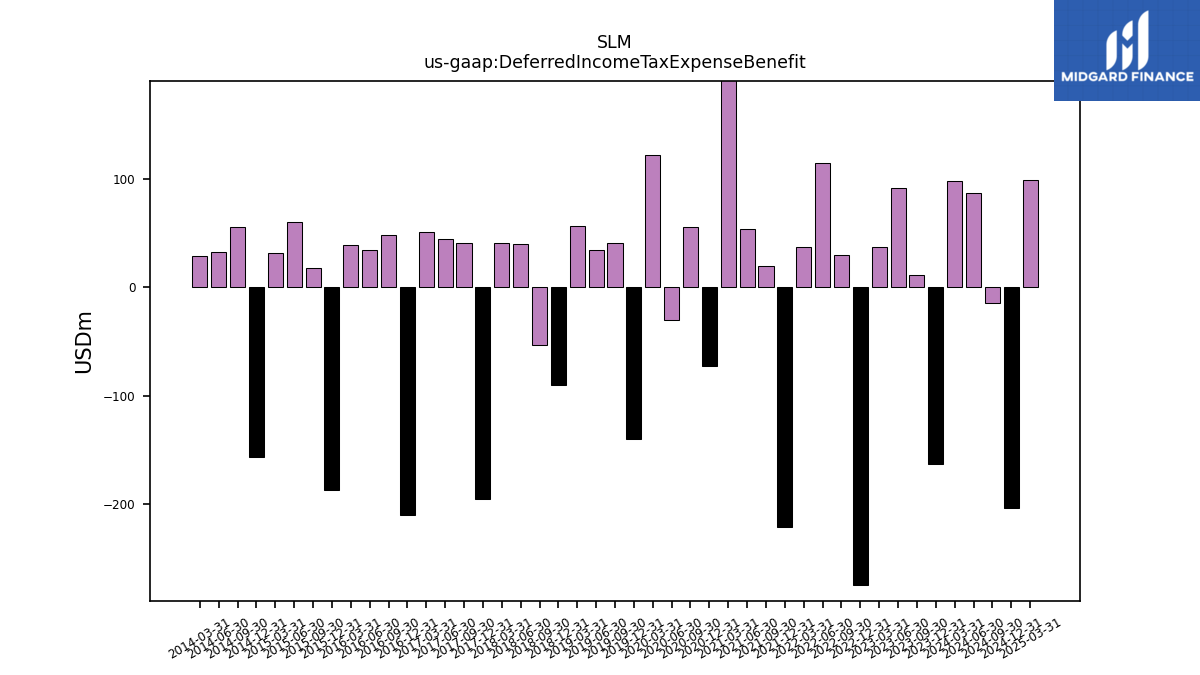
| Deferred Income Tax Expense Benefit | -163.29 | 11.24 | 91.48 | 37.34 | -274.87 | 29.55 | 114.30 | 37.36 | -220.72 | 19.39 | 53.17 | 203.53 | -73.23 | 55.19 | -30.66 | 121.48 | -140.51 | 40.70 | 33.80 | 56.30 | -90.70 | -53.67 | 40.07 | 41.00 | -195.09 | 40.62 | 44.71 | 51.01 | -209.72 | 47.56 | 34.55 | 38.88 | -187.09 | 17.98 | 60.16 | 31.72 | -156.39 | 54.90 | 31.94 | 28.66 | NA | NA | NA | NA | NA | NA | NA | NA | NA | NA | NA | NA | NA | NA | |
| Share Based Compensation | 8.08 | 8.47 | 8.29 | 11.54 | 7.31 | 6.86 | 8.38 | 11.92 | 6.39 | 6.69 | 6.44 | 11.12 | 6.21 | 9.24 | 7.40 | 13.61 | 5.76 | 5.37 | 5.58 | 13.89 | 5.67 | 5.57 | 5.52 | 14.74 | 6.13 | 6.27 | 6.08 | 9.43 | 4.95 | 5.40 | 6.33 | 6.22 | 5.17 | 5.21 | 5.07 | 6.14 | 4.84 | 11.66 | -9.53 | 18.00 | 10.00 | 8.00 | 10.00 | 19.00 | 6.00 | 9.00 | 10.00 | 22.00 | 8.00 | 10.94 | 12.07 | 24.99 | 8.75 | NA |
| 2023-12-31 | 2023-09-30 | 2023-06-30 | 2023-03-31 | 2022-12-31 | 2022-09-30 | 2022-06-30 | 2022-03-31 | 2021-12-31 | 2021-09-30 | 2021-06-30 | 2021-03-31 | 2020-12-31 | 2020-09-30 | 2020-06-30 | 2020-03-31 | 2019-12-31 | 2019-09-30 | 2019-06-30 | 2019-03-31 | 2018-12-31 | 2018-09-30 | 2018-06-30 | 2018-03-31 | 2017-12-31 | 2017-09-30 | 2017-06-30 | 2017-03-31 | 2016-12-31 | 2016-09-30 | 2016-06-30 | 2016-03-31 | 2015-12-31 | 2015-09-30 | 2015-06-30 | 2015-03-31 | 2014-12-31 | 2014-09-30 | 2014-06-30 | 2014-03-31 | 2013-12-31 | 2013-09-30 | 2013-06-30 | 2013-03-31 | 2012-12-31 | 2012-09-30 | 2012-06-30 | 2012-03-31 | 2011-12-31 | 2011-09-30 | 2011-06-30 | 2011-03-31 | 2010-12-31 | 2009-12-31 | ||
|---|---|---|---|---|---|---|---|---|---|---|---|---|---|---|---|---|---|---|---|---|---|---|---|---|---|---|---|---|---|---|---|---|---|---|---|---|---|---|---|---|---|---|---|---|---|---|---|---|---|---|---|---|---|---|---|
| Net Cash Provided By Used In Investing Activities | 922.78 | -1695.27 | 2231.08 | -1471.05 | 63.19 | -343.80 | 2346.86 | -988.87 | 1422.78 | -1605.30 | 396.83 | 2390.36 | 334.44 | -464.13 | -1041.20 | 2118.22 | 278.54 | -1541.81 | 150.23 | -1193.68 | -39.60 | -1626.28 | -48.02 | -1540.97 | -381.42 | -1456.46 | 53.90 | -1428.53 | -243.49 | -1500.42 | -125.92 | -1461.21 | 427.72 | -1495.42 | 588.06 | -1367.88 | -363.26 | -192.67 | -1824.43 | 992.00 | 2570.00 | 1035.00 | 3421.00 | 2184.00 | 3348.00 | 4439.00 | 2081.00 | 1977.00 | 2304.00 | 1863.05 | 2848.69 | 2458.26 | 2194.11 | NA |
| 2023-12-31 | 2023-09-30 | 2023-06-30 | 2023-03-31 | 2022-12-31 | 2022-09-30 | 2022-06-30 | 2022-03-31 | 2021-12-31 | 2021-09-30 | 2021-06-30 | 2021-03-31 | 2020-12-31 | 2020-09-30 | 2020-06-30 | 2020-03-31 | 2019-12-31 | 2019-09-30 | 2019-06-30 | 2019-03-31 | 2018-12-31 | 2018-09-30 | 2018-06-30 | 2018-03-31 | 2017-12-31 | 2017-09-30 | 2017-06-30 | 2017-03-31 | 2016-12-31 | 2016-09-30 | 2016-06-30 | 2016-03-31 | 2015-12-31 | 2015-09-30 | 2015-06-30 | 2015-03-31 | 2014-12-31 | 2014-09-30 | 2014-06-30 | 2014-03-31 | 2013-12-31 | 2013-09-30 | 2013-06-30 | 2013-03-31 | 2012-12-31 | 2012-09-30 | 2012-06-30 | 2012-03-31 | 2011-12-31 | 2011-09-30 | 2011-06-30 | 2011-03-31 | 2010-12-31 | 2009-12-31 | ||
|---|---|---|---|---|---|---|---|---|---|---|---|---|---|---|---|---|---|---|---|---|---|---|---|---|---|---|---|---|---|---|---|---|---|---|---|---|---|---|---|---|---|---|---|---|---|---|---|---|---|---|---|---|---|---|---|
| Net Cash Provided By Used In Financing Activities | -319.42 | 1451.56 | -2035.85 | 587.47 | -314.15 | 1568.34 | -1940.37 | -168.71 | 183.74 | -247.55 | -1881.59 | -674.11 | -264.70 | 20.47 | -1130.45 | -501.03 | 1386.00 | 1410.66 | 1759.68 | 804.88 | 777.13 | 1435.45 | 716.07 | 1474.68 | 713.59 | 1401.75 | 288.70 | 590.93 | 768.90 | 1945.15 | 289.24 | 31.25 | 669.07 | 1543.30 | -120.12 | -97.10 | 1351.22 | 245.24 | 3403.60 | -2998.00 | -2277.00 | -511.00 | -4204.00 | -2928.00 | -3338.00 | -5180.00 | -2574.00 | -2283.00 | -4040.00 | -3192.32 | -3183.65 | -3688.03 | -5687.30 | NA | |
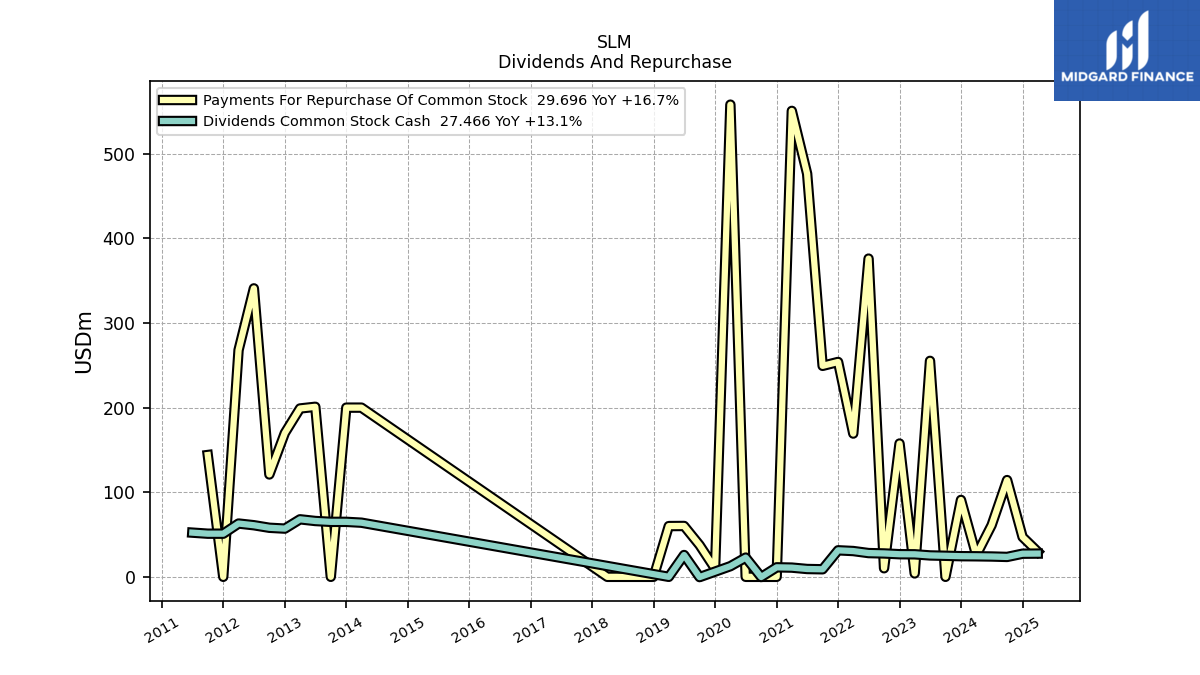
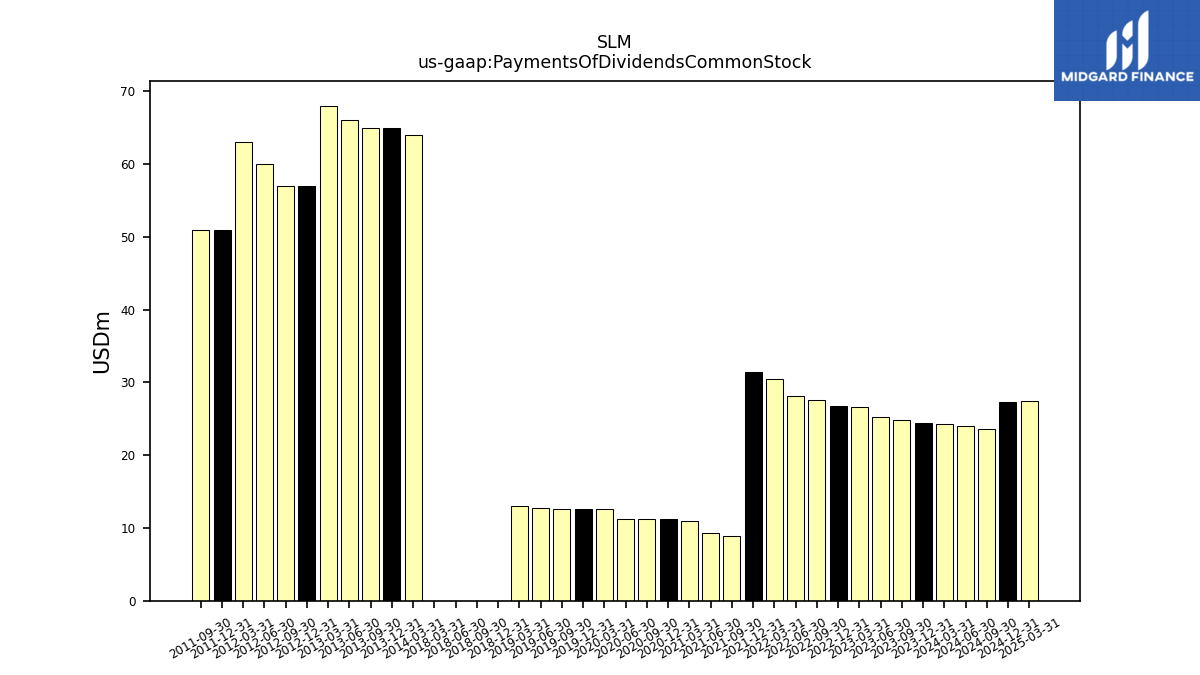
| Payments Of Dividends Common Stock | 24.42 | 24.88 | 25.30 | 26.64 | 26.74 | 27.64 | 28.08 | 30.49 | 31.36 | 8.93 | 9.26 | 10.91 | 11.25 | 11.25 | 11.25 | 12.60 | 12.63 | 12.66 | 12.80 | 13.02 | 0.00 | 0.00 | 0.00 | 0.00 | NA | NA | NA | NA | NA | NA | NA | NA | NA | NA | NA | NA | NA | NA | NA | 64.00 | 65.00 | 65.00 | 66.00 | 68.00 | 57.00 | 57.00 | 60.00 | 63.00 | 51.00 | 51.00 | NA | NA | NA | NA | |
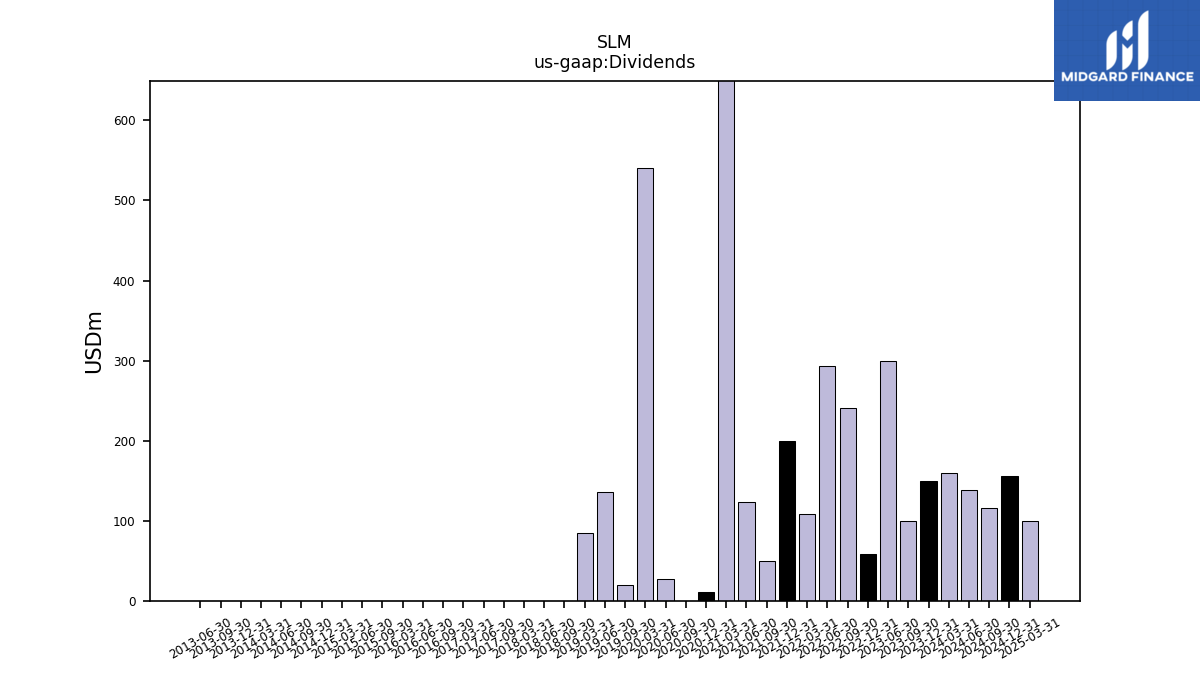
| Dividends | 150.00 | 100.00 | NA | NA | 58.00 | 241.00 | 293.00 | 108.00 | 200.00 | 50.00 | 123.00 | 1000.00 | 11.00 | 0.00 | 27.00 | 541.00 | NA | 20.00 | 136.00 | 85.00 | NA | 0.00 | 0.00 | 0.00 | NA | 0.00 | 0.00 | 0.00 | NA | 0.00 | 0.00 | 0.00 | NA | 0.00 | 0.00 | 0.00 | 0.00 | 0.00 | 0.00 | 0.00 | 0.00 | 0.00 | 0.00 | NA | NA | NA | NA | NA | NA | NA | NA | NA | NA | NA | |
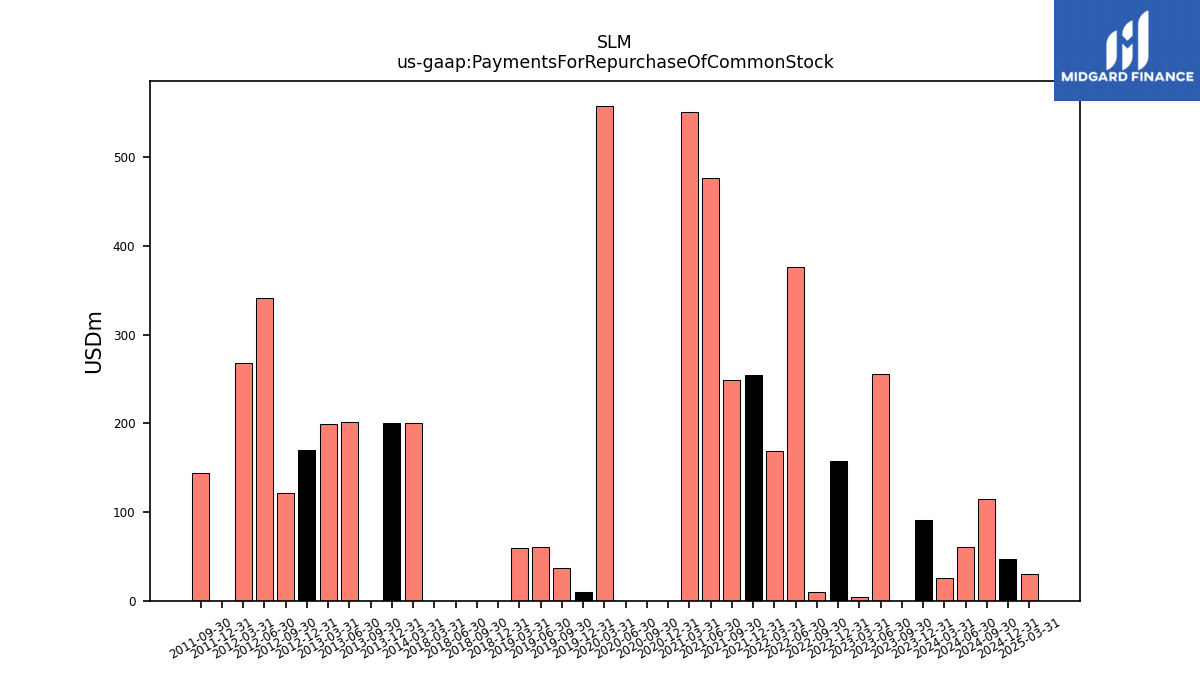
| Payments For Repurchase Of Common Stock | 90.93 | 0.00 | 255.33 | 4.00 | 157.59 | 10.11 | 376.18 | 169.32 | 254.00 | 249.38 | 476.51 | 550.79 | 0.00 | 0.00 | 0.00 | 558.17 | 9.60 | 37.48 | 60.12 | 60.00 | 0.00 | 0.00 | 0.00 | 0.00 | NA | NA | NA | NA | NA | NA | NA | NA | NA | NA | NA | NA | NA | NA | NA | 200.00 | 200.00 | 0.00 | 201.00 | 199.00 | 170.00 | 121.00 | 341.00 | 268.00 | 0.00 | 144.00 | NA | NA | NA | NA |