
| 2023-12-31 | 2023-09-30 | 2023-06-30 | 2023-03-31 | 2022-12-31 | 2022-09-30 | 2022-06-30 | 2022-03-31 | 2021-12-31 | 2021-09-30 | 2021-06-30 | 2021-03-31 | 2020-12-31 | 2020-09-30 | ||
|---|---|---|---|---|---|---|---|---|---|---|---|---|---|---|---|
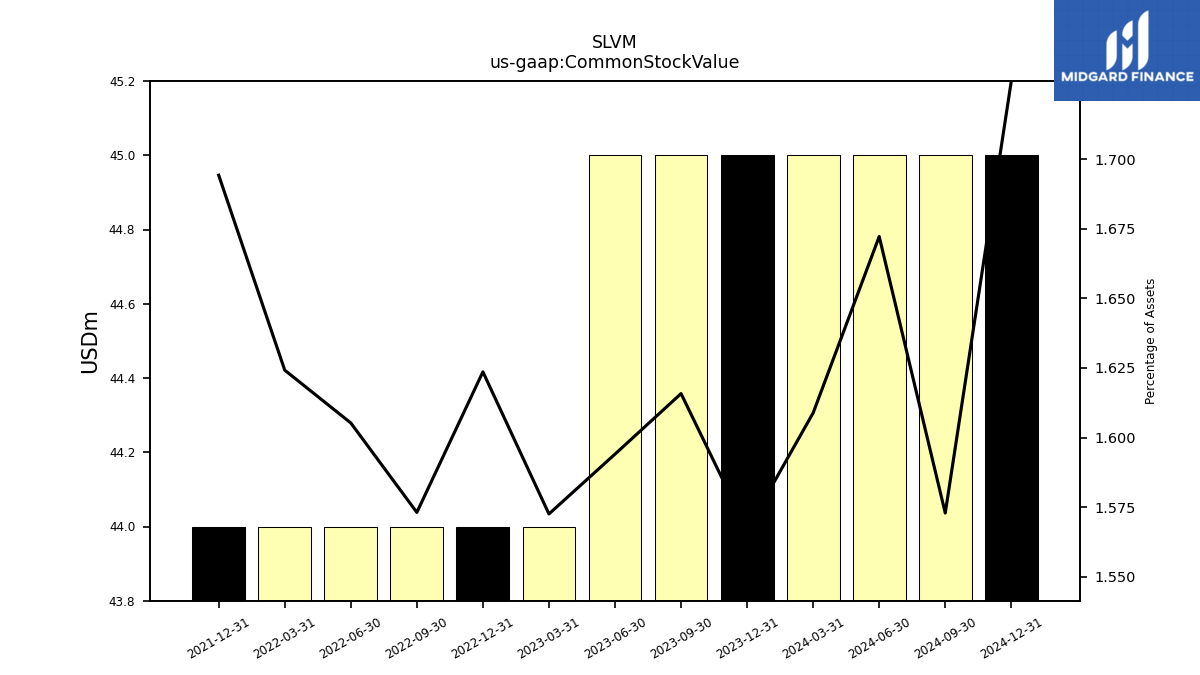
| Common Stock Value | 45.00 | 45.00 | 45.00 | 44.00 | 44.00 | 44.00 | 44.00 | 44.00 | 44.00 | NA | NA | NA | NA | NA | |
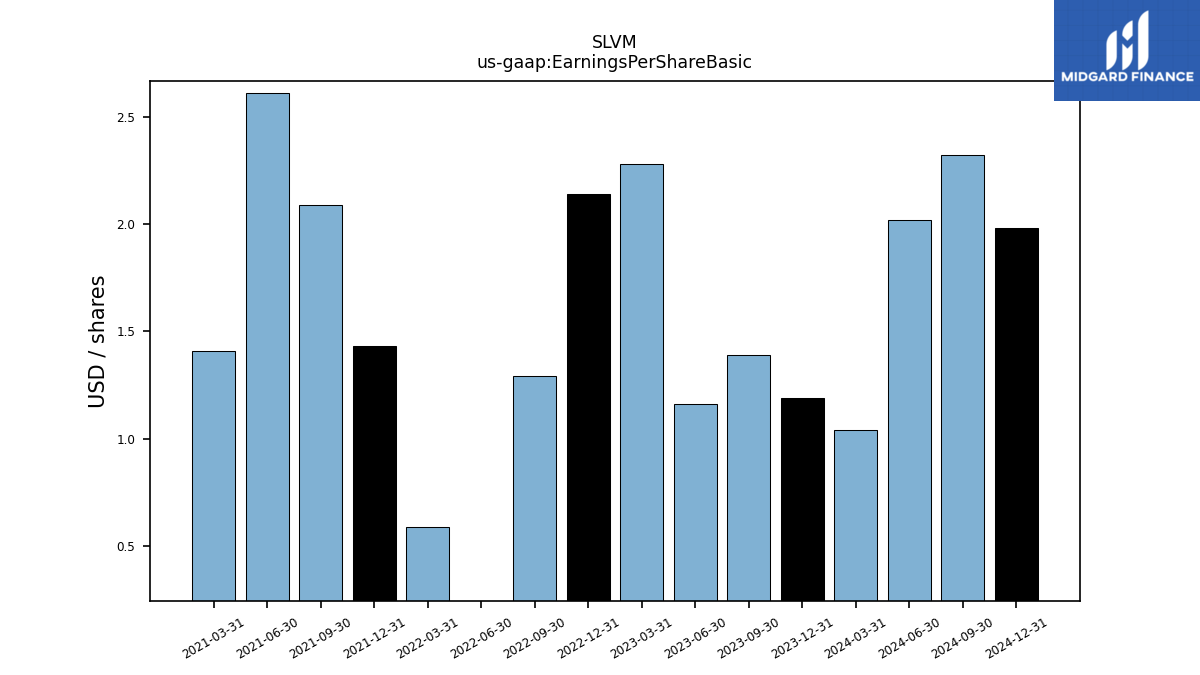
| Earnings Per Share Basic | 1.19 | 1.39 | 1.16 | 2.28 | 2.14 | 1.29 | -1.34 | 0.59 | 1.43 | 2.09 | 2.61 | 1.41 | NA | NA | |
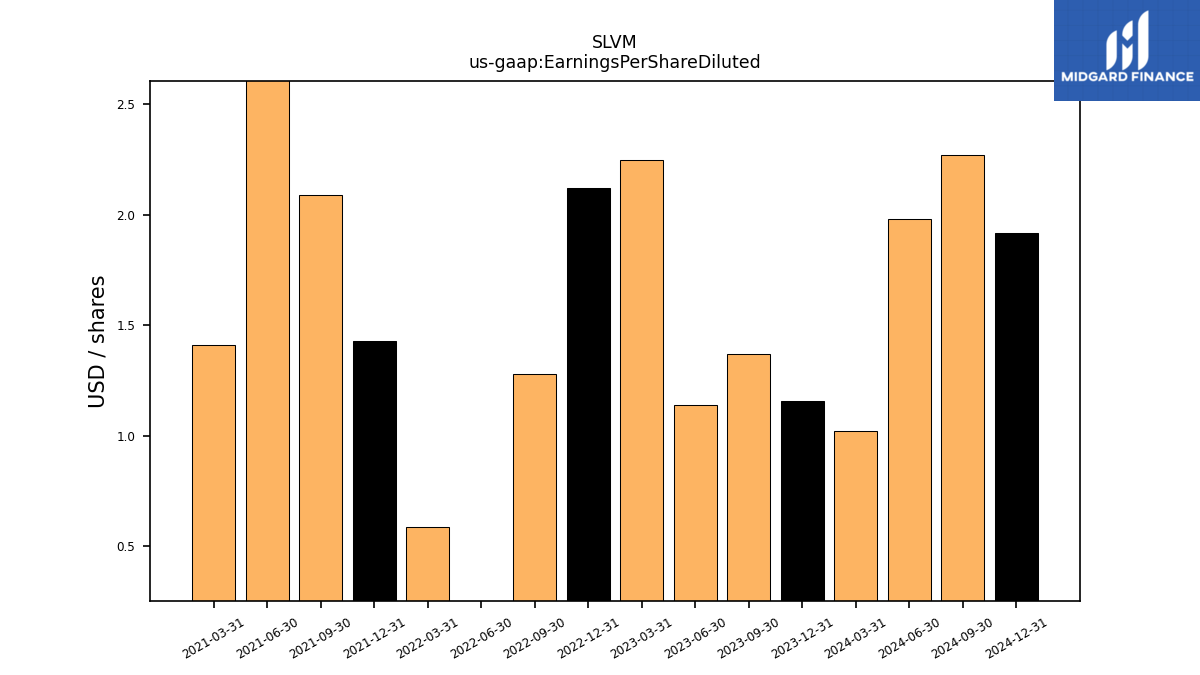
| Earnings Per Share Diluted | 1.16 | 1.37 | 1.14 | 2.25 | 2.12 | 1.28 | -1.33 | 0.59 | 1.43 | 2.09 | 2.61 | 1.41 | NA | NA | |
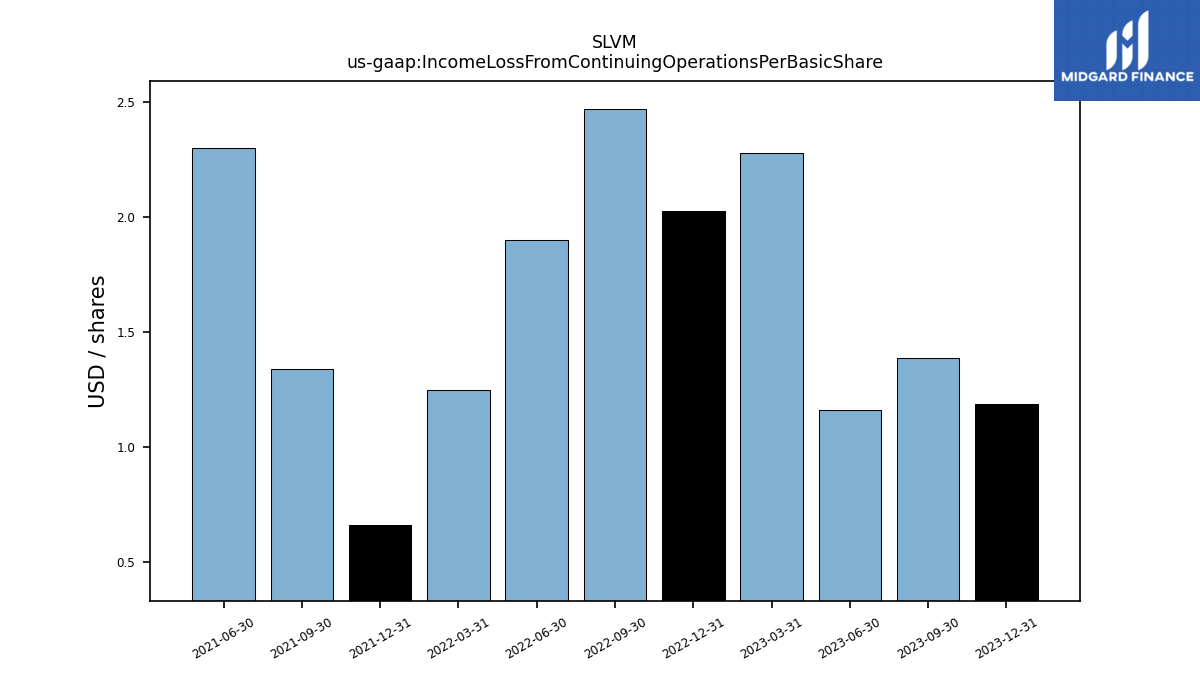
| Income Loss From Continuing Operations Per Basic Share | 0.00 | 0.00 | 0.00 | 0.00 | 0.00 | 0.00 | 0.00 | 0.00 | 0.00 | 0.00 | 0.00 | NA | NA | NA | |
| Income Loss From Continuing Operations Per Diluted Share | 0.00 | 0.00 | 0.00 | 0.00 | 0.00 | 0.00 | 0.00 | 0.00 | 0.00 | 0.00 | 0.00 | NA | NA | NA |
| 2023-12-31 | 2023-09-30 | 2023-06-30 | 2023-03-31 | 2022-12-31 | 2022-09-30 | 2022-06-30 | 2022-03-31 | 2021-12-31 | 2021-09-30 | 2021-06-30 | 2021-03-31 | 2020-12-31 | 2020-09-30 | ||
|---|---|---|---|---|---|---|---|---|---|---|---|---|---|---|---|
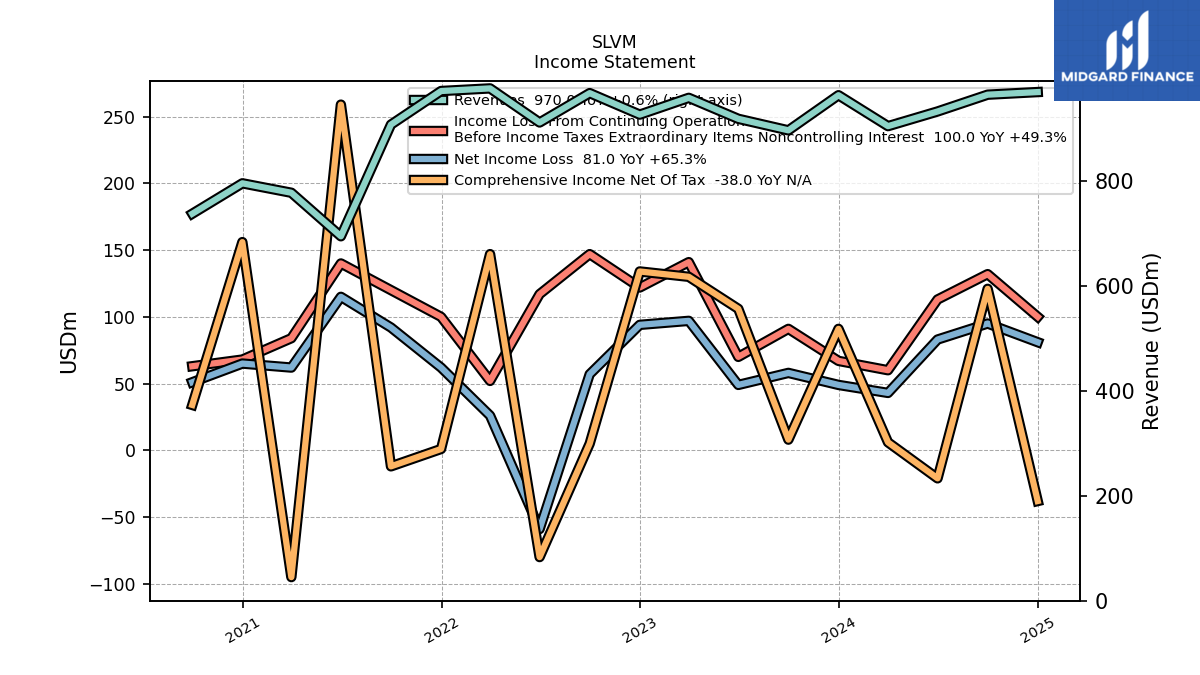
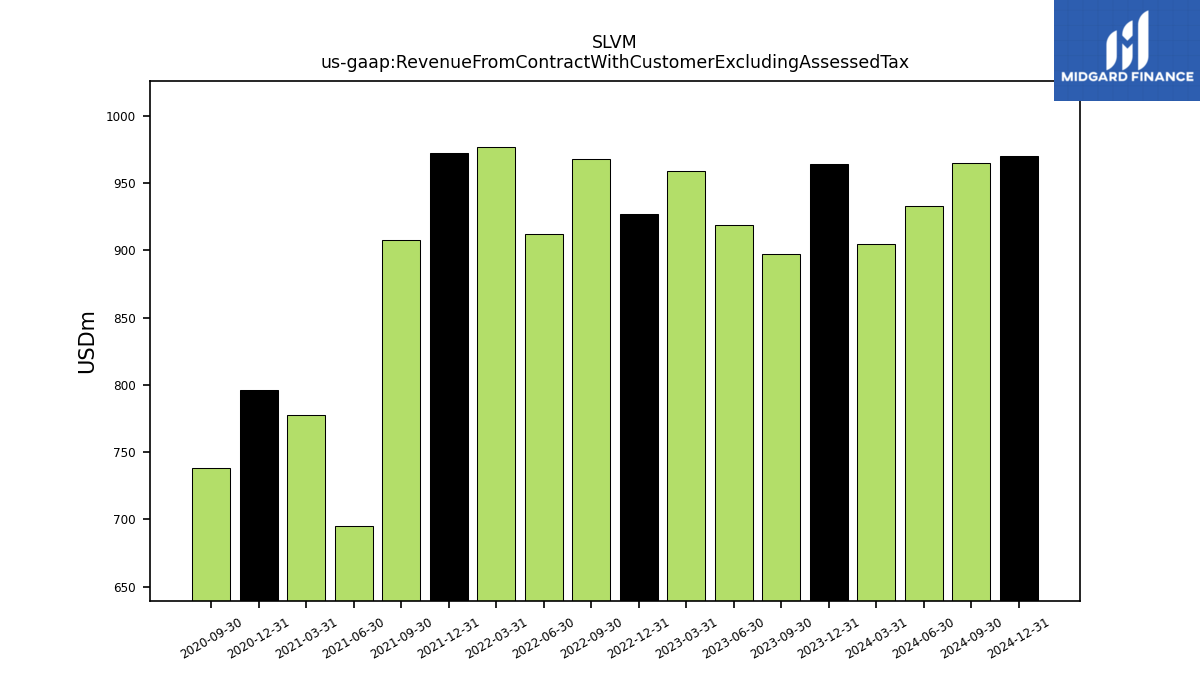
| Revenue From Contract With Customer Excluding Assessed Tax | 964.00 | 897.00 | 919.00 | 959.00 | 927.00 | 968.00 | 912.00 | 977.00 | 972.00 | 908.00 | 695.00 | 778.00 | 796.00 | 738.00 | |
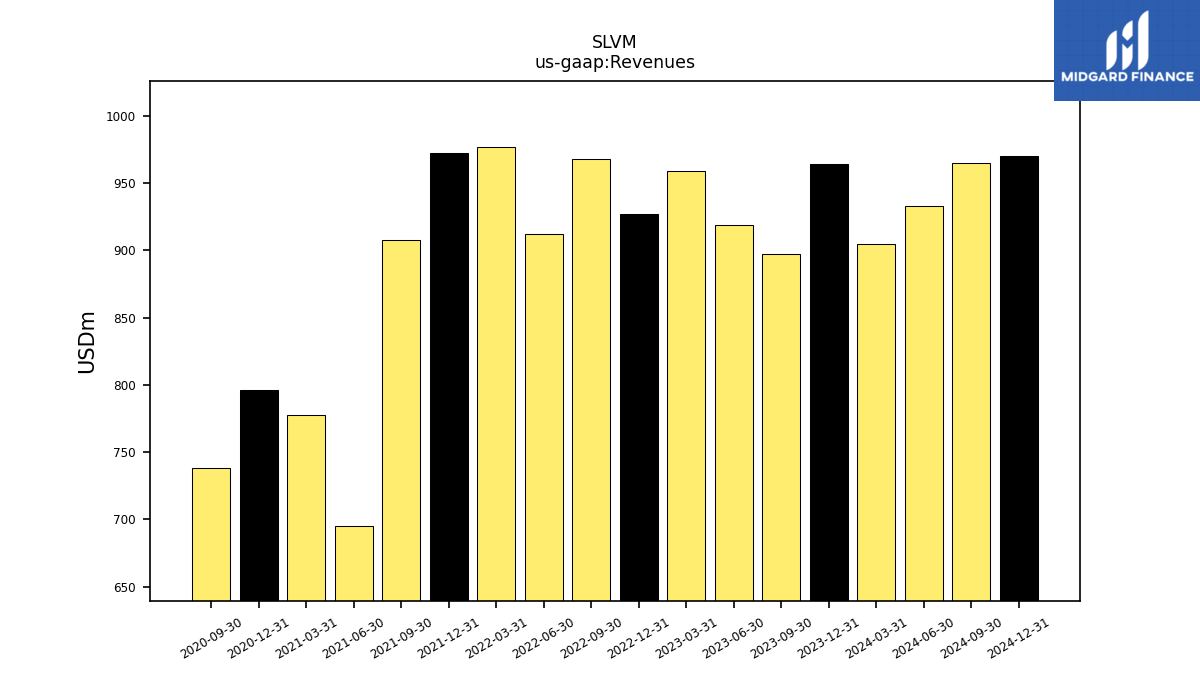
| Revenues | 964.00 | 897.00 | 919.00 | 959.00 | 927.00 | 968.00 | 912.00 | 977.00 | 972.00 | 908.00 | 695.00 | 778.00 | 796.00 | 738.00 | |
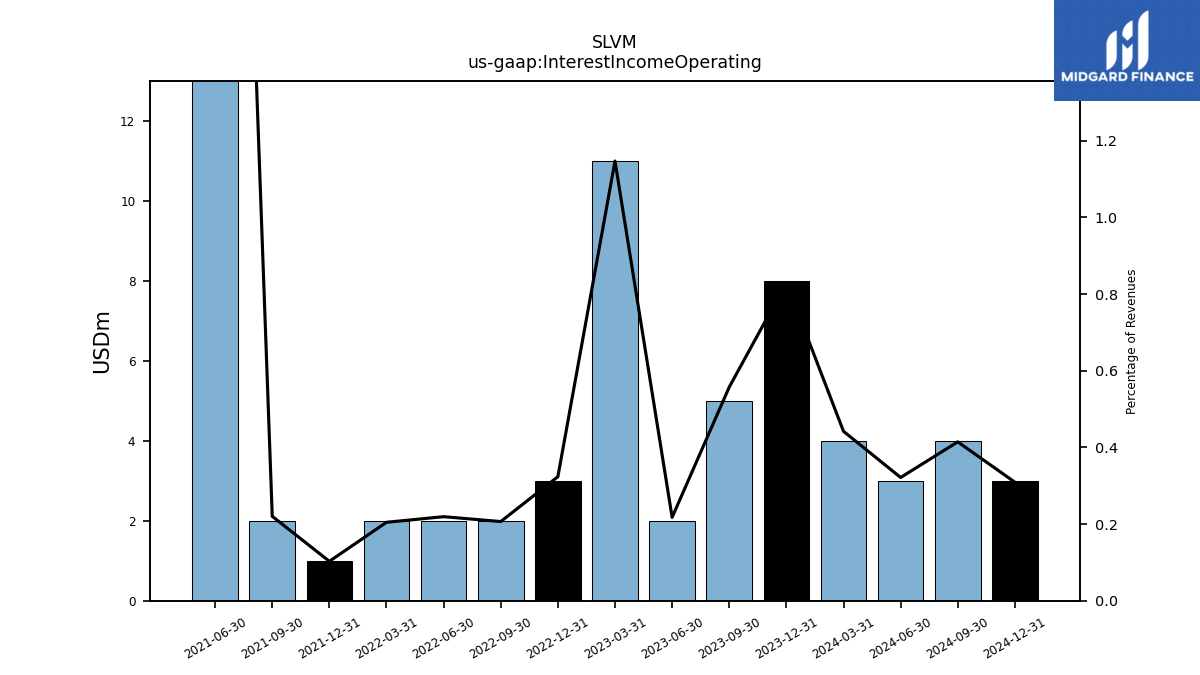
| Interest Income Operating | 8.00 | 5.00 | 2.00 | 11.00 | 3.00 | 2.00 | 2.00 | 2.00 | 1.00 | 2.00 | 30.00 | NA | NA | NA | |
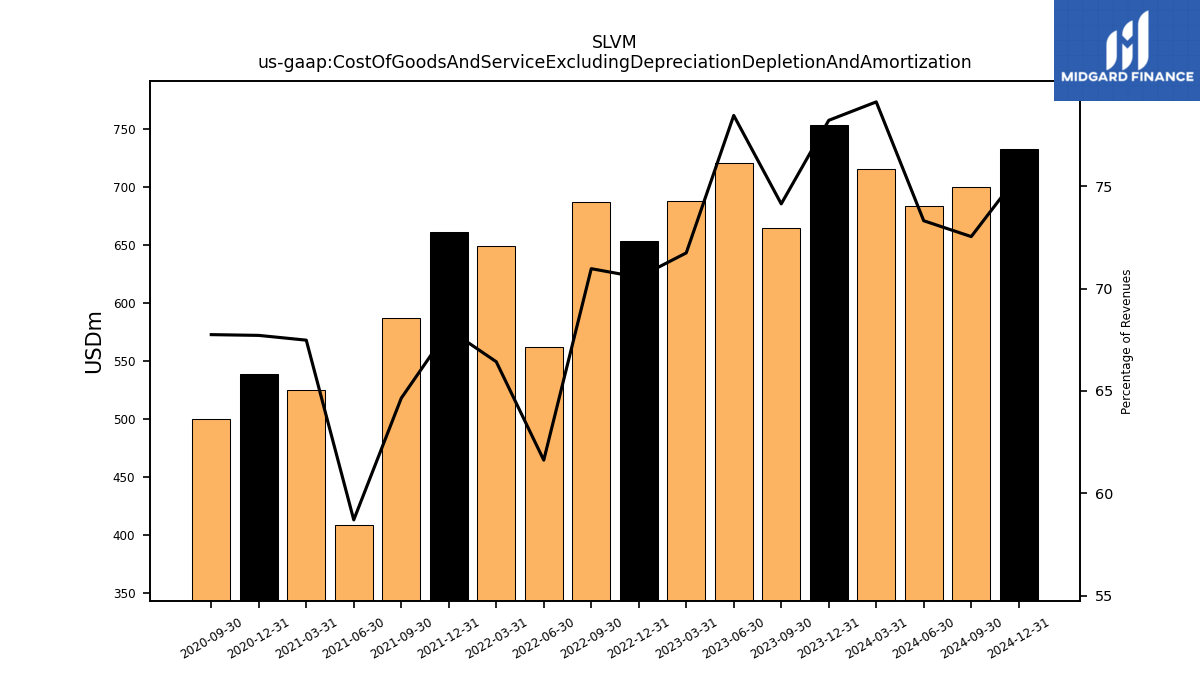
| Cost Of Goods And Service Excluding Depreciation Depletion And Amortization | 754.00 | 665.00 | 721.00 | 688.00 | 654.00 | 687.00 | 562.00 | 649.00 | 661.00 | 587.00 | 408.00 | 525.00 | 539.00 | 500.00 | |
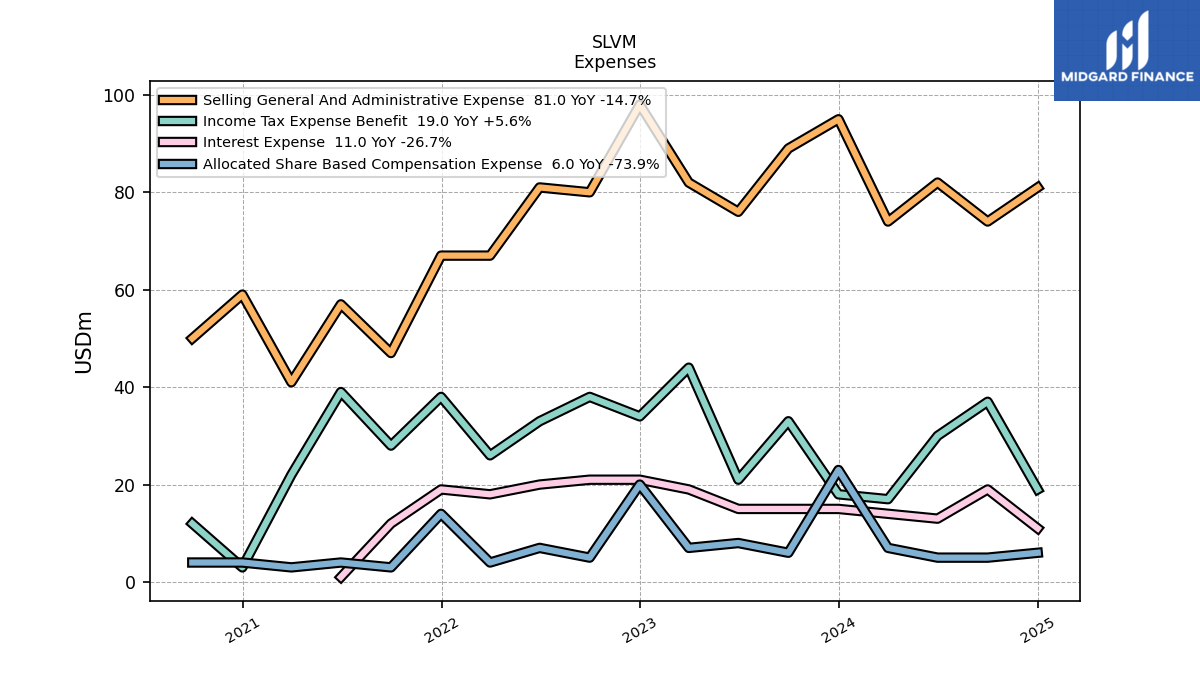
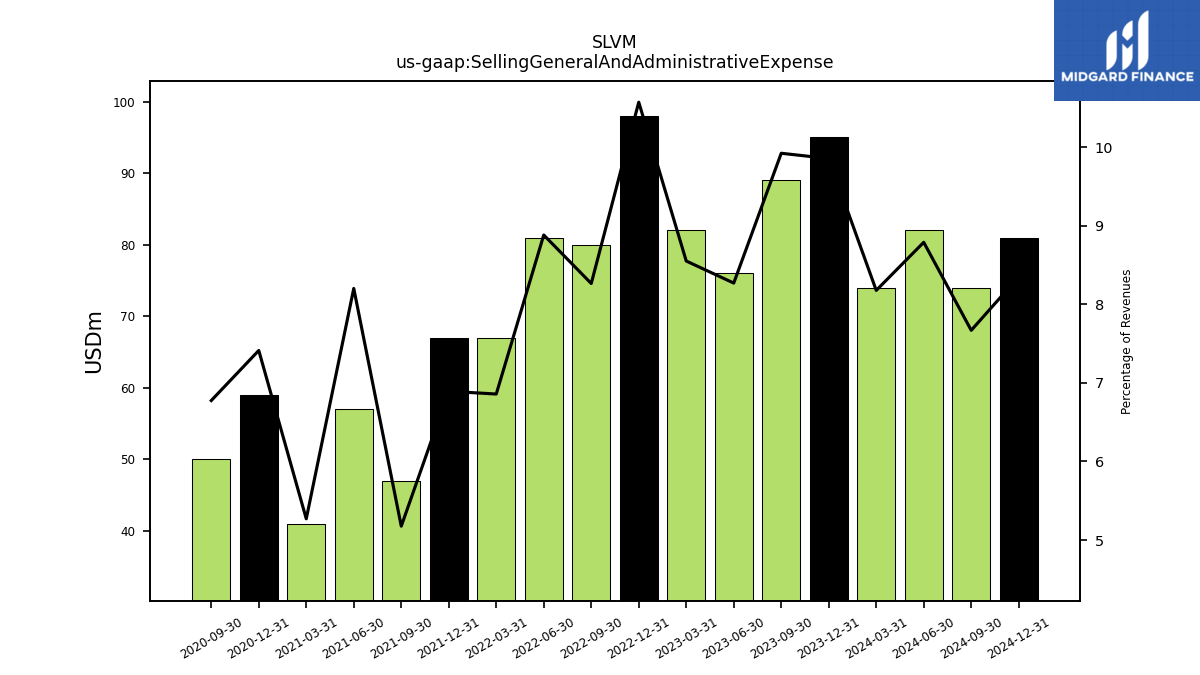
| Selling General And Administrative Expense | 95.00 | 89.00 | 76.00 | 82.00 | 98.00 | 80.00 | 81.00 | 67.00 | 67.00 | 47.00 | 57.00 | 41.00 | 59.00 | 50.00 | |
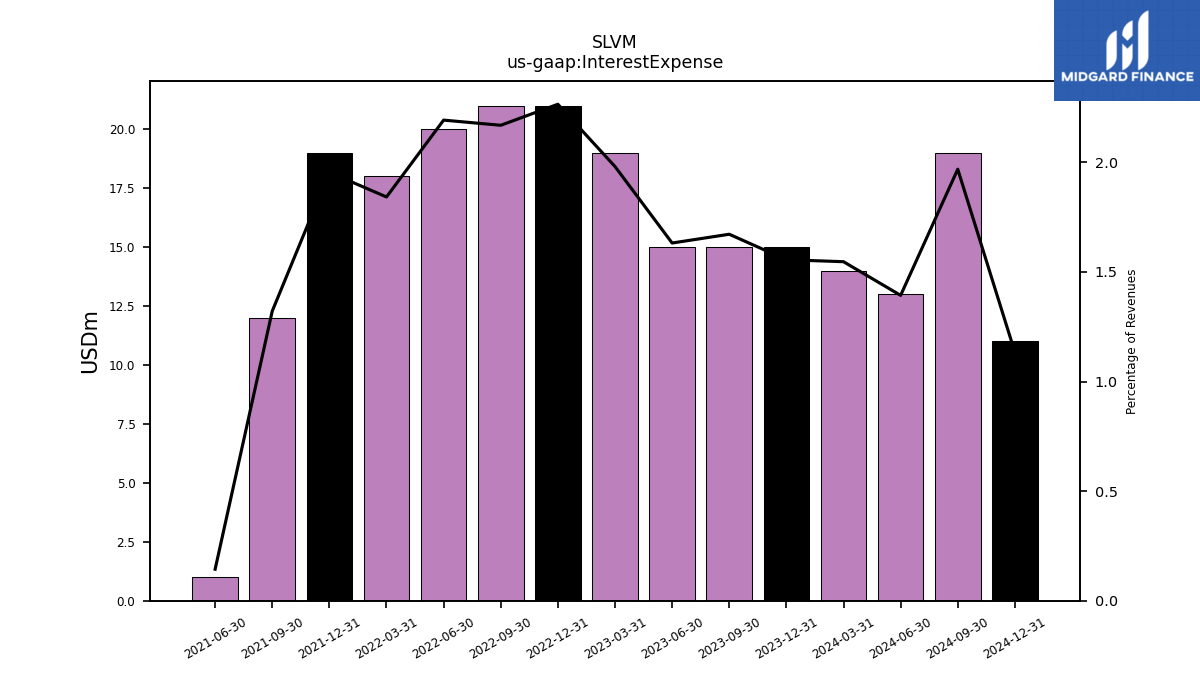
| Interest Expense | 15.00 | 15.00 | 15.00 | 19.00 | 21.00 | 21.00 | 20.00 | 18.00 | 19.00 | 12.00 | 1.00 | NA | NA | NA | |
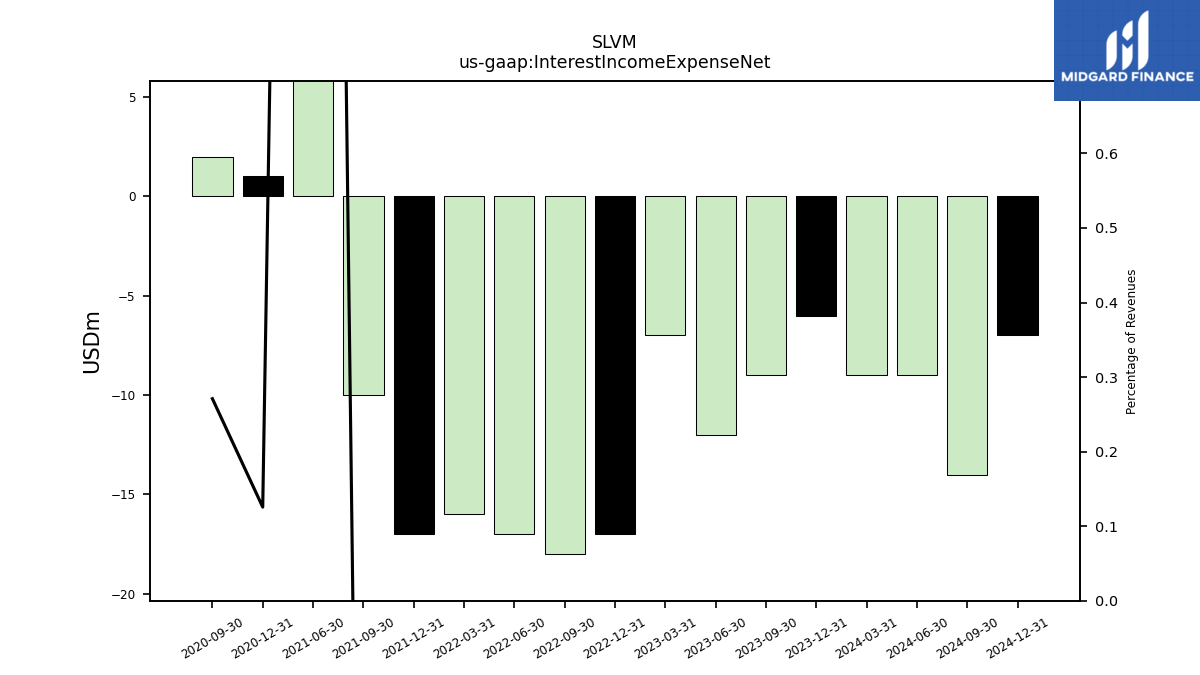
| Interest Income Expense Net | -6.00 | -9.00 | -12.00 | -7.00 | -17.00 | -18.00 | -17.00 | -16.00 | -17.00 | -10.00 | 29.00 | NA | 1.00 | 2.00 | |
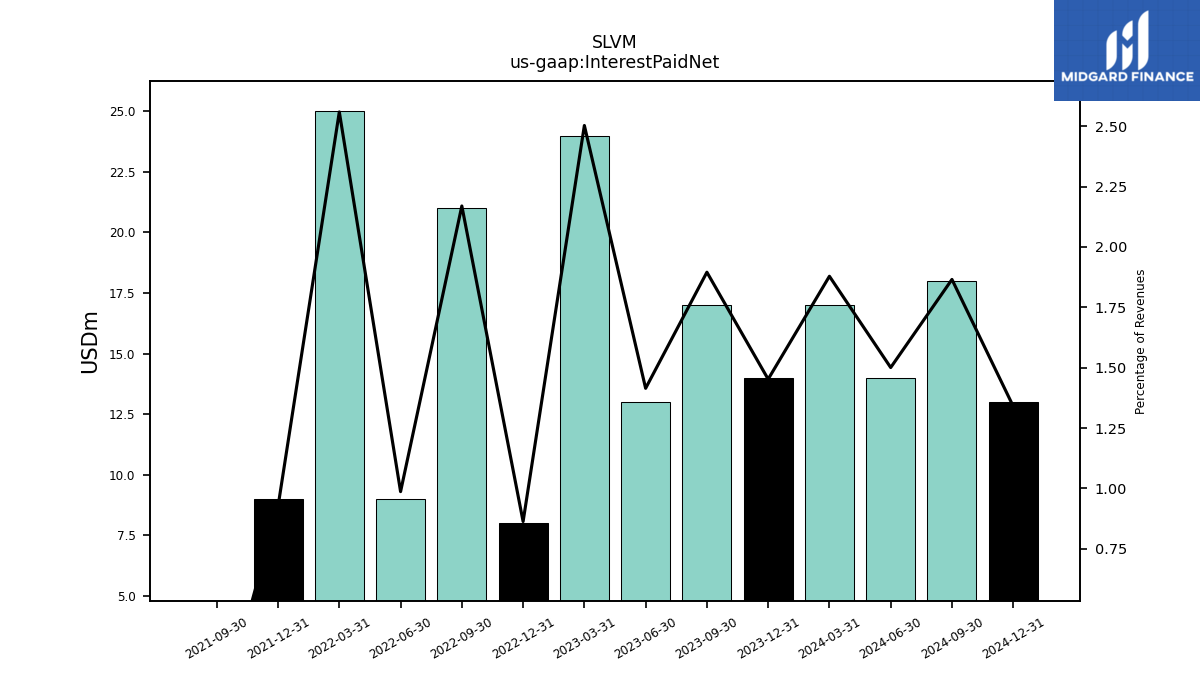
| Interest Paid Net | 14.00 | 17.00 | 13.00 | 24.00 | 8.00 | 21.00 | 9.00 | 25.00 | 9.00 | 0.00 | NA | NA | NA | NA | |
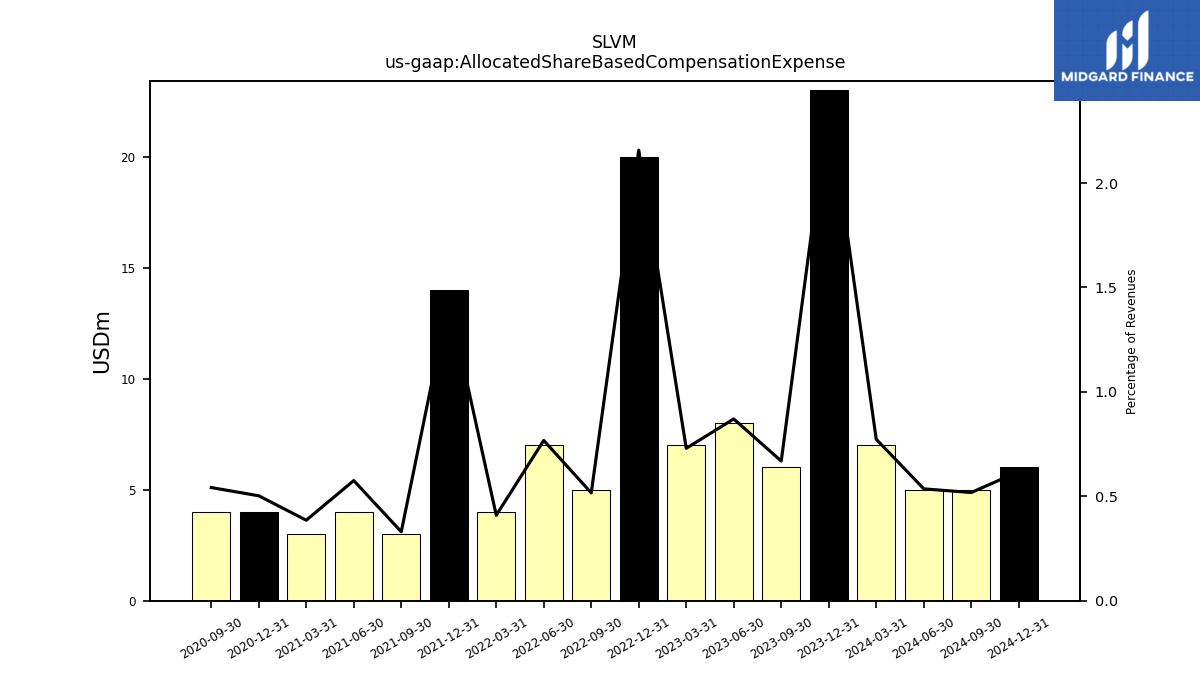
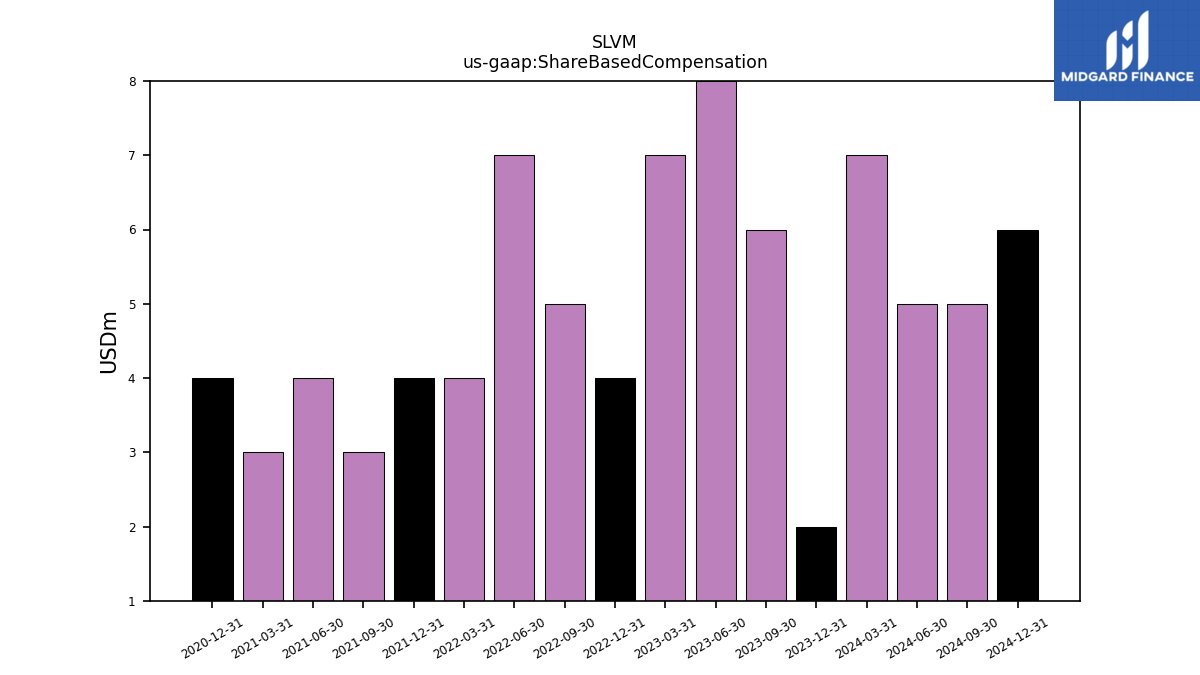
| Allocated Share Based Compensation Expense | 23.00 | 6.00 | 8.00 | 7.00 | 20.00 | 5.00 | 7.00 | 4.00 | 14.00 | 3.00 | 4.00 | 3.00 | 4.00 | 4.00 | |
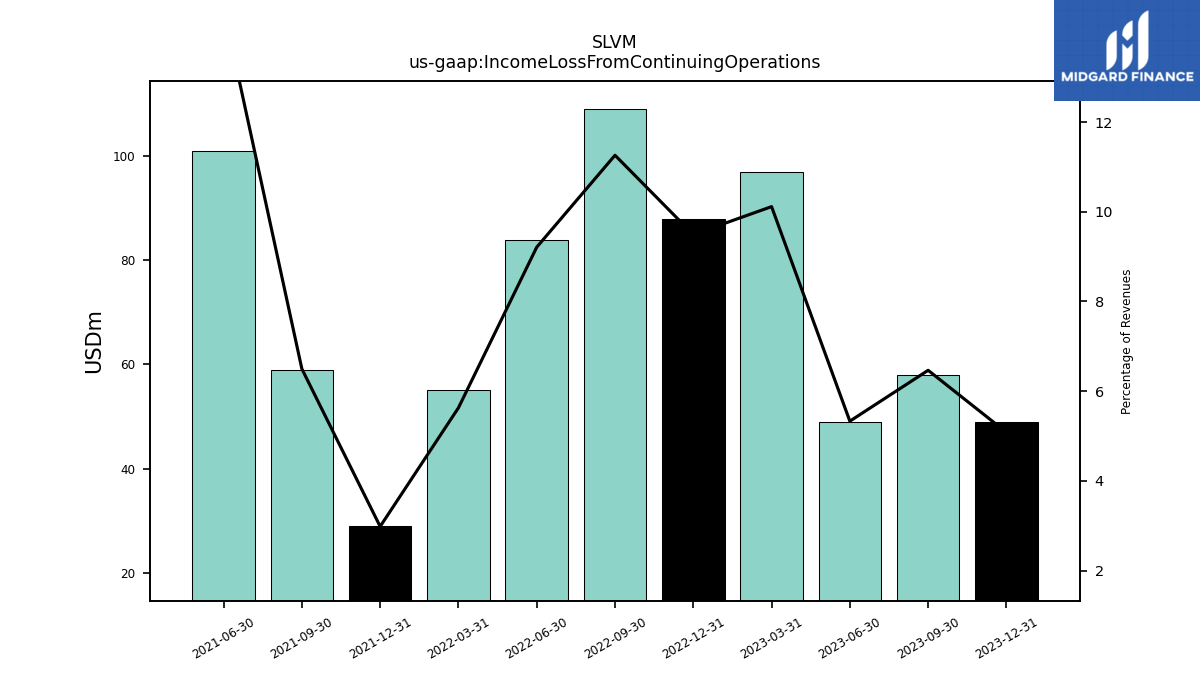
| Income Loss From Continuing Operations | 49.00 | 58.00 | 49.00 | 97.00 | 88.00 | 109.00 | 84.00 | 55.00 | 29.00 | 59.00 | 101.00 | NA | NA | NA | |
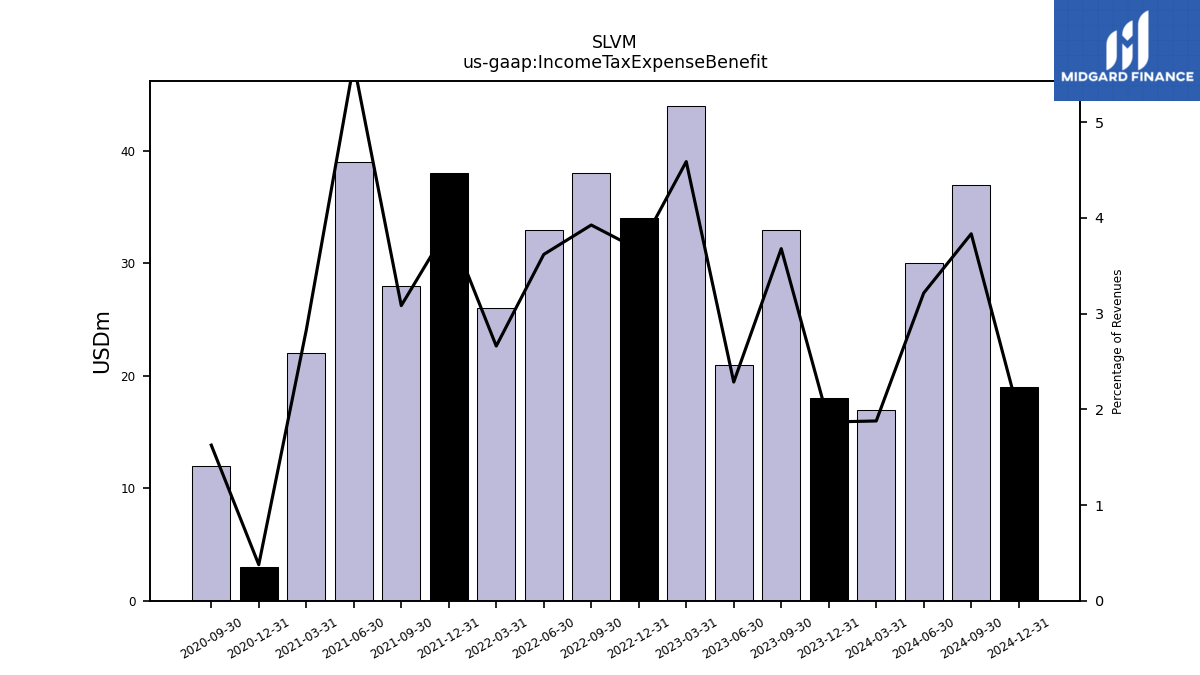
| Income Tax Expense Benefit | 18.00 | 33.00 | 21.00 | 44.00 | 34.00 | 38.00 | 33.00 | 26.00 | 38.00 | 28.00 | 39.00 | 22.00 | 3.00 | 12.00 | |
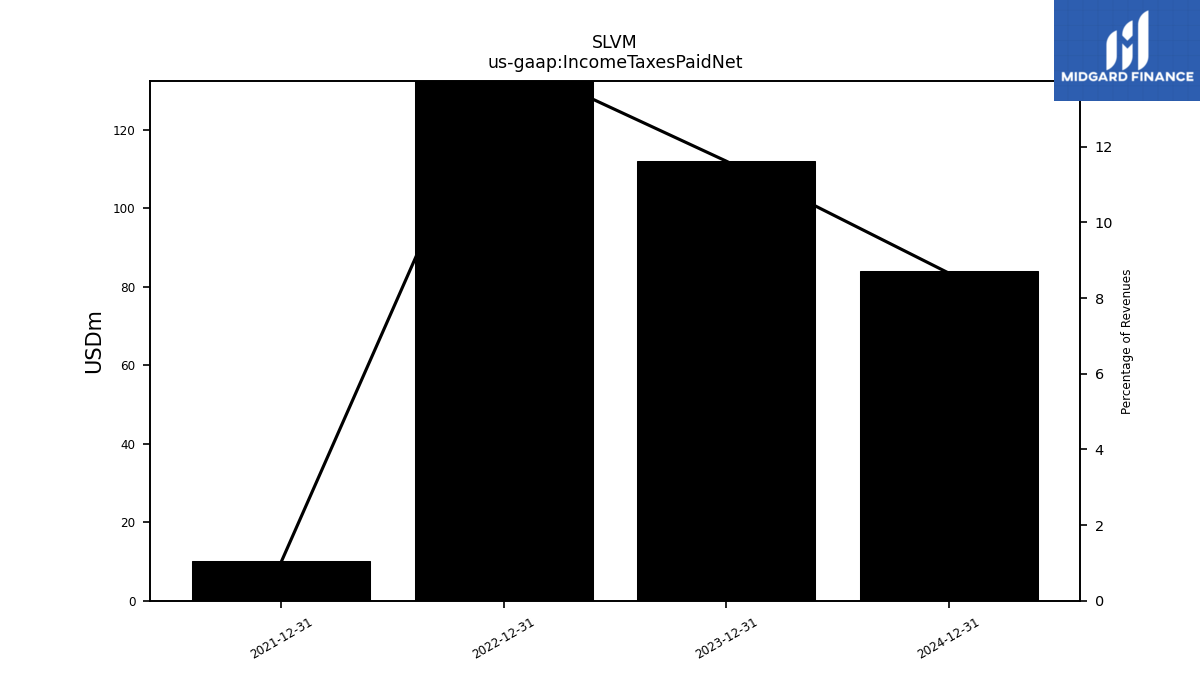
| Income Taxes Paid Net | 112.00 | NA | NA | NA | 133.00 | NA | NA | NA | 10.00 | NA | NA | NA | NA | NA | |
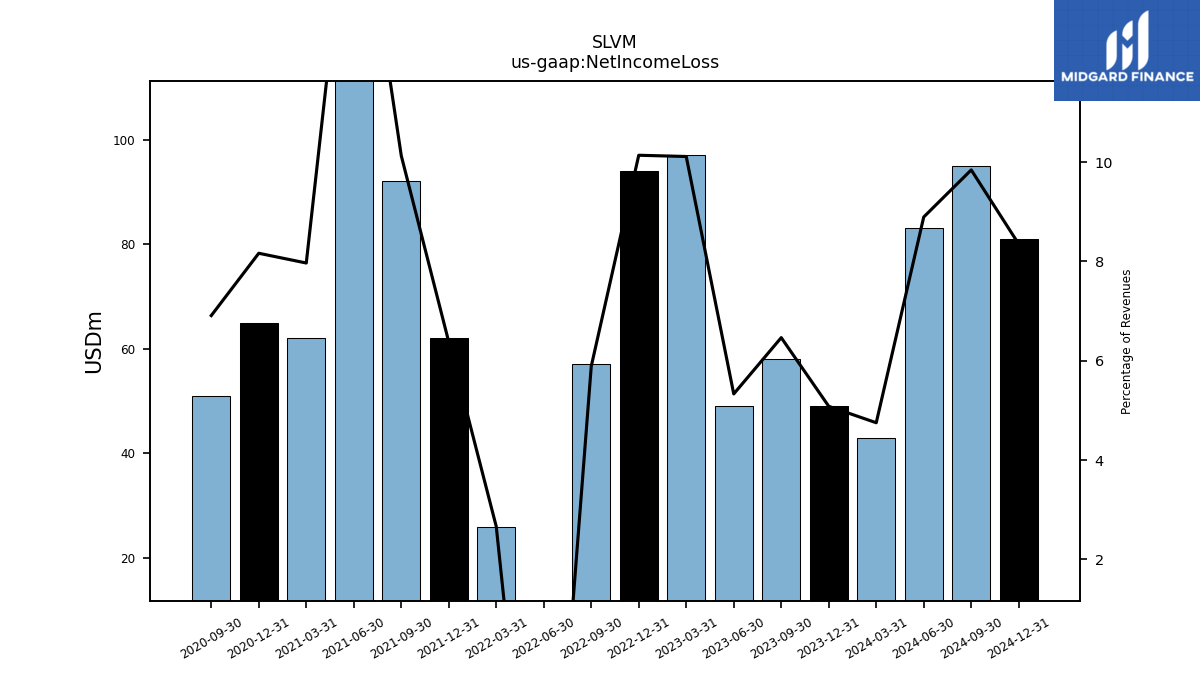
| Net Income Loss | 49.00 | 58.00 | 49.00 | 97.00 | 94.00 | 57.00 | -59.00 | 26.00 | 62.00 | 92.00 | 115.00 | 62.00 | 65.00 | 51.00 | |
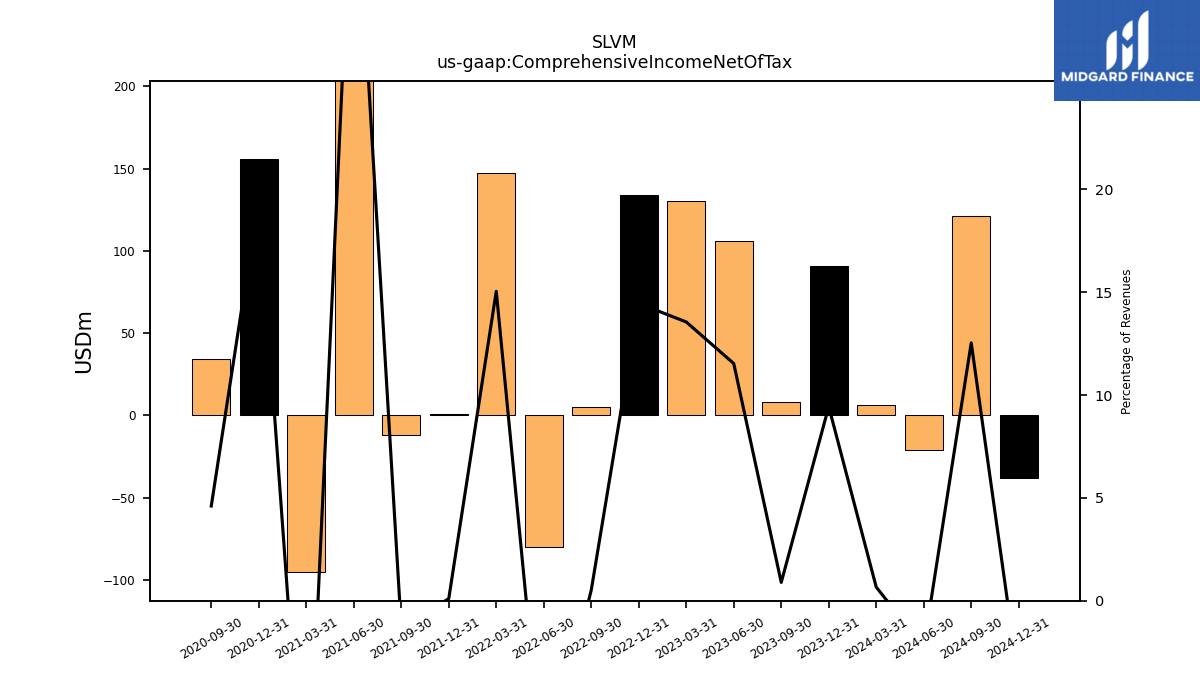
| Comprehensive Income Net Of Tax | 91.00 | 8.00 | 106.00 | 130.00 | 134.00 | 5.00 | -80.00 | 147.00 | 1.00 | -12.00 | 259.00 | -95.00 | 156.00 | 34.00 |
| 2023-12-31 | 2023-09-30 | 2023-06-30 | 2023-03-31 | 2022-12-31 | 2022-09-30 | 2022-06-30 | 2022-03-31 | 2021-12-31 | 2021-09-30 | 2021-06-30 | 2021-03-31 | 2020-12-31 | 2020-09-30 | ||
|---|---|---|---|---|---|---|---|---|---|---|---|---|---|---|---|
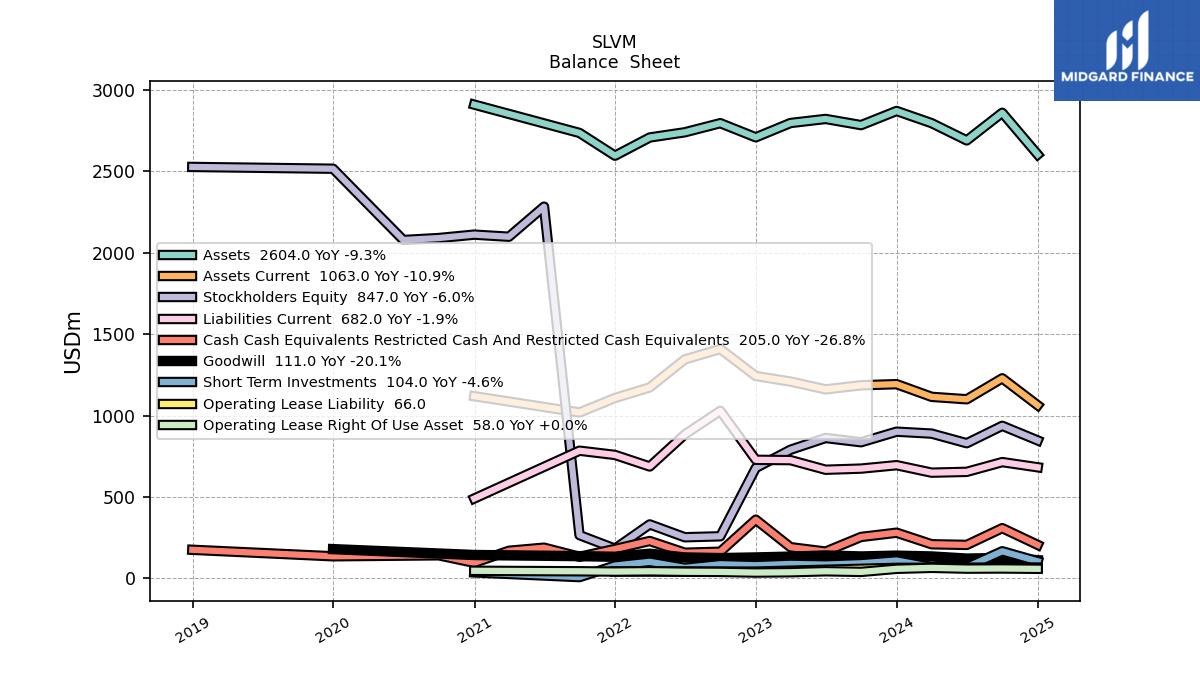
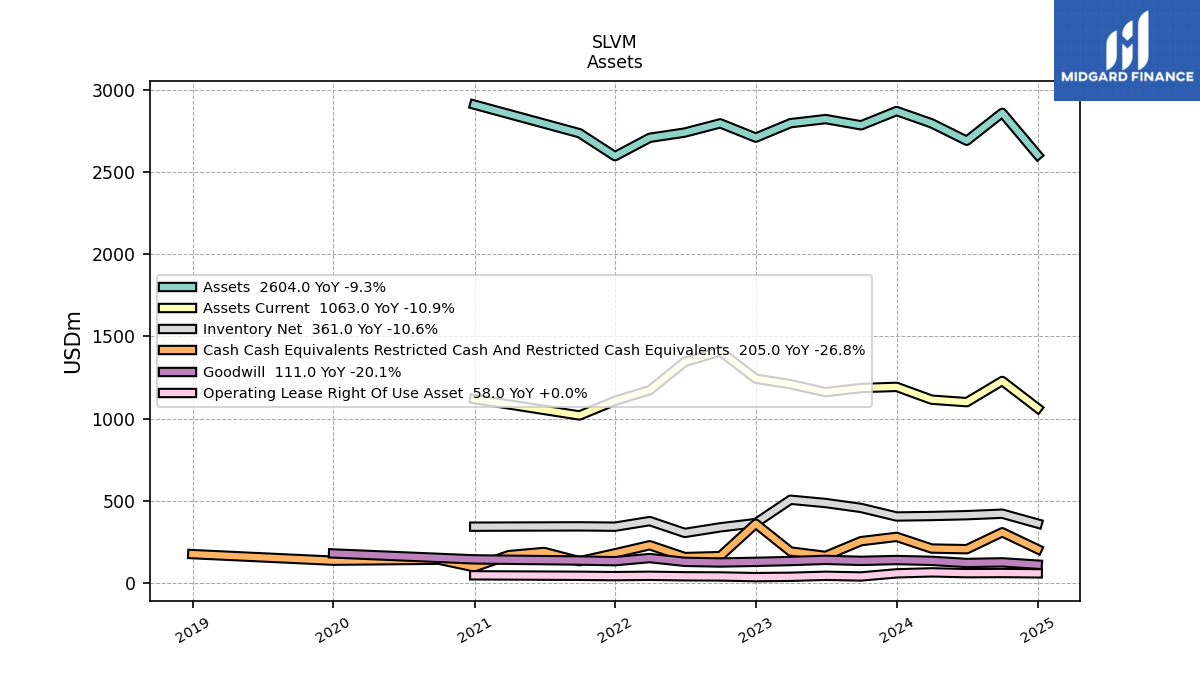
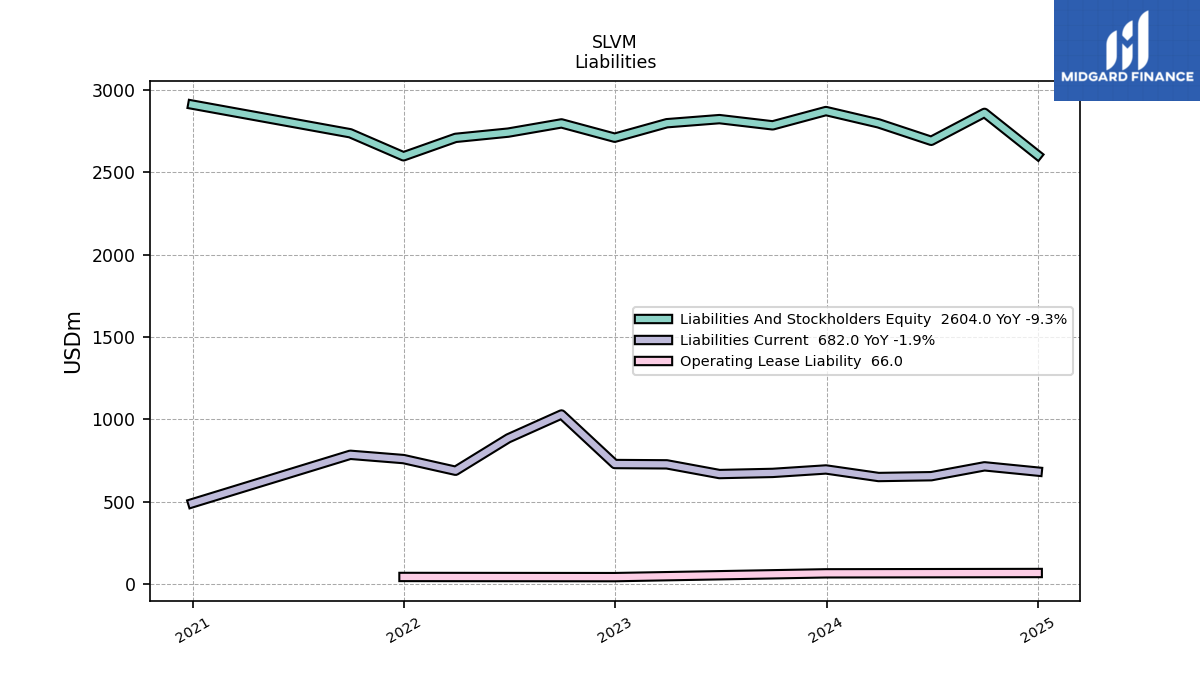
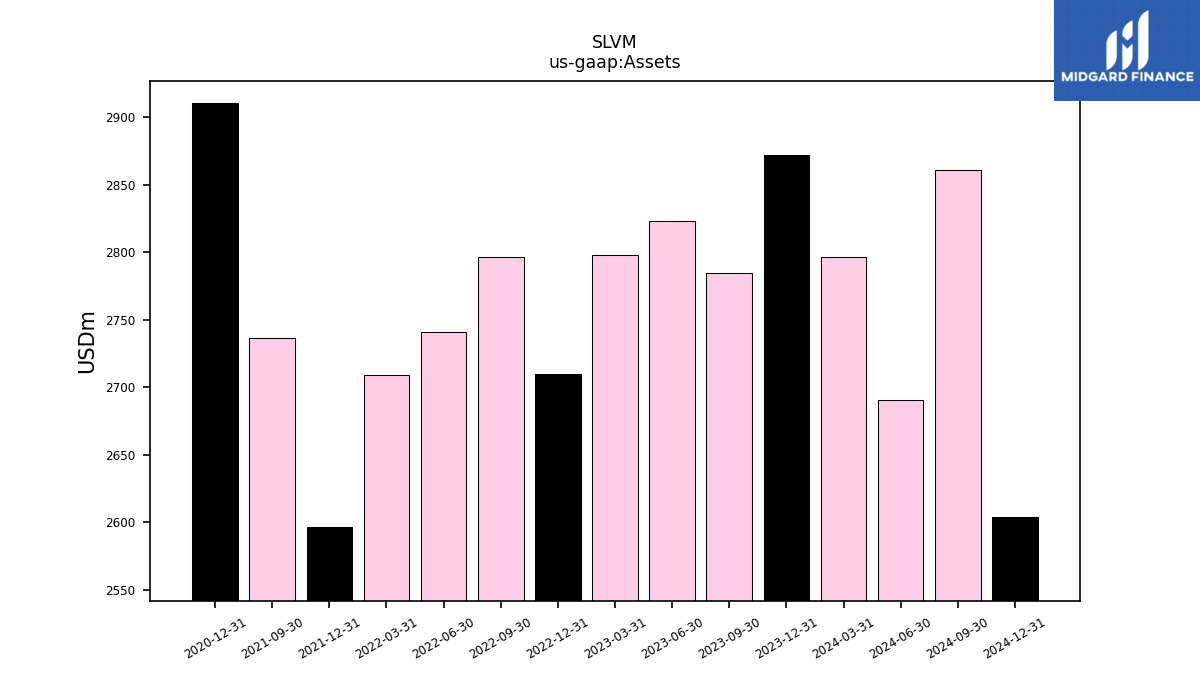
| Assets | 2872.00 | 2785.00 | 2823.00 | 2798.00 | 2710.00 | 2797.00 | 2741.00 | 2709.00 | 2597.00 | 2737.00 | NA | NA | 2911.00 | NA | |
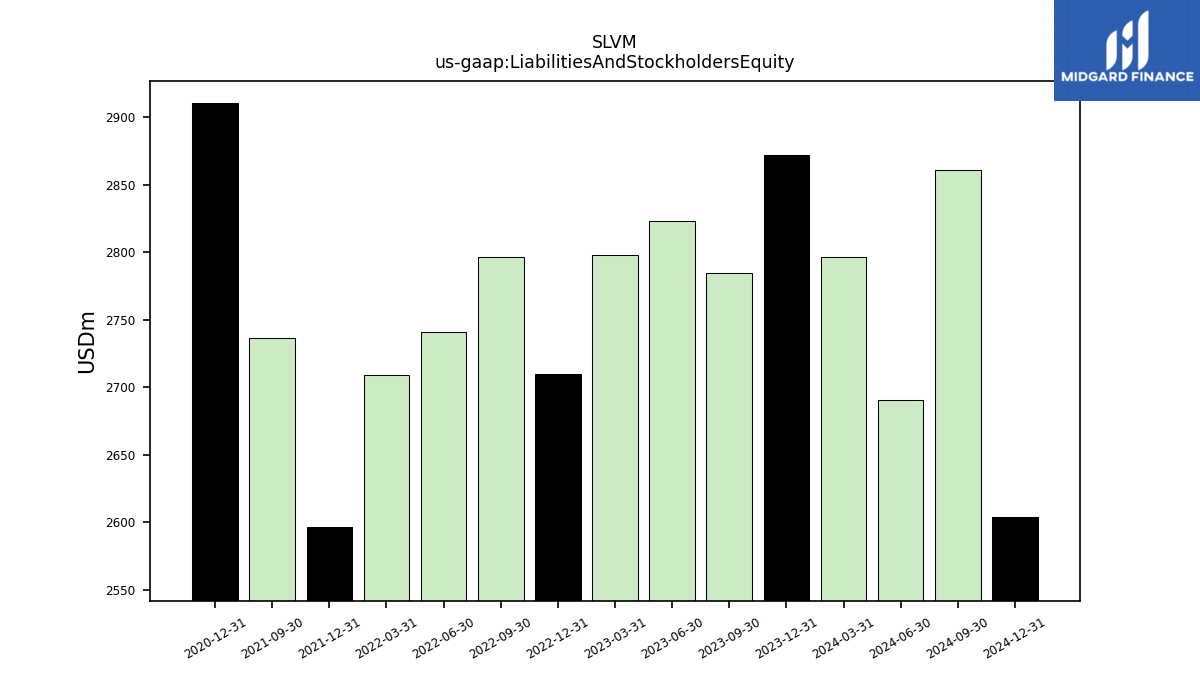
| Liabilities And Stockholders Equity | 2872.00 | 2785.00 | 2823.00 | 2798.00 | 2710.00 | 2797.00 | 2741.00 | 2709.00 | 2597.00 | 2737.00 | NA | NA | 2911.00 | NA | |
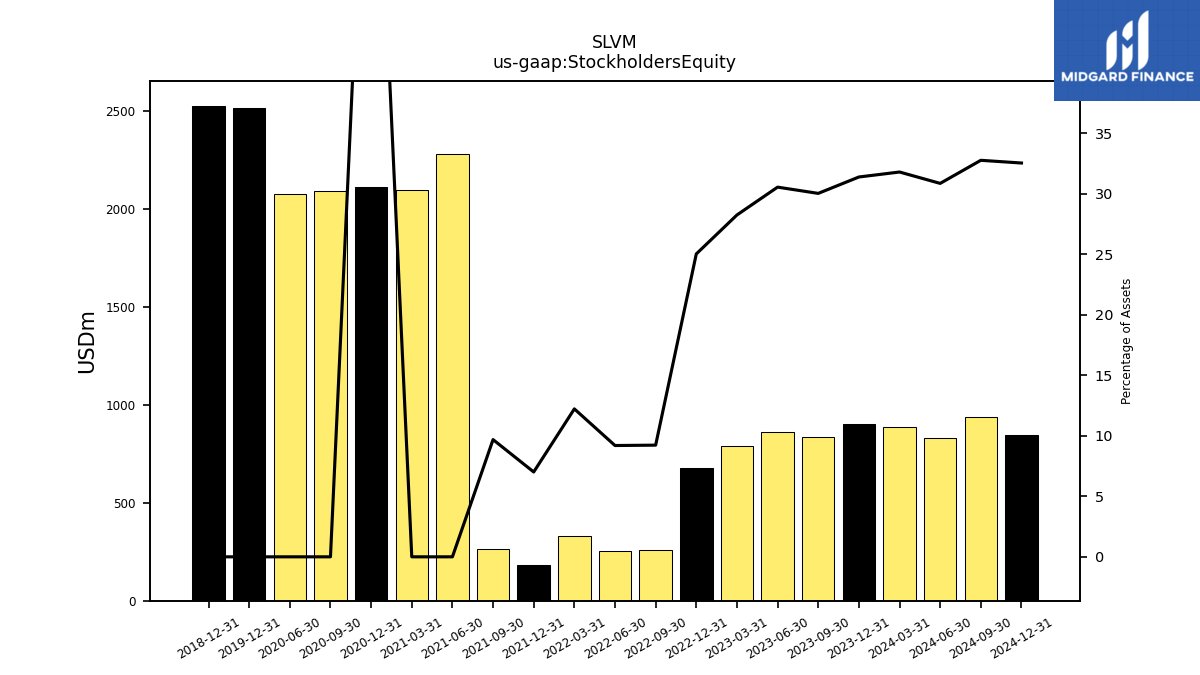
| Stockholders Equity | 901.00 | 836.00 | 862.00 | 790.00 | 678.00 | 258.00 | 252.00 | 331.00 | 182.00 | 265.00 | 2284.00 | 2099.00 | 2112.00 | 2091.00 |
| 2023-12-31 | 2023-09-30 | 2023-06-30 | 2023-03-31 | 2022-12-31 | 2022-09-30 | 2022-06-30 | 2022-03-31 | 2021-12-31 | 2021-09-30 | 2021-06-30 | 2021-03-31 | 2020-12-31 | 2020-09-30 | ||
|---|---|---|---|---|---|---|---|---|---|---|---|---|---|---|---|
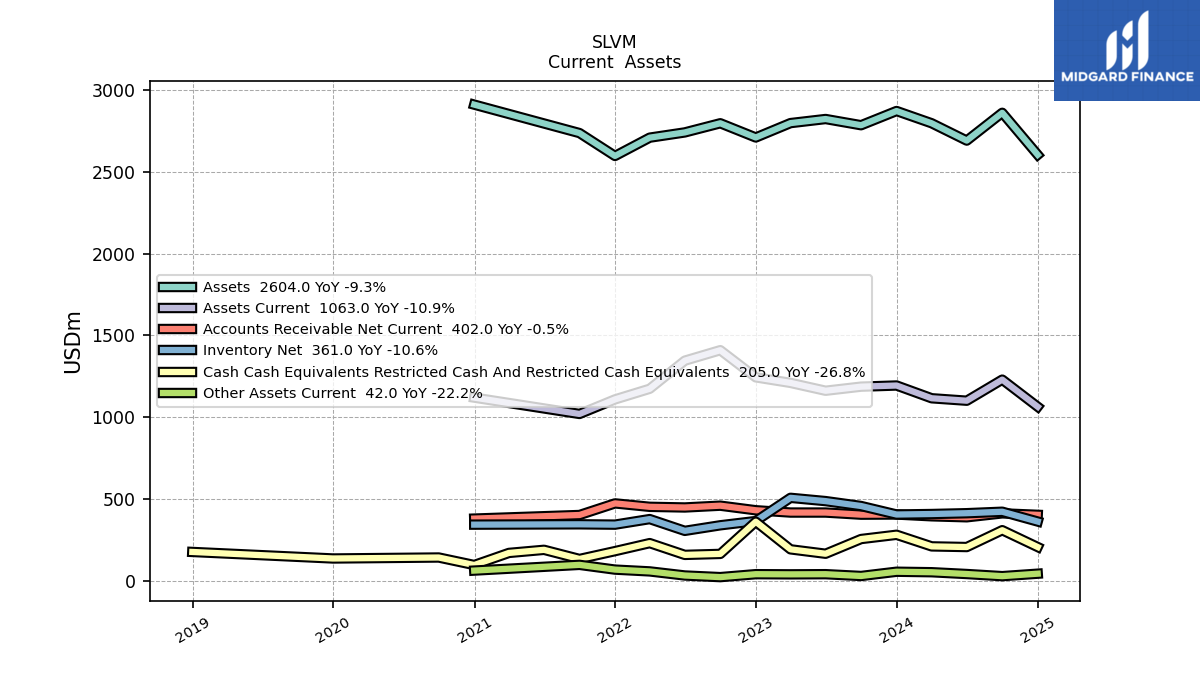
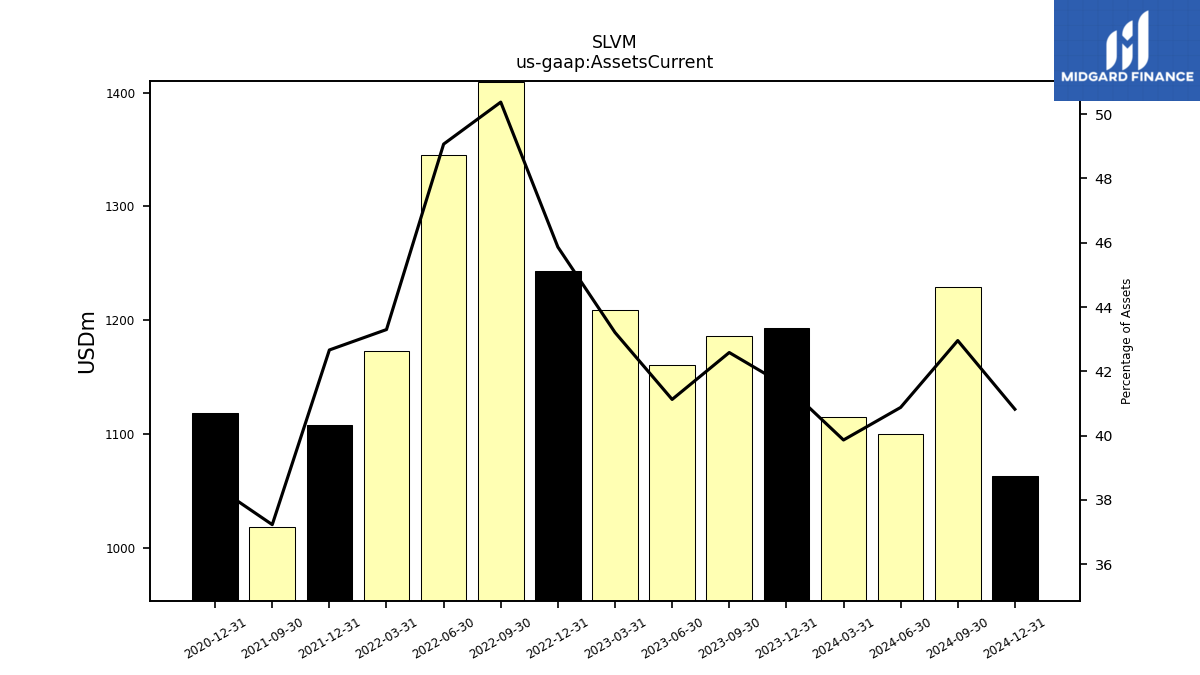
| Assets Current | 1193.00 | 1186.00 | 1161.00 | 1209.00 | 1243.00 | 1409.00 | 1345.00 | 1173.00 | 1108.00 | 1019.00 | NA | NA | 1119.00 | NA | |
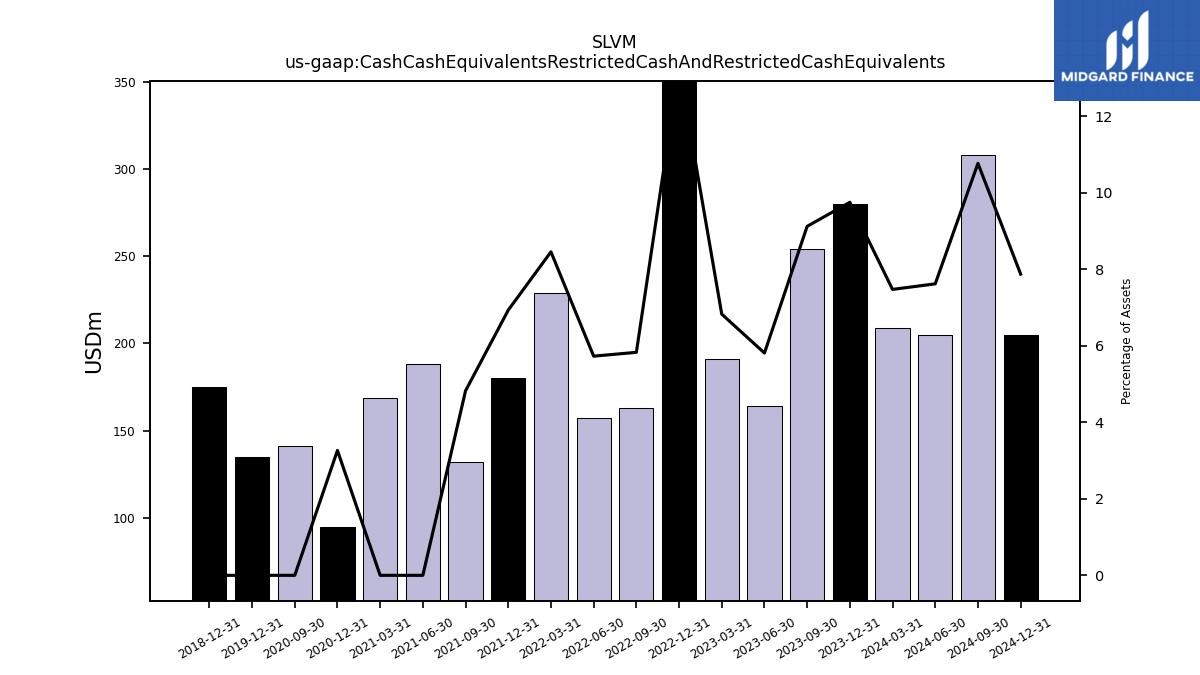
| Cash Cash Equivalents Restricted Cash And Restricted Cash Equivalents | 280.00 | 254.00 | 164.00 | 191.00 | 360.00 | 163.00 | 157.00 | 229.00 | 180.00 | 132.00 | 188.00 | 169.00 | 95.00 | 141.00 | |
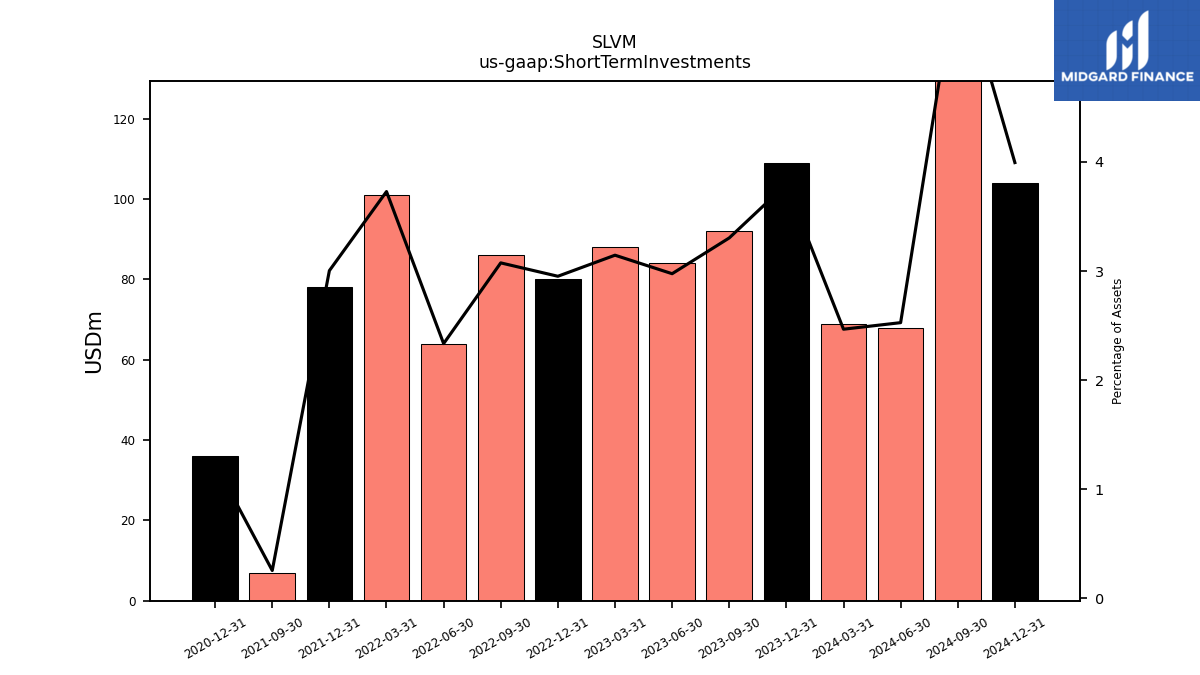
| Short Term Investments | 109.00 | 92.00 | 84.00 | 88.00 | 80.00 | 86.00 | 64.00 | 101.00 | 78.00 | 7.00 | NA | NA | 36.00 | NA | |
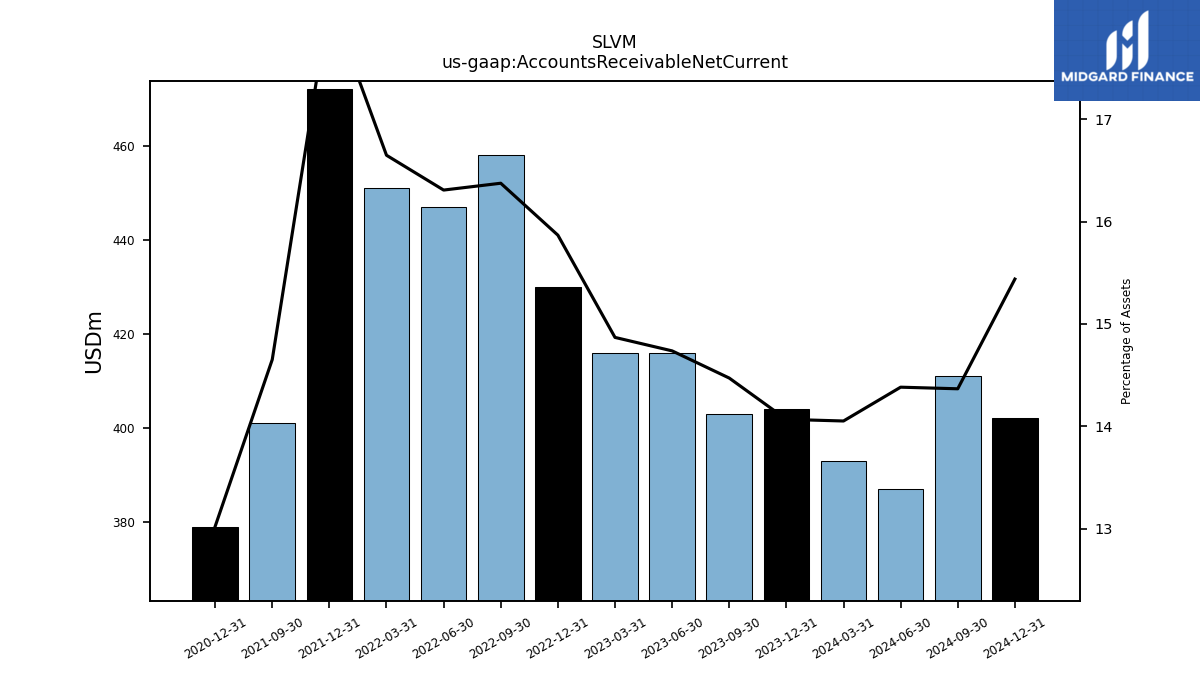
| Accounts Receivable Net Current | 404.00 | 403.00 | 416.00 | 416.00 | 430.00 | 458.00 | 447.00 | 451.00 | 472.00 | 401.00 | NA | NA | 379.00 | NA | |
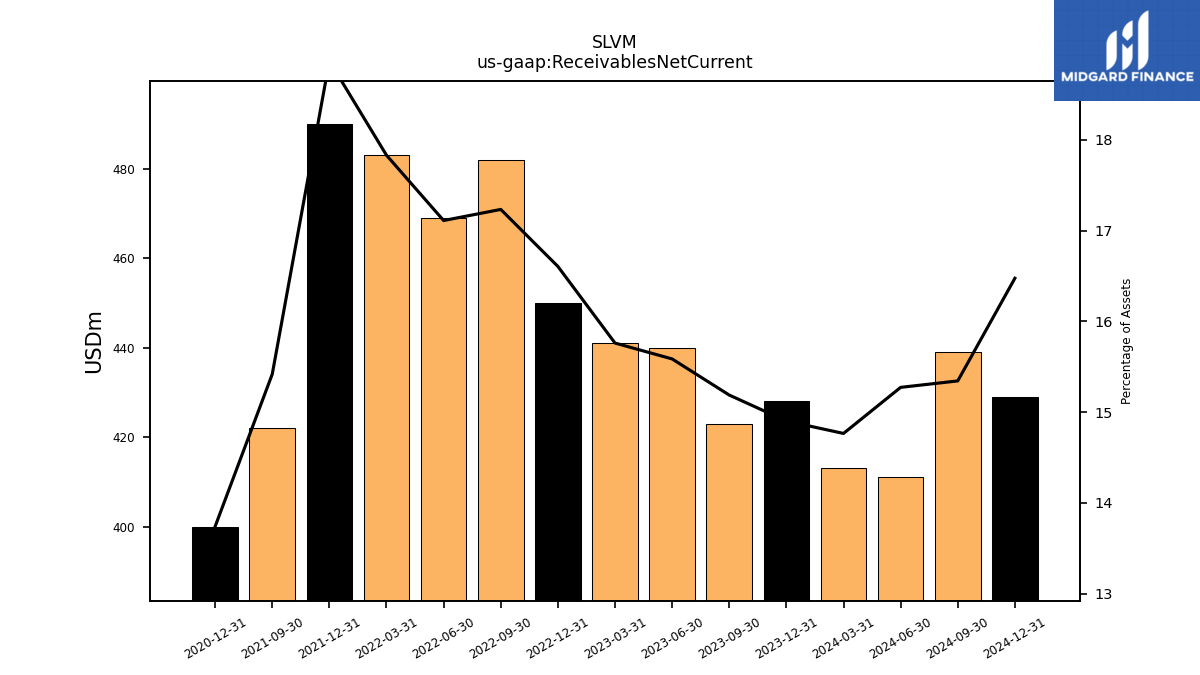
| Receivables Net Current | 428.00 | 423.00 | 440.00 | 441.00 | 450.00 | 482.00 | 469.00 | 483.00 | 490.00 | 422.00 | NA | NA | 400.00 | NA | |
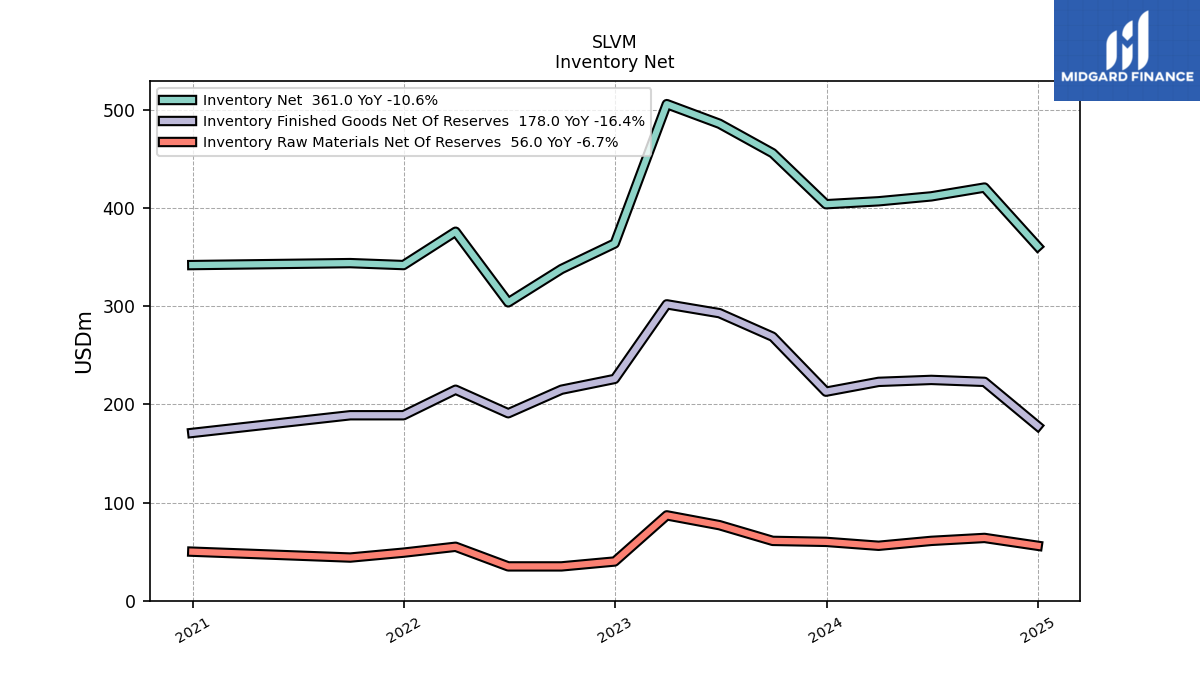
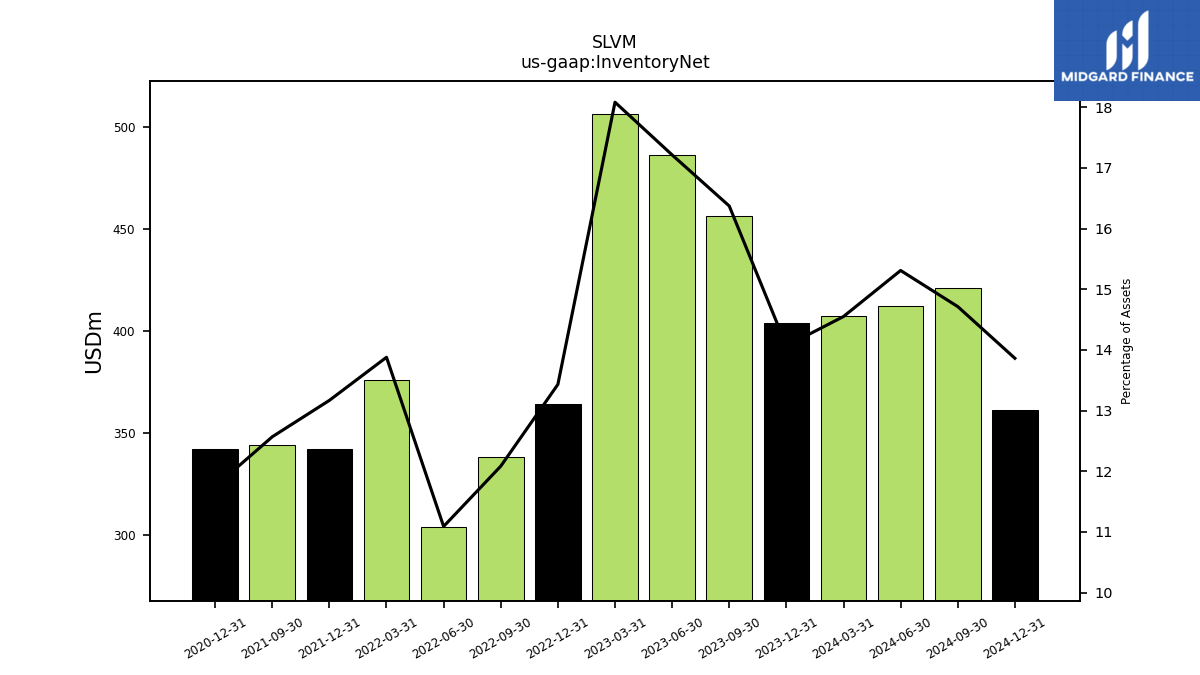
| Inventory Net | 404.00 | 456.00 | 486.00 | 506.00 | 364.00 | 338.00 | 304.00 | 376.00 | 342.00 | 344.00 | NA | NA | 342.00 | NA | |
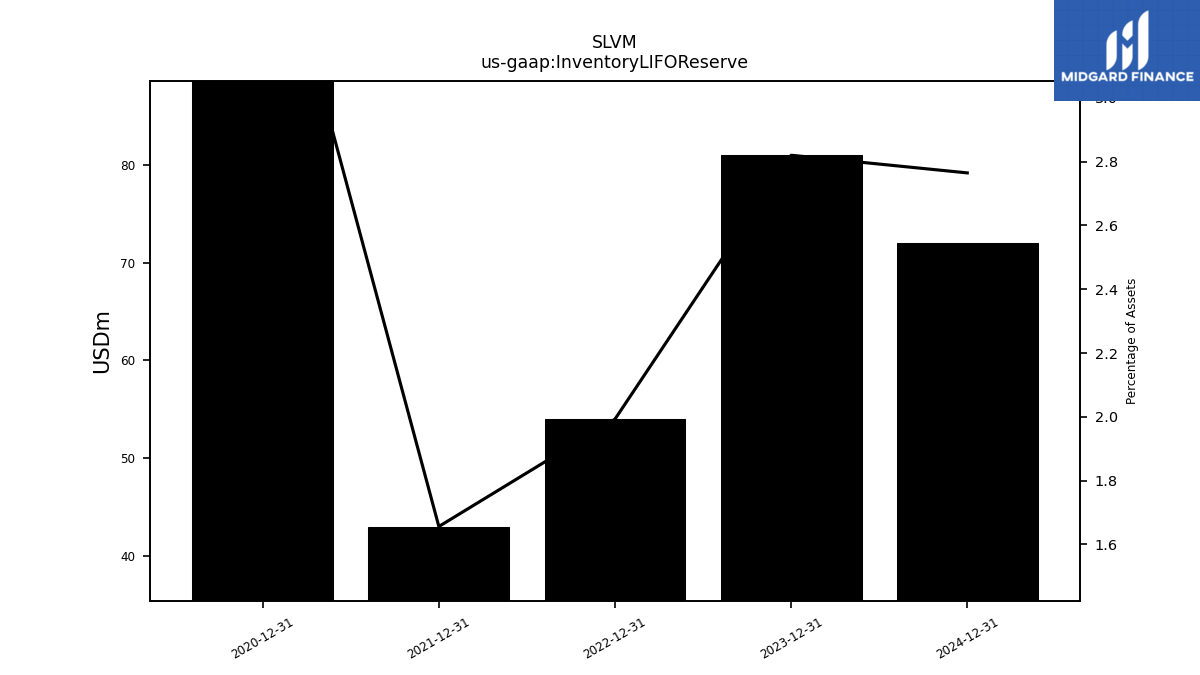
| Inventory L I F O Reserve | 81.00 | NA | NA | NA | 54.00 | NA | NA | NA | 43.00 | NA | NA | NA | 108.00 | NA | |
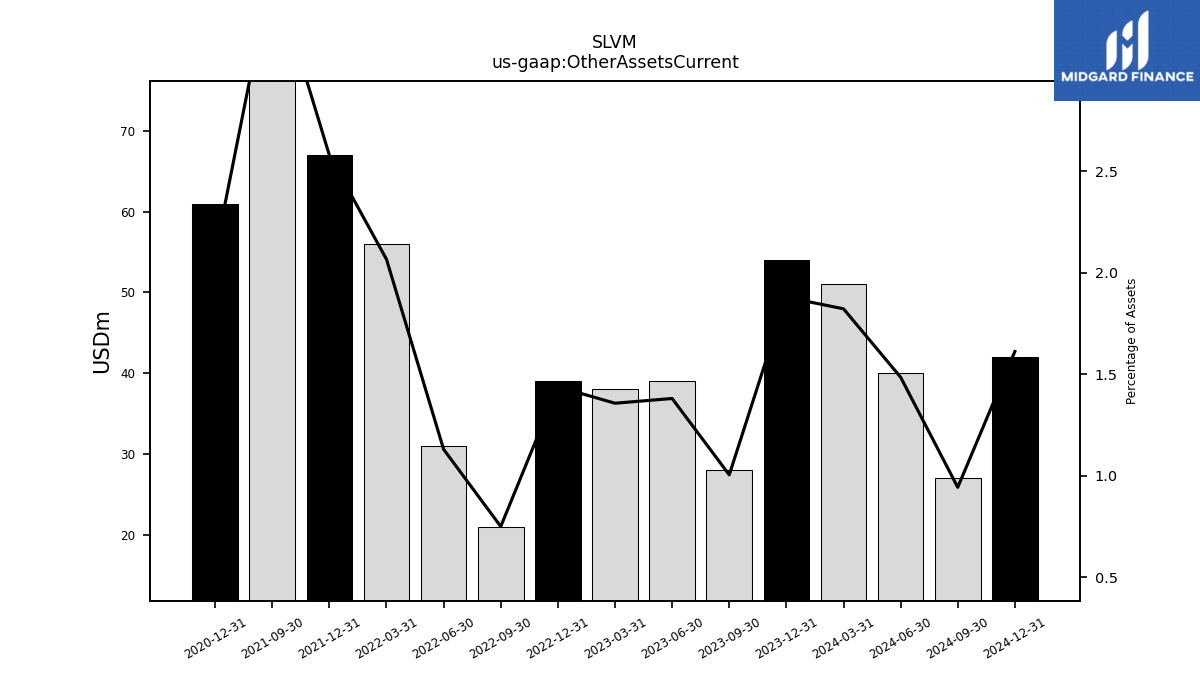
| Other Assets Current | 54.00 | 28.00 | 39.00 | 38.00 | 39.00 | 21.00 | 31.00 | 56.00 | 67.00 | 96.00 | NA | NA | 61.00 | NA |
| 2023-12-31 | 2023-09-30 | 2023-06-30 | 2023-03-31 | 2022-12-31 | 2022-09-30 | 2022-06-30 | 2022-03-31 | 2021-12-31 | 2021-09-30 | 2021-06-30 | 2021-03-31 | 2020-12-31 | 2020-09-30 | ||
|---|---|---|---|---|---|---|---|---|---|---|---|---|---|---|---|
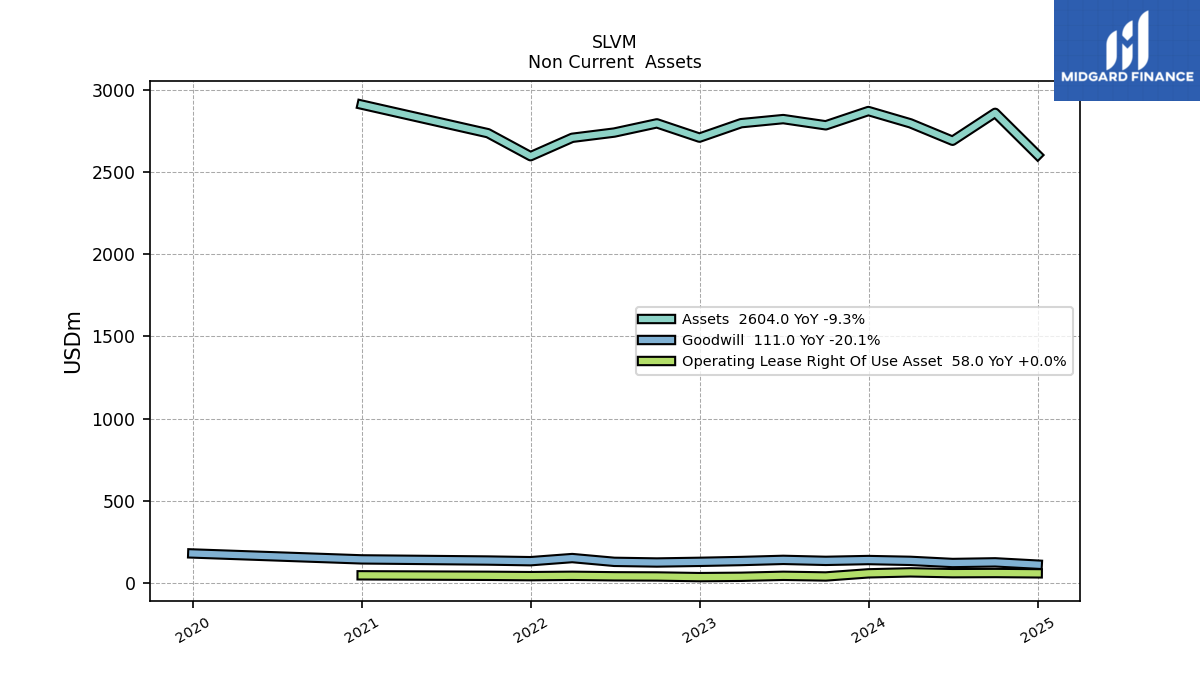
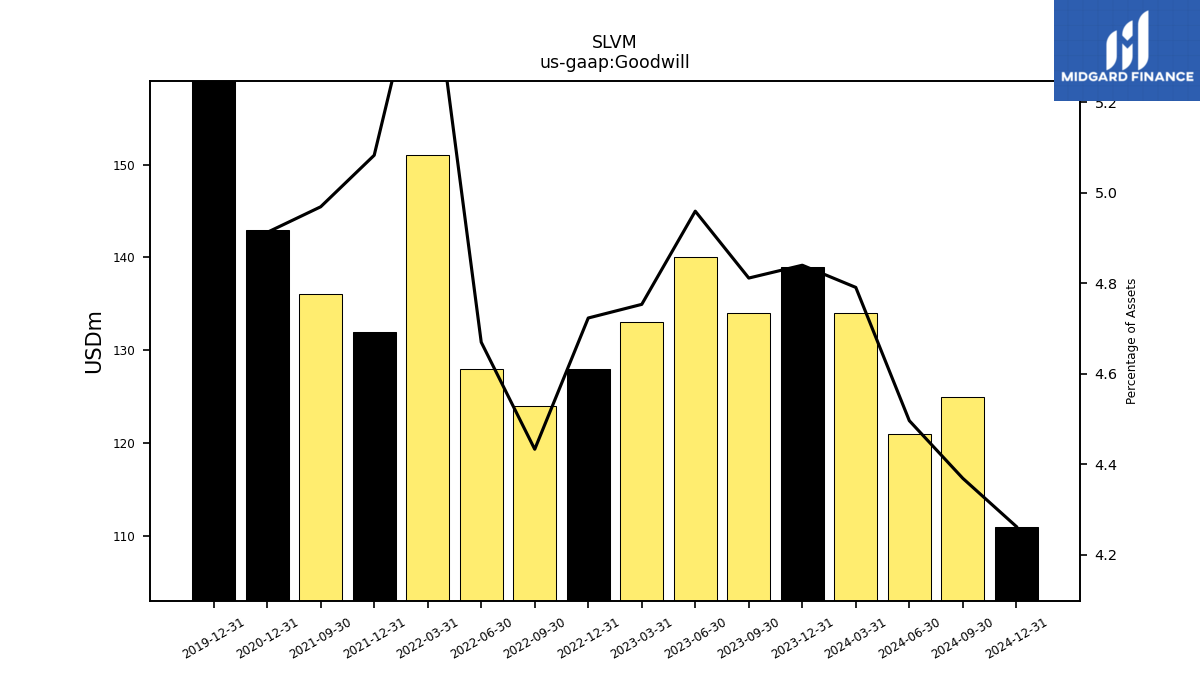
| Goodwill | 139.00 | 134.00 | 140.00 | 133.00 | 128.00 | 124.00 | 128.00 | 151.00 | 132.00 | 136.00 | NA | NA | 143.00 | NA | |
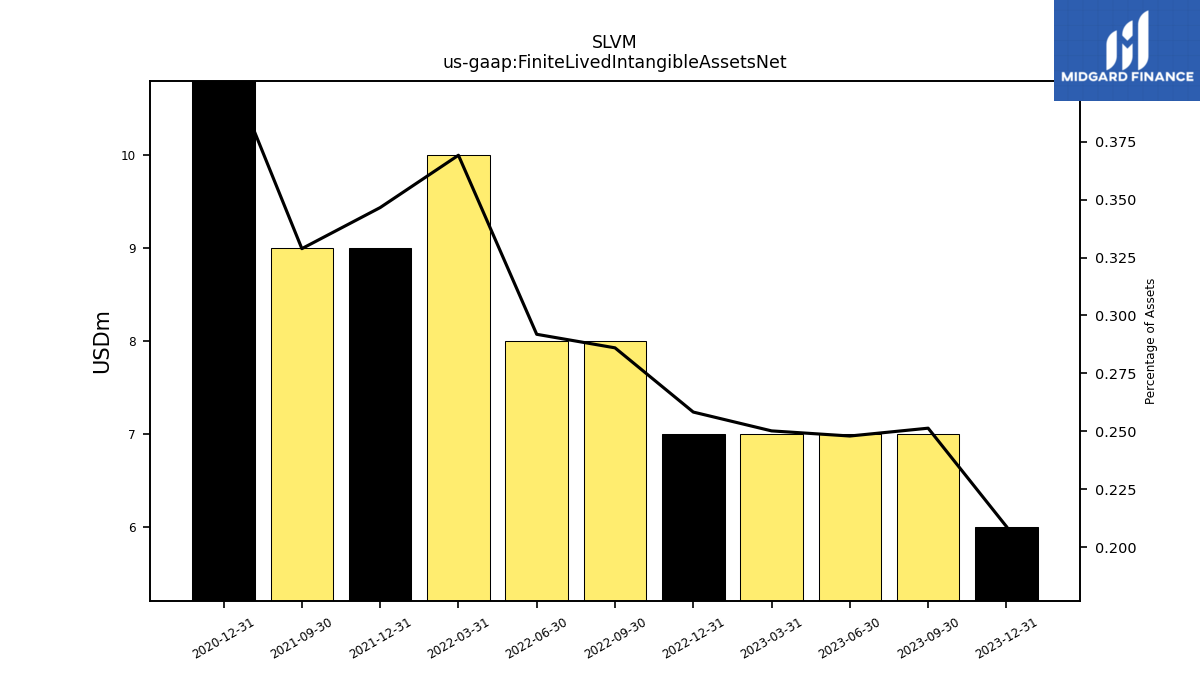
| Finite Lived Intangible Assets Net | 6.00 | 7.00 | 7.00 | 7.00 | 7.00 | 8.00 | 8.00 | 10.00 | 9.00 | 9.00 | NA | NA | 12.00 | NA |
| 2023-12-31 | 2023-09-30 | 2023-06-30 | 2023-03-31 | 2022-12-31 | 2022-09-30 | 2022-06-30 | 2022-03-31 | 2021-12-31 | 2021-09-30 | 2021-06-30 | 2021-03-31 | 2020-12-31 | 2020-09-30 | ||
|---|---|---|---|---|---|---|---|---|---|---|---|---|---|---|---|
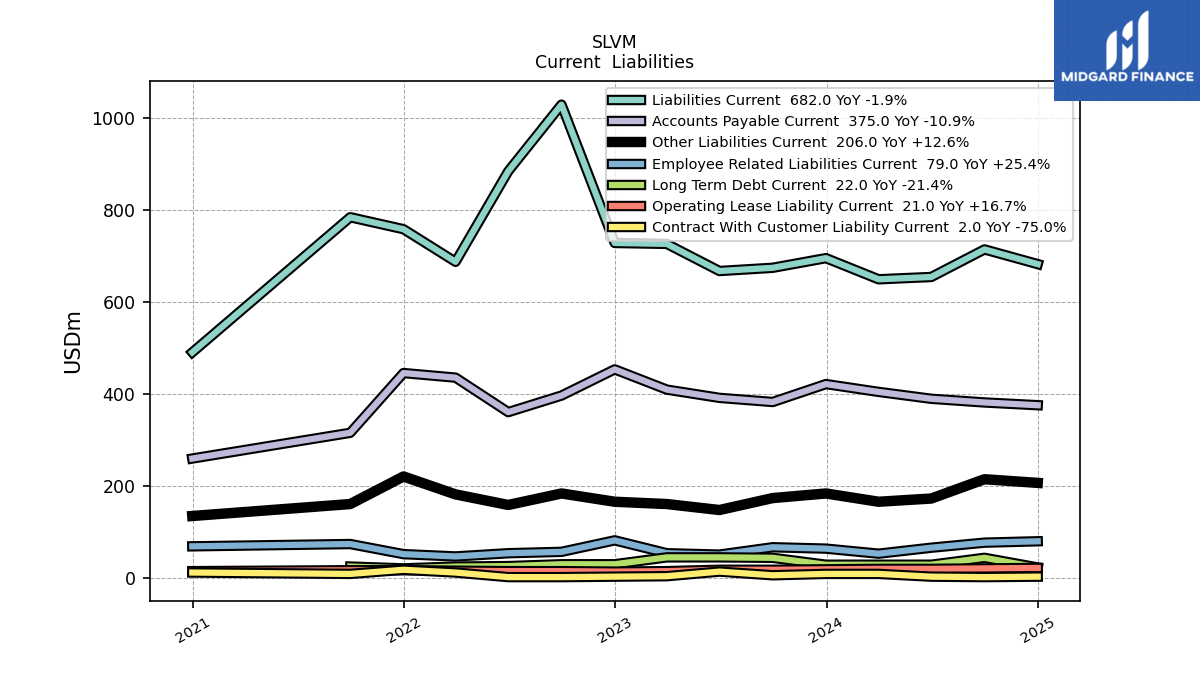
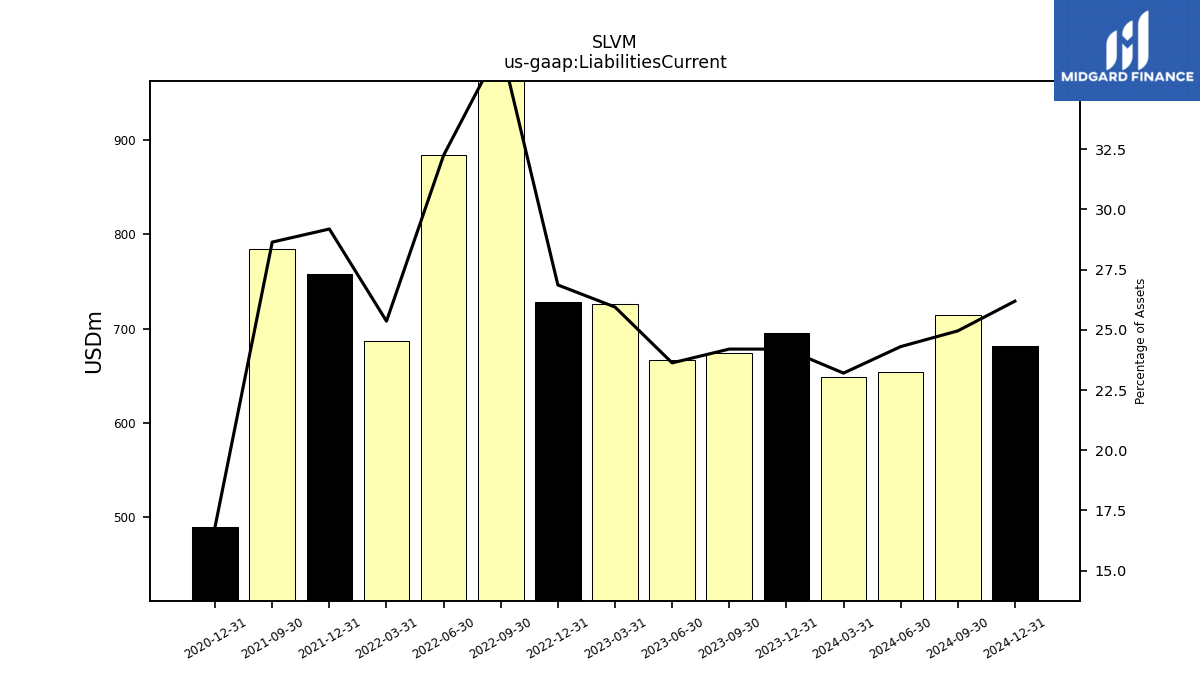
| Liabilities Current | 695.00 | 674.00 | 667.00 | 726.00 | 728.00 | 1029.00 | 884.00 | 687.00 | 758.00 | 784.00 | NA | NA | 490.00 | NA | |
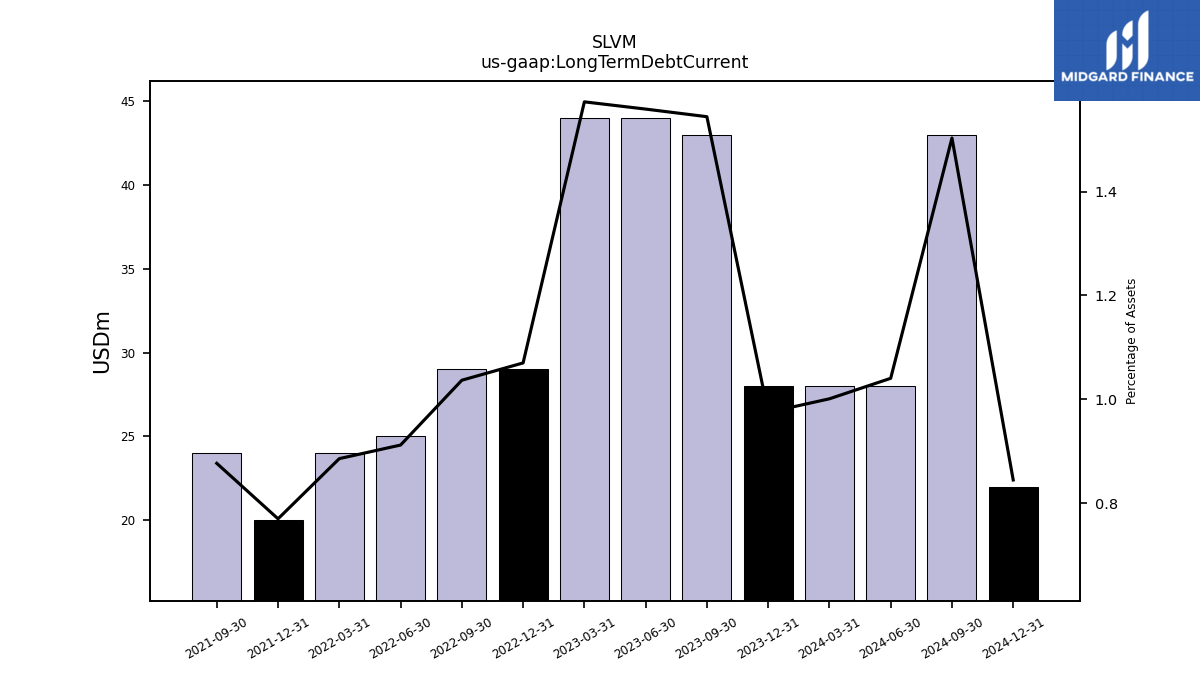
| Long Term Debt Current | 28.00 | 43.00 | 44.00 | 44.00 | 29.00 | 29.00 | 25.00 | 24.00 | 20.00 | 24.00 | NA | NA | NA | NA | |
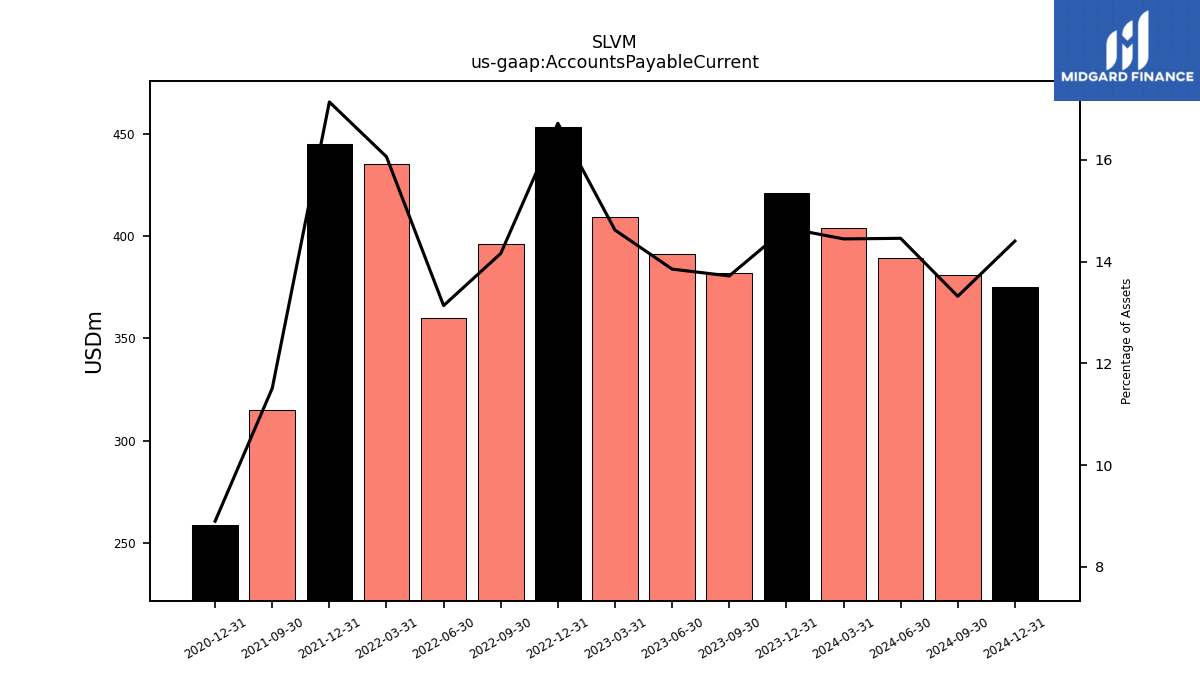
| Accounts Payable Current | 421.00 | 382.00 | 391.00 | 409.00 | 453.00 | 396.00 | 360.00 | 435.00 | 445.00 | 315.00 | NA | NA | 259.00 | NA | |
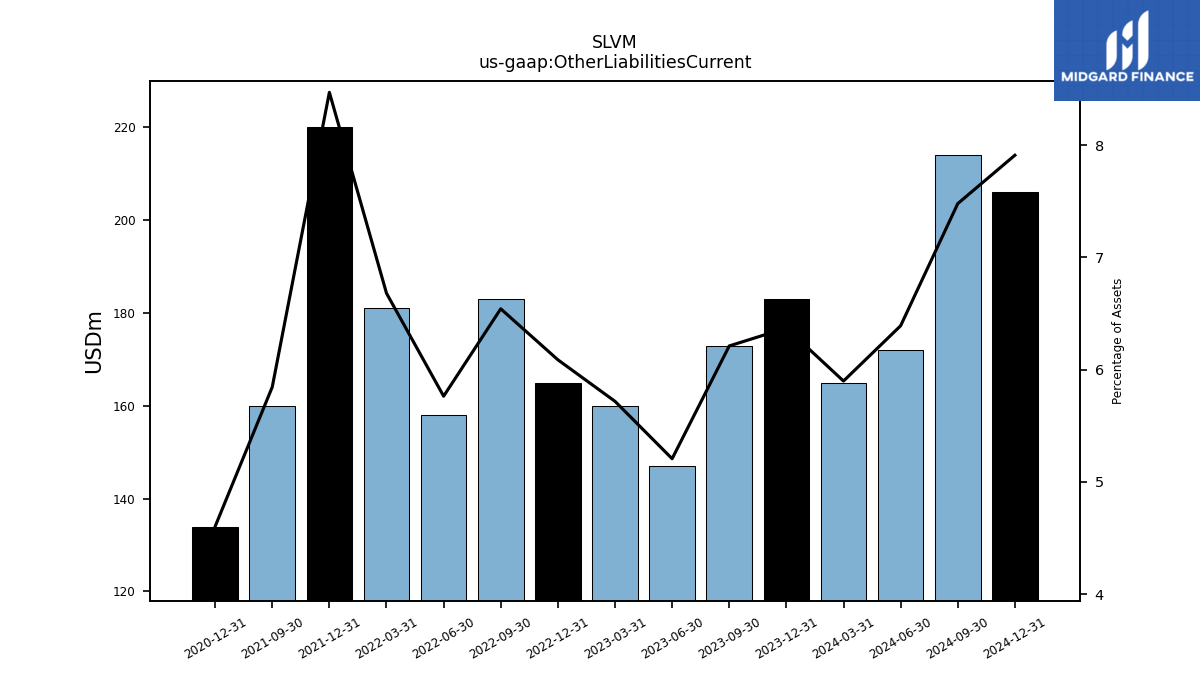
| Other Liabilities Current | 183.00 | 173.00 | 147.00 | 160.00 | 165.00 | 183.00 | 158.00 | 181.00 | 220.00 | 160.00 | NA | NA | 134.00 | NA | |
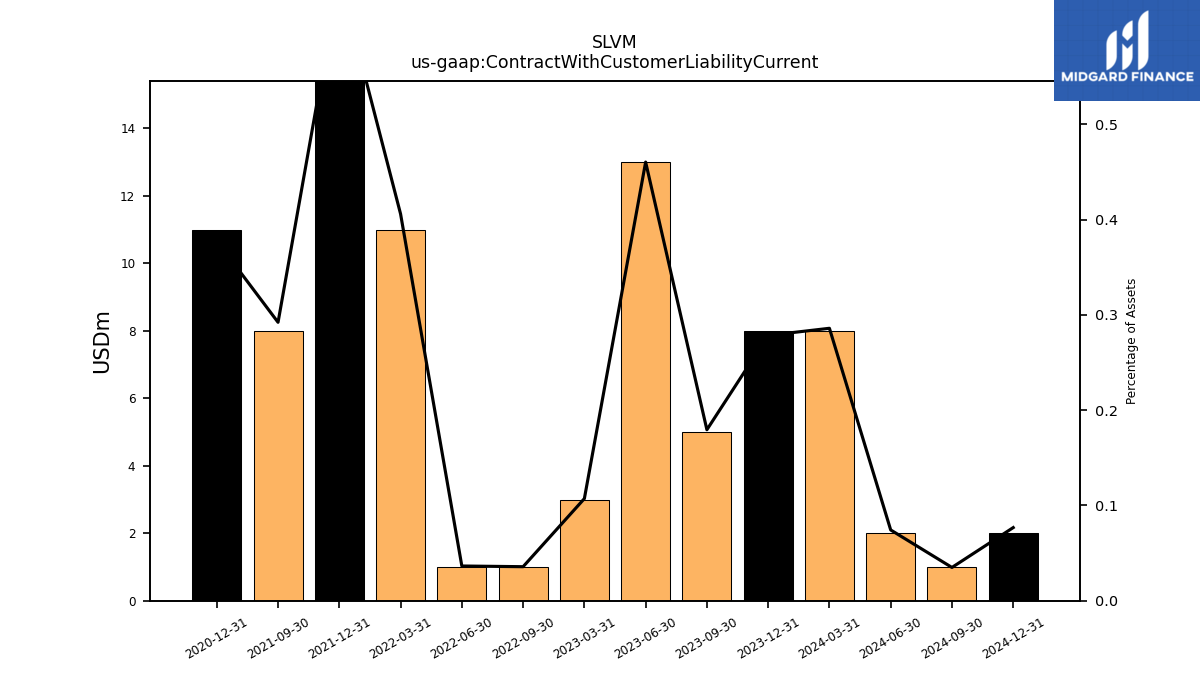
| Contract With Customer Liability Current | 8.00 | 5.00 | 13.00 | 3.00 | NA | 1.00 | 1.00 | 11.00 | 17.00 | 8.00 | NA | NA | 11.00 | NA |
| 2023-12-31 | 2023-09-30 | 2023-06-30 | 2023-03-31 | 2022-12-31 | 2022-09-30 | 2022-06-30 | 2022-03-31 | 2021-12-31 | 2021-09-30 | 2021-06-30 | 2021-03-31 | 2020-12-31 | 2020-09-30 | ||
|---|---|---|---|---|---|---|---|---|---|---|---|---|---|---|---|
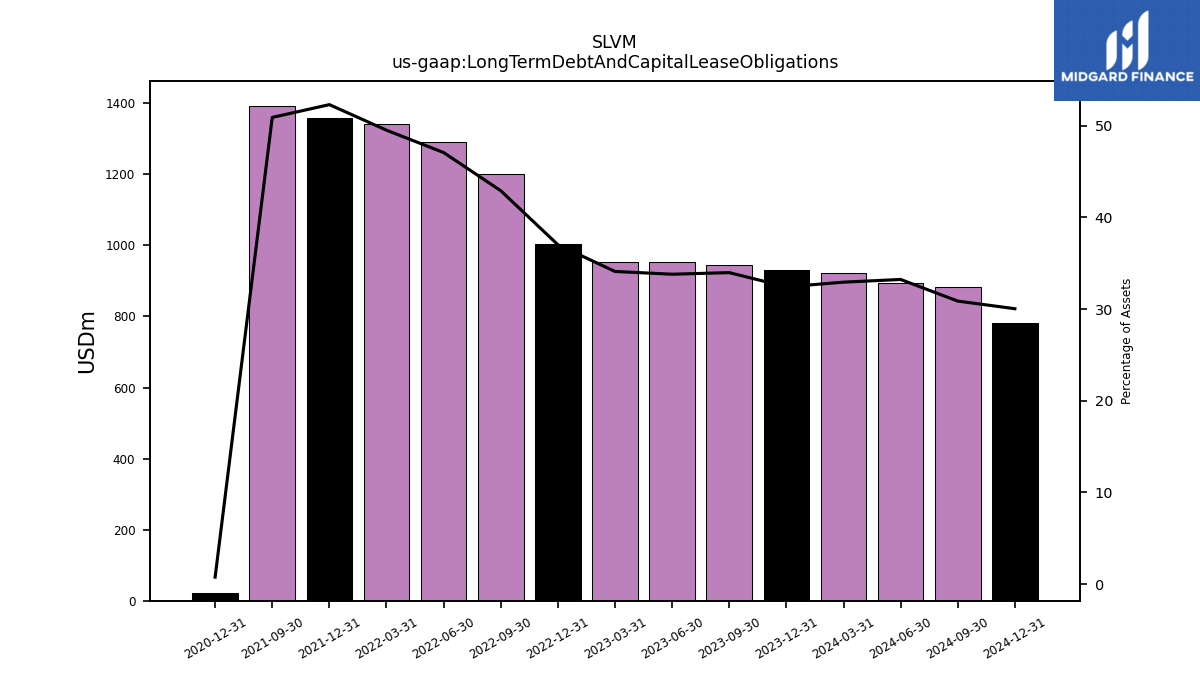
| Long Term Debt And Capital Lease Obligations | 931.00 | 946.00 | 954.00 | 954.00 | 1003.00 | 1200.00 | 1290.00 | 1341.00 | 1358.00 | 1393.00 | NA | NA | 22.00 | NA | |
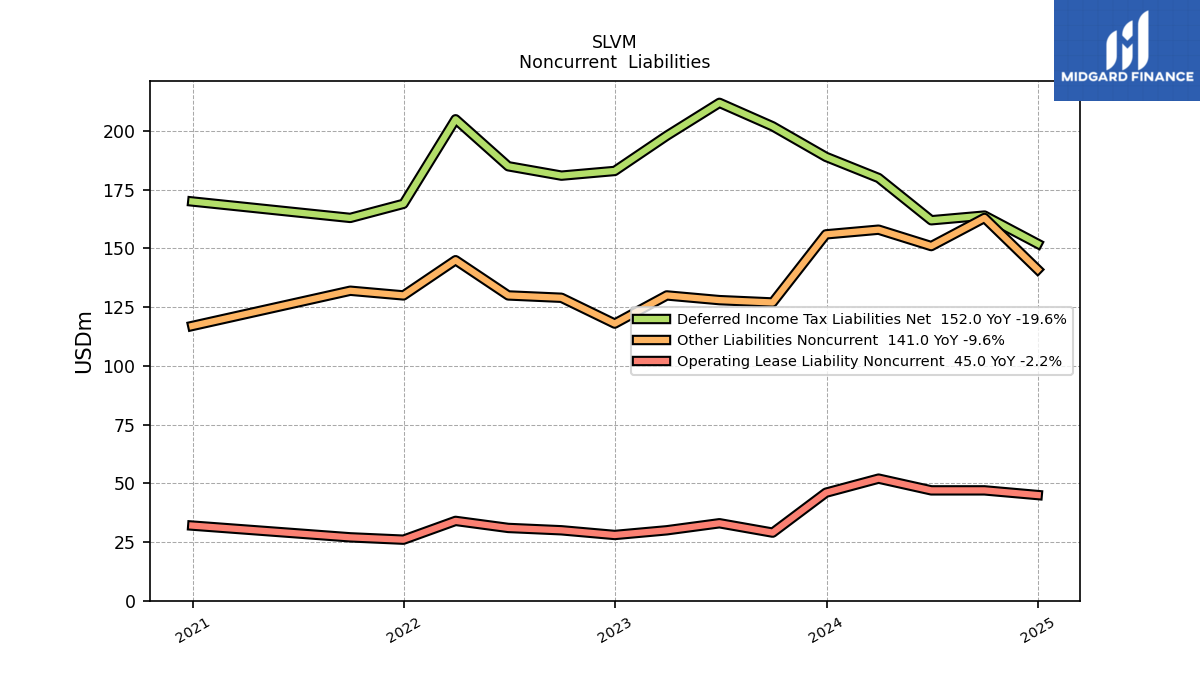
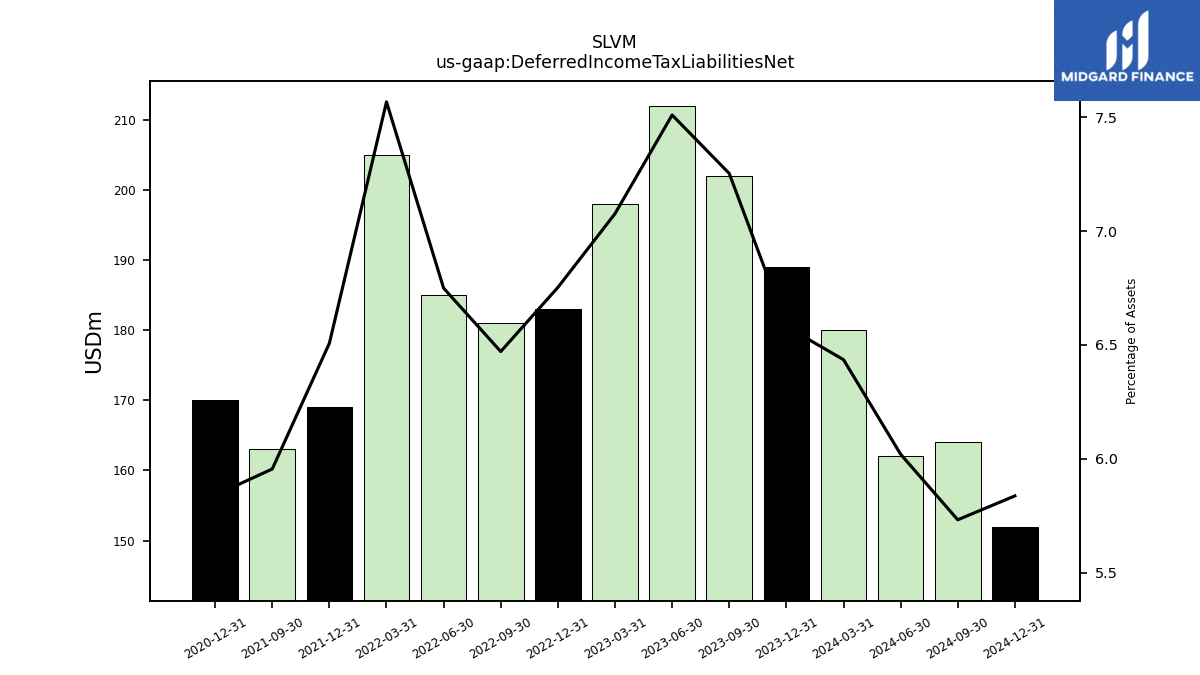
| Deferred Income Tax Liabilities Net | 189.00 | 202.00 | 212.00 | 198.00 | 183.00 | 181.00 | 185.00 | 205.00 | 169.00 | 163.00 | NA | NA | 170.00 | NA | |
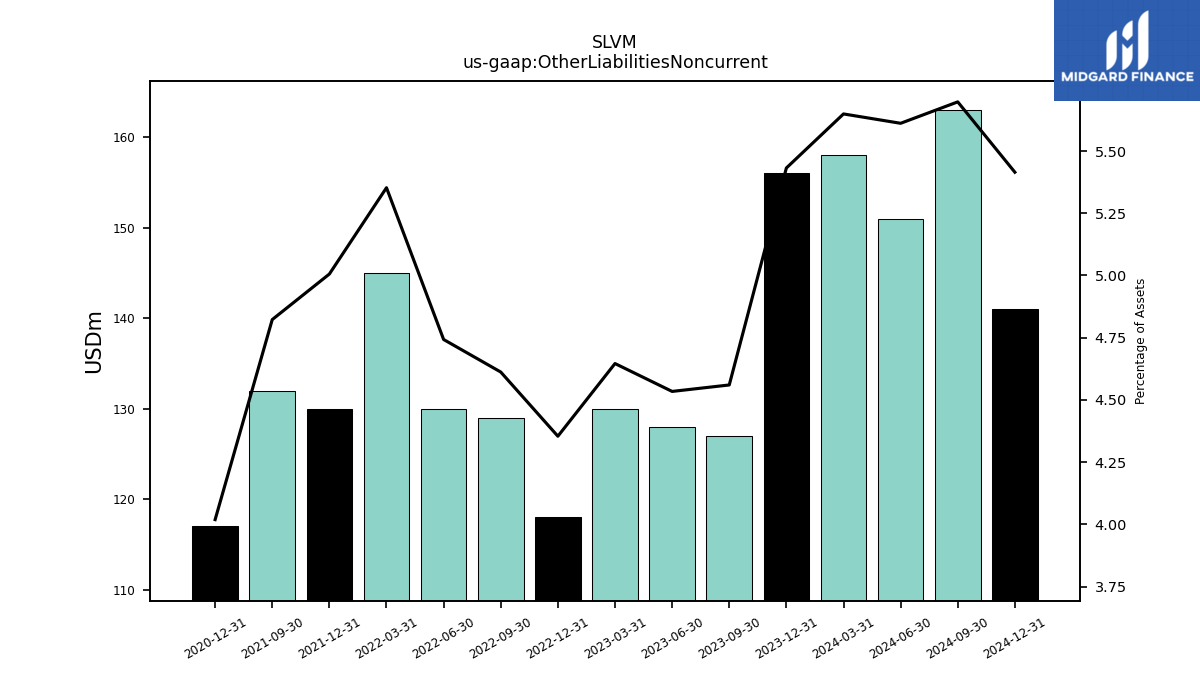
| Other Liabilities Noncurrent | 156.00 | 127.00 | 128.00 | 130.00 | 118.00 | 129.00 | 130.00 | 145.00 | 130.00 | 132.00 | NA | NA | 117.00 | NA | |
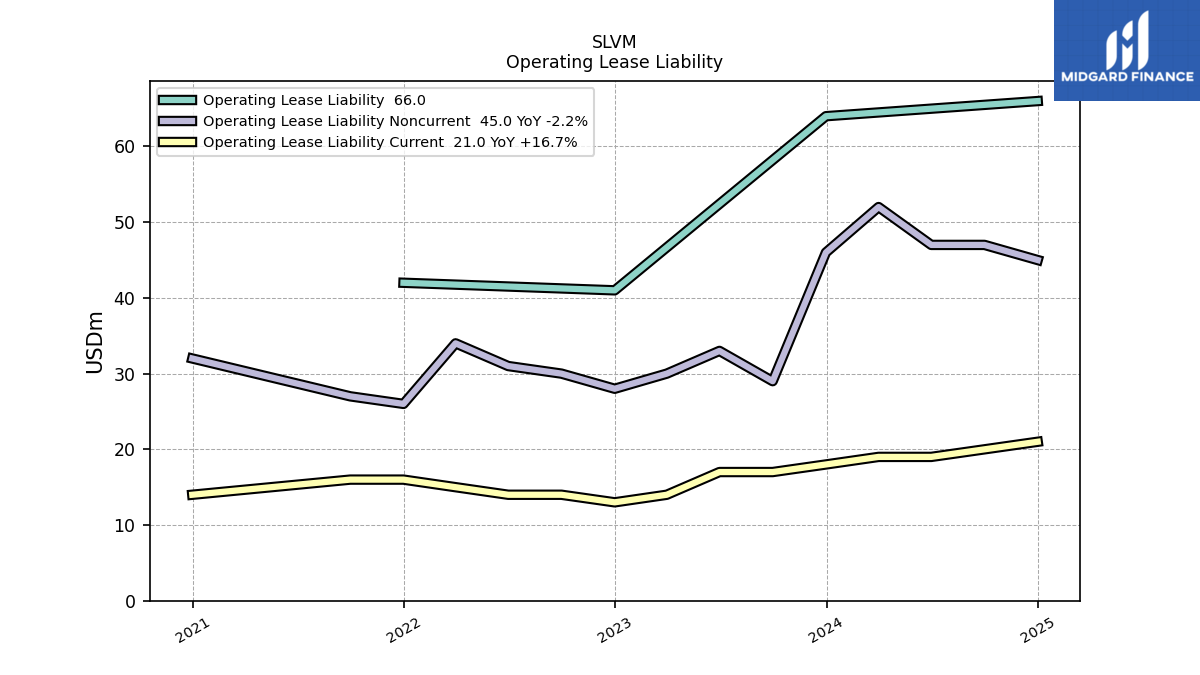
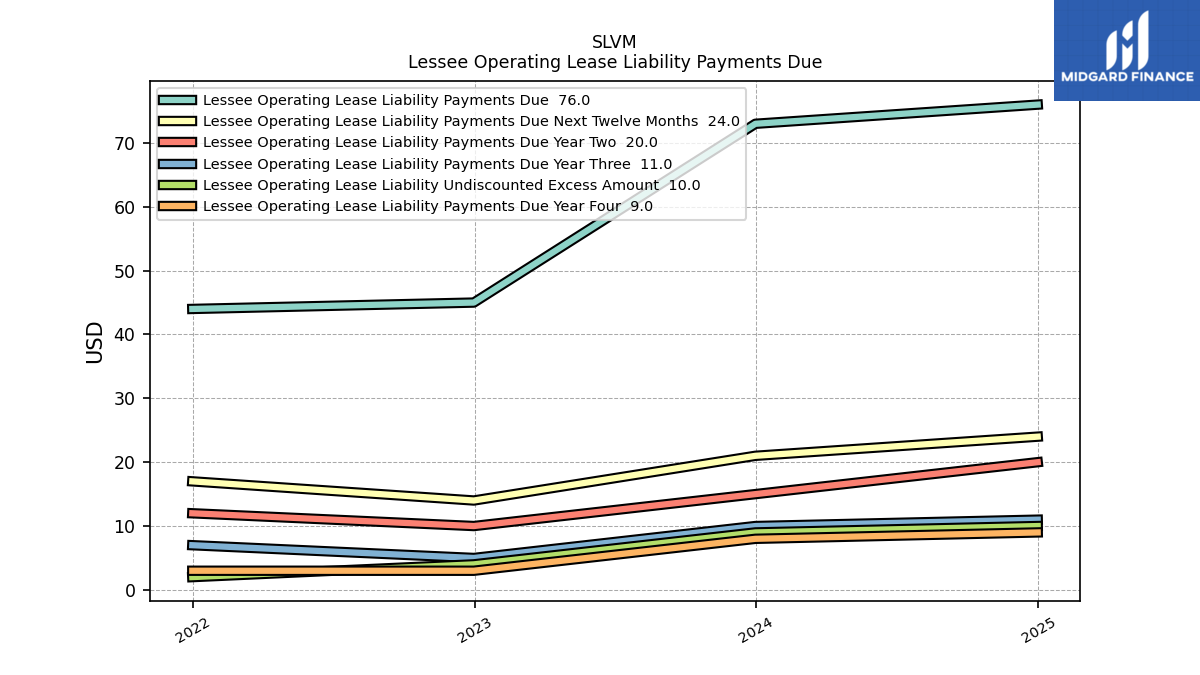
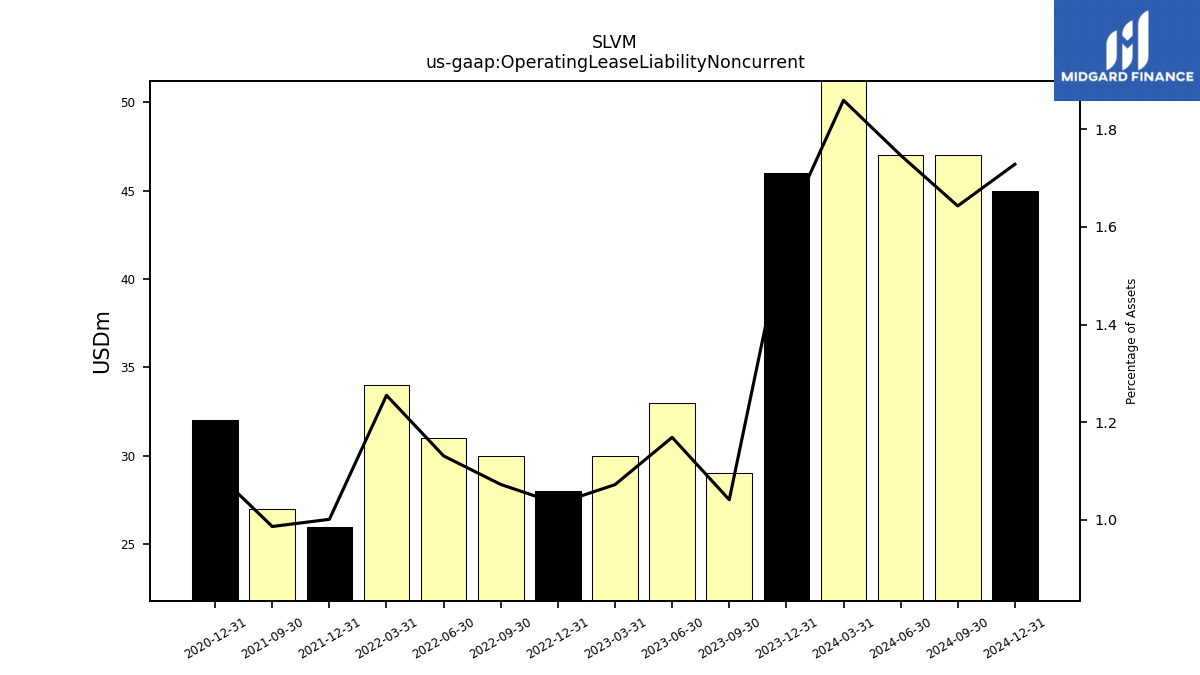
| Operating Lease Liability Noncurrent | 46.00 | 29.00 | 33.00 | 30.00 | 28.00 | 30.00 | 31.00 | 34.00 | 26.00 | 27.00 | NA | NA | 32.00 | NA |
| 2023-12-31 | 2023-09-30 | 2023-06-30 | 2023-03-31 | 2022-12-31 | 2022-09-30 | 2022-06-30 | 2022-03-31 | 2021-12-31 | 2021-09-30 | 2021-06-30 | 2021-03-31 | 2020-12-31 | 2020-09-30 | ||
|---|---|---|---|---|---|---|---|---|---|---|---|---|---|---|---|
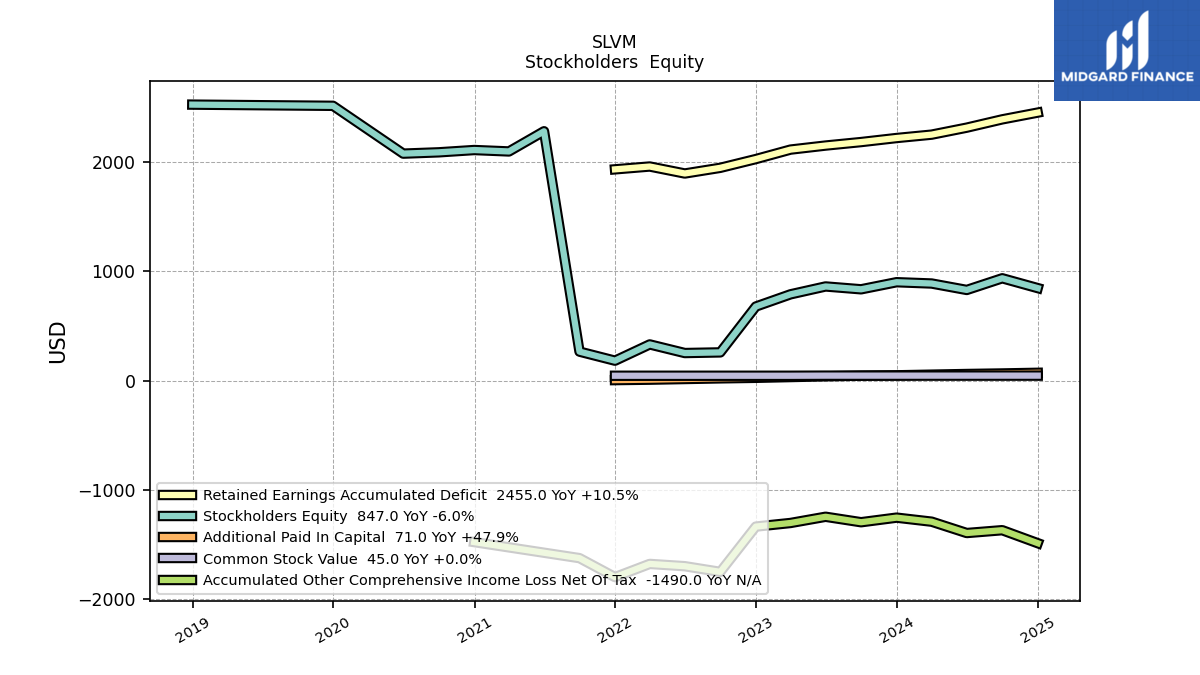
| Stockholders Equity | 901.00 | 836.00 | 862.00 | 790.00 | 678.00 | 258.00 | 252.00 | 331.00 | 182.00 | 265.00 | 2284.00 | 2099.00 | 2112.00 | 2091.00 | |
| Common Stock Value | 45.00 | 45.00 | 45.00 | 44.00 | 44.00 | 44.00 | 44.00 | 44.00 | 44.00 | NA | NA | NA | NA | NA | |
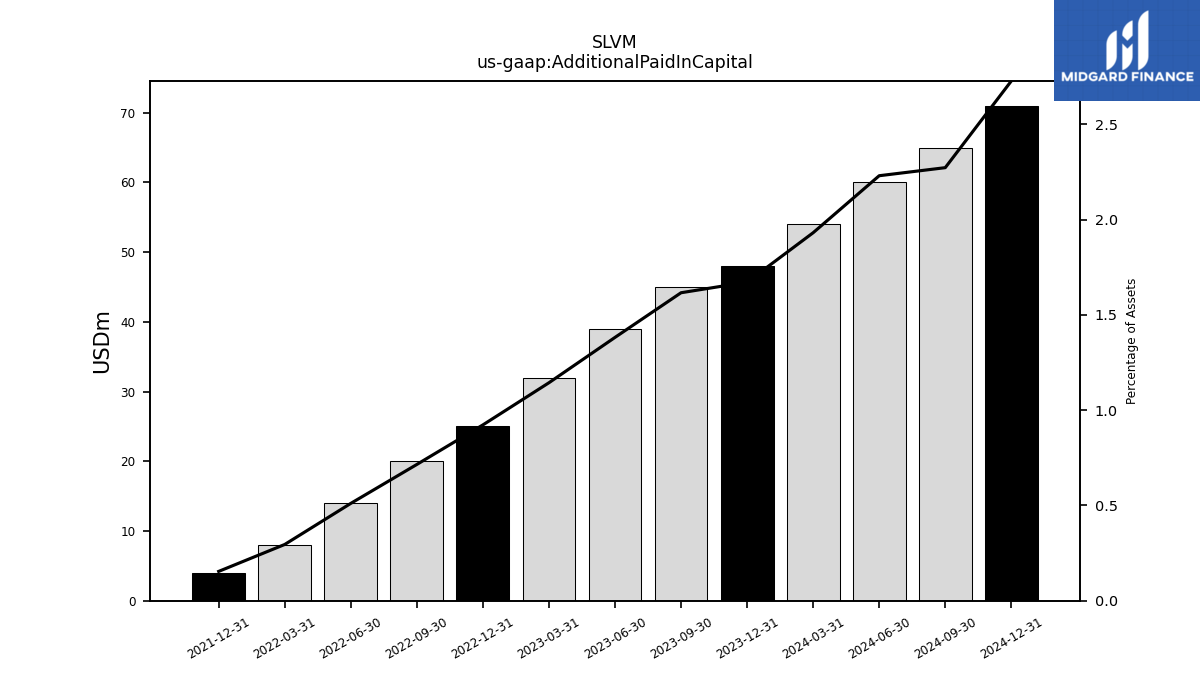
| Additional Paid In Capital | 48.00 | 45.00 | 39.00 | 32.00 | 25.00 | 20.00 | 14.00 | 8.00 | 4.00 | NA | NA | NA | NA | NA | |
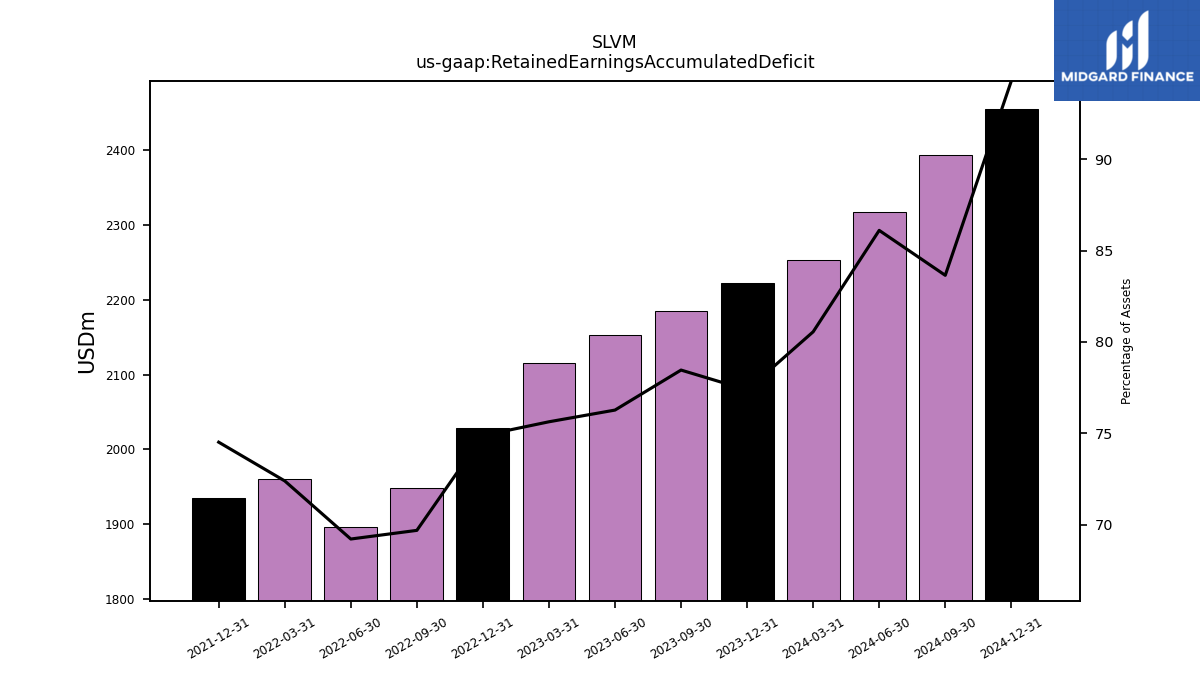
| Retained Earnings Accumulated Deficit | 2222.00 | 2185.00 | 2153.00 | 2116.00 | 2029.00 | 1949.00 | 1897.00 | 1961.00 | 1935.00 | NA | NA | NA | NA | NA | |
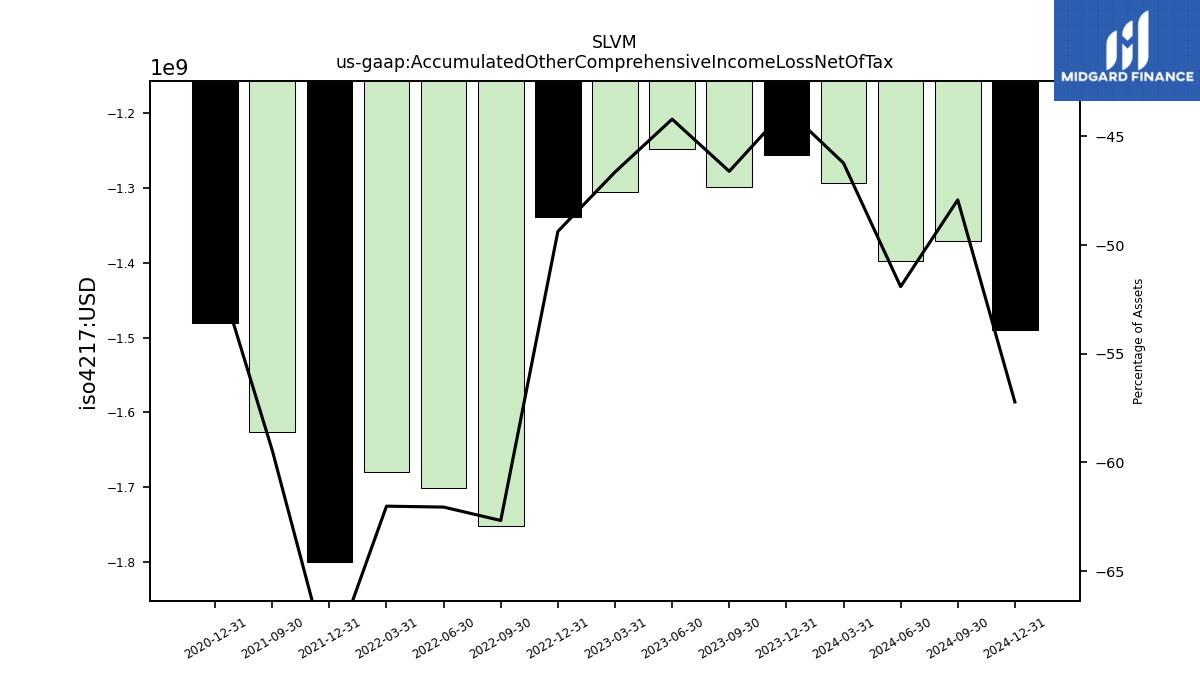
| Accumulated Other Comprehensive Income Loss Net Of Tax | -1256.00 | -1298.00 | -1248.00 | -1305.00 | -1338.00 | -1753.00 | -1701.00 | -1680.00 | -1801.00 | -1627.00 | NA | NA | -1480.00 | NA | |
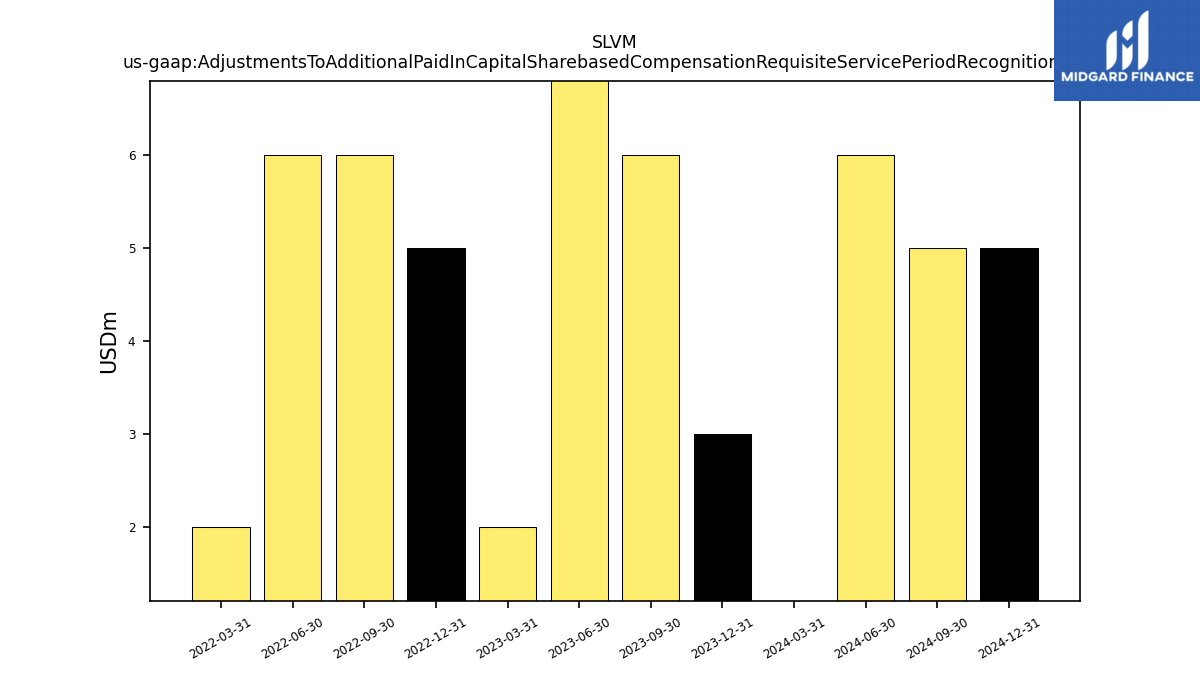
| Adjustments To Additional Paid In Capital Sharebased Compensation Requisite Service Period Recognition Value | 3.00 | 6.00 | 8.00 | 2.00 | 5.00 | 6.00 | 6.00 | 2.00 | NA | NA | NA | NA | NA | NA |
| 2023-12-31 | 2023-09-30 | 2023-06-30 | 2023-03-31 | 2022-12-31 | 2022-09-30 | 2022-06-30 | 2022-03-31 | 2021-12-31 | 2021-09-30 | 2021-06-30 | 2021-03-31 | 2020-12-31 | 2020-09-30 | ||
|---|---|---|---|---|---|---|---|---|---|---|---|---|---|---|---|
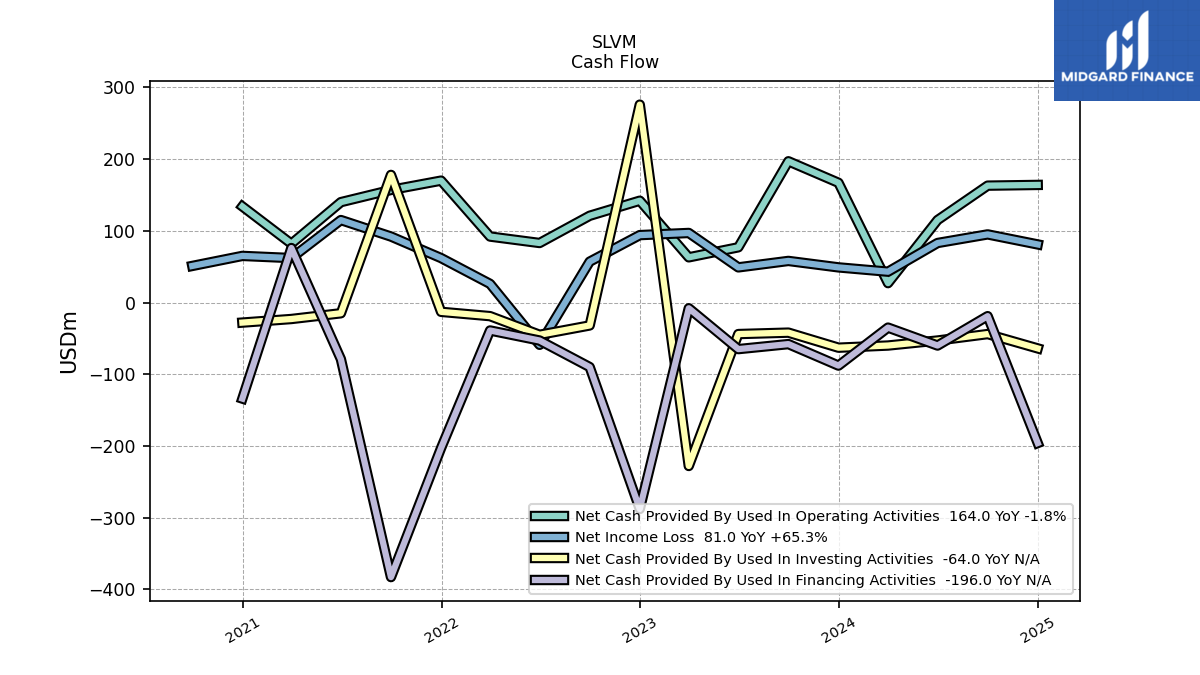
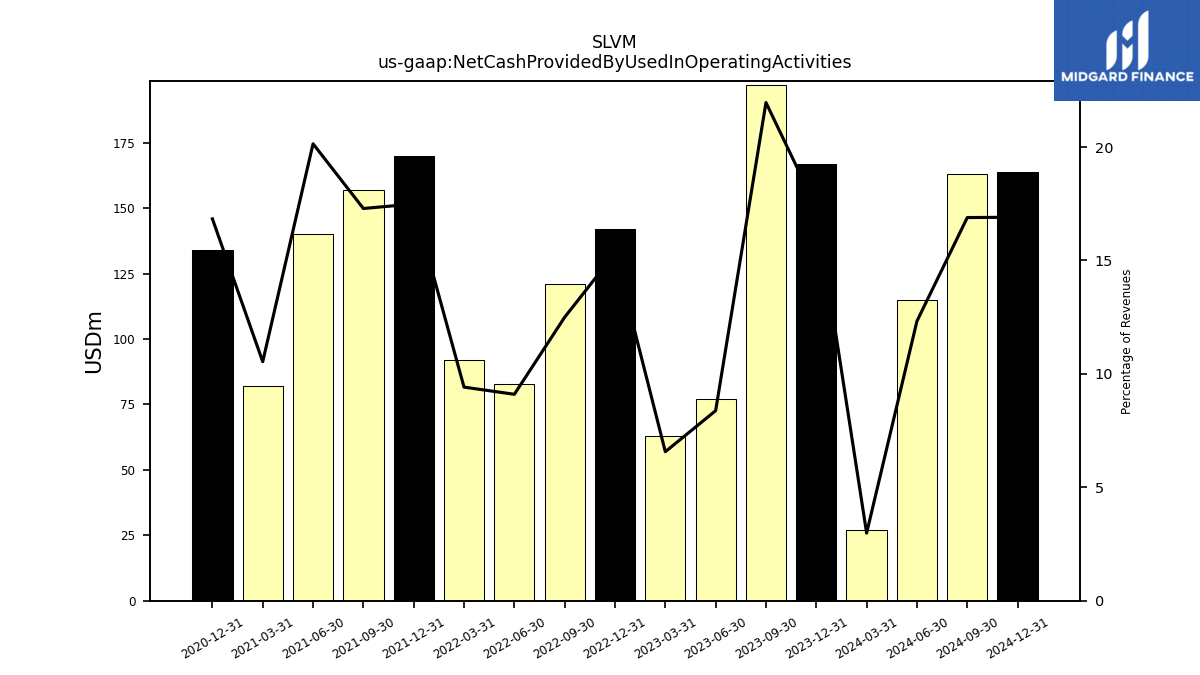
| Net Cash Provided By Used In Operating Activities | 167.00 | 197.00 | 77.00 | 63.00 | 142.00 | 121.00 | 83.00 | 92.00 | 170.00 | 157.00 | 140.00 | 82.00 | 134.00 | NA | |
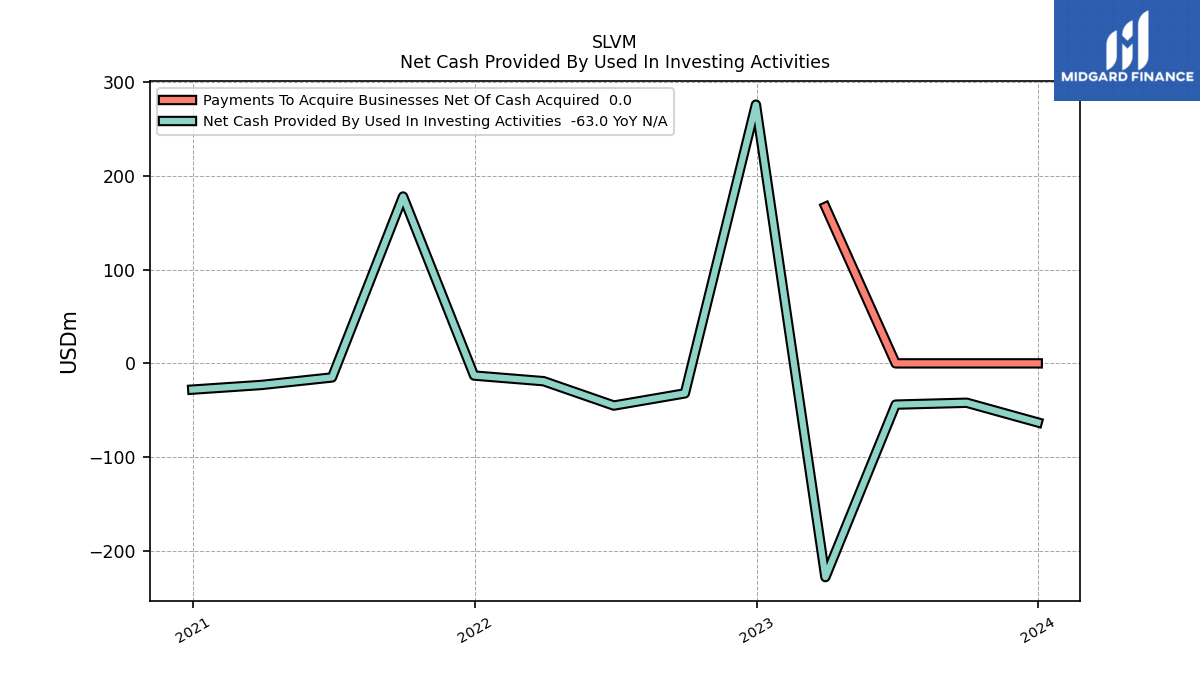
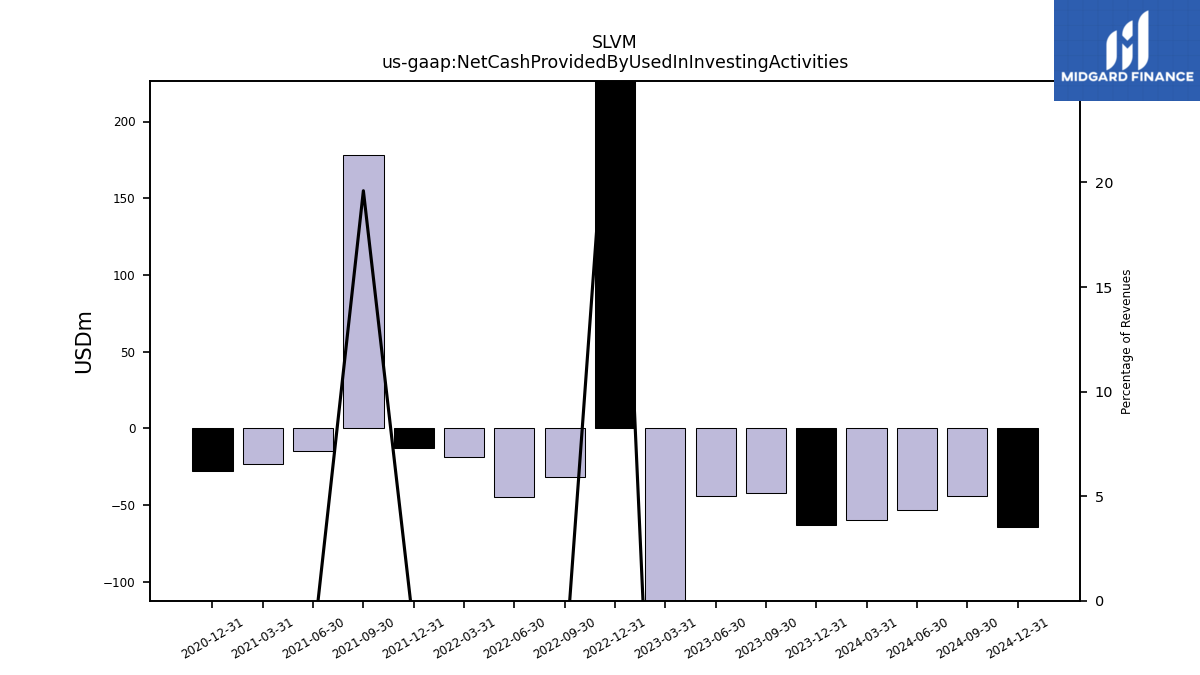
| Net Cash Provided By Used In Investing Activities | -63.00 | -42.00 | -44.00 | -228.00 | 276.00 | -32.00 | -45.00 | -19.00 | -13.00 | 178.00 | -15.00 | -23.00 | -28.00 | NA | |
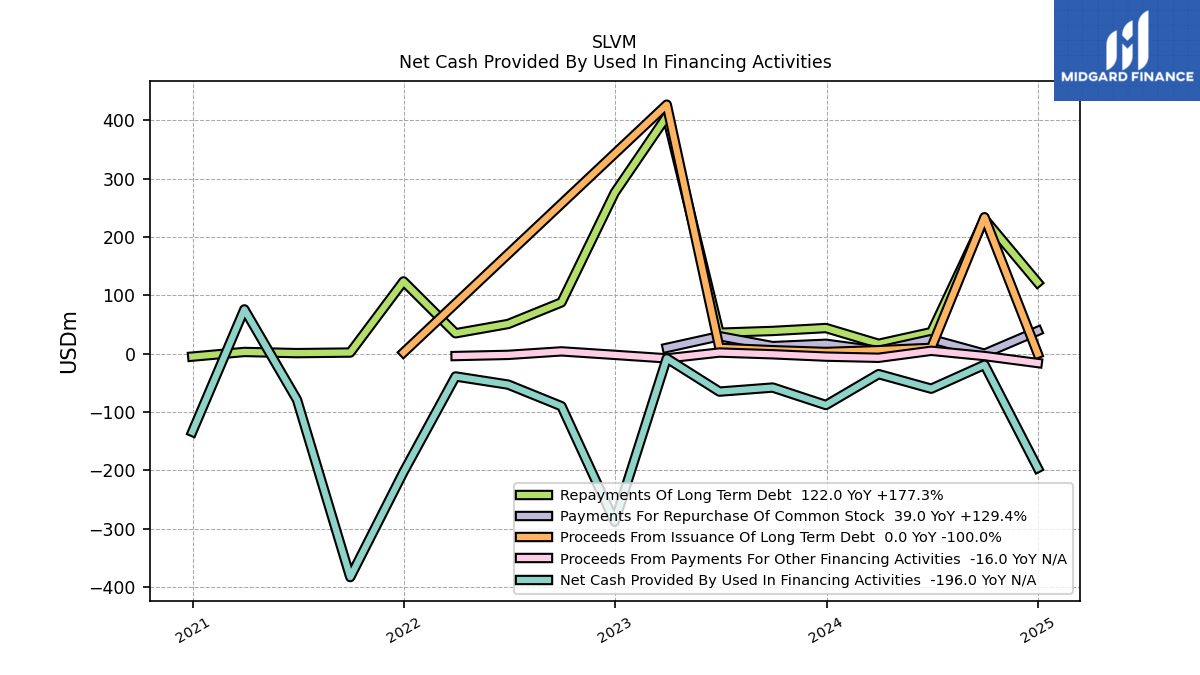
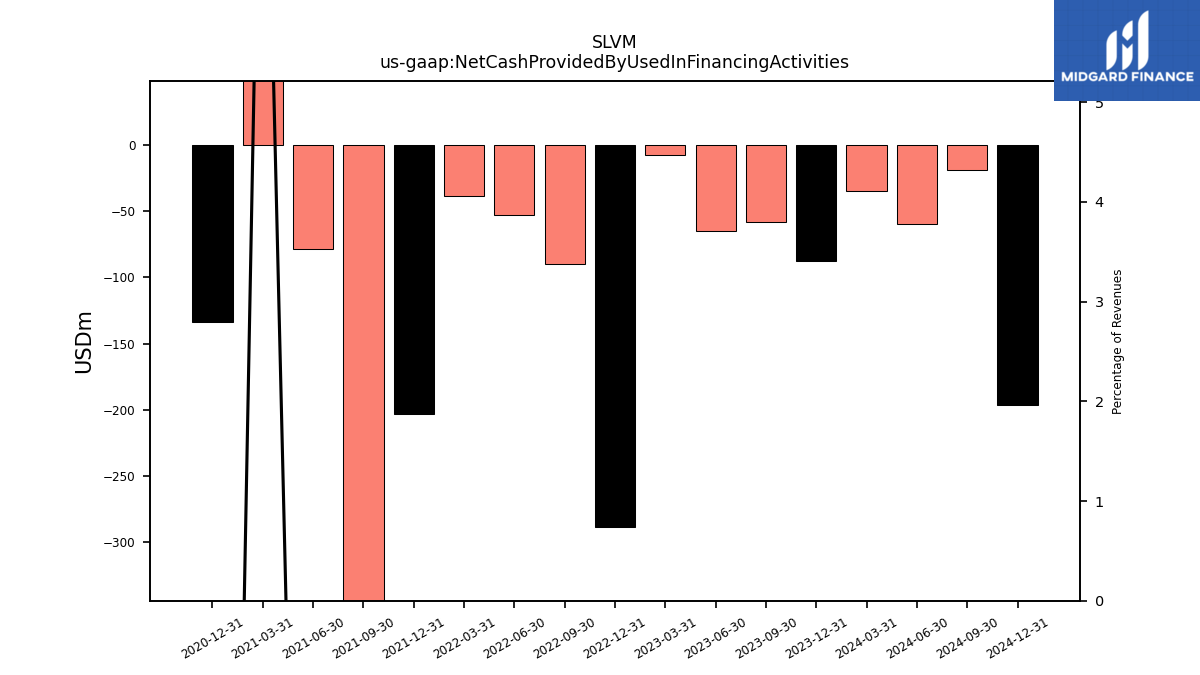
| Net Cash Provided By Used In Financing Activities | -88.00 | -58.00 | -65.00 | -8.00 | -288.00 | -90.00 | -53.00 | -39.00 | -203.00 | -383.00 | -79.00 | 76.00 | -134.00 | NA |
| 2023-12-31 | 2023-09-30 | 2023-06-30 | 2023-03-31 | 2022-12-31 | 2022-09-30 | 2022-06-30 | 2022-03-31 | 2021-12-31 | 2021-09-30 | 2021-06-30 | 2021-03-31 | 2020-12-31 | 2020-09-30 | ||
|---|---|---|---|---|---|---|---|---|---|---|---|---|---|---|---|
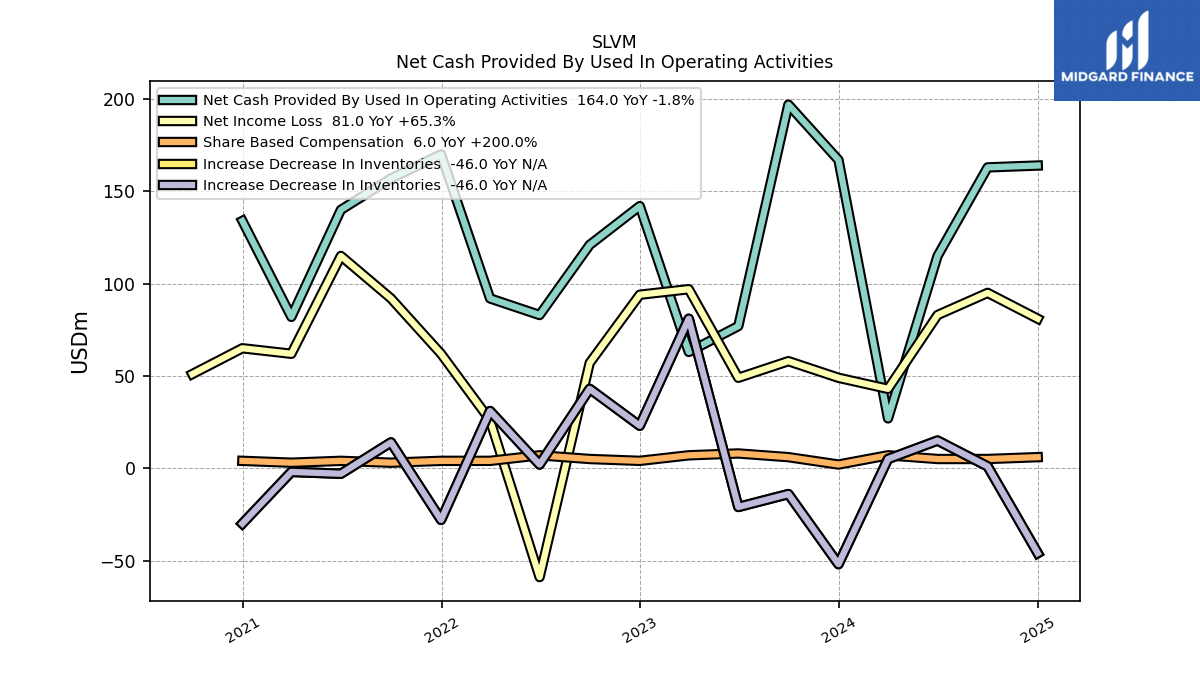
| Net Cash Provided By Used In Operating Activities | 167.00 | 197.00 | 77.00 | 63.00 | 142.00 | 121.00 | 83.00 | 92.00 | 170.00 | 157.00 | 140.00 | 82.00 | 134.00 | NA | |
| Net Income Loss | 49.00 | 58.00 | 49.00 | 97.00 | 94.00 | 57.00 | -59.00 | 26.00 | 62.00 | 92.00 | 115.00 | 62.00 | 65.00 | 51.00 | |
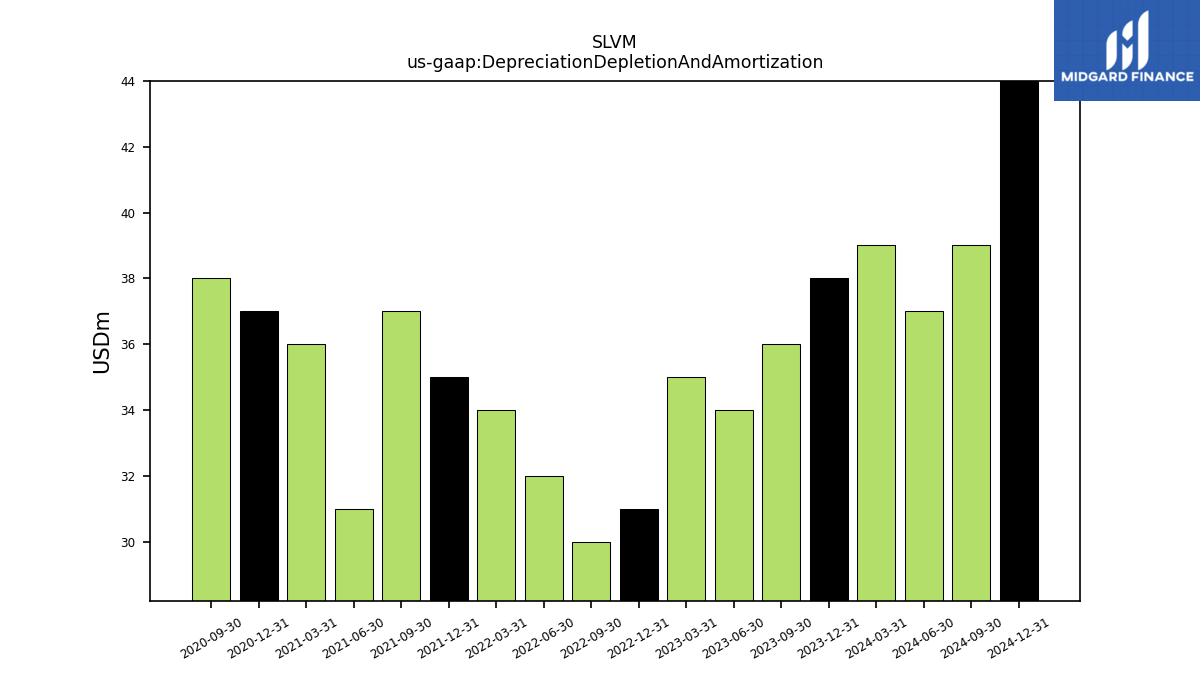
| Depreciation Depletion And Amortization | 38.00 | 36.00 | 34.00 | 35.00 | 31.00 | 30.00 | 32.00 | 34.00 | 35.00 | 37.00 | 31.00 | 36.00 | 37.00 | 38.00 | |
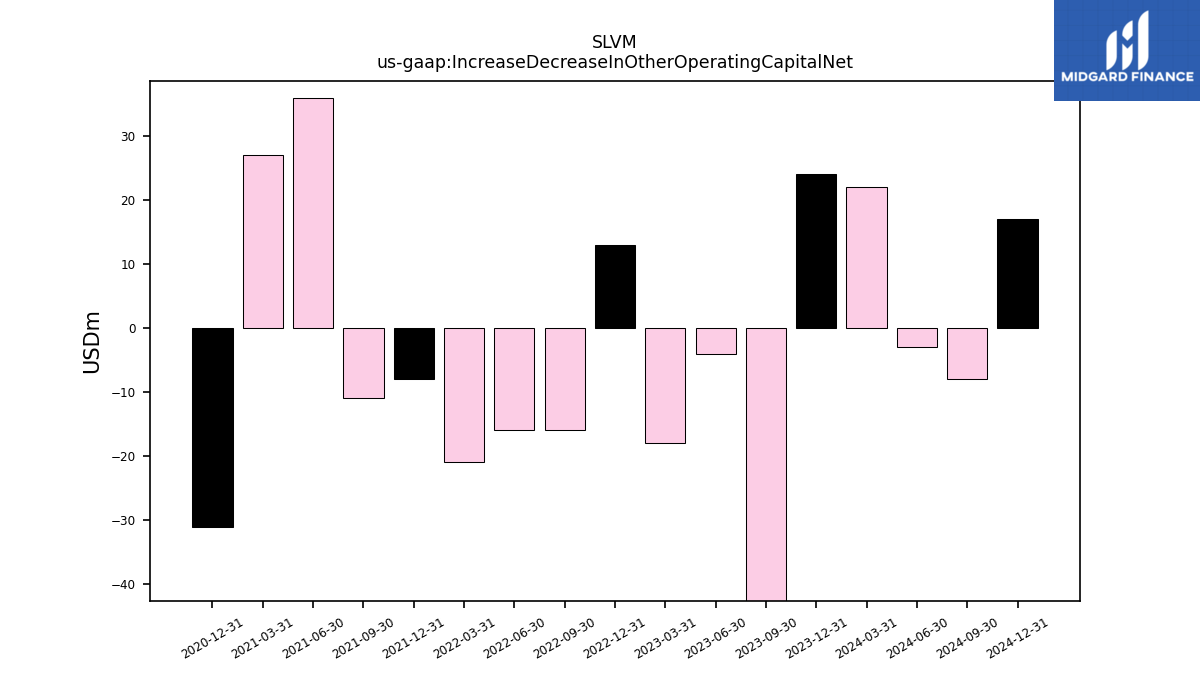
| Increase Decrease In Other Operating Capital Net | 24.00 | -50.00 | -4.00 | -18.00 | 13.00 | -16.00 | -16.00 | -21.00 | -8.00 | -11.00 | 36.00 | 27.00 | -31.00 | NA | |
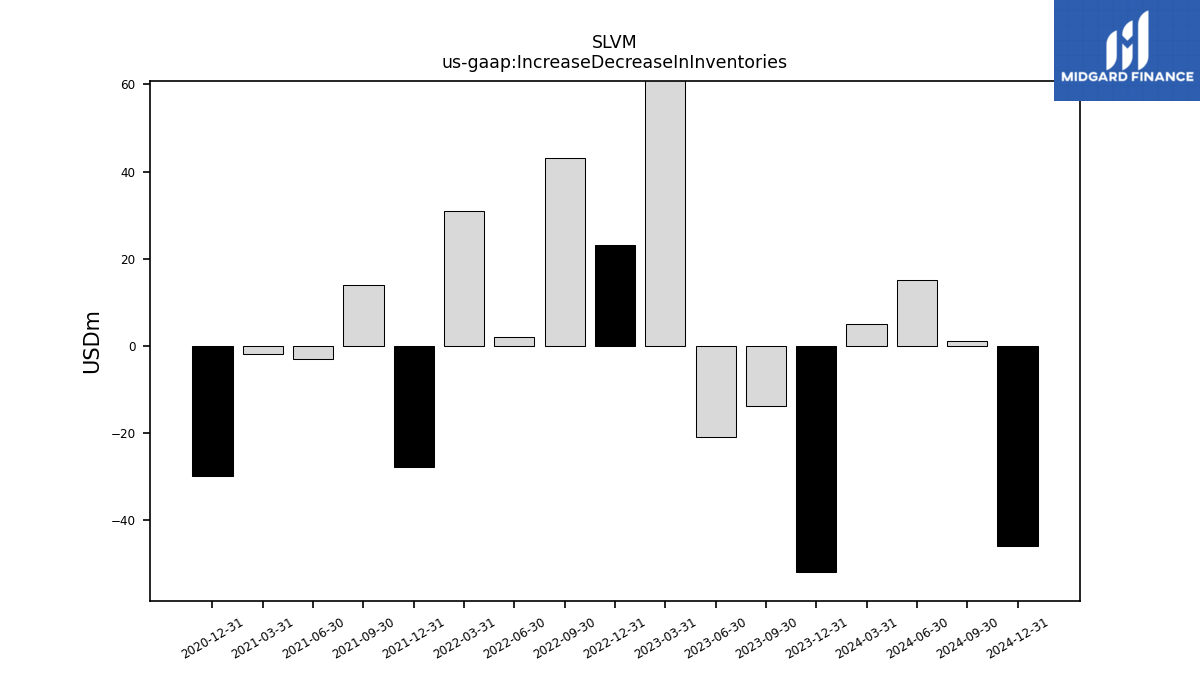
| Increase Decrease In Inventories | -52.00 | -14.00 | -21.00 | 81.00 | 23.00 | 43.00 | 2.00 | 31.00 | -28.00 | 14.00 | -3.00 | -2.00 | -30.00 | NA | |
| Share Based Compensation | 2.00 | 6.00 | 8.00 | 7.00 | 4.00 | 5.00 | 7.00 | 4.00 | 4.00 | 3.00 | 4.00 | 3.00 | 4.00 | NA |
| 2023-12-31 | 2023-09-30 | 2023-06-30 | 2023-03-31 | 2022-12-31 | 2022-09-30 | 2022-06-30 | 2022-03-31 | 2021-12-31 | 2021-09-30 | 2021-06-30 | 2021-03-31 | 2020-12-31 | 2020-09-30 | ||
|---|---|---|---|---|---|---|---|---|---|---|---|---|---|---|---|
| Net Cash Provided By Used In Investing Activities | -63.00 | -42.00 | -44.00 | -228.00 | 276.00 | -32.00 | -45.00 | -19.00 | -13.00 | 178.00 | -15.00 | -23.00 | -28.00 | NA |
| 2023-12-31 | 2023-09-30 | 2023-06-30 | 2023-03-31 | 2022-12-31 | 2022-09-30 | 2022-06-30 | 2022-03-31 | 2021-12-31 | 2021-09-30 | 2021-06-30 | 2021-03-31 | 2020-12-31 | 2020-09-30 | ||
|---|---|---|---|---|---|---|---|---|---|---|---|---|---|---|---|
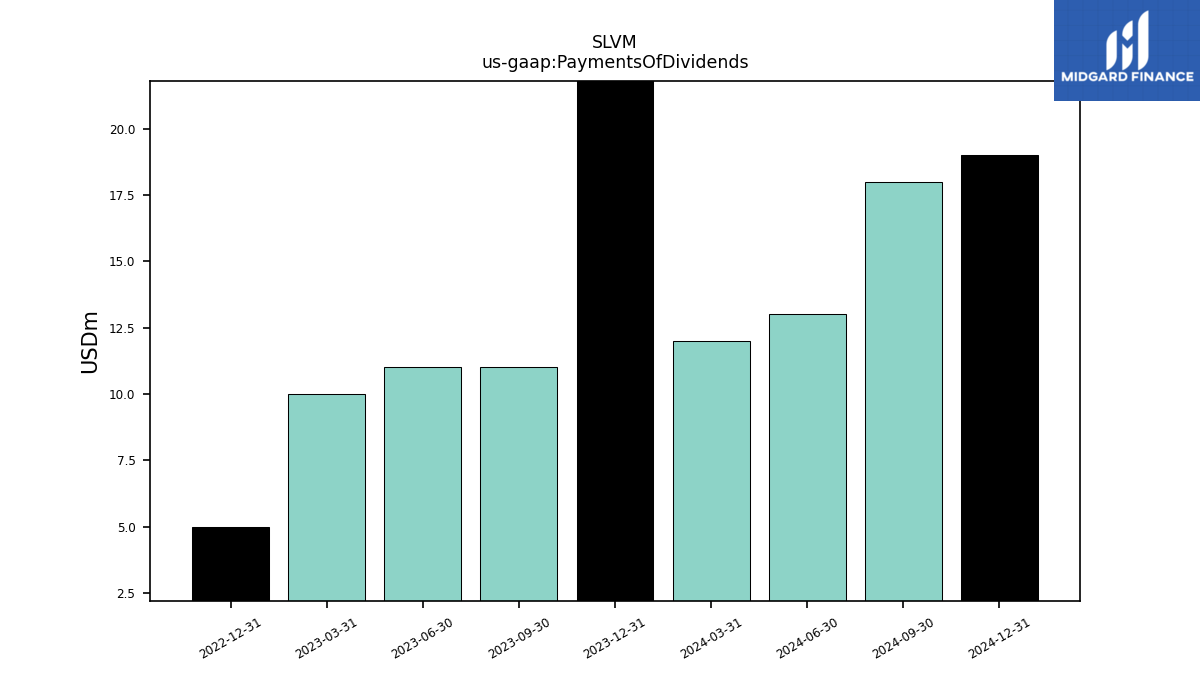
| Net Cash Provided By Used In Financing Activities | -88.00 | -58.00 | -65.00 | -8.00 | -288.00 | -90.00 | -53.00 | -39.00 | -203.00 | -383.00 | -79.00 | 76.00 | -134.00 | NA | |
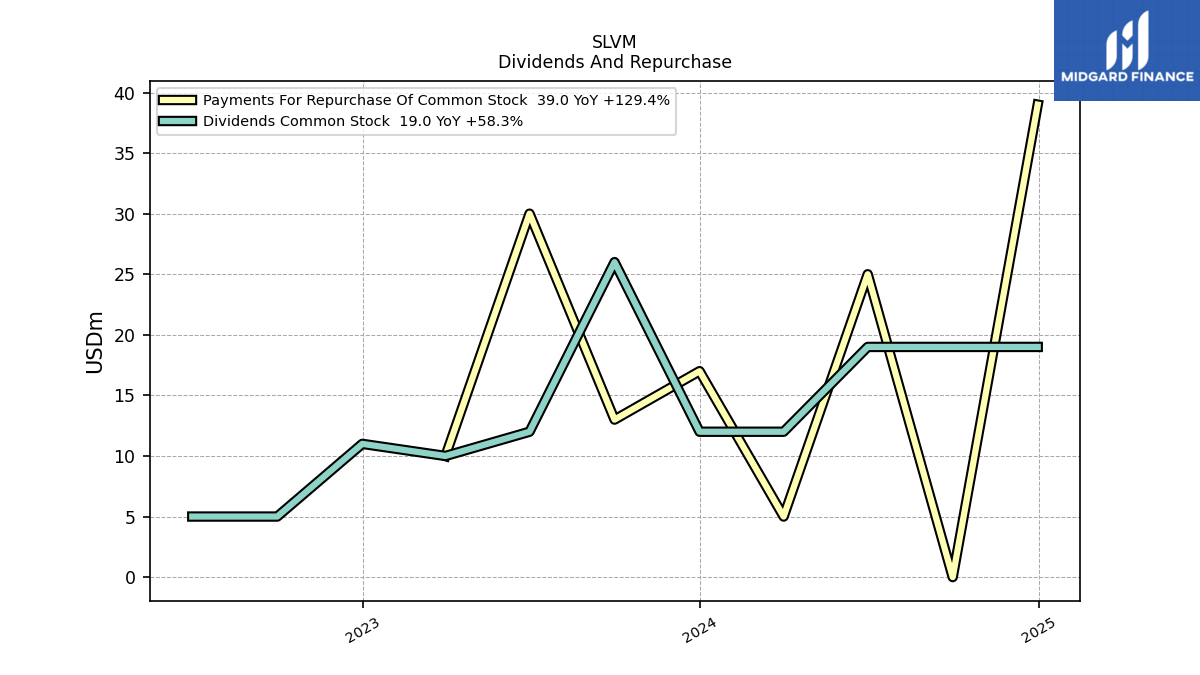
| Payments Of Dividends | 25.00 | 11.00 | 11.00 | 10.00 | 5.00 | NA | NA | NA | NA | NA | NA | NA | NA | NA | |
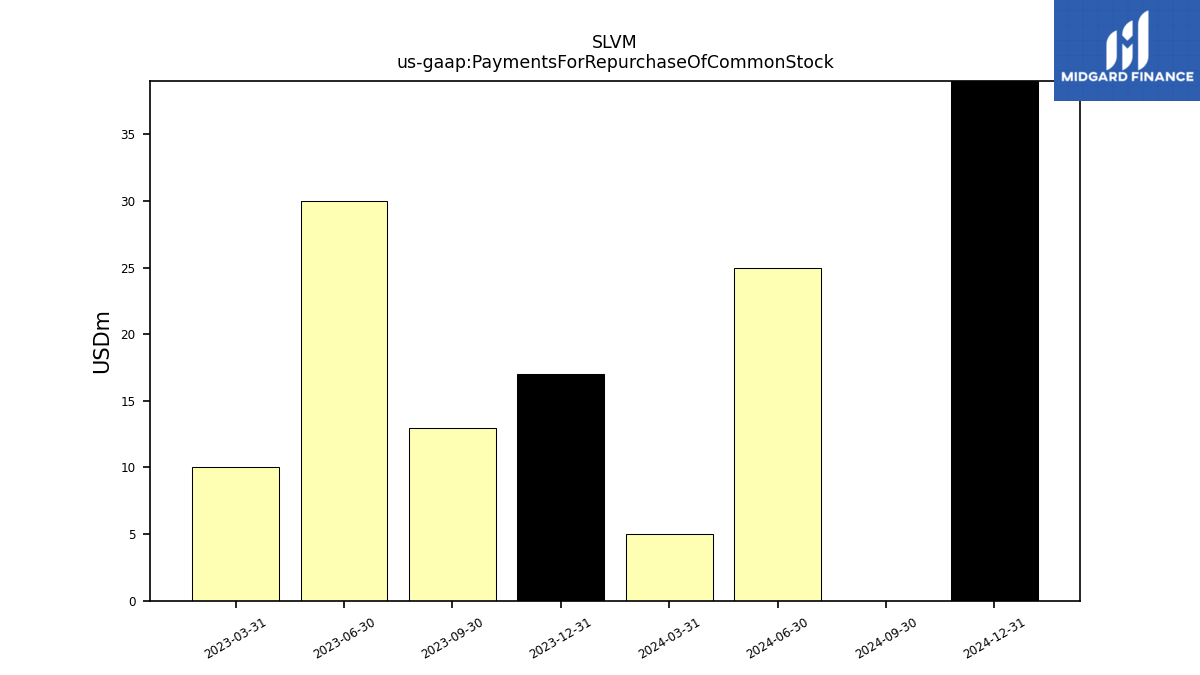
| Payments For Repurchase Of Common Stock | 17.00 | 13.00 | 30.00 | 10.00 | NA | NA | NA | NA | NA | NA | NA | NA | NA | NA |
| 2023-12-31 | 2023-09-30 | 2023-06-30 | 2023-03-31 | 2022-12-31 | 2022-09-30 | 2022-06-30 | 2022-03-31 | 2021-12-31 | 2021-09-30 | 2021-06-30 | 2021-03-31 | 2020-12-31 | 2020-09-30 | ||
|---|---|---|---|---|---|---|---|---|---|---|---|---|---|---|---|
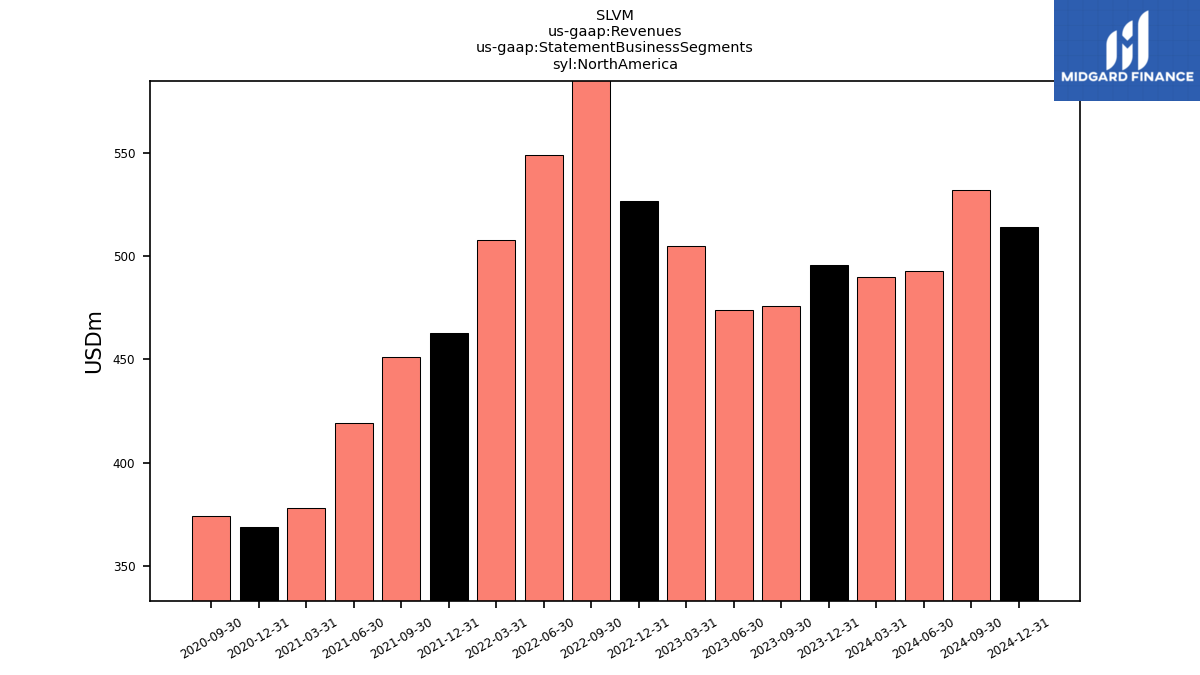
| Revenues | 964.00 | 897.00 | 919.00 | 959.00 | 927.00 | 968.00 | 912.00 | 977.00 | 972.00 | 908.00 | 695.00 | 778.00 | 796.00 | 738.00 | |
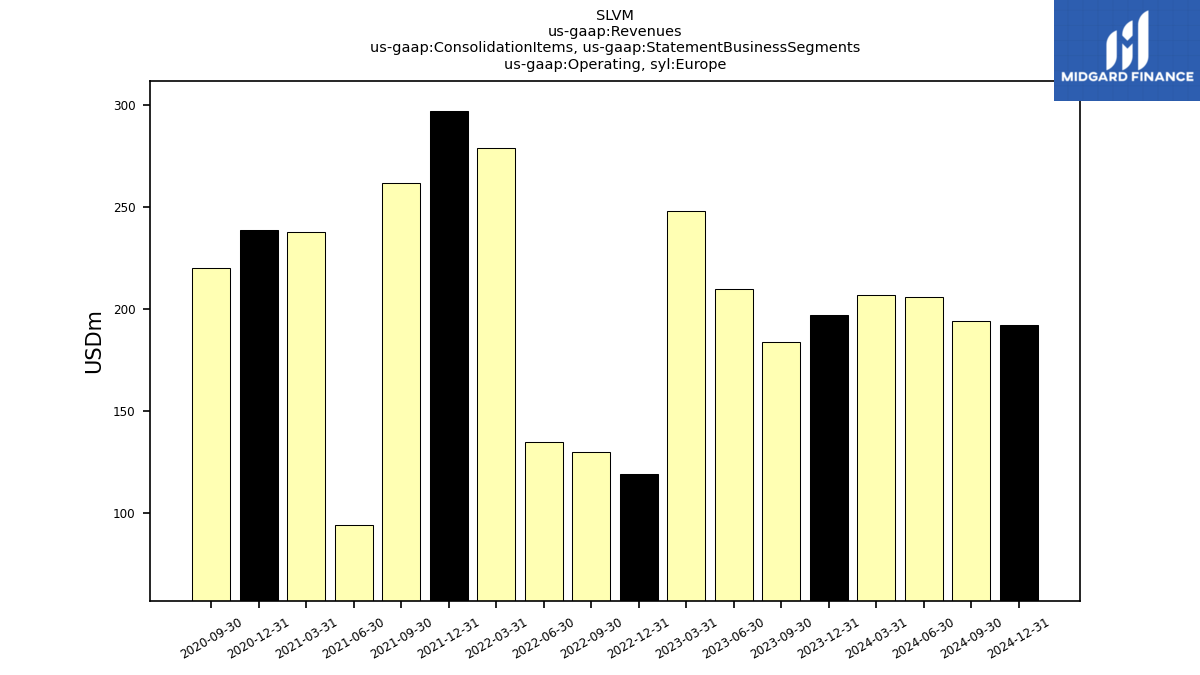
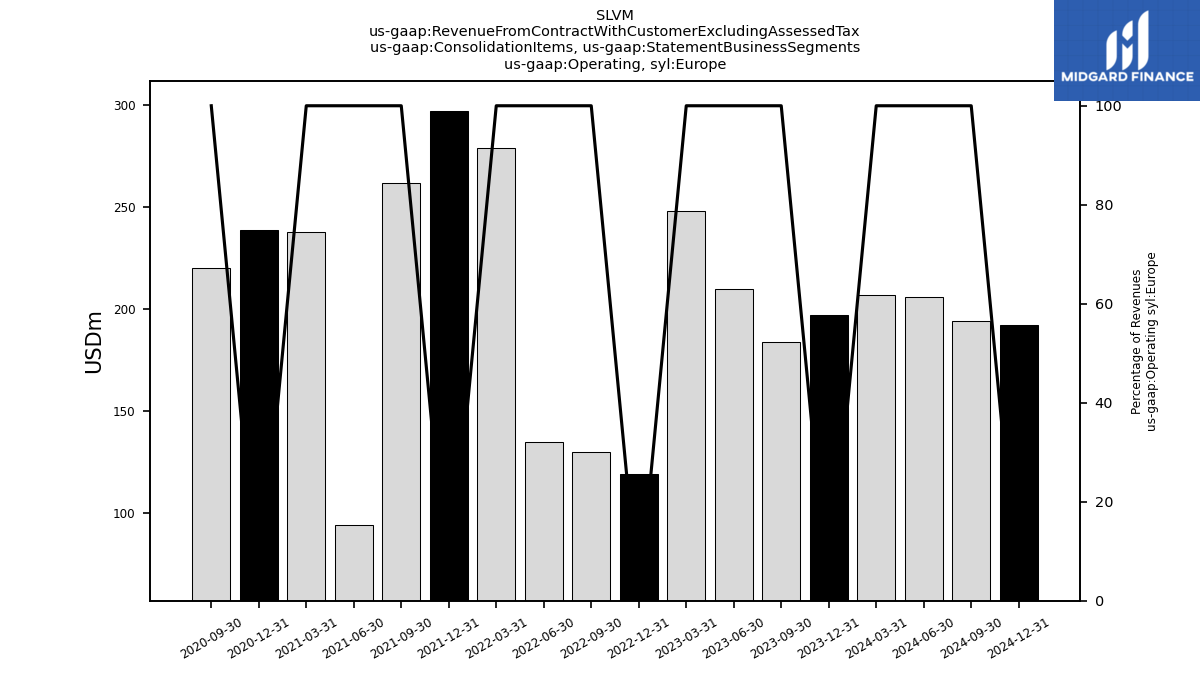
| Operating, Europe | 197.00 | 184.00 | 210.00 | 248.00 | 119.00 | 130.00 | 135.00 | 279.00 | 297.00 | 262.00 | 94.00 | 238.00 | 239.00 | 220.00 | |
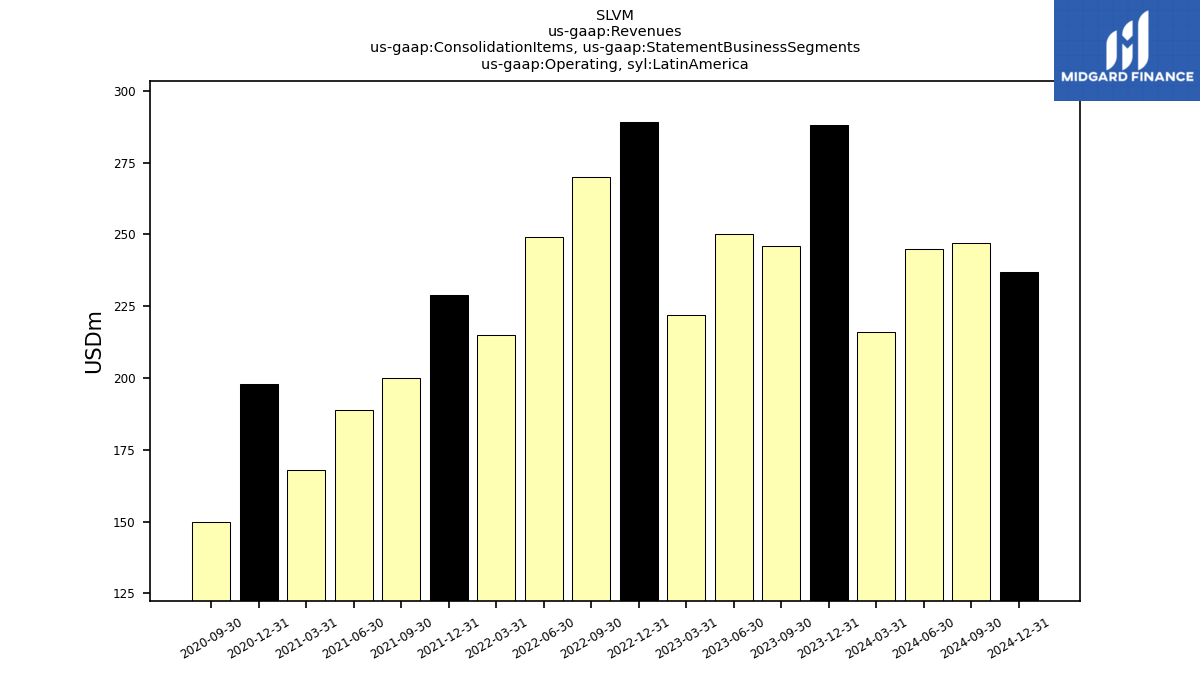
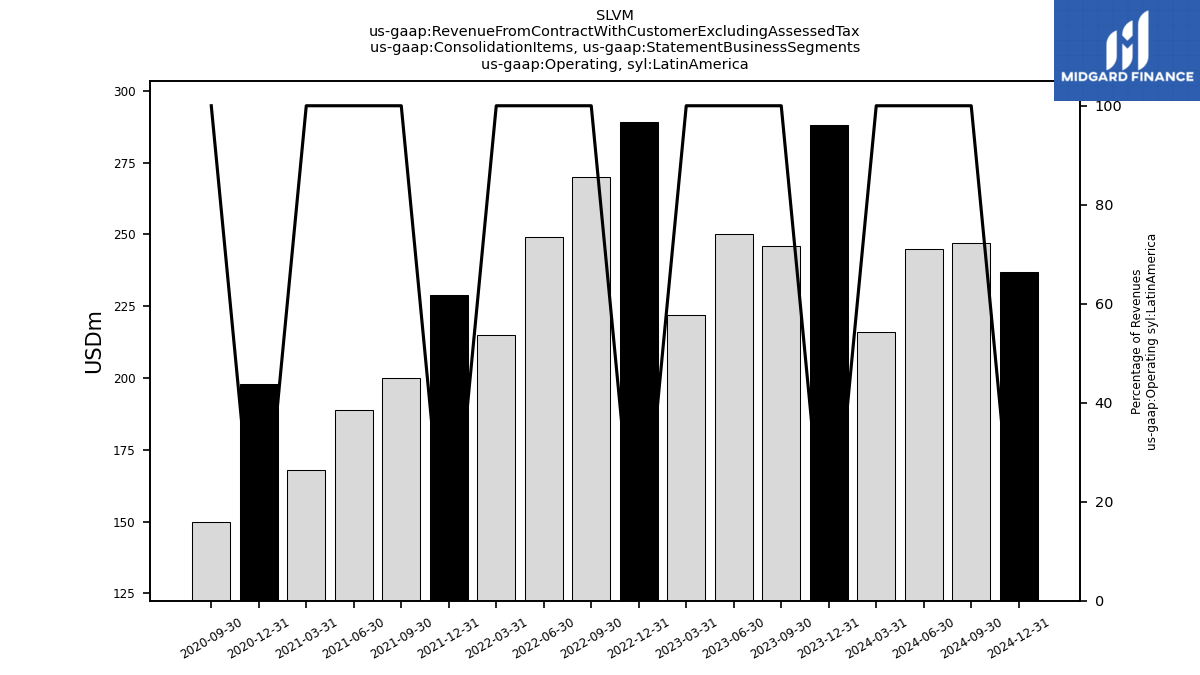
| Operating, Latin America | 288.00 | 246.00 | 250.00 | 222.00 | 289.00 | 270.00 | 249.00 | 215.00 | 229.00 | 200.00 | 189.00 | 168.00 | 198.00 | 150.00 | |
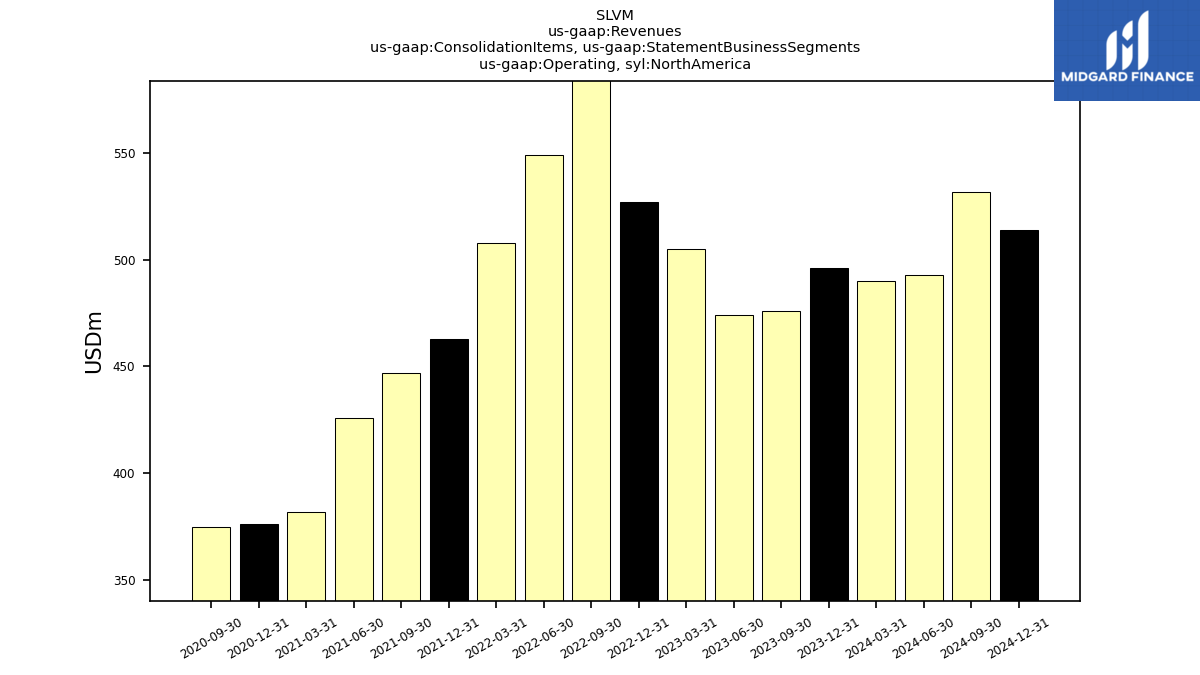
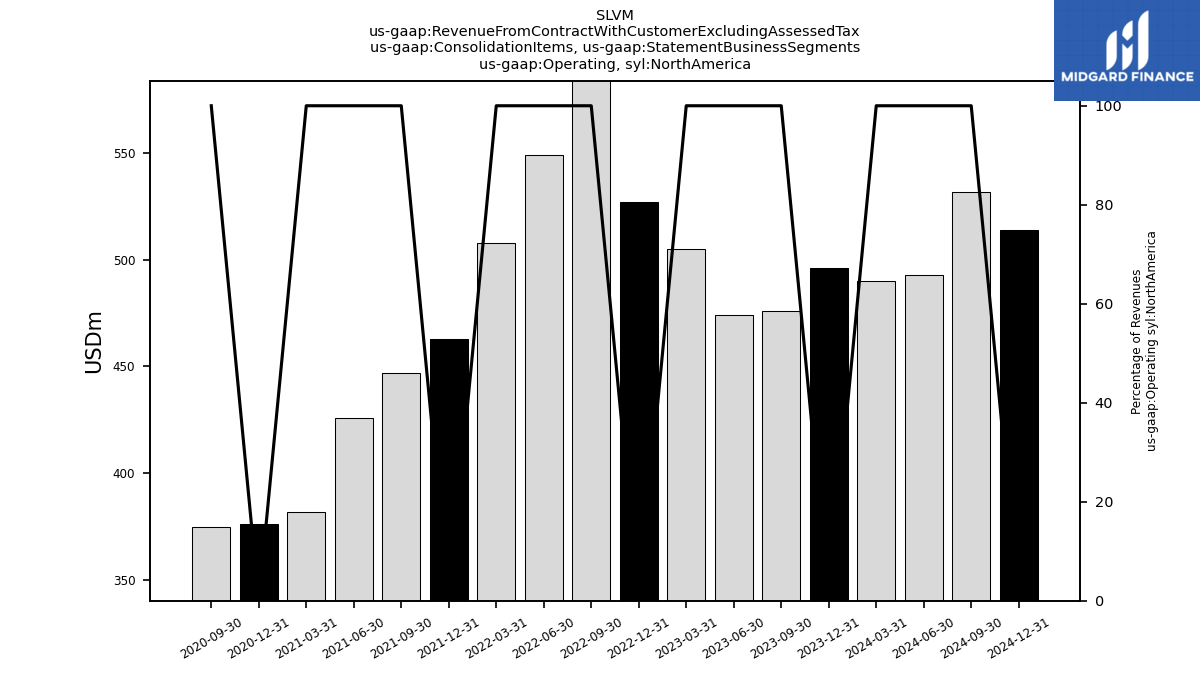
| Operating, North America | 496.00 | 476.00 | 474.00 | 505.00 | 527.00 | 589.00 | 549.00 | 508.00 | 463.00 | 447.00 | 426.00 | 382.00 | 376.00 | 375.00 | |
| Market Pulp, Europe | 22.00 | 22.00 | 18.00 | 27.00 | 28.00 | 27.00 | 23.00 | 40.00 | 39.00 | 41.00 | 23.00 | 39.00 | 32.00 | 31.00 | |
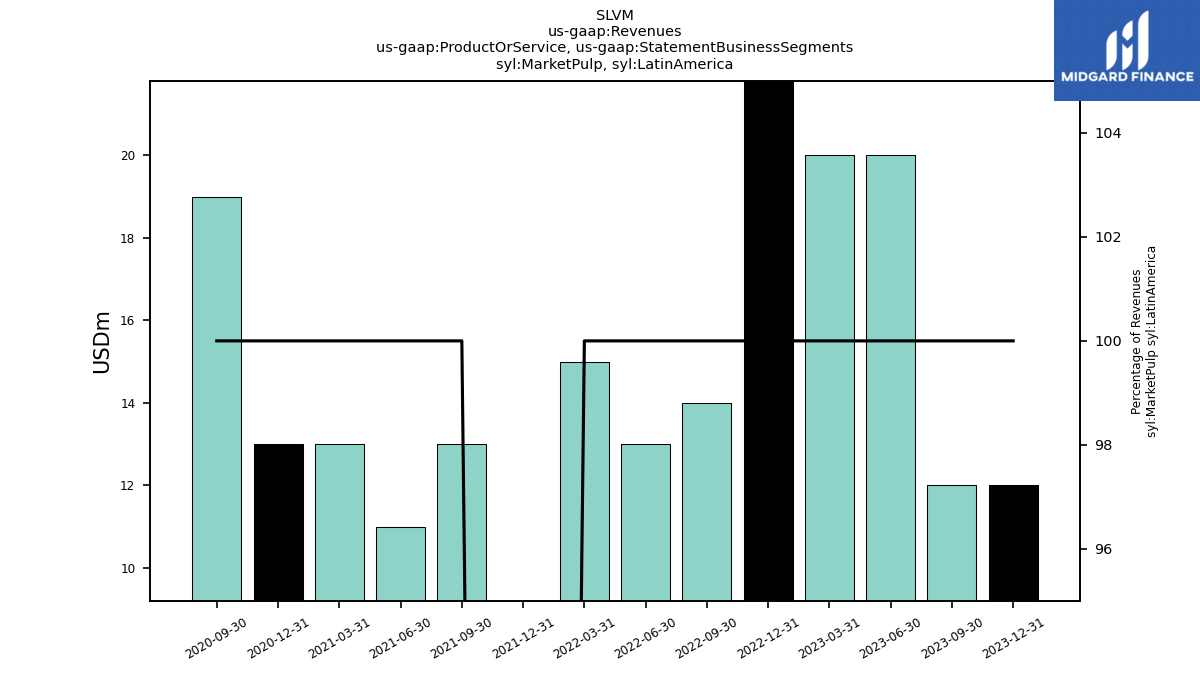
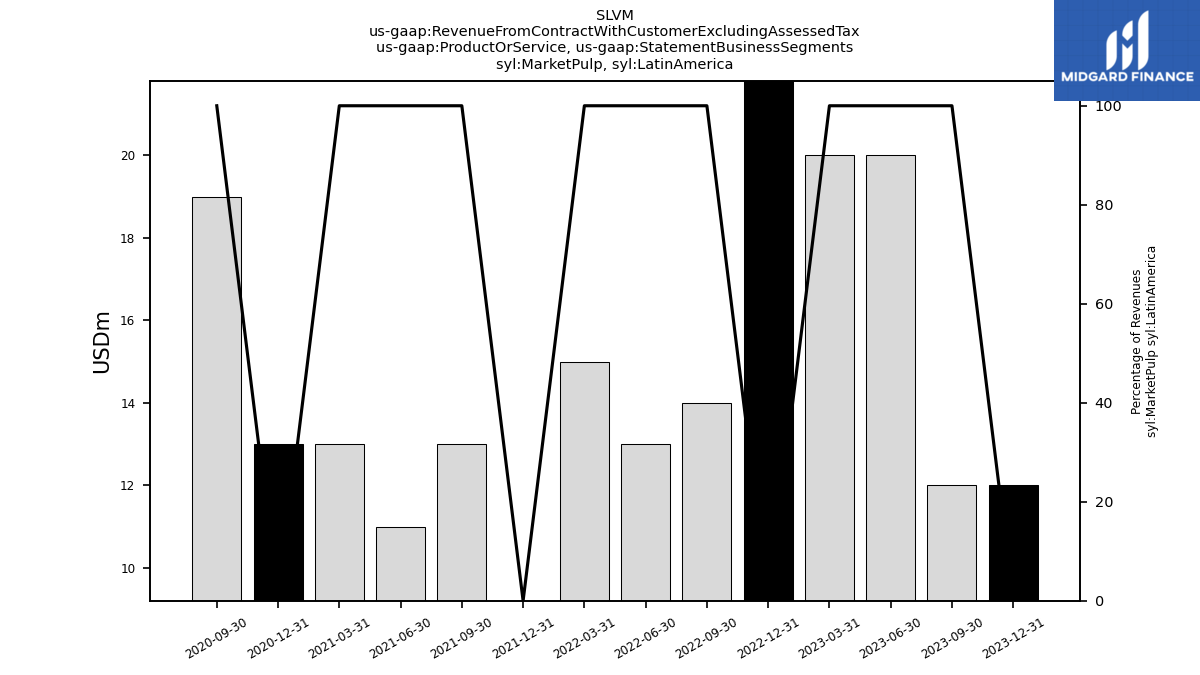
| Market Pulp, Latin America | 12.00 | 12.00 | 20.00 | 20.00 | 25.00 | 14.00 | 13.00 | 15.00 | 0.00 | 13.00 | 11.00 | 13.00 | 13.00 | 19.00 | |
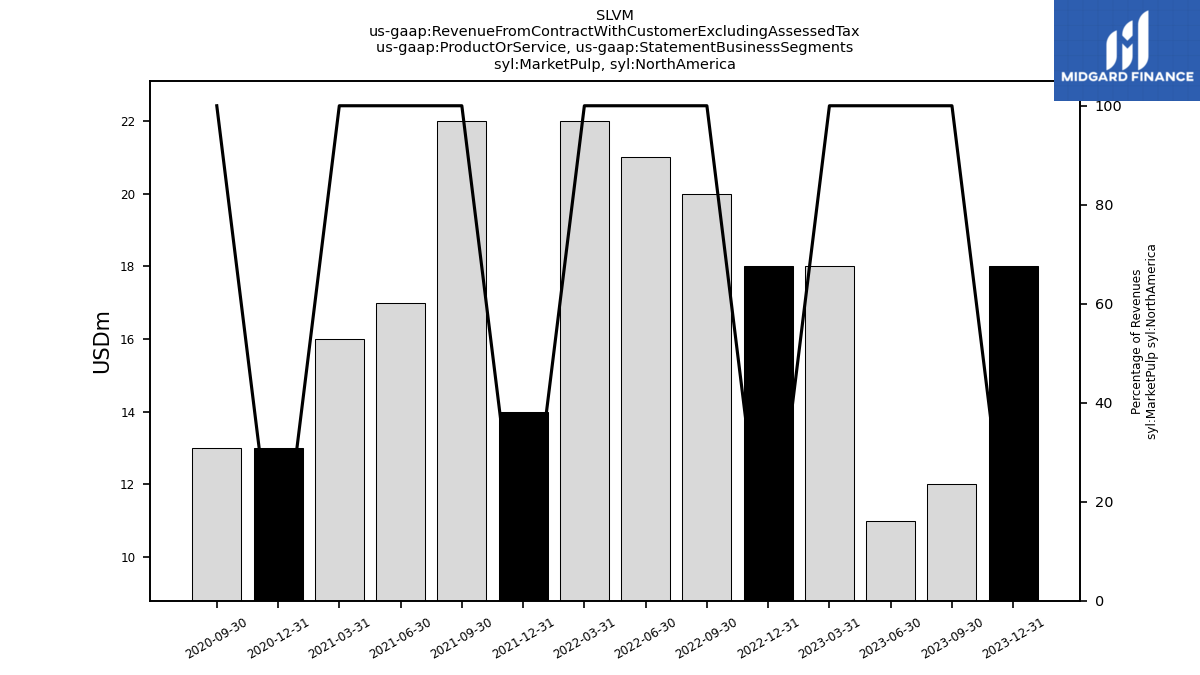
| Market Pulp, North America | 18.00 | 12.00 | 11.00 | 18.00 | 18.00 | 20.00 | 21.00 | 22.00 | 14.00 | 22.00 | 17.00 | 16.00 | 13.00 | 13.00 | |
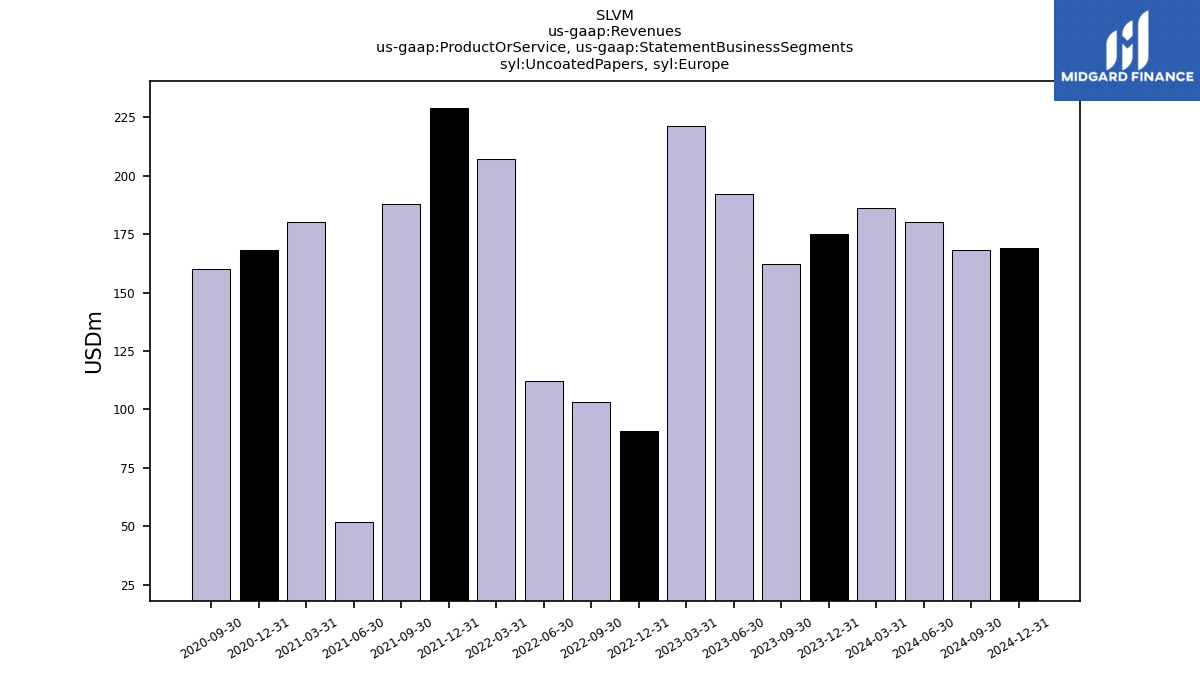
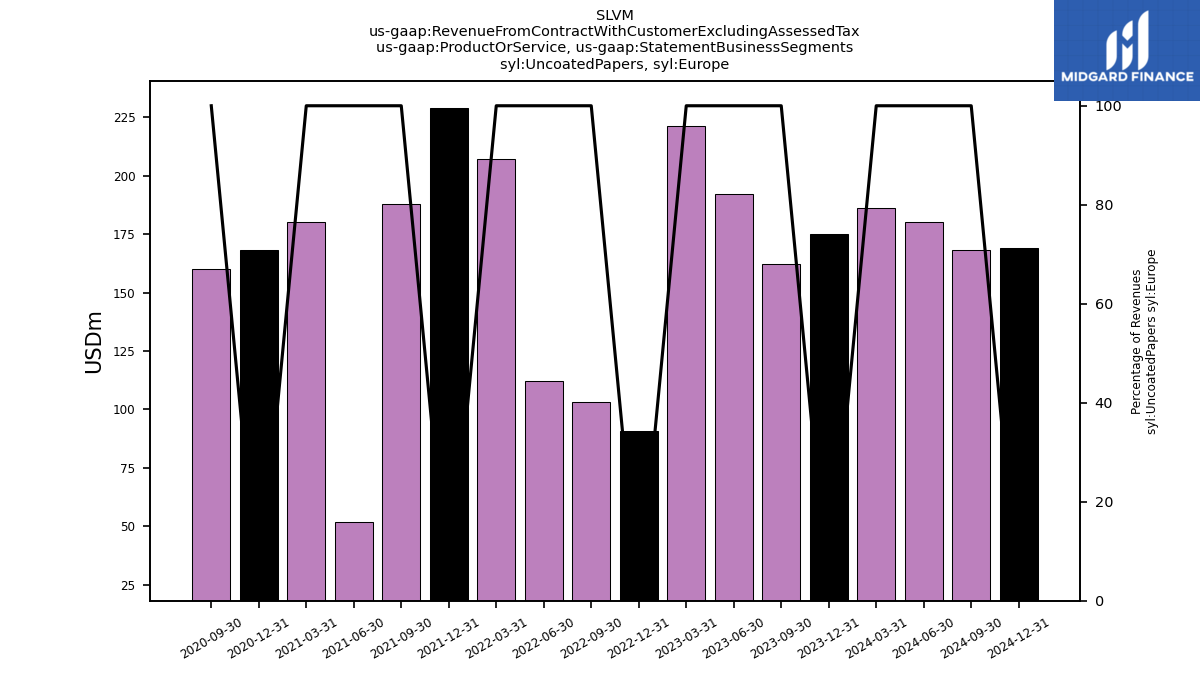
| Uncoated Papers, Europe | 175.00 | 162.00 | 192.00 | 221.00 | 91.00 | 103.00 | 112.00 | 207.00 | 229.00 | 188.00 | 52.00 | 180.00 | 168.00 | 160.00 | |
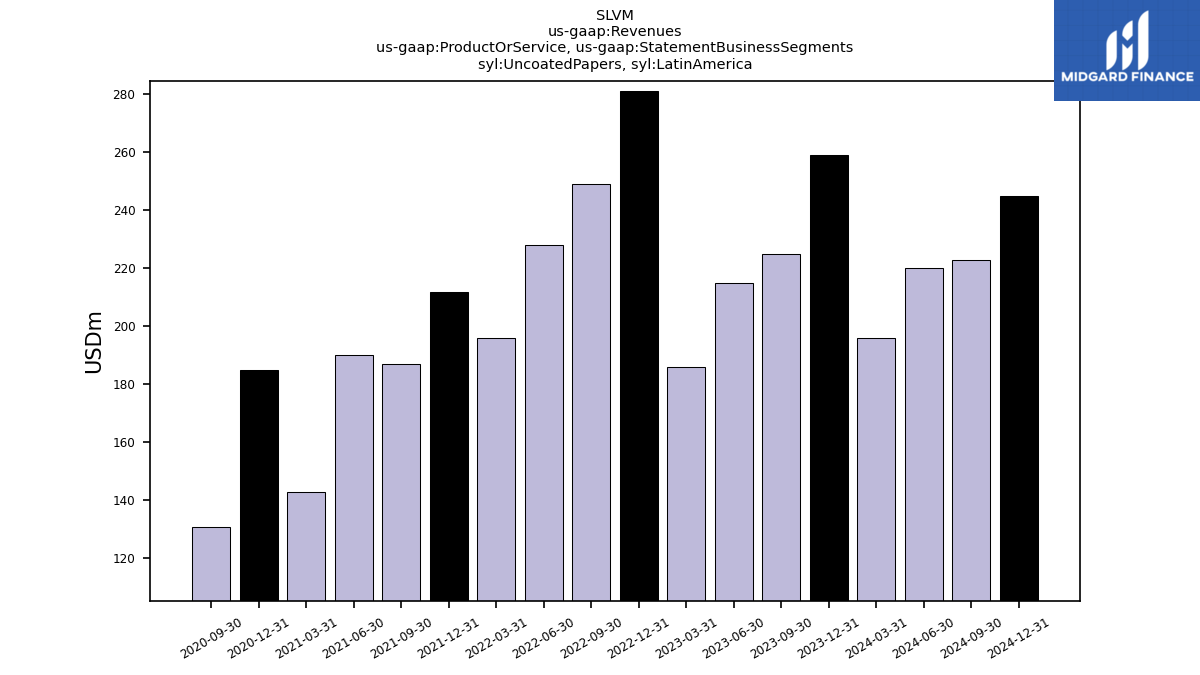
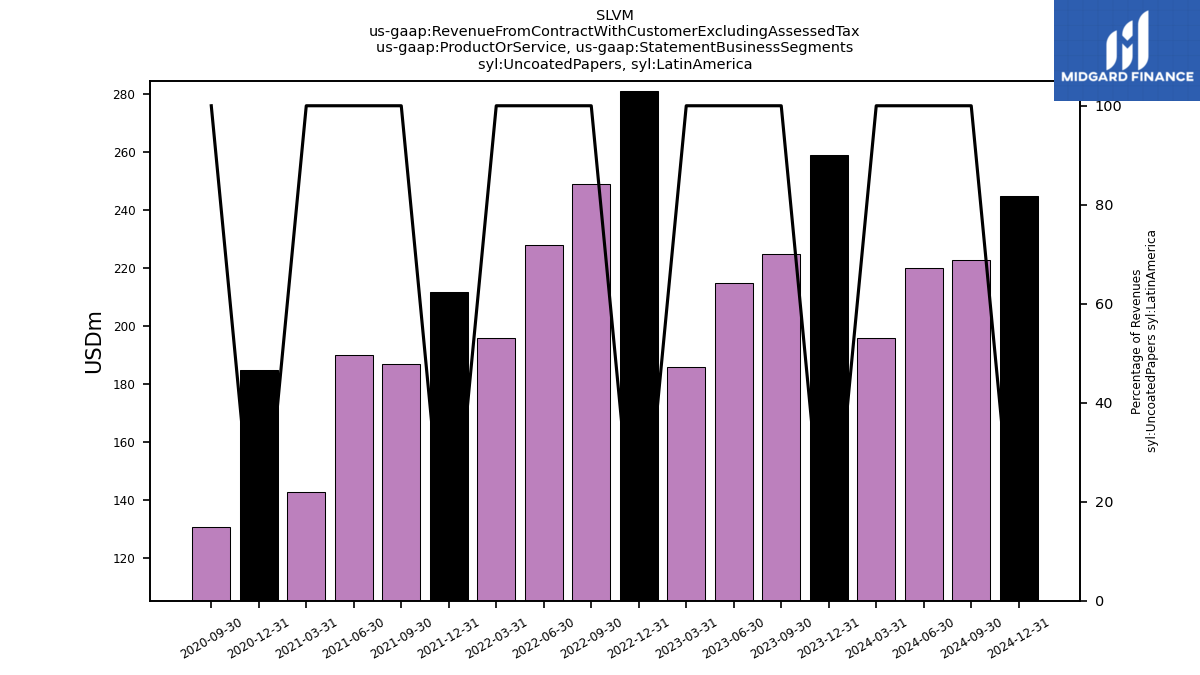
| Uncoated Papers, Latin America | 259.00 | 225.00 | 215.00 | 186.00 | 281.00 | 249.00 | 228.00 | 196.00 | 212.00 | 187.00 | 190.00 | 143.00 | 185.00 | 131.00 | |
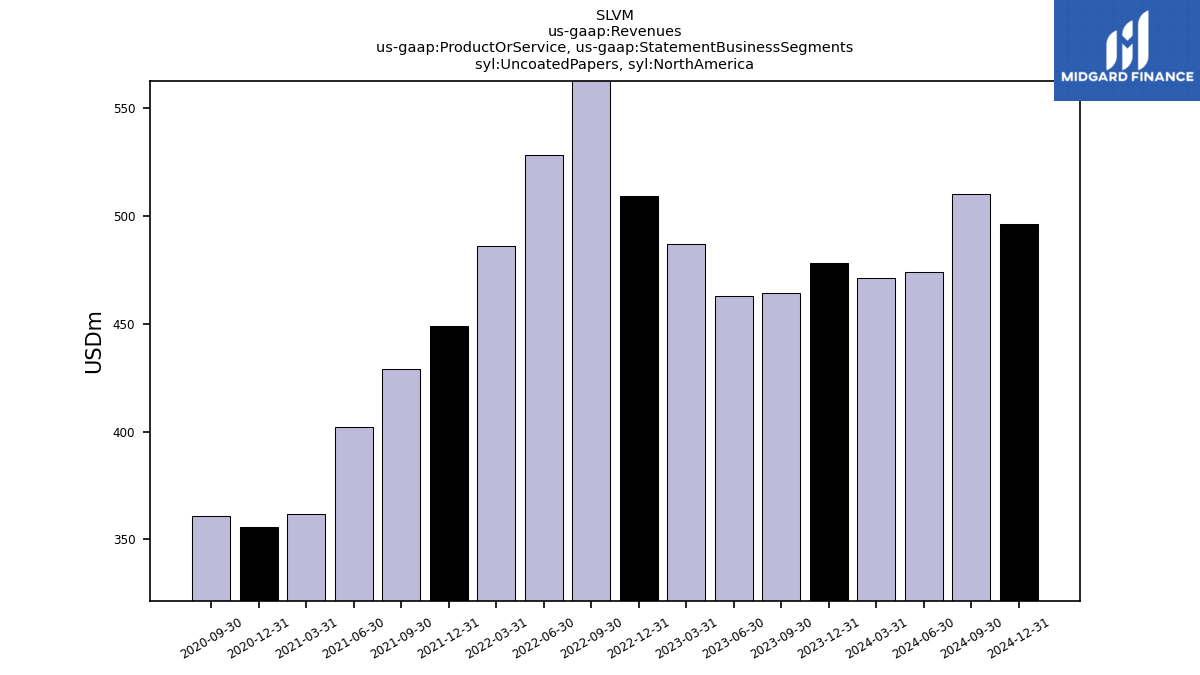
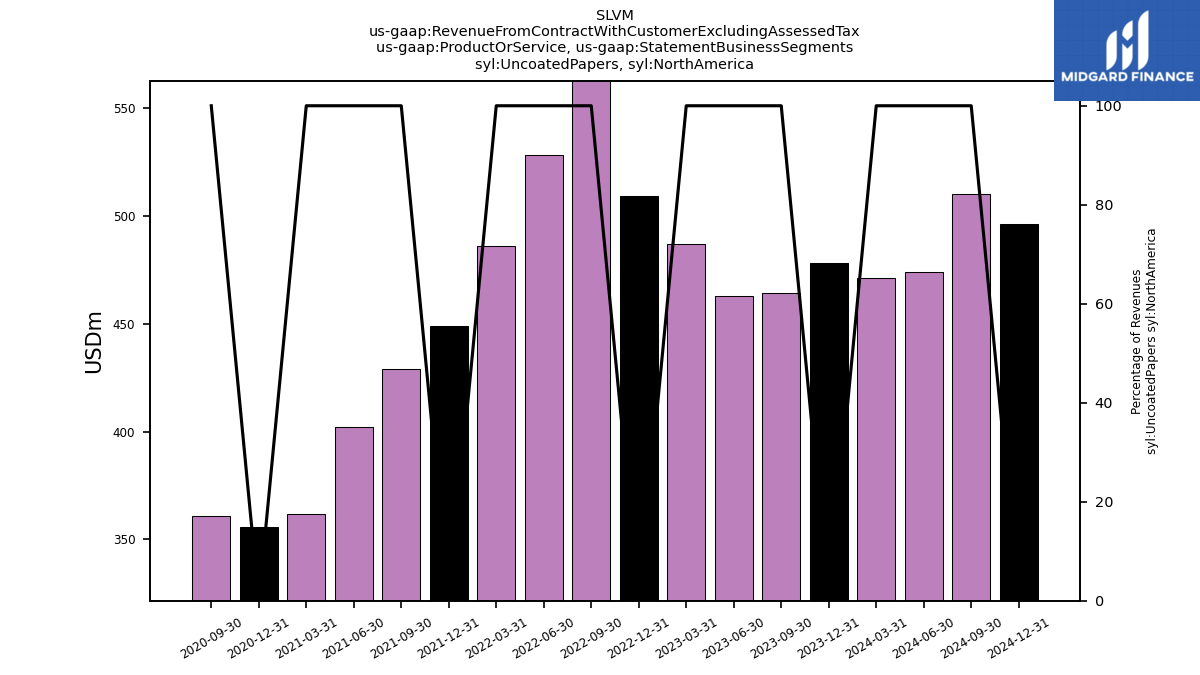
| Uncoated Papers, North America | 478.00 | 464.00 | 463.00 | 487.00 | 509.00 | 569.00 | 528.00 | 486.00 | 449.00 | 429.00 | 402.00 | 362.00 | 356.00 | 361.00 | |
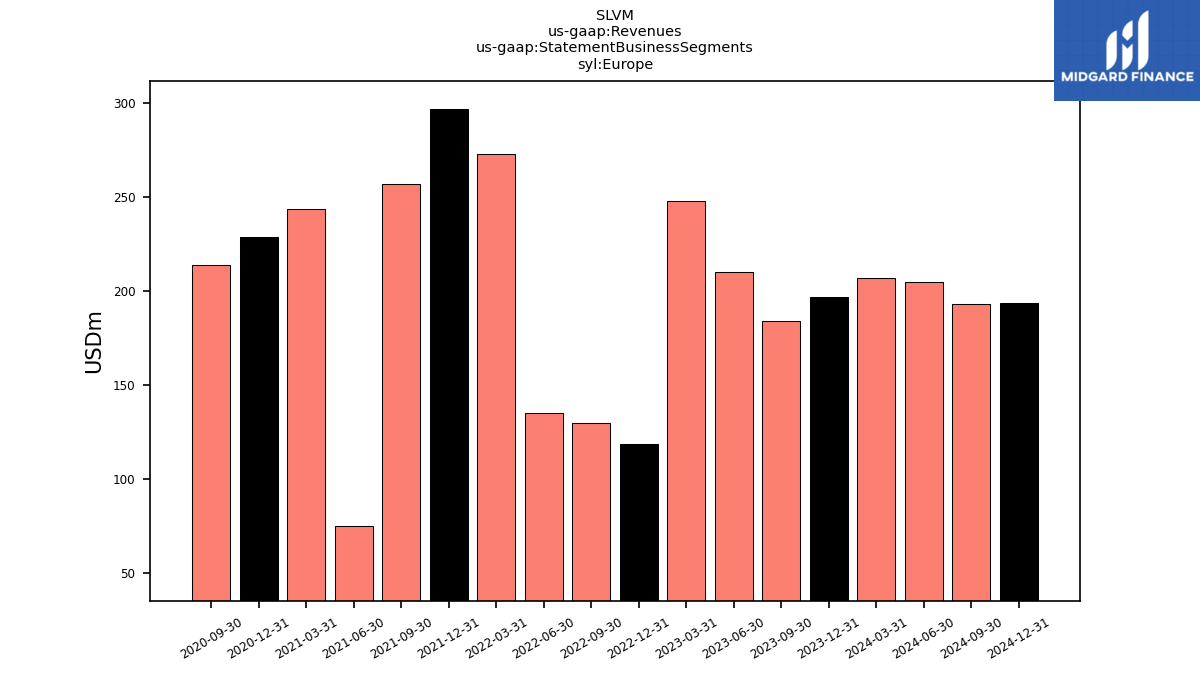
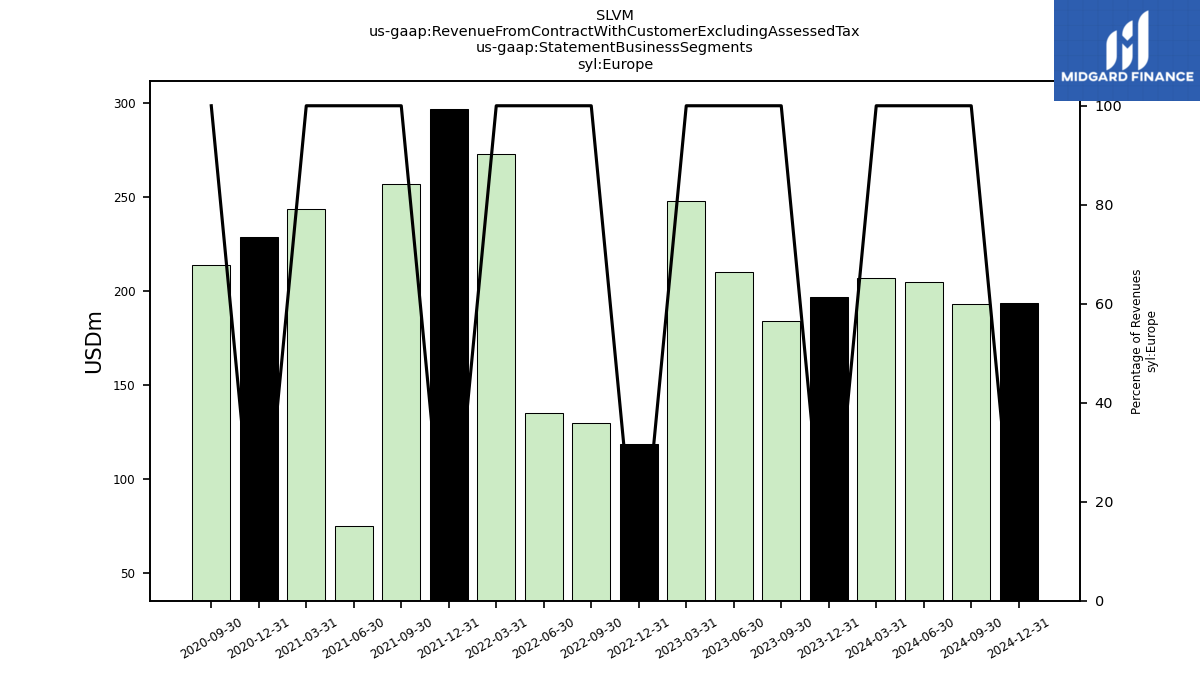
| Europe | 197.00 | 184.00 | 210.00 | 248.00 | 119.00 | 130.00 | 135.00 | 273.00 | 297.00 | 257.00 | 75.00 | 244.00 | 229.00 | 214.00 | |
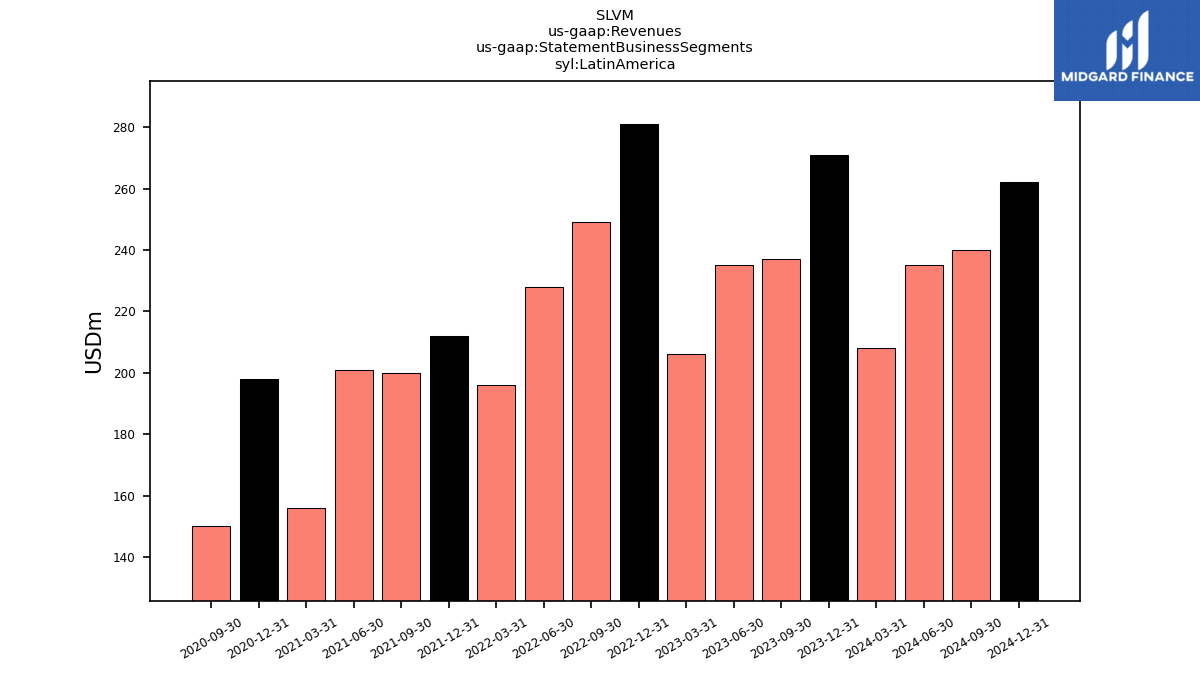
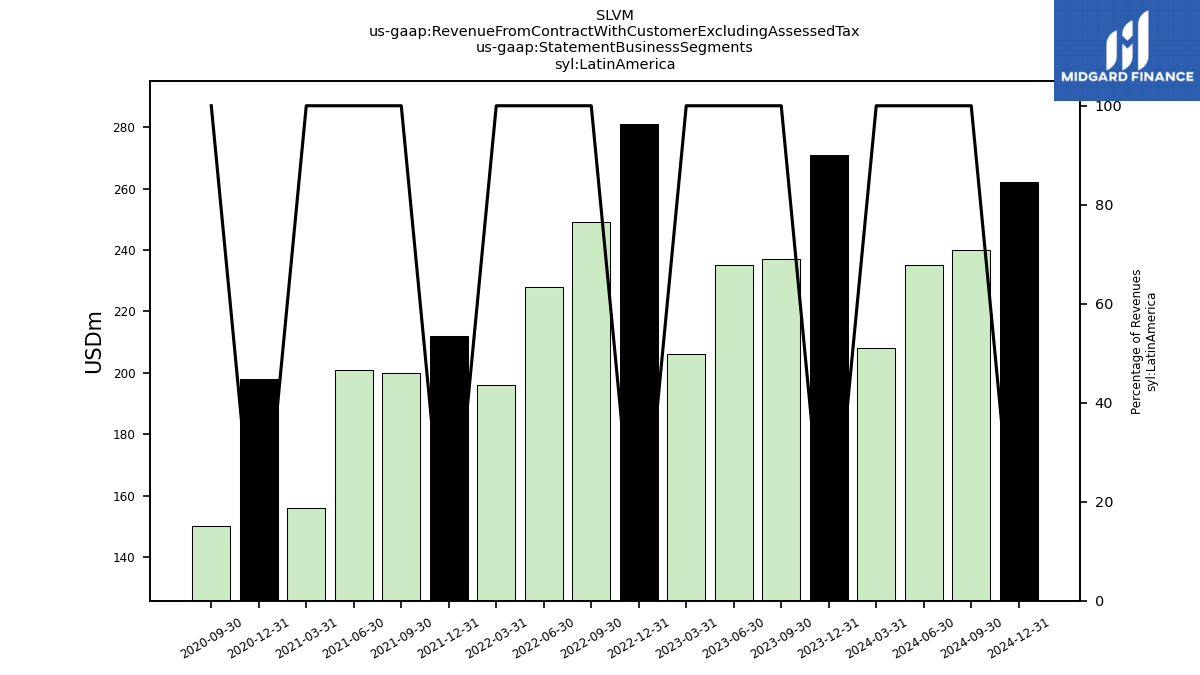
| Latin America | 271.00 | 237.00 | 235.00 | 206.00 | 281.00 | 249.00 | 228.00 | 196.00 | 212.00 | 200.00 | 201.00 | 156.00 | 198.00 | 150.00 | |
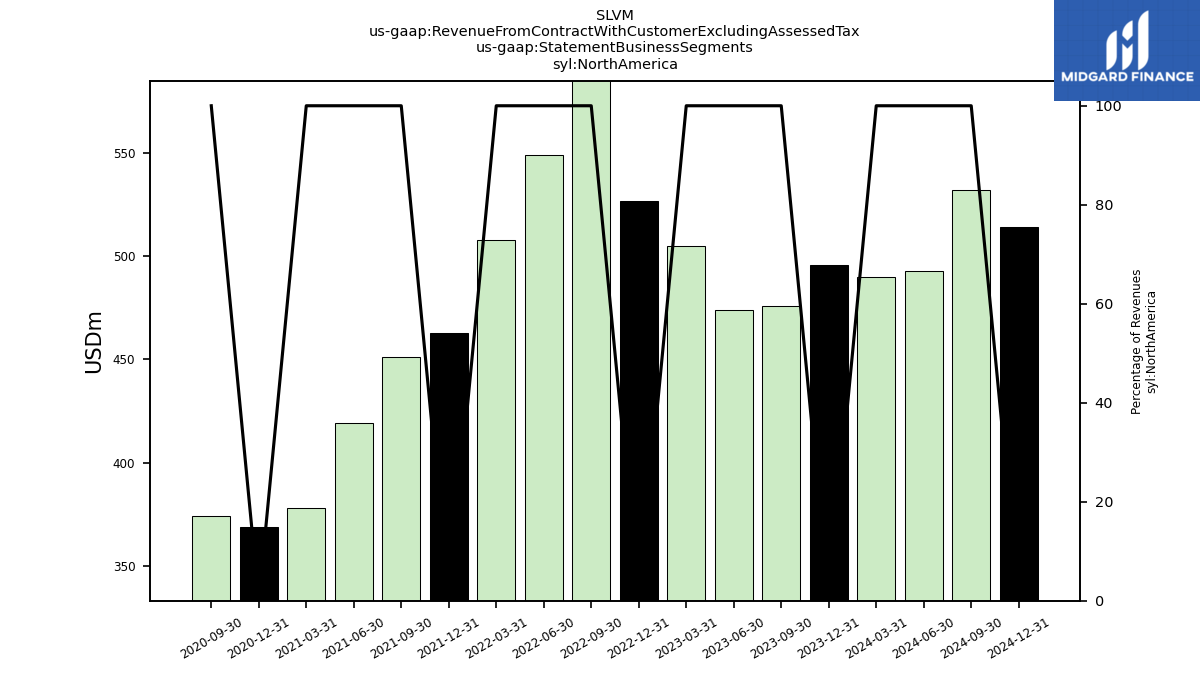
| North America | 496.00 | 476.00 | 474.00 | 505.00 | 527.00 | 589.00 | 549.00 | 508.00 | 463.00 | 451.00 | 419.00 | 378.00 | 369.00 | 374.00 | |
| Revenue From Contract With Customer Excluding Assessed Tax | 964.00 | 897.00 | 919.00 | 959.00 | 927.00 | 968.00 | 912.00 | 977.00 | 972.00 | 908.00 | 695.00 | 778.00 | 796.00 | 738.00 | |
| Operating, Europe | 197.00 | 184.00 | 210.00 | 248.00 | 119.00 | 130.00 | 135.00 | 279.00 | 297.00 | 262.00 | 94.00 | 238.00 | 239.00 | 220.00 | |
| Operating, Latin America | 288.00 | 246.00 | 250.00 | 222.00 | 289.00 | 270.00 | 249.00 | 215.00 | 229.00 | 200.00 | 189.00 | 168.00 | 198.00 | 150.00 | |
| Operating, North America | 496.00 | 476.00 | 474.00 | 505.00 | 527.00 | 589.00 | 549.00 | 508.00 | 463.00 | 447.00 | 426.00 | 382.00 | 376.00 | 375.00 | |
| Market Pulp, Europe | 22.00 | 22.00 | 18.00 | 27.00 | 28.00 | 27.00 | 23.00 | 40.00 | 39.00 | 41.00 | 23.00 | 39.00 | 32.00 | 31.00 | |
| Market Pulp, Latin America | 12.00 | 12.00 | 20.00 | 20.00 | 25.00 | 14.00 | 13.00 | 15.00 | 0.00 | 13.00 | 11.00 | 13.00 | 13.00 | 19.00 | |
| Market Pulp, North America | 18.00 | 12.00 | 11.00 | 18.00 | 18.00 | 20.00 | 21.00 | 22.00 | 14.00 | 22.00 | 17.00 | 16.00 | 13.00 | 13.00 | |
| Uncoated Papers, Europe | 175.00 | 162.00 | 192.00 | 221.00 | 91.00 | 103.00 | 112.00 | 207.00 | 229.00 | 188.00 | 52.00 | 180.00 | 168.00 | 160.00 | |
| Uncoated Papers, Latin America | 259.00 | 225.00 | 215.00 | 186.00 | 281.00 | 249.00 | 228.00 | 196.00 | 212.00 | 187.00 | 190.00 | 143.00 | 185.00 | 131.00 | |
| Uncoated Papers, North America | 478.00 | 464.00 | 463.00 | 487.00 | 509.00 | 569.00 | 528.00 | 486.00 | 449.00 | 429.00 | 402.00 | 362.00 | 356.00 | 361.00 | |
| Europe | 197.00 | 184.00 | 210.00 | 248.00 | 119.00 | 130.00 | 135.00 | 273.00 | 297.00 | 257.00 | 75.00 | 244.00 | 229.00 | 214.00 | |
| Latin America | 271.00 | 237.00 | 235.00 | 206.00 | 281.00 | 249.00 | 228.00 | 196.00 | 212.00 | 200.00 | 201.00 | 156.00 | 198.00 | 150.00 | |
| North America | 496.00 | 476.00 | 474.00 | 505.00 | 527.00 | 589.00 | 549.00 | 508.00 | 463.00 | 451.00 | 419.00 | 378.00 | 369.00 | 374.00 | |
| Interest Income Operating | 8.00 | 5.00 | 2.00 | 11.00 | 3.00 | 2.00 | 2.00 | 2.00 | 1.00 | 2.00 | 30.00 | NA | NA | NA |
