
| 2023-11-25 | 2023-08-26 | 2023-05-27 | 2023-02-25 | 2022-11-26 | 2022-08-27 | 2022-05-28 | 2022-02-26 | 2021-11-27 | 2021-08-28 | 2021-05-29 | 2021-02-27 | 2020-11-28 | 2020-08-29 | 2020-05-30 | 2020-02-29 | 2019-11-30 | 2019-08-31 | 2019-05-25 | 2019-02-23 | 2018-11-24 | 2018-08-25 | 2018-05-26 | 2018-02-24 | 2017-11-25 | 2017-08-26 | 2017-05-27 | 2016-05-28 | ||
|---|---|---|---|---|---|---|---|---|---|---|---|---|---|---|---|---|---|---|---|---|---|---|---|---|---|---|---|---|---|
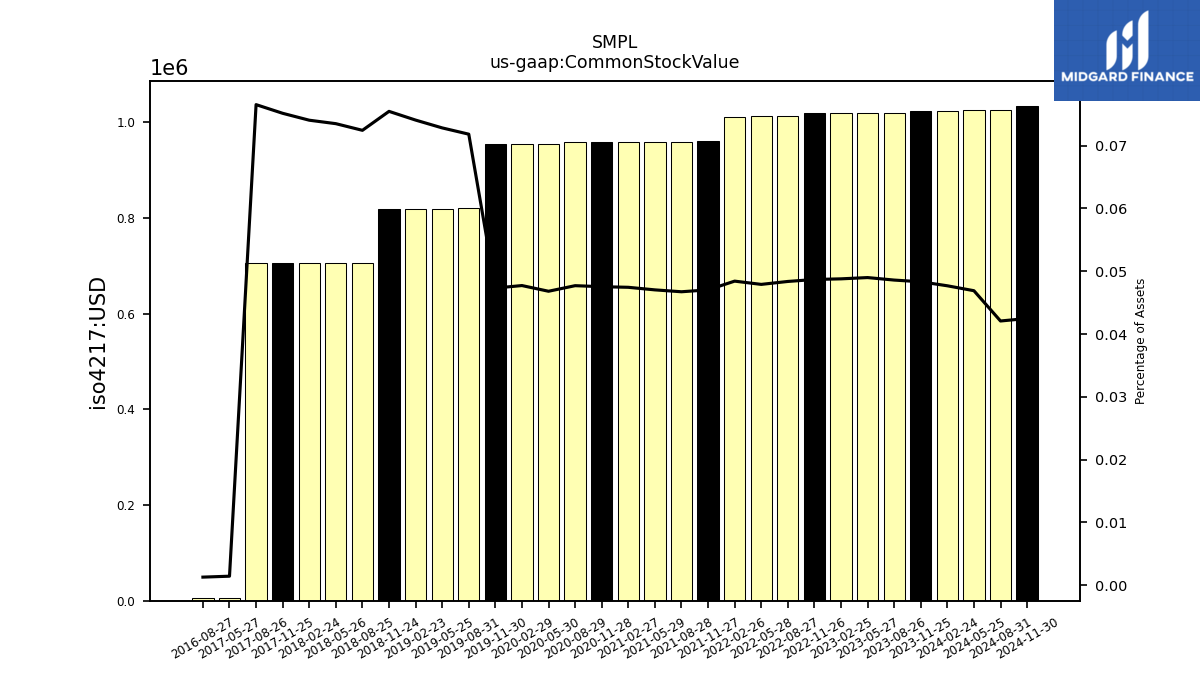
| Common Stock Value | 1.02 | 1.02 | 1.02 | 1.02 | 1.02 | 1.01 | 1.01 | 1.01 | 0.96 | 0.96 | 0.96 | 0.96 | 0.96 | 0.96 | 0.95 | 0.95 | 0.95 | 0.82 | 0.82 | 0.82 | 0.82 | 0.71 | 0.71 | 0.71 | 0.71 | 0.71 | 0.01 | NA | |
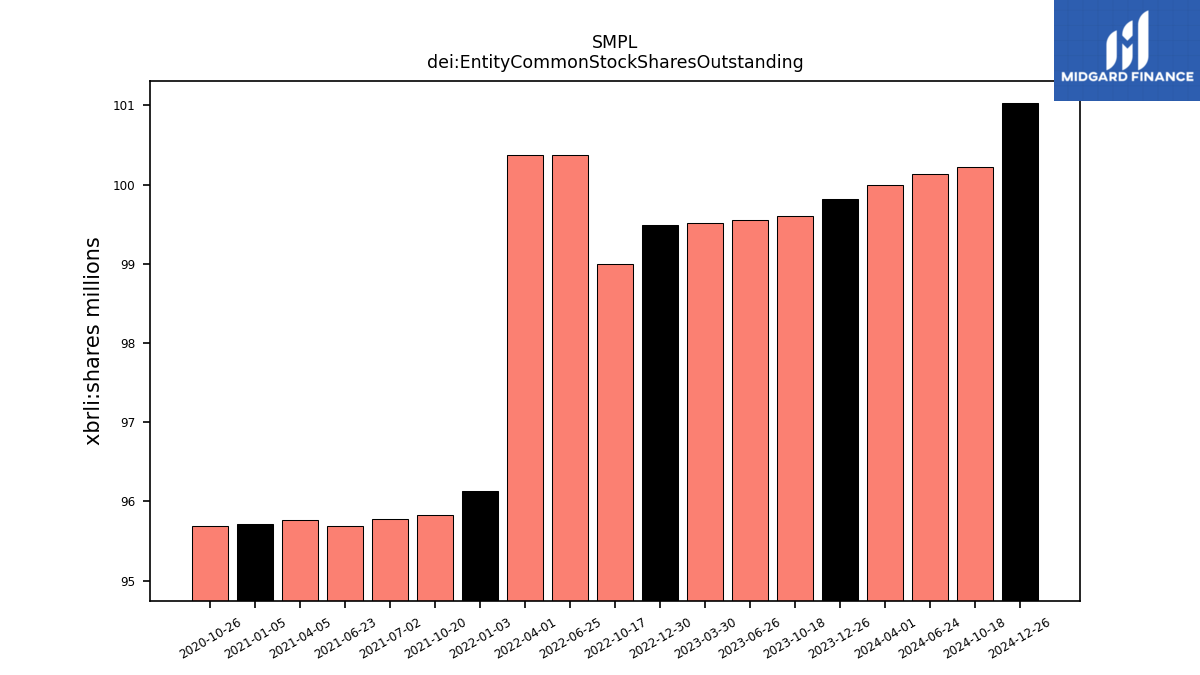
| dei: Entity Common Stock Shares Outstanding | NA | NA | NA | NA | NA | NA | NA | NA | NA | NA | NA | NA | NA | NA | NA | NA | NA | NA | NA | NA | NA | NA | NA | NA | NA | NA | NA | NA | |
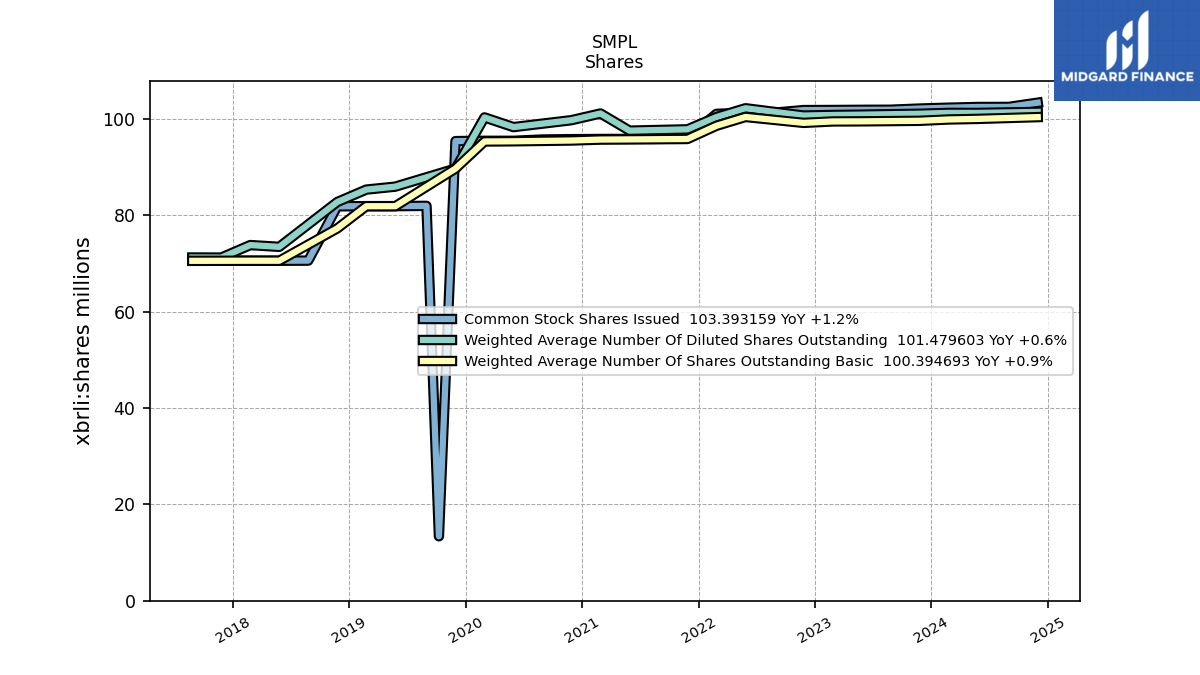
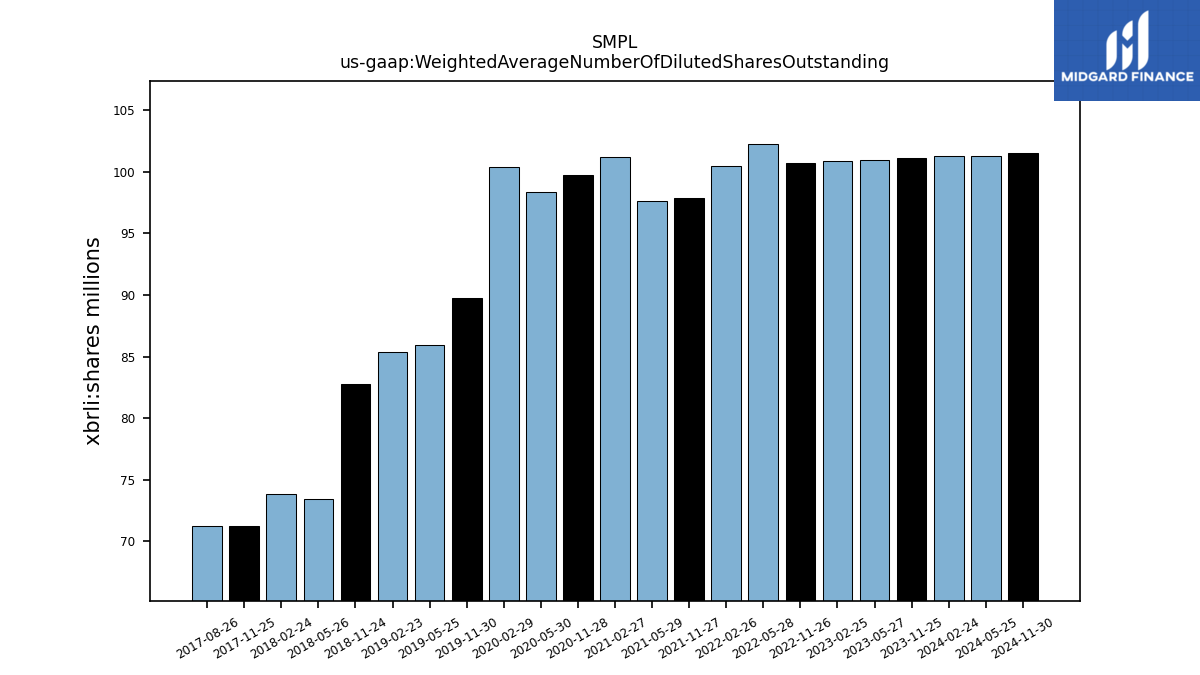
| Weighted Average Number Of Diluted Shares Outstanding | 101.09 | NA | 100.91 | 100.84 | 100.72 | NA | 102.24 | 100.41 | 97.86 | NA | 97.59 | 101.15 | 99.76 | NA | 98.32 | 100.34 | 89.71 | NA | 85.96 | 85.35 | 82.77 | NA | 73.47 | 73.83 | 71.24 | 71.25 | NA | NA | |
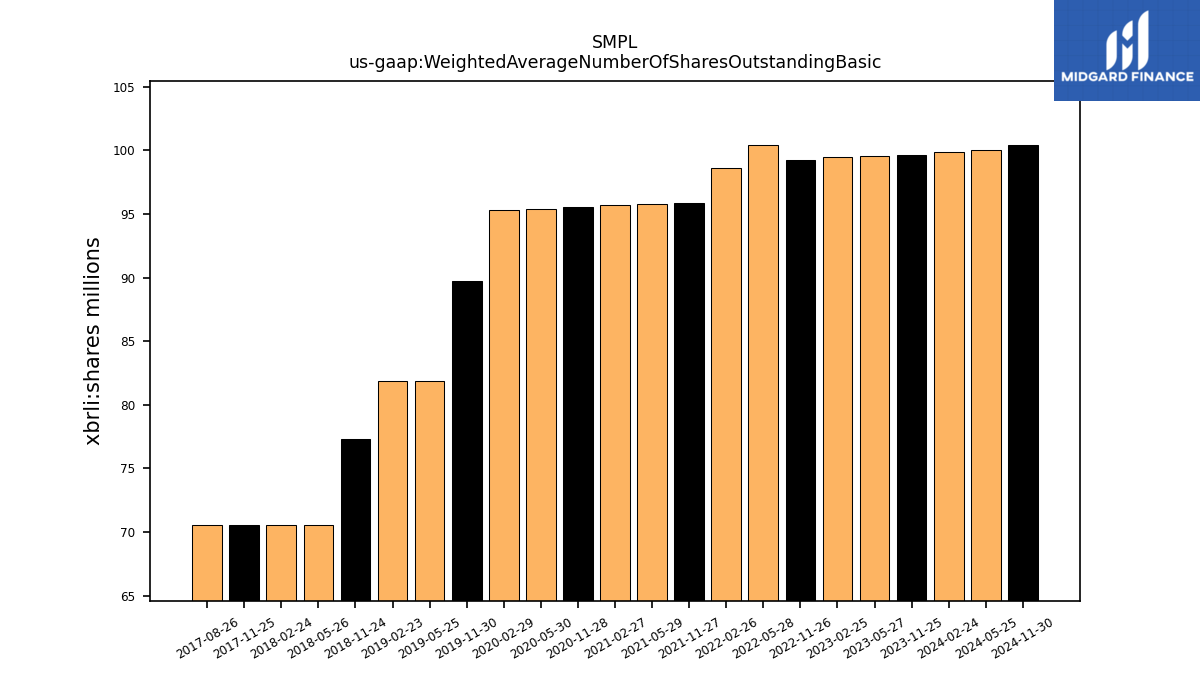
| Weighted Average Number Of Shares Outstanding Basic | 99.63 | NA | 99.52 | 99.50 | 99.20 | NA | 100.43 | 98.60 | 95.86 | NA | 95.77 | 95.73 | 95.54 | NA | 95.38 | 95.34 | 89.71 | NA | 81.90 | 81.90 | 77.29 | NA | 70.58 | 70.58 | 70.57 | 70.56 | NA | NA | |
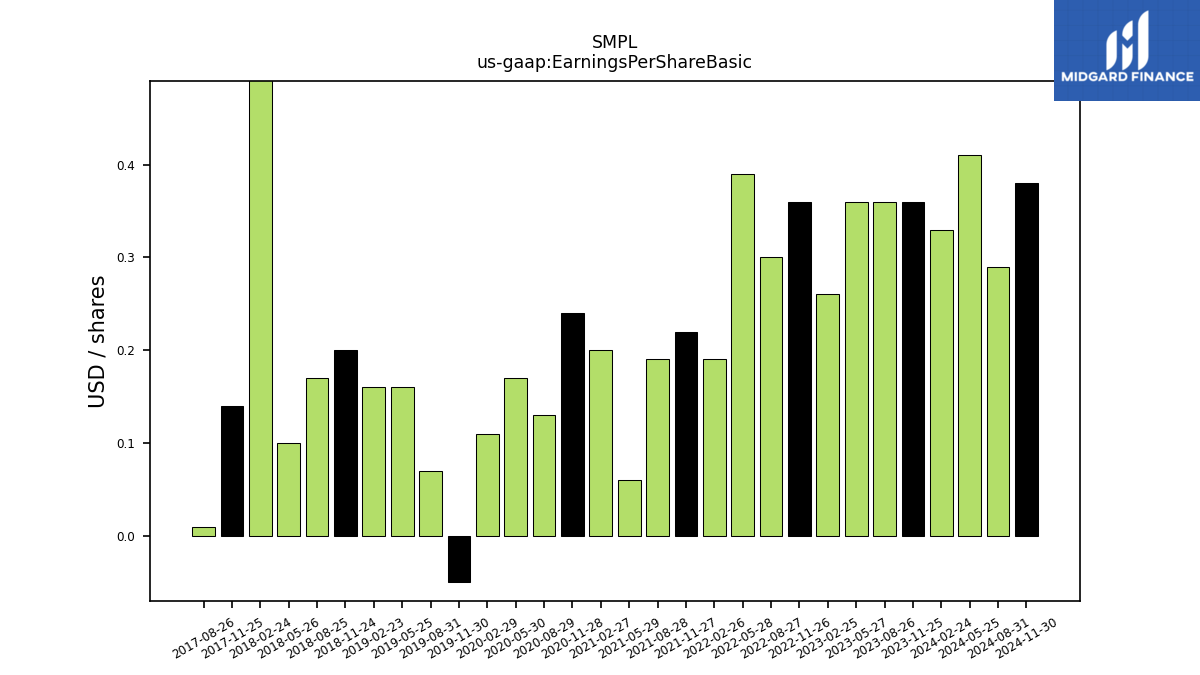
| Earnings Per Share Basic | 0.36 | 0.36 | 0.36 | 0.26 | 0.36 | 0.30 | 0.39 | 0.19 | 0.22 | 0.19 | 0.06 | 0.20 | 0.24 | 0.13 | 0.17 | 0.11 | -0.05 | 0.07 | 0.16 | 0.16 | 0.20 | 0.17 | 0.10 | 0.59 | 0.14 | 0.01 | NA | NA | |
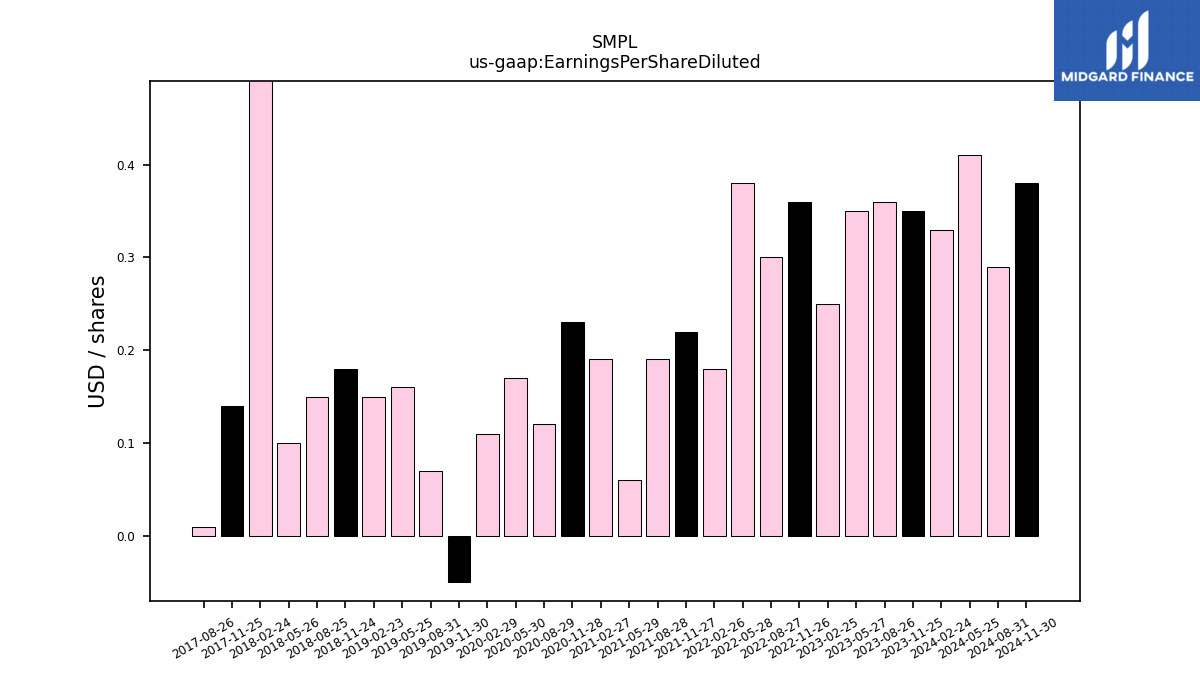
| Earnings Per Share Diluted | 0.35 | 0.36 | 0.35 | 0.25 | 0.36 | 0.30 | 0.38 | 0.18 | 0.22 | 0.19 | 0.06 | 0.19 | 0.23 | 0.12 | 0.17 | 0.11 | -0.05 | 0.07 | 0.16 | 0.15 | 0.18 | 0.15 | 0.10 | 0.56 | 0.14 | 0.01 | NA | NA |
| 2023-11-25 | 2023-08-26 | 2023-05-27 | 2023-02-25 | 2022-11-26 | 2022-08-27 | 2022-05-28 | 2022-02-26 | 2021-11-27 | 2021-08-28 | 2021-05-29 | 2021-02-27 | 2020-11-28 | 2020-08-29 | 2020-05-30 | 2020-02-29 | 2019-11-30 | 2019-08-31 | 2019-05-25 | 2019-02-23 | 2018-11-24 | 2018-08-25 | 2018-05-26 | 2018-02-24 | 2017-11-25 | 2017-08-26 | 2017-05-27 | 2016-05-28 | ||
|---|---|---|---|---|---|---|---|---|---|---|---|---|---|---|---|---|---|---|---|---|---|---|---|---|---|---|---|---|---|
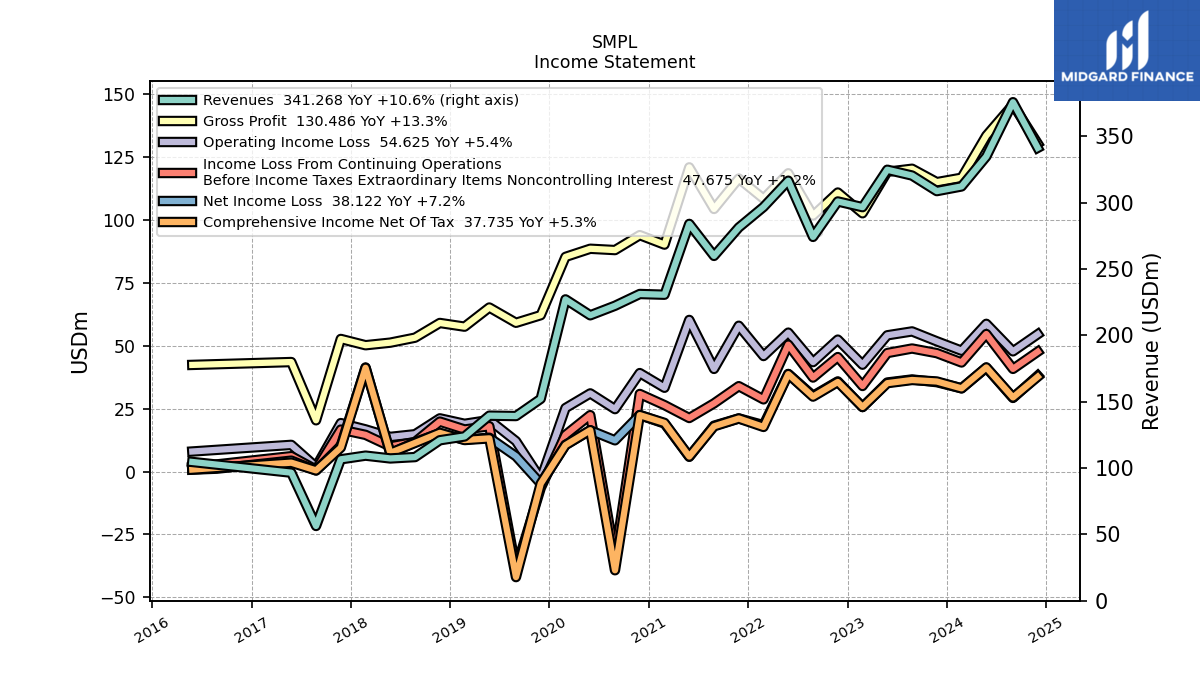
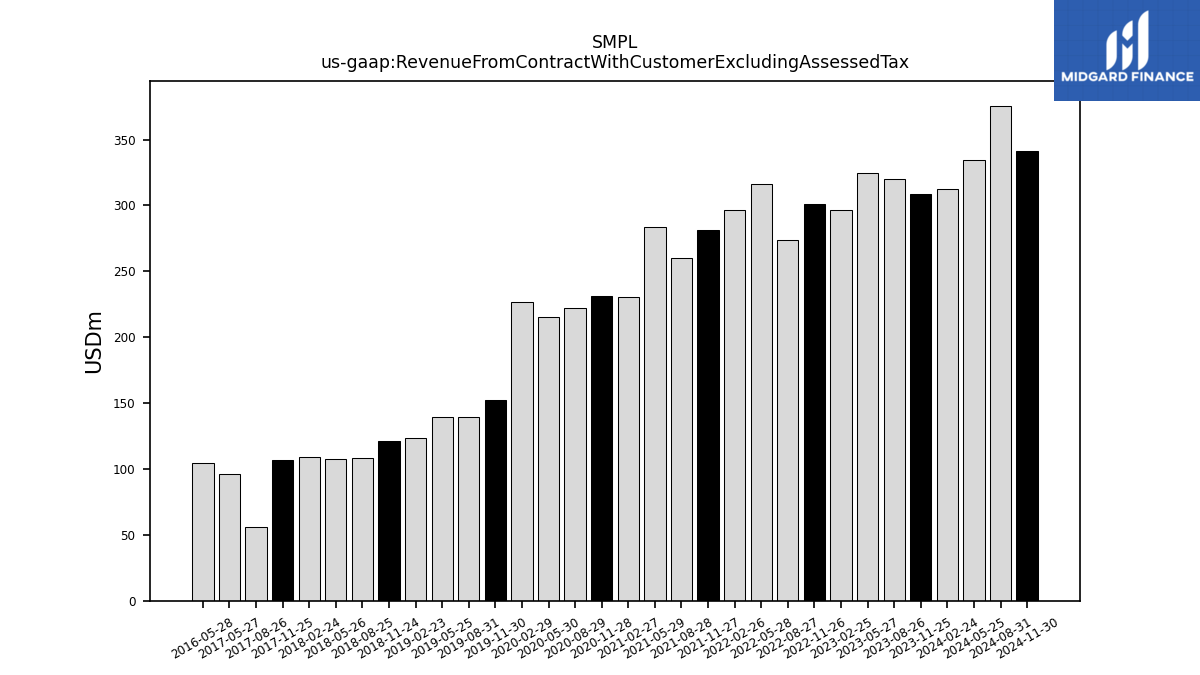
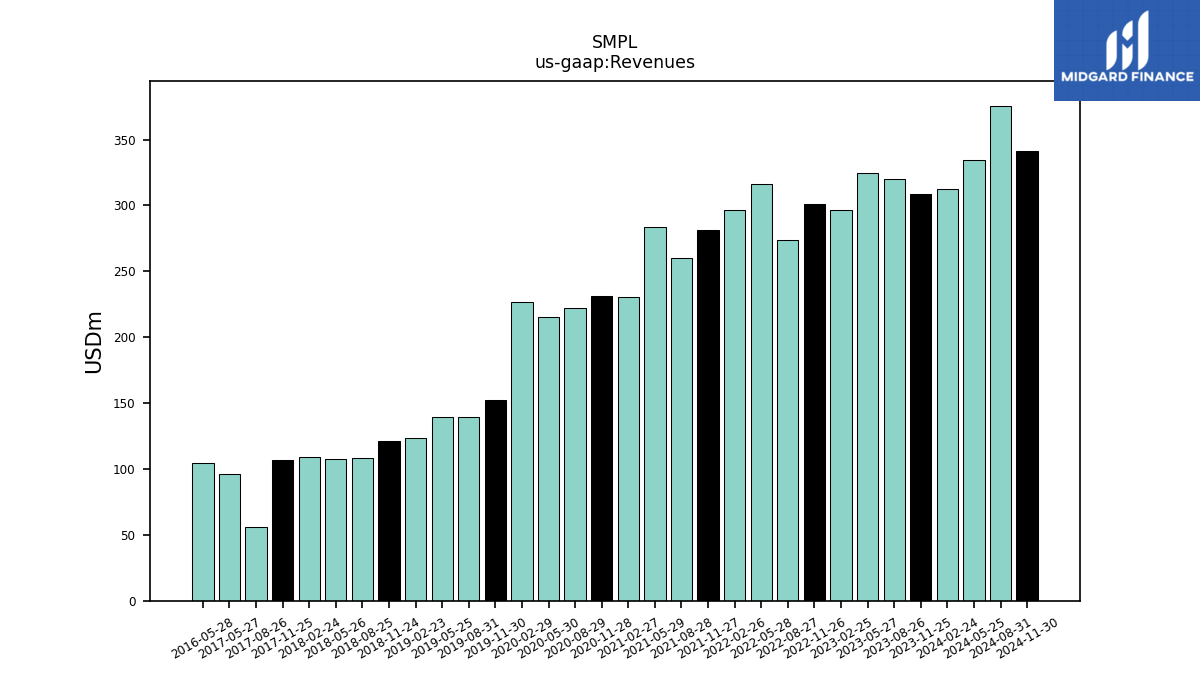
| Revenue From Contract With Customer Excluding Assessed Tax | 308.68 | 320.42 | 324.79 | 296.58 | 300.88 | 274.16 | 316.53 | 296.72 | 281.26 | 259.85 | 284.00 | 230.61 | 231.15 | 222.29 | 215.10 | 227.10 | 152.15 | 139.18 | 139.47 | 123.80 | 120.93 | 108.26 | 107.23 | 109.35 | 106.59 | 56.33 | 96.50 | 104.59 | |
| Revenues | 308.68 | 320.42 | 324.79 | 296.58 | 300.88 | 274.16 | 316.53 | 296.72 | 281.26 | 259.85 | 284.00 | 230.61 | 231.15 | 222.29 | 215.10 | 227.10 | 152.15 | 139.18 | 139.47 | 123.80 | 120.93 | 108.26 | 107.23 | 109.35 | 106.59 | 56.33 | 96.50 | 104.59 | |
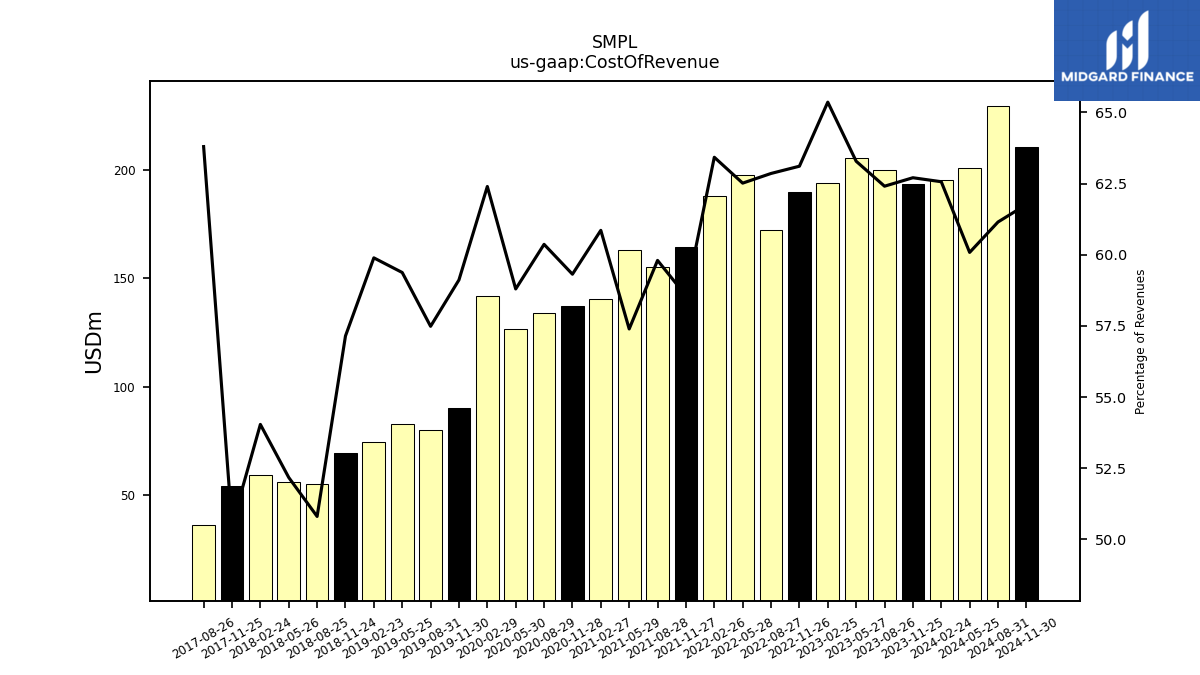
| Cost Of Revenue | 193.56 | 199.97 | 205.55 | 193.85 | 189.89 | 172.33 | 197.88 | 188.19 | 164.71 | 155.40 | 163.00 | 140.34 | 137.11 | 134.18 | 126.47 | 141.71 | 89.95 | 80.01 | 82.81 | 74.14 | 69.11 | 55.00 | 55.95 | 59.09 | 53.83 | 35.94 | NA | NA | |
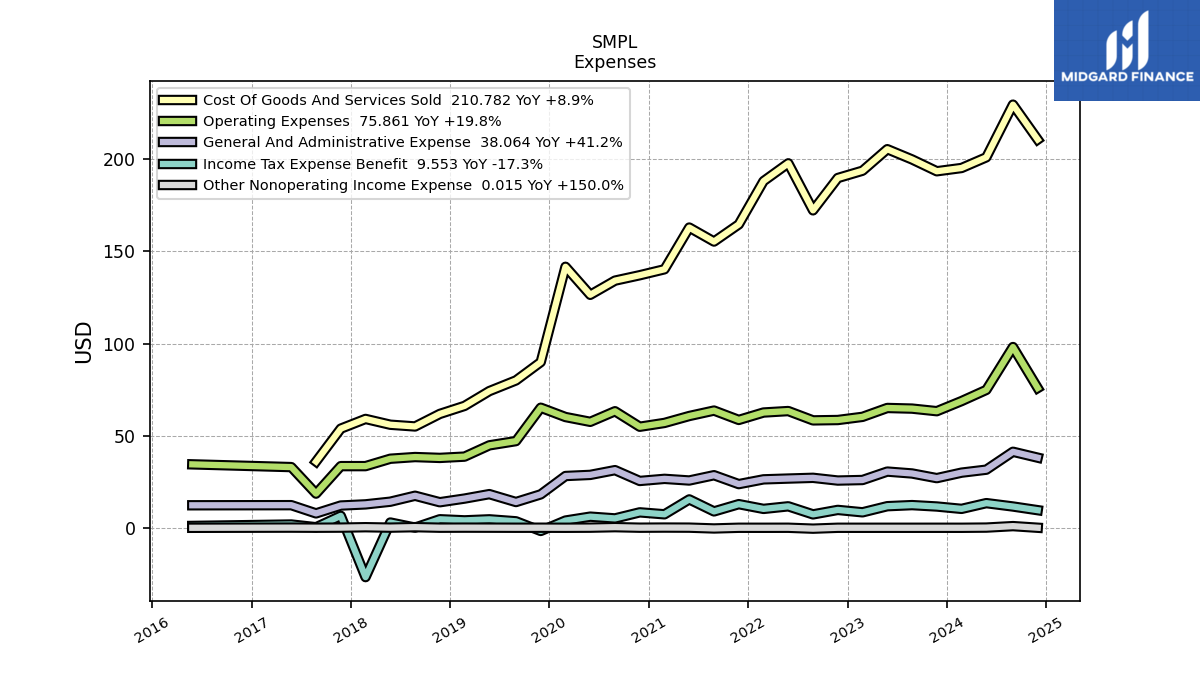
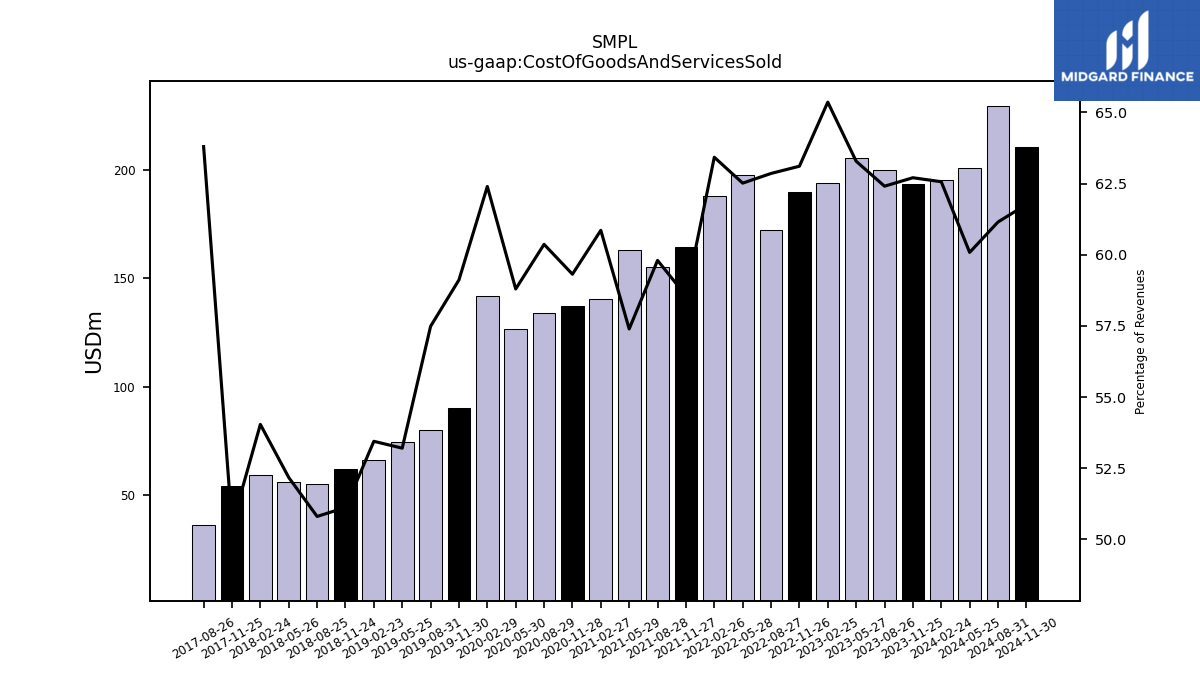
| Cost Of Goods And Services Sold | 193.56 | 199.97 | 205.55 | 193.85 | 189.89 | 172.33 | 197.88 | 188.19 | 164.71 | 155.40 | 163.00 | 140.34 | 137.11 | 134.18 | 126.47 | 141.71 | 89.95 | 80.01 | 74.20 | 66.17 | 61.82 | 55.00 | 55.95 | 59.09 | 53.83 | 35.94 | NA | NA | |
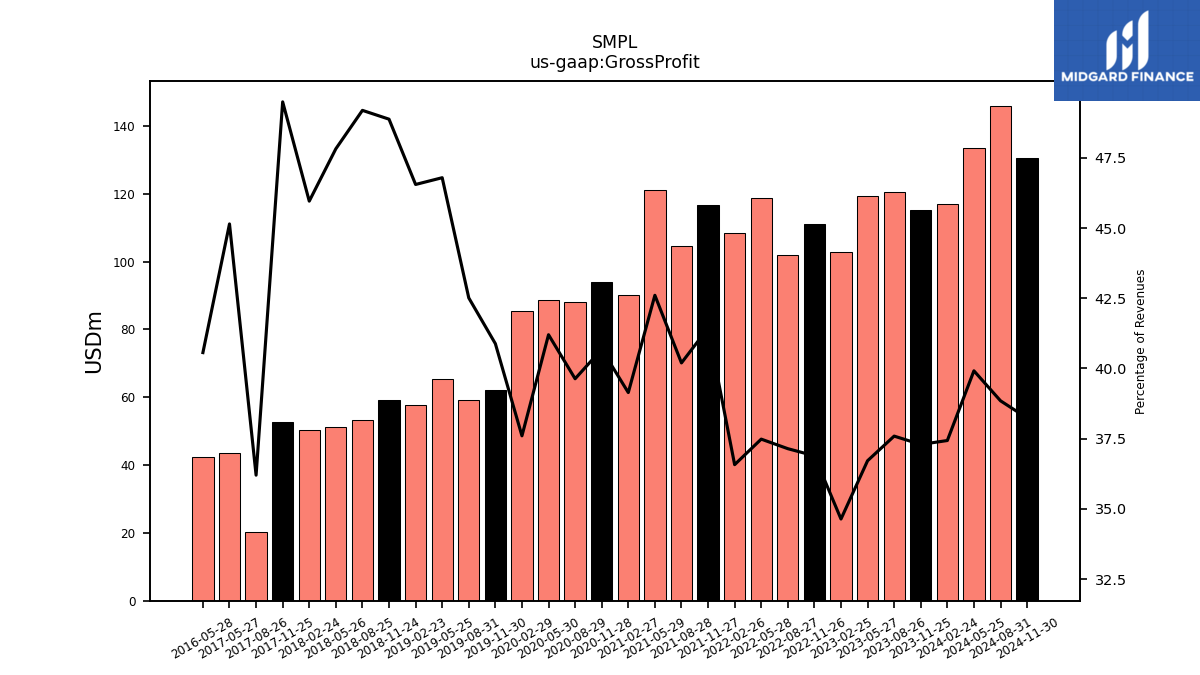
| Gross Profit | 115.12 | 120.45 | 119.25 | 102.73 | 110.99 | 101.83 | 118.65 | 108.52 | 116.56 | 104.46 | 121.00 | 90.27 | 94.04 | 88.10 | 88.63 | 85.39 | 62.21 | 59.17 | 65.26 | 57.63 | 59.11 | 53.26 | 51.28 | 50.26 | 52.76 | 20.39 | 43.57 | 42.43 | |
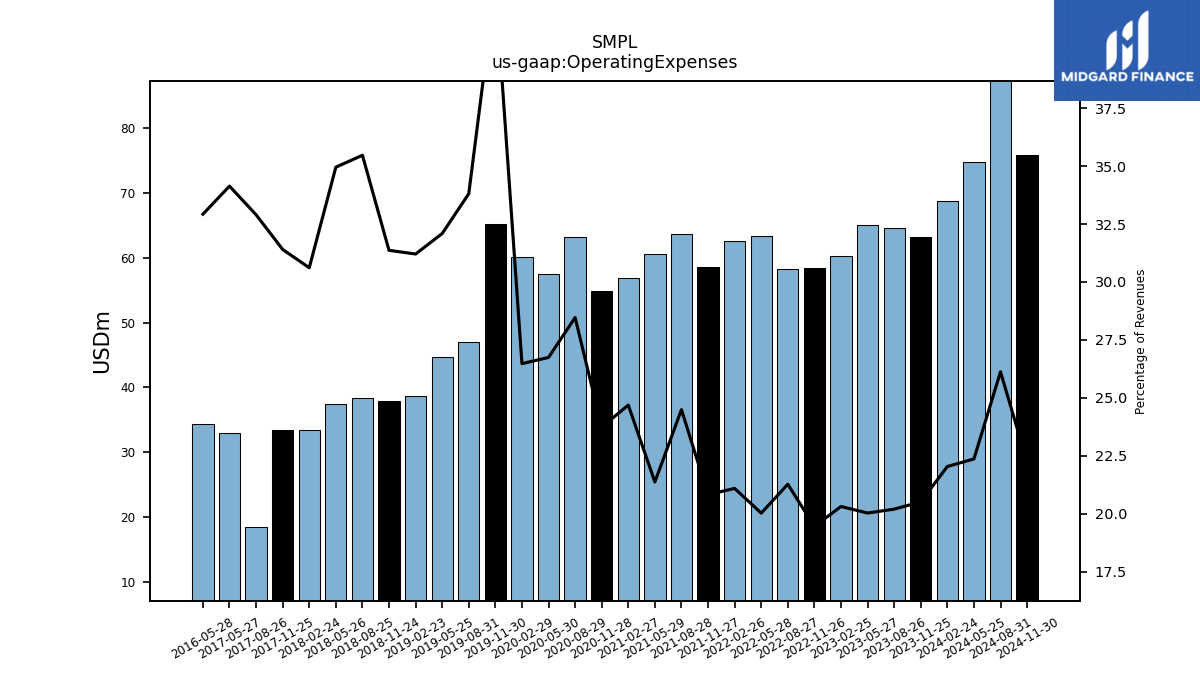
| Operating Expenses | 63.30 | 64.70 | 65.04 | 60.23 | 58.50 | 58.31 | 63.37 | 62.57 | 58.55 | 63.63 | 60.68 | 56.92 | 54.85 | 63.27 | 57.52 | 60.12 | 65.19 | 47.06 | 44.75 | 38.63 | 37.93 | 38.40 | 37.48 | 33.47 | 33.47 | 18.53 | 32.94 | 34.44 | |
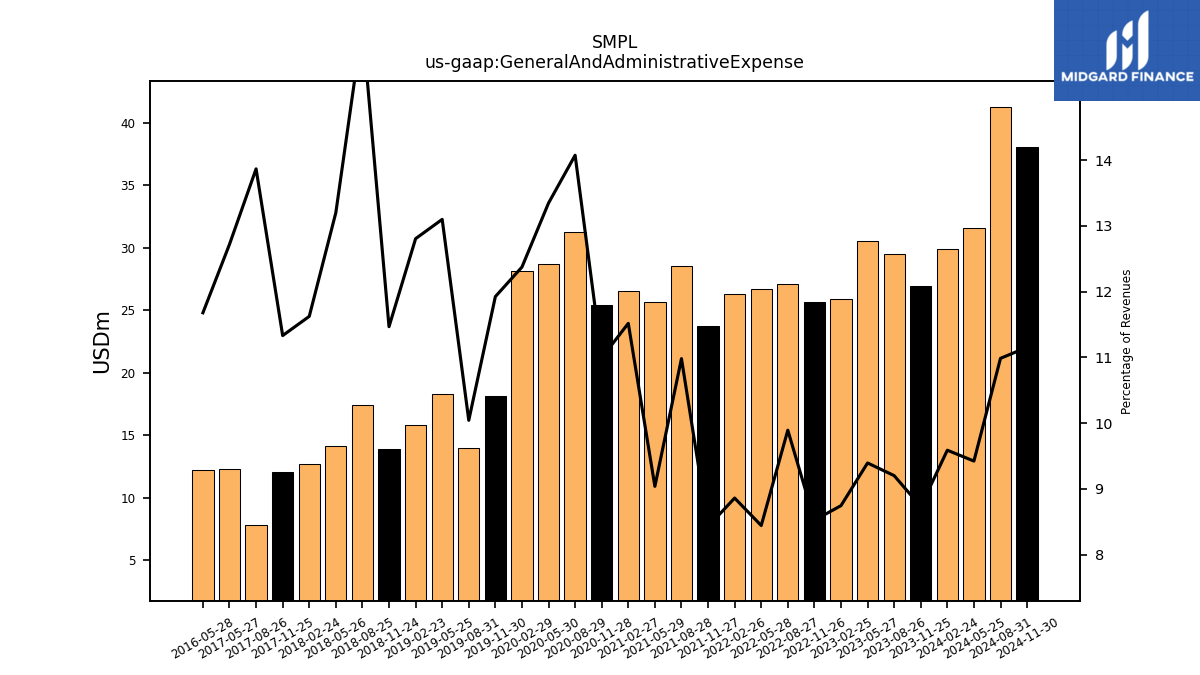
| General And Administrative Expense | 26.95 | 29.48 | 30.51 | 25.93 | 25.64 | 27.12 | 26.72 | 26.29 | 23.70 | 28.54 | 25.67 | 26.56 | 25.41 | 31.29 | 28.71 | 28.10 | 18.14 | 13.98 | 18.27 | 15.86 | 13.87 | 17.39 | 14.16 | 12.71 | 12.08 | 7.81 | 12.28 | 12.21 | |
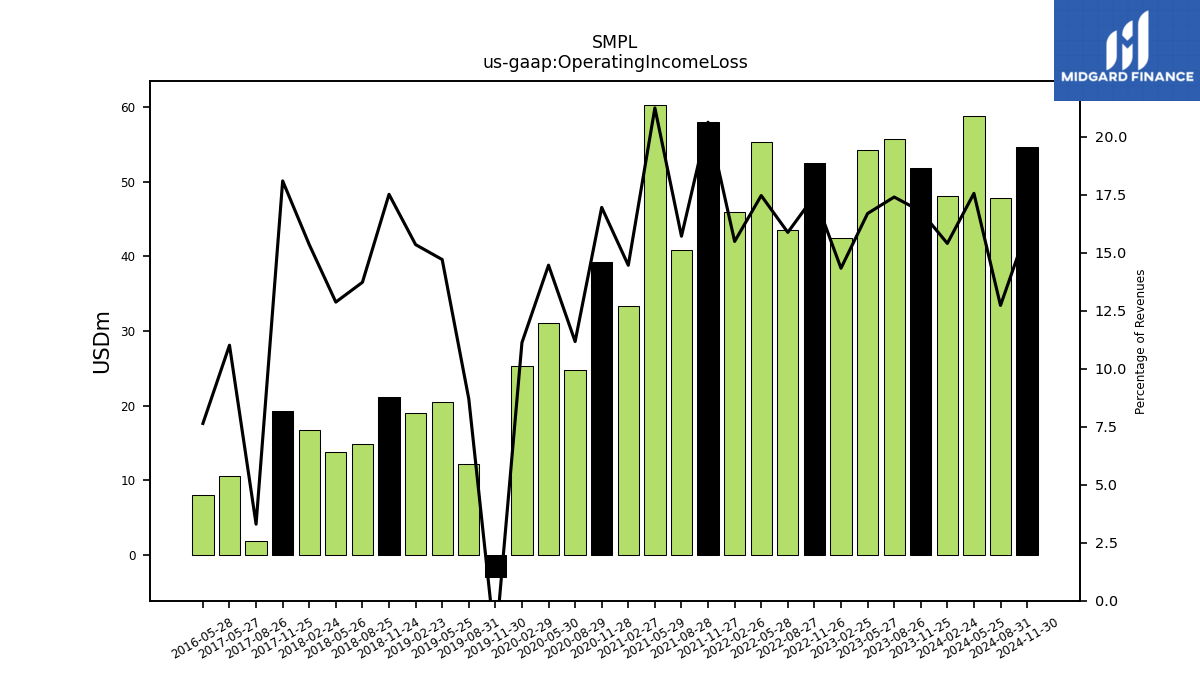
| Operating Income Loss | 51.82 | 55.75 | 54.20 | 42.51 | 52.49 | 43.53 | 55.28 | 45.95 | 58.01 | 40.83 | 60.32 | 33.34 | 39.19 | 24.83 | 31.11 | 25.27 | -2.98 | 12.12 | 20.51 | 19.00 | 21.18 | 14.86 | 13.80 | 16.78 | 19.29 | 1.86 | 10.63 | 7.99 | |
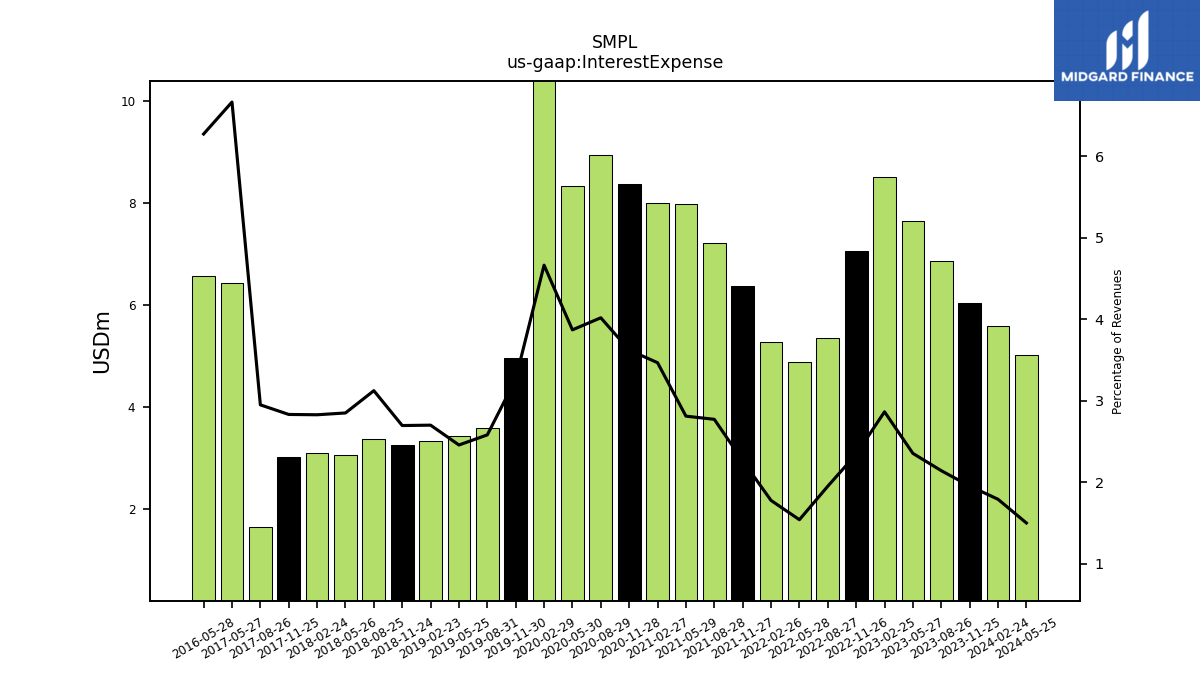
| Interest Expense | 6.03 | 6.87 | 7.65 | 8.50 | 7.05 | 5.35 | 4.88 | 5.28 | 6.37 | 7.21 | 7.99 | 8.00 | 8.37 | 8.93 | 8.32 | 10.59 | 4.97 | 3.59 | 3.43 | 3.34 | 3.26 | 3.38 | 3.06 | 3.09 | 3.02 | 1.66 | 6.43 | 6.56 | |
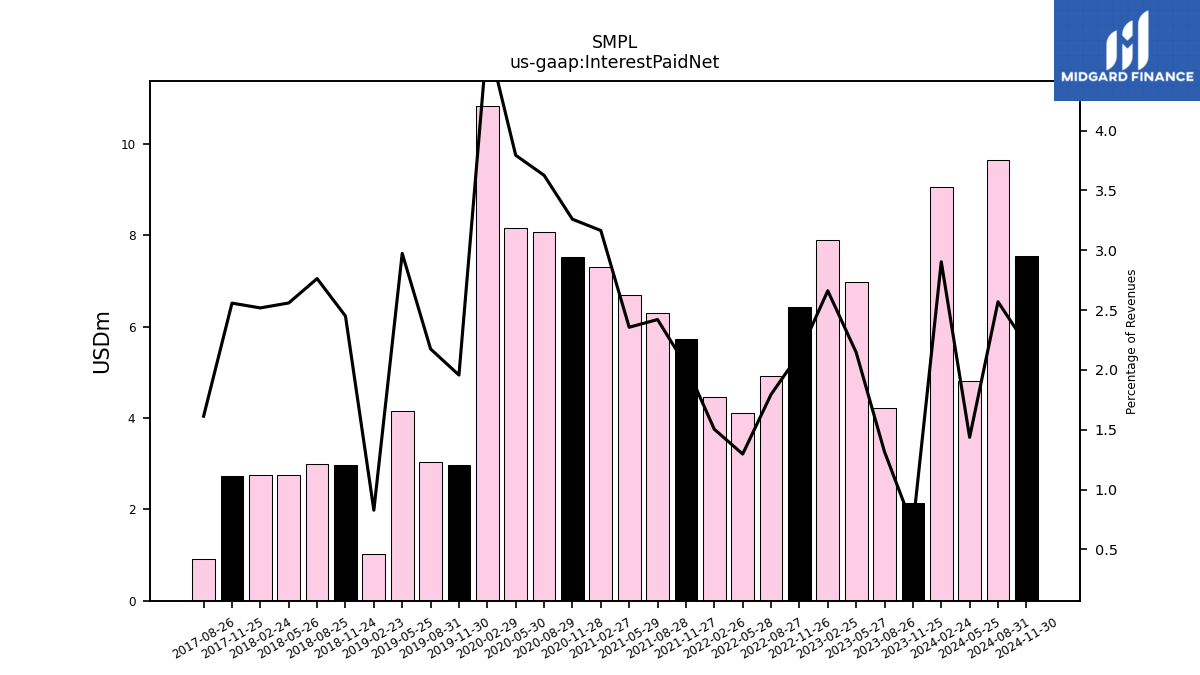
| Interest Paid Net | 2.13 | 4.22 | 6.97 | 7.89 | 6.43 | 4.92 | 4.11 | 4.46 | 5.73 | 6.29 | 6.69 | 7.30 | 7.54 | 8.06 | 8.16 | 10.84 | 2.98 | 3.03 | 4.15 | 1.02 | 2.96 | 2.99 | 2.75 | 2.75 | 2.73 | 0.91 | NA | NA | |
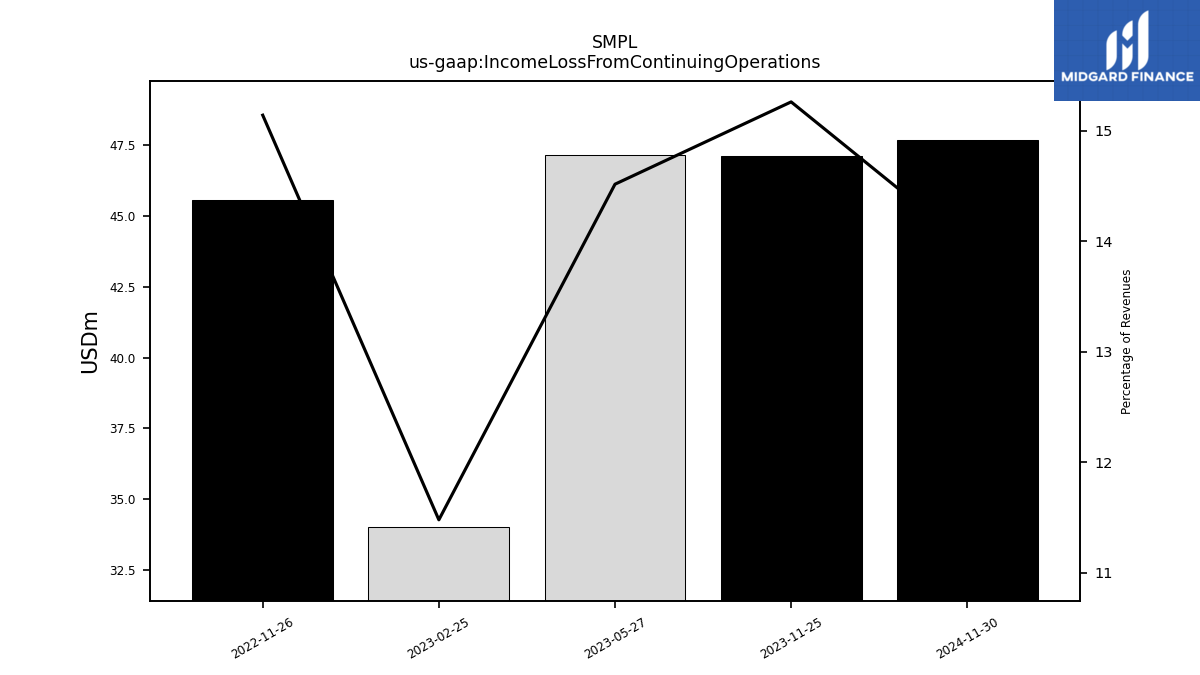
| Income Loss From Continuing Operations | 47.11 | NA | NA | NA | 45.56 | NA | NA | NA | NA | NA | NA | NA | NA | NA | NA | NA | NA | NA | NA | NA | NA | NA | NA | NA | NA | NA | NA | NA | |
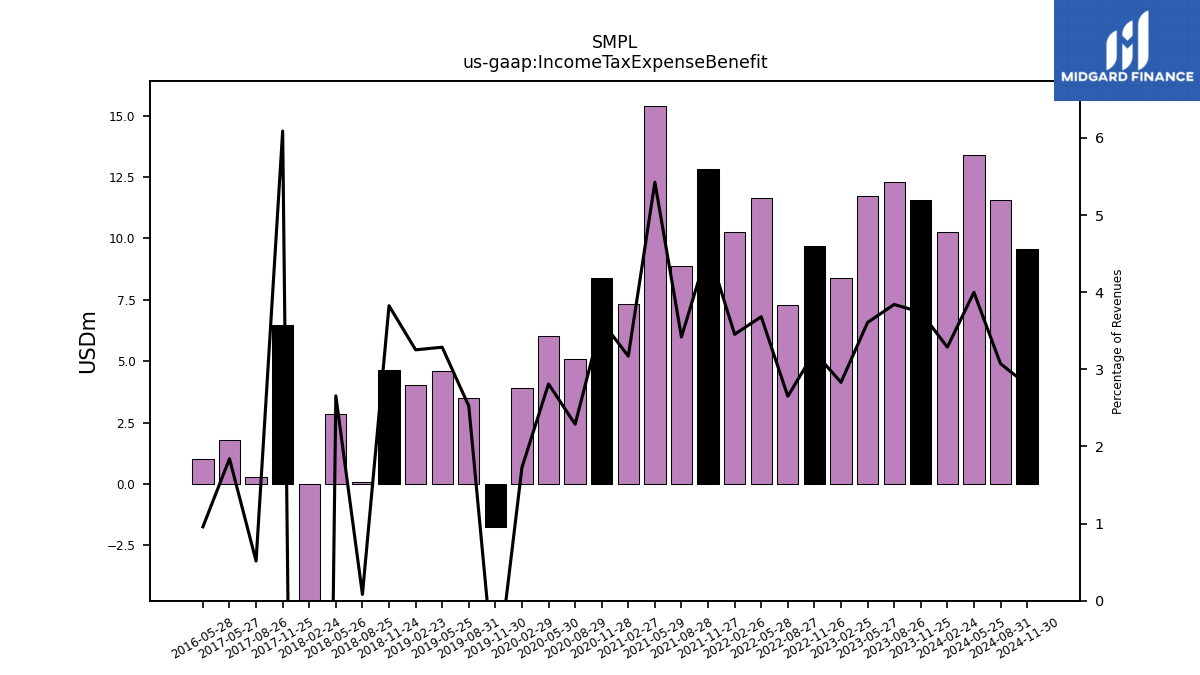
| Income Tax Expense Benefit | 11.55 | 12.31 | 11.72 | 8.40 | 9.70 | 7.27 | 11.65 | 10.25 | 12.82 | 8.88 | 15.41 | 7.31 | 8.37 | 5.09 | 6.04 | 3.92 | -1.73 | 3.51 | 4.58 | 4.03 | 4.62 | 0.09 | 2.85 | -26.79 | 6.49 | 0.29 | 1.78 | 1.00 | |
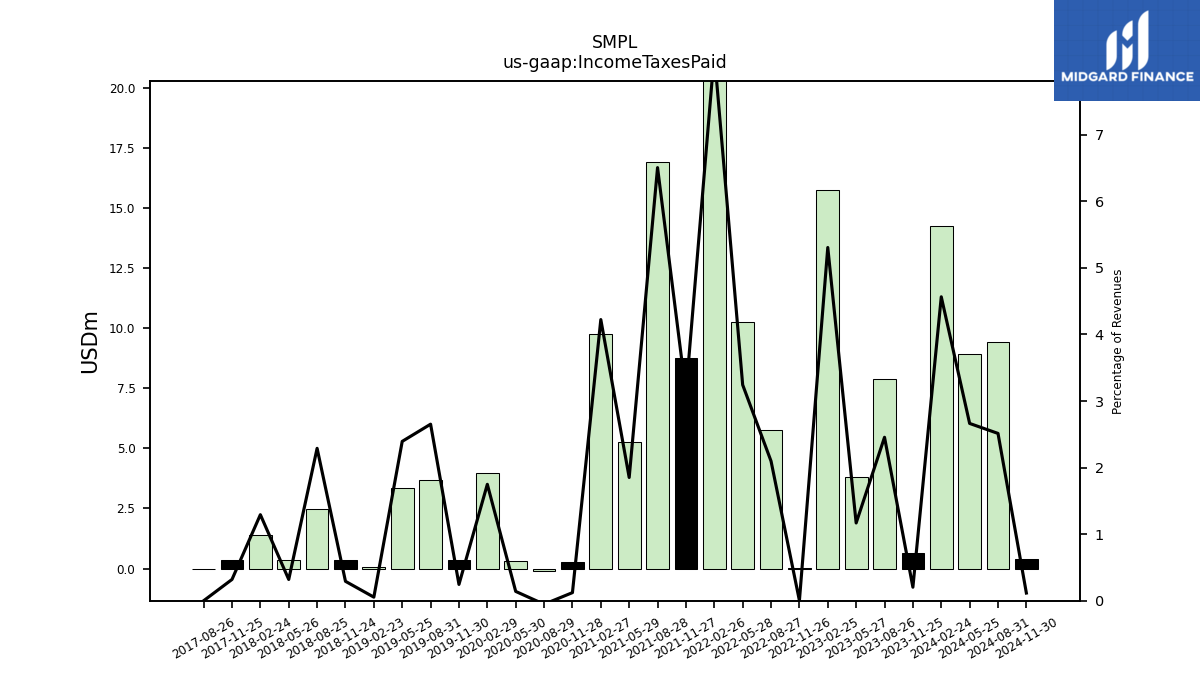
| Income Taxes Paid | 0.63 | 7.87 | 3.79 | 15.74 | 0.01 | 5.75 | 10.27 | 24.39 | 8.78 | 16.91 | 5.26 | 9.74 | 0.28 | -0.12 | 0.30 | 3.97 | 0.37 | 3.69 | 3.34 | 0.07 | 0.35 | 2.48 | 0.34 | 1.41 | 0.34 | 0.00 | NA | NA | |
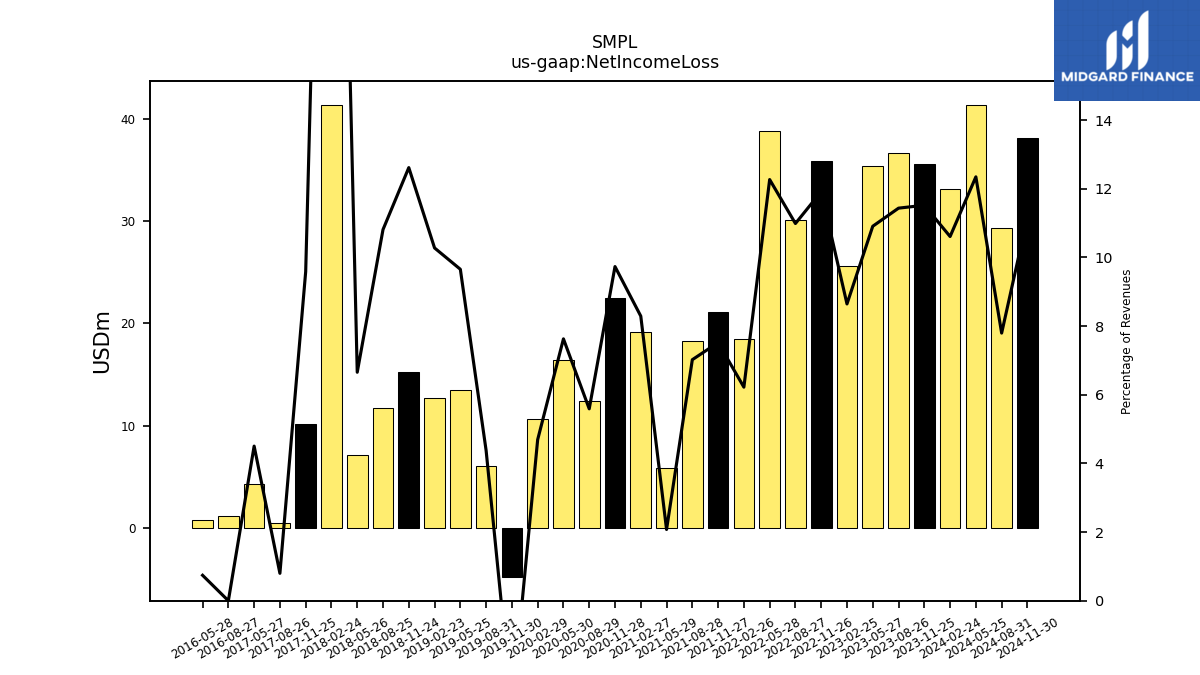
| Net Income Loss | 35.56 | 36.64 | 35.43 | 25.64 | 35.86 | 30.13 | 38.83 | 18.46 | 21.15 | 18.25 | 5.89 | 19.12 | 22.50 | 12.43 | 16.41 | 10.66 | -4.79 | 6.09 | 13.47 | 12.72 | 15.26 | 11.71 | 7.14 | 41.39 | 10.22 | 0.45 | 4.35 | 0.78 | |
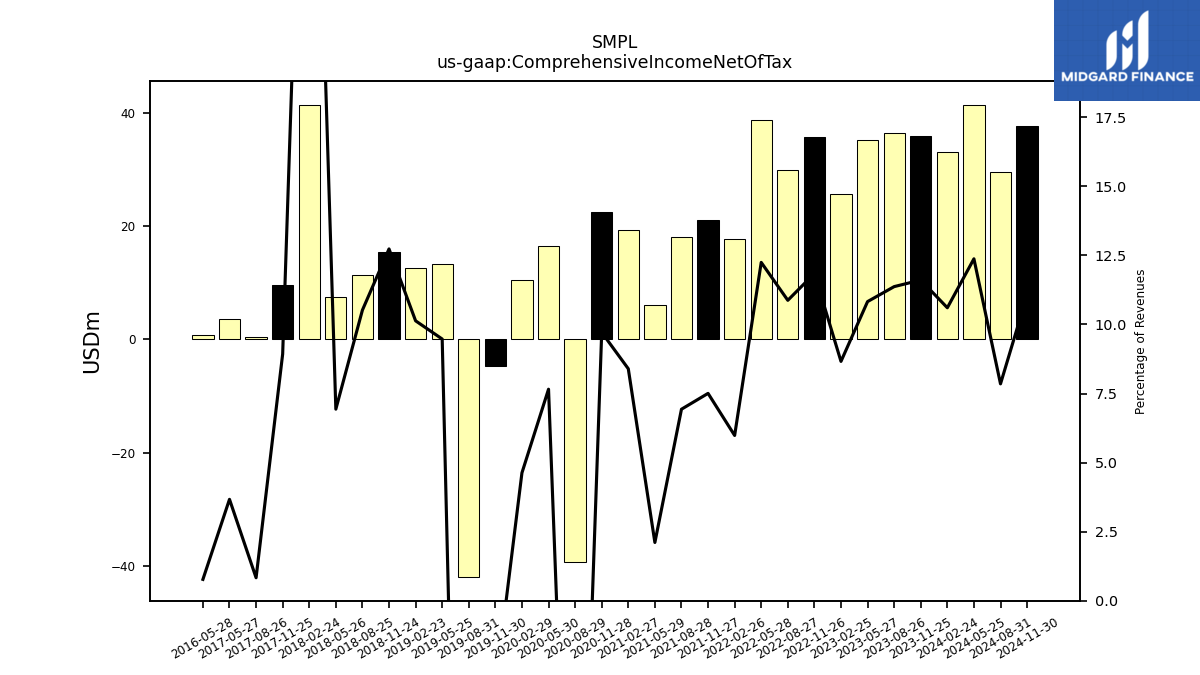
| Comprehensive Income Net Of Tax | 35.83 | 36.43 | 35.17 | 25.70 | 35.64 | 29.81 | 38.76 | 17.75 | 21.11 | 18.01 | 5.99 | 19.36 | 22.45 | -39.25 | 16.47 | 10.52 | -4.79 | -41.98 | 13.21 | 12.54 | 15.40 | 11.39 | 7.44 | 41.29 | 9.52 | 0.47 | 3.54 | 0.81 |
| 2023-11-25 | 2023-08-26 | 2023-05-27 | 2023-02-25 | 2022-11-26 | 2022-08-27 | 2022-05-28 | 2022-02-26 | 2021-11-27 | 2021-08-28 | 2021-05-29 | 2021-02-27 | 2020-11-28 | 2020-08-29 | 2020-05-30 | 2020-02-29 | 2019-11-30 | 2019-08-31 | 2019-05-25 | 2019-02-23 | 2018-11-24 | 2018-08-25 | 2018-05-26 | 2018-02-24 | 2017-11-25 | 2017-08-26 | 2017-05-27 | 2016-05-28 | ||
|---|---|---|---|---|---|---|---|---|---|---|---|---|---|---|---|---|---|---|---|---|---|---|---|---|---|---|---|---|---|
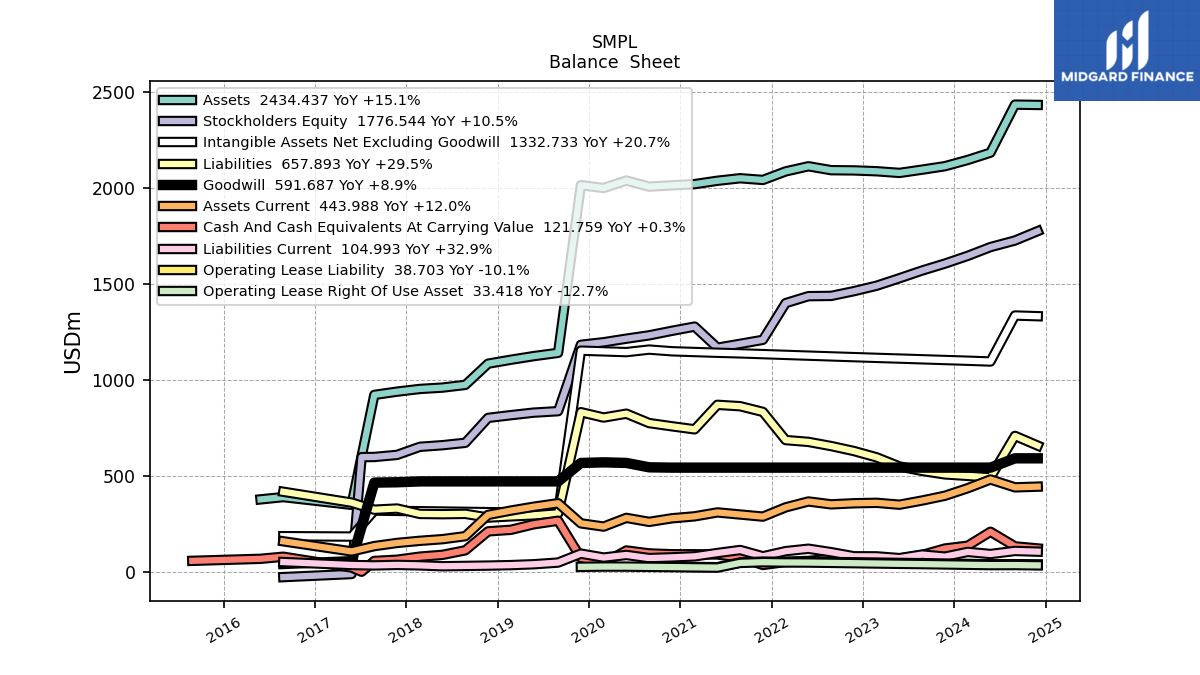
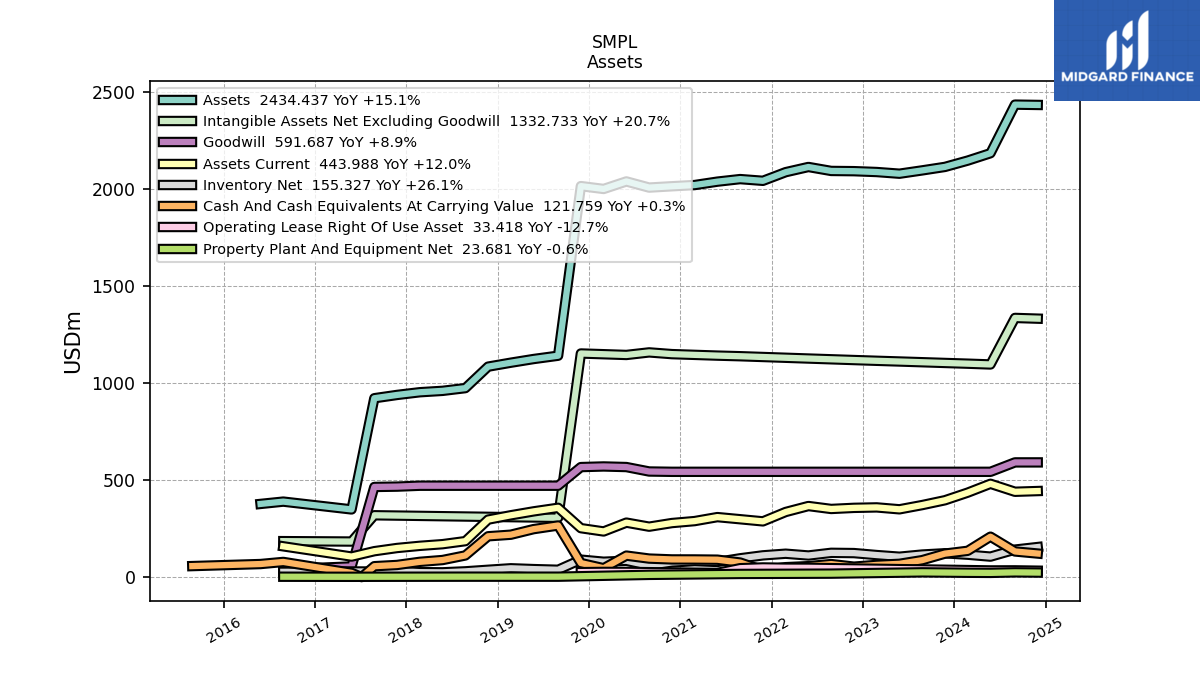
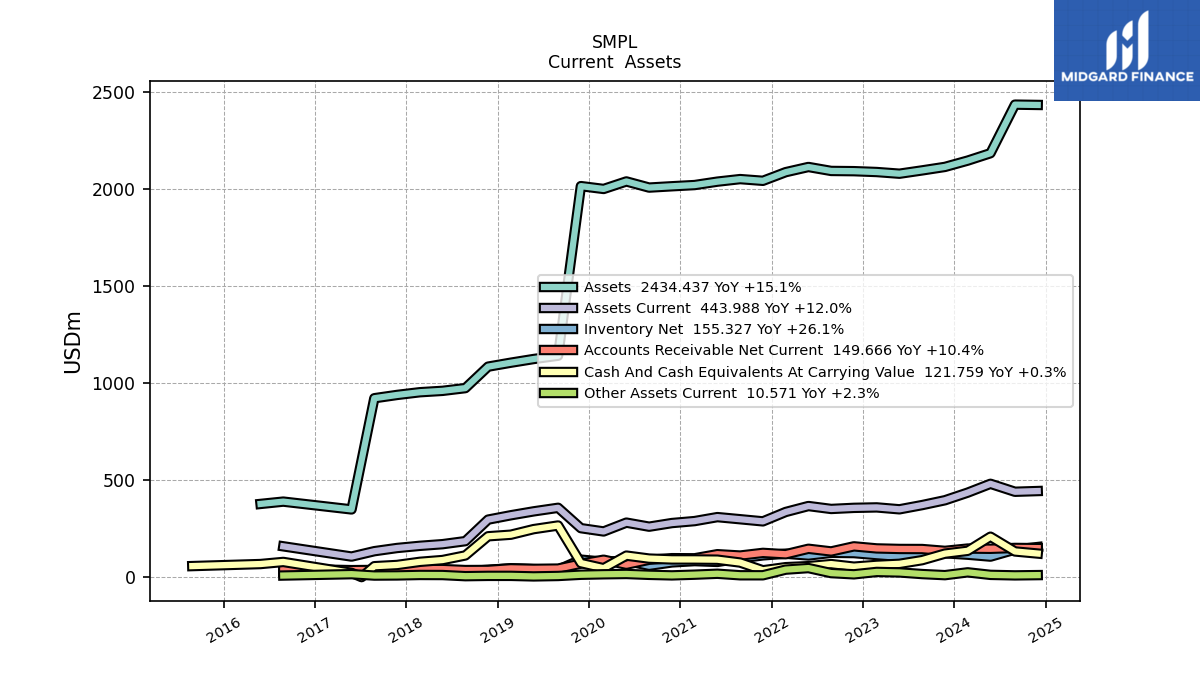
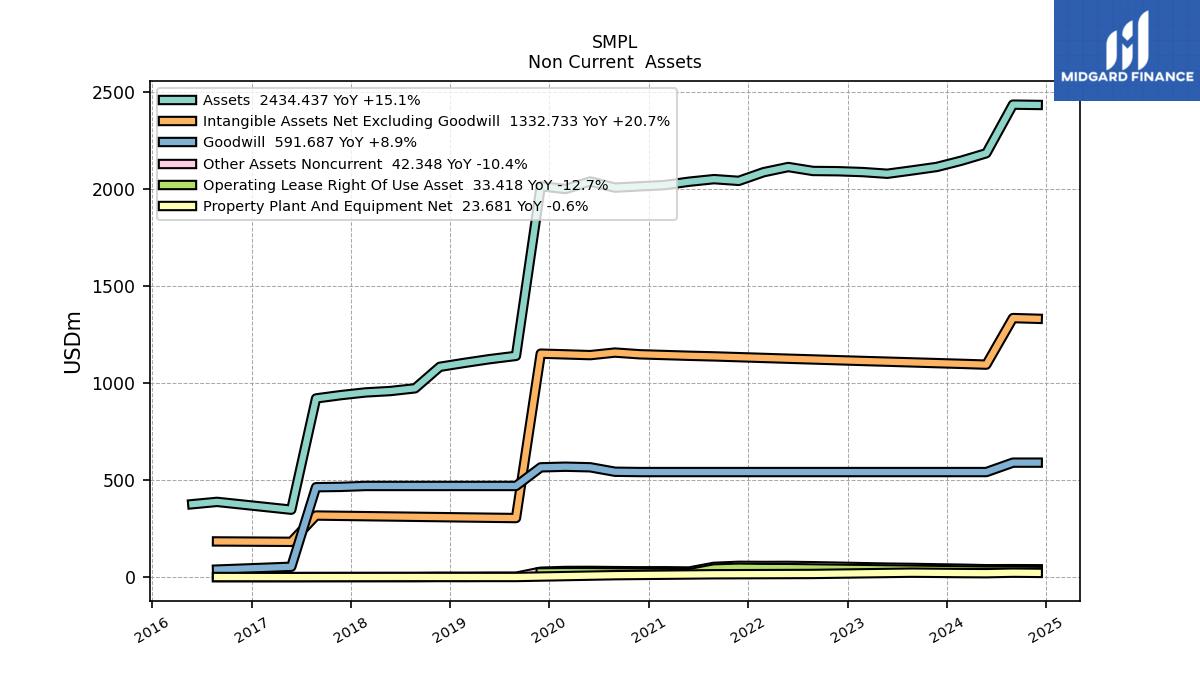
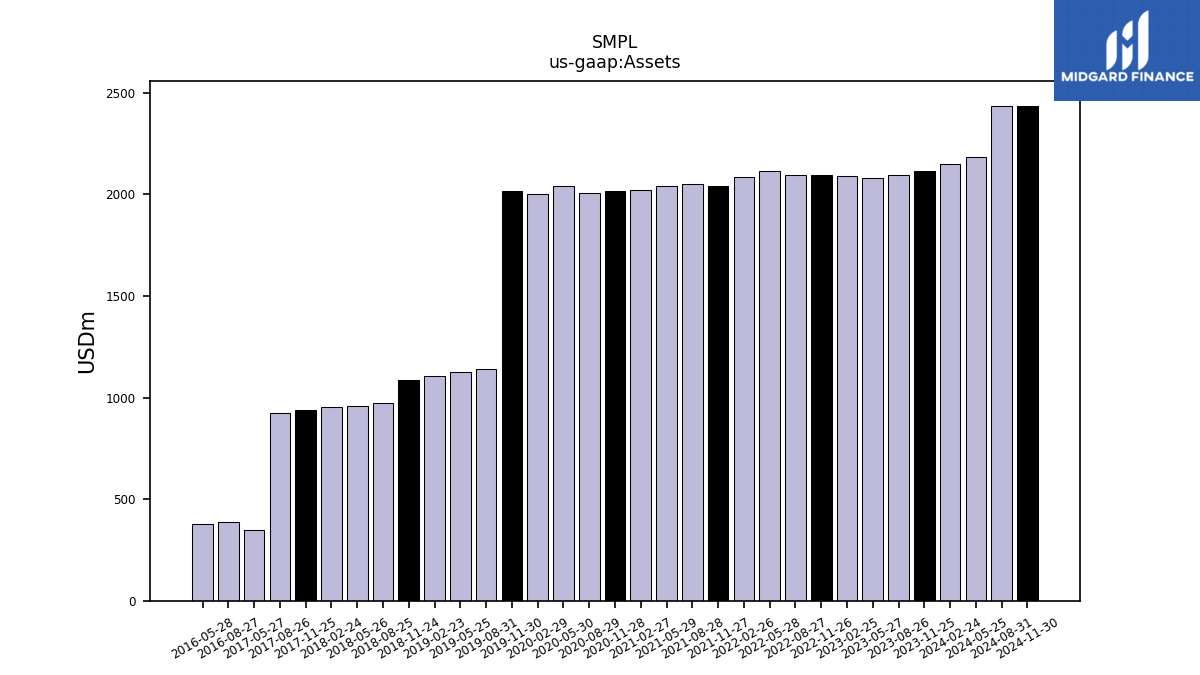
| Assets | 2115.06 | 2097.08 | 2080.00 | 2088.68 | 2093.06 | 2094.25 | 2114.66 | 2087.90 | 2043.34 | 2052.22 | 2039.12 | 2021.52 | 2015.22 | 2008.44 | 2040.14 | 2001.35 | 2016.06 | 1141.65 | 1124.61 | 1105.72 | 1085.35 | 974.61 | 960.55 | 953.40 | 939.44 | 922.49 | 349.16 | 377.53 | |
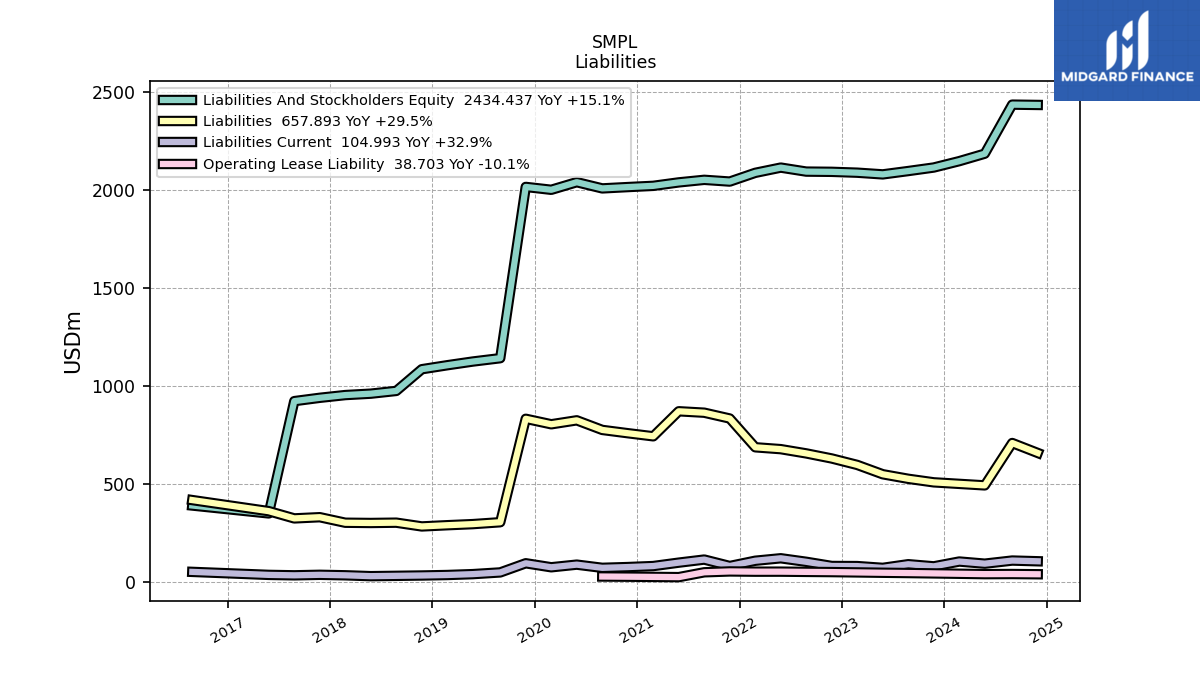
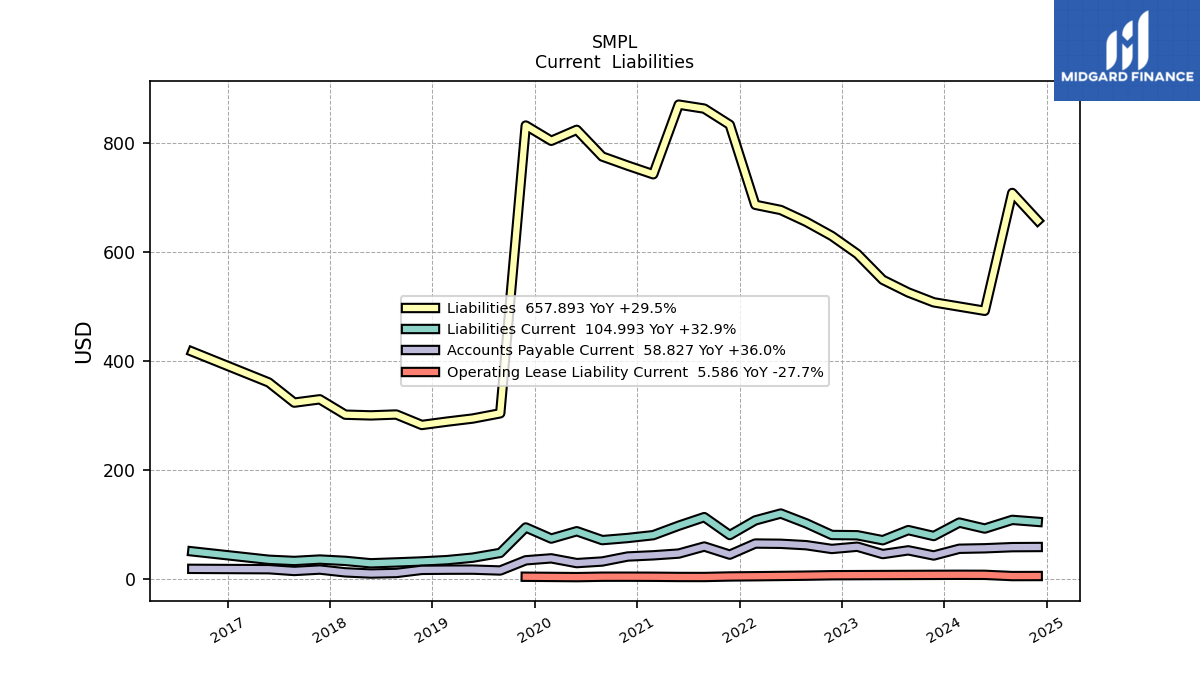
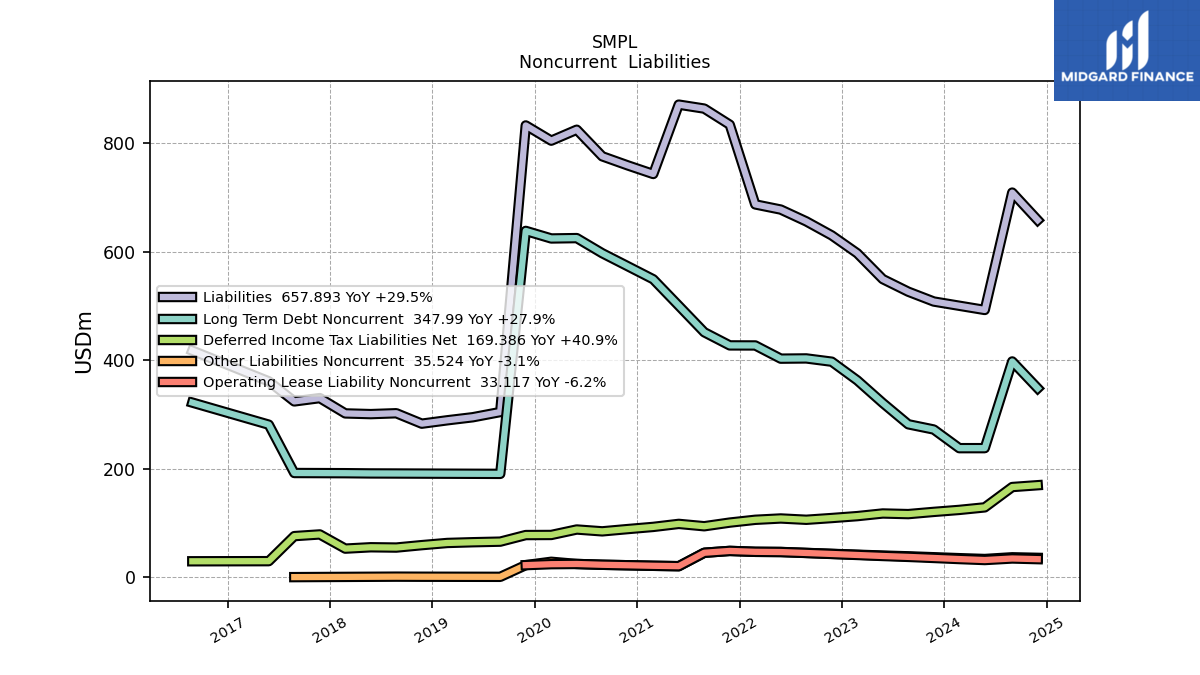
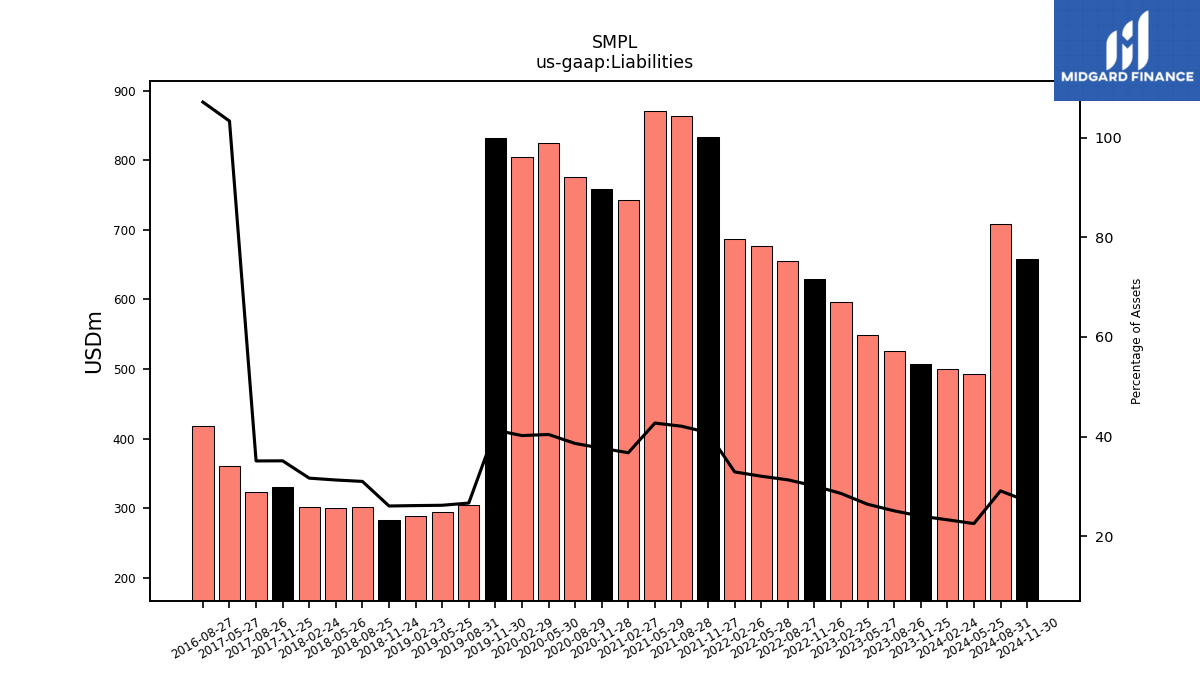
| Liabilities | 507.88 | 525.99 | 549.18 | 596.76 | 629.71 | 655.59 | 677.34 | 686.84 | 833.73 | 863.41 | 870.72 | 742.86 | 758.73 | 775.47 | 824.50 | 804.32 | 832.38 | 304.21 | 294.62 | 289.00 | 282.77 | 302.00 | 300.39 | 301.69 | 329.92 | 323.79 | 360.81 | NA | |
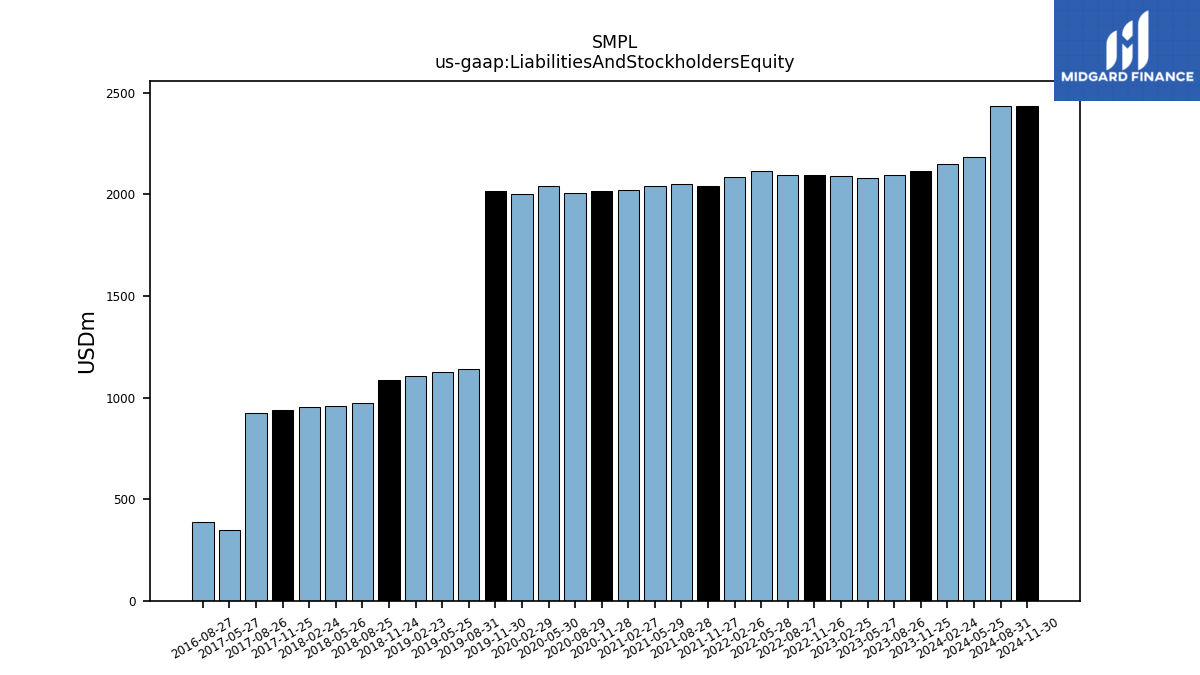
| Liabilities And Stockholders Equity | 2115.06 | 2097.08 | 2080.00 | 2088.68 | 2093.06 | 2094.25 | 2114.66 | 2087.90 | 2043.34 | 2052.22 | 2039.12 | 2021.52 | 2015.22 | 2008.44 | 2040.14 | 2001.35 | 2016.06 | 1141.65 | 1124.61 | 1105.72 | 1085.35 | 974.61 | 960.55 | 953.40 | 939.44 | 922.49 | 349.16 | NA | |
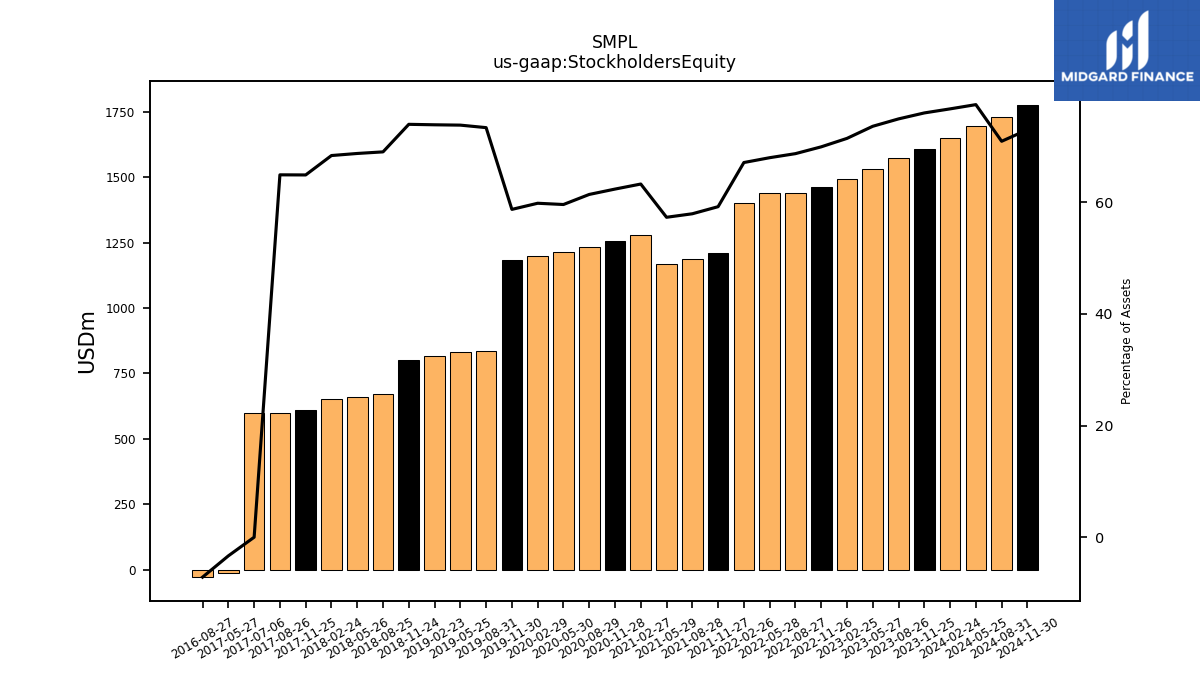
| Stockholders Equity | 1607.18 | 1571.10 | 1530.82 | 1491.91 | 1463.36 | 1438.66 | 1437.32 | 1401.05 | 1209.61 | 1188.80 | 1168.41 | 1278.66 | 1256.49 | 1232.97 | 1215.65 | 1197.03 | 1183.68 | 837.44 | 829.99 | 816.71 | 802.58 | 672.60 | 660.16 | 651.71 | 609.52 | 598.70 | -11.65 | NA |
| 2023-11-25 | 2023-08-26 | 2023-05-27 | 2023-02-25 | 2022-11-26 | 2022-08-27 | 2022-05-28 | 2022-02-26 | 2021-11-27 | 2021-08-28 | 2021-05-29 | 2021-02-27 | 2020-11-28 | 2020-08-29 | 2020-05-30 | 2020-02-29 | 2019-11-30 | 2019-08-31 | 2019-05-25 | 2019-02-23 | 2018-11-24 | 2018-08-25 | 2018-05-26 | 2018-02-24 | 2017-11-25 | 2017-08-26 | 2017-05-27 | 2016-05-28 | ||
|---|---|---|---|---|---|---|---|---|---|---|---|---|---|---|---|---|---|---|---|---|---|---|---|---|---|---|---|---|---|
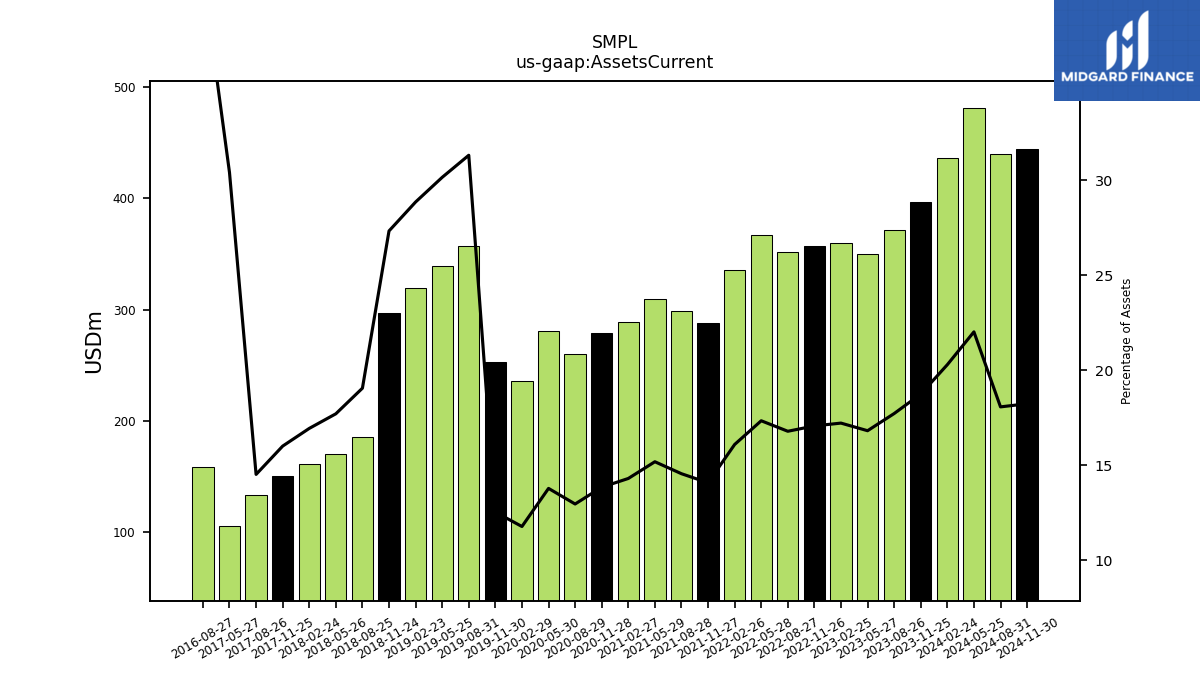
| Assets Current | 396.54 | 371.65 | 349.81 | 359.64 | 357.30 | 351.60 | 366.72 | 335.99 | 287.64 | 298.67 | 309.62 | 289.13 | 278.95 | 260.26 | 281.14 | 235.63 | 252.64 | 357.61 | 339.19 | 319.14 | 296.71 | 185.74 | 170.10 | 161.50 | 150.38 | 133.91 | 106.20 | NA | |
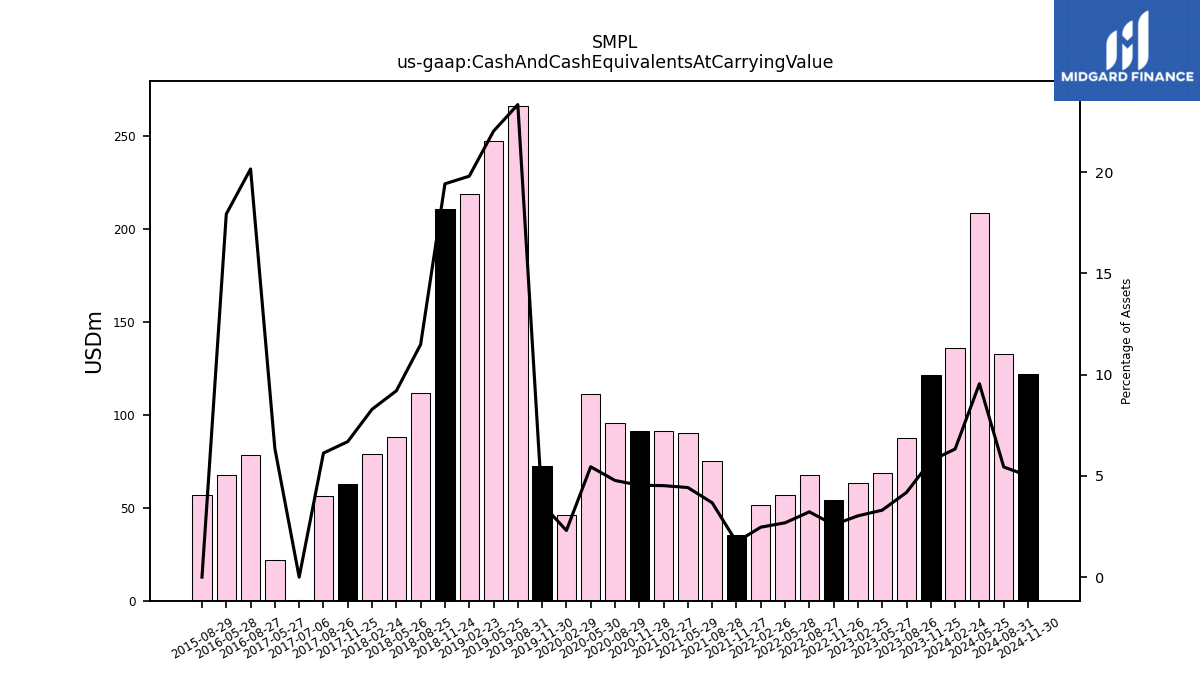
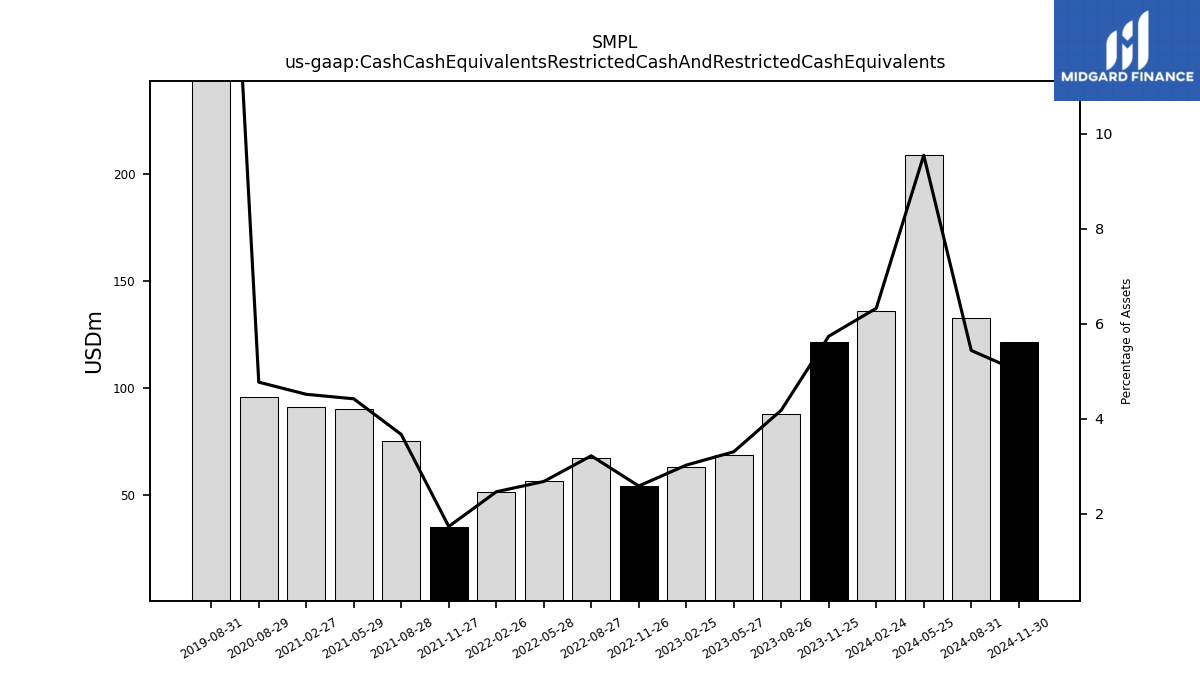
| Cash And Cash Equivalents At Carrying Value | 121.39 | 87.72 | 68.79 | 63.21 | 54.14 | 67.49 | 56.72 | 51.47 | 35.45 | 75.34 | 90.17 | 91.31 | 91.48 | 95.85 | 111.13 | 46.12 | 72.71 | 266.34 | 247.62 | 218.90 | 210.76 | 111.97 | 88.36 | 79.01 | 62.88 | 56.50 | 22.16 | 67.69 | |
| Cash Cash Equivalents Restricted Cash And Restricted Cash Equivalents | 121.39 | 87.72 | 68.79 | 63.21 | 54.14 | 67.49 | 56.72 | 51.47 | 35.45 | 75.34 | 90.17 | 91.31 | NA | 95.85 | NA | NA | NA | 266.34 | NA | NA | NA | NA | NA | NA | NA | NA | NA | NA | |
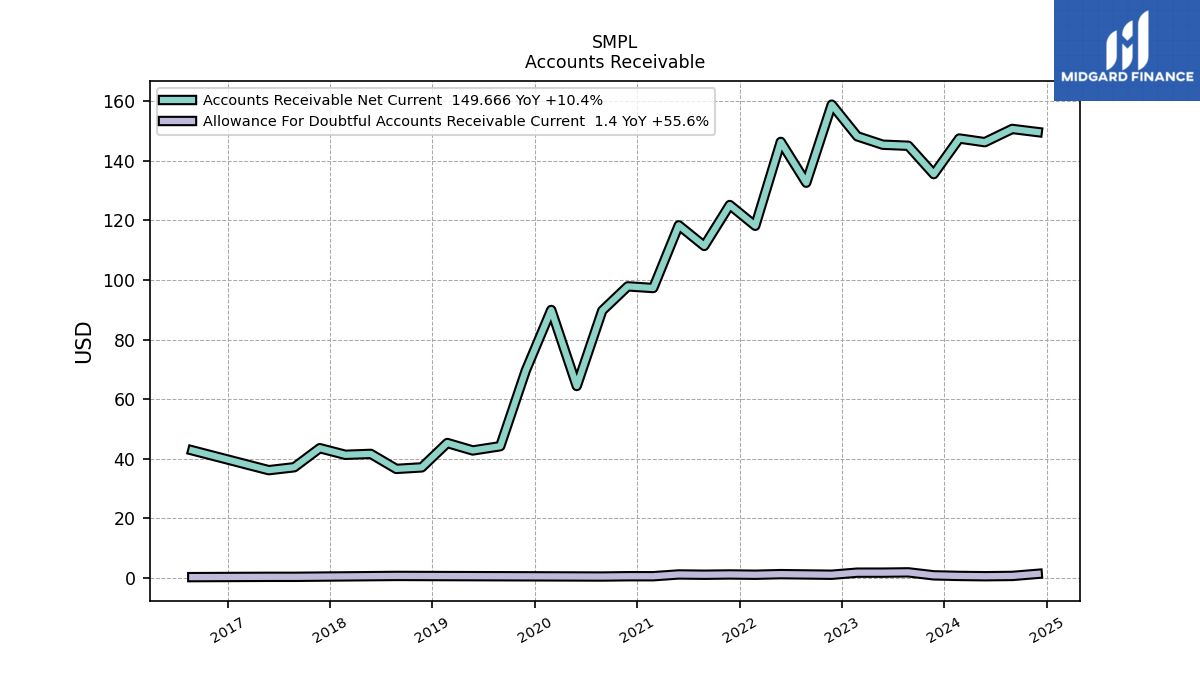
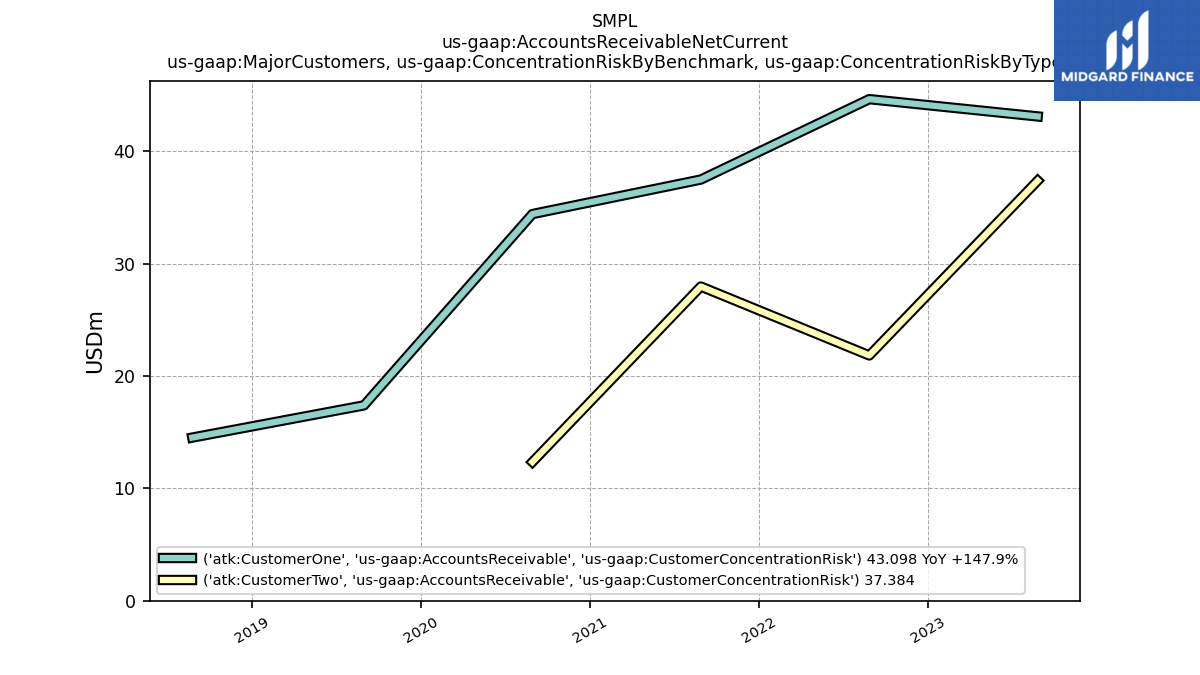
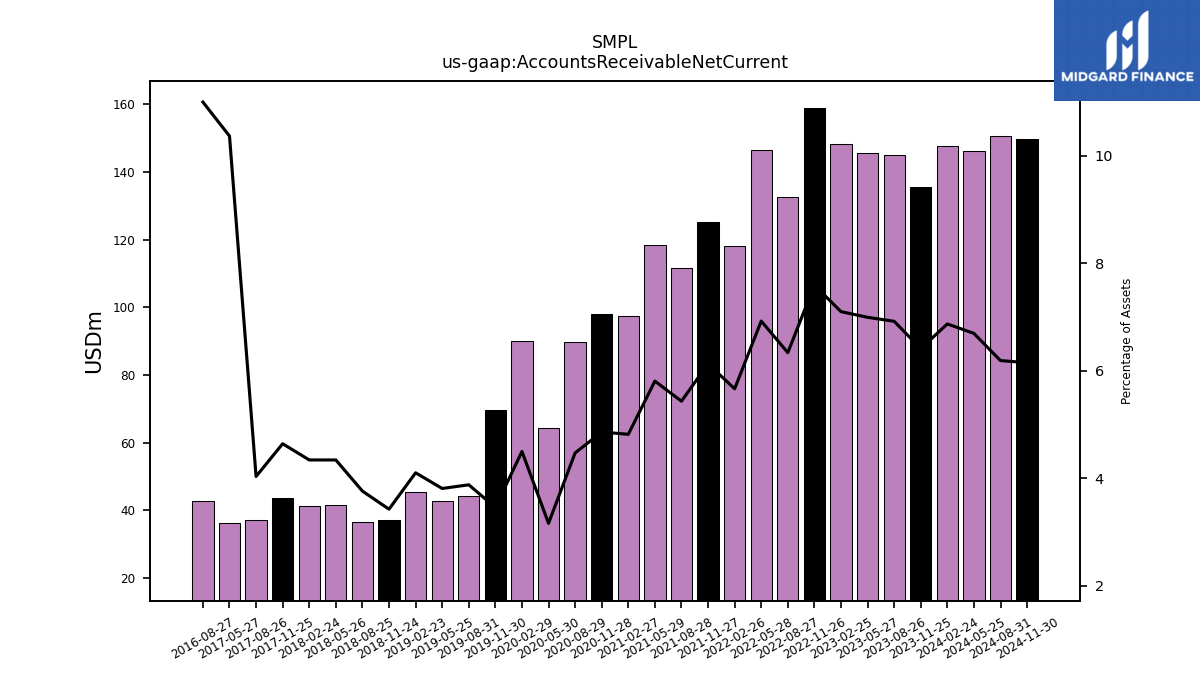
| Accounts Receivable Net Current | 135.56 | 145.08 | 145.43 | 148.25 | 158.88 | 132.67 | 146.38 | 118.21 | 125.19 | 111.46 | 118.37 | 97.33 | 97.89 | 89.74 | 64.44 | 89.97 | 69.59 | 44.24 | 42.81 | 45.32 | 37.13 | 36.62 | 41.66 | 41.35 | 43.58 | 37.18 | 36.19 | NA | |
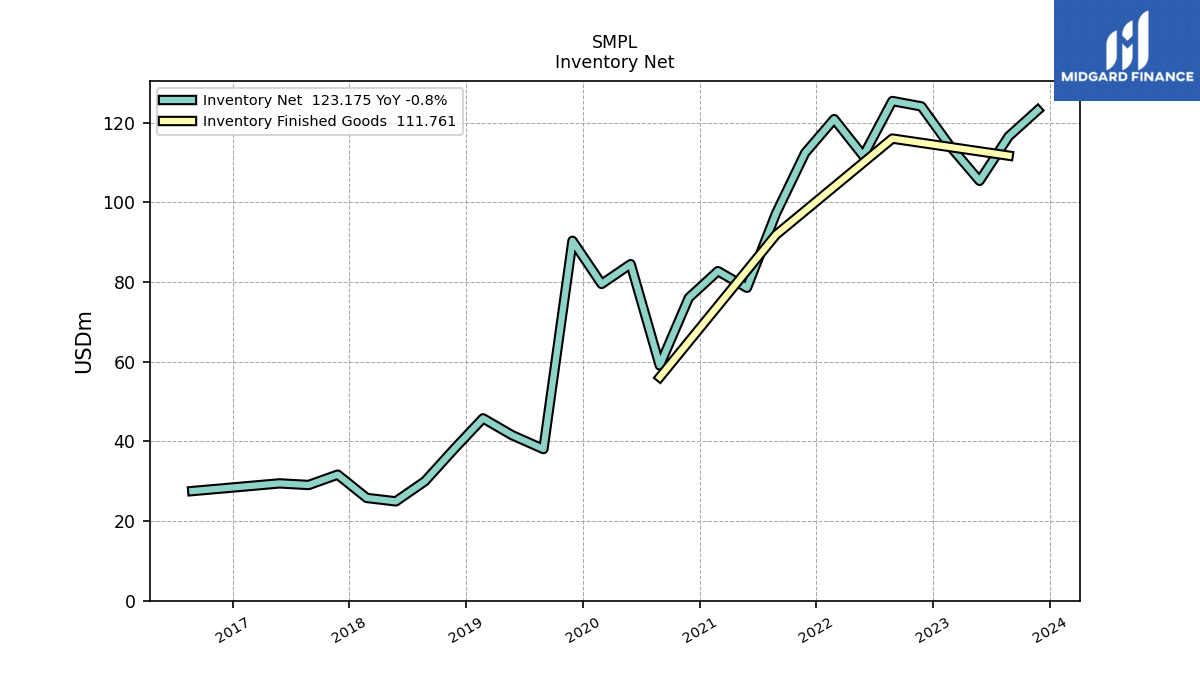
| Inventory Net | 123.17 | 116.59 | 105.44 | 114.01 | 124.12 | 125.48 | 111.71 | 120.94 | 112.43 | 97.27 | 78.58 | 82.77 | 76.07 | 59.09 | 84.52 | 79.55 | 90.38 | 38.09 | 41.57 | 45.80 | 38.06 | 30.00 | 24.95 | 25.81 | 31.66 | 29.06 | 29.47 | NA | |
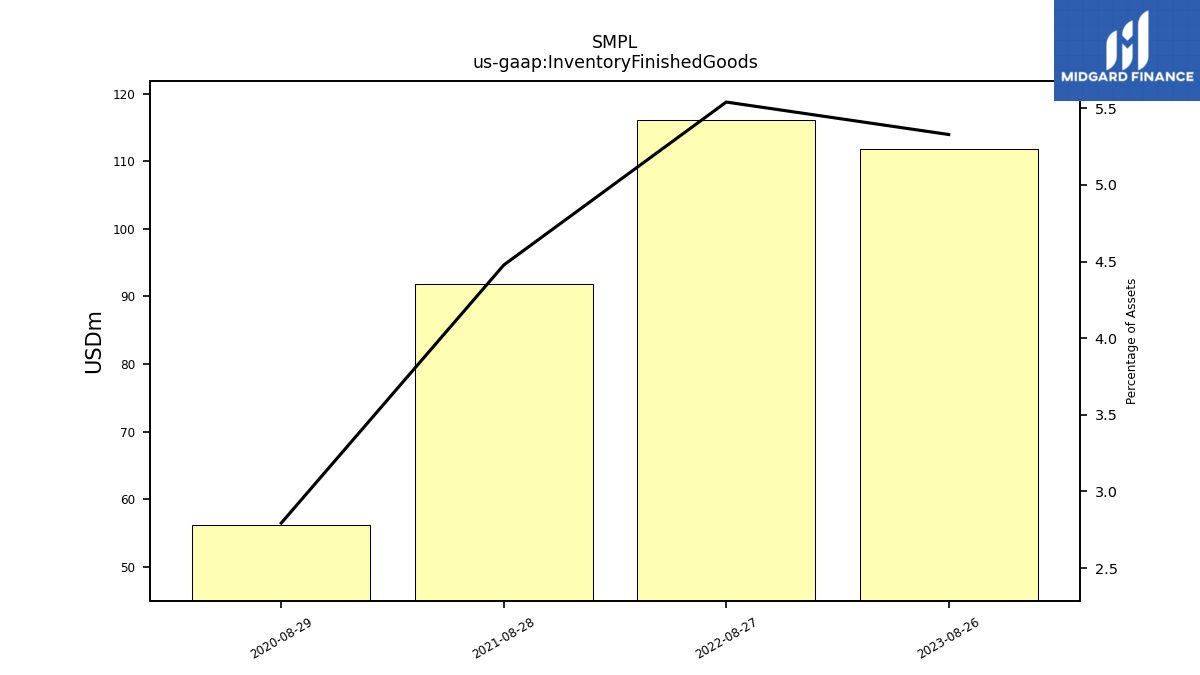
| Inventory Finished Goods | NA | 111.76 | NA | NA | NA | 116.05 | NA | NA | NA | 91.89 | NA | NA | NA | 56.12 | NA | NA | NA | NA | NA | NA | NA | NA | NA | NA | NA | NA | NA | NA | |
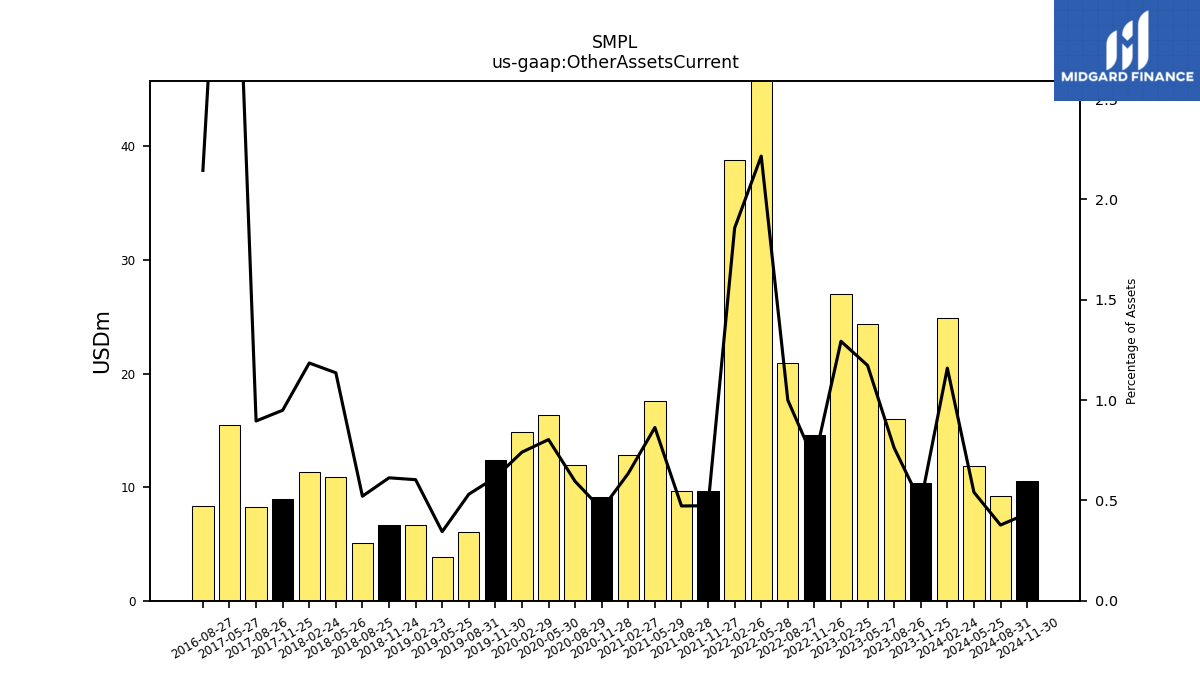
| Other Assets Current | 10.34 | 15.97 | 24.39 | 27.00 | 14.59 | 20.93 | 46.85 | 38.78 | 9.67 | 9.69 | 17.60 | 12.83 | 9.18 | 11.95 | 16.39 | 14.82 | 12.39 | 6.06 | 3.87 | 6.67 | 6.65 | 5.08 | 10.91 | 11.29 | 8.92 | 8.26 | 15.46 | NA |
| 2023-11-25 | 2023-08-26 | 2023-05-27 | 2023-02-25 | 2022-11-26 | 2022-08-27 | 2022-05-28 | 2022-02-26 | 2021-11-27 | 2021-08-28 | 2021-05-29 | 2021-02-27 | 2020-11-28 | 2020-08-29 | 2020-05-30 | 2020-02-29 | 2019-11-30 | 2019-08-31 | 2019-05-25 | 2019-02-23 | 2018-11-24 | 2018-08-25 | 2018-05-26 | 2018-02-24 | 2017-11-25 | 2017-08-26 | 2017-05-27 | 2016-05-28 | ||
|---|---|---|---|---|---|---|---|---|---|---|---|---|---|---|---|---|---|---|---|---|---|---|---|---|---|---|---|---|---|
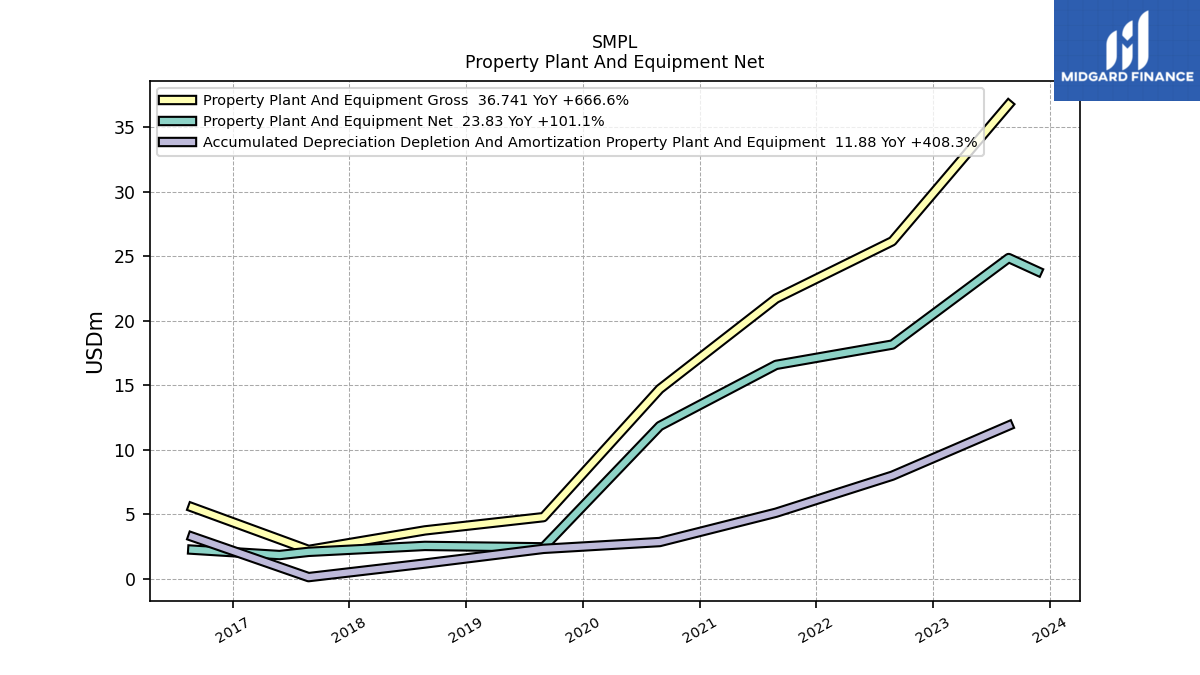
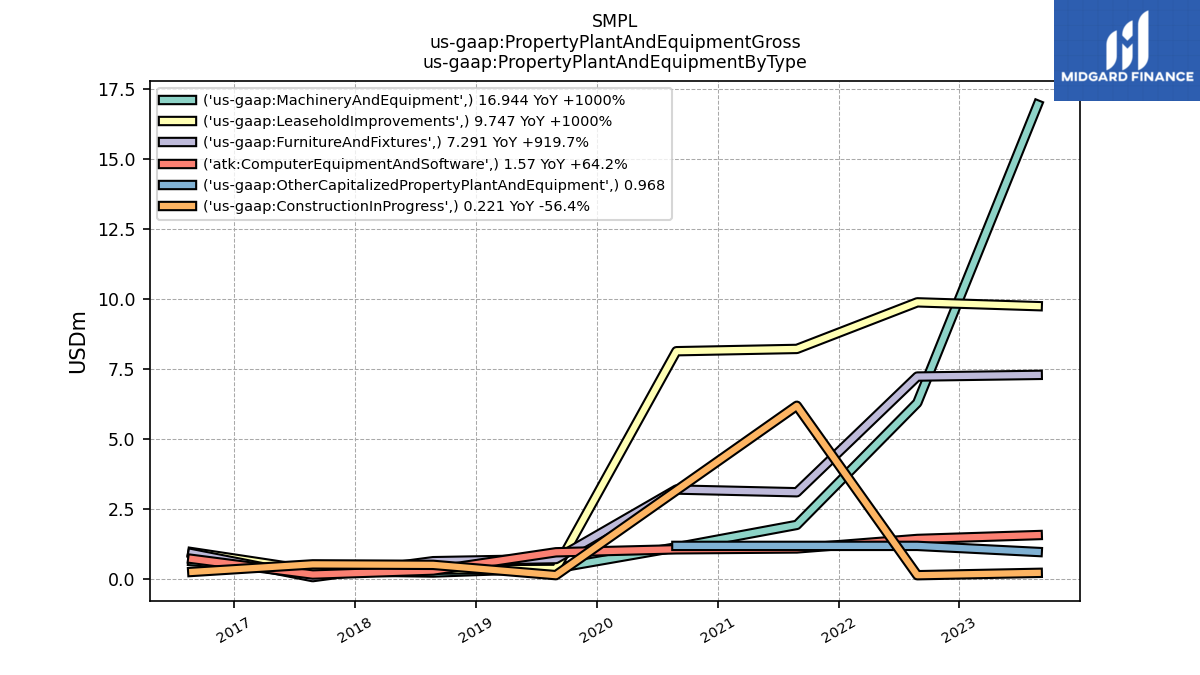
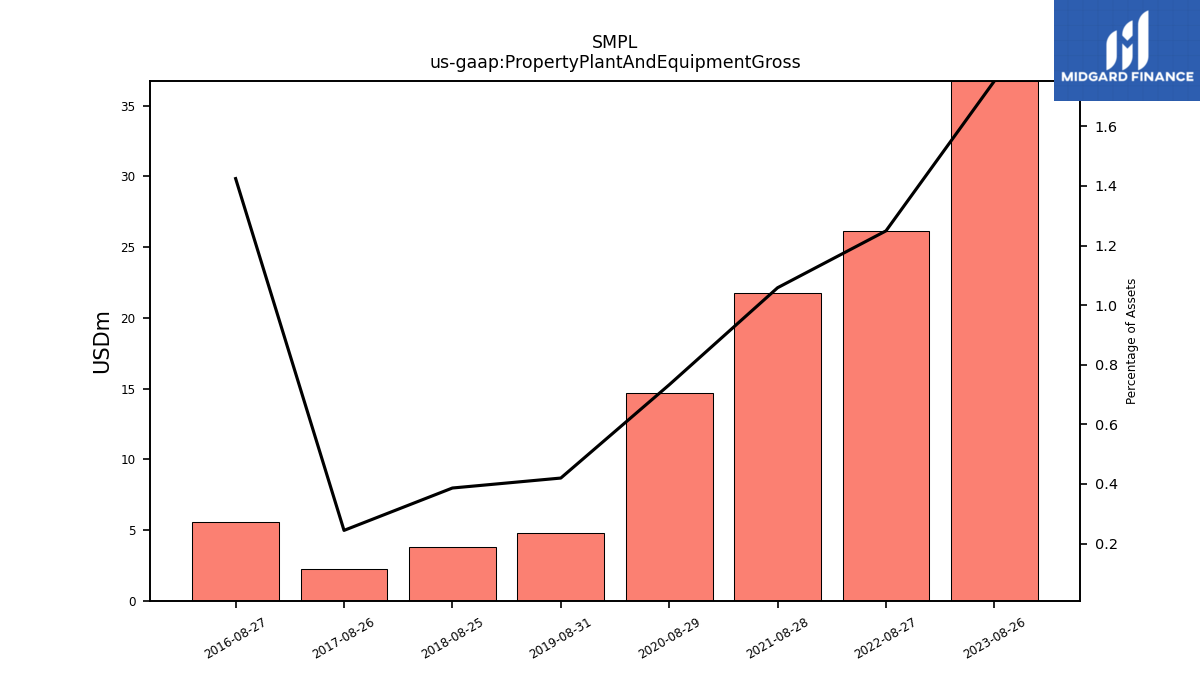
| Property Plant And Equipment Gross | NA | 36.74 | NA | NA | NA | 26.16 | NA | NA | NA | 21.72 | NA | NA | NA | 14.72 | NA | NA | NA | 4.79 | NA | NA | NA | 3.77 | NA | NA | NA | 2.25 | NA | NA | |
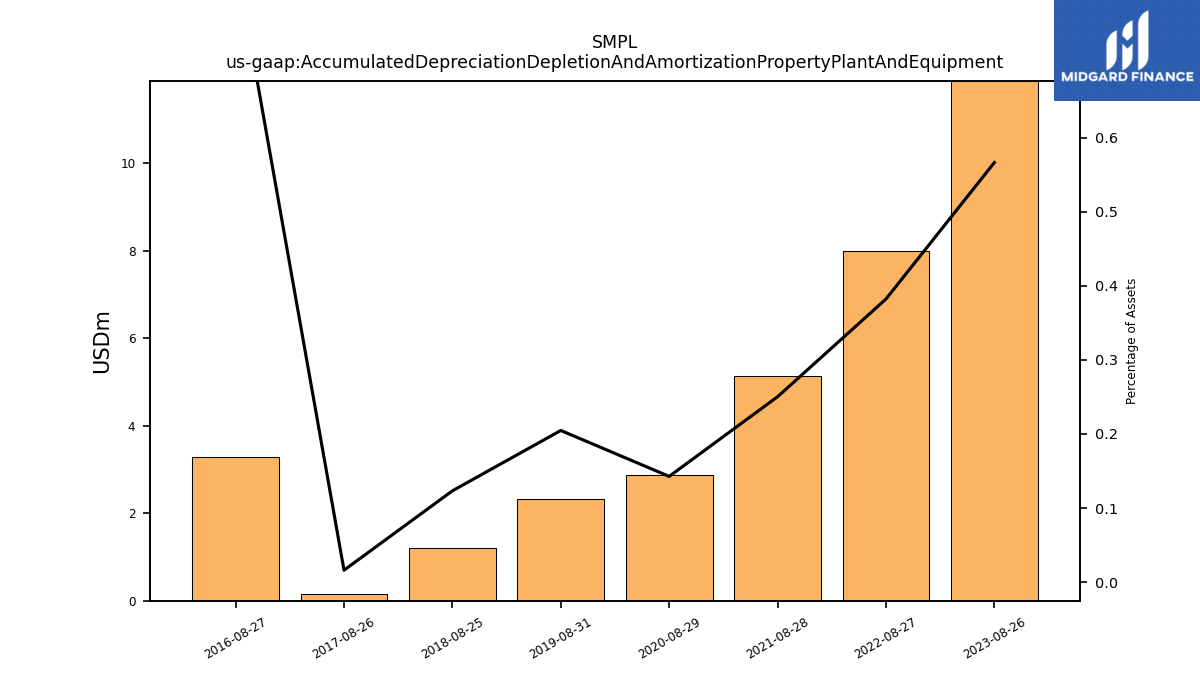
| Accumulated Depreciation Depletion And Amortization Property Plant And Equipment | NA | 11.88 | NA | NA | NA | 8.00 | NA | NA | NA | 5.14 | NA | NA | NA | 2.87 | NA | NA | NA | 2.34 | NA | NA | NA | 1.20 | NA | NA | NA | 0.15 | NA | NA | |
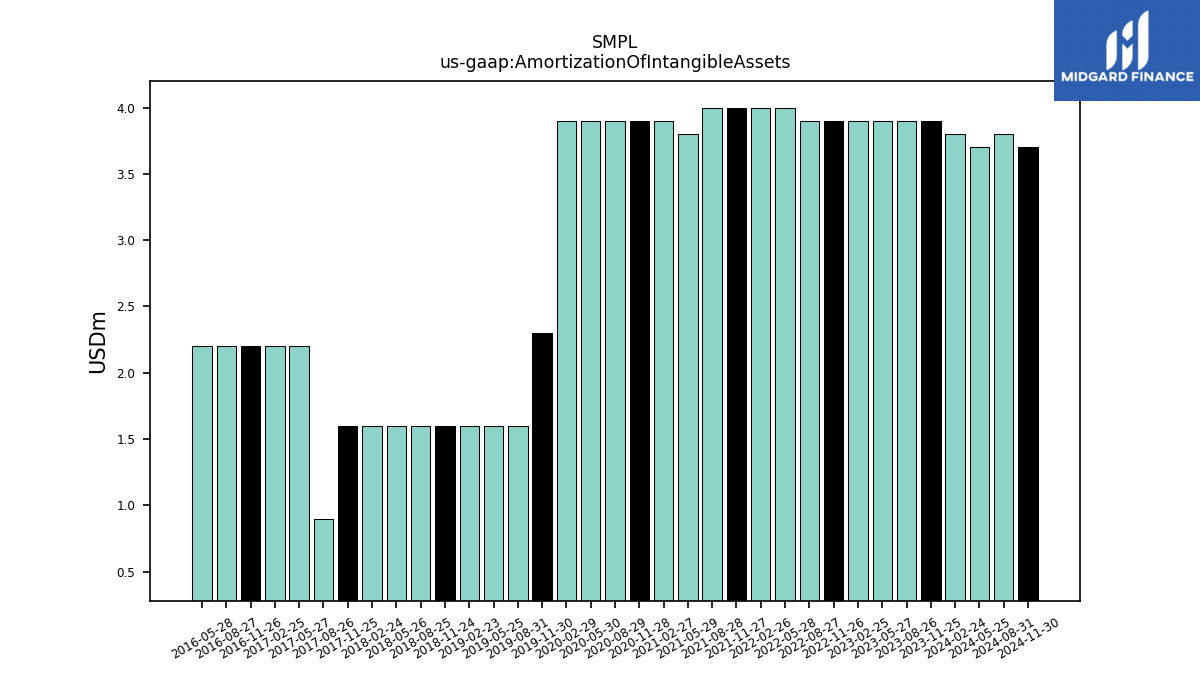
| Amortization Of Intangible Assets | 3.90 | 3.90 | 3.90 | 3.90 | 3.90 | 3.90 | 4.00 | 4.00 | 4.00 | 4.00 | 3.80 | 3.90 | 3.90 | 3.90 | 3.90 | 3.90 | 2.30 | 1.60 | 1.60 | 1.60 | 1.60 | 1.60 | 1.60 | 1.60 | 1.60 | 0.90 | 2.20 | 2.20 | |
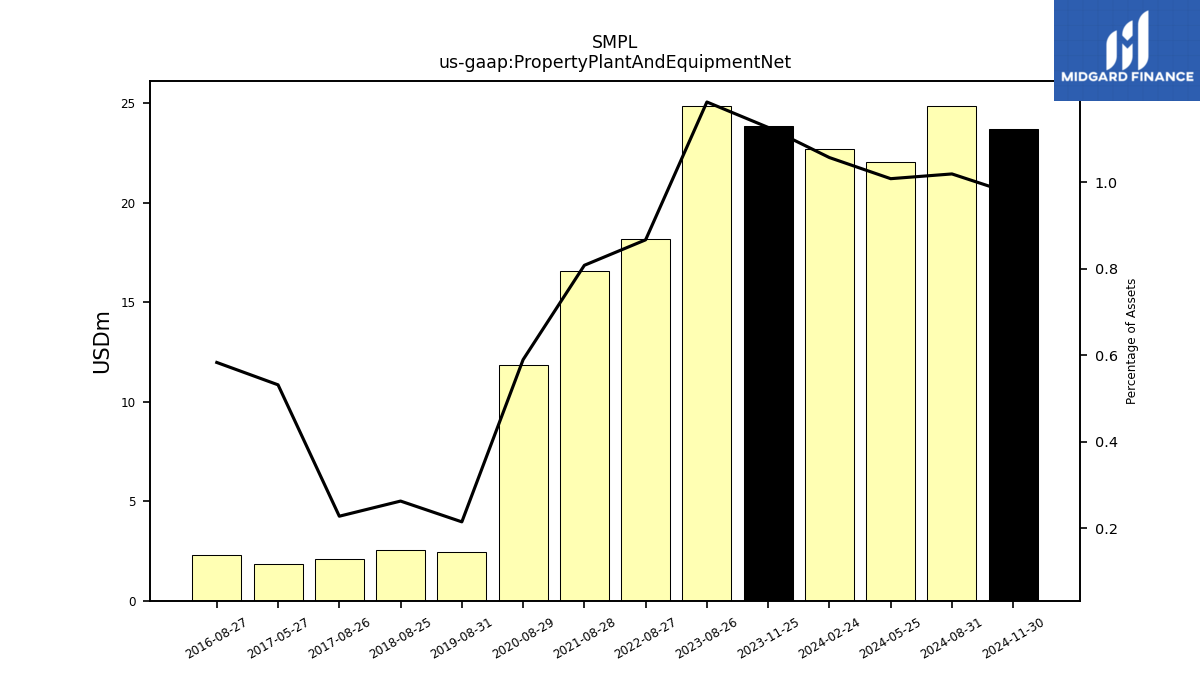
| Property Plant And Equipment Net | 23.83 | 24.86 | NA | NA | NA | 18.16 | NA | NA | NA | 16.58 | NA | NA | NA | 11.85 | NA | NA | NA | 2.46 | NA | NA | NA | 2.56 | NA | NA | NA | 2.10 | 1.86 | NA | |
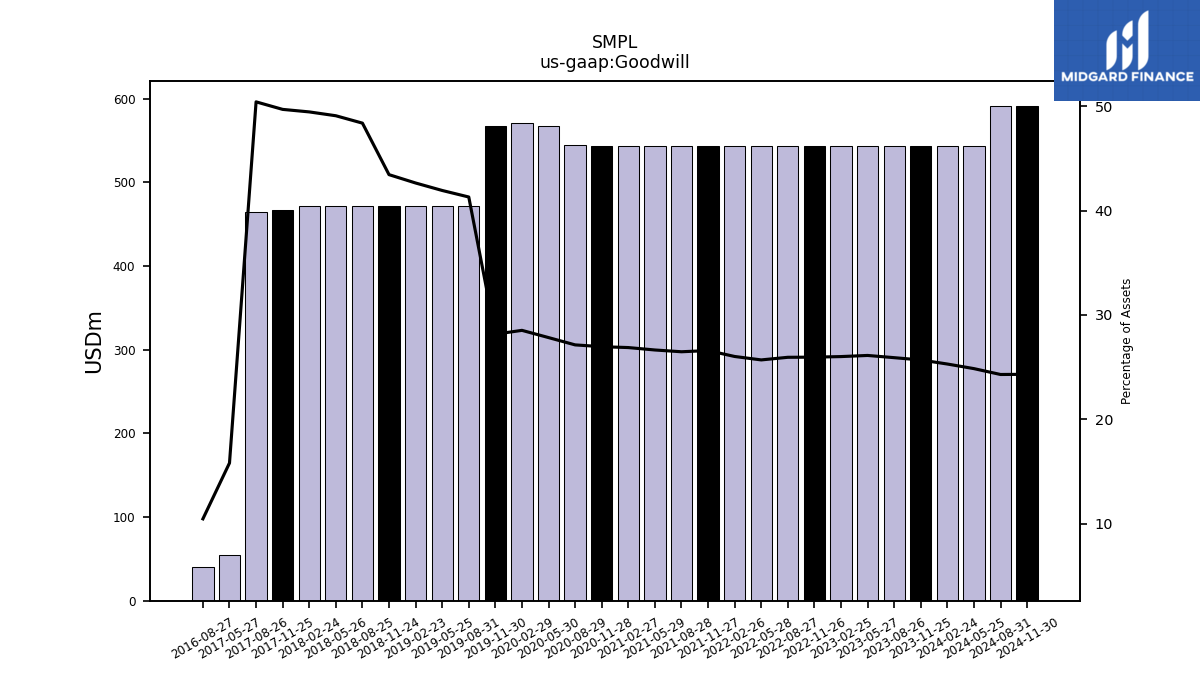
| Goodwill | 543.13 | 543.13 | 543.13 | 543.13 | 543.13 | 543.13 | 543.13 | 543.13 | 543.13 | 543.13 | 543.13 | 543.13 | 543.13 | 544.77 | 567.66 | 570.72 | 567.46 | 471.43 | 471.43 | 471.43 | 471.43 | 471.43 | 471.43 | 471.43 | 466.79 | 465.03 | 55.19 | NA | |
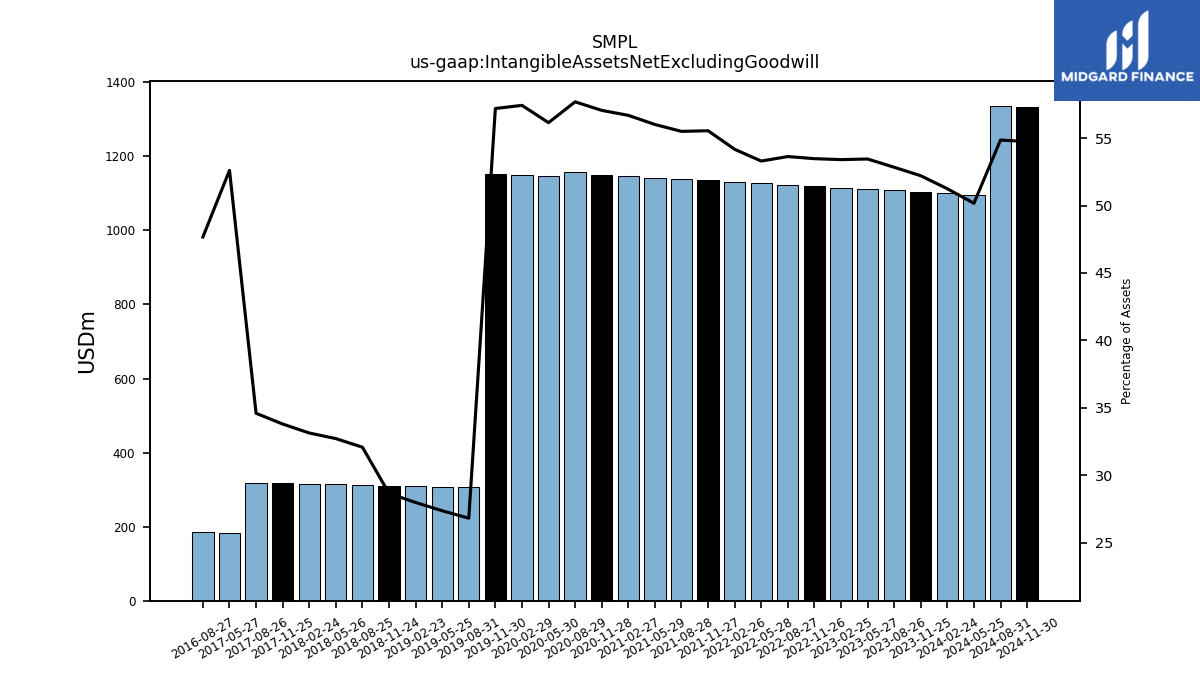
| Intangible Assets Net Excluding Goodwill | 1104.32 | 1108.12 | 1111.87 | 1115.51 | 1119.35 | 1123.26 | 1127.14 | 1131.10 | 1135.07 | 1139.04 | 1142.20 | 1146.04 | 1149.89 | 1158.77 | 1145.52 | 1149.41 | 1153.16 | 306.14 | 307.76 | 309.39 | 311.02 | 312.64 | 314.27 | 315.90 | 317.52 | 319.15 | 183.69 | NA | |
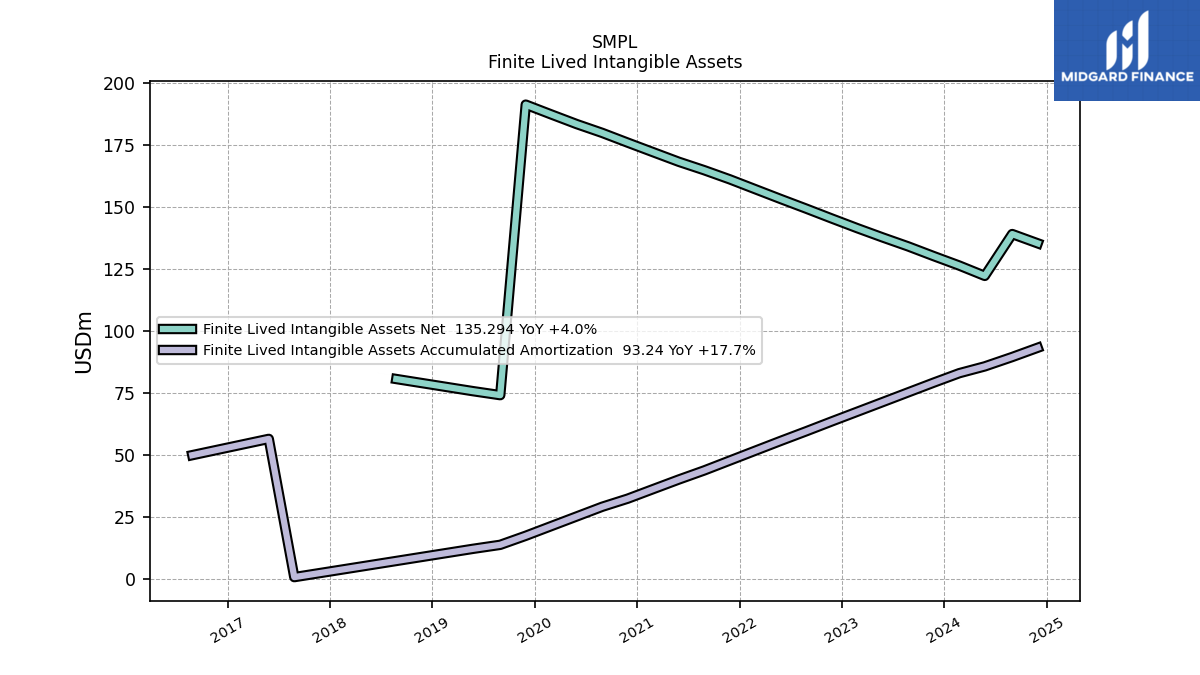
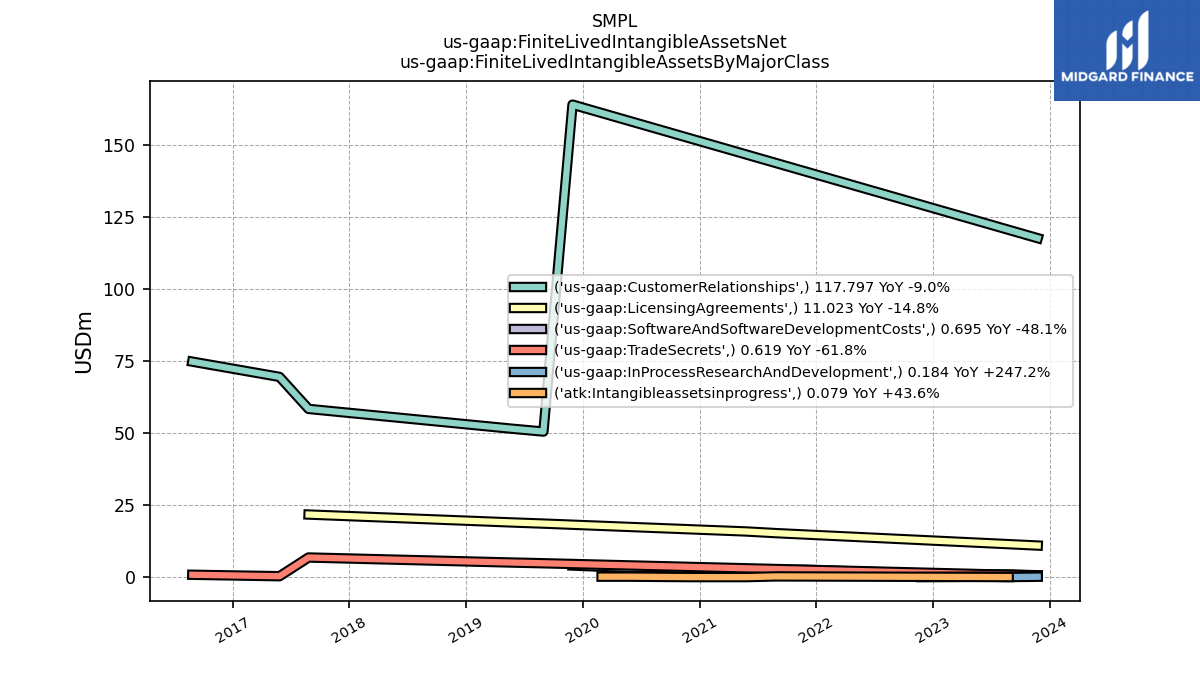
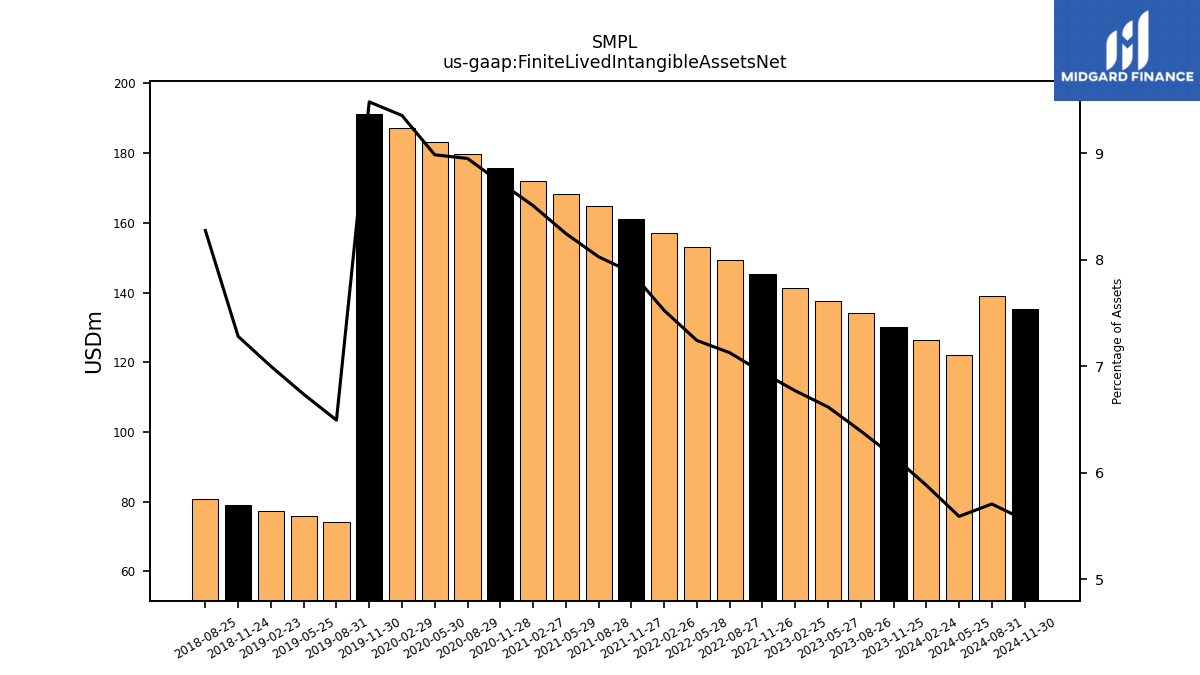
| Finite Lived Intangible Assets Net | 130.13 | 134.04 | 137.65 | 141.40 | 145.29 | 149.26 | 153.14 | 157.10 | 161.07 | 164.74 | 168.14 | 171.98 | 175.84 | 179.77 | 183.31 | 187.20 | 191.16 | 74.14 | 75.77 | 77.39 | 79.02 | 80.64 | NA | NA | NA | NA | NA | NA | |
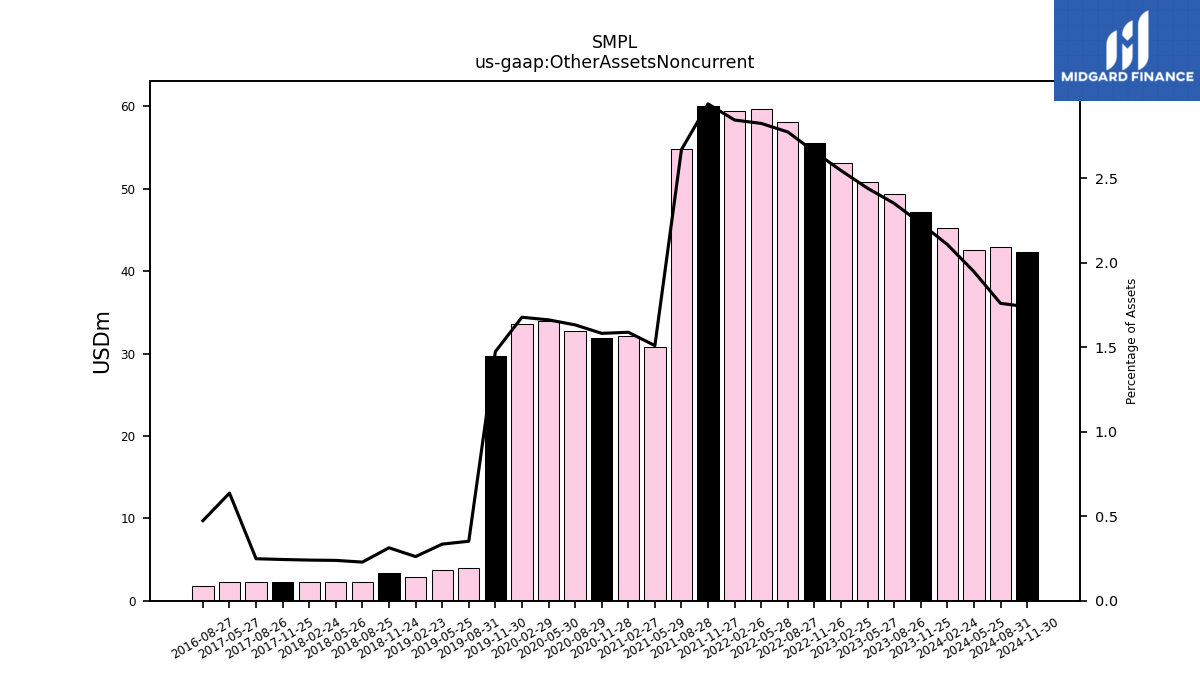
| Other Assets Noncurrent | 47.24 | 49.32 | 50.78 | 53.18 | 55.61 | 58.10 | 59.74 | 59.40 | 60.08 | 54.79 | 30.79 | 32.12 | 31.89 | 32.79 | 33.91 | 33.58 | 29.72 | 4.02 | 3.77 | 2.89 | 3.40 | 2.23 | 2.29 | 2.29 | 2.29 | 2.29 | 2.22 | NA |
| 2023-11-25 | 2023-08-26 | 2023-05-27 | 2023-02-25 | 2022-11-26 | 2022-08-27 | 2022-05-28 | 2022-02-26 | 2021-11-27 | 2021-08-28 | 2021-05-29 | 2021-02-27 | 2020-11-28 | 2020-08-29 | 2020-05-30 | 2020-02-29 | 2019-11-30 | 2019-08-31 | 2019-05-25 | 2019-02-23 | 2018-11-24 | 2018-08-25 | 2018-05-26 | 2018-02-24 | 2017-11-25 | 2017-08-26 | 2017-05-27 | 2016-05-28 | ||
|---|---|---|---|---|---|---|---|---|---|---|---|---|---|---|---|---|---|---|---|---|---|---|---|---|---|---|---|---|---|
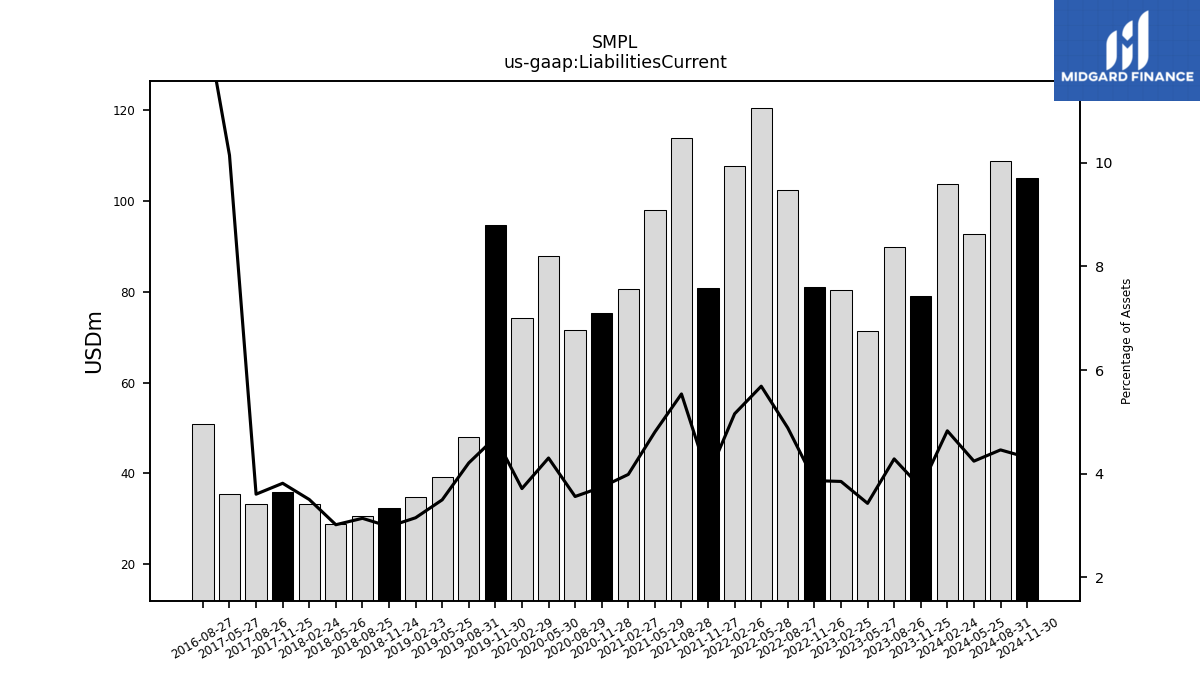
| Liabilities Current | 78.99 | 89.86 | 71.28 | 80.40 | 80.91 | 102.25 | 120.29 | 107.66 | 80.77 | 113.66 | 97.96 | 80.56 | 75.38 | 71.48 | 87.77 | 74.29 | 94.73 | 48.03 | 39.30 | 34.81 | 32.34 | 30.58 | 28.95 | 33.38 | 35.83 | 33.24 | 35.43 | NA | |
| Long Term Debt Current | 0.08 | 0.14 | 0.20 | 0.24 | 0.25 | 0.26 | 0.28 | 0.29 | 0.29 | 0.28 | 0.28 | 0.28 | 0.28 | 0.27 | 25.27 | 0.26 | 5.29 | 0.68 | 0.66 | 0.65 | 0.65 | 0.65 | 0.66 | 0.71 | 0.71 | 0.23 | 0.00 | NA | |
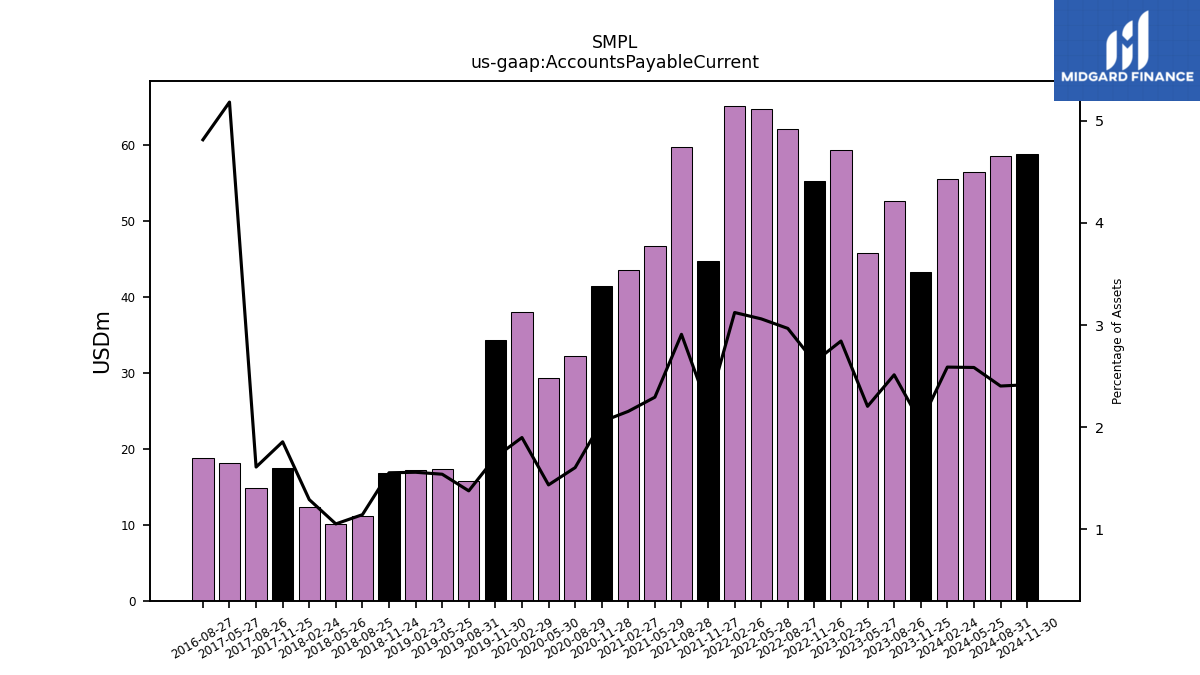
| Accounts Payable Current | 43.25 | 52.71 | 45.87 | 59.40 | 55.25 | 62.15 | 64.73 | 65.21 | 44.81 | 59.71 | 46.79 | 43.59 | 41.41 | 32.24 | 29.30 | 38.02 | 34.41 | 15.73 | 17.33 | 17.25 | 16.88 | 11.16 | 10.13 | 12.32 | 17.45 | 14.86 | 18.09 | NA | |
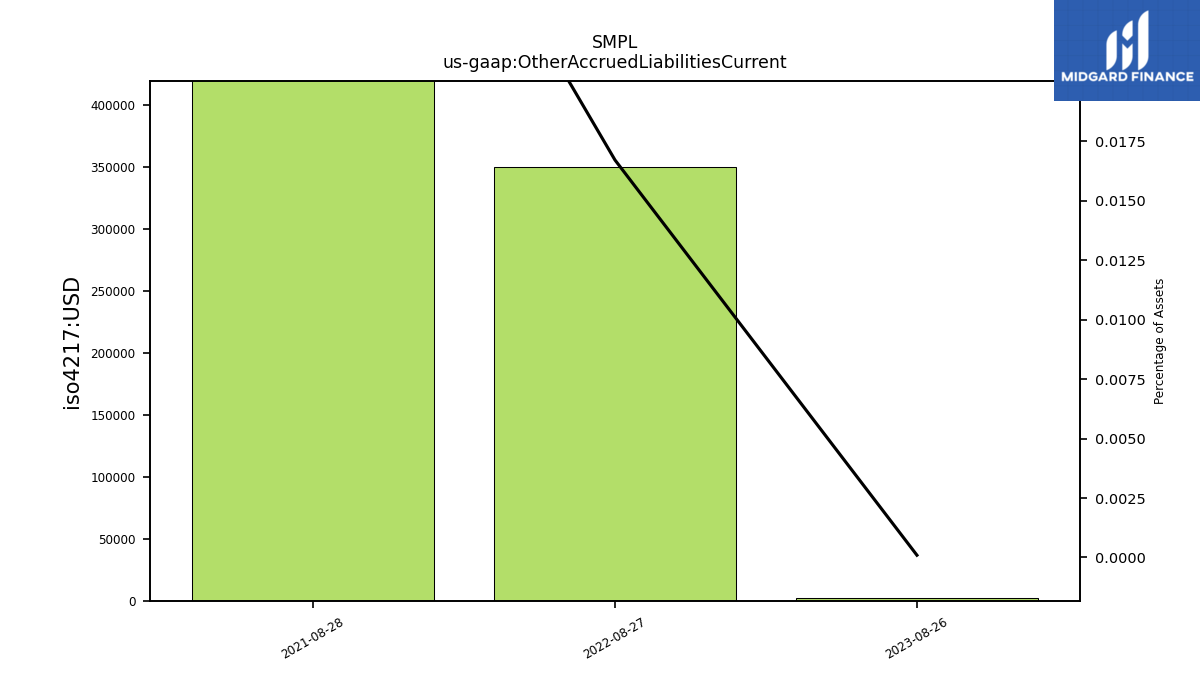
| Other Accrued Liabilities Current | NA | 0.00 | NA | NA | NA | 0.35 | NA | NA | NA | 0.79 | NA | NA | NA | NA | NA | NA | NA | NA | NA | NA | NA | NA | NA | NA | NA | NA | NA | NA | |
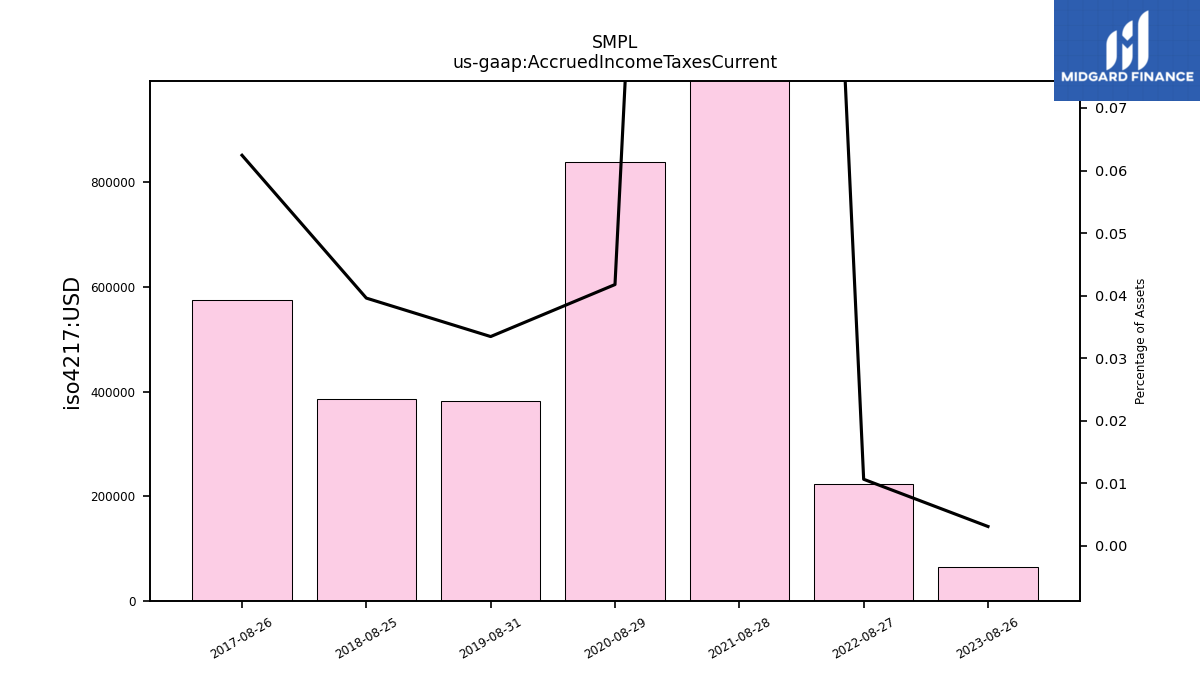
| Accrued Income Taxes Current | NA | 0.07 | NA | NA | NA | 0.22 | NA | NA | NA | 9.02 | NA | NA | NA | 0.84 | NA | NA | NA | 0.38 | NA | NA | NA | 0.39 | NA | NA | NA | 0.58 | NA | NA | |
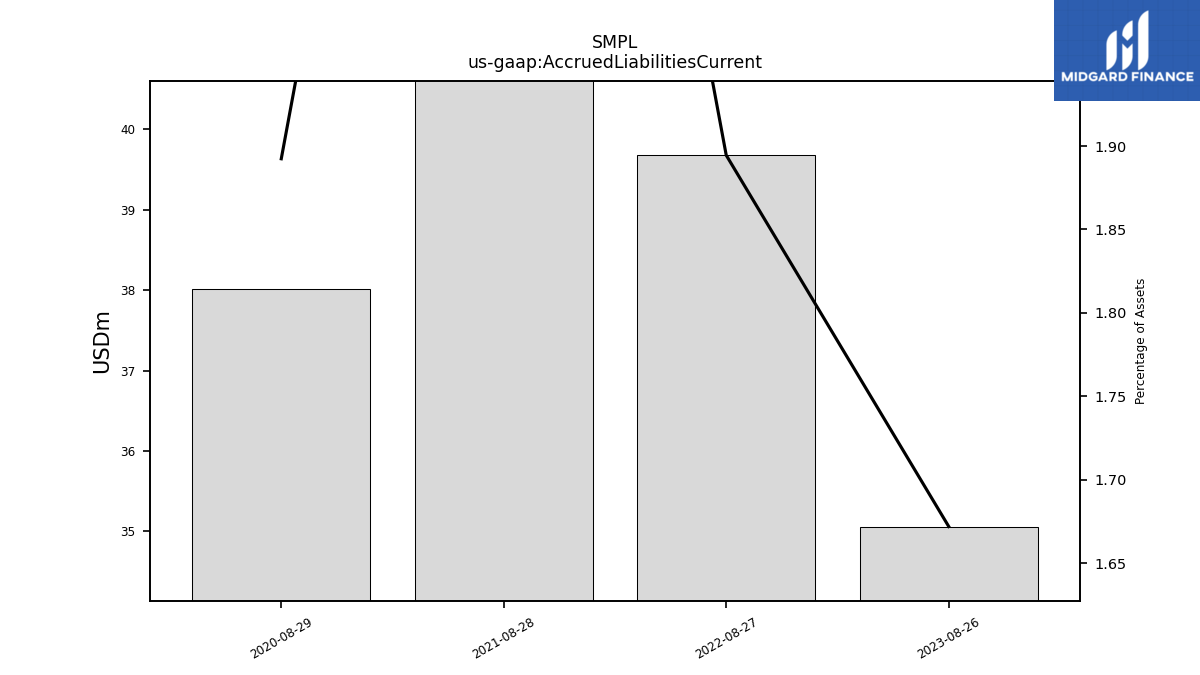
| Accrued Liabilities Current | NA | 35.06 | NA | NA | NA | 39.67 | NA | NA | NA | 53.61 | NA | NA | NA | 38.01 | NA | NA | NA | NA | NA | NA | NA | NA | NA | NA | NA | NA | NA | NA | |
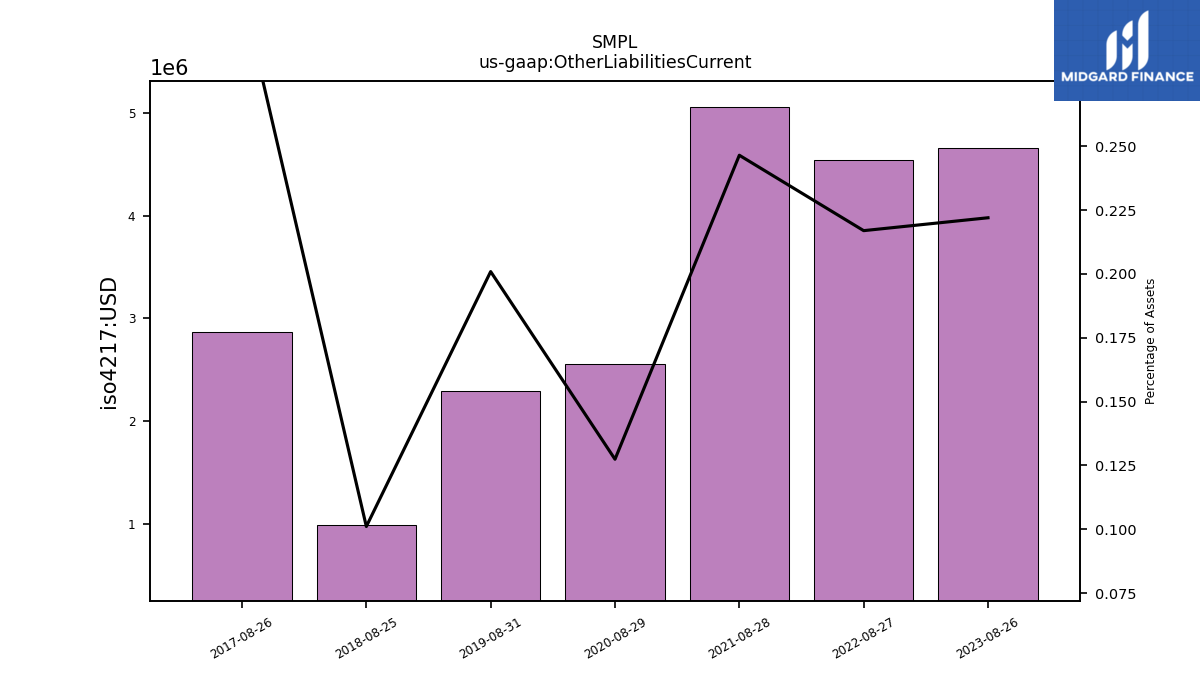
| Other Liabilities Current | NA | 4.66 | NA | NA | NA | 4.54 | NA | NA | NA | 5.06 | NA | NA | NA | 2.56 | NA | NA | NA | 2.29 | NA | NA | NA | 0.98 | NA | NA | NA | 2.87 | NA | NA |
| 2023-11-25 | 2023-08-26 | 2023-05-27 | 2023-02-25 | 2022-11-26 | 2022-08-27 | 2022-05-28 | 2022-02-26 | 2021-11-27 | 2021-08-28 | 2021-05-29 | 2021-02-27 | 2020-11-28 | 2020-08-29 | 2020-05-30 | 2020-02-29 | 2019-11-30 | 2019-08-31 | 2019-05-25 | 2019-02-23 | 2018-11-24 | 2018-08-25 | 2018-05-26 | 2018-02-24 | 2017-11-25 | 2017-08-26 | 2017-05-27 | 2016-05-28 | ||
|---|---|---|---|---|---|---|---|---|---|---|---|---|---|---|---|---|---|---|---|---|---|---|---|---|---|---|---|---|---|
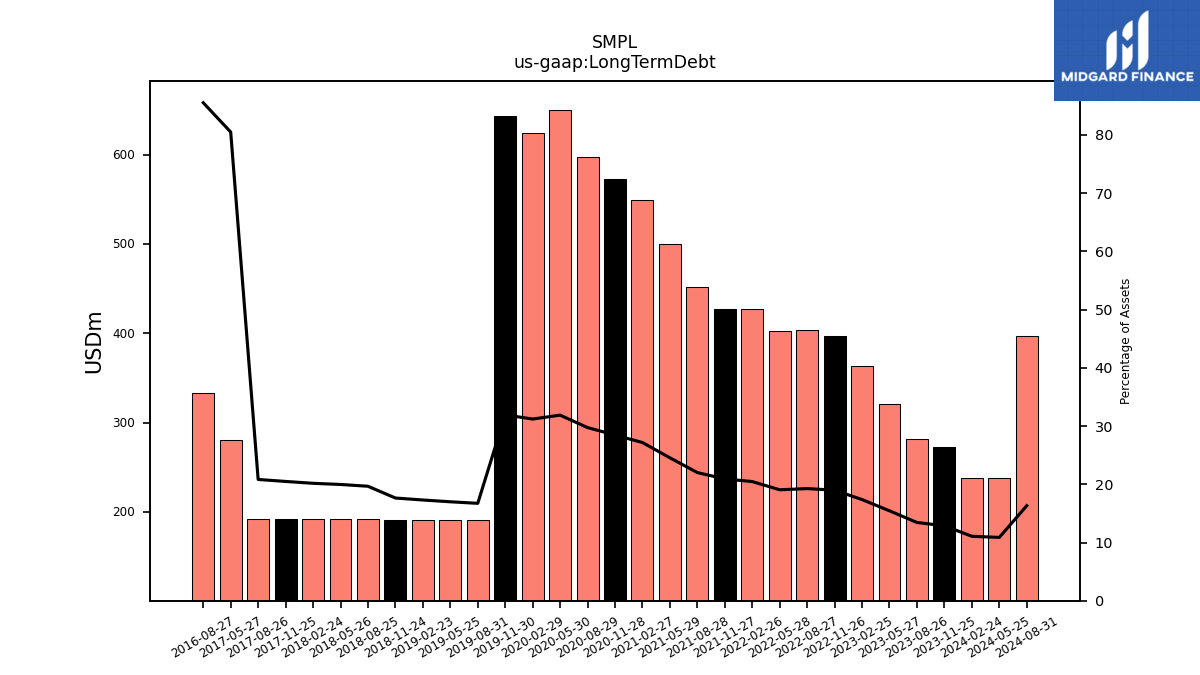
| Long Term Debt | 272.12 | 281.79 | 321.10 | 362.86 | 397.24 | 403.29 | 402.87 | 427.20 | 427.31 | 451.55 | 500.44 | 549.16 | 573.20 | 597.15 | 650.02 | 624.34 | 643.33 | 190.94 | 191.08 | 191.25 | 191.42 | 191.58 | 191.75 | 192.24 | 192.41 | 192.09 | 280.95 | NA | |
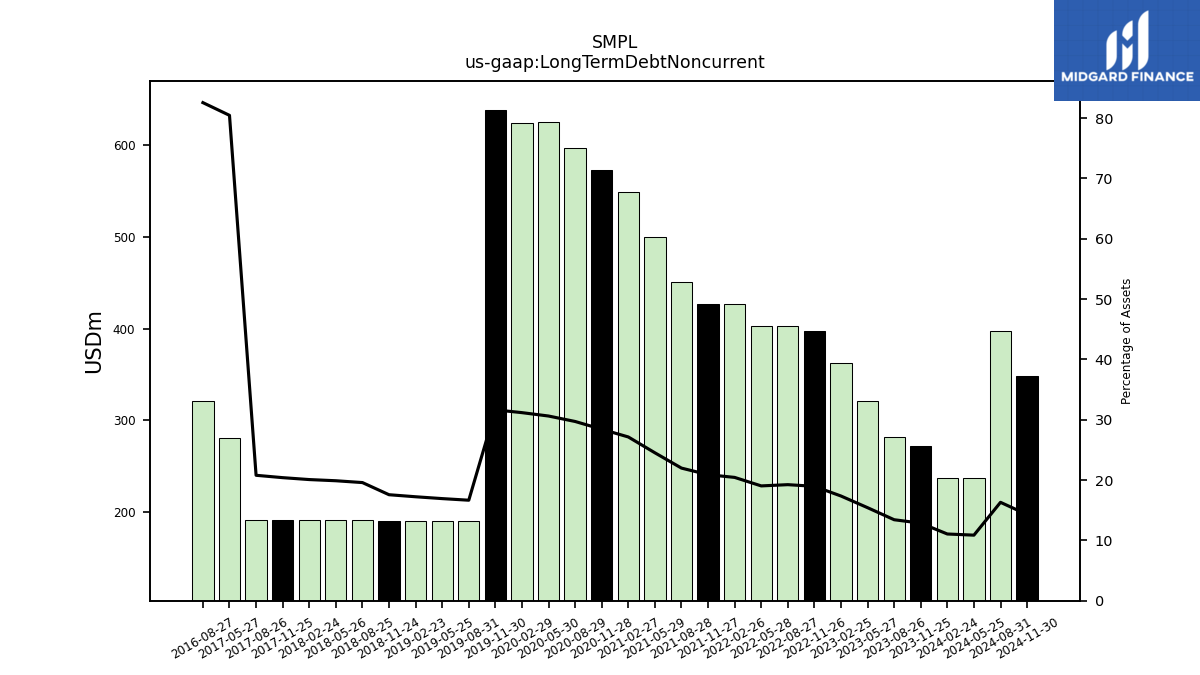
| Long Term Debt Noncurrent | 272.03 | 281.65 | 320.90 | 362.62 | 396.99 | 403.02 | 402.59 | 426.92 | 427.02 | 451.27 | 500.15 | 548.88 | 572.92 | 596.88 | 624.75 | 624.08 | 638.03 | 190.26 | 190.43 | 190.60 | 190.77 | 190.94 | 191.08 | 191.52 | 191.70 | 191.86 | 280.95 | NA | |
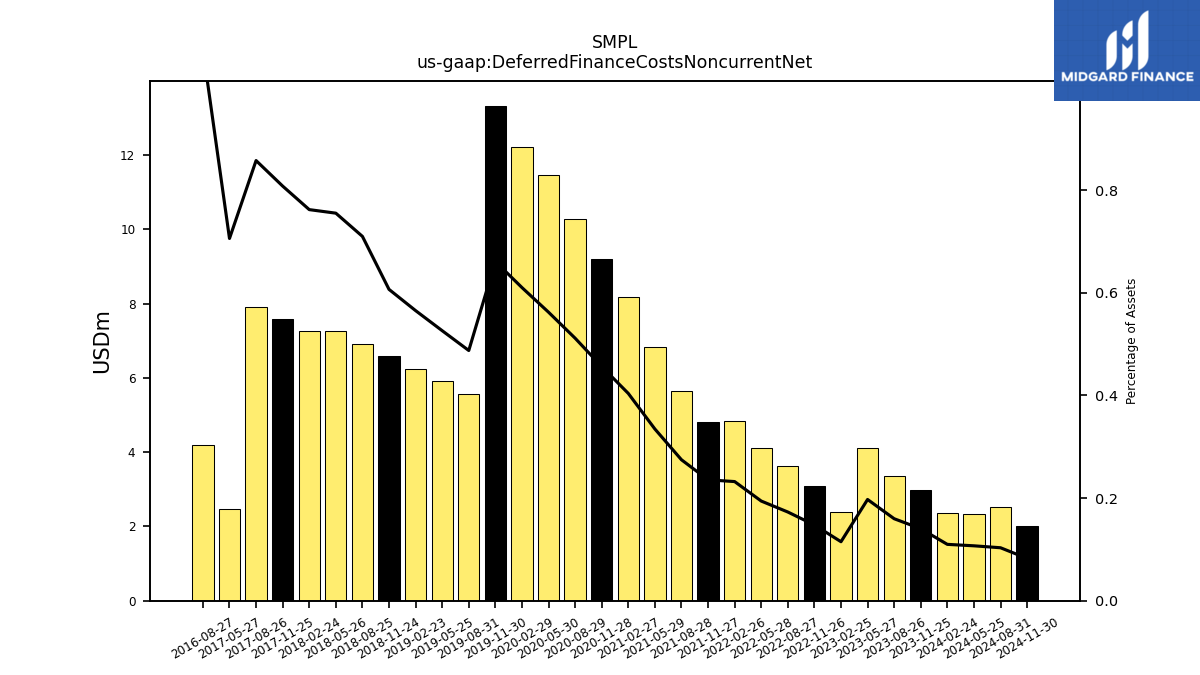
| Deferred Finance Costs Noncurrent Net | 2.97 | 3.35 | 4.10 | 2.40 | 3.09 | 3.62 | 4.11 | 4.85 | 4.81 | 5.64 | 6.82 | 8.16 | 9.19 | 10.27 | 11.47 | 12.21 | 13.32 | 5.57 | 5.92 | 6.25 | 6.58 | 6.92 | 7.25 | 7.26 | 7.59 | 7.91 | 2.46 | NA | |
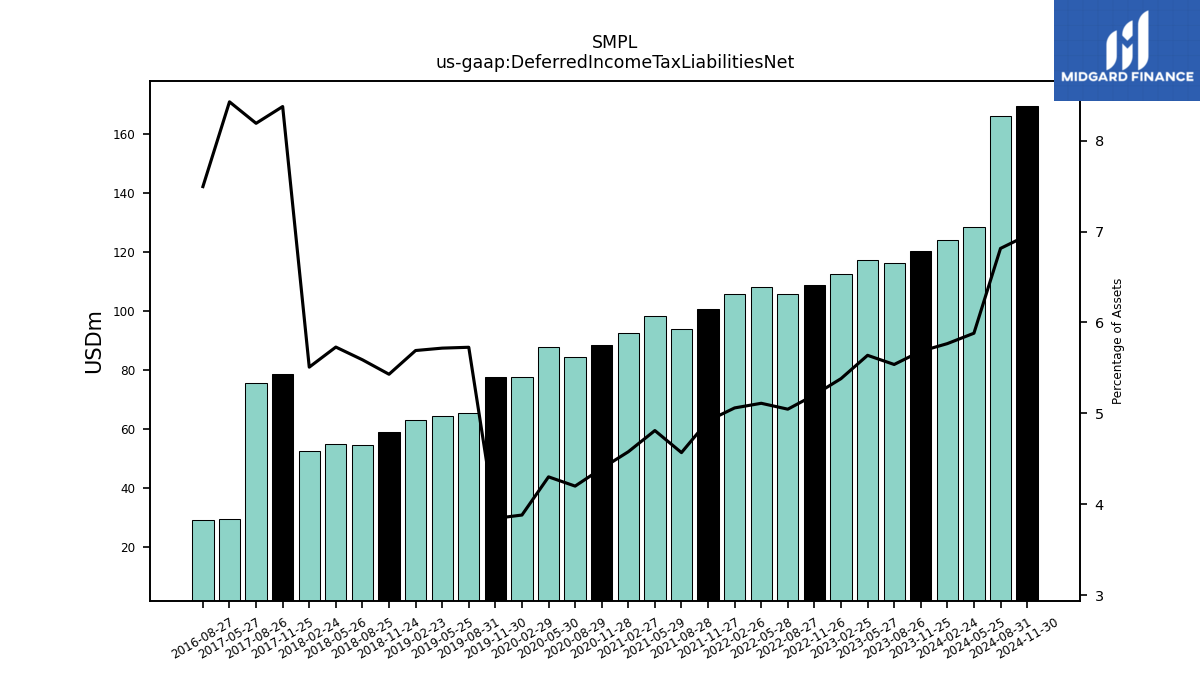
| Deferred Income Tax Liabilities Net | 120.20 | 116.13 | 117.28 | 112.41 | 108.89 | 105.68 | 108.08 | 105.64 | 100.50 | 93.75 | 98.10 | 92.54 | 88.54 | 84.35 | 87.76 | 77.68 | 77.51 | 65.38 | 64.30 | 62.93 | 58.94 | 54.48 | 55.03 | 52.52 | 78.68 | 75.56 | 29.42 | NA | |
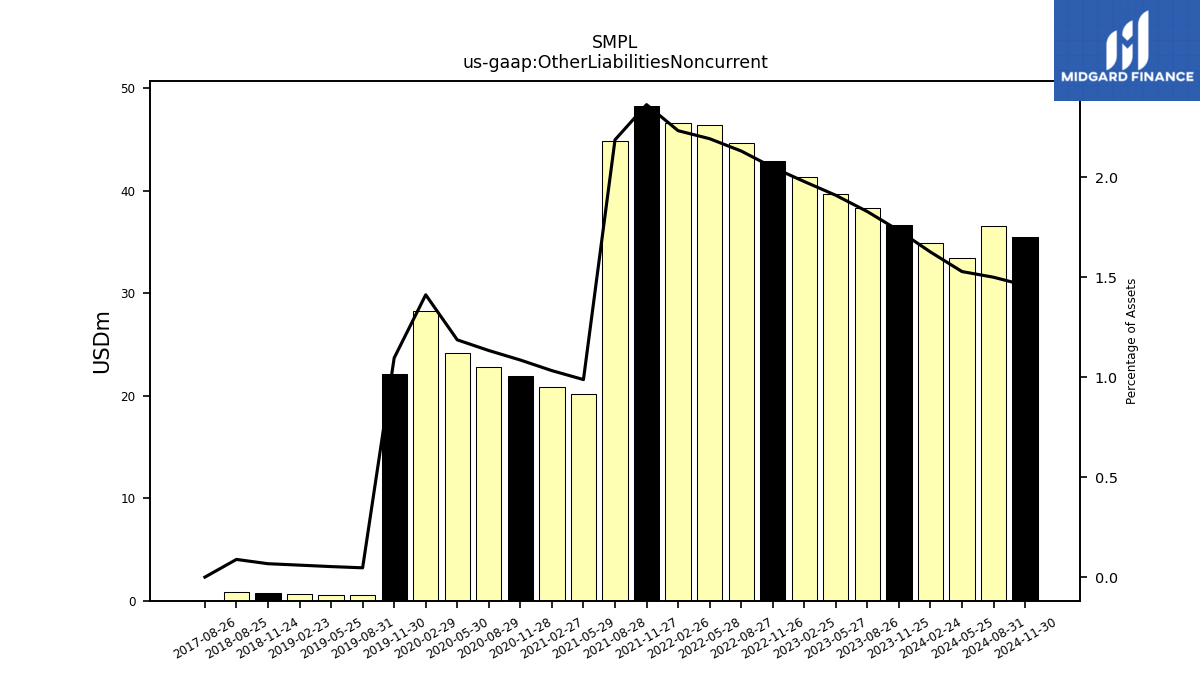
| Other Liabilities Noncurrent | 36.66 | 38.35 | 39.73 | 41.33 | 42.91 | 44.64 | 46.38 | 46.63 | 48.30 | 44.89 | 20.15 | 20.88 | 21.88 | 22.77 | 24.21 | 28.27 | 22.10 | 0.53 | 0.59 | 0.66 | 0.73 | 0.86 | NA | NA | NA | 0.00 | NA | NA | |
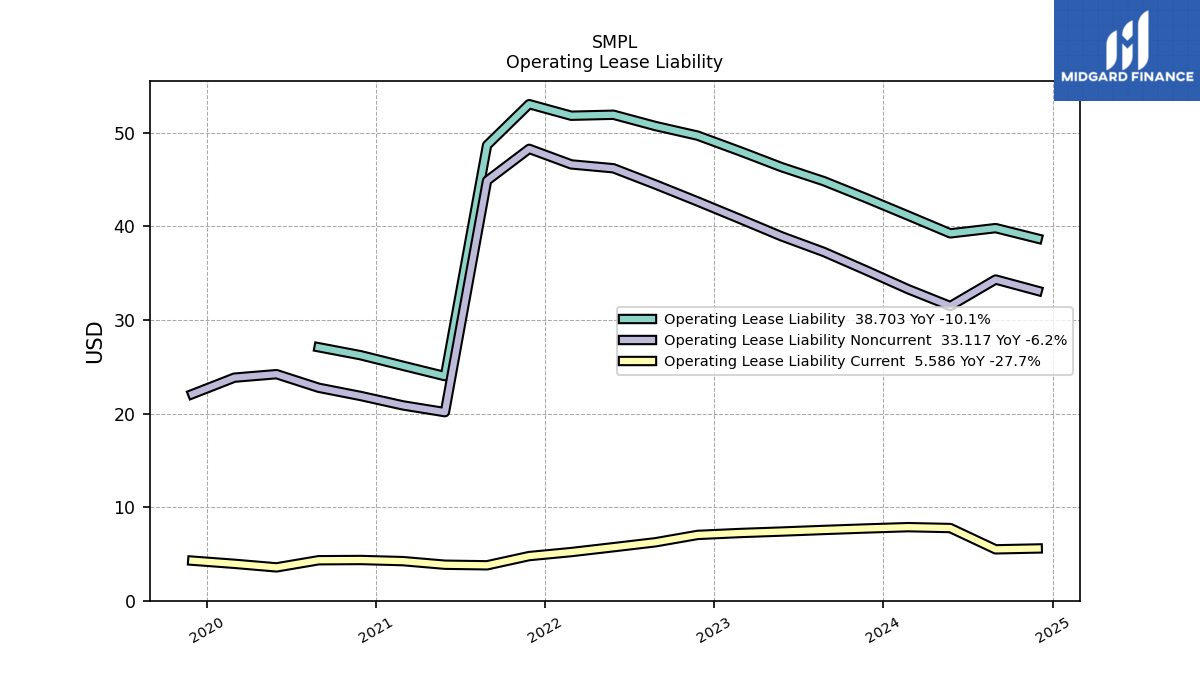
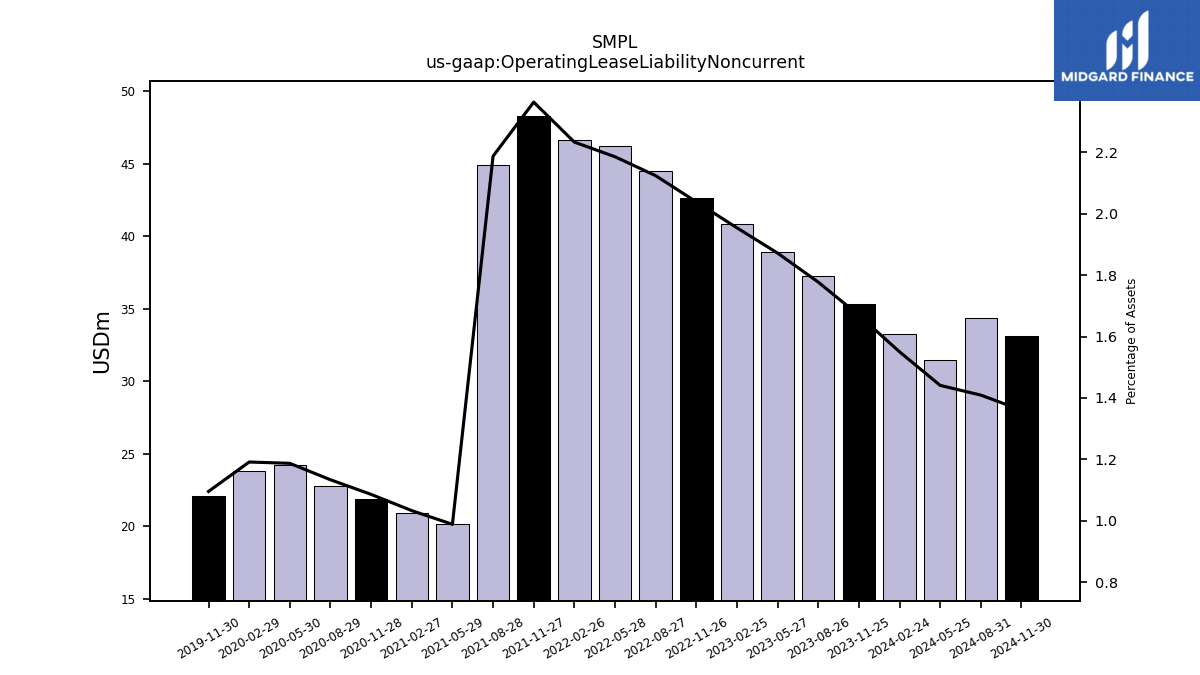
| Operating Lease Liability Noncurrent | 35.31 | 37.27 | 38.93 | 40.81 | 42.67 | 44.48 | 46.22 | 46.63 | 48.30 | 44.89 | 20.15 | 20.88 | 21.88 | 22.76 | 24.22 | 23.84 | 22.08 | NA | NA | NA | NA | NA | NA | NA | NA | NA | NA | NA |
| 2023-11-25 | 2023-08-26 | 2023-05-27 | 2023-02-25 | 2022-11-26 | 2022-08-27 | 2022-05-28 | 2022-02-26 | 2021-11-27 | 2021-08-28 | 2021-05-29 | 2021-02-27 | 2020-11-28 | 2020-08-29 | 2020-05-30 | 2020-02-29 | 2019-11-30 | 2019-08-31 | 2019-05-25 | 2019-02-23 | 2018-11-24 | 2018-08-25 | 2018-05-26 | 2018-02-24 | 2017-11-25 | 2017-08-26 | 2017-05-27 | 2016-05-28 | ||
|---|---|---|---|---|---|---|---|---|---|---|---|---|---|---|---|---|---|---|---|---|---|---|---|---|---|---|---|---|---|
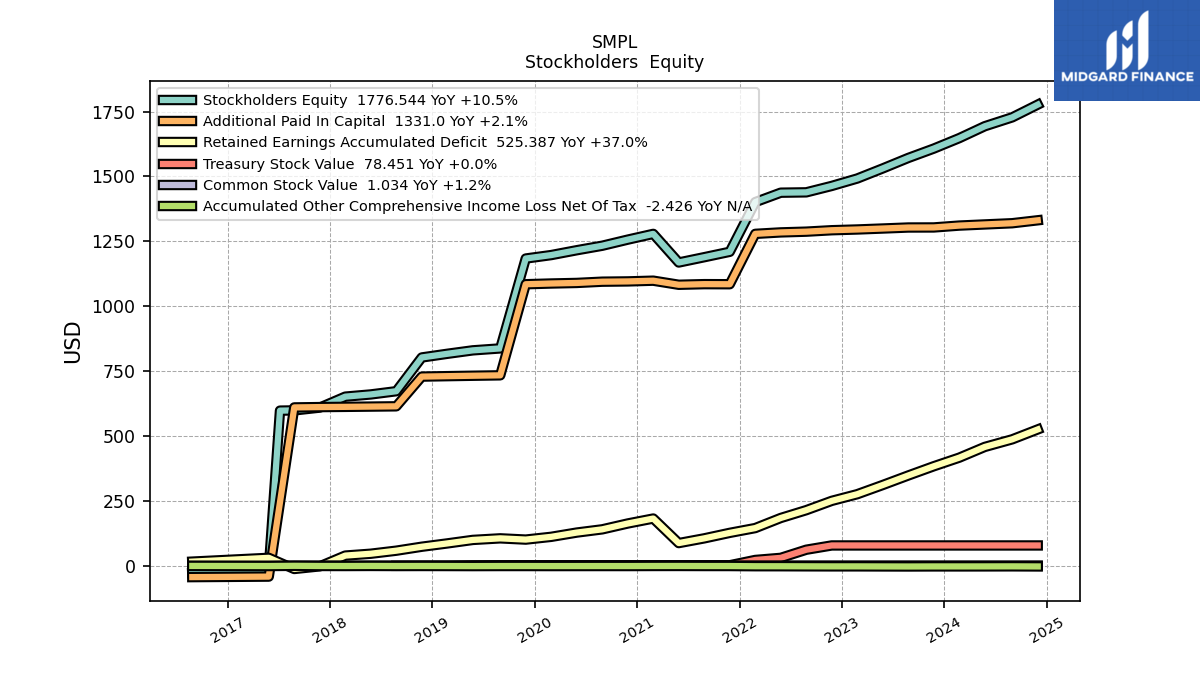
| Stockholders Equity | 1607.18 | 1571.10 | 1530.82 | 1491.91 | 1463.36 | 1438.66 | 1437.32 | 1401.05 | 1209.61 | 1188.80 | 1168.41 | 1278.66 | 1256.49 | 1232.97 | 1215.65 | 1197.03 | 1183.68 | 837.44 | 829.99 | 816.71 | 802.58 | 672.60 | 660.16 | 651.71 | 609.52 | 598.70 | -11.65 | NA | |
| Common Stock Value | 1.02 | 1.02 | 1.02 | 1.02 | 1.02 | 1.01 | 1.01 | 1.01 | 0.96 | 0.96 | 0.96 | 0.96 | 0.96 | 0.96 | 0.95 | 0.95 | 0.95 | 0.82 | 0.82 | 0.82 | 0.82 | 0.71 | 0.71 | 0.71 | 0.71 | 0.71 | 0.01 | NA | |
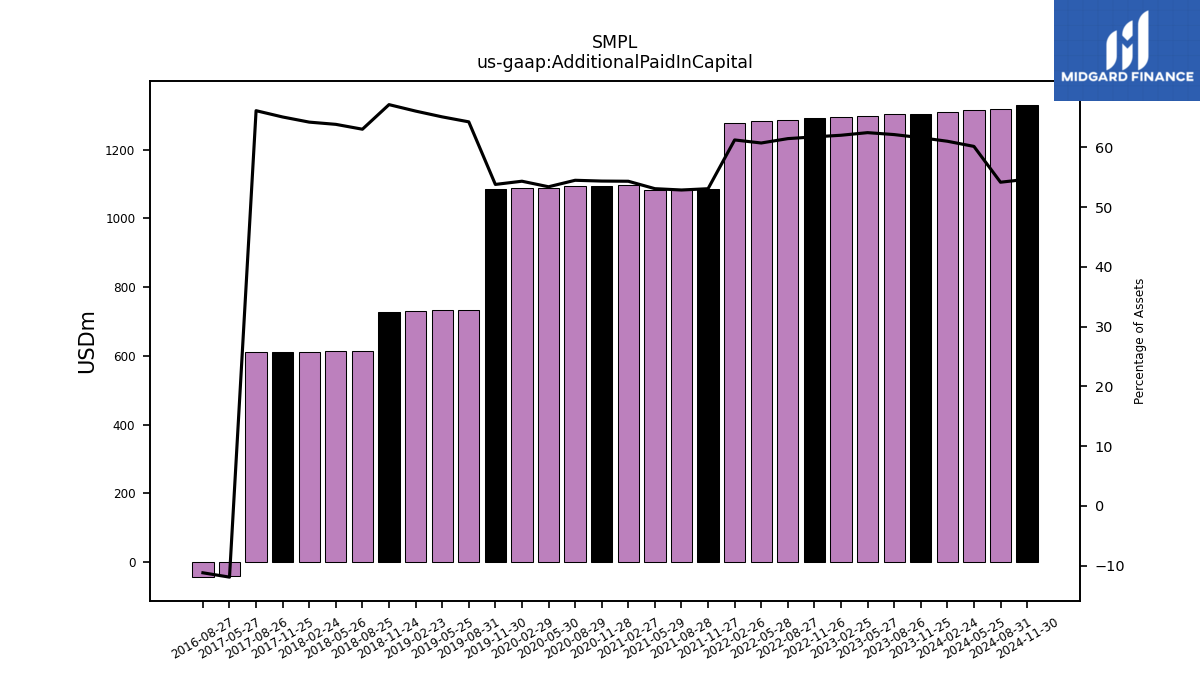
| Additional Paid In Capital | 1303.41 | 1303.17 | 1299.32 | 1295.58 | 1292.72 | 1287.22 | 1284.34 | 1278.73 | 1084.69 | 1085.00 | 1082.62 | 1098.38 | 1095.57 | 1094.51 | 1089.65 | 1087.51 | 1084.67 | 733.77 | 732.18 | 730.58 | 728.86 | 614.40 | 613.35 | 612.34 | 611.44 | 610.14 | -41.57 | NA | |
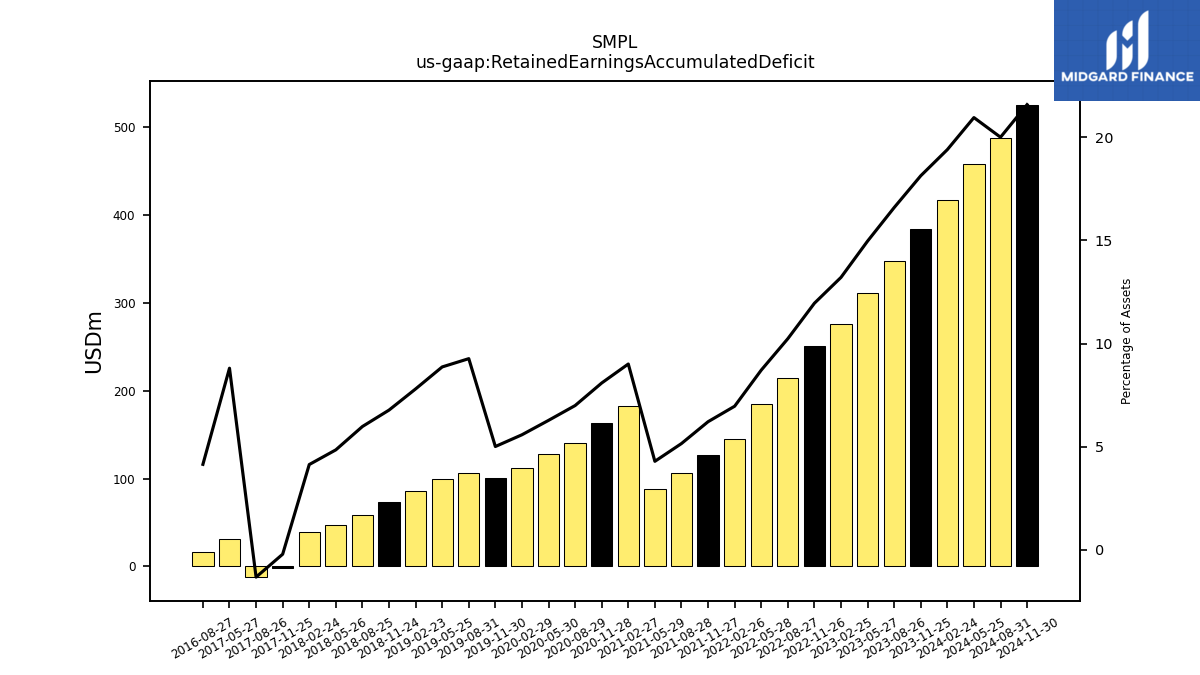
| Retained Earnings Accumulated Deficit | 383.52 | 347.96 | 311.31 | 275.88 | 250.24 | 214.38 | 184.25 | 145.42 | 126.96 | 105.81 | 87.56 | 182.15 | 163.03 | 140.53 | 128.10 | 111.69 | 101.04 | 105.83 | 99.74 | 86.27 | 73.55 | 58.29 | 46.59 | 39.45 | -1.94 | -12.16 | 30.75 | NA | |
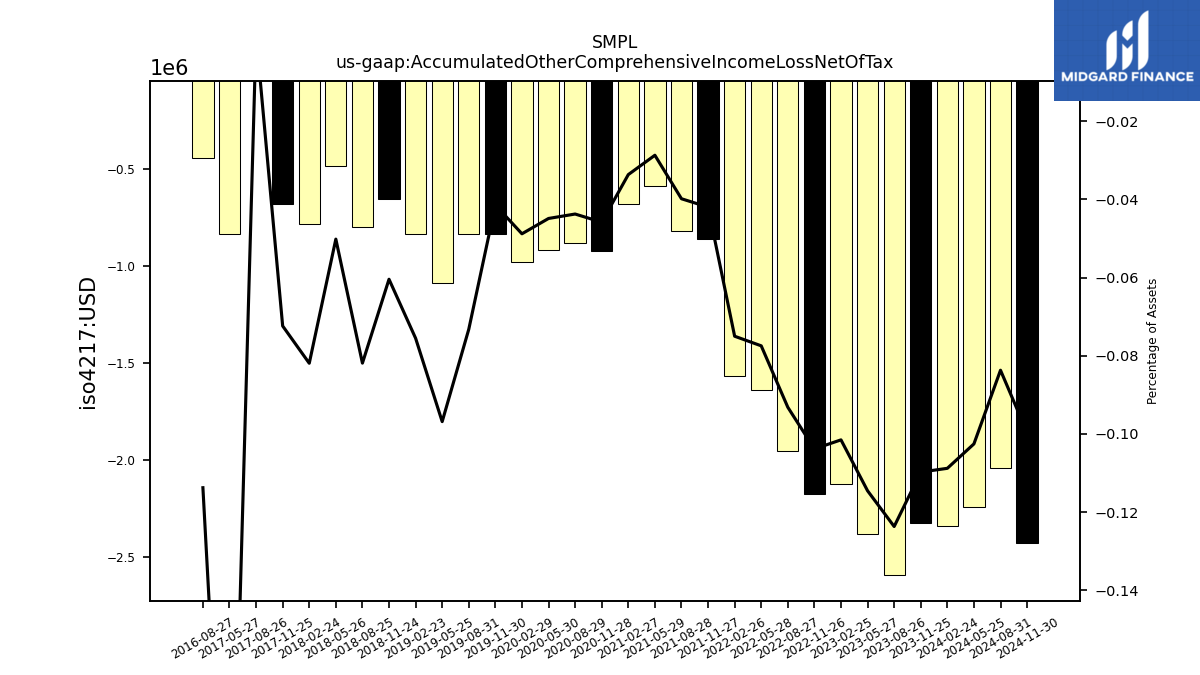
| Accumulated Other Comprehensive Income Loss Net Of Tax | -2.32 | -2.59 | -2.38 | -2.12 | -2.17 | -1.95 | -1.64 | -1.57 | -0.86 | -0.82 | -0.59 | -0.68 | -0.92 | -0.88 | -0.92 | -0.98 | -0.84 | -0.84 | -1.09 | -0.83 | -0.66 | -0.80 | -0.48 | -0.78 | -0.68 | 0.02 | -0.83 | NA | |
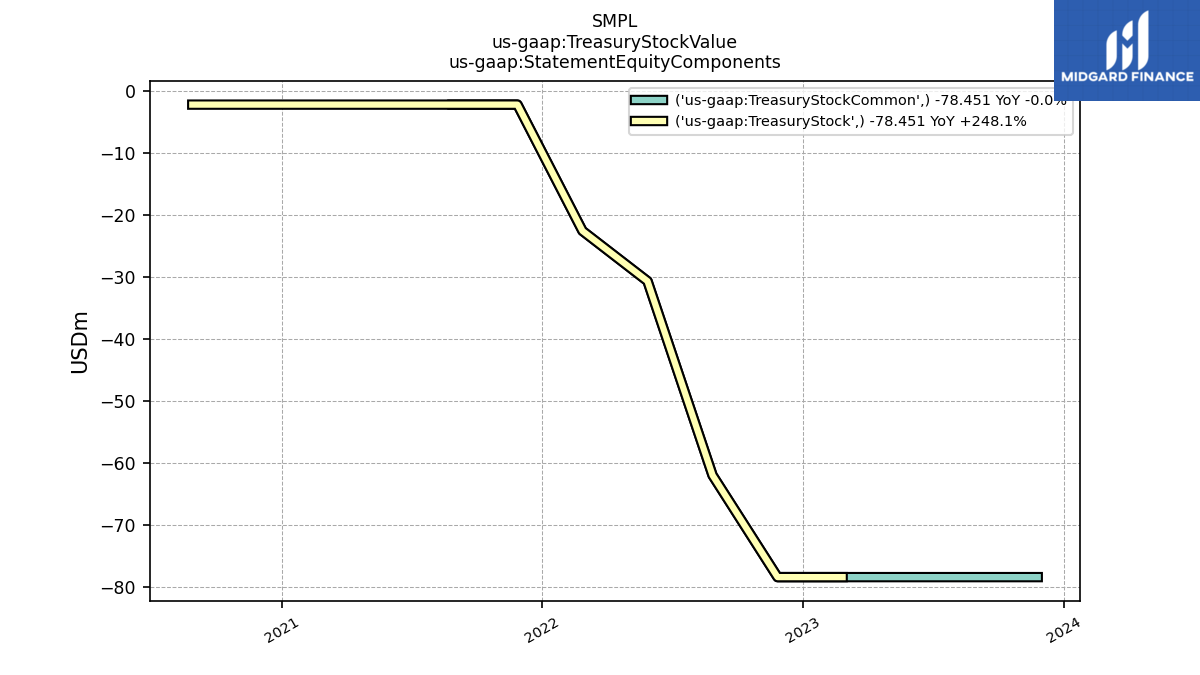
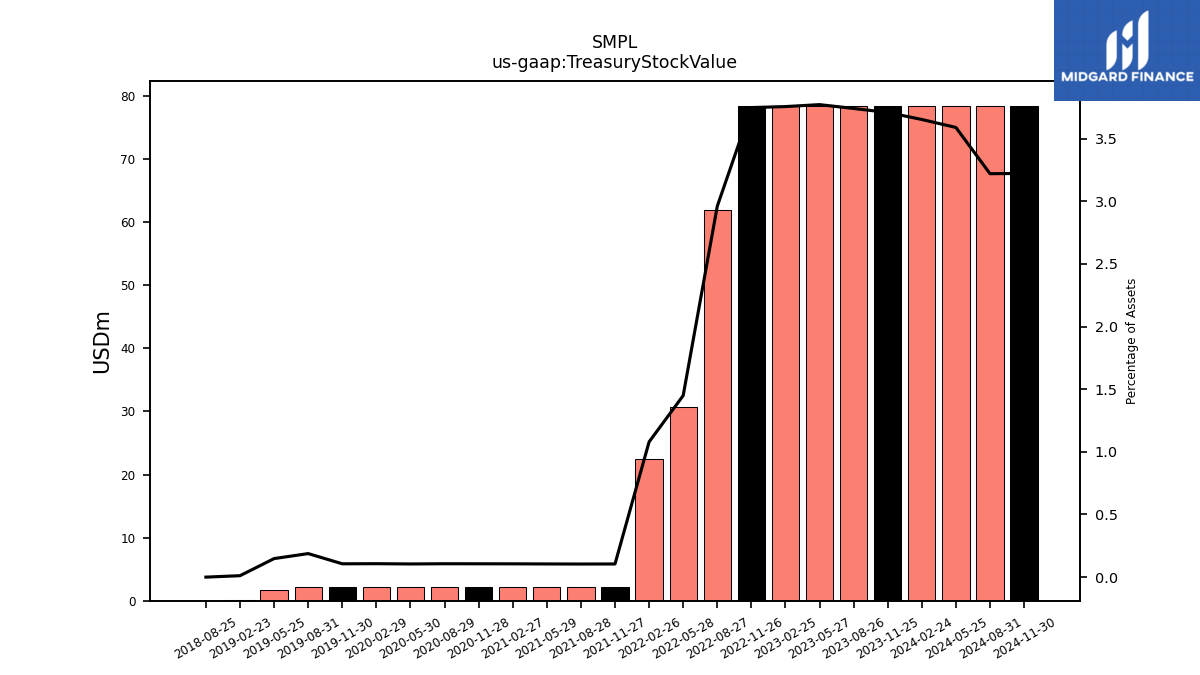
| Treasury Stock Value | 78.45 | 78.45 | 78.45 | 78.45 | 78.45 | 62.00 | 30.65 | 22.54 | 2.15 | 2.15 | 2.15 | 2.15 | 2.15 | 2.15 | 2.15 | 2.15 | 2.15 | 2.15 | 1.66 | 0.13 | NA | 0.00 | NA | NA | NA | NA | NA | NA | |
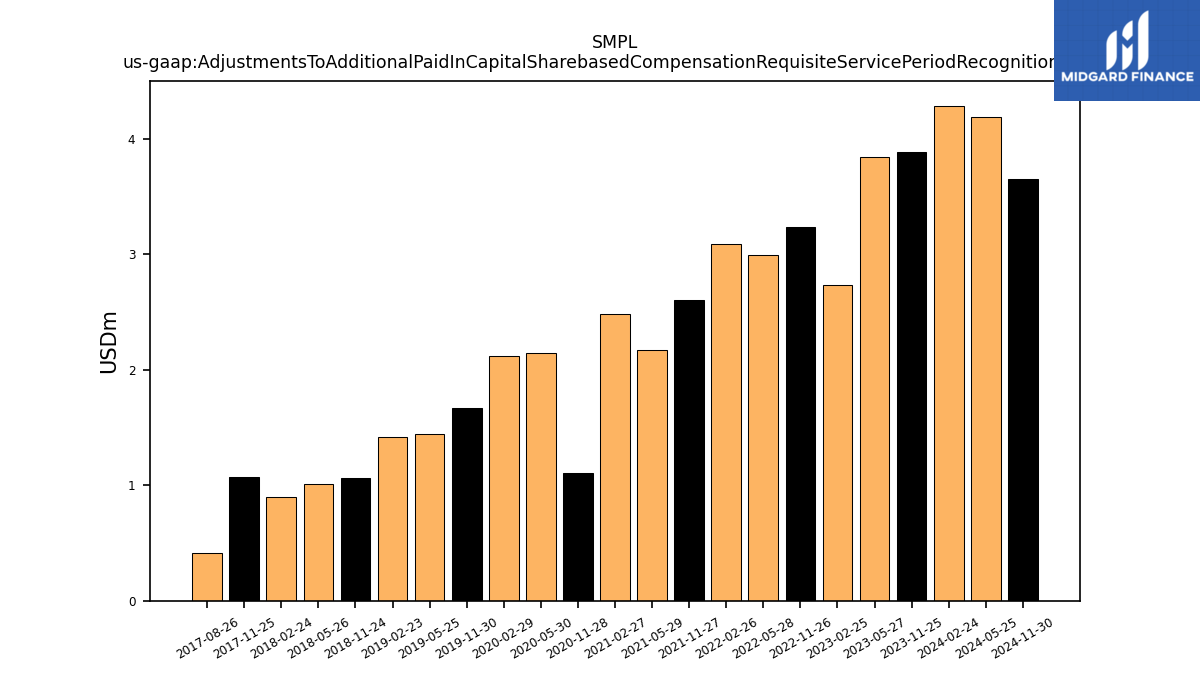
| Adjustments To Additional Paid In Capital Sharebased Compensation Requisite Service Period Recognition Value | 3.89 | NA | 3.84 | 2.74 | 3.24 | NA | 2.99 | 3.09 | 2.60 | NA | 2.17 | 2.48 | 1.11 | NA | 2.15 | 2.12 | 1.67 | NA | 1.44 | 1.42 | 1.06 | NA | 1.01 | 0.90 | 1.07 | 0.41 | NA | NA |
| 2023-11-25 | 2023-08-26 | 2023-05-27 | 2023-02-25 | 2022-11-26 | 2022-08-27 | 2022-05-28 | 2022-02-26 | 2021-11-27 | 2021-08-28 | 2021-05-29 | 2021-02-27 | 2020-11-28 | 2020-08-29 | 2020-05-30 | 2020-02-29 | 2019-11-30 | 2019-08-31 | 2019-05-25 | 2019-02-23 | 2018-11-24 | 2018-08-25 | 2018-05-26 | 2018-02-24 | 2017-11-25 | 2017-08-26 | 2017-05-27 | 2016-05-28 | ||
|---|---|---|---|---|---|---|---|---|---|---|---|---|---|---|---|---|---|---|---|---|---|---|---|---|---|---|---|---|---|
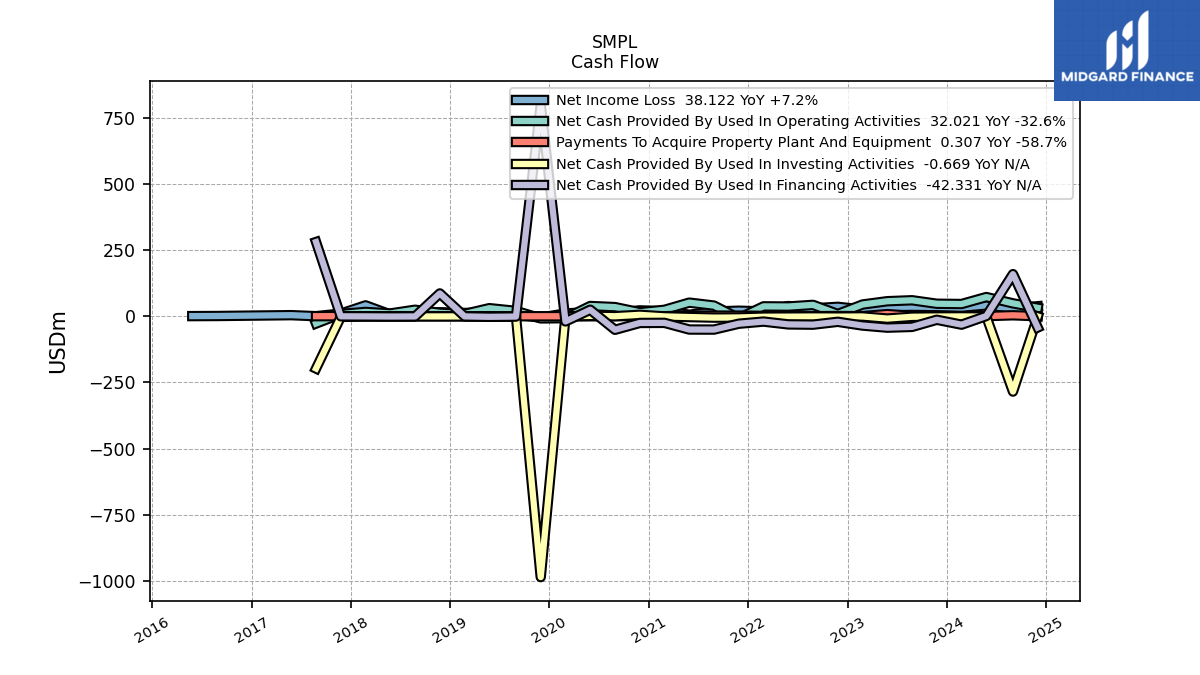
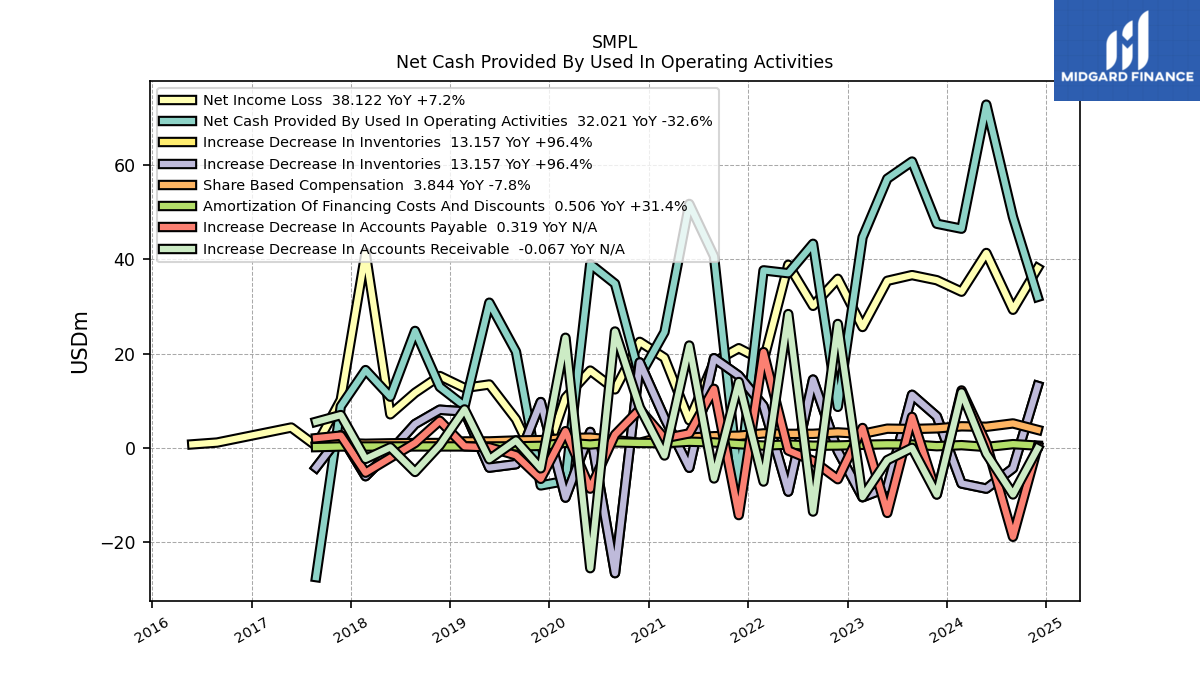
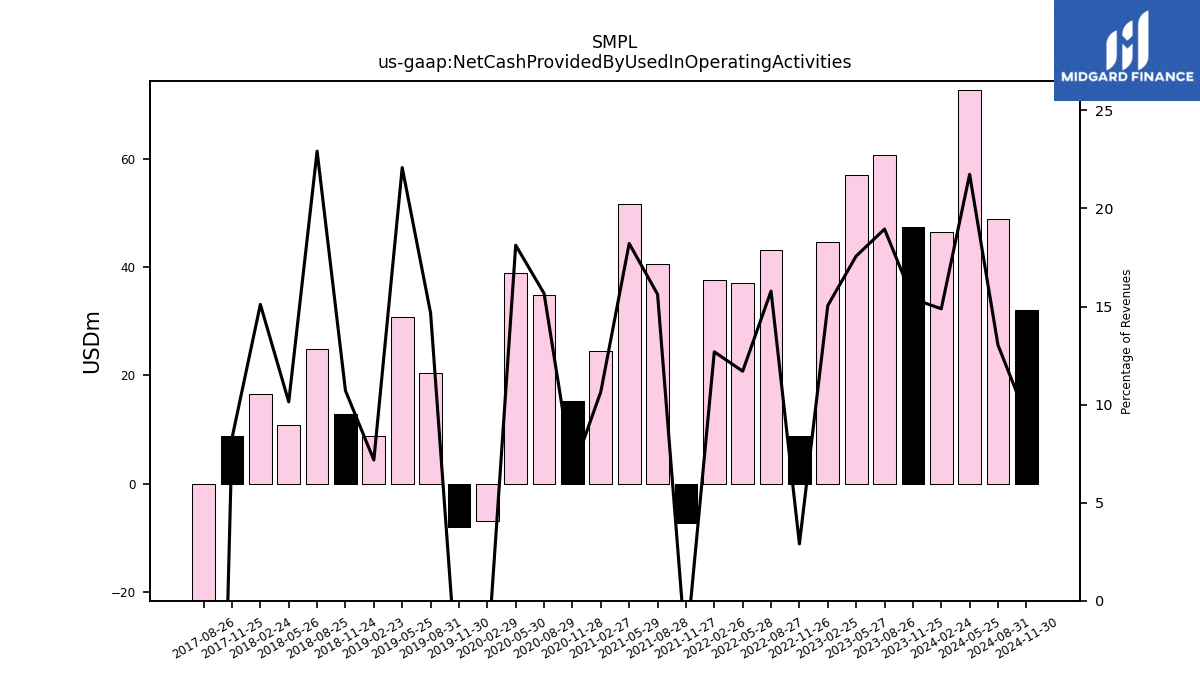
| Net Cash Provided By Used In Operating Activities | 47.52 | 60.70 | 57.07 | 44.63 | 8.72 | 43.28 | 37.04 | 37.65 | -7.33 | 40.60 | 51.72 | 24.57 | 15.20 | 34.82 | 38.99 | -6.96 | -7.93 | 20.41 | 30.80 | 8.88 | 12.95 | 24.82 | 10.87 | 16.52 | 8.83 | -27.36 | NA | NA | |
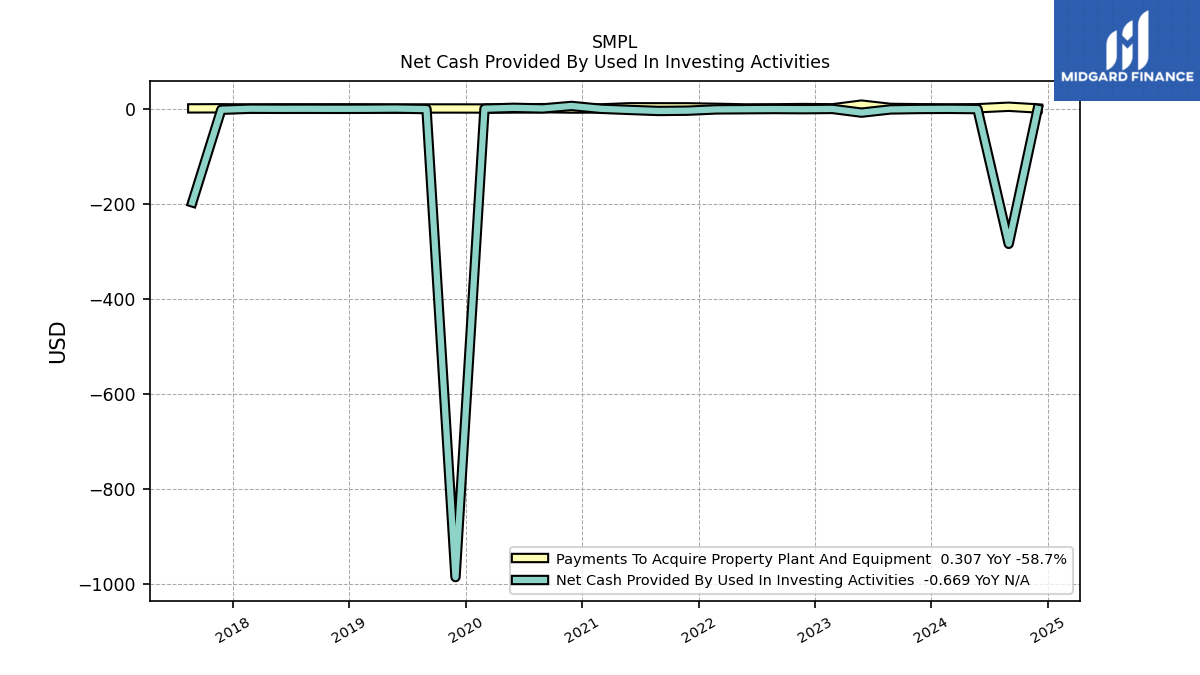
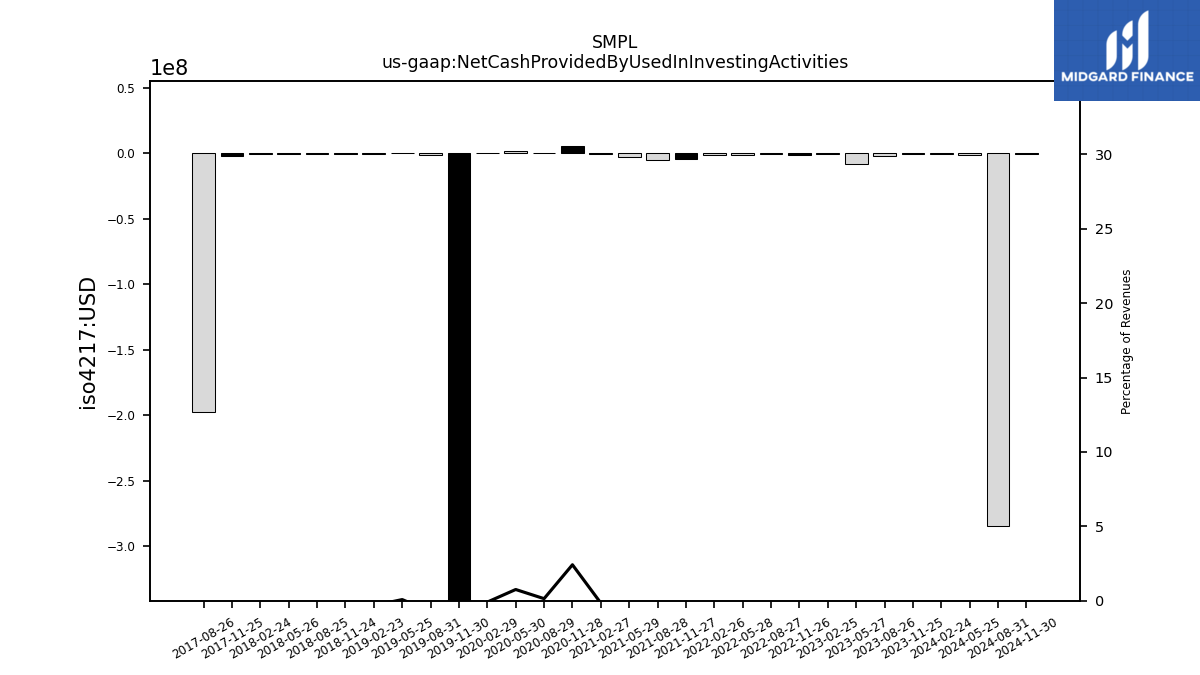
| Net Cash Provided By Used In Investing Activities | -0.80 | -1.74 | -8.51 | -0.69 | -1.24 | -0.87 | -1.26 | -1.65 | -4.38 | -4.96 | -2.78 | -0.36 | 5.59 | 0.31 | 1.63 | -0.20 | -985.73 | -1.01 | 0.11 | -0.39 | -0.49 | -0.41 | -0.46 | -0.23 | -2.42 | -197.30 | NA | NA | |
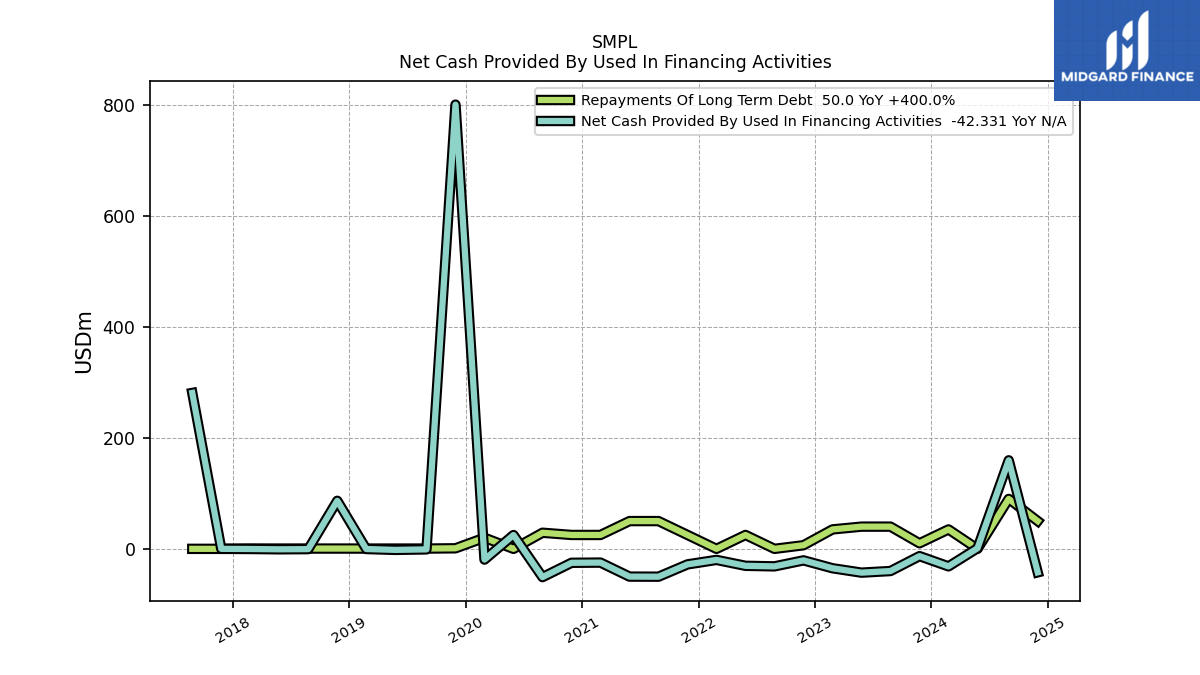
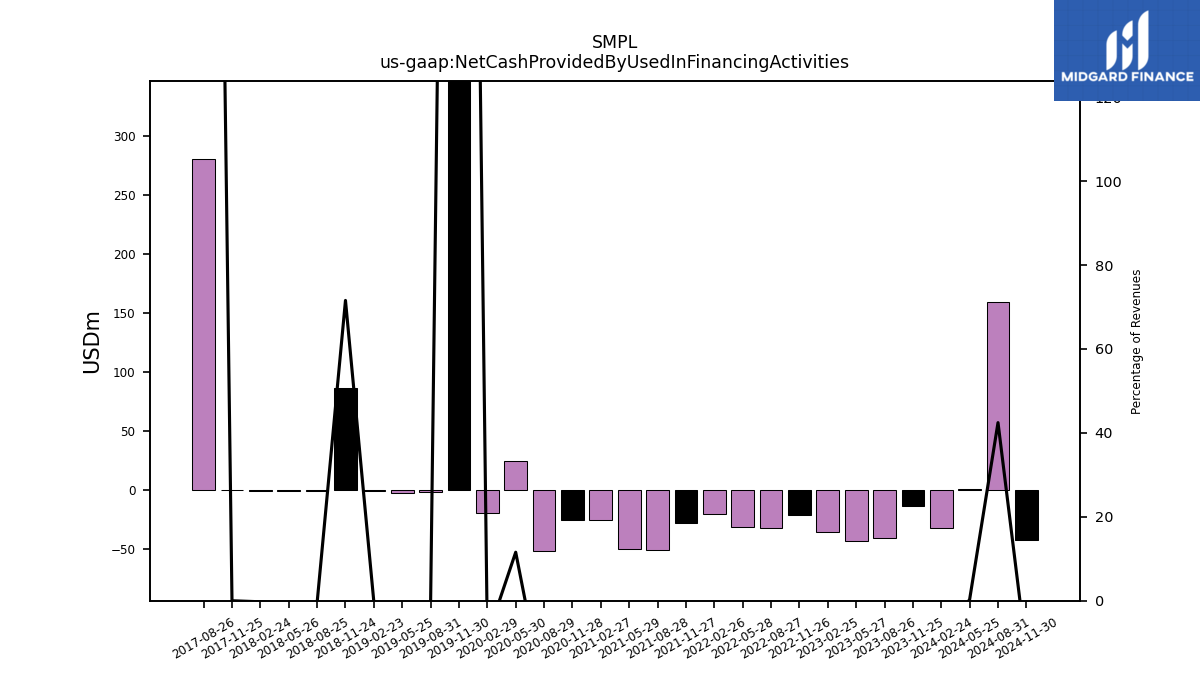
| Net Cash Provided By Used In Financing Activities | -13.10 | -39.95 | -42.87 | -34.95 | -20.76 | -31.56 | -30.57 | -19.92 | -27.99 | -50.16 | -50.00 | -24.77 | -25.12 | -50.93 | 24.88 | -19.37 | 800.07 | -0.96 | -1.88 | -0.32 | 86.55 | -0.50 | -0.82 | -0.27 | 0.00 | 280.80 | NA | NA |
| 2023-11-25 | 2023-08-26 | 2023-05-27 | 2023-02-25 | 2022-11-26 | 2022-08-27 | 2022-05-28 | 2022-02-26 | 2021-11-27 | 2021-08-28 | 2021-05-29 | 2021-02-27 | 2020-11-28 | 2020-08-29 | 2020-05-30 | 2020-02-29 | 2019-11-30 | 2019-08-31 | 2019-05-25 | 2019-02-23 | 2018-11-24 | 2018-08-25 | 2018-05-26 | 2018-02-24 | 2017-11-25 | 2017-08-26 | 2017-05-27 | 2016-05-28 | ||
|---|---|---|---|---|---|---|---|---|---|---|---|---|---|---|---|---|---|---|---|---|---|---|---|---|---|---|---|---|---|
| Net Cash Provided By Used In Operating Activities | 47.52 | 60.70 | 57.07 | 44.63 | 8.72 | 43.28 | 37.04 | 37.65 | -7.33 | 40.60 | 51.72 | 24.57 | 15.20 | 34.82 | 38.99 | -6.96 | -7.93 | 20.41 | 30.80 | 8.88 | 12.95 | 24.82 | 10.87 | 16.52 | 8.83 | -27.36 | NA | NA | |
| Net Income Loss | 35.56 | 36.64 | 35.43 | 25.64 | 35.86 | 30.13 | 38.83 | 18.46 | 21.15 | 18.25 | 5.89 | 19.12 | 22.50 | 12.43 | 16.41 | 10.66 | -4.79 | 6.09 | 13.47 | 12.72 | 15.26 | 11.71 | 7.14 | 41.39 | 10.22 | 0.45 | 4.35 | 0.78 | |
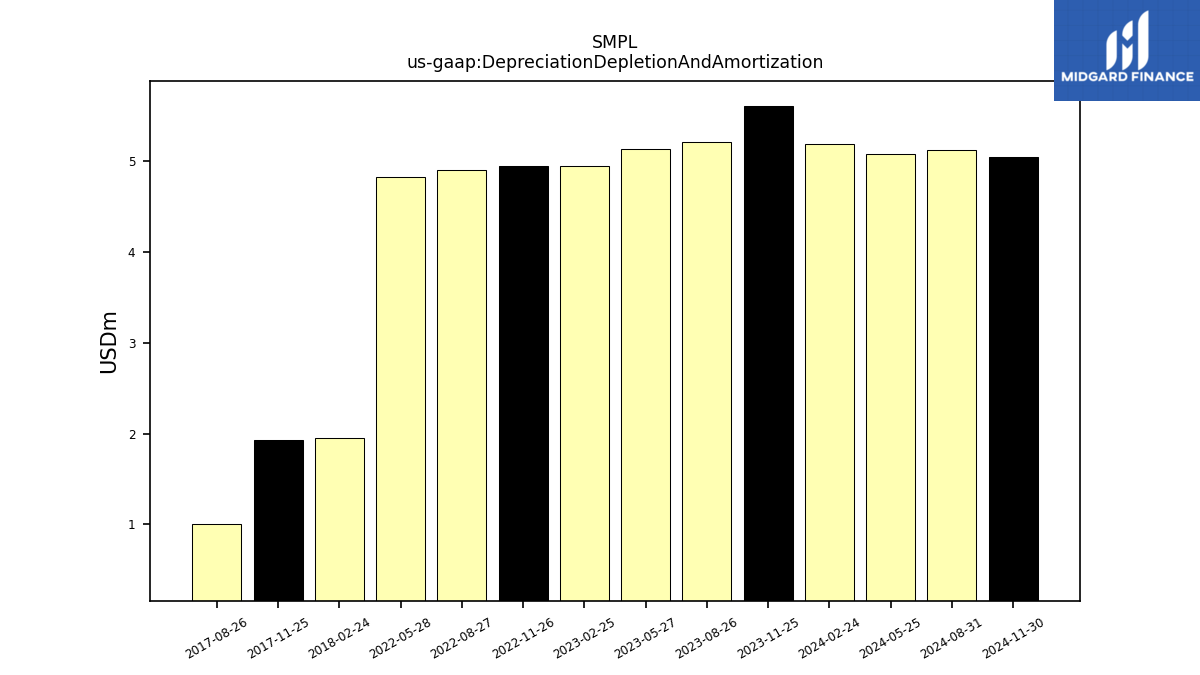
| Depreciation Depletion And Amortization | 5.61 | 5.21 | 5.14 | 4.95 | 4.95 | 4.90 | 4.83 | NA | NA | NA | NA | NA | NA | NA | NA | NA | NA | NA | NA | NA | NA | NA | NA | 1.95 | 1.93 | 1.00 | NA | NA | |
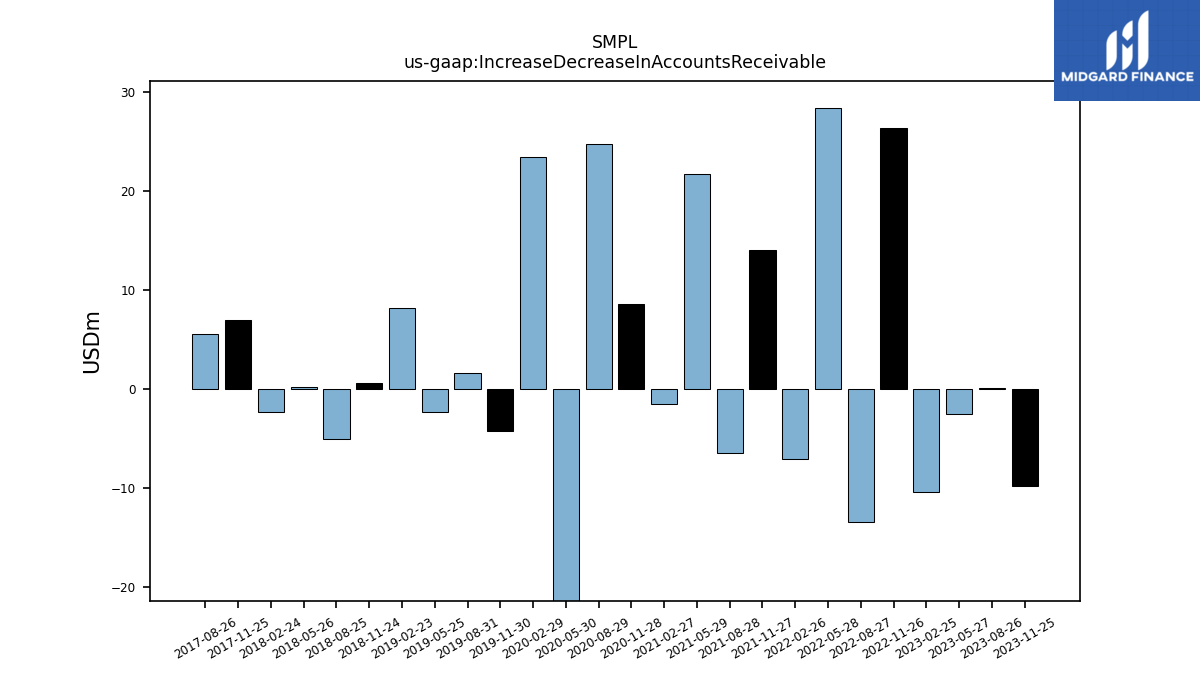
| Increase Decrease In Accounts Receivable | -9.87 | 0.04 | -2.56 | -10.39 | 26.29 | -13.47 | 28.39 | -7.11 | 13.99 | -6.45 | 21.72 | -1.59 | 8.60 | 24.70 | -25.47 | 23.37 | -4.30 | 1.60 | -2.39 | 8.18 | 0.59 | -5.08 | 0.14 | -2.31 | 6.99 | 5.56 | NA | NA | |
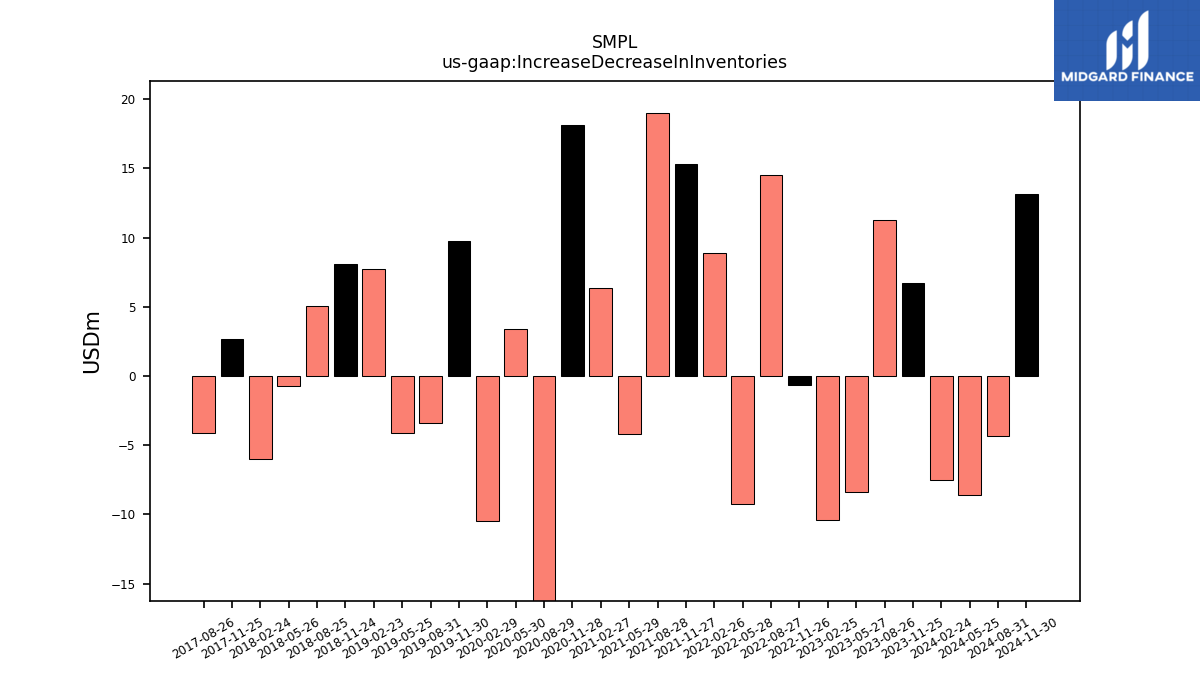
| Increase Decrease In Inventories | 6.70 | 11.28 | -8.38 | -10.43 | -0.64 | 14.50 | -9.23 | 8.91 | 15.33 | 19.03 | -4.18 | 6.36 | 18.14 | -26.52 | 3.40 | -10.51 | 9.74 | -3.43 | -4.16 | 7.74 | 8.11 | 5.08 | -0.72 | -5.97 | 2.69 | -4.13 | NA | NA | |
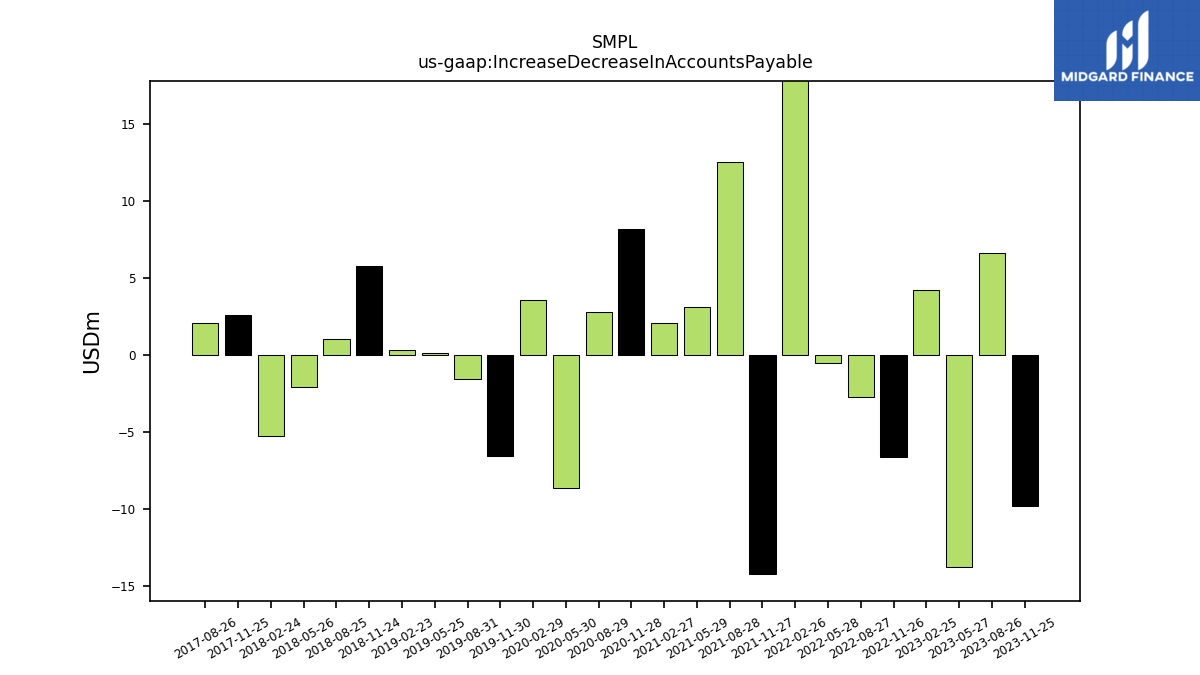
| Increase Decrease In Accounts Payable | -9.81 | 6.61 | -13.76 | 4.25 | -6.61 | -2.71 | -0.52 | 20.33 | -14.22 | 12.54 | 3.10 | 2.06 | 8.22 | 2.83 | -8.61 | 3.58 | -6.53 | -1.55 | 0.14 | 0.37 | 5.78 | 1.07 | -2.08 | -5.23 | 2.63 | 2.09 | NA | NA | |
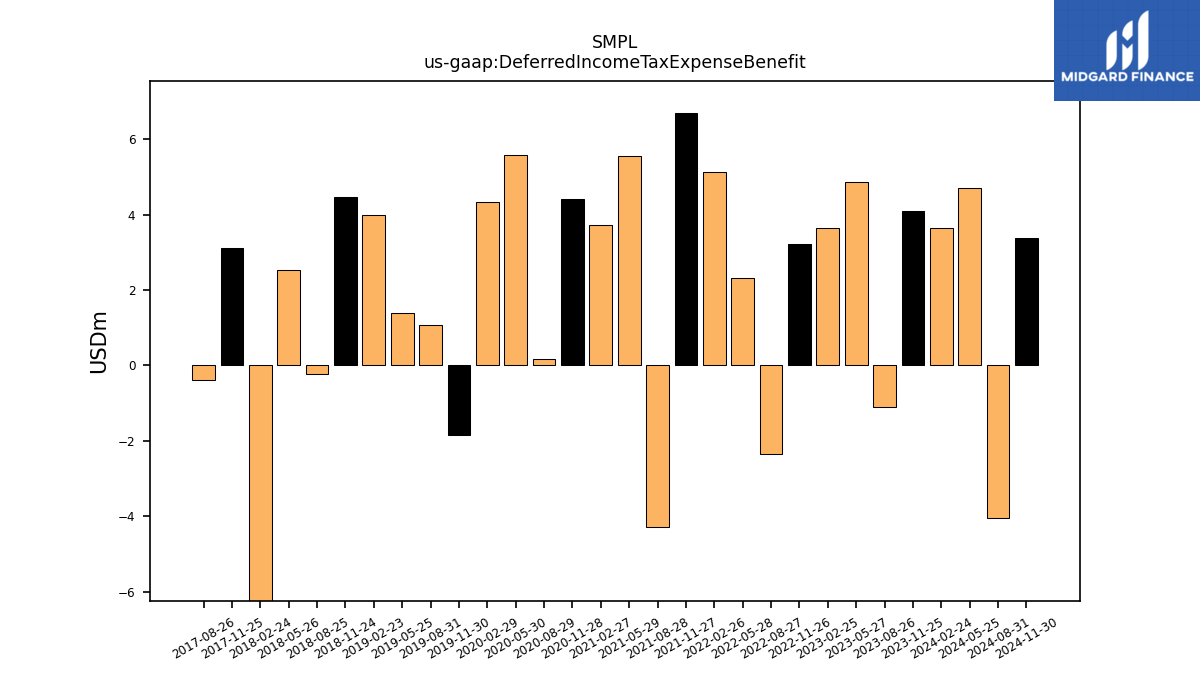
| Deferred Income Tax Expense Benefit | 4.08 | -1.11 | 4.85 | 3.64 | 3.21 | -2.35 | 2.33 | 5.13 | 6.69 | -4.27 | 5.55 | 3.72 | 4.40 | 0.16 | 5.57 | 4.34 | -1.85 | 1.07 | 1.38 | 4.00 | 4.46 | -0.23 | 2.52 | -26.52 | 3.12 | -0.38 | NA | NA | |
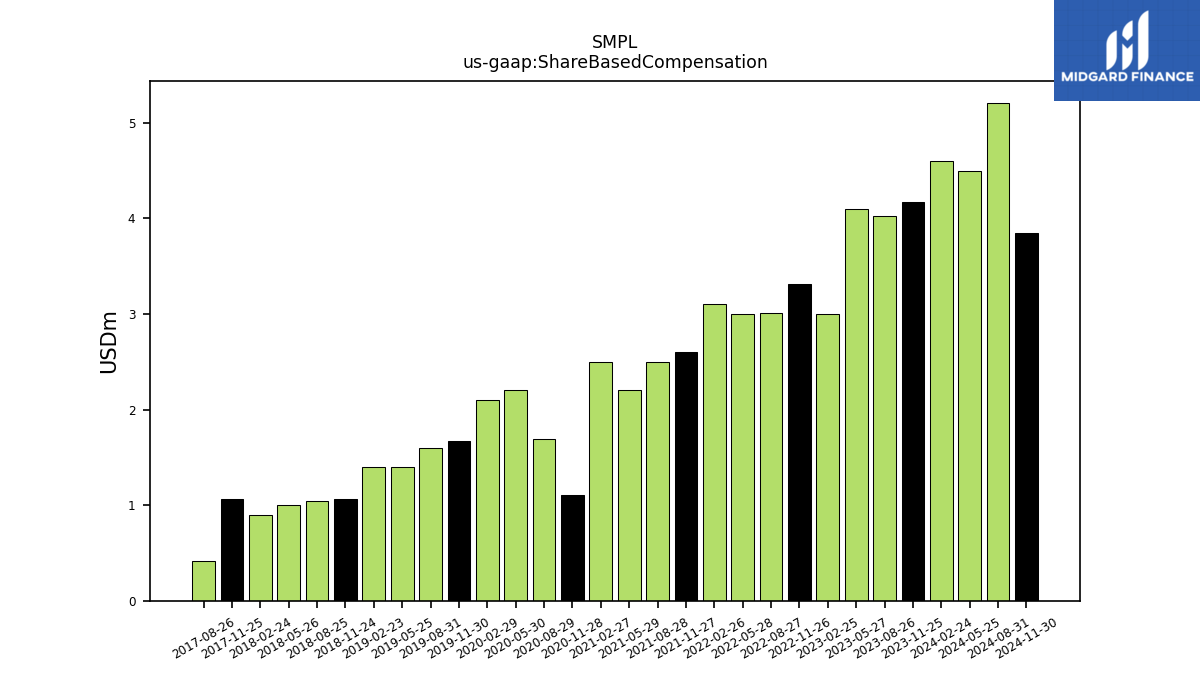
| Share Based Compensation | 4.17 | 4.02 | 4.10 | 3.00 | 3.31 | 3.01 | 3.00 | 3.10 | 2.60 | 2.50 | 2.20 | 2.50 | 1.11 | 1.69 | 2.20 | 2.10 | 1.67 | 1.60 | 1.40 | 1.40 | 1.06 | 1.05 | 1.00 | 0.90 | 1.07 | 0.41 | NA | NA |
| 2023-11-25 | 2023-08-26 | 2023-05-27 | 2023-02-25 | 2022-11-26 | 2022-08-27 | 2022-05-28 | 2022-02-26 | 2021-11-27 | 2021-08-28 | 2021-05-29 | 2021-02-27 | 2020-11-28 | 2020-08-29 | 2020-05-30 | 2020-02-29 | 2019-11-30 | 2019-08-31 | 2019-05-25 | 2019-02-23 | 2018-11-24 | 2018-08-25 | 2018-05-26 | 2018-02-24 | 2017-11-25 | 2017-08-26 | 2017-05-27 | 2016-05-28 | ||
|---|---|---|---|---|---|---|---|---|---|---|---|---|---|---|---|---|---|---|---|---|---|---|---|---|---|---|---|---|---|
| Net Cash Provided By Used In Investing Activities | -0.80 | -1.74 | -8.51 | -0.69 | -1.24 | -0.87 | -1.26 | -1.65 | -4.38 | -4.96 | -2.78 | -0.36 | 5.59 | 0.31 | 1.63 | -0.20 | -985.73 | -1.01 | 0.11 | -0.39 | -0.49 | -0.41 | -0.46 | -0.23 | -2.42 | -197.30 | NA | NA | |
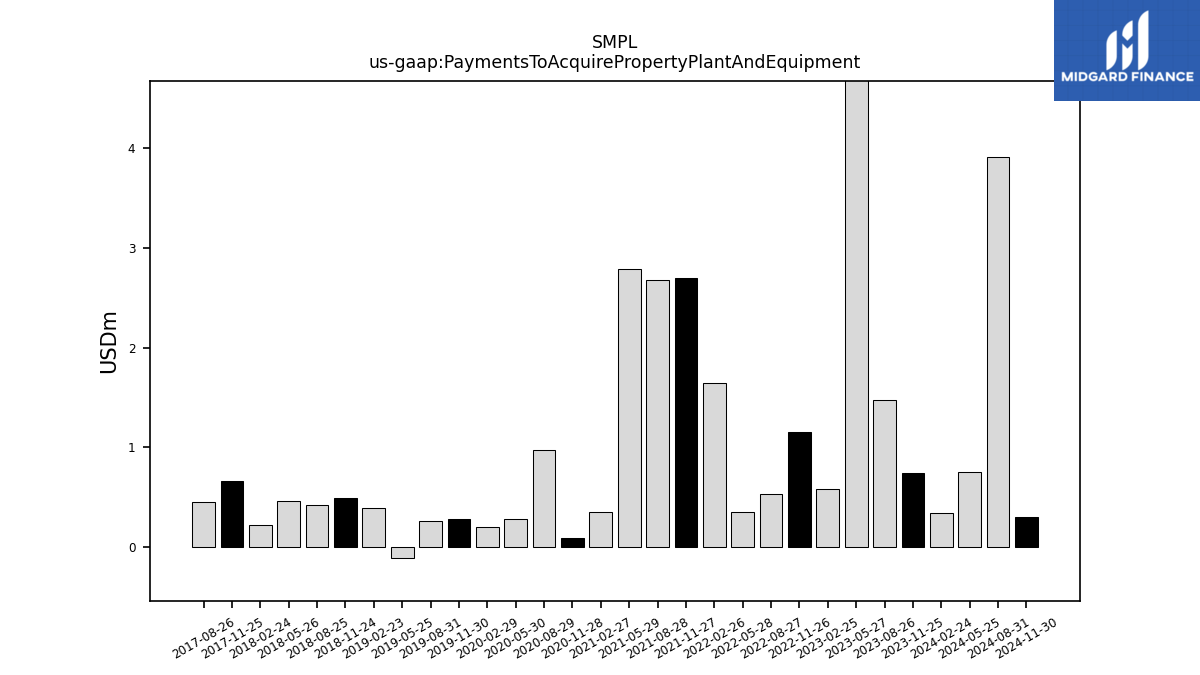
| Payments To Acquire Property Plant And Equipment | 0.74 | 1.48 | 8.37 | 0.59 | 1.15 | 0.54 | 0.36 | 1.65 | 2.69 | 2.68 | 2.78 | 0.36 | 0.09 | 0.97 | 0.28 | 0.20 | 0.28 | 0.26 | -0.11 | 0.39 | 0.49 | 0.42 | 0.46 | 0.23 | 0.66 | 0.46 | NA | NA |
| 2023-11-25 | 2023-08-26 | 2023-05-27 | 2023-02-25 | 2022-11-26 | 2022-08-27 | 2022-05-28 | 2022-02-26 | 2021-11-27 | 2021-08-28 | 2021-05-29 | 2021-02-27 | 2020-11-28 | 2020-08-29 | 2020-05-30 | 2020-02-29 | 2019-11-30 | 2019-08-31 | 2019-05-25 | 2019-02-23 | 2018-11-24 | 2018-08-25 | 2018-05-26 | 2018-02-24 | 2017-11-25 | 2017-08-26 | 2017-05-27 | 2016-05-28 | ||
|---|---|---|---|---|---|---|---|---|---|---|---|---|---|---|---|---|---|---|---|---|---|---|---|---|---|---|---|---|---|
| Net Cash Provided By Used In Financing Activities | -13.10 | -39.95 | -42.87 | -34.95 | -20.76 | -31.56 | -30.57 | -19.92 | -27.99 | -50.16 | -50.00 | -24.77 | -25.12 | -50.93 | 24.88 | -19.37 | 800.07 | -0.96 | -1.88 | -0.32 | 86.55 | -0.50 | -0.82 | -0.27 | 0.00 | 280.80 | NA | NA | |
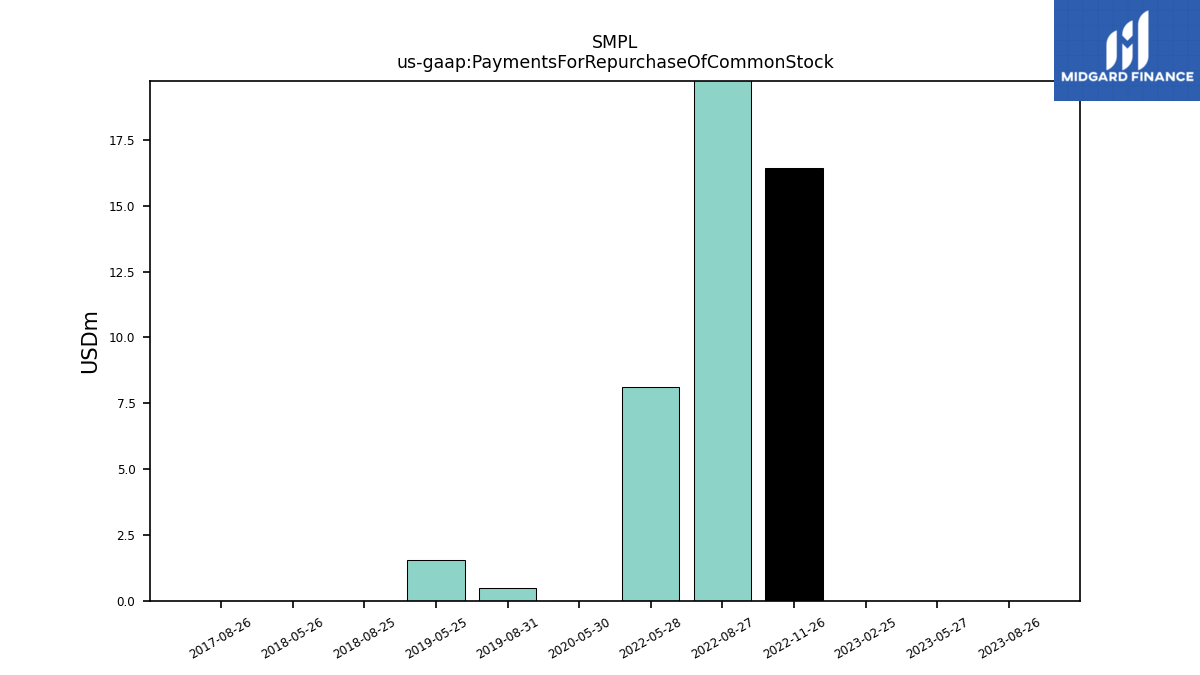
| Payments For Repurchase Of Common Stock | NA | 0.00 | 0.00 | 0.00 | 16.45 | 31.35 | 8.11 | NA | NA | NA | NA | NA | NA | NA | 0.00 | NA | NA | 0.48 | 1.54 | NA | NA | 0.00 | 0.00 | NA | NA | 0.00 | NA | NA |
| 2023-11-25 | 2023-08-26 | 2023-05-27 | 2023-02-25 | 2022-11-26 | 2022-08-27 | 2022-05-28 | 2022-02-26 | 2021-11-27 | 2021-08-28 | 2021-05-29 | 2021-02-27 | 2020-11-28 | 2020-08-29 | 2020-05-30 | 2020-02-29 | 2019-11-30 | 2019-08-31 | 2019-05-25 | 2019-02-23 | 2018-11-24 | 2018-08-25 | 2018-05-26 | 2018-02-24 | 2017-11-25 | 2017-08-26 | 2017-05-27 | 2016-05-28 | ||
|---|---|---|---|---|---|---|---|---|---|---|---|---|---|---|---|---|---|---|---|---|---|---|---|---|---|---|---|---|---|
| Revenues | 308.68 | 320.42 | 324.79 | 296.58 | 300.88 | 274.16 | 316.53 | 296.72 | 281.26 | 259.85 | 284.00 | 230.61 | 231.15 | 222.29 | 215.10 | 227.10 | 152.15 | 139.18 | 139.47 | 123.80 | 120.93 | 108.26 | 107.23 | 109.35 | 106.59 | 56.33 | 96.50 | 104.59 | |
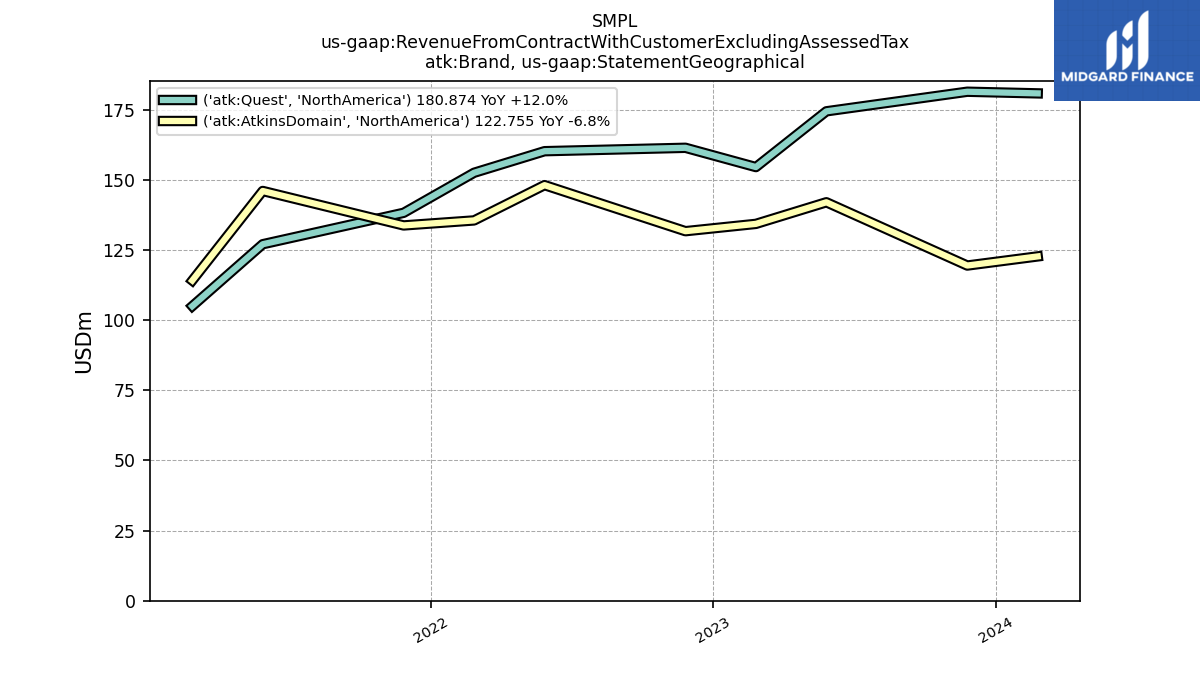
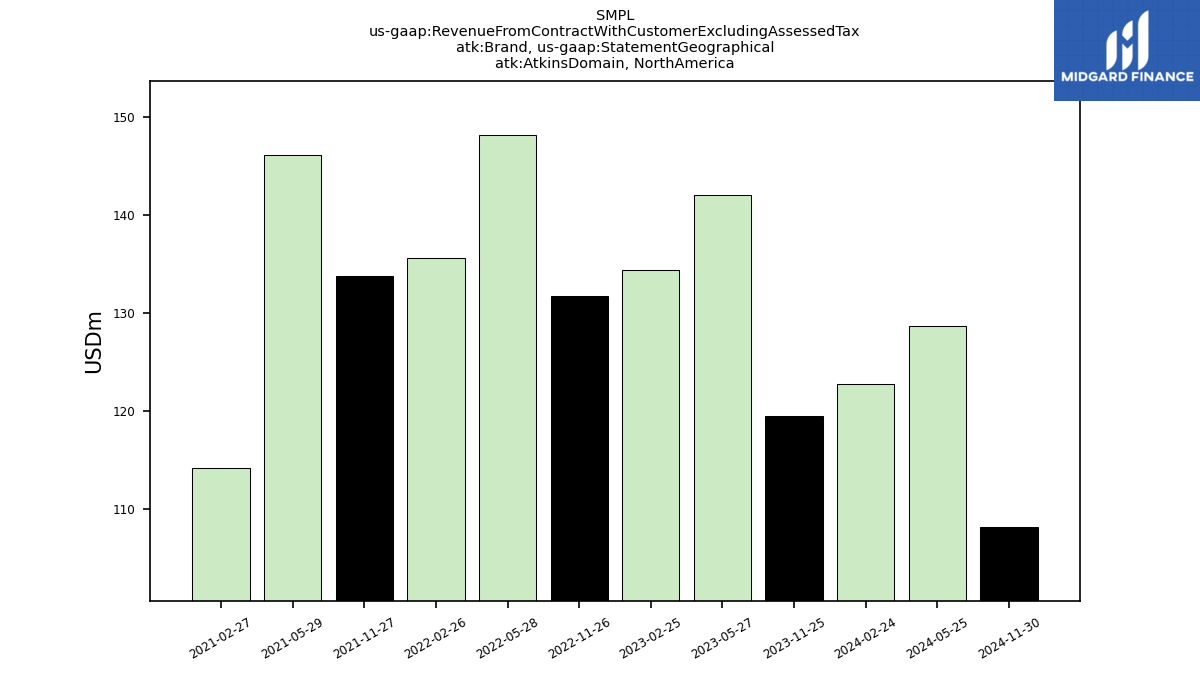
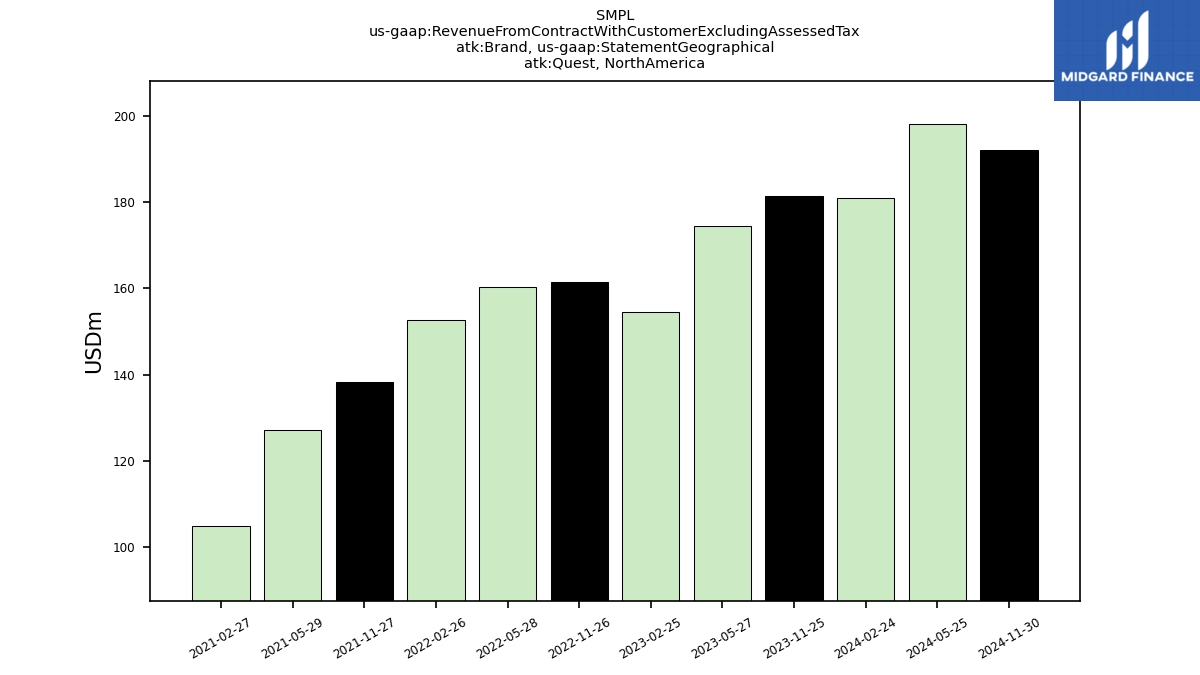
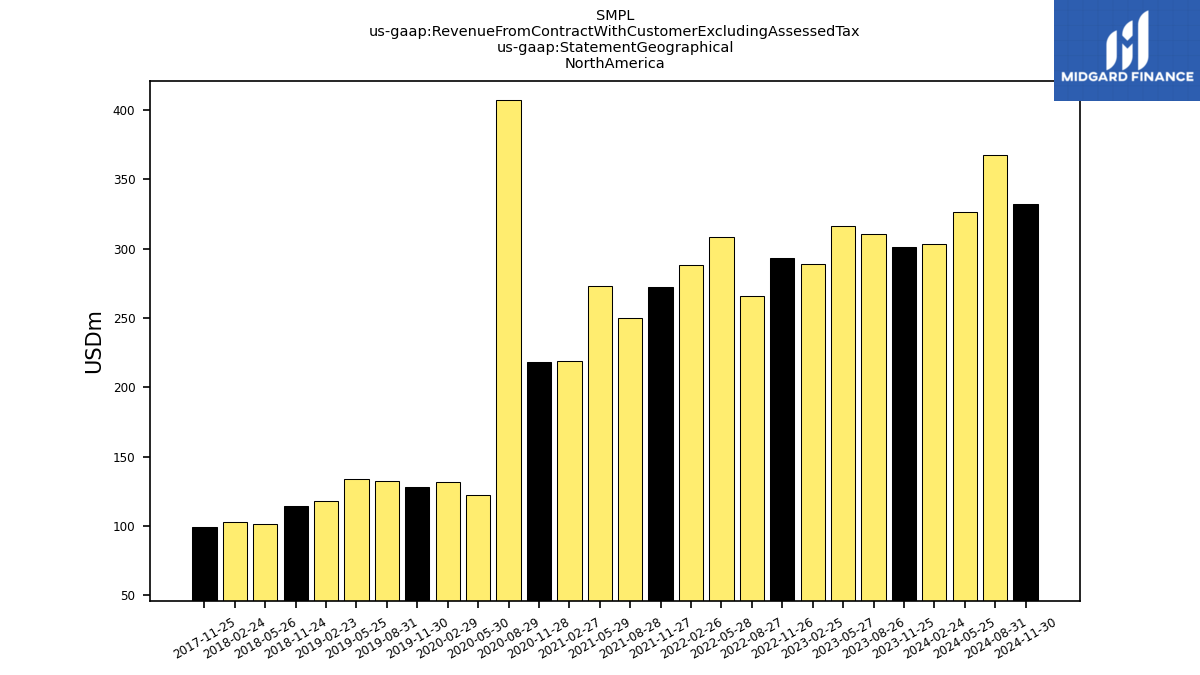
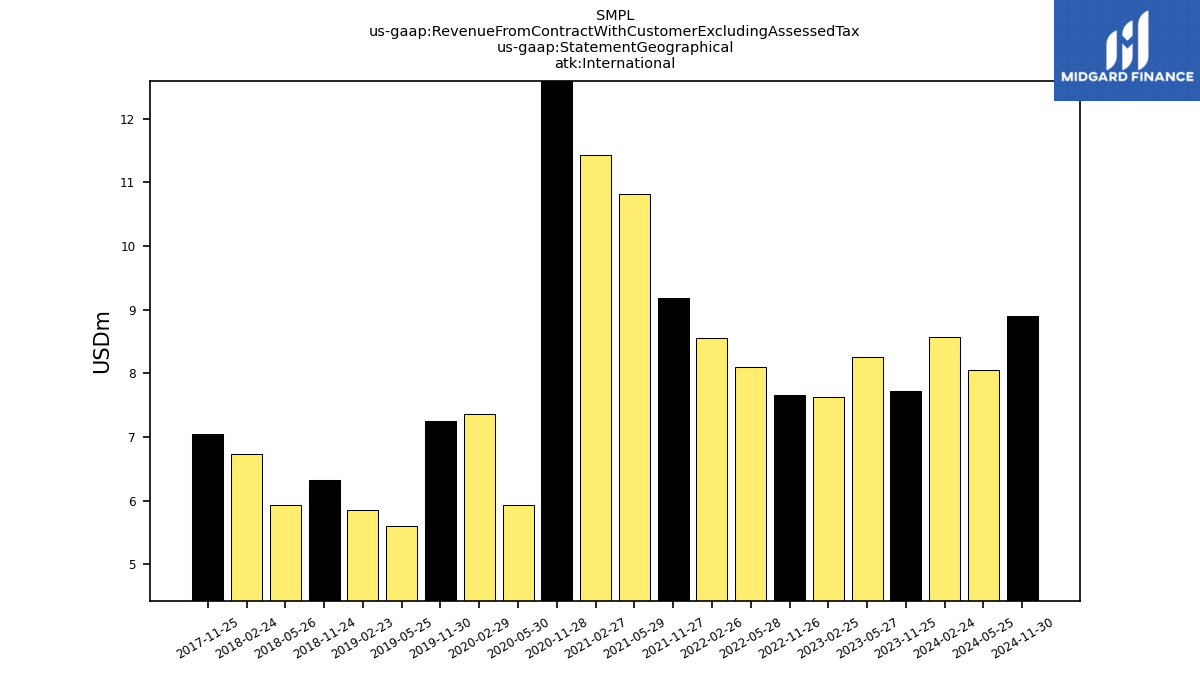
| Revenue From Contract With Customer Excluding Assessed Tax | 308.68 | 320.42 | 324.79 | 296.58 | 300.88 | 274.16 | 316.53 | 296.72 | 281.26 | 259.85 | 284.00 | 230.61 | 231.15 | 222.29 | 215.10 | 227.10 | 152.15 | 139.18 | 139.47 | 123.80 | 120.93 | 108.26 | 107.23 | 109.35 | 106.59 | 56.33 | 96.50 | 104.59 | |
| Atkins Domain, | 119.50 | NA | 142.06 | 134.35 | 131.75 | NA | 148.16 | 135.58 | 133.79 | NA | 146.08 | 114.16 | NA | NA | NA | NA | NA | NA | NA | NA | NA | NA | NA | NA | NA | NA | NA | NA | |
| Quest, | 181.46 | NA | 174.48 | 154.60 | 161.47 | NA | 160.26 | 152.57 | 138.29 | NA | 127.10 | 105.03 | NA | NA | NA | NA | NA | NA | NA | NA | NA | NA | NA | NA | NA | NA | NA | NA | |
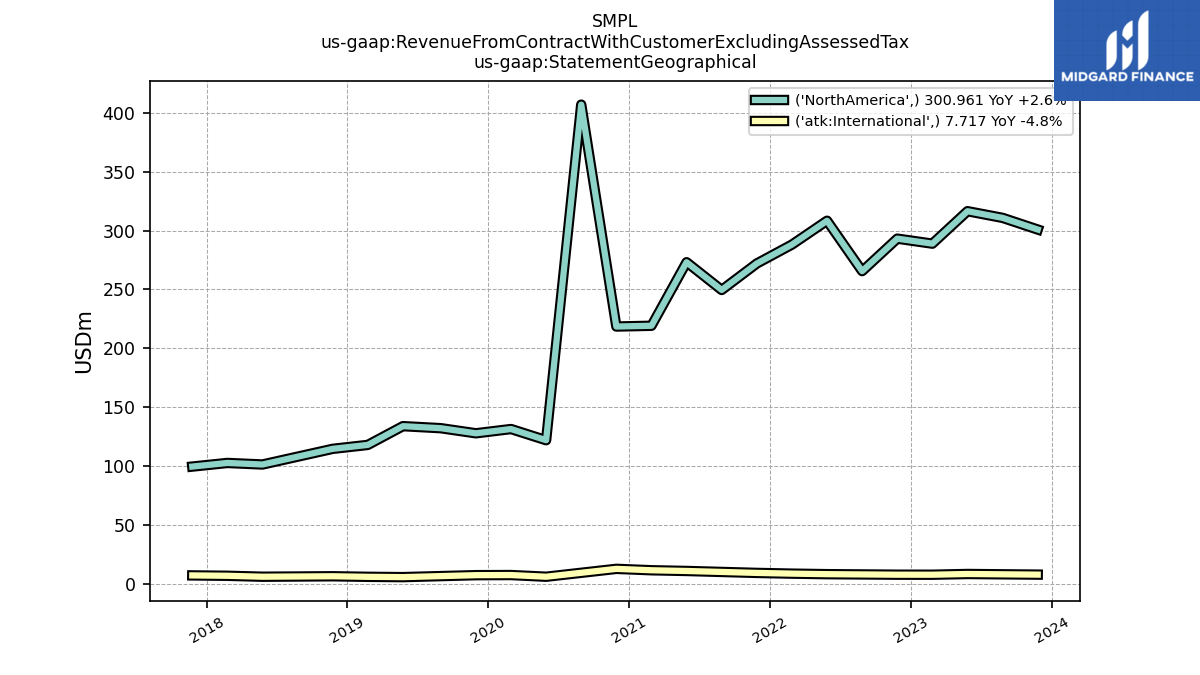
| 300.96 | 310.86 | 316.53 | 288.95 | 293.22 | 265.60 | 308.42 | 288.15 | 272.09 | 249.59 | 273.18 | 219.18 | 218.53 | 407.09 | 121.94 | 131.44 | 127.81 | 132.15 | 133.87 | 117.95 | 114.61 | NA | 101.29 | 102.61 | 99.53 | NA | NA | NA | ||
| International | 7.72 | NA | 8.26 | 7.63 | 7.66 | NA | 8.11 | 8.56 | 9.18 | NA | 10.82 | 11.43 | 12.62 | NA | 5.93 | 7.36 | 7.26 | NA | 5.59 | 5.85 | 6.33 | NA | 5.94 | 6.74 | 7.05 | NA | NA | NA |