
| 2023-09-30 | 2023-06-30 | 2023-03-31 | 2022-12-31 | 2022-09-30 | 2022-06-30 | 2022-03-31 | 2021-12-31 | 2021-09-30 | 2021-06-30 | 2021-03-31 | 2020-12-31 | 2020-09-30 | ||
|---|---|---|---|---|---|---|---|---|---|---|---|---|---|---|
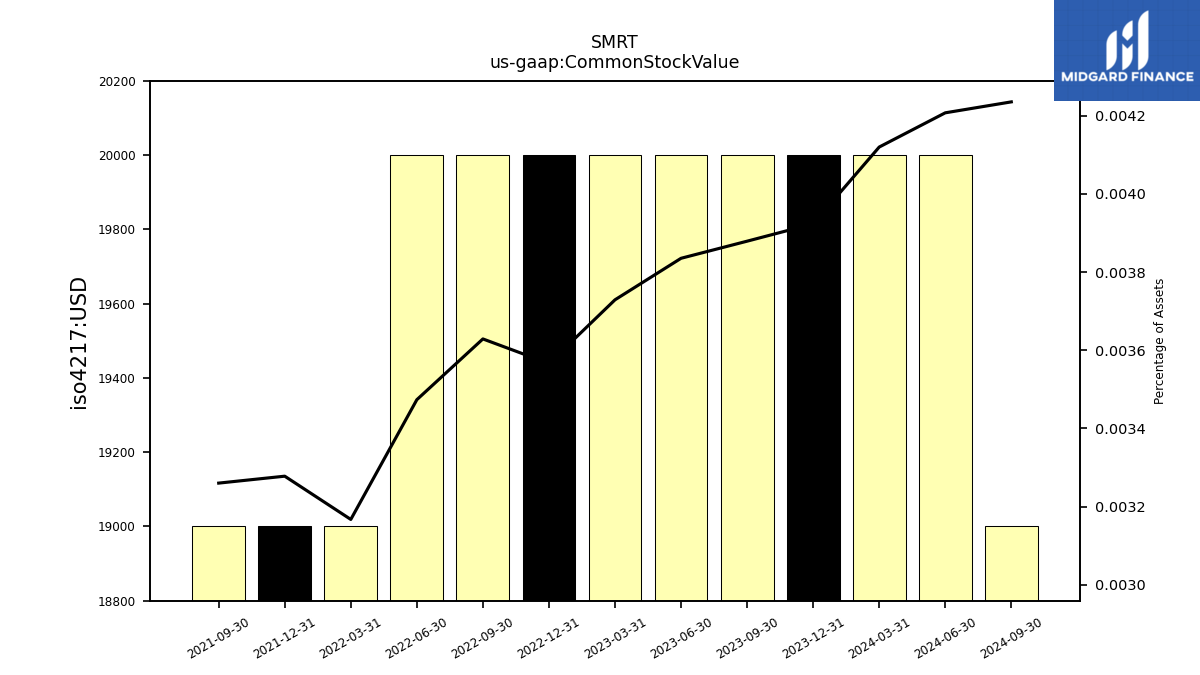
| Common Stock Value | 0.02 | 0.02 | 0.02 | 0.02 | 0.02 | 0.02 | 0.02 | 0.02 | 0.02 | NA | NA | NA | NA | |
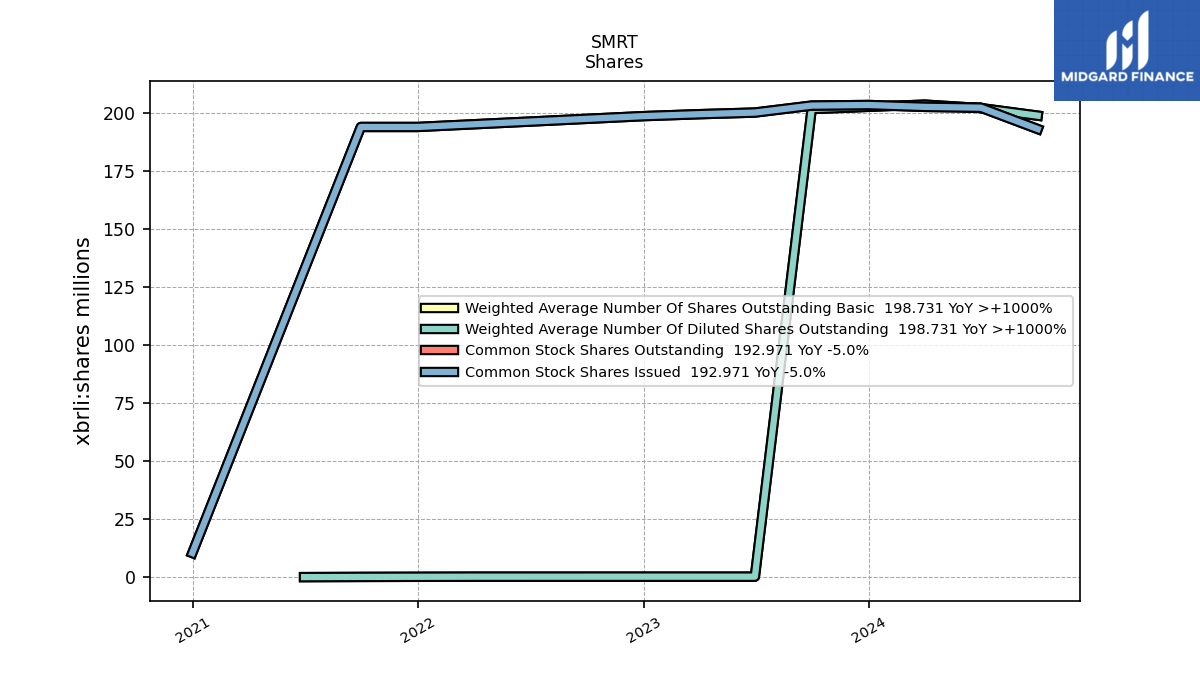
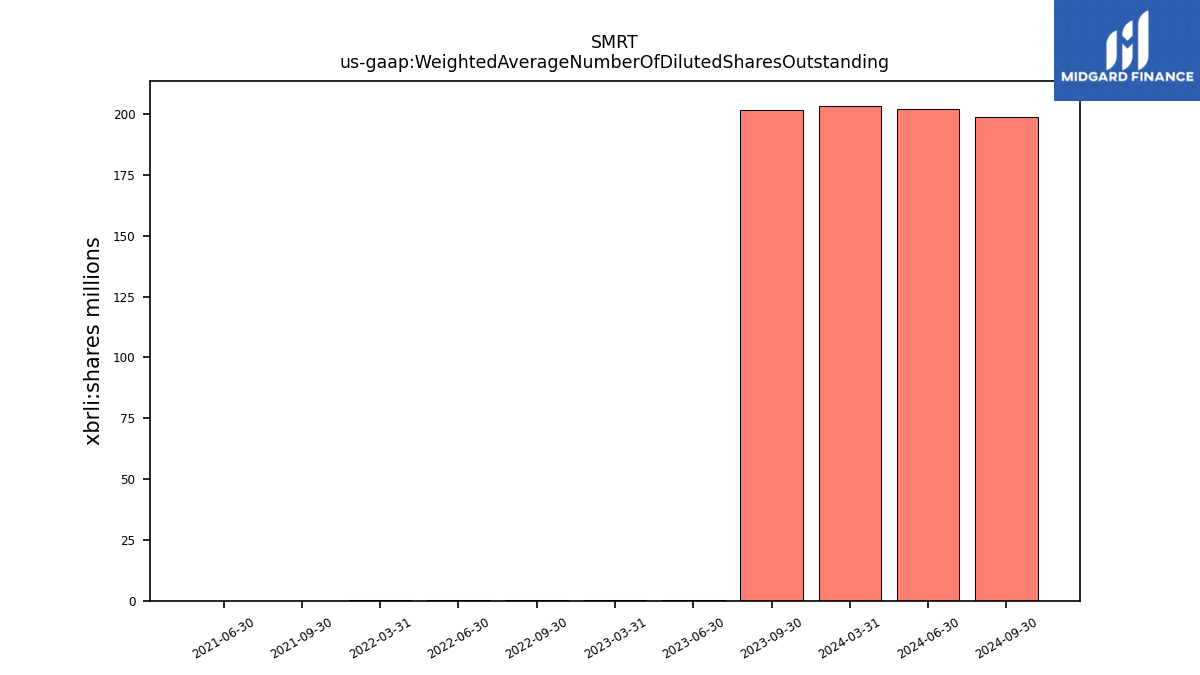
| Weighted Average Number Of Diluted Shares Outstanding | 201.58 | 0.20 | 0.20 | NA | 0.20 | 0.20 | 0.19 | NA | 0.09 | 0.00 | NA | NA | NA | |
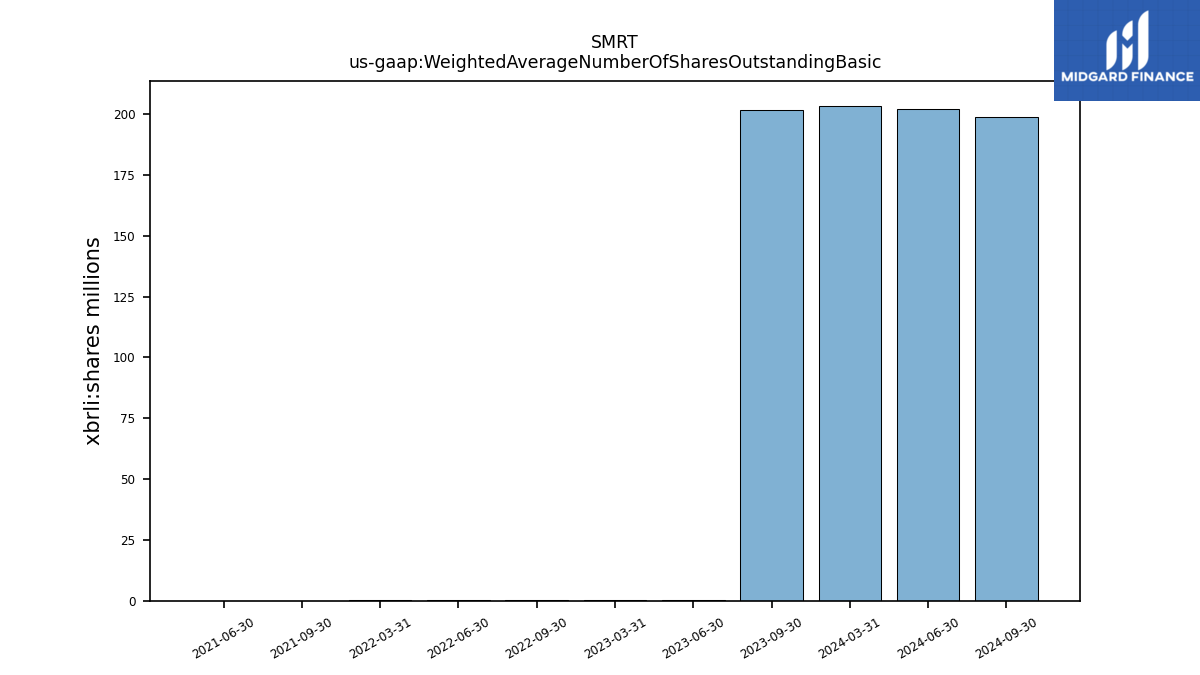
| Weighted Average Number Of Shares Outstanding Basic | 201.58 | 0.20 | 0.20 | NA | 0.20 | 0.20 | 0.19 | NA | 0.09 | 0.00 | NA | NA | NA | |
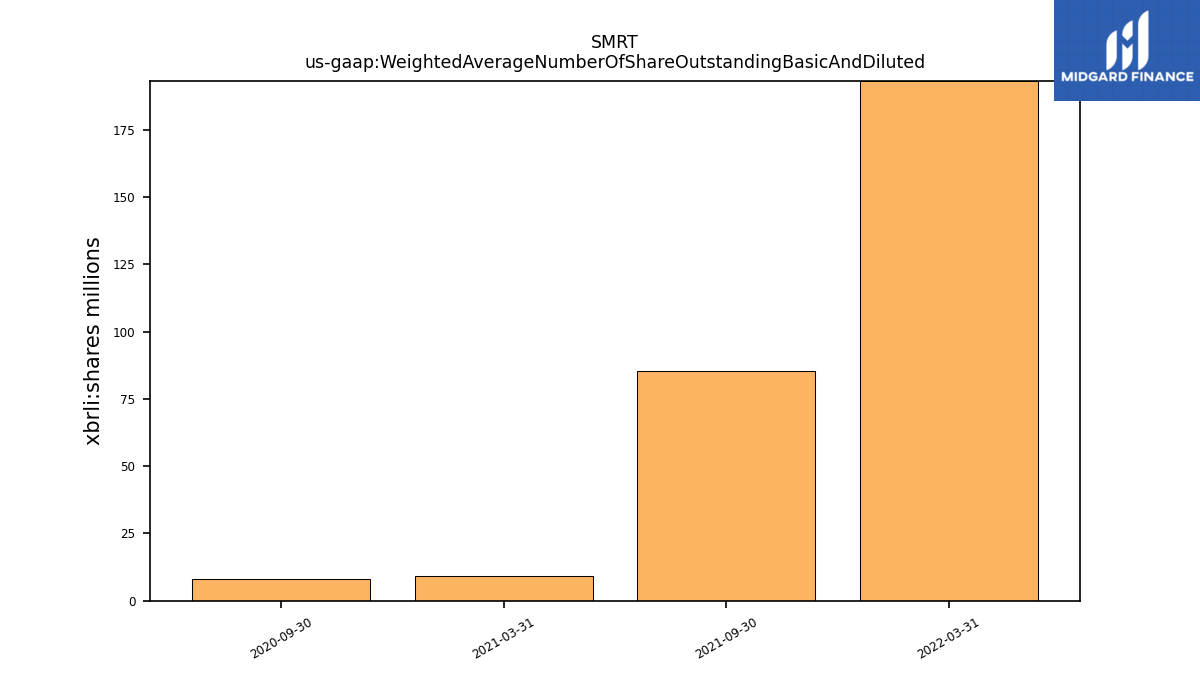
| Weighted Average Number Of Share Outstanding Basic And Diluted | NA | NA | NA | NA | NA | NA | 193.06 | NA | 85.27 | NA | 9.35 | NA | 8.15 | |
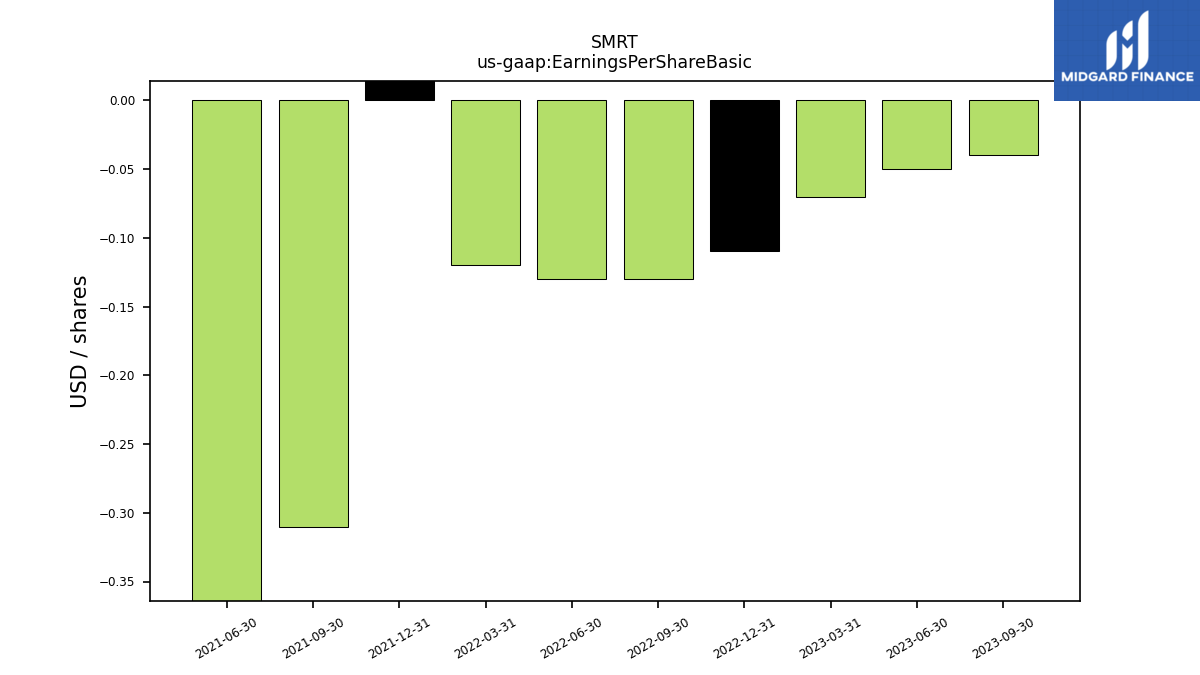
| Earnings Per Share Basic | -0.04 | -0.05 | -0.07 | -0.11 | -0.13 | -0.13 | -0.12 | 0.35 | -0.31 | -4.87 | NA | NA | NA | |
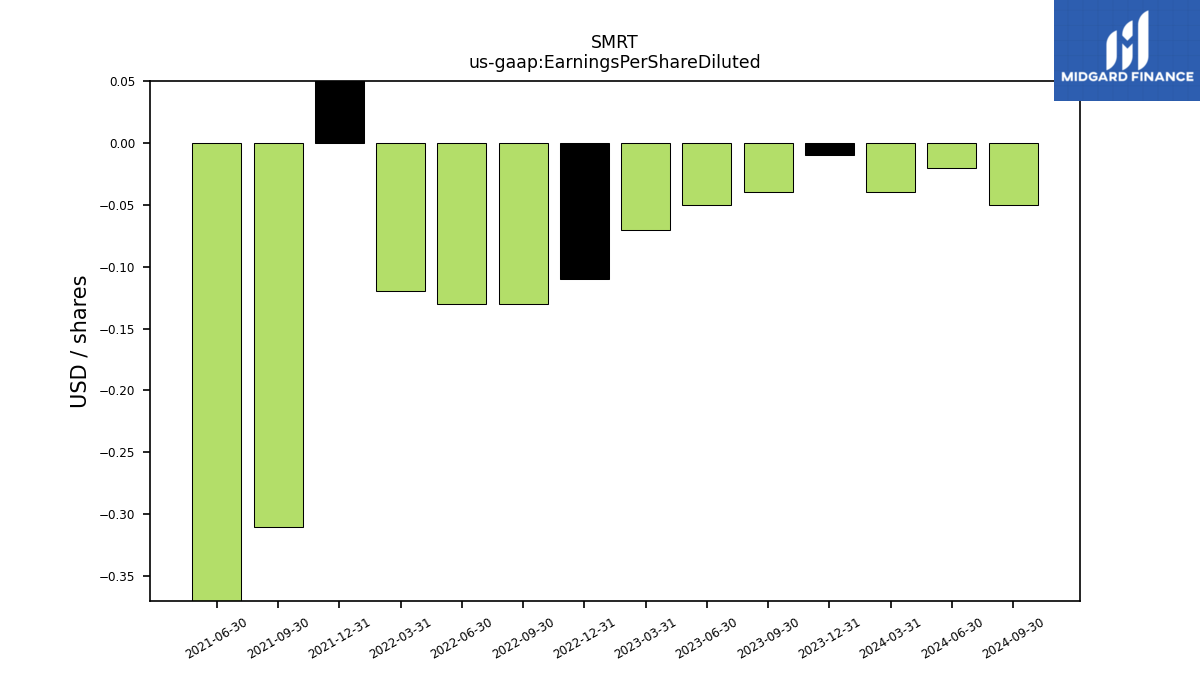
| Earnings Per Share Diluted | -0.04 | -0.05 | -0.07 | -0.11 | -0.13 | -0.13 | -0.12 | 0.35 | -0.31 | -4.87 | NA | NA | NA | |
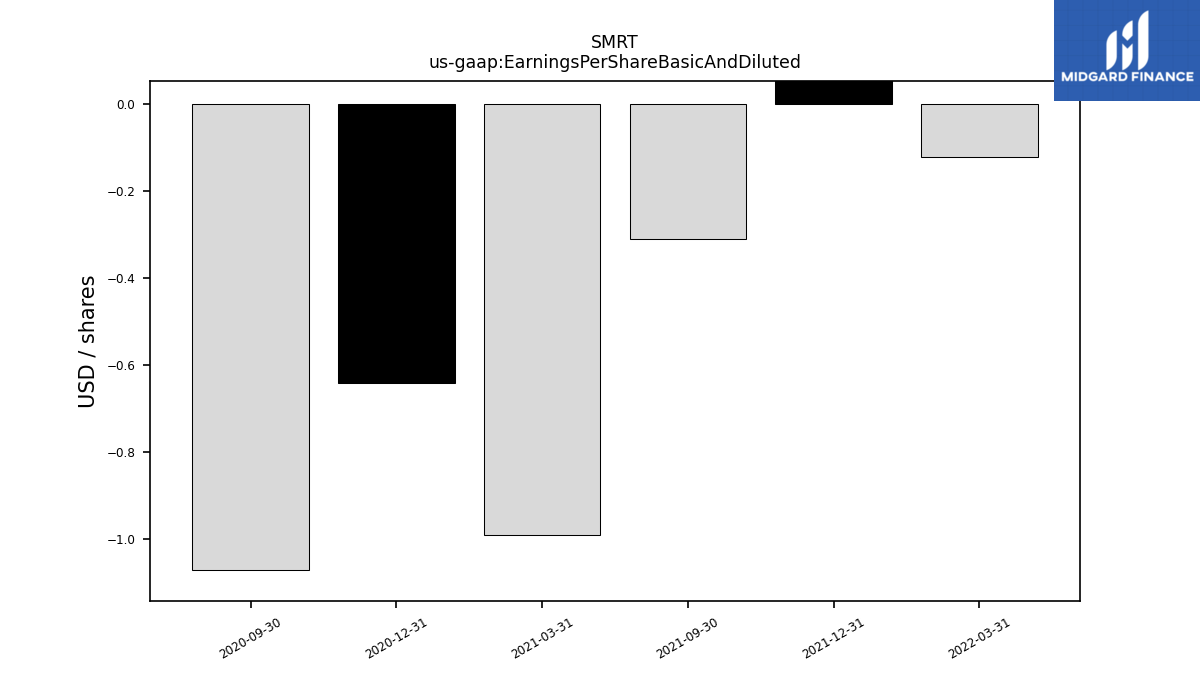
| Earnings Per Share Basic And Diluted | NA | NA | NA | NA | NA | NA | -0.12 | 0.35 | -0.31 | NA | -0.99 | -0.64 | -1.07 |
| 2023-09-30 | 2023-06-30 | 2023-03-31 | 2022-12-31 | 2022-09-30 | 2022-06-30 | 2022-03-31 | 2021-12-31 | 2021-09-30 | 2021-06-30 | 2021-03-31 | 2020-12-31 | 2020-09-30 | ||
|---|---|---|---|---|---|---|---|---|---|---|---|---|---|---|
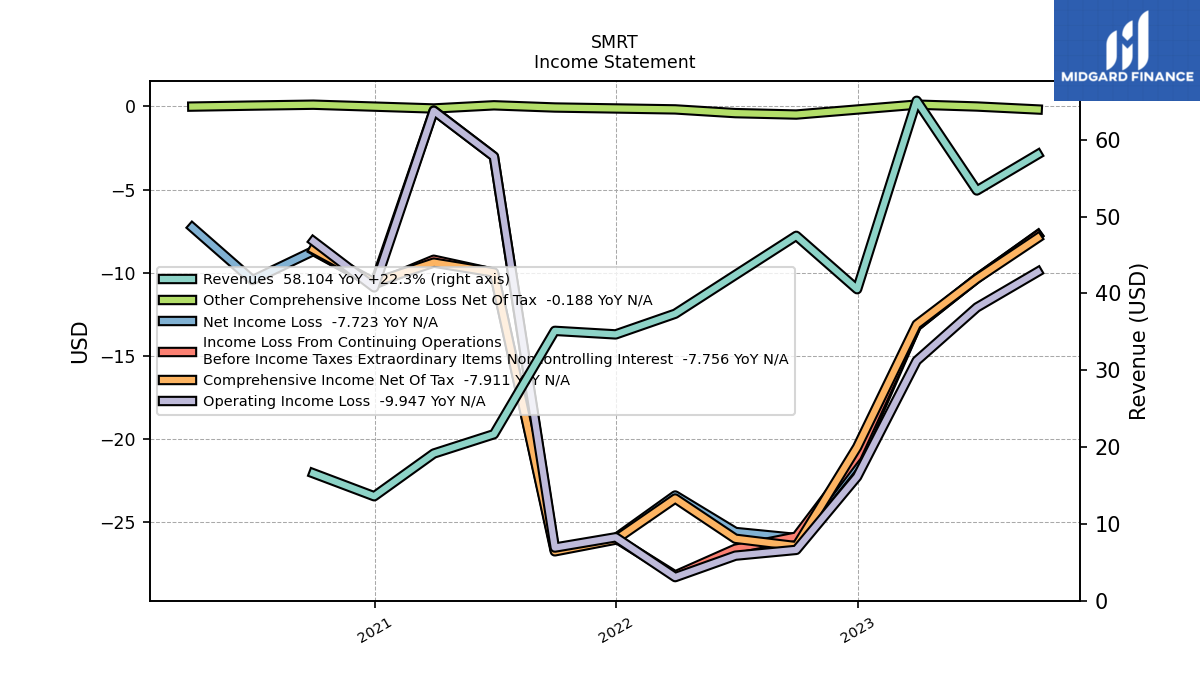
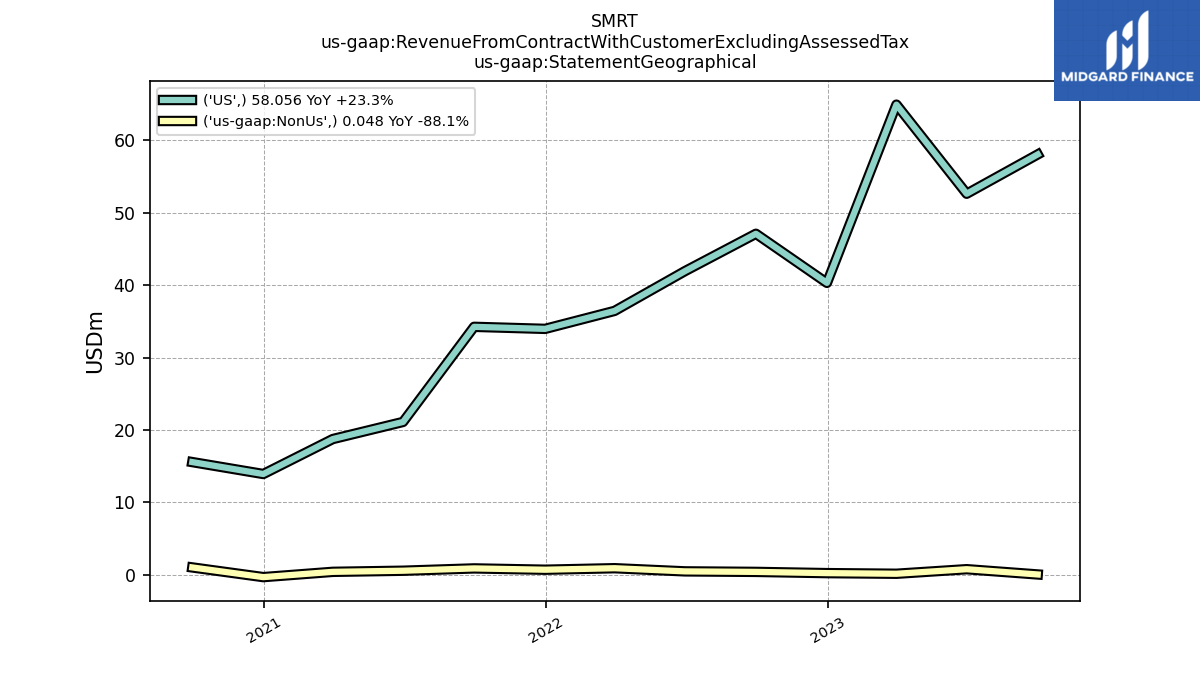
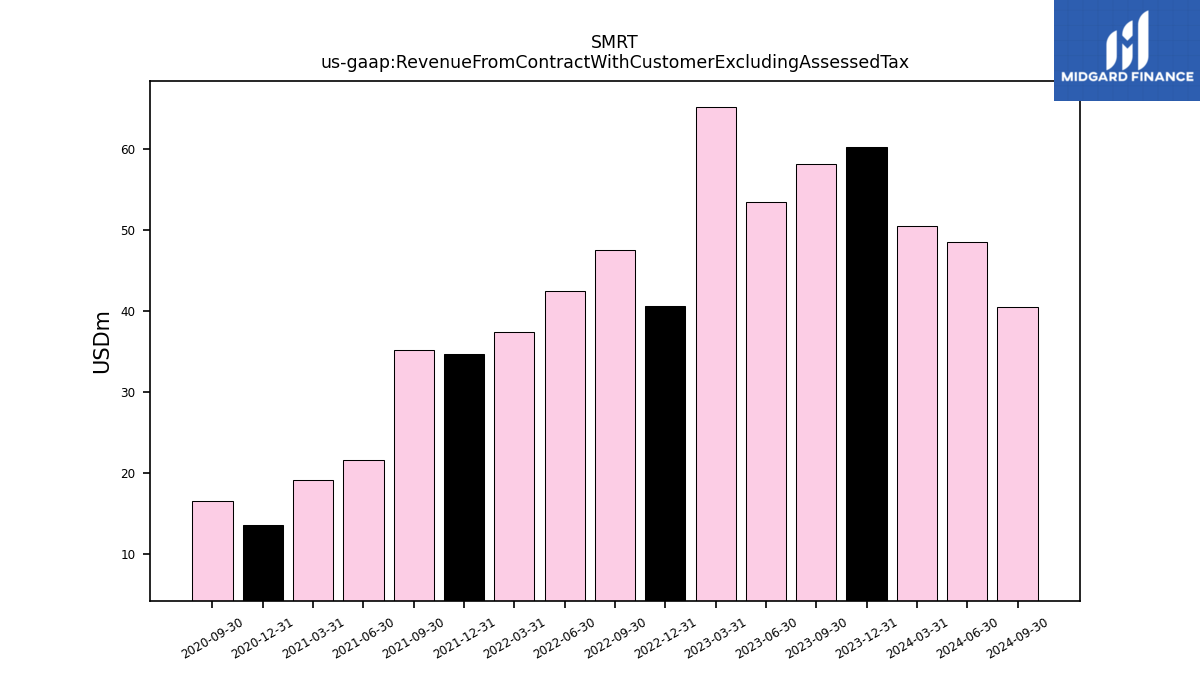
| Revenue From Contract With Customer Excluding Assessed Tax | 58.10 | 53.40 | 65.08 | 40.55 | 47.50 | 42.41 | 37.36 | 34.67 | 35.13 | 21.68 | 19.16 | 13.60 | 16.59 | |
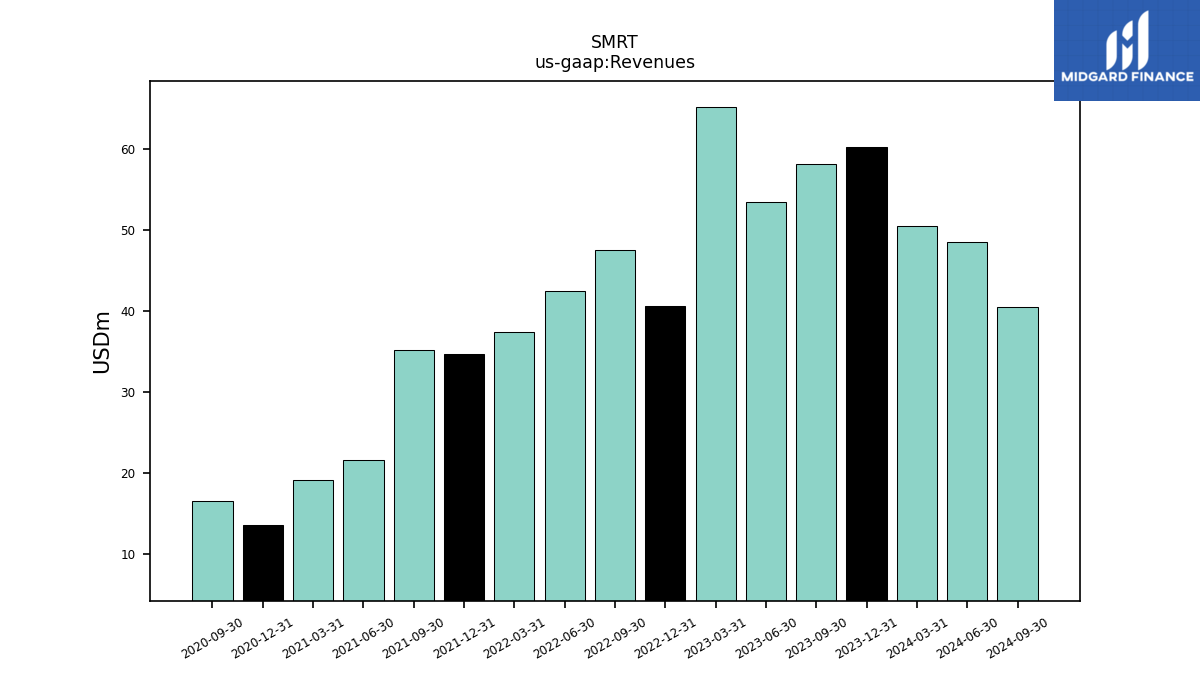
| Revenues | 58.10 | 53.40 | 65.08 | 40.55 | 47.50 | 42.41 | 37.36 | 34.67 | 35.13 | 21.68 | 19.16 | 13.60 | 16.59 | |
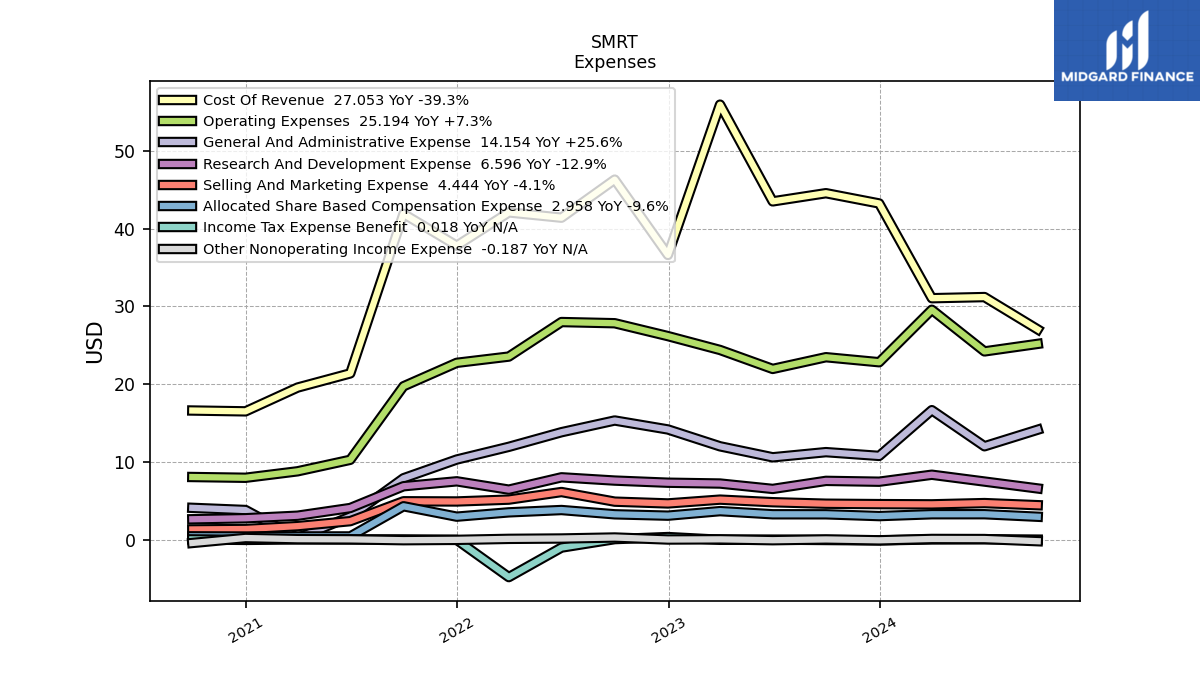
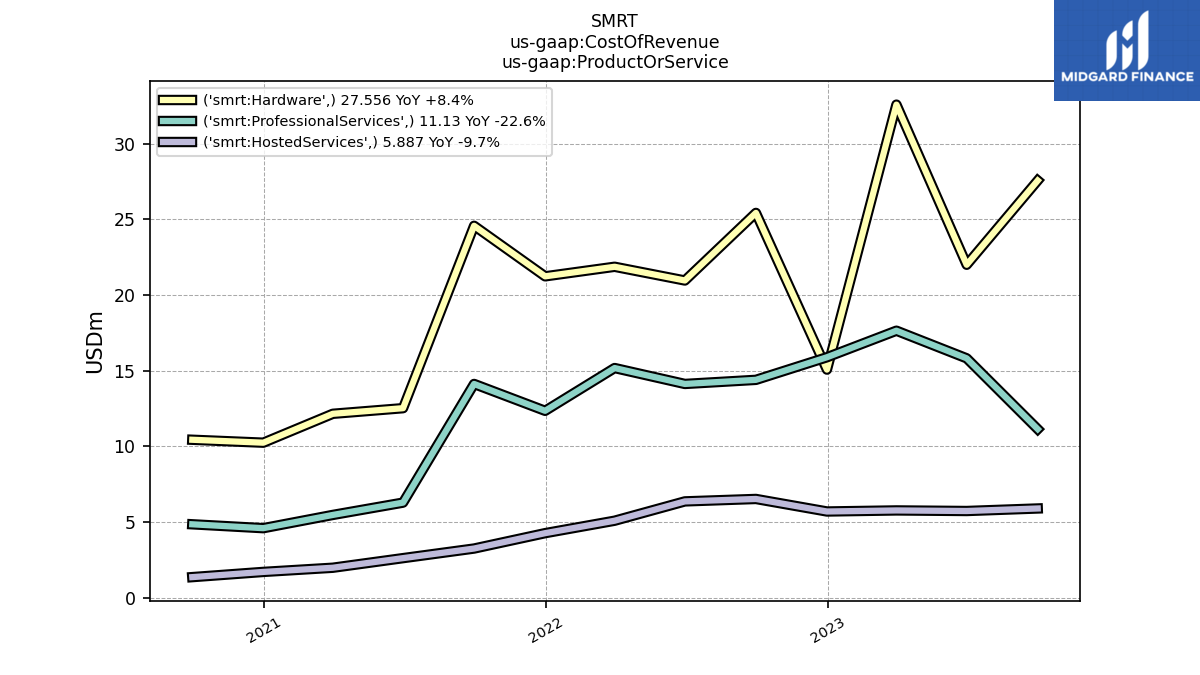
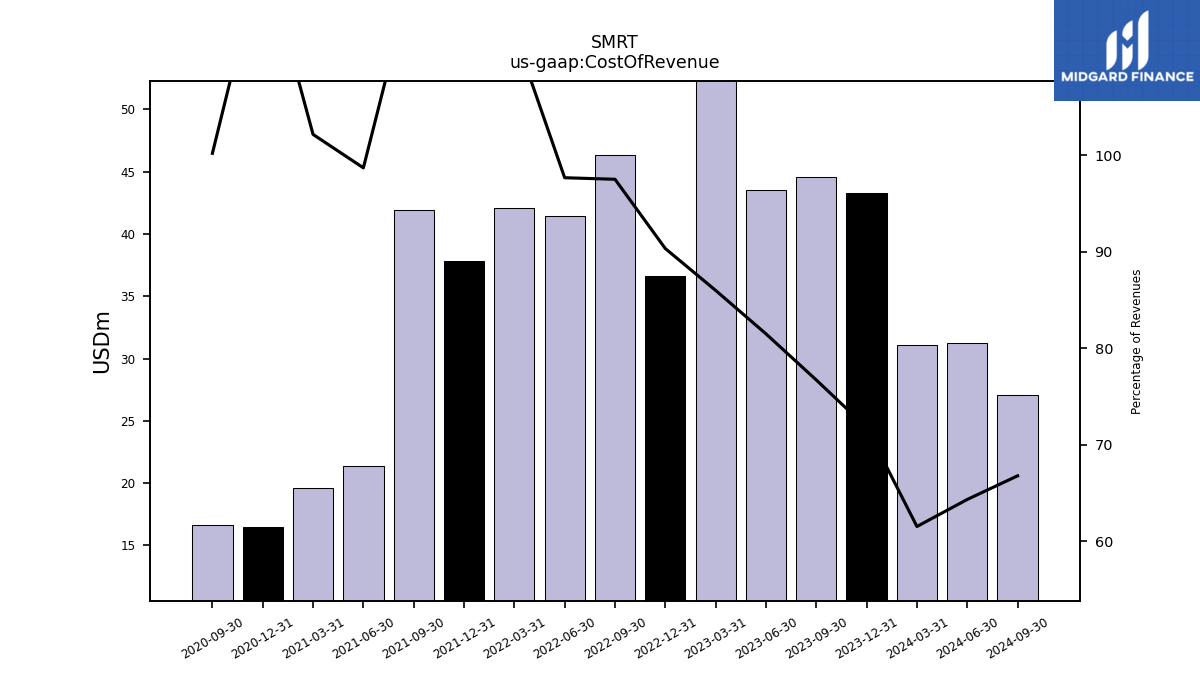
| Cost Of Revenue | 44.57 | 43.52 | 55.96 | 36.63 | 46.32 | 41.42 | 42.10 | 37.82 | 41.92 | 21.39 | 19.57 | 16.51 | 16.62 | |
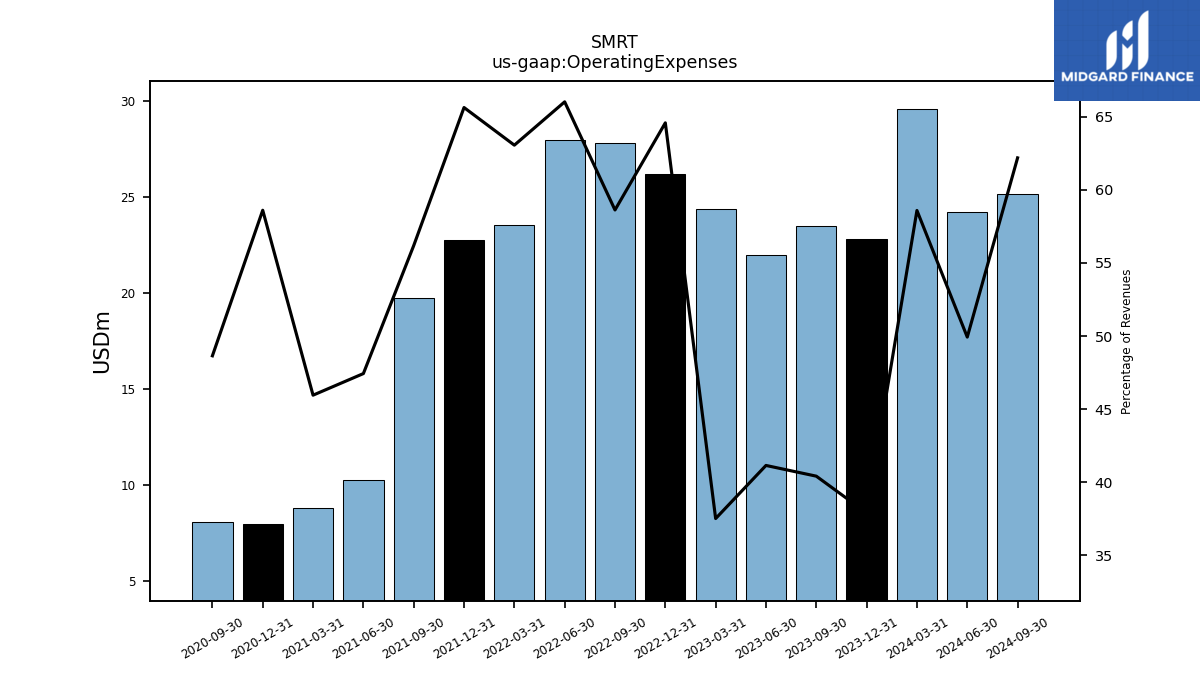
| Operating Expenses | 23.48 | 21.97 | 24.41 | 26.19 | 27.85 | 28.00 | 23.56 | 22.75 | 19.74 | 10.28 | 8.80 | 7.97 | 8.07 | |
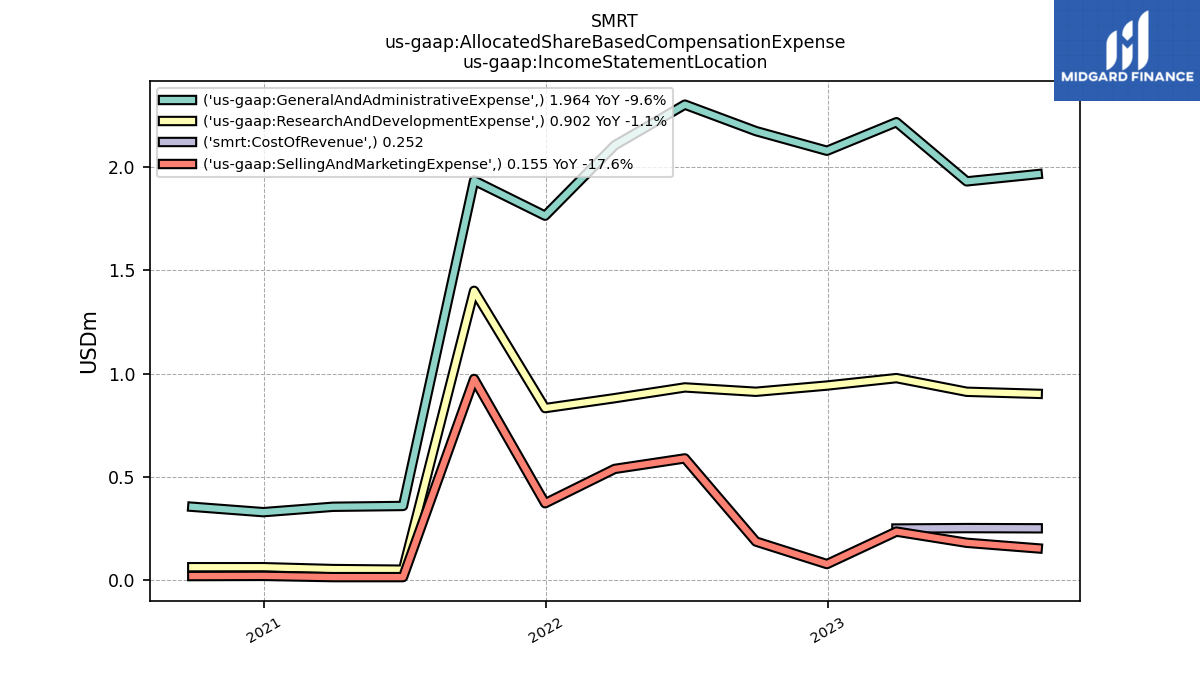
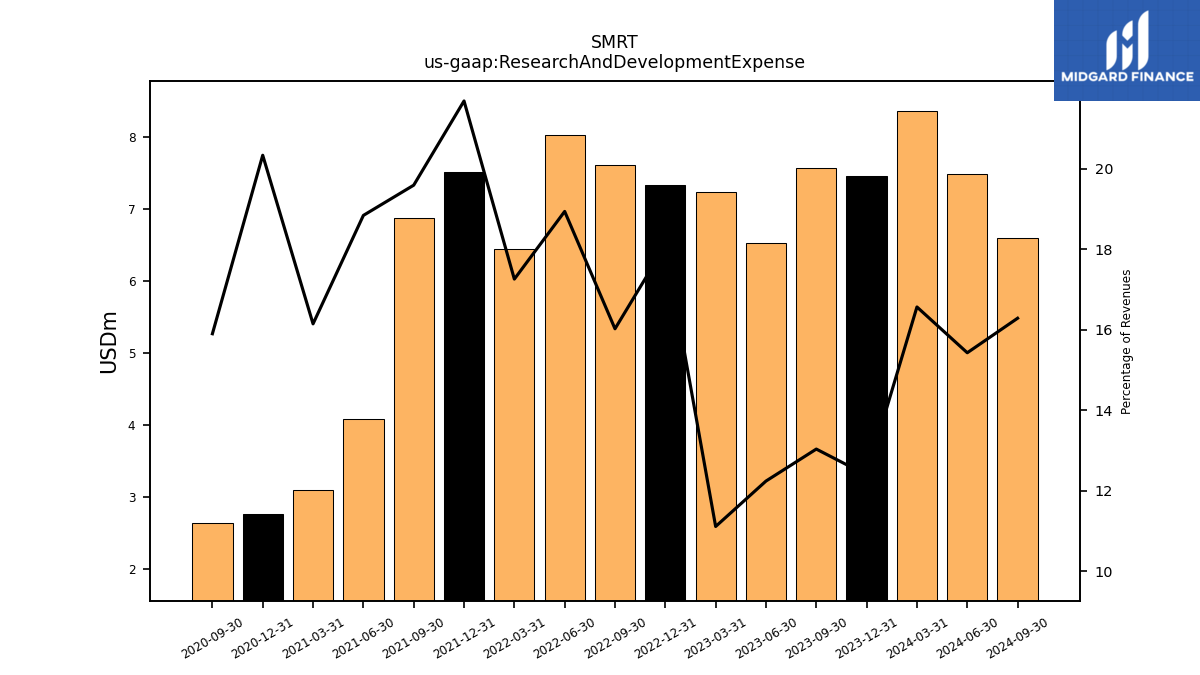
| Research And Development Expense | 7.57 | 6.54 | 7.23 | 7.34 | 7.61 | 8.03 | 6.45 | 7.51 | 6.88 | 4.08 | 3.09 | 2.77 | 2.64 | |
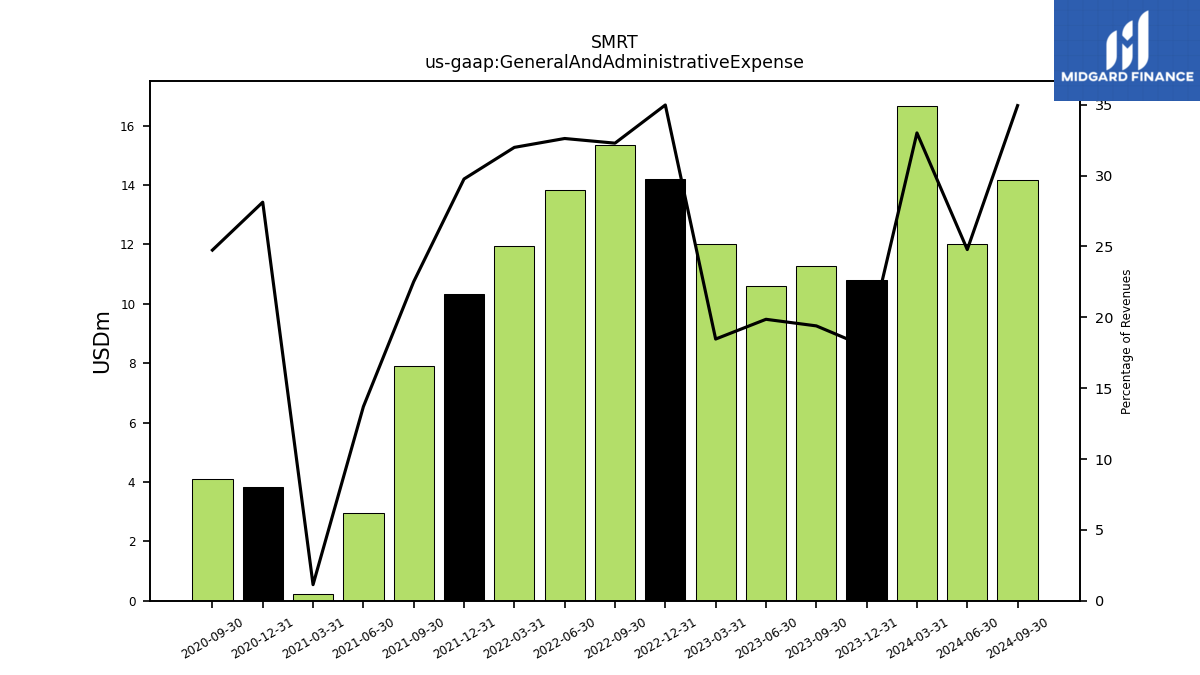
| General And Administrative Expense | 11.27 | 10.61 | 12.02 | 14.19 | 15.34 | 13.83 | 11.95 | 10.32 | 7.91 | 2.97 | 0.22 | 3.83 | 4.10 | |
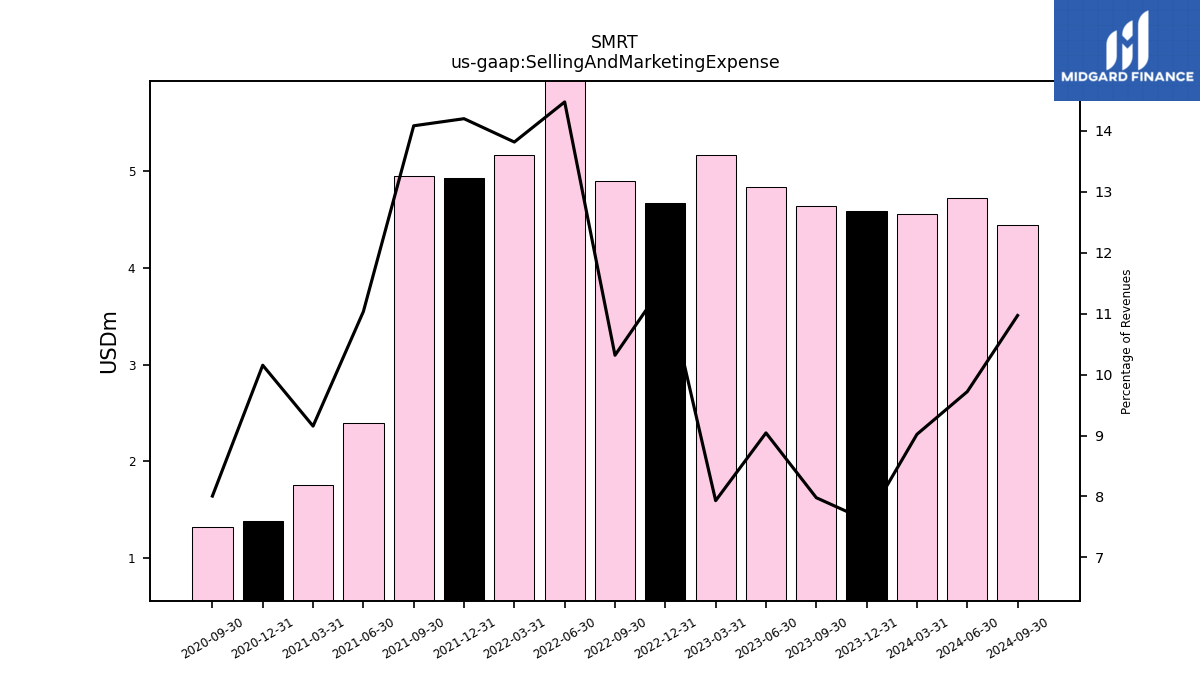
| Selling And Marketing Expense | 4.64 | 4.83 | 5.16 | 4.67 | 4.90 | 6.14 | 5.16 | 4.92 | 4.95 | 2.39 | 1.75 | 1.38 | 1.33 | |
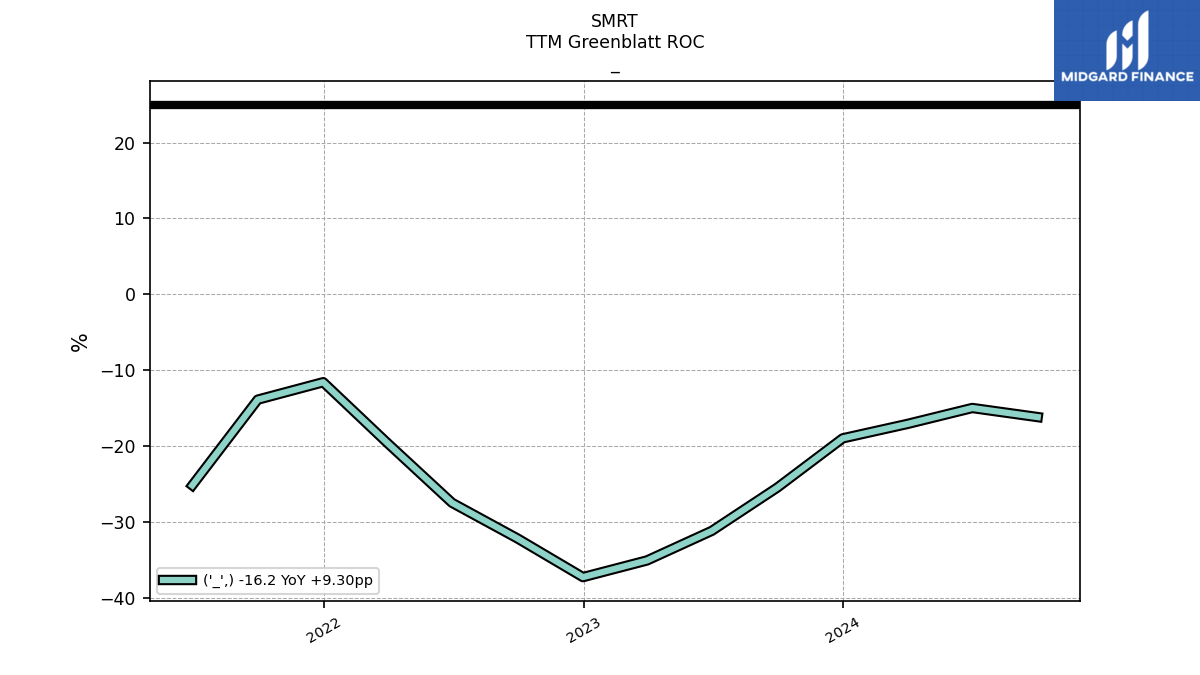
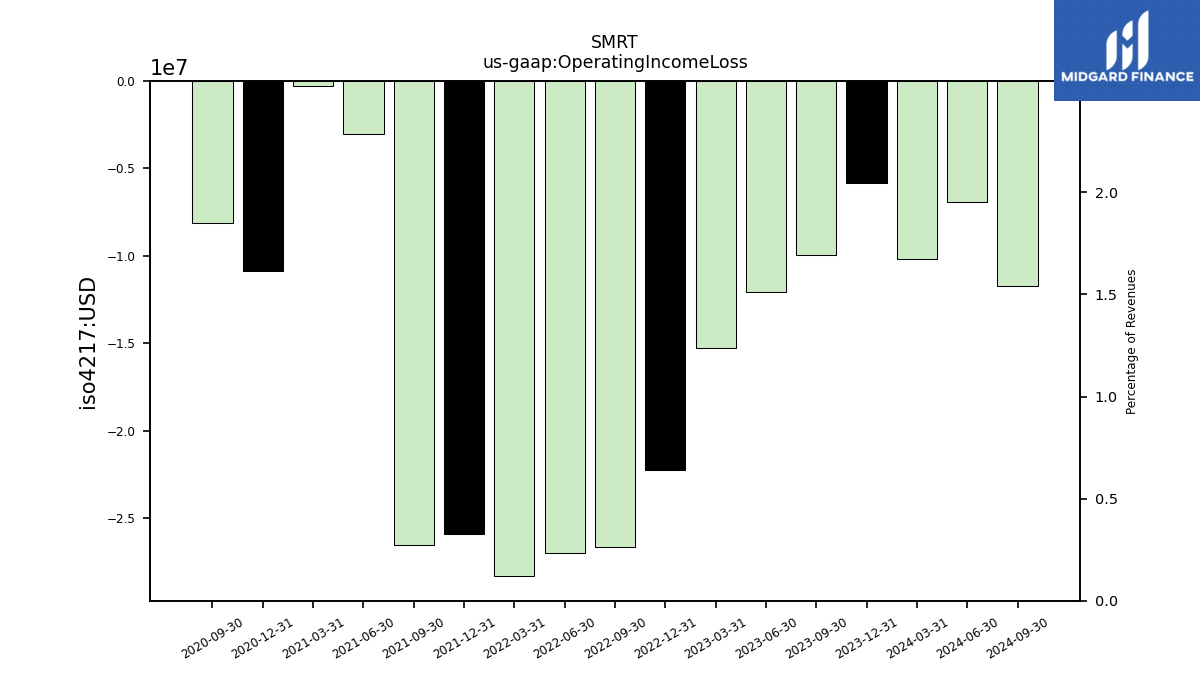
| Operating Income Loss | -9.95 | -12.09 | -15.29 | -22.27 | -26.66 | -27.01 | -28.30 | -25.91 | -26.53 | -3.02 | -0.27 | -10.88 | -8.10 | |
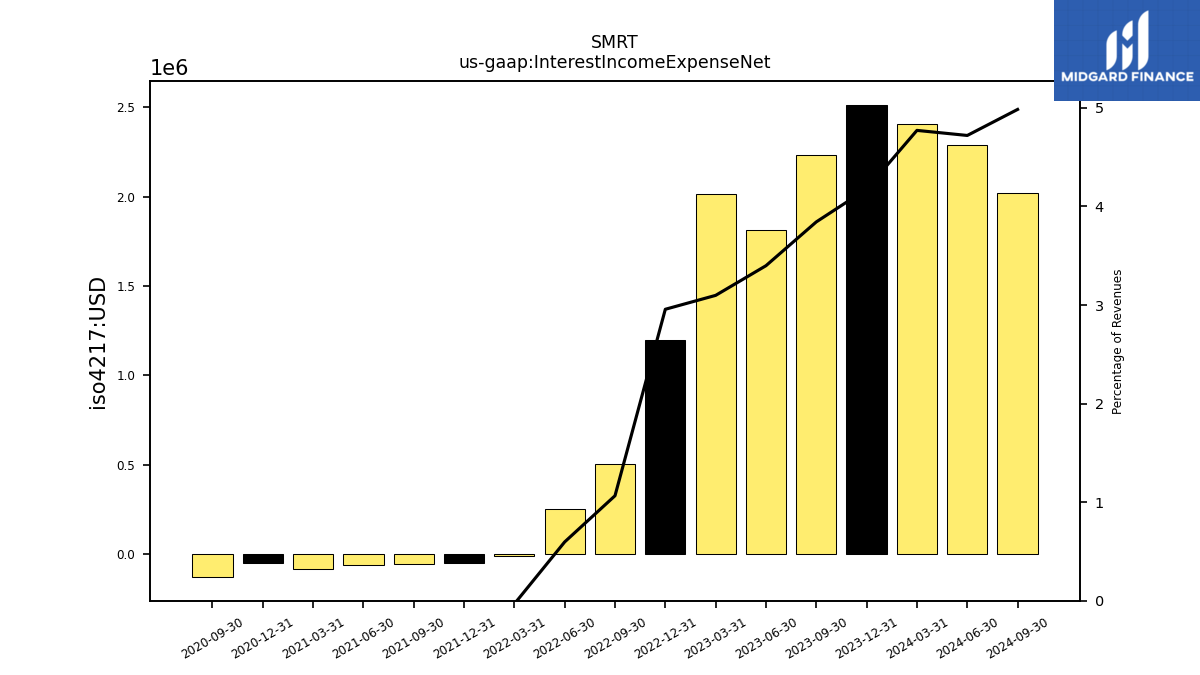
| Interest Income Expense Net | 2.23 | 1.81 | 2.02 | 1.20 | 0.51 | 0.25 | -0.01 | -0.05 | -0.06 | -0.06 | -0.08 | -0.05 | -0.13 | |
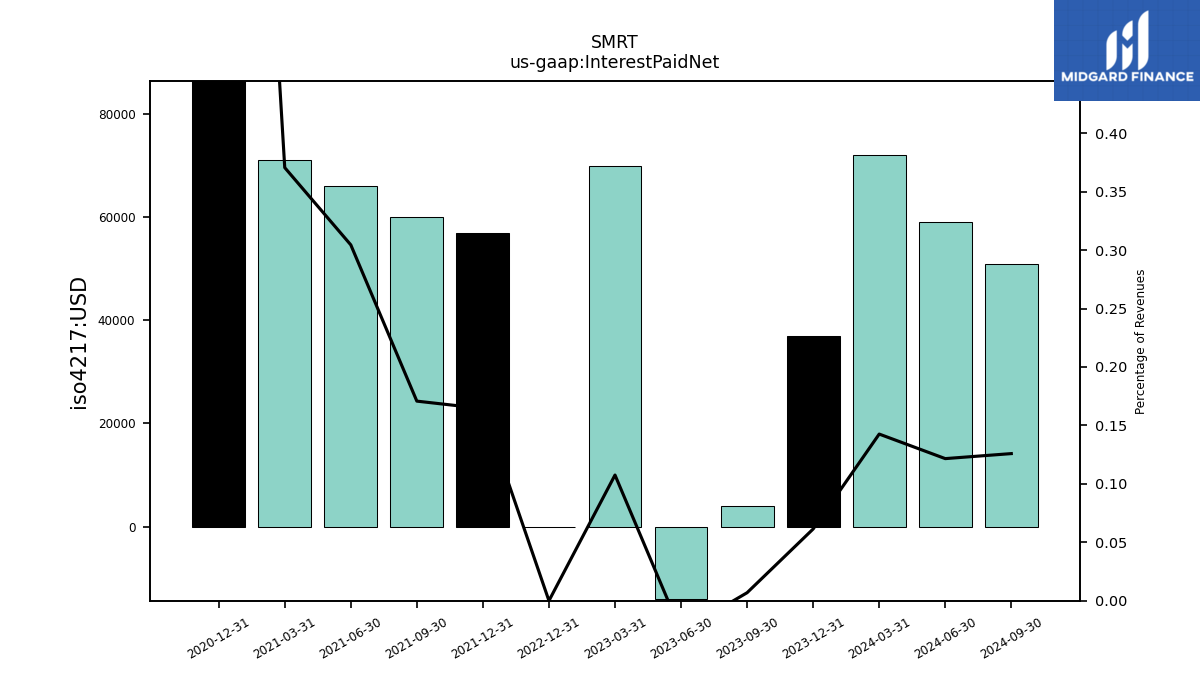
| Interest Paid Net | 0.00 | -0.01 | 0.07 | 0.00 | NA | NA | NA | 0.06 | 0.06 | 0.07 | 0.07 | 0.18 | NA | |
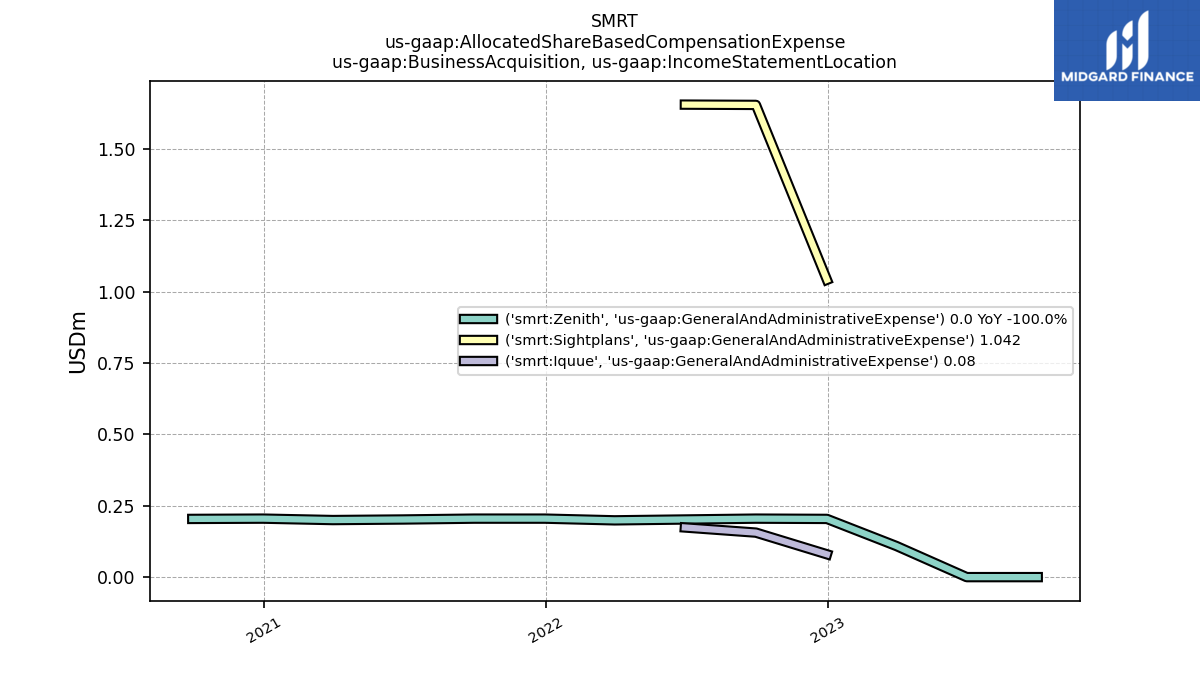
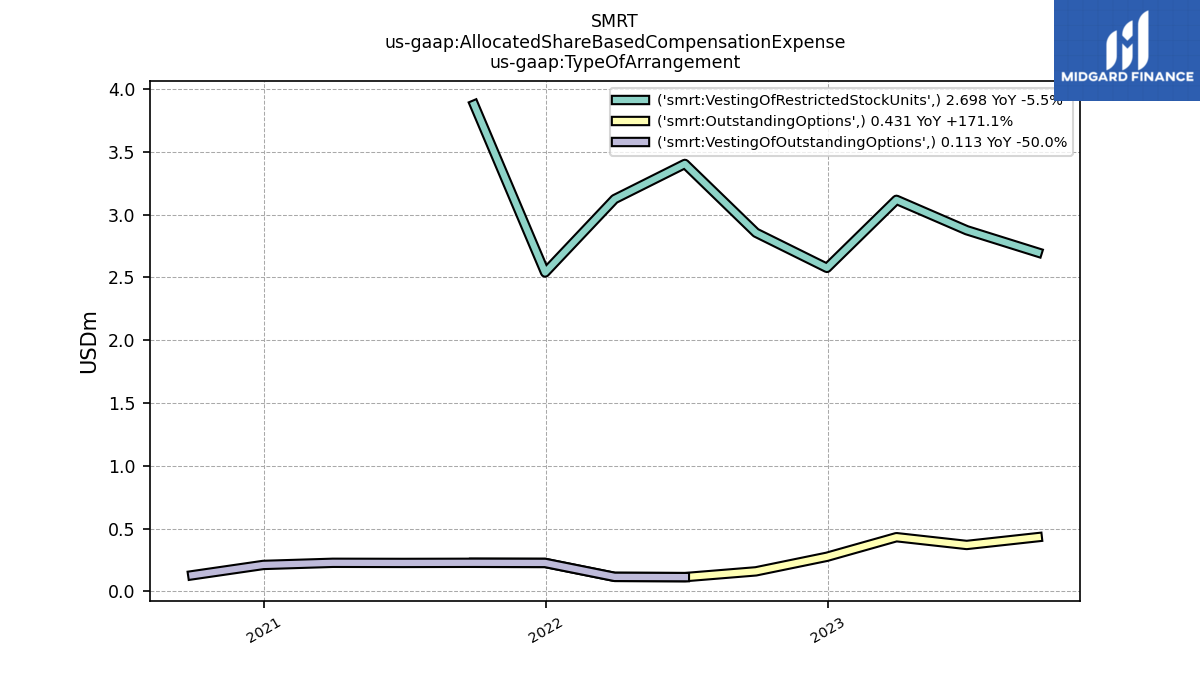
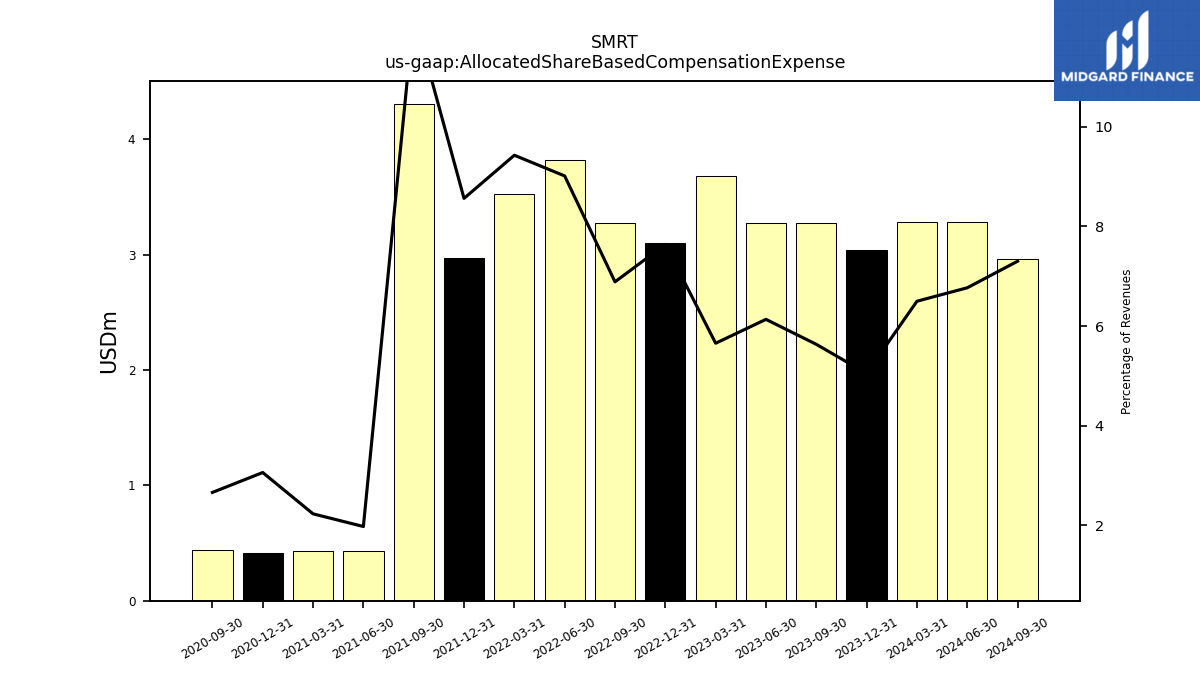
| Allocated Share Based Compensation Expense | 3.27 | 3.28 | 3.68 | 3.10 | 3.27 | 3.82 | 3.52 | 2.97 | 4.31 | 0.43 | 0.43 | 0.42 | 0.44 | |
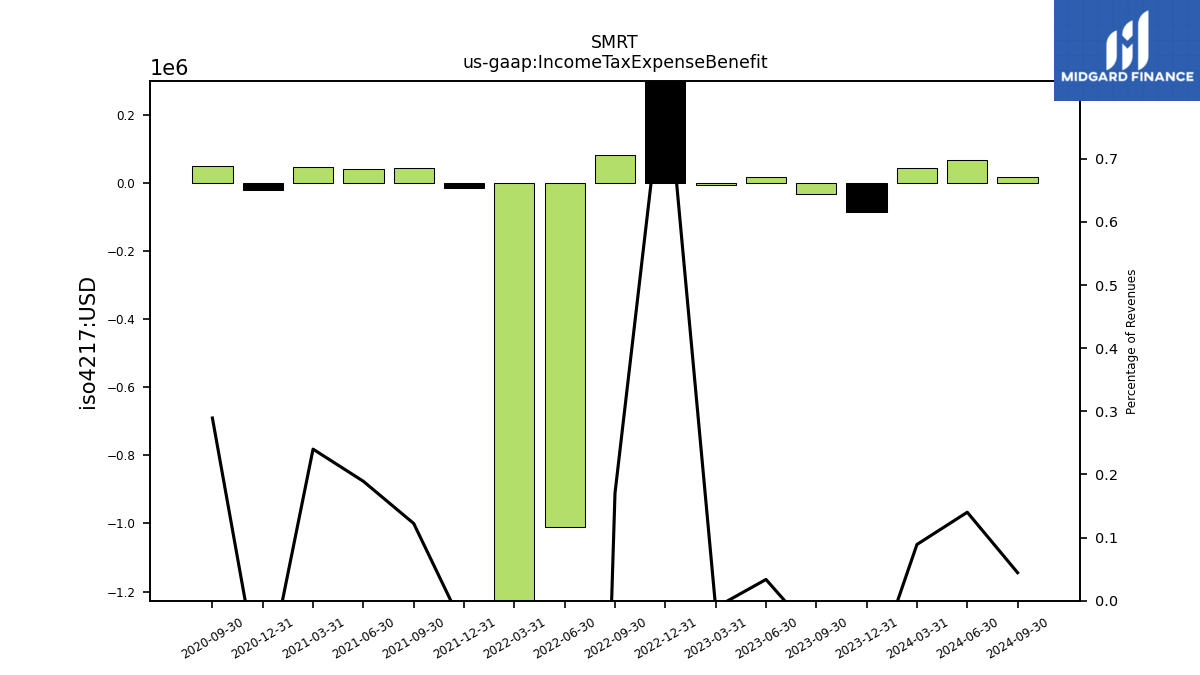
| Income Tax Expense Benefit | -0.03 | 0.02 | -0.01 | 0.35 | 0.08 | -1.01 | -4.81 | -0.01 | 0.04 | 0.04 | 0.05 | -0.02 | 0.05 | |
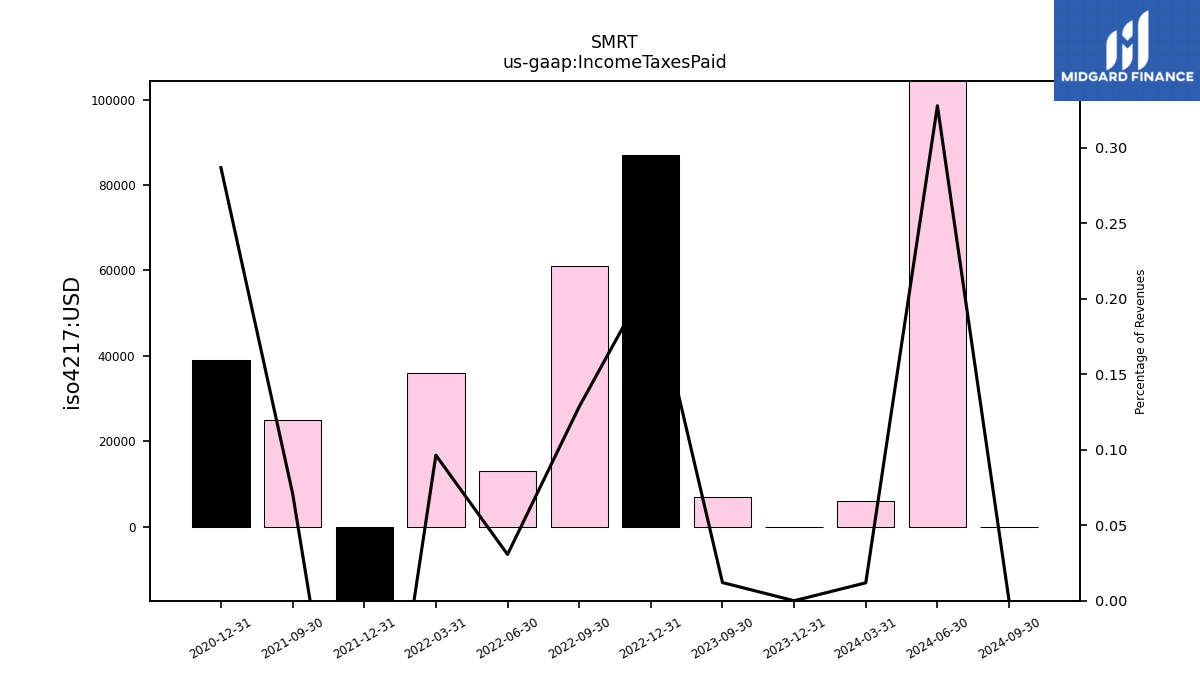
| Income Taxes Paid | 0.01 | NA | NA | 0.09 | 0.06 | 0.01 | 0.04 | -0.08 | 0.03 | NA | NA | 0.04 | NA | |
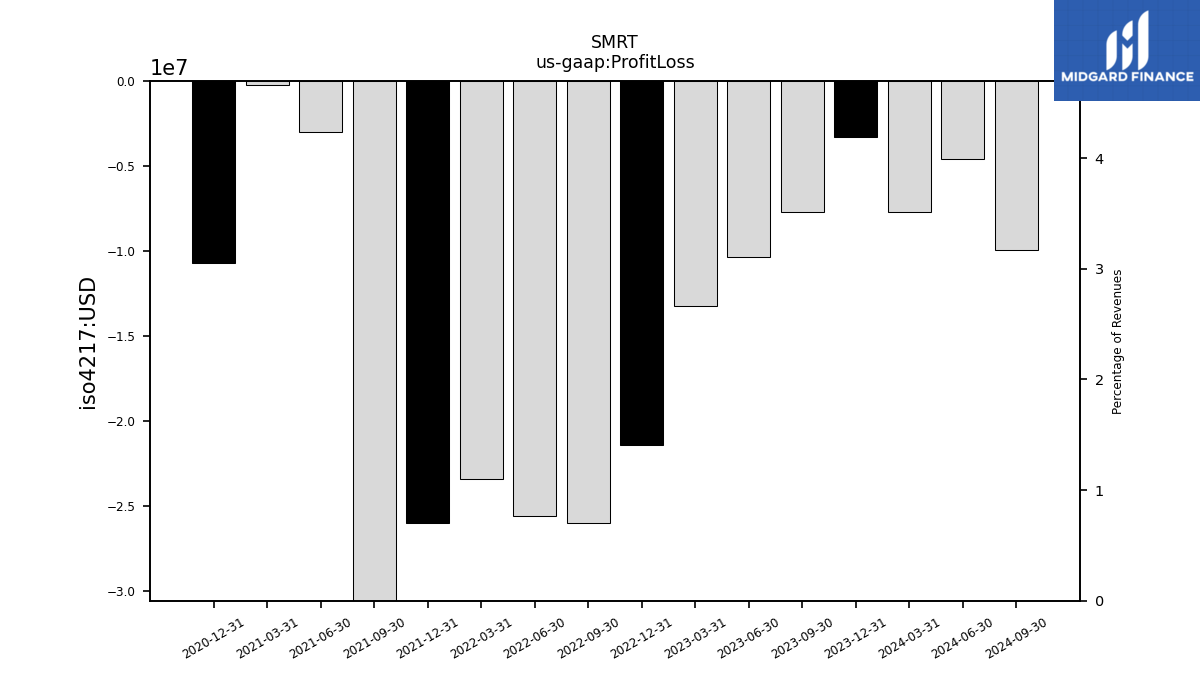
| Profit Loss | -7.72 | -10.35 | -13.21 | -21.39 | -25.95 | -25.59 | -23.39 | -25.96 | -42.74 | -3.01 | -0.25 | -10.69 | NA | |
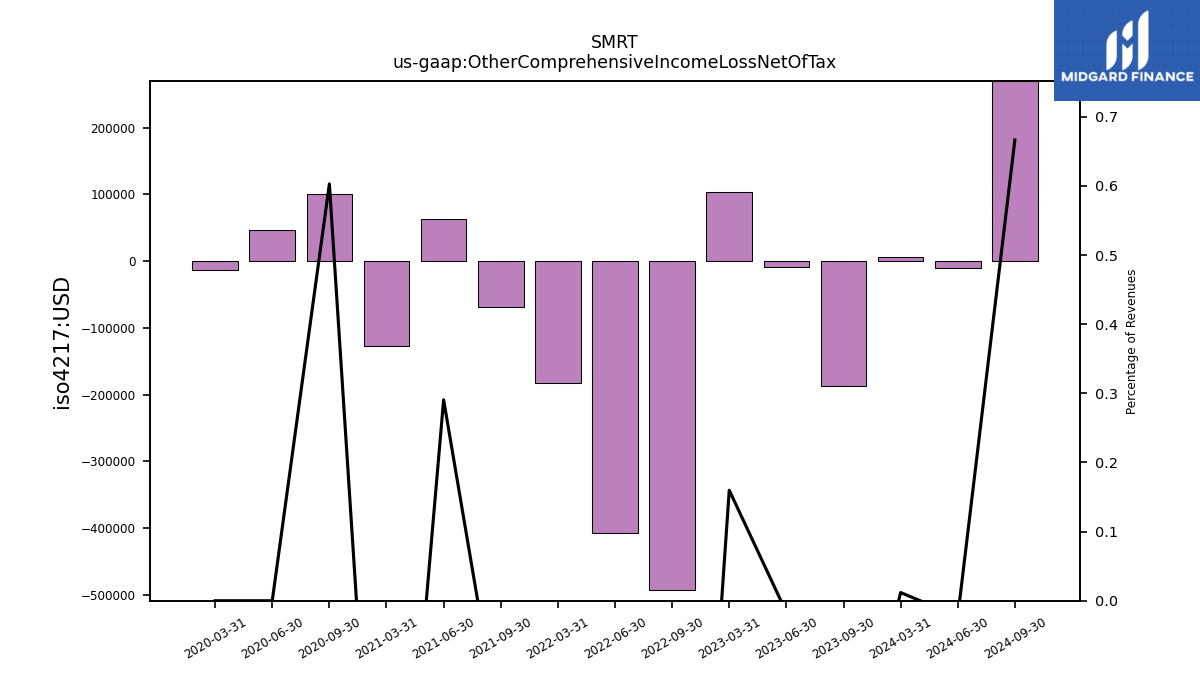
| Other Comprehensive Income Loss Net Of Tax | -0.19 | -0.01 | 0.10 | NA | -0.49 | -0.41 | -0.18 | NA | -0.07 | 0.06 | -0.13 | NA | 0.10 | |
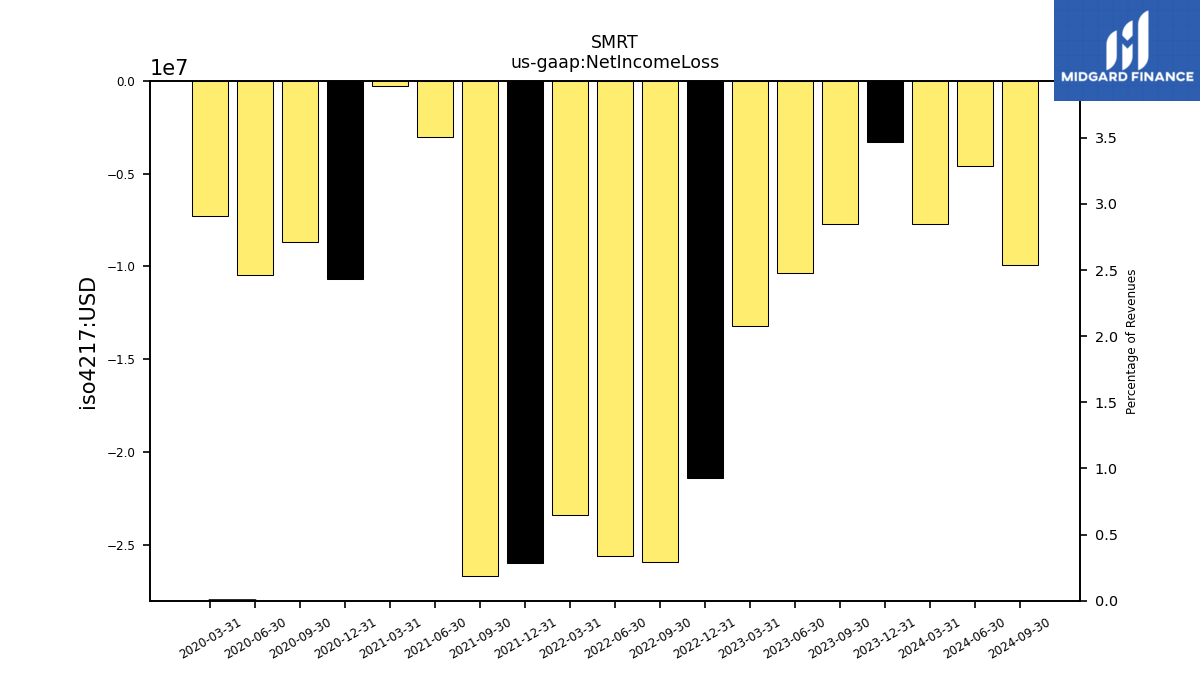
| Net Income Loss | -7.72 | -10.35 | -13.21 | -21.39 | -25.95 | -25.59 | -23.39 | -25.96 | -26.68 | -3.01 | -0.25 | -10.69 | -8.70 | |
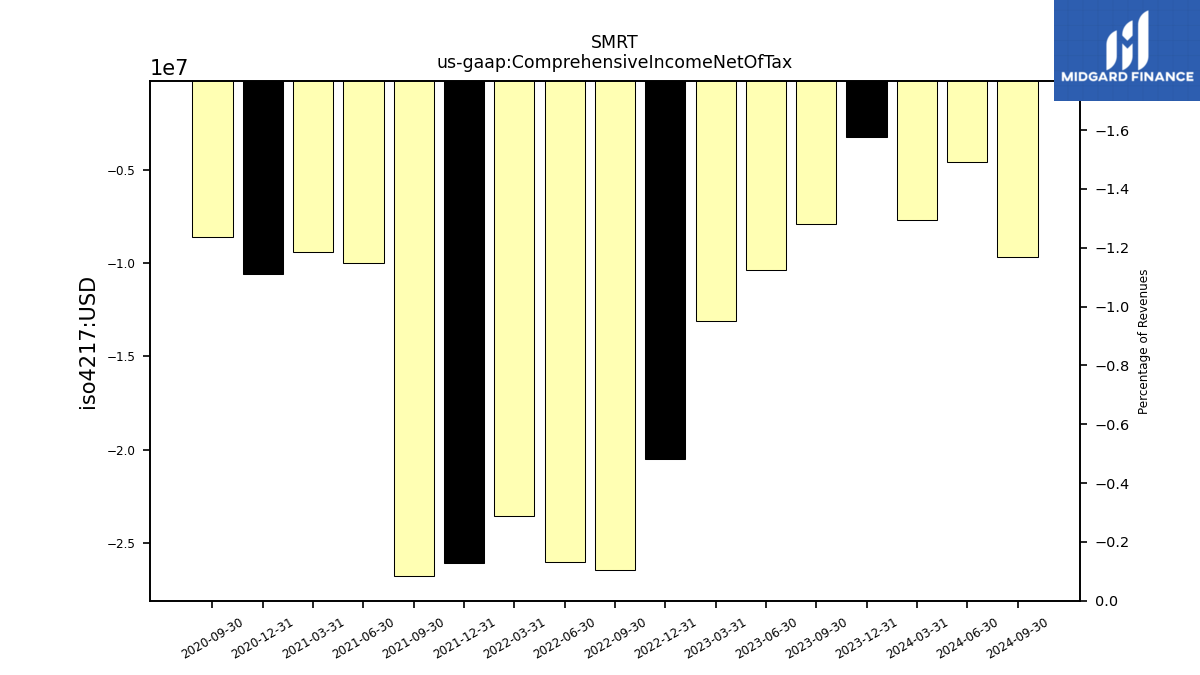
| Comprehensive Income Net Of Tax | -7.91 | -10.36 | -13.11 | -20.49 | -26.44 | -26.00 | -23.58 | -26.05 | -26.75 | -9.99 | -9.39 | -10.59 | -8.60 |
| 2023-09-30 | 2023-06-30 | 2023-03-31 | 2022-12-31 | 2022-09-30 | 2022-06-30 | 2022-03-31 | 2021-12-31 | 2021-09-30 | 2021-06-30 | 2021-03-31 | 2020-12-31 | 2020-09-30 | ||
|---|---|---|---|---|---|---|---|---|---|---|---|---|---|---|
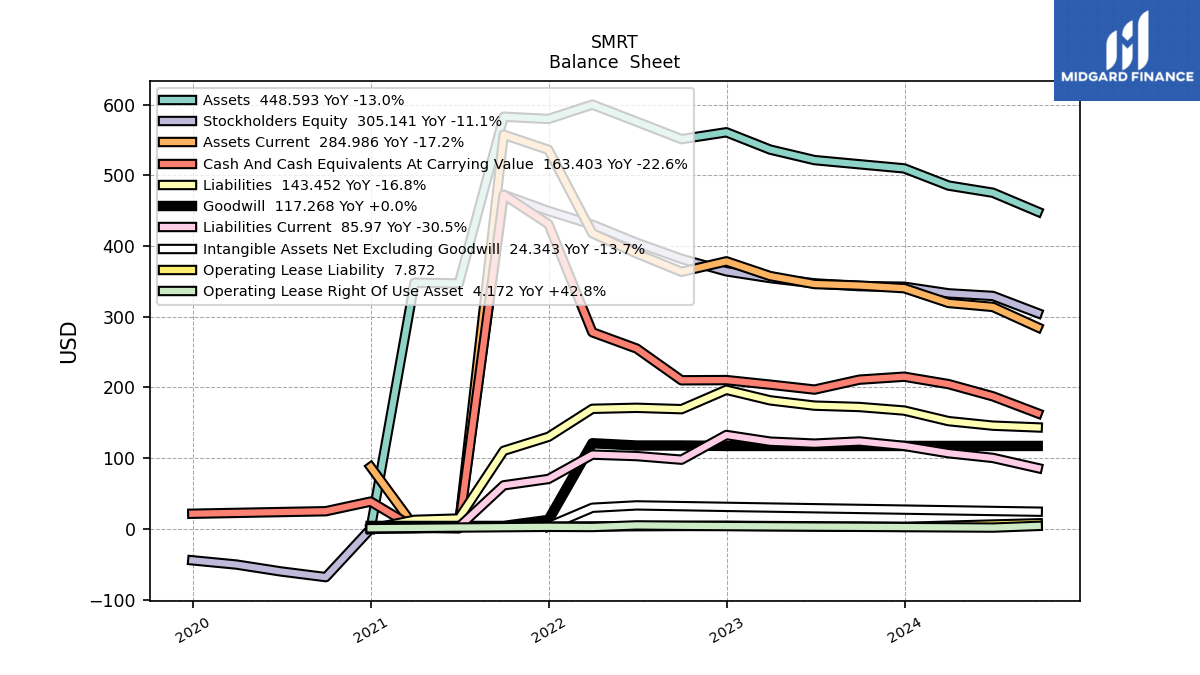
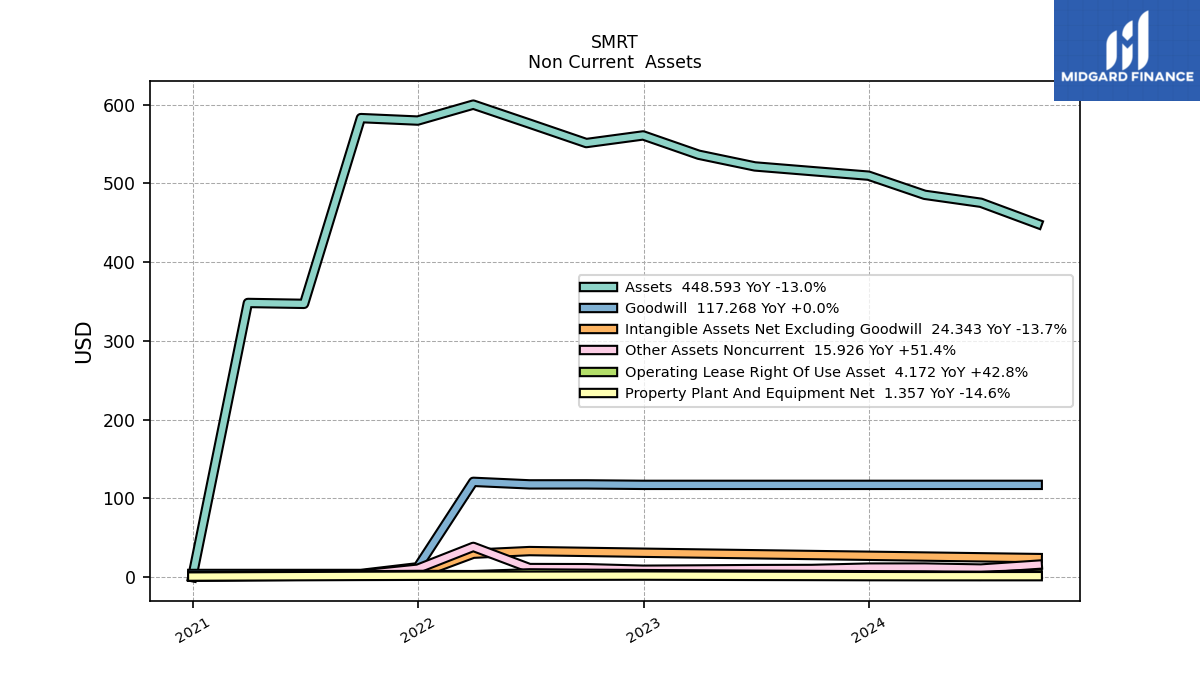
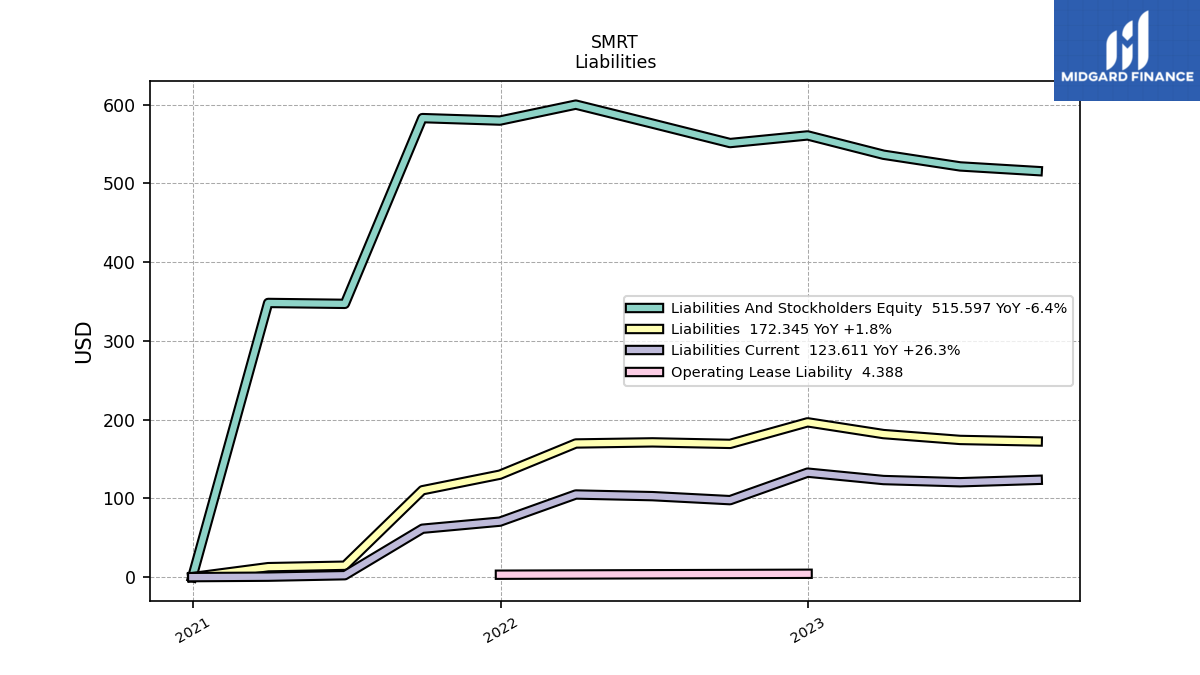
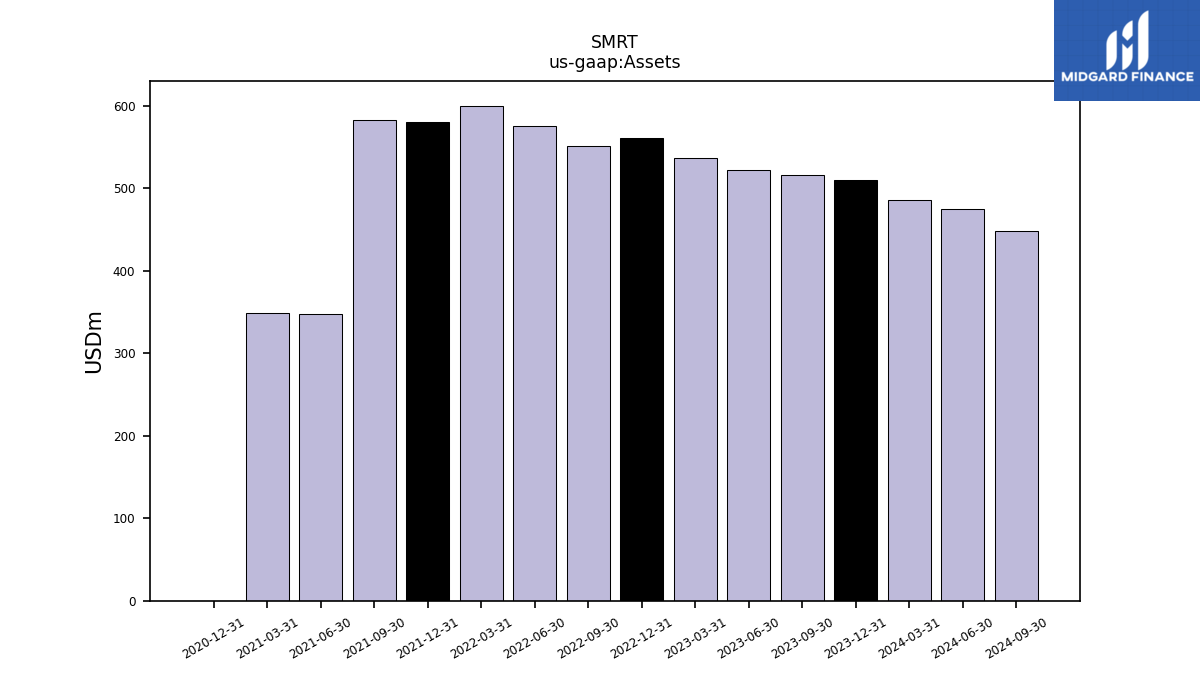
| Assets | 515.60 | 521.48 | 536.34 | 560.85 | 551.14 | 575.81 | 599.94 | 579.68 | 582.83 | 347.03 | 348.17 | 0.15 | NA | |
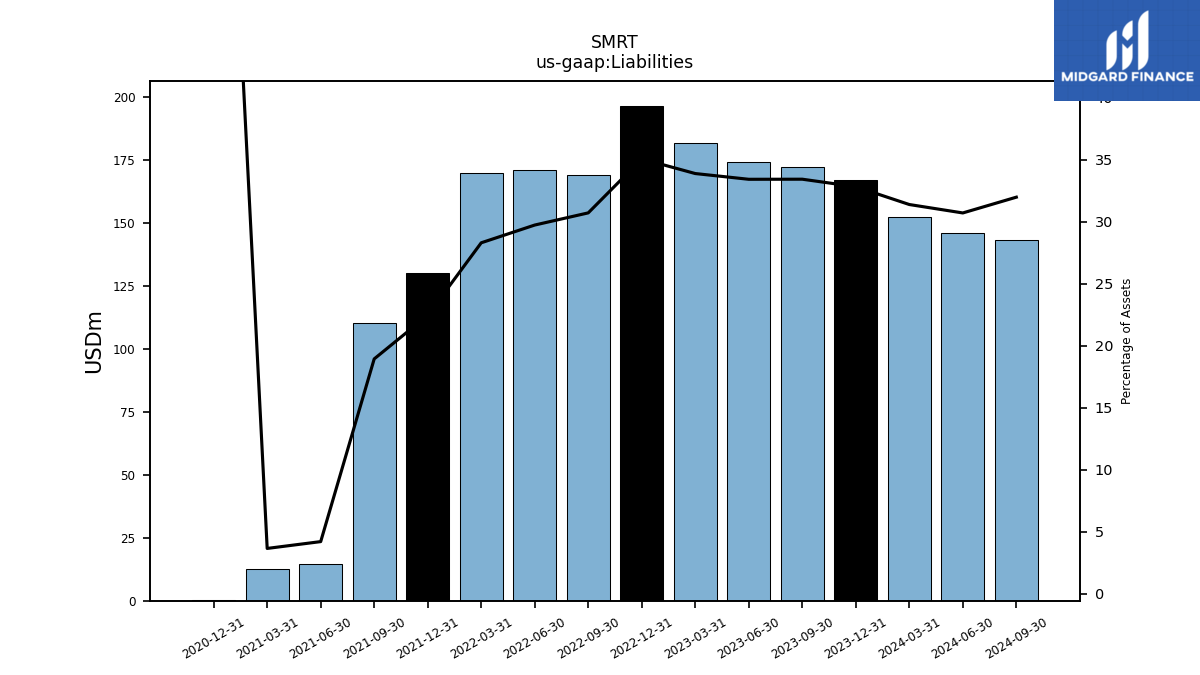
| Liabilities | 172.34 | 174.28 | 181.72 | 196.65 | 169.27 | 171.20 | 169.79 | 130.18 | 110.41 | 14.64 | 12.78 | 0.14 | NA | |
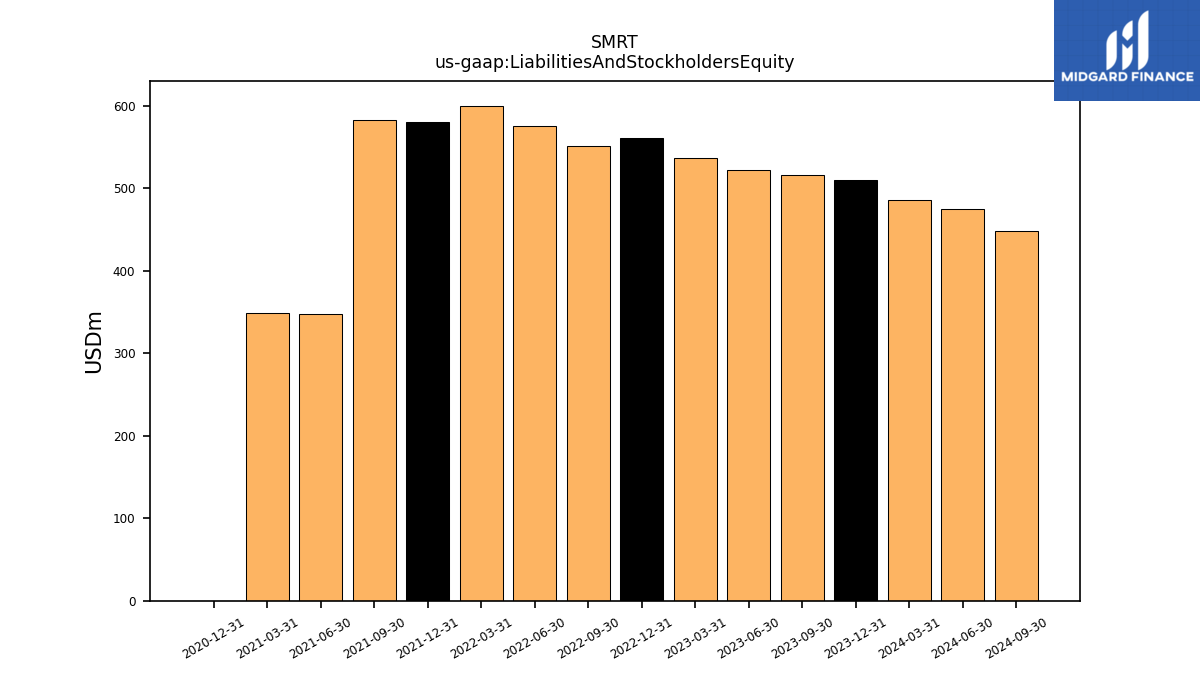
| Liabilities And Stockholders Equity | 515.60 | 521.48 | 536.34 | 560.85 | 551.14 | 575.81 | 599.94 | 579.68 | 582.83 | 347.03 | 348.17 | 0.15 | NA | |
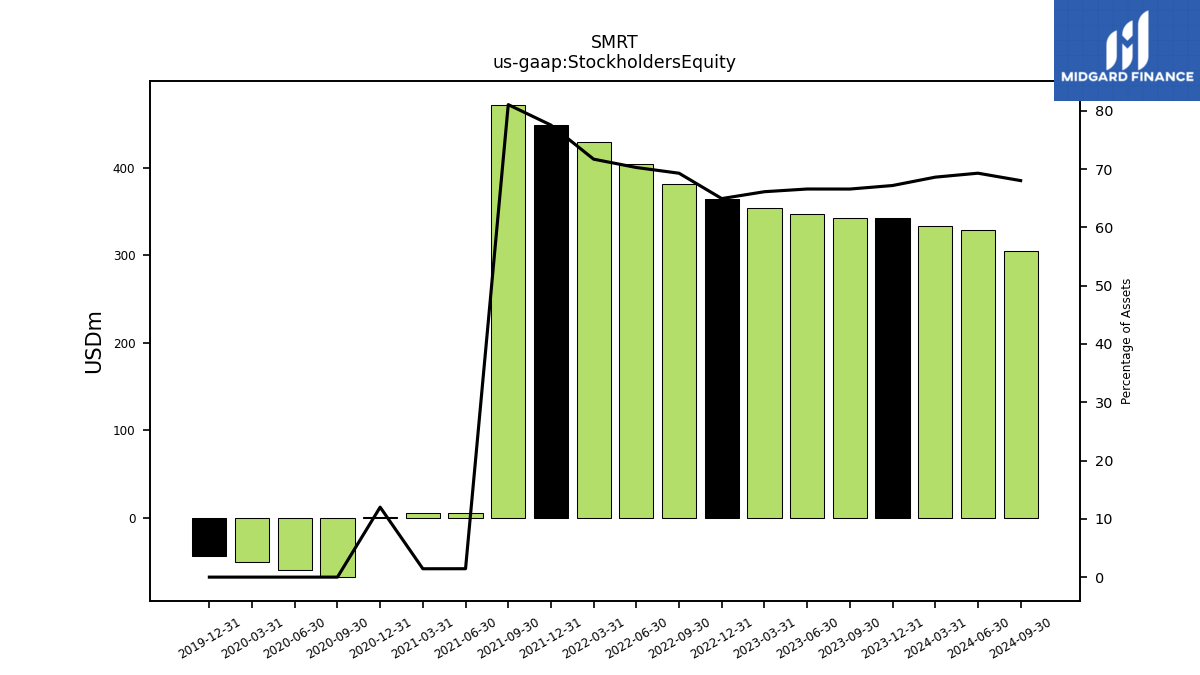
| Stockholders Equity | 343.25 | 347.20 | 354.62 | 364.20 | 381.87 | 404.61 | 430.15 | 449.50 | 472.42 | 5.00 | 5.00 | 0.02 | -68.22 |
| 2023-09-30 | 2023-06-30 | 2023-03-31 | 2022-12-31 | 2022-09-30 | 2022-06-30 | 2022-03-31 | 2021-12-31 | 2021-09-30 | 2021-06-30 | 2021-03-31 | 2020-12-31 | 2020-09-30 | ||
|---|---|---|---|---|---|---|---|---|---|---|---|---|---|---|
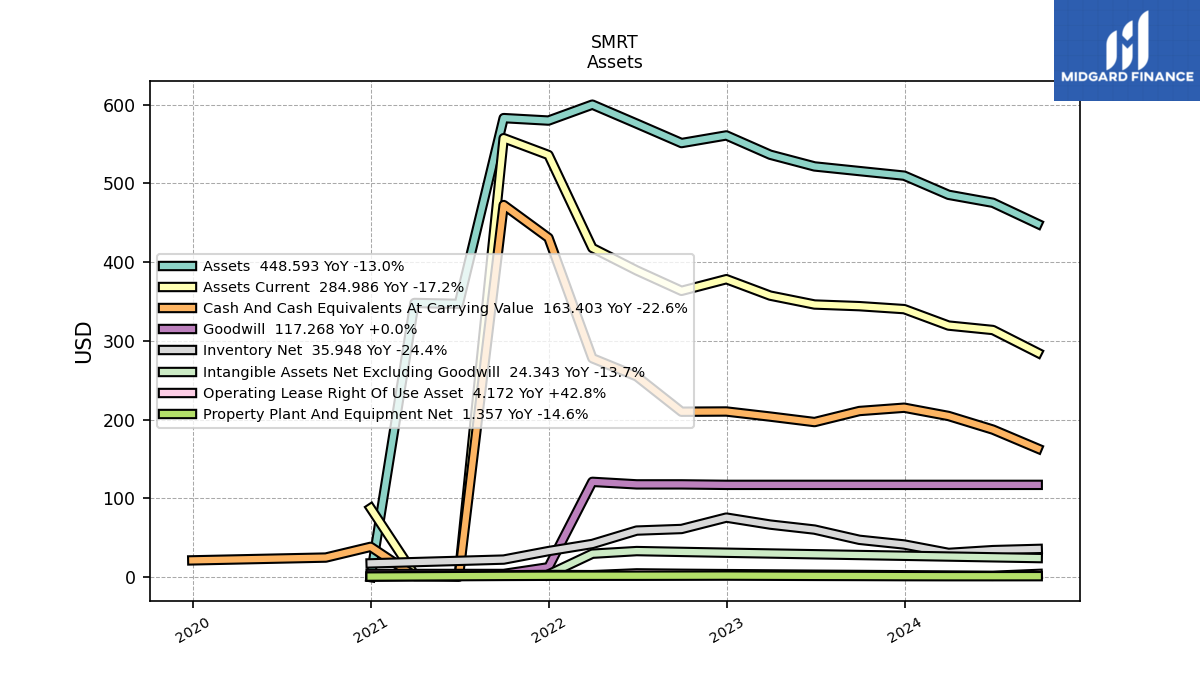
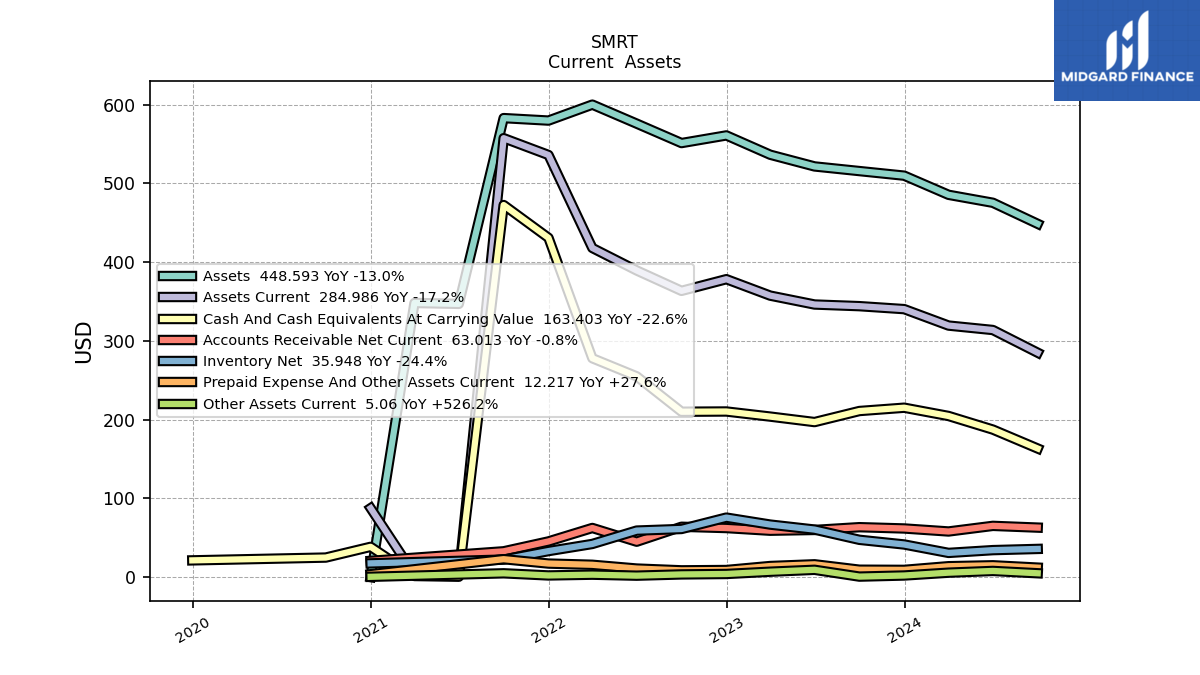
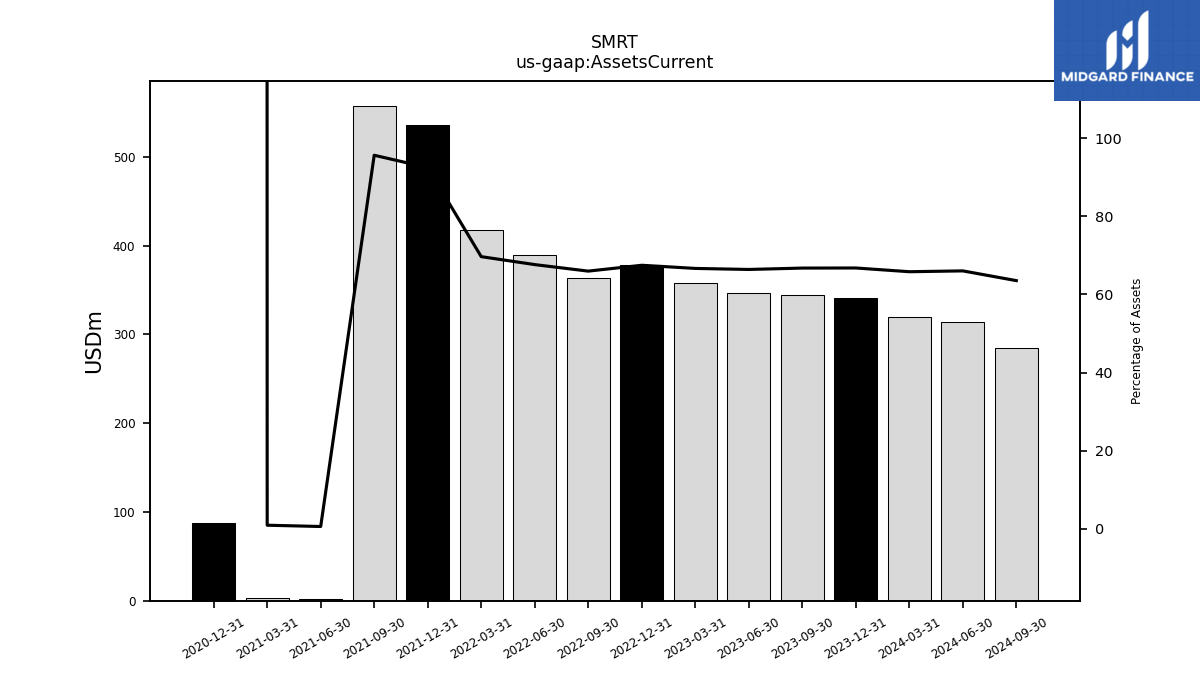
| Assets Current | 344.12 | 346.20 | 357.49 | 378.36 | 363.54 | 389.43 | 417.97 | 536.01 | 557.36 | 2.01 | 3.16 | 87.66 | NA | |
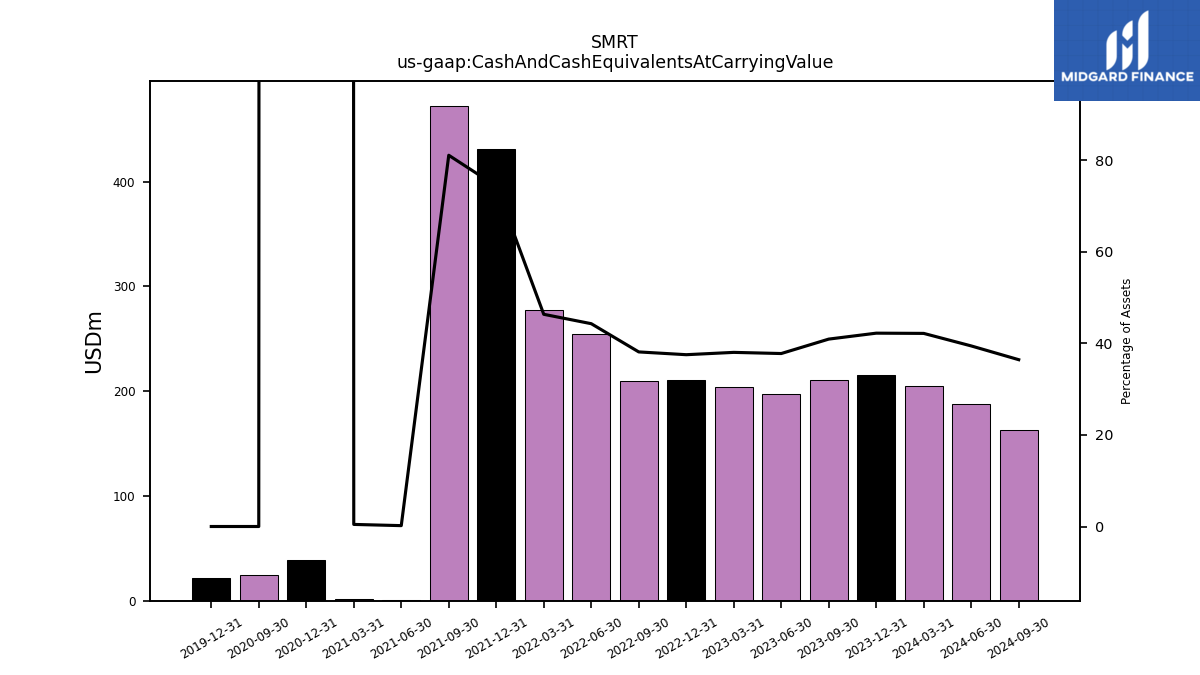
| Cash And Cash Equivalents At Carrying Value | 211.00 | 196.97 | 203.93 | 210.41 | 210.11 | 255.01 | 278.00 | 430.84 | 472.50 | 0.66 | 1.58 | 38.62 | 24.98 | |
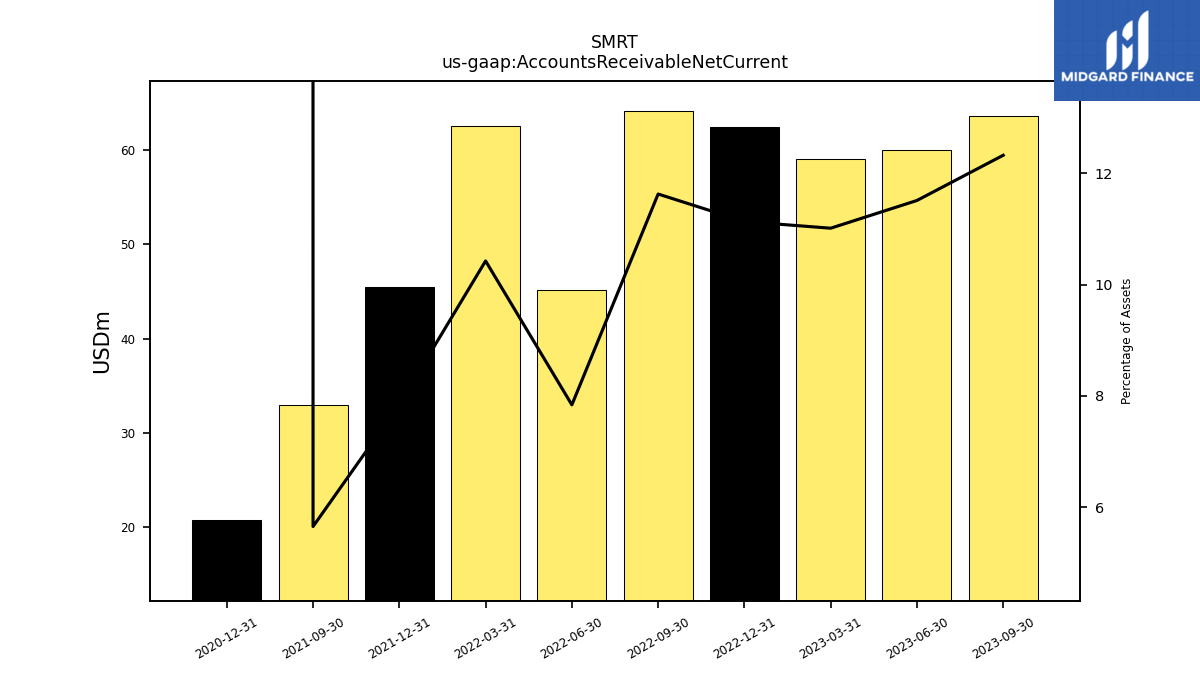
| Accounts Receivable Net Current | 63.55 | 60.03 | 59.07 | 62.44 | 64.08 | 45.13 | 62.54 | 45.49 | 32.94 | NA | NA | 20.79 | NA | |
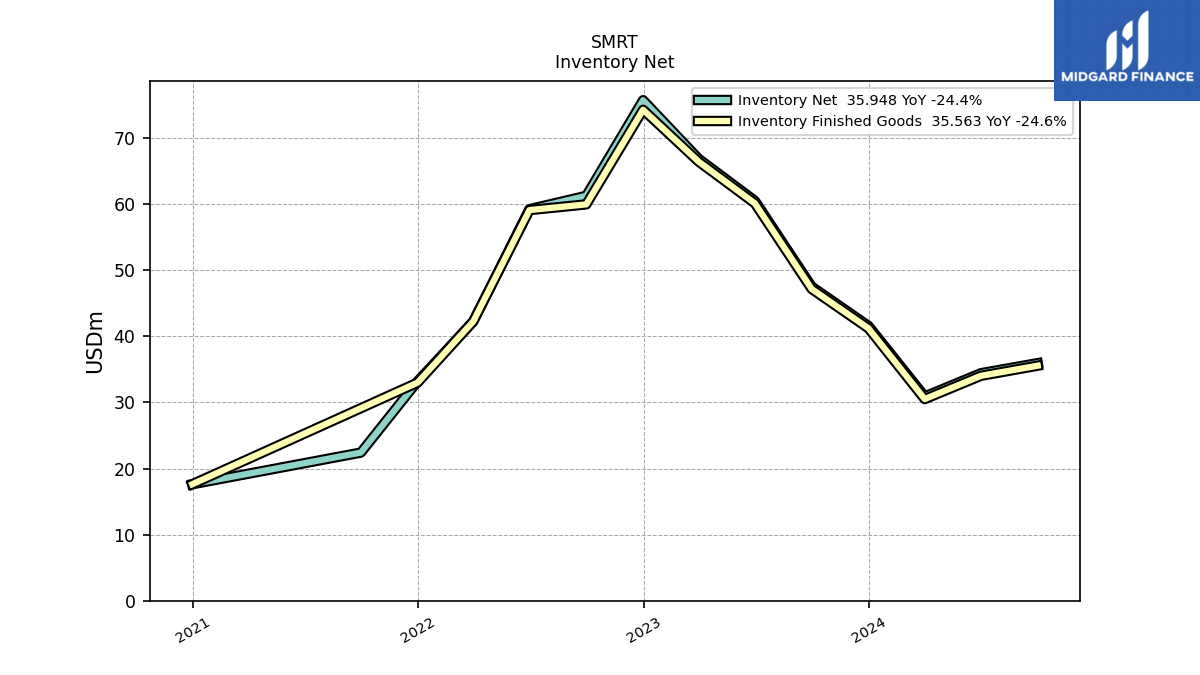
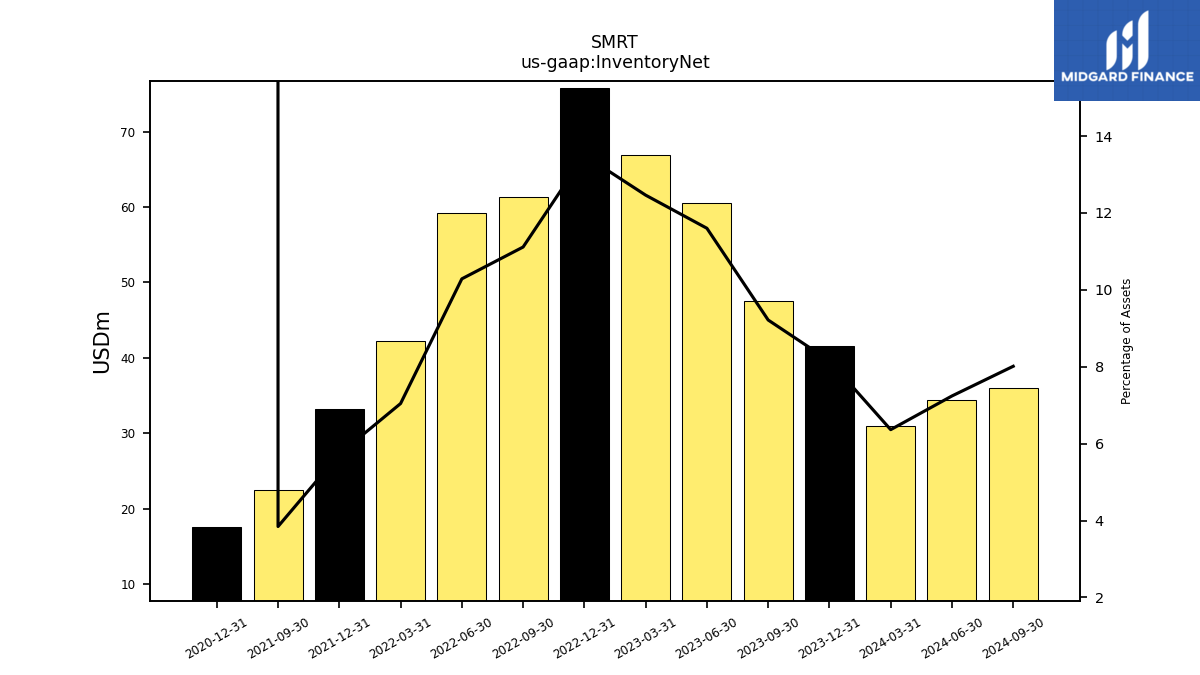
| Inventory Net | 47.52 | 60.51 | 66.85 | 75.72 | 61.26 | 59.23 | 42.26 | 33.21 | 22.41 | NA | NA | 17.63 | NA | |
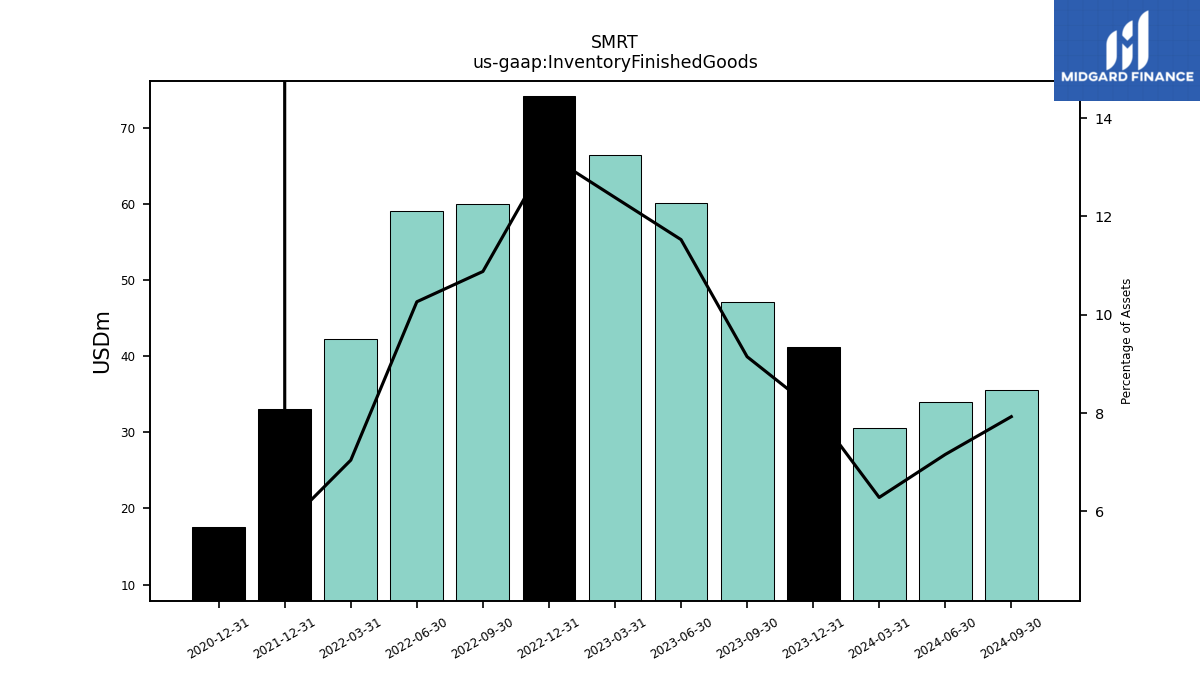
| Inventory Finished Goods | 47.16 | 60.12 | 66.42 | 74.28 | 59.97 | 59.10 | 42.26 | 33.01 | NA | NA | NA | 17.63 | NA | |
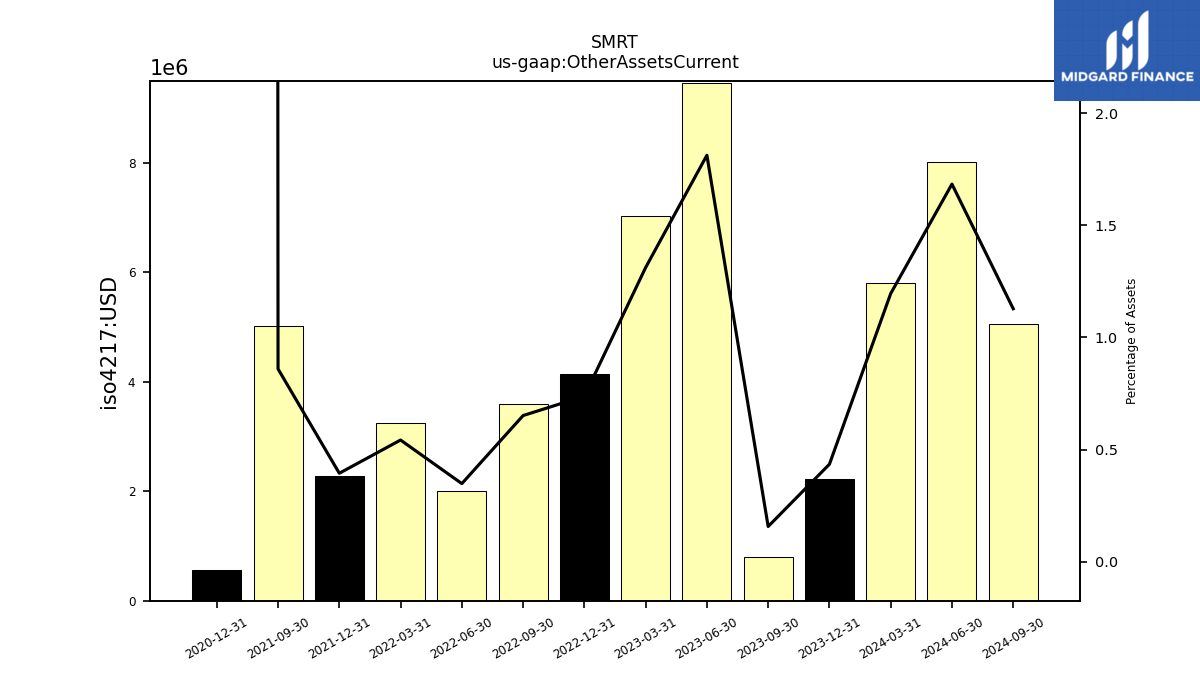
| Other Assets Current | 0.81 | 9.45 | 7.04 | 4.14 | 3.59 | 2.00 | 3.25 | 2.29 | 5.01 | NA | NA | 0.56 | NA | |
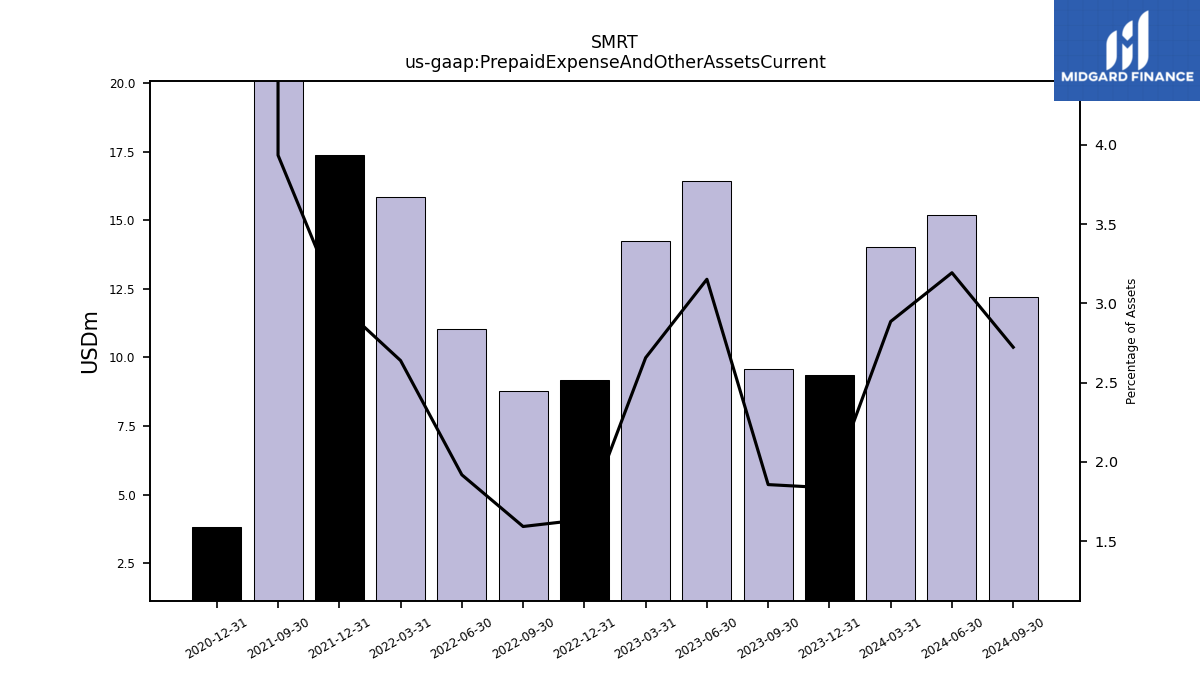
| Prepaid Expense And Other Assets Current | 9.57 | 16.44 | 14.25 | 9.18 | 8.78 | 11.05 | 15.83 | 17.37 | 22.93 | NA | NA | 3.84 | NA |
| 2023-09-30 | 2023-06-30 | 2023-03-31 | 2022-12-31 | 2022-09-30 | 2022-06-30 | 2022-03-31 | 2021-12-31 | 2021-09-30 | 2021-06-30 | 2021-03-31 | 2020-12-31 | 2020-09-30 | ||
|---|---|---|---|---|---|---|---|---|---|---|---|---|---|---|
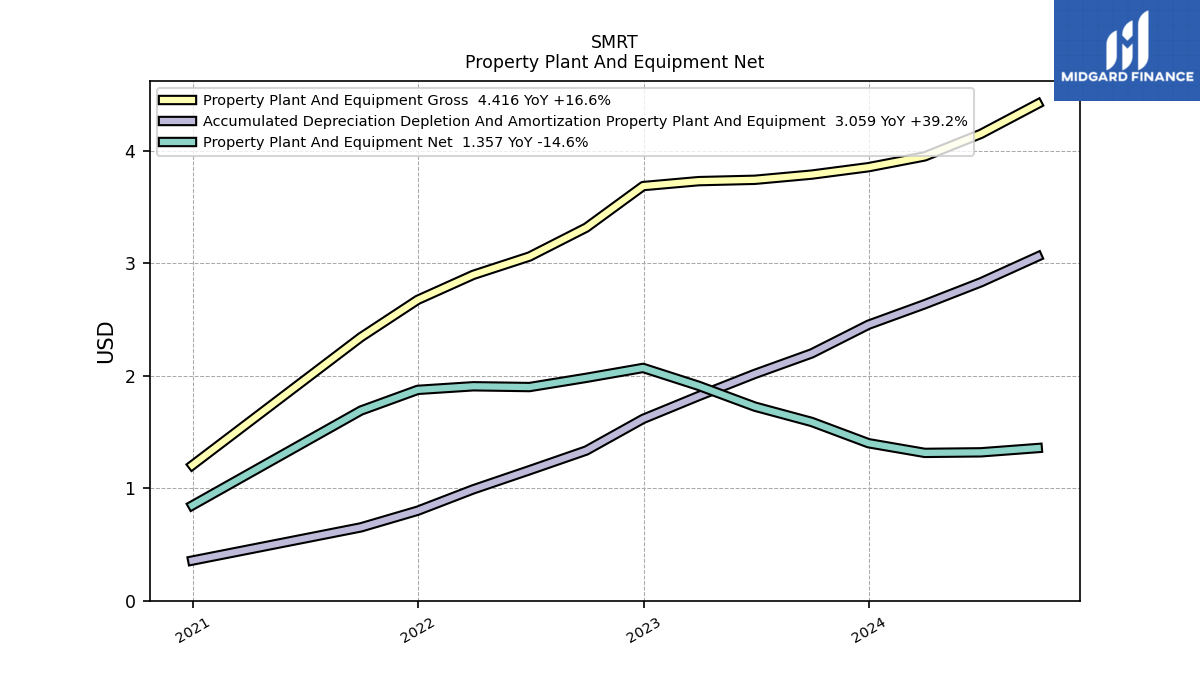
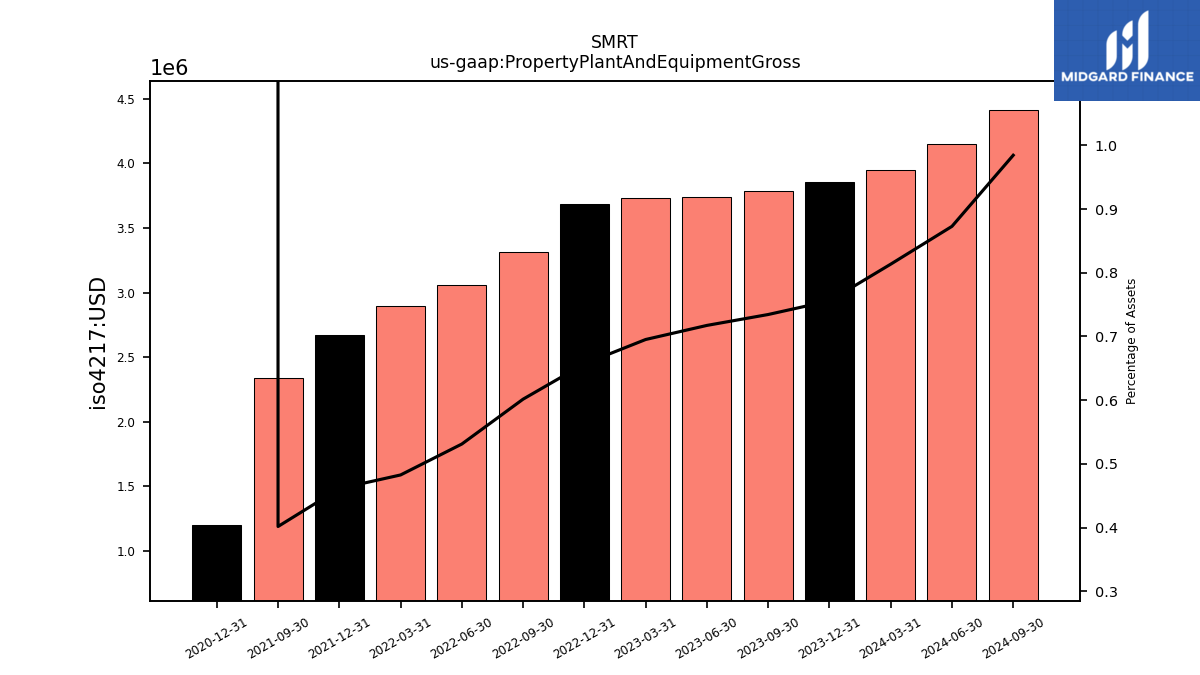
| Property Plant And Equipment Gross | 3.79 | 3.74 | 3.73 | 3.69 | 3.32 | 3.06 | 2.90 | 2.67 | 2.34 | NA | NA | 1.20 | NA | |
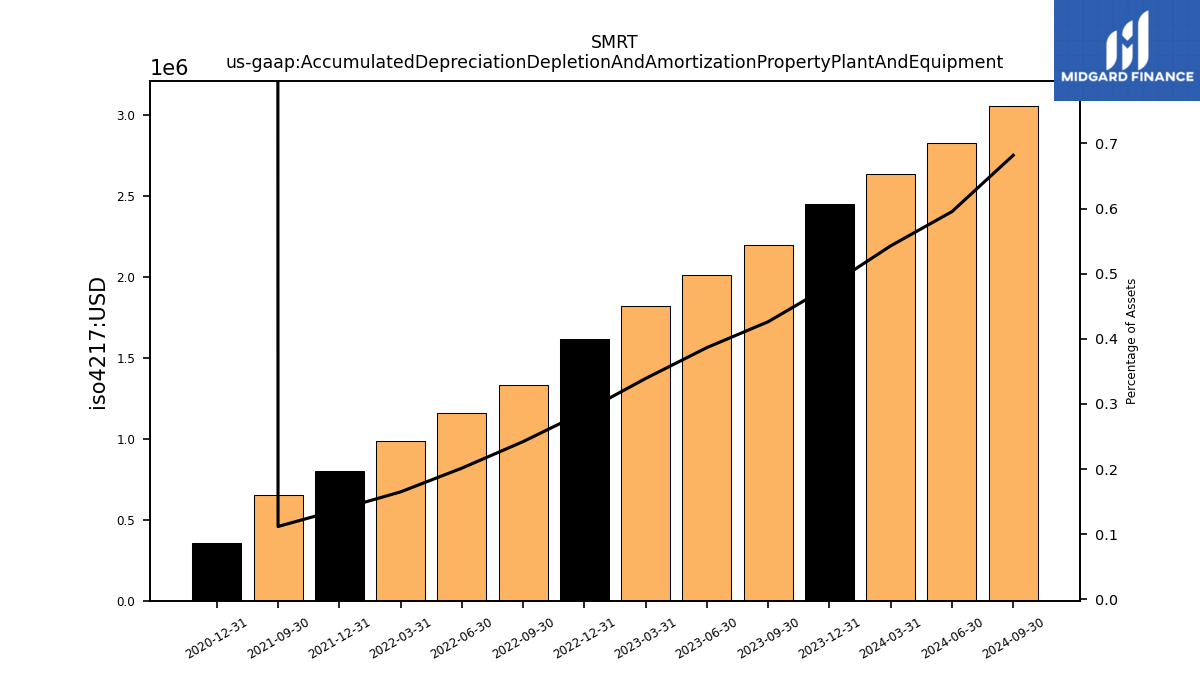
| Accumulated Depreciation Depletion And Amortization Property Plant And Equipment | 2.20 | 2.02 | 1.82 | 1.62 | 1.33 | 1.16 | 0.99 | 0.80 | 0.65 | NA | NA | 0.36 | NA | |
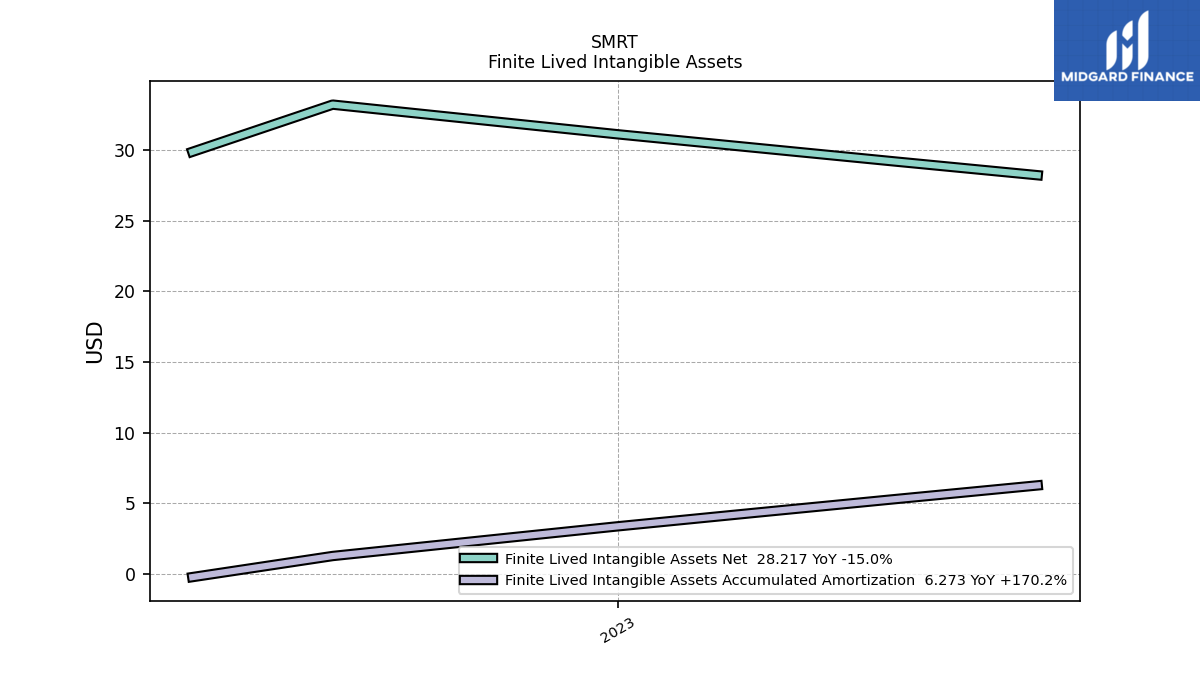
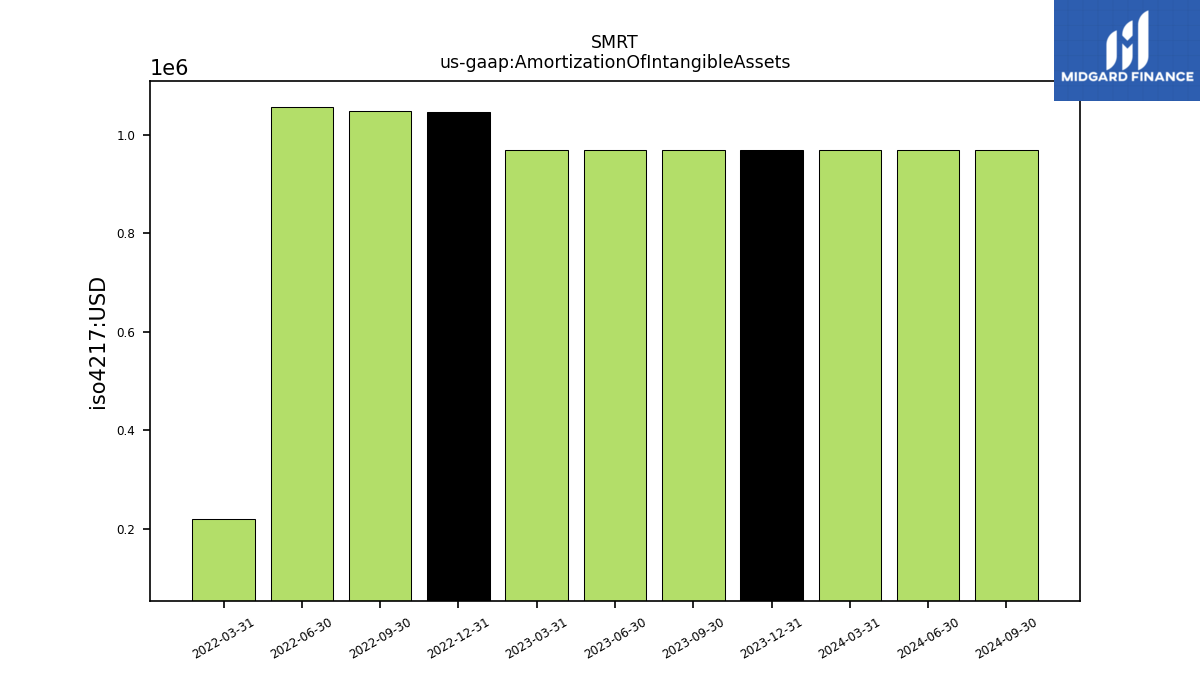
| Amortization Of Intangible Assets | 0.97 | 0.97 | 0.97 | 1.04 | 1.05 | 1.06 | 0.22 | NA | NA | NA | NA | NA | NA | |
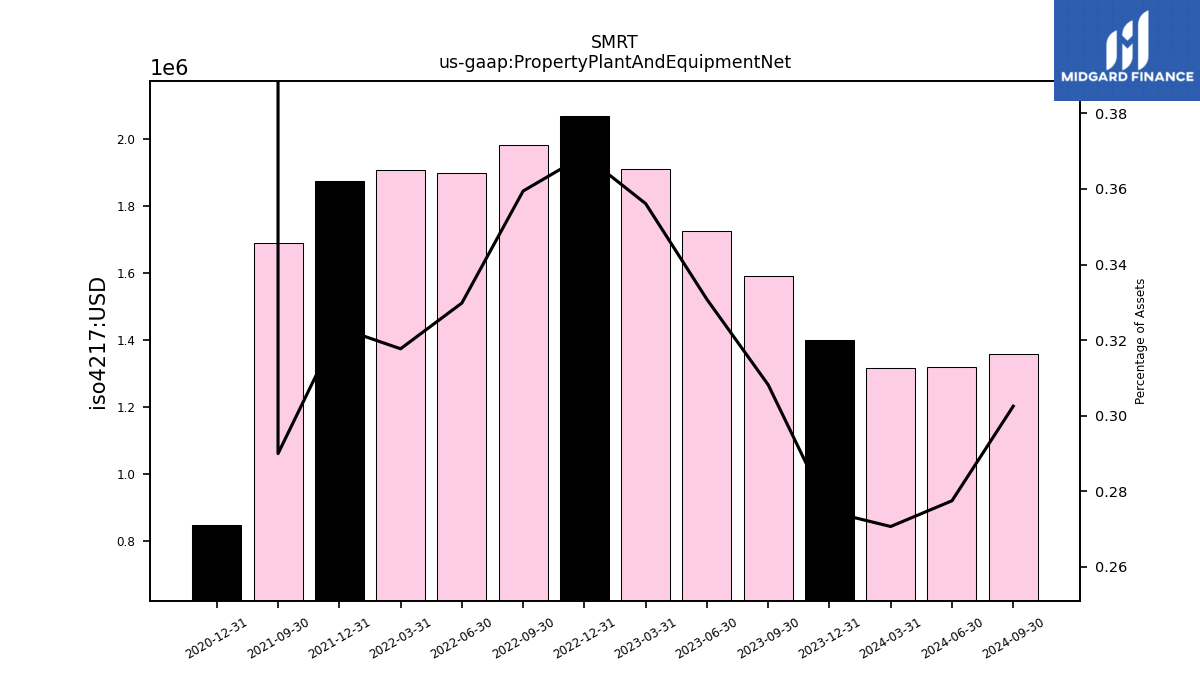
| Property Plant And Equipment Net | 1.59 | 1.73 | 1.91 | 2.07 | 1.98 | 1.90 | 1.91 | 1.87 | 1.69 | NA | NA | 0.85 | NA | |
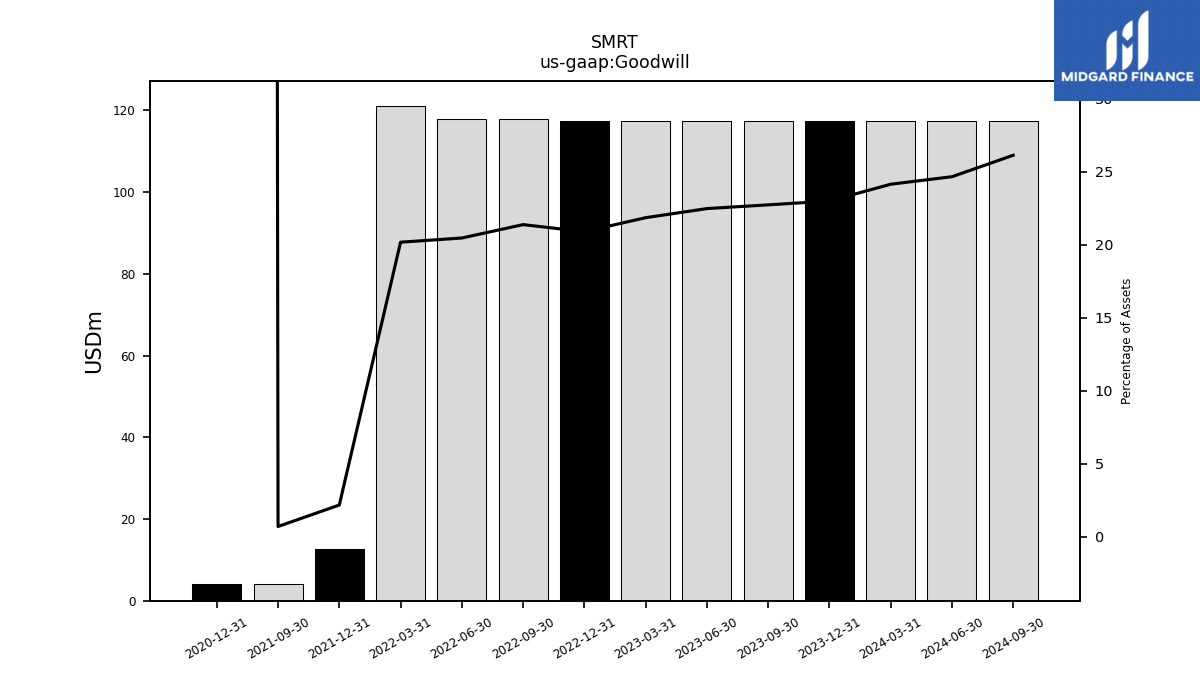
| Goodwill | 117.27 | 117.27 | 117.27 | 117.27 | 117.89 | 117.89 | 121.11 | 12.67 | 4.16 | NA | NA | 4.16 | NA | |
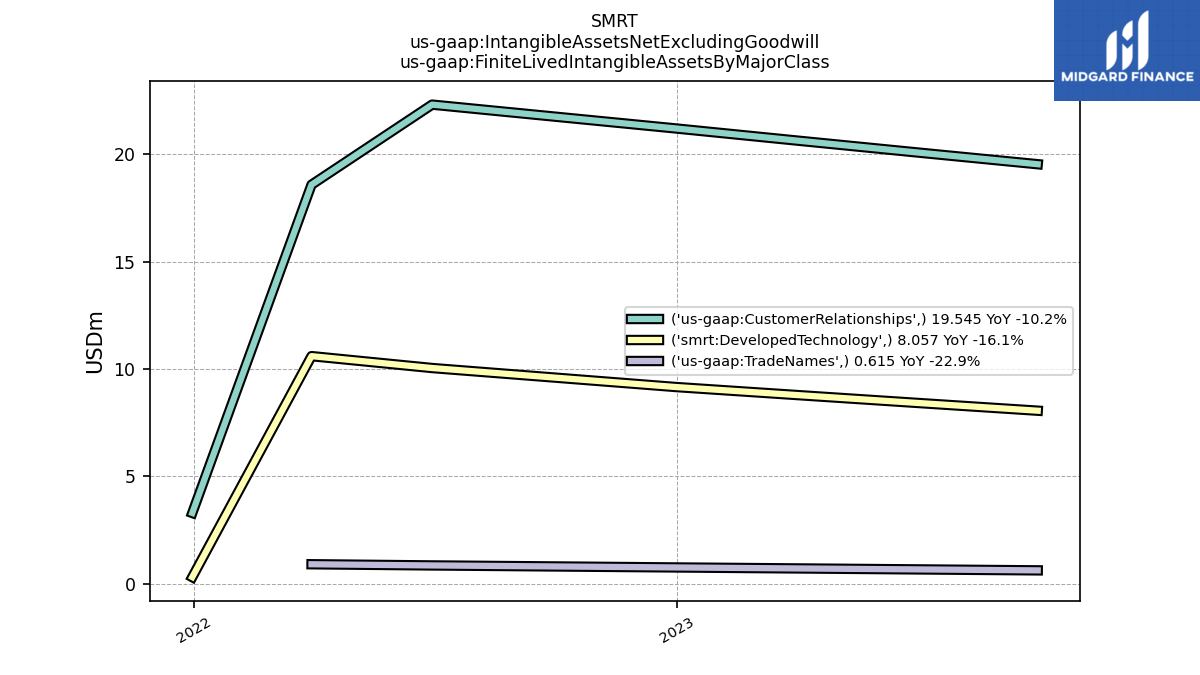
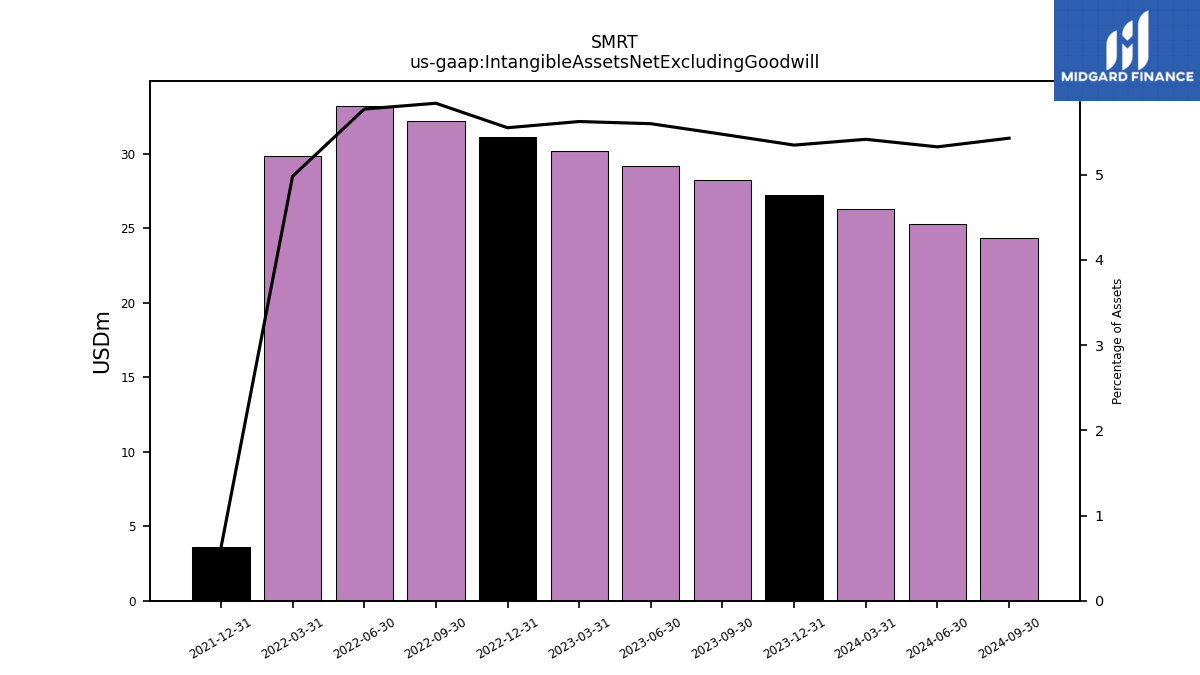
| Intangible Assets Net Excluding Goodwill | 28.22 | 29.18 | 30.15 | 31.12 | 32.17 | 33.21 | 29.87 | 3.59 | NA | NA | NA | NA | NA | |
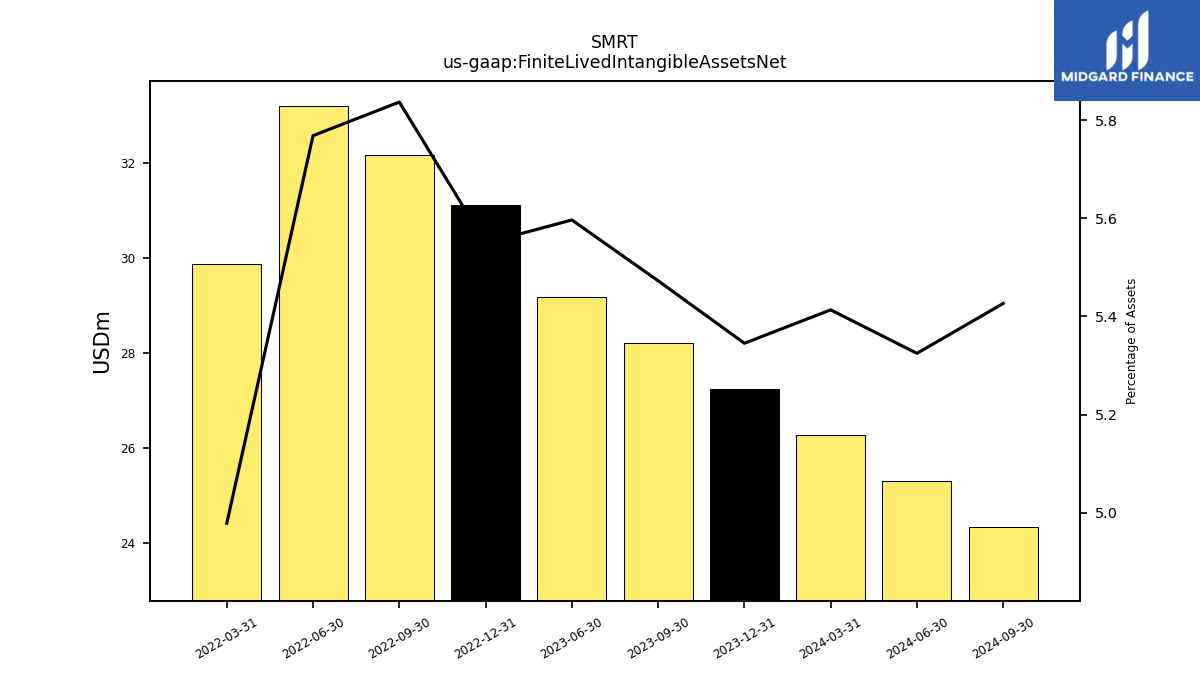
| Finite Lived Intangible Assets Net | 28.22 | 29.18 | NA | 31.12 | 32.17 | 33.21 | 29.87 | NA | NA | NA | NA | NA | NA | |
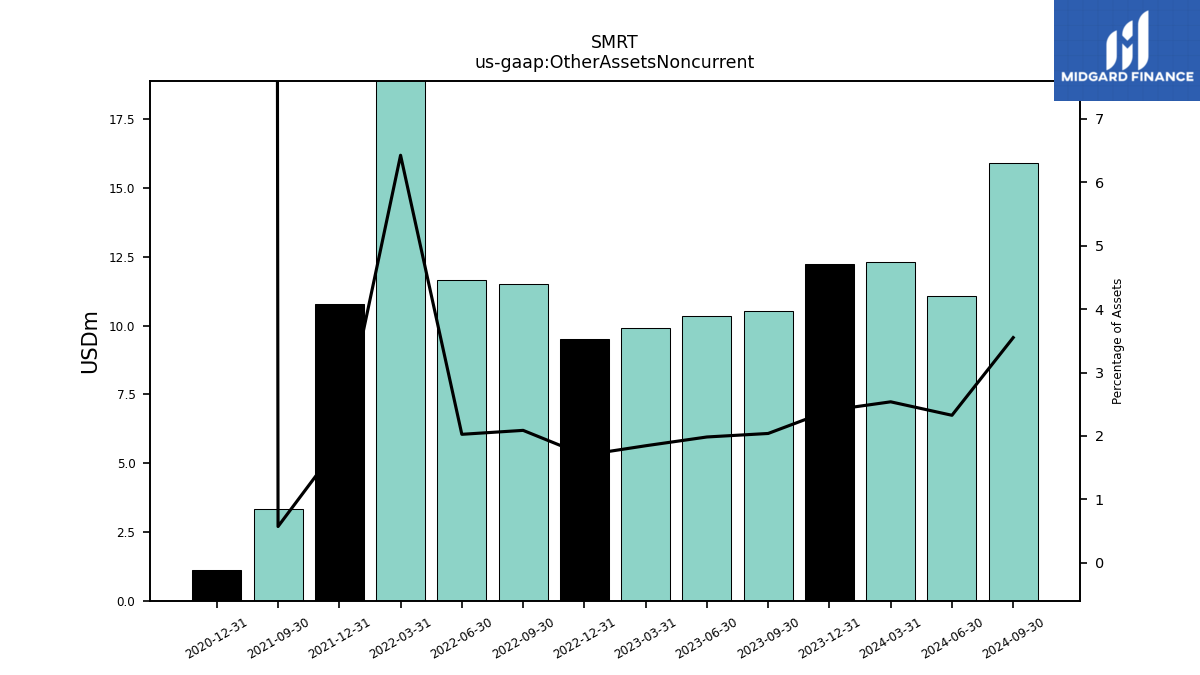
| Other Assets Noncurrent | 10.52 | 10.35 | 9.90 | 9.52 | 11.51 | 11.67 | 38.54 | 10.80 | 3.34 | NA | NA | 1.11 | NA |
| 2023-09-30 | 2023-06-30 | 2023-03-31 | 2022-12-31 | 2022-09-30 | 2022-06-30 | 2022-03-31 | 2021-12-31 | 2021-09-30 | 2021-06-30 | 2021-03-31 | 2020-12-31 | 2020-09-30 | ||
|---|---|---|---|---|---|---|---|---|---|---|---|---|---|---|
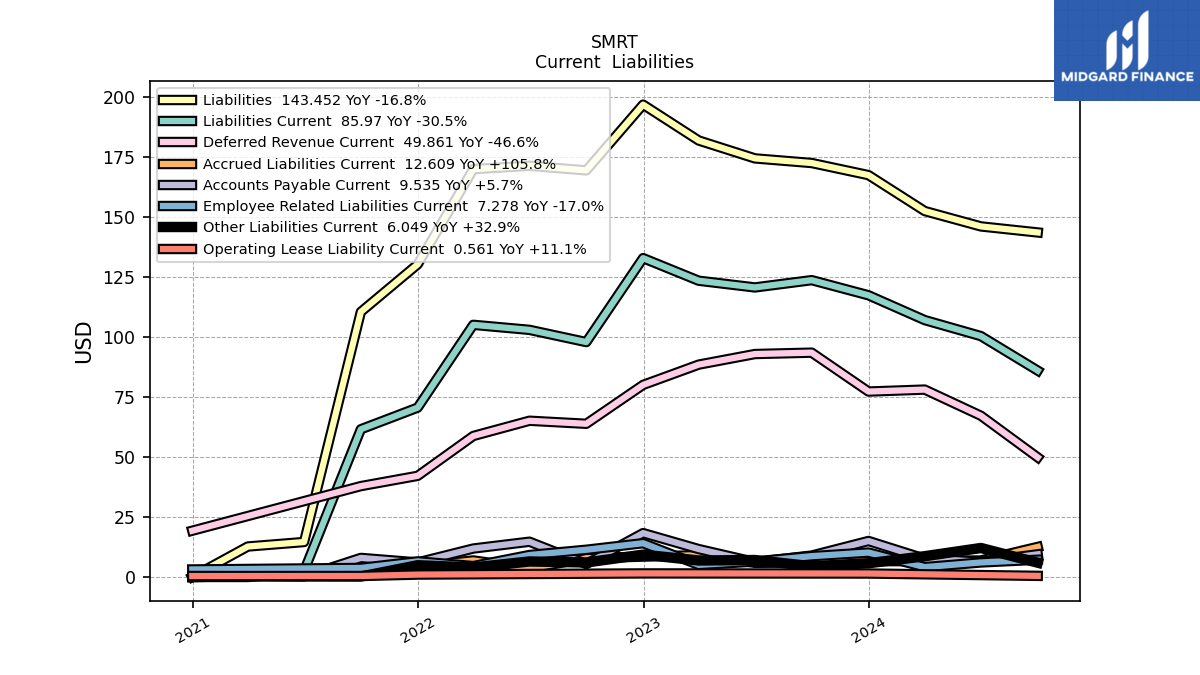
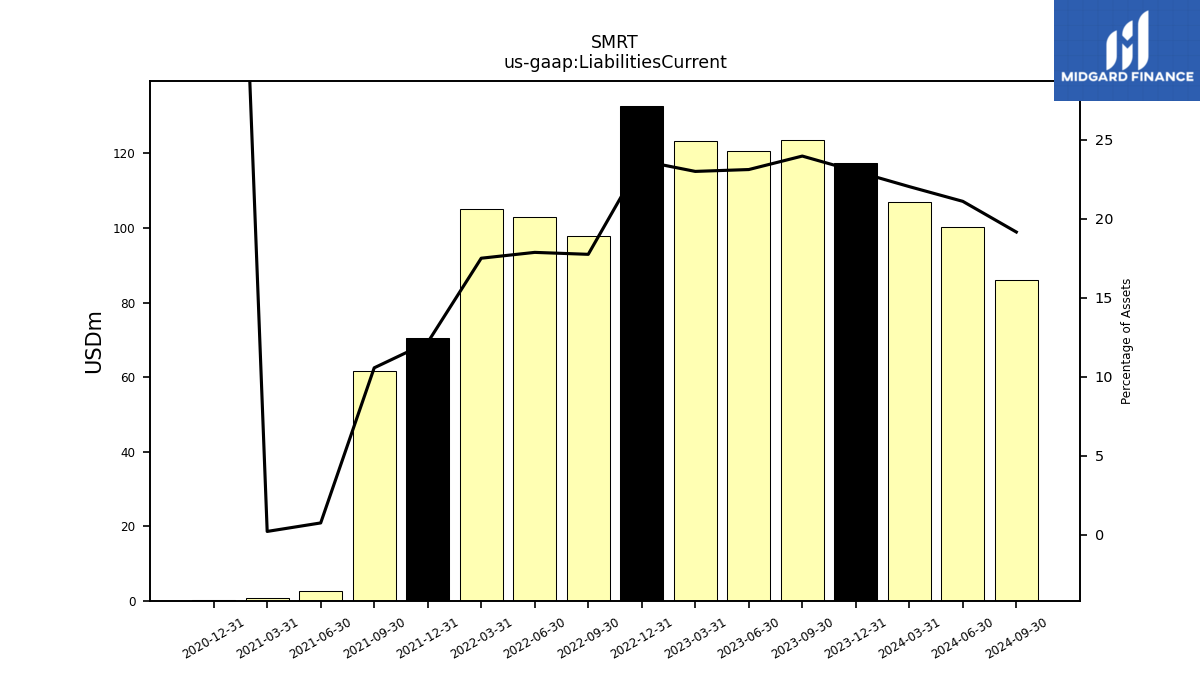
| Liabilities Current | 123.61 | 120.57 | 123.38 | 132.78 | 97.84 | 102.93 | 105.02 | 70.57 | 61.57 | 2.57 | 0.70 | 0.14 | NA | |
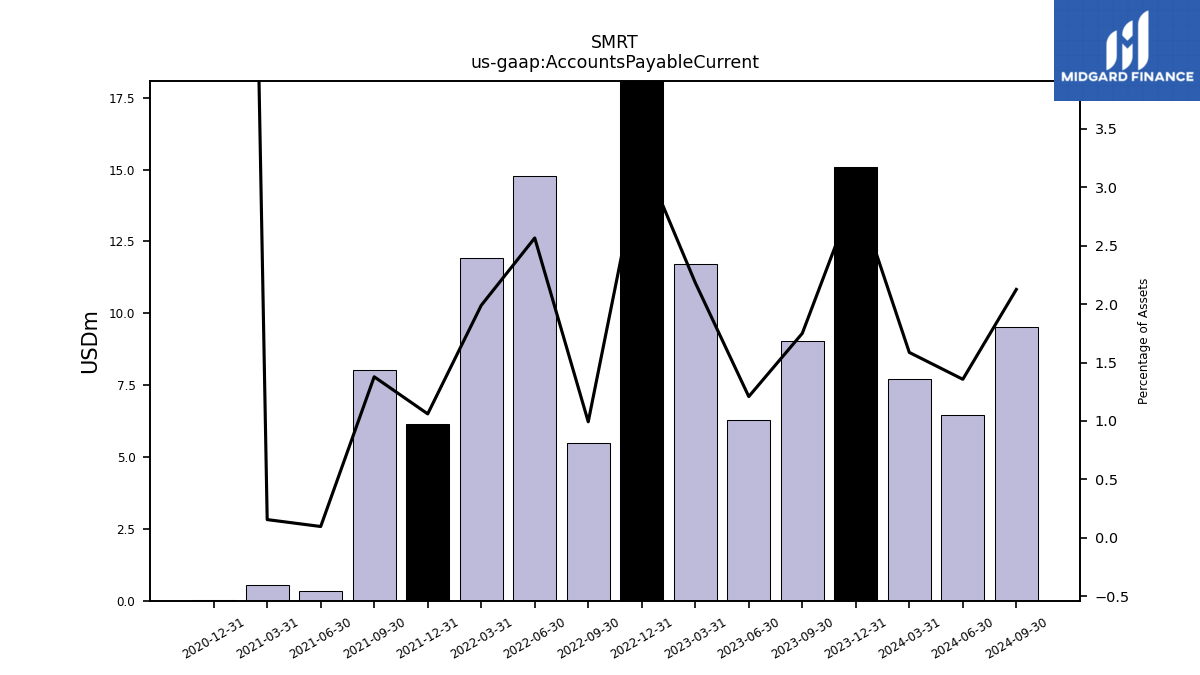
| Accounts Payable Current | 9.02 | 6.30 | 11.71 | 18.36 | 5.47 | 14.77 | 11.93 | 6.15 | 8.03 | 0.34 | 0.54 | 0.04 | NA | |
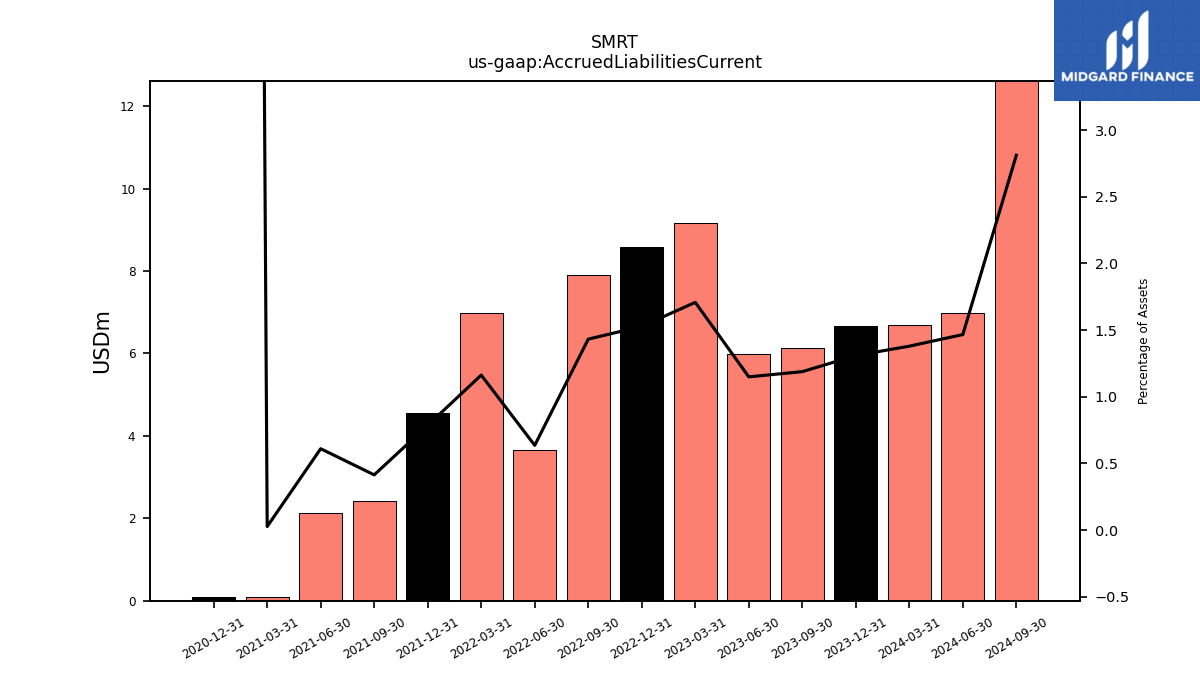
| Accrued Liabilities Current | 6.13 | 6.00 | 9.16 | 8.57 | 7.89 | 3.66 | 6.98 | 4.56 | 2.42 | 2.12 | 0.10 | 0.10 | NA | |
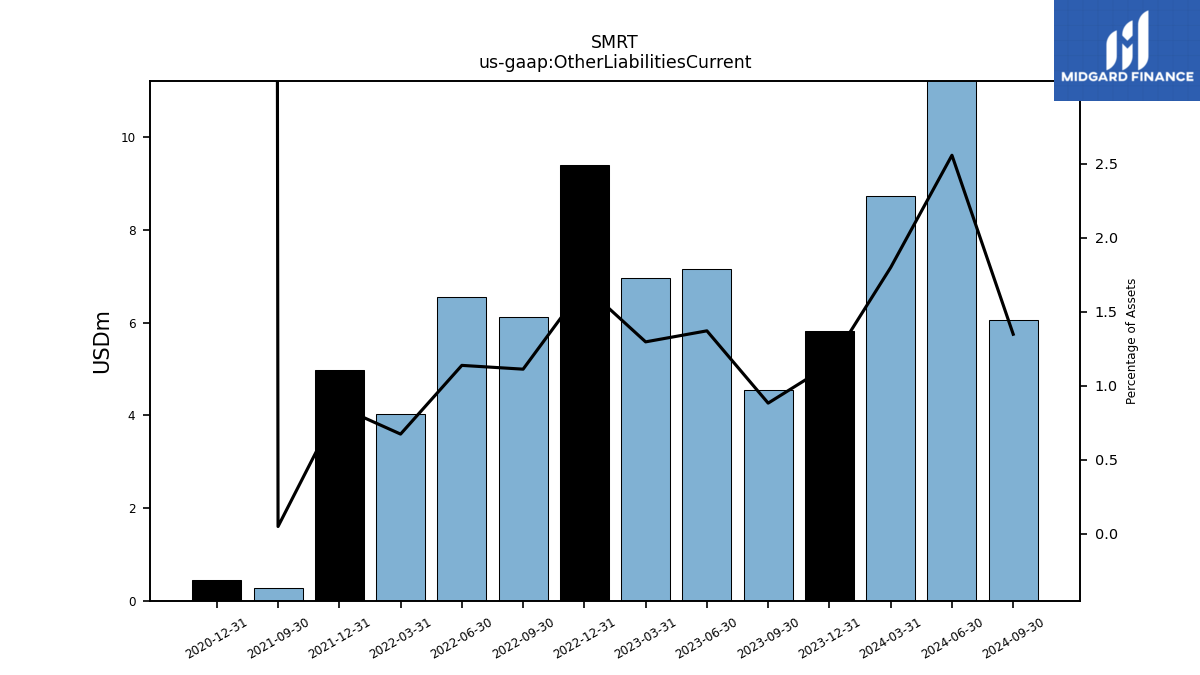
| Other Liabilities Current | 4.55 | 7.15 | 6.96 | 9.39 | 6.13 | 6.55 | 4.04 | 4.98 | 0.28 | NA | NA | 0.45 | NA |
| 2023-09-30 | 2023-06-30 | 2023-03-31 | 2022-12-31 | 2022-09-30 | 2022-06-30 | 2022-03-31 | 2021-12-31 | 2021-09-30 | 2021-06-30 | 2021-03-31 | 2020-12-31 | 2020-09-30 | ||
|---|---|---|---|---|---|---|---|---|---|---|---|---|---|---|
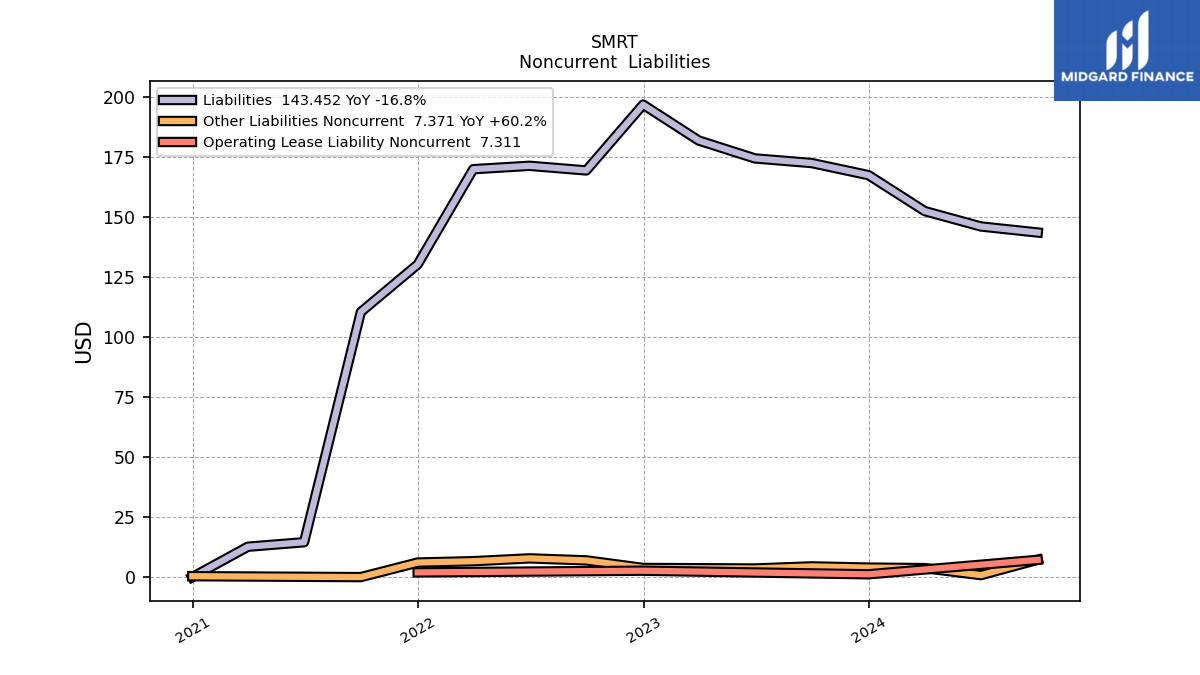
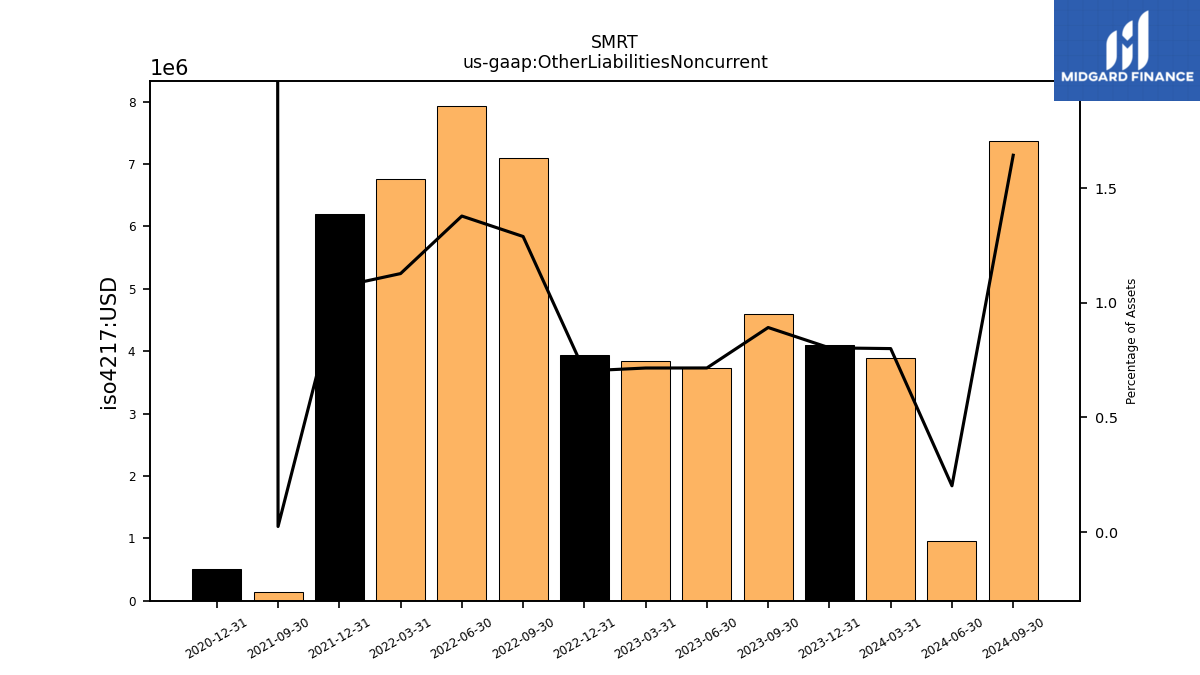
| Other Liabilities Noncurrent | 4.60 | 3.73 | 3.84 | 3.94 | 7.10 | 7.93 | 6.76 | 6.20 | 0.14 | NA | NA | 0.52 | NA | |
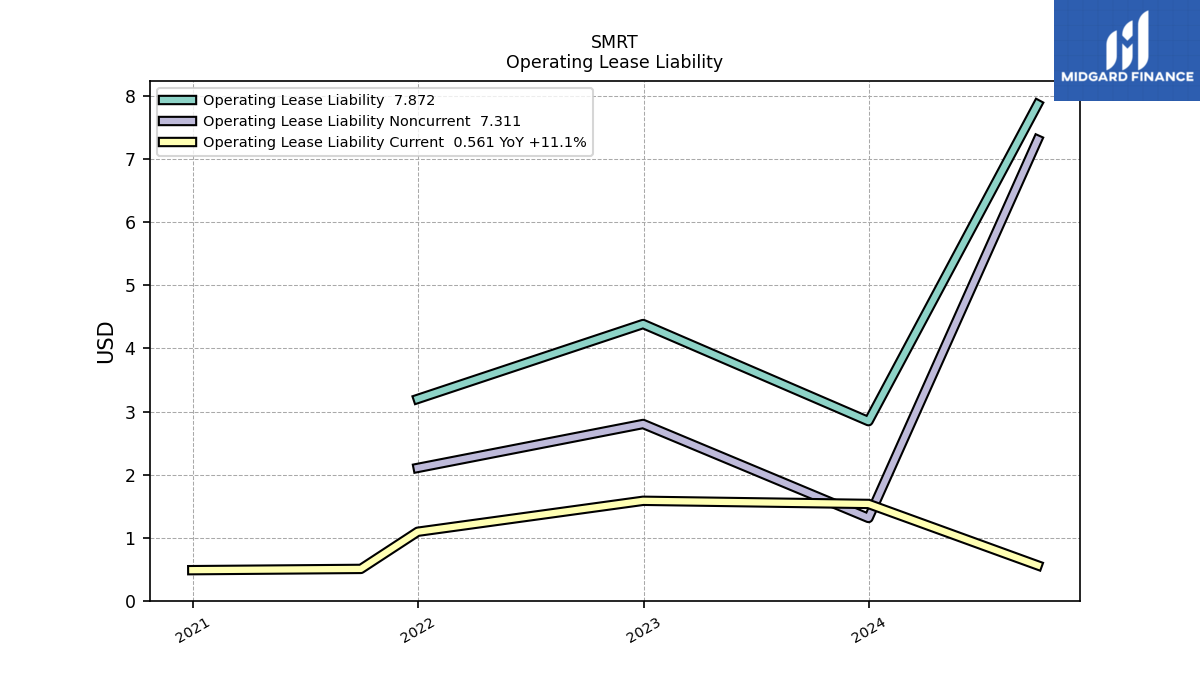
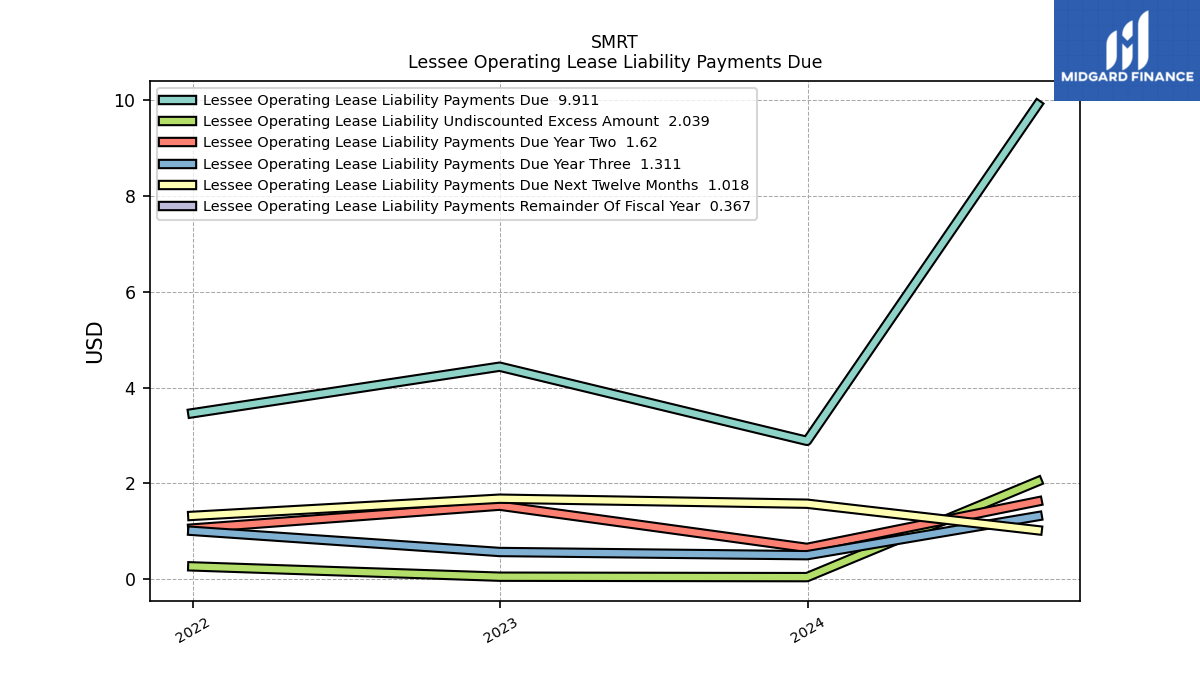
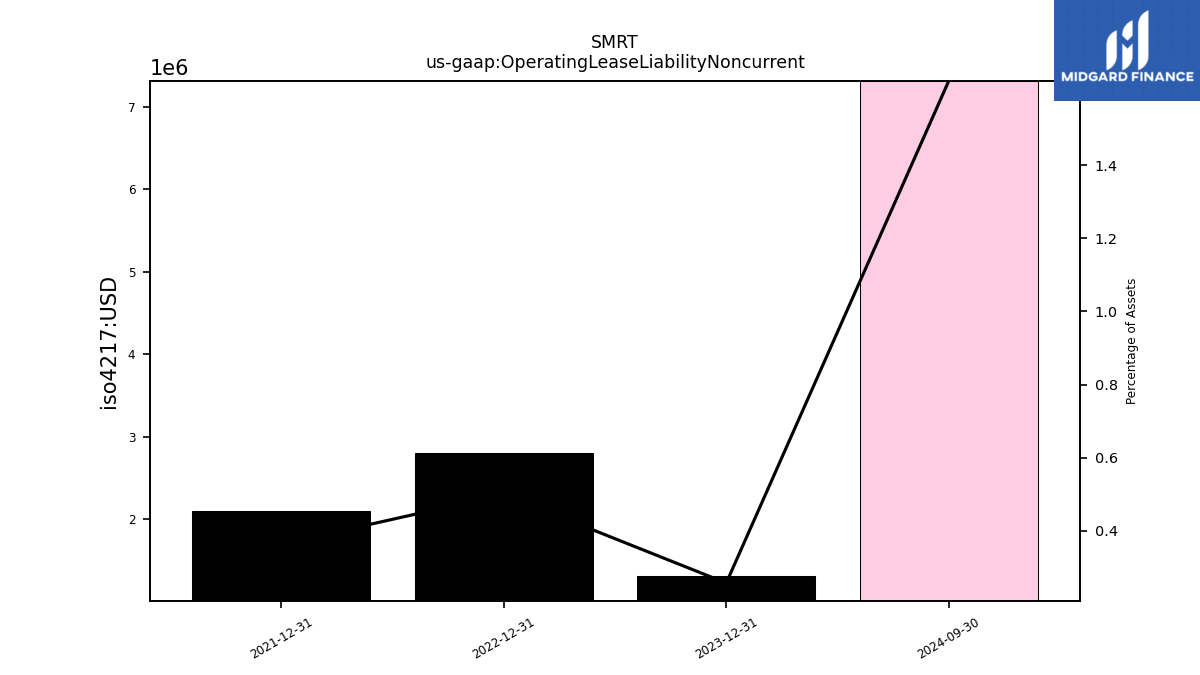
| Operating Lease Liability Noncurrent | NA | NA | NA | 2.80 | NA | NA | NA | 2.11 | NA | NA | NA | NA | NA |
| 2023-09-30 | 2023-06-30 | 2023-03-31 | 2022-12-31 | 2022-09-30 | 2022-06-30 | 2022-03-31 | 2021-12-31 | 2021-09-30 | 2021-06-30 | 2021-03-31 | 2020-12-31 | 2020-09-30 | ||
|---|---|---|---|---|---|---|---|---|---|---|---|---|---|---|
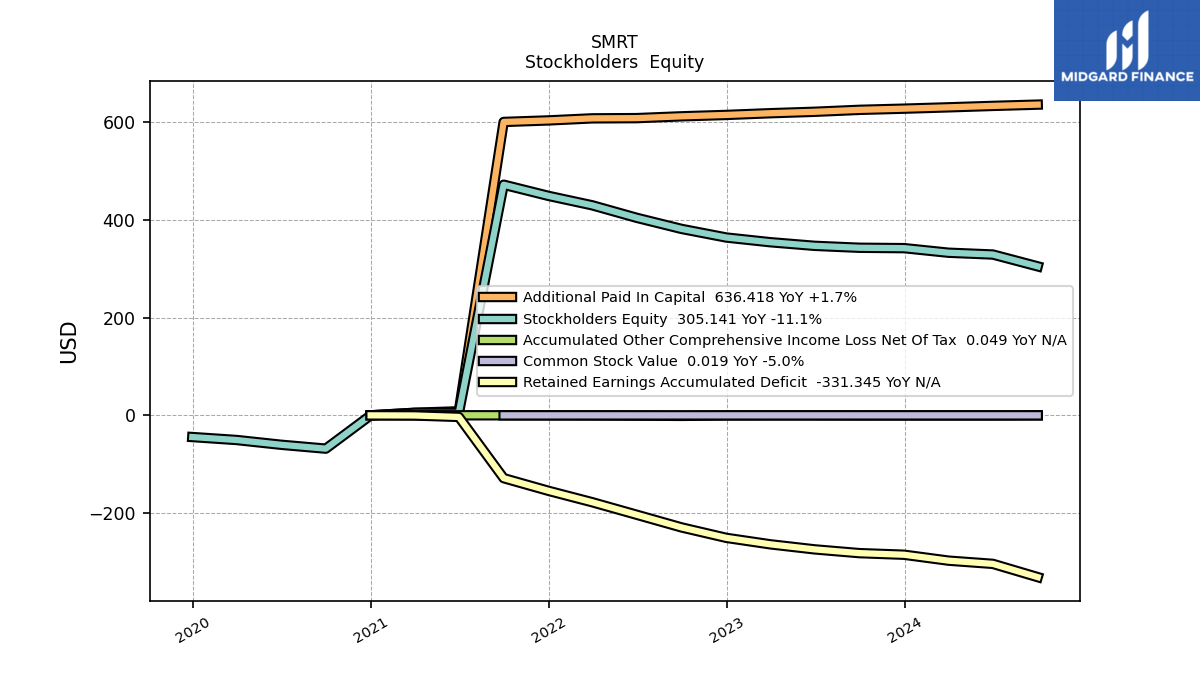
| Stockholders Equity | 343.25 | 347.20 | 354.62 | 364.20 | 381.87 | 404.61 | 430.15 | 449.50 | 472.42 | 5.00 | 5.00 | 0.02 | -68.22 | |
| Common Stock Value | 0.02 | 0.02 | 0.02 | 0.02 | 0.02 | 0.02 | 0.02 | 0.02 | 0.02 | NA | NA | NA | NA | |
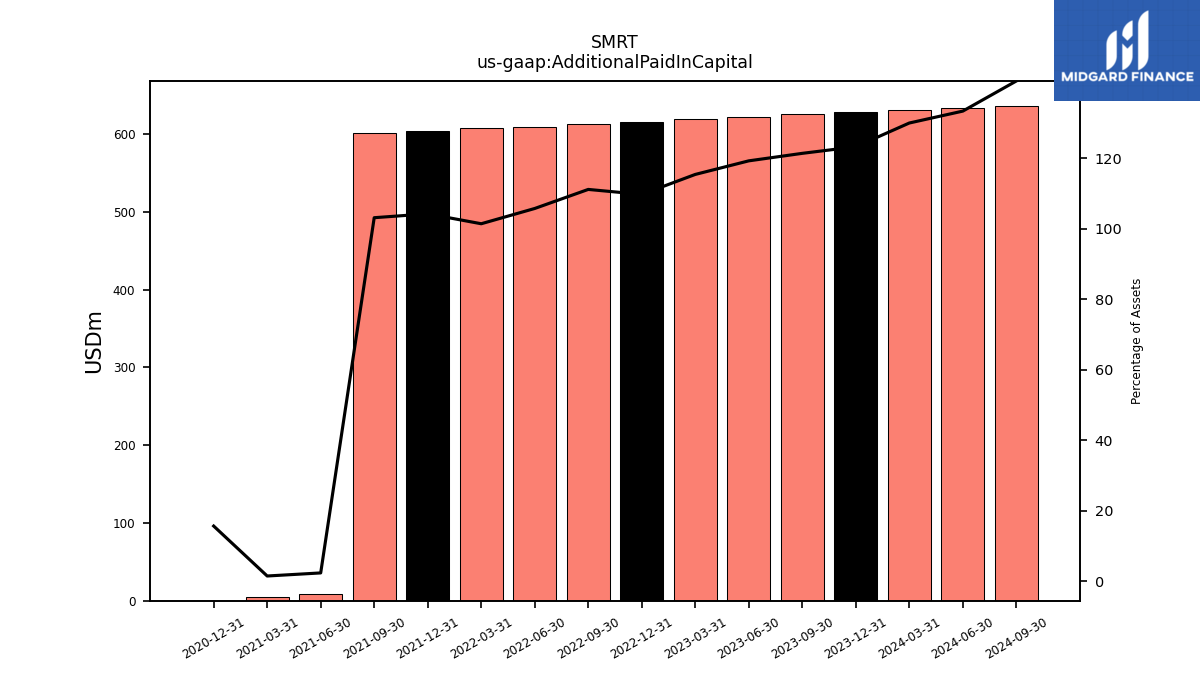
| Additional Paid In Capital | 625.71 | 621.75 | 618.81 | 615.28 | 612.46 | 608.75 | 608.30 | 604.08 | 600.95 | 8.27 | 5.26 | 0.02 | NA | |
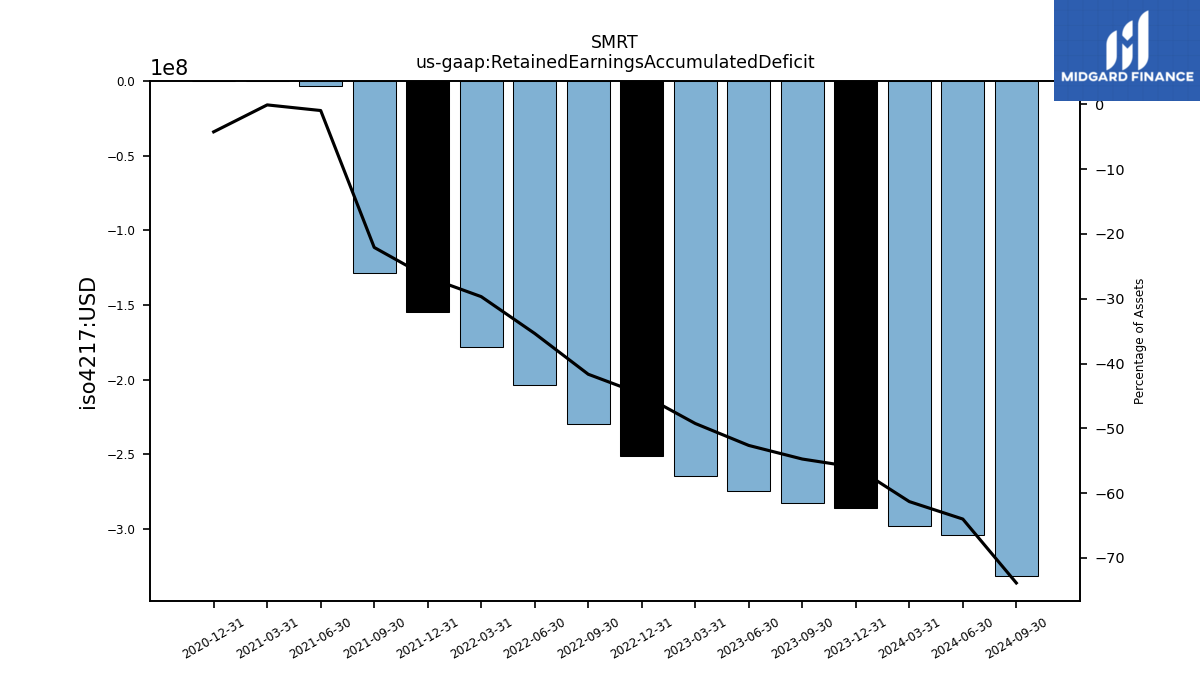
| Retained Earnings Accumulated Deficit | -282.21 | -274.49 | -264.14 | -250.93 | -229.54 | -203.59 | -178.00 | -154.60 | -128.65 | -3.27 | -0.26 | -0.01 | NA | |
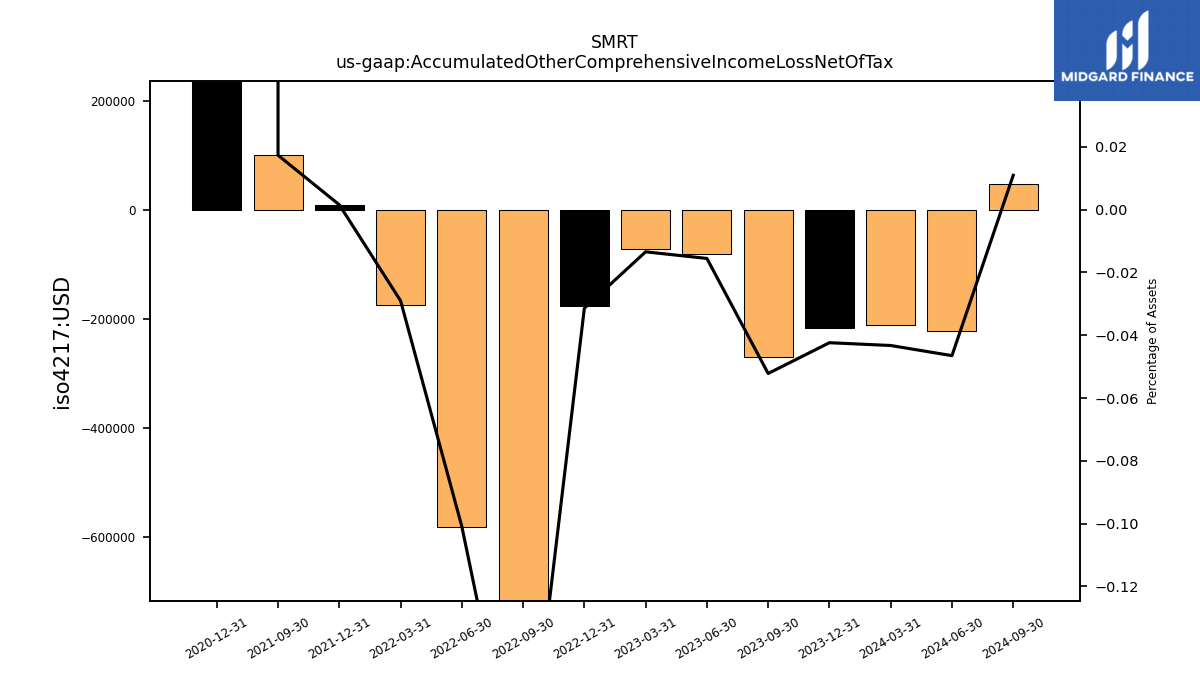
| Accumulated Other Comprehensive Income Loss Net Of Tax | -0.27 | -0.08 | -0.07 | -0.18 | -1.07 | -0.58 | -0.17 | 0.01 | 0.10 | NA | NA | 0.23 | NA | |
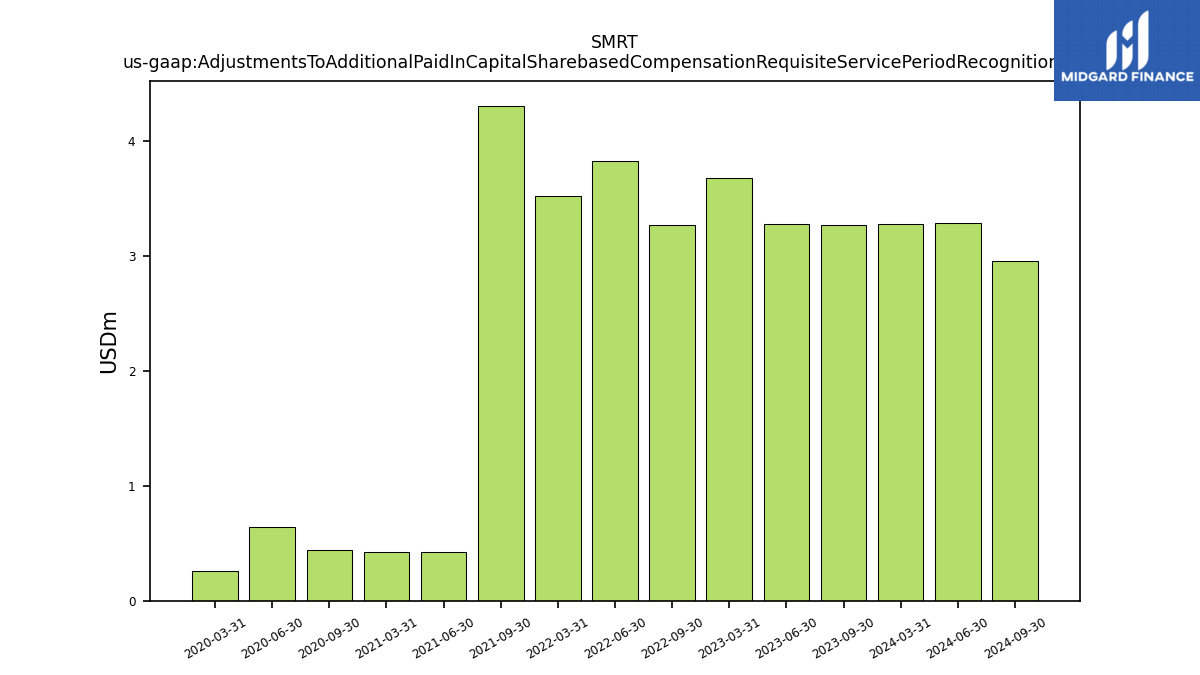
| Adjustments To Additional Paid In Capital Sharebased Compensation Requisite Service Period Recognition Value | 3.27 | 3.28 | 3.68 | NA | 3.27 | 3.82 | 3.52 | NA | 4.31 | 0.43 | 0.43 | NA | 0.44 |
| 2023-09-30 | 2023-06-30 | 2023-03-31 | 2022-12-31 | 2022-09-30 | 2022-06-30 | 2022-03-31 | 2021-12-31 | 2021-09-30 | 2021-06-30 | 2021-03-31 | 2020-12-31 | 2020-09-30 | ||
|---|---|---|---|---|---|---|---|---|---|---|---|---|---|---|
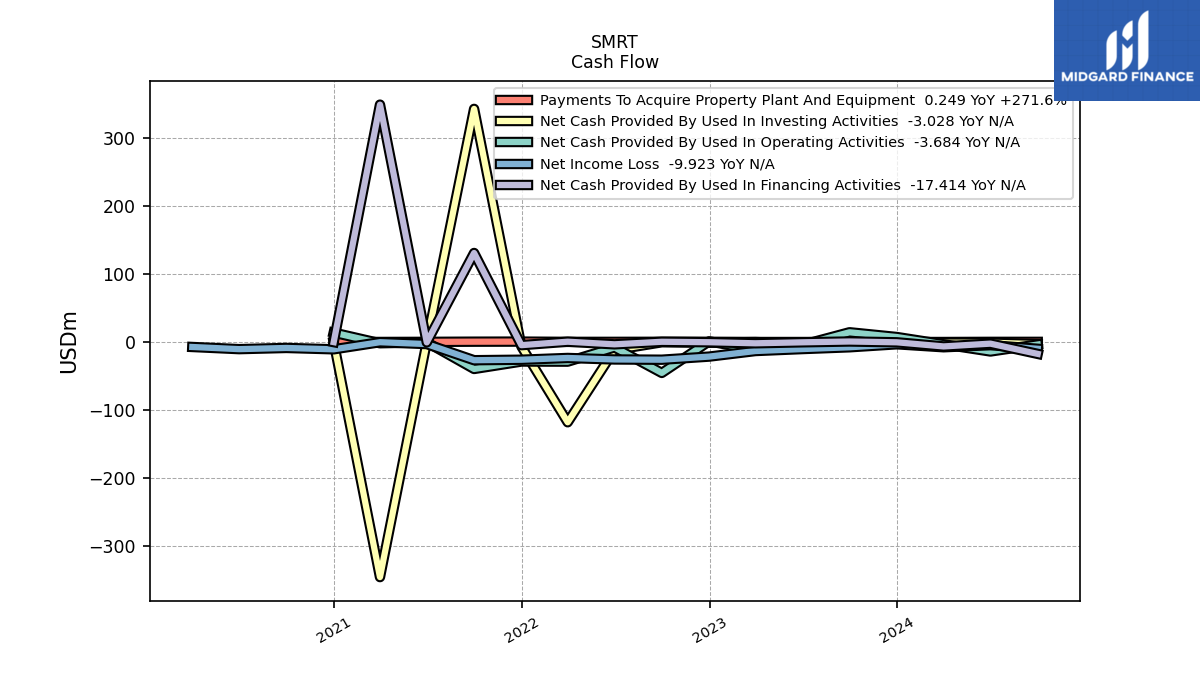
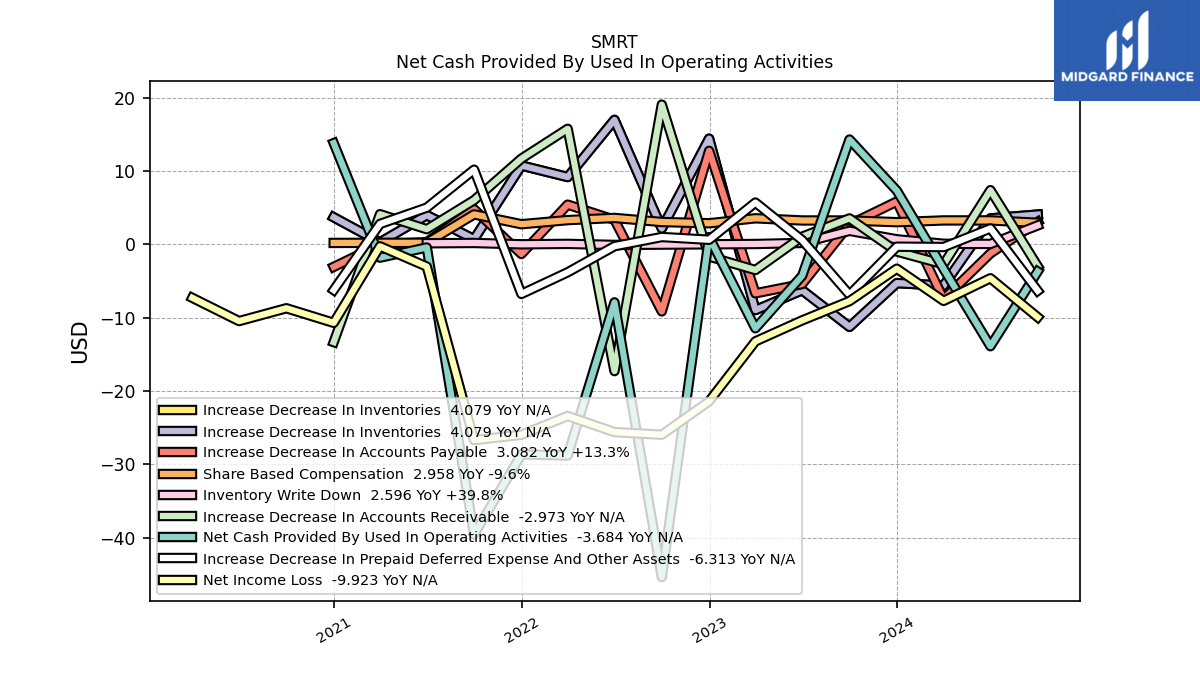
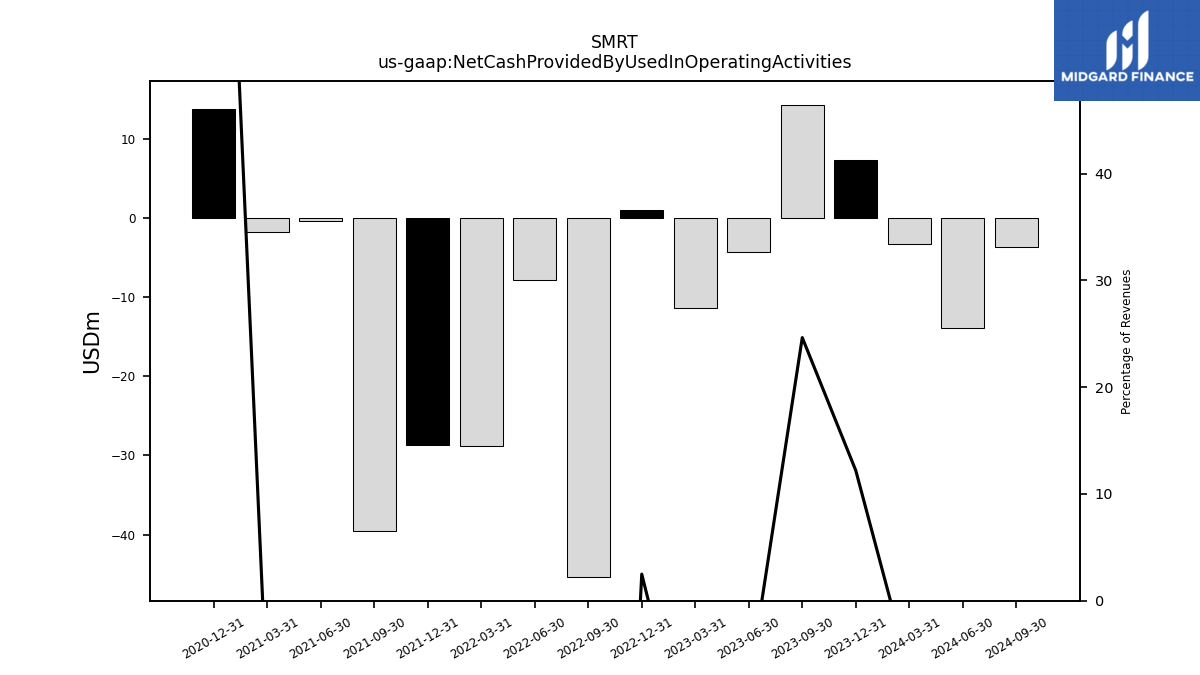
| Net Cash Provided By Used In Operating Activities | 14.32 | -4.25 | -11.43 | 1.01 | -45.37 | -7.89 | -28.79 | -28.63 | -39.54 | -0.41 | -1.80 | 13.82 | NA | |
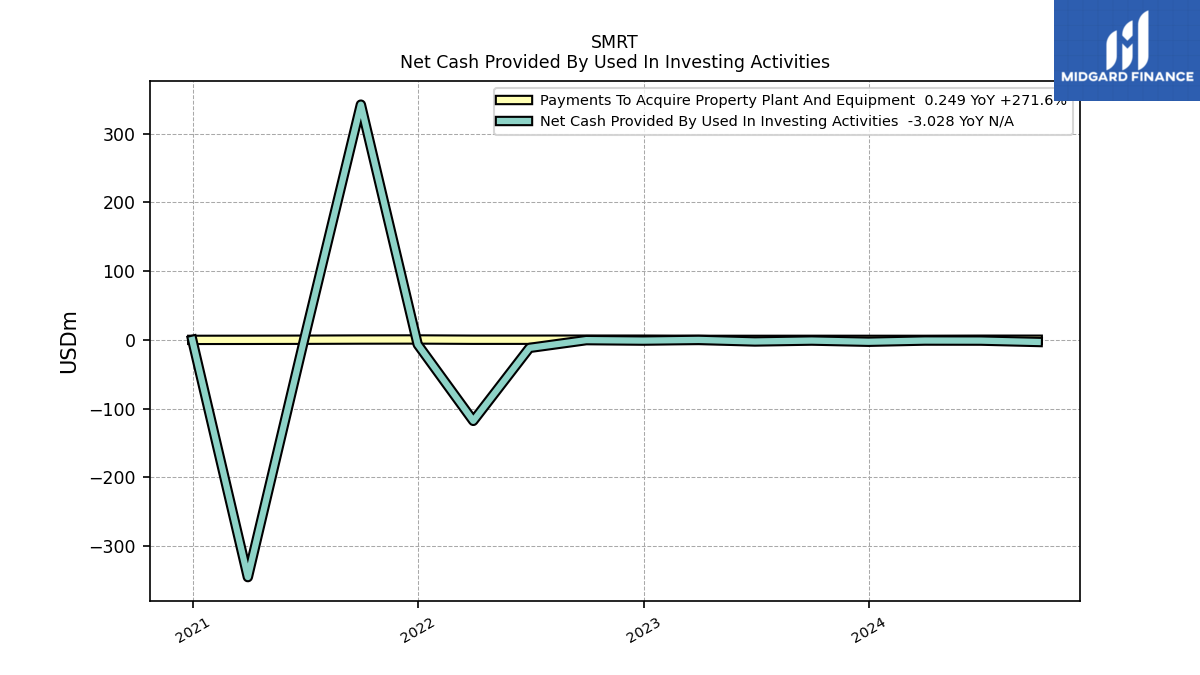
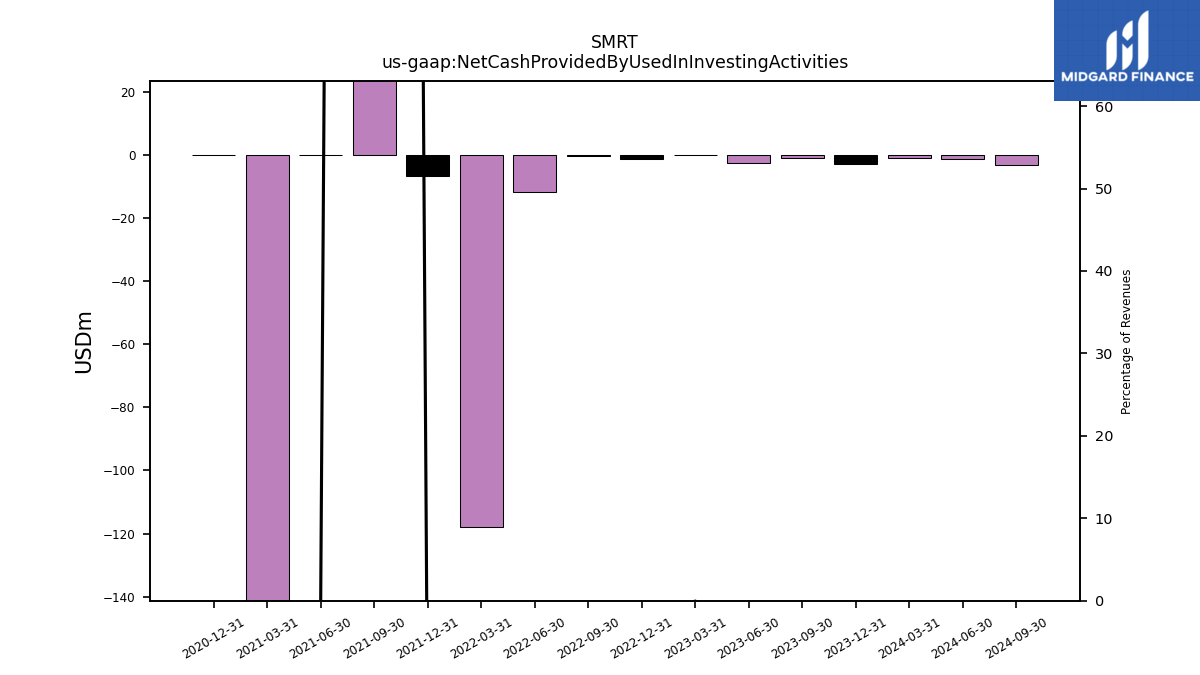
| Net Cash Provided By Used In Investing Activities | -0.98 | -2.30 | -0.03 | -1.03 | -0.33 | -11.65 | -117.77 | -6.52 | 342.15 | 0.00 | -345.00 | -0.02 | NA | |
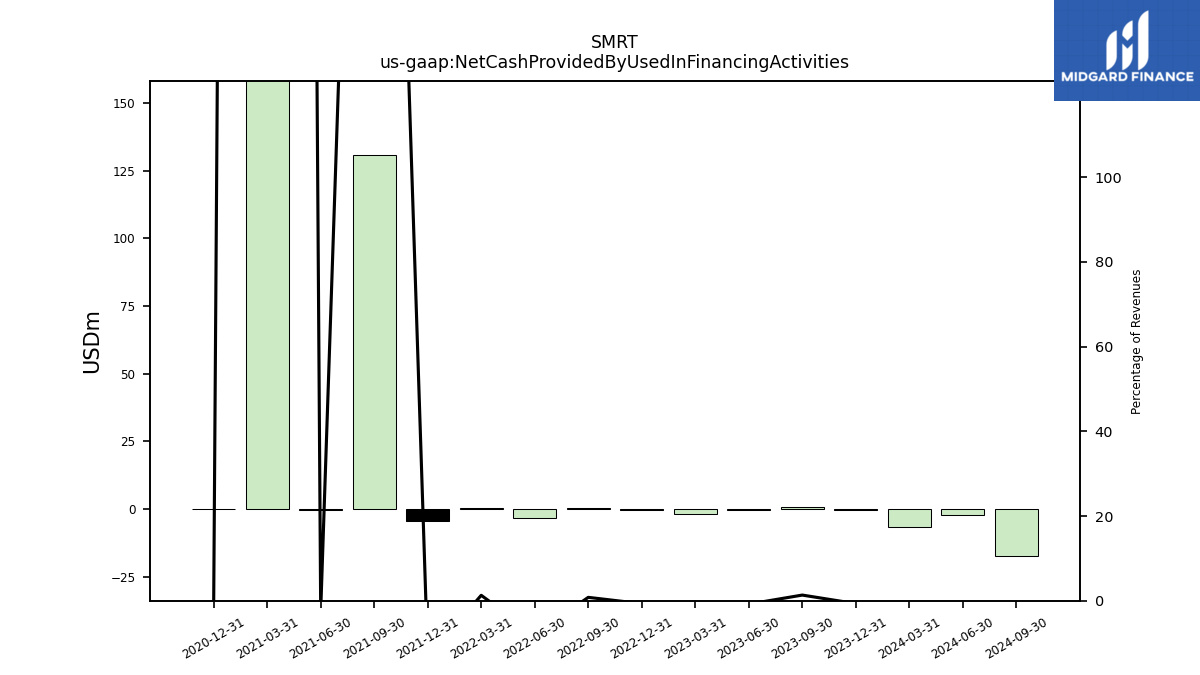
| Net Cash Provided By Used In Financing Activities | 0.78 | -0.42 | -1.85 | -0.28 | 0.38 | -3.39 | 0.48 | -4.61 | 130.67 | -0.52 | 348.38 | -0.14 | NA |
| 2023-09-30 | 2023-06-30 | 2023-03-31 | 2022-12-31 | 2022-09-30 | 2022-06-30 | 2022-03-31 | 2021-12-31 | 2021-09-30 | 2021-06-30 | 2021-03-31 | 2020-12-31 | 2020-09-30 | ||
|---|---|---|---|---|---|---|---|---|---|---|---|---|---|---|
| Net Cash Provided By Used In Operating Activities | 14.32 | -4.25 | -11.43 | 1.01 | -45.37 | -7.89 | -28.79 | -28.63 | -39.54 | -0.41 | -1.80 | 13.82 | NA | |
| Net Income Loss | -7.72 | -10.35 | -13.21 | -21.39 | -25.95 | -25.59 | -23.39 | -25.96 | -26.68 | -3.01 | -0.25 | -10.69 | -8.70 | |
| Profit Loss | -7.72 | -10.35 | -13.21 | -21.39 | -25.95 | -25.59 | -23.39 | -25.96 | -42.74 | -3.01 | -0.25 | -10.69 | NA | |
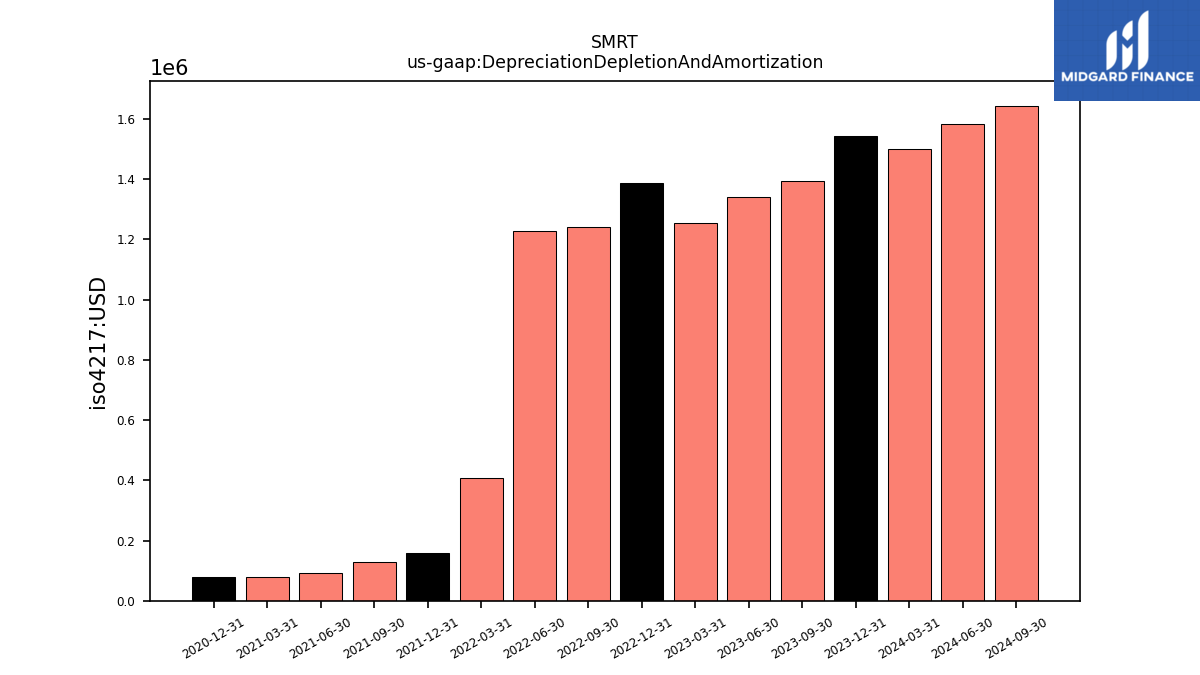
| Depreciation Depletion And Amortization | 1.40 | 1.34 | 1.25 | 1.39 | 1.24 | 1.23 | 0.41 | 0.16 | 0.13 | 0.09 | 0.08 | 0.08 | NA | |
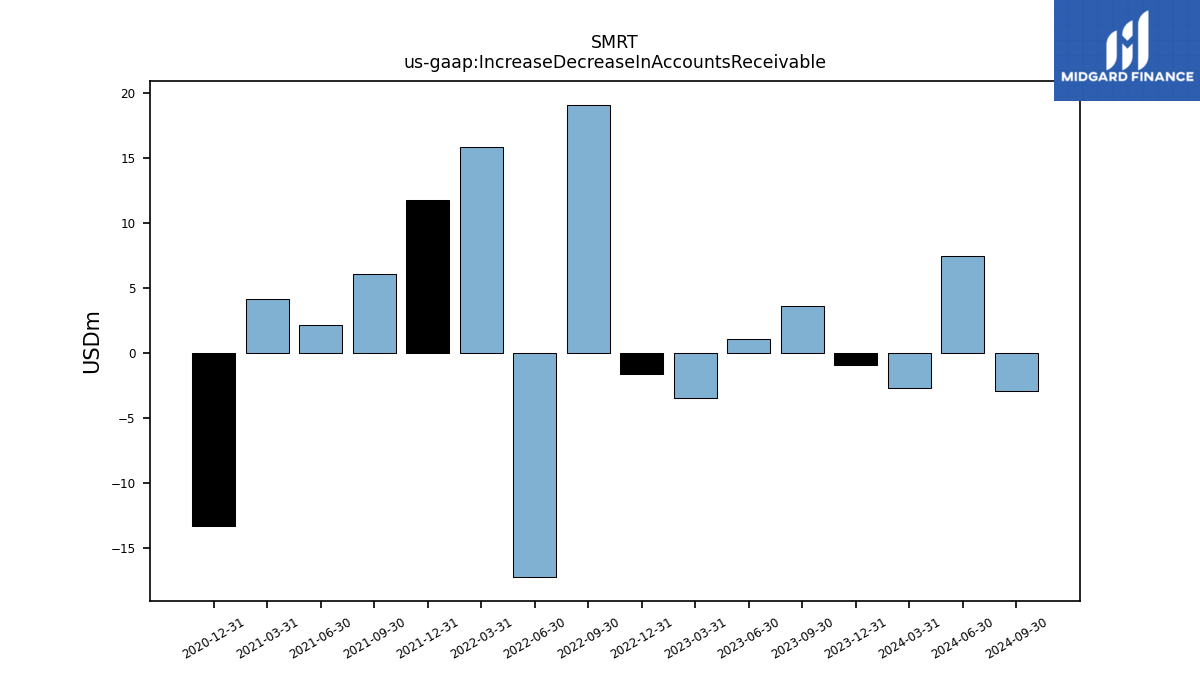
| Increase Decrease In Accounts Receivable | 3.56 | 1.07 | -3.48 | -1.64 | 19.07 | -17.27 | 15.78 | 11.71 | 6.04 | 2.08 | 4.13 | -13.31 | NA | |
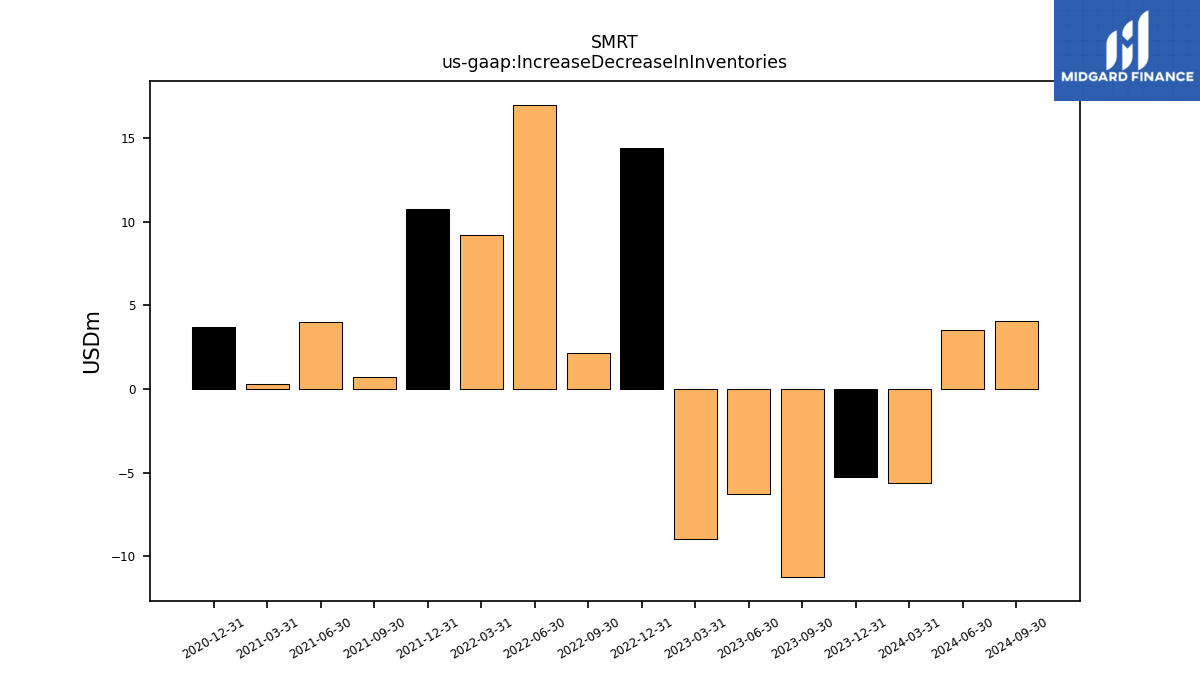
| Increase Decrease In Inventories | -11.23 | -6.24 | -8.95 | 14.43 | 2.18 | 17.00 | 9.20 | 10.77 | 0.72 | 4.00 | 0.29 | 3.71 | NA | |
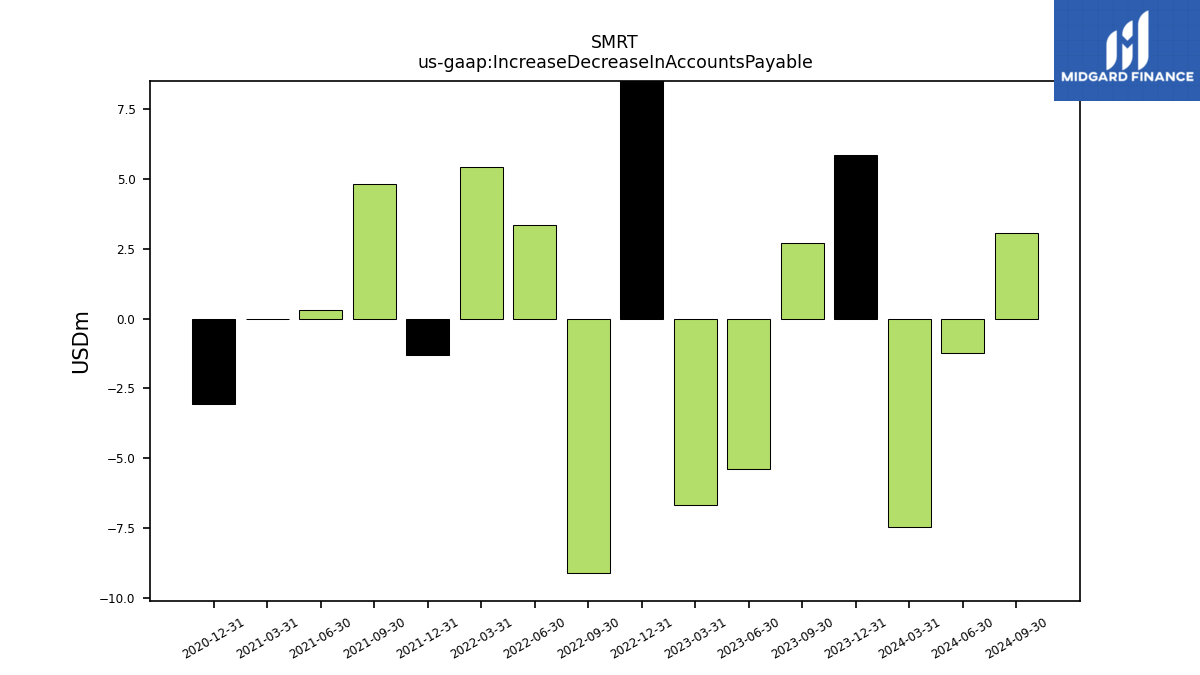
| Increase Decrease In Accounts Payable | 2.72 | -5.40 | -6.66 | 12.78 | -9.13 | 3.37 | 5.43 | -1.30 | 4.81 | 0.31 | -0.02 | -3.05 | NA | |
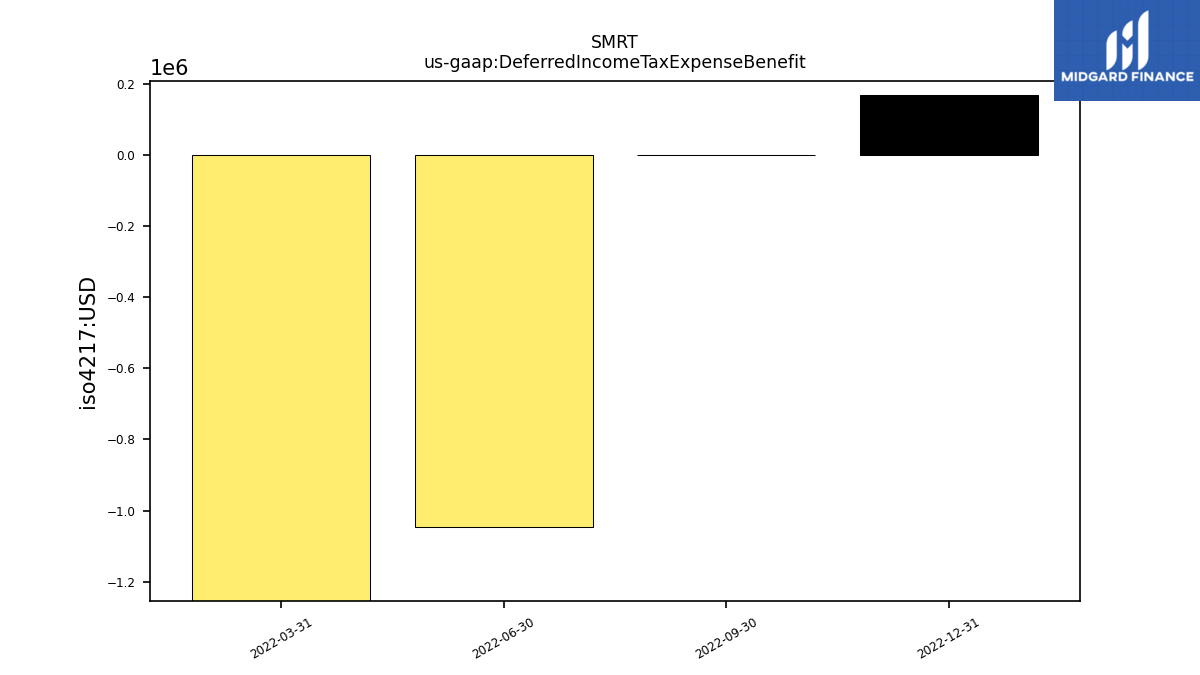
| Deferred Income Tax Expense Benefit | NA | NA | NA | 0.17 | 0.00 | -1.04 | -4.84 | NA | NA | NA | NA | NA | NA | |
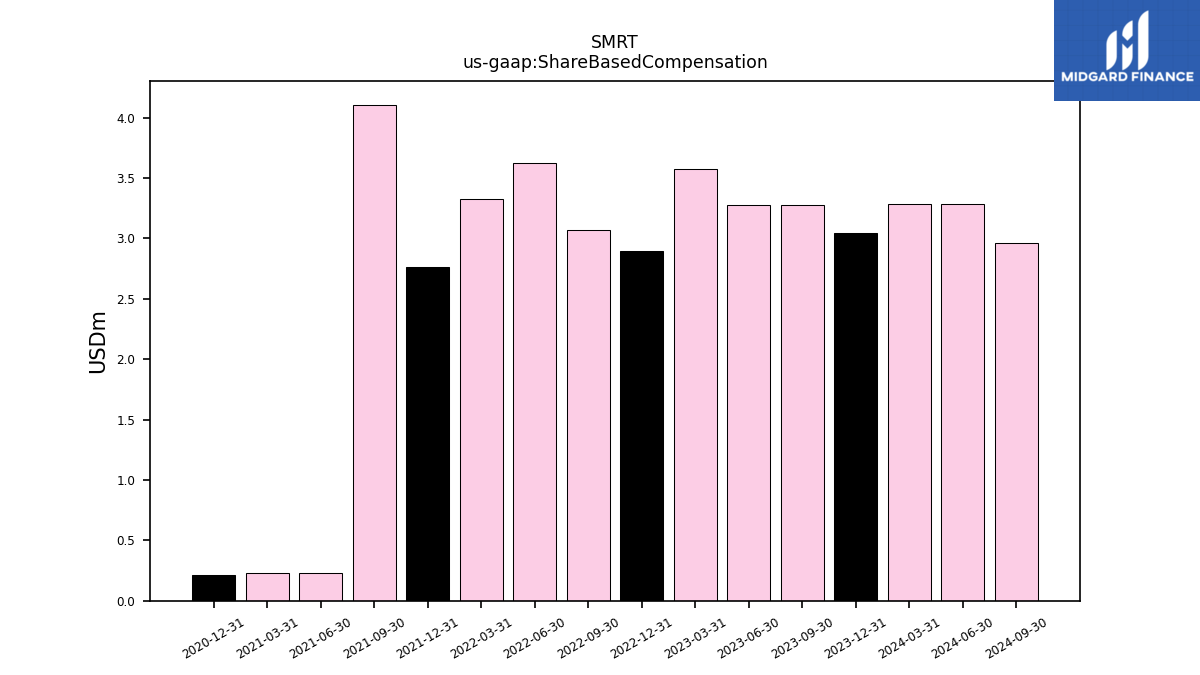
| Share Based Compensation | 3.27 | 3.28 | 3.57 | 2.89 | 3.07 | 3.62 | 3.32 | 2.76 | 4.10 | 0.23 | 0.23 | 0.21 | NA |
| 2023-09-30 | 2023-06-30 | 2023-03-31 | 2022-12-31 | 2022-09-30 | 2022-06-30 | 2022-03-31 | 2021-12-31 | 2021-09-30 | 2021-06-30 | 2021-03-31 | 2020-12-31 | 2020-09-30 | ||
|---|---|---|---|---|---|---|---|---|---|---|---|---|---|---|
| Net Cash Provided By Used In Investing Activities | -0.98 | -2.30 | -0.03 | -1.03 | -0.33 | -11.65 | -117.77 | -6.52 | 342.15 | 0.00 | -345.00 | -0.02 | NA | |
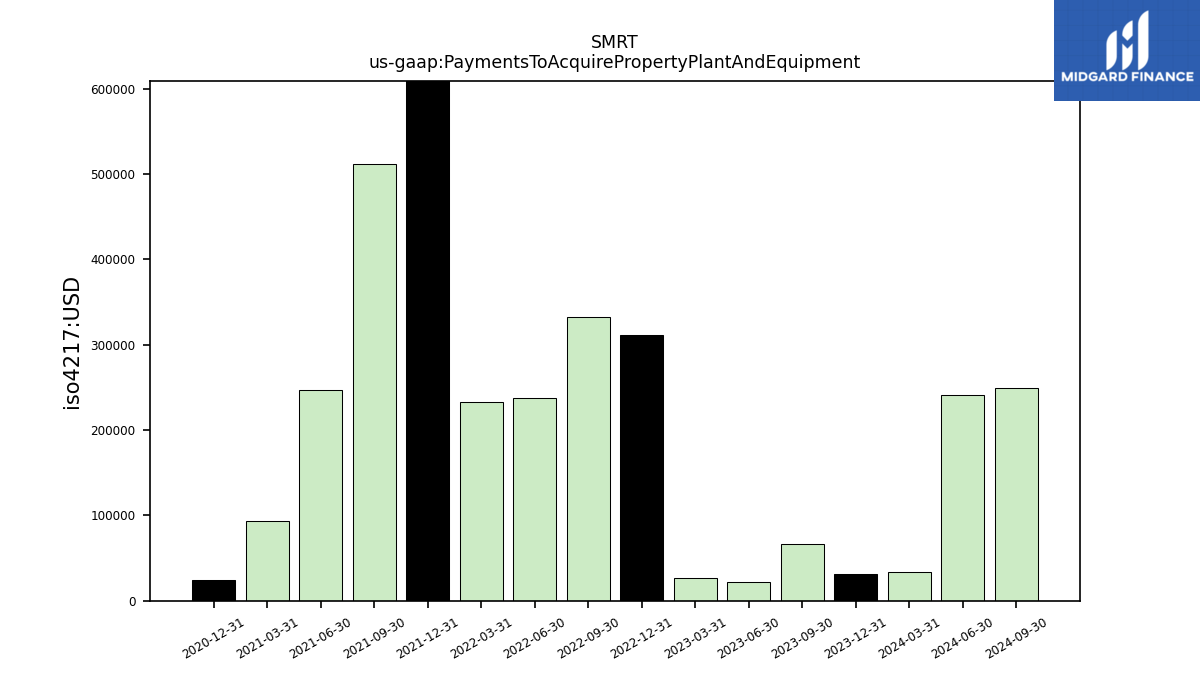
| Payments To Acquire Property Plant And Equipment | 0.07 | 0.02 | 0.03 | 0.31 | 0.33 | 0.24 | 0.23 | 0.62 | 0.51 | 0.25 | 0.09 | 0.02 | NA |
| 2023-09-30 | 2023-06-30 | 2023-03-31 | 2022-12-31 | 2022-09-30 | 2022-06-30 | 2022-03-31 | 2021-12-31 | 2021-09-30 | 2021-06-30 | 2021-03-31 | 2020-12-31 | 2020-09-30 | ||
|---|---|---|---|---|---|---|---|---|---|---|---|---|---|---|
| Net Cash Provided By Used In Financing Activities | 0.78 | -0.42 | -1.85 | -0.28 | 0.38 | -3.39 | 0.48 | -4.61 | 130.67 | -0.52 | 348.38 | -0.14 | NA |
| 2023-09-30 | 2023-06-30 | 2023-03-31 | 2022-12-31 | 2022-09-30 | 2022-06-30 | 2022-03-31 | 2021-12-31 | 2021-09-30 | 2021-06-30 | 2021-03-31 | 2020-12-31 | 2020-09-30 | ||
|---|---|---|---|---|---|---|---|---|---|---|---|---|---|---|
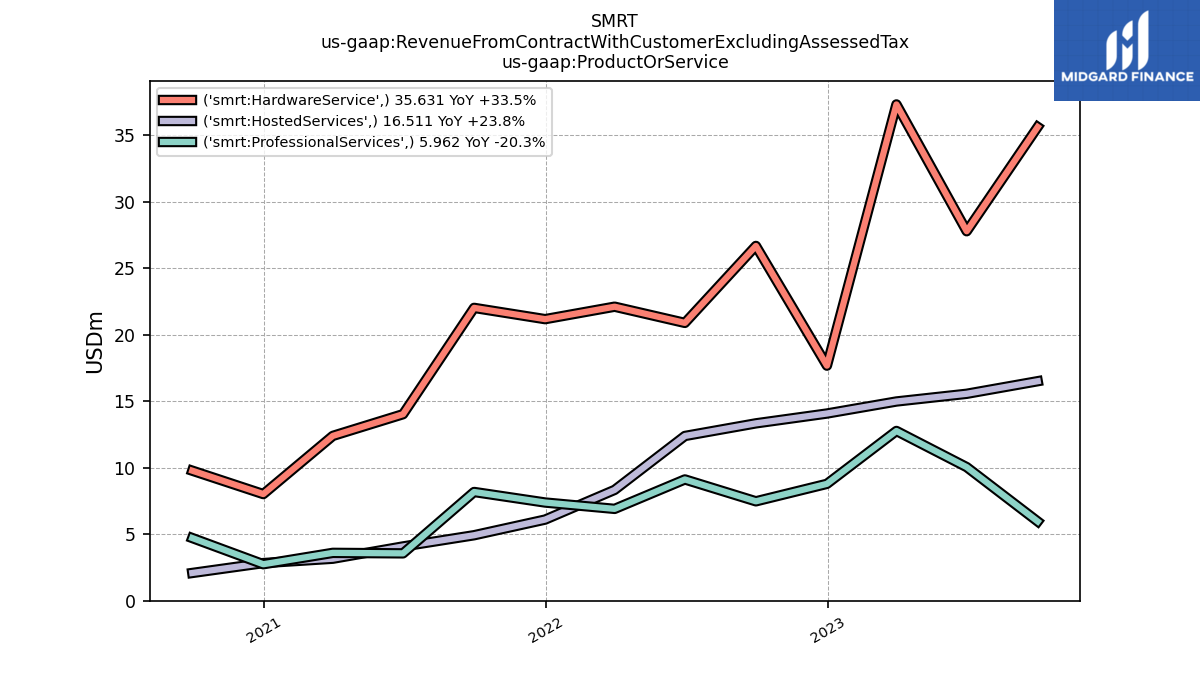
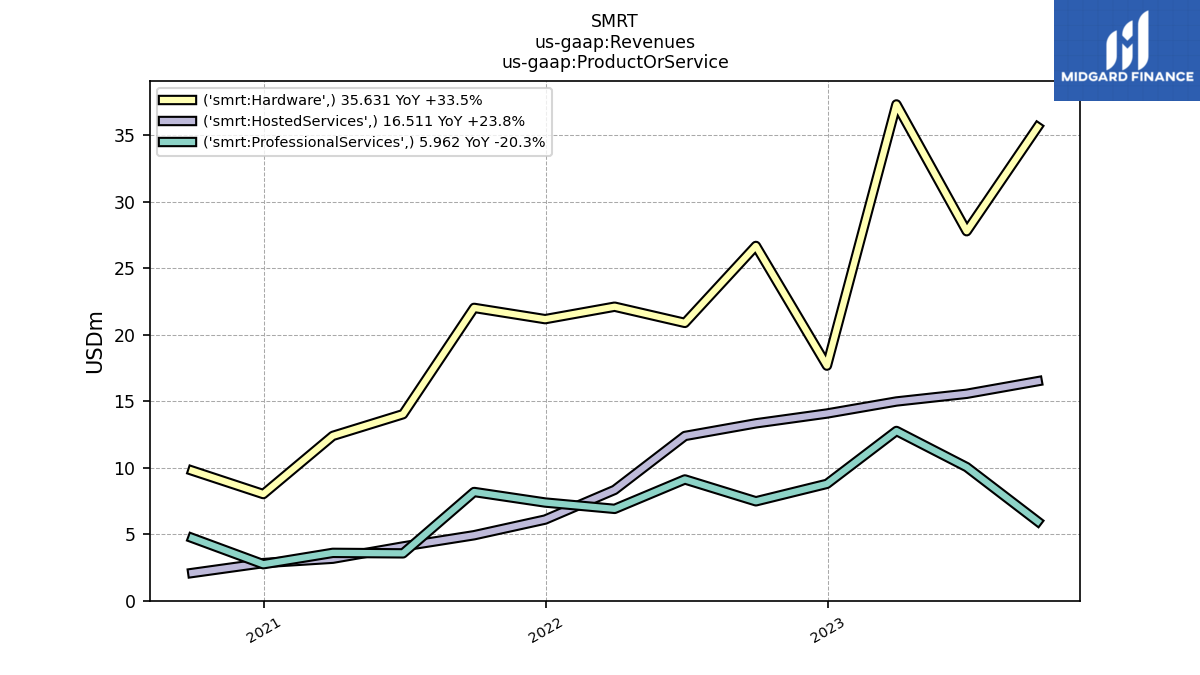
| Revenues | 58.10 | 53.40 | 65.08 | 40.55 | 47.50 | 42.41 | 37.36 | 34.67 | 35.13 | 21.68 | 19.16 | 13.60 | 16.59 | |
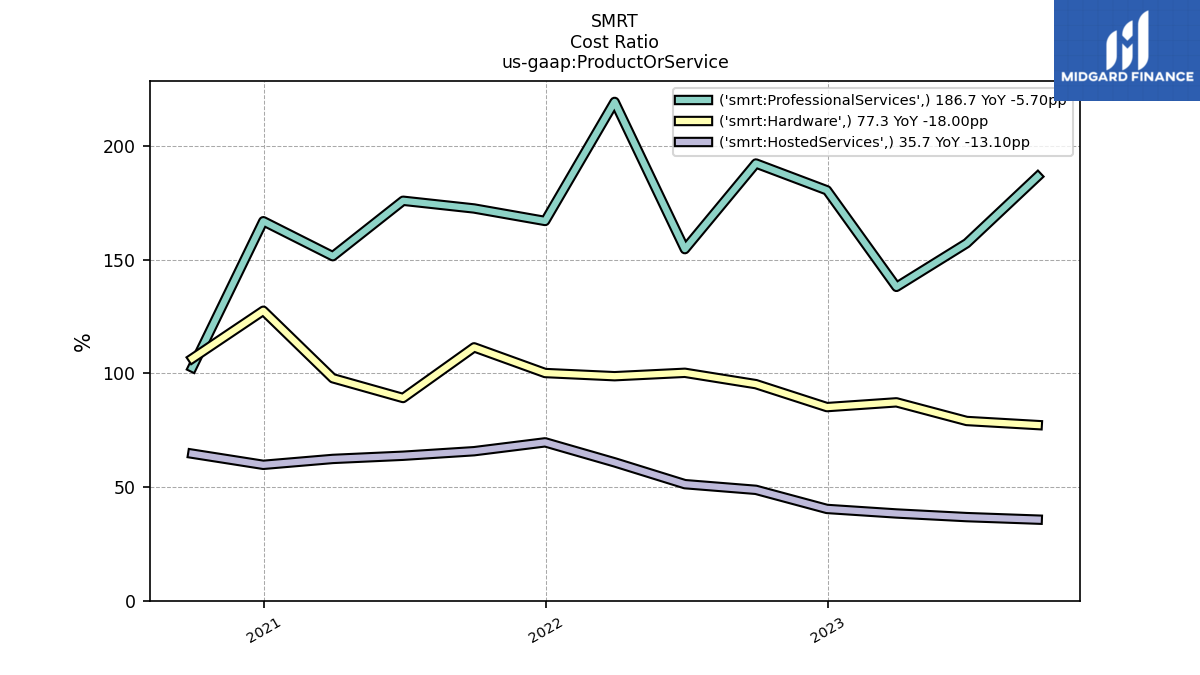
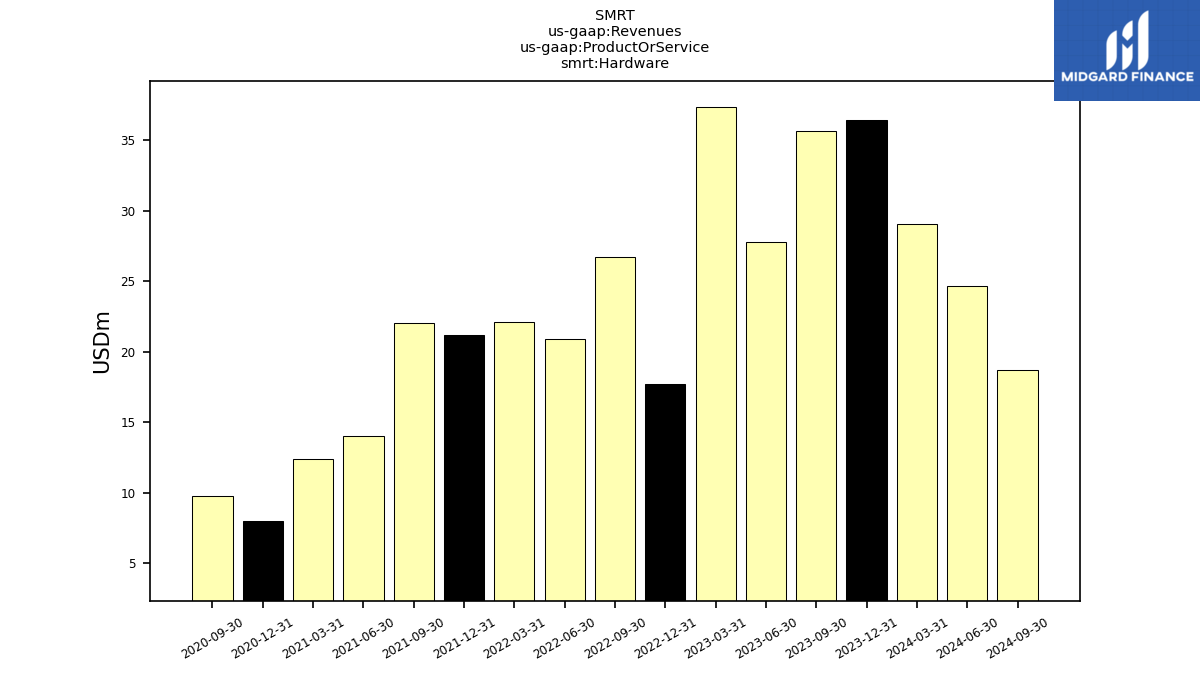
| Hardware | 35.63 | 27.79 | 37.33 | 17.68 | 26.68 | 20.89 | 22.11 | 21.18 | 22.02 | 14.03 | 12.40 | 8.02 | 9.78 | |
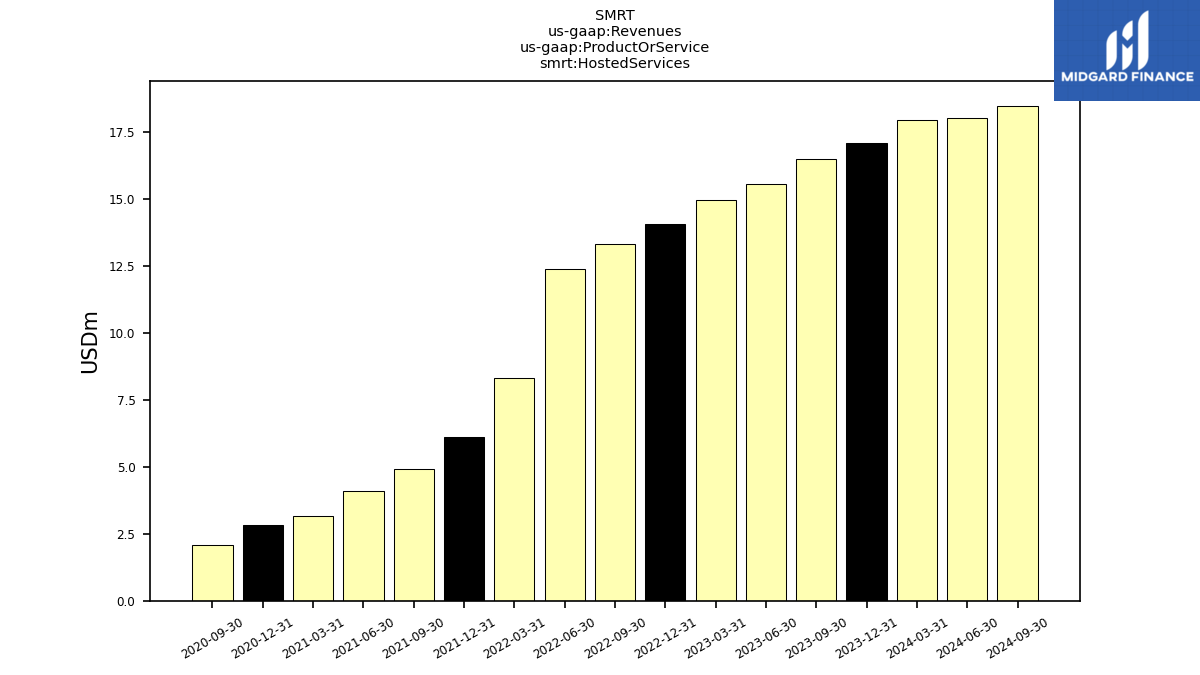
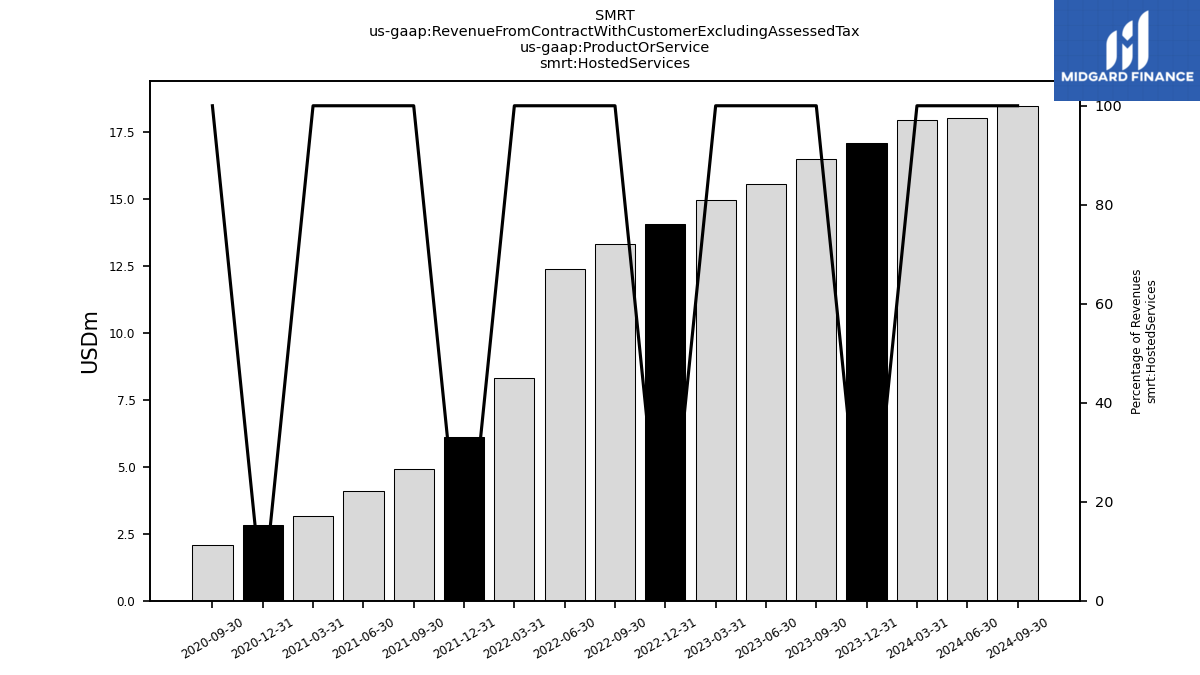
| Hosted Services | 16.51 | 15.56 | 14.98 | 14.08 | 13.34 | 12.39 | 8.34 | 6.10 | 4.93 | 4.08 | 3.16 | 2.83 | 2.09 | |
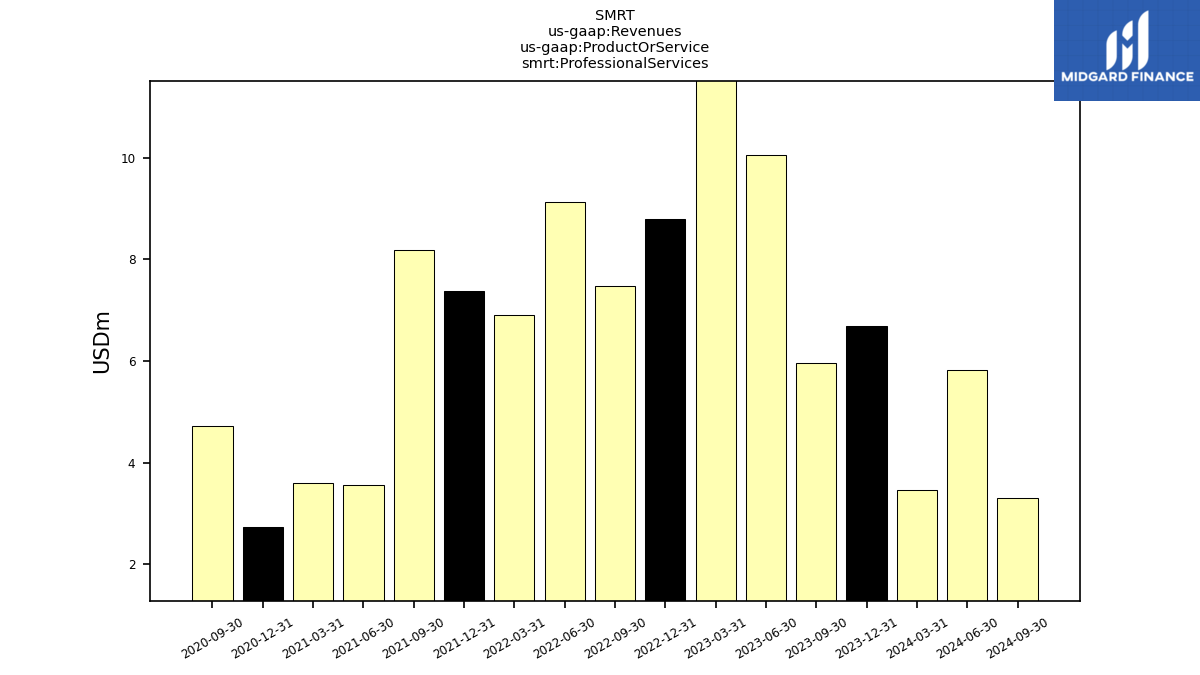
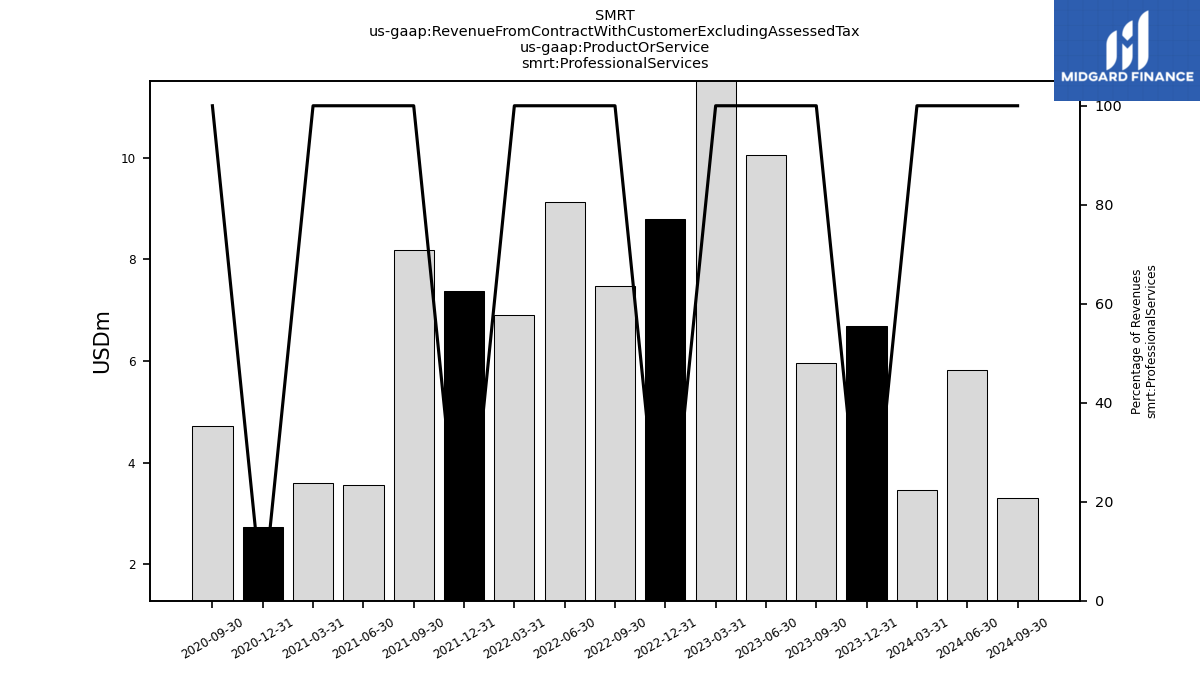
| Professional Services | 5.96 | 10.05 | 12.77 | 8.79 | 7.48 | 9.12 | 6.91 | 7.39 | 8.18 | 3.56 | 3.60 | 2.75 | 4.72 | |
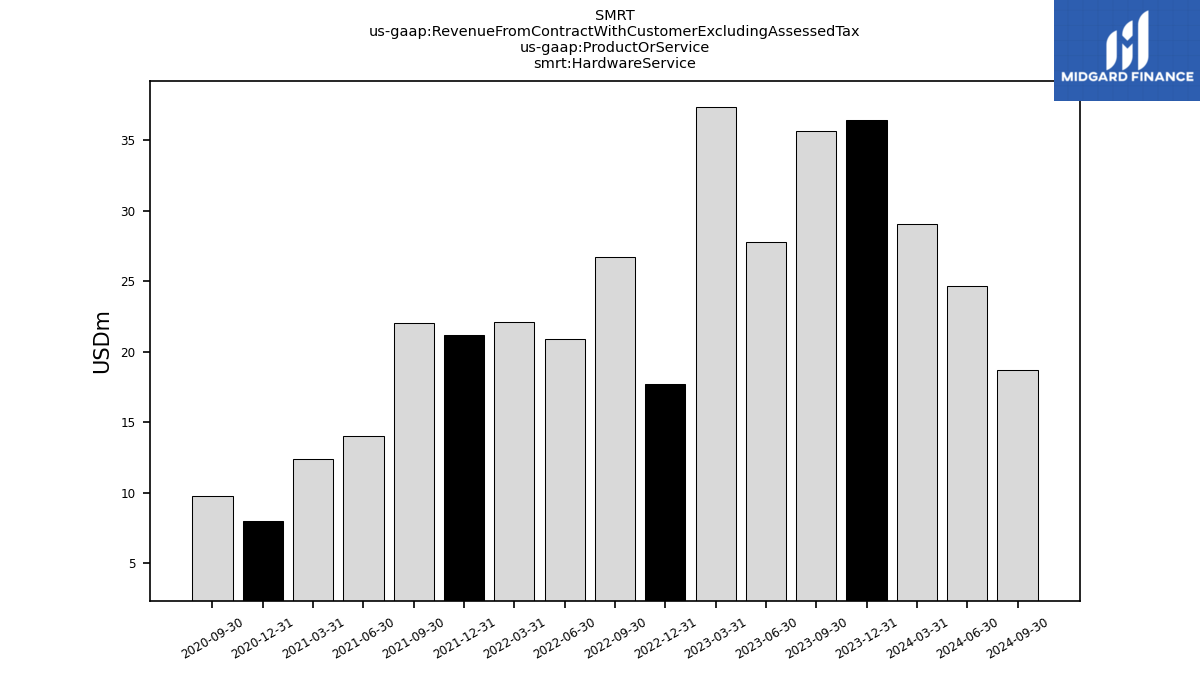
| Revenue From Contract With Customer Excluding Assessed Tax | 58.10 | 53.40 | 65.08 | 40.55 | 47.50 | 42.41 | 37.36 | 34.67 | 35.13 | 21.68 | 19.16 | 13.60 | 16.59 | |
| Hardware Service | 35.63 | 27.79 | 37.33 | 17.68 | 26.68 | 20.89 | 22.11 | 21.18 | 22.02 | 14.03 | 12.40 | 8.02 | 9.78 | |
| Hosted Services | 16.51 | 15.56 | 14.98 | 14.08 | 13.34 | 12.39 | 8.34 | 6.10 | 4.93 | 4.08 | 3.16 | 2.83 | 2.09 | |
| Professional Services | 5.96 | 10.05 | 12.77 | 8.79 | 7.48 | 9.12 | 6.91 | 7.39 | 8.18 | 3.56 | 3.60 | 2.75 | 4.72 | |
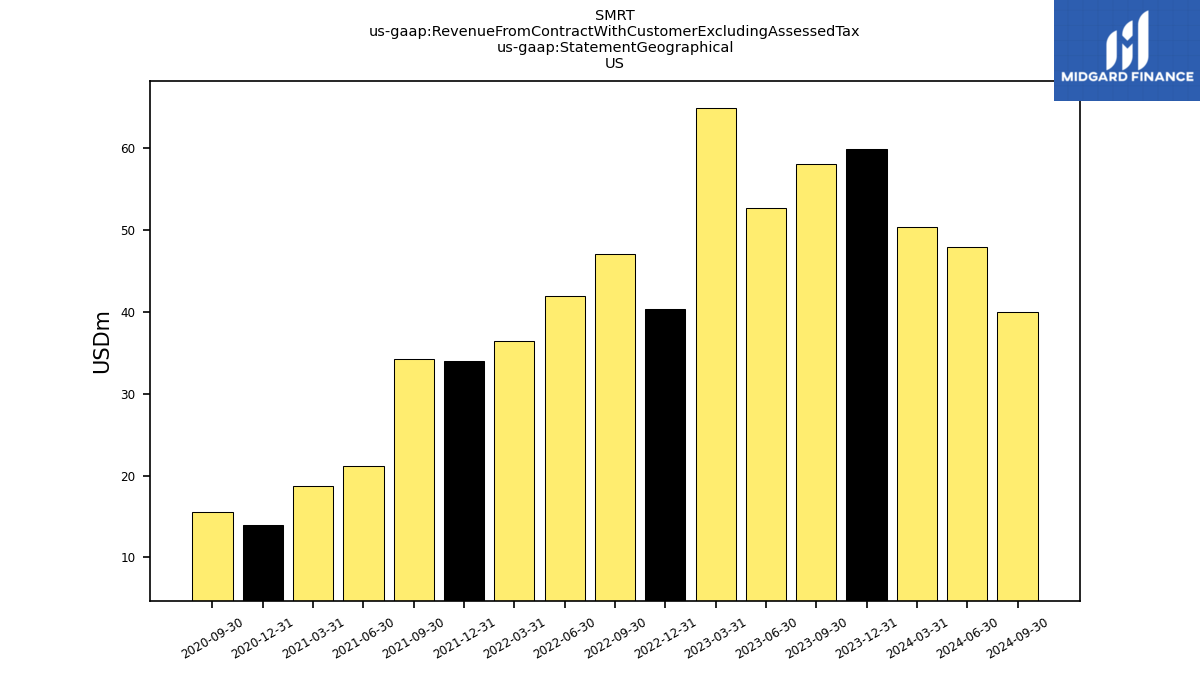
| US | 58.06 | 52.63 | 64.93 | 40.32 | 47.10 | 41.93 | 36.45 | 33.96 | 34.25 | 21.11 | 18.75 | 13.92 | 15.57 | |
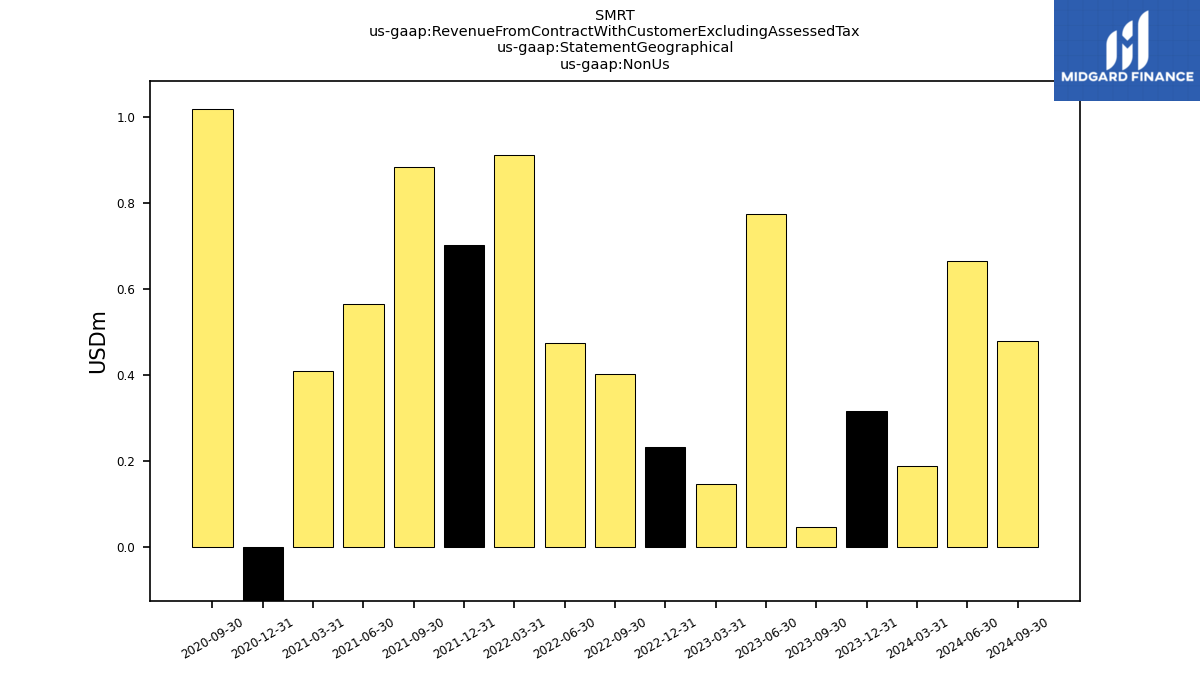
| Non Us | 0.05 | 0.78 | 0.15 | 0.23 | 0.40 | 0.48 | 0.91 | 0.70 | 0.89 | 0.56 | 0.41 | -0.32 | 1.02 |