
| 2024-01-28 | 2023-10-29 | 2023-07-30 | 2023-04-30 | 2023-01-29 | 2022-10-30 | 2022-07-31 | 2022-05-01 | 2022-01-30 | 2021-10-31 | 2021-08-01 | 2021-05-02 | 2021-01-31 | 2020-10-25 | 2020-07-26 | 2020-04-26 | 2020-01-26 | 2019-10-27 | 2019-07-28 | 2019-04-28 | 2019-01-27 | 2018-10-28 | 2018-07-29 | 2018-04-29 | 2018-01-28 | 2017-10-29 | 2017-07-30 | 2017-04-30 | 2017-01-29 | 2016-10-30 | 2016-07-31 | 2016-05-01 | 2016-01-31 | 2015-10-25 | 2015-07-26 | 2015-04-26 | 2015-01-25 | 2014-10-26 | 2014-07-27 | 2014-04-27 | 2014-01-26 | 2013-10-27 | 2013-07-28 | 2013-04-28 | 2013-01-27 | 2012-10-28 | 2012-07-29 | 2012-04-29 | 2012-01-29 | 2011-10-30 | 2011-07-31 | 2011-05-01 | 2011-01-30 | 2010-10-31 | 2010-08-01 | 2010-05-02 | ||
|---|---|---|---|---|---|---|---|---|---|---|---|---|---|---|---|---|---|---|---|---|---|---|---|---|---|---|---|---|---|---|---|---|---|---|---|---|---|---|---|---|---|---|---|---|---|---|---|---|---|---|---|---|---|---|---|---|---|
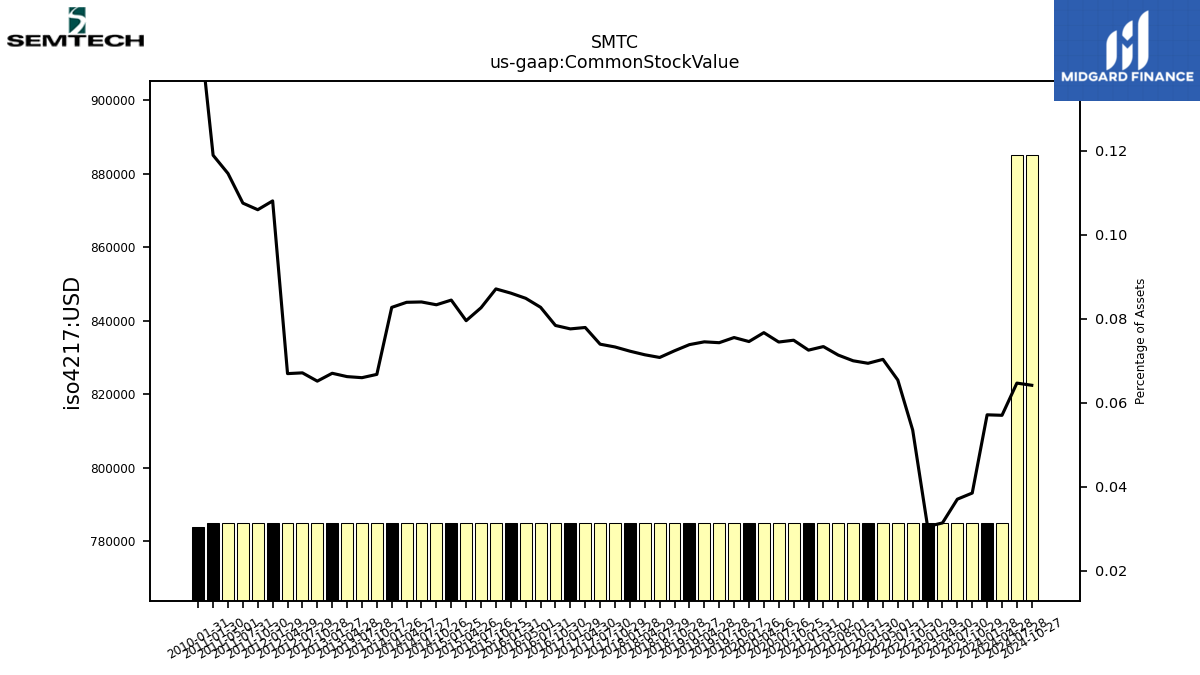
| Common Stock Value | 0.79 | 0.79 | 0.79 | 0.79 | 0.79 | 0.79 | 0.79 | 0.79 | 0.79 | 0.79 | 0.79 | 0.79 | 0.79 | 0.79 | 0.79 | 0.79 | 0.79 | 0.79 | 0.79 | 0.79 | 0.79 | 0.79 | 0.79 | 0.79 | 0.79 | 0.79 | 0.79 | 0.79 | 0.79 | 0.79 | 0.79 | 0.79 | 0.79 | 0.79 | 0.79 | 0.79 | 0.79 | 0.79 | 0.79 | 0.79 | 0.79 | 0.79 | 0.79 | 0.79 | 0.79 | 0.79 | 0.79 | 0.79 | 0.79 | 0.79 | 0.79 | 0.79 | 0.79 | NA | NA | NA | |
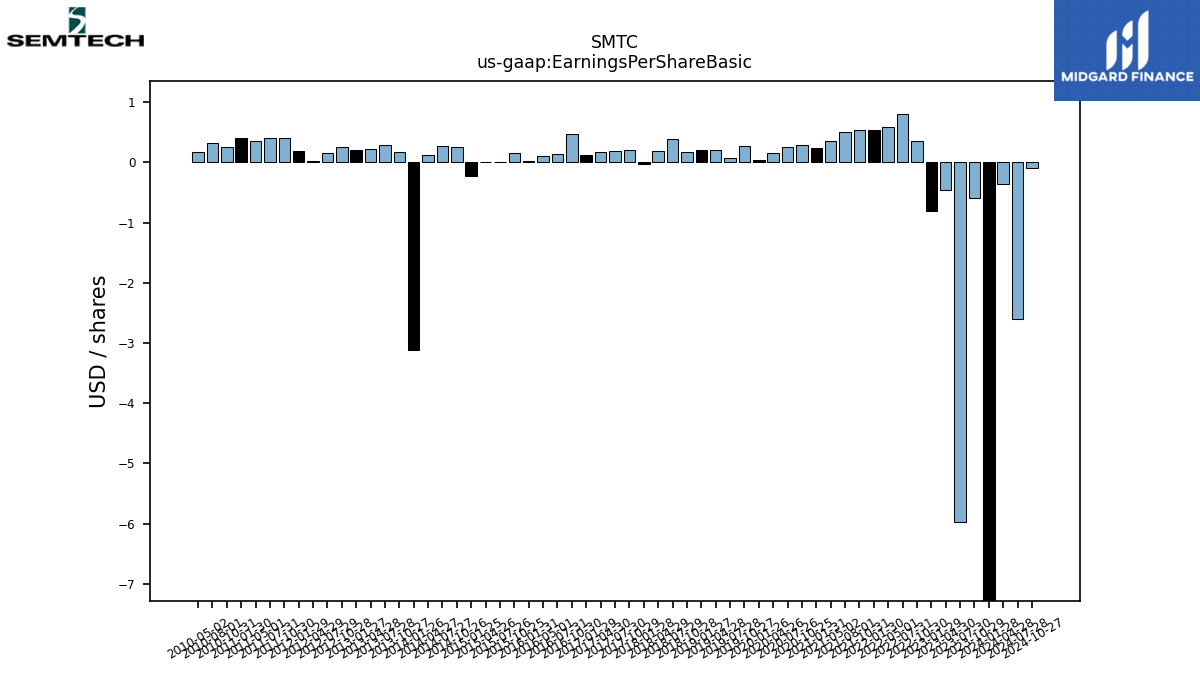
| Earnings Per Share Basic | -10.01 | -0.60 | -5.97 | -0.46 | -0.80 | 0.36 | 0.81 | 0.59 | 0.54 | 0.53 | 0.51 | 0.36 | 0.24 | 0.28 | 0.25 | 0.15 | 0.04 | 0.27 | 0.08 | 0.20 | 0.20 | 0.18 | 0.38 | 0.19 | -0.02 | 0.20 | 0.19 | 0.18 | 0.12 | 0.47 | 0.14 | 0.11 | 0.02 | 0.16 | 0.00 | 0.00 | -0.23 | 0.26 | 0.27 | 0.12 | -3.12 | 0.18 | 0.28 | 0.22 | 0.20 | 0.25 | 0.15 | 0.03 | 0.19 | 0.41 | 0.41 | 0.35 | 0.41 | 0.26 | 0.32 | 0.18 | |
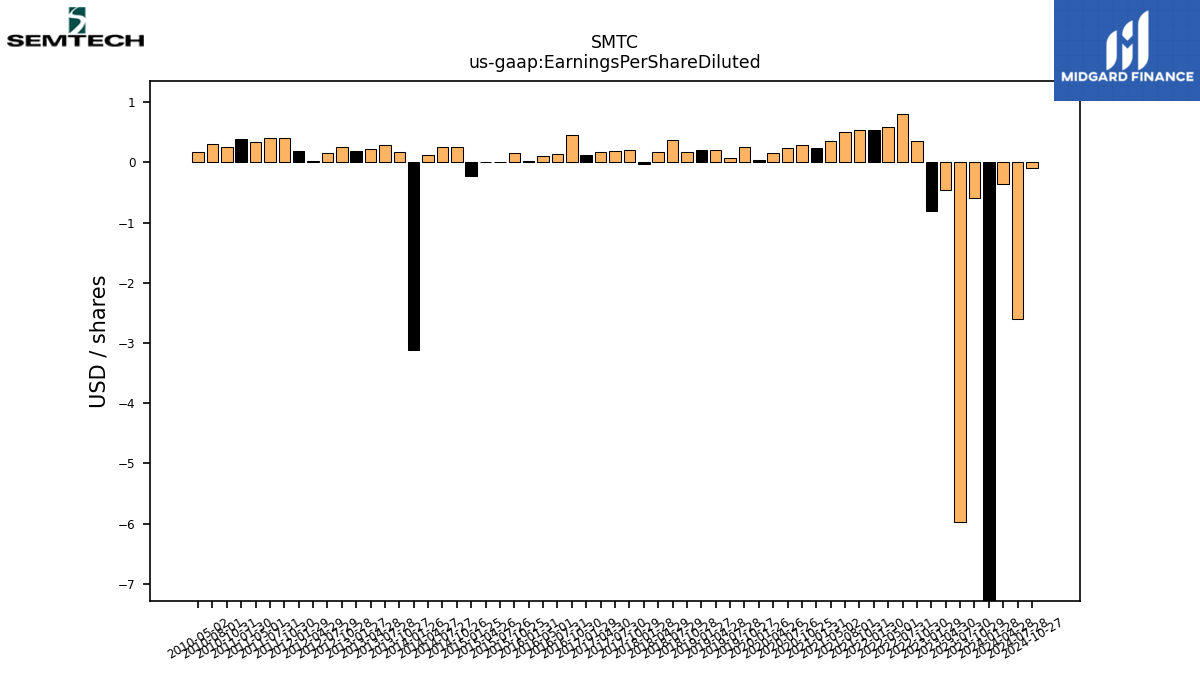
| Earnings Per Share Diluted | -10.01 | -0.60 | -5.97 | -0.46 | -0.80 | 0.36 | 0.81 | 0.59 | 0.54 | 0.53 | 0.50 | 0.36 | 0.24 | 0.28 | 0.24 | 0.15 | 0.04 | 0.26 | 0.08 | 0.20 | 0.20 | 0.18 | 0.37 | 0.18 | -0.02 | 0.20 | 0.19 | 0.18 | 0.12 | 0.46 | 0.14 | 0.11 | 0.02 | 0.16 | 0.00 | 0.00 | -0.23 | 0.26 | 0.26 | 0.12 | -3.12 | 0.18 | 0.28 | 0.22 | 0.19 | 0.25 | 0.15 | 0.03 | 0.19 | 0.40 | 0.40 | 0.34 | 0.39 | 0.25 | 0.31 | 0.17 |
| 2024-01-28 | 2023-10-29 | 2023-07-30 | 2023-04-30 | 2023-01-29 | 2022-10-30 | 2022-07-31 | 2022-05-01 | 2022-01-30 | 2021-10-31 | 2021-08-01 | 2021-05-02 | 2021-01-31 | 2020-10-25 | 2020-07-26 | 2020-04-26 | 2020-01-26 | 2019-10-27 | 2019-07-28 | 2019-04-28 | 2019-01-27 | 2018-10-28 | 2018-07-29 | 2018-04-29 | 2018-01-28 | 2017-10-29 | 2017-07-30 | 2017-04-30 | 2017-01-29 | 2016-10-30 | 2016-07-31 | 2016-05-01 | 2016-01-31 | 2015-10-25 | 2015-07-26 | 2015-04-26 | 2015-01-25 | 2014-10-26 | 2014-07-27 | 2014-04-27 | 2014-01-26 | 2013-10-27 | 2013-07-28 | 2013-04-28 | 2013-01-27 | 2012-10-28 | 2012-07-29 | 2012-04-29 | 2012-01-29 | 2011-10-30 | 2011-07-31 | 2011-05-01 | 2011-01-30 | 2010-10-31 | 2010-08-01 | 2010-05-02 | ||
|---|---|---|---|---|---|---|---|---|---|---|---|---|---|---|---|---|---|---|---|---|---|---|---|---|---|---|---|---|---|---|---|---|---|---|---|---|---|---|---|---|---|---|---|---|---|---|---|---|---|---|---|---|---|---|---|---|---|
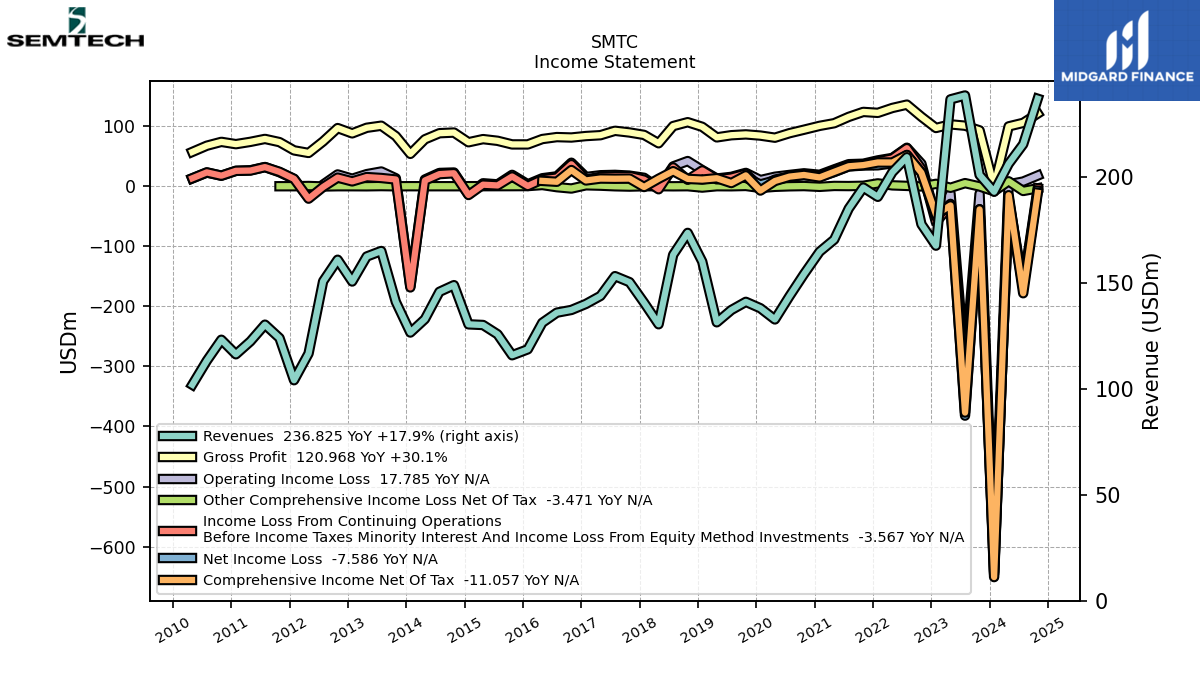
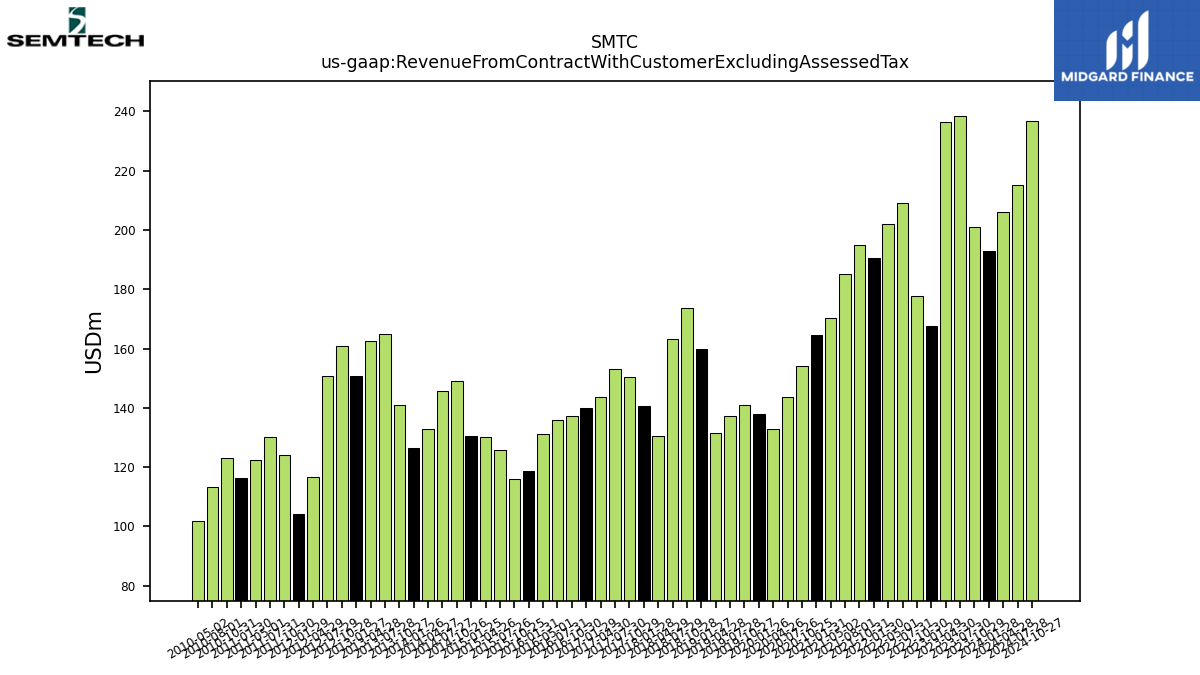
| Revenue From Contract With Customer Excluding Assessed Tax | 192.95 | 200.90 | 238.37 | 236.54 | 167.51 | 177.62 | 209.25 | 202.15 | 190.55 | 194.93 | 185.00 | 170.37 | 164.67 | 154.08 | 143.66 | 132.70 | 138.00 | 141.01 | 137.15 | 131.35 | 160.01 | 173.55 | 163.21 | 130.43 | 140.61 | 150.30 | 153.13 | 143.80 | 140.03 | 137.19 | 135.91 | 131.15 | 118.61 | 115.81 | 125.71 | 130.09 | 130.39 | 148.89 | 145.74 | 132.86 | 126.53 | 141.03 | 165.01 | 162.41 | 150.60 | 160.88 | 150.70 | 116.64 | 104.03 | 123.94 | 130.25 | 122.37 | 116.27 | 123.12 | 113.23 | 101.88 | |
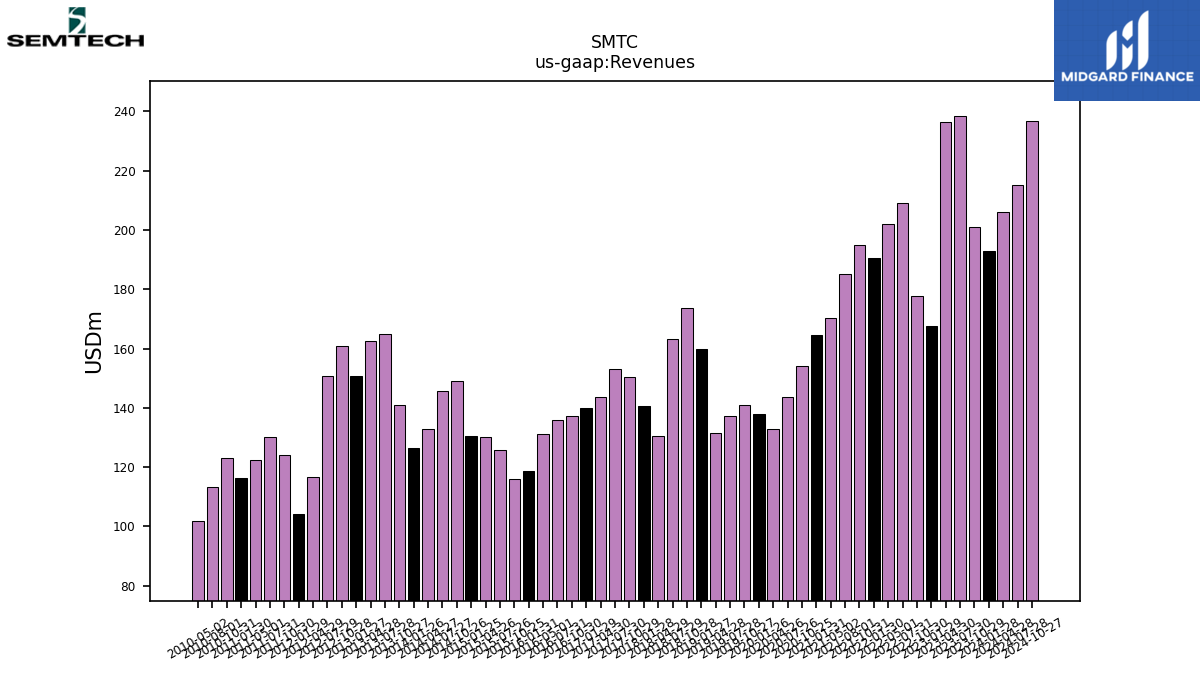
| Revenues | 192.95 | 200.90 | 238.37 | 236.54 | 167.51 | 177.62 | 209.25 | 202.15 | 190.55 | 194.93 | 185.00 | 170.37 | 164.67 | 154.08 | 143.66 | 132.70 | 138.00 | 141.01 | 137.15 | 131.35 | 160.01 | 173.55 | 163.21 | 130.43 | 140.61 | 150.30 | 153.13 | 143.80 | 140.03 | 137.19 | 135.91 | 131.15 | 118.61 | 115.81 | 125.71 | 130.09 | 130.39 | 148.89 | 145.74 | 132.86 | 126.53 | 141.03 | 165.01 | 162.41 | 150.60 | 160.88 | 150.70 | 116.64 | 104.03 | 123.94 | 130.25 | 122.37 | 116.27 | 123.12 | 113.23 | 101.88 | |
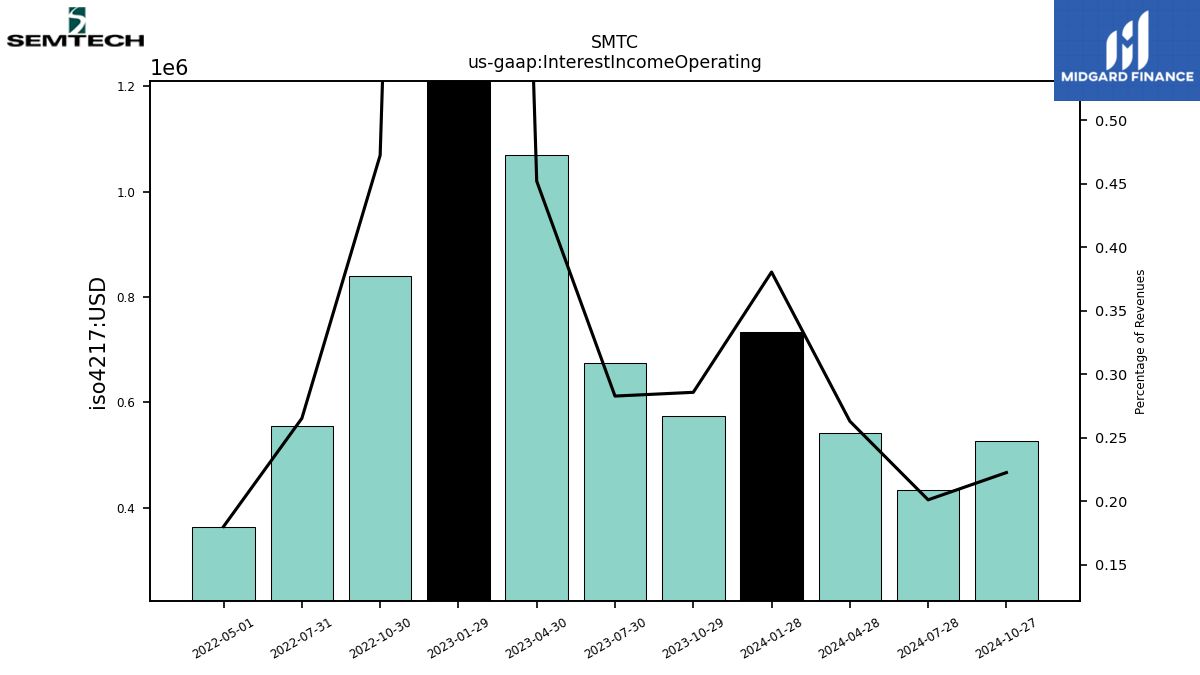
| Interest Income Operating | 0.73 | 0.57 | 0.67 | 1.07 | 4.04 | 0.84 | 0.56 | 0.36 | NA | NA | NA | NA | NA | NA | NA | NA | NA | NA | NA | NA | NA | NA | NA | NA | NA | NA | NA | NA | NA | NA | NA | NA | NA | NA | NA | NA | NA | NA | NA | NA | NA | NA | NA | NA | NA | NA | NA | NA | NA | NA | NA | NA | NA | NA | NA | NA | |
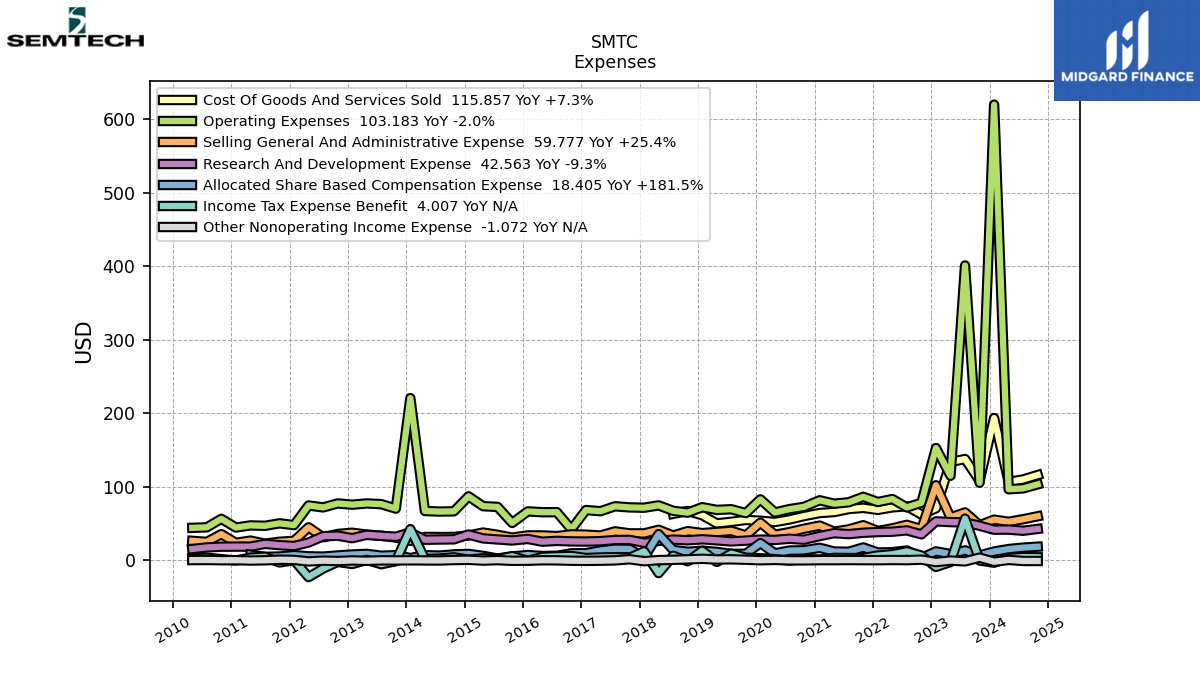
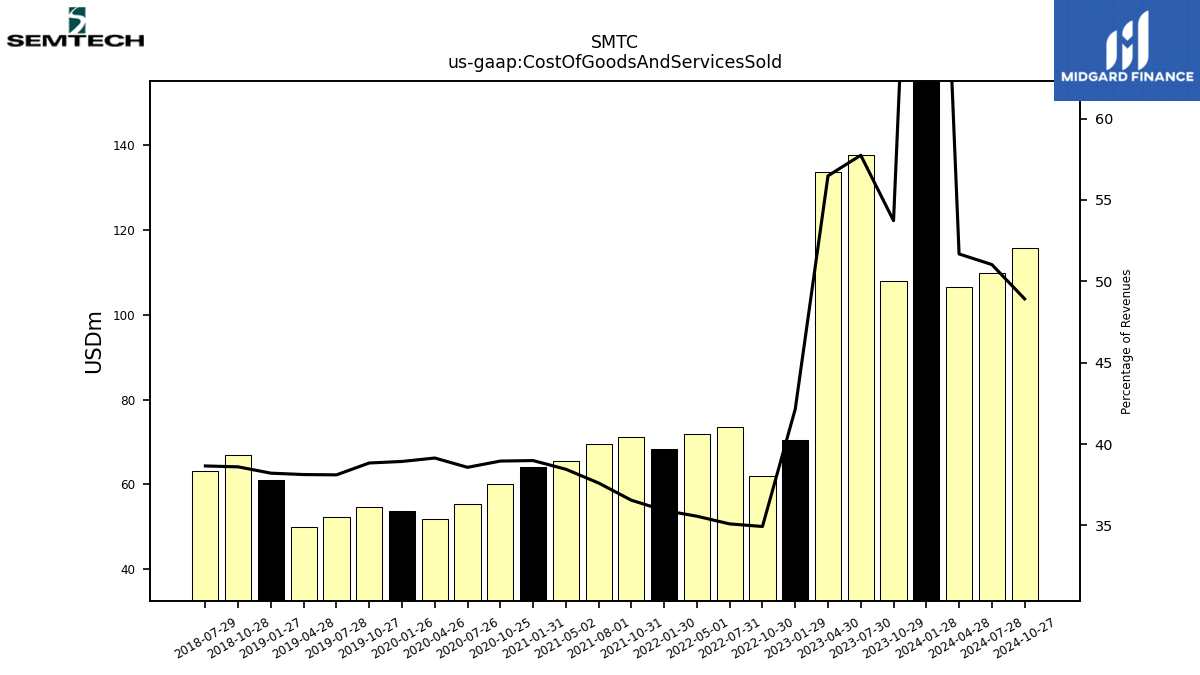
| Cost Of Goods And Services Sold | 193.34 | 107.93 | 137.64 | 133.59 | 70.59 | 62.05 | 73.44 | 71.90 | 68.45 | 71.24 | 69.57 | 65.51 | 64.20 | 60.02 | 55.41 | 51.94 | 53.72 | 54.76 | 52.26 | 50.08 | 61.14 | 66.99 | 63.09 | NA | NA | NA | NA | NA | NA | NA | NA | NA | NA | NA | NA | NA | NA | NA | NA | NA | NA | NA | NA | NA | NA | NA | NA | NA | NA | NA | NA | NA | NA | NA | NA | NA | |
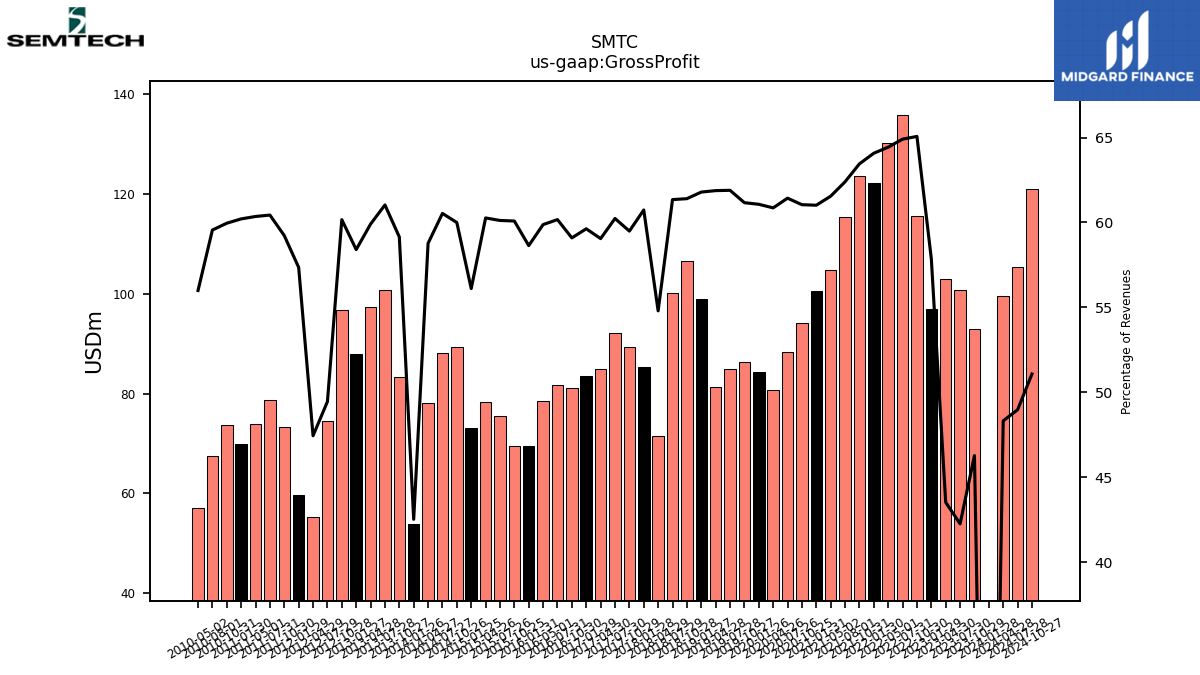
| Gross Profit | -0.39 | 92.97 | 100.73 | 102.95 | 96.92 | 115.57 | 135.82 | 130.25 | 122.10 | 123.69 | 115.43 | 104.86 | 100.48 | 94.06 | 88.25 | 80.76 | 84.28 | 86.25 | 84.88 | 81.28 | 98.87 | 106.56 | 100.12 | 71.47 | 85.40 | 89.42 | 92.24 | 84.92 | 83.50 | 81.06 | 81.78 | 78.52 | 69.55 | 69.58 | 75.58 | 78.40 | 73.16 | 89.33 | 88.22 | 78.08 | 53.80 | 83.41 | 100.71 | 97.29 | 87.96 | 96.79 | 74.53 | 55.34 | 59.66 | 73.41 | 78.72 | 73.85 | 70.01 | 73.82 | 67.43 | 57.05 | |
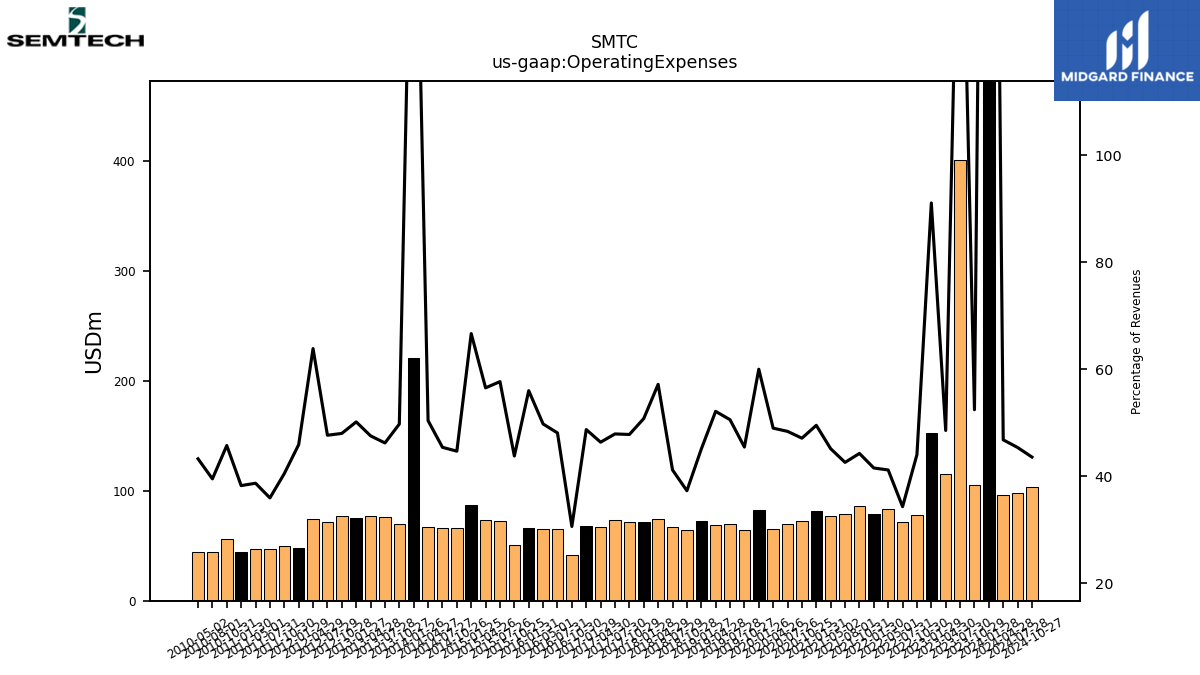
| Operating Expenses | 619.57 | 105.34 | 400.84 | 114.83 | 152.58 | 78.20 | 71.78 | 83.20 | 79.14 | 86.27 | 78.77 | 76.89 | 81.53 | 72.58 | 69.50 | 64.99 | 82.80 | 64.08 | 69.34 | 68.46 | 72.10 | 64.69 | 67.19 | 74.57 | 71.39 | 71.84 | 73.34 | 66.66 | 68.21 | 41.97 | 65.35 | 65.26 | 66.40 | 50.69 | 72.51 | 73.52 | 86.92 | 66.52 | 66.16 | 66.94 | 220.52 | 70.15 | 76.25 | 77.21 | 75.52 | 77.21 | 71.81 | 74.48 | 47.74 | 50.17 | 46.81 | 47.33 | 44.46 | 56.31 | 44.72 | 44.06 | |
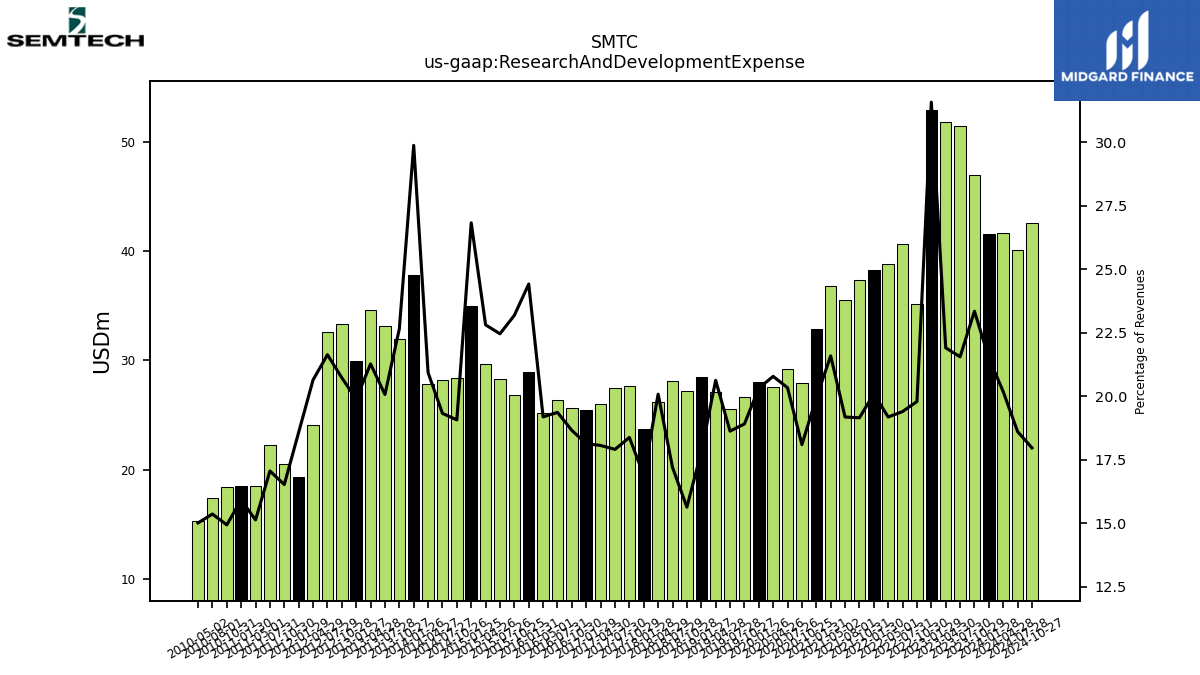
| Research And Development Expense | 41.51 | 46.91 | 51.39 | 51.83 | 52.90 | 35.16 | 40.60 | 38.79 | 38.29 | 37.35 | 35.50 | 36.79 | 32.83 | 27.89 | 29.22 | 27.59 | 28.05 | 26.67 | 25.55 | 27.10 | 28.49 | 27.15 | 28.08 | 26.20 | 23.75 | 27.63 | 27.43 | 25.98 | 25.40 | 25.60 | 26.32 | 25.17 | 28.97 | 26.86 | 28.24 | 29.68 | 34.98 | 28.40 | 28.17 | 27.81 | 37.80 | 31.95 | 33.12 | 34.56 | 29.96 | 33.35 | 32.61 | 24.08 | 19.34 | 20.49 | 22.23 | 18.52 | 18.52 | 18.40 | 17.40 | 15.30 | |
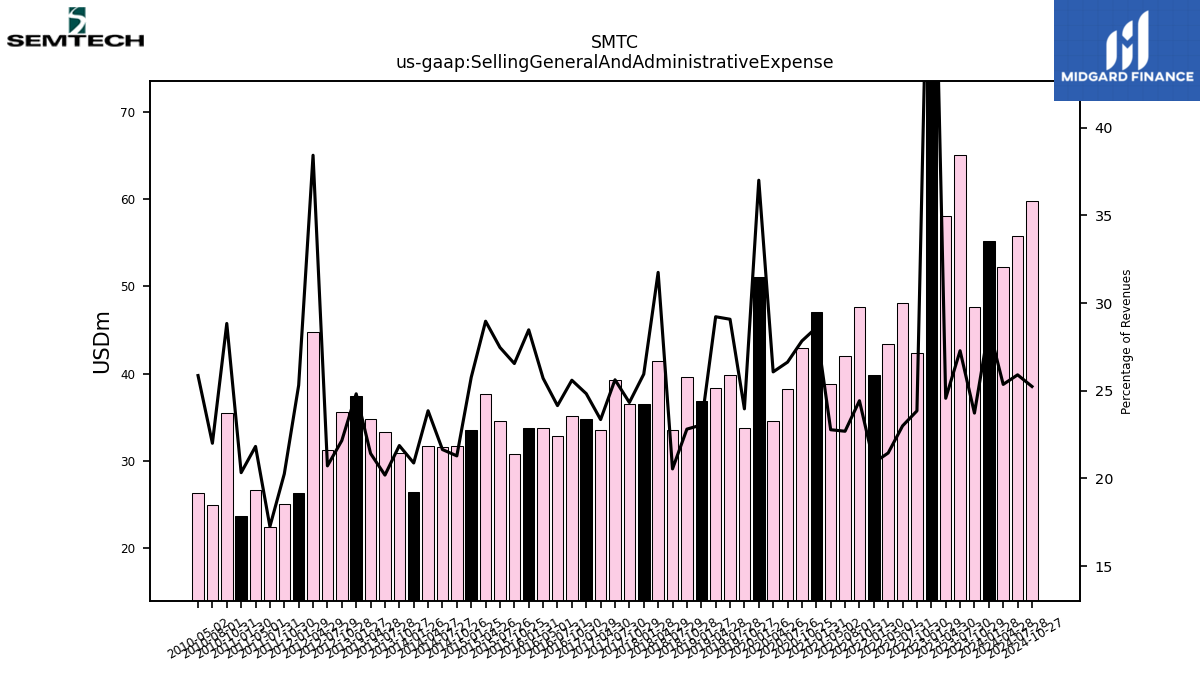
| Selling General And Administrative Expense | 55.20 | 47.66 | 65.02 | 58.12 | 101.95 | 42.37 | 48.12 | 43.36 | 39.81 | 47.62 | 41.98 | 38.80 | 47.09 | 42.89 | 38.26 | 34.60 | 51.06 | 33.80 | 39.88 | 38.38 | 36.88 | 39.59 | 33.53 | 41.41 | 36.48 | 36.57 | 39.24 | 33.59 | 34.77 | 35.12 | 32.82 | 33.72 | 33.77 | 30.75 | 34.53 | 37.67 | 33.59 | 31.69 | 31.55 | 31.70 | 26.42 | 30.85 | 33.31 | 34.79 | 37.39 | 35.65 | 31.22 | 44.82 | 26.33 | 25.11 | 22.48 | 26.70 | 23.64 | 35.50 | 24.91 | 26.35 | |
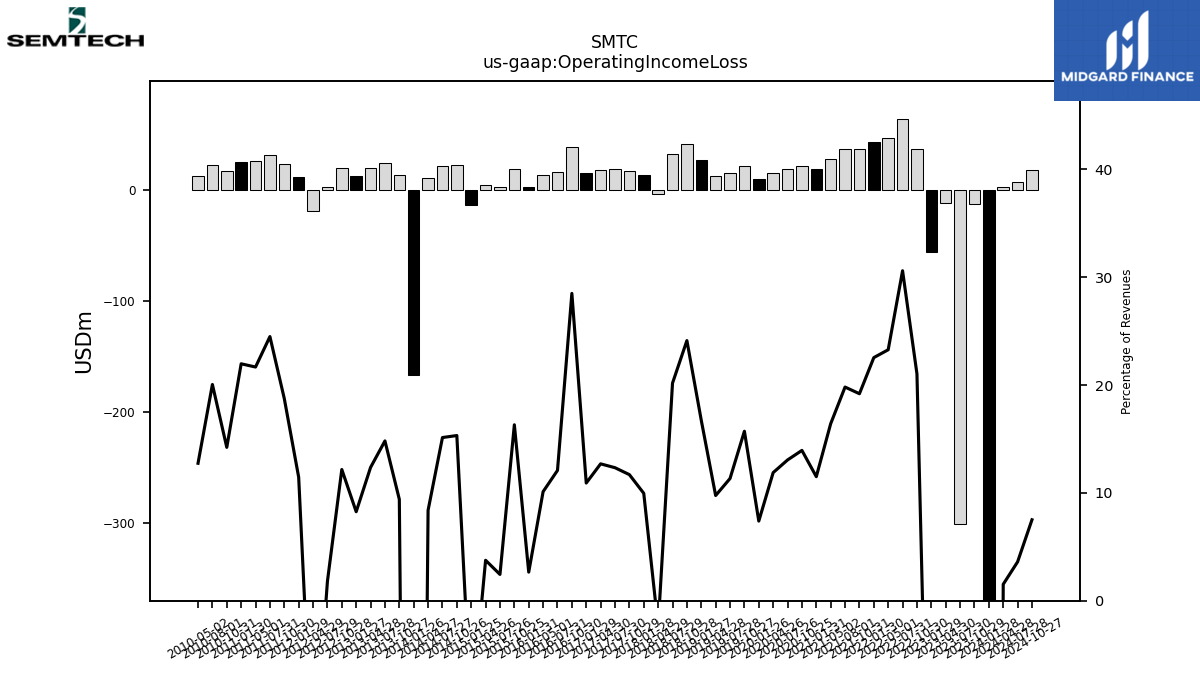
| Operating Income Loss | -619.96 | -12.37 | -300.11 | -11.88 | -55.66 | 37.37 | 64.04 | 47.05 | 42.96 | 37.42 | 36.66 | 27.97 | 18.95 | 21.48 | 18.76 | 15.77 | 10.20 | 22.16 | 15.55 | 12.82 | 26.77 | 41.87 | 32.94 | -3.10 | 14.01 | 17.58 | 18.89 | 18.26 | 15.29 | 39.10 | 16.43 | 13.27 | 3.15 | 18.90 | 3.07 | 4.88 | -13.76 | 22.81 | 22.06 | 11.15 | -166.72 | 13.27 | 24.46 | 20.08 | 12.44 | 19.58 | 2.71 | -19.14 | 11.92 | 23.23 | 31.91 | 26.52 | 25.55 | 17.51 | 22.71 | 12.99 | |
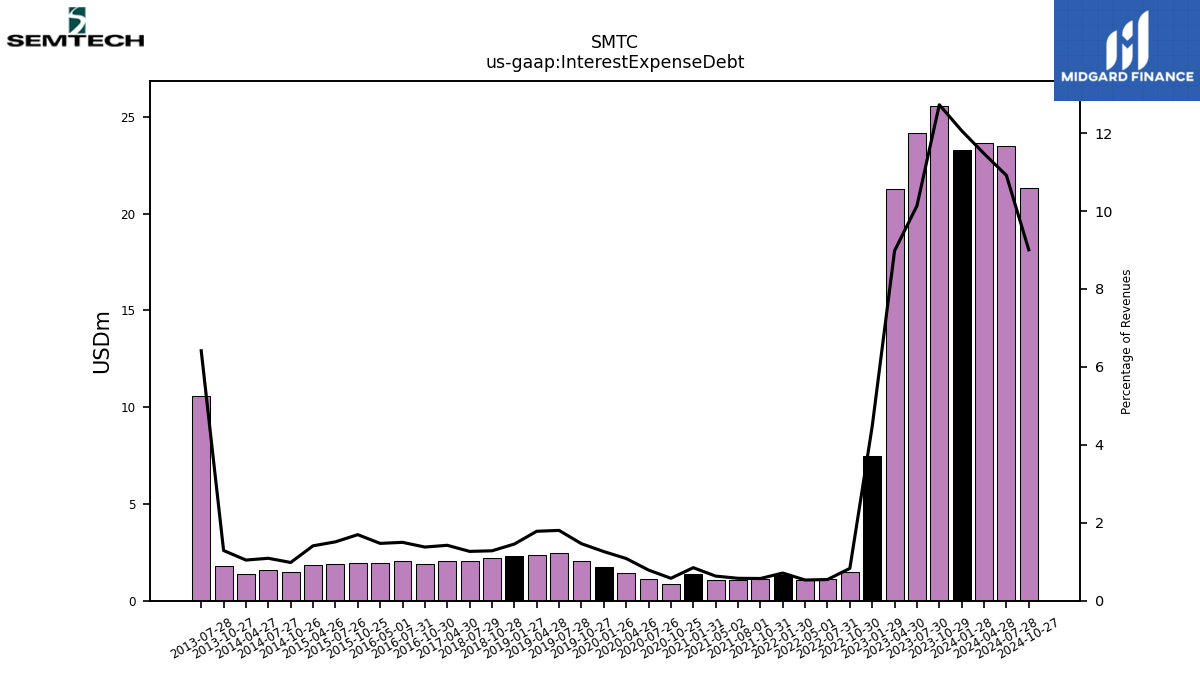
| Interest Expense Debt | 23.27 | 25.57 | 24.16 | 21.24 | 7.50 | 1.48 | 1.14 | 1.08 | 1.35 | 1.11 | 1.06 | 1.08 | 1.40 | 0.89 | 1.13 | 1.44 | 1.74 | 2.06 | 2.48 | 2.34 | 2.33 | 2.22 | 2.07 | NA | NA | NA | NA | 2.05 | NA | 1.89 | 2.04 | 1.93 | NA | 1.96 | 1.90 | 1.83 | NA | 1.46 | 1.59 | 1.39 | NA | 1.82 | 10.58 | NA | NA | NA | NA | NA | NA | NA | NA | NA | NA | NA | NA | NA | |
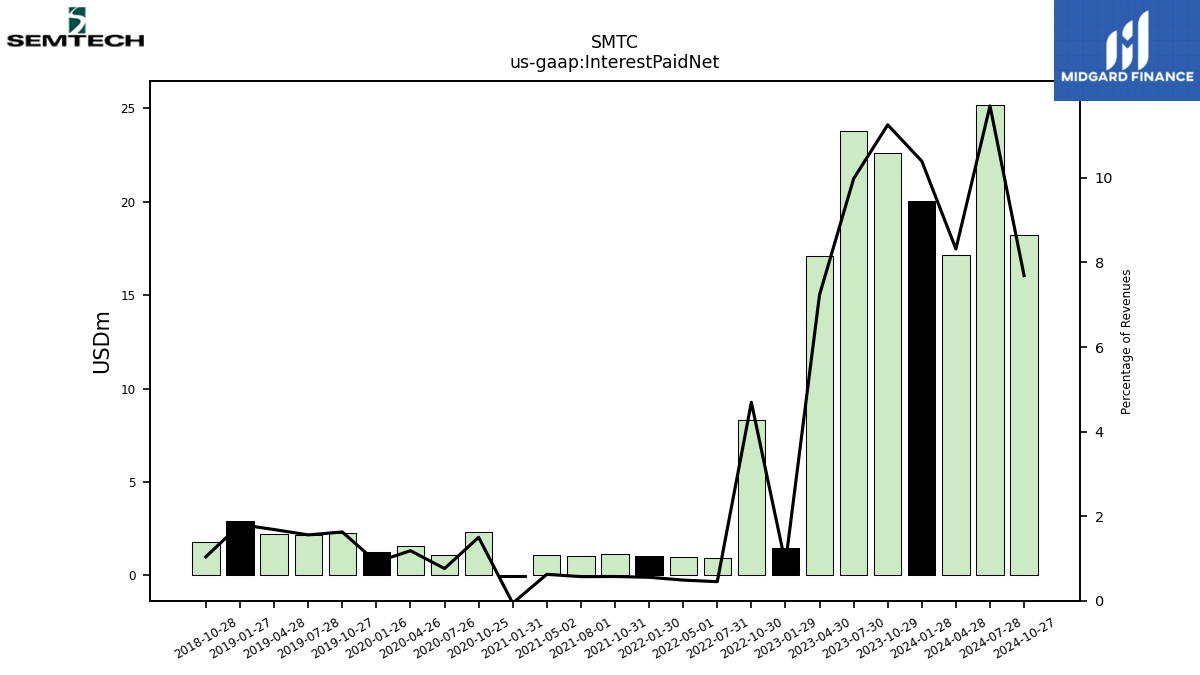
| Interest Paid Net | 20.06 | 22.61 | 23.80 | 17.12 | 1.48 | 8.34 | 0.94 | 0.99 | 1.06 | 1.12 | 1.05 | 1.06 | -0.10 | 2.31 | 1.09 | 1.57 | 1.26 | 2.29 | 2.14 | 2.21 | 2.88 | 1.80 | NA | NA | NA | NA | NA | NA | NA | NA | NA | NA | NA | NA | NA | NA | NA | NA | NA | NA | NA | NA | NA | NA | NA | NA | NA | NA | NA | NA | NA | NA | NA | NA | NA | NA | |
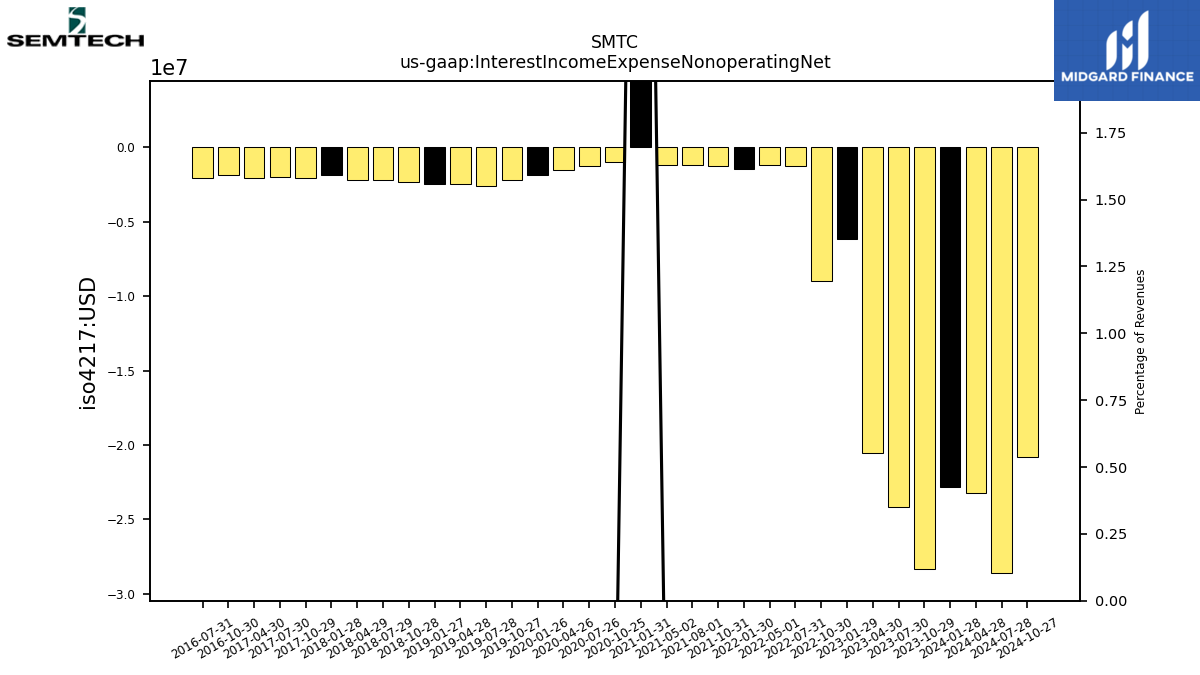
| Interest Income Expense Nonoperating Net | -22.83 | -28.30 | -24.17 | -20.51 | -6.18 | -9.01 | -1.26 | -1.20 | -1.47 | -1.23 | -1.19 | -1.20 | 9.15 | -1.01 | -1.25 | -1.56 | -1.86 | -2.18 | -2.60 | -2.47 | -2.46 | -2.35 | -2.20 | -2.19 | -1.86 | -2.03 | -2.03 | -2.05 | NA | -1.89 | -2.04 | NA | NA | NA | NA | NA | NA | NA | NA | NA | NA | NA | NA | NA | NA | NA | NA | NA | NA | NA | NA | NA | NA | NA | NA | NA | |
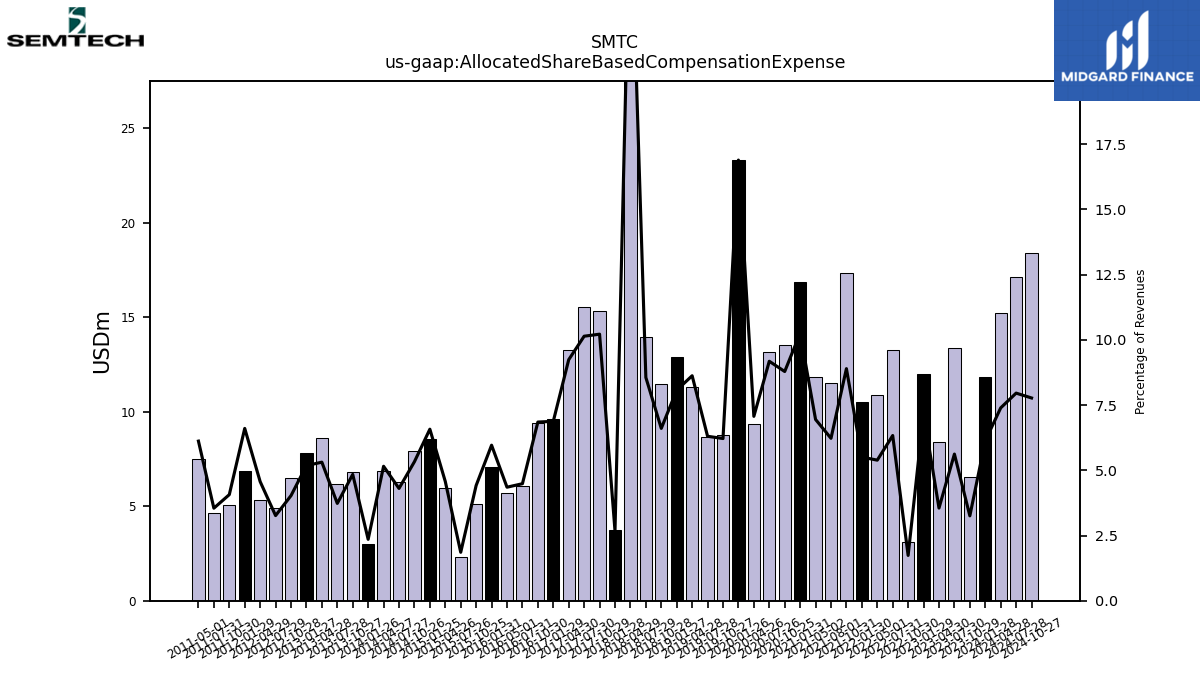
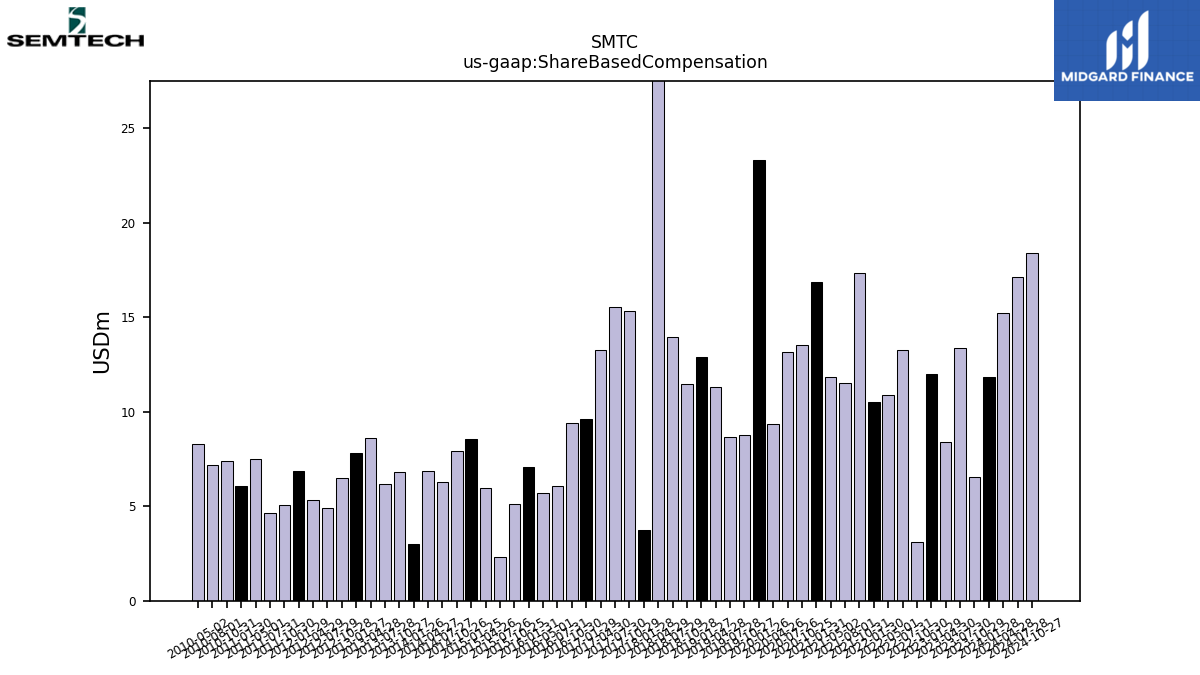
| Allocated Share Based Compensation Expense | 11.83 | 6.54 | 13.40 | 8.40 | 12.02 | 3.08 | 13.25 | 10.89 | 10.49 | 17.34 | 11.52 | 11.84 | 16.88 | 13.54 | 13.19 | 9.38 | 23.31 | 8.77 | 8.65 | 11.33 | 12.91 | 11.47 | 13.97 | 35.52 | 3.77 | 15.36 | 15.53 | 13.29 | 9.63 | 9.39 | 6.10 | 5.71 | 7.07 | 5.12 | 2.33 | 5.95 | 8.57 | 7.93 | 6.27 | 6.85 | 2.98 | 6.83 | 6.16 | 8.63 | 7.80 | 6.48 | 4.92 | 5.33 | 6.87 | 5.04 | 4.62 | 7.49 | NA | NA | NA | NA | |
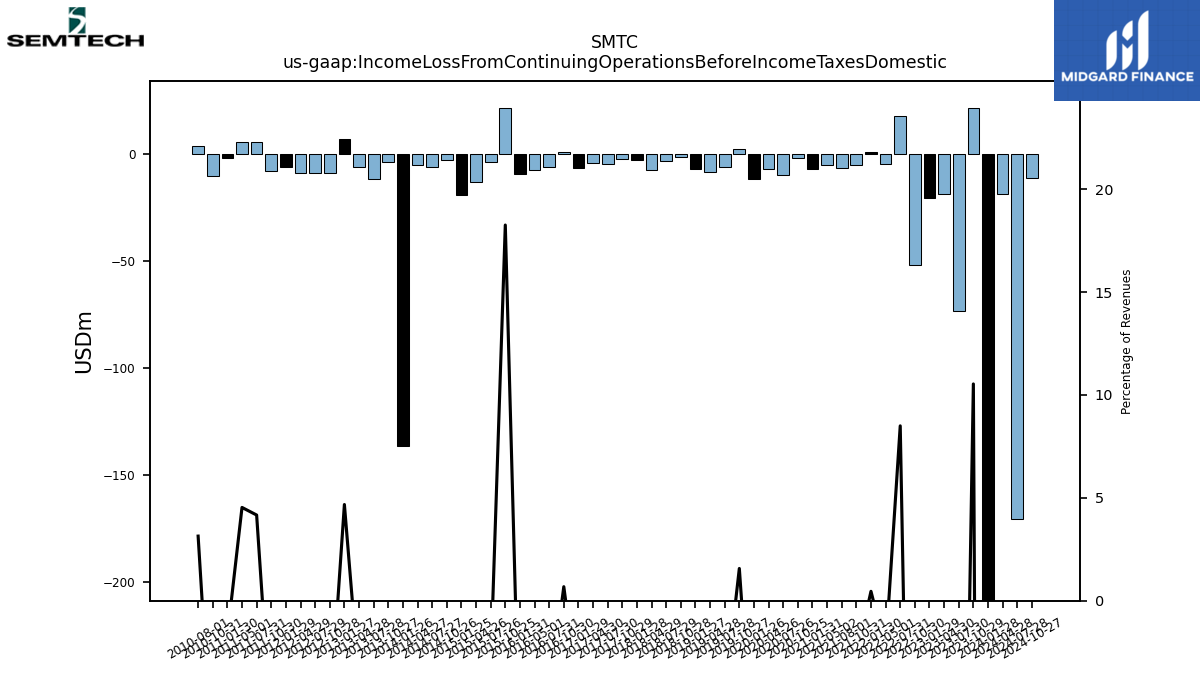
| Income Loss From Continuing Operations Before Income Taxes Domestic | -234.89 | 21.16 | -73.47 | -18.84 | -20.88 | -52.09 | 17.79 | -4.78 | 0.87 | -5.36 | -6.62 | -5.48 | -7.11 | -2.05 | -10.12 | -6.98 | -11.85 | 2.21 | -6.43 | -8.47 | -7.34 | -1.65 | -3.52 | -7.70 | -3.02 | -2.37 | -4.86 | -4.17 | -6.55 | 0.94 | -6.44 | -7.54 | -9.42 | 21.15 | -3.92 | -13.44 | -19.54 | -2.86 | -6.00 | -5.14 | -136.79 | -3.75 | -11.83 | -6.41 | 7.04 | -9.19 | -8.89 | -8.84 | -6.15 | -7.89 | 5.43 | 5.55 | -1.94 | -10.26 | 3.56 | NA | |
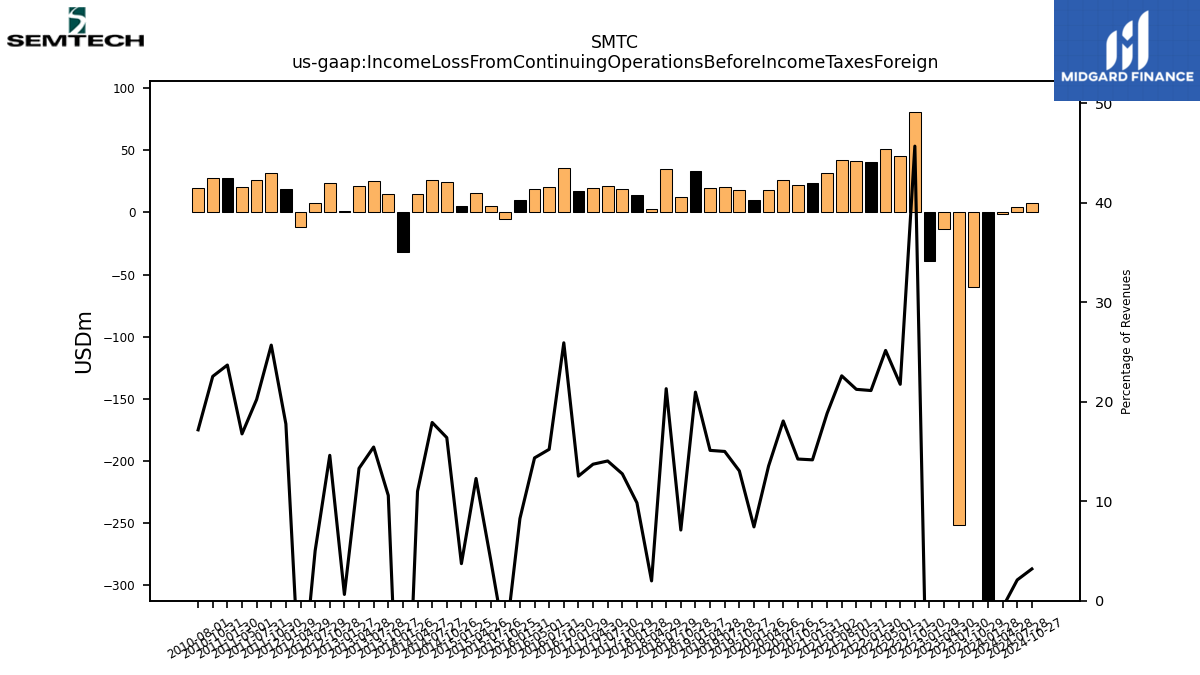
| Income Loss From Continuing Operations Before Income Taxes Foreign | -410.88 | -59.72 | -251.93 | -12.99 | -39.19 | 81.19 | 45.55 | 50.88 | 40.28 | 41.44 | 41.84 | 32.10 | 23.33 | 21.96 | 25.97 | 17.98 | 10.25 | 18.41 | 20.59 | 19.86 | 33.56 | 12.34 | 34.80 | 2.60 | 13.85 | 19.18 | 21.52 | 19.75 | 17.55 | 35.58 | 20.69 | 18.84 | 9.80 | -4.99 | 5.21 | 15.99 | 4.87 | 24.42 | 26.13 | 14.62 | -31.77 | 14.93 | 25.51 | 21.62 | 0.96 | 23.52 | 7.57 | -11.93 | 18.49 | 31.86 | 26.36 | 20.53 | 27.56 | 27.78 | 19.46 | NA | |
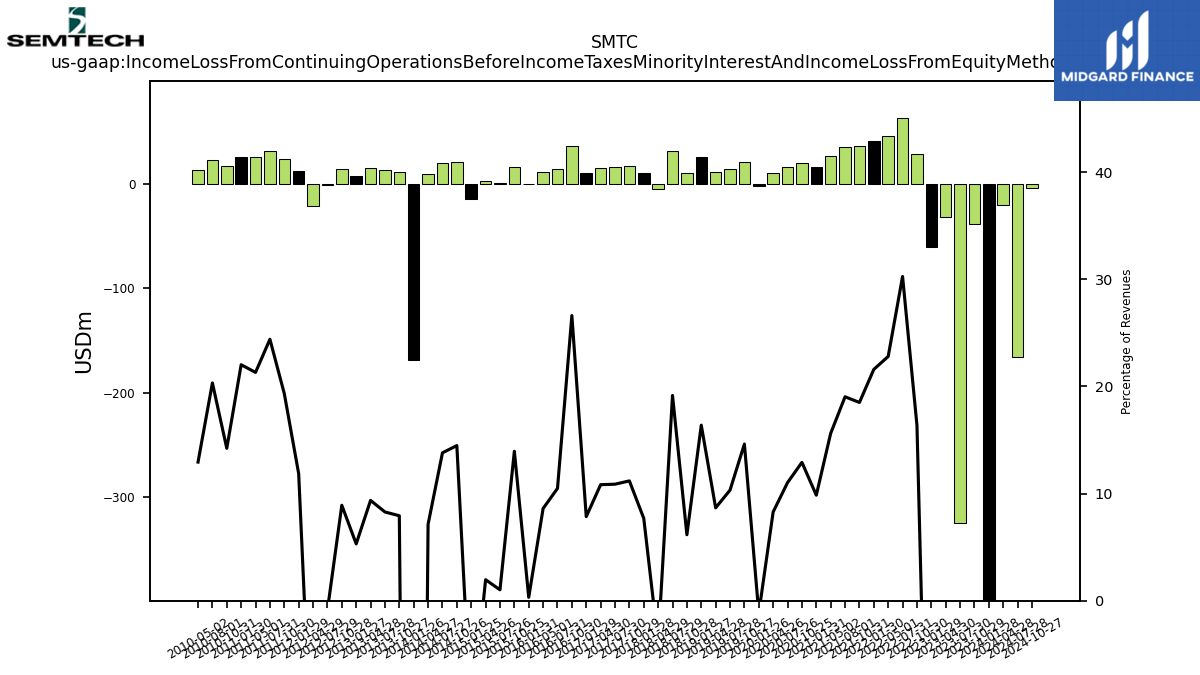
| Income Loss From Continuing Operations Before Income Taxes Minority Interest And Income Loss From Equity Method Investments | -645.78 | -38.55 | -325.40 | -31.83 | -60.06 | 29.11 | 63.33 | 46.09 | 41.15 | 36.08 | 35.22 | 26.62 | 16.23 | 19.90 | 15.84 | 11.00 | -1.60 | 20.63 | 14.16 | 11.39 | 26.22 | 10.69 | 31.28 | -5.10 | 10.82 | 16.81 | 16.66 | 15.58 | 10.99 | 36.52 | 14.25 | 11.29 | 0.38 | 16.16 | 1.28 | 2.56 | -14.68 | 21.56 | 20.12 | 9.48 | -168.56 | 11.19 | 13.68 | 15.21 | 8.00 | 14.34 | -1.32 | -20.77 | 12.34 | 23.96 | 31.79 | 26.08 | 25.61 | 17.52 | 23.02 | 13.19 | |
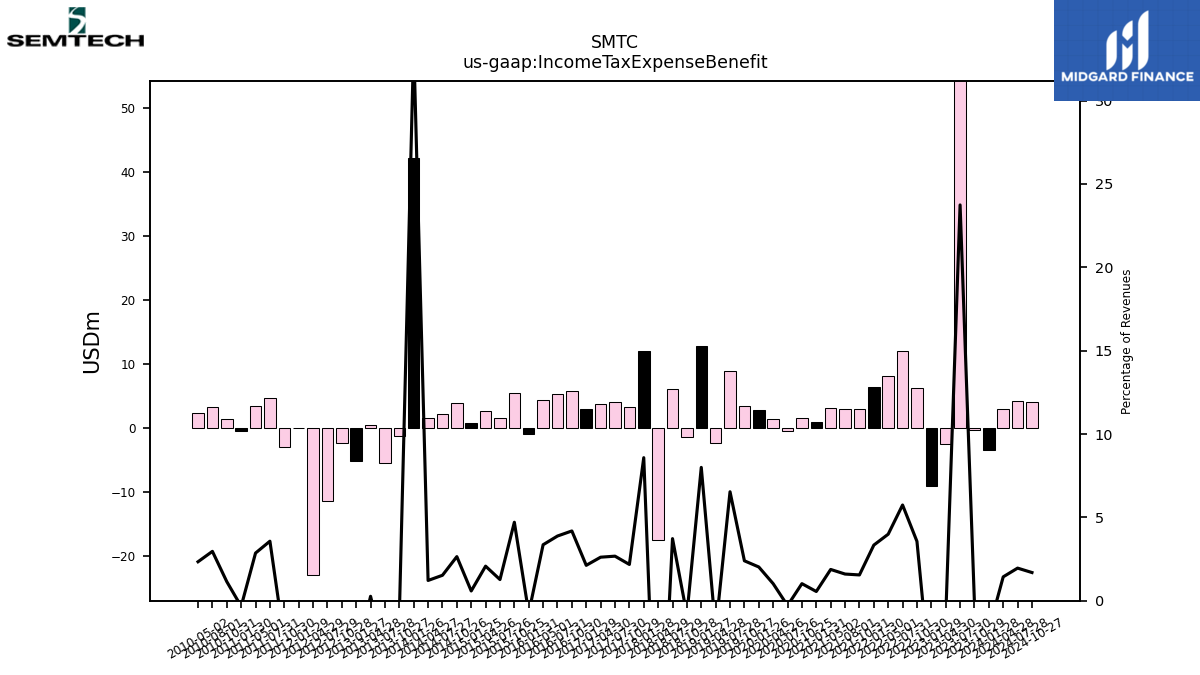
| Income Tax Expense Benefit | -3.35 | -0.31 | 56.59 | -2.42 | -9.07 | 6.33 | 12.02 | 8.07 | 6.36 | 3.02 | 2.96 | 3.20 | 0.91 | 1.58 | -0.42 | 1.36 | 2.79 | 3.38 | 8.97 | -2.31 | 12.80 | -1.45 | 6.08 | -17.51 | 12.07 | 3.27 | 4.09 | 3.76 | 2.98 | 5.74 | 5.28 | 4.41 | -0.87 | 5.45 | 1.60 | 2.70 | 0.76 | 3.94 | 2.23 | 1.62 | 42.25 | -1.26 | -5.44 | 0.43 | -5.12 | -2.25 | -11.34 | -22.98 | -0.05 | -3.02 | 4.65 | 3.50 | -0.39 | 1.41 | 3.35 | 2.38 | |
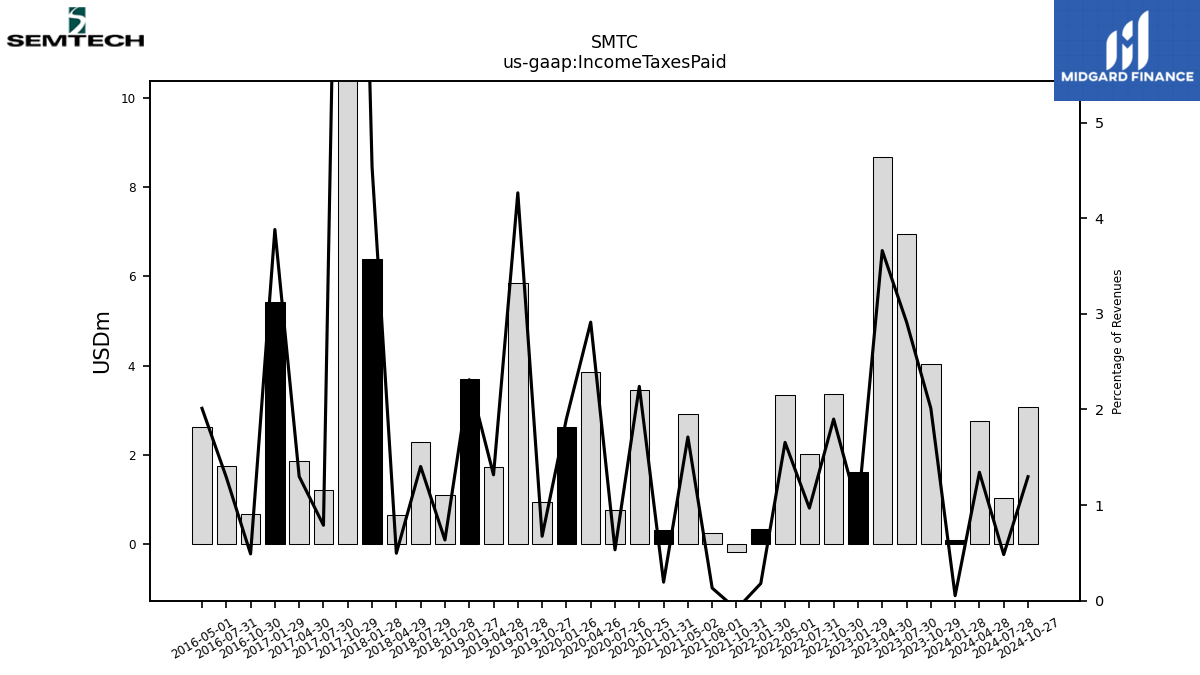
| Income Taxes Paid | 0.10 | 4.04 | 6.95 | 8.66 | 1.61 | 3.37 | 2.03 | 3.35 | 0.34 | -0.17 | 0.25 | 2.92 | 0.32 | 3.45 | 0.77 | 3.87 | 2.63 | 0.95 | 5.85 | 1.73 | 3.70 | 1.10 | 2.29 | 0.65 | 6.38 | 21.55 | 1.21 | 1.87 | 5.44 | 0.67 | 1.76 | 2.64 | NA | NA | NA | NA | NA | NA | NA | NA | NA | NA | NA | NA | NA | NA | NA | NA | NA | NA | NA | NA | NA | NA | NA | NA | |
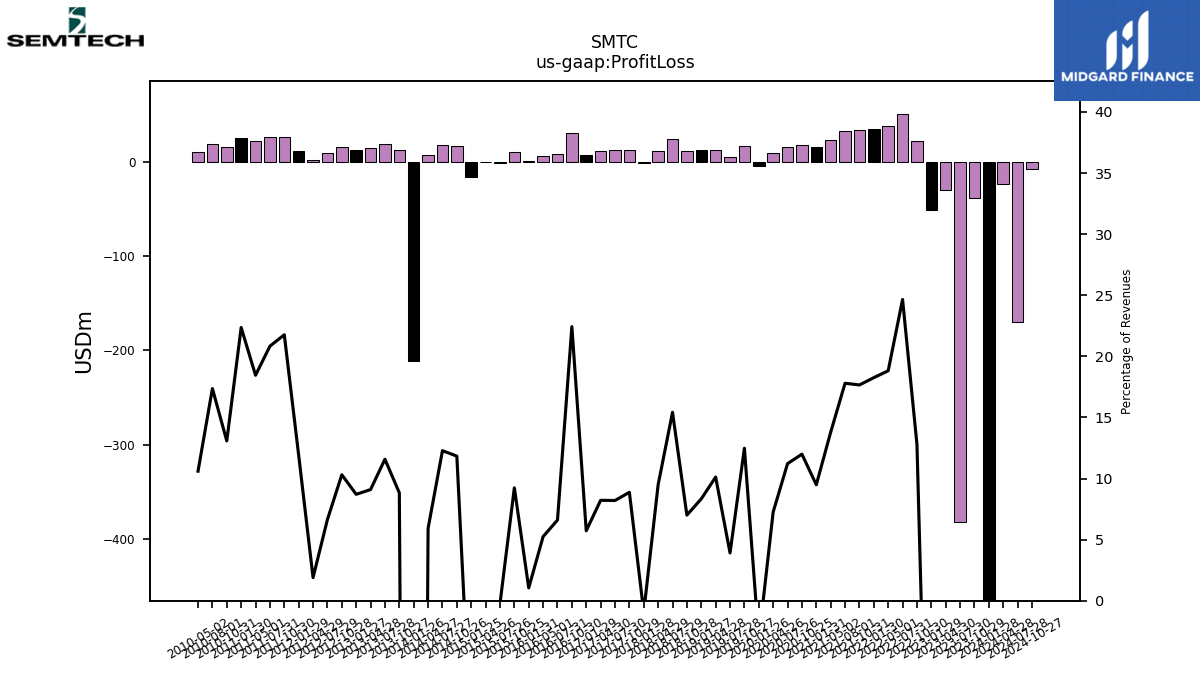
| Profit Loss | -642.36 | -38.25 | -382.00 | -29.42 | -51.02 | 22.74 | 51.60 | 38.05 | 34.79 | 34.42 | 32.93 | 23.50 | 15.63 | 18.48 | 16.12 | 9.63 | -4.39 | 17.60 | 5.37 | 13.29 | 13.34 | 12.16 | 25.17 | 12.38 | -1.30 | 13.34 | 12.56 | 11.82 | 8.02 | 30.78 | 8.98 | 6.89 | 1.25 | 10.70 | -0.31 | -0.14 | -15.44 | 17.62 | 17.90 | 7.87 | -210.81 | 12.45 | 19.11 | 14.78 | 13.12 | 16.59 | 10.02 | 2.21 | 12.39 | 26.98 | 27.14 | 22.58 | 26.00 | 16.11 | 19.66 | 10.80 | |
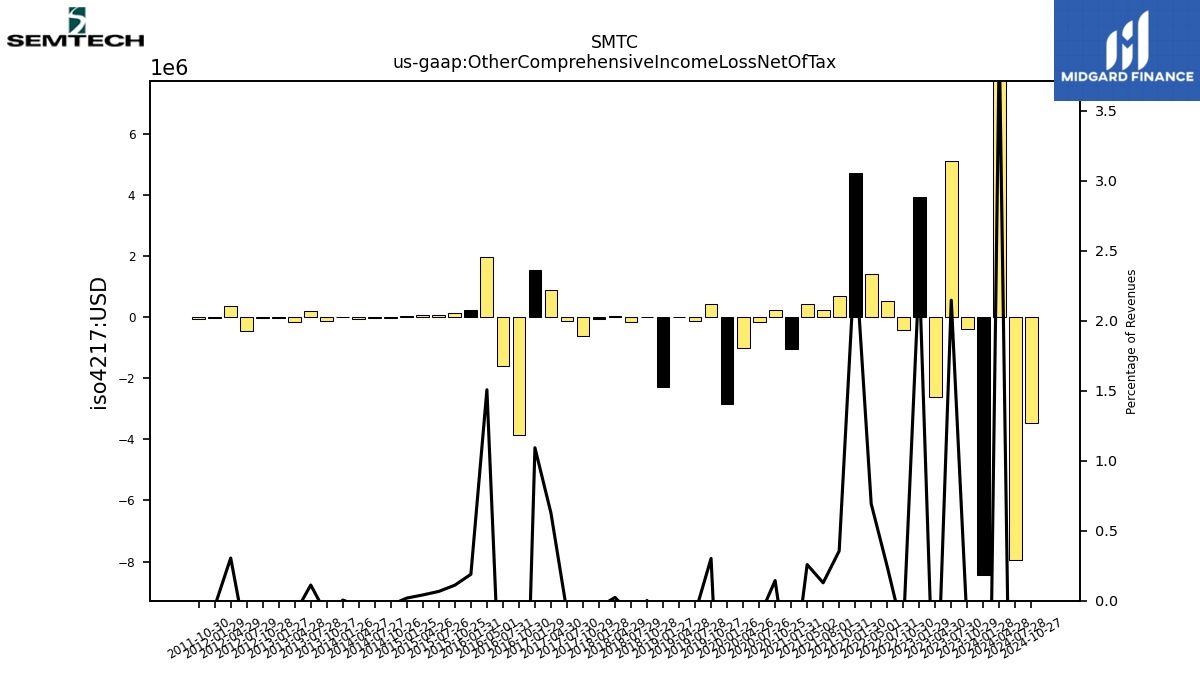
| Other Comprehensive Income Loss Net Of Tax | -8.45 | -0.40 | 5.12 | -2.62 | 3.93 | -0.41 | 0.51 | 1.40 | 4.72 | 0.69 | 0.24 | 0.44 | -1.05 | 0.22 | -0.17 | -1.01 | -2.85 | 0.43 | -0.12 | -0.01 | -2.29 | 0.00 | -0.15 | 0.03 | -0.06 | -0.63 | -0.12 | 0.90 | 1.53 | -3.85 | -1.61 | 1.98 | 0.22 | 0.13 | 0.08 | 0.05 | 0.03 | -0.04 | -0.02 | -0.05 | 0.01 | -0.14 | 0.18 | -0.15 | -0.04 | -0.04 | -0.46 | 0.36 | -0.04 | -0.07 | NA | NA | NA | NA | NA | NA | |
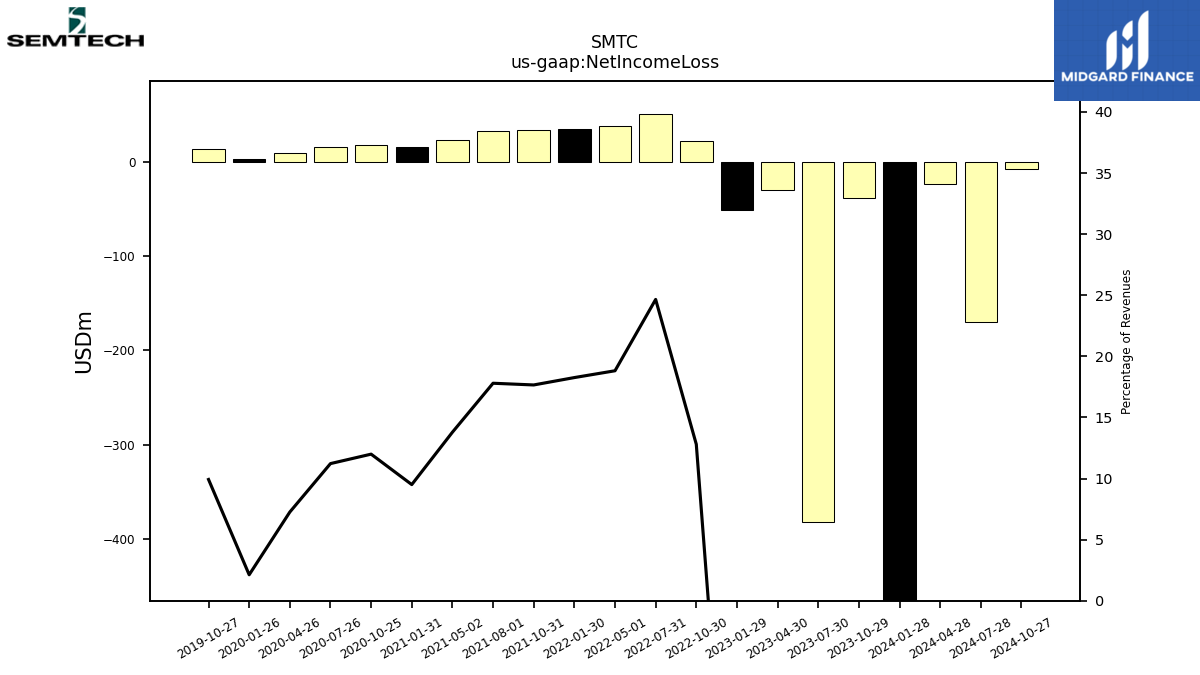
| Net Income Loss | -642.36 | -38.25 | -382.00 | -29.41 | -51.01 | 22.75 | 51.60 | 38.05 | 34.80 | 34.43 | 32.93 | 23.50 | 15.66 | 18.49 | 16.12 | 9.63 | 2.93 | 14.00 | NA | NA | NA | NA | NA | NA | NA | NA | NA | NA | NA | NA | NA | NA | NA | NA | NA | NA | NA | NA | NA | NA | NA | NA | NA | NA | NA | NA | NA | NA | NA | NA | NA | NA | NA | NA | NA | NA | |
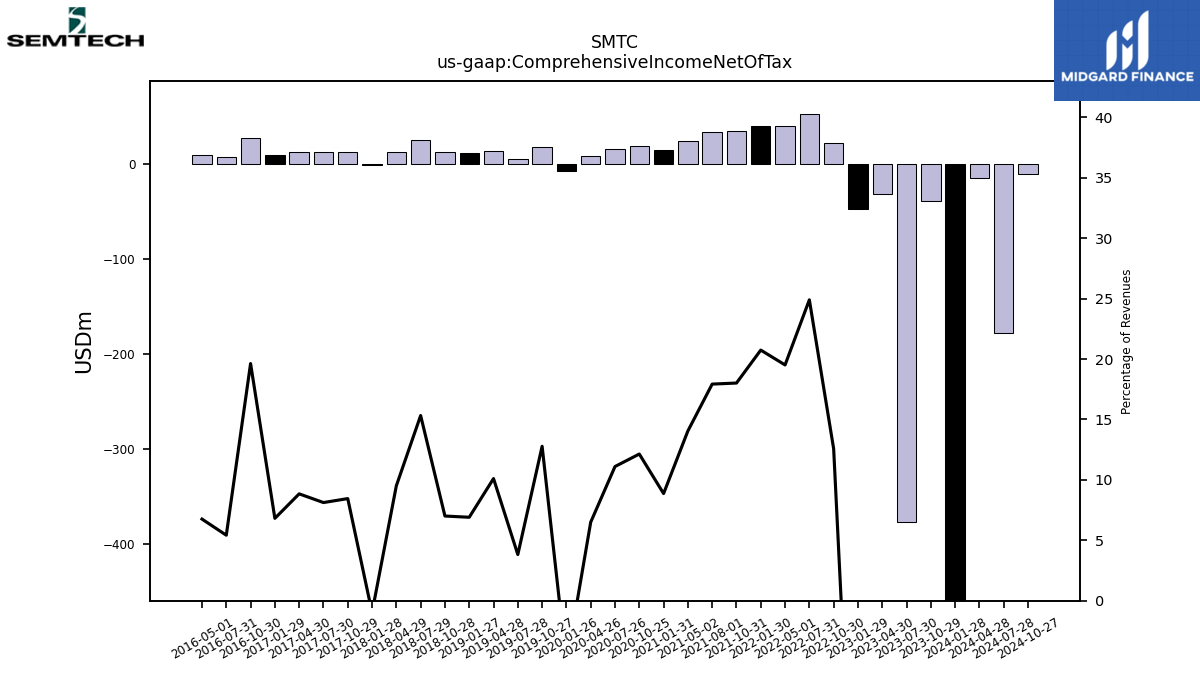
| Comprehensive Income Net Of Tax | -650.81 | -38.65 | -376.89 | -32.04 | -47.08 | 22.34 | 52.11 | 39.45 | 39.53 | 35.12 | 33.17 | 23.94 | 14.61 | 18.71 | 15.96 | 8.63 | -7.24 | 18.02 | 5.24 | 13.28 | 11.05 | 12.17 | 25.01 | 12.41 | -1.36 | 12.71 | 12.44 | 12.72 | 9.55 | 26.93 | 7.37 | 8.86 | NA | NA | NA | NA | NA | NA | NA | NA | NA | NA | NA | NA | NA | NA | NA | NA | NA | NA | NA | NA | NA | NA | NA | NA | |
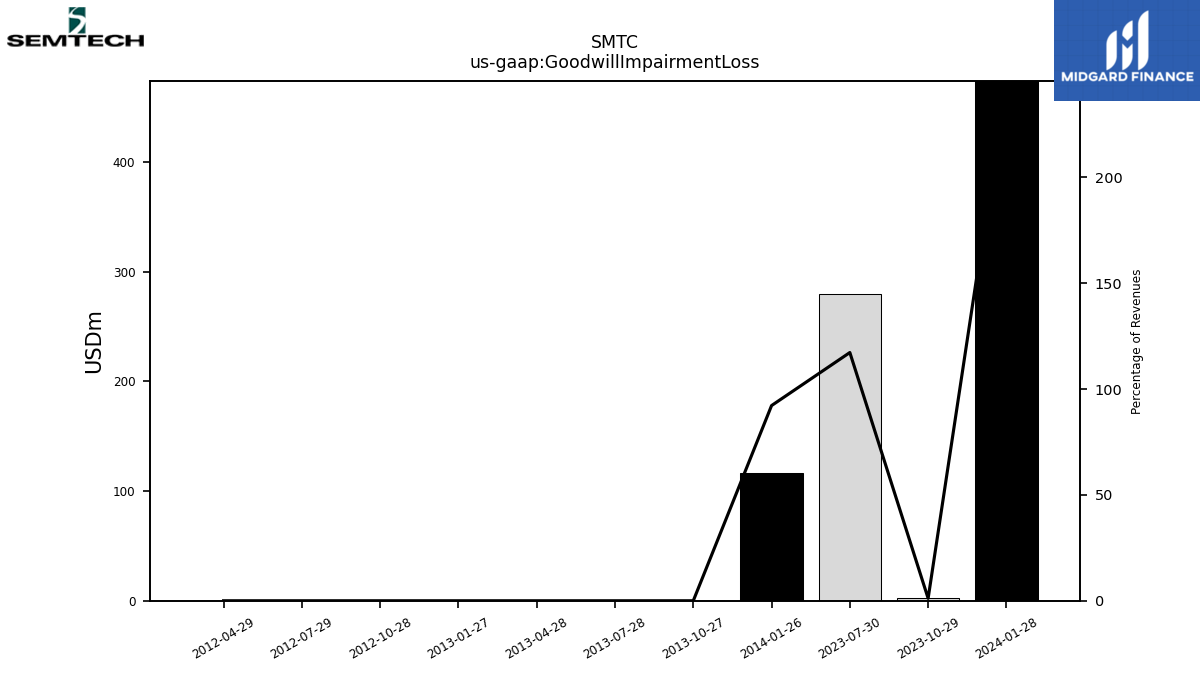
| Goodwill Impairment Loss | 473.80 | 2.27 | 279.56 | NA | NA | NA | NA | NA | NA | NA | NA | NA | NA | NA | NA | NA | NA | NA | NA | NA | NA | NA | NA | NA | NA | NA | NA | NA | NA | NA | NA | NA | NA | NA | NA | NA | NA | NA | NA | NA | 116.69 | 0.00 | 0.00 | 0.00 | 0.00 | 0.00 | 0.00 | 0.00 | NA | NA | NA | NA | NA | NA | NA | NA |
| 2024-01-28 | 2023-10-29 | 2023-07-30 | 2023-04-30 | 2023-01-29 | 2022-10-30 | 2022-07-31 | 2022-05-01 | 2022-01-30 | 2021-10-31 | 2021-08-01 | 2021-05-02 | 2021-01-31 | 2020-10-25 | 2020-07-26 | 2020-04-26 | 2020-01-26 | 2019-10-27 | 2019-07-28 | 2019-04-28 | 2019-01-27 | 2018-10-28 | 2018-07-29 | 2018-04-29 | 2018-01-28 | 2017-10-29 | 2017-07-30 | 2017-04-30 | 2017-01-29 | 2016-10-30 | 2016-07-31 | 2016-05-01 | 2016-01-31 | 2015-10-25 | 2015-07-26 | 2015-04-26 | 2015-01-25 | 2014-10-26 | 2014-07-27 | 2014-04-27 | 2014-01-26 | 2013-10-27 | 2013-07-28 | 2013-04-28 | 2013-01-27 | 2012-10-28 | 2012-07-29 | 2012-04-29 | 2012-01-29 | 2011-10-30 | 2011-07-31 | 2011-05-01 | 2011-01-30 | 2010-10-31 | 2010-08-01 | 2010-05-02 | ||
|---|---|---|---|---|---|---|---|---|---|---|---|---|---|---|---|---|---|---|---|---|---|---|---|---|---|---|---|---|---|---|---|---|---|---|---|---|---|---|---|---|---|---|---|---|---|---|---|---|---|---|---|---|---|---|---|---|---|
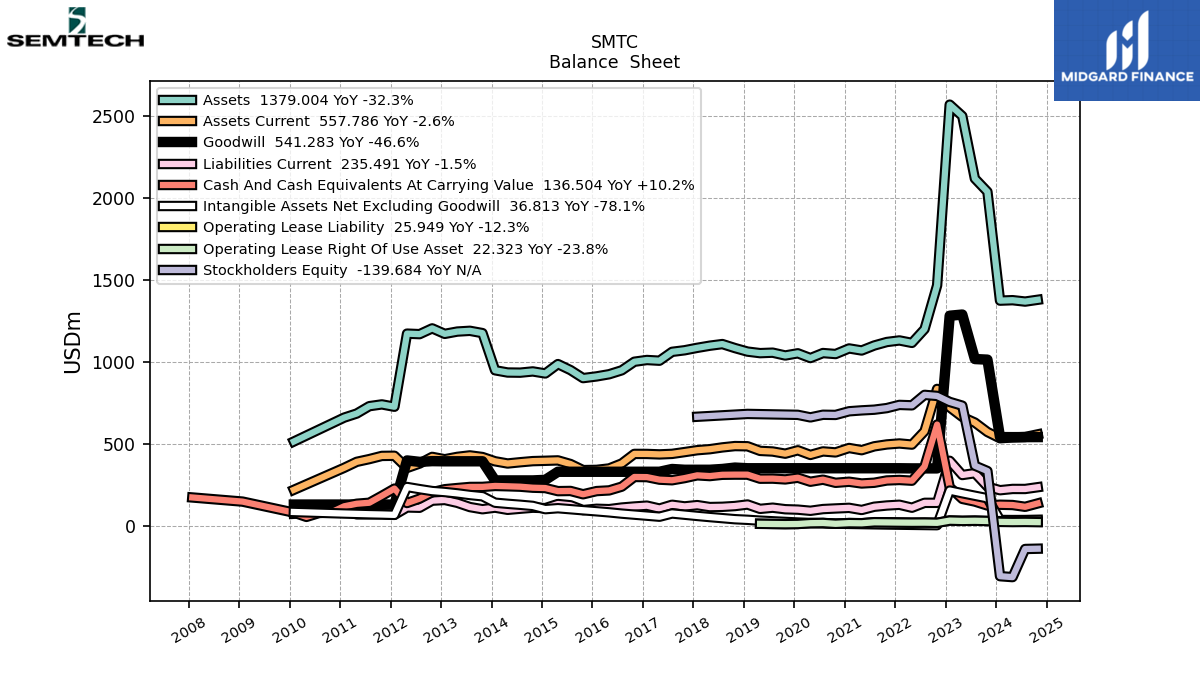
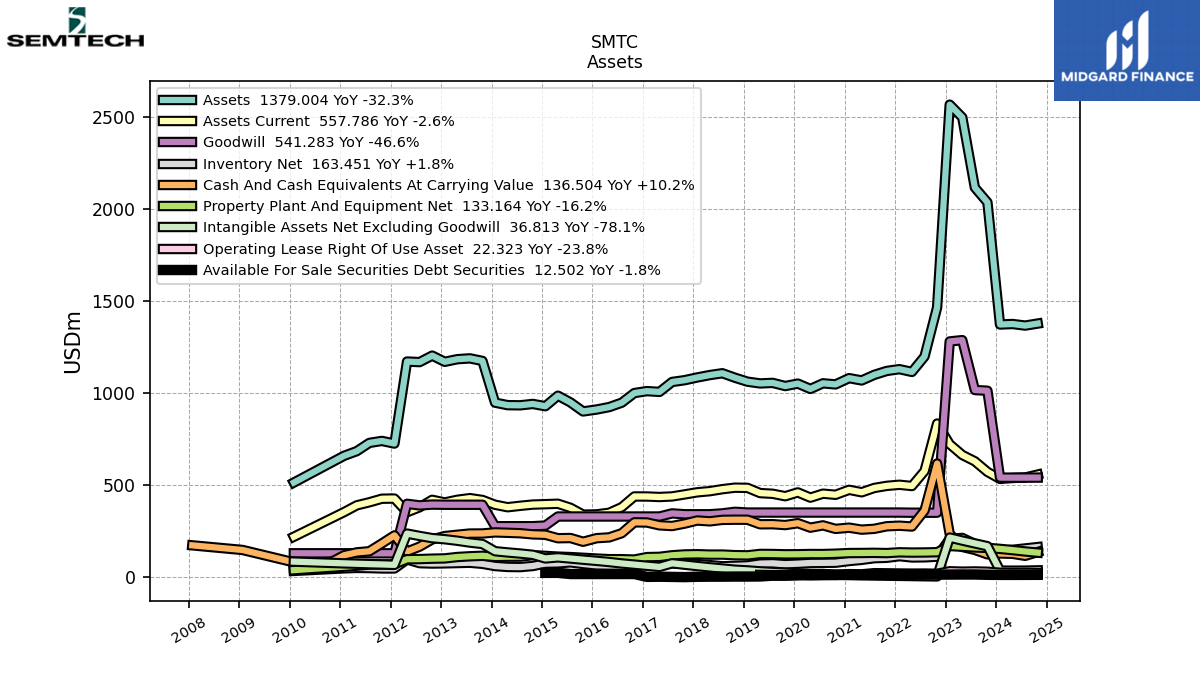
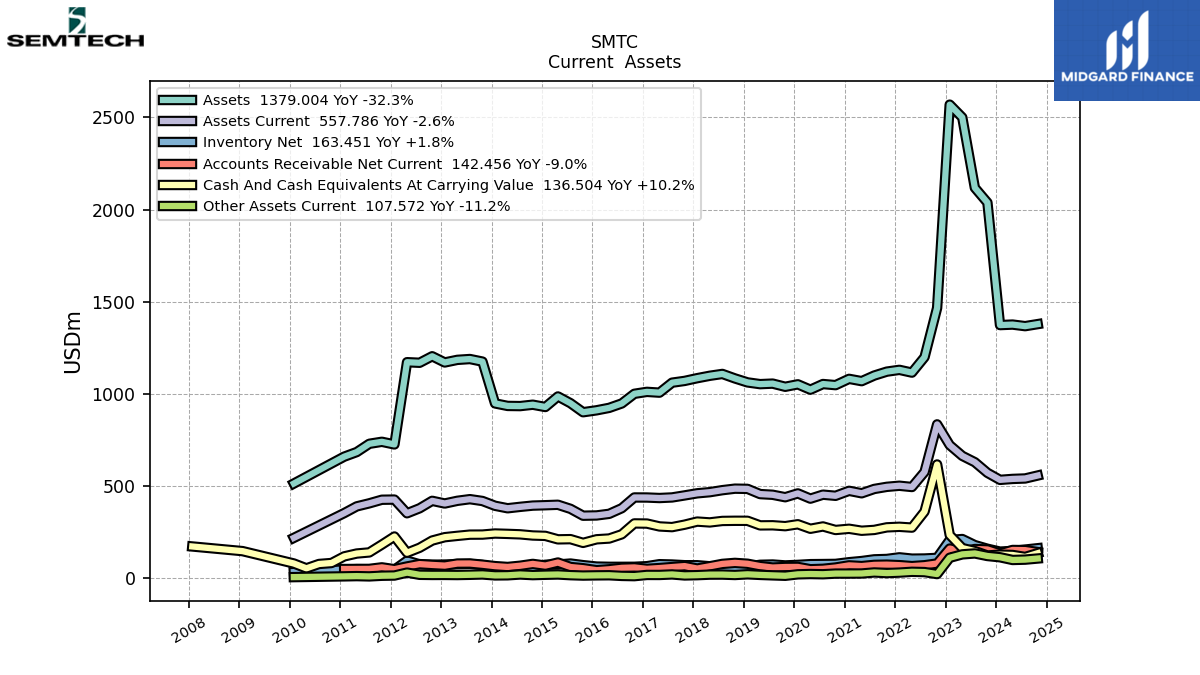
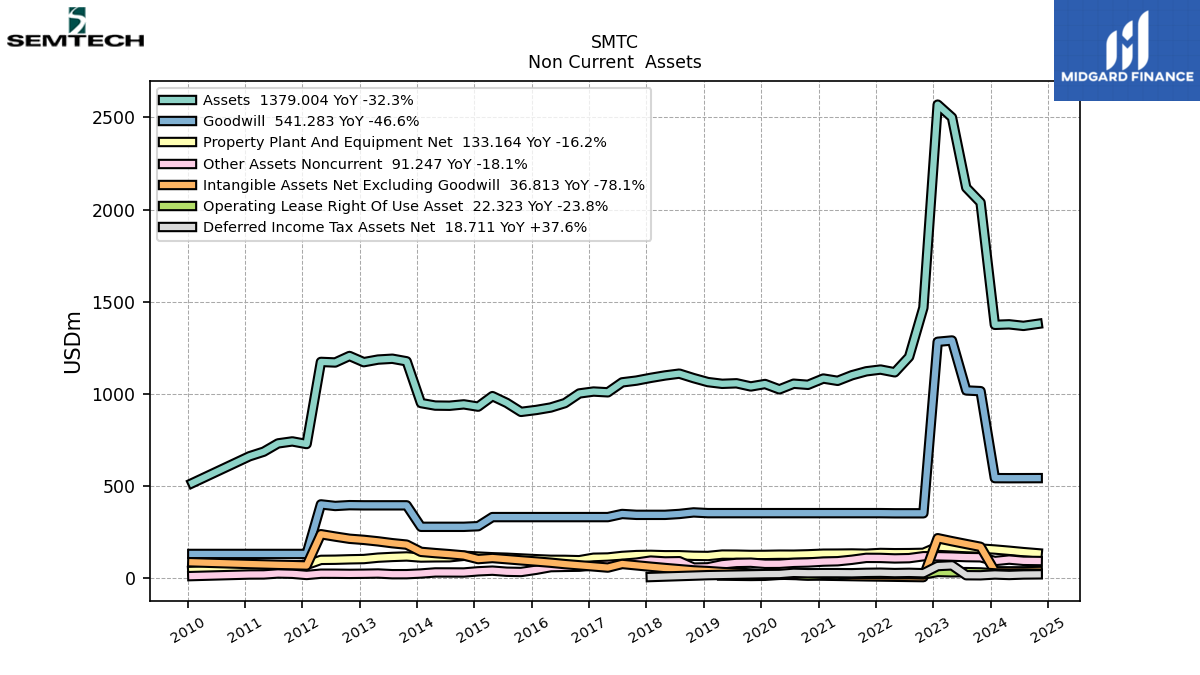
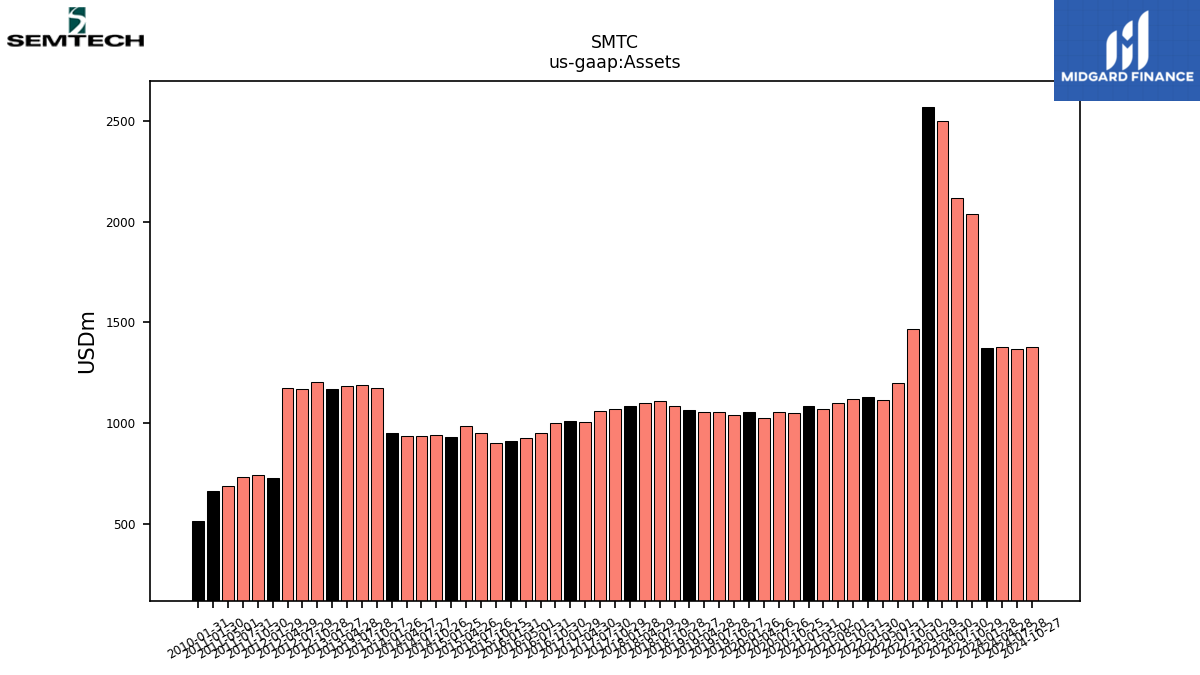
| Assets | 1373.73 | 2038.13 | 2118.60 | 2500.02 | 2569.63 | 1466.85 | 1199.83 | 1115.92 | 1130.91 | 1121.30 | 1100.00 | 1069.62 | 1082.10 | 1047.97 | 1054.03 | 1023.35 | 1052.43 | 1039.14 | 1056.31 | 1053.41 | 1062.88 | 1084.38 | 1108.77 | 1098.81 | 1085.78 | 1070.96 | 1061.38 | 1007.25 | 1011.54 | 1001.05 | 948.67 | 924.75 | 911.52 | 901.04 | 949.90 | 986.68 | 929.43 | 941.86 | 934.36 | 935.26 | 948.94 | 1175.69 | 1189.65 | 1185.11 | 1171.01 | 1204.67 | 1169.30 | 1172.46 | 726.32 | 740.71 | 729.89 | 684.95 | 659.94 | NA | NA | NA | |
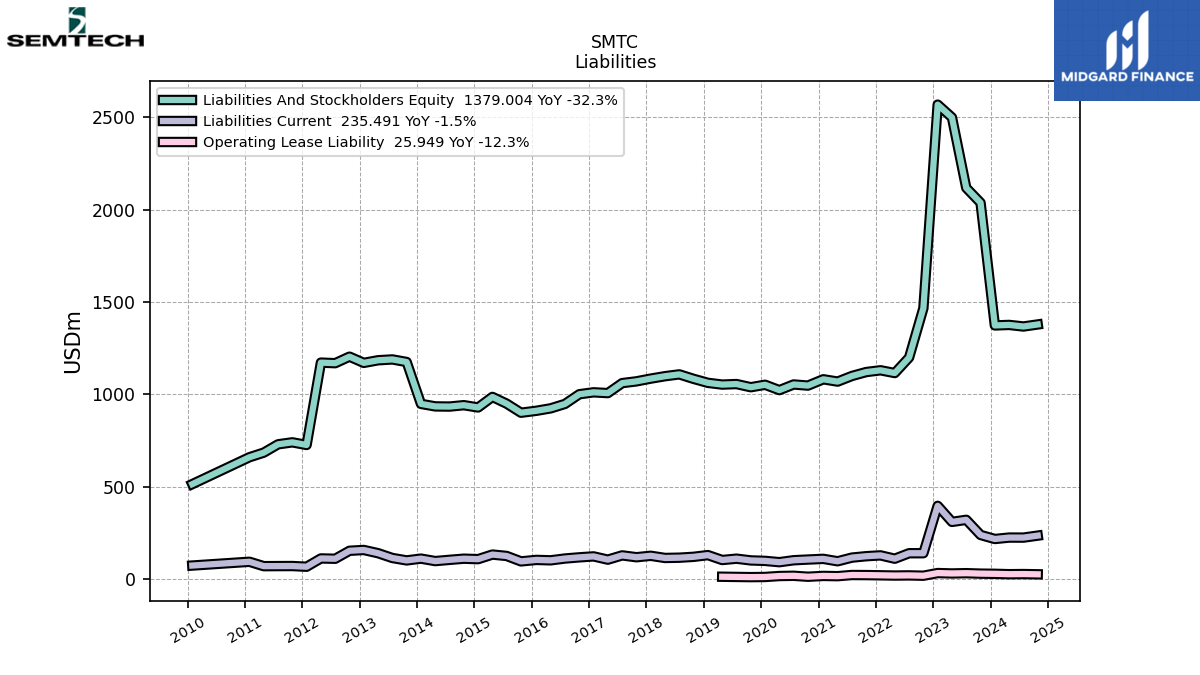
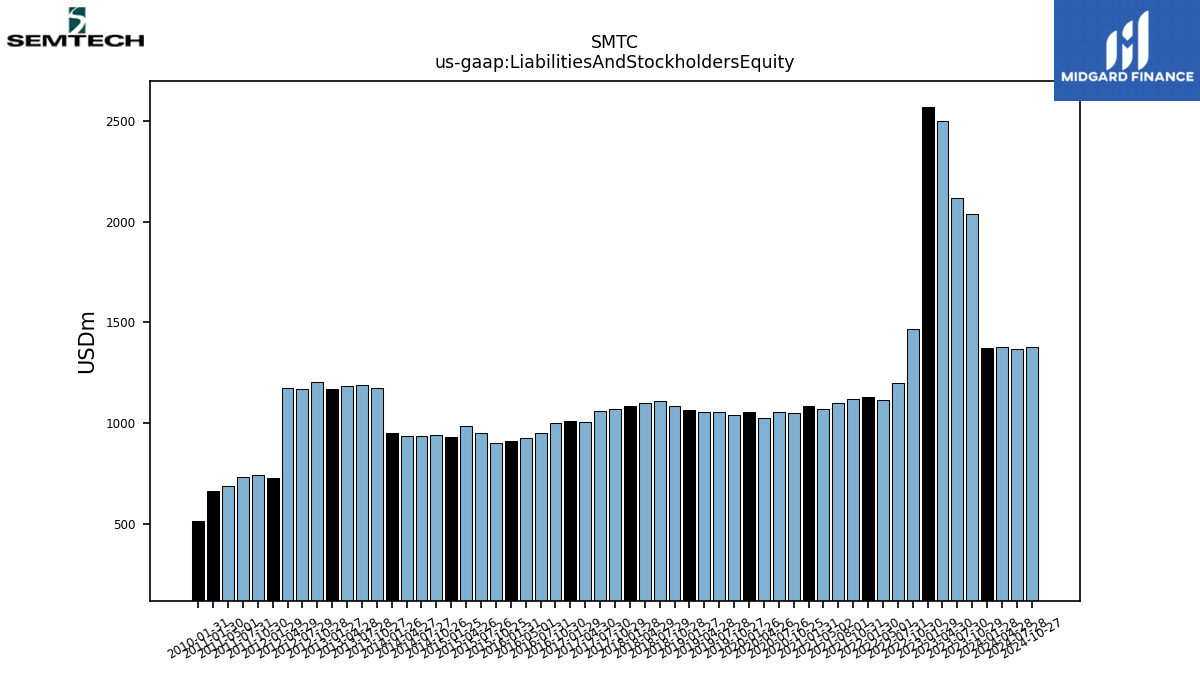
| Liabilities And Stockholders Equity | 1373.73 | 2038.13 | 2118.60 | 2500.02 | 2569.63 | 1466.85 | 1199.83 | 1115.92 | 1130.91 | 1121.30 | 1100.00 | 1069.62 | 1082.10 | 1047.97 | 1054.03 | 1023.35 | 1052.43 | 1039.14 | 1056.31 | 1053.41 | 1062.88 | 1084.38 | 1108.77 | 1098.81 | 1085.78 | 1070.96 | 1061.38 | 1007.25 | 1011.54 | 1001.05 | 948.67 | 924.75 | 911.52 | 901.04 | 949.90 | 986.68 | 929.43 | 941.86 | 934.36 | 935.26 | 948.94 | 1175.69 | 1189.65 | 1185.11 | 1171.01 | 1204.67 | 1169.30 | 1172.46 | 726.32 | 740.71 | 729.89 | 684.95 | 659.94 | NA | NA | NA | |
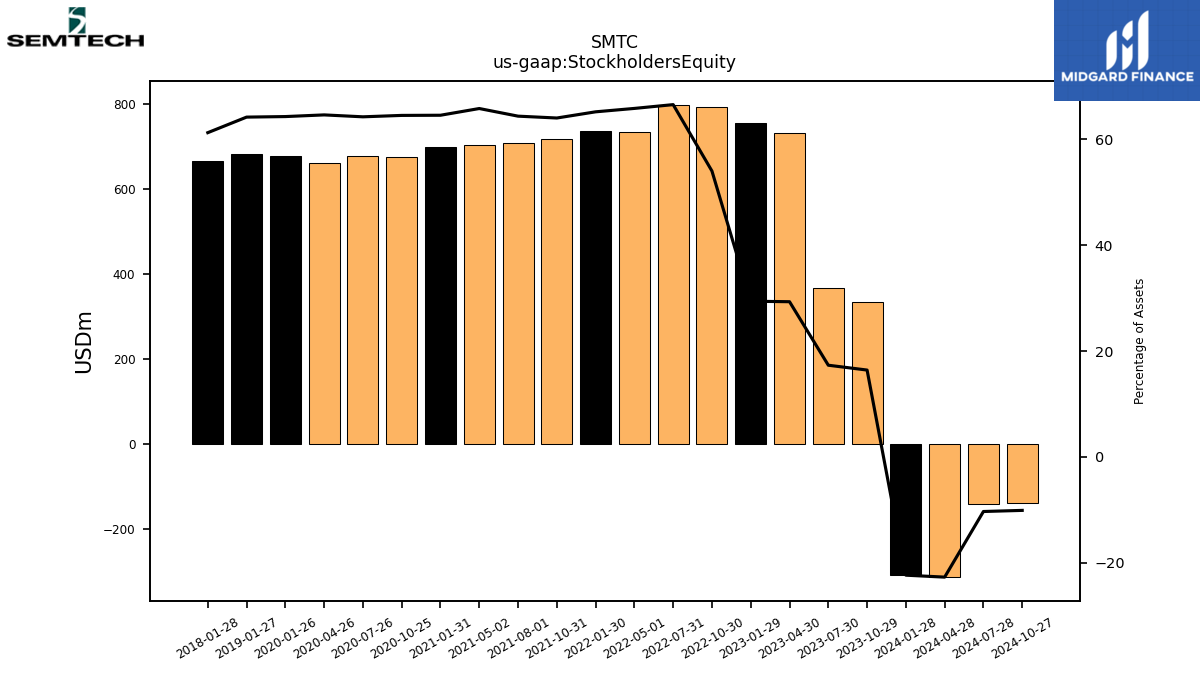
| Stockholders Equity | -307.43 | 334.26 | 366.83 | 733.03 | 755.85 | 792.41 | 798.86 | 734.98 | 737.58 | 718.19 | 708.42 | 704.28 | 698.74 | 676.39 | 677.49 | 661.47 | 676.95 | NA | NA | NA | 682.58 | NA | NA | NA | 665.35 | NA | NA | NA | NA | NA | NA | NA | NA | NA | NA | NA | NA | NA | NA | NA | NA | NA | NA | NA | NA | NA | NA | NA | NA | NA | NA | NA | NA | NA | NA | NA |
| 2024-01-28 | 2023-10-29 | 2023-07-30 | 2023-04-30 | 2023-01-29 | 2022-10-30 | 2022-07-31 | 2022-05-01 | 2022-01-30 | 2021-10-31 | 2021-08-01 | 2021-05-02 | 2021-01-31 | 2020-10-25 | 2020-07-26 | 2020-04-26 | 2020-01-26 | 2019-10-27 | 2019-07-28 | 2019-04-28 | 2019-01-27 | 2018-10-28 | 2018-07-29 | 2018-04-29 | 2018-01-28 | 2017-10-29 | 2017-07-30 | 2017-04-30 | 2017-01-29 | 2016-10-30 | 2016-07-31 | 2016-05-01 | 2016-01-31 | 2015-10-25 | 2015-07-26 | 2015-04-26 | 2015-01-25 | 2014-10-26 | 2014-07-27 | 2014-04-27 | 2014-01-26 | 2013-10-27 | 2013-07-28 | 2013-04-28 | 2013-01-27 | 2012-10-28 | 2012-07-29 | 2012-04-29 | 2012-01-29 | 2011-10-30 | 2011-07-31 | 2011-05-01 | 2011-01-30 | 2010-10-31 | 2010-08-01 | 2010-05-02 | ||
|---|---|---|---|---|---|---|---|---|---|---|---|---|---|---|---|---|---|---|---|---|---|---|---|---|---|---|---|---|---|---|---|---|---|---|---|---|---|---|---|---|---|---|---|---|---|---|---|---|---|---|---|---|---|---|---|---|---|
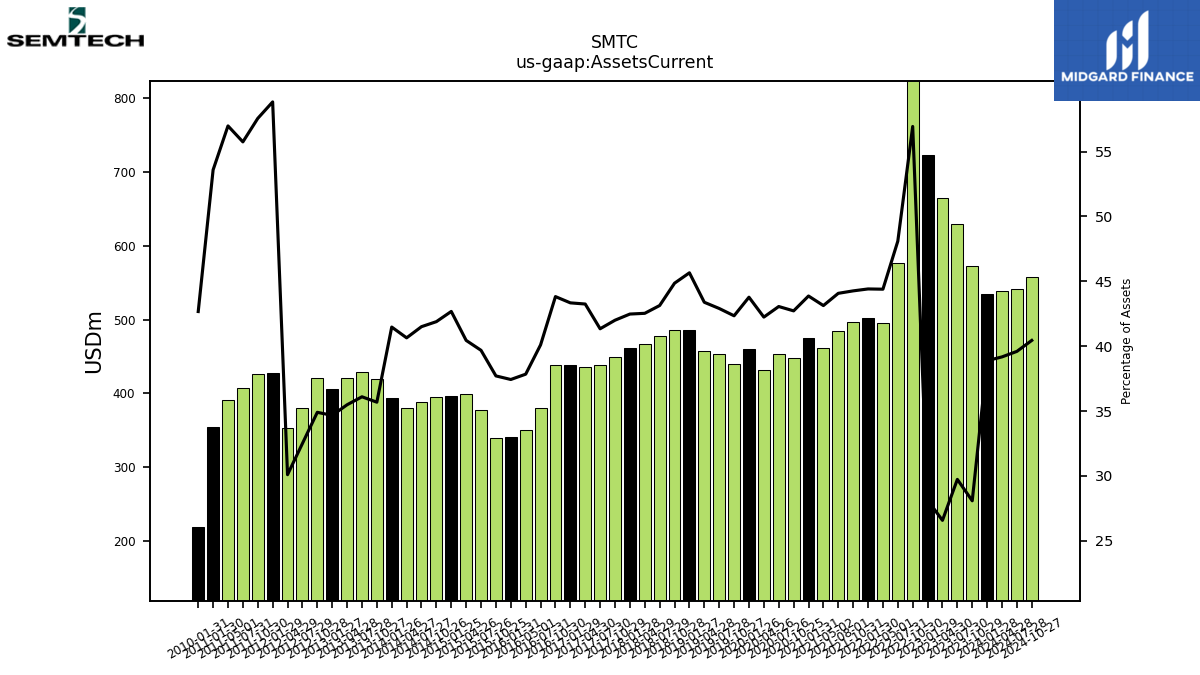
| Assets Current | 534.20 | 572.40 | 629.94 | 664.40 | 722.79 | 835.23 | 577.09 | 495.42 | 502.30 | 496.36 | 484.85 | 461.36 | 474.73 | 447.75 | 453.87 | 432.30 | 460.74 | 440.03 | 453.26 | 457.05 | 485.30 | 486.43 | 478.30 | 467.39 | 461.23 | 449.85 | 438.83 | 435.66 | 438.43 | 438.71 | 380.44 | 349.97 | 341.22 | 339.79 | 376.95 | 399.10 | 396.69 | 394.58 | 387.82 | 380.14 | 393.60 | 419.55 | 429.49 | 420.55 | 405.99 | 420.48 | 380.03 | 352.88 | 427.31 | 426.37 | 406.93 | 390.30 | 353.70 | NA | NA | NA | |
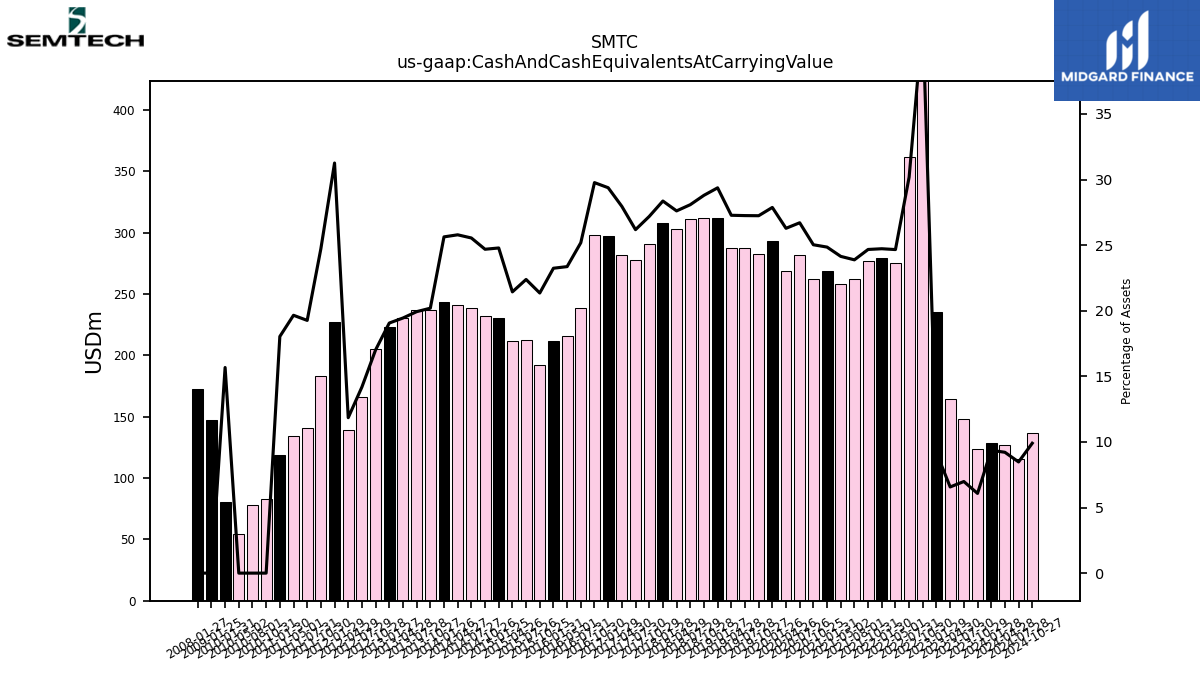
| Cash And Cash Equivalents At Carrying Value | 128.59 | 123.82 | 147.91 | 164.20 | 235.51 | 617.80 | 362.15 | 275.18 | 279.60 | 276.60 | 262.66 | 258.22 | 268.89 | 262.27 | 281.46 | 268.95 | 293.32 | 283.06 | 287.84 | 287.30 | 312.12 | 312.24 | 311.33 | 303.35 | 307.92 | 291.12 | 277.85 | 281.55 | 297.13 | 297.94 | 238.89 | 216.03 | 211.81 | 192.36 | 212.60 | 211.50 | 230.33 | 232.49 | 238.67 | 241.15 | 243.19 | 237.39 | 237.06 | 230.43 | 223.19 | 204.95 | 165.86 | 138.90 | 227.02 | 183.14 | 140.59 | 134.60 | 119.02 | 83.21 | 77.92 | 54.37 | |
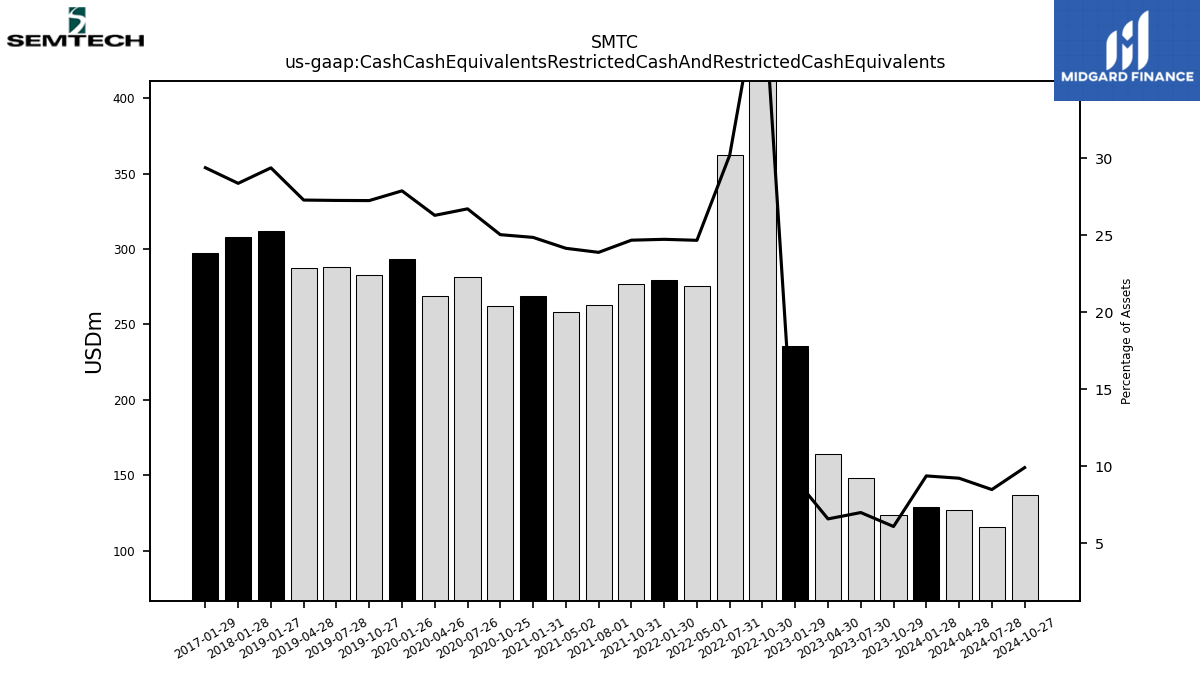
| Cash Cash Equivalents Restricted Cash And Restricted Cash Equivalents | 128.59 | 123.82 | 147.91 | 164.20 | 235.51 | 617.80 | 362.15 | 275.18 | 279.60 | 276.60 | 262.66 | 258.22 | 268.89 | 262.27 | 281.46 | 268.95 | 293.32 | 283.06 | 287.84 | 287.30 | 312.12 | NA | NA | NA | 307.92 | NA | NA | NA | 297.13 | NA | NA | NA | NA | NA | NA | NA | NA | NA | NA | NA | NA | NA | NA | NA | NA | NA | NA | NA | NA | NA | NA | NA | NA | NA | NA | NA | |
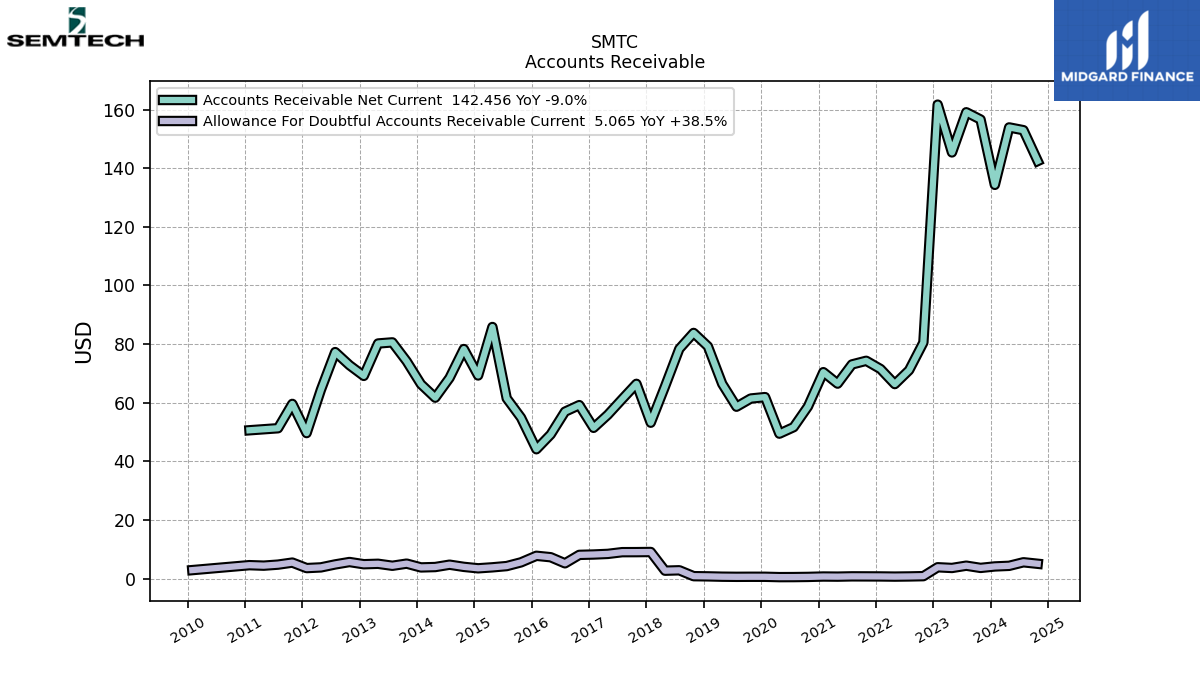
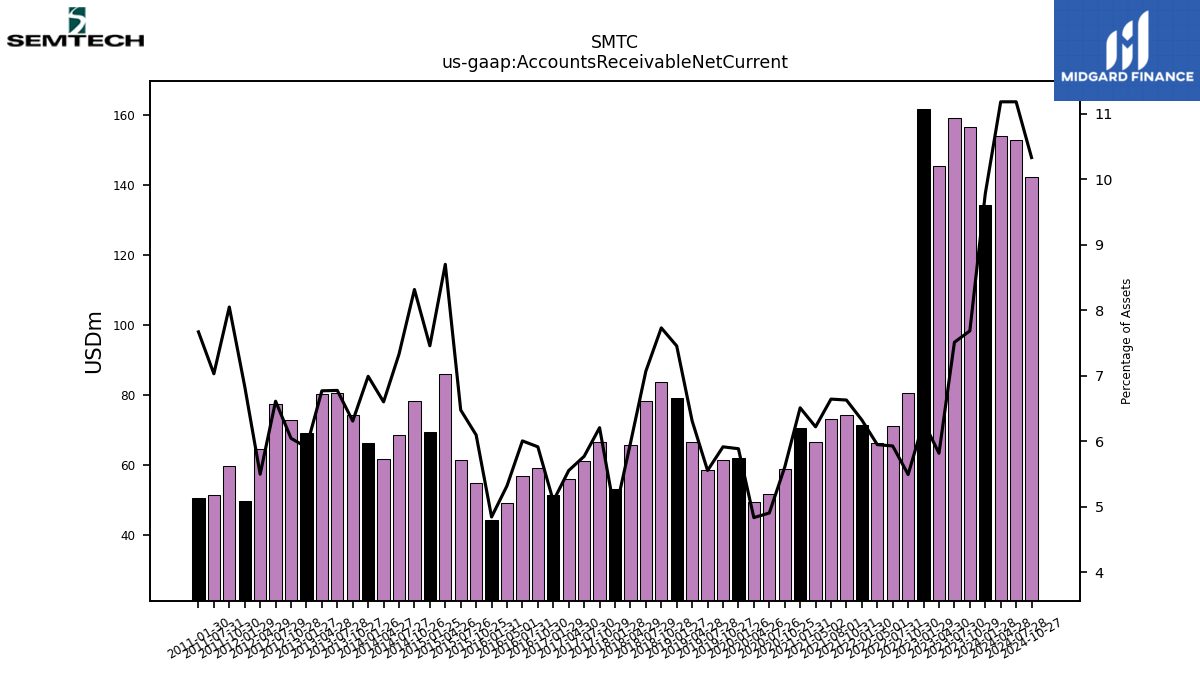
| Accounts Receivable Net Current | 134.32 | 156.61 | 159.10 | 145.38 | 161.69 | 80.54 | 71.11 | 66.36 | 71.51 | 74.31 | 73.06 | 66.52 | 70.43 | 58.70 | 51.67 | 49.45 | 61.93 | 61.44 | 58.64 | 66.46 | 79.22 | 83.82 | 78.38 | 65.57 | 53.18 | 66.46 | 61.22 | 55.91 | 51.44 | 59.19 | 56.95 | 49.18 | 44.13 | 54.91 | 61.51 | 85.84 | 69.30 | 78.32 | 68.47 | 61.72 | 66.33 | 74.15 | 80.59 | 80.21 | 69.16 | 72.80 | 77.28 | 64.42 | 49.64 | 59.61 | 51.30 | NA | 50.61 | NA | NA | NA | |
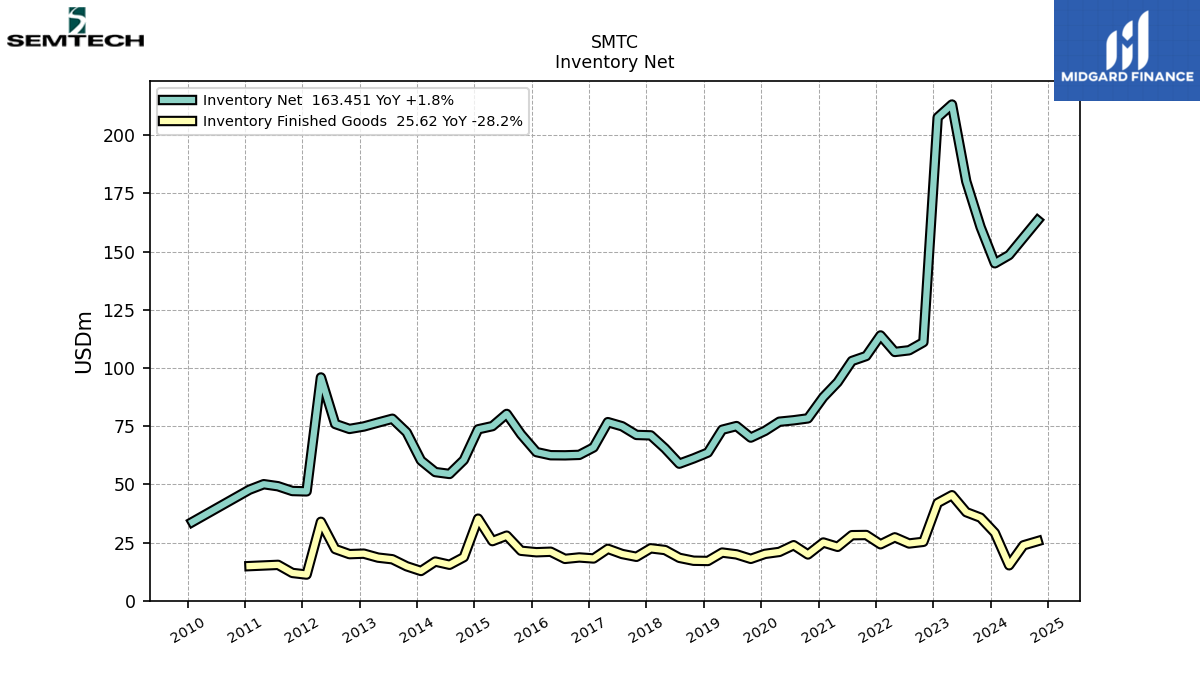
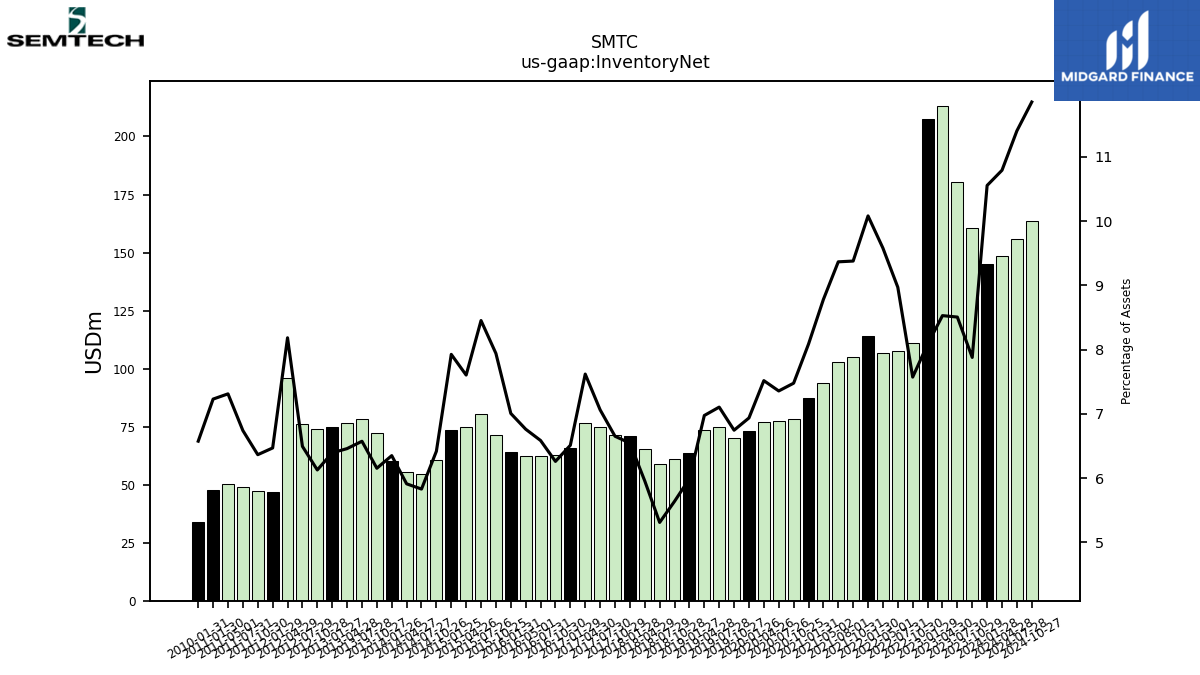
| Inventory Net | 144.99 | 160.59 | 180.23 | 213.23 | 207.70 | 111.08 | 107.63 | 106.90 | 114.00 | 105.16 | 103.03 | 93.92 | 87.49 | 78.37 | 77.55 | 76.93 | 73.01 | 70.11 | 75.06 | 73.48 | 63.68 | 61.16 | 58.89 | 65.46 | 71.07 | 71.25 | 74.97 | 76.75 | 65.87 | 62.68 | 62.48 | 62.53 | 63.88 | 71.55 | 80.29 | 75.03 | 73.67 | 60.46 | 54.48 | 55.30 | 60.27 | 72.36 | 78.21 | 76.56 | 74.88 | 73.83 | 75.95 | 95.96 | 46.99 | 47.15 | 49.20 | 50.08 | 47.72 | NA | NA | NA | |
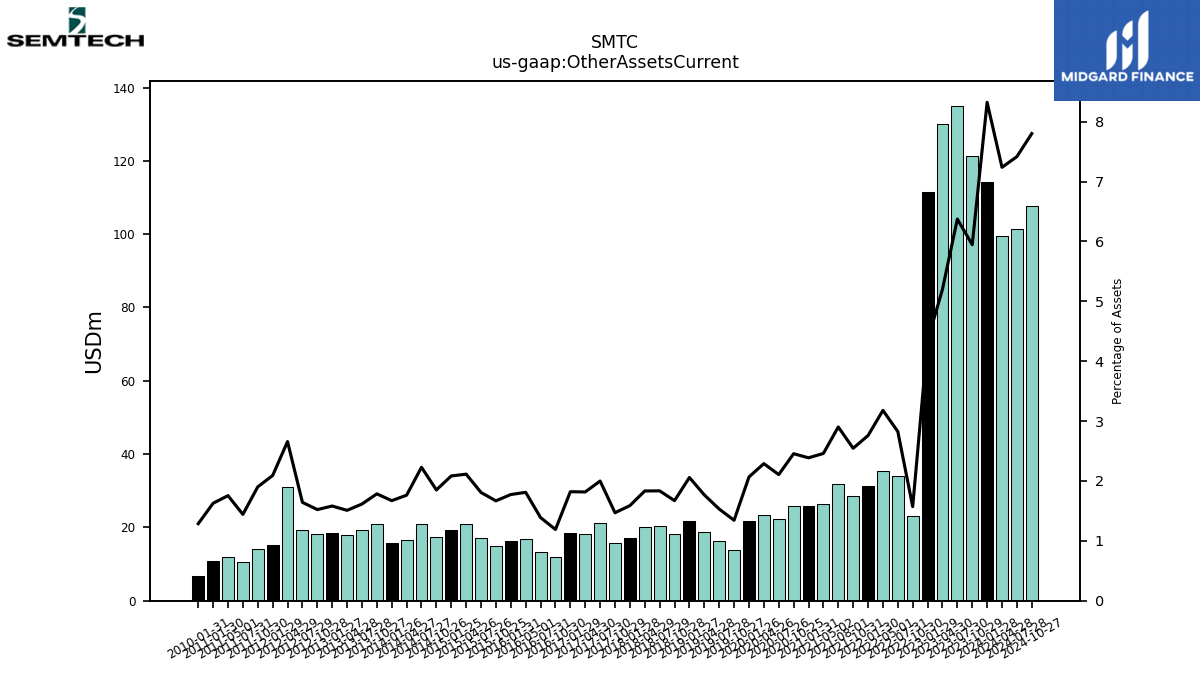
| Other Assets Current | 114.33 | 121.19 | 135.03 | 130.03 | 111.63 | 23.05 | 33.91 | 35.47 | 31.20 | 28.55 | 31.92 | 26.31 | 25.83 | 25.73 | 22.20 | 23.43 | 21.76 | 13.97 | 16.18 | 18.62 | 21.88 | 18.13 | 20.35 | 20.14 | 17.25 | 15.74 | 21.22 | 18.30 | 18.42 | 11.92 | 13.17 | 16.74 | 16.17 | 15.03 | 17.17 | 20.86 | 19.37 | 17.43 | 20.82 | 16.48 | 15.86 | 20.99 | 19.21 | 17.89 | 18.52 | 18.34 | 19.22 | 31.16 | 15.19 | 14.09 | 10.53 | 12.02 | 10.74 | NA | NA | NA | |
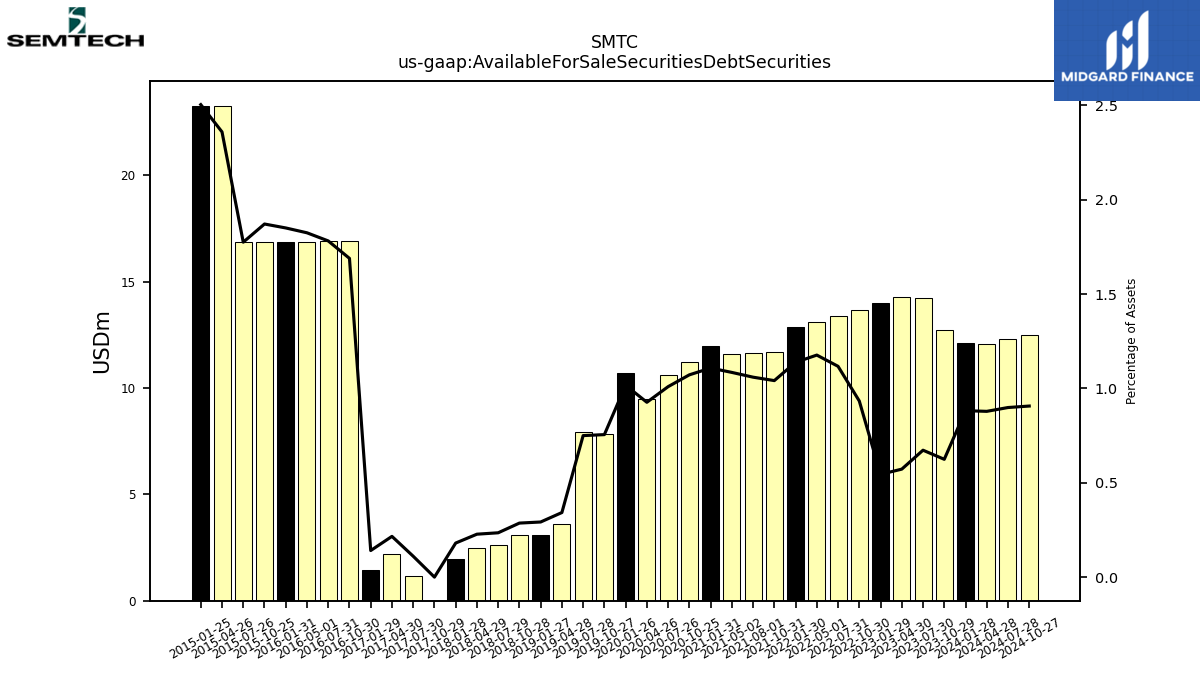
| Available For Sale Securities Debt Securities | 12.12 | 12.72 | 14.25 | 14.30 | 13.99 | 13.69 | 13.40 | 13.13 | 12.87 | 11.68 | 11.65 | 11.60 | 11.99 | 11.23 | 10.64 | 9.48 | 10.70 | 7.85 | 7.92 | 3.60 | 3.10 | 3.10 | 2.60 | 2.50 | 1.96 | 0.00 | 1.18 | 2.17 | 1.43 | 16.91 | 16.90 | 16.87 | 16.87 | 16.86 | 16.86 | 23.28 | 23.27 | NA | NA | NA | NA | NA | NA | NA | NA | NA | NA | NA | NA | NA | NA | NA | NA | NA | NA | NA |
| 2024-01-28 | 2023-10-29 | 2023-07-30 | 2023-04-30 | 2023-01-29 | 2022-10-30 | 2022-07-31 | 2022-05-01 | 2022-01-30 | 2021-10-31 | 2021-08-01 | 2021-05-02 | 2021-01-31 | 2020-10-25 | 2020-07-26 | 2020-04-26 | 2020-01-26 | 2019-10-27 | 2019-07-28 | 2019-04-28 | 2019-01-27 | 2018-10-28 | 2018-07-29 | 2018-04-29 | 2018-01-28 | 2017-10-29 | 2017-07-30 | 2017-04-30 | 2017-01-29 | 2016-10-30 | 2016-07-31 | 2016-05-01 | 2016-01-31 | 2015-10-25 | 2015-07-26 | 2015-04-26 | 2015-01-25 | 2014-10-26 | 2014-07-27 | 2014-04-27 | 2014-01-26 | 2013-10-27 | 2013-07-28 | 2013-04-28 | 2013-01-27 | 2012-10-28 | 2012-07-29 | 2012-04-29 | 2012-01-29 | 2011-10-30 | 2011-07-31 | 2011-05-01 | 2011-01-30 | 2010-10-31 | 2010-08-01 | 2010-05-02 | ||
|---|---|---|---|---|---|---|---|---|---|---|---|---|---|---|---|---|---|---|---|---|---|---|---|---|---|---|---|---|---|---|---|---|---|---|---|---|---|---|---|---|---|---|---|---|---|---|---|---|---|---|---|---|---|---|---|---|---|
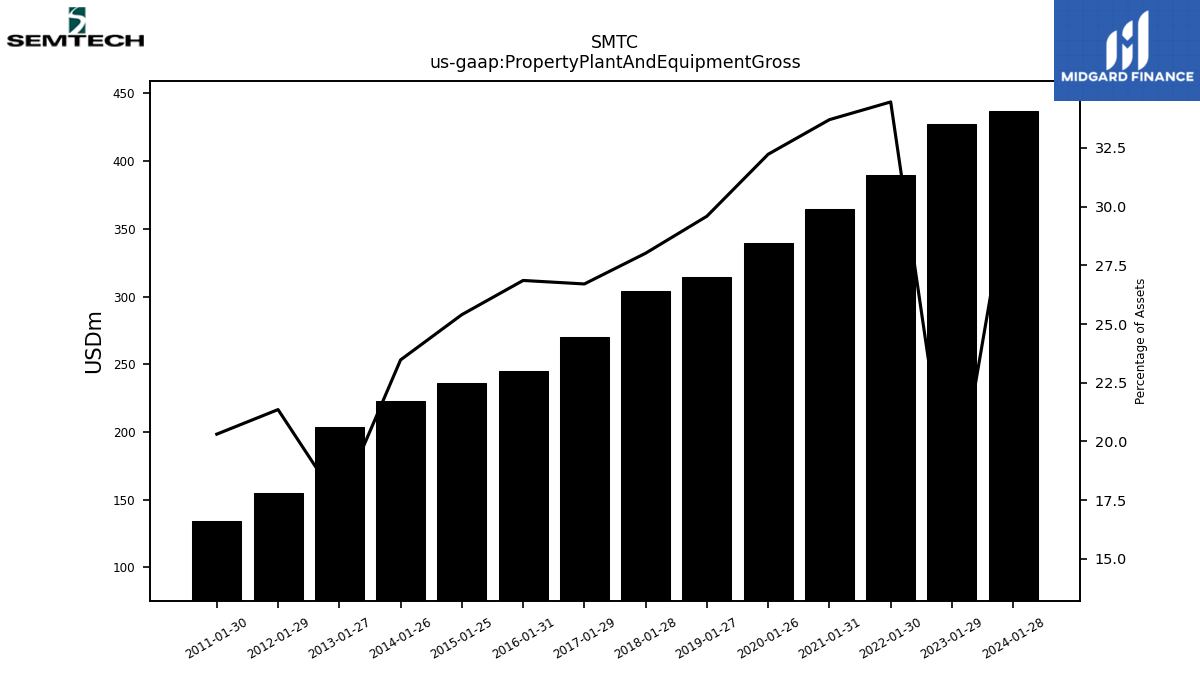
| Property Plant And Equipment Gross | 437.34 | NA | NA | NA | 427.27 | NA | NA | NA | 389.70 | NA | NA | NA | 364.71 | NA | NA | NA | 339.20 | NA | NA | NA | 314.52 | NA | NA | NA | 304.19 | NA | NA | NA | 270.15 | NA | NA | NA | 244.79 | NA | NA | NA | 236.06 | NA | NA | NA | 222.73 | NA | NA | NA | 203.60 | NA | NA | NA | 155.11 | NA | NA | NA | 134.02 | NA | NA | NA | |
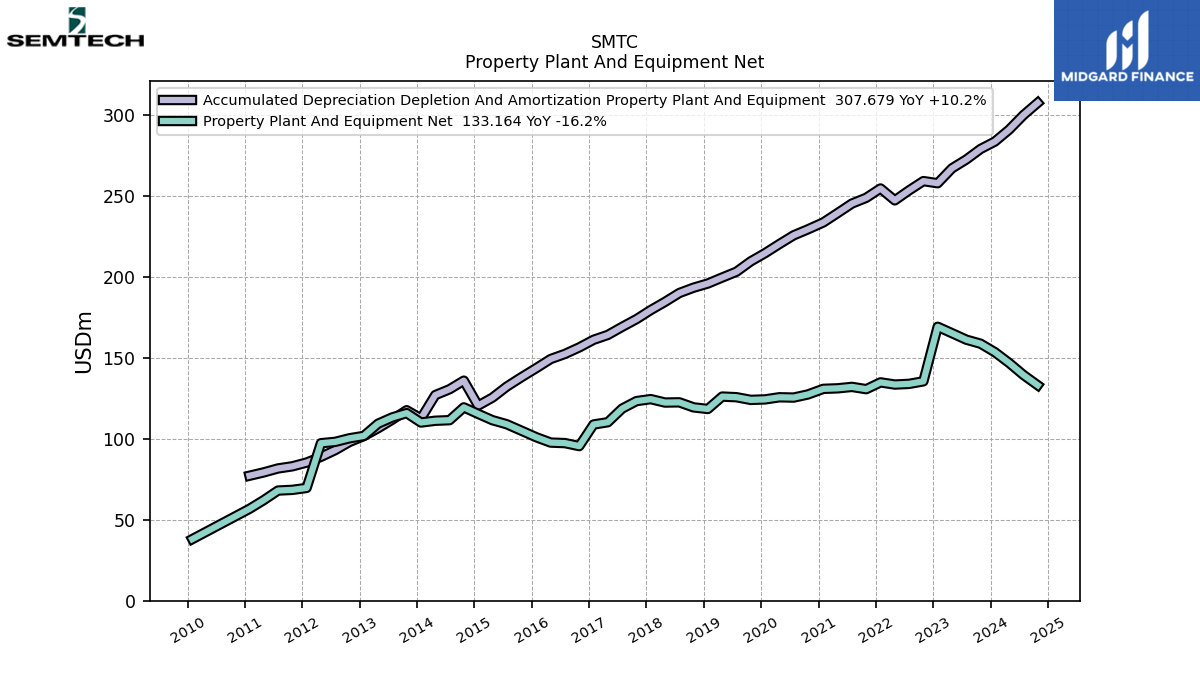
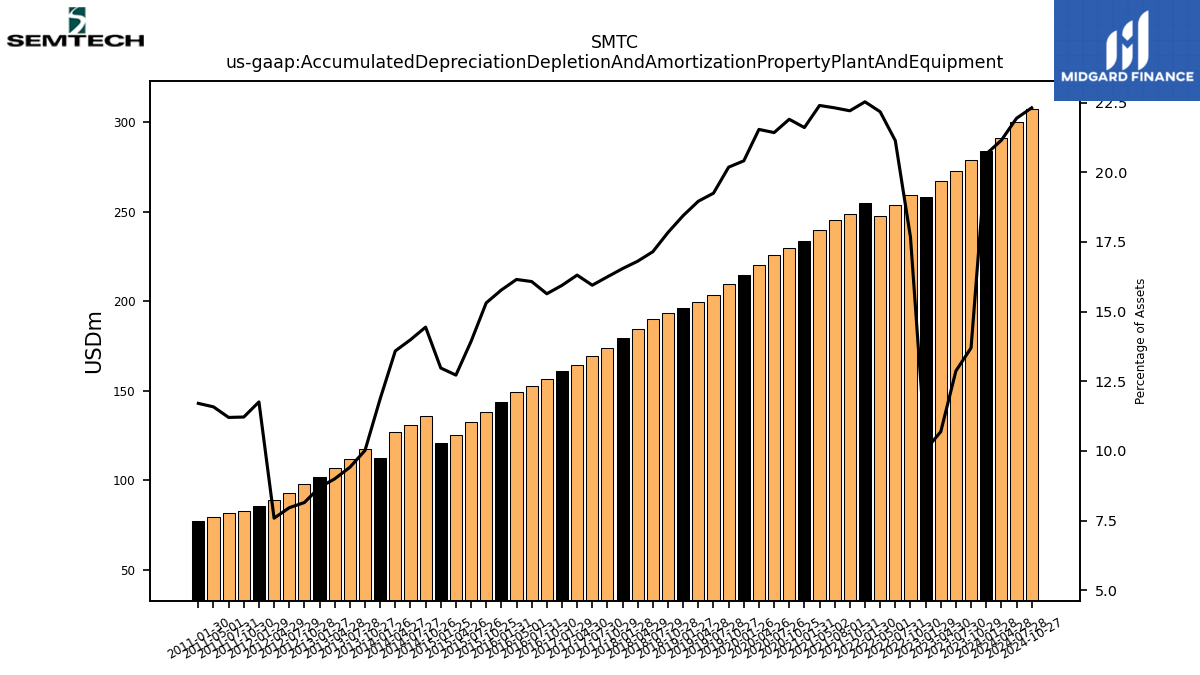
| Accumulated Depreciation Depletion And Amortization Property Plant And Equipment | 283.73 | 279.15 | 272.63 | 267.19 | 257.98 | 259.31 | 253.58 | 247.40 | 254.76 | 248.99 | 245.42 | 239.56 | 233.78 | 229.51 | 225.81 | 220.40 | 214.79 | 209.72 | 203.32 | 199.72 | 196.03 | 193.45 | 190.15 | 184.69 | 179.60 | 174.00 | 169.24 | 164.26 | 161.24 | 156.55 | 152.52 | 149.36 | 143.78 | 137.96 | 132.31 | 125.50 | 120.59 | 136.01 | 130.69 | 127.07 | 112.61 | 117.74 | 111.94 | 106.61 | 101.77 | 98.13 | 93.07 | 88.91 | 85.39 | 83.07 | 81.75 | 79.31 | 77.24 | NA | NA | NA | |
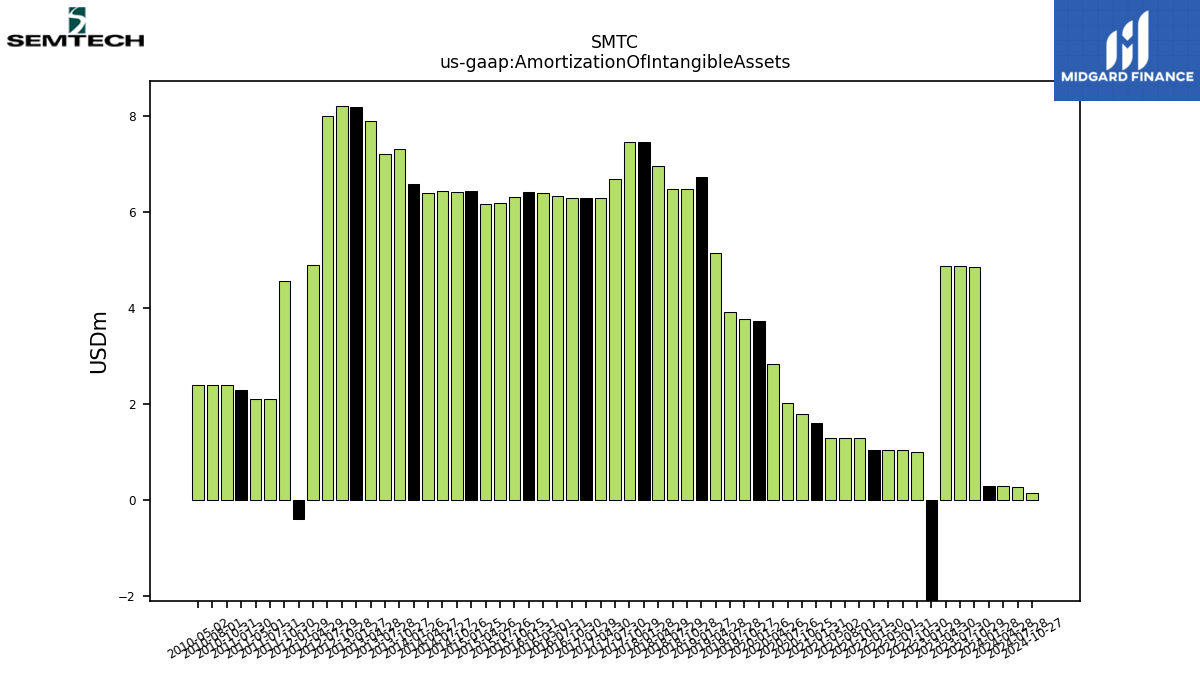
| Amortization Of Intangible Assets | 0.31 | 4.85 | 4.87 | 4.88 | -2.27 | 1.00 | 1.05 | 1.05 | 1.05 | 1.30 | 1.30 | 1.30 | 1.61 | 1.80 | 2.02 | 2.84 | 3.73 | 3.77 | 3.91 | 5.14 | 6.73 | 6.48 | 6.48 | 6.96 | 7.45 | 7.45 | 6.67 | 6.29 | 6.28 | 6.29 | 6.33 | 6.40 | 6.41 | 6.31 | 6.18 | 6.16 | 6.43 | 6.42 | 6.44 | 6.40 | 6.59 | 7.30 | 7.20 | 7.90 | 8.18 | 8.20 | 8.00 | 4.90 | -0.38 | 4.57 | 2.10 | 2.10 | 2.30 | 2.41 | 2.40 | 2.40 | |
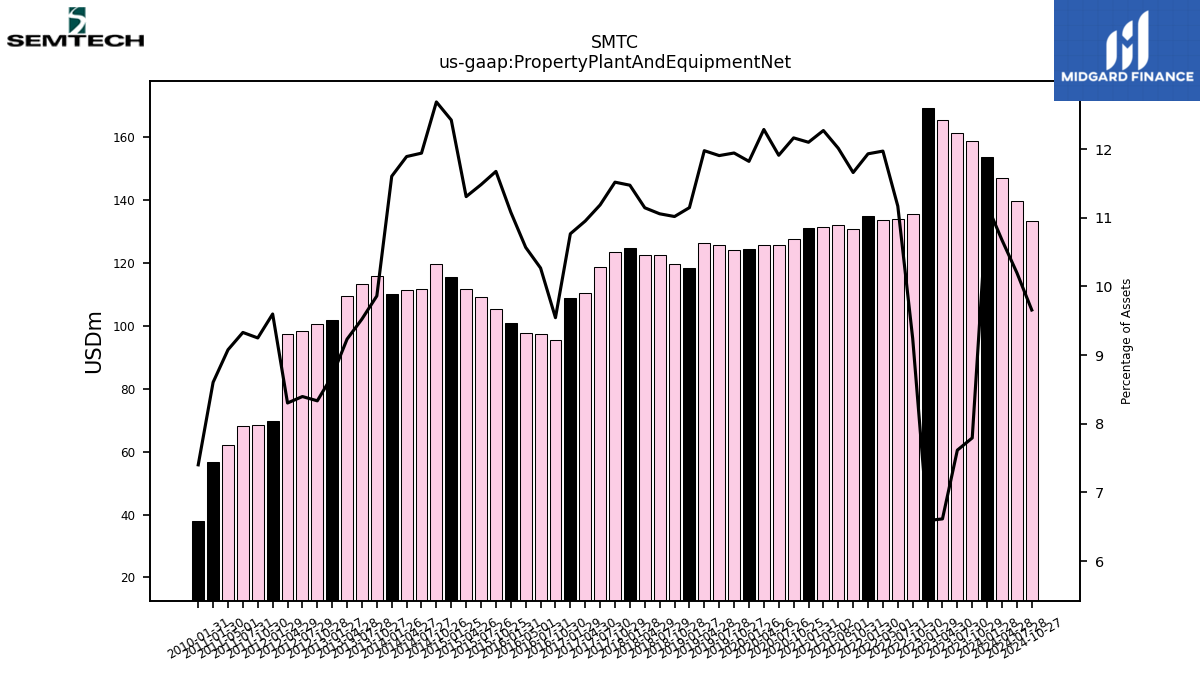
| Property Plant And Equipment Net | 153.62 | 158.83 | 161.33 | 165.34 | 169.29 | 135.57 | 134.01 | 133.59 | 134.94 | 130.73 | 132.14 | 131.25 | 130.93 | 127.47 | 125.54 | 125.73 | 124.42 | 124.11 | 125.76 | 126.17 | 118.49 | 119.48 | 122.61 | 122.47 | 124.59 | 123.36 | 118.74 | 110.32 | 108.91 | 95.55 | 97.41 | 97.73 | 101.01 | 105.20 | 109.08 | 111.58 | 115.47 | 119.50 | 111.58 | 111.22 | 110.12 | 115.94 | 113.31 | 109.41 | 101.84 | 100.39 | 98.17 | 97.34 | 69.71 | 68.51 | 68.10 | 62.17 | 56.78 | NA | NA | NA | |
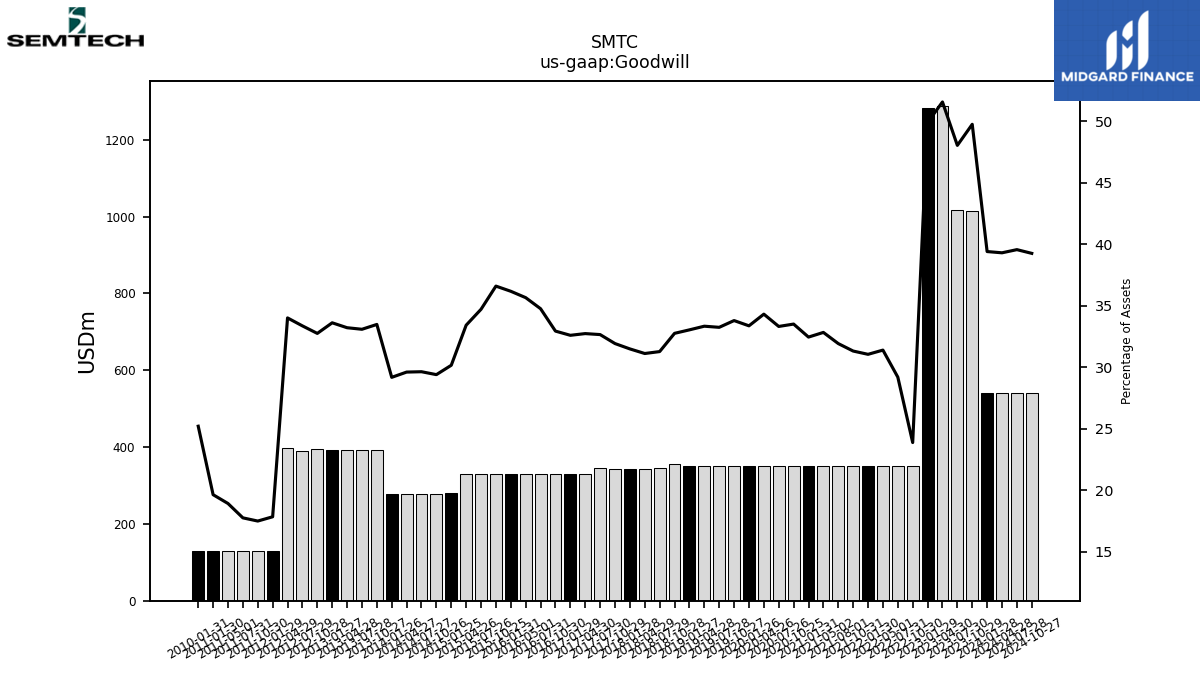
| Goodwill | 541.23 | 1013.68 | 1017.44 | 1288.83 | 1281.70 | 350.31 | 350.31 | 350.31 | 351.14 | 351.14 | 351.14 | 351.14 | 351.14 | 351.14 | 351.14 | 351.14 | 351.14 | 351.14 | 351.14 | 351.14 | 351.14 | 355.18 | 346.73 | 341.90 | 341.90 | 341.89 | 346.57 | 329.70 | 329.70 | 329.70 | 329.70 | 329.70 | 329.70 | 329.70 | 329.70 | 329.70 | 280.32 | 276.90 | 276.90 | 276.90 | 276.90 | 393.58 | 393.58 | 393.58 | 393.58 | 394.51 | 390.08 | 398.72 | 129.65 | 129.65 | 129.65 | 129.65 | 129.65 | NA | NA | NA | |
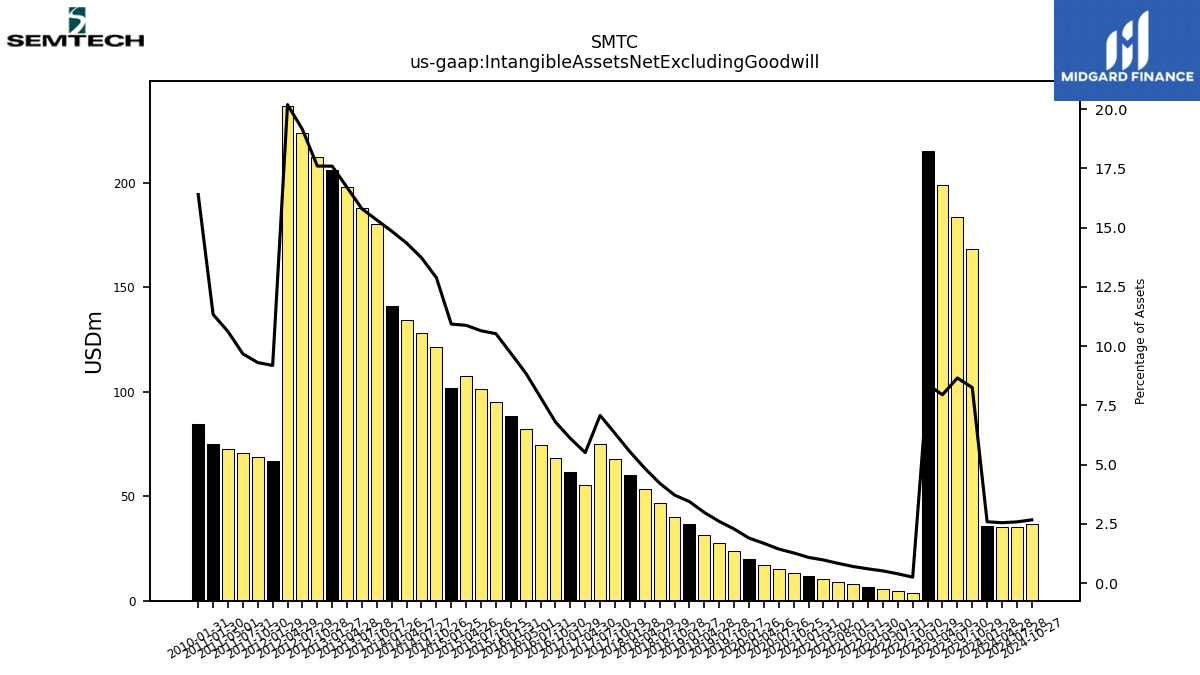
| Intangible Assets Net Excluding Goodwill | 35.57 | 168.23 | 183.40 | 198.78 | 215.10 | 3.71 | 4.71 | 5.76 | 6.80 | 7.85 | 9.15 | 10.45 | 11.75 | 13.35 | 15.15 | 17.17 | 20.01 | 23.74 | 27.51 | 31.41 | 36.56 | 40.29 | 46.77 | 53.25 | 60.21 | 67.66 | 75.11 | 55.49 | 61.77 | 68.06 | 74.36 | 82.01 | 88.43 | 94.84 | 101.17 | 107.36 | 101.60 | 121.42 | 128.30 | 134.21 | 140.94 | 180.16 | 187.92 | 197.89 | 206.06 | 212.04 | 223.91 | 236.77 | 66.72 | 68.94 | 70.62 | 72.72 | 74.82 | NA | NA | NA | |
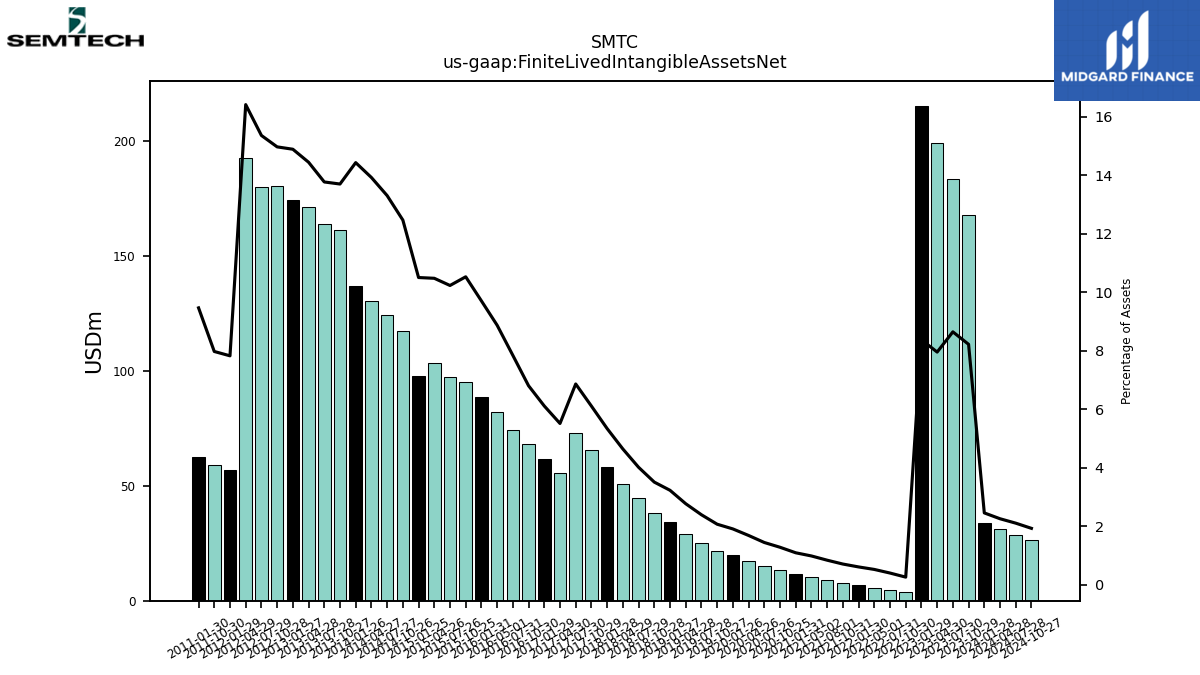
| Finite Lived Intangible Assets Net | 33.65 | 167.46 | 183.11 | 198.78 | 215.10 | 3.71 | 4.71 | 5.76 | 6.80 | 7.85 | 9.15 | 10.45 | 11.75 | 13.35 | 15.15 | 17.17 | 20.01 | 21.44 | 25.21 | 29.11 | 34.26 | 37.99 | 44.47 | 50.95 | 57.91 | 65.36 | 72.81 | 55.49 | 61.77 | 68.06 | 74.36 | 82.01 | 88.43 | 94.84 | 97.17 | 103.36 | 97.60 | 117.42 | 124.30 | 130.21 | 136.94 | 161.06 | 163.82 | 171.19 | 174.36 | 180.34 | 179.61 | 192.47 | 56.82 | 59.05 | NA | NA | 62.45 | NA | NA | NA | |
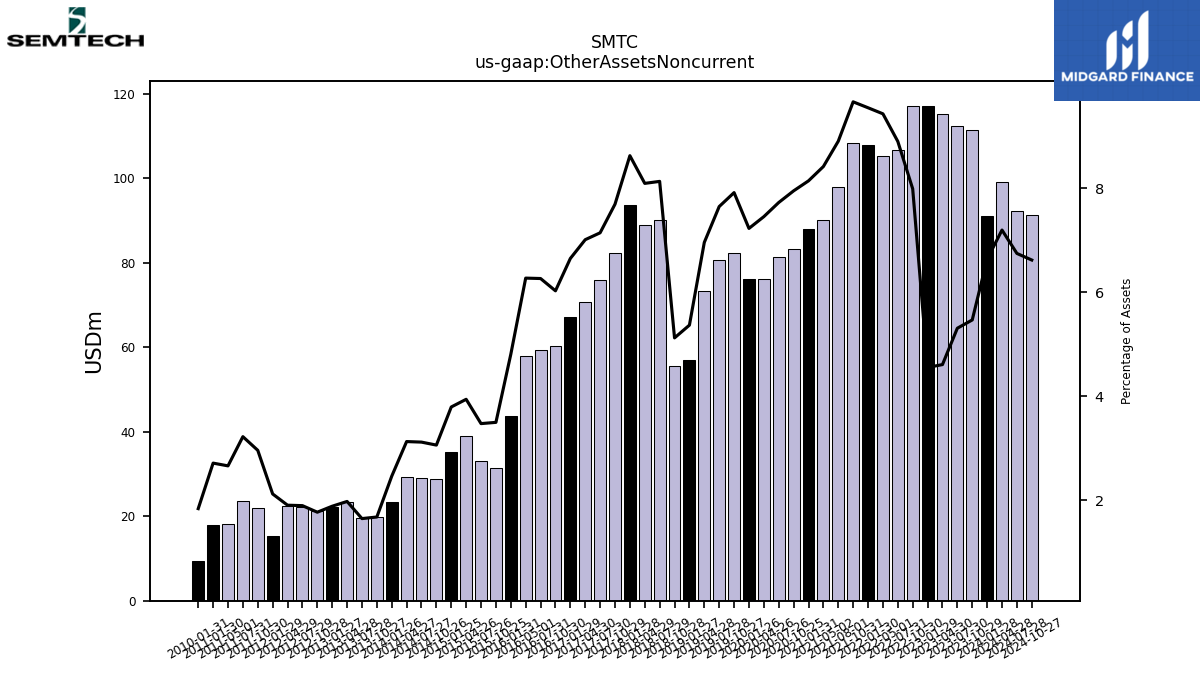
| Other Assets Noncurrent | 91.11 | 111.39 | 112.41 | 115.18 | 116.96 | 117.14 | 106.74 | 105.20 | 107.93 | 108.29 | 97.91 | 90.00 | 88.07 | 83.28 | 81.40 | 76.25 | 76.03 | 82.22 | 80.75 | 73.27 | 57.03 | 55.52 | 90.12 | 88.89 | 93.62 | 82.35 | 75.78 | 70.59 | 67.23 | 60.31 | 59.40 | 57.97 | 43.80 | 31.51 | 32.99 | 38.88 | 35.25 | 28.82 | 29.12 | 29.25 | 23.36 | 19.72 | 19.59 | 23.42 | 22.07 | 21.32 | 22.17 | 22.33 | 15.40 | 21.92 | 23.51 | 18.22 | 17.91 | NA | NA | NA | |
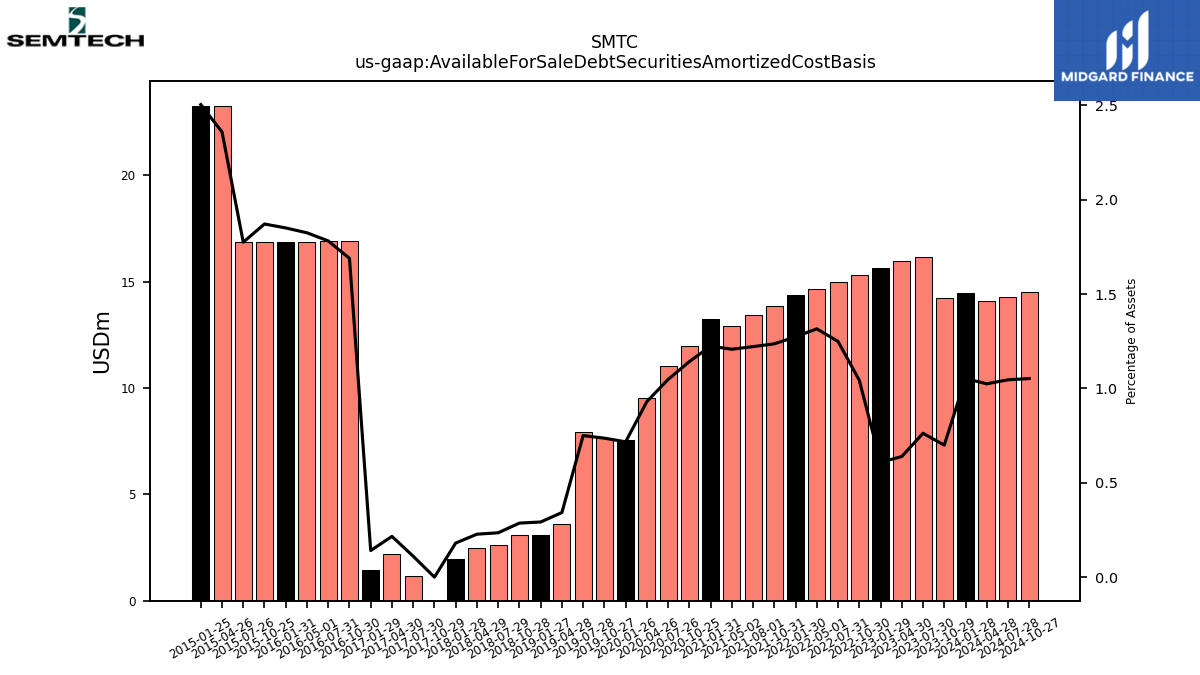
| Available For Sale Debt Securities Amortized Cost Basis | 14.45 | 14.26 | 16.15 | 15.98 | 15.63 | 15.30 | 14.98 | 14.68 | 14.40 | 13.86 | 13.44 | 12.92 | 13.24 | 11.97 | 11.04 | 9.52 | 7.54 | 7.65 | 7.92 | 3.60 | 3.10 | 3.10 | 2.60 | 2.50 | 1.96 | 0.00 | 1.18 | 2.17 | 1.43 | 16.91 | 16.90 | 16.87 | 16.87 | 16.86 | 16.86 | 23.28 | 23.27 | NA | NA | NA | NA | NA | NA | NA | NA | NA | NA | NA | NA | NA | NA | NA | NA | NA | NA | NA |
| 2024-01-28 | 2023-10-29 | 2023-07-30 | 2023-04-30 | 2023-01-29 | 2022-10-30 | 2022-07-31 | 2022-05-01 | 2022-01-30 | 2021-10-31 | 2021-08-01 | 2021-05-02 | 2021-01-31 | 2020-10-25 | 2020-07-26 | 2020-04-26 | 2020-01-26 | 2019-10-27 | 2019-07-28 | 2019-04-28 | 2019-01-27 | 2018-10-28 | 2018-07-29 | 2018-04-29 | 2018-01-28 | 2017-10-29 | 2017-07-30 | 2017-04-30 | 2017-01-29 | 2016-10-30 | 2016-07-31 | 2016-05-01 | 2016-01-31 | 2015-10-25 | 2015-07-26 | 2015-04-26 | 2015-01-25 | 2014-10-26 | 2014-07-27 | 2014-04-27 | 2014-01-26 | 2013-10-27 | 2013-07-28 | 2013-04-28 | 2013-01-27 | 2012-10-28 | 2012-07-29 | 2012-04-29 | 2012-01-29 | 2011-10-30 | 2011-07-31 | 2011-05-01 | 2011-01-30 | 2010-10-31 | 2010-08-01 | 2010-05-02 | ||
|---|---|---|---|---|---|---|---|---|---|---|---|---|---|---|---|---|---|---|---|---|---|---|---|---|---|---|---|---|---|---|---|---|---|---|---|---|---|---|---|---|---|---|---|---|---|---|---|---|---|---|---|---|---|---|---|---|---|
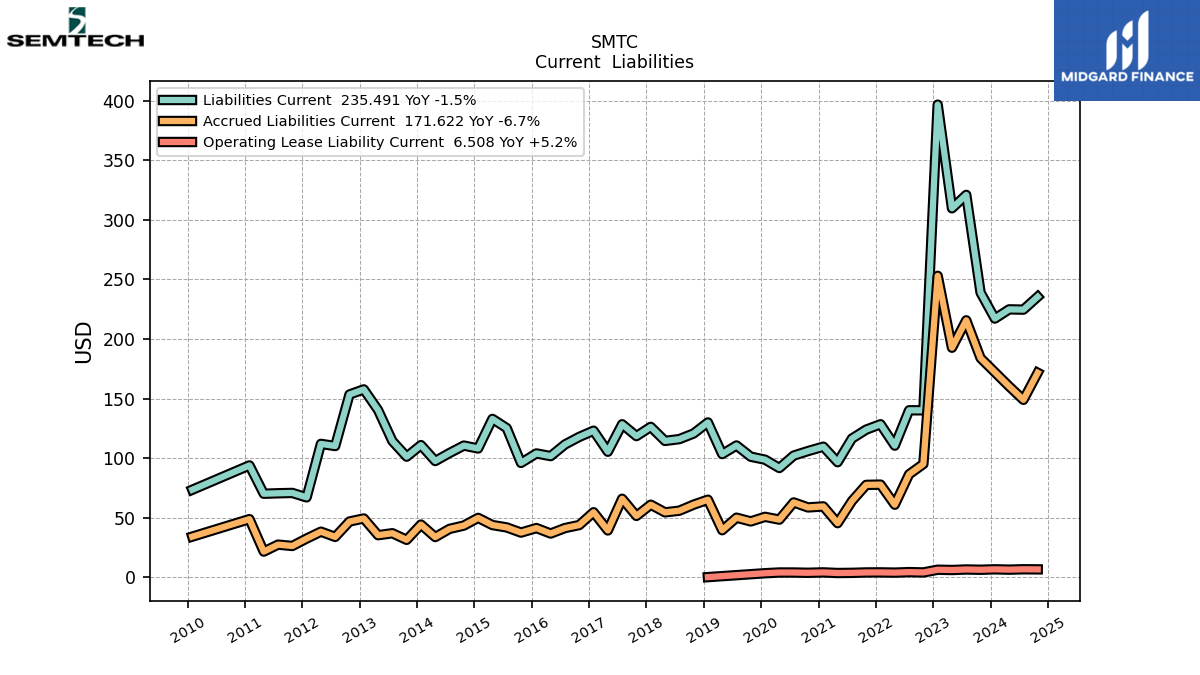
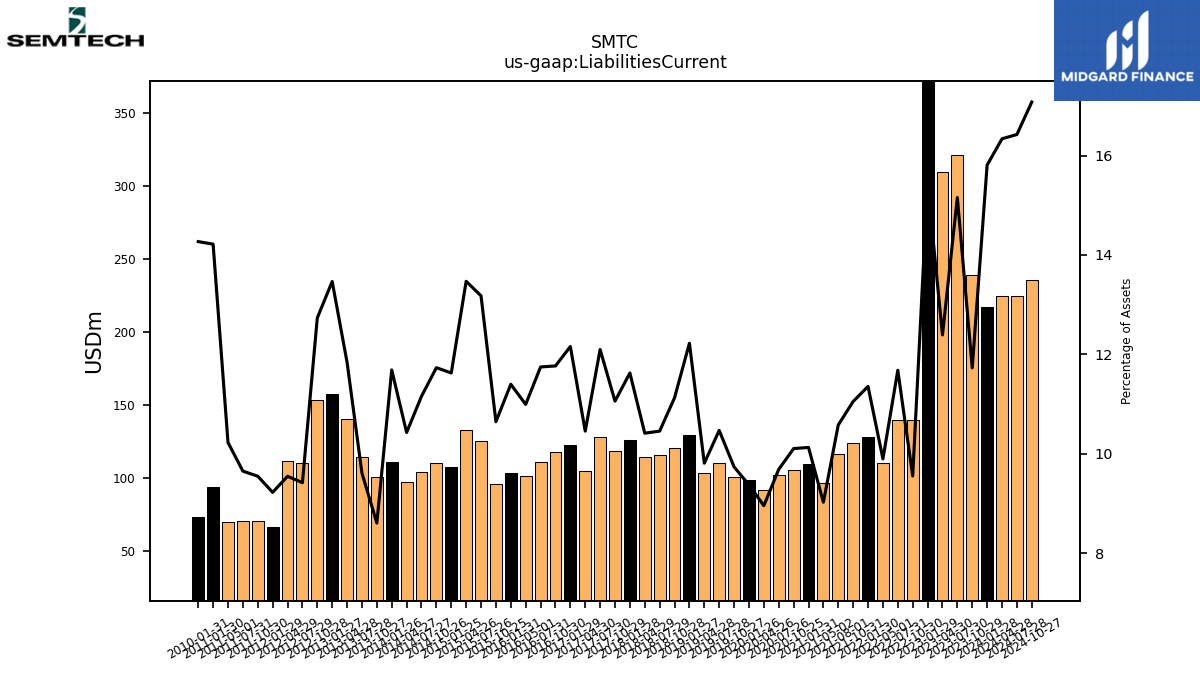
| Liabilities Current | 217.16 | 239.00 | 321.06 | 309.76 | 396.86 | 140.09 | 140.13 | 110.42 | 128.40 | 123.91 | 116.37 | 96.51 | 109.57 | 105.87 | 102.07 | 91.63 | 98.64 | 101.15 | 110.58 | 103.33 | 129.91 | 120.63 | 115.92 | 114.41 | 126.21 | 118.42 | 128.39 | 105.30 | 122.97 | 117.78 | 111.42 | 101.64 | 103.89 | 95.91 | 125.17 | 132.90 | 108.04 | 110.49 | 104.23 | 97.51 | 110.89 | 101.16 | 114.30 | 140.29 | 157.68 | 153.40 | 110.11 | 111.91 | 66.98 | 70.71 | 70.43 | 70.04 | 93.83 | NA | NA | NA | |
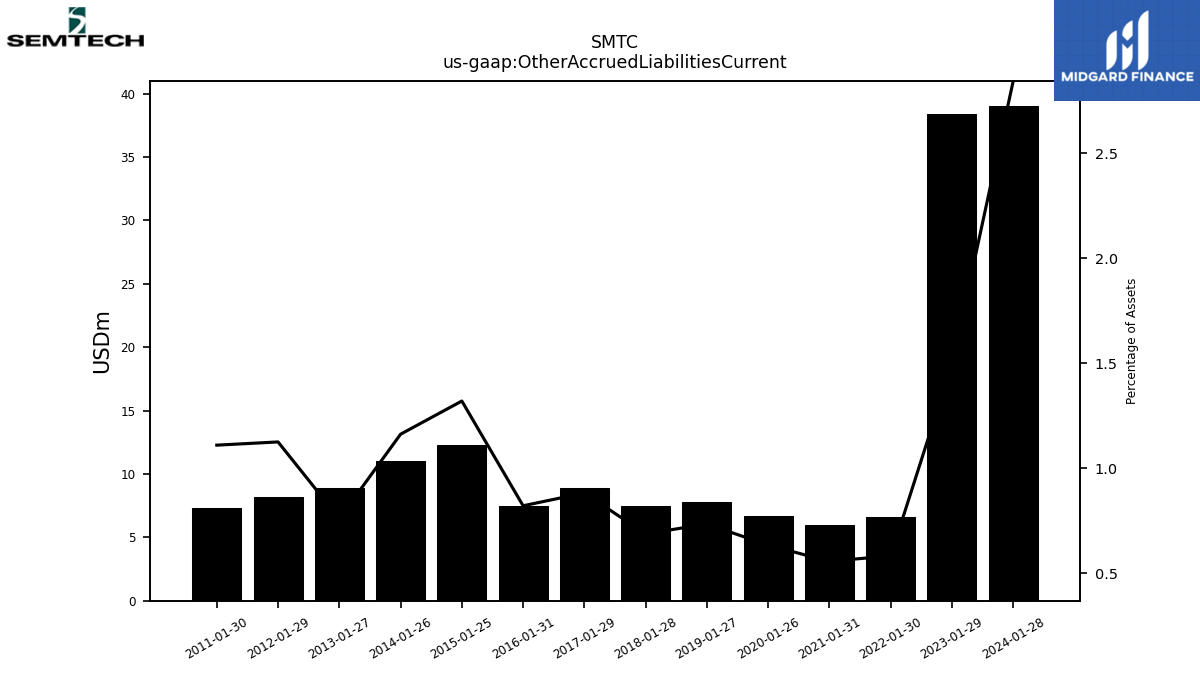
| Other Accrued Liabilities Current | 39.05 | NA | NA | NA | 38.40 | NA | NA | NA | 6.58 | NA | NA | NA | 6.01 | NA | NA | NA | 6.66 | NA | NA | NA | 7.80 | NA | NA | NA | 7.45 | NA | NA | NA | 8.91 | NA | NA | NA | 7.48 | NA | NA | NA | 12.26 | NA | NA | NA | 11.02 | NA | NA | NA | 8.89 | NA | NA | NA | 8.17 | NA | NA | NA | 7.32 | NA | NA | NA | |
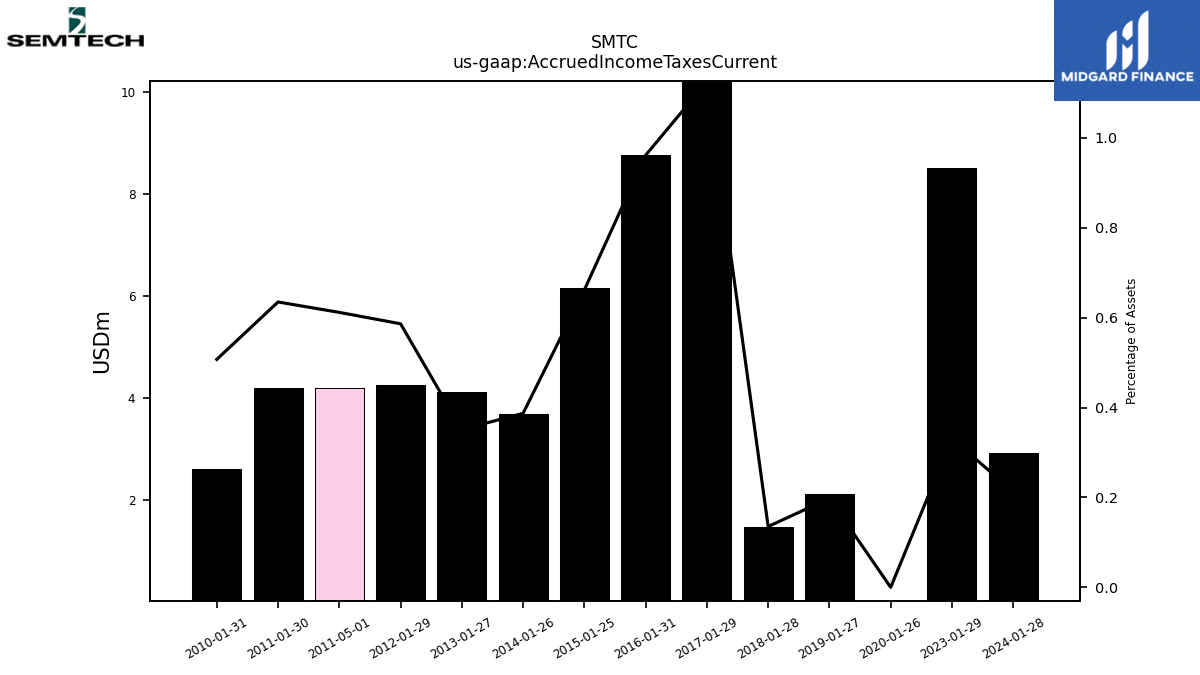
| Accrued Income Taxes Current | 2.92 | NA | NA | NA | 8.52 | NA | NA | NA | NA | NA | NA | NA | NA | NA | NA | NA | 0.00 | NA | NA | NA | 2.10 | NA | NA | NA | 1.47 | NA | NA | NA | 11.38 | NA | NA | NA | 8.77 | NA | NA | NA | 6.15 | NA | NA | NA | 3.67 | NA | NA | NA | 4.11 | NA | NA | NA | 4.26 | NA | NA | 4.19 | 4.19 | NA | NA | NA | |
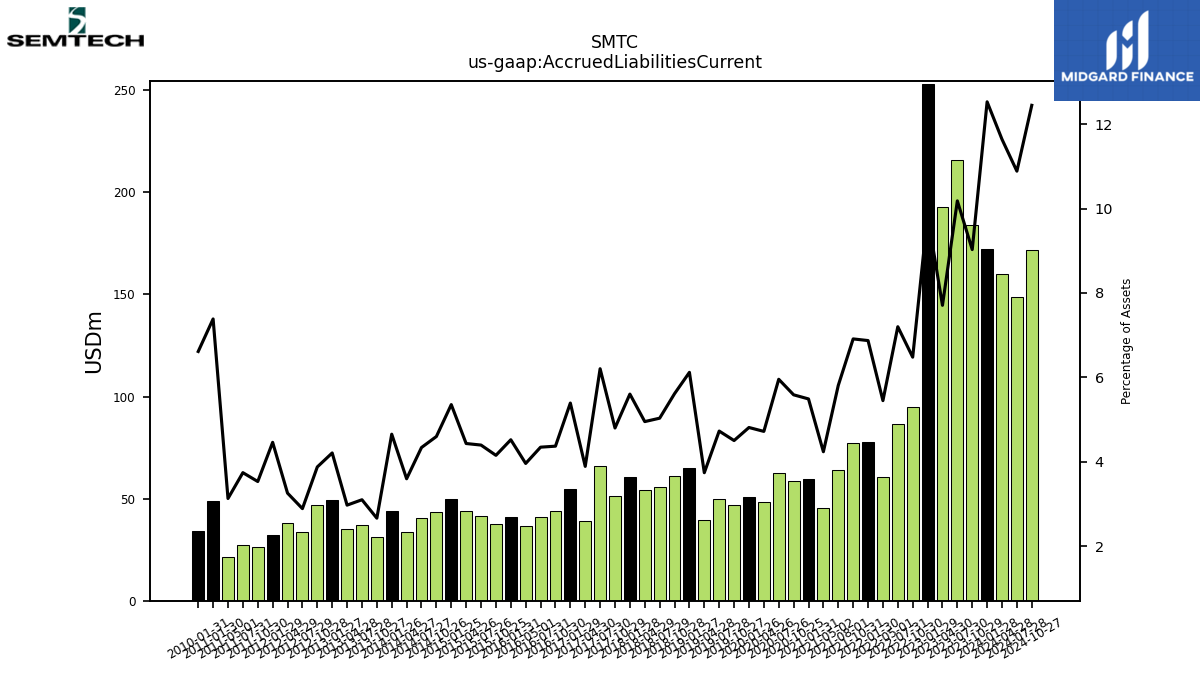
| Accrued Liabilities Current | 172.10 | 183.99 | 215.69 | 192.65 | 253.07 | 95.02 | 86.37 | 60.79 | 77.70 | 77.48 | 63.89 | 45.32 | 59.38 | 58.53 | 62.75 | 48.29 | 50.63 | 46.78 | 49.92 | 39.39 | 65.02 | 60.86 | 55.79 | 54.40 | 60.83 | 51.40 | 65.84 | 39.18 | 54.52 | 43.73 | 41.22 | 36.61 | 41.20 | 37.41 | 41.74 | 43.72 | 49.75 | 43.30 | 40.52 | 33.64 | 44.15 | 31.30 | 36.87 | 35.21 | 49.28 | 46.70 | 33.78 | 38.17 | 32.39 | 26.16 | 27.30 | 21.43 | 48.72 | NA | NA | NA | |
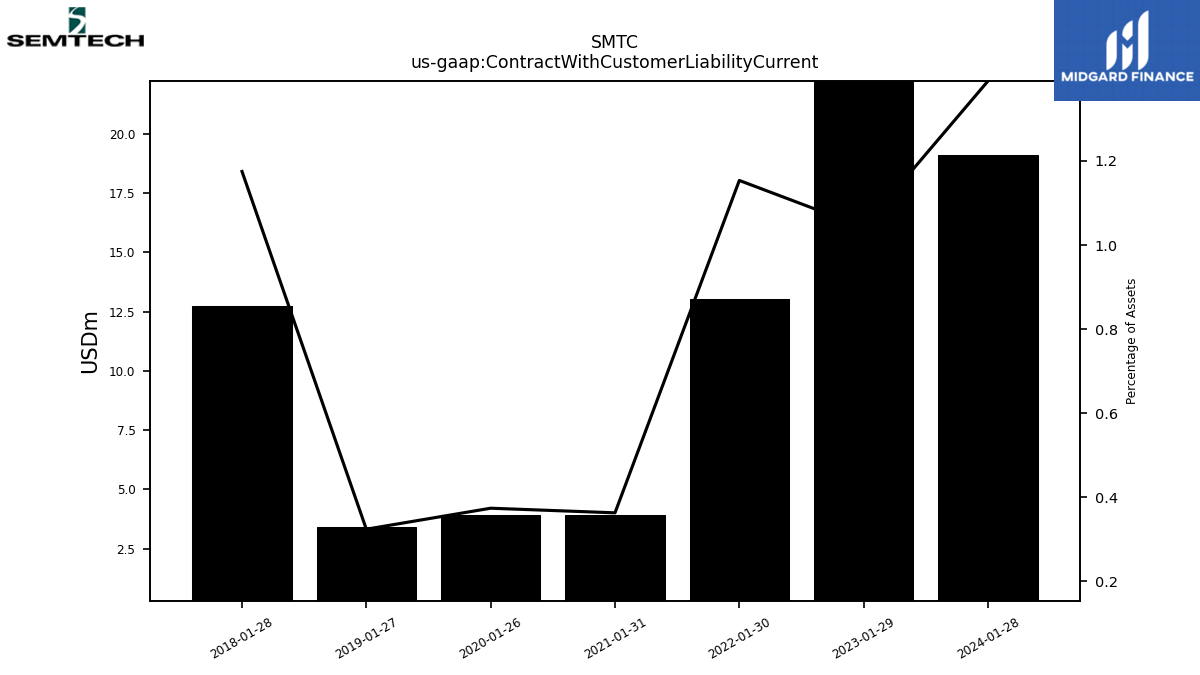
| Contract With Customer Liability Current | 19.10 | NA | NA | NA | 26.77 | NA | NA | NA | 13.05 | NA | NA | NA | 3.92 | NA | NA | NA | 3.93 | NA | NA | NA | 3.44 | NA | NA | NA | 12.76 | NA | NA | NA | NA | NA | NA | NA | NA | NA | NA | NA | NA | NA | NA | NA | NA | NA | NA | NA | NA | NA | NA | NA | NA | NA | NA | NA | NA | NA | NA | NA |
| 2024-01-28 | 2023-10-29 | 2023-07-30 | 2023-04-30 | 2023-01-29 | 2022-10-30 | 2022-07-31 | 2022-05-01 | 2022-01-30 | 2021-10-31 | 2021-08-01 | 2021-05-02 | 2021-01-31 | 2020-10-25 | 2020-07-26 | 2020-04-26 | 2020-01-26 | 2019-10-27 | 2019-07-28 | 2019-04-28 | 2019-01-27 | 2018-10-28 | 2018-07-29 | 2018-04-29 | 2018-01-28 | 2017-10-29 | 2017-07-30 | 2017-04-30 | 2017-01-29 | 2016-10-30 | 2016-07-31 | 2016-05-01 | 2016-01-31 | 2015-10-25 | 2015-07-26 | 2015-04-26 | 2015-01-25 | 2014-10-26 | 2014-07-27 | 2014-04-27 | 2014-01-26 | 2013-10-27 | 2013-07-28 | 2013-04-28 | 2013-01-27 | 2012-10-28 | 2012-07-29 | 2012-04-29 | 2012-01-29 | 2011-10-30 | 2011-07-31 | 2011-05-01 | 2011-01-30 | 2010-10-31 | 2010-08-01 | 2010-05-02 | ||
|---|---|---|---|---|---|---|---|---|---|---|---|---|---|---|---|---|---|---|---|---|---|---|---|---|---|---|---|---|---|---|---|---|---|---|---|---|---|---|---|---|---|---|---|---|---|---|---|---|---|---|---|---|---|---|---|---|---|
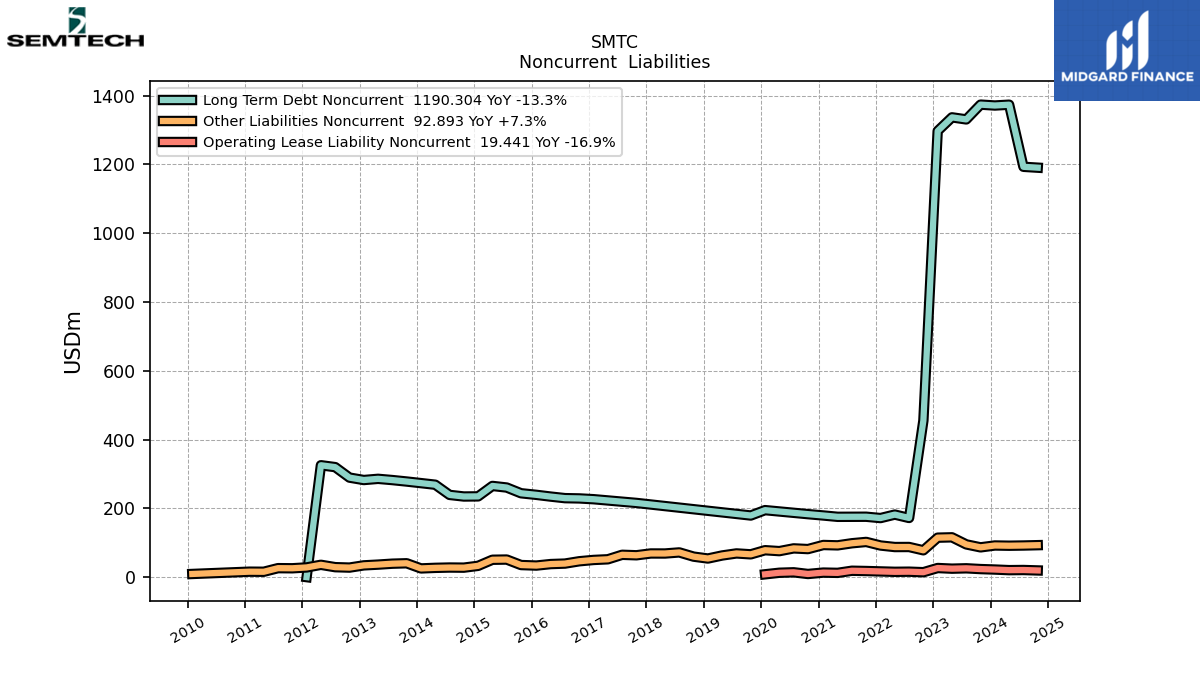
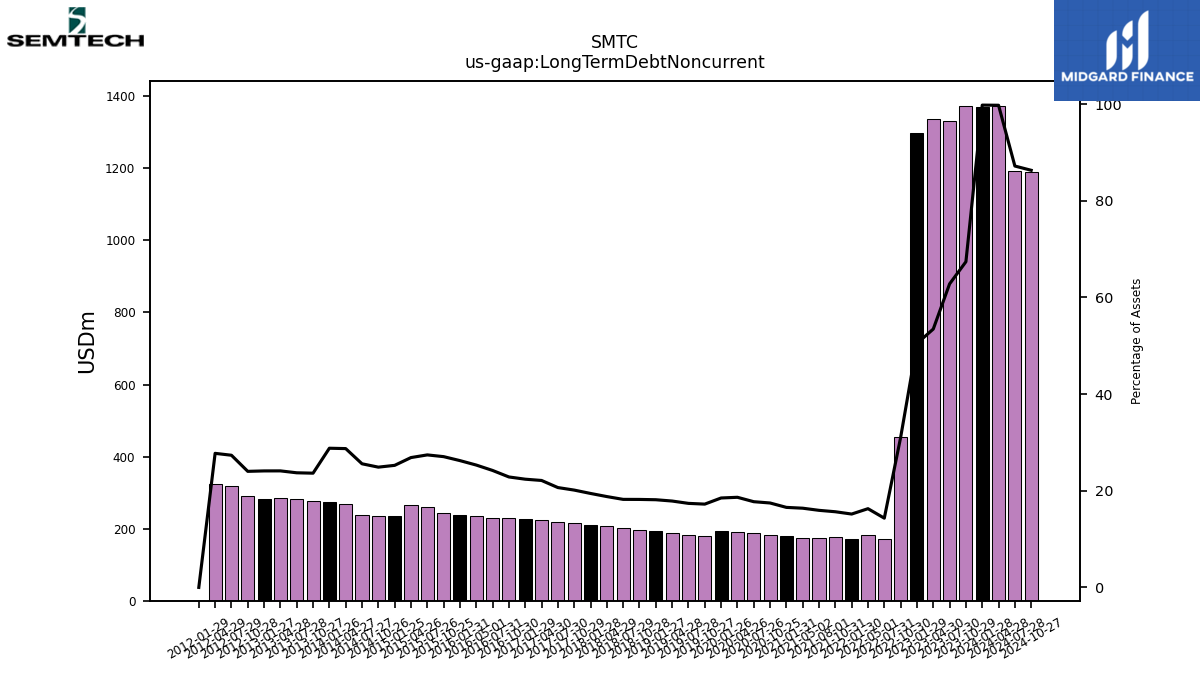
| Long Term Debt Noncurrent | 1371.04 | 1373.62 | 1330.61 | 1336.64 | 1296.97 | 455.11 | 171.92 | 181.80 | 171.68 | 175.56 | 175.44 | 175.32 | 179.19 | 183.07 | 186.96 | 190.84 | 194.74 | 179.11 | 183.69 | 188.27 | 192.84 | 197.42 | 201.99 | 206.55 | 211.11 | 215.67 | 219.29 | 222.91 | 226.52 | 228.79 | 229.59 | 234.13 | 239.18 | 243.82 | 260.46 | 265.11 | 234.75 | 234.38 | 239.02 | 268.66 | 273.29 | 277.93 | 282.16 | 285.75 | 282.29 | 289.32 | 319.79 | 325.25 | 0.00 | NA | NA | NA | NA | NA | NA | NA | |
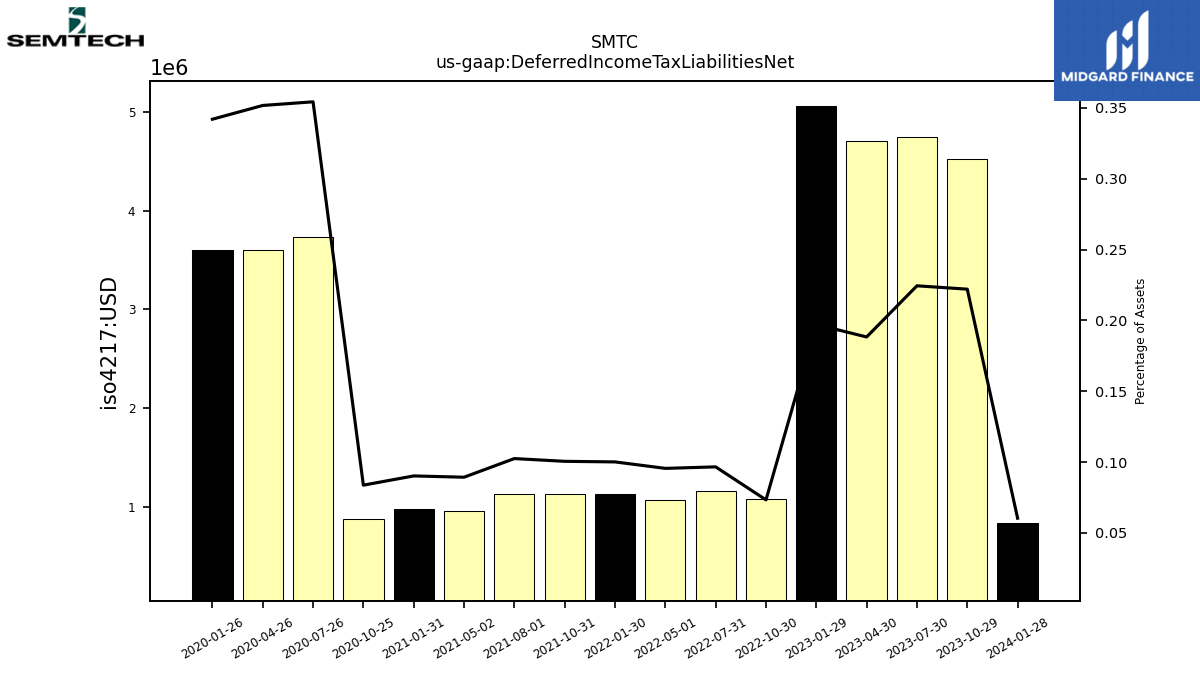
| Deferred Income Tax Liabilities Net | 0.83 | 4.53 | 4.75 | 4.71 | 5.07 | 1.07 | 1.16 | 1.07 | 1.13 | 1.13 | 1.13 | 0.95 | 0.98 | 0.88 | 3.73 | 3.60 | 3.60 | NA | NA | NA | NA | NA | NA | NA | NA | NA | NA | NA | NA | NA | NA | NA | NA | NA | NA | NA | NA | NA | NA | NA | NA | NA | NA | NA | NA | NA | NA | NA | NA | NA | NA | NA | NA | NA | NA | NA | |
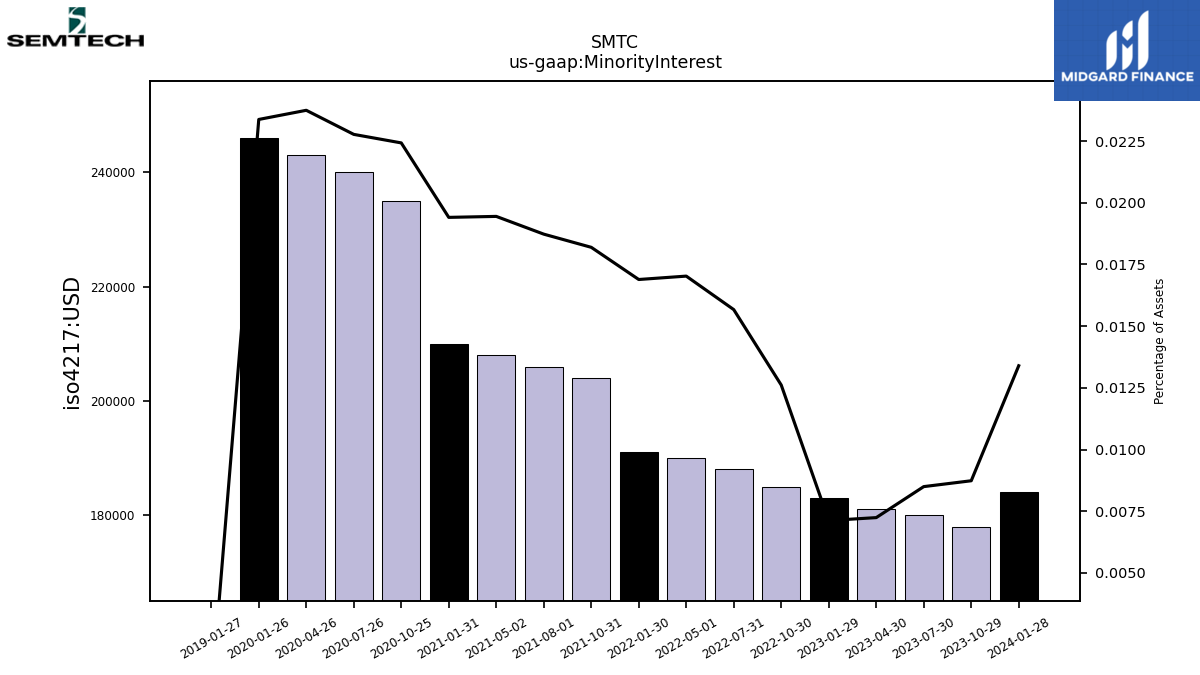
| Minority Interest | 0.18 | 0.18 | 0.18 | 0.18 | 0.18 | 0.18 | 0.19 | 0.19 | 0.19 | 0.20 | 0.21 | 0.21 | 0.21 | 0.23 | 0.24 | 0.24 | 0.25 | NA | NA | NA | 0.00 | NA | NA | NA | NA | NA | NA | NA | NA | NA | NA | NA | NA | NA | NA | NA | NA | NA | NA | NA | NA | NA | NA | NA | NA | NA | NA | NA | NA | NA | NA | NA | NA | NA | NA | NA | |
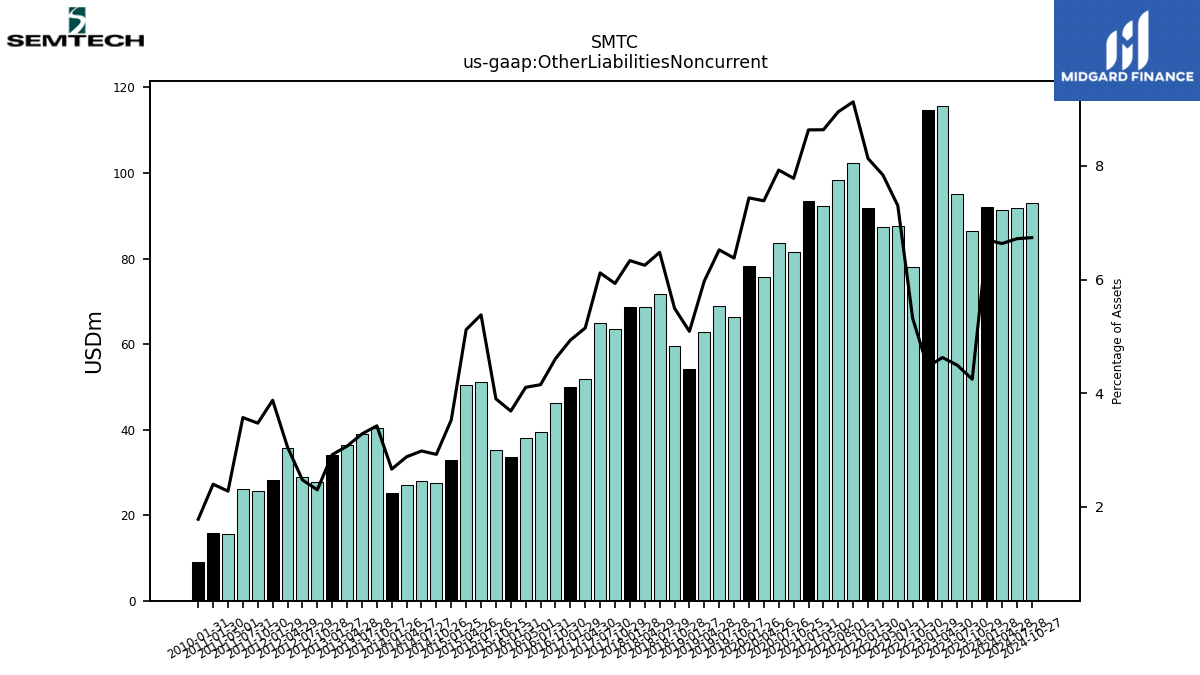
| Other Liabilities Noncurrent | 91.96 | 86.55 | 95.16 | 115.72 | 114.71 | 77.97 | 87.58 | 87.46 | 91.93 | 102.31 | 98.45 | 92.35 | 93.41 | 81.52 | 83.54 | 75.57 | 78.25 | 66.27 | 68.89 | 62.94 | 54.08 | 59.58 | 71.82 | 68.68 | 68.76 | 63.52 | 64.92 | 51.85 | 49.90 | 46.12 | 39.37 | 37.95 | 33.60 | 35.15 | 51.09 | 50.50 | 32.81 | 27.54 | 27.88 | 26.95 | 25.29 | 40.28 | 39.07 | 36.37 | 34.18 | 27.71 | 28.94 | 35.78 | 28.15 | 25.73 | 26.07 | 15.60 | 15.84 | NA | NA | NA | |
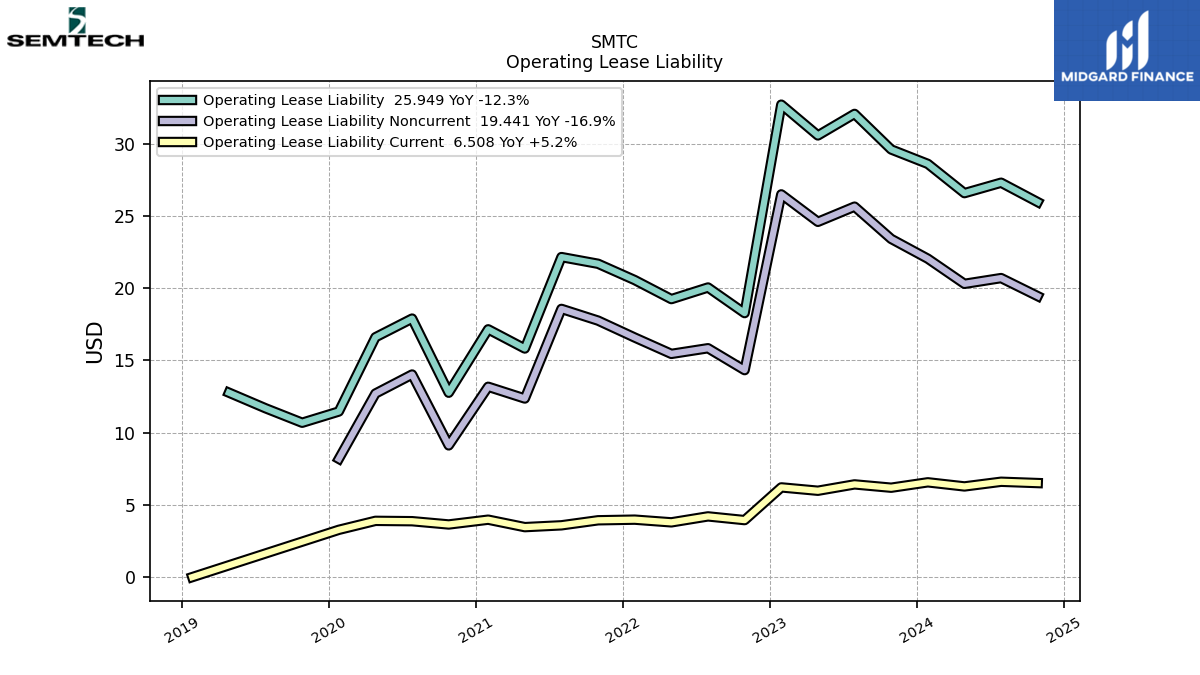
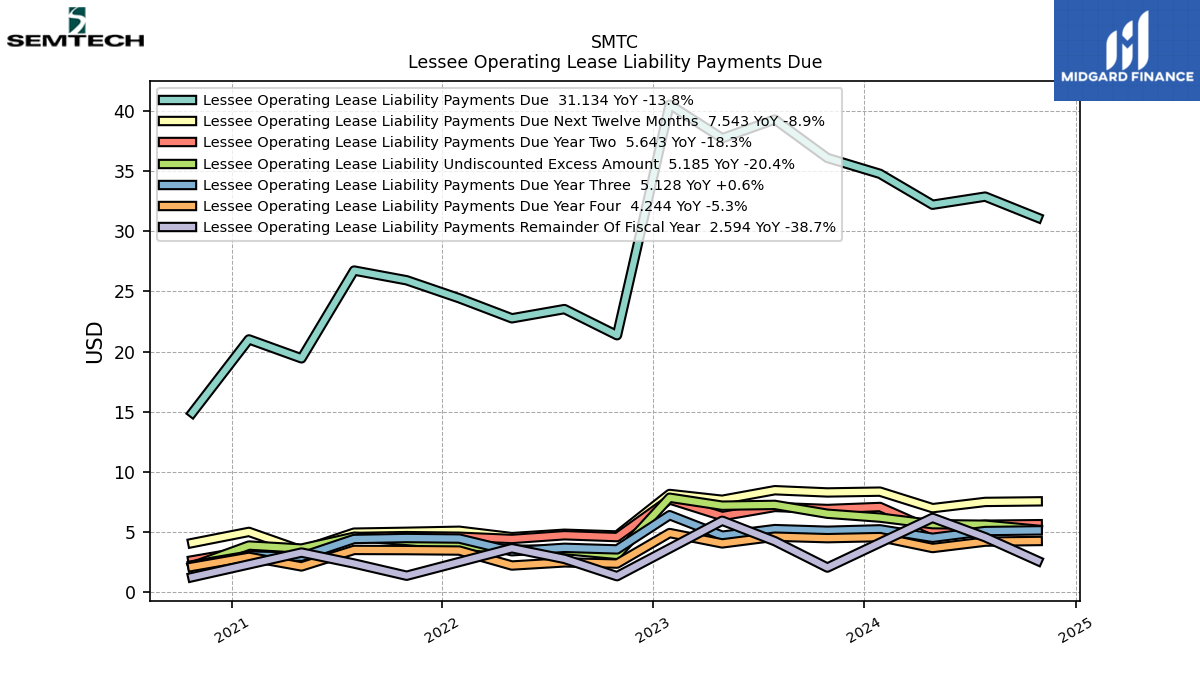
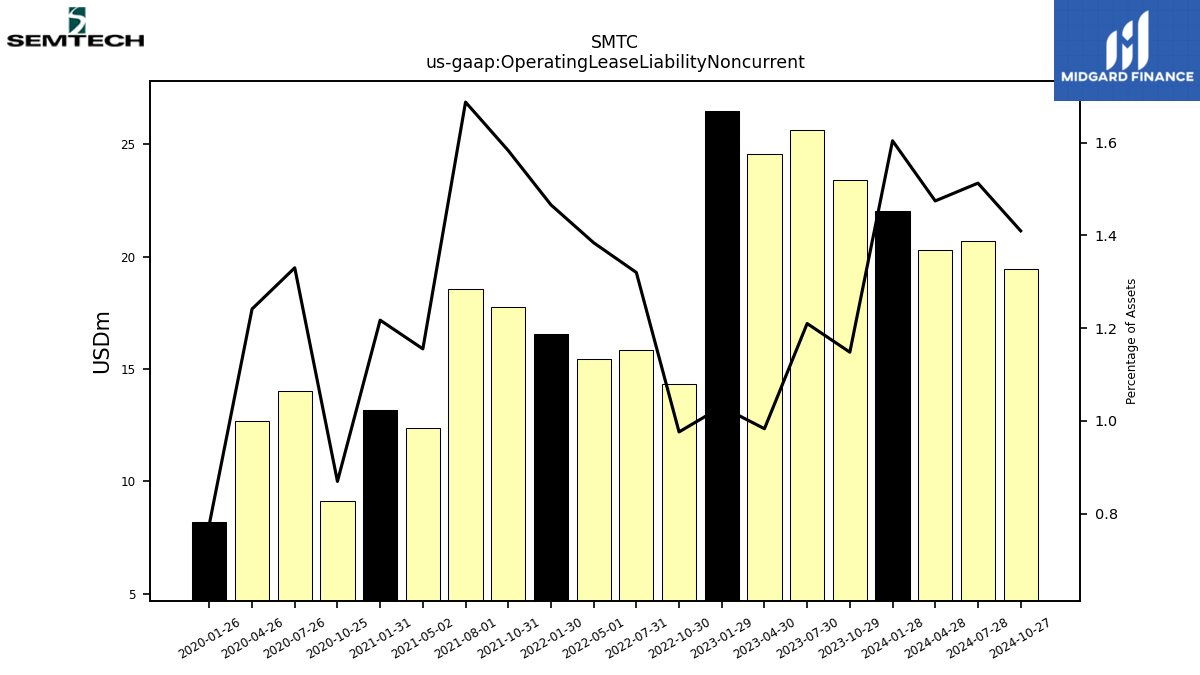
| Operating Lease Liability Noncurrent | 22.03 | 23.40 | 25.64 | 24.58 | 26.48 | 14.32 | 15.84 | 15.45 | 16.58 | 17.75 | 18.56 | 12.36 | 13.17 | 9.11 | 14.02 | 12.70 | 8.19 | NA | NA | NA | NA | NA | NA | NA | NA | NA | NA | NA | NA | NA | NA | NA | NA | NA | NA | NA | NA | NA | NA | NA | NA | NA | NA | NA | NA | NA | NA | NA | NA | NA | NA | NA | NA | NA | NA | NA |
| 2024-01-28 | 2023-10-29 | 2023-07-30 | 2023-04-30 | 2023-01-29 | 2022-10-30 | 2022-07-31 | 2022-05-01 | 2022-01-30 | 2021-10-31 | 2021-08-01 | 2021-05-02 | 2021-01-31 | 2020-10-25 | 2020-07-26 | 2020-04-26 | 2020-01-26 | 2019-10-27 | 2019-07-28 | 2019-04-28 | 2019-01-27 | 2018-10-28 | 2018-07-29 | 2018-04-29 | 2018-01-28 | 2017-10-29 | 2017-07-30 | 2017-04-30 | 2017-01-29 | 2016-10-30 | 2016-07-31 | 2016-05-01 | 2016-01-31 | 2015-10-25 | 2015-07-26 | 2015-04-26 | 2015-01-25 | 2014-10-26 | 2014-07-27 | 2014-04-27 | 2014-01-26 | 2013-10-27 | 2013-07-28 | 2013-04-28 | 2013-01-27 | 2012-10-28 | 2012-07-29 | 2012-04-29 | 2012-01-29 | 2011-10-30 | 2011-07-31 | 2011-05-01 | 2011-01-30 | 2010-10-31 | 2010-08-01 | 2010-05-02 | ||
|---|---|---|---|---|---|---|---|---|---|---|---|---|---|---|---|---|---|---|---|---|---|---|---|---|---|---|---|---|---|---|---|---|---|---|---|---|---|---|---|---|---|---|---|---|---|---|---|---|---|---|---|---|---|---|---|---|---|
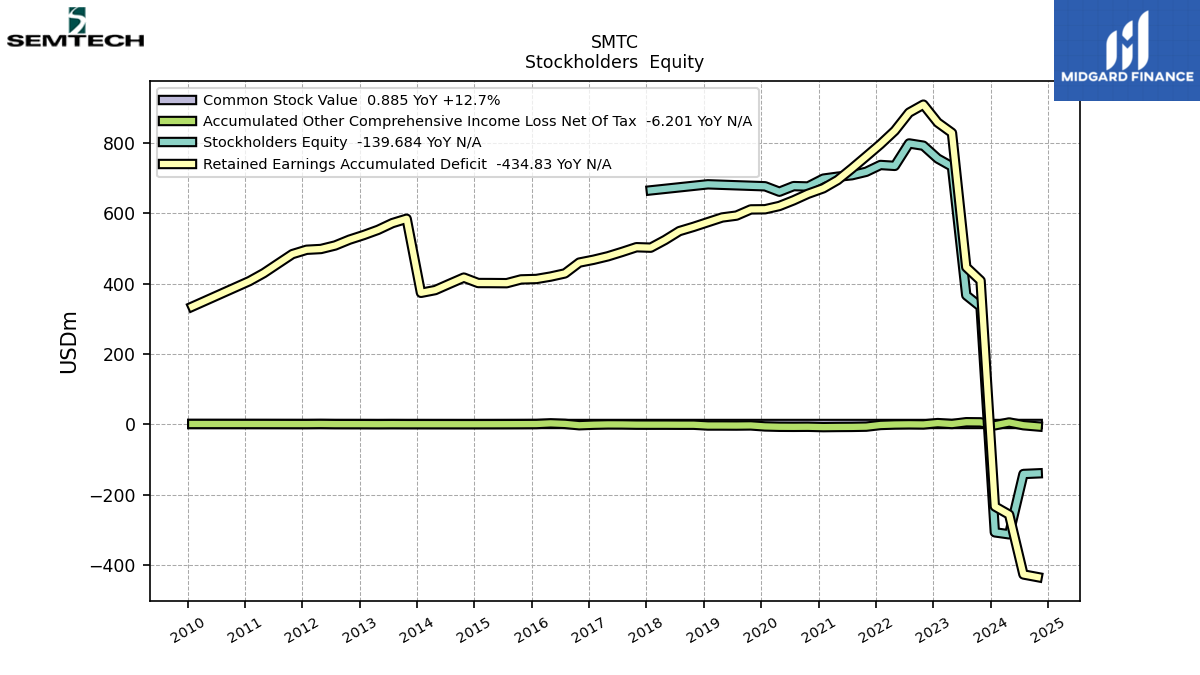
| Stockholders Equity | -307.43 | 334.26 | 366.83 | 733.03 | 755.85 | 792.41 | 798.86 | 734.98 | 737.58 | 718.19 | 708.42 | 704.28 | 698.74 | 676.39 | 677.49 | 661.47 | 676.95 | NA | NA | NA | 682.58 | NA | NA | NA | 665.35 | NA | NA | NA | NA | NA | NA | NA | NA | NA | NA | NA | NA | NA | NA | NA | NA | NA | NA | NA | NA | NA | NA | NA | NA | NA | NA | NA | NA | NA | NA | NA | |
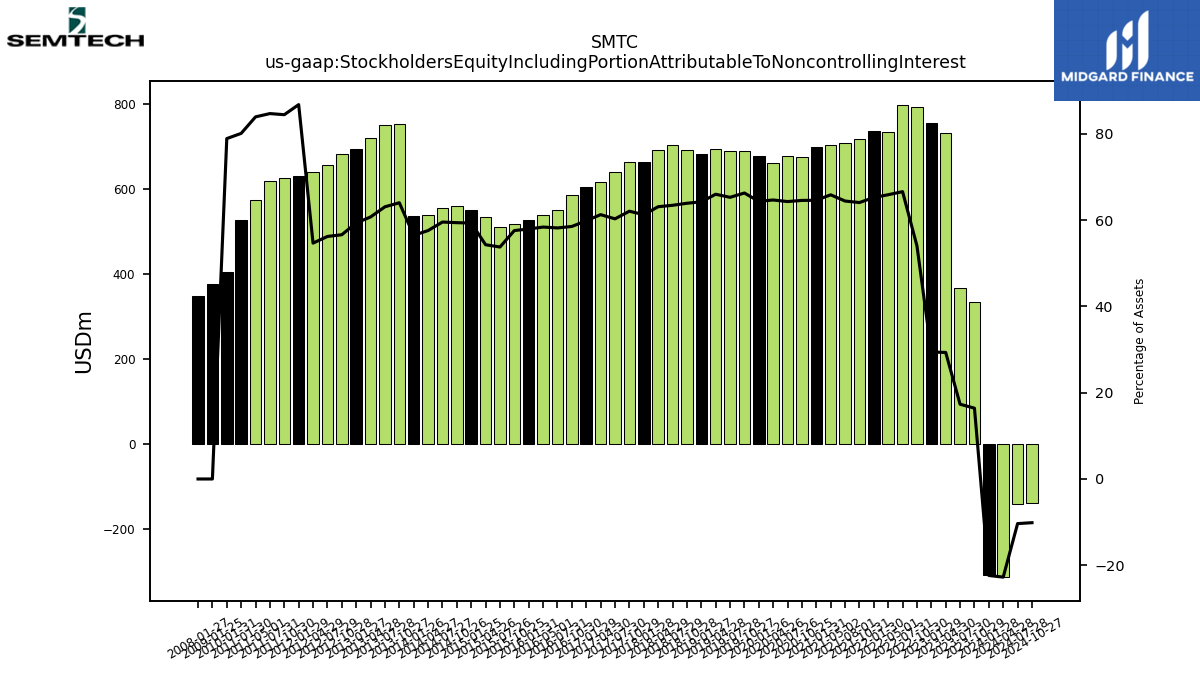
| Stockholders Equity Including Portion Attributable To Noncontrolling Interest | -307.25 | 334.44 | 367.01 | 733.21 | 756.03 | 792.60 | 799.05 | 735.17 | 737.77 | 718.40 | 708.62 | 704.49 | 698.95 | 676.63 | 677.73 | 661.72 | 677.20 | 688.72 | 689.54 | 695.23 | 682.68 | 692.94 | 703.29 | 693.35 | 665.01 | 664.66 | 639.90 | 617.12 | 605.26 | 585.89 | 551.98 | 539.96 | 528.05 | 518.84 | 510.70 | 535.70 | 551.36 | 559.50 | 556.42 | 538.51 | 535.84 | 752.70 | 750.49 | 719.68 | 694.83 | 681.93 | 657.27 | 640.94 | 630.19 | 625.38 | 618.13 | 574.86 | 528.62 | NA | NA | NA | |
| Common Stock Value | 0.79 | 0.79 | 0.79 | 0.79 | 0.79 | 0.79 | 0.79 | 0.79 | 0.79 | 0.79 | 0.79 | 0.79 | 0.79 | 0.79 | 0.79 | 0.79 | 0.79 | 0.79 | 0.79 | 0.79 | 0.79 | 0.79 | 0.79 | 0.79 | 0.79 | 0.79 | 0.79 | 0.79 | 0.79 | 0.79 | 0.79 | 0.79 | 0.79 | 0.79 | 0.79 | 0.79 | 0.79 | 0.79 | 0.79 | 0.79 | 0.79 | 0.79 | 0.79 | 0.79 | 0.79 | 0.79 | 0.79 | 0.79 | 0.79 | 0.79 | 0.79 | 0.79 | 0.79 | NA | NA | NA | |
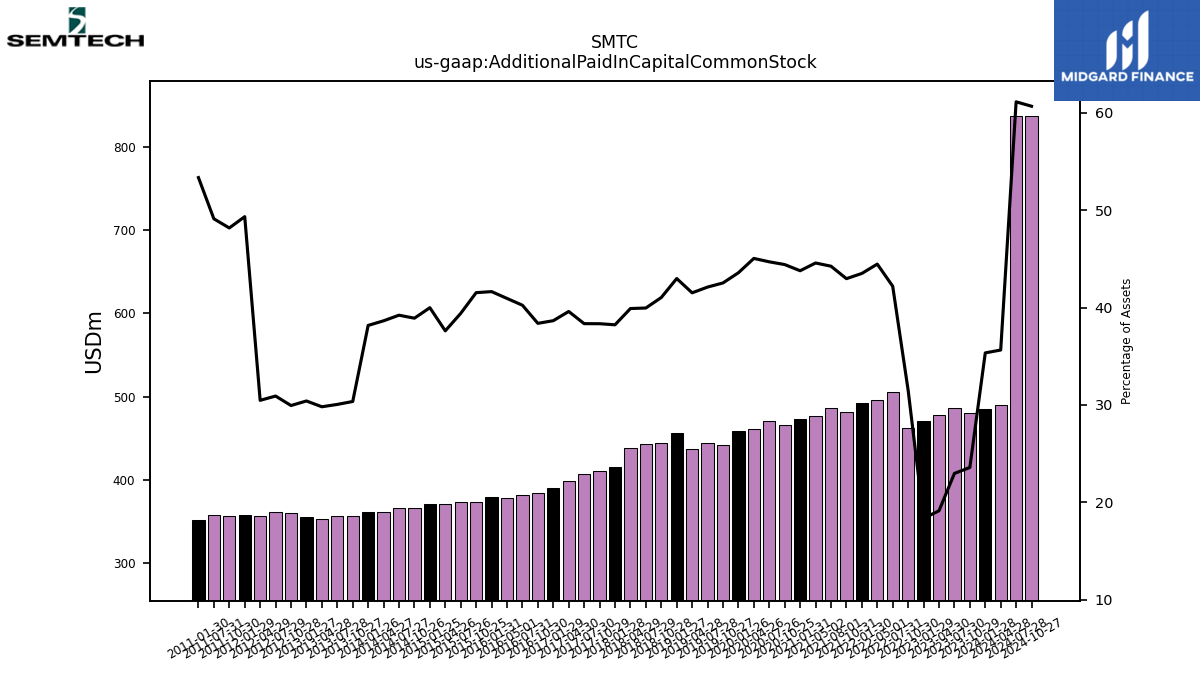
| Additional Paid In Capital Common Stock | 485.45 | 480.34 | 486.37 | 478.00 | 471.37 | 462.21 | 506.18 | 496.15 | 491.96 | 481.76 | 486.69 | 476.77 | 473.73 | 465.43 | 471.09 | 460.96 | 458.58 | 441.90 | 444.72 | 437.28 | 456.79 | 444.90 | 442.96 | 438.36 | 415.06 | 410.57 | 406.96 | 398.81 | 390.94 | 384.15 | 381.70 | 378.55 | 379.51 | 374.16 | 374.26 | 371.03 | 371.60 | 366.43 | 366.37 | 361.34 | 362.12 | 356.78 | 357.44 | 353.22 | 355.99 | 360.59 | 361.38 | 357.20 | 358.33 | 356.82 | 358.47 | NA | 352.08 | NA | NA | NA | |
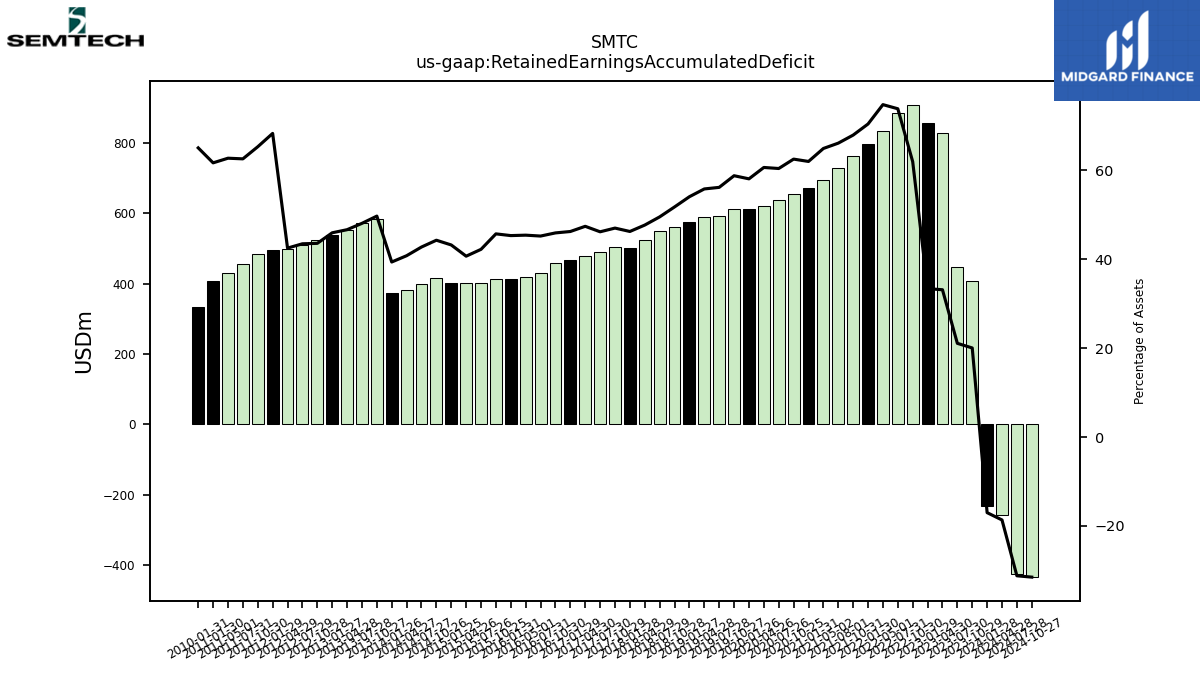
| Retained Earnings Accumulated Deficit | -233.79 | 408.57 | 446.82 | 828.83 | 858.24 | 909.25 | 886.51 | 834.91 | 796.86 | 762.06 | 727.63 | 694.70 | 671.20 | 655.54 | 637.05 | 620.93 | 611.61 | 611.19 | 593.59 | 588.22 | 574.93 | 561.59 | 549.40 | 524.24 | 502.35 | 503.64 | 490.30 | 477.74 | 467.94 | 459.92 | 429.15 | 420.17 | 413.28 | 412.03 | 401.33 | 401.64 | 401.78 | 417.22 | 399.60 | 381.70 | 373.84 | 584.64 | 572.19 | 553.08 | 538.30 | 525.18 | 508.59 | 498.57 | 496.36 | 483.98 | 457.00 | 429.86 | 407.28 | NA | NA | NA | |
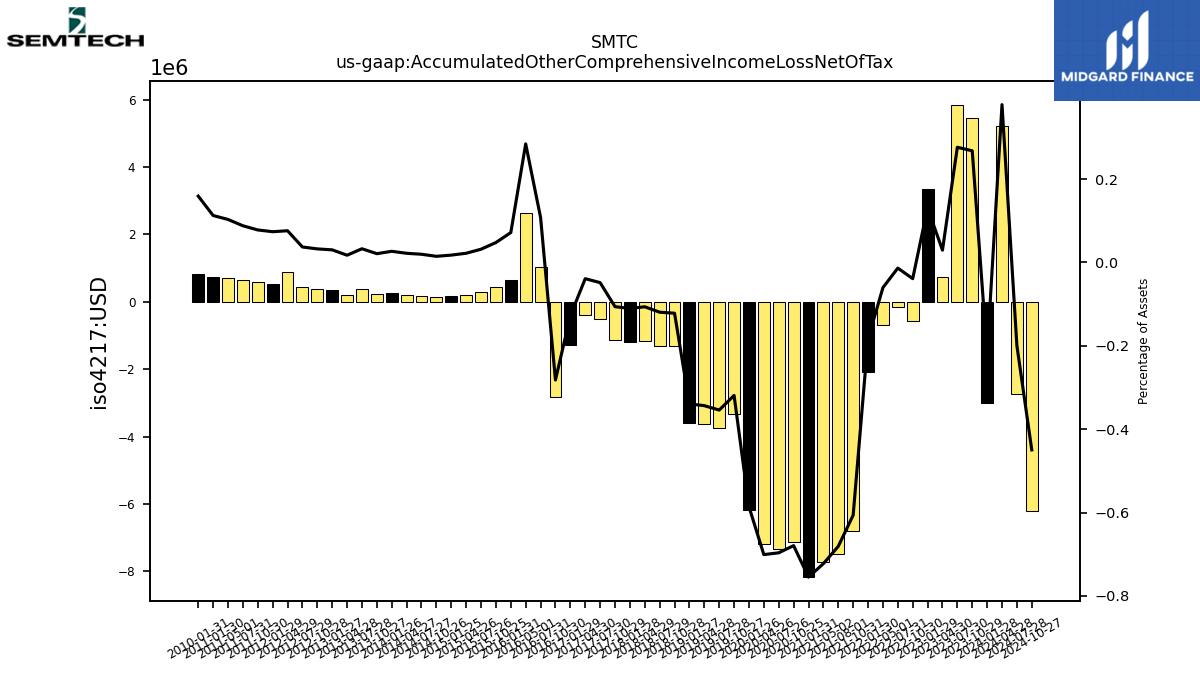
| Accumulated Other Comprehensive Income Loss Net Of Tax | -2.99 | 5.46 | 5.85 | 0.74 | 3.36 | -0.57 | -0.16 | -0.68 | -2.08 | -6.80 | -7.49 | -7.73 | -8.17 | -7.12 | -7.34 | -7.17 | -6.17 | -3.31 | -3.74 | -3.62 | -3.61 | -1.32 | -1.32 | -1.17 | -1.20 | -1.14 | -0.51 | -0.39 | -1.29 | -2.82 | 1.02 | 2.63 | 0.65 | 0.43 | 0.30 | 0.22 | 0.16 | 0.14 | 0.18 | 0.20 | 0.25 | 0.25 | 0.39 | 0.20 | 0.35 | 0.39 | 0.43 | 0.89 | 0.54 | 0.58 | 0.64 | 0.71 | 0.74 | NA | NA | NA | |
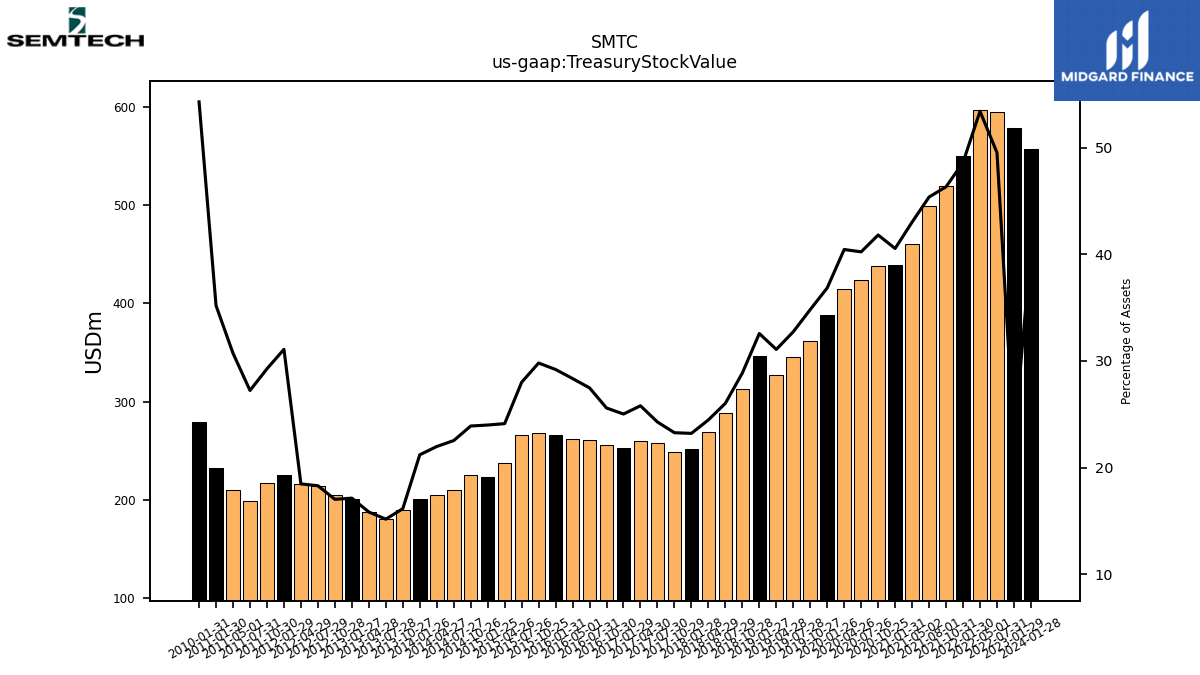
| Treasury Stock Value | 556.89 | NA | NA | NA | 577.91 | NA | 594.45 | 596.19 | 549.94 | 519.61 | 499.20 | 460.25 | 438.80 | 438.25 | 424.10 | 414.03 | 387.85 | 361.84 | 345.81 | 327.44 | 346.22 | 313.02 | 288.54 | 268.86 | 251.97 | 249.20 | 257.63 | 259.83 | 253.11 | 256.14 | 260.67 | 262.17 | 266.18 | 268.57 | 265.97 | 237.97 | 222.97 | 225.08 | 210.52 | 205.52 | 201.15 | 189.76 | 180.32 | 187.61 | 200.60 | 205.02 | 213.93 | 216.50 | 225.82 | 216.77 | 198.76 | 210.43 | 232.27 | NA | NA | NA | |
| Minority Interest | 0.18 | 0.18 | 0.18 | 0.18 | 0.18 | 0.18 | 0.19 | 0.19 | 0.19 | 0.20 | 0.21 | 0.21 | 0.21 | 0.23 | 0.24 | 0.24 | 0.25 | NA | NA | NA | 0.00 | NA | NA | NA | NA | NA | NA | NA | NA | NA | NA | NA | NA | NA | NA | NA | NA | NA | NA | NA | NA | NA | NA | NA | NA | NA | NA | NA | NA | NA | NA | NA | NA | NA | NA | NA | |
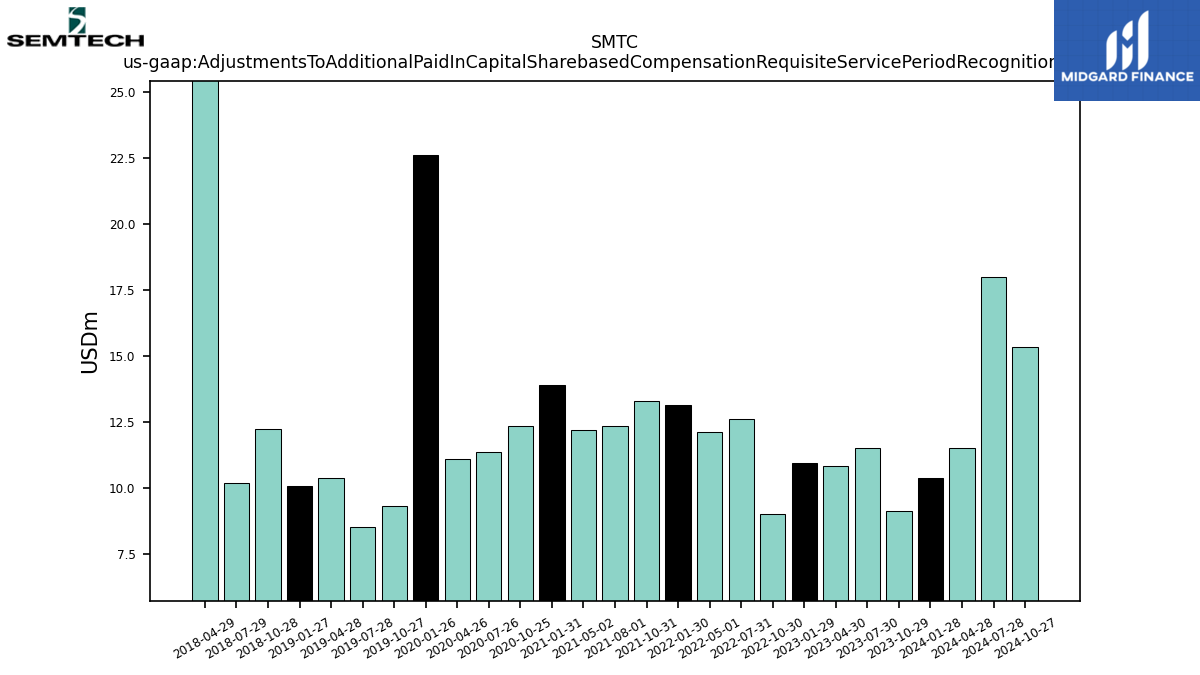
| Adjustments To Additional Paid In Capital Sharebased Compensation Requisite Service Period Recognition Value | 10.36 | 9.13 | 11.50 | 10.82 | 10.95 | 9.02 | 12.61 | 12.10 | 13.15 | 13.29 | 12.33 | 12.20 | 13.87 | 12.33 | 11.34 | 11.08 | 22.59 | 9.30 | 8.53 | 10.36 | 10.07 | 12.22 | 10.18 | 33.47 | NA | NA | NA | NA | NA | NA | NA | NA | NA | NA | NA | NA | NA | NA | NA | NA | NA | NA | NA | NA | NA | NA | NA | NA | NA | NA | NA | NA | NA | NA | NA | NA |
| 2024-01-28 | 2023-10-29 | 2023-07-30 | 2023-04-30 | 2023-01-29 | 2022-10-30 | 2022-07-31 | 2022-05-01 | 2022-01-30 | 2021-10-31 | 2021-08-01 | 2021-05-02 | 2021-01-31 | 2020-10-25 | 2020-07-26 | 2020-04-26 | 2020-01-26 | 2019-10-27 | 2019-07-28 | 2019-04-28 | 2019-01-27 | 2018-10-28 | 2018-07-29 | 2018-04-29 | 2018-01-28 | 2017-10-29 | 2017-07-30 | 2017-04-30 | 2017-01-29 | 2016-10-30 | 2016-07-31 | 2016-05-01 | 2016-01-31 | 2015-10-25 | 2015-07-26 | 2015-04-26 | 2015-01-25 | 2014-10-26 | 2014-07-27 | 2014-04-27 | 2014-01-26 | 2013-10-27 | 2013-07-28 | 2013-04-28 | 2013-01-27 | 2012-10-28 | 2012-07-29 | 2012-04-29 | 2012-01-29 | 2011-10-30 | 2011-07-31 | 2011-05-01 | 2011-01-30 | 2010-10-31 | 2010-08-01 | 2010-05-02 | ||
|---|---|---|---|---|---|---|---|---|---|---|---|---|---|---|---|---|---|---|---|---|---|---|---|---|---|---|---|---|---|---|---|---|---|---|---|---|---|---|---|---|---|---|---|---|---|---|---|---|---|---|---|---|---|---|---|---|---|
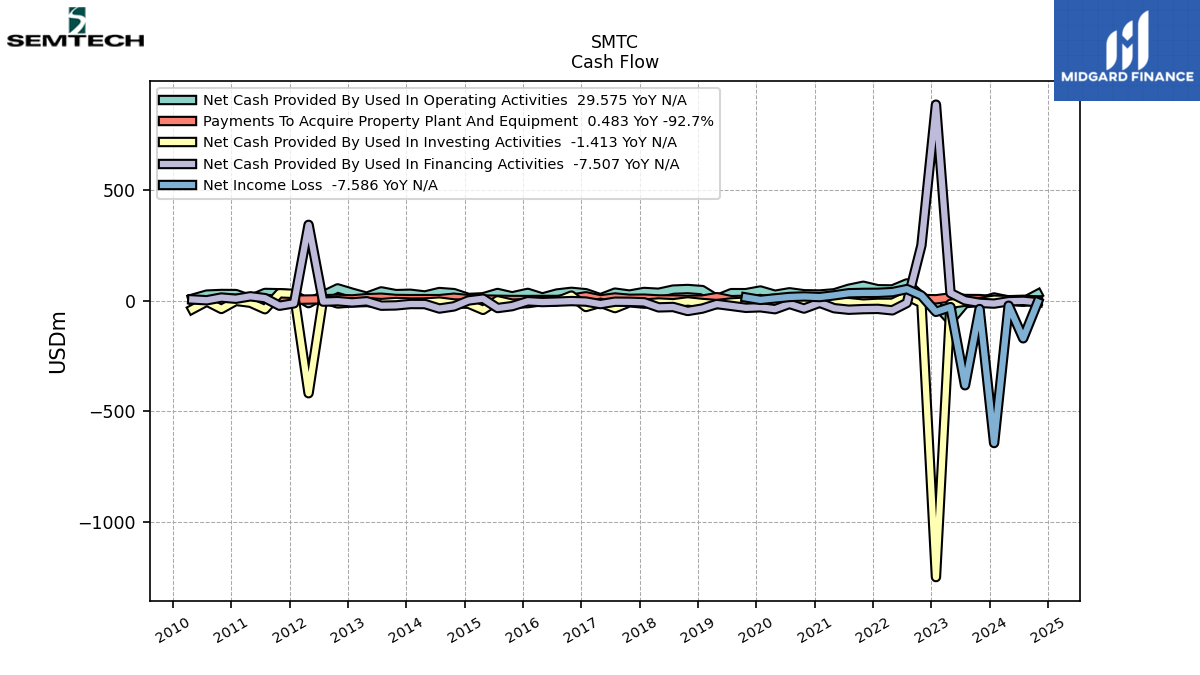
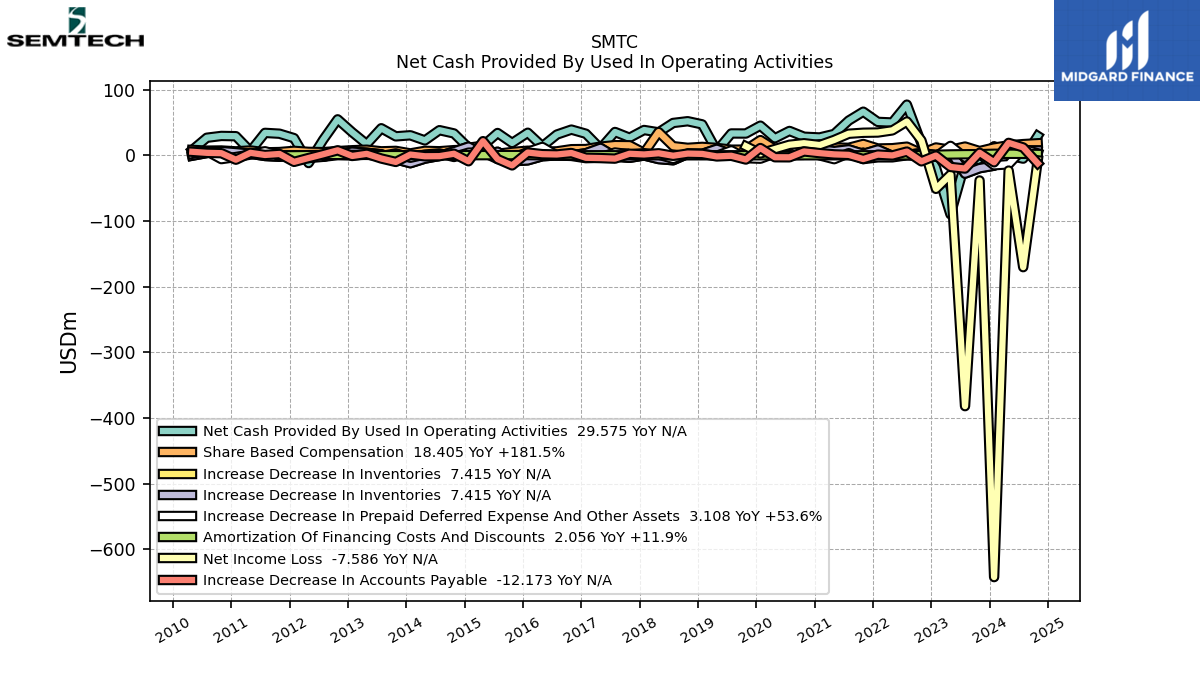
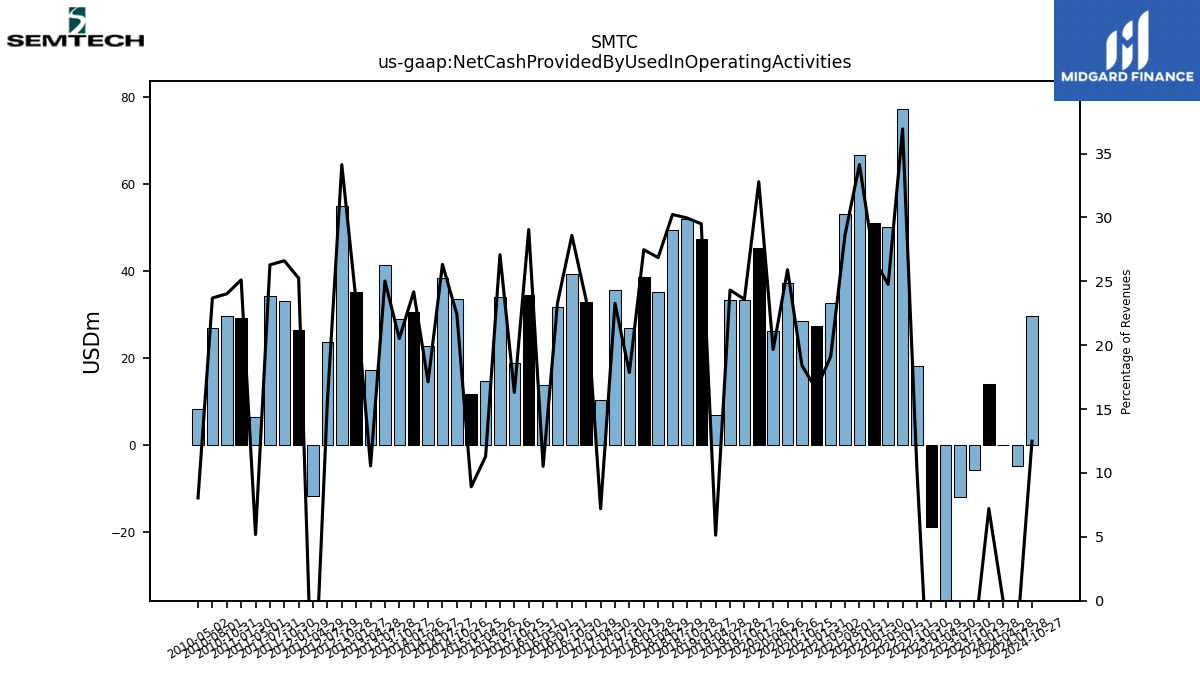
| Net Cash Provided By Used In Operating Activities | 13.92 | -5.85 | -12.01 | -89.99 | -18.80 | 18.18 | 77.28 | 50.05 | 50.99 | 66.54 | 53.01 | 32.59 | 27.25 | 28.38 | 37.22 | 26.08 | 45.26 | 33.27 | 33.35 | 6.74 | 47.20 | 52.00 | 49.34 | 35.03 | 38.63 | 26.85 | 35.64 | 10.36 | 32.92 | 39.23 | 31.67 | 13.80 | 34.46 | 18.87 | 34.05 | 14.70 | 11.63 | 33.39 | 38.37 | 22.77 | 30.60 | 28.94 | 41.30 | 17.15 | 35.19 | 54.91 | 23.61 | -11.73 | 26.26 | 32.98 | 34.24 | 6.34 | 29.20 | 29.58 | 26.83 | 8.20 | |
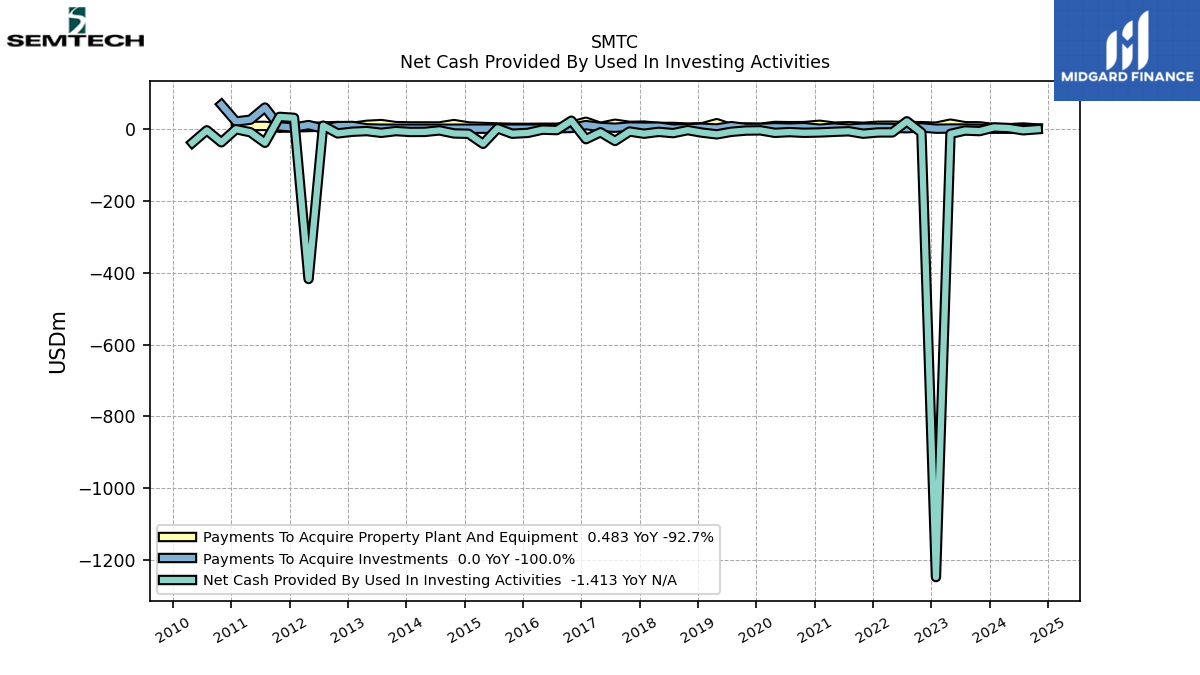
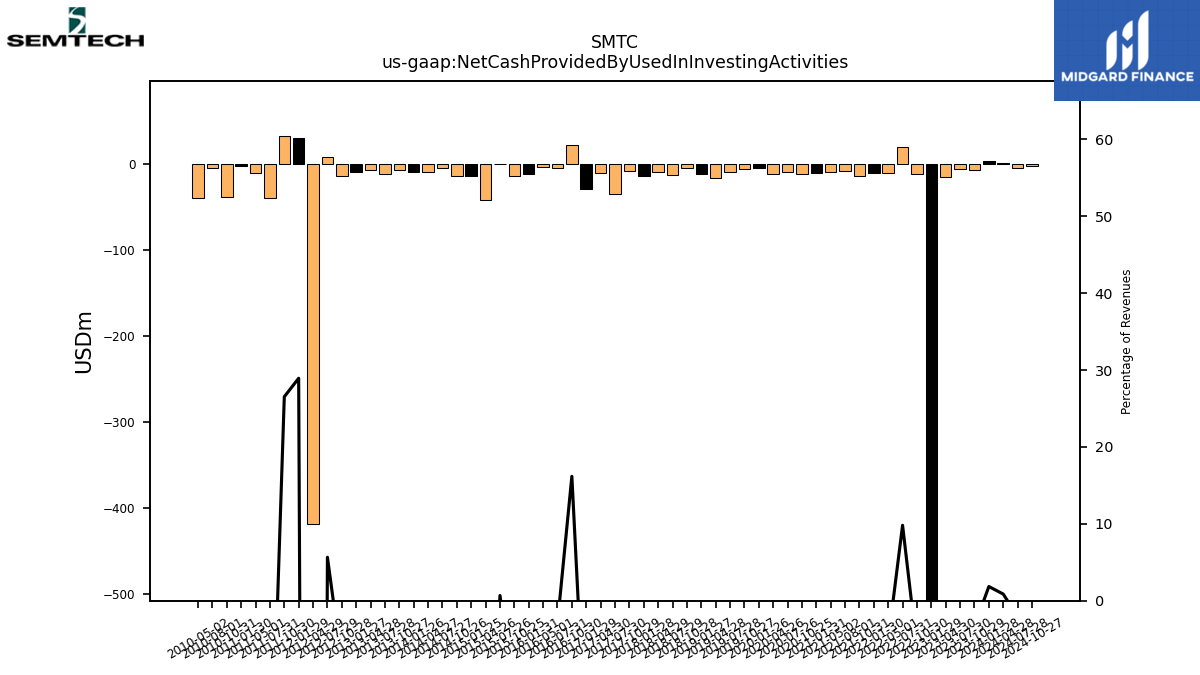
| Net Cash Provided By Used In Investing Activities | 3.57 | -6.69 | -5.17 | -14.41 | -1246.56 | -10.98 | 20.53 | -10.31 | -10.48 | -13.96 | -7.21 | -8.65 | -10.51 | -11.42 | -9.42 | -11.56 | -4.66 | -5.23 | -8.67 | -15.77 | -11.04 | -4.05 | -12.33 | -8.80 | -13.96 | -7.87 | -34.11 | -9.92 | -29.11 | 22.19 | -3.88 | -2.71 | -11.72 | -13.96 | 0.86 | -42.00 | -14.18 | -13.18 | -4.81 | -8.92 | -9.11 | -6.68 | -11.50 | -6.64 | -8.51 | -13.17 | 8.52 | -417.86 | 30.10 | 32.88 | -39.20 | -9.88 | -1.50 | -37.86 | -4.54 | -39.38 | |
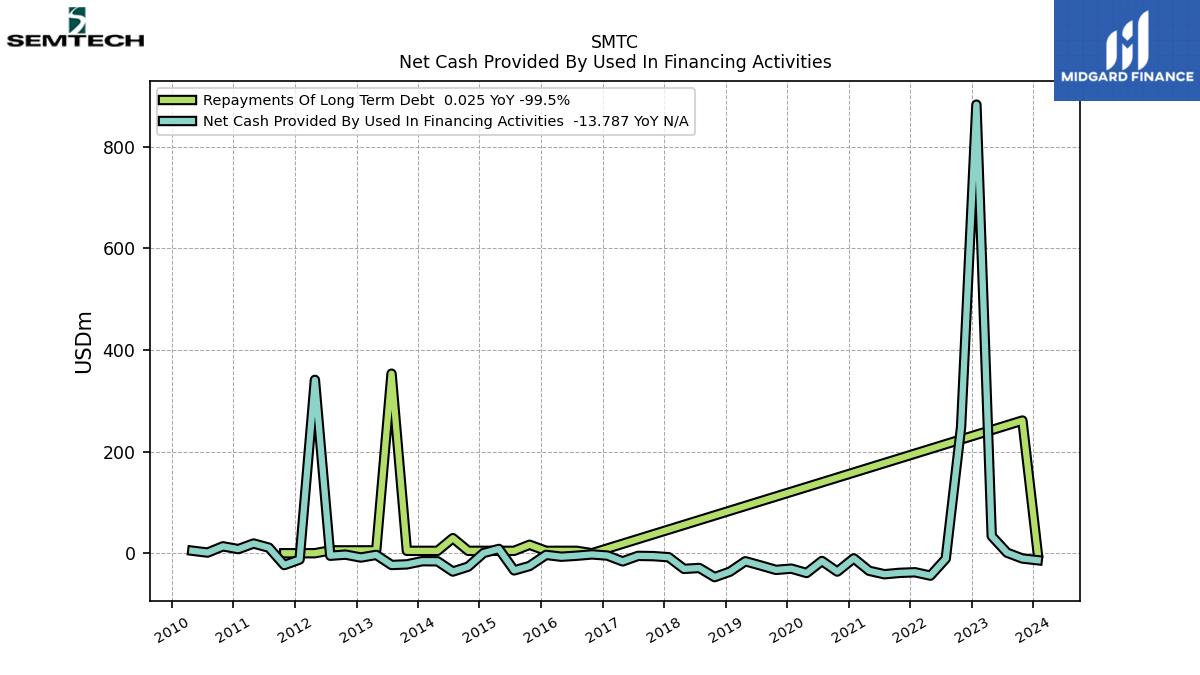
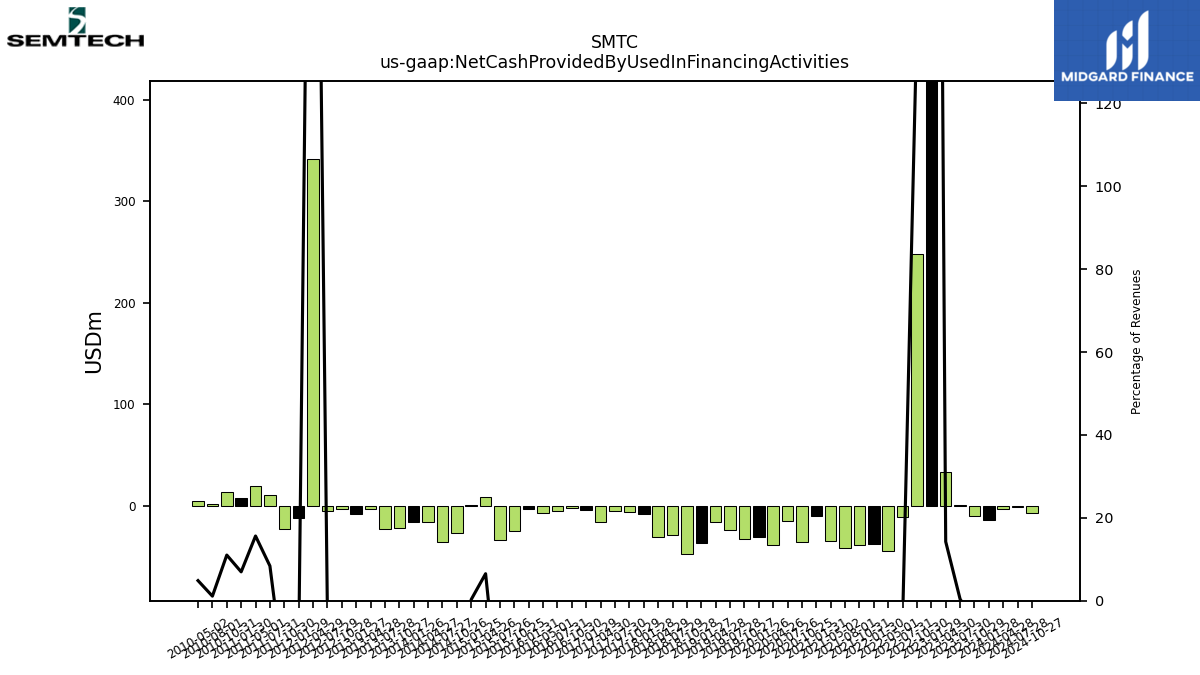
| Net Cash Provided By Used In Financing Activities | -13.79 | -10.39 | 1.00 | 33.73 | 883.07 | 248.45 | -10.84 | -44.15 | -37.50 | -38.63 | -41.36 | -34.60 | -10.12 | -36.14 | -15.29 | -38.90 | -30.33 | -32.82 | -24.14 | -15.79 | -36.28 | -47.04 | -29.02 | -30.81 | -7.88 | -5.72 | -5.22 | -16.02 | -4.61 | -2.37 | -4.92 | -6.87 | -3.29 | -25.15 | -33.81 | 8.48 | 0.39 | -26.39 | -36.05 | -15.89 | -15.69 | -21.92 | -23.16 | -3.27 | -8.44 | -2.78 | -4.93 | 341.30 | -12.48 | -23.31 | 10.94 | 19.13 | 8.11 | 13.57 | 1.26 | 4.95 |
| 2024-01-28 | 2023-10-29 | 2023-07-30 | 2023-04-30 | 2023-01-29 | 2022-10-30 | 2022-07-31 | 2022-05-01 | 2022-01-30 | 2021-10-31 | 2021-08-01 | 2021-05-02 | 2021-01-31 | 2020-10-25 | 2020-07-26 | 2020-04-26 | 2020-01-26 | 2019-10-27 | 2019-07-28 | 2019-04-28 | 2019-01-27 | 2018-10-28 | 2018-07-29 | 2018-04-29 | 2018-01-28 | 2017-10-29 | 2017-07-30 | 2017-04-30 | 2017-01-29 | 2016-10-30 | 2016-07-31 | 2016-05-01 | 2016-01-31 | 2015-10-25 | 2015-07-26 | 2015-04-26 | 2015-01-25 | 2014-10-26 | 2014-07-27 | 2014-04-27 | 2014-01-26 | 2013-10-27 | 2013-07-28 | 2013-04-28 | 2013-01-27 | 2012-10-28 | 2012-07-29 | 2012-04-29 | 2012-01-29 | 2011-10-30 | 2011-07-31 | 2011-05-01 | 2011-01-30 | 2010-10-31 | 2010-08-01 | 2010-05-02 | ||
|---|---|---|---|---|---|---|---|---|---|---|---|---|---|---|---|---|---|---|---|---|---|---|---|---|---|---|---|---|---|---|---|---|---|---|---|---|---|---|---|---|---|---|---|---|---|---|---|---|---|---|---|---|---|---|---|---|---|
| Net Cash Provided By Used In Operating Activities | 13.92 | -5.85 | -12.01 | -89.99 | -18.80 | 18.18 | 77.28 | 50.05 | 50.99 | 66.54 | 53.01 | 32.59 | 27.25 | 28.38 | 37.22 | 26.08 | 45.26 | 33.27 | 33.35 | 6.74 | 47.20 | 52.00 | 49.34 | 35.03 | 38.63 | 26.85 | 35.64 | 10.36 | 32.92 | 39.23 | 31.67 | 13.80 | 34.46 | 18.87 | 34.05 | 14.70 | 11.63 | 33.39 | 38.37 | 22.77 | 30.60 | 28.94 | 41.30 | 17.15 | 35.19 | 54.91 | 23.61 | -11.73 | 26.26 | 32.98 | 34.24 | 6.34 | 29.20 | 29.58 | 26.83 | 8.20 | |
| Net Income Loss | -642.36 | -38.25 | -382.00 | -29.41 | -51.01 | 22.75 | 51.60 | 38.05 | 34.80 | 34.43 | 32.93 | 23.50 | 15.66 | 18.49 | 16.12 | 9.63 | 2.93 | 14.00 | NA | NA | NA | NA | NA | NA | NA | NA | NA | NA | NA | NA | NA | NA | NA | NA | NA | NA | NA | NA | NA | NA | NA | NA | NA | NA | NA | NA | NA | NA | NA | NA | NA | NA | NA | NA | NA | NA | |
| Profit Loss | -642.36 | -38.25 | -382.00 | -29.42 | -51.02 | 22.74 | 51.60 | 38.05 | 34.79 | 34.42 | 32.93 | 23.50 | 15.63 | 18.48 | 16.12 | 9.63 | -4.39 | 17.60 | 5.37 | 13.29 | 13.34 | 12.16 | 25.17 | 12.38 | -1.30 | 13.34 | 12.56 | 11.82 | 8.02 | 30.78 | 8.98 | 6.89 | 1.25 | 10.70 | -0.31 | -0.14 | -15.44 | 17.62 | 17.90 | 7.87 | -210.81 | 12.45 | 19.11 | 14.78 | 13.12 | 16.59 | 10.02 | 2.21 | 12.39 | 26.98 | 27.14 | 22.58 | 26.00 | 16.11 | 19.66 | 10.80 | |
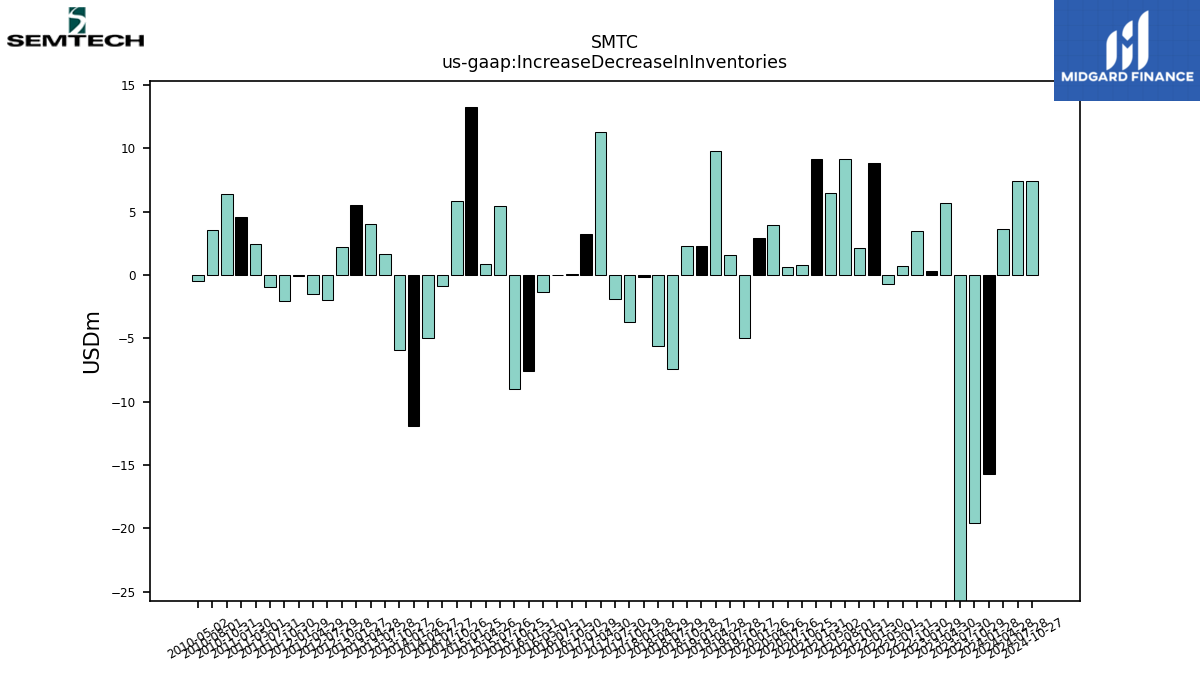
| Increase Decrease In Inventories | -15.68 | -19.54 | -27.79 | 5.70 | 0.28 | 3.46 | 0.73 | -0.71 | 8.84 | 2.13 | 9.11 | 6.42 | 9.13 | 0.82 | 0.61 | 3.92 | 2.90 | -4.95 | 1.58 | 9.80 | 2.31 | 2.27 | -7.41 | -5.61 | -0.18 | -3.73 | -1.87 | 11.29 | 3.26 | 0.07 | -0.04 | -1.34 | -7.57 | -9.03 | 5.46 | 0.87 | 13.25 | 5.86 | -0.85 | -4.96 | -11.94 | -5.95 | 1.64 | 4.02 | 5.48 | 2.19 | -1.95 | -1.48 | -0.12 | -2.09 | -0.92 | 2.45 | 4.56 | 6.38 | 3.54 | -0.47 | |
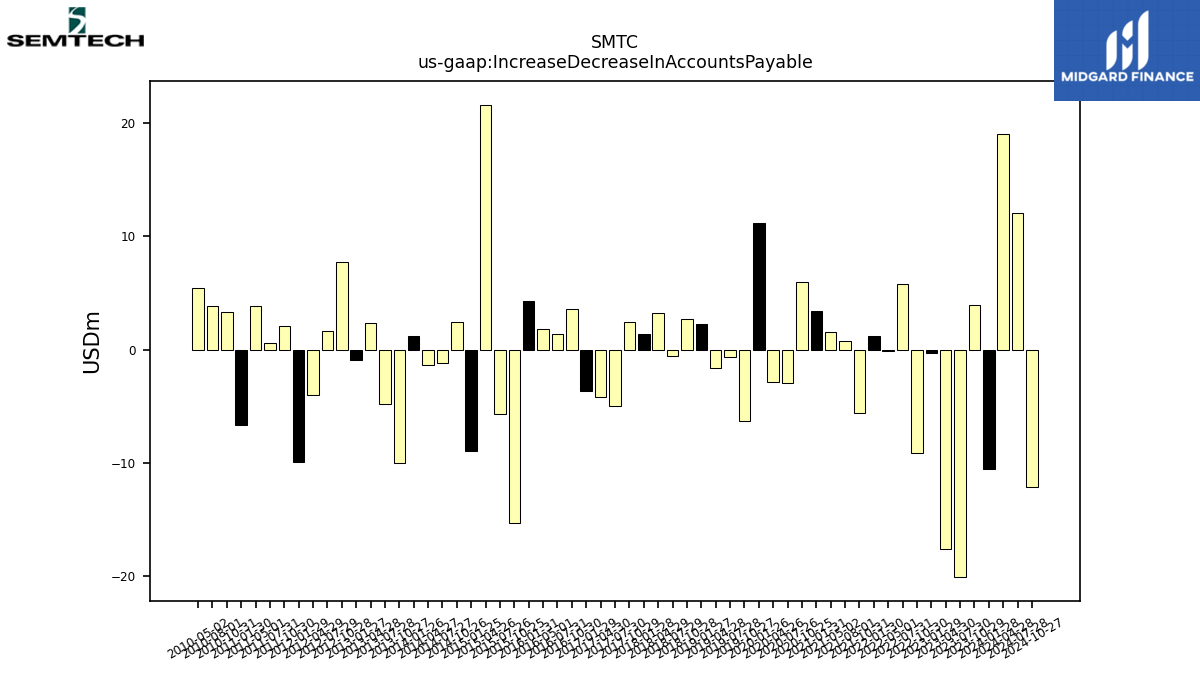
| Increase Decrease In Accounts Payable | -10.58 | 3.96 | -20.09 | -17.64 | -0.27 | -9.11 | 5.80 | -0.13 | 1.18 | -5.60 | 0.76 | 1.51 | 3.41 | 5.98 | -2.96 | -2.86 | 11.20 | -6.34 | -0.62 | -1.64 | 2.21 | 2.70 | -0.58 | 3.20 | 1.38 | 2.45 | -4.99 | -4.15 | -3.67 | 3.60 | 1.35 | 1.82 | 4.30 | -15.28 | -5.65 | 21.61 | -8.98 | 2.45 | -1.19 | -1.35 | 1.22 | -10.03 | -4.79 | 2.31 | -0.92 | 7.72 | 1.66 | -4.01 | -9.93 | 2.12 | 0.60 | 3.86 | -6.64 | 3.33 | 3.87 | 5.43 | |
| Share Based Compensation | 11.83 | 6.54 | 13.40 | 8.40 | 12.02 | 3.08 | 13.25 | 10.89 | 10.49 | 17.34 | 11.52 | 11.84 | 16.88 | 13.54 | 13.19 | 9.38 | 23.31 | 8.77 | 8.65 | 11.33 | 12.91 | 11.47 | 13.96 | 35.52 | 3.77 | 15.36 | 15.52 | 13.29 | 9.63 | 9.39 | 6.10 | 5.71 | 7.07 | 5.12 | 2.34 | 5.95 | 8.57 | 7.93 | 6.27 | 6.85 | 2.98 | 6.83 | 6.16 | 8.63 | 7.80 | 6.48 | 4.92 | 5.33 | 6.87 | 5.04 | 4.62 | 7.49 | 6.08 | 7.42 | 7.21 | 8.30 |
| 2024-01-28 | 2023-10-29 | 2023-07-30 | 2023-04-30 | 2023-01-29 | 2022-10-30 | 2022-07-31 | 2022-05-01 | 2022-01-30 | 2021-10-31 | 2021-08-01 | 2021-05-02 | 2021-01-31 | 2020-10-25 | 2020-07-26 | 2020-04-26 | 2020-01-26 | 2019-10-27 | 2019-07-28 | 2019-04-28 | 2019-01-27 | 2018-10-28 | 2018-07-29 | 2018-04-29 | 2018-01-28 | 2017-10-29 | 2017-07-30 | 2017-04-30 | 2017-01-29 | 2016-10-30 | 2016-07-31 | 2016-05-01 | 2016-01-31 | 2015-10-25 | 2015-07-26 | 2015-04-26 | 2015-01-25 | 2014-10-26 | 2014-07-27 | 2014-04-27 | 2014-01-26 | 2013-10-27 | 2013-07-28 | 2013-04-28 | 2013-01-27 | 2012-10-28 | 2012-07-29 | 2012-04-29 | 2012-01-29 | 2011-10-30 | 2011-07-31 | 2011-05-01 | 2011-01-30 | 2010-10-31 | 2010-08-01 | 2010-05-02 | ||
|---|---|---|---|---|---|---|---|---|---|---|---|---|---|---|---|---|---|---|---|---|---|---|---|---|---|---|---|---|---|---|---|---|---|---|---|---|---|---|---|---|---|---|---|---|---|---|---|---|---|---|---|---|---|---|---|---|---|
| Net Cash Provided By Used In Investing Activities | 3.57 | -6.69 | -5.17 | -14.41 | -1246.56 | -10.98 | 20.53 | -10.31 | -10.48 | -13.96 | -7.21 | -8.65 | -10.51 | -11.42 | -9.42 | -11.56 | -4.66 | -5.23 | -8.67 | -15.77 | -11.04 | -4.05 | -12.33 | -8.80 | -13.96 | -7.87 | -34.11 | -9.92 | -29.11 | 22.19 | -3.88 | -2.71 | -11.72 | -13.96 | 0.86 | -42.00 | -14.18 | -13.18 | -4.81 | -8.92 | -9.11 | -6.68 | -11.50 | -6.64 | -8.51 | -13.17 | 8.52 | -417.86 | 30.10 | 32.88 | -39.20 | -9.88 | -1.50 | -37.86 | -4.54 | -39.38 | |
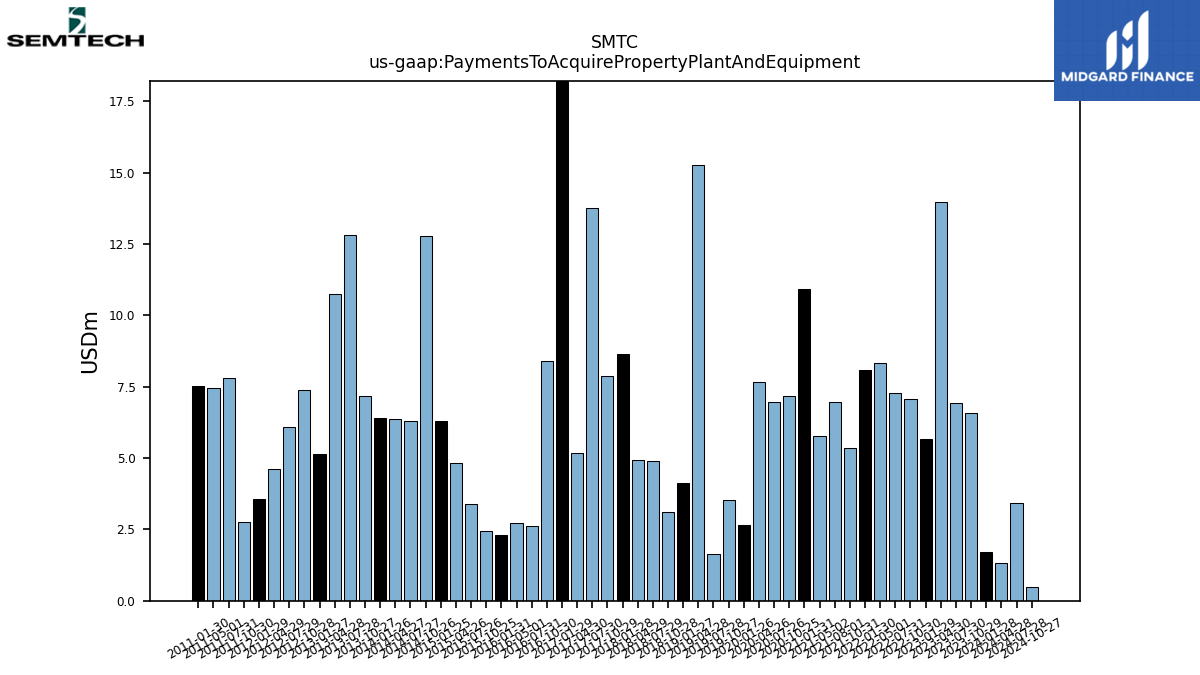
| Payments To Acquire Property Plant And Equipment | 1.71 | 6.58 | 6.92 | 13.98 | 5.68 | 7.06 | 7.27 | 8.31 | 8.10 | 5.35 | 6.97 | 5.76 | 10.93 | 7.17 | 6.97 | 7.67 | 2.65 | 3.52 | 1.64 | 15.26 | 4.12 | 3.11 | 4.89 | 4.93 | 8.64 | 7.87 | 13.78 | 5.17 | 19.17 | 8.41 | 2.63 | 2.71 | 2.32 | 2.46 | 3.40 | 4.84 | 6.30 | 12.80 | 6.28 | 6.38 | 6.41 | 7.18 | 12.81 | 10.75 | 5.15 | 7.40 | 6.08 | 4.63 | 3.56 | 2.75 | 7.79 | 7.47 | 7.52 | NA | NA | NA | |
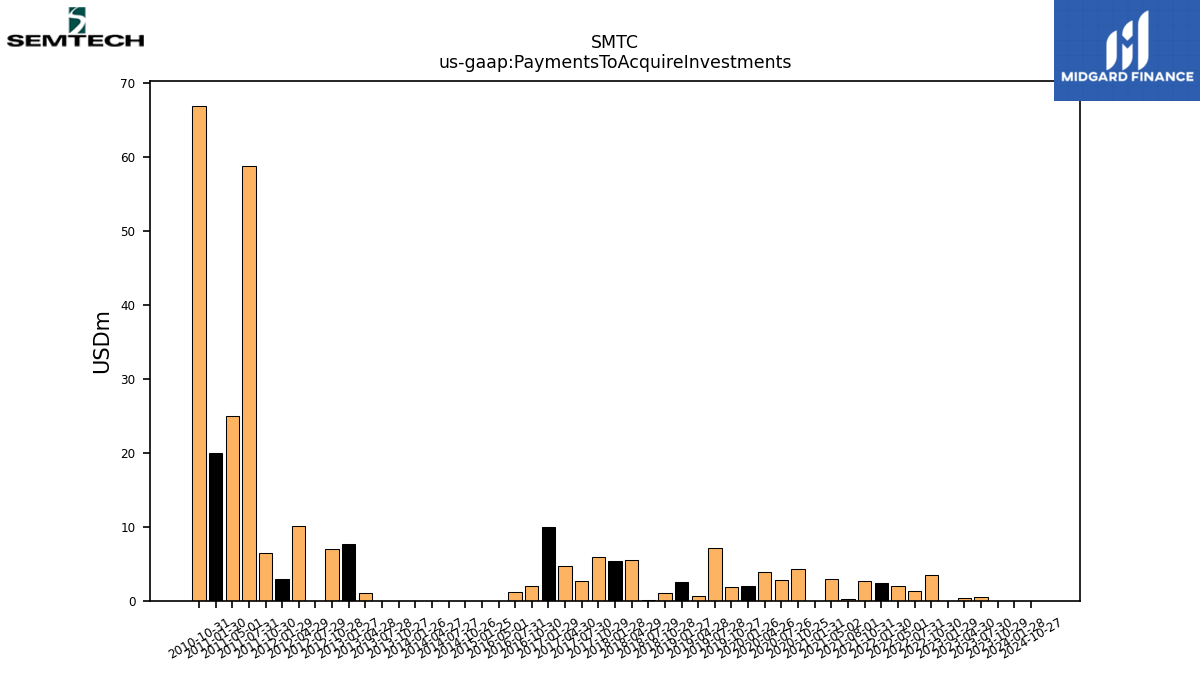
| Payments To Acquire Investments | 0.00 | 0.00 | 0.50 | 0.43 | 0.00 | 3.46 | 1.29 | 2.00 | 2.41 | 2.65 | 0.25 | 2.93 | 0.00 | 4.25 | 2.80 | 3.89 | 2.04 | 1.90 | 7.07 | 0.62 | 2.60 | 1.11 | 0.10 | 5.49 | 5.33 | 5.88 | 2.71 | 4.75 | 9.95 | 2.00 | 1.25 | 0.00 | NA | NA | NA | NA | 0.00 | 0.00 | 0.00 | 0.00 | 0.00 | 0.00 | 0.00 | 1.05 | 7.62 | 7.02 | 0.00 | 10.11 | 3.00 | 6.50 | 58.83 | 25.00 | 20.00 | 66.91 | NA | NA |
| 2024-01-28 | 2023-10-29 | 2023-07-30 | 2023-04-30 | 2023-01-29 | 2022-10-30 | 2022-07-31 | 2022-05-01 | 2022-01-30 | 2021-10-31 | 2021-08-01 | 2021-05-02 | 2021-01-31 | 2020-10-25 | 2020-07-26 | 2020-04-26 | 2020-01-26 | 2019-10-27 | 2019-07-28 | 2019-04-28 | 2019-01-27 | 2018-10-28 | 2018-07-29 | 2018-04-29 | 2018-01-28 | 2017-10-29 | 2017-07-30 | 2017-04-30 | 2017-01-29 | 2016-10-30 | 2016-07-31 | 2016-05-01 | 2016-01-31 | 2015-10-25 | 2015-07-26 | 2015-04-26 | 2015-01-25 | 2014-10-26 | 2014-07-27 | 2014-04-27 | 2014-01-26 | 2013-10-27 | 2013-07-28 | 2013-04-28 | 2013-01-27 | 2012-10-28 | 2012-07-29 | 2012-04-29 | 2012-01-29 | 2011-10-30 | 2011-07-31 | 2011-05-01 | 2011-01-30 | 2010-10-31 | 2010-08-01 | 2010-05-02 | ||
|---|---|---|---|---|---|---|---|---|---|---|---|---|---|---|---|---|---|---|---|---|---|---|---|---|---|---|---|---|---|---|---|---|---|---|---|---|---|---|---|---|---|---|---|---|---|---|---|---|---|---|---|---|---|---|---|---|---|
| Net Cash Provided By Used In Financing Activities | -13.79 | -10.39 | 1.00 | 33.73 | 883.07 | 248.45 | -10.84 | -44.15 | -37.50 | -38.63 | -41.36 | -34.60 | -10.12 | -36.14 | -15.29 | -38.90 | -30.33 | -32.82 | -24.14 | -15.79 | -36.28 | -47.04 | -29.02 | -30.81 | -7.88 | -5.72 | -5.22 | -16.02 | -4.61 | -2.37 | -4.92 | -6.87 | -3.29 | -25.15 | -33.81 | 8.48 | 0.39 | -26.39 | -36.05 | -15.89 | -15.69 | -21.92 | -23.16 | -3.27 | -8.44 | -2.78 | -4.93 | 341.30 | -12.48 | -23.31 | 10.94 | 19.13 | 8.11 | 13.57 | 1.26 | 4.95 |
| 2024-01-28 | 2023-10-29 | 2023-07-30 | 2023-04-30 | 2023-01-29 | 2022-10-30 | 2022-07-31 | 2022-05-01 | 2022-01-30 | 2021-10-31 | 2021-08-01 | 2021-05-02 | 2021-01-31 | 2020-10-25 | 2020-07-26 | 2020-04-26 | 2020-01-26 | 2019-10-27 | 2019-07-28 | 2019-04-28 | 2019-01-27 | 2018-10-28 | 2018-07-29 | 2018-04-29 | 2018-01-28 | 2017-10-29 | 2017-07-30 | 2017-04-30 | 2017-01-29 | 2016-10-30 | 2016-07-31 | 2016-05-01 | 2016-01-31 | 2015-10-25 | 2015-07-26 | 2015-04-26 | 2015-01-25 | 2014-10-26 | 2014-07-27 | 2014-04-27 | 2014-01-26 | 2013-10-27 | 2013-07-28 | 2013-04-28 | 2013-01-27 | 2012-10-28 | 2012-07-29 | 2012-04-29 | 2012-01-29 | 2011-10-30 | 2011-07-31 | 2011-05-01 | 2011-01-30 | 2010-10-31 | 2010-08-01 | 2010-05-02 | ||
|---|---|---|---|---|---|---|---|---|---|---|---|---|---|---|---|---|---|---|---|---|---|---|---|---|---|---|---|---|---|---|---|---|---|---|---|---|---|---|---|---|---|---|---|---|---|---|---|---|---|---|---|---|---|---|---|---|---|
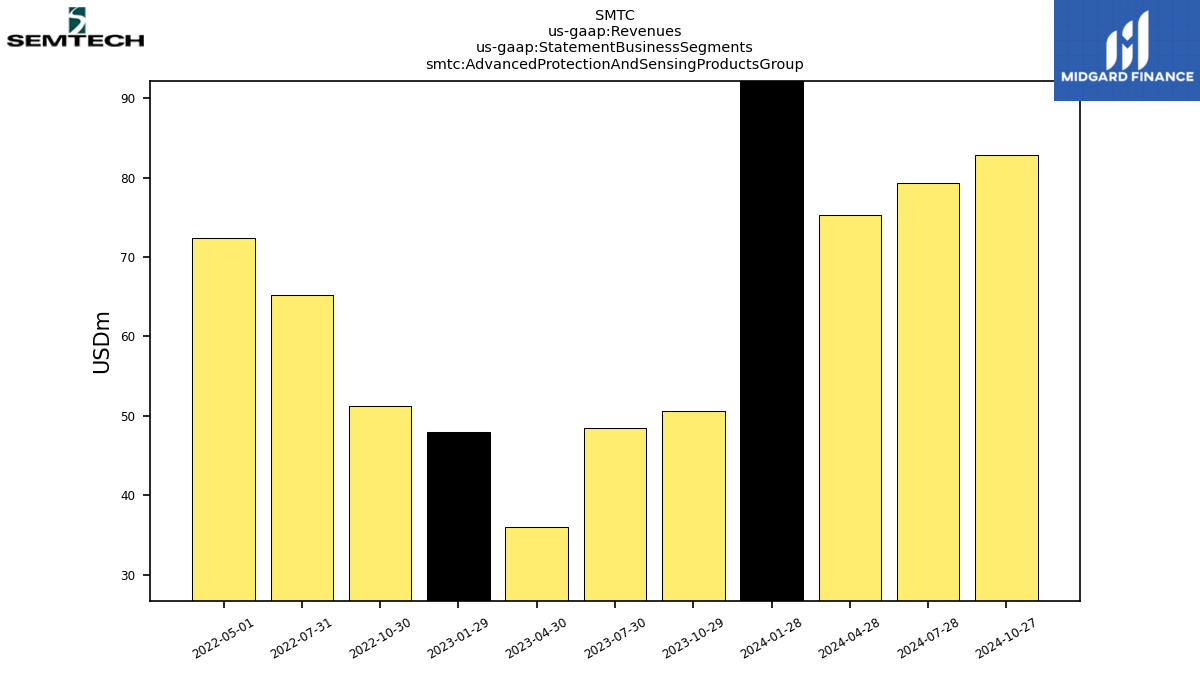
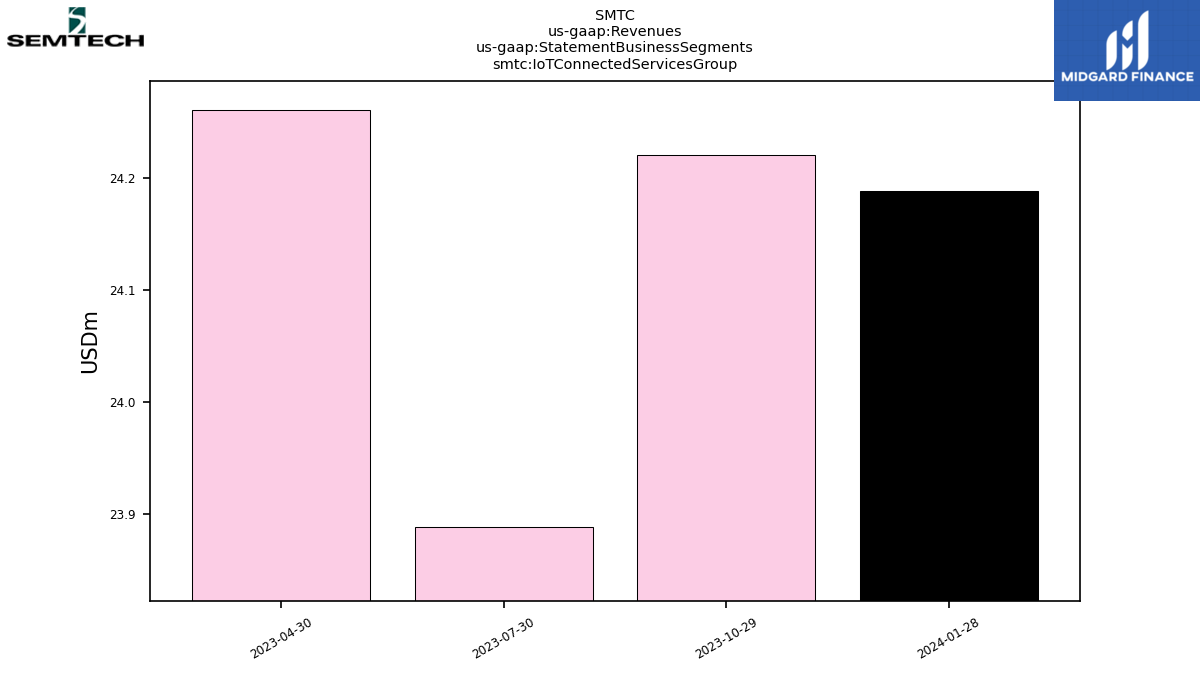
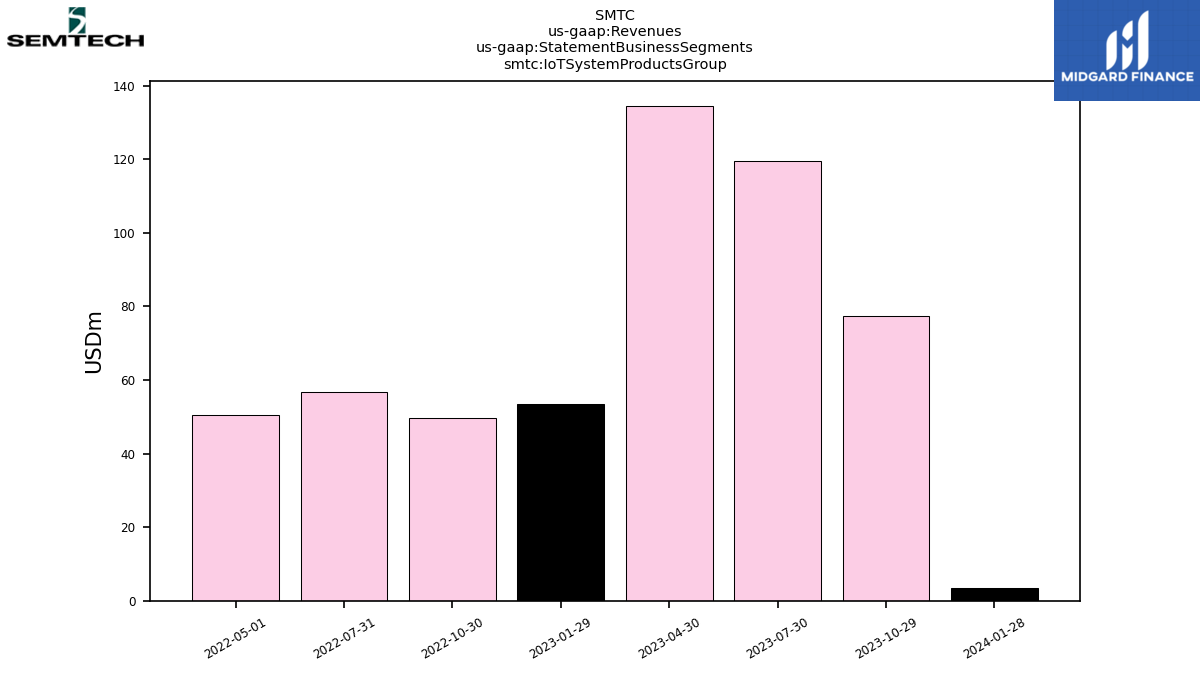
| Revenues | 192.95 | 200.90 | 238.37 | 236.54 | 167.51 | 177.62 | 209.25 | 202.15 | 190.55 | 194.93 | 185.00 | 170.37 | 164.67 | 154.08 | 143.66 | 132.70 | 138.00 | 141.01 | 137.15 | 131.35 | 160.01 | 173.55 | 163.21 | 130.43 | 140.61 | 150.30 | 153.13 | 143.80 | 140.03 | 137.19 | 135.91 | 131.15 | 118.61 | 115.81 | 125.71 | 130.09 | 130.39 | 148.89 | 145.74 | 132.86 | 126.53 | 141.03 | 165.01 | 162.41 | 150.60 | 160.88 | 150.70 | 116.64 | 104.03 | 123.94 | 130.25 | 122.37 | 116.27 | 123.12 | 113.23 | 101.88 | |
| Advanced Protection And Sensing Products Group | 125.12 | 50.57 | 48.52 | 36.06 | 47.97 | 51.23 | 65.28 | 72.42 | NA | NA | NA | NA | NA | NA | NA | NA | NA | NA | NA | NA | NA | NA | NA | NA | NA | NA | NA | NA | NA | NA | NA | NA | NA | NA | NA | NA | NA | NA | NA | NA | NA | NA | NA | NA | NA | NA | NA | NA | NA | NA | NA | NA | NA | NA | NA | NA | |
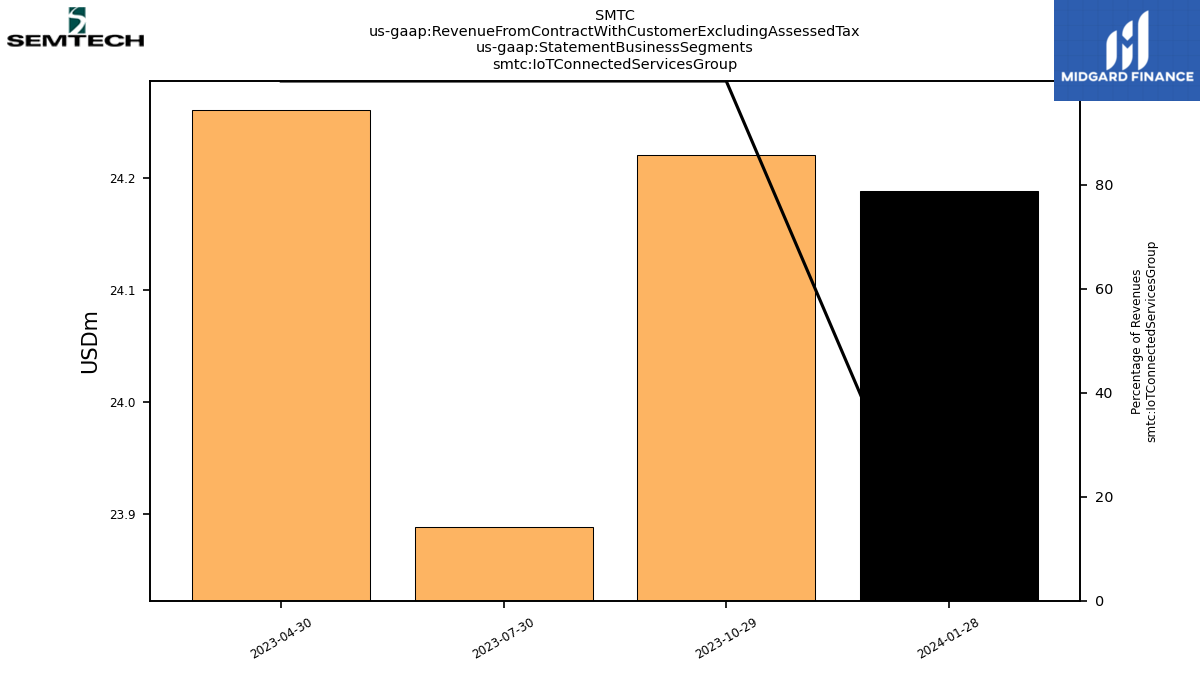
| Io T Connected Services Group | 24.19 | 24.22 | 23.89 | 24.26 | NA | NA | NA | NA | NA | NA | NA | NA | NA | NA | NA | NA | NA | NA | NA | NA | NA | NA | NA | NA | NA | NA | NA | NA | NA | NA | NA | NA | NA | NA | NA | NA | NA | NA | NA | NA | NA | NA | NA | NA | NA | NA | NA | NA | NA | NA | NA | NA | NA | NA | NA | NA | |
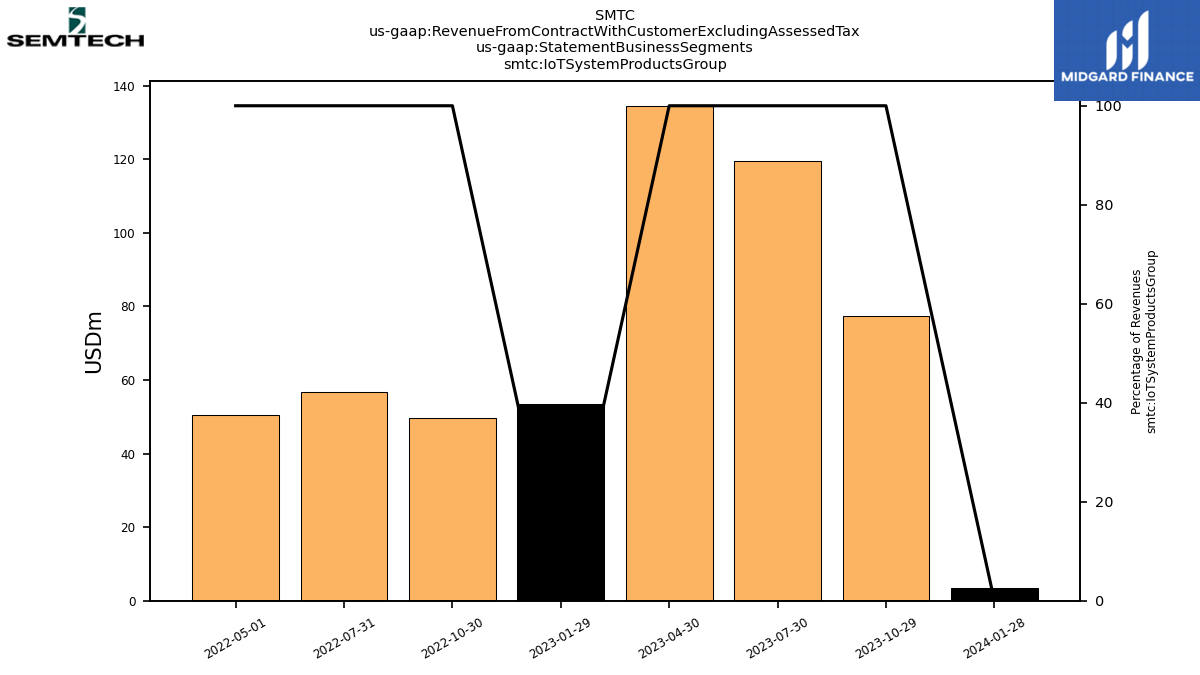
| Io T System Products Group | 3.50 | 77.37 | 119.45 | 134.58 | 53.59 | 49.69 | 56.62 | 50.42 | NA | NA | NA | NA | NA | NA | NA | NA | NA | NA | NA | NA | NA | NA | NA | NA | NA | NA | NA | NA | NA | NA | NA | NA | NA | NA | NA | NA | NA | NA | NA | NA | NA | NA | NA | NA | NA | NA | NA | NA | NA | NA | NA | NA | NA | NA | NA | NA | |
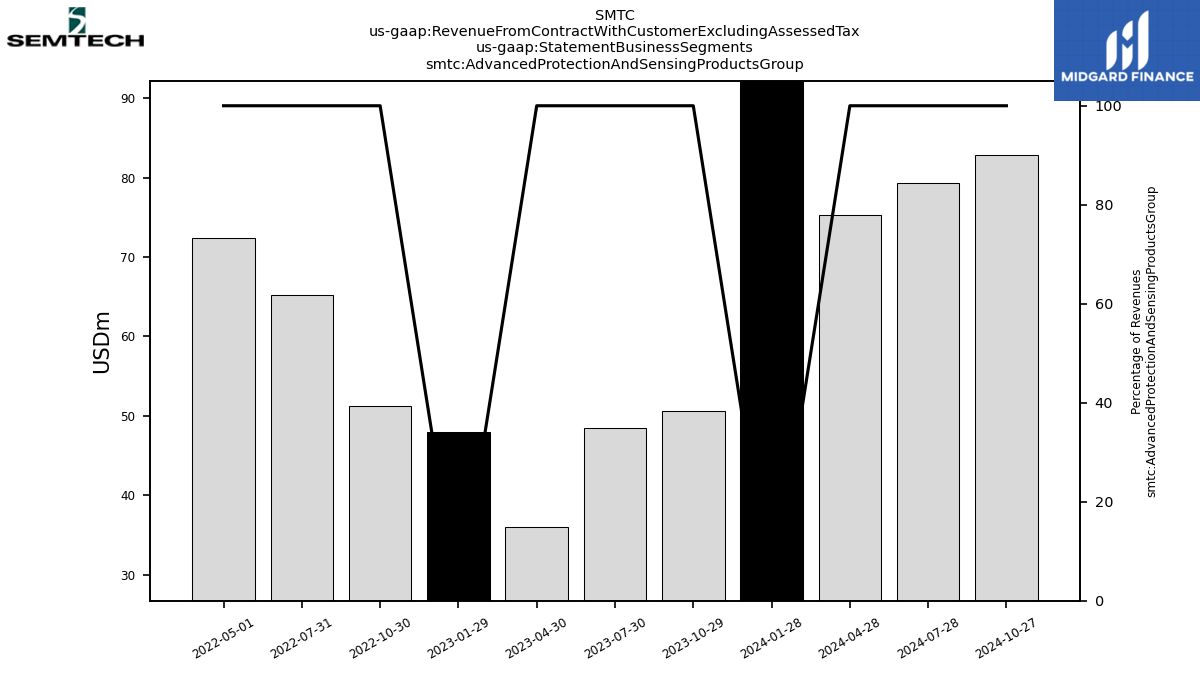
| Revenue From Contract With Customer Excluding Assessed Tax | 192.95 | 200.90 | 238.37 | 236.54 | 167.51 | 177.62 | 209.25 | 202.15 | 190.55 | 194.93 | 185.00 | 170.37 | 164.67 | 154.08 | 143.66 | 132.70 | 138.00 | 141.01 | 137.15 | 131.35 | 160.01 | 173.55 | 163.21 | 130.43 | 140.61 | 150.30 | 153.13 | 143.80 | 140.03 | 137.19 | 135.91 | 131.15 | 118.61 | 115.81 | 125.71 | 130.09 | 130.39 | 148.89 | 145.74 | 132.86 | 126.53 | 141.03 | 165.01 | 162.41 | 150.60 | 160.88 | 150.70 | 116.64 | 104.03 | 123.94 | 130.25 | 122.37 | 116.27 | 123.12 | 113.23 | 101.88 | |
| Advanced Protection And Sensing Products Group | 125.12 | 50.57 | 48.52 | 36.06 | 47.97 | 51.23 | 65.28 | 72.42 | NA | NA | NA | NA | NA | NA | NA | NA | NA | NA | NA | NA | NA | NA | NA | NA | NA | NA | NA | NA | NA | NA | NA | NA | NA | NA | NA | NA | NA | NA | NA | NA | NA | NA | NA | NA | NA | NA | NA | NA | NA | NA | NA | NA | NA | NA | NA | NA | |
| Io T Connected Services Group | 24.19 | 24.22 | 23.89 | 24.26 | NA | NA | NA | NA | NA | NA | NA | NA | NA | NA | NA | NA | NA | NA | NA | NA | NA | NA | NA | NA | NA | NA | NA | NA | NA | NA | NA | NA | NA | NA | NA | NA | NA | NA | NA | NA | NA | NA | NA | NA | NA | NA | NA | NA | NA | NA | NA | NA | NA | NA | NA | NA | |
| Io T System Products Group | 3.50 | 77.37 | 119.45 | 134.58 | 53.59 | 49.69 | 56.62 | 50.42 | NA | NA | NA | NA | NA | NA | NA | NA | NA | NA | NA | NA | NA | NA | NA | NA | NA | NA | NA | NA | NA | NA | NA | NA | NA | NA | NA | NA | NA | NA | NA | NA | NA | NA | NA | NA | NA | NA | NA | NA | NA | NA | NA | NA | NA | NA | NA | NA | |
| Interest Income Operating | 0.73 | 0.57 | 0.67 | 1.07 | 4.04 | 0.84 | 0.56 | 0.36 | NA | NA | NA | NA | NA | NA | NA | NA | NA | NA | NA | NA | NA | NA | NA | NA | NA | NA | NA | NA | NA | NA | NA | NA | NA | NA | NA | NA | NA | NA | NA | NA | NA | NA | NA | NA | NA | NA | NA | NA | NA | NA | NA | NA | NA | NA | NA | NA |