
| 2023-12-31 | 2023-09-30 | 2023-06-30 | 2023-03-31 | 2022-12-31 | 2022-09-30 | 2022-06-30 | 2022-03-31 | 2021-12-31 | 2021-09-30 | 2021-06-30 | 2021-03-31 | 2020-12-31 | 2020-09-30 | 2020-06-30 | 2020-03-31 | ||
|---|---|---|---|---|---|---|---|---|---|---|---|---|---|---|---|---|---|
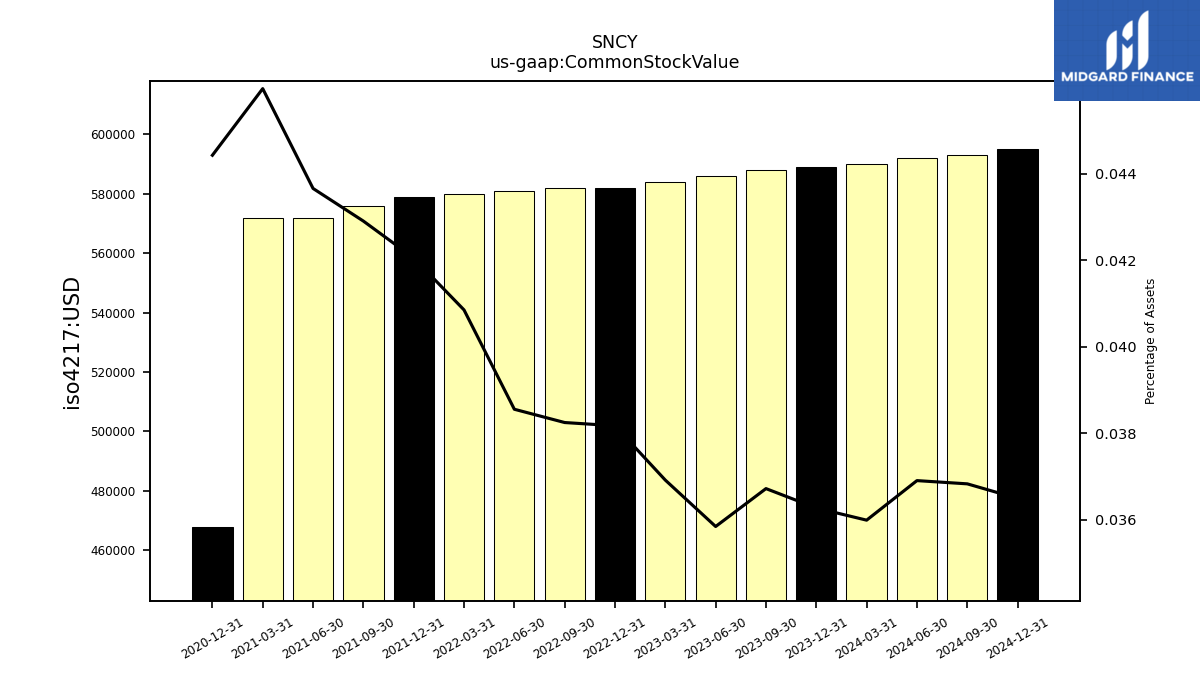
| Common Stock Value | 0.59 | 0.59 | 0.59 | 0.58 | 0.58 | 0.58 | 0.58 | 0.58 | 0.58 | 0.58 | 0.57 | 0.57 | 0.47 | NA | NA | NA | |
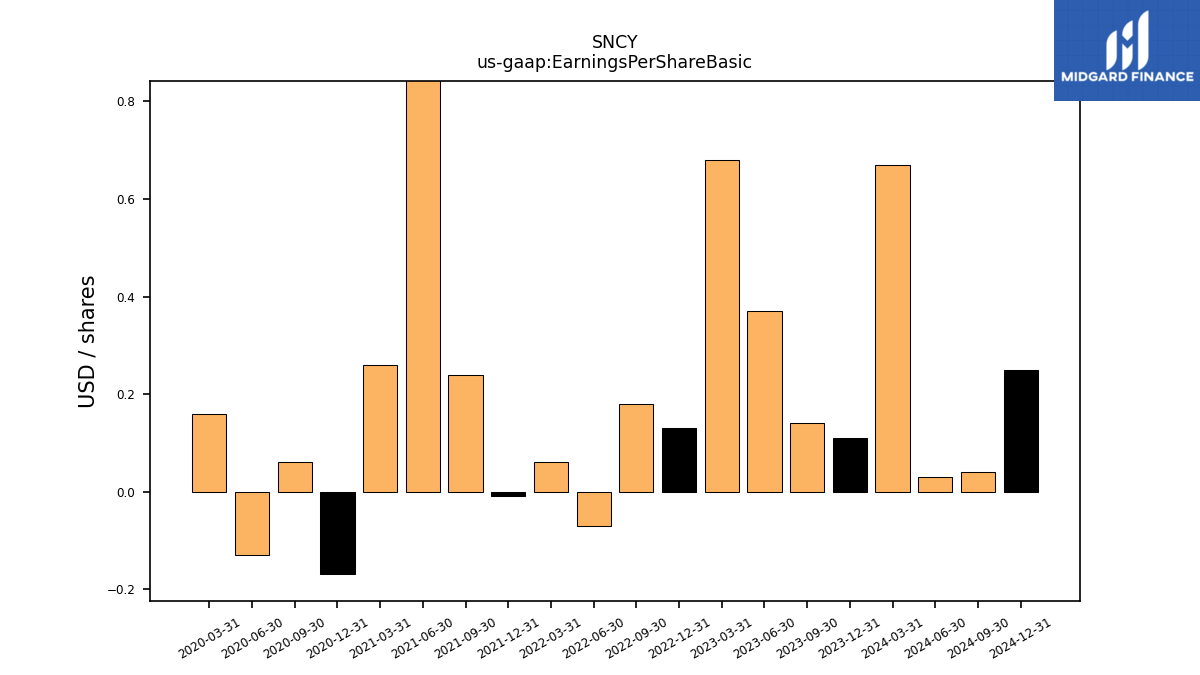
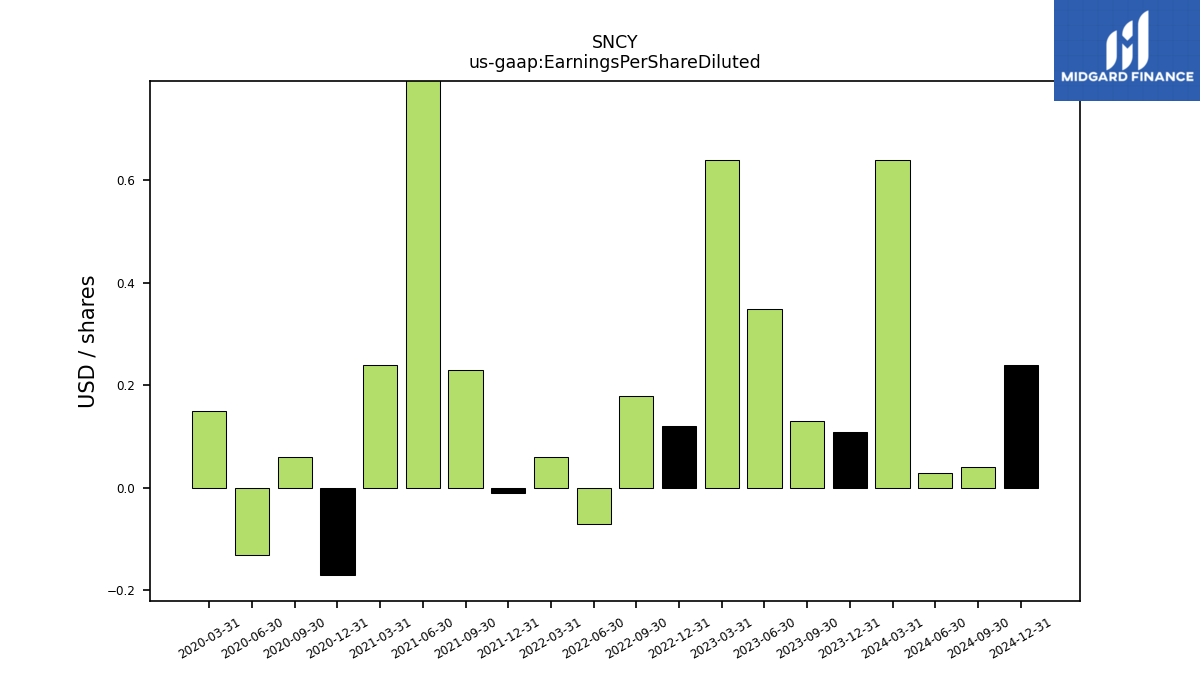
| Earnings Per Share Basic | 0.11 | 0.14 | 0.37 | 0.68 | 0.13 | 0.18 | -0.07 | 0.06 | -0.01 | 0.24 | 0.91 | 0.26 | -0.17 | 0.06 | -0.13 | 0.16 | |
| Earnings Per Share Diluted | 0.11 | 0.13 | 0.35 | 0.64 | 0.12 | 0.18 | -0.07 | 0.06 | -0.01 | 0.23 | 0.83 | 0.24 | -0.17 | 0.06 | -0.13 | 0.15 |
| 2023-12-31 | 2023-09-30 | 2023-06-30 | 2023-03-31 | 2022-12-31 | 2022-09-30 | 2022-06-30 | 2022-03-31 | 2021-12-31 | 2021-09-30 | 2021-06-30 | 2021-03-31 | 2020-12-31 | 2020-09-30 | 2020-06-30 | 2020-03-31 | ||
|---|---|---|---|---|---|---|---|---|---|---|---|---|---|---|---|---|---|
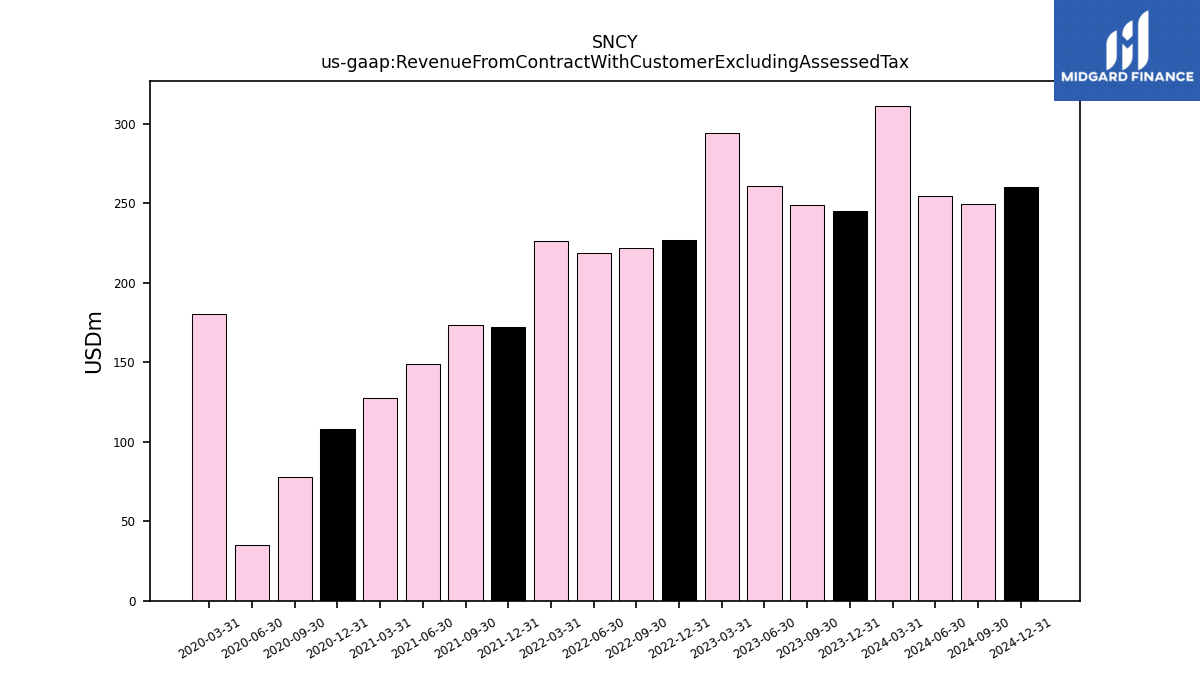
| Revenue From Contract With Customer Excluding Assessed Tax | 245.54 | 248.88 | 261.09 | 294.12 | 227.15 | 221.70 | 219.07 | 226.53 | 172.55 | 173.66 | 149.19 | 127.61 | 107.81 | 77.97 | 35.38 | 180.33 | |
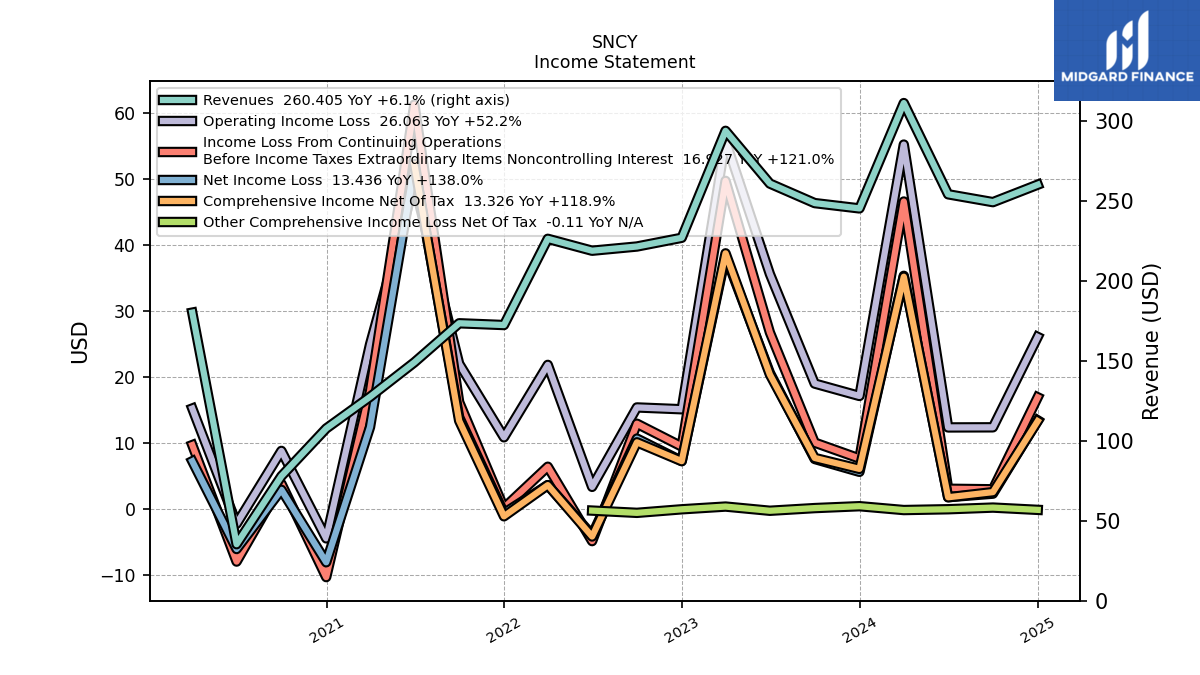
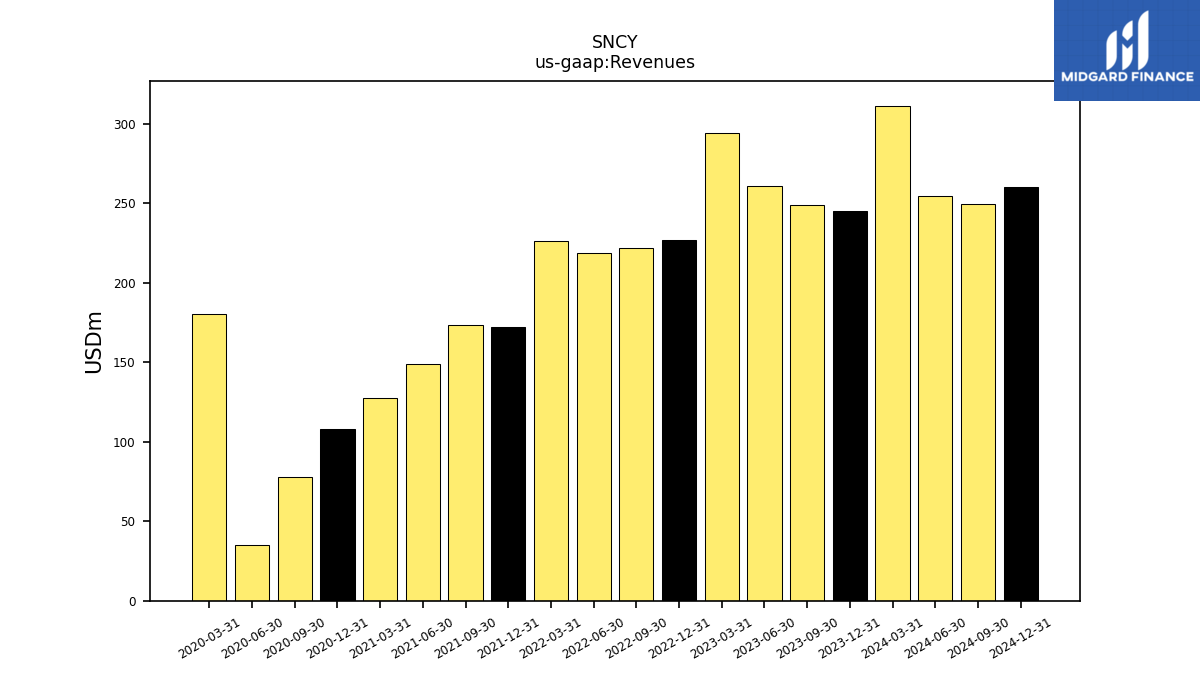
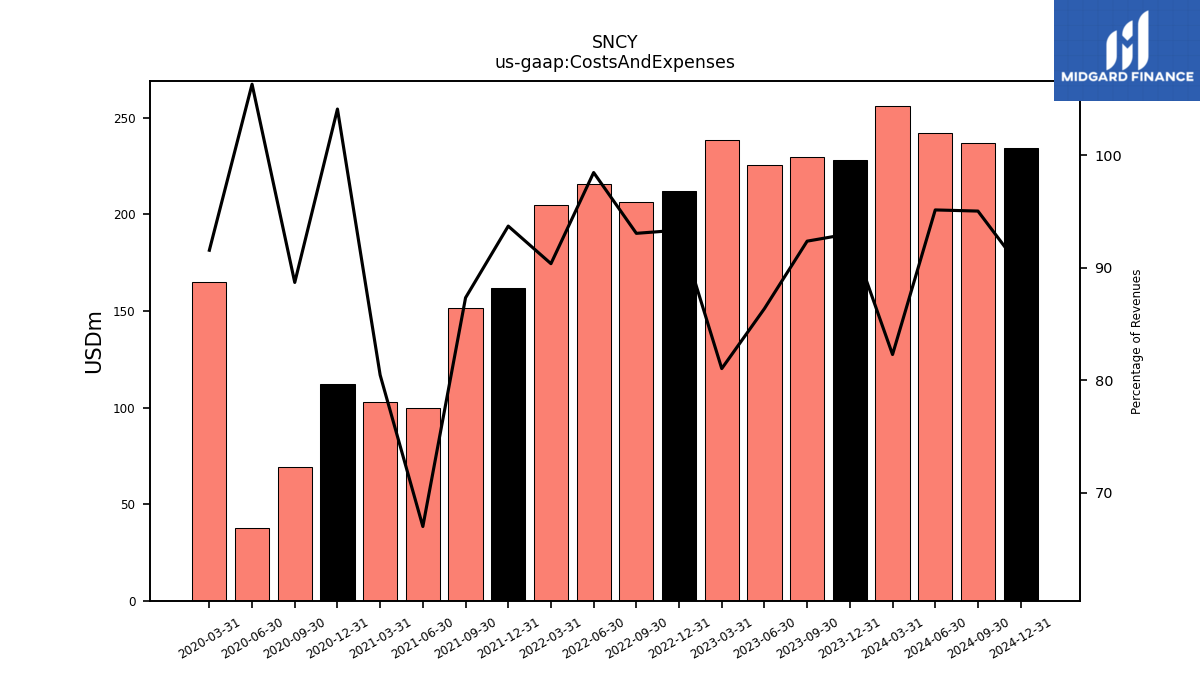
| Revenues | 245.54 | 248.88 | 261.09 | 294.12 | 227.15 | 221.70 | 219.07 | 226.53 | 172.55 | 173.66 | 149.19 | 127.61 | 107.81 | 77.97 | 35.38 | 180.33 | |
| Costs And Expenses | 228.42 | 229.87 | 225.50 | 238.33 | 212.04 | 206.31 | 215.70 | 204.69 | 161.69 | 151.66 | 99.95 | 102.68 | 112.23 | 69.16 | 37.61 | 165.10 | |
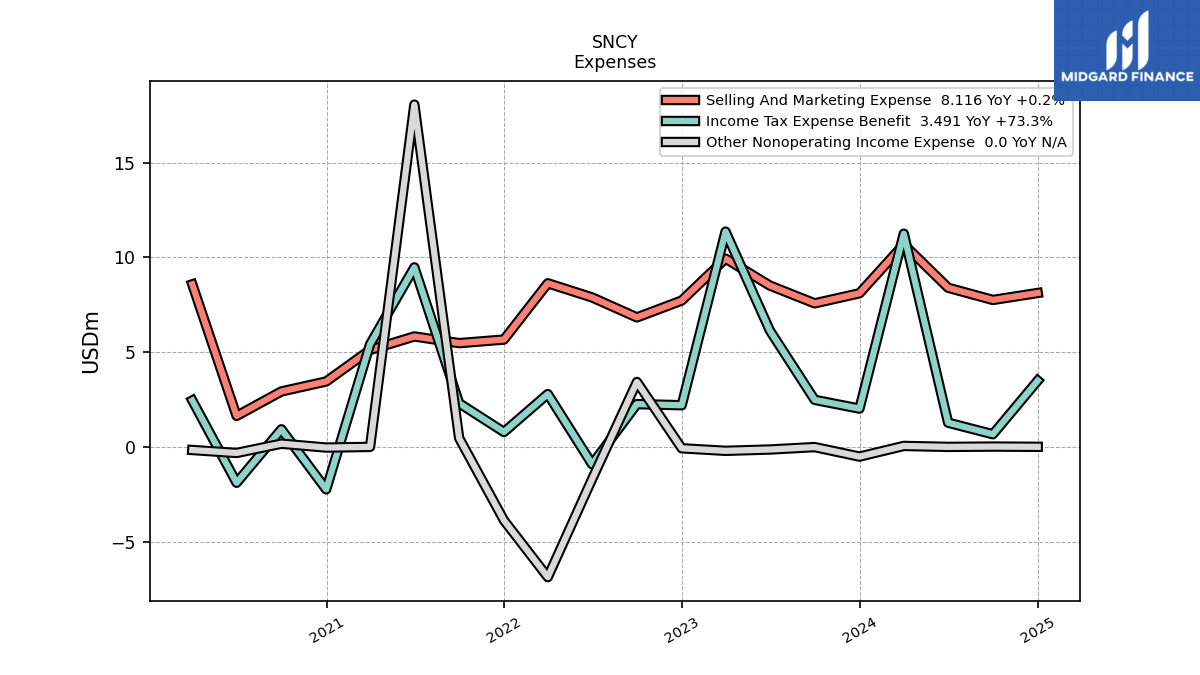
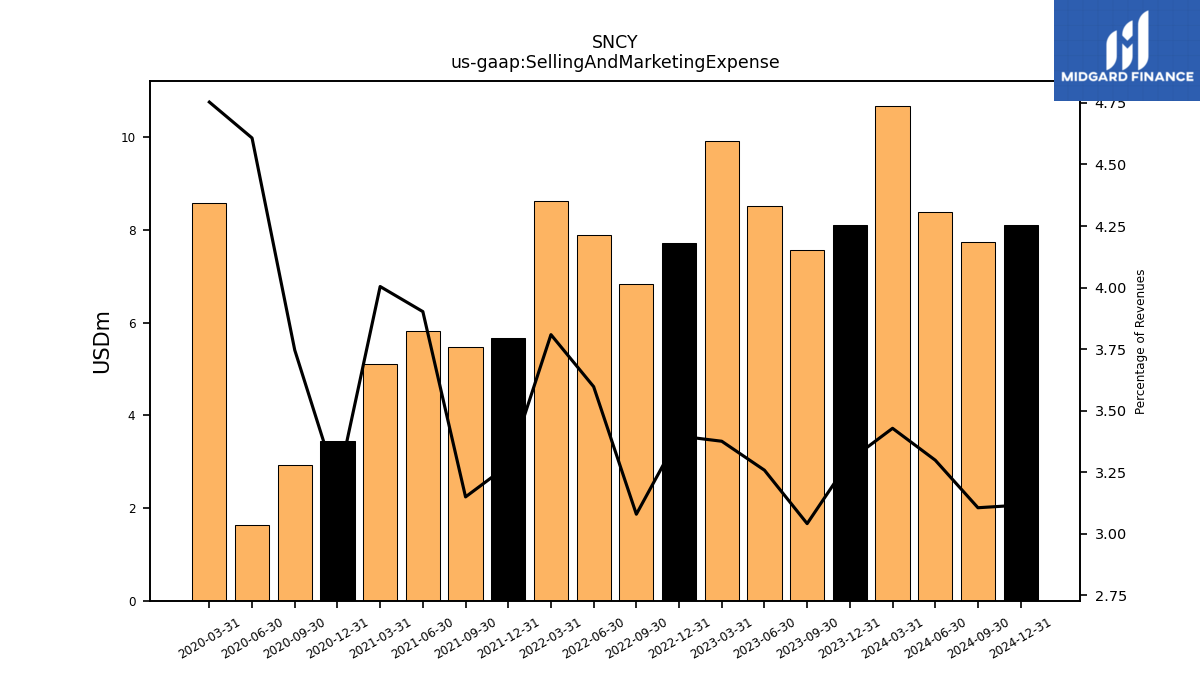
| Selling And Marketing Expense | 8.10 | 7.57 | 8.51 | 9.93 | 7.72 | 6.83 | 7.88 | 8.63 | 5.66 | 5.47 | 5.82 | 5.11 | 3.45 | 2.92 | 1.63 | 8.57 | |
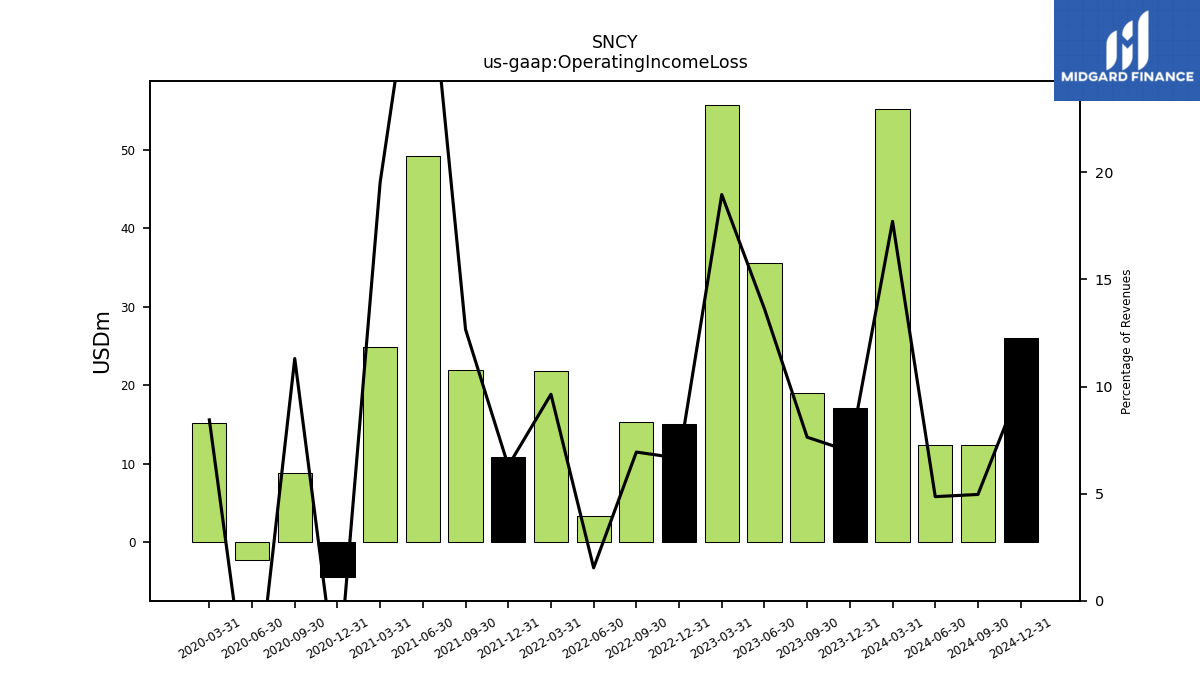
| Operating Income Loss | 17.12 | 19.01 | 35.59 | 55.78 | 15.12 | 15.39 | 3.37 | 21.83 | 10.87 | 22.00 | 49.24 | 24.93 | -4.43 | 8.82 | -2.23 | 15.23 | |
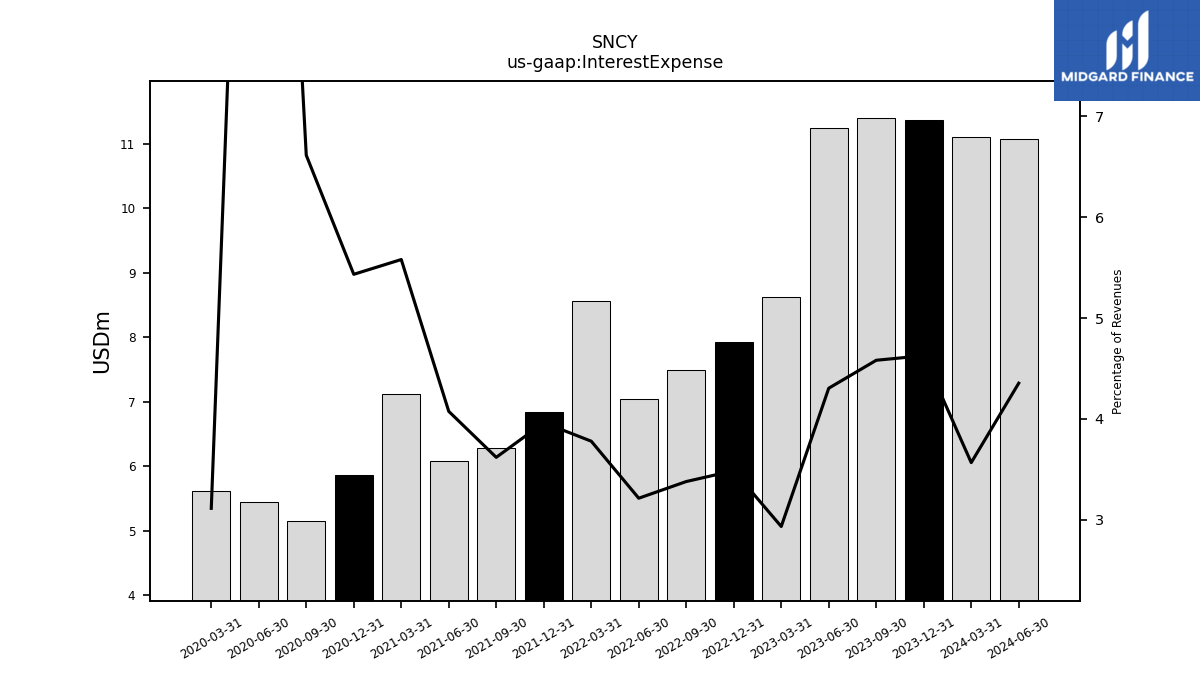
| Interest Expense | 11.36 | 11.40 | 11.24 | 8.63 | 7.92 | 7.49 | 7.04 | 8.56 | 6.84 | 6.29 | 6.08 | 7.12 | 5.86 | 5.16 | 5.44 | 5.62 | |
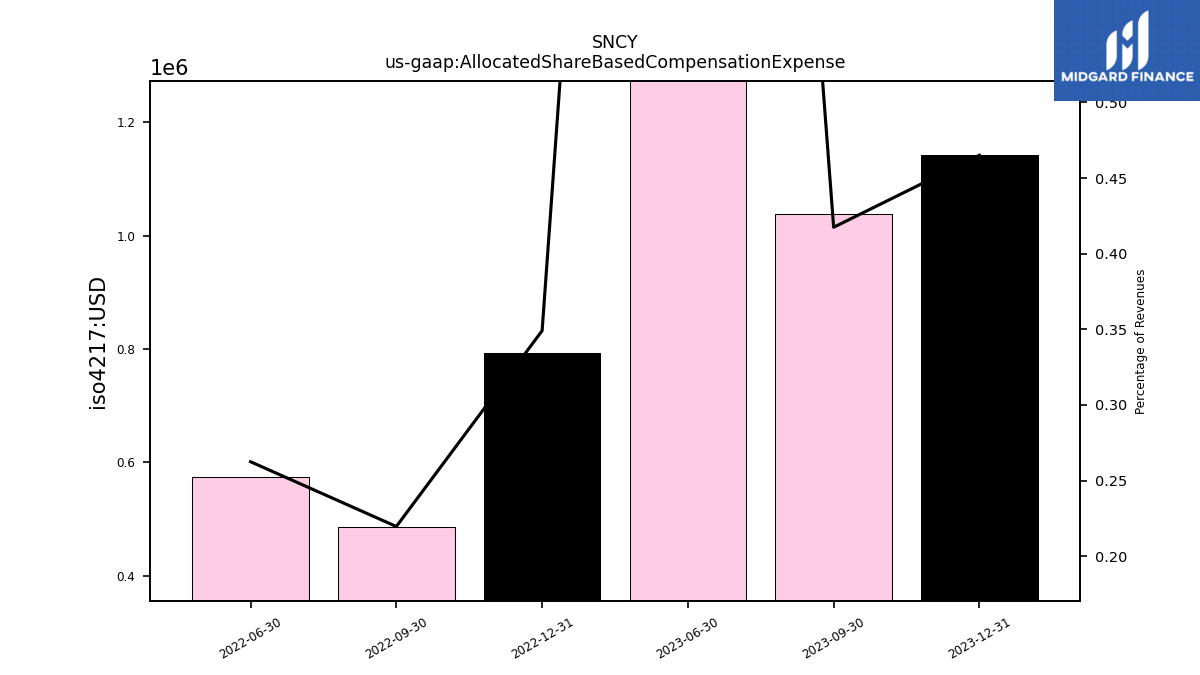
| Allocated Share Based Compensation Expense | 1.14 | 1.04 | 4.42 | NA | 0.79 | 0.49 | 0.57 | NA | NA | NA | NA | NA | NA | NA | NA | NA | |
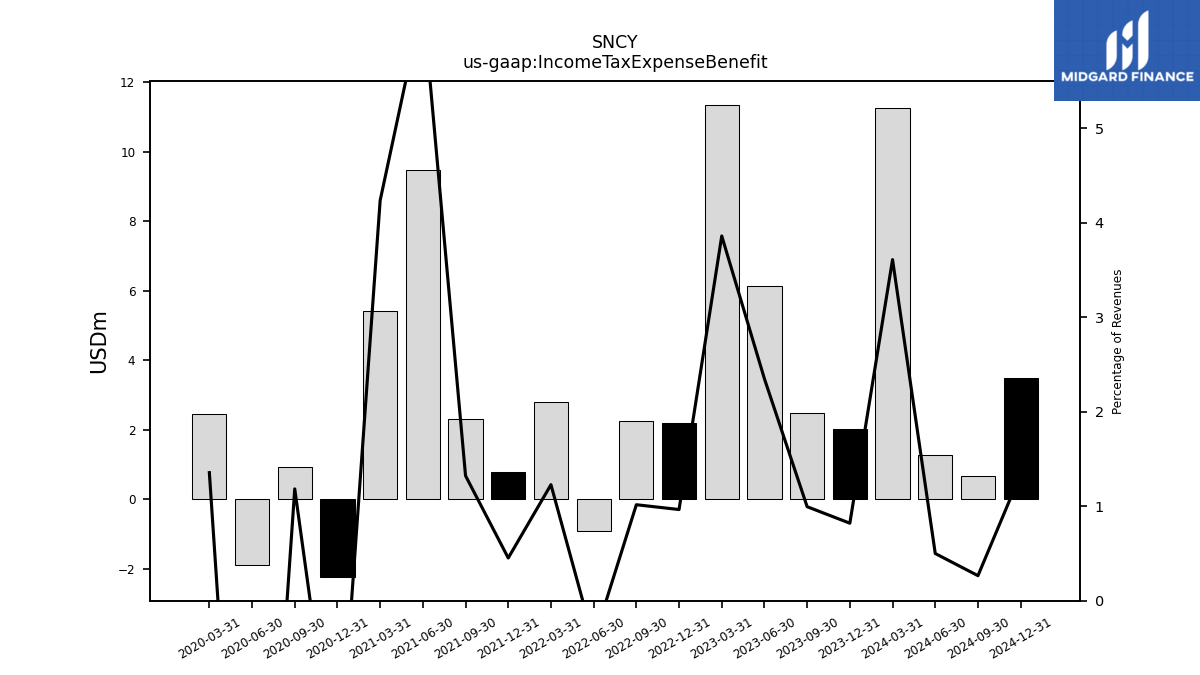
| Income Tax Expense Benefit | 2.02 | 2.48 | 6.13 | 11.35 | 2.19 | 2.25 | -0.92 | 2.78 | 0.78 | 2.30 | 9.47 | 5.41 | -2.25 | 0.92 | -1.90 | 2.44 | |
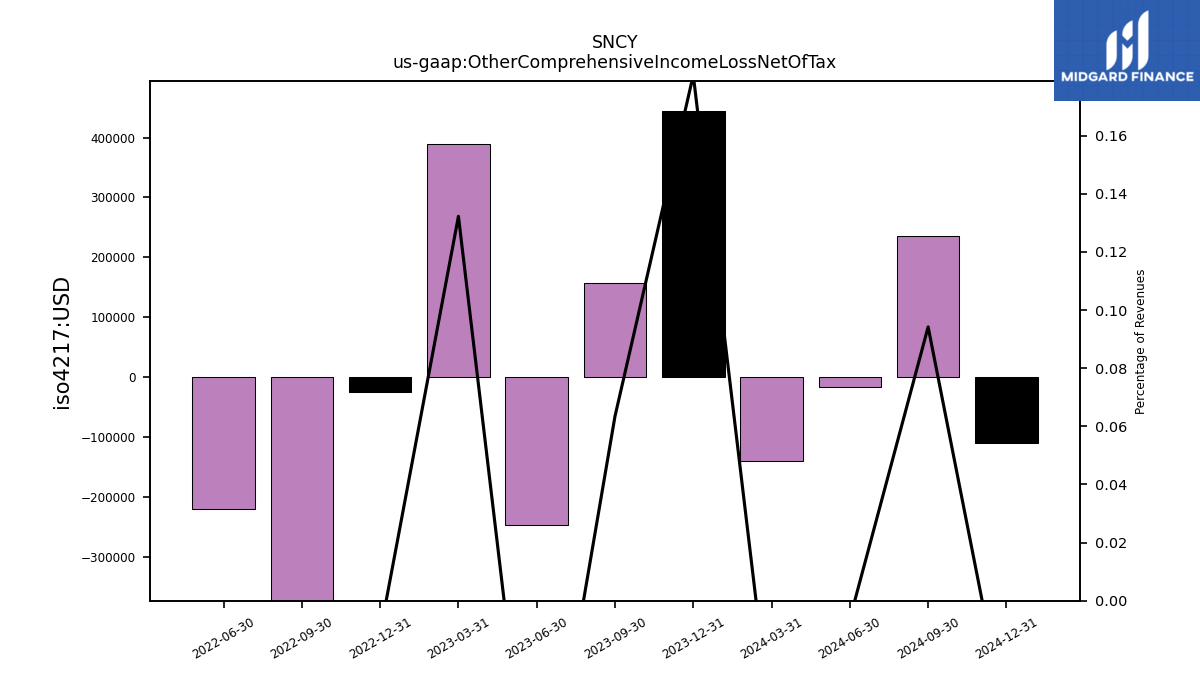
| Other Comprehensive Income Loss Net Of Tax | 0.44 | 0.16 | -0.25 | 0.39 | -0.03 | -0.56 | -0.22 | NA | NA | NA | NA | NA | NA | NA | NA | NA | |
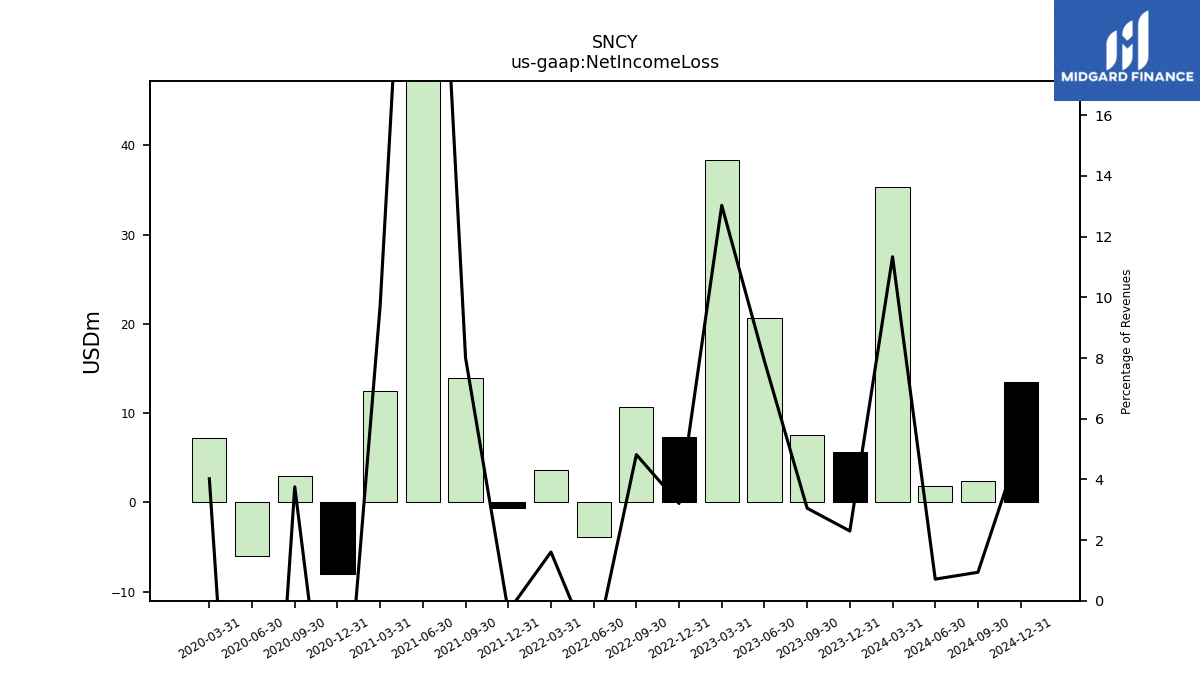
| Net Income Loss | 5.64 | 7.59 | 20.62 | 38.33 | 7.28 | 10.68 | -3.92 | 3.64 | -0.60 | 13.90 | 51.75 | 12.42 | -8.04 | 2.93 | -6.04 | 7.25 | |
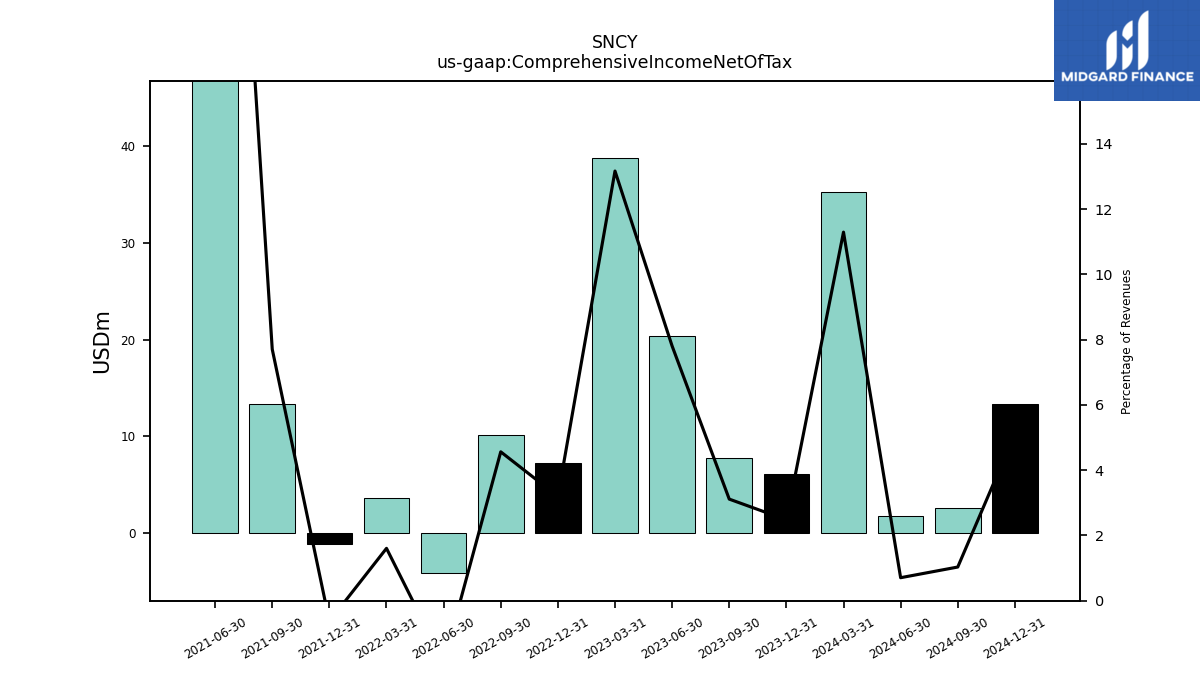
| Comprehensive Income Net Of Tax | 6.09 | 7.75 | 20.37 | 38.72 | 7.26 | 10.12 | -4.14 | 3.64 | -1.09 | 13.38 | 52.18 | NA | NA | NA | NA | NA |
| 2023-12-31 | 2023-09-30 | 2023-06-30 | 2023-03-31 | 2022-12-31 | 2022-09-30 | 2022-06-30 | 2022-03-31 | 2021-12-31 | 2021-09-30 | 2021-06-30 | 2021-03-31 | 2020-12-31 | 2020-09-30 | 2020-06-30 | 2020-03-31 | ||
|---|---|---|---|---|---|---|---|---|---|---|---|---|---|---|---|---|---|
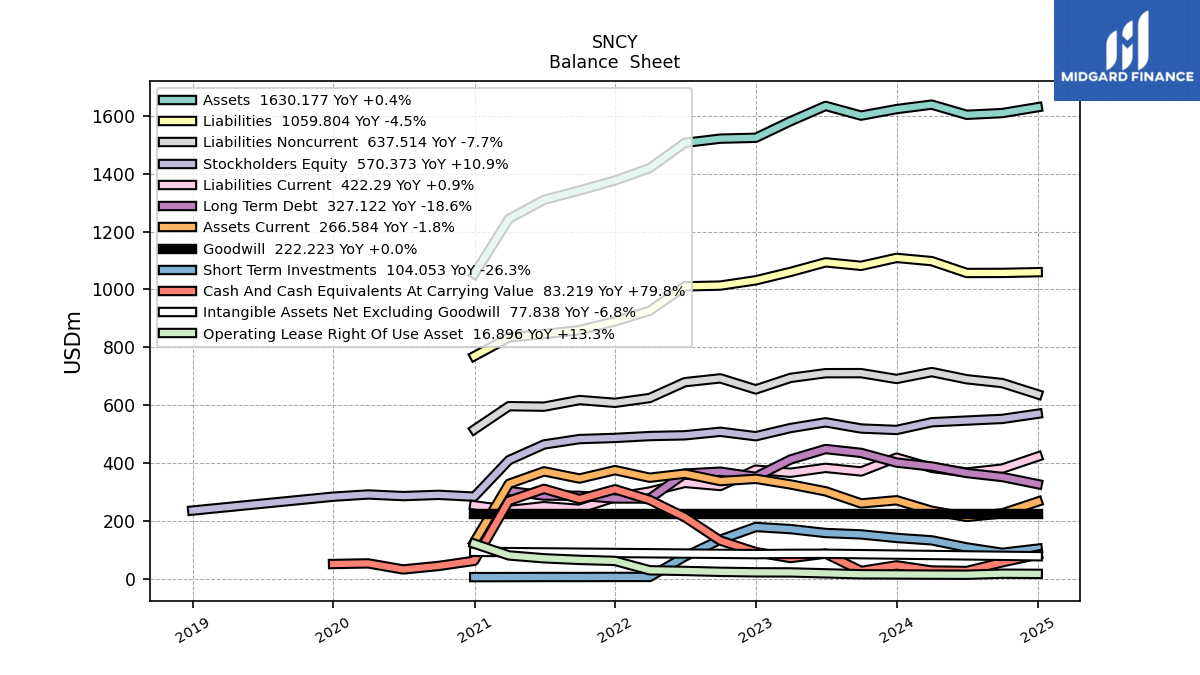
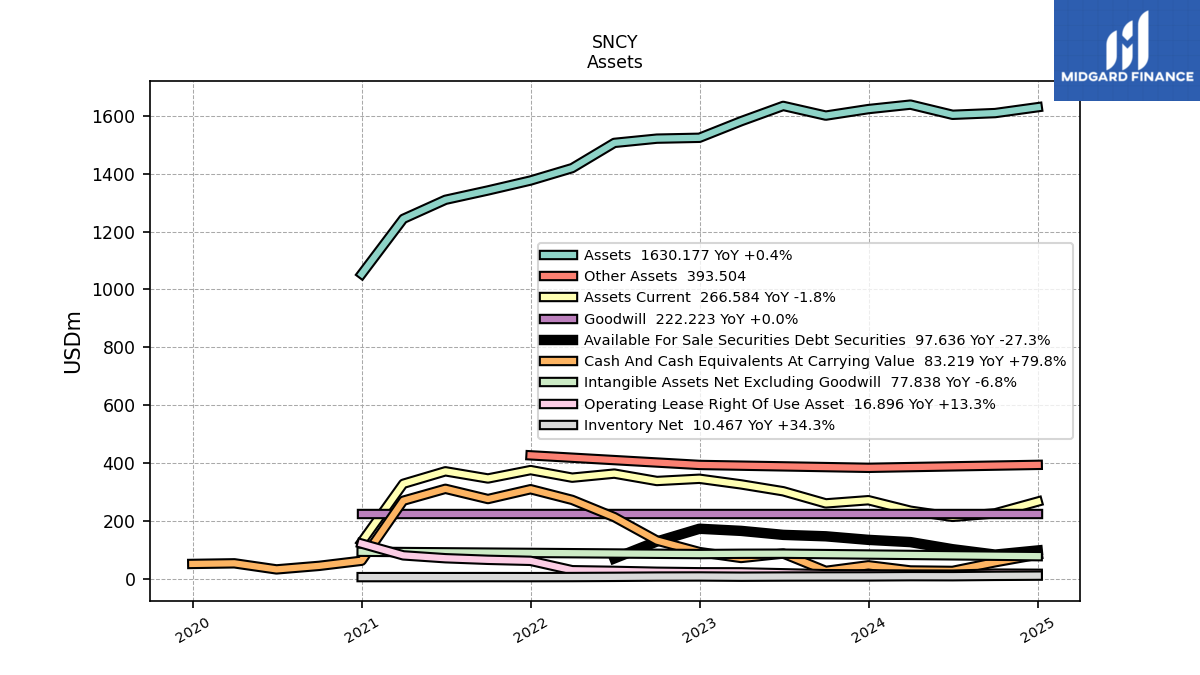
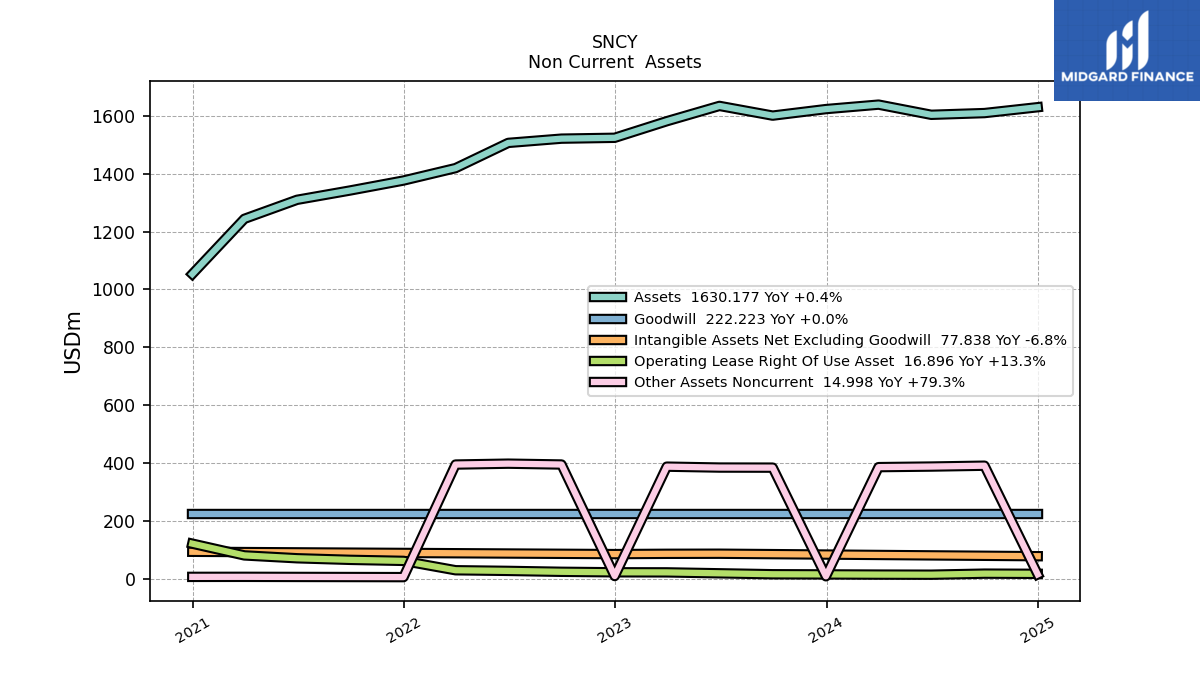
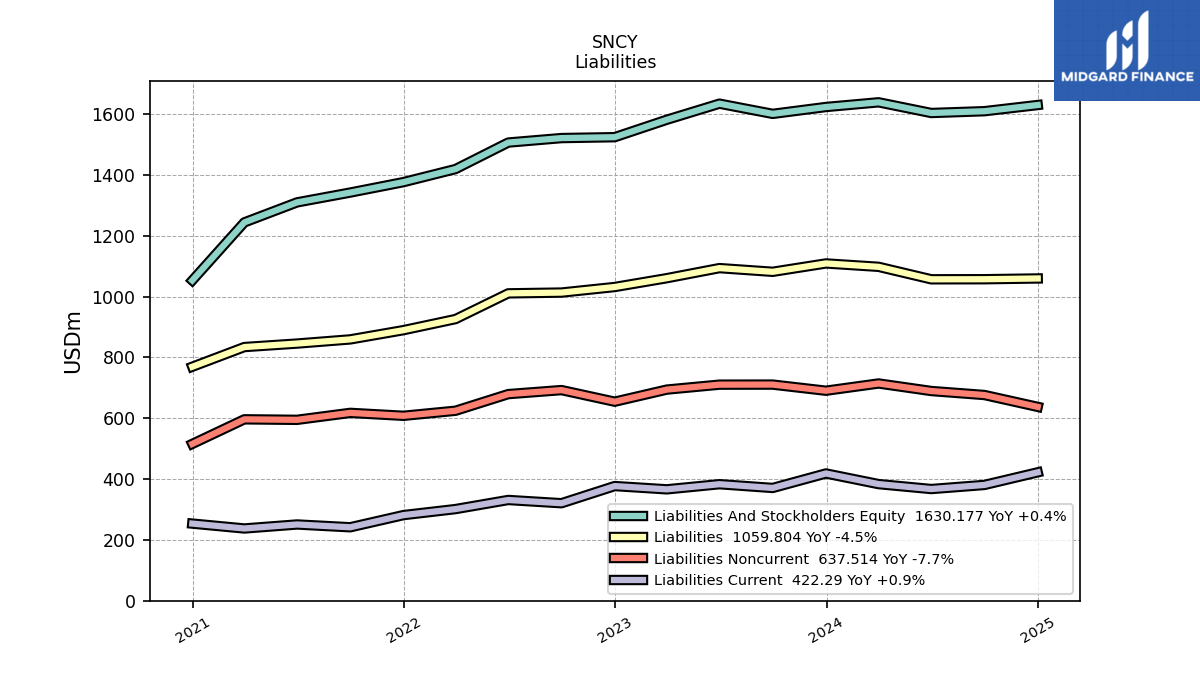
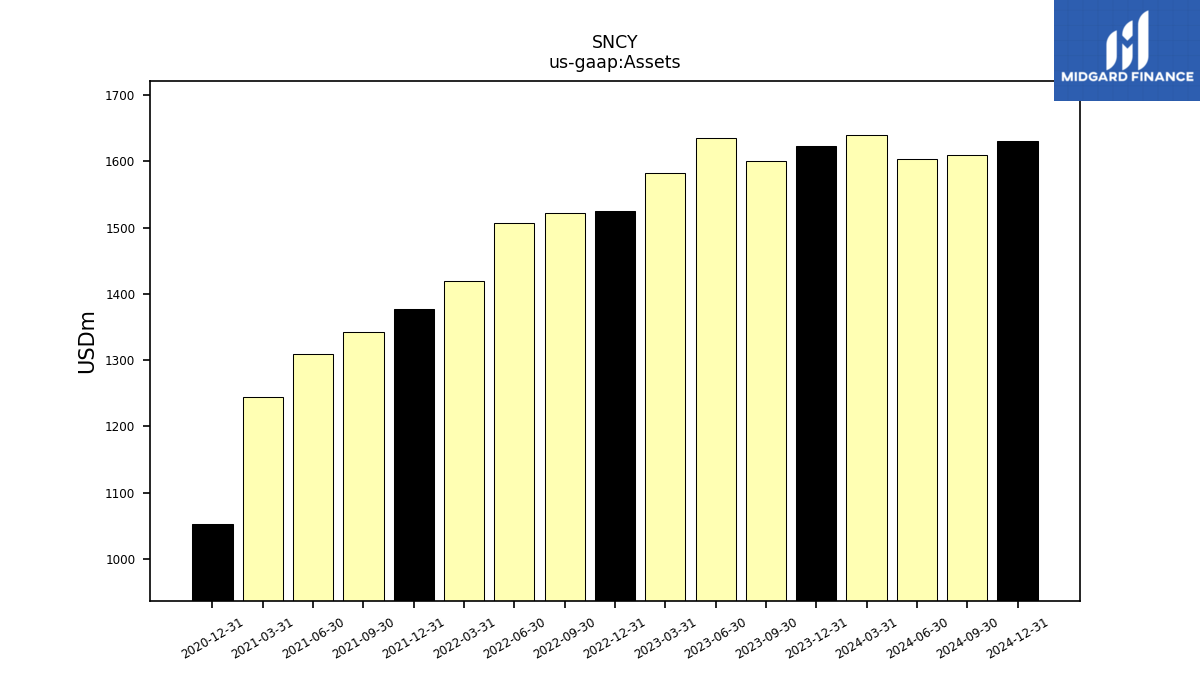
| Assets | 1623.63 | 1601.07 | 1634.62 | 1581.73 | 1524.41 | 1521.44 | 1506.74 | 1419.59 | 1376.64 | 1342.31 | 1309.96 | 1244.20 | 1053.27 | NA | NA | NA | |
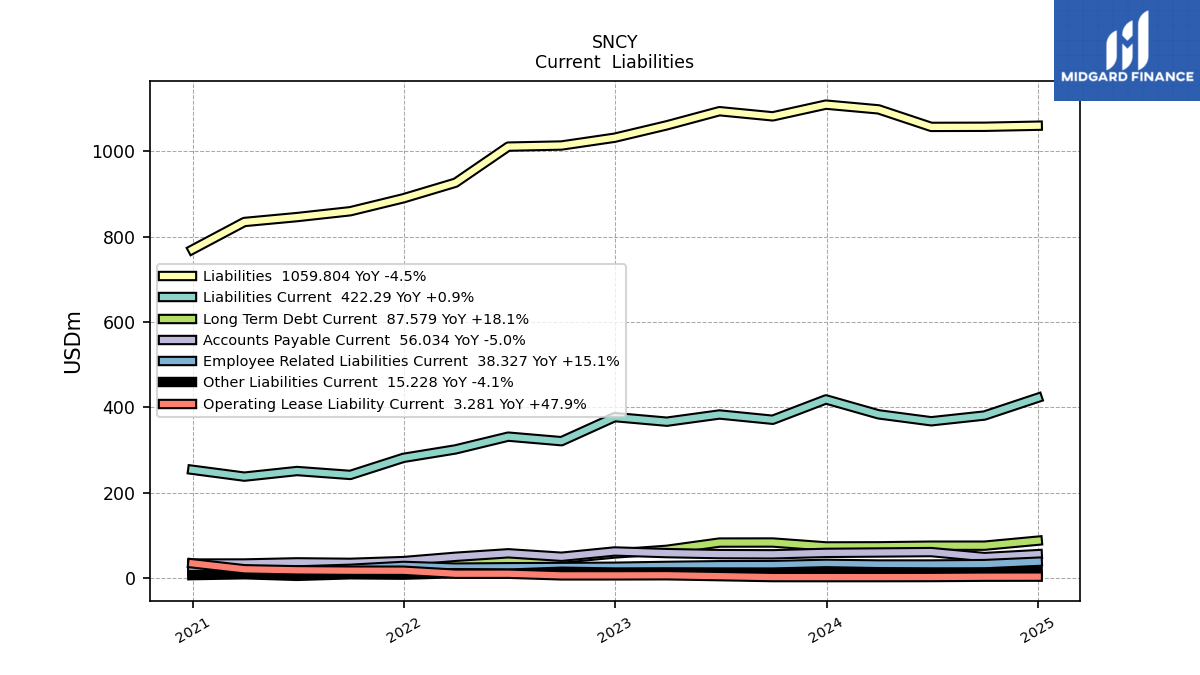
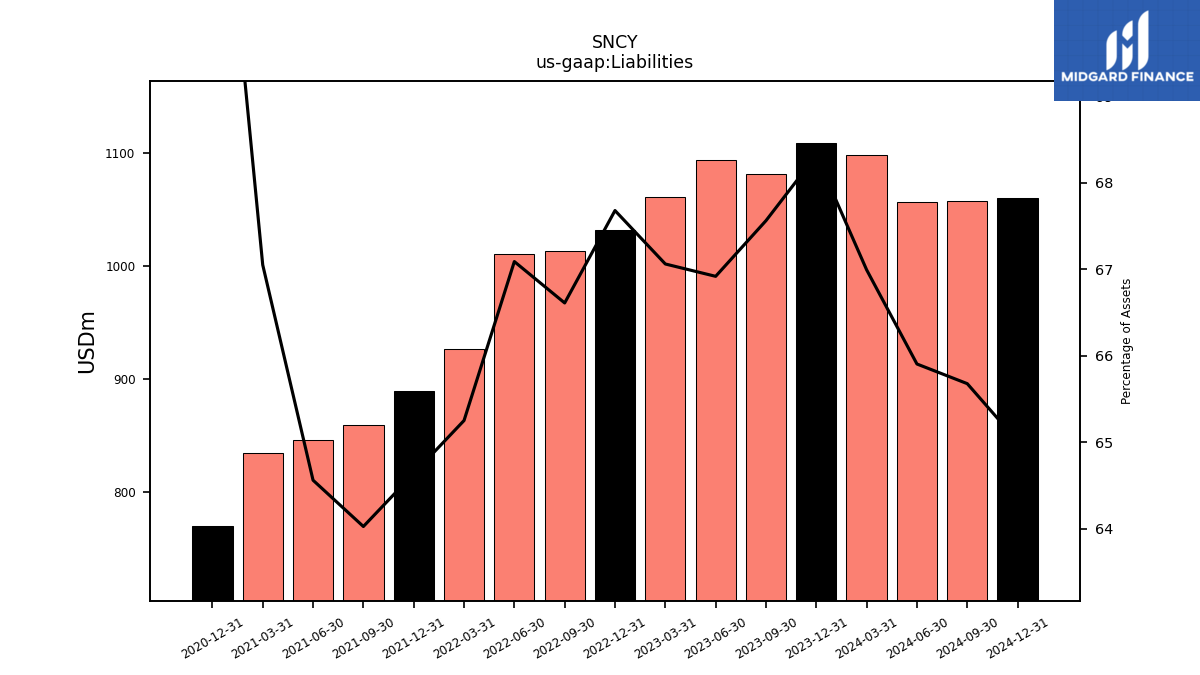
| Liabilities | 1109.22 | 1081.71 | 1093.86 | 1060.72 | 1031.70 | 1013.44 | 1010.85 | 926.30 | 889.83 | 859.43 | 845.73 | 834.24 | 769.45 | NA | NA | NA | |
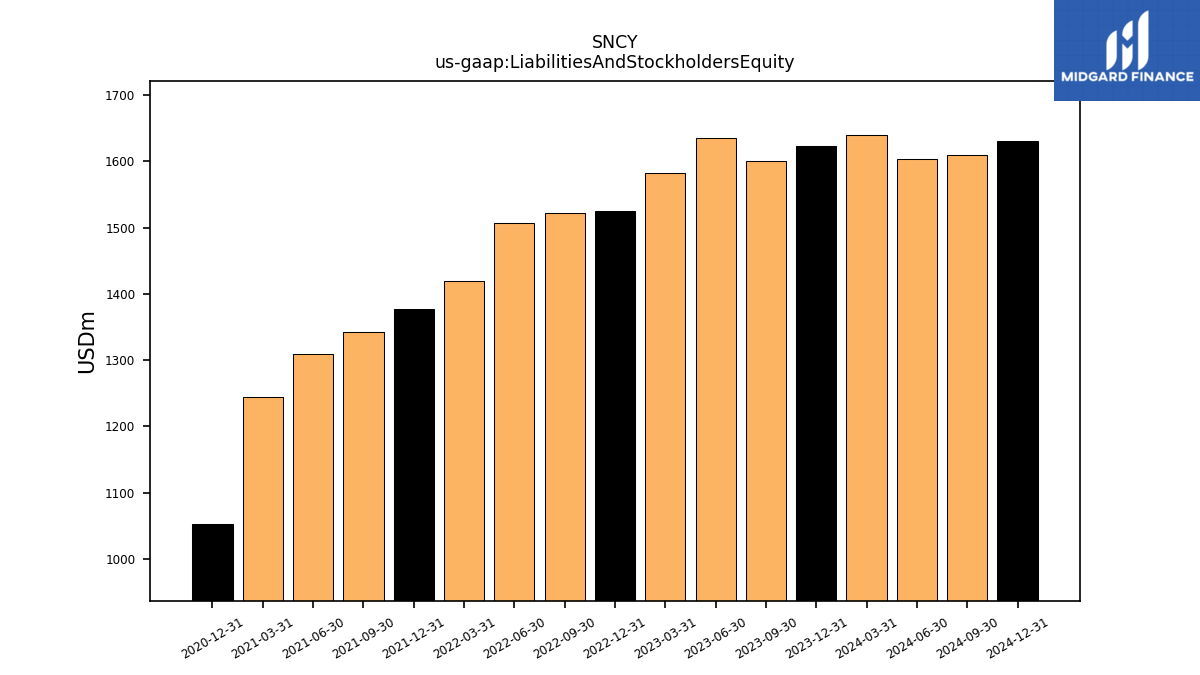
| Liabilities And Stockholders Equity | 1623.63 | 1601.07 | 1634.62 | 1581.73 | 1524.41 | 1521.44 | 1506.74 | 1419.59 | 1376.64 | 1342.31 | 1309.96 | 1244.20 | 1053.27 | NA | NA | NA | |
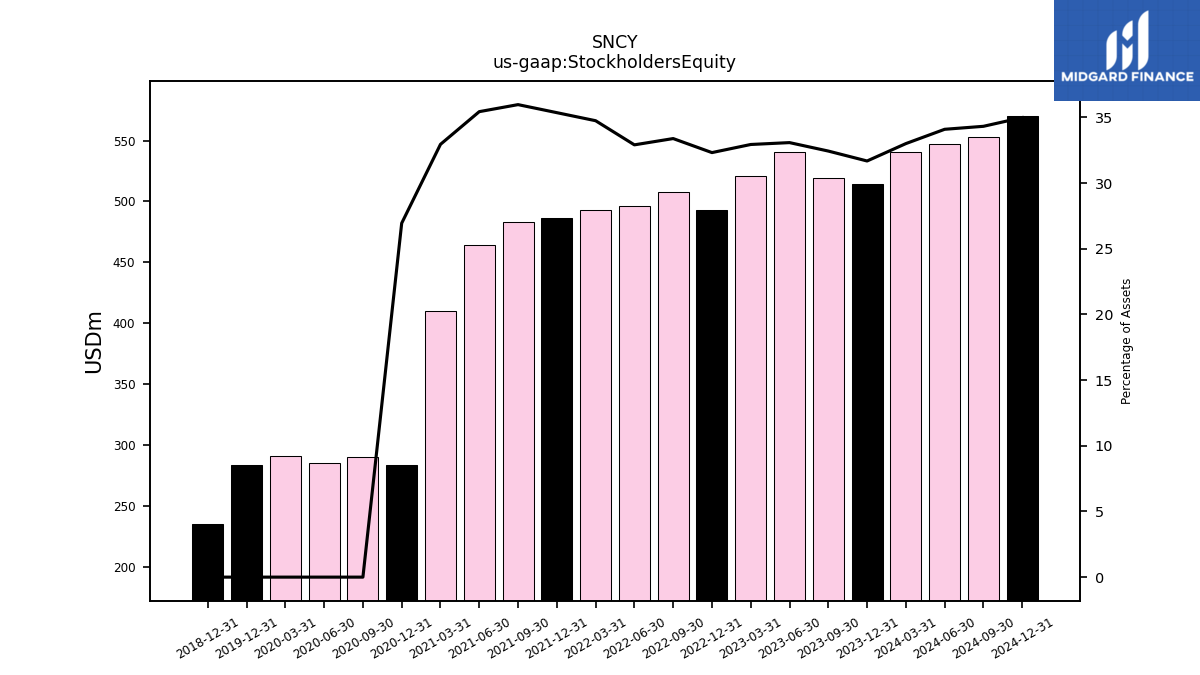
| Stockholders Equity | 514.40 | 519.36 | 540.76 | 521.01 | 492.71 | 508.00 | 495.89 | 493.29 | 486.81 | 482.88 | 464.23 | 409.96 | 283.82 | 290.07 | 285.71 | 291.37 |
| 2023-12-31 | 2023-09-30 | 2023-06-30 | 2023-03-31 | 2022-12-31 | 2022-09-30 | 2022-06-30 | 2022-03-31 | 2021-12-31 | 2021-09-30 | 2021-06-30 | 2021-03-31 | 2020-12-31 | 2020-09-30 | 2020-06-30 | 2020-03-31 | ||
|---|---|---|---|---|---|---|---|---|---|---|---|---|---|---|---|---|---|
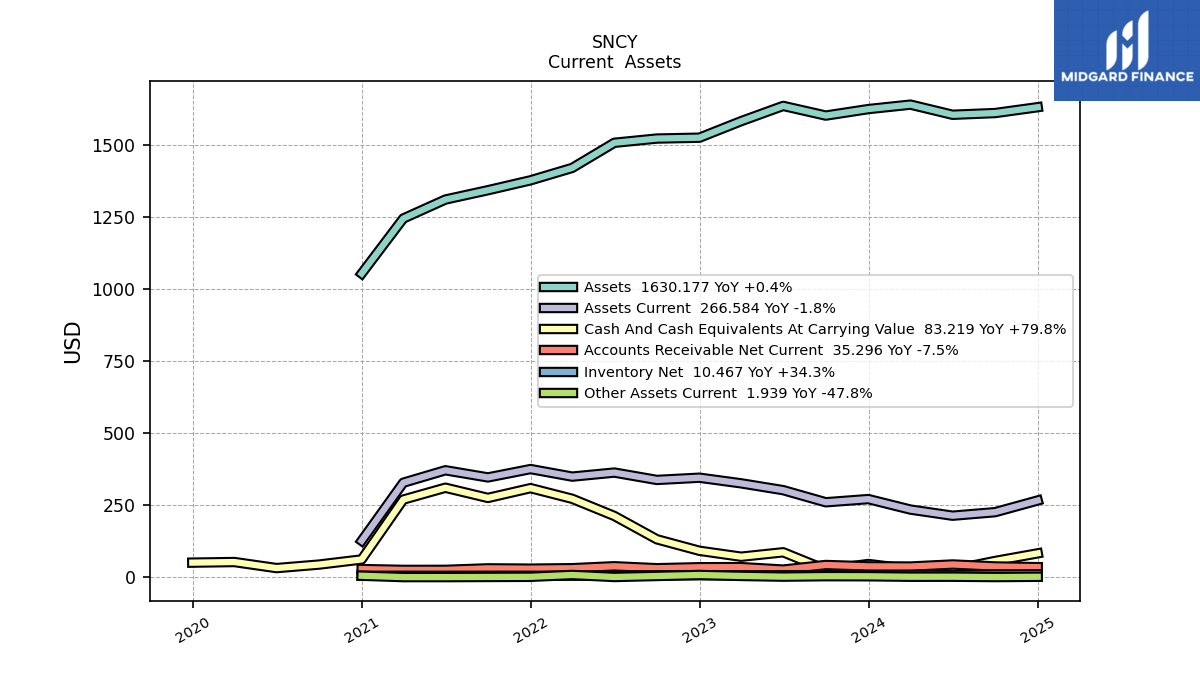
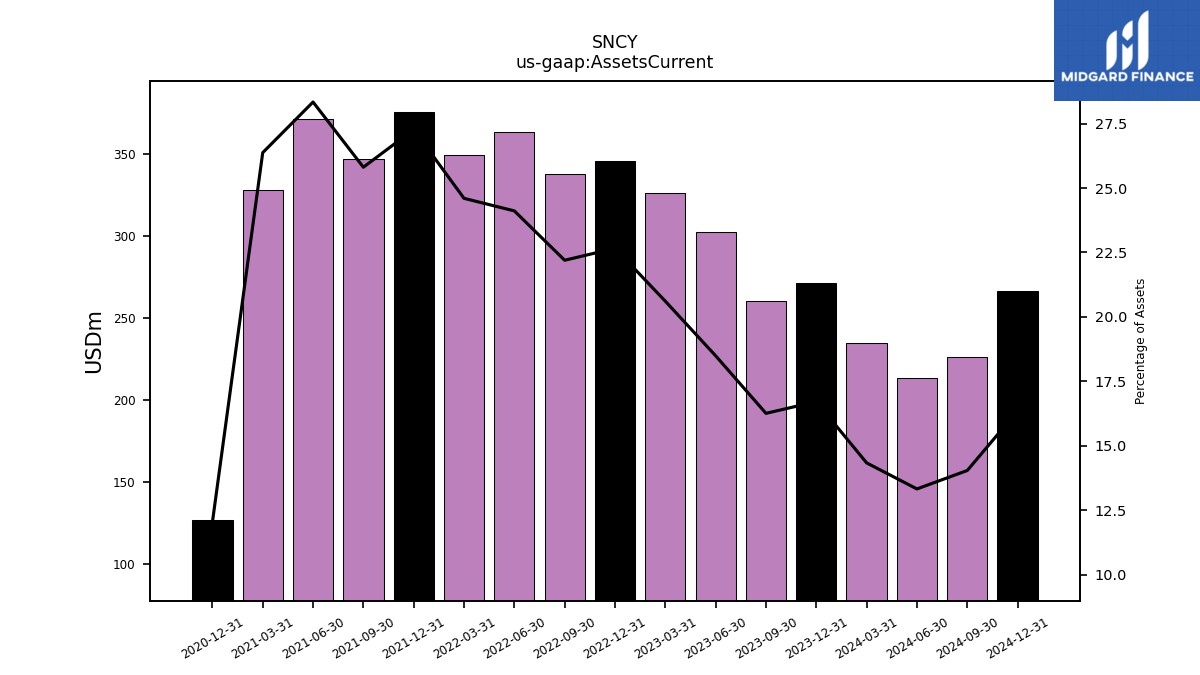
| Assets Current | 271.35 | 260.31 | 302.26 | 325.99 | 345.49 | 337.74 | 363.34 | 349.24 | 375.44 | 346.44 | 371.25 | 328.16 | 126.74 | NA | NA | NA | |
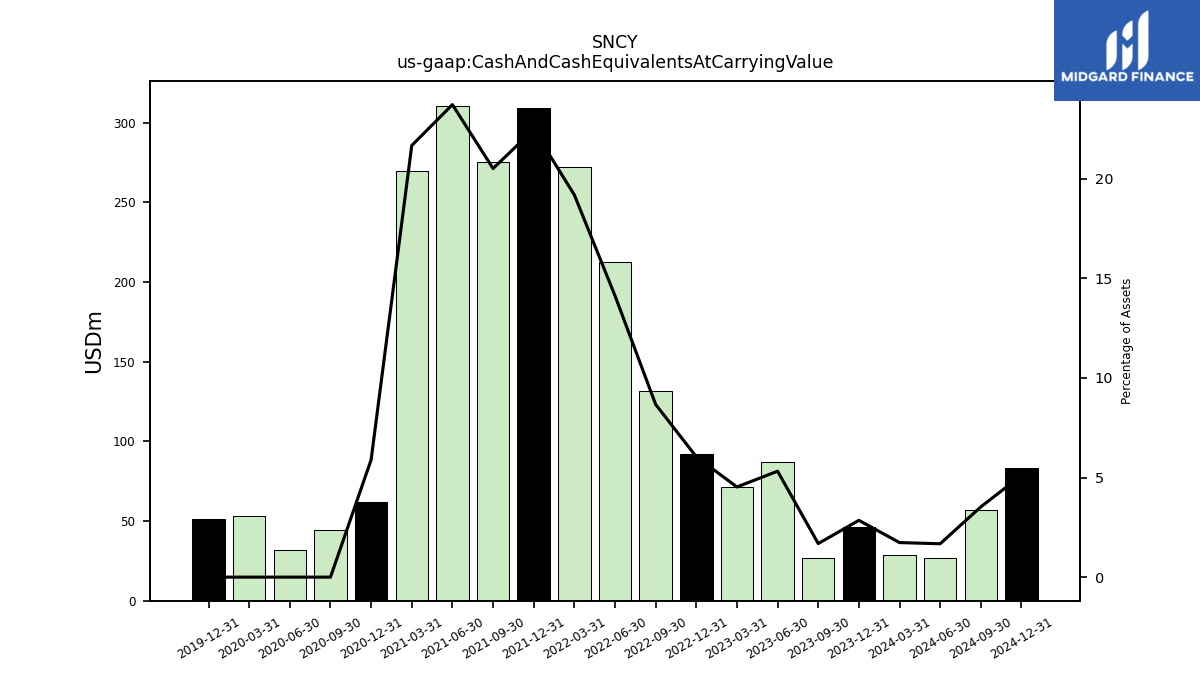
| Cash And Cash Equivalents At Carrying Value | 46.28 | 26.97 | 86.93 | 71.59 | 92.09 | 131.91 | 212.86 | 272.40 | 309.34 | 275.33 | 310.72 | 269.60 | 62.03 | 44.29 | 32.08 | 53.11 | |
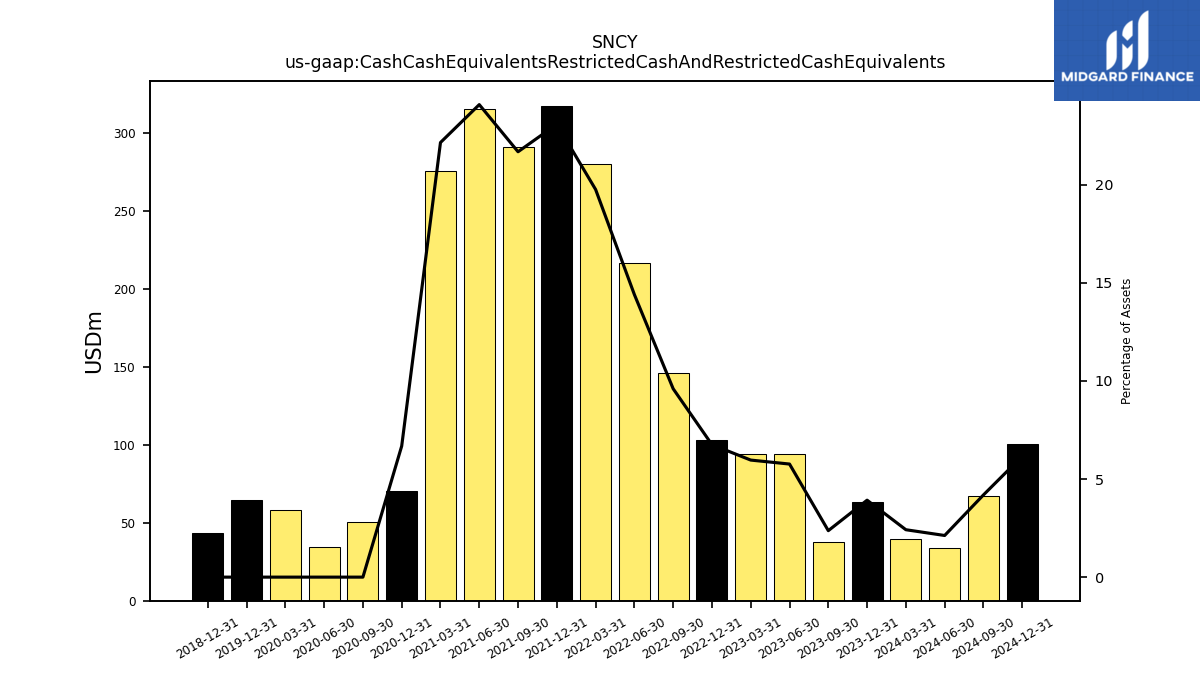
| Cash Cash Equivalents Restricted Cash And Restricted Cash Equivalents | 63.68 | 37.92 | 94.21 | 94.36 | 102.93 | 146.07 | 216.99 | 280.49 | 317.79 | 291.02 | 315.49 | 275.62 | 70.36 | 50.53 | 34.65 | 58.14 | |
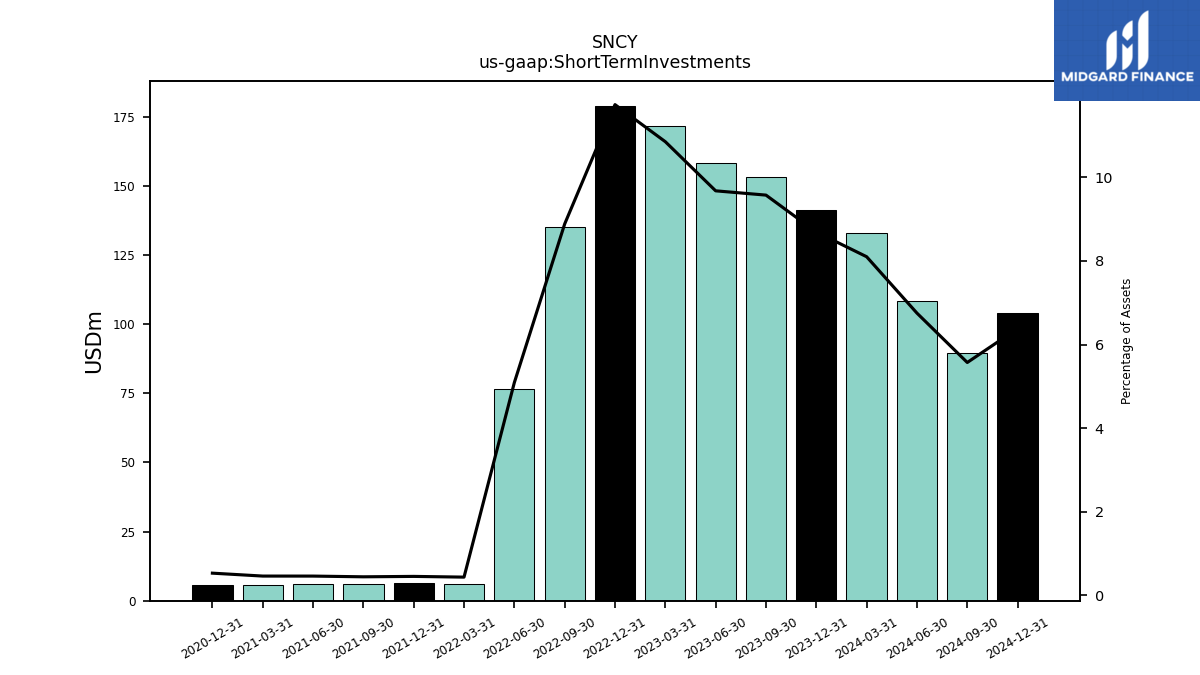
| Short Term Investments | 141.13 | 153.29 | 158.18 | 171.64 | 178.94 | 135.17 | 76.72 | 6.23 | 6.28 | 6.00 | 6.08 | 5.78 | 5.62 | NA | NA | NA | |
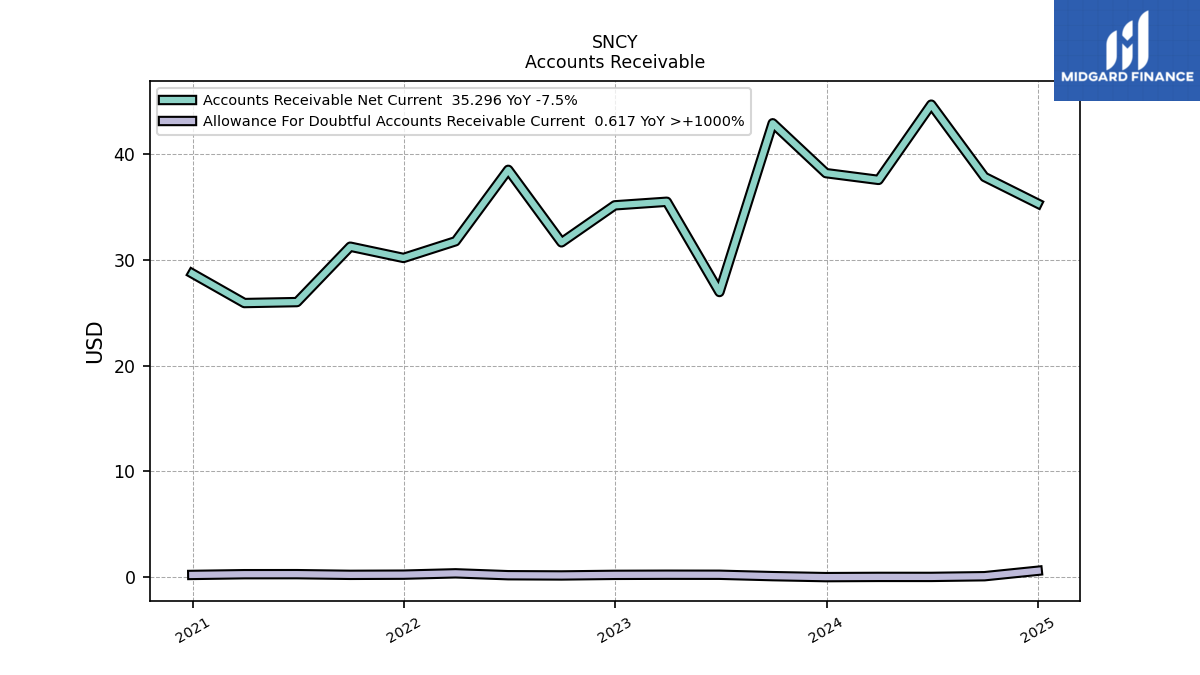
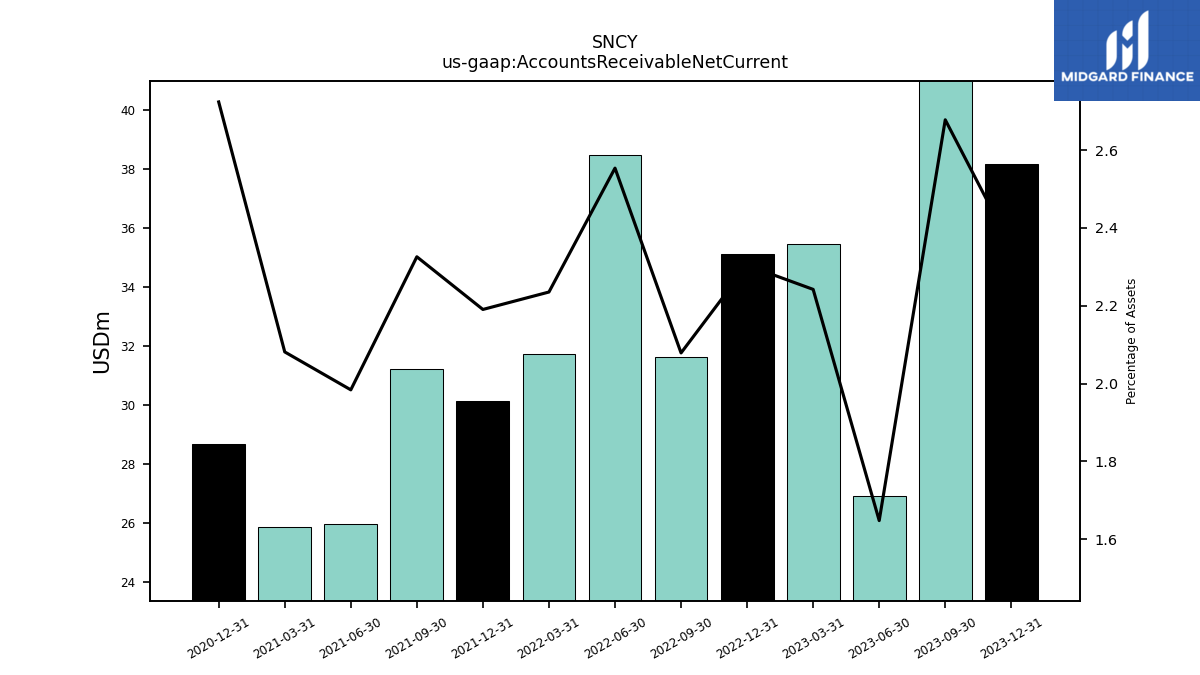
| Accounts Receivable Net Current | 38.17 | 42.88 | 26.94 | 35.46 | 35.12 | 31.63 | 38.48 | 31.73 | 30.16 | 31.22 | 25.99 | 25.90 | 28.69 | NA | NA | NA | |
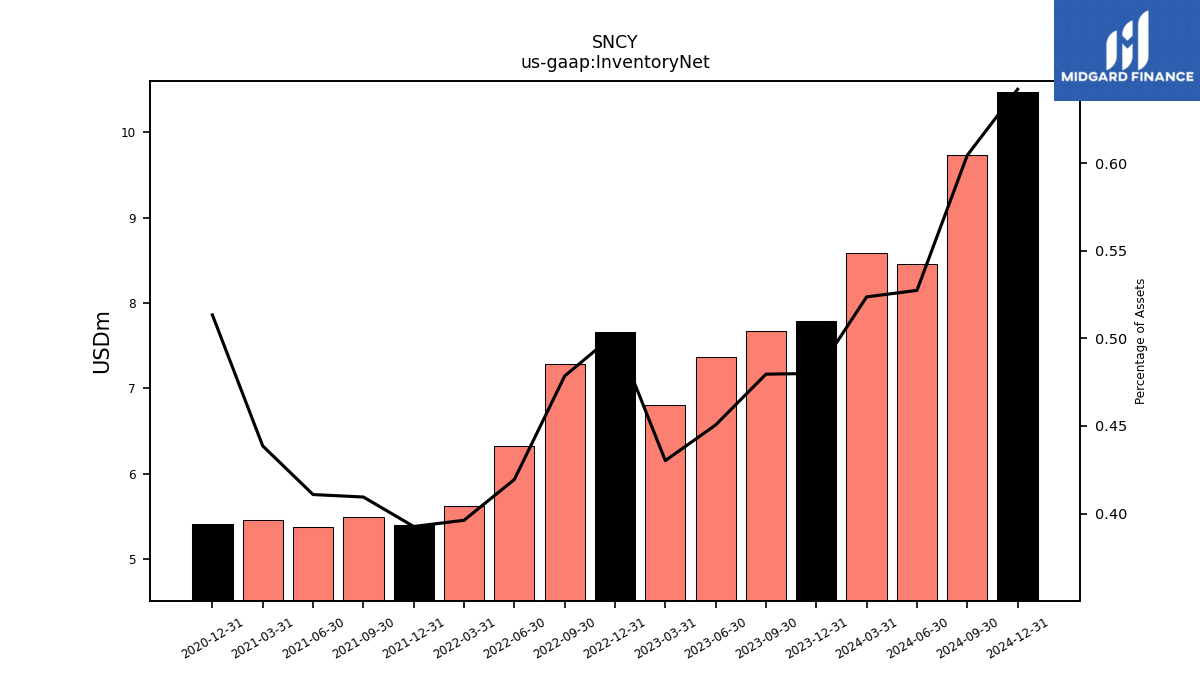
| Inventory Net | 7.79 | 7.68 | 7.37 | 6.80 | 7.66 | 7.28 | 6.32 | 5.62 | 5.41 | 5.50 | 5.38 | 5.46 | 5.41 | NA | NA | NA | |
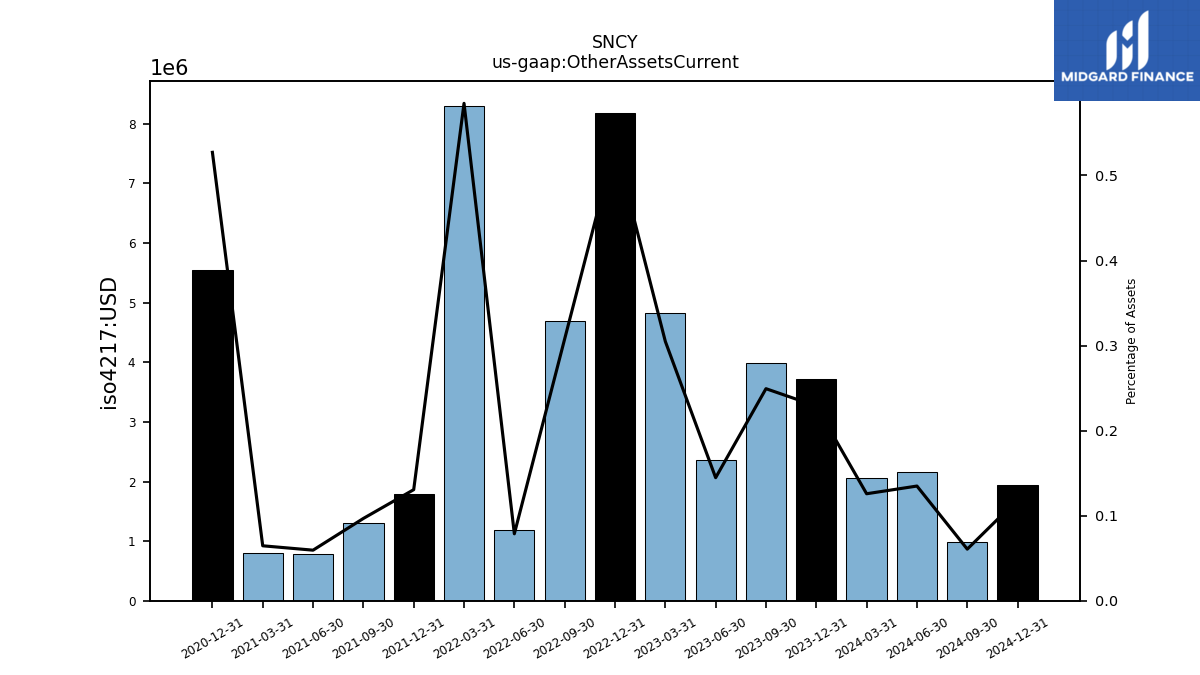
| Other Assets Current | 3.72 | 3.99 | 2.37 | 4.82 | 8.18 | 4.68 | 1.19 | 8.30 | 1.80 | 1.30 | 0.78 | 0.80 | 5.55 | NA | NA | NA | |
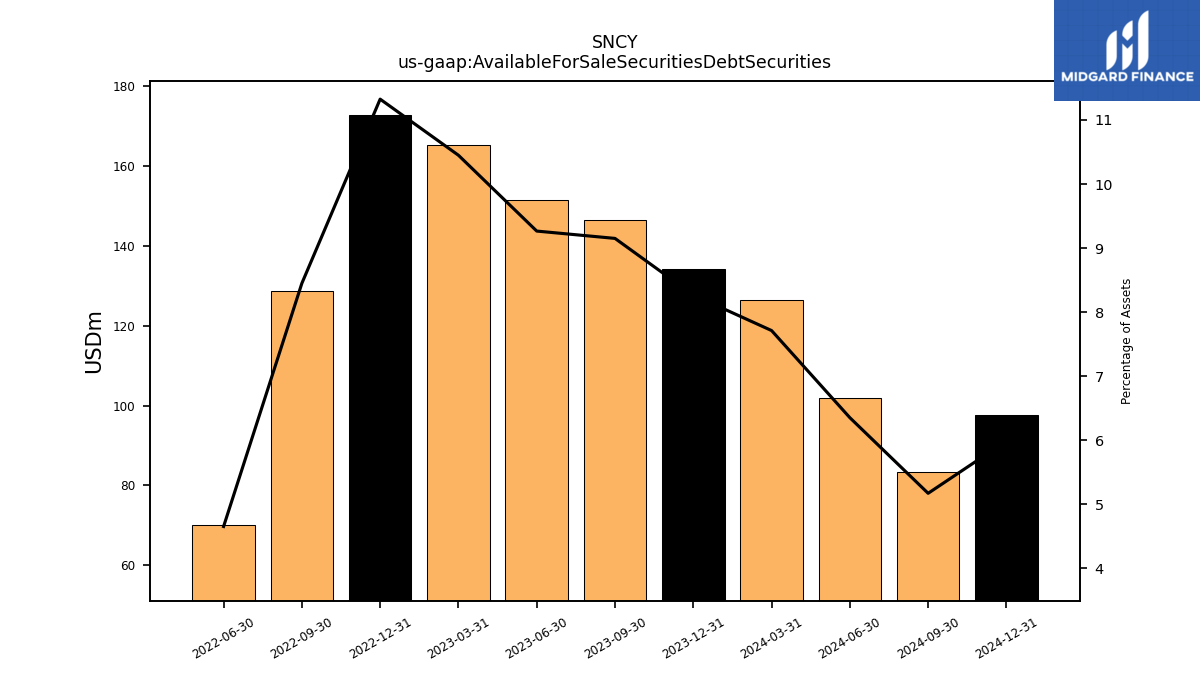
| Available For Sale Securities Debt Securities | 134.24 | 146.52 | 151.46 | 165.28 | 172.63 | 128.57 | 70.14 | NA | NA | NA | NA | NA | NA | NA | NA | NA |
| 2023-12-31 | 2023-09-30 | 2023-06-30 | 2023-03-31 | 2022-12-31 | 2022-09-30 | 2022-06-30 | 2022-03-31 | 2021-12-31 | 2021-09-30 | 2021-06-30 | 2021-03-31 | 2020-12-31 | 2020-09-30 | 2020-06-30 | 2020-03-31 | ||
|---|---|---|---|---|---|---|---|---|---|---|---|---|---|---|---|---|---|
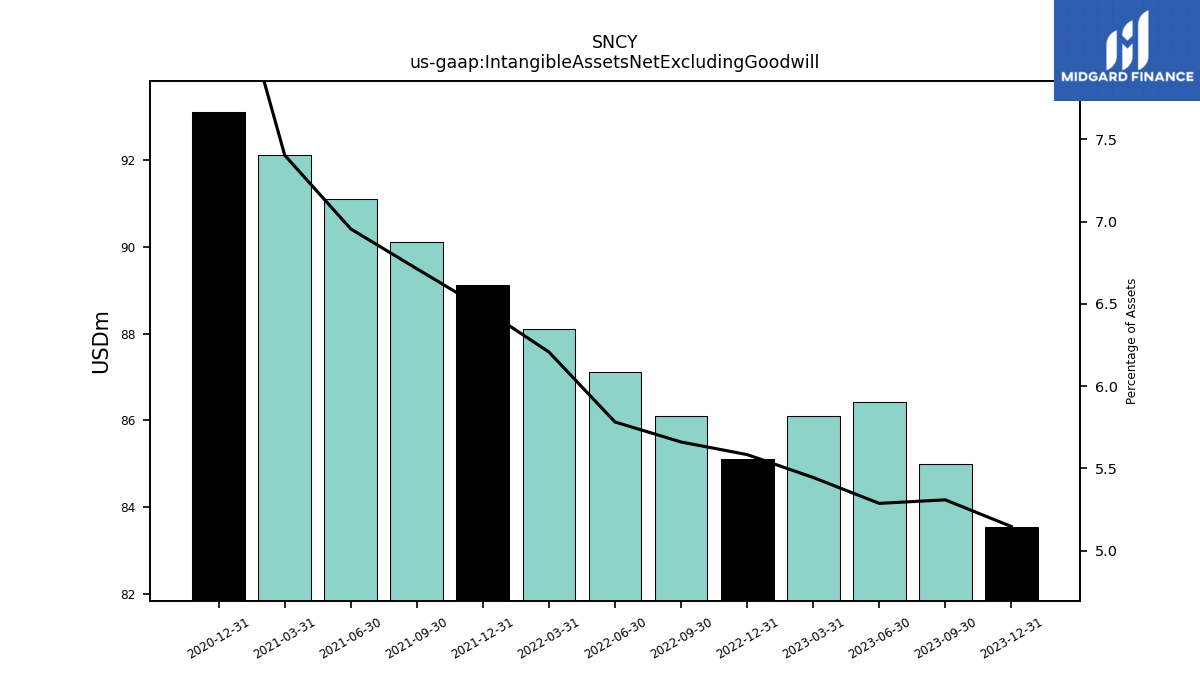
| Intangible Assets Net Excluding Goodwill | 83.55 | 84.98 | 86.42 | 86.11 | 85.11 | 86.11 | 87.11 | 88.11 | 89.11 | 90.11 | 91.11 | 92.11 | 93.11 | NA | NA | NA | |
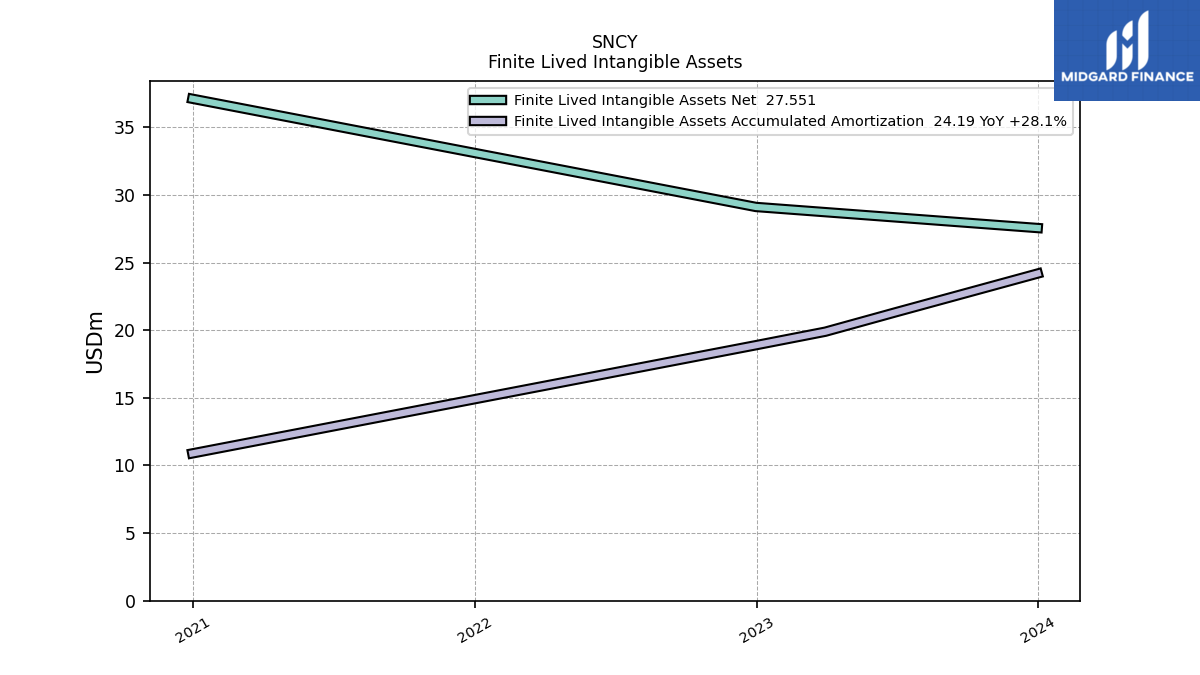
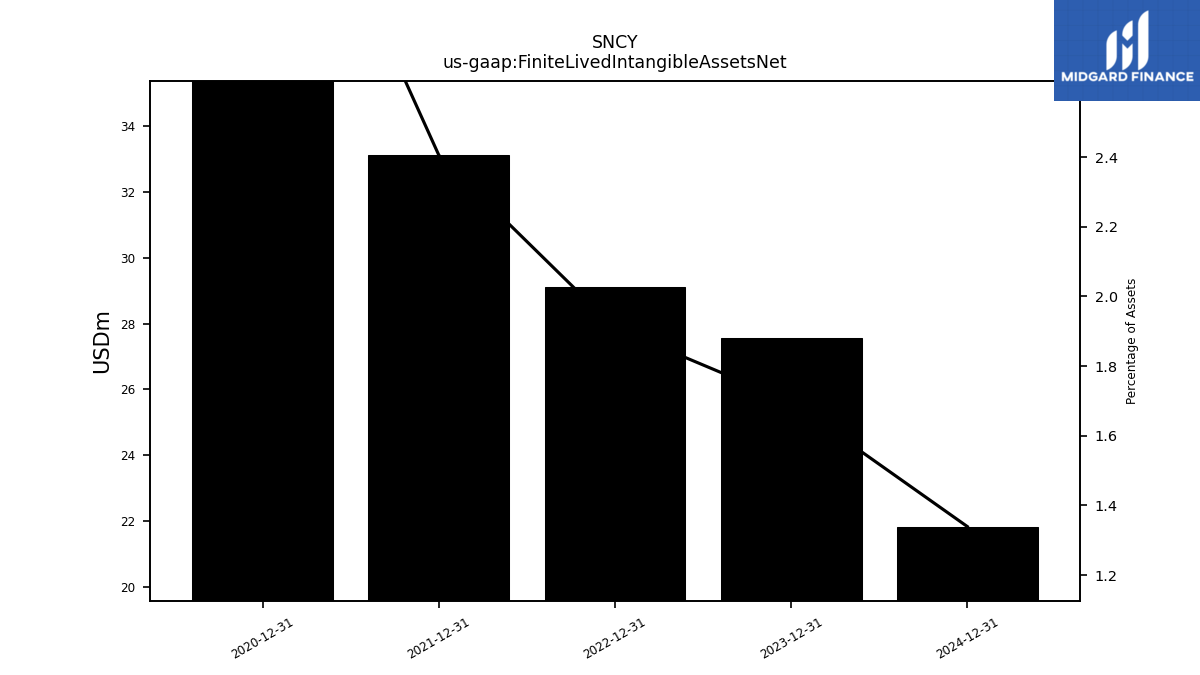
| Finite Lived Intangible Assets Net | 27.55 | NA | NA | NA | 29.11 | NA | NA | NA | 33.11 | NA | NA | NA | 37.11 | NA | NA | NA | |
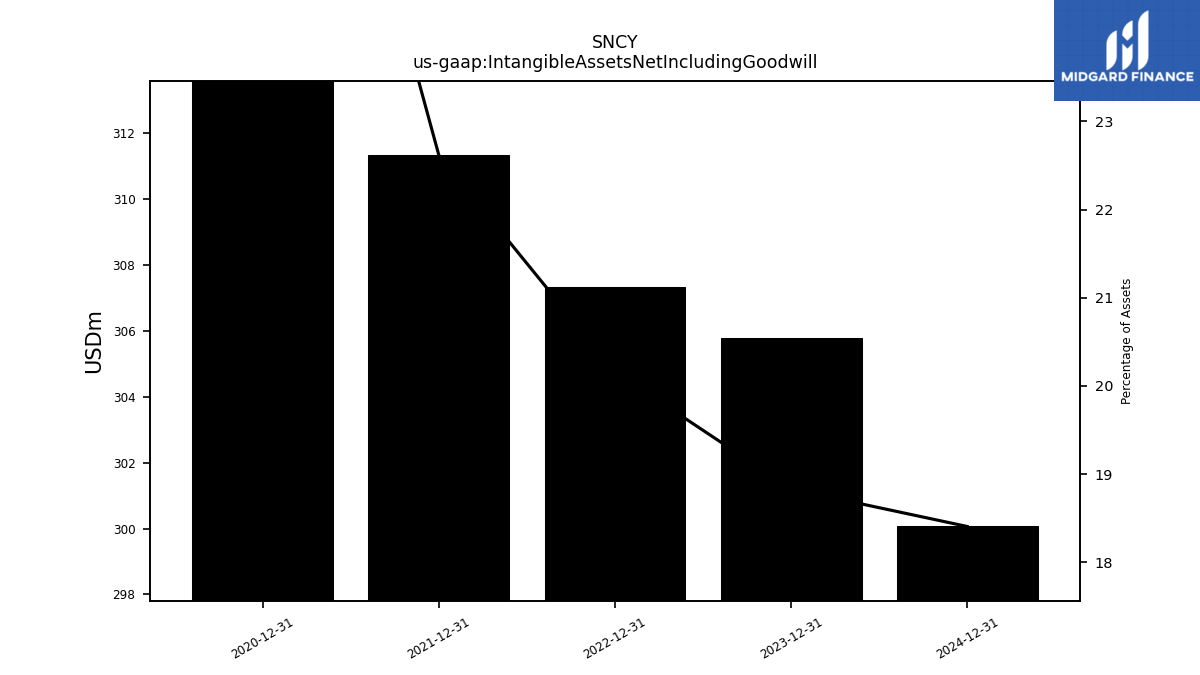
| Intangible Assets Net Including Goodwill | 305.77 | NA | NA | NA | 307.33 | NA | NA | NA | 311.33 | NA | NA | NA | 315.33 | NA | NA | NA | |
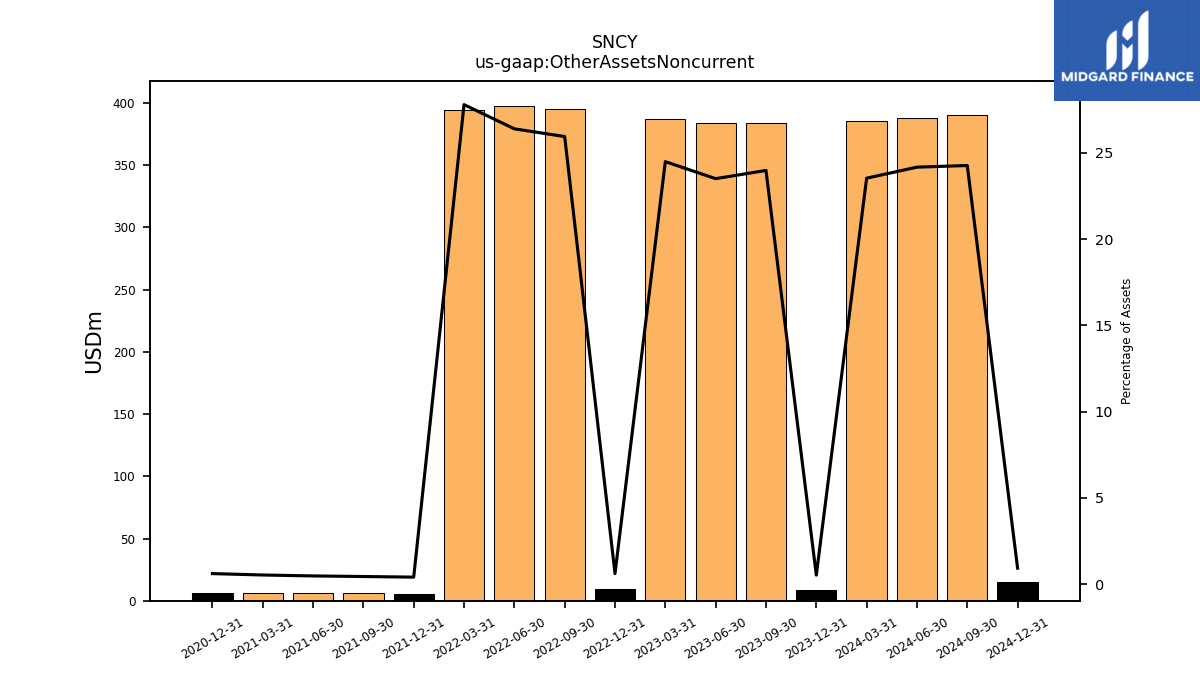
| Other Assets Noncurrent | 8.37 | 384.02 | 384.30 | 387.46 | 9.22 | 394.85 | 397.78 | 394.70 | 5.50 | 5.83 | 6.14 | 6.50 | 6.36 | NA | NA | NA |
| 2023-12-31 | 2023-09-30 | 2023-06-30 | 2023-03-31 | 2022-12-31 | 2022-09-30 | 2022-06-30 | 2022-03-31 | 2021-12-31 | 2021-09-30 | 2021-06-30 | 2021-03-31 | 2020-12-31 | 2020-09-30 | 2020-06-30 | 2020-03-31 | ||
|---|---|---|---|---|---|---|---|---|---|---|---|---|---|---|---|---|---|
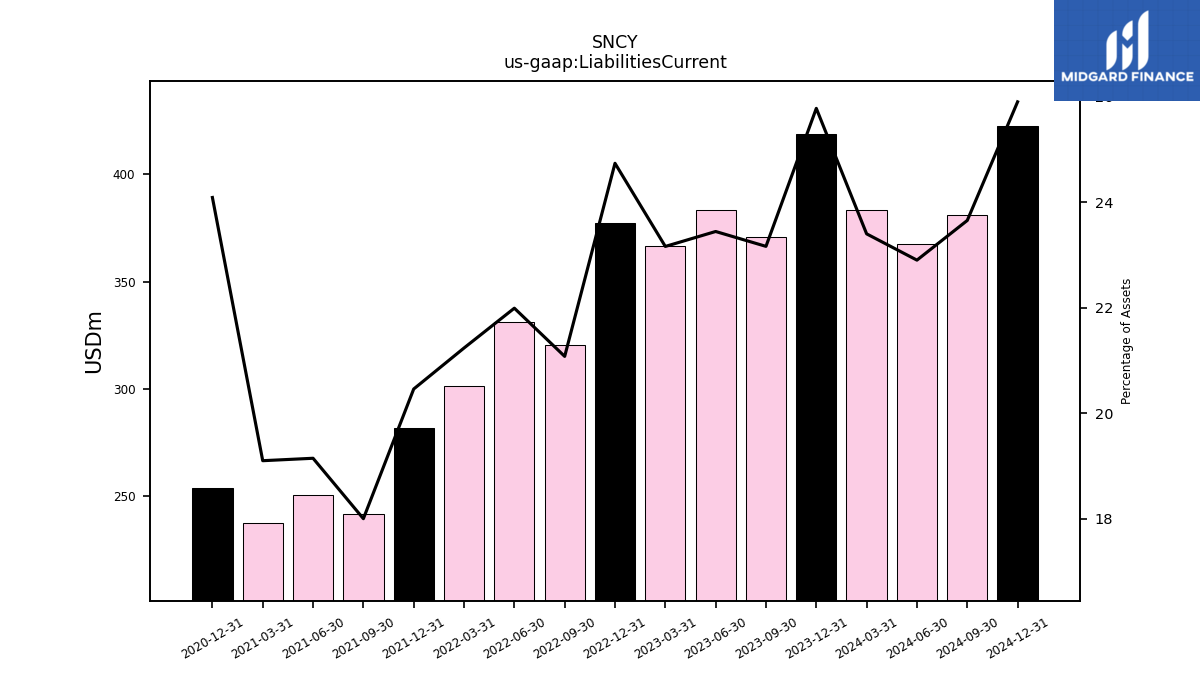
| Liabilities Current | 418.58 | 370.88 | 383.25 | 366.37 | 377.13 | 320.69 | 331.36 | 301.48 | 281.65 | 241.62 | 250.81 | 237.64 | 253.74 | NA | NA | NA | |
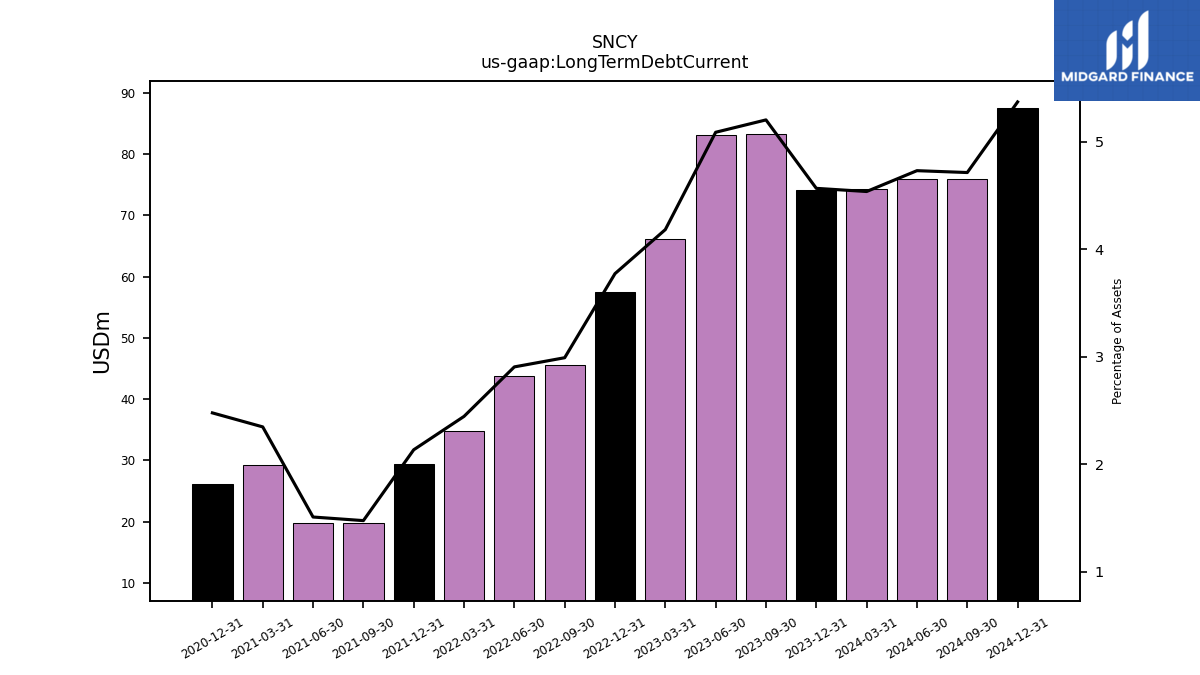
| Long Term Debt Current | 74.18 | 83.34 | 83.20 | 66.19 | 57.55 | 45.53 | 43.81 | 34.74 | 29.41 | 19.84 | 19.80 | 29.23 | 26.12 | NA | NA | NA | |
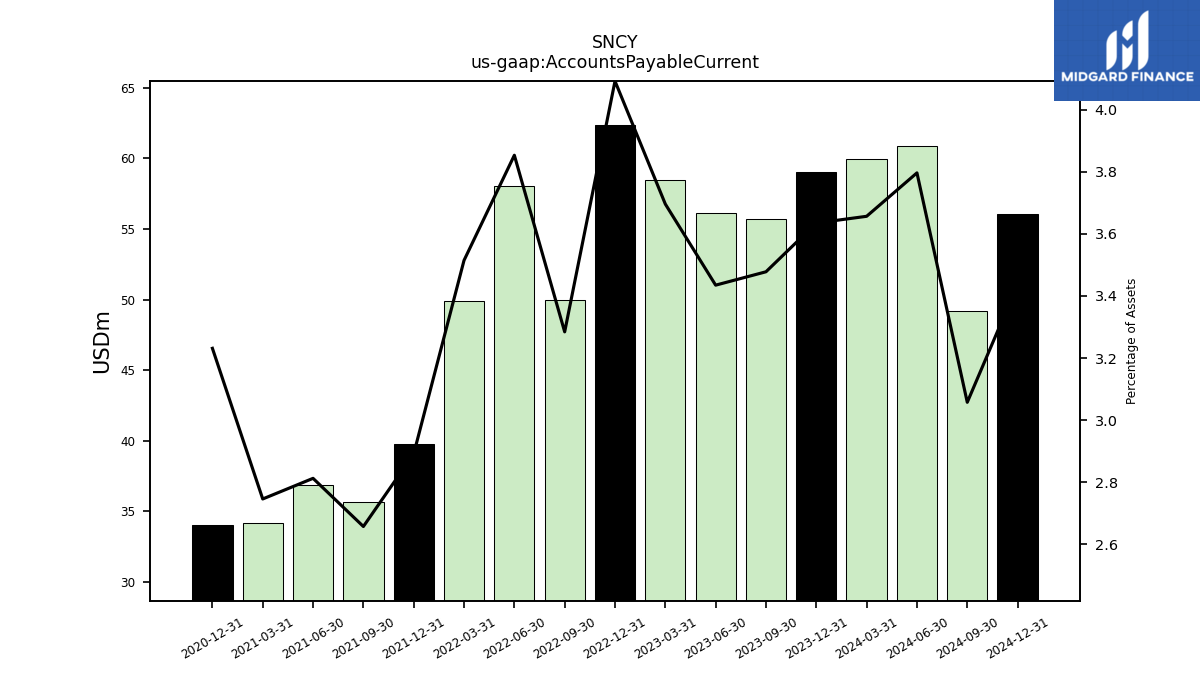
| Accounts Payable Current | 59.01 | 55.68 | 56.14 | 58.45 | 62.37 | 49.97 | 58.05 | 49.89 | 39.80 | 35.68 | 36.85 | 34.17 | 34.03 | NA | NA | NA | |
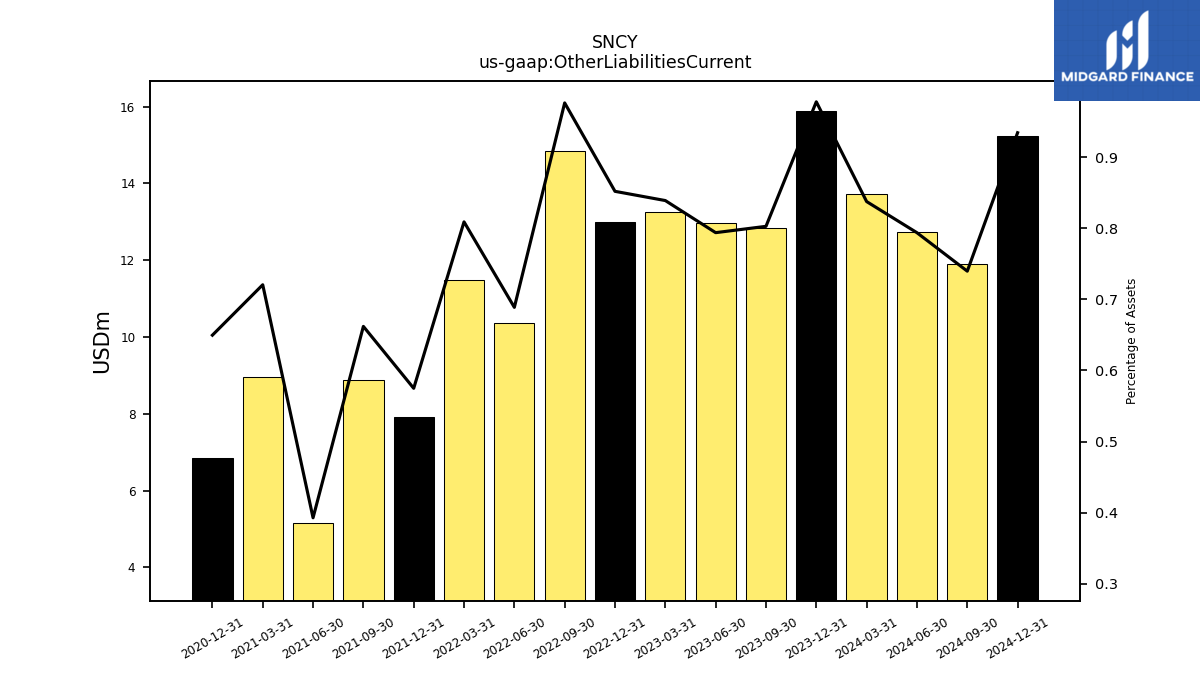
| Other Liabilities Current | 15.87 | 12.85 | 12.97 | 13.27 | 12.98 | 14.85 | 10.38 | 11.48 | 7.91 | 8.88 | 5.14 | 8.96 | 6.84 | NA | NA | NA |
| 2023-12-31 | 2023-09-30 | 2023-06-30 | 2023-03-31 | 2022-12-31 | 2022-09-30 | 2022-06-30 | 2022-03-31 | 2021-12-31 | 2021-09-30 | 2021-06-30 | 2021-03-31 | 2020-12-31 | 2020-09-30 | 2020-06-30 | 2020-03-31 | ||
|---|---|---|---|---|---|---|---|---|---|---|---|---|---|---|---|---|---|
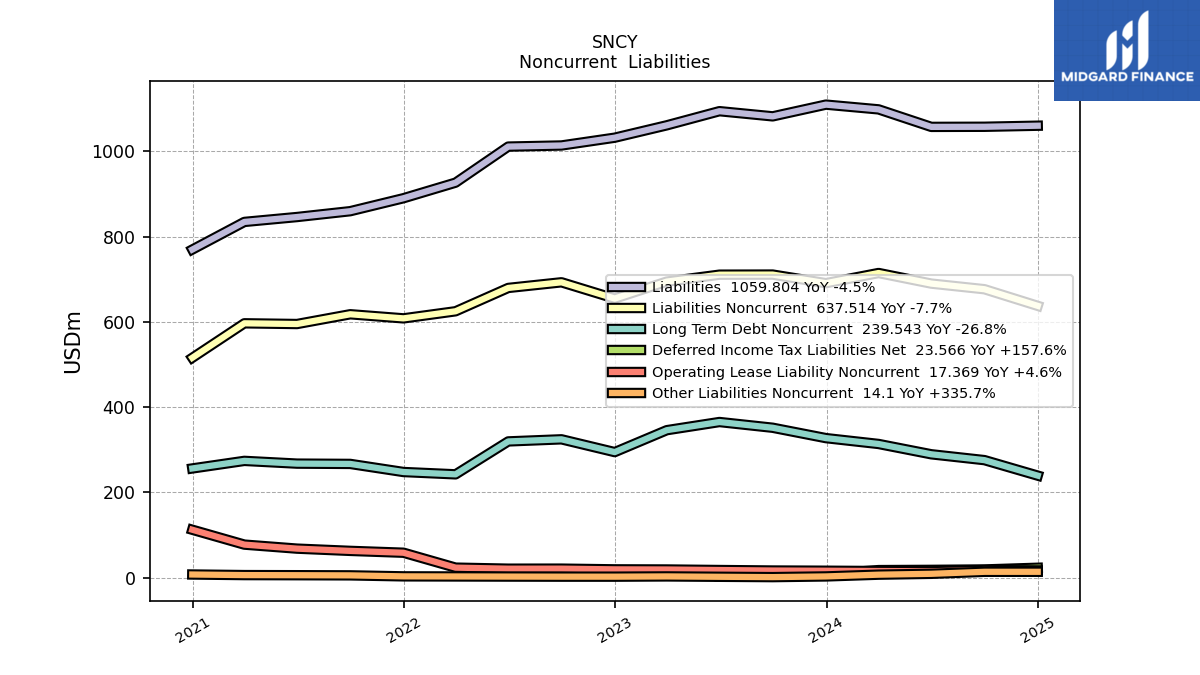
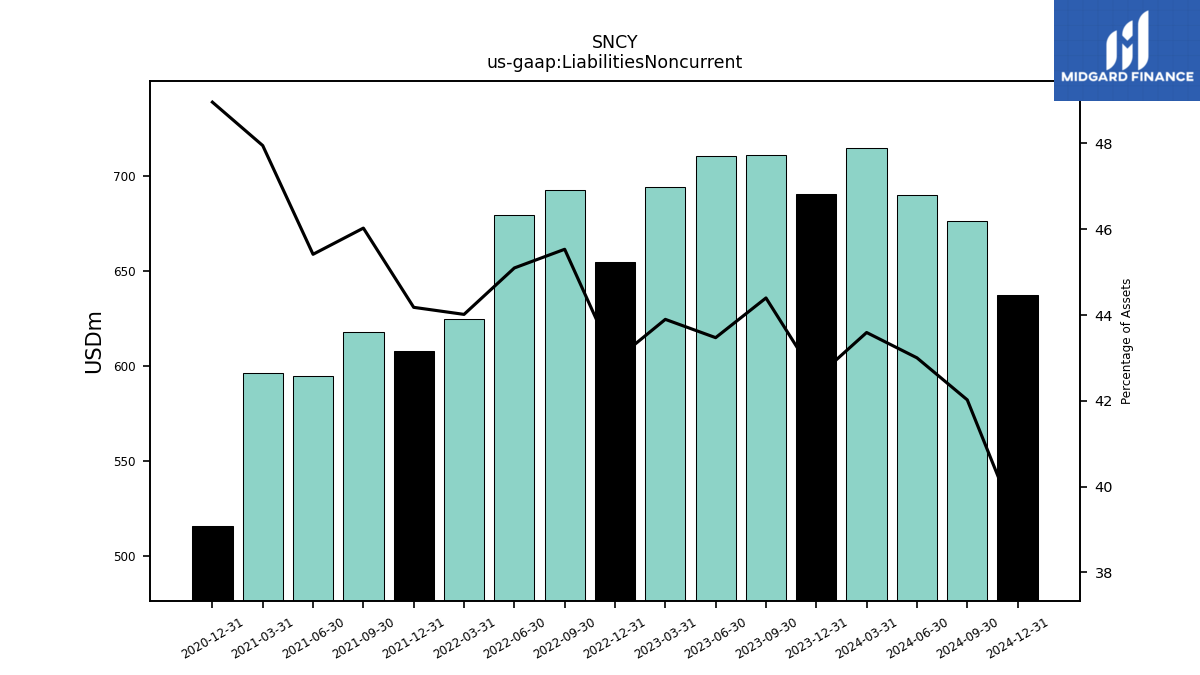
| Liabilities Noncurrent | 690.64 | 710.83 | 710.60 | 694.35 | 654.57 | 692.75 | 679.49 | 624.83 | 608.18 | 617.81 | 594.92 | 596.60 | 515.71 | NA | NA | NA | |
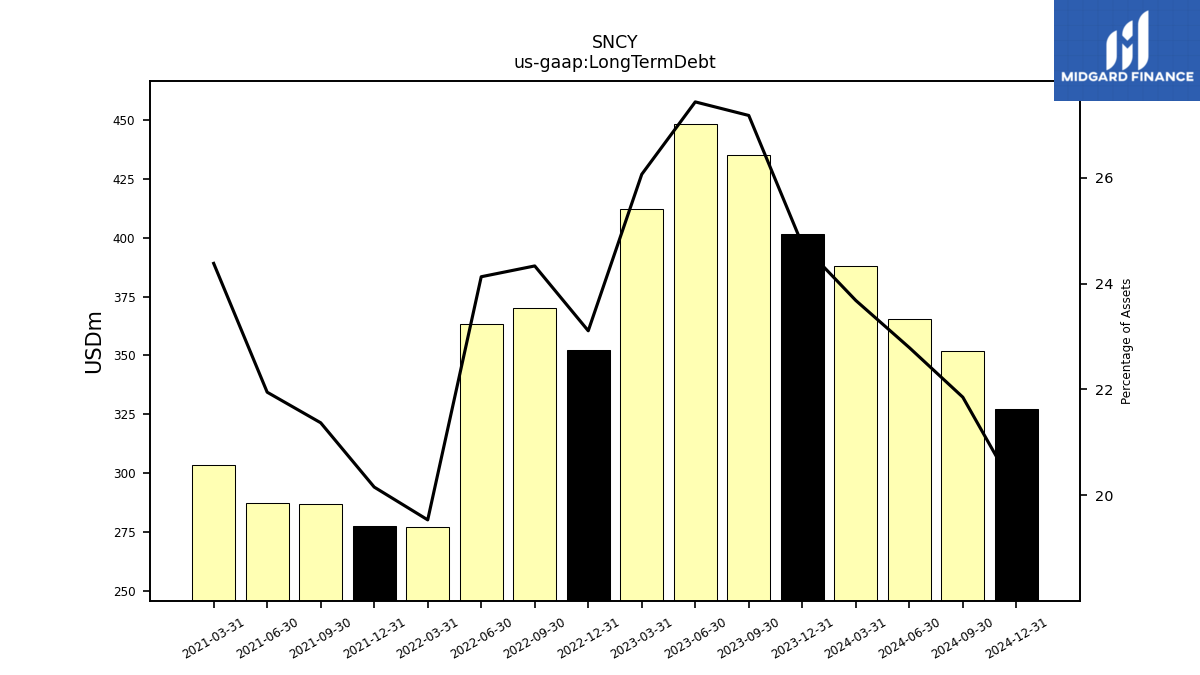
| Long Term Debt | 401.64 | 435.11 | 448.42 | 412.26 | 352.24 | 370.20 | 363.54 | 277.29 | 277.43 | 286.82 | 287.48 | 303.34 | NA | NA | NA | NA | |
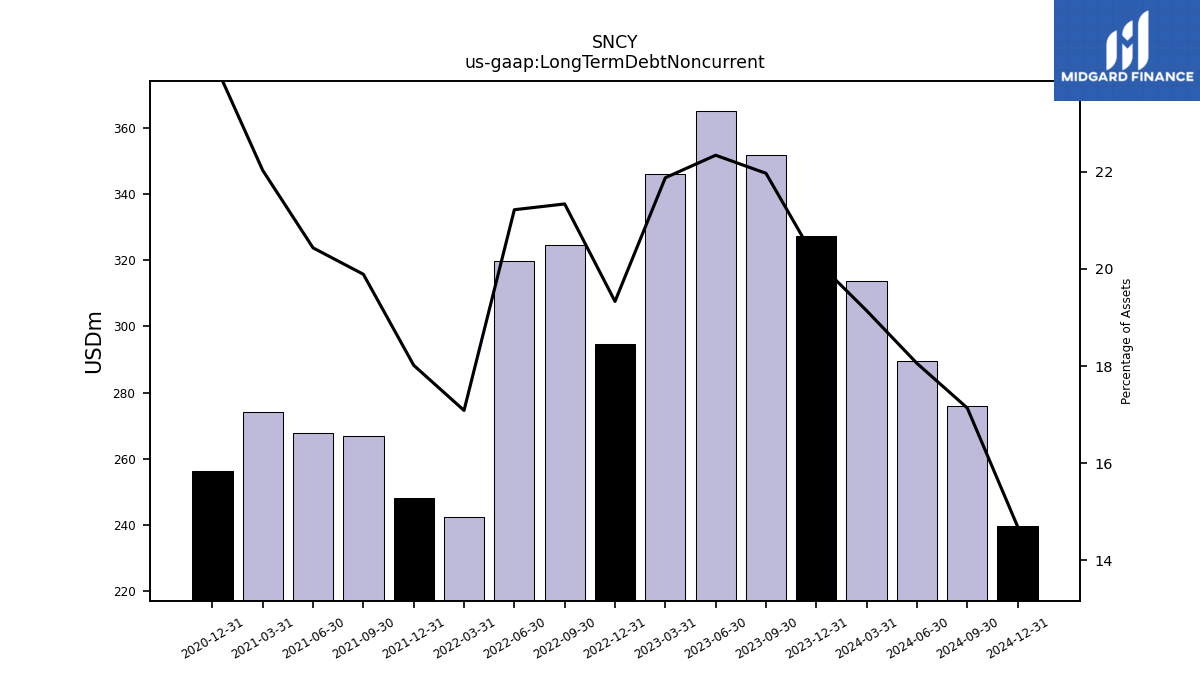
| Long Term Debt Noncurrent | 327.47 | 351.77 | 365.21 | 346.06 | 294.69 | 324.66 | 319.73 | 242.54 | 248.01 | 266.99 | 267.68 | 274.11 | 256.35 | NA | NA | NA | |
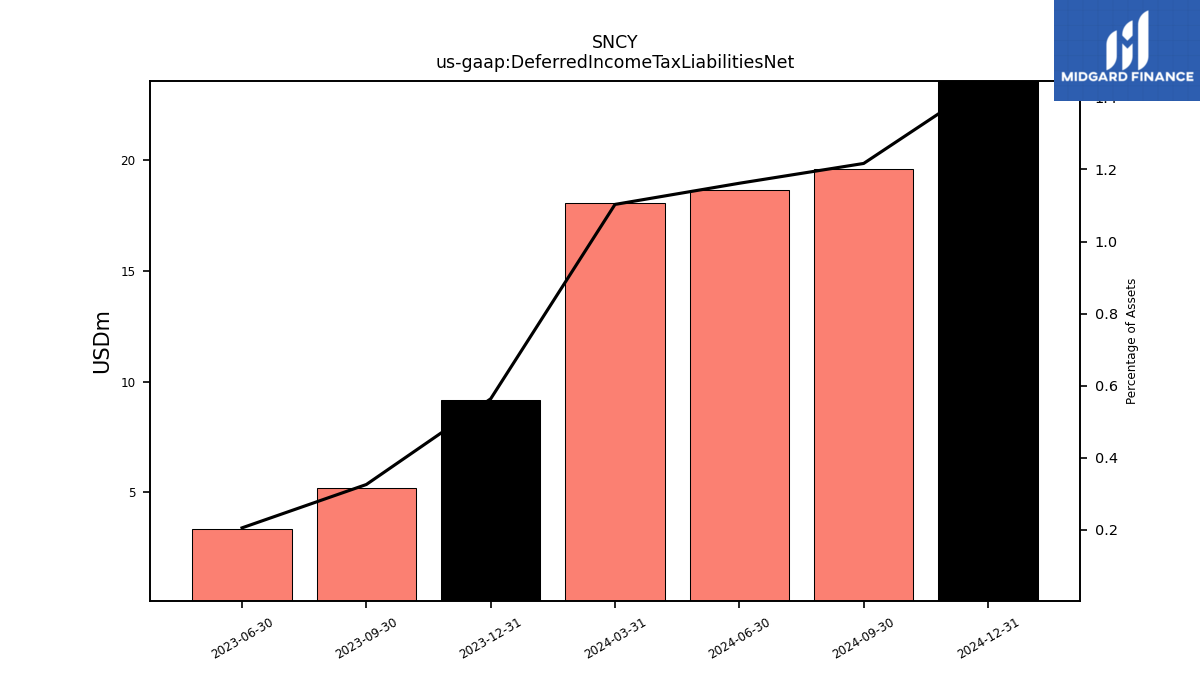
| Deferred Income Tax Liabilities Net | 9.15 | 5.21 | 3.36 | NA | NA | NA | NA | NA | NA | NA | NA | NA | NA | NA | NA | NA | |
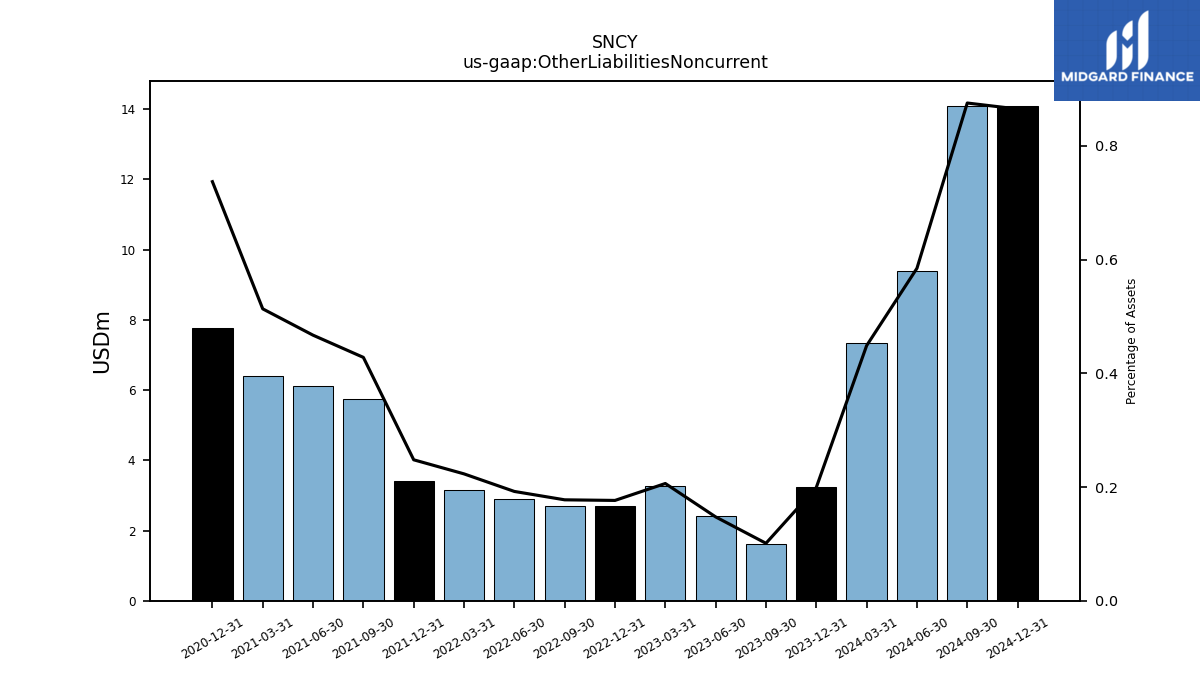
| Other Liabilities Noncurrent | 3.24 | 1.62 | 2.41 | 3.26 | 2.69 | 2.70 | 2.90 | 3.17 | 3.41 | 5.75 | 6.12 | 6.39 | 7.76 | NA | NA | NA | |
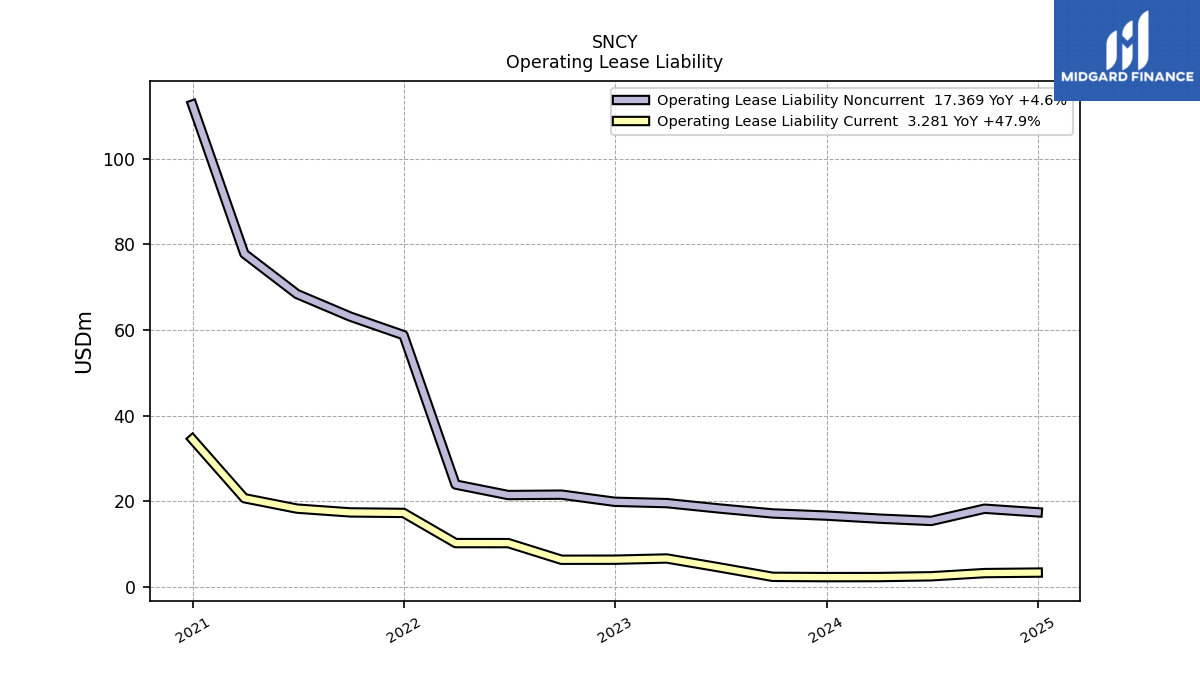
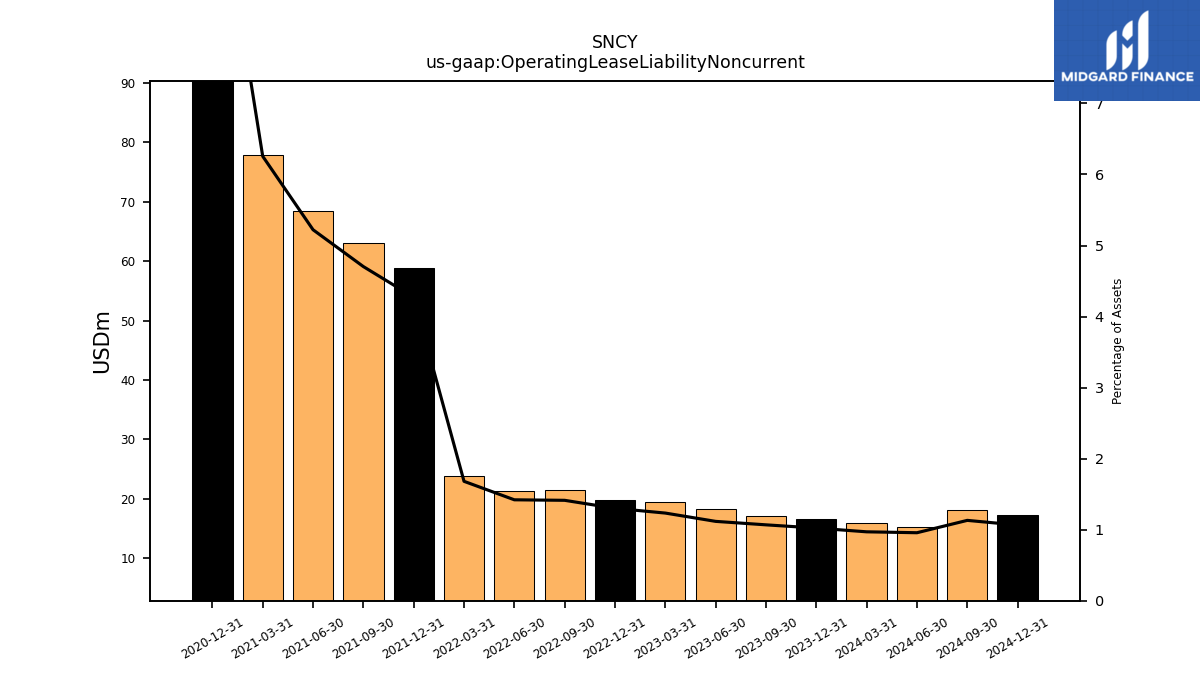
| Operating Lease Liability Noncurrent | 16.61 | 17.11 | 18.26 | 19.52 | 19.84 | 21.51 | 21.41 | 23.86 | 58.81 | 63.14 | 68.41 | 77.84 | 112.71 | NA | NA | NA |
| 2023-12-31 | 2023-09-30 | 2023-06-30 | 2023-03-31 | 2022-12-31 | 2022-09-30 | 2022-06-30 | 2022-03-31 | 2021-12-31 | 2021-09-30 | 2021-06-30 | 2021-03-31 | 2020-12-31 | 2020-09-30 | 2020-06-30 | 2020-03-31 | ||
|---|---|---|---|---|---|---|---|---|---|---|---|---|---|---|---|---|---|
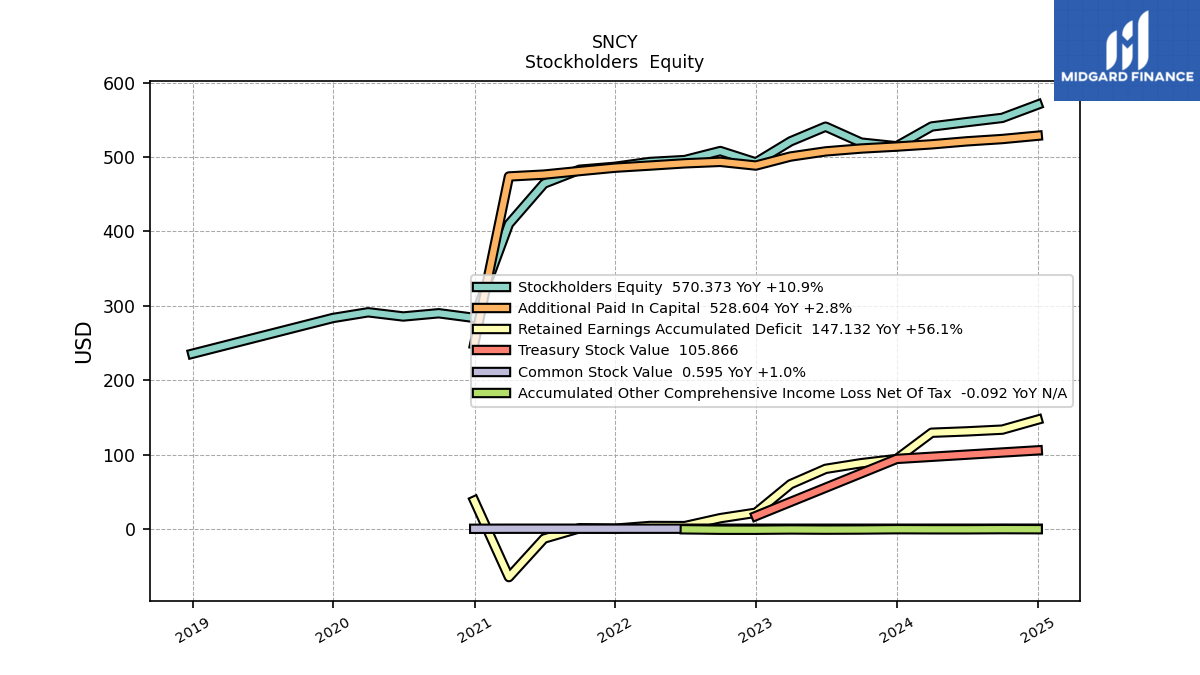
| Stockholders Equity | 514.40 | 519.36 | 540.76 | 521.01 | 492.71 | 508.00 | 495.89 | 493.29 | 486.81 | 482.88 | 464.23 | 409.96 | 283.82 | 290.07 | 285.71 | 291.37 | |
| Common Stock Value | 0.59 | 0.59 | 0.59 | 0.58 | 0.58 | 0.58 | 0.58 | 0.58 | 0.58 | 0.58 | 0.57 | 0.57 | 0.47 | NA | NA | NA | |
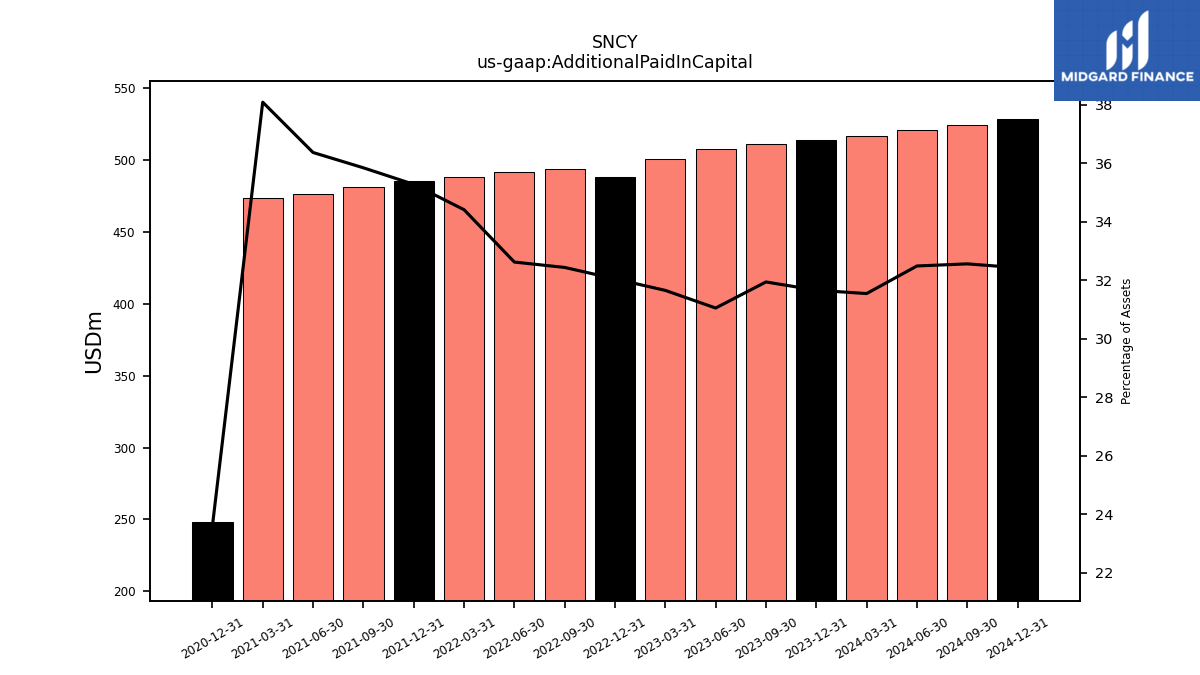
| Additional Paid In Capital | 513.99 | 511.38 | 507.52 | 500.63 | 488.49 | 493.49 | 491.49 | 488.48 | 485.64 | 481.11 | 476.37 | 473.85 | 248.53 | NA | NA | NA | |
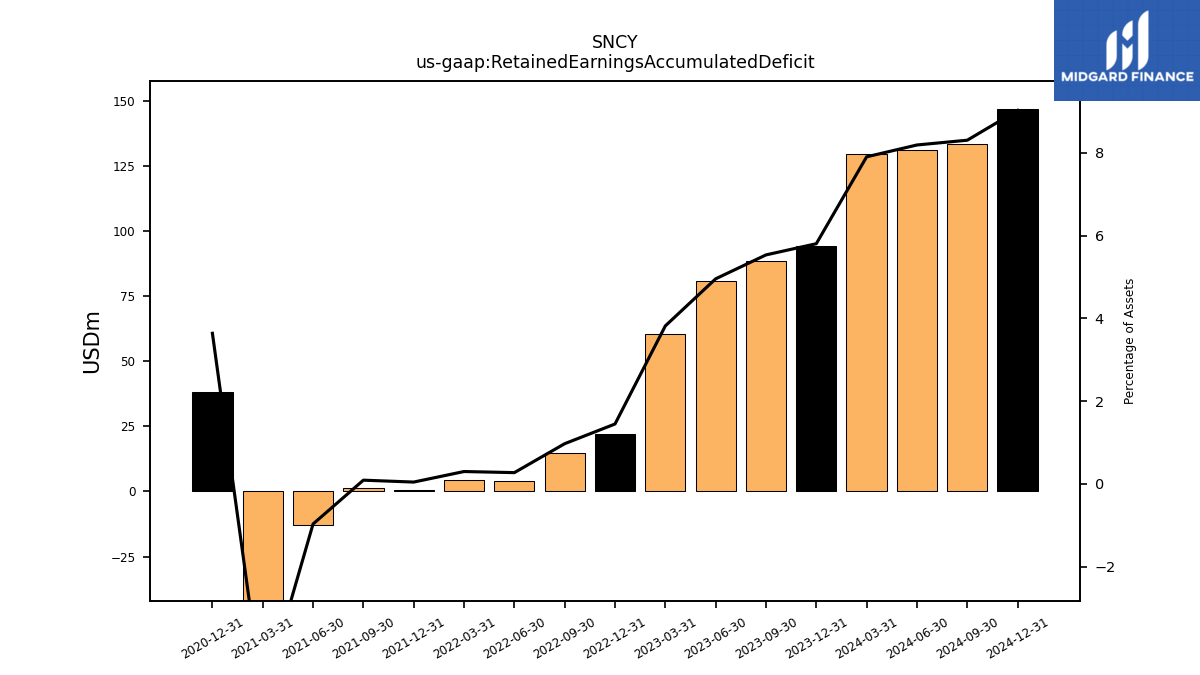
| Retained Earnings Accumulated Deficit | 94.23 | 88.58 | 80.99 | 60.38 | 22.05 | 14.76 | 4.09 | 4.23 | 0.59 | 1.20 | -12.71 | -64.46 | 38.32 | NA | NA | NA | |
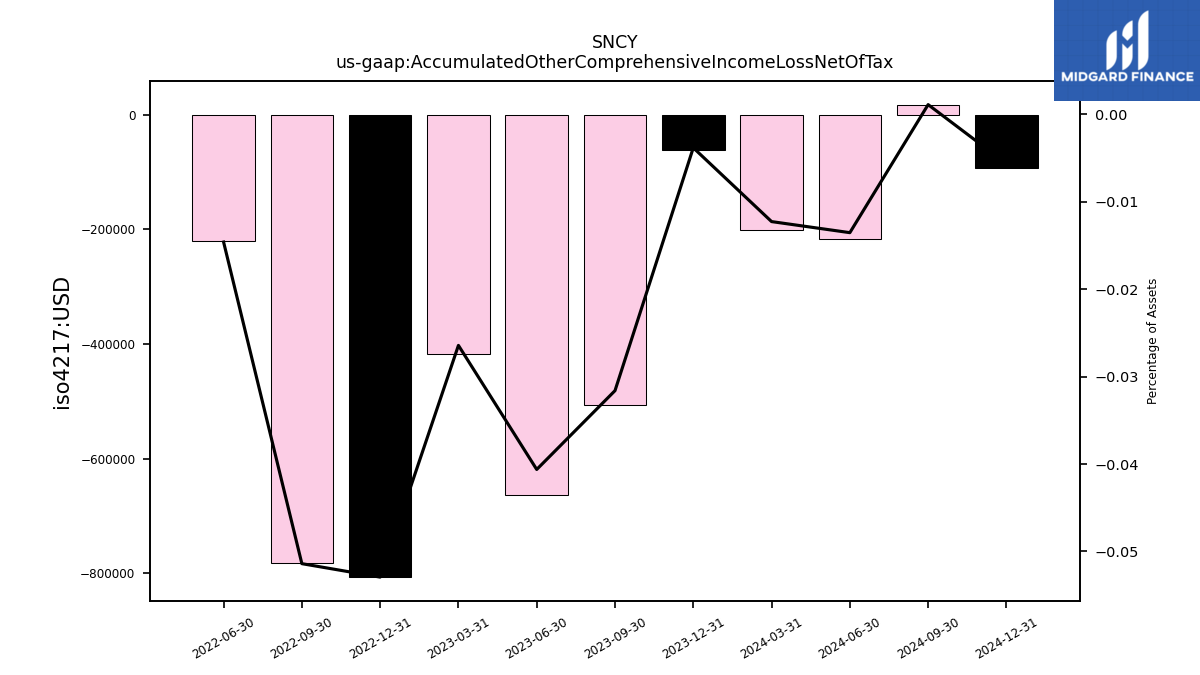
| Accumulated Other Comprehensive Income Loss Net Of Tax | -0.06 | -0.51 | -0.66 | -0.42 | -0.81 | -0.78 | -0.22 | NA | NA | NA | NA | NA | NA | NA | NA | NA | |
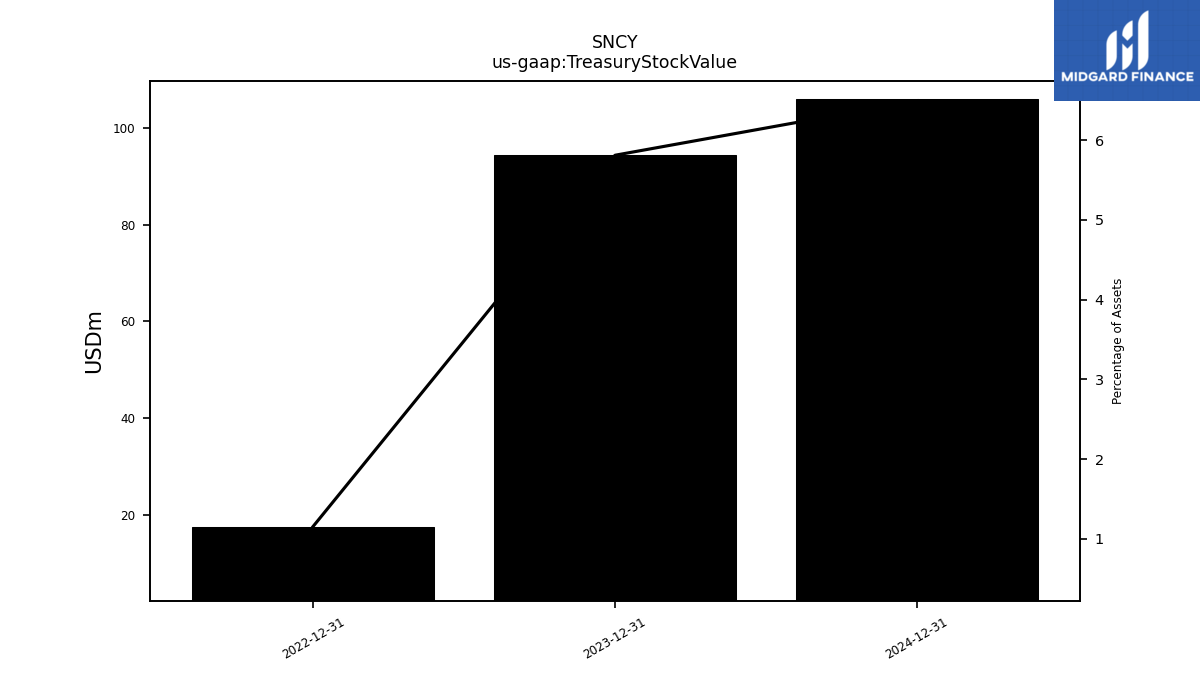
| Treasury Stock Value | 94.34 | NA | NA | NA | 17.61 | NA | NA | NA | NA | NA | NA | NA | NA | NA | NA | NA |
| 2023-12-31 | 2023-09-30 | 2023-06-30 | 2023-03-31 | 2022-12-31 | 2022-09-30 | 2022-06-30 | 2022-03-31 | 2021-12-31 | 2021-09-30 | 2021-06-30 | 2021-03-31 | 2020-12-31 | 2020-09-30 | 2020-06-30 | 2020-03-31 | ||
|---|---|---|---|---|---|---|---|---|---|---|---|---|---|---|---|---|---|
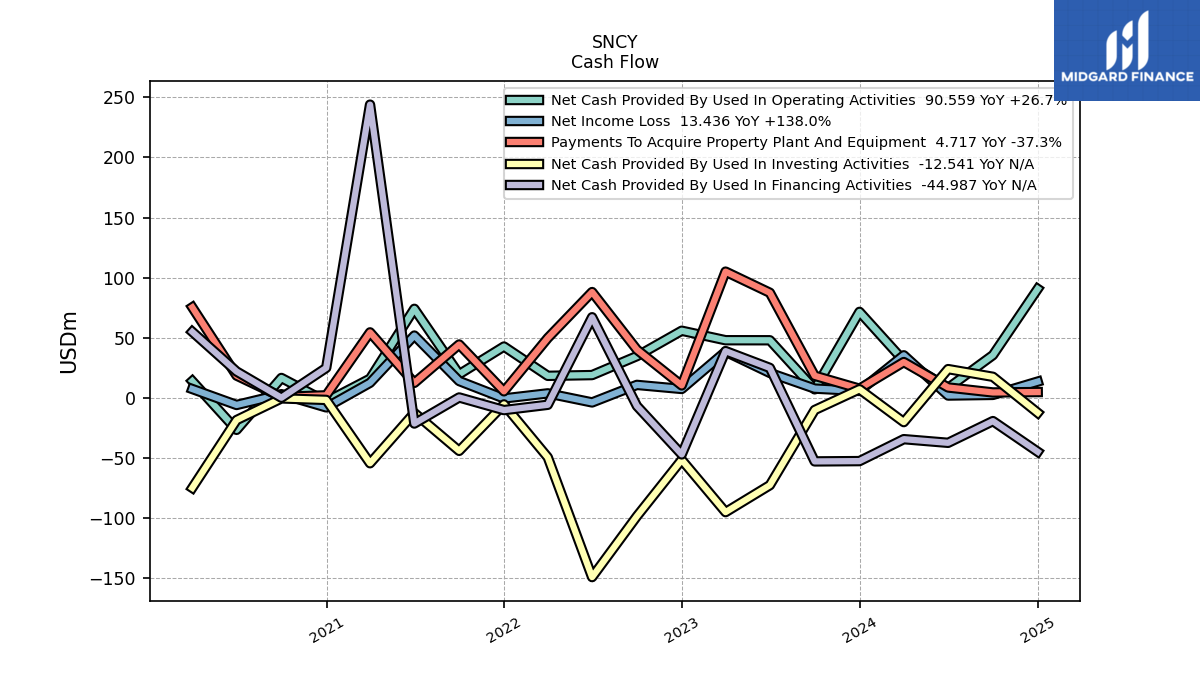
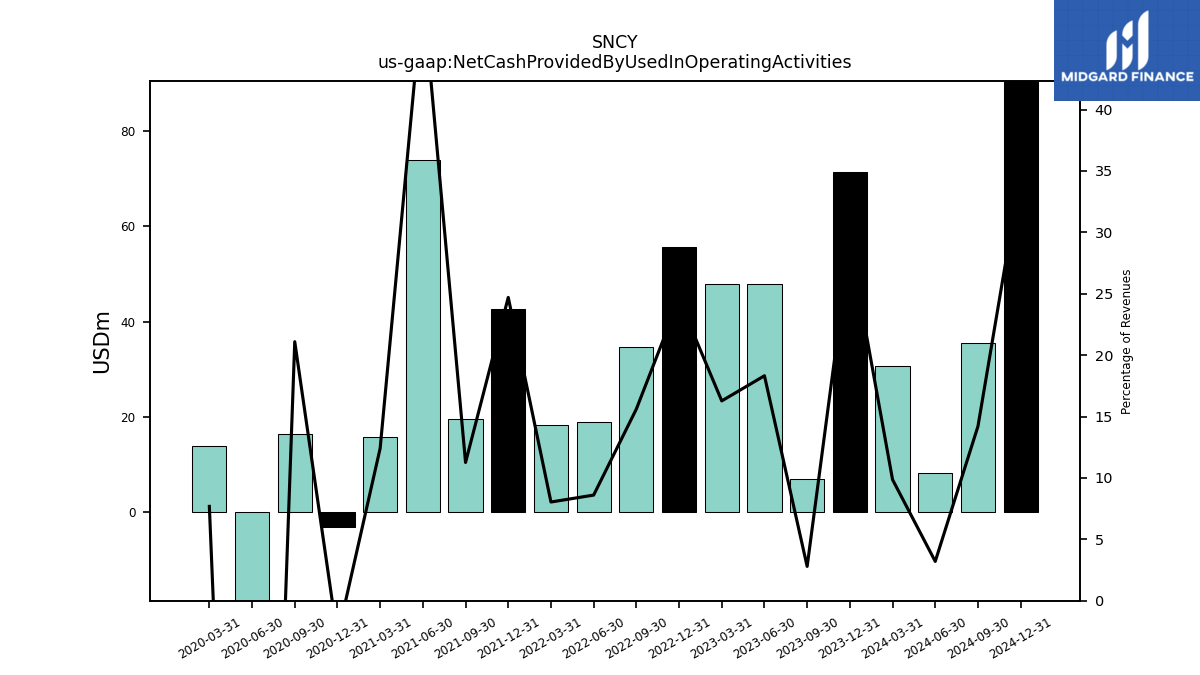
| Net Cash Provided By Used In Operating Activities | 71.47 | 6.96 | 47.83 | 47.86 | 55.77 | 34.61 | 18.85 | 18.21 | 42.62 | 19.55 | 74.00 | 15.84 | -3.18 | 16.45 | -26.75 | 13.86 | |
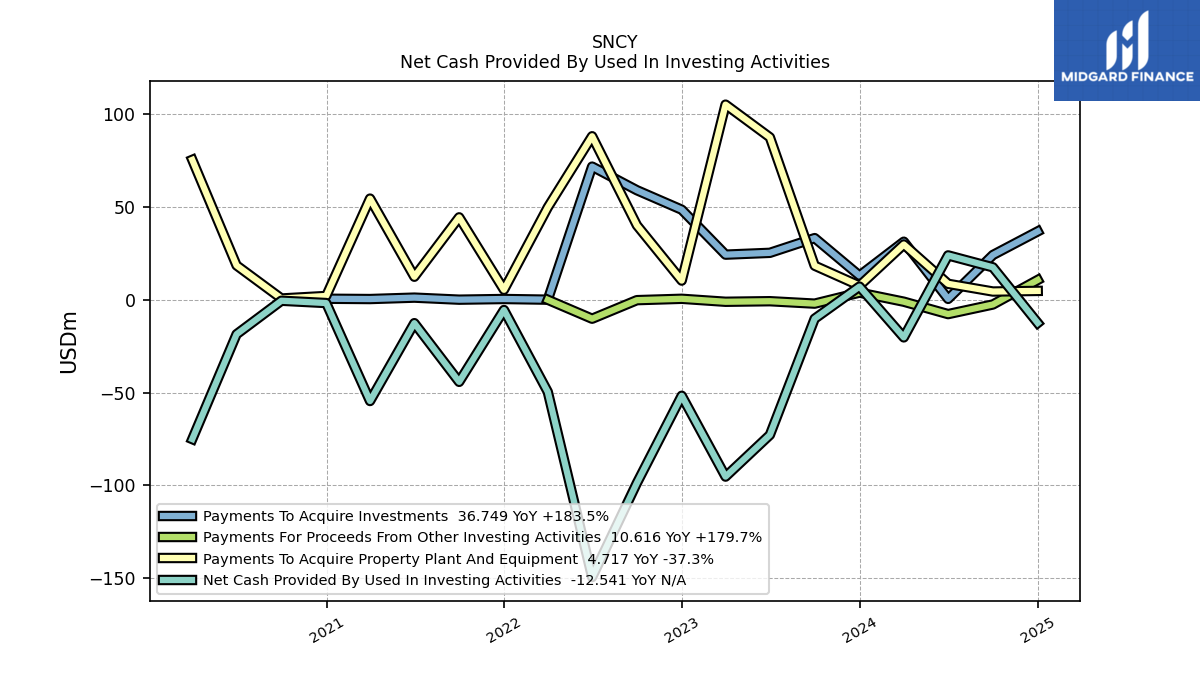
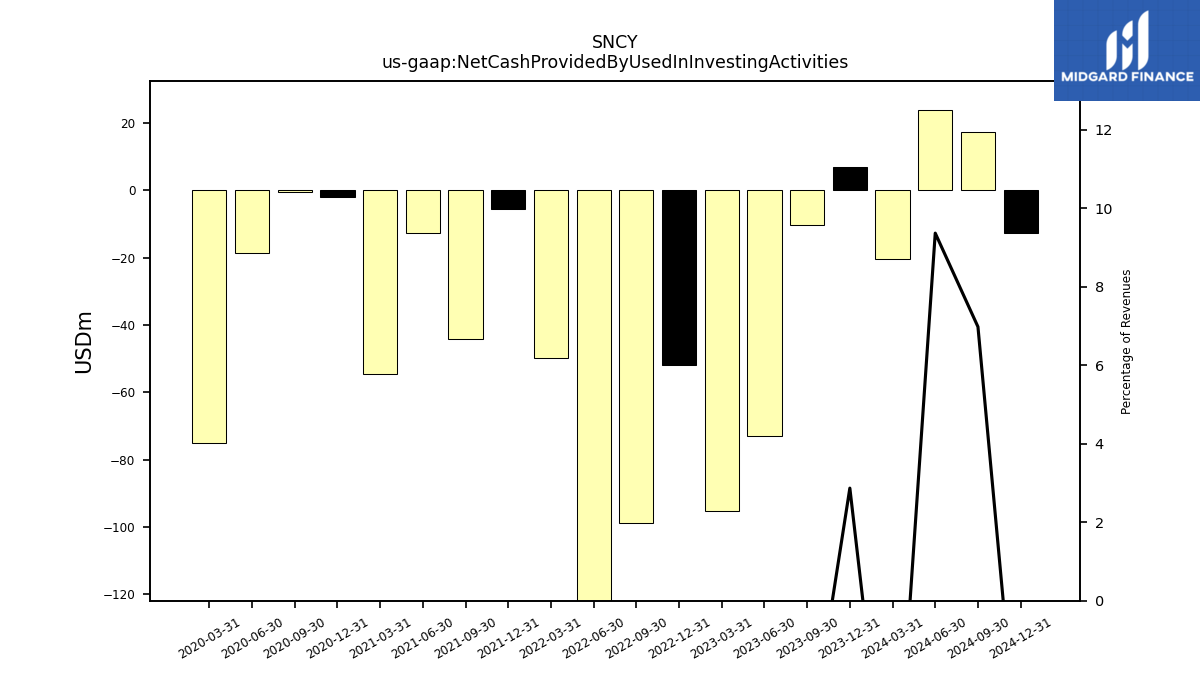
| Net Cash Provided By Used In Investing Activities | 7.05 | -10.24 | -72.80 | -95.24 | -51.72 | -98.65 | -149.33 | -49.63 | -5.55 | -44.24 | -12.64 | -54.55 | -1.82 | -0.57 | -18.59 | -75.05 | |
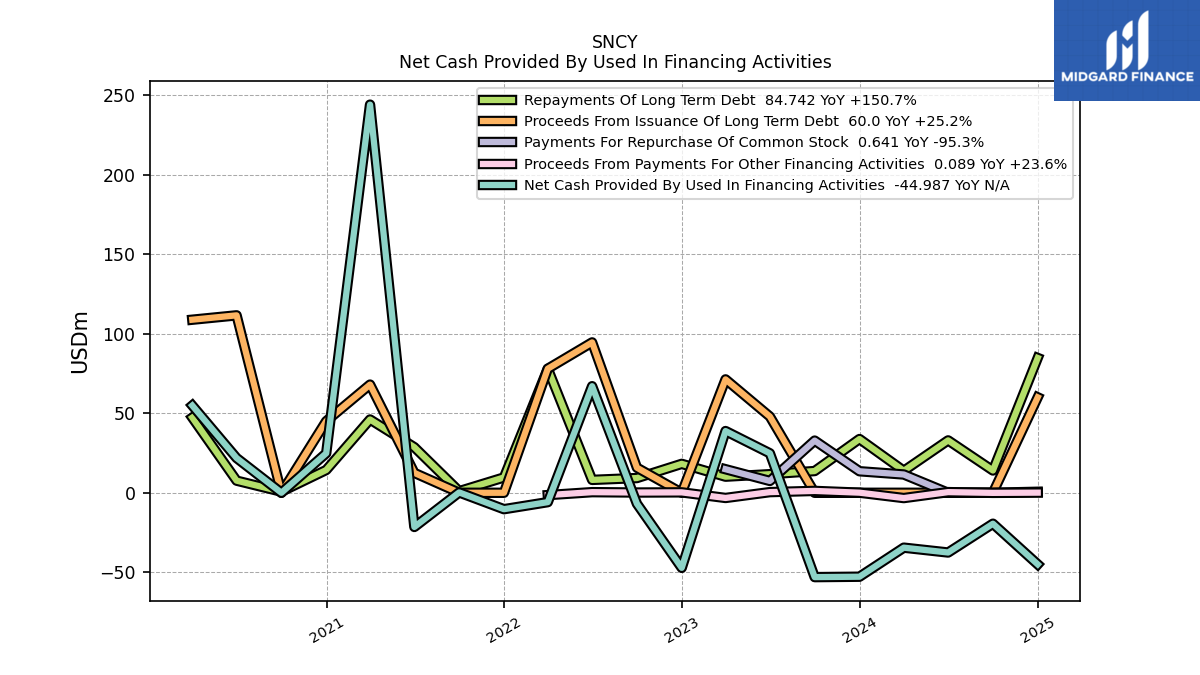
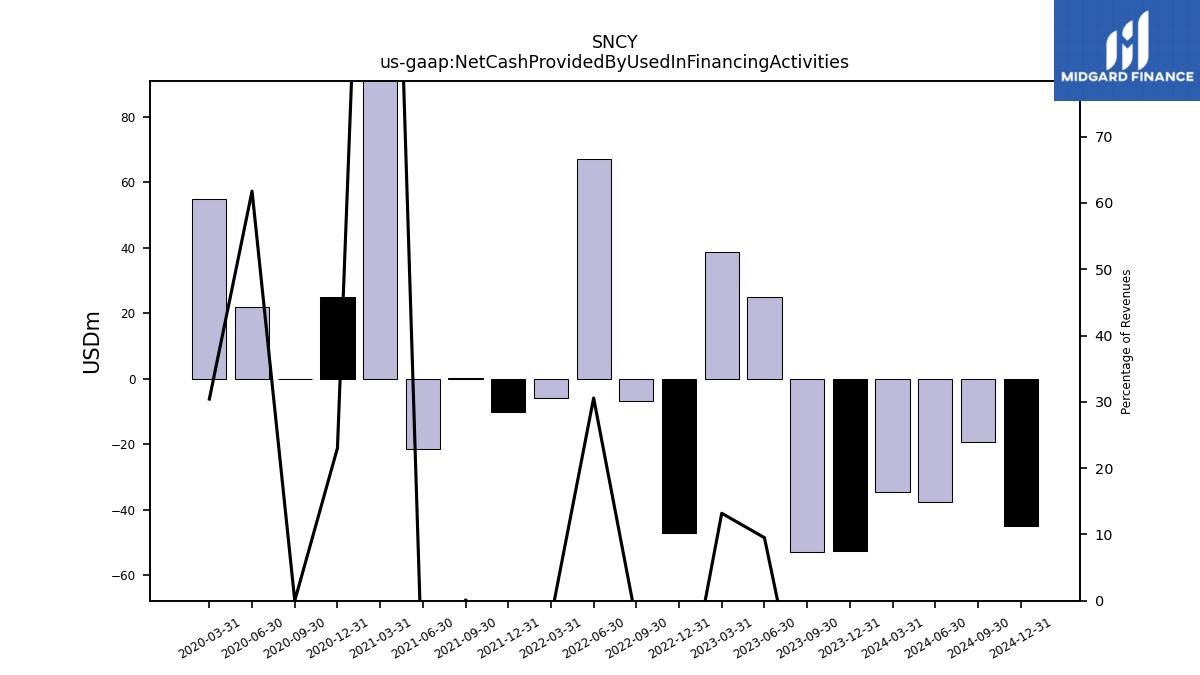
| Net Cash Provided By Used In Financing Activities | -52.76 | -53.01 | 24.82 | 38.81 | -47.20 | -6.88 | 66.99 | -5.88 | -10.31 | 0.23 | -21.50 | 243.97 | 24.83 | 0.00 | 21.85 | 54.85 |
| 2023-12-31 | 2023-09-30 | 2023-06-30 | 2023-03-31 | 2022-12-31 | 2022-09-30 | 2022-06-30 | 2022-03-31 | 2021-12-31 | 2021-09-30 | 2021-06-30 | 2021-03-31 | 2020-12-31 | 2020-09-30 | 2020-06-30 | 2020-03-31 | ||
|---|---|---|---|---|---|---|---|---|---|---|---|---|---|---|---|---|---|
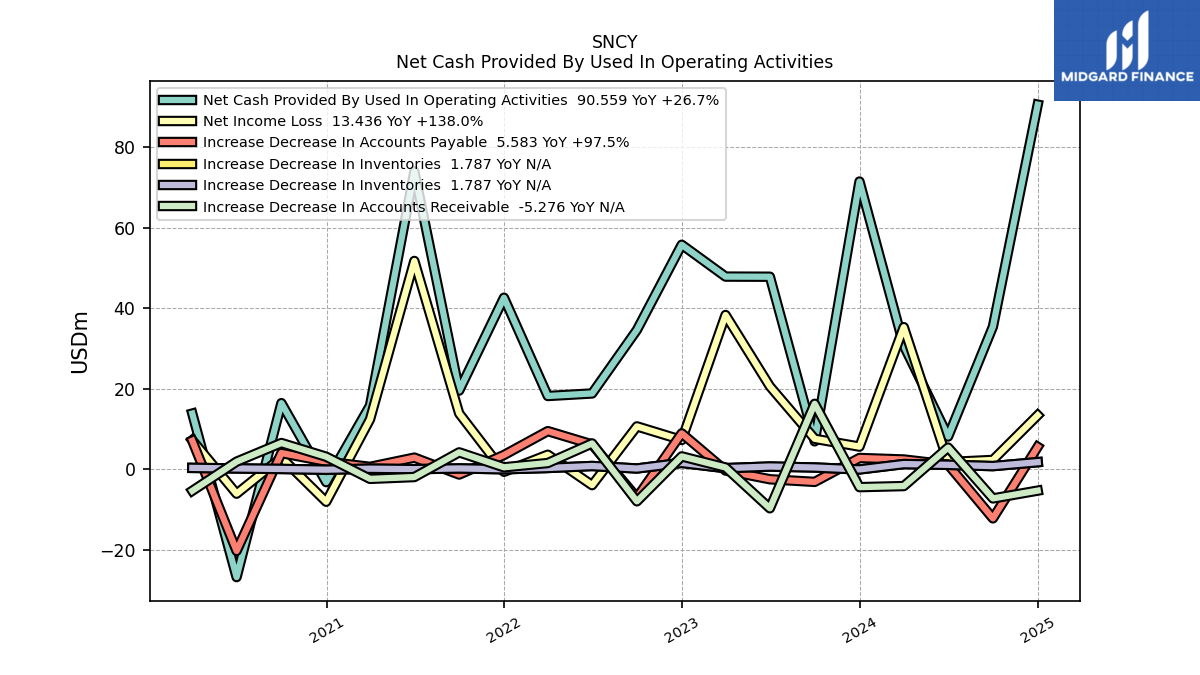
| Net Cash Provided By Used In Operating Activities | 71.47 | 6.96 | 47.83 | 47.86 | 55.77 | 34.61 | 18.85 | 18.21 | 42.62 | 19.55 | 74.00 | 15.84 | -3.18 | 16.45 | -26.75 | 13.86 | |
| Net Income Loss | 5.64 | 7.59 | 20.62 | 38.33 | 7.28 | 10.68 | -3.92 | 3.64 | -0.60 | 13.90 | 51.75 | 12.42 | -8.04 | 2.93 | -6.04 | 7.25 | |
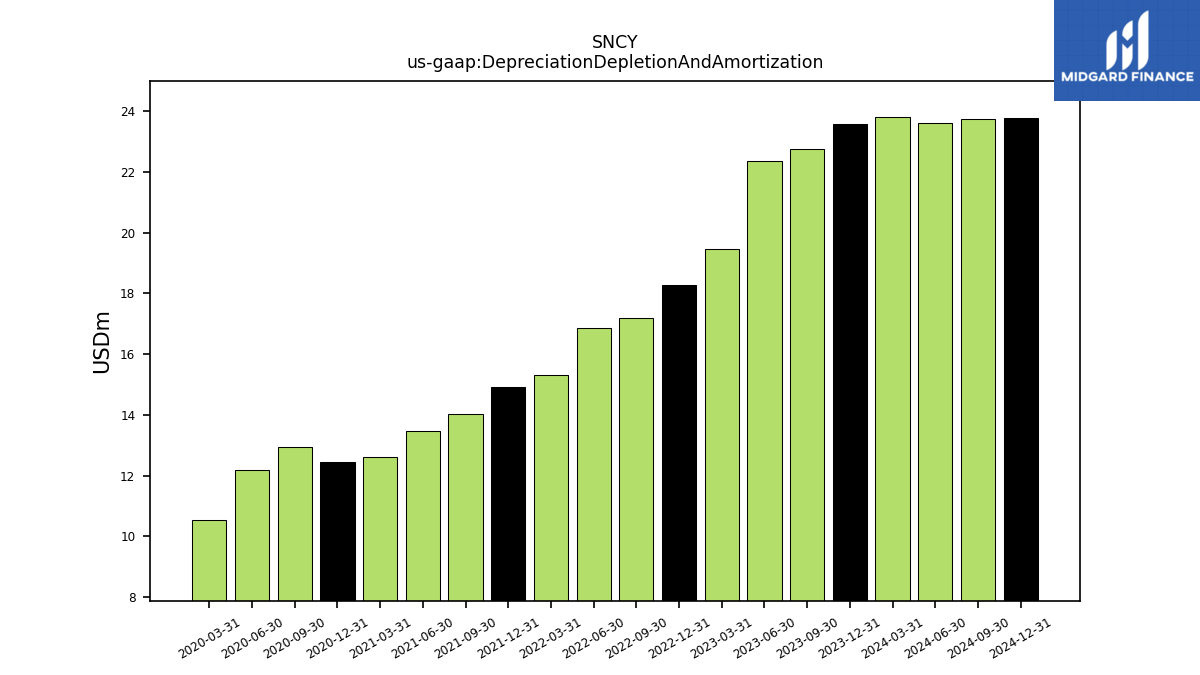
| Depreciation Depletion And Amortization | 23.57 | 22.76 | 22.36 | 19.46 | 18.28 | 17.18 | 16.85 | 15.33 | 14.92 | 14.03 | 13.46 | 12.62 | 12.46 | 12.93 | 12.18 | 10.53 | |
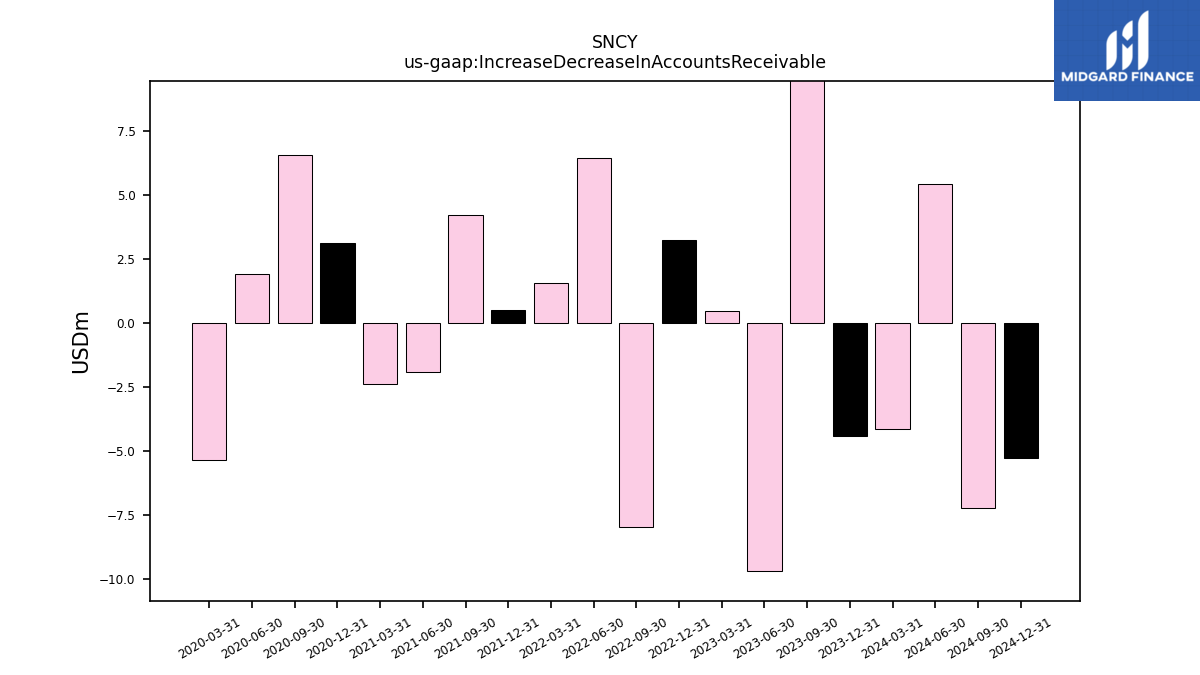
| Increase Decrease In Accounts Receivable | -4.42 | 16.28 | -9.67 | 0.47 | 3.22 | -7.93 | 6.45 | 1.58 | 0.52 | 4.23 | -1.91 | -2.36 | 3.14 | 6.55 | 1.92 | -5.32 | |
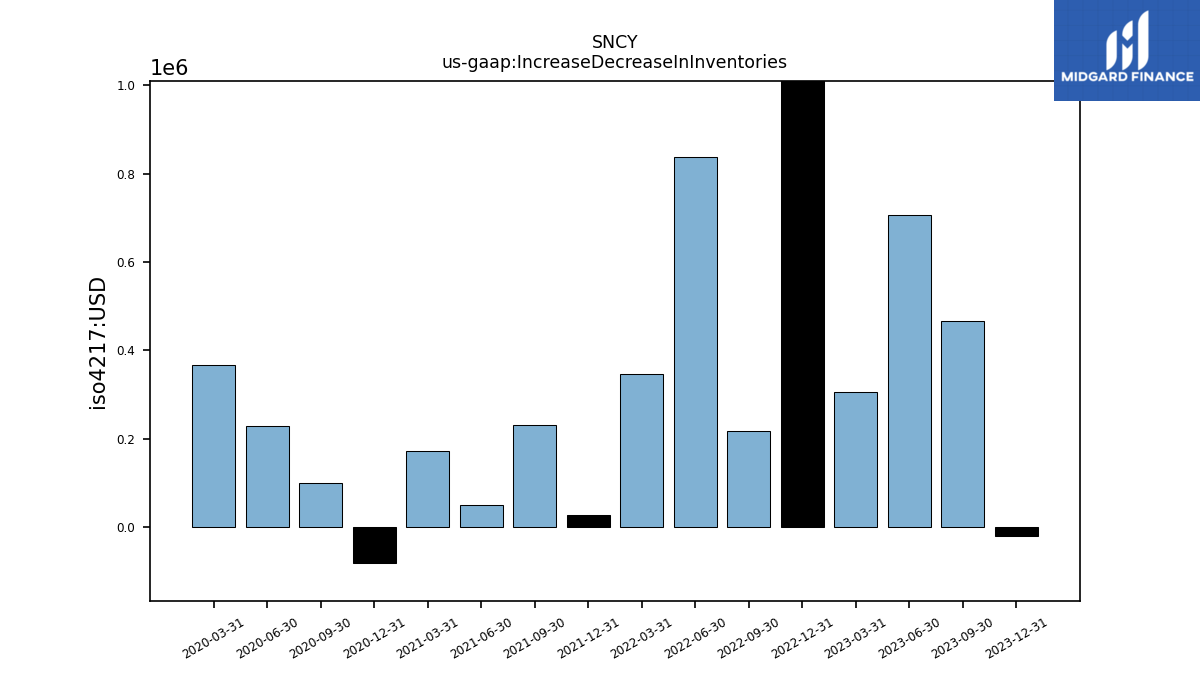
| Increase Decrease In Inventories | -0.02 | 0.47 | 0.71 | 0.30 | 1.61 | 0.22 | 0.84 | 0.35 | 0.03 | 0.23 | 0.05 | 0.17 | -0.08 | 0.10 | 0.23 | 0.37 | |
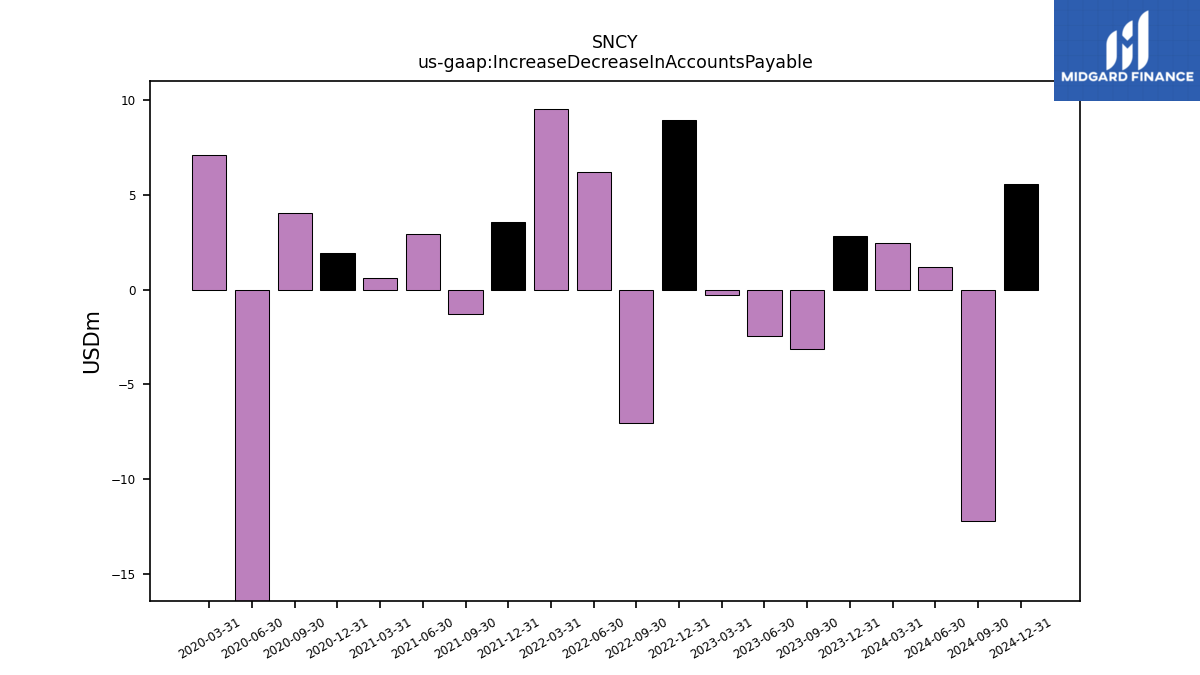
| Increase Decrease In Accounts Payable | 2.83 | -3.11 | -2.46 | -0.29 | 8.95 | -7.02 | 6.19 | 9.50 | 3.56 | -1.29 | 2.92 | 0.63 | 1.92 | 4.05 | -20.25 | 7.11 | |
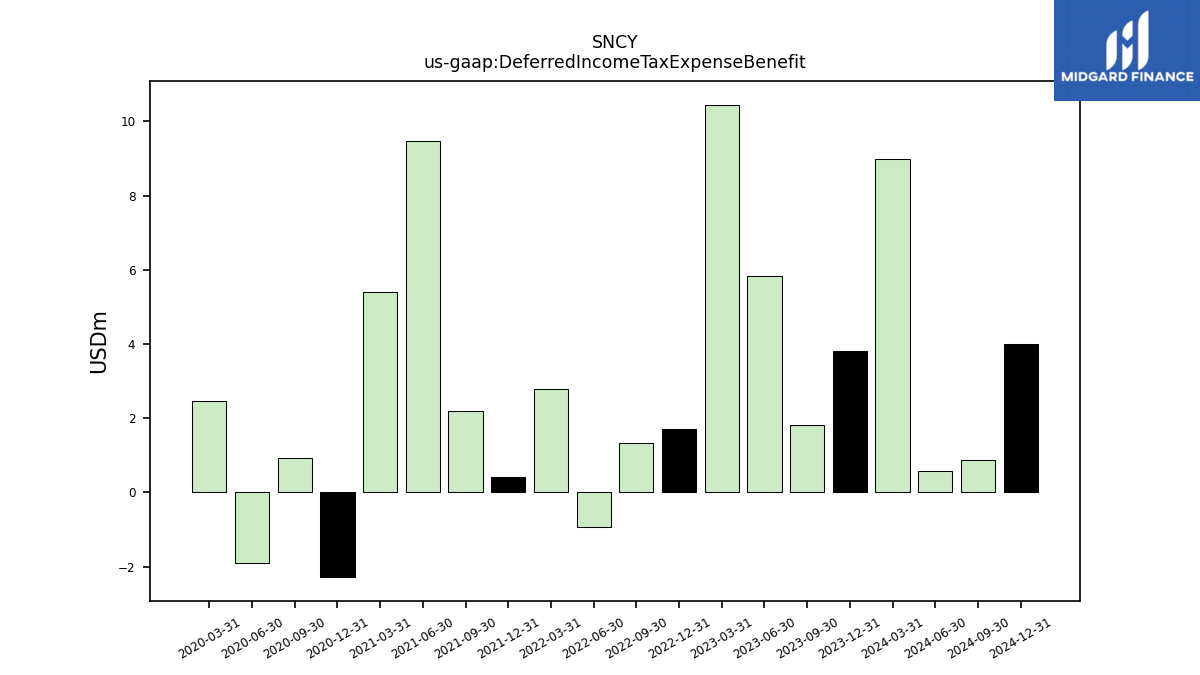
| Deferred Income Tax Expense Benefit | 3.81 | 1.81 | 5.82 | 10.45 | 1.71 | 1.32 | -0.92 | 2.78 | 0.41 | 2.19 | 9.47 | 5.41 | -2.28 | 0.92 | -1.90 | 2.47 |
| 2023-12-31 | 2023-09-30 | 2023-06-30 | 2023-03-31 | 2022-12-31 | 2022-09-30 | 2022-06-30 | 2022-03-31 | 2021-12-31 | 2021-09-30 | 2021-06-30 | 2021-03-31 | 2020-12-31 | 2020-09-30 | 2020-06-30 | 2020-03-31 | ||
|---|---|---|---|---|---|---|---|---|---|---|---|---|---|---|---|---|---|
| Net Cash Provided By Used In Investing Activities | 7.05 | -10.24 | -72.80 | -95.24 | -51.72 | -98.65 | -149.33 | -49.63 | -5.55 | -44.24 | -12.64 | -54.55 | -1.82 | -0.57 | -18.59 | -75.05 | |
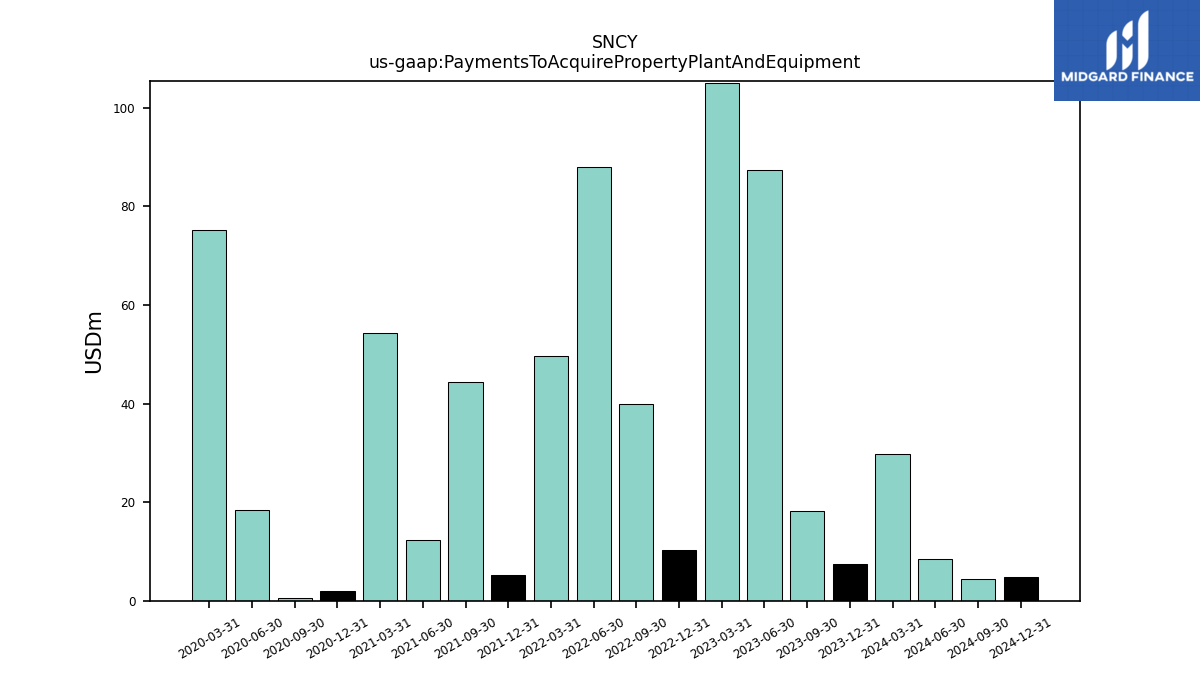
| Payments To Acquire Property Plant And Equipment | 7.52 | 18.29 | 87.37 | 104.98 | 10.26 | 40.01 | 87.96 | 49.68 | 5.32 | 44.32 | 12.34 | 54.40 | 1.99 | 0.63 | 18.43 | 75.25 | |
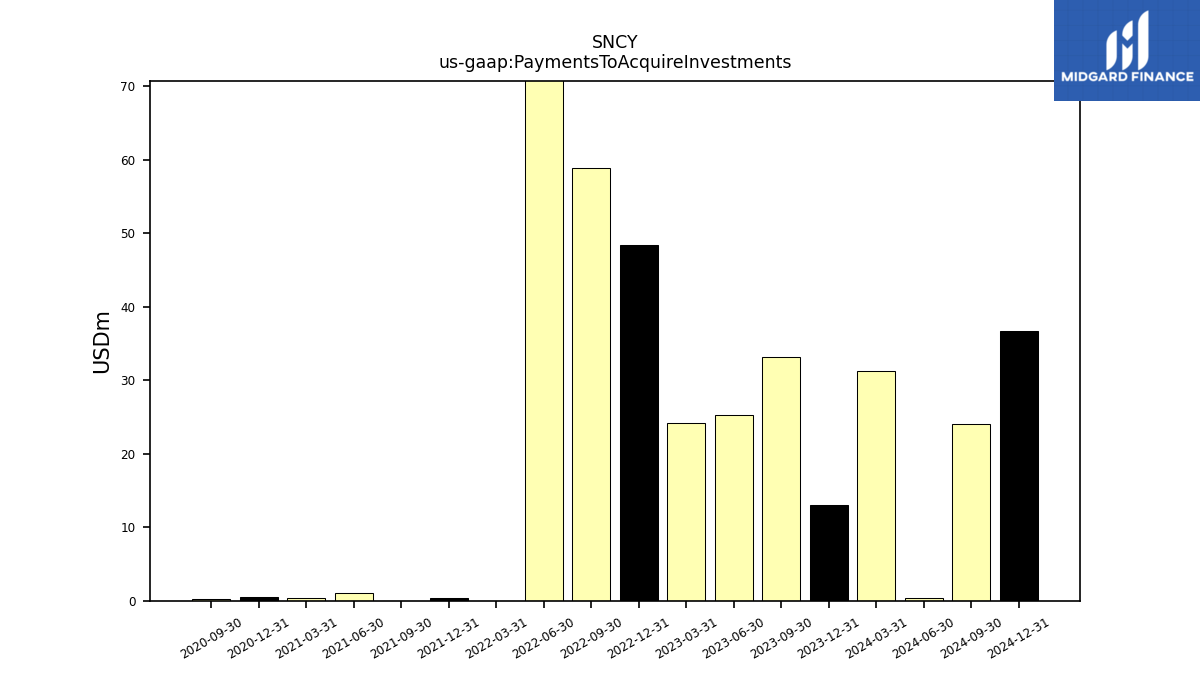
| Payments To Acquire Investments | 12.96 | 33.14 | 25.21 | 24.23 | 48.43 | 58.90 | 71.63 | 0.00 | 0.36 | 0.00 | 1.10 | 0.34 | 0.50 | 0.24 | NA | NA |
| 2023-12-31 | 2023-09-30 | 2023-06-30 | 2023-03-31 | 2022-12-31 | 2022-09-30 | 2022-06-30 | 2022-03-31 | 2021-12-31 | 2021-09-30 | 2021-06-30 | 2021-03-31 | 2020-12-31 | 2020-09-30 | 2020-06-30 | 2020-03-31 | ||
|---|---|---|---|---|---|---|---|---|---|---|---|---|---|---|---|---|---|
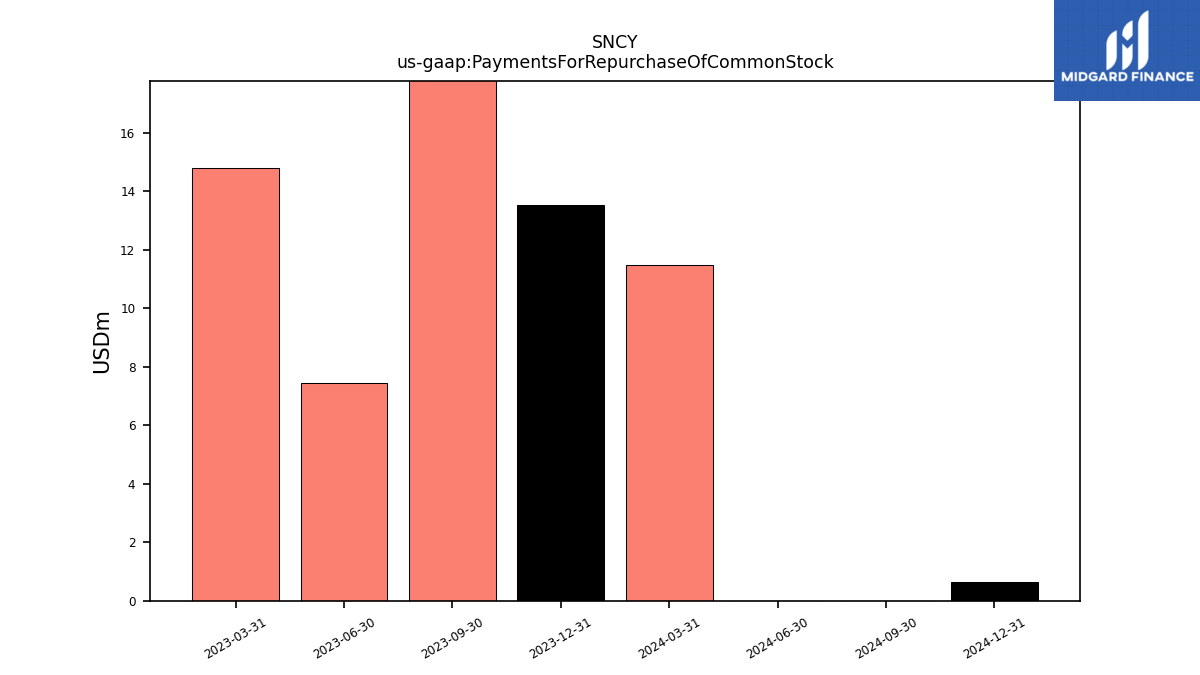
| Net Cash Provided By Used In Financing Activities | -52.76 | -53.01 | 24.82 | 38.81 | -47.20 | -6.88 | 66.99 | -5.88 | -10.31 | 0.23 | -21.50 | 243.97 | 24.83 | 0.00 | 21.85 | 54.85 | |
| Payments For Repurchase Of Common Stock | 13.53 | 32.80 | 7.44 | 14.81 | NA | NA | NA | NA | NA | NA | NA | NA | NA | NA | NA | NA |
| 2023-12-31 | 2023-09-30 | 2023-06-30 | 2023-03-31 | 2022-12-31 | 2022-09-30 | 2022-06-30 | 2022-03-31 | 2021-12-31 | 2021-09-30 | 2021-06-30 | 2021-03-31 | 2020-12-31 | 2020-09-30 | 2020-06-30 | 2020-03-31 | ||
|---|---|---|---|---|---|---|---|---|---|---|---|---|---|---|---|---|---|
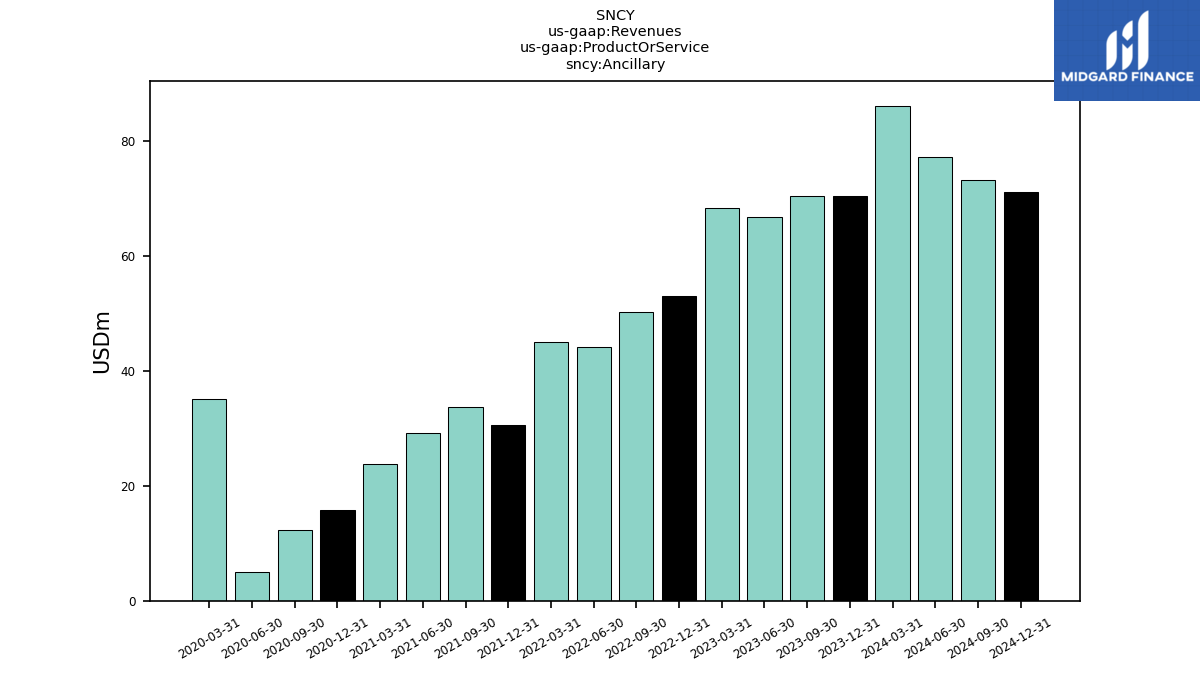
| Revenues | 245.54 | 248.88 | 261.09 | 294.12 | 227.15 | 221.70 | 219.07 | 226.53 | 172.55 | 173.66 | 149.19 | 127.61 | 107.81 | 77.97 | 35.38 | 180.33 | |
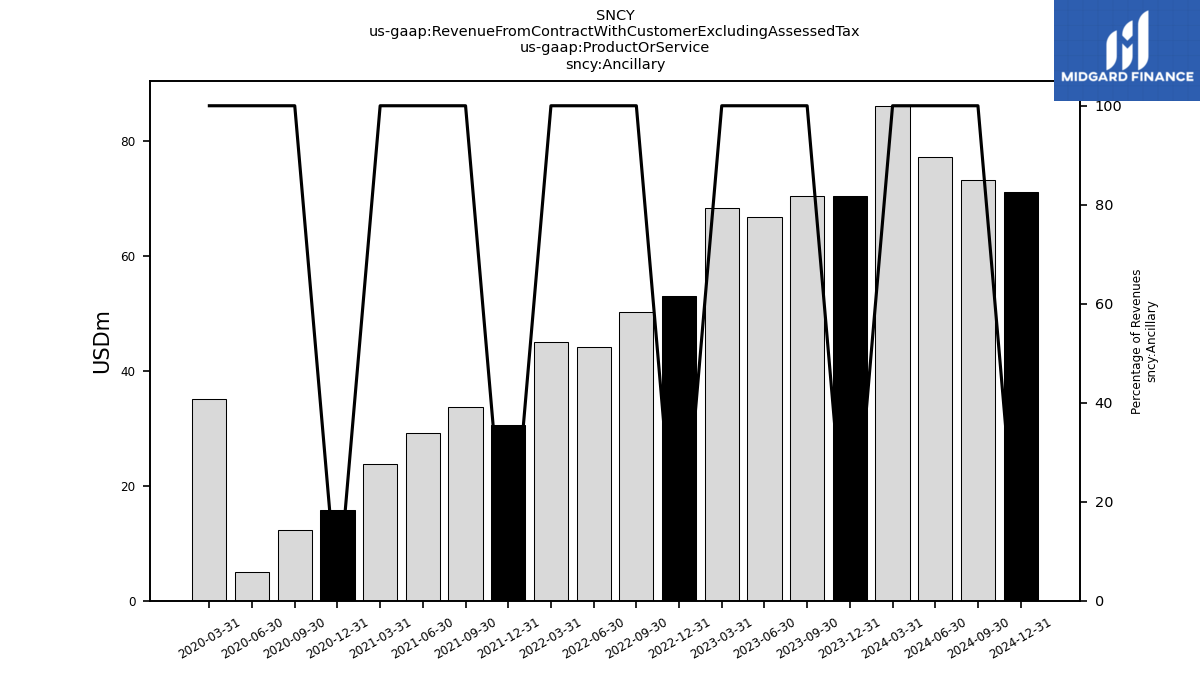
| Ancillary | 70.50 | 70.44 | 66.77 | 68.42 | 52.96 | 50.26 | 44.20 | 45.09 | 30.61 | 33.70 | 29.16 | 23.77 | 15.80 | 12.25 | 4.97 | 35.03 | |
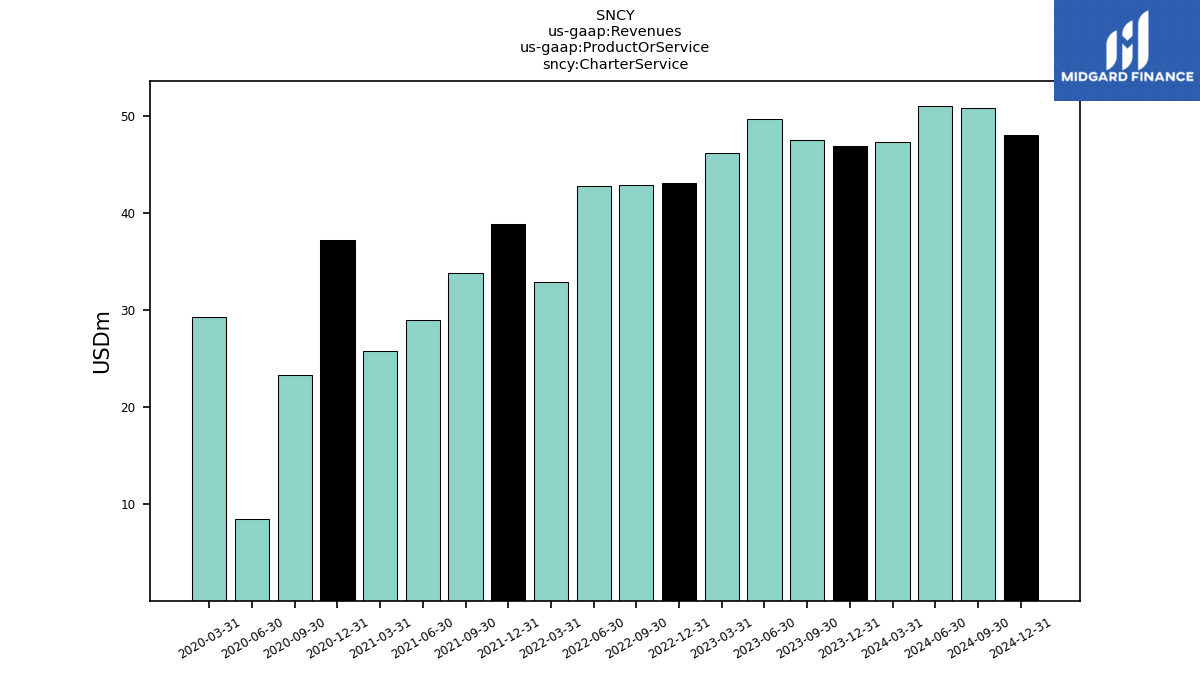
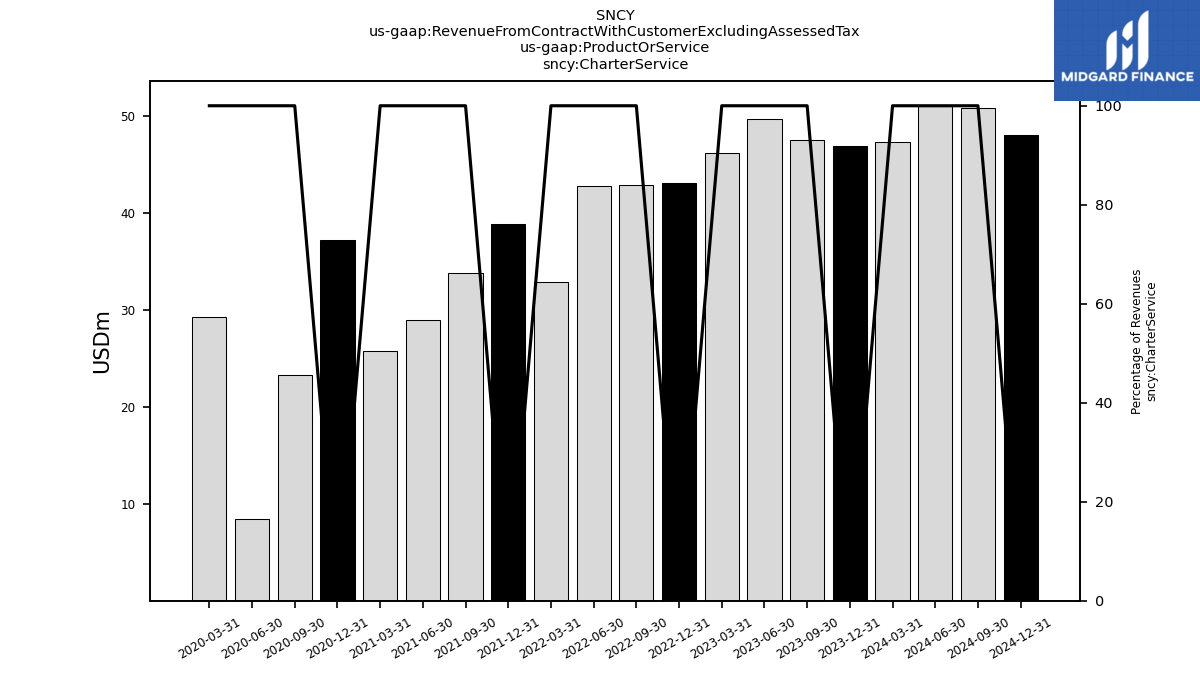
| Charter Service | 46.88 | 47.44 | 49.63 | 46.19 | 43.09 | 42.90 | 42.75 | 32.88 | 38.82 | 33.81 | 28.90 | 25.80 | 37.15 | 23.26 | 8.49 | 29.23 | |
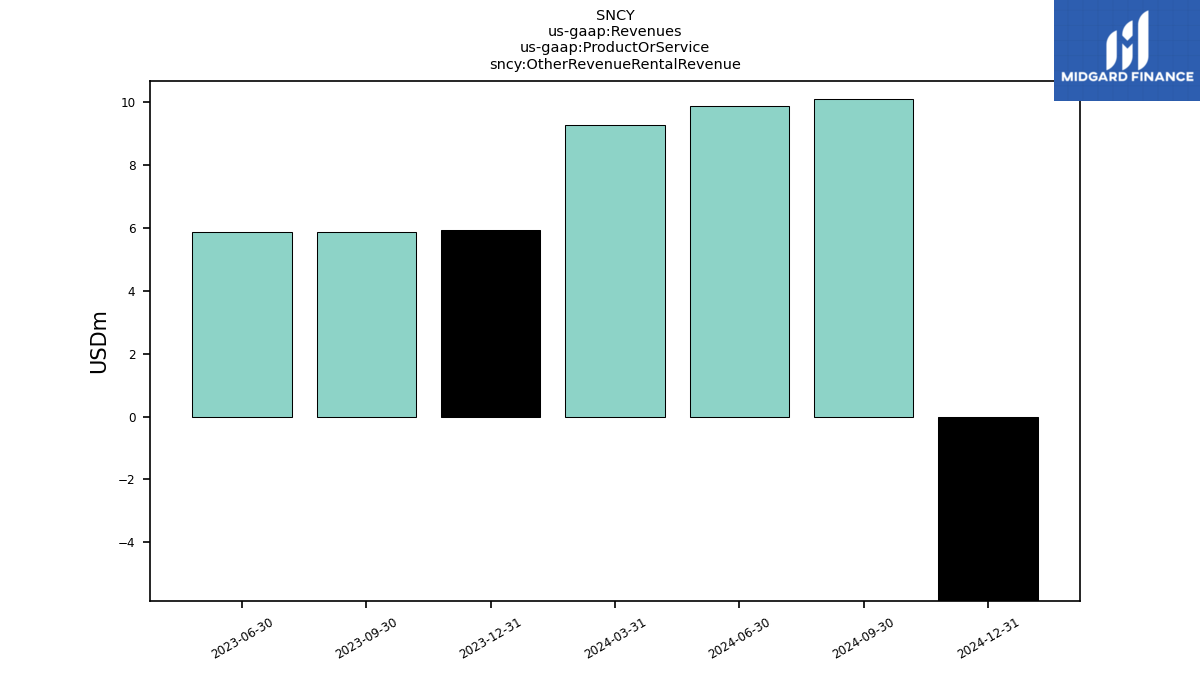
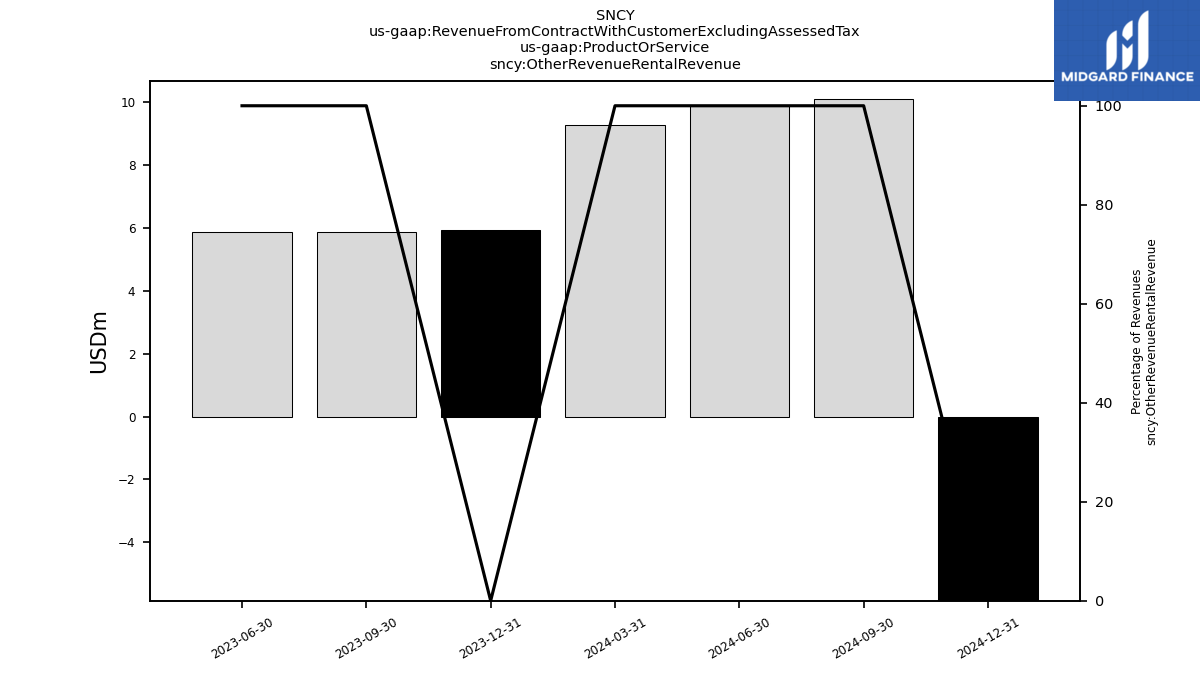
| Other Revenue Rental Revenue | 5.95 | 5.87 | NA | NA | NA | NA | NA | NA | NA | NA | NA | NA | NA | NA | NA | NA | |
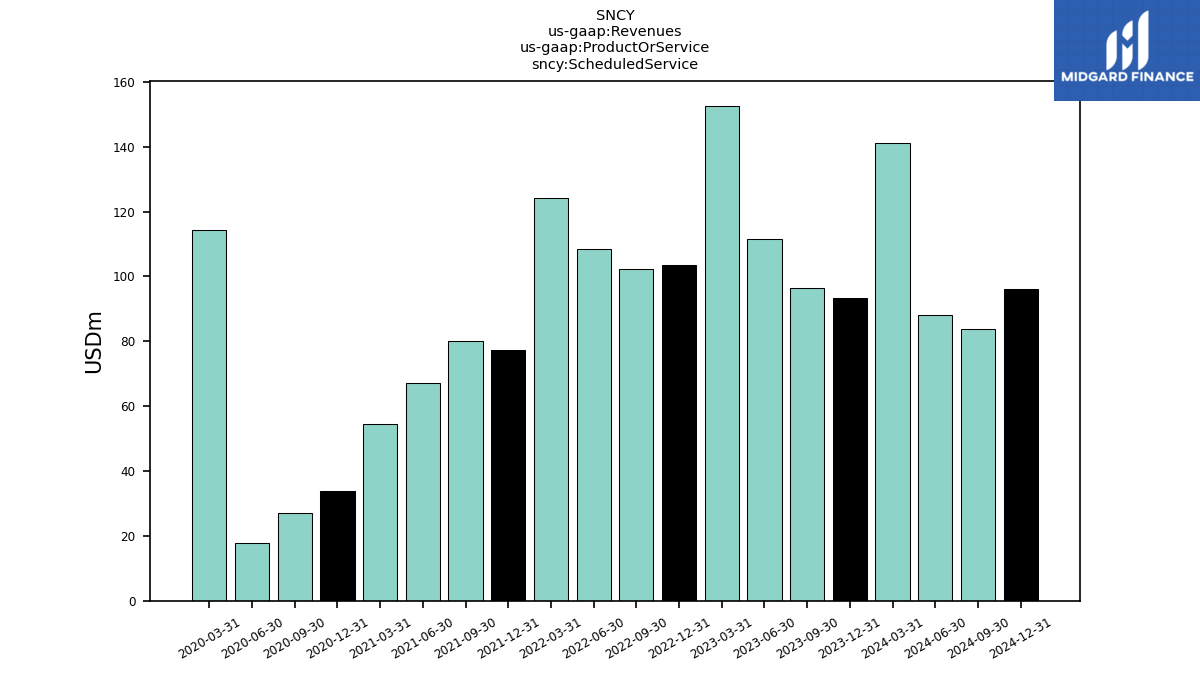
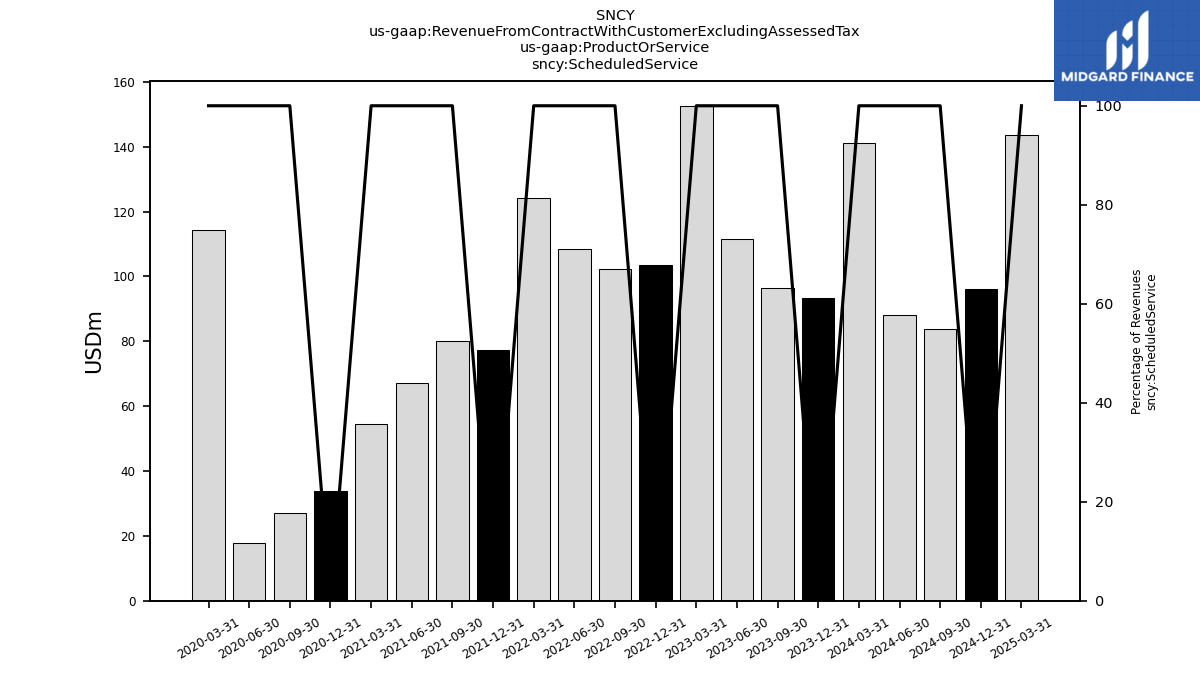
| Scheduled Service | 93.25 | 96.48 | 111.47 | 152.66 | 103.63 | 102.20 | 108.41 | 124.07 | 77.47 | 80.21 | 67.07 | 54.62 | 33.98 | 26.95 | 17.88 | 114.23 | |
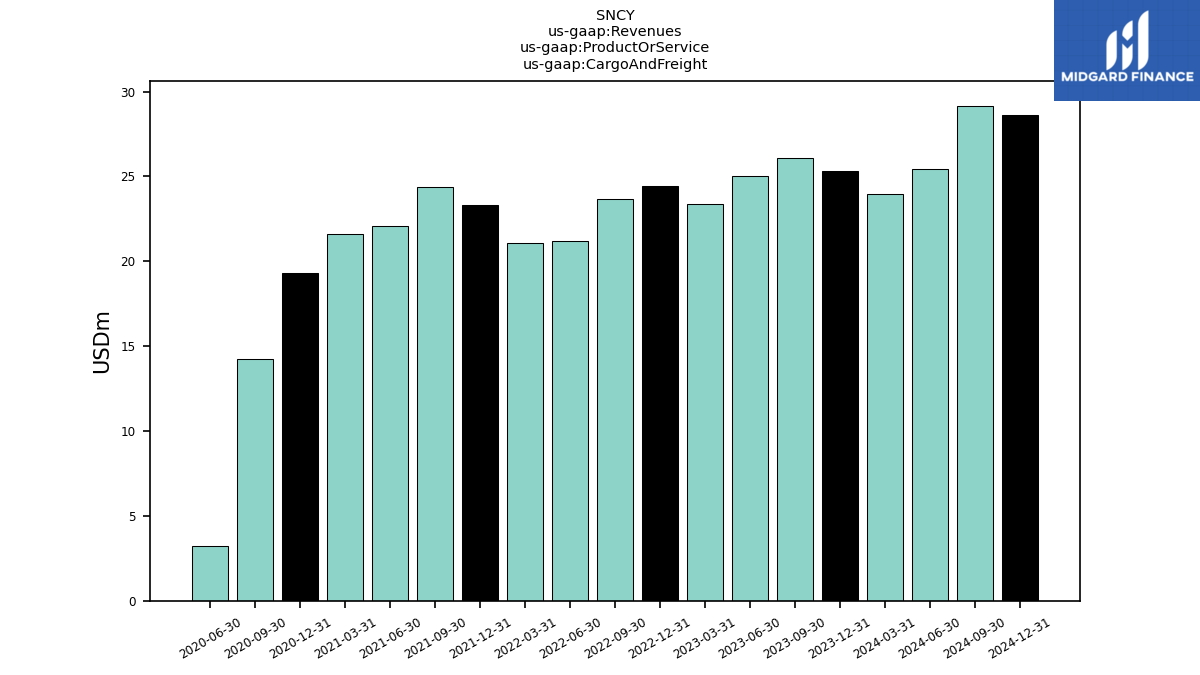
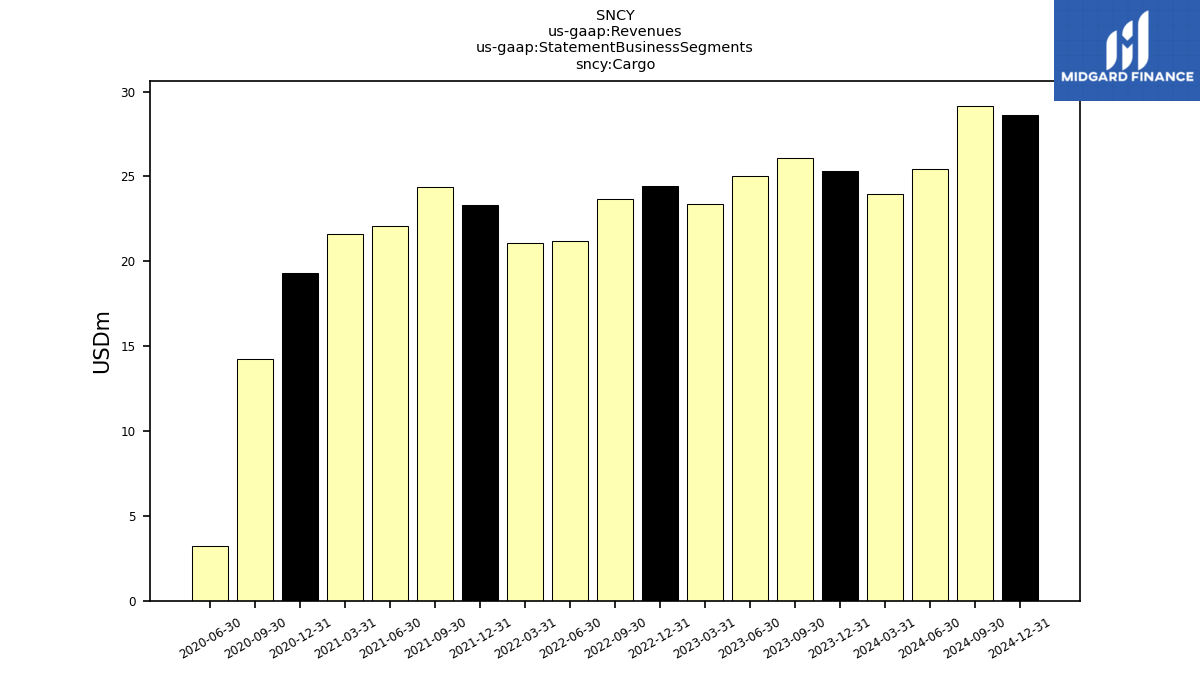
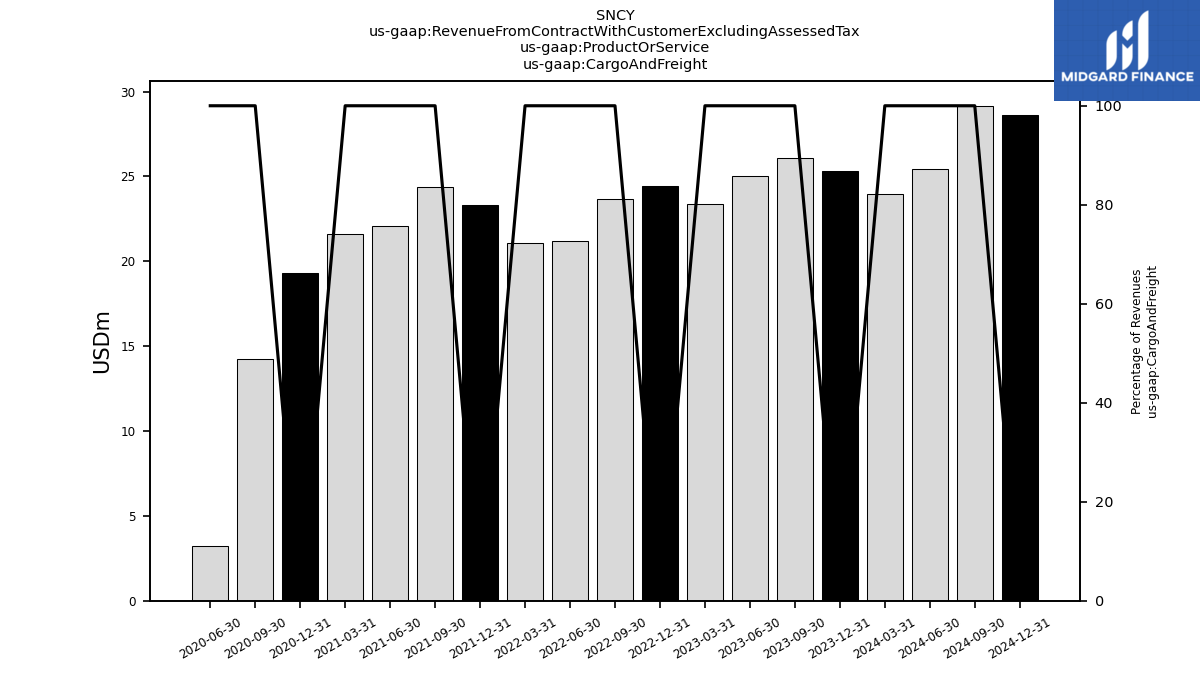
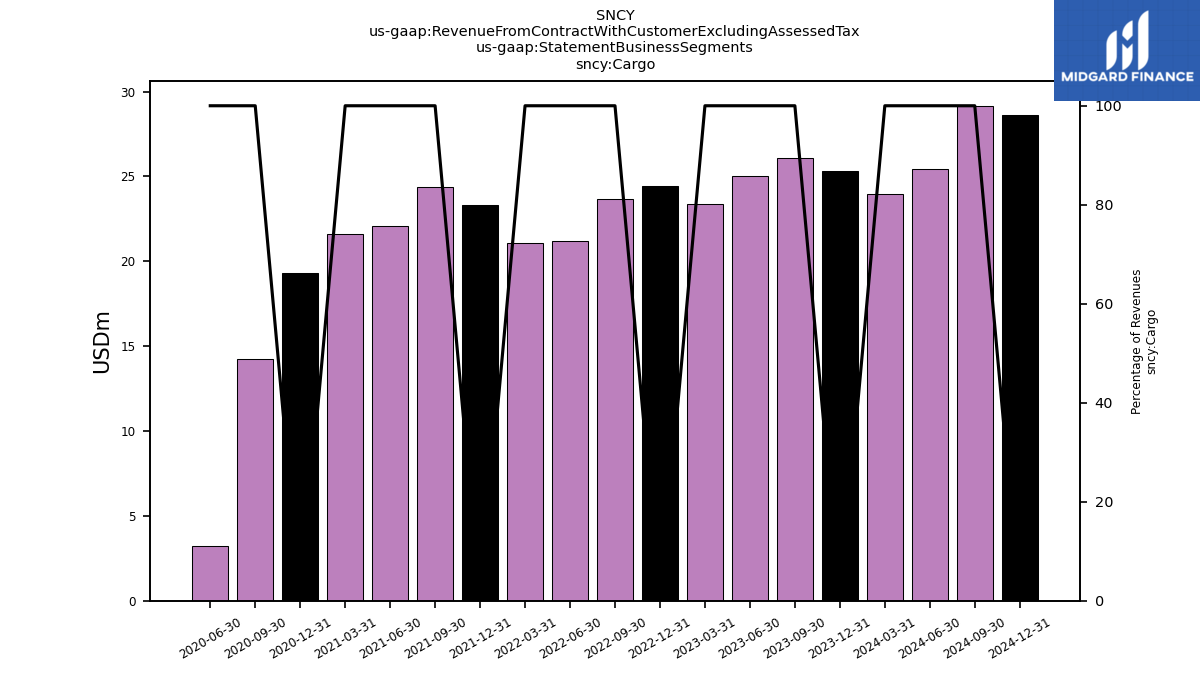
| Cargo And Freight | 25.30 | 26.06 | 25.02 | 23.36 | 24.42 | 23.69 | 21.19 | 21.05 | 23.34 | 24.40 | 22.10 | 21.59 | 19.32 | 14.27 | 3.22 | NA | |
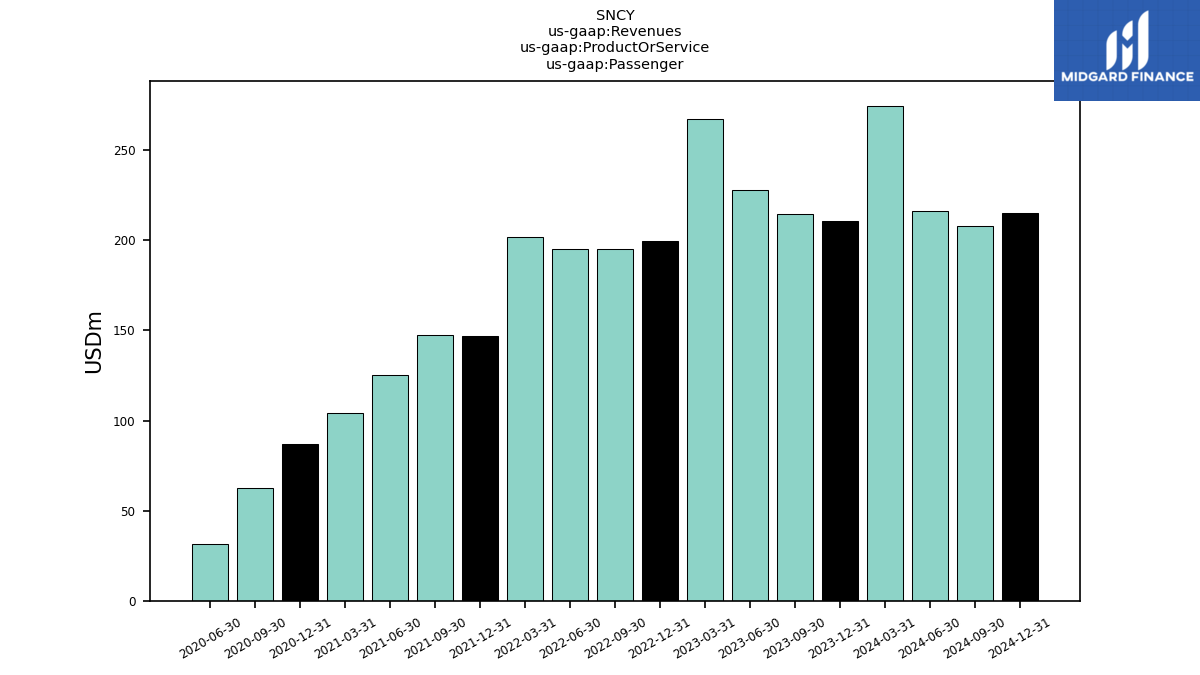
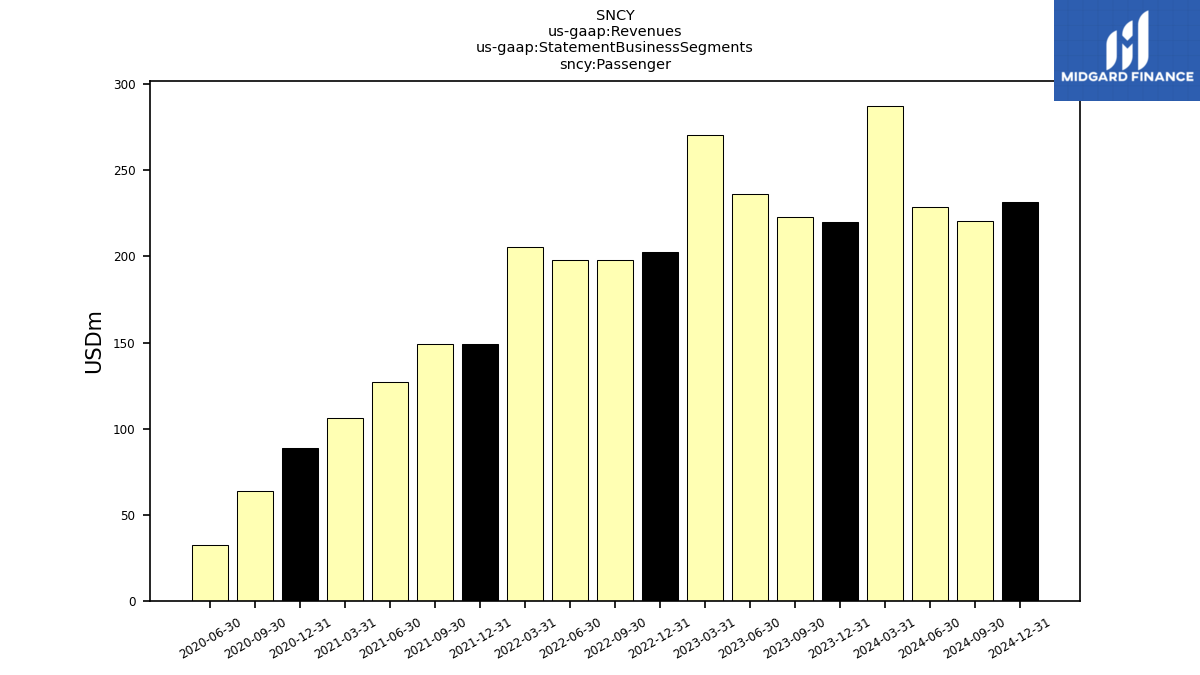
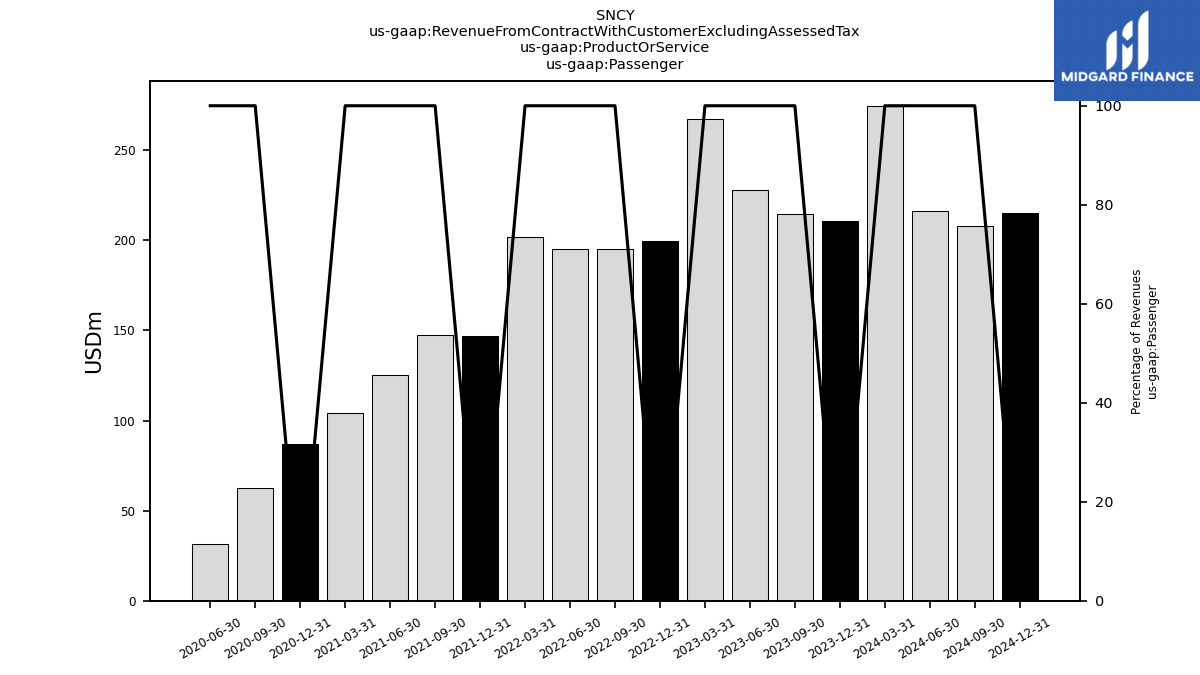
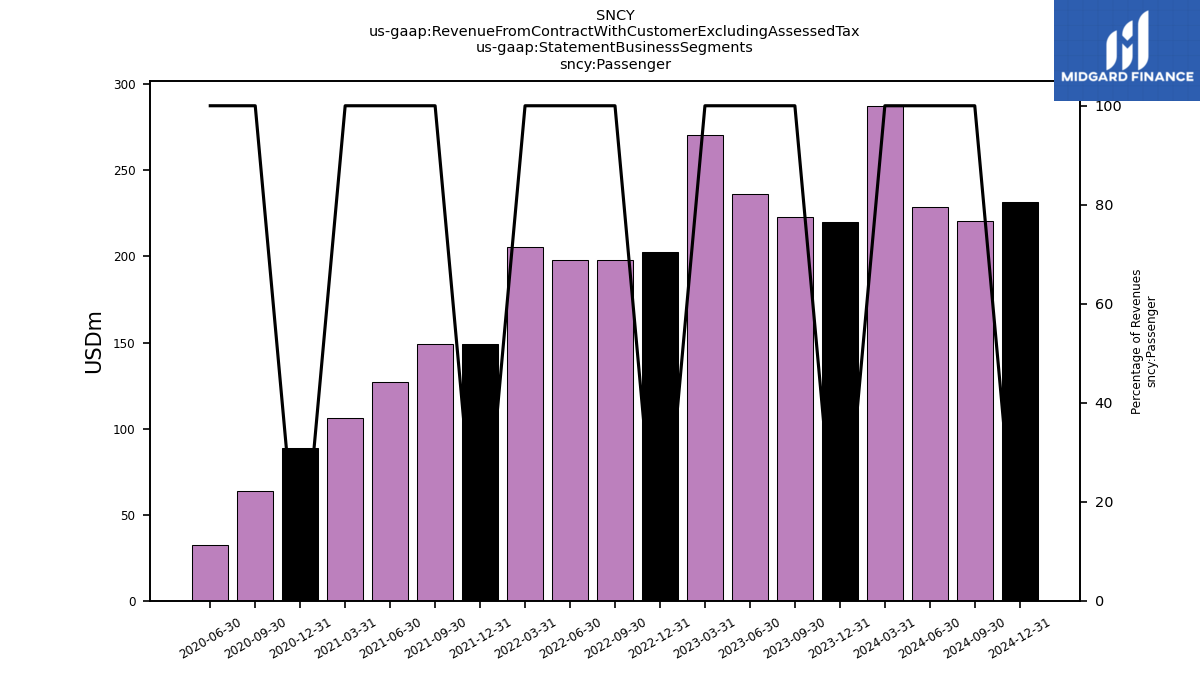
| Passenger | 210.63 | 214.35 | 227.87 | 267.27 | 199.68 | 195.36 | 195.36 | 202.03 | 146.90 | 147.72 | 125.13 | 104.19 | 86.93 | 62.47 | 31.34 | NA | |
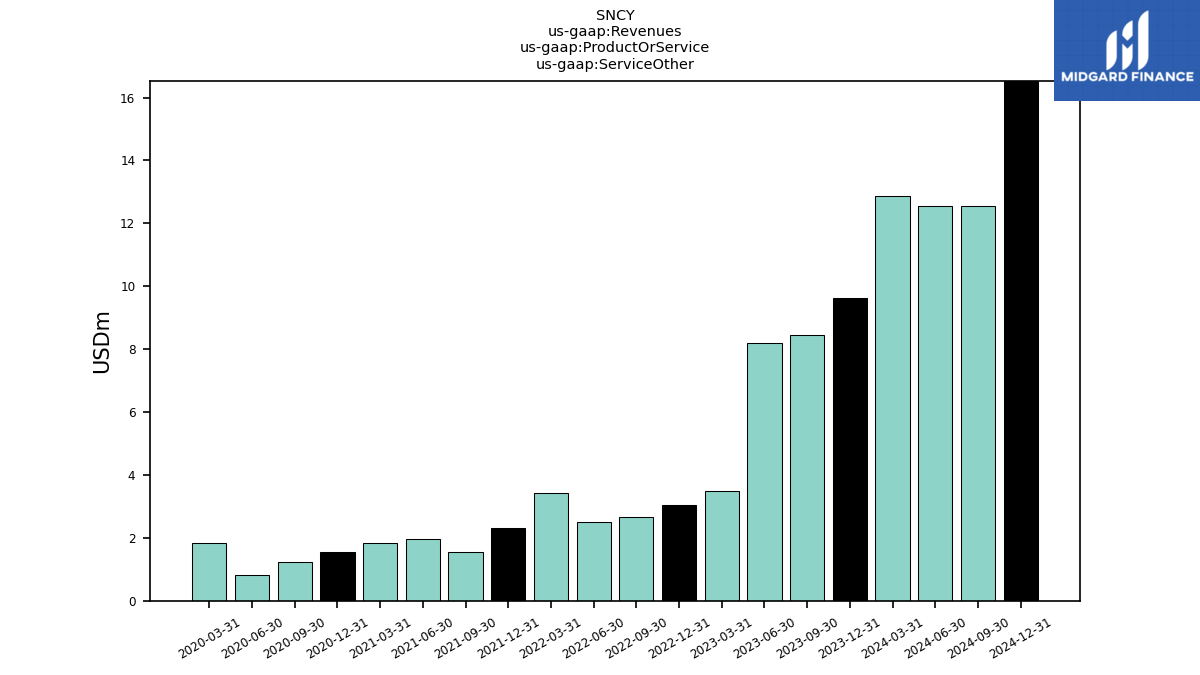
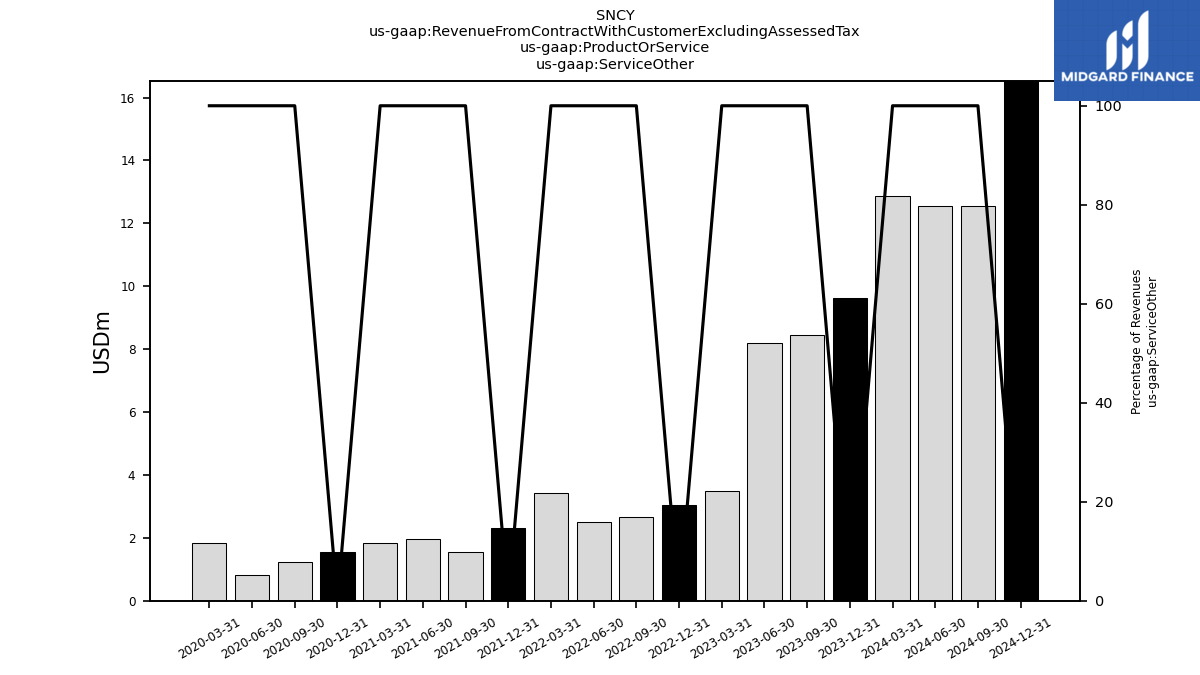
| Service Other | 9.61 | 8.46 | 8.20 | 3.48 | 3.05 | 2.65 | 2.52 | 3.44 | 2.30 | 1.54 | 1.96 | 1.83 | 1.56 | 1.23 | 0.82 | 1.84 | |
| Cargo | 25.30 | 26.06 | 25.02 | 23.36 | 24.42 | 23.69 | 21.19 | 21.05 | 23.34 | 24.40 | 22.10 | 21.59 | 19.32 | 14.27 | 3.22 | NA | |
| Passenger | 220.25 | 222.82 | 236.07 | 270.75 | 202.73 | 198.01 | 197.88 | 205.47 | 149.21 | 149.26 | 127.09 | 106.03 | 88.49 | 63.70 | 32.16 | NA | |
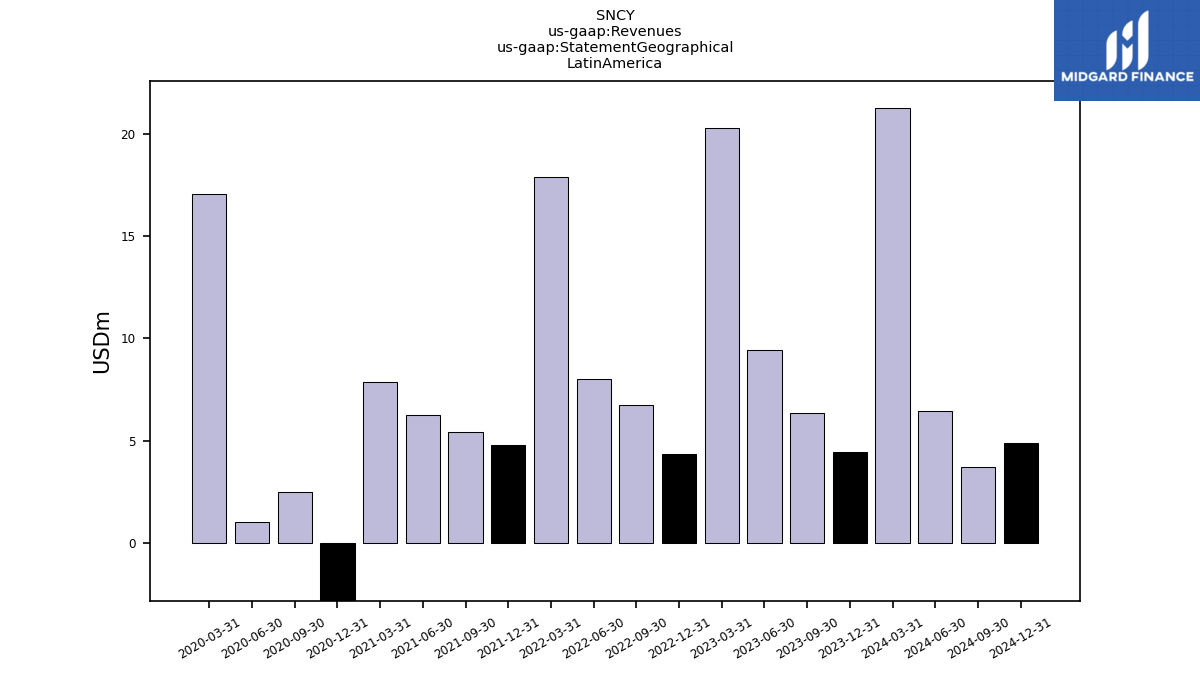
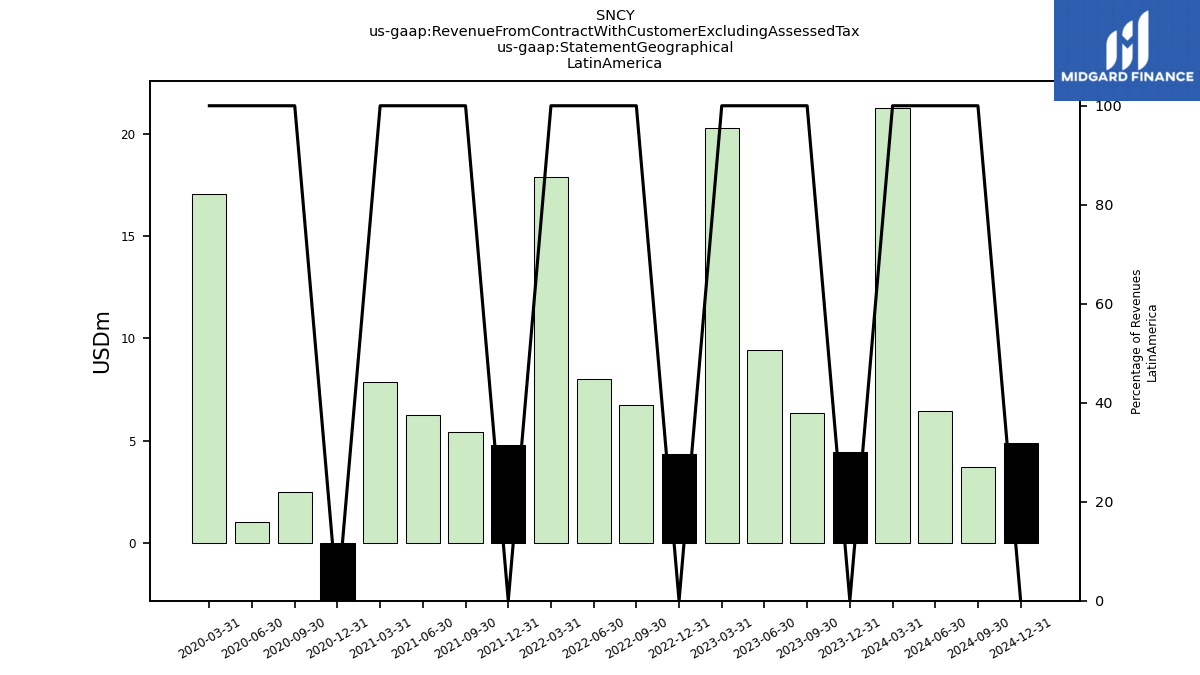
| 4.47 | 6.37 | 9.45 | 20.25 | 4.36 | 6.76 | 8.01 | 17.87 | 4.78 | 5.45 | 6.27 | 7.88 | -4.77 | 2.50 | 1.04 | 17.08 | ||
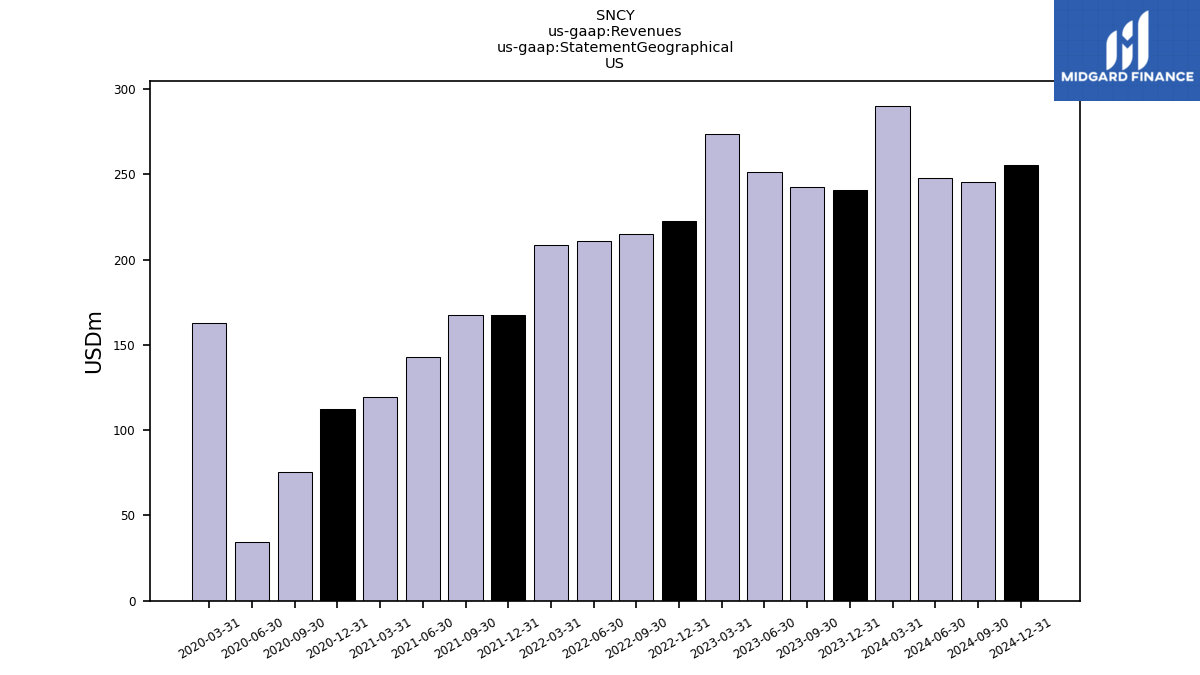
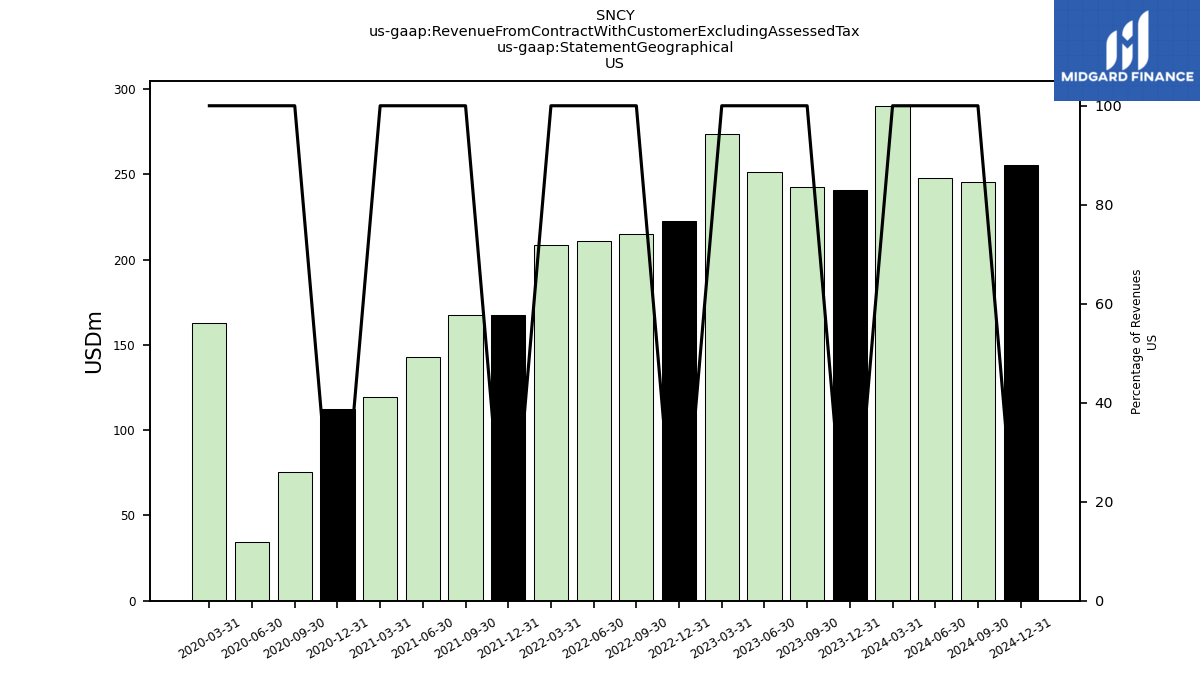
| US | 241.07 | 242.50 | 251.58 | 273.42 | 222.80 | 214.90 | 211.01 | 208.59 | 167.50 | 167.66 | 142.77 | 119.31 | 112.40 | 75.29 | 34.31 | 163.04 | |
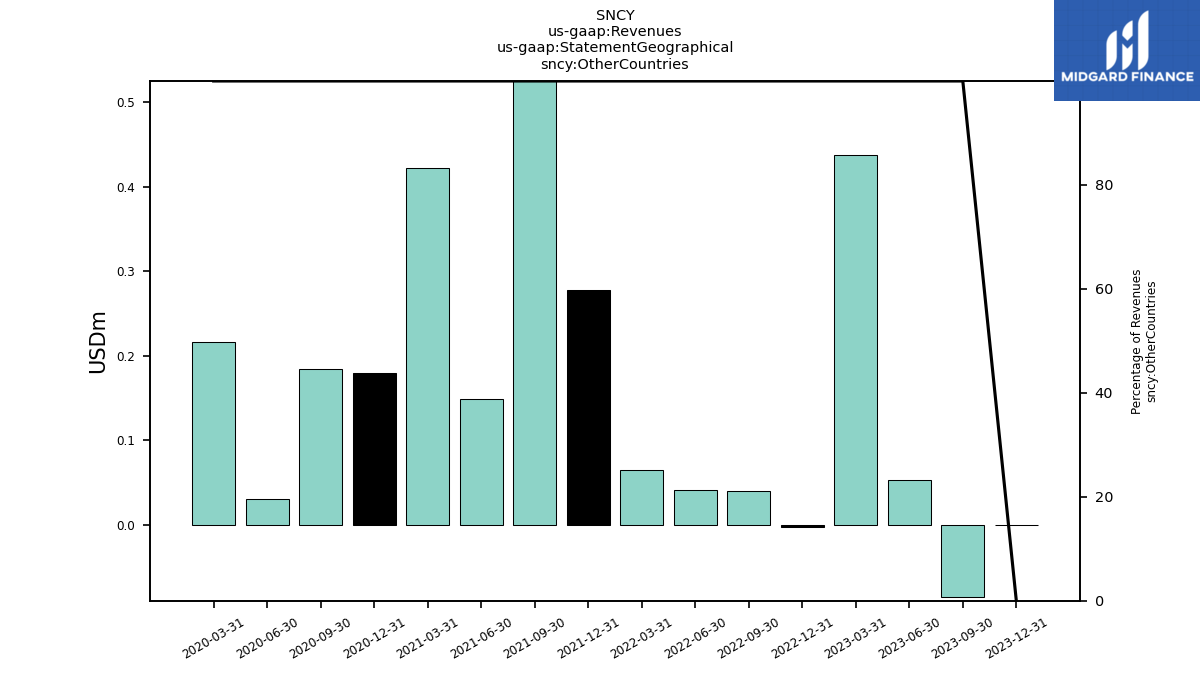
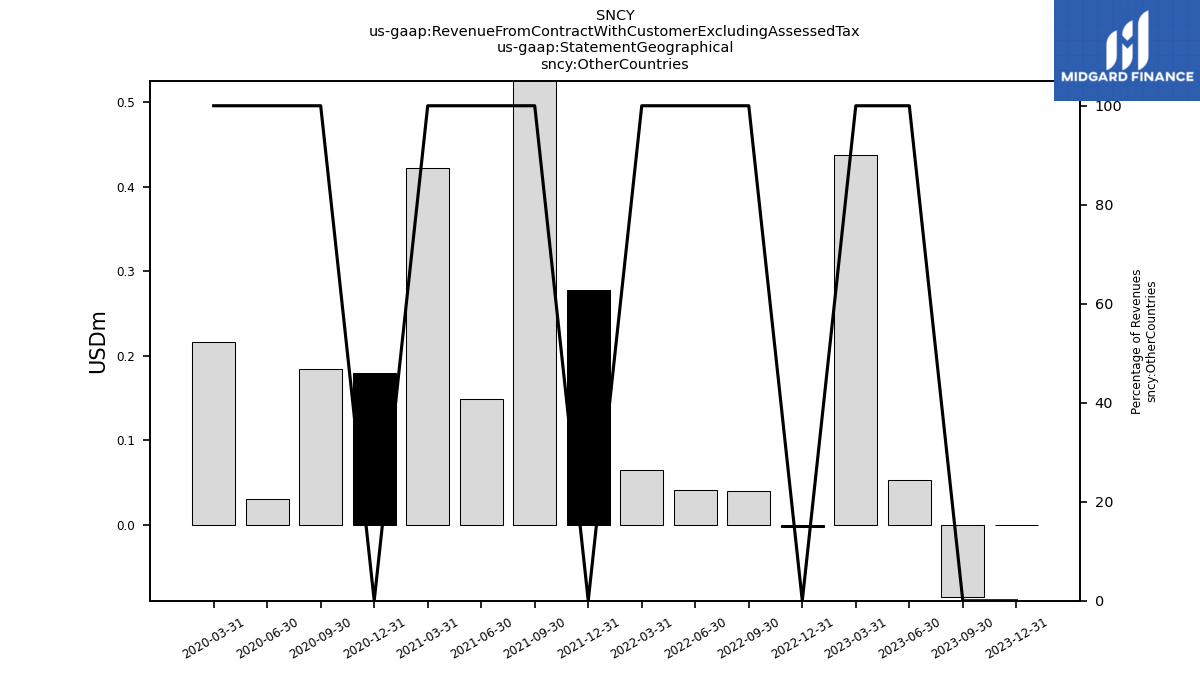
| Other Countries | 0.00 | -0.09 | 0.05 | 0.44 | -0.00 | 0.04 | 0.04 | 0.07 | 0.28 | 0.56 | 0.15 | 0.42 | 0.18 | 0.18 | 0.03 | 0.22 | |
| Revenue From Contract With Customer Excluding Assessed Tax | 245.54 | 248.88 | 261.09 | 294.12 | 227.15 | 221.70 | 219.07 | 226.53 | 172.55 | 173.66 | 149.19 | 127.61 | 107.81 | 77.97 | 35.38 | 180.33 | |
| Ancillary | 70.50 | 70.44 | 66.77 | 68.42 | 52.96 | 50.26 | 44.20 | 45.09 | 30.61 | 33.70 | 29.16 | 23.77 | 15.80 | 12.25 | 4.97 | 35.03 | |
| Charter Service | 46.88 | 47.44 | 49.63 | 46.19 | 43.09 | 42.90 | 42.75 | 32.88 | 38.82 | 33.81 | 28.90 | 25.80 | 37.15 | 23.26 | 8.49 | 29.23 | |
| Other Revenue Rental Revenue | 5.95 | 5.87 | NA | NA | NA | NA | NA | NA | NA | NA | NA | NA | NA | NA | NA | NA | |
| Scheduled Service | 93.25 | 96.48 | 111.47 | 152.66 | 103.63 | 102.20 | 108.41 | 124.07 | 77.47 | 80.21 | 67.07 | 54.62 | 33.98 | 26.95 | 17.88 | 114.23 | |
| Cargo And Freight | 25.30 | 26.06 | 25.02 | 23.36 | 24.42 | 23.69 | 21.19 | 21.05 | 23.34 | 24.40 | 22.10 | 21.59 | 19.32 | 14.27 | 3.22 | NA | |
| Passenger | 210.63 | 214.35 | 227.87 | 267.27 | 199.68 | 195.36 | 195.36 | 202.03 | 146.90 | 147.72 | 125.13 | 104.19 | 86.93 | 62.47 | 31.34 | NA | |
| Service Other | 9.61 | 8.46 | 8.20 | 3.48 | 3.05 | 2.65 | 2.52 | 3.44 | 2.30 | 1.54 | 1.96 | 1.83 | 1.56 | 1.23 | 0.82 | 1.84 | |
| Cargo | 25.30 | 26.06 | 25.02 | 23.36 | 24.42 | 23.69 | 21.19 | 21.05 | 23.34 | 24.40 | 22.10 | 21.59 | 19.32 | 14.27 | 3.22 | NA | |
| Passenger | 220.25 | 222.82 | 236.07 | 270.75 | 202.73 | 198.01 | 197.88 | 205.47 | 149.21 | 149.26 | 127.09 | 106.03 | 88.49 | 63.70 | 32.16 | NA | |
| 4.47 | 6.37 | 9.45 | 20.25 | 4.36 | 6.76 | 8.01 | 17.87 | 4.78 | 5.45 | 6.27 | 7.88 | -4.77 | 2.50 | 1.04 | 17.08 | ||
| US | 241.07 | 242.50 | 251.58 | 273.42 | 222.80 | 214.90 | 211.01 | 208.59 | 167.50 | 167.66 | 142.77 | 119.31 | 112.40 | 75.29 | 34.31 | 163.04 | |
| Other Countries | 0.00 | -0.09 | 0.05 | 0.44 | -0.00 | 0.04 | 0.04 | 0.07 | 0.28 | 0.56 | 0.15 | 0.42 | 0.18 | 0.18 | 0.03 | 0.22 |