
| 2024-01-31 | 2023-10-31 | 2023-07-31 | 2023-04-30 | 2023-01-31 | 2022-10-31 | 2022-07-31 | 2022-04-30 | 2022-01-31 | 2021-10-31 | 2021-07-31 | 2021-04-30 | 2021-01-31 | 2020-10-31 | 2020-07-31 | 2020-04-30 | 2020-01-31 | 2019-10-31 | 2019-07-31 | 2019-04-30 | 2019-01-31 | 2018-10-31 | 2018-07-31 | 2018-04-30 | 2018-01-31 | 2017-10-31 | 2017-07-31 | 2017-04-30 | 2017-01-31 | 2016-10-31 | 2016-07-31 | 2016-04-30 | 2016-01-31 | 2015-10-31 | 2015-07-31 | 2015-04-30 | 2015-01-31 | 2014-10-31 | 2014-07-31 | 2014-04-30 | 2014-01-31 | 2013-10-31 | 2013-07-31 | 2013-04-30 | 2013-01-31 | 2012-10-31 | 2012-07-31 | 2012-04-30 | 2012-01-31 | 2011-10-31 | 2011-07-31 | 2011-04-30 | 2011-01-31 | 2010-10-31 | 2010-07-31 | 2010-04-30 | 2010-01-31 | ||
|---|---|---|---|---|---|---|---|---|---|---|---|---|---|---|---|---|---|---|---|---|---|---|---|---|---|---|---|---|---|---|---|---|---|---|---|---|---|---|---|---|---|---|---|---|---|---|---|---|---|---|---|---|---|---|---|---|---|---|
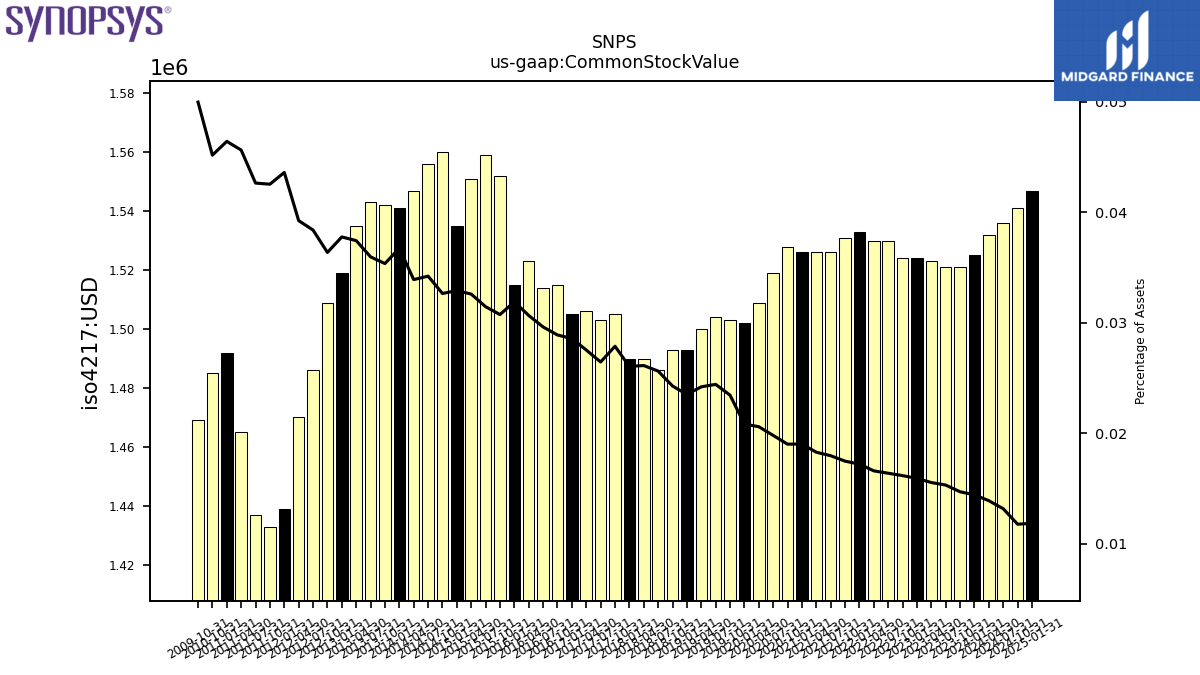
| Common Stock Value | 1.52 | 1.52 | 1.52 | 1.52 | 1.52 | 1.52 | 1.53 | 1.53 | 1.53 | 1.53 | 1.53 | 1.53 | 1.53 | 1.53 | 1.52 | 1.51 | 1.50 | 1.50 | 1.50 | 1.50 | 1.49 | 1.49 | 1.49 | 1.49 | 1.49 | 1.50 | 1.50 | 1.51 | 1.50 | 1.51 | 1.51 | 1.52 | 1.51 | 1.55 | 1.56 | 1.55 | 1.53 | 1.56 | 1.56 | 1.55 | 1.54 | 1.54 | 1.54 | 1.53 | 1.52 | 1.51 | 1.49 | 1.47 | 1.44 | 1.43 | 1.44 | 1.47 | 1.49 | 1.49 | NA | NA | NA | |
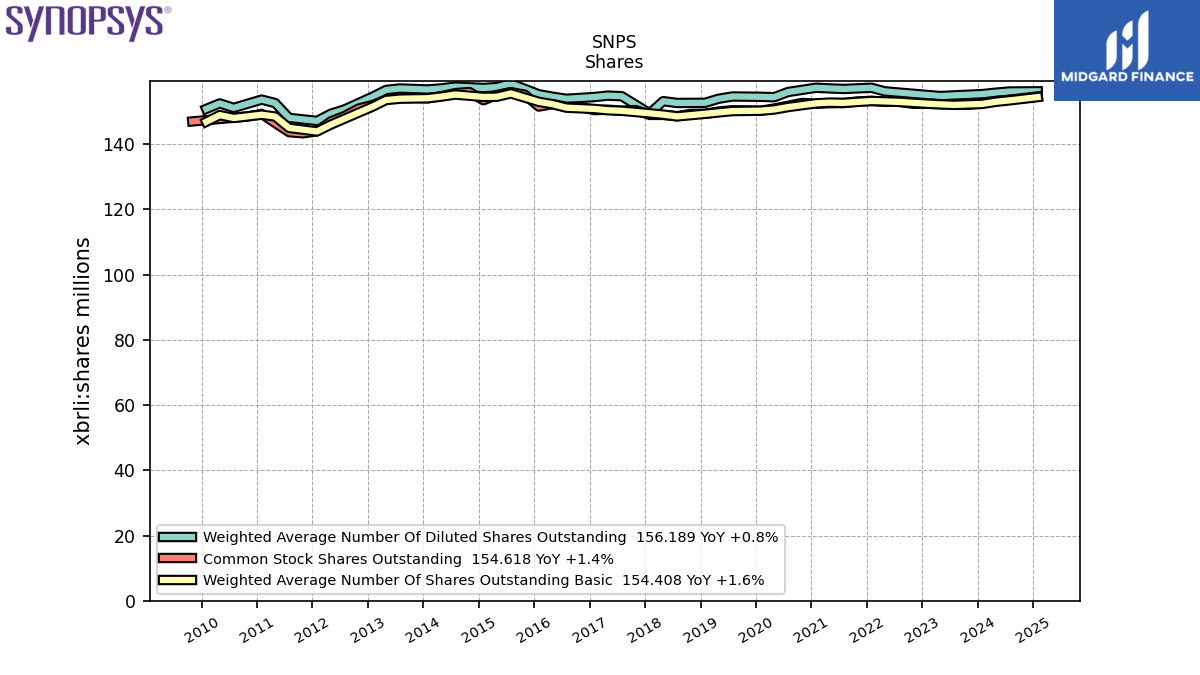
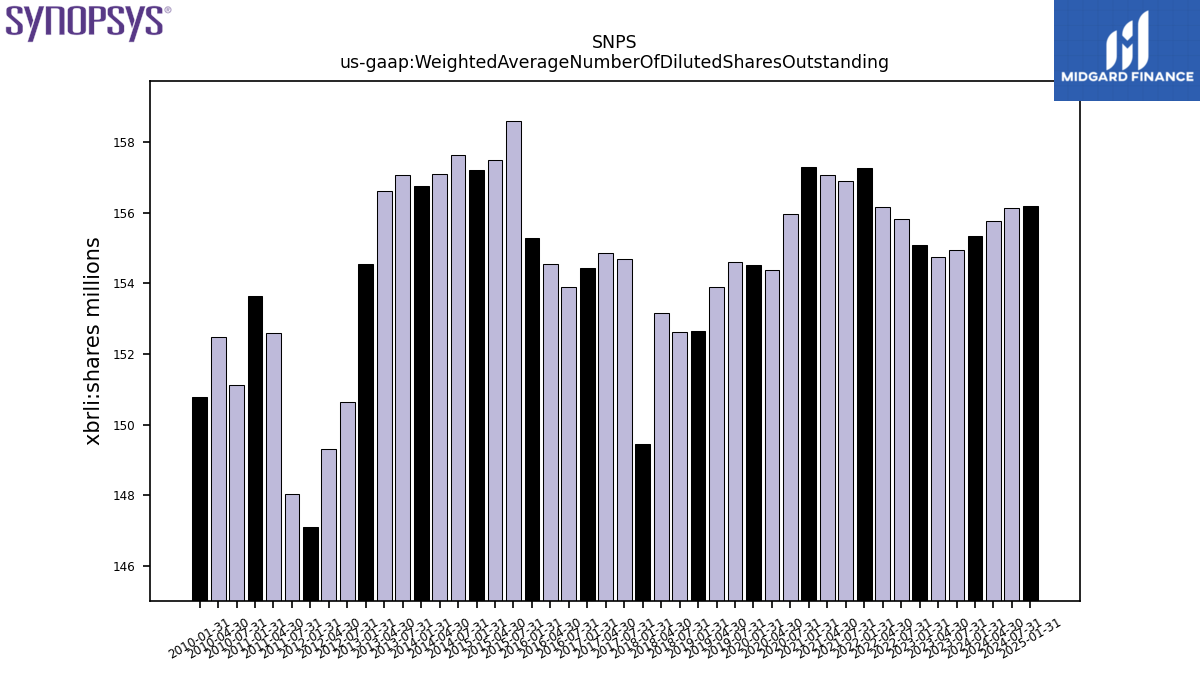
| Weighted Average Number Of Diluted Shares Outstanding | 155.33 | NA | 154.95 | 154.73 | 155.08 | NA | 155.81 | 156.17 | 157.27 | NA | 156.91 | 157.08 | 157.28 | NA | 155.97 | 154.38 | 154.50 | NA | 154.60 | 153.90 | 152.66 | NA | 152.61 | 153.17 | 149.44 | NA | 154.68 | 154.86 | 154.43 | NA | 153.89 | 154.54 | 155.28 | NA | 158.58 | 157.48 | 157.21 | NA | 157.62 | 157.08 | 156.76 | NA | 157.06 | 156.61 | 154.53 | NA | 150.64 | 149.30 | 147.11 | NA | 148.04 | 152.59 | 153.64 | NA | 151.11 | 152.48 | 150.79 | |
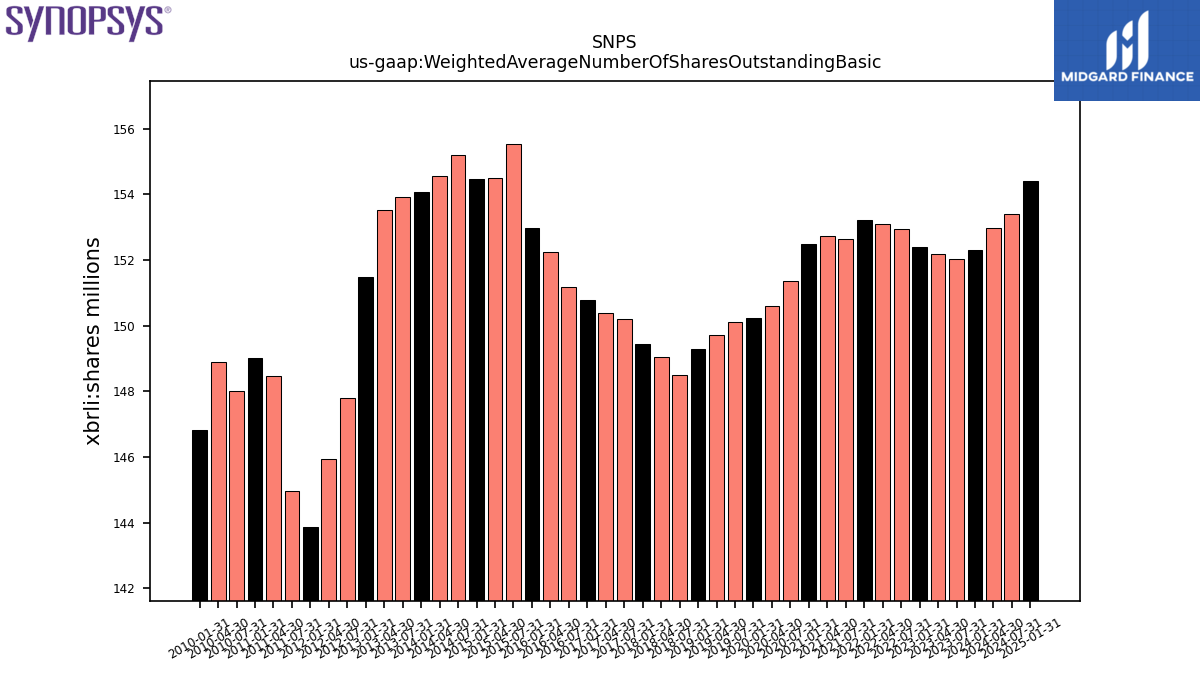
| Weighted Average Number Of Shares Outstanding Basic | 152.31 | NA | 152.02 | 152.19 | 152.40 | NA | 152.94 | 153.09 | 153.22 | NA | 152.63 | 152.72 | 152.50 | NA | 151.35 | 150.60 | 150.24 | NA | 150.12 | 149.71 | 149.29 | NA | 148.49 | 149.03 | 149.44 | NA | 150.21 | 150.38 | 150.78 | NA | 151.17 | 152.25 | 152.97 | NA | 155.53 | 154.51 | 154.46 | NA | 155.19 | 154.57 | 154.07 | NA | 153.91 | 153.51 | 151.48 | NA | 147.80 | 145.95 | 143.88 | NA | 144.96 | 148.46 | 149.02 | NA | 148.01 | 148.89 | 146.83 | |
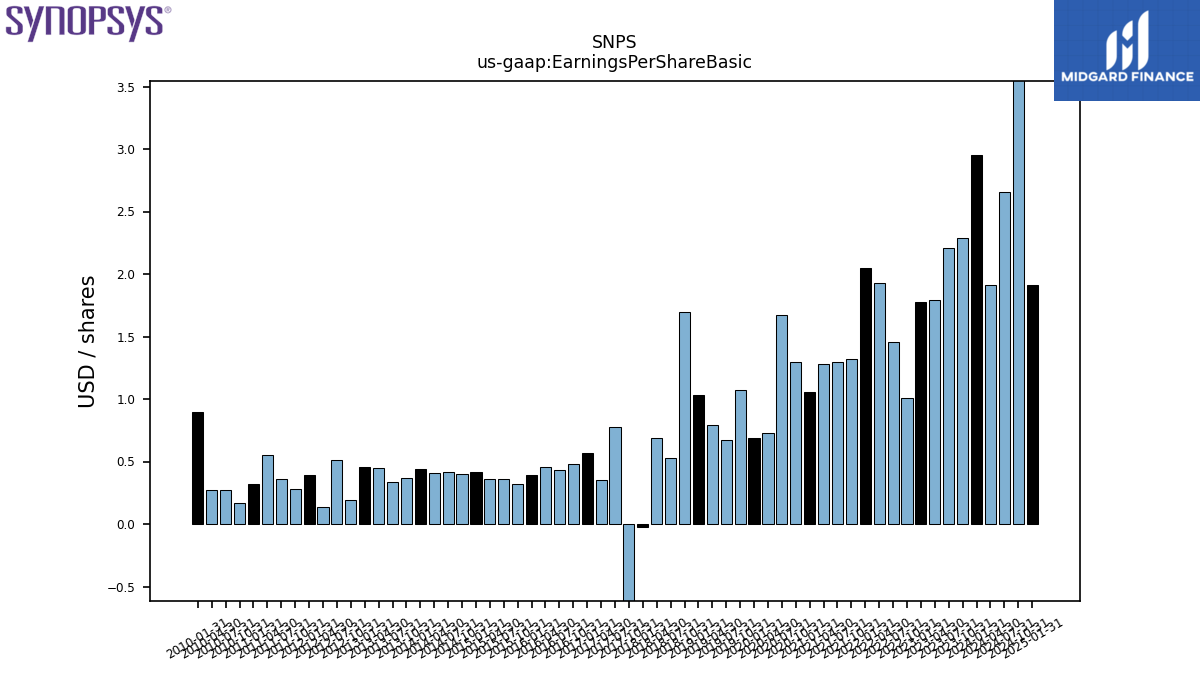
| Earnings Per Share Basic | 2.95 | 2.29 | 2.21 | 1.79 | 1.78 | 1.01 | 1.46 | 1.93 | 2.05 | 1.32 | 1.30 | 1.28 | 1.06 | 1.30 | 1.67 | 0.73 | 0.69 | 1.07 | 0.67 | 0.79 | 1.03 | 1.70 | 0.53 | 0.69 | -0.02 | -0.80 | 0.78 | 0.35 | 0.57 | 0.48 | 0.43 | 0.46 | 0.39 | 0.32 | 0.36 | 0.36 | 0.42 | 0.40 | 0.42 | 0.41 | 0.44 | 0.37 | 0.34 | 0.45 | 0.46 | 0.19 | 0.51 | 0.14 | 0.39 | 0.28 | 0.36 | 0.55 | 0.32 | 0.17 | 0.27 | 0.27 | 0.90 | |
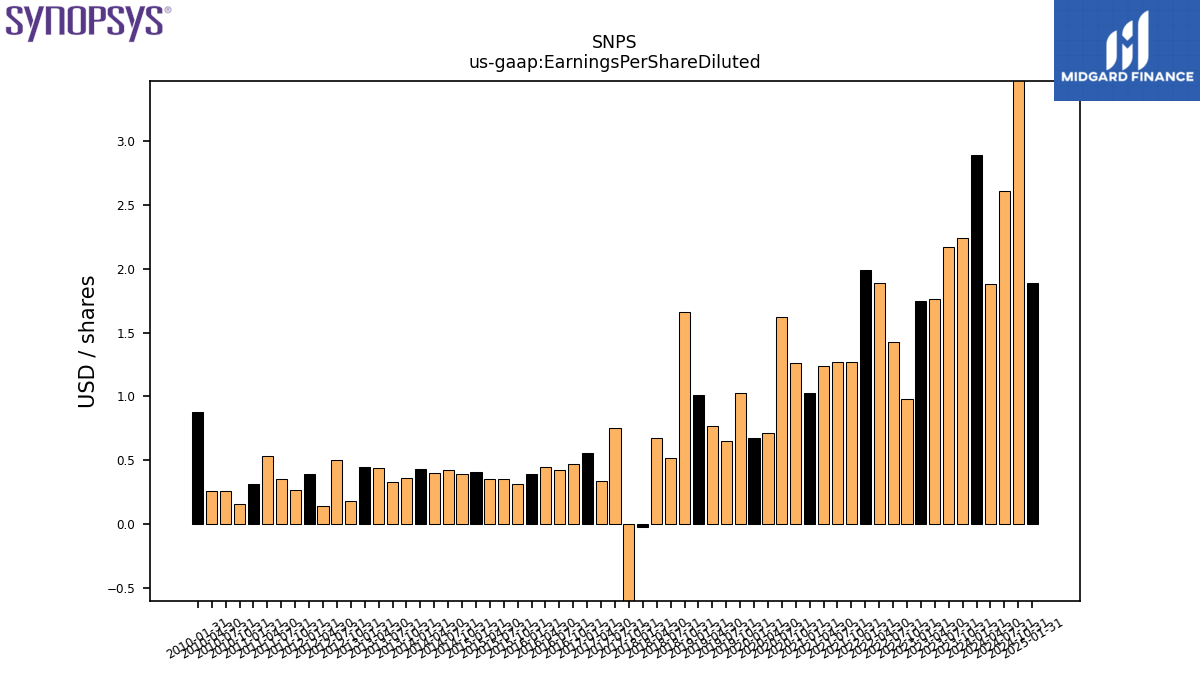
| Earnings Per Share Diluted | 2.89 | 2.24 | 2.17 | 1.76 | 1.75 | 0.98 | 1.43 | 1.89 | 1.99 | 1.27 | 1.27 | 1.24 | 1.03 | 1.26 | 1.62 | 0.71 | 0.67 | 1.03 | 0.65 | 0.77 | 1.01 | 1.66 | 0.52 | 0.67 | -0.02 | -0.78 | 0.75 | 0.34 | 0.56 | 0.47 | 0.42 | 0.45 | 0.39 | 0.31 | 0.35 | 0.35 | 0.41 | 0.39 | 0.42 | 0.40 | 0.43 | 0.36 | 0.33 | 0.44 | 0.45 | 0.18 | 0.50 | 0.14 | 0.39 | 0.27 | 0.35 | 0.53 | 0.31 | 0.16 | 0.26 | 0.26 | 0.88 |
| 2024-01-31 | 2023-10-31 | 2023-07-31 | 2023-04-30 | 2023-01-31 | 2022-10-31 | 2022-07-31 | 2022-04-30 | 2022-01-31 | 2021-10-31 | 2021-07-31 | 2021-04-30 | 2021-01-31 | 2020-10-31 | 2020-07-31 | 2020-04-30 | 2020-01-31 | 2019-10-31 | 2019-07-31 | 2019-04-30 | 2019-01-31 | 2018-10-31 | 2018-07-31 | 2018-04-30 | 2018-01-31 | 2017-10-31 | 2017-07-31 | 2017-04-30 | 2017-01-31 | 2016-10-31 | 2016-07-31 | 2016-04-30 | 2016-01-31 | 2015-10-31 | 2015-07-31 | 2015-04-30 | 2015-01-31 | 2014-10-31 | 2014-07-31 | 2014-04-30 | 2014-01-31 | 2013-10-31 | 2013-07-31 | 2013-04-30 | 2013-01-31 | 2012-10-31 | 2012-07-31 | 2012-04-30 | 2012-01-31 | 2011-10-31 | 2011-07-31 | 2011-04-30 | 2011-01-31 | 2010-10-31 | 2010-07-31 | 2010-04-30 | 2010-01-31 | ||
|---|---|---|---|---|---|---|---|---|---|---|---|---|---|---|---|---|---|---|---|---|---|---|---|---|---|---|---|---|---|---|---|---|---|---|---|---|---|---|---|---|---|---|---|---|---|---|---|---|---|---|---|---|---|---|---|---|---|---|
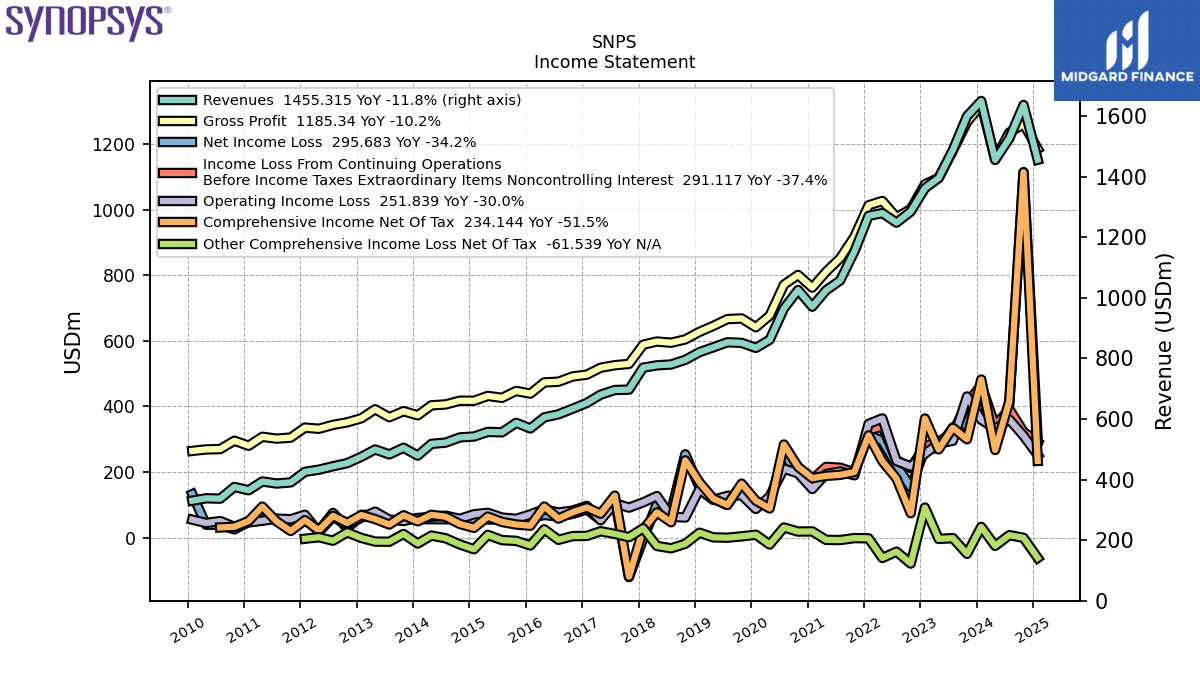
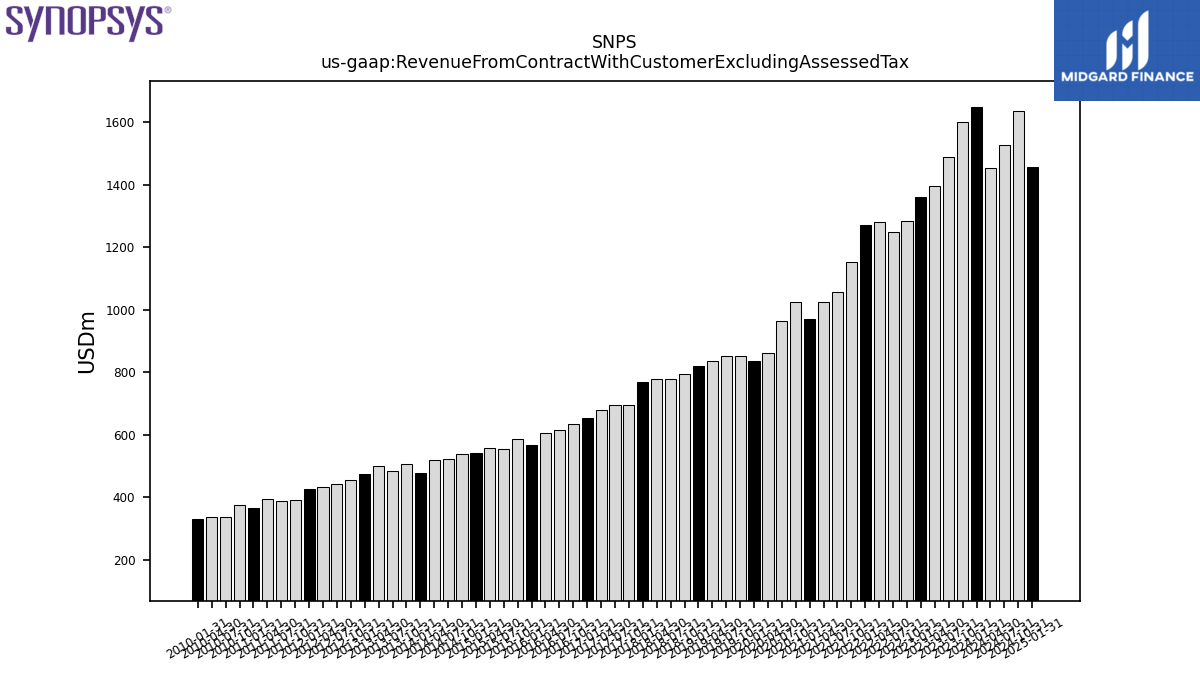
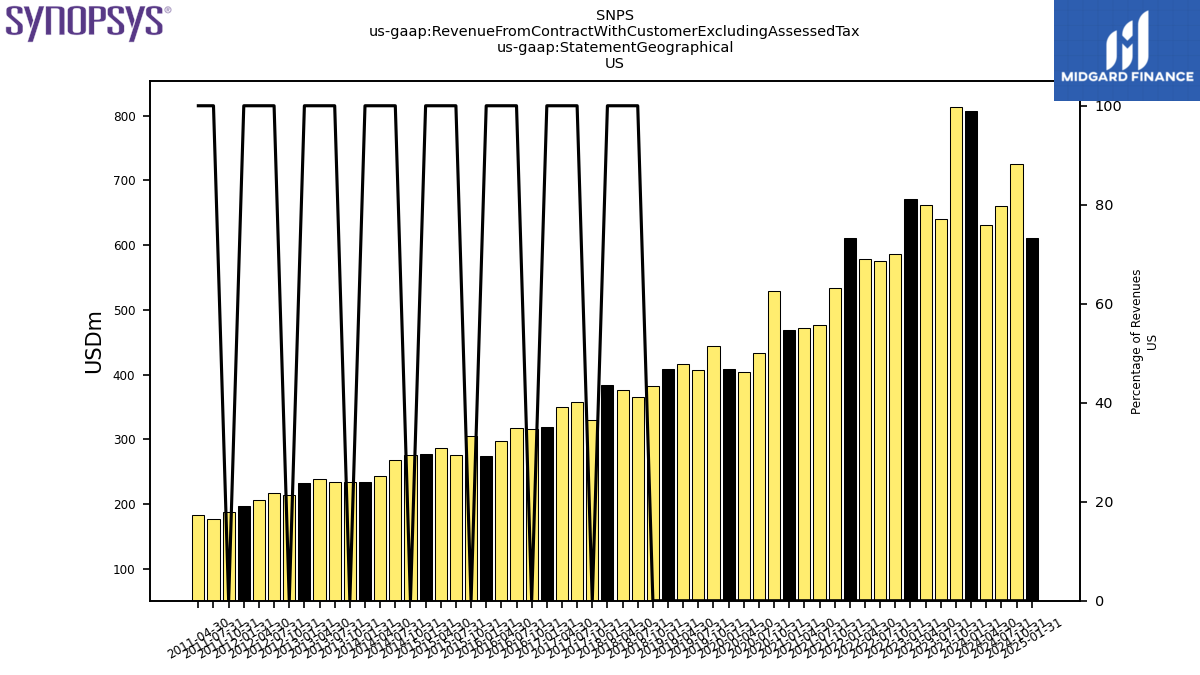
| Revenue From Contract With Customer Excluding Assessed Tax | 1649.23 | 1599.13 | 1487.29 | 1394.86 | 1361.34 | 1284.29 | 1247.77 | 1279.23 | 1270.26 | 1152.42 | 1057.13 | 1024.32 | 970.32 | 1025.44 | 964.13 | 861.33 | 834.38 | 851.08 | 852.97 | 836.24 | 820.40 | 795.08 | 779.71 | 776.84 | 769.43 | 696.64 | 695.38 | 680.07 | 652.79 | 633.72 | 615.20 | 605.00 | 568.60 | 587.16 | 555.80 | 557.20 | 542.04 | 539.01 | 521.81 | 517.70 | 478.95 | 504.88 | 482.94 | 499.26 | 475.14 | 454.21 | 443.75 | 432.56 | 425.50 | 390.53 | 386.80 | 393.67 | 364.64 | 375.46 | 336.93 | 338.11 | 330.17 | |
| Revenues | 1649.23 | 1599.13 | 1487.29 | 1394.86 | 1361.34 | 1284.29 | 1247.77 | 1279.23 | 1270.26 | 1152.42 | 1057.13 | 1024.32 | 970.32 | 1025.44 | 964.13 | 861.33 | 834.38 | 851.08 | 852.97 | 836.24 | 820.40 | 795.08 | 779.71 | 776.84 | 769.43 | 696.64 | 695.38 | 680.07 | 652.79 | 633.72 | 615.20 | 605.00 | 568.60 | 587.16 | 555.80 | 557.20 | 542.04 | 539.01 | 521.81 | 517.70 | 478.95 | 504.88 | 482.94 | 499.26 | 475.14 | 454.21 | 443.75 | 432.56 | 425.50 | 390.53 | 386.80 | 393.67 | 364.64 | 375.46 | 336.93 | 338.11 | 330.17 | |
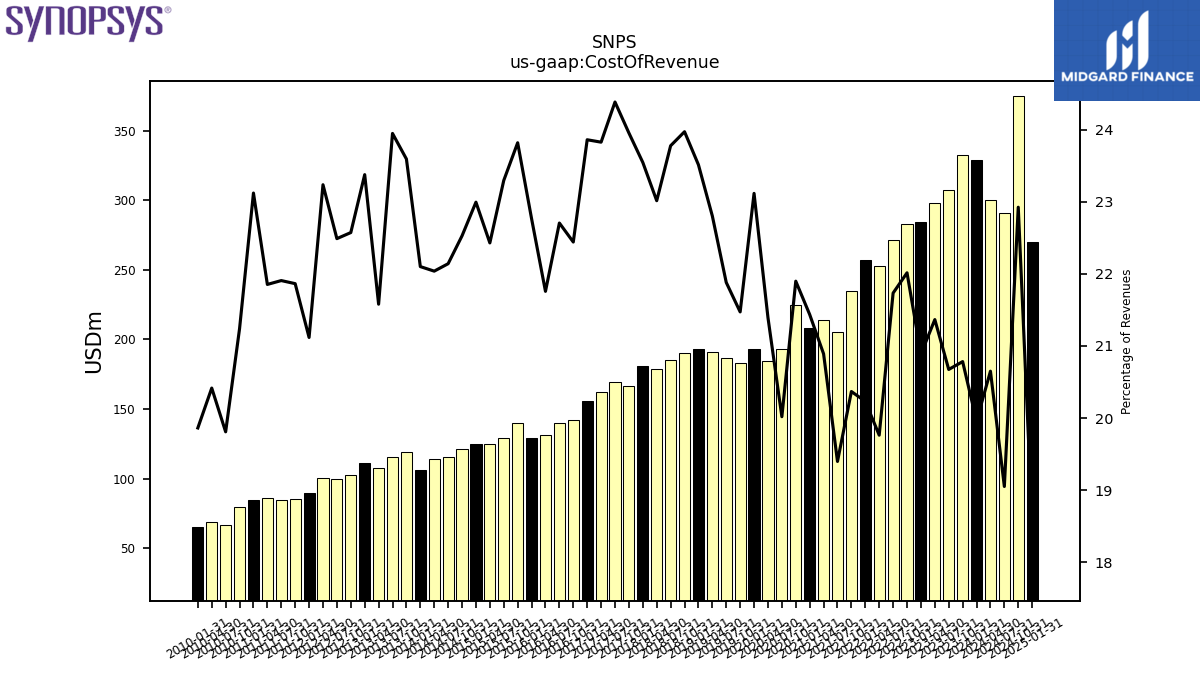
| Cost Of Revenue | 329.18 | 332.34 | 307.48 | 298.01 | 284.35 | 282.72 | 271.18 | 252.81 | 256.98 | 234.73 | 205.07 | 213.99 | 208.00 | 224.55 | 193.01 | 184.26 | 192.87 | 182.74 | 186.63 | 190.68 | 192.89 | 190.58 | 185.38 | 178.78 | 181.16 | 166.86 | 169.55 | 162.03 | 155.75 | 142.21 | 139.68 | 131.63 | 129.44 | 139.84 | 129.47 | 124.97 | 124.63 | 121.42 | 115.53 | 114.08 | 105.85 | 119.11 | 115.65 | 107.73 | 111.06 | 102.52 | 99.79 | 100.51 | 89.85 | 85.39 | 84.73 | 86.03 | 84.31 | 79.74 | 66.74 | 69.03 | 65.58 | |
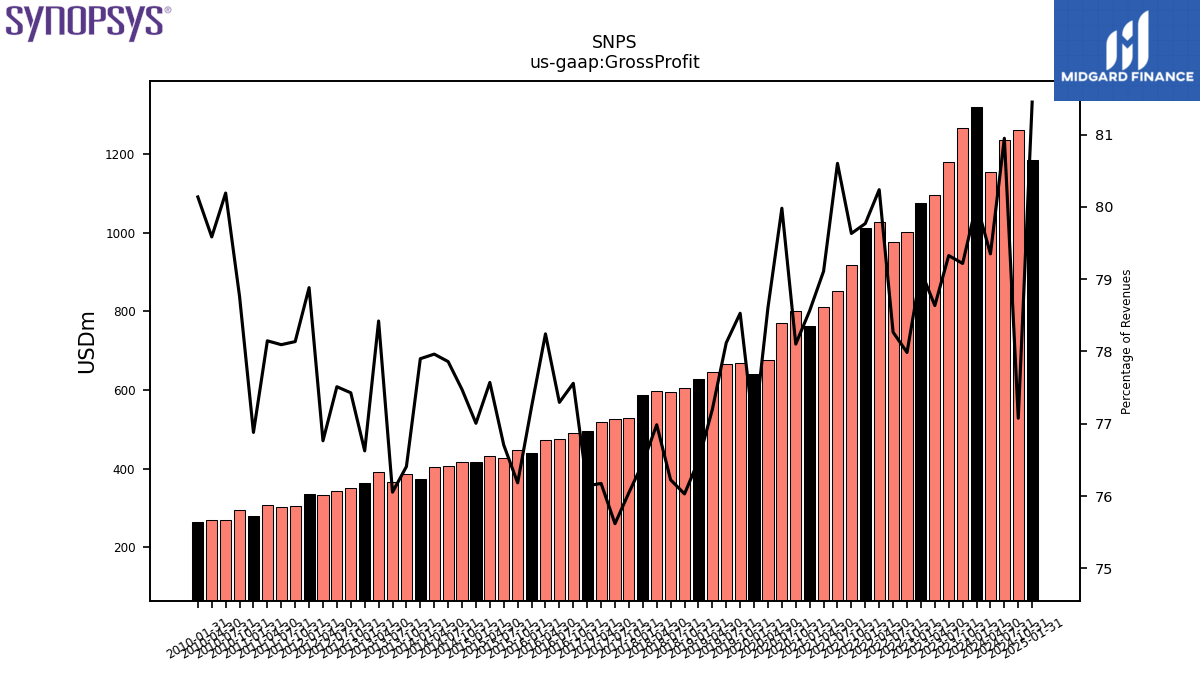
| Gross Profit | 1320.06 | 1266.79 | 1179.81 | 1096.85 | 1076.99 | 1001.57 | 976.59 | 1026.42 | 1013.27 | 917.69 | 852.06 | 810.34 | 762.32 | 800.89 | 771.13 | 677.06 | 641.51 | 668.34 | 666.34 | 645.56 | 627.51 | 604.50 | 594.33 | 598.06 | 588.27 | 529.78 | 525.84 | 518.04 | 497.04 | 491.51 | 475.53 | 473.38 | 439.16 | 447.31 | 426.33 | 432.23 | 417.41 | 417.59 | 406.28 | 403.61 | 373.10 | 385.77 | 367.30 | 391.52 | 364.07 | 351.69 | 343.96 | 332.06 | 335.64 | 305.15 | 302.06 | 307.64 | 280.34 | 295.72 | 270.19 | 269.08 | 264.59 | |
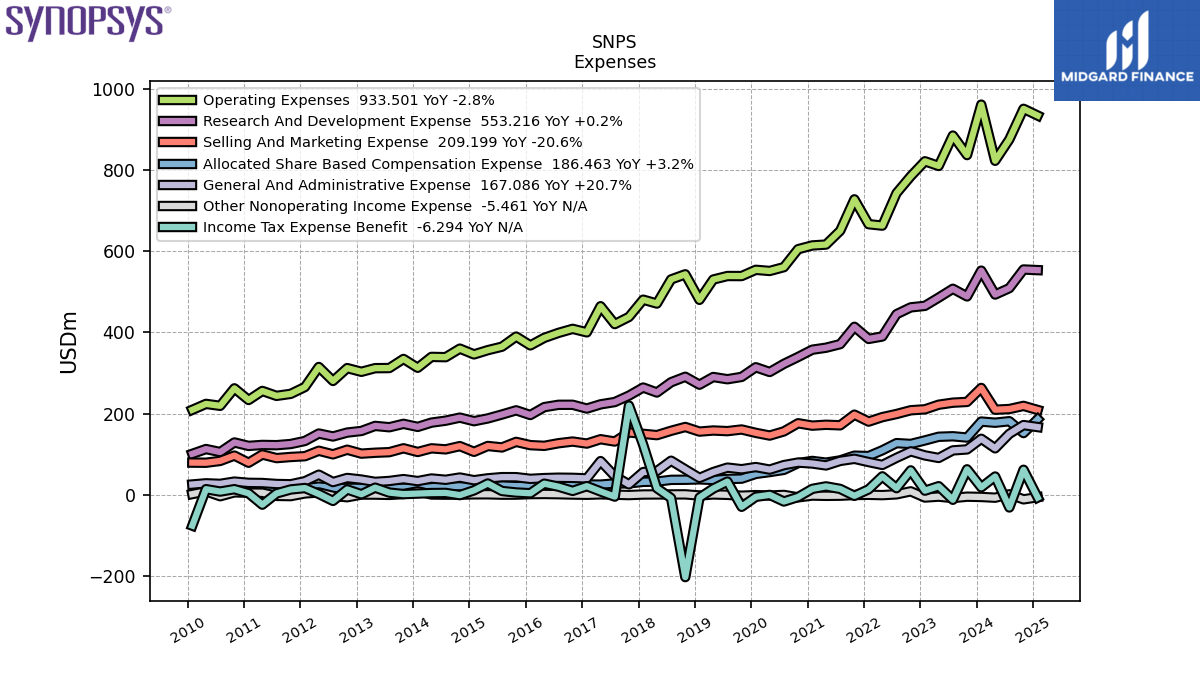
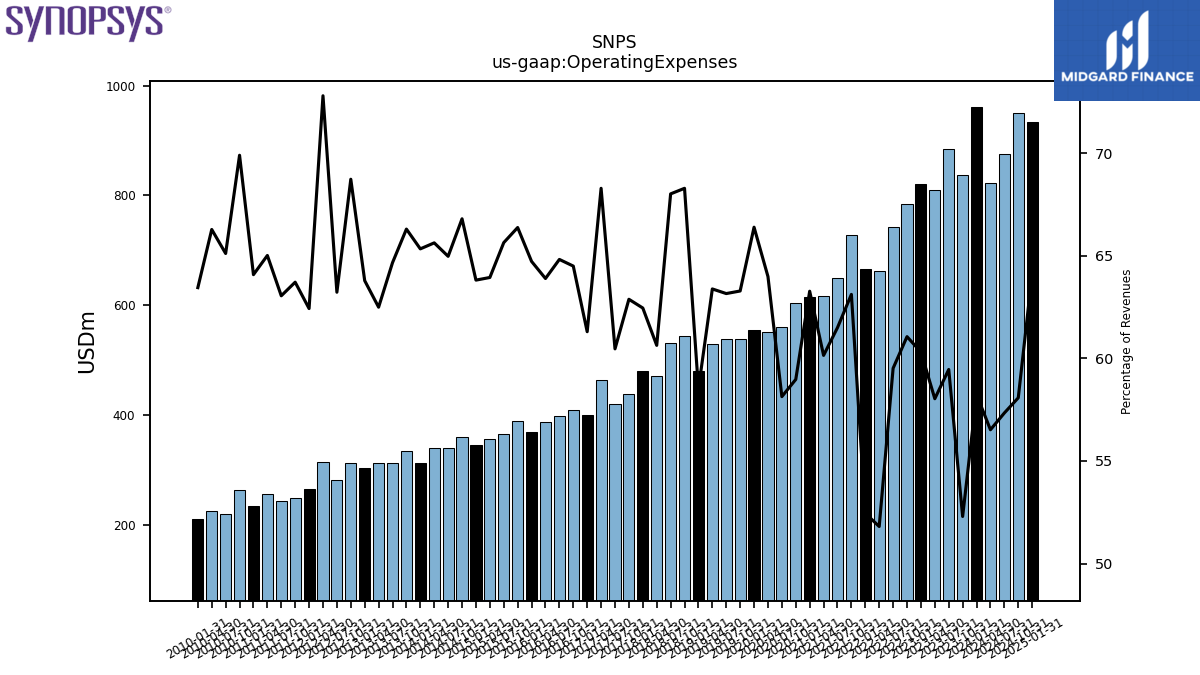
| Operating Expenses | 960.43 | 836.26 | 884.33 | 809.52 | 821.05 | 784.20 | 742.66 | 662.72 | 666.24 | 727.40 | 650.14 | 616.11 | 613.97 | 604.76 | 560.53 | 551.17 | 554.00 | 538.62 | 538.74 | 530.06 | 480.10 | 542.98 | 530.37 | 471.04 | 480.55 | 438.07 | 420.46 | 464.44 | 400.17 | 408.75 | 398.81 | 386.57 | 368.05 | 389.76 | 364.85 | 356.31 | 345.91 | 360.09 | 339.06 | 339.78 | 312.95 | 334.75 | 312.30 | 312.02 | 303.09 | 312.20 | 280.56 | 314.92 | 265.64 | 248.83 | 243.88 | 255.96 | 233.68 | 262.46 | 219.39 | 224.11 | 209.49 | |
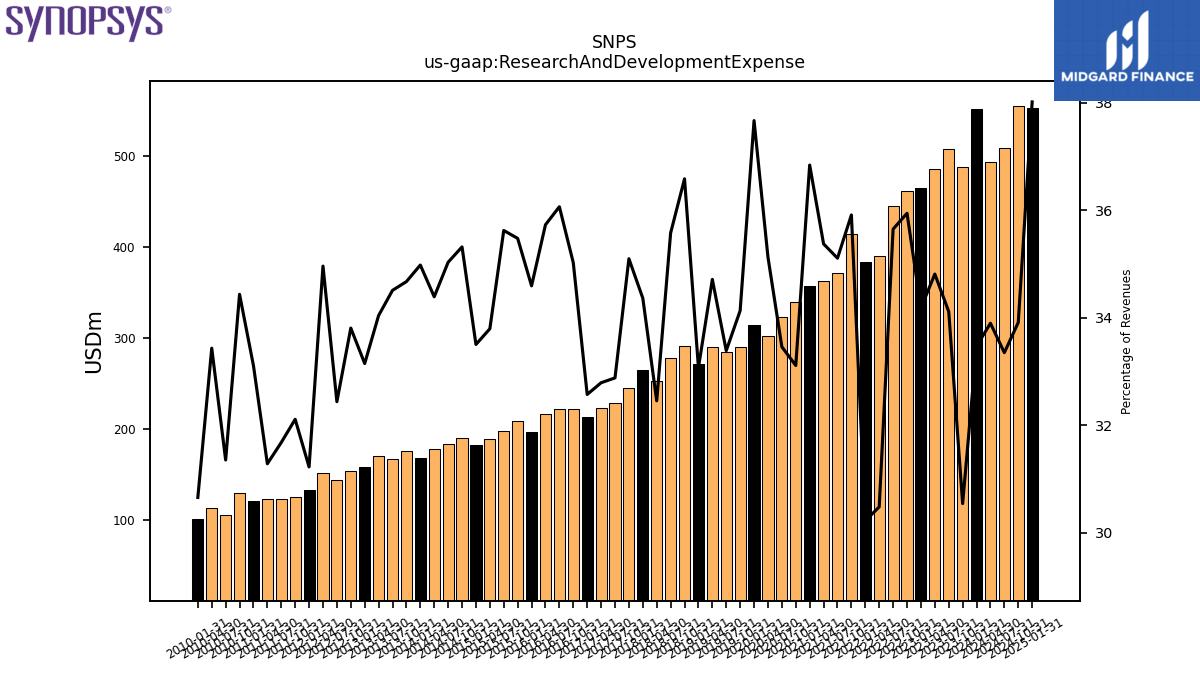
| Research And Development Expense | 552.06 | 488.49 | 507.40 | 485.60 | 465.33 | 461.62 | 444.83 | 389.96 | 383.97 | 413.86 | 371.15 | 362.35 | 357.47 | 339.57 | 322.60 | 302.57 | 314.28 | 290.50 | 284.80 | 290.30 | 271.33 | 290.88 | 277.40 | 252.13 | 264.41 | 244.51 | 228.66 | 223.01 | 212.65 | 221.95 | 221.87 | 216.17 | 196.71 | 208.31 | 198.00 | 188.31 | 181.61 | 190.37 | 182.81 | 178.04 | 167.54 | 175.06 | 166.67 | 169.96 | 157.51 | 153.57 | 143.96 | 151.23 | 132.88 | 125.42 | 122.55 | 123.17 | 120.74 | 129.30 | 105.65 | 113.05 | 101.23 | |
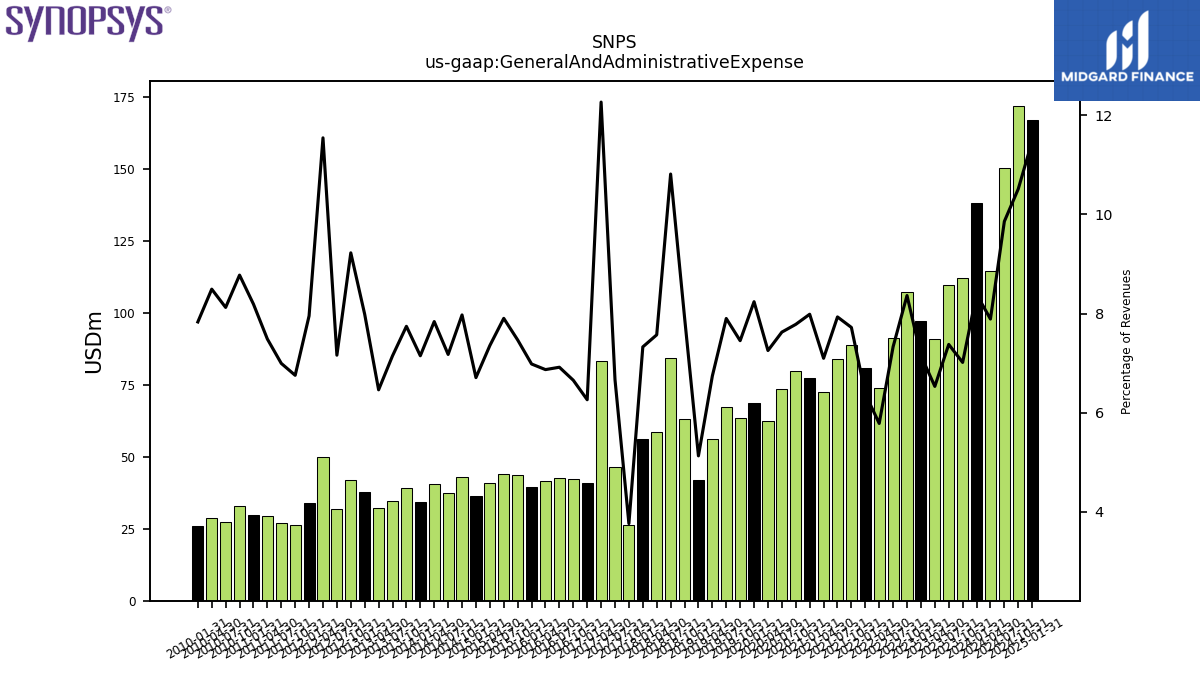
| General And Administrative Expense | 138.37 | 112.15 | 109.71 | 91.08 | 97.36 | 107.41 | 91.46 | 73.96 | 81.01 | 88.96 | 83.85 | 72.69 | 77.49 | 79.80 | 73.52 | 62.47 | 68.74 | 63.42 | 67.38 | 56.35 | 42.06 | 63.04 | 84.34 | 58.81 | 56.37 | 26.19 | 46.35 | 83.44 | 40.87 | 42.16 | 42.55 | 41.55 | 39.70 | 43.84 | 43.92 | 40.98 | 36.35 | 42.97 | 37.44 | 40.58 | 34.23 | 39.09 | 34.51 | 32.25 | 37.94 | 41.90 | 31.77 | 49.95 | 33.84 | 26.37 | 27.05 | 29.47 | 29.86 | 32.95 | 27.37 | 28.71 | 25.85 | |
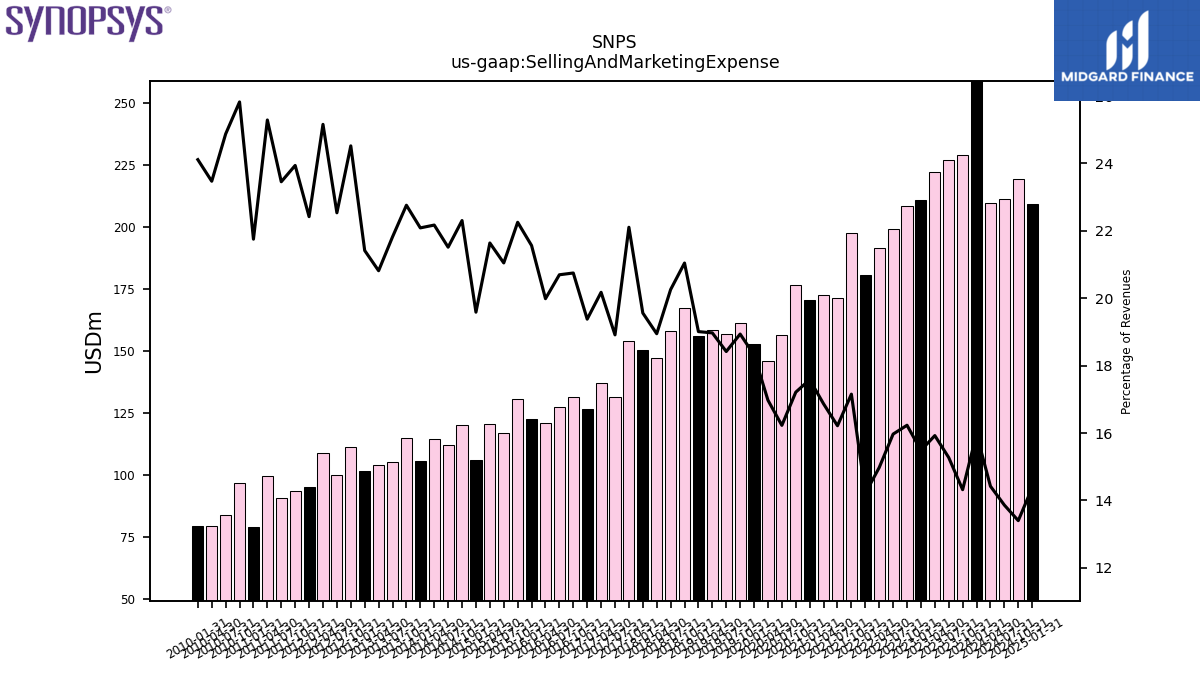
| Selling And Marketing Expense | 263.41 | 228.98 | 227.13 | 222.12 | 210.78 | 208.45 | 199.25 | 191.57 | 180.51 | 197.68 | 171.43 | 172.75 | 170.63 | 176.50 | 156.46 | 146.20 | 152.85 | 161.17 | 157.11 | 158.65 | 155.96 | 167.32 | 157.95 | 147.19 | 150.51 | 154.01 | 131.52 | 137.21 | 126.51 | 131.49 | 127.33 | 120.93 | 122.62 | 130.67 | 116.99 | 120.58 | 106.17 | 120.23 | 112.27 | 114.78 | 105.79 | 114.91 | 105.38 | 103.93 | 101.76 | 111.39 | 100.00 | 108.84 | 95.40 | 93.50 | 90.73 | 99.56 | 79.32 | 96.97 | 83.81 | 79.36 | 79.62 | |
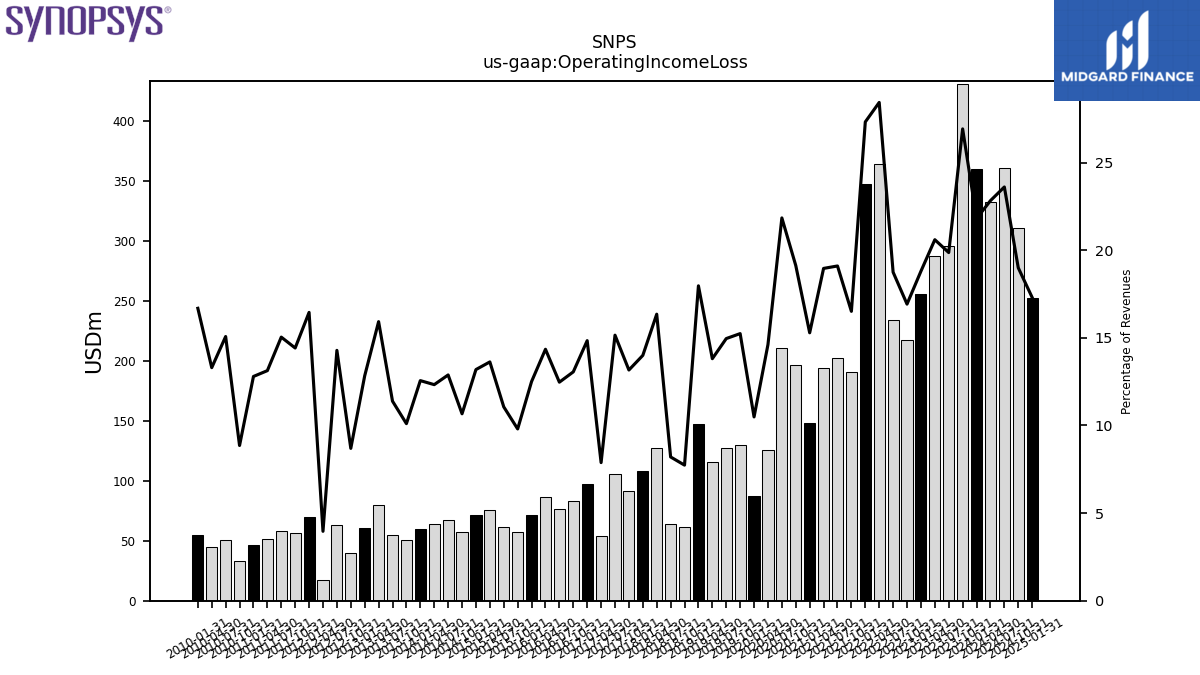
| Operating Income Loss | 359.62 | 430.52 | 295.47 | 287.33 | 255.93 | 217.37 | 233.93 | 363.70 | 347.04 | 190.29 | 201.92 | 194.23 | 148.35 | 196.13 | 210.60 | 125.89 | 87.52 | 129.72 | 127.59 | 115.50 | 147.41 | 61.52 | 63.97 | 127.01 | 107.72 | 91.71 | 105.37 | 53.61 | 96.87 | 82.76 | 76.72 | 86.81 | 71.11 | 57.56 | 61.48 | 75.93 | 71.50 | 57.50 | 67.23 | 63.83 | 60.16 | 51.01 | 54.99 | 79.50 | 60.98 | 39.49 | 63.40 | 17.14 | 70.00 | 56.32 | 58.18 | 51.69 | 46.66 | 33.26 | 50.79 | 44.97 | 55.09 | |
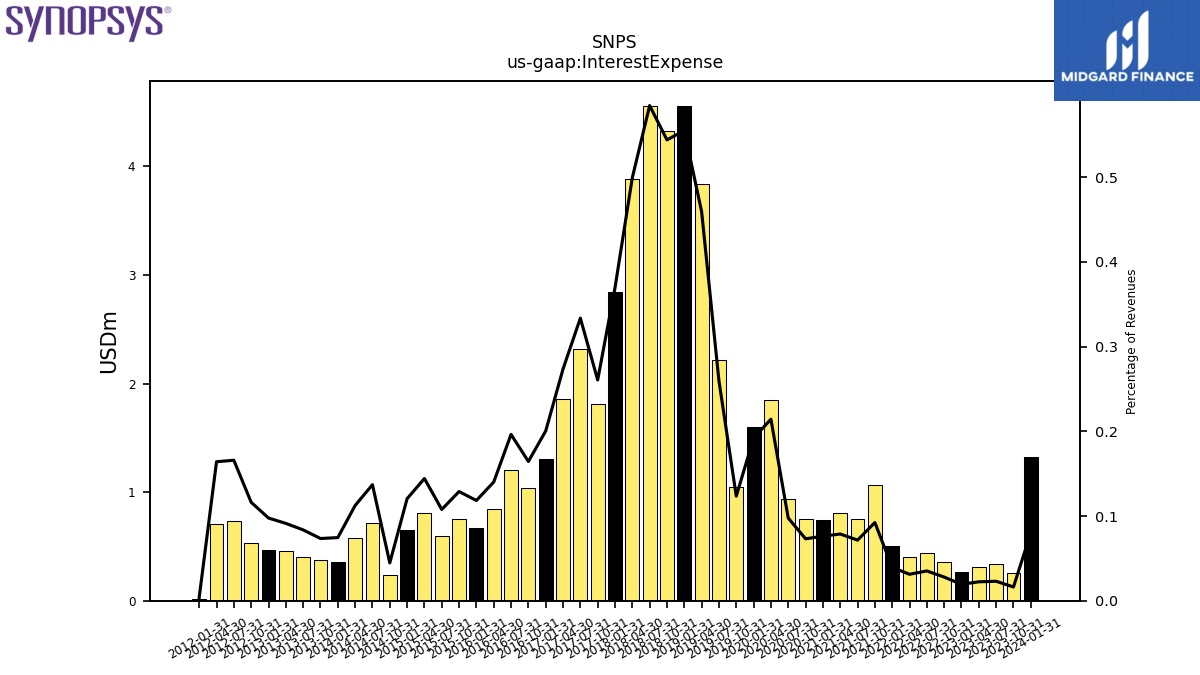
| Interest Expense | 1.32 | 0.26 | 0.34 | 0.31 | 0.26 | 0.36 | 0.44 | 0.40 | 0.50 | 1.06 | 0.76 | 0.81 | 0.74 | 0.75 | 0.94 | 1.85 | 1.60 | 1.05 | 2.21 | 3.84 | 4.55 | 4.33 | 4.56 | 3.88 | 2.84 | 1.82 | 2.32 | 1.86 | 1.31 | 1.04 | 1.21 | 0.85 | 0.67 | 0.76 | 0.60 | 0.80 | 0.65 | 0.24 | 0.71 | 0.58 | 0.36 | 0.37 | 0.40 | 0.46 | 0.46 | 0.53 | 0.74 | 0.71 | 0.02 | NA | NA | NA | NA | NA | NA | NA | NA | |
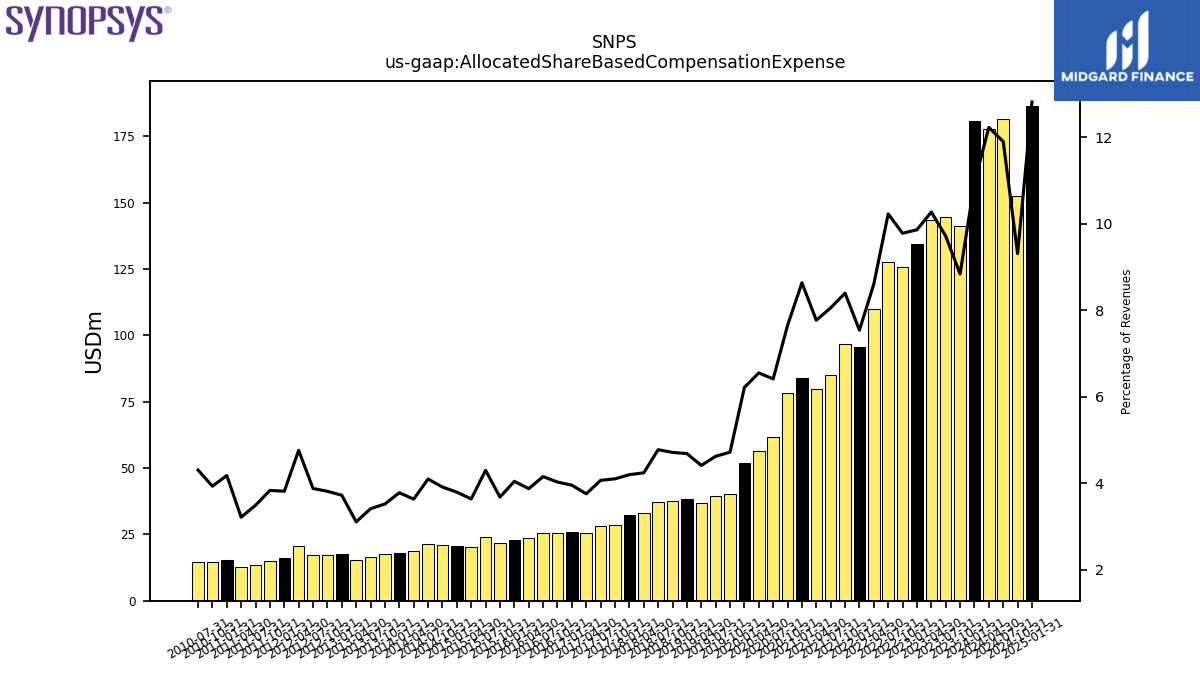
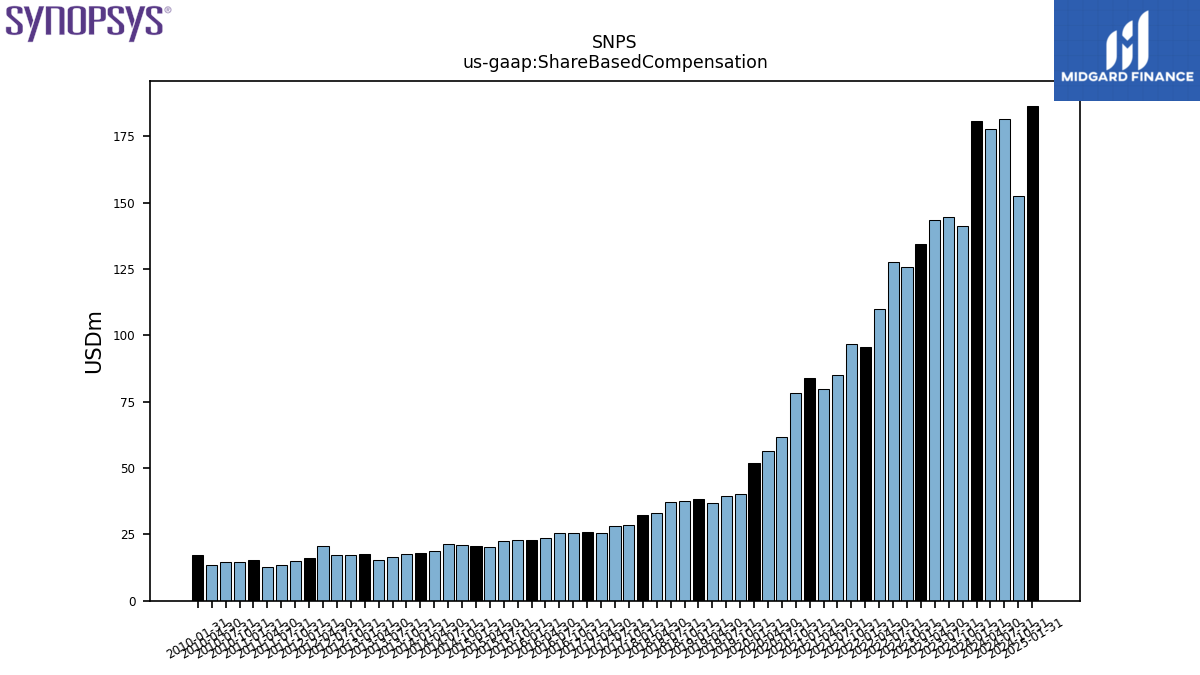
| Allocated Share Based Compensation Expense | 180.65 | 141.34 | 144.46 | 143.26 | 134.23 | 125.59 | 127.61 | 110.06 | 95.77 | 96.74 | 85.16 | 79.59 | 83.78 | 78.43 | 61.84 | 56.44 | 51.88 | 40.17 | 39.45 | 36.91 | 38.46 | 37.49 | 37.25 | 32.97 | 32.32 | 28.60 | 28.30 | 25.56 | 25.83 | 25.54 | 25.57 | 23.46 | 23.01 | 21.63 | 23.91 | 20.28 | 20.58 | 21.10 | 21.40 | 18.82 | 18.12 | 17.79 | 16.49 | 15.53 | 17.70 | 17.34 | 17.22 | 20.60 | 16.25 | 14.98 | 13.52 | 12.67 | 15.25 | 14.77 | 14.51 | NA | NA | |
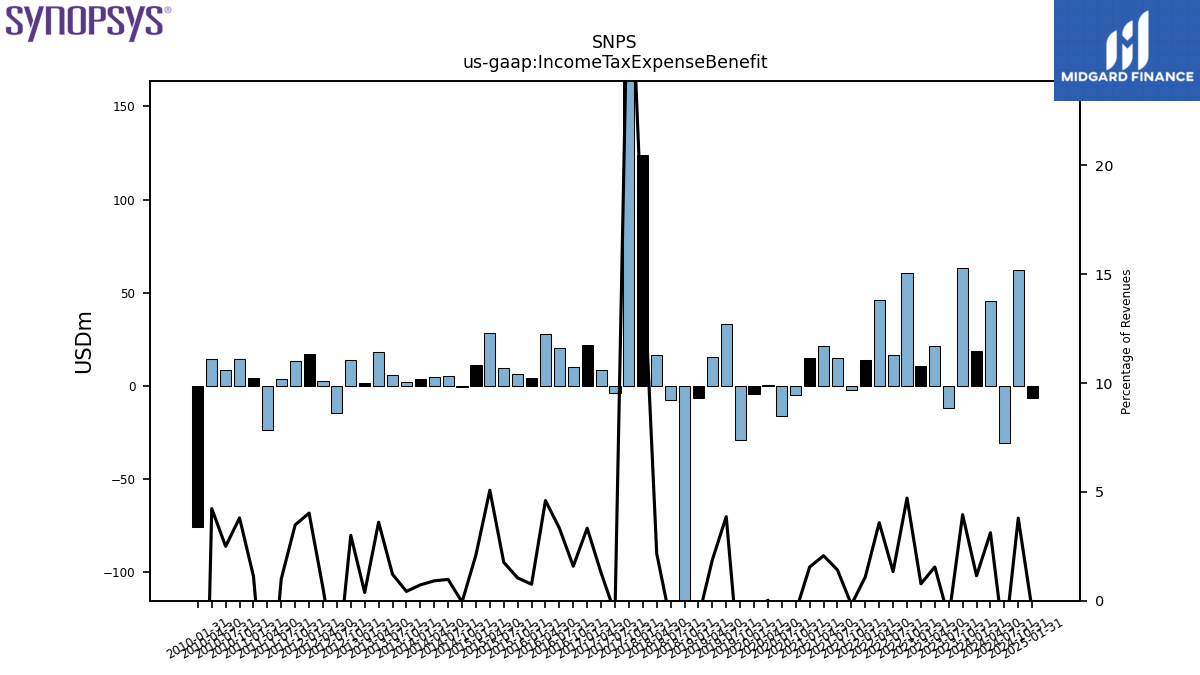
| Income Tax Expense Benefit | 18.90 | 63.20 | -11.77 | 21.64 | 10.60 | 60.57 | 16.71 | 45.90 | 13.90 | -2.06 | 14.95 | 21.19 | 15.08 | -4.99 | -16.06 | 0.25 | -4.49 | -29.09 | 32.98 | 15.71 | -6.46 | -202.08 | -7.52 | 16.83 | 123.79 | 220.01 | -3.96 | 8.71 | 21.77 | 10.05 | 20.51 | 27.85 | 4.31 | 6.16 | 9.81 | 28.29 | 11.43 | -0.33 | 5.12 | 4.74 | 3.49 | 2.17 | 5.88 | 18.02 | 1.81 | 13.65 | -14.57 | 2.52 | 17.14 | 13.61 | 3.88 | -23.86 | 4.11 | 14.29 | 8.42 | 14.32 | -75.44 | |
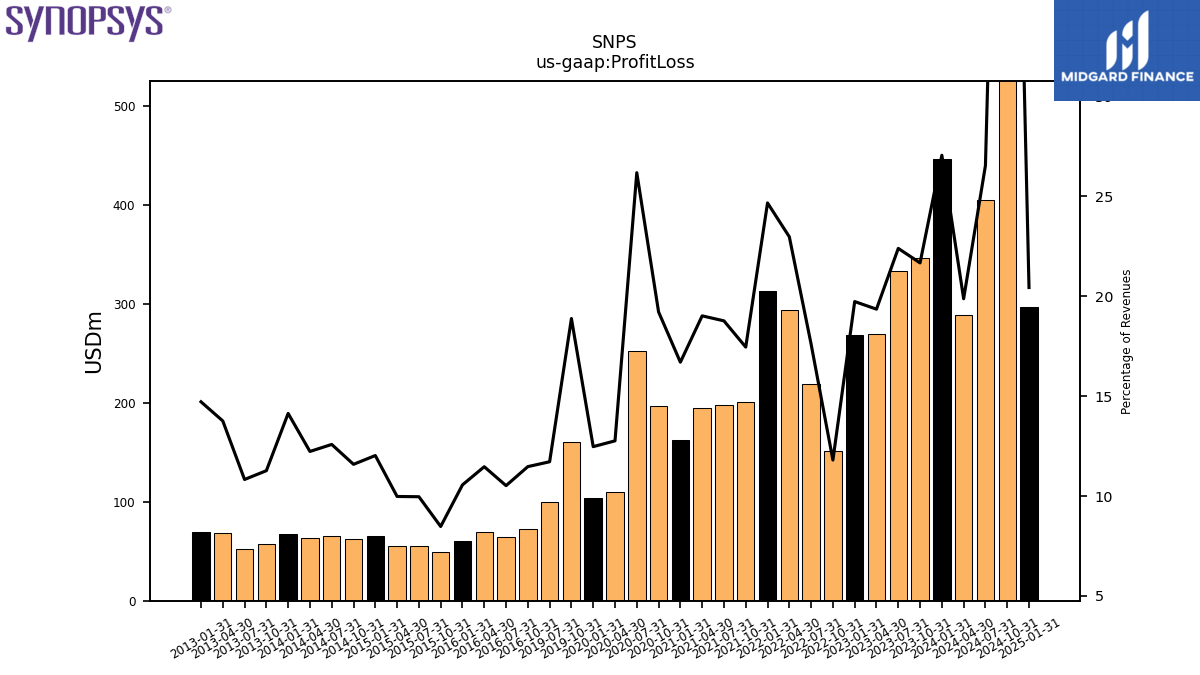
| Profit Loss | 446.21 | 346.50 | 333.06 | 269.95 | 268.63 | 151.56 | 219.65 | 293.89 | 313.34 | 201.14 | 198.39 | 194.80 | 162.03 | 197.03 | 252.44 | 109.92 | 104.06 | 160.71 | 99.93 | NA | NA | NA | NA | NA | NA | NA | NA | NA | NA | 72.70 | 64.72 | 69.38 | 60.03 | 49.76 | 55.39 | 55.60 | 65.19 | 62.45 | 65.66 | 63.32 | 67.70 | 56.89 | 52.30 | 68.69 | 69.92 | NA | NA | NA | NA | NA | NA | NA | NA | NA | NA | NA | NA | |
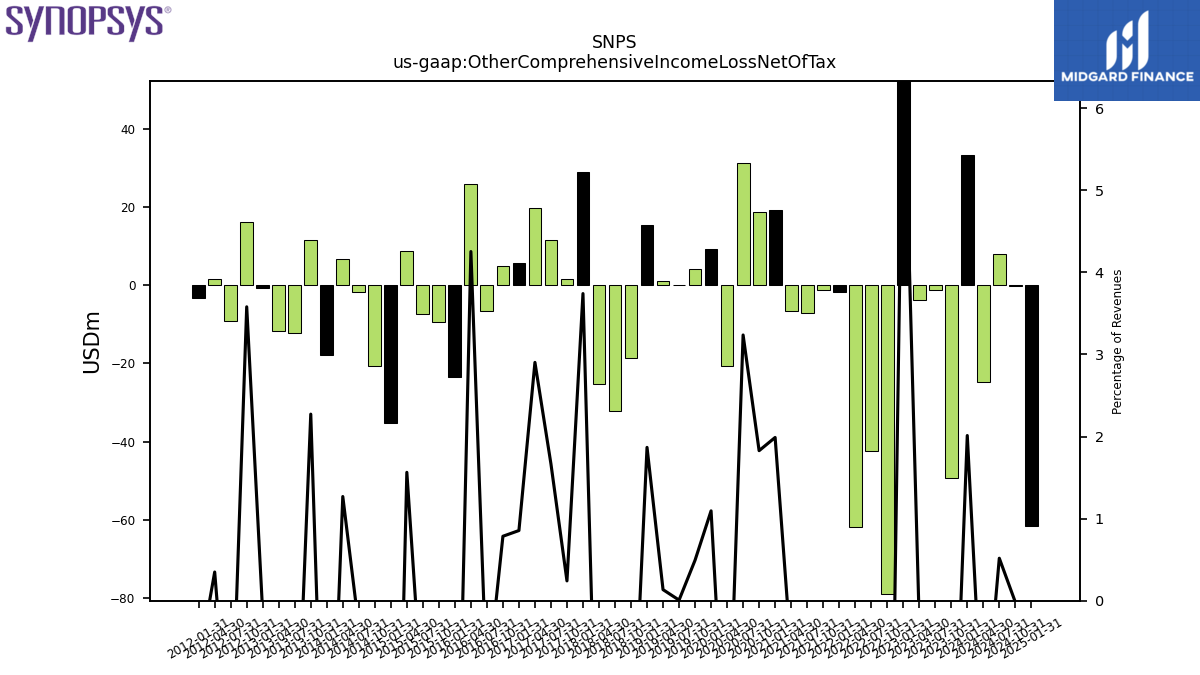
| Other Comprehensive Income Loss Net Of Tax | 33.19 | -49.13 | -1.29 | -3.66 | 91.94 | -78.78 | -42.39 | -61.64 | -1.85 | -1.19 | -7.06 | -6.58 | 19.30 | 18.75 | 31.21 | -20.72 | 9.14 | 4.21 | 0.07 | 1.13 | 15.32 | -18.52 | -32.26 | -25.20 | 28.79 | 1.69 | 11.59 | 19.74 | 5.58 | 4.98 | -6.49 | 25.73 | -23.42 | -9.51 | -7.33 | 8.71 | -35.16 | -20.58 | -1.66 | 6.57 | -17.73 | 11.48 | -12.16 | -11.81 | -0.74 | 16.26 | -9.08 | 1.51 | -3.21 | NA | NA | NA | NA | NA | NA | NA | NA | |
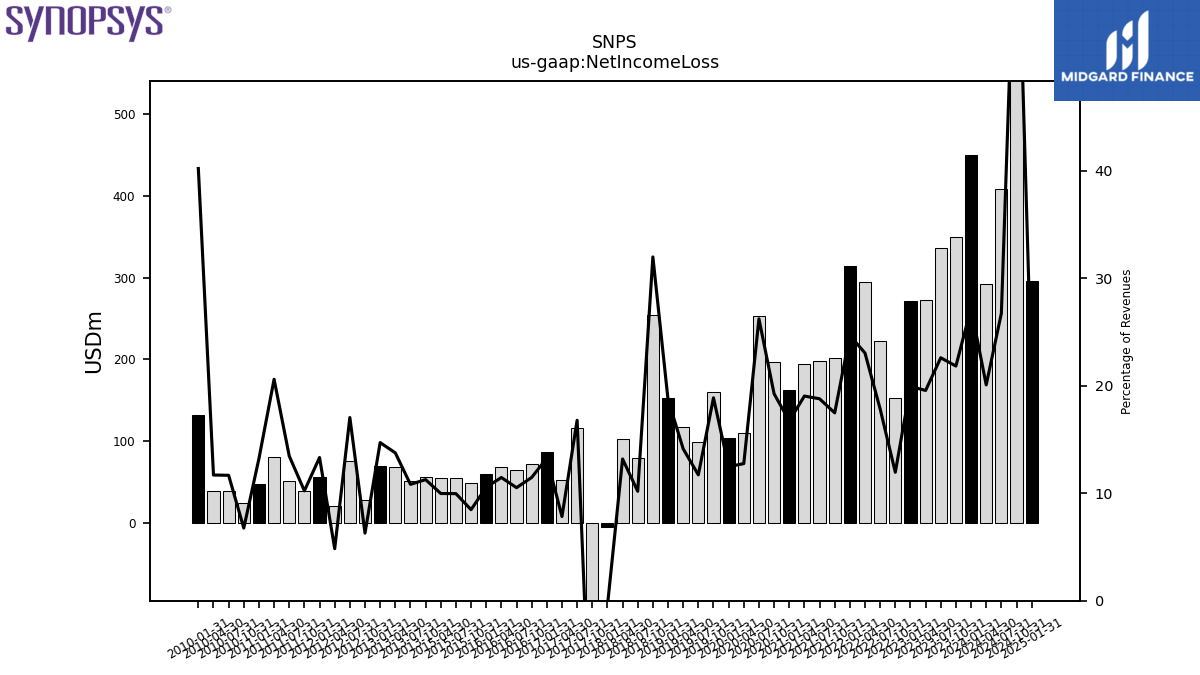
| Net Income Loss | 449.11 | 349.19 | 336.25 | 272.91 | 271.54 | 153.50 | 222.63 | 294.78 | 313.69 | 201.45 | 198.65 | 195.08 | 162.34 | 197.46 | 252.91 | 109.92 | 104.06 | 160.71 | 99.93 | 118.21 | 153.51 | 254.33 | 79.41 | 102.47 | -3.69 | -120.08 | 116.75 | 53.31 | 86.59 | 72.70 | 64.72 | 69.38 | 60.03 | 49.76 | 55.39 | 55.60 | NA | NA | NA | NA | NA | 56.89 | 52.30 | 68.69 | 69.92 | 28.58 | 75.66 | 20.97 | 56.69 | 39.94 | 52.08 | 81.11 | 48.23 | 25.40 | 39.33 | 39.55 | 132.79 | |
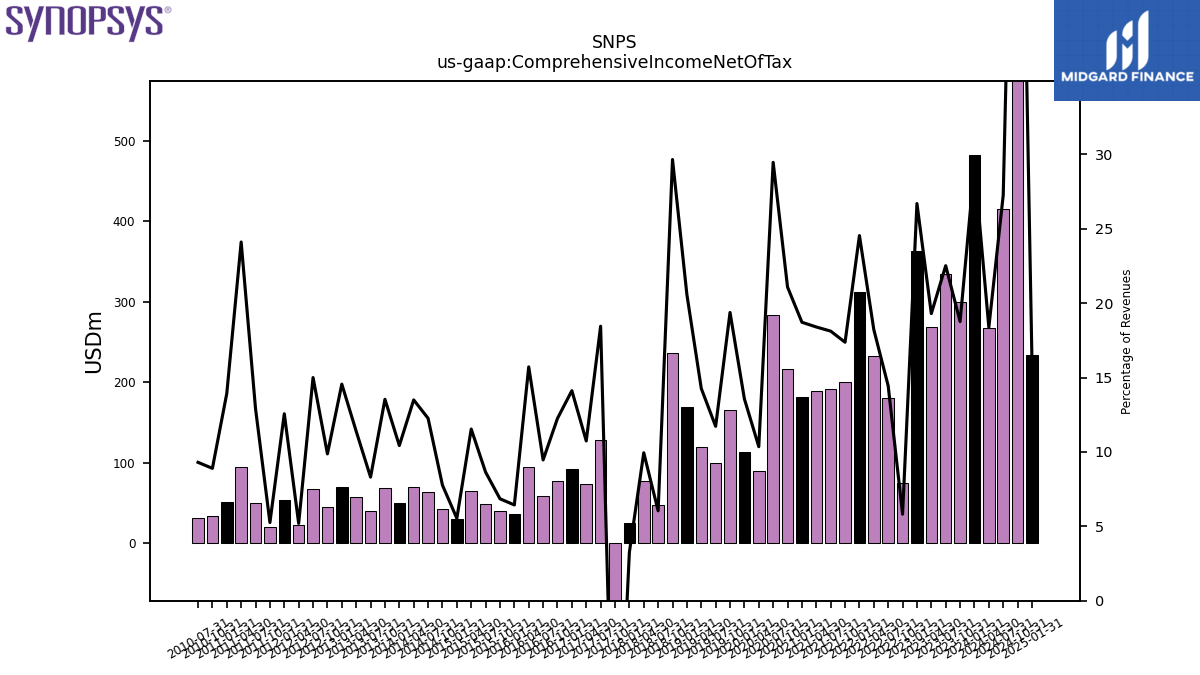
| Comprehensive Income Net Of Tax | 482.30 | 300.06 | 334.96 | 269.25 | 363.48 | 74.72 | 180.23 | 233.14 | 311.83 | 200.25 | 191.59 | 188.50 | 181.64 | 216.20 | 284.12 | 89.20 | 113.20 | 164.92 | 100.00 | 119.34 | 168.84 | 235.80 | 47.15 | 77.28 | 25.10 | -118.40 | 128.34 | 73.05 | 92.17 | 77.67 | 58.23 | 95.11 | 36.62 | 40.25 | 48.05 | 64.31 | 30.03 | 41.88 | 64.00 | 69.89 | 49.97 | 68.37 | 40.13 | 56.88 | 69.18 | 44.84 | 66.58 | 22.48 | 53.48 | 20.54 | 49.91 | 94.93 | 50.81 | 33.42 | 31.35 | NA | NA |
| 2024-01-31 | 2023-10-31 | 2023-07-31 | 2023-04-30 | 2023-01-31 | 2022-10-31 | 2022-07-31 | 2022-04-30 | 2022-01-31 | 2021-10-31 | 2021-07-31 | 2021-04-30 | 2021-01-31 | 2020-10-31 | 2020-07-31 | 2020-04-30 | 2020-01-31 | 2019-10-31 | 2019-07-31 | 2019-04-30 | 2019-01-31 | 2018-10-31 | 2018-07-31 | 2018-04-30 | 2018-01-31 | 2017-10-31 | 2017-07-31 | 2017-04-30 | 2017-01-31 | 2016-10-31 | 2016-07-31 | 2016-04-30 | 2016-01-31 | 2015-10-31 | 2015-07-31 | 2015-04-30 | 2015-01-31 | 2014-10-31 | 2014-07-31 | 2014-04-30 | 2014-01-31 | 2013-10-31 | 2013-07-31 | 2013-04-30 | 2013-01-31 | 2012-10-31 | 2012-07-31 | 2012-04-30 | 2012-01-31 | 2011-10-31 | 2011-07-31 | 2011-04-30 | 2011-01-31 | 2010-10-31 | 2010-07-31 | 2010-04-30 | 2010-01-31 | ||
|---|---|---|---|---|---|---|---|---|---|---|---|---|---|---|---|---|---|---|---|---|---|---|---|---|---|---|---|---|---|---|---|---|---|---|---|---|---|---|---|---|---|---|---|---|---|---|---|---|---|---|---|---|---|---|---|---|---|---|
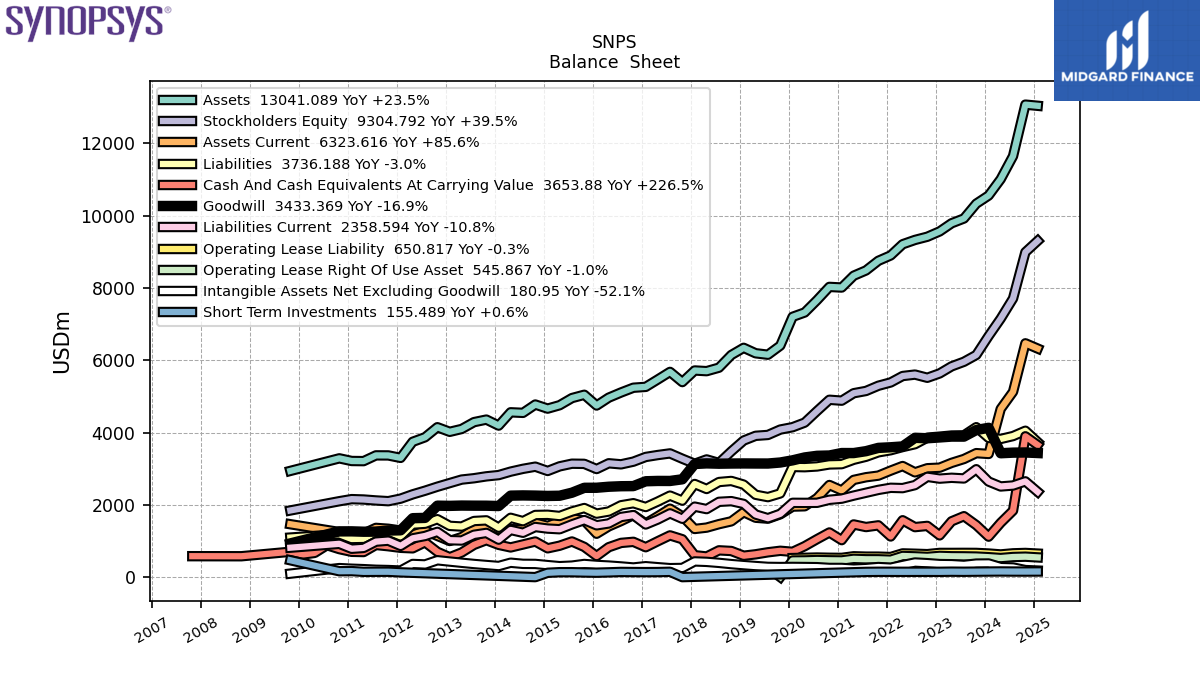
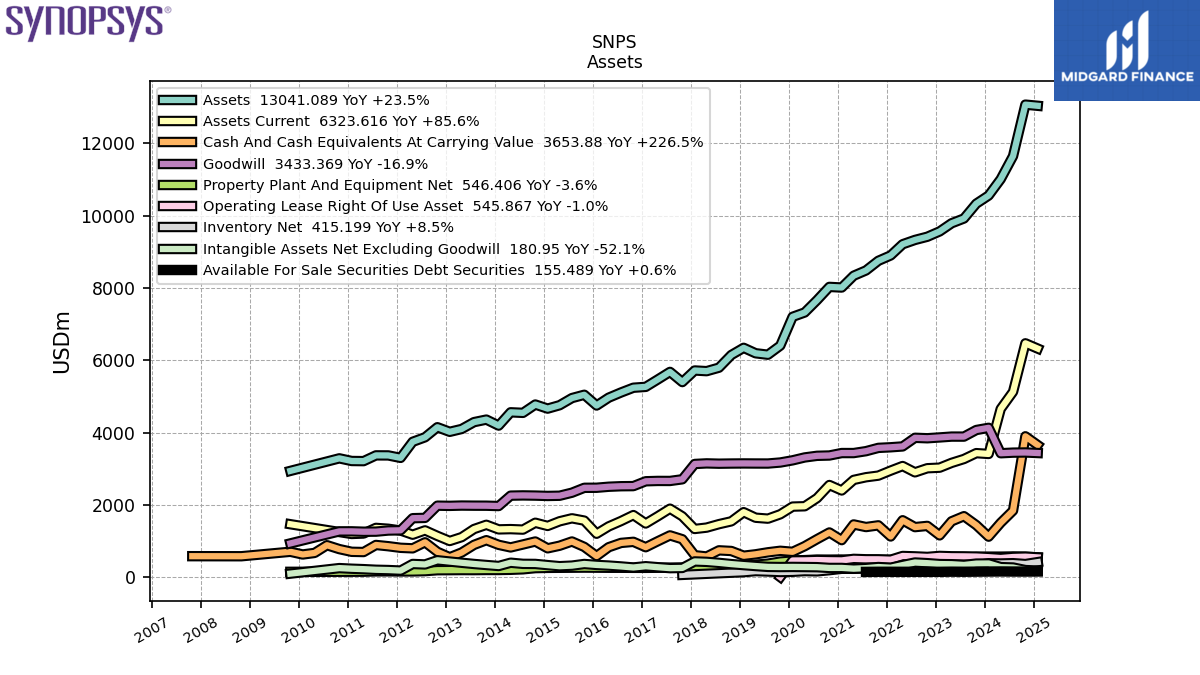
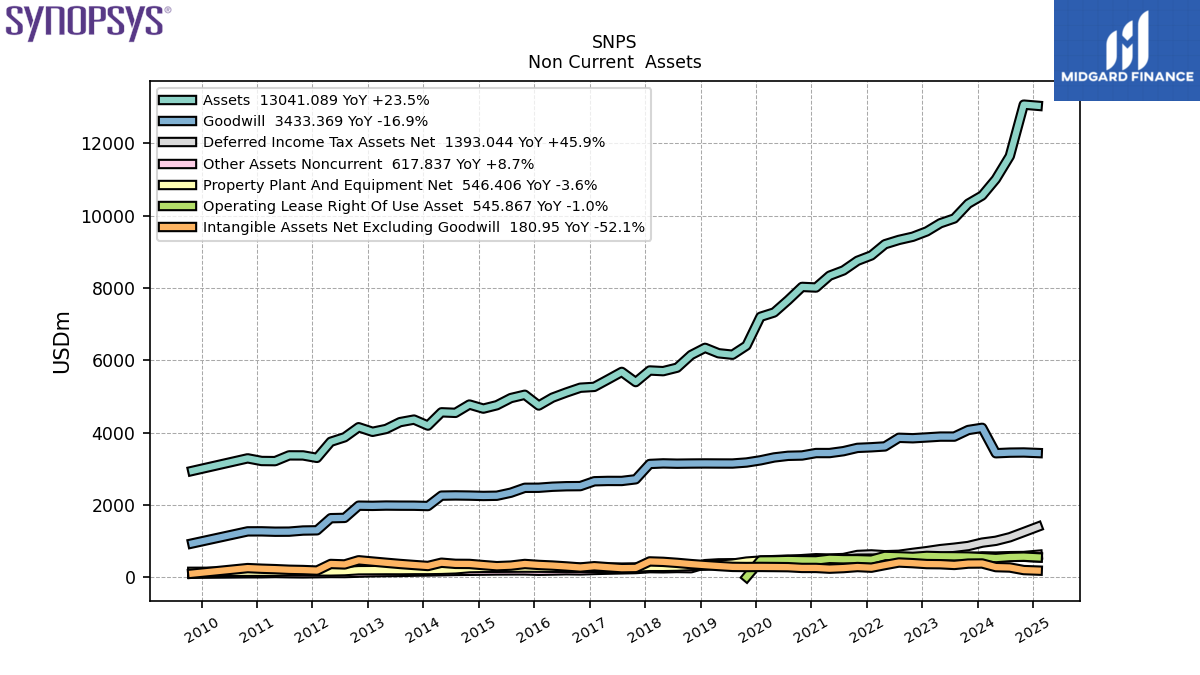
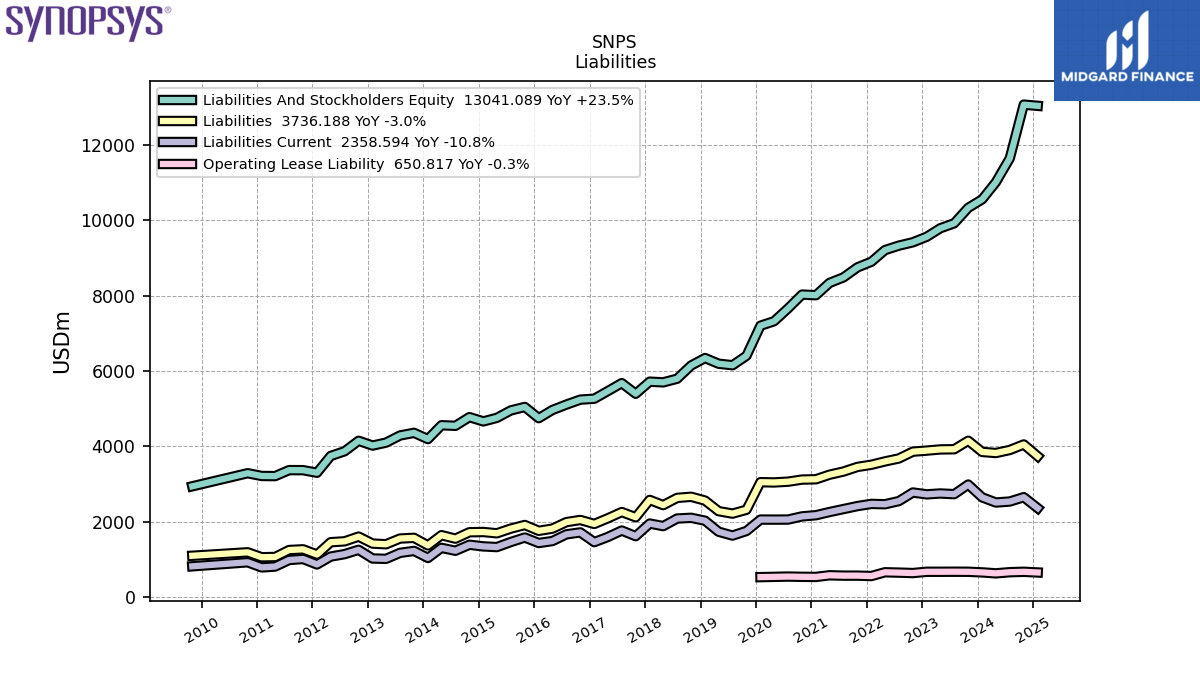
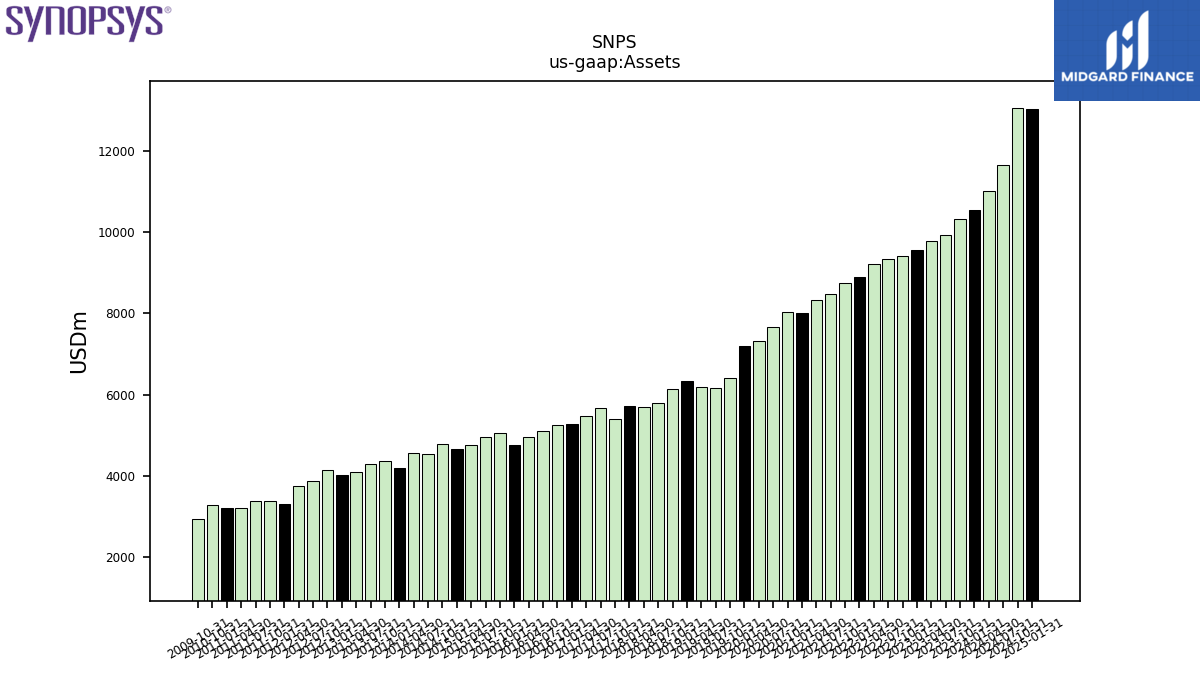
| Assets | 10558.26 | 10333.13 | 9923.23 | 9790.73 | 9565.62 | 9418.09 | 9329.55 | 9210.38 | 8901.35 | 8752.26 | 8485.91 | 8339.57 | 8012.84 | 8030.06 | 7663.25 | 7322.47 | 7202.90 | 6405.16 | 6153.41 | 6194.22 | 6344.49 | 6145.97 | 5795.22 | 5699.07 | 5717.55 | 5396.41 | 5678.94 | 5466.56 | 5264.25 | 5240.36 | 5108.79 | 4965.26 | 4747.52 | 5045.74 | 4953.97 | 4756.17 | 4662.35 | 4775.50 | 4544.93 | 4560.54 | 4192.16 | 4358.94 | 4288.47 | 4098.89 | 4020.55 | 4147.66 | 3869.27 | 3744.48 | 3299.00 | 3367.33 | 3368.64 | 3209.47 | 3213.29 | 3286.54 | NA | NA | NA | |
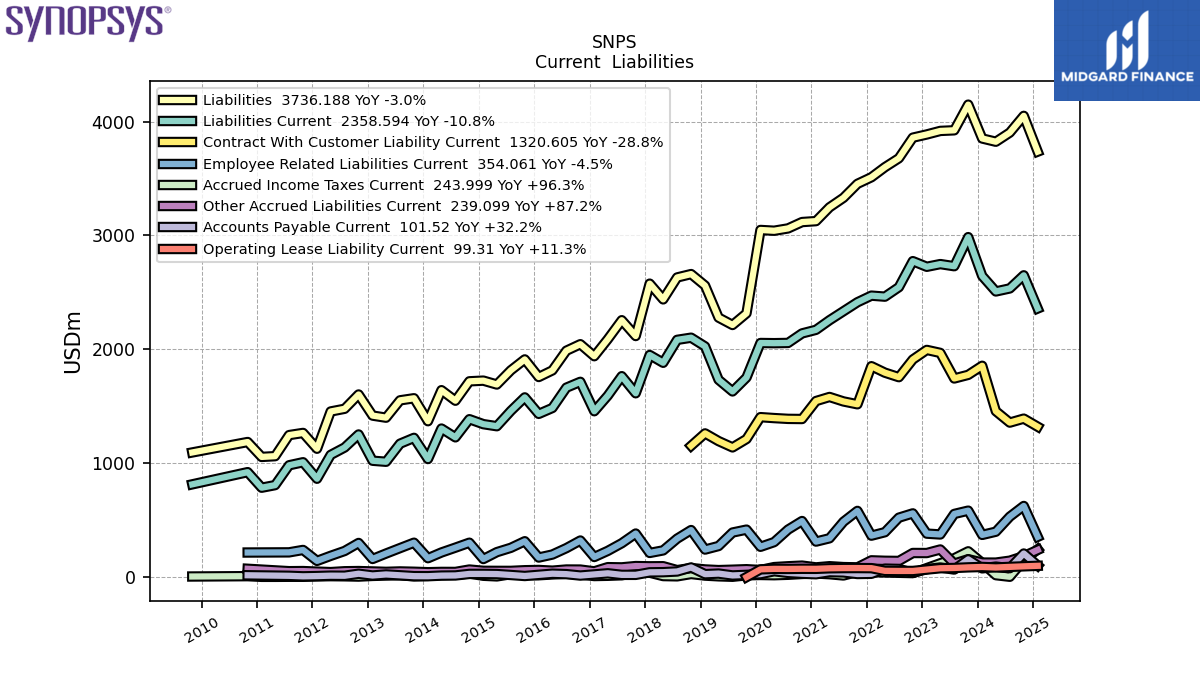
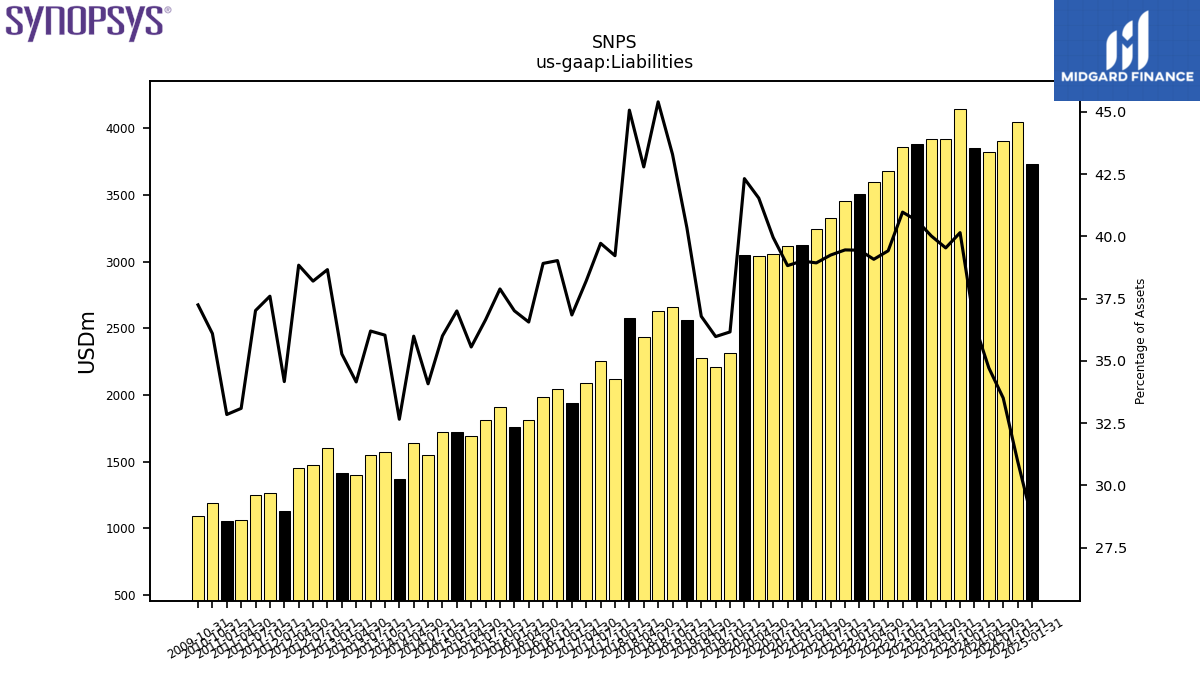
| Liabilities | 3851.64 | 4148.83 | 3923.35 | 3917.91 | 3886.87 | 3858.90 | 3677.91 | 3599.43 | 3511.11 | 3453.32 | 3330.77 | 3247.06 | 3125.94 | 3117.70 | 3061.93 | 3041.52 | 3048.21 | 2316.28 | 2213.74 | 2278.79 | 2559.82 | 2660.96 | 2631.21 | 2438.67 | 2576.92 | 2116.69 | 2255.77 | 2089.06 | 1939.57 | 2045.22 | 1988.04 | 1815.26 | 1757.14 | 1911.75 | 1815.72 | 1691.17 | 1725.33 | 1719.33 | 1548.88 | 1641.42 | 1368.94 | 1570.66 | 1552.34 | 1399.96 | 1418.39 | 1603.68 | 1478.17 | 1454.51 | 1127.19 | 1266.03 | 1247.13 | 1062.07 | 1055.41 | 1186.36 | NA | NA | NA | |
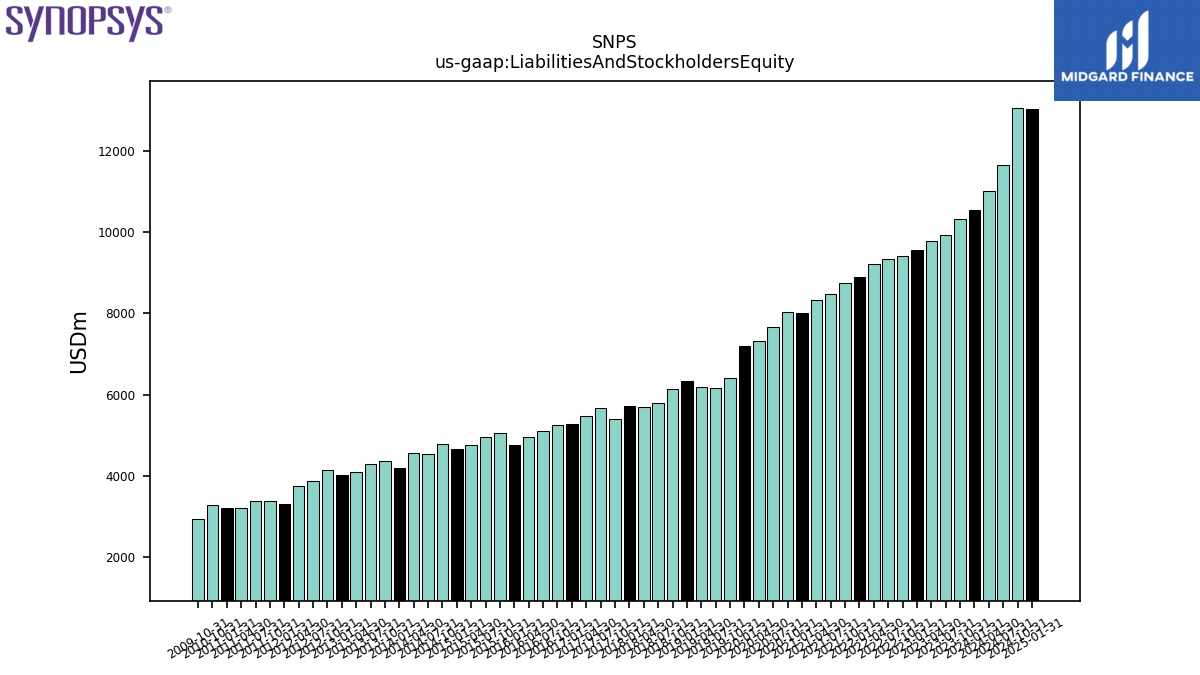
| Liabilities And Stockholders Equity | 10558.26 | 10333.13 | 9923.23 | 9790.73 | 9565.62 | 9418.09 | 9329.55 | 9210.38 | 8901.35 | 8752.26 | 8485.91 | 8339.57 | 8012.84 | 8030.06 | 7663.25 | 7322.47 | 7202.90 | 6405.16 | 6153.41 | 6194.22 | 6344.49 | 6145.97 | 5795.22 | 5699.07 | 5717.55 | 5396.41 | 5678.94 | 5466.56 | 5264.25 | 5240.36 | 5108.79 | 4965.26 | 4747.52 | 5045.74 | 4953.97 | 4756.17 | 4662.35 | 4775.50 | 4544.93 | 4560.54 | 4192.16 | 4358.94 | 4288.47 | 4098.89 | 4020.55 | 4147.66 | 3869.27 | 3744.48 | 3299.00 | 3367.33 | 3368.64 | 3209.47 | 3213.29 | 3286.54 | NA | NA | NA | |
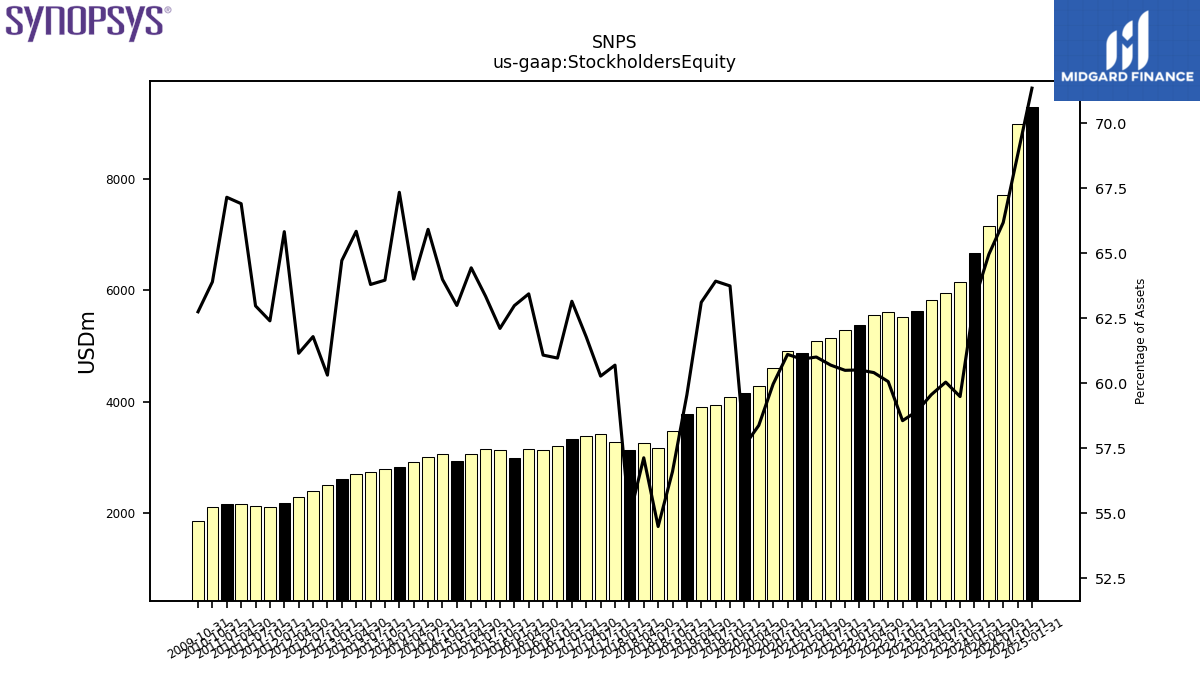
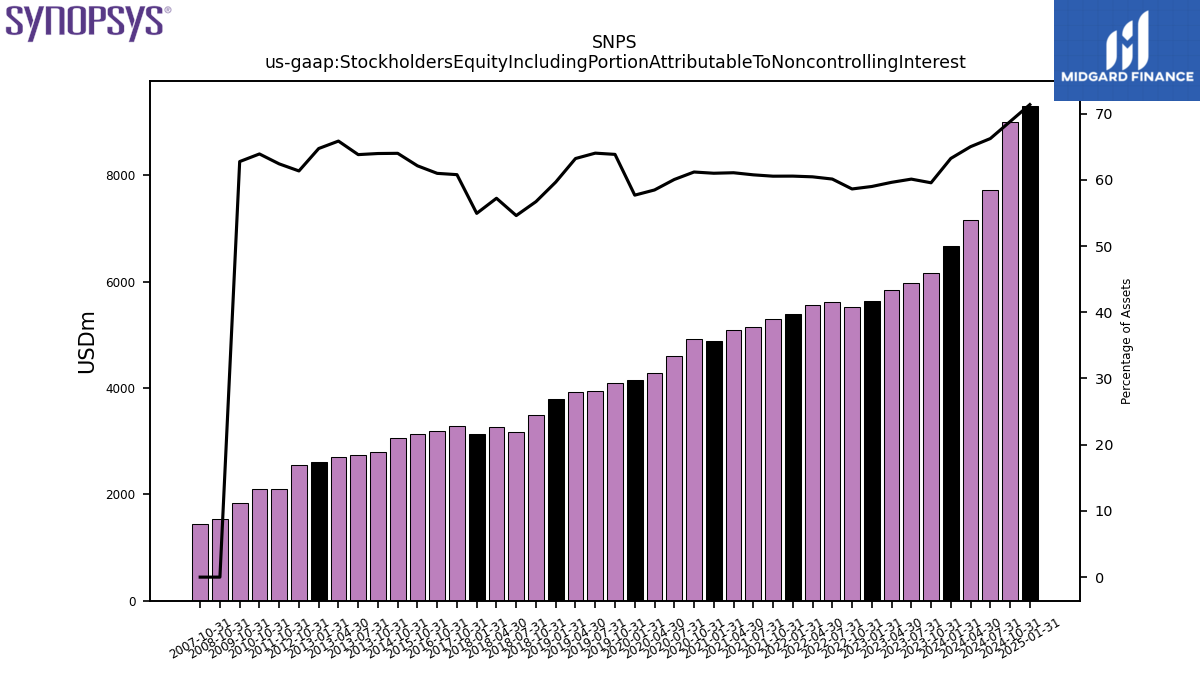
| Stockholders Equity | 6670.98 | 6147.31 | 5958.56 | 5831.86 | 5636.75 | 5515.73 | 5604.03 | 5564.31 | 5386.77 | 5295.14 | 5151.02 | 5088.14 | 4882.25 | 4907.40 | 4595.93 | 4275.09 | 4148.83 | 4083.01 | 3933.81 | 3909.57 | 3778.80 | 3479.15 | 3158.14 | 3256.29 | 3136.53 | 3275.62 | 3423.17 | 3377.49 | 3324.68 | 3195.15 | 3120.75 | 3150.01 | 2990.38 | 3133.99 | 3138.25 | 3065.00 | 2937.02 | 3056.17 | 2996.05 | 2919.12 | 2823.22 | 2788.28 | 2736.13 | 2698.93 | 2602.16 | 2501.69 | 2391.10 | 2289.98 | 2171.80 | 2101.30 | 2121.51 | 2147.40 | 2157.87 | 2100.18 | NA | NA | NA |
| 2024-01-31 | 2023-10-31 | 2023-07-31 | 2023-04-30 | 2023-01-31 | 2022-10-31 | 2022-07-31 | 2022-04-30 | 2022-01-31 | 2021-10-31 | 2021-07-31 | 2021-04-30 | 2021-01-31 | 2020-10-31 | 2020-07-31 | 2020-04-30 | 2020-01-31 | 2019-10-31 | 2019-07-31 | 2019-04-30 | 2019-01-31 | 2018-10-31 | 2018-07-31 | 2018-04-30 | 2018-01-31 | 2017-10-31 | 2017-07-31 | 2017-04-30 | 2017-01-31 | 2016-10-31 | 2016-07-31 | 2016-04-30 | 2016-01-31 | 2015-10-31 | 2015-07-31 | 2015-04-30 | 2015-01-31 | 2014-10-31 | 2014-07-31 | 2014-04-30 | 2014-01-31 | 2013-10-31 | 2013-07-31 | 2013-04-30 | 2013-01-31 | 2012-10-31 | 2012-07-31 | 2012-04-30 | 2012-01-31 | 2011-10-31 | 2011-07-31 | 2011-04-30 | 2011-01-31 | 2010-10-31 | 2010-07-31 | 2010-04-30 | 2010-01-31 | ||
|---|---|---|---|---|---|---|---|---|---|---|---|---|---|---|---|---|---|---|---|---|---|---|---|---|---|---|---|---|---|---|---|---|---|---|---|---|---|---|---|---|---|---|---|---|---|---|---|---|---|---|---|---|---|---|---|---|---|---|
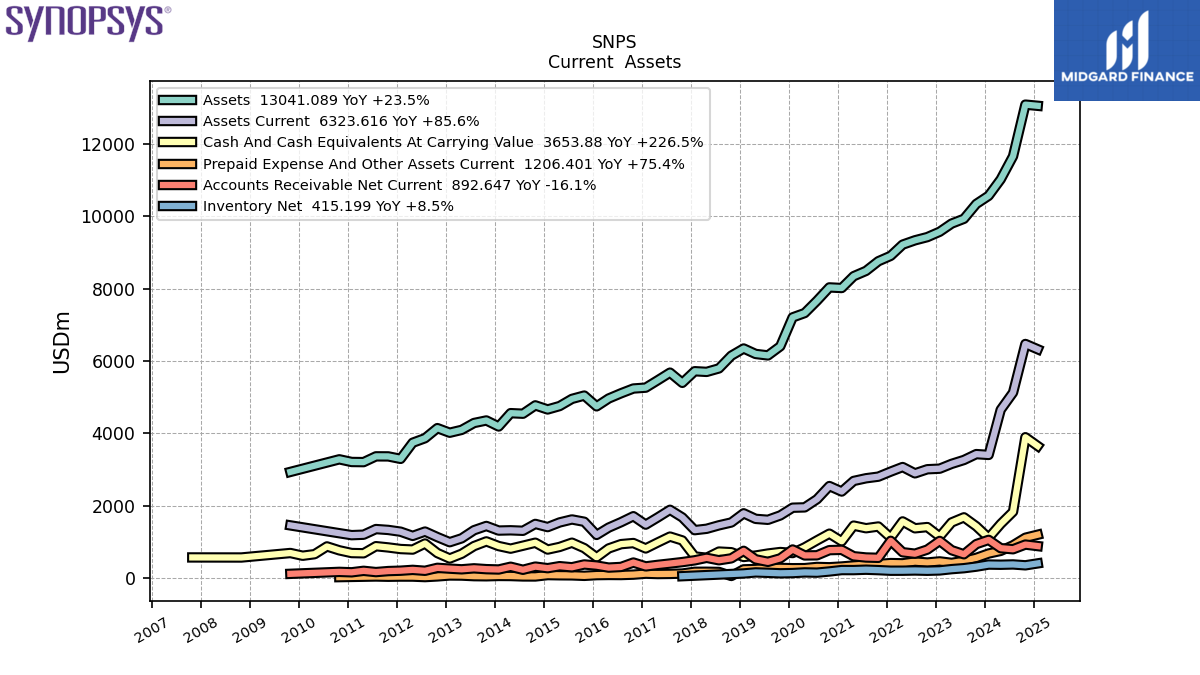
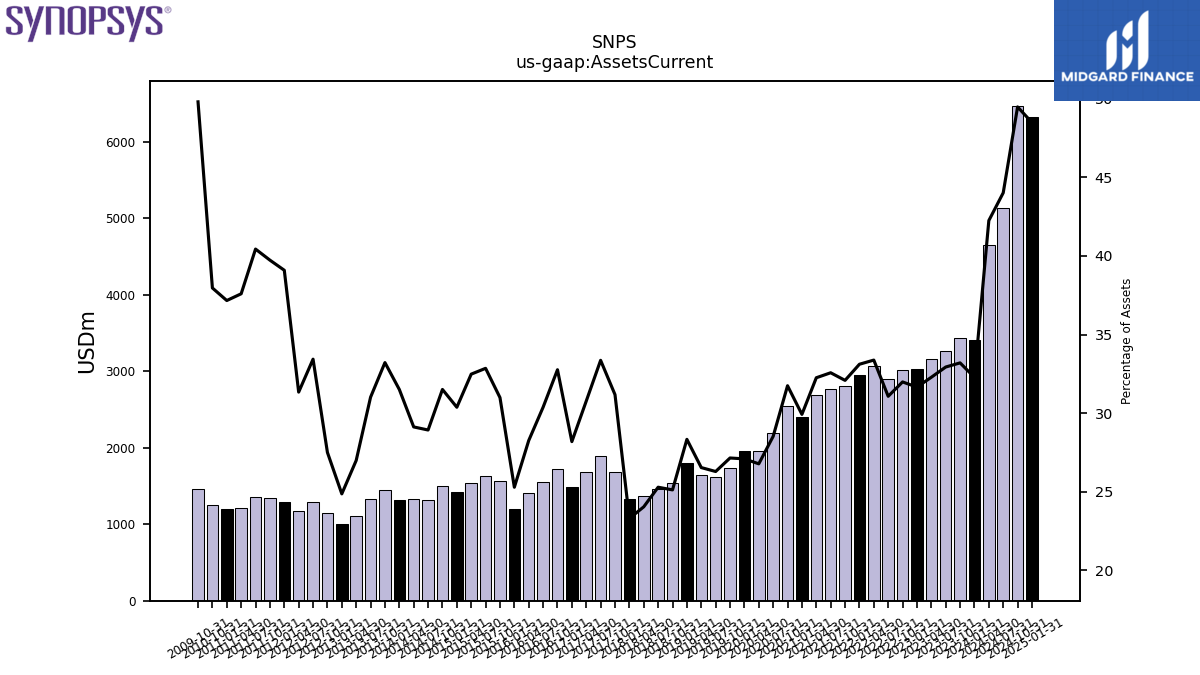
| Assets Current | 3407.93 | 3430.62 | 3268.31 | 3160.93 | 3028.40 | 3012.67 | 2899.03 | 3074.25 | 2947.50 | 2808.34 | 2763.98 | 2689.80 | 2397.72 | 2549.22 | 2186.01 | 1960.76 | 1951.43 | 1738.92 | 1617.64 | 1643.88 | 1797.63 | 1543.80 | 1465.58 | 1370.19 | 1332.35 | 1682.59 | 1894.63 | 1682.01 | 1484.04 | 1716.94 | 1552.04 | 1403.20 | 1200.53 | 1563.80 | 1627.54 | 1544.97 | 1416.27 | 1504.73 | 1314.78 | 1328.27 | 1320.87 | 1447.98 | 1330.08 | 1106.37 | 999.78 | 1140.66 | 1293.70 | 1173.54 | 1289.65 | 1338.06 | 1362.30 | 1206.62 | 1194.28 | 1247.76 | NA | NA | NA | |
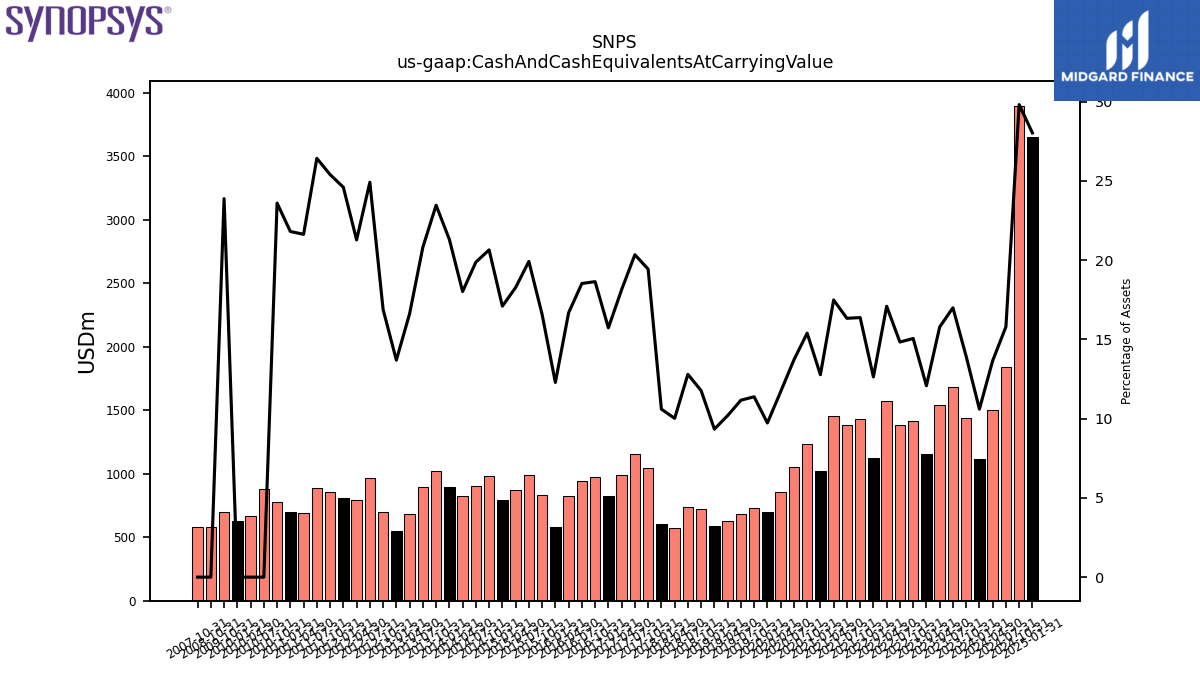
| Cash And Cash Equivalents At Carrying Value | 1118.94 | 1438.91 | 1686.14 | 1544.59 | 1154.87 | 1417.61 | 1383.56 | 1573.62 | 1124.30 | 1432.84 | 1385.39 | 1457.92 | 1023.07 | 1235.65 | 1049.92 | 856.42 | 700.36 | 728.60 | 686.78 | 631.16 | 592.30 | 723.12 | 741.24 | 570.80 | 605.89 | 1048.36 | 1154.99 | 991.33 | 827.71 | 976.62 | 946.32 | 827.95 | 582.99 | 836.19 | 986.42 | 868.85 | 796.82 | 985.76 | 903.05 | 821.63 | 893.05 | 1022.44 | 892.37 | 681.02 | 550.37 | 700.38 | 963.77 | 796.59 | 811.34 | 855.08 | 889.89 | 694.03 | 700.61 | 775.41 | 883.44 | 669.43 | 626.49 | |
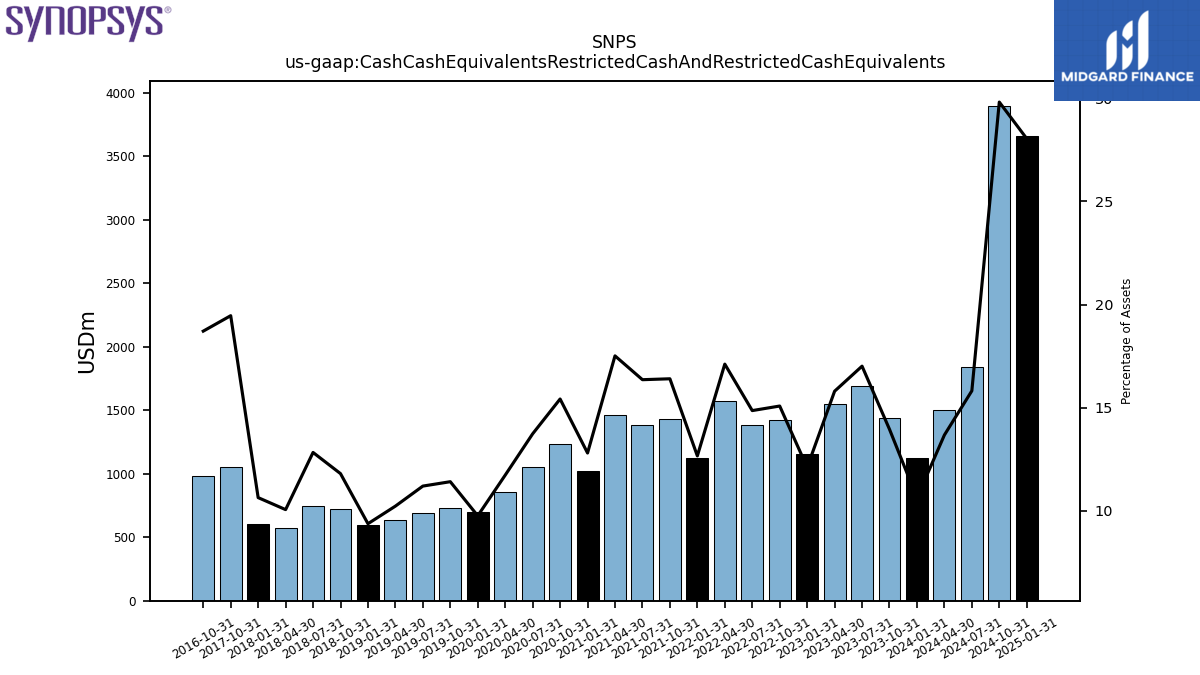
| Cash Cash Equivalents Restricted Cash And Restricted Cash Equivalents | 1121.17 | 1441.19 | 1687.94 | 1546.38 | 1157.27 | 1419.86 | 1385.86 | 1575.85 | 1126.59 | 1435.18 | 1387.74 | 1460.24 | 1025.40 | 1237.97 | 1051.99 | 858.42 | 702.28 | 730.53 | 688.68 | 633.05 | 594.21 | 725.00 | 743.16 | 572.77 | 607.92 | 1050.08 | NA | NA | NA | 980.42 | NA | NA | NA | NA | NA | NA | NA | NA | NA | NA | NA | NA | NA | NA | NA | NA | NA | NA | NA | NA | NA | NA | NA | NA | NA | NA | NA | |
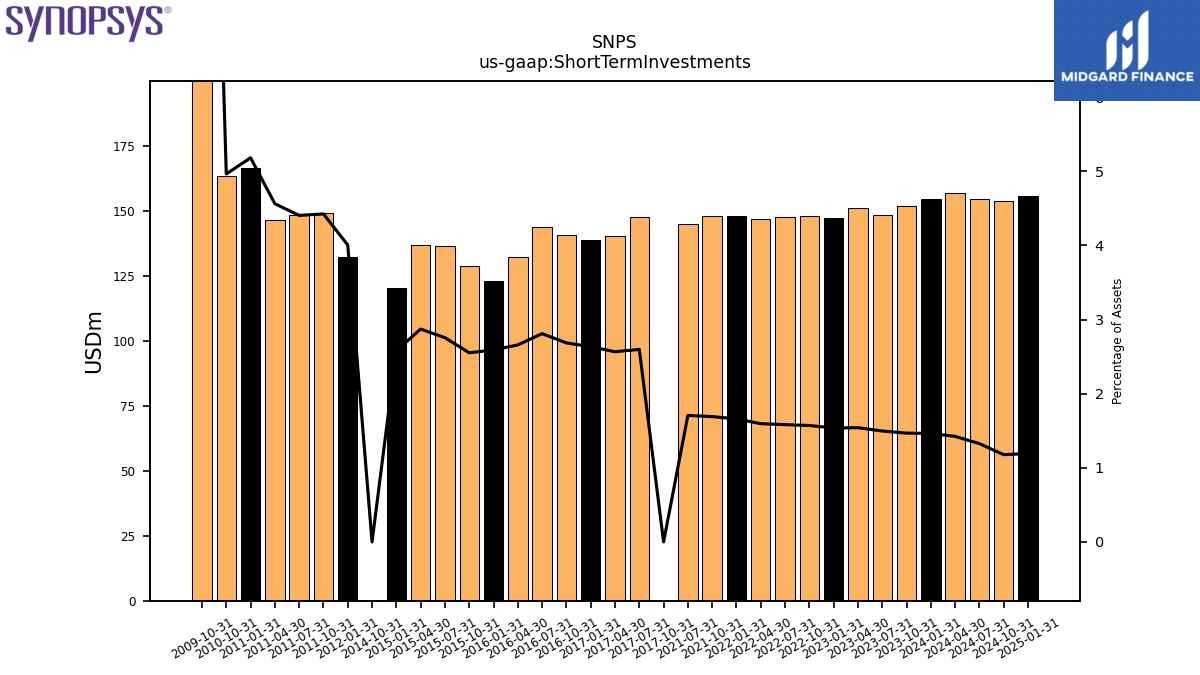
| Short Term Investments | 154.49 | 151.64 | 148.44 | 150.85 | 147.05 | 147.91 | 147.60 | 146.90 | 147.75 | 147.95 | 144.77 | NA | NA | NA | NA | NA | NA | NA | NA | NA | NA | NA | NA | NA | NA | 0.00 | 147.51 | 140.24 | 138.65 | 140.69 | 143.54 | 131.98 | 122.95 | 128.75 | 136.50 | 136.58 | 120.24 | 0.00 | NA | NA | NA | NA | NA | NA | NA | NA | NA | NA | 132.15 | 149.00 | 148.40 | 146.43 | 166.52 | 163.15 | NA | NA | NA | |
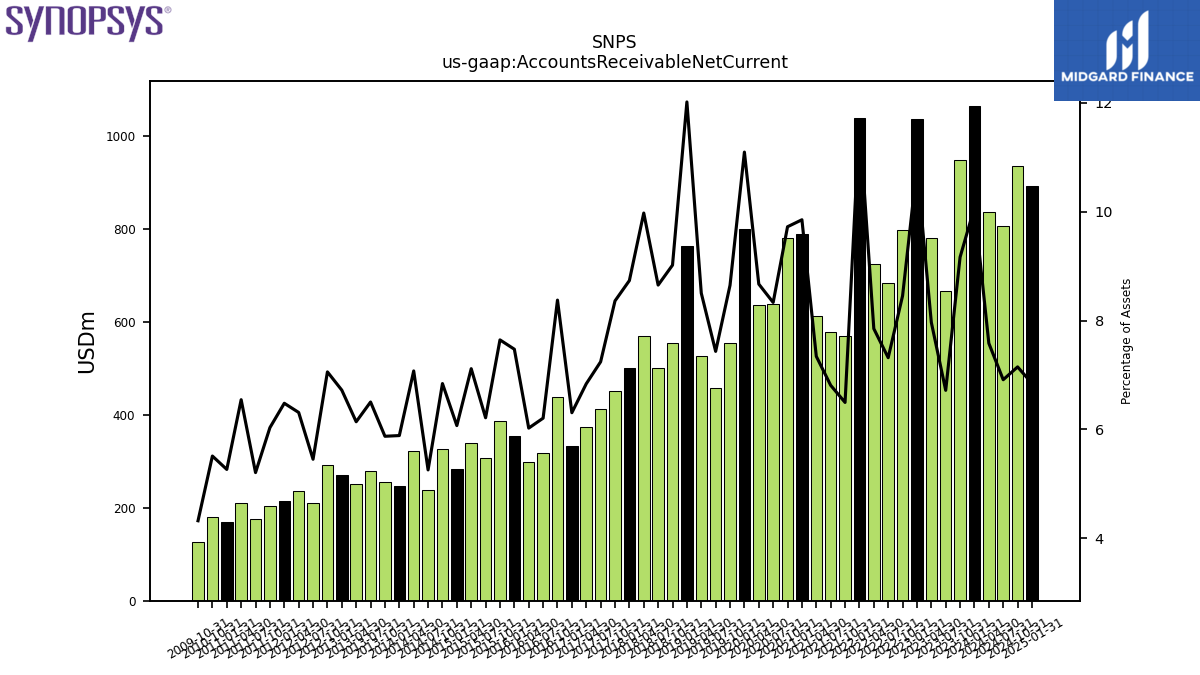
| Accounts Receivable Net Current | 1064.13 | 946.97 | 666.58 | 779.89 | 1035.32 | 796.09 | 682.65 | 722.99 | 1038.75 | 568.50 | 577.85 | 612.28 | 789.32 | 780.71 | 638.49 | 634.81 | 799.08 | 553.89 | 457.39 | 526.69 | 762.29 | 554.22 | 501.33 | 568.43 | 499.37 | 451.14 | 411.26 | 373.77 | 331.98 | 438.87 | 317.07 | 299.08 | 354.77 | 385.69 | 307.82 | 338.41 | 283.01 | 326.73 | 238.86 | 322.61 | 246.77 | 256.03 | 278.88 | 251.68 | 270.22 | 292.67 | 210.93 | 236.31 | 213.76 | 203.12 | 175.39 | 210.07 | 169.16 | 181.10 | NA | NA | NA | |
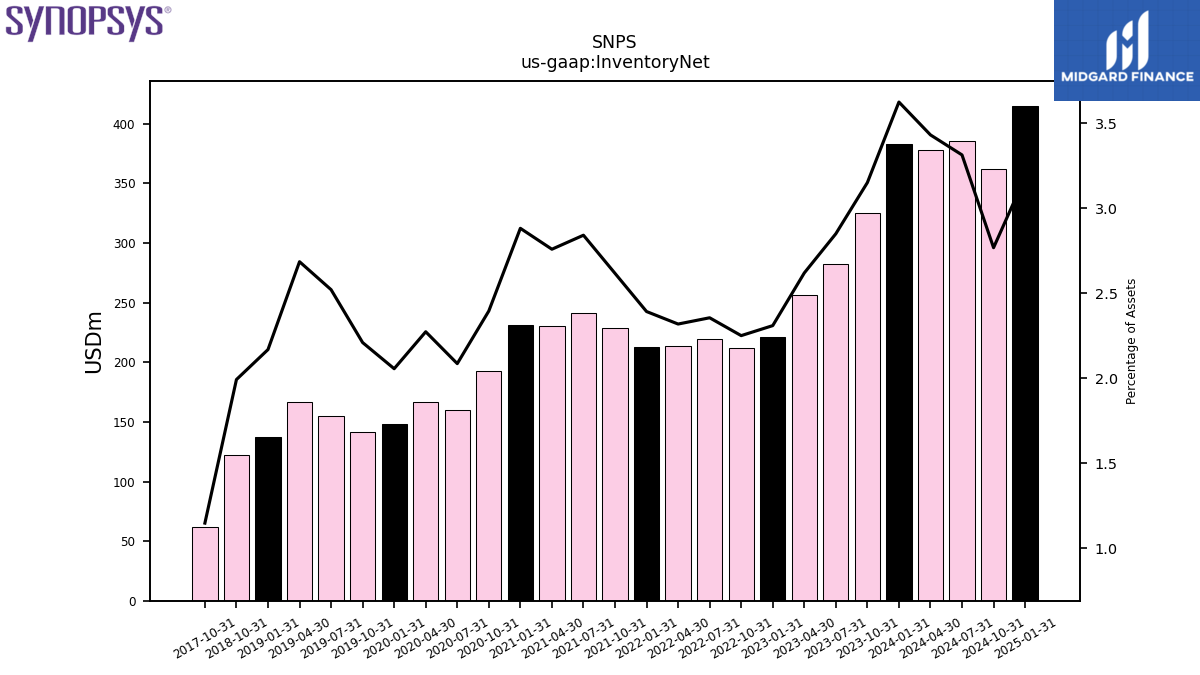
| Inventory Net | 382.73 | 325.59 | 282.79 | 256.43 | 220.88 | 211.93 | 219.74 | 213.53 | 212.92 | 229.02 | 241.10 | 230.07 | 230.91 | 192.33 | 159.81 | 166.44 | 148.06 | 141.52 | 155.11 | 166.33 | 137.56 | 122.41 | NA | NA | NA | 61.88 | NA | NA | NA | NA | NA | NA | NA | NA | NA | NA | NA | NA | NA | NA | NA | NA | NA | NA | NA | NA | NA | NA | NA | NA | NA | NA | NA | NA | NA | NA | NA | |
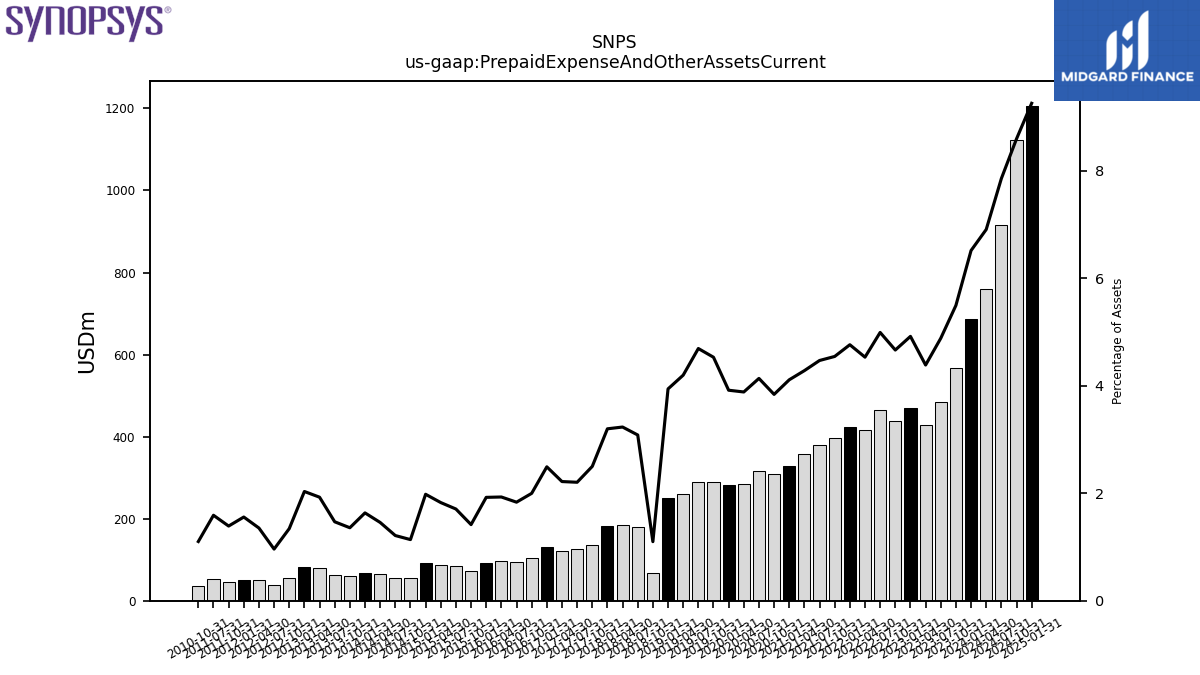
| Prepaid Expense And Other Assets Current | 687.63 | 567.51 | 484.36 | 429.18 | 470.27 | 439.13 | 465.49 | 417.20 | 423.78 | 397.62 | 379.14 | 356.87 | 329.23 | 308.17 | 316.83 | 284.28 | 281.99 | 290.05 | 288.62 | 259.85 | 249.93 | 67.53 | 178.64 | 184.10 | 182.82 | 134.84 | 125.13 | 121.17 | 131.11 | 104.66 | 93.65 | 95.80 | 91.28 | 71.45 | 84.51 | 86.84 | 92.31 | 54.30 | 55.11 | 66.41 | 68.49 | 59.17 | 62.98 | 78.93 | 81.69 | 55.63 | 37.17 | 50.63 | 51.36 | 46.78 | 53.55 | NA | NA | 36.20 | NA | NA | NA | |
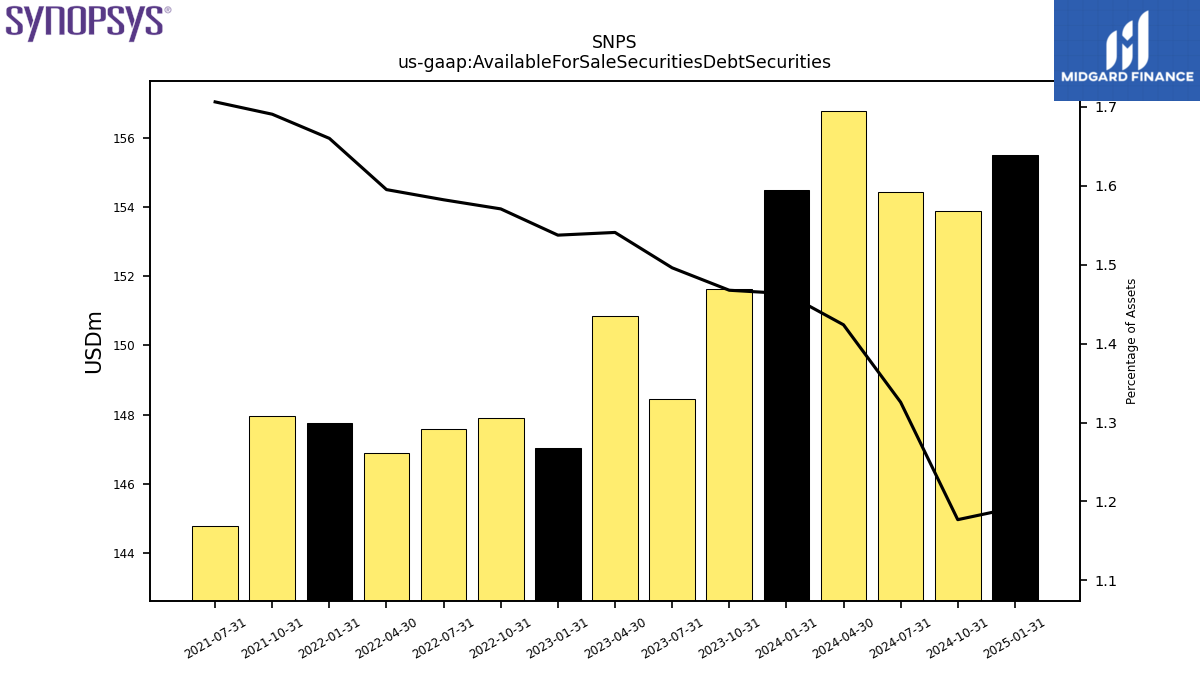
| Available For Sale Securities Debt Securities | 154.49 | 151.64 | 148.44 | 150.85 | 147.05 | 147.91 | 147.60 | 146.90 | 147.75 | 147.95 | 144.77 | NA | NA | NA | NA | NA | NA | NA | NA | NA | NA | NA | NA | NA | NA | NA | NA | NA | NA | NA | NA | NA | NA | NA | NA | NA | NA | NA | NA | NA | NA | NA | NA | NA | NA | NA | NA | NA | NA | NA | NA | NA | NA | NA | NA | NA | NA |
| 2024-01-31 | 2023-10-31 | 2023-07-31 | 2023-04-30 | 2023-01-31 | 2022-10-31 | 2022-07-31 | 2022-04-30 | 2022-01-31 | 2021-10-31 | 2021-07-31 | 2021-04-30 | 2021-01-31 | 2020-10-31 | 2020-07-31 | 2020-04-30 | 2020-01-31 | 2019-10-31 | 2019-07-31 | 2019-04-30 | 2019-01-31 | 2018-10-31 | 2018-07-31 | 2018-04-30 | 2018-01-31 | 2017-10-31 | 2017-07-31 | 2017-04-30 | 2017-01-31 | 2016-10-31 | 2016-07-31 | 2016-04-30 | 2016-01-31 | 2015-10-31 | 2015-07-31 | 2015-04-30 | 2015-01-31 | 2014-10-31 | 2014-07-31 | 2014-04-30 | 2014-01-31 | 2013-10-31 | 2013-07-31 | 2013-04-30 | 2013-01-31 | 2012-10-31 | 2012-07-31 | 2012-04-30 | 2012-01-31 | 2011-10-31 | 2011-07-31 | 2011-04-30 | 2011-01-31 | 2010-10-31 | 2010-07-31 | 2010-04-30 | 2010-01-31 | ||
|---|---|---|---|---|---|---|---|---|---|---|---|---|---|---|---|---|---|---|---|---|---|---|---|---|---|---|---|---|---|---|---|---|---|---|---|---|---|---|---|---|---|---|---|---|---|---|---|---|---|---|---|---|---|---|---|---|---|---|
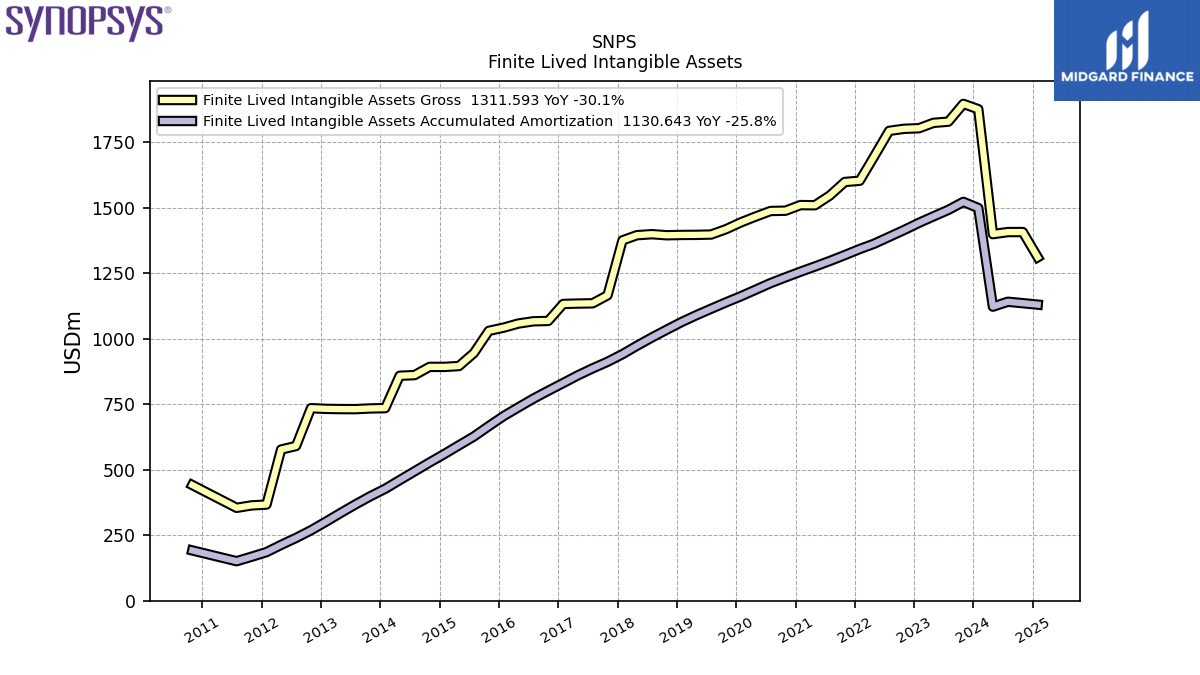
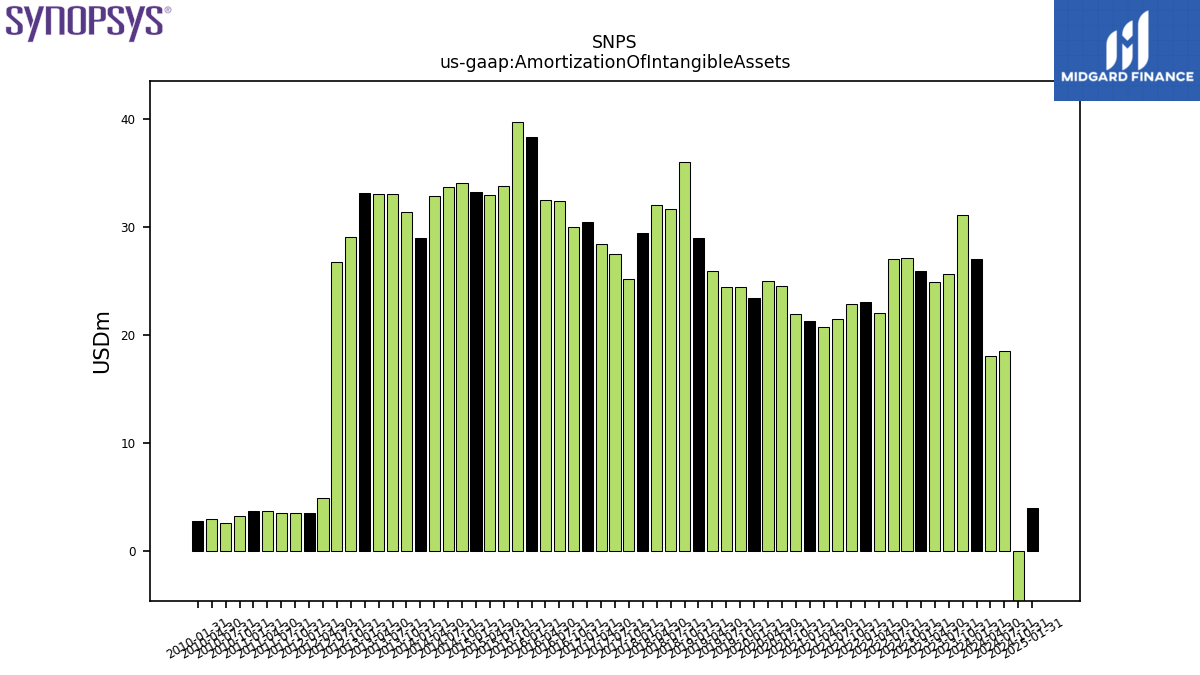
| Amortization Of Intangible Assets | 27.05 | 31.15 | 25.63 | 24.96 | 25.92 | 27.13 | 27.07 | 22.05 | 23.11 | 22.89 | 21.45 | 20.79 | 21.31 | 21.95 | 24.60 | 25.03 | 23.43 | 24.44 | 24.41 | 25.93 | 29.00 | 36.02 | 31.70 | 32.08 | 29.47 | 25.21 | 27.52 | 28.49 | 30.48 | 30.00 | 32.45 | 32.50 | 38.38 | 39.70 | 33.81 | 32.96 | 33.21 | 34.05 | 33.72 | 32.94 | 29.00 | 31.37 | 33.09 | 33.07 | 33.19 | 29.11 | 26.74 | 4.91 | 3.52 | 3.54 | 3.55 | 3.76 | 3.75 | 3.24 | 2.56 | 2.98 | 2.79 | |
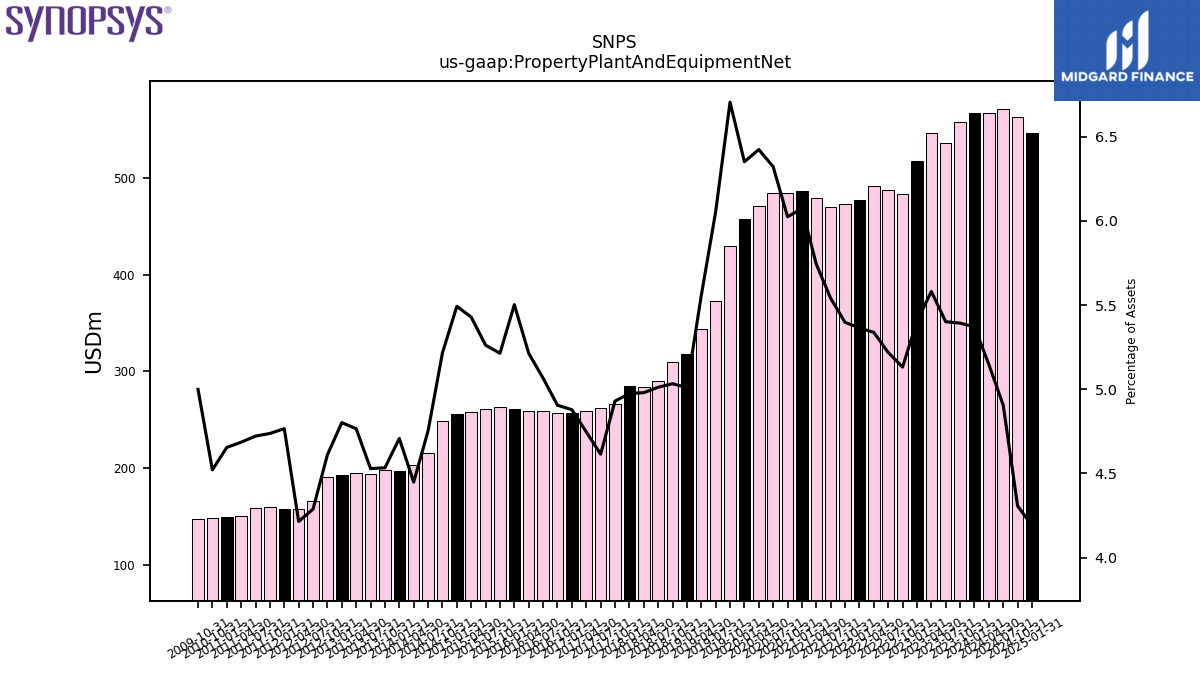
| Property Plant And Equipment Net | 567.04 | 557.26 | 535.97 | 546.44 | 516.92 | 483.30 | 486.87 | 491.64 | 477.52 | 472.40 | 470.13 | 478.98 | 486.60 | 483.82 | 484.53 | 470.41 | 457.53 | 429.53 | 372.57 | 344.18 | 317.90 | 309.31 | 290.45 | 283.78 | 284.44 | 266.01 | 262.02 | 259.48 | 256.81 | 257.04 | 258.79 | 258.86 | 261.24 | 263.08 | 260.67 | 258.20 | 256.09 | 249.10 | 216.01 | 202.86 | 197.34 | 197.60 | 194.20 | 195.31 | 193.05 | 191.24 | 165.91 | 157.79 | 157.22 | 159.52 | 159.06 | 150.37 | 149.55 | 148.58 | NA | NA | NA | |
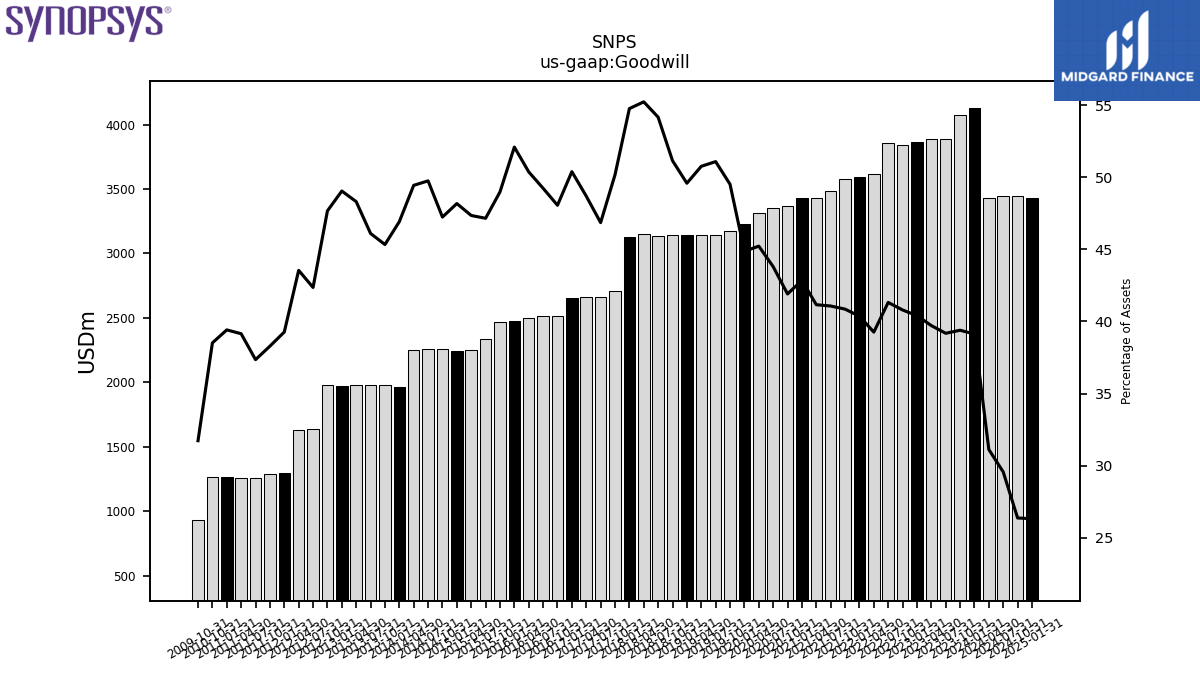
| Goodwill | 4131.42 | 4070.34 | 3887.86 | 3888.25 | 3864.83 | 3842.23 | 3854.89 | 3616.13 | 3592.79 | 3575.78 | 3485.18 | 3432.58 | 3433.00 | 3365.11 | 3356.41 | 3311.24 | 3231.59 | 3171.18 | 3143.06 | 3143.80 | 3145.70 | 3143.25 | 3138.67 | 3147.12 | 3130.60 | 2706.97 | 2660.68 | 2661.54 | 2652.26 | 2518.24 | 2515.09 | 2500.80 | 2472.84 | 2471.24 | 2335.82 | 2251.84 | 2245.92 | 2255.71 | 2260.90 | 2254.45 | 1966.82 | 1975.97 | 1976.96 | 1980.01 | 1971.65 | 1976.99 | 1638.88 | 1630.41 | 1295.48 | 1289.29 | 1258.29 | 1256.48 | 1266.52 | 1265.84 | NA | NA | NA | |
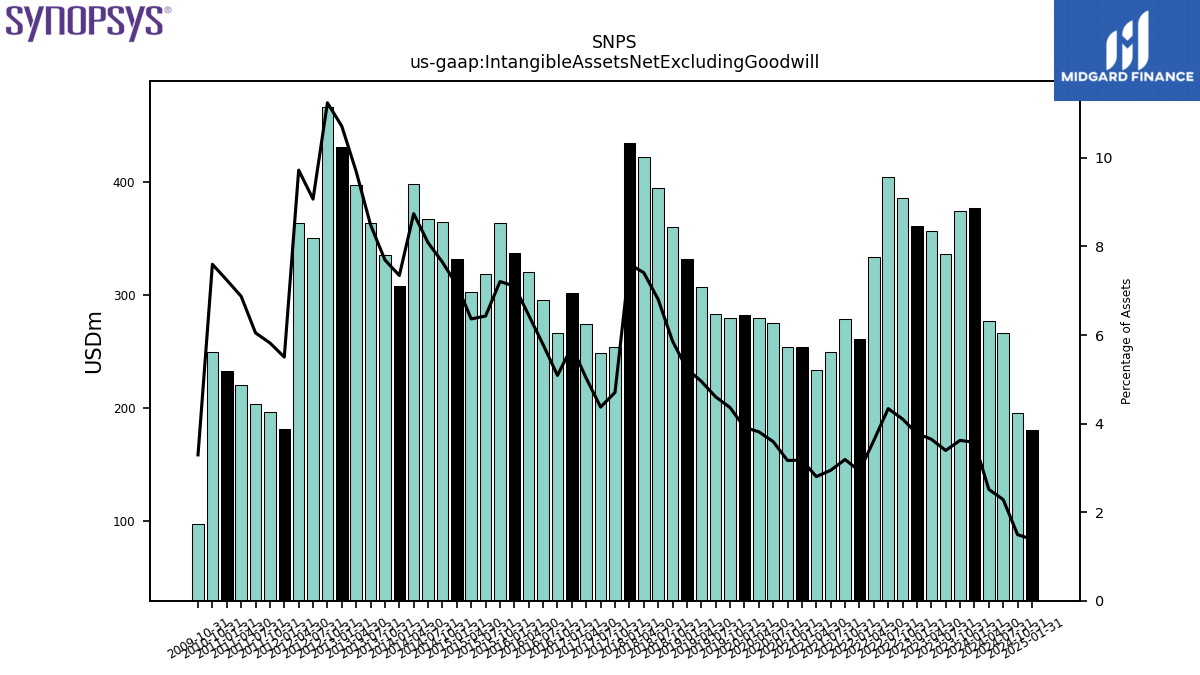
| Intangible Assets Net Excluding Goodwill | 377.42 | 374.19 | 336.72 | 357.11 | 361.15 | 386.45 | 404.65 | 333.32 | 260.81 | 279.13 | 249.97 | 233.81 | 254.38 | 254.32 | 275.34 | 279.31 | 282.14 | 279.37 | 283.31 | 306.93 | 332.19 | 360.40 | 394.49 | 422.19 | 434.54 | 253.84 | 248.34 | 274.61 | 301.92 | 266.66 | 295.44 | 320.08 | 337.38 | 363.66 | 318.50 | 302.66 | 332.38 | 365.03 | 367.42 | 398.56 | 307.91 | 335.43 | 364.00 | 397.22 | 430.80 | 466.32 | 350.89 | 364.11 | 181.51 | 196.03 | 203.74 | 220.61 | 232.67 | 249.66 | NA | NA | NA | |
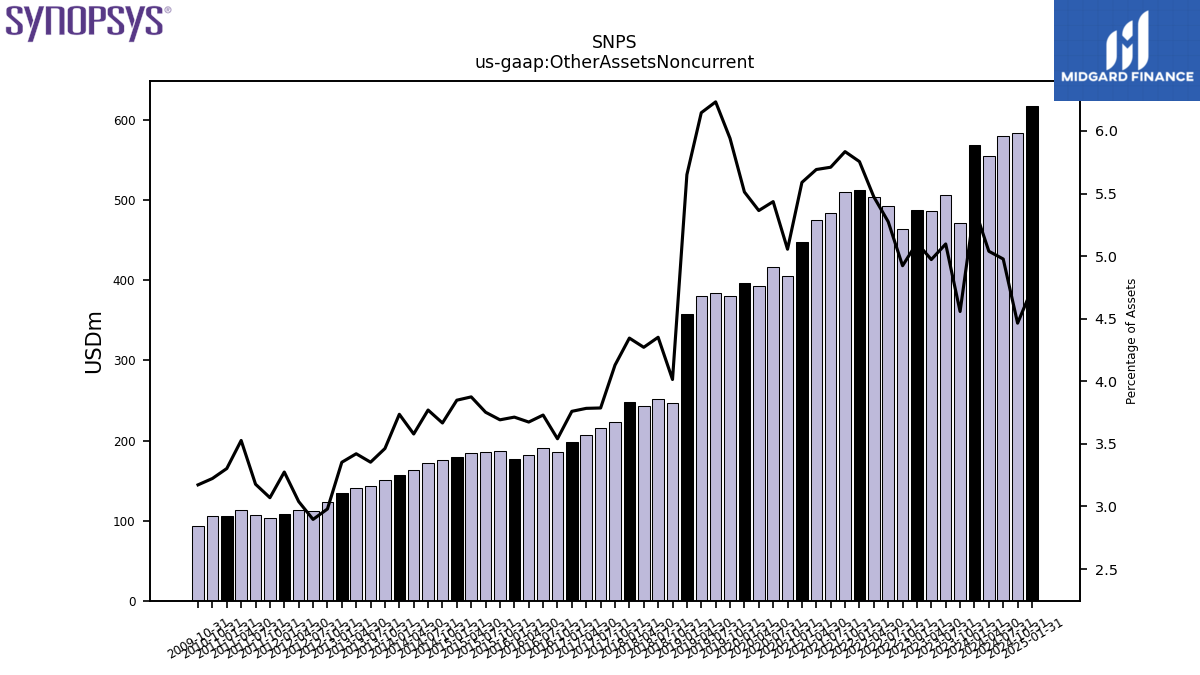
| Other Assets Noncurrent | 568.51 | 470.97 | 505.83 | 486.88 | 488.34 | 463.69 | 492.18 | 504.15 | 512.33 | 510.70 | 484.58 | 474.70 | 447.84 | 405.95 | 416.54 | 392.79 | 397.08 | 380.53 | 383.51 | 380.68 | 358.53 | 246.74 | 252.20 | 243.45 | 248.44 | 222.84 | 215.07 | 206.85 | 197.95 | 185.57 | 190.59 | 182.46 | 176.32 | 186.31 | 185.92 | 184.33 | 179.46 | 175.13 | 171.37 | 163.23 | 156.65 | 150.96 | 143.83 | 140.23 | 134.82 | 123.61 | 112.08 | 113.82 | 108.05 | 103.39 | 107.06 | 113.21 | 106.15 | 105.95 | NA | NA | NA | |
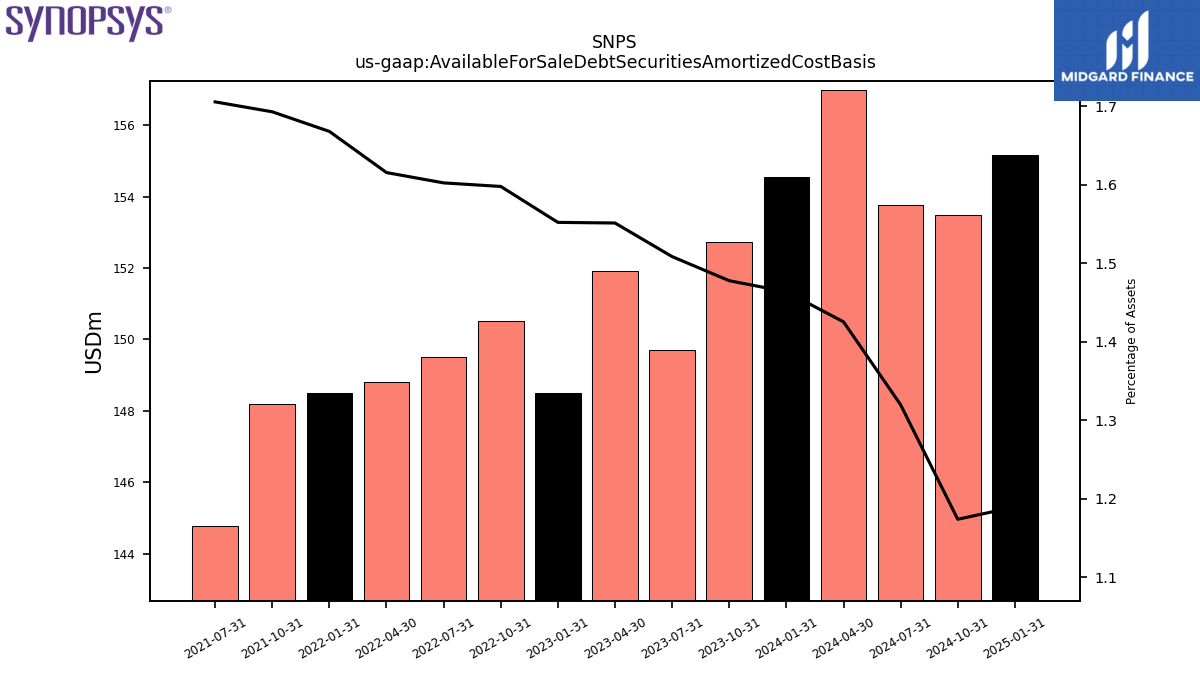
| Available For Sale Debt Securities Amortized Cost Basis | 154.56 | 152.72 | 149.72 | 151.91 | 148.49 | 150.51 | 149.52 | 148.82 | 148.49 | 148.19 | 144.76 | NA | NA | NA | NA | NA | NA | NA | NA | NA | NA | NA | NA | NA | NA | NA | NA | NA | NA | NA | NA | NA | NA | NA | NA | NA | NA | NA | NA | NA | NA | NA | NA | NA | NA | NA | NA | NA | NA | NA | NA | NA | NA | NA | NA | NA | NA |
| 2024-01-31 | 2023-10-31 | 2023-07-31 | 2023-04-30 | 2023-01-31 | 2022-10-31 | 2022-07-31 | 2022-04-30 | 2022-01-31 | 2021-10-31 | 2021-07-31 | 2021-04-30 | 2021-01-31 | 2020-10-31 | 2020-07-31 | 2020-04-30 | 2020-01-31 | 2019-10-31 | 2019-07-31 | 2019-04-30 | 2019-01-31 | 2018-10-31 | 2018-07-31 | 2018-04-30 | 2018-01-31 | 2017-10-31 | 2017-07-31 | 2017-04-30 | 2017-01-31 | 2016-10-31 | 2016-07-31 | 2016-04-30 | 2016-01-31 | 2015-10-31 | 2015-07-31 | 2015-04-30 | 2015-01-31 | 2014-10-31 | 2014-07-31 | 2014-04-30 | 2014-01-31 | 2013-10-31 | 2013-07-31 | 2013-04-30 | 2013-01-31 | 2012-10-31 | 2012-07-31 | 2012-04-30 | 2012-01-31 | 2011-10-31 | 2011-07-31 | 2011-04-30 | 2011-01-31 | 2010-10-31 | 2010-07-31 | 2010-04-30 | 2010-01-31 | ||
|---|---|---|---|---|---|---|---|---|---|---|---|---|---|---|---|---|---|---|---|---|---|---|---|---|---|---|---|---|---|---|---|---|---|---|---|---|---|---|---|---|---|---|---|---|---|---|---|---|---|---|---|---|---|---|---|---|---|---|
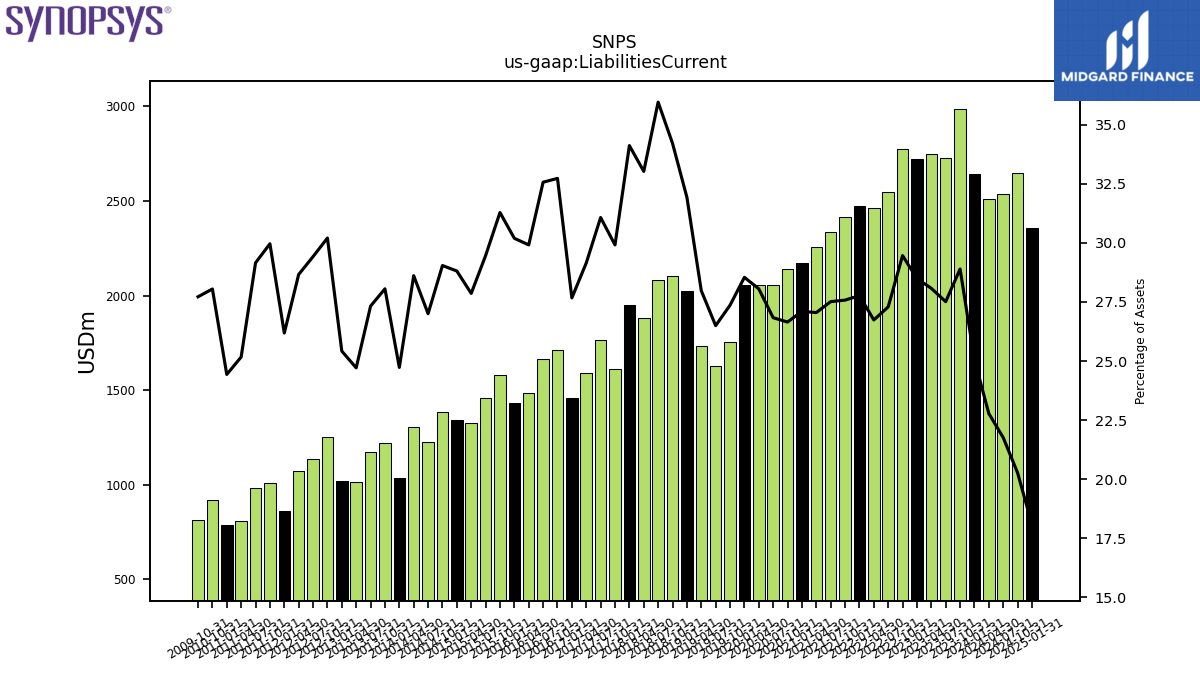
| Liabilities Current | 2644.51 | 2985.45 | 2729.98 | 2748.68 | 2725.00 | 2774.50 | 2545.86 | 2462.66 | 2471.66 | 2413.48 | 2334.64 | 2255.70 | 2171.38 | 2139.92 | 2056.28 | 2054.20 | 2055.74 | 1752.45 | 1630.45 | 1732.93 | 2025.64 | 2102.41 | 2083.41 | 1881.92 | 1950.41 | 1614.11 | 1764.40 | 1593.35 | 1456.56 | 1714.95 | 1663.60 | 1485.21 | 1433.28 | 1578.35 | 1459.34 | 1325.04 | 1343.10 | 1386.76 | 1227.28 | 1304.73 | 1036.70 | 1222.92 | 1171.68 | 1012.92 | 1022.01 | 1252.64 | 1138.21 | 1073.22 | 863.83 | 1008.81 | 982.09 | 807.84 | 785.08 | 921.77 | NA | NA | NA | |
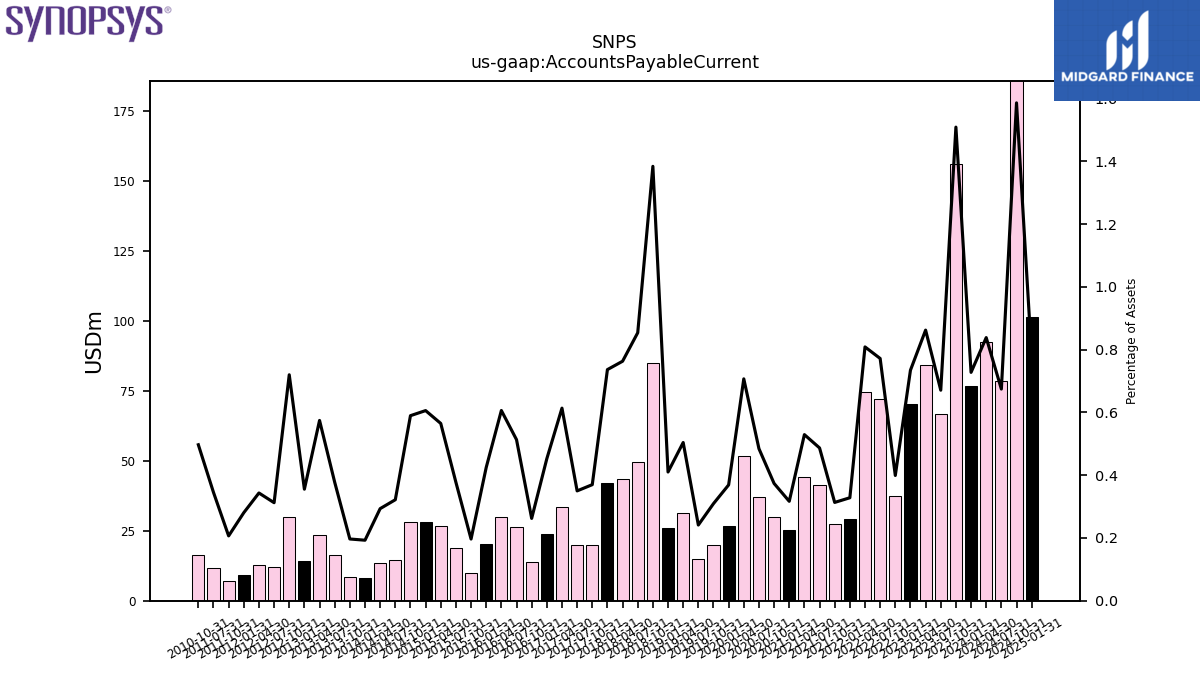
| Accounts Payable Current | 76.81 | 155.89 | 66.55 | 84.40 | 70.25 | 37.58 | 72.00 | 74.47 | 29.20 | 27.41 | 41.30 | 44.13 | 25.38 | 30.00 | 37.13 | 51.76 | 26.58 | 19.82 | 14.85 | 31.22 | 26.02 | 85.05 | 49.47 | 43.48 | 42.10 | 19.95 | 19.87 | 33.54 | 23.82 | 13.74 | 26.22 | 30.09 | 20.16 | 9.92 | 18.69 | 26.86 | 28.24 | 28.15 | 14.62 | 13.38 | 8.08 | 8.57 | 16.19 | 23.54 | 14.29 | 29.86 | 12.08 | 12.85 | 9.25 | 6.96 | 11.63 | NA | NA | 16.33 | NA | NA | NA | |
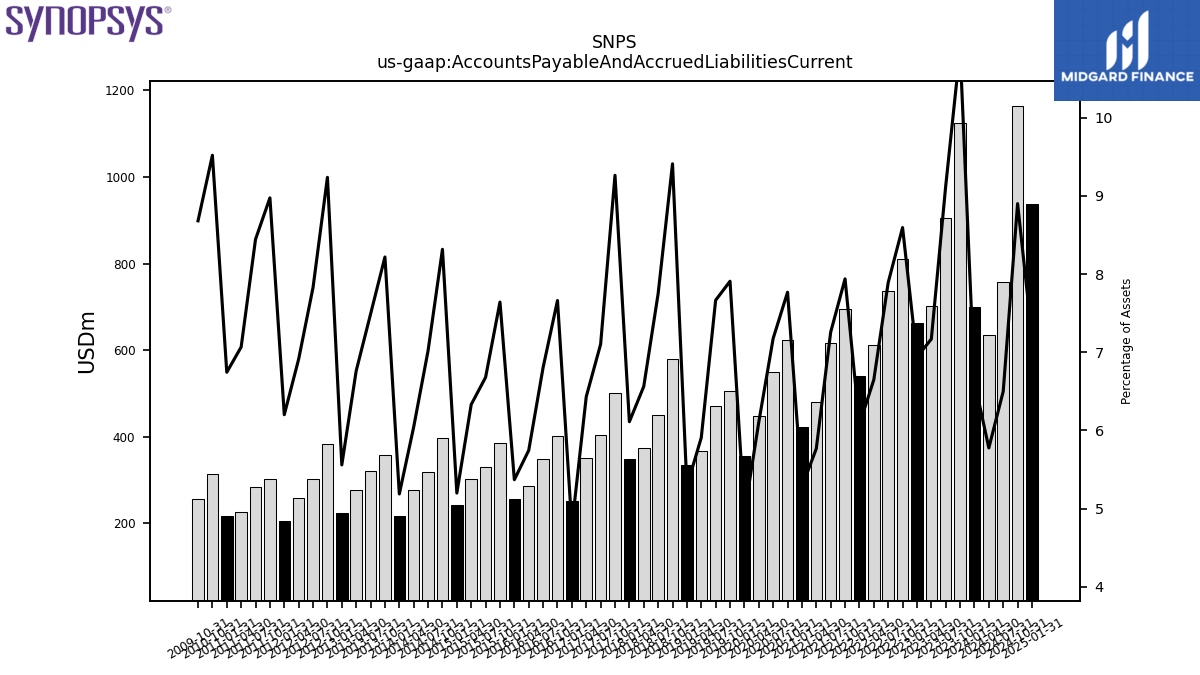
| Accounts Payable And Accrued Liabilities Current | 699.47 | 1123.76 | 905.46 | 701.82 | 663.59 | 809.40 | 736.10 | 612.22 | 540.73 | 694.75 | 615.74 | 480.83 | 422.93 | 623.66 | 549.91 | 447.06 | 355.35 | 506.46 | 471.63 | 365.85 | 335.34 | 578.33 | 449.04 | 373.94 | 349.37 | 499.85 | 403.30 | 351.50 | 251.10 | 401.45 | 347.61 | 285.20 | 254.87 | 385.54 | 330.82 | 301.10 | 242.34 | 397.11 | 319.04 | 275.61 | 217.40 | 358.20 | 321.10 | 277.11 | 223.46 | 383.09 | 302.89 | 258.82 | 204.54 | 302.18 | 284.46 | 226.78 | 216.67 | 312.85 | NA | NA | NA | |
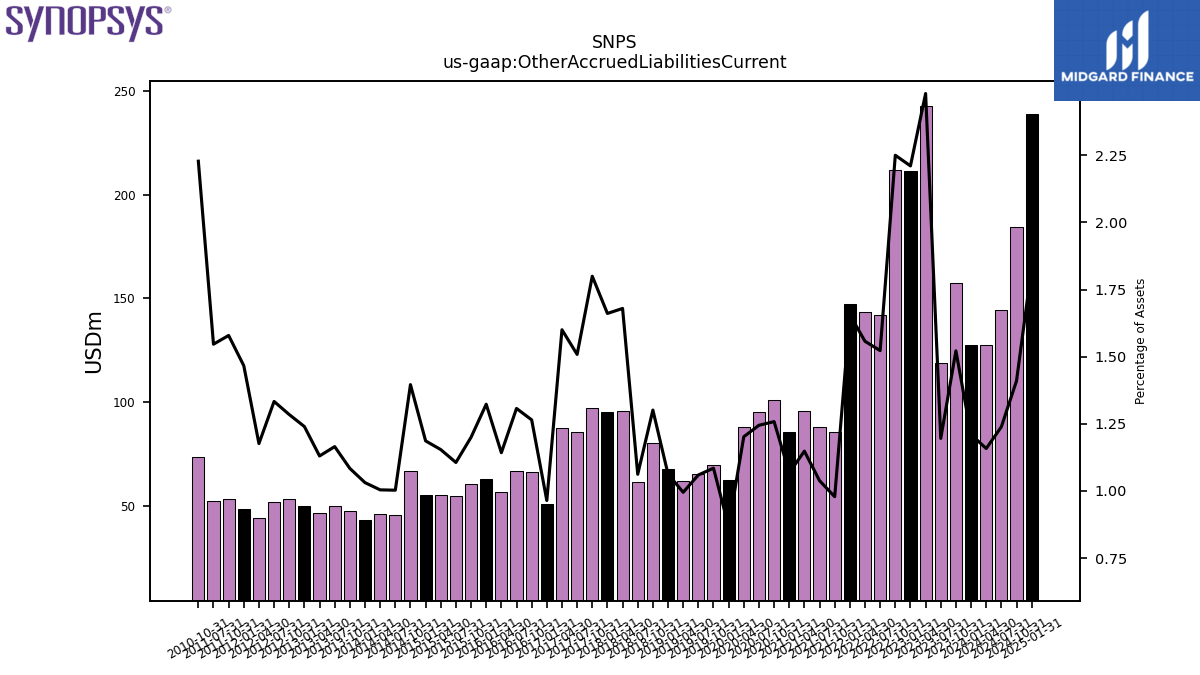
| Other Accrued Liabilities Current | 127.75 | 157.25 | 118.65 | 242.83 | 211.46 | 211.94 | 142.06 | 143.44 | 147.41 | 85.65 | 88.11 | 95.75 | 85.57 | 101.03 | 95.38 | 88.01 | 62.49 | 69.49 | 65.19 | 61.63 | 67.42 | 79.97 | 61.55 | 95.72 | 94.98 | 97.12 | 85.67 | 87.48 | 50.77 | 66.28 | 66.79 | 56.73 | 62.81 | 60.55 | 54.79 | 54.89 | 55.32 | 66.67 | 45.58 | 45.79 | 43.22 | 47.25 | 49.97 | 46.33 | 49.85 | 53.28 | 51.59 | 44.05 | 48.38 | 53.17 | 52.10 | NA | NA | 73.23 | NA | NA | NA | |
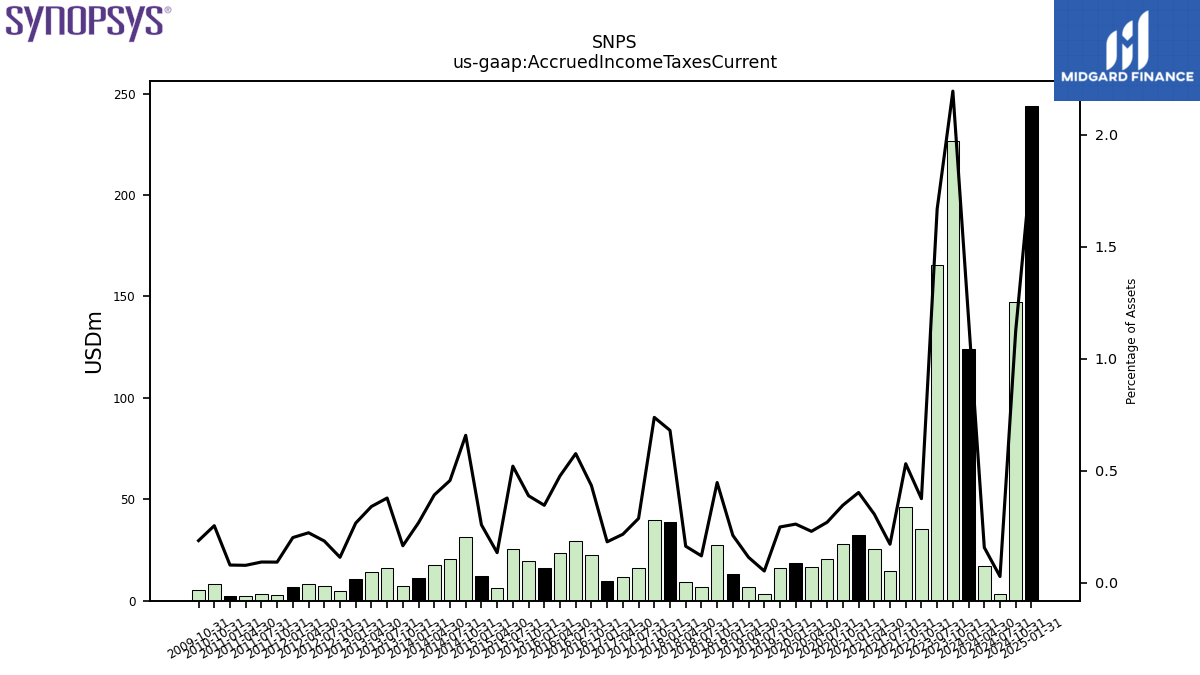
| Accrued Income Taxes Current | 124.29 | 226.76 | 165.51 | NA | NA | 35.29 | NA | NA | NA | 46.44 | 14.54 | 25.47 | 32.23 | 27.74 | 20.65 | 16.75 | 18.81 | 15.90 | 3.17 | 6.98 | 13.37 | 27.46 | 6.91 | 9.25 | 38.87 | 39.81 | 16.27 | 11.80 | 9.58 | 22.69 | 29.42 | 23.65 | 16.39 | 19.57 | 25.75 | 6.36 | 12.02 | 31.40 | 20.72 | 17.85 | 11.22 | 7.17 | 16.19 | 13.93 | 10.68 | 4.68 | 7.18 | 8.33 | 6.63 | 3.08 | 3.09 | 2.48 | 2.52 | 8.35 | NA | NA | NA | |
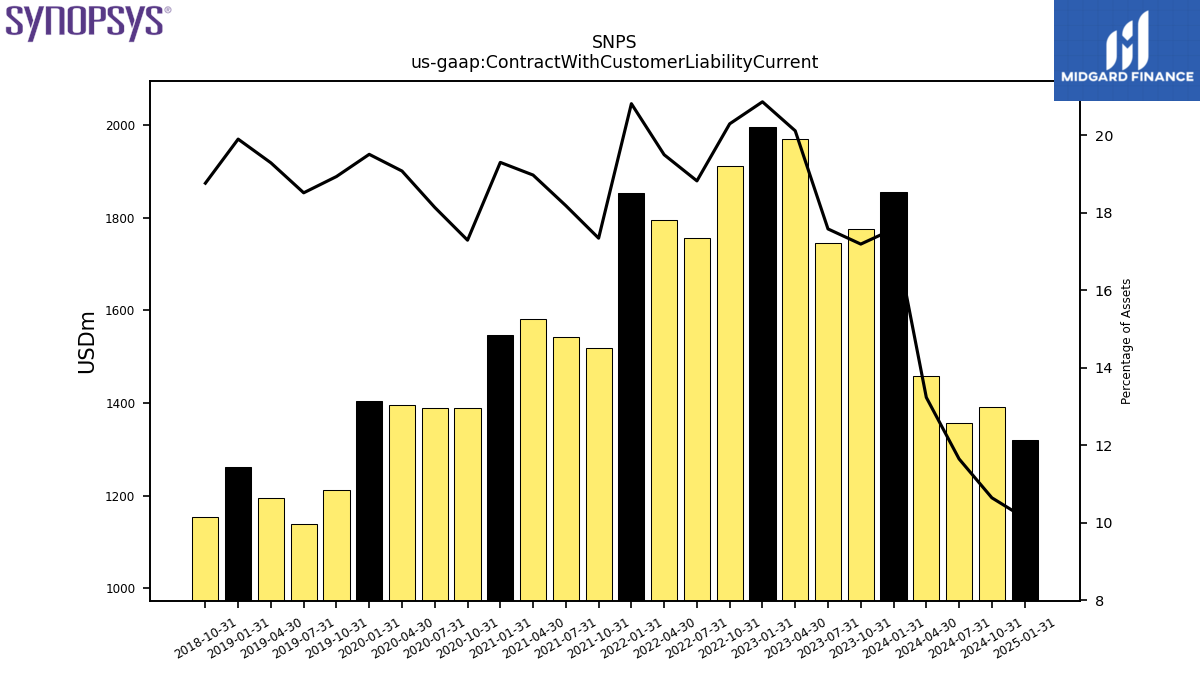
| Contract With Customer Liability Current | 1855.84 | 1776.00 | 1744.33 | 1968.81 | 1995.08 | 1910.82 | 1755.59 | 1795.27 | 1852.17 | 1517.62 | 1542.61 | 1581.84 | 1546.04 | 1388.26 | 1389.61 | 1396.51 | 1404.73 | 1212.48 | 1138.99 | 1194.40 | 1262.20 | 1152.86 | NA | NA | NA | NA | NA | NA | NA | NA | NA | NA | NA | NA | NA | NA | NA | NA | NA | NA | NA | NA | NA | NA | NA | NA | NA | NA | NA | NA | NA | NA | NA | NA | NA | NA | NA |
| 2024-01-31 | 2023-10-31 | 2023-07-31 | 2023-04-30 | 2023-01-31 | 2022-10-31 | 2022-07-31 | 2022-04-30 | 2022-01-31 | 2021-10-31 | 2021-07-31 | 2021-04-30 | 2021-01-31 | 2020-10-31 | 2020-07-31 | 2020-04-30 | 2020-01-31 | 2019-10-31 | 2019-07-31 | 2019-04-30 | 2019-01-31 | 2018-10-31 | 2018-07-31 | 2018-04-30 | 2018-01-31 | 2017-10-31 | 2017-07-31 | 2017-04-30 | 2017-01-31 | 2016-10-31 | 2016-07-31 | 2016-04-30 | 2016-01-31 | 2015-10-31 | 2015-07-31 | 2015-04-30 | 2015-01-31 | 2014-10-31 | 2014-07-31 | 2014-04-30 | 2014-01-31 | 2013-10-31 | 2013-07-31 | 2013-04-30 | 2013-01-31 | 2012-10-31 | 2012-07-31 | 2012-04-30 | 2012-01-31 | 2011-10-31 | 2011-07-31 | 2011-04-30 | 2011-01-31 | 2010-10-31 | 2010-07-31 | 2010-04-30 | 2010-01-31 | ||
|---|---|---|---|---|---|---|---|---|---|---|---|---|---|---|---|---|---|---|---|---|---|---|---|---|---|---|---|---|---|---|---|---|---|---|---|---|---|---|---|---|---|---|---|---|---|---|---|---|---|---|---|---|---|---|---|---|---|---|
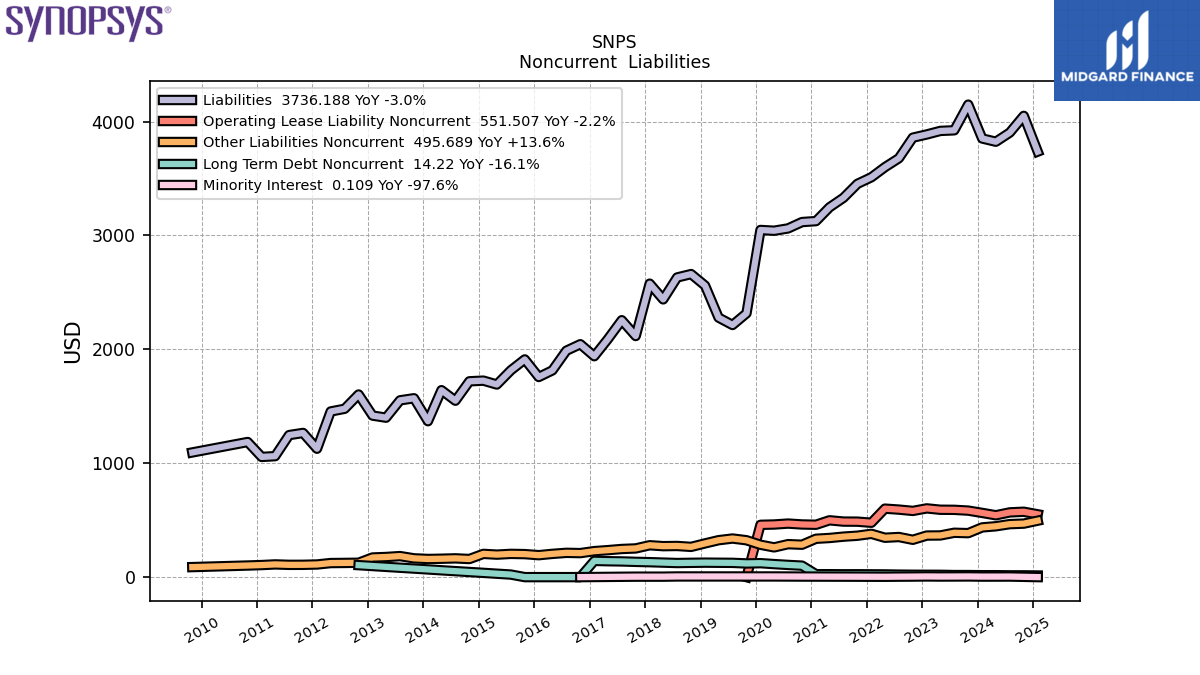
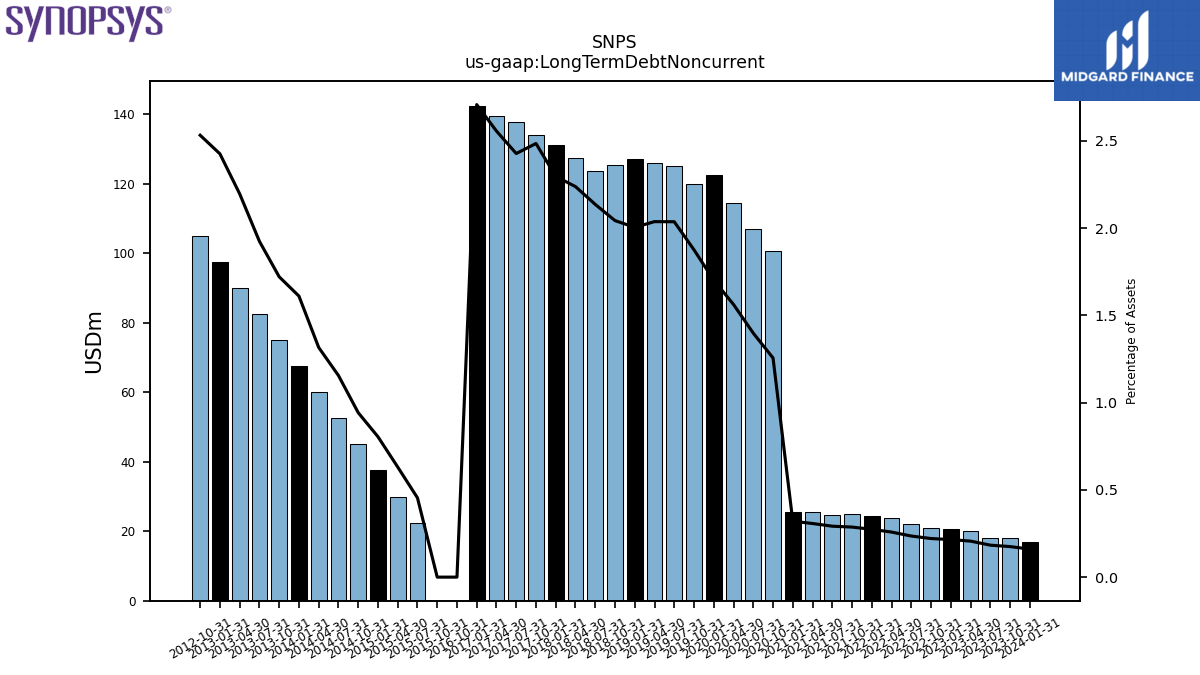
| Long Term Debt Noncurrent | 16.95 | 18.08 | 18.16 | 20.20 | 20.57 | 20.82 | 21.96 | 23.77 | 24.37 | 25.09 | 24.75 | 25.62 | 25.66 | 100.82 | 107.10 | 114.37 | 122.52 | 120.09 | 125.28 | 126.15 | 127.14 | 125.53 | 123.75 | 127.50 | 131.25 | 134.06 | 137.81 | 139.69 | 142.50 | 0.00 | NA | NA | NA | 0.00 | 22.50 | 30.00 | 37.50 | 45.00 | 52.50 | 60.00 | 67.50 | 75.00 | 82.50 | 90.00 | 97.50 | 105.00 | NA | NA | NA | NA | NA | NA | NA | NA | NA | NA | NA | |
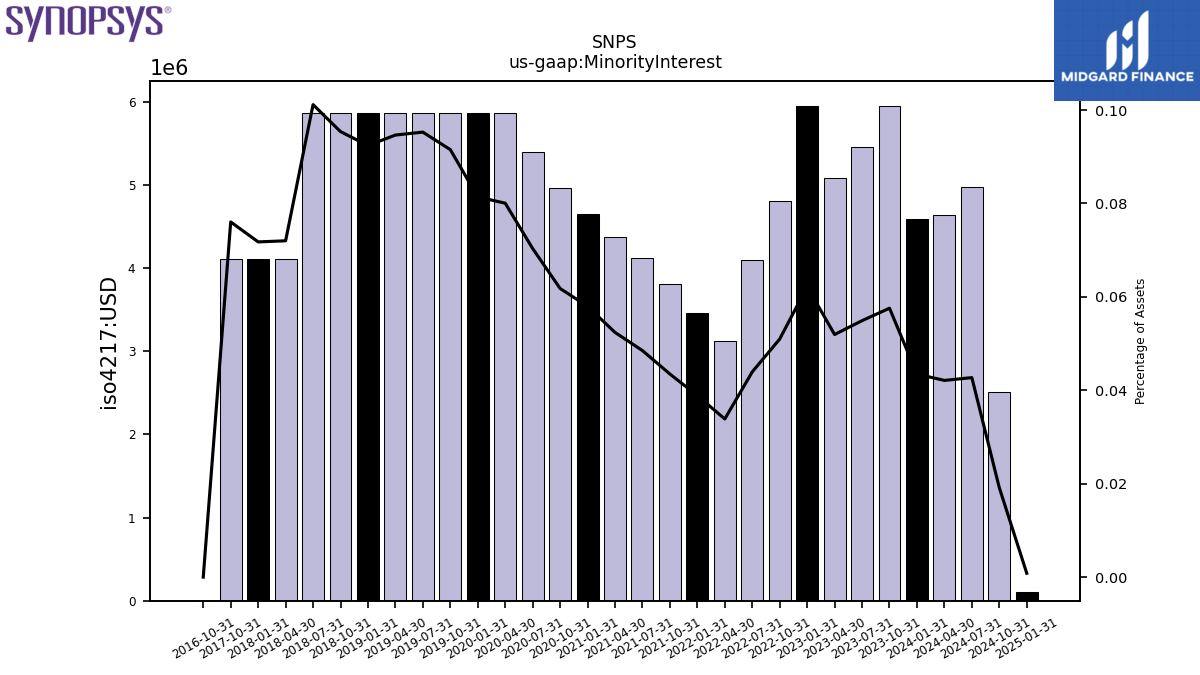
| Minority Interest | 4.59 | 5.95 | 5.45 | 5.09 | 5.95 | 4.80 | 4.10 | 3.12 | 3.46 | 3.81 | 4.12 | 4.37 | 4.65 | 4.96 | 5.39 | 5.86 | 5.86 | 5.86 | 5.86 | 5.86 | 5.86 | 5.86 | 5.86 | 4.10 | 4.10 | 4.10 | NA | NA | NA | 0.00 | NA | NA | NA | NA | NA | NA | NA | NA | NA | NA | NA | NA | NA | NA | NA | NA | NA | NA | NA | NA | NA | NA | NA | NA | NA | NA | NA | |
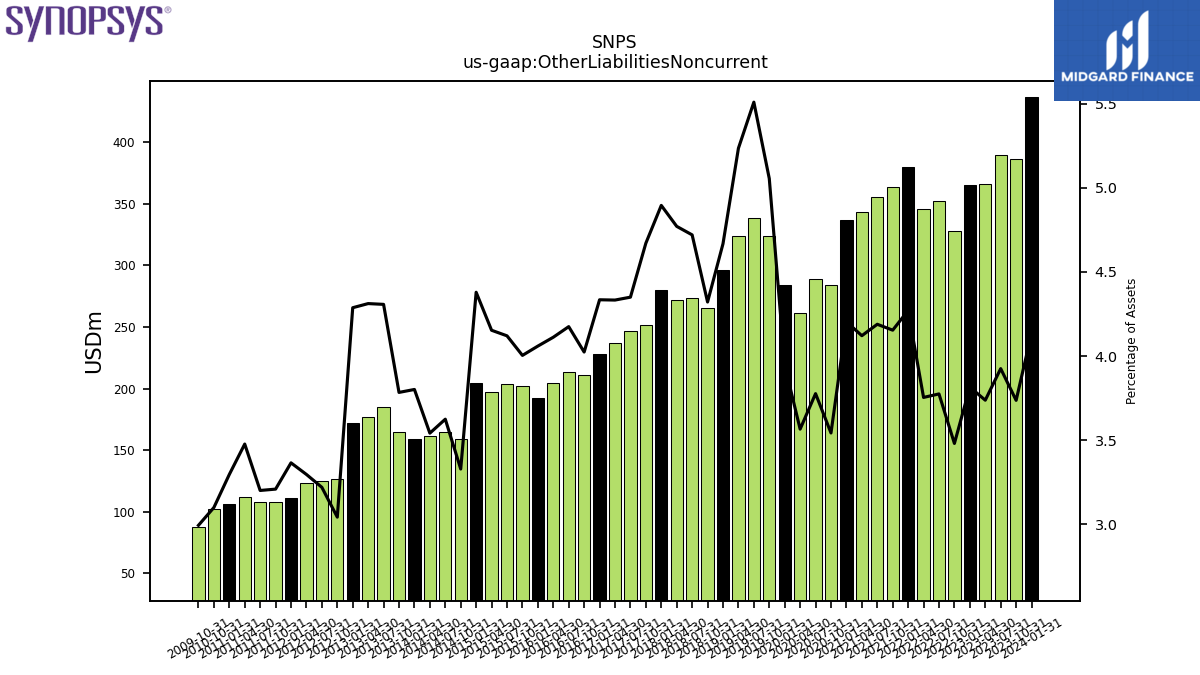
| Other Liabilities Noncurrent | 436.53 | 386.14 | 389.52 | 365.95 | 364.98 | 327.83 | 352.19 | 345.77 | 380.13 | 363.54 | 355.45 | 343.66 | 336.83 | 284.51 | 289.41 | 261.11 | 284.21 | 323.73 | 338.93 | 324.22 | 296.10 | 265.56 | 273.51 | 271.86 | 279.86 | 252.03 | 247.01 | 236.84 | 228.16 | 210.85 | 213.27 | 204.16 | 192.71 | 202.02 | 204.10 | 197.53 | 204.16 | 158.97 | 164.75 | 161.53 | 159.37 | 164.94 | 184.70 | 176.73 | 172.36 | 126.22 | 124.59 | 123.44 | 111.03 | 108.08 | 107.85 | 111.60 | 105.92 | 101.89 | NA | NA | NA | |
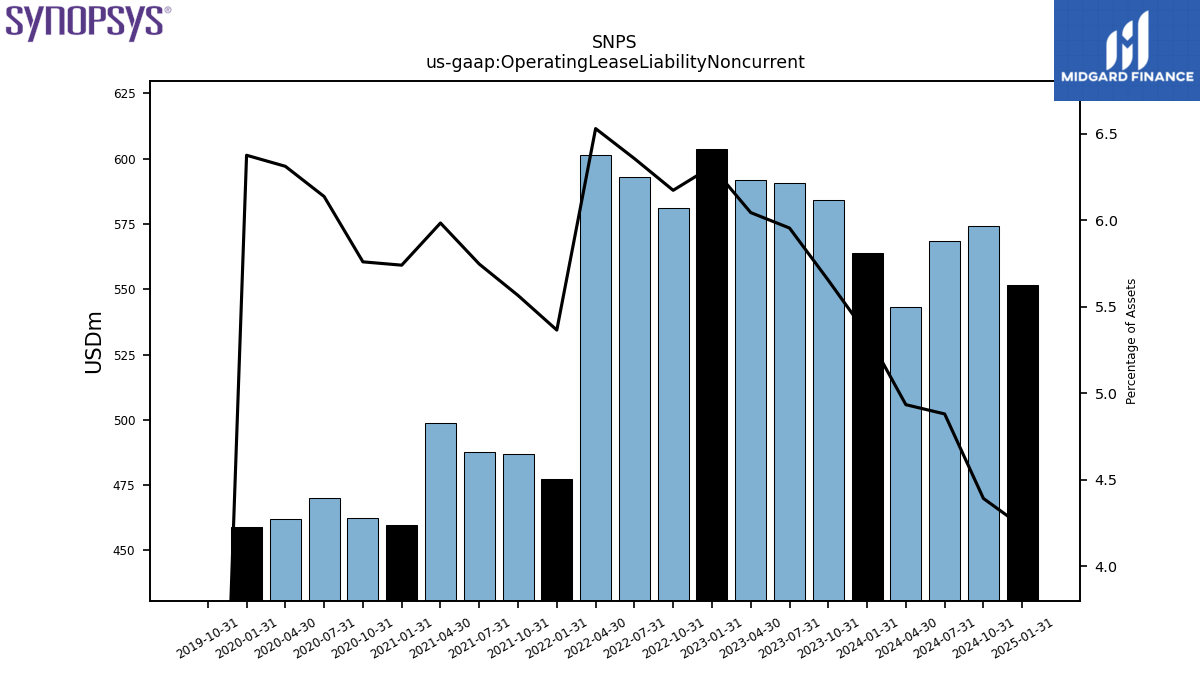
| Operating Lease Liability Noncurrent | 563.82 | 584.03 | 590.83 | 591.67 | 603.54 | 581.27 | 592.93 | 601.32 | 477.49 | 487.00 | 487.57 | 498.95 | 459.88 | 462.41 | 470.21 | 462.09 | 459.15 | 0.00 | NA | NA | NA | NA | NA | NA | NA | NA | NA | NA | NA | NA | NA | NA | NA | NA | NA | NA | NA | NA | NA | NA | NA | NA | NA | NA | NA | NA | NA | NA | NA | NA | NA | NA | NA | NA | NA | NA | NA |
| 2024-01-31 | 2023-10-31 | 2023-07-31 | 2023-04-30 | 2023-01-31 | 2022-10-31 | 2022-07-31 | 2022-04-30 | 2022-01-31 | 2021-10-31 | 2021-07-31 | 2021-04-30 | 2021-01-31 | 2020-10-31 | 2020-07-31 | 2020-04-30 | 2020-01-31 | 2019-10-31 | 2019-07-31 | 2019-04-30 | 2019-01-31 | 2018-10-31 | 2018-07-31 | 2018-04-30 | 2018-01-31 | 2017-10-31 | 2017-07-31 | 2017-04-30 | 2017-01-31 | 2016-10-31 | 2016-07-31 | 2016-04-30 | 2016-01-31 | 2015-10-31 | 2015-07-31 | 2015-04-30 | 2015-01-31 | 2014-10-31 | 2014-07-31 | 2014-04-30 | 2014-01-31 | 2013-10-31 | 2013-07-31 | 2013-04-30 | 2013-01-31 | 2012-10-31 | 2012-07-31 | 2012-04-30 | 2012-01-31 | 2011-10-31 | 2011-07-31 | 2011-04-30 | 2011-01-31 | 2010-10-31 | 2010-07-31 | 2010-04-30 | 2010-01-31 | ||
|---|---|---|---|---|---|---|---|---|---|---|---|---|---|---|---|---|---|---|---|---|---|---|---|---|---|---|---|---|---|---|---|---|---|---|---|---|---|---|---|---|---|---|---|---|---|---|---|---|---|---|---|---|---|---|---|---|---|---|
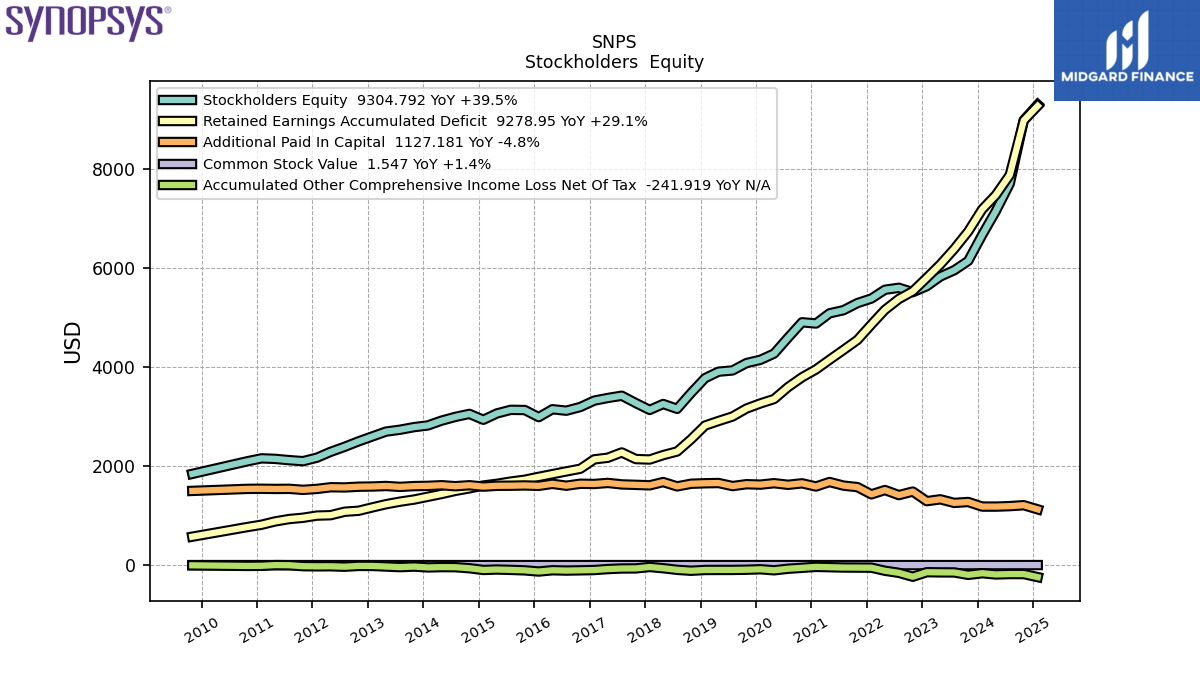
| Stockholders Equity | 6670.98 | 6147.31 | 5958.56 | 5831.86 | 5636.75 | 5515.73 | 5604.03 | 5564.31 | 5386.77 | 5295.14 | 5151.02 | 5088.14 | 4882.25 | 4907.40 | 4595.93 | 4275.09 | 4148.83 | 4083.01 | 3933.81 | 3909.57 | 3778.80 | 3479.15 | 3158.14 | 3256.29 | 3136.53 | 3275.62 | 3423.17 | 3377.49 | 3324.68 | 3195.15 | 3120.75 | 3150.01 | 2990.38 | 3133.99 | 3138.25 | 3065.00 | 2937.02 | 3056.17 | 2996.05 | 2919.12 | 2823.22 | 2788.28 | 2736.13 | 2698.93 | 2602.16 | 2501.69 | 2391.10 | 2289.98 | 2171.80 | 2101.30 | 2121.51 | 2147.40 | 2157.87 | 2100.18 | NA | NA | NA | |
| Stockholders Equity Including Portion Attributable To Noncontrolling Interest | 6675.57 | 6153.26 | 5964.00 | 5836.94 | 5642.70 | 5520.53 | 5608.13 | 5567.43 | 5390.23 | 5298.94 | 5155.14 | 5092.51 | 4886.90 | 4912.37 | 4601.32 | 4280.95 | 4154.69 | 4088.88 | 3939.67 | 3915.43 | 3784.66 | 3485.01 | 3164.00 | 3260.40 | 3140.63 | 3279.72 | NA | NA | NA | 3195.15 | NA | NA | NA | 3133.99 | NA | NA | NA | 3056.17 | NA | NA | NA | 2788.28 | 2736.13 | 2698.93 | 2602.16 | 2543.97 | NA | NA | NA | 2101.30 | NA | NA | NA | 2100.18 | NA | NA | NA | |
| Common Stock Value | 1.52 | 1.52 | 1.52 | 1.52 | 1.52 | 1.52 | 1.53 | 1.53 | 1.53 | 1.53 | 1.53 | 1.53 | 1.53 | 1.53 | 1.52 | 1.51 | 1.50 | 1.50 | 1.50 | 1.50 | 1.49 | 1.49 | 1.49 | 1.49 | 1.49 | 1.50 | 1.50 | 1.51 | 1.50 | 1.51 | 1.51 | 1.52 | 1.51 | 1.55 | 1.56 | 1.55 | 1.53 | 1.56 | 1.56 | 1.55 | 1.54 | 1.54 | 1.54 | 1.53 | 1.52 | 1.51 | 1.49 | 1.47 | 1.44 | 1.43 | 1.44 | 1.47 | 1.49 | 1.49 | NA | NA | NA | |
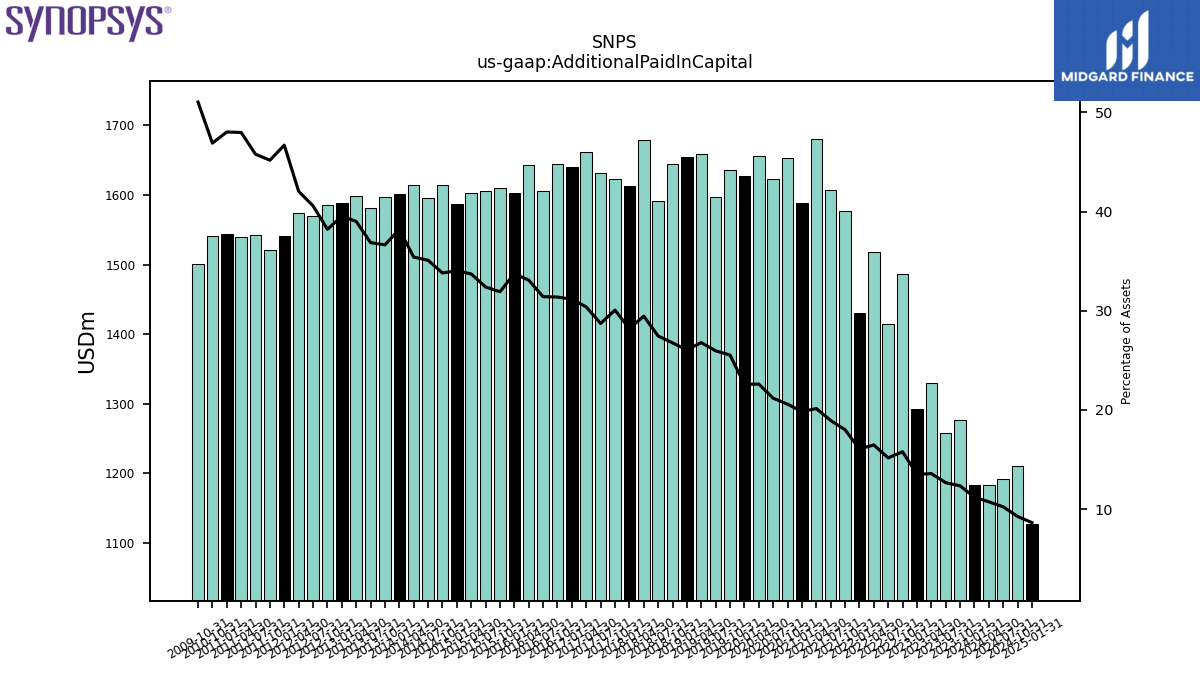
| Additional Paid In Capital | 1183.47 | 1276.15 | 1257.38 | 1330.07 | 1292.90 | 1487.13 | 1415.24 | 1517.48 | 1430.23 | 1576.36 | 1606.98 | 1679.80 | 1589.17 | 1653.17 | 1623.59 | 1655.79 | 1626.78 | 1635.45 | 1597.63 | 1659.48 | 1654.36 | 1644.83 | 1591.29 | 1678.92 | 1612.46 | 1622.43 | 1631.20 | 1661.20 | 1640.04 | 1644.67 | 1605.27 | 1642.78 | 1602.21 | 1610.46 | 1604.99 | 1603.40 | 1586.96 | 1614.60 | 1594.96 | 1614.84 | 1601.93 | 1597.24 | 1581.34 | 1599.16 | 1589.04 | 1585.03 | 1570.06 | 1574.06 | 1540.53 | 1521.33 | 1542.22 | 1539.83 | 1543.20 | 1541.38 | NA | NA | NA | |
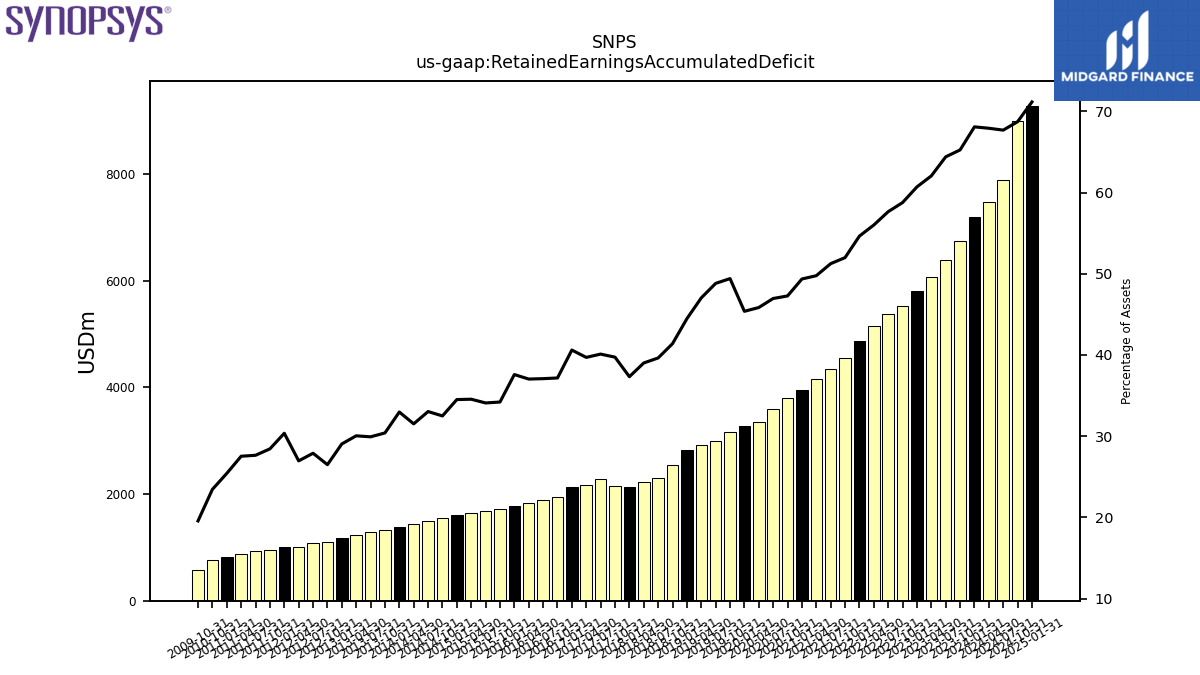
| Retained Earnings Accumulated Deficit | 7188.55 | 6741.70 | 6389.82 | 6075.01 | 5805.84 | 5534.31 | 5377.59 | 5157.63 | 4863.40 | 4549.71 | 4348.27 | 4149.62 | 3954.54 | 3795.40 | 3597.94 | 3356.49 | 3268.20 | 3164.14 | 3003.43 | 2912.81 | 2820.91 | 2543.69 | 2296.55 | 2223.29 | 2133.85 | 2143.87 | 2277.50 | 2170.13 | 2137.39 | 1947.59 | 1894.33 | 1838.70 | 1784.32 | 1725.73 | 1688.76 | 1643.21 | 1608.76 | 1551.59 | 1501.24 | 1437.25 | 1382.20 | 1324.85 | 1283.07 | 1231.38 | 1167.62 | 1098.69 | 1079.38 | 1009.48 | 1001.41 | 957.52 | 931.28 | 883.49 | 816.70 | 770.67 | NA | NA | NA | |
| Accumulated Other Comprehensive Income Loss Net Of Tax | -163.22 | -196.41 | -147.28 | -146.00 | -142.33 | -234.28 | -155.49 | -113.10 | -51.46 | -49.60 | -48.41 | -41.35 | -34.77 | -54.07 | -72.82 | -104.03 | -83.31 | -92.45 | -96.65 | -96.72 | -97.85 | -113.18 | -94.65 | -62.39 | -37.19 | -65.98 | -67.66 | -79.25 | -98.99 | -104.58 | -109.56 | -103.06 | -128.79 | -105.38 | -95.86 | -88.53 | -97.25 | -62.09 | -41.51 | -39.85 | -46.42 | -28.70 | -40.17 | -28.01 | -16.20 | -15.46 | -31.72 | -22.64 | -24.16 | -20.95 | -1.54 | 0.63 | -13.19 | -15.77 | NA | NA | NA | |
| Minority Interest | 4.59 | 5.95 | 5.45 | 5.09 | 5.95 | 4.80 | 4.10 | 3.12 | 3.46 | 3.81 | 4.12 | 4.37 | 4.65 | 4.96 | 5.39 | 5.86 | 5.86 | 5.86 | 5.86 | 5.86 | 5.86 | 5.86 | 5.86 | 4.10 | 4.10 | 4.10 | NA | NA | NA | 0.00 | NA | NA | NA | NA | NA | NA | NA | NA | NA | NA | NA | NA | NA | NA | NA | NA | NA | NA | NA | NA | NA | NA | NA | NA | NA | NA | NA | |
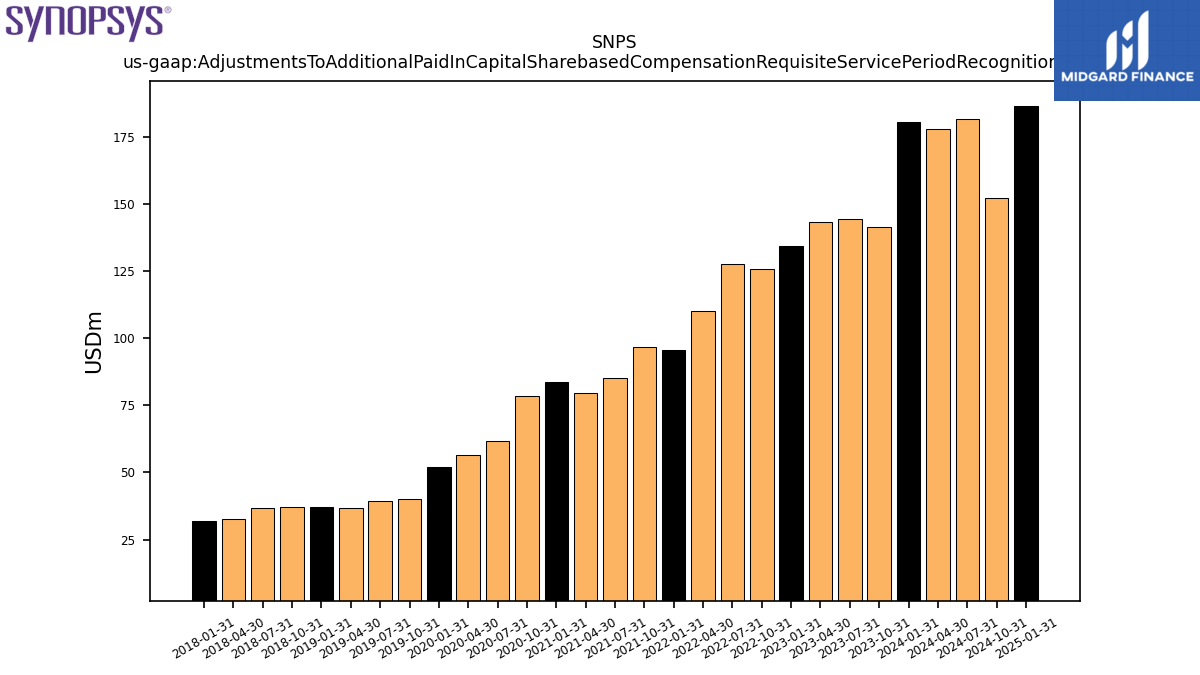
| Adjustments To Additional Paid In Capital Sharebased Compensation Requisite Service Period Recognition Value | 180.65 | 141.34 | 144.46 | 143.26 | 134.23 | 125.59 | 127.61 | 110.06 | 95.77 | 96.74 | 85.16 | 79.59 | 83.78 | 78.43 | 61.84 | 56.44 | 51.88 | 40.17 | 39.45 | 36.91 | 37.27 | 37.18 | 36.94 | 32.65 | 32.11 | NA | NA | NA | NA | NA | NA | NA | NA | NA | NA | NA | NA | NA | NA | NA | NA | NA | NA | NA | NA | NA | NA | NA | NA | NA | NA | NA | NA | NA | NA | NA | NA |
| 2024-01-31 | 2023-10-31 | 2023-07-31 | 2023-04-30 | 2023-01-31 | 2022-10-31 | 2022-07-31 | 2022-04-30 | 2022-01-31 | 2021-10-31 | 2021-07-31 | 2021-04-30 | 2021-01-31 | 2020-10-31 | 2020-07-31 | 2020-04-30 | 2020-01-31 | 2019-10-31 | 2019-07-31 | 2019-04-30 | 2019-01-31 | 2018-10-31 | 2018-07-31 | 2018-04-30 | 2018-01-31 | 2017-10-31 | 2017-07-31 | 2017-04-30 | 2017-01-31 | 2016-10-31 | 2016-07-31 | 2016-04-30 | 2016-01-31 | 2015-10-31 | 2015-07-31 | 2015-04-30 | 2015-01-31 | 2014-10-31 | 2014-07-31 | 2014-04-30 | 2014-01-31 | 2013-10-31 | 2013-07-31 | 2013-04-30 | 2013-01-31 | 2012-10-31 | 2012-07-31 | 2012-04-30 | 2012-01-31 | 2011-10-31 | 2011-07-31 | 2011-04-30 | 2011-01-31 | 2010-10-31 | 2010-07-31 | 2010-04-30 | 2010-01-31 | ||
|---|---|---|---|---|---|---|---|---|---|---|---|---|---|---|---|---|---|---|---|---|---|---|---|---|---|---|---|---|---|---|---|---|---|---|---|---|---|---|---|---|---|---|---|---|---|---|---|---|---|---|---|---|---|---|---|---|---|---|
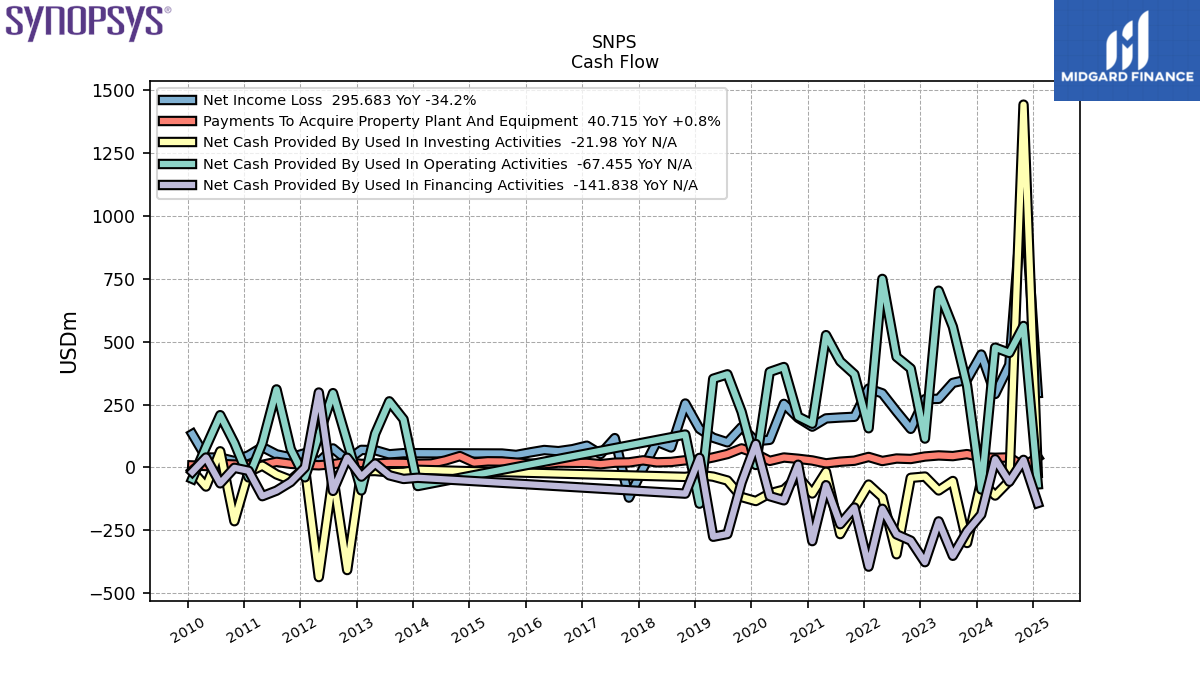
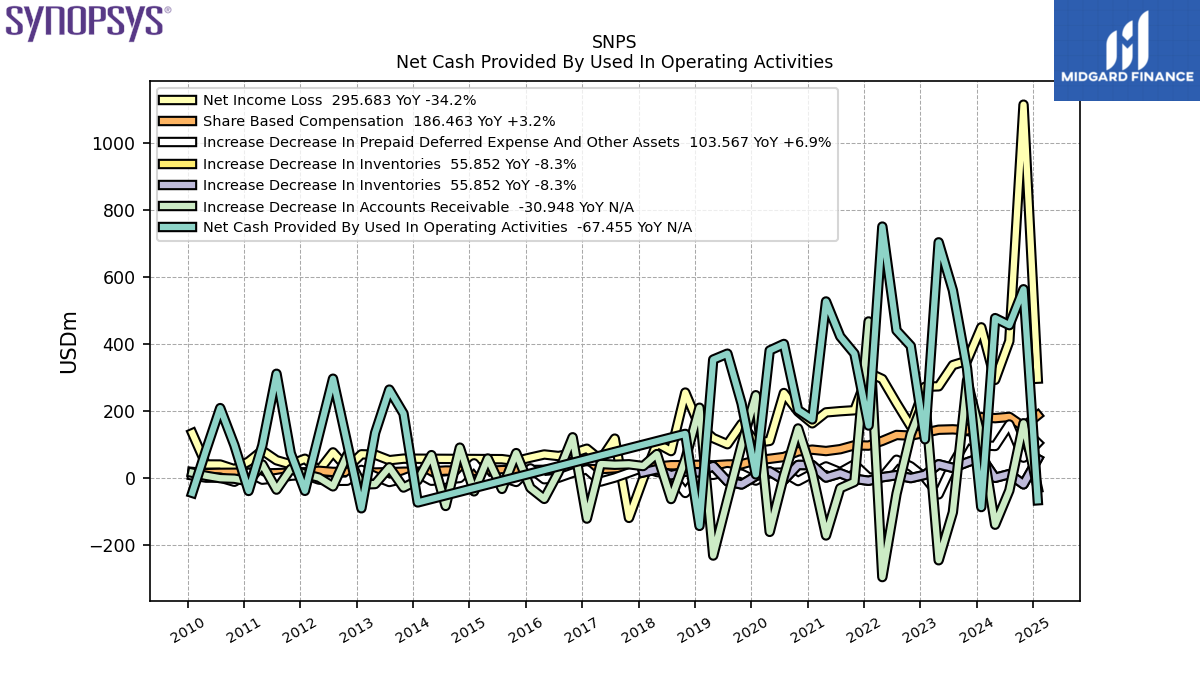
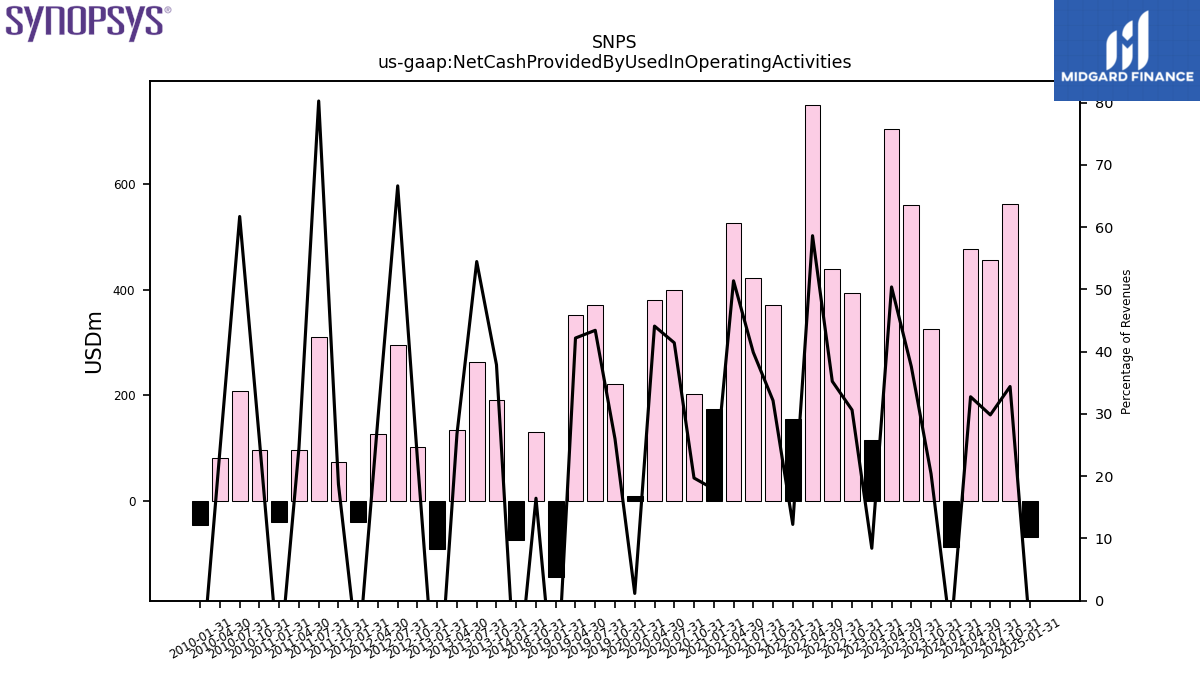
| Net Cash Provided By Used In Operating Activities | -87.79 | 326.06 | 559.52 | 702.94 | 114.75 | 393.50 | 439.69 | 749.96 | 155.74 | 370.56 | 421.77 | 526.34 | 173.96 | 202.15 | 399.42 | 379.92 | 9.82 | 221.25 | 370.46 | 352.82 | -144.02 | 130.92 | NA | NA | NA | NA | NA | NA | NA | NA | NA | NA | NA | NA | NA | NA | NA | NA | NA | NA | -73.89 | 191.34 | 263.08 | 133.73 | -91.44 | 102.93 | 295.68 | 126.77 | -39.32 | 73.03 | 310.44 | 96.49 | -39.63 | 96.89 | 207.92 | 81.64 | -45.42 | |
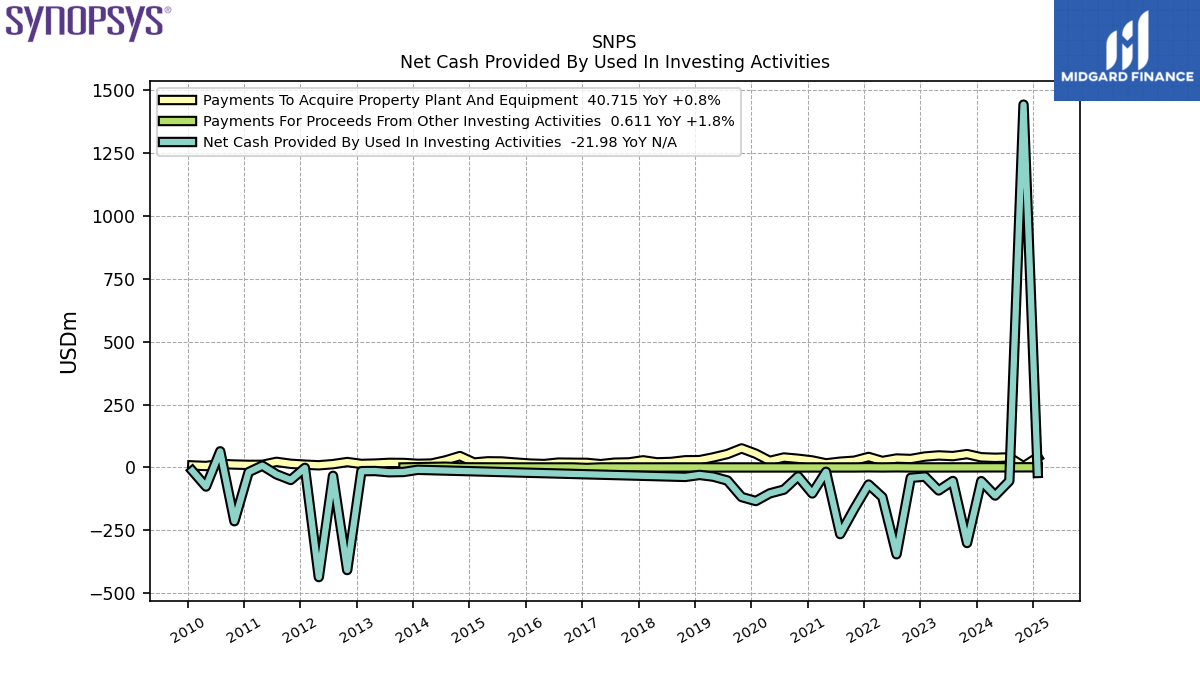
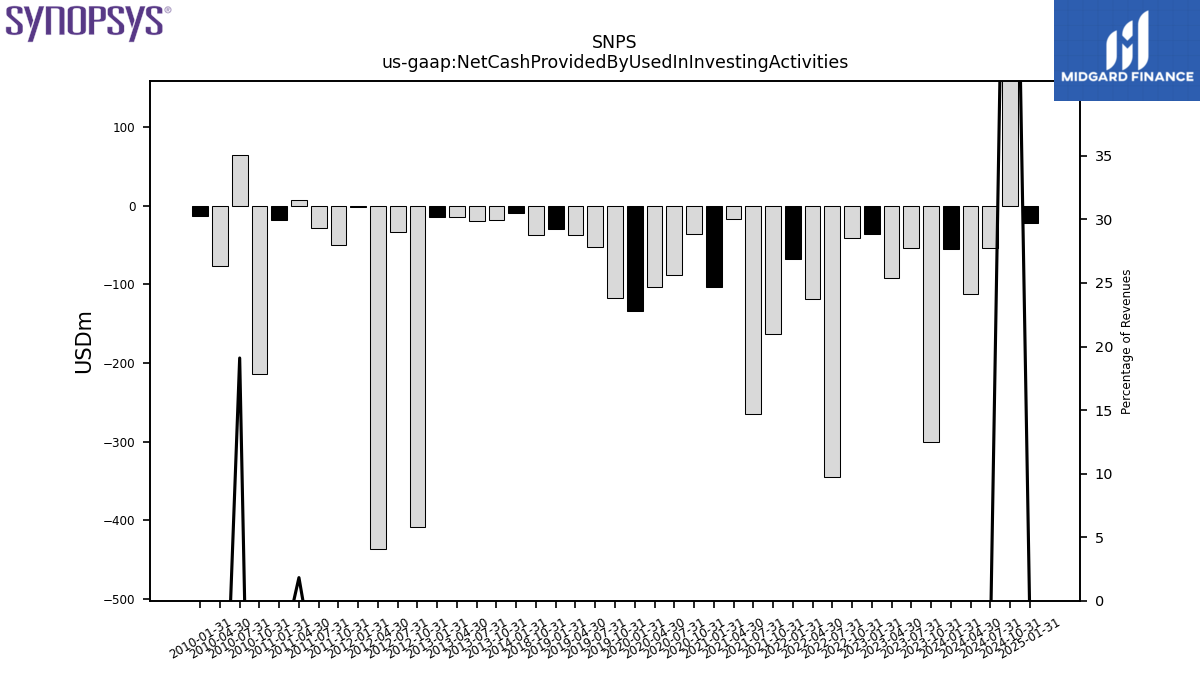
| Net Cash Provided By Used In Investing Activities | -54.40 | -300.55 | -53.84 | -91.47 | -36.25 | -41.30 | -345.31 | -117.99 | -68.03 | -163.16 | -265.12 | -17.29 | -103.46 | -35.49 | -88.19 | -103.17 | -133.56 | -117.64 | -51.97 | -36.53 | -29.74 | -37.62 | NA | NA | NA | NA | NA | NA | NA | NA | NA | NA | NA | NA | NA | NA | NA | NA | NA | NA | -9.36 | -18.00 | -19.09 | -14.19 | -14.80 | -408.14 | -33.29 | -436.19 | -1.51 | -49.73 | -27.67 | 7.16 | -18.58 | -213.90 | 64.34 | -76.01 | -13.16 | |
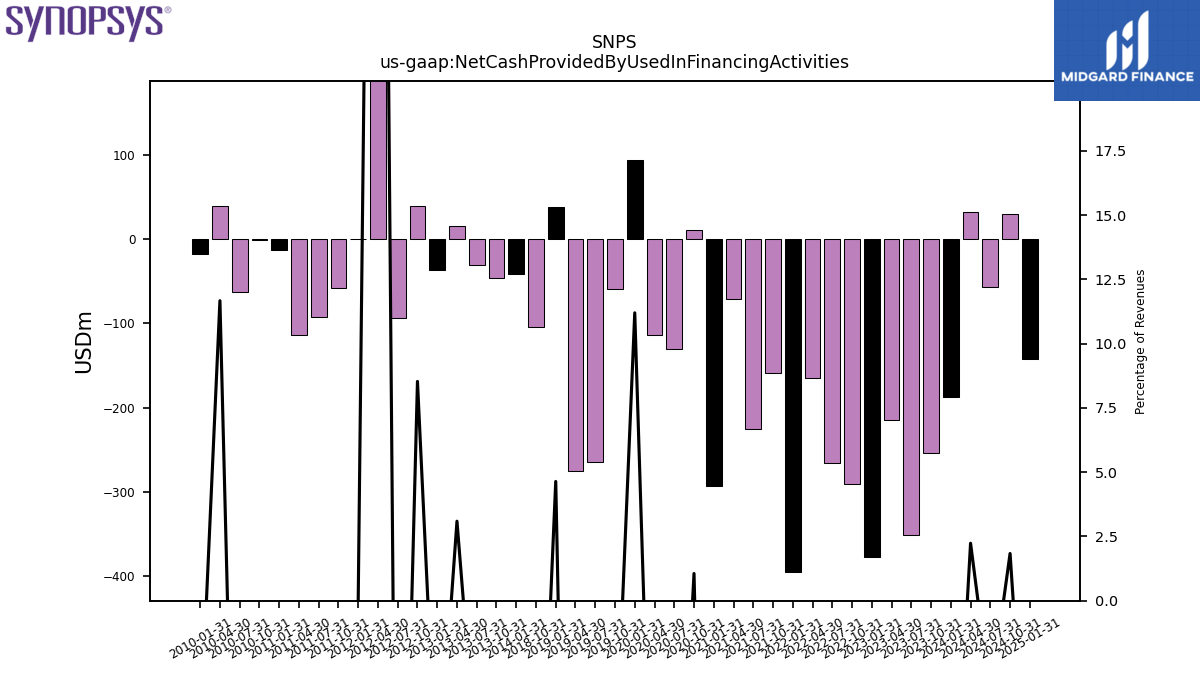
| Net Cash Provided By Used In Financing Activities | -187.15 | -254.29 | -351.41 | -214.40 | -376.77 | -291.07 | -266.17 | -164.47 | -394.60 | -159.34 | -225.67 | -70.67 | -293.06 | 10.87 | -130.78 | -114.17 | 93.48 | -59.58 | -264.75 | -275.66 | 38.09 | -104.21 | NA | NA | NA | NA | NA | NA | NA | NA | NA | NA | NA | NA | NA | NA | NA | NA | NA | NA | -41.02 | -45.76 | -31.27 | 15.46 | -36.42 | 38.77 | -93.41 | 298.11 | 0.03 | -57.87 | -92.30 | -114.26 | -13.19 | -1.44 | -63.23 | 39.48 | -17.87 |
| 2024-01-31 | 2023-10-31 | 2023-07-31 | 2023-04-30 | 2023-01-31 | 2022-10-31 | 2022-07-31 | 2022-04-30 | 2022-01-31 | 2021-10-31 | 2021-07-31 | 2021-04-30 | 2021-01-31 | 2020-10-31 | 2020-07-31 | 2020-04-30 | 2020-01-31 | 2019-10-31 | 2019-07-31 | 2019-04-30 | 2019-01-31 | 2018-10-31 | 2018-07-31 | 2018-04-30 | 2018-01-31 | 2017-10-31 | 2017-07-31 | 2017-04-30 | 2017-01-31 | 2016-10-31 | 2016-07-31 | 2016-04-30 | 2016-01-31 | 2015-10-31 | 2015-07-31 | 2015-04-30 | 2015-01-31 | 2014-10-31 | 2014-07-31 | 2014-04-30 | 2014-01-31 | 2013-10-31 | 2013-07-31 | 2013-04-30 | 2013-01-31 | 2012-10-31 | 2012-07-31 | 2012-04-30 | 2012-01-31 | 2011-10-31 | 2011-07-31 | 2011-04-30 | 2011-01-31 | 2010-10-31 | 2010-07-31 | 2010-04-30 | 2010-01-31 | ||
|---|---|---|---|---|---|---|---|---|---|---|---|---|---|---|---|---|---|---|---|---|---|---|---|---|---|---|---|---|---|---|---|---|---|---|---|---|---|---|---|---|---|---|---|---|---|---|---|---|---|---|---|---|---|---|---|---|---|---|
| Net Cash Provided By Used In Operating Activities | -87.79 | 326.06 | 559.52 | 702.94 | 114.75 | 393.50 | 439.69 | 749.96 | 155.74 | 370.56 | 421.77 | 526.34 | 173.96 | 202.15 | 399.42 | 379.92 | 9.82 | 221.25 | 370.46 | 352.82 | -144.02 | 130.92 | NA | NA | NA | NA | NA | NA | NA | NA | NA | NA | NA | NA | NA | NA | NA | NA | NA | NA | -73.89 | 191.34 | 263.08 | 133.73 | -91.44 | 102.93 | 295.68 | 126.77 | -39.32 | 73.03 | 310.44 | 96.49 | -39.63 | 96.89 | 207.92 | 81.64 | -45.42 | |
| Net Income Loss | 449.11 | 349.19 | 336.25 | 272.91 | 271.54 | 153.50 | 222.63 | 294.78 | 313.69 | 201.45 | 198.65 | 195.08 | 162.34 | 197.46 | 252.91 | 109.92 | 104.06 | 160.71 | 99.93 | 118.21 | 153.51 | 254.33 | 79.41 | 102.47 | -3.69 | -120.08 | 116.75 | 53.31 | 86.59 | 72.70 | 64.72 | 69.38 | 60.03 | 49.76 | 55.39 | 55.60 | NA | NA | NA | NA | NA | 56.89 | 52.30 | 68.69 | 69.92 | 28.58 | 75.66 | 20.97 | 56.69 | 39.94 | 52.08 | 81.11 | 48.23 | 25.40 | 39.33 | 39.55 | 132.79 | |
| Profit Loss | 446.21 | 346.50 | 333.06 | 269.95 | 268.63 | 151.56 | 219.65 | 293.89 | 313.34 | 201.14 | 198.39 | 194.80 | 162.03 | 197.03 | 252.44 | 109.92 | 104.06 | 160.71 | 99.93 | NA | NA | NA | NA | NA | NA | NA | NA | NA | NA | 72.70 | 64.72 | 69.38 | 60.03 | 49.76 | 55.39 | 55.60 | 65.19 | 62.45 | 65.66 | 63.32 | 67.70 | 56.89 | 52.30 | 68.69 | 69.92 | NA | NA | NA | NA | NA | NA | NA | NA | NA | NA | NA | NA | |
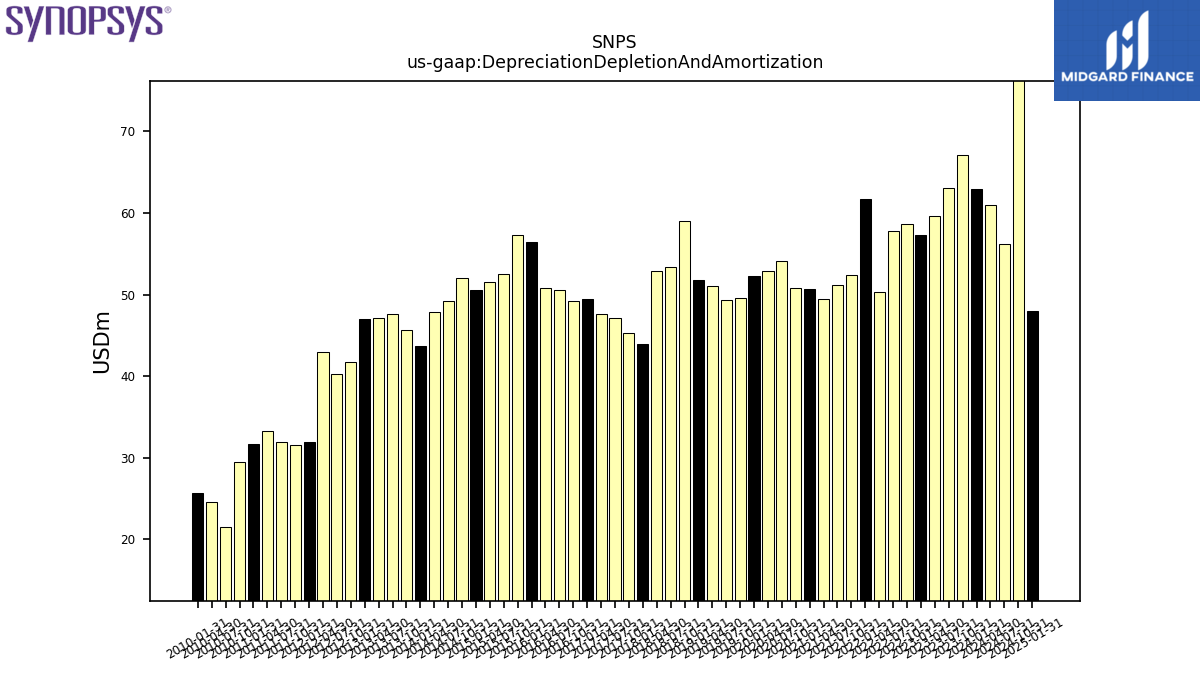
| Depreciation Depletion And Amortization | 62.89 | 67.09 | 63.11 | 59.63 | 57.29 | 58.70 | 57.75 | 50.28 | 61.69 | 52.40 | 51.21 | 49.44 | 50.63 | 50.83 | 54.08 | 52.85 | 52.23 | 49.54 | 49.29 | 51.01 | 51.83 | 58.96 | 53.42 | 52.91 | 43.92 | 45.33 | 47.07 | 47.58 | 49.46 | 49.22 | 50.59 | 50.79 | 56.44 | 57.29 | 52.48 | 51.52 | 50.53 | 52.08 | 49.16 | 47.87 | 43.71 | 45.65 | 47.60 | 47.09 | 47.06 | 41.76 | 40.21 | 42.90 | 31.96 | 31.59 | 31.96 | 33.32 | 31.68 | 29.43 | 21.55 | 24.57 | 25.65 | |
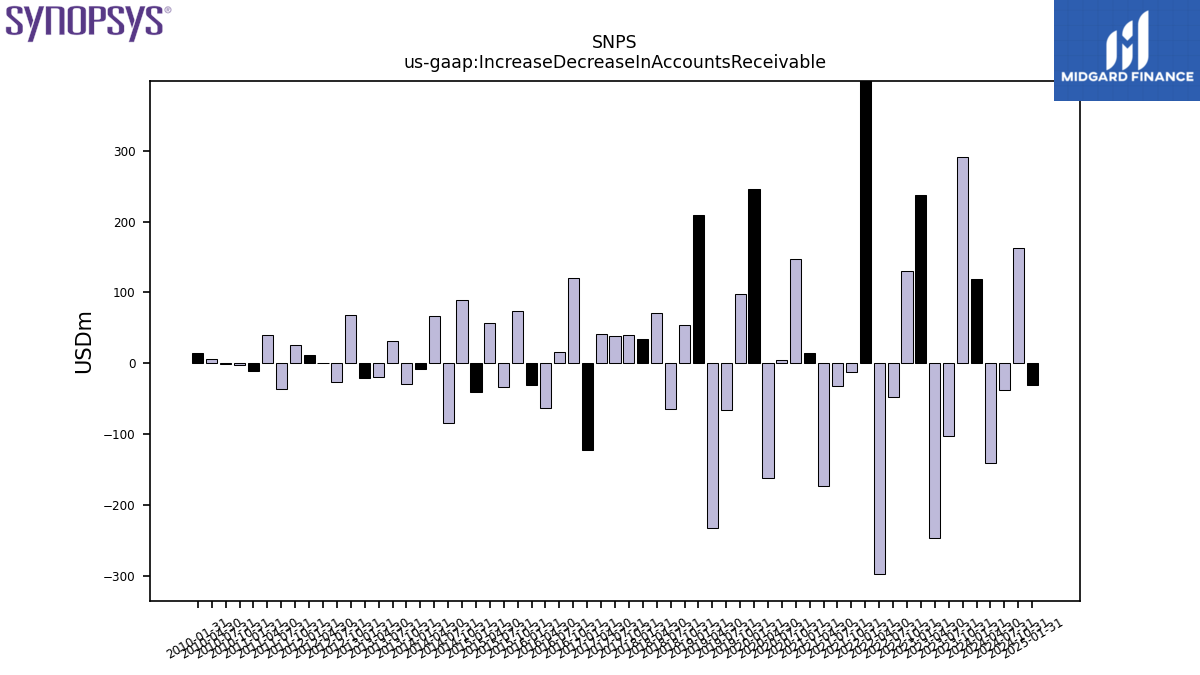
| Increase Decrease In Accounts Receivable | 119.57 | 290.94 | -103.22 | -246.65 | 237.36 | 129.60 | -48.00 | -296.90 | 466.68 | -12.71 | -31.36 | -172.55 | 14.91 | 147.14 | 5.13 | -161.83 | 246.36 | 97.94 | -65.89 | -232.53 | 209.05 | 54.09 | -63.76 | 70.65 | 34.81 | 40.12 | 38.69 | 41.09 | -122.19 | 120.80 | 16.09 | -63.25 | -30.36 | 73.51 | -33.47 | 57.35 | -40.86 | 89.85 | -84.41 | 67.49 | -7.91 | -29.38 | 31.08 | -18.95 | -20.34 | 67.80 | -25.92 | 0.41 | 11.10 | 25.75 | -35.68 | 39.52 | -10.61 | -2.98 | -1.45 | 5.79 | 14.84 | |
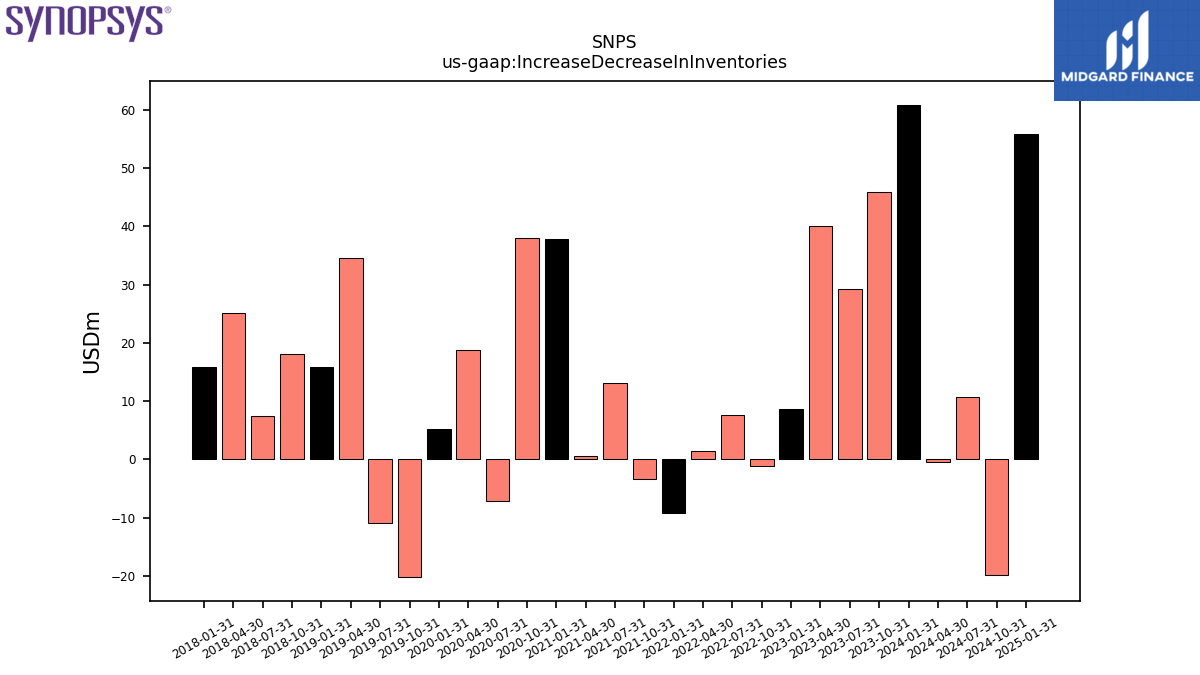
| Increase Decrease In Inventories | 60.88 | 45.83 | 29.27 | 40.04 | 8.61 | -1.20 | 7.61 | 1.43 | -9.15 | -3.40 | 13.14 | 0.54 | 37.76 | 37.98 | -7.06 | 18.79 | 5.30 | -20.19 | -10.93 | 34.53 | 15.83 | 18.07 | 7.44 | 25.19 | 15.81 | NA | NA | NA | NA | NA | NA | NA | NA | NA | NA | NA | NA | NA | NA | NA | NA | NA | NA | NA | NA | NA | NA | NA | NA | NA | NA | NA | NA | NA | NA | NA | NA | |
| Share Based Compensation | 180.65 | 141.34 | 144.46 | 143.26 | 134.23 | 125.59 | 127.61 | 110.06 | 95.77 | 96.74 | 85.16 | 79.59 | 83.78 | 78.43 | 61.84 | 56.44 | 51.88 | 40.17 | 39.45 | 36.91 | 38.46 | 37.49 | 37.25 | 32.97 | 32.32 | 28.60 | 28.30 | 25.56 | 25.83 | 25.54 | 25.57 | 23.46 | 23.01 | 22.94 | 22.60 | 20.28 | 20.58 | 21.10 | 21.40 | 18.82 | 18.12 | 17.79 | 16.49 | 15.53 | 17.70 | 17.34 | 17.23 | 20.61 | 16.25 | 14.98 | 13.52 | 12.67 | 15.25 | 14.77 | 14.51 | 13.47 | 17.23 | |
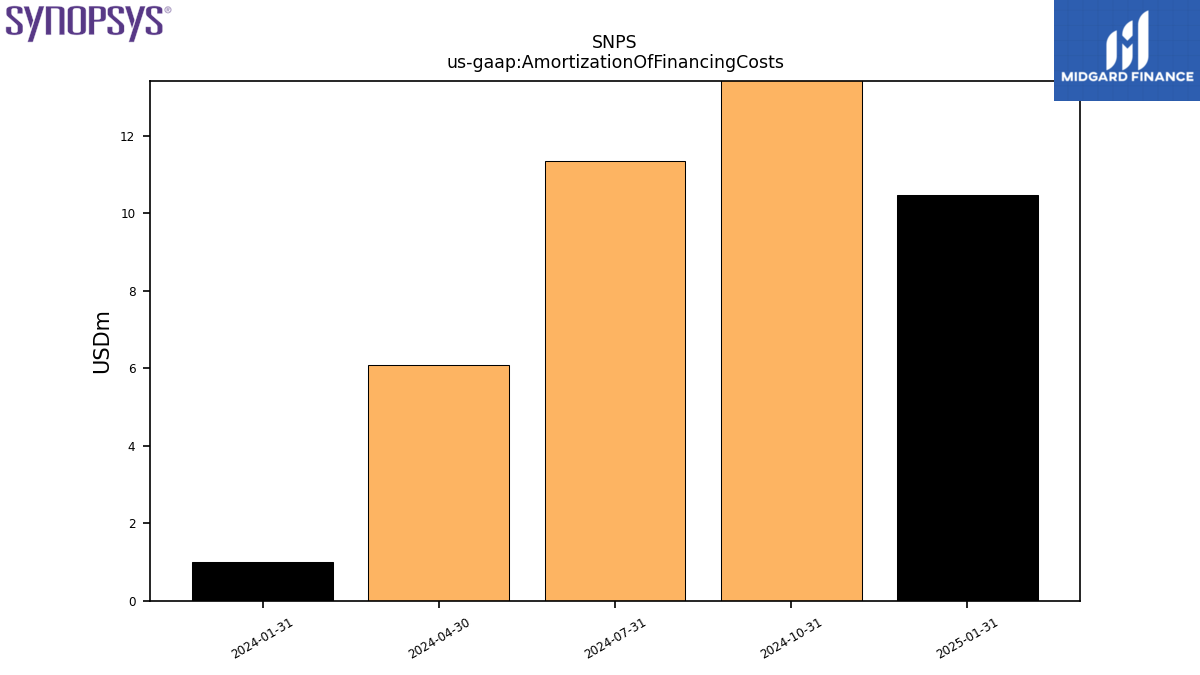
| Amortization Of Financing Costs | 1.00 | NA | NA | NA | NA | NA | NA | NA | NA | NA | NA | NA | NA | NA | NA | NA | NA | NA | NA | NA | NA | NA | NA | NA | NA | NA | NA | NA | NA | NA | NA | NA | NA | NA | NA | NA | NA | NA | NA | NA | NA | NA | NA | NA | NA | NA | NA | NA | NA | NA | NA | NA | NA | NA | NA | NA | NA |
| 2024-01-31 | 2023-10-31 | 2023-07-31 | 2023-04-30 | 2023-01-31 | 2022-10-31 | 2022-07-31 | 2022-04-30 | 2022-01-31 | 2021-10-31 | 2021-07-31 | 2021-04-30 | 2021-01-31 | 2020-10-31 | 2020-07-31 | 2020-04-30 | 2020-01-31 | 2019-10-31 | 2019-07-31 | 2019-04-30 | 2019-01-31 | 2018-10-31 | 2018-07-31 | 2018-04-30 | 2018-01-31 | 2017-10-31 | 2017-07-31 | 2017-04-30 | 2017-01-31 | 2016-10-31 | 2016-07-31 | 2016-04-30 | 2016-01-31 | 2015-10-31 | 2015-07-31 | 2015-04-30 | 2015-01-31 | 2014-10-31 | 2014-07-31 | 2014-04-30 | 2014-01-31 | 2013-10-31 | 2013-07-31 | 2013-04-30 | 2013-01-31 | 2012-10-31 | 2012-07-31 | 2012-04-30 | 2012-01-31 | 2011-10-31 | 2011-07-31 | 2011-04-30 | 2011-01-31 | 2010-10-31 | 2010-07-31 | 2010-04-30 | 2010-01-31 | ||
|---|---|---|---|---|---|---|---|---|---|---|---|---|---|---|---|---|---|---|---|---|---|---|---|---|---|---|---|---|---|---|---|---|---|---|---|---|---|---|---|---|---|---|---|---|---|---|---|---|---|---|---|---|---|---|---|---|---|---|
| Net Cash Provided By Used In Investing Activities | -54.40 | -300.55 | -53.84 | -91.47 | -36.25 | -41.30 | -345.31 | -117.99 | -68.03 | -163.16 | -265.12 | -17.29 | -103.46 | -35.49 | -88.19 | -103.17 | -133.56 | -117.64 | -51.97 | -36.53 | -29.74 | -37.62 | NA | NA | NA | NA | NA | NA | NA | NA | NA | NA | NA | NA | NA | NA | NA | NA | NA | NA | -9.36 | -18.00 | -19.09 | -14.19 | -14.80 | -408.14 | -33.29 | -436.19 | -1.51 | -49.73 | -27.67 | 7.16 | -18.58 | -213.90 | 64.34 | -76.01 | -13.16 | |
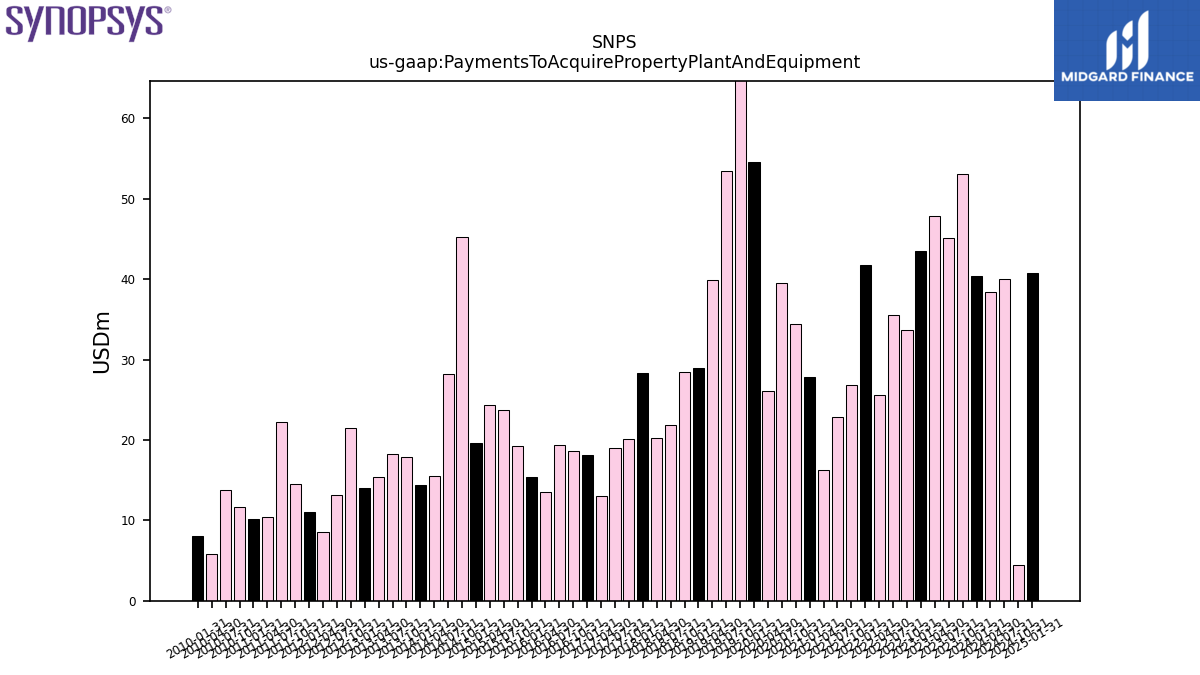
| Payments To Acquire Property Plant And Equipment | 40.39 | 53.10 | 45.15 | 47.87 | 43.50 | 33.66 | 35.57 | 25.62 | 41.75 | 26.81 | 22.90 | 16.28 | 27.78 | 34.48 | 39.57 | 26.06 | 54.60 | 75.77 | 53.40 | 39.95 | 29.01 | 28.51 | 21.86 | 20.30 | 28.32 | 20.10 | 19.03 | 13.02 | 18.18 | 18.66 | 19.35 | 13.56 | 15.34 | 19.26 | 23.73 | 24.37 | 19.61 | 45.19 | 28.18 | 15.55 | 14.35 | 17.84 | 18.20 | 15.45 | 13.98 | 21.47 | 13.13 | 8.57 | 11.02 | 14.51 | 22.24 | 10.38 | 10.22 | 11.63 | 13.80 | 5.76 | 8.04 |
| 2024-01-31 | 2023-10-31 | 2023-07-31 | 2023-04-30 | 2023-01-31 | 2022-10-31 | 2022-07-31 | 2022-04-30 | 2022-01-31 | 2021-10-31 | 2021-07-31 | 2021-04-30 | 2021-01-31 | 2020-10-31 | 2020-07-31 | 2020-04-30 | 2020-01-31 | 2019-10-31 | 2019-07-31 | 2019-04-30 | 2019-01-31 | 2018-10-31 | 2018-07-31 | 2018-04-30 | 2018-01-31 | 2017-10-31 | 2017-07-31 | 2017-04-30 | 2017-01-31 | 2016-10-31 | 2016-07-31 | 2016-04-30 | 2016-01-31 | 2015-10-31 | 2015-07-31 | 2015-04-30 | 2015-01-31 | 2014-10-31 | 2014-07-31 | 2014-04-30 | 2014-01-31 | 2013-10-31 | 2013-07-31 | 2013-04-30 | 2013-01-31 | 2012-10-31 | 2012-07-31 | 2012-04-30 | 2012-01-31 | 2011-10-31 | 2011-07-31 | 2011-04-30 | 2011-01-31 | 2010-10-31 | 2010-07-31 | 2010-04-30 | 2010-01-31 | ||
|---|---|---|---|---|---|---|---|---|---|---|---|---|---|---|---|---|---|---|---|---|---|---|---|---|---|---|---|---|---|---|---|---|---|---|---|---|---|---|---|---|---|---|---|---|---|---|---|---|---|---|---|---|---|---|---|---|---|---|
| Net Cash Provided By Used In Financing Activities | -187.15 | -254.29 | -351.41 | -214.40 | -376.77 | -291.07 | -266.17 | -164.47 | -394.60 | -159.34 | -225.67 | -70.67 | -293.06 | 10.87 | -130.78 | -114.17 | 93.48 | -59.58 | -264.75 | -275.66 | 38.09 | -104.21 | NA | NA | NA | NA | NA | NA | NA | NA | NA | NA | NA | NA | NA | NA | NA | NA | NA | NA | -41.02 | -45.76 | -31.27 | 15.46 | -36.42 | 38.77 | -93.41 | 298.11 | 0.03 | -57.87 | -92.30 | -114.26 | -13.19 | -1.44 | -63.23 | 39.48 | -17.87 |
| 2024-01-31 | 2023-10-31 | 2023-07-31 | 2023-04-30 | 2023-01-31 | 2022-10-31 | 2022-07-31 | 2022-04-30 | 2022-01-31 | 2021-10-31 | 2021-07-31 | 2021-04-30 | 2021-01-31 | 2020-10-31 | 2020-07-31 | 2020-04-30 | 2020-01-31 | 2019-10-31 | 2019-07-31 | 2019-04-30 | 2019-01-31 | 2018-10-31 | 2018-07-31 | 2018-04-30 | 2018-01-31 | 2017-10-31 | 2017-07-31 | 2017-04-30 | 2017-01-31 | 2016-10-31 | 2016-07-31 | 2016-04-30 | 2016-01-31 | 2015-10-31 | 2015-07-31 | 2015-04-30 | 2015-01-31 | 2014-10-31 | 2014-07-31 | 2014-04-30 | 2014-01-31 | 2013-10-31 | 2013-07-31 | 2013-04-30 | 2013-01-31 | 2012-10-31 | 2012-07-31 | 2012-04-30 | 2012-01-31 | 2011-10-31 | 2011-07-31 | 2011-04-30 | 2011-01-31 | 2010-10-31 | 2010-07-31 | 2010-04-30 | 2010-01-31 | ||
|---|---|---|---|---|---|---|---|---|---|---|---|---|---|---|---|---|---|---|---|---|---|---|---|---|---|---|---|---|---|---|---|---|---|---|---|---|---|---|---|---|---|---|---|---|---|---|---|---|---|---|---|---|---|---|---|---|---|---|
| Revenues | 1649.23 | 1599.13 | 1487.29 | 1394.86 | 1361.34 | 1284.29 | 1247.77 | 1279.23 | 1270.26 | 1152.42 | 1057.13 | 1024.32 | 970.32 | 1025.44 | 964.13 | 861.33 | 834.38 | 851.08 | 852.97 | 836.24 | 820.40 | 795.08 | 779.71 | 776.84 | 769.43 | 696.64 | 695.38 | 680.07 | 652.79 | 633.72 | 615.20 | 605.00 | 568.60 | 587.16 | 555.80 | 557.20 | 542.04 | 539.01 | 521.81 | 517.70 | 478.95 | 504.88 | 482.94 | 499.26 | 475.14 | 454.21 | 443.75 | 432.56 | 425.50 | 390.53 | 386.80 | 393.67 | 364.64 | 375.46 | 336.93 | 338.11 | 330.17 | |
| Revenue From Contract With Customer Excluding Assessed Tax | 1649.23 | 1599.13 | 1487.29 | 1394.86 | 1361.34 | 1284.29 | 1247.77 | 1279.23 | 1270.26 | 1152.42 | 1057.13 | 1024.32 | 970.32 | 1025.44 | 964.13 | 861.33 | 834.38 | 851.08 | 852.97 | 836.24 | 820.40 | 795.08 | 779.71 | 776.84 | 769.43 | 696.64 | 695.38 | 680.07 | 652.79 | 633.72 | 615.20 | 605.00 | 568.60 | 587.16 | 555.80 | 557.20 | 542.04 | 539.01 | 521.81 | 517.70 | 478.95 | 504.88 | 482.94 | 499.26 | 475.14 | 454.21 | 443.75 | 432.56 | 425.50 | 390.53 | 386.80 | 393.67 | 364.64 | 375.46 | 336.93 | 338.11 | 330.17 | |
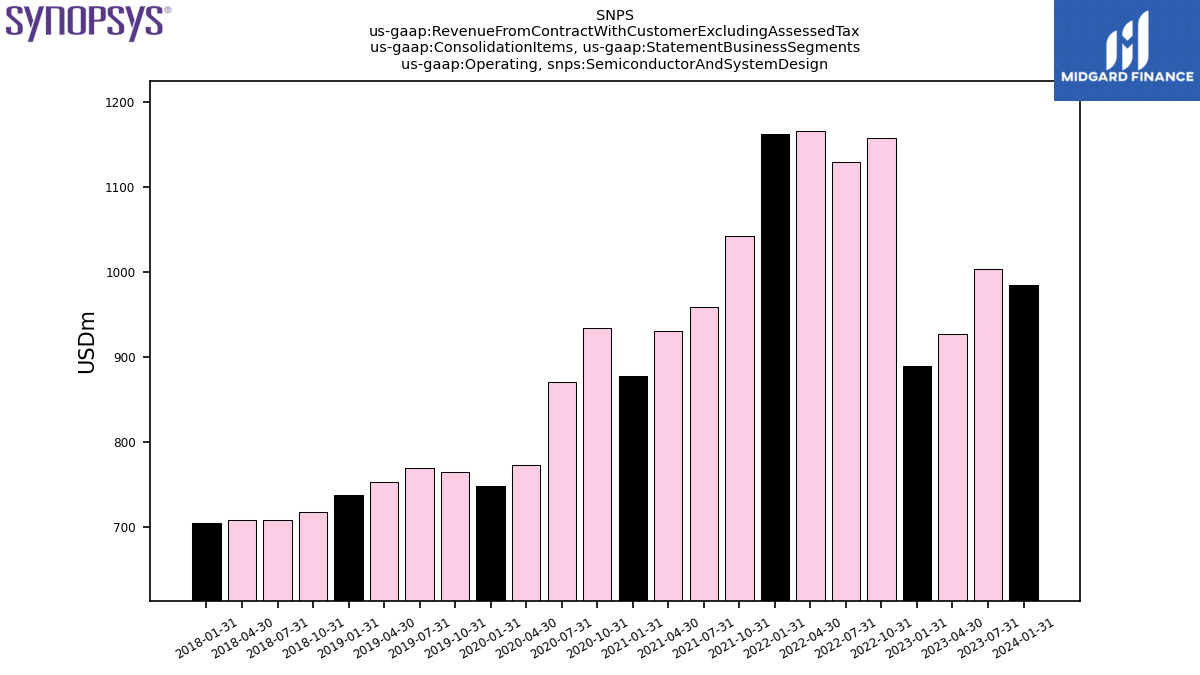
| Operating, Semiconductor And System Design | 985.34 | NA | 1004.16 | 927.57 | 889.85 | 1157.21 | 1129.43 | 1166.38 | 1162.69 | 1042.46 | 959.15 | 930.43 | 878.37 | 934.67 | 870.73 | 773.07 | 748.74 | 765.73 | 769.41 | 753.05 | 737.91 | 717.81 | 708.41 | 709.03 | 705.33 | NA | NA | NA | NA | NA | NA | NA | NA | NA | NA | NA | NA | NA | NA | NA | NA | NA | NA | NA | NA | NA | NA | NA | NA | NA | NA | NA | NA | NA | NA | NA | NA | |
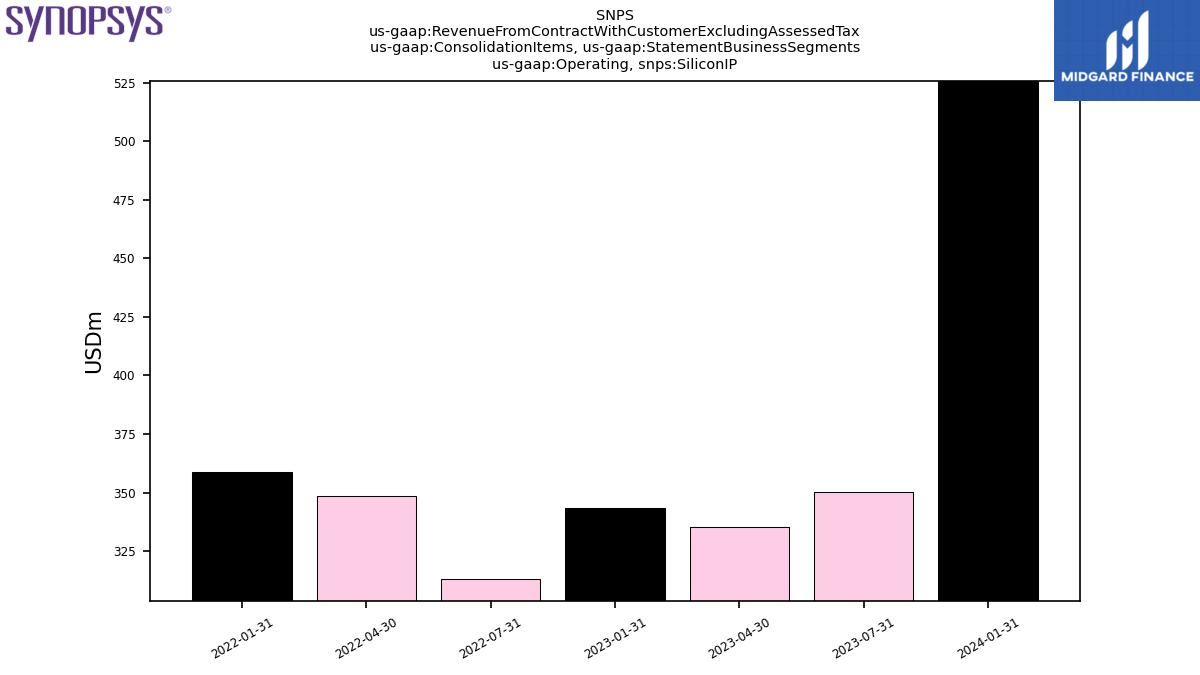
| Operating, Silicon I P | 525.65 | NA | 350.23 | 335.18 | 343.65 | NA | 313.03 | 348.52 | 358.83 | NA | NA | NA | NA | NA | NA | NA | NA | NA | NA | NA | NA | NA | NA | NA | NA | NA | NA | NA | NA | NA | NA | NA | NA | NA | NA | NA | NA | NA | NA | NA | NA | NA | NA | NA | NA | NA | NA | NA | NA | NA | NA | NA | NA | NA | NA | NA | NA | |
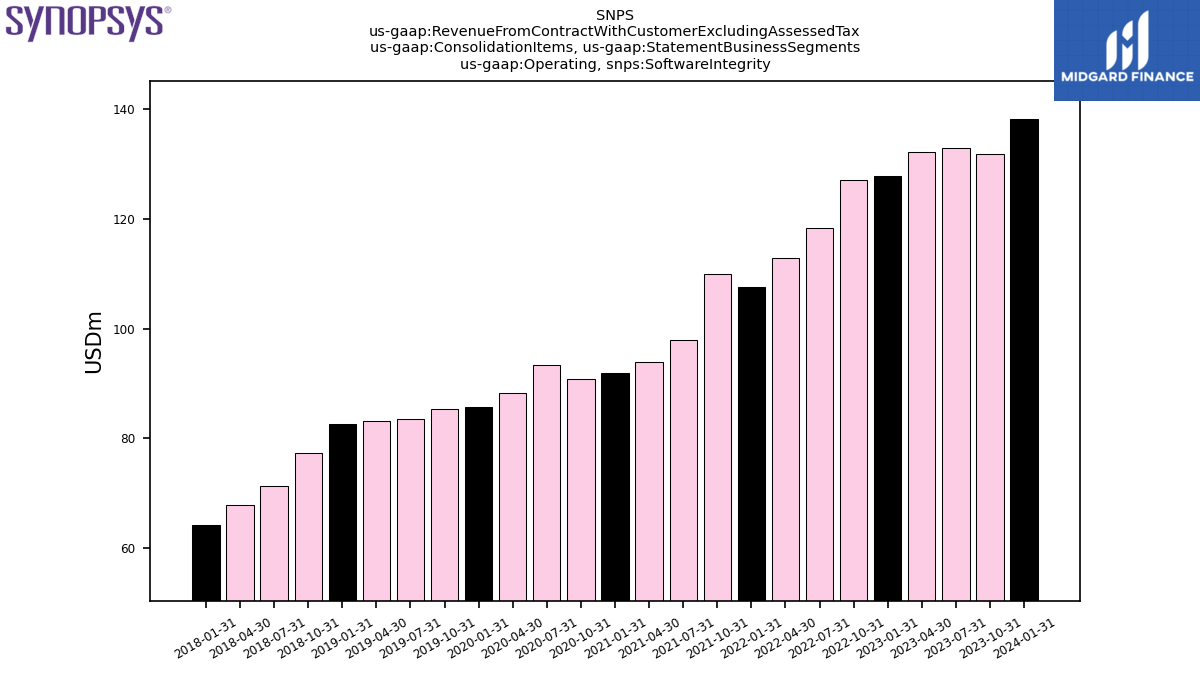
| Operating, Software Integrity | 138.24 | 131.75 | 132.90 | 132.12 | 127.84 | 127.08 | 118.34 | 112.85 | 107.56 | 109.96 | 97.97 | 93.90 | 91.95 | 90.77 | 93.40 | 88.26 | 85.64 | 85.36 | 83.56 | 83.19 | 82.50 | 77.27 | 71.30 | 67.80 | 64.09 | NA | NA | NA | NA | NA | NA | NA | NA | NA | NA | NA | NA | NA | NA | NA | NA | NA | NA | NA | NA | NA | NA | NA | NA | NA | NA | NA | NA | NA | NA | NA | NA | |
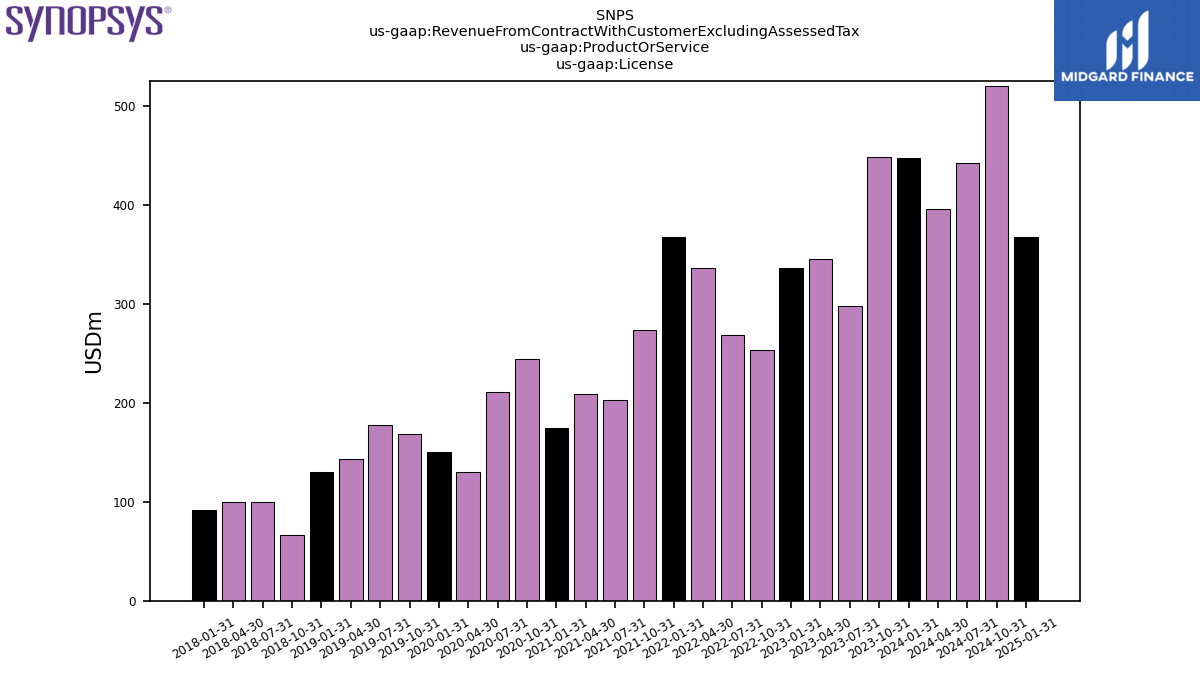
| License | 447.86 | 449.18 | 297.97 | 345.52 | 336.66 | 253.25 | 268.58 | 336.62 | 368.27 | 274.26 | 203.30 | 209.12 | 174.38 | 244.16 | 210.93 | 129.76 | 150.72 | 168.32 | 177.55 | 143.40 | 130.51 | 66.56 | 99.58 | 99.96 | 91.60 | NA | NA | NA | NA | NA | NA | NA | NA | NA | NA | NA | NA | NA | NA | NA | NA | NA | NA | NA | NA | NA | NA | NA | NA | NA | NA | NA | NA | NA | NA | NA | NA | |
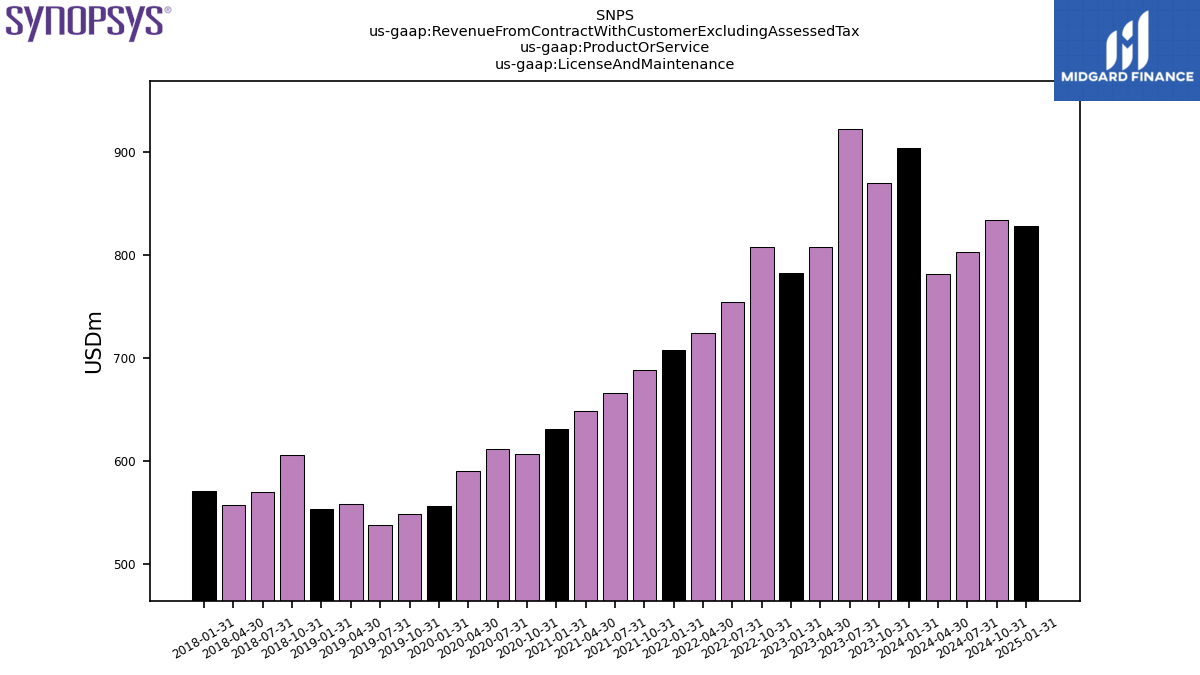
| License And Maintenance | 904.38 | 870.25 | 922.87 | 808.20 | 782.31 | 808.16 | 754.32 | 723.82 | 707.48 | 688.12 | 665.56 | 648.79 | 631.29 | 606.60 | 612.07 | 590.10 | 556.44 | 548.38 | 537.57 | 558.30 | 553.72 | 605.56 | 570.05 | 556.77 | 570.93 | NA | NA | NA | NA | NA | NA | NA | NA | NA | NA | NA | NA | NA | NA | NA | NA | NA | NA | NA | NA | NA | NA | NA | NA | NA | NA | NA | NA | NA | NA | NA | NA | |
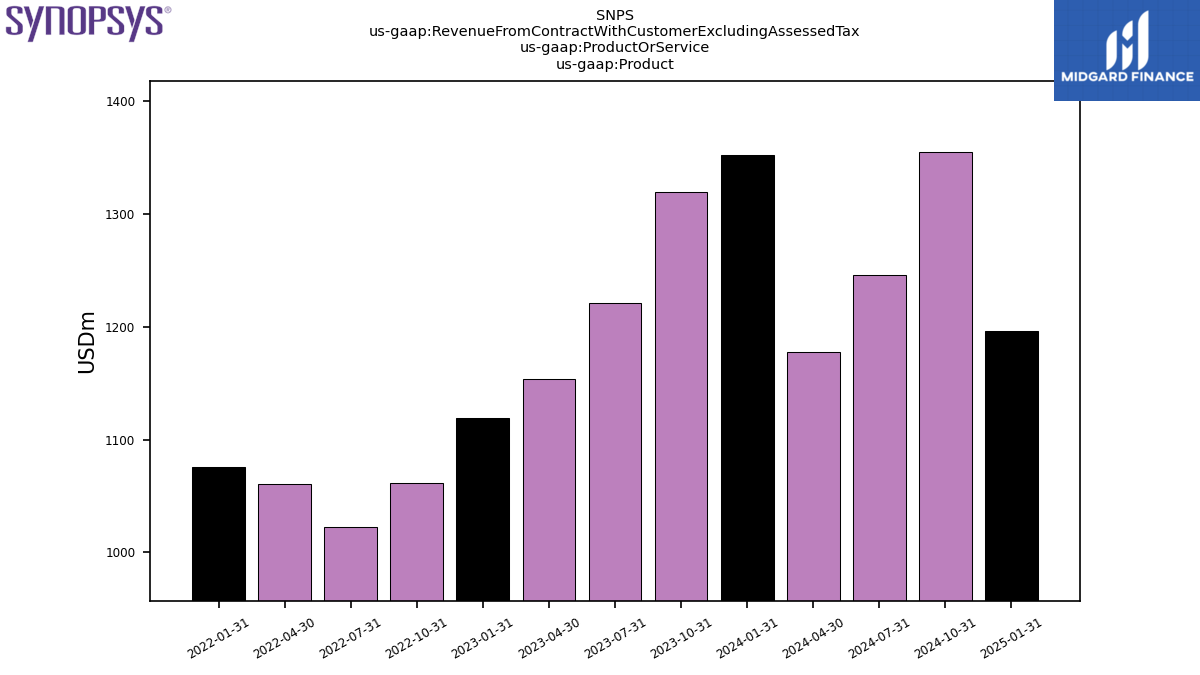
| Product | 1352.24 | 1319.43 | 1220.84 | 1153.72 | 1118.97 | 1061.40 | 1022.91 | 1060.45 | 1075.76 | NA | NA | NA | NA | NA | NA | NA | NA | NA | NA | NA | NA | NA | NA | NA | NA | NA | NA | NA | NA | NA | NA | NA | NA | NA | NA | NA | NA | NA | NA | NA | NA | NA | NA | NA | NA | NA | NA | NA | NA | NA | NA | NA | NA | NA | NA | NA | NA | |
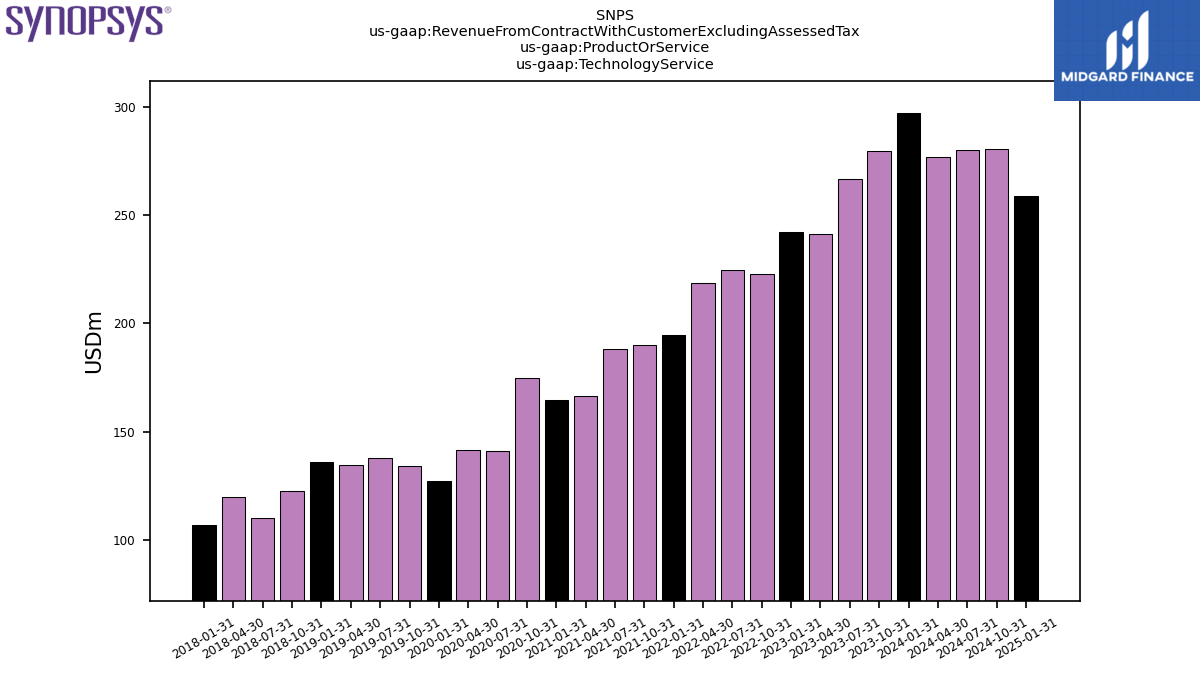
| Technology Service | 296.99 | 279.70 | 266.45 | 241.14 | 242.37 | 222.89 | 224.86 | 218.78 | 194.50 | 190.04 | 188.27 | 166.41 | 164.65 | 174.69 | 141.14 | 141.47 | 127.22 | 134.38 | 137.85 | 134.54 | 136.17 | 122.97 | 110.08 | 120.11 | 106.89 | NA | NA | NA | NA | NA | NA | NA | NA | NA | NA | NA | NA | NA | NA | NA | NA | NA | NA | NA | NA | NA | NA | NA | NA | NA | NA | NA | NA | NA | NA | NA | NA | |
| 249.97 | 188.03 | 304.02 | 196.43 | 197.78 | 177.88 | 189.14 | 215.56 | 212.82 | 157.25 | 164.17 | 125.52 | 115.77 | 112.17 | 160.23 | 81.11 | 67.32 | NA | NA | NA | NA | NA | NA | NA | NA | NA | NA | NA | NA | NA | NA | NA | NA | NA | NA | NA | NA | NA | NA | NA | NA | NA | NA | NA | NA | NA | NA | NA | NA | NA | NA | NA | NA | NA | NA | NA | NA | ||
| 159.11 | 158.04 | 145.63 | 156.96 | 135.01 | 117.23 | 127.29 | 116.19 | 132.72 | 116.61 | 112.88 | 106.16 | 105.17 | 107.34 | 94.30 | 89.28 | 94.37 | 91.53 | 90.07 | 83.54 | 83.89 | 95.99 | 90.66 | 97.01 | 85.47 | NA | NA | NA | NA | NA | NA | NA | NA | NA | NA | NA | NA | NA | NA | NA | NA | NA | NA | NA | NA | NA | NA | NA | NA | NA | NA | NA | NA | NA | NA | NA | NA | ||
| 184.60 | 168.26 | 163.94 | 156.82 | 145.79 | 172.67 | 125.31 | 119.21 | 114.36 | 113.29 | 110.54 | 105.39 | 98.25 | 97.83 | 96.34 | 105.31 | 89.52 | 80.87 | 84.97 | 84.85 | 102.67 | NA | NA | NA | NA | NA | NA | NA | NA | NA | NA | NA | NA | NA | NA | NA | NA | NA | NA | NA | NA | NA | NA | NA | NA | NA | NA | NA | NA | NA | NA | NA | NA | NA | NA | NA | NA | ||
| US | 807.62 | 812.72 | 640.15 | 661.41 | 671.78 | 586.23 | 575.33 | 577.88 | 610.33 | 534.33 | 477.22 | 471.72 | 468.70 | 528.78 | 432.69 | 404.39 | 408.49 | 444.23 | 407.41 | 416.74 | 407.80 | 381.60 | 365.41 | 376.64 | 384.57 | 329.26 | 358.20 | 350.49 | 319.42 | 316.66 | 316.90 | 297.39 | 274.93 | 304.49 | 275.62 | 286.11 | 277.59 | 275.20 | 268.23 | 243.60 | 233.63 | 233.67 | 234.77 | 238.18 | 233.13 | 213.21 | 216.31 | 206.99 | 197.68 | 187.91 | 176.81 | 182.62 | NA | NA | NA | NA | NA | |
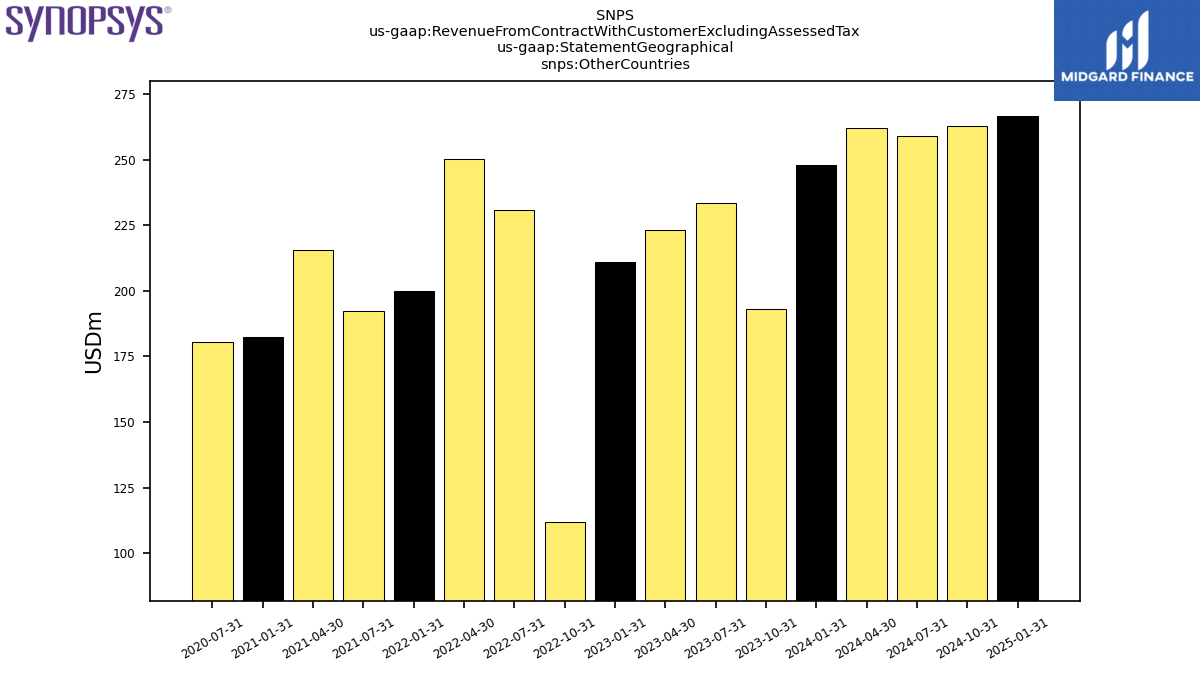
| Other Countries | 247.92 | NA | 233.55 | 223.25 | 210.98 | NA | 230.71 | 250.38 | 200.03 | NA | 192.33 | 215.54 | 182.42 | NA | 180.57 | NA | NA | NA | NA | NA | NA | NA | NA | NA | NA | NA | NA | NA | NA | NA | NA | NA | NA | NA | NA | NA | NA | NA | NA | NA | NA | NA | NA | NA | NA | NA | NA | NA | NA | NA | NA | NA | NA | NA | NA | NA | NA |
