
| 2023-12-31 | 2023-10-01 | 2023-07-02 | 2023-04-02 | 2022-12-31 | 2022-10-02 | 2022-07-03 | 2022-04-03 | 2021-12-31 | 2021-10-03 | 2021-07-04 | 2021-04-04 | 2020-12-31 | 2020-09-27 | 2020-06-28 | 2020-03-29 | 2019-12-31 | 2019-09-29 | 2019-06-30 | 2019-03-31 | 2018-12-31 | 2018-09-30 | 2018-07-01 | 2018-04-01 | 2017-12-31 | 2017-10-01 | 2017-07-02 | 2017-04-02 | 2016-12-31 | 2016-10-02 | 2016-07-03 | 2016-04-03 | 2015-12-31 | 2015-09-27 | 2015-06-28 | 2015-03-29 | 2014-12-31 | 2014-09-28 | 2014-06-29 | 2014-03-30 | 2013-12-31 | 2013-09-30 | 2013-09-29 | 2013-06-30 | 2013-03-31 | 2012-12-31 | 2012-09-30 | 2012-07-01 | 2012-06-30 | 2012-04-01 | 2012-03-31 | 2011-12-31 | 2011-10-02 | 2011-09-30 | 2011-07-03 | 2011-06-30 | 2011-04-03 | 2011-03-31 | 2010-12-31 | 2010-09-26 | 2010-06-27 | 2010-03-28 | ||
|---|---|---|---|---|---|---|---|---|---|---|---|---|---|---|---|---|---|---|---|---|---|---|---|---|---|---|---|---|---|---|---|---|---|---|---|---|---|---|---|---|---|---|---|---|---|---|---|---|---|---|---|---|---|---|---|---|---|---|---|---|---|---|---|
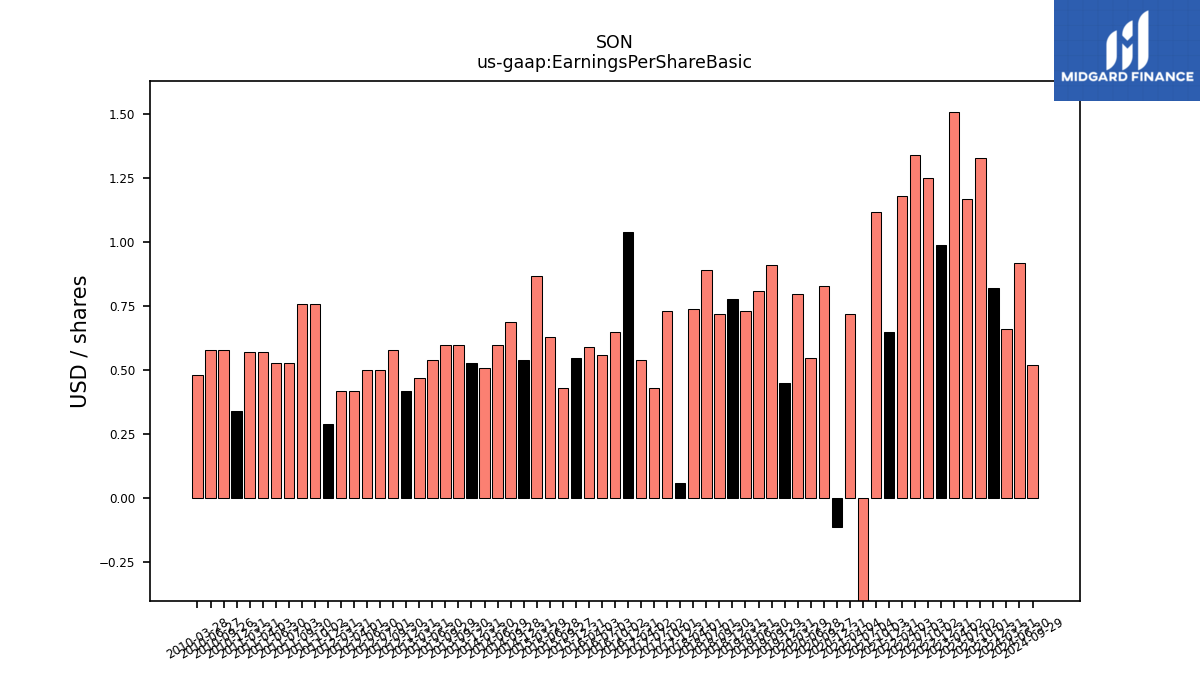
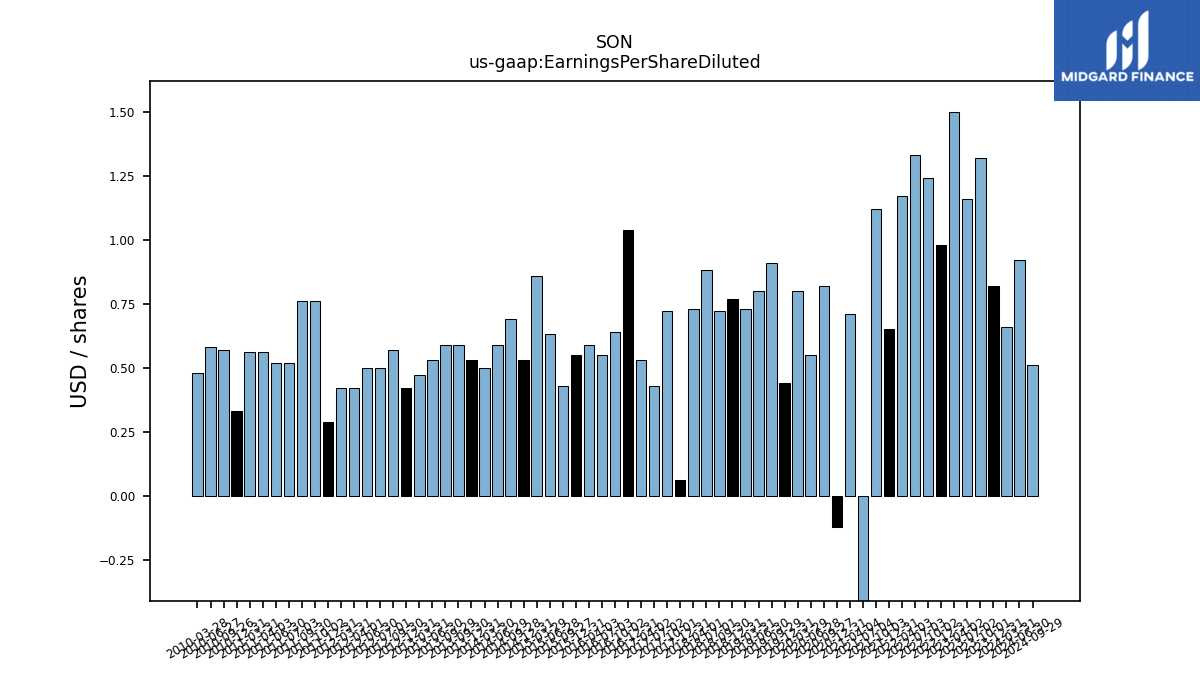
| Earnings Per Share Basic | 0.82 | 1.33 | 1.17 | 1.51 | 0.99 | 1.25 | 1.34 | 1.18 | 0.65 | 1.12 | -3.34 | 0.72 | -0.11 | 0.83 | 0.55 | 0.80 | 0.45 | 0.91 | 0.81 | 0.73 | 0.78 | 0.72 | 0.89 | 0.74 | 0.06 | 0.73 | 0.43 | 0.54 | 1.04 | 0.65 | 0.56 | 0.59 | 0.55 | 0.43 | 0.63 | 0.87 | 0.54 | 0.69 | 0.60 | 0.51 | 0.53 | 0.60 | 0.60 | 0.54 | 0.47 | 0.42 | 0.58 | 0.50 | 0.50 | 0.42 | 0.42 | 0.29 | 0.76 | 0.76 | 0.53 | 0.53 | 0.57 | 0.57 | 0.34 | 0.58 | 0.58 | 0.48 | |
| Earnings Per Share Diluted | 0.82 | 1.32 | 1.16 | 1.50 | 0.98 | 1.24 | 1.33 | 1.17 | 0.65 | 1.12 | -3.34 | 0.71 | -0.12 | 0.82 | 0.55 | 0.80 | 0.44 | 0.91 | 0.80 | 0.73 | 0.77 | 0.72 | 0.88 | 0.73 | 0.06 | 0.72 | 0.43 | 0.53 | 1.04 | 0.64 | 0.55 | 0.59 | 0.55 | 0.43 | 0.63 | 0.86 | 0.53 | 0.69 | 0.59 | 0.50 | 0.53 | 0.59 | 0.59 | 0.53 | 0.47 | 0.42 | 0.57 | 0.50 | 0.50 | 0.42 | 0.42 | 0.29 | 0.76 | 0.76 | 0.52 | 0.52 | 0.56 | 0.56 | 0.33 | 0.57 | 0.58 | 0.48 |
| 2023-12-31 | 2023-10-01 | 2023-07-02 | 2023-04-02 | 2022-12-31 | 2022-10-02 | 2022-07-03 | 2022-04-03 | 2021-12-31 | 2021-10-03 | 2021-07-04 | 2021-04-04 | 2020-12-31 | 2020-09-27 | 2020-06-28 | 2020-03-29 | 2019-12-31 | 2019-09-29 | 2019-06-30 | 2019-03-31 | 2018-12-31 | 2018-09-30 | 2018-07-01 | 2018-04-01 | 2017-12-31 | 2017-10-01 | 2017-07-02 | 2017-04-02 | 2016-12-31 | 2016-10-02 | 2016-07-03 | 2016-04-03 | 2015-12-31 | 2015-09-27 | 2015-06-28 | 2015-03-29 | 2014-12-31 | 2014-09-28 | 2014-06-29 | 2014-03-30 | 2013-12-31 | 2013-09-30 | 2013-09-29 | 2013-06-30 | 2013-03-31 | 2012-12-31 | 2012-09-30 | 2012-07-01 | 2012-06-30 | 2012-04-01 | 2012-03-31 | 2011-12-31 | 2011-10-02 | 2011-09-30 | 2011-07-03 | 2011-06-30 | 2011-04-03 | 2011-03-31 | 2010-12-31 | 2010-09-26 | 2010-06-27 | 2010-03-28 | ||
|---|---|---|---|---|---|---|---|---|---|---|---|---|---|---|---|---|---|---|---|---|---|---|---|---|---|---|---|---|---|---|---|---|---|---|---|---|---|---|---|---|---|---|---|---|---|---|---|---|---|---|---|---|---|---|---|---|---|---|---|---|---|---|---|
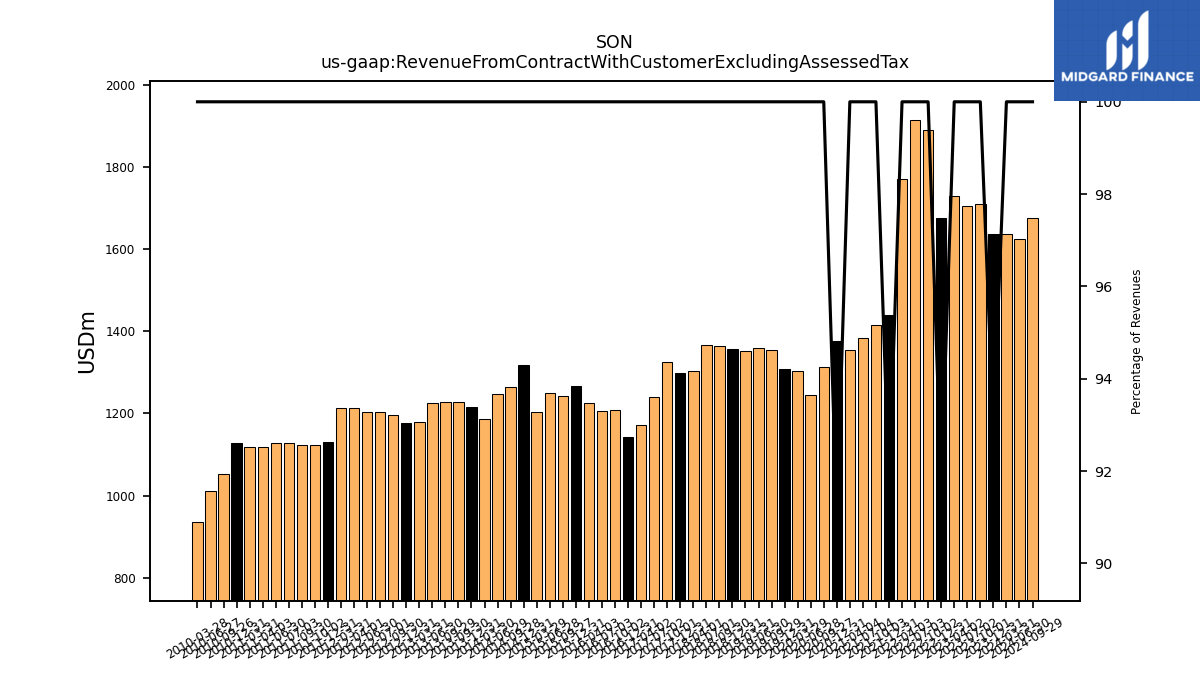
| Revenue From Contract With Customer Excluding Assessed Tax | 1635.80 | 1710.42 | 1705.29 | 1729.78 | 1676.02 | 1890.22 | 1913.33 | 1770.98 | 1439.19 | 1415.19 | 1382.75 | 1353.30 | 1376.35 | 1312.31 | 1245.48 | 1303.30 | 1308.85 | 1353.93 | 1359.72 | 1351.70 | 1355.62 | 1364.76 | 1366.37 | 1304.19 | 1299.02 | 1324.63 | 1240.67 | 1172.32 | 1142.20 | 1208.72 | 1205.68 | 1226.28 | 1267.13 | 1242.59 | 1248.59 | 1203.26 | 1317.95 | 1263.57 | 1247.38 | 1185.63 | 1214.87 | 1227.75 | 1227.75 | 1226.26 | 1179.21 | 1175.87 | 1195.53 | 1202.36 | 1202.36 | 1212.37 | 1212.37 | 1129.57 | 1124.17 | 1124.17 | 1127.87 | 1127.87 | 1117.32 | 1117.32 | 1127.15 | 1051.72 | 1010.12 | 935.13 | |
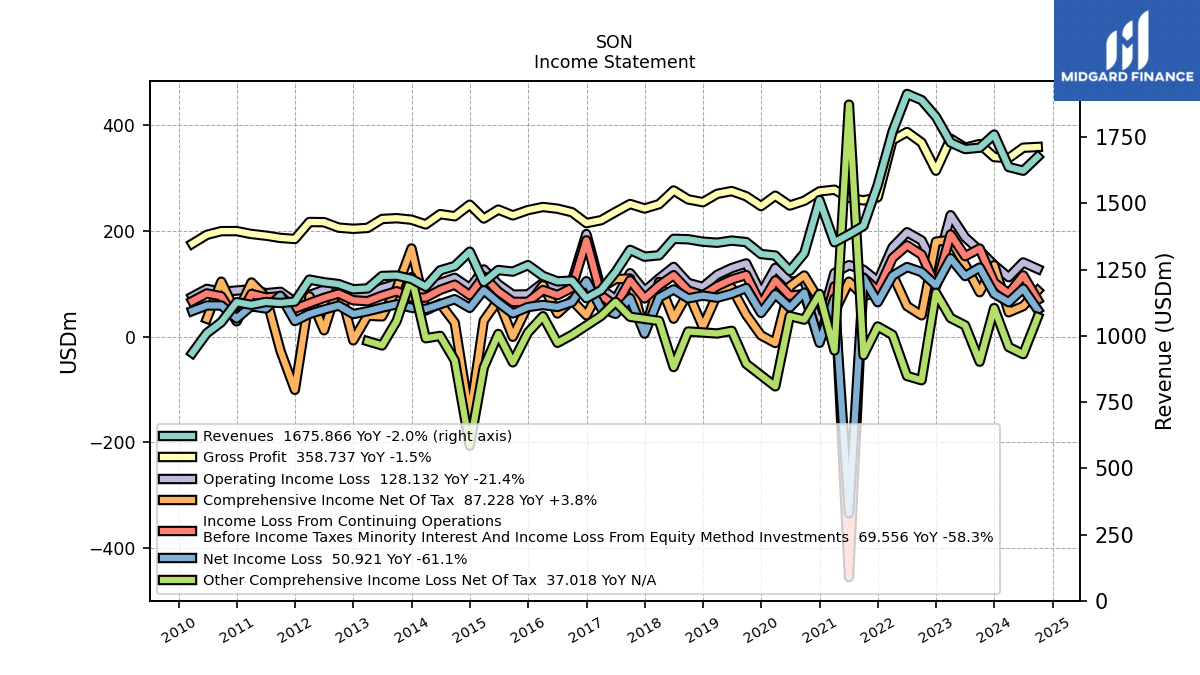
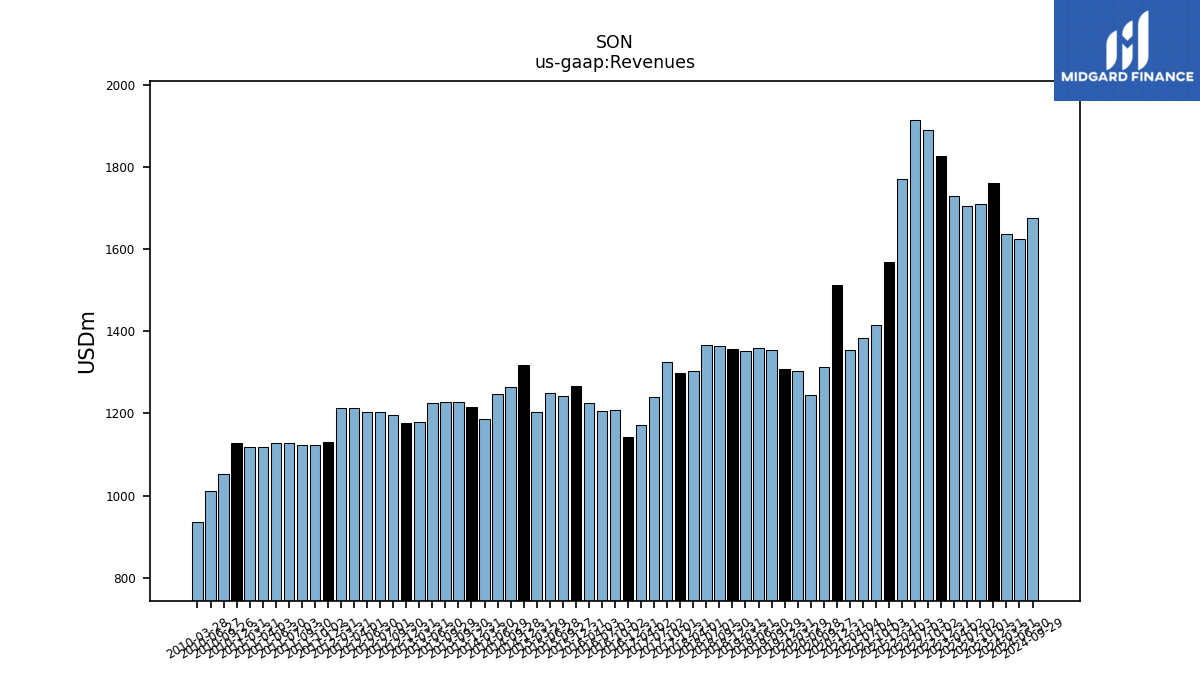
| Revenues | 1759.98 | 1710.42 | 1705.29 | 1729.78 | 1827.27 | 1890.22 | 1913.33 | 1770.98 | 1569.19 | 1415.19 | 1382.75 | 1353.30 | 1512.58 | 1312.31 | 1245.48 | 1303.30 | 1308.85 | 1353.93 | 1359.72 | 1351.70 | 1355.62 | 1364.76 | 1366.37 | 1304.19 | 1299.02 | 1324.63 | 1240.67 | 1172.32 | 1142.20 | 1208.72 | 1205.68 | 1226.28 | 1267.13 | 1242.59 | 1248.59 | 1203.26 | 1317.95 | 1263.57 | 1247.38 | 1185.63 | 1214.87 | 1227.75 | 1227.75 | 1226.26 | 1179.21 | 1175.87 | 1195.53 | 1202.36 | 1202.36 | 1212.37 | 1212.37 | 1129.57 | 1124.17 | 1124.17 | 1127.87 | 1127.87 | 1117.32 | 1117.32 | 1127.15 | 1051.72 | 1010.12 | 935.13 | |
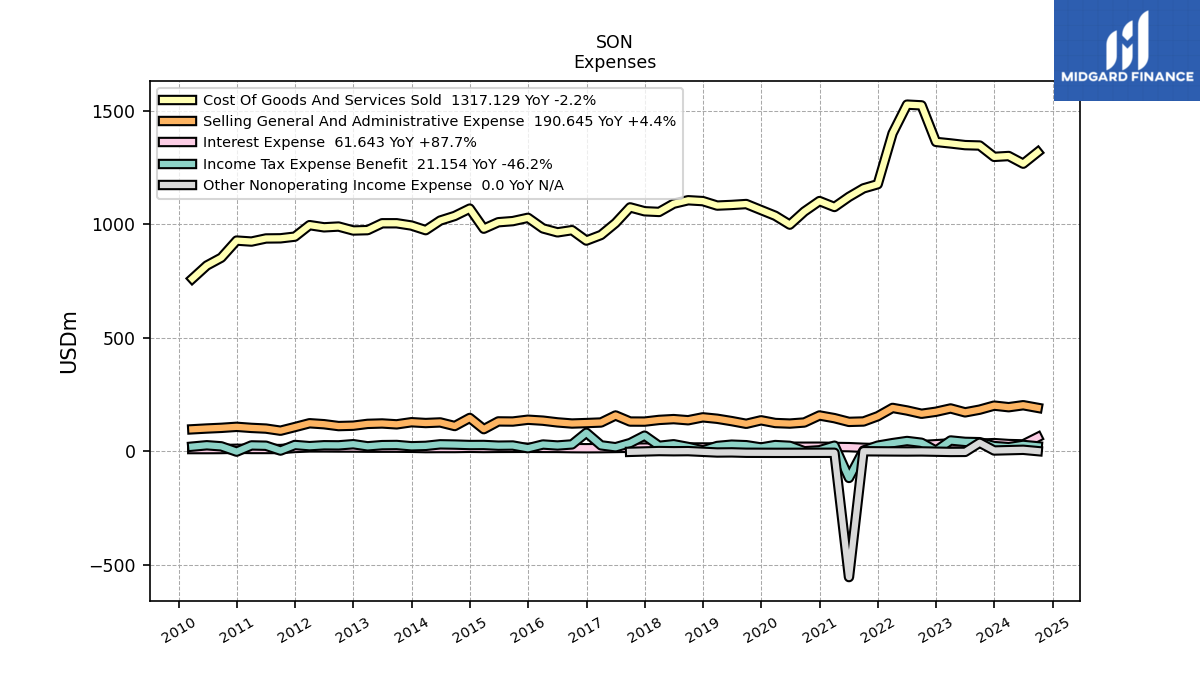
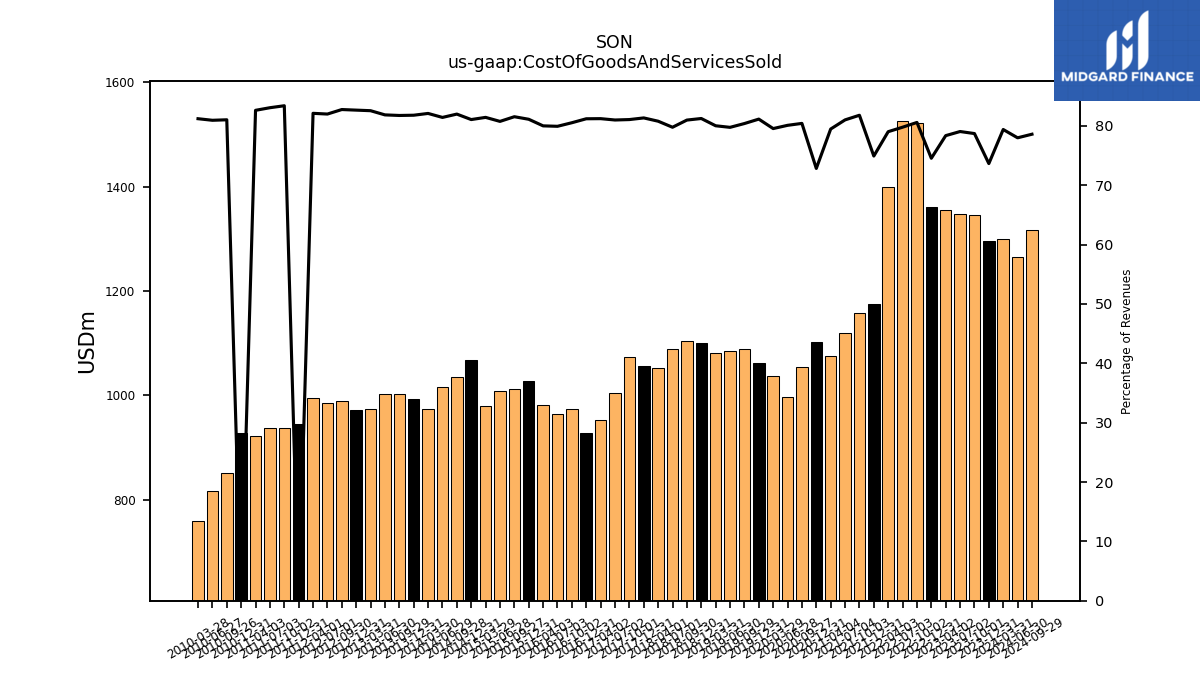
| Cost Of Goods And Services Sold | 1296.15 | 1346.16 | 1347.97 | 1355.36 | 1362.09 | 1523.07 | 1526.33 | 1399.42 | 1175.56 | 1157.46 | 1120.10 | 1075.40 | 1101.59 | 1055.30 | 997.50 | 1036.71 | 1061.96 | 1088.45 | 1084.38 | 1081.58 | 1101.31 | 1105.13 | 1089.91 | 1053.59 | 1056.60 | 1073.76 | 1004.80 | 952.10 | 927.41 | 973.35 | 963.67 | 981.02 | 1027.79 | 1013.22 | 1008.27 | 979.82 | 1068.36 | 1035.91 | 1015.64 | 973.32 | 993.69 | NA | 1003.71 | 1003.69 | 973.50 | 971.87 | 989.30 | 985.82 | NA | 995.51 | NA | 944.83 | 937.43 | NA | 936.77 | NA | 923.11 | NA | 927.48 | 852.14 | 817.59 | 759.38 | |
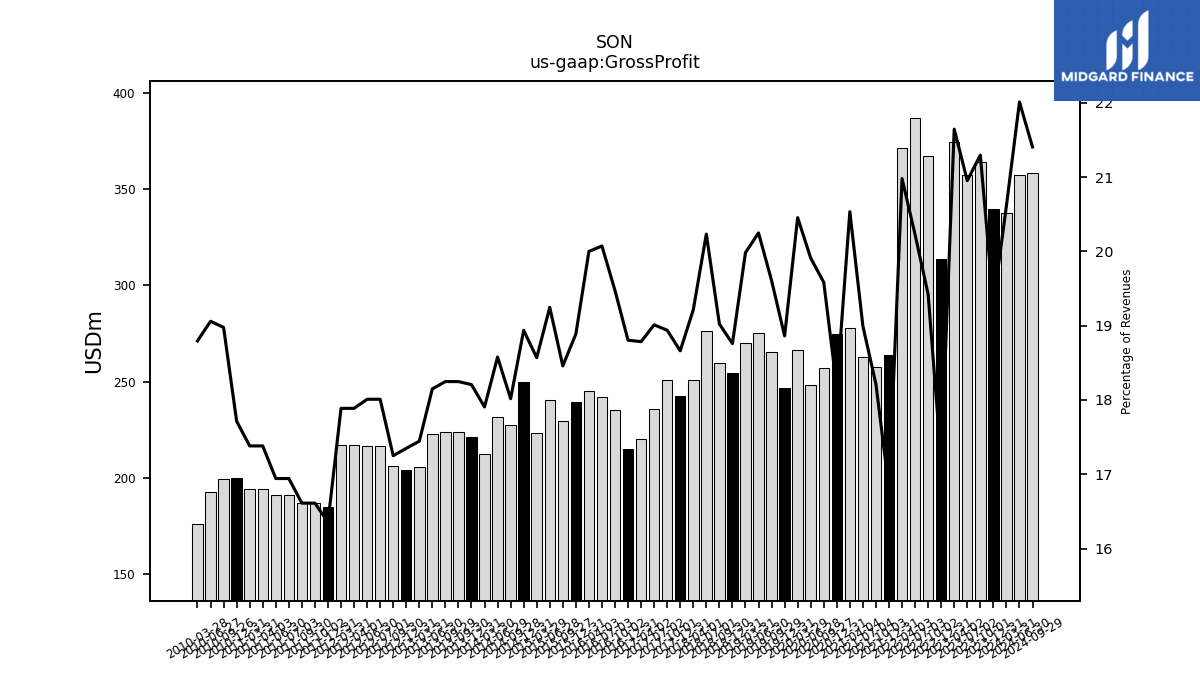
| Gross Profit | 339.65 | 364.26 | 357.32 | 374.43 | 313.94 | 367.15 | 387.00 | 371.56 | 263.62 | 257.73 | 262.65 | 277.90 | 274.76 | 257.01 | 247.98 | 266.59 | 246.89 | 265.49 | 275.34 | 270.12 | 254.31 | 259.64 | 276.46 | 250.60 | 242.42 | 250.87 | 235.88 | 220.22 | 214.79 | 235.37 | 242.01 | 245.25 | 239.34 | 229.37 | 240.32 | 223.45 | 249.59 | 227.66 | 231.74 | 212.30 | 221.19 | 224.04 | 224.04 | 222.56 | 205.72 | 204.00 | 206.23 | 216.54 | 216.54 | 216.86 | 216.86 | 184.74 | 186.74 | 186.74 | 191.09 | 191.09 | 194.21 | 194.21 | 199.67 | 199.58 | 192.52 | 175.76 | |
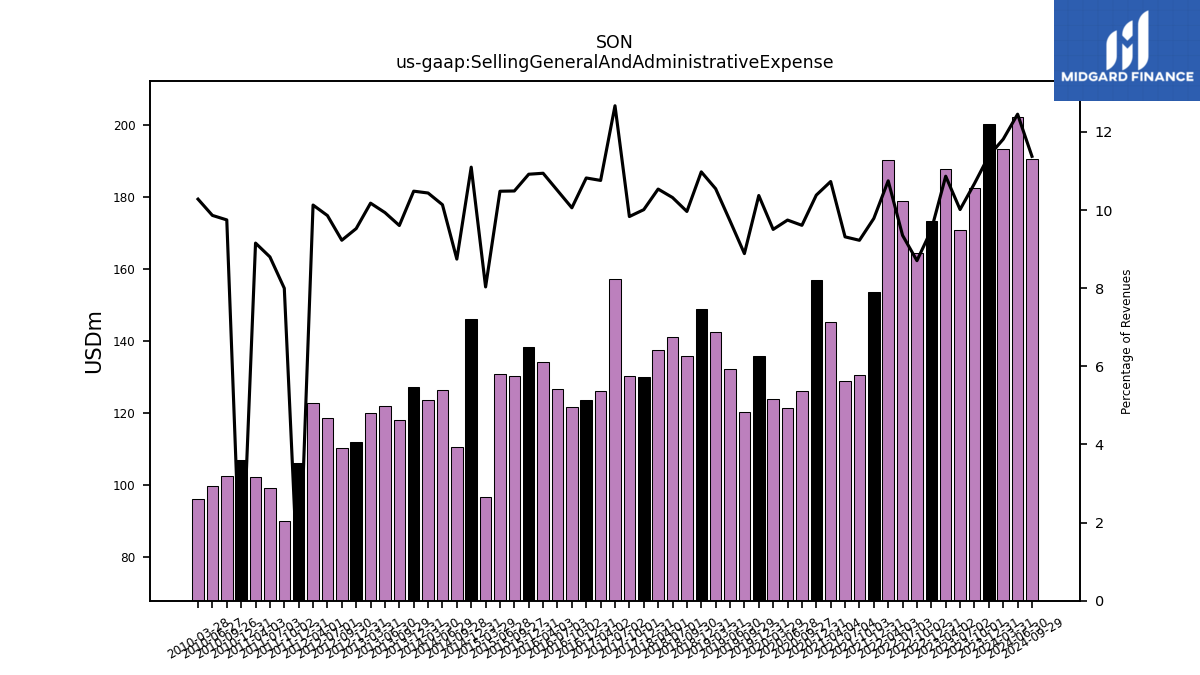
| Selling General And Administrative Expense | 200.44 | 182.67 | 170.77 | 187.98 | 173.47 | 164.55 | 178.96 | 190.36 | 153.56 | 130.58 | 128.81 | 145.23 | 157.06 | 126.12 | 121.37 | 123.89 | 135.77 | 120.32 | 132.21 | 142.56 | 148.83 | 136.00 | 141.03 | 137.44 | 130.05 | 130.28 | 157.21 | 126.14 | 123.61 | 121.58 | 126.61 | 134.19 | 138.35 | 130.34 | 130.89 | 96.67 | 146.28 | 110.51 | 126.45 | 123.75 | 127.38 | NA | 117.94 | 121.85 | 120.01 | 112.03 | 110.33 | 118.55 | NA | 122.81 | NA | 105.98 | 89.92 | NA | 99.27 | NA | 102.30 | NA | 107.05 | 102.53 | 99.64 | 96.14 | |
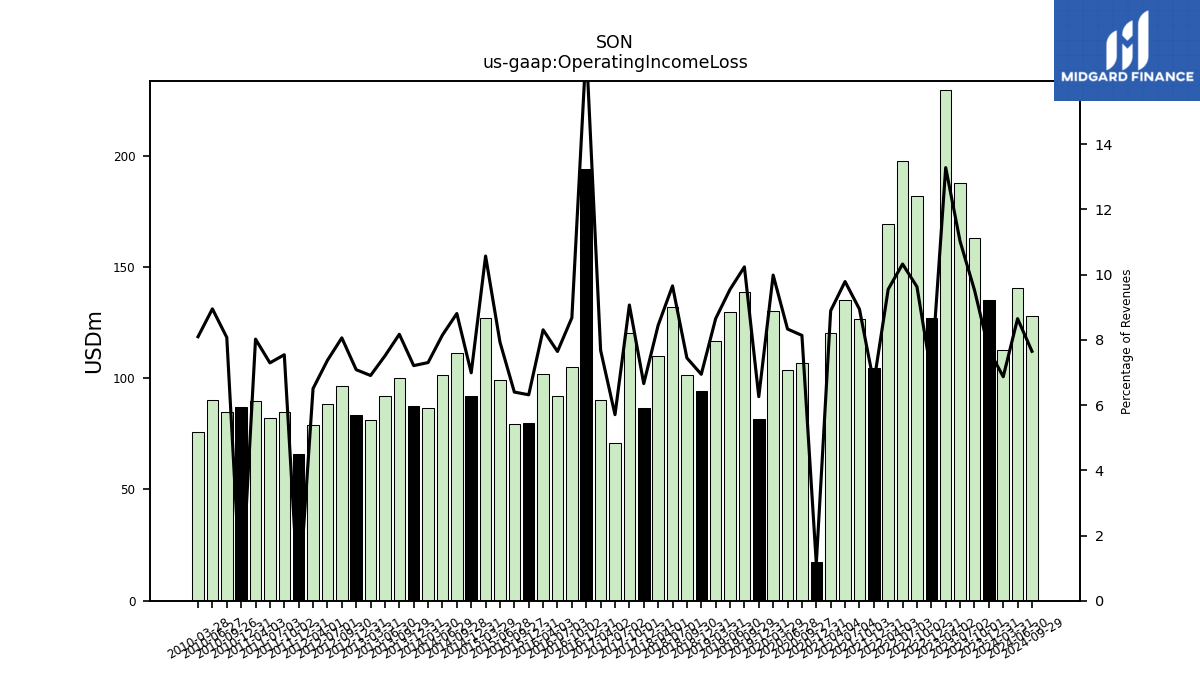
| Operating Income Loss | 135.35 | 162.94 | 187.86 | 229.65 | 126.92 | 181.94 | 197.48 | 169.06 | 104.74 | 126.51 | 135.29 | 120.31 | 17.23 | 106.74 | 103.73 | 130.10 | 81.88 | 138.55 | 129.77 | 116.89 | 94.10 | 101.57 | 131.86 | 110.10 | 86.47 | 120.08 | 70.77 | 89.97 | 194.03 | 104.84 | 92.12 | 101.83 | 80.00 | 79.48 | 98.98 | 127.14 | 92.09 | 111.25 | 101.61 | 86.56 | 87.56 | NA | 100.28 | 92.04 | 81.42 | 83.28 | 96.34 | 88.59 | NA | 78.84 | NA | 65.88 | 84.77 | NA | 82.24 | NA | 89.59 | NA | 87.24 | 84.89 | 90.37 | 75.67 | |
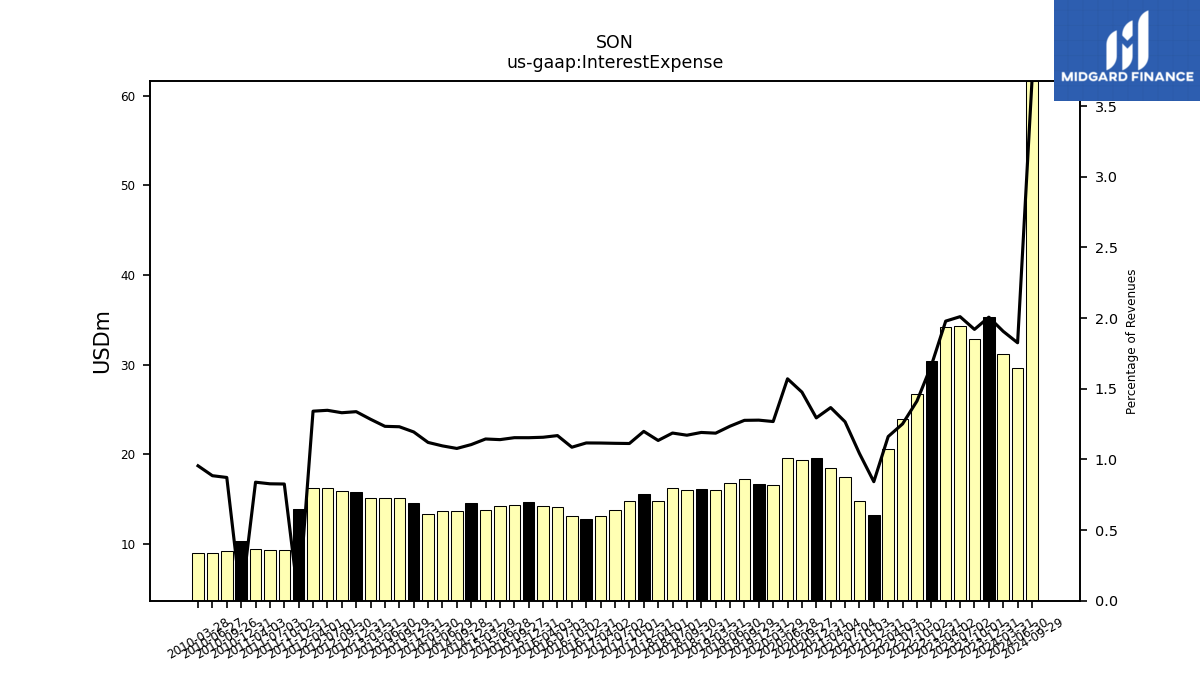
| Interest Expense | 35.32 | 32.85 | 34.28 | 34.23 | 30.42 | 26.71 | 23.95 | 20.58 | 13.22 | 14.75 | 17.51 | 18.50 | 19.58 | 19.38 | 19.56 | 16.53 | 16.73 | 17.29 | 16.80 | 16.03 | 16.15 | 15.99 | 16.22 | 14.79 | 15.57 | 14.74 | 13.82 | 13.09 | 12.76 | 13.13 | 14.09 | 14.19 | 14.62 | 14.34 | 14.24 | 13.78 | 14.57 | 13.62 | 13.67 | 13.28 | 14.51 | NA | 15.12 | 15.14 | 15.14 | 15.73 | 15.91 | 16.20 | NA | 16.27 | NA | 13.84 | 9.29 | NA | 9.34 | NA | 9.37 | NA | 10.37 | 9.18 | 8.94 | 8.93 | |
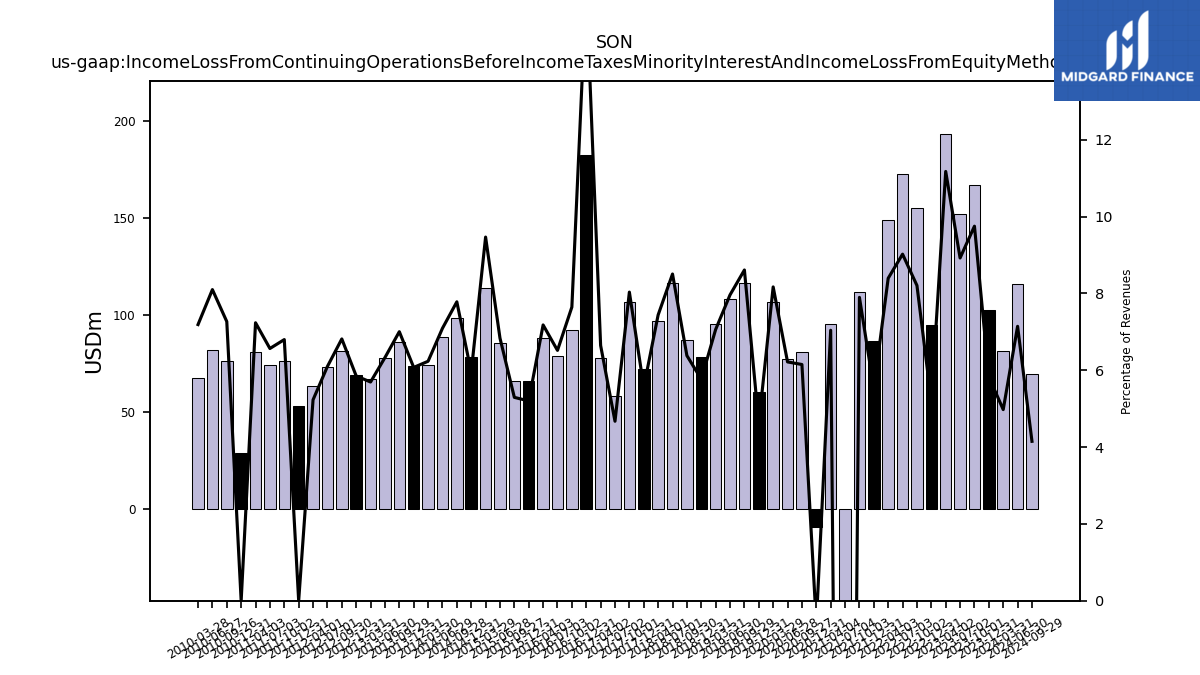
| Income Loss From Continuing Operations Before Income Taxes Minority Interest And Income Loss From Equity Method Investments | 102.55 | 166.78 | 152.18 | 193.32 | 94.84 | 155.13 | 172.64 | 148.67 | 86.65 | 111.77 | -454.70 | 95.29 | -9.04 | 80.71 | 77.44 | 106.48 | 60.46 | 116.58 | 108.27 | 95.46 | 78.18 | 87.10 | 116.22 | 97.03 | 72.23 | 106.44 | 57.98 | 77.92 | 182.25 | 92.41 | 78.58 | 88.05 | 65.91 | 65.79 | 85.38 | 113.92 | 78.39 | 98.33 | 88.48 | 73.92 | 73.79 | NA | 86.00 | 77.63 | 67.15 | 68.82 | 81.49 | 73.34 | NA | 63.42 | NA | 53.05 | 76.43 | NA | 74.06 | NA | 80.86 | NA | 28.96 | 76.44 | 81.82 | 67.24 | |
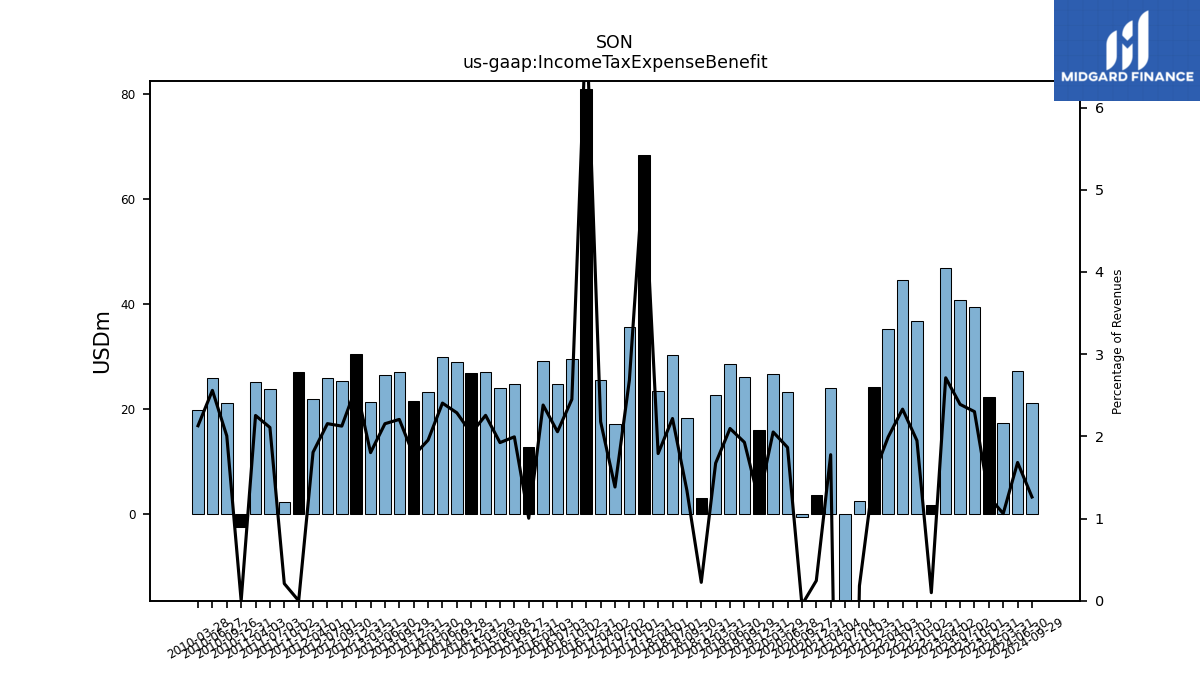
| Income Tax Expense Benefit | 22.27 | 39.35 | 40.74 | 46.91 | 1.80 | 36.82 | 44.60 | 35.29 | 24.11 | 2.56 | -118.15 | 24.05 | 3.69 | -0.65 | 23.23 | 26.76 | 16.06 | 26.10 | 28.49 | 22.62 | 3.03 | 18.32 | 30.29 | 23.36 | 68.34 | 35.55 | 17.17 | 25.54 | 81.03 | 29.62 | 24.79 | 29.19 | 12.72 | 24.77 | 24.02 | 27.14 | 26.87 | 28.89 | 29.99 | 23.17 | 21.46 | NA | 27.09 | 26.41 | 21.25 | 30.56 | 25.40 | 25.91 | NA | 21.90 | NA | 27.12 | 2.34 | NA | 23.77 | NA | 25.18 | NA | -2.37 | 21.09 | 25.85 | 19.91 | |
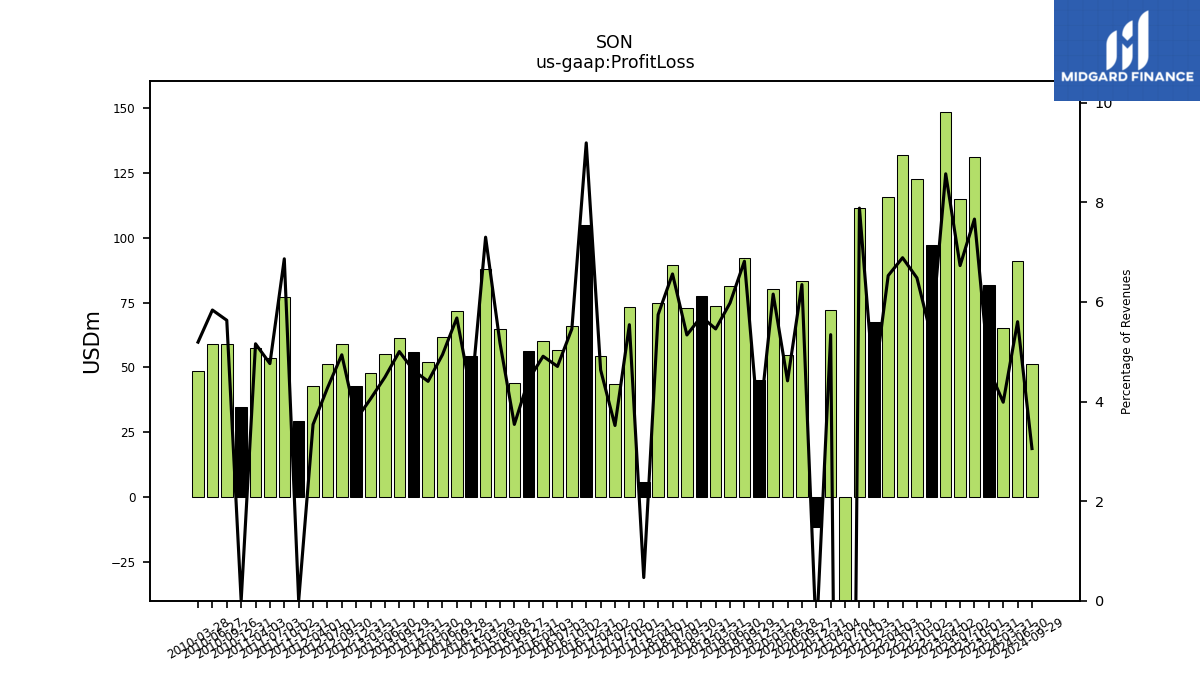
| Profit Loss | 81.83 | 131.06 | 114.75 | 148.26 | 97.10 | 122.50 | 131.77 | 115.61 | 67.68 | 111.56 | -334.24 | 72.29 | -11.28 | 83.30 | 54.99 | 80.24 | 45.33 | 92.28 | 81.29 | 73.77 | 77.35 | 72.82 | 89.64 | 74.92 | 6.05 | 73.41 | 43.66 | 54.33 | 105.00 | 65.98 | 56.72 | 60.19 | 56.31 | 43.99 | 64.63 | 87.83 | 54.52 | 71.73 | 61.61 | 52.23 | 56.13 | NA | 61.42 | 55.05 | 47.79 | 42.83 | 59.03 | 51.35 | NA | 42.91 | NA | 29.53 | 77.17 | NA | 53.71 | NA | 57.64 | NA | 34.74 | 59.22 | 58.96 | 48.55 | |
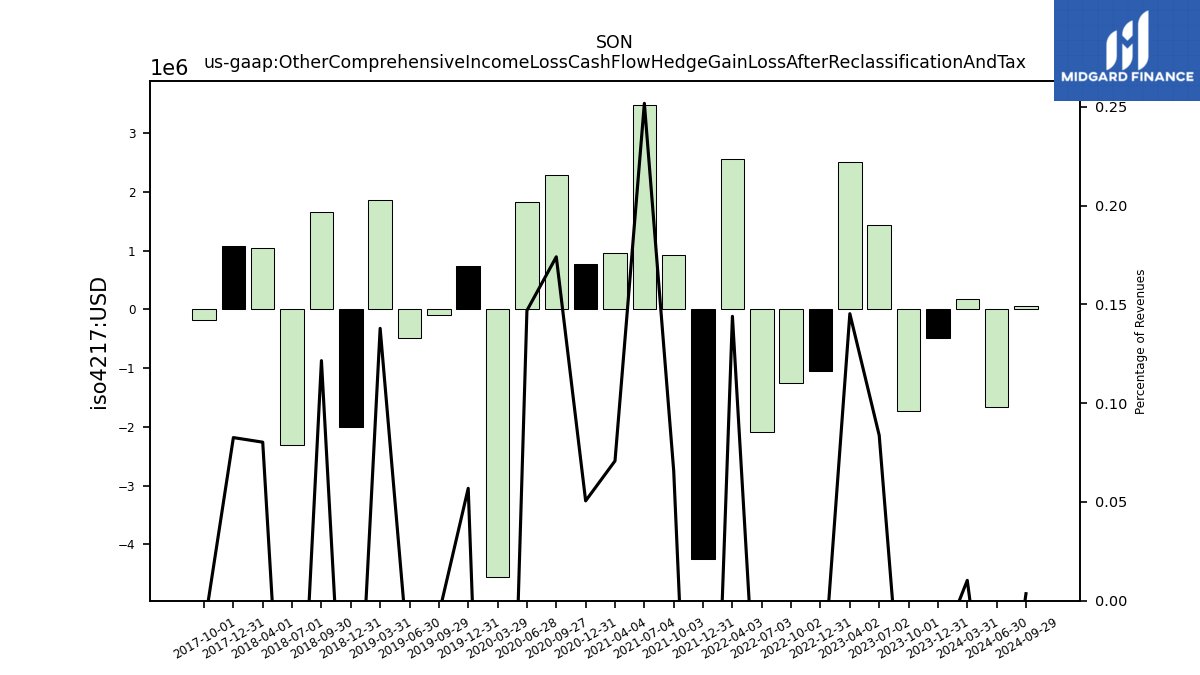
| Other Comprehensive Income Loss Cash Flow Hedge Gain Loss After Reclassification And Tax | -0.48 | -1.72 | 1.43 | 2.51 | -1.05 | -1.25 | -2.09 | 2.55 | -4.25 | 0.93 | 3.48 | 0.96 | 0.77 | 2.29 | 1.83 | -4.55 | 0.74 | -0.09 | -0.48 | 1.86 | -2.01 | 1.66 | -2.31 | 1.05 | 1.07 | -0.19 | NA | NA | NA | NA | NA | NA | NA | NA | NA | NA | NA | NA | NA | NA | NA | NA | NA | NA | NA | NA | NA | NA | NA | NA | NA | NA | NA | NA | NA | NA | NA | NA | NA | NA | NA | NA | |
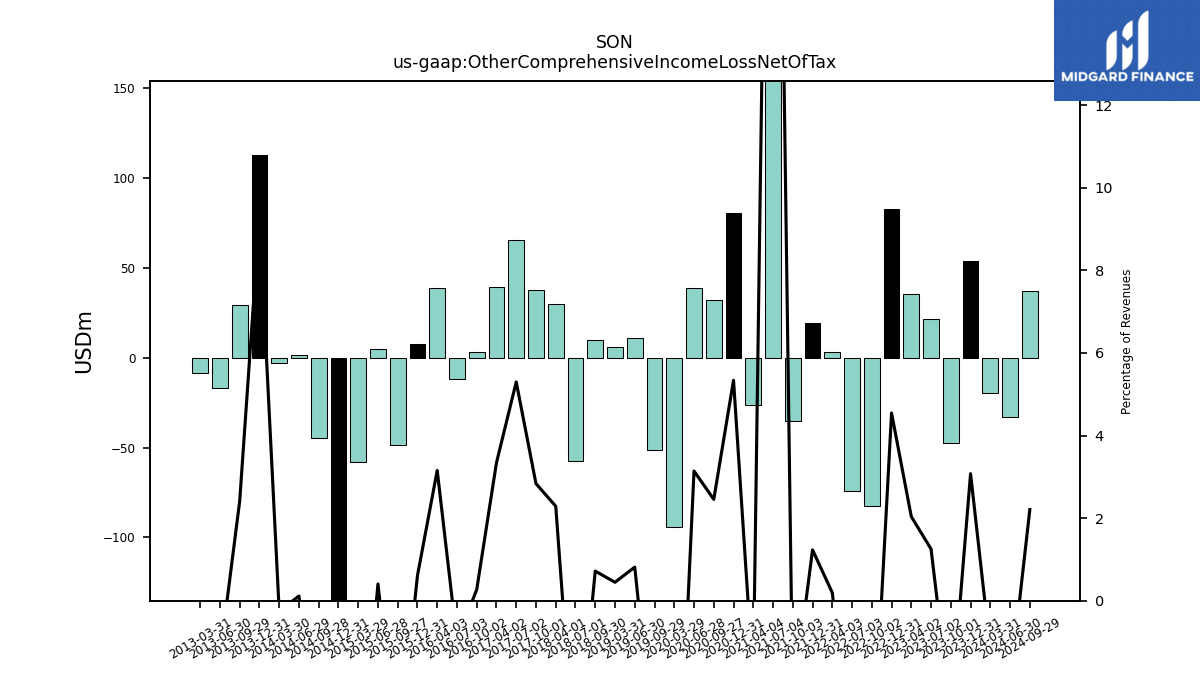
| Other Comprehensive Income Loss Net Of Tax | 54.15 | -47.35 | 21.36 | 35.24 | 83.05 | -82.36 | -74.33 | 3.45 | 19.33 | -35.12 | 438.82 | -26.20 | 80.75 | 32.21 | 39.11 | -93.99 | NA | -51.37 | 11.07 | 6.05 | NA | 9.81 | -57.48 | 29.85 | NA | 37.56 | 65.72 | 39.19 | NA | 3.28 | -11.66 | 38.68 | 7.71 | -48.54 | 5.06 | -58.23 | -206.19 | -44.86 | 1.42 | -2.95 | 112.80 | NA | 29.59 | -16.62 | -8.46 | NA | NA | NA | NA | NA | NA | NA | NA | NA | NA | NA | NA | NA | NA | NA | NA | NA | |
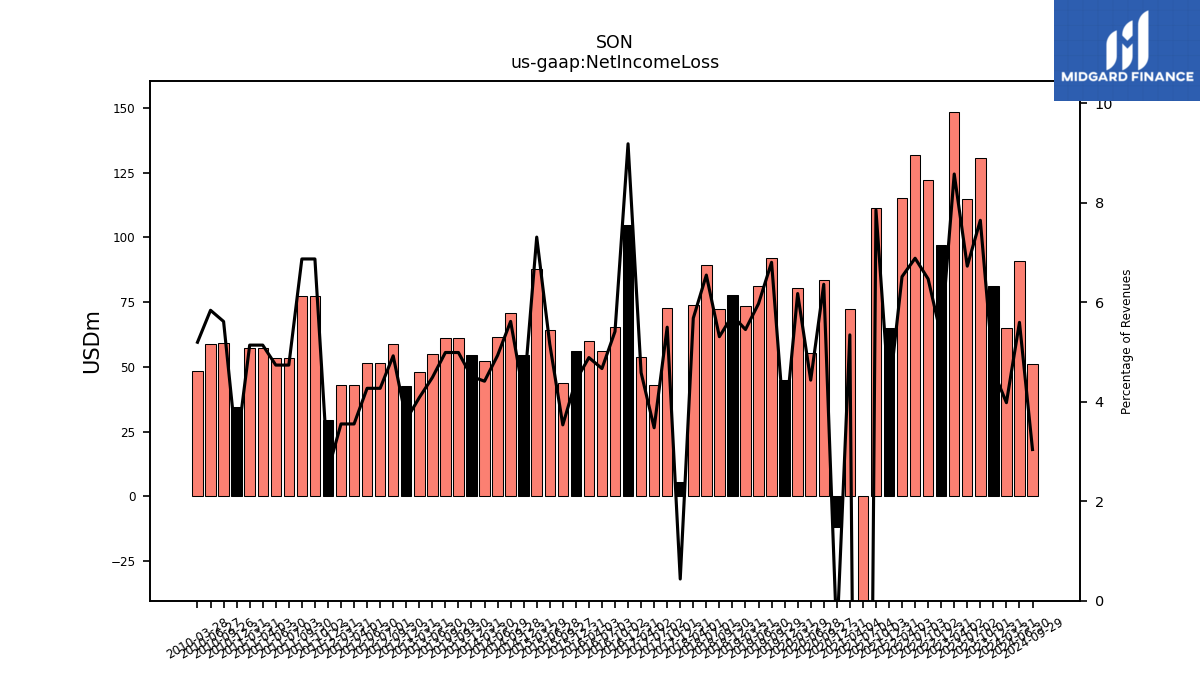
| Net Income Loss | 81.24 | 130.75 | 114.65 | 148.32 | 97.20 | 122.23 | 131.67 | 115.33 | 65.16 | 111.14 | -334.07 | 72.30 | -11.64 | 83.45 | 55.21 | 80.44 | 44.90 | 92.06 | 81.16 | 73.66 | 77.68 | 72.42 | 89.41 | 74.06 | 5.67 | 72.81 | 43.12 | 53.73 | 104.87 | 65.39 | 56.25 | 59.91 | 56.06 | 43.91 | 64.38 | 87.92 | 54.45 | 70.92 | 61.48 | 52.30 | 54.75 | 61.24 | 61.24 | 54.99 | 48.14 | 42.78 | 58.84 | 51.32 | 51.32 | 43.07 | 43.07 | 29.52 | 77.20 | 77.20 | 53.41 | 53.41 | 57.39 | 57.39 | 34.51 | 59.02 | 58.95 | 48.57 | |
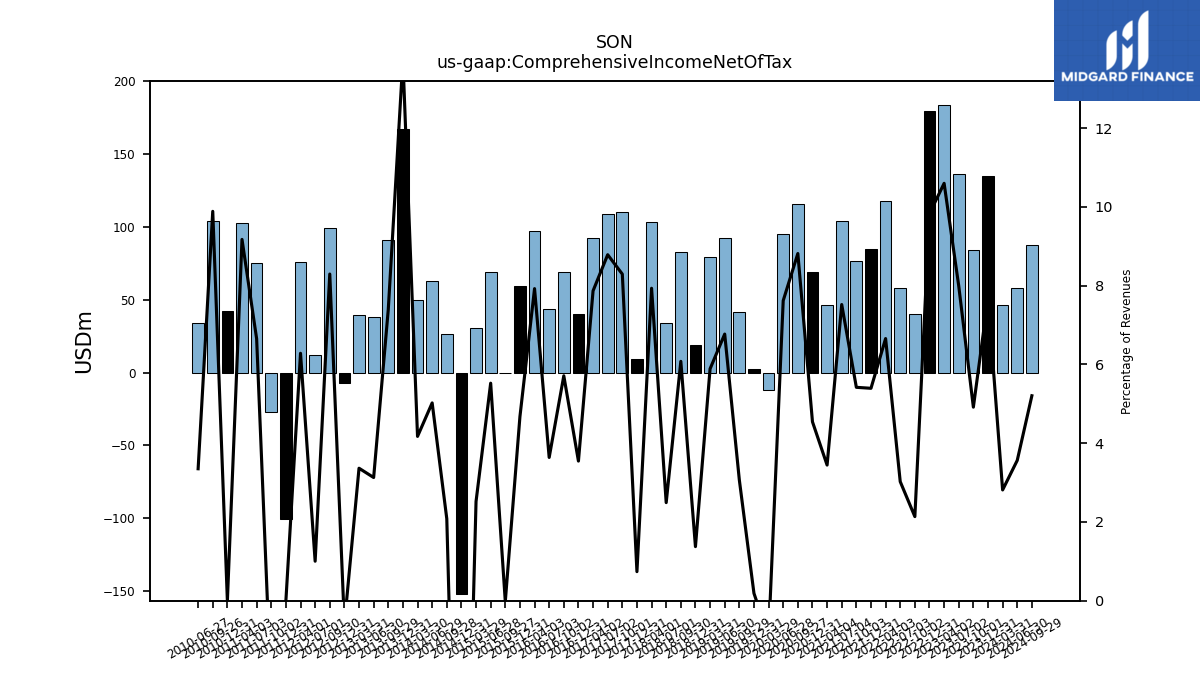
| Comprehensive Income Net Of Tax | 135.09 | 84.07 | 136.30 | 183.32 | 179.65 | 40.38 | 57.86 | 117.89 | 84.64 | 76.69 | 103.99 | 46.62 | 68.73 | 115.69 | 94.91 | -11.90 | 2.47 | 41.54 | 92.06 | 79.59 | 18.63 | 82.95 | 34.04 | 103.47 | 9.60 | 109.86 | 109.00 | 92.24 | 40.50 | 69.04 | 43.87 | 97.18 | 59.20 | -0.22 | 68.97 | 30.32 | -151.85 | 26.31 | 62.65 | 49.47 | 166.95 | NA | 90.80 | 38.37 | 39.68 | -6.92 | 99.17 | 12.07 | NA | 76.17 | NA | -100.55 | -26.90 | NA | 75.03 | NA | 102.50 | NA | 42.40 | 103.98 | 33.85 | NA |
| 2023-12-31 | 2023-10-01 | 2023-07-02 | 2023-04-02 | 2022-12-31 | 2022-10-02 | 2022-07-03 | 2022-04-03 | 2021-12-31 | 2021-10-03 | 2021-07-04 | 2021-04-04 | 2020-12-31 | 2020-09-27 | 2020-06-28 | 2020-03-29 | 2019-12-31 | 2019-09-29 | 2019-06-30 | 2019-03-31 | 2018-12-31 | 2018-09-30 | 2018-07-01 | 2018-04-01 | 2017-12-31 | 2017-10-01 | 2017-07-02 | 2017-04-02 | 2016-12-31 | 2016-10-02 | 2016-07-03 | 2016-04-03 | 2015-12-31 | 2015-09-27 | 2015-06-28 | 2015-03-29 | 2014-12-31 | 2014-09-28 | 2014-06-29 | 2014-03-30 | 2013-12-31 | 2013-09-30 | 2013-09-29 | 2013-06-30 | 2013-03-31 | 2012-12-31 | 2012-09-30 | 2012-07-01 | 2012-06-30 | 2012-04-01 | 2012-03-31 | 2011-12-31 | 2011-10-02 | 2011-09-30 | 2011-07-03 | 2011-06-30 | 2011-04-03 | 2011-03-31 | 2010-12-31 | 2010-09-26 | 2010-06-27 | 2010-03-28 | ||
|---|---|---|---|---|---|---|---|---|---|---|---|---|---|---|---|---|---|---|---|---|---|---|---|---|---|---|---|---|---|---|---|---|---|---|---|---|---|---|---|---|---|---|---|---|---|---|---|---|---|---|---|---|---|---|---|---|---|---|---|---|---|---|---|
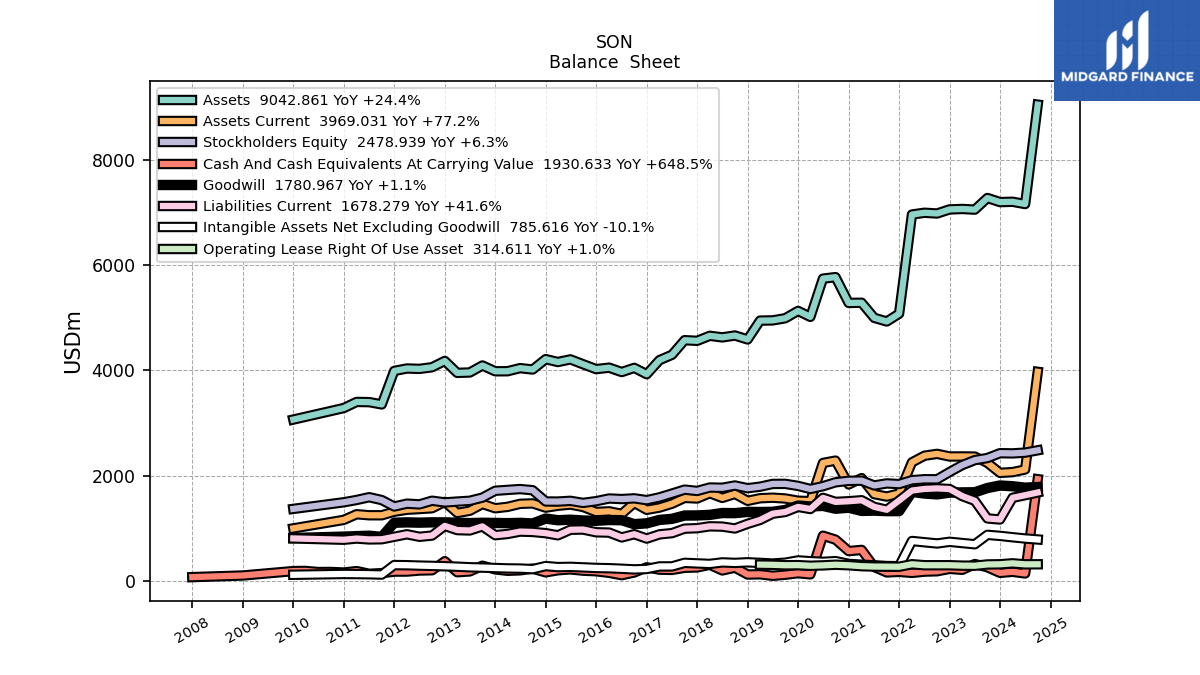
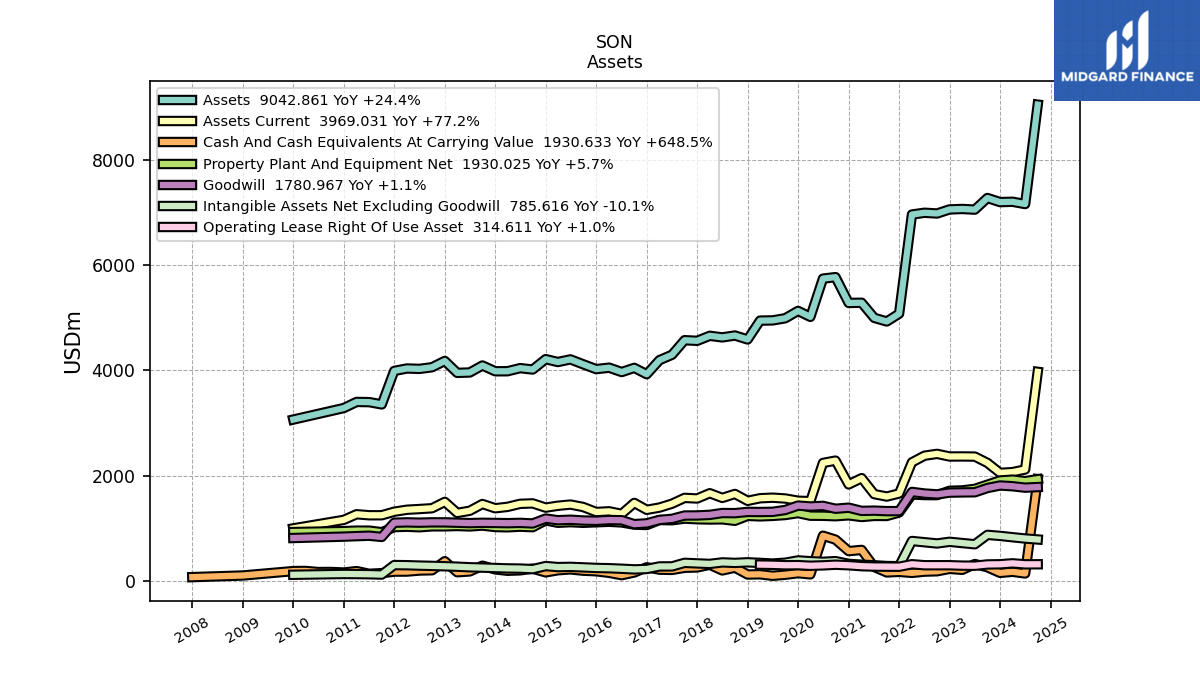
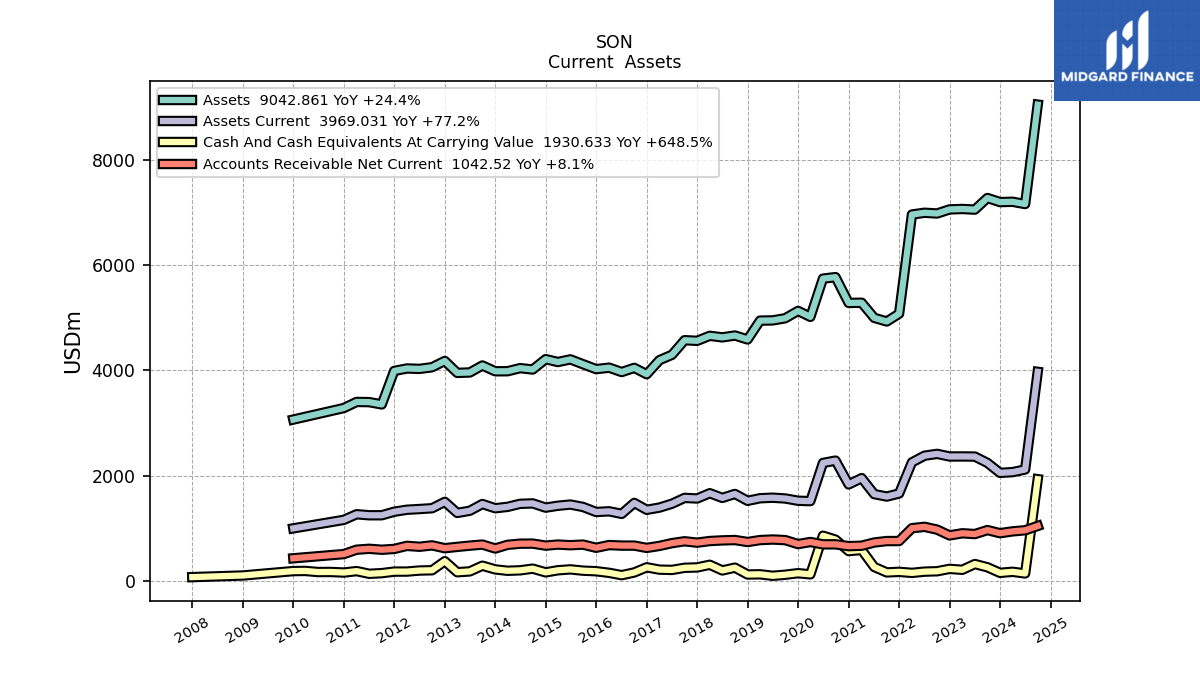
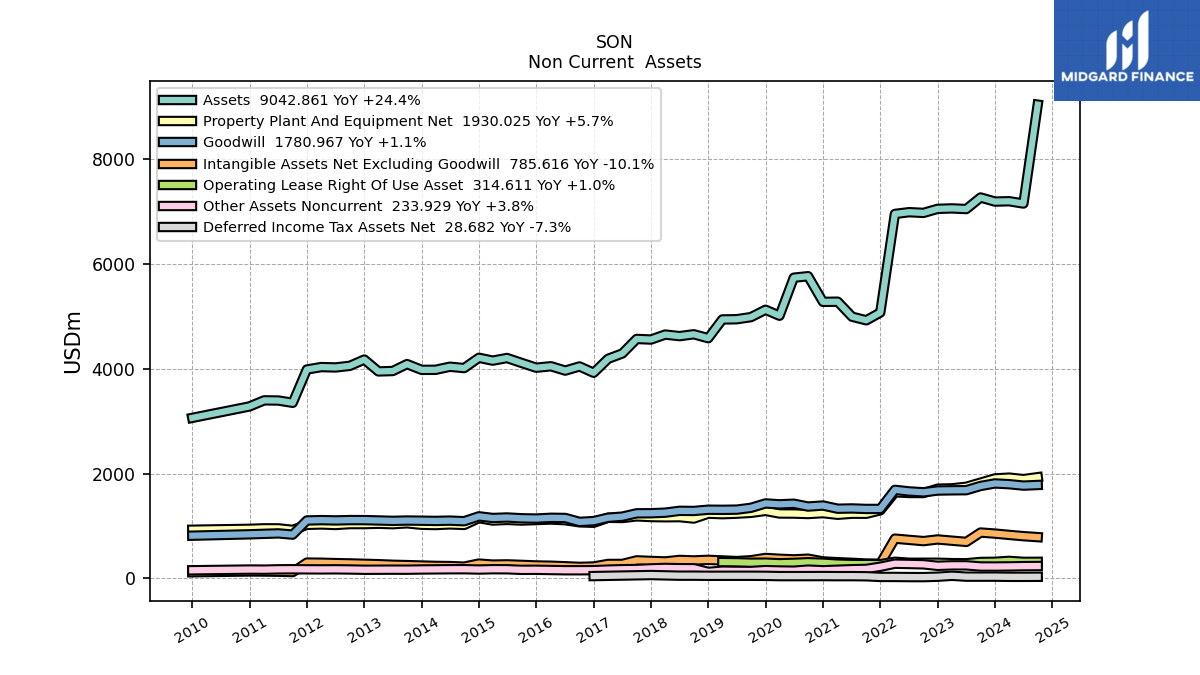
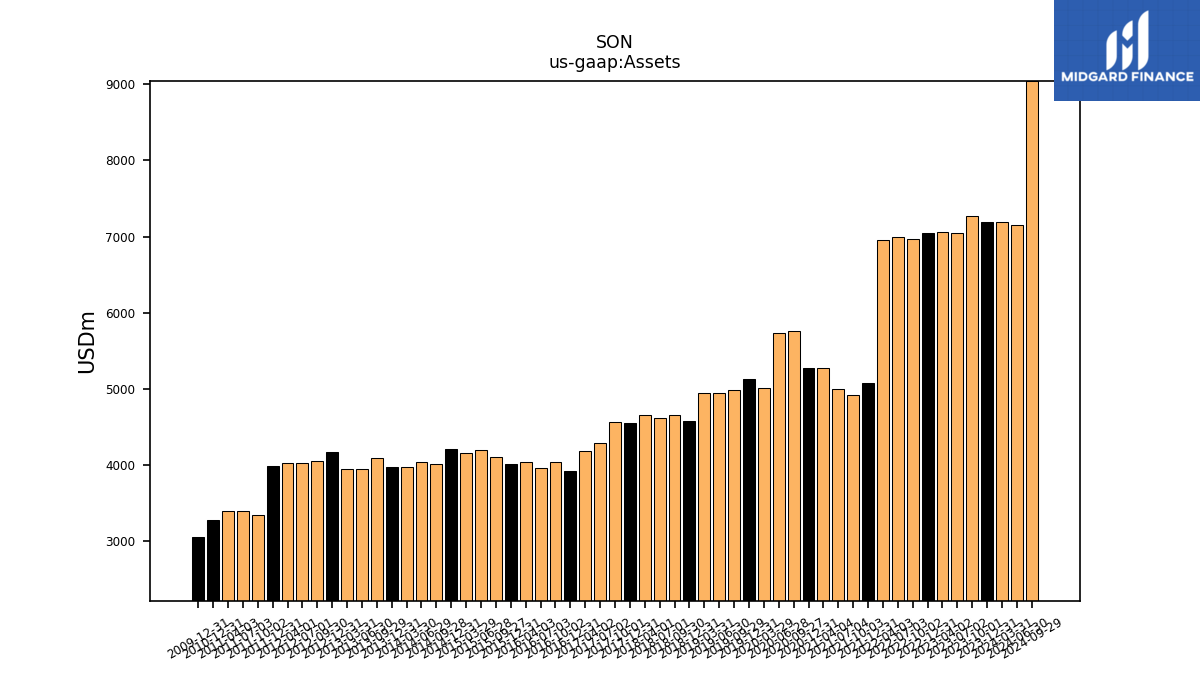
| Assets | 7191.96 | 7270.00 | 7048.99 | 7061.43 | 7052.94 | 6975.65 | 6989.51 | 6955.99 | 5073.23 | 4925.15 | 4994.04 | 5280.75 | 5277.26 | 5767.23 | 5738.86 | 5012.14 | 5126.29 | 4986.18 | 4945.56 | 4941.50 | 4583.47 | 4658.63 | 4622.97 | 4653.07 | 4557.72 | 4569.63 | 4292.74 | 4190.40 | 3923.20 | 4044.55 | 3964.88 | 4048.01 | 4020.27 | 4113.64 | 4205.49 | 4155.16 | 4210.00 | 4013.00 | 4038.95 | 3980.32 | 3979.29 | NA | 4089.36 | 3956.83 | 3949.12 | 4176.06 | 4056.30 | 4024.92 | NA | 4032.43 | NA | 3986.17 | 3350.18 | NA | 3393.59 | NA | 3397.24 | NA | 3281.01 | NA | NA | NA | |
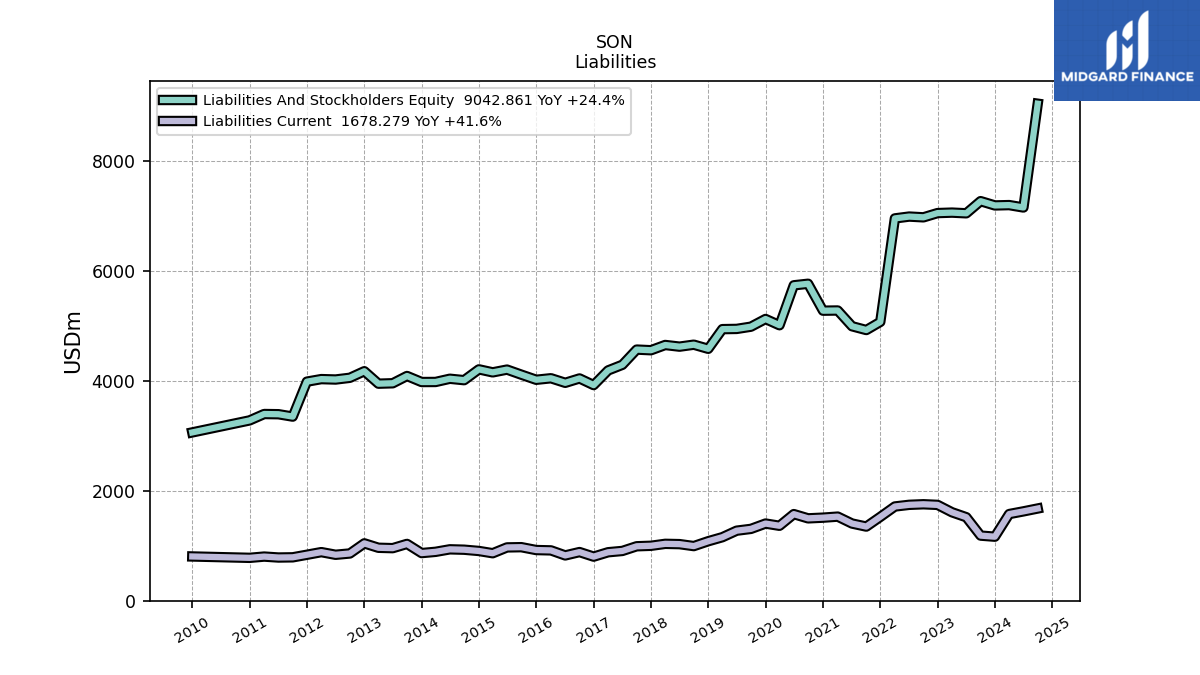
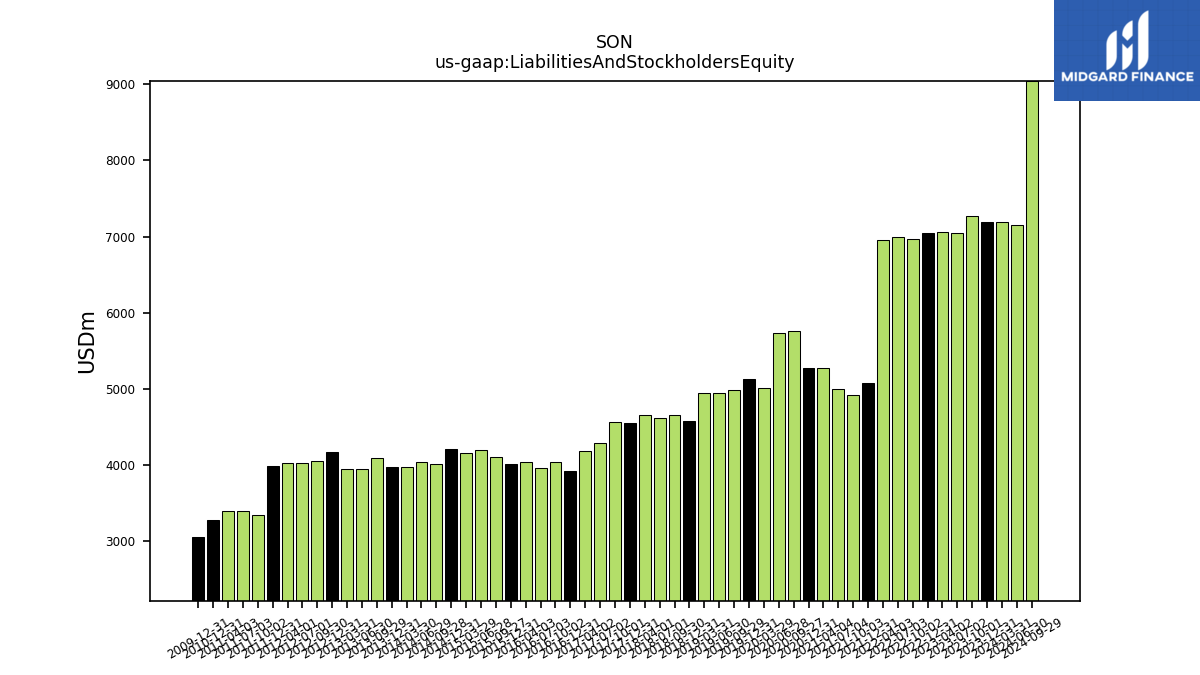
| Liabilities And Stockholders Equity | 7191.96 | 7270.00 | 7048.99 | 7061.43 | 7052.94 | 6975.65 | 6989.51 | 6955.99 | 5073.23 | 4925.15 | 4994.04 | 5280.75 | 5277.26 | 5767.23 | 5738.86 | 5012.14 | 5126.29 | 4986.18 | 4945.56 | 4941.50 | 4583.47 | 4658.63 | 4622.97 | 4653.07 | 4557.72 | 4569.63 | 4292.74 | 4190.40 | 3923.20 | 4044.55 | 3964.88 | 4048.01 | 4020.27 | 4113.64 | 4205.49 | 4155.16 | 4210.00 | 4013.00 | 4038.95 | 3980.32 | 3979.29 | NA | 4089.36 | 3956.83 | 3949.12 | 4176.06 | 4056.30 | 4024.92 | NA | 4032.43 | NA | 3986.17 | 3350.18 | NA | 3393.59 | NA | 3397.24 | NA | 3281.01 | NA | NA | NA | |
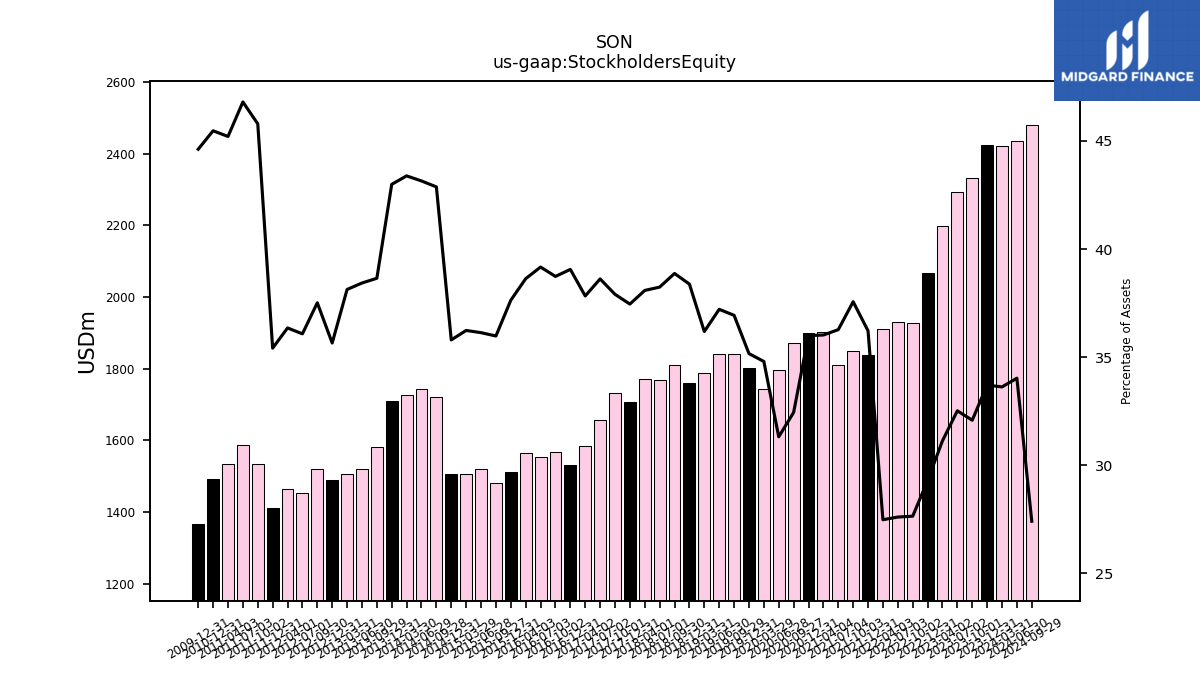
| Stockholders Equity | 2424.34 | 2332.55 | 2292.35 | 2198.40 | 2065.81 | 1928.61 | 1929.67 | 1911.79 | 1837.44 | 1849.99 | 1811.44 | 1902.40 | 1899.61 | 1871.14 | 1797.34 | 1744.26 | 1802.68 | 1841.68 | 1840.36 | 1788.18 | 1759.09 | 1810.82 | 1767.83 | 1772.16 | 1707.07 | 1732.17 | 1657.80 | 1585.24 | 1532.36 | 1566.59 | 1552.89 | 1563.71 | 1512.93 | 1480.05 | 1519.56 | 1505.63 | 1507.12 | 1720.49 | 1742.69 | 1726.78 | 1710.74 | NA | 1580.46 | 1520.56 | 1505.78 | 1488.99 | 1521.69 | 1452.15 | NA | 1465.81 | NA | 1411.80 | 1534.02 | NA | 1588.19 | NA | 1535.66 | NA | 1491.79 | NA | NA | NA |
| 2023-12-31 | 2023-10-01 | 2023-07-02 | 2023-04-02 | 2022-12-31 | 2022-10-02 | 2022-07-03 | 2022-04-03 | 2021-12-31 | 2021-10-03 | 2021-07-04 | 2021-04-04 | 2020-12-31 | 2020-09-27 | 2020-06-28 | 2020-03-29 | 2019-12-31 | 2019-09-29 | 2019-06-30 | 2019-03-31 | 2018-12-31 | 2018-09-30 | 2018-07-01 | 2018-04-01 | 2017-12-31 | 2017-10-01 | 2017-07-02 | 2017-04-02 | 2016-12-31 | 2016-10-02 | 2016-07-03 | 2016-04-03 | 2015-12-31 | 2015-09-27 | 2015-06-28 | 2015-03-29 | 2014-12-31 | 2014-09-28 | 2014-06-29 | 2014-03-30 | 2013-12-31 | 2013-09-30 | 2013-09-29 | 2013-06-30 | 2013-03-31 | 2012-12-31 | 2012-09-30 | 2012-07-01 | 2012-06-30 | 2012-04-01 | 2012-03-31 | 2011-12-31 | 2011-10-02 | 2011-09-30 | 2011-07-03 | 2011-06-30 | 2011-04-03 | 2011-03-31 | 2010-12-31 | 2010-09-26 | 2010-06-27 | 2010-03-28 | ||
|---|---|---|---|---|---|---|---|---|---|---|---|---|---|---|---|---|---|---|---|---|---|---|---|---|---|---|---|---|---|---|---|---|---|---|---|---|---|---|---|---|---|---|---|---|---|---|---|---|---|---|---|---|---|---|---|---|---|---|---|---|---|---|---|
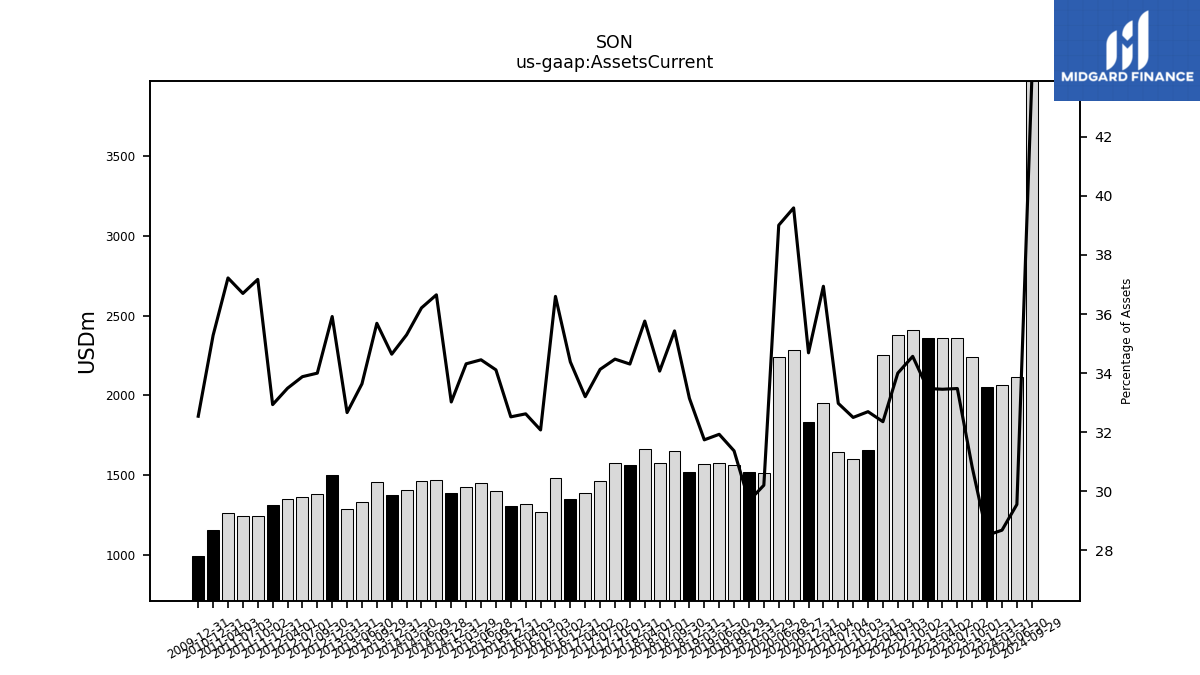
| Assets Current | 2050.36 | 2239.89 | 2359.88 | 2362.33 | 2361.25 | 2411.32 | 2376.48 | 2250.64 | 1658.68 | 1600.65 | 1646.84 | 1950.74 | 1830.55 | 2283.43 | 2238.66 | 1513.83 | 1521.20 | 1564.02 | 1579.02 | 1568.49 | 1519.27 | 1650.51 | 1574.97 | 1664.04 | 1563.64 | 1575.33 | 1464.98 | 1391.30 | 1348.77 | 1480.21 | 1271.75 | 1320.48 | 1307.38 | 1403.17 | 1448.83 | 1425.84 | 1390.28 | 1470.81 | 1462.46 | 1404.95 | 1378.47 | NA | 1459.35 | 1330.94 | 1289.95 | 1499.90 | 1379.11 | 1363.63 | NA | 1350.38 | NA | 1312.79 | 1245.37 | NA | 1245.40 | NA | 1264.56 | NA | 1157.52 | NA | NA | NA | |
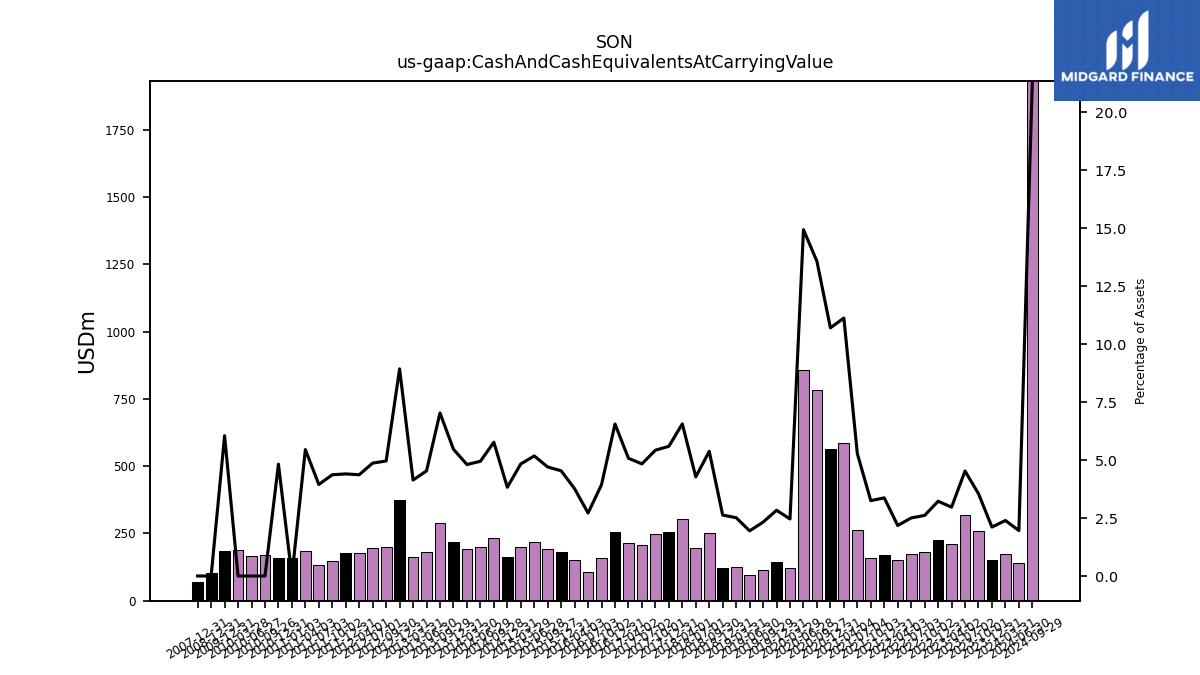
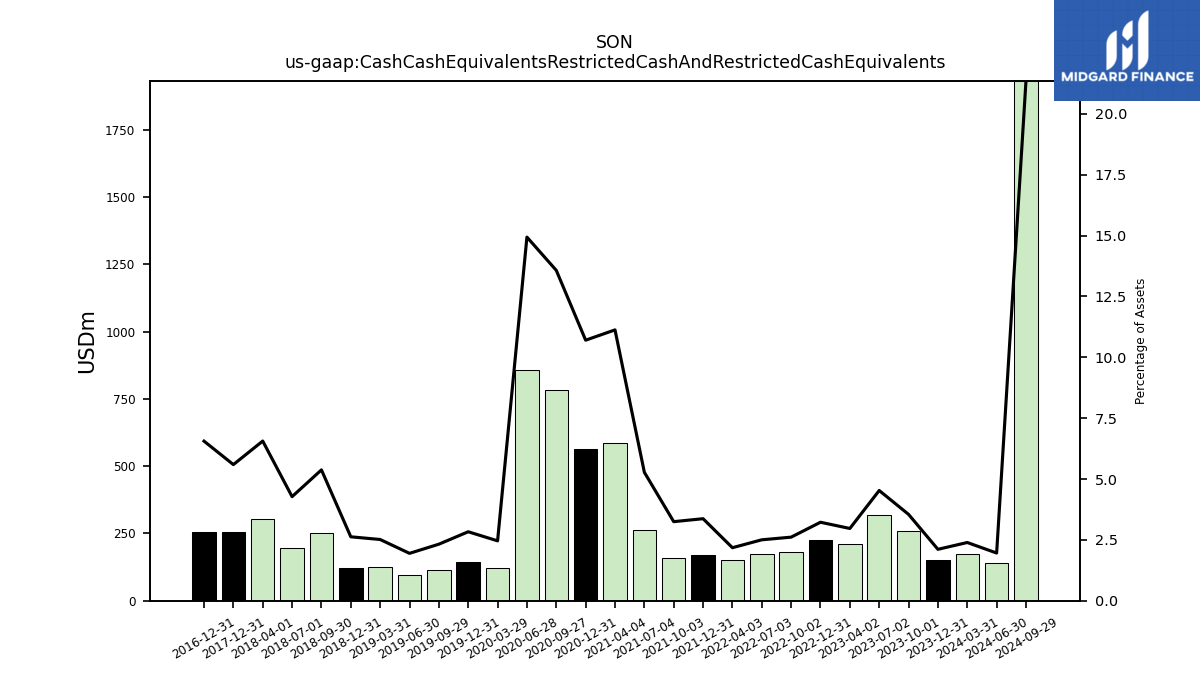
| Cash And Cash Equivalents At Carrying Value | 151.94 | 257.94 | 319.22 | 209.65 | 227.44 | 182.24 | 175.00 | 151.54 | 170.98 | 160.01 | 263.53 | 587.53 | 564.85 | 782.68 | 857.27 | 123.33 | 145.28 | 115.85 | 96.30 | 124.33 | 120.39 | 250.42 | 197.69 | 305.25 | 254.91 | 247.91 | 207.59 | 212.79 | 257.23 | 159.32 | 107.75 | 152.34 | 182.43 | 193.42 | 217.78 | 200.80 | 161.17 | 231.56 | 199.78 | 191.41 | 217.57 | NA | 287.58 | 179.36 | 163.45 | 373.08 | 201.14 | 196.00 | NA | 176.10 | NA | 175.52 | 146.29 | NA | 133.98 | NA | 185.18 | NA | 158.25 | 168.70 | 167.38 | 188.23 | |
| Cash Cash Equivalents Restricted Cash And Restricted Cash Equivalents | 151.94 | 257.94 | 319.22 | 209.65 | 227.44 | 182.24 | 175.00 | 151.54 | 170.98 | 160.01 | 263.53 | 587.53 | 564.85 | 782.68 | 857.27 | 123.33 | 145.28 | 115.85 | 96.30 | 124.33 | 120.39 | 250.42 | 197.69 | 305.25 | 254.91 | NA | NA | NA | 257.23 | NA | NA | NA | NA | NA | NA | NA | NA | NA | NA | NA | NA | NA | NA | NA | NA | NA | NA | NA | NA | NA | NA | NA | NA | NA | NA | NA | NA | NA | NA | NA | NA | NA | |
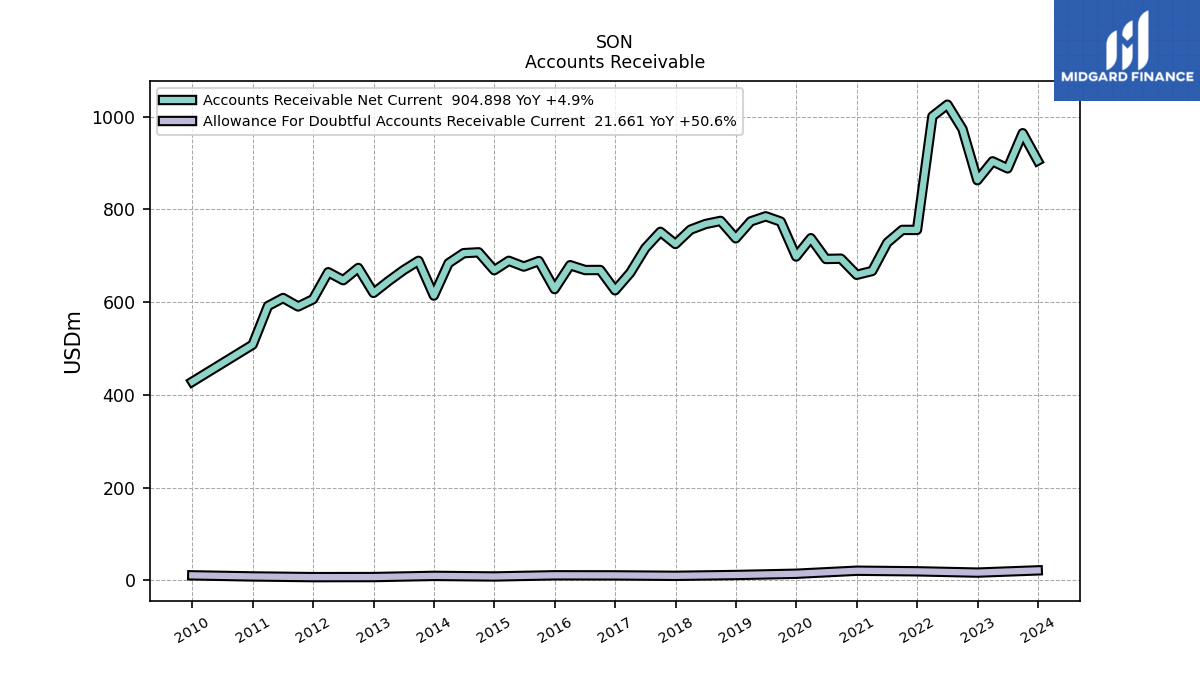
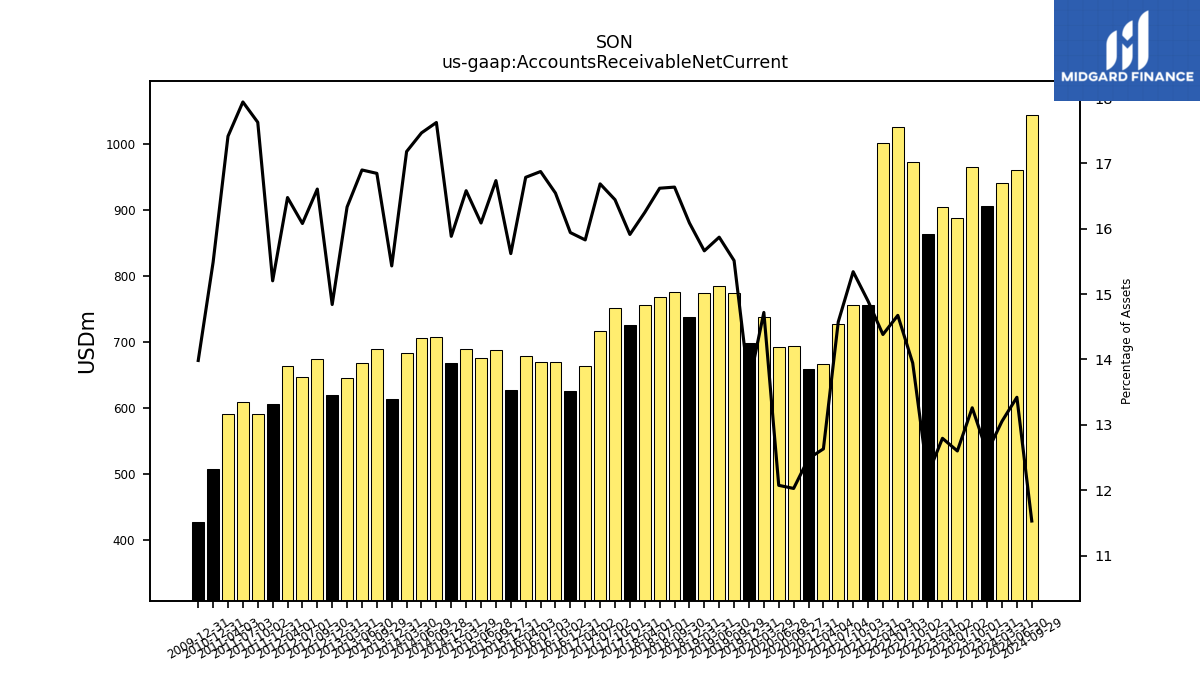
| Accounts Receivable Net Current | 904.90 | 964.05 | 888.19 | 903.42 | 862.71 | 972.87 | 1025.68 | 1000.41 | 755.61 | 755.64 | 727.97 | 667.06 | 658.81 | 693.61 | 692.94 | 737.76 | 698.15 | 773.49 | 784.91 | 773.94 | 737.42 | 775.05 | 768.34 | 756.10 | 725.25 | 751.45 | 716.31 | 663.31 | 625.41 | 669.20 | 669.09 | 679.53 | 627.96 | 688.48 | 676.58 | 689.00 | 668.71 | 707.31 | 705.47 | 683.86 | 614.05 | NA | 688.95 | 668.67 | 645.00 | 619.76 | 673.63 | 647.20 | NA | 664.43 | NA | 606.03 | 590.59 | NA | 608.80 | NA | 591.64 | NA | 508.14 | NA | NA | NA | |
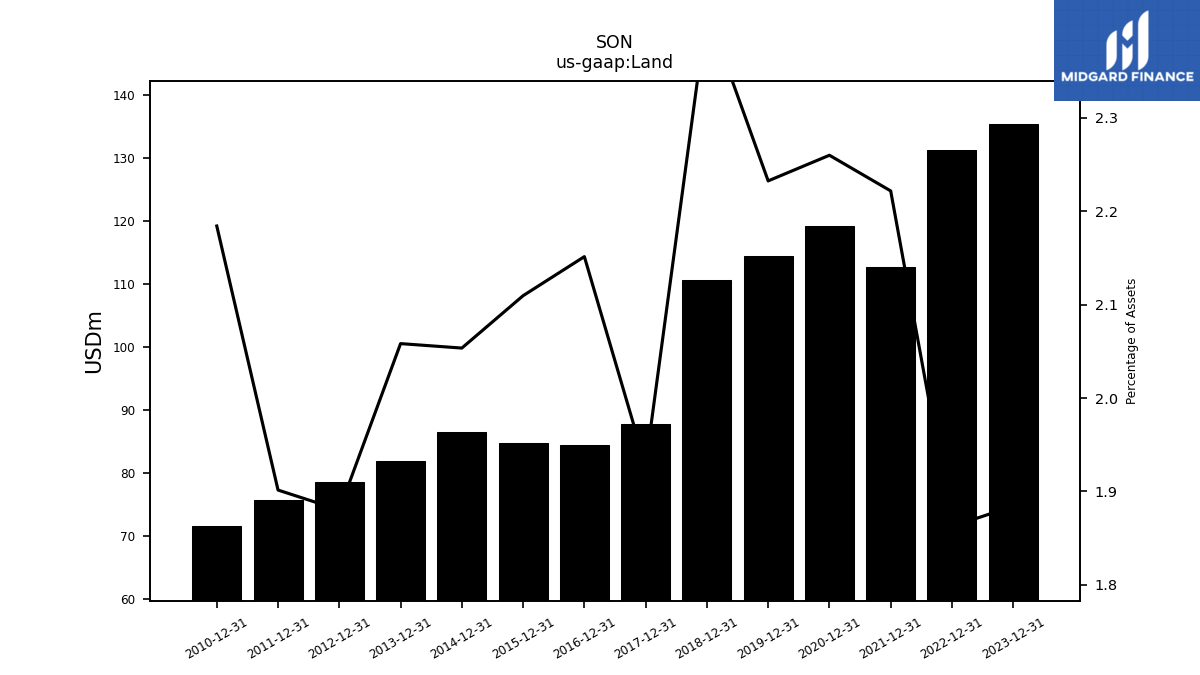
| Land | 135.52 | NA | NA | NA | 131.36 | NA | NA | NA | 112.71 | NA | NA | NA | 119.26 | NA | NA | NA | 114.44 | NA | NA | NA | 110.70 | NA | NA | NA | 87.88 | NA | NA | NA | 84.40 | NA | NA | NA | 84.81 | NA | NA | NA | 86.45 | NA | NA | NA | 81.91 | NA | NA | NA | NA | 78.52 | NA | NA | NA | NA | NA | 75.80 | NA | NA | NA | NA | NA | NA | 71.66 | NA | NA | NA | |
| Machinery And Equipment Gross | 3825.13 | NA | NA | NA | 3528.55 | NA | NA | NA | 3179.78 | NA | NA | NA | 3191.01 | NA | NA | NA | 3077.50 | NA | NA | NA | 2977.16 | NA | NA | NA | 2871.62 | NA | NA | NA | 2637.75 | NA | NA | NA | 2796.26 | NA | NA | NA | 2851.05 | NA | NA | NA | 2725.43 | NA | NA | NA | NA | 2567.40 | NA | NA | NA | NA | NA | 2501.95 | NA | NA | NA | NA | NA | NA | 2430.51 | NA | NA | NA |
| 2023-12-31 | 2023-10-01 | 2023-07-02 | 2023-04-02 | 2022-12-31 | 2022-10-02 | 2022-07-03 | 2022-04-03 | 2021-12-31 | 2021-10-03 | 2021-07-04 | 2021-04-04 | 2020-12-31 | 2020-09-27 | 2020-06-28 | 2020-03-29 | 2019-12-31 | 2019-09-29 | 2019-06-30 | 2019-03-31 | 2018-12-31 | 2018-09-30 | 2018-07-01 | 2018-04-01 | 2017-12-31 | 2017-10-01 | 2017-07-02 | 2017-04-02 | 2016-12-31 | 2016-10-02 | 2016-07-03 | 2016-04-03 | 2015-12-31 | 2015-09-27 | 2015-06-28 | 2015-03-29 | 2014-12-31 | 2014-09-28 | 2014-06-29 | 2014-03-30 | 2013-12-31 | 2013-09-30 | 2013-09-29 | 2013-06-30 | 2013-03-31 | 2012-12-31 | 2012-09-30 | 2012-07-01 | 2012-06-30 | 2012-04-01 | 2012-03-31 | 2011-12-31 | 2011-10-02 | 2011-09-30 | 2011-07-03 | 2011-06-30 | 2011-04-03 | 2011-03-31 | 2010-12-31 | 2010-09-26 | 2010-06-27 | 2010-03-28 | ||
|---|---|---|---|---|---|---|---|---|---|---|---|---|---|---|---|---|---|---|---|---|---|---|---|---|---|---|---|---|---|---|---|---|---|---|---|---|---|---|---|---|---|---|---|---|---|---|---|---|---|---|---|---|---|---|---|---|---|---|---|---|---|---|---|
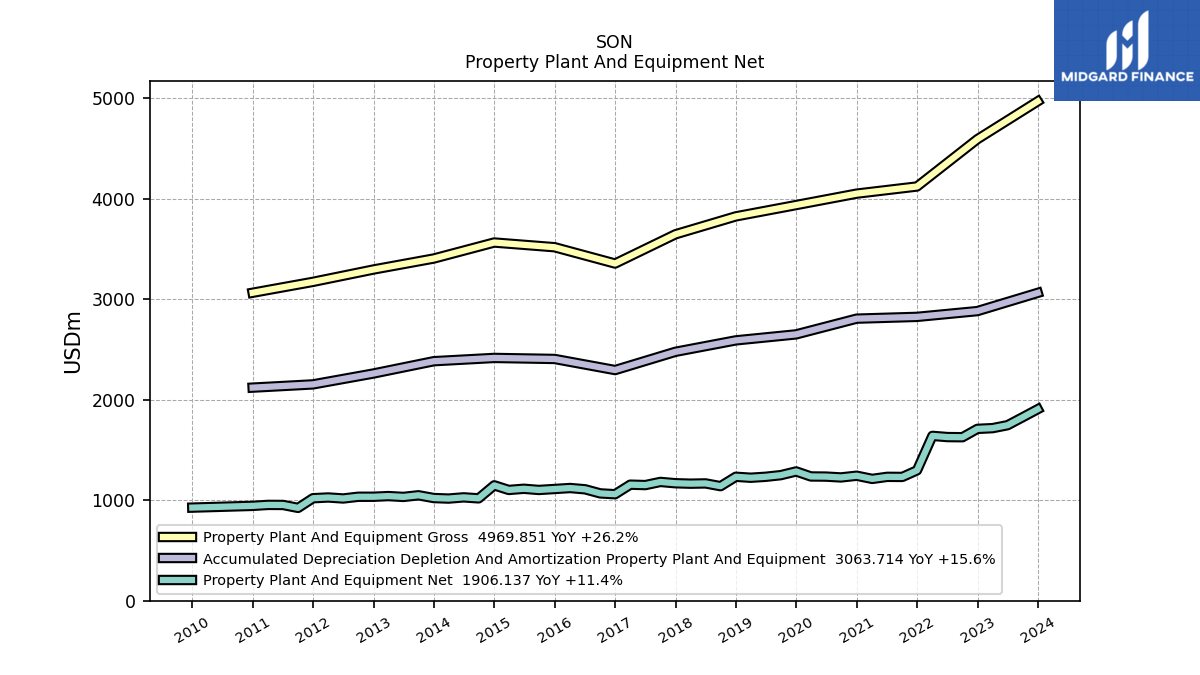
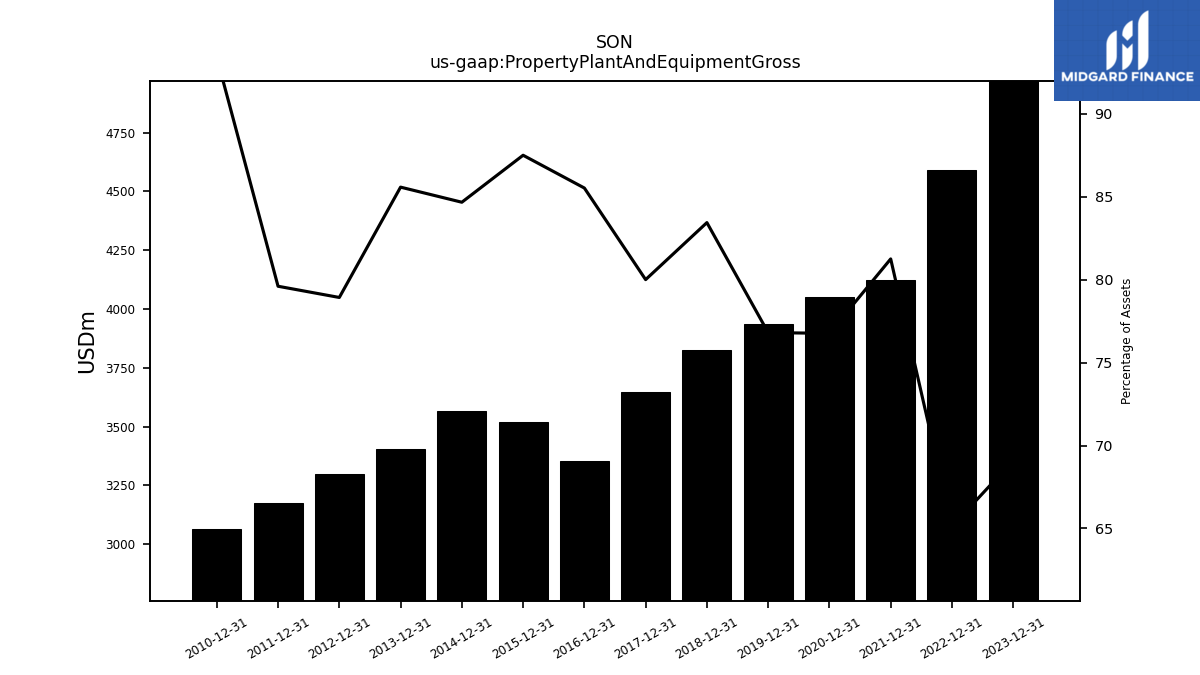
| Property Plant And Equipment Gross | 4969.85 | NA | NA | NA | 4592.82 | NA | NA | NA | 4122.40 | NA | NA | NA | 4051.33 | NA | NA | NA | 3937.64 | NA | NA | NA | 3824.81 | NA | NA | NA | 3646.61 | NA | NA | NA | 3355.64 | NA | NA | NA | 3518.15 | NA | NA | NA | 3564.87 | NA | NA | NA | 3405.76 | NA | NA | NA | NA | 3296.29 | NA | NA | NA | NA | NA | 3173.36 | NA | NA | NA | NA | NA | NA | 3064.90 | NA | NA | NA | |
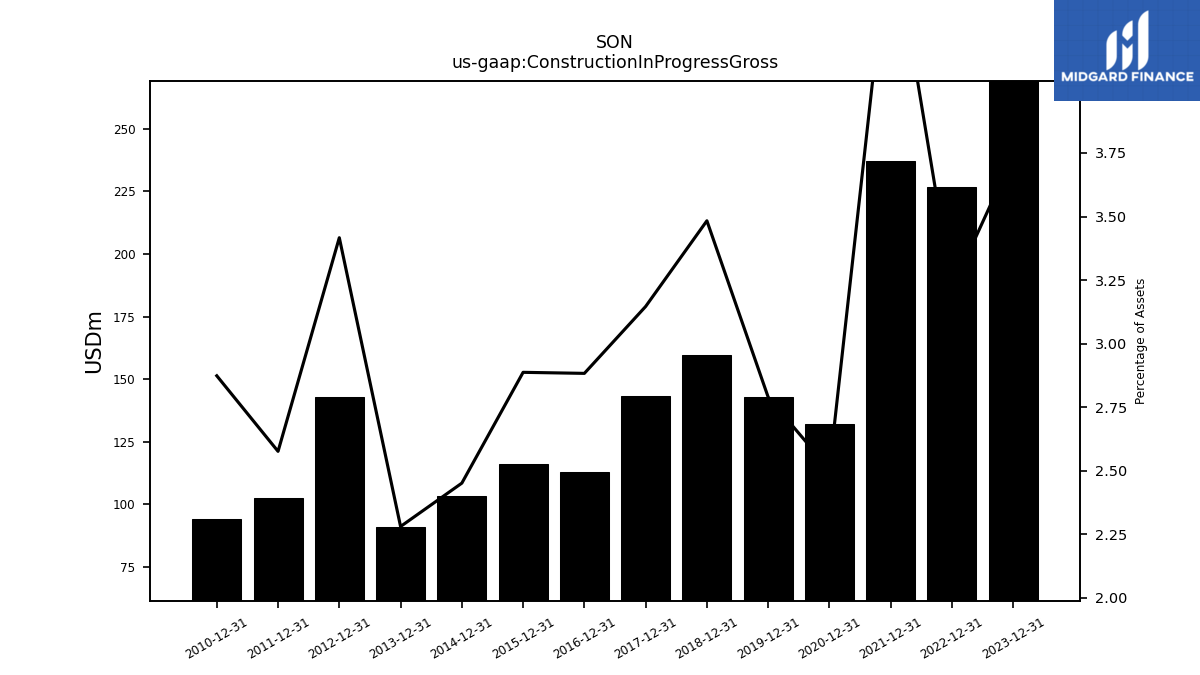
| Construction In Progress Gross | 269.06 | NA | NA | NA | 226.70 | NA | NA | NA | 237.06 | NA | NA | NA | 132.22 | NA | NA | NA | 143.02 | NA | NA | NA | 159.66 | NA | NA | NA | 143.40 | NA | NA | NA | 113.12 | NA | NA | NA | 116.08 | NA | NA | NA | 103.21 | NA | NA | NA | 90.77 | NA | NA | NA | NA | 142.69 | NA | NA | NA | NA | NA | 102.71 | NA | NA | NA | NA | NA | NA | 94.29 | NA | NA | NA | |
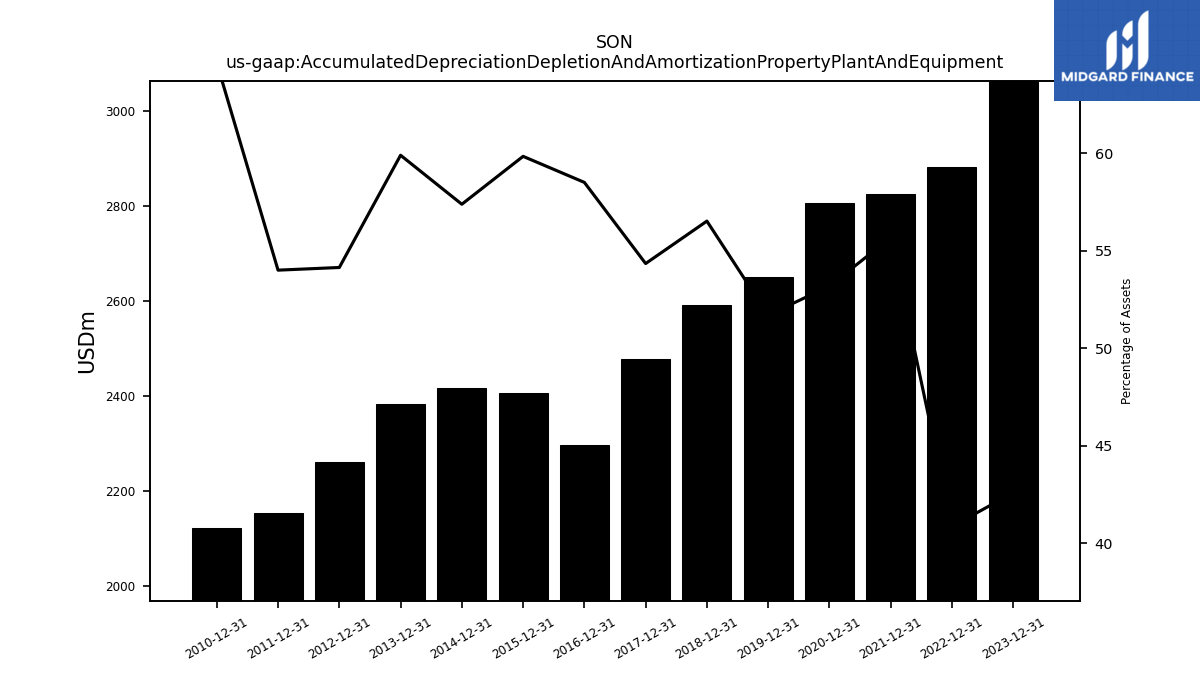
| Accumulated Depreciation Depletion And Amortization Property Plant And Equipment | 3063.71 | NA | NA | NA | 2882.42 | NA | NA | NA | 2824.90 | NA | NA | NA | 2807.22 | NA | NA | NA | 2650.79 | NA | NA | NA | 2590.99 | NA | NA | NA | 2477.24 | NA | NA | NA | 2295.62 | NA | NA | NA | 2406.11 | NA | NA | NA | 2416.26 | NA | NA | NA | 2383.84 | NA | NA | NA | NA | 2261.38 | NA | NA | NA | NA | NA | 2153.07 | NA | NA | NA | NA | NA | NA | 2120.77 | NA | NA | NA | |
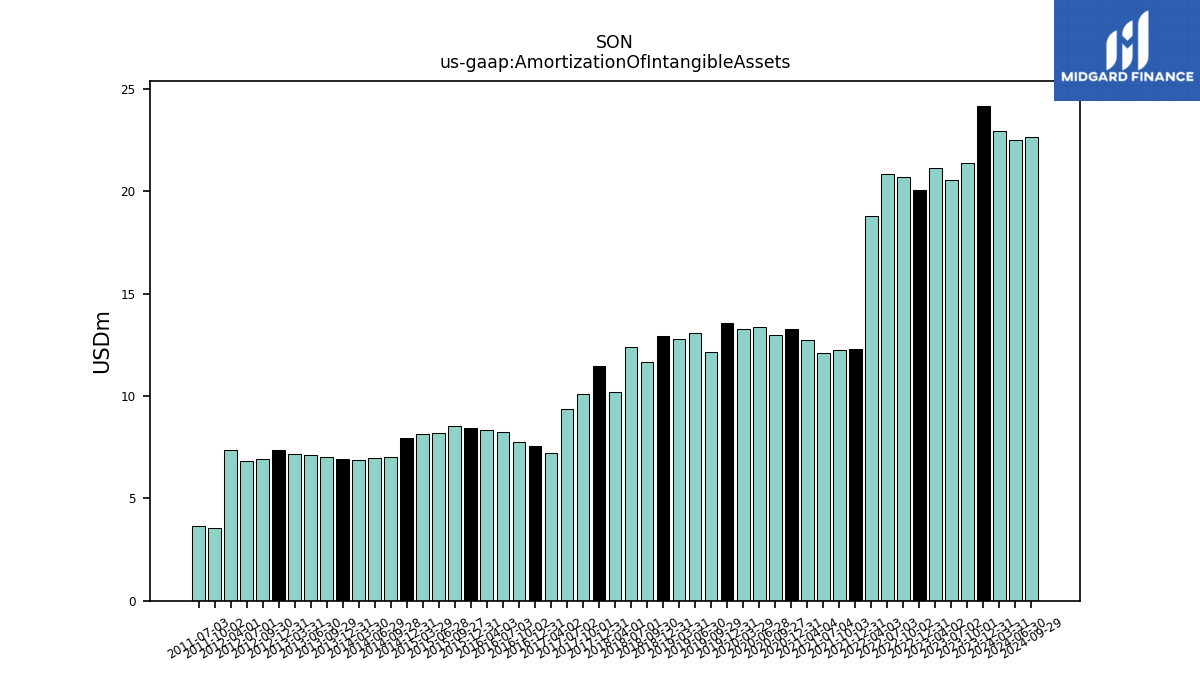
| Amortization Of Intangible Assets | 24.18 | 21.38 | 20.54 | 21.16 | 20.08 | 20.69 | 20.87 | 18.80 | 12.30 | 12.26 | 12.11 | 12.75 | 13.28 | 12.99 | 13.36 | 13.27 | 13.54 | 12.14 | 13.10 | 12.79 | 12.91 | 11.66 | 12.40 | 10.20 | 11.46 | 10.12 | 9.38 | 7.21 | 7.55 | 7.77 | 8.23 | 8.34 | 8.42 | 8.53 | 8.17 | 8.15 | 7.94 | 7.04 | 6.96 | 6.86 | 6.92 | NA | 7.04 | 7.14 | 7.17 | 7.38 | 6.95 | 6.82 | NA | 7.36 | NA | NA | 3.57 | NA | 3.65 | NA | NA | NA | NA | NA | NA | NA | |
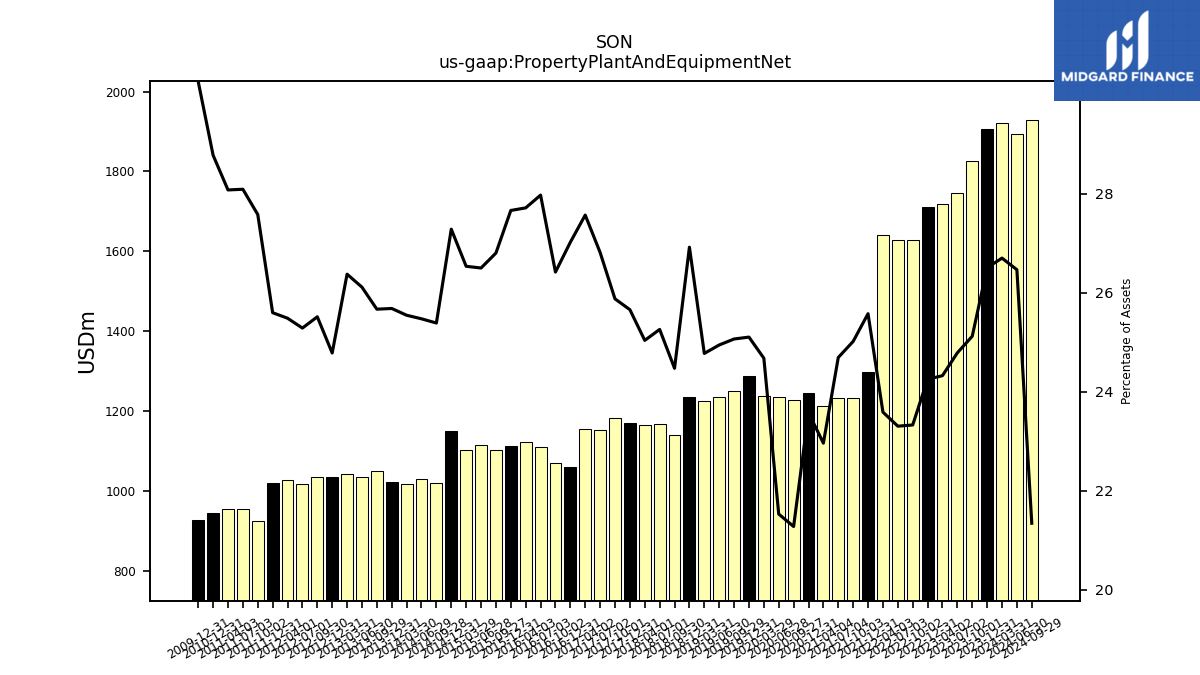
| Property Plant And Equipment Net | 1906.14 | 1826.23 | 1747.12 | 1717.62 | 1710.40 | 1627.28 | 1628.82 | 1640.77 | 1297.50 | 1232.07 | 1233.07 | 1212.52 | 1244.11 | 1227.12 | 1235.51 | 1236.83 | 1286.84 | 1249.76 | 1233.62 | 1224.14 | 1233.82 | 1140.11 | 1167.66 | 1164.97 | 1169.38 | 1182.38 | 1150.99 | 1155.19 | 1060.02 | 1068.43 | 1109.01 | 1121.82 | 1112.04 | 1102.47 | 1114.38 | 1102.48 | 1148.61 | 1018.78 | 1028.81 | 1016.75 | 1021.92 | NA | 1049.60 | 1033.19 | 1041.53 | 1034.91 | 1034.89 | 1017.71 | NA | 1027.62 | NA | 1020.29 | 923.94 | NA | 953.22 | NA | 953.77 | NA | 944.14 | NA | NA | NA | |
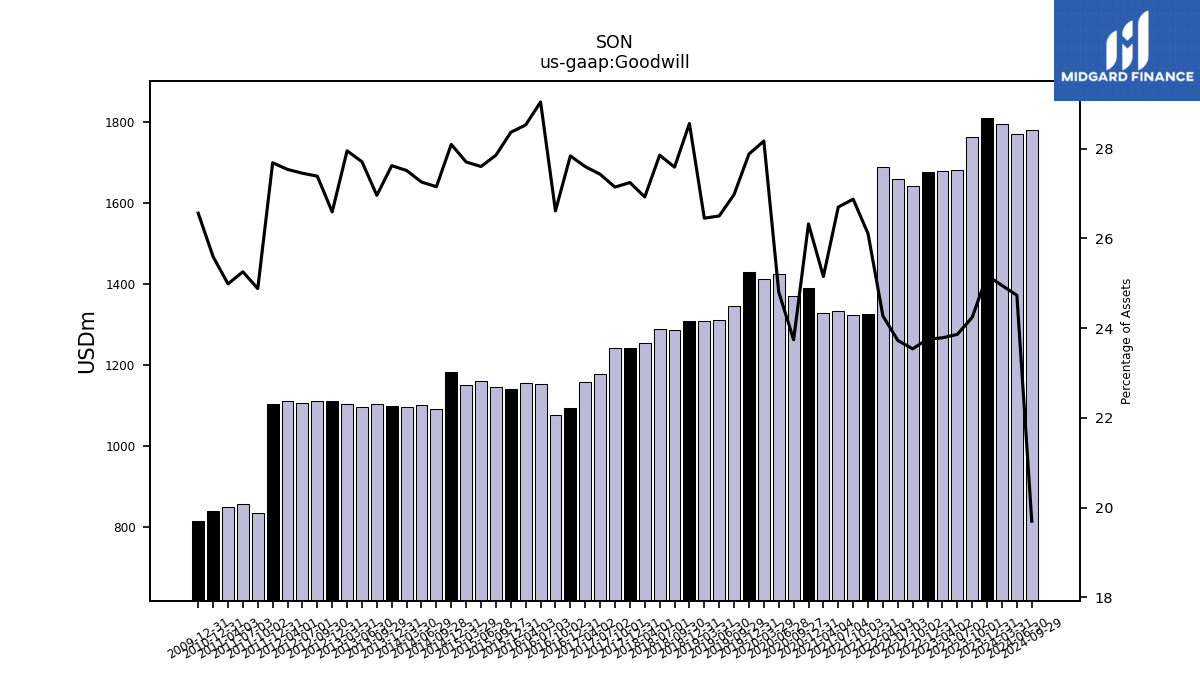
| Goodwill | 1810.65 | 1762.41 | 1681.97 | 1679.55 | 1675.31 | 1641.95 | 1658.36 | 1688.31 | 1324.50 | 1323.72 | 1333.40 | 1328.21 | 1389.26 | 1369.28 | 1423.71 | 1412.06 | 1429.35 | 1345.27 | 1310.64 | 1307.17 | 1309.17 | 1285.37 | 1287.84 | 1252.88 | 1241.88 | 1240.44 | 1177.56 | 1156.67 | 1092.21 | 1076.49 | 1151.56 | 1154.95 | 1140.46 | 1145.92 | 1160.93 | 1151.17 | 1182.94 | 1089.70 | 1100.98 | 1095.21 | 1099.21 | NA | 1102.56 | 1096.48 | 1103.96 | 1110.51 | 1110.99 | 1105.04 | NA | 1110.50 | NA | 1103.68 | 833.59 | NA | 857.12 | NA | 848.86 | NA | 839.75 | NA | NA | NA | |
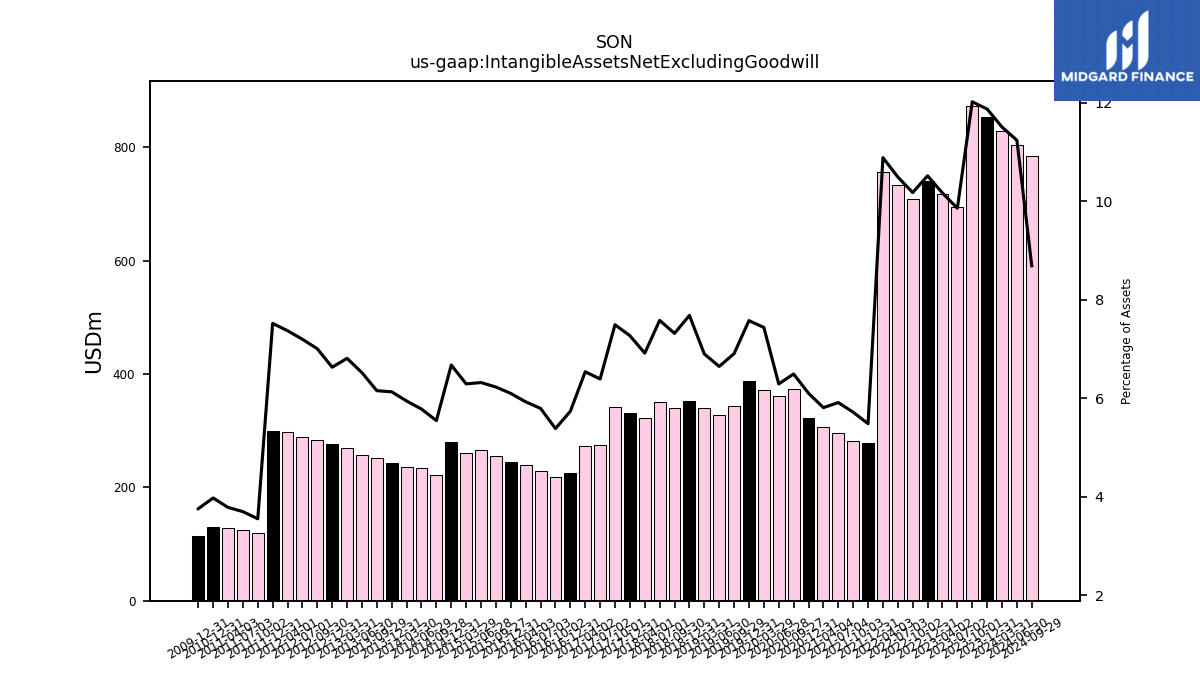
| Intangible Assets Net Excluding Goodwill | 853.67 | 873.52 | 694.76 | 717.78 | 741.60 | 709.72 | 733.21 | 756.97 | 278.14 | 281.53 | 295.19 | 306.74 | 321.93 | 374.37 | 361.00 | 372.72 | 388.29 | 344.25 | 328.62 | 340.84 | 352.04 | 340.82 | 350.42 | 321.77 | 331.30 | 342.32 | 274.32 | 273.89 | 224.96 | 217.77 | 229.70 | 239.90 | 245.09 | 256.14 | 265.70 | 261.38 | 280.94 | 222.54 | 233.42 | 236.54 | 243.92 | NA | 251.59 | 257.93 | 268.90 | 276.81 | 284.08 | 289.62 | NA | 297.18 | NA | 299.70 | 119.01 | NA | 125.48 | NA | 128.54 | NA | 130.40 | NA | NA | NA | |
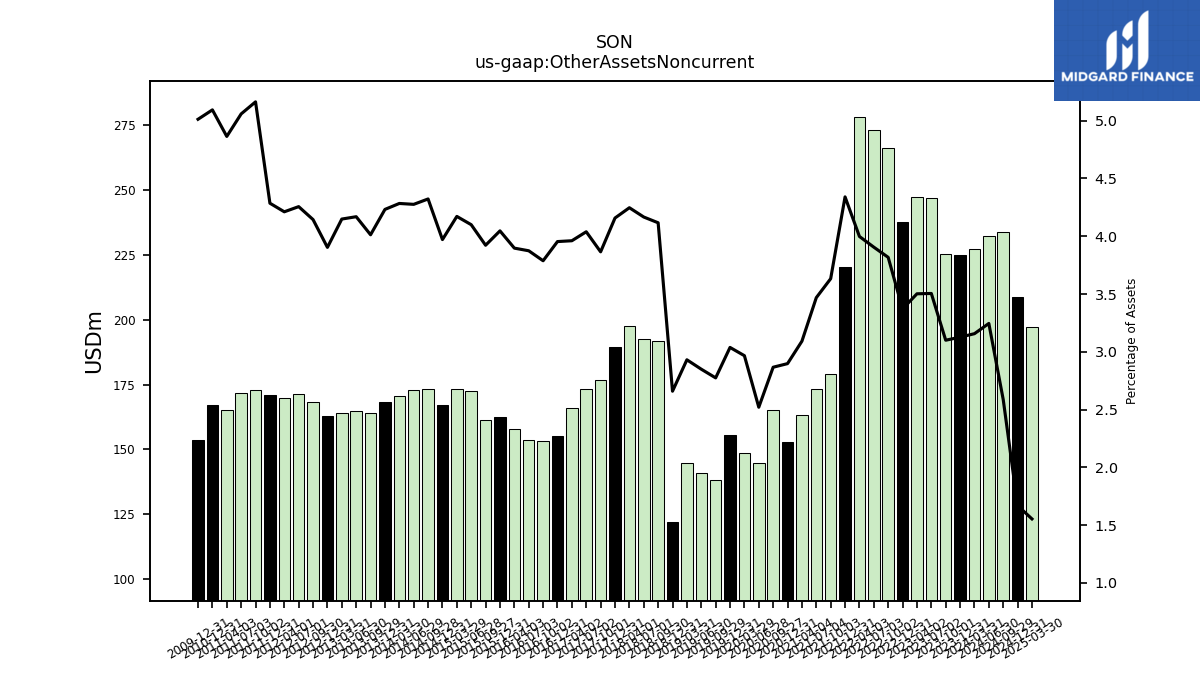
| Other Assets Noncurrent | 224.86 | 225.38 | 247.04 | 247.28 | 237.72 | 266.27 | 272.97 | 278.10 | 220.21 | 178.91 | 173.22 | 163.26 | 152.91 | 165.31 | 144.63 | 148.67 | 155.72 | 138.33 | 140.92 | 144.82 | 121.87 | 191.76 | 192.60 | 197.60 | 189.49 | 176.62 | 173.37 | 165.98 | 155.12 | 153.19 | 153.60 | 157.75 | 162.67 | 161.34 | 172.41 | 173.33 | 167.18 | 173.46 | 172.70 | 170.50 | 168.41 | NA | 164.09 | 164.96 | 163.83 | 163.01 | 168.09 | 171.31 | NA | 169.82 | NA | 170.84 | 172.96 | NA | 171.66 | NA | 165.23 | NA | 167.11 | NA | NA | NA |
| 2023-12-31 | 2023-10-01 | 2023-07-02 | 2023-04-02 | 2022-12-31 | 2022-10-02 | 2022-07-03 | 2022-04-03 | 2021-12-31 | 2021-10-03 | 2021-07-04 | 2021-04-04 | 2020-12-31 | 2020-09-27 | 2020-06-28 | 2020-03-29 | 2019-12-31 | 2019-09-29 | 2019-06-30 | 2019-03-31 | 2018-12-31 | 2018-09-30 | 2018-07-01 | 2018-04-01 | 2017-12-31 | 2017-10-01 | 2017-07-02 | 2017-04-02 | 2016-12-31 | 2016-10-02 | 2016-07-03 | 2016-04-03 | 2015-12-31 | 2015-09-27 | 2015-06-28 | 2015-03-29 | 2014-12-31 | 2014-09-28 | 2014-06-29 | 2014-03-30 | 2013-12-31 | 2013-09-30 | 2013-09-29 | 2013-06-30 | 2013-03-31 | 2012-12-31 | 2012-09-30 | 2012-07-01 | 2012-06-30 | 2012-04-01 | 2012-03-31 | 2011-12-31 | 2011-10-02 | 2011-09-30 | 2011-07-03 | 2011-06-30 | 2011-04-03 | 2011-03-31 | 2010-12-31 | 2010-09-26 | 2010-06-27 | 2010-03-28 | ||
|---|---|---|---|---|---|---|---|---|---|---|---|---|---|---|---|---|---|---|---|---|---|---|---|---|---|---|---|---|---|---|---|---|---|---|---|---|---|---|---|---|---|---|---|---|---|---|---|---|---|---|---|---|---|---|---|---|---|---|---|---|---|---|---|
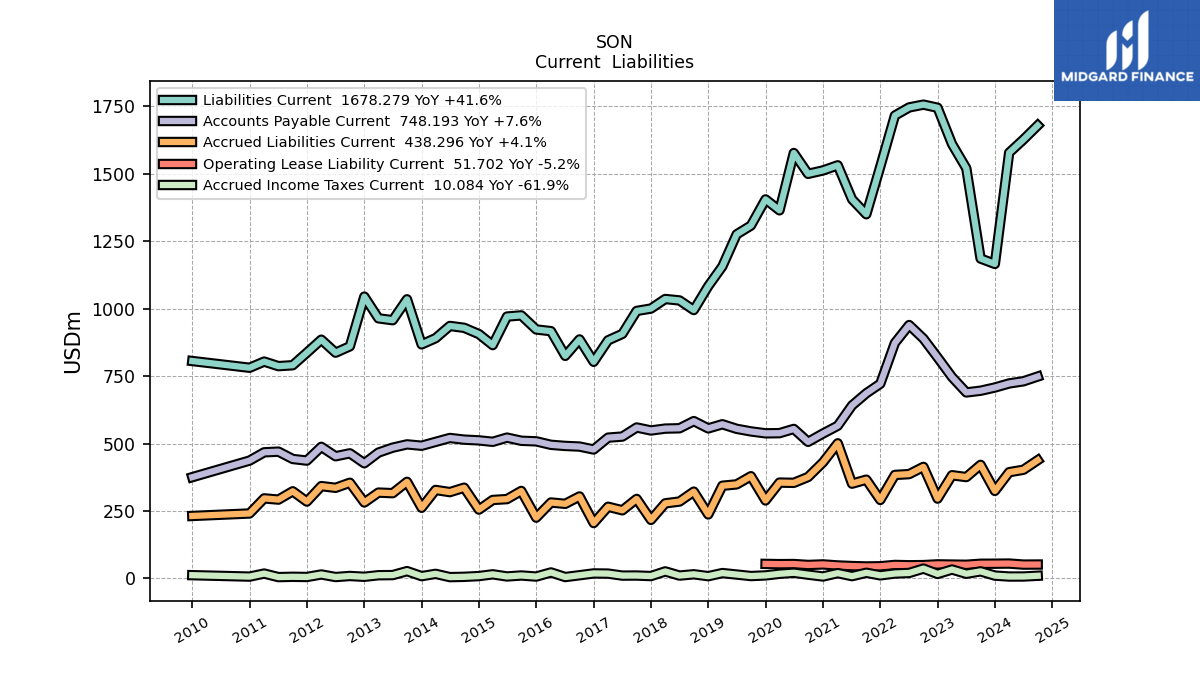
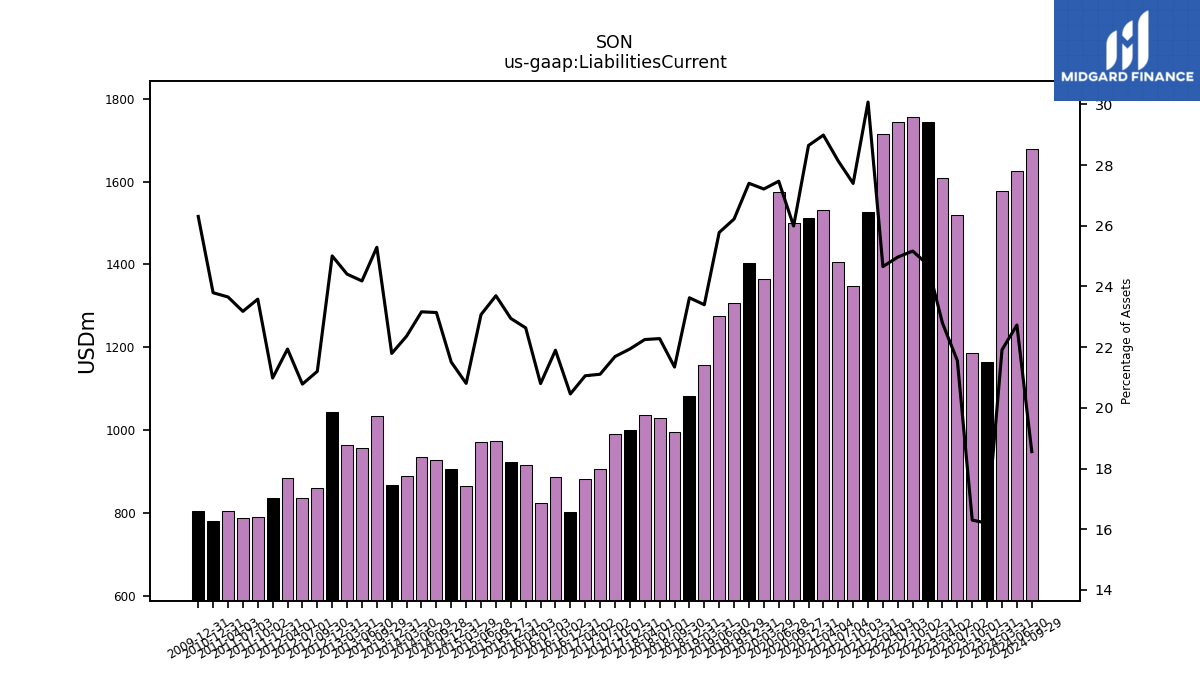
| Liabilities Current | 1165.28 | 1185.20 | 1519.58 | 1609.49 | 1743.90 | 1755.47 | 1745.14 | 1715.01 | 1525.76 | 1349.24 | 1404.91 | 1530.67 | 1511.63 | 1499.04 | 1576.27 | 1363.80 | 1404.49 | 1307.46 | 1274.89 | 1156.23 | 1082.93 | 994.38 | 1030.07 | 1035.37 | 999.97 | 991.17 | 906.11 | 882.40 | 802.62 | 885.70 | 824.69 | 916.27 | 922.52 | 974.71 | 970.33 | 864.55 | 905.45 | 928.67 | 935.58 | 890.18 | 867.23 | NA | 1034.25 | 956.82 | 963.81 | 1044.23 | 860.07 | 836.49 | NA | 884.66 | NA | 836.48 | 790.04 | NA | 786.59 | NA | 803.57 | NA | 780.65 | NA | NA | NA | |
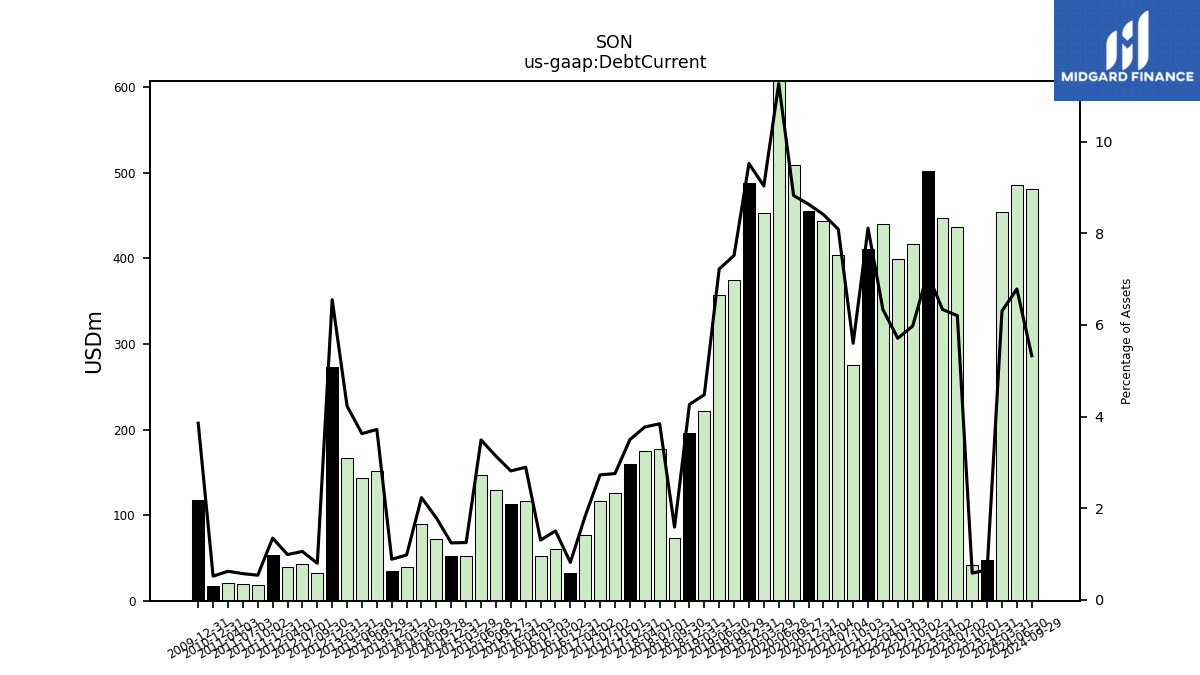
| Debt Current | 47.13 | 42.28 | 437.21 | 447.60 | 502.44 | 416.93 | 399.02 | 440.70 | 411.56 | 275.80 | 404.03 | 444.17 | 455.78 | 508.96 | 646.62 | 452.83 | 488.23 | 374.75 | 357.22 | 221.20 | 195.44 | 73.90 | 177.65 | 175.53 | 159.33 | 125.92 | 117.06 | 76.71 | 32.05 | 60.79 | 51.72 | 117.13 | 113.10 | 129.02 | 146.78 | 51.94 | 52.28 | 71.70 | 90.07 | 38.91 | 35.20 | NA | 152.09 | 143.52 | 167.01 | 273.61 | 32.37 | 42.45 | NA | 39.84 | NA | 53.67 | 17.97 | NA | 19.37 | NA | 21.15 | NA | 16.95 | NA | NA | NA | |
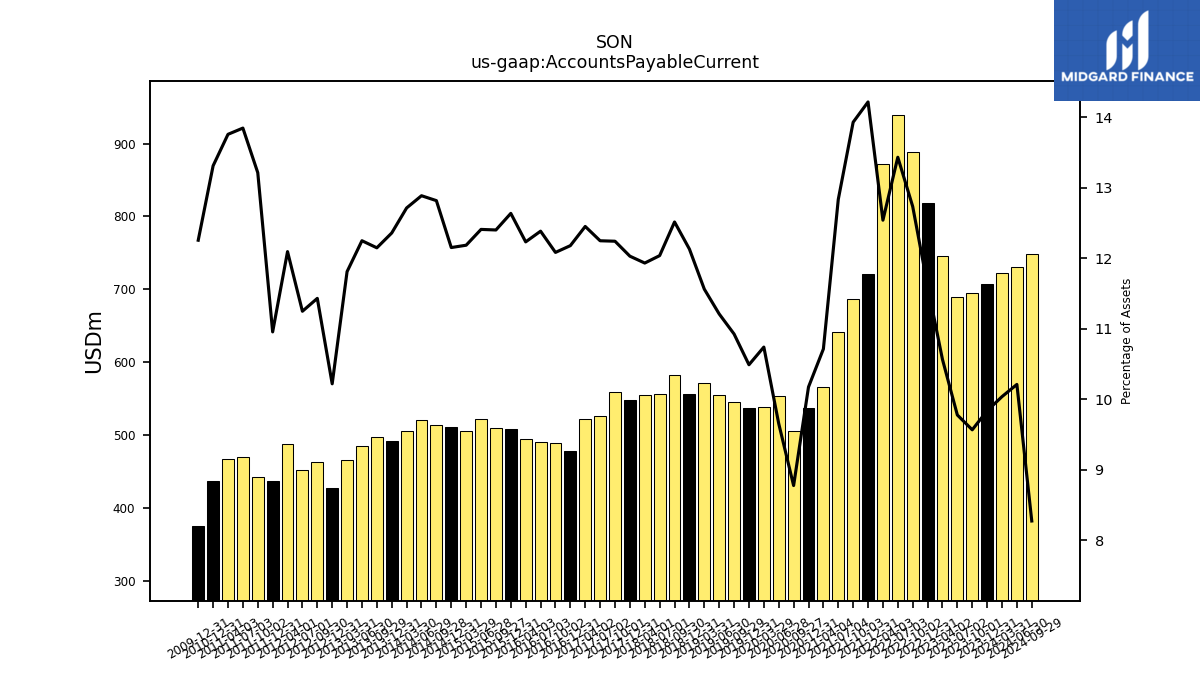
| Accounts Payable Current | 707.49 | 695.55 | 689.21 | 746.12 | 818.88 | 888.39 | 938.93 | 872.34 | 721.31 | 686.11 | 641.00 | 565.78 | 536.94 | 506.17 | 554.09 | 538.35 | 537.76 | 544.80 | 554.43 | 571.37 | 556.01 | 583.05 | 556.52 | 555.25 | 548.31 | 559.43 | 525.82 | 521.78 | 477.83 | 488.73 | 491.04 | 495.20 | 508.06 | 510.17 | 521.90 | 506.33 | 511.63 | 514.40 | 520.53 | 506.07 | 491.81 | NA | 496.81 | 484.69 | 466.44 | 426.79 | 463.70 | 452.76 | NA | 487.73 | NA | 436.73 | 442.73 | NA | 469.92 | NA | 467.42 | NA | 436.79 | NA | NA | NA | |
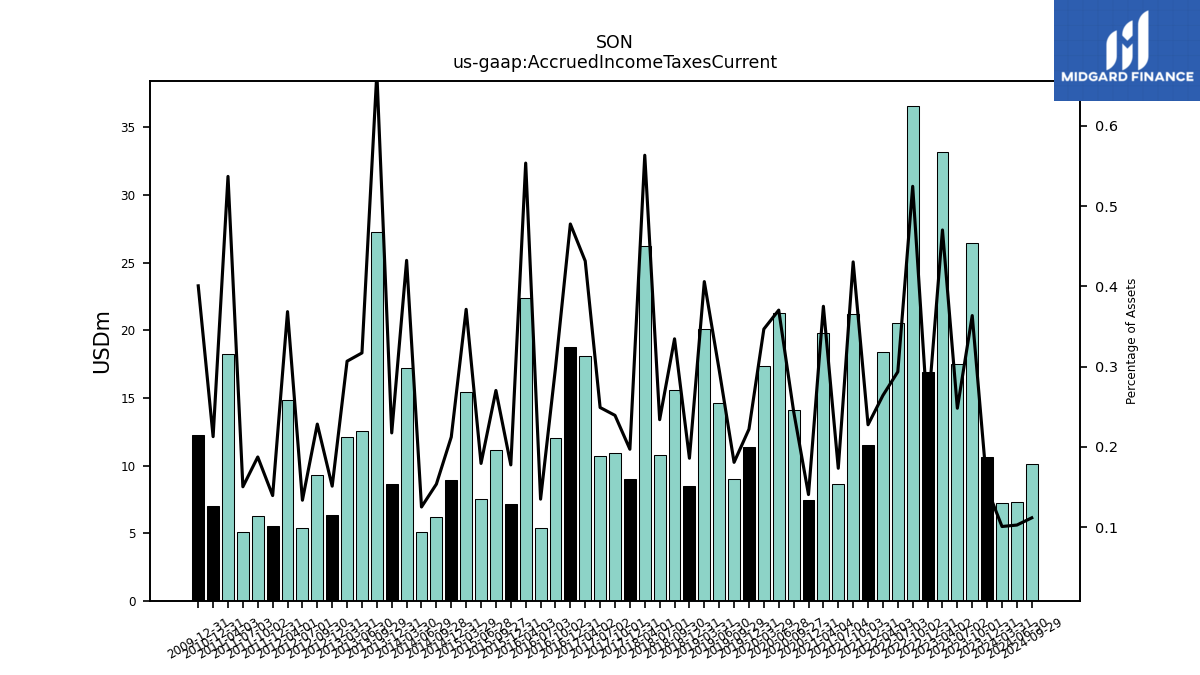
| Accrued Income Taxes Current | 10.64 | 26.43 | 17.49 | 33.21 | 16.91 | 36.60 | 20.52 | 18.37 | 11.54 | 21.20 | 8.65 | 19.81 | 7.42 | 14.09 | 21.26 | 17.38 | 11.38 | 9.01 | 14.63 | 20.06 | 8.52 | 15.59 | 10.81 | 26.22 | 8.98 | 10.93 | 10.69 | 18.09 | 18.74 | 12.05 | 5.34 | 22.41 | 7.13 | 11.12 | 7.54 | 15.43 | 8.94 | 6.16 | 5.05 | 17.21 | 8.65 | NA | 27.25 | 12.54 | 12.11 | 6.30 | 9.26 | 5.37 | NA | 14.86 | NA | 5.55 | 6.28 | NA | 5.10 | NA | 18.25 | NA | 6.98 | NA | NA | NA | |
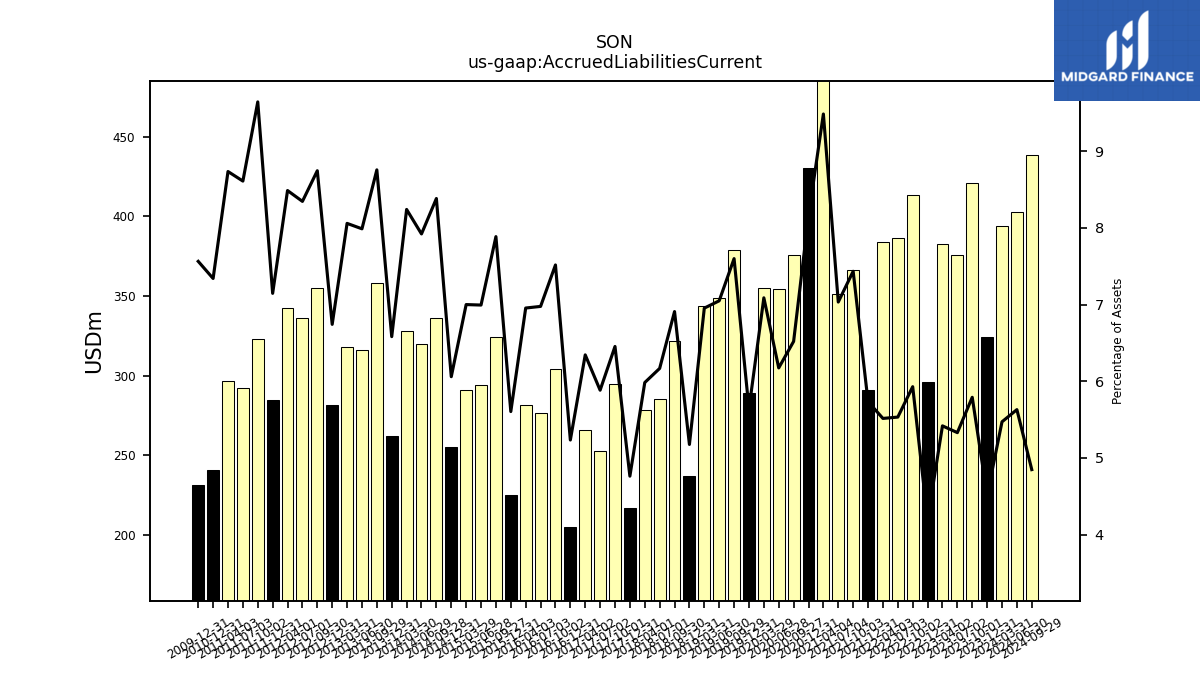
| Accrued Liabilities Current | 324.34 | 420.94 | 375.67 | 382.56 | 295.84 | 413.55 | 386.66 | 383.60 | 290.87 | 366.13 | 351.22 | 500.90 | 430.24 | 375.97 | 354.30 | 355.25 | 289.07 | 378.90 | 348.61 | 343.60 | 237.20 | 321.84 | 285.10 | 278.38 | 217.02 | 294.89 | 252.54 | 265.82 | 205.30 | 304.00 | 276.58 | 281.52 | 225.30 | 324.40 | 294.11 | 290.85 | 255.08 | 336.42 | 319.93 | 328.00 | 261.89 | NA | 358.10 | 316.07 | 318.25 | 281.53 | 354.74 | 335.91 | NA | 342.24 | NA | 284.85 | 323.07 | NA | 292.20 | NA | 296.76 | NA | 240.83 | NA | NA | NA |
| 2023-12-31 | 2023-10-01 | 2023-07-02 | 2023-04-02 | 2022-12-31 | 2022-10-02 | 2022-07-03 | 2022-04-03 | 2021-12-31 | 2021-10-03 | 2021-07-04 | 2021-04-04 | 2020-12-31 | 2020-09-27 | 2020-06-28 | 2020-03-29 | 2019-12-31 | 2019-09-29 | 2019-06-30 | 2019-03-31 | 2018-12-31 | 2018-09-30 | 2018-07-01 | 2018-04-01 | 2017-12-31 | 2017-10-01 | 2017-07-02 | 2017-04-02 | 2016-12-31 | 2016-10-02 | 2016-07-03 | 2016-04-03 | 2015-12-31 | 2015-09-27 | 2015-06-28 | 2015-03-29 | 2014-12-31 | 2014-09-28 | 2014-06-29 | 2014-03-30 | 2013-12-31 | 2013-09-30 | 2013-09-29 | 2013-06-30 | 2013-03-31 | 2012-12-31 | 2012-09-30 | 2012-07-01 | 2012-06-30 | 2012-04-01 | 2012-03-31 | 2011-12-31 | 2011-10-02 | 2011-09-30 | 2011-07-03 | 2011-06-30 | 2011-04-03 | 2011-03-31 | 2010-12-31 | 2010-09-26 | 2010-06-27 | 2010-03-28 | ||
|---|---|---|---|---|---|---|---|---|---|---|---|---|---|---|---|---|---|---|---|---|---|---|---|---|---|---|---|---|---|---|---|---|---|---|---|---|---|---|---|---|---|---|---|---|---|---|---|---|---|---|---|---|---|---|---|---|---|---|---|---|---|---|---|
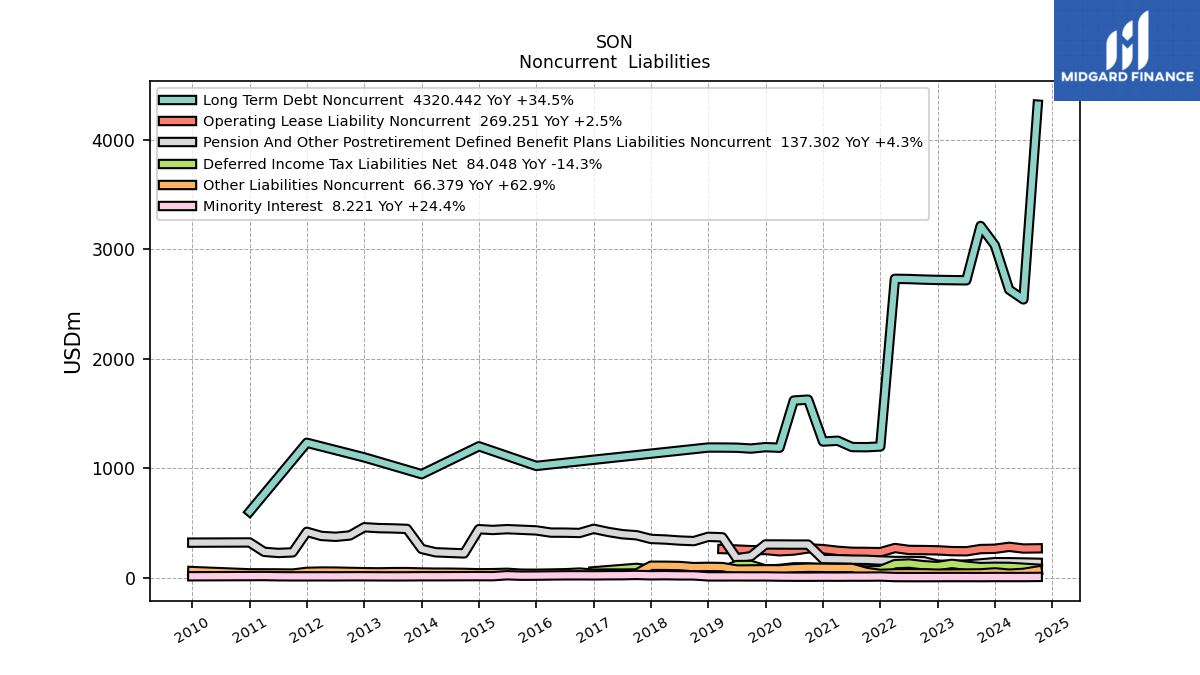
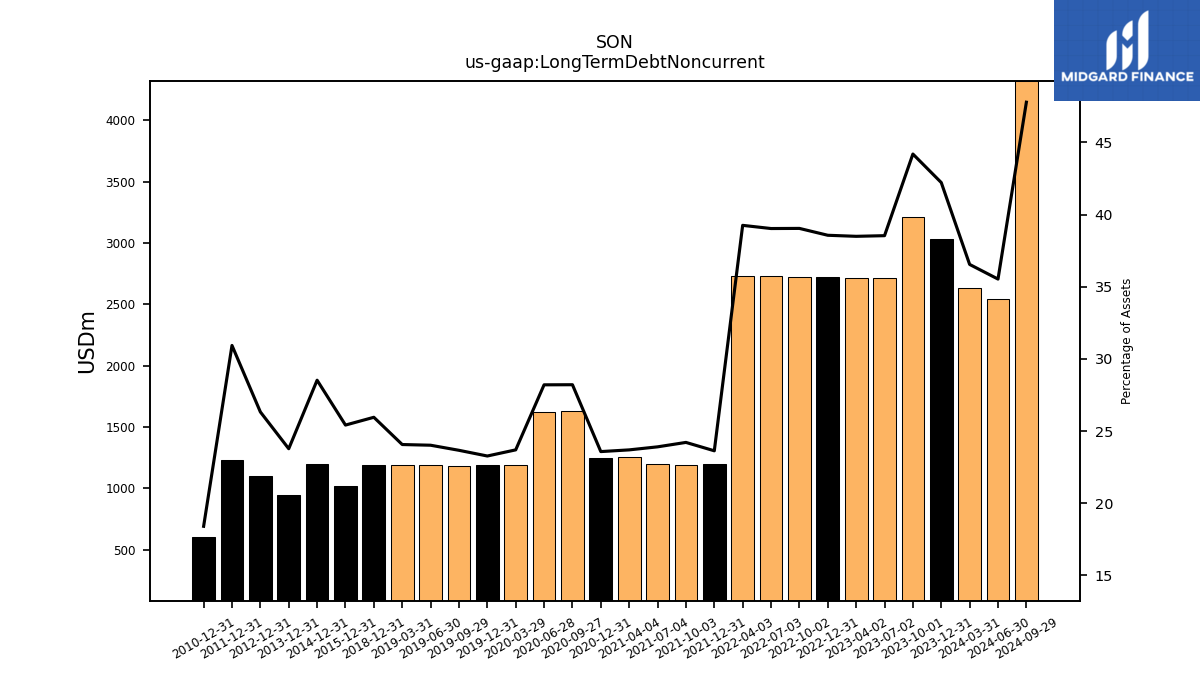
| Long Term Debt Noncurrent | 3035.87 | 3212.45 | 2716.25 | 2717.89 | 2719.78 | 2723.10 | 2727.92 | 2730.15 | 1199.11 | 1192.71 | 1194.06 | 1251.51 | 1244.44 | 1627.04 | 1618.64 | 1187.90 | 1193.13 | 1180.22 | 1188.03 | 1189.41 | 1189.72 | NA | NA | NA | NA | NA | NA | NA | NA | NA | NA | NA | 1021.85 | NA | NA | NA | 1200.88 | NA | NA | NA | 946.26 | NA | NA | NA | NA | 1099.45 | NA | NA | NA | NA | NA | 1232.97 | NA | NA | NA | NA | NA | NA | 603.94 | NA | NA | NA | |
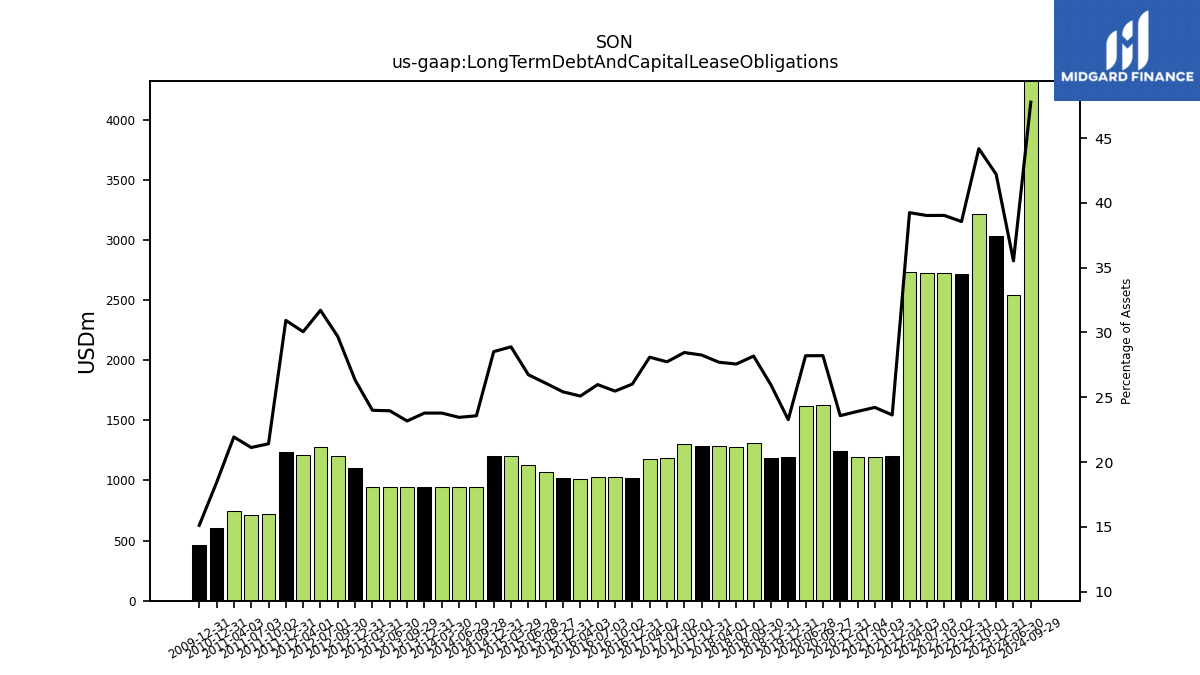
| Long Term Debt And Capital Lease Obligations | 3035.87 | 3212.45 | NA | NA | 2719.78 | 2723.10 | 2727.92 | 2730.15 | 1199.11 | 1192.71 | 1194.06 | NA | 1244.44 | 1627.04 | 1618.64 | NA | 1193.13 | NA | NA | NA | 1189.72 | 1312.68 | 1274.33 | 1289.05 | 1288.00 | 1300.19 | 1190.65 | 1177.19 | 1020.70 | 1030.34 | 1029.94 | 1015.80 | 1021.85 | 1073.04 | 1124.58 | 1200.51 | 1200.88 | 945.90 | 947.08 | 946.51 | 946.26 | NA | 947.54 | 947.96 | 947.57 | 1099.45 | 1204.11 | 1276.50 | NA | 1212.05 | NA | 1232.97 | 717.23 | NA | 716.81 | NA | 745.19 | NA | 603.94 | NA | NA | NA | |
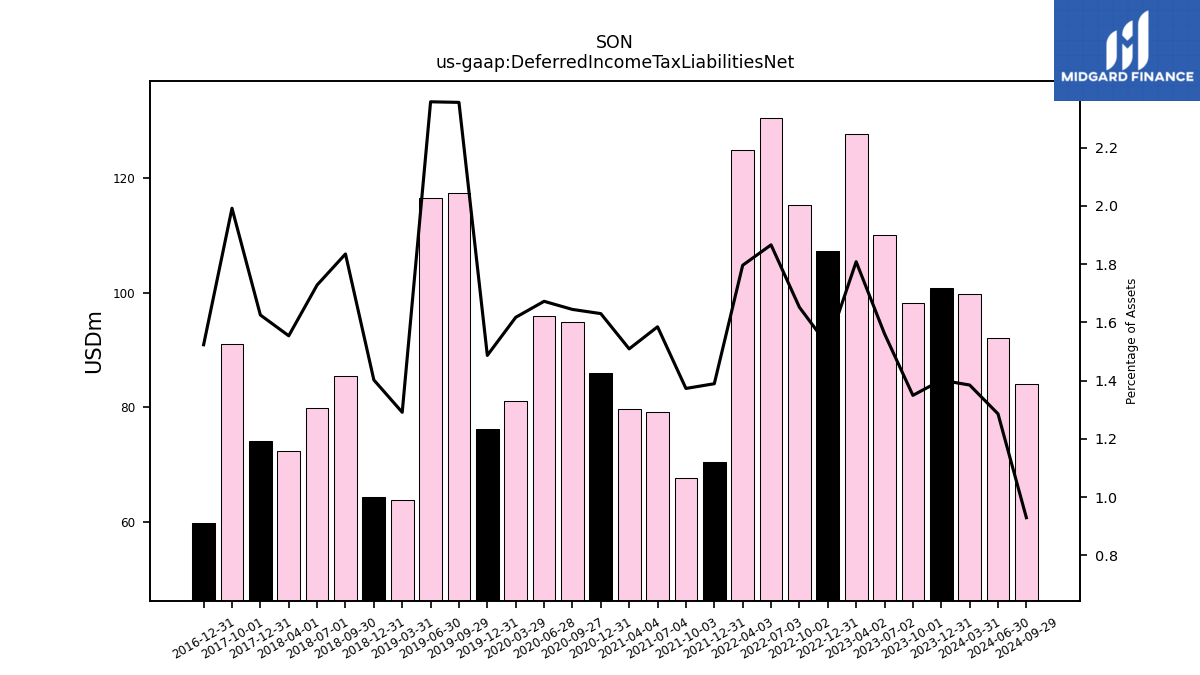
| Deferred Income Tax Liabilities Net | 100.79 | 98.10 | 110.02 | 127.67 | 107.29 | 115.22 | 130.42 | 124.92 | 70.48 | 67.63 | 79.14 | 79.68 | 86.02 | 94.83 | 95.96 | 81.06 | 76.21 | 117.43 | 116.57 | 63.81 | 64.27 | 85.47 | 79.89 | 72.30 | 74.07 | 91.01 | NA | NA | 59.75 | NA | NA | NA | NA | NA | NA | NA | NA | NA | NA | NA | NA | NA | NA | NA | NA | NA | NA | NA | NA | NA | NA | NA | NA | NA | NA | NA | NA | NA | NA | NA | NA | NA | |
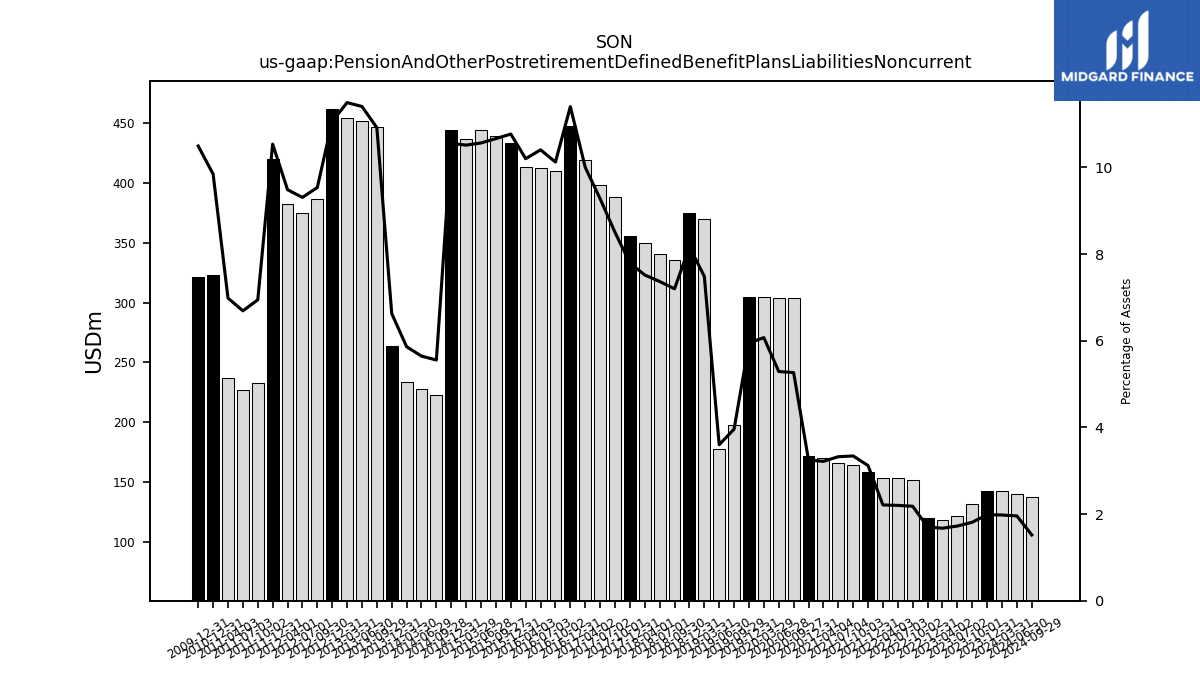
| Pension And Other Postretirement Defined Benefit Plans Liabilities Noncurrent | 142.90 | 131.67 | 121.52 | 118.16 | 120.08 | 152.12 | 153.81 | 153.82 | 158.26 | 164.58 | 166.00 | 169.86 | 171.52 | 303.62 | 303.61 | 304.36 | 304.80 | 197.45 | 178.07 | 369.91 | 374.42 | 335.38 | 340.60 | 349.82 | 355.19 | 388.49 | 398.25 | 419.18 | 447.34 | 409.46 | 412.57 | 412.97 | 432.96 | 438.72 | 444.29 | 436.90 | 444.23 | 222.93 | 228.01 | 233.33 | 263.72 | NA | 446.49 | 451.33 | 453.96 | 461.88 | 386.83 | 374.65 | NA | 382.50 | NA | 420.05 | 232.63 | NA | 227.06 | NA | 237.25 | NA | 323.04 | NA | NA | NA | |
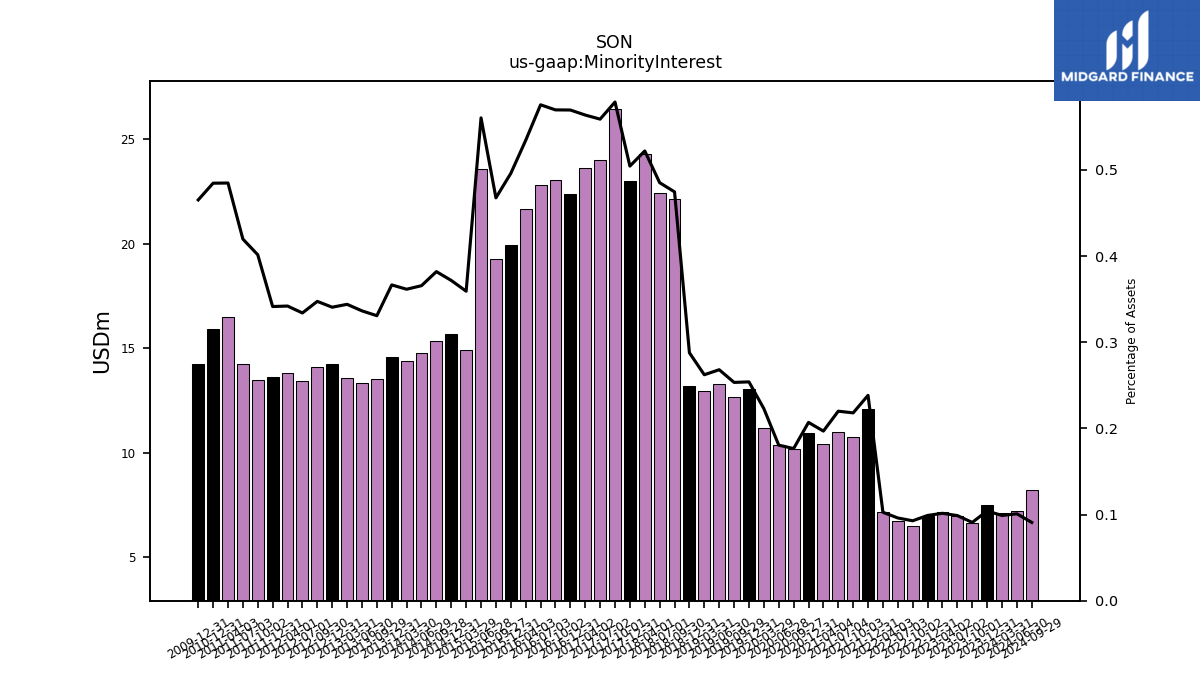
| Minority Interest | 7.50 | 6.61 | 6.97 | 7.17 | 6.98 | 6.47 | 6.72 | 7.14 | 12.10 | 10.74 | 10.99 | 10.40 | 10.92 | 10.19 | 10.37 | 11.18 | 13.02 | 12.64 | 13.26 | 12.96 | 13.19 | 22.11 | 22.43 | 24.29 | 22.99 | 26.45 | 24.00 | 23.62 | 22.35 | 23.04 | 22.82 | 21.63 | 19.94 | 19.24 | 23.57 | 14.93 | 15.65 | 15.33 | 14.77 | 14.39 | 14.59 | NA | 13.53 | 13.31 | 13.59 | 14.23 | 14.10 | 13.45 | NA | 13.79 | NA | 13.61 | 13.45 | NA | 14.25 | NA | 16.47 | NA | 15.90 | NA | NA | NA | |
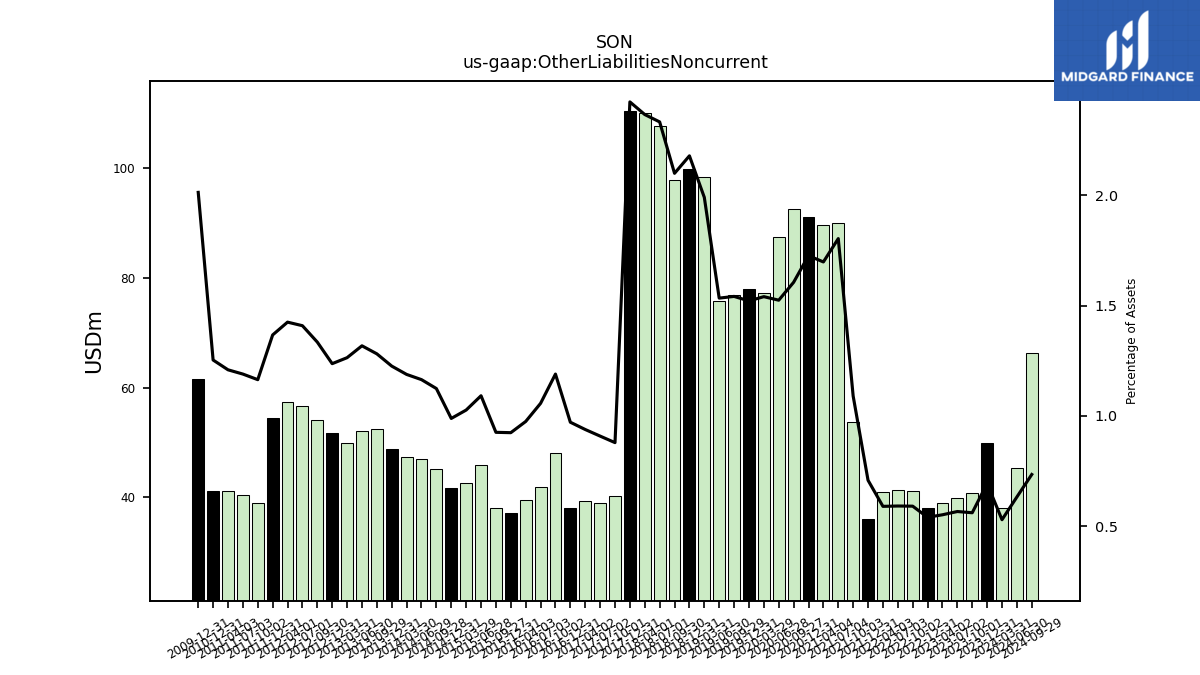
| Other Liabilities Noncurrent | 49.84 | 40.76 | 39.91 | 38.94 | 38.09 | 41.19 | 41.32 | 41.01 | 35.91 | 53.67 | 90.05 | 89.64 | 91.08 | 92.58 | 87.46 | 77.19 | 77.96 | 76.85 | 75.84 | 98.34 | 99.85 | 97.79 | 107.81 | 110.07 | 110.43 | 40.14 | 38.98 | 39.30 | 38.09 | 48.09 | 41.89 | 39.44 | 37.13 | 38.06 | 45.88 | 42.63 | 41.60 | 45.09 | 47.01 | 47.27 | 48.76 | NA | 52.38 | 52.12 | 49.90 | 51.63 | 54.12 | 56.69 | NA | 57.45 | NA | 54.47 | 38.99 | NA | 40.36 | NA | 41.06 | NA | 41.11 | NA | NA | NA | |
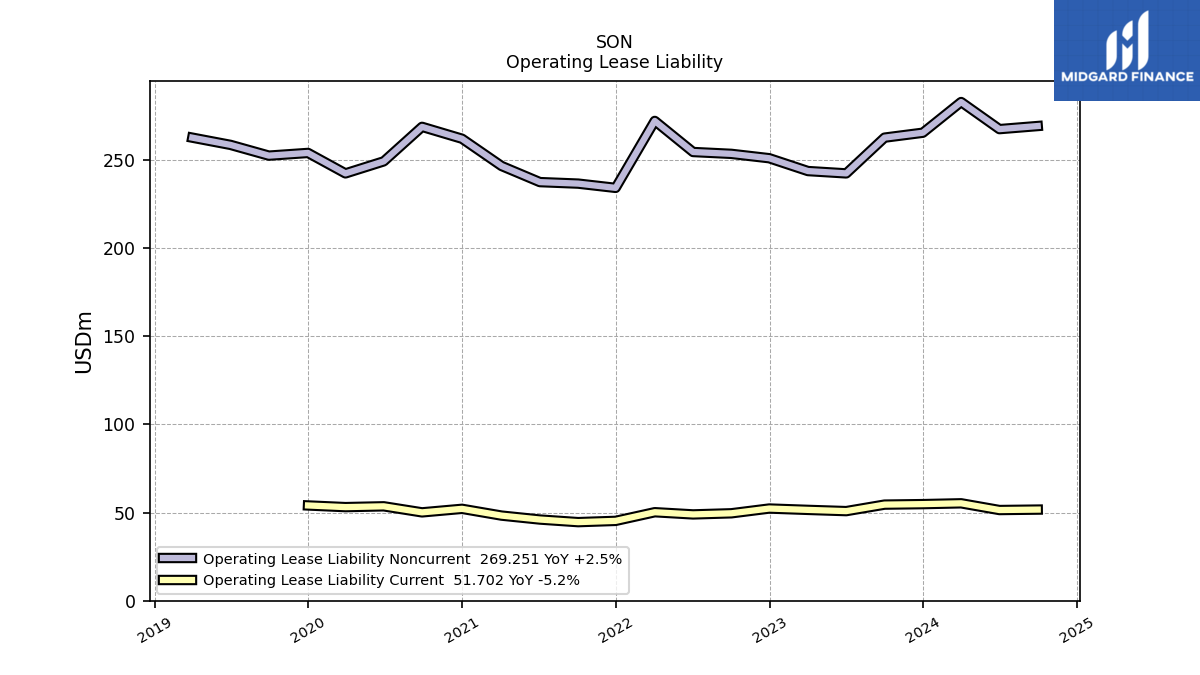
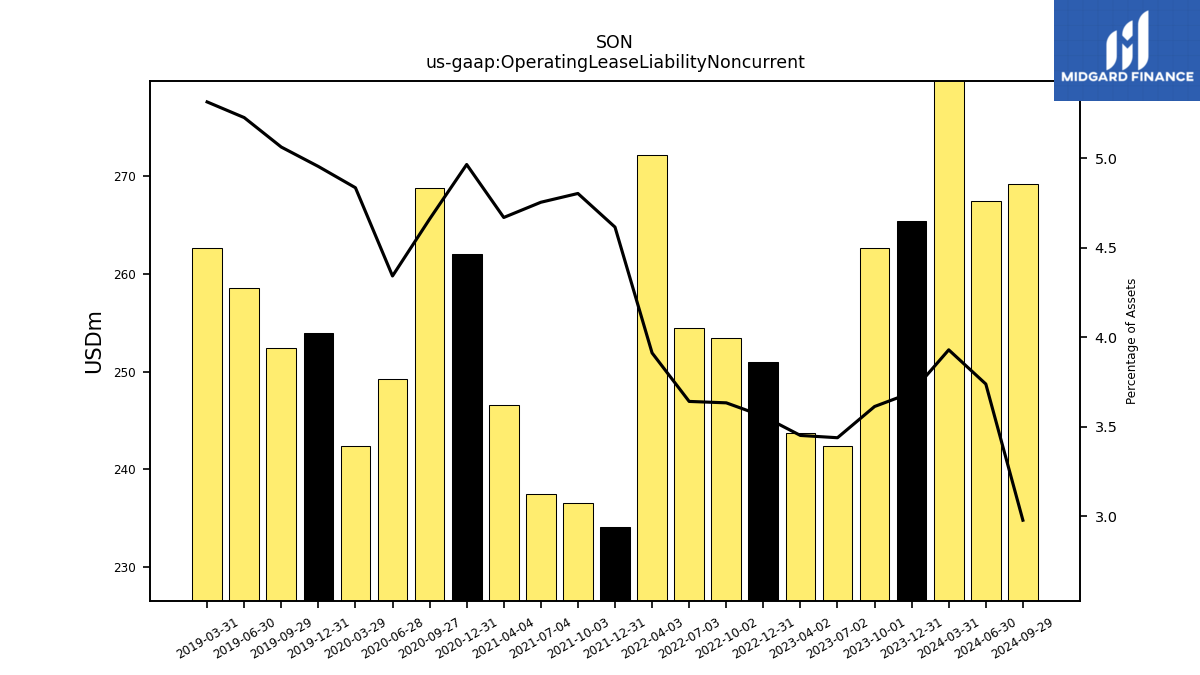
| Operating Lease Liability Noncurrent | 265.45 | 262.67 | 242.38 | 243.71 | 250.99 | 253.47 | 254.52 | 272.16 | 234.17 | 236.59 | 237.45 | 246.59 | 262.05 | 268.79 | 249.22 | 242.38 | 253.99 | 252.46 | 258.55 | 262.66 | NA | NA | NA | NA | NA | NA | NA | NA | NA | NA | NA | NA | NA | NA | NA | NA | NA | NA | NA | NA | NA | NA | NA | NA | NA | NA | NA | NA | NA | NA | NA | NA | NA | NA | NA | NA | NA | NA | NA | NA | NA | NA |
| 2023-12-31 | 2023-10-01 | 2023-07-02 | 2023-04-02 | 2022-12-31 | 2022-10-02 | 2022-07-03 | 2022-04-03 | 2021-12-31 | 2021-10-03 | 2021-07-04 | 2021-04-04 | 2020-12-31 | 2020-09-27 | 2020-06-28 | 2020-03-29 | 2019-12-31 | 2019-09-29 | 2019-06-30 | 2019-03-31 | 2018-12-31 | 2018-09-30 | 2018-07-01 | 2018-04-01 | 2017-12-31 | 2017-10-01 | 2017-07-02 | 2017-04-02 | 2016-12-31 | 2016-10-02 | 2016-07-03 | 2016-04-03 | 2015-12-31 | 2015-09-27 | 2015-06-28 | 2015-03-29 | 2014-12-31 | 2014-09-28 | 2014-06-29 | 2014-03-30 | 2013-12-31 | 2013-09-30 | 2013-09-29 | 2013-06-30 | 2013-03-31 | 2012-12-31 | 2012-09-30 | 2012-07-01 | 2012-06-30 | 2012-04-01 | 2012-03-31 | 2011-12-31 | 2011-10-02 | 2011-09-30 | 2011-07-03 | 2011-06-30 | 2011-04-03 | 2011-03-31 | 2010-12-31 | 2010-09-26 | 2010-06-27 | 2010-03-28 | ||
|---|---|---|---|---|---|---|---|---|---|---|---|---|---|---|---|---|---|---|---|---|---|---|---|---|---|---|---|---|---|---|---|---|---|---|---|---|---|---|---|---|---|---|---|---|---|---|---|---|---|---|---|---|---|---|---|---|---|---|---|---|---|---|---|
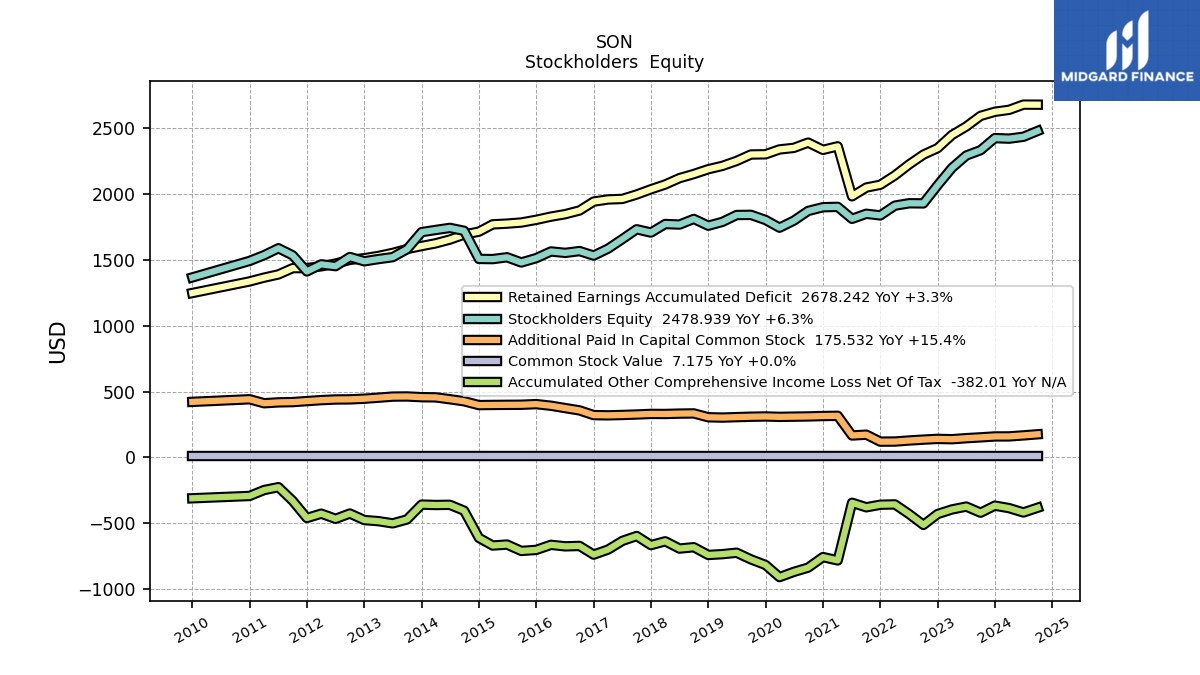
| Stockholders Equity | 2424.34 | 2332.55 | 2292.35 | 2198.40 | 2065.81 | 1928.61 | 1929.67 | 1911.79 | 1837.44 | 1849.99 | 1811.44 | 1902.40 | 1899.61 | 1871.14 | 1797.34 | 1744.26 | 1802.68 | 1841.68 | 1840.36 | 1788.18 | 1759.09 | 1810.82 | 1767.83 | 1772.16 | 1707.07 | 1732.17 | 1657.80 | 1585.24 | 1532.36 | 1566.59 | 1552.89 | 1563.71 | 1512.93 | 1480.05 | 1519.56 | 1505.63 | 1507.12 | 1720.49 | 1742.69 | 1726.78 | 1710.74 | NA | 1580.46 | 1520.56 | 1505.78 | 1488.99 | 1521.69 | 1452.15 | NA | 1465.81 | NA | 1411.80 | 1534.02 | NA | 1588.19 | NA | 1535.66 | NA | 1491.79 | NA | NA | NA | |
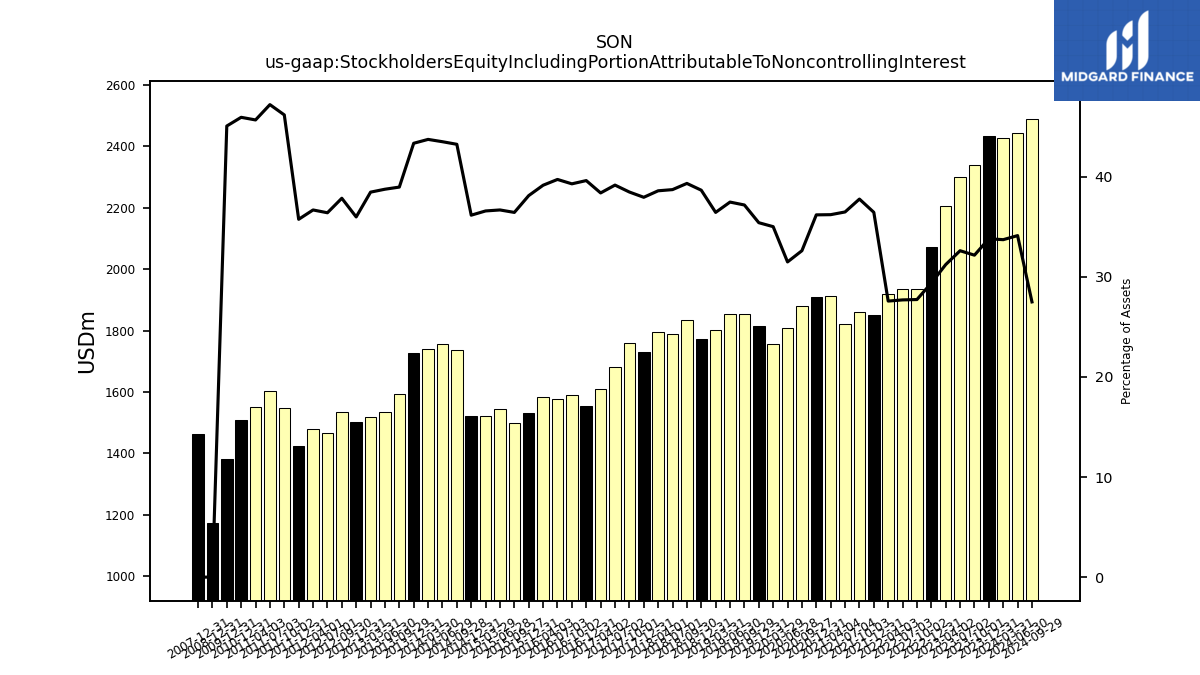
| Stockholders Equity Including Portion Attributable To Noncontrolling Interest | 2431.84 | 2339.16 | 2299.32 | 2205.57 | 2072.80 | 1935.08 | 1936.39 | 1918.93 | 1849.54 | 1860.73 | 1822.43 | 1912.80 | 1910.53 | 1881.33 | 1807.70 | 1755.44 | 1815.70 | 1854.31 | 1853.62 | 1801.14 | 1772.28 | 1832.93 | 1790.27 | 1796.46 | 1730.06 | 1758.63 | 1681.79 | 1608.87 | 1554.70 | 1589.64 | 1575.72 | 1585.34 | 1532.87 | 1499.29 | 1543.13 | 1520.56 | 1522.78 | 1735.83 | 1757.46 | 1741.17 | 1725.33 | NA | 1593.99 | 1533.87 | 1519.37 | 1503.21 | 1535.78 | 1465.60 | NA | 1479.60 | NA | 1425.41 | 1547.48 | NA | 1602.43 | NA | 1552.13 | NA | 1507.69 | NA | NA | NA | |
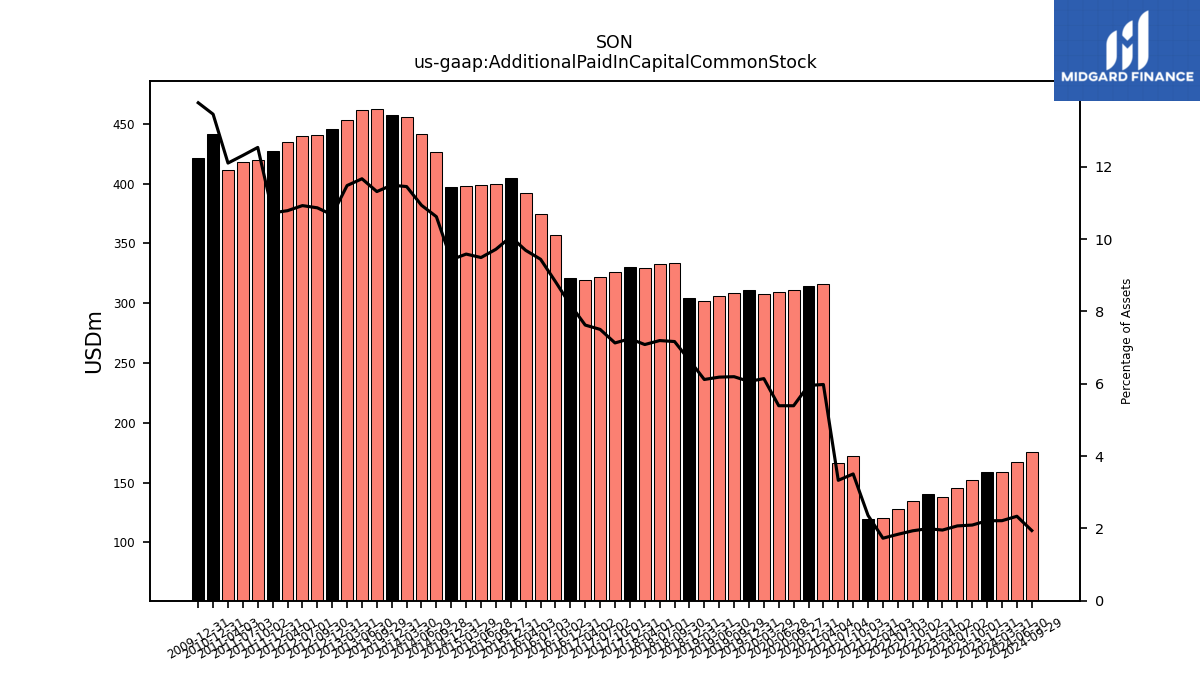
| Additional Paid In Capital Common Stock | 159.05 | 152.15 | 145.84 | 138.01 | 140.54 | 134.92 | 128.33 | 120.27 | 119.69 | 172.66 | 166.29 | 315.74 | 314.06 | 310.91 | 309.43 | 307.81 | 310.78 | 308.87 | 305.75 | 302.27 | 304.71 | 333.85 | 332.53 | 329.60 | 330.16 | 325.71 | 322.05 | 319.37 | 321.05 | 356.82 | 374.33 | 392.15 | 404.46 | 399.74 | 399.05 | 398.22 | 396.98 | 426.09 | 441.61 | 455.76 | 457.19 | NA | 462.62 | 461.61 | 453.32 | 445.49 | 440.65 | 439.70 | NA | 434.86 | NA | 427.48 | 419.86 | NA | 417.83 | NA | 411.08 | NA | 441.33 | NA | NA | NA | |
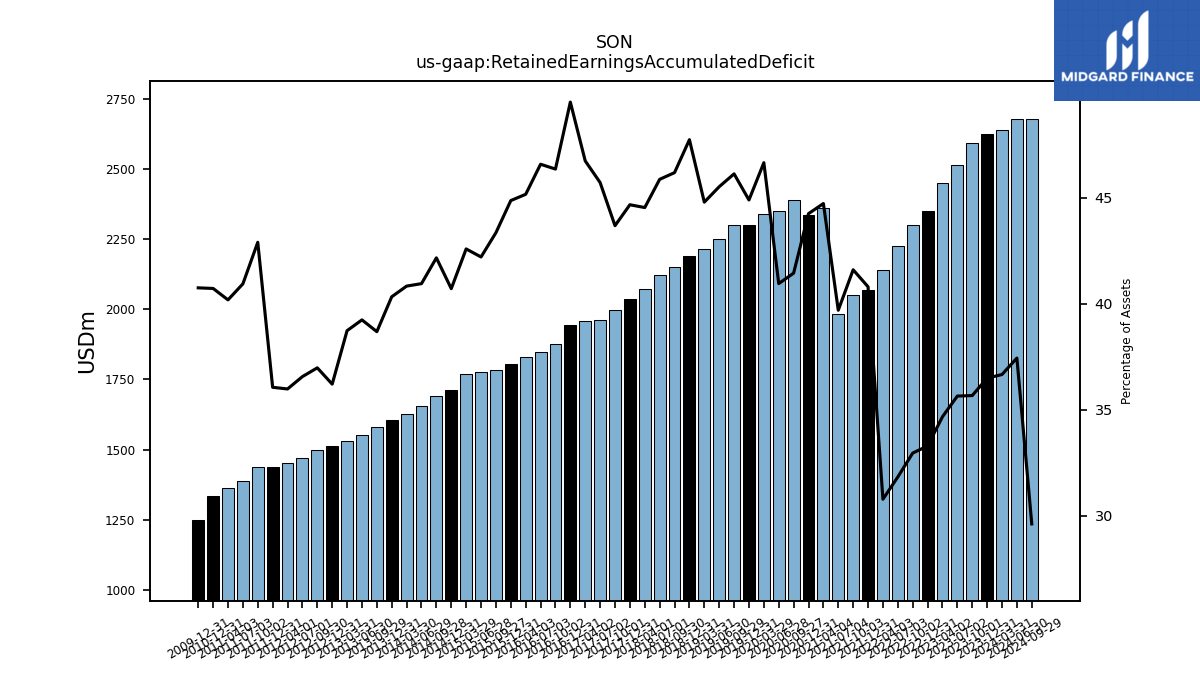
| Retained Earnings Accumulated Deficit | 2624.38 | 2593.33 | 2512.77 | 2448.30 | 2348.18 | 2299.04 | 2224.84 | 2141.21 | 2070.01 | 2049.07 | 1982.43 | 2362.00 | 2335.22 | 2390.27 | 2350.19 | 2338.43 | 2301.53 | 2300.01 | 2251.28 | 2213.47 | 2188.11 | 2151.66 | 2120.53 | 2072.42 | 2036.01 | 1996.24 | 1962.57 | 1958.58 | 1942.51 | 1874.83 | 1846.90 | 1828.24 | 1803.83 | 1783.38 | 1775.04 | 1769.55 | 1714.07 | 1692.14 | 1653.95 | 1625.31 | 1604.89 | NA | 1581.98 | 1552.69 | 1529.57 | 1512.14 | 1499.98 | 1471.73 | NA | 1450.97 | NA | 1437.43 | 1437.23 | NA | 1389.32 | NA | 1365.16 | NA | 1336.15 | NA | NA | NA | |
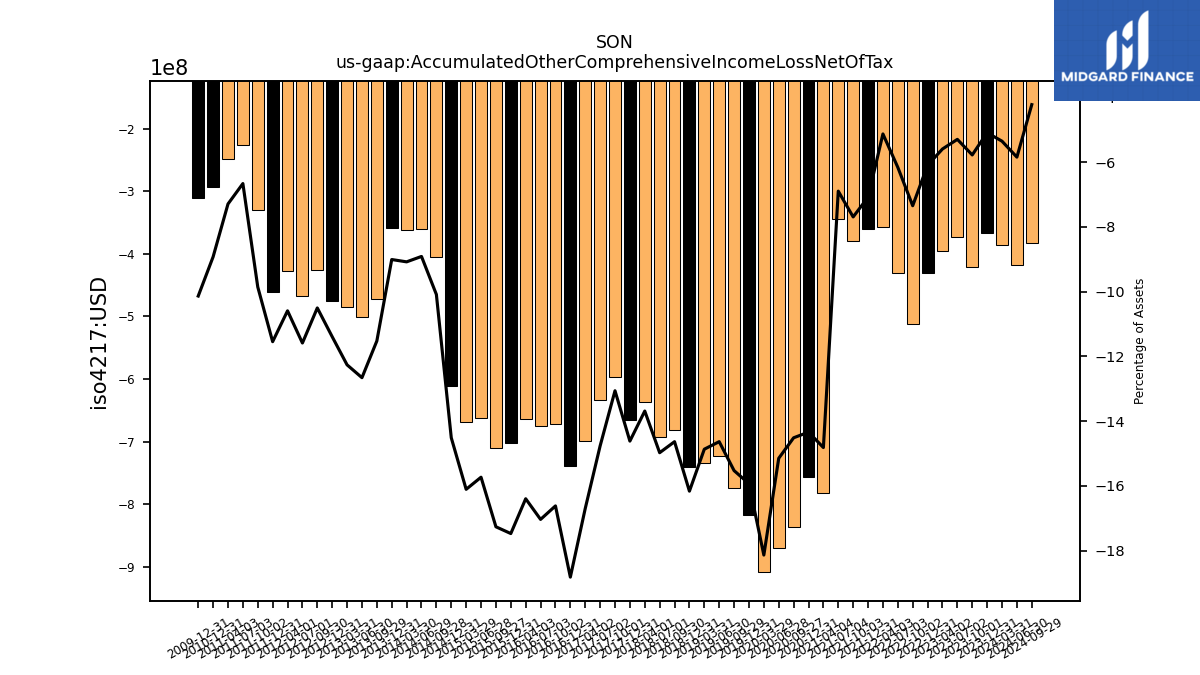
| Accumulated Other Comprehensive Income Loss Net Of Tax | -366.26 | -420.11 | -373.43 | -395.08 | -430.08 | -512.52 | -430.68 | -356.87 | -359.43 | -378.91 | -344.46 | -782.52 | -756.84 | -837.21 | -869.45 | -909.15 | -816.80 | -774.37 | -723.85 | -734.75 | -740.91 | -681.87 | -692.40 | -637.03 | -666.27 | -596.95 | -634.00 | -699.87 | -738.38 | -672.24 | -675.52 | -663.86 | -702.53 | -710.25 | -661.71 | -669.33 | -611.10 | -404.91 | -360.05 | -361.47 | -358.52 | NA | -471.31 | -500.91 | -484.29 | -475.83 | -426.12 | -466.45 | NA | -427.19 | NA | -460.30 | -330.24 | NA | -226.13 | NA | -247.75 | NA | -292.87 | NA | NA | NA | |
| Minority Interest | 7.50 | 6.61 | 6.97 | 7.17 | 6.98 | 6.47 | 6.72 | 7.14 | 12.10 | 10.74 | 10.99 | 10.40 | 10.92 | 10.19 | 10.37 | 11.18 | 13.02 | 12.64 | 13.26 | 12.96 | 13.19 | 22.11 | 22.43 | 24.29 | 22.99 | 26.45 | 24.00 | 23.62 | 22.35 | 23.04 | 22.82 | 21.63 | 19.94 | 19.24 | 23.57 | 14.93 | 15.65 | 15.33 | 14.77 | 14.39 | 14.59 | NA | 13.53 | 13.31 | 13.59 | 14.23 | 14.10 | 13.45 | NA | 13.79 | NA | 13.61 | 13.45 | NA | 14.25 | NA | 16.47 | NA | 15.90 | NA | NA | NA |
| 2023-12-31 | 2023-10-01 | 2023-07-02 | 2023-04-02 | 2022-12-31 | 2022-10-02 | 2022-07-03 | 2022-04-03 | 2021-12-31 | 2021-10-03 | 2021-07-04 | 2021-04-04 | 2020-12-31 | 2020-09-27 | 2020-06-28 | 2020-03-29 | 2019-12-31 | 2019-09-29 | 2019-06-30 | 2019-03-31 | 2018-12-31 | 2018-09-30 | 2018-07-01 | 2018-04-01 | 2017-12-31 | 2017-10-01 | 2017-07-02 | 2017-04-02 | 2016-12-31 | 2016-10-02 | 2016-07-03 | 2016-04-03 | 2015-12-31 | 2015-09-27 | 2015-06-28 | 2015-03-29 | 2014-12-31 | 2014-09-28 | 2014-06-29 | 2014-03-30 | 2013-12-31 | 2013-09-30 | 2013-09-29 | 2013-06-30 | 2013-03-31 | 2012-12-31 | 2012-09-30 | 2012-07-01 | 2012-06-30 | 2012-04-01 | 2012-03-31 | 2011-12-31 | 2011-10-02 | 2011-09-30 | 2011-07-03 | 2011-06-30 | 2011-04-03 | 2011-03-31 | 2010-12-31 | 2010-09-26 | 2010-06-27 | 2010-03-28 | ||
|---|---|---|---|---|---|---|---|---|---|---|---|---|---|---|---|---|---|---|---|---|---|---|---|---|---|---|---|---|---|---|---|---|---|---|---|---|---|---|---|---|---|---|---|---|---|---|---|---|---|---|---|---|---|---|---|---|---|---|---|---|---|---|---|
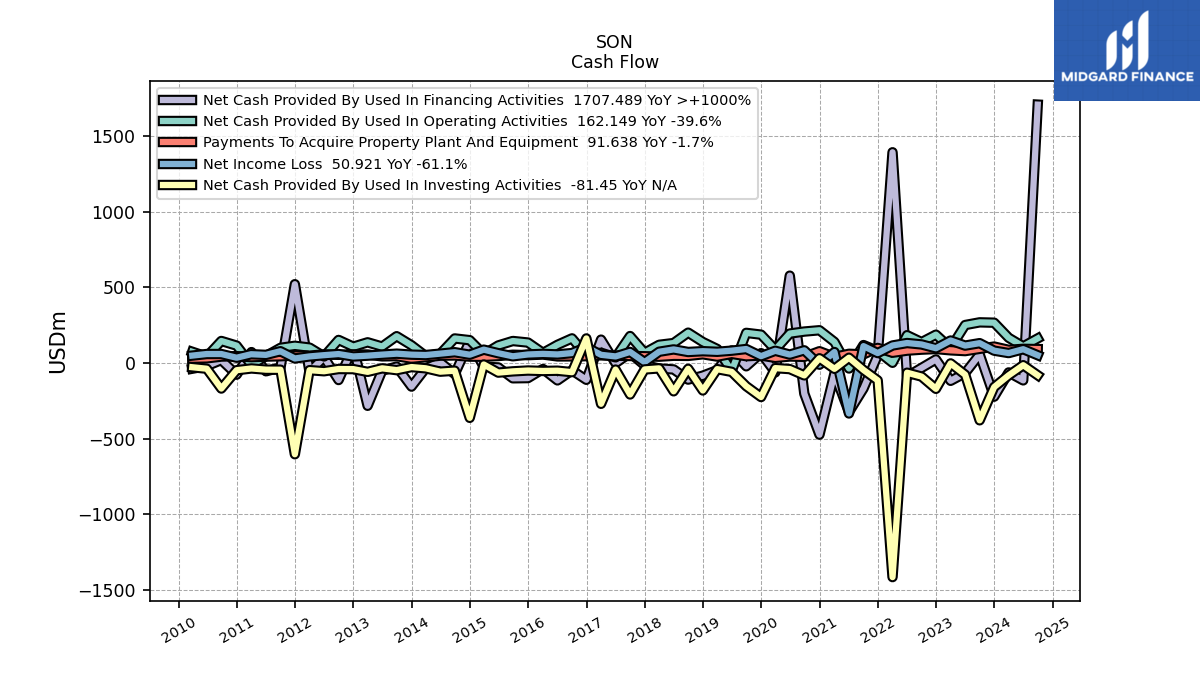
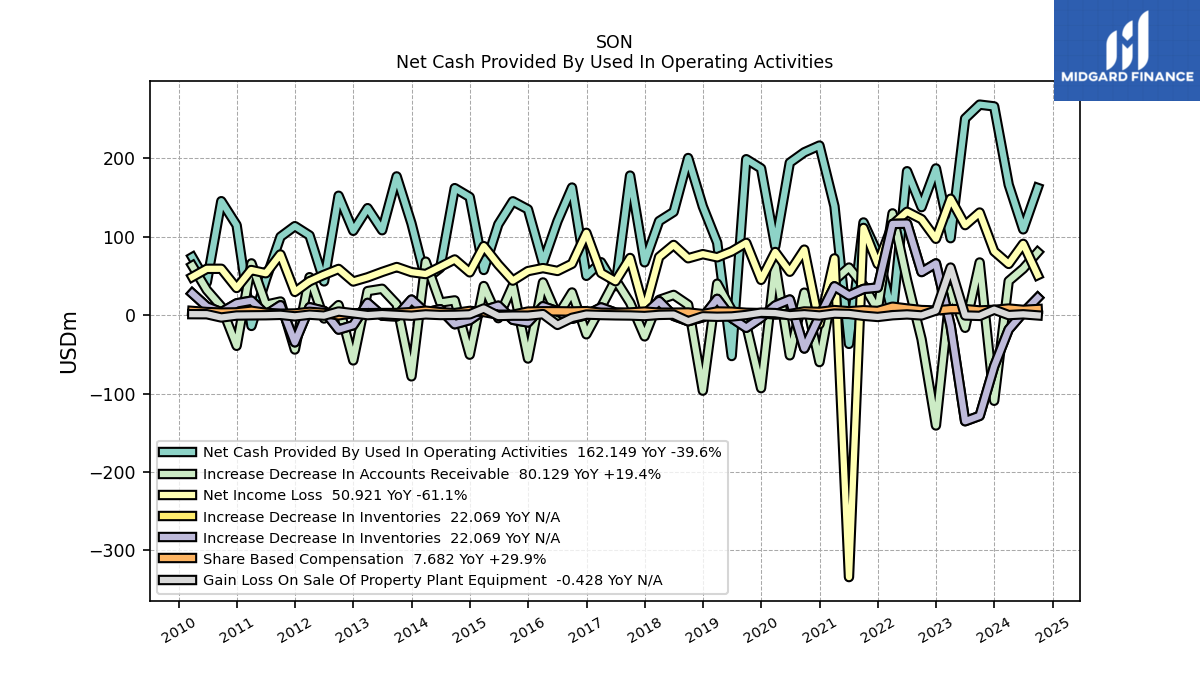
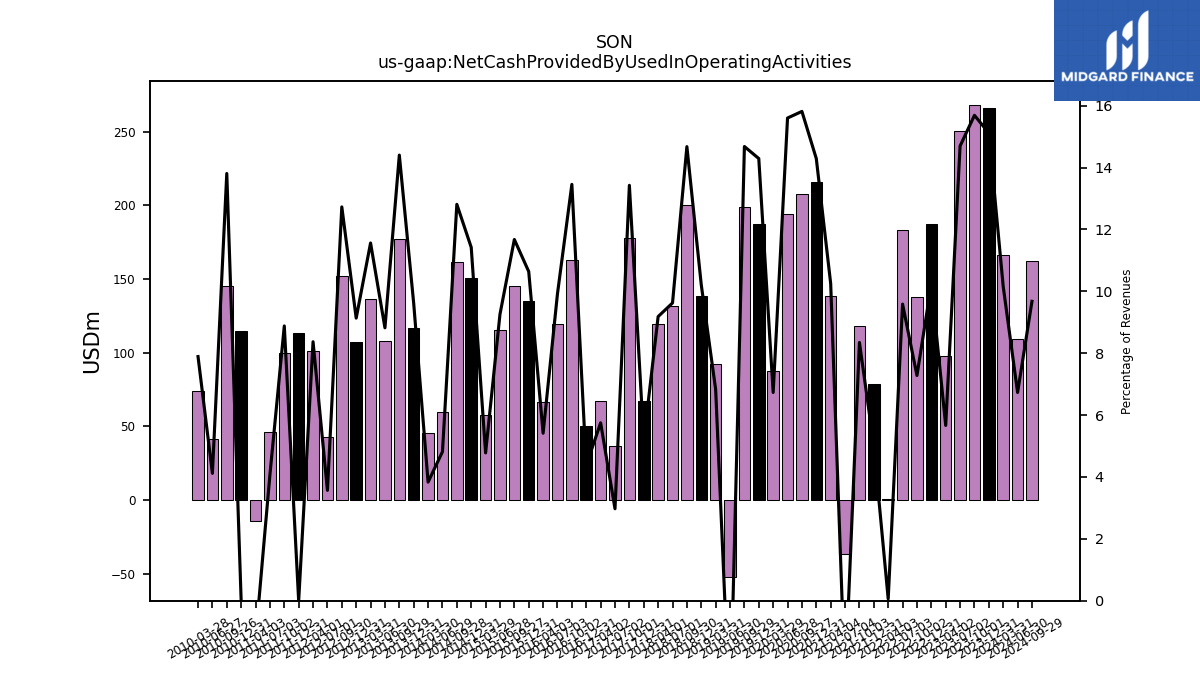
| Net Cash Provided By Used In Operating Activities | 266.04 | 268.29 | 250.58 | 98.00 | 186.99 | 137.59 | 183.41 | 1.06 | 78.59 | 118.12 | -36.76 | 138.72 | 216.12 | 207.51 | 194.28 | 87.71 | 187.03 | 198.74 | -52.24 | 92.32 | 138.38 | 200.27 | 131.48 | 119.77 | 67.25 | 177.83 | 36.88 | 67.40 | 50.00 | 162.63 | 119.66 | 66.39 | 134.79 | 145.06 | 115.59 | 57.49 | 150.52 | 161.86 | 60.07 | 45.46 | 116.74 | NA | 176.80 | 108.16 | 136.32 | 107.39 | 152.16 | 42.90 | NA | 101.47 | NA | 113.37 | 99.83 | NA | 45.92 | NA | -13.85 | NA | 114.55 | 145.21 | 41.59 | 73.79 | |
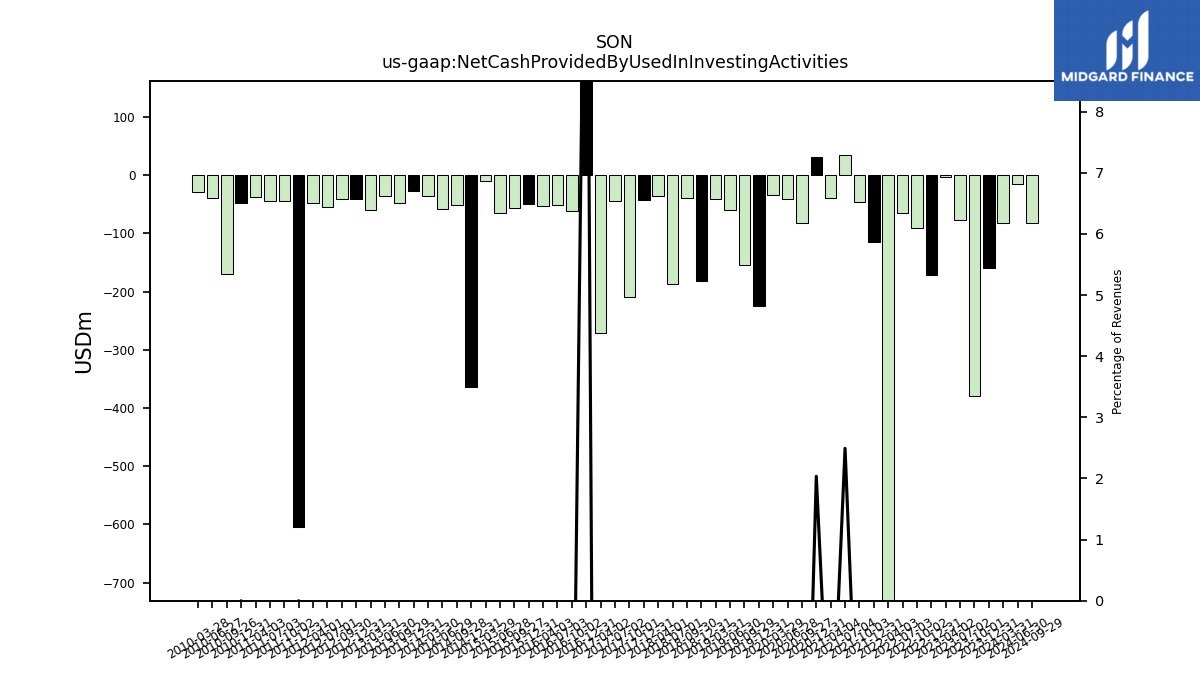
| Net Cash Provided By Used In Investing Activities | -159.61 | -379.30 | -77.46 | -2.97 | -171.02 | -90.15 | -64.50 | -1415.77 | -115.04 | -46.36 | 34.46 | -38.97 | 30.79 | -82.28 | -40.66 | -34.17 | -225.46 | -153.71 | -58.96 | -40.97 | -182.06 | -38.64 | -187.57 | -35.86 | -43.07 | -208.55 | -43.81 | -270.26 | 162.08 | -60.91 | -51.26 | -53.05 | -50.09 | -55.60 | -63.97 | -10.21 | -363.11 | -51.20 | -57.73 | -35.40 | -27.21 | NA | -47.71 | -35.61 | -58.92 | -40.75 | -40.08 | -54.86 | NA | -47.67 | NA | -603.55 | -44.75 | NA | -44.38 | NA | -36.49 | NA | -48.01 | -169.21 | -38.19 | -28.30 | |
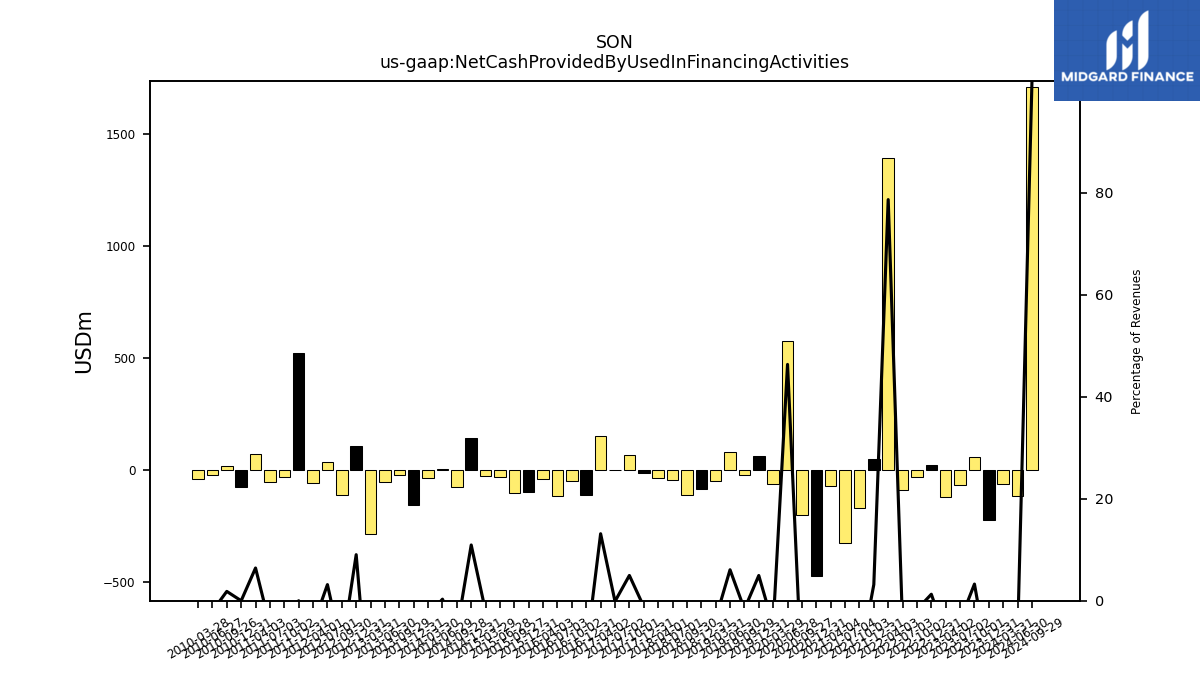
| Net Cash Provided By Used In Financing Activities | -222.92 | 55.90 | -66.79 | -118.18 | 23.34 | -32.55 | -89.22 | 1392.64 | 49.67 | -169.04 | -324.36 | -69.82 | -474.28 | -202.93 | 576.99 | -62.66 | 64.74 | -22.29 | 82.57 | -47.82 | -84.15 | -110.11 | -42.80 | -36.60 | -15.09 | 65.72 | -1.41 | 154.02 | -111.44 | -48.78 | -115.50 | -39.97 | -100.07 | -101.47 | -29.60 | -25.21 | 144.10 | -73.63 | 3.90 | -34.90 | -156.33 | NA | -24.10 | -51.33 | -283.31 | 106.21 | -113.11 | 38.03 | NA | -58.49 | NA | 520.46 | -29.52 | NA | -55.17 | NA | 71.72 | NA | -77.43 | 19.29 | -20.41 | -38.03 |
| 2023-12-31 | 2023-10-01 | 2023-07-02 | 2023-04-02 | 2022-12-31 | 2022-10-02 | 2022-07-03 | 2022-04-03 | 2021-12-31 | 2021-10-03 | 2021-07-04 | 2021-04-04 | 2020-12-31 | 2020-09-27 | 2020-06-28 | 2020-03-29 | 2019-12-31 | 2019-09-29 | 2019-06-30 | 2019-03-31 | 2018-12-31 | 2018-09-30 | 2018-07-01 | 2018-04-01 | 2017-12-31 | 2017-10-01 | 2017-07-02 | 2017-04-02 | 2016-12-31 | 2016-10-02 | 2016-07-03 | 2016-04-03 | 2015-12-31 | 2015-09-27 | 2015-06-28 | 2015-03-29 | 2014-12-31 | 2014-09-28 | 2014-06-29 | 2014-03-30 | 2013-12-31 | 2013-09-30 | 2013-09-29 | 2013-06-30 | 2013-03-31 | 2012-12-31 | 2012-09-30 | 2012-07-01 | 2012-06-30 | 2012-04-01 | 2012-03-31 | 2011-12-31 | 2011-10-02 | 2011-09-30 | 2011-07-03 | 2011-06-30 | 2011-04-03 | 2011-03-31 | 2010-12-31 | 2010-09-26 | 2010-06-27 | 2010-03-28 | ||
|---|---|---|---|---|---|---|---|---|---|---|---|---|---|---|---|---|---|---|---|---|---|---|---|---|---|---|---|---|---|---|---|---|---|---|---|---|---|---|---|---|---|---|---|---|---|---|---|---|---|---|---|---|---|---|---|---|---|---|---|---|---|---|---|
| Net Cash Provided By Used In Operating Activities | 266.04 | 268.29 | 250.58 | 98.00 | 186.99 | 137.59 | 183.41 | 1.06 | 78.59 | 118.12 | -36.76 | 138.72 | 216.12 | 207.51 | 194.28 | 87.71 | 187.03 | 198.74 | -52.24 | 92.32 | 138.38 | 200.27 | 131.48 | 119.77 | 67.25 | 177.83 | 36.88 | 67.40 | 50.00 | 162.63 | 119.66 | 66.39 | 134.79 | 145.06 | 115.59 | 57.49 | 150.52 | 161.86 | 60.07 | 45.46 | 116.74 | NA | 176.80 | 108.16 | 136.32 | 107.39 | 152.16 | 42.90 | NA | 101.47 | NA | 113.37 | 99.83 | NA | 45.92 | NA | -13.85 | NA | 114.55 | 145.21 | 41.59 | 73.79 | |
| Net Income Loss | 81.24 | 130.75 | 114.65 | 148.32 | 97.20 | 122.23 | 131.67 | 115.33 | 65.16 | 111.14 | -334.07 | 72.30 | -11.64 | 83.45 | 55.21 | 80.44 | 44.90 | 92.06 | 81.16 | 73.66 | 77.68 | 72.42 | 89.41 | 74.06 | 5.67 | 72.81 | 43.12 | 53.73 | 104.87 | 65.39 | 56.25 | 59.91 | 56.06 | 43.91 | 64.38 | 87.92 | 54.45 | 70.92 | 61.48 | 52.30 | 54.75 | 61.24 | 61.24 | 54.99 | 48.14 | 42.78 | 58.84 | 51.32 | 51.32 | 43.07 | 43.07 | 29.52 | 77.20 | 77.20 | 53.41 | 53.41 | 57.39 | 57.39 | 34.51 | 59.02 | 58.95 | 48.57 | |
| Profit Loss | 81.83 | 131.06 | 114.75 | 148.26 | 97.10 | 122.50 | 131.77 | 115.61 | 67.68 | 111.56 | -334.24 | 72.29 | -11.28 | 83.30 | 54.99 | 80.24 | 45.33 | 92.28 | 81.29 | 73.77 | 77.35 | 72.82 | 89.64 | 74.92 | 6.05 | 73.41 | 43.66 | 54.33 | 105.00 | 65.98 | 56.72 | 60.19 | 56.31 | 43.99 | 64.63 | 87.83 | 54.52 | 71.73 | 61.61 | 52.23 | 56.13 | NA | 61.42 | 55.05 | 47.79 | 42.83 | 59.03 | 51.35 | NA | 42.91 | NA | 29.53 | 77.17 | NA | 53.71 | NA | 57.64 | NA | 34.74 | 59.22 | 58.96 | 48.55 | |
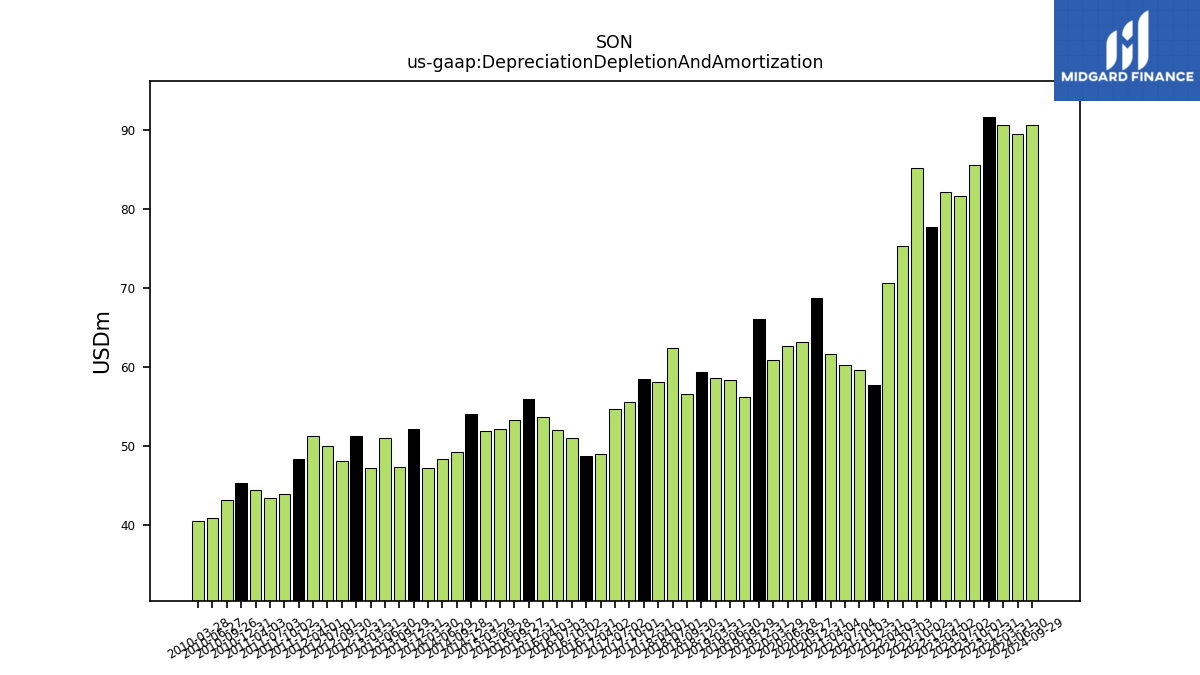
| Depreciation Depletion And Amortization | 91.60 | 85.57 | 81.68 | 82.14 | 77.73 | 85.14 | 75.35 | 70.60 | 57.68 | 59.62 | 60.19 | 61.60 | 68.76 | 63.16 | 62.62 | 60.82 | 66.06 | 56.11 | 58.36 | 58.61 | 59.35 | 56.49 | 62.33 | 58.07 | 58.49 | 55.48 | 54.64 | 49.01 | 48.64 | 51.01 | 51.96 | 53.57 | 55.95 | 53.19 | 52.15 | 51.88 | 53.99 | 49.21 | 48.34 | 47.18 | 52.10 | NA | 47.32 | 51.02 | 47.23 | 51.24 | 48.03 | 49.90 | NA | 51.23 | NA | 48.26 | 43.93 | NA | 43.34 | NA | 44.34 | NA | 45.26 | 43.13 | 40.87 | 40.41 | |
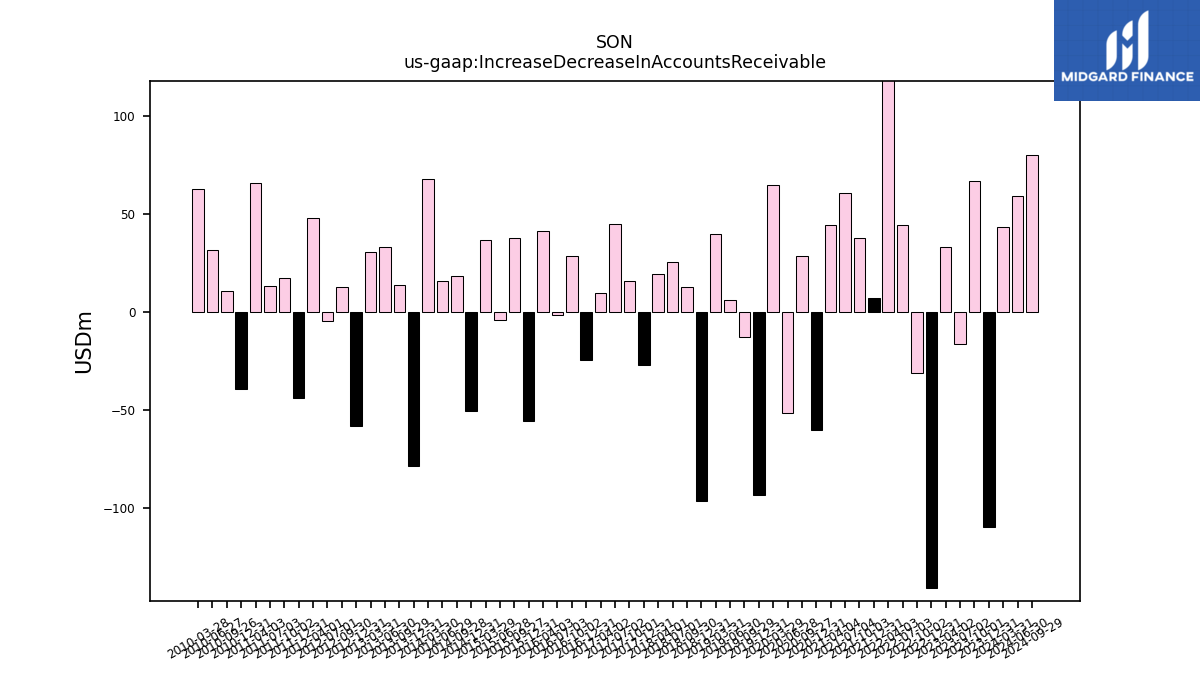
| Increase Decrease In Accounts Receivable | -109.28 | 67.09 | -16.23 | 33.48 | -140.75 | -30.84 | 44.39 | 129.67 | 7.06 | 37.77 | 60.62 | 44.31 | -59.95 | 28.59 | -51.35 | 64.87 | -93.19 | -12.62 | 6.16 | 40.04 | -96.38 | 13.15 | 25.69 | 19.35 | -27.14 | 15.77 | 45.14 | 10.00 | -24.52 | 28.83 | -1.27 | 41.62 | -55.40 | 37.71 | -3.95 | 37.04 | -50.53 | 18.73 | 15.98 | 68.14 | -78.17 | NA | 13.87 | 33.53 | 30.60 | -57.83 | 12.72 | -4.39 | NA | 48.32 | NA | -43.94 | 17.31 | NA | 13.19 | NA | 65.93 | NA | -39.25 | 10.73 | 32.03 | 62.90 | |
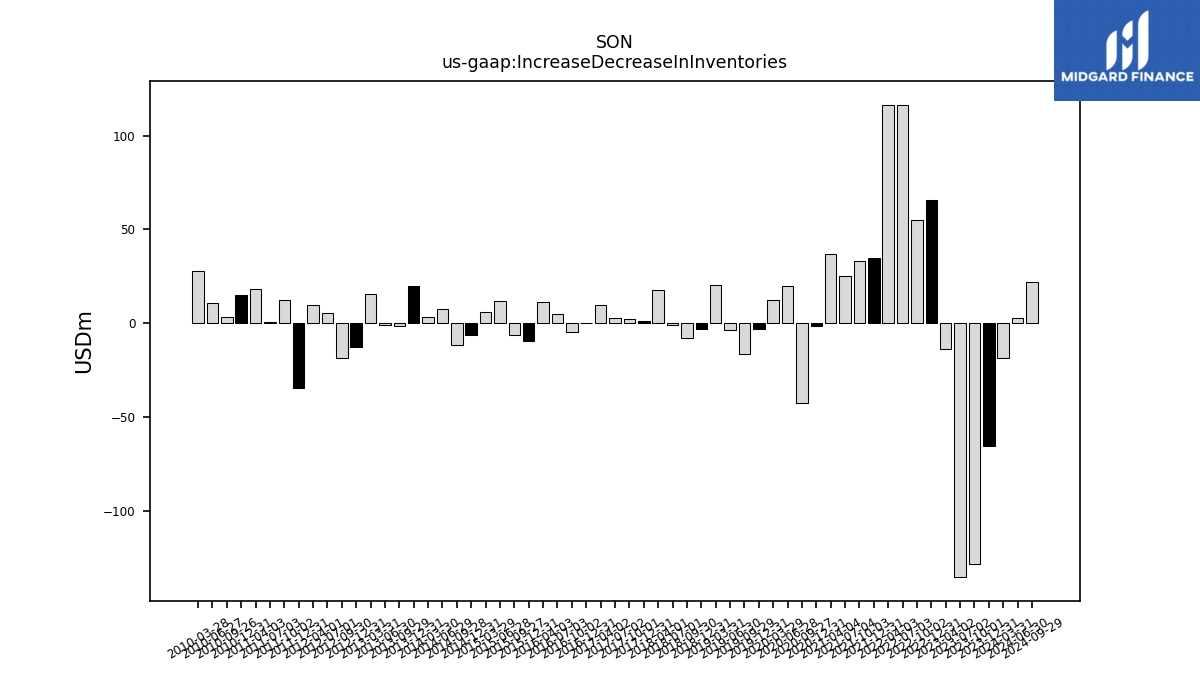
| Increase Decrease In Inventories | -65.32 | -128.51 | -135.33 | -13.55 | 65.87 | 54.88 | 116.56 | 116.17 | 35.05 | 33.34 | 25.04 | 36.68 | -1.50 | -42.60 | 19.80 | 12.19 | -3.27 | -16.18 | -3.81 | 20.63 | -2.79 | -7.80 | -1.07 | 17.81 | 1.10 | 2.17 | 3.04 | 9.75 | 0.23 | -4.71 | 4.78 | 11.22 | -9.41 | -6.04 | 11.95 | 6.07 | -6.40 | -11.68 | 7.48 | 3.19 | 19.72 | NA | -1.65 | -0.80 | 15.52 | -12.91 | -18.48 | 5.29 | NA | 9.95 | NA | -34.73 | 12.49 | NA | 0.45 | NA | 18.37 | NA | 14.93 | 3.59 | 10.92 | 27.63 | |
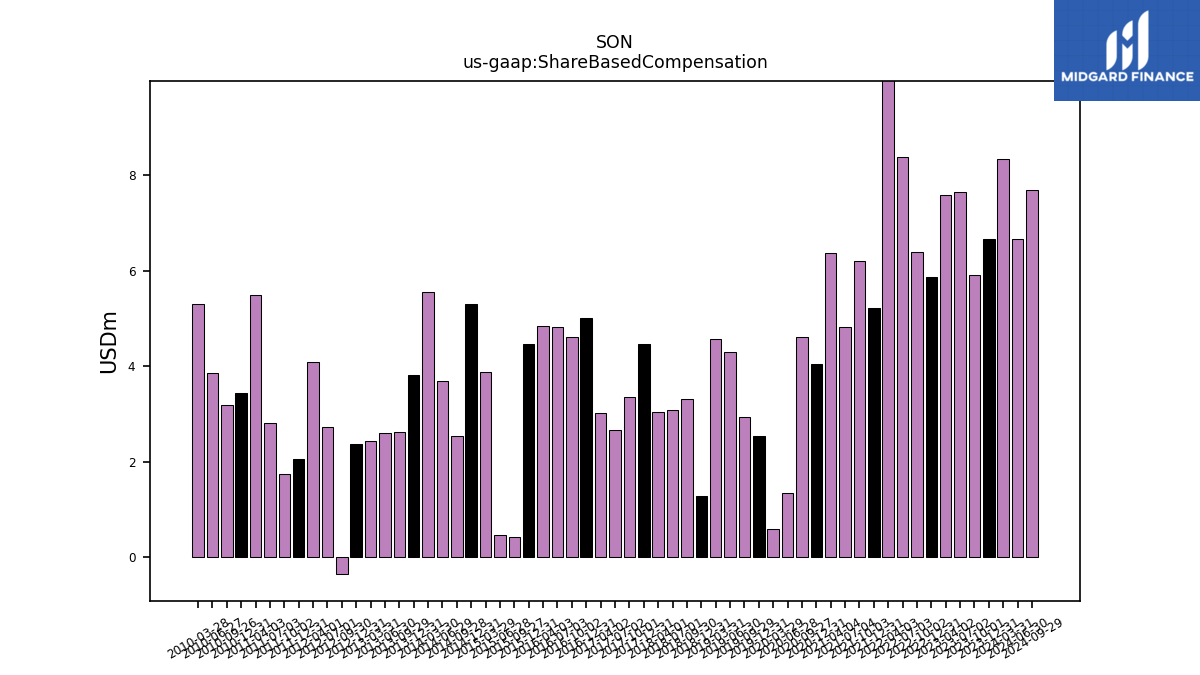
| Share Based Compensation | 6.66 | 5.91 | 7.64 | 7.57 | 5.86 | 6.39 | 8.38 | 10.69 | 5.22 | 6.19 | 4.83 | 6.37 | 4.06 | 4.62 | 1.34 | 0.60 | 2.53 | 2.93 | 4.31 | 4.56 | 1.29 | 3.32 | 3.07 | 3.05 | 4.46 | 3.35 | 2.66 | 3.03 | 5.01 | 4.61 | 4.83 | 4.84 | 4.47 | 0.43 | 0.47 | 3.88 | 5.31 | 2.54 | 3.69 | 5.56 | 3.81 | NA | 2.63 | 2.60 | 2.44 | 2.38 | -0.35 | 2.73 | NA | 4.09 | NA | 2.06 | 1.75 | NA | 2.80 | NA | 5.48 | NA | 3.45 | 3.19 | 3.86 | 5.31 |
| 2023-12-31 | 2023-10-01 | 2023-07-02 | 2023-04-02 | 2022-12-31 | 2022-10-02 | 2022-07-03 | 2022-04-03 | 2021-12-31 | 2021-10-03 | 2021-07-04 | 2021-04-04 | 2020-12-31 | 2020-09-27 | 2020-06-28 | 2020-03-29 | 2019-12-31 | 2019-09-29 | 2019-06-30 | 2019-03-31 | 2018-12-31 | 2018-09-30 | 2018-07-01 | 2018-04-01 | 2017-12-31 | 2017-10-01 | 2017-07-02 | 2017-04-02 | 2016-12-31 | 2016-10-02 | 2016-07-03 | 2016-04-03 | 2015-12-31 | 2015-09-27 | 2015-06-28 | 2015-03-29 | 2014-12-31 | 2014-09-28 | 2014-06-29 | 2014-03-30 | 2013-12-31 | 2013-09-30 | 2013-09-29 | 2013-06-30 | 2013-03-31 | 2012-12-31 | 2012-09-30 | 2012-07-01 | 2012-06-30 | 2012-04-01 | 2012-03-31 | 2011-12-31 | 2011-10-02 | 2011-09-30 | 2011-07-03 | 2011-06-30 | 2011-04-03 | 2011-03-31 | 2010-12-31 | 2010-09-26 | 2010-06-27 | 2010-03-28 | ||
|---|---|---|---|---|---|---|---|---|---|---|---|---|---|---|---|---|---|---|---|---|---|---|---|---|---|---|---|---|---|---|---|---|---|---|---|---|---|---|---|---|---|---|---|---|---|---|---|---|---|---|---|---|---|---|---|---|---|---|---|---|---|---|---|
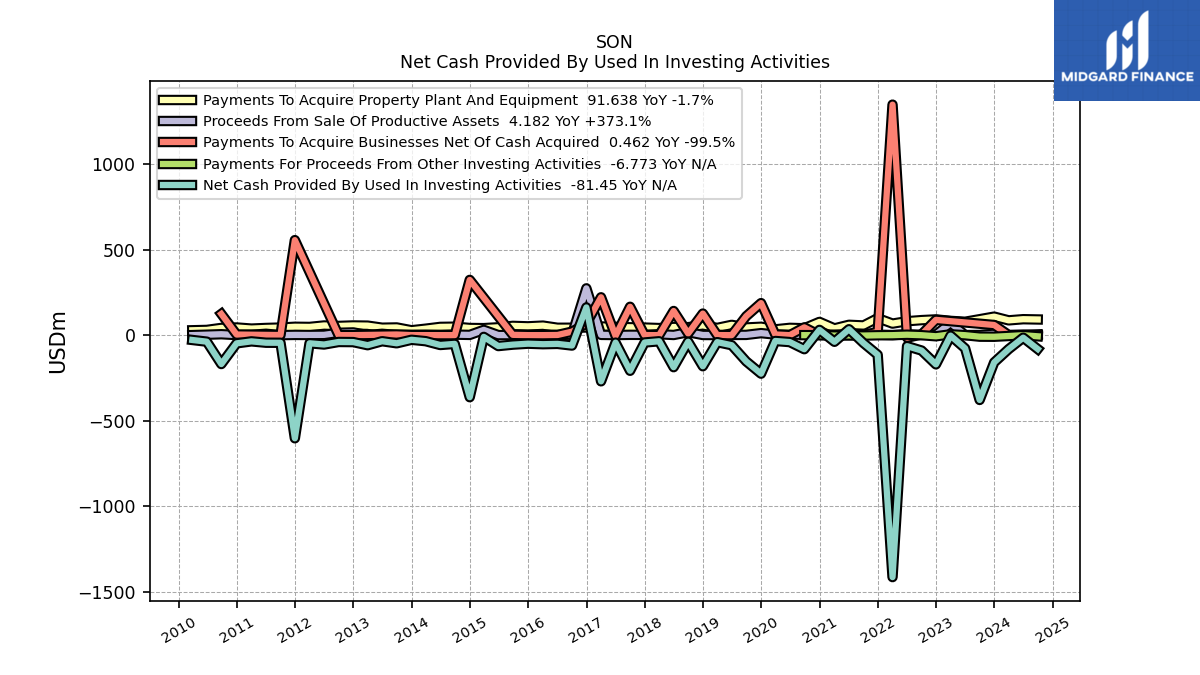
| Net Cash Provided By Used In Investing Activities | -159.61 | -379.30 | -77.46 | -2.97 | -171.02 | -90.15 | -64.50 | -1415.77 | -115.04 | -46.36 | 34.46 | -38.97 | 30.79 | -82.28 | -40.66 | -34.17 | -225.46 | -153.71 | -58.96 | -40.97 | -182.06 | -38.64 | -187.57 | -35.86 | -43.07 | -208.55 | -43.81 | -270.26 | 162.08 | -60.91 | -51.26 | -53.05 | -50.09 | -55.60 | -63.97 | -10.21 | -363.11 | -51.20 | -57.73 | -35.40 | -27.21 | NA | -47.71 | -35.61 | -58.92 | -40.75 | -40.08 | -54.86 | NA | -47.67 | NA | -603.55 | -44.75 | NA | -44.38 | NA | -36.49 | NA | -48.01 | -169.21 | -38.19 | -28.30 | |
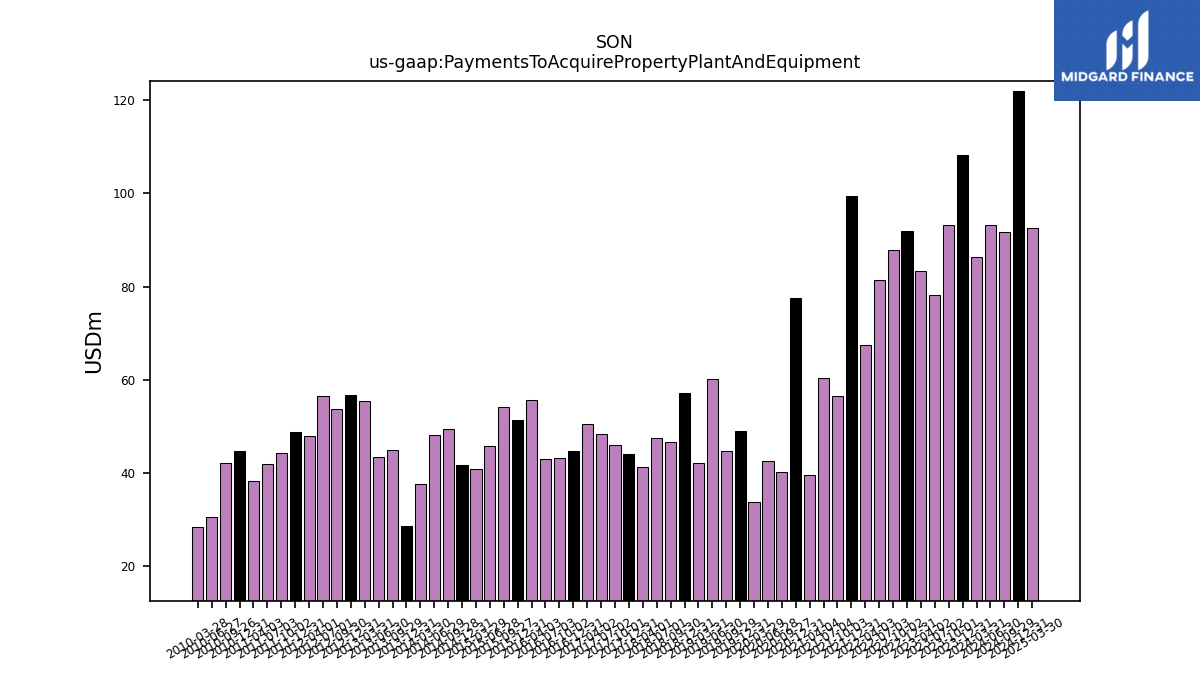
| Payments To Acquire Property Plant And Equipment | 108.20 | 93.18 | 78.29 | 83.40 | 92.00 | 87.86 | 81.41 | 67.51 | 99.43 | 56.63 | 60.41 | 39.55 | 77.46 | 40.25 | 42.57 | 33.85 | 48.92 | 44.74 | 60.12 | 42.16 | 57.15 | 46.57 | 47.49 | 41.36 | 44.17 | 45.92 | 48.36 | 50.45 | 44.67 | 43.30 | 43.09 | 55.69 | 51.43 | 54.16 | 45.76 | 40.95 | 41.79 | 49.40 | 48.17 | 37.72 | 28.52 | NA | 44.95 | 43.44 | 55.54 | 56.65 | 53.78 | 56.47 | NA | 47.96 | NA | 48.89 | 44.27 | NA | 41.93 | NA | 38.29 | NA | 44.75 | 42.13 | 30.52 | 28.51 |
| 2023-12-31 | 2023-10-01 | 2023-07-02 | 2023-04-02 | 2022-12-31 | 2022-10-02 | 2022-07-03 | 2022-04-03 | 2021-12-31 | 2021-10-03 | 2021-07-04 | 2021-04-04 | 2020-12-31 | 2020-09-27 | 2020-06-28 | 2020-03-29 | 2019-12-31 | 2019-09-29 | 2019-06-30 | 2019-03-31 | 2018-12-31 | 2018-09-30 | 2018-07-01 | 2018-04-01 | 2017-12-31 | 2017-10-01 | 2017-07-02 | 2017-04-02 | 2016-12-31 | 2016-10-02 | 2016-07-03 | 2016-04-03 | 2015-12-31 | 2015-09-27 | 2015-06-28 | 2015-03-29 | 2014-12-31 | 2014-09-28 | 2014-06-29 | 2014-03-30 | 2013-12-31 | 2013-09-30 | 2013-09-29 | 2013-06-30 | 2013-03-31 | 2012-12-31 | 2012-09-30 | 2012-07-01 | 2012-06-30 | 2012-04-01 | 2012-03-31 | 2011-12-31 | 2011-10-02 | 2011-09-30 | 2011-07-03 | 2011-06-30 | 2011-04-03 | 2011-03-31 | 2010-12-31 | 2010-09-26 | 2010-06-27 | 2010-03-28 | ||
|---|---|---|---|---|---|---|---|---|---|---|---|---|---|---|---|---|---|---|---|---|---|---|---|---|---|---|---|---|---|---|---|---|---|---|---|---|---|---|---|---|---|---|---|---|---|---|---|---|---|---|---|---|---|---|---|---|---|---|---|---|---|---|---|
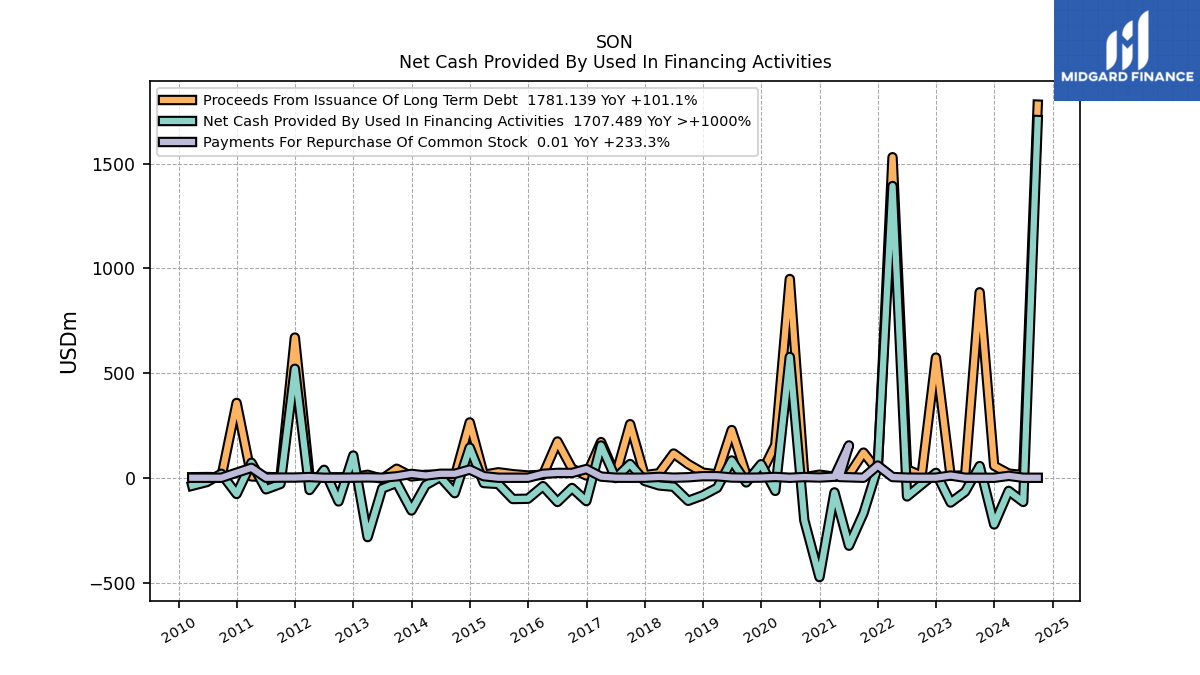
| Net Cash Provided By Used In Financing Activities | -222.92 | 55.90 | -66.79 | -118.18 | 23.34 | -32.55 | -89.22 | 1392.64 | 49.67 | -169.04 | -324.36 | -69.82 | -474.28 | -202.93 | 576.99 | -62.66 | 64.74 | -22.29 | 82.57 | -47.82 | -84.15 | -110.11 | -42.80 | -36.60 | -15.09 | 65.72 | -1.41 | 154.02 | -111.44 | -48.78 | -115.50 | -39.97 | -100.07 | -101.47 | -29.60 | -25.21 | 144.10 | -73.63 | 3.90 | -34.90 | -156.33 | NA | -24.10 | -51.33 | -283.31 | 106.21 | -113.11 | 38.03 | NA | -58.49 | NA | 520.46 | -29.52 | NA | -55.17 | NA | 71.72 | NA | -77.43 | 19.29 | -20.41 | -38.03 | |
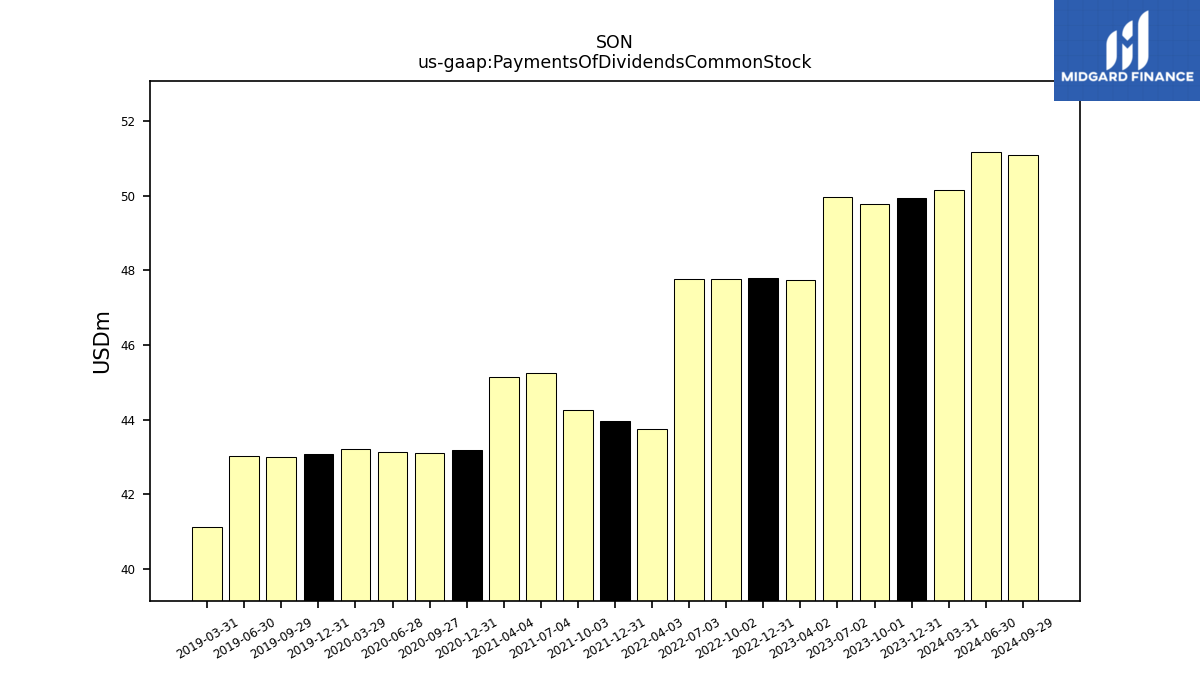
| Payments Of Dividends Common Stock | 49.94 | 49.79 | 49.96 | 47.73 | 47.80 | 47.76 | 47.78 | 43.75 | 43.97 | 44.25 | 45.26 | 45.14 | 43.18 | 43.11 | 43.13 | 43.20 | 43.08 | 43.01 | 43.02 | 41.14 | NA | NA | NA | NA | NA | NA | NA | NA | NA | NA | NA | NA | NA | NA | NA | NA | NA | NA | NA | NA | NA | NA | NA | NA | NA | NA | NA | NA | NA | NA | NA | NA | NA | NA | NA | NA | NA | NA | NA | NA | NA | NA | |
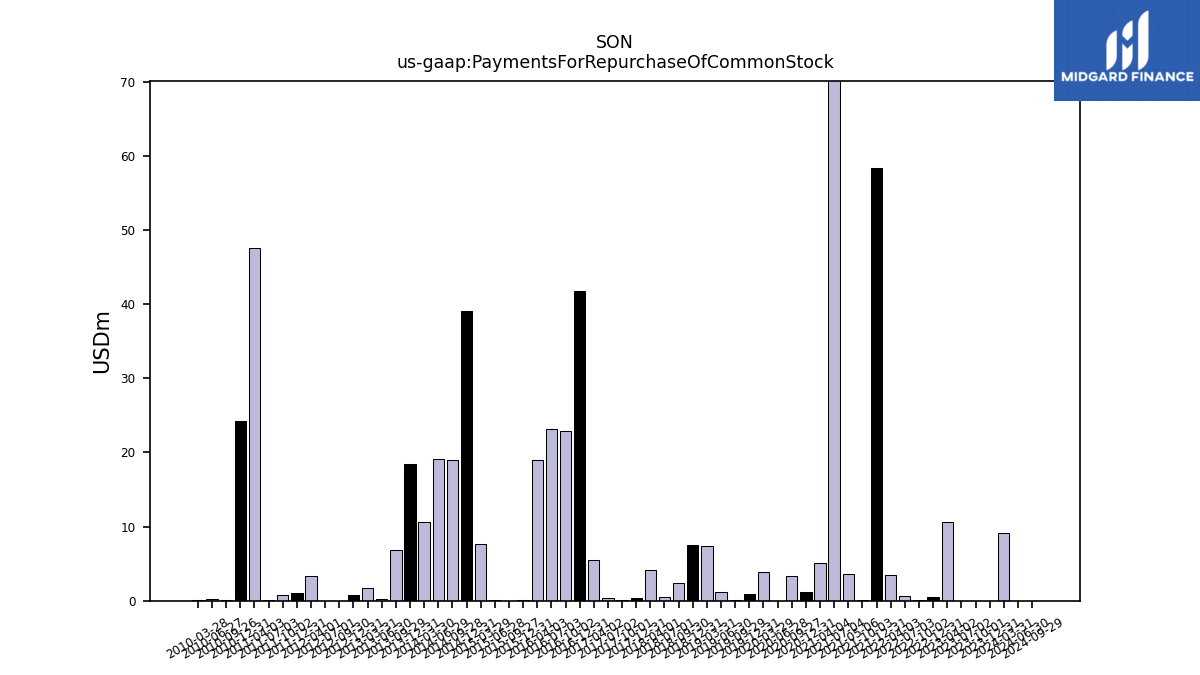
| Payments For Repurchase Of Common Stock | 0.01 | 0.00 | 0.03 | 10.58 | 0.49 | 0.07 | 0.57 | 3.41 | 58.43 | 0.08 | 154.52 | 5.05 | 1.15 | 3.38 | 0.01 | 3.94 | 0.91 | 0.15 | 1.16 | 7.39 | 7.57 | 2.43 | 0.47 | 4.09 | 0.39 | 0.06 | 0.34 | 5.54 | 41.72 | 22.89 | 23.19 | 18.93 | 0.14 | 0.00 | 0.14 | 7.59 | 39.07 | 18.99 | 19.06 | 10.68 | 18.40 | NA | 6.87 | 0.27 | 1.69 | 0.73 | 0.01 | 0.03 | NA | 3.40 | NA | 1.00 | 0.84 | NA | 0.07 | NA | 47.53 | NA | 24.28 | 0.05 | 0.22 | 0.11 |
| 2023-12-31 | 2023-10-01 | 2023-07-02 | 2023-04-02 | 2022-12-31 | 2022-10-02 | 2022-07-03 | 2022-04-03 | 2021-12-31 | 2021-10-03 | 2021-07-04 | 2021-04-04 | 2020-12-31 | 2020-09-27 | 2020-06-28 | 2020-03-29 | 2019-12-31 | 2019-09-29 | 2019-06-30 | 2019-03-31 | 2018-12-31 | 2018-09-30 | 2018-07-01 | 2018-04-01 | 2017-12-31 | 2017-10-01 | 2017-07-02 | 2017-04-02 | 2016-12-31 | 2016-10-02 | 2016-07-03 | 2016-04-03 | 2015-12-31 | 2015-09-27 | 2015-06-28 | 2015-03-29 | 2014-12-31 | 2014-09-28 | 2014-06-29 | 2014-03-30 | 2013-12-31 | 2013-09-30 | 2013-09-29 | 2013-06-30 | 2013-03-31 | 2012-12-31 | 2012-09-30 | 2012-07-01 | 2012-06-30 | 2012-04-01 | 2012-03-31 | 2011-12-31 | 2011-10-02 | 2011-09-30 | 2011-07-03 | 2011-06-30 | 2011-04-03 | 2011-03-31 | 2010-12-31 | 2010-09-26 | 2010-06-27 | 2010-03-28 | ||
|---|---|---|---|---|---|---|---|---|---|---|---|---|---|---|---|---|---|---|---|---|---|---|---|---|---|---|---|---|---|---|---|---|---|---|---|---|---|---|---|---|---|---|---|---|---|---|---|---|---|---|---|---|---|---|---|---|---|---|---|---|---|---|---|
| Revenues | 1759.98 | 1710.42 | 1705.29 | 1729.78 | 1827.27 | 1890.22 | 1913.33 | 1770.98 | 1569.19 | 1415.19 | 1382.75 | 1353.30 | 1512.58 | 1312.31 | 1245.48 | 1303.30 | 1308.85 | 1353.93 | 1359.72 | 1351.70 | 1355.62 | 1364.76 | 1366.37 | 1304.19 | 1299.02 | 1324.63 | 1240.67 | 1172.32 | 1142.20 | 1208.72 | 1205.68 | 1226.28 | 1267.13 | 1242.59 | 1248.59 | 1203.26 | 1317.95 | 1263.57 | 1247.38 | 1185.63 | 1214.87 | 1227.75 | 1227.75 | 1226.26 | 1179.21 | 1175.87 | 1195.53 | 1202.36 | 1202.36 | 1212.37 | 1212.37 | 1129.57 | 1124.17 | 1124.17 | 1127.87 | 1127.87 | 1117.32 | 1117.32 | 1127.15 | 1051.72 | 1010.12 | 935.13 | |
| Revenue From Contract With Customer Excluding Assessed Tax | 1635.80 | 1710.42 | 1705.29 | 1729.78 | 1676.02 | 1890.22 | 1913.33 | 1770.98 | 1439.19 | 1415.19 | 1382.75 | 1353.30 | 1376.35 | 1312.31 | 1245.48 | 1303.30 | 1308.85 | 1353.93 | 1359.72 | 1351.70 | 1355.62 | 1364.76 | 1366.37 | 1304.19 | 1299.02 | 1324.63 | 1240.67 | 1172.32 | 1142.20 | 1208.72 | 1205.68 | 1226.28 | 1267.13 | 1242.59 | 1248.59 | 1203.26 | 1317.95 | 1263.57 | 1247.38 | 1185.63 | 1214.87 | 1227.75 | 1227.75 | 1226.26 | 1179.21 | 1175.87 | 1195.53 | 1202.36 | 1202.36 | 1212.37 | 1212.37 | 1129.57 | 1124.17 | 1124.17 | 1127.87 | 1127.87 | 1117.32 | 1117.32 | 1127.15 | 1051.72 | 1010.12 | 935.13 | |
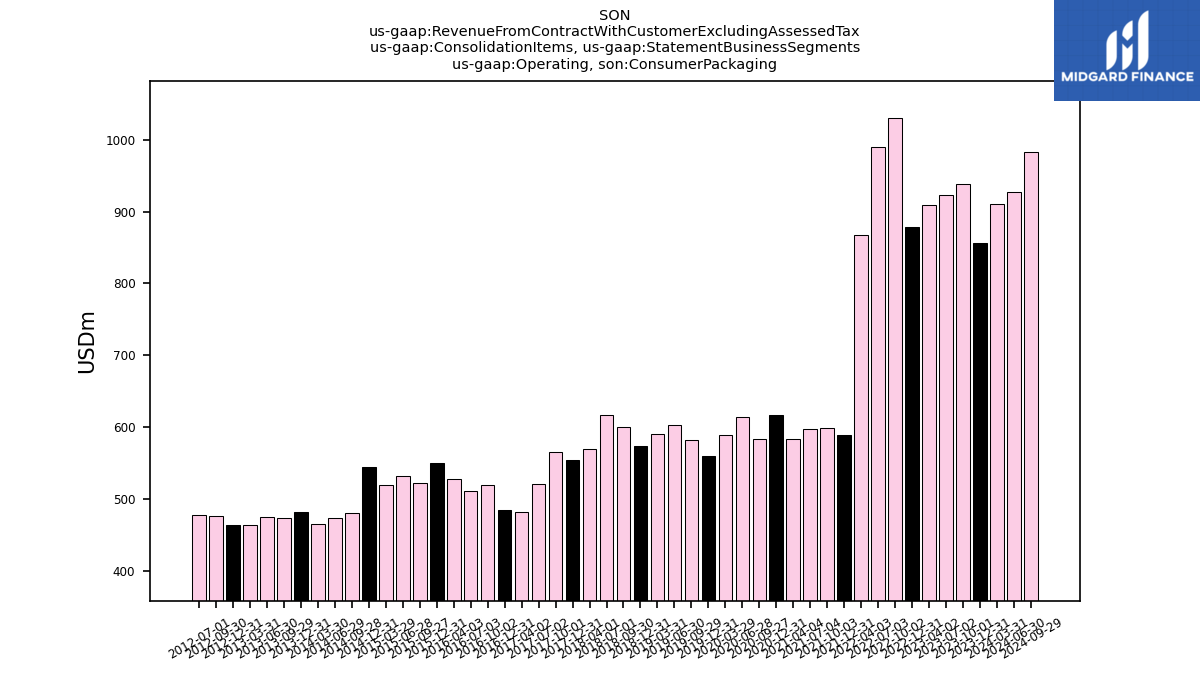
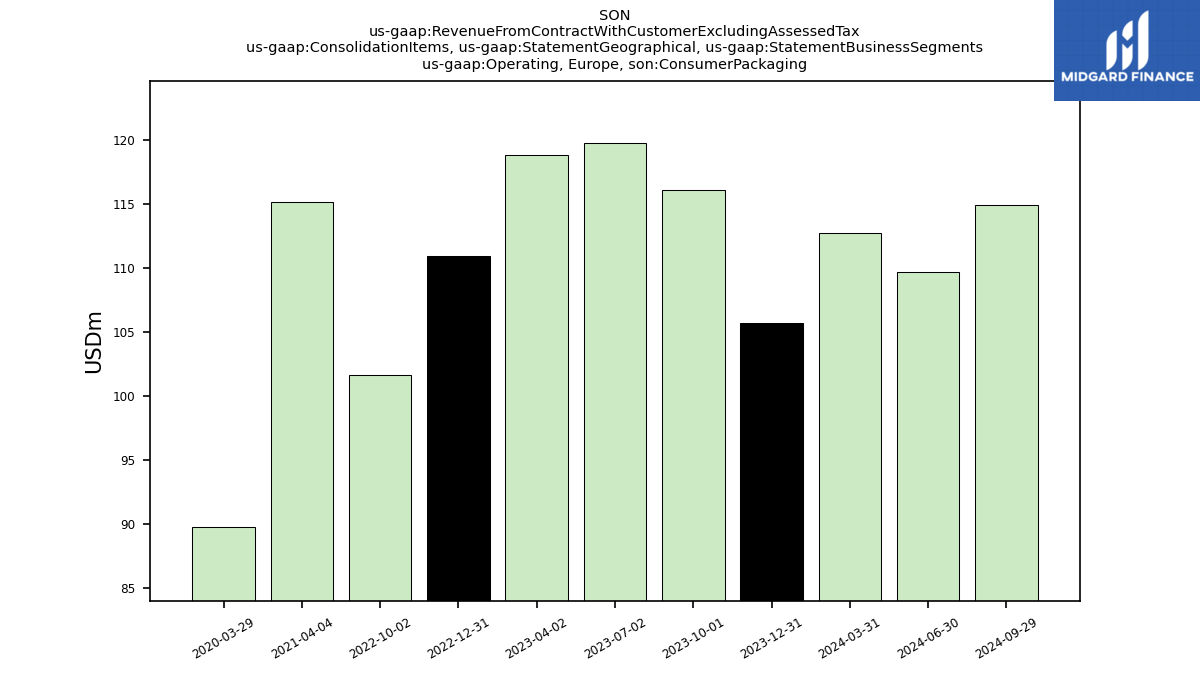
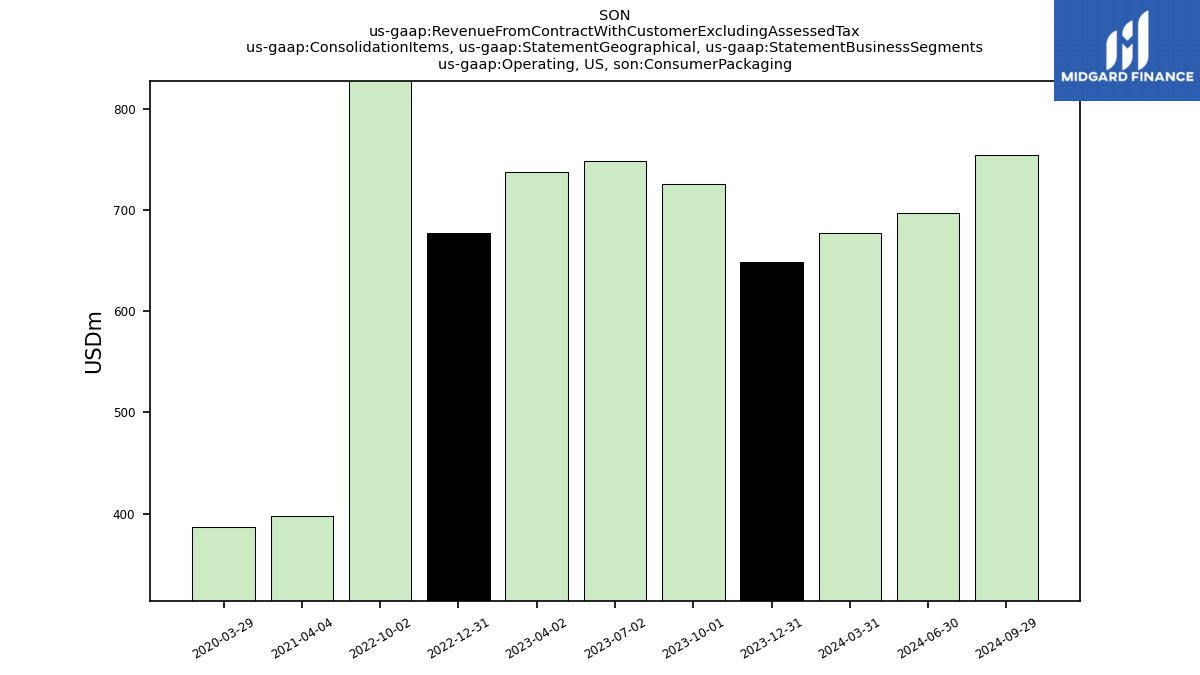
| Operating, Consumer Packaging | 855.69 | 938.41 | 923.61 | 909.28 | 879.33 | 1030.55 | 989.98 | 868.10 | 588.82 | 598.97 | 597.80 | 582.75 | 616.13 | 583.74 | 614.62 | 588.42 | 559.55 | 581.37 | 602.75 | 589.72 | 573.93 | 600.15 | 616.06 | 569.85 | 554.23 | 565.79 | 521.26 | 482.18 | 485.04 | 519.73 | 511.01 | 527.34 | 550.07 | 521.50 | 531.11 | 519.88 | 544.70 | 479.61 | 473.67 | 464.93 | 481.89 | NA | 473.33 | 475.01 | 463.30 | 463.87 | 475.95 | 477.04 | NA | NA | NA | NA | NA | NA | NA | NA | NA | NA | NA | NA | NA | NA | |
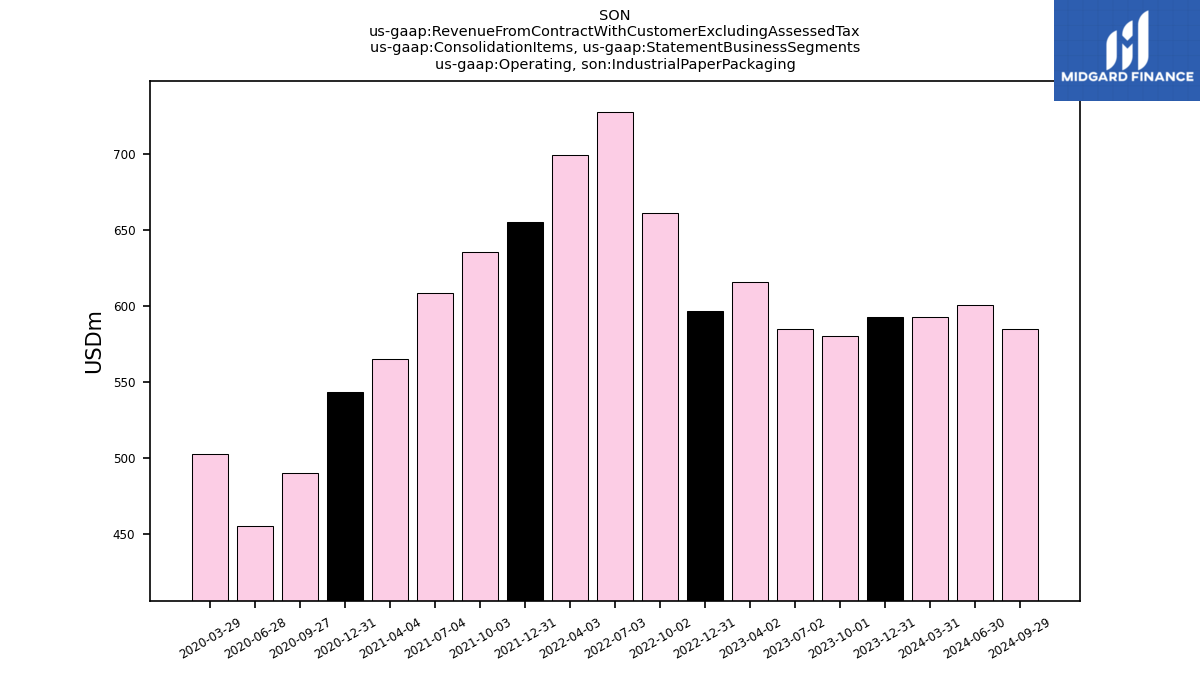
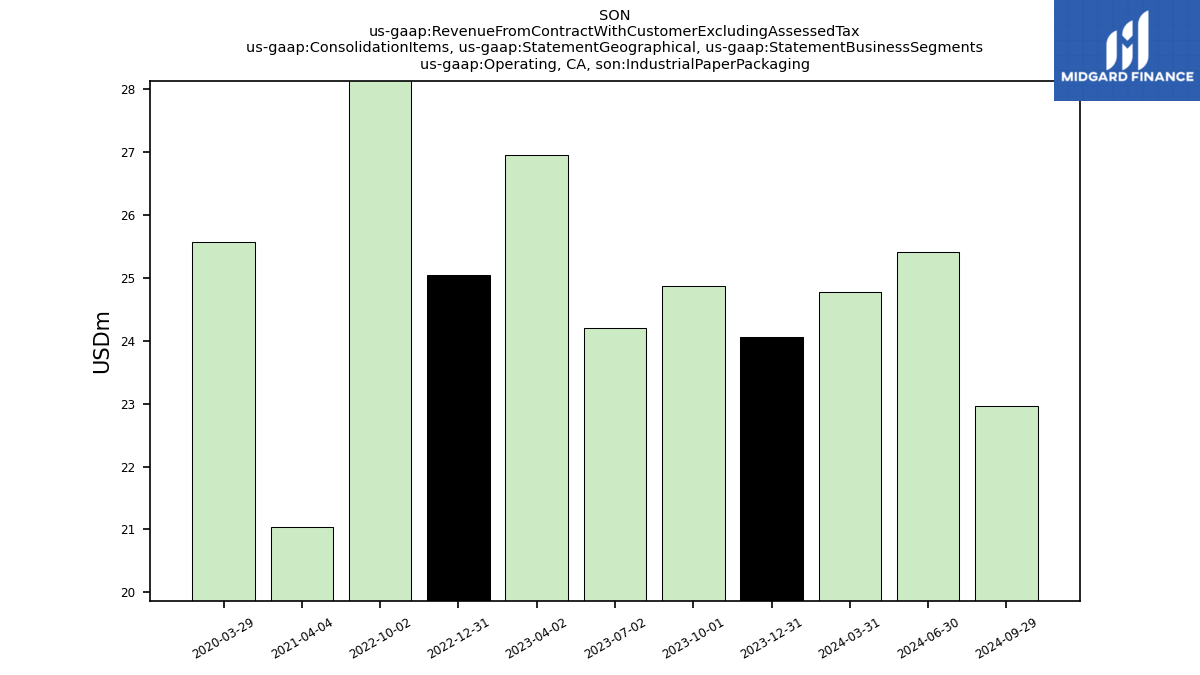
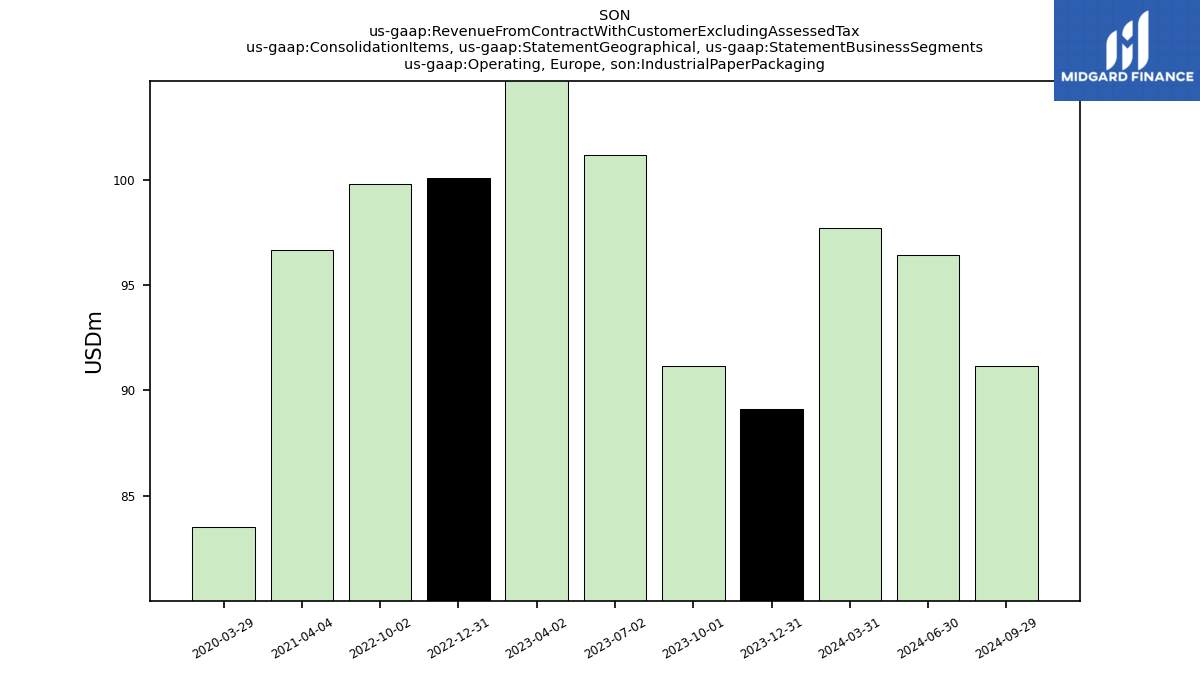
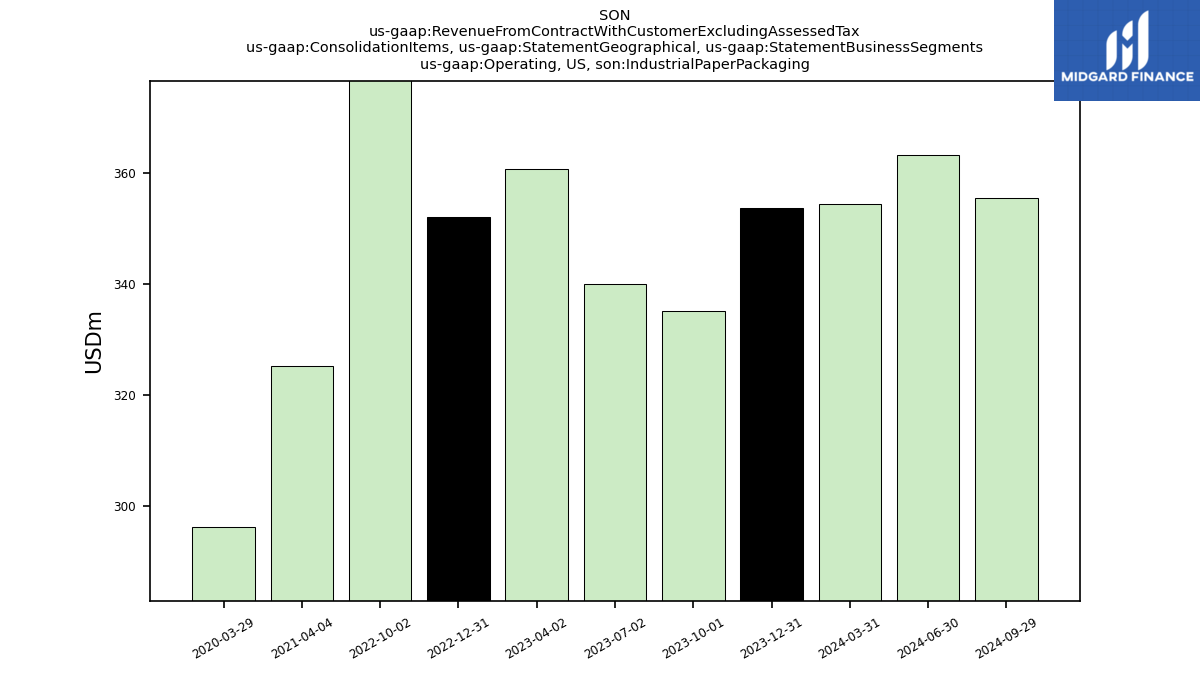
| Operating, Industrial Paper Packaging | 593.08 | 580.03 | 585.14 | 615.86 | 596.58 | 661.45 | 727.40 | 699.13 | 655.15 | 635.23 | 608.53 | 565.40 | 543.59 | 490.37 | 455.03 | 502.49 | NA | NA | NA | NA | NA | NA | NA | NA | NA | NA | NA | NA | NA | NA | NA | NA | NA | NA | NA | NA | NA | NA | NA | NA | NA | NA | NA | NA | NA | NA | NA | NA | NA | NA | NA | NA | NA | NA | NA | NA | NA | NA | NA | NA | NA | NA | |
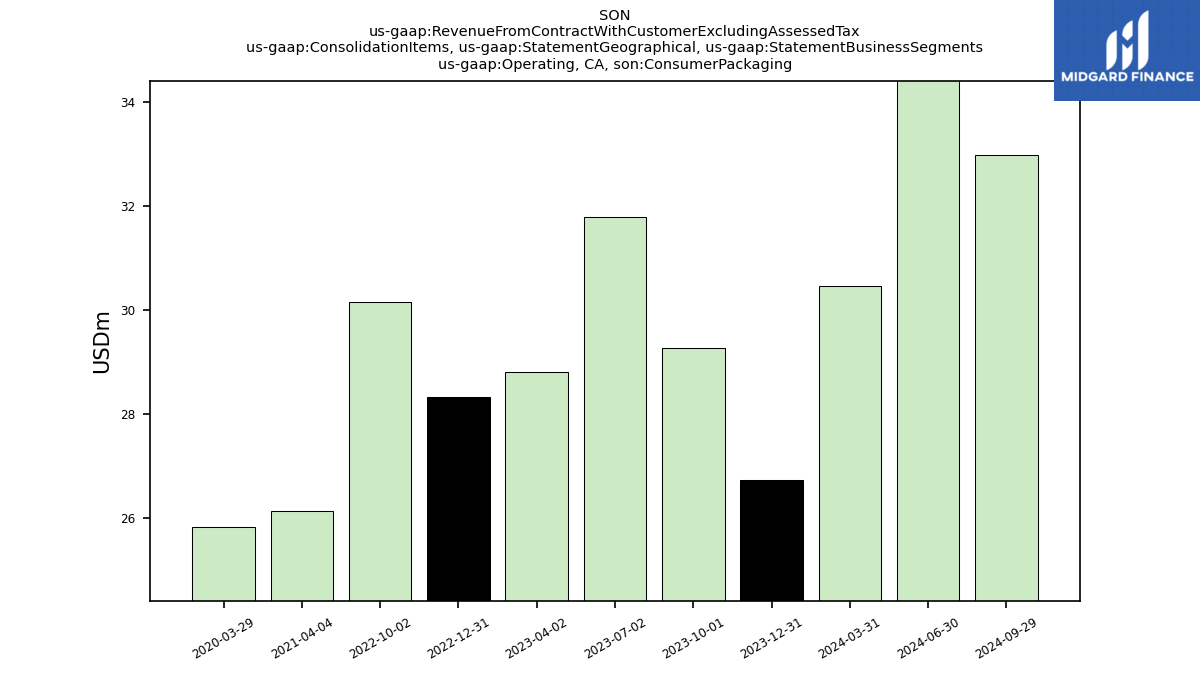
| Operating,, Consumer Packaging | 26.73 | 29.27 | NA | NA | 28.33 | 30.15 | NA | NA | NA | NA | NA | 26.14 | NA | NA | NA | 25.84 | NA | NA | NA | NA | NA | NA | NA | NA | NA | NA | NA | NA | NA | NA | NA | NA | NA | NA | NA | NA | NA | NA | NA | NA | NA | NA | NA | NA | NA | NA | NA | NA | NA | NA | NA | NA | NA | NA | NA | NA | NA | NA | NA | NA | NA | NA | |
| Operating,, Industrial Paper Packaging | 24.07 | 24.87 | NA | NA | 25.05 | 28.47 | NA | NA | NA | NA | NA | 21.05 | NA | NA | NA | 25.58 | NA | NA | NA | NA | NA | NA | NA | NA | NA | NA | NA | NA | NA | NA | NA | NA | NA | NA | NA | NA | NA | NA | NA | NA | NA | NA | NA | NA | NA | NA | NA | NA | NA | NA | NA | NA | NA | NA | NA | NA | NA | NA | NA | NA | NA | NA | |
| Operating,, Consumer Packaging | 105.70 | 116.15 | NA | NA | 111.00 | 101.67 | NA | NA | NA | NA | NA | 115.18 | NA | NA | NA | 89.82 | NA | NA | NA | NA | NA | NA | NA | NA | NA | NA | NA | NA | NA | NA | NA | NA | NA | NA | NA | NA | NA | NA | NA | NA | NA | NA | NA | NA | NA | NA | NA | NA | NA | NA | NA | NA | NA | NA | NA | NA | NA | NA | NA | NA | NA | NA | |
| Operating,, Industrial Paper Packaging | 89.12 | 91.17 | NA | NA | 100.07 | 99.80 | NA | NA | NA | NA | NA | 96.68 | NA | NA | NA | 83.54 | NA | NA | NA | NA | NA | NA | NA | NA | NA | NA | NA | NA | NA | NA | NA | NA | NA | NA | NA | NA | NA | NA | NA | NA | NA | NA | NA | NA | NA | NA | NA | NA | NA | NA | NA | NA | NA | NA | NA | NA | NA | NA | NA | NA | NA | NA | |
| Operating,US, Consumer Packaging | 648.85 | 726.14 | NA | NA | 677.54 | 837.05 | NA | NA | NA | NA | NA | 397.80 | NA | NA | NA | 387.26 | NA | NA | NA | NA | NA | NA | NA | NA | NA | NA | NA | NA | NA | NA | NA | NA | NA | NA | NA | NA | NA | NA | NA | NA | NA | NA | NA | NA | NA | NA | NA | NA | NA | NA | NA | NA | NA | NA | NA | NA | NA | NA | NA | NA | NA | NA | |
| Operating,US, Industrial Paper Packaging | 353.64 | 335.14 | NA | NA | 352.04 | 405.38 | NA | NA | NA | NA | NA | 325.22 | NA | NA | NA | 296.22 | NA | NA | NA | NA | NA | NA | NA | NA | NA | NA | NA | NA | NA | NA | NA | NA | NA | NA | NA | NA | NA | NA | NA | NA | NA | NA | NA | NA | NA | NA | NA | NA | NA | NA | NA | NA | NA | NA | NA | NA | NA | NA | NA | NA | NA | NA | |
| Foreign Exchange Contract, Reclassification Out Of Accumulated Other Comprehensive Income, Accumulated Gain Loss Net Cash Flow Hedge Parent | 4.09 | 3.19 | 2.52 | 1.06 | 1.03 | 0.56 | 0.84 | 0.57 | 0.45 | 0.94 | 1.49 | 0.34 | -0.42 | -1.72 | -3.38 | -1.14 | 0.39 | 0.14 | 0.53 | 0.32 | -1.39 | 0.61 | -0.24 | 0.81 | 3.64 | 4.81 | NA | NA | NA | NA | NA | NA | NA | NA | NA | NA | NA | NA | NA | NA | NA | NA | NA | NA | NA | NA | NA | NA | NA | NA | NA | NA | NA | NA | NA | NA | NA | NA | NA | NA | NA | NA | |
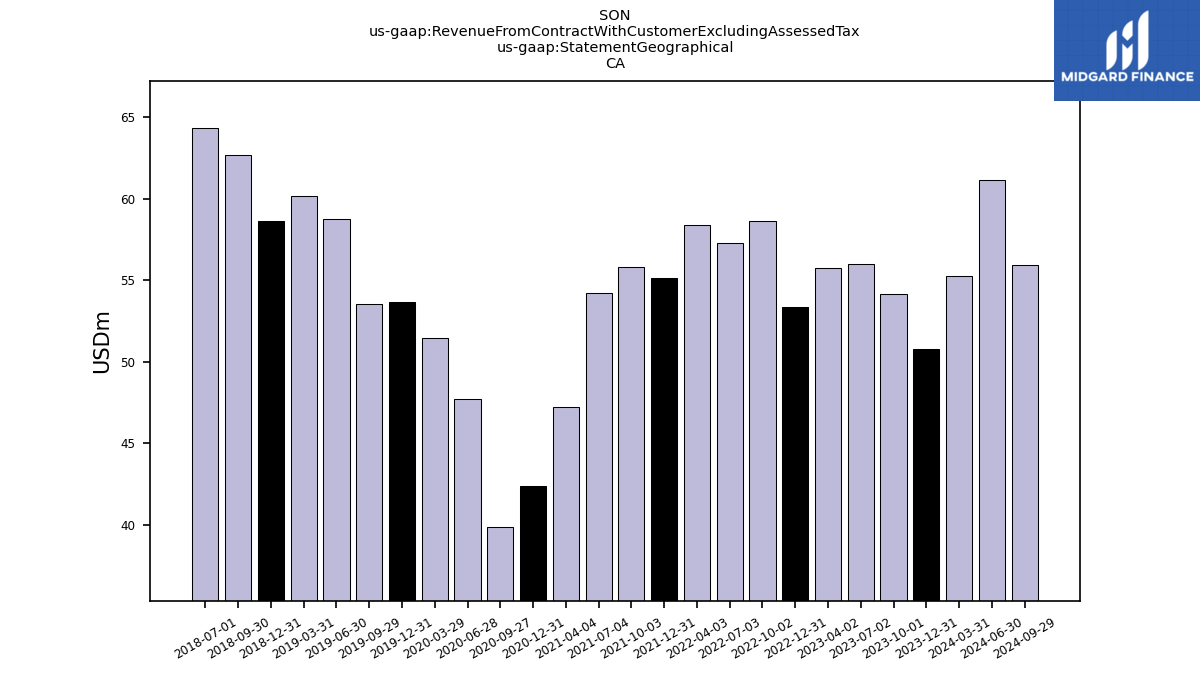
| 50.80 | 54.13 | 56.00 | 55.76 | 53.37 | 58.62 | 57.29 | 58.38 | 55.11 | 55.80 | 54.18 | 47.19 | 42.40 | 39.88 | 47.73 | 51.42 | 53.65 | 53.53 | 58.74 | 60.13 | 58.61 | 62.66 | 64.36 | NA | NA | NA | NA | NA | NA | NA | NA | NA | NA | NA | NA | NA | NA | NA | NA | NA | NA | NA | NA | NA | NA | NA | NA | NA | NA | NA | NA | NA | NA | NA | NA | NA | NA | NA | NA | NA | NA | NA | ||
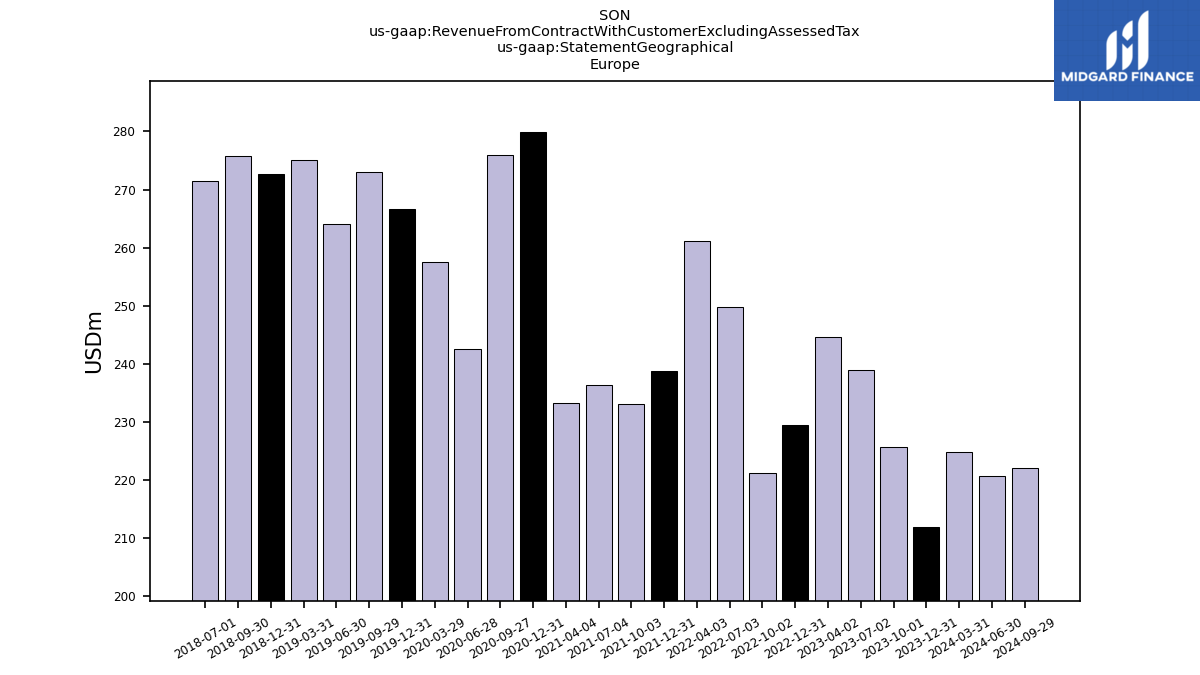
| 212.02 | 225.63 | 239.00 | 244.70 | 229.44 | 221.28 | 249.85 | 261.12 | 238.79 | 233.17 | 236.42 | 233.27 | 279.92 | 275.90 | 242.52 | 257.49 | 266.57 | 273.04 | 264.12 | 275.03 | 272.67 | 275.79 | 271.54 | NA | NA | NA | NA | NA | NA | NA | NA | NA | NA | NA | NA | NA | NA | NA | NA | NA | NA | NA | NA | NA | NA | NA | NA | NA | NA | NA | NA | NA | NA | NA | NA | NA | NA | NA | NA | NA | NA | NA | ||
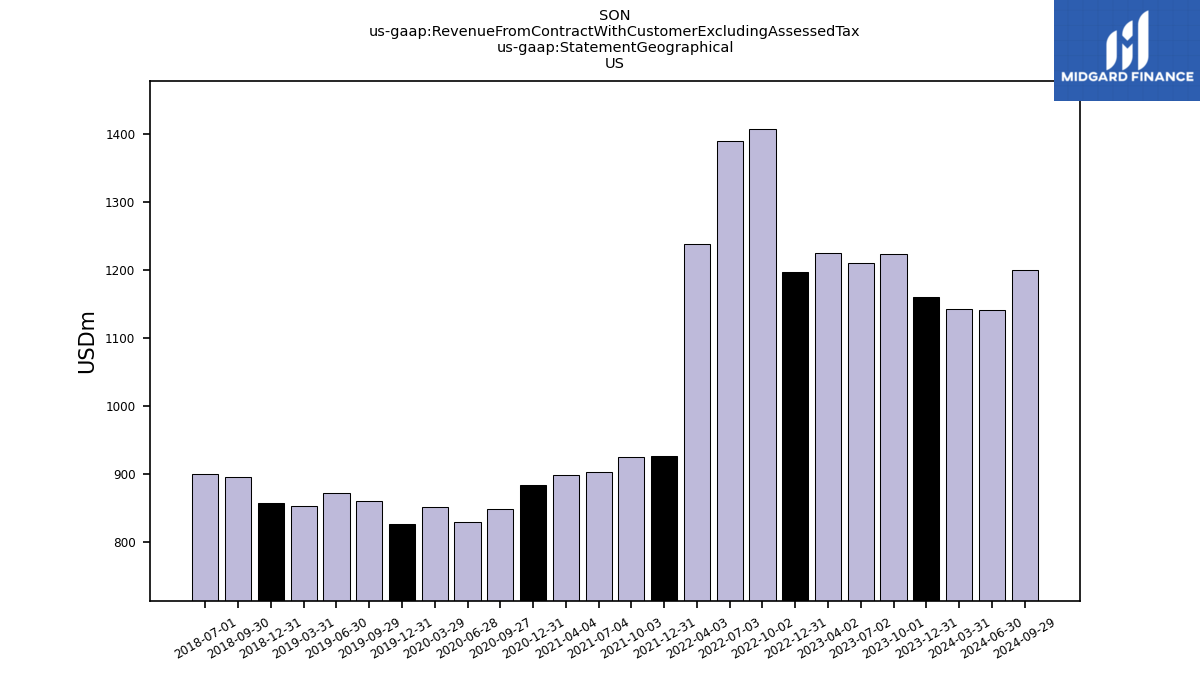
| US | 1160.17 | 1222.87 | 1209.99 | 1225.70 | 1197.05 | 1407.91 | 1389.36 | 1237.77 | 926.18 | 923.98 | 902.18 | 897.75 | 882.88 | 848.58 | 829.30 | 850.50 | 825.57 | 859.25 | 871.94 | 851.70 | 857.06 | 894.37 | 899.28 | NA | NA | NA | NA | NA | NA | NA | NA | NA | NA | NA | NA | NA | NA | NA | NA | NA | NA | NA | NA | NA | NA | NA | NA | NA | NA | NA | NA | NA | NA | NA | NA | NA | NA | NA | NA | NA | NA | NA |