
| 2023-09-30 | 2023-06-30 | 2023-03-31 | 2022-12-31 | 2022-09-30 | 2022-06-30 | 2022-03-31 | 2021-12-31 | 2021-09-30 | 2021-06-30 | 2021-03-31 | 2020-12-31 | 2020-09-30 | 2020-06-30 | 2020-03-31 | 2019-12-31 | 2019-09-30 | 2019-06-30 | 2019-03-31 | ||
|---|---|---|---|---|---|---|---|---|---|---|---|---|---|---|---|---|---|---|---|---|
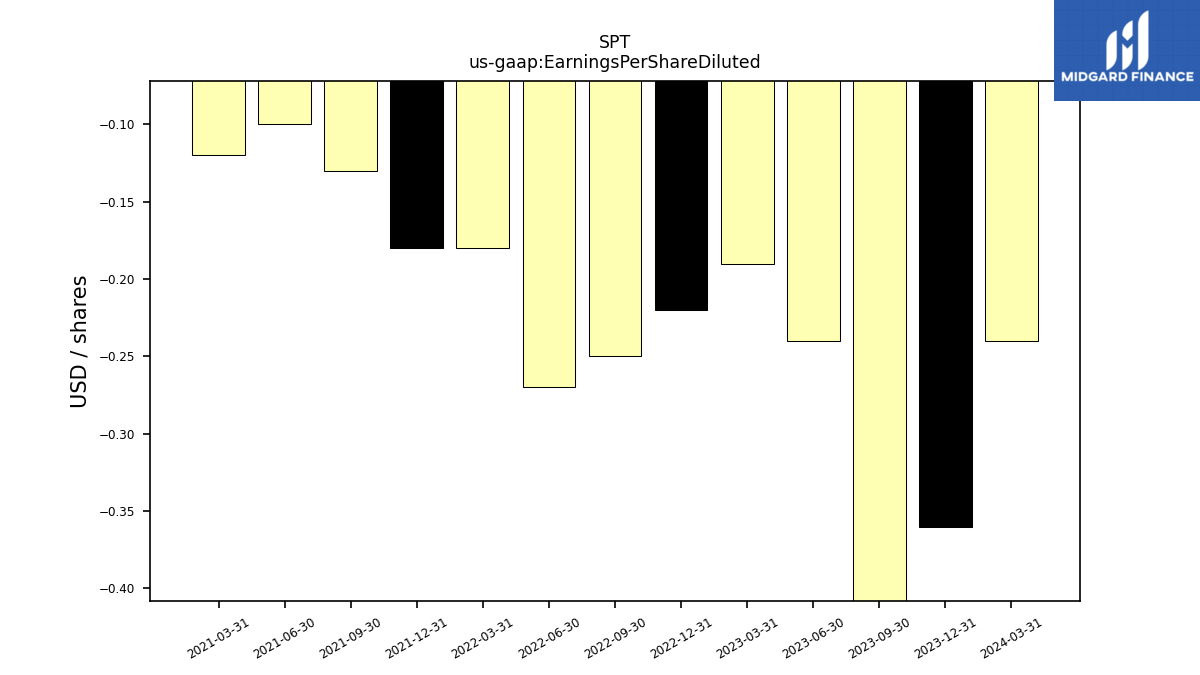
| Earnings Per Share Diluted | -0.41 | -0.24 | -0.19 | -0.22 | -0.25 | -0.27 | -0.18 | -0.18 | -0.13 | -0.10 | -0.12 | NA | NA | NA | NA | NA | NA | NA | NA |
| 2023-09-30 | 2023-06-30 | 2023-03-31 | 2022-12-31 | 2022-09-30 | 2022-06-30 | 2022-03-31 | 2021-12-31 | 2021-09-30 | 2021-06-30 | 2021-03-31 | 2020-12-31 | 2020-09-30 | 2020-06-30 | 2020-03-31 | 2019-12-31 | 2019-09-30 | 2019-06-30 | 2019-03-31 | ||
|---|---|---|---|---|---|---|---|---|---|---|---|---|---|---|---|---|---|---|---|---|
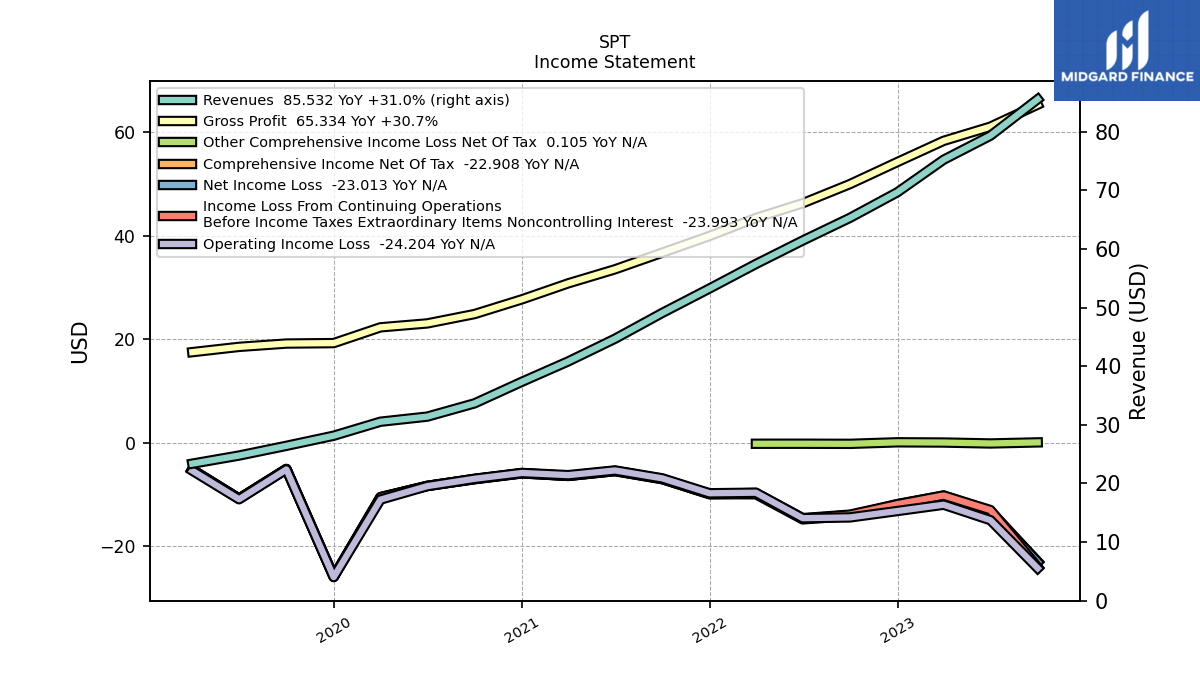
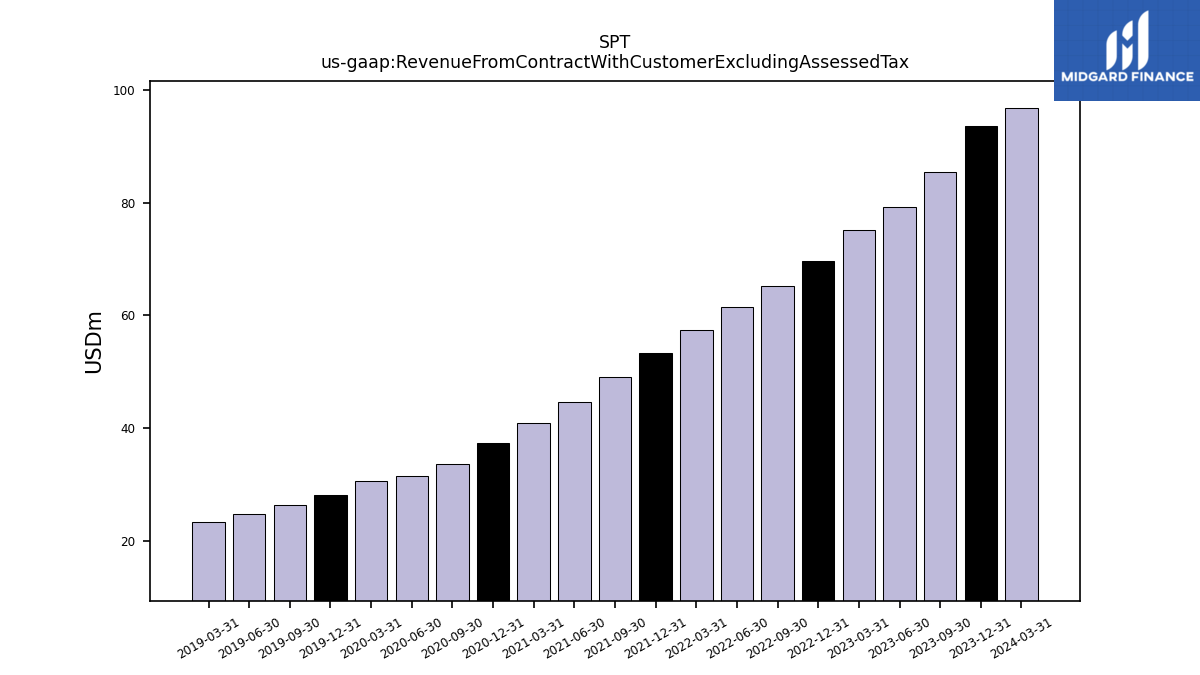
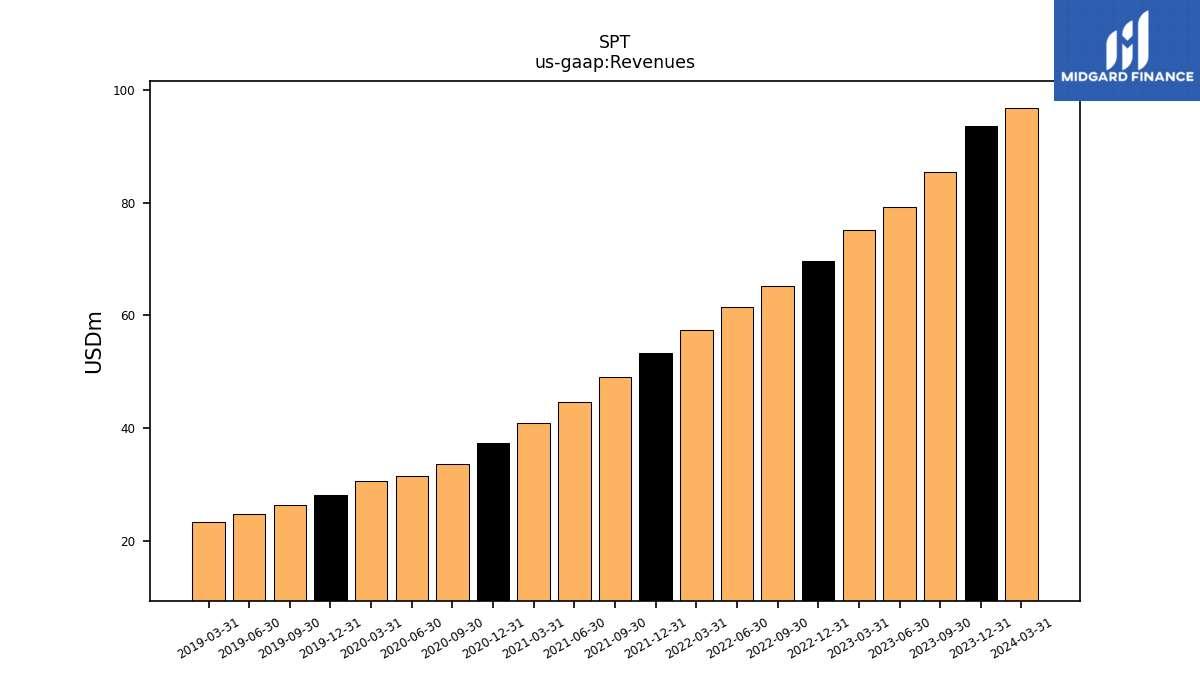
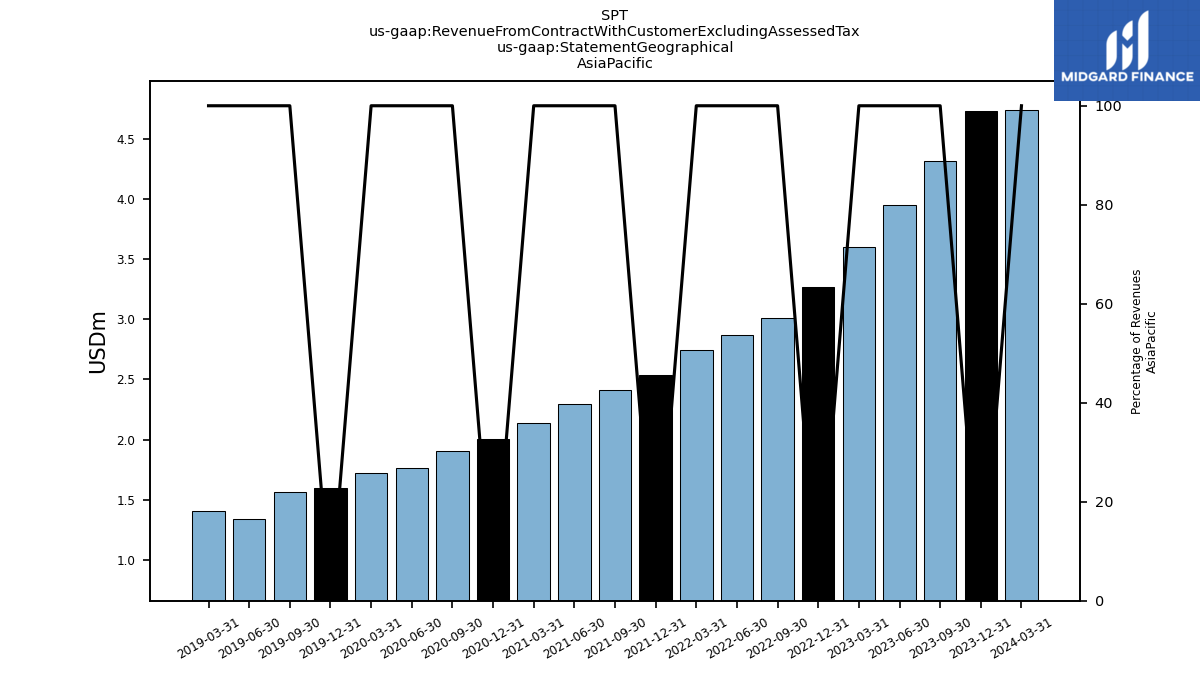
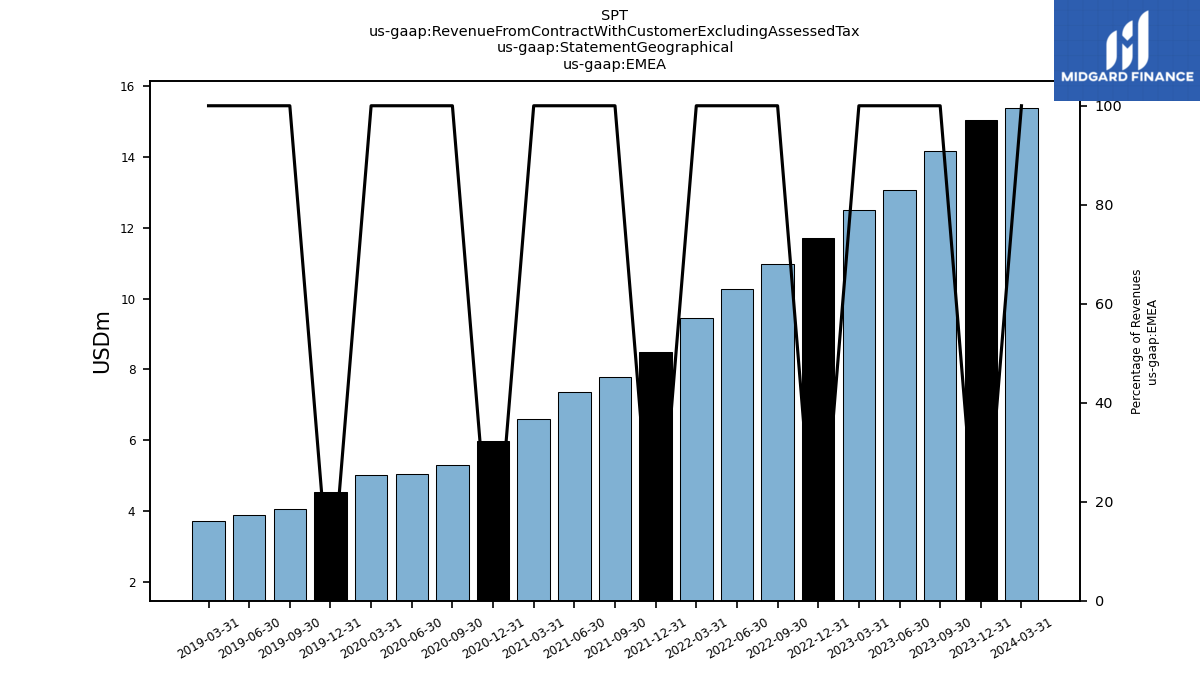
| Revenue From Contract With Customer Excluding Assessed Tax | 85.53 | 79.31 | 75.21 | 69.66 | 65.31 | 61.43 | 57.43 | 53.27 | 49.09 | 44.69 | 40.82 | 37.35 | 33.67 | 31.40 | 30.54 | 28.14 | 26.42 | 24.76 | 23.38 | |
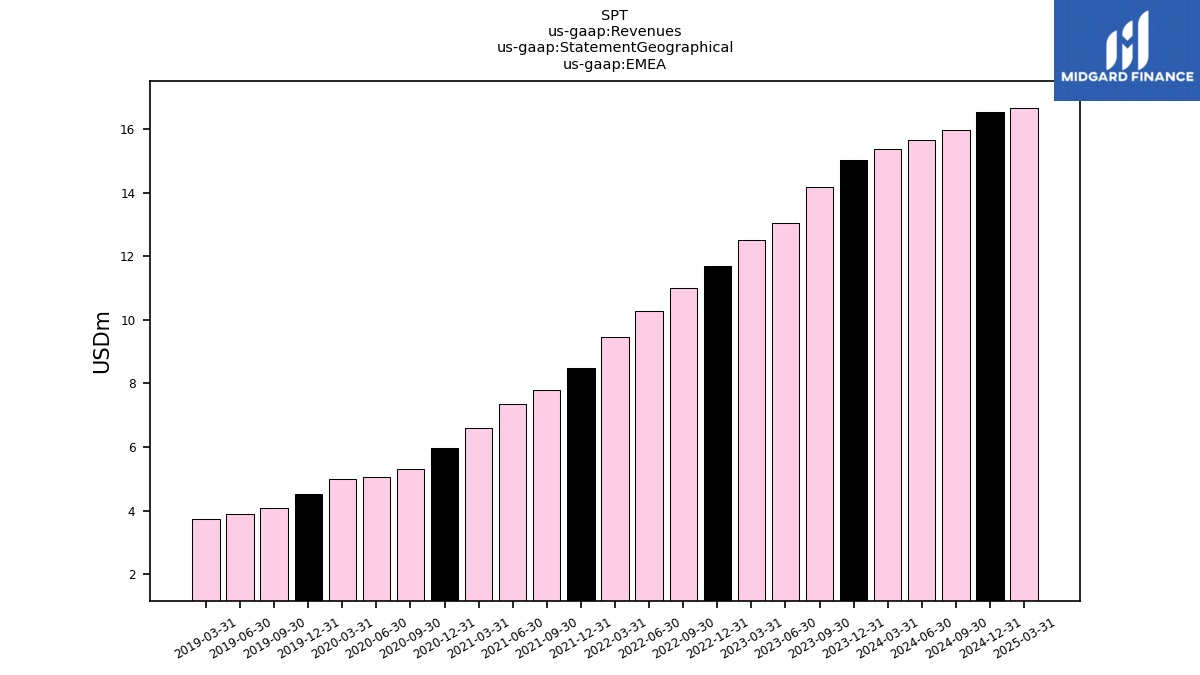
| Revenues | 85.53 | 79.31 | 75.21 | 69.66 | 65.31 | 61.43 | 57.43 | 53.27 | 49.09 | 44.69 | 40.82 | 37.35 | 33.67 | 31.40 | 30.54 | 28.14 | 26.42 | 24.76 | 23.38 | |
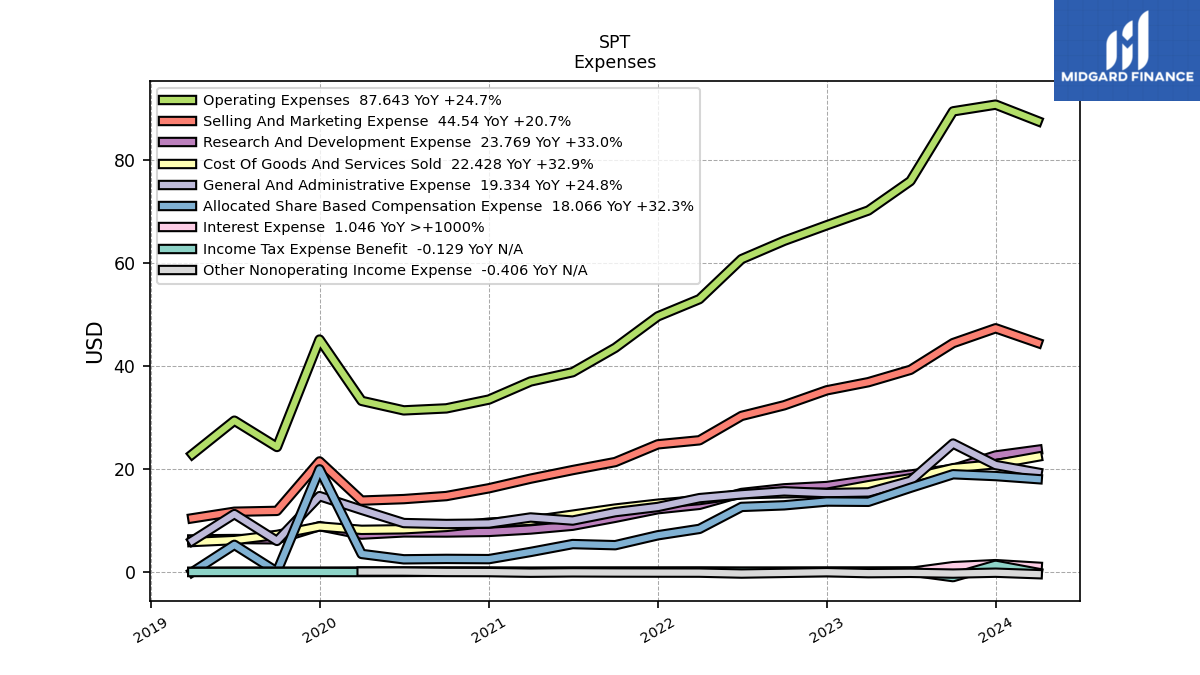
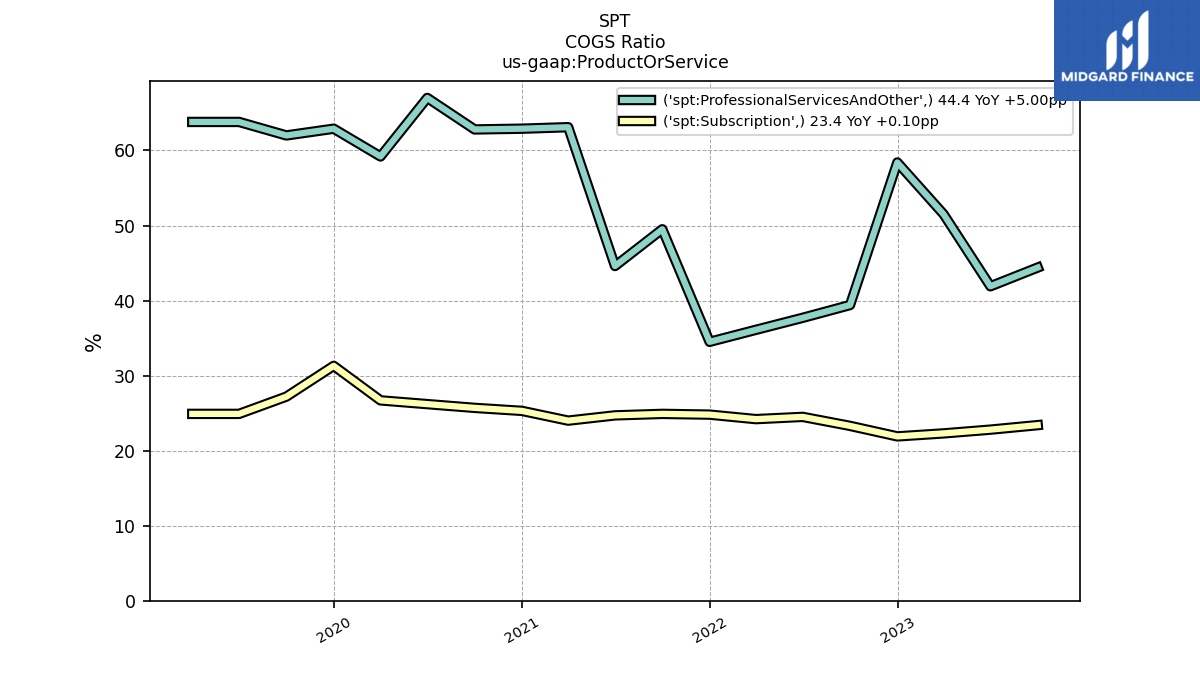
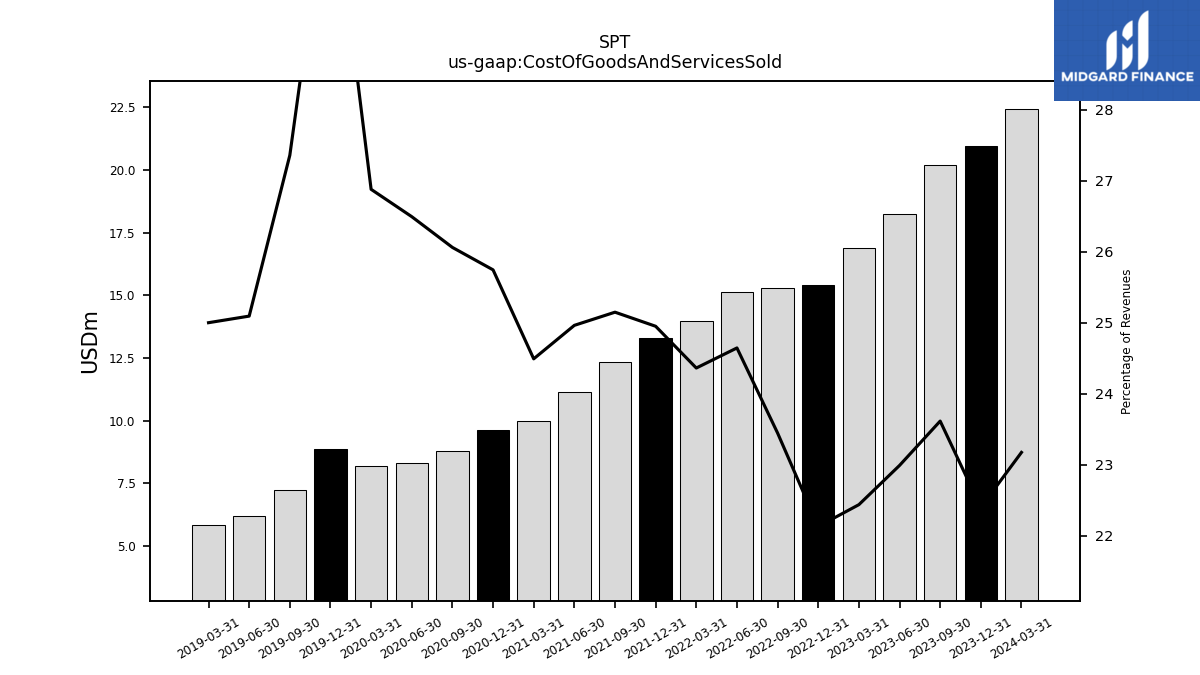
| Cost Of Goods And Services Sold | 20.20 | 18.23 | 16.88 | 15.41 | 15.31 | 15.14 | 13.99 | 13.29 | 12.35 | 11.15 | 10.00 | 9.62 | 8.77 | 8.32 | 8.21 | 8.87 | 7.23 | 6.21 | 5.84 | |
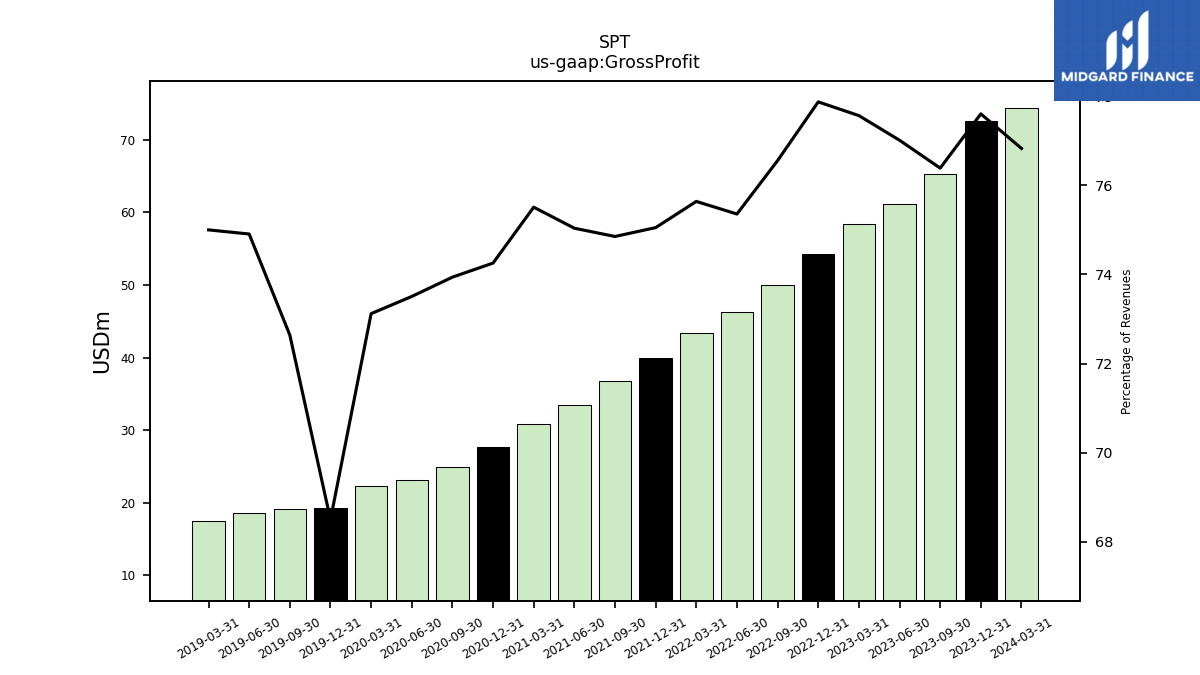
| Gross Profit | 65.33 | 61.08 | 58.34 | 54.24 | 49.99 | 46.29 | 43.44 | 39.98 | 36.74 | 33.53 | 30.82 | 27.73 | 24.89 | 23.08 | 22.33 | 19.28 | 19.19 | 18.55 | 17.53 | |
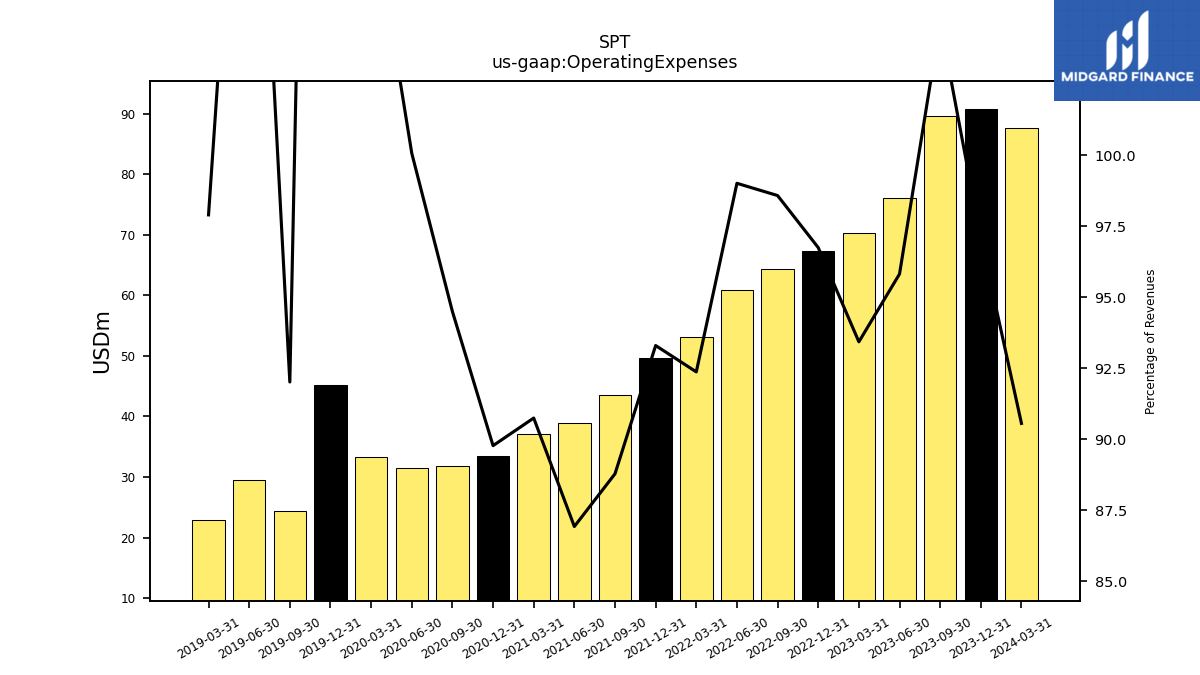
| Operating Expenses | 89.54 | 76.00 | 70.27 | 67.39 | 64.38 | 60.83 | 53.05 | 49.70 | 43.58 | 38.84 | 37.04 | 33.53 | 31.81 | 31.42 | 33.27 | 45.19 | 24.31 | 29.43 | 22.89 | |
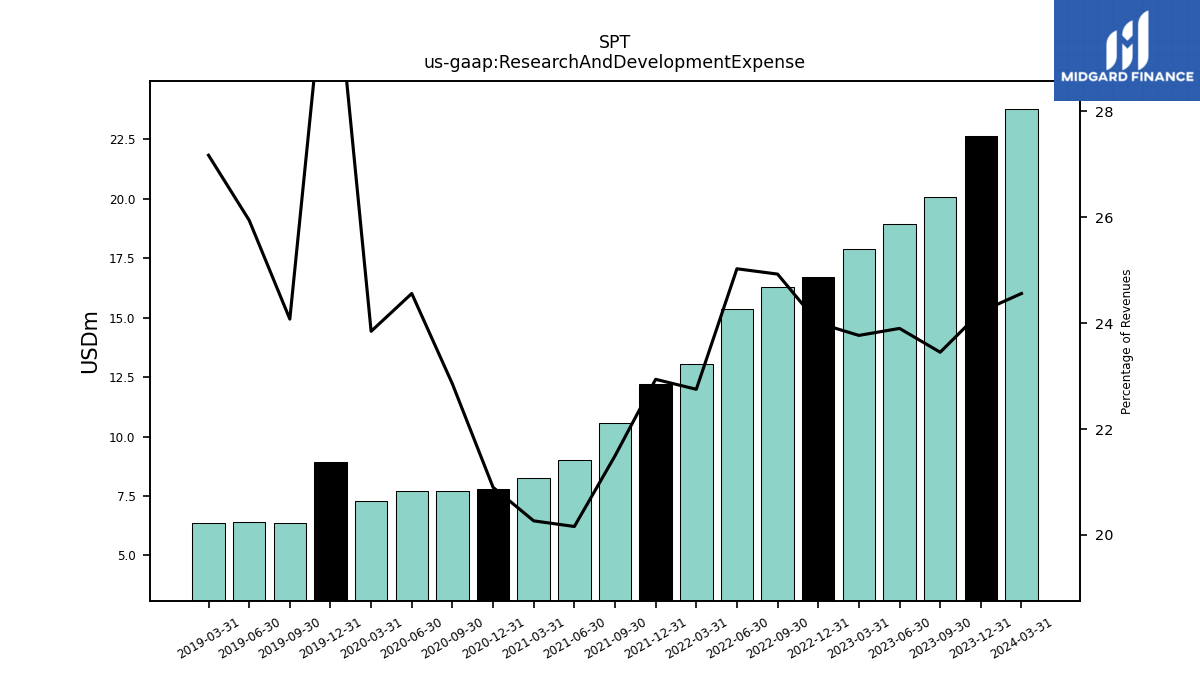
| Research And Development Expense | 20.06 | 18.96 | 17.88 | 16.72 | 16.28 | 15.37 | 13.06 | 12.22 | 10.55 | 9.01 | 8.27 | 7.80 | 7.69 | 7.71 | 7.28 | 8.92 | 6.36 | 6.42 | 6.35 | |
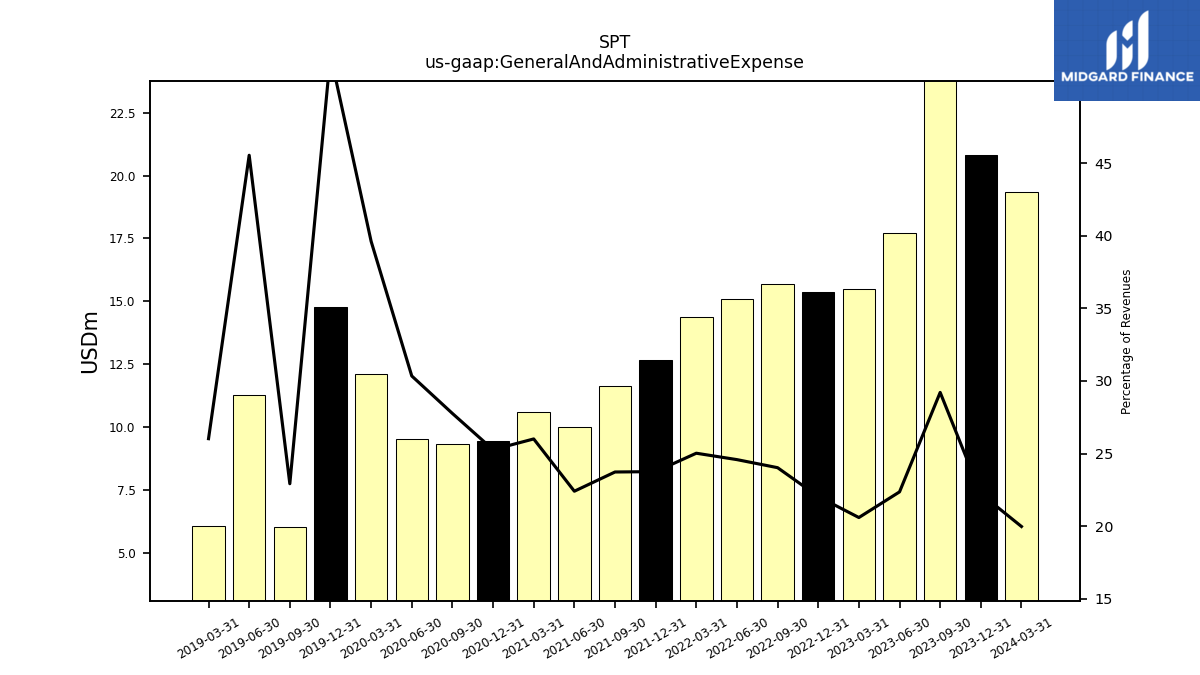
| General And Administrative Expense | 24.98 | 17.73 | 15.49 | 15.35 | 15.69 | 15.10 | 14.37 | 12.65 | 11.65 | 10.01 | 10.62 | 9.44 | 9.35 | 9.53 | 12.10 | 14.76 | 6.06 | 11.28 | 6.08 | |
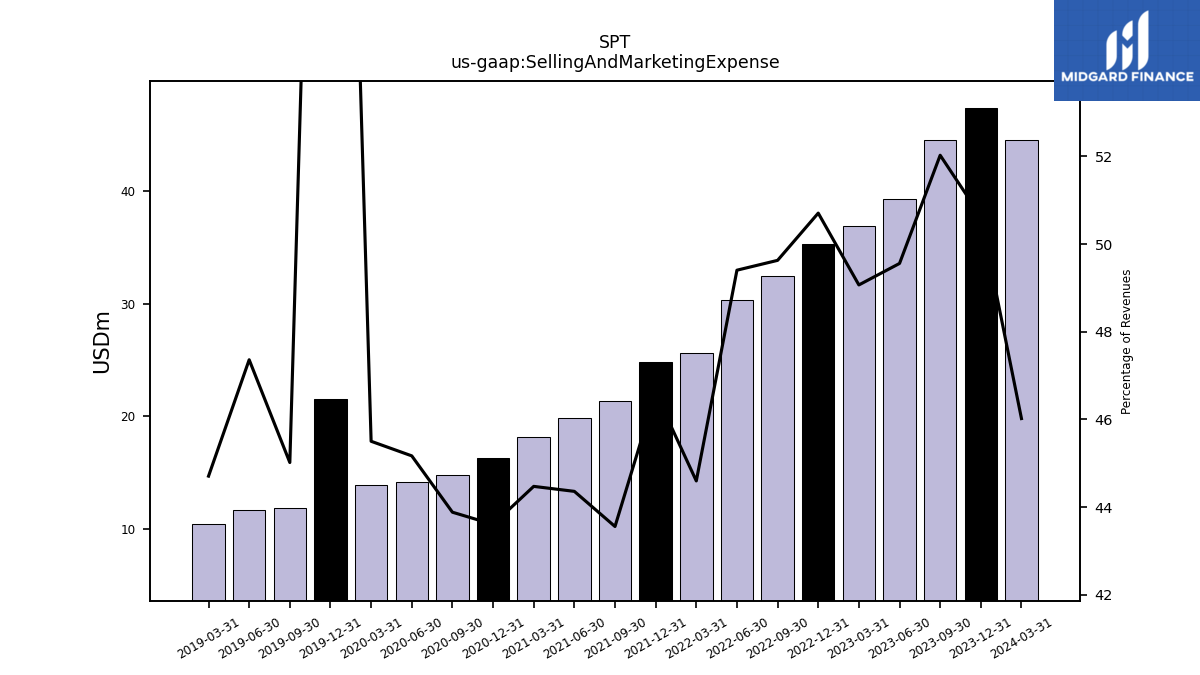
| Selling And Marketing Expense | 44.50 | 39.31 | 36.91 | 35.32 | 32.41 | 30.35 | 25.61 | 24.82 | 21.38 | 19.82 | 18.15 | 16.29 | 14.77 | 14.18 | 13.89 | 21.51 | 11.89 | 11.73 | 10.45 | |
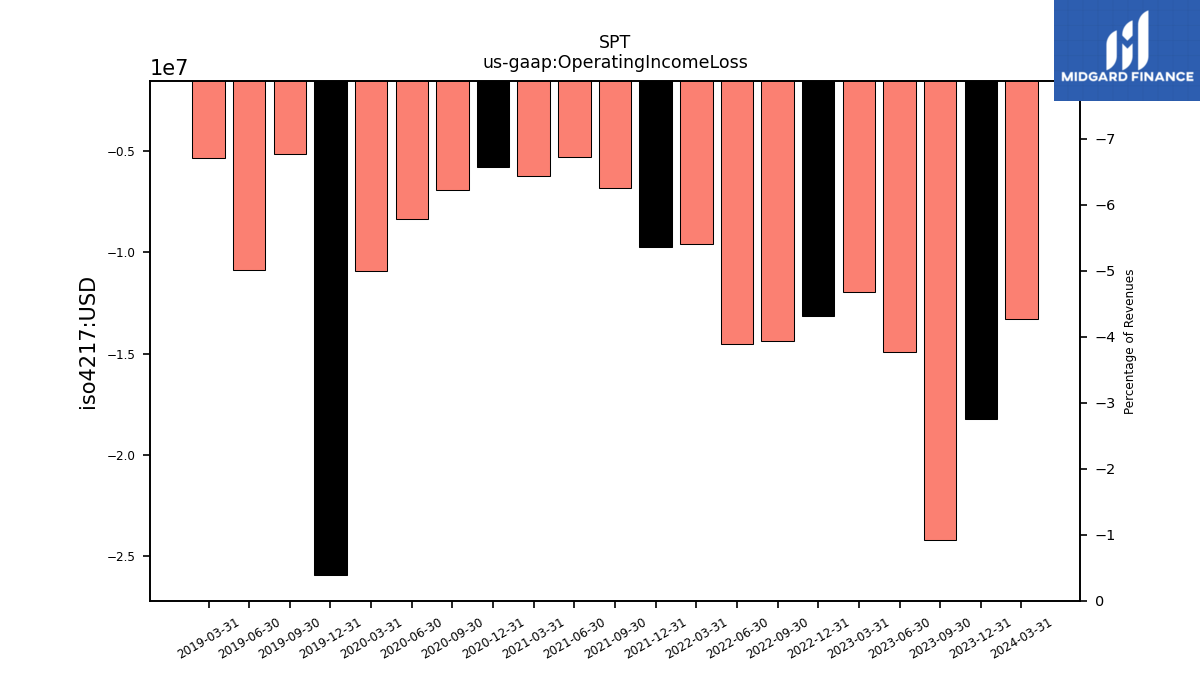
| Operating Income Loss | -24.20 | -14.92 | -11.93 | -13.15 | -14.38 | -14.53 | -9.61 | -9.72 | -6.84 | -5.31 | -6.22 | -5.79 | -6.92 | -8.34 | -10.94 | -25.91 | -5.12 | -10.88 | -5.35 | |
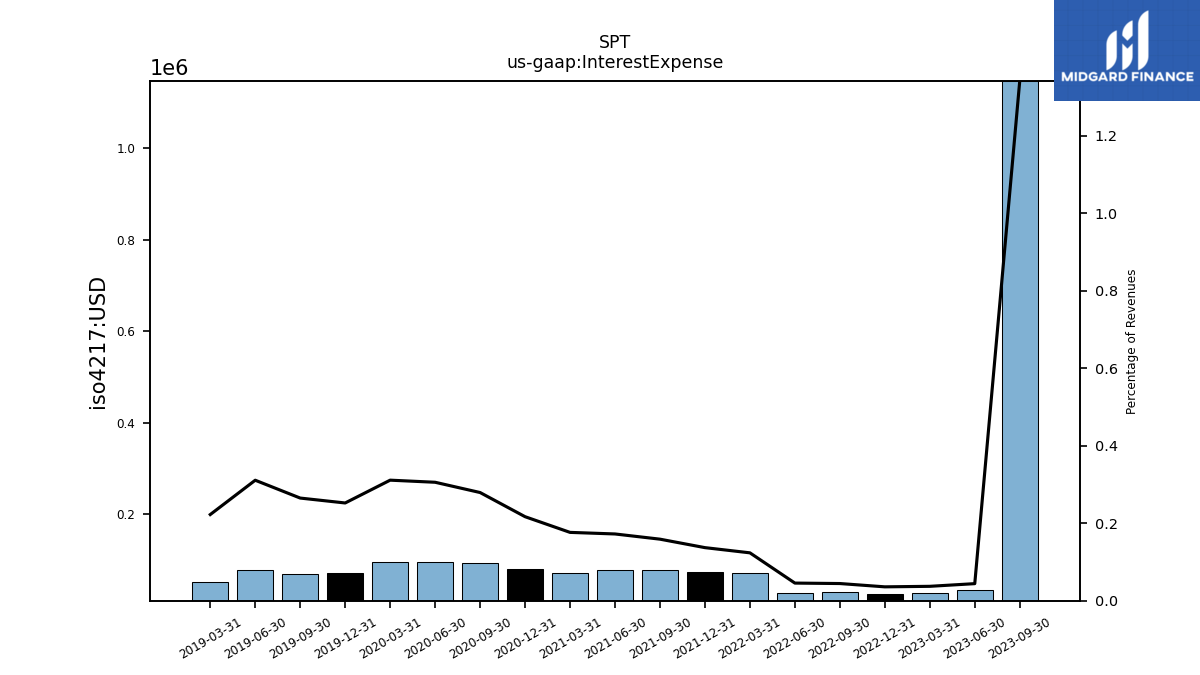
| Interest Expense | 1.15 | 0.04 | 0.03 | 0.03 | 0.03 | 0.03 | 0.07 | 0.07 | 0.08 | 0.08 | 0.07 | 0.08 | 0.09 | 0.10 | 0.10 | 0.07 | 0.07 | 0.08 | 0.05 | |
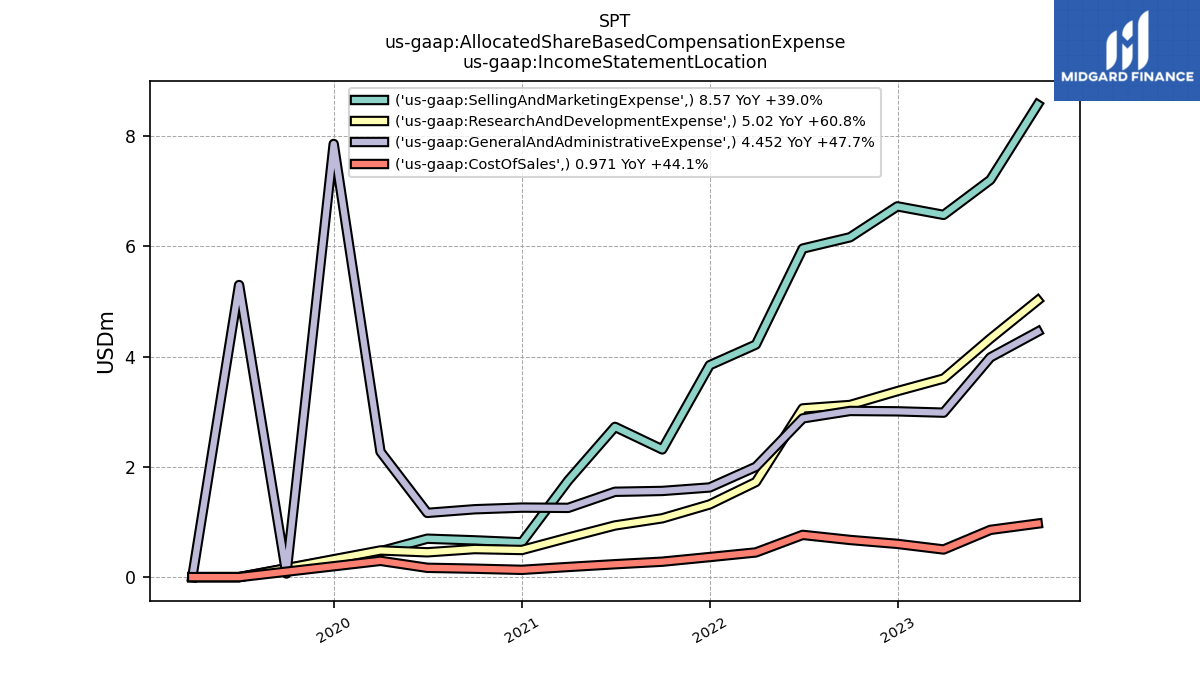
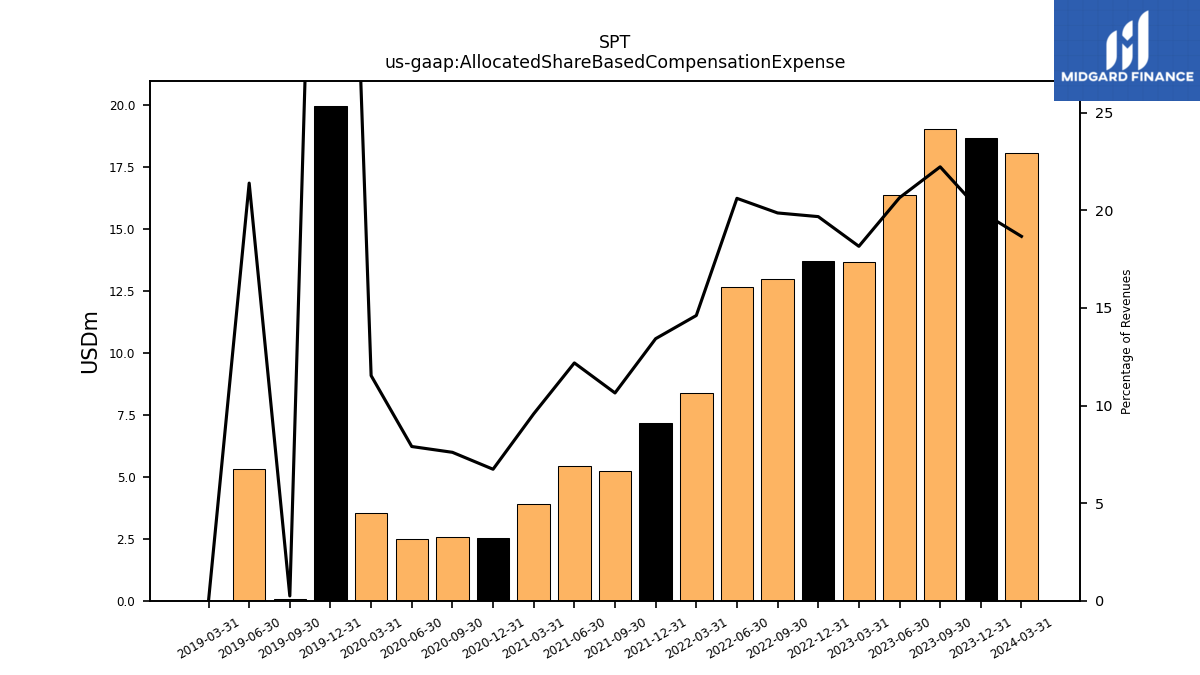
| Allocated Share Based Compensation Expense | 19.01 | 16.38 | 13.66 | NA | 12.97 | 12.66 | 8.39 | NA | 5.23 | 5.44 | 3.91 | 2.52 | 2.56 | 2.48 | 3.52 | 19.97 | 0.07 | 5.30 | 0.00 | |
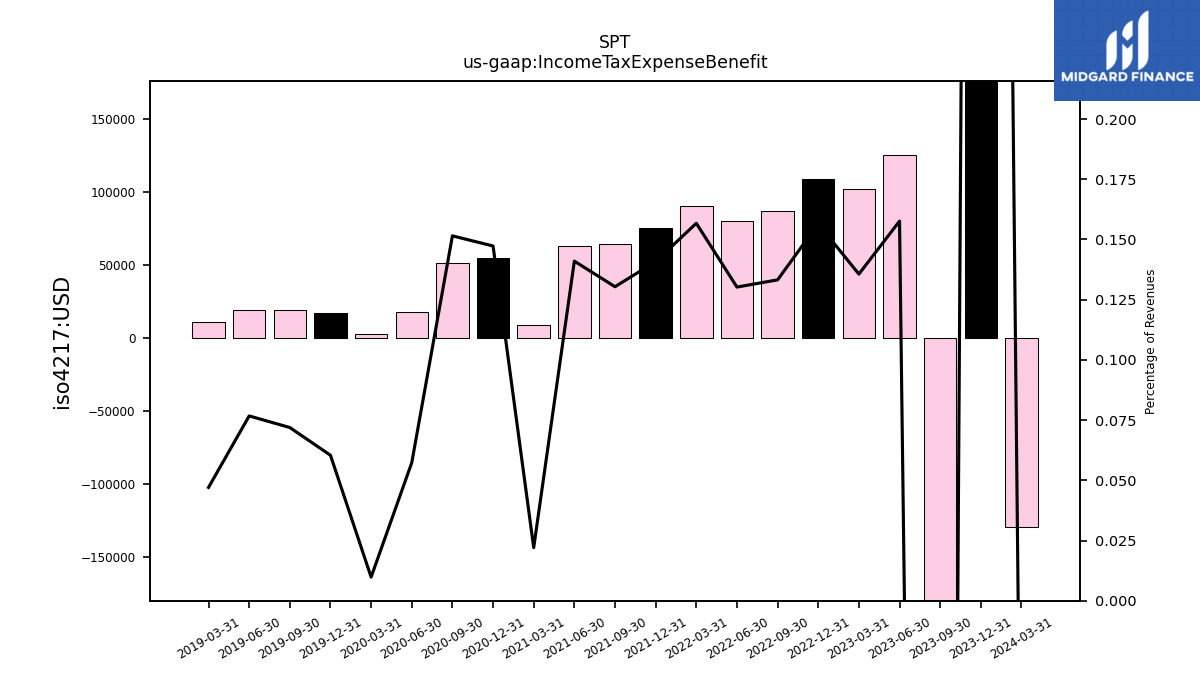
| Income Tax Expense Benefit | -0.98 | 0.12 | 0.10 | 0.11 | 0.09 | 0.08 | 0.09 | 0.07 | 0.06 | 0.06 | 0.01 | 0.06 | 0.05 | 0.02 | 0.00 | 0.02 | 0.02 | 0.02 | 0.01 | |
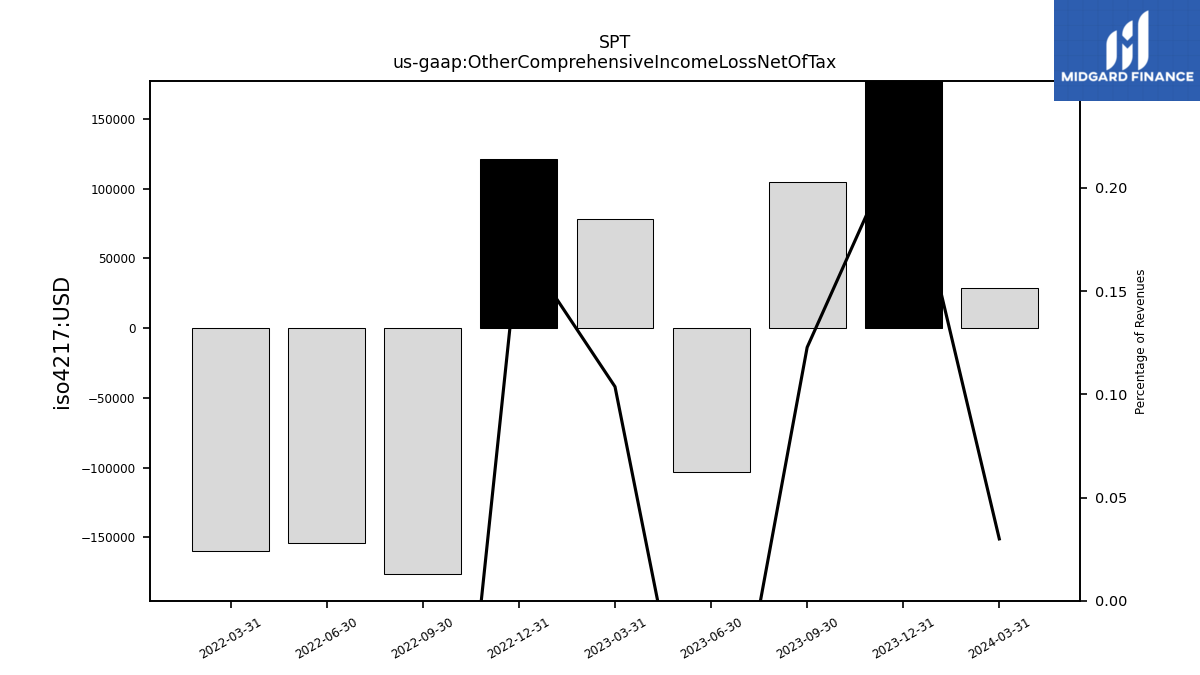
| Other Comprehensive Income Loss Net Of Tax | 0.10 | -0.10 | 0.08 | 0.12 | -0.18 | -0.15 | -0.16 | NA | NA | NA | NA | NA | NA | NA | NA | NA | NA | NA | NA | |
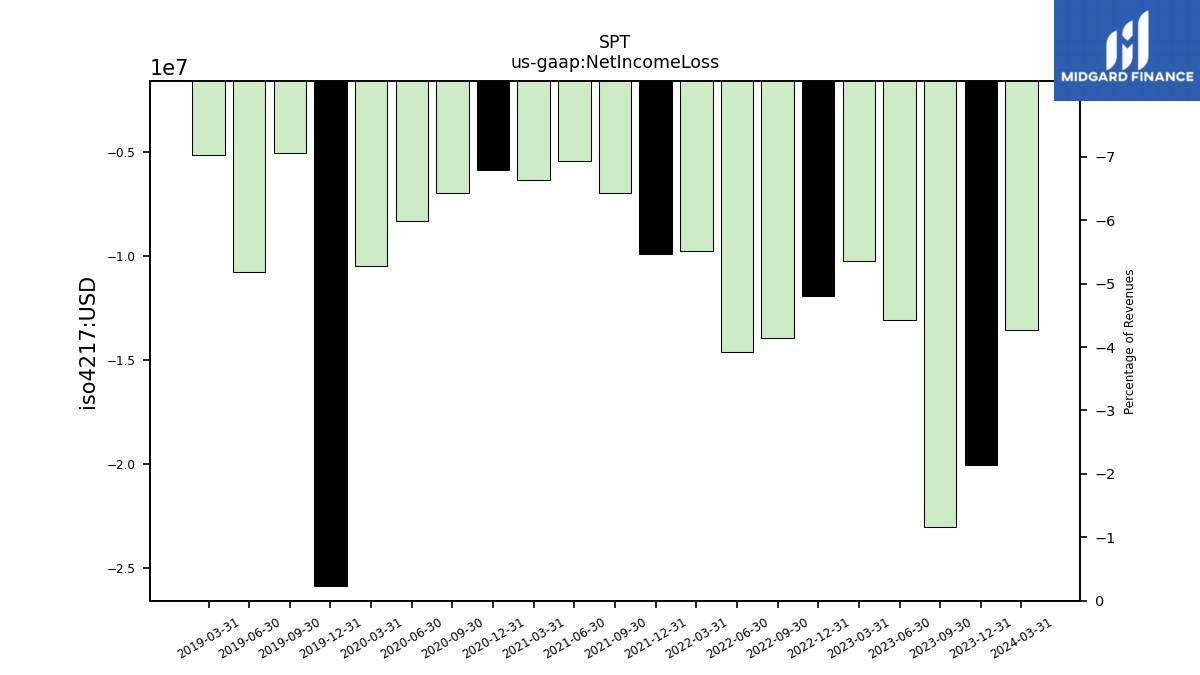
| Net Income Loss | -23.01 | -13.09 | -10.25 | -11.94 | -13.93 | -14.61 | -9.76 | -9.90 | -6.99 | -5.44 | -6.37 | -5.88 | -7.00 | -8.30 | -10.48 | -25.85 | -5.04 | -10.76 | -5.16 | |
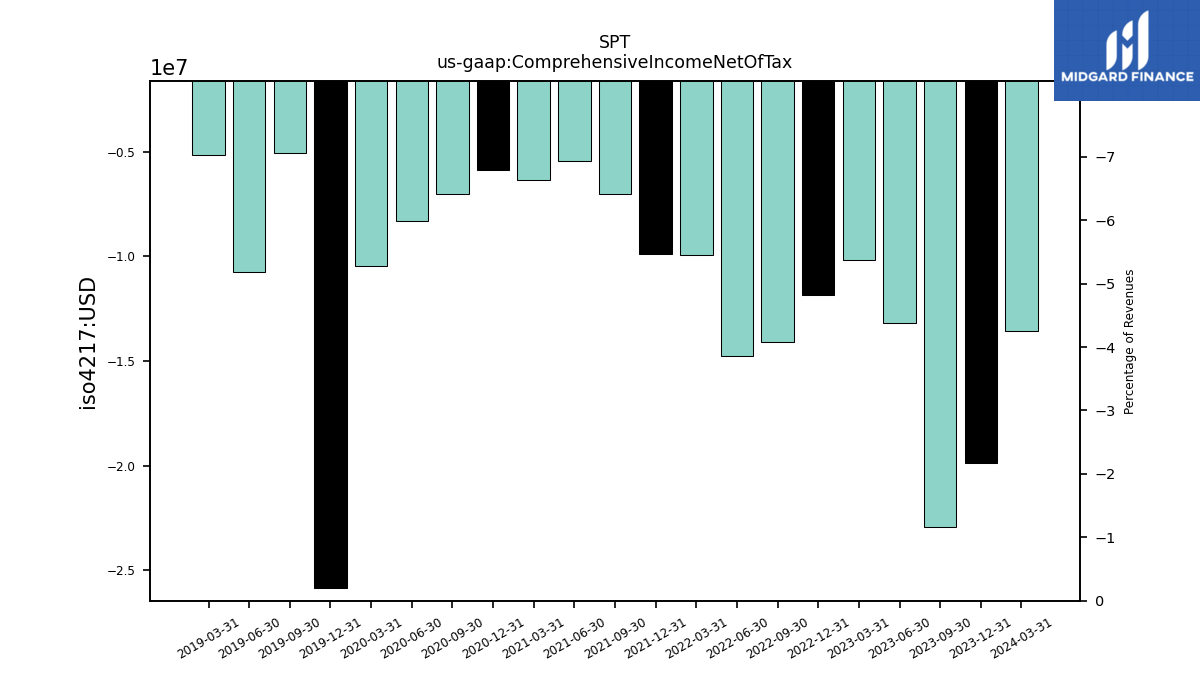
| Comprehensive Income Net Of Tax | -22.91 | -13.19 | -10.17 | -11.82 | -14.11 | -14.76 | -9.91 | -9.90 | -6.99 | -5.44 | -6.37 | -5.88 | -7.00 | -8.30 | -10.48 | -25.85 | -5.04 | -10.76 | -5.16 |
| 2023-09-30 | 2023-06-30 | 2023-03-31 | 2022-12-31 | 2022-09-30 | 2022-06-30 | 2022-03-31 | 2021-12-31 | 2021-09-30 | 2021-06-30 | 2021-03-31 | 2020-12-31 | 2020-09-30 | 2020-06-30 | 2020-03-31 | 2019-12-31 | 2019-09-30 | 2019-06-30 | 2019-03-31 | ||
|---|---|---|---|---|---|---|---|---|---|---|---|---|---|---|---|---|---|---|---|---|
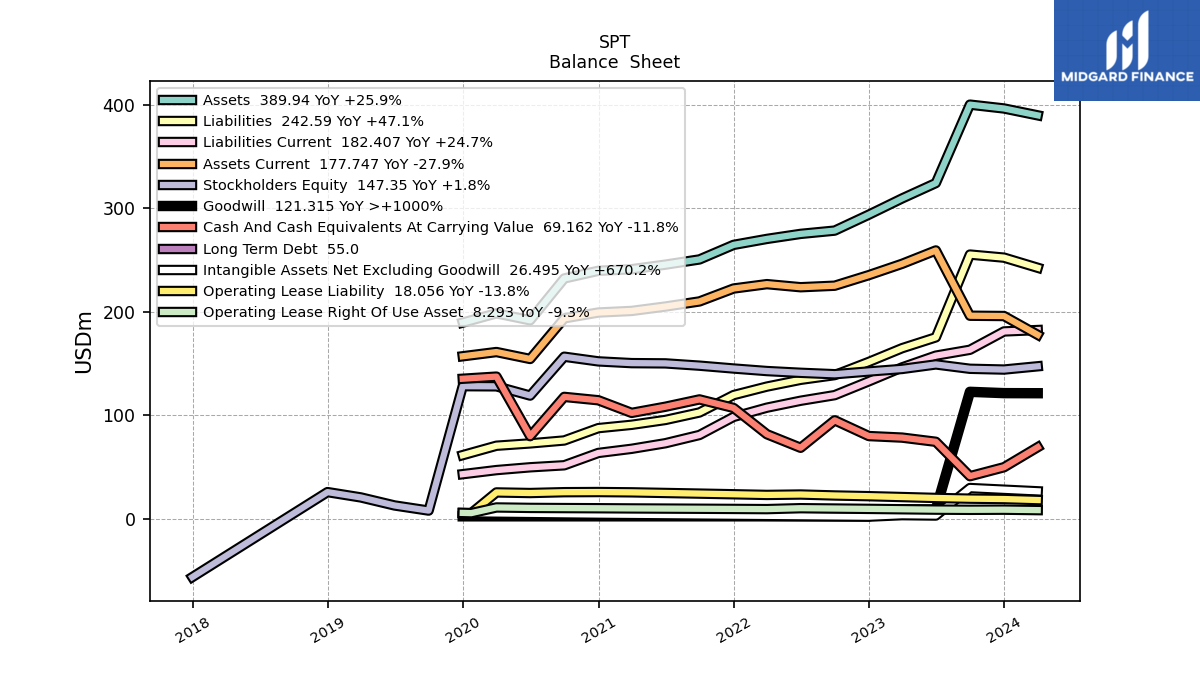
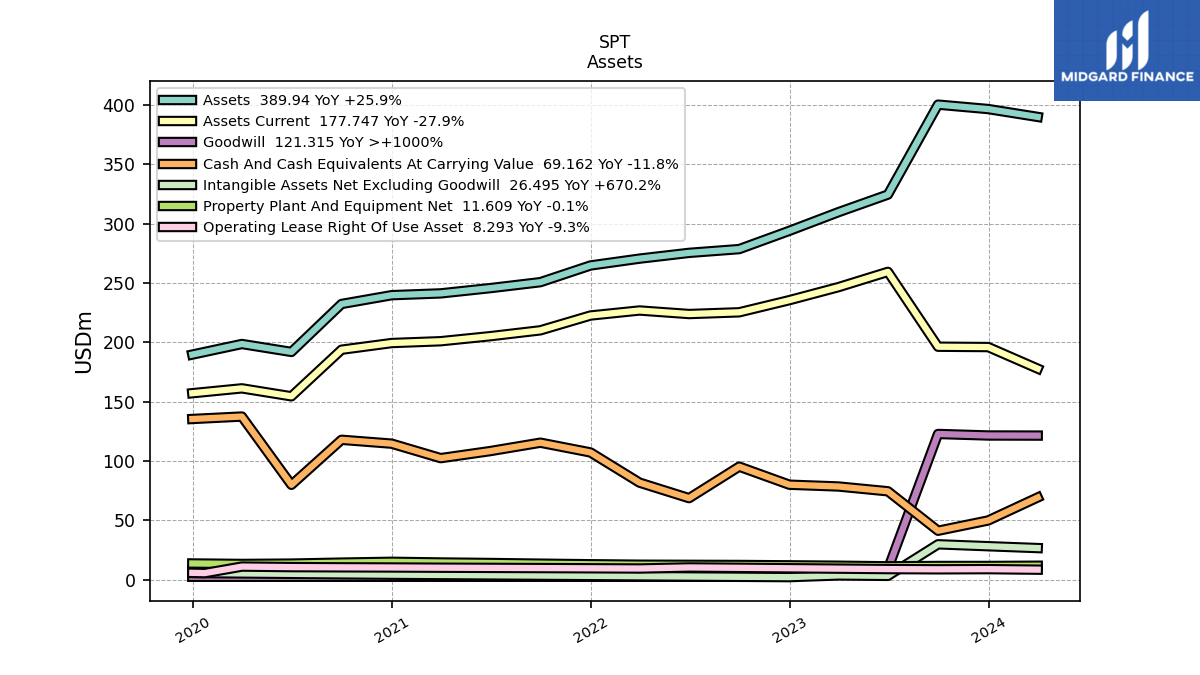
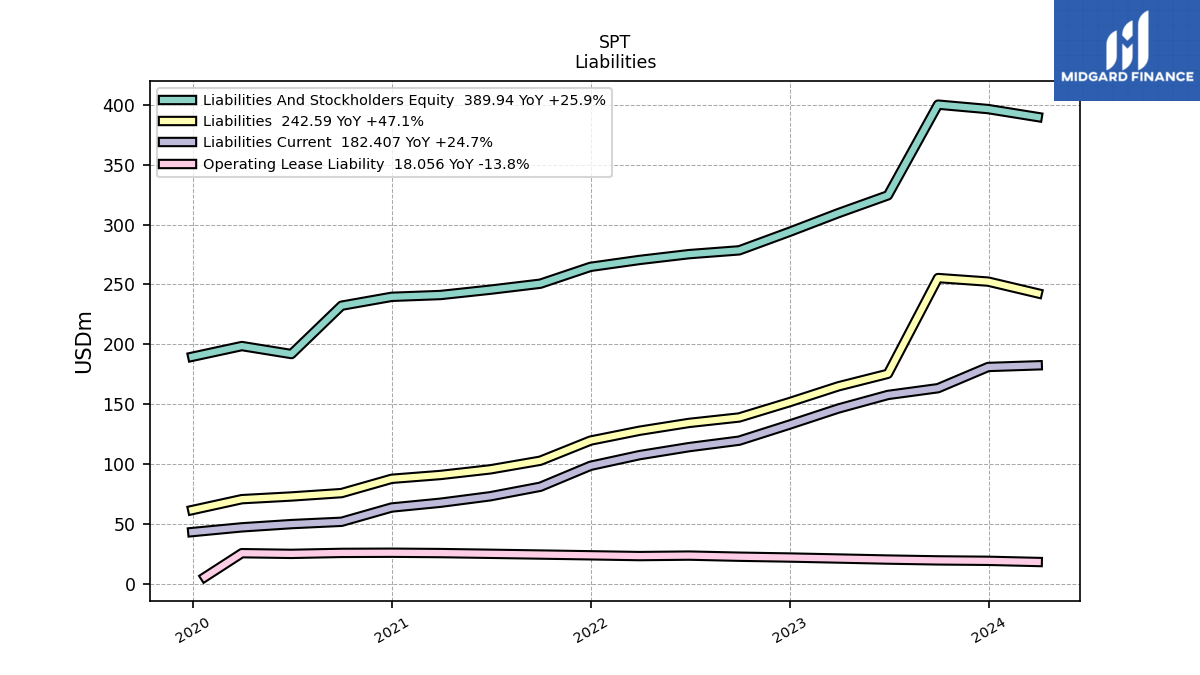
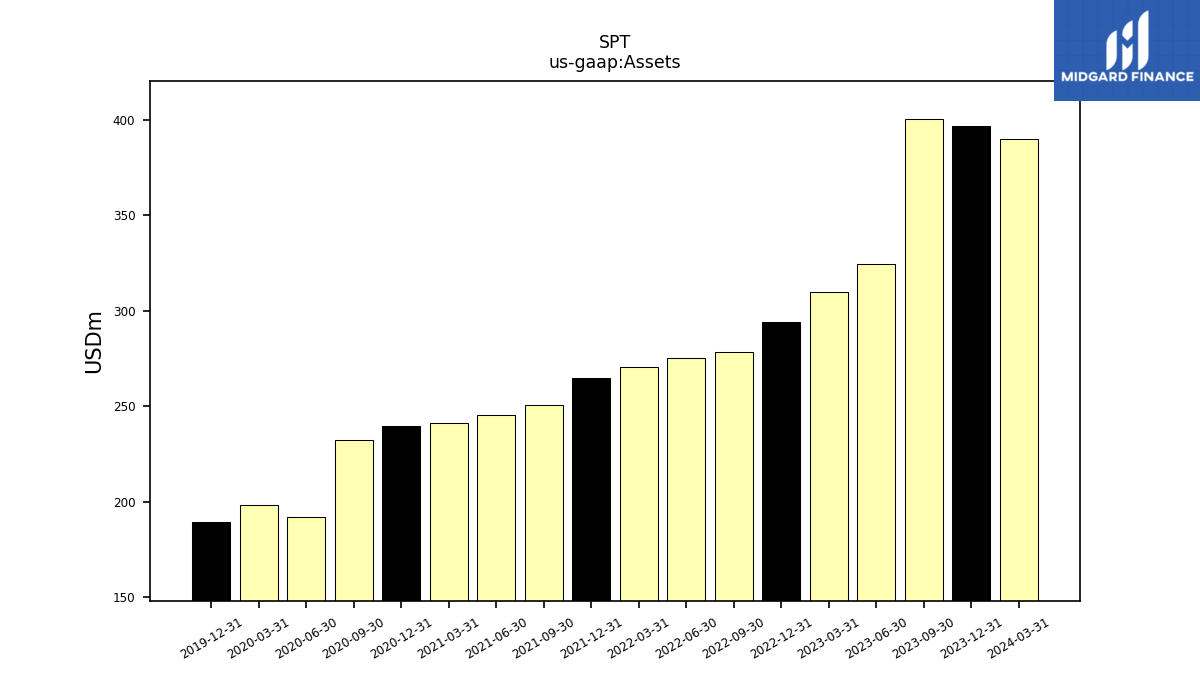
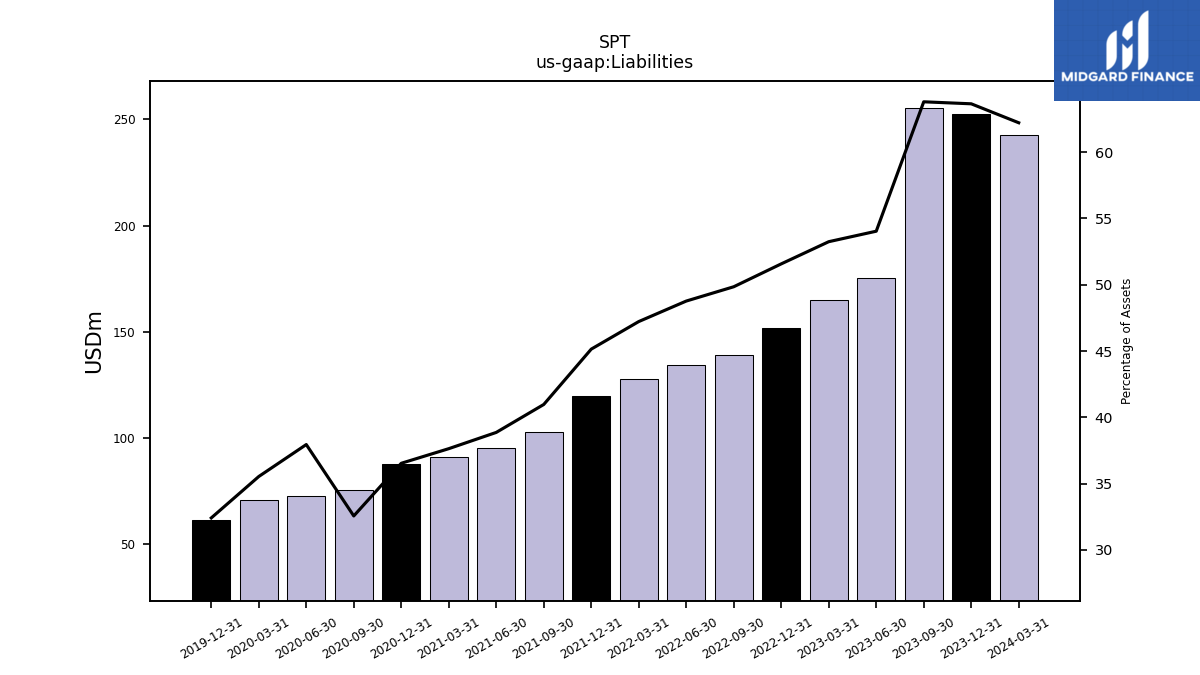
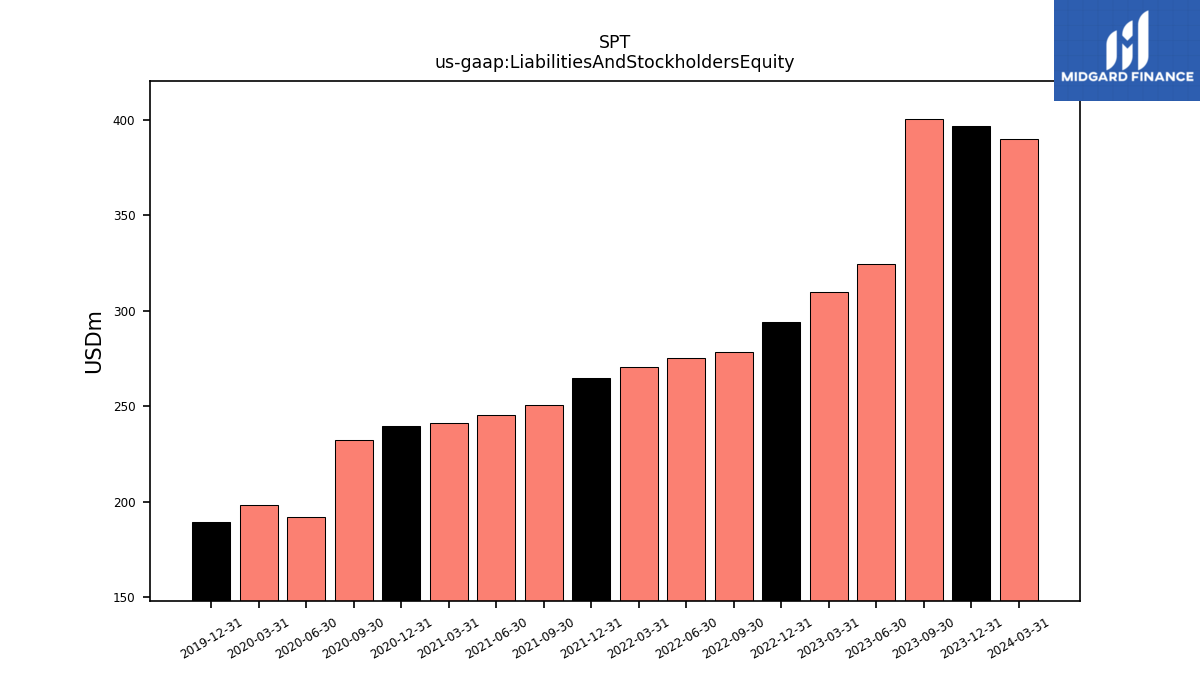
| Assets | 400.31 | 324.48 | 309.63 | 293.92 | 278.52 | 275.35 | 270.49 | 264.72 | 250.65 | 245.62 | 241.19 | 239.67 | 232.25 | 191.84 | 198.53 | 189.59 | NA | NA | NA | |
| Liabilities | 255.37 | 175.33 | 164.86 | 151.58 | 138.84 | 134.28 | 127.73 | 119.51 | 102.69 | 95.46 | 90.78 | 87.57 | 75.64 | 72.80 | 70.56 | 61.46 | NA | NA | NA | |
| Liabilities And Stockholders Equity | 400.31 | 324.48 | 309.63 | 293.92 | 278.52 | 275.35 | 270.49 | 264.72 | 250.65 | 245.62 | 241.19 | 239.67 | 232.25 | 191.84 | 198.53 | 189.59 | NA | NA | NA | |
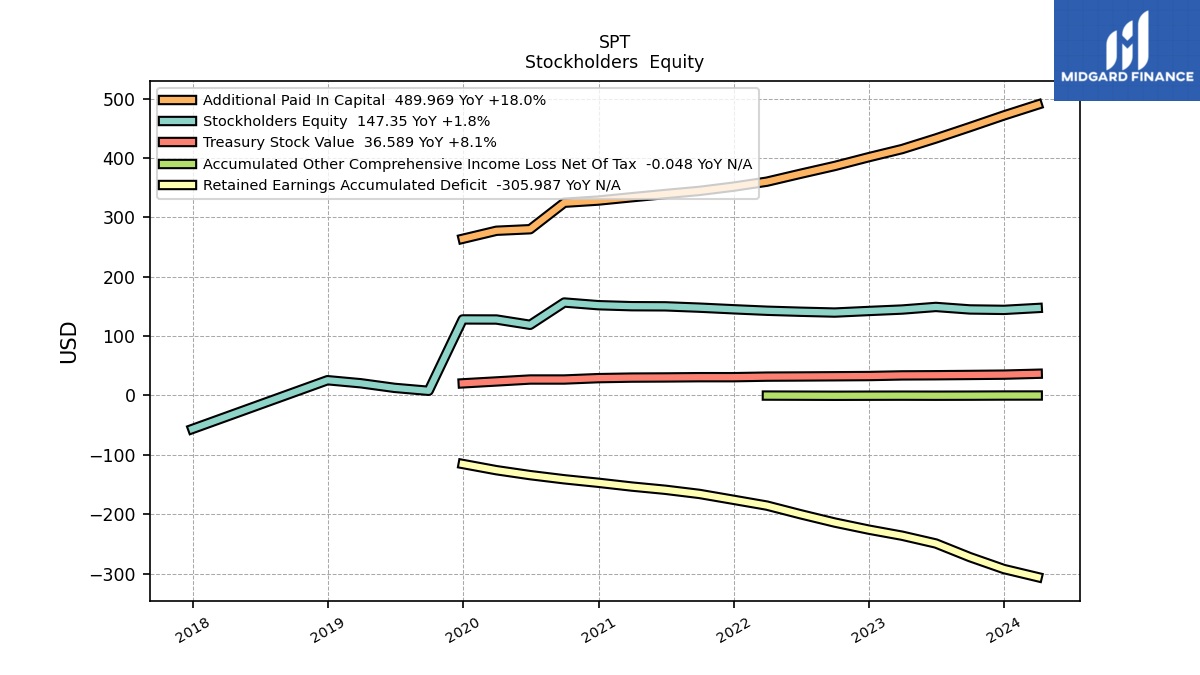
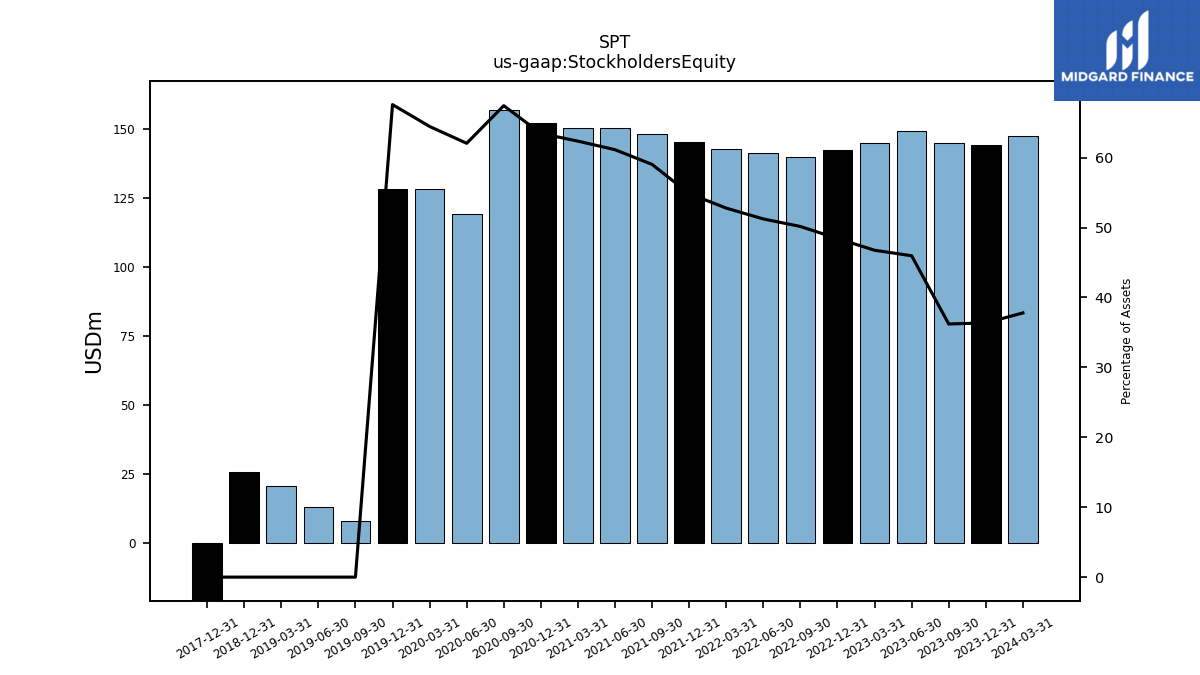
| Stockholders Equity | 144.94 | 149.14 | 144.77 | 142.34 | 139.69 | 141.06 | 142.75 | 145.21 | 147.95 | 150.16 | 150.41 | 152.10 | 156.62 | 119.03 | 127.97 | 128.13 | 7.86 | 12.81 | 20.58 |
| 2023-09-30 | 2023-06-30 | 2023-03-31 | 2022-12-31 | 2022-09-30 | 2022-06-30 | 2022-03-31 | 2021-12-31 | 2021-09-30 | 2021-06-30 | 2021-03-31 | 2020-12-31 | 2020-09-30 | 2020-06-30 | 2020-03-31 | 2019-12-31 | 2019-09-30 | 2019-06-30 | 2019-03-31 | ||
|---|---|---|---|---|---|---|---|---|---|---|---|---|---|---|---|---|---|---|---|---|
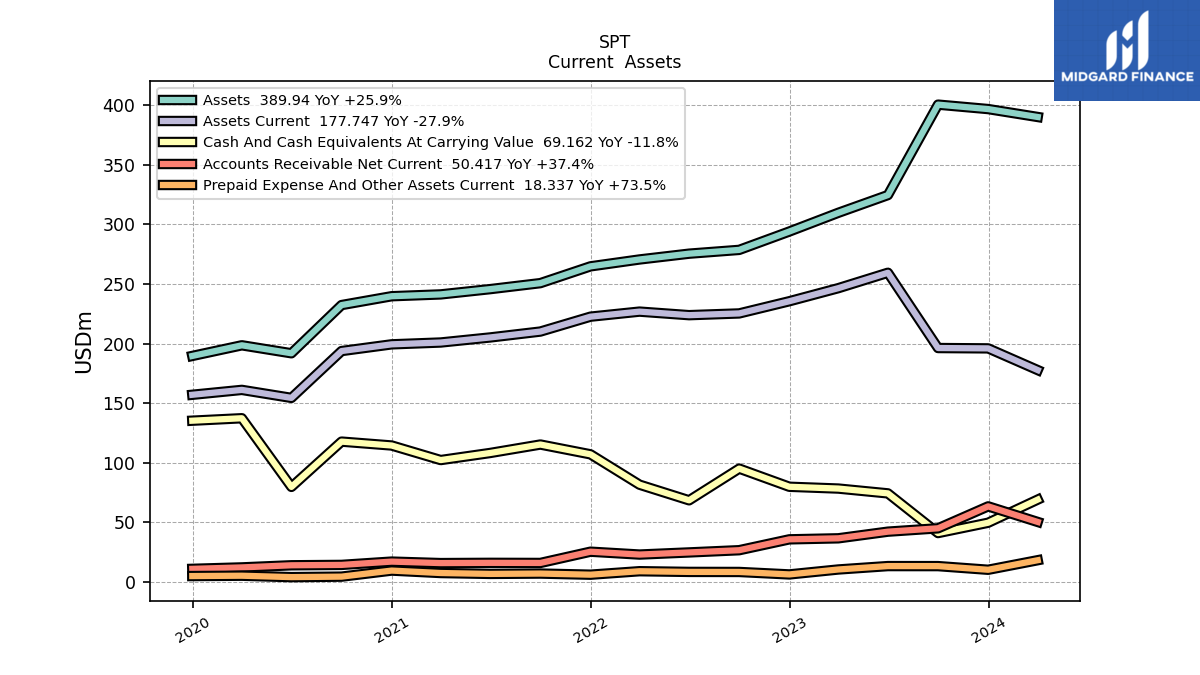
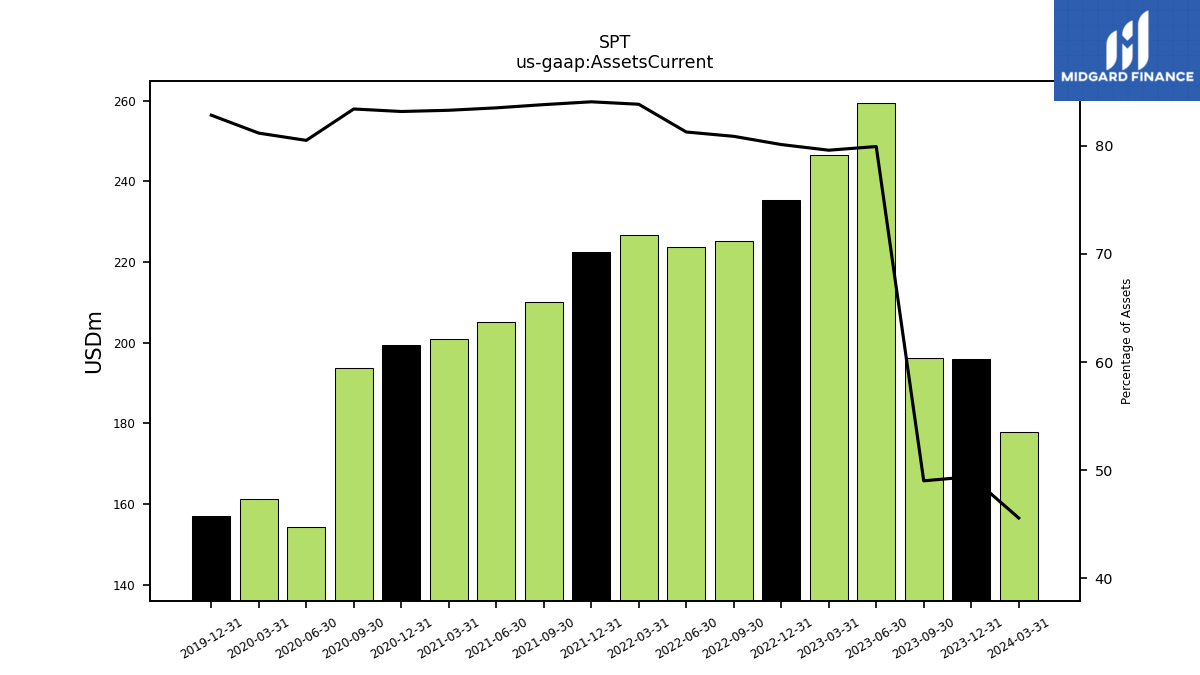
| Assets Current | 196.23 | 259.35 | 246.43 | 235.47 | 225.25 | 223.78 | 226.77 | 222.53 | 210.05 | 205.11 | 200.87 | 199.33 | 193.70 | 154.42 | 161.14 | 157.03 | NA | NA | NA | |
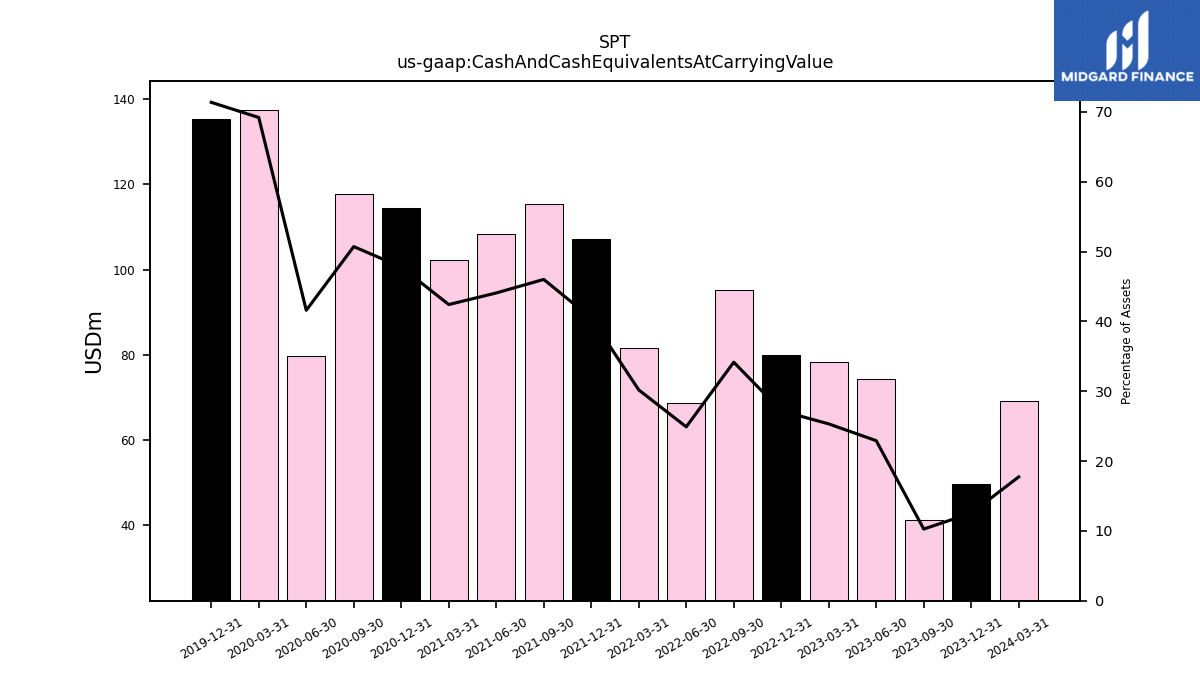
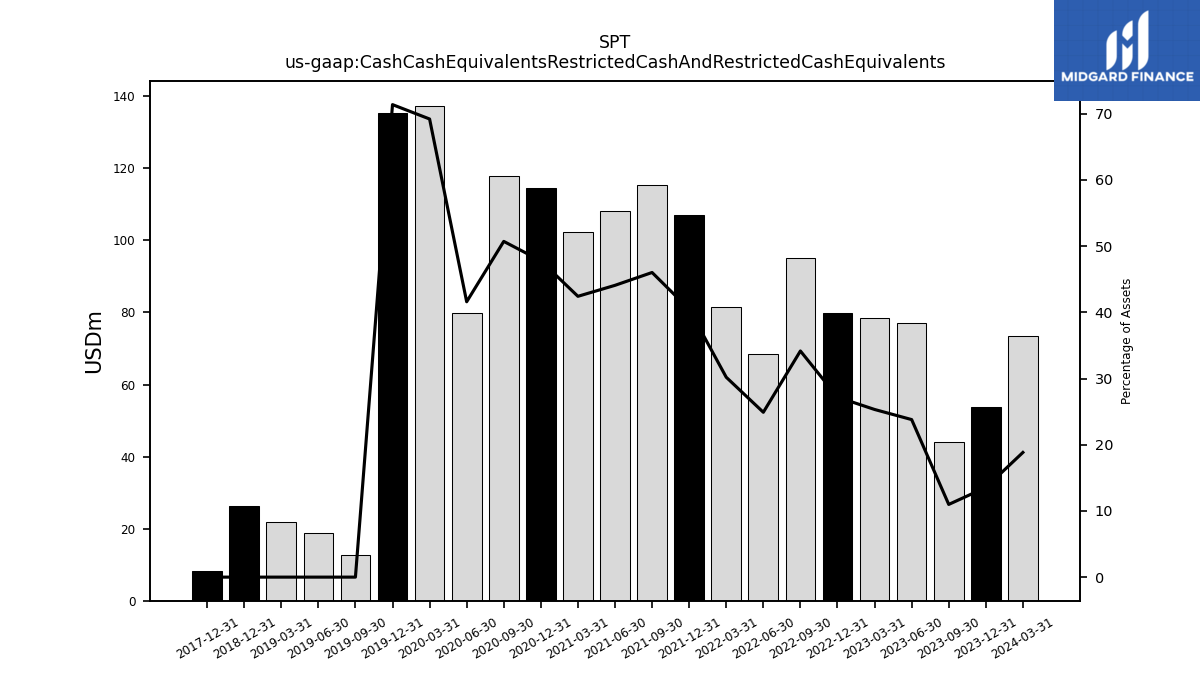
| Cash And Cash Equivalents At Carrying Value | 41.10 | 74.36 | 78.41 | 79.92 | 95.14 | 68.56 | 81.66 | 107.11 | 115.33 | 108.26 | 102.30 | 114.52 | 117.78 | 79.79 | 137.38 | 135.31 | NA | NA | NA | |
| Cash Cash Equivalents Restricted Cash And Restricted Cash Equivalents | 43.96 | 77.21 | 78.41 | 79.92 | 95.14 | 68.56 | 81.66 | 107.11 | 115.33 | 108.26 | 102.30 | 114.52 | 117.78 | 79.79 | 137.38 | 135.31 | 12.60 | 18.84 | 21.92 | |
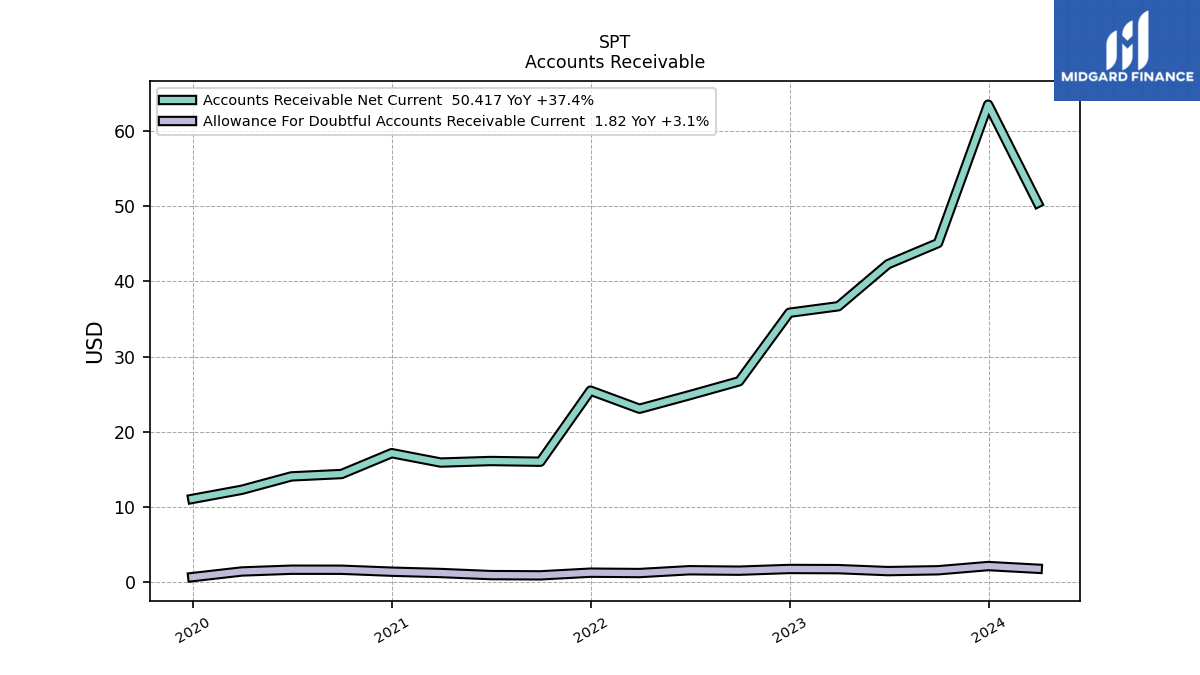
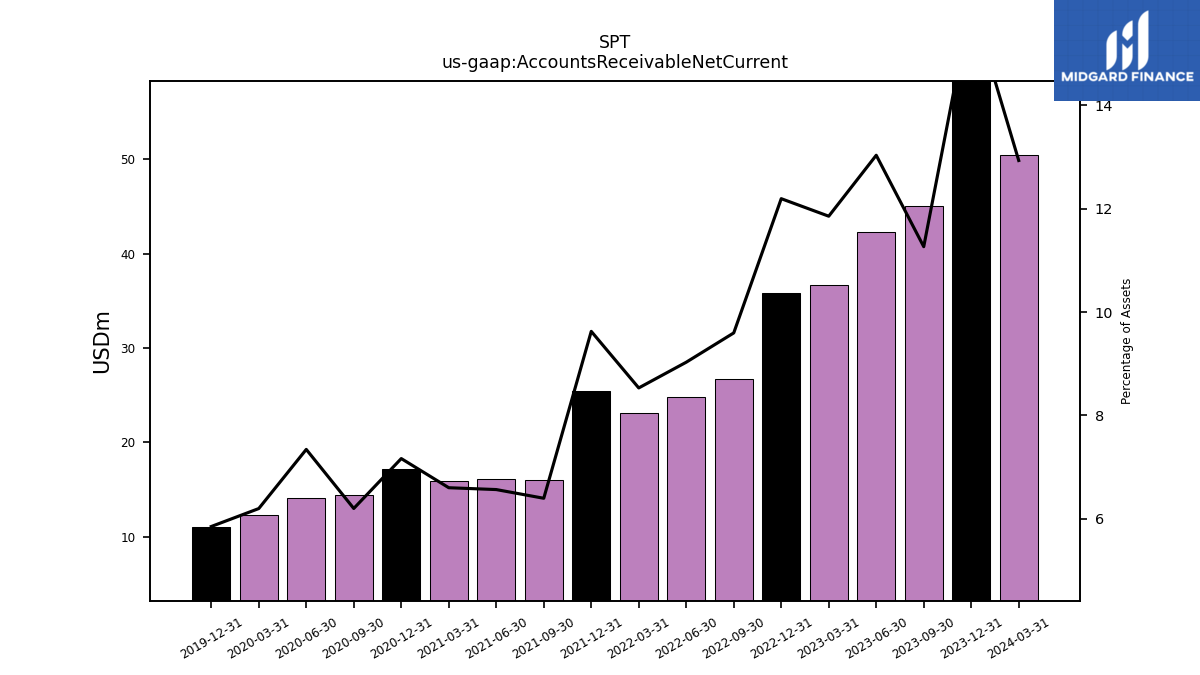
| Accounts Receivable Net Current | 45.09 | 42.28 | 36.70 | 35.83 | 26.73 | 24.86 | 23.08 | 25.48 | 16.04 | 16.13 | 15.93 | 17.18 | 14.41 | 14.09 | 12.31 | 11.10 | NA | NA | NA | |
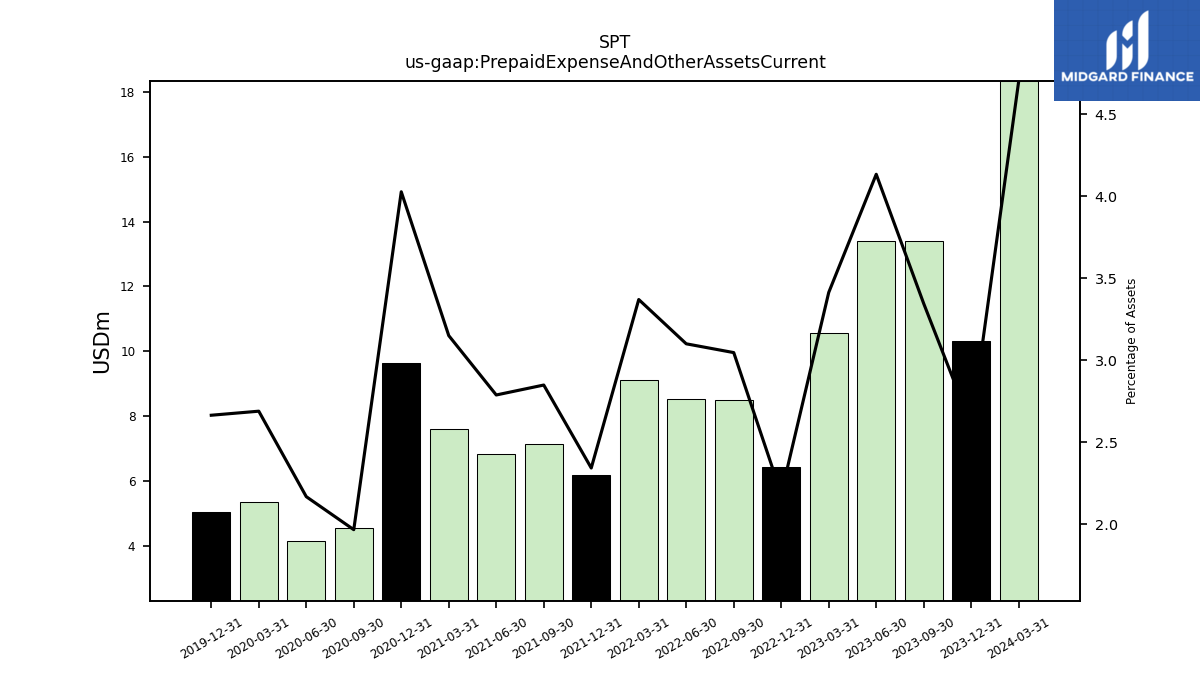
| Prepaid Expense And Other Assets Current | 13.39 | 13.41 | 10.57 | 6.42 | 8.48 | 8.53 | 9.11 | 6.20 | 7.14 | 6.85 | 7.60 | 9.65 | 4.57 | 4.16 | 5.34 | 5.05 | NA | NA | NA |
| 2023-09-30 | 2023-06-30 | 2023-03-31 | 2022-12-31 | 2022-09-30 | 2022-06-30 | 2022-03-31 | 2021-12-31 | 2021-09-30 | 2021-06-30 | 2021-03-31 | 2020-12-31 | 2020-09-30 | 2020-06-30 | 2020-03-31 | 2019-12-31 | 2019-09-30 | 2019-06-30 | 2019-03-31 | ||
|---|---|---|---|---|---|---|---|---|---|---|---|---|---|---|---|---|---|---|---|---|
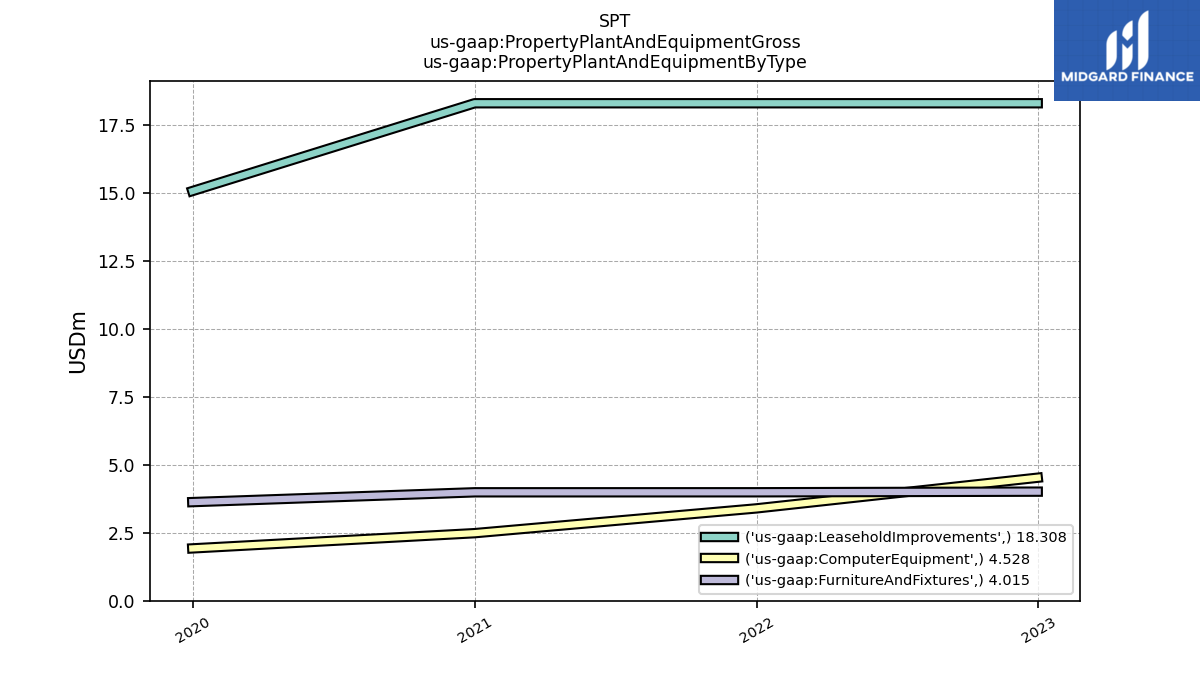
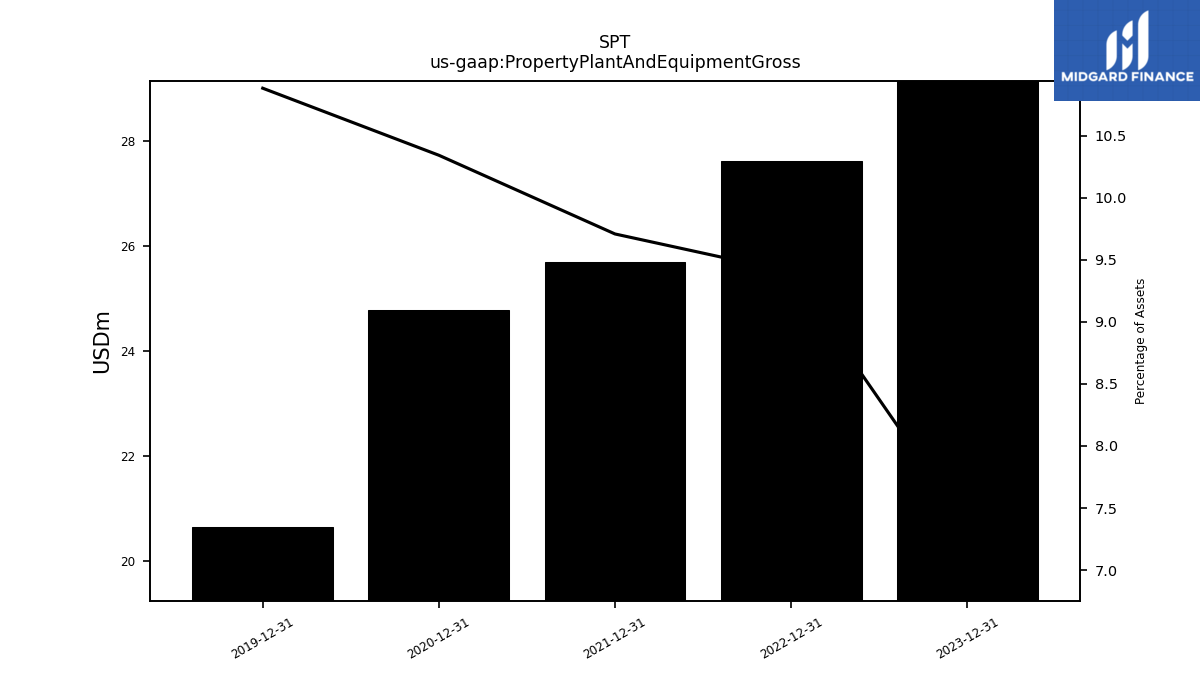
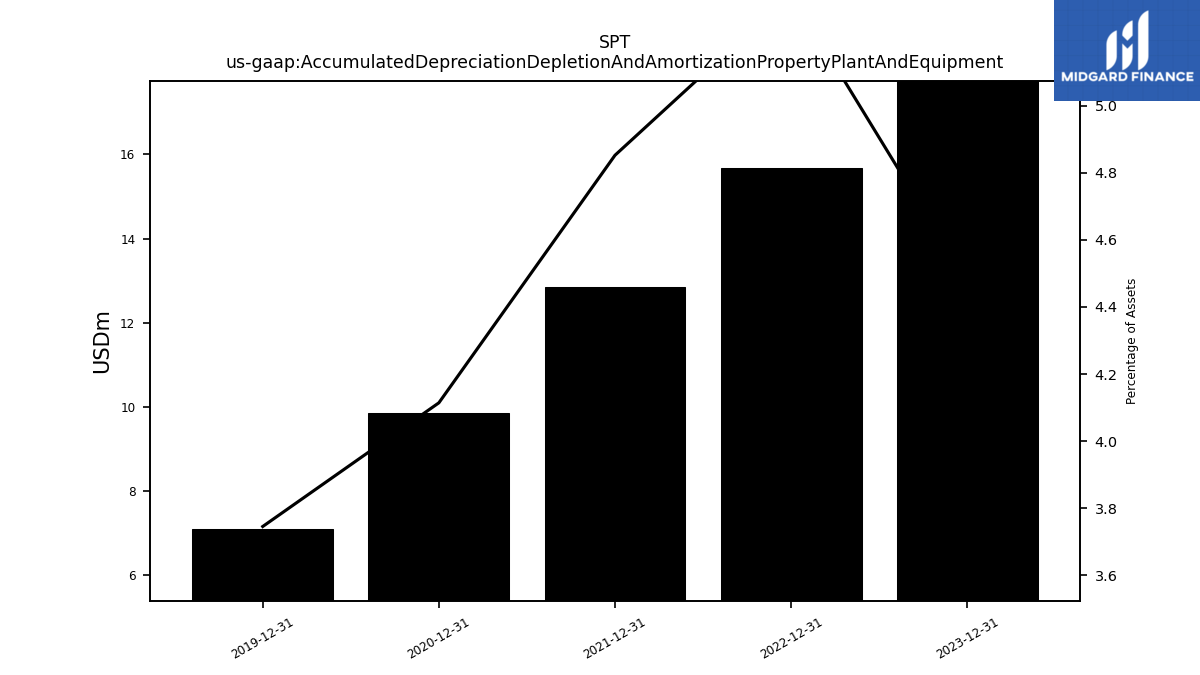
| Property Plant And Equipment Gross | NA | NA | NA | 27.62 | NA | NA | NA | 25.70 | NA | NA | NA | 24.79 | NA | NA | NA | 20.63 | NA | NA | NA | |
| Accumulated Depreciation Depletion And Amortization Property Plant And Equipment | NA | NA | NA | 15.68 | NA | NA | NA | 12.84 | NA | NA | NA | 9.86 | NA | NA | NA | 7.10 | NA | NA | NA | |
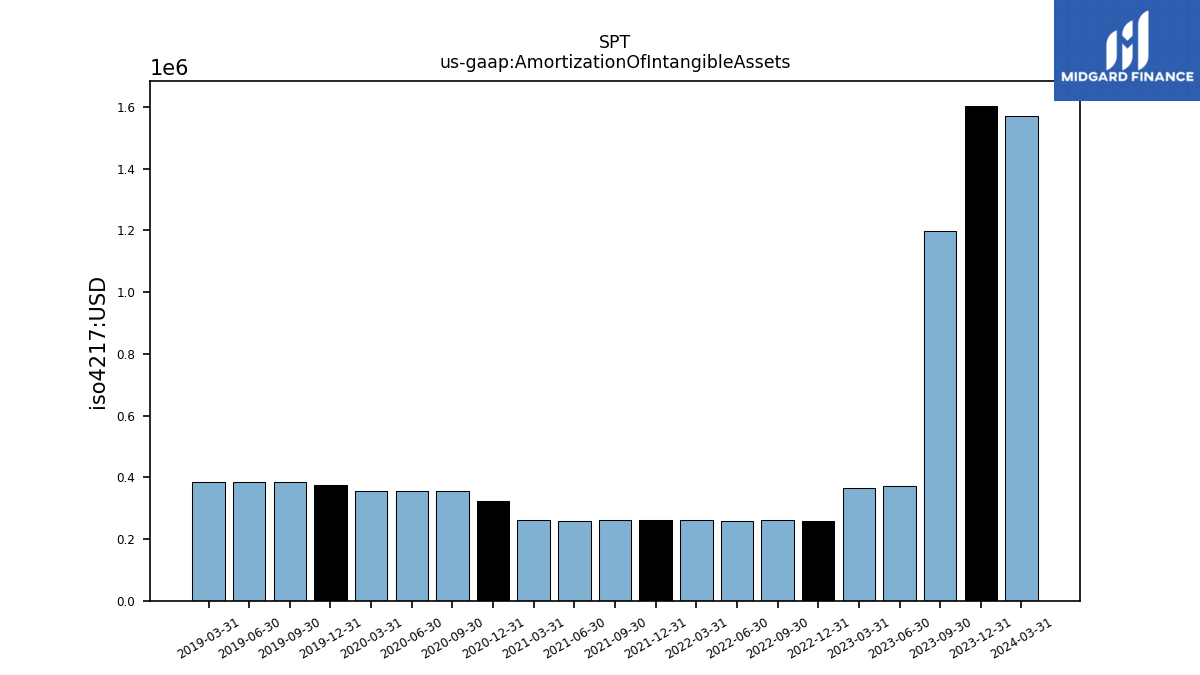
| Amortization Of Intangible Assets | 1.20 | 0.37 | 0.37 | 0.26 | 0.26 | 0.26 | 0.26 | 0.26 | 0.26 | 0.26 | 0.26 | 0.32 | 0.36 | 0.36 | 0.36 | 0.38 | 0.39 | 0.39 | 0.39 | |
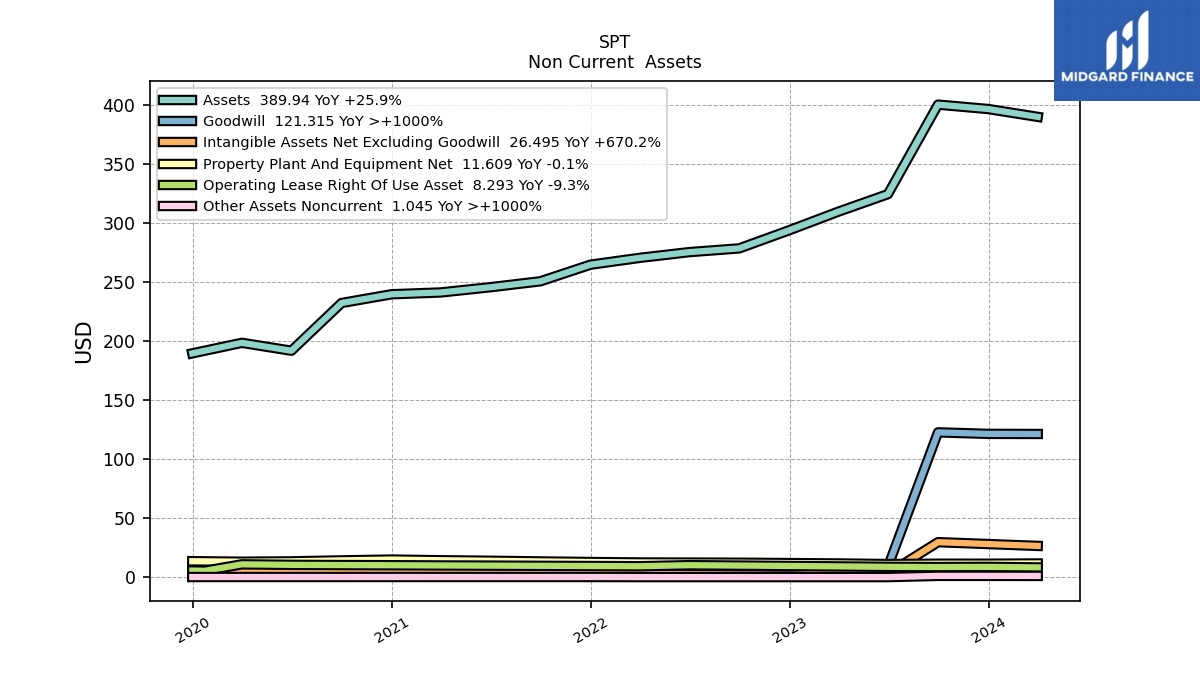
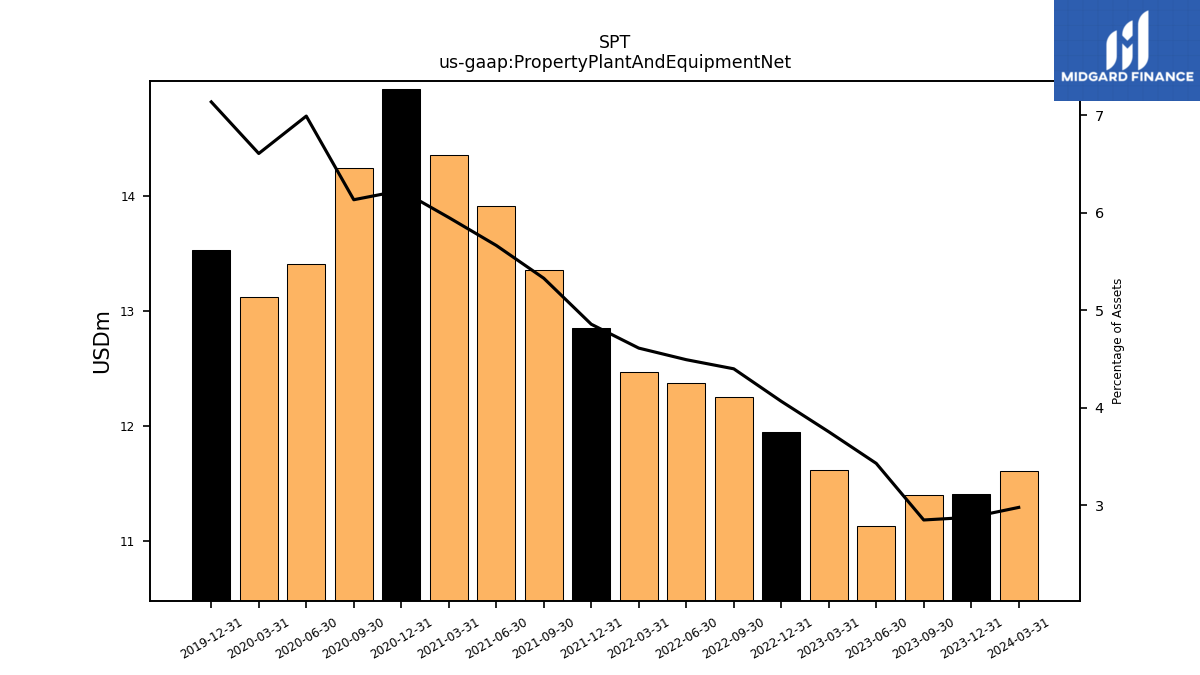
| Property Plant And Equipment Net | 11.40 | 11.12 | 11.62 | 11.95 | 12.25 | 12.37 | 12.47 | 12.85 | 13.35 | 13.91 | 14.35 | 14.93 | 14.24 | 13.41 | 13.12 | 13.53 | NA | NA | NA | |
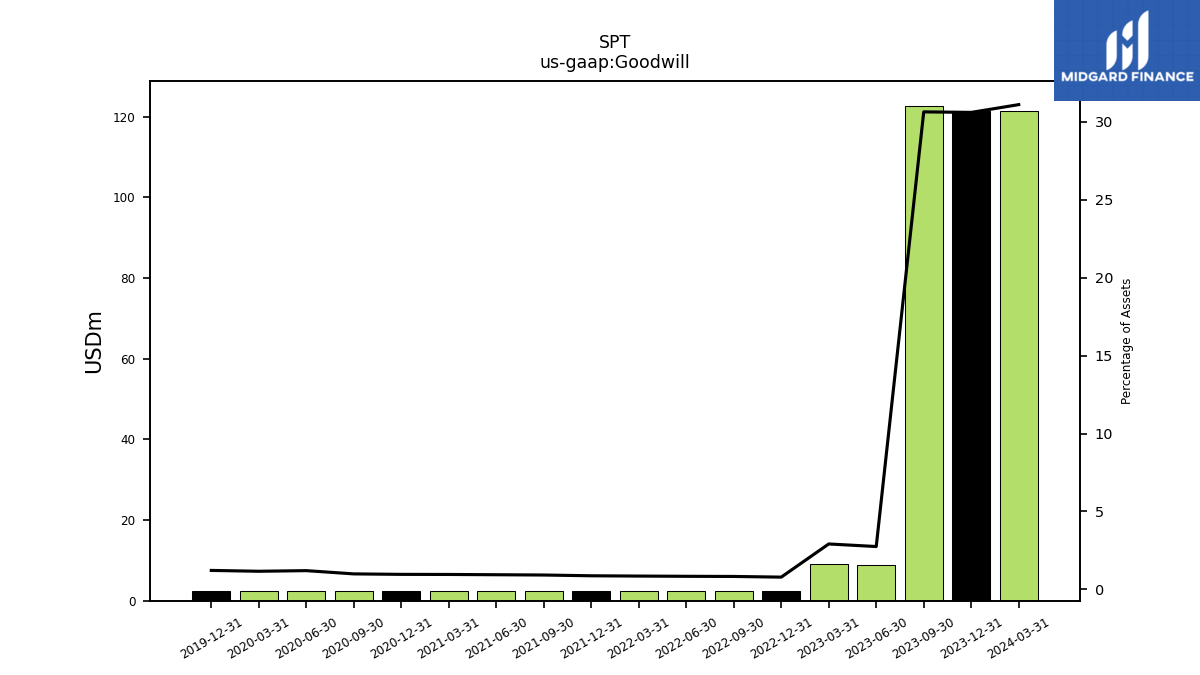
| Goodwill | 122.68 | 8.91 | 9.01 | 2.30 | 2.30 | 2.30 | 2.30 | 2.30 | 2.30 | 2.30 | 2.30 | 2.30 | 2.30 | 2.30 | 2.30 | 2.30 | NA | NA | NA | |
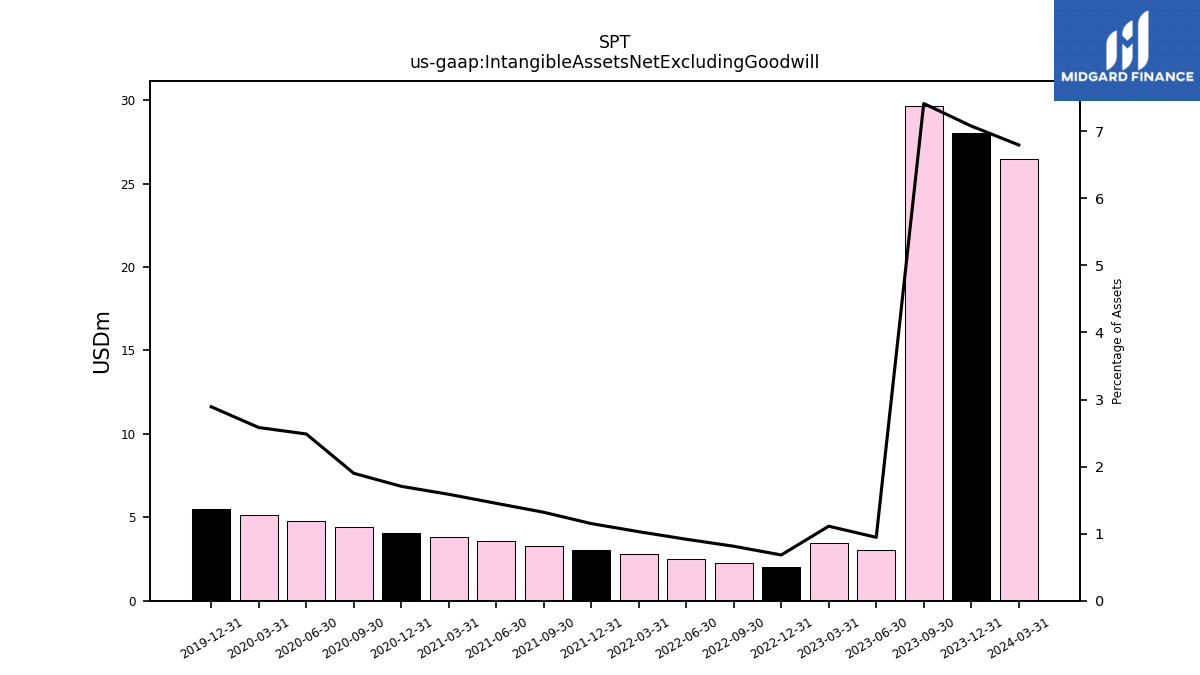
| Intangible Assets Net Excluding Goodwill | 29.67 | 3.07 | 3.44 | 2.01 | 2.26 | 2.52 | 2.79 | 3.04 | 3.31 | 3.57 | 3.83 | 4.09 | 4.41 | 4.77 | 5.13 | 5.48 | NA | NA | NA | |
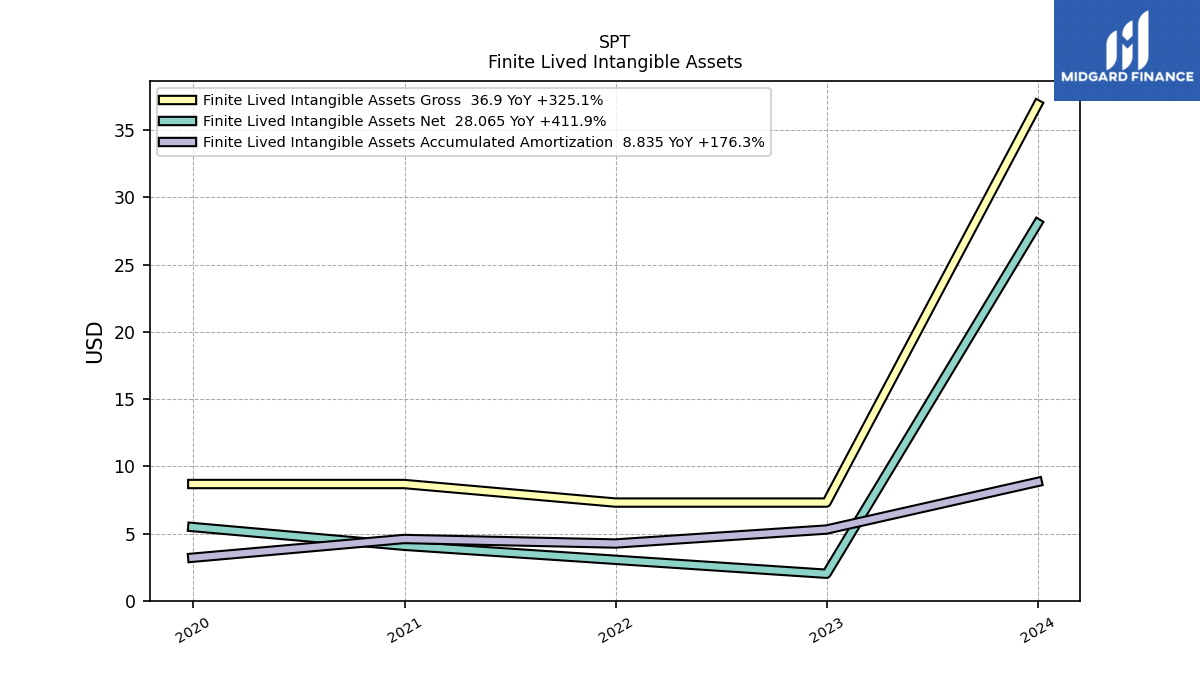
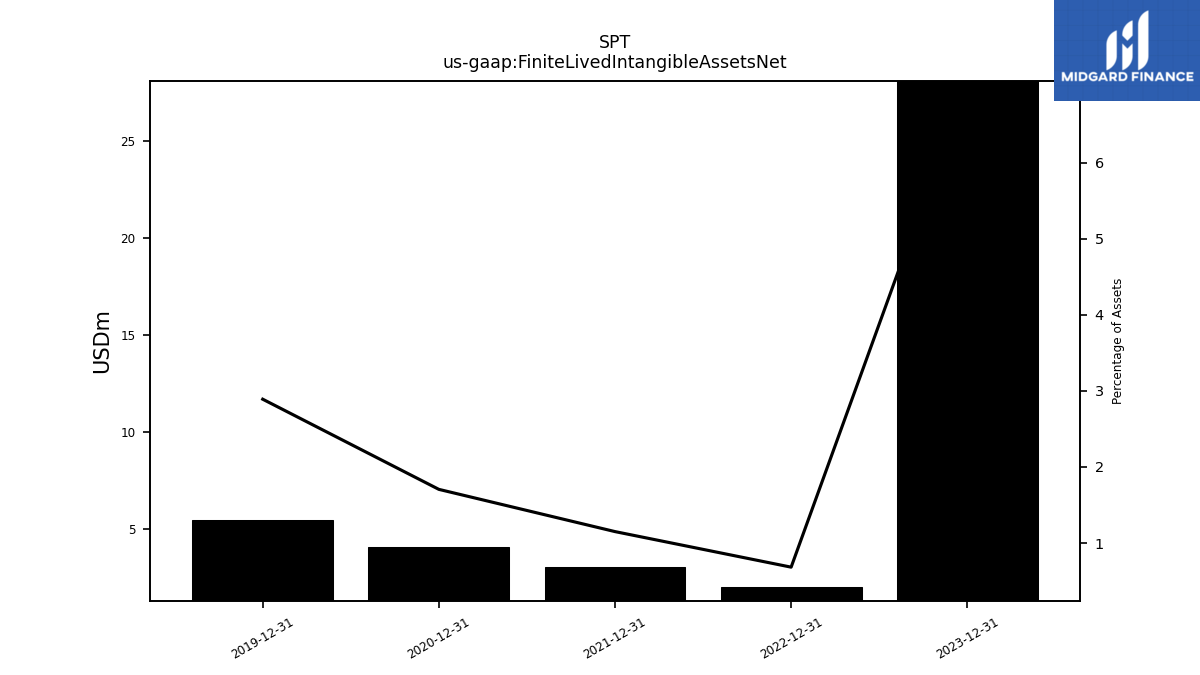
| Finite Lived Intangible Assets Net | NA | NA | NA | 2.01 | NA | NA | NA | 3.04 | NA | NA | NA | 4.09 | NA | NA | NA | 5.48 | NA | NA | NA | |
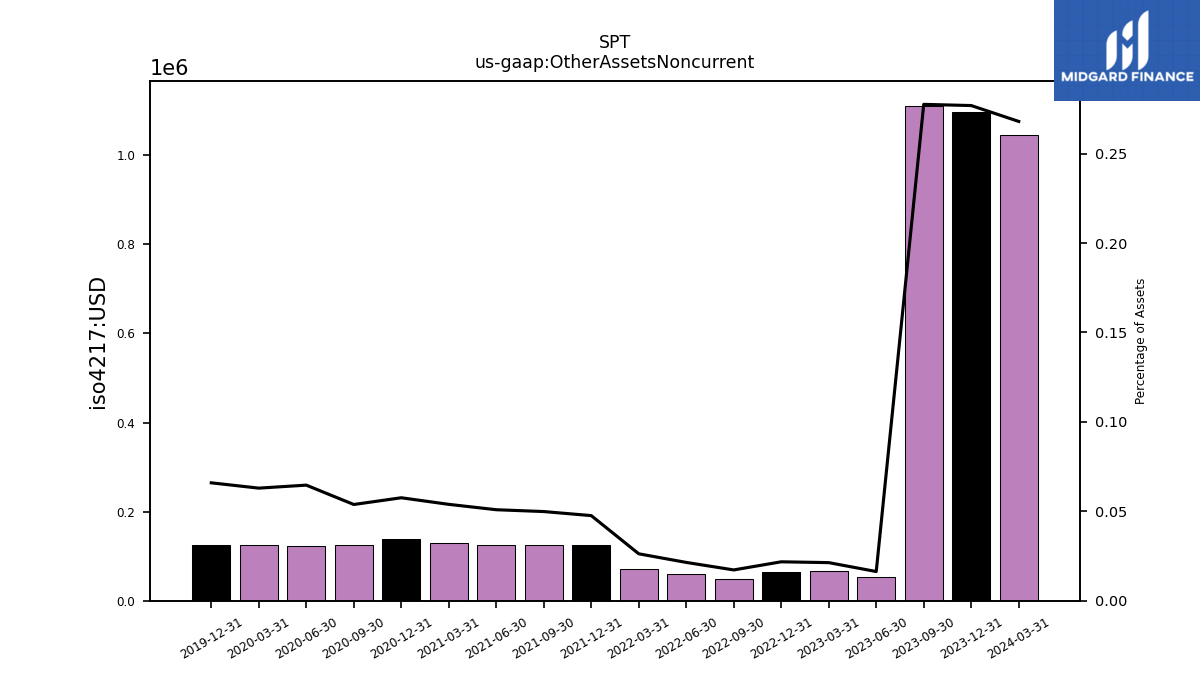
| Other Assets Noncurrent | 1.11 | 0.05 | 0.07 | 0.06 | 0.05 | 0.06 | 0.07 | 0.13 | 0.12 | 0.12 | 0.13 | 0.14 | 0.12 | 0.12 | 0.12 | 0.12 | NA | NA | NA |
| 2023-09-30 | 2023-06-30 | 2023-03-31 | 2022-12-31 | 2022-09-30 | 2022-06-30 | 2022-03-31 | 2021-12-31 | 2021-09-30 | 2021-06-30 | 2021-03-31 | 2020-12-31 | 2020-09-30 | 2020-06-30 | 2020-03-31 | 2019-12-31 | 2019-09-30 | 2019-06-30 | 2019-03-31 | ||
|---|---|---|---|---|---|---|---|---|---|---|---|---|---|---|---|---|---|---|---|---|
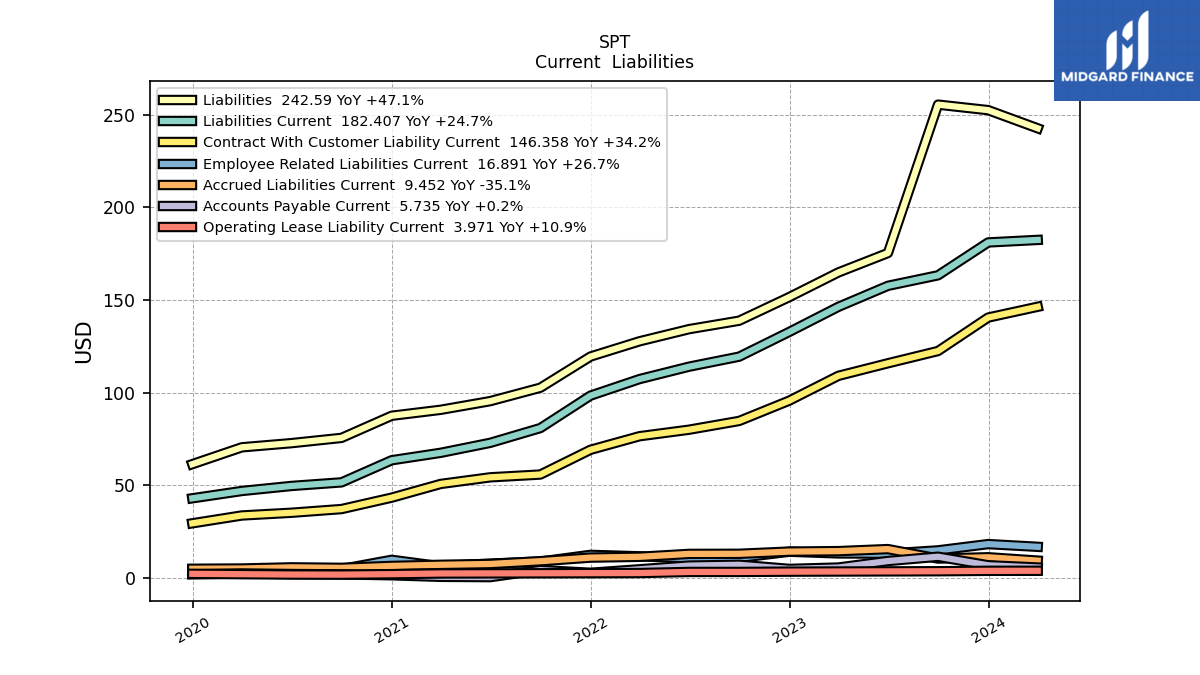
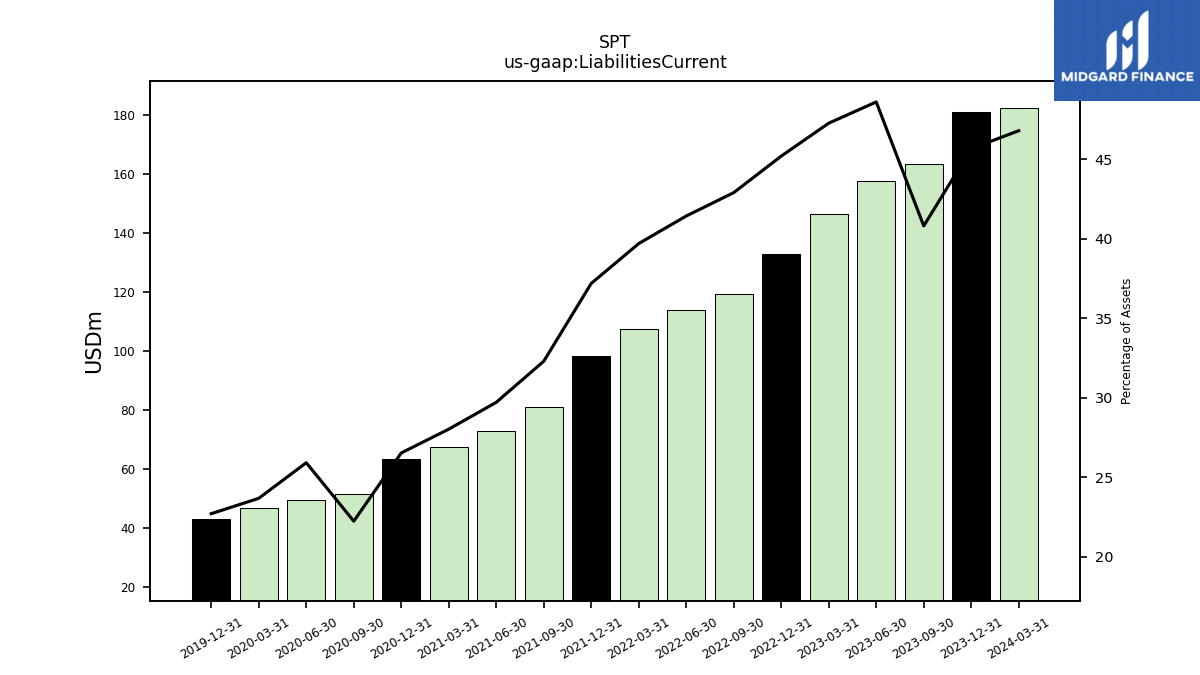
| Liabilities Current | 163.32 | 157.65 | 146.31 | 132.81 | 119.46 | 114.05 | 107.35 | 98.43 | 80.94 | 72.97 | 67.59 | 63.58 | 51.65 | 49.71 | 47.00 | 43.06 | NA | NA | NA | |
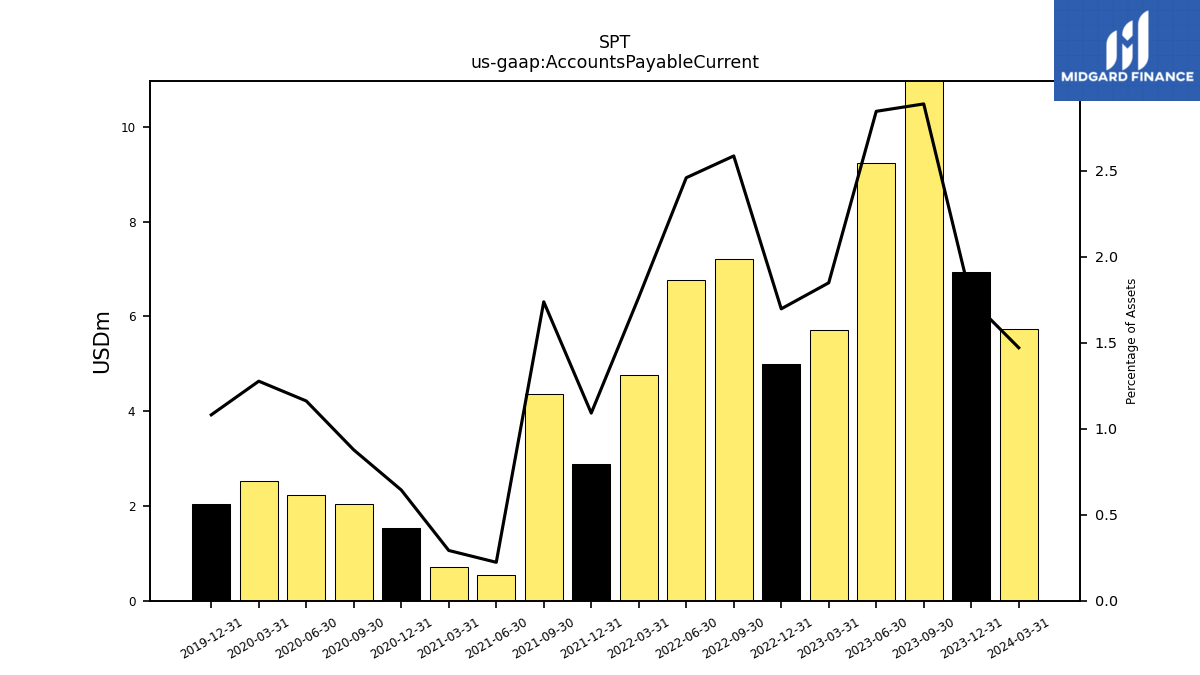
| Accounts Payable Current | 11.56 | 9.23 | 5.72 | 4.99 | 7.20 | 6.77 | 4.77 | 2.89 | 4.36 | 0.55 | 0.70 | 1.54 | 2.04 | 2.23 | 2.53 | 2.05 | NA | NA | NA | |
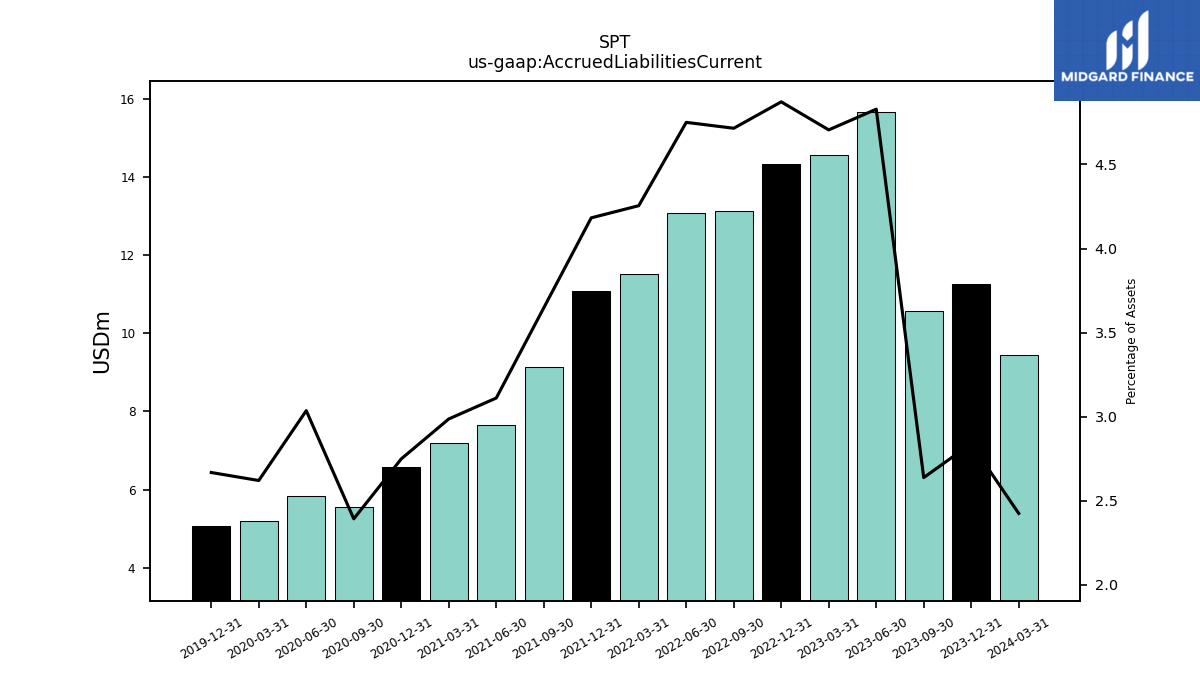
| Accrued Liabilities Current | 10.56 | 15.67 | 14.57 | 14.32 | 13.13 | 13.08 | 11.51 | 11.07 | 9.14 | 7.64 | 7.20 | 6.59 | 5.55 | 5.82 | 5.20 | 5.06 | NA | NA | NA | |
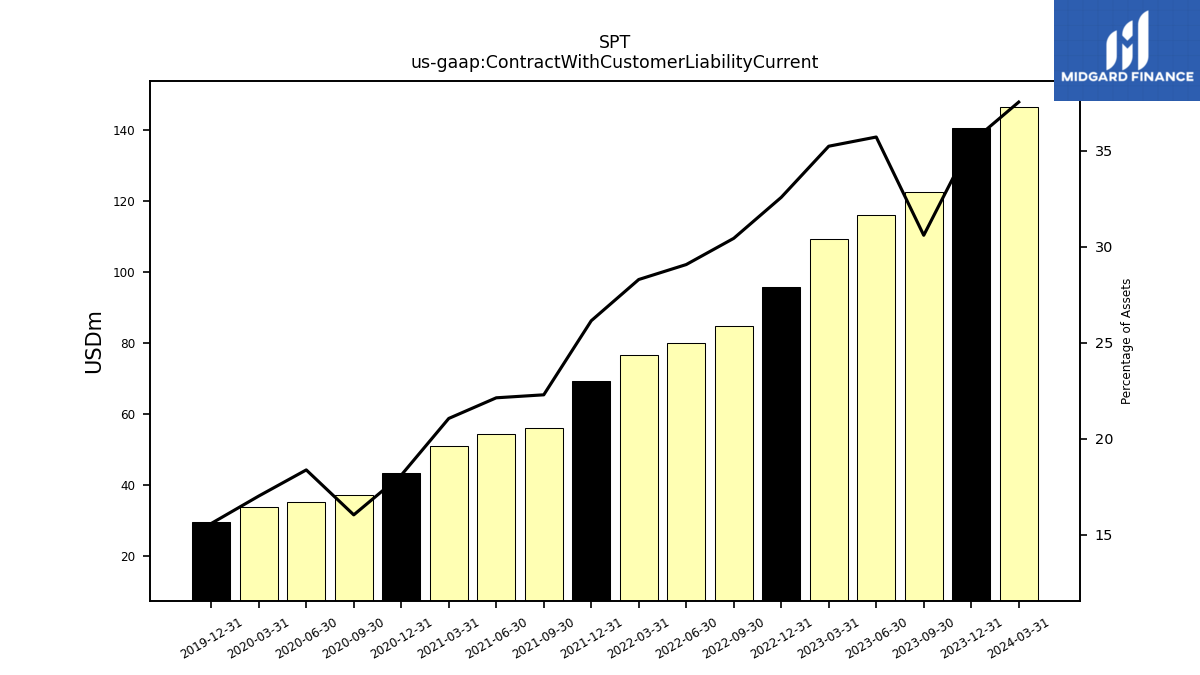
| Contract With Customer Liability Current | 122.49 | 115.88 | 109.10 | 95.74 | 84.78 | 80.06 | 76.54 | 69.22 | 55.88 | 54.37 | 50.80 | 43.41 | 37.26 | 35.26 | 33.79 | 29.57 | NA | NA | NA |
| 2023-09-30 | 2023-06-30 | 2023-03-31 | 2022-12-31 | 2022-09-30 | 2022-06-30 | 2022-03-31 | 2021-12-31 | 2021-09-30 | 2021-06-30 | 2021-03-31 | 2020-12-31 | 2020-09-30 | 2020-06-30 | 2020-03-31 | 2019-12-31 | 2019-09-30 | 2019-06-30 | 2019-03-31 | ||
|---|---|---|---|---|---|---|---|---|---|---|---|---|---|---|---|---|---|---|---|---|
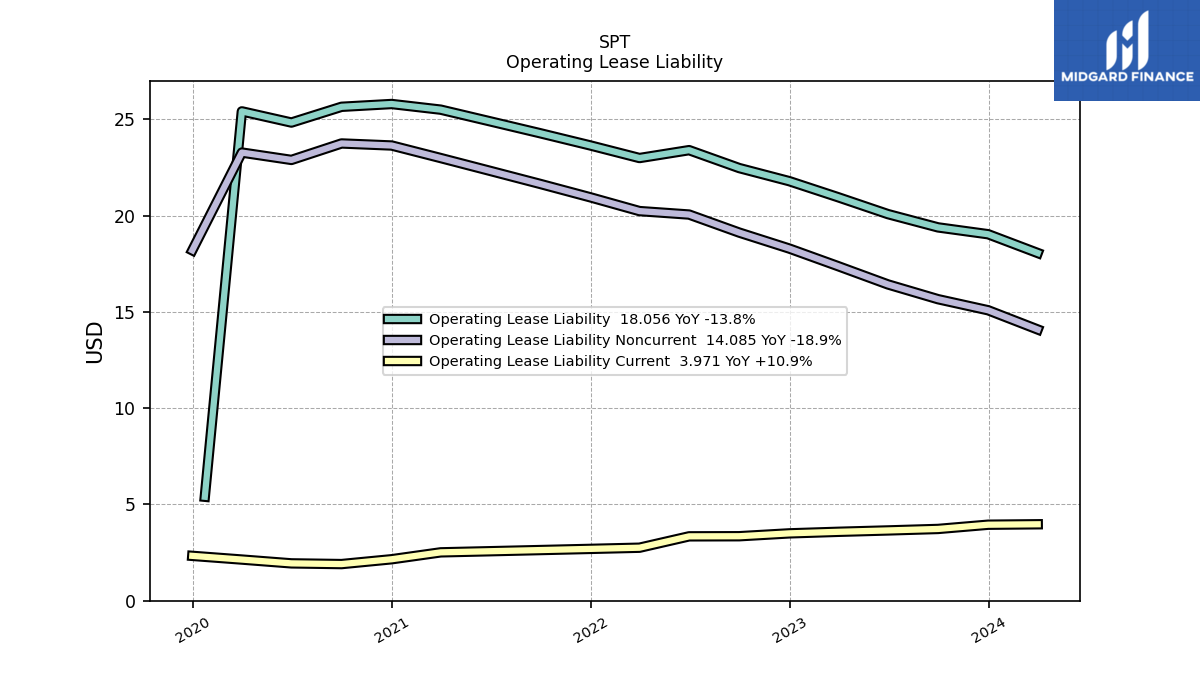
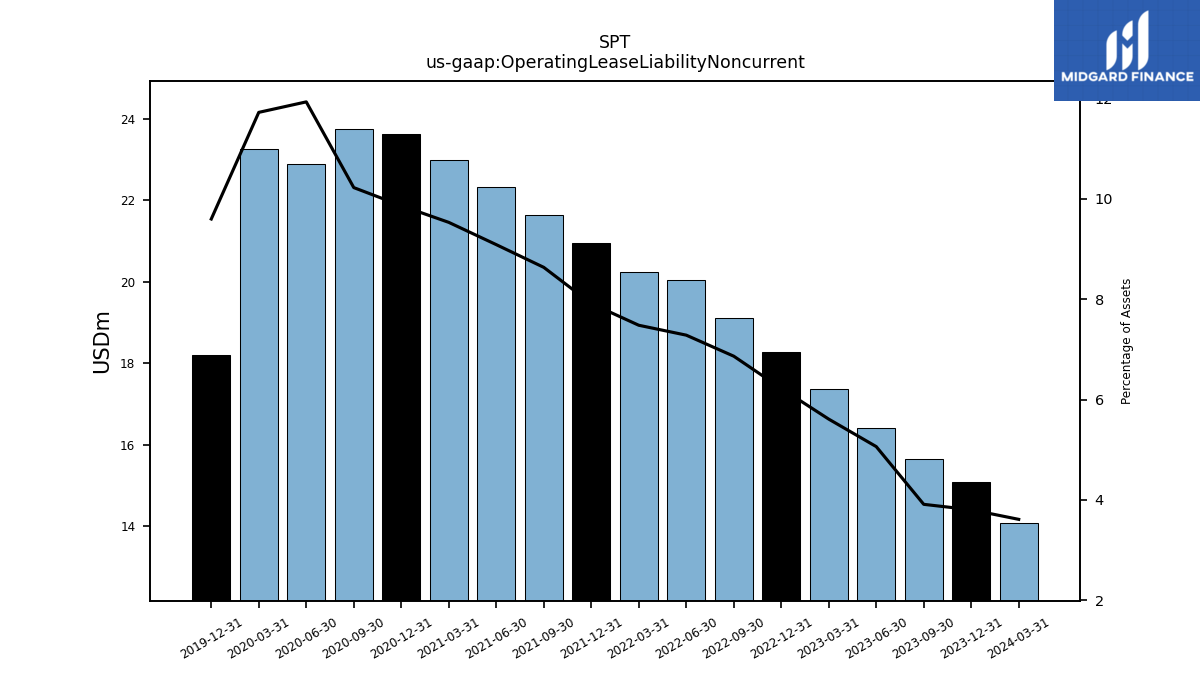
| Operating Lease Liability Noncurrent | 15.66 | 16.43 | 17.37 | 18.29 | 19.12 | 20.05 | 20.23 | 20.95 | 21.64 | 22.32 | 22.99 | 23.64 | 23.74 | 22.89 | 23.27 | 18.20 | NA | NA | NA |
| 2023-09-30 | 2023-06-30 | 2023-03-31 | 2022-12-31 | 2022-09-30 | 2022-06-30 | 2022-03-31 | 2021-12-31 | 2021-09-30 | 2021-06-30 | 2021-03-31 | 2020-12-31 | 2020-09-30 | 2020-06-30 | 2020-03-31 | 2019-12-31 | 2019-09-30 | 2019-06-30 | 2019-03-31 | ||
|---|---|---|---|---|---|---|---|---|---|---|---|---|---|---|---|---|---|---|---|---|
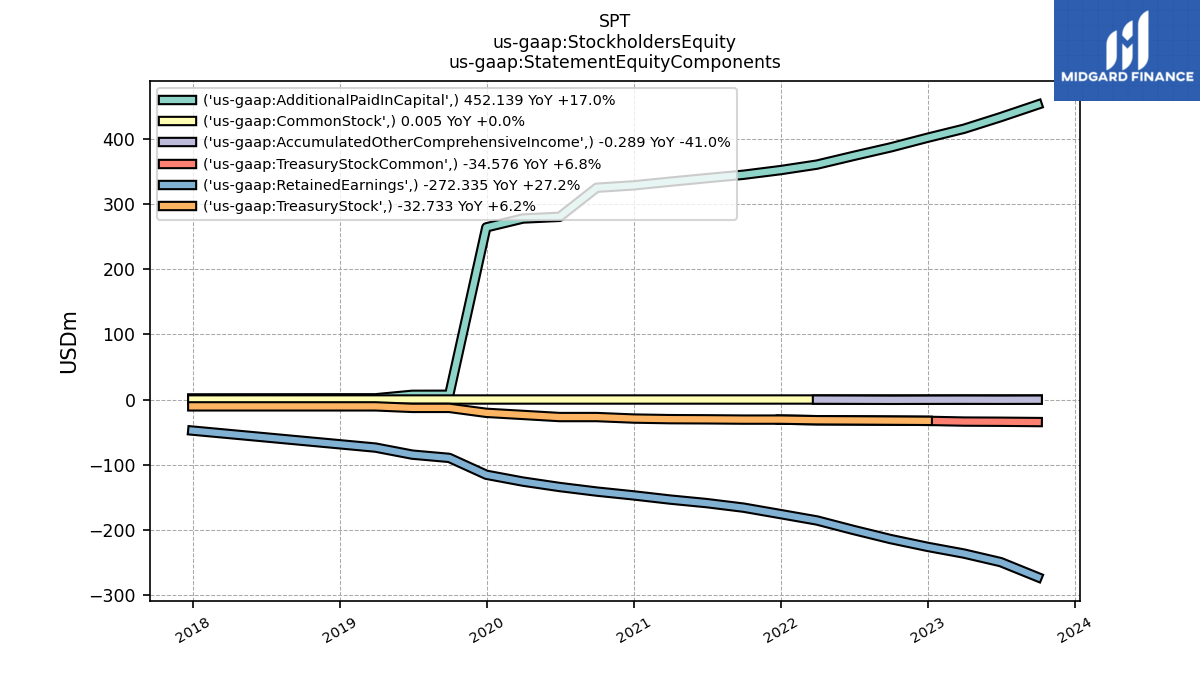
| Stockholders Equity | 144.94 | 149.14 | 144.77 | 142.34 | 139.69 | 141.06 | 142.75 | 145.21 | 147.95 | 150.16 | 150.41 | 152.10 | 156.62 | 119.03 | 127.97 | 128.13 | 7.86 | 12.81 | 20.58 | |
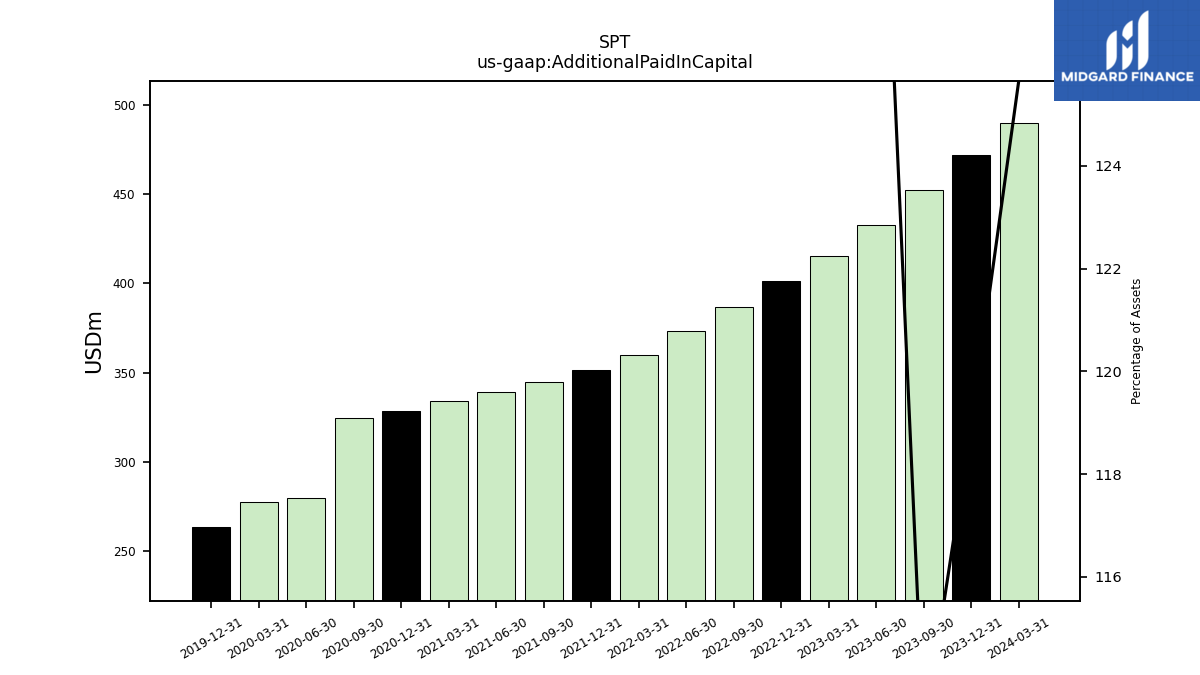
| Additional Paid In Capital | 452.14 | 432.95 | 415.12 | 401.42 | 386.59 | 373.52 | 360.17 | 351.77 | 344.62 | 339.39 | 333.94 | 328.34 | 324.68 | 280.10 | 277.49 | 263.94 | NA | NA | NA | |
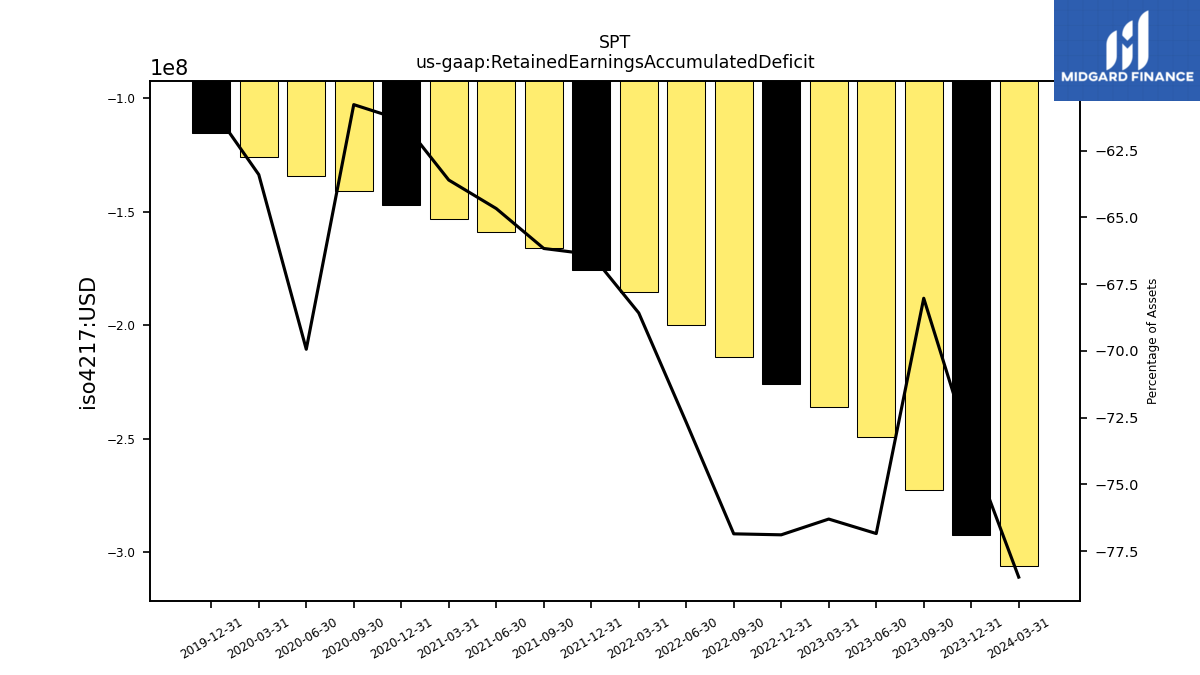
| Retained Earnings Accumulated Deficit | -272.33 | -249.32 | -236.24 | -225.99 | -214.04 | -200.11 | -185.50 | -175.75 | -165.84 | -158.85 | -153.41 | -147.04 | -141.17 | -134.17 | -125.87 | -115.39 | NA | NA | NA | |
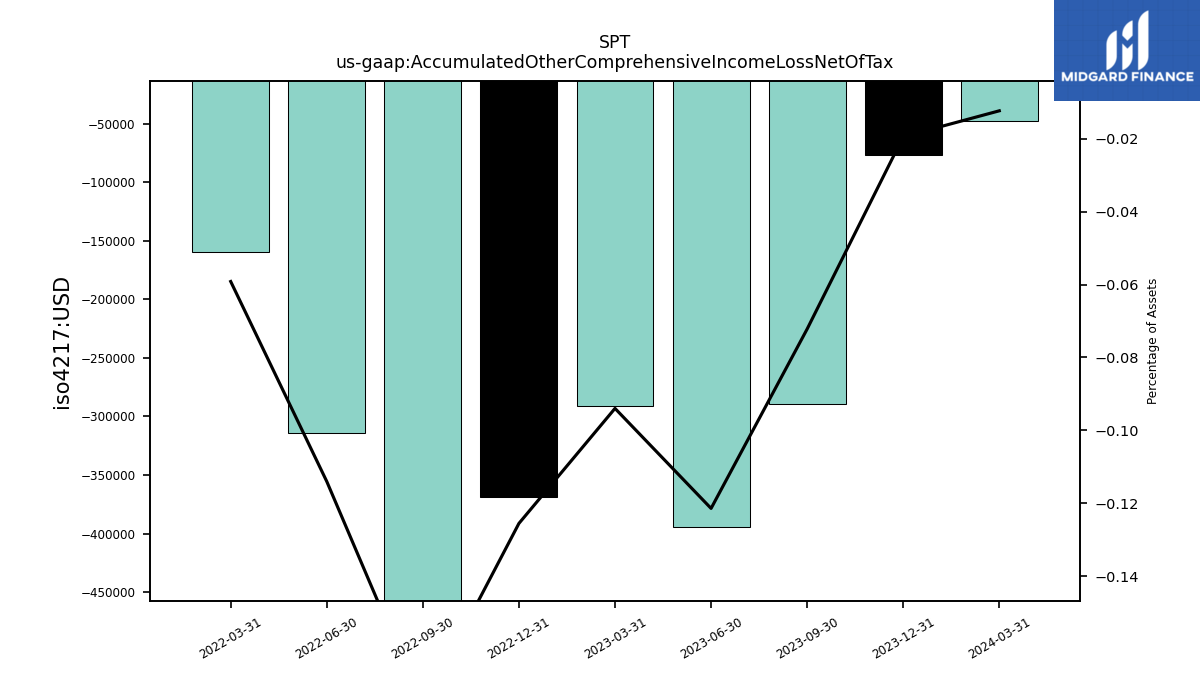
| Accumulated Other Comprehensive Income Loss Net Of Tax | -0.29 | -0.39 | -0.29 | -0.37 | -0.49 | -0.31 | -0.16 | NA | NA | NA | NA | NA | NA | NA | NA | NA | NA | NA | NA | |
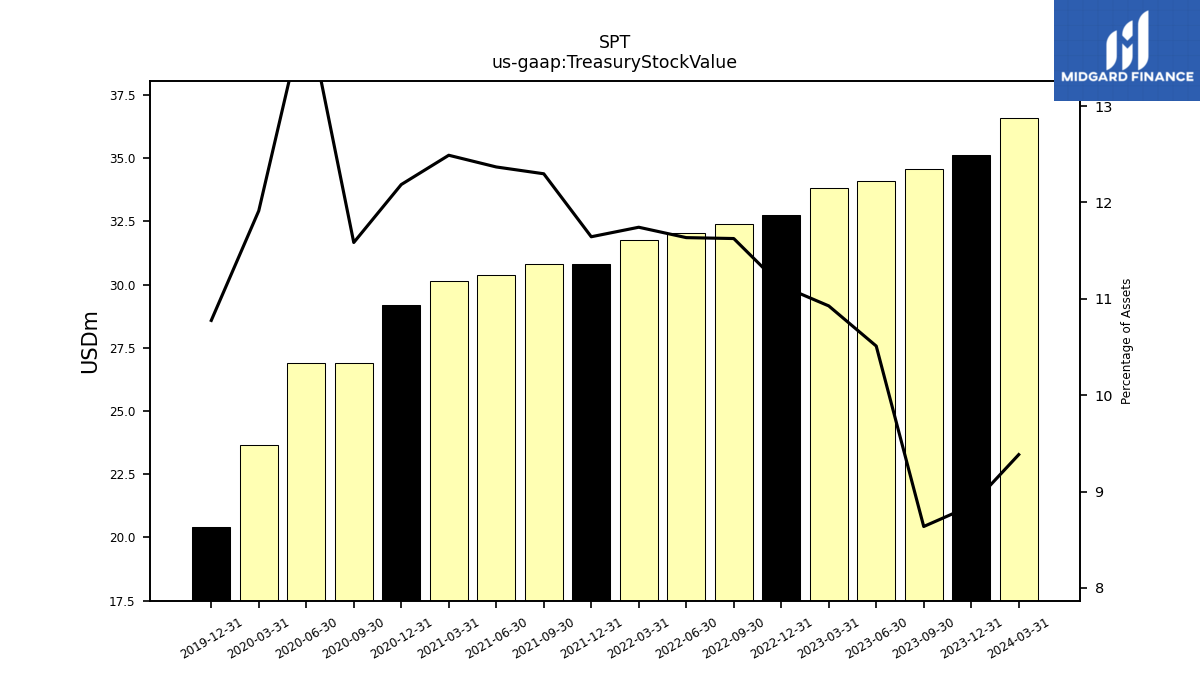
| Treasury Stock Value | 34.58 | 34.10 | 33.83 | 32.73 | 32.38 | 32.04 | 31.76 | 30.82 | 30.82 | 30.38 | 30.12 | 29.21 | 26.91 | 26.91 | 23.65 | 20.43 | NA | NA | NA | |
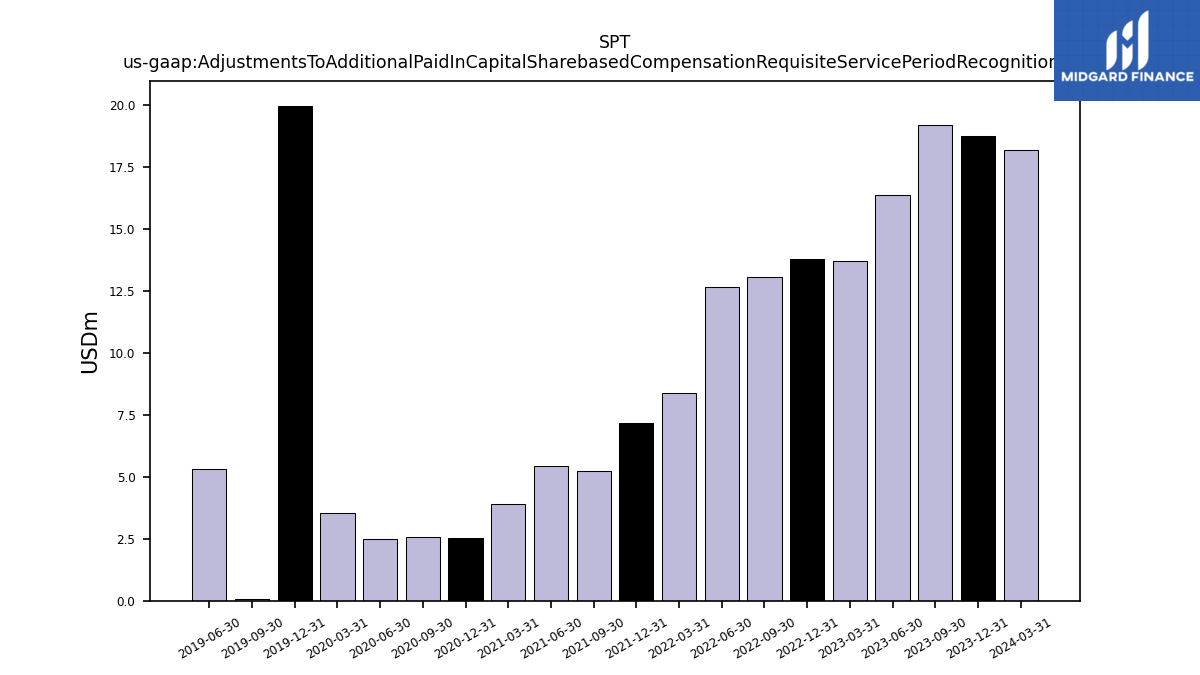
| Adjustments To Additional Paid In Capital Sharebased Compensation Requisite Service Period Recognition Value | 19.18 | 16.38 | 13.70 | 13.78 | 13.07 | 12.66 | 8.39 | 7.15 | 5.23 | 5.44 | 3.91 | 2.52 | 2.56 | 2.48 | 3.52 | 19.97 | 0.07 | 5.30 | NA |
| 2023-09-30 | 2023-06-30 | 2023-03-31 | 2022-12-31 | 2022-09-30 | 2022-06-30 | 2022-03-31 | 2021-12-31 | 2021-09-30 | 2021-06-30 | 2021-03-31 | 2020-12-31 | 2020-09-30 | 2020-06-30 | 2020-03-31 | 2019-12-31 | 2019-09-30 | 2019-06-30 | 2019-03-31 | ||
|---|---|---|---|---|---|---|---|---|---|---|---|---|---|---|---|---|---|---|---|---|
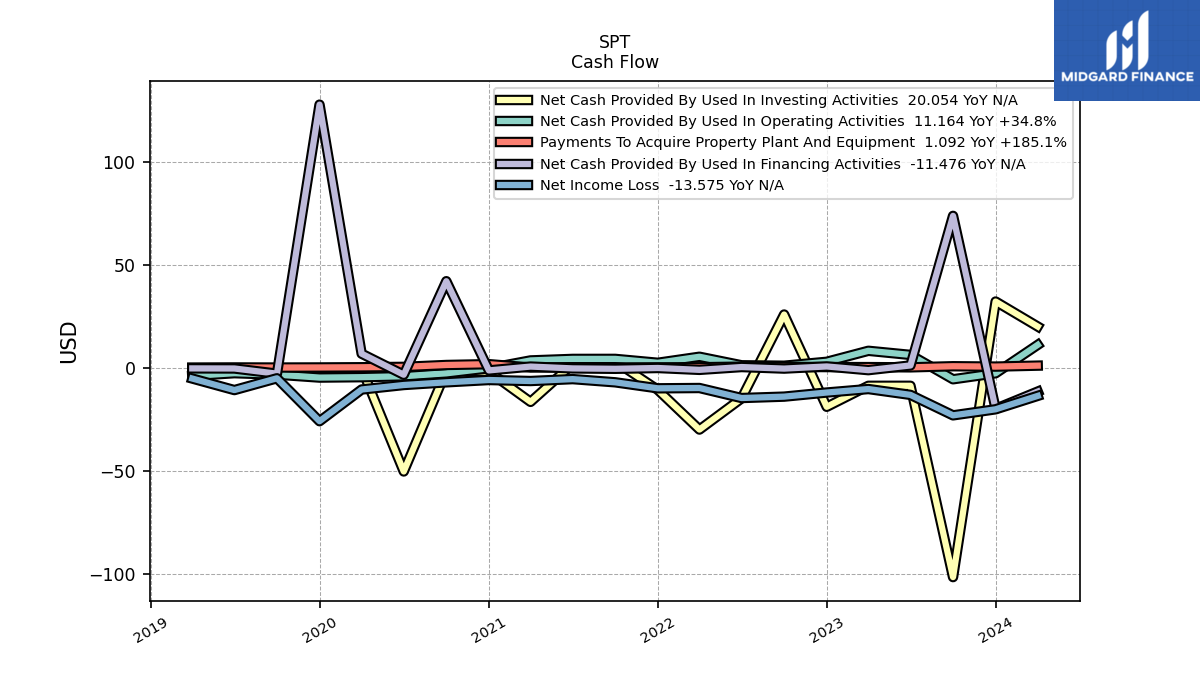
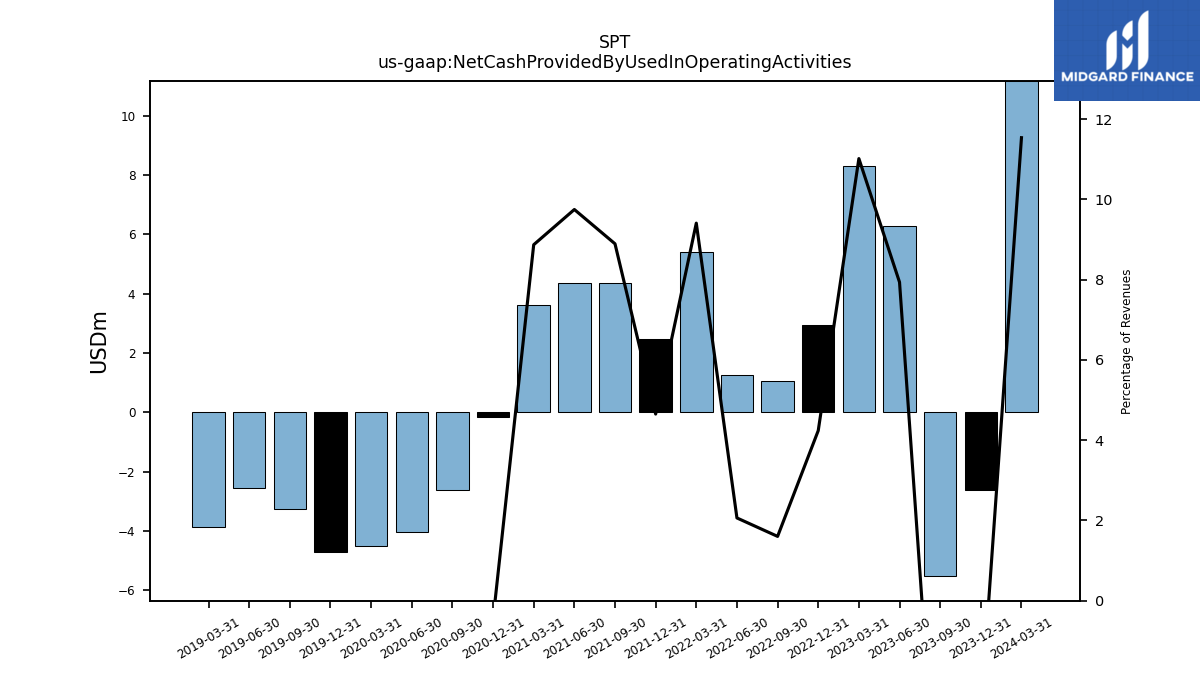
| Net Cash Provided By Used In Operating Activities | -5.52 | 6.29 | 8.28 | 2.95 | 1.05 | 1.27 | 5.40 | 2.48 | 4.37 | 4.36 | 3.62 | -0.17 | -2.63 | -4.04 | -4.50 | -4.70 | -3.27 | -2.57 | -3.87 | |
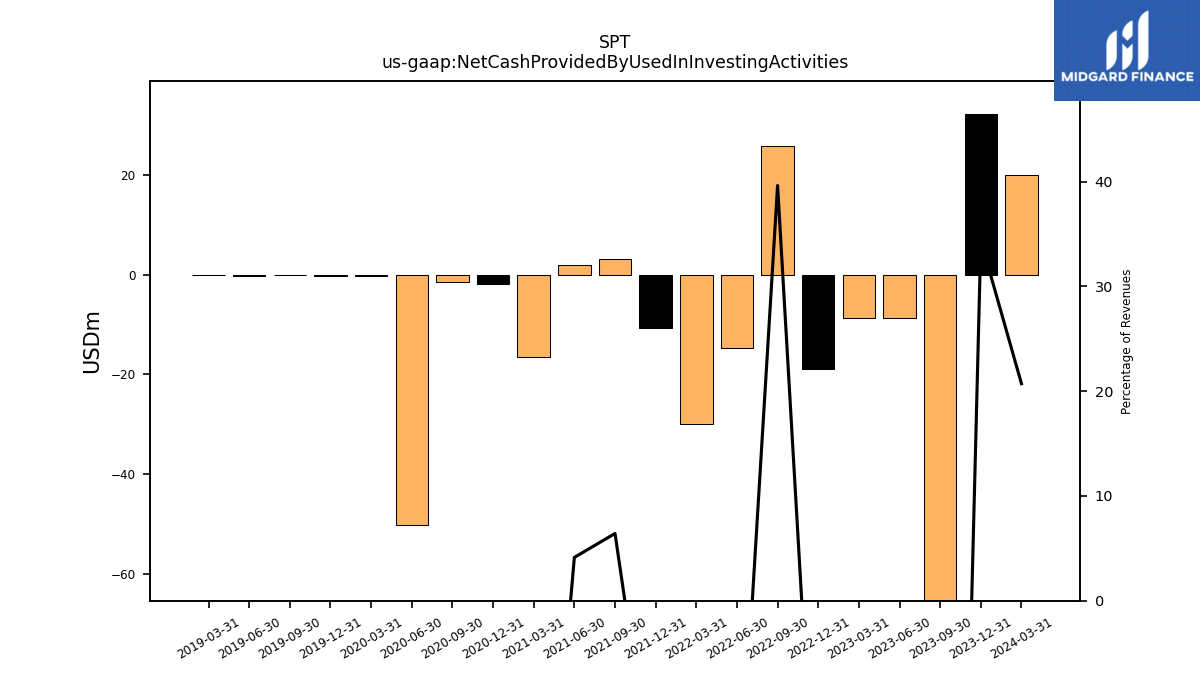
| Net Cash Provided By Used In Investing Activities | -101.44 | -8.68 | -8.69 | -18.87 | 25.88 | -14.78 | -29.90 | -10.64 | 3.15 | 1.85 | -16.48 | -1.86 | -1.41 | -50.22 | -0.31 | -0.22 | -0.17 | -0.22 | -0.16 | |
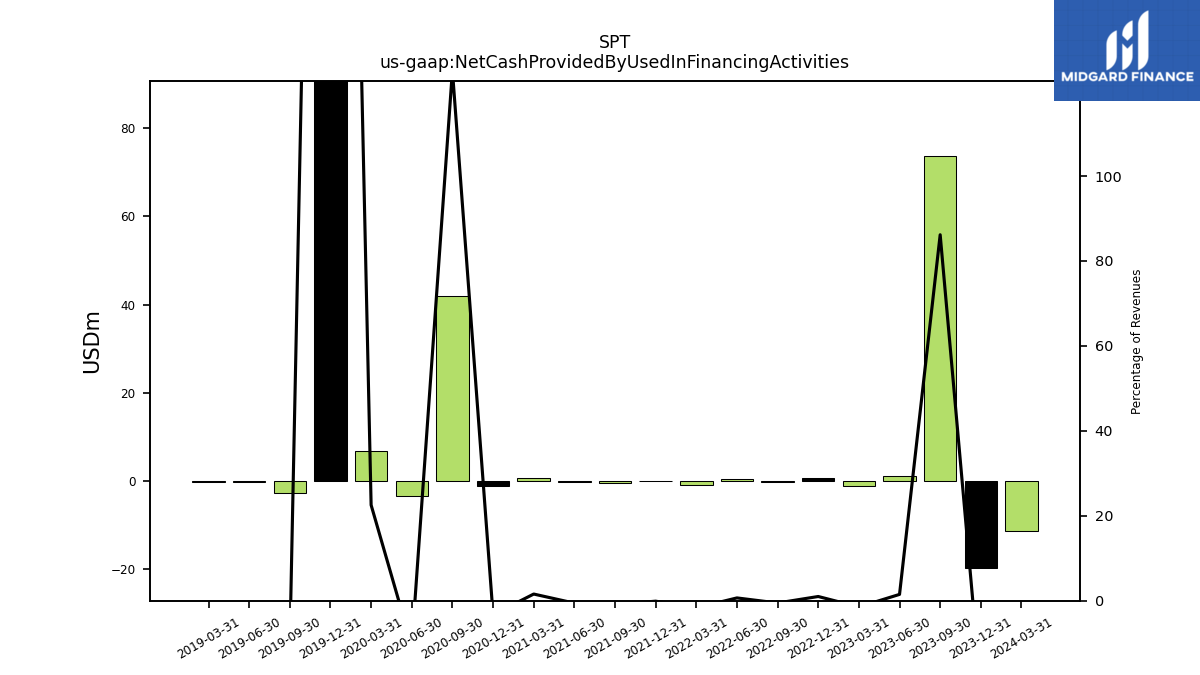
| Net Cash Provided By Used In Financing Activities | 73.70 | 1.19 | -1.10 | 0.70 | -0.34 | 0.41 | -0.96 | -0.05 | -0.44 | -0.25 | 0.64 | -1.23 | 42.03 | -3.33 | 6.88 | 127.63 | -2.80 | -0.29 | -0.24 |
| 2023-09-30 | 2023-06-30 | 2023-03-31 | 2022-12-31 | 2022-09-30 | 2022-06-30 | 2022-03-31 | 2021-12-31 | 2021-09-30 | 2021-06-30 | 2021-03-31 | 2020-12-31 | 2020-09-30 | 2020-06-30 | 2020-03-31 | 2019-12-31 | 2019-09-30 | 2019-06-30 | 2019-03-31 | ||
|---|---|---|---|---|---|---|---|---|---|---|---|---|---|---|---|---|---|---|---|---|
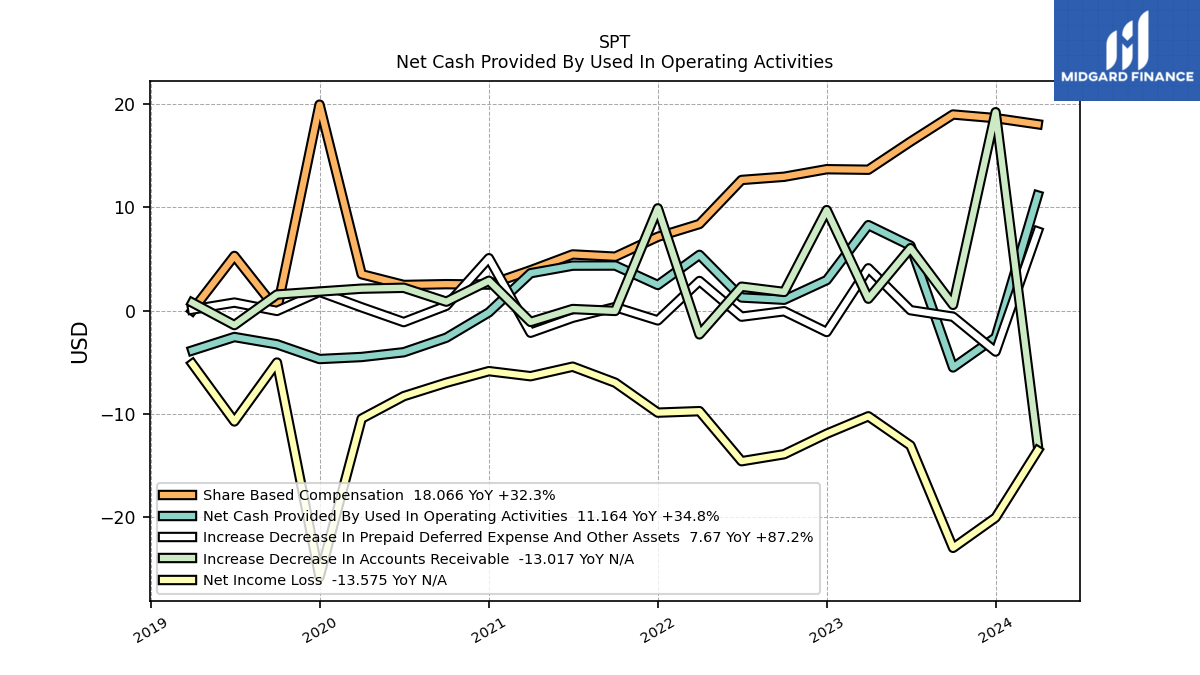
| Net Cash Provided By Used In Operating Activities | -5.52 | 6.29 | 8.28 | 2.95 | 1.05 | 1.27 | 5.40 | 2.48 | 4.37 | 4.36 | 3.62 | -0.17 | -2.63 | -4.04 | -4.50 | -4.70 | -3.27 | -2.57 | -3.87 | |
| Net Income Loss | -23.01 | -13.09 | -10.25 | -11.94 | -13.93 | -14.61 | -9.76 | -9.90 | -6.99 | -5.44 | -6.37 | -5.88 | -7.00 | -8.30 | -10.48 | -25.85 | -5.04 | -10.76 | -5.16 | |
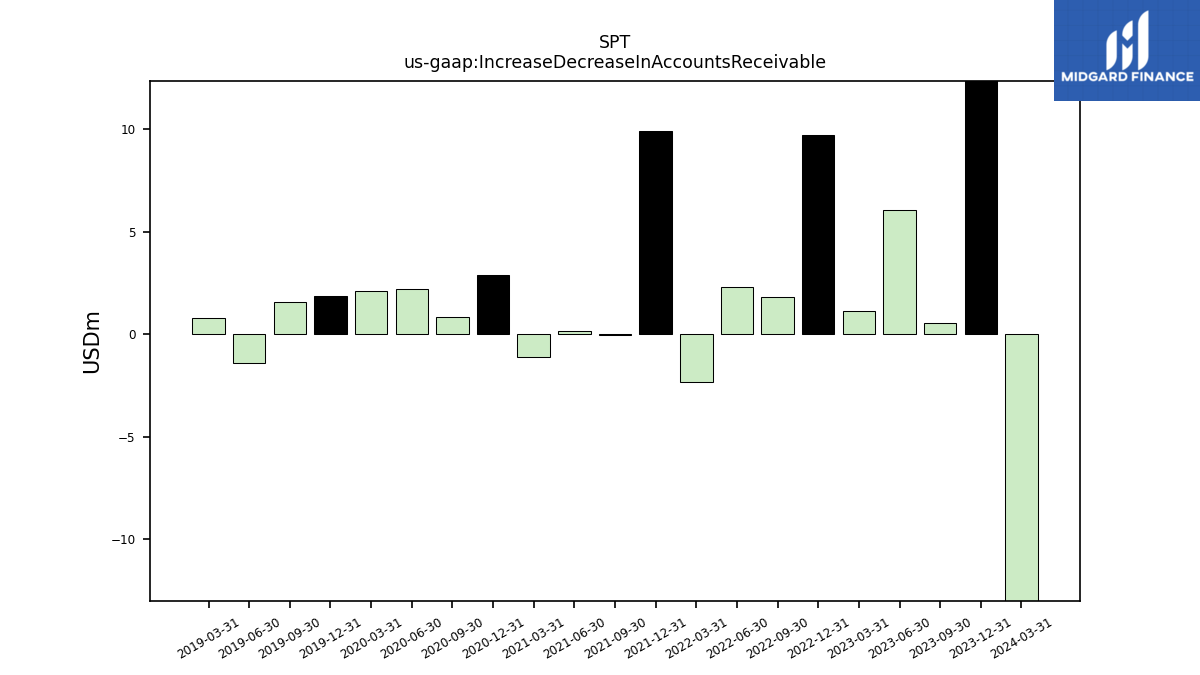
| Increase Decrease In Accounts Receivable | 0.55 | 6.05 | 1.15 | 9.74 | 1.80 | 2.32 | -2.31 | 9.91 | -0.04 | 0.15 | -1.11 | 2.89 | 0.86 | 2.21 | 2.12 | 1.84 | 1.55 | -1.41 | 0.77 | |
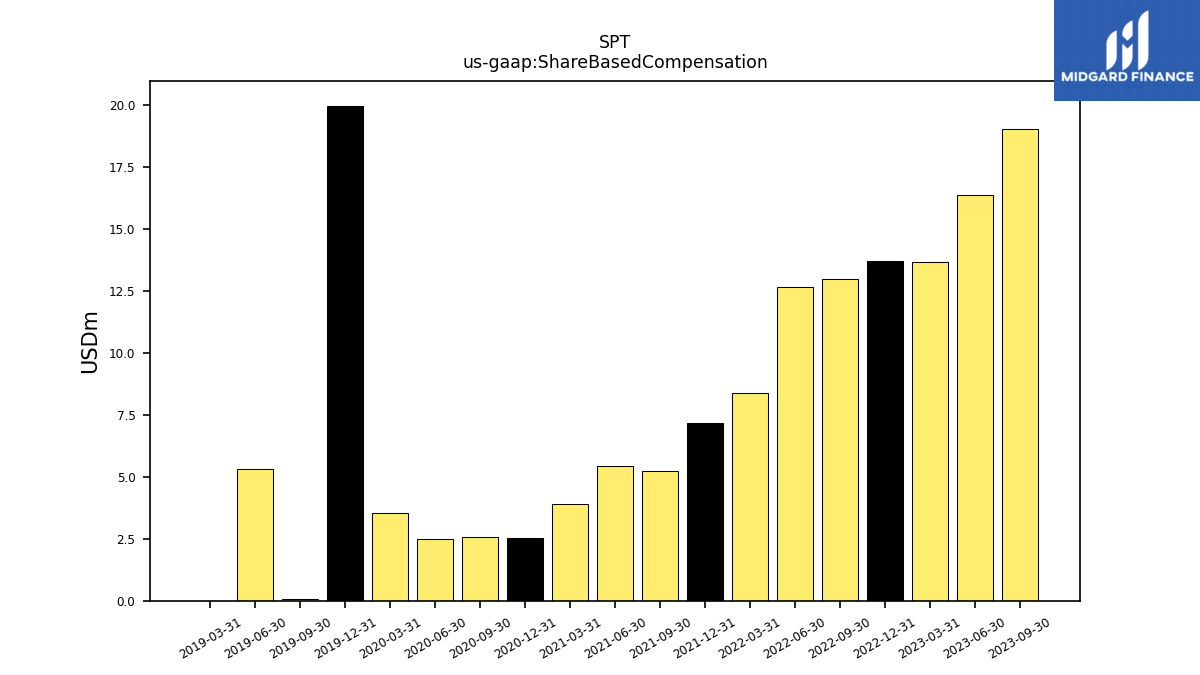
| Share Based Compensation | 19.01 | 16.38 | 13.66 | 13.71 | 12.97 | 12.66 | 8.39 | 7.15 | 5.23 | 5.44 | 3.91 | 2.52 | 2.56 | 2.48 | 3.52 | 19.97 | 0.07 | 5.30 | 0.00 | |
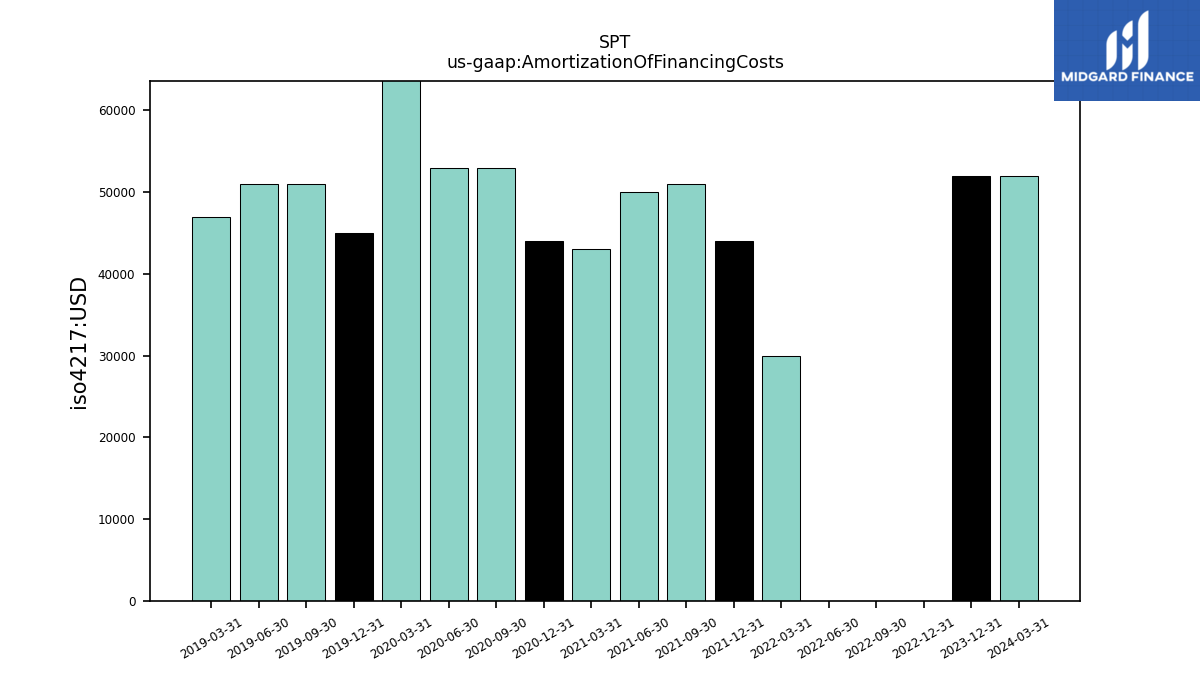
| Amortization Of Financing Costs | NA | NA | NA | 0.00 | 0.00 | 0.00 | 0.03 | 0.04 | 0.05 | 0.05 | 0.04 | 0.04 | 0.05 | 0.05 | 0.07 | 0.04 | 0.05 | 0.05 | 0.05 |
| 2023-09-30 | 2023-06-30 | 2023-03-31 | 2022-12-31 | 2022-09-30 | 2022-06-30 | 2022-03-31 | 2021-12-31 | 2021-09-30 | 2021-06-30 | 2021-03-31 | 2020-12-31 | 2020-09-30 | 2020-06-30 | 2020-03-31 | 2019-12-31 | 2019-09-30 | 2019-06-30 | 2019-03-31 | ||
|---|---|---|---|---|---|---|---|---|---|---|---|---|---|---|---|---|---|---|---|---|
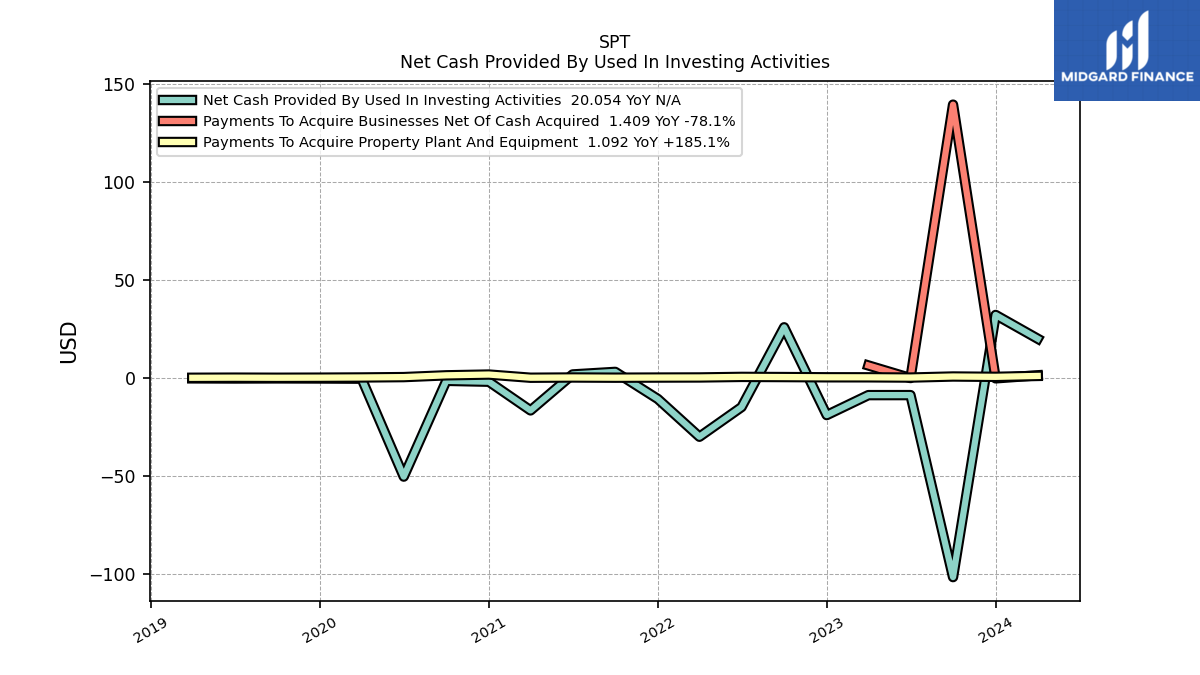
| Net Cash Provided By Used In Investing Activities | -101.44 | -8.68 | -8.69 | -18.87 | 25.88 | -14.78 | -29.90 | -10.64 | 3.15 | 1.85 | -16.48 | -1.86 | -1.41 | -50.22 | -0.31 | -0.22 | -0.17 | -0.22 | -0.16 | |
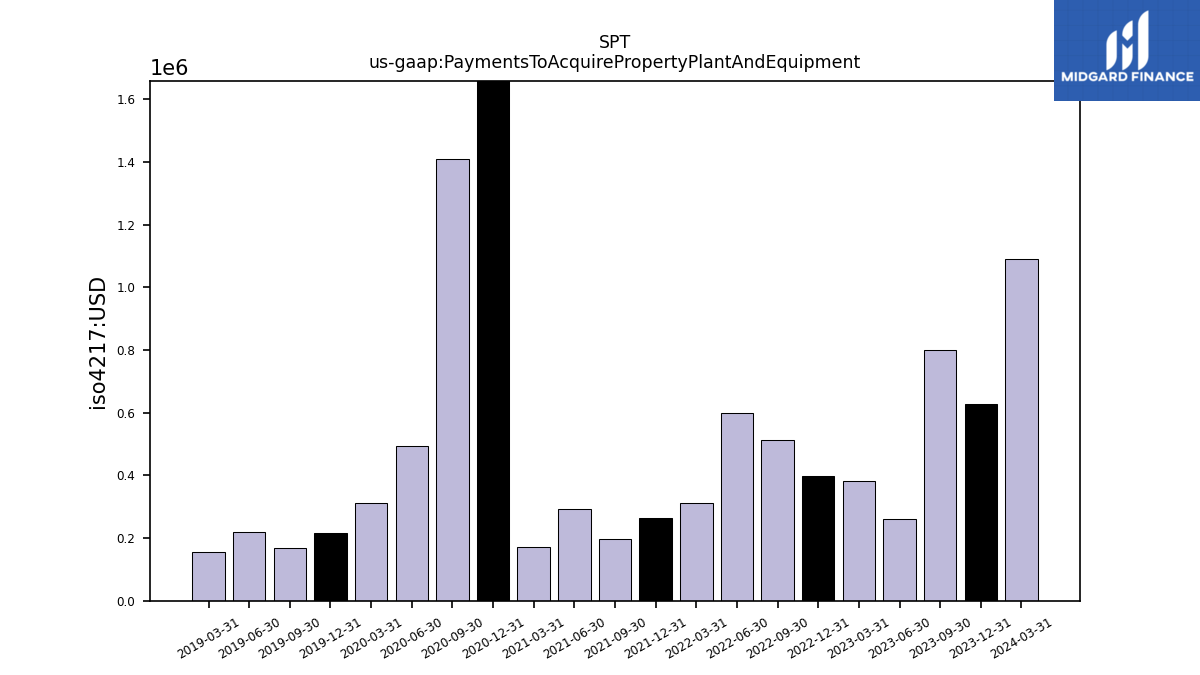
| Payments To Acquire Property Plant And Equipment | 0.80 | 0.26 | 0.38 | 0.40 | 0.51 | 0.60 | 0.31 | 0.26 | 0.20 | 0.29 | 0.17 | 1.80 | 1.41 | 0.49 | 0.31 | 0.22 | 0.17 | 0.22 | 0.16 |
| 2023-09-30 | 2023-06-30 | 2023-03-31 | 2022-12-31 | 2022-09-30 | 2022-06-30 | 2022-03-31 | 2021-12-31 | 2021-09-30 | 2021-06-30 | 2021-03-31 | 2020-12-31 | 2020-09-30 | 2020-06-30 | 2020-03-31 | 2019-12-31 | 2019-09-30 | 2019-06-30 | 2019-03-31 | ||
|---|---|---|---|---|---|---|---|---|---|---|---|---|---|---|---|---|---|---|---|---|
| Net Cash Provided By Used In Financing Activities | 73.70 | 1.19 | -1.10 | 0.70 | -0.34 | 0.41 | -0.96 | -0.05 | -0.44 | -0.25 | 0.64 | -1.23 | 42.03 | -3.33 | 6.88 | 127.63 | -2.80 | -0.29 | -0.24 |
| 2023-09-30 | 2023-06-30 | 2023-03-31 | 2022-12-31 | 2022-09-30 | 2022-06-30 | 2022-03-31 | 2021-12-31 | 2021-09-30 | 2021-06-30 | 2021-03-31 | 2020-12-31 | 2020-09-30 | 2020-06-30 | 2020-03-31 | 2019-12-31 | 2019-09-30 | 2019-06-30 | 2019-03-31 | ||
|---|---|---|---|---|---|---|---|---|---|---|---|---|---|---|---|---|---|---|---|---|
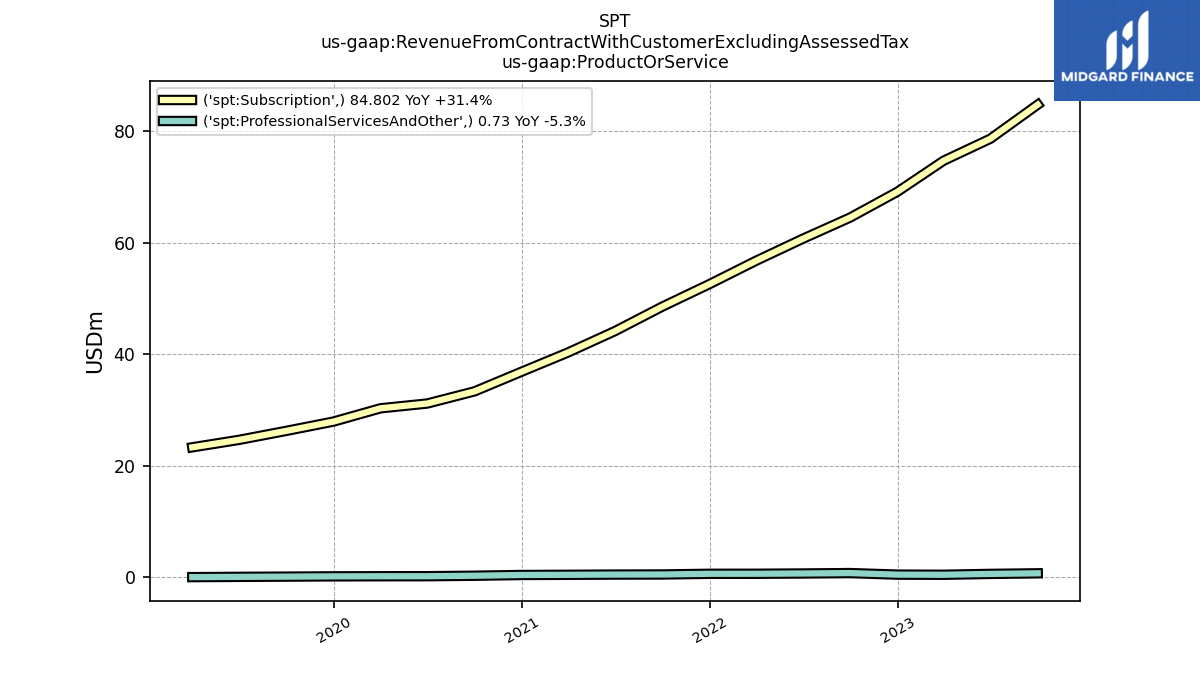
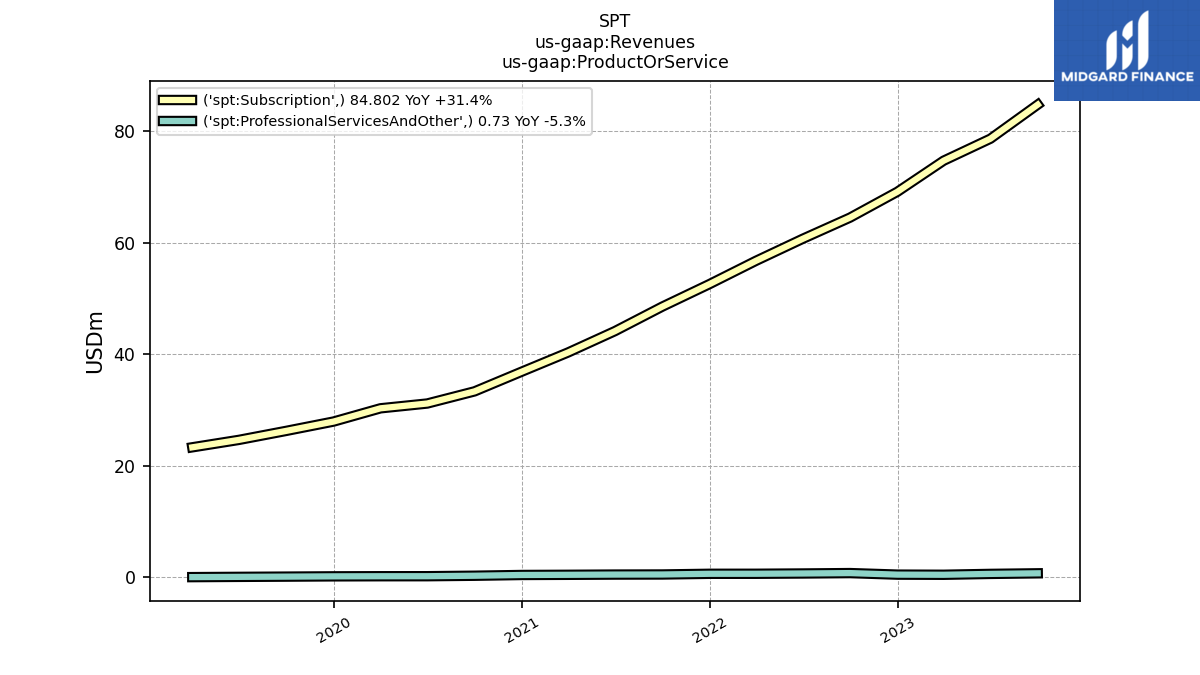
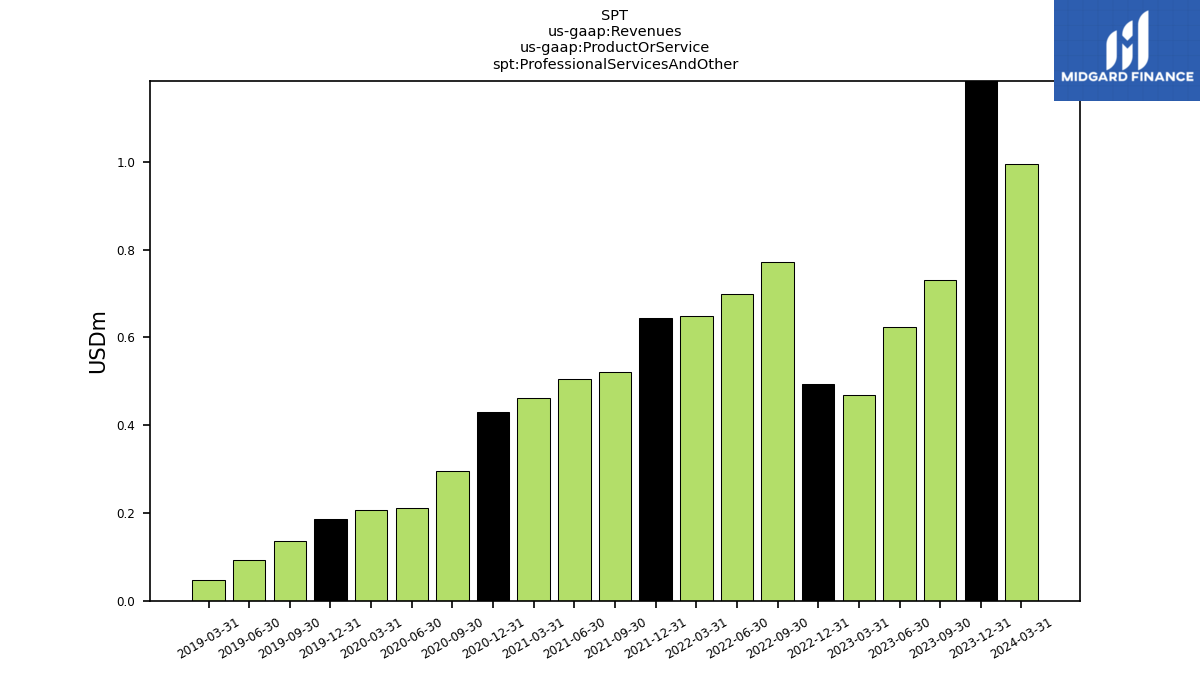
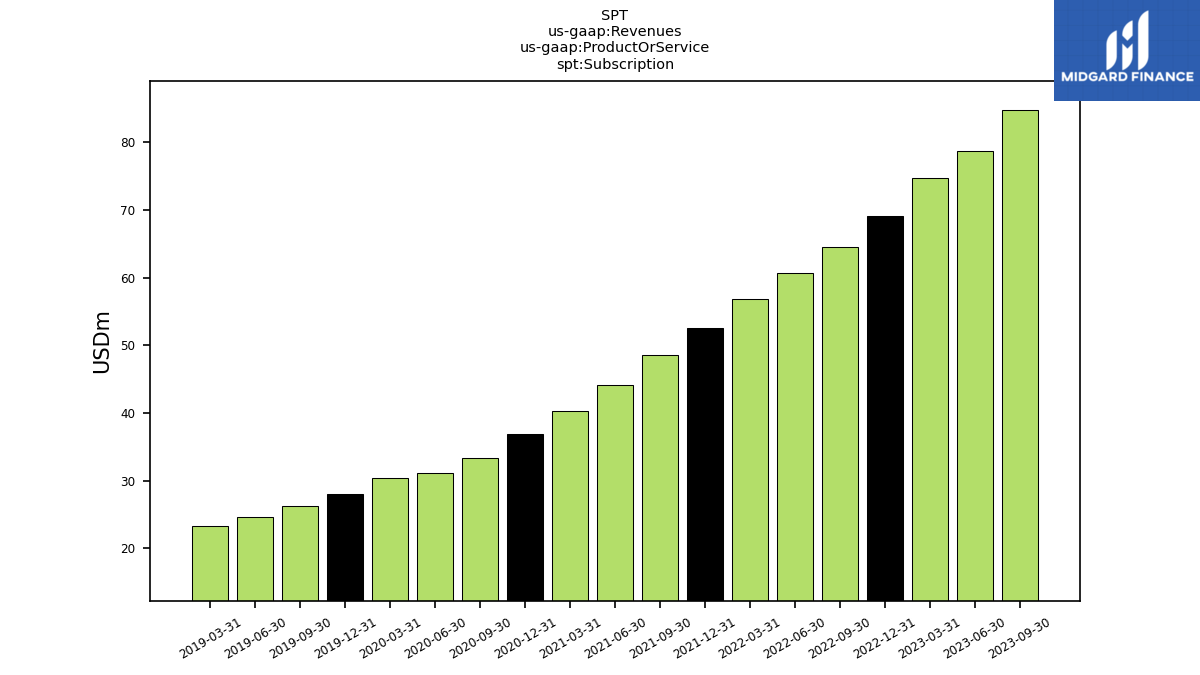
| Revenues | 85.53 | 79.31 | 75.21 | 69.66 | 65.31 | 61.43 | 57.43 | 53.27 | 49.09 | 44.69 | 40.82 | 37.35 | 33.67 | 31.40 | 30.54 | 28.14 | 26.42 | 24.76 | 23.38 | |
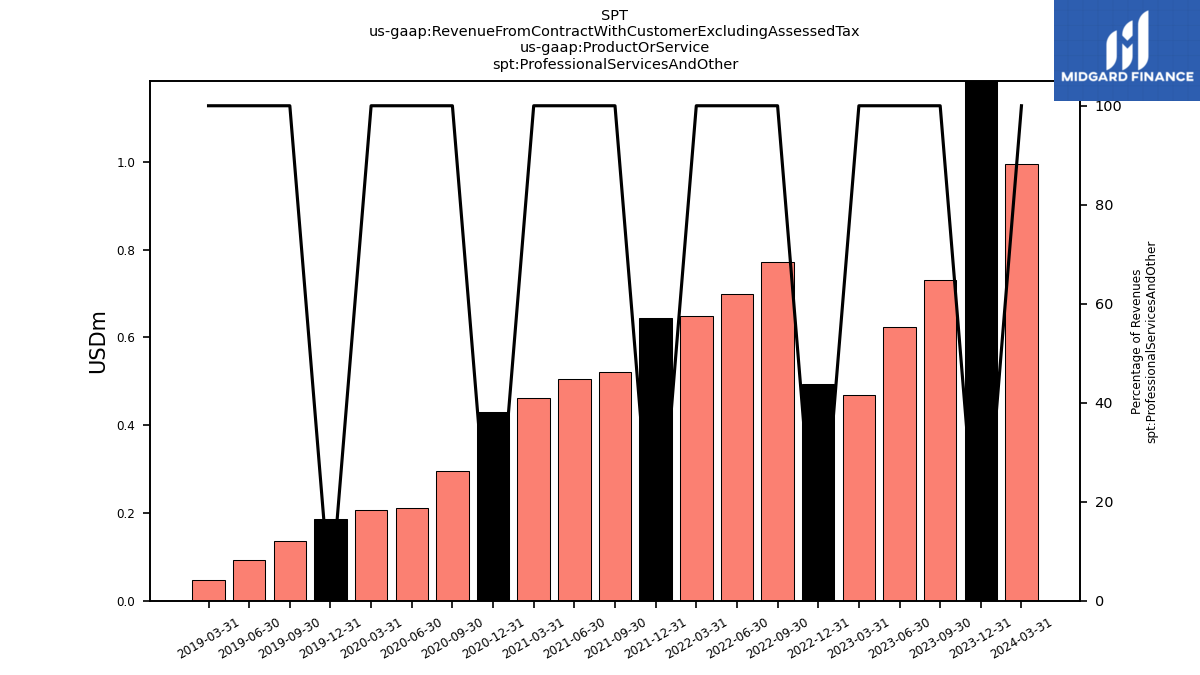
| Professional Services And Other | 0.73 | 0.62 | 0.47 | 0.49 | 0.77 | 0.70 | 0.65 | 0.64 | 0.52 | 0.51 | 0.46 | 0.43 | 0.30 | 0.21 | 0.21 | 0.19 | 0.14 | 0.09 | 0.05 | |
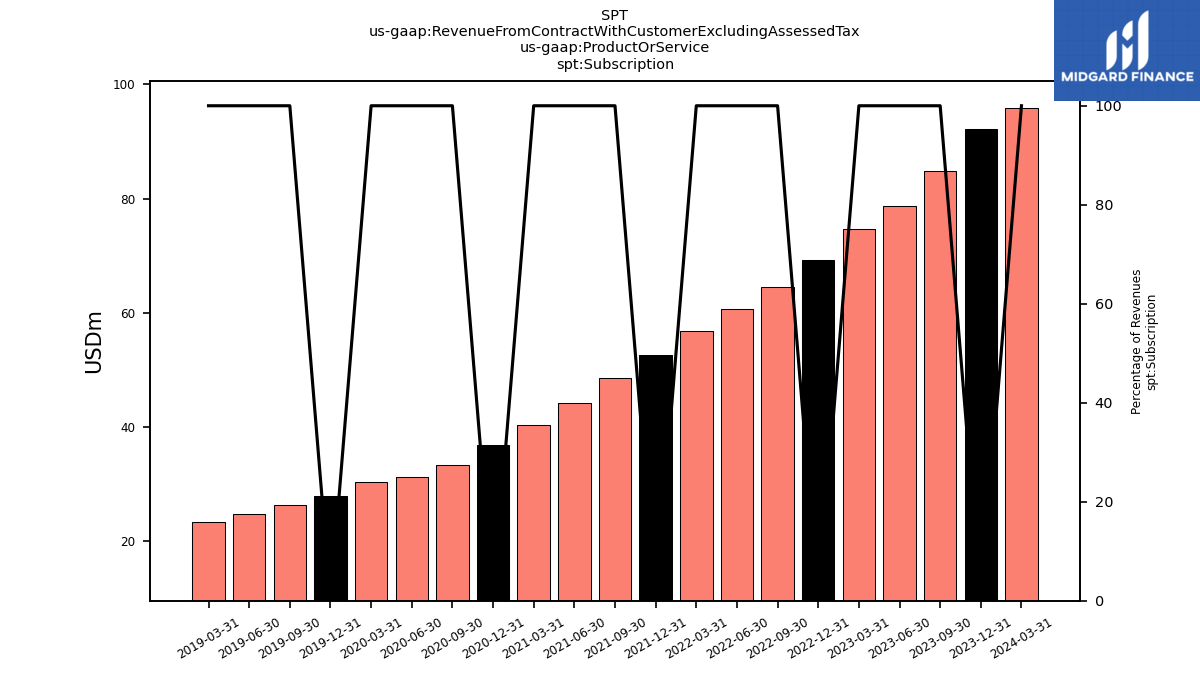
| Subscription | 84.80 | 78.69 | 74.74 | 69.17 | 64.54 | 60.73 | 56.78 | 52.62 | 48.57 | 44.18 | 40.35 | 36.91 | 33.37 | 31.19 | 30.33 | 27.96 | 26.28 | 24.67 | 23.33 | |
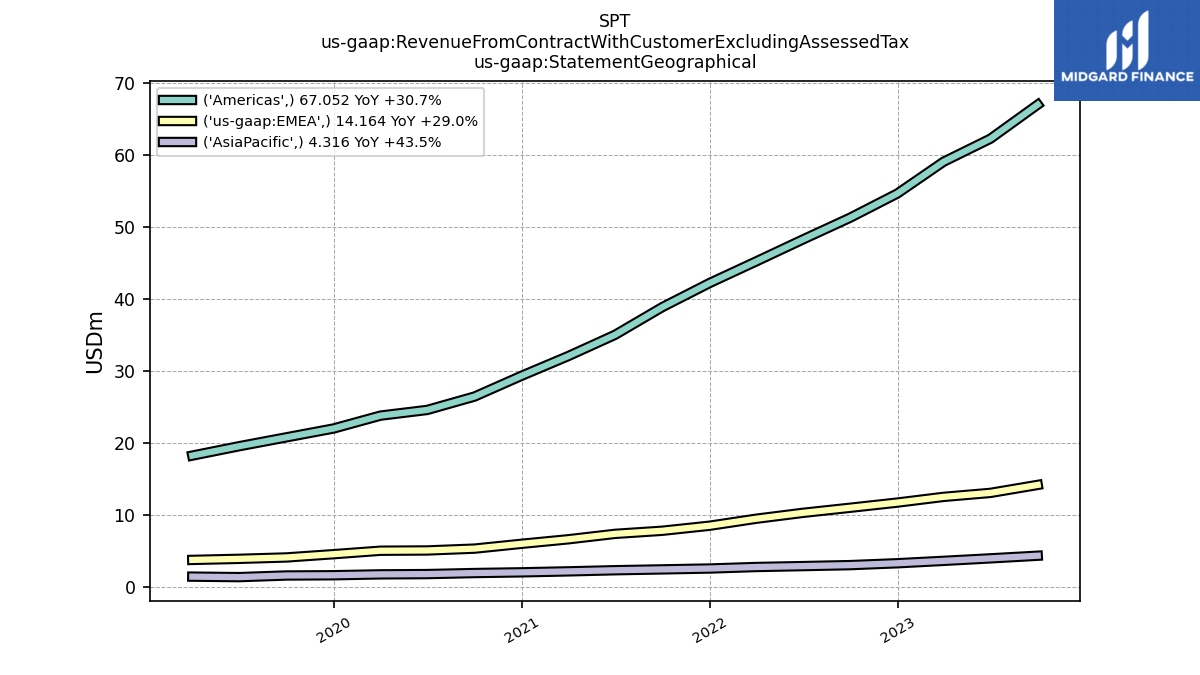
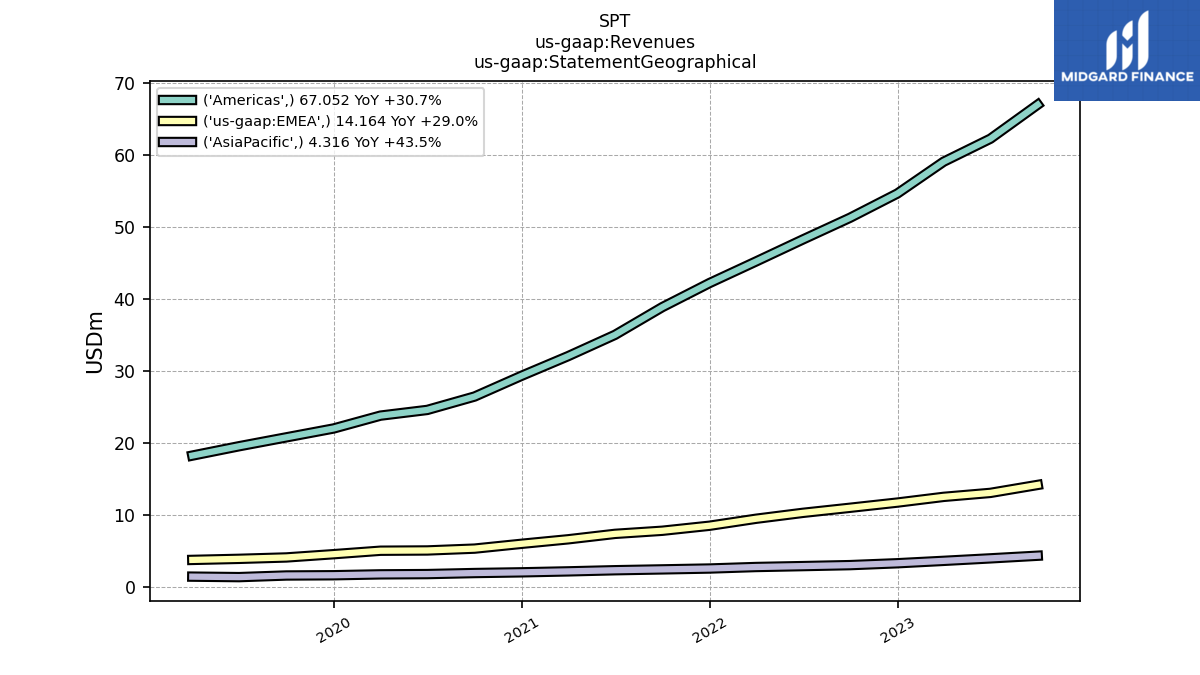
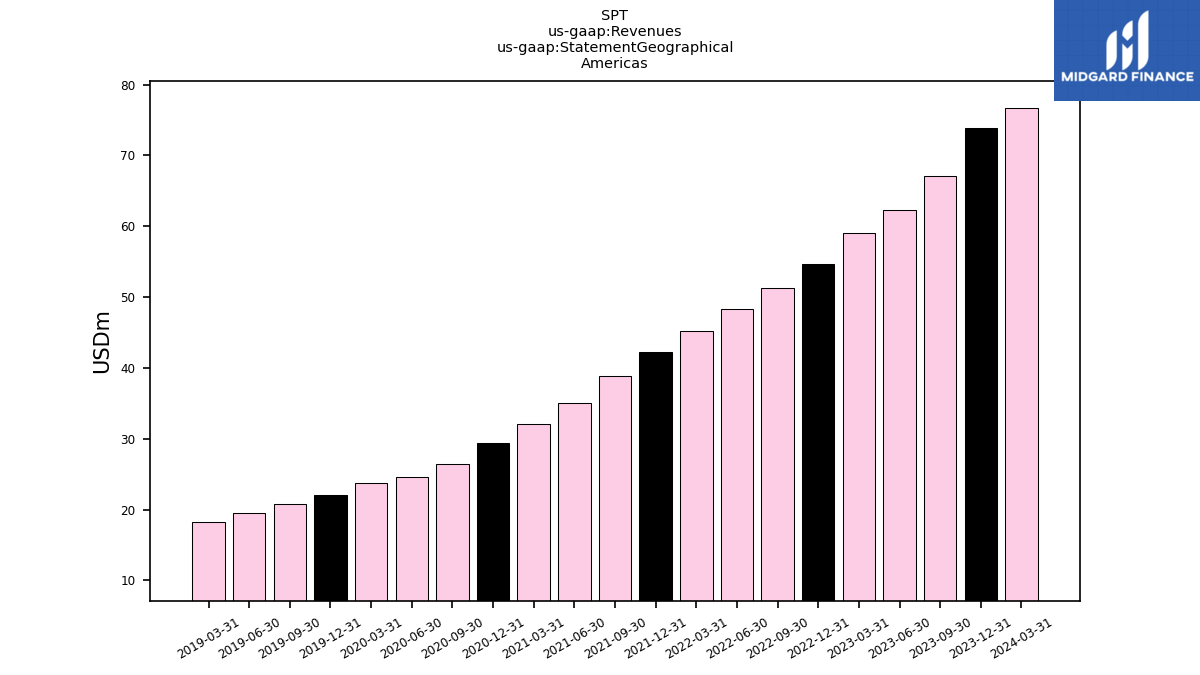
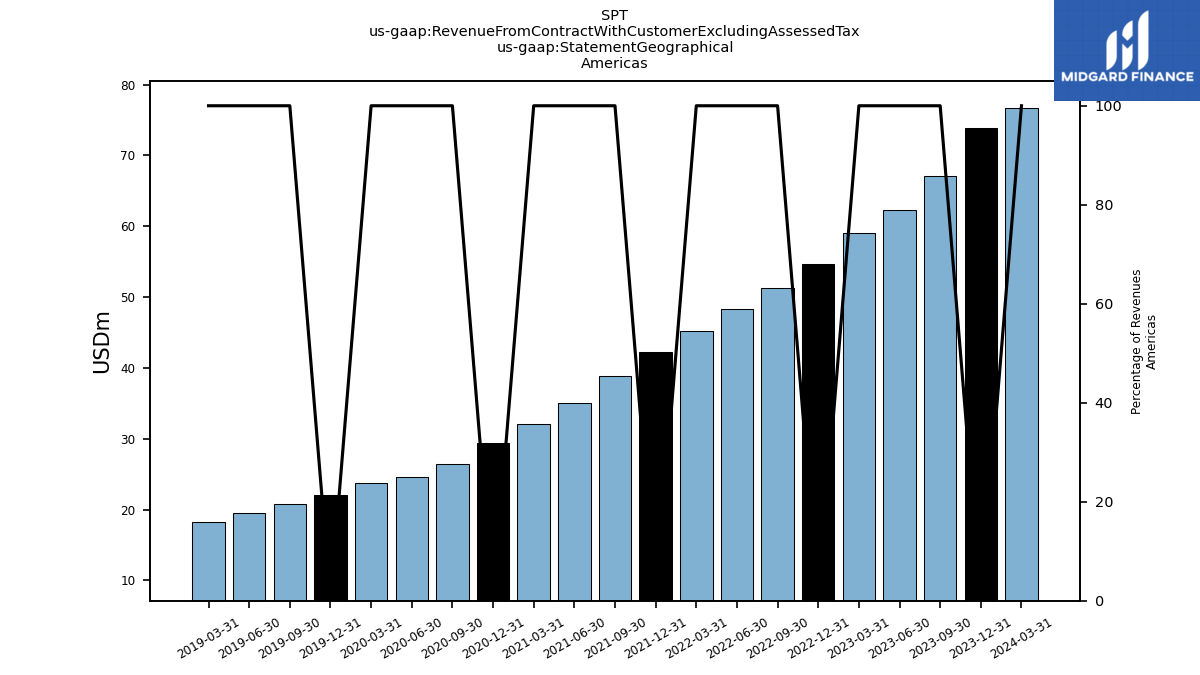
| 67.05 | 62.31 | 59.11 | 54.69 | 51.31 | 48.28 | 45.23 | 42.24 | 38.89 | 35.03 | 32.08 | 29.36 | 26.45 | 24.59 | 23.80 | 22.01 | 20.78 | 19.54 | 18.24 | ||
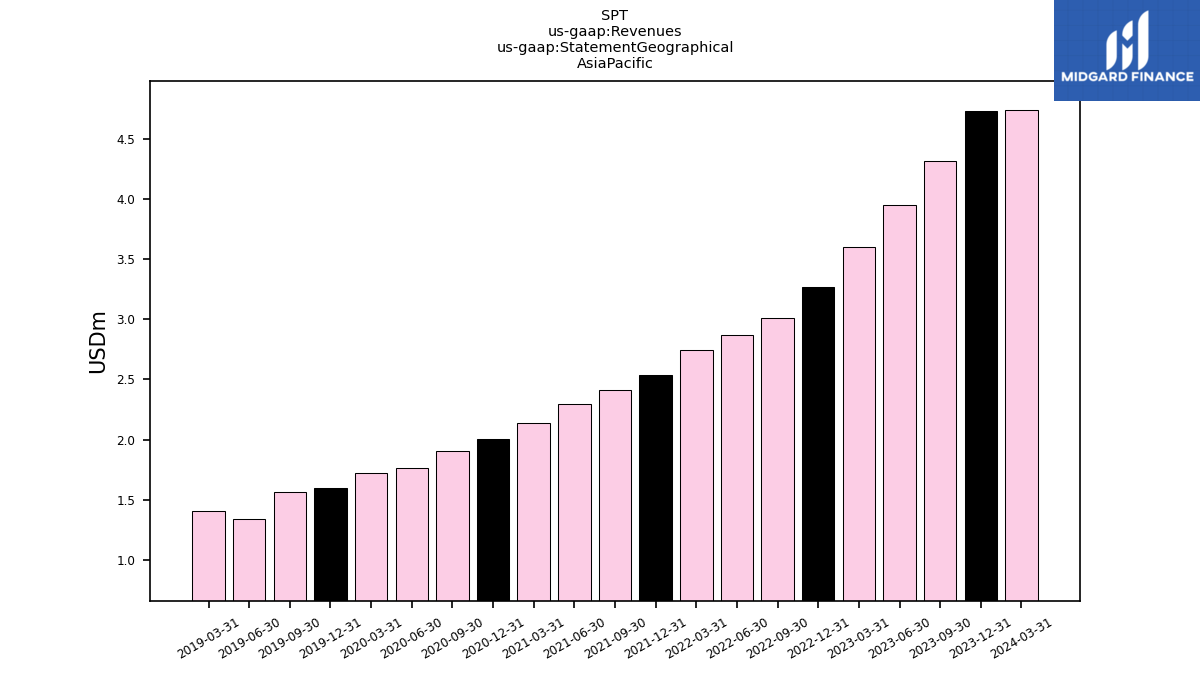
| 4.32 | 3.95 | 3.60 | 3.27 | 3.01 | 2.87 | 2.75 | 2.54 | 2.42 | 2.30 | 2.14 | 2.01 | 1.91 | 1.76 | 1.72 | 1.60 | 1.57 | 1.34 | 1.41 | ||
| EMEA | 14.16 | 13.05 | 12.50 | 11.71 | 10.98 | 10.28 | 9.45 | 8.49 | 7.79 | 7.36 | 6.60 | 5.98 | 5.30 | 5.05 | 5.01 | 4.53 | 4.08 | 3.88 | 3.73 | |
| Revenue From Contract With Customer Excluding Assessed Tax | 85.53 | 79.31 | 75.21 | 69.66 | 65.31 | 61.43 | 57.43 | 53.27 | 49.09 | 44.69 | 40.82 | 37.35 | 33.67 | 31.40 | 30.54 | 28.14 | 26.42 | 24.76 | 23.38 | |
| Professional Services And Other | 0.73 | 0.62 | 0.47 | 0.49 | 0.77 | 0.70 | 0.65 | 0.64 | 0.52 | 0.51 | 0.46 | 0.43 | 0.30 | 0.21 | 0.21 | 0.19 | 0.14 | 0.09 | 0.05 | |
| Subscription | 84.80 | 78.69 | 74.74 | 69.17 | 64.54 | 60.73 | 56.78 | 52.62 | 48.57 | 44.18 | 40.35 | 36.91 | 33.37 | 31.19 | 30.33 | 27.96 | 26.28 | 24.67 | 23.33 | |
| 67.05 | 62.31 | 59.11 | 54.69 | 51.31 | 48.28 | 45.23 | 42.24 | 38.89 | 35.03 | 32.08 | 29.36 | 26.45 | 24.59 | 23.80 | 22.01 | 20.78 | 19.54 | 18.24 | ||
| 4.32 | 3.95 | 3.60 | 3.27 | 3.01 | 2.87 | 2.75 | 2.54 | 2.42 | 2.30 | 2.14 | 2.01 | 1.91 | 1.76 | 1.72 | 1.60 | 1.57 | 1.34 | 1.41 | ||
| EMEA | 14.16 | 13.05 | 12.50 | 11.71 | 10.98 | 10.28 | 9.45 | 8.49 | 7.79 | 7.36 | 6.60 | 5.98 | 5.30 | 5.05 | 5.01 | 4.53 | 4.08 | 3.88 | 3.73 |


