
| 2023-12-31 | 2023-09-30 | 2023-07-01 | 2023-04-01 | 2022-12-31 | 2022-10-01 | 2022-07-02 | 2022-04-02 | 2021-12-31 | 2021-10-02 | 2021-07-03 | 2021-04-03 | 2020-12-31 | 2020-09-26 | 2020-06-27 | 2020-03-28 | 2019-12-31 | 2019-09-28 | 2019-06-29 | 2019-03-30 | 2018-12-31 | 2018-09-29 | 2018-06-30 | 2018-03-31 | 2017-12-31 | 2017-09-30 | 2017-07-01 | 2017-04-01 | 2016-12-31 | 2016-10-01 | 2016-07-02 | 2016-04-02 | 2015-12-31 | 2015-09-26 | 2015-06-27 | 2015-03-28 | 2014-12-31 | 2014-09-27 | 2014-06-28 | 2014-03-29 | 2013-12-31 | 2013-09-28 | 2013-06-29 | 2013-03-30 | 2012-12-31 | 2012-09-29 | 2012-06-30 | 2012-03-31 | 2011-12-31 | 2011-10-01 | 2011-07-02 | 2011-04-02 | 2010-12-31 | 2010-10-02 | 2010-07-03 | 2010-04-03 | ||
|---|---|---|---|---|---|---|---|---|---|---|---|---|---|---|---|---|---|---|---|---|---|---|---|---|---|---|---|---|---|---|---|---|---|---|---|---|---|---|---|---|---|---|---|---|---|---|---|---|---|---|---|---|---|---|---|---|---|
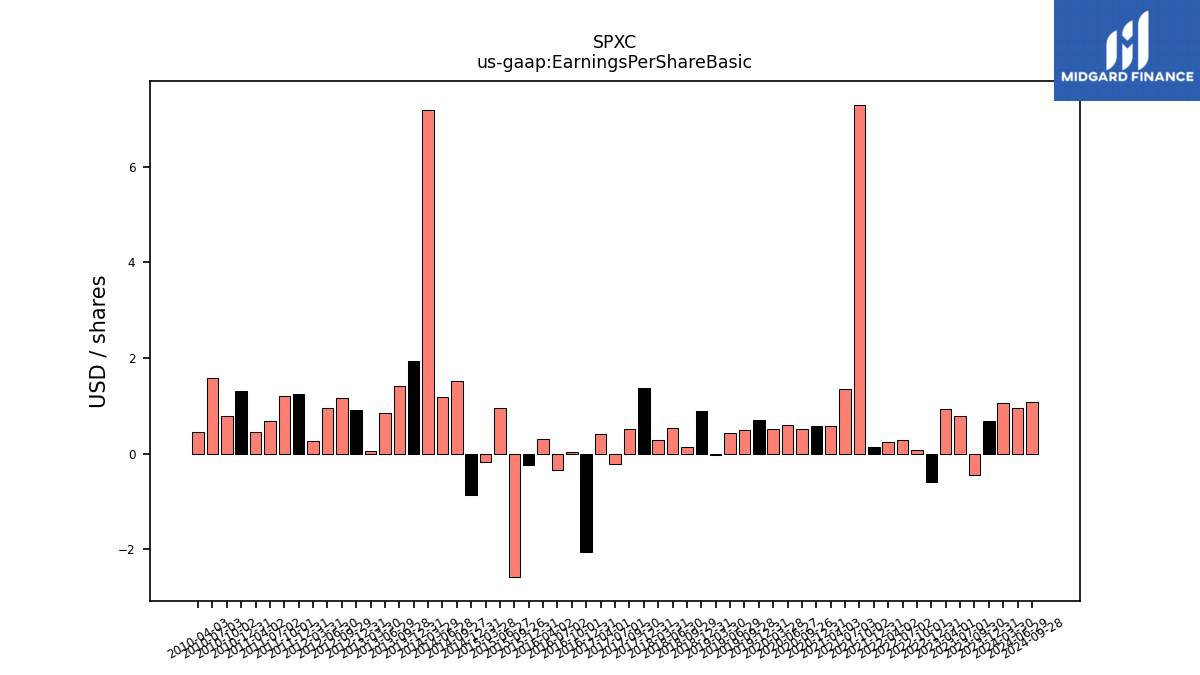
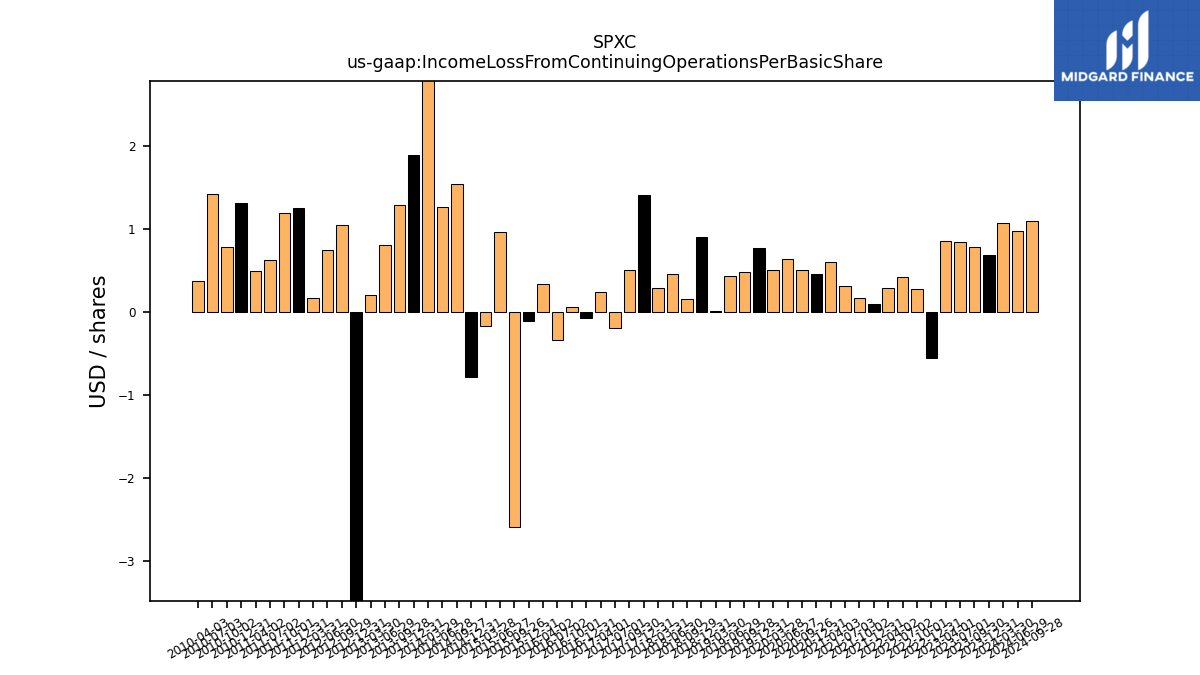
| Earnings Per Share Basic | 0.69 | -0.45 | 0.79 | 0.94 | -0.60 | 0.07 | 0.29 | 0.25 | 0.14 | 7.30 | 1.36 | 0.59 | 0.57 | 0.51 | 0.61 | 0.51 | 0.70 | 0.49 | 0.44 | -0.02 | 0.90 | 0.15 | 0.54 | 0.29 | 1.38 | 0.52 | -0.21 | 0.41 | -2.06 | 0.04 | -0.34 | 0.31 | -0.23 | -2.58 | 0.96 | -0.18 | -0.86 | 1.52 | 1.19 | 7.19 | 1.94 | 1.41 | 0.85 | 0.05 | 0.91 | 1.16 | 0.95 | 0.27 | 1.24 | 1.20 | 0.68 | 0.46 | 1.31 | 0.79 | 1.59 | 0.45 | |
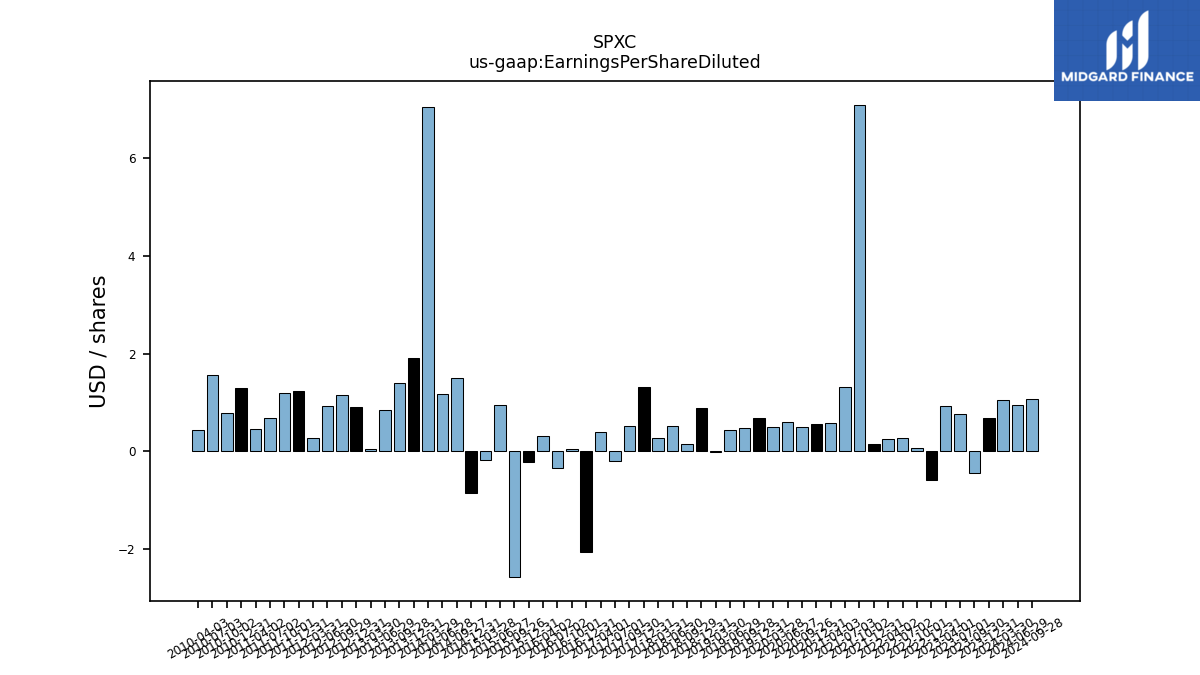
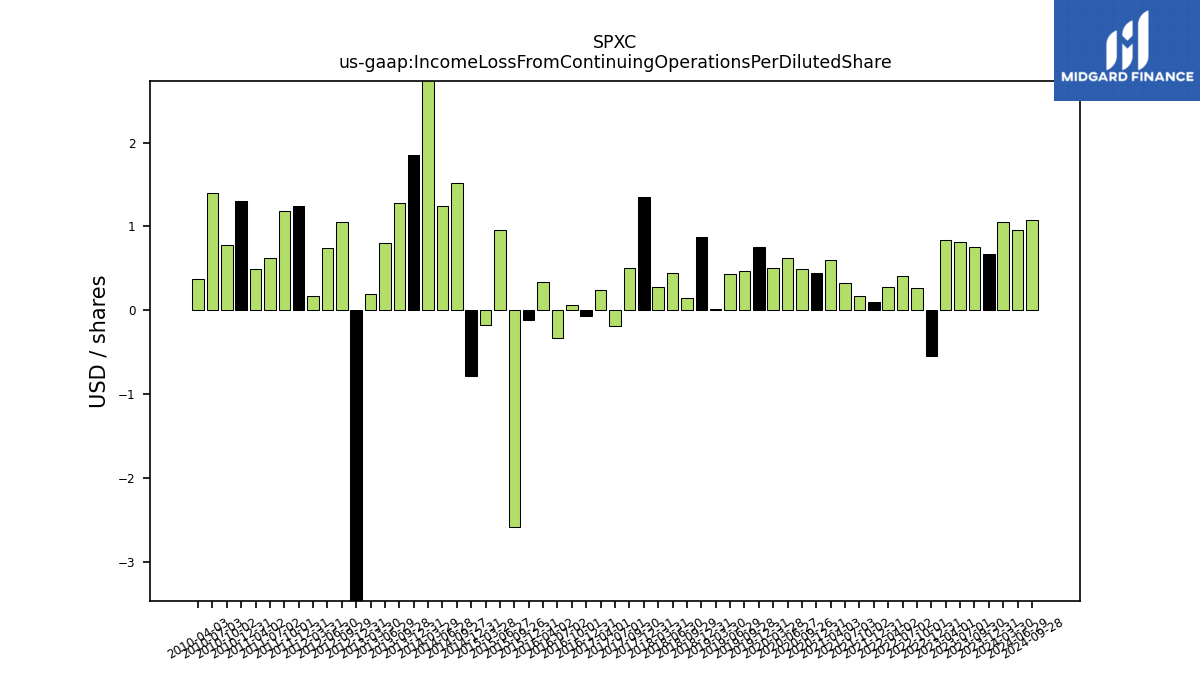
| Earnings Per Share Diluted | 0.68 | -0.44 | 0.77 | 0.92 | -0.60 | 0.07 | 0.28 | 0.25 | 0.14 | 7.10 | 1.32 | 0.58 | 0.56 | 0.50 | 0.59 | 0.50 | 0.68 | 0.48 | 0.43 | -0.02 | 0.88 | 0.15 | 0.51 | 0.28 | 1.32 | 0.51 | -0.21 | 0.40 | -2.06 | 0.04 | -0.34 | 0.31 | -0.23 | -2.58 | 0.95 | -0.18 | -0.86 | 1.50 | 1.17 | 7.06 | 1.91 | 1.40 | 0.84 | 0.05 | 0.91 | 1.16 | 0.93 | 0.26 | 1.23 | 1.20 | 0.67 | 0.45 | 1.29 | 0.78 | 1.57 | 0.44 | |
| Income Loss From Continuing Operations Per Basic Share | 0.00 | 0.00 | 0.00 | 0.00 | -0.00 | 0.00 | 0.00 | 0.00 | 0.00 | 0.00 | 0.00 | 0.00 | 0.00 | 0.00 | 0.00 | 0.00 | 0.00 | 0.00 | 0.00 | 0.00 | 0.00 | 0.00 | 0.00 | 0.00 | 0.00 | 0.00 | -0.00 | 0.00 | -0.00 | 0.00 | -0.00 | 0.00 | -0.00 | -0.00 | 0.00 | -0.00 | -0.00 | 0.00 | 0.00 | 0.00 | 0.00 | 0.00 | 0.00 | 0.00 | -0.00 | 0.00 | 0.00 | 0.00 | 0.00 | 0.00 | 0.00 | 0.00 | 0.00 | 0.00 | 0.00 | 0.00 | |
| Income Loss From Continuing Operations Per Diluted Share | 0.00 | 0.00 | 0.00 | 0.00 | -0.00 | 0.00 | 0.00 | 0.00 | 0.00 | 0.00 | 0.00 | 0.00 | 0.00 | 0.00 | 0.00 | 0.00 | 0.00 | 0.00 | 0.00 | 0.00 | 0.00 | 0.00 | 0.00 | 0.00 | 0.00 | 0.00 | -0.00 | 0.00 | -0.00 | 0.00 | -0.00 | 0.00 | -0.00 | -0.00 | 0.00 | -0.00 | -0.00 | 0.00 | 0.00 | 0.00 | 0.00 | 0.00 | 0.00 | 0.00 | -0.00 | 0.00 | 0.00 | 0.00 | 0.00 | 0.00 | 0.00 | 0.00 | 0.00 | 0.00 | 0.00 | 0.00 |
| 2023-12-31 | 2023-09-30 | 2023-07-01 | 2023-04-01 | 2022-12-31 | 2022-10-01 | 2022-07-02 | 2022-04-02 | 2021-12-31 | 2021-10-02 | 2021-07-03 | 2021-04-03 | 2020-12-31 | 2020-09-26 | 2020-06-27 | 2020-03-28 | 2019-12-31 | 2019-09-28 | 2019-06-29 | 2019-03-30 | 2018-12-31 | 2018-09-29 | 2018-06-30 | 2018-03-31 | 2017-12-31 | 2017-09-30 | 2017-07-01 | 2017-04-01 | 2016-12-31 | 2016-10-01 | 2016-07-02 | 2016-04-02 | 2015-12-31 | 2015-09-26 | 2015-06-27 | 2015-03-28 | 2014-12-31 | 2014-09-27 | 2014-06-28 | 2014-03-29 | 2013-12-31 | 2013-09-28 | 2013-06-29 | 2013-03-30 | 2012-12-31 | 2012-09-29 | 2012-06-30 | 2012-03-31 | 2011-12-31 | 2011-10-01 | 2011-07-02 | 2011-04-02 | 2010-12-31 | 2010-10-02 | 2010-07-03 | 2010-04-03 | ||
|---|---|---|---|---|---|---|---|---|---|---|---|---|---|---|---|---|---|---|---|---|---|---|---|---|---|---|---|---|---|---|---|---|---|---|---|---|---|---|---|---|---|---|---|---|---|---|---|---|---|---|---|---|---|---|---|---|---|
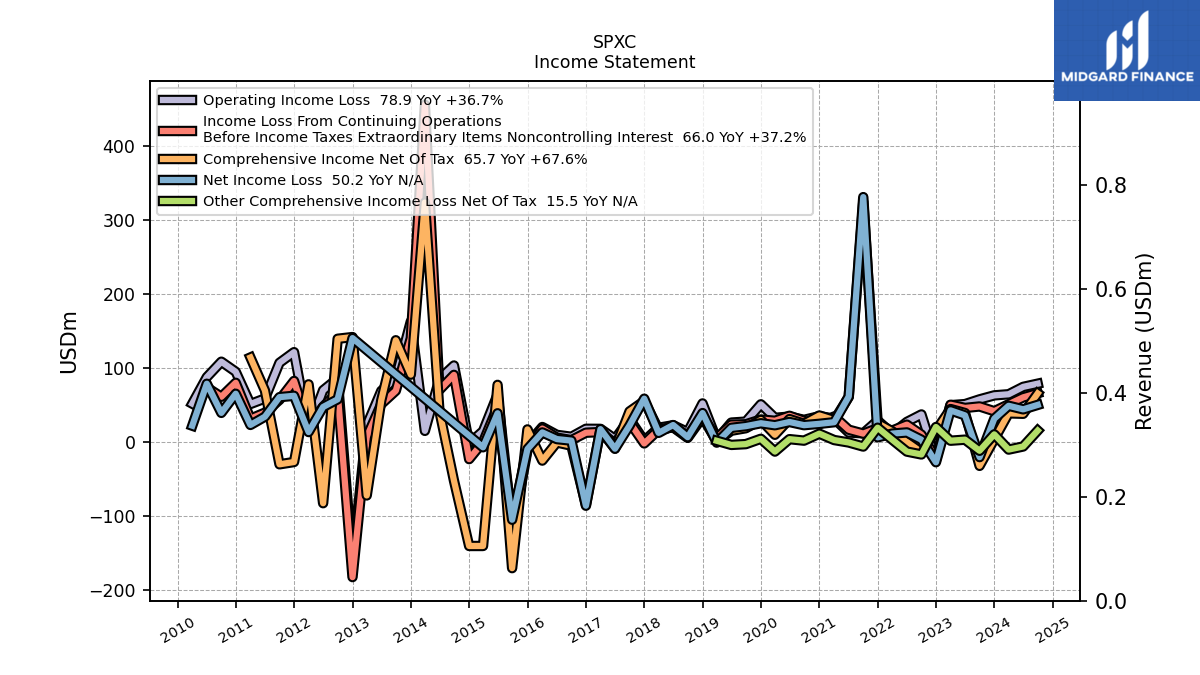
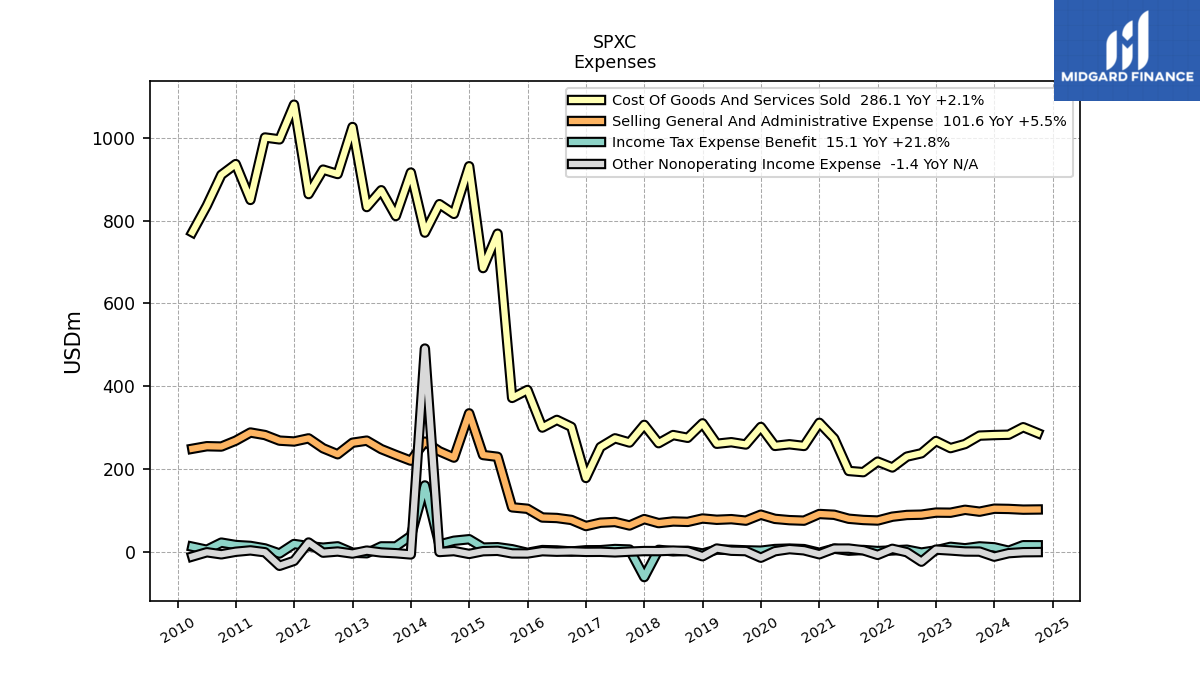
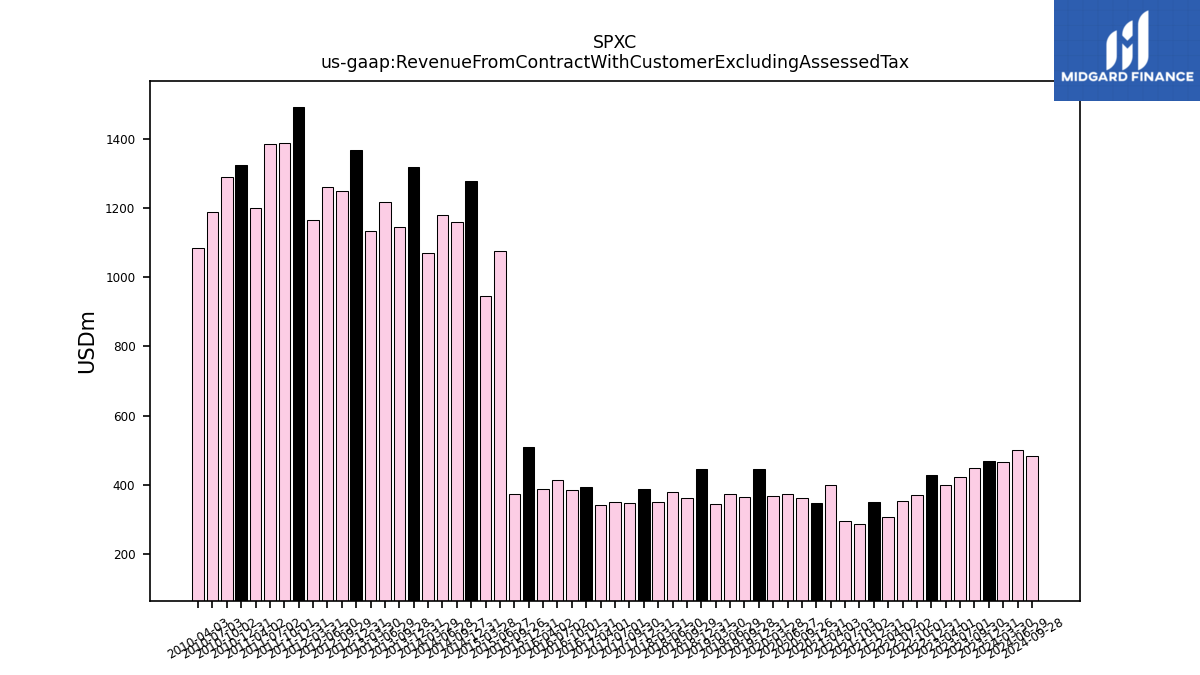
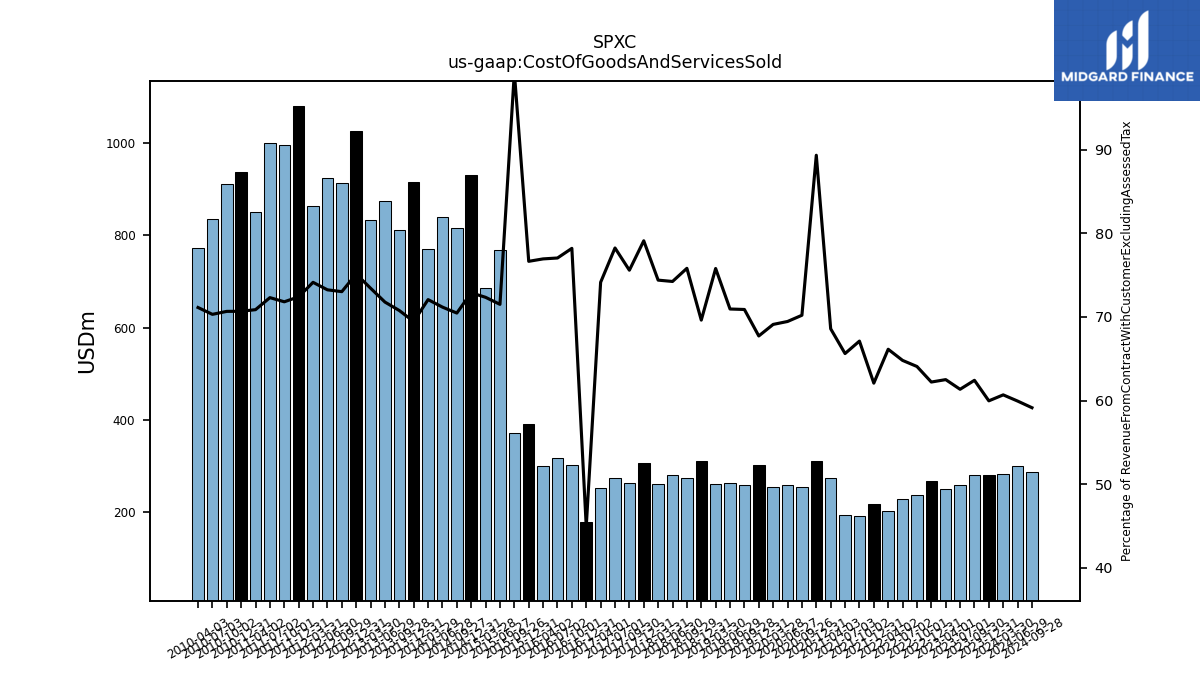
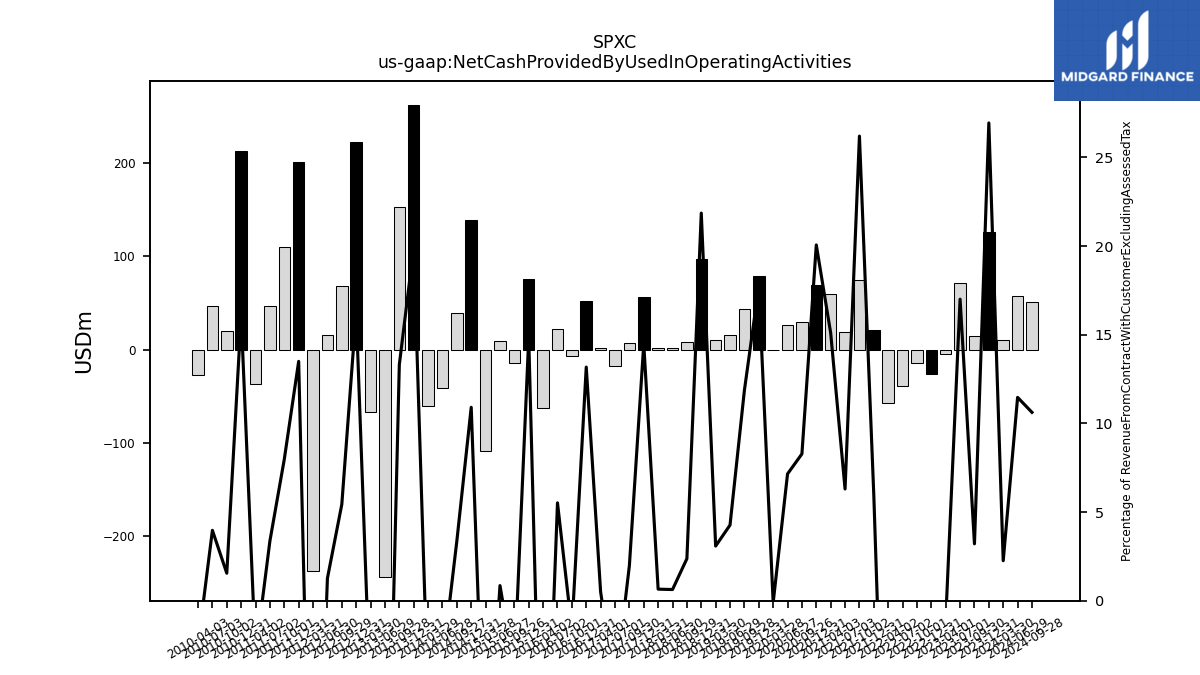
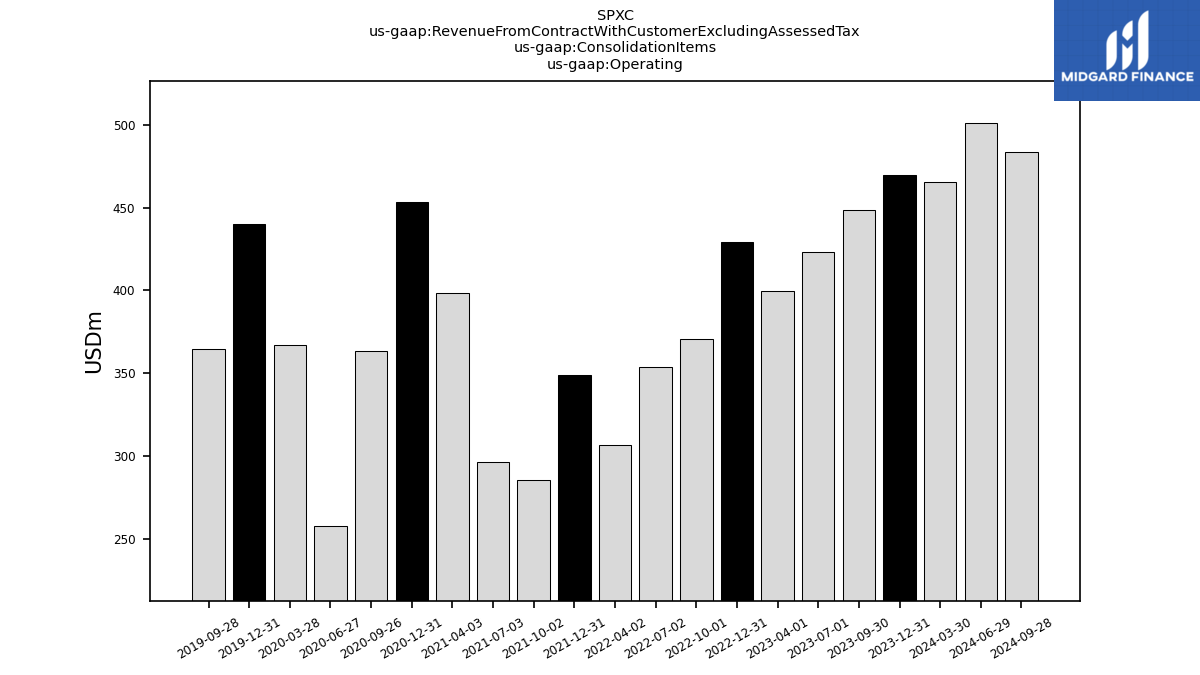
| Revenue From Contract With Customer Excluding Assessed Tax | 469.40 | 448.70 | 423.30 | 399.80 | 429.30 | 370.50 | 354.00 | 307.10 | 350.00 | 285.80 | 296.70 | 398.50 | 348.30 | 363.40 | 373.20 | 369.30 | 444.60 | 364.80 | 372.40 | 343.60 | 445.00 | 362.50 | 379.20 | 351.90 | 387.00 | 348.50 | 349.70 | 340.60 | 395.30 | 385.20 | 412.90 | 389.30 | 509.50 | 374.10 | 1074.40 | 946.90 | 1277.70 | 1158.10 | 1179.70 | 1069.40 | 1319.00 | 1145.80 | 1216.60 | 1133.70 | 1366.00 | 1249.40 | 1260.30 | 1165.20 | 1491.70 | 1387.20 | 1384.00 | 1199.00 | 1325.00 | 1288.40 | 1188.80 | 1084.60 | |
| Cost Of Goods And Services Sold | 281.50 | 280.10 | 259.70 | 249.90 | 267.10 | 237.40 | 229.40 | 203.10 | 217.30 | 191.80 | 194.70 | 273.30 | 311.10 | 255.10 | 259.20 | 255.20 | 301.10 | 258.60 | 264.20 | 260.40 | 309.80 | 274.80 | 281.50 | 261.80 | 306.10 | 263.40 | 273.60 | 252.50 | 177.70 | 301.20 | 318.10 | 299.50 | 390.50 | 371.20 | 768.20 | 685.00 | 931.20 | 816.00 | 839.60 | 770.70 | 916.00 | 810.80 | 873.20 | 832.50 | 1026.10 | 912.30 | 923.00 | 863.80 | 1080.10 | 996.10 | 1000.70 | 849.70 | 936.40 | 910.40 | 835.80 | 771.40 | |
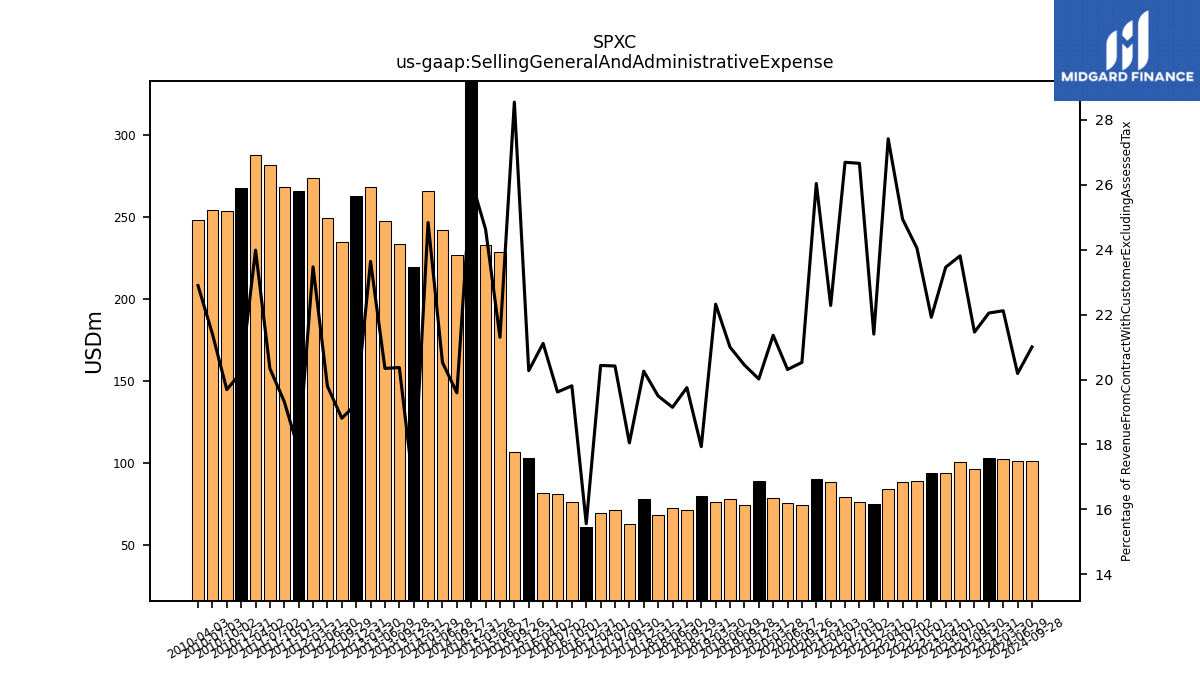
| Selling General And Administrative Expense | 103.50 | 96.30 | 100.80 | 93.80 | 94.10 | 89.10 | 88.30 | 84.20 | 74.90 | 76.20 | 79.20 | 88.80 | 90.70 | 74.60 | 75.80 | 78.90 | 89.00 | 74.60 | 78.20 | 76.70 | 79.80 | 71.60 | 72.60 | 68.60 | 78.40 | 62.90 | 71.40 | 69.60 | 61.50 | 76.30 | 81.00 | 82.20 | 103.30 | 106.80 | 228.90 | 233.20 | 334.00 | 226.90 | 242.20 | 265.60 | 219.50 | 233.40 | 247.50 | 268.00 | 262.90 | 235.00 | 249.50 | 273.50 | 265.90 | 268.00 | 281.50 | 287.60 | 267.90 | 253.70 | 254.50 | 248.30 | |
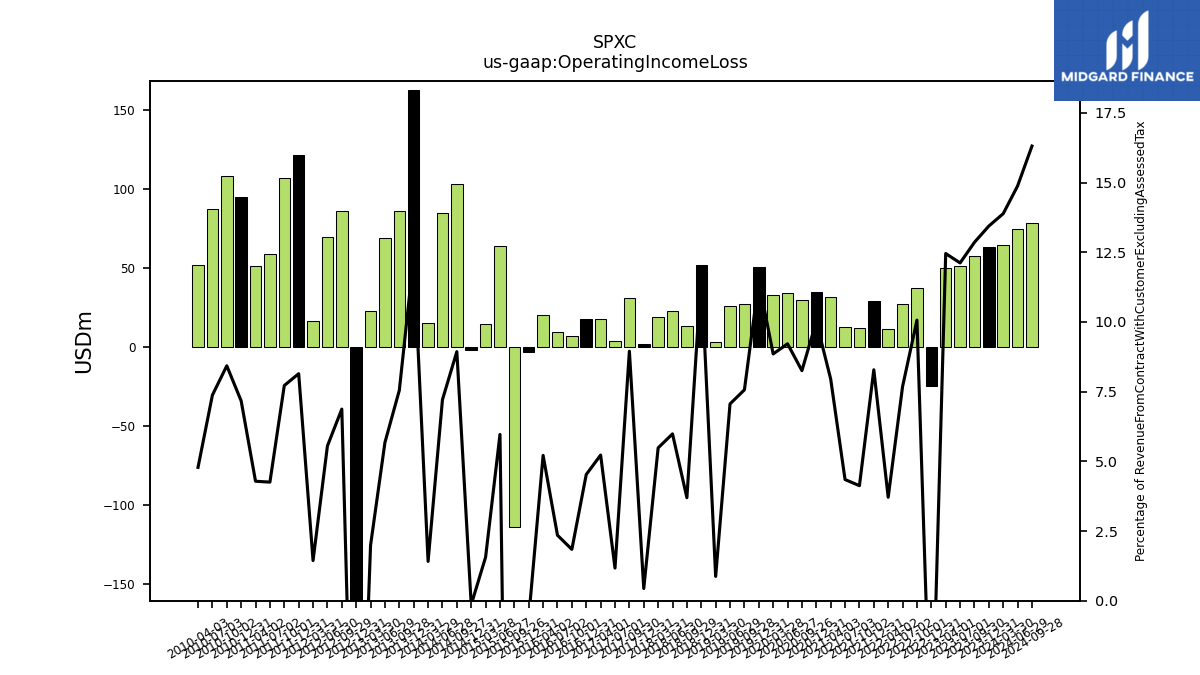
| Operating Income Loss | 63.10 | 57.70 | 51.30 | 49.80 | -24.90 | 37.30 | 27.20 | 11.40 | 29.00 | 11.80 | 12.90 | 31.70 | 34.90 | 30.00 | 34.40 | 32.70 | 51.00 | 27.60 | 26.30 | 3.00 | 52.20 | 13.40 | 22.70 | 19.30 | 1.70 | 31.20 | 4.10 | 17.80 | 17.90 | 7.10 | 9.70 | 20.30 | -3.10 | -113.60 | 64.10 | 14.80 | -1.80 | 103.50 | 85.10 | 15.10 | 163.00 | 86.50 | 69.10 | 22.60 | -163.70 | 85.90 | 70.00 | 16.80 | 121.50 | 107.10 | 58.90 | 51.40 | 95.00 | 108.60 | 87.70 | 51.90 | |
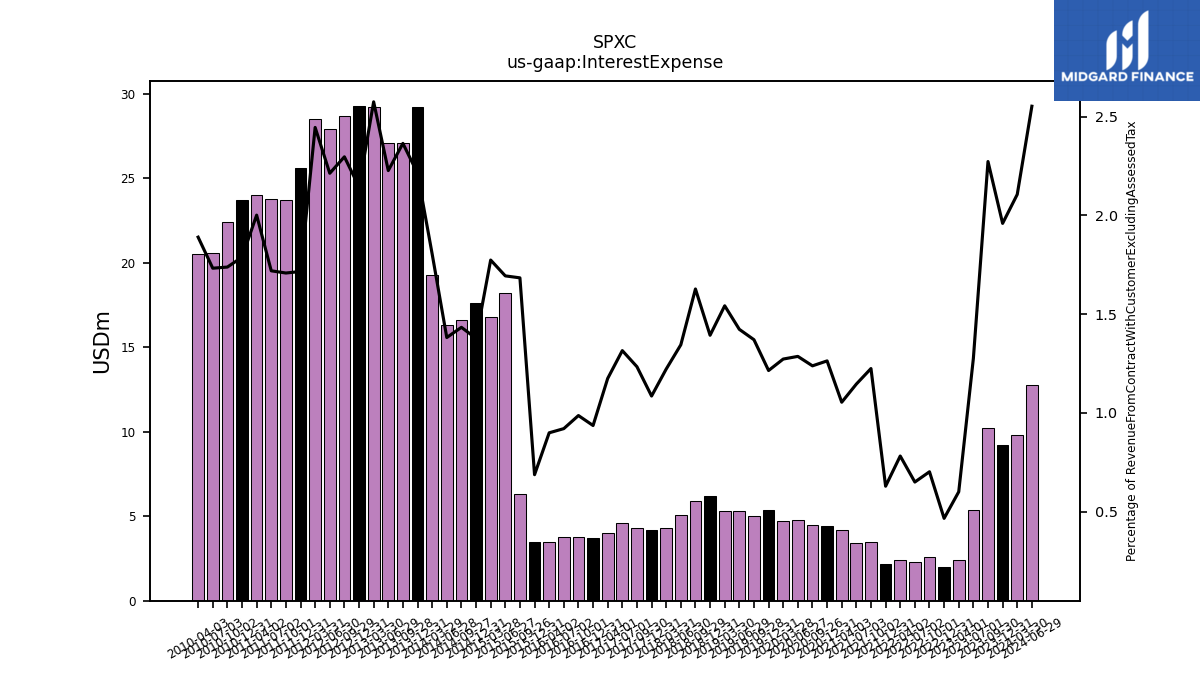
| Interest Expense | 9.20 | 10.20 | 5.40 | 2.40 | 2.00 | 2.60 | 2.30 | 2.40 | 2.20 | 3.50 | 3.40 | 4.20 | 4.40 | 4.50 | 4.80 | 4.70 | 5.40 | 5.00 | 5.30 | 5.30 | 6.20 | 5.90 | 5.10 | 4.30 | 4.20 | 4.30 | 4.60 | 4.00 | 3.70 | 3.80 | 3.80 | 3.50 | 3.50 | 6.30 | 18.20 | 16.80 | 17.60 | 16.60 | 16.30 | 19.30 | 29.20 | 27.10 | 27.10 | 29.20 | 29.30 | 28.70 | 27.90 | 28.50 | 25.60 | 23.70 | 23.80 | 24.00 | 23.70 | 22.40 | 20.60 | 20.50 | |
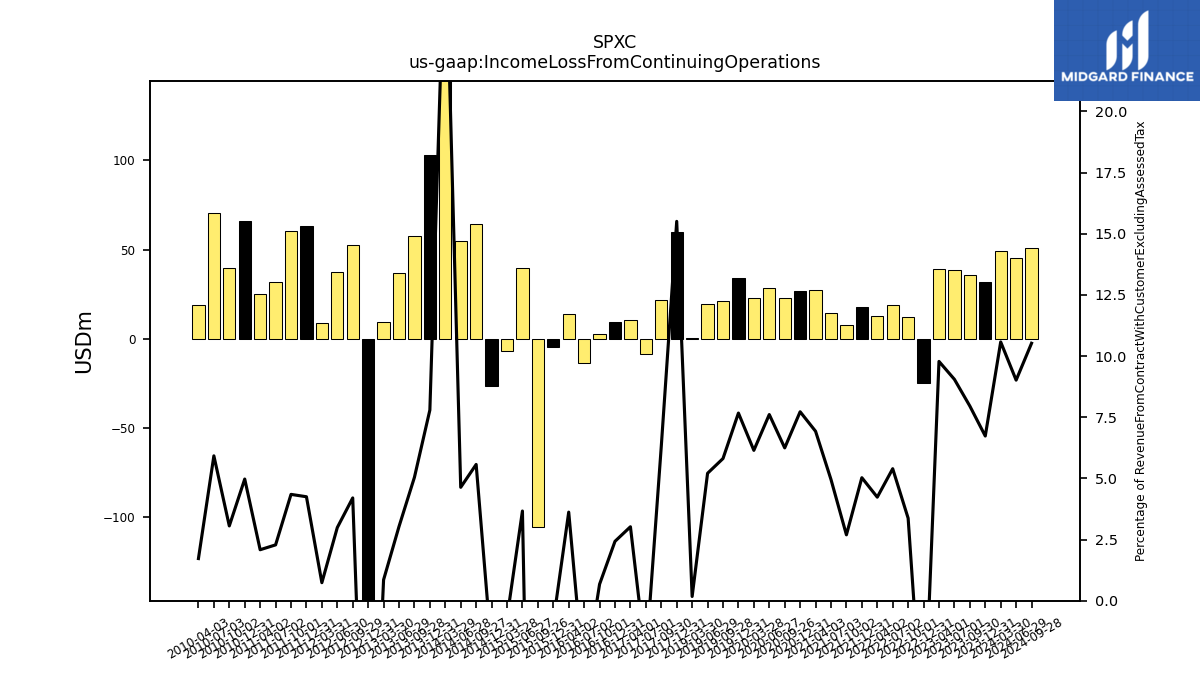
| Income Loss From Continuing Operations | 31.60 | 35.70 | 38.30 | 39.10 | -24.80 | 12.50 | 19.10 | 13.00 | 17.60 | 7.70 | 14.70 | 27.60 | 26.90 | 22.70 | 28.40 | 22.70 | 34.10 | 21.20 | 19.40 | 0.60 | NA | NA | NA | NA | 60.00 | 22.00 | -8.30 | 10.30 | 9.60 | 2.60 | -13.70 | 14.10 | -4.40 | -105.10 | 39.40 | -6.70 | -26.40 | 64.50 | 54.70 | 296.80 | 102.80 | 57.80 | 36.90 | 9.70 | -180.00 | 52.50 | 37.70 | 8.60 | 63.40 | 60.30 | 31.60 | 25.00 | 65.90 | 39.40 | 70.40 | 18.70 | |
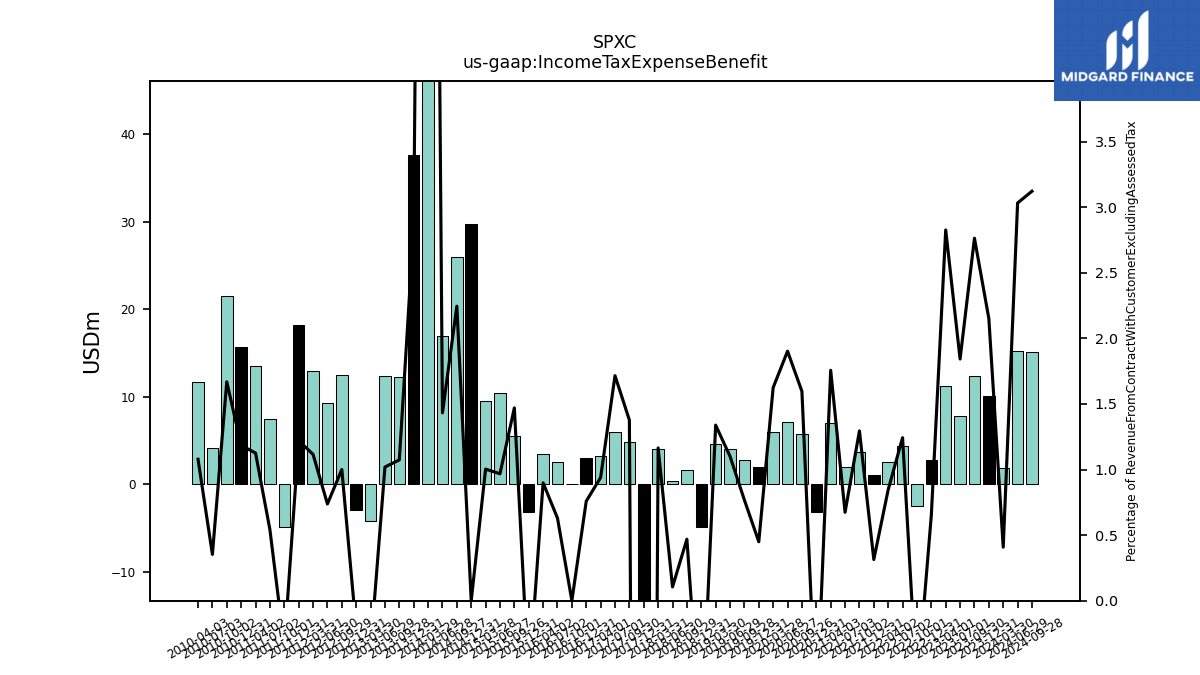
| Income Tax Expense Benefit | 10.10 | 12.40 | 7.80 | 11.30 | 2.80 | -2.50 | 4.40 | 2.60 | 1.10 | 3.70 | 2.00 | 7.00 | -3.10 | 5.80 | 7.10 | 6.00 | 2.00 | 2.80 | 4.10 | 4.60 | -4.80 | 1.70 | 0.40 | 4.10 | -61.90 | 4.80 | 6.00 | 3.20 | 3.00 | 0.00 | 2.60 | 3.50 | -3.20 | 5.50 | 10.40 | 9.50 | 29.70 | 26.00 | 16.90 | 159.70 | 37.60 | 12.30 | 12.40 | -4.20 | -2.90 | 12.50 | 9.30 | 13.00 | 18.20 | -4.80 | 7.50 | 13.50 | 15.70 | 21.50 | 4.20 | 11.70 | |
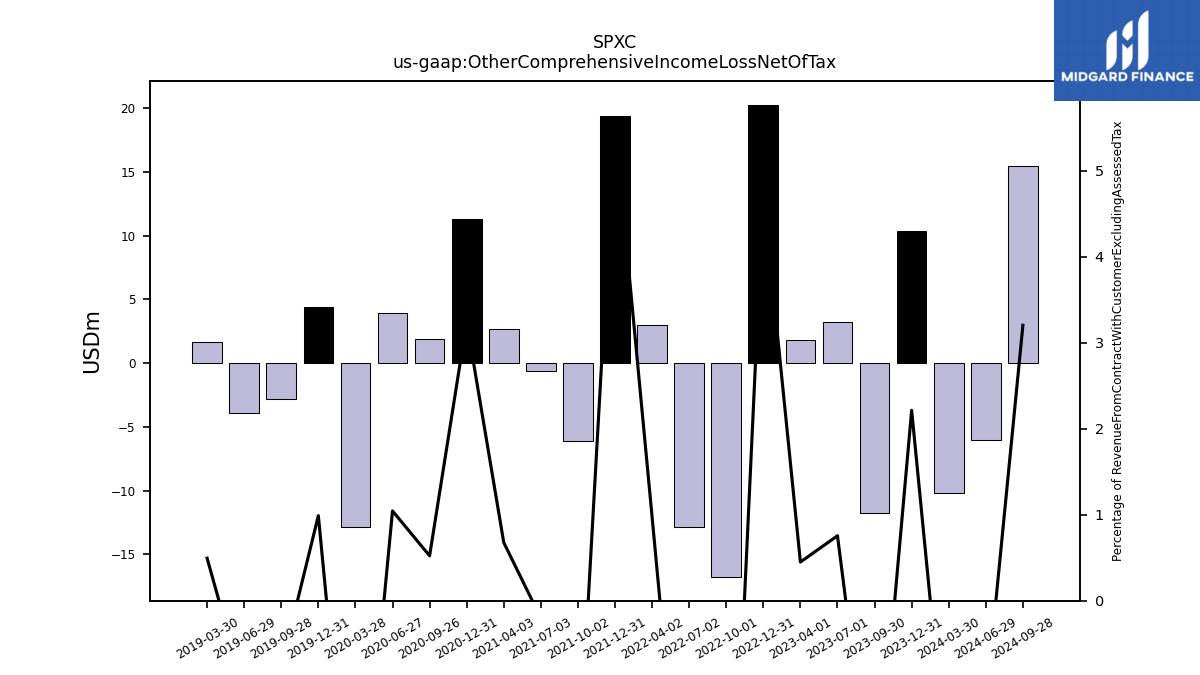
| Other Comprehensive Income Loss Net Of Tax | 10.40 | -11.80 | 3.20 | 1.80 | 20.30 | -16.80 | -12.90 | 3.00 | 19.40 | -6.10 | -0.60 | 2.70 | 11.30 | 1.90 | 3.90 | -12.90 | 4.40 | -2.80 | -3.90 | 1.70 | NA | NA | NA | NA | NA | NA | NA | NA | NA | NA | NA | NA | NA | NA | NA | NA | NA | NA | NA | NA | NA | NA | NA | NA | NA | NA | NA | NA | NA | NA | NA | NA | NA | NA | NA | NA | |
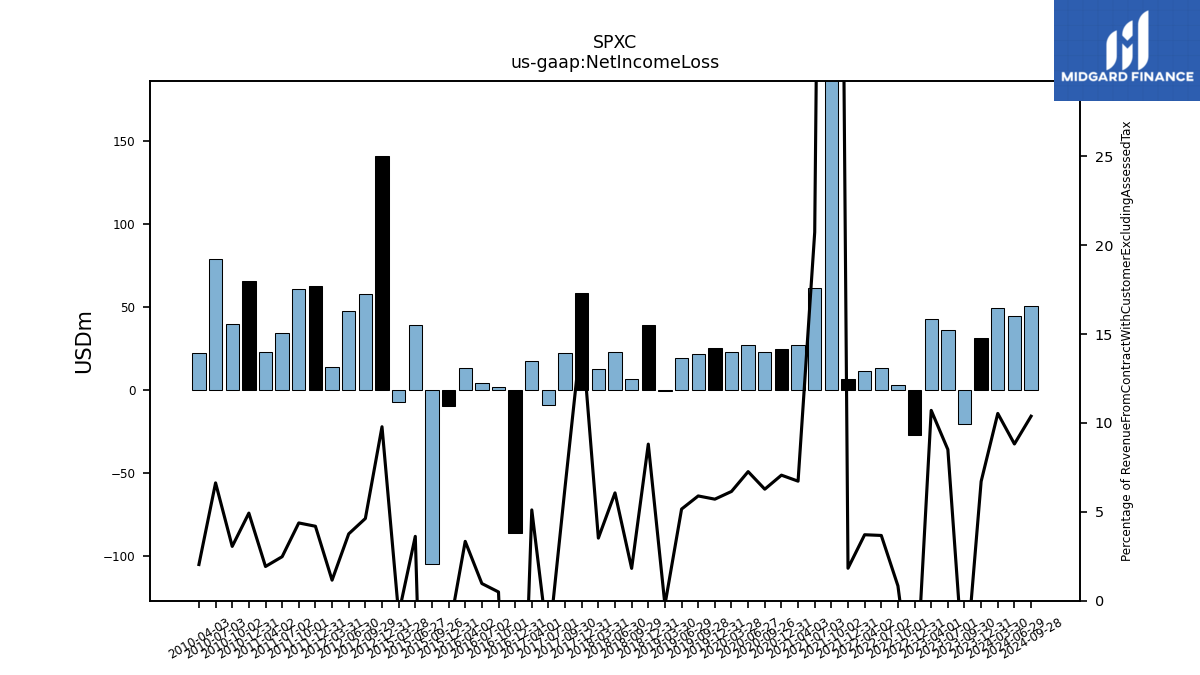
| Net Income Loss | 31.50 | -20.40 | 36.00 | 42.80 | -27.30 | 3.10 | 13.00 | 11.40 | 6.40 | 331.10 | 61.50 | 26.80 | 24.60 | 22.80 | 27.10 | 22.70 | 25.40 | 21.50 | 19.20 | -0.80 | 39.20 | 6.60 | 23.00 | 12.40 | 58.60 | 22.30 | -9.00 | 17.40 | -86.10 | 1.90 | 4.00 | 13.00 | -9.50 | -105.00 | 38.90 | -7.10 | NA | NA | NA | NA | NA | NA | NA | NA | 140.50 | 57.80 | 47.40 | 13.50 | 62.50 | 60.70 | 34.30 | 23.10 | 65.30 | 39.40 | 78.80 | 22.10 |
| 2023-12-31 | 2023-09-30 | 2023-07-01 | 2023-04-01 | 2022-12-31 | 2022-10-01 | 2022-07-02 | 2022-04-02 | 2021-12-31 | 2021-10-02 | 2021-07-03 | 2021-04-03 | 2020-12-31 | 2020-09-26 | 2020-06-27 | 2020-03-28 | 2019-12-31 | 2019-09-28 | 2019-06-29 | 2019-03-30 | 2018-12-31 | 2018-09-29 | 2018-06-30 | 2018-03-31 | 2017-12-31 | 2017-09-30 | 2017-07-01 | 2017-04-01 | 2016-12-31 | 2016-10-01 | 2016-07-02 | 2016-04-02 | 2015-12-31 | 2015-09-26 | 2015-06-27 | 2015-03-28 | 2014-12-31 | 2014-09-27 | 2014-06-28 | 2014-03-29 | 2013-12-31 | 2013-09-28 | 2013-06-29 | 2013-03-30 | 2012-12-31 | 2012-09-29 | 2012-06-30 | 2012-03-31 | 2011-12-31 | 2011-10-01 | 2011-07-02 | 2011-04-02 | 2010-12-31 | 2010-10-02 | 2010-07-03 | 2010-04-03 | ||
|---|---|---|---|---|---|---|---|---|---|---|---|---|---|---|---|---|---|---|---|---|---|---|---|---|---|---|---|---|---|---|---|---|---|---|---|---|---|---|---|---|---|---|---|---|---|---|---|---|---|---|---|---|---|---|---|---|---|
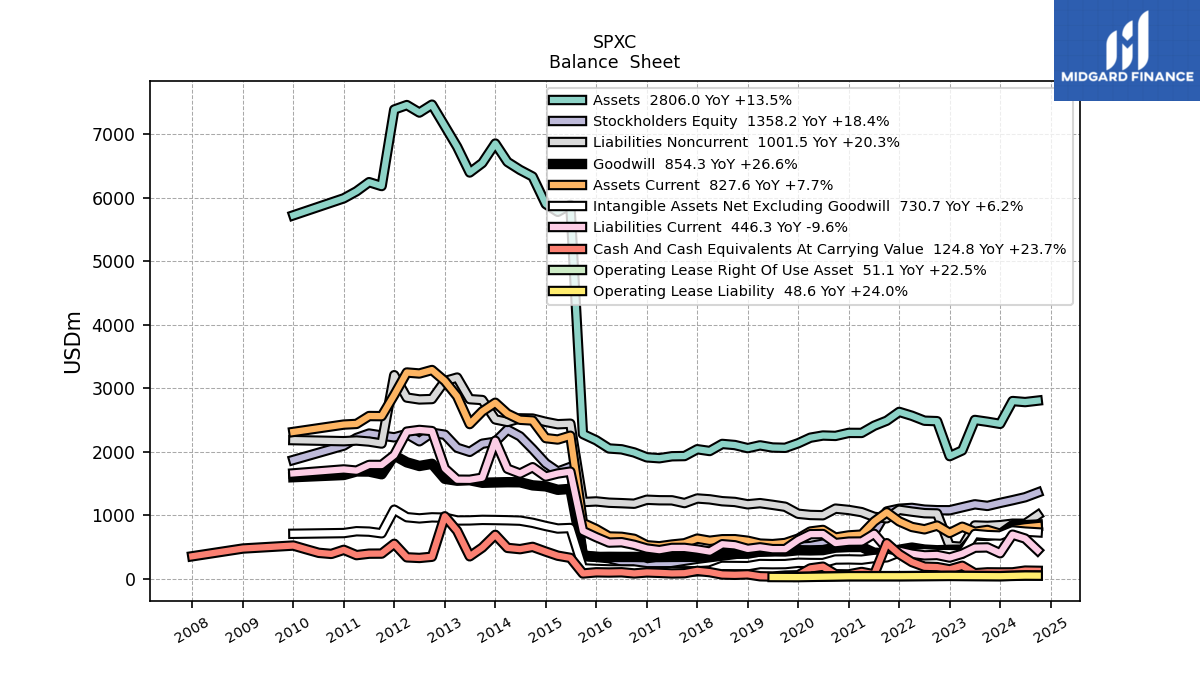
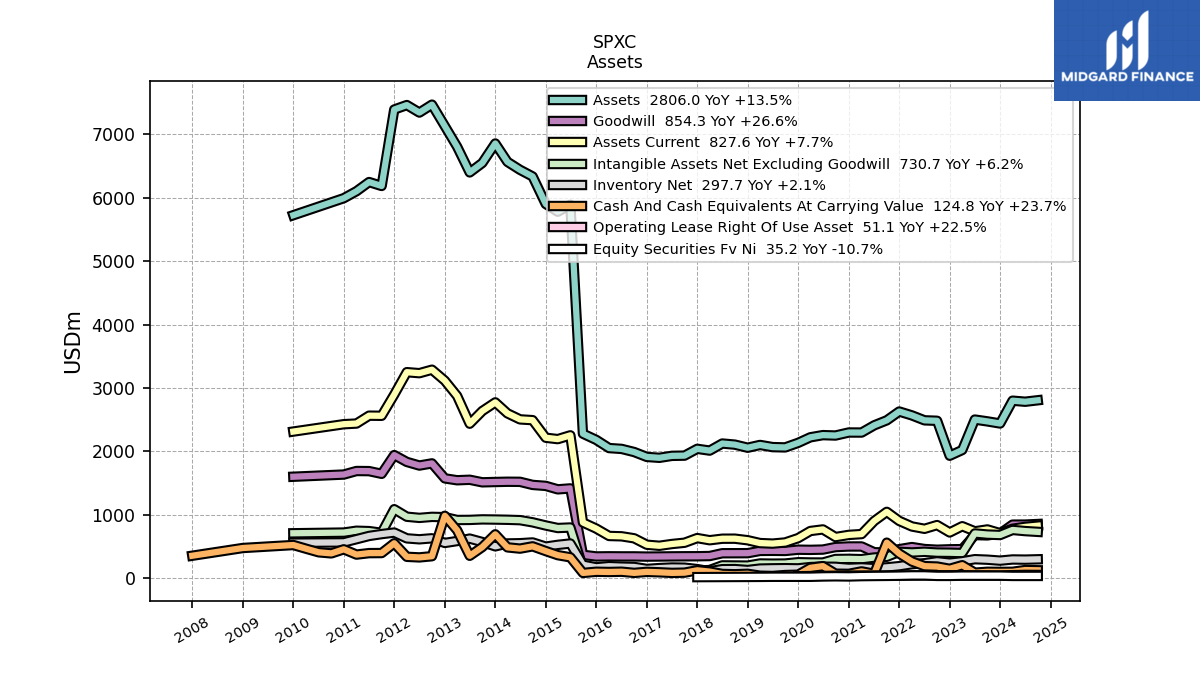
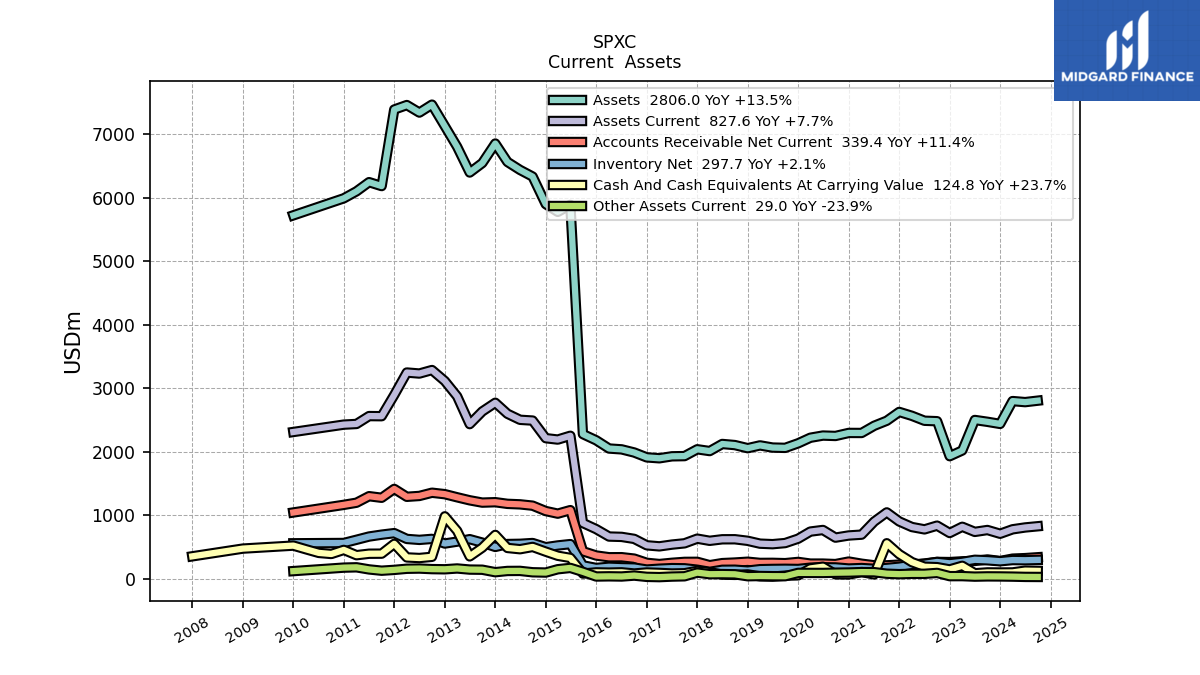
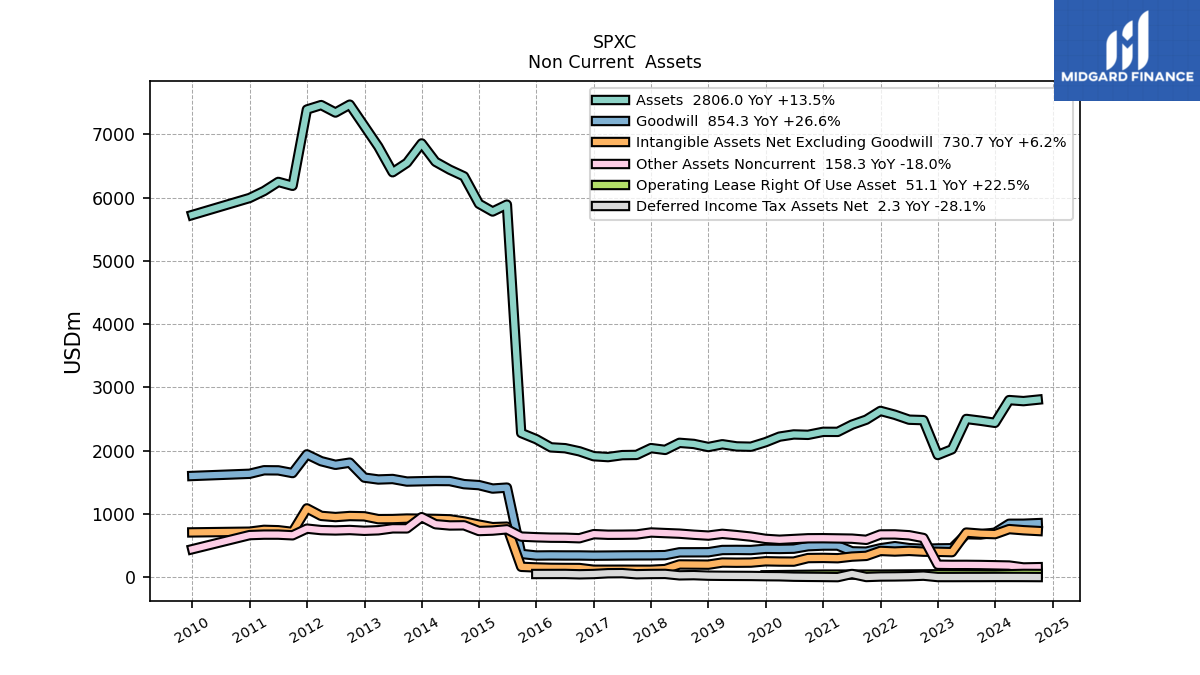
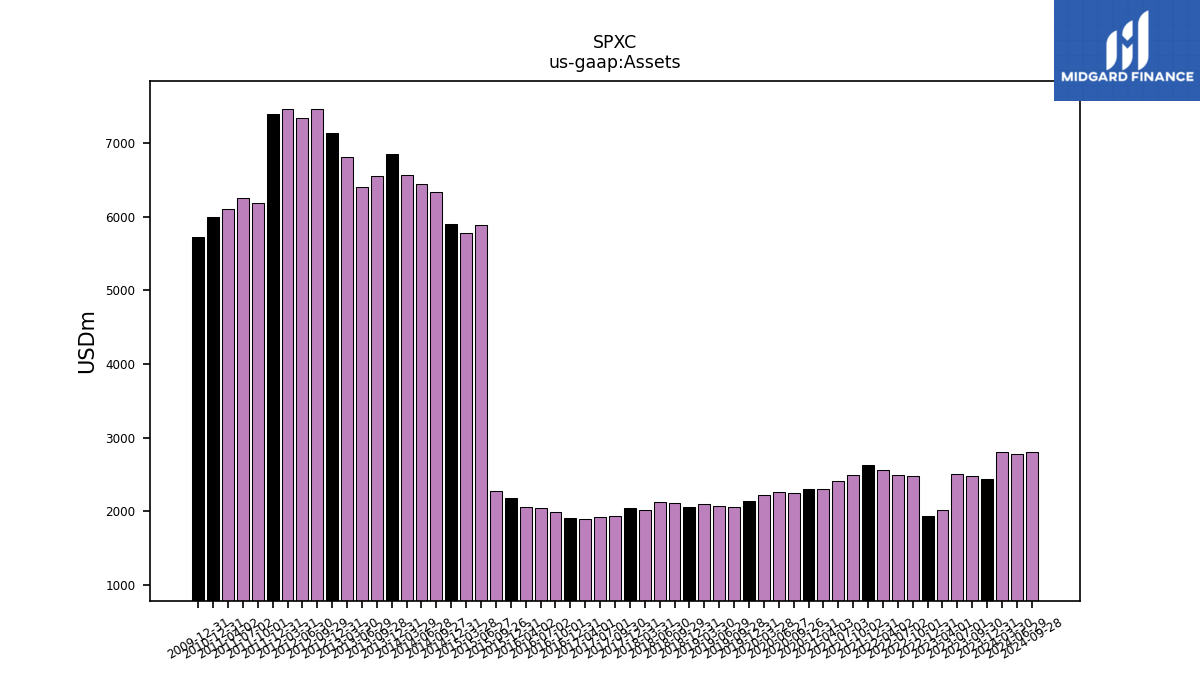
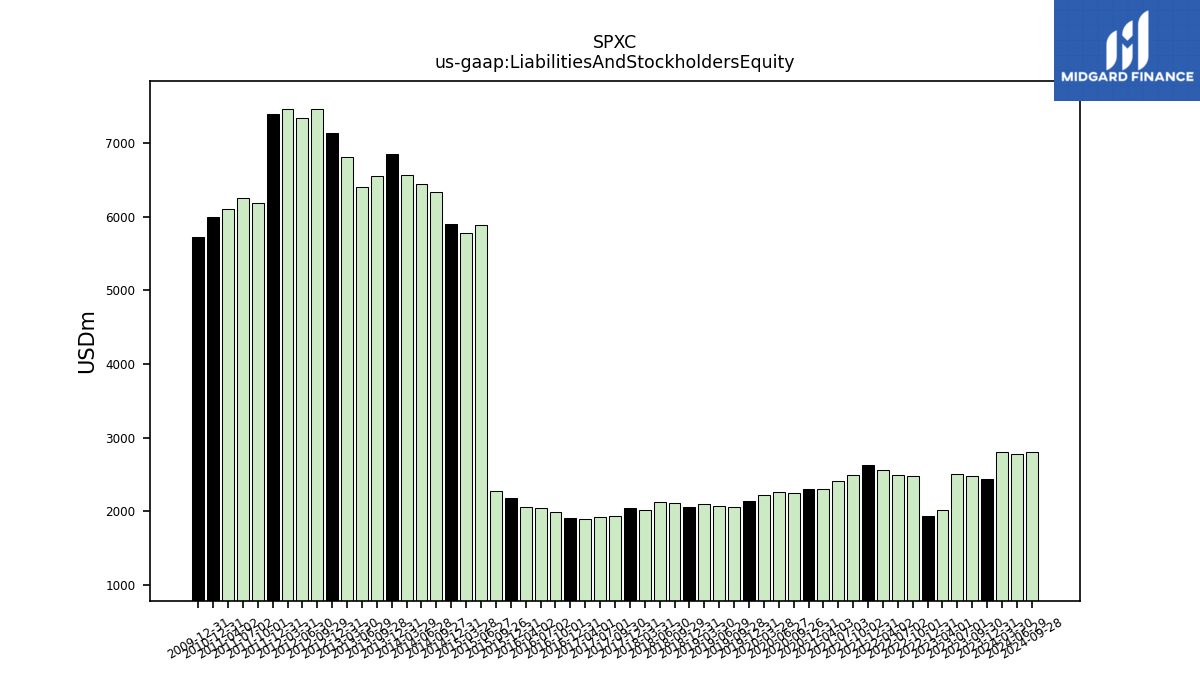
| Assets | 2439.70 | 2473.00 | 2501.60 | 2021.40 | 1930.90 | 2482.50 | 2489.60 | 2567.20 | 2628.60 | 2489.80 | 2410.50 | 2297.00 | 2297.70 | 2250.00 | 2256.40 | 2221.90 | 2134.50 | 2062.40 | 2067.30 | 2101.40 | 2057.50 | 2106.40 | 2123.80 | 2012.10 | 2040.40 | 1932.80 | 1929.40 | 1898.40 | 1912.50 | 1989.50 | 2038.90 | 2052.20 | 2181.30 | 2278.80 | 5889.20 | 5779.80 | 5902.20 | 6335.80 | 6440.50 | 6566.20 | 6856.20 | 6548.90 | 6399.90 | 6804.90 | 7130.10 | 7469.10 | 7343.90 | 7462.20 | 7391.80 | 6185.80 | 6247.80 | 6103.50 | 5993.30 | NA | NA | NA | |
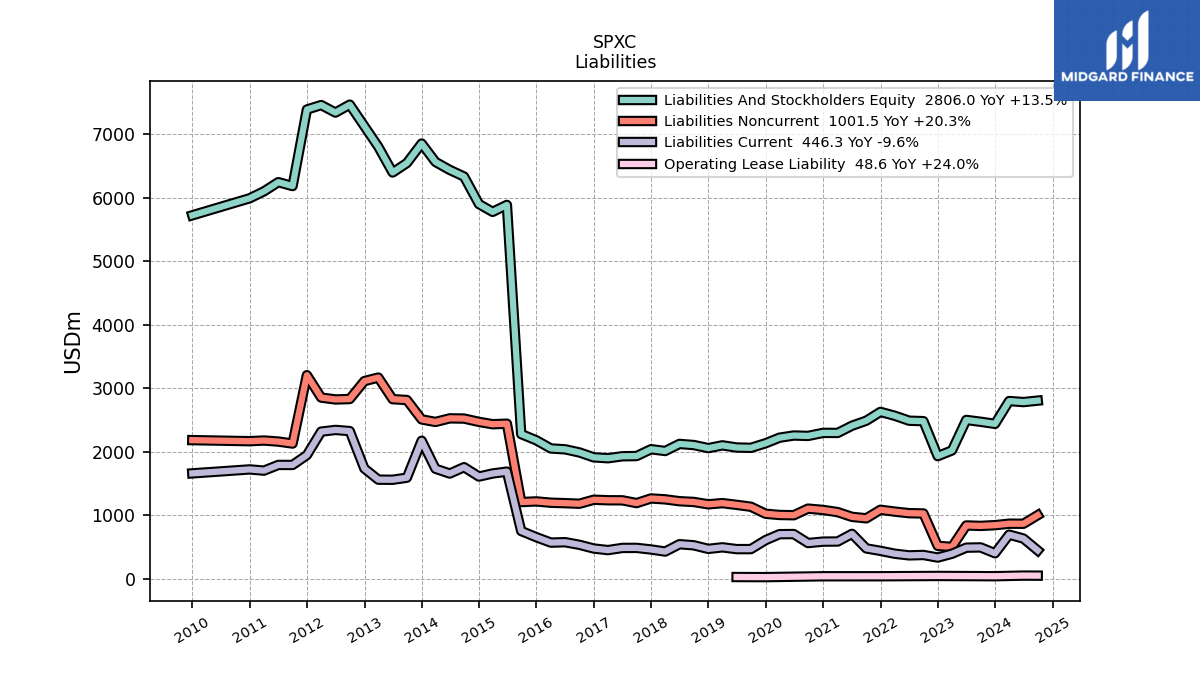
| Liabilities And Stockholders Equity | 2439.70 | 2473.00 | 2501.60 | 2021.40 | 1930.90 | 2482.50 | 2489.60 | 2567.20 | 2628.60 | 2489.80 | 2410.50 | 2297.00 | 2297.70 | 2250.00 | 2256.40 | 2221.90 | 2134.50 | 2062.40 | 2067.30 | 2101.40 | 2057.50 | 2106.40 | 2123.80 | 2012.10 | 2040.40 | 1932.80 | 1929.40 | 1898.40 | 1912.50 | 1989.50 | 2038.90 | 2052.20 | 2181.30 | 2278.80 | 5889.20 | 5779.80 | 5902.20 | 6335.80 | 6440.50 | 6566.20 | 6856.20 | 6548.90 | 6399.90 | 6804.90 | 7130.10 | 7469.10 | 7343.90 | 7462.20 | 7391.80 | 6185.80 | 6247.80 | 6103.50 | 5993.30 | NA | NA | NA | |
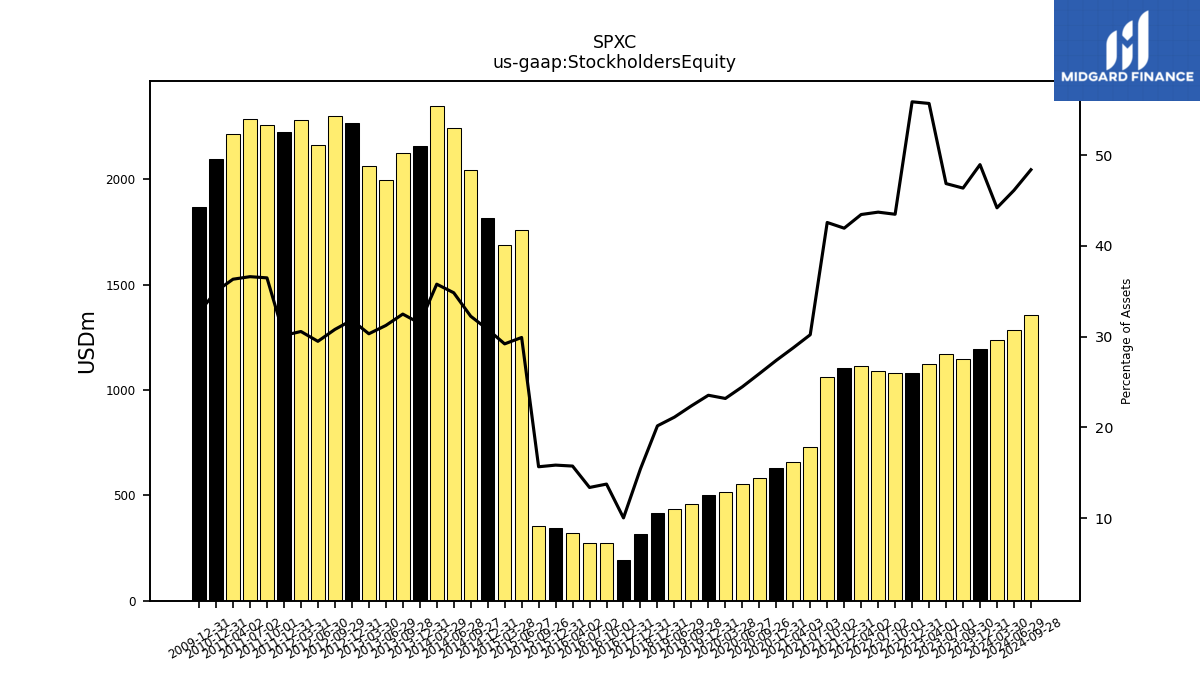
| Stockholders Equity | 1194.60 | 1146.90 | 1172.60 | 1126.10 | 1079.20 | 1079.70 | 1088.60 | 1115.80 | 1102.90 | 1060.30 | 728.20 | 660.80 | 629.20 | 583.10 | 552.10 | 515.10 | 502.40 | 461.30 | 436.70 | NA | 414.90 | NA | NA | NA | 314.70 | NA | NA | NA | 191.60 | 273.40 | 272.60 | 322.80 | 345.40 | 356.70 | 1761.30 | 1687.80 | 1817.90 | 2043.30 | 2243.80 | 2349.60 | 2158.00 | 2127.40 | 1998.70 | 2062.90 | 2268.70 | 2300.00 | 2165.20 | 2280.90 | 2227.30 | 2256.60 | 2287.40 | 2217.50 | 2097.70 | NA | NA | NA |
| 2023-12-31 | 2023-09-30 | 2023-07-01 | 2023-04-01 | 2022-12-31 | 2022-10-01 | 2022-07-02 | 2022-04-02 | 2021-12-31 | 2021-10-02 | 2021-07-03 | 2021-04-03 | 2020-12-31 | 2020-09-26 | 2020-06-27 | 2020-03-28 | 2019-12-31 | 2019-09-28 | 2019-06-29 | 2019-03-30 | 2018-12-31 | 2018-09-29 | 2018-06-30 | 2018-03-31 | 2017-12-31 | 2017-09-30 | 2017-07-01 | 2017-04-01 | 2016-12-31 | 2016-10-01 | 2016-07-02 | 2016-04-02 | 2015-12-31 | 2015-09-26 | 2015-06-27 | 2015-03-28 | 2014-12-31 | 2014-09-27 | 2014-06-28 | 2014-03-29 | 2013-12-31 | 2013-09-28 | 2013-06-29 | 2013-03-30 | 2012-12-31 | 2012-09-29 | 2012-06-30 | 2012-03-31 | 2011-12-31 | 2011-10-01 | 2011-07-02 | 2011-04-02 | 2010-12-31 | 2010-10-02 | 2010-07-03 | 2010-04-03 | ||
|---|---|---|---|---|---|---|---|---|---|---|---|---|---|---|---|---|---|---|---|---|---|---|---|---|---|---|---|---|---|---|---|---|---|---|---|---|---|---|---|---|---|---|---|---|---|---|---|---|---|---|---|---|---|---|---|---|---|
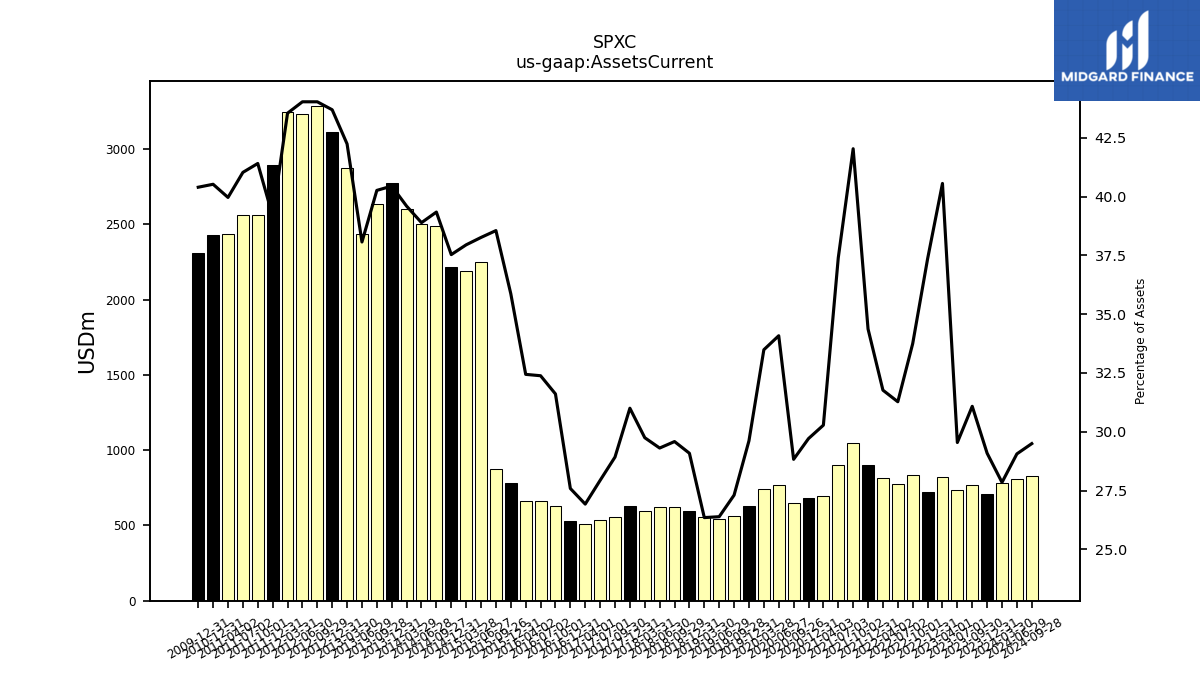
| Assets Current | 709.60 | 768.60 | 739.00 | 819.80 | 721.10 | 837.70 | 778.60 | 815.50 | 903.40 | 1046.50 | 901.40 | 695.50 | 682.60 | 648.60 | 769.00 | 744.00 | 632.10 | 563.10 | 545.50 | 553.70 | 598.40 | 623.10 | 622.40 | 598.50 | 632.50 | 559.00 | 538.90 | 511.10 | 527.60 | 628.80 | 660.20 | 665.70 | 782.30 | 878.50 | 2253.20 | 2193.20 | 2215.10 | 2492.40 | 2504.60 | 2599.60 | 2772.90 | 2636.60 | 2436.20 | 2874.10 | 3115.00 | 3288.40 | 3233.30 | 3249.20 | 2895.30 | 2561.20 | 2563.20 | 2439.00 | 2428.50 | NA | NA | NA | |
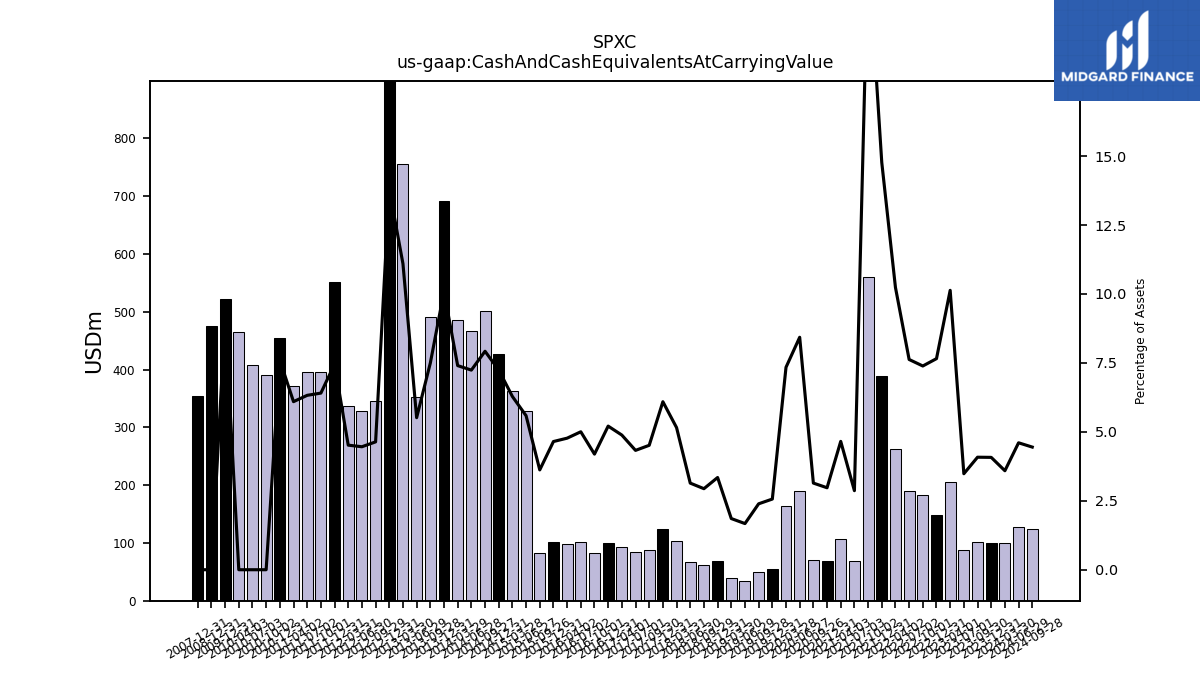
| Cash And Cash Equivalents At Carrying Value | 99.40 | 100.90 | 87.10 | 204.80 | 147.80 | 183.40 | 189.80 | 262.80 | 388.20 | 560.10 | 69.10 | 106.90 | 68.30 | 70.70 | 190.20 | 163.10 | 54.70 | 49.30 | 34.60 | 39.00 | 68.80 | 61.90 | 66.70 | 103.70 | 124.30 | 87.20 | 83.50 | 92.70 | 99.60 | 83.40 | 102.00 | 97.90 | 101.40 | 82.50 | 328.90 | 363.10 | 427.60 | 501.90 | 466.20 | 486.00 | 691.80 | 490.70 | 352.90 | 755.10 | 984.10 | 346.30 | 327.50 | 337.10 | 551.00 | 396.20 | 395.10 | 372.00 | 455.40 | 391.00 | 408.10 | 464.10 | |
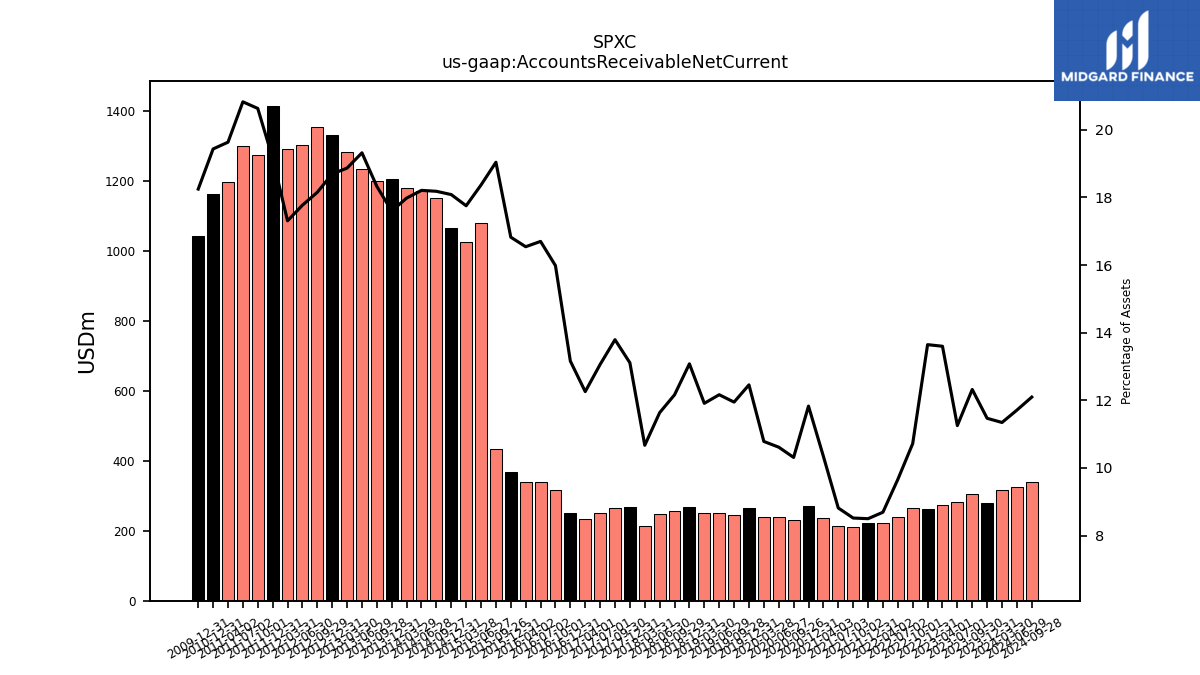
| Accounts Receivable Net Current | 279.80 | 304.70 | 281.50 | 274.90 | 263.50 | 266.10 | 240.50 | 223.10 | 223.40 | 212.10 | 212.50 | 237.60 | 271.80 | 232.00 | 239.50 | 239.60 | 265.90 | 246.40 | 251.50 | 250.30 | 269.10 | 256.20 | 247.10 | 214.70 | 267.50 | 266.60 | 252.00 | 232.70 | 251.70 | 318.00 | 340.50 | 339.50 | 367.00 | 433.90 | 1081.80 | 1026.20 | 1067.40 | 1152.00 | 1172.80 | 1180.70 | 1206.70 | 1200.20 | 1236.50 | 1284.00 | 1333.00 | 1355.90 | 1305.10 | 1291.70 | 1416.30 | 1276.30 | 1301.30 | 1198.40 | 1164.80 | NA | NA | NA | |
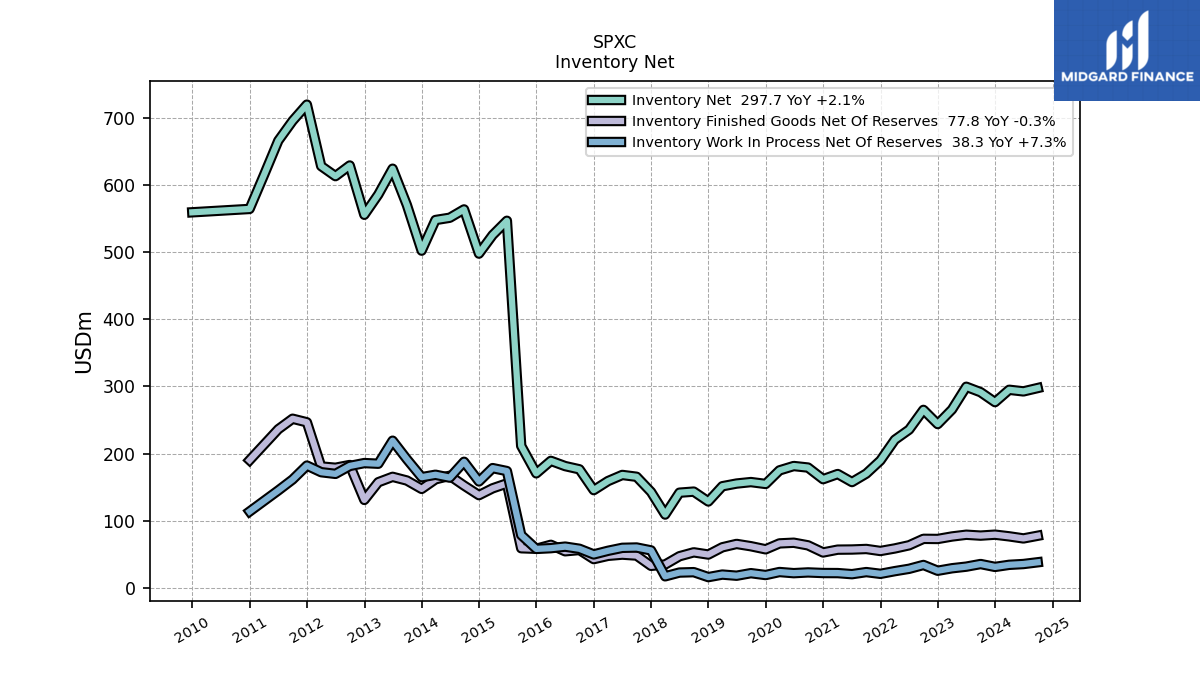
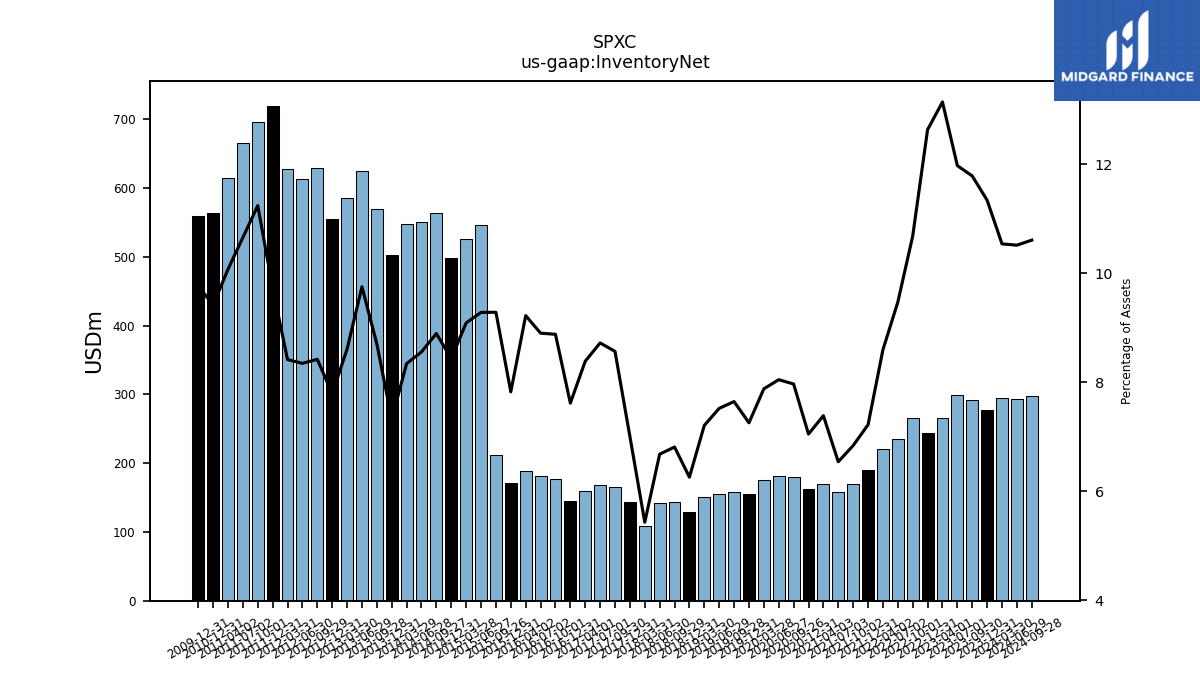
| Inventory Net | 276.70 | 291.50 | 299.60 | 265.70 | 244.00 | 265.20 | 235.80 | 220.70 | 189.80 | 170.30 | 157.70 | 169.70 | 162.00 | 179.30 | 181.60 | 175.10 | 154.90 | 157.70 | 155.50 | 151.50 | 128.80 | 143.50 | 141.90 | 109.30 | 143.00 | 165.60 | 168.30 | 159.20 | 145.70 | 176.70 | 181.50 | 189.30 | 170.70 | 211.60 | 546.70 | 525.40 | 497.80 | 563.60 | 551.20 | 547.80 | 502.20 | 570.10 | 624.20 | 585.80 | 555.60 | 629.00 | 613.10 | 628.10 | 719.60 | 695.40 | 665.90 | 614.90 | 564.30 | NA | NA | NA | |
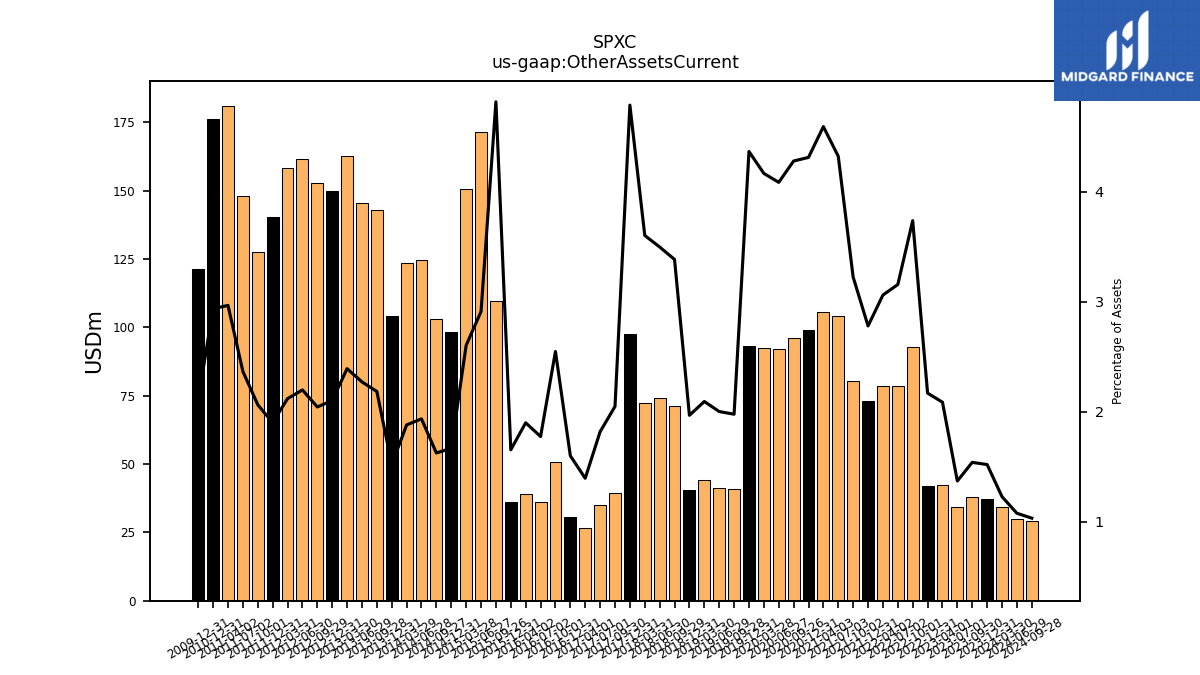
| Other Assets Current | 37.10 | 38.10 | 34.30 | 42.20 | 41.90 | 92.80 | 78.60 | 78.60 | 73.10 | 80.30 | 104.20 | 105.50 | 99.10 | 96.30 | 92.20 | 92.60 | 93.20 | 40.80 | 41.40 | 44.00 | 40.50 | 71.30 | 74.30 | 72.50 | 97.70 | 39.60 | 35.10 | 26.50 | 30.60 | 50.70 | 36.20 | 39.00 | 36.10 | 109.80 | 171.50 | 150.50 | 98.50 | 103.00 | 124.70 | 123.50 | 104.30 | 143.10 | 145.40 | 162.80 | 149.90 | 152.70 | 161.50 | 158.20 | 140.50 | 127.70 | 147.90 | 181.10 | 176.10 | NA | NA | NA | |
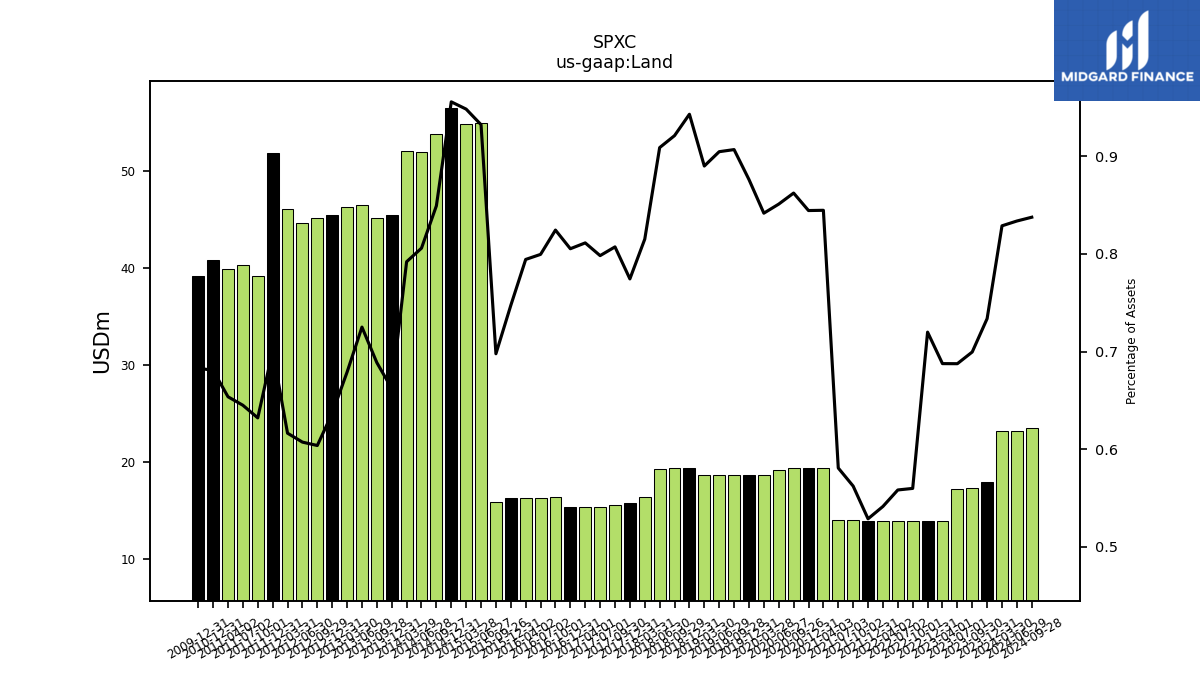
| Land | 17.90 | 17.30 | 17.20 | 13.90 | 13.90 | 13.90 | 13.90 | 13.90 | 13.90 | 14.00 | 14.00 | 19.40 | 19.40 | 19.40 | 19.20 | 18.70 | 18.70 | 18.70 | 18.70 | 18.70 | 19.40 | 19.40 | 19.30 | 16.40 | 15.80 | 15.60 | 15.40 | 15.40 | 15.40 | 16.40 | 16.30 | 16.30 | 16.30 | 15.90 | 54.90 | 54.80 | 56.40 | 53.80 | 51.90 | 52.00 | 45.40 | 45.10 | 46.40 | 46.20 | 45.40 | 45.10 | 44.60 | 46.00 | 51.80 | 39.10 | 40.30 | 39.90 | 40.80 | NA | NA | NA | |
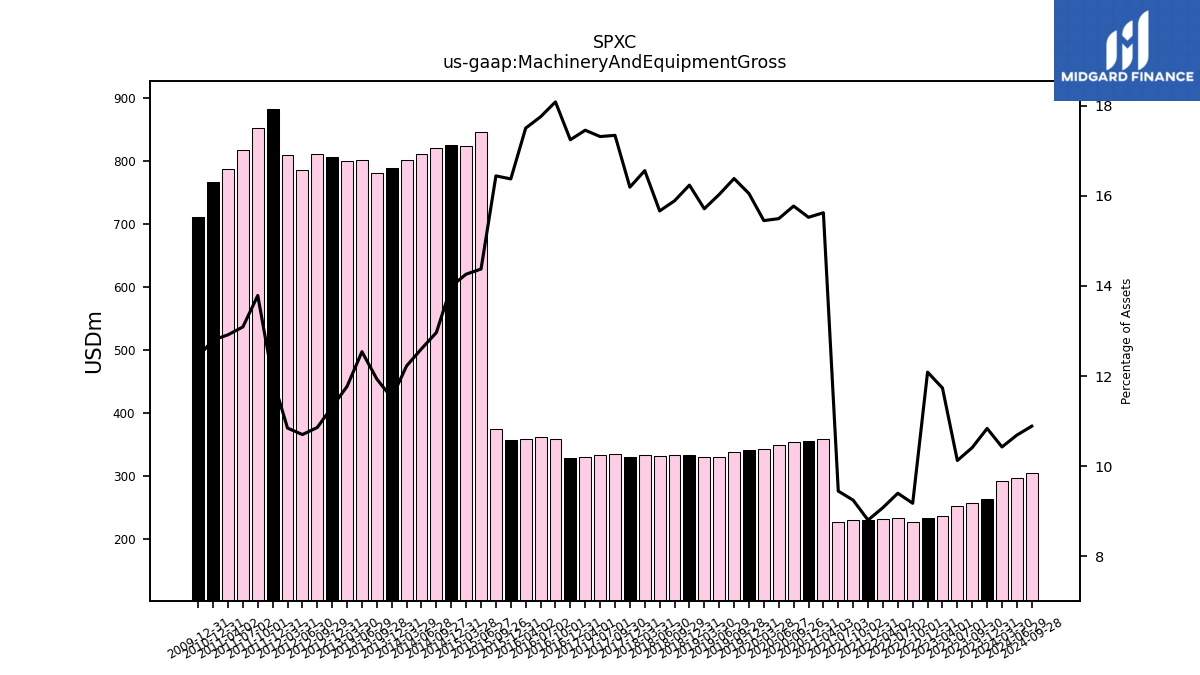
| Machinery And Equipment Gross | 264.40 | 257.50 | 253.30 | 237.20 | 233.40 | 227.80 | 234.00 | 233.10 | 231.40 | 230.20 | 227.70 | 358.90 | 356.70 | 354.90 | 349.60 | 343.30 | 342.60 | 337.90 | 331.40 | 330.20 | 334.10 | 334.70 | 332.70 | 333.20 | 330.40 | 335.20 | 334.10 | 331.40 | 329.80 | 359.80 | 362.00 | 359.20 | 357.20 | 374.70 | 846.60 | 824.30 | 825.90 | 821.50 | 811.90 | 802.70 | 789.70 | 781.50 | 802.60 | 801.00 | 806.90 | 811.10 | 785.90 | 809.30 | 883.20 | 852.90 | 817.90 | 788.30 | 767.10 | NA | NA | NA | |
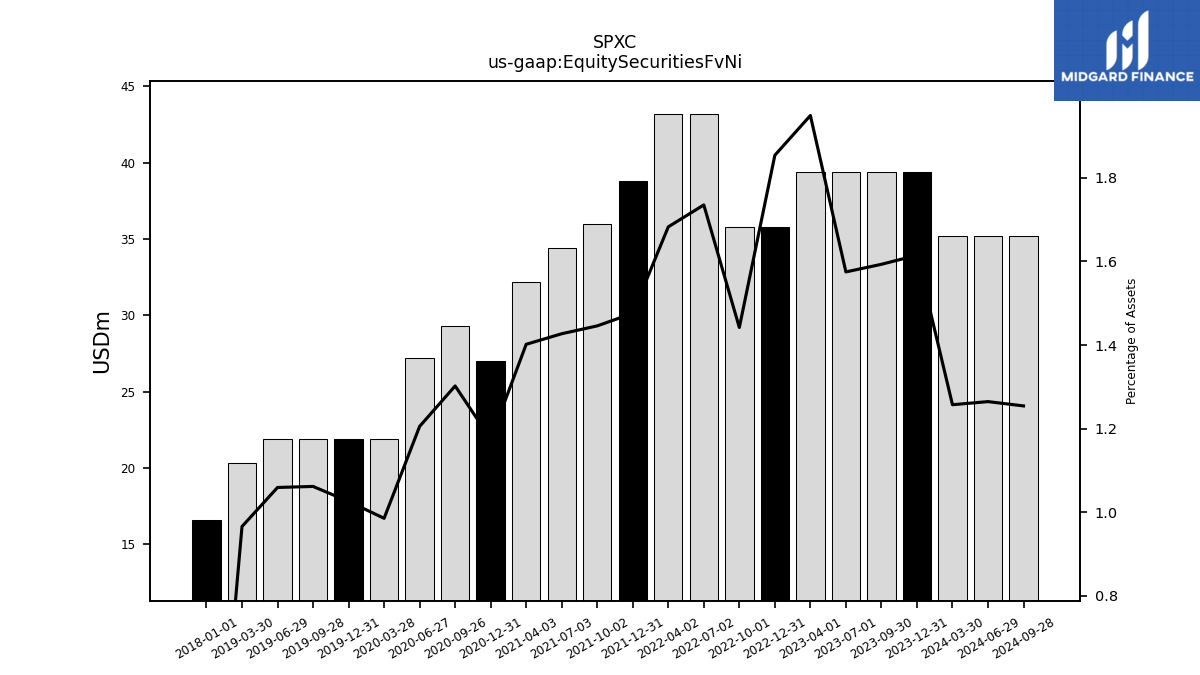
| Equity Securities Fv Ni | 39.40 | 39.40 | 39.40 | 39.40 | 35.80 | 35.80 | 43.20 | 43.20 | 38.80 | 36.00 | 34.40 | 32.20 | 27.00 | 29.30 | 27.20 | 21.90 | 21.90 | 21.90 | 21.90 | 20.30 | NA | NA | NA | NA | NA | NA | NA | NA | NA | NA | NA | NA | NA | NA | NA | NA | NA | NA | NA | NA | NA | NA | NA | NA | NA | NA | NA | NA | NA | NA | NA | NA | NA | NA | NA | NA |
| 2023-12-31 | 2023-09-30 | 2023-07-01 | 2023-04-01 | 2022-12-31 | 2022-10-01 | 2022-07-02 | 2022-04-02 | 2021-12-31 | 2021-10-02 | 2021-07-03 | 2021-04-03 | 2020-12-31 | 2020-09-26 | 2020-06-27 | 2020-03-28 | 2019-12-31 | 2019-09-28 | 2019-06-29 | 2019-03-30 | 2018-12-31 | 2018-09-29 | 2018-06-30 | 2018-03-31 | 2017-12-31 | 2017-09-30 | 2017-07-01 | 2017-04-01 | 2016-12-31 | 2016-10-01 | 2016-07-02 | 2016-04-02 | 2015-12-31 | 2015-09-26 | 2015-06-27 | 2015-03-28 | 2014-12-31 | 2014-09-27 | 2014-06-28 | 2014-03-29 | 2013-12-31 | 2013-09-28 | 2013-06-29 | 2013-03-30 | 2012-12-31 | 2012-09-29 | 2012-06-30 | 2012-03-31 | 2011-12-31 | 2011-10-01 | 2011-07-02 | 2011-04-02 | 2010-12-31 | 2010-10-02 | 2010-07-03 | 2010-04-03 | ||
|---|---|---|---|---|---|---|---|---|---|---|---|---|---|---|---|---|---|---|---|---|---|---|---|---|---|---|---|---|---|---|---|---|---|---|---|---|---|---|---|---|---|---|---|---|---|---|---|---|---|---|---|---|---|---|---|---|---|
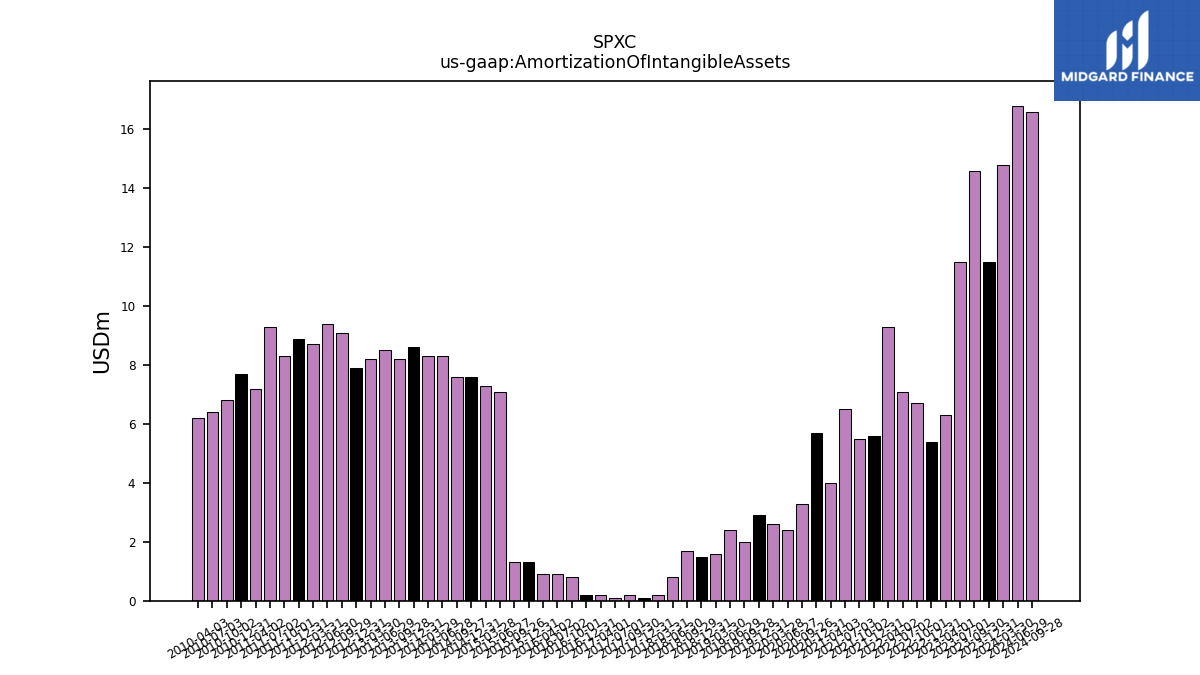
| Amortization Of Intangible Assets | 11.50 | 14.60 | 11.50 | 6.30 | 5.40 | 6.70 | 7.10 | 9.30 | 5.60 | 5.50 | 6.50 | 4.00 | 5.70 | 3.30 | 2.40 | 2.60 | 2.90 | 2.00 | 2.40 | 1.60 | 1.50 | 1.70 | 0.80 | 0.20 | 0.10 | 0.20 | 0.10 | 0.20 | 0.20 | 0.80 | 0.90 | 0.90 | 1.30 | 1.30 | 7.10 | 7.30 | 7.60 | 7.60 | 8.30 | 8.30 | 8.60 | 8.20 | 8.50 | 8.20 | 7.90 | 9.10 | 9.40 | 8.70 | 8.90 | 8.30 | 9.30 | 7.20 | 7.70 | 6.80 | 6.40 | 6.20 | |
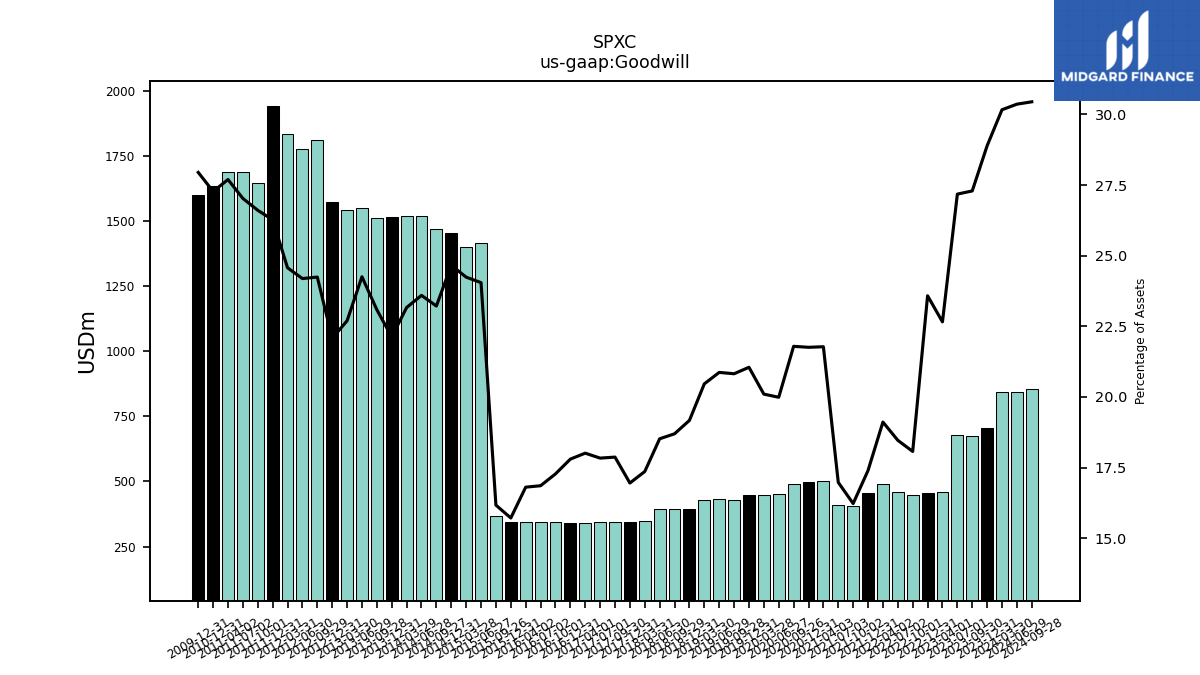
| Goodwill | 704.80 | 674.90 | 679.90 | 458.00 | 455.30 | 448.60 | 459.70 | 490.60 | 457.30 | 404.00 | 409.20 | 500.20 | 499.90 | 490.30 | 451.00 | 446.60 | 449.30 | 429.40 | 431.40 | 430.00 | 394.40 | 393.80 | 393.30 | 349.30 | 345.90 | 345.40 | 344.10 | 341.90 | 340.40 | 343.70 | 343.70 | 344.90 | 342.80 | 368.50 | 1416.10 | 1401.00 | 1455.40 | 1471.00 | 1519.60 | 1521.00 | 1517.00 | 1511.90 | 1552.20 | 1544.40 | 1574.00 | 1810.70 | 1776.40 | 1833.50 | 1941.80 | 1645.80 | 1688.50 | 1690.30 | 1634.60 | NA | NA | NA | |
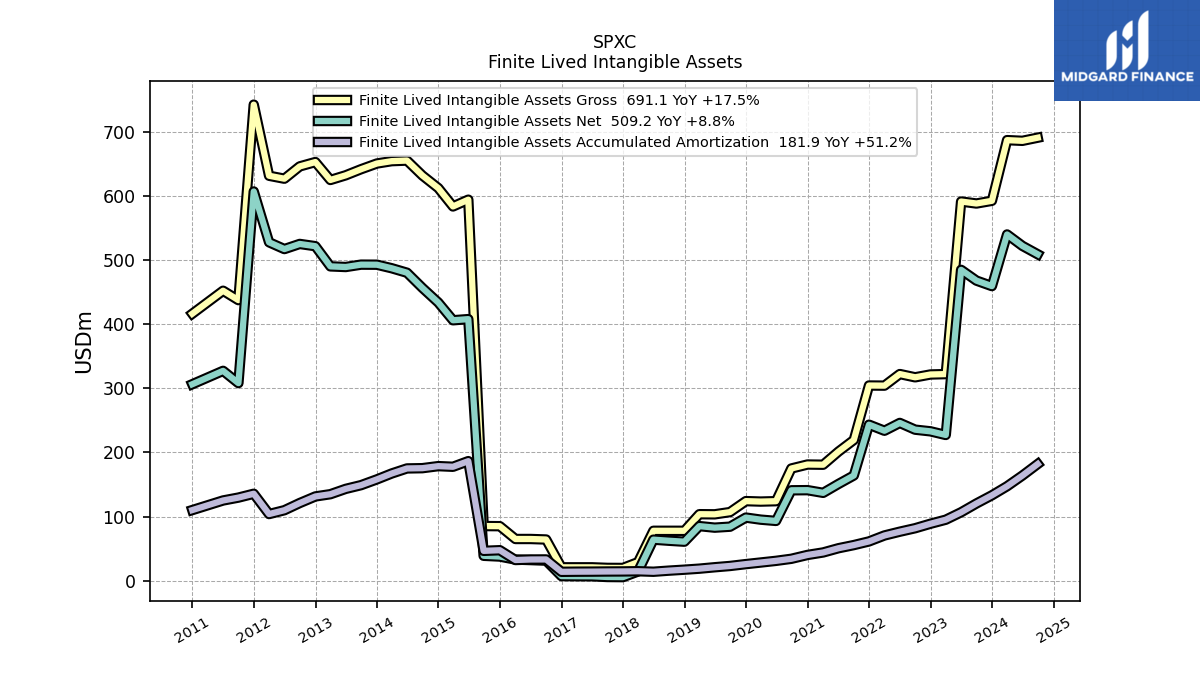
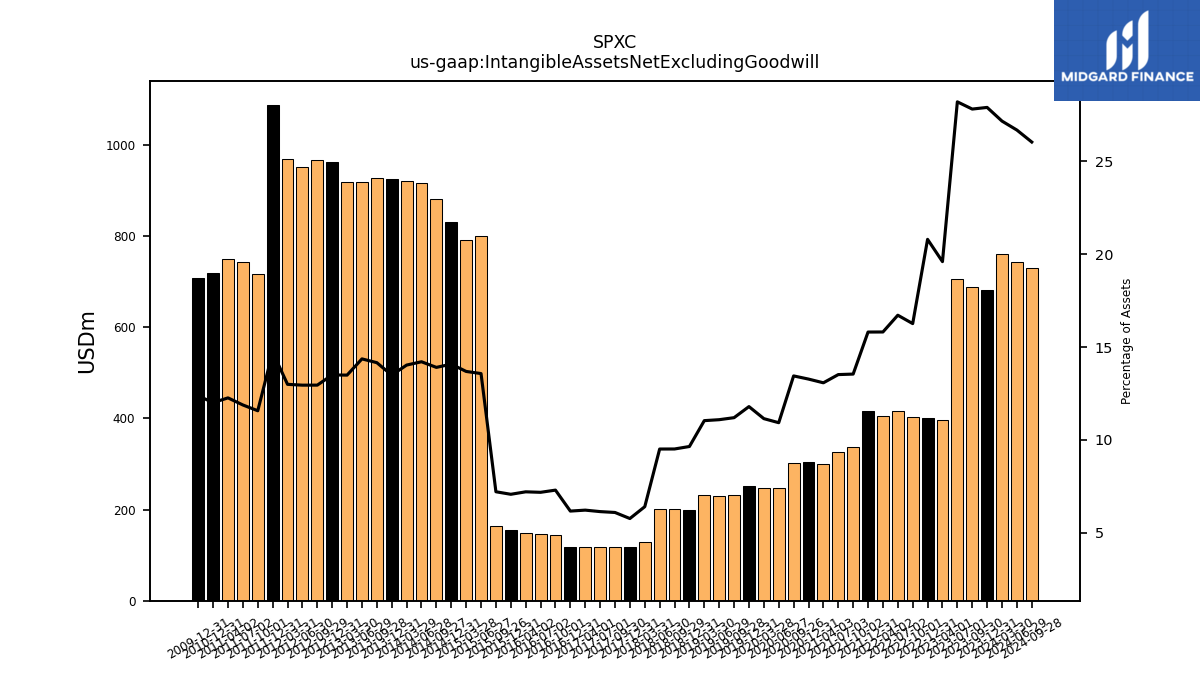
| Intangible Assets Net Excluding Goodwill | 680.80 | 687.90 | 705.60 | 396.20 | 401.60 | 403.70 | 416.10 | 405.90 | 415.50 | 337.20 | 325.80 | 300.30 | 305.00 | 302.50 | 246.50 | 247.60 | 251.70 | 230.90 | 229.20 | 231.90 | 198.40 | 200.30 | 201.90 | 128.80 | 117.60 | 117.70 | 118.40 | 118.00 | 117.90 | 145.10 | 146.30 | 147.80 | 154.20 | 164.20 | 799.20 | 791.00 | 831.00 | 880.90 | 915.00 | 921.10 | 924.70 | 927.20 | 919.10 | 917.80 | 962.40 | 967.10 | 950.80 | 969.40 | 1088.20 | 715.60 | 742.20 | 748.40 | 719.50 | NA | NA | NA | |
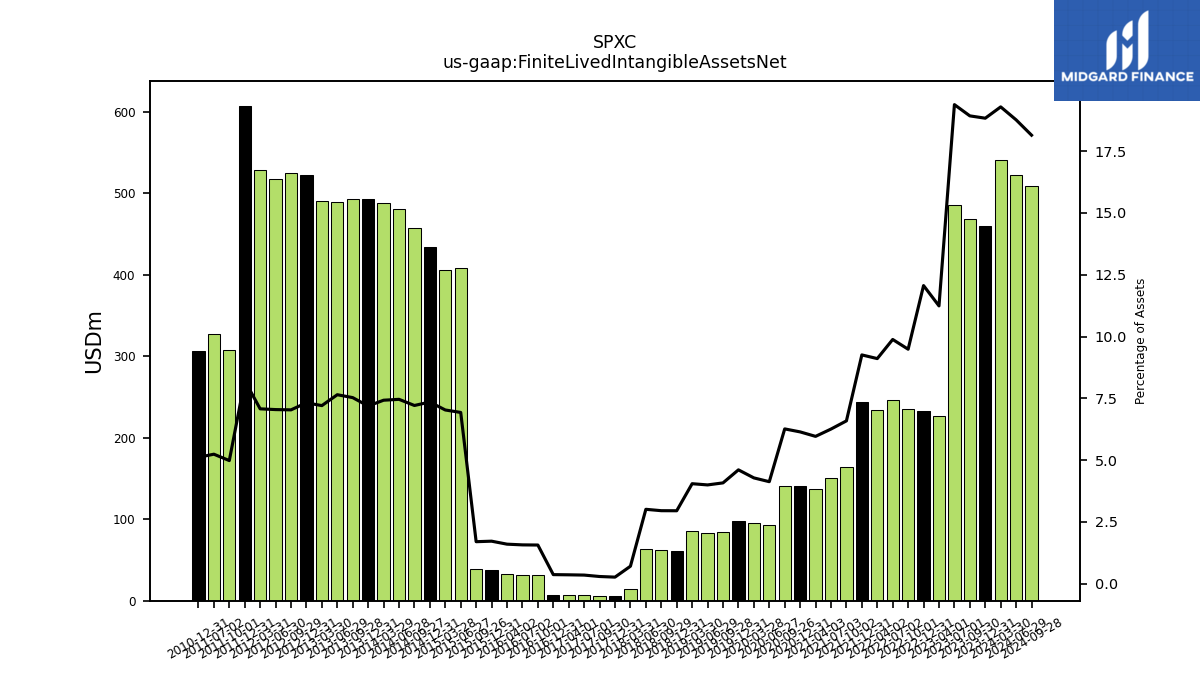
| Finite Lived Intangible Assets Net | 459.50 | 468.10 | 484.90 | 227.20 | 232.90 | 235.50 | 246.00 | 233.80 | 243.30 | 164.00 | 150.80 | 136.90 | 141.10 | 140.90 | 93.10 | 95.10 | 98.30 | 84.10 | 82.60 | 85.00 | 60.70 | 62.20 | 63.90 | 14.20 | 5.40 | 5.60 | 6.70 | 6.80 | 7.00 | 31.10 | 32.00 | 32.80 | 37.50 | 38.70 | 408.00 | 406.20 | 433.80 | 456.80 | 480.40 | 487.40 | 492.90 | 493.00 | 489.30 | 490.30 | 521.80 | 525.30 | 517.30 | 527.90 | 607.20 | 308.10 | 327.30 | NA | 306.40 | NA | NA | NA | |
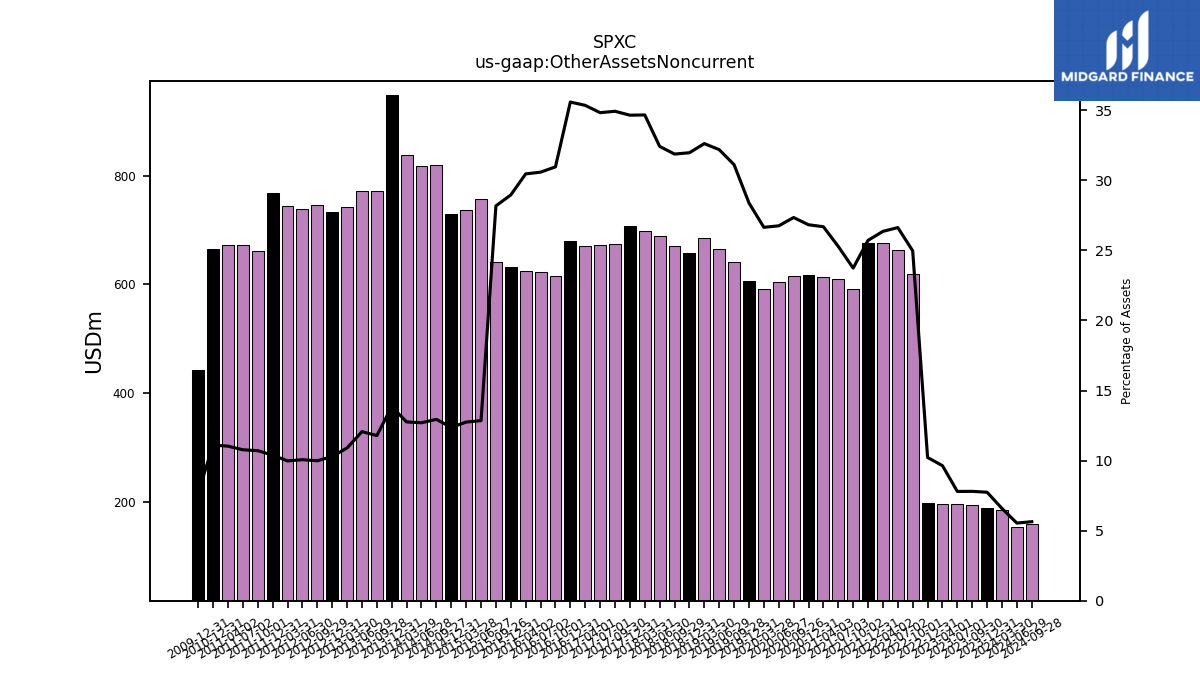
| Other Assets Noncurrent | 188.90 | 193.00 | 195.10 | 194.80 | 197.40 | 619.80 | 662.90 | 676.60 | 675.90 | 590.90 | 609.40 | 613.00 | 616.40 | 615.20 | 603.60 | 592.00 | 605.90 | 641.70 | 665.40 | 685.40 | 657.70 | 671.30 | 688.50 | 697.40 | 706.90 | 675.00 | 671.90 | 671.00 | 680.50 | 615.90 | 623.50 | 625.00 | 631.60 | 642.00 | 756.90 | 736.90 | 729.80 | 820.10 | 817.90 | 837.80 | 949.30 | 771.70 | 772.20 | 741.80 | 733.70 | 746.00 | 739.10 | 744.50 | 767.80 | 662.30 | 673.00 | 673.20 | 665.50 | NA | NA | NA | |
| Equity Securities Fv Ni | 39.40 | 39.40 | 39.40 | 39.40 | 35.80 | 35.80 | 43.20 | 43.20 | 38.80 | 36.00 | 34.40 | 32.20 | 27.00 | 29.30 | 27.20 | 21.90 | 21.90 | 21.90 | 21.90 | 20.30 | NA | NA | NA | NA | NA | NA | NA | NA | NA | NA | NA | NA | NA | NA | NA | NA | NA | NA | NA | NA | NA | NA | NA | NA | NA | NA | NA | NA | NA | NA | NA | NA | NA | NA | NA | NA |
| 2023-12-31 | 2023-09-30 | 2023-07-01 | 2023-04-01 | 2022-12-31 | 2022-10-01 | 2022-07-02 | 2022-04-02 | 2021-12-31 | 2021-10-02 | 2021-07-03 | 2021-04-03 | 2020-12-31 | 2020-09-26 | 2020-06-27 | 2020-03-28 | 2019-12-31 | 2019-09-28 | 2019-06-29 | 2019-03-30 | 2018-12-31 | 2018-09-29 | 2018-06-30 | 2018-03-31 | 2017-12-31 | 2017-09-30 | 2017-07-01 | 2017-04-01 | 2016-12-31 | 2016-10-01 | 2016-07-02 | 2016-04-02 | 2015-12-31 | 2015-09-26 | 2015-06-27 | 2015-03-28 | 2014-12-31 | 2014-09-27 | 2014-06-28 | 2014-03-29 | 2013-12-31 | 2013-09-28 | 2013-06-29 | 2013-03-30 | 2012-12-31 | 2012-09-29 | 2012-06-30 | 2012-03-31 | 2011-12-31 | 2011-10-01 | 2011-07-02 | 2011-04-02 | 2010-12-31 | 2010-10-02 | 2010-07-03 | 2010-04-03 | ||
|---|---|---|---|---|---|---|---|---|---|---|---|---|---|---|---|---|---|---|---|---|---|---|---|---|---|---|---|---|---|---|---|---|---|---|---|---|---|---|---|---|---|---|---|---|---|---|---|---|---|---|---|---|---|---|---|---|---|
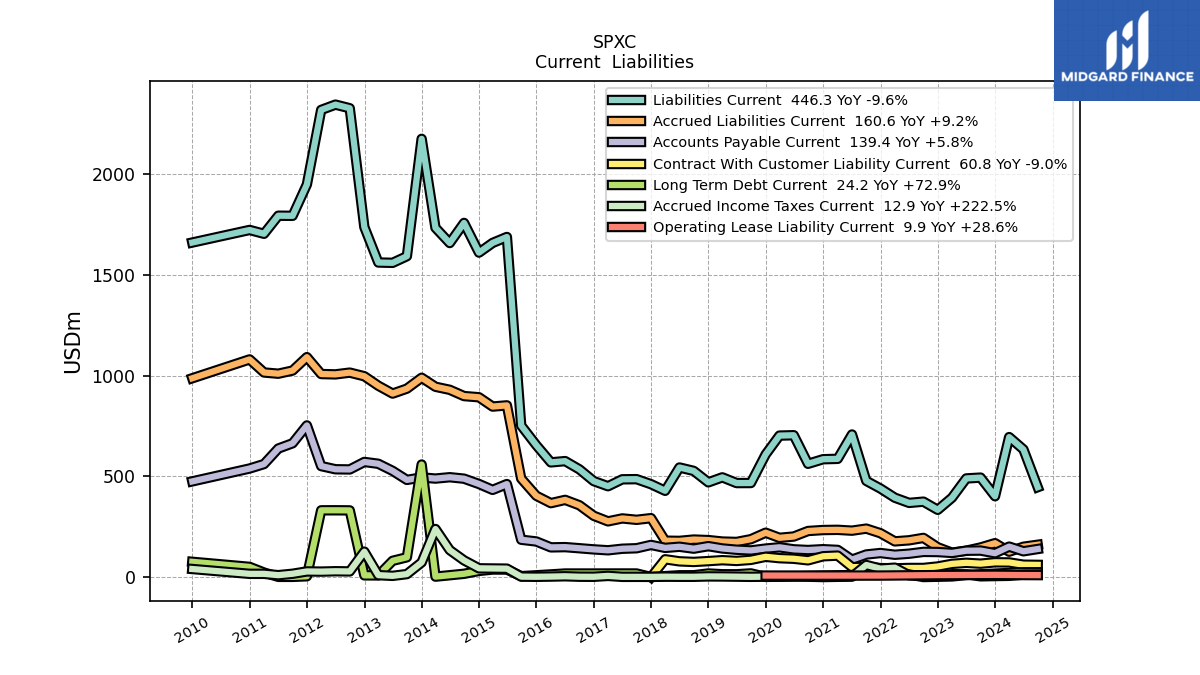
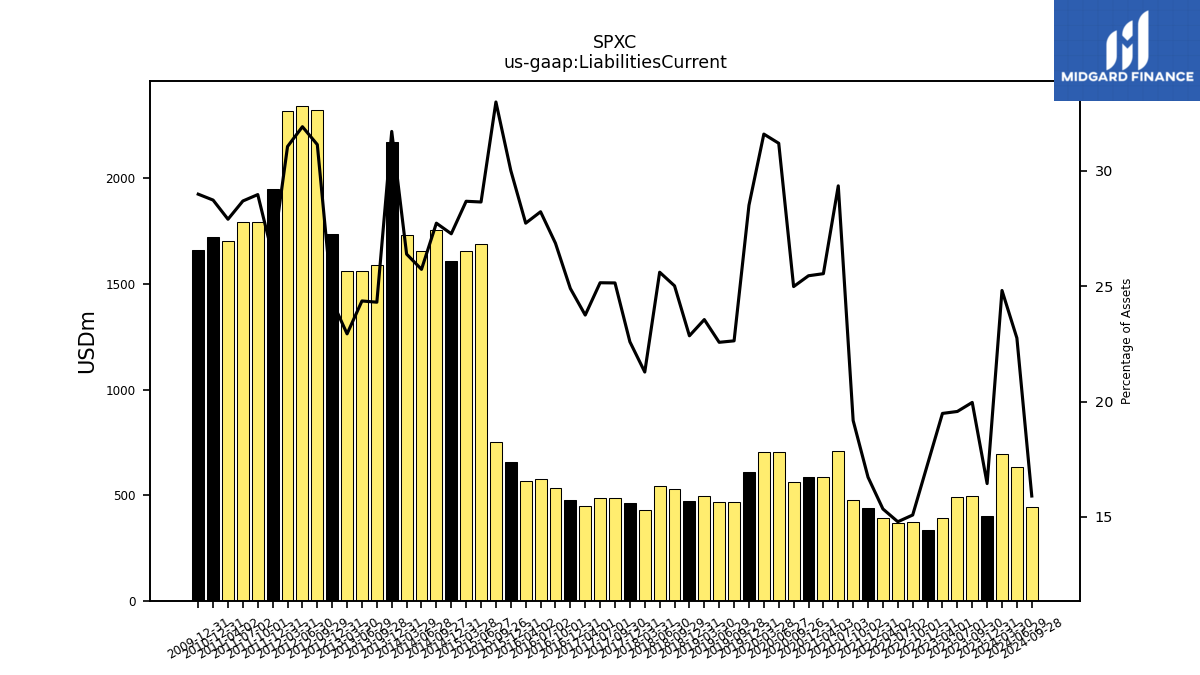
| Liabilities Current | 401.20 | 493.70 | 489.60 | 393.90 | 333.80 | 374.40 | 368.20 | 393.90 | 439.50 | 477.50 | 707.60 | 586.80 | 584.90 | 562.20 | 704.00 | 702.10 | 608.60 | 466.80 | 466.60 | 495.00 | 470.20 | 527.00 | 543.90 | 428.20 | 461.00 | 486.00 | 485.30 | 450.90 | 476.30 | 534.50 | 575.60 | 569.20 | 654.80 | 751.80 | 1687.50 | 1658.00 | 1609.90 | 1757.30 | 1657.40 | 1733.10 | 2174.40 | 1592.00 | 1559.20 | 1560.80 | 1736.60 | 2326.20 | 2344.10 | 2317.80 | 1947.80 | 1792.40 | 1793.00 | 1703.30 | 1722.30 | NA | NA | NA | |
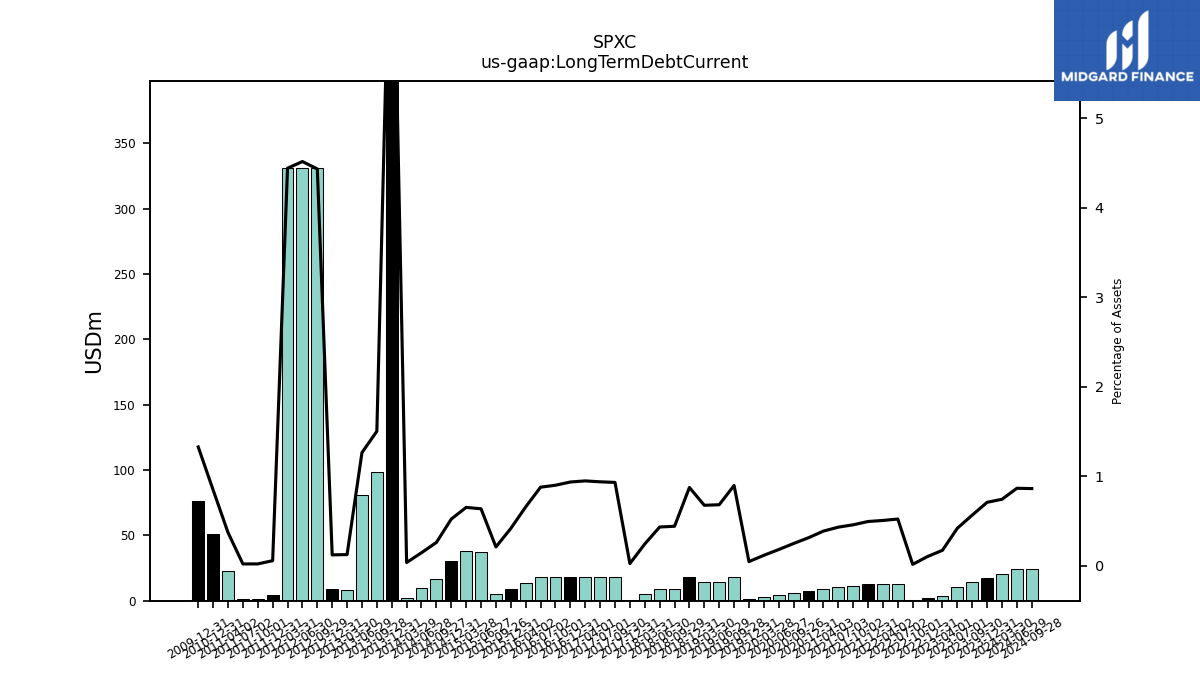
| Long Term Debt Current | 17.30 | 14.00 | 10.50 | 3.50 | 2.00 | 0.40 | 13.00 | 13.00 | 13.00 | 11.40 | 10.40 | 8.90 | 7.20 | 5.60 | 4.10 | 2.60 | 1.00 | 18.50 | 14.10 | 14.20 | 18.00 | 9.30 | 9.20 | 4.90 | 0.50 | 18.00 | 18.10 | 18.00 | 17.90 | 17.90 | 17.90 | 13.50 | 9.10 | 4.80 | 37.50 | 37.70 | 30.80 | 16.50 | 9.40 | 2.40 | 558.70 | 98.40 | 80.90 | 8.50 | 8.70 | 331.10 | 331.60 | 331.40 | 4.20 | 1.30 | 1.30 | 22.70 | 50.80 | NA | NA | NA | |
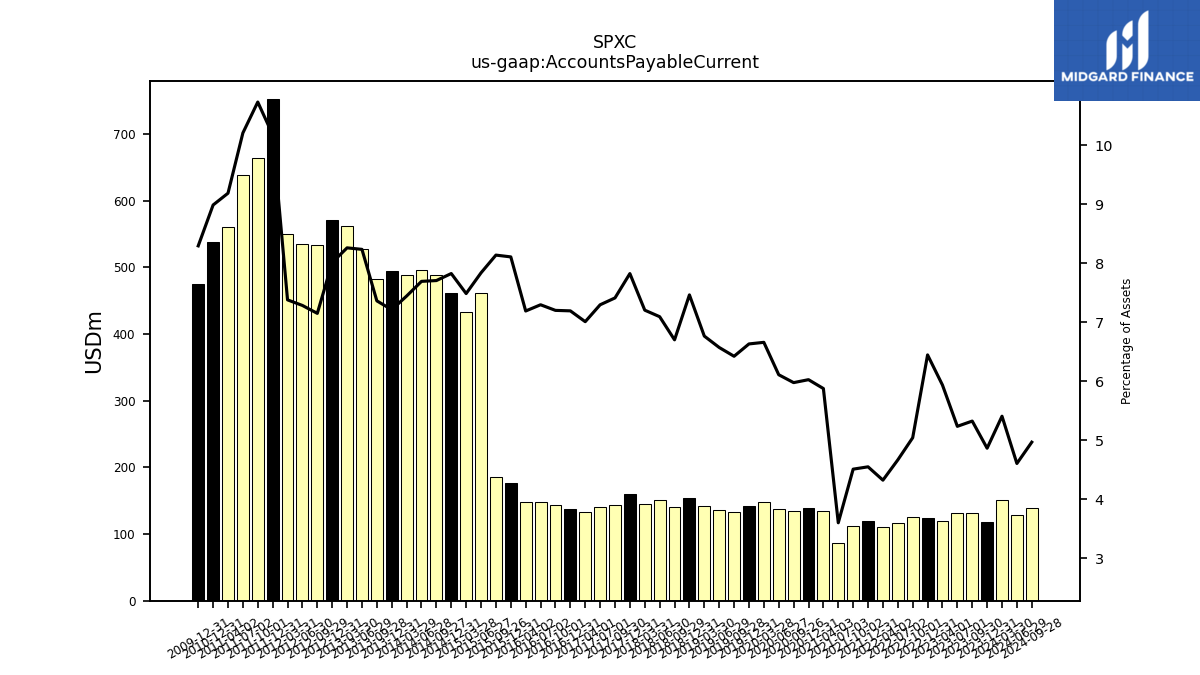
| Accounts Payable Current | 118.70 | 131.70 | 131.00 | 120.00 | 124.50 | 125.20 | 116.20 | 111.00 | 119.60 | 112.30 | 86.80 | 135.00 | 138.50 | 134.50 | 137.90 | 148.00 | 141.60 | 132.50 | 135.90 | 142.20 | 153.60 | 141.20 | 150.70 | 145.00 | 159.70 | 143.30 | 140.80 | 133.10 | 137.60 | 143.30 | 148.80 | 147.60 | 176.90 | 185.50 | 461.70 | 432.80 | 462.00 | 488.40 | 495.60 | 488.90 | 494.60 | 482.30 | 527.20 | 562.30 | 571.40 | 534.20 | 535.10 | 550.80 | 752.70 | 664.10 | 638.00 | 560.90 | 538.80 | NA | NA | NA | |
| Other Accrued Liabilities Current | 78.80 | NA | NA | NA | 76.80 | NA | NA | NA | 139.40 | NA | NA | NA | 137.50 | NA | NA | NA | 129.30 | NA | NA | NA | 103.20 | NA | NA | NA | 109.80 | NA | NA | NA | 101.60 | NA | NA | NA | 131.60 | NA | NA | NA | 259.00 | NA | NA | NA | 271.70 | NA | NA | NA | 281.80 | NA | NA | NA | 310.60 | NA | NA | NA | 315.00 | NA | NA | NA | |
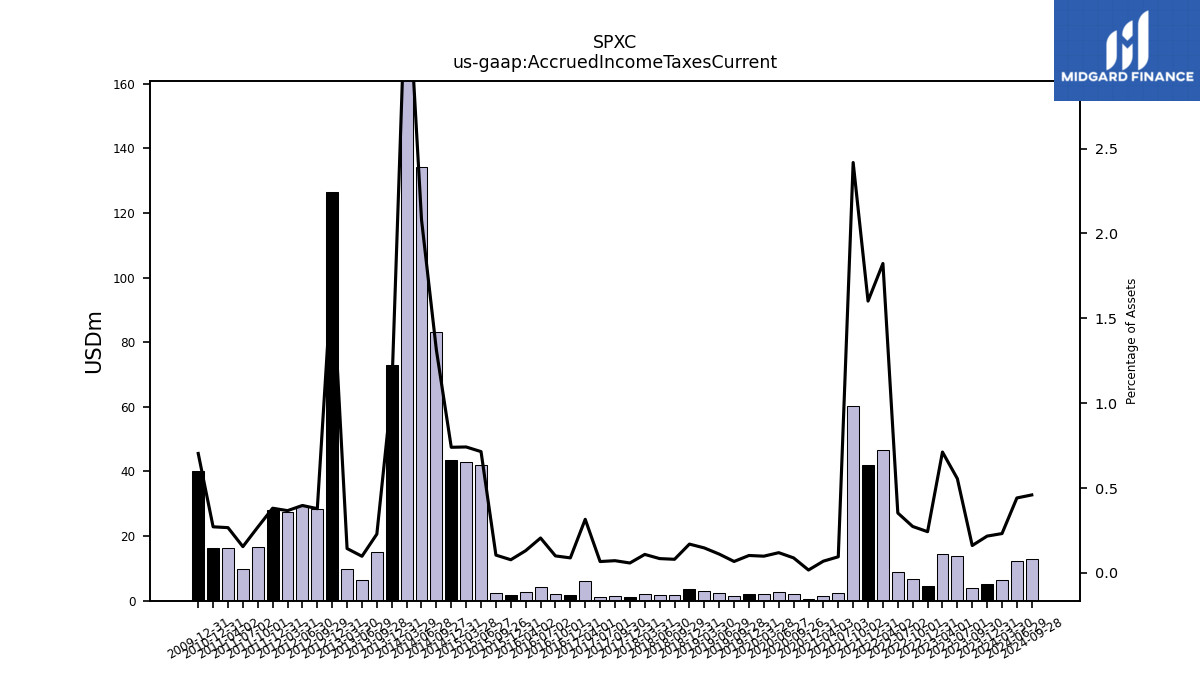
| Accrued Income Taxes Current | 5.30 | 4.00 | 13.90 | 14.40 | 4.70 | 6.80 | 8.80 | 46.80 | 42.10 | 60.20 | 2.30 | 1.60 | 0.40 | 2.00 | 2.70 | 2.20 | 2.20 | 1.40 | 2.30 | 3.10 | 3.50 | 1.70 | 1.80 | 2.20 | 1.20 | 1.40 | 1.30 | 6.00 | 1.70 | 2.00 | 4.20 | 2.70 | 1.70 | 2.40 | 42.10 | 42.90 | 43.70 | 83.20 | 134.10 | 238.80 | 73.10 | 15.00 | 6.30 | 9.80 | 126.50 | 28.30 | 29.20 | 27.40 | 28.20 | 16.70 | 9.70 | 16.30 | 16.30 | NA | NA | NA | |
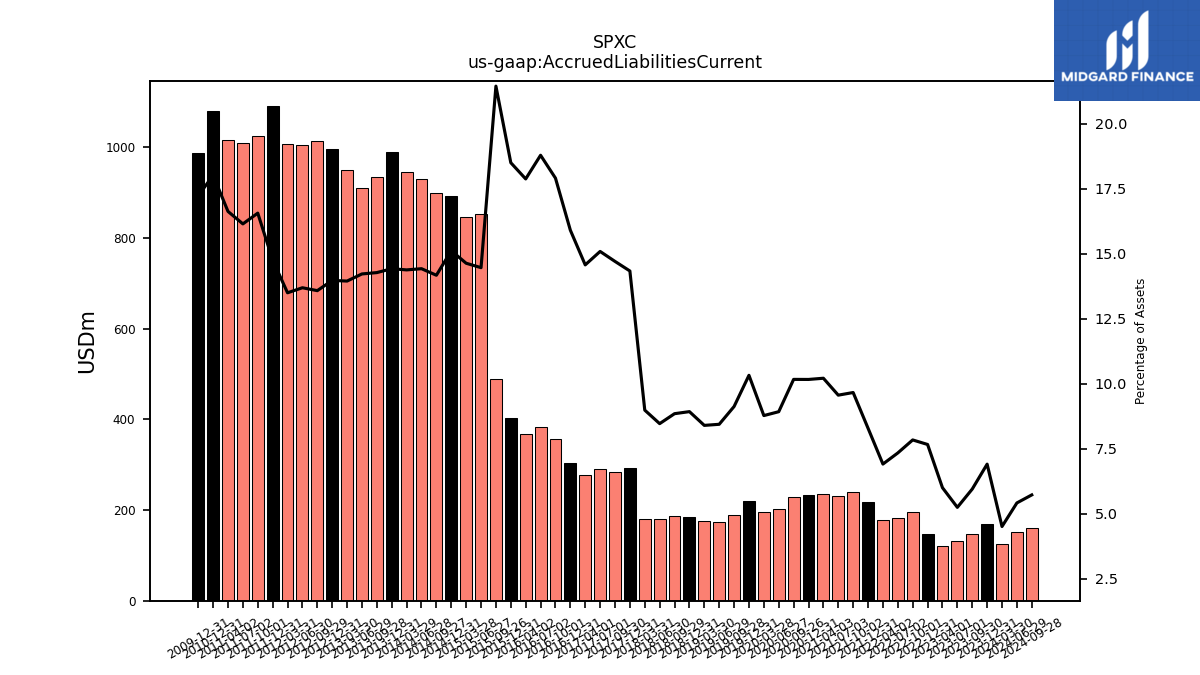
| Accrued Liabilities Current | 168.50 | 147.10 | 131.20 | 121.30 | 148.00 | 194.60 | 182.70 | 177.40 | 217.90 | 240.60 | 230.50 | 234.60 | 233.60 | 228.80 | 201.40 | 195.00 | 220.40 | 188.20 | 174.50 | 176.50 | 183.70 | 186.40 | 179.80 | 180.80 | 292.60 | 284.30 | 291.20 | 276.70 | 304.30 | 356.40 | 383.20 | 367.00 | 403.70 | 488.90 | 852.10 | 846.10 | 892.30 | 898.20 | 929.30 | 944.40 | 989.20 | 935.10 | 910.50 | 949.50 | 996.60 | 1014.60 | 1005.80 | 1007.50 | 1091.40 | 1024.80 | 1009.20 | 1015.20 | 1080.10 | NA | NA | NA | |
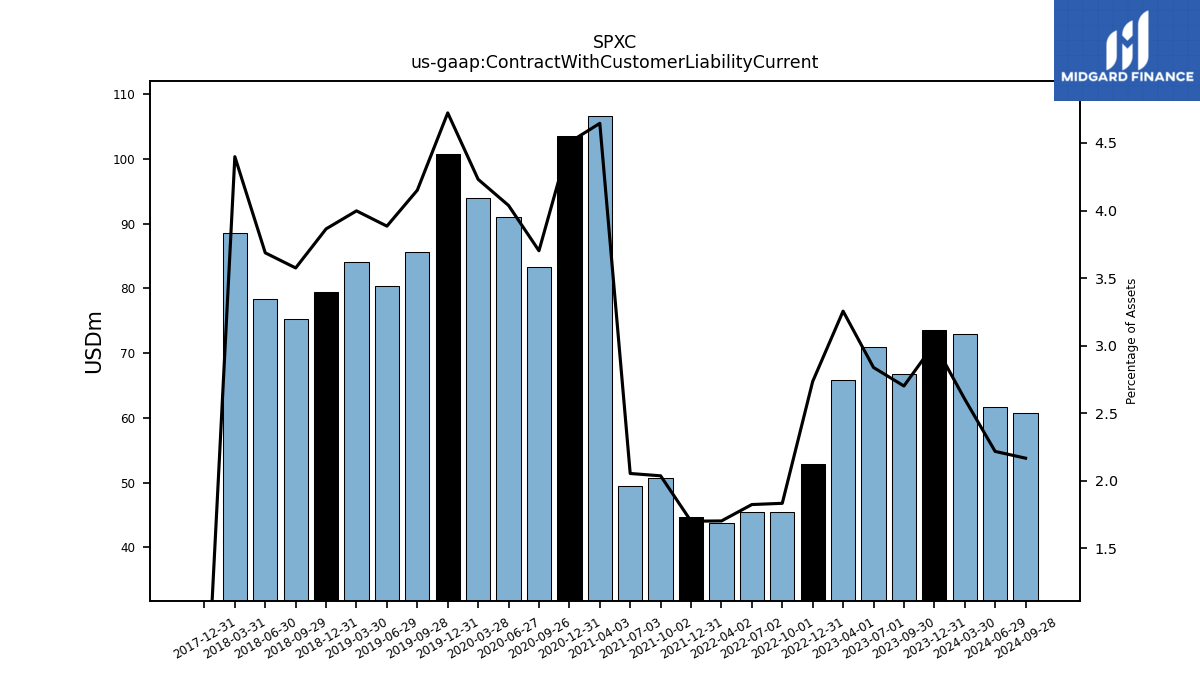
| Contract With Customer Liability Current | 73.50 | 66.80 | 71.00 | 65.80 | 52.80 | 45.50 | 45.40 | 43.70 | 44.70 | 50.70 | 49.50 | 106.70 | 103.50 | 83.30 | 91.10 | 94.00 | 100.80 | 85.60 | 80.30 | 84.00 | 79.50 | 75.30 | 78.30 | 88.50 | 0.00 | NA | NA | NA | NA | NA | NA | NA | NA | NA | NA | NA | NA | NA | NA | NA | NA | NA | NA | NA | NA | NA | NA | NA | NA | NA | NA | NA | NA | NA | NA | NA |
| 2023-12-31 | 2023-09-30 | 2023-07-01 | 2023-04-01 | 2022-12-31 | 2022-10-01 | 2022-07-02 | 2022-04-02 | 2021-12-31 | 2021-10-02 | 2021-07-03 | 2021-04-03 | 2020-12-31 | 2020-09-26 | 2020-06-27 | 2020-03-28 | 2019-12-31 | 2019-09-28 | 2019-06-29 | 2019-03-30 | 2018-12-31 | 2018-09-29 | 2018-06-30 | 2018-03-31 | 2017-12-31 | 2017-09-30 | 2017-07-01 | 2017-04-01 | 2016-12-31 | 2016-10-01 | 2016-07-02 | 2016-04-02 | 2015-12-31 | 2015-09-26 | 2015-06-27 | 2015-03-28 | 2014-12-31 | 2014-09-27 | 2014-06-28 | 2014-03-29 | 2013-12-31 | 2013-09-28 | 2013-06-29 | 2013-03-30 | 2012-12-31 | 2012-09-29 | 2012-06-30 | 2012-03-31 | 2011-12-31 | 2011-10-01 | 2011-07-02 | 2011-04-02 | 2010-12-31 | 2010-10-02 | 2010-07-03 | 2010-04-03 | ||
|---|---|---|---|---|---|---|---|---|---|---|---|---|---|---|---|---|---|---|---|---|---|---|---|---|---|---|---|---|---|---|---|---|---|---|---|---|---|---|---|---|---|---|---|---|---|---|---|---|---|---|---|---|---|---|---|---|---|
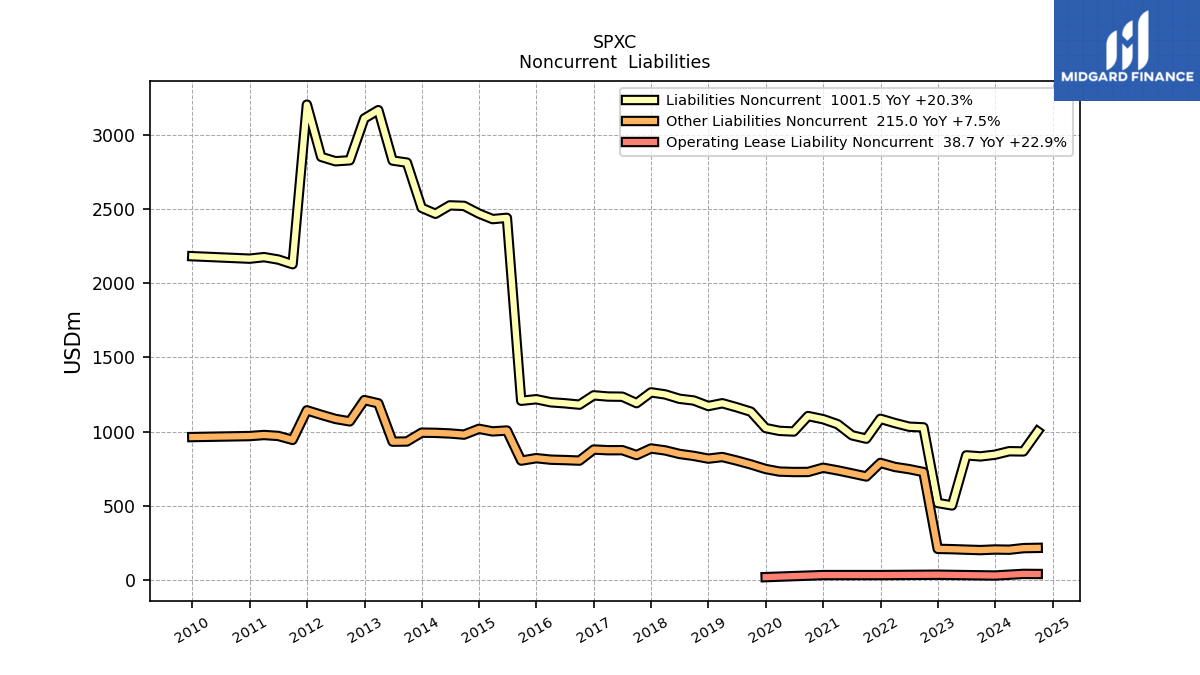
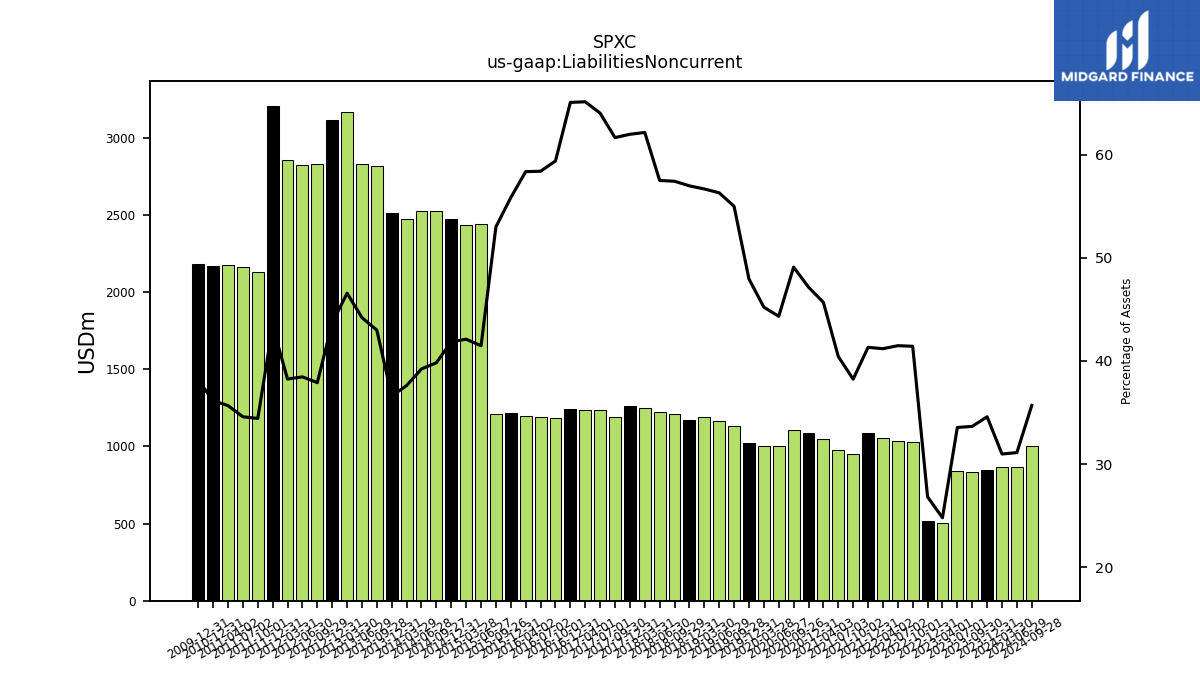
| Liabilities Noncurrent | 843.90 | 832.40 | 839.40 | 501.40 | 517.90 | 1028.40 | 1032.80 | 1057.50 | 1086.20 | 952.00 | 974.70 | 1049.40 | 1083.60 | 1104.70 | 1000.30 | 1004.70 | 1023.50 | 1134.30 | 1164.00 | 1191.10 | 1172.40 | 1209.70 | 1221.30 | 1250.70 | 1264.70 | 1191.80 | 1235.40 | 1236.50 | 1244.60 | 1181.60 | 1190.70 | 1197.70 | 1218.20 | 1207.90 | 2442.60 | 2434.10 | 2471.20 | 2523.30 | 2526.70 | 2470.00 | 2509.80 | 2815.40 | 2829.10 | 3169.40 | 3113.50 | 2830.80 | 2824.50 | 2854.00 | 3206.70 | 2129.60 | 2161.10 | 2177.30 | 2167.00 | NA | NA | NA | |
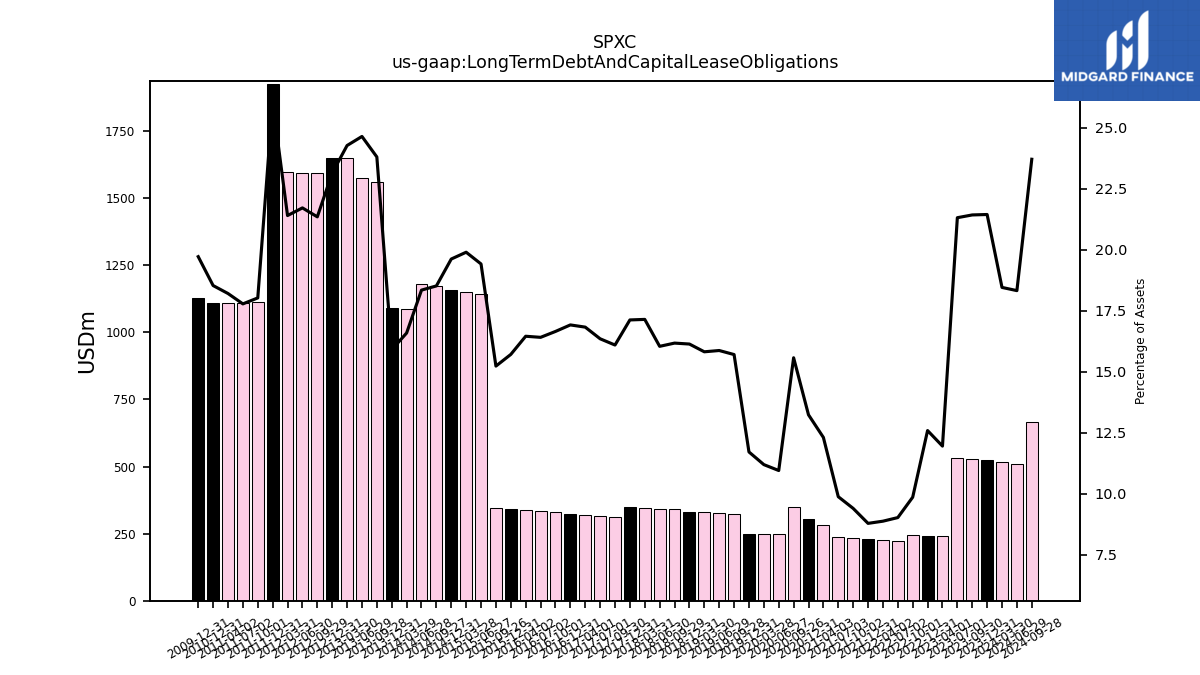
| Long Term Debt And Capital Lease Obligations | 523.10 | 529.80 | 533.10 | 241.50 | 243.00 | 244.60 | 224.50 | 227.70 | 230.80 | 233.90 | 238.00 | 282.60 | 304.00 | 350.30 | 247.00 | 248.60 | 249.90 | 323.80 | 328.00 | 332.30 | 331.90 | 340.60 | 340.60 | 344.90 | 349.30 | 311.00 | 315.40 | 319.40 | 323.50 | 331.20 | 334.50 | 337.60 | 342.60 | 347.00 | 1143.30 | 1149.90 | 1157.80 | 1173.00 | 1181.30 | 1088.90 | 1090.00 | 1558.70 | 1577.00 | 1651.50 | 1649.90 | 1594.30 | 1594.50 | 1596.80 | 1925.60 | 1114.80 | 1110.70 | 1111.00 | 1110.50 | NA | NA | NA | |
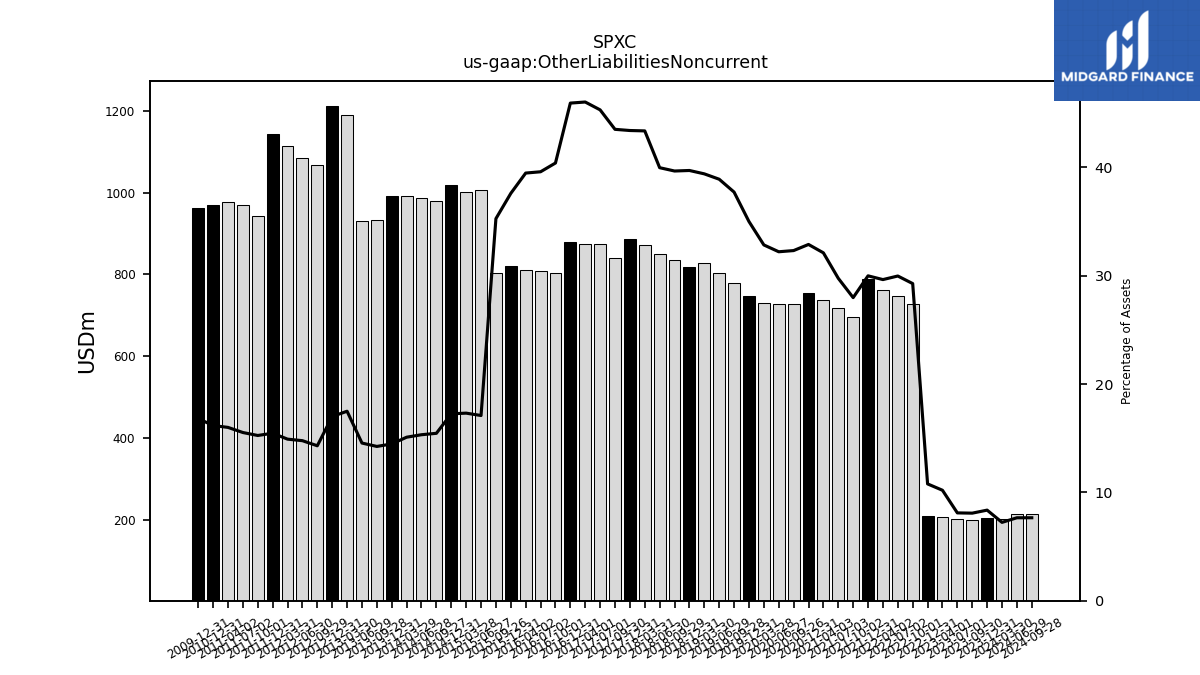
| Other Liabilities Noncurrent | 204.10 | 200.00 | 202.90 | 206.20 | 208.30 | 726.90 | 746.40 | 761.20 | 788.50 | 696.80 | 717.60 | 737.80 | 755.80 | 727.40 | 727.00 | 729.90 | 747.30 | 778.10 | 804.50 | 828.20 | 817.30 | 835.70 | 849.10 | 872.80 | 885.80 | 841.20 | 874.40 | 874.10 | 878.70 | 804.00 | 807.50 | 810.30 | 820.40 | 803.90 | 1007.10 | 1001.10 | 1018.50 | 979.40 | 987.20 | 991.40 | 992.60 | 933.00 | 931.80 | 1190.70 | 1212.50 | 1068.60 | 1085.30 | 1113.30 | 1143.40 | 943.80 | 970.40 | 976.80 | 969.60 | NA | NA | NA | |
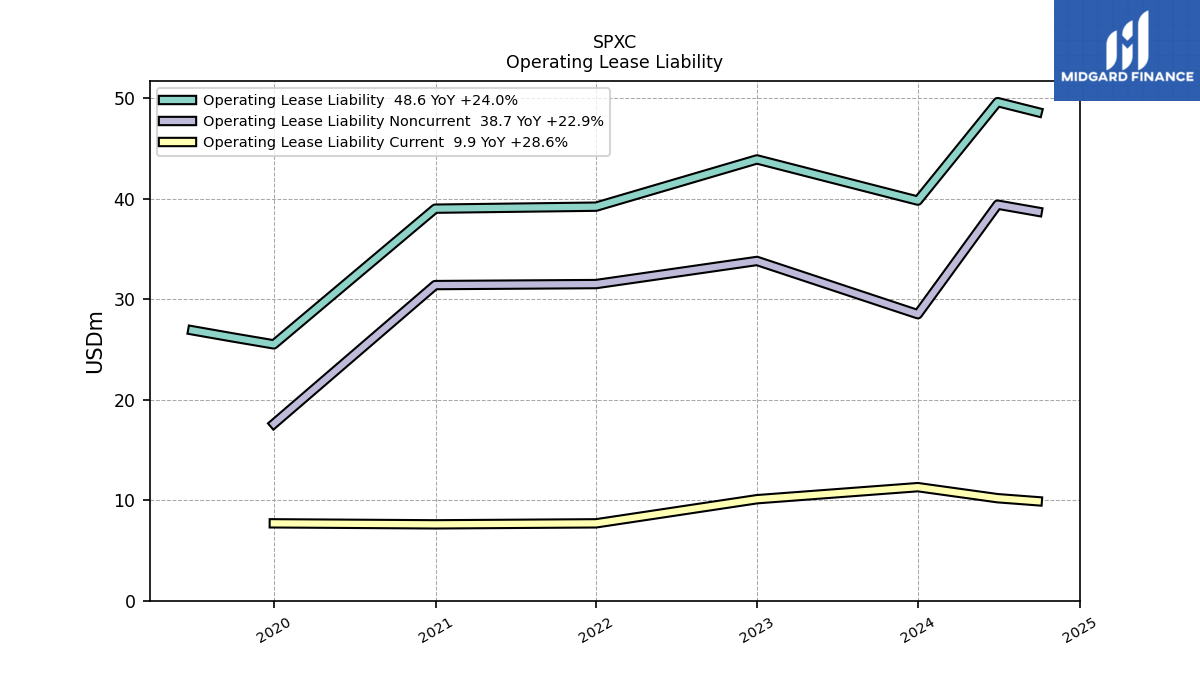
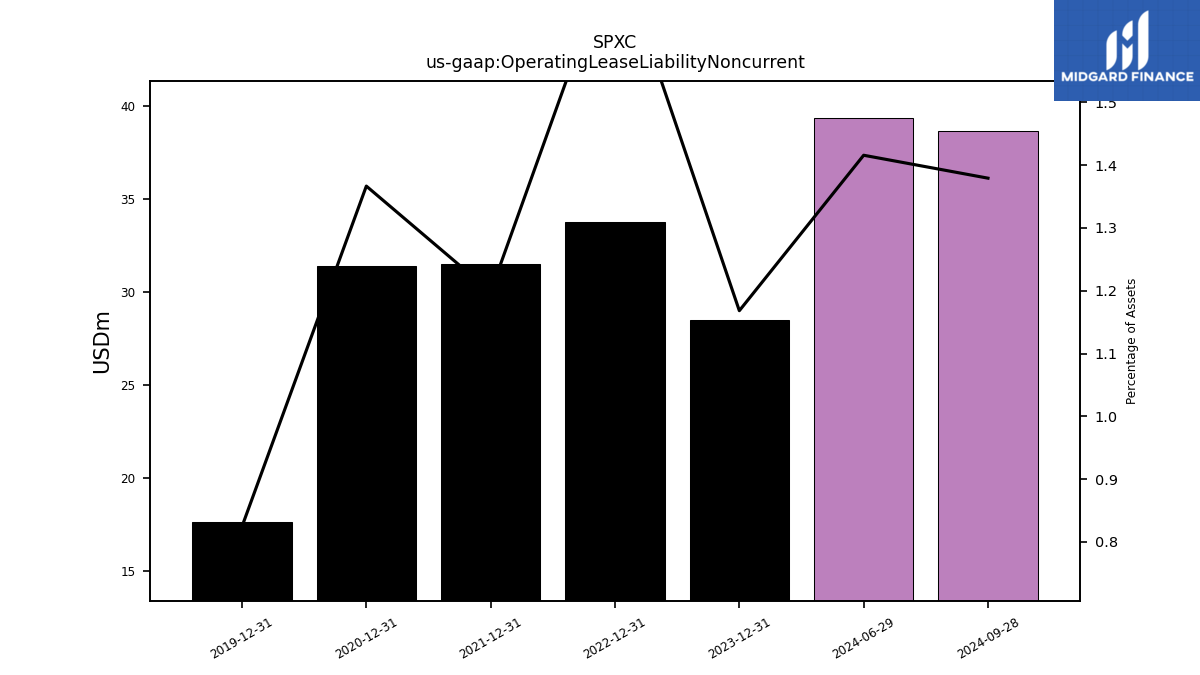
| Operating Lease Liability Noncurrent | 28.50 | NA | NA | NA | 33.80 | NA | NA | NA | 31.50 | NA | NA | NA | 31.40 | NA | NA | NA | 17.60 | NA | NA | NA | NA | NA | NA | NA | NA | NA | NA | NA | NA | NA | NA | NA | NA | NA | NA | NA | NA | NA | NA | NA | NA | NA | NA | NA | NA | NA | NA | NA | NA | NA | NA | NA | NA | NA | NA | NA |
| 2023-12-31 | 2023-09-30 | 2023-07-01 | 2023-04-01 | 2022-12-31 | 2022-10-01 | 2022-07-02 | 2022-04-02 | 2021-12-31 | 2021-10-02 | 2021-07-03 | 2021-04-03 | 2020-12-31 | 2020-09-26 | 2020-06-27 | 2020-03-28 | 2019-12-31 | 2019-09-28 | 2019-06-29 | 2019-03-30 | 2018-12-31 | 2018-09-29 | 2018-06-30 | 2018-03-31 | 2017-12-31 | 2017-09-30 | 2017-07-01 | 2017-04-01 | 2016-12-31 | 2016-10-01 | 2016-07-02 | 2016-04-02 | 2015-12-31 | 2015-09-26 | 2015-06-27 | 2015-03-28 | 2014-12-31 | 2014-09-27 | 2014-06-28 | 2014-03-29 | 2013-12-31 | 2013-09-28 | 2013-06-29 | 2013-03-30 | 2012-12-31 | 2012-09-29 | 2012-06-30 | 2012-03-31 | 2011-12-31 | 2011-10-01 | 2011-07-02 | 2011-04-02 | 2010-12-31 | 2010-10-02 | 2010-07-03 | 2010-04-03 | ||
|---|---|---|---|---|---|---|---|---|---|---|---|---|---|---|---|---|---|---|---|---|---|---|---|---|---|---|---|---|---|---|---|---|---|---|---|---|---|---|---|---|---|---|---|---|---|---|---|---|---|---|---|---|---|---|---|---|---|
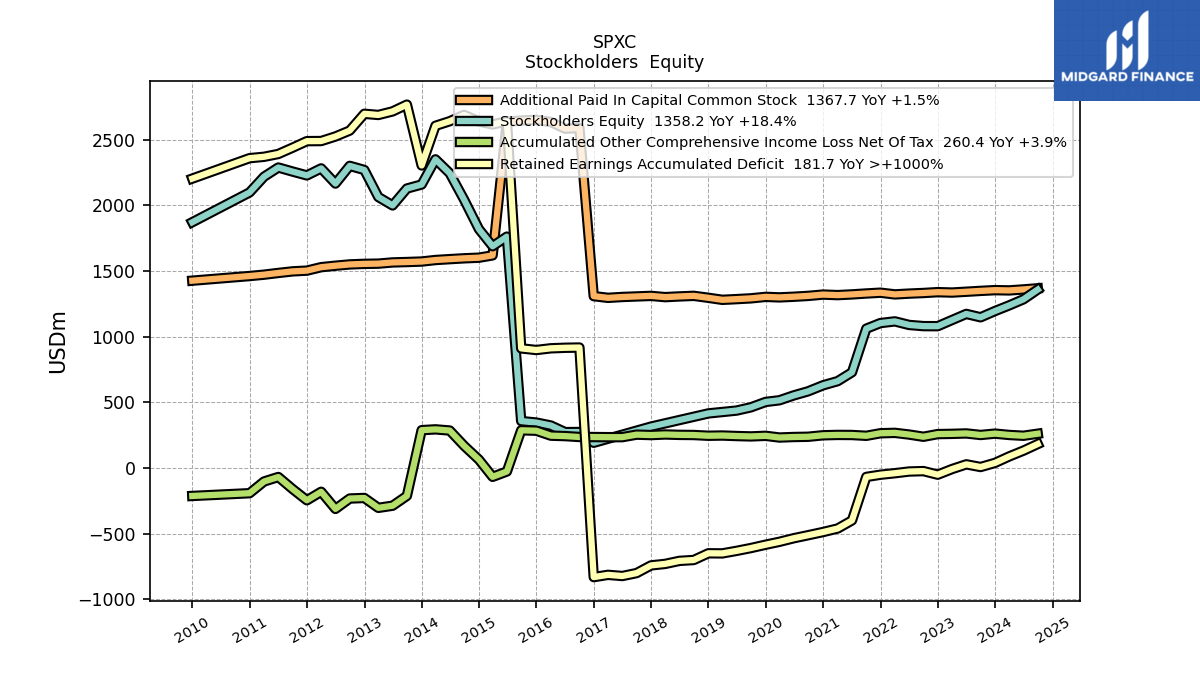
| Stockholders Equity | 1194.60 | 1146.90 | 1172.60 | 1126.10 | 1079.20 | 1079.70 | 1088.60 | 1115.80 | 1102.90 | 1060.30 | 728.20 | 660.80 | 629.20 | 583.10 | 552.10 | 515.10 | 502.40 | 461.30 | 436.70 | NA | 414.90 | NA | NA | NA | 314.70 | NA | NA | NA | 191.60 | 273.40 | 272.60 | 322.80 | 345.40 | 356.70 | 1761.30 | 1687.80 | 1817.90 | 2043.30 | 2243.80 | 2349.60 | 2158.00 | 2127.40 | 1998.70 | 2062.90 | 2268.70 | 2300.00 | 2165.20 | 2280.90 | 2227.30 | 2256.60 | 2287.40 | 2217.50 | 2097.70 | NA | NA | NA | |
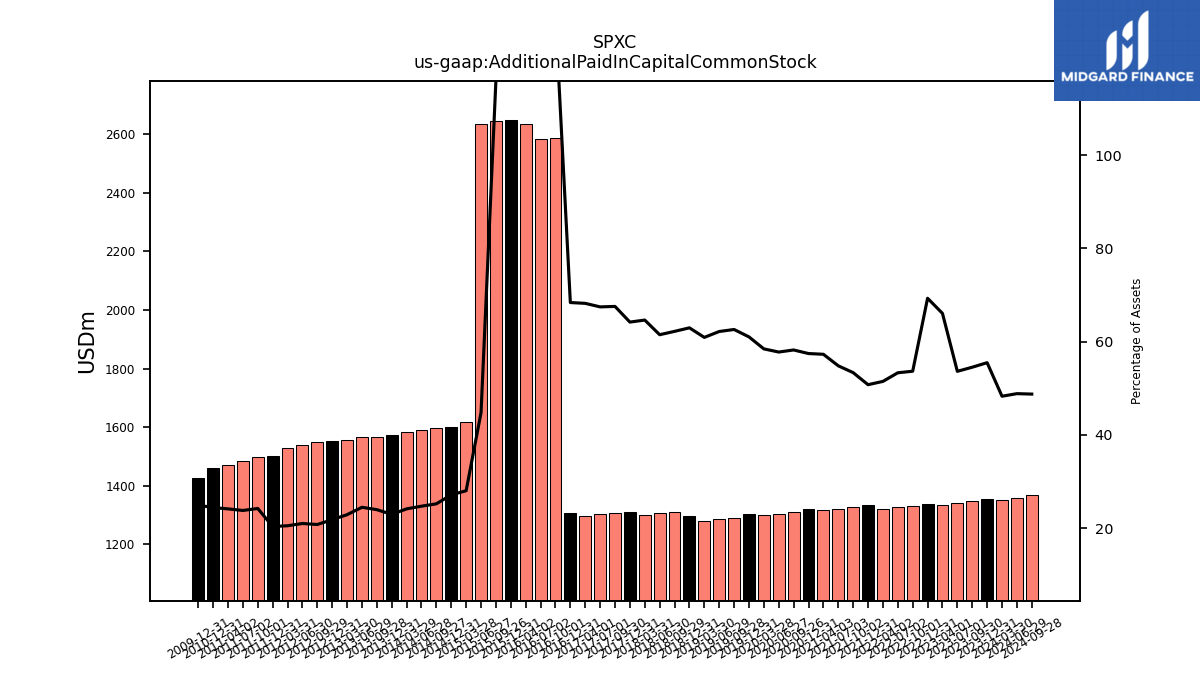
| Additional Paid In Capital Common Stock | 1353.60 | 1348.00 | 1341.50 | 1335.30 | 1338.30 | 1331.90 | 1327.30 | 1321.20 | 1334.20 | 1328.20 | 1321.20 | 1315.80 | 1319.90 | 1309.70 | 1303.40 | 1298.50 | 1302.40 | 1291.20 | 1285.30 | 1279.90 | 1295.40 | 1310.20 | 1305.80 | 1300.40 | 1309.80 | 1305.70 | 1301.50 | 1295.00 | 1307.90 | 2588.00 | 2583.20 | 2633.90 | 2649.60 | 2645.10 | 2635.80 | 1618.40 | 1600.80 | 1596.00 | 1589.70 | 1583.00 | 1571.50 | 1567.70 | 1564.70 | 1555.50 | 1553.70 | 1549.50 | 1539.70 | 1528.50 | 1502.20 | 1496.60 | 1484.50 | 1471.40 | 1461.10 | NA | NA | NA | |
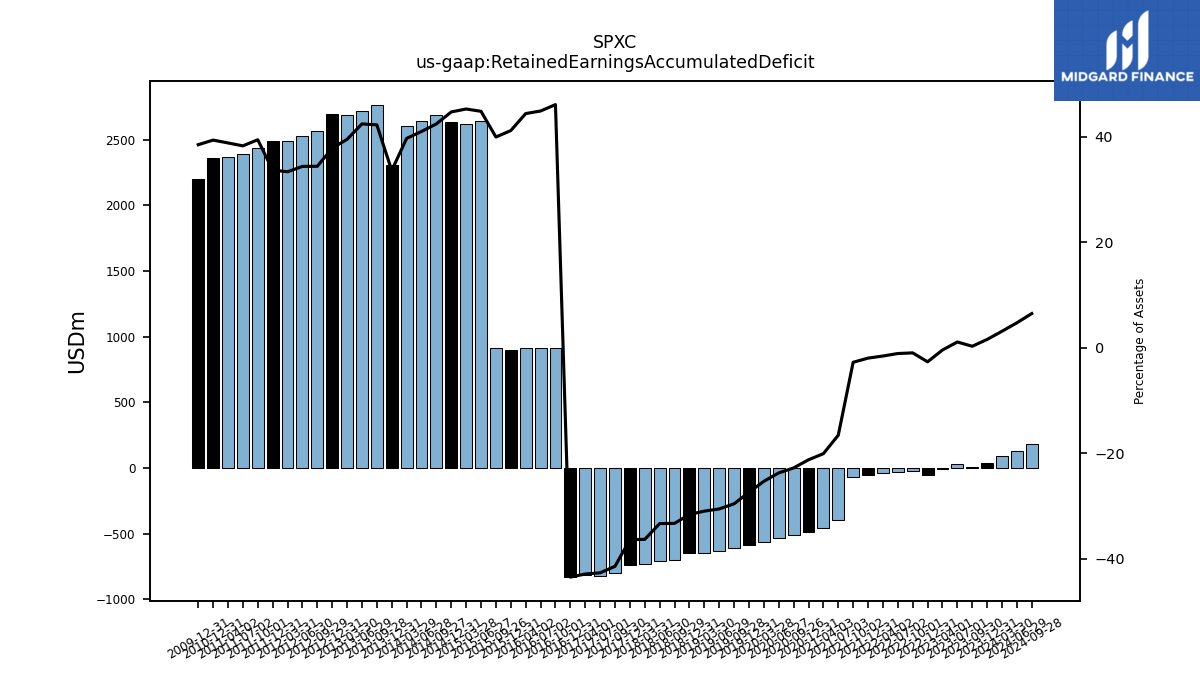
| Retained Earnings Accumulated Deficit | 38.30 | 6.80 | 27.20 | -8.80 | -51.60 | -24.30 | -27.40 | -40.40 | -51.80 | -68.70 | -399.80 | -461.30 | -488.10 | -512.70 | -535.50 | -562.60 | -584.80 | -610.20 | -631.70 | -650.90 | -650.10 | -701.30 | -707.90 | -730.90 | -742.30 | -800.90 | -823.20 | -814.20 | -831.60 | 916.70 | 914.80 | 910.80 | 897.80 | 910.10 | 2638.70 | 2615.30 | 2637.80 | 2687.70 | 2640.10 | 2605.00 | 2303.10 | 2766.30 | 2714.80 | 2687.50 | 2696.60 | 2568.80 | 2523.70 | 2489.00 | 2488.30 | 2438.50 | 2390.50 | 2369.00 | 2358.60 | NA | NA | NA | |
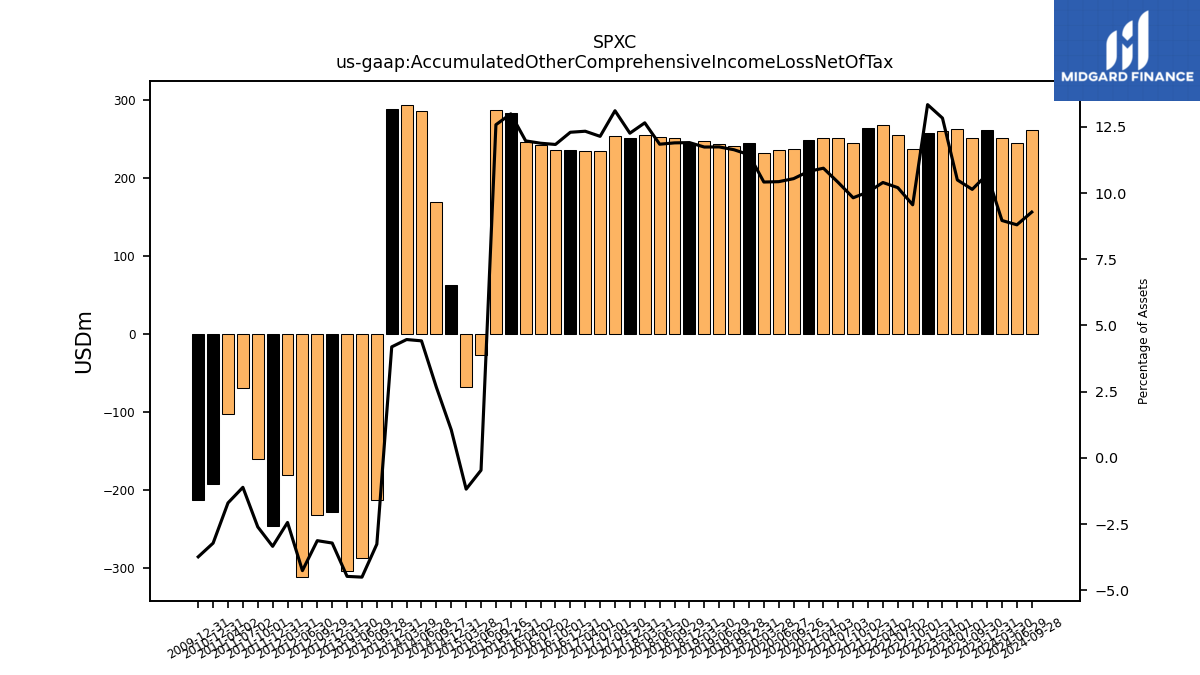
| Accumulated Other Comprehensive Income Loss Net Of Tax | 261.10 | 250.70 | 262.50 | 259.30 | 257.50 | 237.20 | 254.00 | 266.90 | 263.90 | 244.50 | 250.60 | 251.20 | 248.50 | 237.20 | 235.30 | 231.40 | 244.30 | 239.90 | 242.70 | 246.60 | 244.90 | 250.50 | 251.50 | 254.50 | 250.10 | 253.30 | 234.20 | 234.10 | 235.10 | 235.40 | 242.20 | 245.60 | 283.30 | 286.60 | -27.20 | -68.00 | 62.60 | 169.00 | 284.70 | 293.50 | 287.50 | -213.00 | -287.80 | -304.10 | -228.90 | -233.10 | -312.20 | -181.60 | -246.50 | -160.90 | -69.20 | -103.50 | -192.60 | NA | NA | NA | |
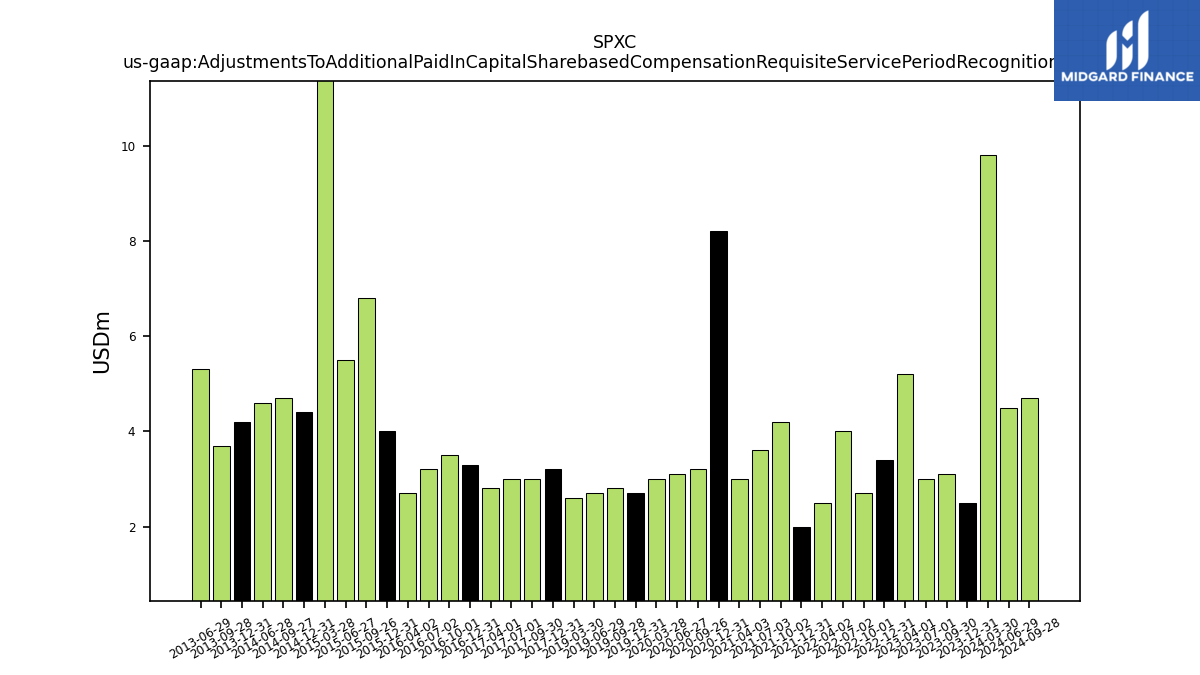
| Adjustments To Additional Paid In Capital Sharebased Compensation Requisite Service Period Recognition Value | 2.50 | 3.10 | 3.00 | 5.20 | 3.40 | 2.70 | 4.00 | 2.50 | 2.00 | 4.20 | 3.60 | 3.00 | 8.20 | 3.20 | 3.10 | 3.00 | 2.70 | 2.80 | 2.70 | 2.60 | NA | NA | NA | NA | 3.20 | 3.00 | 3.00 | 2.80 | 3.30 | 3.50 | 3.20 | 2.70 | 4.00 | 6.80 | 5.50 | 23.60 | 4.40 | 4.70 | 4.60 | NA | 4.20 | 3.70 | 5.30 | NA | NA | NA | NA | NA | NA | NA | NA | NA | NA | NA | NA | NA |
| 2023-12-31 | 2023-09-30 | 2023-07-01 | 2023-04-01 | 2022-12-31 | 2022-10-01 | 2022-07-02 | 2022-04-02 | 2021-12-31 | 2021-10-02 | 2021-07-03 | 2021-04-03 | 2020-12-31 | 2020-09-26 | 2020-06-27 | 2020-03-28 | 2019-12-31 | 2019-09-28 | 2019-06-29 | 2019-03-30 | 2018-12-31 | 2018-09-29 | 2018-06-30 | 2018-03-31 | 2017-12-31 | 2017-09-30 | 2017-07-01 | 2017-04-01 | 2016-12-31 | 2016-10-01 | 2016-07-02 | 2016-04-02 | 2015-12-31 | 2015-09-26 | 2015-06-27 | 2015-03-28 | 2014-12-31 | 2014-09-27 | 2014-06-28 | 2014-03-29 | 2013-12-31 | 2013-09-28 | 2013-06-29 | 2013-03-30 | 2012-12-31 | 2012-09-29 | 2012-06-30 | 2012-03-31 | 2011-12-31 | 2011-10-01 | 2011-07-02 | 2011-04-02 | 2010-12-31 | 2010-10-02 | 2010-07-03 | 2010-04-03 | ||
|---|---|---|---|---|---|---|---|---|---|---|---|---|---|---|---|---|---|---|---|---|---|---|---|---|---|---|---|---|---|---|---|---|---|---|---|---|---|---|---|---|---|---|---|---|---|---|---|---|---|---|---|---|---|---|---|---|---|
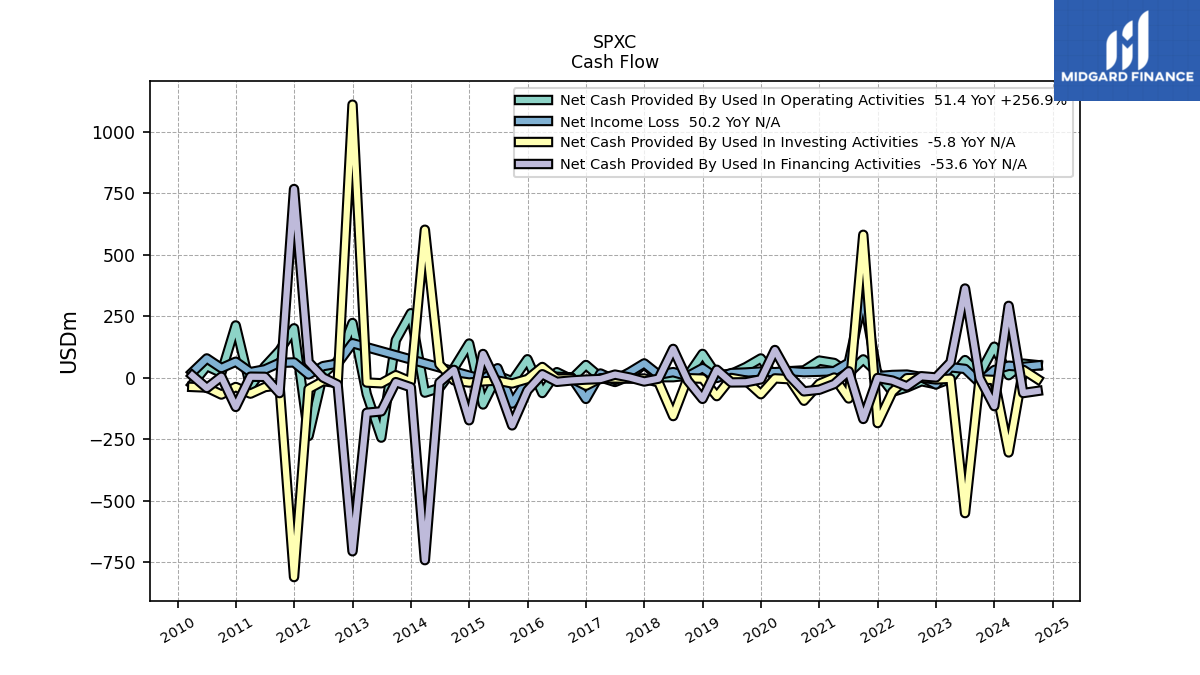
| Net Cash Provided By Used In Operating Activities | 126.50 | 14.40 | 72.00 | -4.40 | -26.30 | -14.00 | -39.30 | -57.20 | 20.80 | 74.90 | 18.70 | 60.20 | 69.90 | 30.10 | 26.70 | -0.40 | 78.80 | 43.30 | 15.90 | 10.60 | 97.30 | 8.60 | 2.40 | 2.30 | 56.10 | 6.90 | -17.10 | 1.70 | 52.10 | -6.20 | 22.80 | -62.20 | 75.50 | -14.40 | 9.20 | -108.80 | 139.40 | 39.00 | -41.40 | -60.60 | 262.80 | 152.60 | -243.70 | -66.40 | 223.00 | 67.90 | 16.00 | -237.10 | 201.40 | 110.70 | 46.70 | -36.20 | 213.10 | 20.00 | 47.20 | -26.70 | |
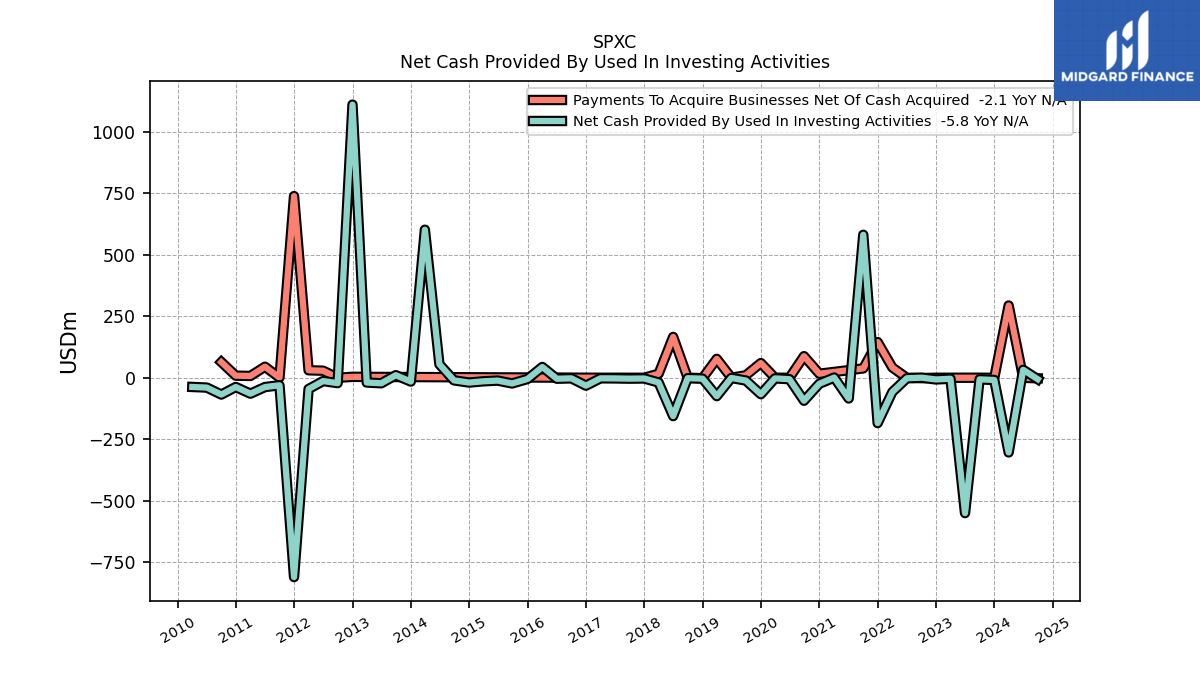
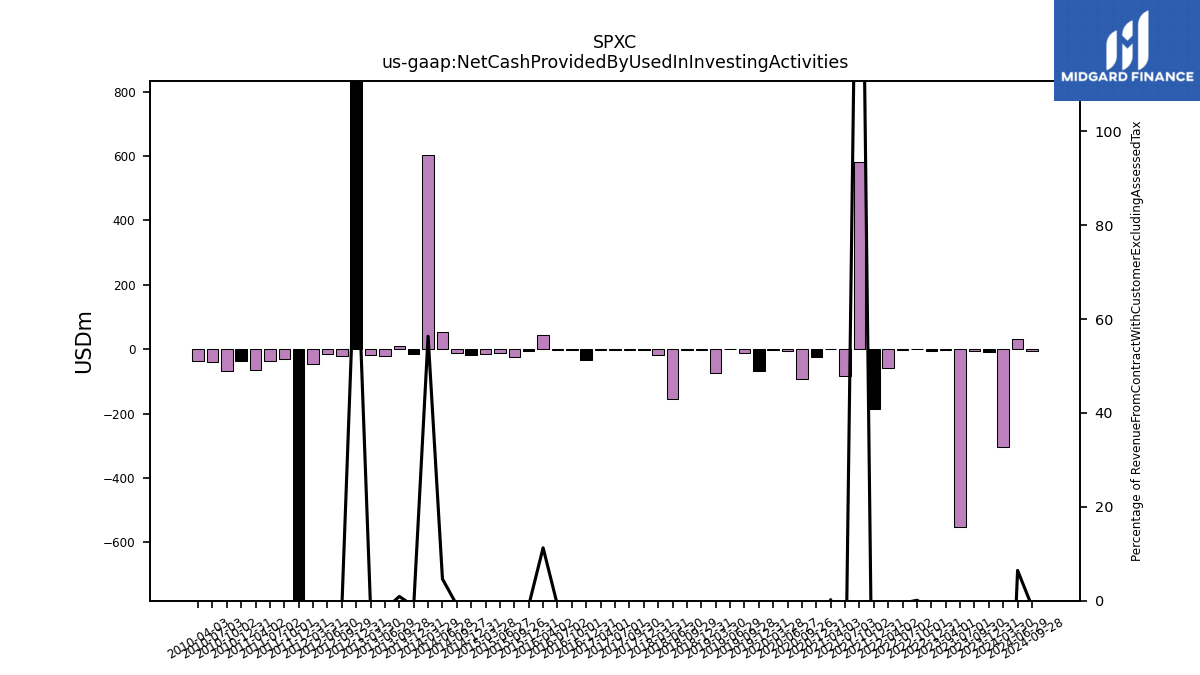
| Net Cash Provided By Used In Investing Activities | -9.00 | -6.40 | -550.90 | -3.90 | -6.80 | 0.40 | -1.90 | -57.80 | -184.50 | 582.00 | -84.30 | 0.90 | -24.30 | -93.50 | -5.80 | -2.50 | -67.00 | -11.20 | -0.80 | -74.70 | -3.60 | -1.70 | -156.00 | -19.30 | -2.90 | -3.60 | -2.60 | -2.20 | -32.10 | -2.40 | -3.90 | 43.90 | -5.10 | -23.20 | -11.40 | -14.50 | -19.50 | -10.50 | 54.80 | 602.60 | -15.40 | 10.50 | -22.40 | -19.40 | 1111.60 | -21.80 | -13.40 | -45.70 | -811.30 | -30.50 | -37.80 | -64.70 | -37.50 | -68.30 | -39.90 | -37.40 | |
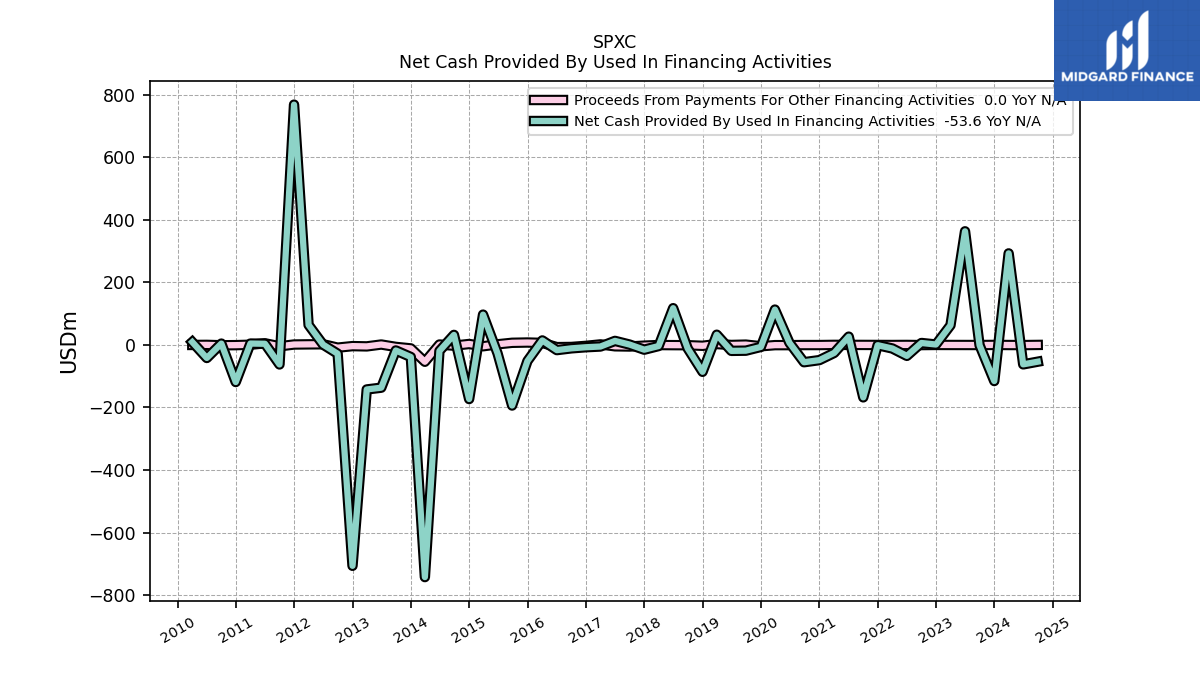
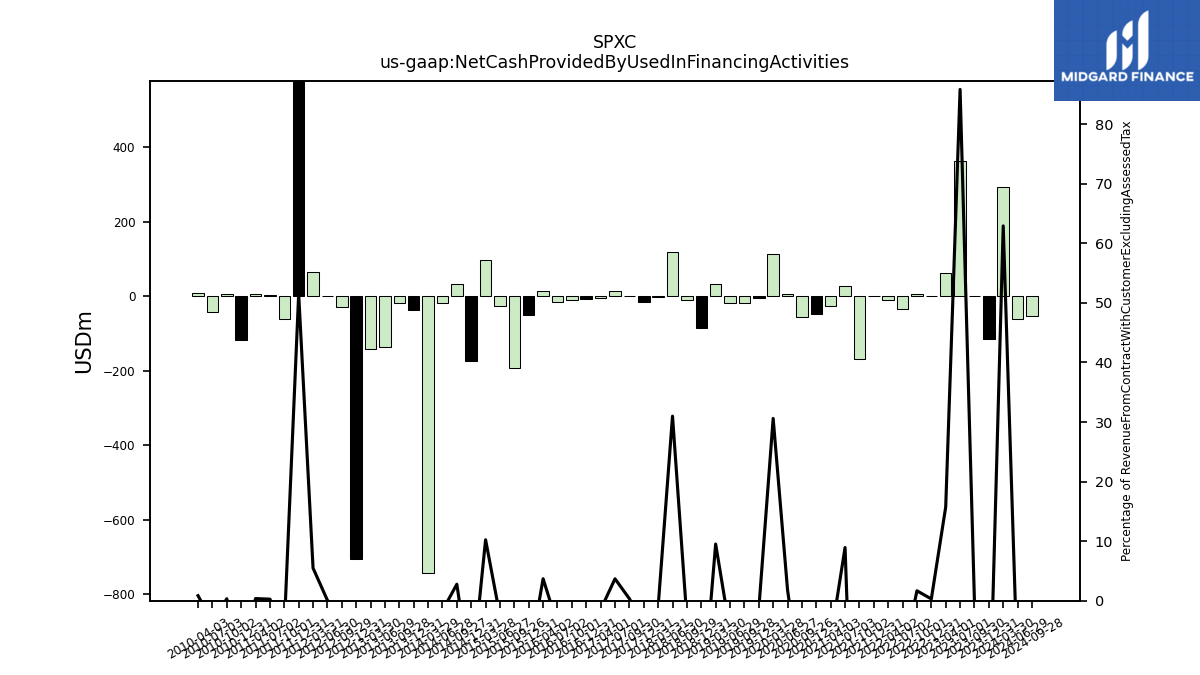
| Net Cash Provided By Used In Financing Activities | -115.50 | -1.10 | 363.30 | 62.90 | 1.30 | 6.20 | -35.00 | -11.40 | -0.80 | -167.70 | 26.50 | -25.60 | -48.60 | -55.30 | 6.80 | 113.00 | -6.40 | -18.40 | -19.00 | 32.70 | -86.00 | -11.10 | 117.50 | -3.60 | -15.20 | 1.20 | 12.90 | -5.10 | -7.40 | -10.90 | -16.60 | 14.40 | -51.40 | -193.80 | -27.30 | 96.90 | -173.10 | 32.10 | -19.40 | -742.40 | -38.60 | -17.70 | -136.70 | -142.40 | -706.30 | -28.10 | 0.90 | 63.90 | 768.30 | -62.50 | 3.70 | 4.40 | -118.70 | 4.30 | -41.80 | 9.20 |
| 2023-12-31 | 2023-09-30 | 2023-07-01 | 2023-04-01 | 2022-12-31 | 2022-10-01 | 2022-07-02 | 2022-04-02 | 2021-12-31 | 2021-10-02 | 2021-07-03 | 2021-04-03 | 2020-12-31 | 2020-09-26 | 2020-06-27 | 2020-03-28 | 2019-12-31 | 2019-09-28 | 2019-06-29 | 2019-03-30 | 2018-12-31 | 2018-09-29 | 2018-06-30 | 2018-03-31 | 2017-12-31 | 2017-09-30 | 2017-07-01 | 2017-04-01 | 2016-12-31 | 2016-10-01 | 2016-07-02 | 2016-04-02 | 2015-12-31 | 2015-09-26 | 2015-06-27 | 2015-03-28 | 2014-12-31 | 2014-09-27 | 2014-06-28 | 2014-03-29 | 2013-12-31 | 2013-09-28 | 2013-06-29 | 2013-03-30 | 2012-12-31 | 2012-09-29 | 2012-06-30 | 2012-03-31 | 2011-12-31 | 2011-10-01 | 2011-07-02 | 2011-04-02 | 2010-12-31 | 2010-10-02 | 2010-07-03 | 2010-04-03 | ||
|---|---|---|---|---|---|---|---|---|---|---|---|---|---|---|---|---|---|---|---|---|---|---|---|---|---|---|---|---|---|---|---|---|---|---|---|---|---|---|---|---|---|---|---|---|---|---|---|---|---|---|---|---|---|---|---|---|---|
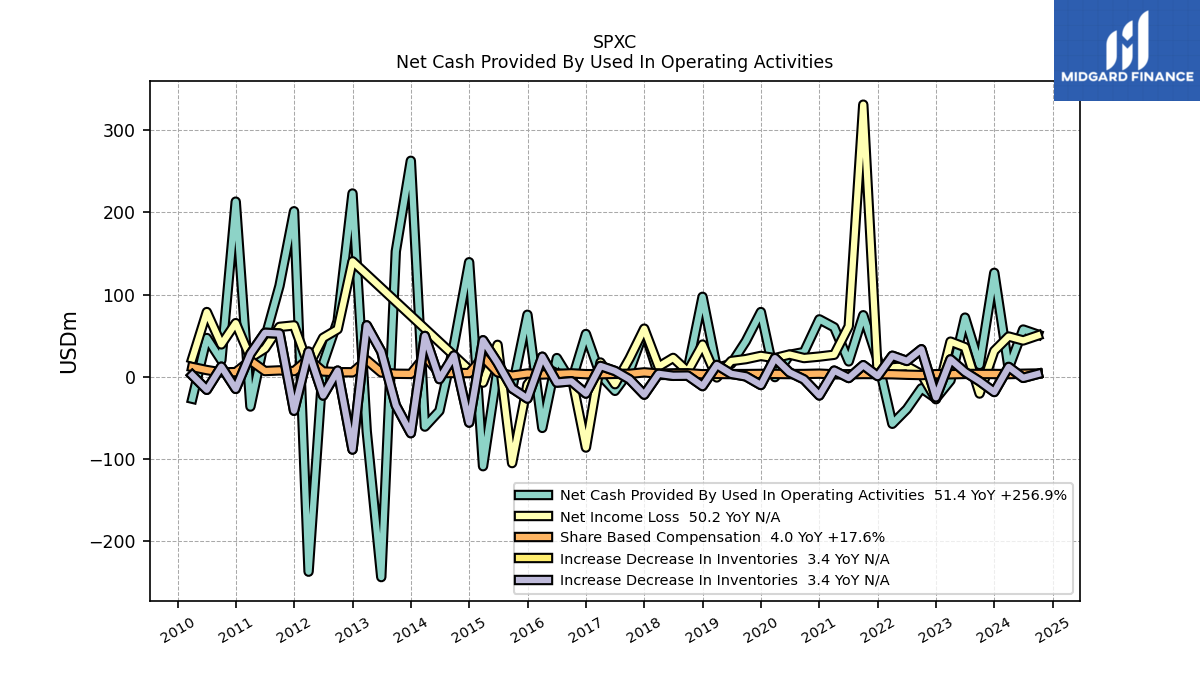
| Net Cash Provided By Used In Operating Activities | 126.50 | 14.40 | 72.00 | -4.40 | -26.30 | -14.00 | -39.30 | -57.20 | 20.80 | 74.90 | 18.70 | 60.20 | 69.90 | 30.10 | 26.70 | -0.40 | 78.80 | 43.30 | 15.90 | 10.60 | 97.30 | 8.60 | 2.40 | 2.30 | 56.10 | 6.90 | -17.10 | 1.70 | 52.10 | -6.20 | 22.80 | -62.20 | 75.50 | -14.40 | 9.20 | -108.80 | 139.40 | 39.00 | -41.40 | -60.60 | 262.80 | 152.60 | -243.70 | -66.40 | 223.00 | 67.90 | 16.00 | -237.10 | 201.40 | 110.70 | 46.70 | -36.20 | 213.10 | 20.00 | 47.20 | -26.70 | |
| Net Income Loss | 31.50 | -20.40 | 36.00 | 42.80 | -27.30 | 3.10 | 13.00 | 11.40 | 6.40 | 331.10 | 61.50 | 26.80 | 24.60 | 22.80 | 27.10 | 22.70 | 25.40 | 21.50 | 19.20 | -0.80 | 39.20 | 6.60 | 23.00 | 12.40 | 58.60 | 22.30 | -9.00 | 17.40 | -86.10 | 1.90 | 4.00 | 13.00 | -9.50 | -105.00 | 38.90 | -7.10 | NA | NA | NA | NA | NA | NA | NA | NA | 140.50 | 57.80 | 47.40 | 13.50 | 62.50 | 60.70 | 34.30 | 23.10 | 65.30 | 39.40 | 78.80 | 22.10 | |
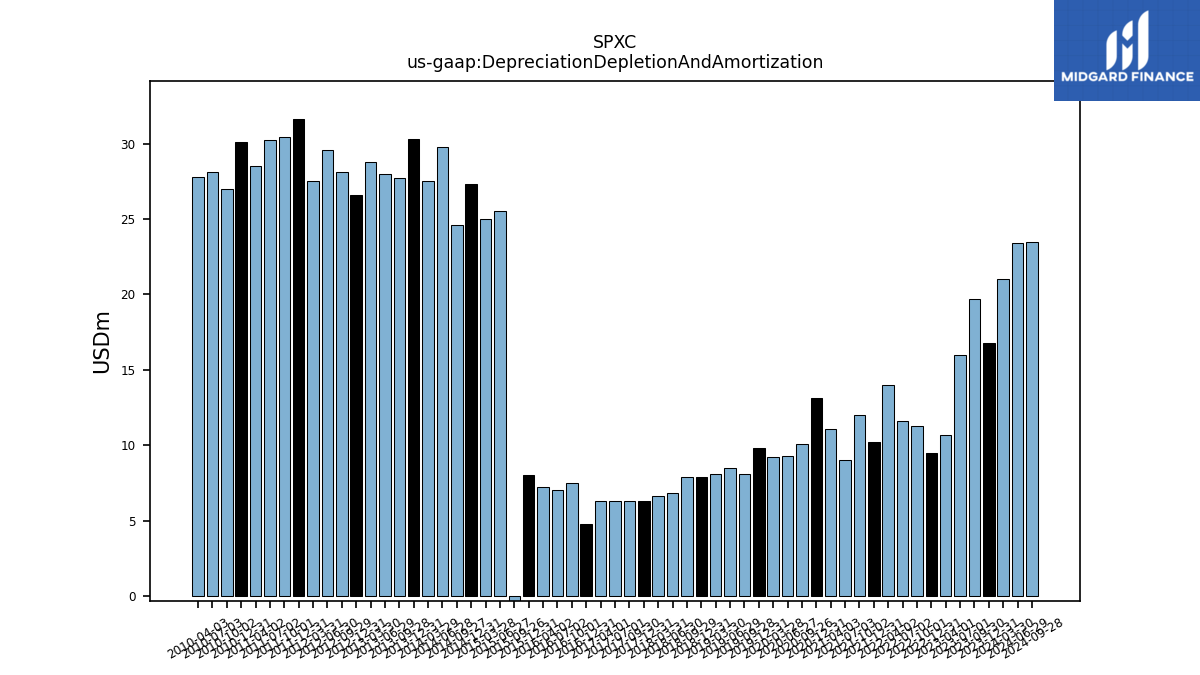
| Depreciation Depletion And Amortization | 16.80 | 19.70 | 16.00 | 10.70 | 9.50 | 11.30 | 11.60 | 14.00 | 10.20 | 12.00 | 9.00 | 11.10 | 13.10 | 10.10 | 9.30 | 9.20 | 9.80 | 8.10 | 8.50 | 8.10 | 7.90 | 7.90 | 6.80 | 6.60 | 6.30 | 6.30 | 6.30 | 6.30 | 4.80 | 7.50 | 7.00 | 7.20 | 8.00 | -19.30 | 25.50 | 25.00 | 27.30 | 24.60 | 29.80 | 27.50 | 30.30 | 27.70 | 28.00 | 28.80 | 26.60 | 28.10 | 29.60 | 27.50 | 31.60 | 30.40 | 30.20 | 28.50 | 30.10 | 27.00 | 28.10 | 27.80 | |
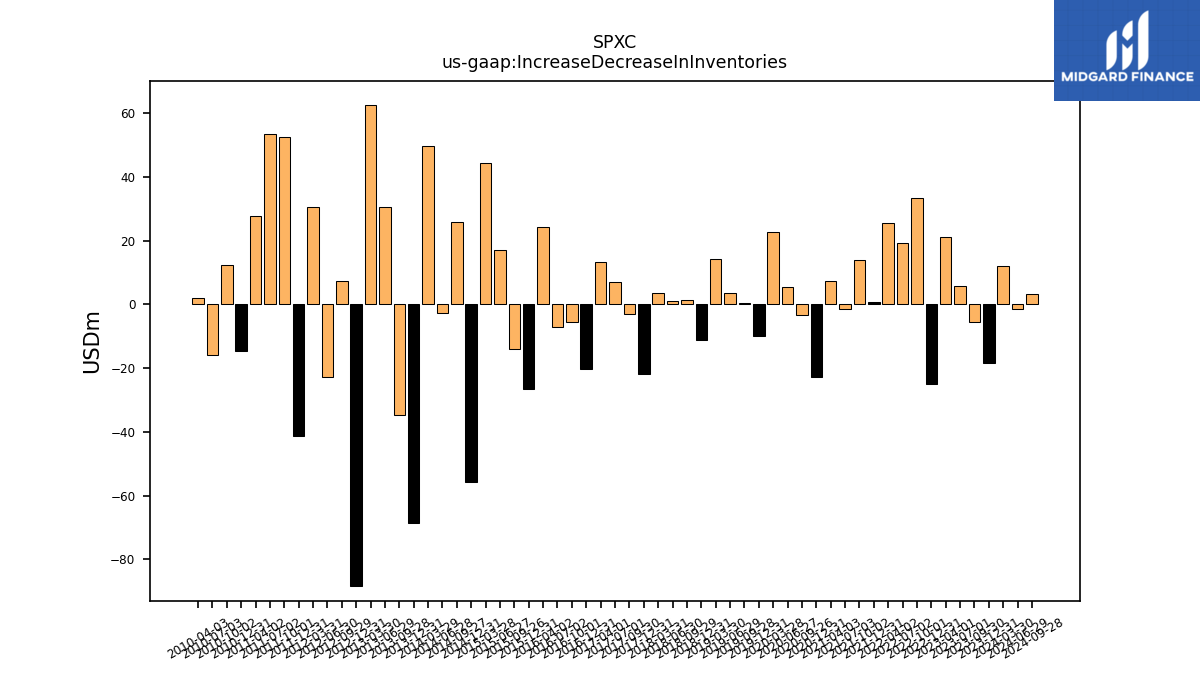
| Increase Decrease In Inventories | -18.50 | -5.40 | 5.80 | 21.20 | -25.00 | 33.50 | 19.30 | 25.60 | 0.90 | 14.10 | -1.50 | 7.50 | -22.70 | -3.20 | 5.40 | 22.70 | -10.00 | 0.50 | 3.60 | 14.40 | -11.30 | 1.40 | 1.20 | 3.60 | -21.70 | -3.10 | 7.10 | 13.20 | -20.40 | -5.50 | -7.00 | 24.40 | -26.50 | -14.10 | 17.10 | 44.40 | -55.70 | 25.90 | -2.80 | 49.70 | -68.60 | -34.80 | 30.70 | 62.60 | -88.50 | 7.50 | -22.80 | 30.60 | -41.30 | 52.60 | 53.50 | 27.90 | -14.70 | 12.30 | -15.80 | 1.90 | |
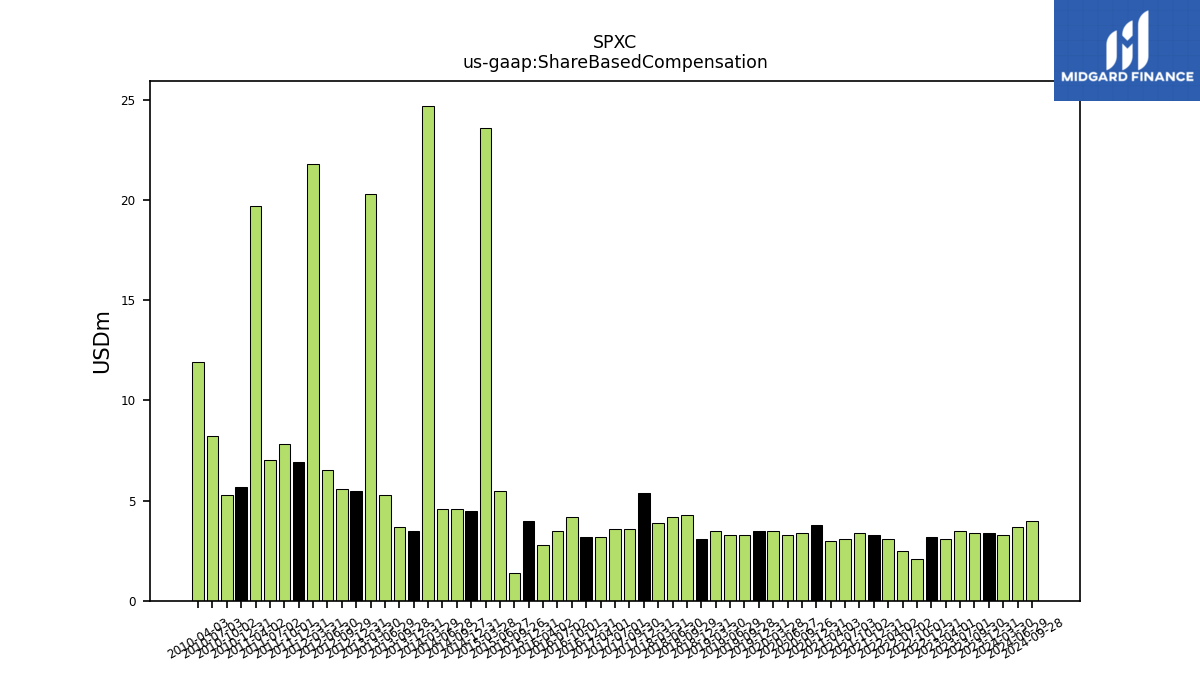
| Share Based Compensation | 3.40 | 3.40 | 3.50 | 3.10 | 3.20 | 2.10 | 2.50 | 3.10 | 3.30 | 3.40 | 3.10 | 3.00 | 3.80 | 3.40 | 3.30 | 3.50 | 3.50 | 3.30 | 3.30 | 3.50 | 3.10 | 4.30 | 4.20 | 3.90 | 5.40 | 3.60 | 3.60 | 3.20 | 3.20 | 4.20 | 3.50 | 2.80 | 4.00 | 1.40 | 5.50 | 23.60 | 4.50 | 4.60 | 4.60 | 24.70 | 3.50 | 3.70 | 5.30 | 20.30 | 5.50 | 5.60 | 6.50 | 21.80 | 6.90 | 7.80 | 7.00 | 19.70 | 5.70 | 5.30 | 8.20 | 11.90 |
| 2023-12-31 | 2023-09-30 | 2023-07-01 | 2023-04-01 | 2022-12-31 | 2022-10-01 | 2022-07-02 | 2022-04-02 | 2021-12-31 | 2021-10-02 | 2021-07-03 | 2021-04-03 | 2020-12-31 | 2020-09-26 | 2020-06-27 | 2020-03-28 | 2019-12-31 | 2019-09-28 | 2019-06-29 | 2019-03-30 | 2018-12-31 | 2018-09-29 | 2018-06-30 | 2018-03-31 | 2017-12-31 | 2017-09-30 | 2017-07-01 | 2017-04-01 | 2016-12-31 | 2016-10-01 | 2016-07-02 | 2016-04-02 | 2015-12-31 | 2015-09-26 | 2015-06-27 | 2015-03-28 | 2014-12-31 | 2014-09-27 | 2014-06-28 | 2014-03-29 | 2013-12-31 | 2013-09-28 | 2013-06-29 | 2013-03-30 | 2012-12-31 | 2012-09-29 | 2012-06-30 | 2012-03-31 | 2011-12-31 | 2011-10-01 | 2011-07-02 | 2011-04-02 | 2010-12-31 | 2010-10-02 | 2010-07-03 | 2010-04-03 | ||
|---|---|---|---|---|---|---|---|---|---|---|---|---|---|---|---|---|---|---|---|---|---|---|---|---|---|---|---|---|---|---|---|---|---|---|---|---|---|---|---|---|---|---|---|---|---|---|---|---|---|---|---|---|---|---|---|---|---|
| Net Cash Provided By Used In Investing Activities | -9.00 | -6.40 | -550.90 | -3.90 | -6.80 | 0.40 | -1.90 | -57.80 | -184.50 | 582.00 | -84.30 | 0.90 | -24.30 | -93.50 | -5.80 | -2.50 | -67.00 | -11.20 | -0.80 | -74.70 | -3.60 | -1.70 | -156.00 | -19.30 | -2.90 | -3.60 | -2.60 | -2.20 | -32.10 | -2.40 | -3.90 | 43.90 | -5.10 | -23.20 | -11.40 | -14.50 | -19.50 | -10.50 | 54.80 | 602.60 | -15.40 | 10.50 | -22.40 | -19.40 | 1111.60 | -21.80 | -13.40 | -45.70 | -811.30 | -30.50 | -37.80 | -64.70 | -37.50 | -68.30 | -39.90 | -37.40 | |
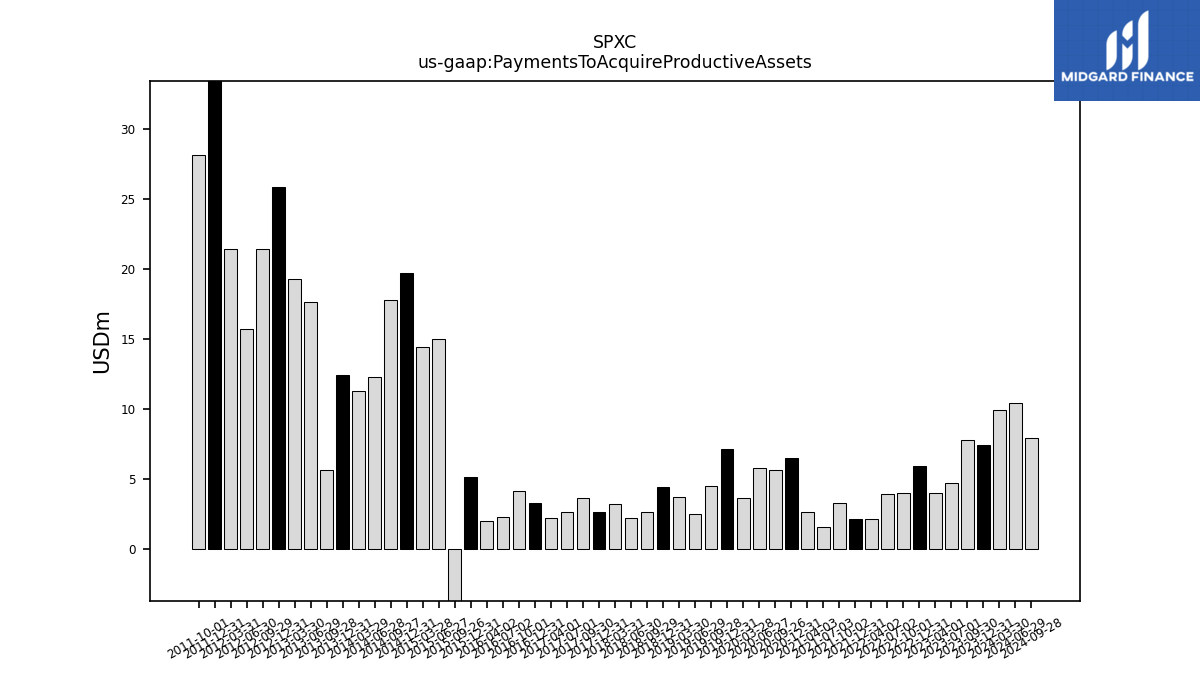
| Payments To Acquire Productive Assets | 7.40 | 7.80 | 4.70 | 4.00 | 5.90 | 4.00 | 3.90 | 2.10 | 2.10 | 3.30 | 1.60 | 2.60 | 6.50 | 5.60 | 5.80 | 3.60 | 7.10 | 4.50 | 2.50 | 3.70 | 4.40 | 2.60 | 2.20 | 3.20 | 2.60 | 3.60 | 2.60 | 2.20 | 3.30 | 4.10 | 2.30 | 2.00 | 5.10 | -16.60 | 15.00 | 14.40 | 19.70 | 17.80 | 12.30 | 11.30 | 12.40 | 5.60 | 17.60 | 19.30 | 25.80 | 21.40 | 15.70 | 21.40 | 74.50 | 28.10 | NA | NA | NA | NA | NA | NA |
| 2023-12-31 | 2023-09-30 | 2023-07-01 | 2023-04-01 | 2022-12-31 | 2022-10-01 | 2022-07-02 | 2022-04-02 | 2021-12-31 | 2021-10-02 | 2021-07-03 | 2021-04-03 | 2020-12-31 | 2020-09-26 | 2020-06-27 | 2020-03-28 | 2019-12-31 | 2019-09-28 | 2019-06-29 | 2019-03-30 | 2018-12-31 | 2018-09-29 | 2018-06-30 | 2018-03-31 | 2017-12-31 | 2017-09-30 | 2017-07-01 | 2017-04-01 | 2016-12-31 | 2016-10-01 | 2016-07-02 | 2016-04-02 | 2015-12-31 | 2015-09-26 | 2015-06-27 | 2015-03-28 | 2014-12-31 | 2014-09-27 | 2014-06-28 | 2014-03-29 | 2013-12-31 | 2013-09-28 | 2013-06-29 | 2013-03-30 | 2012-12-31 | 2012-09-29 | 2012-06-30 | 2012-03-31 | 2011-12-31 | 2011-10-01 | 2011-07-02 | 2011-04-02 | 2010-12-31 | 2010-10-02 | 2010-07-03 | 2010-04-03 | ||
|---|---|---|---|---|---|---|---|---|---|---|---|---|---|---|---|---|---|---|---|---|---|---|---|---|---|---|---|---|---|---|---|---|---|---|---|---|---|---|---|---|---|---|---|---|---|---|---|---|---|---|---|---|---|---|---|---|---|
| Net Cash Provided By Used In Financing Activities | -115.50 | -1.10 | 363.30 | 62.90 | 1.30 | 6.20 | -35.00 | -11.40 | -0.80 | -167.70 | 26.50 | -25.60 | -48.60 | -55.30 | 6.80 | 113.00 | -6.40 | -18.40 | -19.00 | 32.70 | -86.00 | -11.10 | 117.50 | -3.60 | -15.20 | 1.20 | 12.90 | -5.10 | -7.40 | -10.90 | -16.60 | 14.40 | -51.40 | -193.80 | -27.30 | 96.90 | -173.10 | 32.10 | -19.40 | -742.40 | -38.60 | -17.70 | -136.70 | -142.40 | -706.30 | -28.10 | 0.90 | 63.90 | 768.30 | -62.50 | 3.70 | 4.40 | -118.70 | 4.30 | -41.80 | 9.20 |
| 2023-12-31 | 2023-09-30 | 2023-07-01 | 2023-04-01 | 2022-12-31 | 2022-10-01 | 2022-07-02 | 2022-04-02 | 2021-12-31 | 2021-10-02 | 2021-07-03 | 2021-04-03 | 2020-12-31 | 2020-09-26 | 2020-06-27 | 2020-03-28 | 2019-12-31 | 2019-09-28 | 2019-06-29 | 2019-03-30 | 2018-12-31 | 2018-09-29 | 2018-06-30 | 2018-03-31 | 2017-12-31 | 2017-09-30 | 2017-07-01 | 2017-04-01 | 2016-12-31 | 2016-10-01 | 2016-07-02 | 2016-04-02 | 2015-12-31 | 2015-09-26 | 2015-06-27 | 2015-03-28 | 2014-12-31 | 2014-09-27 | 2014-06-28 | 2014-03-29 | 2013-12-31 | 2013-09-28 | 2013-06-29 | 2013-03-30 | 2012-12-31 | 2012-09-29 | 2012-06-30 | 2012-03-31 | 2011-12-31 | 2011-10-01 | 2011-07-02 | 2011-04-02 | 2010-12-31 | 2010-10-02 | 2010-07-03 | 2010-04-03 | ||
|---|---|---|---|---|---|---|---|---|---|---|---|---|---|---|---|---|---|---|---|---|---|---|---|---|---|---|---|---|---|---|---|---|---|---|---|---|---|---|---|---|---|---|---|---|---|---|---|---|---|---|---|---|---|---|---|---|---|
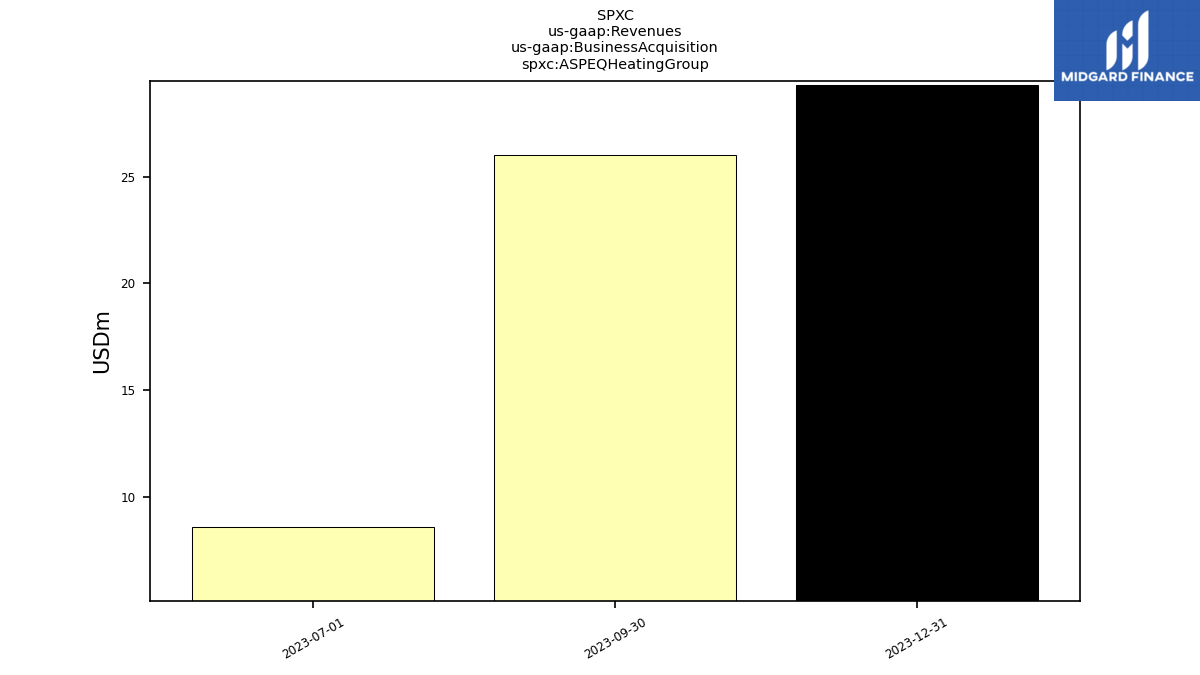
| A S P E Q Heating Group | 29.30 | 26.00 | 8.60 | NA | NA | NA | NA | NA | NA | NA | NA | NA | NA | NA | NA | NA | NA | NA | NA | NA | NA | NA | NA | NA | NA | NA | NA | NA | NA | NA | NA | NA | NA | NA | NA | NA | NA | NA | NA | NA | NA | NA | NA | NA | NA | NA | NA | NA | NA | NA | NA | NA | NA | NA | NA | NA | |
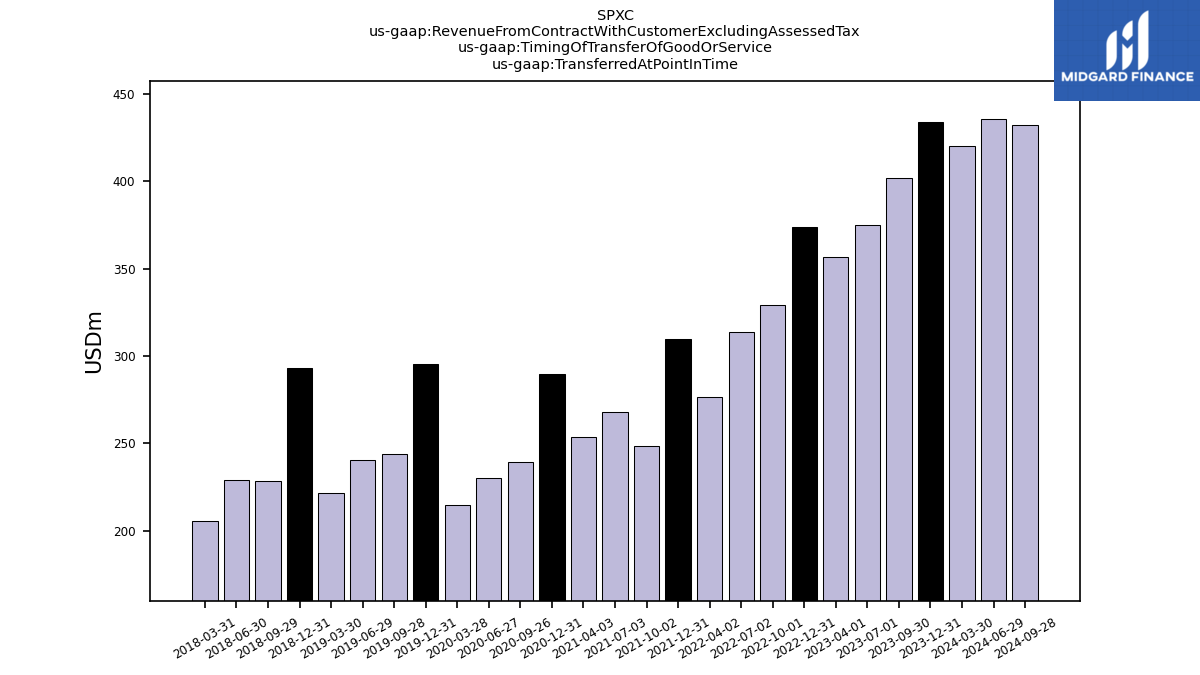
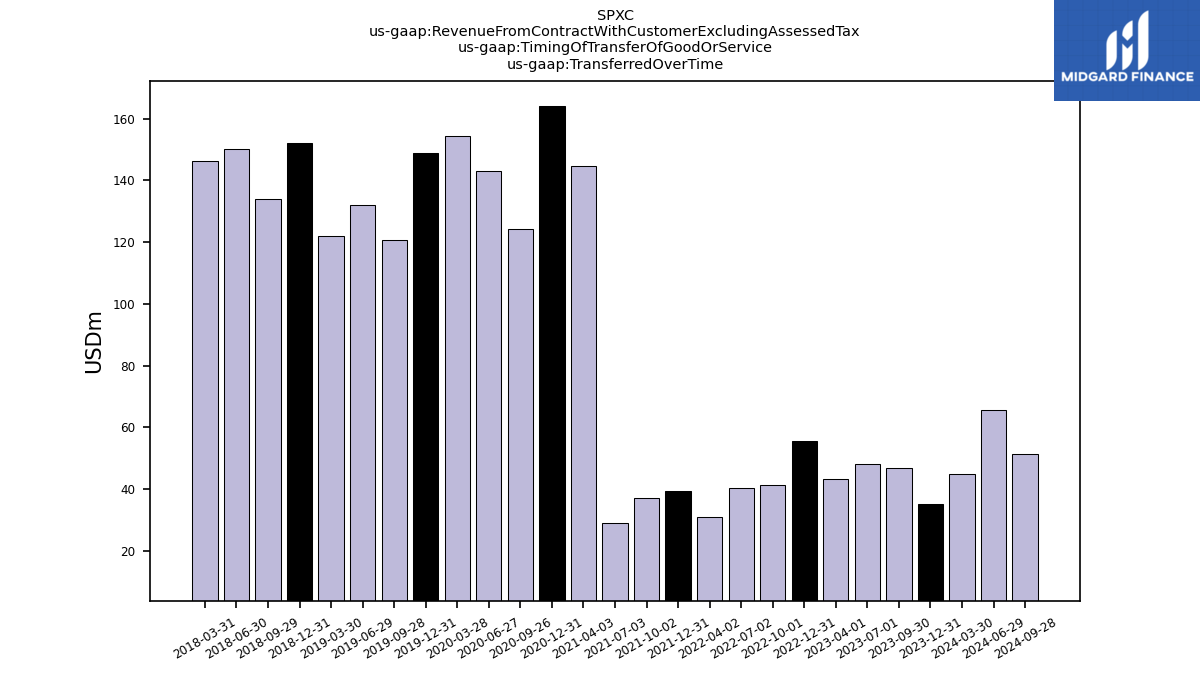
| Revenue From Contract With Customer Excluding Assessed Tax | 469.40 | 448.70 | 423.30 | 399.80 | 429.30 | 370.50 | 354.00 | 307.10 | 350.00 | 285.80 | 296.70 | 398.50 | 348.30 | 363.40 | 373.20 | 369.30 | 444.60 | 364.80 | 372.40 | 343.60 | 445.00 | 362.50 | 379.20 | 351.90 | 387.00 | 348.50 | 349.70 | 340.60 | 395.30 | 385.20 | 412.90 | 389.30 | 509.50 | 374.10 | 1074.40 | 946.90 | 1277.70 | 1158.10 | 1179.70 | 1069.40 | 1319.00 | 1145.80 | 1216.60 | 1133.70 | 1366.00 | 1249.40 | 1260.30 | 1165.20 | 1491.70 | 1387.20 | 1384.00 | 1199.00 | 1325.00 | 1288.40 | 1188.80 | 1084.60 | |
| Operating | 469.40 | 448.70 | 423.30 | 399.80 | 429.30 | 370.50 | 354.00 | 307.10 | 349.10 | 285.80 | 296.70 | 398.50 | 453.60 | 363.40 | 258.00 | 367.40 | 440.10 | 364.80 | NA | NA | NA | NA | NA | NA | NA | NA | NA | NA | NA | NA | NA | NA | NA | NA | NA | NA | NA | NA | NA | NA | NA | NA | NA | NA | NA | NA | NA | NA | NA | NA | NA | NA | NA | NA | NA | NA | |
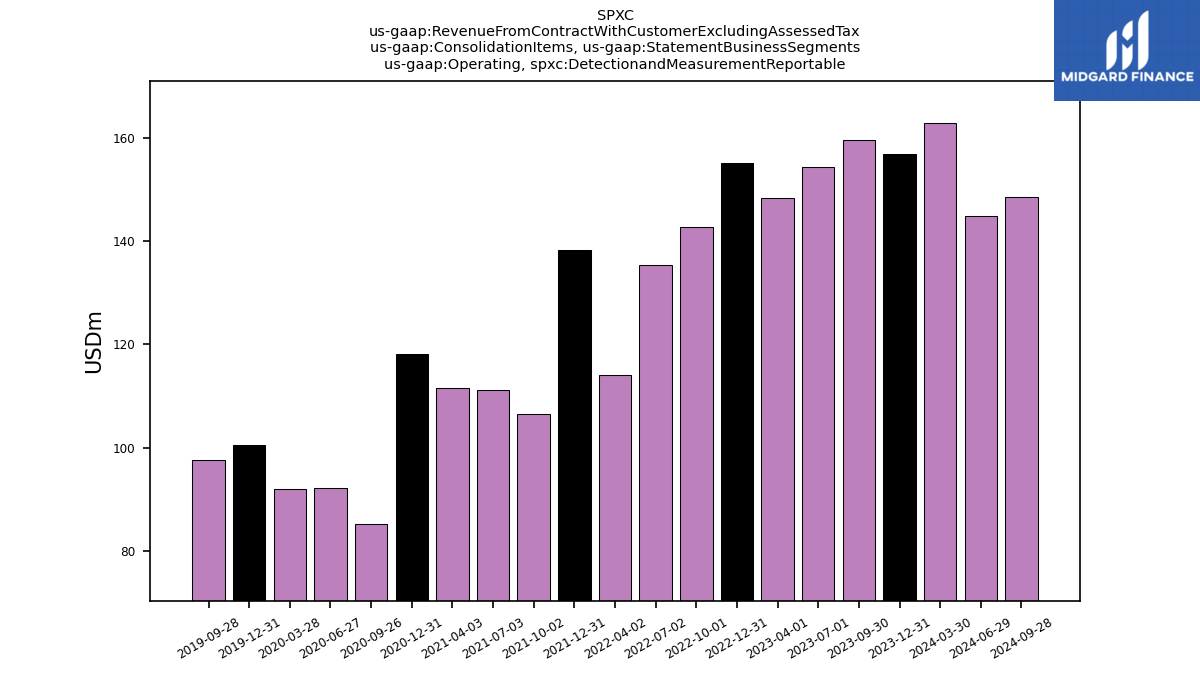
| Operating, Detectionand Measurement Reportable | 156.90 | 159.50 | 154.30 | 148.20 | 155.10 | 142.70 | 135.30 | 114.00 | 138.20 | 106.40 | 111.20 | 111.60 | 118.10 | 85.20 | 92.10 | 91.90 | 100.50 | 97.60 | NA | NA | NA | NA | NA | NA | NA | NA | NA | NA | NA | NA | NA | NA | NA | NA | NA | NA | NA | NA | NA | NA | NA | NA | NA | NA | NA | NA | NA | NA | NA | NA | NA | NA | NA | NA | NA | NA | |
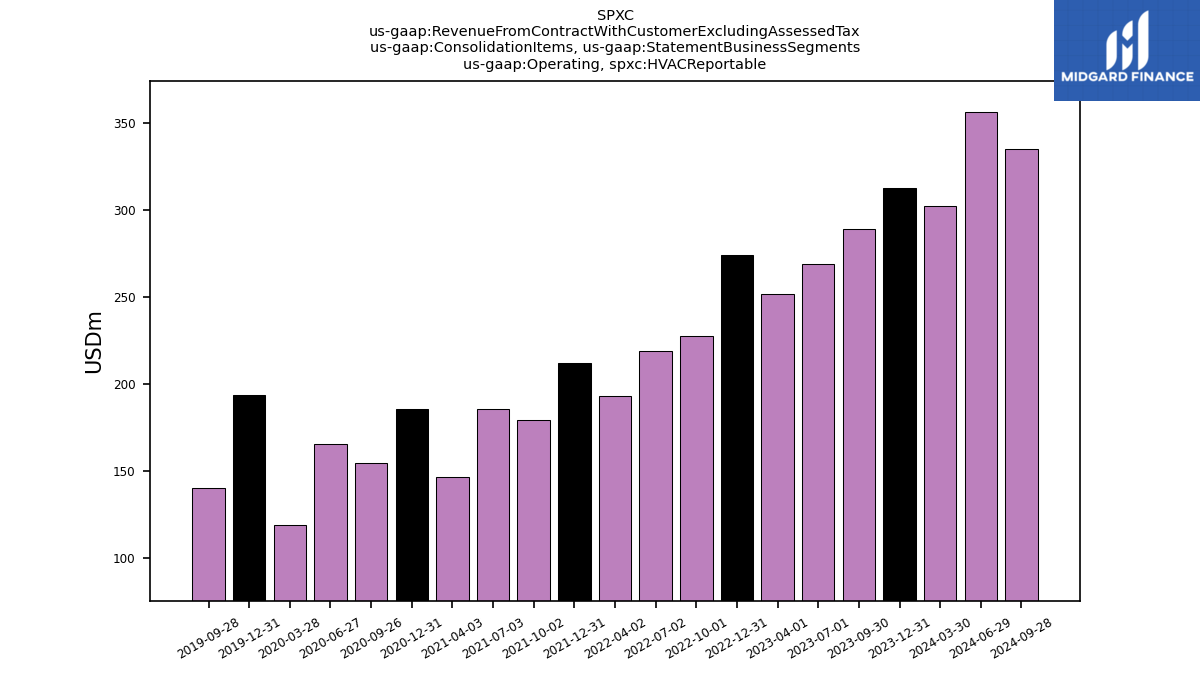
| Operating, H V A C Reportable | 312.50 | 289.20 | 269.00 | 251.60 | 274.20 | 227.80 | 218.70 | 193.10 | 211.80 | 179.30 | 185.40 | 146.50 | 185.30 | 154.60 | 165.20 | 118.50 | 193.80 | 140.10 | NA | NA | NA | NA | NA | NA | NA | NA | NA | NA | NA | NA | NA | NA | NA | NA | NA | NA | NA | NA | NA | NA | NA | NA | NA | NA | NA | NA | NA | NA | NA | NA | NA | NA | NA | NA | NA | NA | |
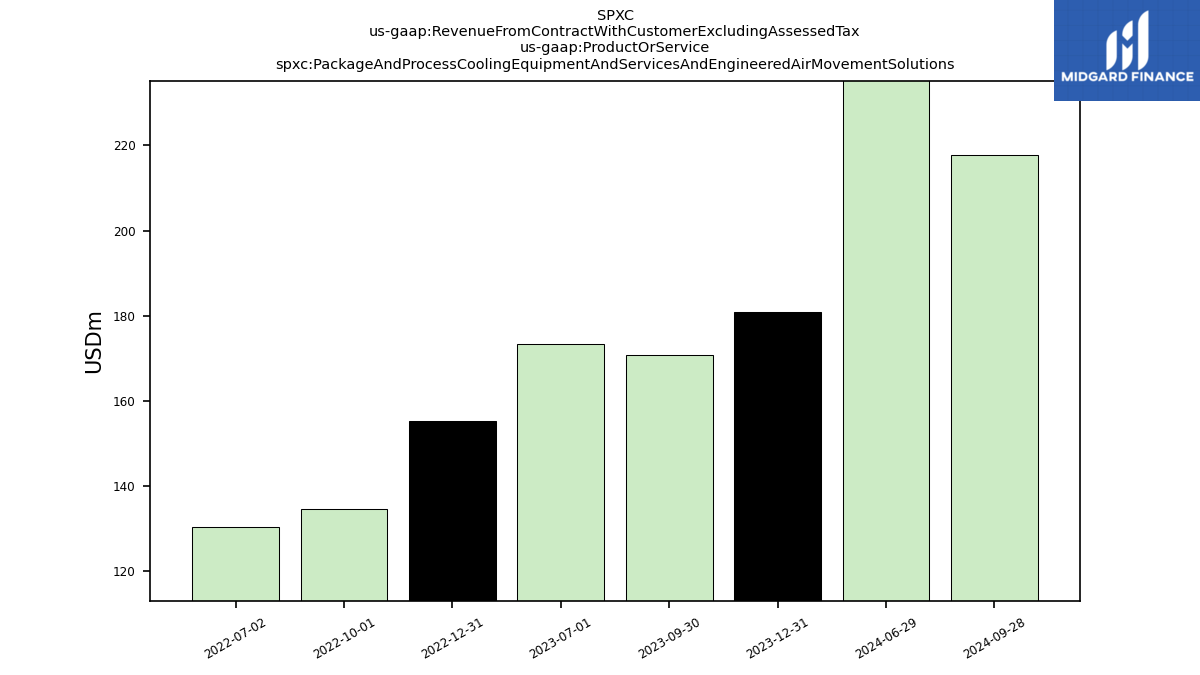
| Package And Process Cooling Equipment And Services And Engineered Air Movement Solutions | 180.80 | 170.80 | 173.30 | NA | 155.20 | 134.50 | 130.50 | NA | NA | NA | NA | NA | NA | NA | NA | NA | NA | NA | NA | NA | NA | NA | NA | NA | NA | NA | NA | NA | NA | NA | NA | NA | NA | NA | NA | NA | NA | NA | NA | NA | NA | NA | NA | NA | NA | NA | NA | NA | NA | NA | NA | NA | NA | NA | NA | NA | |
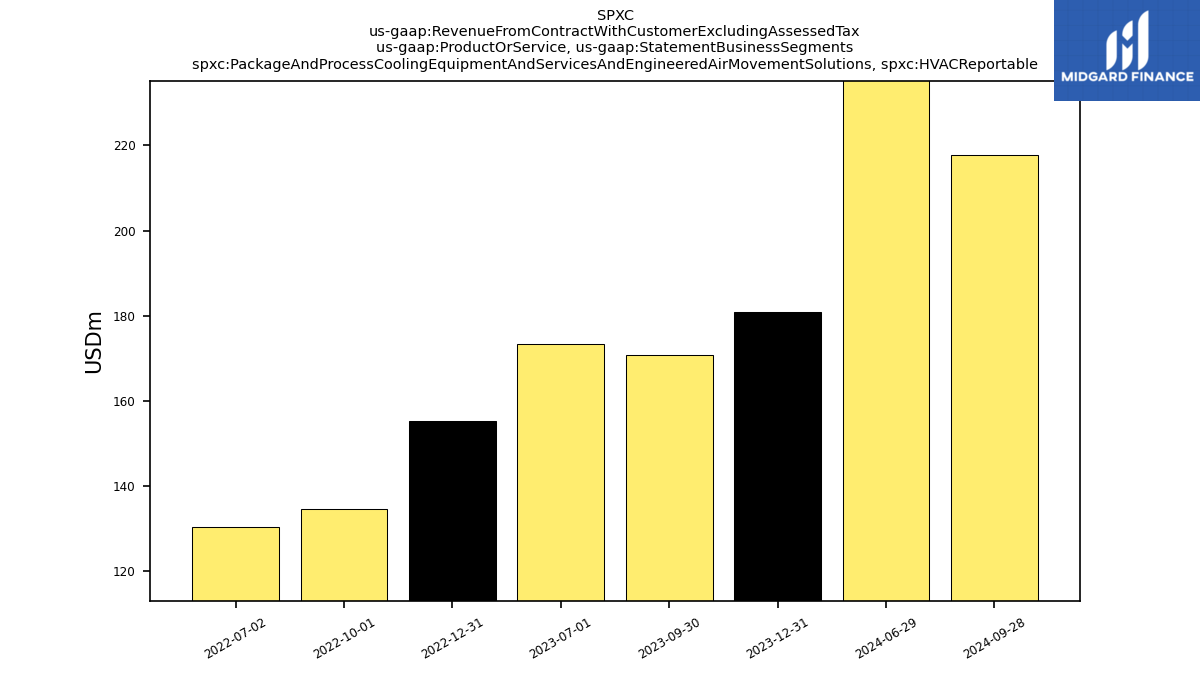
| Package And Process Cooling Equipment And Services And Engineered Air Movement Solutions, H V A C Reportable | 180.80 | 170.80 | 173.30 | NA | 155.20 | 134.50 | 130.50 | NA | NA | NA | NA | NA | NA | NA | NA | NA | NA | NA | NA | NA | NA | NA | NA | NA | NA | NA | NA | NA | NA | NA | NA | NA | NA | NA | NA | NA | NA | NA | NA | NA | NA | NA | NA | NA | NA | NA | NA | NA | NA | NA | NA | NA | NA | NA | NA | NA | |
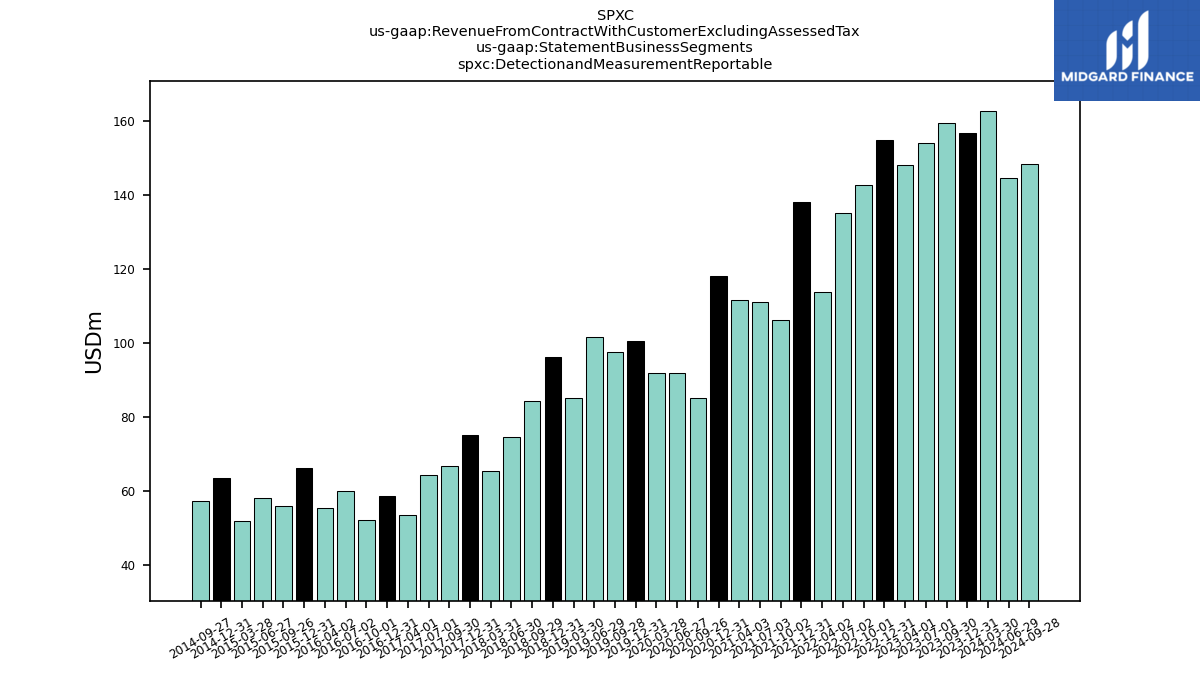
| Detectionand Measurement Reportable | 156.90 | 159.50 | 154.30 | 148.20 | 155.10 | 142.70 | 135.30 | 114.00 | 138.20 | 106.40 | 111.20 | 111.60 | 118.10 | 85.20 | 92.10 | 91.90 | 100.50 | 97.60 | 101.70 | 85.10 | 96.40 | 84.30 | 74.60 | 65.60 | 75.30 | 66.90 | 64.50 | 53.60 | 58.60 | 52.30 | 60.10 | 55.40 | 66.30 | 55.90 | 58.20 | 51.90 | 63.70 | 57.30 | NA | NA | NA | NA | NA | NA | NA | NA | NA | NA | NA | NA | NA | NA | NA | NA | NA | NA | |
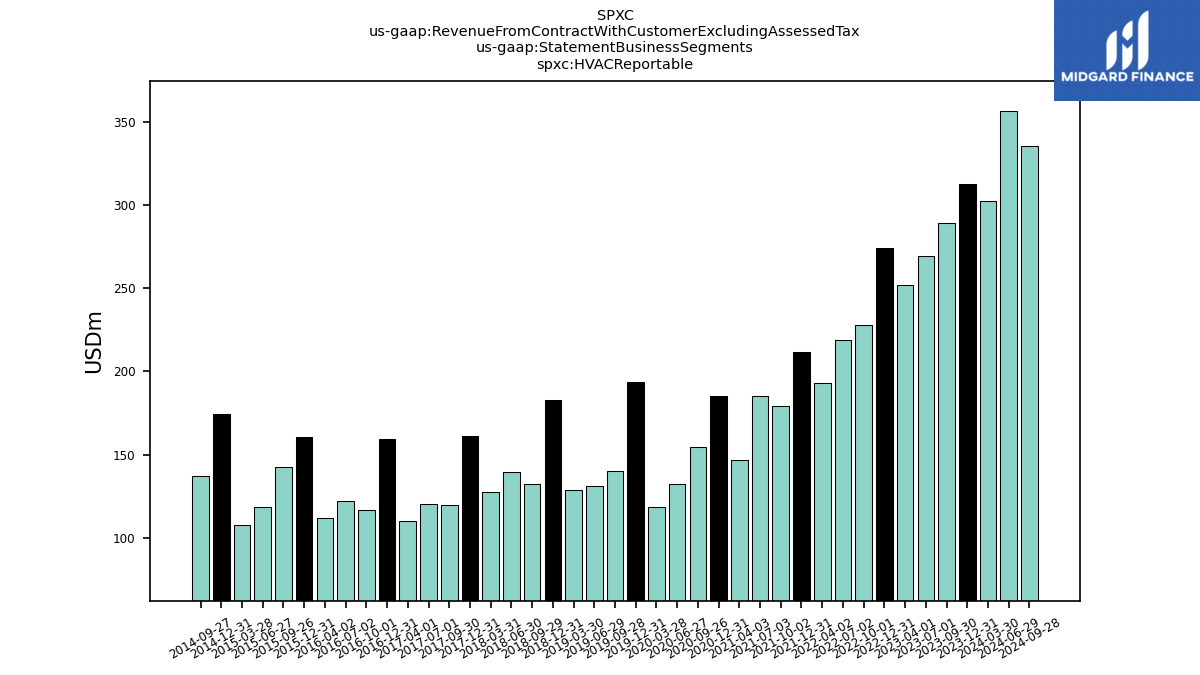
| H V A C Reportable | 312.50 | 289.20 | 269.00 | 251.60 | 274.20 | 227.80 | 218.70 | 193.10 | 211.80 | 179.30 | 185.40 | 146.50 | 185.30 | 154.60 | 132.30 | 118.50 | 193.80 | 140.10 | 130.90 | 128.40 | 182.70 | 132.00 | 139.70 | 127.70 | 161.20 | 119.40 | 120.30 | 110.10 | 159.10 | 116.90 | 121.90 | 111.60 | 160.40 | 142.70 | 118.30 | 107.70 | 174.60 | 137.40 | NA | NA | NA | NA | NA | NA | NA | NA | NA | NA | NA | NA | NA | NA | NA | NA | NA | NA | |
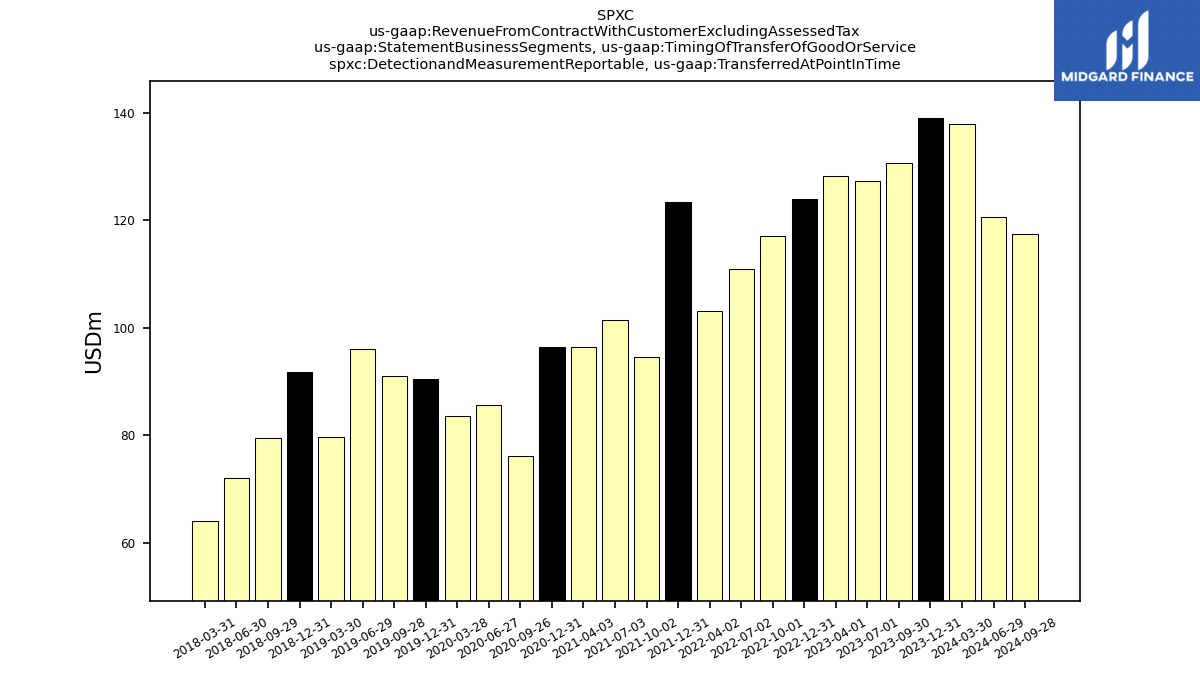
| Detectionand Measurement Reportable, Transferred At Point In Time | 139.00 | 130.70 | 127.30 | 128.20 | 123.90 | 117.10 | 110.90 | 103.20 | 123.40 | 94.50 | 101.50 | 96.50 | 96.50 | 76.20 | 85.70 | 83.50 | 90.40 | 91.00 | 96.10 | 79.60 | 91.70 | 79.50 | 72.10 | 64.00 | NA | NA | NA | NA | NA | NA | NA | NA | NA | NA | NA | NA | NA | NA | NA | NA | NA | NA | NA | NA | NA | NA | NA | NA | NA | NA | NA | NA | NA | NA | NA | NA | |
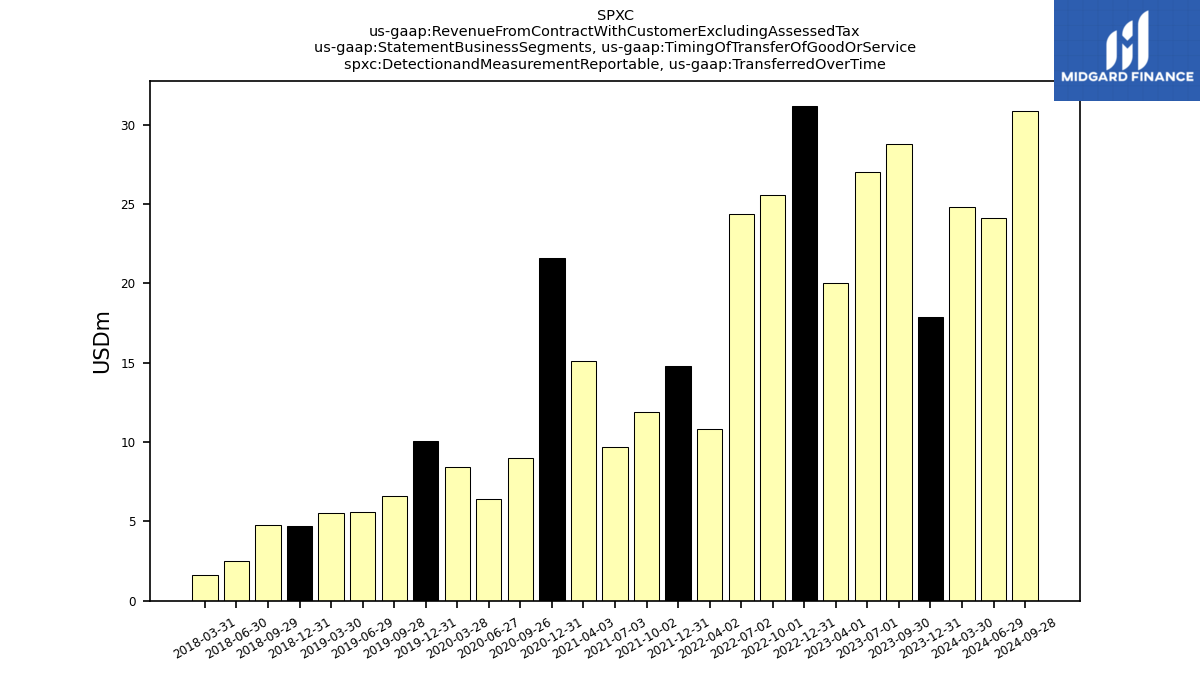
| Detectionand Measurement Reportable, Transferred Over Time | 17.90 | 28.80 | 27.00 | 20.00 | 31.20 | 25.60 | 24.40 | 10.80 | 14.80 | 11.90 | 9.70 | 15.10 | 21.60 | 9.00 | 6.40 | 8.40 | 10.10 | 6.60 | 5.60 | 5.50 | 4.70 | 4.80 | 2.50 | 1.60 | NA | NA | NA | NA | NA | NA | NA | NA | NA | NA | NA | NA | NA | NA | NA | NA | NA | NA | NA | NA | NA | NA | NA | NA | NA | NA | NA | NA | NA | NA | NA | NA | |
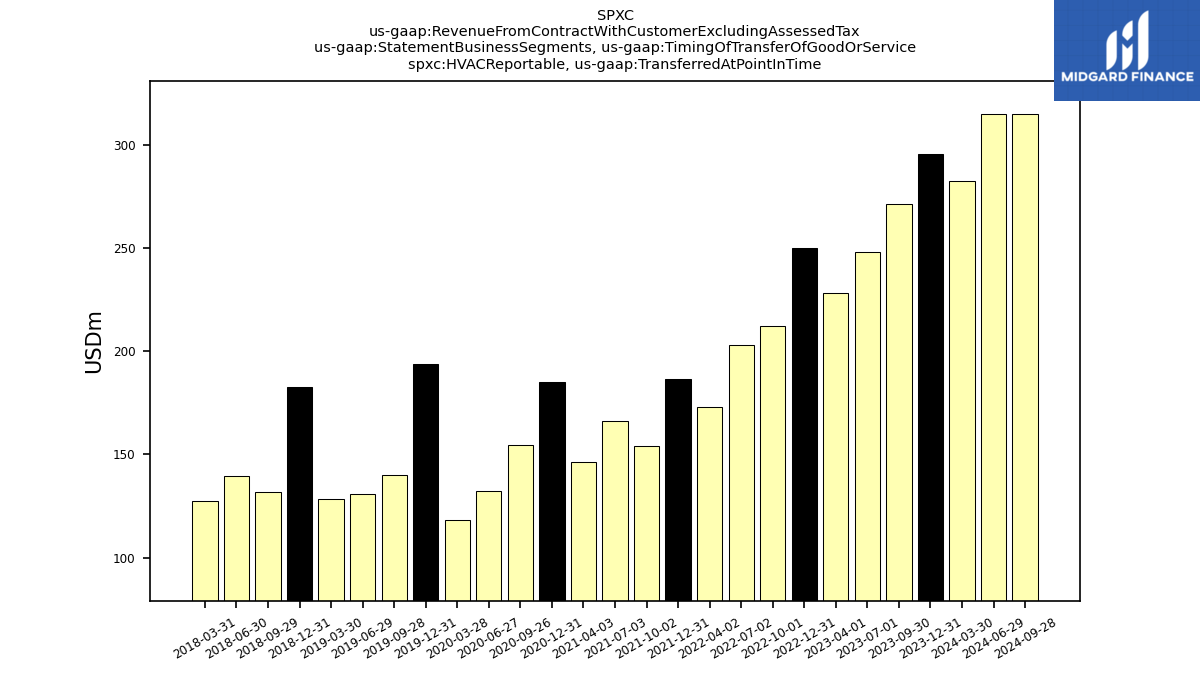
| H V A C Reportable, Transferred At Point In Time | 295.20 | 271.30 | 248.00 | 228.30 | 249.90 | 212.20 | 202.80 | 173.10 | 186.40 | 154.10 | 166.30 | 146.50 | 185.30 | 154.60 | 132.30 | 118.50 | 193.80 | 140.10 | 130.90 | 128.40 | 182.70 | 132.00 | 139.70 | 127.70 | NA | NA | NA | NA | NA | NA | NA | NA | NA | NA | NA | NA | NA | NA | NA | NA | NA | NA | NA | NA | NA | NA | NA | NA | NA | NA | NA | NA | NA | NA | NA | NA | |
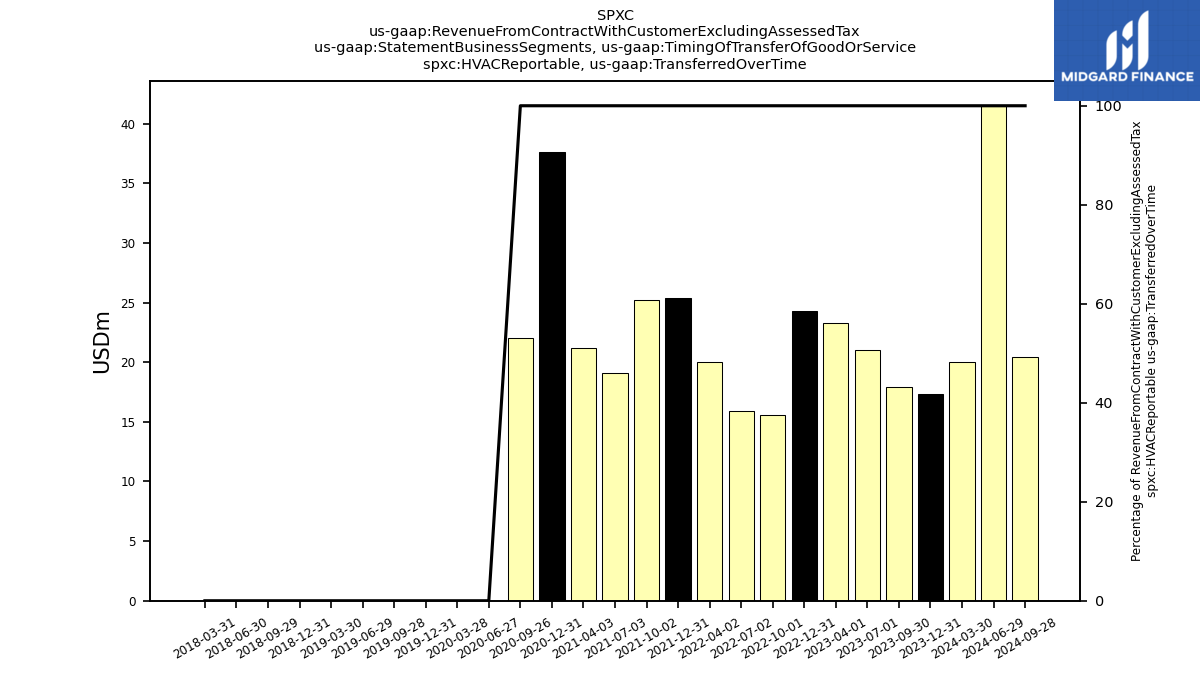
| H V A C Reportable, Transferred Over Time | 17.30 | 17.90 | 21.00 | 23.30 | 24.30 | 15.60 | 15.90 | 20.00 | 25.40 | 25.20 | 19.10 | 21.20 | 37.60 | 22.00 | 0.00 | 0.00 | 0.00 | 0.00 | 0.00 | 0.00 | 0.00 | 0.00 | 0.00 | 0.00 | NA | NA | NA | NA | NA | NA | NA | NA | NA | NA | NA | NA | NA | NA | NA | NA | NA | NA | NA | NA | NA | NA | NA | NA | NA | NA | NA | NA | NA | NA | NA | NA | |
| Transferred At Point In Time | 434.20 | 402.00 | 375.30 | 356.50 | 373.80 | 329.30 | 313.70 | 276.30 | 309.80 | 248.60 | 267.80 | 253.90 | 289.60 | 239.30 | 230.30 | 214.90 | 295.60 | 244.10 | 240.40 | 221.60 | 292.90 | 228.60 | 228.90 | 205.60 | NA | NA | NA | NA | NA | NA | NA | NA | NA | NA | NA | NA | NA | NA | NA | NA | NA | NA | NA | NA | NA | NA | NA | NA | NA | NA | NA | NA | NA | NA | NA | NA | |
| Transferred Over Time | 35.20 | 46.70 | 48.00 | 43.30 | 55.50 | 41.20 | 40.30 | 30.80 | 39.30 | 37.20 | 28.90 | 144.60 | 164.00 | 124.10 | 142.90 | 154.40 | 149.00 | 120.70 | 132.00 | 122.00 | 152.10 | 133.90 | 150.30 | 146.30 | NA | NA | NA | NA | NA | NA | NA | NA | NA | NA | NA | NA | NA | NA | NA | NA | NA | NA | NA | NA | NA | NA | NA | NA | NA | NA | NA | NA | NA | NA | NA | NA |