
| 2023-12-31 | 2023-09-30 | 2023-06-30 | 2023-03-31 | 2022-12-31 | 2022-09-30 | 2022-06-30 | 2022-03-31 | 2021-12-31 | 2021-09-30 | 2021-06-30 | 2021-03-31 | 2020-12-31 | 2020-09-30 | 2020-06-30 | 2020-03-31 | 2019-12-31 | 2019-09-30 | 2019-06-30 | 2019-03-31 | 2018-12-31 | 2018-09-30 | 2018-06-30 | 2018-03-31 | 2017-12-31 | 2017-09-30 | 2017-06-30 | 2017-03-31 | 2016-12-31 | 2016-09-30 | 2016-06-30 | 2016-03-31 | 2015-12-31 | 2015-09-30 | 2015-06-30 | 2015-03-31 | 2014-12-31 | 2014-09-30 | 2014-06-30 | 2014-03-31 | 2013-12-31 | 2013-09-30 | 2013-06-30 | 2013-03-31 | 2012-12-31 | 2012-09-30 | 2012-06-30 | 2012-03-31 | 2011-12-31 | 2011-09-30 | 2011-06-30 | 2011-03-31 | 2010-12-31 | 2010-09-30 | 2010-06-30 | 2010-03-31 | 2009-12-31 | 2009-09-30 | 2009-06-30 | 2009-03-31 | ||
|---|---|---|---|---|---|---|---|---|---|---|---|---|---|---|---|---|---|---|---|---|---|---|---|---|---|---|---|---|---|---|---|---|---|---|---|---|---|---|---|---|---|---|---|---|---|---|---|---|---|---|---|---|---|---|---|---|---|---|---|---|---|
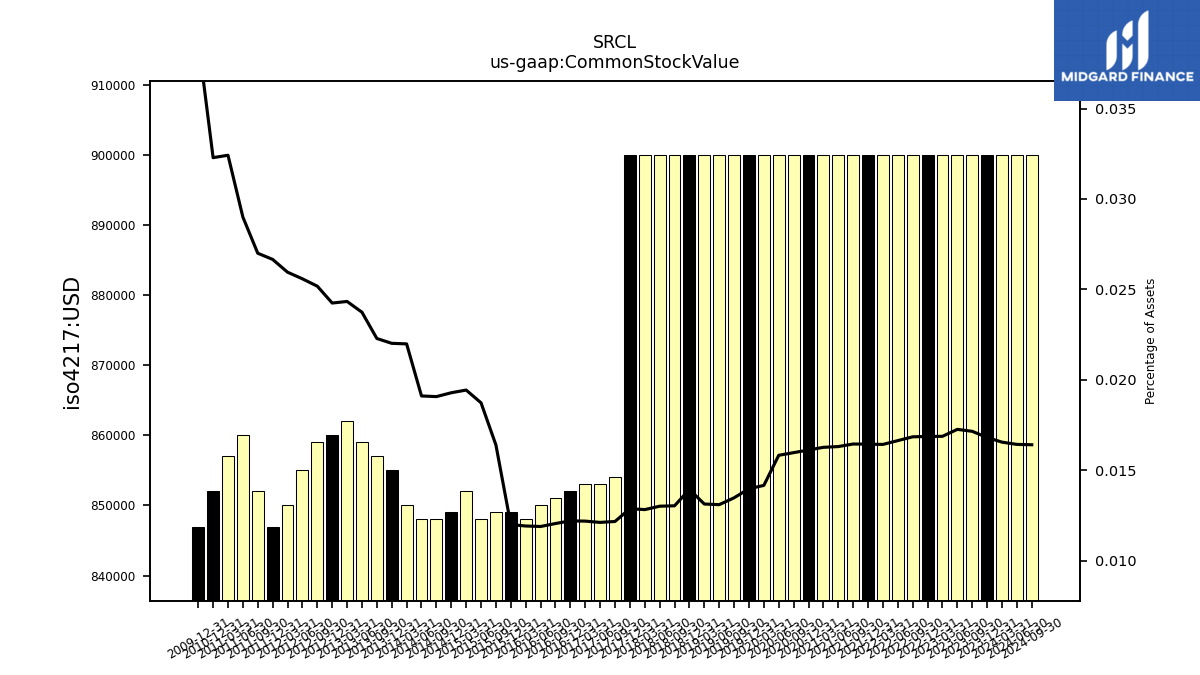
| Common Stock Value | 0.90 | 0.90 | 0.90 | 0.90 | 0.90 | 0.90 | 0.90 | 0.90 | 0.90 | 0.90 | 0.90 | 0.90 | 0.90 | 0.90 | 0.90 | 0.90 | 0.90 | 0.90 | 0.90 | 0.90 | 0.90 | 0.90 | 0.90 | 0.90 | 0.90 | 0.85 | 0.85 | 0.85 | 0.85 | 0.85 | 0.85 | 0.85 | 0.85 | 0.85 | 0.85 | 0.85 | 0.85 | 0.85 | 0.85 | 0.85 | 0.85 | 0.86 | 0.86 | 0.86 | 0.86 | 0.86 | 0.85 | 0.85 | 0.85 | 0.85 | 0.86 | 0.86 | 0.85 | NA | NA | NA | 0.85 | NA | NA | NA | |
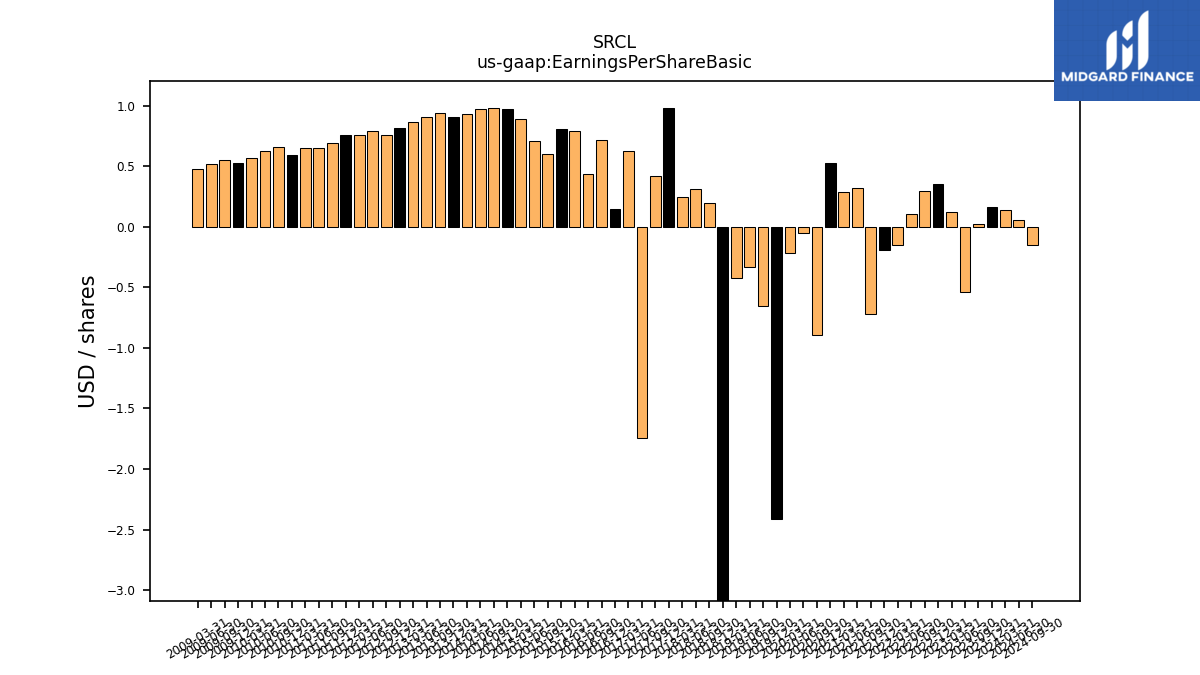
| Earnings Per Share Basic | 0.16 | 0.02 | -0.54 | 0.12 | 0.35 | 0.30 | 0.11 | -0.15 | -0.19 | -0.72 | 0.32 | 0.29 | 0.53 | -0.89 | -0.05 | -0.22 | -2.41 | -0.65 | -0.33 | -0.42 | -3.51 | 0.20 | 0.31 | 0.25 | 0.98 | 0.42 | -1.74 | 0.63 | 0.15 | 0.72 | 0.44 | 0.79 | 0.81 | 0.60 | 0.71 | 0.89 | 0.97 | 0.98 | 0.97 | 0.93 | 0.91 | 0.94 | 0.91 | 0.87 | 0.82 | 0.76 | 0.79 | 0.76 | 0.76 | 0.69 | 0.65 | 0.65 | 0.59 | 0.66 | 0.63 | 0.57 | 0.53 | 0.55 | 0.52 | 0.48 | |
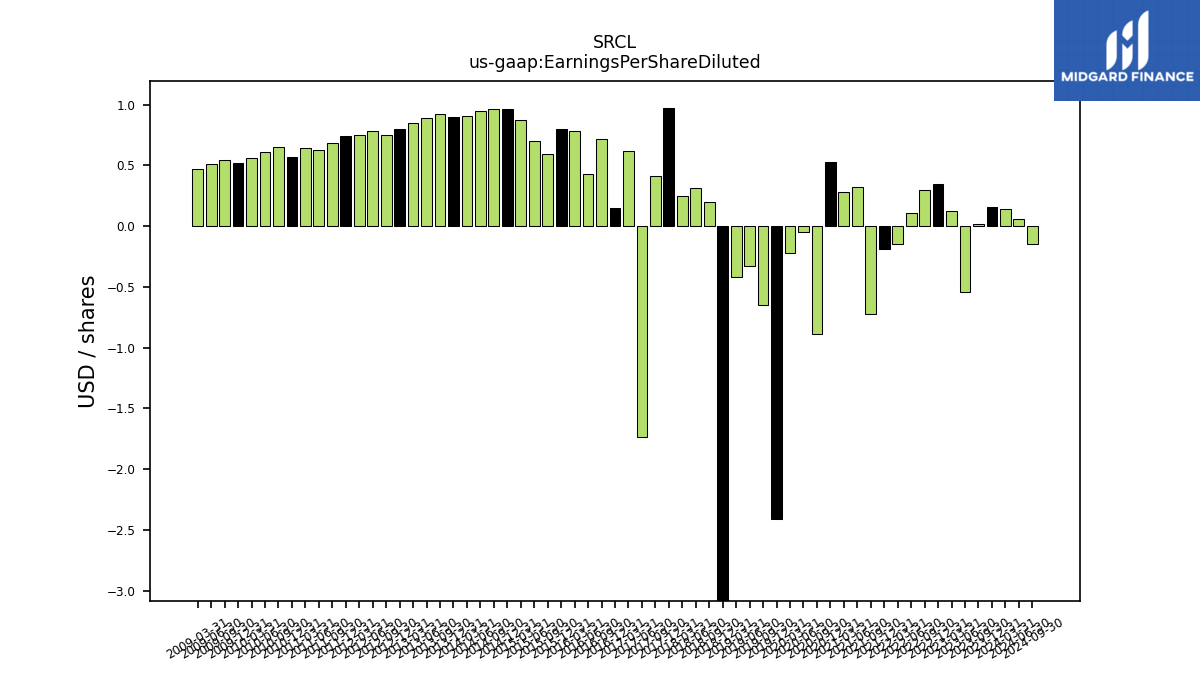
| Earnings Per Share Diluted | 0.16 | 0.02 | -0.54 | 0.12 | 0.35 | 0.30 | 0.11 | -0.15 | -0.19 | -0.72 | 0.32 | 0.28 | 0.53 | -0.89 | -0.05 | -0.22 | -2.41 | -0.65 | -0.33 | -0.42 | -3.51 | 0.20 | 0.31 | 0.25 | 0.97 | 0.41 | -1.74 | 0.62 | 0.15 | 0.72 | 0.43 | 0.78 | 0.80 | 0.59 | 0.70 | 0.87 | 0.96 | 0.96 | 0.95 | 0.91 | 0.90 | 0.92 | 0.89 | 0.85 | 0.80 | 0.75 | 0.78 | 0.75 | 0.74 | 0.68 | 0.63 | 0.64 | 0.57 | 0.65 | 0.61 | 0.56 | 0.52 | 0.54 | 0.51 | 0.47 |
| 2023-12-31 | 2023-09-30 | 2023-06-30 | 2023-03-31 | 2022-12-31 | 2022-09-30 | 2022-06-30 | 2022-03-31 | 2021-12-31 | 2021-09-30 | 2021-06-30 | 2021-03-31 | 2020-12-31 | 2020-09-30 | 2020-06-30 | 2020-03-31 | 2019-12-31 | 2019-09-30 | 2019-06-30 | 2019-03-31 | 2018-12-31 | 2018-09-30 | 2018-06-30 | 2018-03-31 | 2017-12-31 | 2017-09-30 | 2017-06-30 | 2017-03-31 | 2016-12-31 | 2016-09-30 | 2016-06-30 | 2016-03-31 | 2015-12-31 | 2015-09-30 | 2015-06-30 | 2015-03-31 | 2014-12-31 | 2014-09-30 | 2014-06-30 | 2014-03-31 | 2013-12-31 | 2013-09-30 | 2013-06-30 | 2013-03-31 | 2012-12-31 | 2012-09-30 | 2012-06-30 | 2012-03-31 | 2011-12-31 | 2011-09-30 | 2011-06-30 | 2011-03-31 | 2010-12-31 | 2010-09-30 | 2010-06-30 | 2010-03-31 | 2009-12-31 | 2009-09-30 | 2009-06-30 | 2009-03-31 | ||
|---|---|---|---|---|---|---|---|---|---|---|---|---|---|---|---|---|---|---|---|---|---|---|---|---|---|---|---|---|---|---|---|---|---|---|---|---|---|---|---|---|---|---|---|---|---|---|---|---|---|---|---|---|---|---|---|---|---|---|---|---|---|
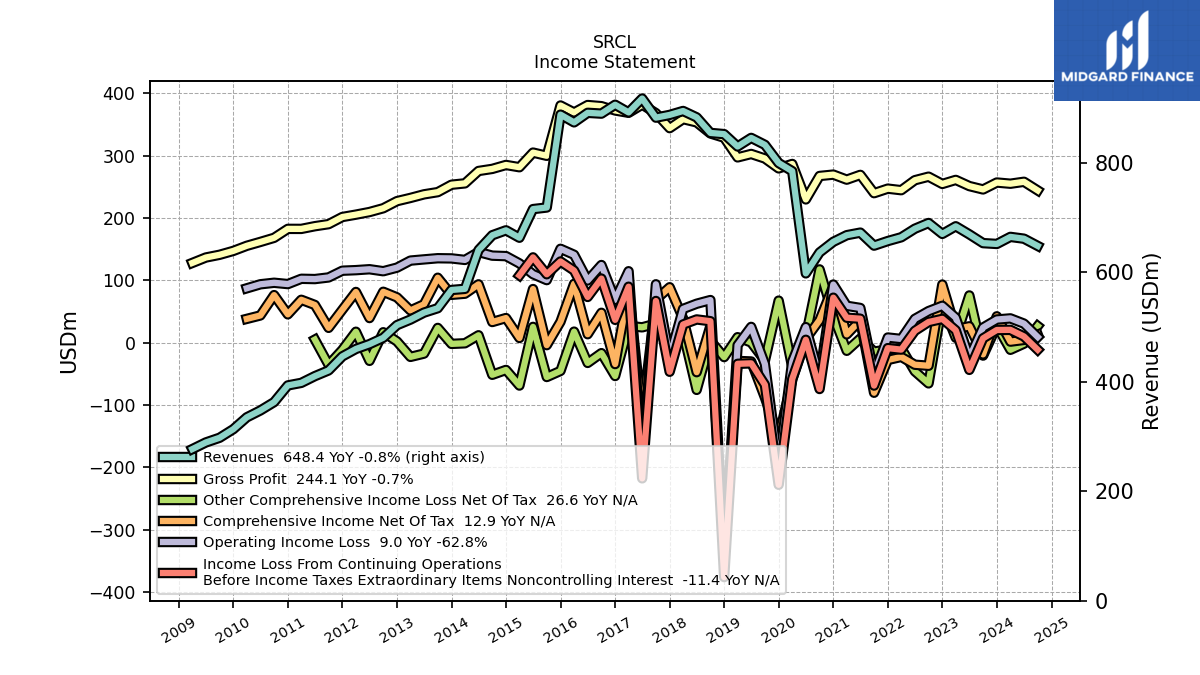
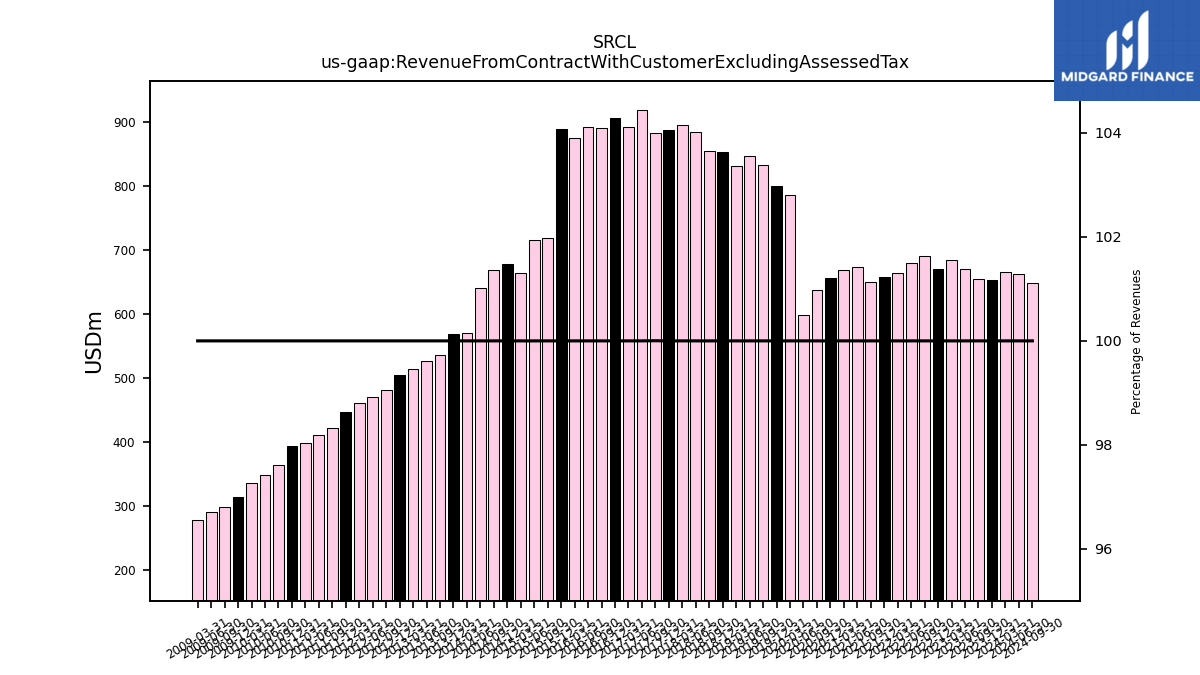
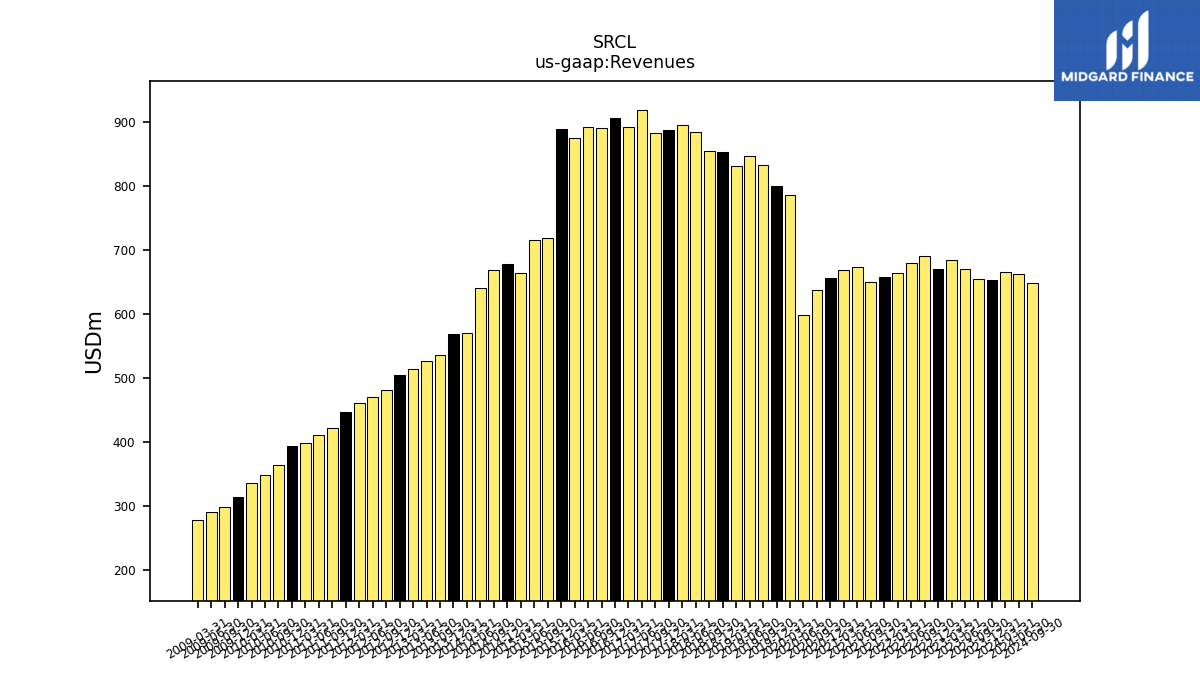
| Revenue From Contract With Customer Excluding Assessed Tax | 652.00 | 653.50 | 669.50 | 684.30 | 670.30 | 690.30 | 679.80 | 664.20 | 657.30 | 648.90 | 672.70 | 668.00 | 655.90 | 636.40 | 598.20 | 785.00 | 799.90 | 833.10 | 845.80 | 830.10 | 852.70 | 854.90 | 883.30 | 895.00 | 887.80 | 882.80 | 917.73 | 892.40 | 906.40 | 890.14 | 891.62 | 874.18 | 888.30 | 718.60 | 715.69 | 663.32 | 676.95 | 667.88 | 640.82 | 569.96 | 567.90 | 534.58 | 526.52 | 513.80 | 503.64 | 480.48 | 468.95 | 460.08 | 446.56 | 420.92 | 410.44 | 398.13 | 393.49 | 362.99 | 347.73 | 335.18 | 313.54 | 297.84 | 289.27 | 277.09 | |
| Revenues | 652.00 | 653.50 | 669.50 | 684.30 | 670.30 | 690.30 | 679.80 | 664.20 | 657.30 | 648.90 | 672.70 | 668.00 | 655.90 | 636.40 | 598.20 | 785.00 | 799.90 | 833.10 | 845.80 | 830.10 | 852.70 | 854.90 | 883.30 | 895.00 | 887.80 | 882.77 | 917.73 | 892.40 | 906.40 | 890.14 | 891.62 | 874.18 | 888.30 | 718.60 | 715.69 | 663.32 | 676.95 | 667.88 | 640.82 | 569.96 | 567.90 | 534.58 | 526.52 | 513.80 | 503.64 | 480.48 | 468.95 | 460.08 | 446.56 | 420.92 | 410.44 | 398.13 | 393.49 | 362.99 | 347.73 | 335.18 | 313.54 | 297.84 | 289.27 | 277.09 | |
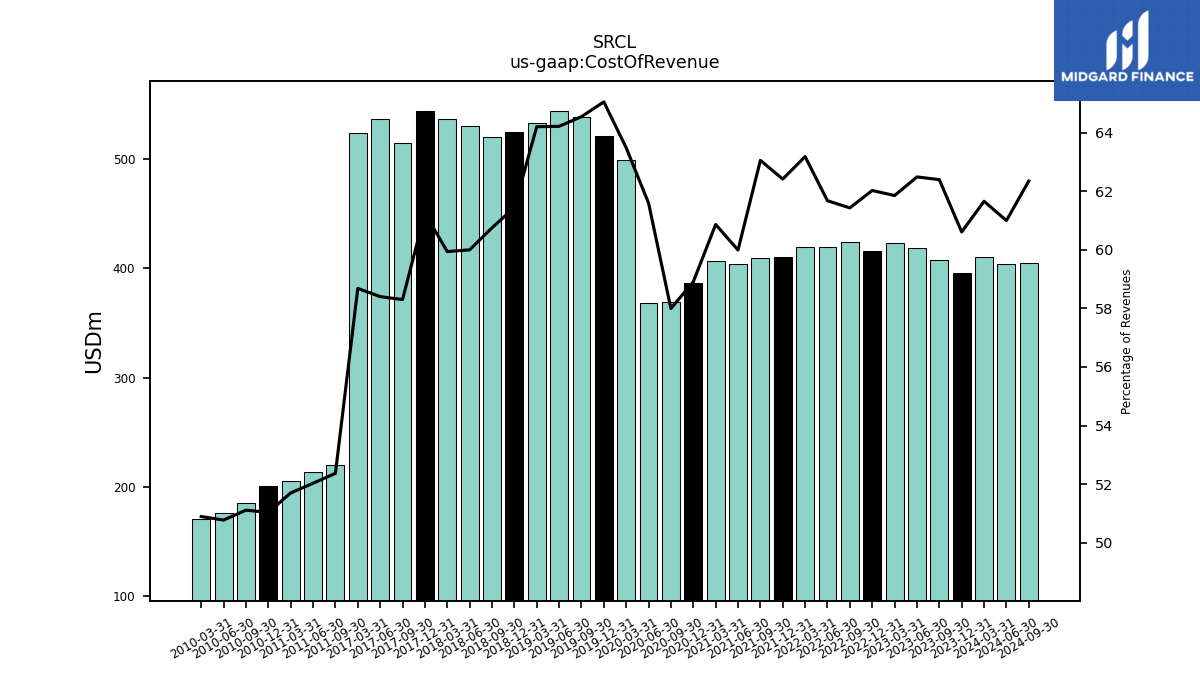
| Cost Of Revenue | 395.20 | 407.80 | 418.40 | 423.30 | 415.80 | 424.10 | 419.30 | 419.70 | 410.30 | 409.20 | 403.60 | 406.60 | 386.40 | 369.10 | 368.50 | 498.40 | 520.40 | 537.80 | 543.20 | 533.00 | 524.00 | 519.40 | 530.00 | 536.50 | 543.80 | 514.70 | 536.00 | 523.70 | NA | NA | NA | NA | NA | NA | NA | NA | NA | NA | NA | NA | NA | NA | NA | NA | NA | NA | NA | NA | NA | 220.42 | 213.54 | 205.82 | 200.79 | 185.51 | 176.54 | 170.57 | NA | NA | NA | NA | |
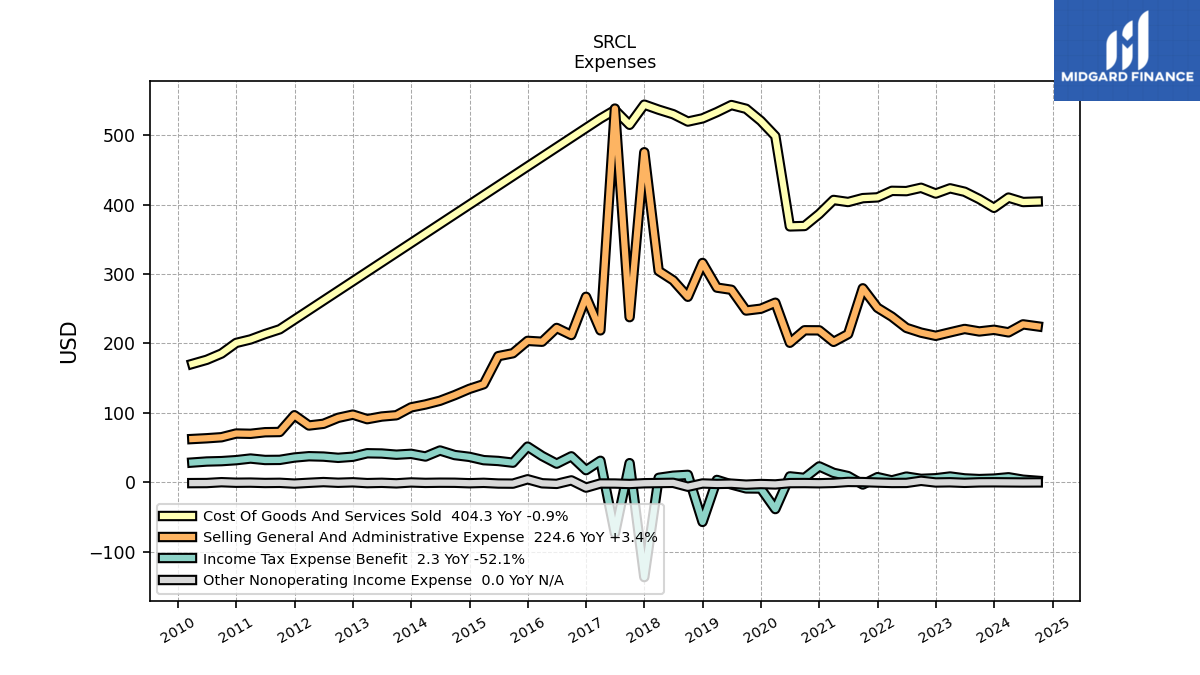
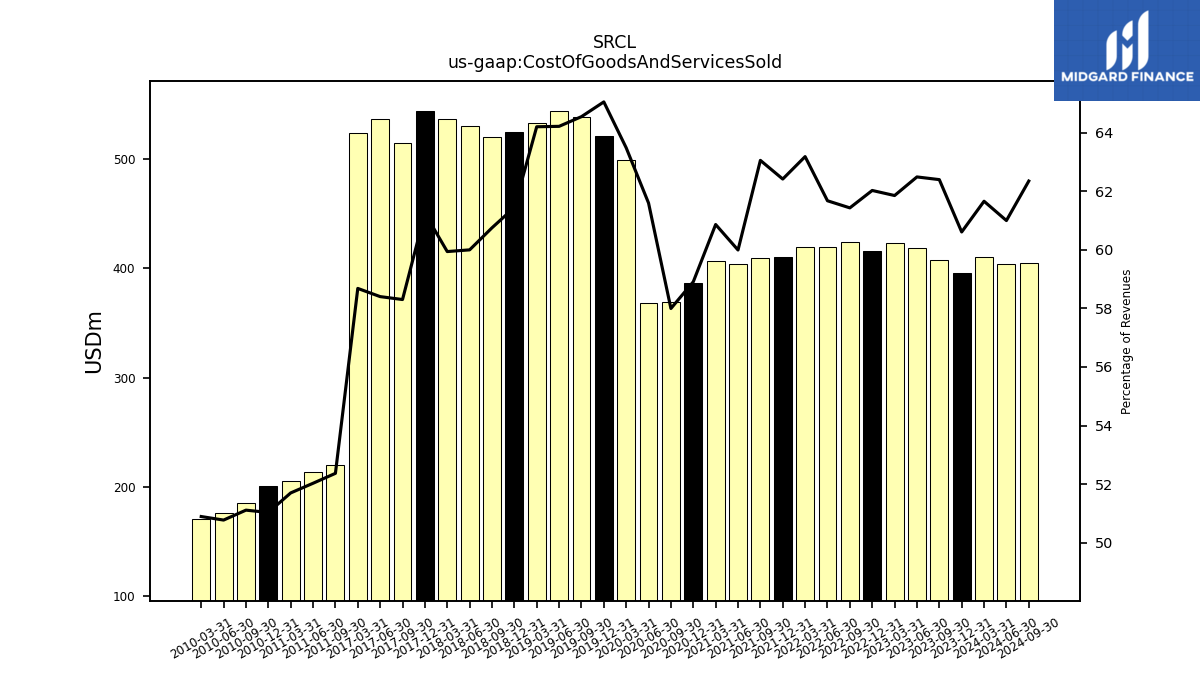
| Cost Of Goods And Services Sold | 395.20 | 407.80 | 418.40 | 423.30 | 415.80 | 424.10 | 419.30 | 419.70 | 410.30 | 409.20 | 403.60 | 406.60 | 386.40 | 369.10 | 368.50 | 498.40 | 520.40 | 537.80 | 543.20 | 533.00 | 524.00 | 519.40 | 530.00 | 536.50 | 543.80 | 514.70 | 536.00 | 523.70 | NA | NA | NA | NA | NA | NA | NA | NA | NA | NA | NA | NA | NA | NA | NA | NA | NA | NA | NA | NA | NA | 220.42 | 213.54 | 205.82 | 200.79 | 185.51 | 176.54 | 170.57 | NA | NA | NA | NA | |
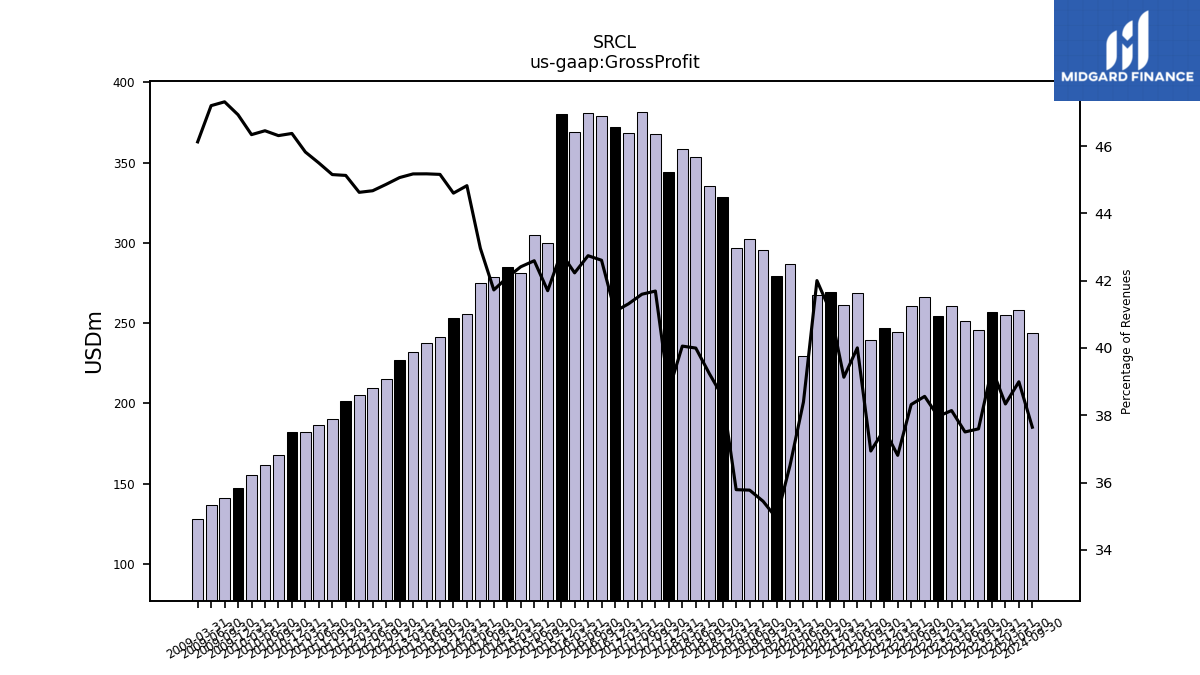
| Gross Profit | 256.80 | 245.70 | 251.10 | 261.00 | 254.50 | 266.20 | 260.50 | 244.50 | 247.00 | 239.70 | 269.10 | 261.40 | 269.50 | 267.30 | 229.70 | 286.60 | 279.50 | 295.30 | 302.60 | 297.10 | 328.70 | 335.50 | 353.30 | 358.50 | 344.00 | 368.04 | 381.75 | 368.66 | 372.42 | 379.26 | 381.10 | 369.18 | 380.36 | 299.68 | 304.82 | 281.33 | 284.97 | 278.67 | 275.30 | 255.47 | 253.28 | 241.40 | 237.85 | 232.09 | 226.96 | 215.55 | 209.49 | 205.31 | 201.52 | 190.06 | 186.74 | 182.43 | 182.47 | 168.10 | 161.54 | 155.32 | 147.14 | 140.92 | 136.53 | 127.80 | |
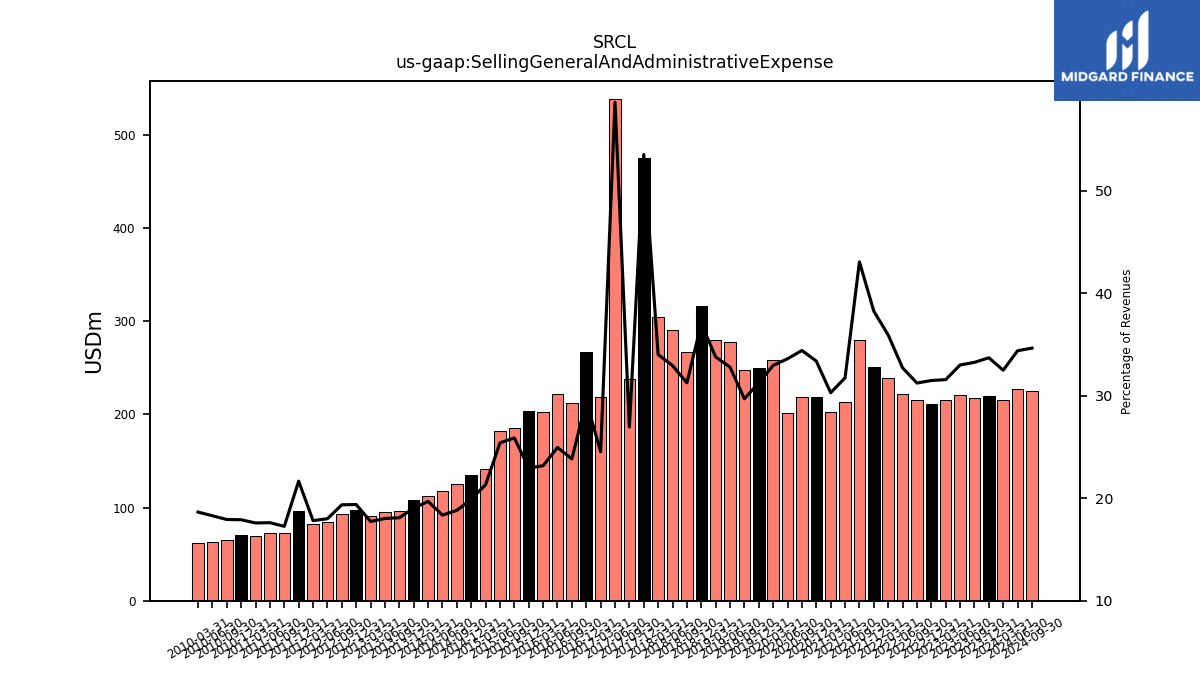
| Selling General And Administrative Expense | 219.70 | 217.30 | 220.90 | 216.00 | 211.00 | 215.60 | 222.40 | 238.60 | 251.40 | 279.40 | 213.50 | 202.30 | 218.90 | 219.00 | 201.00 | 258.70 | 250.00 | 247.40 | 277.30 | 280.40 | 315.90 | 267.20 | 290.90 | 304.40 | 475.29 | 237.81 | 538.15 | 218.84 | 267.20 | 212.12 | 222.38 | 202.49 | 203.76 | 185.93 | 181.75 | 141.36 | 134.61 | 125.60 | 117.55 | 112.18 | 108.03 | 96.69 | 94.84 | 91.05 | 97.57 | 92.97 | 84.36 | 81.92 | 96.71 | 72.58 | 72.26 | 69.97 | 70.39 | 65.03 | 63.56 | 62.47 | NA | NA | NA | NA | |
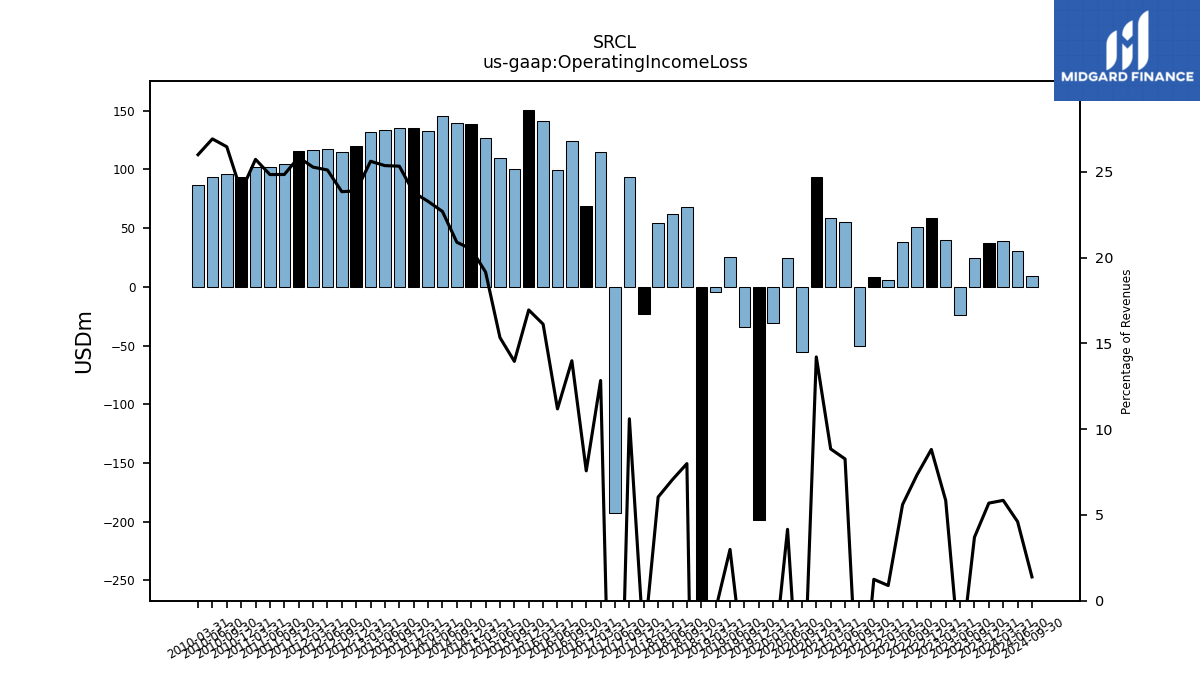
| Operating Income Loss | 37.10 | 24.20 | -24.00 | 40.00 | 59.10 | 50.60 | 38.10 | 5.90 | 8.20 | -50.60 | 55.60 | 59.10 | 93.20 | -55.80 | 24.90 | -30.40 | -198.50 | -34.50 | 25.30 | -4.20 | -345.90 | 68.30 | 62.40 | 54.10 | -23.40 | 93.60 | -192.35 | 114.55 | 68.63 | 124.52 | 99.71 | 140.92 | 150.54 | 100.26 | 109.76 | 127.05 | 138.76 | 139.54 | 145.38 | 132.66 | 135.11 | 135.40 | 133.52 | 131.60 | 120.30 | 114.55 | 117.73 | 116.26 | 115.38 | 104.57 | 101.95 | 102.41 | 93.91 | 96.04 | 93.60 | 87.13 | NA | NA | NA | NA | |
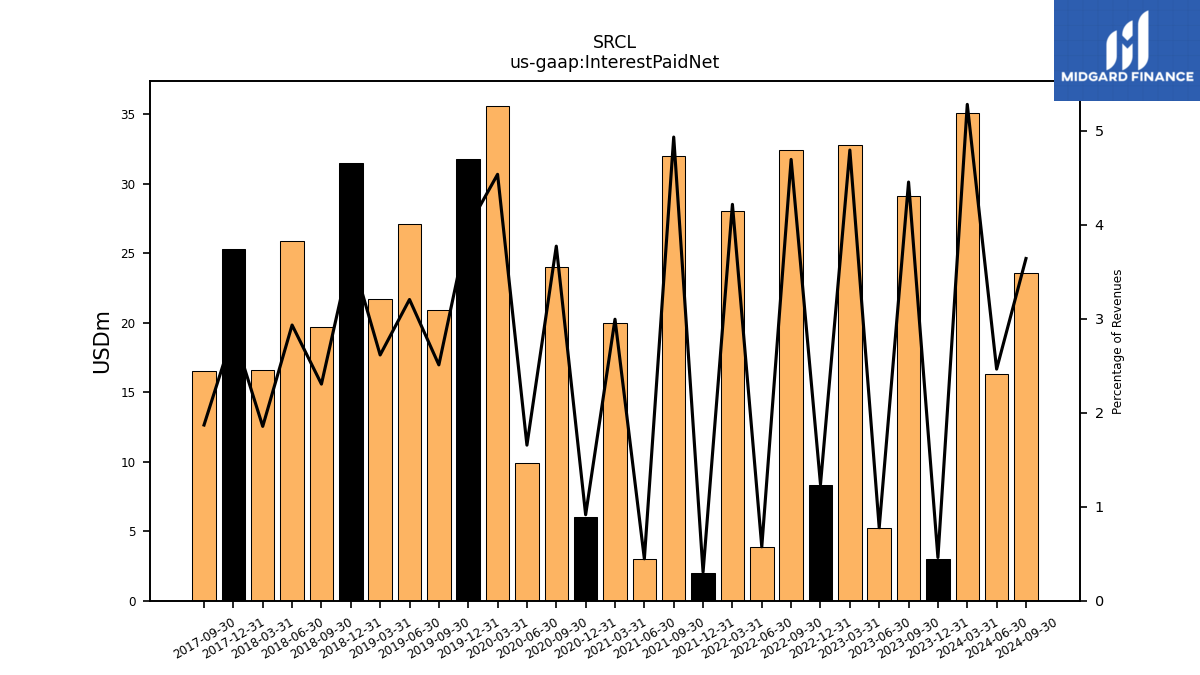
| Interest Paid Net | 3.00 | 29.10 | 5.20 | 32.80 | 8.30 | 32.40 | 3.90 | 28.00 | 2.00 | 32.00 | 3.00 | 20.00 | 6.00 | 24.00 | 9.90 | 35.60 | 31.80 | 20.90 | 27.10 | 21.70 | 31.50 | 19.70 | 25.90 | 16.60 | 25.30 | 16.50 | NA | NA | NA | NA | NA | NA | NA | NA | NA | NA | NA | NA | NA | NA | NA | NA | NA | NA | NA | NA | NA | NA | NA | NA | NA | NA | NA | NA | NA | NA | NA | NA | NA | NA | |
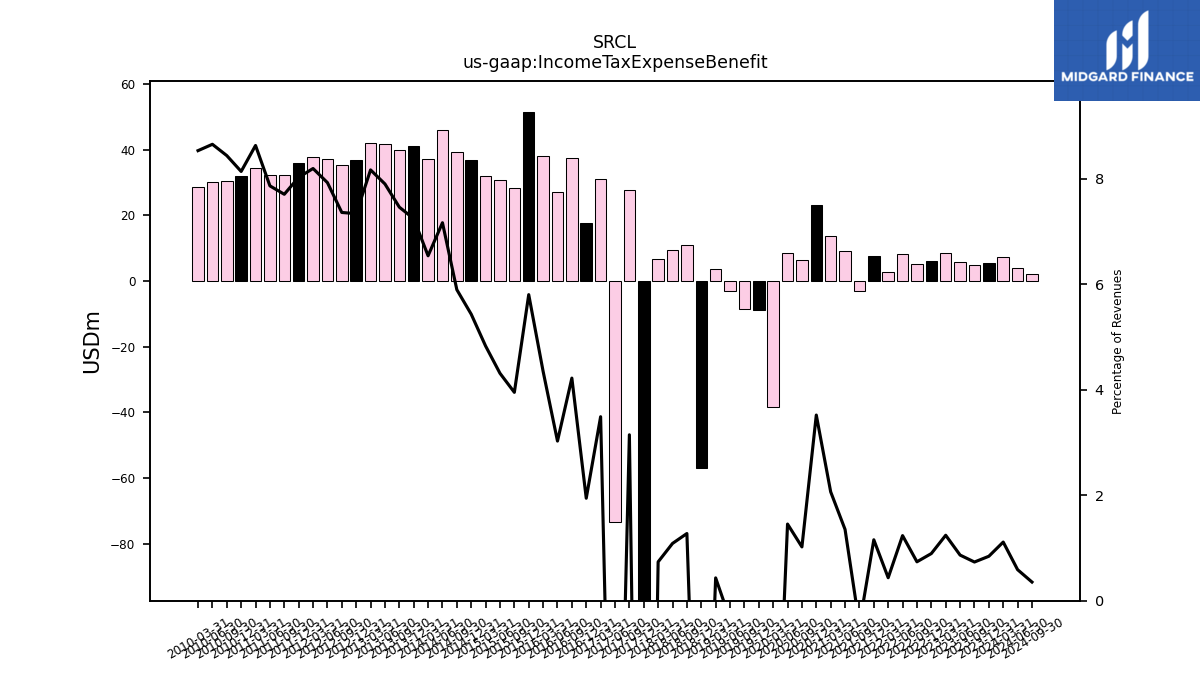
| Income Tax Expense Benefit | 5.50 | 4.80 | 5.80 | 8.50 | 6.00 | 5.10 | 8.40 | 2.90 | 7.60 | -3.00 | 9.10 | 13.80 | 23.10 | 6.50 | 8.70 | -38.40 | -8.80 | -8.60 | -3.00 | 3.60 | -56.90 | 10.90 | 9.60 | 6.60 | -136.31 | 27.78 | -73.51 | 31.15 | 17.62 | 37.59 | 27.00 | 38.04 | 51.57 | 28.40 | 30.87 | 32.05 | 36.79 | 39.40 | 45.94 | 37.29 | 41.15 | 39.91 | 41.62 | 41.98 | 36.97 | 35.38 | 37.19 | 37.72 | 35.86 | 32.45 | 32.30 | 34.38 | 32.04 | 30.64 | 30.10 | 28.61 | NA | NA | NA | NA | |
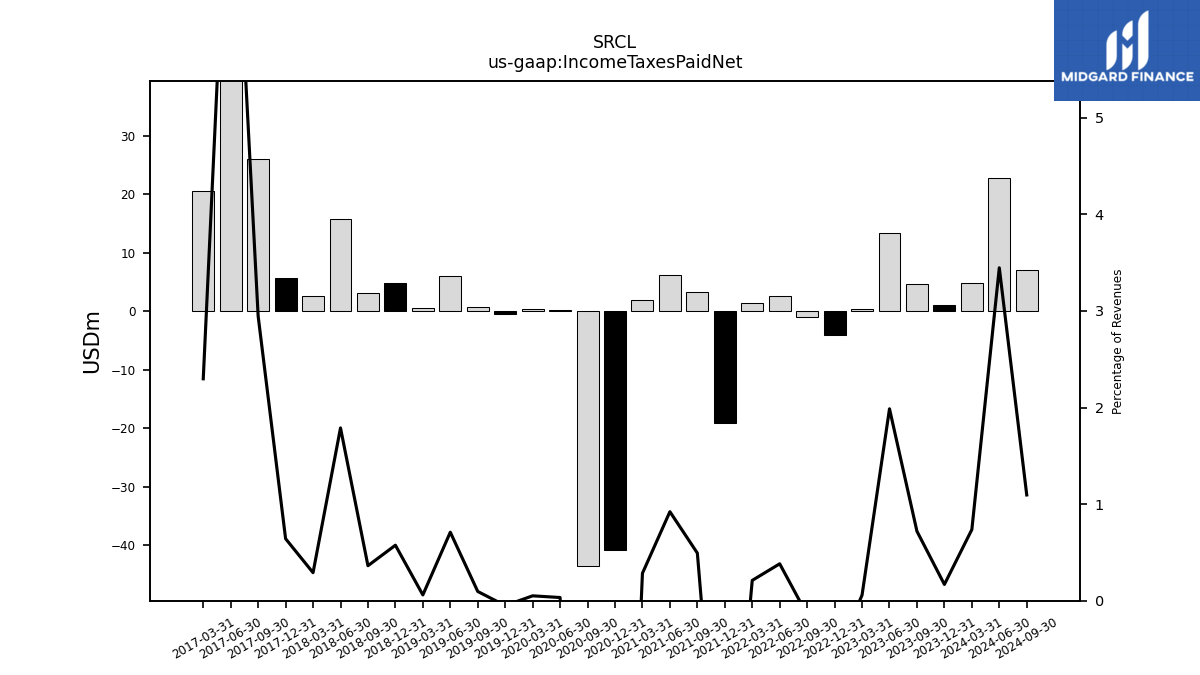
| Income Taxes Paid Net | 1.10 | 4.70 | 13.30 | 0.40 | -4.10 | -1.00 | 2.60 | 1.40 | -19.10 | 3.20 | 6.20 | 1.90 | -40.80 | -43.50 | 0.20 | 0.40 | -0.40 | 0.80 | 6.00 | 0.50 | 4.90 | 3.10 | 15.80 | 2.60 | 5.70 | 26.00 | 76.70 | 20.50 | NA | NA | NA | NA | NA | NA | NA | NA | NA | NA | NA | NA | NA | NA | NA | NA | NA | NA | NA | NA | NA | NA | NA | NA | NA | NA | NA | NA | NA | NA | NA | NA | |
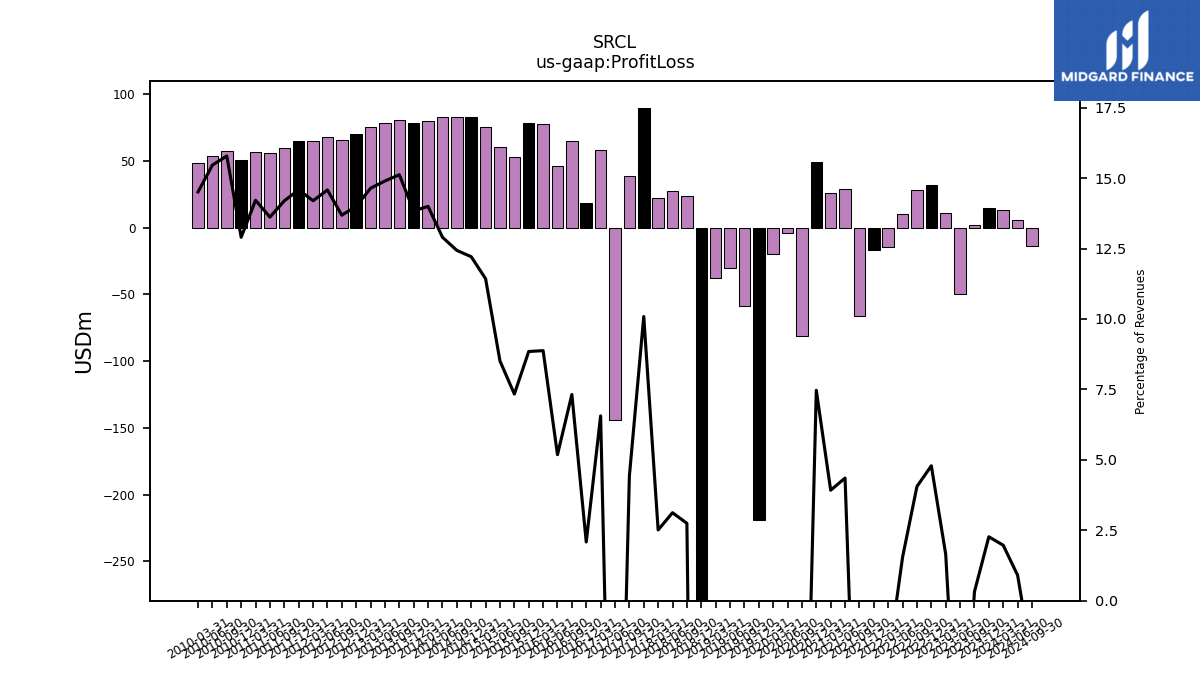
| Profit Loss | 14.80 | 2.10 | -49.50 | 11.30 | 32.10 | 28.00 | 10.50 | -14.10 | -16.40 | -65.90 | 29.30 | 26.20 | 49.00 | -80.90 | -4.10 | -19.90 | -219.20 | -59.00 | -30.20 | -37.60 | -319.20 | 23.50 | 27.60 | 22.50 | 89.57 | 39.07 | -144.19 | 58.56 | 18.90 | 65.17 | 46.23 | 77.59 | 78.59 | 52.72 | 60.90 | 75.81 | 82.66 | 83.04 | 82.68 | 79.77 | 78.59 | 80.83 | 78.44 | 75.22 | 70.51 | 65.75 | 68.37 | 65.31 | 65.12 | 59.74 | 55.89 | 56.59 | 50.76 | 57.30 | 53.77 | 48.63 | NA | NA | NA | NA | |
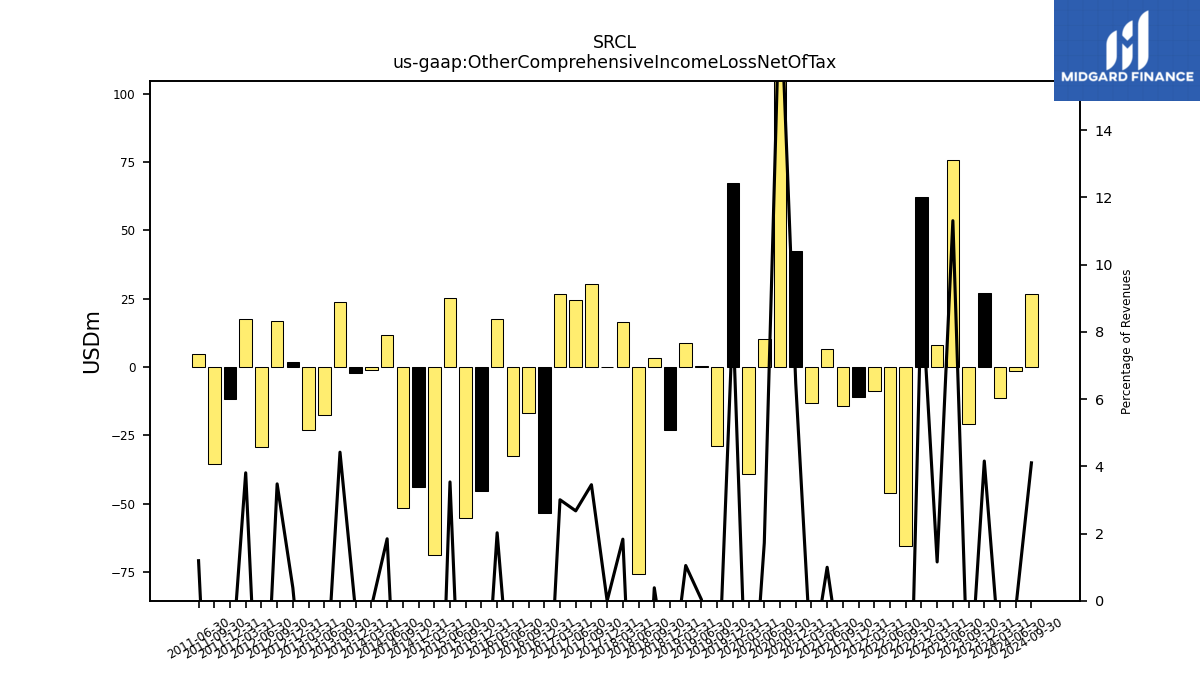
| Other Comprehensive Income Loss Net Of Tax | 27.10 | -20.80 | 75.70 | 7.90 | 62.20 | -65.40 | -46.00 | -8.90 | -10.90 | -14.40 | 6.70 | -13.10 | 42.50 | 117.50 | 10.30 | -39.10 | 67.40 | -28.90 | 0.30 | 8.70 | -23.20 | 3.30 | -75.80 | 16.40 | -0.03 | 30.47 | 24.55 | 26.81 | -53.55 | -16.82 | -32.55 | 17.68 | -45.36 | -55.15 | 25.30 | -68.83 | -43.77 | -51.61 | 11.81 | -1.03 | -2.01 | 23.63 | -17.59 | -22.88 | 1.94 | 16.71 | -29.24 | 17.51 | -11.53 | -35.55 | 4.89 | NA | NA | NA | NA | NA | NA | NA | NA | NA | |
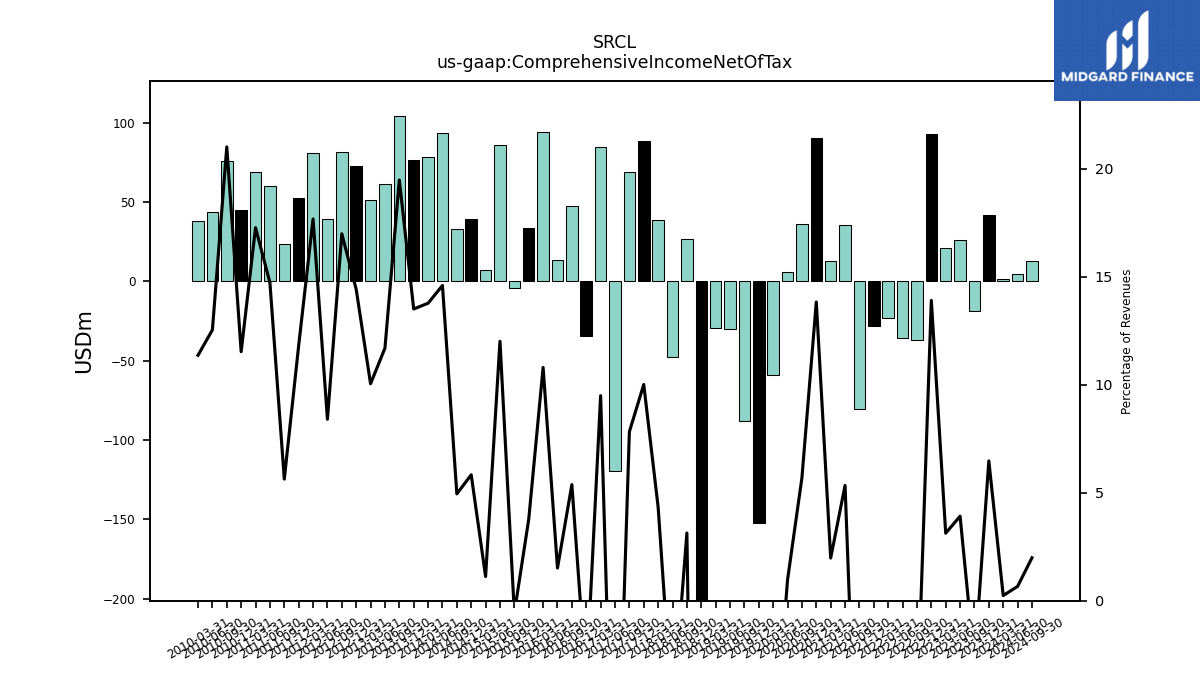
| Comprehensive Income Net Of Tax | 42.20 | -18.80 | 26.20 | 21.40 | 93.20 | -37.10 | -35.40 | -22.90 | -27.80 | -80.40 | 35.90 | 13.20 | 90.70 | 36.20 | 5.80 | -59.20 | -152.00 | -88.00 | -30.20 | -29.40 | -341.20 | 26.80 | -47.40 | 38.80 | 88.86 | 69.08 | -119.66 | 84.71 | -34.40 | 47.85 | 13.49 | 94.40 | 33.49 | -4.08 | 85.98 | 7.44 | 39.46 | 33.05 | 93.51 | 78.49 | 76.69 | 104.11 | 61.55 | 51.61 | 72.61 | 81.61 | 39.40 | 81.30 | 52.76 | 23.70 | 60.43 | 68.75 | 45.36 | 76.25 | 43.61 | 38.09 | NA | NA | NA | NA | |
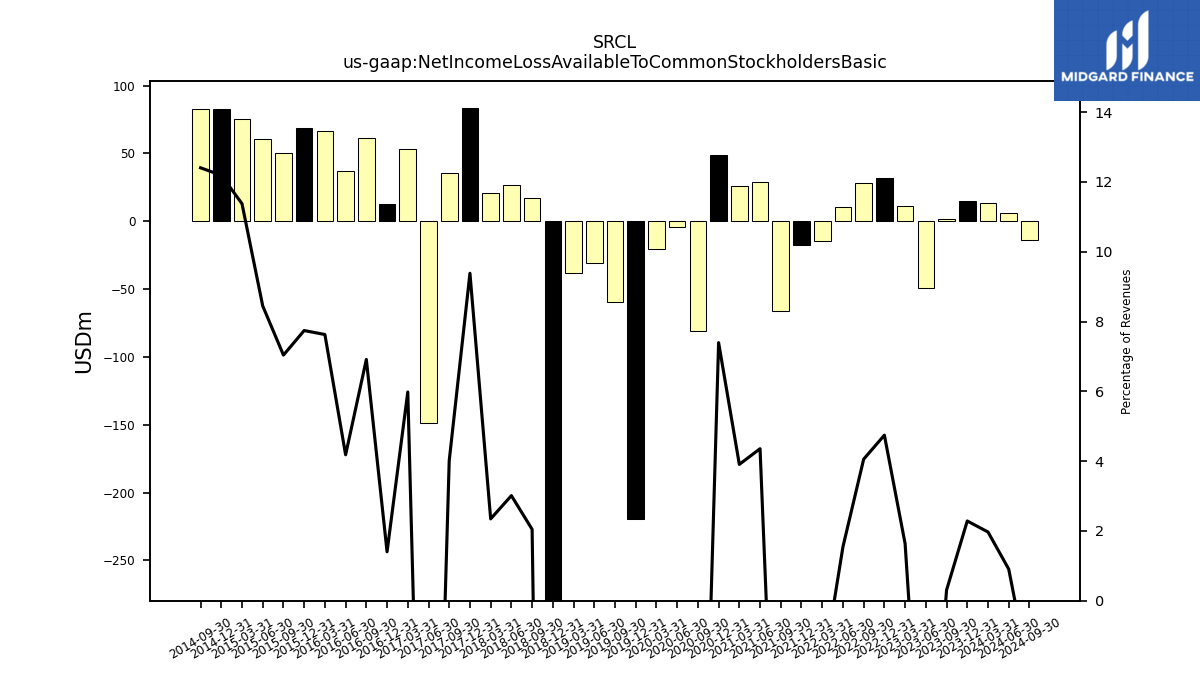
| Net Income Loss Available To Common Stockholders Basic | 14.90 | 2.00 | -49.50 | 11.20 | 31.80 | 28.00 | 10.50 | -14.20 | -17.20 | -66.00 | 29.30 | 26.10 | 48.50 | -81.20 | -4.50 | -20.10 | -219.30 | -59.20 | -30.50 | -37.80 | -318.40 | 17.50 | 26.60 | 21.00 | 83.30 | 35.45 | -148.77 | 53.39 | 12.72 | 61.54 | 37.29 | 66.68 | 68.77 | 50.58 | 60.45 | 75.46 | 82.53 | 82.84 | NA | NA | NA | NA | NA | NA | NA | NA | NA | NA | NA | NA | NA | NA | NA | NA | NA | NA | NA | NA | NA | NA |
| 2023-12-31 | 2023-09-30 | 2023-06-30 | 2023-03-31 | 2022-12-31 | 2022-09-30 | 2022-06-30 | 2022-03-31 | 2021-12-31 | 2021-09-30 | 2021-06-30 | 2021-03-31 | 2020-12-31 | 2020-09-30 | 2020-06-30 | 2020-03-31 | 2019-12-31 | 2019-09-30 | 2019-06-30 | 2019-03-31 | 2018-12-31 | 2018-09-30 | 2018-06-30 | 2018-03-31 | 2017-12-31 | 2017-09-30 | 2017-06-30 | 2017-03-31 | 2016-12-31 | 2016-09-30 | 2016-06-30 | 2016-03-31 | 2015-12-31 | 2015-09-30 | 2015-06-30 | 2015-03-31 | 2014-12-31 | 2014-09-30 | 2014-06-30 | 2014-03-31 | 2013-12-31 | 2013-09-30 | 2013-06-30 | 2013-03-31 | 2012-12-31 | 2012-09-30 | 2012-06-30 | 2012-03-31 | 2011-12-31 | 2011-09-30 | 2011-06-30 | 2011-03-31 | 2010-12-31 | 2010-09-30 | 2010-06-30 | 2010-03-31 | 2009-12-31 | 2009-09-30 | 2009-06-30 | 2009-03-31 | ||
|---|---|---|---|---|---|---|---|---|---|---|---|---|---|---|---|---|---|---|---|---|---|---|---|---|---|---|---|---|---|---|---|---|---|---|---|---|---|---|---|---|---|---|---|---|---|---|---|---|---|---|---|---|---|---|---|---|---|---|---|---|---|
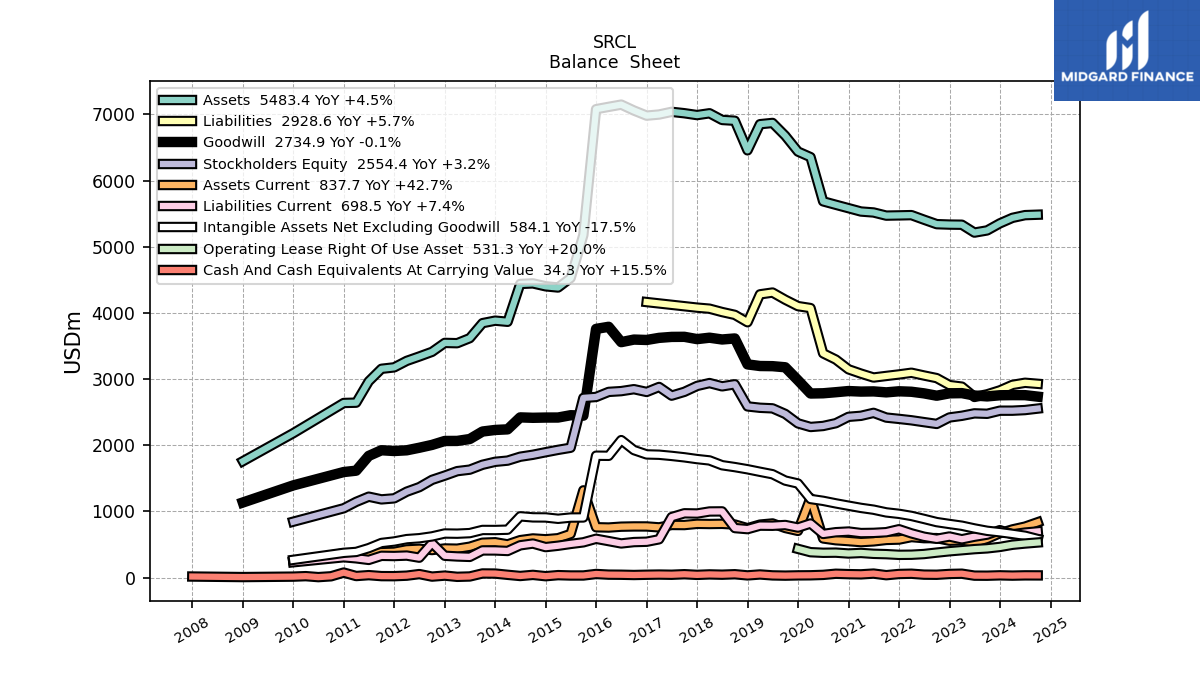
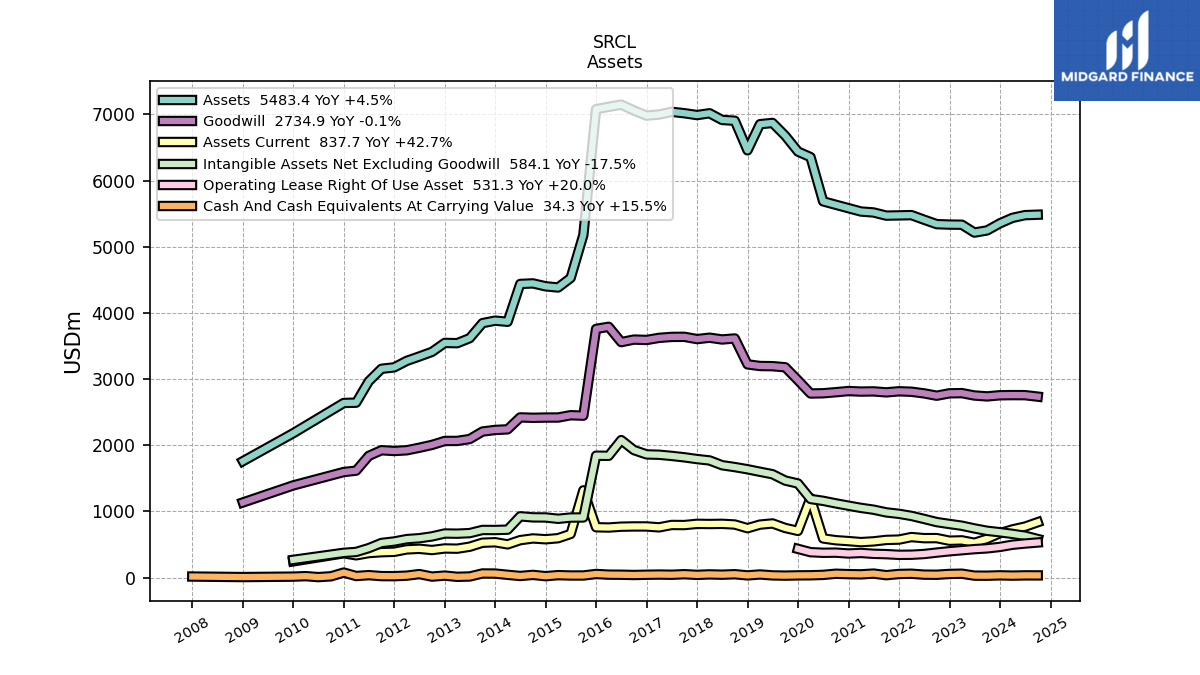
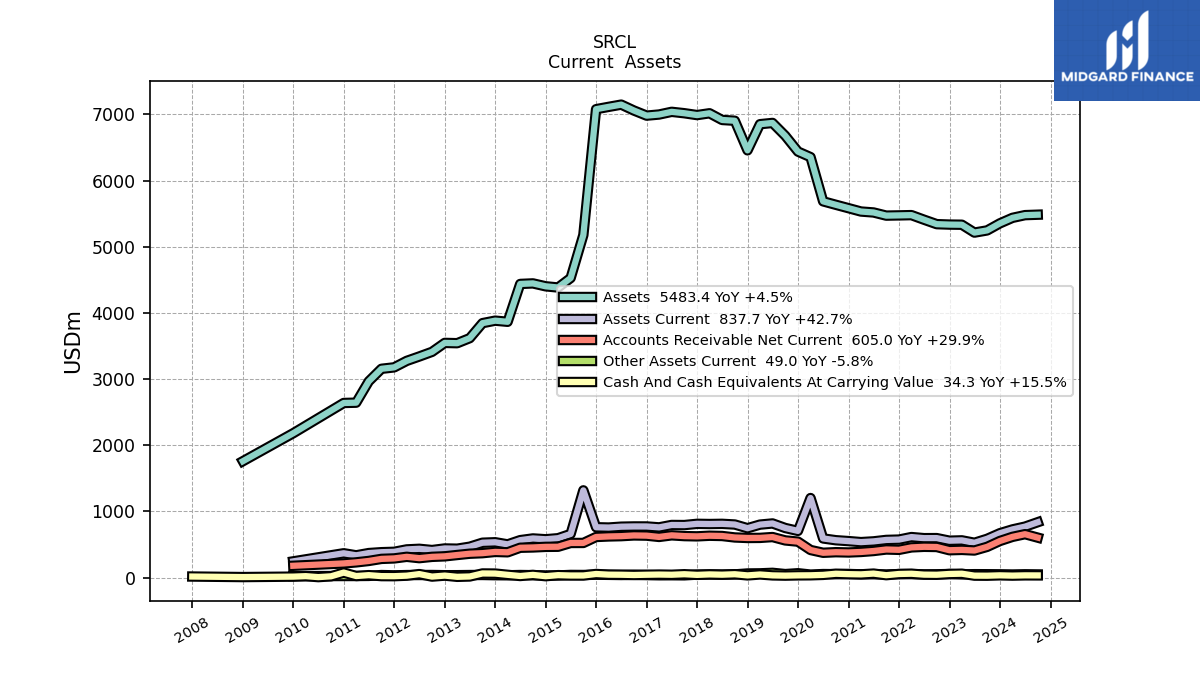
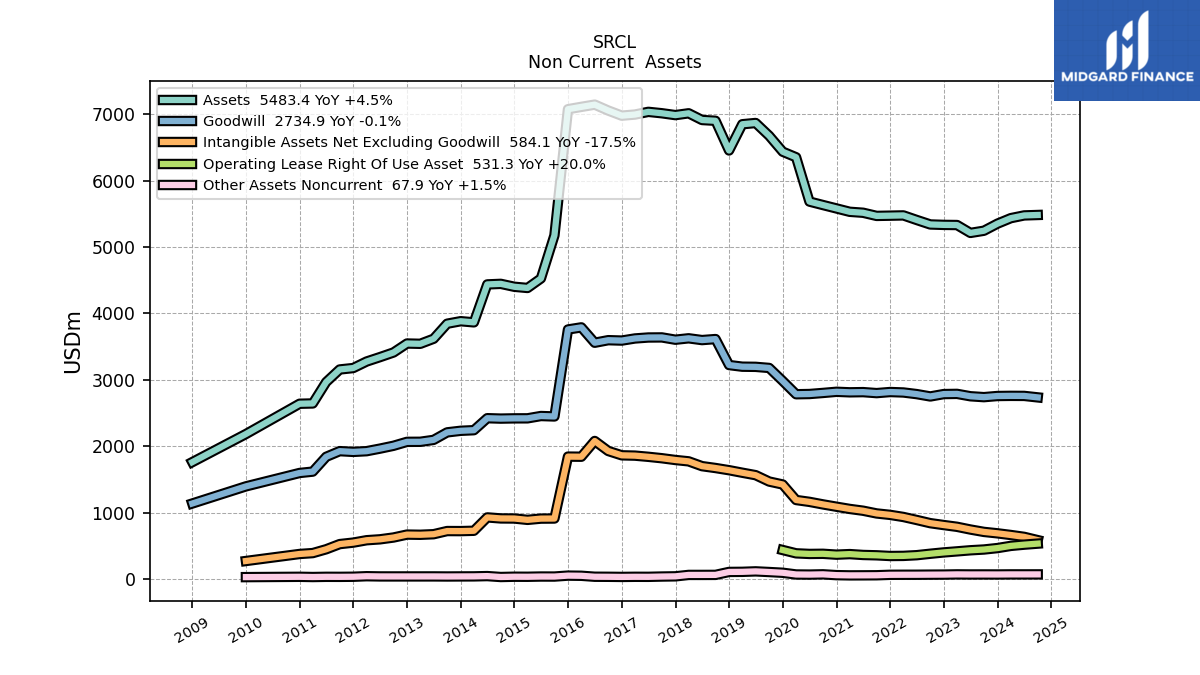
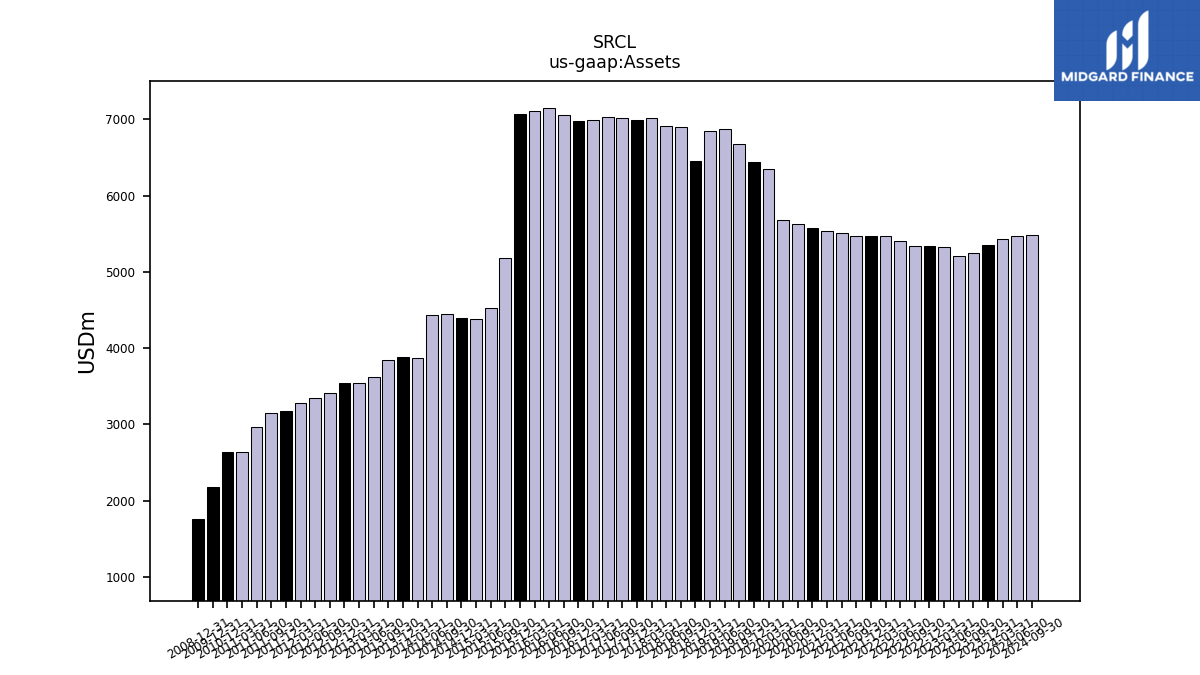
| Assets | 5352.60 | 5246.10 | 5213.10 | 5332.00 | 5334.10 | 5340.60 | 5408.00 | 5477.10 | 5473.10 | 5469.50 | 5517.10 | 5531.40 | 5581.90 | 5633.20 | 5685.30 | 6353.20 | 6437.00 | 6676.30 | 6869.70 | 6850.70 | 6455.50 | 6902.90 | 6914.60 | 7015.70 | 6988.30 | 7016.36 | 7037.50 | 6996.86 | 6980.06 | 7057.26 | 7146.37 | 7112.54 | 7077.45 | 5176.46 | 4526.94 | 4383.51 | 4401.72 | 4445.63 | 4437.28 | 3865.58 | 3882.80 | 3845.13 | 3618.43 | 3542.21 | 3546.74 | 3411.60 | 3341.65 | 3275.23 | 3177.09 | 3155.51 | 2965.60 | 2643.64 | 2639.02 | NA | NA | NA | 2182.80 | NA | NA | NA | |
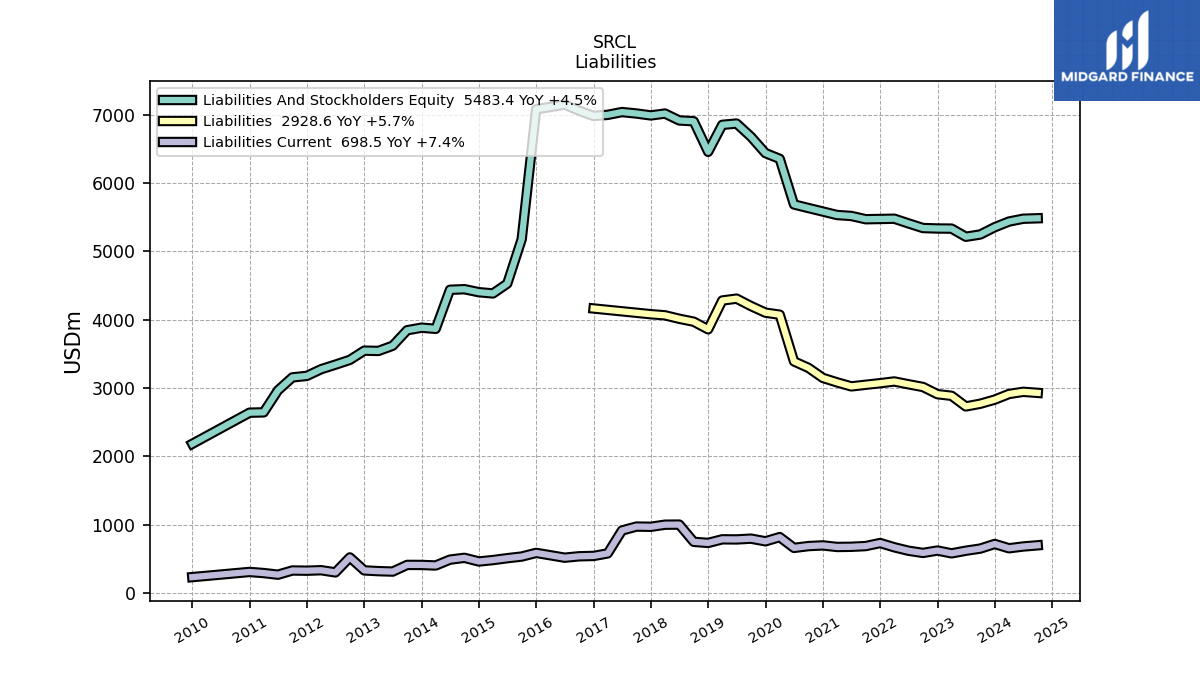
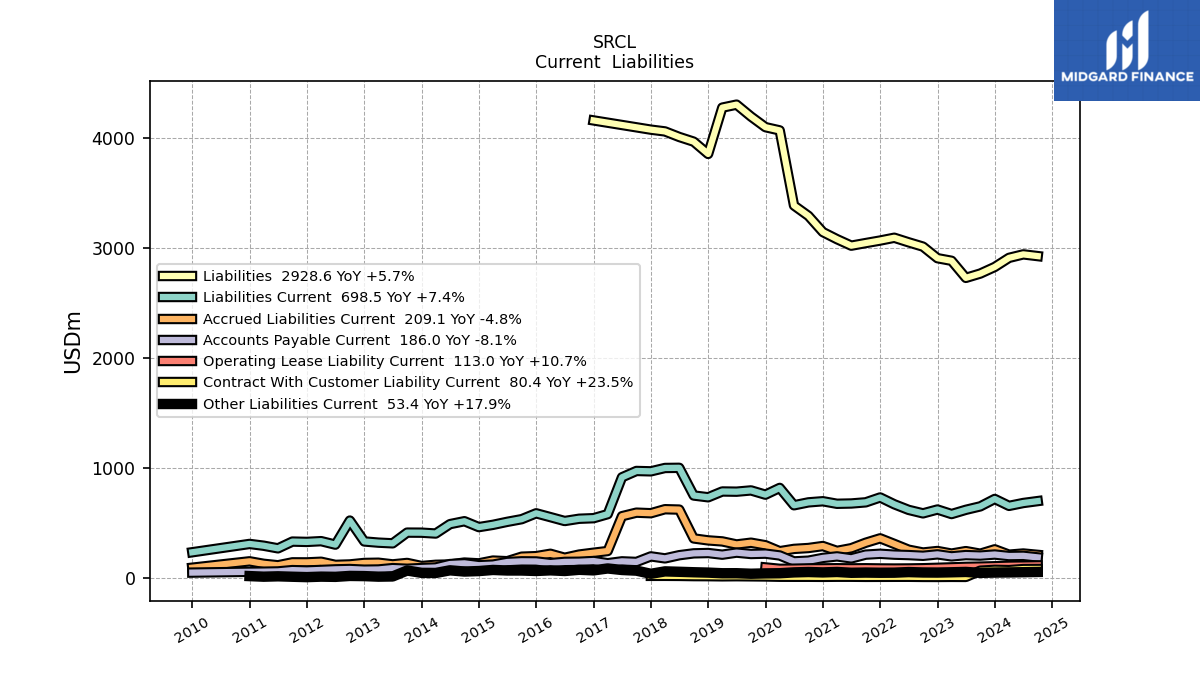
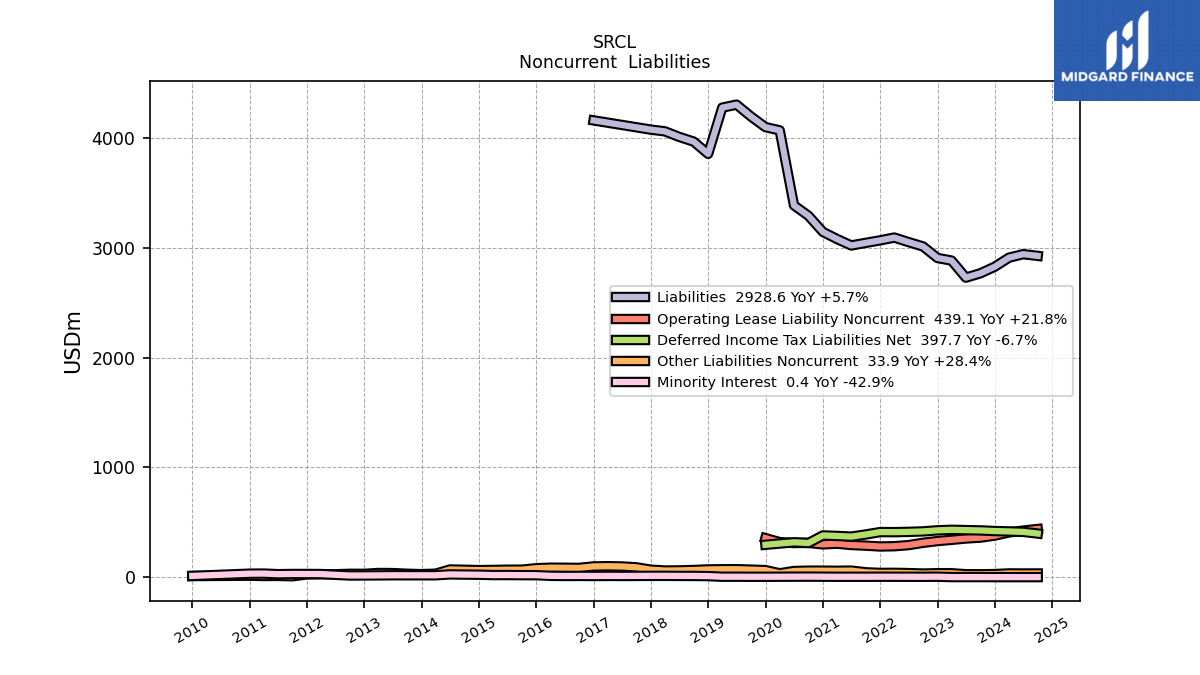
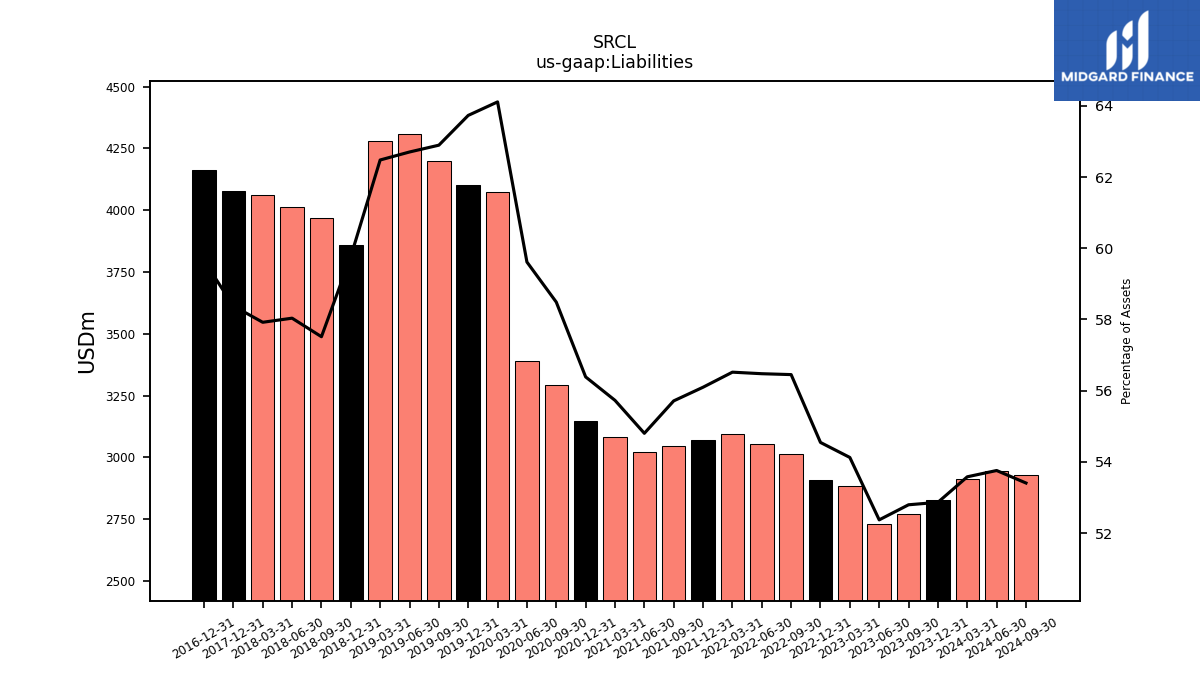
| Liabilities | 2829.70 | 2769.80 | 2730.30 | 2886.00 | 2909.60 | 3014.90 | 3054.30 | 3095.70 | 3070.30 | 3047.30 | 3023.60 | 3082.60 | 3147.50 | 3294.70 | 3389.20 | 4073.00 | 4102.30 | 4199.00 | 4307.50 | 4280.20 | 3858.40 | 3970.30 | 4013.00 | 4063.60 | 4079.70 | NA | NA | NA | 4163.70 | NA | NA | NA | NA | NA | NA | NA | NA | NA | NA | NA | NA | NA | NA | NA | NA | NA | NA | NA | NA | NA | NA | NA | NA | NA | NA | NA | NA | NA | NA | NA | |
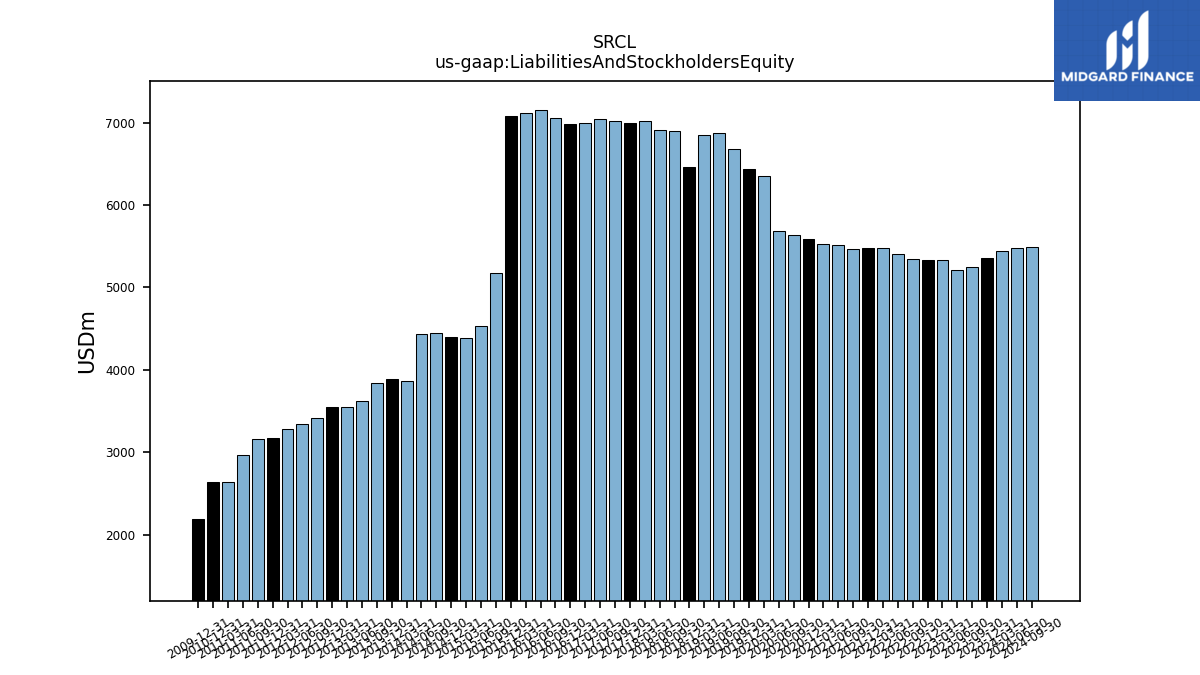
| Liabilities And Stockholders Equity | 5352.60 | 5246.10 | 5213.10 | 5332.00 | 5334.10 | 5340.60 | 5408.00 | 5477.10 | 5473.10 | 5469.50 | 5517.10 | 5531.40 | 5581.90 | 5633.20 | 5685.30 | 6353.20 | 6437.00 | 6676.30 | 6869.70 | 6850.70 | 6455.50 | 6902.90 | 6914.60 | 7015.70 | 6988.30 | 7016.36 | 7037.50 | 6996.86 | 6980.06 | 7057.26 | 7146.37 | 7112.54 | 7077.45 | 5176.46 | 4526.94 | 4383.51 | 4401.72 | 4445.63 | 4437.28 | 3865.58 | 3882.80 | 3845.13 | 3618.43 | 3542.21 | 3546.74 | 3411.60 | 3341.65 | 3275.23 | 3177.09 | 3155.51 | 2965.60 | 2643.64 | 2639.02 | NA | NA | NA | 2182.80 | NA | NA | NA | |
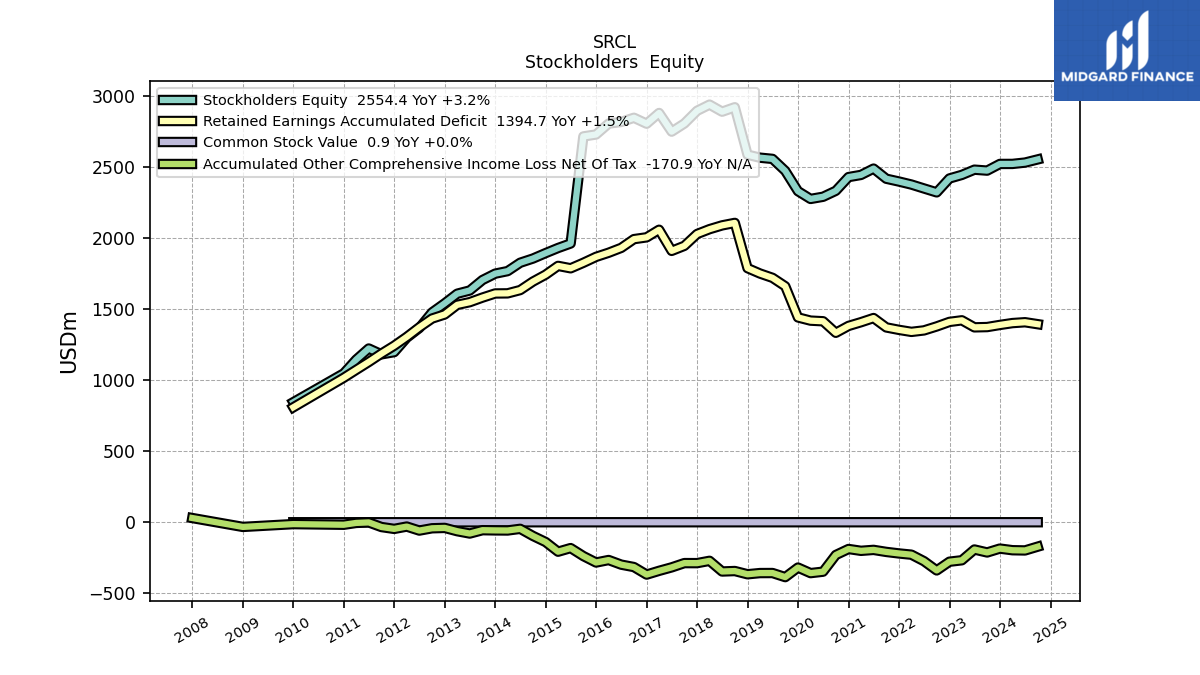
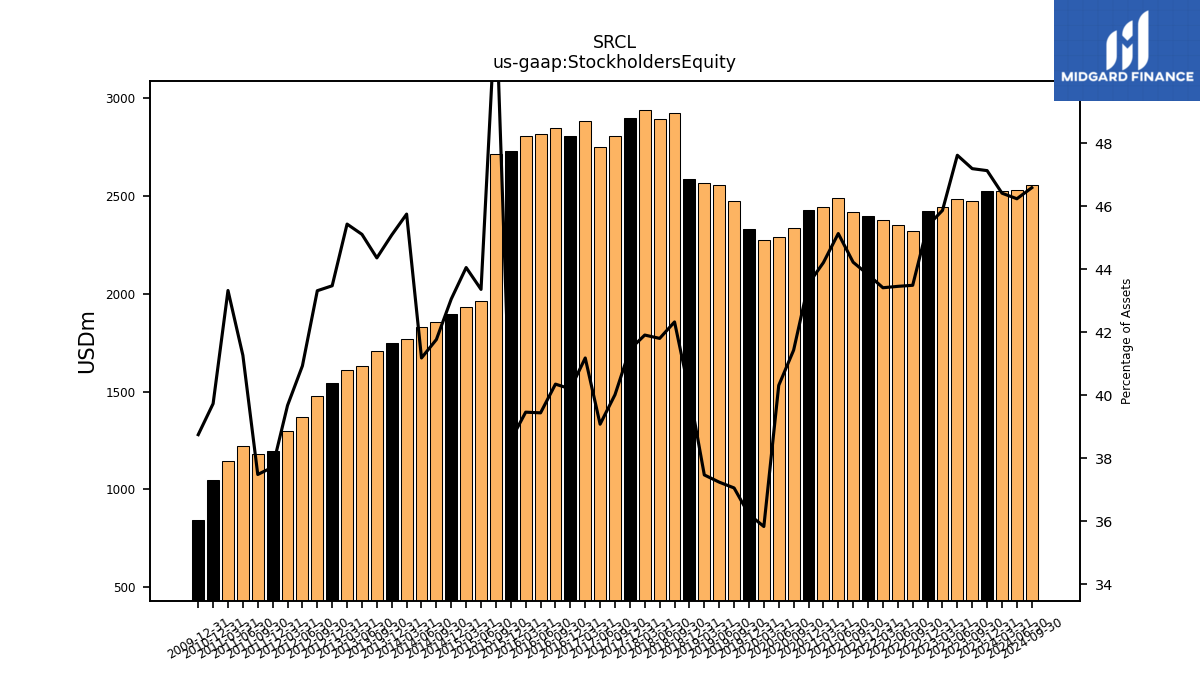
| Stockholders Equity | 2522.50 | 2475.60 | 2482.20 | 2445.40 | 2420.20 | 2322.40 | 2349.90 | 2377.50 | 2398.70 | 2418.50 | 2489.80 | 2445.20 | 2430.10 | 2333.60 | 2291.60 | 2276.20 | 2330.90 | 2473.70 | 2558.00 | 2566.60 | 2587.40 | 2921.50 | 2890.30 | 2940.00 | 2896.60 | 2807.38 | 2749.94 | 2881.18 | 2805.74 | 2847.46 | 2818.25 | 2806.44 | 2729.89 | 2716.11 | 1962.70 | 1930.90 | 1895.01 | 1856.69 | 1827.22 | 1768.35 | 1750.46 | 1705.53 | 1632.03 | 1609.20 | 1541.79 | 1477.68 | 1367.71 | 1299.33 | 1198.17 | 1182.66 | 1223.65 | 1145.24 | 1048.42 | NA | NA | NA | 845.70 | NA | NA | NA |
| 2023-12-31 | 2023-09-30 | 2023-06-30 | 2023-03-31 | 2022-12-31 | 2022-09-30 | 2022-06-30 | 2022-03-31 | 2021-12-31 | 2021-09-30 | 2021-06-30 | 2021-03-31 | 2020-12-31 | 2020-09-30 | 2020-06-30 | 2020-03-31 | 2019-12-31 | 2019-09-30 | 2019-06-30 | 2019-03-31 | 2018-12-31 | 2018-09-30 | 2018-06-30 | 2018-03-31 | 2017-12-31 | 2017-09-30 | 2017-06-30 | 2017-03-31 | 2016-12-31 | 2016-09-30 | 2016-06-30 | 2016-03-31 | 2015-12-31 | 2015-09-30 | 2015-06-30 | 2015-03-31 | 2014-12-31 | 2014-09-30 | 2014-06-30 | 2014-03-31 | 2013-12-31 | 2013-09-30 | 2013-06-30 | 2013-03-31 | 2012-12-31 | 2012-09-30 | 2012-06-30 | 2012-03-31 | 2011-12-31 | 2011-09-30 | 2011-06-30 | 2011-03-31 | 2010-12-31 | 2010-09-30 | 2010-06-30 | 2010-03-31 | 2009-12-31 | 2009-09-30 | 2009-06-30 | 2009-03-31 | ||
|---|---|---|---|---|---|---|---|---|---|---|---|---|---|---|---|---|---|---|---|---|---|---|---|---|---|---|---|---|---|---|---|---|---|---|---|---|---|---|---|---|---|---|---|---|---|---|---|---|---|---|---|---|---|---|---|---|---|---|---|---|---|
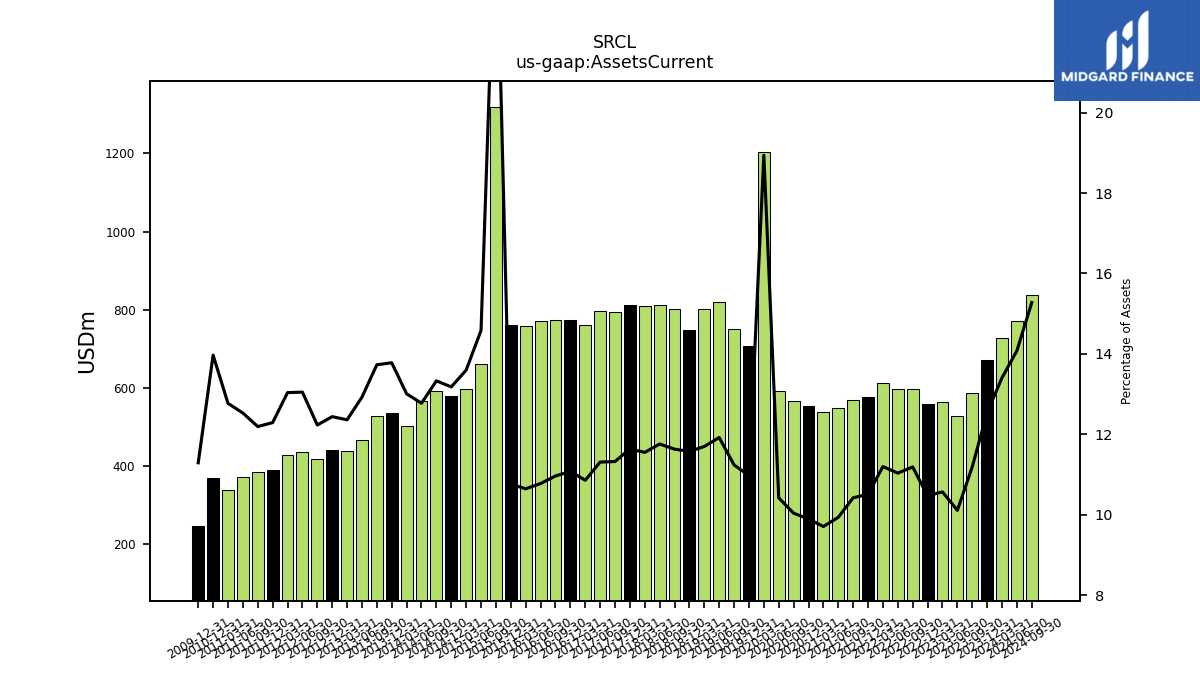
| Assets Current | 671.50 | 587.20 | 527.20 | 563.70 | 558.70 | 597.70 | 596.90 | 613.50 | 575.50 | 570.20 | 548.40 | 537.20 | 552.50 | 565.70 | 592.60 | 1203.20 | 706.60 | 750.50 | 819.10 | 801.60 | 747.30 | 803.10 | 813.30 | 810.60 | 813.40 | 794.71 | 796.11 | 759.92 | 773.62 | 773.94 | 770.36 | 757.36 | 761.83 | 1319.46 | 660.19 | 596.06 | 580.22 | 592.68 | 566.88 | 502.89 | 535.09 | 527.97 | 467.76 | 437.95 | 441.29 | 417.38 | 436.13 | 427.08 | 390.60 | 384.84 | 371.65 | 337.66 | 368.69 | NA | NA | NA | 246.54 | NA | NA | NA | |
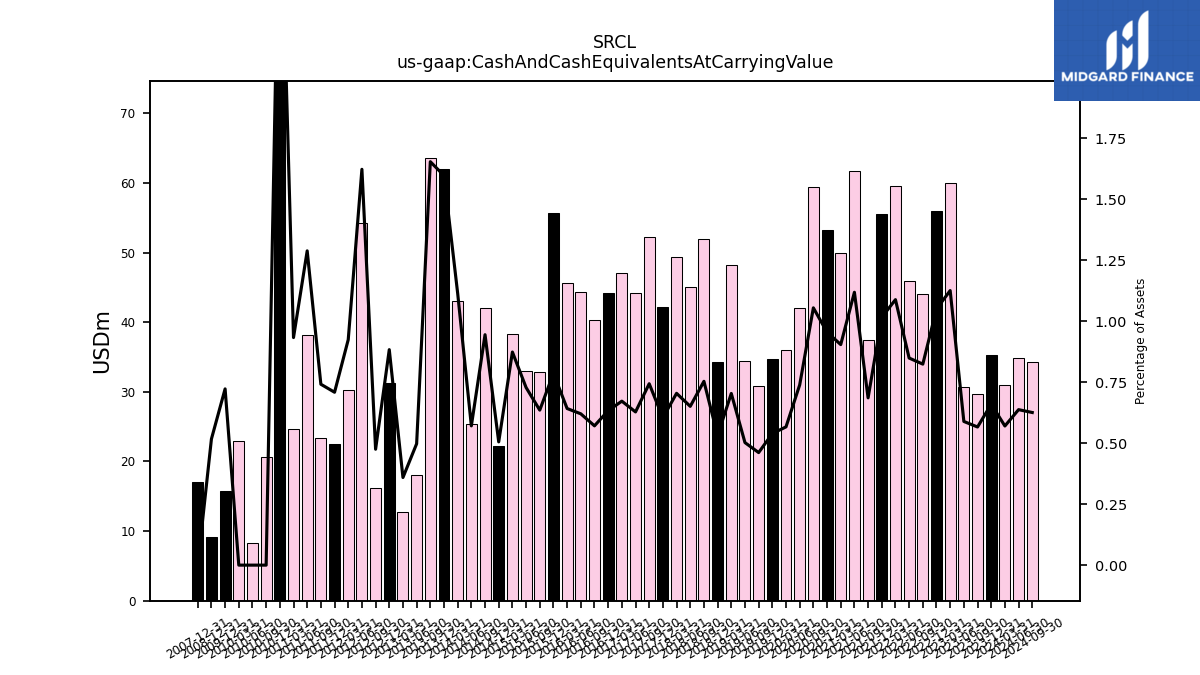
| Cash And Cash Equivalents At Carrying Value | 35.30 | 29.70 | 30.70 | 60.00 | 56.00 | 44.00 | 45.90 | 59.60 | 55.60 | 37.50 | 61.70 | 50.00 | 53.30 | 59.40 | 42.00 | 36.00 | 34.70 | 30.80 | 34.50 | 48.20 | 34.30 | 52.00 | 45.00 | 49.40 | 42.20 | 52.17 | 44.19 | 47.02 | 44.19 | 40.29 | 44.32 | 45.66 | 55.63 | 32.88 | 32.96 | 38.28 | 22.24 | 41.98 | 25.33 | 43.06 | 61.99 | 63.58 | 18.00 | 12.72 | 31.32 | 16.20 | 54.21 | 30.26 | 22.51 | 23.39 | 38.20 | 24.66 | 77.05 | 20.63 | 8.25 | 22.89 | 15.77 | NA | NA | NA | |
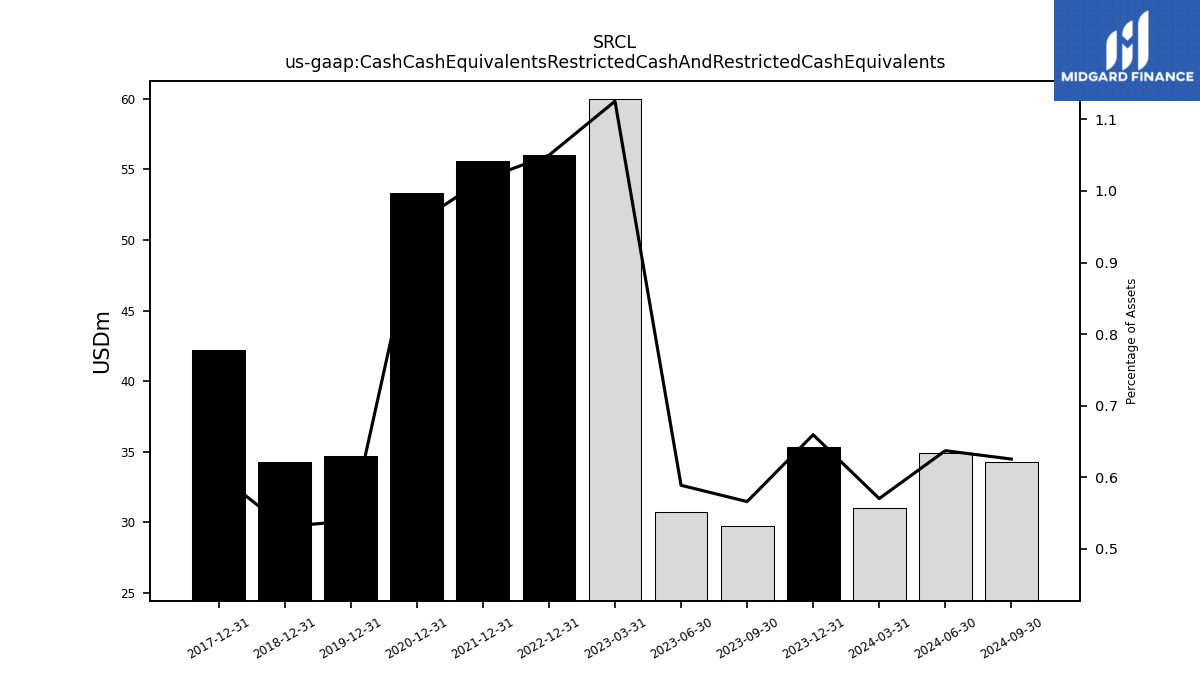
| Cash Cash Equivalents Restricted Cash And Restricted Cash Equivalents | 35.30 | NA | NA | NA | 56.00 | NA | NA | NA | 55.60 | NA | NA | NA | 53.30 | NA | NA | NA | 34.70 | NA | NA | NA | 34.30 | NA | NA | NA | 42.20 | NA | NA | NA | NA | NA | NA | NA | NA | NA | NA | NA | NA | NA | NA | NA | NA | NA | NA | NA | NA | NA | NA | NA | NA | NA | NA | NA | NA | NA | NA | NA | NA | NA | NA | NA | |
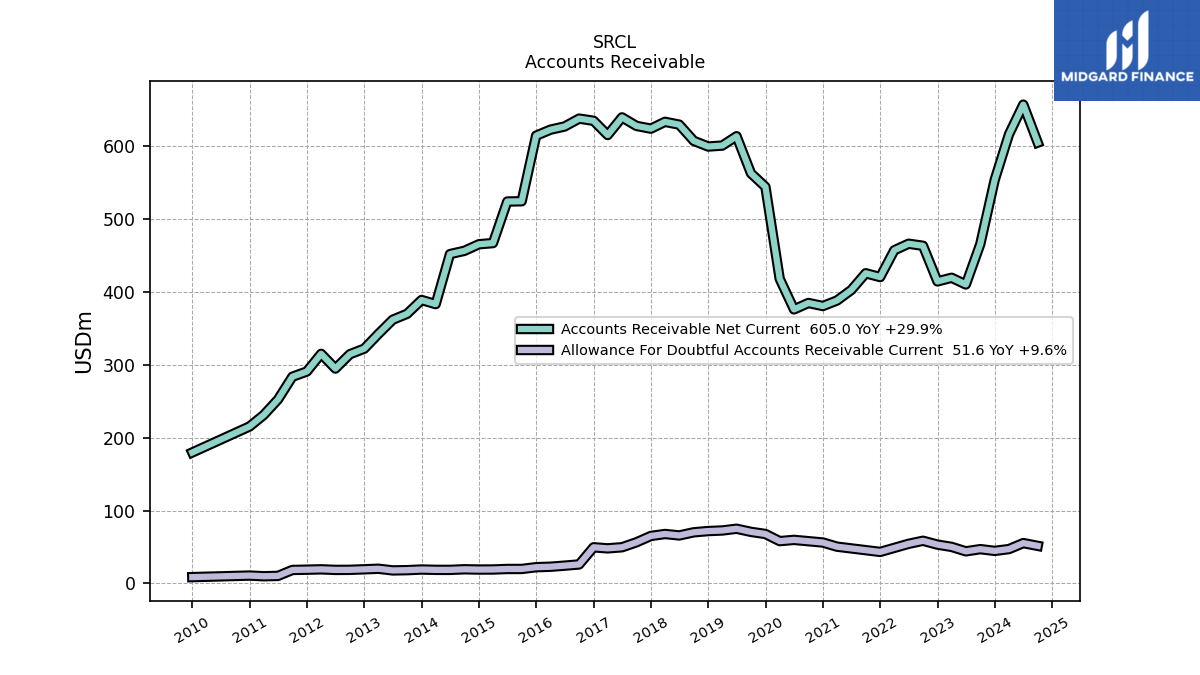
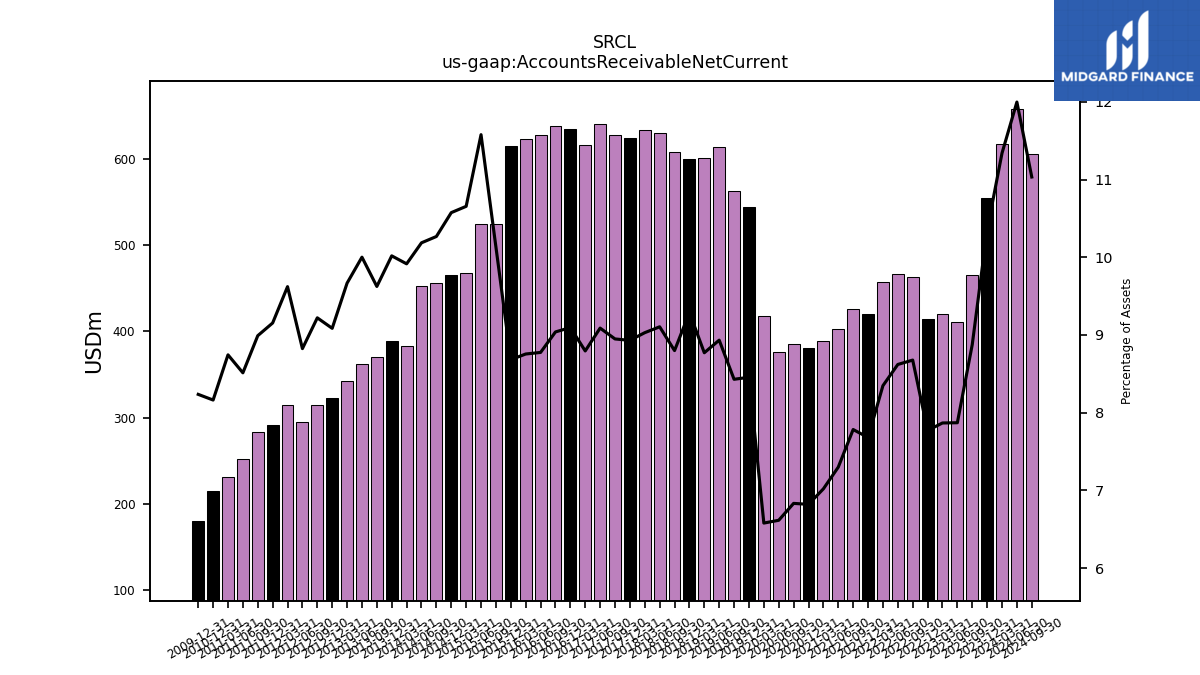
| Accounts Receivable Net Current | 553.90 | 465.60 | 410.30 | 419.50 | 414.50 | 463.40 | 466.20 | 457.20 | 420.40 | 425.70 | 402.70 | 388.30 | 380.70 | 384.90 | 376.10 | 418.00 | 544.30 | 562.80 | 613.70 | 600.90 | 599.60 | 607.40 | 629.60 | 633.50 | 624.10 | 627.90 | 639.61 | 615.35 | 634.90 | 637.92 | 627.13 | 622.71 | 614.49 | 524.50 | 524.13 | 467.09 | 465.47 | 456.46 | 452.00 | 383.30 | 389.00 | 370.08 | 361.89 | 342.43 | 322.25 | 314.58 | 294.89 | 315.14 | 290.85 | 283.71 | 252.46 | 231.17 | 215.42 | NA | NA | NA | 179.77 | NA | NA | NA | |
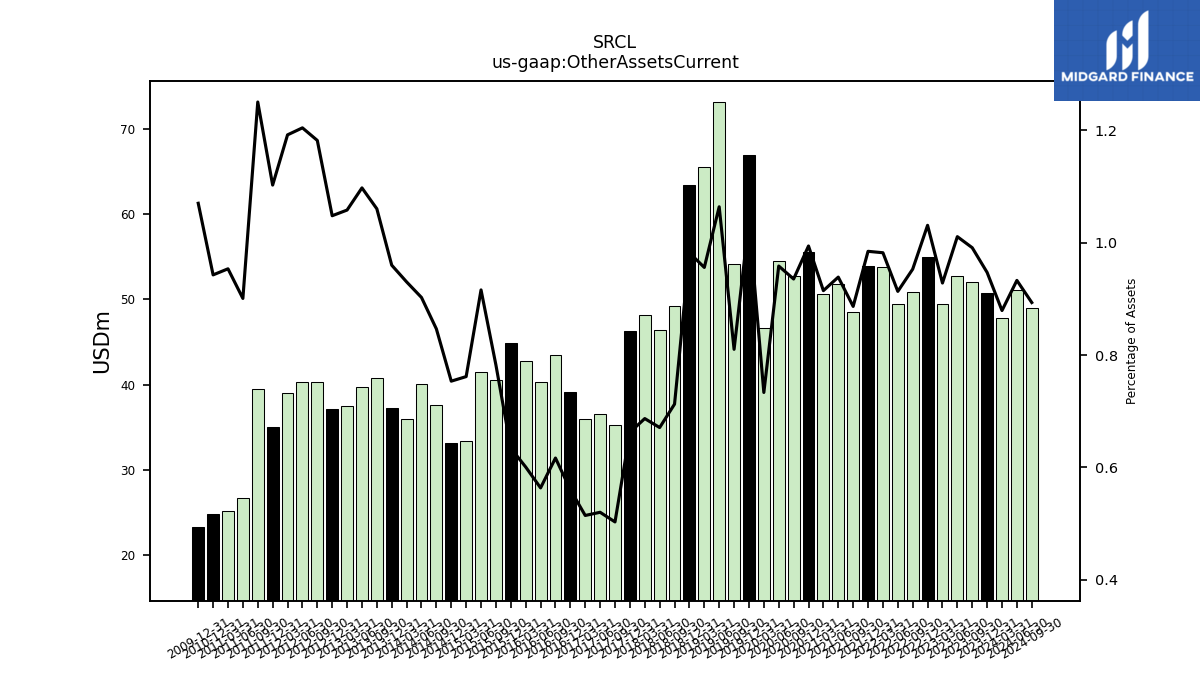
| Other Assets Current | 50.70 | 52.00 | 52.70 | 49.50 | 55.00 | 50.90 | 49.40 | 53.80 | 53.90 | 48.50 | 51.80 | 50.60 | 55.50 | 52.70 | 54.50 | 46.60 | 66.90 | 54.10 | 73.10 | 65.50 | 63.40 | 49.20 | 46.40 | 48.20 | 46.30 | 35.29 | 36.61 | 36.00 | 39.12 | 43.53 | 40.28 | 42.73 | 44.89 | 40.50 | 41.47 | 33.39 | 33.17 | 37.64 | 40.05 | 35.96 | 37.28 | 40.78 | 39.72 | 37.49 | 37.18 | 40.33 | 40.26 | 39.05 | 35.03 | 39.47 | 26.72 | 25.21 | 24.88 | NA | NA | NA | 23.36 | NA | NA | NA |
| 2023-12-31 | 2023-09-30 | 2023-06-30 | 2023-03-31 | 2022-12-31 | 2022-09-30 | 2022-06-30 | 2022-03-31 | 2021-12-31 | 2021-09-30 | 2021-06-30 | 2021-03-31 | 2020-12-31 | 2020-09-30 | 2020-06-30 | 2020-03-31 | 2019-12-31 | 2019-09-30 | 2019-06-30 | 2019-03-31 | 2018-12-31 | 2018-09-30 | 2018-06-30 | 2018-03-31 | 2017-12-31 | 2017-09-30 | 2017-06-30 | 2017-03-31 | 2016-12-31 | 2016-09-30 | 2016-06-30 | 2016-03-31 | 2015-12-31 | 2015-09-30 | 2015-06-30 | 2015-03-31 | 2014-12-31 | 2014-09-30 | 2014-06-30 | 2014-03-31 | 2013-12-31 | 2013-09-30 | 2013-06-30 | 2013-03-31 | 2012-12-31 | 2012-09-30 | 2012-06-30 | 2012-03-31 | 2011-12-31 | 2011-09-30 | 2011-06-30 | 2011-03-31 | 2010-12-31 | 2010-09-30 | 2010-06-30 | 2010-03-31 | 2009-12-31 | 2009-09-30 | 2009-06-30 | 2009-03-31 | ||
|---|---|---|---|---|---|---|---|---|---|---|---|---|---|---|---|---|---|---|---|---|---|---|---|---|---|---|---|---|---|---|---|---|---|---|---|---|---|---|---|---|---|---|---|---|---|---|---|---|---|---|---|---|---|---|---|---|---|---|---|---|---|
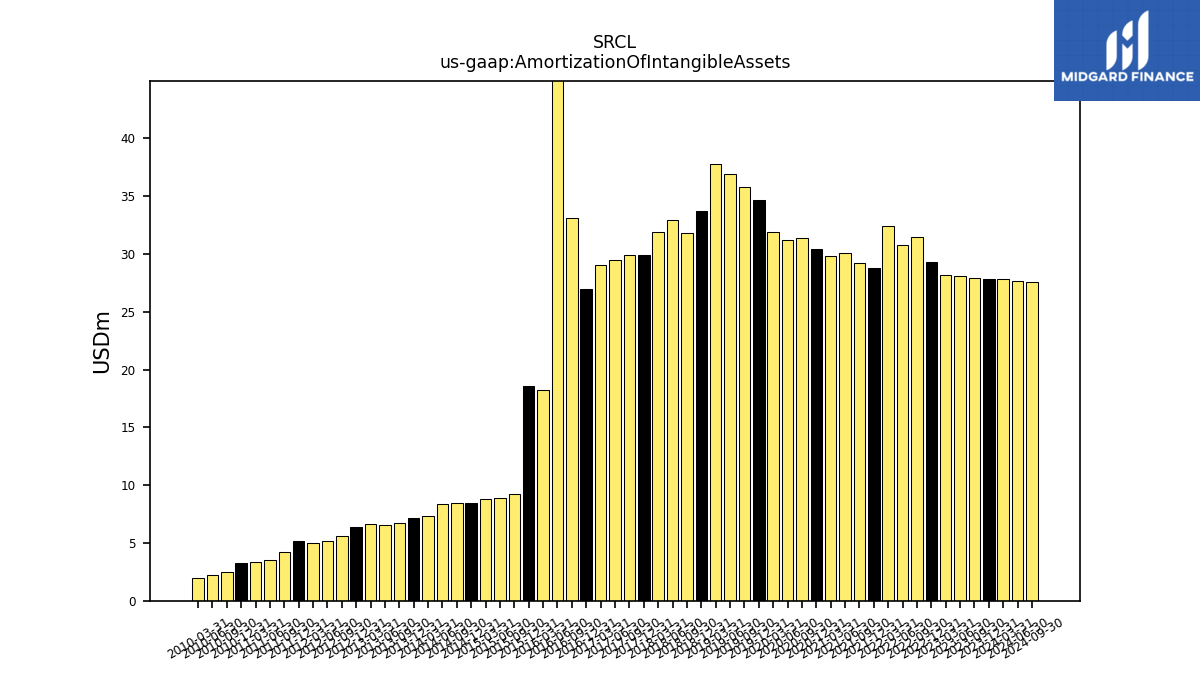
| Amortization Of Intangible Assets | 27.80 | 27.90 | 28.10 | 28.20 | 29.30 | 31.50 | 30.80 | 32.40 | 28.80 | 29.20 | 30.10 | 29.80 | 30.40 | 31.40 | 31.20 | 31.90 | 34.70 | 35.80 | 36.90 | 37.80 | 33.70 | 31.80 | 32.90 | 31.90 | 29.90 | 29.91 | 29.48 | 29.09 | 26.99 | 33.13 | 50.91 | 18.27 | 18.54 | 9.24 | 8.92 | 8.80 | 8.48 | 8.50 | 8.40 | 7.32 | 7.18 | 6.71 | 6.53 | 6.64 | 6.38 | 5.56 | 5.13 | 4.98 | 5.17 | 4.20 | 3.50 | 3.35 | 3.27 | 2.50 | 2.20 | 1.98 | NA | NA | NA | NA | |
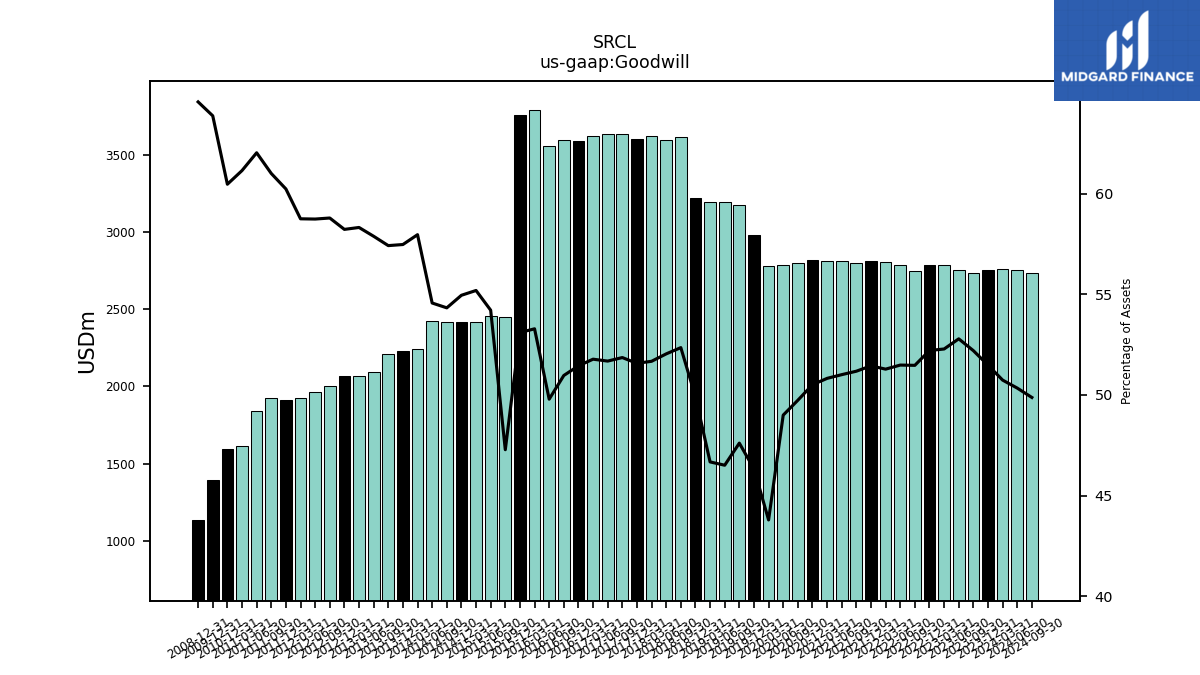
| Goodwill | 2755.60 | 2738.50 | 2751.90 | 2787.80 | 2784.90 | 2748.90 | 2784.30 | 2808.80 | 2815.70 | 2799.30 | 2814.20 | 2811.30 | 2819.30 | 2801.80 | 2785.70 | 2782.20 | 2982.20 | 3178.40 | 3195.10 | 3197.50 | 3222.20 | 3613.80 | 3598.40 | 3625.20 | 3604.00 | 3638.57 | 3637.18 | 3622.79 | 3591.02 | 3596.90 | 3558.28 | 3790.02 | 3758.18 | 2447.45 | 2454.09 | 2419.28 | 2418.83 | 2415.21 | 2421.35 | 2240.60 | 2231.58 | 2207.84 | 2094.46 | 2065.84 | 2065.10 | 2005.70 | 1962.85 | 1924.24 | 1913.70 | 1924.99 | 1839.60 | 1616.50 | 1595.76 | NA | NA | NA | 1394.09 | NA | NA | NA | |
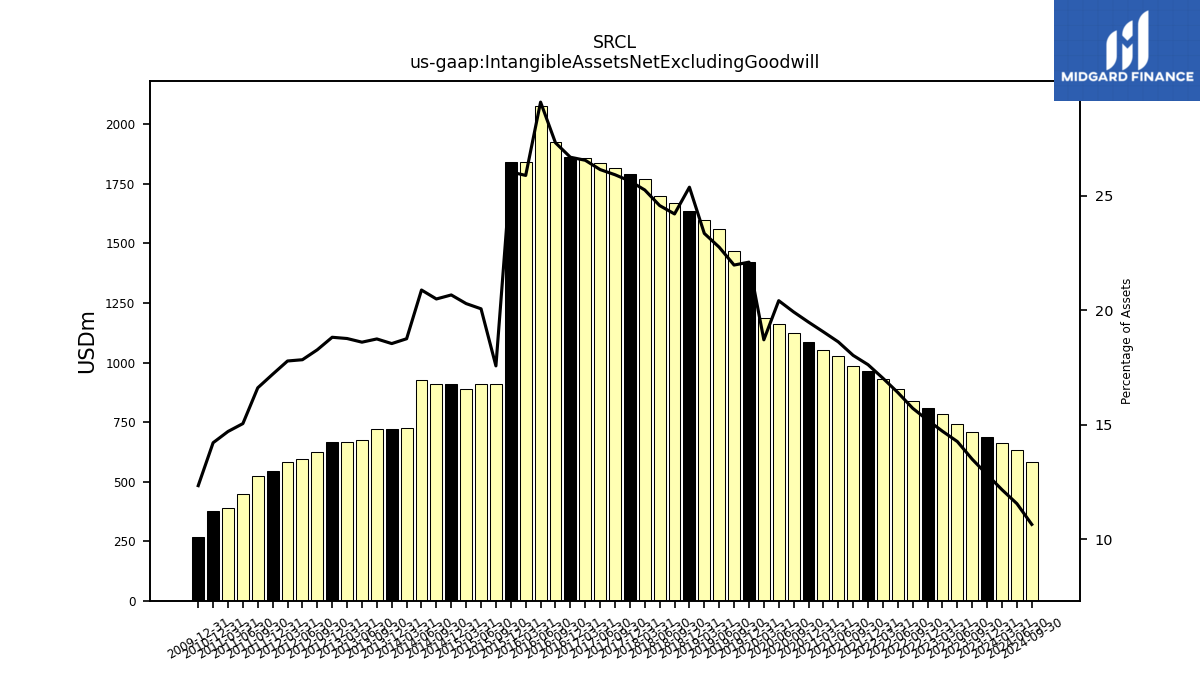
| Intangible Assets Net Excluding Goodwill | 686.50 | 708.00 | 743.80 | 784.80 | 811.10 | 839.60 | 887.40 | 932.90 | 964.50 | 986.10 | 1027.20 | 1054.00 | 1087.40 | 1122.40 | 1160.70 | 1188.60 | 1422.40 | 1466.80 | 1562.80 | 1599.70 | 1637.70 | 1670.60 | 1698.70 | 1771.20 | 1791.50 | 1818.08 | 1839.43 | 1857.21 | 1861.97 | 1927.11 | 2078.23 | 1840.84 | 1842.56 | 909.50 | 908.18 | 889.36 | 909.64 | 910.93 | 926.54 | 724.98 | 720.03 | 720.81 | 673.22 | 664.68 | 667.47 | 623.42 | 596.13 | 582.47 | 546.62 | 524.23 | 446.38 | 388.81 | 375.17 | NA | NA | NA | 269.45 | NA | NA | NA | |
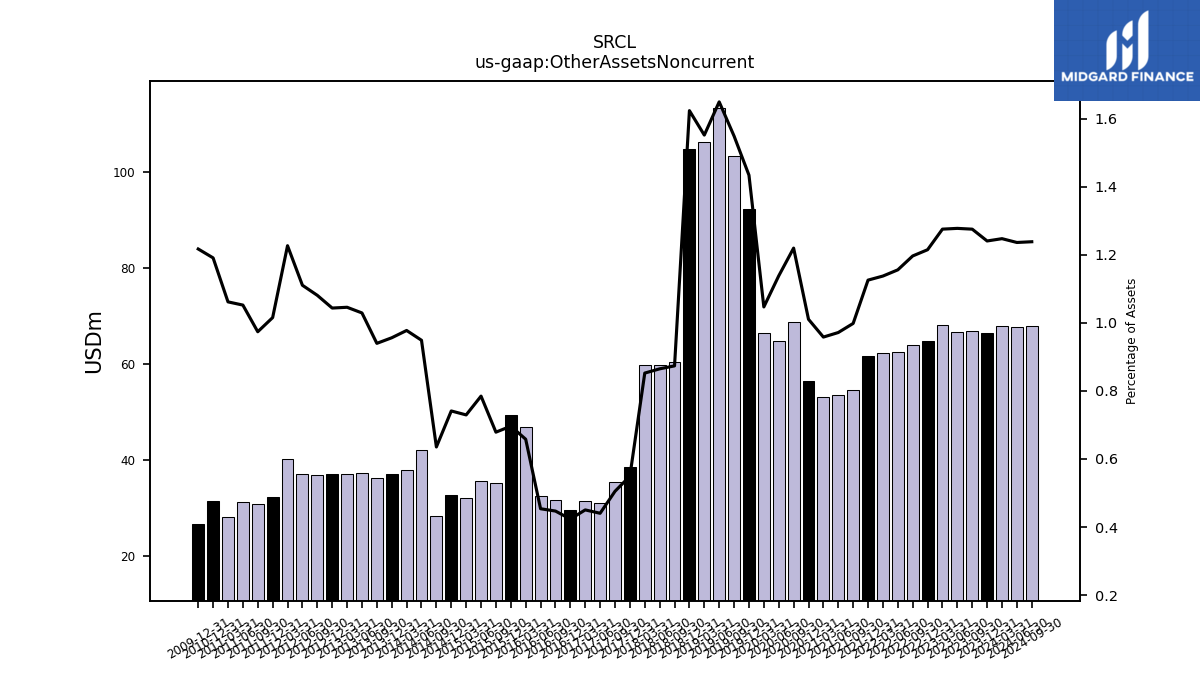
| Other Assets Noncurrent | 66.40 | 66.90 | 66.60 | 68.00 | 64.80 | 63.90 | 62.50 | 62.30 | 61.60 | 54.60 | 53.60 | 53.00 | 56.40 | 68.70 | 64.70 | 66.50 | 92.30 | 103.40 | 113.30 | 106.30 | 104.80 | 60.30 | 59.80 | 59.80 | 38.40 | 35.43 | 31.00 | 31.51 | 29.56 | 31.54 | 32.43 | 46.80 | 49.28 | 35.14 | 35.52 | 31.98 | 32.62 | 28.24 | 42.10 | 37.79 | 37.12 | 36.13 | 37.24 | 37.04 | 37.01 | 36.87 | 37.11 | 40.17 | 32.26 | 30.73 | 31.20 | 28.07 | 31.43 | NA | NA | NA | 26.56 | NA | NA | NA |
| 2023-12-31 | 2023-09-30 | 2023-06-30 | 2023-03-31 | 2022-12-31 | 2022-09-30 | 2022-06-30 | 2022-03-31 | 2021-12-31 | 2021-09-30 | 2021-06-30 | 2021-03-31 | 2020-12-31 | 2020-09-30 | 2020-06-30 | 2020-03-31 | 2019-12-31 | 2019-09-30 | 2019-06-30 | 2019-03-31 | 2018-12-31 | 2018-09-30 | 2018-06-30 | 2018-03-31 | 2017-12-31 | 2017-09-30 | 2017-06-30 | 2017-03-31 | 2016-12-31 | 2016-09-30 | 2016-06-30 | 2016-03-31 | 2015-12-31 | 2015-09-30 | 2015-06-30 | 2015-03-31 | 2014-12-31 | 2014-09-30 | 2014-06-30 | 2014-03-31 | 2013-12-31 | 2013-09-30 | 2013-06-30 | 2013-03-31 | 2012-12-31 | 2012-09-30 | 2012-06-30 | 2012-03-31 | 2011-12-31 | 2011-09-30 | 2011-06-30 | 2011-03-31 | 2010-12-31 | 2010-09-30 | 2010-06-30 | 2010-03-31 | 2009-12-31 | 2009-09-30 | 2009-06-30 | 2009-03-31 | ||
|---|---|---|---|---|---|---|---|---|---|---|---|---|---|---|---|---|---|---|---|---|---|---|---|---|---|---|---|---|---|---|---|---|---|---|---|---|---|---|---|---|---|---|---|---|---|---|---|---|---|---|---|---|---|---|---|---|---|---|---|---|---|
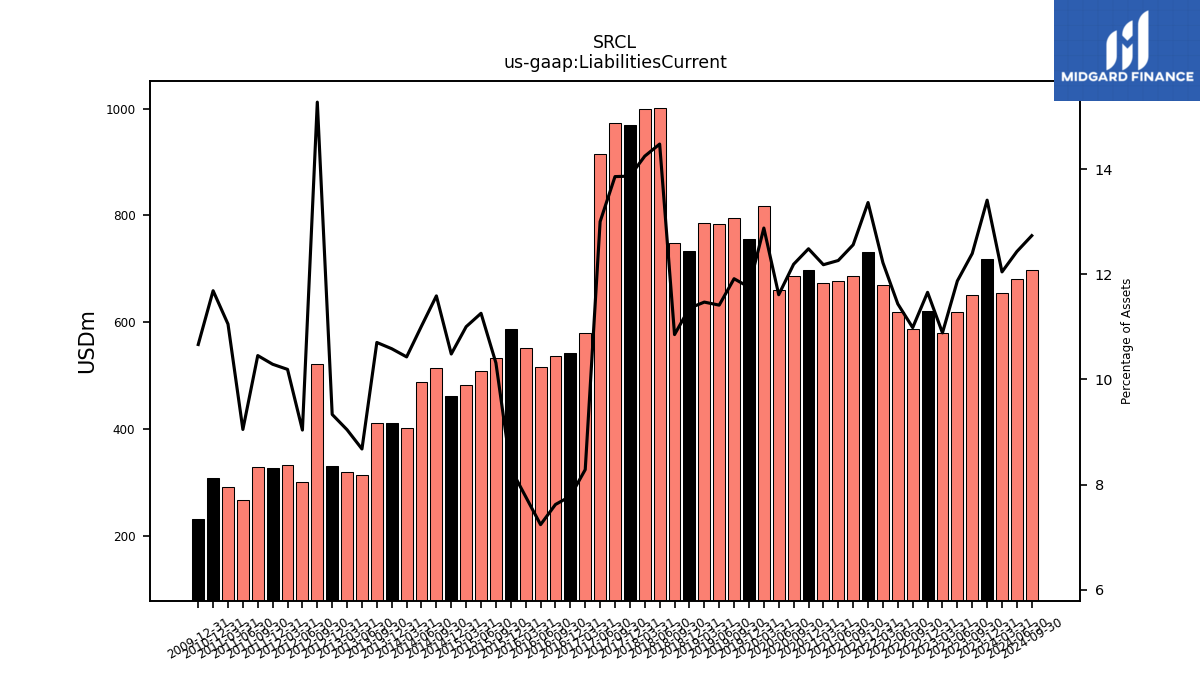
| Liabilities Current | 718.00 | 650.40 | 619.10 | 580.50 | 621.90 | 586.80 | 618.60 | 669.50 | 731.70 | 687.20 | 676.70 | 674.00 | 697.10 | 686.90 | 660.30 | 818.50 | 756.90 | 795.70 | 784.20 | 786.00 | 733.20 | 749.30 | 1001.40 | 999.90 | 969.40 | 972.67 | 915.23 | 579.56 | 542.85 | 537.73 | 517.10 | 552.51 | 587.35 | 533.93 | 509.74 | 482.40 | 461.53 | 515.30 | 488.84 | 403.18 | 411.01 | 411.60 | 313.96 | 320.30 | 331.06 | 521.32 | 301.98 | 333.82 | 326.91 | 329.91 | 268.33 | 292.25 | 308.49 | NA | NA | NA | 232.81 | NA | NA | NA | |
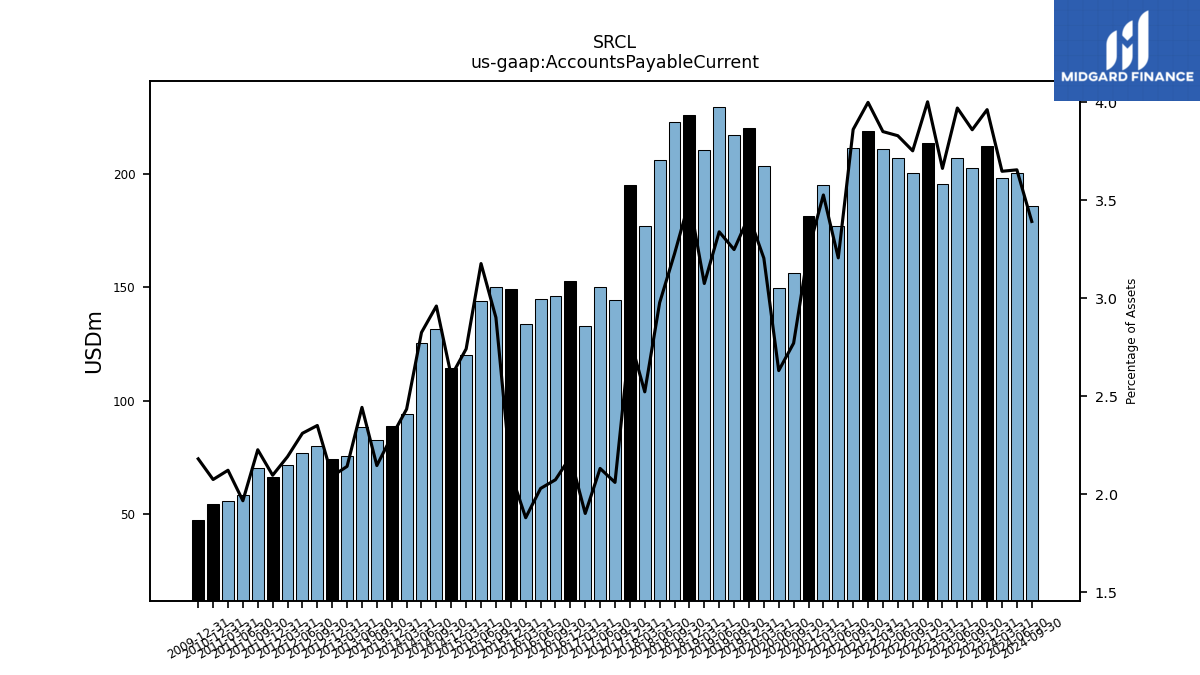
| Accounts Payable Current | 212.10 | 202.50 | 207.00 | 195.30 | 213.50 | 200.40 | 207.10 | 210.90 | 218.90 | 211.20 | 176.90 | 195.10 | 181.20 | 156.10 | 149.60 | 203.60 | 220.10 | 216.90 | 229.40 | 210.70 | 225.80 | 222.80 | 205.90 | 177.00 | 195.20 | 144.60 | 150.04 | 133.12 | 152.88 | 146.40 | 145.07 | 133.78 | 149.20 | 150.21 | 143.83 | 120.20 | 114.60 | 131.62 | 125.39 | 94.12 | 89.15 | 82.55 | 88.42 | 75.89 | 74.22 | 80.21 | 77.24 | 71.81 | 66.64 | 70.28 | 58.35 | 56.12 | 54.78 | NA | NA | NA | 47.61 | NA | NA | NA | |
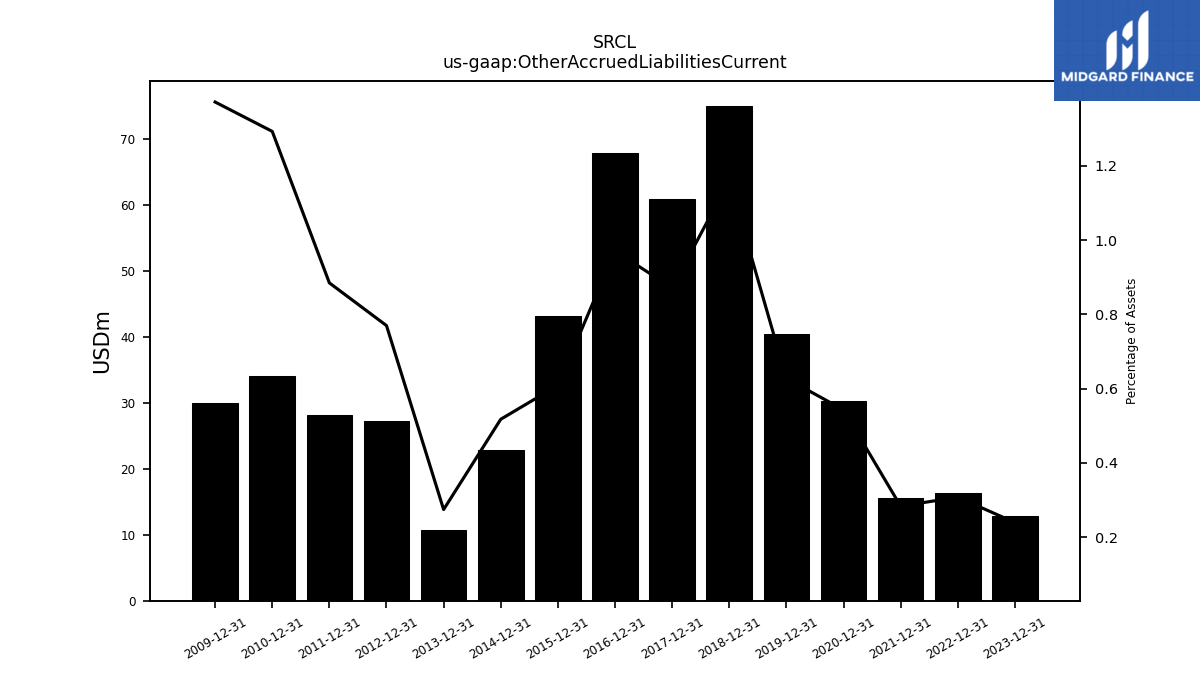
| Other Accrued Liabilities Current | 12.80 | NA | NA | NA | 16.40 | NA | NA | NA | 15.50 | NA | NA | NA | 30.30 | NA | NA | NA | 40.40 | NA | NA | NA | 75.00 | NA | NA | NA | 60.90 | NA | NA | NA | 67.78 | NA | NA | NA | 43.08 | NA | NA | NA | 22.78 | NA | NA | NA | 10.64 | NA | NA | NA | 27.30 | NA | NA | NA | 28.11 | NA | NA | NA | 34.13 | NA | NA | NA | 29.96 | NA | NA | NA | |
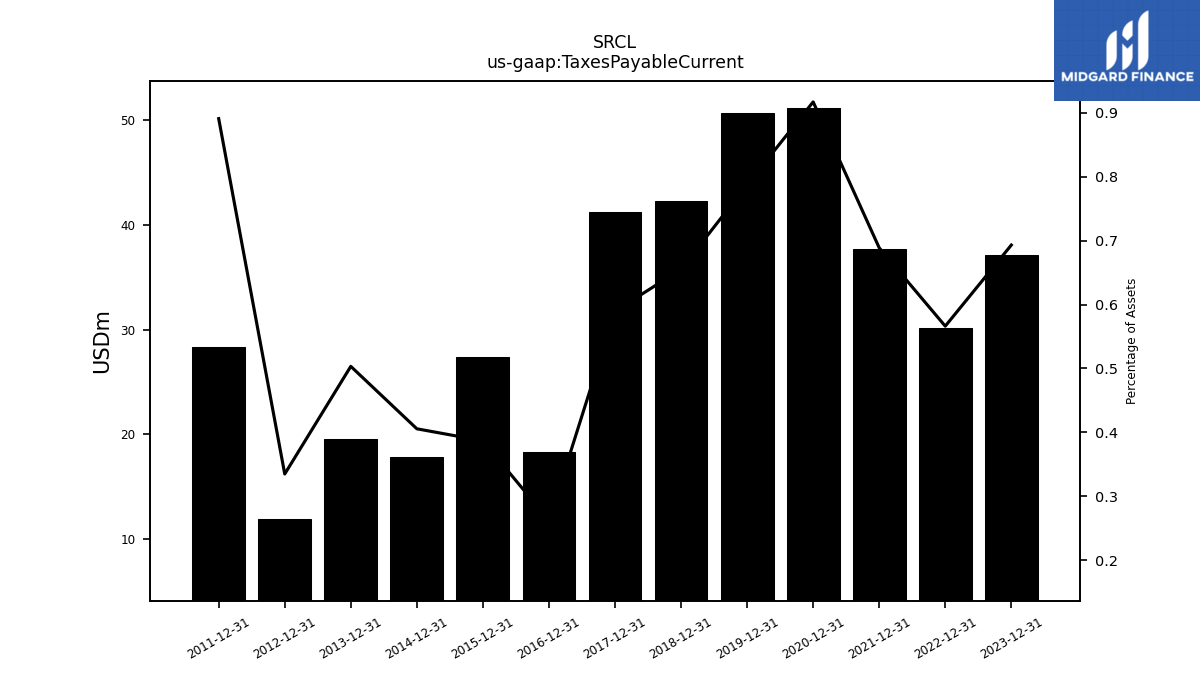
| Taxes Payable Current | 37.10 | NA | NA | NA | 30.20 | NA | NA | NA | 37.70 | NA | NA | NA | 51.20 | NA | NA | NA | 50.70 | NA | NA | NA | 42.30 | NA | NA | NA | 41.20 | NA | NA | NA | 18.29 | NA | NA | NA | 27.36 | NA | NA | NA | 17.85 | NA | NA | NA | 19.54 | NA | NA | NA | 11.87 | NA | NA | NA | 28.31 | NA | NA | NA | NA | NA | NA | NA | NA | NA | NA | NA | |
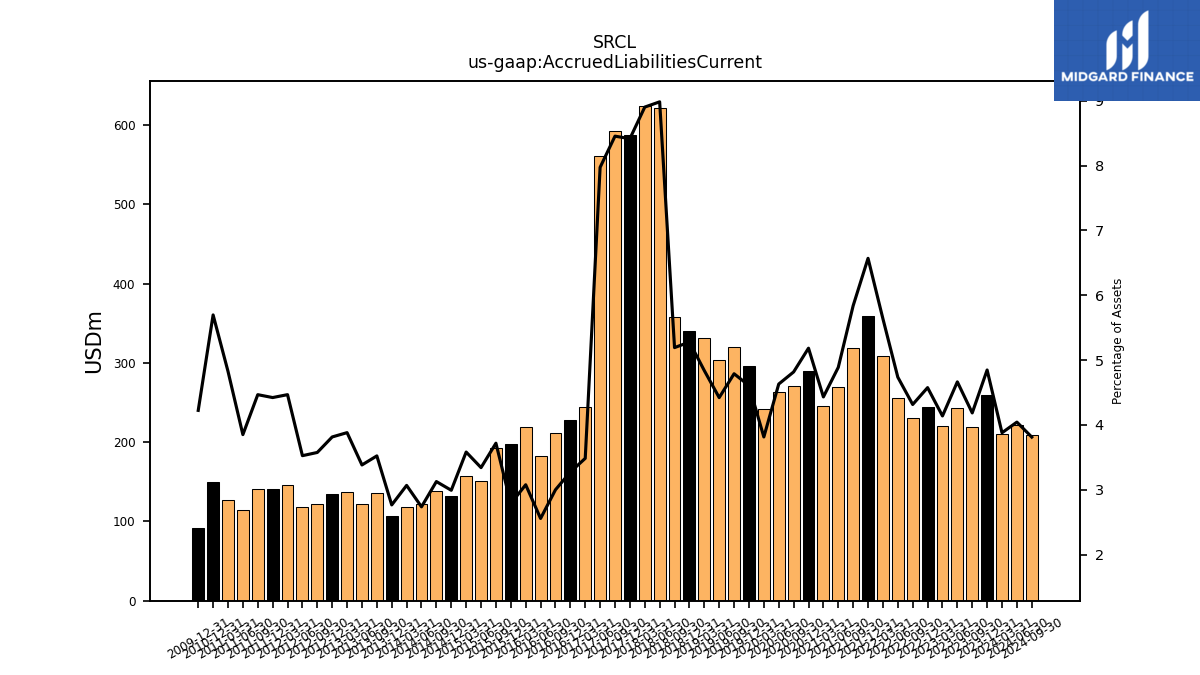
| Accrued Liabilities Current | 259.50 | 219.60 | 243.20 | 220.70 | 244.10 | 230.50 | 256.20 | 308.80 | 359.60 | 319.40 | 269.70 | 245.20 | 289.40 | 271.40 | 263.30 | 242.40 | 296.60 | 319.80 | 303.80 | 331.50 | 340.80 | 358.50 | 621.20 | 624.60 | 588.10 | 593.20 | 561.13 | 243.87 | 228.53 | 211.76 | 182.81 | 218.93 | 197.33 | 192.51 | 151.31 | 157.05 | 131.74 | 139.03 | 121.47 | 118.61 | 107.44 | 135.47 | 122.43 | 137.51 | 135.32 | 122.01 | 117.84 | 146.33 | 140.52 | 140.97 | 114.22 | 127.62 | 150.36 | NA | NA | NA | 92.23 | NA | NA | NA | |
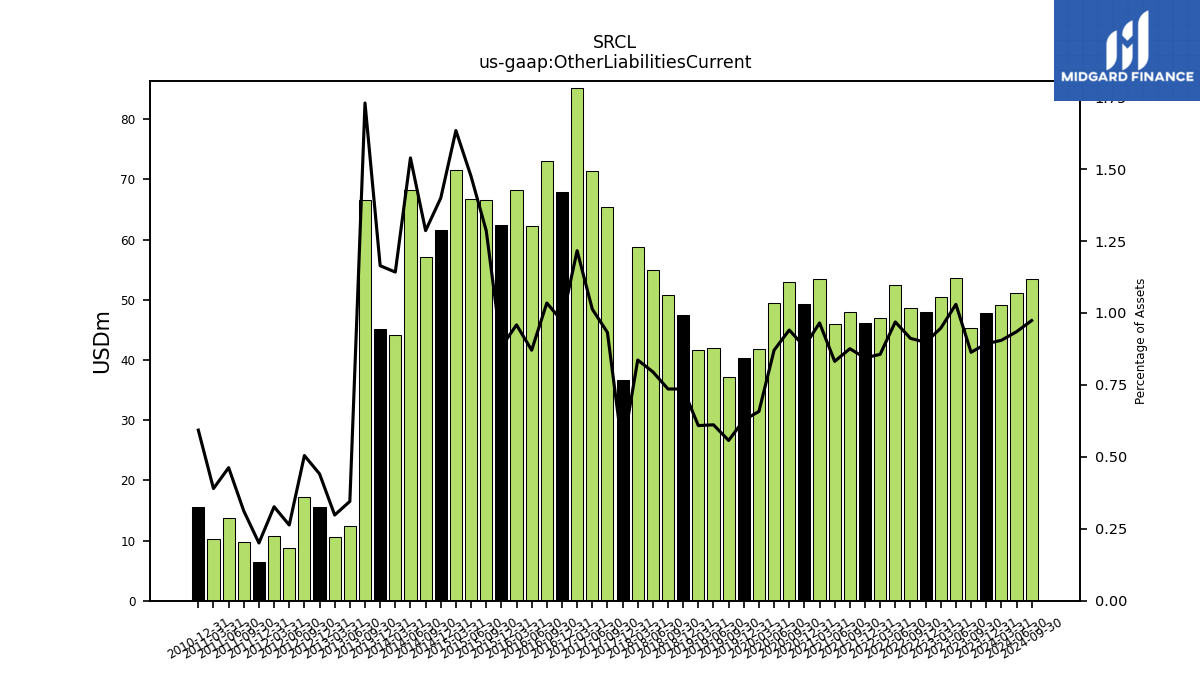
| Other Liabilities Current | 47.80 | 45.30 | 53.70 | 50.50 | 47.90 | 48.70 | 52.40 | 46.90 | 46.20 | 47.90 | 45.90 | 53.40 | 49.30 | 53.00 | 49.50 | 41.80 | 40.40 | 37.20 | 42.00 | 41.70 | 47.50 | 50.80 | 55.00 | 58.70 | 36.60 | 65.42 | 71.33 | 85.12 | 67.86 | 73.02 | 62.22 | 68.19 | 62.42 | 66.59 | 66.76 | 71.63 | 61.60 | 57.18 | 68.29 | 44.15 | 45.21 | 66.51 | 12.50 | 10.55 | 15.64 | 17.22 | 8.79 | 10.70 | 6.38 | 9.84 | 13.72 | 10.31 | 15.65 | NA | NA | NA | NA | NA | NA | NA | |
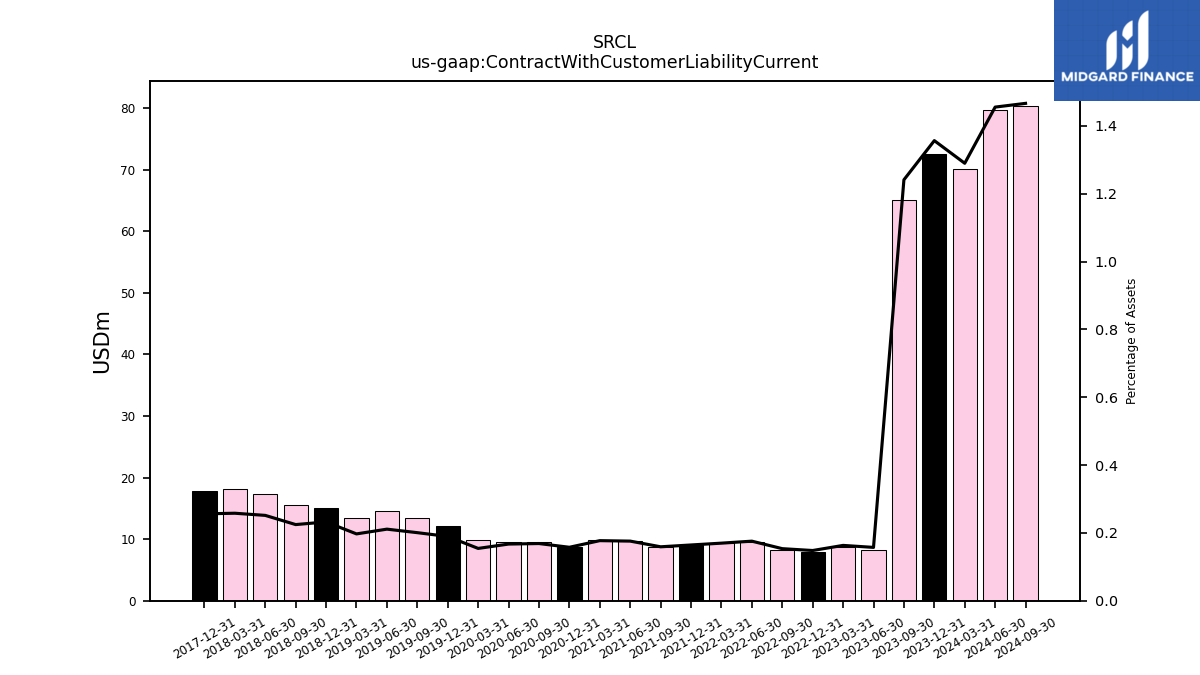
| Contract With Customer Liability Current | 72.60 | 65.10 | 8.20 | 8.70 | 7.90 | 8.20 | 9.50 | 9.30 | 9.00 | 8.70 | 9.70 | 9.80 | 8.80 | 9.50 | 9.50 | 9.80 | 12.20 | 13.40 | 14.50 | 13.50 | 15.00 | 15.50 | 17.40 | 18.10 | 17.90 | NA | NA | NA | NA | NA | NA | NA | NA | NA | NA | NA | NA | NA | NA | NA | NA | NA | NA | NA | NA | NA | NA | NA | NA | NA | NA | NA | NA | NA | NA | NA | NA | NA | NA | NA |
| 2023-12-31 | 2023-09-30 | 2023-06-30 | 2023-03-31 | 2022-12-31 | 2022-09-30 | 2022-06-30 | 2022-03-31 | 2021-12-31 | 2021-09-30 | 2021-06-30 | 2021-03-31 | 2020-12-31 | 2020-09-30 | 2020-06-30 | 2020-03-31 | 2019-12-31 | 2019-09-30 | 2019-06-30 | 2019-03-31 | 2018-12-31 | 2018-09-30 | 2018-06-30 | 2018-03-31 | 2017-12-31 | 2017-09-30 | 2017-06-30 | 2017-03-31 | 2016-12-31 | 2016-09-30 | 2016-06-30 | 2016-03-31 | 2015-12-31 | 2015-09-30 | 2015-06-30 | 2015-03-31 | 2014-12-31 | 2014-09-30 | 2014-06-30 | 2014-03-31 | 2013-12-31 | 2013-09-30 | 2013-06-30 | 2013-03-31 | 2012-12-31 | 2012-09-30 | 2012-06-30 | 2012-03-31 | 2011-12-31 | 2011-09-30 | 2011-06-30 | 2011-03-31 | 2010-12-31 | 2010-09-30 | 2010-06-30 | 2010-03-31 | 2009-12-31 | 2009-09-30 | 2009-06-30 | 2009-03-31 | ||
|---|---|---|---|---|---|---|---|---|---|---|---|---|---|---|---|---|---|---|---|---|---|---|---|---|---|---|---|---|---|---|---|---|---|---|---|---|---|---|---|---|---|---|---|---|---|---|---|---|---|---|---|---|---|---|---|---|---|---|---|---|---|
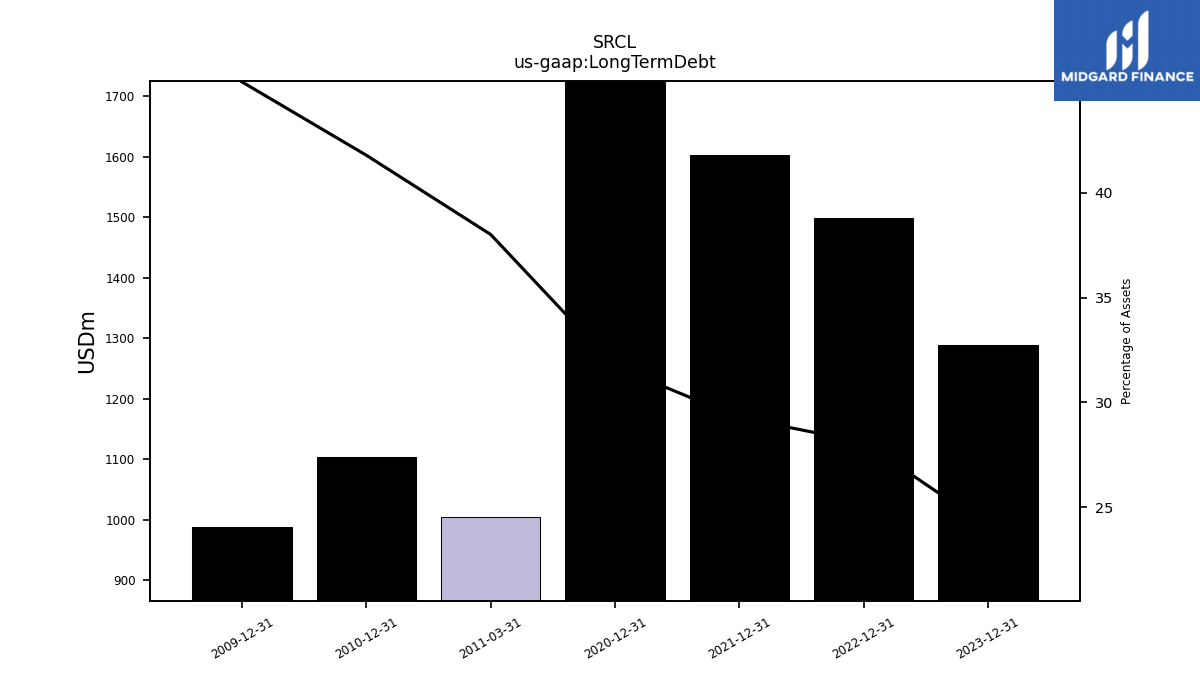
| Long Term Debt | 1288.90 | NA | NA | NA | 1499.10 | NA | NA | NA | 1602.30 | NA | NA | NA | 1770.40 | NA | NA | NA | NA | NA | NA | NA | NA | NA | NA | NA | NA | NA | NA | NA | NA | NA | NA | NA | NA | NA | NA | NA | NA | NA | NA | NA | NA | NA | NA | NA | NA | NA | NA | NA | NA | NA | NA | 1005.07 | 1103.12 | NA | NA | NA | 988.85 | NA | NA | NA | |
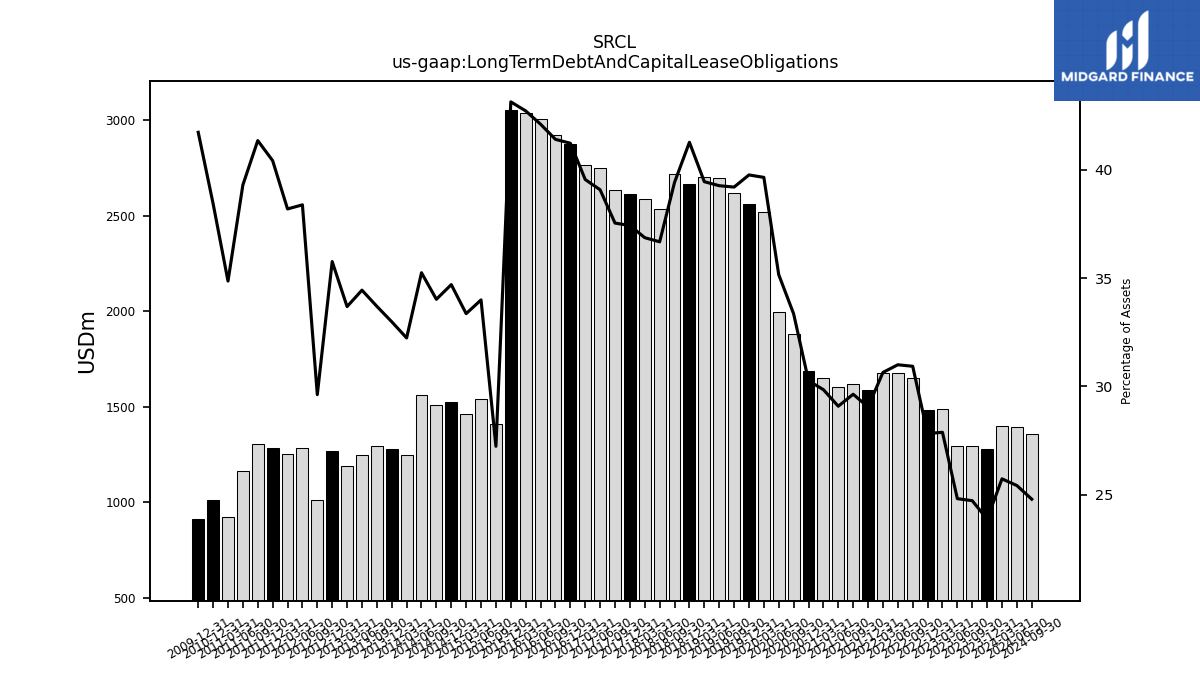
| Long Term Debt And Capital Lease Obligations | 1277.80 | 1297.00 | 1293.70 | 1486.50 | 1484.00 | 1651.70 | 1676.30 | 1678.30 | 1589.80 | 1621.00 | 1604.50 | 1651.00 | 1689.10 | 1878.70 | 1998.70 | 2518.80 | 2559.30 | 2617.00 | 2697.20 | 2702.40 | 2663.90 | 2720.80 | 2535.70 | 2586.20 | 2615.30 | 2633.73 | 2749.82 | 2767.03 | 2877.32 | 2921.77 | 3008.59 | 3038.08 | 3052.64 | 1409.69 | 1538.74 | 1462.18 | 1527.25 | 1512.33 | 1563.91 | 1246.07 | 1280.66 | 1295.59 | 1246.20 | 1193.11 | 1268.30 | 1010.51 | 1282.46 | 1250.77 | 1284.11 | 1304.63 | 1165.39 | 921.55 | 1014.22 | NA | NA | NA | 910.83 | NA | NA | NA | |
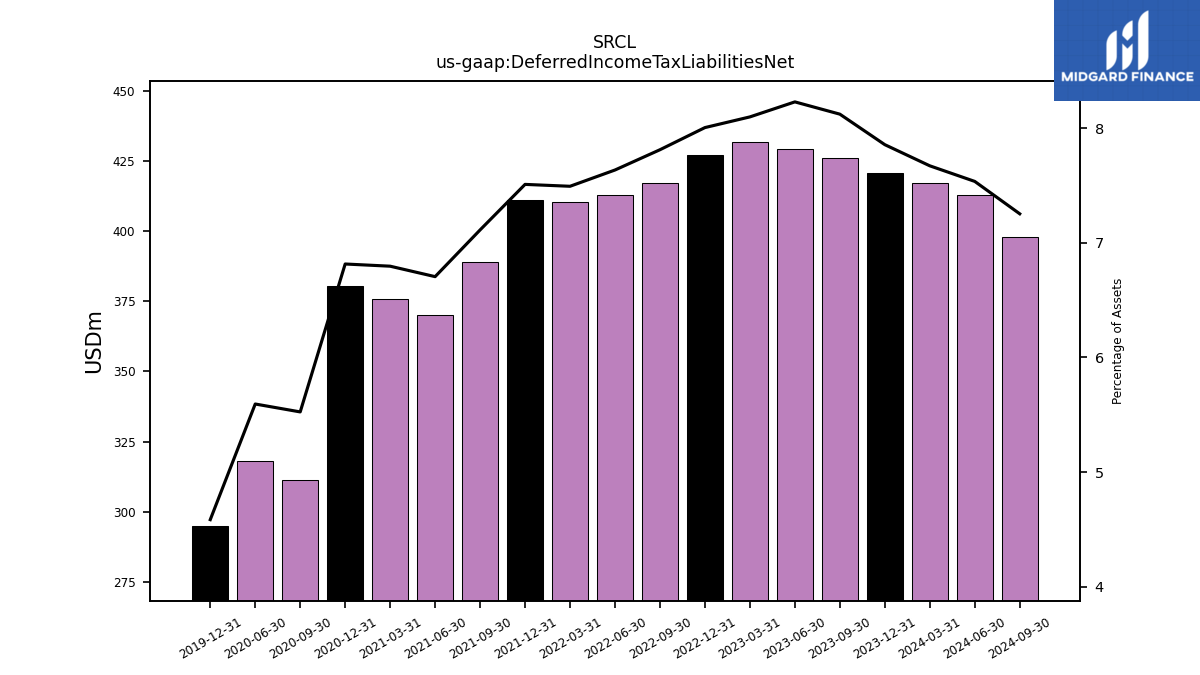
| Deferred Income Tax Liabilities Net | 420.50 | 426.10 | 429.00 | 431.80 | 427.00 | 417.20 | 412.90 | 410.40 | 411.00 | 389.00 | 369.90 | 375.90 | 380.40 | 311.20 | 318.00 | NA | 295.10 | NA | NA | NA | NA | NA | NA | NA | NA | NA | NA | NA | NA | NA | NA | NA | NA | NA | NA | NA | NA | NA | NA | NA | NA | NA | NA | NA | NA | NA | NA | NA | NA | NA | NA | NA | NA | NA | NA | NA | NA | NA | NA | NA | |
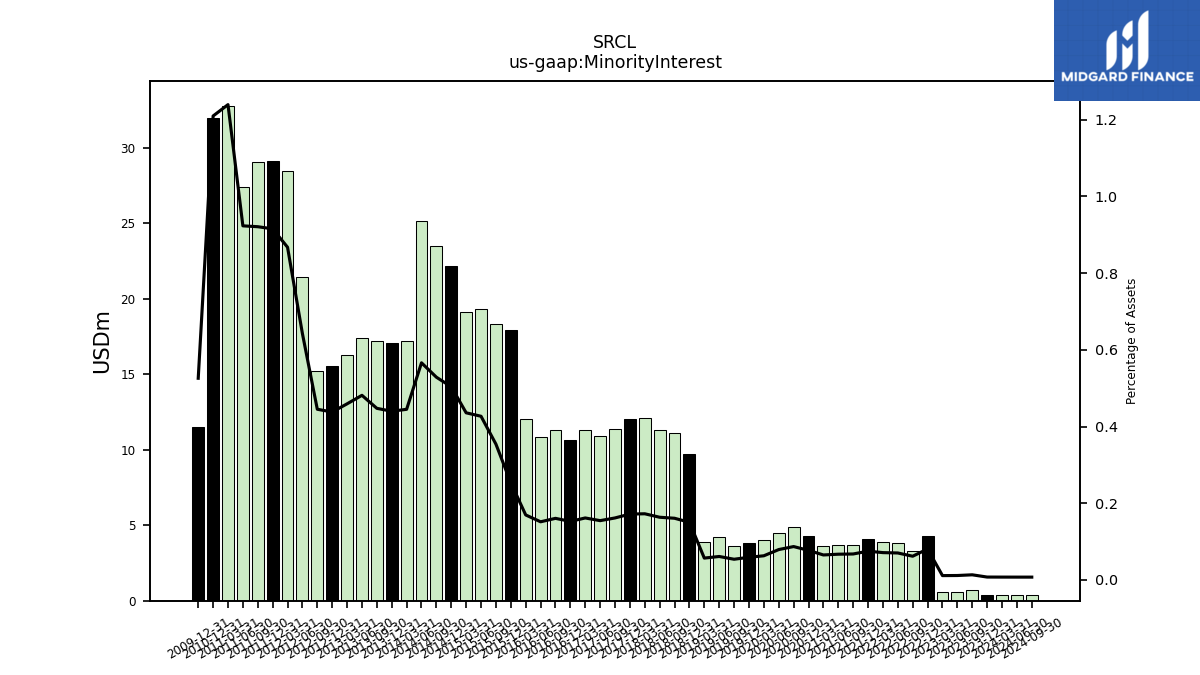
| Minority Interest | 0.40 | 0.70 | 0.60 | 0.60 | 4.30 | 3.30 | 3.80 | 3.90 | 4.10 | 3.70 | 3.70 | 3.60 | 4.30 | 4.90 | 4.50 | 4.00 | 3.80 | 3.60 | 4.20 | 3.90 | 9.70 | 11.10 | 11.30 | 12.10 | 12.00 | 11.34 | 10.88 | 11.30 | 10.65 | 11.33 | 10.83 | 12.05 | 17.95 | 18.33 | 19.32 | 19.10 | 22.17 | 23.50 | 25.12 | 17.20 | 17.08 | 17.20 | 17.42 | 16.26 | 15.53 | 15.18 | 21.46 | 28.41 | 29.09 | 29.06 | 27.38 | 32.76 | 31.93 | NA | NA | NA | 11.48 | NA | NA | NA | |
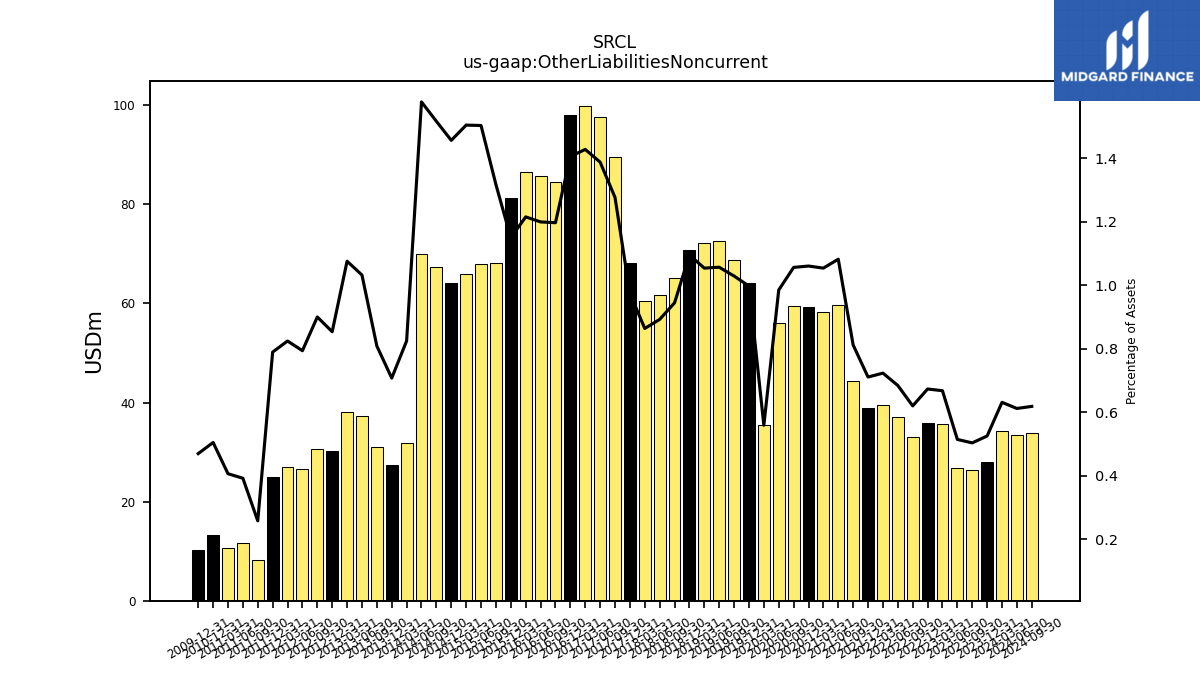
| Other Liabilities Noncurrent | 28.10 | 26.40 | 26.80 | 35.60 | 35.90 | 33.10 | 37.00 | 39.60 | 38.90 | 44.40 | 59.70 | 58.30 | 59.20 | 59.50 | 56.00 | 35.50 | 64.20 | 68.70 | 72.60 | 72.20 | 70.70 | 65.20 | 61.70 | 60.60 | 68.10 | 89.59 | 97.68 | 99.91 | 98.14 | 84.48 | 85.72 | 86.45 | 81.35 | 68.19 | 68.06 | 65.96 | 64.12 | 67.43 | 70.01 | 31.87 | 27.47 | 31.09 | 37.35 | 38.11 | 30.27 | 30.70 | 26.52 | 27.00 | 25.08 | 8.13 | 11.62 | 10.73 | 13.31 | NA | NA | NA | 10.25 | NA | NA | NA | |
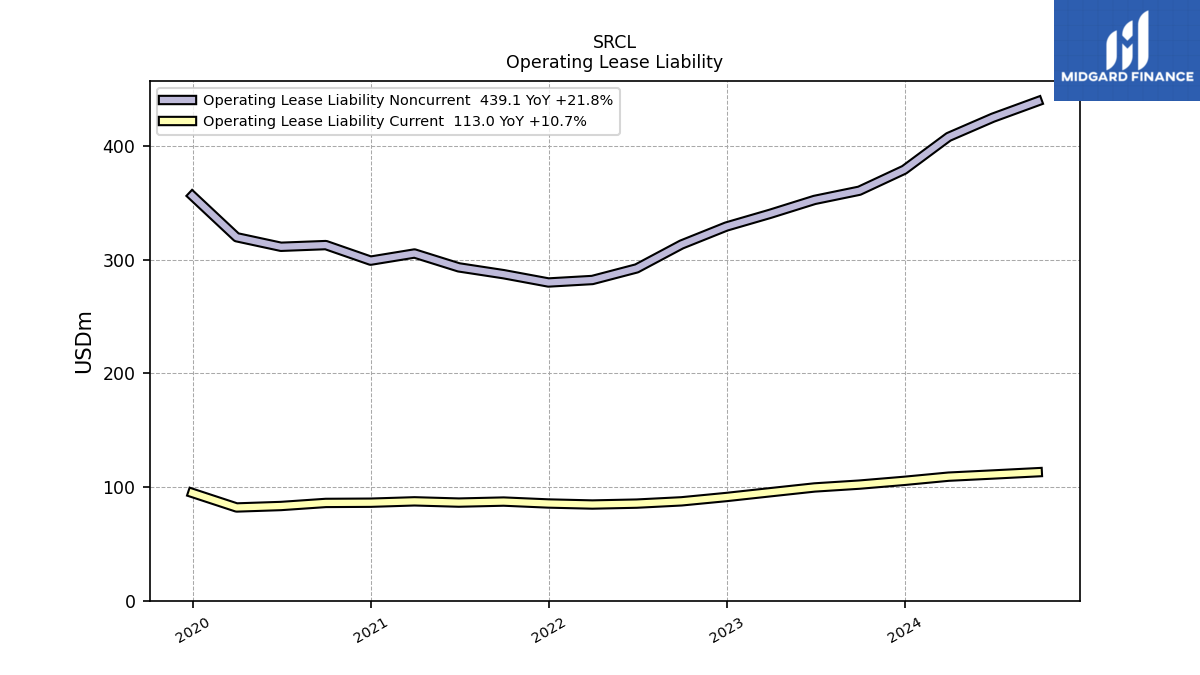
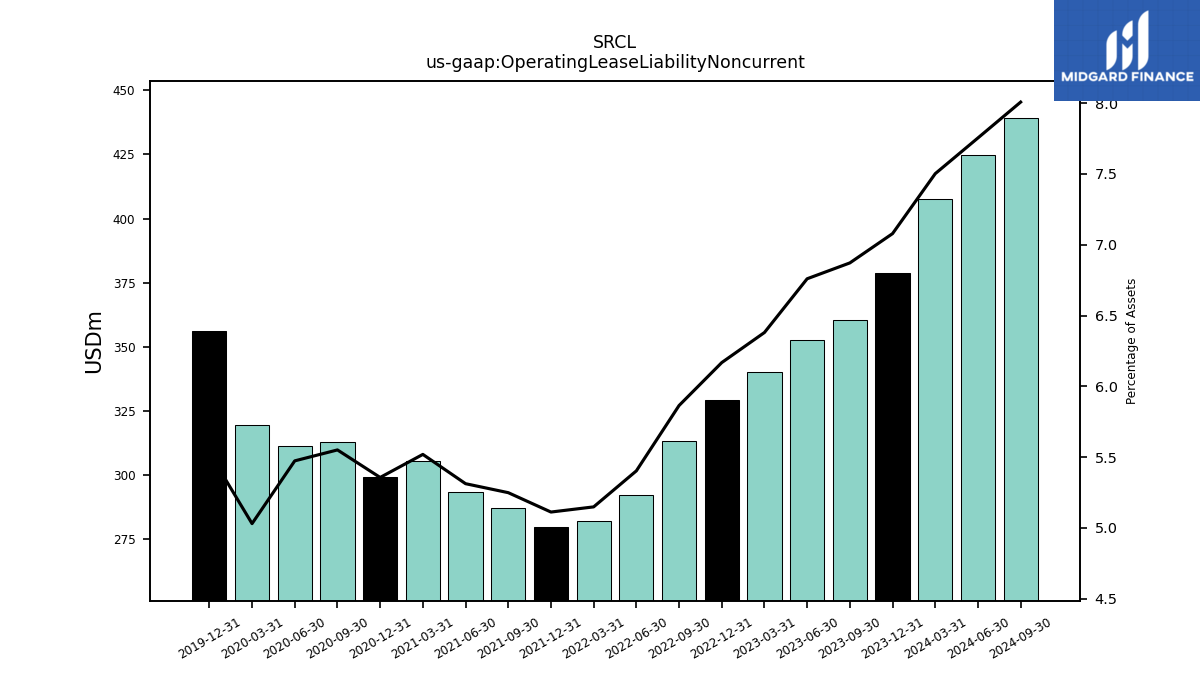
| Operating Lease Liability Noncurrent | 378.90 | 360.50 | 352.40 | 340.20 | 329.00 | 313.20 | 292.20 | 282.00 | 279.80 | 287.10 | 293.10 | 305.30 | 299.00 | 312.70 | 311.20 | 319.60 | 356.10 | NA | NA | NA | NA | NA | NA | NA | NA | NA | NA | NA | NA | NA | NA | NA | NA | NA | NA | NA | NA | NA | NA | NA | NA | NA | NA | NA | NA | NA | NA | NA | NA | NA | NA | NA | NA | NA | NA | NA | NA | NA | NA | NA |
| 2023-12-31 | 2023-09-30 | 2023-06-30 | 2023-03-31 | 2022-12-31 | 2022-09-30 | 2022-06-30 | 2022-03-31 | 2021-12-31 | 2021-09-30 | 2021-06-30 | 2021-03-31 | 2020-12-31 | 2020-09-30 | 2020-06-30 | 2020-03-31 | 2019-12-31 | 2019-09-30 | 2019-06-30 | 2019-03-31 | 2018-12-31 | 2018-09-30 | 2018-06-30 | 2018-03-31 | 2017-12-31 | 2017-09-30 | 2017-06-30 | 2017-03-31 | 2016-12-31 | 2016-09-30 | 2016-06-30 | 2016-03-31 | 2015-12-31 | 2015-09-30 | 2015-06-30 | 2015-03-31 | 2014-12-31 | 2014-09-30 | 2014-06-30 | 2014-03-31 | 2013-12-31 | 2013-09-30 | 2013-06-30 | 2013-03-31 | 2012-12-31 | 2012-09-30 | 2012-06-30 | 2012-03-31 | 2011-12-31 | 2011-09-30 | 2011-06-30 | 2011-03-31 | 2010-12-31 | 2010-09-30 | 2010-06-30 | 2010-03-31 | 2009-12-31 | 2009-09-30 | 2009-06-30 | 2009-03-31 | ||
|---|---|---|---|---|---|---|---|---|---|---|---|---|---|---|---|---|---|---|---|---|---|---|---|---|---|---|---|---|---|---|---|---|---|---|---|---|---|---|---|---|---|---|---|---|---|---|---|---|---|---|---|---|---|---|---|---|---|---|---|---|---|
| Stockholders Equity | 2522.50 | 2475.60 | 2482.20 | 2445.40 | 2420.20 | 2322.40 | 2349.90 | 2377.50 | 2398.70 | 2418.50 | 2489.80 | 2445.20 | 2430.10 | 2333.60 | 2291.60 | 2276.20 | 2330.90 | 2473.70 | 2558.00 | 2566.60 | 2587.40 | 2921.50 | 2890.30 | 2940.00 | 2896.60 | 2807.38 | 2749.94 | 2881.18 | 2805.74 | 2847.46 | 2818.25 | 2806.44 | 2729.89 | 2716.11 | 1962.70 | 1930.90 | 1895.01 | 1856.69 | 1827.22 | 1768.35 | 1750.46 | 1705.53 | 1632.03 | 1609.20 | 1541.79 | 1477.68 | 1367.71 | 1299.33 | 1198.17 | 1182.66 | 1223.65 | 1145.24 | 1048.42 | NA | NA | NA | 845.70 | NA | NA | NA | |
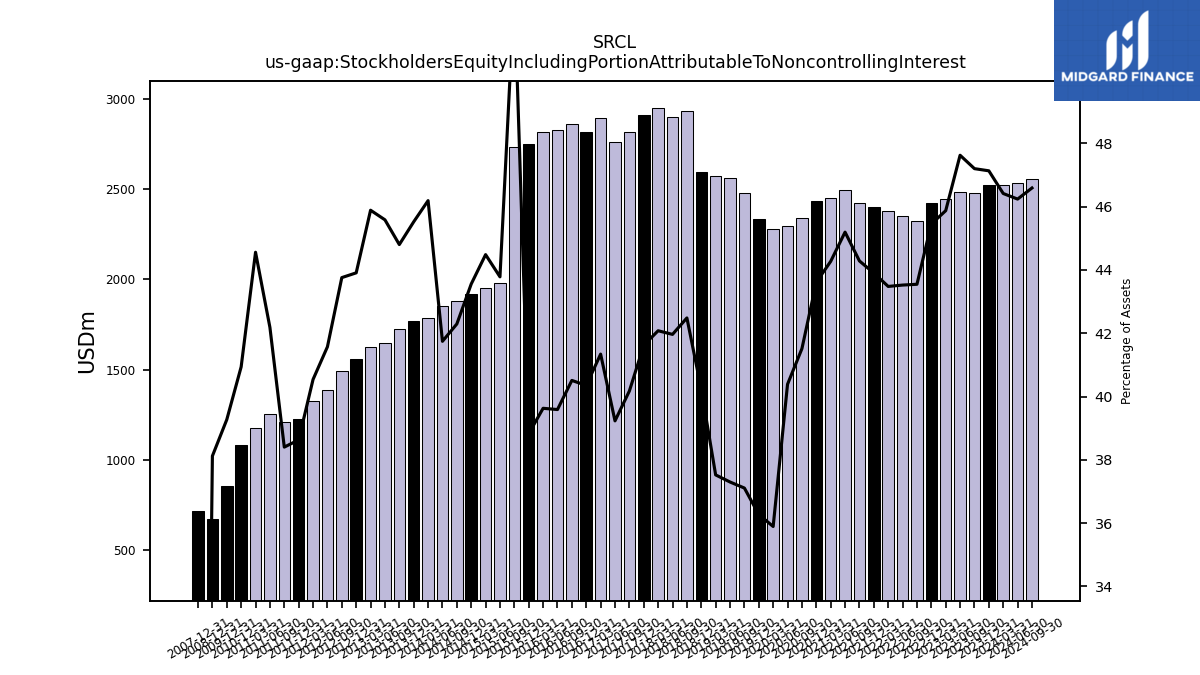
| Stockholders Equity Including Portion Attributable To Noncontrolling Interest | 2522.90 | 2476.30 | 2482.80 | 2446.00 | 2424.50 | 2325.70 | 2353.70 | 2381.40 | 2402.80 | 2422.20 | 2493.50 | 2448.80 | 2434.40 | 2338.50 | 2296.10 | 2280.20 | 2334.70 | 2477.30 | 2562.20 | 2570.50 | 2597.10 | 2932.60 | 2901.60 | 2952.10 | 2908.60 | 2818.72 | 2760.82 | 2892.48 | 2816.39 | 2858.79 | 2829.08 | 2818.49 | 2747.84 | 2734.44 | 1982.02 | 1950.01 | 1917.18 | 1880.19 | 1852.34 | 1785.55 | 1767.54 | 1722.73 | 1649.44 | 1625.47 | 1557.32 | 1492.86 | 1389.18 | 1327.74 | 1227.25 | 1211.72 | 1251.03 | 1178.01 | 1080.35 | NA | NA | NA | 857.17 | NA | NA | NA | |
| Common Stock Value | 0.90 | 0.90 | 0.90 | 0.90 | 0.90 | 0.90 | 0.90 | 0.90 | 0.90 | 0.90 | 0.90 | 0.90 | 0.90 | 0.90 | 0.90 | 0.90 | 0.90 | 0.90 | 0.90 | 0.90 | 0.90 | 0.90 | 0.90 | 0.90 | 0.90 | 0.85 | 0.85 | 0.85 | 0.85 | 0.85 | 0.85 | 0.85 | 0.85 | 0.85 | 0.85 | 0.85 | 0.85 | 0.85 | 0.85 | 0.85 | 0.85 | 0.86 | 0.86 | 0.86 | 0.86 | 0.86 | 0.85 | 0.85 | 0.85 | 0.85 | 0.86 | 0.86 | 0.85 | NA | NA | NA | 0.85 | NA | NA | NA | |
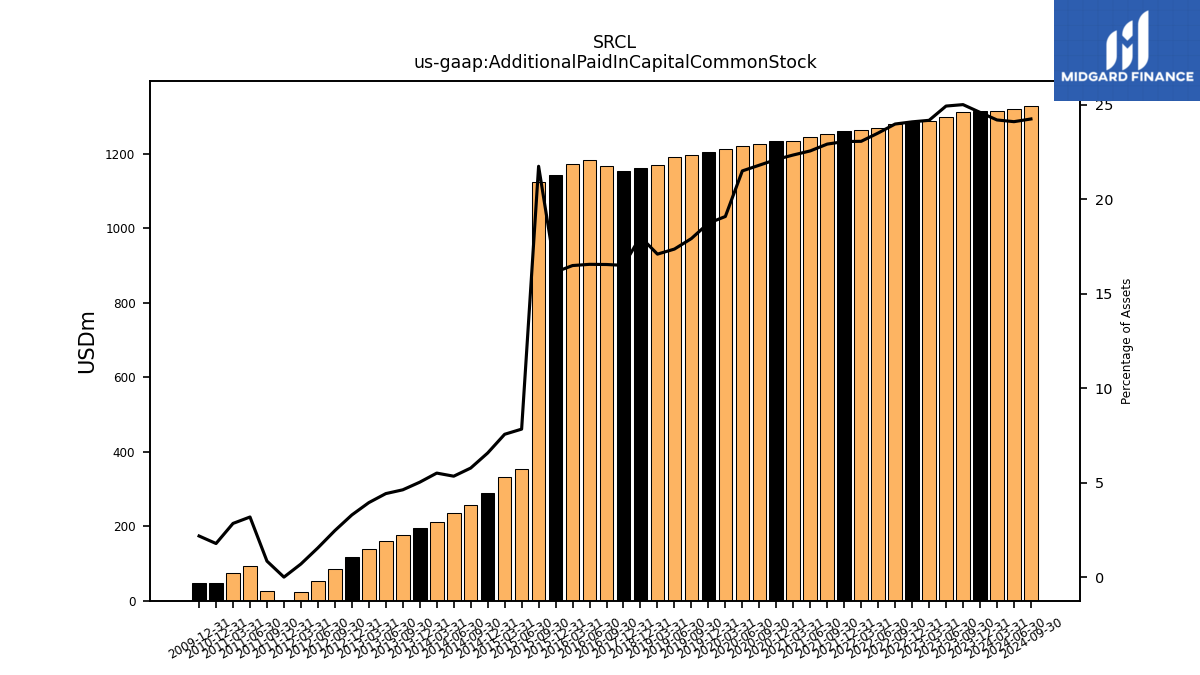
| Additional Paid In Capital Common Stock | 1316.70 | 1312.00 | 1299.80 | 1289.20 | 1285.40 | 1280.80 | 1271.20 | 1263.40 | 1261.80 | 1253.60 | 1244.60 | 1235.90 | 1234.00 | 1228.20 | 1222.40 | 1212.70 | 1205.70 | 1196.50 | 1192.80 | 1171.20 | 1162.60 | NA | NA | NA | 1153.20 | NA | NA | NA | NA | 1167.76 | 1183.14 | 1172.96 | 1143.02 | 1125.67 | 354.64 | 331.43 | 289.21 | 256.64 | 237.05 | 212.85 | 195.11 | 177.71 | 159.96 | 139.68 | 116.72 | 84.05 | 51.79 | 22.80 | 0.00 | 26.72 | 94.36 | 75.15 | 46.95 | NA | NA | NA | 47.52 | NA | NA | NA | |
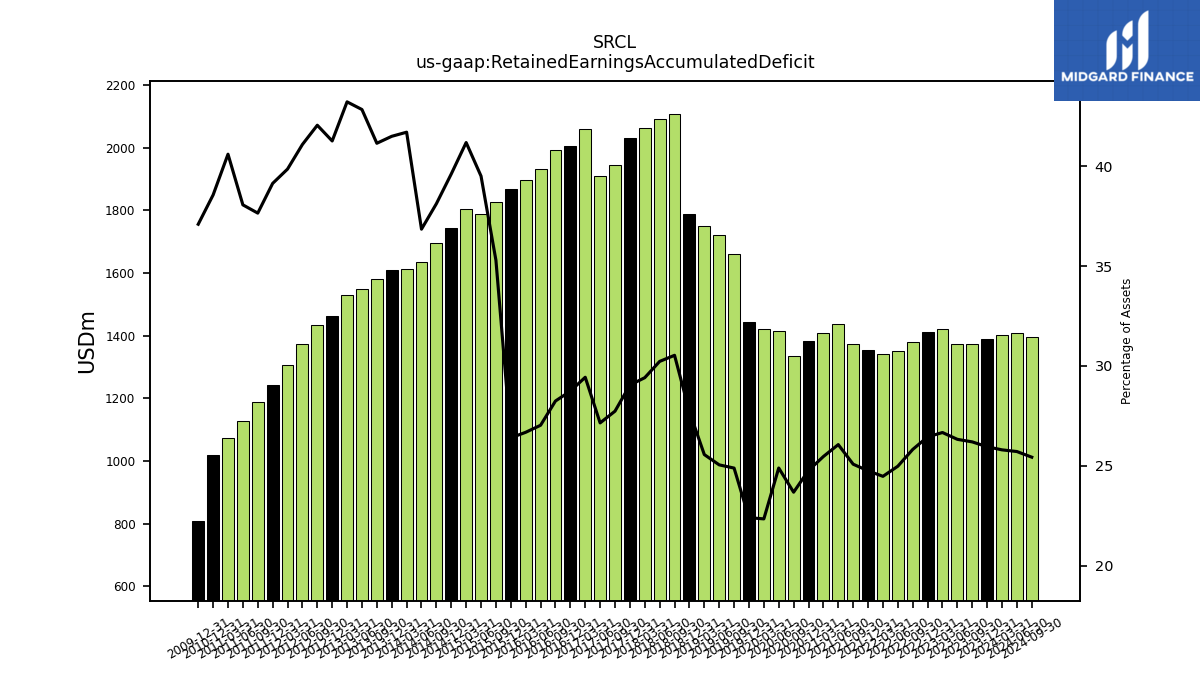
| Retained Earnings Accumulated Deficit | 1389.40 | 1374.50 | 1372.50 | 1422.00 | 1410.80 | 1379.00 | 1351.00 | 1340.60 | 1354.80 | 1372.00 | 1438.00 | 1408.70 | 1382.60 | 1334.10 | 1415.30 | 1419.80 | 1442.40 | 1661.70 | 1720.90 | 1751.40 | 1789.20 | 2107.60 | 2090.10 | 2063.50 | 2029.50 | 1946.13 | 1910.68 | 2059.45 | 2006.06 | 1993.34 | 1931.81 | 1897.64 | 1868.64 | 1826.84 | 1788.12 | 1805.06 | 1743.37 | 1694.55 | 1634.88 | 1611.78 | 1610.96 | 1581.96 | 1549.77 | 1530.73 | 1463.28 | 1434.37 | 1372.81 | 1305.21 | 1243.30 | 1187.96 | 1128.71 | 1073.17 | 1017.50 | NA | NA | NA | 809.62 | NA | NA | NA | |
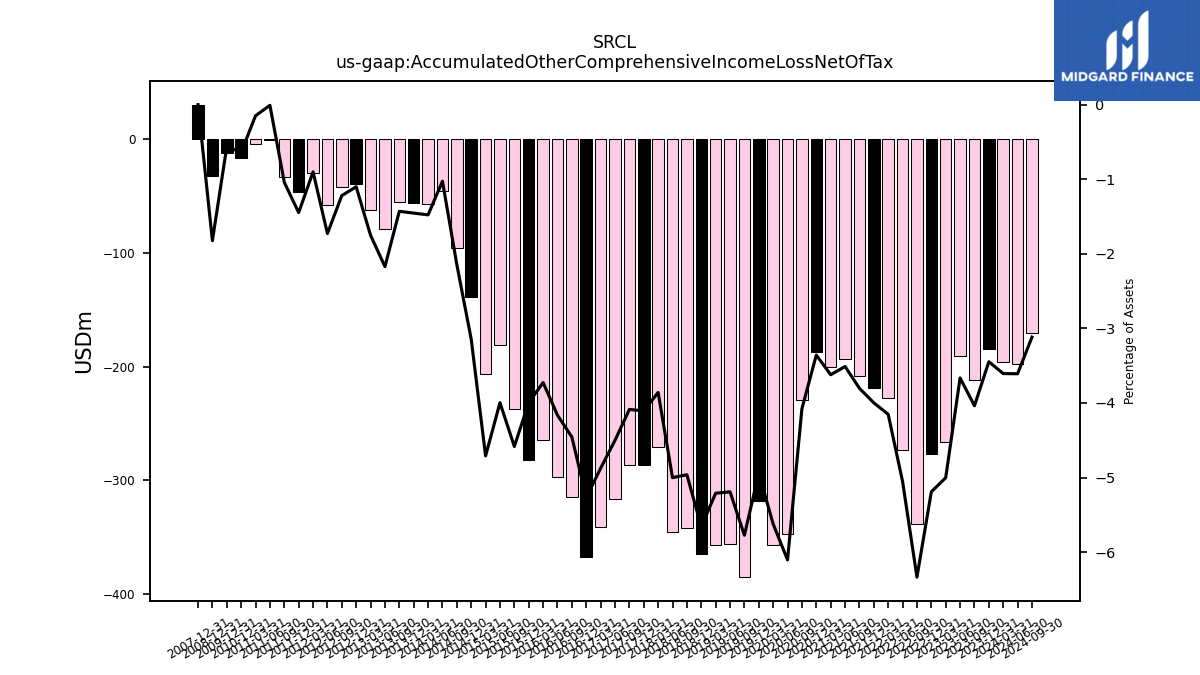
| Accumulated Other Comprehensive Income Loss Net Of Tax | -184.50 | -211.80 | -191.00 | -266.70 | -276.90 | -338.30 | -273.20 | -227.40 | -218.80 | -208.00 | -193.70 | -200.30 | -187.40 | -229.60 | -347.00 | -357.20 | -318.10 | -385.40 | -356.60 | -356.90 | -365.30 | -342.50 | -345.80 | -270.70 | -287.00 | -286.69 | -316.74 | -341.12 | -367.64 | -314.50 | -297.56 | -265.02 | -282.63 | -237.25 | -180.91 | -206.43 | -138.42 | -95.35 | -45.55 | -57.13 | -56.47 | -55.00 | -78.56 | -62.07 | -39.06 | -41.60 | -57.74 | -29.54 | -45.98 | -32.87 | -0.29 | -3.93 | -16.87 | NA | NA | NA | -12.29 | NA | NA | NA | |
| Minority Interest | 0.40 | 0.70 | 0.60 | 0.60 | 4.30 | 3.30 | 3.80 | 3.90 | 4.10 | 3.70 | 3.70 | 3.60 | 4.30 | 4.90 | 4.50 | 4.00 | 3.80 | 3.60 | 4.20 | 3.90 | 9.70 | 11.10 | 11.30 | 12.10 | 12.00 | 11.34 | 10.88 | 11.30 | 10.65 | 11.33 | 10.83 | 12.05 | 17.95 | 18.33 | 19.32 | 19.10 | 22.17 | 23.50 | 25.12 | 17.20 | 17.08 | 17.20 | 17.42 | 16.26 | 15.53 | 15.18 | 21.46 | 28.41 | 29.09 | 29.06 | 27.38 | 32.76 | 31.93 | NA | NA | NA | 11.48 | NA | NA | NA | |
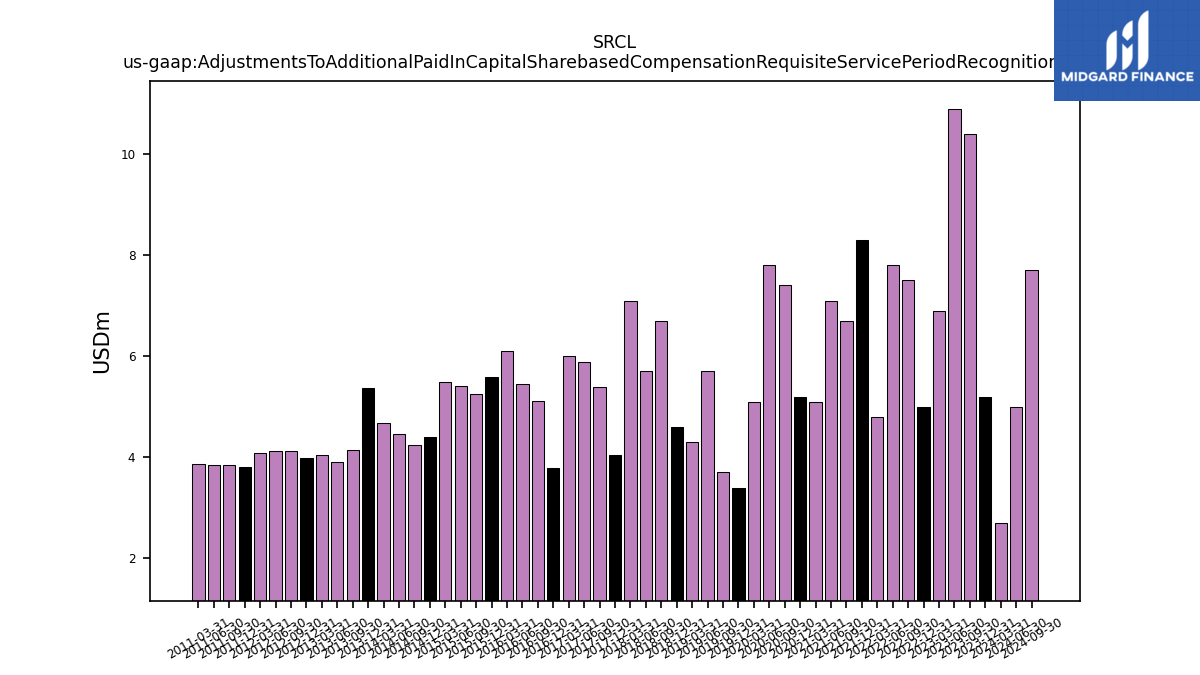
| Adjustments To Additional Paid In Capital Sharebased Compensation Requisite Service Period Recognition Value | 5.20 | 10.40 | 10.90 | 6.90 | 5.00 | 7.50 | 7.80 | 4.80 | 8.30 | 6.70 | 7.10 | 5.10 | 5.20 | 7.40 | 7.80 | 5.10 | 3.40 | 3.70 | 5.70 | 4.30 | 4.60 | 6.70 | 5.70 | 7.10 | 4.04 | 5.38 | 5.88 | 6.00 | 3.78 | 5.11 | 5.45 | 6.11 | 5.59 | 5.25 | 5.42 | 5.49 | 4.41 | 4.24 | 4.45 | 4.67 | 5.37 | 4.14 | 3.90 | 4.05 | 3.99 | 4.13 | 4.13 | 4.08 | 3.80 | 3.85 | 3.85 | 3.86 | NA | NA | NA | NA | NA | NA | NA | NA |
| 2023-12-31 | 2023-09-30 | 2023-06-30 | 2023-03-31 | 2022-12-31 | 2022-09-30 | 2022-06-30 | 2022-03-31 | 2021-12-31 | 2021-09-30 | 2021-06-30 | 2021-03-31 | 2020-12-31 | 2020-09-30 | 2020-06-30 | 2020-03-31 | 2019-12-31 | 2019-09-30 | 2019-06-30 | 2019-03-31 | 2018-12-31 | 2018-09-30 | 2018-06-30 | 2018-03-31 | 2017-12-31 | 2017-09-30 | 2017-06-30 | 2017-03-31 | 2016-12-31 | 2016-09-30 | 2016-06-30 | 2016-03-31 | 2015-12-31 | 2015-09-30 | 2015-06-30 | 2015-03-31 | 2014-12-31 | 2014-09-30 | 2014-06-30 | 2014-03-31 | 2013-12-31 | 2013-09-30 | 2013-06-30 | 2013-03-31 | 2012-12-31 | 2012-09-30 | 2012-06-30 | 2012-03-31 | 2011-12-31 | 2011-09-30 | 2011-06-30 | 2011-03-31 | 2010-12-31 | 2010-09-30 | 2010-06-30 | 2010-03-31 | 2009-12-31 | 2009-09-30 | 2009-06-30 | 2009-03-31 | ||
|---|---|---|---|---|---|---|---|---|---|---|---|---|---|---|---|---|---|---|---|---|---|---|---|---|---|---|---|---|---|---|---|---|---|---|---|---|---|---|---|---|---|---|---|---|---|---|---|---|---|---|---|---|---|---|---|---|---|---|---|---|---|
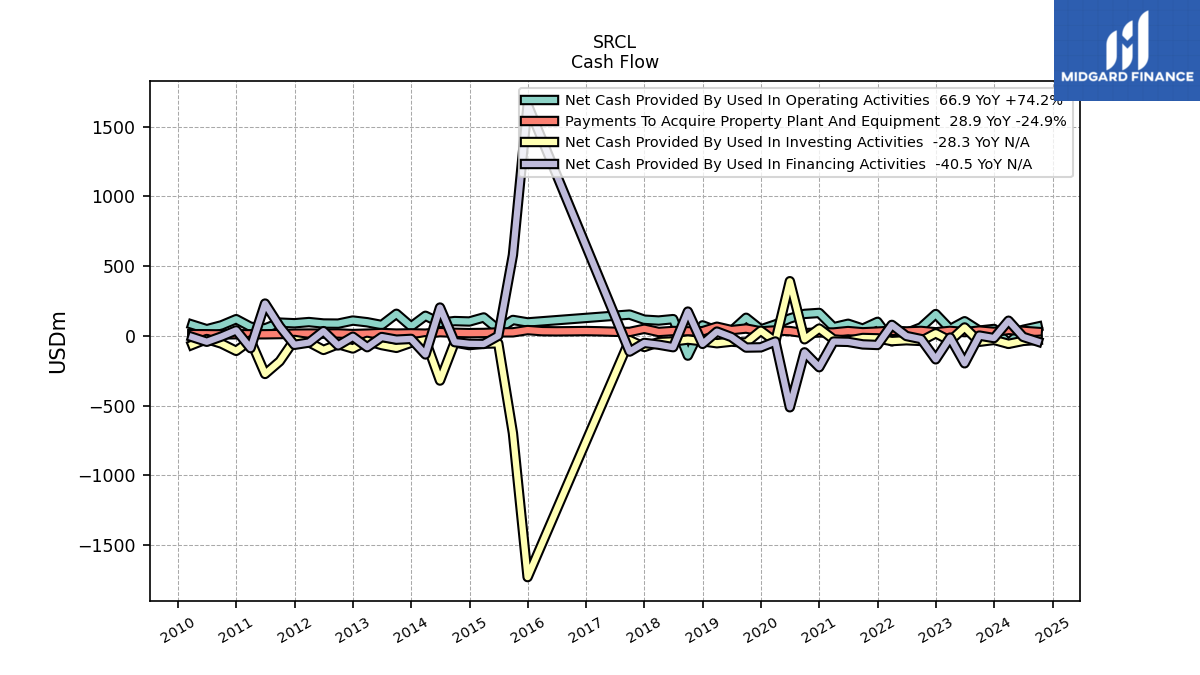
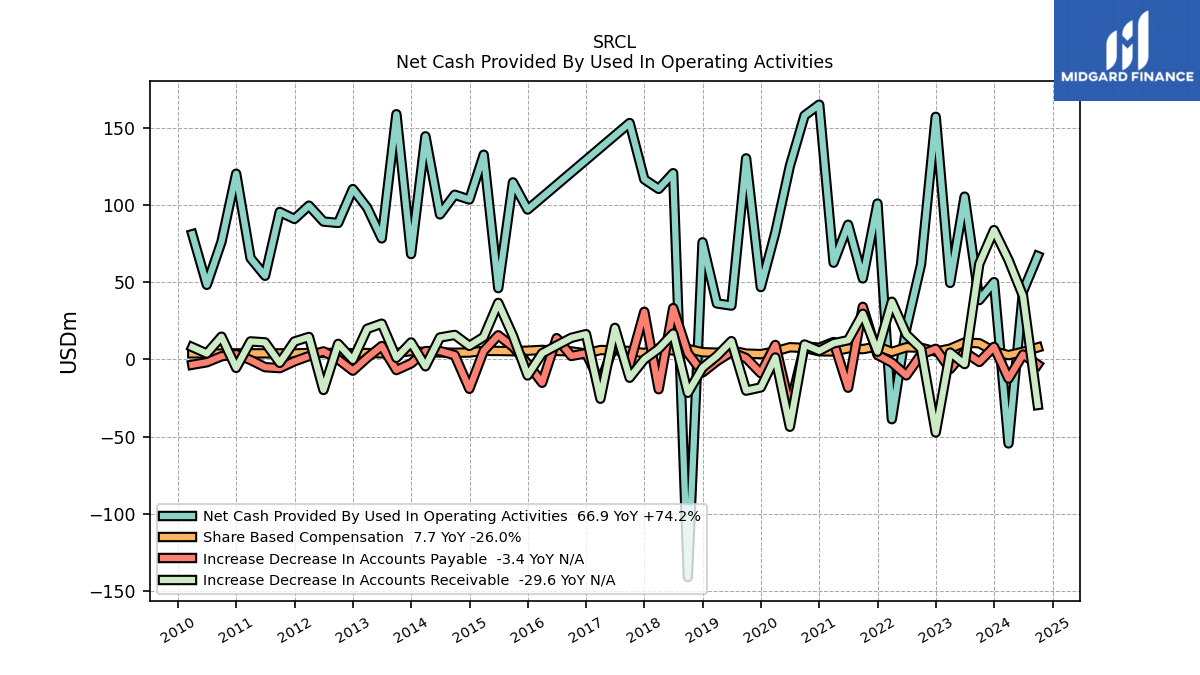
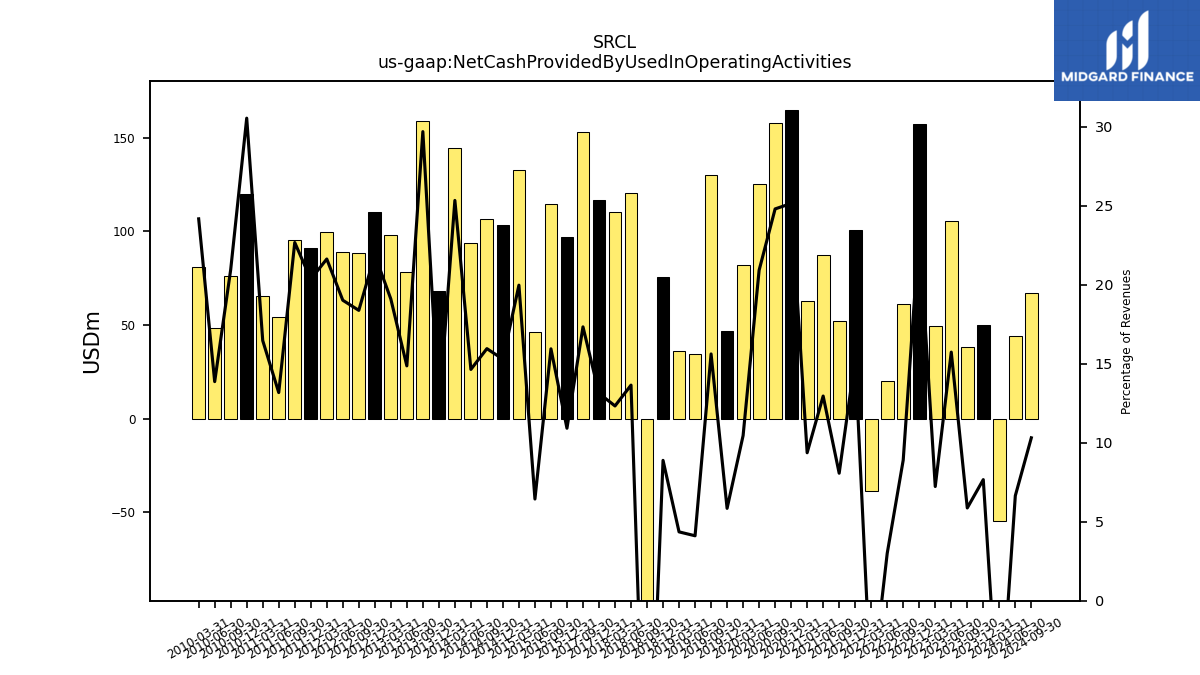
| Net Cash Provided By Used In Operating Activities | 50.00 | 38.40 | 105.40 | 49.50 | 157.10 | 61.50 | 20.40 | -38.80 | 100.90 | 52.40 | 87.20 | 62.60 | 165.00 | 157.90 | 125.20 | 82.10 | 46.80 | 130.20 | 34.80 | 36.20 | 75.80 | -141.10 | 120.60 | 110.40 | 116.60 | 153.10 | NA | NA | NA | NA | NA | NA | 97.04 | 114.63 | 46.11 | 132.55 | 103.53 | 106.62 | 93.87 | 144.47 | 68.18 | 158.80 | 78.31 | 98.17 | 110.30 | 88.35 | 89.24 | 99.56 | 90.93 | 95.48 | 54.11 | 65.58 | 120.24 | 76.12 | 48.25 | 81.06 | NA | NA | NA | NA | |
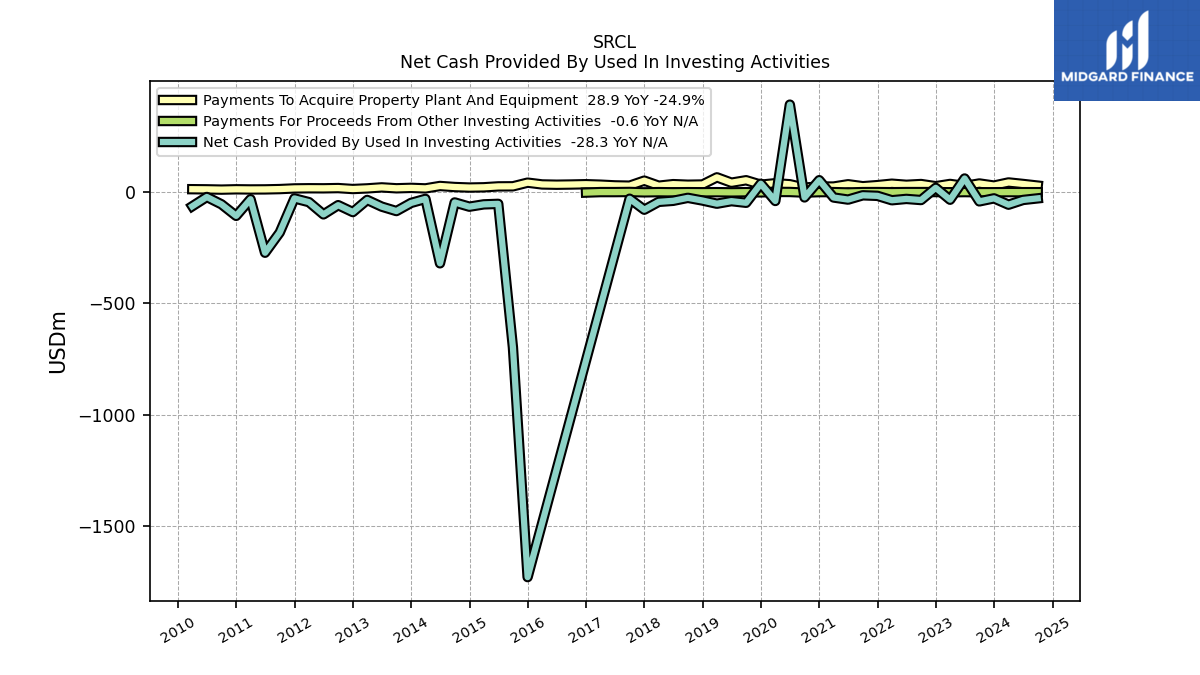
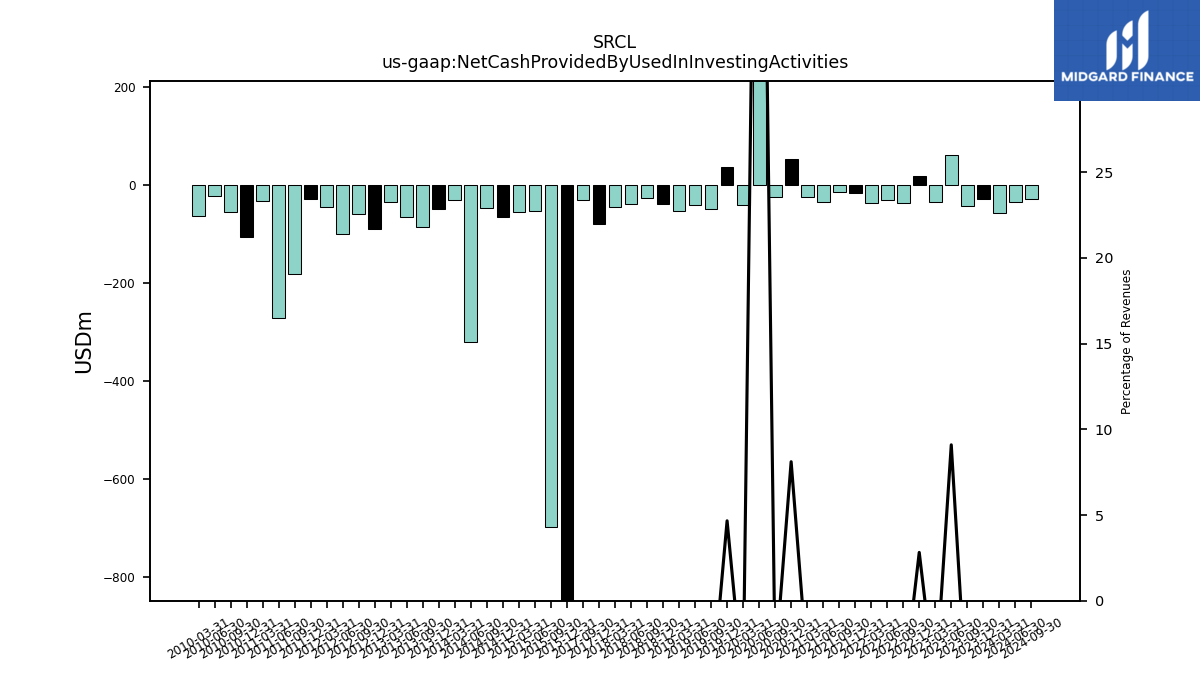
| Net Cash Provided By Used In Investing Activities | -28.30 | -41.90 | 60.90 | -34.50 | 18.90 | -35.90 | -30.80 | -36.80 | -17.10 | -14.60 | -33.90 | -24.50 | 53.20 | -24.10 | 392.40 | -40.10 | 37.30 | -48.20 | -40.80 | -52.30 | -38.10 | -26.00 | -39.30 | -44.10 | -79.30 | -29.90 | NA | NA | NA | NA | NA | NA | -1728.32 | -697.29 | -52.98 | -55.31 | -65.65 | -46.57 | -319.92 | -30.63 | -48.79 | -85.38 | -65.45 | -35.36 | -89.91 | -58.80 | -100.30 | -45.23 | -28.55 | -181.61 | -272.40 | -32.09 | -106.98 | -54.97 | -22.07 | -63.69 | NA | NA | NA | NA | |
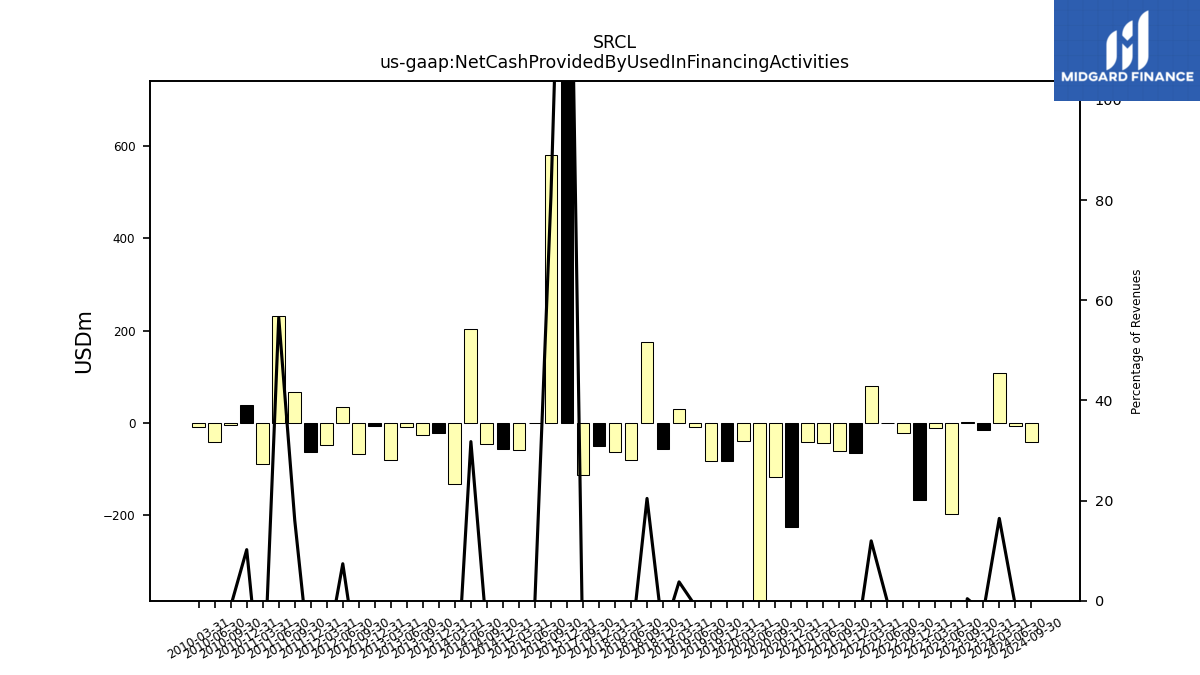
| Net Cash Provided By Used In Financing Activities | -15.20 | 2.70 | -196.30 | -11.60 | -167.70 | -22.30 | -0.40 | 79.40 | -64.70 | -60.60 | -42.50 | -40.10 | -224.20 | -117.30 | -511.40 | -39.60 | -81.60 | -83.30 | -8.00 | 31.30 | -57.10 | 174.60 | -80.60 | -62.60 | -49.90 | -112.30 | NA | NA | NA | NA | NA | NA | 1657.69 | 580.38 | 0.73 | -57.60 | -56.26 | -44.55 | 203.58 | -132.82 | -20.97 | -26.58 | -7.67 | -80.80 | -5.51 | -67.89 | 34.65 | -47.46 | -63.63 | 67.59 | 232.07 | -87.70 | 40.14 | -4.01 | -41.78 | -7.92 | NA | NA | NA | NA |
| 2023-12-31 | 2023-09-30 | 2023-06-30 | 2023-03-31 | 2022-12-31 | 2022-09-30 | 2022-06-30 | 2022-03-31 | 2021-12-31 | 2021-09-30 | 2021-06-30 | 2021-03-31 | 2020-12-31 | 2020-09-30 | 2020-06-30 | 2020-03-31 | 2019-12-31 | 2019-09-30 | 2019-06-30 | 2019-03-31 | 2018-12-31 | 2018-09-30 | 2018-06-30 | 2018-03-31 | 2017-12-31 | 2017-09-30 | 2017-06-30 | 2017-03-31 | 2016-12-31 | 2016-09-30 | 2016-06-30 | 2016-03-31 | 2015-12-31 | 2015-09-30 | 2015-06-30 | 2015-03-31 | 2014-12-31 | 2014-09-30 | 2014-06-30 | 2014-03-31 | 2013-12-31 | 2013-09-30 | 2013-06-30 | 2013-03-31 | 2012-12-31 | 2012-09-30 | 2012-06-30 | 2012-03-31 | 2011-12-31 | 2011-09-30 | 2011-06-30 | 2011-03-31 | 2010-12-31 | 2010-09-30 | 2010-06-30 | 2010-03-31 | 2009-12-31 | 2009-09-30 | 2009-06-30 | 2009-03-31 | ||
|---|---|---|---|---|---|---|---|---|---|---|---|---|---|---|---|---|---|---|---|---|---|---|---|---|---|---|---|---|---|---|---|---|---|---|---|---|---|---|---|---|---|---|---|---|---|---|---|---|---|---|---|---|---|---|---|---|---|---|---|---|---|
| Net Cash Provided By Used In Operating Activities | 50.00 | 38.40 | 105.40 | 49.50 | 157.10 | 61.50 | 20.40 | -38.80 | 100.90 | 52.40 | 87.20 | 62.60 | 165.00 | 157.90 | 125.20 | 82.10 | 46.80 | 130.20 | 34.80 | 36.20 | 75.80 | -141.10 | 120.60 | 110.40 | 116.60 | 153.10 | NA | NA | NA | NA | NA | NA | 97.04 | 114.63 | 46.11 | 132.55 | 103.53 | 106.62 | 93.87 | 144.47 | 68.18 | 158.80 | 78.31 | 98.17 | 110.30 | 88.35 | 89.24 | 99.56 | 90.93 | 95.48 | 54.11 | 65.58 | 120.24 | 76.12 | 48.25 | 81.06 | NA | NA | NA | NA | |
| Profit Loss | 14.80 | 2.10 | -49.50 | 11.30 | 32.10 | 28.00 | 10.50 | -14.10 | -16.40 | -65.90 | 29.30 | 26.20 | 49.00 | -80.90 | -4.10 | -19.90 | -219.20 | -59.00 | -30.20 | -37.60 | -319.20 | 23.50 | 27.60 | 22.50 | 89.57 | 39.07 | -144.19 | 58.56 | 18.90 | 65.17 | 46.23 | 77.59 | 78.59 | 52.72 | 60.90 | 75.81 | 82.66 | 83.04 | 82.68 | 79.77 | 78.59 | 80.83 | 78.44 | 75.22 | 70.51 | 65.75 | 68.37 | 65.31 | 65.12 | 59.74 | 55.89 | 56.59 | 50.76 | 57.30 | 53.77 | 48.63 | NA | NA | NA | NA | |
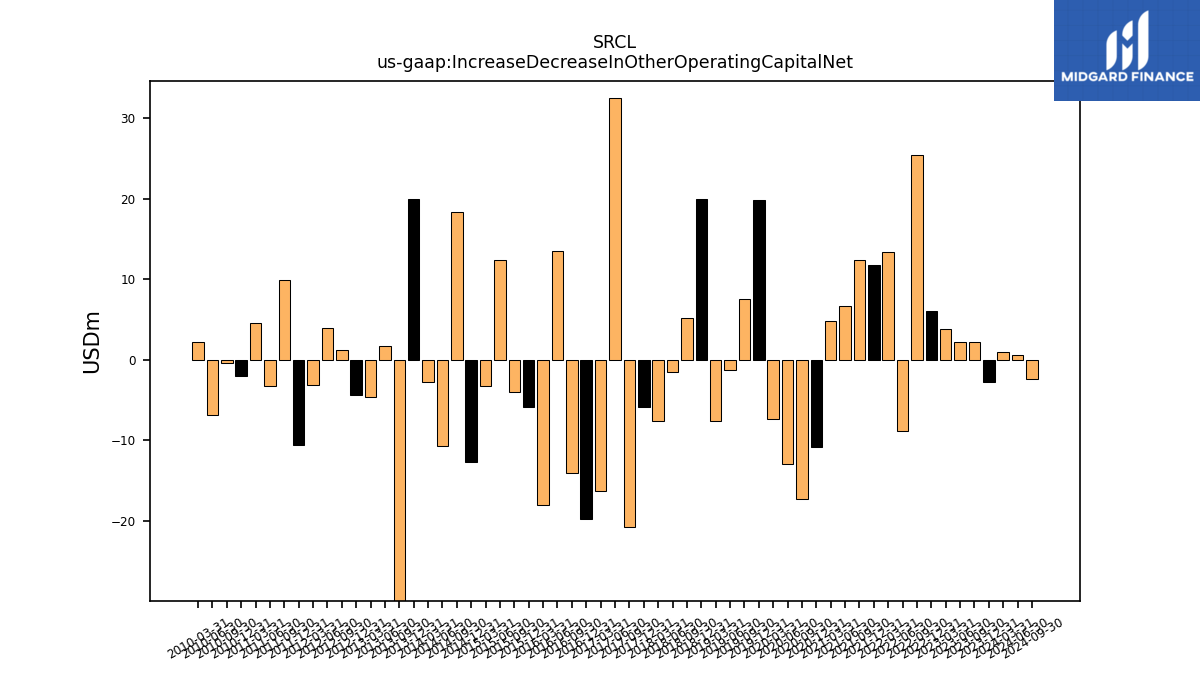
| Increase Decrease In Other Operating Capital Net | -2.80 | 2.20 | 2.20 | 3.80 | 6.00 | 25.40 | -8.90 | 13.40 | 11.70 | 12.40 | 6.70 | 4.80 | -10.80 | -17.30 | -13.00 | -7.40 | 19.90 | 7.50 | -1.30 | -7.60 | 20.00 | 5.20 | -1.50 | -7.60 | -5.88 | -20.73 | 32.54 | -16.32 | -19.77 | -14.12 | 13.49 | -18.03 | -5.94 | -4.06 | 12.36 | -3.31 | -12.75 | 18.41 | -10.77 | -2.81 | 19.91 | -38.05 | 1.66 | -4.69 | -4.36 | 1.18 | 3.92 | -3.12 | -10.59 | 9.84 | -3.33 | 4.50 | -1.98 | -0.37 | -6.91 | 2.22 | NA | NA | NA | NA | |
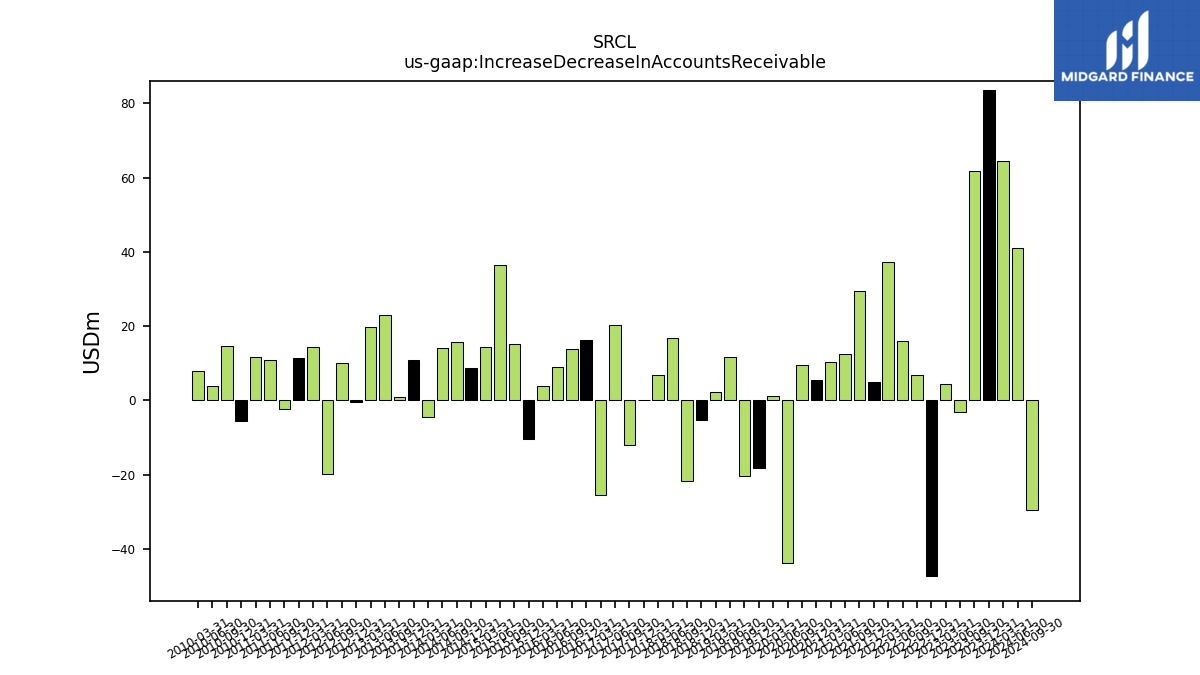
| Increase Decrease In Accounts Receivable | 83.70 | 61.80 | -3.10 | 4.40 | -47.40 | 6.90 | 16.10 | 37.30 | 4.90 | 29.50 | 12.40 | 10.40 | 5.50 | 9.60 | -43.70 | 1.20 | -18.20 | -20.30 | 11.80 | 2.20 | -5.40 | -21.70 | 16.70 | 6.80 | 0.01 | -11.94 | 20.37 | -25.55 | 16.31 | 13.94 | 8.97 | 3.92 | -10.46 | 15.31 | 36.55 | 14.49 | 8.70 | 15.81 | 14.13 | -4.53 | 10.95 | 0.94 | 23.10 | 19.77 | -0.33 | 10.03 | -19.86 | 14.49 | 11.53 | -2.30 | 10.97 | 11.62 | -5.58 | 14.68 | 3.76 | 7.93 | NA | NA | NA | NA | |
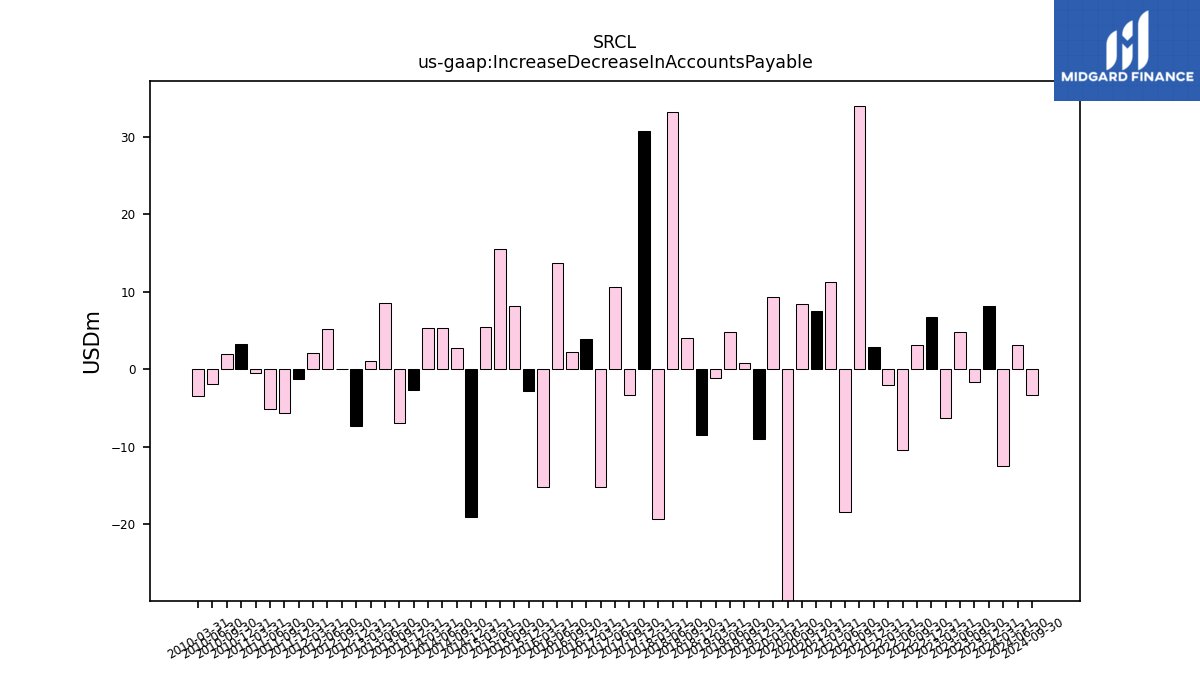
| Increase Decrease In Accounts Payable | 8.10 | -1.70 | 4.80 | -6.30 | 6.80 | 3.10 | -10.40 | -2.10 | 2.90 | 34.00 | -18.40 | 11.20 | 7.50 | 8.40 | -30.70 | 9.30 | -9.00 | 0.80 | 4.80 | -1.20 | -8.50 | 4.00 | 33.20 | -19.40 | 30.80 | -3.36 | 10.62 | -15.16 | 3.94 | 2.18 | 13.71 | -15.20 | -2.80 | 8.15 | 15.58 | 5.44 | -19.09 | 2.74 | 5.37 | 5.28 | -2.64 | -6.97 | 8.61 | 1.01 | -7.35 | -0.01 | 5.15 | 2.10 | -1.30 | -5.71 | -5.10 | -0.43 | 3.31 | 1.96 | -1.91 | -3.52 | NA | NA | NA | NA | |
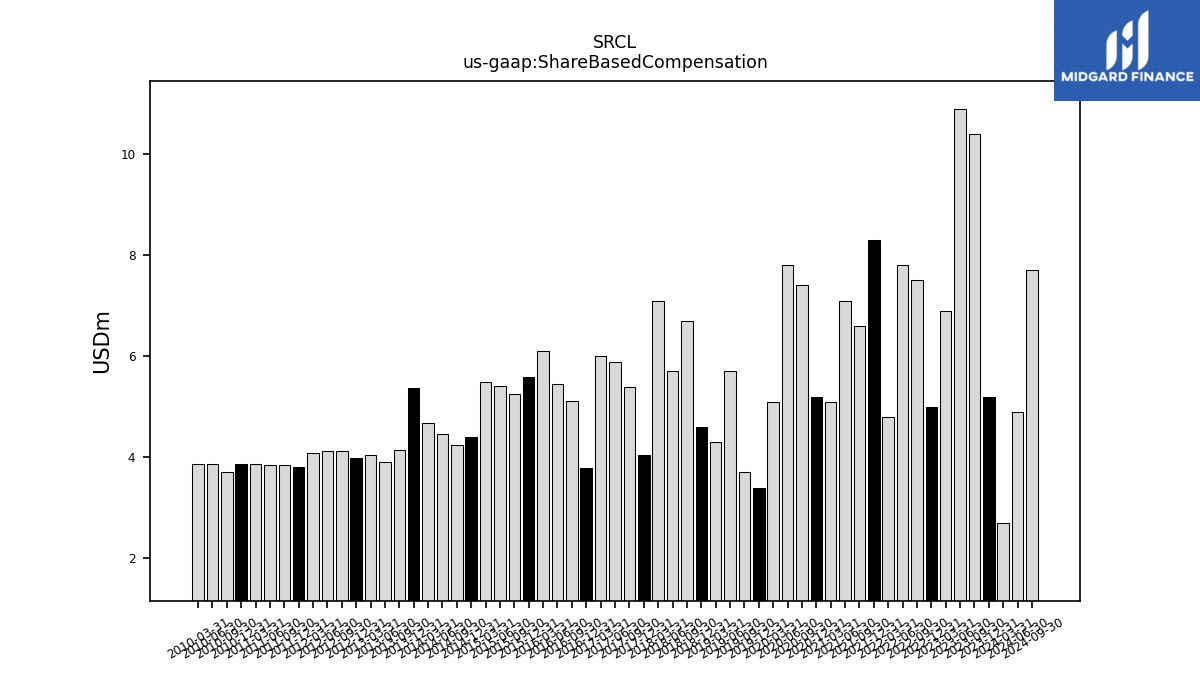
| Share Based Compensation | 5.20 | 10.40 | 10.90 | 6.90 | 5.00 | 7.50 | 7.80 | 4.80 | 8.30 | 6.60 | 7.10 | 5.10 | 5.20 | 7.40 | 7.80 | 5.10 | 3.40 | 3.70 | 5.70 | 4.30 | 4.60 | 6.70 | 5.70 | 7.10 | 4.04 | 5.38 | 5.88 | 6.00 | 3.78 | 5.11 | 5.45 | 6.11 | 5.59 | 5.25 | 5.42 | 5.49 | 4.41 | 4.24 | 4.45 | 4.67 | 5.37 | 4.14 | 3.90 | 4.05 | 3.99 | 4.13 | 4.13 | 4.08 | 3.80 | 3.85 | 3.85 | 3.86 | 3.86 | 3.70 | 3.87 | 3.87 | NA | NA | NA | NA |
| 2023-12-31 | 2023-09-30 | 2023-06-30 | 2023-03-31 | 2022-12-31 | 2022-09-30 | 2022-06-30 | 2022-03-31 | 2021-12-31 | 2021-09-30 | 2021-06-30 | 2021-03-31 | 2020-12-31 | 2020-09-30 | 2020-06-30 | 2020-03-31 | 2019-12-31 | 2019-09-30 | 2019-06-30 | 2019-03-31 | 2018-12-31 | 2018-09-30 | 2018-06-30 | 2018-03-31 | 2017-12-31 | 2017-09-30 | 2017-06-30 | 2017-03-31 | 2016-12-31 | 2016-09-30 | 2016-06-30 | 2016-03-31 | 2015-12-31 | 2015-09-30 | 2015-06-30 | 2015-03-31 | 2014-12-31 | 2014-09-30 | 2014-06-30 | 2014-03-31 | 2013-12-31 | 2013-09-30 | 2013-06-30 | 2013-03-31 | 2012-12-31 | 2012-09-30 | 2012-06-30 | 2012-03-31 | 2011-12-31 | 2011-09-30 | 2011-06-30 | 2011-03-31 | 2010-12-31 | 2010-09-30 | 2010-06-30 | 2010-03-31 | 2009-12-31 | 2009-09-30 | 2009-06-30 | 2009-03-31 | ||
|---|---|---|---|---|---|---|---|---|---|---|---|---|---|---|---|---|---|---|---|---|---|---|---|---|---|---|---|---|---|---|---|---|---|---|---|---|---|---|---|---|---|---|---|---|---|---|---|---|---|---|---|---|---|---|---|---|---|---|---|---|---|
| Net Cash Provided By Used In Investing Activities | -28.30 | -41.90 | 60.90 | -34.50 | 18.90 | -35.90 | -30.80 | -36.80 | -17.10 | -14.60 | -33.90 | -24.50 | 53.20 | -24.10 | 392.40 | -40.10 | 37.30 | -48.20 | -40.80 | -52.30 | -38.10 | -26.00 | -39.30 | -44.10 | -79.30 | -29.90 | NA | NA | NA | NA | NA | NA | -1728.32 | -697.29 | -52.98 | -55.31 | -65.65 | -46.57 | -319.92 | -30.63 | -48.79 | -85.38 | -65.45 | -35.36 | -89.91 | -58.80 | -100.30 | -45.23 | -28.55 | -181.61 | -272.40 | -32.09 | -106.98 | -54.97 | -22.07 | -63.69 | NA | NA | NA | NA | |
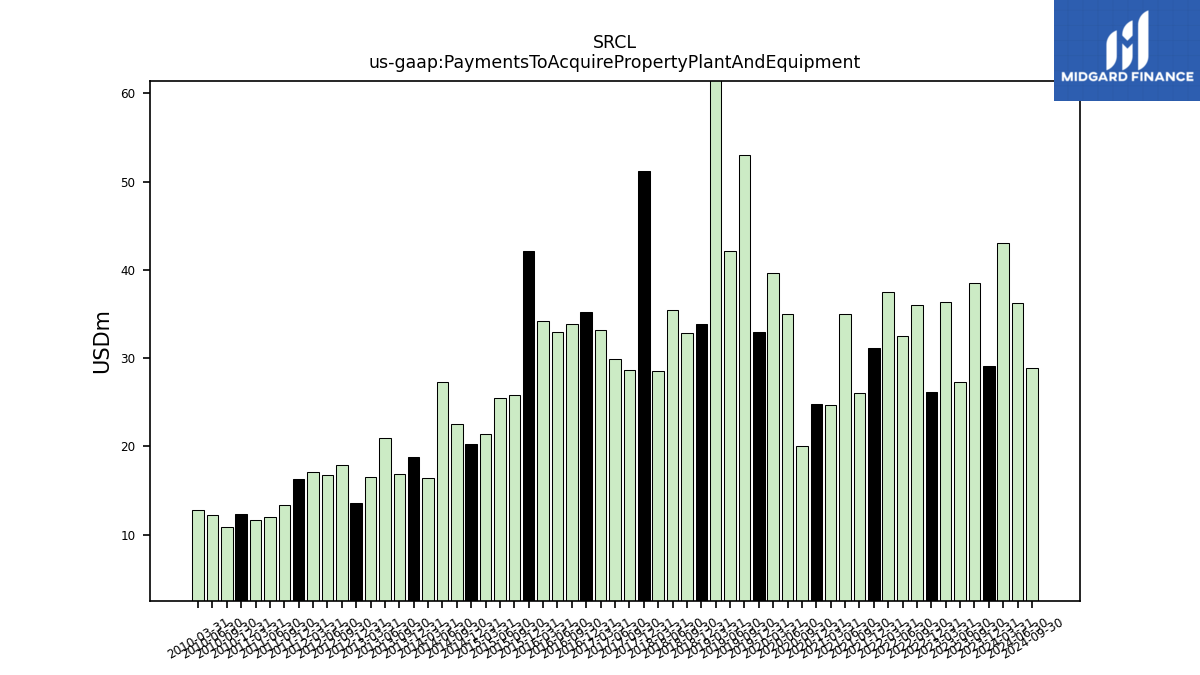
| Payments To Acquire Property Plant And Equipment | 29.10 | 38.50 | 27.30 | 36.40 | 26.20 | 36.00 | 32.50 | 37.50 | 31.10 | 26.10 | 35.00 | 24.70 | 24.80 | 20.10 | 35.00 | 39.60 | 33.00 | 53.00 | 42.10 | 66.10 | 33.90 | 32.90 | 35.50 | 28.50 | 51.27 | 28.64 | 29.96 | 33.14 | 35.18 | 33.85 | 32.95 | 34.19 | 42.20 | 25.77 | 25.44 | 21.36 | 20.23 | 22.59 | 27.25 | 16.42 | 18.78 | 16.89 | 20.96 | 16.48 | 13.58 | 17.84 | 16.77 | 17.05 | 16.32 | 13.33 | 11.96 | 11.69 | 12.38 | 10.92 | 12.21 | 12.80 | NA | NA | NA | NA |
| 2023-12-31 | 2023-09-30 | 2023-06-30 | 2023-03-31 | 2022-12-31 | 2022-09-30 | 2022-06-30 | 2022-03-31 | 2021-12-31 | 2021-09-30 | 2021-06-30 | 2021-03-31 | 2020-12-31 | 2020-09-30 | 2020-06-30 | 2020-03-31 | 2019-12-31 | 2019-09-30 | 2019-06-30 | 2019-03-31 | 2018-12-31 | 2018-09-30 | 2018-06-30 | 2018-03-31 | 2017-12-31 | 2017-09-30 | 2017-06-30 | 2017-03-31 | 2016-12-31 | 2016-09-30 | 2016-06-30 | 2016-03-31 | 2015-12-31 | 2015-09-30 | 2015-06-30 | 2015-03-31 | 2014-12-31 | 2014-09-30 | 2014-06-30 | 2014-03-31 | 2013-12-31 | 2013-09-30 | 2013-06-30 | 2013-03-31 | 2012-12-31 | 2012-09-30 | 2012-06-30 | 2012-03-31 | 2011-12-31 | 2011-09-30 | 2011-06-30 | 2011-03-31 | 2010-12-31 | 2010-09-30 | 2010-06-30 | 2010-03-31 | 2009-12-31 | 2009-09-30 | 2009-06-30 | 2009-03-31 | ||
|---|---|---|---|---|---|---|---|---|---|---|---|---|---|---|---|---|---|---|---|---|---|---|---|---|---|---|---|---|---|---|---|---|---|---|---|---|---|---|---|---|---|---|---|---|---|---|---|---|---|---|---|---|---|---|---|---|---|---|---|---|---|
| Net Cash Provided By Used In Financing Activities | -15.20 | 2.70 | -196.30 | -11.60 | -167.70 | -22.30 | -0.40 | 79.40 | -64.70 | -60.60 | -42.50 | -40.10 | -224.20 | -117.30 | -511.40 | -39.60 | -81.60 | -83.30 | -8.00 | 31.30 | -57.10 | 174.60 | -80.60 | -62.60 | -49.90 | -112.30 | NA | NA | NA | NA | NA | NA | 1657.69 | 580.38 | 0.73 | -57.60 | -56.26 | -44.55 | 203.58 | -132.82 | -20.97 | -26.58 | -7.67 | -80.80 | -5.51 | -67.89 | 34.65 | -47.46 | -63.63 | 67.59 | 232.07 | -87.70 | 40.14 | -4.01 | -41.78 | -7.92 | NA | NA | NA | NA |
| 2023-12-31 | 2023-09-30 | 2023-06-30 | 2023-03-31 | 2022-12-31 | 2022-09-30 | 2022-06-30 | 2022-03-31 | 2021-12-31 | 2021-09-30 | 2021-06-30 | 2021-03-31 | 2020-12-31 | 2020-09-30 | 2020-06-30 | 2020-03-31 | 2019-12-31 | 2019-09-30 | 2019-06-30 | 2019-03-31 | 2018-12-31 | 2018-09-30 | 2018-06-30 | 2018-03-31 | 2017-12-31 | 2017-09-30 | 2017-06-30 | 2017-03-31 | 2016-12-31 | 2016-09-30 | 2016-06-30 | 2016-03-31 | 2015-12-31 | 2015-09-30 | 2015-06-30 | 2015-03-31 | 2014-12-31 | 2014-09-30 | 2014-06-30 | 2014-03-31 | 2013-12-31 | 2013-09-30 | 2013-06-30 | 2013-03-31 | 2012-12-31 | 2012-09-30 | 2012-06-30 | 2012-03-31 | 2011-12-31 | 2011-09-30 | 2011-06-30 | 2011-03-31 | 2010-12-31 | 2010-09-30 | 2010-06-30 | 2010-03-31 | 2009-12-31 | 2009-09-30 | 2009-06-30 | 2009-03-31 | ||
|---|---|---|---|---|---|---|---|---|---|---|---|---|---|---|---|---|---|---|---|---|---|---|---|---|---|---|---|---|---|---|---|---|---|---|---|---|---|---|---|---|---|---|---|---|---|---|---|---|---|---|---|---|---|---|---|---|---|---|---|---|---|
| Revenues | 652.00 | 653.50 | 669.50 | 684.30 | 670.30 | 690.30 | 679.80 | 664.20 | 657.30 | 648.90 | 672.70 | 668.00 | 655.90 | 636.40 | 598.20 | 785.00 | 799.90 | 833.10 | 845.80 | 830.10 | 852.70 | 854.90 | 883.30 | 895.00 | 887.80 | 882.77 | 917.73 | 892.40 | 906.40 | 890.14 | 891.62 | 874.18 | 888.30 | 718.60 | 715.69 | 663.32 | 676.95 | 667.88 | 640.82 | 569.96 | 567.90 | 534.58 | 526.52 | 513.80 | 503.64 | 480.48 | 468.95 | 460.08 | 446.56 | 420.92 | 410.44 | 398.13 | 393.49 | 362.99 | 347.73 | 335.18 | 313.54 | 297.84 | 289.27 | 277.09 | |
| Revenue From Contract With Customer Excluding Assessed Tax | 652.00 | 653.50 | 669.50 | 684.30 | 670.30 | 690.30 | 679.80 | 664.20 | 657.30 | 648.90 | 672.70 | 668.00 | 655.90 | 636.40 | 598.20 | 785.00 | 799.90 | 833.10 | 845.80 | 830.10 | 852.70 | 854.90 | 883.30 | 895.00 | 887.80 | 882.80 | 917.73 | 892.40 | 906.40 | 890.14 | 891.62 | 874.18 | 888.30 | 718.60 | 715.69 | 663.32 | 676.95 | 667.88 | 640.82 | 569.96 | 567.90 | 534.58 | 526.52 | 513.80 | 503.64 | 480.48 | 468.95 | 460.08 | 446.56 | 420.92 | 410.44 | 398.13 | 393.49 | 362.99 | 347.73 | 335.18 | 313.54 | 297.84 | 289.27 | 277.09 | |
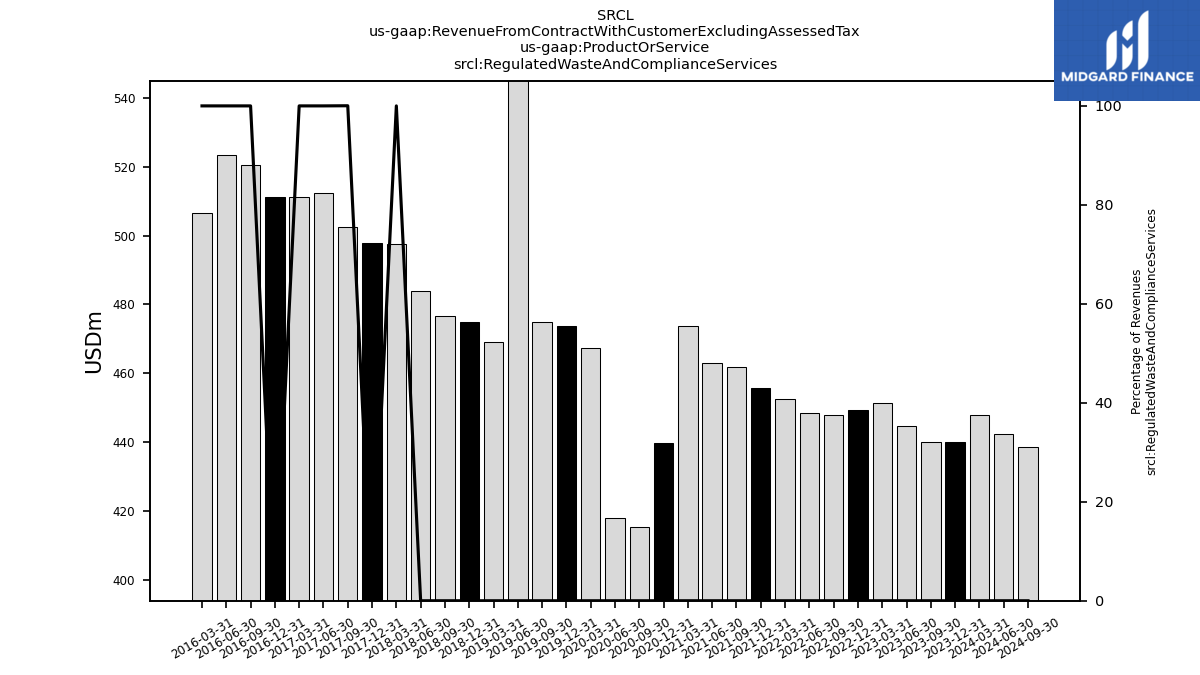
| Regulated Waste And Compliance Services | 439.90 | 439.90 | 444.70 | 451.30 | 449.30 | 447.80 | 448.40 | 452.60 | 455.70 | 461.70 | 463.00 | 473.60 | 439.70 | 415.50 | 418.10 | 467.30 | 473.70 | 474.90 | 553.20 | 469.20 | 474.80 | 476.60 | 483.80 | 497.40 | 497.70 | 502.50 | 512.32 | 511.18 | 511.14 | 520.39 | 523.30 | 506.58 | NA | NA | NA | NA | NA | NA | NA | NA | NA | NA | NA | NA | NA | NA | NA | NA | NA | NA | NA | NA | NA | NA | NA | NA | NA | NA | NA | NA | |
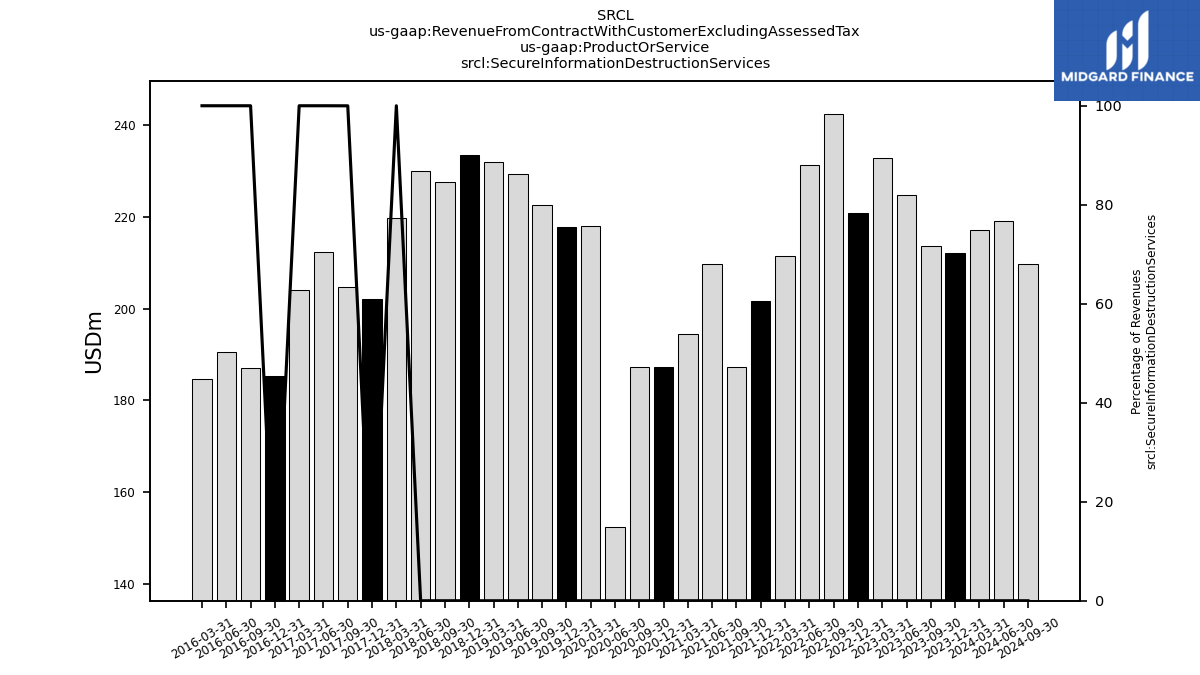
| Secure Information Destruction Services | 212.10 | 213.60 | 224.80 | 233.00 | 221.00 | 242.50 | 231.40 | 211.60 | 201.60 | 187.20 | 209.70 | 194.40 | 187.40 | 187.30 | 152.50 | 218.10 | 217.90 | 222.60 | 229.40 | 232.00 | 233.50 | 227.60 | 230.00 | 219.90 | 202.20 | 204.70 | 212.41 | 204.07 | 185.26 | 187.09 | 190.53 | 184.63 | NA | NA | NA | NA | NA | NA | NA | NA | NA | NA | NA | NA | NA | NA | NA | NA | NA | NA | NA | NA | NA | NA | NA | NA | NA | NA | NA | NA | |
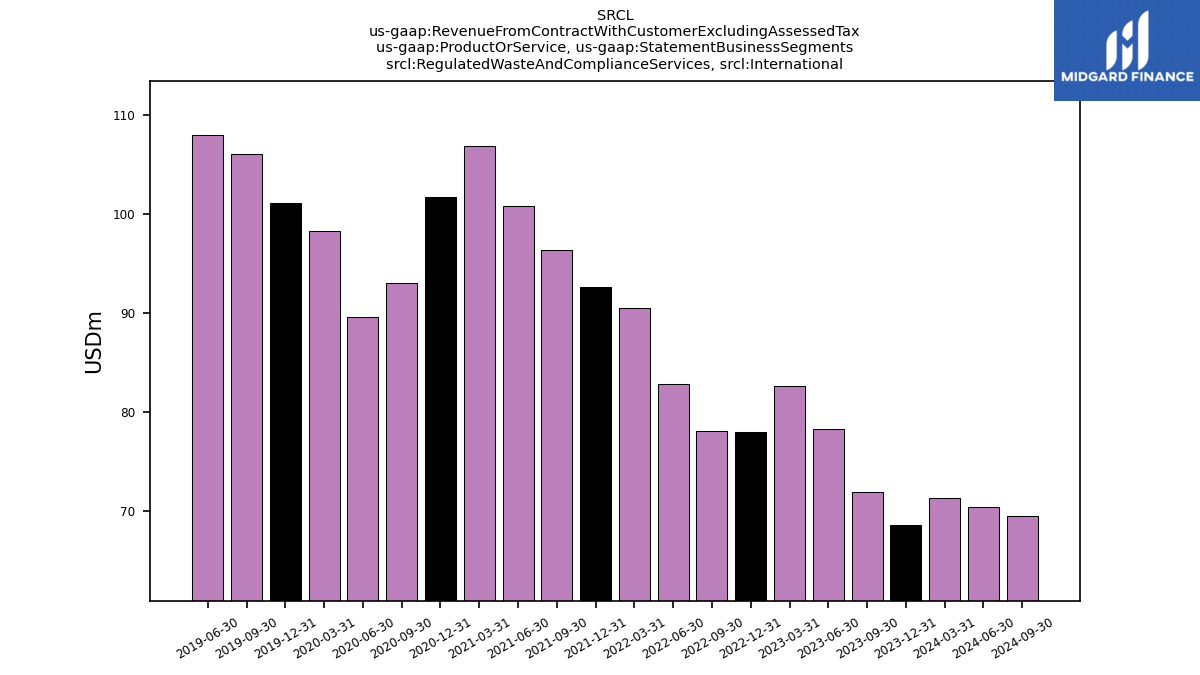
| Regulated Waste And Compliance Services, International | 68.60 | 71.90 | 78.30 | 82.60 | 78.00 | 78.10 | 82.80 | 90.50 | 92.60 | 96.30 | 100.80 | 106.80 | 101.70 | 93.00 | 89.60 | 98.30 | 101.10 | 106.00 | 108.00 | NA | NA | NA | NA | NA | NA | NA | NA | NA | NA | NA | NA | NA | NA | NA | NA | NA | NA | NA | NA | NA | NA | NA | NA | NA | NA | NA | NA | NA | NA | NA | NA | NA | NA | NA | NA | NA | NA | NA | NA | NA | |
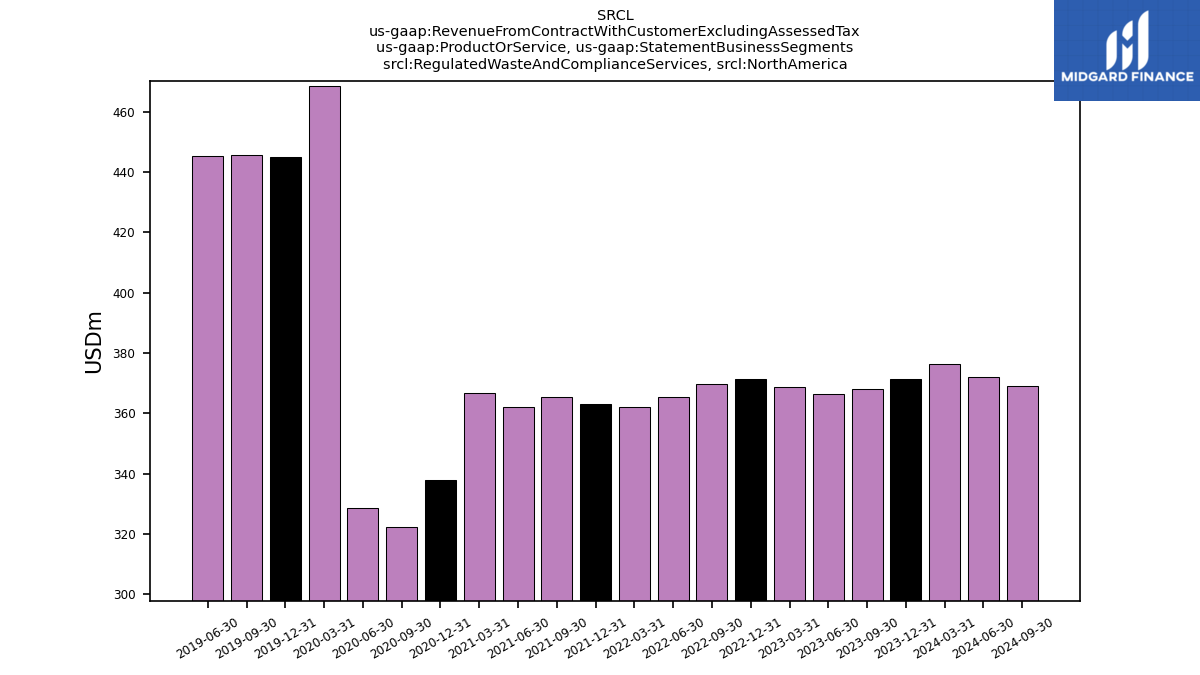
| Regulated Waste And Compliance Services, North America | 371.30 | 368.00 | 366.40 | 368.70 | 371.30 | 369.70 | 365.60 | 362.10 | 363.10 | 365.40 | 362.20 | 366.80 | 338.00 | 322.50 | 328.50 | 468.60 | 445.00 | 445.60 | 445.20 | NA | NA | NA | NA | NA | NA | NA | NA | NA | NA | NA | NA | NA | NA | NA | NA | NA | NA | NA | NA | NA | NA | NA | NA | NA | NA | NA | NA | NA | NA | NA | NA | NA | NA | NA | NA | NA | NA | NA | NA | NA | |
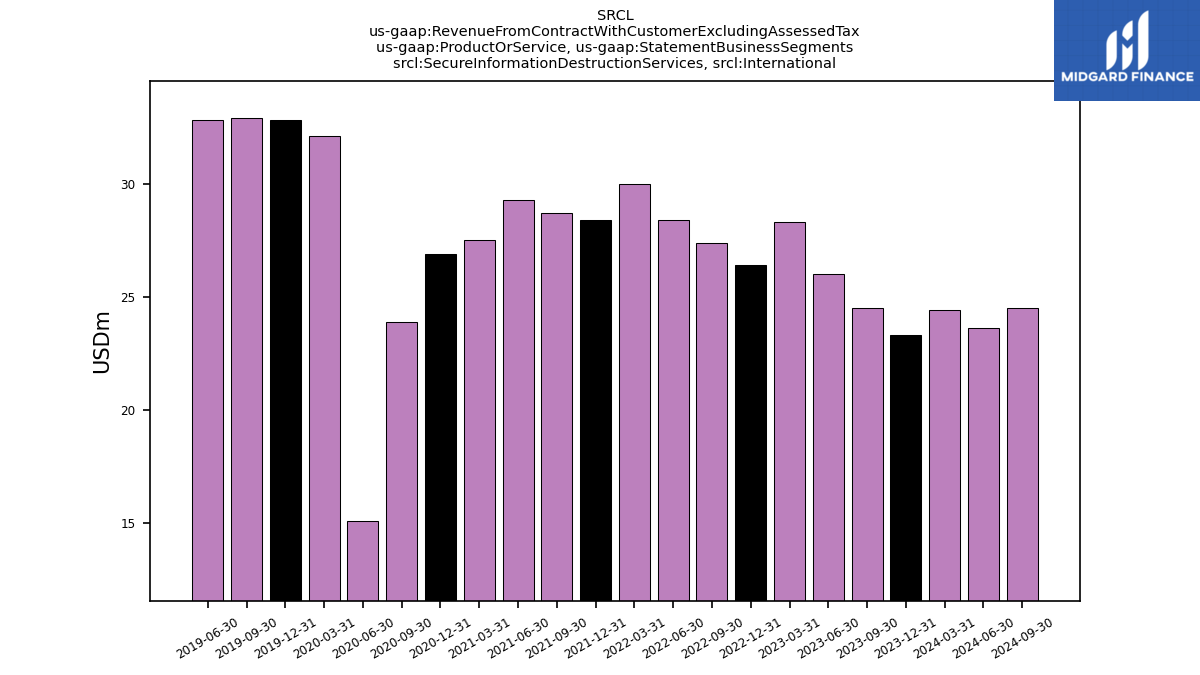
| Secure Information Destruction Services, International | 23.30 | 24.50 | 26.00 | 28.30 | 26.40 | 27.40 | 28.40 | 30.00 | 28.40 | 28.70 | 29.30 | 27.50 | 26.90 | 23.90 | 15.10 | 32.10 | 32.80 | 32.90 | 32.80 | NA | NA | NA | NA | NA | NA | NA | NA | NA | NA | NA | NA | NA | NA | NA | NA | NA | NA | NA | NA | NA | NA | NA | NA | NA | NA | NA | NA | NA | NA | NA | NA | NA | NA | NA | NA | NA | NA | NA | NA | NA | |
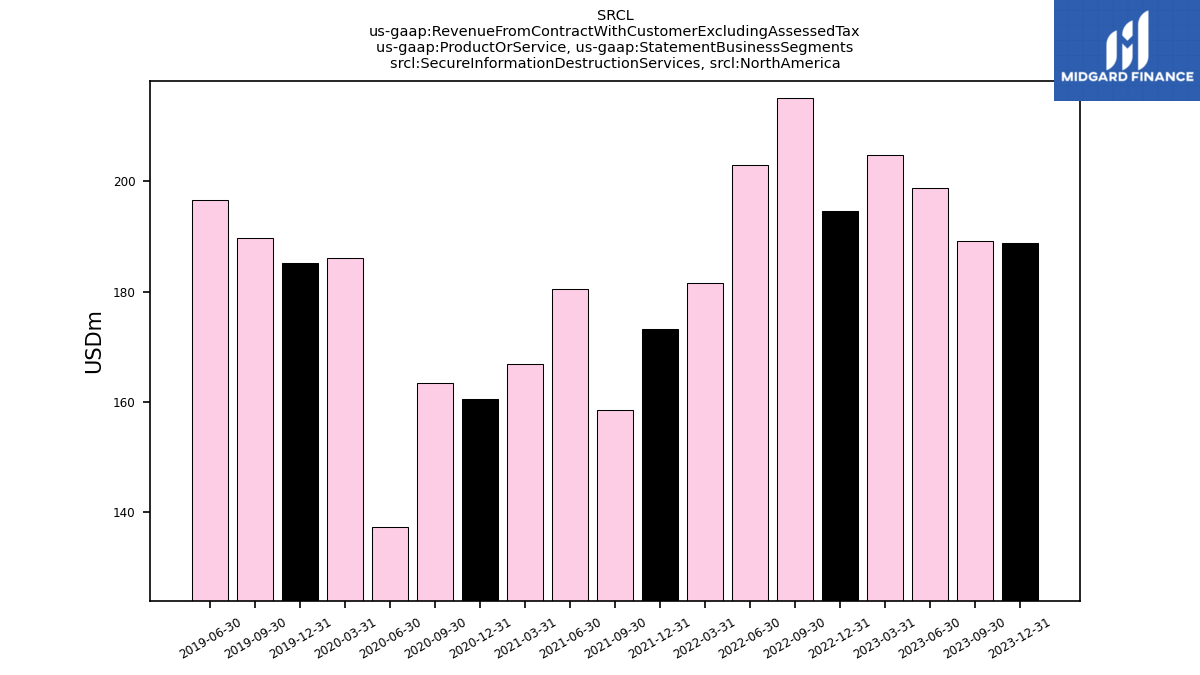
| Secure Information Destruction Services, North America | 188.80 | 189.10 | 198.80 | 204.70 | 194.60 | 215.10 | 203.00 | 181.60 | 173.20 | 158.50 | 180.40 | 166.90 | 160.50 | 163.40 | 137.40 | 186.00 | 185.10 | 189.70 | 196.60 | NA | NA | NA | NA | NA | NA | NA | NA | NA | NA | NA | NA | NA | NA | NA | NA | NA | NA | NA | NA | NA | NA | NA | NA | NA | NA | NA | NA | NA | NA | NA | NA | NA | NA | NA | NA | NA | NA | NA | NA | NA |