
| 2023-12-31 | 2023-09-30 | 2023-06-30 | 2023-03-31 | 2022-12-31 | 2022-09-30 | 2022-06-30 | 2022-03-31 | 2021-12-31 | 2021-09-30 | 2021-06-30 | 2021-03-31 | 2020-12-31 | 2020-09-30 | 2020-06-30 | 2020-03-31 | 2019-12-31 | 2019-09-30 | 2019-06-30 | 2019-03-31 | 2018-12-31 | 2018-09-30 | 2018-06-30 | 2018-03-31 | 2017-12-31 | 2017-09-30 | 2017-06-30 | 2017-03-31 | 2016-12-31 | ||
|---|---|---|---|---|---|---|---|---|---|---|---|---|---|---|---|---|---|---|---|---|---|---|---|---|---|---|---|---|---|---|
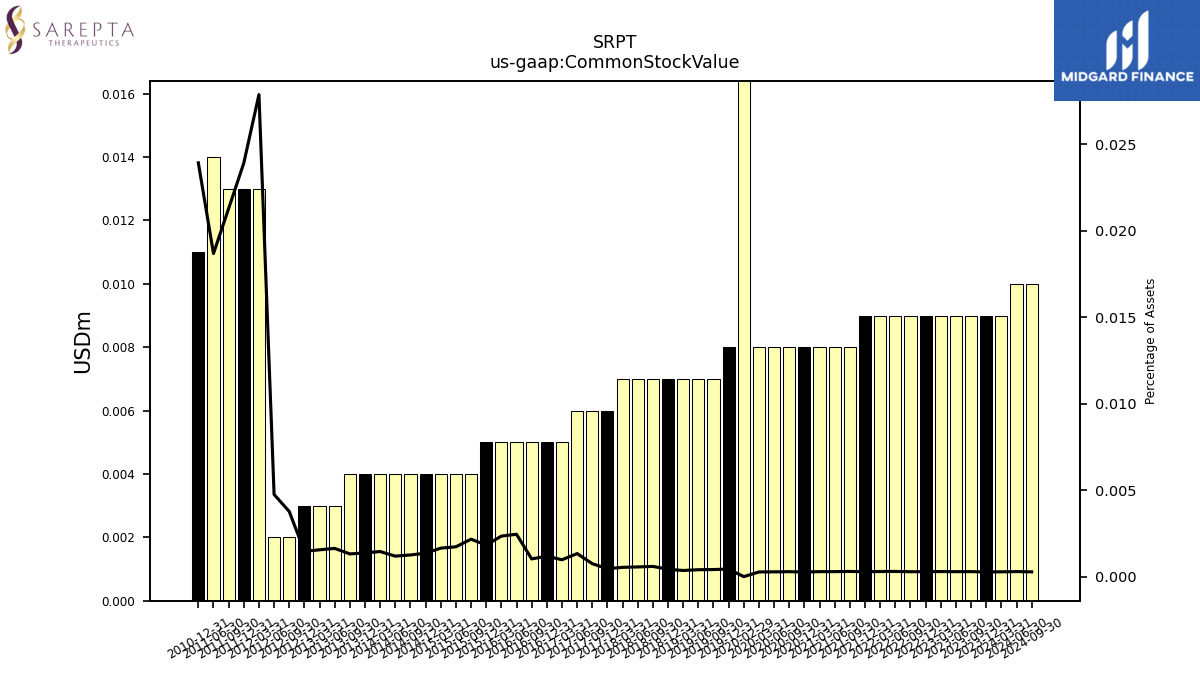
| Common Stock Value | 0.01 | 0.01 | 0.01 | 0.01 | 0.01 | 0.01 | 0.01 | 0.01 | 0.01 | 0.01 | 0.01 | 0.01 | 0.01 | 0.01 | 0.01 | 0.01 | 0.01 | 0.01 | 0.01 | 0.01 | 0.01 | 0.01 | 0.01 | 0.01 | 0.01 | 0.01 | 0.01 | 0.01 | 0.01 | |
| dei: Entity Common Stock Shares Outstanding | NA | NA | NA | NA | NA | NA | NA | NA | NA | NA | NA | NA | NA | NA | NA | NA | NA | NA | NA | NA | NA | NA | NA | NA | NA | NA | NA | NA | NA | |
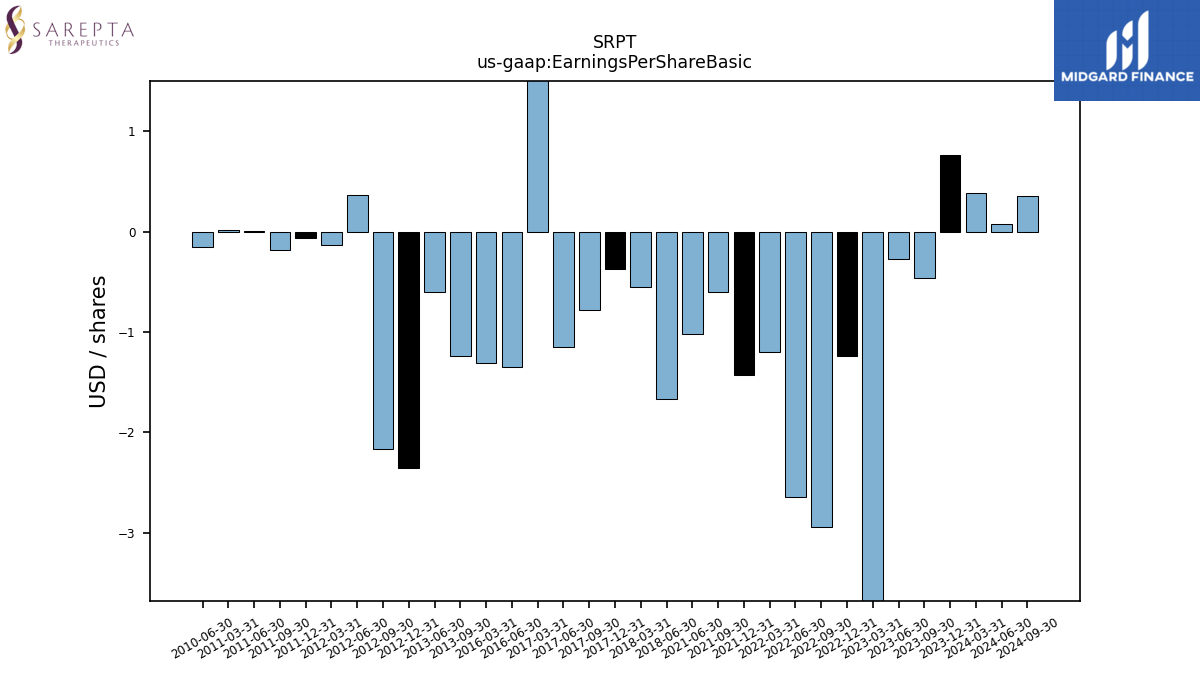
| Earnings Per Share Basic | 0.76 | -0.46 | -0.27 | -5.86 | -1.24 | -2.94 | -2.65 | -1.20 | -1.43 | -0.60 | -1.02 | NA | NA | NA | NA | NA | NA | NA | NA | NA | NA | NA | -1.67 | -0.55 | -0.37 | -0.78 | -1.15 | 1.53 | NA | |
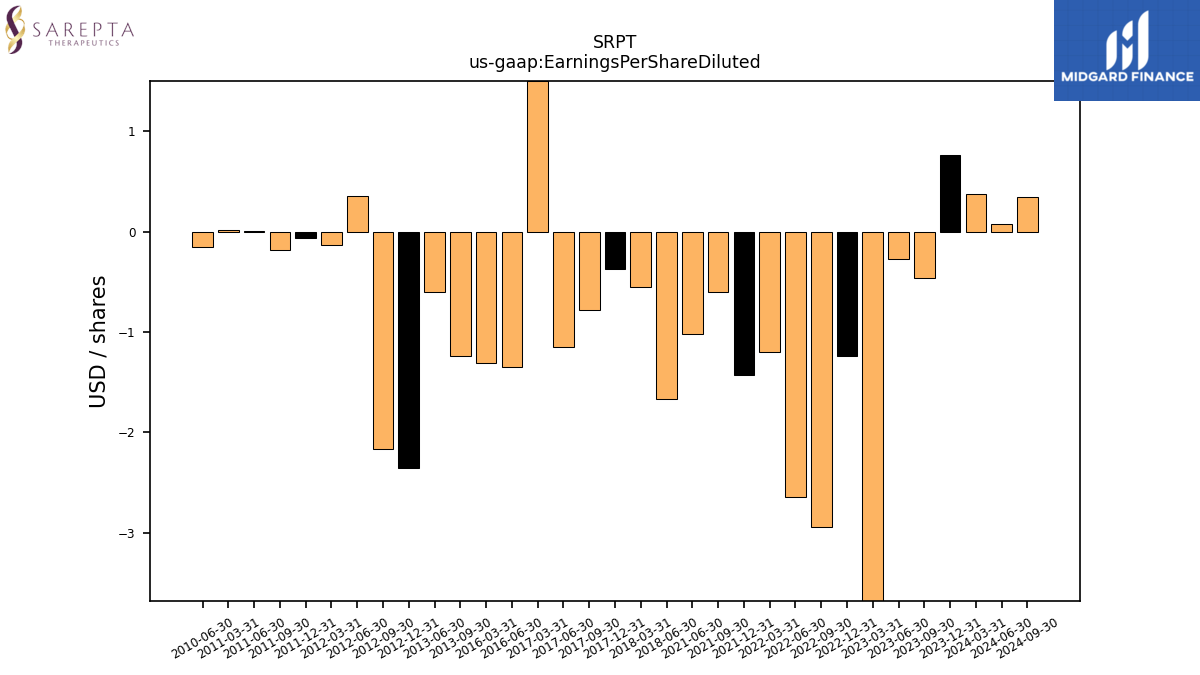
| Earnings Per Share Diluted | 0.76 | -0.46 | -0.27 | -5.86 | -1.24 | -2.94 | -2.65 | -1.20 | -1.43 | -0.60 | -1.02 | NA | NA | NA | NA | NA | NA | NA | NA | NA | NA | NA | -1.67 | -0.55 | -0.37 | -0.78 | -1.15 | 1.50 | NA |
| 2023-12-31 | 2023-09-30 | 2023-06-30 | 2023-03-31 | 2022-12-31 | 2022-09-30 | 2022-06-30 | 2022-03-31 | 2021-12-31 | 2021-09-30 | 2021-06-30 | 2021-03-31 | 2020-12-31 | 2020-09-30 | 2020-06-30 | 2020-03-31 | 2019-12-31 | 2019-09-30 | 2019-06-30 | 2019-03-31 | 2018-12-31 | 2018-09-30 | 2018-06-30 | 2018-03-31 | 2017-12-31 | 2017-09-30 | 2017-06-30 | 2017-03-31 | 2016-12-31 | ||
|---|---|---|---|---|---|---|---|---|---|---|---|---|---|---|---|---|---|---|---|---|---|---|---|---|---|---|---|---|---|---|
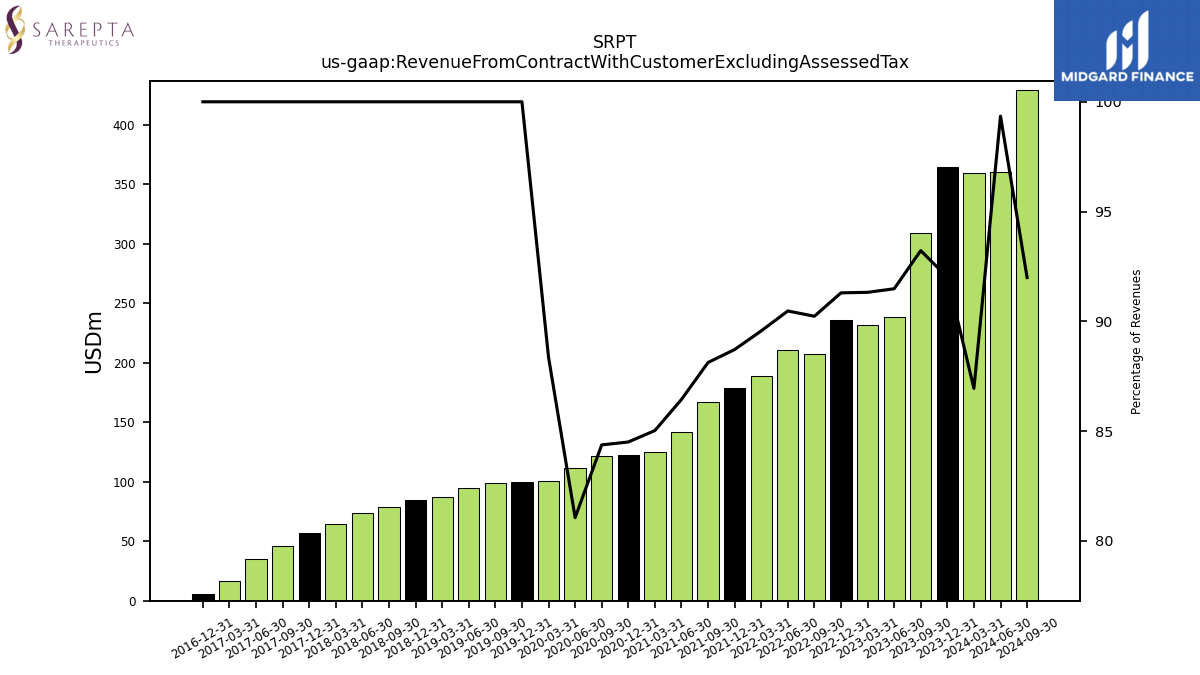
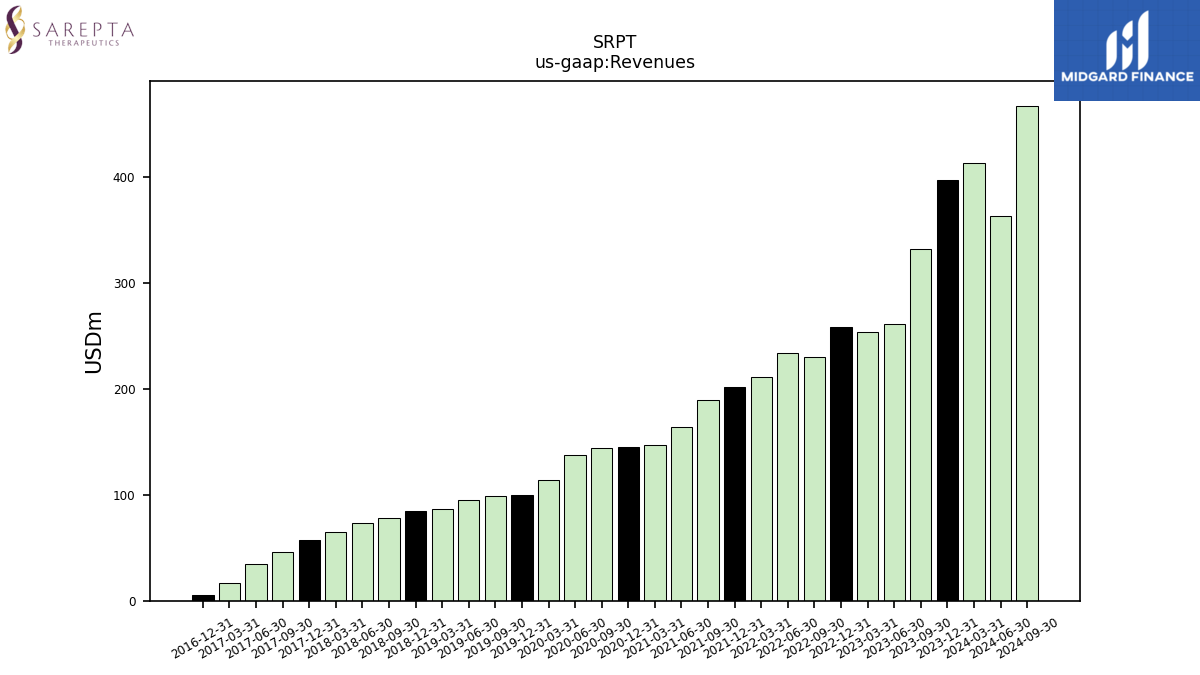
| Revenue From Contract With Customer Excluding Assessed Tax | 365.07 | 309.32 | 238.99 | 231.50 | 235.93 | 207.77 | 211.24 | 188.82 | 178.72 | 166.91 | 141.84 | 124.93 | 122.64 | 121.43 | 111.34 | 100.45 | 100.11 | 99.04 | 94.67 | 87.01 | 84.42 | 78.49 | 73.53 | 64.60 | 57.28 | 45.95 | 35.01 | 16.34 | 5.42 | |
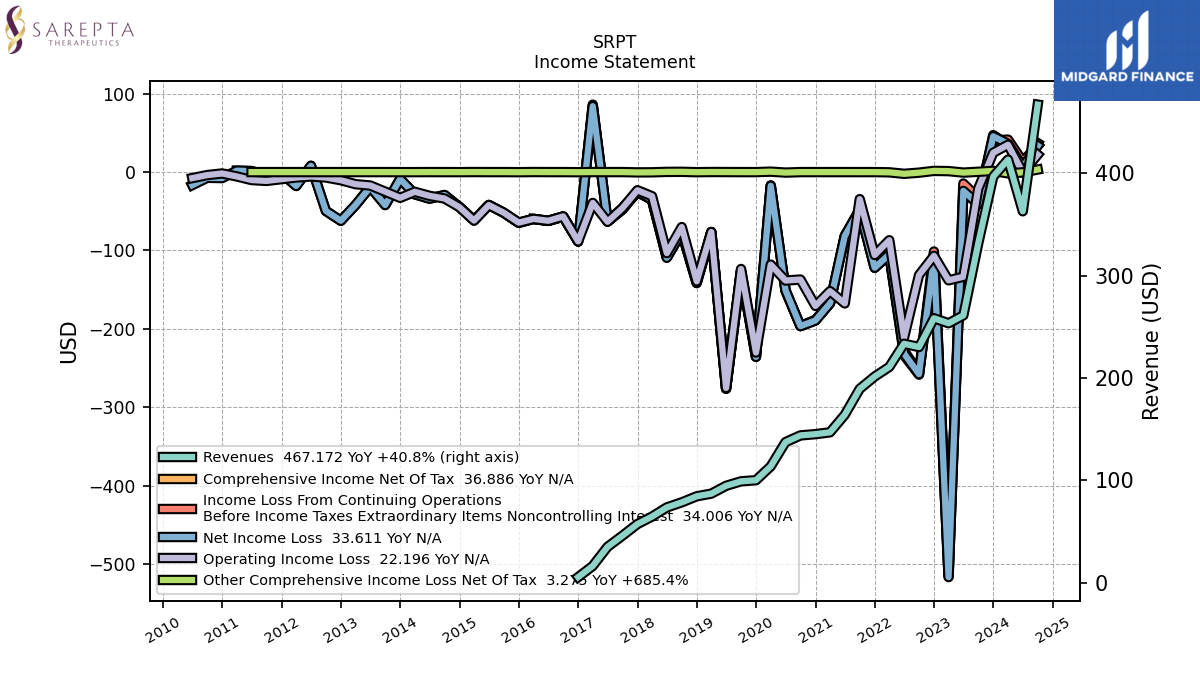
| Revenues | 396.78 | 331.82 | 261.24 | 253.50 | 258.43 | 230.27 | 233.49 | 210.83 | 201.46 | 189.41 | 164.09 | 146.93 | 145.14 | 143.92 | 137.36 | 113.67 | 100.11 | 99.04 | 94.67 | 87.01 | 84.42 | 78.49 | 73.53 | 64.60 | 57.28 | 45.95 | 35.01 | 16.34 | 5.42 | |
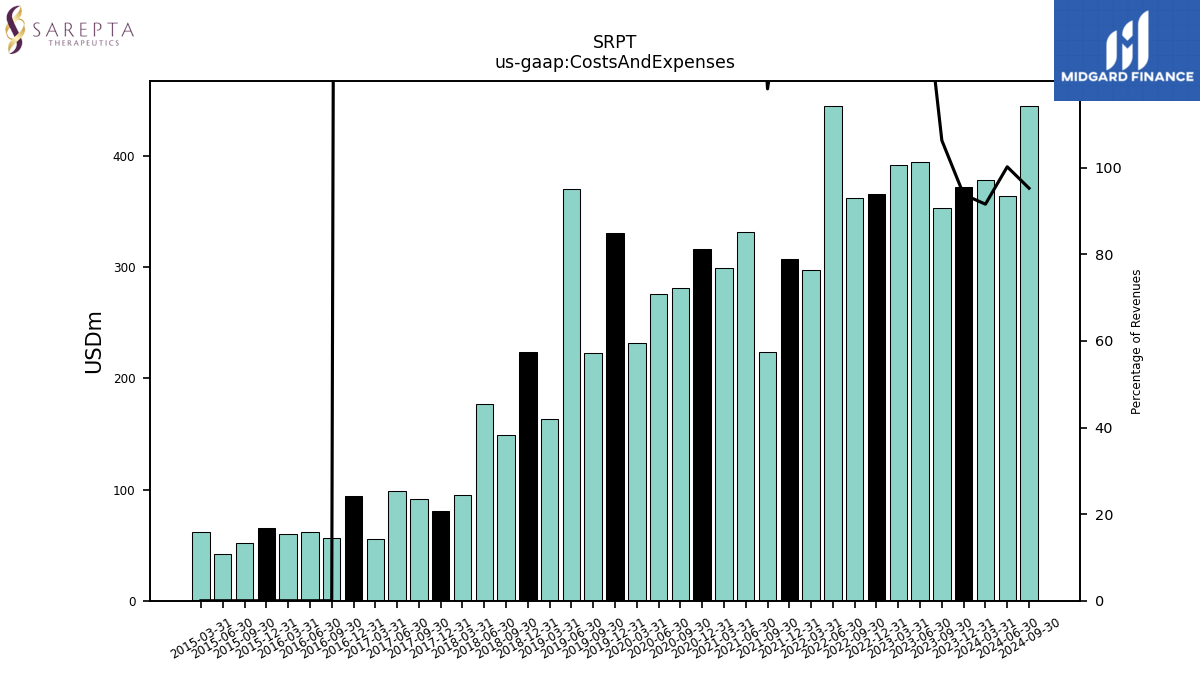
| Costs And Expenses | 372.16 | 352.66 | 394.76 | 391.59 | 365.26 | 361.62 | 444.62 | 297.71 | 307.27 | 223.86 | 331.66 | 298.80 | 315.85 | 280.99 | 275.72 | 231.70 | 330.33 | 222.63 | 370.04 | 163.40 | 223.78 | 148.59 | 176.96 | 95.34 | 80.42 | 91.86 | 98.35 | 55.59 | 93.82 | |
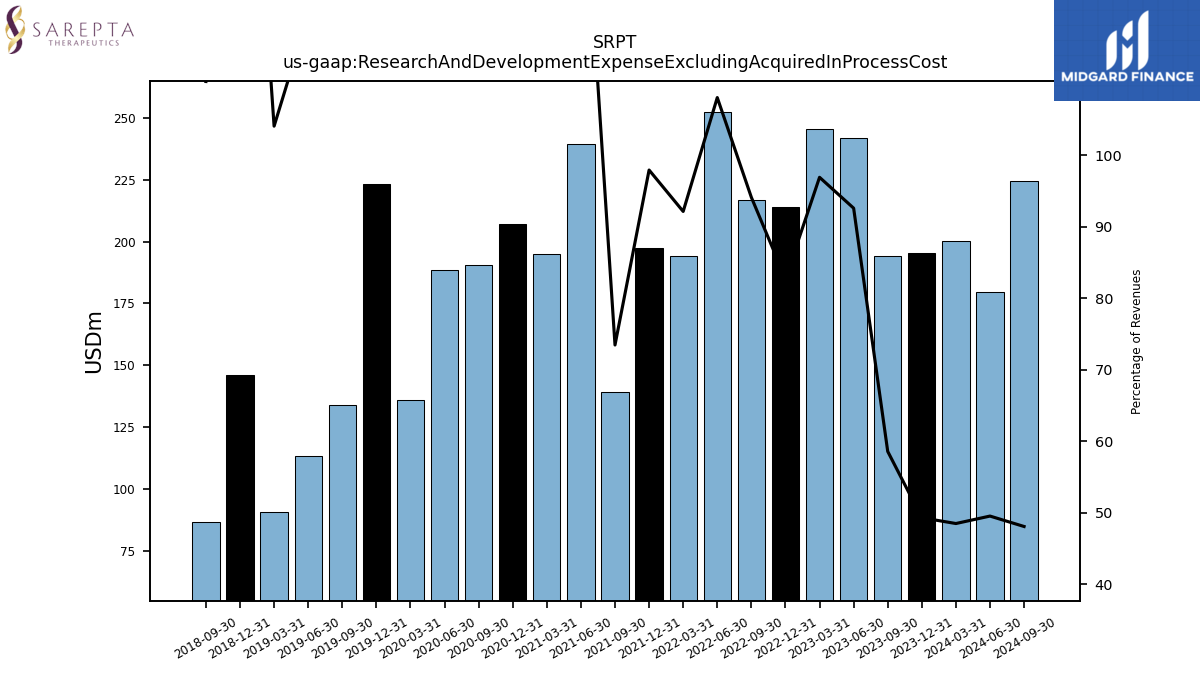
| Research And Development Expense Excluding Acquired In Process Cost | 195.52 | 194.30 | 241.89 | 245.68 | 213.80 | 216.71 | 252.33 | 194.25 | 197.30 | 139.12 | 239.62 | 195.15 | 207.24 | 190.44 | 188.52 | 136.14 | 223.14 | 133.95 | 113.27 | 90.55 | 146.21 | 86.58 | NA | NA | NA | NA | NA | NA | NA | |
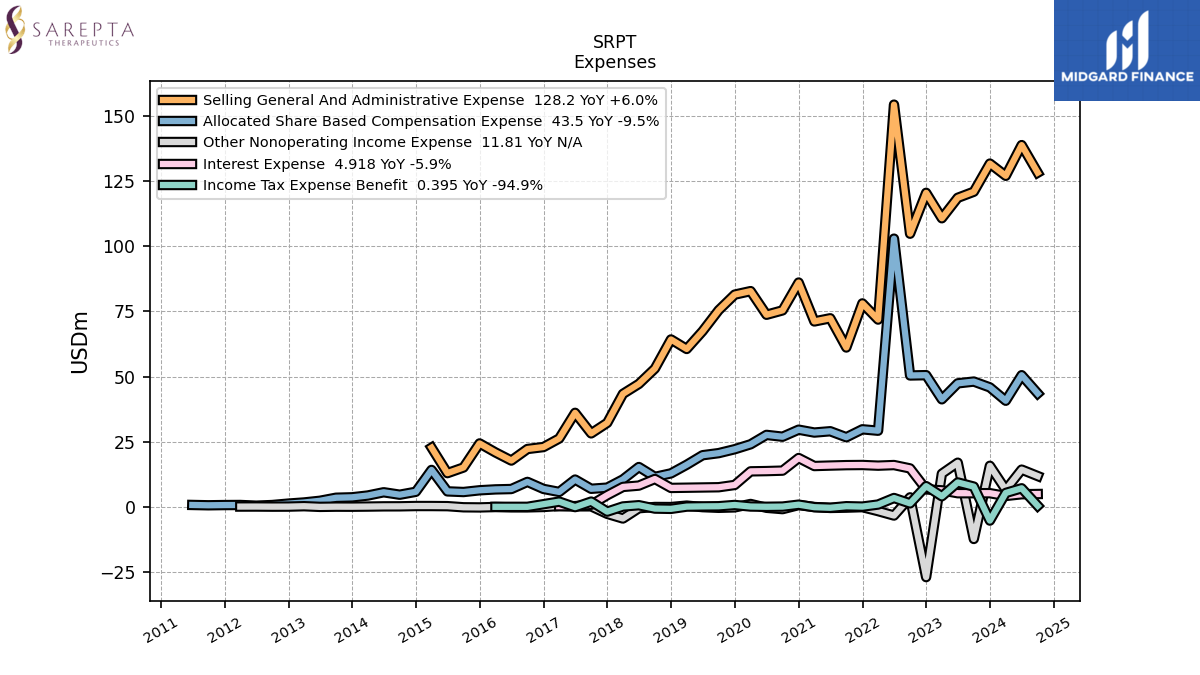
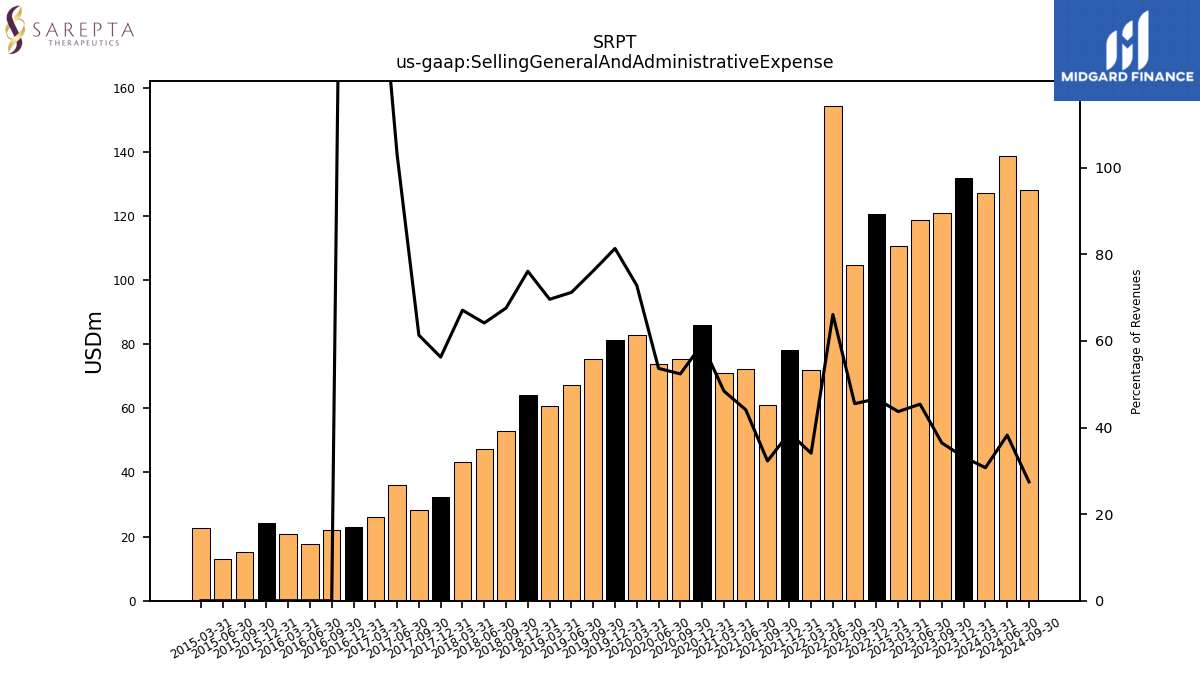
| Selling General And Administrative Expense | 131.70 | 120.89 | 118.56 | 110.71 | 120.48 | 104.79 | 154.32 | 71.84 | 78.06 | 61.13 | 72.35 | 71.13 | 86.05 | 75.37 | 73.69 | 82.77 | 81.42 | 75.43 | 67.39 | 60.57 | 64.22 | 53.04 | 47.16 | 43.34 | 32.22 | 28.18 | 36.07 | 26.22 | 22.94 | |
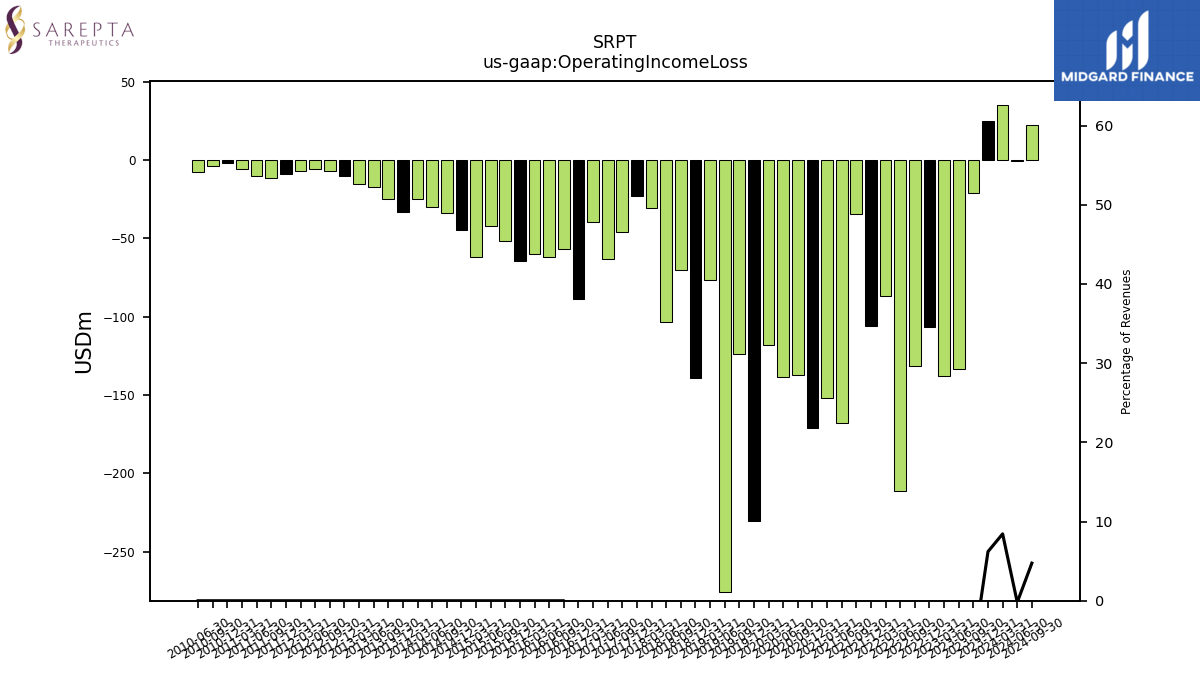
| Operating Income Loss | 24.62 | -20.84 | -133.52 | -138.09 | -106.83 | -131.35 | -211.13 | -86.88 | -105.81 | -34.46 | -167.57 | -151.87 | -170.72 | -137.07 | -138.35 | -118.03 | -230.22 | -123.59 | -275.37 | -76.39 | -139.36 | -70.10 | -103.43 | -30.74 | -23.15 | -45.91 | -63.34 | -39.24 | -88.39 | |
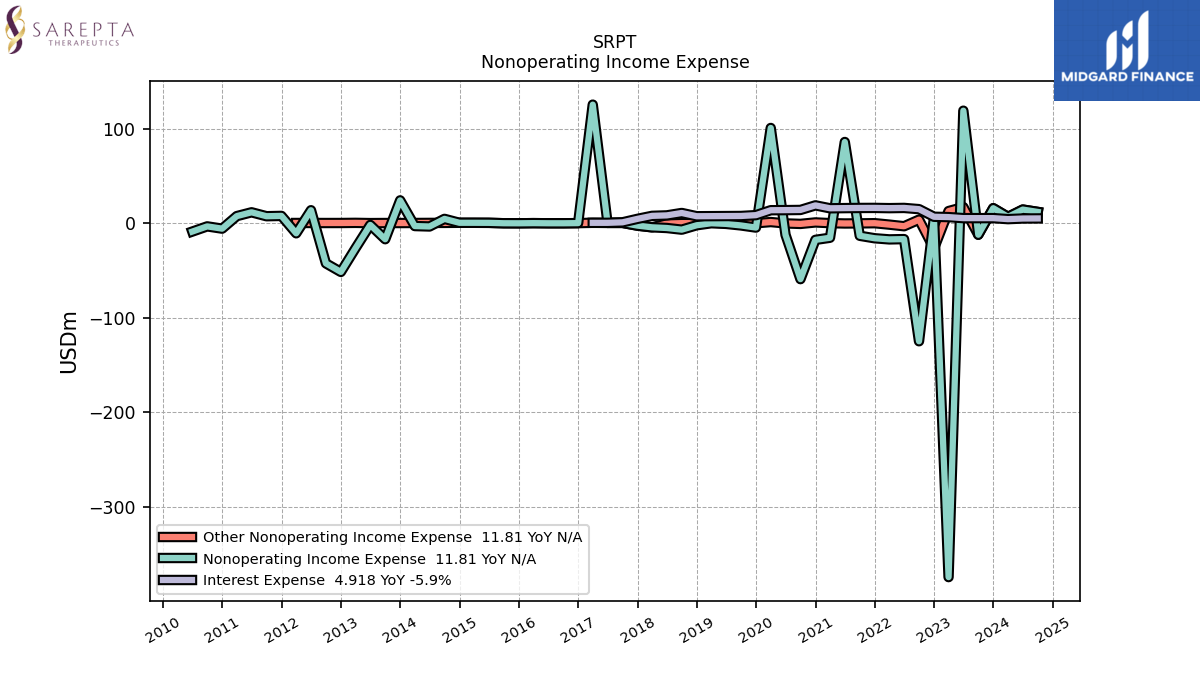
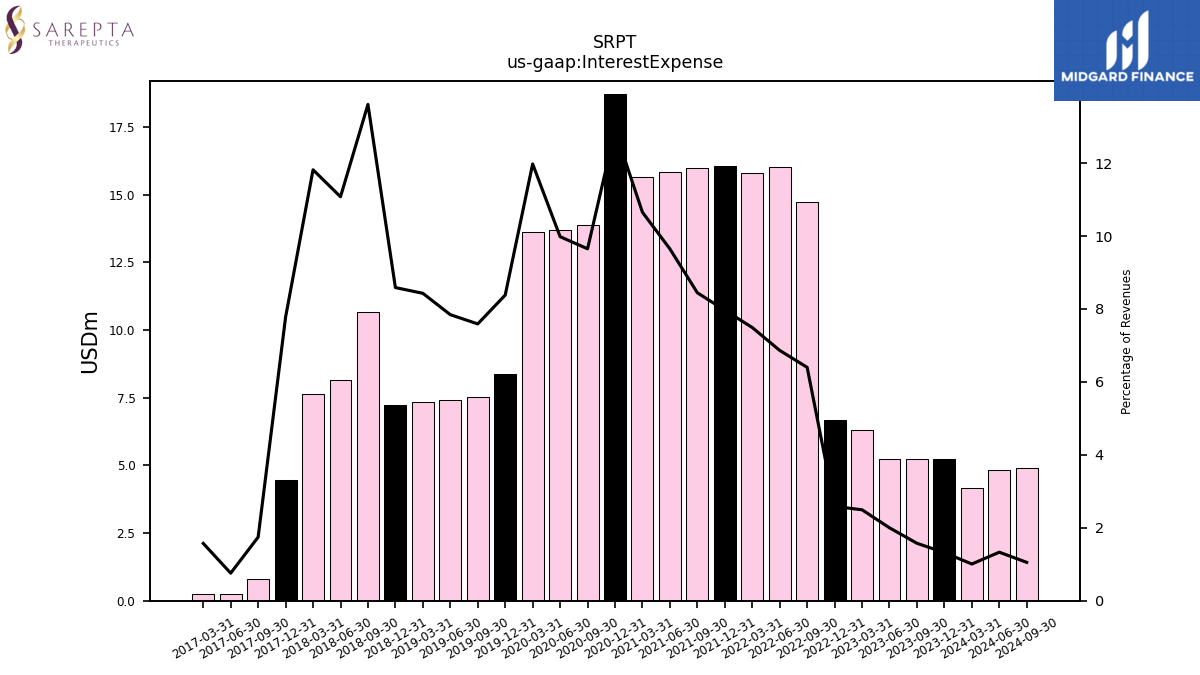
| Interest Expense | 5.23 | 5.23 | 5.22 | 6.32 | 6.69 | 14.74 | 16.03 | 15.80 | 16.05 | 15.99 | 15.83 | 15.65 | 18.73 | 13.89 | 13.71 | 13.62 | 8.39 | 7.52 | 7.43 | 7.33 | 7.25 | 10.68 | 8.14 | 7.63 | 4.46 | 0.80 | 0.27 | 0.26 | NA | |
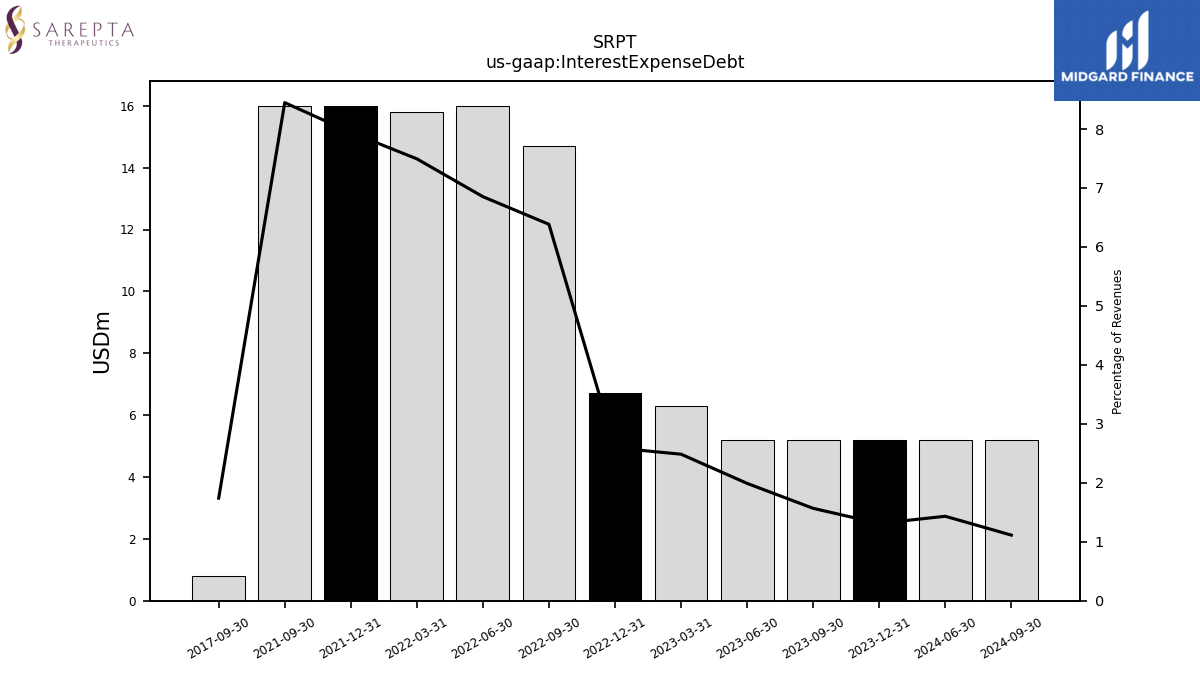
| Interest Expense Debt | 5.20 | 5.20 | 5.20 | 6.30 | 6.70 | 14.70 | 16.00 | 15.80 | 16.00 | 16.00 | NA | NA | NA | NA | NA | NA | NA | NA | NA | NA | NA | NA | NA | NA | NA | 0.80 | NA | NA | NA | |
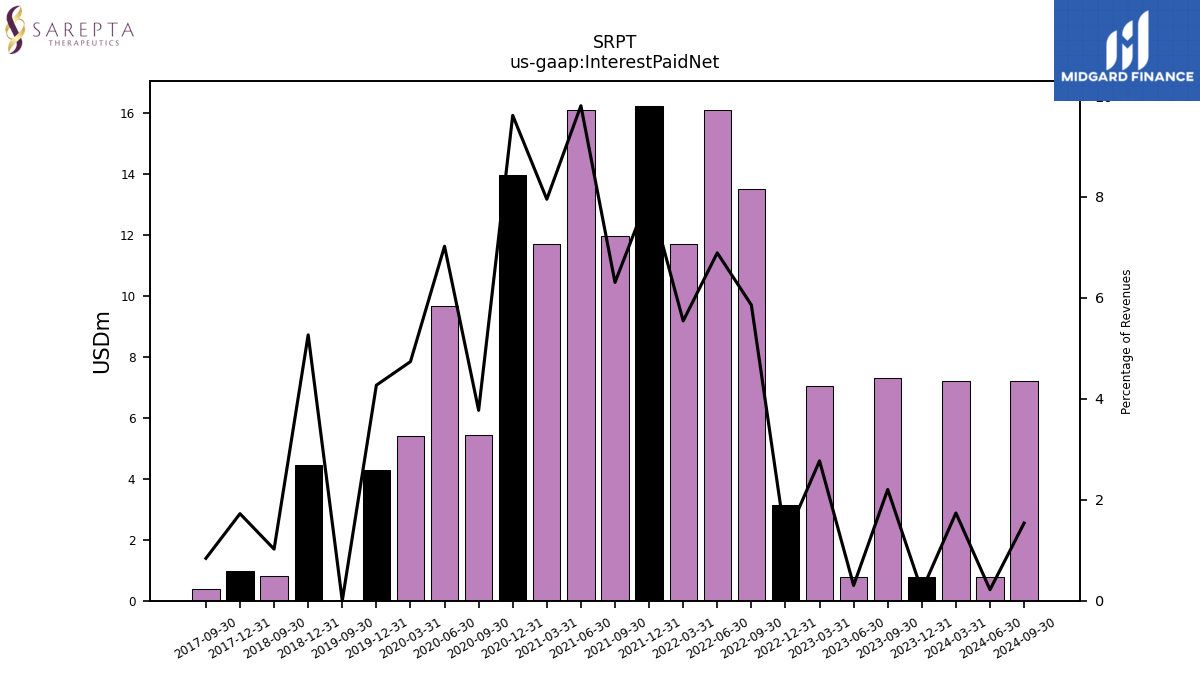
| Interest Paid Net | 0.79 | 7.31 | 0.79 | 7.02 | 3.15 | 13.49 | 16.09 | 11.69 | 16.22 | 11.95 | 16.09 | 11.69 | 13.96 | 5.43 | 9.65 | 5.38 | 4.28 | 0.00 | NA | NA | 4.45 | 0.80 | NA | NA | 0.99 | 0.39 | NA | NA | NA | |
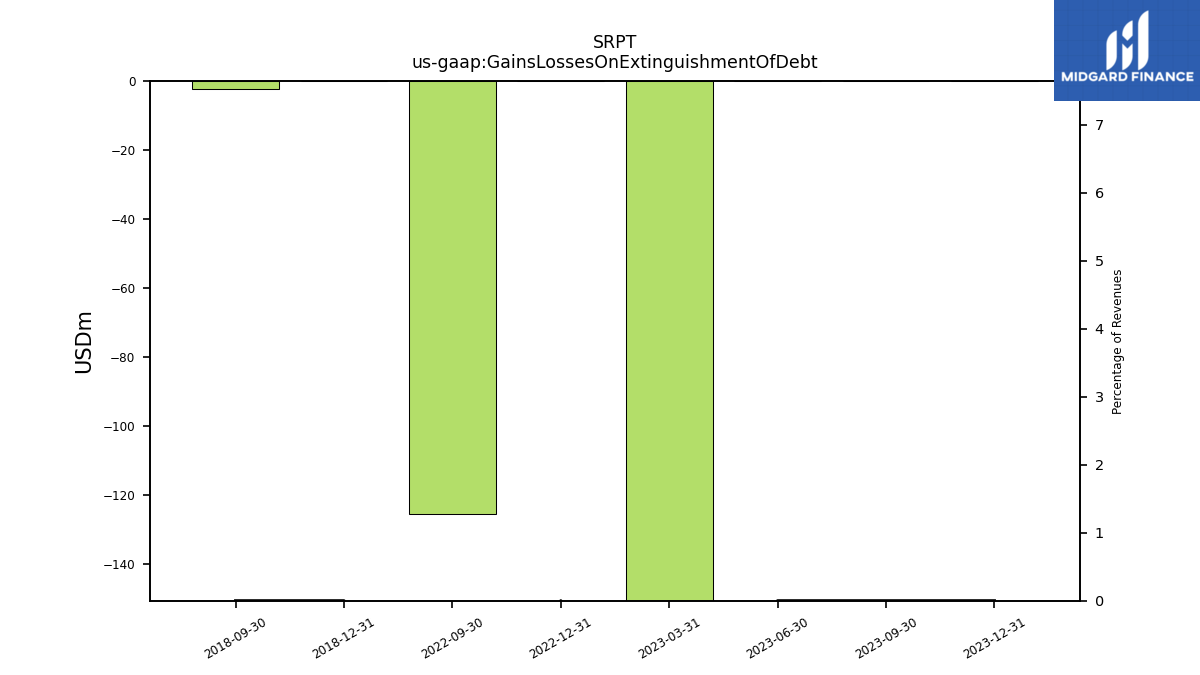
| Gains Losses On Extinguishment Of Debt | 0.00 | 0.00 | 0.00 | -387.33 | 0.00 | -125.44 | NA | NA | NA | NA | NA | NA | NA | NA | NA | NA | NA | NA | NA | NA | 0.00 | -2.30 | NA | NA | NA | NA | NA | NA | NA | |
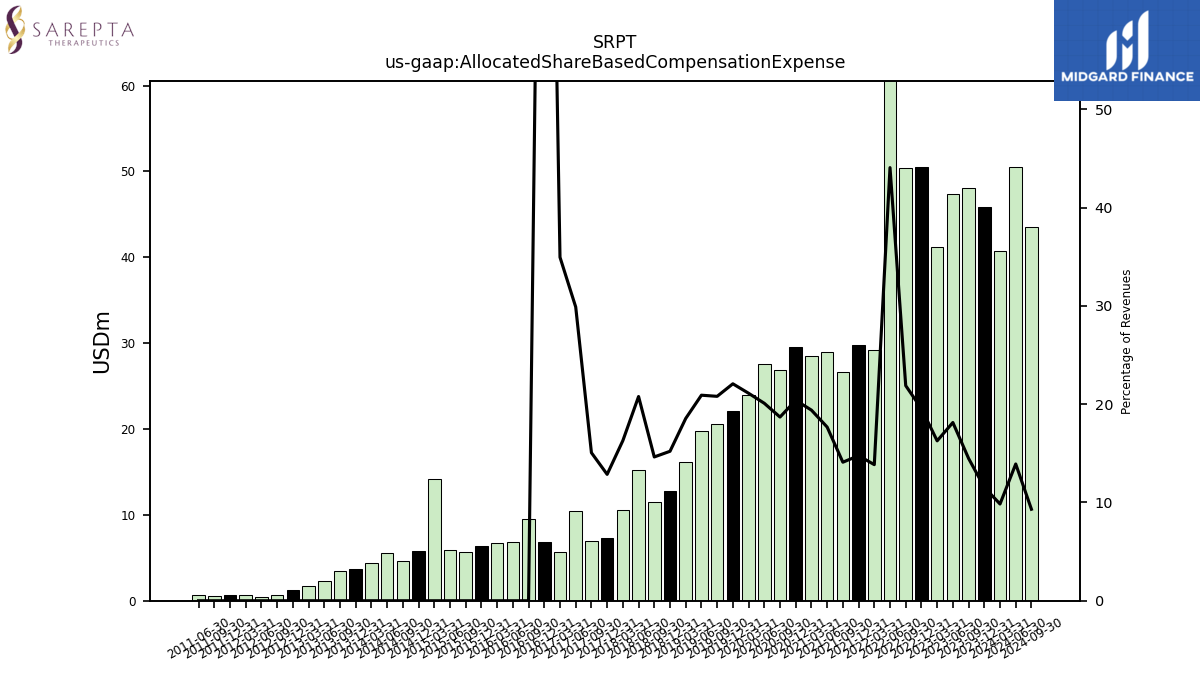
| Allocated Share Based Compensation Expense | 45.83 | 48.06 | 47.38 | 41.25 | 50.52 | 50.40 | 102.90 | 29.20 | 29.74 | 26.70 | 29.00 | 28.50 | 29.60 | 26.90 | 27.60 | 24.00 | 22.10 | 20.60 | 19.80 | 16.14 | 12.84 | 11.48 | 15.28 | 10.53 | 7.37 | 6.92 | 10.46 | 5.71 | 6.87 | |
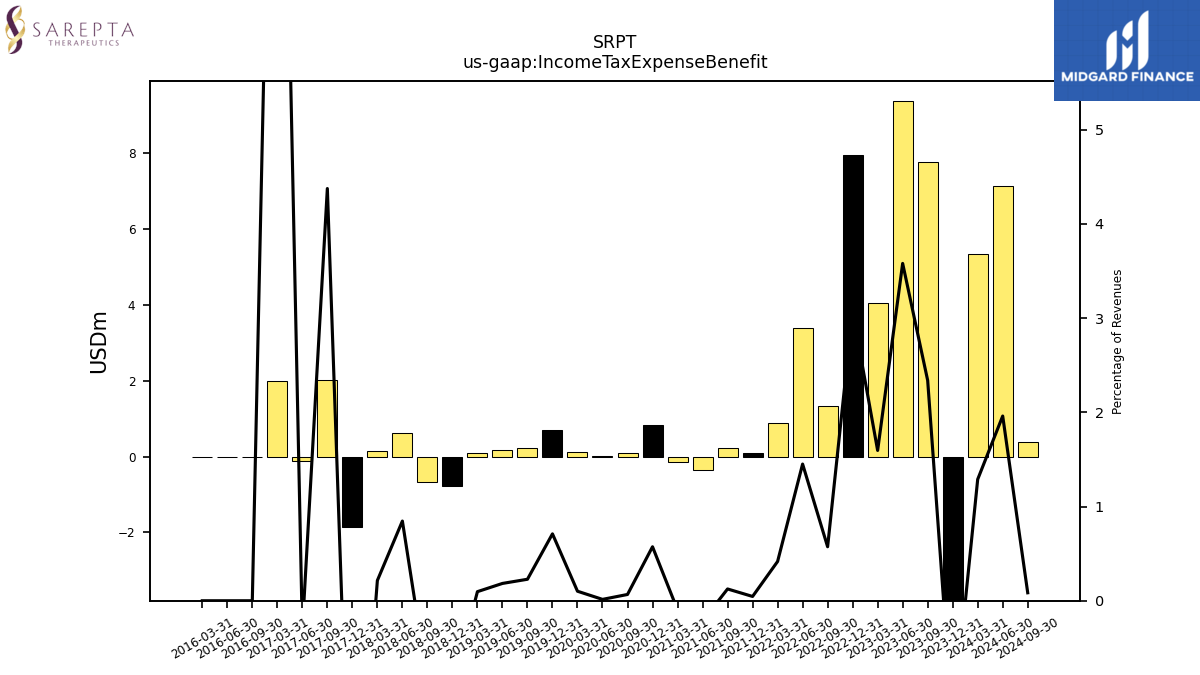
| Income Tax Expense Benefit | -5.28 | 7.76 | 9.36 | 4.04 | 7.94 | 1.32 | 3.39 | 0.88 | 0.09 | 0.24 | -0.35 | -0.14 | 0.83 | 0.10 | 0.02 | 0.12 | 0.71 | 0.23 | 0.17 | 0.08 | -0.78 | -0.67 | 0.62 | 0.14 | -1.84 | 2.01 | -0.11 | 2.00 | NA | |
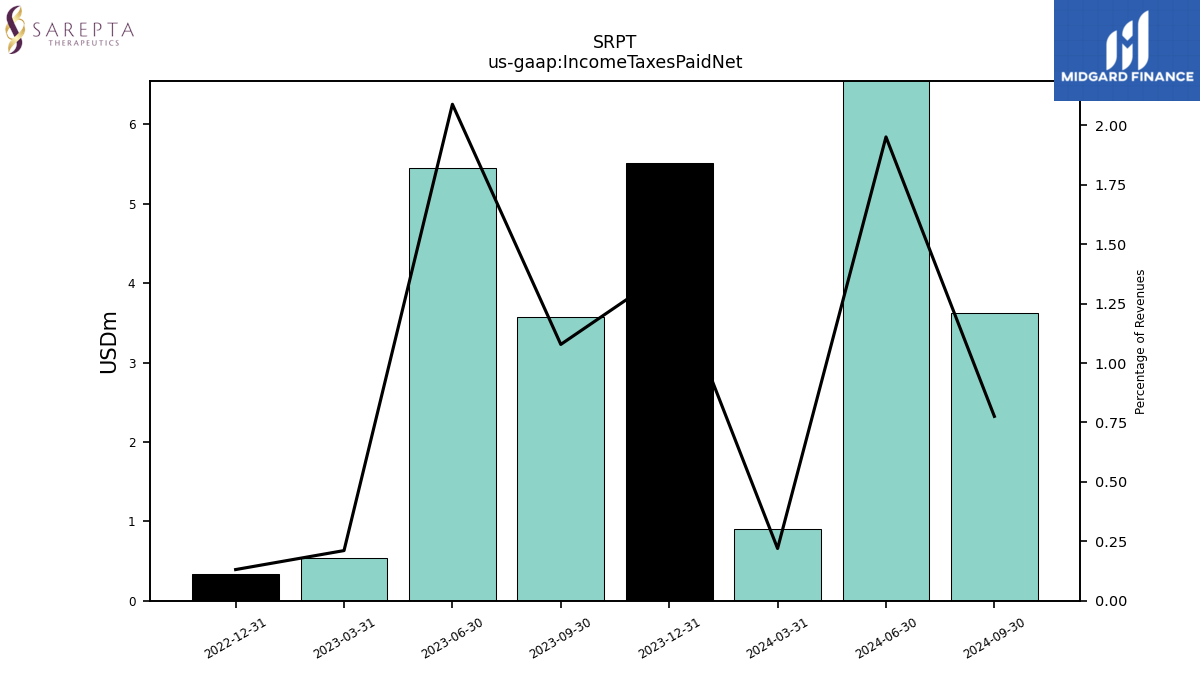
| Income Taxes Paid Net | 5.51 | NA | NA | NA | 0.34 | NA | NA | NA | NA | NA | NA | NA | NA | NA | NA | NA | NA | NA | NA | NA | NA | NA | NA | NA | NA | NA | NA | NA | NA | |
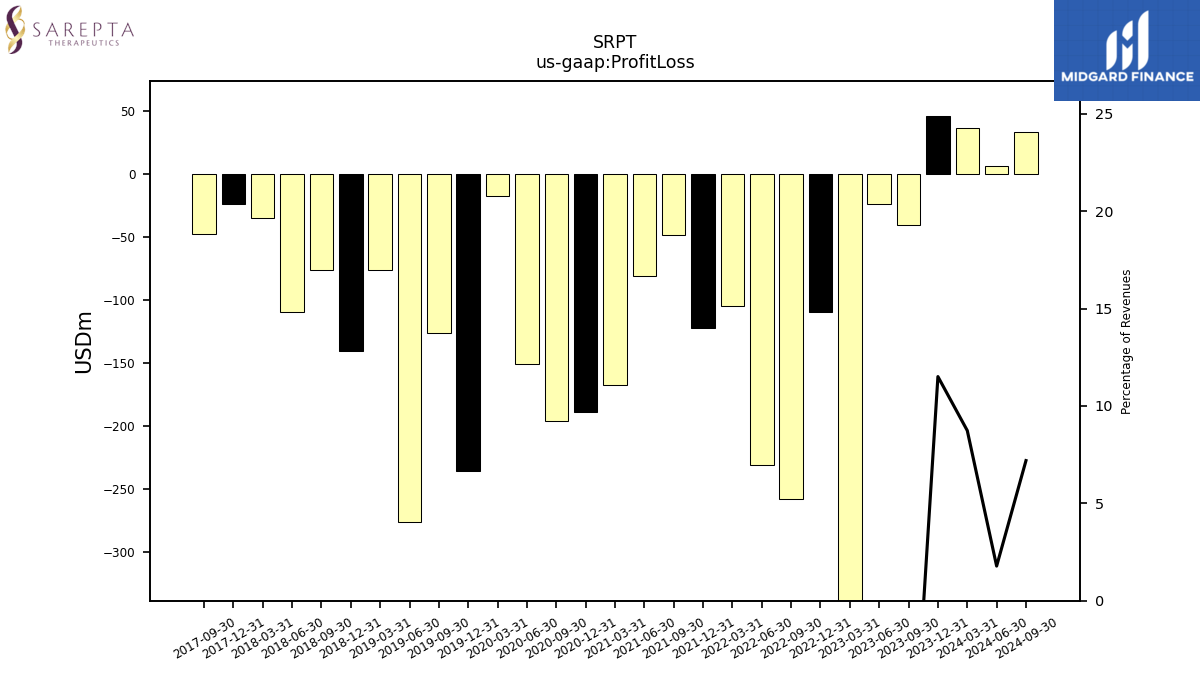
| Profit Loss | 45.66 | -40.94 | -23.94 | -516.75 | -109.24 | -257.74 | -231.48 | -105.03 | -121.98 | -48.14 | -81.41 | -167.25 | -189.32 | -196.50 | -150.82 | -17.49 | -235.70 | -126.33 | -276.40 | -76.64 | -140.90 | -76.39 | -109.27 | -35.36 | -24.00 | -47.73 | NA | NA | NA | |
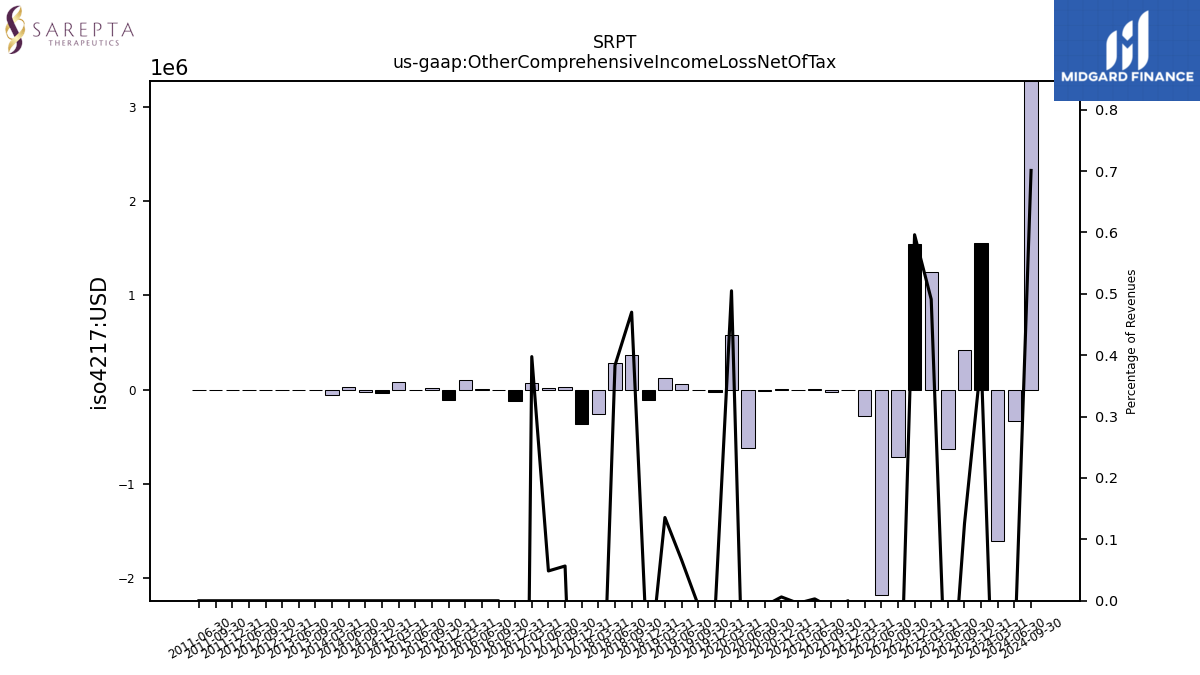
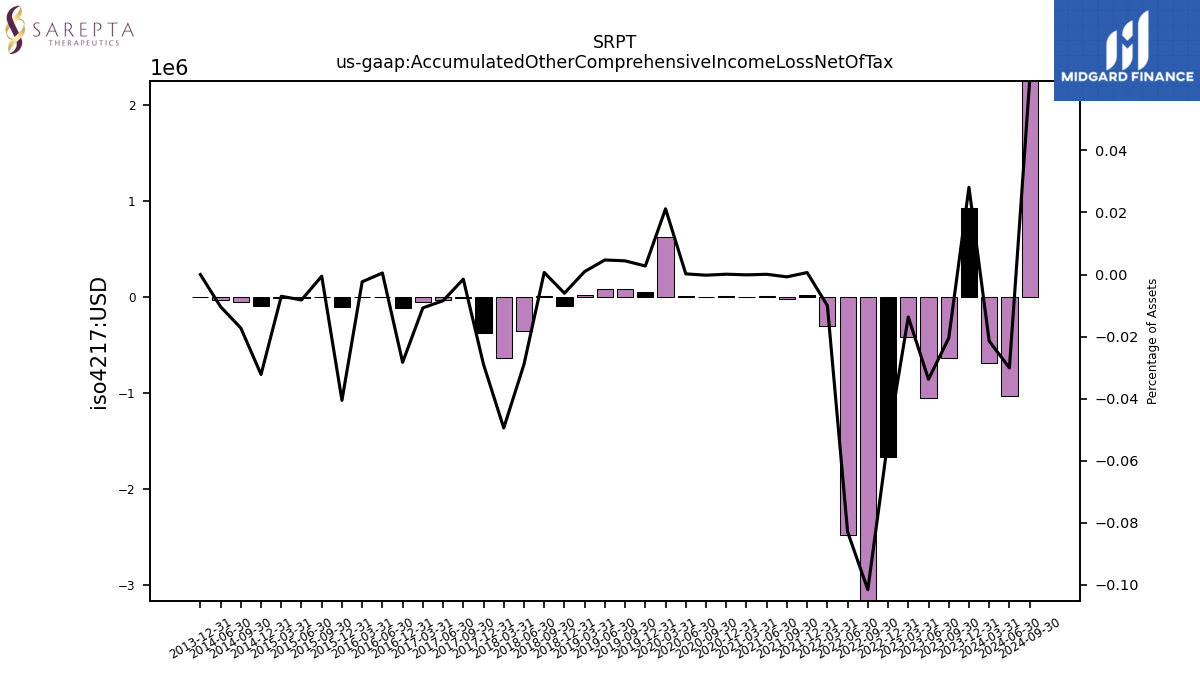
| Other Comprehensive Income Loss Net Of Tax | 1.56 | 0.42 | -0.64 | 1.25 | 1.54 | -0.72 | -2.18 | -0.29 | 0.00 | -0.02 | 0.01 | -0.01 | 0.01 | -0.01 | -0.62 | 0.57 | -0.03 | -0.01 | 0.06 | 0.12 | -0.11 | 0.37 | 0.28 | -0.26 | -0.37 | 0.03 | 0.02 | 0.07 | -0.12 | |
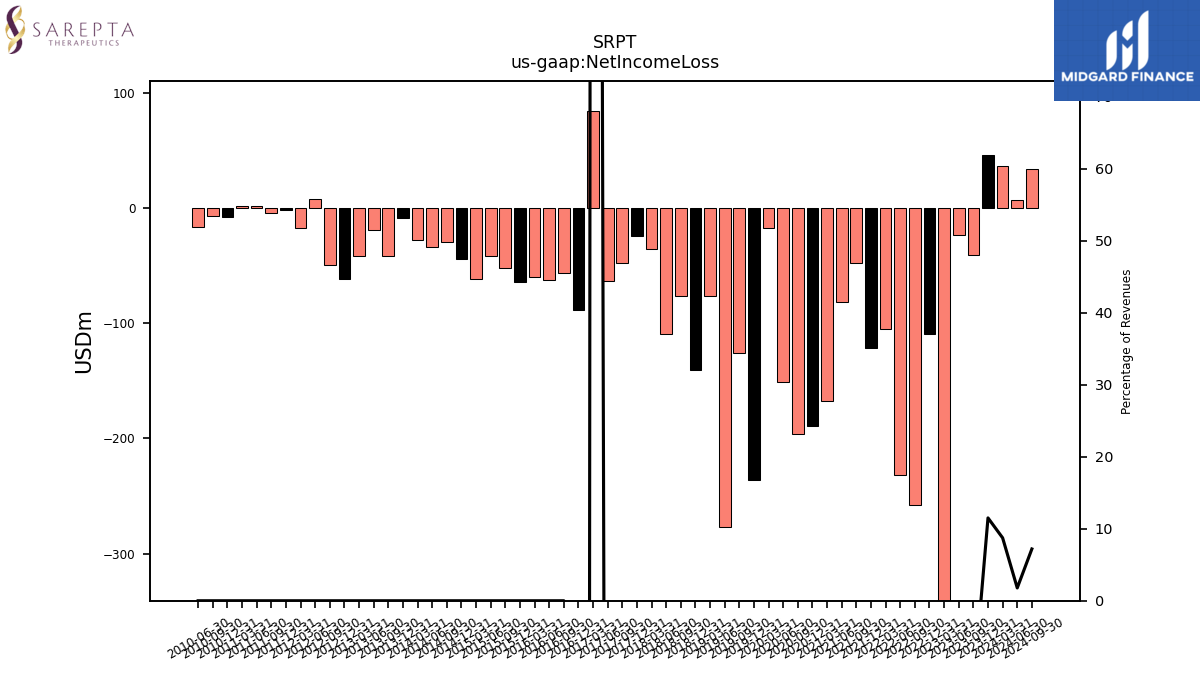
| Net Income Loss | 45.66 | -40.94 | -23.94 | -516.75 | -109.24 | -257.74 | -231.48 | -105.03 | -121.98 | -48.14 | -81.41 | -167.25 | -189.32 | -196.50 | -150.82 | -17.49 | -235.70 | -126.33 | -276.40 | -76.64 | -140.90 | -76.39 | -109.27 | -35.36 | -24.00 | -47.73 | -63.05 | 84.09 | -88.45 | |
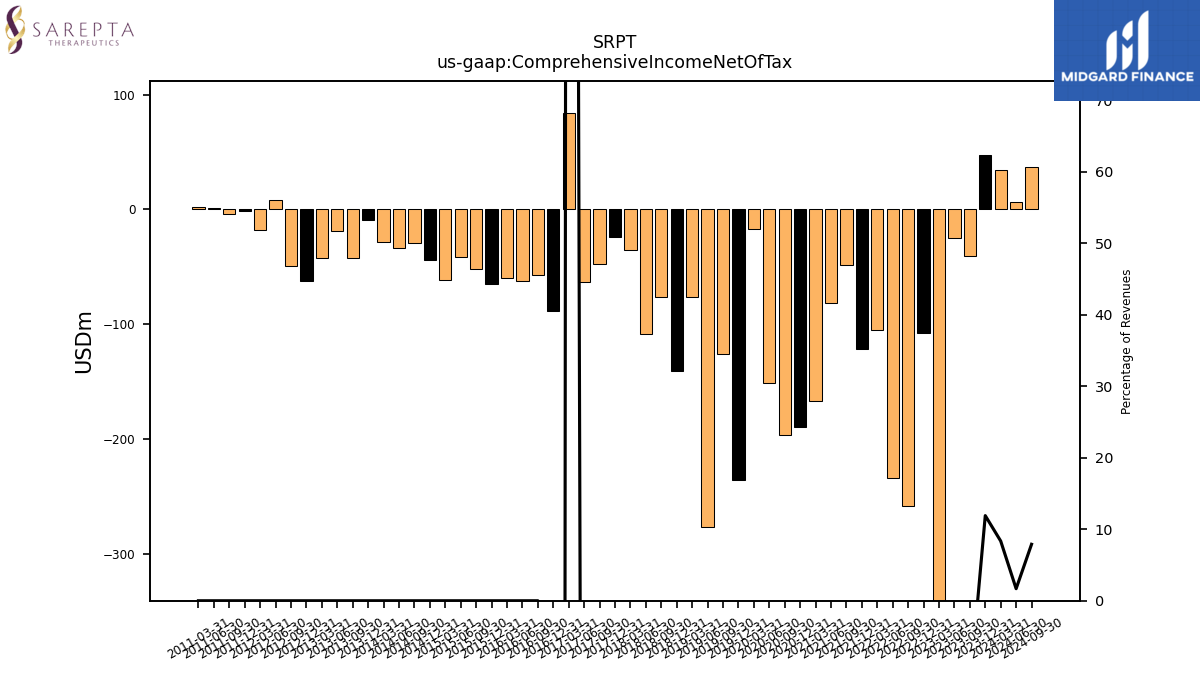
| Comprehensive Income Net Of Tax | 47.21 | -40.52 | -24.58 | -515.51 | -107.70 | -258.46 | -233.66 | -105.31 | -121.98 | -48.17 | -81.40 | -167.26 | -189.31 | -196.51 | -151.44 | -16.92 | -235.73 | -126.33 | -276.34 | -76.53 | -141.00 | -76.02 | -108.98 | -35.63 | -24.36 | -47.71 | -63.03 | 84.16 | -88.57 |
| 2023-12-31 | 2023-09-30 | 2023-06-30 | 2023-03-31 | 2022-12-31 | 2022-09-30 | 2022-06-30 | 2022-03-31 | 2021-12-31 | 2021-09-30 | 2021-06-30 | 2021-03-31 | 2020-12-31 | 2020-09-30 | 2020-06-30 | 2020-03-31 | 2019-12-31 | 2019-09-30 | 2019-06-30 | 2019-03-31 | 2018-12-31 | 2018-09-30 | 2018-06-30 | 2018-03-31 | 2017-12-31 | 2017-09-30 | 2017-06-30 | 2017-03-31 | 2016-12-31 | ||
|---|---|---|---|---|---|---|---|---|---|---|---|---|---|---|---|---|---|---|---|---|---|---|---|---|---|---|---|---|---|---|
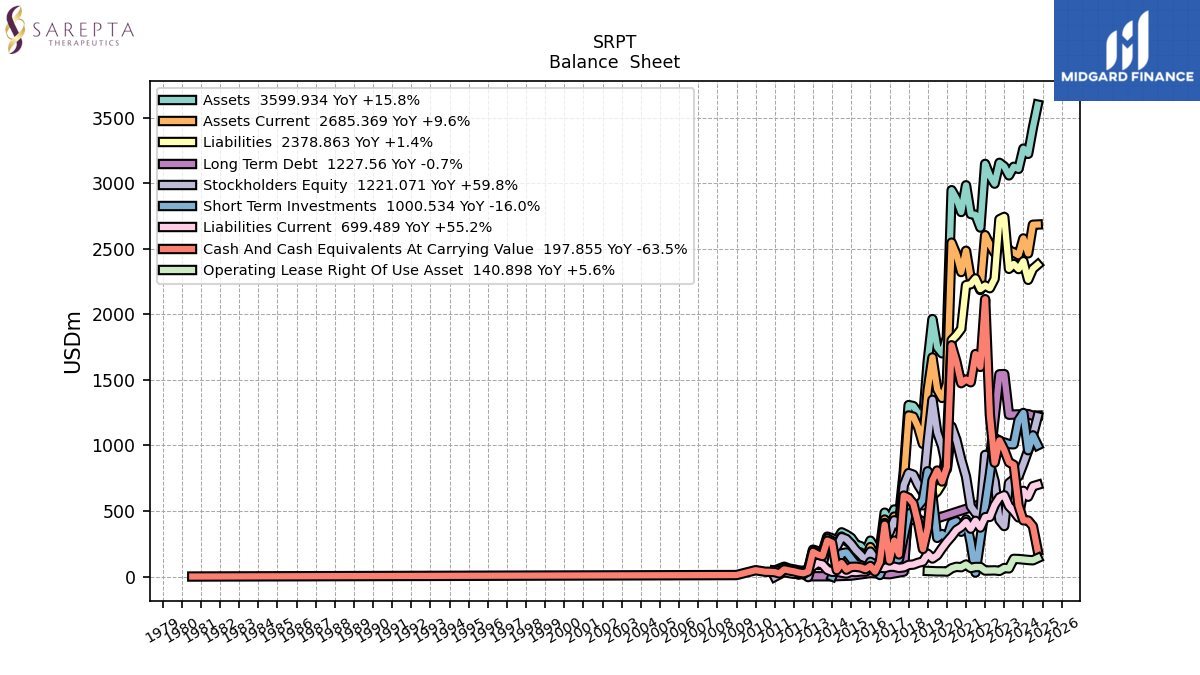
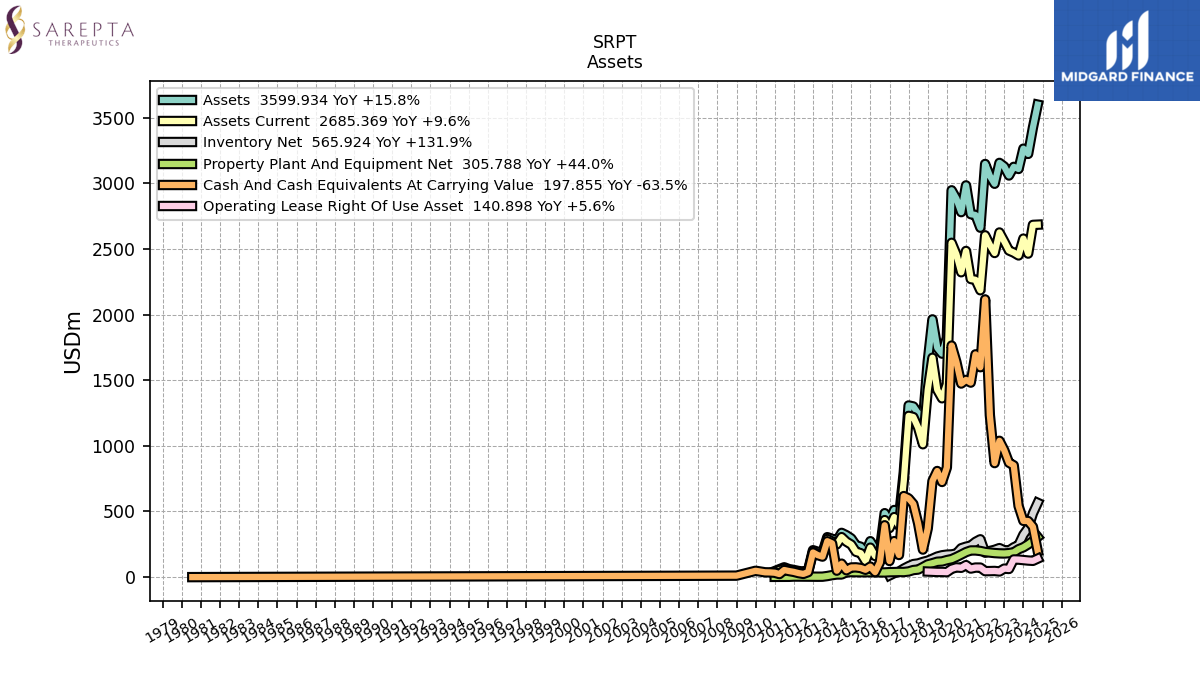
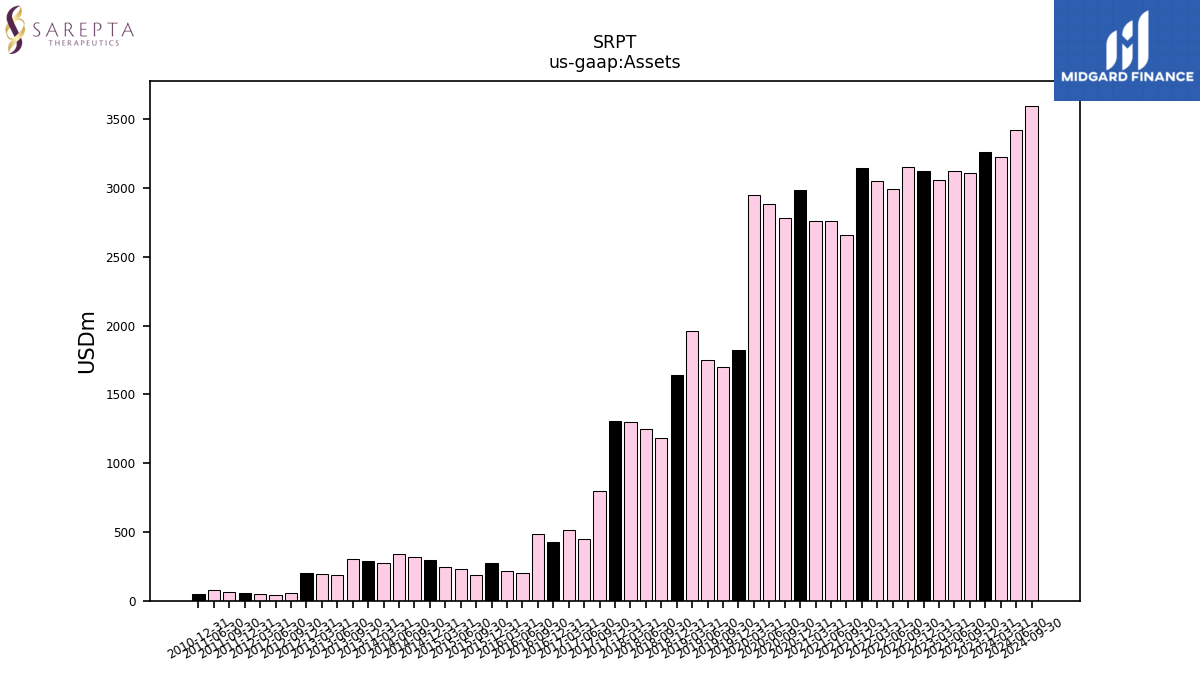
| Assets | 3264.58 | 3109.71 | 3125.89 | 3059.79 | 3128.37 | 3156.15 | 2996.85 | 3056.15 | 3147.97 | 2662.22 | 2759.07 | 2765.23 | 2984.72 | 2780.66 | 2883.04 | 2947.39 | 1822.82 | 1702.47 | 1747.75 | 1963.89 | 1642.08 | 1182.91 | 1247.16 | 1300.28 | 1307.96 | 800.28 | 450.14 | 511.53 | 424.10 | |
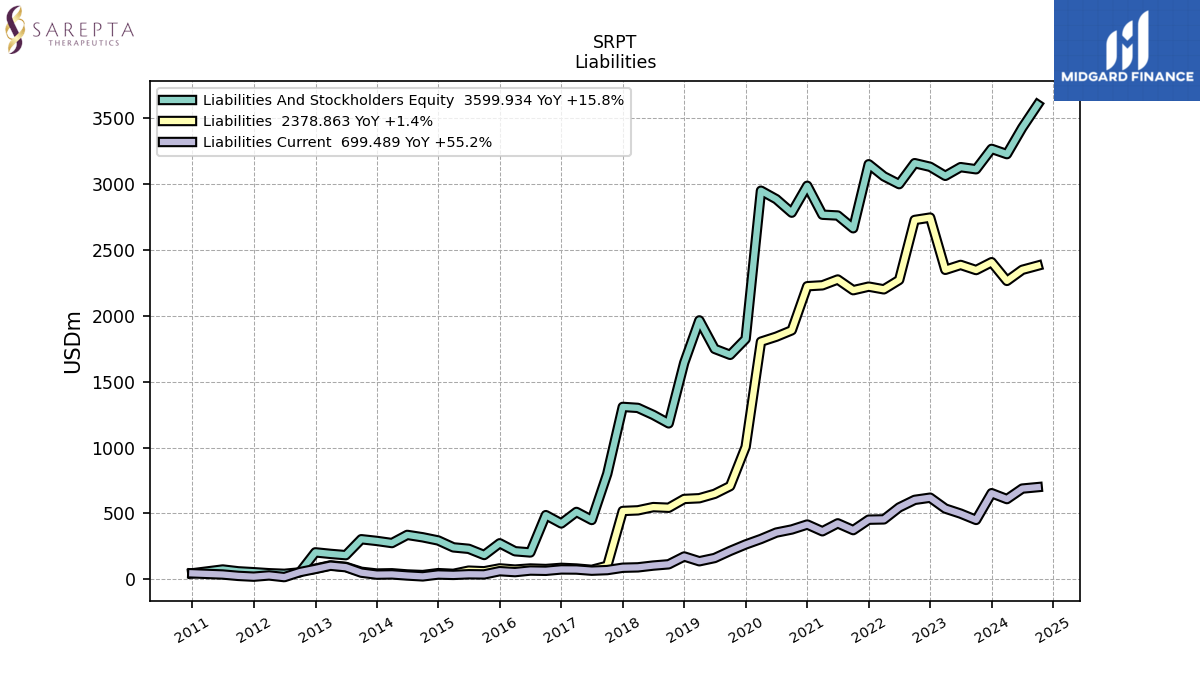
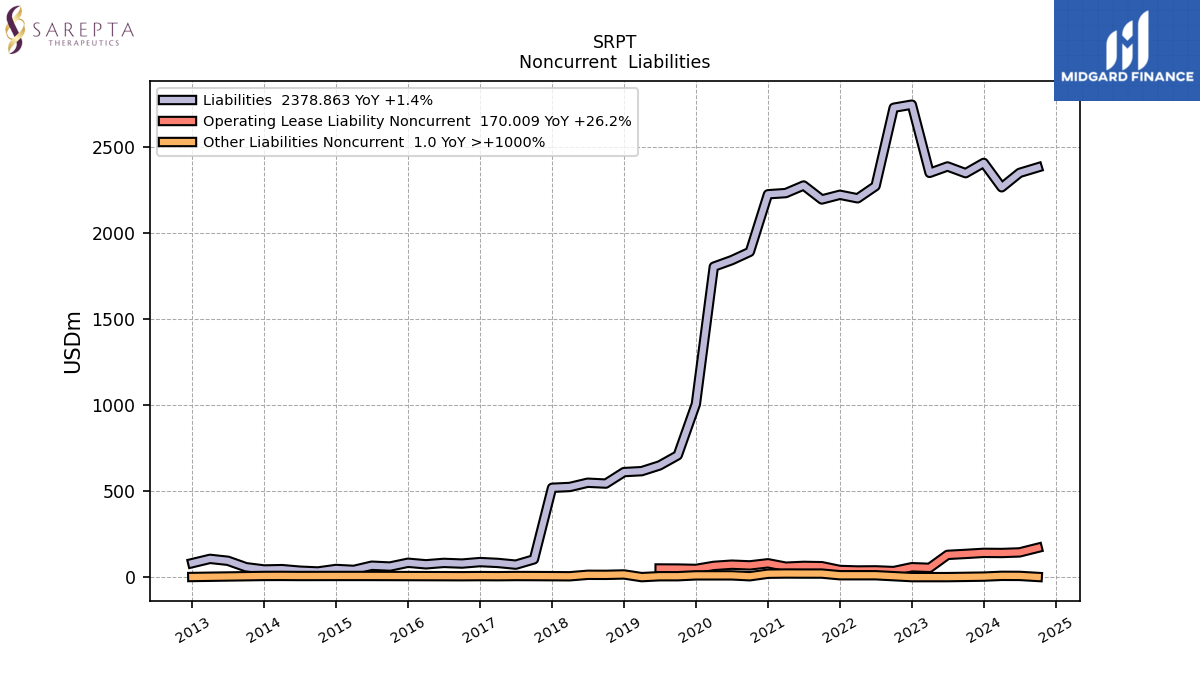
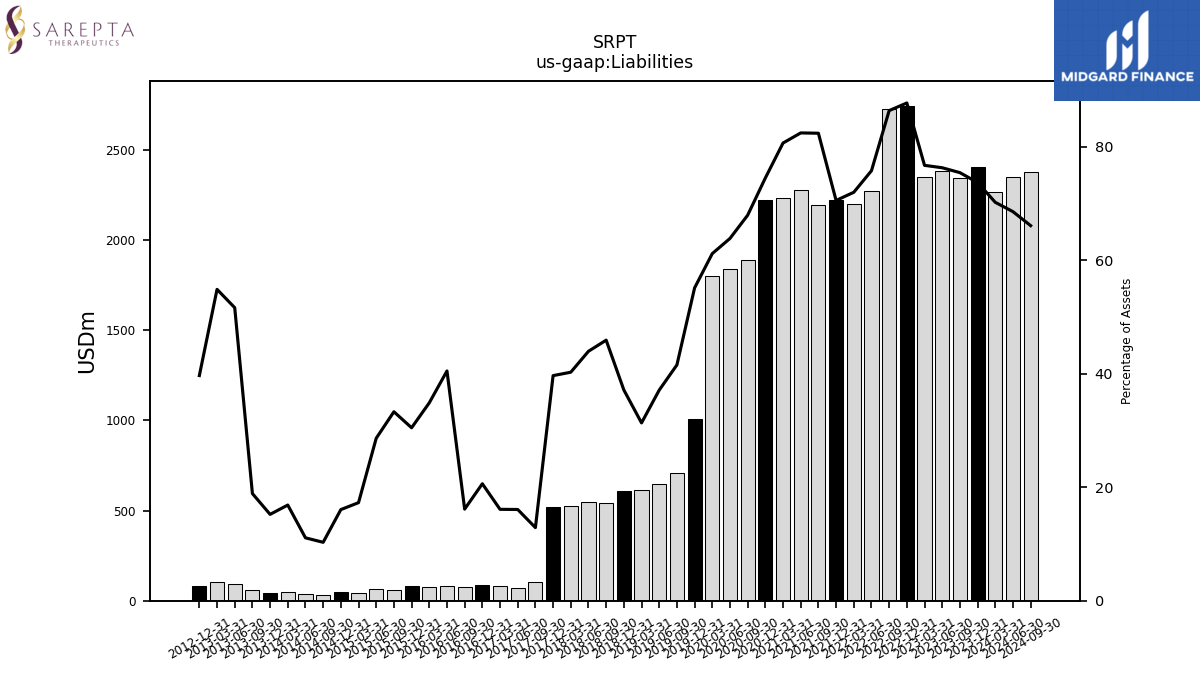
| Liabilities | 2405.24 | 2345.35 | 2384.48 | 2347.04 | 2743.42 | 2725.31 | 2270.40 | 2199.27 | 2219.97 | 2192.69 | 2273.97 | 2229.79 | 2222.96 | 1888.62 | 1840.18 | 1802.56 | 1004.63 | 707.27 | 648.59 | 615.33 | 609.80 | 543.06 | 548.11 | 523.52 | 518.75 | 103.12 | 72.37 | 82.39 | 87.41 | |
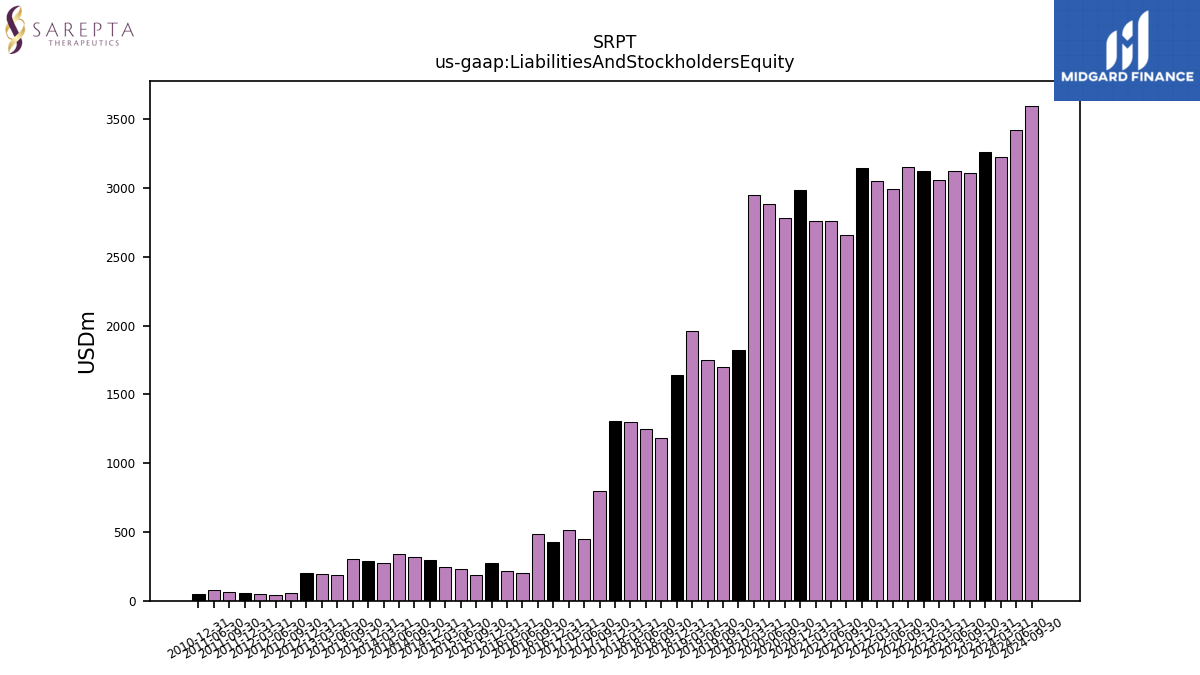
| Liabilities And Stockholders Equity | 3264.58 | 3109.71 | 3125.89 | 3059.79 | 3128.37 | 3156.15 | 2996.85 | 3056.15 | 3147.97 | 2662.22 | 2759.07 | 2765.23 | 2984.72 | 2780.66 | 2883.04 | 2947.39 | 1822.82 | 1702.47 | 1747.75 | 1963.89 | 1642.08 | 1182.91 | 1247.16 | 1300.28 | 1307.96 | 800.28 | 450.14 | 511.53 | 424.10 | |
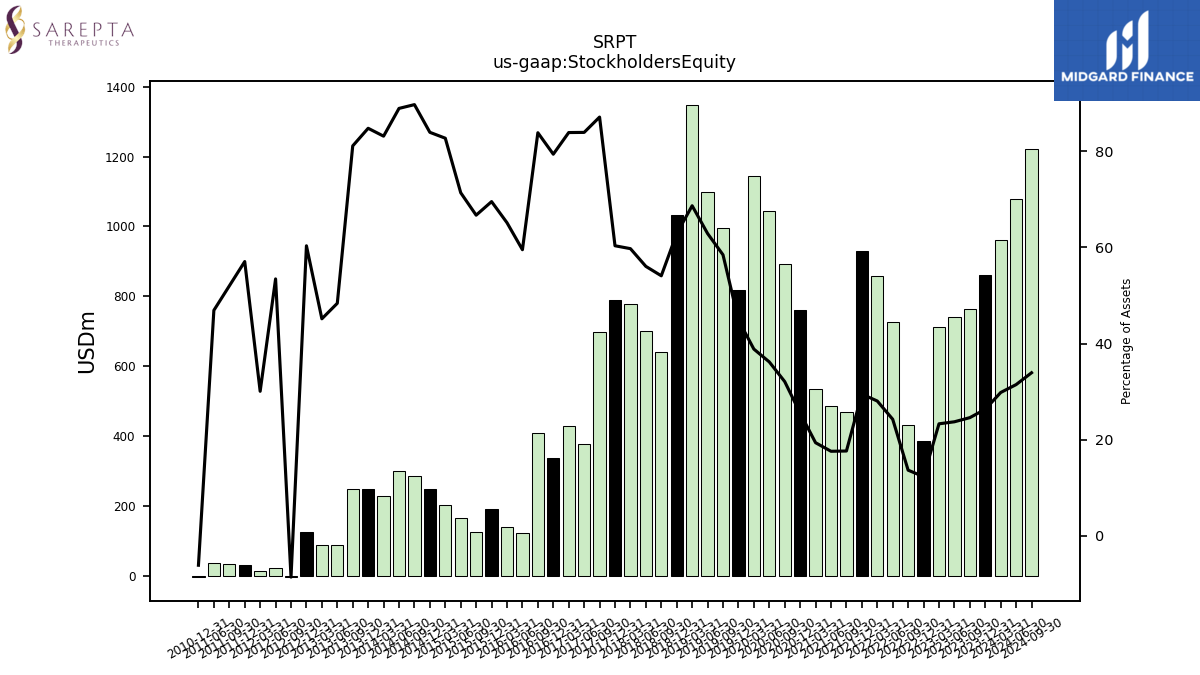
| Stockholders Equity | 859.34 | 764.36 | 741.41 | 712.75 | 384.95 | 430.84 | 726.46 | 856.89 | 928.01 | 469.53 | 485.11 | 535.45 | 761.76 | 892.05 | 1042.87 | 1144.83 | 818.19 | 995.20 | 1099.17 | 1348.56 | 1032.28 | 639.85 | 699.05 | 776.76 | 789.22 | 697.16 | 377.77 | 429.14 | 336.69 |
| 2023-12-31 | 2023-09-30 | 2023-06-30 | 2023-03-31 | 2022-12-31 | 2022-09-30 | 2022-06-30 | 2022-03-31 | 2021-12-31 | 2021-09-30 | 2021-06-30 | 2021-03-31 | 2020-12-31 | 2020-09-30 | 2020-06-30 | 2020-03-31 | 2019-12-31 | 2019-09-30 | 2019-06-30 | 2019-03-31 | 2018-12-31 | 2018-09-30 | 2018-06-30 | 2018-03-31 | 2017-12-31 | 2017-09-30 | 2017-06-30 | 2017-03-31 | 2016-12-31 | ||
|---|---|---|---|---|---|---|---|---|---|---|---|---|---|---|---|---|---|---|---|---|---|---|---|---|---|---|---|---|---|---|
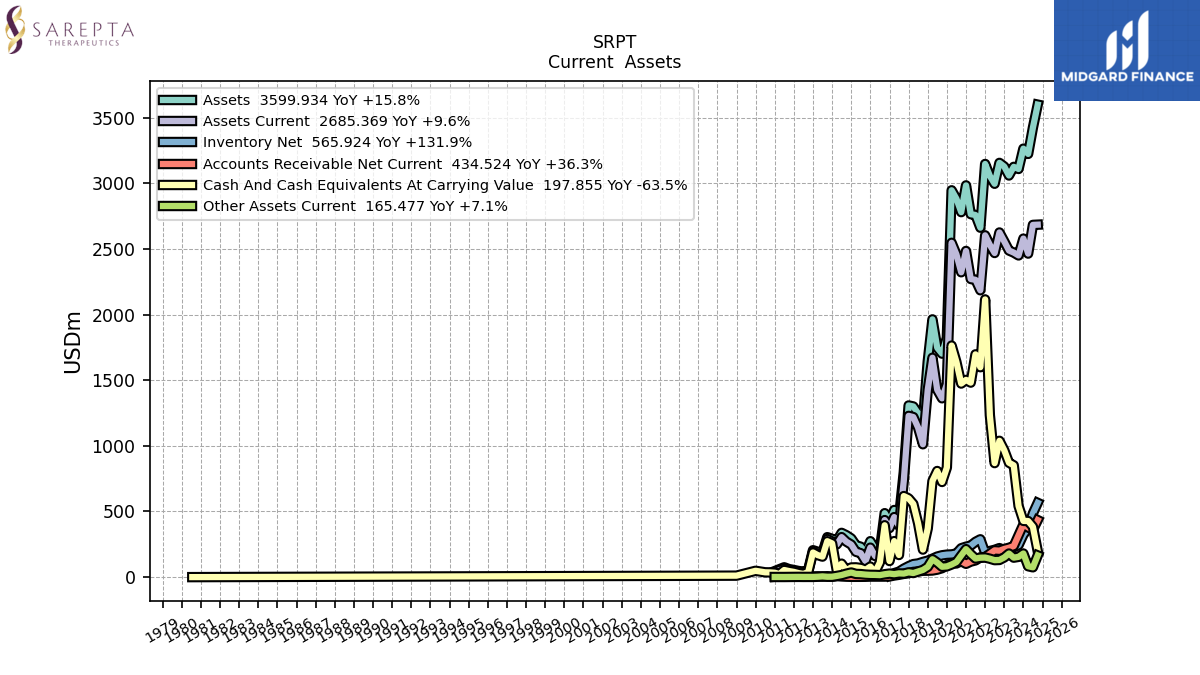
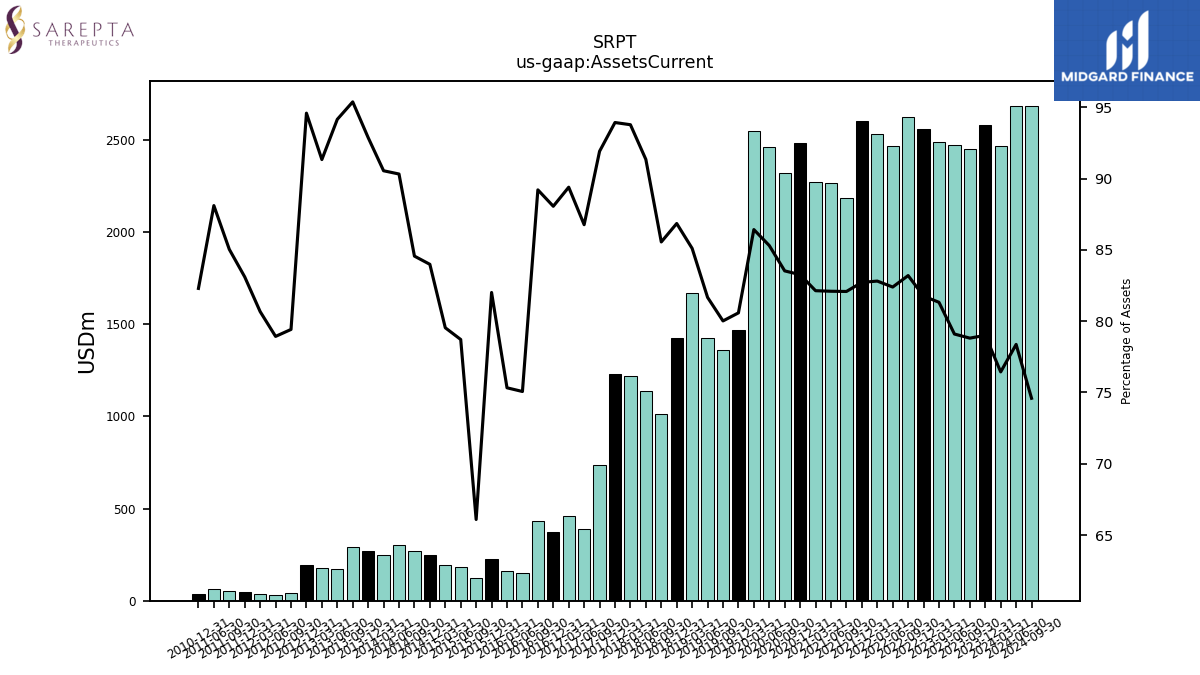
| Assets Current | 2579.33 | 2450.85 | 2472.61 | 2488.38 | 2557.86 | 2625.93 | 2469.30 | 2530.95 | 2604.10 | 2185.31 | 2265.22 | 2271.35 | 2485.20 | 2322.67 | 2459.42 | 2547.35 | 1468.91 | 1362.30 | 1427.42 | 1671.42 | 1426.18 | 1012.08 | 1139.24 | 1219.42 | 1228.64 | 735.61 | 390.58 | 457.31 | 373.48 | |
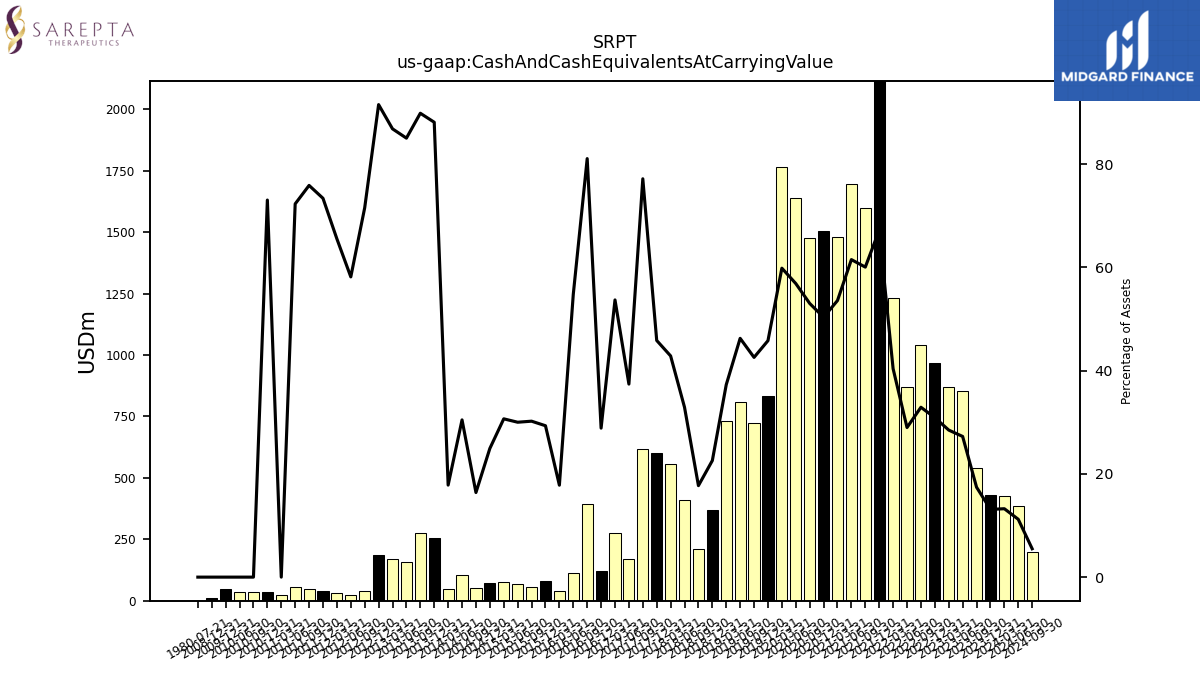
| Cash And Cash Equivalents At Carrying Value | 428.43 | 541.93 | 851.93 | 871.67 | 966.78 | 1038.62 | 868.57 | 1233.88 | 2115.87 | 1599.11 | 1697.28 | 1481.84 | 1502.65 | 1474.64 | 1639.96 | 1764.21 | 835.08 | 724.83 | 808.59 | 732.19 | 370.83 | 209.70 | 410.38 | 557.23 | 599.69 | 617.63 | 168.35 | 274.72 | 122.42 | |
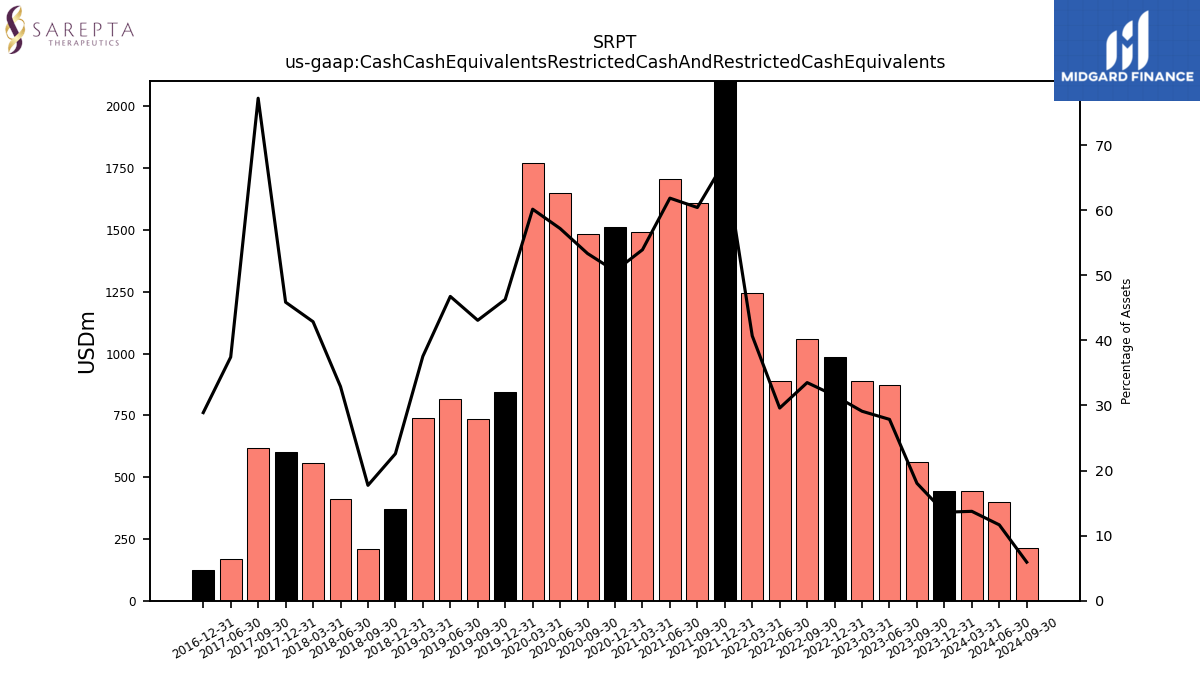
| Cash Cash Equivalents Restricted Cash And Restricted Cash Equivalents | 444.01 | 561.08 | 870.95 | 890.69 | 985.80 | 1057.65 | 887.06 | 1243.53 | 2125.52 | 1608.18 | 1706.34 | 1490.90 | 1511.71 | 1483.20 | 1648.52 | 1772.78 | 843.64 | 733.39 | 817.05 | 737.39 | 370.83 | 209.70 | 410.38 | 557.37 | 599.83 | 617.77 | 168.48 | NA | 122.56 | |
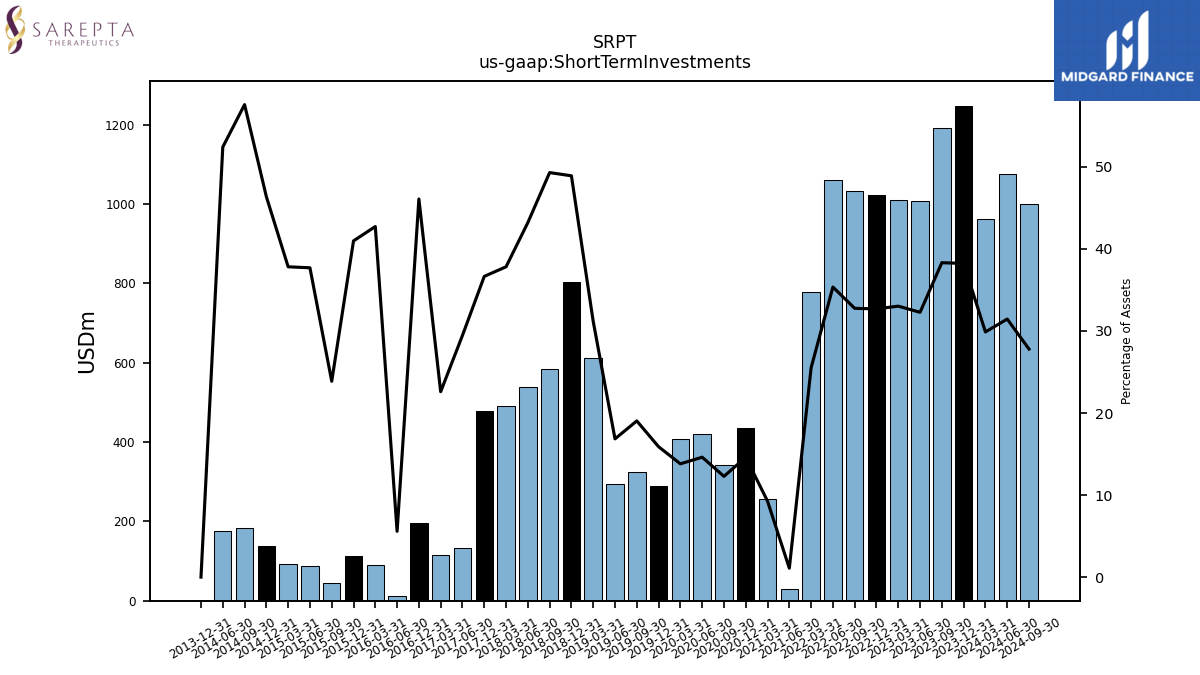
| Short Term Investments | 1247.82 | 1191.61 | 1008.79 | 1010.43 | 1022.60 | 1033.86 | 1059.45 | 779.55 | NA | NA | 30.00 | 256.00 | 435.92 | 341.47 | 421.35 | 406.94 | 289.67 | 324.06 | 294.48 | 612.02 | 803.08 | 583.16 | 538.77 | 491.76 | 479.37 | NA | 132.60 | 115.59 | 195.43 | |
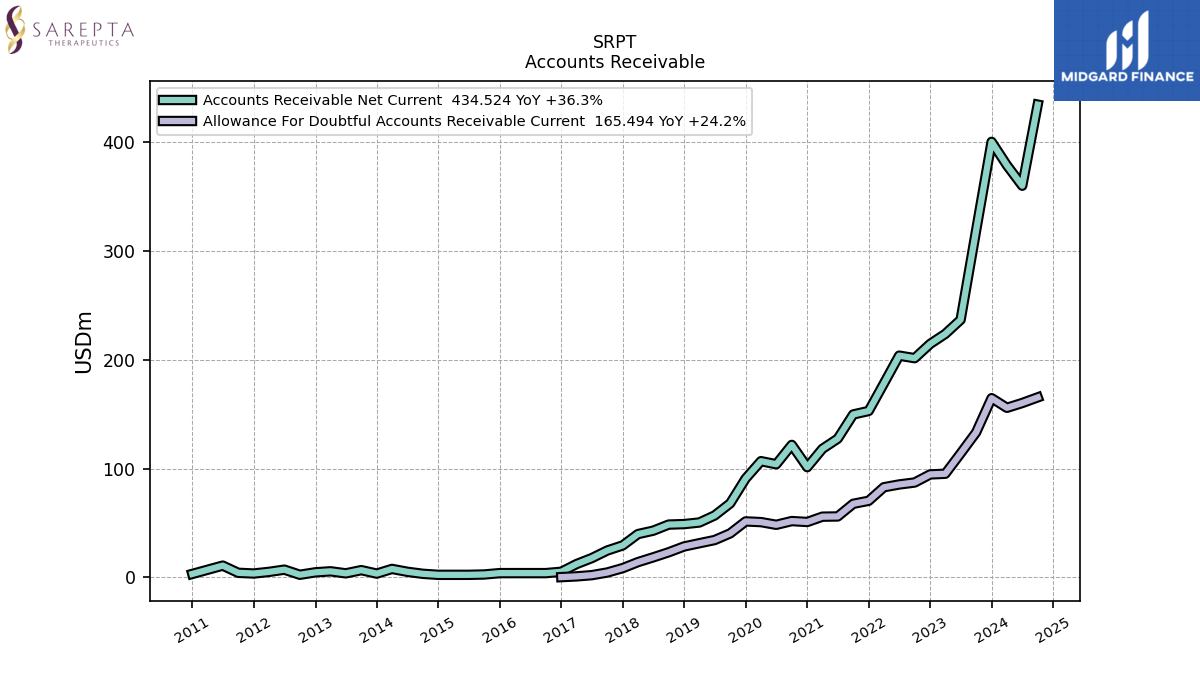
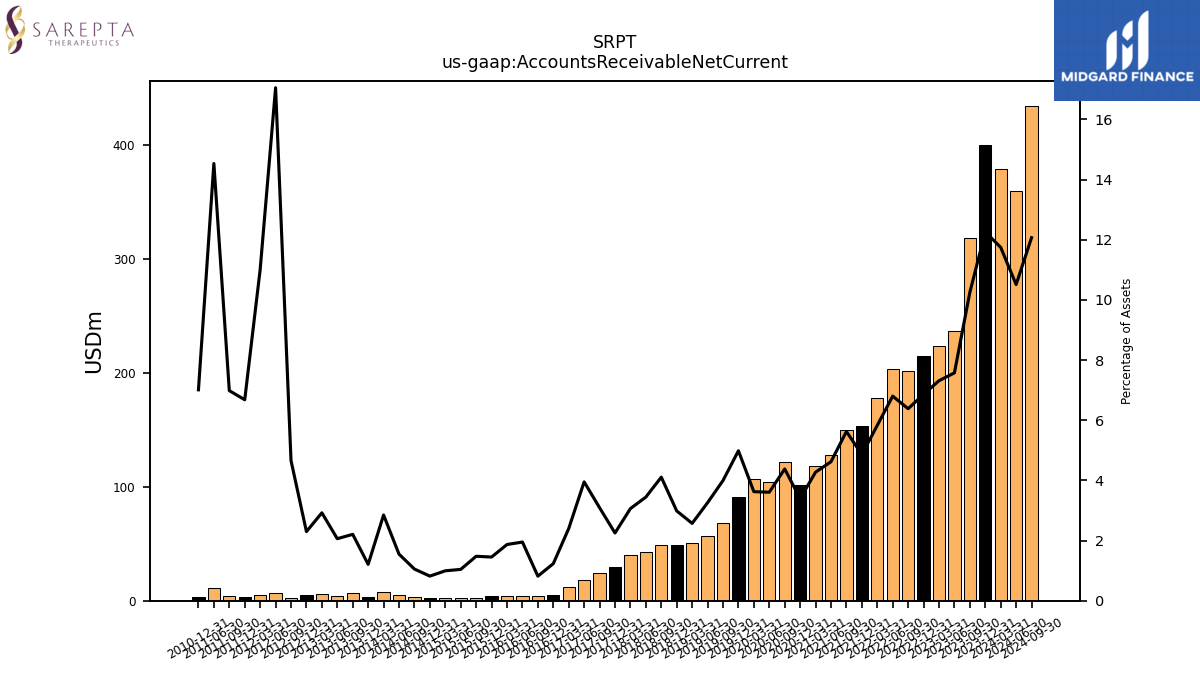
| Accounts Receivable Net Current | 400.33 | 318.86 | 236.81 | 223.84 | 214.63 | 201.51 | 203.85 | 178.19 | 152.99 | 149.79 | 127.52 | 118.20 | 101.34 | 121.83 | 104.03 | 106.88 | 90.88 | 68.03 | 56.98 | 50.51 | 49.04 | 48.60 | 42.98 | 39.85 | 29.47 | 24.75 | 17.79 | 12.28 | 5.23 | |
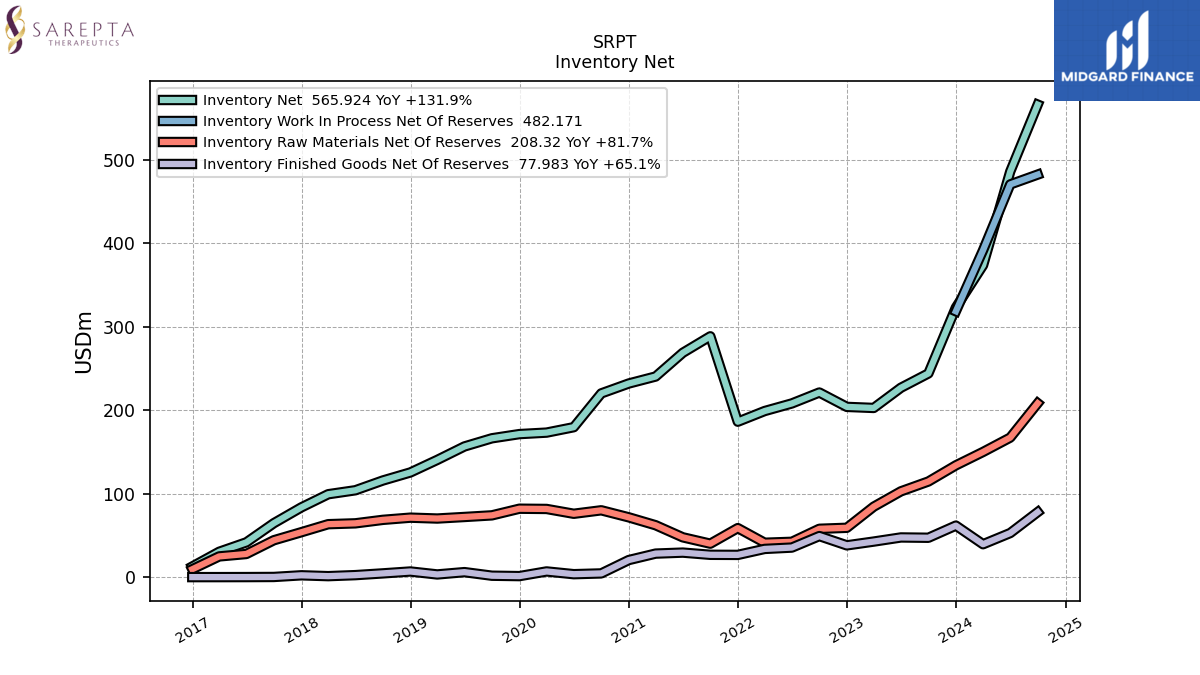
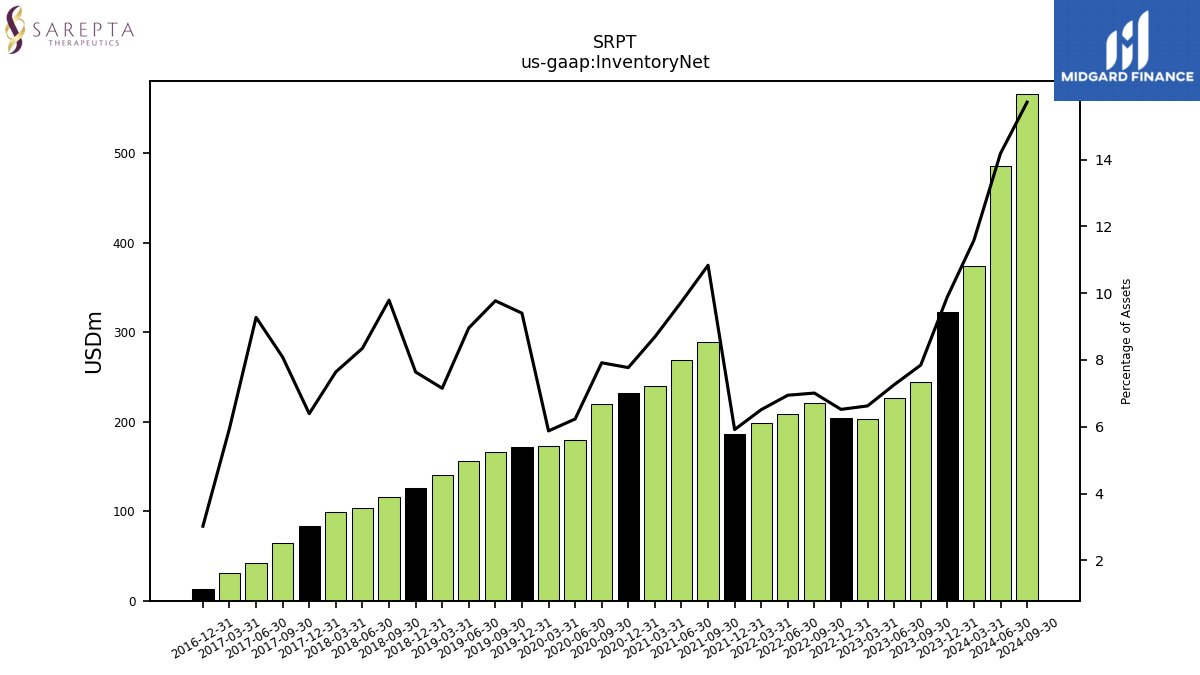
| Inventory Net | 322.86 | 244.01 | 226.88 | 202.68 | 203.97 | 221.19 | 208.09 | 199.00 | 186.21 | 288.47 | 268.76 | 240.33 | 231.96 | 220.12 | 179.65 | 173.17 | 171.38 | 166.36 | 156.57 | 140.47 | 125.44 | 115.82 | 104.13 | 99.38 | 83.61 | 64.69 | 41.75 | 30.45 | 12.81 | |
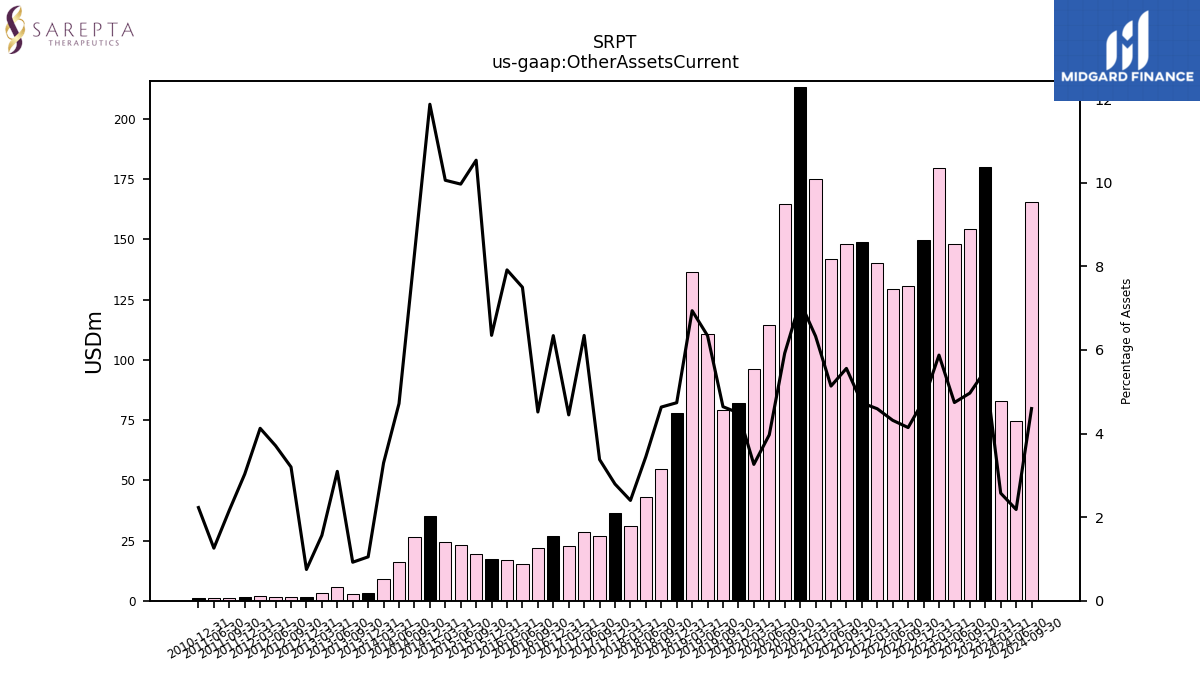
| Other Assets Current | 179.90 | 154.44 | 148.22 | 179.77 | 149.89 | 130.74 | 129.33 | 140.33 | 149.03 | 147.94 | 141.67 | 174.98 | 213.32 | 164.62 | 114.44 | 96.15 | 81.91 | 79.02 | 110.80 | 136.24 | 77.78 | 54.80 | 42.99 | 31.20 | 36.51 | 27.03 | 28.57 | 22.74 | 26.89 |
| 2023-12-31 | 2023-09-30 | 2023-06-30 | 2023-03-31 | 2022-12-31 | 2022-09-30 | 2022-06-30 | 2022-03-31 | 2021-12-31 | 2021-09-30 | 2021-06-30 | 2021-03-31 | 2020-12-31 | 2020-09-30 | 2020-06-30 | 2020-03-31 | 2019-12-31 | 2019-09-30 | 2019-06-30 | 2019-03-31 | 2018-12-31 | 2018-09-30 | 2018-06-30 | 2018-03-31 | 2017-12-31 | 2017-09-30 | 2017-06-30 | 2017-03-31 | 2016-12-31 | ||
|---|---|---|---|---|---|---|---|---|---|---|---|---|---|---|---|---|---|---|---|---|---|---|---|---|---|---|---|---|---|---|
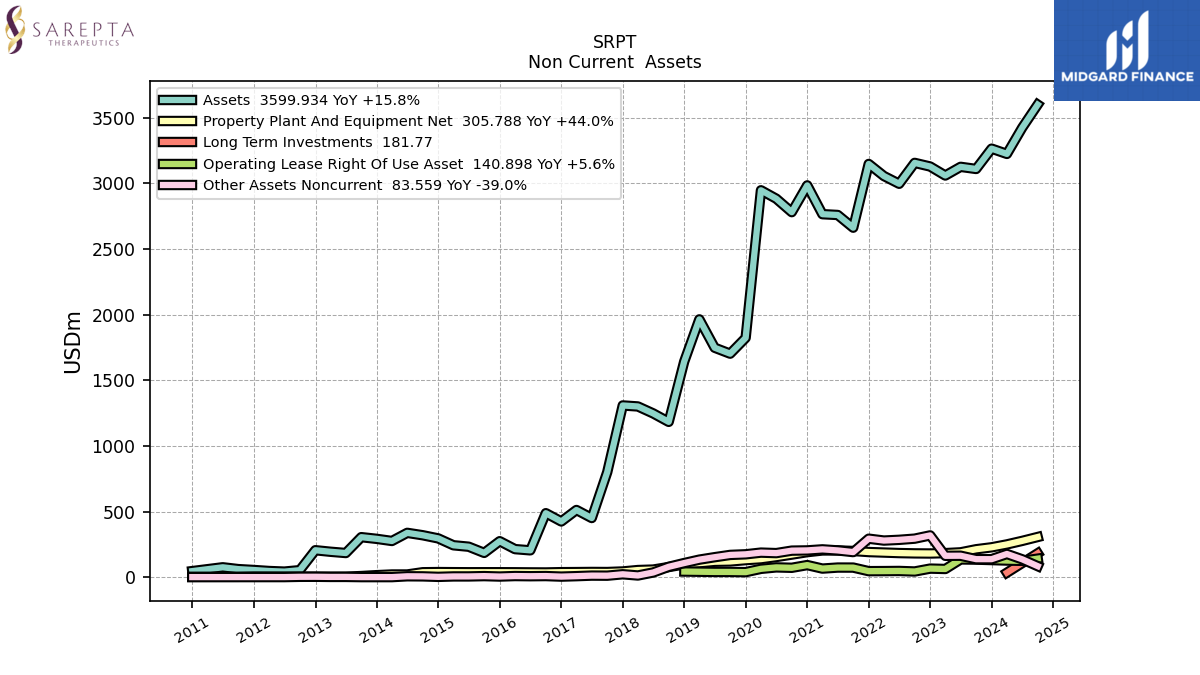
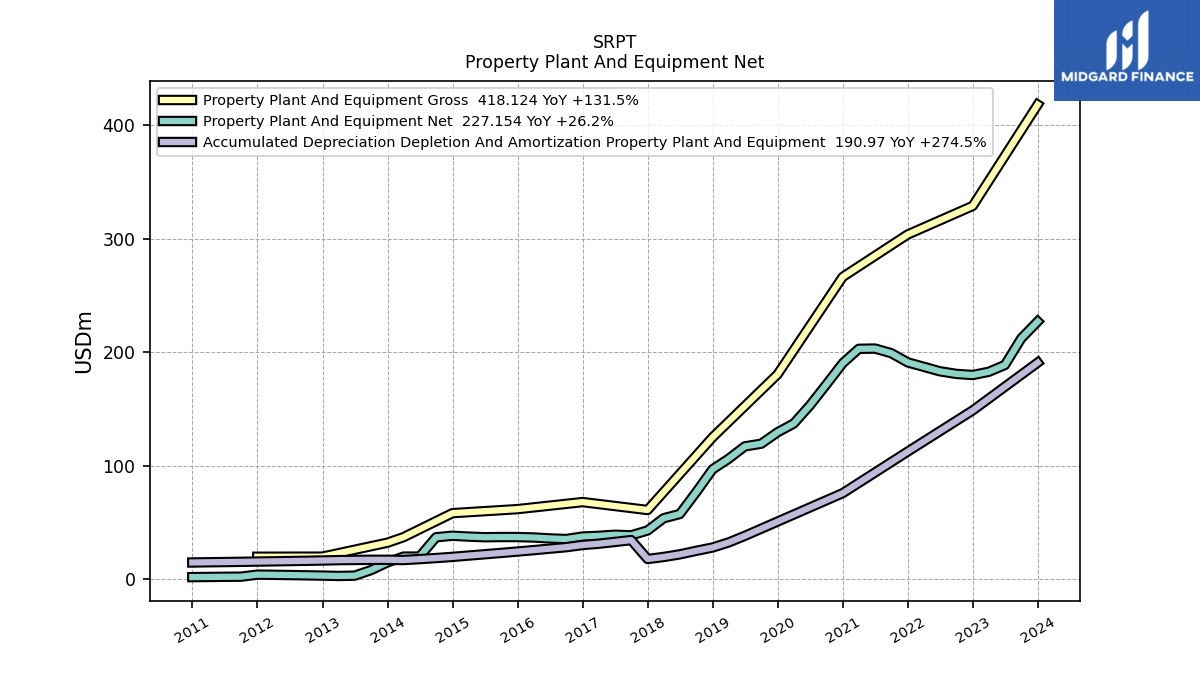
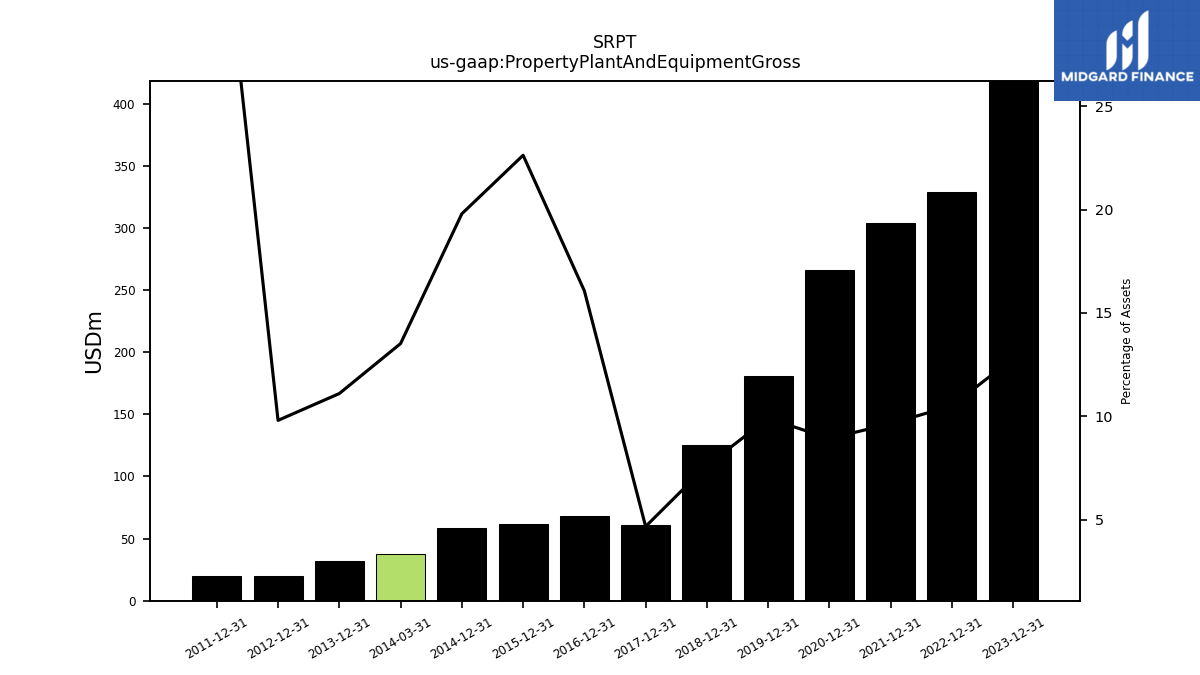
| Property Plant And Equipment Gross | 418.12 | NA | NA | NA | 328.91 | NA | NA | NA | 303.79 | NA | NA | NA | 266.46 | NA | NA | NA | 180.62 | NA | NA | NA | 125.17 | NA | NA | NA | 61.18 | NA | NA | NA | 68.15 | |
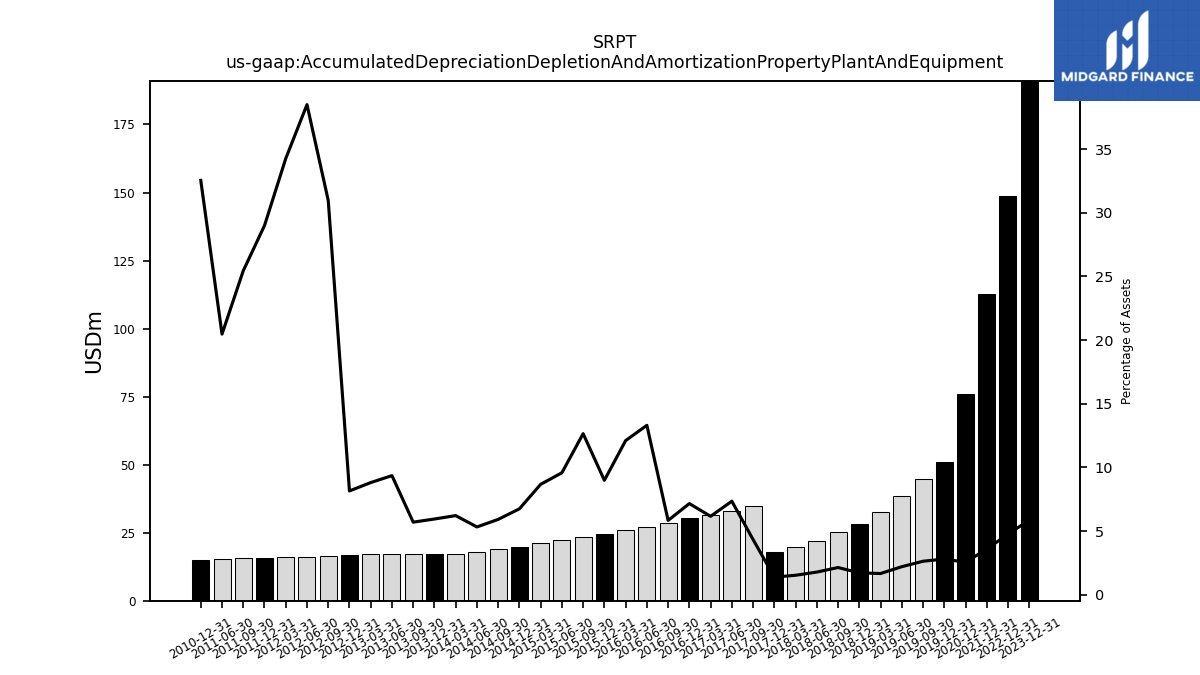
| Accumulated Depreciation Depletion And Amortization Property Plant And Equipment | 190.97 | NA | NA | NA | 148.88 | NA | NA | NA | 112.63 | NA | NA | NA | 76.03 | NA | NA | NA | 50.99 | 44.70 | 38.40 | 32.61 | 28.15 | 25.22 | 22.12 | 19.82 | 18.02 | 34.68 | 33.05 | 31.49 | 30.35 | |
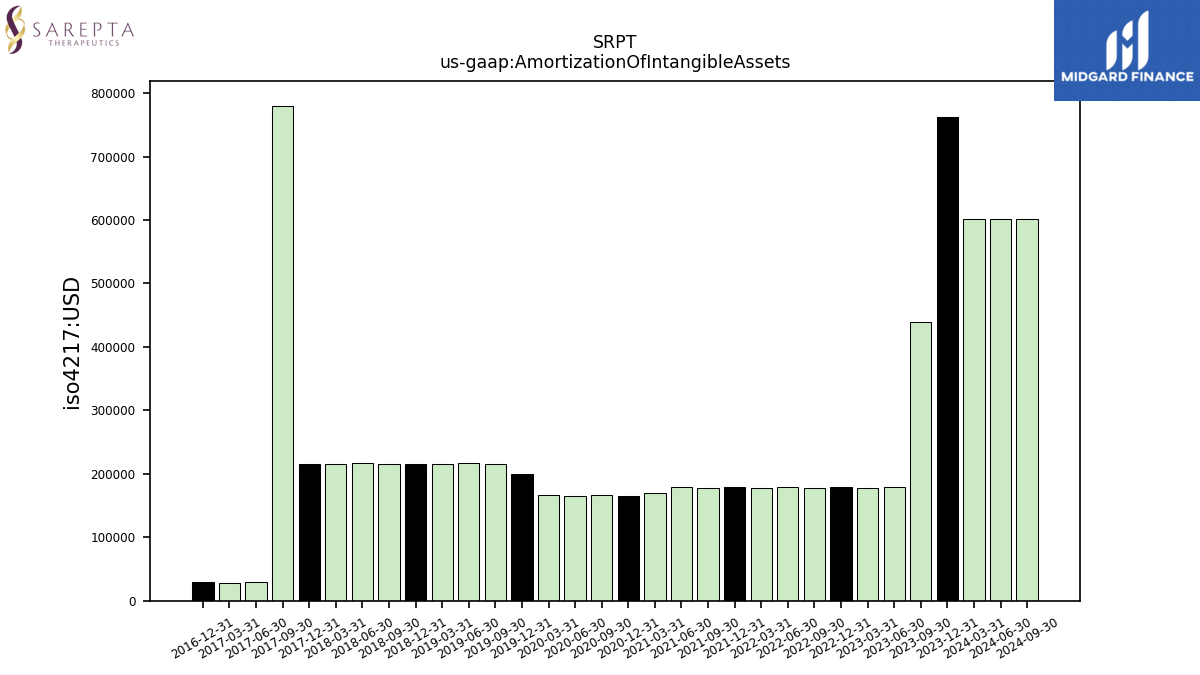
| Amortization Of Intangible Assets | 0.76 | 0.44 | 0.18 | 0.18 | 0.18 | 0.18 | 0.18 | 0.18 | 0.18 | 0.18 | 0.18 | 0.17 | 0.17 | 0.17 | 0.17 | 0.17 | 0.20 | 0.22 | 0.22 | 0.22 | 0.22 | 0.22 | 0.22 | 0.22 | 0.22 | 0.78 | 0.03 | 0.03 | 0.03 | |
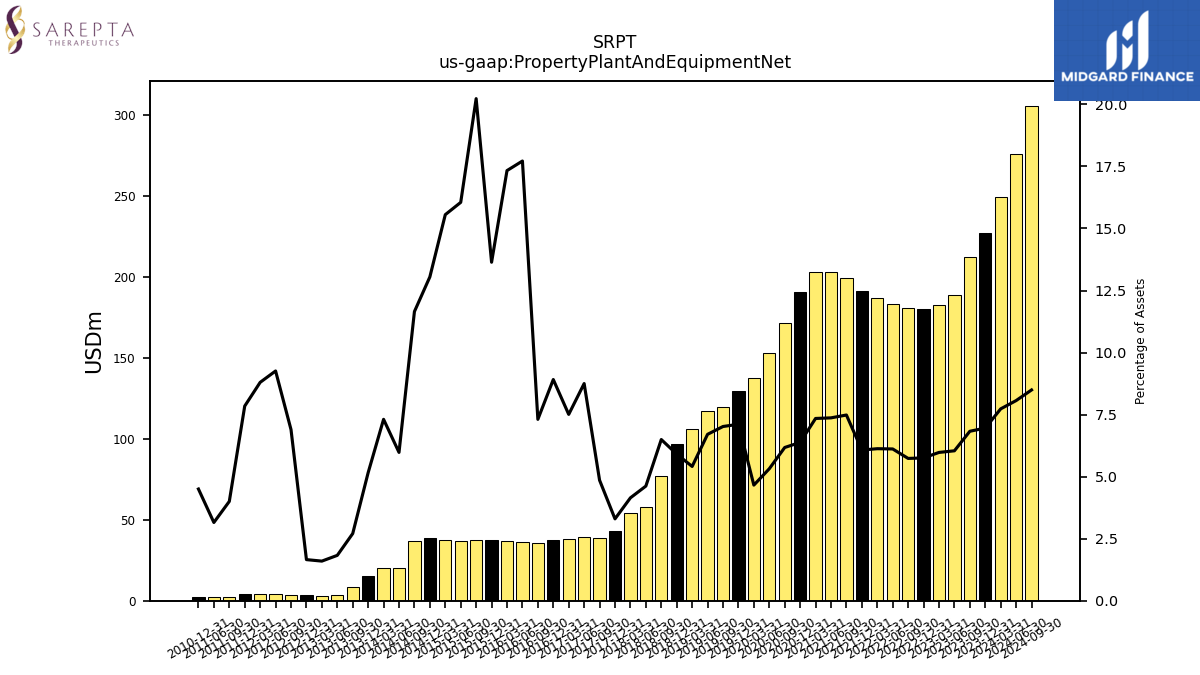
| Property Plant And Equipment Net | 227.15 | 212.37 | 188.87 | 182.86 | 180.04 | 181.00 | 183.29 | 187.25 | 191.16 | 199.25 | 203.33 | 203.11 | 190.43 | 171.72 | 153.34 | 137.32 | 129.62 | 119.53 | 117.20 | 106.28 | 97.02 | 76.84 | 57.62 | 53.93 | 43.16 | 38.87 | 39.39 | 38.41 | 37.80 | |
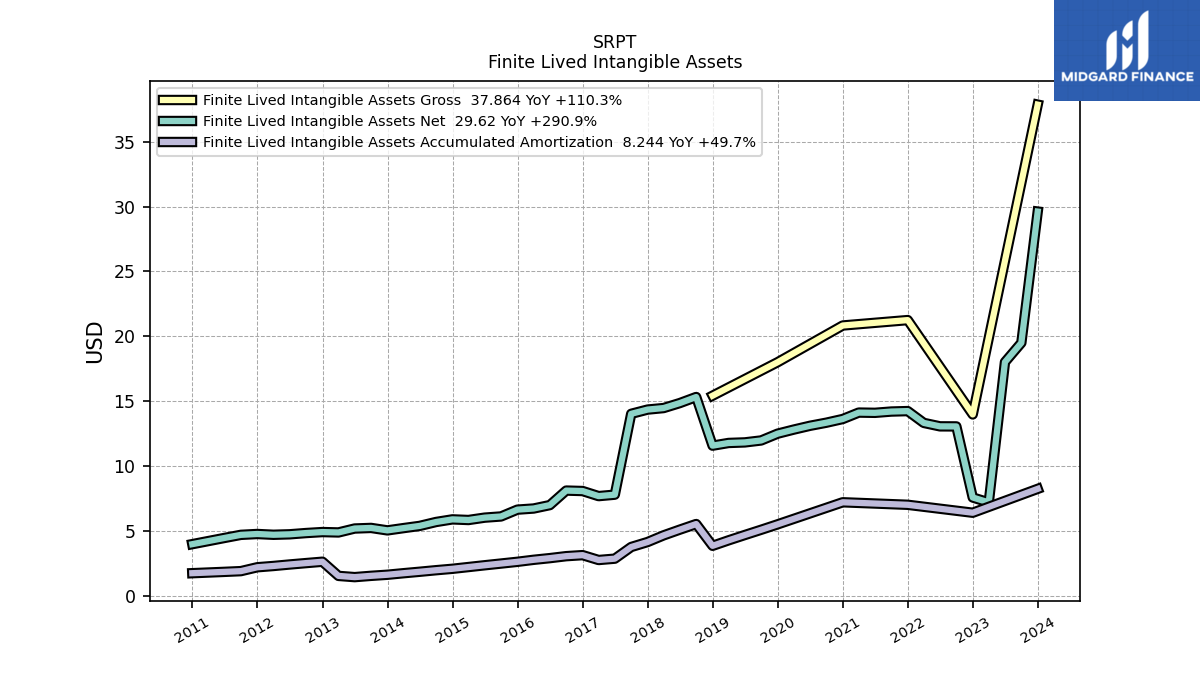
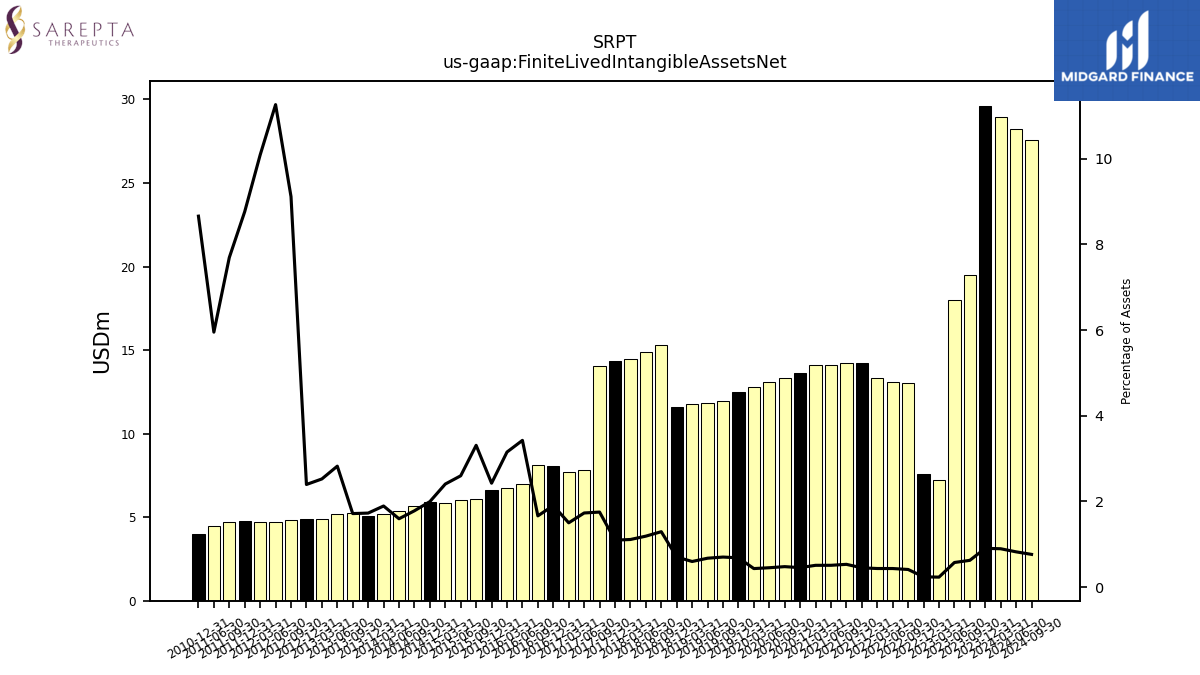
| Finite Lived Intangible Assets Net | 29.62 | 19.50 | 18.02 | 7.20 | 7.58 | 13.06 | 13.06 | 13.33 | 14.24 | 14.20 | 14.11 | 14.12 | 13.63 | 13.34 | 13.11 | 12.81 | 12.50 | 11.97 | 11.82 | 11.78 | 11.57 | 15.32 | 14.86 | 14.47 | 14.36 | 14.03 | 7.79 | 7.68 | 8.08 | |
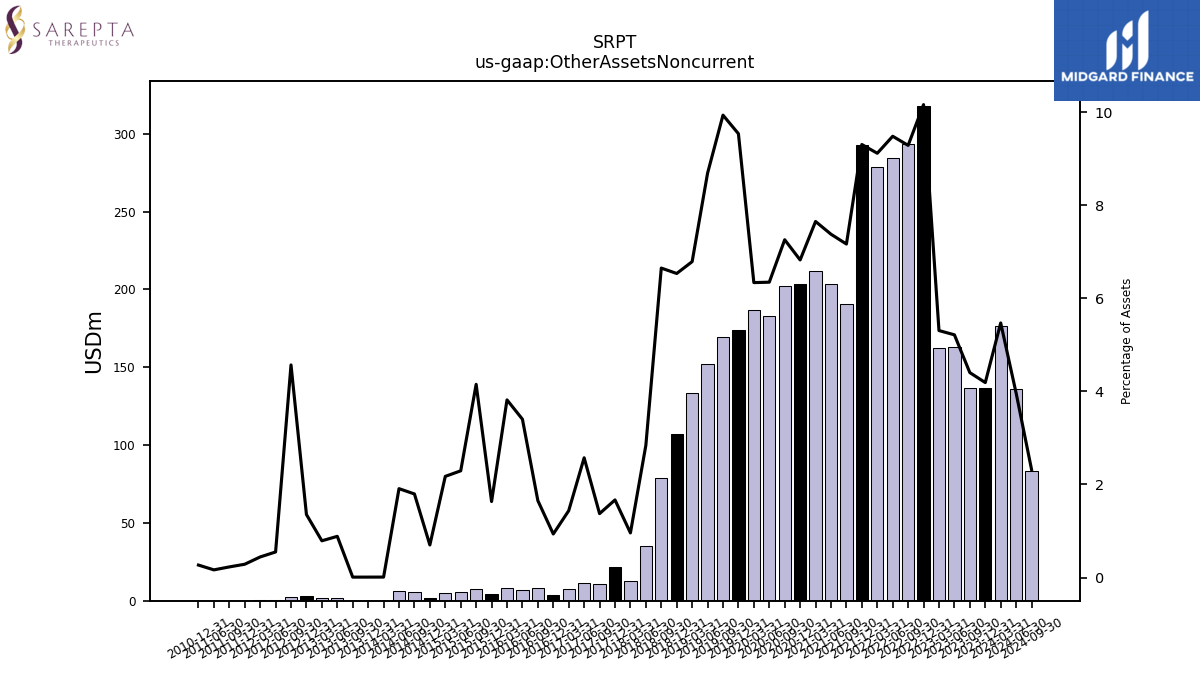
| Other Assets Noncurrent | 136.77 | 136.93 | 163.04 | 162.39 | 317.94 | 293.12 | 284.20 | 278.65 | 292.95 | 190.79 | 203.55 | 211.58 | 203.70 | 201.85 | 182.98 | 186.81 | 173.86 | 169.17 | 151.86 | 133.31 | 107.29 | 78.66 | 35.44 | 12.47 | 21.81 | 10.99 | 11.58 | 7.35 | 3.97 |
| 2023-12-31 | 2023-09-30 | 2023-06-30 | 2023-03-31 | 2022-12-31 | 2022-09-30 | 2022-06-30 | 2022-03-31 | 2021-12-31 | 2021-09-30 | 2021-06-30 | 2021-03-31 | 2020-12-31 | 2020-09-30 | 2020-06-30 | 2020-03-31 | 2019-12-31 | 2019-09-30 | 2019-06-30 | 2019-03-31 | 2018-12-31 | 2018-09-30 | 2018-06-30 | 2018-03-31 | 2017-12-31 | 2017-09-30 | 2017-06-30 | 2017-03-31 | 2016-12-31 | ||
|---|---|---|---|---|---|---|---|---|---|---|---|---|---|---|---|---|---|---|---|---|---|---|---|---|---|---|---|---|---|---|
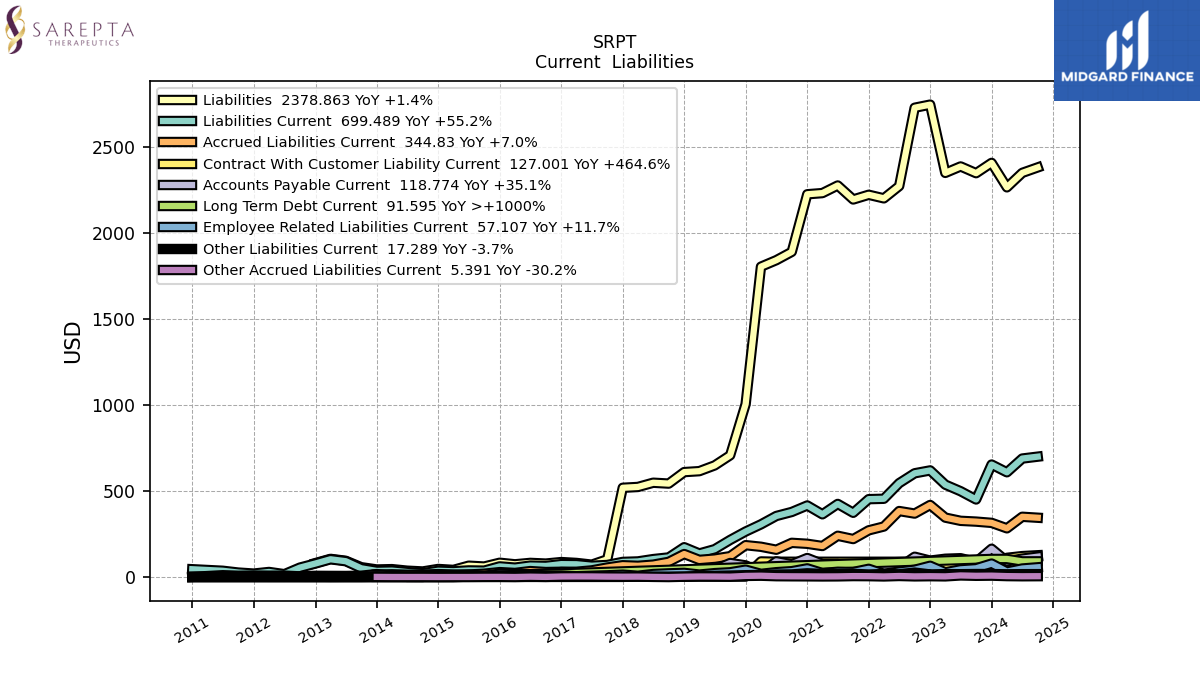
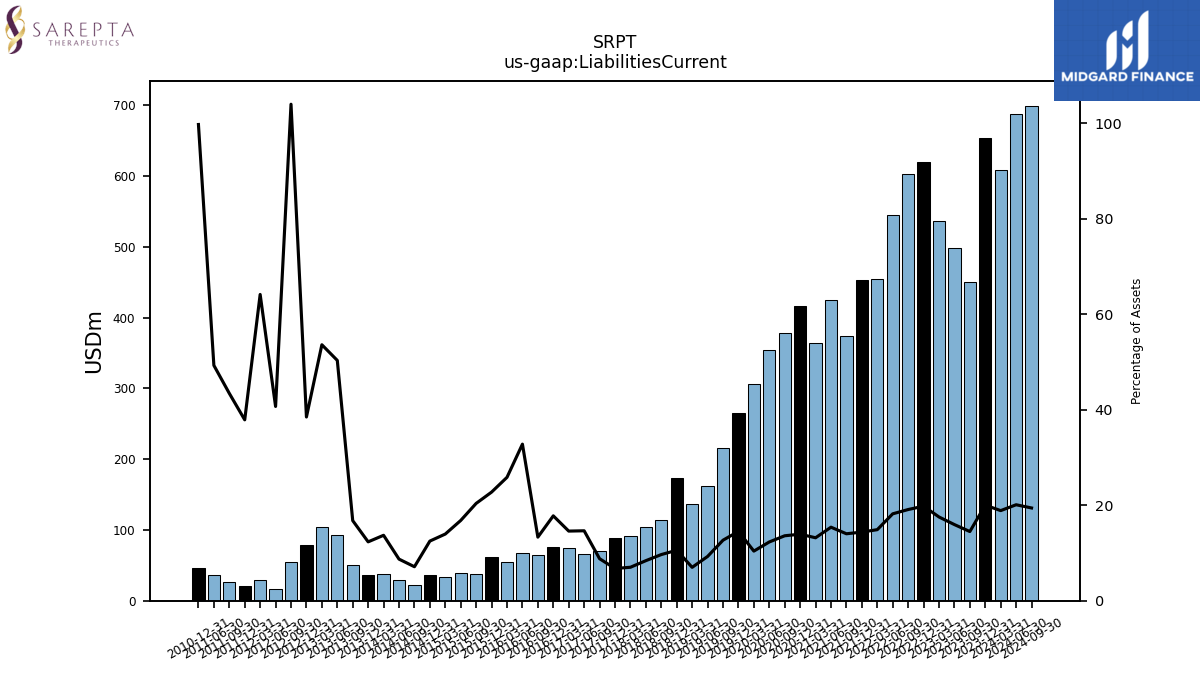
| Liabilities Current | 653.66 | 450.74 | 498.65 | 536.88 | 619.60 | 602.92 | 545.57 | 454.96 | 452.73 | 373.44 | 425.02 | 364.74 | 416.03 | 378.39 | 354.90 | 306.43 | 264.77 | 215.86 | 162.09 | 137.37 | 173.69 | 114.39 | 104.69 | 91.20 | 88.33 | 70.47 | 65.96 | 74.63 | 75.42 | |
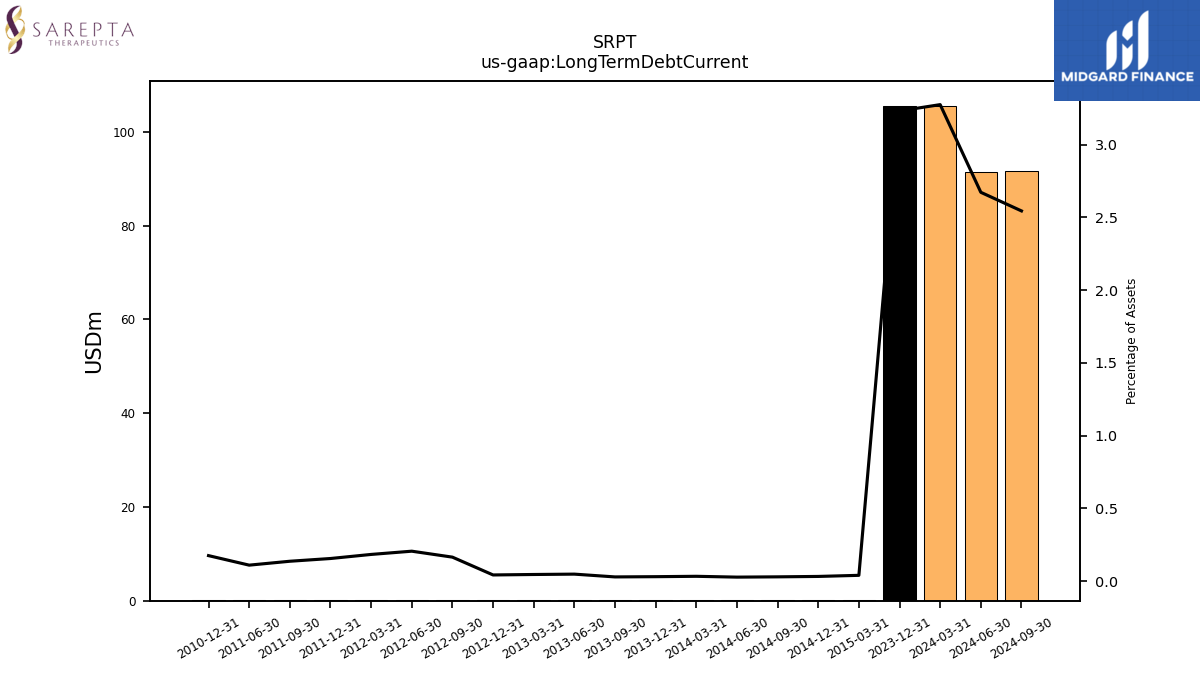
| Long Term Debt Current | 105.48 | NA | NA | NA | NA | NA | NA | NA | NA | NA | NA | NA | NA | NA | NA | NA | NA | NA | NA | NA | NA | NA | NA | NA | NA | NA | NA | NA | NA | |
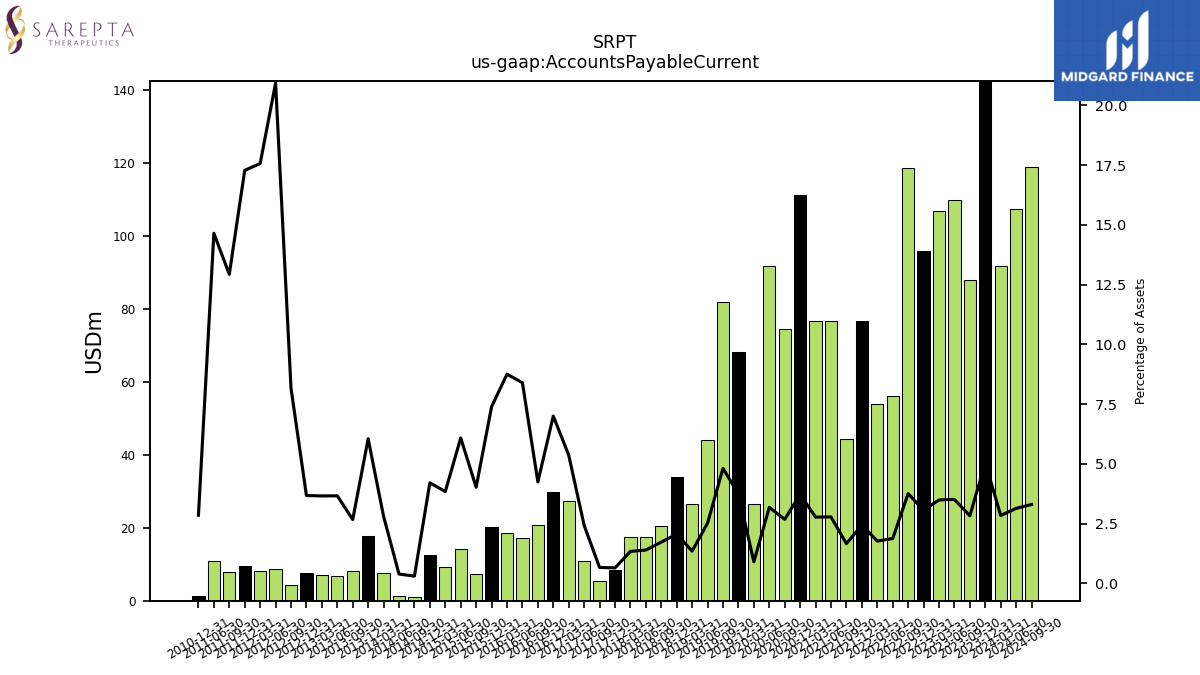
| Accounts Payable Current | 164.92 | 87.95 | 109.80 | 106.71 | 95.88 | 118.46 | 56.21 | 54.01 | 76.74 | 44.16 | 76.68 | 76.65 | 111.09 | 74.53 | 91.66 | 26.59 | 68.09 | 81.95 | 44.05 | 26.50 | 33.83 | 20.41 | 17.38 | 17.38 | 8.47 | 5.32 | 10.92 | 27.45 | 29.69 | |
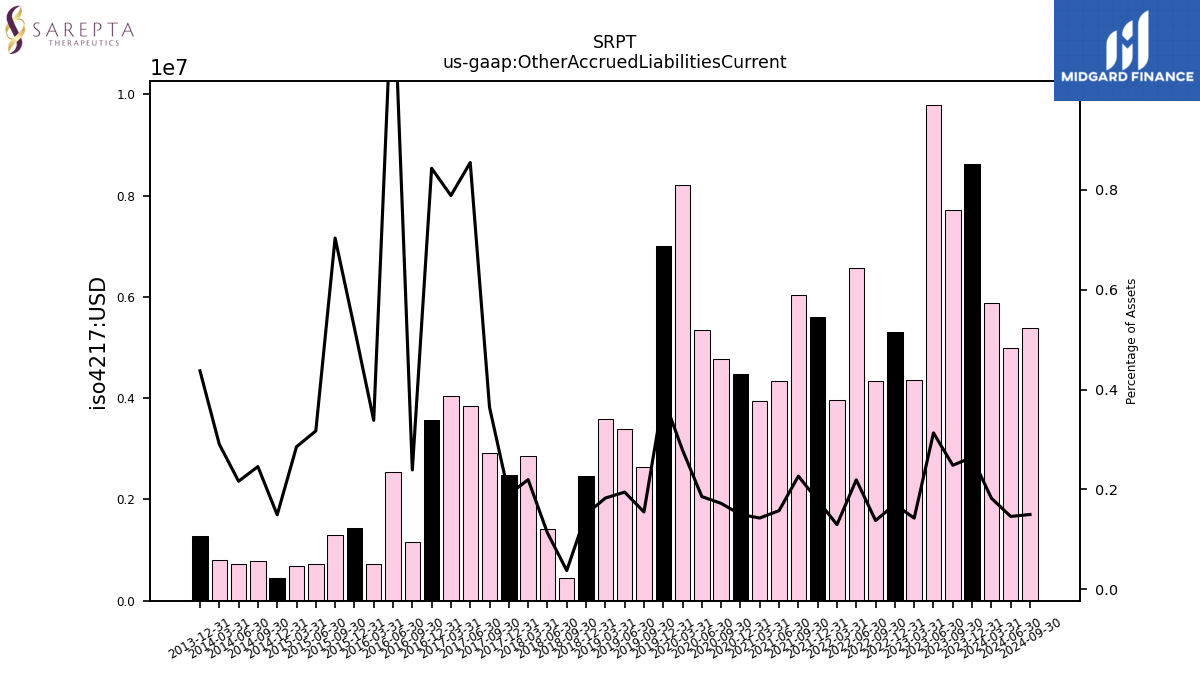
| Other Accrued Liabilities Current | 8.63 | 7.72 | 9.79 | 4.36 | 5.31 | 4.34 | 6.57 | 3.96 | 5.61 | 6.04 | 4.35 | 3.95 | 4.47 | 4.78 | 5.35 | 8.21 | 7.01 | 2.64 | 3.40 | 3.59 | 2.47 | 0.44 | 1.41 | 2.86 | 2.48 | 2.92 | 3.85 | 4.04 | 3.58 | |
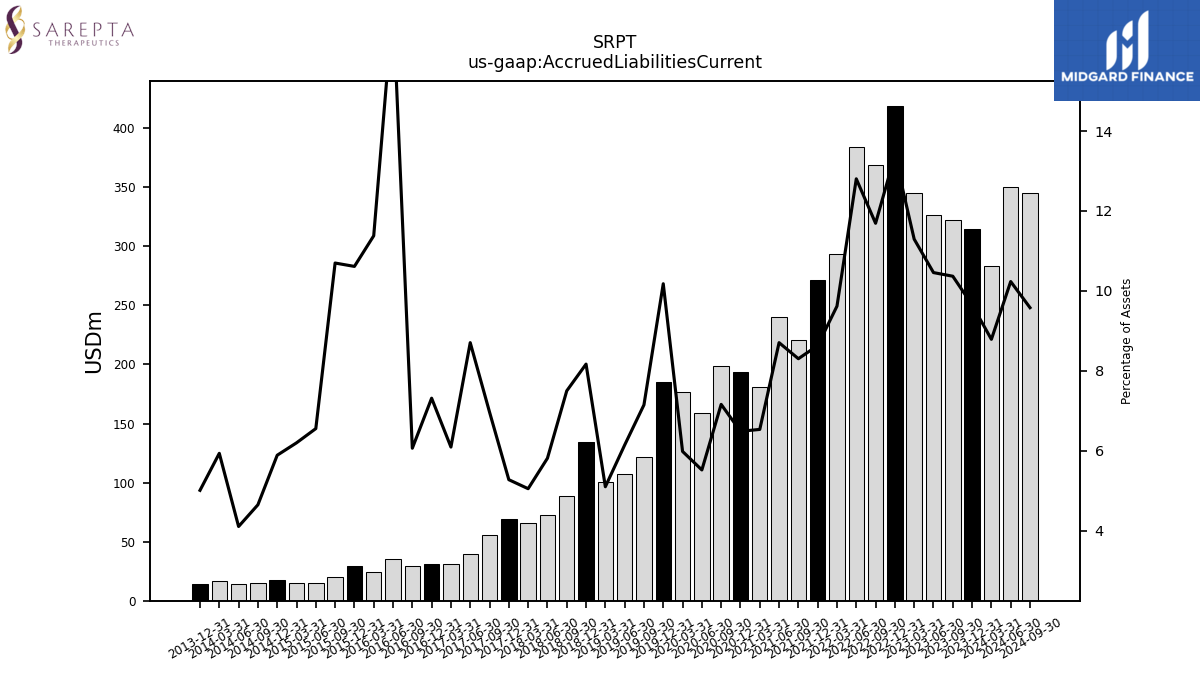
| Accrued Liabilities Current | 315.00 | 322.35 | 326.88 | 345.55 | 419.00 | 369.00 | 383.70 | 293.91 | 271.70 | 221.01 | 240.14 | 180.64 | 193.55 | 199.06 | 159.09 | 176.30 | 185.53 | 121.66 | 107.33 | 100.12 | 134.09 | 88.69 | 72.48 | 65.65 | 68.98 | 55.75 | 39.18 | 31.16 | 31.02 | |
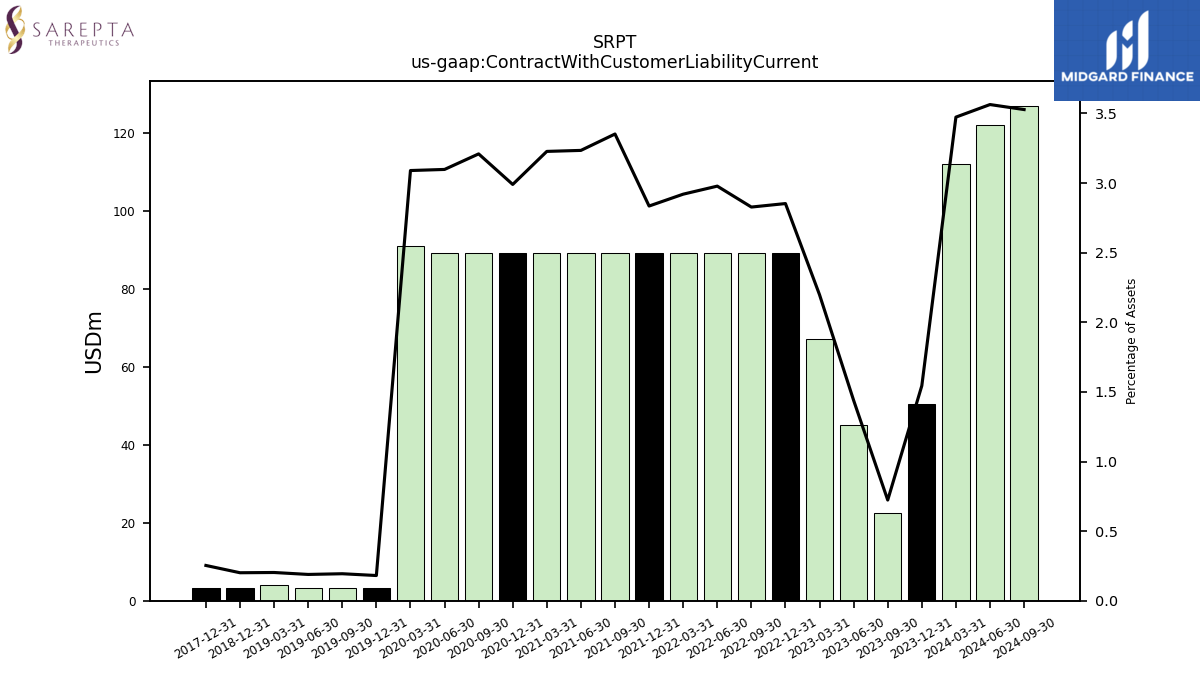
| Contract With Customer Liability Current | 50.42 | 22.49 | 44.99 | 67.24 | 89.24 | 89.24 | 89.24 | 89.24 | 89.24 | 89.24 | 89.24 | 89.24 | 89.24 | 89.24 | 89.31 | 91.07 | 3.30 | 3.30 | 3.30 | 3.98 | 3.30 | NA | NA | NA | 3.32 | NA | NA | NA | NA |
| 2023-12-31 | 2023-09-30 | 2023-06-30 | 2023-03-31 | 2022-12-31 | 2022-09-30 | 2022-06-30 | 2022-03-31 | 2021-12-31 | 2021-09-30 | 2021-06-30 | 2021-03-31 | 2020-12-31 | 2020-09-30 | 2020-06-30 | 2020-03-31 | 2019-12-31 | 2019-09-30 | 2019-06-30 | 2019-03-31 | 2018-12-31 | 2018-09-30 | 2018-06-30 | 2018-03-31 | 2017-12-31 | 2017-09-30 | 2017-06-30 | 2017-03-31 | 2016-12-31 | ||
|---|---|---|---|---|---|---|---|---|---|---|---|---|---|---|---|---|---|---|---|---|---|---|---|---|---|---|---|---|---|---|
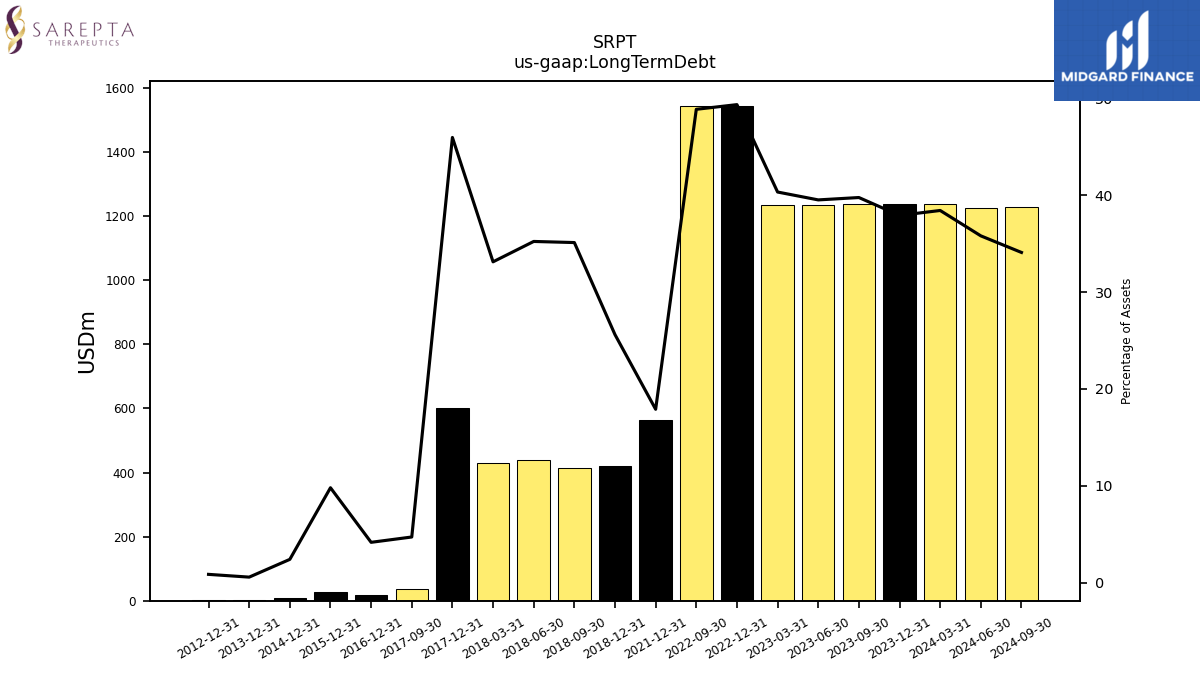
| Long Term Debt | 1238.00 | 1236.76 | 1235.52 | 1234.28 | 1544.29 | 1542.77 | NA | NA | 563.67 | NA | NA | NA | NA | NA | NA | NA | NA | NA | NA | NA | 420.55 | 415.45 | 439.44 | 430.81 | 601.33 | 37.74 | NA | NA | 17.67 | |
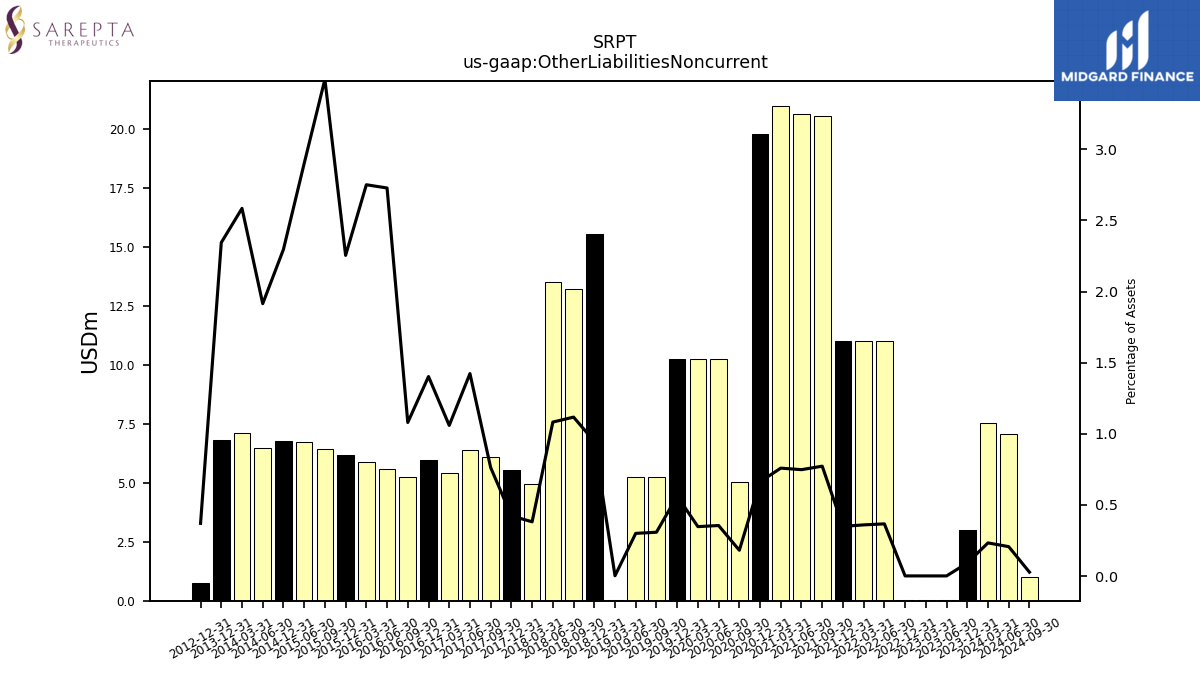
| Other Liabilities Noncurrent | 3.00 | NA | 0.04 | 0.04 | 0.04 | NA | 11.00 | 11.00 | 11.00 | 20.57 | 20.64 | 20.98 | 19.79 | 5.05 | 10.25 | 10.25 | 10.25 | 5.25 | 5.25 | 0.05 | 15.55 | 13.22 | 13.50 | 4.96 | 5.54 | 6.11 | 6.41 | 5.42 | 5.95 | |
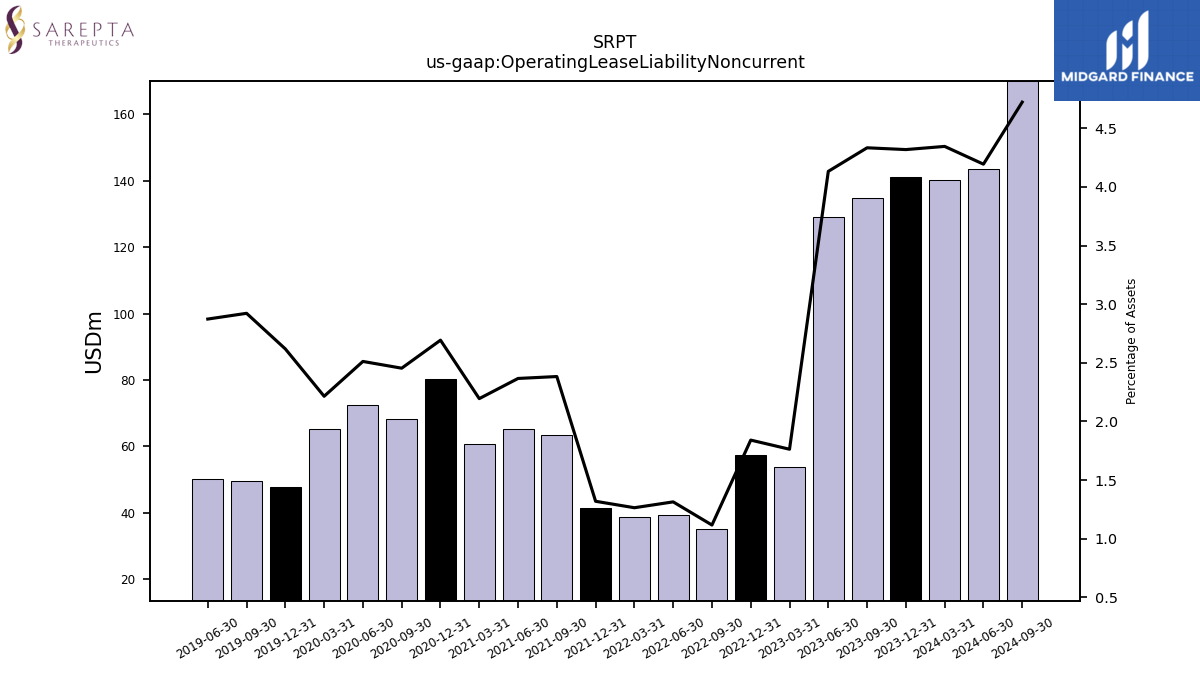
| Operating Lease Liability Noncurrent | 140.97 | 134.75 | 129.17 | 53.93 | 57.58 | 35.23 | 39.37 | 38.62 | 41.51 | 63.43 | 65.28 | 60.67 | 80.37 | 68.23 | 72.40 | 65.26 | 47.72 | 49.74 | 50.21 | NA | NA | NA | NA | NA | NA | NA | NA | NA | NA |
| 2023-12-31 | 2023-09-30 | 2023-06-30 | 2023-03-31 | 2022-12-31 | 2022-09-30 | 2022-06-30 | 2022-03-31 | 2021-12-31 | 2021-09-30 | 2021-06-30 | 2021-03-31 | 2020-12-31 | 2020-09-30 | 2020-06-30 | 2020-03-31 | 2019-12-31 | 2019-09-30 | 2019-06-30 | 2019-03-31 | 2018-12-31 | 2018-09-30 | 2018-06-30 | 2018-03-31 | 2017-12-31 | 2017-09-30 | 2017-06-30 | 2017-03-31 | 2016-12-31 | ||
|---|---|---|---|---|---|---|---|---|---|---|---|---|---|---|---|---|---|---|---|---|---|---|---|---|---|---|---|---|---|---|
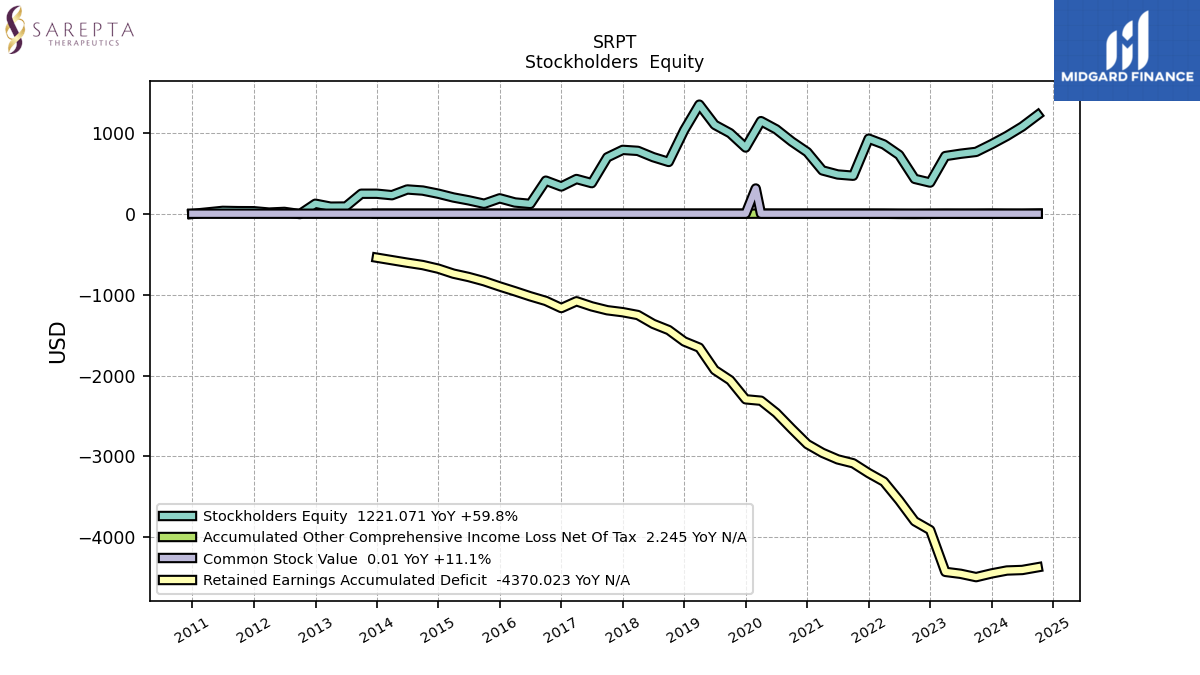
| Stockholders Equity | 859.34 | 764.36 | 741.41 | 712.75 | 384.95 | 430.84 | 726.46 | 856.89 | 928.01 | 469.53 | 485.11 | 535.45 | 761.76 | 892.05 | 1042.87 | 1144.83 | 818.19 | 995.20 | 1099.17 | 1348.56 | 1032.28 | 639.85 | 699.05 | 776.76 | 789.22 | 697.16 | 377.77 | 429.14 | 336.69 | |
| Common Stock Value | 0.01 | 0.01 | 0.01 | 0.01 | 0.01 | 0.01 | 0.01 | 0.01 | 0.01 | 0.01 | 0.01 | 0.01 | 0.01 | 0.01 | 0.01 | 0.01 | 0.01 | 0.01 | 0.01 | 0.01 | 0.01 | 0.01 | 0.01 | 0.01 | 0.01 | 0.01 | 0.01 | 0.01 | 0.01 | |
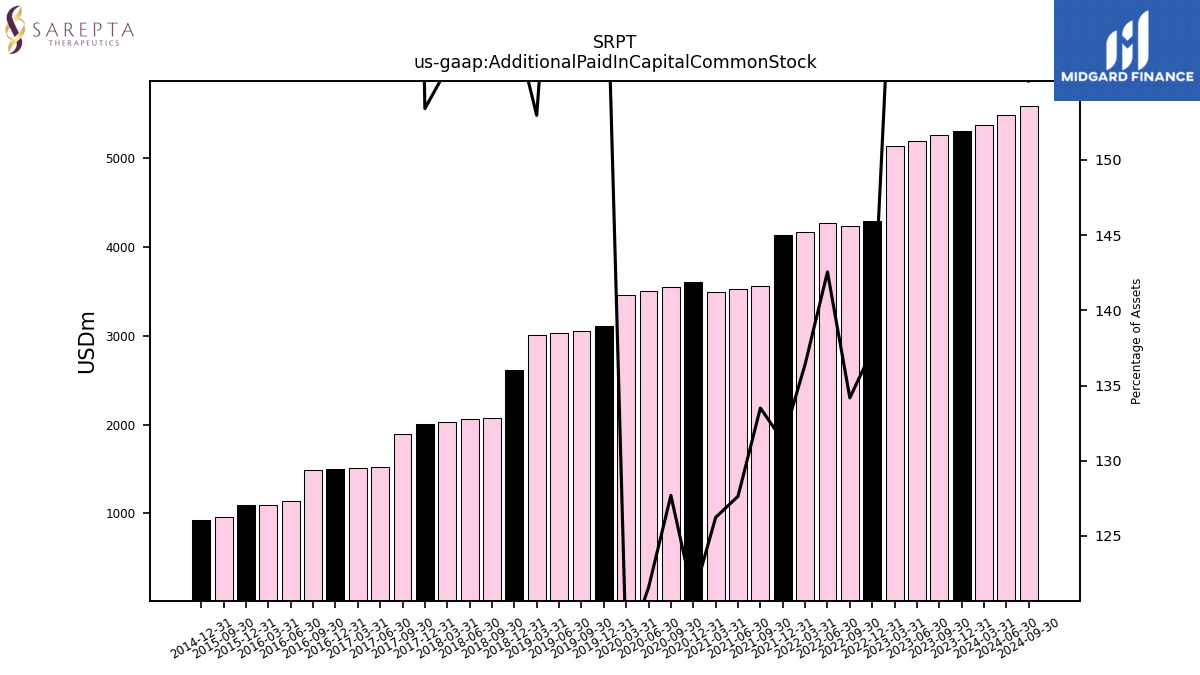
| Additional Paid In Capital Common Stock | 5304.62 | 5256.85 | 5193.39 | 5140.15 | 4296.84 | 4235.03 | 4272.19 | 4168.96 | 4134.77 | 3554.31 | 3521.72 | 3490.66 | 3609.88 | 3550.86 | 3505.16 | 3455.69 | 3112.13 | 3053.42 | 3031.05 | 3004.11 | 2611.29 | 2077.86 | 2061.04 | 2029.77 | 2006.60 | 1890.17 | 1523.08 | 1511.42 | 1503.13 | |
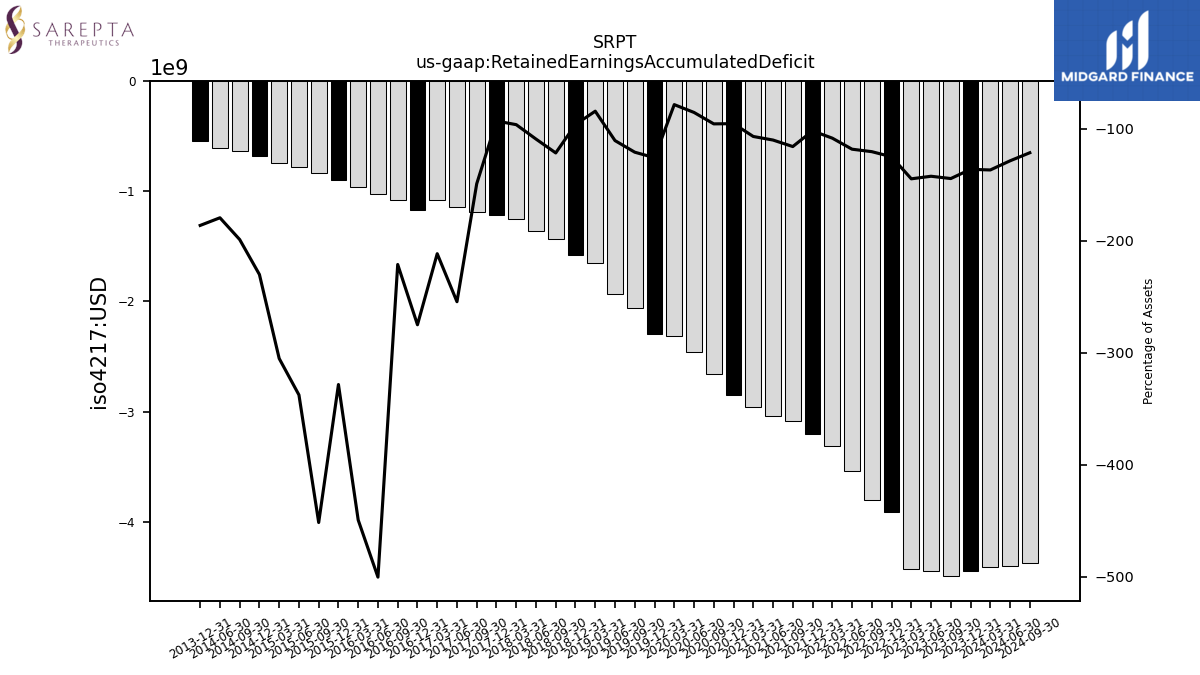
| Retained Earnings Accumulated Deficit | -4446.21 | -4491.87 | -4450.93 | -4426.99 | -3910.24 | -3800.99 | -3543.25 | -3311.77 | -3206.75 | -3084.77 | -3036.62 | -2955.22 | -2848.13 | -2658.81 | -2462.31 | -2311.49 | -2294.00 | -2058.30 | -1931.97 | -1655.57 | -1578.93 | -1438.03 | -1361.64 | -1252.37 | -1217.01 | -1193.01 | -1145.28 | -1082.23 | -1166.32 | |
| Accumulated Other Comprehensive Income Loss Net Of Tax | 0.92 | -0.64 | -1.05 | -0.42 | -1.66 | -3.21 | -2.48 | -0.31 | 0.02 | -0.02 | 0.00 | -0.00 | 0.00 | -0.01 | 0.01 | 0.62 | 0.05 | 0.07 | 0.08 | 0.02 | -0.10 | 0.01 | -0.36 | -0.64 | -0.38 | -0.01 | -0.04 | -0.06 | -0.12 |
| 2023-12-31 | 2023-09-30 | 2023-06-30 | 2023-03-31 | 2022-12-31 | 2022-09-30 | 2022-06-30 | 2022-03-31 | 2021-12-31 | 2021-09-30 | 2021-06-30 | 2021-03-31 | 2020-12-31 | 2020-09-30 | 2020-06-30 | 2020-03-31 | 2019-12-31 | 2019-09-30 | 2019-06-30 | 2019-03-31 | 2018-12-31 | 2018-09-30 | 2018-06-30 | 2018-03-31 | 2017-12-31 | 2017-09-30 | 2017-06-30 | 2017-03-31 | 2016-12-31 | ||
|---|---|---|---|---|---|---|---|---|---|---|---|---|---|---|---|---|---|---|---|---|---|---|---|---|---|---|---|---|---|---|
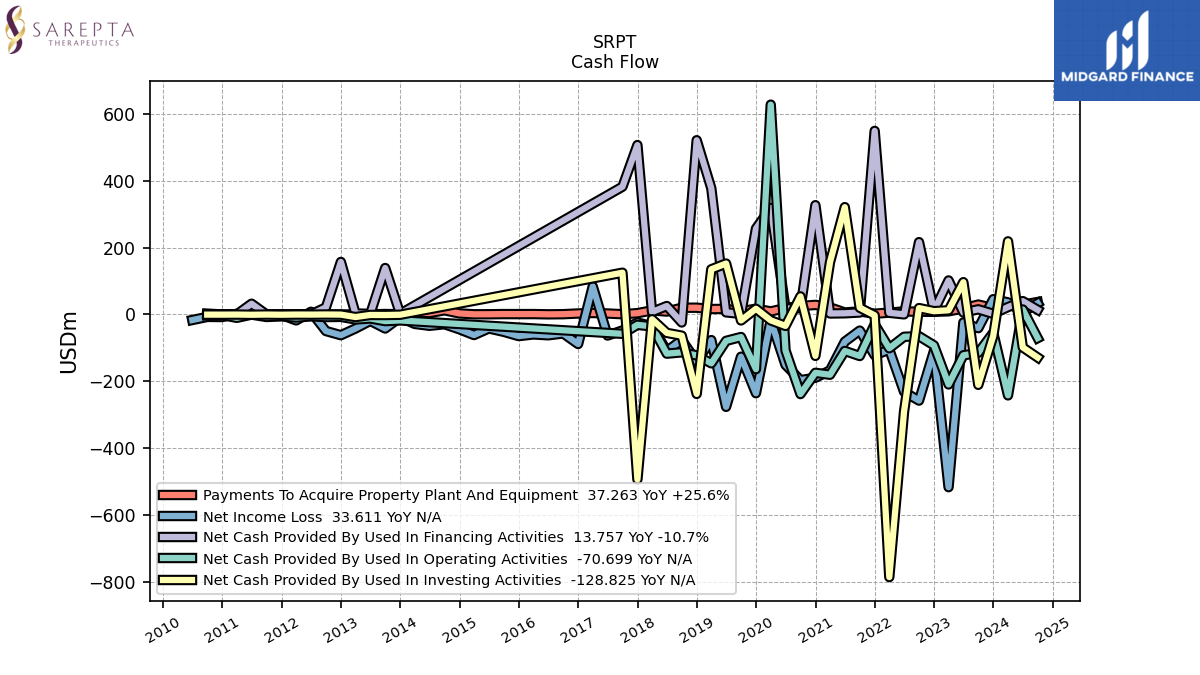
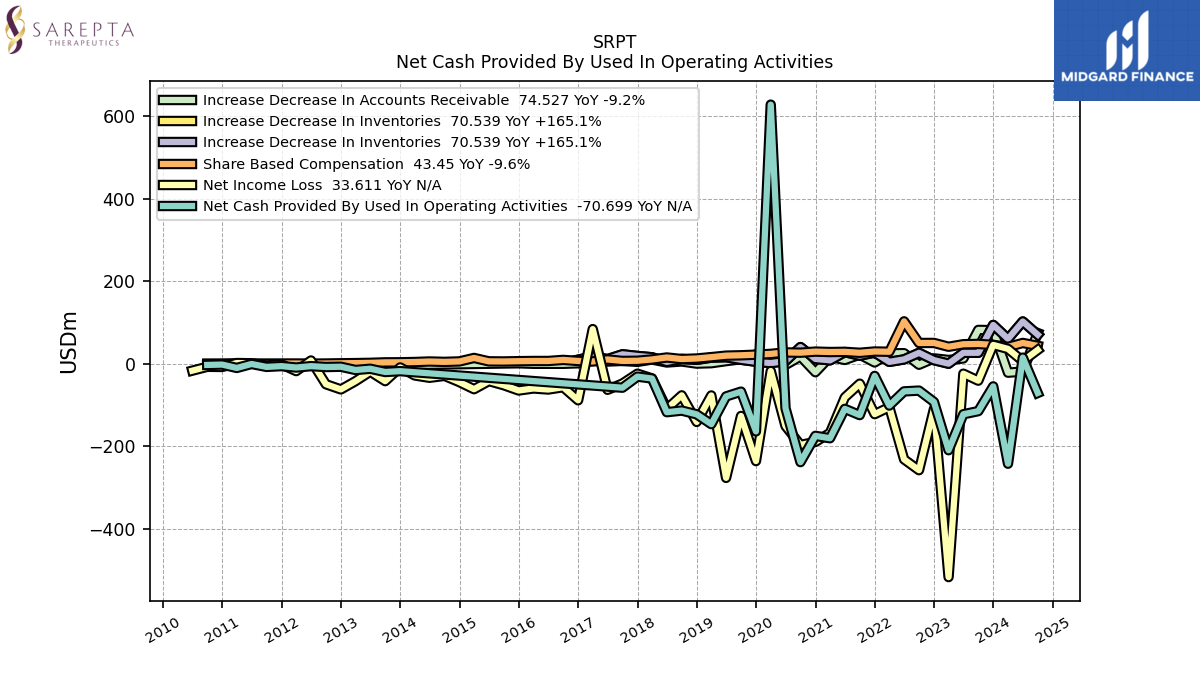
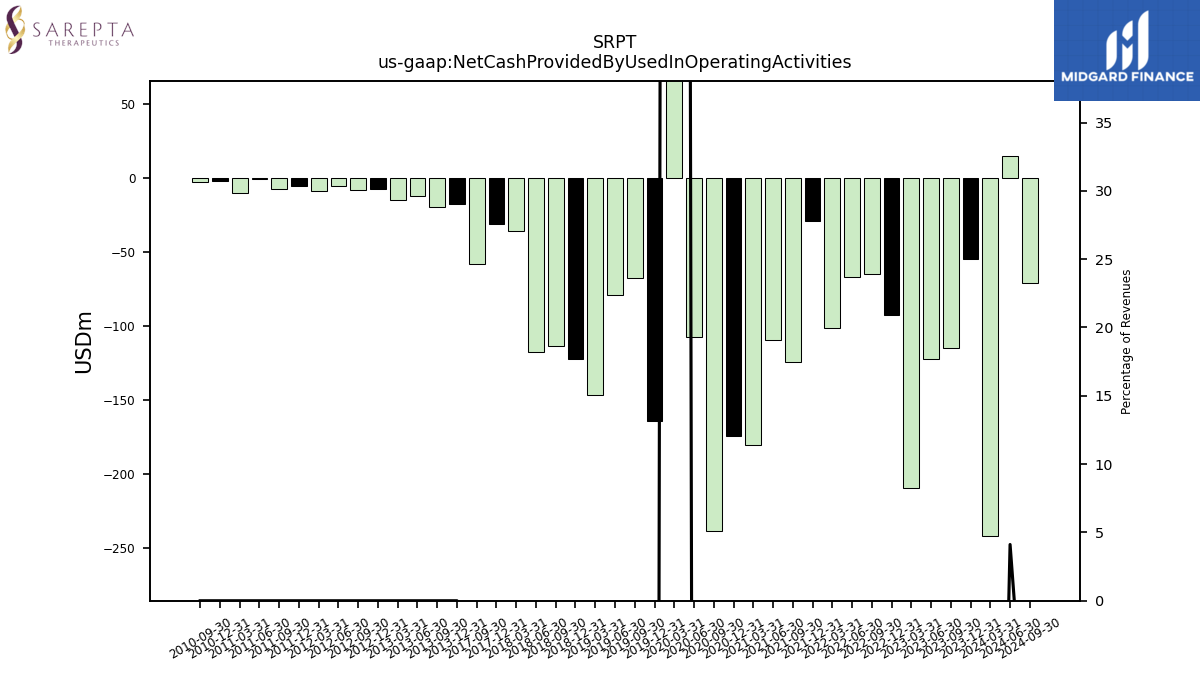
| Net Cash Provided By Used In Operating Activities | -54.66 | -114.71 | -122.23 | -209.40 | -92.39 | -64.96 | -66.81 | -101.17 | -29.33 | -124.33 | -109.15 | -180.37 | -174.53 | -238.19 | -107.60 | 627.79 | -163.79 | -67.43 | -79.00 | -146.23 | -122.42 | -113.32 | -117.25 | -35.67 | -31.06 | -57.90 | NA | NA | NA | |
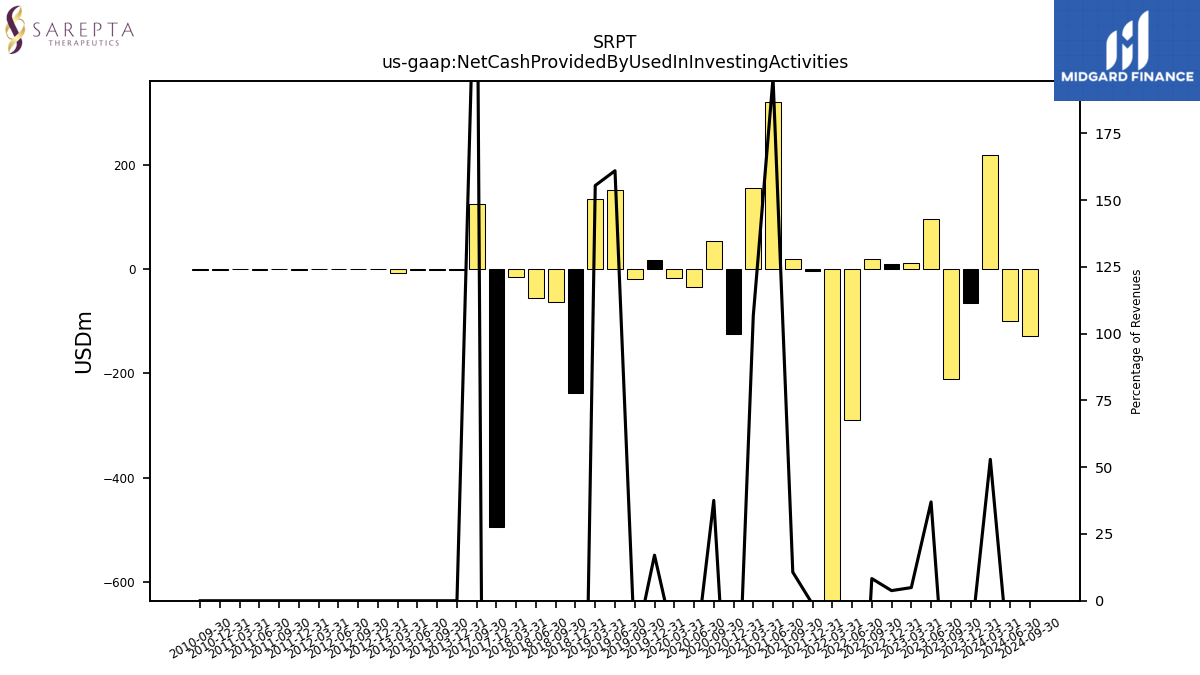
| Net Cash Provided By Used In Investing Activities | -64.36 | -210.57 | 96.63 | 12.49 | 9.80 | 19.12 | -289.99 | -785.81 | -2.58 | 20.27 | 321.06 | 156.67 | -123.89 | 54.08 | -34.23 | -17.68 | 17.08 | -17.96 | 152.37 | 135.23 | -237.74 | -63.40 | -55.09 | -14.26 | -493.69 | 124.95 | NA | NA | NA | |
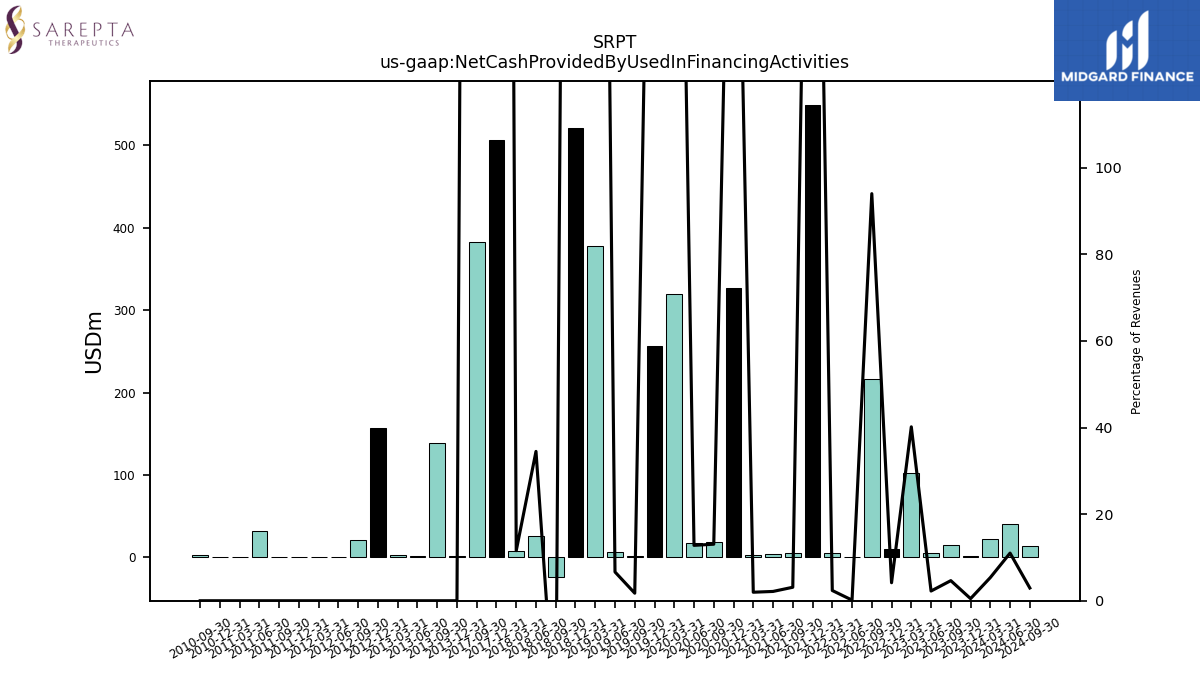
| Net Cash Provided By Used In Financing Activities | 1.94 | 15.40 | 5.86 | 101.80 | 10.75 | 216.43 | 0.34 | 4.99 | 549.25 | 5.90 | 3.53 | 2.89 | 326.94 | 18.79 | 17.57 | 319.02 | 256.97 | 1.73 | 6.29 | 377.56 | 521.28 | -23.95 | 25.35 | 7.47 | 506.81 | 382.24 | NA | NA | NA |
| 2023-12-31 | 2023-09-30 | 2023-06-30 | 2023-03-31 | 2022-12-31 | 2022-09-30 | 2022-06-30 | 2022-03-31 | 2021-12-31 | 2021-09-30 | 2021-06-30 | 2021-03-31 | 2020-12-31 | 2020-09-30 | 2020-06-30 | 2020-03-31 | 2019-12-31 | 2019-09-30 | 2019-06-30 | 2019-03-31 | 2018-12-31 | 2018-09-30 | 2018-06-30 | 2018-03-31 | 2017-12-31 | 2017-09-30 | 2017-06-30 | 2017-03-31 | 2016-12-31 | ||
|---|---|---|---|---|---|---|---|---|---|---|---|---|---|---|---|---|---|---|---|---|---|---|---|---|---|---|---|---|---|---|
| Net Cash Provided By Used In Operating Activities | -54.66 | -114.71 | -122.23 | -209.40 | -92.39 | -64.96 | -66.81 | -101.17 | -29.33 | -124.33 | -109.15 | -180.37 | -174.53 | -238.19 | -107.60 | 627.79 | -163.79 | -67.43 | -79.00 | -146.23 | -122.42 | -113.32 | -117.25 | -35.67 | -31.06 | -57.90 | NA | NA | NA | |
| Net Income Loss | 45.66 | -40.94 | -23.94 | -516.75 | -109.24 | -257.74 | -231.48 | -105.03 | -121.98 | -48.14 | -81.41 | -167.25 | -189.32 | -196.50 | -150.82 | -17.49 | -235.70 | -126.33 | -276.40 | -76.64 | -140.90 | -76.39 | -109.27 | -35.36 | -24.00 | -47.73 | -63.05 | 84.09 | -88.45 | |
| Profit Loss | 45.66 | -40.94 | -23.94 | -516.75 | -109.24 | -257.74 | -231.48 | -105.03 | -121.98 | -48.14 | -81.41 | -167.25 | -189.32 | -196.50 | -150.82 | -17.49 | -235.70 | -126.33 | -276.40 | -76.64 | -140.90 | -76.39 | -109.27 | -35.36 | -24.00 | -47.73 | NA | NA | NA | |
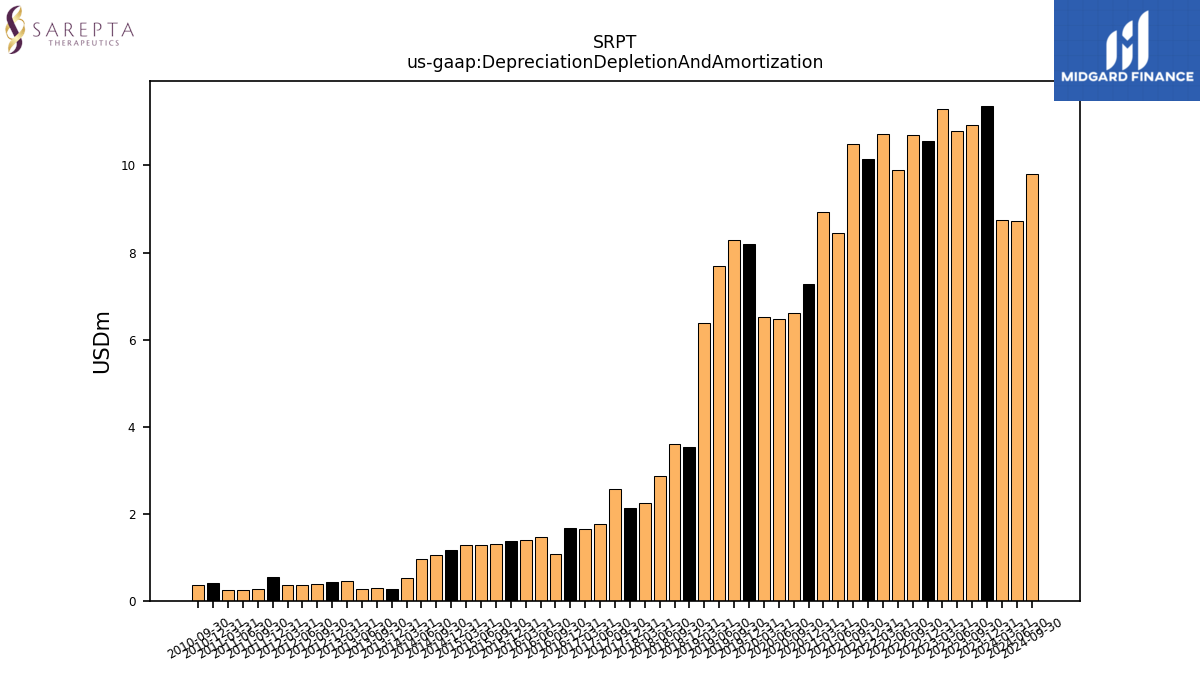
| Depreciation Depletion And Amortization | 11.37 | 10.93 | 10.79 | 11.30 | 10.55 | 10.70 | 9.89 | 10.72 | 10.14 | 10.49 | 8.45 | 8.93 | 7.29 | 6.62 | 6.47 | 6.53 | 8.21 | 8.28 | 7.69 | 6.37 | 3.53 | 3.59 | 2.87 | 2.25 | 2.12 | 2.56 | 1.77 | 1.64 | 1.66 | |
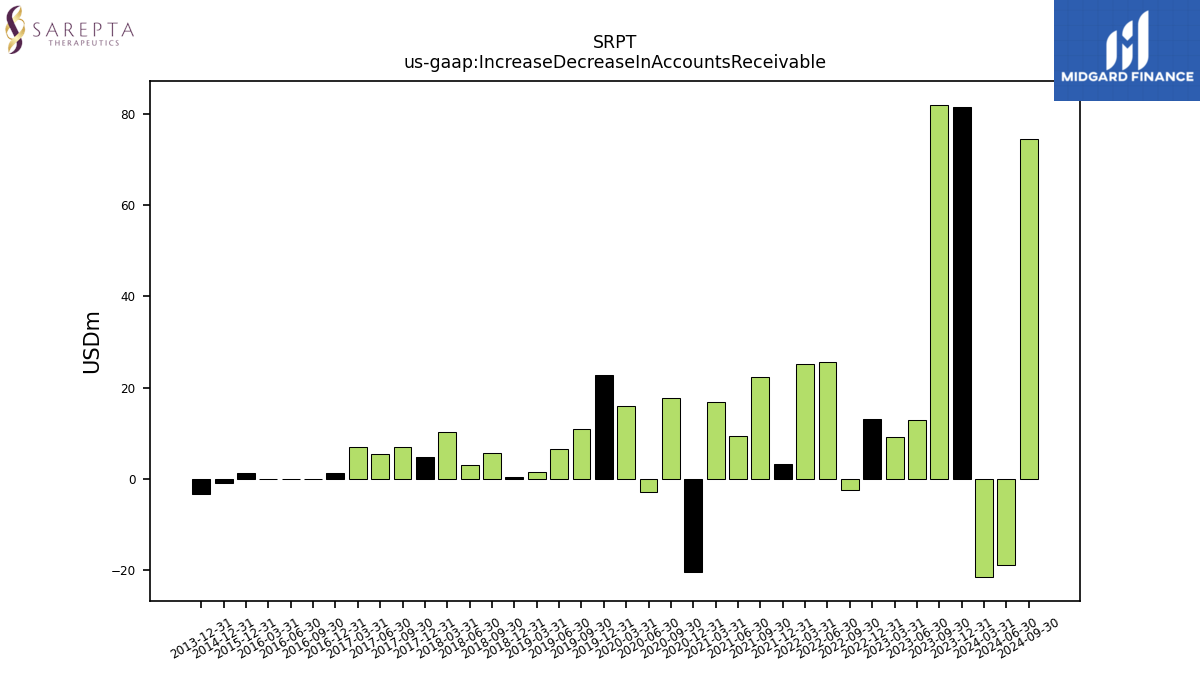
| Increase Decrease In Accounts Receivable | 81.47 | 82.05 | 12.97 | 9.21 | 13.12 | -2.35 | 25.66 | 25.20 | 3.20 | 22.27 | 9.32 | 16.86 | -20.49 | 17.80 | -2.85 | 16.00 | 22.85 | 11.05 | 6.47 | 1.47 | 0.44 | 5.62 | 3.14 | 10.38 | 4.72 | 6.96 | 5.51 | 7.05 | 1.24 | |
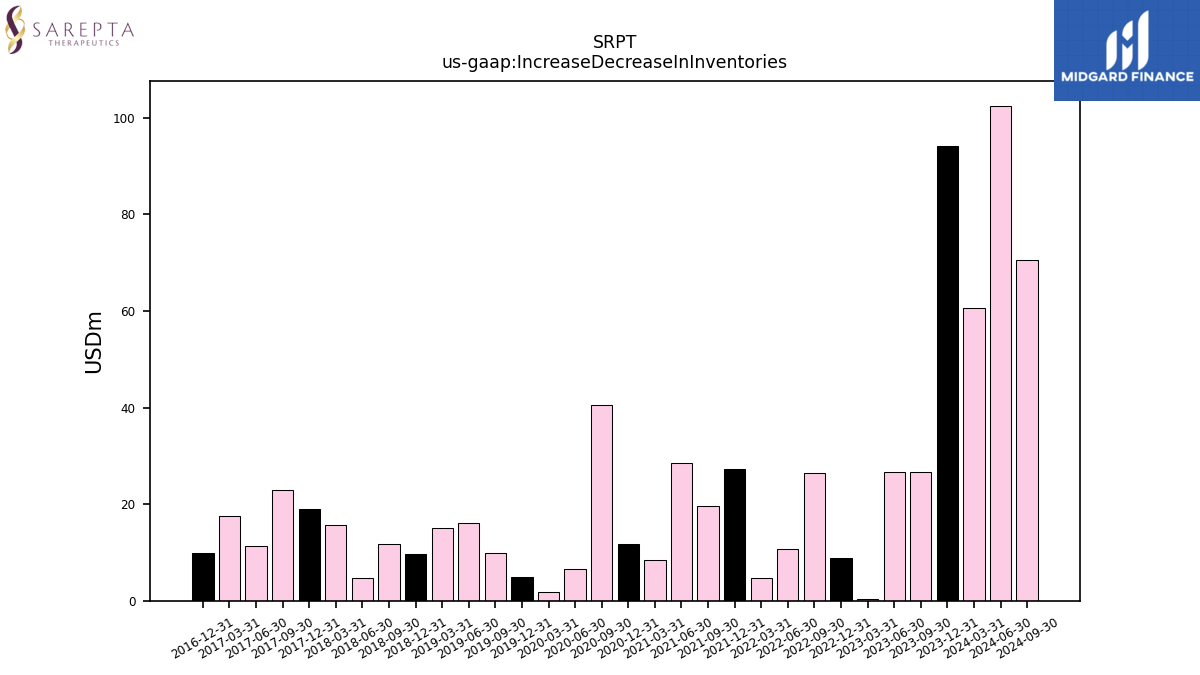
| Increase Decrease In Inventories | 94.10 | 26.61 | 26.69 | 0.31 | 8.88 | 26.54 | 10.68 | 4.69 | 27.26 | 19.71 | 28.42 | 8.37 | 11.84 | 40.47 | 6.48 | 1.79 | 5.02 | 9.79 | 16.10 | 15.02 | 9.63 | 11.69 | 4.75 | 15.77 | 18.91 | 22.94 | 11.31 | 17.63 | 9.89 | |
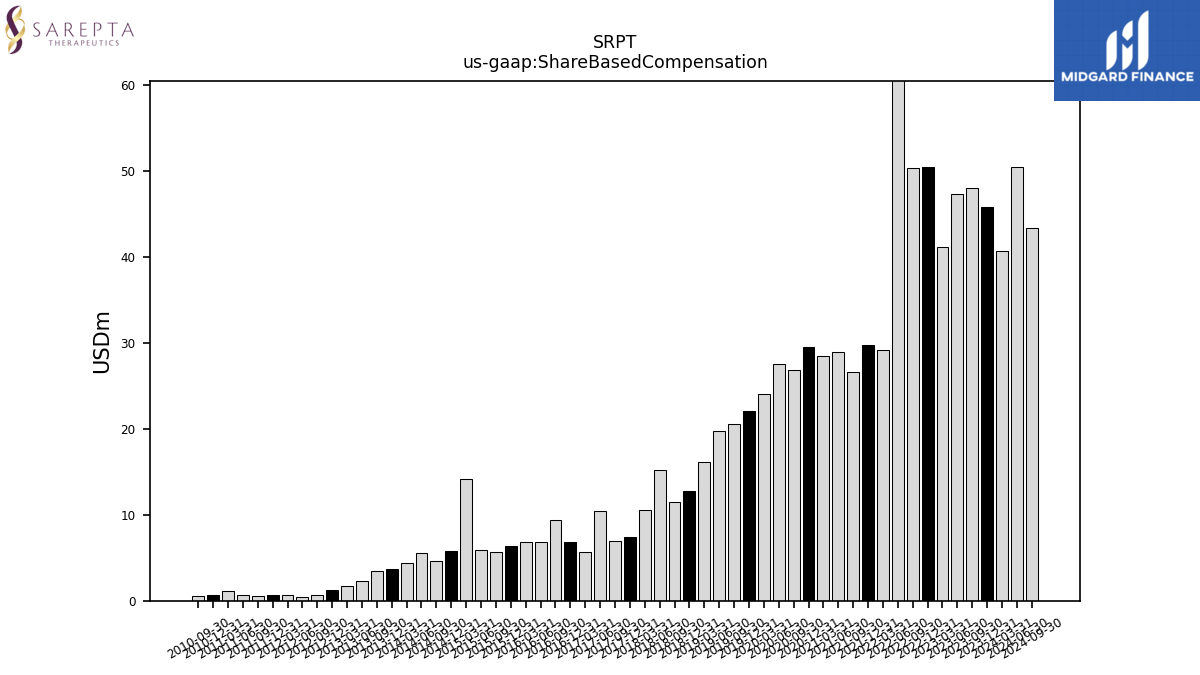
| Share Based Compensation | 45.83 | 48.06 | 47.38 | 41.25 | 50.51 | 50.42 | 102.89 | 29.20 | 29.78 | 26.68 | 28.97 | 28.51 | 29.53 | 26.90 | 27.62 | 24.02 | 22.06 | 20.64 | 19.76 | 16.14 | 12.84 | 11.48 | 15.28 | 10.53 | 7.37 | 6.92 | 10.46 | 5.71 | 6.87 | |
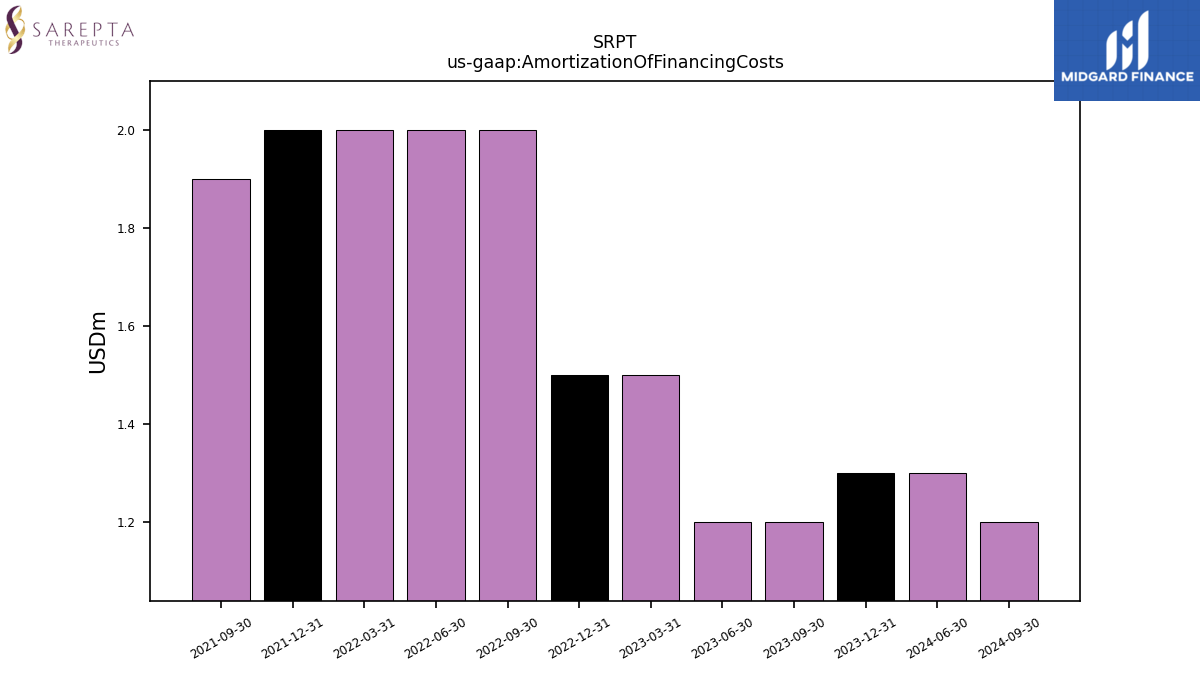
| Amortization Of Financing Costs | 1.30 | 1.20 | 1.20 | 1.50 | 1.50 | 2.00 | 2.00 | 2.00 | 2.00 | 1.90 | NA | NA | NA | NA | NA | NA | NA | NA | NA | NA | NA | NA | NA | NA | NA | NA | NA | NA | NA |
| 2023-12-31 | 2023-09-30 | 2023-06-30 | 2023-03-31 | 2022-12-31 | 2022-09-30 | 2022-06-30 | 2022-03-31 | 2021-12-31 | 2021-09-30 | 2021-06-30 | 2021-03-31 | 2020-12-31 | 2020-09-30 | 2020-06-30 | 2020-03-31 | 2019-12-31 | 2019-09-30 | 2019-06-30 | 2019-03-31 | 2018-12-31 | 2018-09-30 | 2018-06-30 | 2018-03-31 | 2017-12-31 | 2017-09-30 | 2017-06-30 | 2017-03-31 | 2016-12-31 | ||
|---|---|---|---|---|---|---|---|---|---|---|---|---|---|---|---|---|---|---|---|---|---|---|---|---|---|---|---|---|---|---|
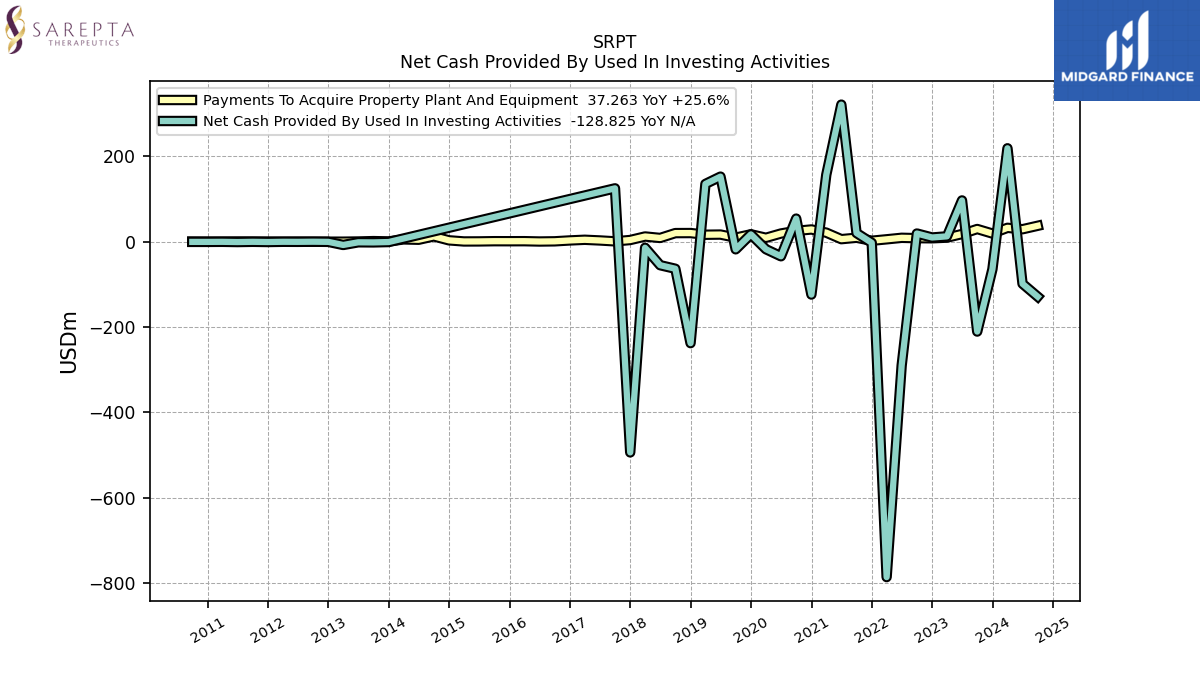
| Net Cash Provided By Used In Investing Activities | -64.36 | -210.57 | 96.63 | 12.49 | 9.80 | 19.12 | -289.99 | -785.81 | -2.58 | 20.27 | 321.06 | 156.67 | -123.89 | 54.08 | -34.23 | -17.68 | 17.08 | -17.96 | 152.37 | 135.23 | -237.74 | -63.40 | -55.09 | -14.26 | -493.69 | 124.95 | NA | NA | NA | |
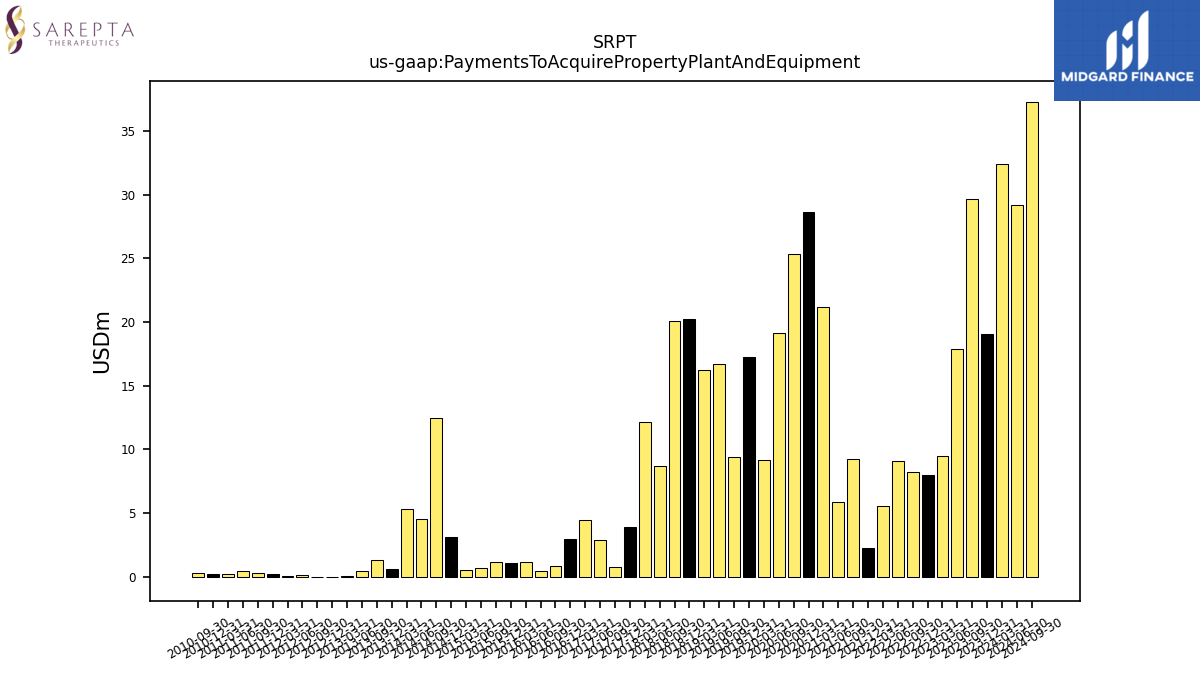
| Payments To Acquire Property Plant And Equipment | 19.04 | 29.67 | 17.91 | 9.48 | 7.96 | 8.23 | 9.08 | 5.55 | 2.21 | 9.24 | 5.89 | 21.15 | 28.61 | 25.30 | 19.17 | 9.12 | 17.26 | 9.43 | 16.68 | 16.26 | 20.20 | 20.09 | 8.70 | 12.17 | 3.90 | 0.77 | 2.87 | 4.46 | 2.91 |
| 2023-12-31 | 2023-09-30 | 2023-06-30 | 2023-03-31 | 2022-12-31 | 2022-09-30 | 2022-06-30 | 2022-03-31 | 2021-12-31 | 2021-09-30 | 2021-06-30 | 2021-03-31 | 2020-12-31 | 2020-09-30 | 2020-06-30 | 2020-03-31 | 2019-12-31 | 2019-09-30 | 2019-06-30 | 2019-03-31 | 2018-12-31 | 2018-09-30 | 2018-06-30 | 2018-03-31 | 2017-12-31 | 2017-09-30 | 2017-06-30 | 2017-03-31 | 2016-12-31 | ||
|---|---|---|---|---|---|---|---|---|---|---|---|---|---|---|---|---|---|---|---|---|---|---|---|---|---|---|---|---|---|---|
| Net Cash Provided By Used In Financing Activities | 1.94 | 15.40 | 5.86 | 101.80 | 10.75 | 216.43 | 0.34 | 4.99 | 549.25 | 5.90 | 3.53 | 2.89 | 326.94 | 18.79 | 17.57 | 319.02 | 256.97 | 1.73 | 6.29 | 377.56 | 521.28 | -23.95 | 25.35 | 7.47 | 506.81 | 382.24 | NA | NA | NA |
| 2023-12-31 | 2023-09-30 | 2023-06-30 | 2023-03-31 | 2022-12-31 | 2022-09-30 | 2022-06-30 | 2022-03-31 | 2021-12-31 | 2021-09-30 | 2021-06-30 | 2021-03-31 | 2020-12-31 | 2020-09-30 | 2020-06-30 | 2020-03-31 | 2019-12-31 | 2019-09-30 | 2019-06-30 | 2019-03-31 | 2018-12-31 | 2018-09-30 | 2018-06-30 | 2018-03-31 | 2017-12-31 | 2017-09-30 | 2017-06-30 | 2017-03-31 | 2016-12-31 | ||
|---|---|---|---|---|---|---|---|---|---|---|---|---|---|---|---|---|---|---|---|---|---|---|---|---|---|---|---|---|---|---|
| Revenues | 396.78 | 331.82 | 261.24 | 253.50 | 258.43 | 230.27 | 233.49 | 210.83 | 201.46 | 189.41 | 164.09 | 146.93 | 145.14 | 143.92 | 137.36 | 113.67 | 100.11 | 99.04 | 94.67 | 87.01 | 84.42 | 78.49 | 73.53 | 64.60 | 57.28 | 45.95 | 35.01 | 16.34 | 5.42 | |
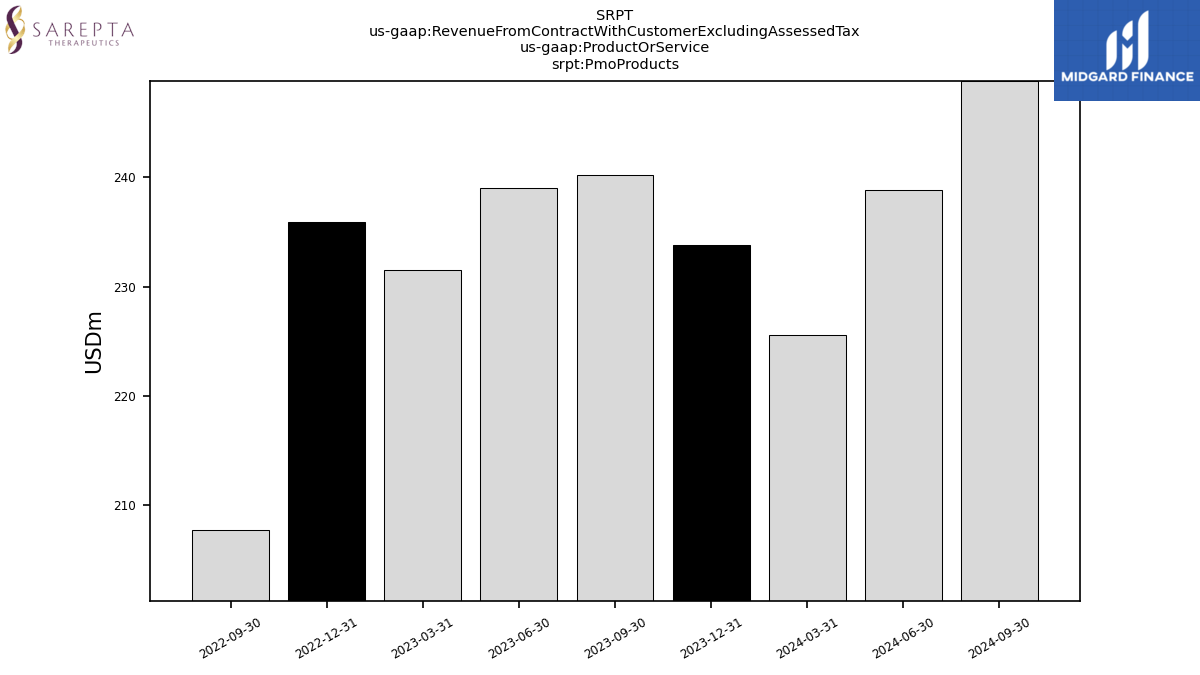
| Revenue From Contract With Customer Excluding Assessed Tax | 365.07 | 309.32 | 238.99 | 231.50 | 235.93 | 207.77 | 211.24 | 188.82 | 178.72 | 166.91 | 141.84 | 124.93 | 122.64 | 121.43 | 111.34 | 100.45 | 100.11 | 99.04 | 94.67 | 87.01 | 84.42 | 78.49 | 73.53 | 64.60 | 57.28 | 45.95 | 35.01 | 16.34 | 5.42 | |
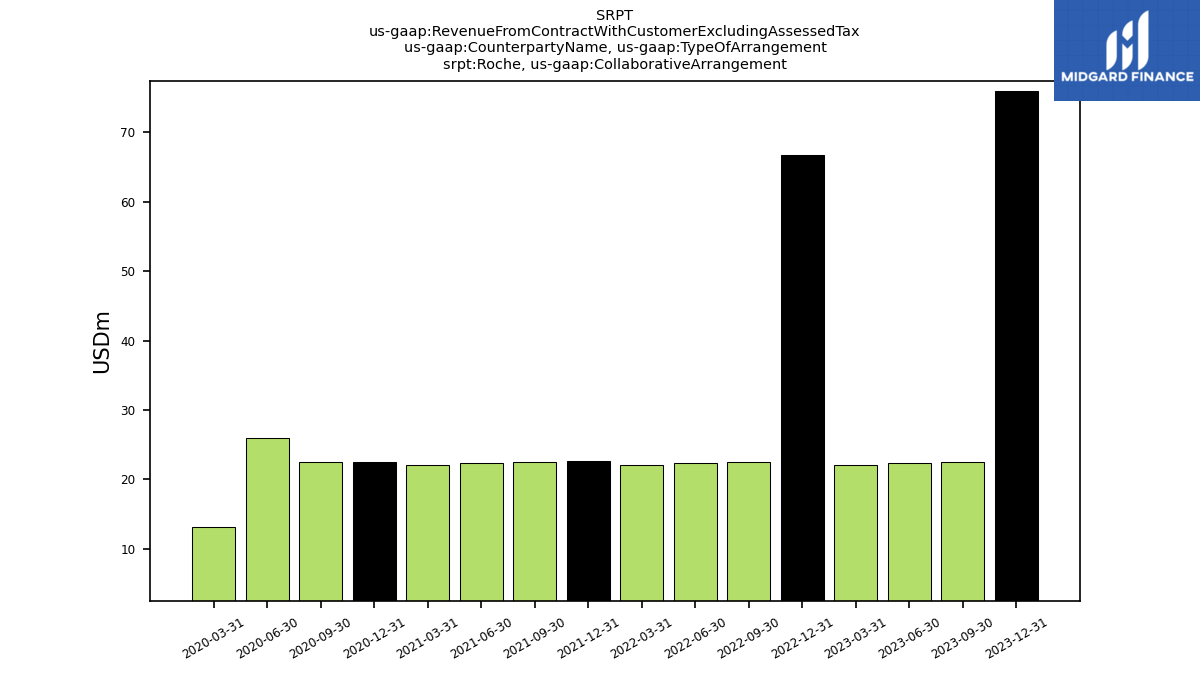
| Roche, Collaborative Arrangement | 76.00 | 22.50 | 22.30 | 22.00 | 66.70 | 22.50 | 22.30 | 22.00 | 22.70 | 22.50 | 22.30 | 22.00 | 22.50 | 22.50 | 26.00 | 13.20 | NA | NA | NA | NA | NA | NA | NA | NA | NA | NA | NA | NA | NA | |
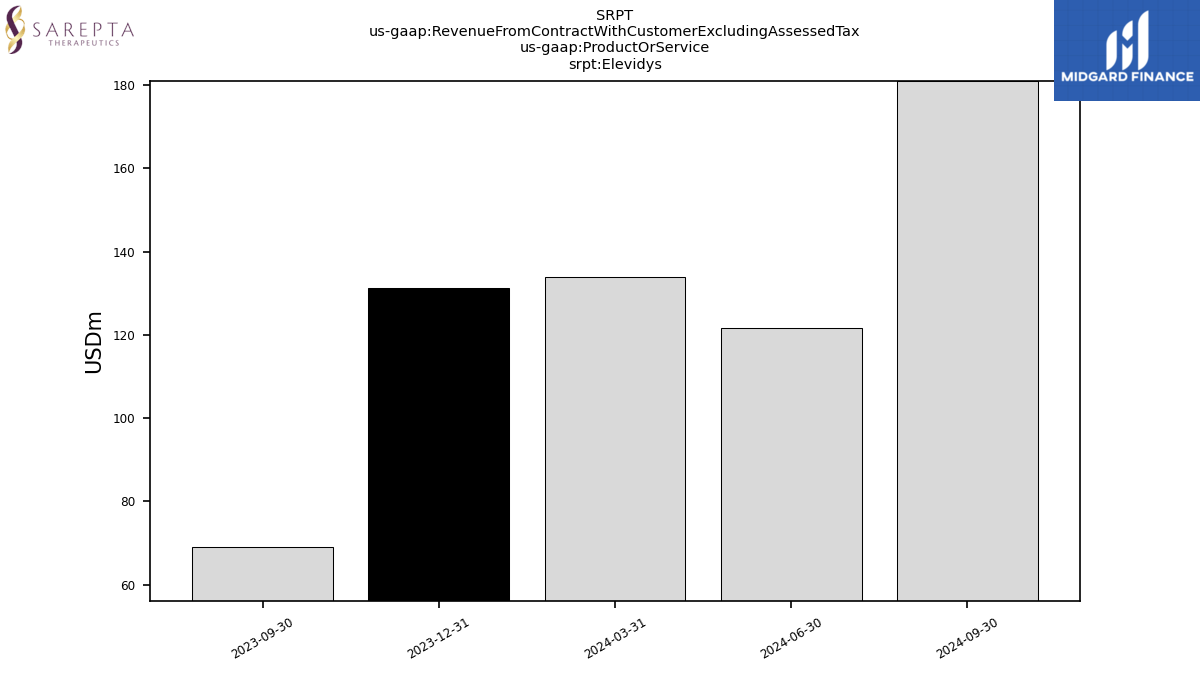
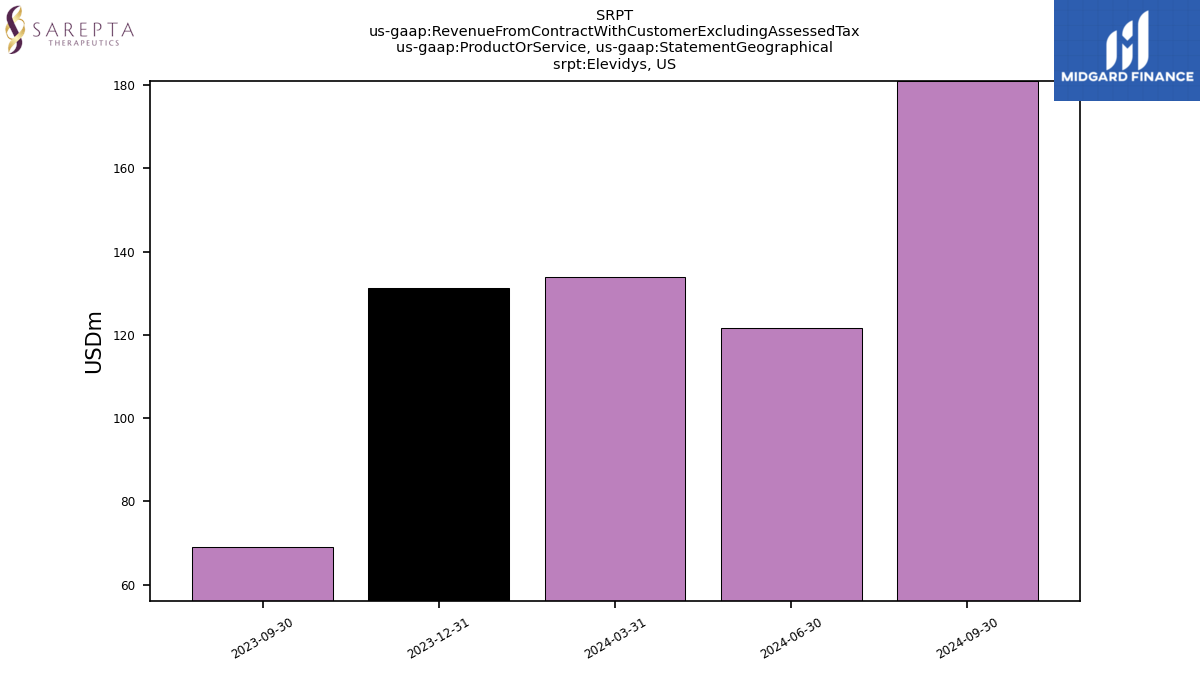
| Elevidys | 131.25 | 69.11 | NA | NA | NA | NA | NA | NA | NA | NA | NA | NA | NA | NA | NA | NA | NA | NA | NA | NA | NA | NA | NA | NA | NA | NA | NA | NA | NA | |
| Pmo Products | 233.82 | 240.21 | NA | NA | 235.93 | 207.77 | NA | NA | NA | NA | NA | NA | NA | NA | NA | NA | NA | NA | NA | NA | NA | NA | NA | NA | NA | NA | NA | NA | NA | |
| Elevidys,US | 131.25 | 69.11 | NA | NA | NA | NA | NA | NA | NA | NA | NA | NA | NA | NA | NA | NA | NA | NA | NA | NA | NA | NA | NA | NA | NA | NA | NA | NA | NA | |
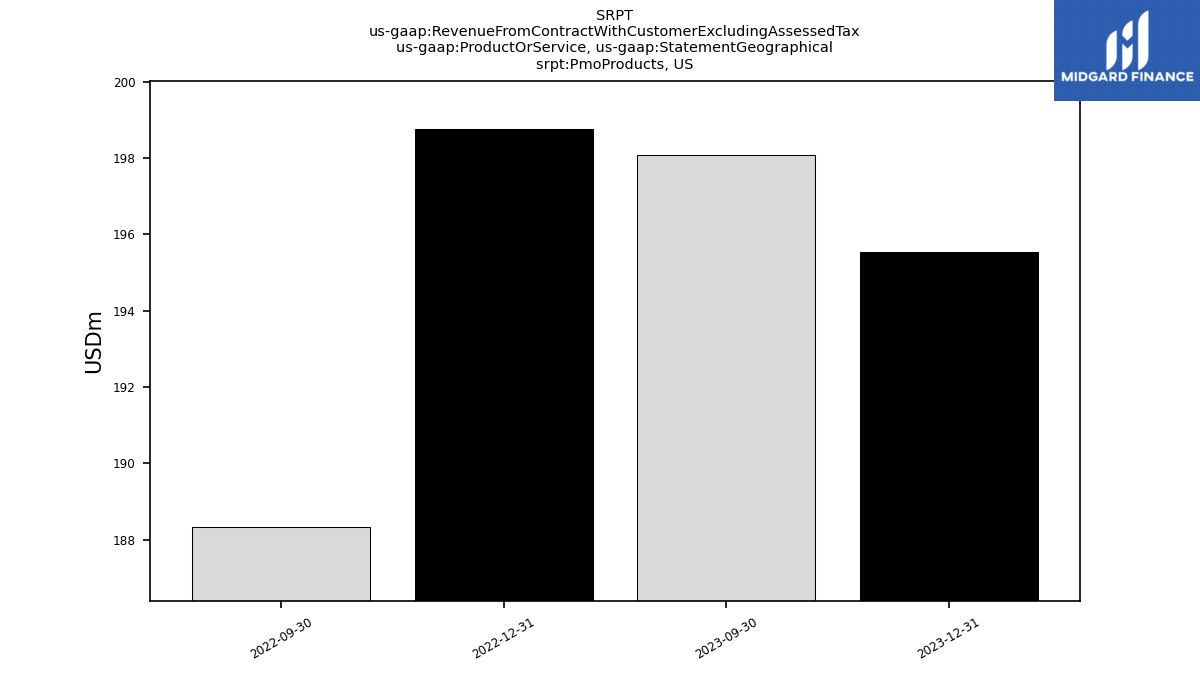
| Pmo Products,US | 195.53 | 198.07 | NA | NA | 198.75 | 188.35 | NA | NA | NA | NA | NA | NA | NA | NA | NA | NA | NA | NA | NA | NA | NA | NA | NA | NA | NA | NA | NA | NA | NA | |
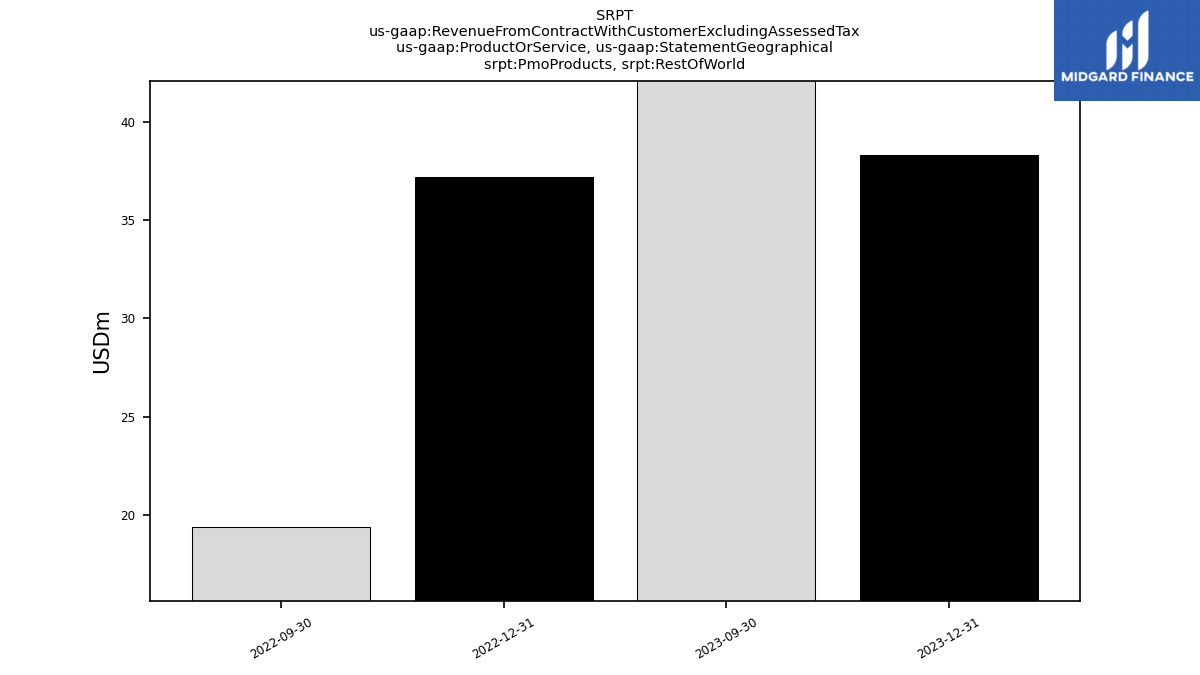
| Pmo Products, Rest Of World | 38.29 | 42.15 | NA | NA | 37.19 | 19.43 | NA | NA | NA | NA | NA | NA | NA | NA | NA | NA | NA | NA | NA | NA | NA | NA | NA | NA | NA | NA | NA | NA | NA |
