
| 2023-12-31 | 2023-09-30 | 2023-06-30 | 2023-03-31 | 2022-12-31 | 2022-09-30 | 2022-06-30 | 2022-03-31 | 2021-12-31 | 2021-09-30 | 2021-06-30 | 2021-03-31 | 2020-12-31 | 2020-09-30 | 2020-06-30 | 2020-03-31 | 2019-12-31 | 2019-09-30 | 2019-06-30 | ||
|---|---|---|---|---|---|---|---|---|---|---|---|---|---|---|---|---|---|---|---|---|
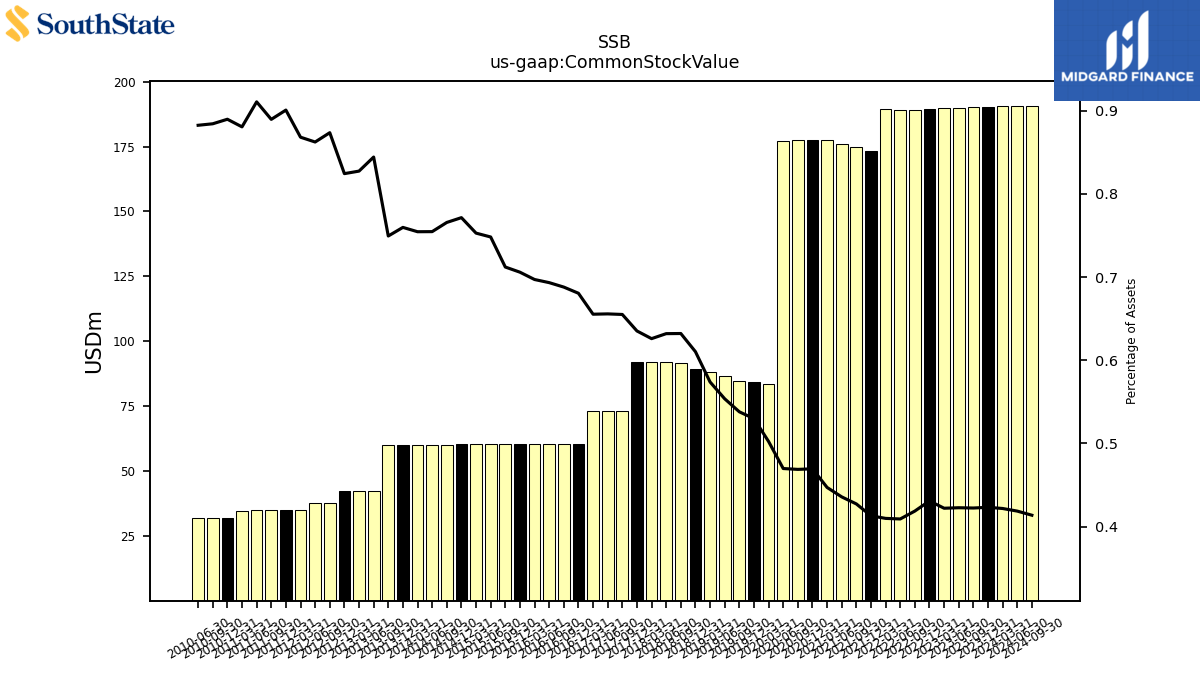
| Common Stock Value | 190.06 | 190.04 | 189.99 | 189.65 | 189.26 | 189.19 | 189.10 | 189.40 | 173.33 | 174.79 | 175.96 | 177.65 | 177.43 | 177.32 | 177.27 | 83.61 | 84.36 | 84.76 | 86.84 | |
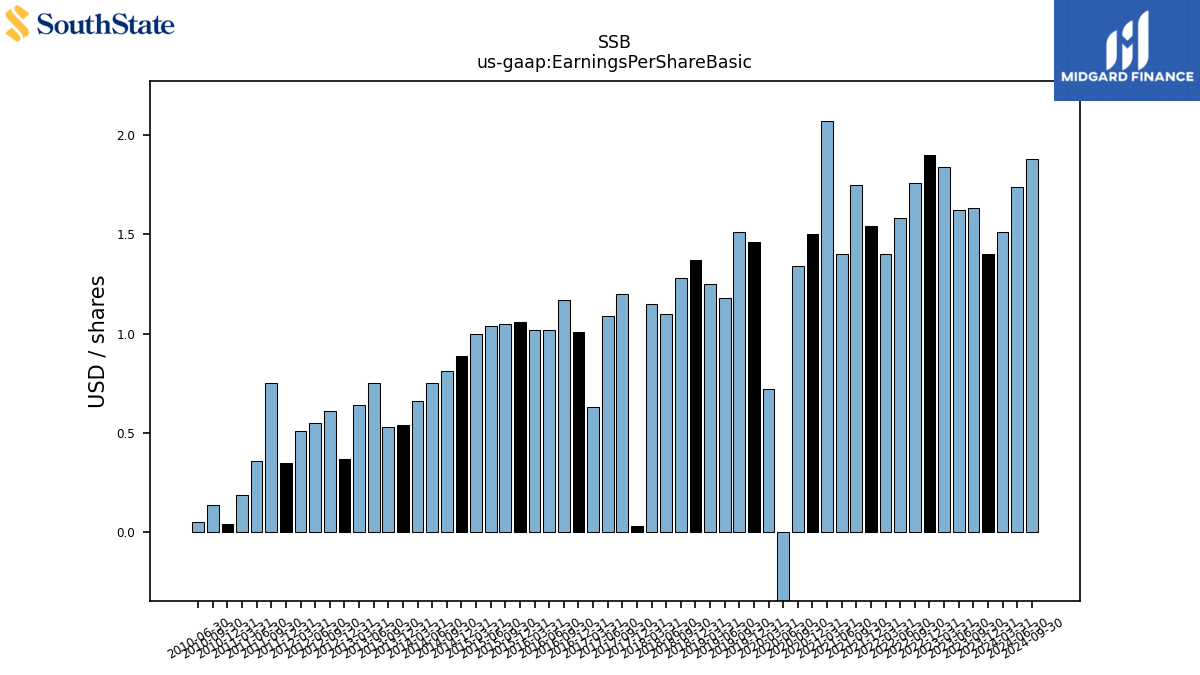
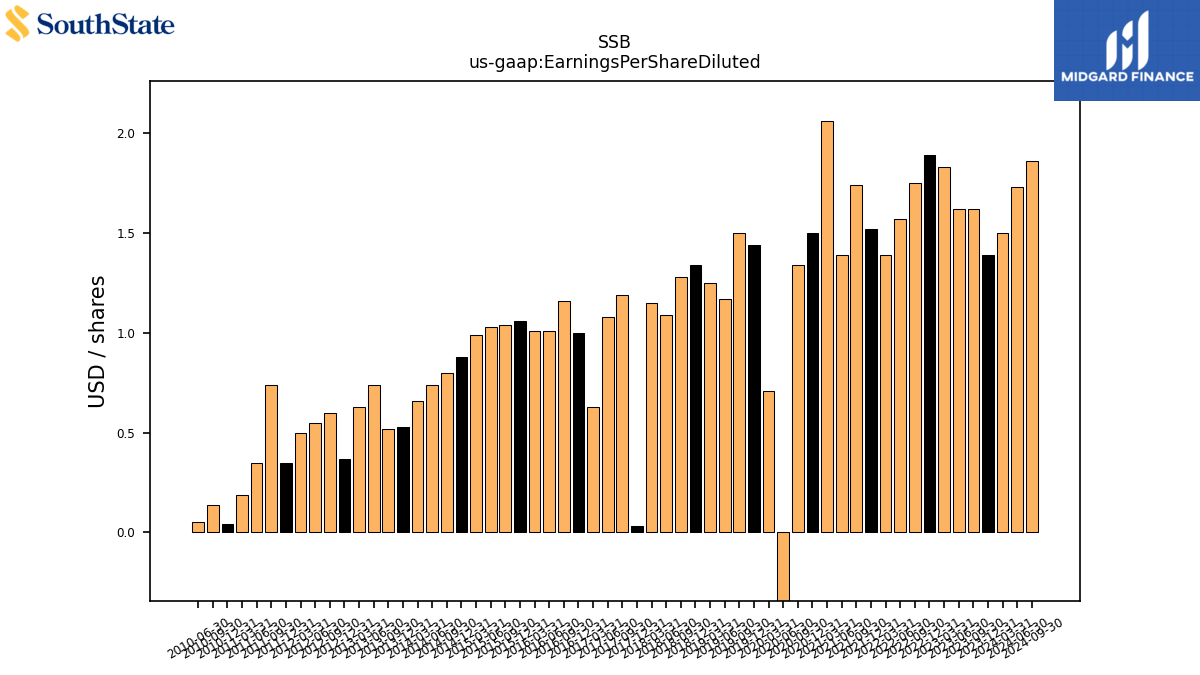
| Earnings Per Share Basic | 1.40 | 1.63 | 1.62 | 1.84 | 1.90 | 1.76 | 1.58 | 1.40 | 1.54 | 1.75 | 1.40 | 2.07 | 1.50 | 1.34 | -1.96 | 0.72 | 1.46 | 1.51 | 1.18 | |
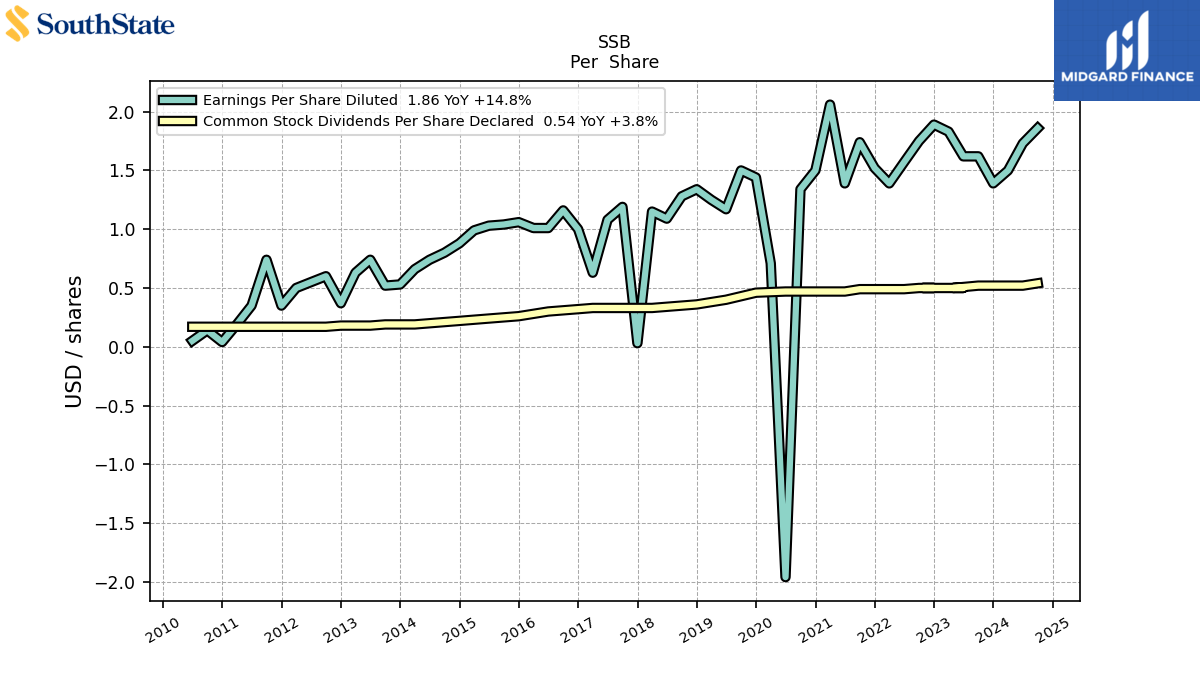
| Earnings Per Share Diluted | 1.39 | 1.62 | 1.62 | 1.83 | 1.89 | 1.75 | 1.57 | 1.39 | 1.52 | 1.74 | 1.39 | 2.06 | 1.50 | 1.34 | -1.96 | 0.71 | 1.44 | 1.50 | 1.17 | |
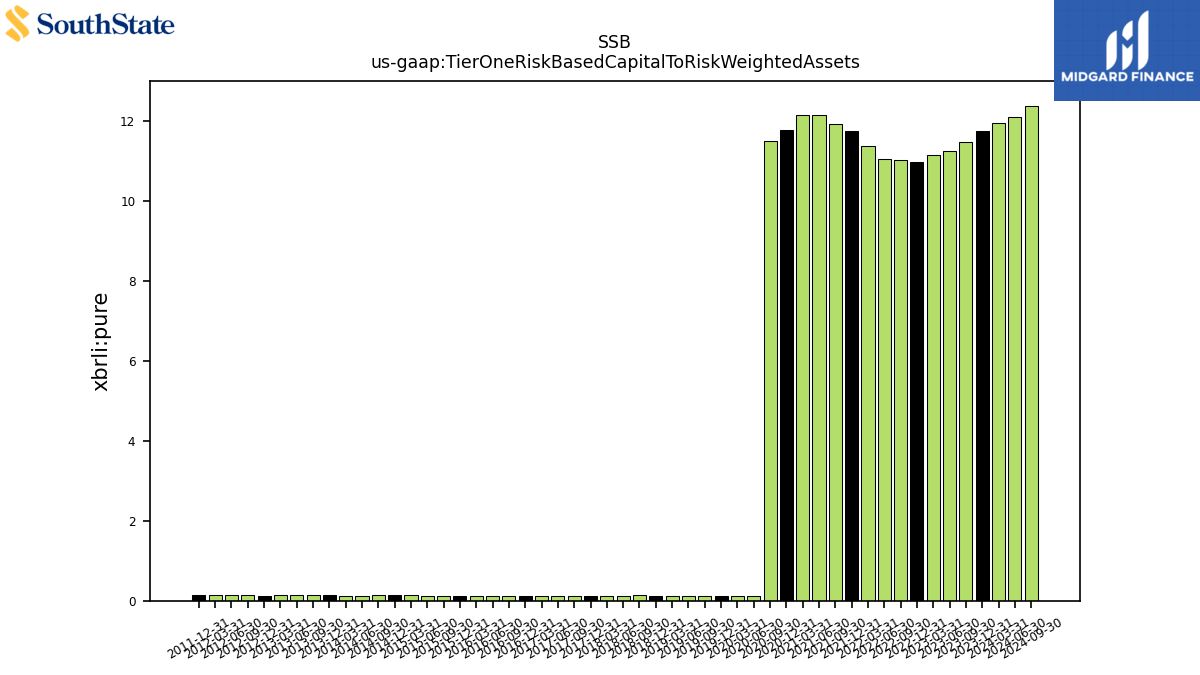
| Tier One Risk Based Capital To Risk Weighted Assets | 0.00 | 0.00 | 0.00 | 0.00 | 0.00 | 0.00 | 0.00 | 0.00 | 0.00 | 0.00 | 0.00 | 0.00 | 0.00 | 0.00 | 0.00 | 0.00 | 0.00 | 0.00 | 0.00 | |
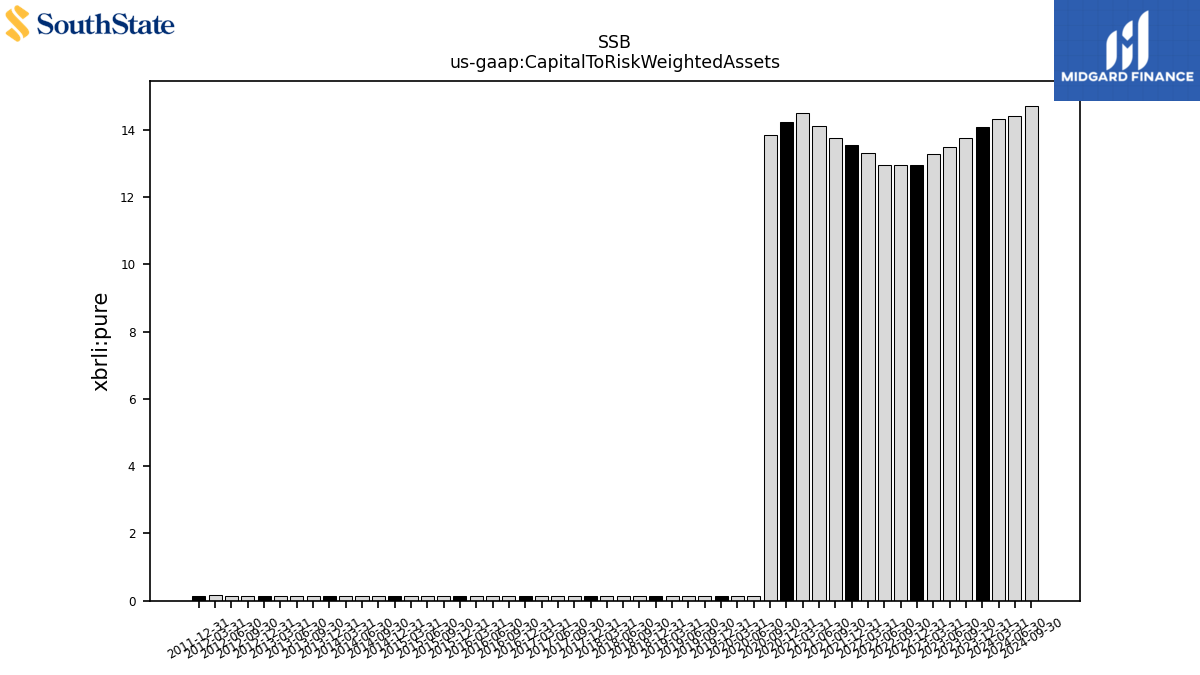
| Capital To Risk Weighted Assets | 0.00 | 0.00 | 0.00 | 0.00 | 0.00 | 0.00 | 0.00 | 0.00 | 0.00 | 0.00 | 0.00 | 0.00 | 0.00 | 0.00 | 0.00 | 0.00 | 0.00 | 0.00 | 0.00 |
| 2023-12-31 | 2023-09-30 | 2023-06-30 | 2023-03-31 | 2022-12-31 | 2022-09-30 | 2022-06-30 | 2022-03-31 | 2021-12-31 | 2021-09-30 | 2021-06-30 | 2021-03-31 | 2020-12-31 | 2020-09-30 | 2020-06-30 | 2020-03-31 | 2019-12-31 | 2019-09-30 | 2019-06-30 | ||
|---|---|---|---|---|---|---|---|---|---|---|---|---|---|---|---|---|---|---|---|---|
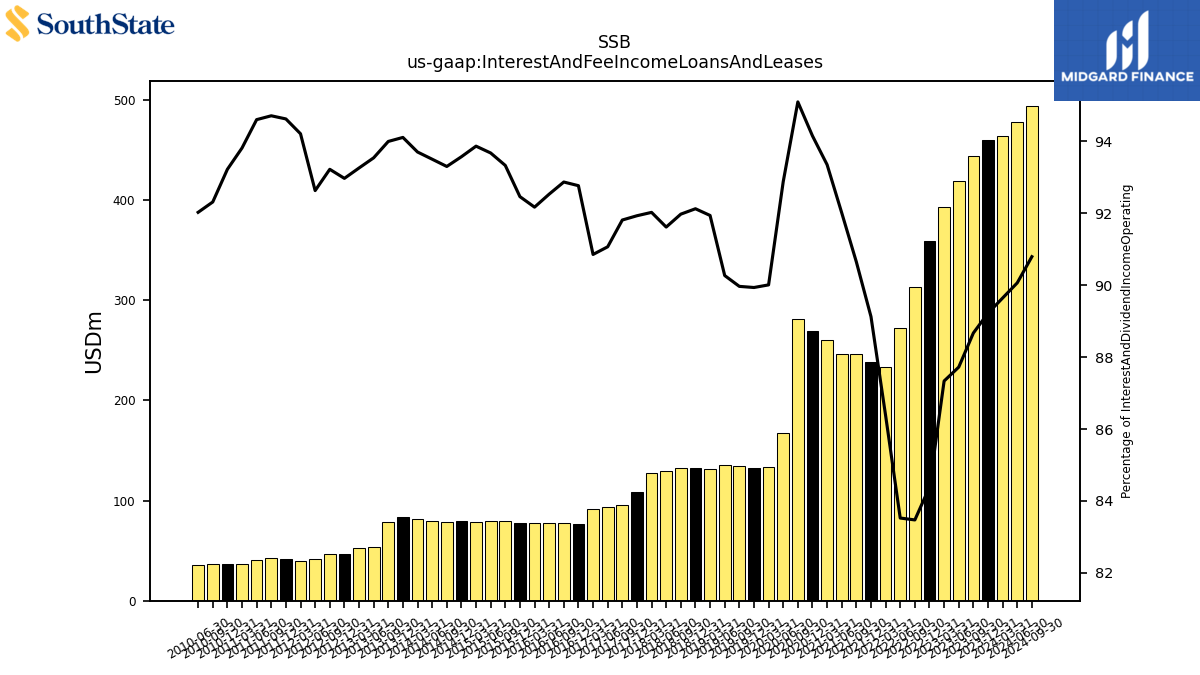
| Interest And Fee Income Loans And Leases | 459.88 | 443.81 | 419.36 | 393.37 | 359.55 | 312.86 | 272.00 | 233.62 | 238.31 | 246.06 | 246.18 | 259.97 | 269.63 | 280.82 | 167.71 | 133.03 | 132.62 | 134.95 | 135.39 | |
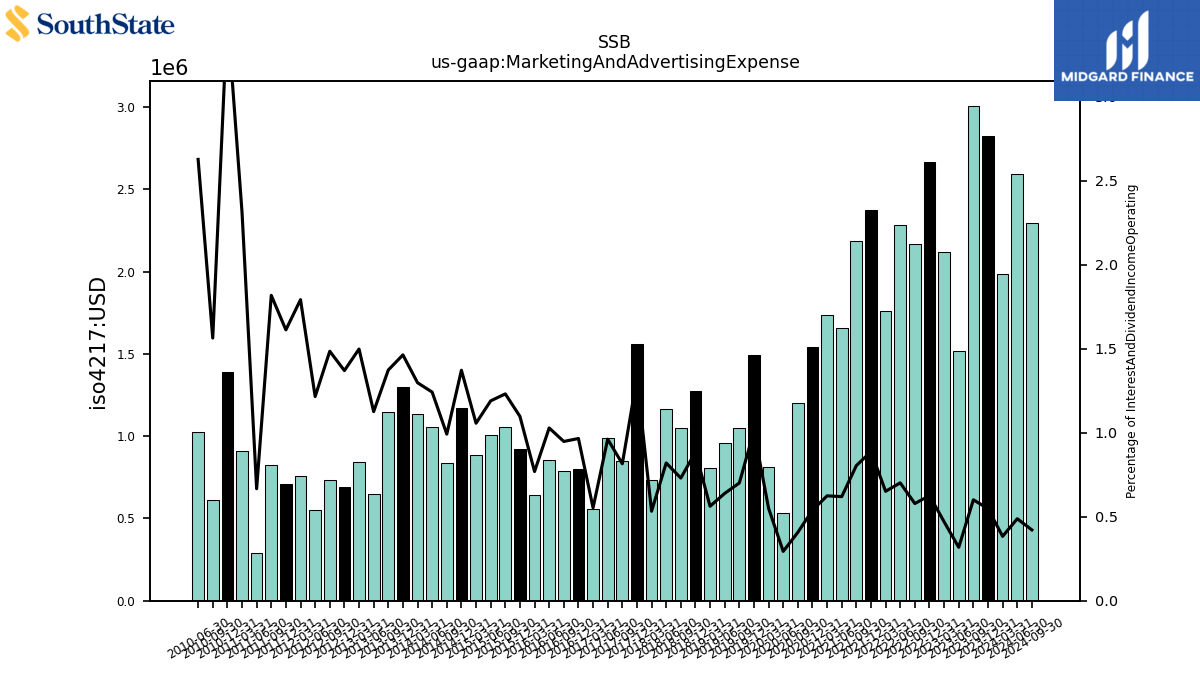
| Marketing And Advertising Expense | 2.83 | 3.01 | 1.52 | 2.12 | 2.67 | 2.17 | 2.29 | 1.76 | 2.38 | 2.19 | 1.66 | 1.74 | 1.54 | 1.20 | 0.53 | 0.81 | 1.49 | 1.05 | 0.96 | |
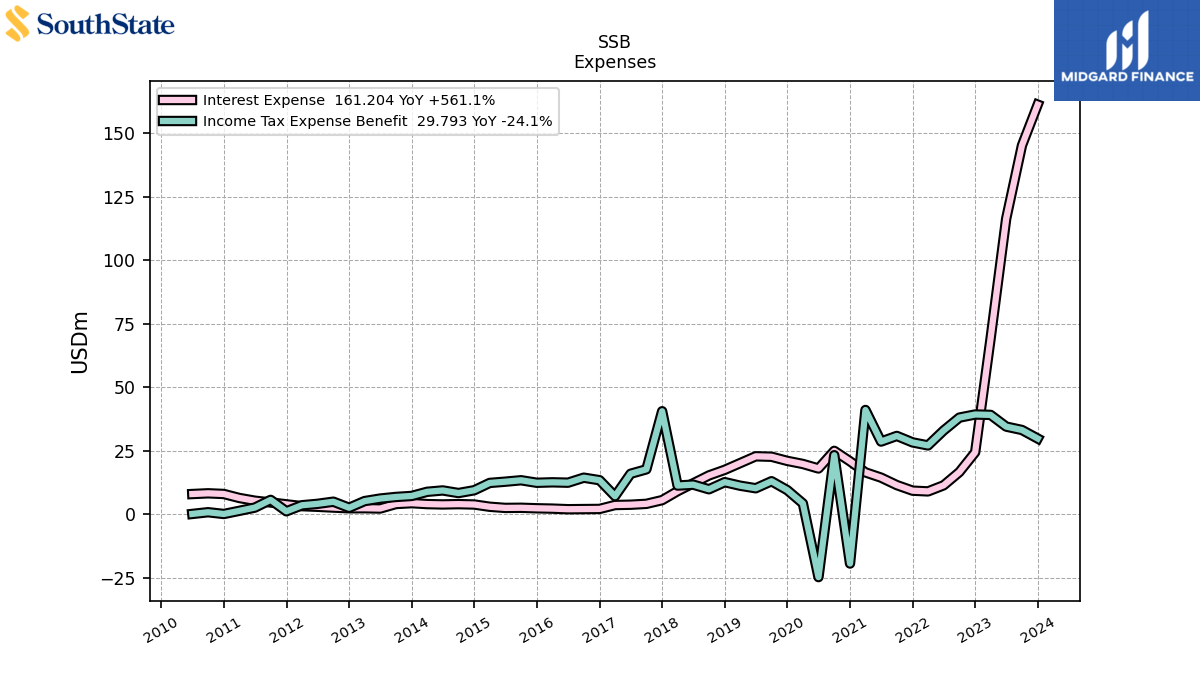
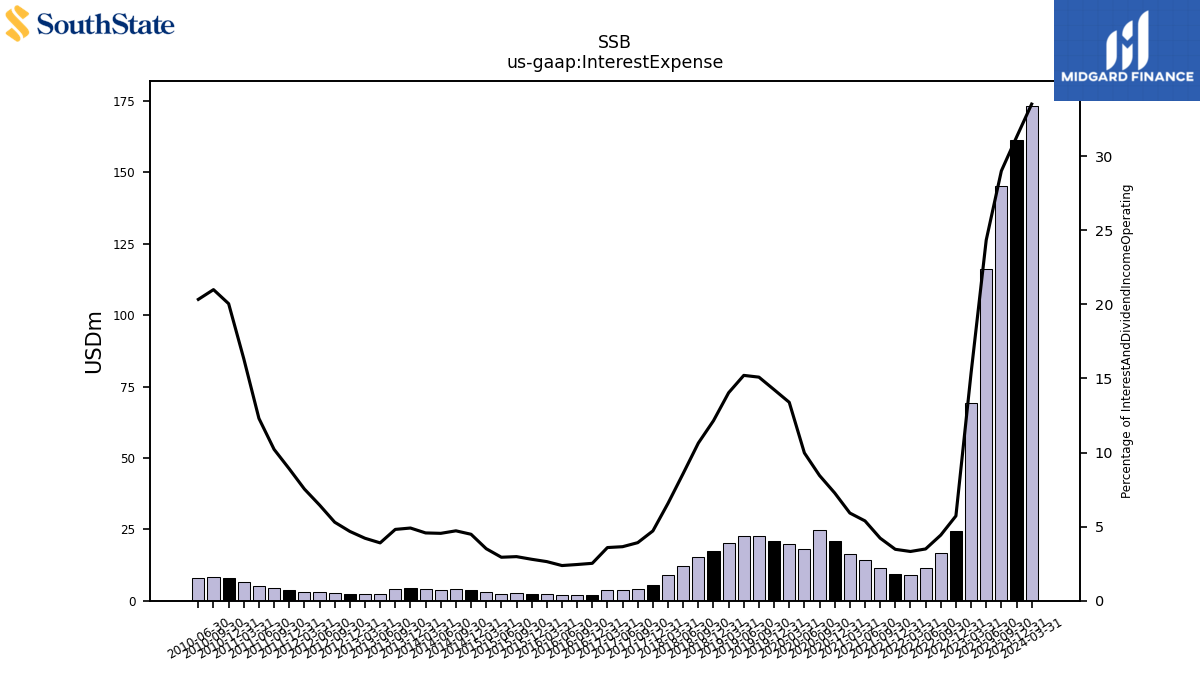
| Interest Expense | 161.20 | 145.14 | 116.31 | 69.15 | 24.38 | 16.60 | 11.38 | 8.99 | 9.28 | 11.46 | 14.41 | 16.48 | 20.82 | 24.95 | 18.01 | 19.79 | 21.00 | 22.63 | 22.80 | |
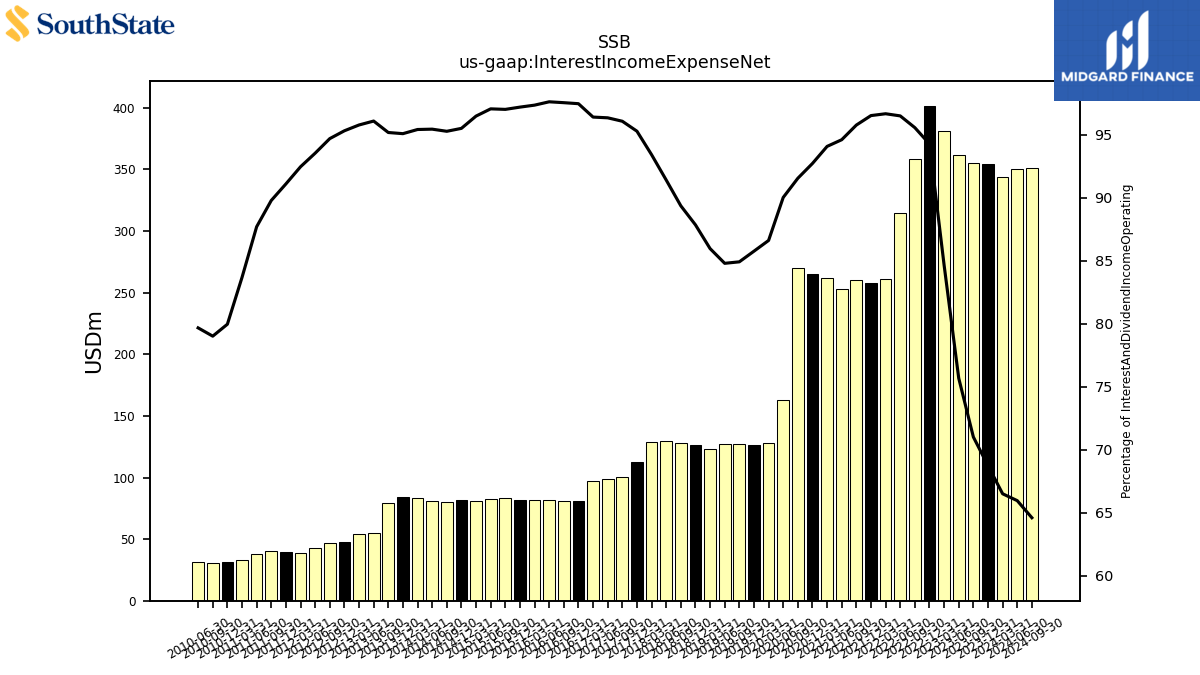
| Interest Income Expense Net | 354.23 | 355.37 | 361.74 | 381.26 | 401.71 | 358.21 | 314.28 | 261.47 | 258.10 | 259.99 | 253.13 | 262.00 | 265.55 | 270.35 | 162.56 | 128.01 | 126.46 | 127.37 | 127.18 | |
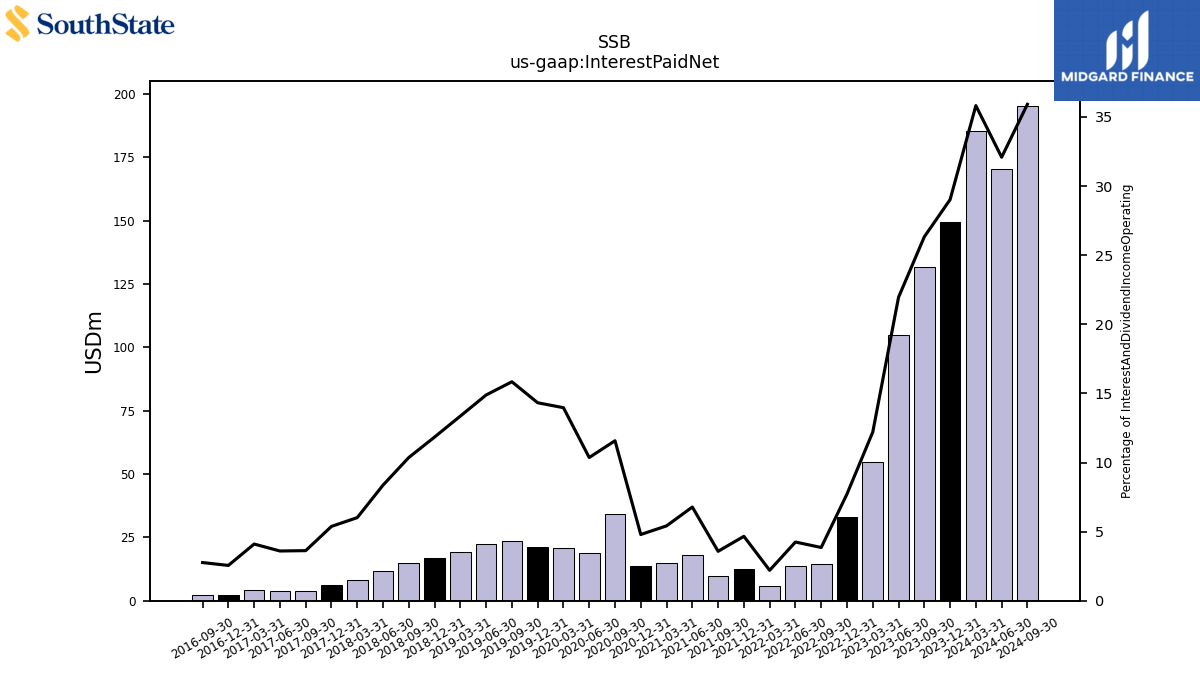
| Interest Paid Net | 149.56 | 131.77 | 104.93 | 54.95 | 32.90 | 14.44 | 13.83 | 5.96 | 12.46 | 9.71 | 18.14 | 15.08 | 13.72 | 34.18 | 18.71 | 20.64 | 21.12 | 23.76 | 22.32 | |
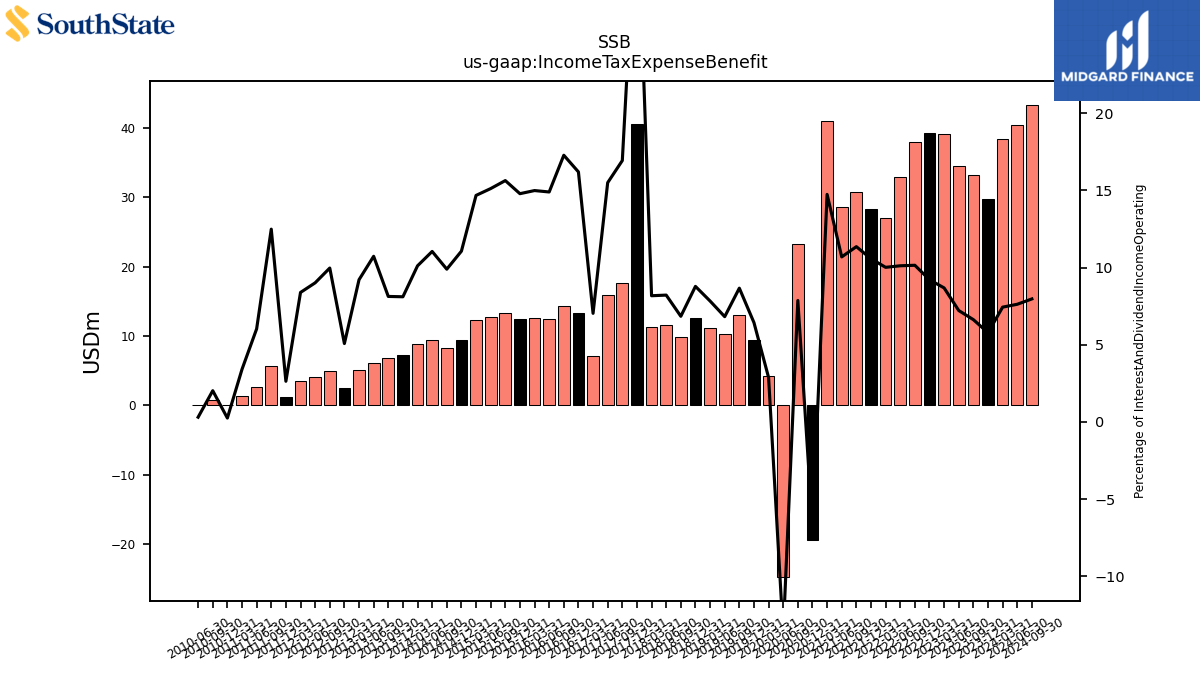
| Income Tax Expense Benefit | 29.79 | 33.16 | 34.49 | 39.10 | 39.25 | 38.03 | 32.94 | 27.08 | 28.27 | 30.82 | 28.60 | 41.04 | -19.40 | 23.23 | -24.75 | 4.25 | 9.49 | 13.00 | 10.23 | |
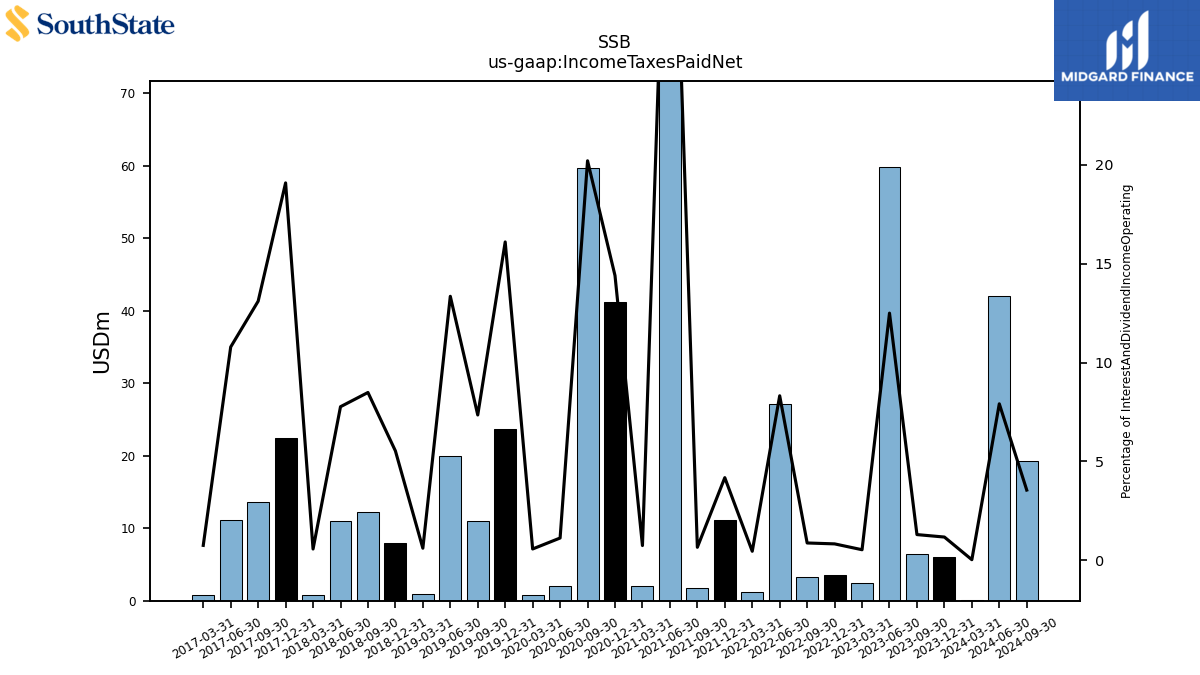
| Income Taxes Paid Net | 6.05 | 6.50 | 59.77 | 2.40 | 3.53 | 3.28 | 27.10 | 1.23 | 11.17 | 1.78 | 111.18 | 2.07 | 41.25 | 59.68 | 2.03 | 0.84 | 23.75 | 11.03 | 20.03 | |
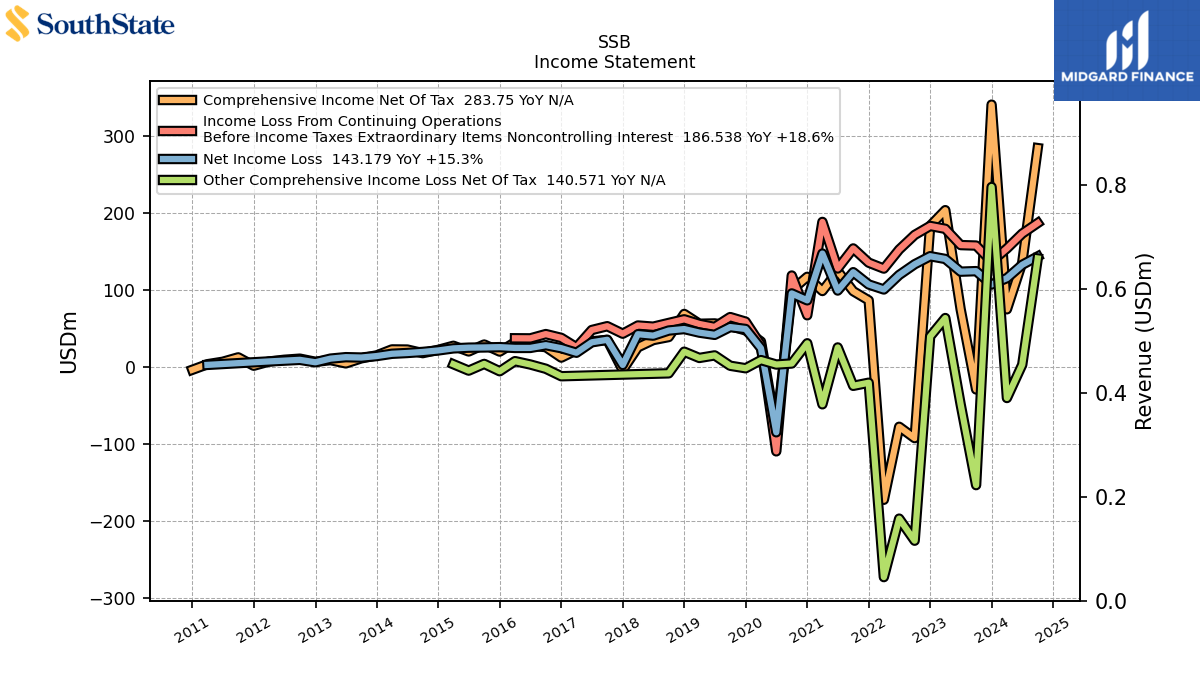
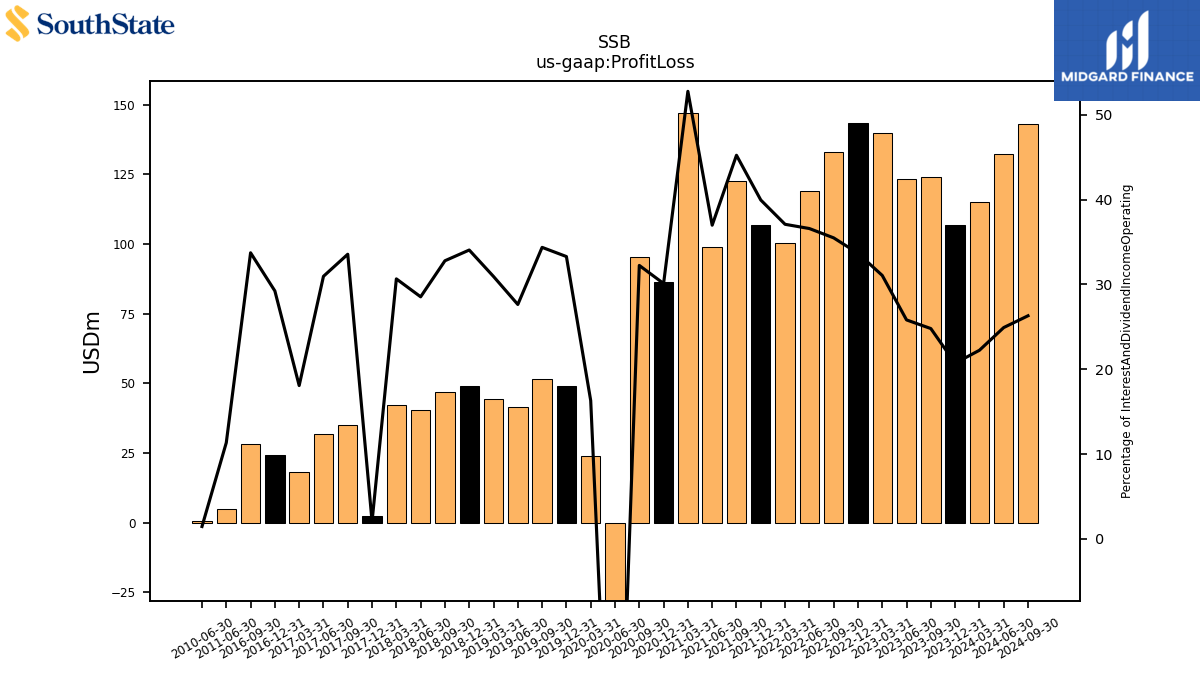
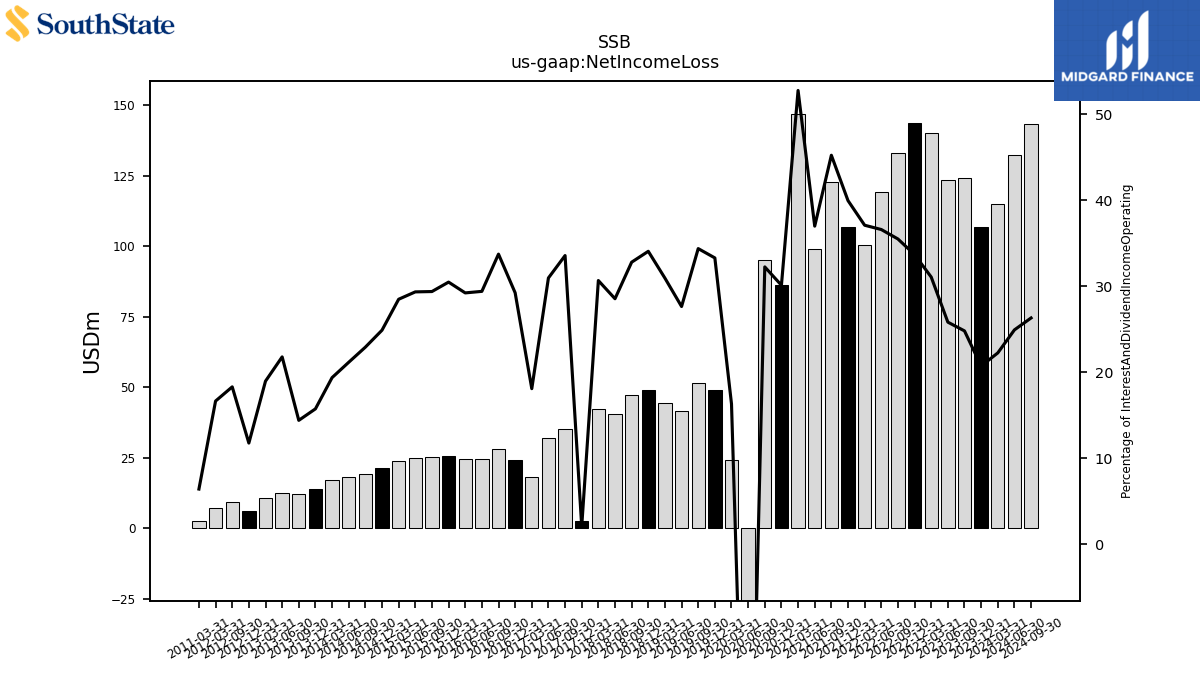
| Profit Loss | 106.79 | 124.14 | 123.45 | 139.93 | 143.50 | 133.04 | 119.17 | 100.33 | 106.85 | 122.79 | 98.96 | 146.95 | 86.24 | 95.22 | -84.94 | 24.11 | 49.09 | 51.56 | 41.46 | |
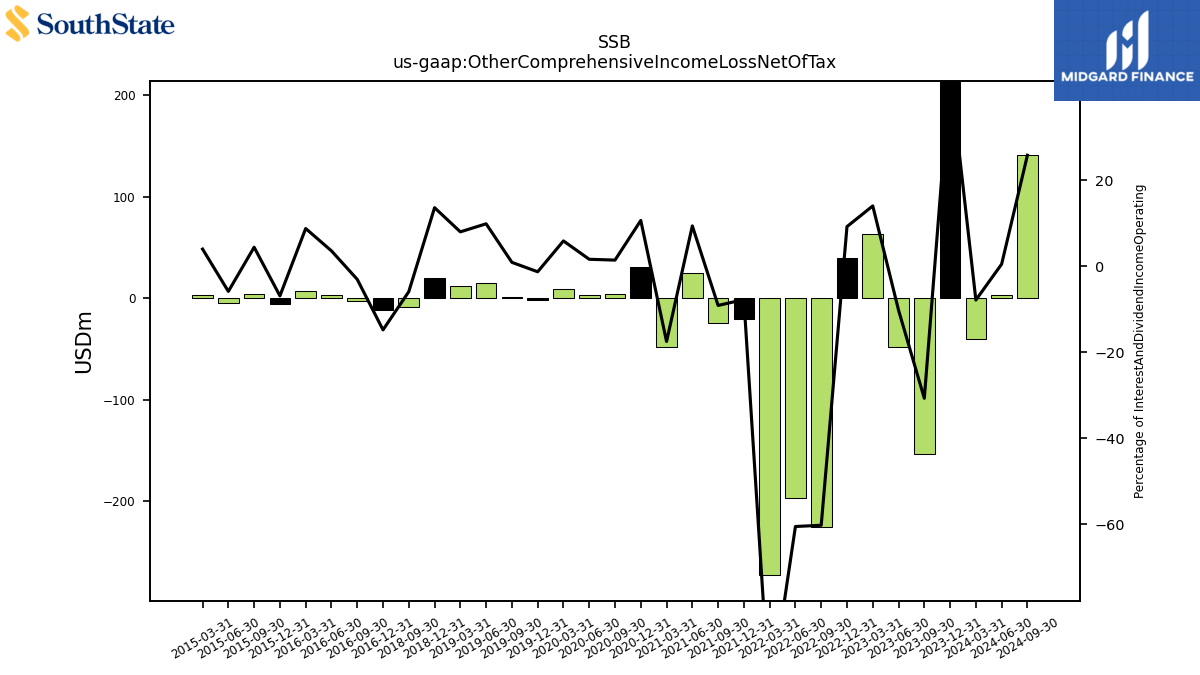
| Other Comprehensive Income Loss Net Of Tax | 233.35 | -153.49 | -48.61 | 63.30 | 39.37 | -225.57 | -196.93 | -272.81 | -20.63 | -24.66 | 25.17 | -48.62 | 30.54 | 4.31 | 2.97 | 8.75 | -1.85 | 1.40 | 14.84 | |
| Net Income Loss | 106.79 | 124.14 | 123.45 | 139.93 | 143.50 | 133.04 | 119.17 | 100.33 | 106.85 | 122.79 | 98.96 | 146.95 | 86.24 | 95.22 | -84.94 | 24.11 | 49.09 | 51.56 | 41.46 | |
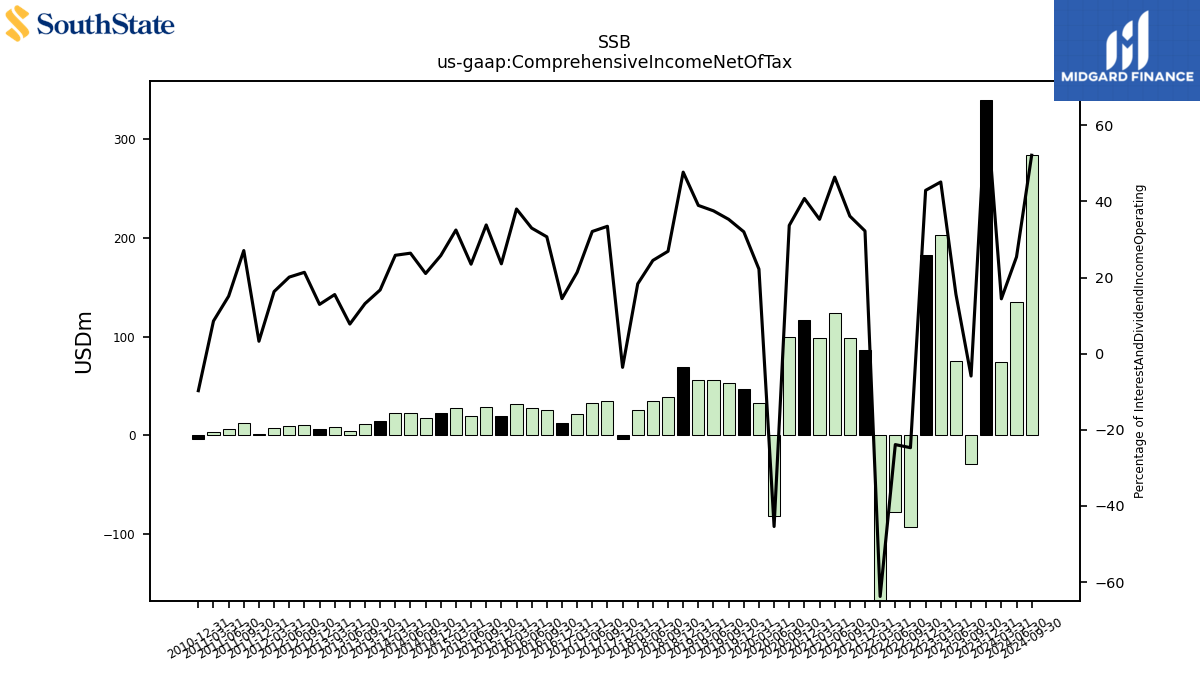
| Comprehensive Income Net Of Tax | 340.14 | -29.35 | 74.83 | 203.23 | 182.87 | -92.53 | -77.75 | -172.48 | 86.22 | 98.13 | 124.13 | 98.33 | 116.78 | 99.53 | -81.96 | 32.86 | 47.24 | 52.97 | 56.30 | |
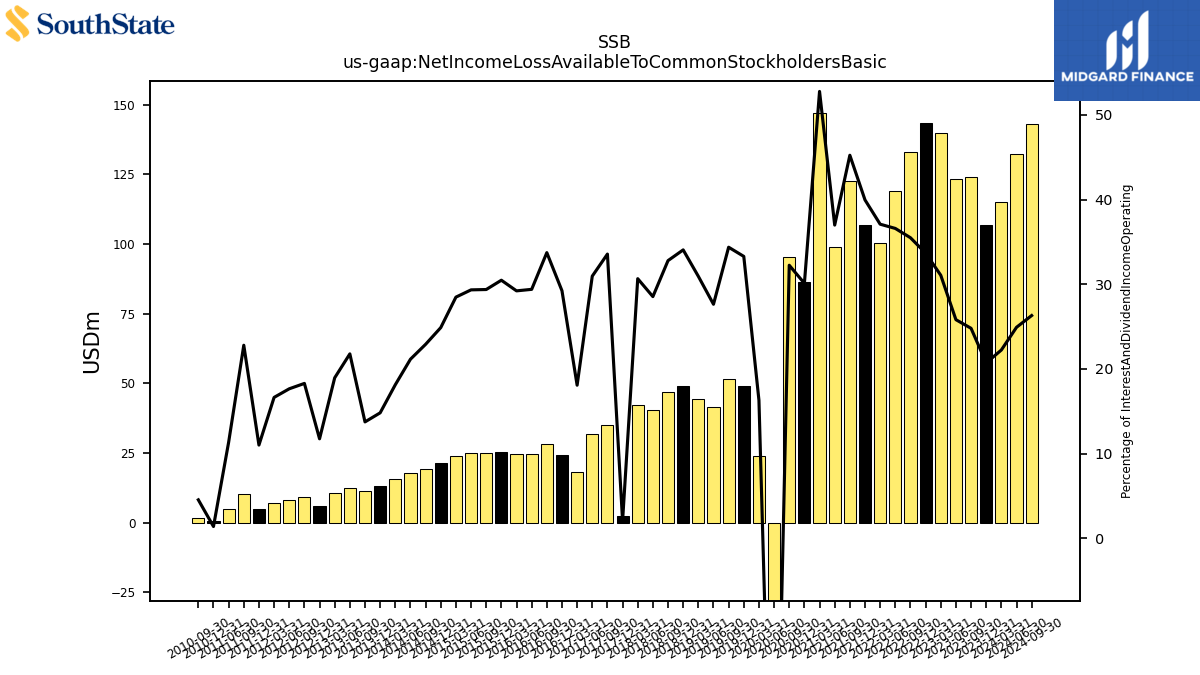
| Net Income Loss Available To Common Stockholders Basic | 106.79 | 124.14 | 123.45 | 139.93 | 143.50 | 133.04 | 119.17 | 100.33 | 106.85 | 122.79 | 98.96 | 146.95 | 86.24 | 95.22 | -84.94 | 24.11 | 49.09 | 51.56 | 41.46 | |
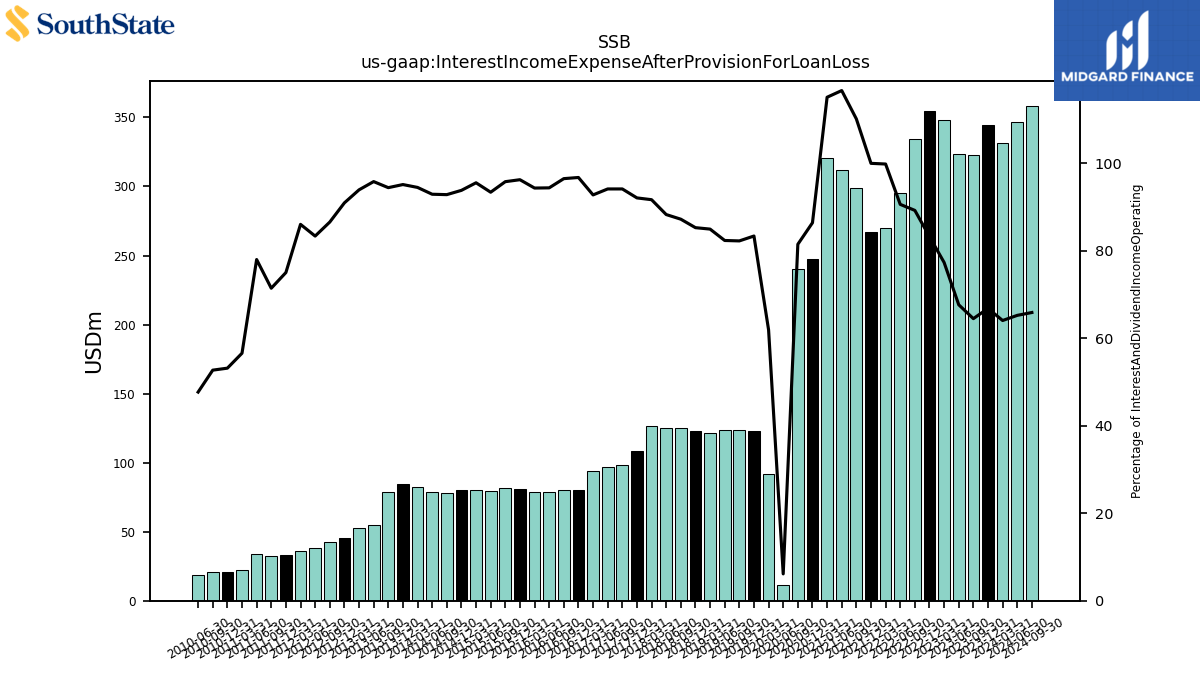
| Interest Income Expense After Provision For Loan Loss | 344.34 | 322.66 | 323.35 | 348.17 | 354.57 | 334.33 | 294.99 | 269.92 | 267.26 | 298.89 | 311.92 | 320.42 | 247.36 | 240.55 | 11.08 | 91.48 | 122.90 | 123.34 | 123.47 | |
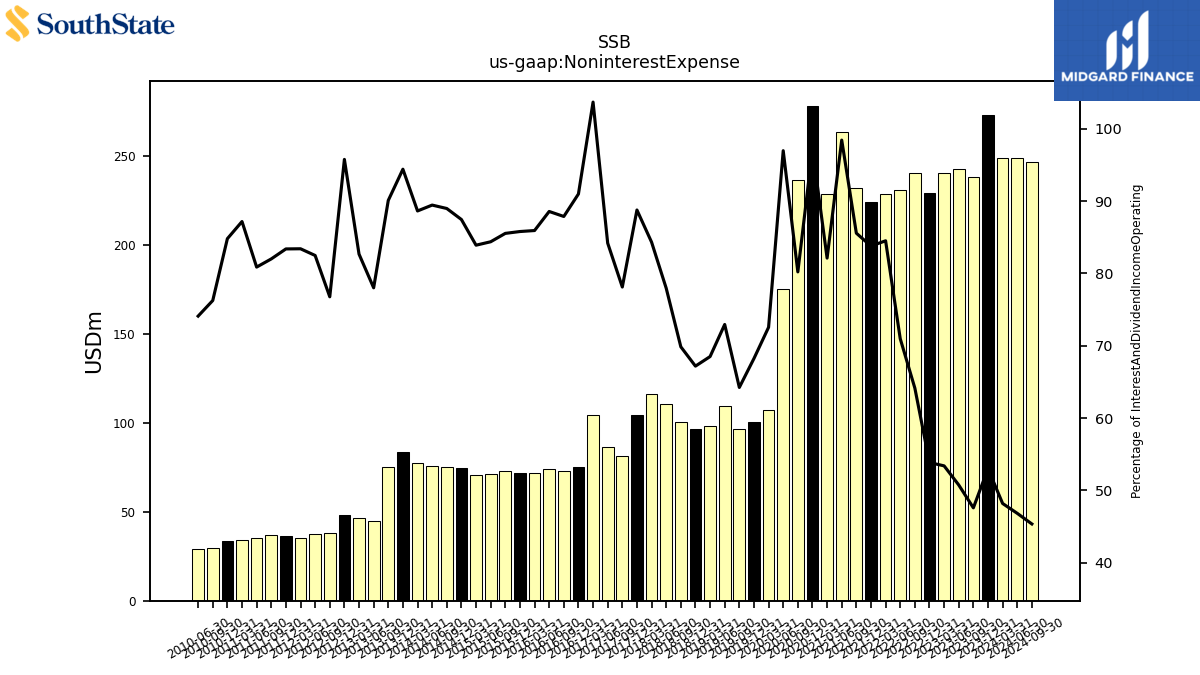
| Noninterest Expense | 273.24 | 238.21 | 242.63 | 240.50 | 229.50 | 240.43 | 231.17 | 228.60 | 224.04 | 232.29 | 263.38 | 228.71 | 278.40 | 236.89 | 175.11 | 107.25 | 100.63 | 96.36 | 109.41 | |
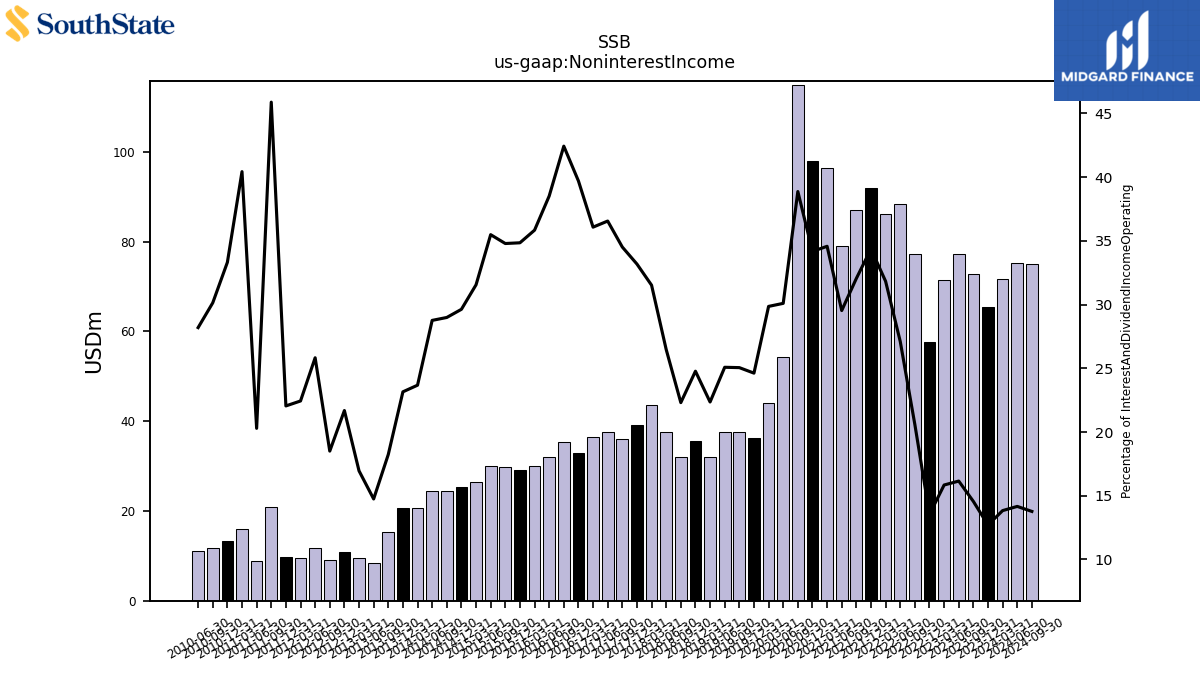
| Noninterest Income | 65.49 | 72.85 | 77.21 | 71.36 | 57.69 | 77.18 | 88.29 | 86.09 | 91.89 | 87.01 | 79.02 | 96.28 | 97.87 | 114.79 | 54.35 | 44.13 | 36.31 | 37.58 | 37.62 |
| 2023-12-31 | 2023-09-30 | 2023-06-30 | 2023-03-31 | 2022-12-31 | 2022-09-30 | 2022-06-30 | 2022-03-31 | 2021-12-31 | 2021-09-30 | 2021-06-30 | 2021-03-31 | 2020-12-31 | 2020-09-30 | 2020-06-30 | 2020-03-31 | 2019-12-31 | 2019-09-30 | 2019-06-30 | ||
|---|---|---|---|---|---|---|---|---|---|---|---|---|---|---|---|---|---|---|---|---|
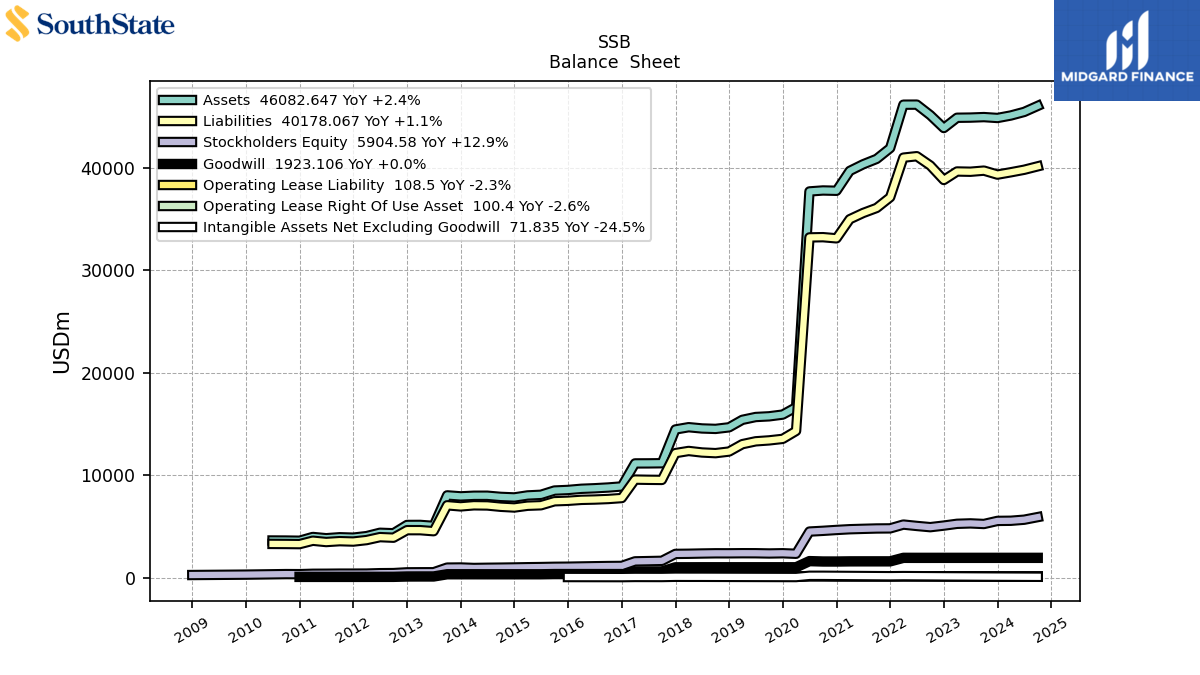
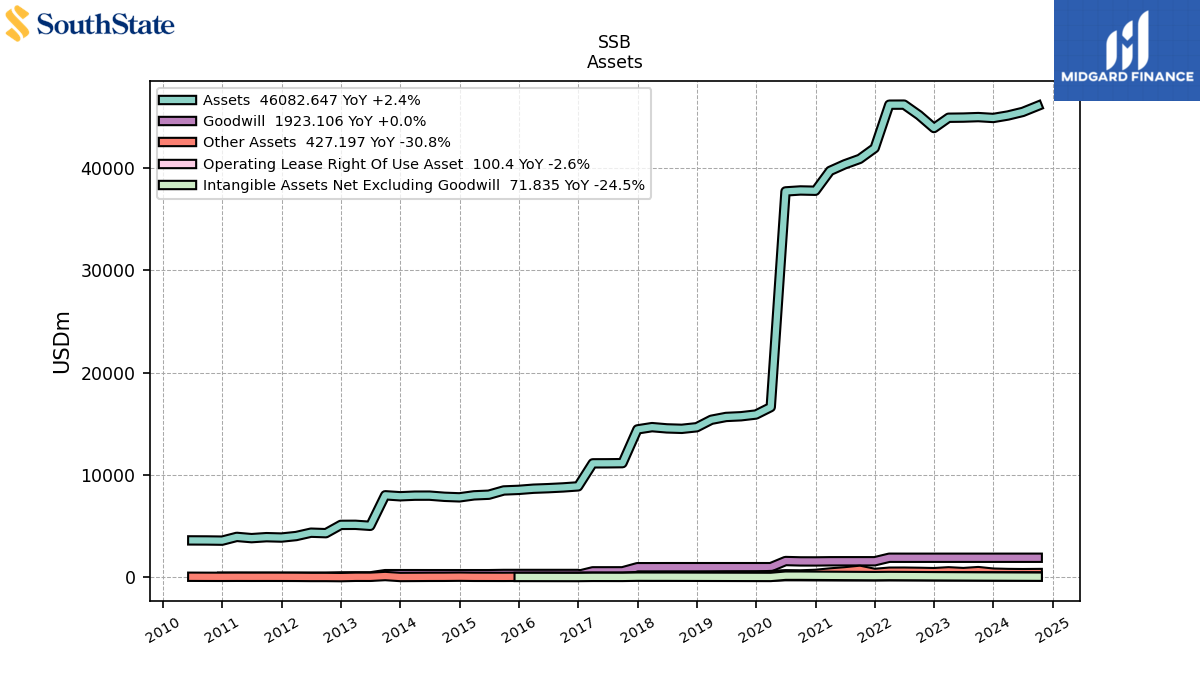
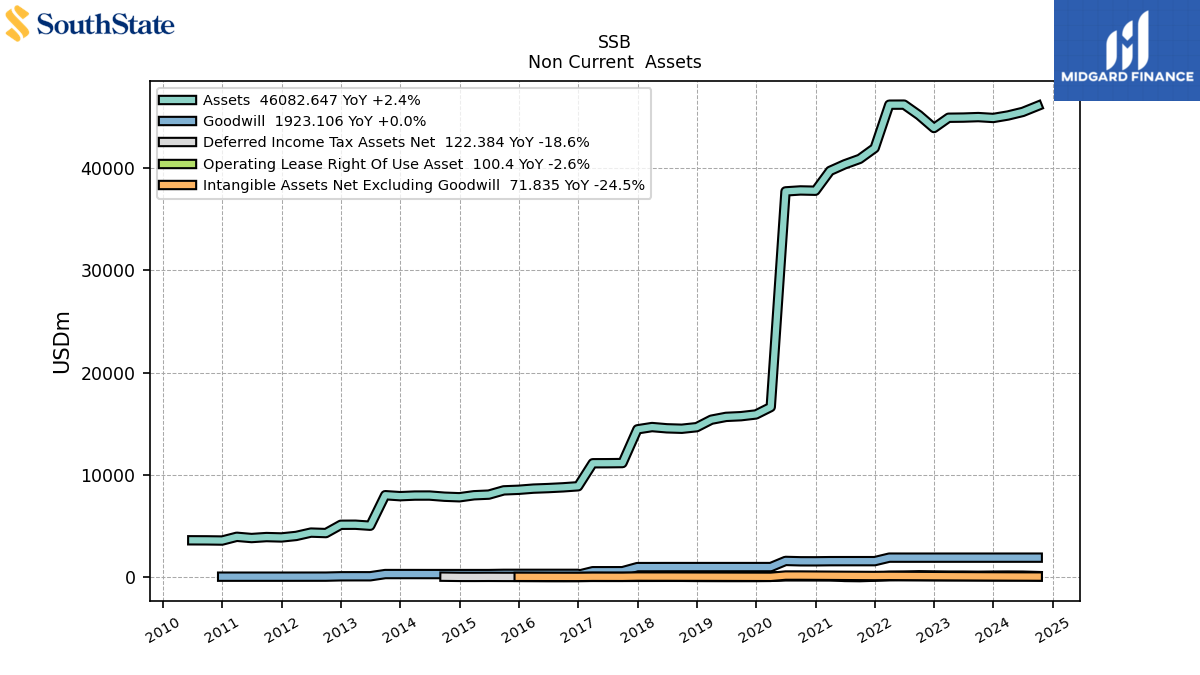
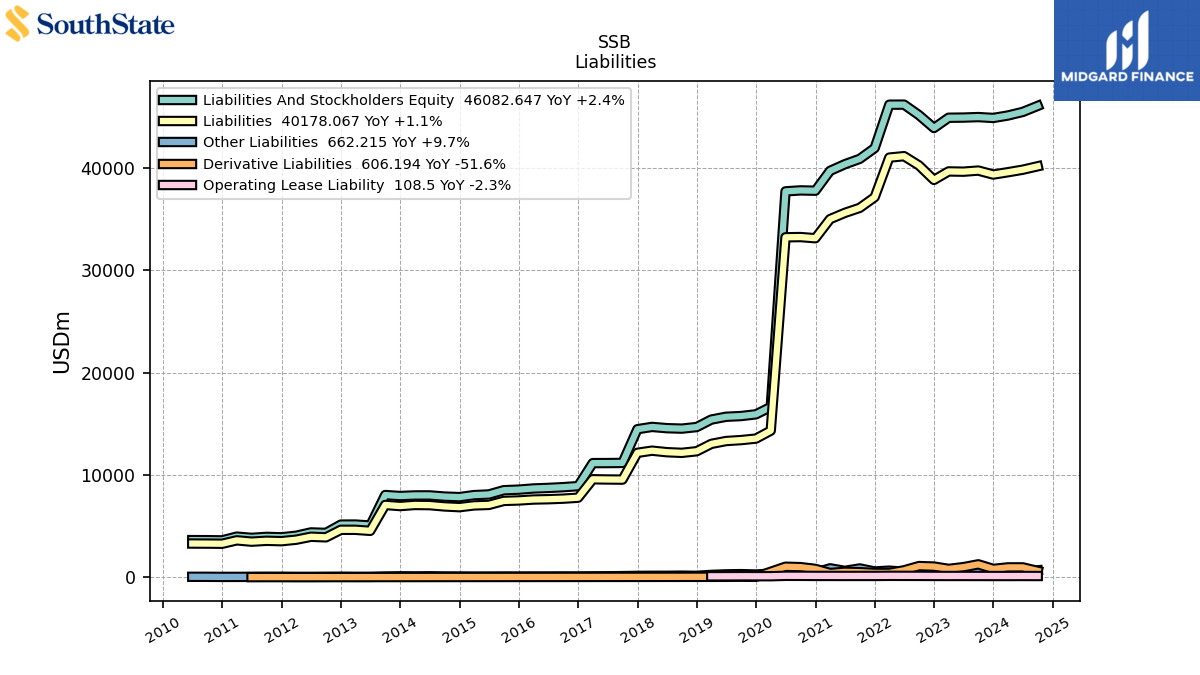
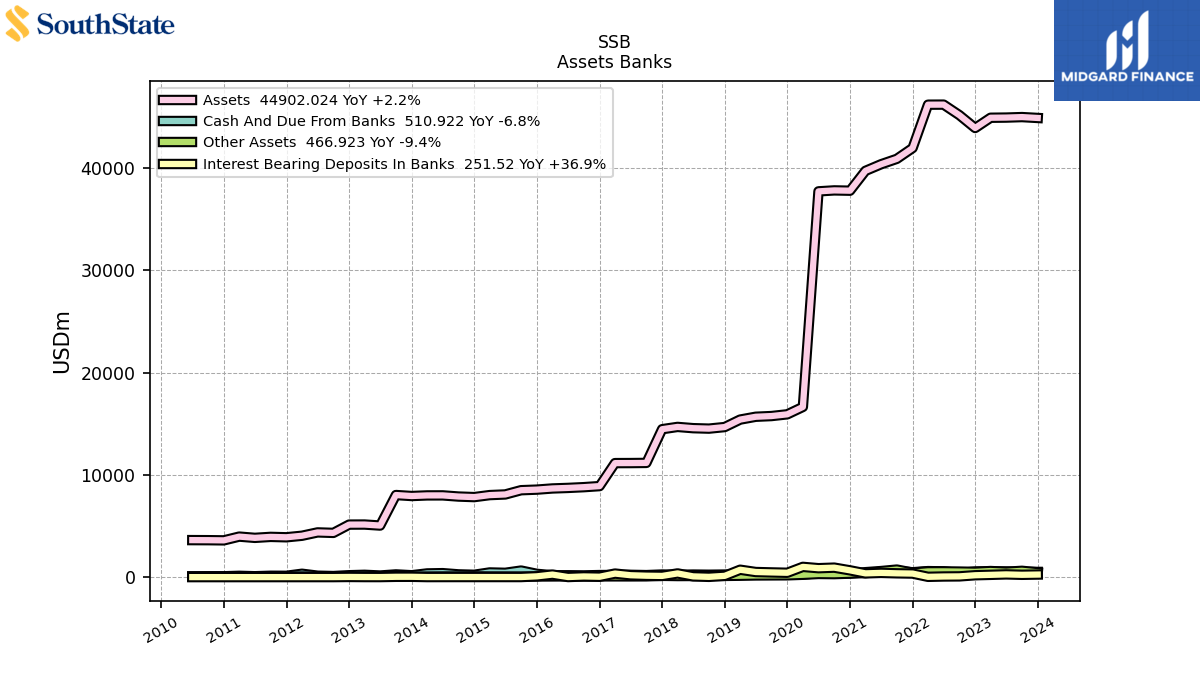
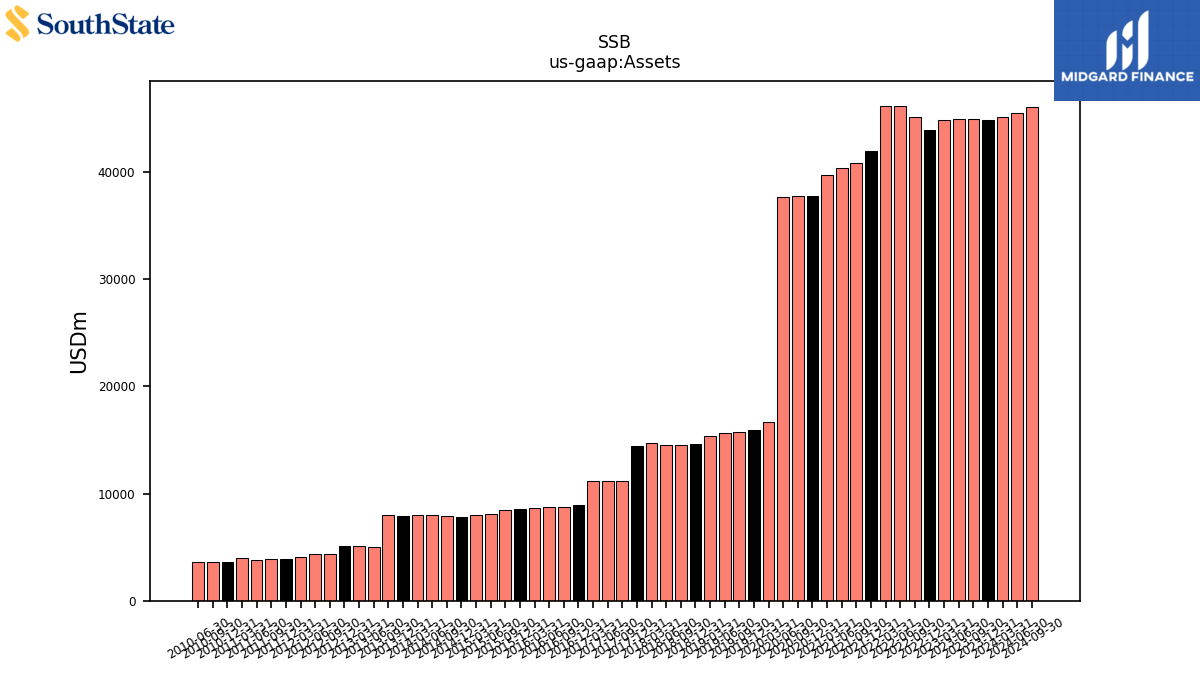
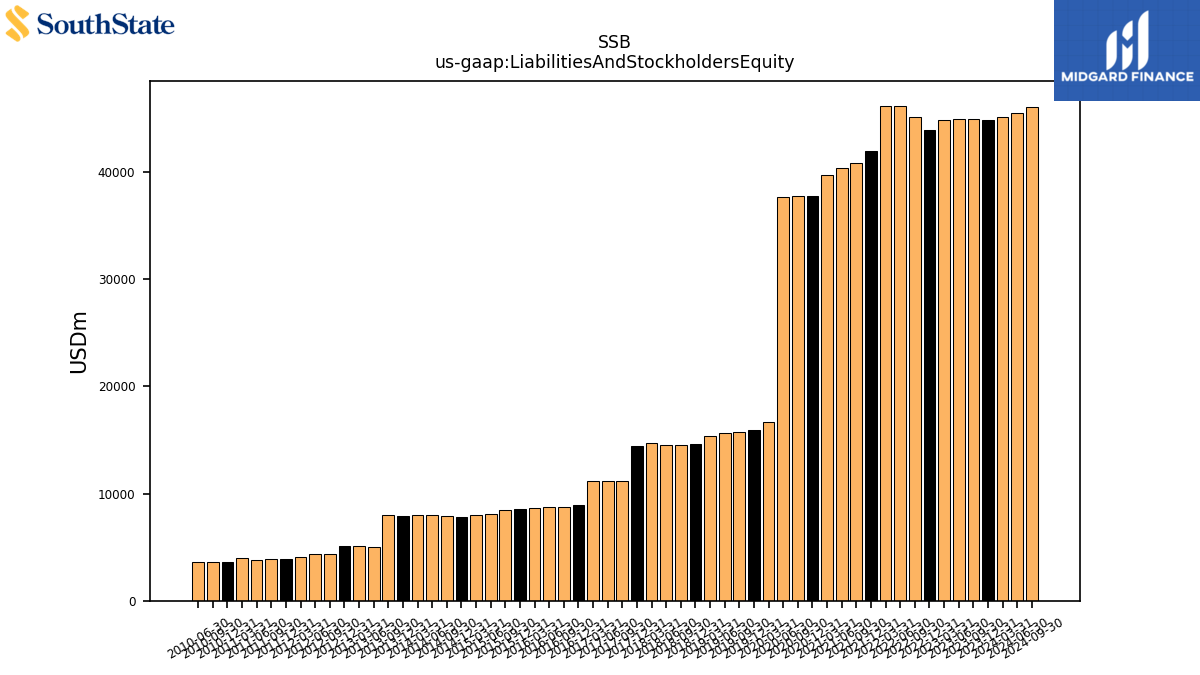
| Assets | 44902.02 | 44989.13 | 44940.33 | 44923.83 | 43918.70 | 45178.61 | 46207.42 | 46201.54 | 41960.03 | 40903.71 | 40375.87 | 39730.33 | 37789.87 | 37819.37 | 37725.36 | 16642.91 | 15921.09 | 15752.08 | 15683.34 | |
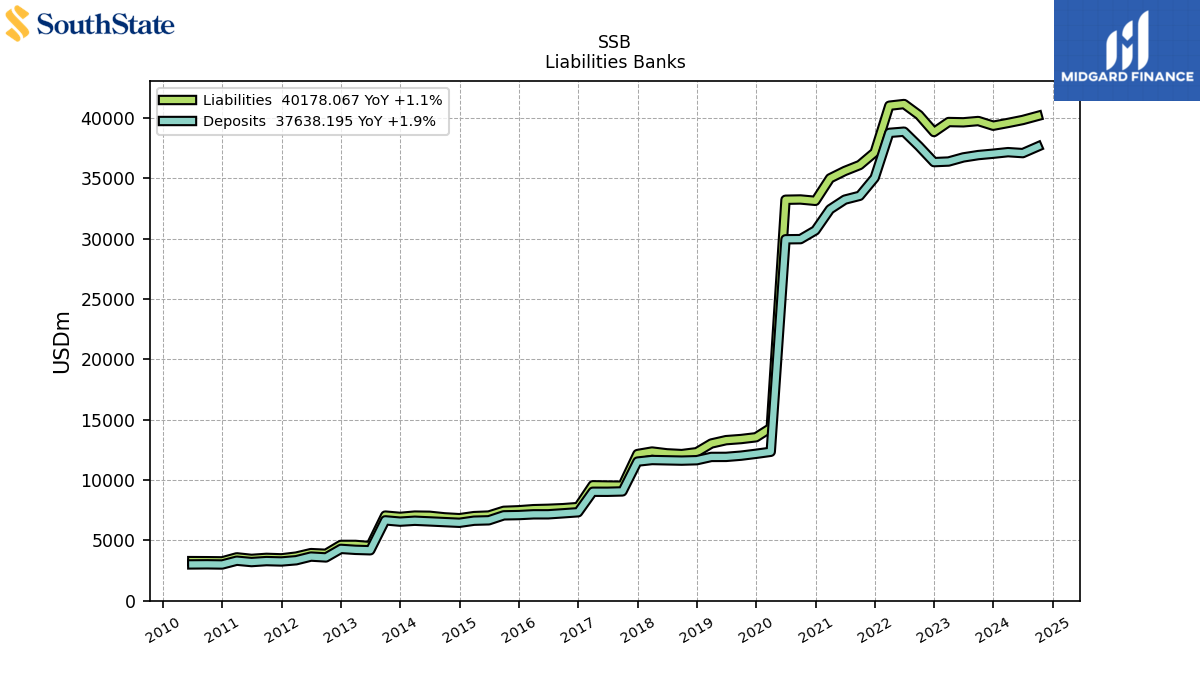
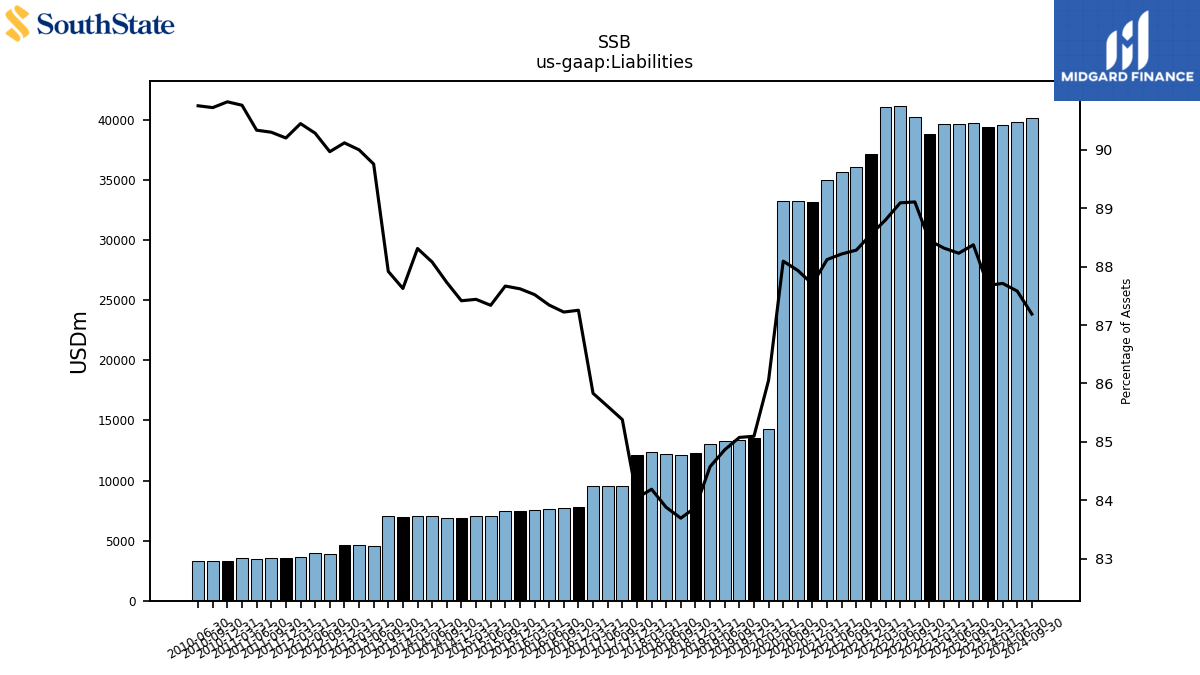
| Liabilities | 39368.93 | 39758.14 | 39650.32 | 39674.82 | 38843.77 | 40257.42 | 41167.00 | 41027.13 | 37157.09 | 36110.77 | 35618.25 | 35010.51 | 33141.99 | 33255.95 | 33233.51 | 14321.87 | 13548.08 | 13401.13 | 13309.36 | |
| Liabilities And Stockholders Equity | 44902.02 | 44989.13 | 44940.33 | 44923.83 | 43918.70 | 45178.61 | 46207.42 | 46201.54 | 41960.03 | 40903.71 | 40375.87 | 39730.33 | 37789.87 | 37819.37 | 37725.36 | 16642.91 | 15921.09 | 15752.08 | 15683.34 | |
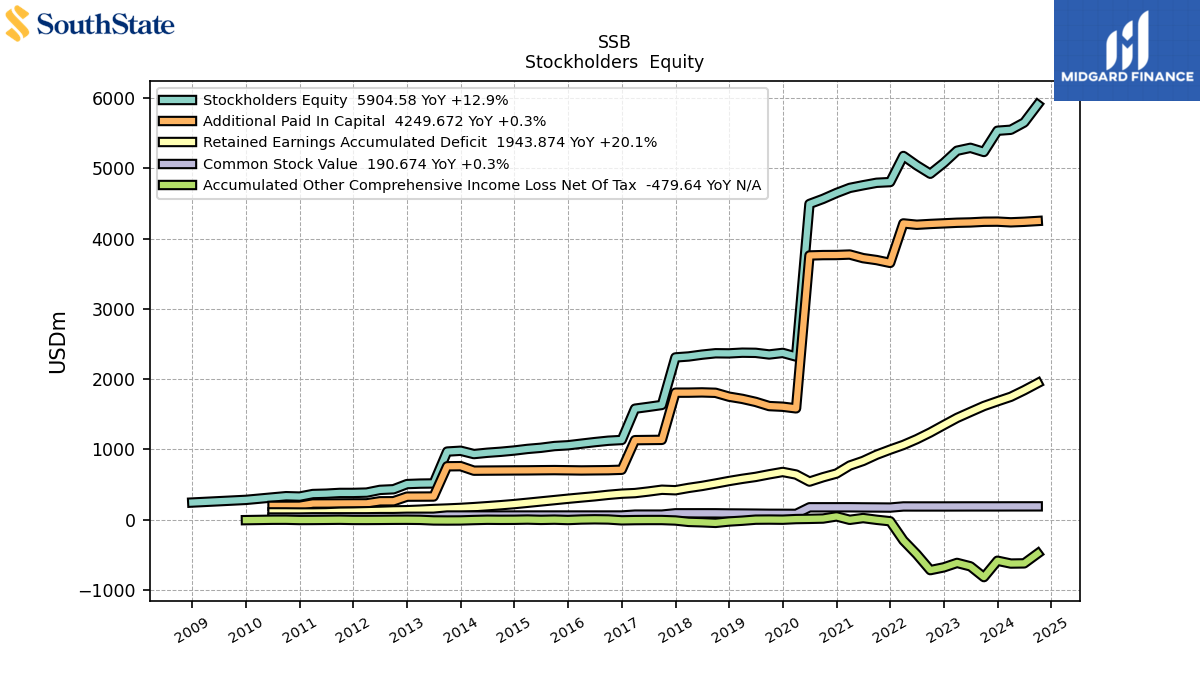
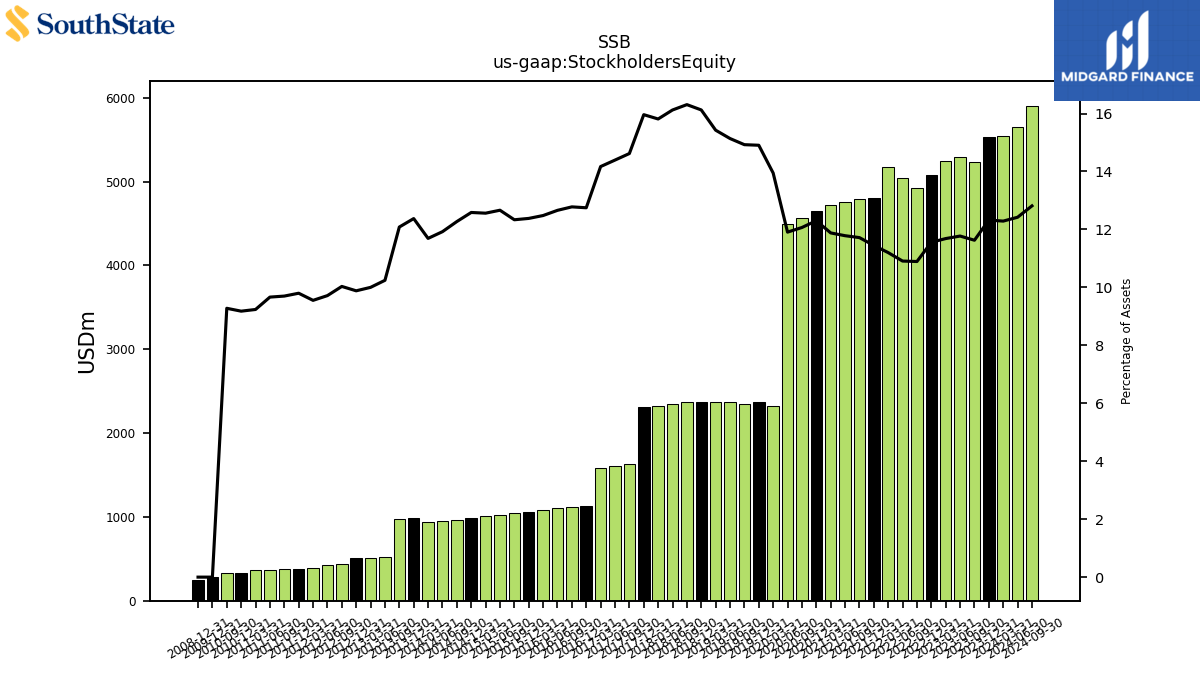
| Stockholders Equity | 5533.10 | 5230.99 | 5290.01 | 5249.00 | 5074.93 | 4921.19 | 5040.43 | 5174.41 | 4802.94 | 4792.94 | 4757.62 | 4719.82 | 4647.88 | 4563.41 | 4491.85 | 2321.04 | 2373.01 | 2350.96 | 2373.98 | |
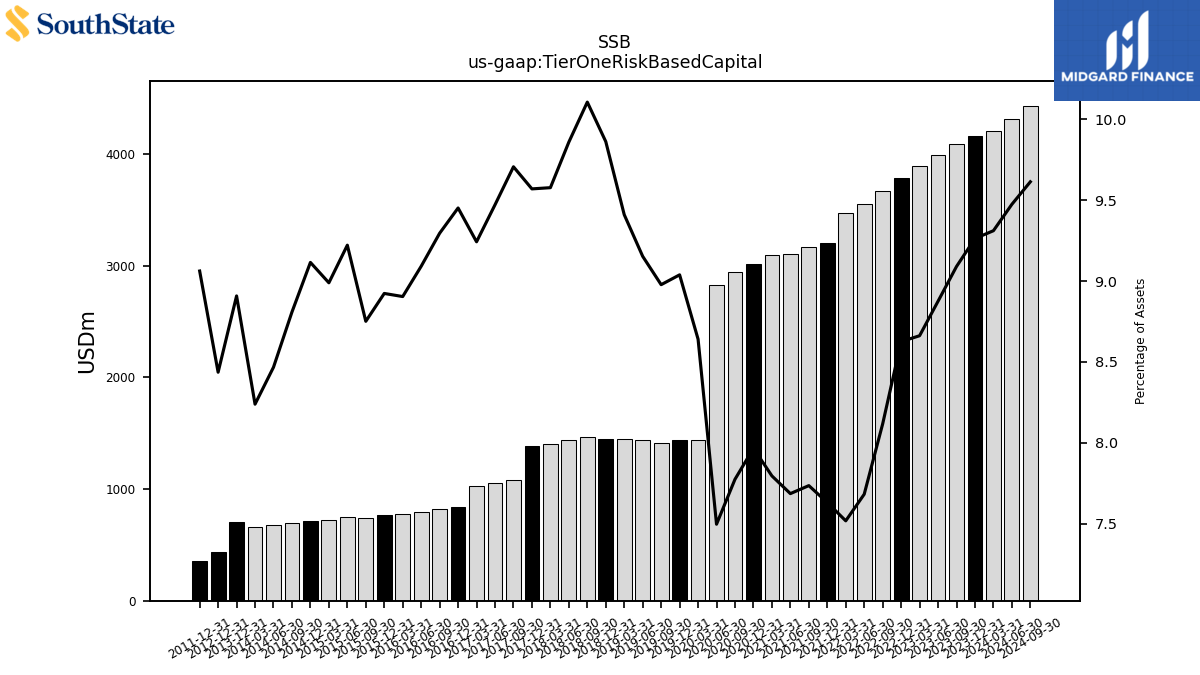
| Tier One Risk Based Capital | 4159.19 | 4089.42 | 3988.47 | 3891.16 | 3788.11 | 3666.83 | 3549.38 | 3472.95 | 3201.64 | 3163.77 | 3102.96 | 3096.86 | 3010.17 | 2940.04 | 2827.85 | 1438.04 | 1438.99 | 1414.14 | 1435.47 |
| 2023-12-31 | 2023-09-30 | 2023-06-30 | 2023-03-31 | 2022-12-31 | 2022-09-30 | 2022-06-30 | 2022-03-31 | 2021-12-31 | 2021-09-30 | 2021-06-30 | 2021-03-31 | 2020-12-31 | 2020-09-30 | 2020-06-30 | 2020-03-31 | 2019-12-31 | 2019-09-30 | 2019-06-30 | ||
|---|---|---|---|---|---|---|---|---|---|---|---|---|---|---|---|---|---|---|---|---|
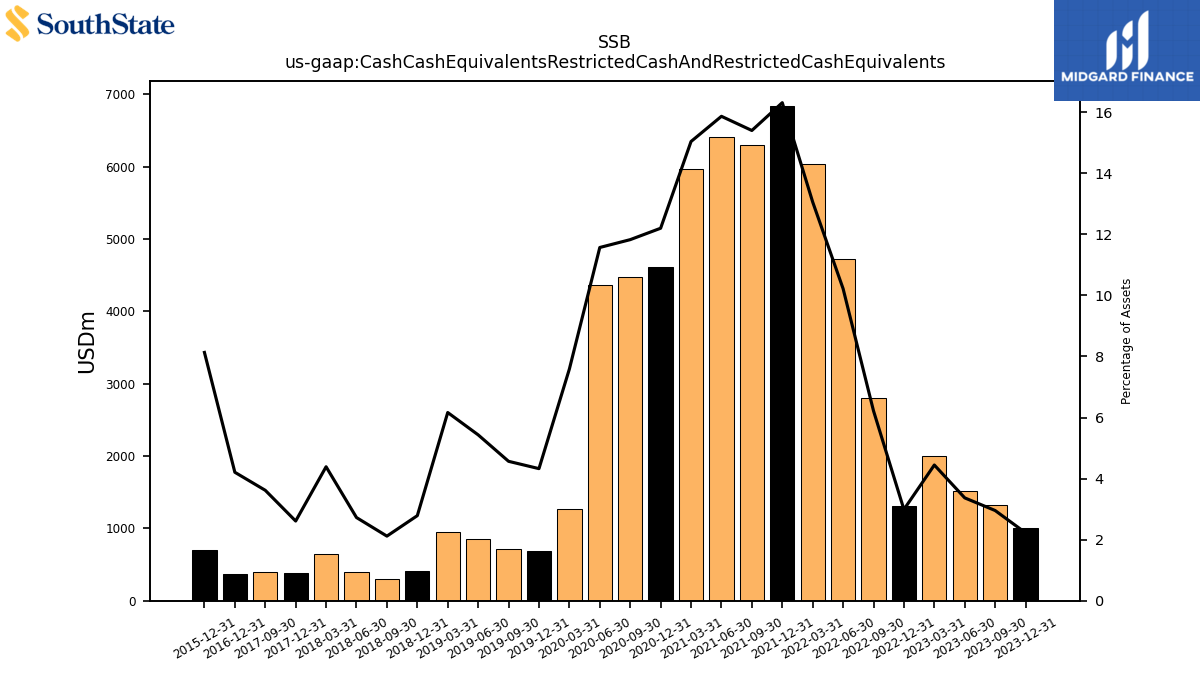
| Cash Cash Equivalents Restricted Cash And Restricted Cash Equivalents | 998.88 | 1329.14 | 1513.75 | 1996.66 | 1312.56 | 2809.70 | 4722.10 | 6032.61 | 6843.15 | 6298.32 | 6404.51 | 5974.14 | 4609.26 | 4471.64 | 4363.71 | 1262.84 | 688.70 | 719.19 | 851.97 |
| 2023-12-31 | 2023-09-30 | 2023-06-30 | 2023-03-31 | 2022-12-31 | 2022-09-30 | 2022-06-30 | 2022-03-31 | 2021-12-31 | 2021-09-30 | 2021-06-30 | 2021-03-31 | 2020-12-31 | 2020-09-30 | 2020-06-30 | 2020-03-31 | 2019-12-31 | 2019-09-30 | 2019-06-30 | ||
|---|---|---|---|---|---|---|---|---|---|---|---|---|---|---|---|---|---|---|---|---|
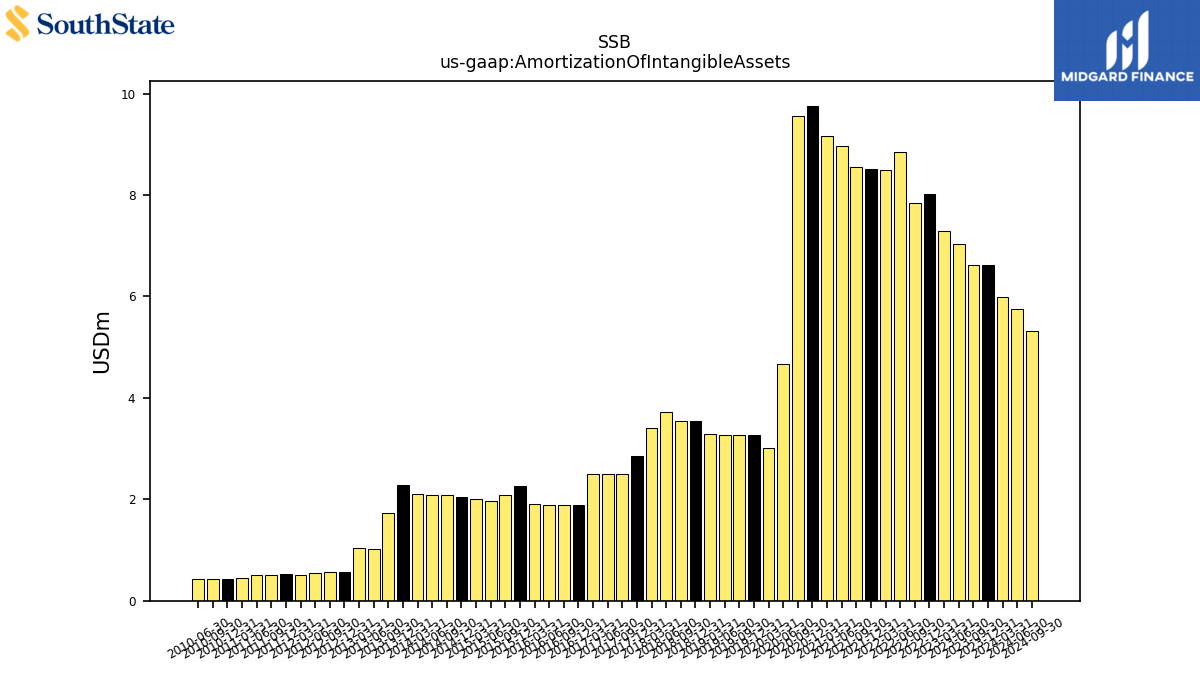
| Amortization Of Intangible Assets | 6.62 | 6.62 | 7.03 | 7.30 | 8.03 | 7.84 | 8.85 | 8.49 | 8.52 | 8.54 | 8.97 | 9.16 | 9.76 | 9.56 | 4.67 | 3.01 | 3.27 | 3.27 | 3.27 | |
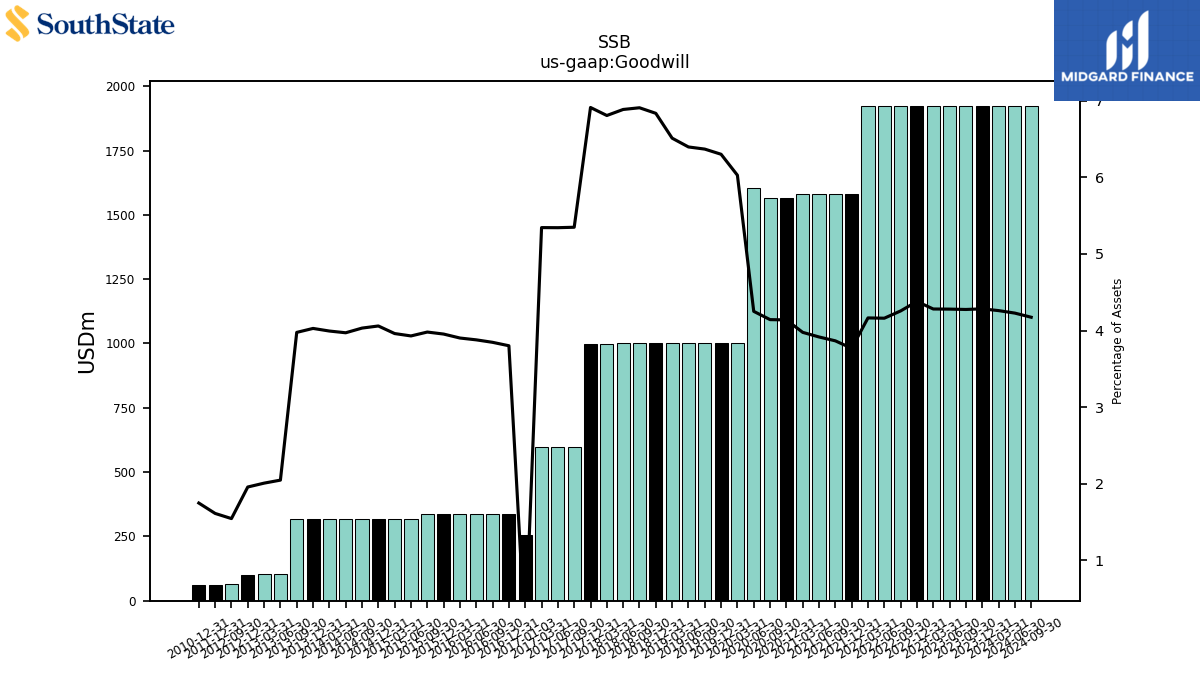
| Goodwill | 1923.11 | 1923.11 | 1923.11 | 1923.11 | 1923.11 | 1922.53 | 1922.53 | 1924.02 | 1581.09 | 1581.09 | 1581.09 | 1579.76 | 1563.94 | 1566.52 | 1603.38 | 1002.90 | 1002.90 | 1002.90 | 1002.90 | |
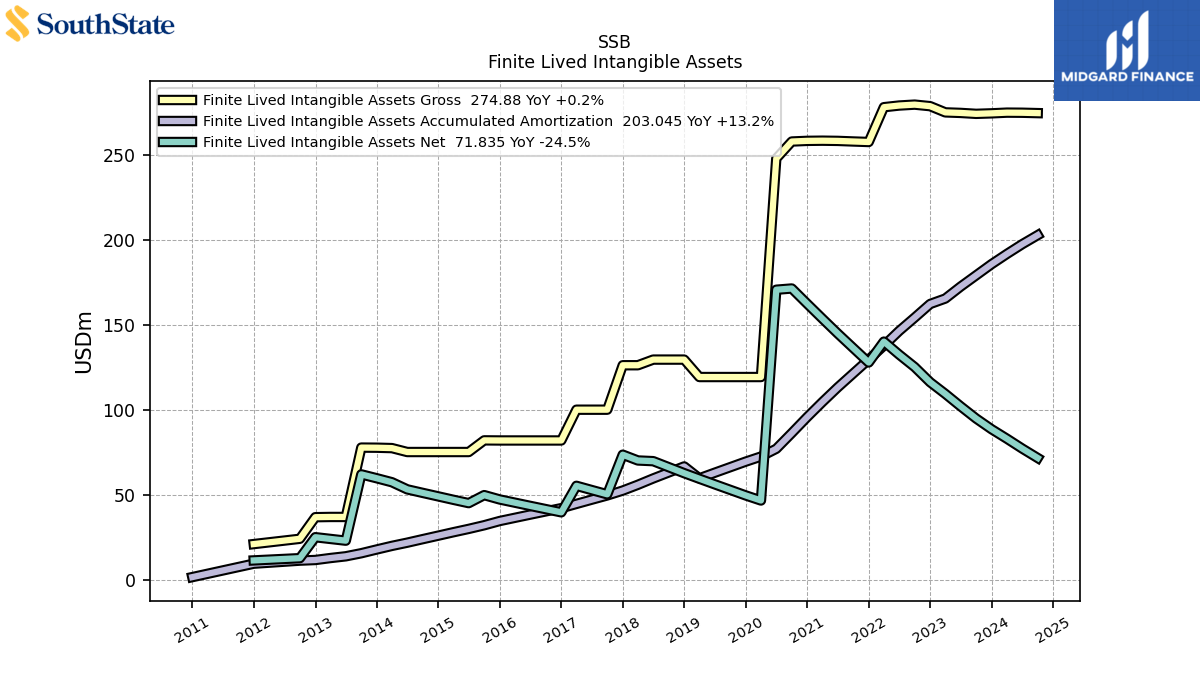
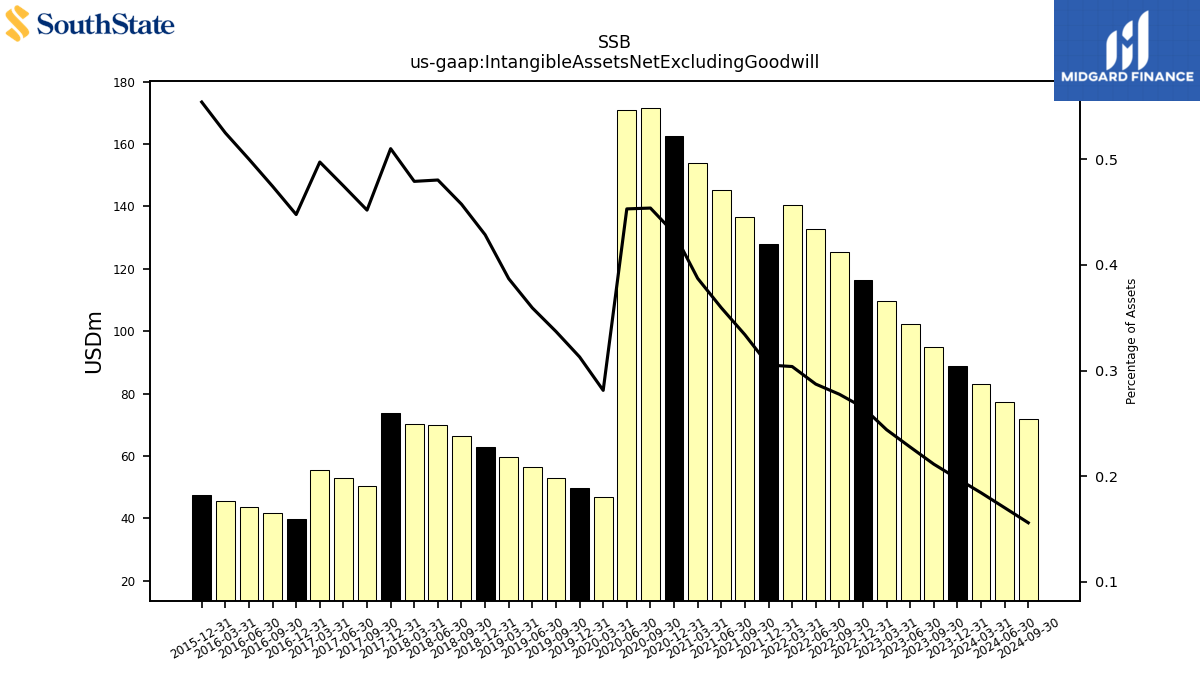
| Intangible Assets Net Excluding Goodwill | 88.78 | 95.09 | 102.26 | 109.60 | 116.45 | 125.39 | 132.69 | 140.36 | 128.07 | 136.58 | 145.13 | 153.86 | 162.59 | 171.64 | 170.91 | 46.81 | 49.82 | 53.08 | 56.35 | |
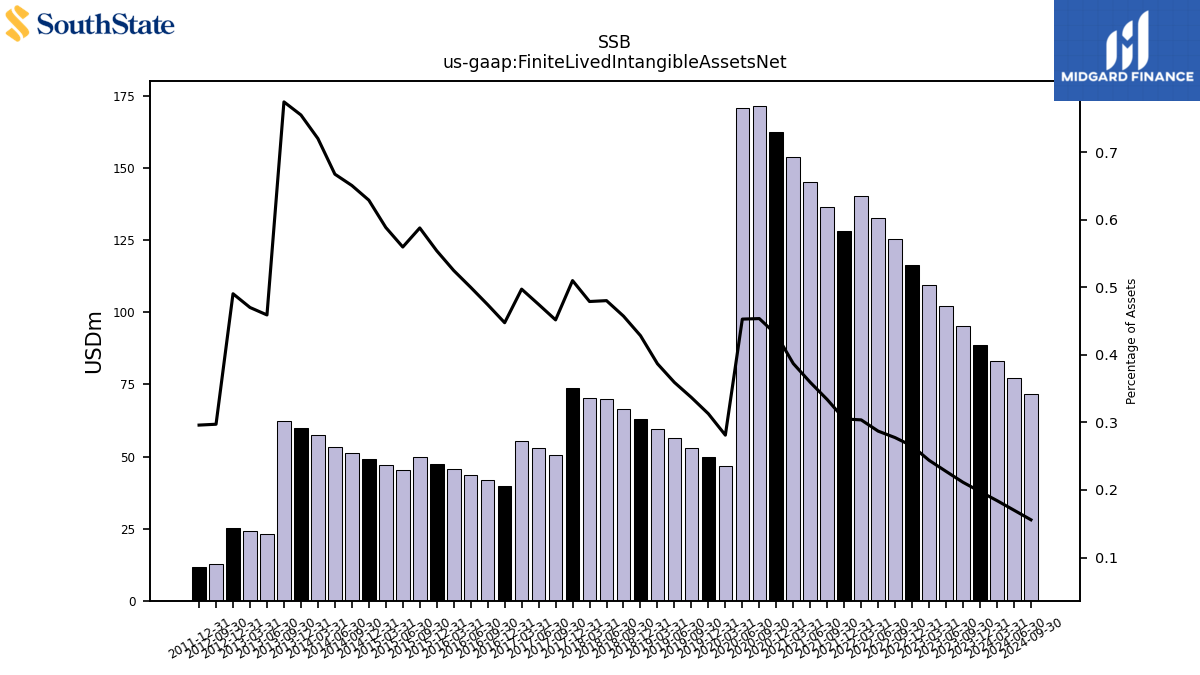
| Finite Lived Intangible Assets Net | 88.78 | 95.09 | 102.26 | 109.60 | 116.45 | 125.39 | 132.69 | 140.36 | 128.07 | 136.58 | 145.13 | 153.86 | 162.59 | 171.64 | 170.91 | 46.81 | 49.82 | 53.08 | 56.35 | |
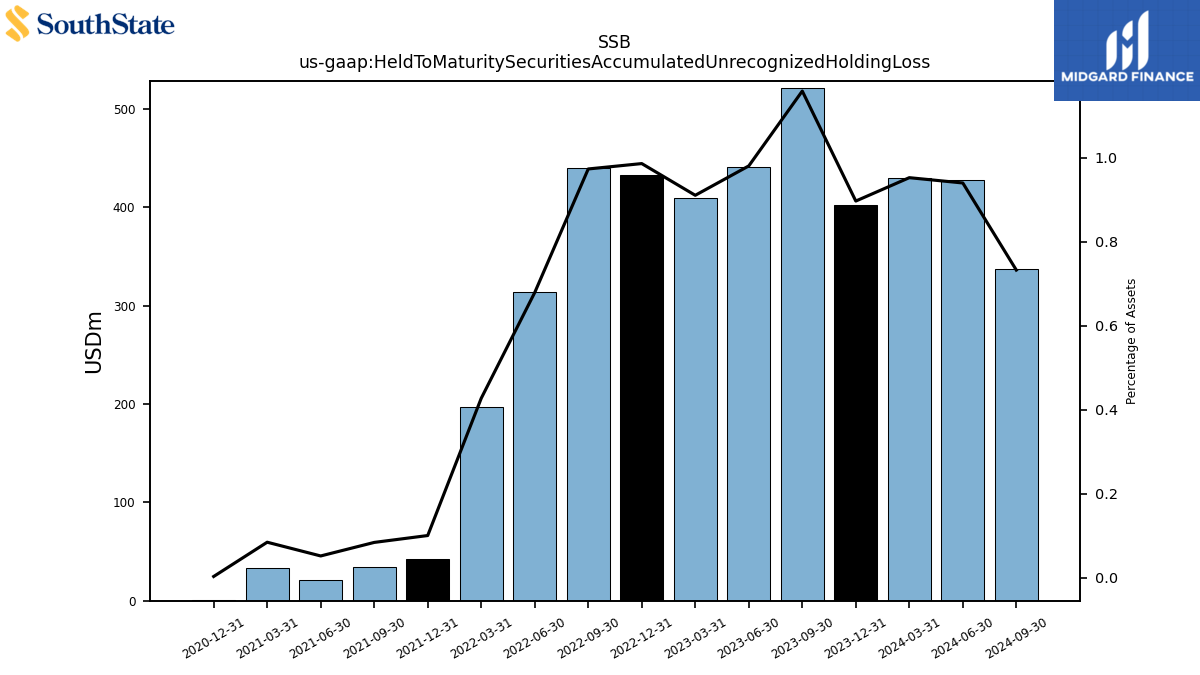
| Held To Maturity Securities Accumulated Unrecognized Holding Loss | 402.70 | 521.31 | 440.64 | 409.06 | 433.07 | 439.71 | 313.78 | 197.38 | 42.16 | 34.38 | 20.93 | 33.59 | 1.12 | NA | NA | NA | NA | NA | NA | |
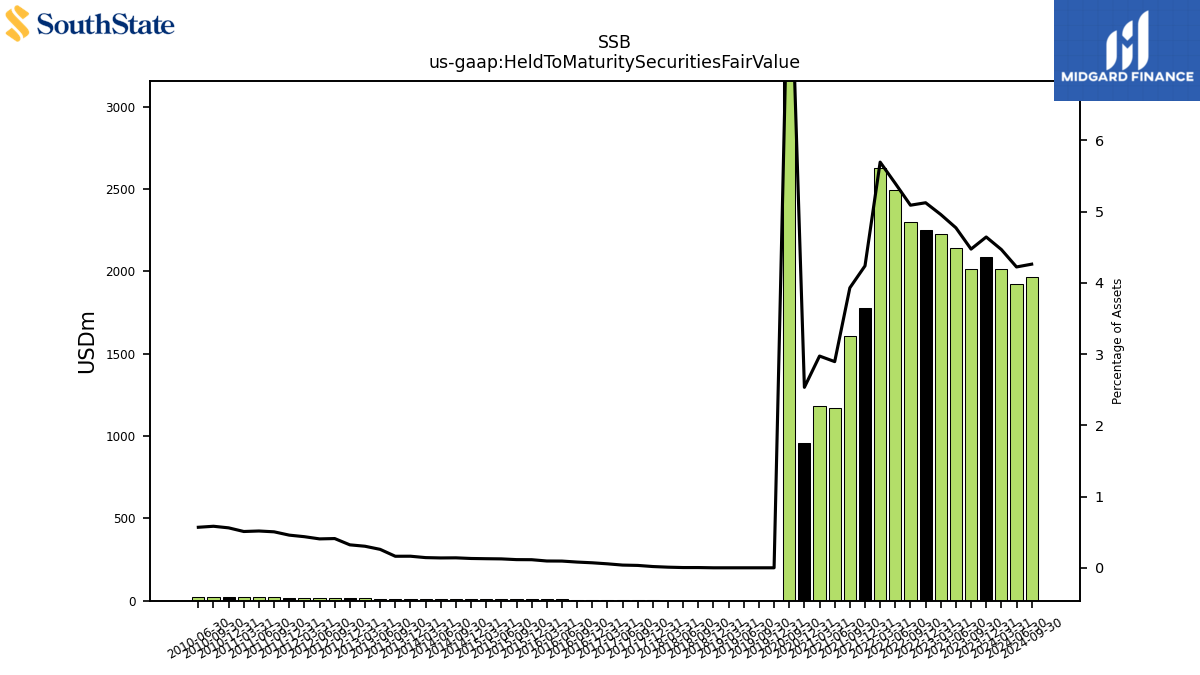
| Held To Maturity Securities Fair Value | 2084.74 | 2012.40 | 2144.51 | 2227.61 | 2250.17 | 2299.16 | 2492.69 | 2630.49 | 1778.06 | 1607.18 | 1168.39 | 1180.76 | 957.18 | 3498.09 | NA | NA | 0.00 | 0.00 | 0.00 | |
| Held To Maturity Securities Accumulated Unrecognized Holding Loss | 402.70 | 521.31 | 440.64 | 409.06 | 433.07 | 439.71 | 313.78 | 197.38 | 42.16 | 34.38 | 20.93 | 33.59 | 1.12 | NA | NA | NA | NA | NA | NA | |
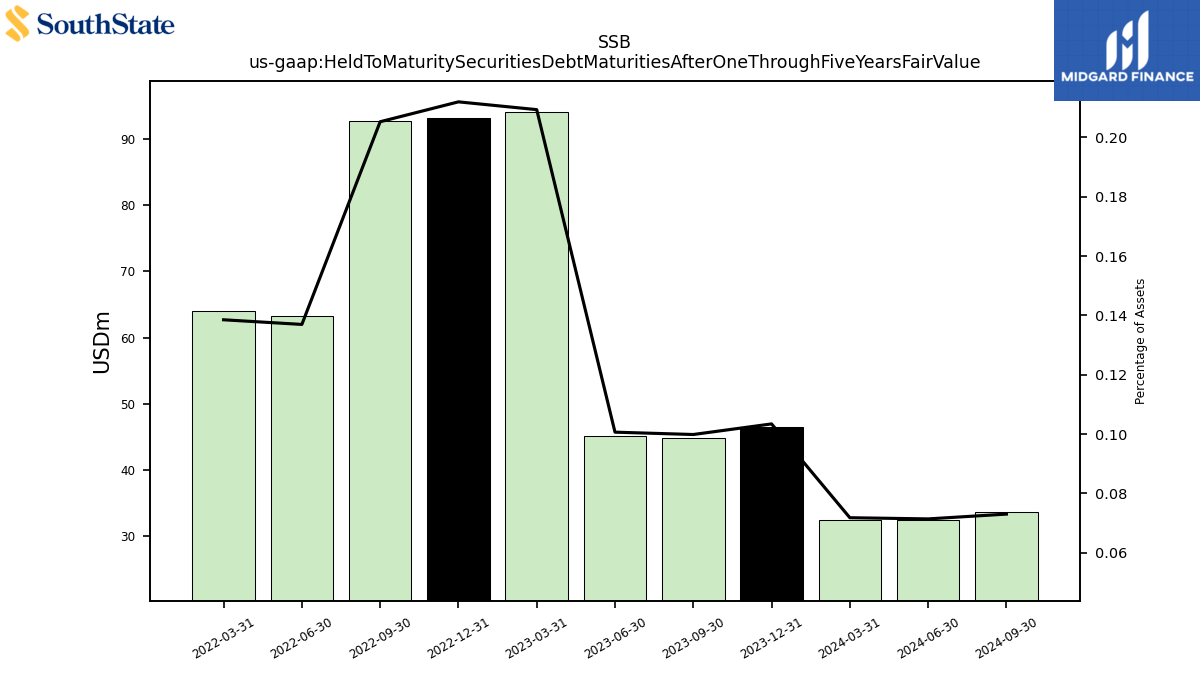
| Held To Maturity Securities Debt Maturities After One Through Five Years Fair Value | 46.44 | 44.92 | 45.23 | 94.06 | 93.11 | 92.75 | 63.29 | 64.00 | NA | NA | NA | NA | NA | NA | NA | NA | NA | NA | NA | |
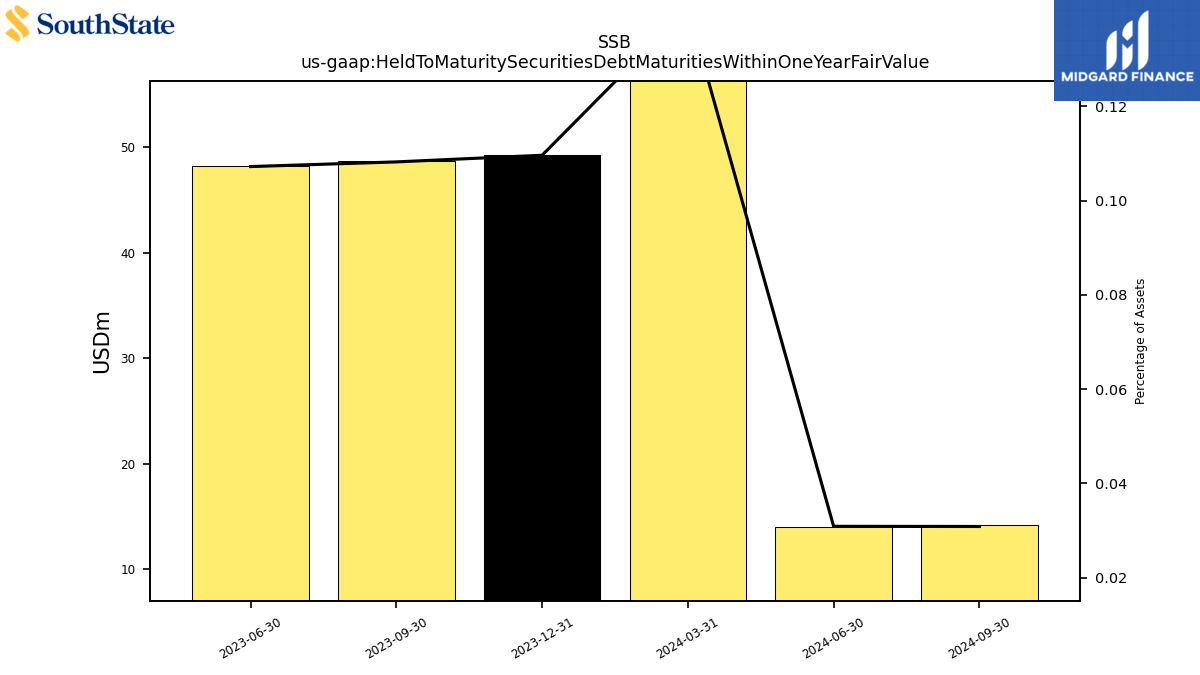
| Held To Maturity Securities Debt Maturities Within One Year Fair Value | 49.22 | 48.68 | 48.19 | NA | NA | NA | NA | NA | NA | NA | NA | NA | NA | NA | NA | NA | NA | NA | NA | |
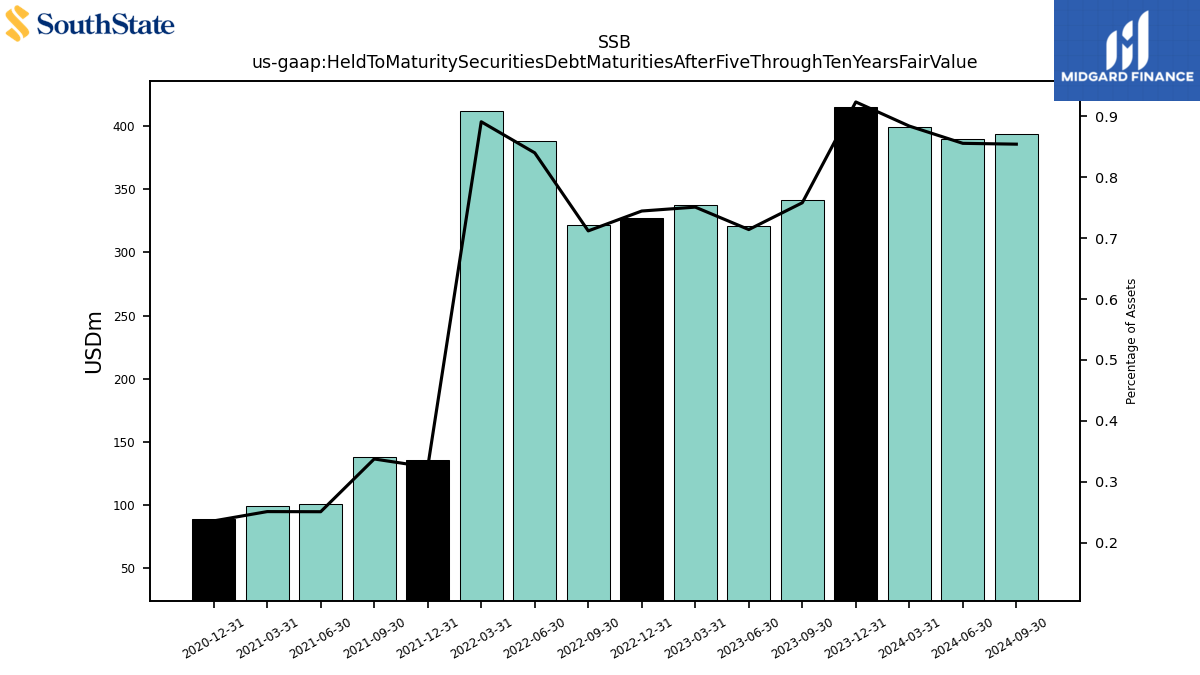
| Held To Maturity Securities Debt Maturities After Five Through Ten Years Fair Value | 414.83 | 341.12 | 320.96 | 337.41 | 327.05 | 321.68 | 388.26 | 411.81 | 135.93 | 137.97 | 101.20 | 99.66 | 89.01 | NA | NA | NA | NA | NA | NA | |
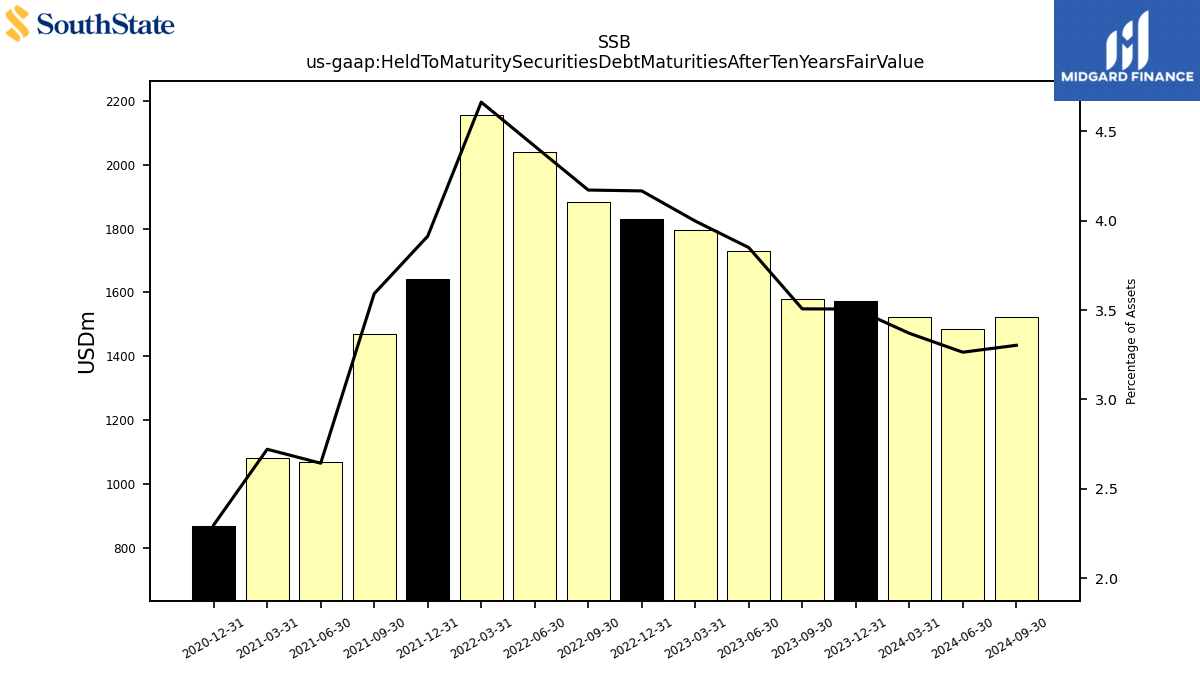
| Held To Maturity Securities Debt Maturities After Ten Years Fair Value | 1574.24 | 1577.67 | 1730.14 | 1796.14 | 1830.02 | 1884.74 | 2041.14 | 2154.69 | 1642.13 | 1469.21 | 1067.19 | 1081.10 | 868.18 | NA | NA | NA | NA | NA | NA |
| 2023-12-31 | 2023-09-30 | 2023-06-30 | 2023-03-31 | 2022-12-31 | 2022-09-30 | 2022-06-30 | 2022-03-31 | 2021-12-31 | 2021-09-30 | 2021-06-30 | 2021-03-31 | 2020-12-31 | 2020-09-30 | 2020-06-30 | 2020-03-31 | 2019-12-31 | 2019-09-30 | 2019-06-30 | ||
|---|---|---|---|---|---|---|---|---|---|---|---|---|---|---|---|---|---|---|---|---|
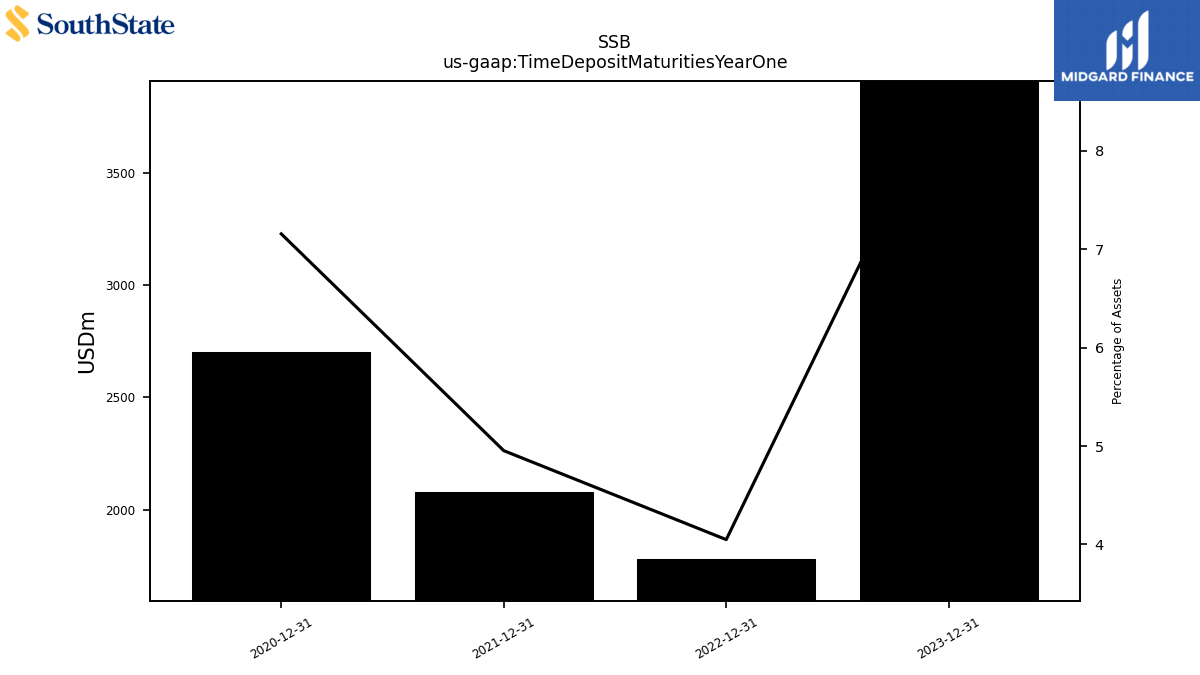
| Time Deposit Maturities Year One | 3910.86 | NA | NA | NA | 1778.37 | NA | NA | NA | 2078.33 | NA | NA | NA | 2704.31 | NA | NA | NA | NA | NA | NA | |
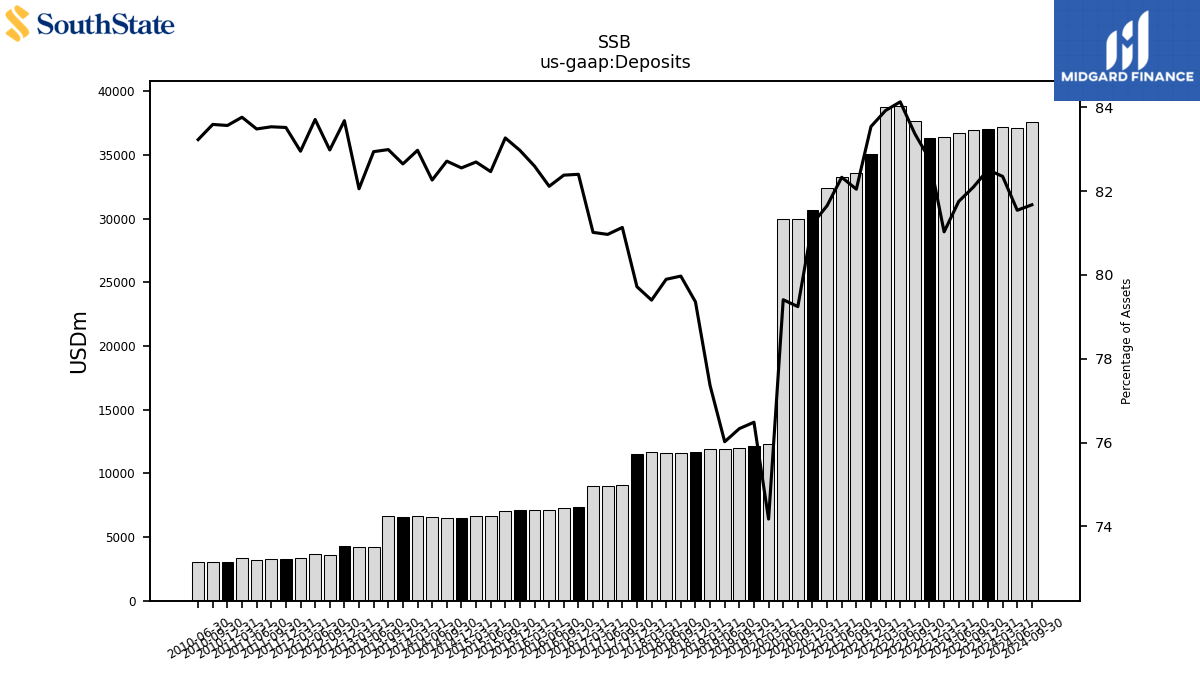
| Deposits | 37048.91 | 36935.20 | 36741.88 | 36401.59 | 36350.62 | 37666.02 | 38875.85 | 38775.83 | 35054.83 | 33560.56 | 33242.37 | 32441.41 | 30693.88 | 29969.95 | 29957.28 | 12344.55 | 12177.10 | 12023.79 | 11922.28 |
| 2023-12-31 | 2023-09-30 | 2023-06-30 | 2023-03-31 | 2022-12-31 | 2022-09-30 | 2022-06-30 | 2022-03-31 | 2021-12-31 | 2021-09-30 | 2021-06-30 | 2021-03-31 | 2020-12-31 | 2020-09-30 | 2020-06-30 | 2020-03-31 | 2019-12-31 | 2019-09-30 | 2019-06-30 | ||
|---|---|---|---|---|---|---|---|---|---|---|---|---|---|---|---|---|---|---|---|---|
| Stockholders Equity | 5533.10 | 5230.99 | 5290.01 | 5249.00 | 5074.93 | 4921.19 | 5040.43 | 5174.41 | 4802.94 | 4792.94 | 4757.62 | 4719.82 | 4647.88 | 4563.41 | 4491.85 | 2321.04 | 2373.01 | 2350.96 | 2373.98 | |
| Common Stock Value | 190.06 | 190.04 | 189.99 | 189.65 | 189.26 | 189.19 | 189.10 | 189.40 | 173.33 | 174.79 | 175.96 | 177.65 | 177.43 | 177.32 | 177.27 | 83.61 | 84.36 | 84.76 | 86.84 | |
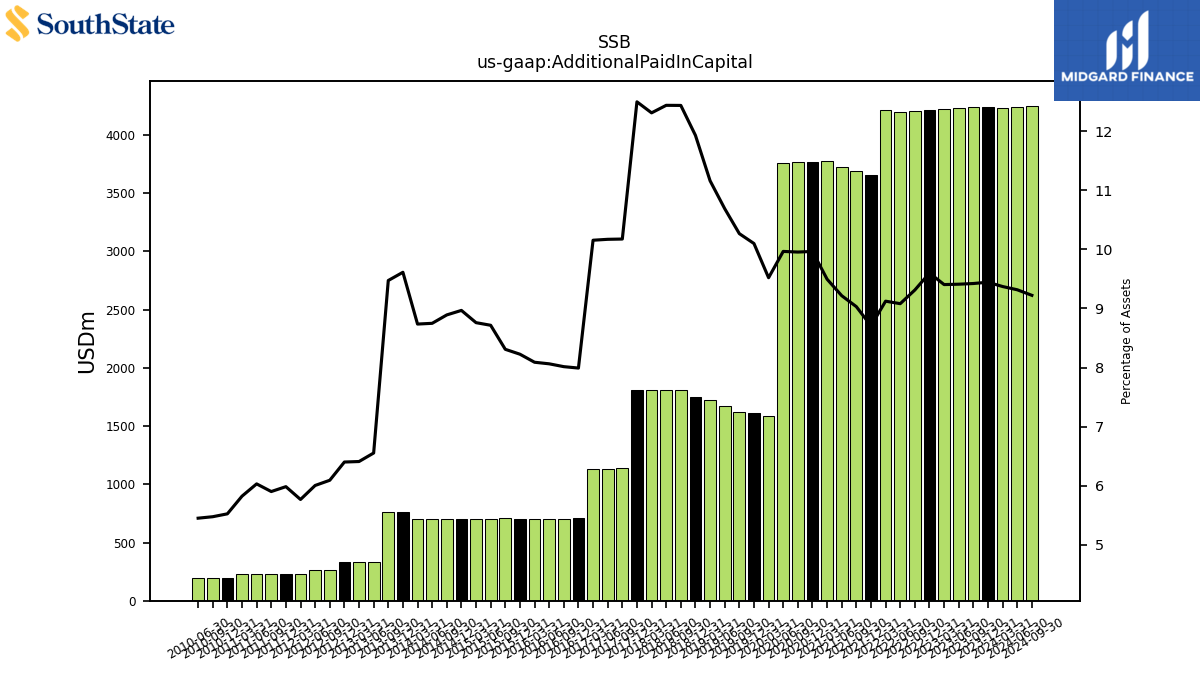
| Additional Paid In Capital | 4240.41 | 4238.75 | 4228.91 | 4224.50 | 4215.71 | 4207.04 | 4195.98 | 4214.90 | 3653.10 | 3693.62 | 3720.95 | 3772.25 | 3765.41 | 3764.48 | 3759.17 | 1584.32 | 1607.74 | 1617.00 | 1676.23 | |
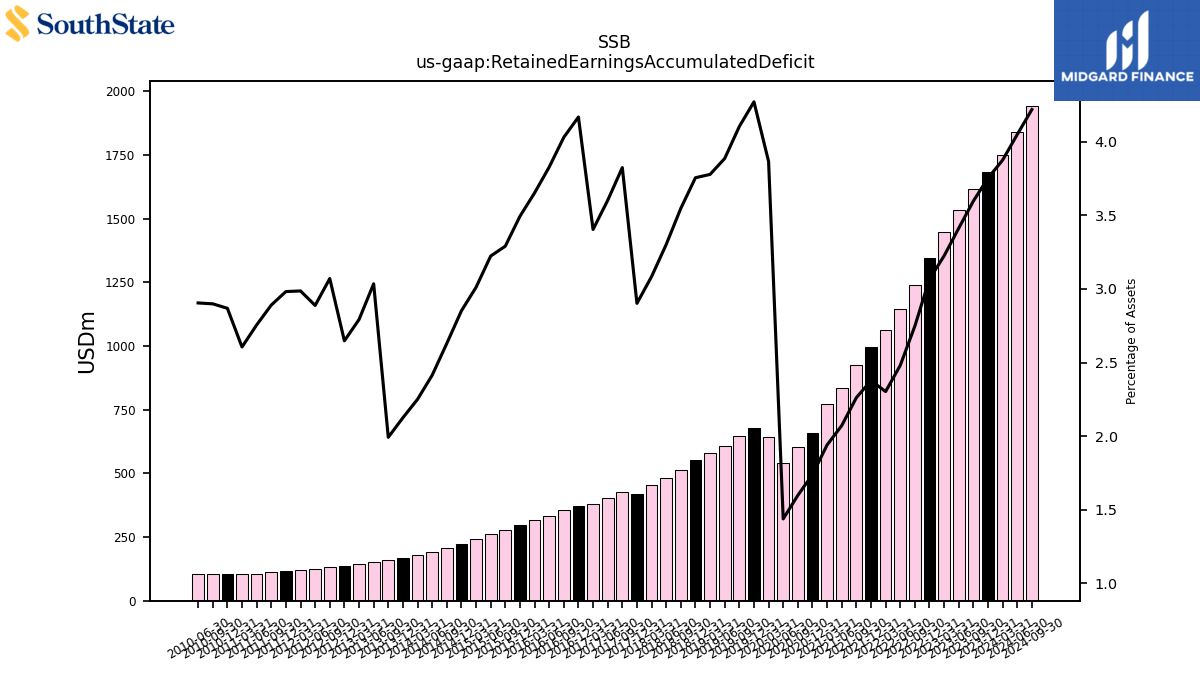
| Retained Earnings Accumulated Deficit | 1685.17 | 1618.08 | 1533.51 | 1448.64 | 1347.04 | 1241.41 | 1146.23 | 1064.06 | 997.66 | 925.04 | 836.58 | 770.95 | 657.45 | 604.56 | 542.68 | 643.35 | 679.89 | 646.33 | 609.44 | |
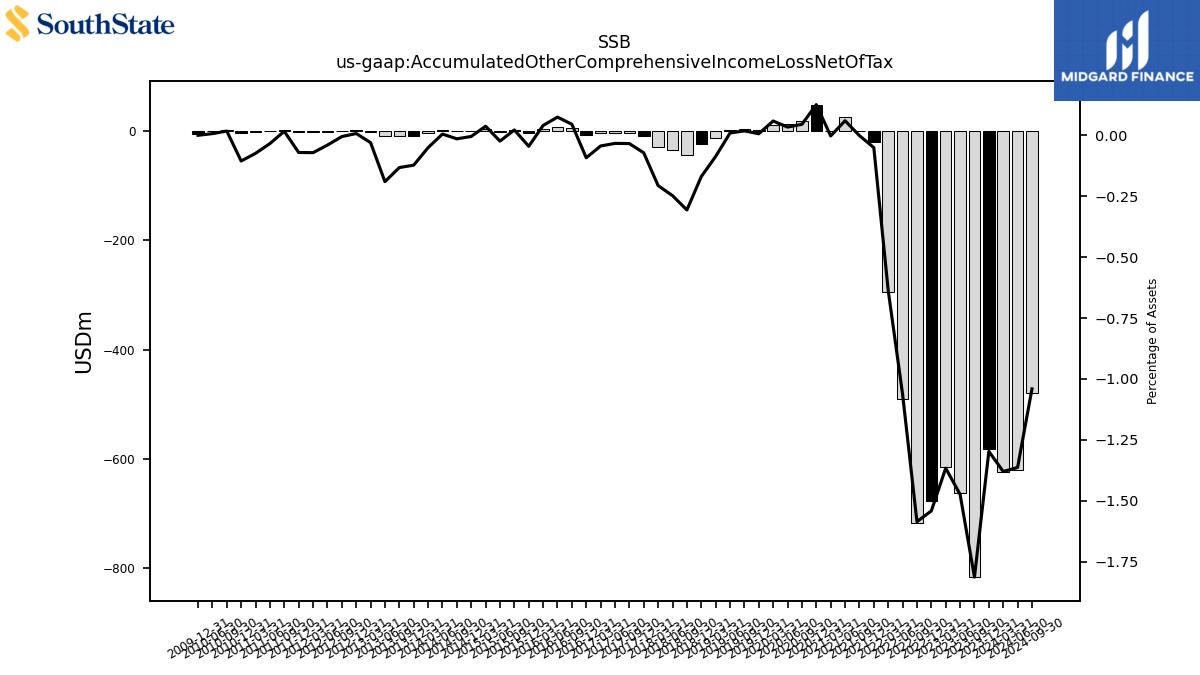
| Accumulated Other Comprehensive Income Loss Net Of Tax | -582.54 | -815.89 | -662.40 | -613.78 | -677.09 | -716.46 | -490.88 | -293.96 | -21.15 | -0.52 | 24.14 | -1.03 | 47.59 | 17.05 | 12.74 | 9.77 | 1.02 | 2.87 | 1.47 | |
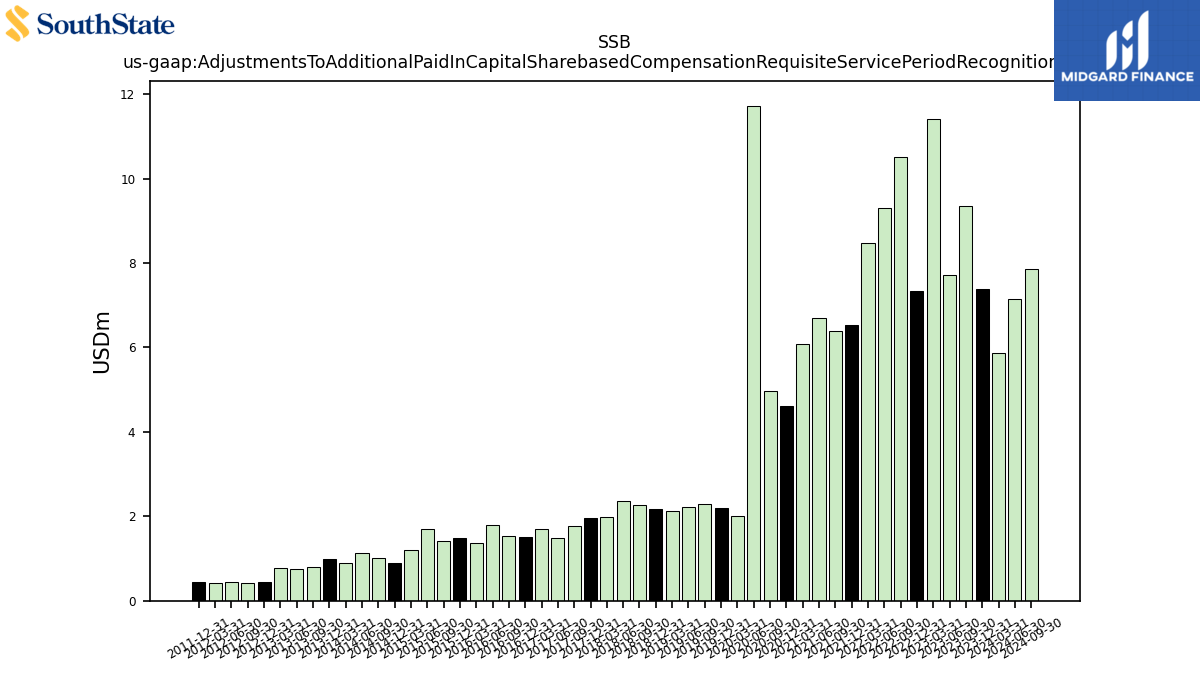
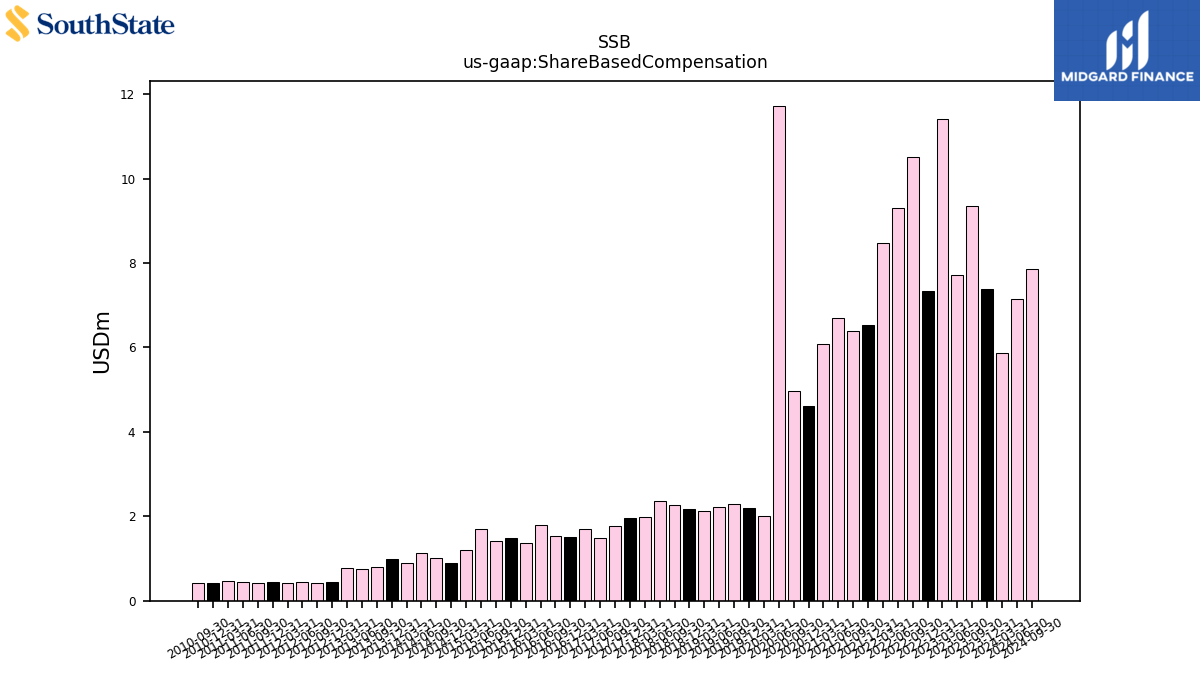
| Adjustments To Additional Paid In Capital Sharebased Compensation Requisite Service Period Recognition Value | 7.38 | 9.36 | 7.71 | 11.42 | 7.33 | 10.51 | 9.31 | 8.49 | 6.53 | 6.40 | 6.71 | 6.09 | 4.62 | 4.96 | 11.73 | 2.01 | 2.20 | 2.29 | 2.23 |
| 2023-12-31 | 2023-09-30 | 2023-06-30 | 2023-03-31 | 2022-12-31 | 2022-09-30 | 2022-06-30 | 2022-03-31 | 2021-12-31 | 2021-09-30 | 2021-06-30 | 2021-03-31 | 2020-12-31 | 2020-09-30 | 2020-06-30 | 2020-03-31 | 2019-12-31 | 2019-09-30 | 2019-06-30 | ||
|---|---|---|---|---|---|---|---|---|---|---|---|---|---|---|---|---|---|---|---|---|
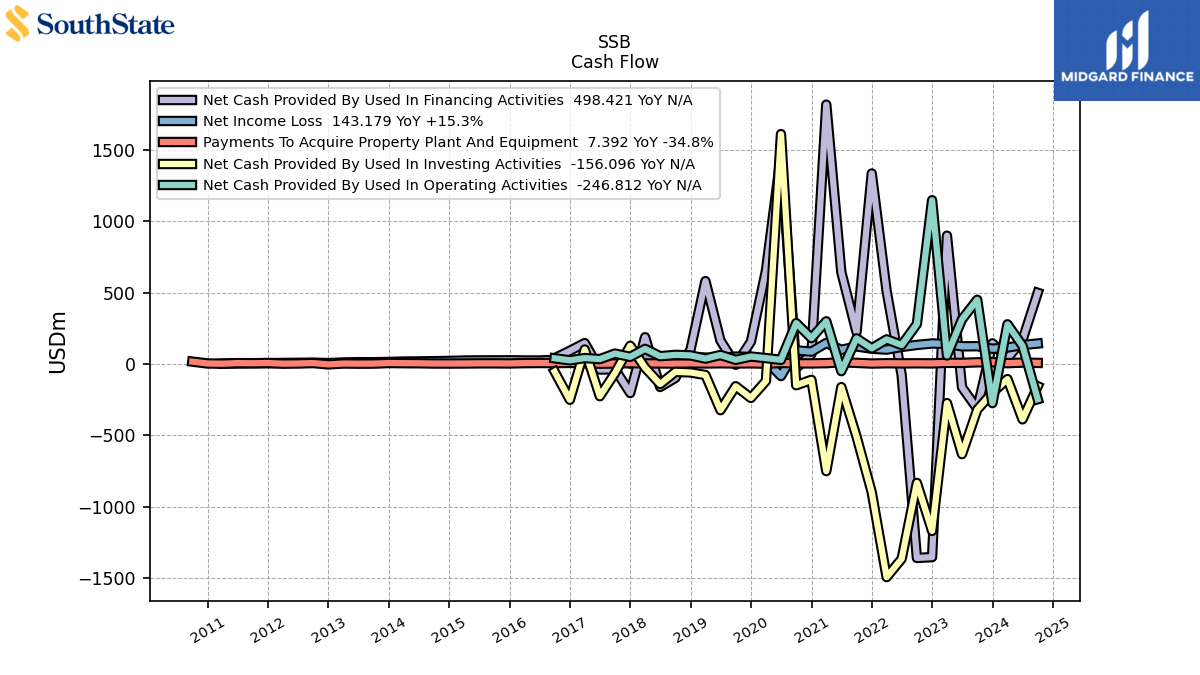
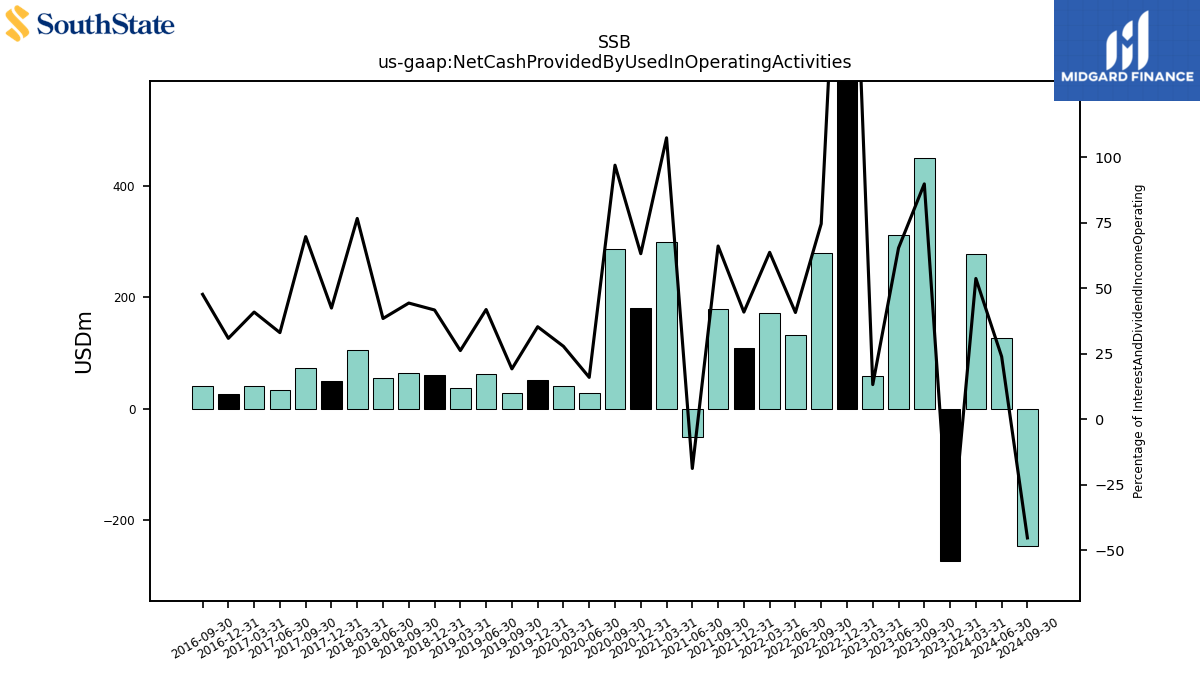
| Net Cash Provided By Used In Operating Activities | -274.32 | 449.42 | 312.27 | 59.38 | 1146.69 | 279.46 | 132.55 | 172.19 | 109.25 | 179.38 | -50.40 | 299.04 | 180.84 | 286.24 | 28.79 | 41.08 | 52.00 | 28.77 | 62.74 | |
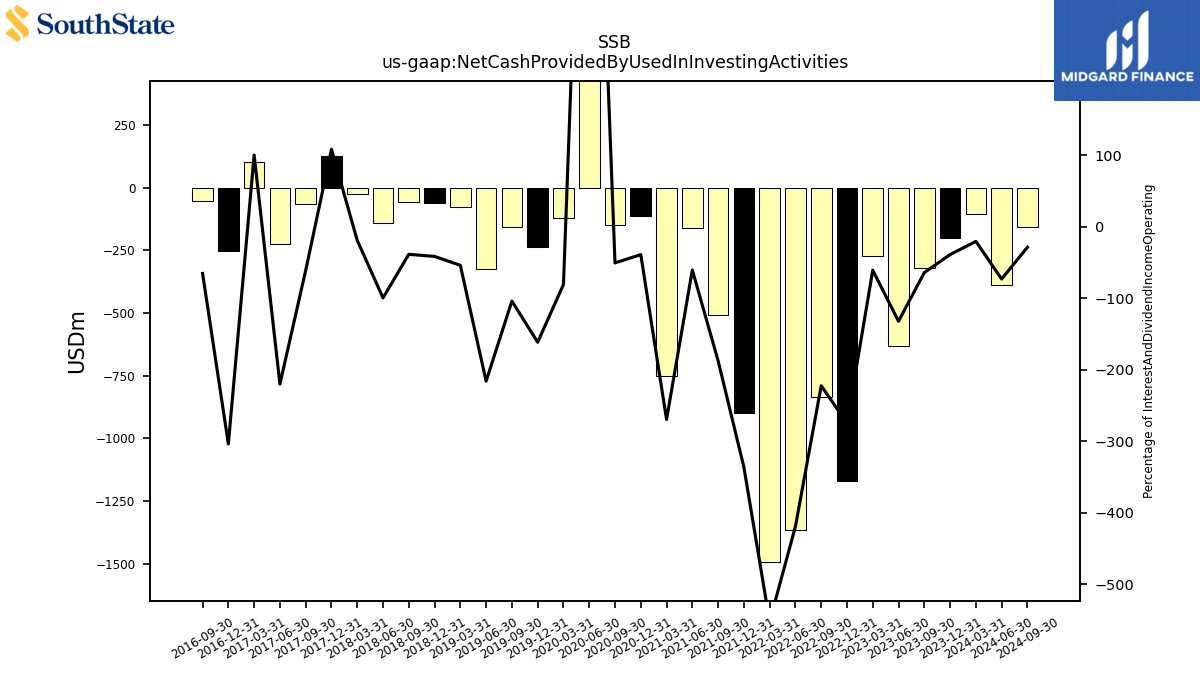
| Net Cash Provided By Used In Investing Activities | -200.40 | -320.52 | -631.67 | -273.85 | -1169.51 | -833.15 | -1364.82 | -1492.91 | -898.64 | -508.38 | -161.87 | -750.37 | -111.50 | -149.22 | 1609.87 | -119.37 | -238.09 | -155.82 | -323.78 | |
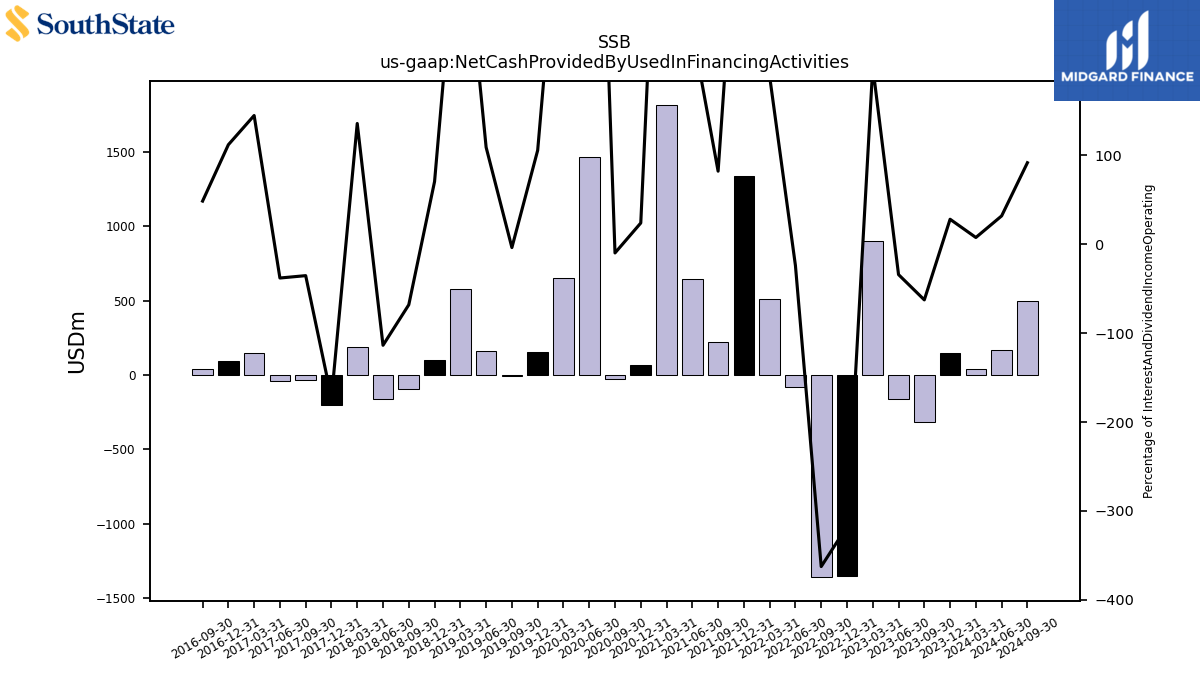
| Net Cash Provided By Used In Financing Activities | 144.46 | -313.51 | -163.52 | 898.57 | -1352.74 | -1358.71 | -78.24 | 510.18 | 1334.21 | 222.82 | 642.64 | 1816.22 | 68.27 | -29.08 | 1462.22 | 652.42 | 155.60 | -5.73 | 163.42 |
| 2023-12-31 | 2023-09-30 | 2023-06-30 | 2023-03-31 | 2022-12-31 | 2022-09-30 | 2022-06-30 | 2022-03-31 | 2021-12-31 | 2021-09-30 | 2021-06-30 | 2021-03-31 | 2020-12-31 | 2020-09-30 | 2020-06-30 | 2020-03-31 | 2019-12-31 | 2019-09-30 | 2019-06-30 | ||
|---|---|---|---|---|---|---|---|---|---|---|---|---|---|---|---|---|---|---|---|---|
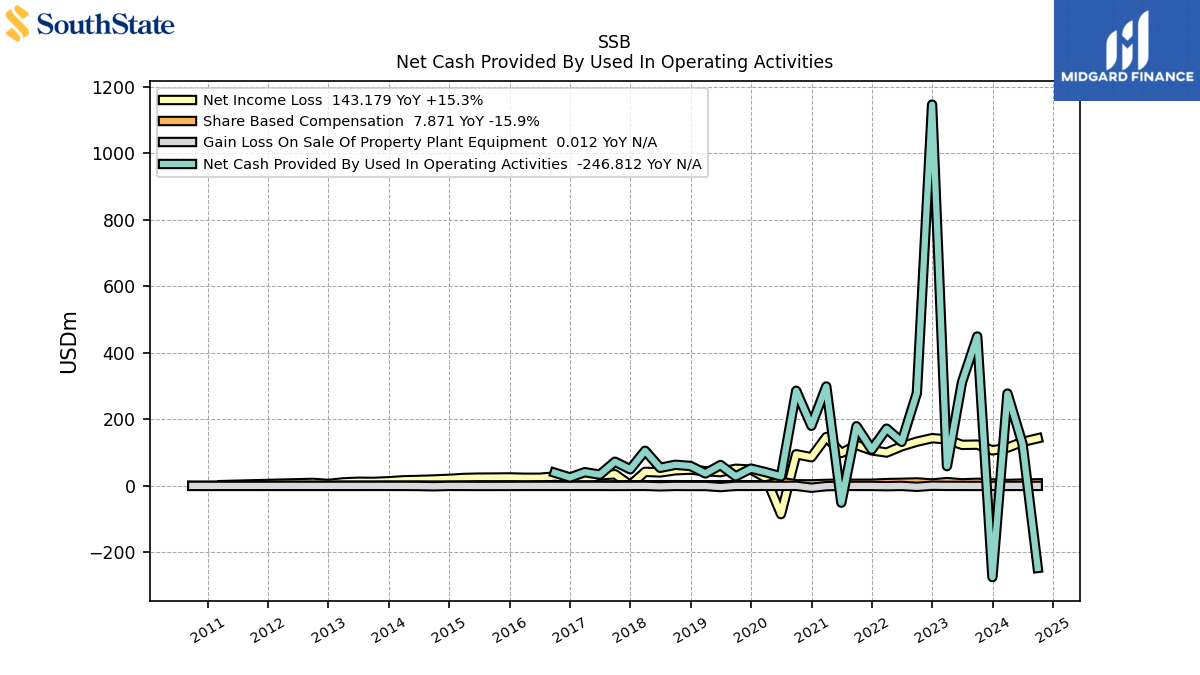
| Net Cash Provided By Used In Operating Activities | -274.32 | 449.42 | 312.27 | 59.38 | 1146.69 | 279.46 | 132.55 | 172.19 | 109.25 | 179.38 | -50.40 | 299.04 | 180.84 | 286.24 | 28.79 | 41.08 | 52.00 | 28.77 | 62.74 | |
| Net Income Loss | 106.79 | 124.14 | 123.45 | 139.93 | 143.50 | 133.04 | 119.17 | 100.33 | 106.85 | 122.79 | 98.96 | 146.95 | 86.24 | 95.22 | -84.94 | 24.11 | 49.09 | 51.56 | 41.46 | |
| Profit Loss | 106.79 | 124.14 | 123.45 | 139.93 | 143.50 | 133.04 | 119.17 | 100.33 | 106.85 | 122.79 | 98.96 | 146.95 | 86.24 | 95.22 | -84.94 | 24.11 | 49.09 | 51.56 | 41.46 | |
| Share Based Compensation | 7.38 | 9.36 | 7.71 | 11.42 | 7.33 | 10.51 | 9.31 | 8.49 | 6.53 | 6.40 | 6.71 | 6.09 | 4.62 | 4.96 | 11.73 | 2.01 | 2.20 | 2.29 | 2.23 |
| 2023-12-31 | 2023-09-30 | 2023-06-30 | 2023-03-31 | 2022-12-31 | 2022-09-30 | 2022-06-30 | 2022-03-31 | 2021-12-31 | 2021-09-30 | 2021-06-30 | 2021-03-31 | 2020-12-31 | 2020-09-30 | 2020-06-30 | 2020-03-31 | 2019-12-31 | 2019-09-30 | 2019-06-30 | ||
|---|---|---|---|---|---|---|---|---|---|---|---|---|---|---|---|---|---|---|---|---|
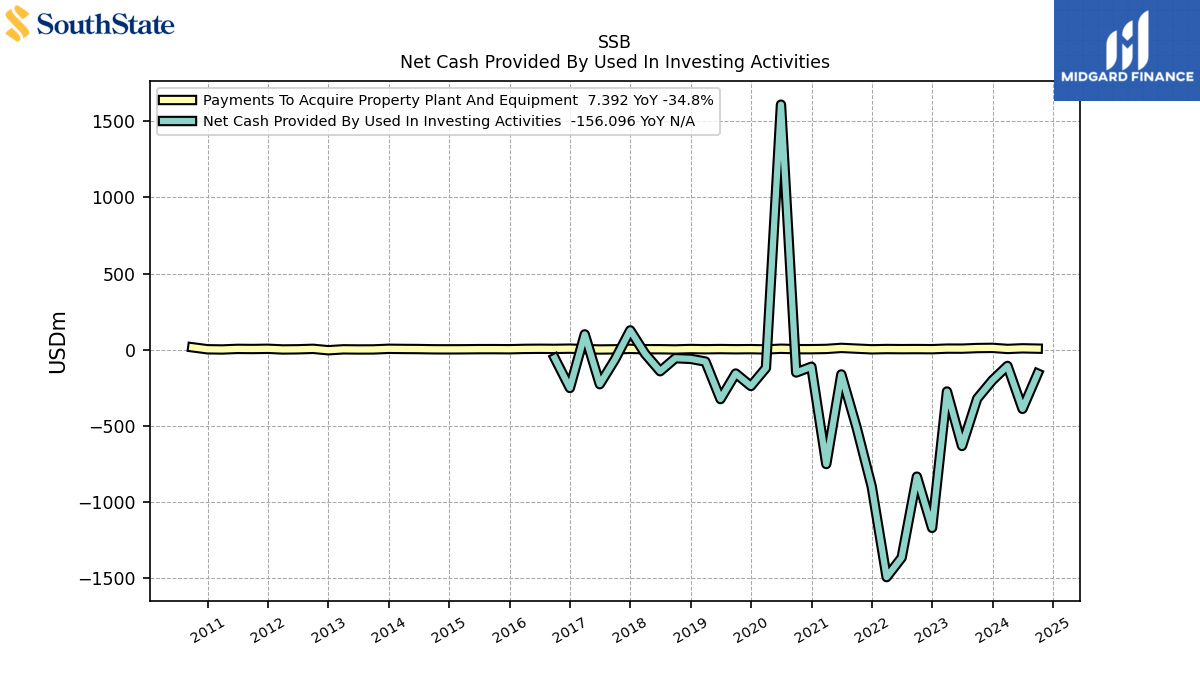
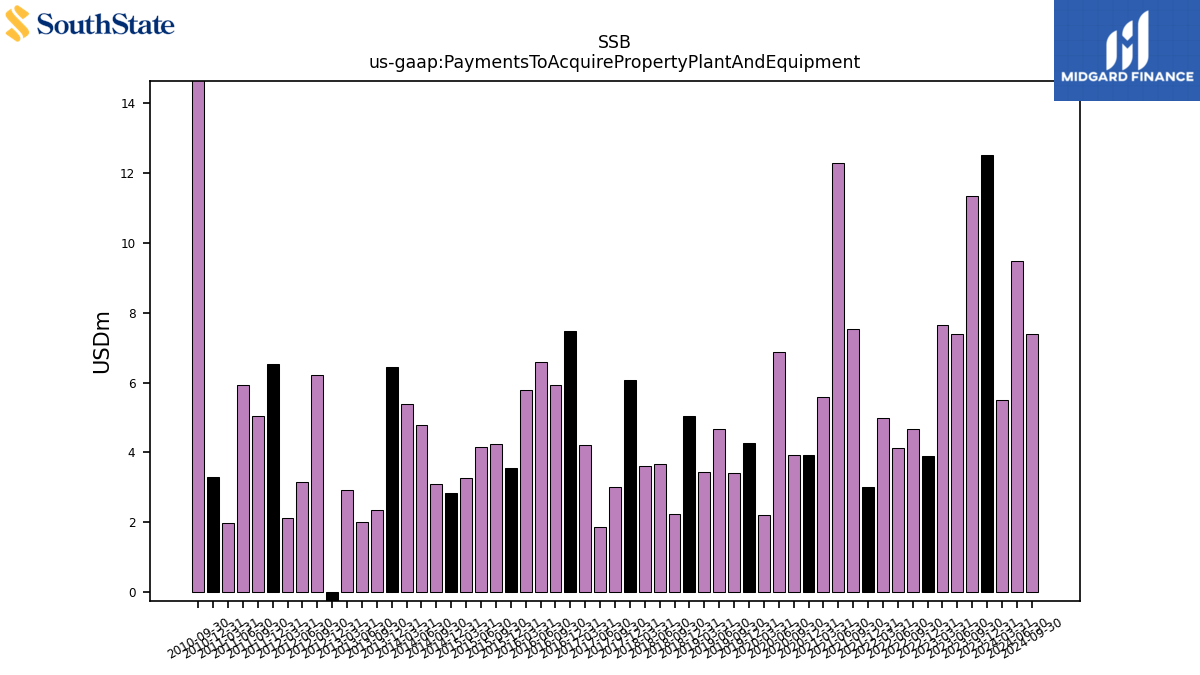
| Net Cash Provided By Used In Investing Activities | -200.40 | -320.52 | -631.67 | -273.85 | -1169.51 | -833.15 | -1364.82 | -1492.91 | -898.64 | -508.38 | -161.87 | -750.37 | -111.50 | -149.22 | 1609.87 | -119.37 | -238.09 | -155.82 | -323.78 | |
| Payments To Acquire Property Plant And Equipment | 12.51 | 11.34 | 7.39 | 7.64 | 3.89 | 4.68 | 4.12 | 4.98 | 3.01 | 7.55 | 12.28 | 5.58 | 3.92 | 3.93 | 6.89 | 2.19 | 4.26 | 3.42 | 4.68 |
| 2023-12-31 | 2023-09-30 | 2023-06-30 | 2023-03-31 | 2022-12-31 | 2022-09-30 | 2022-06-30 | 2022-03-31 | 2021-12-31 | 2021-09-30 | 2021-06-30 | 2021-03-31 | 2020-12-31 | 2020-09-30 | 2020-06-30 | 2020-03-31 | 2019-12-31 | 2019-09-30 | 2019-06-30 | ||
|---|---|---|---|---|---|---|---|---|---|---|---|---|---|---|---|---|---|---|---|---|
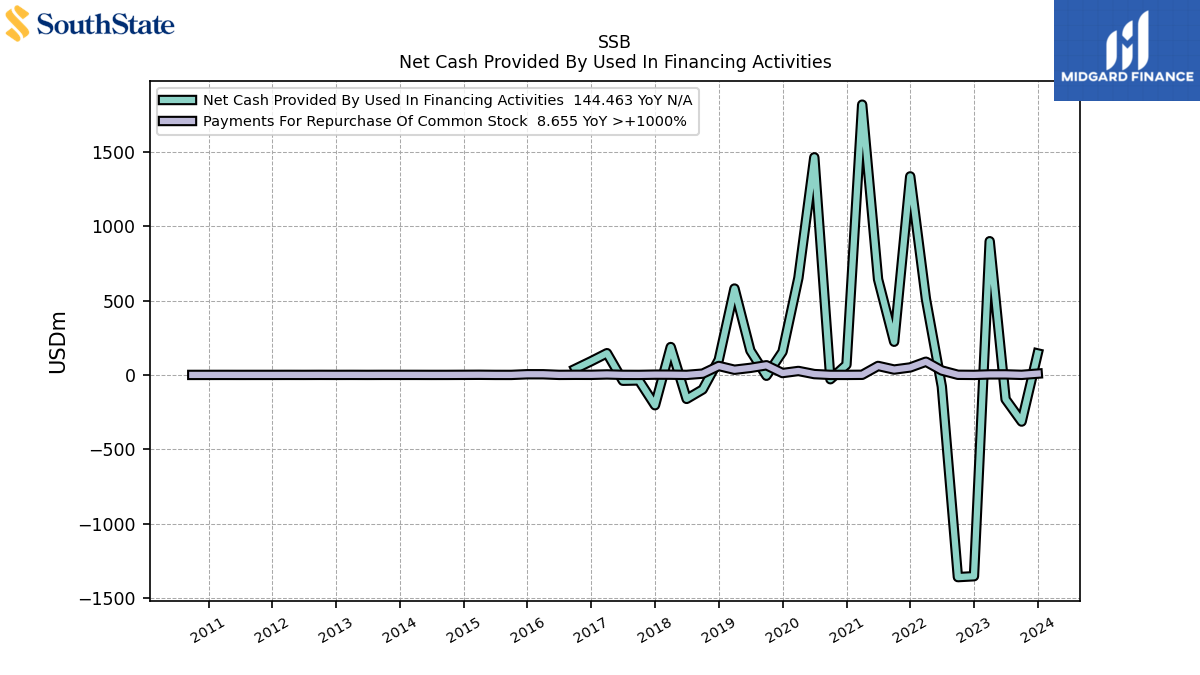
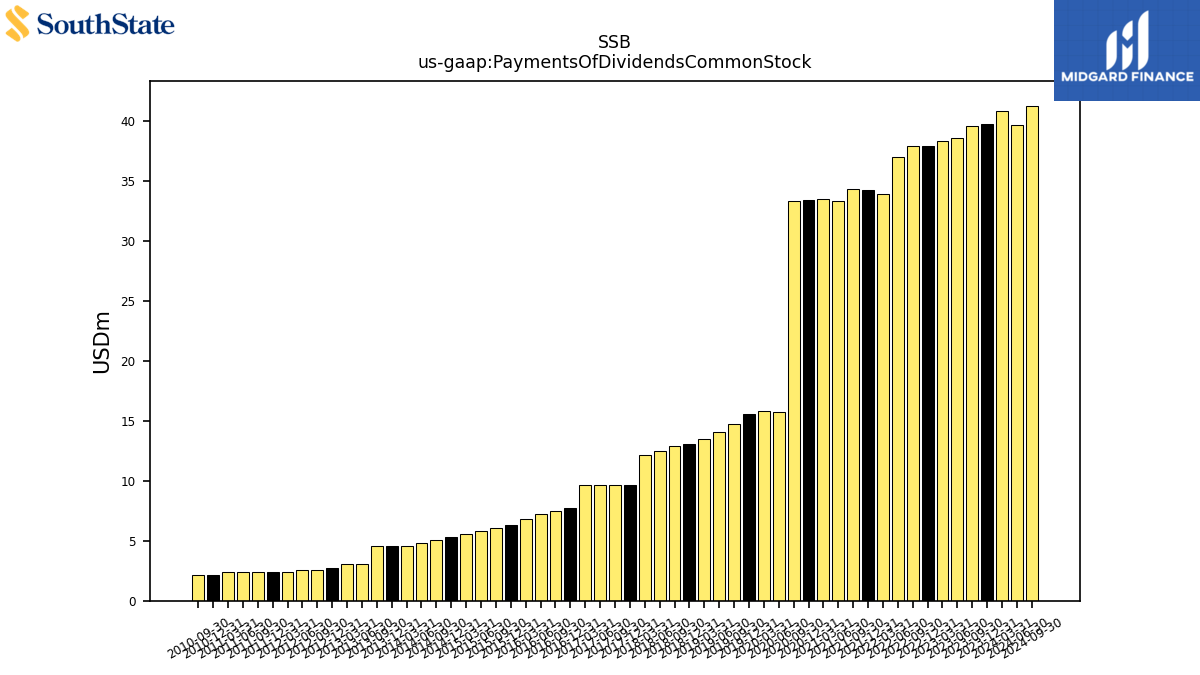
| Net Cash Provided By Used In Financing Activities | 144.46 | -313.51 | -163.52 | 898.57 | -1352.74 | -1358.71 | -78.24 | 510.18 | 1334.21 | 222.82 | 642.64 | 1816.22 | 68.27 | -29.08 | 1462.22 | 652.42 | 155.60 | -5.73 | 163.42 | |
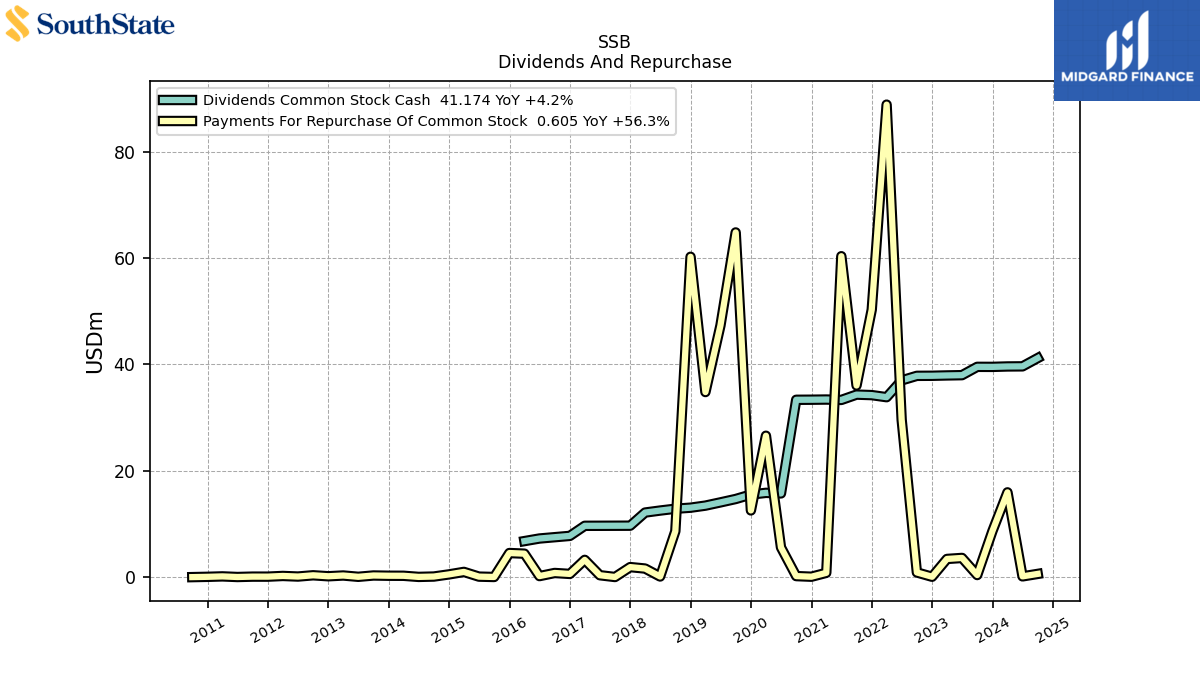
| Payments Of Dividends Common Stock | 39.70 | 39.57 | 38.57 | 38.33 | 37.87 | 37.86 | 37.01 | 33.92 | 34.23 | 34.33 | 33.33 | 33.45 | 33.35 | 33.33 | 15.73 | 15.84 | 15.52 | 14.68 | 14.05 | |
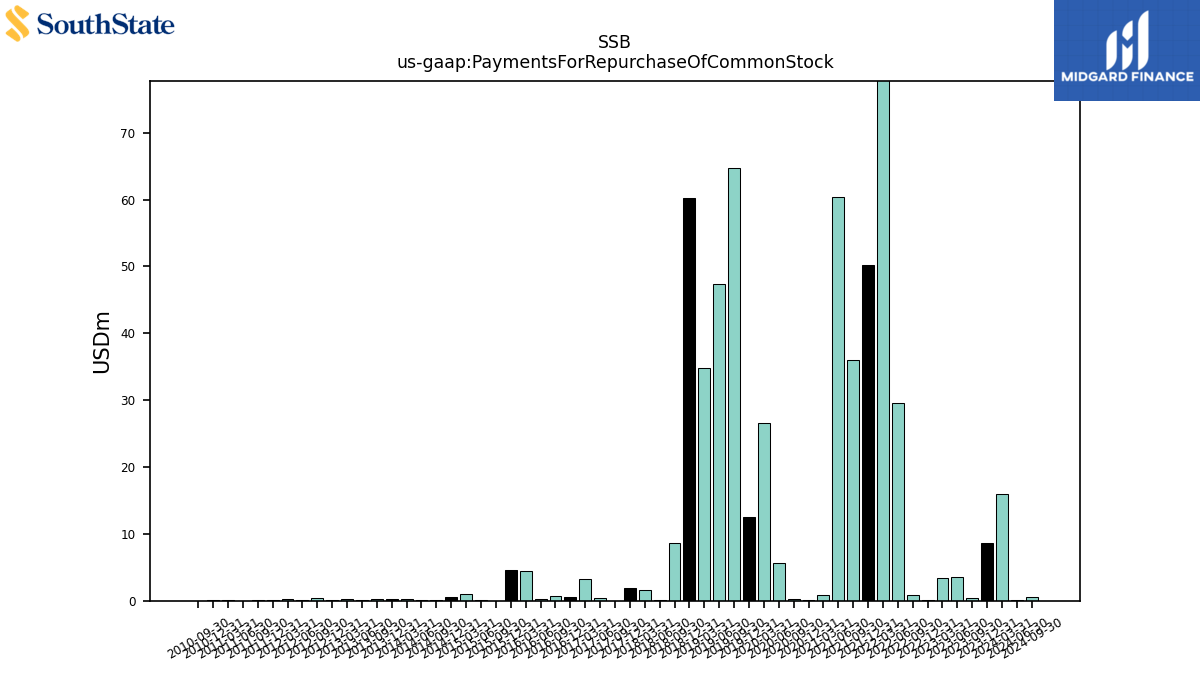
| Payments For Repurchase Of Common Stock | 8.65 | 0.39 | 3.61 | 3.42 | 0.07 | 0.88 | 29.57 | 88.81 | 50.27 | 36.02 | 60.32 | 0.80 | 0.08 | 0.19 | 5.58 | 26.58 | 12.53 | 64.79 | 47.32 |
| 2023-12-31 | 2023-09-30 | 2023-06-30 | 2023-03-31 | 2022-12-31 | 2022-09-30 | 2022-06-30 | 2022-03-31 | 2021-12-31 | 2021-09-30 | 2021-06-30 | 2021-03-31 | 2020-12-31 | 2020-09-30 | 2020-06-30 | 2020-03-31 | 2019-12-31 | 2019-09-30 | 2019-06-30 | ||
|---|---|---|---|---|---|---|---|---|---|---|---|---|---|---|---|---|---|---|---|---|
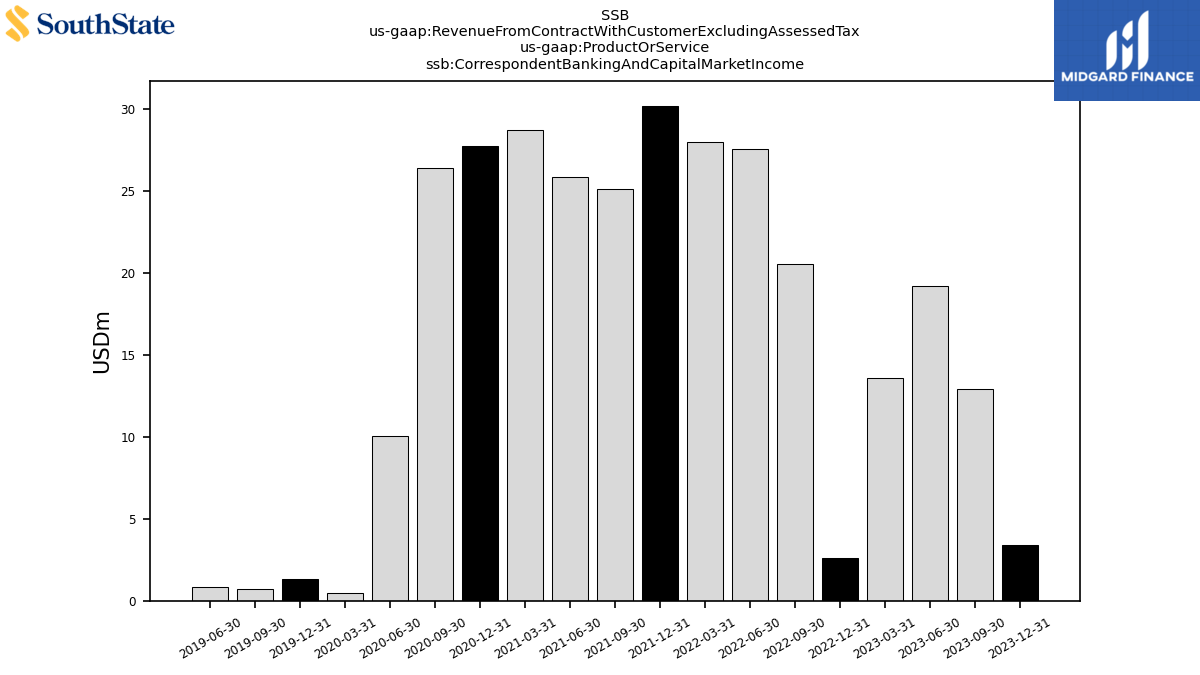
| Correspondent Banking And Capital Market Income | 3.40 | 12.92 | 19.19 | 13.59 | 2.60 | 20.55 | 27.60 | 27.99 | 30.22 | 25.16 | 25.88 | 28.75 | 27.75 | 26.43 | 10.07 | 0.49 | 1.36 | 0.69 | 0.86 | |
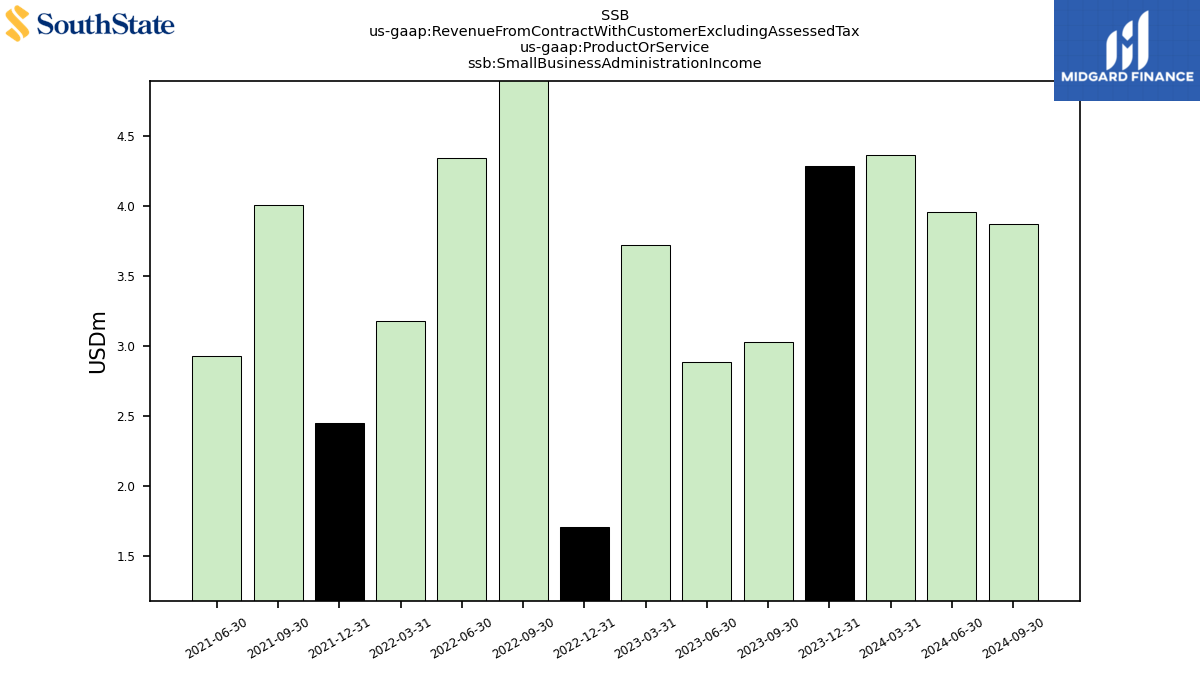
| Small Business Administration Income | 4.29 | 3.03 | 2.88 | 3.72 | 1.71 | 6.40 | 4.34 | 3.18 | 2.45 | 4.01 | 2.93 | NA | NA | NA | NA | NA | NA | NA | NA | |
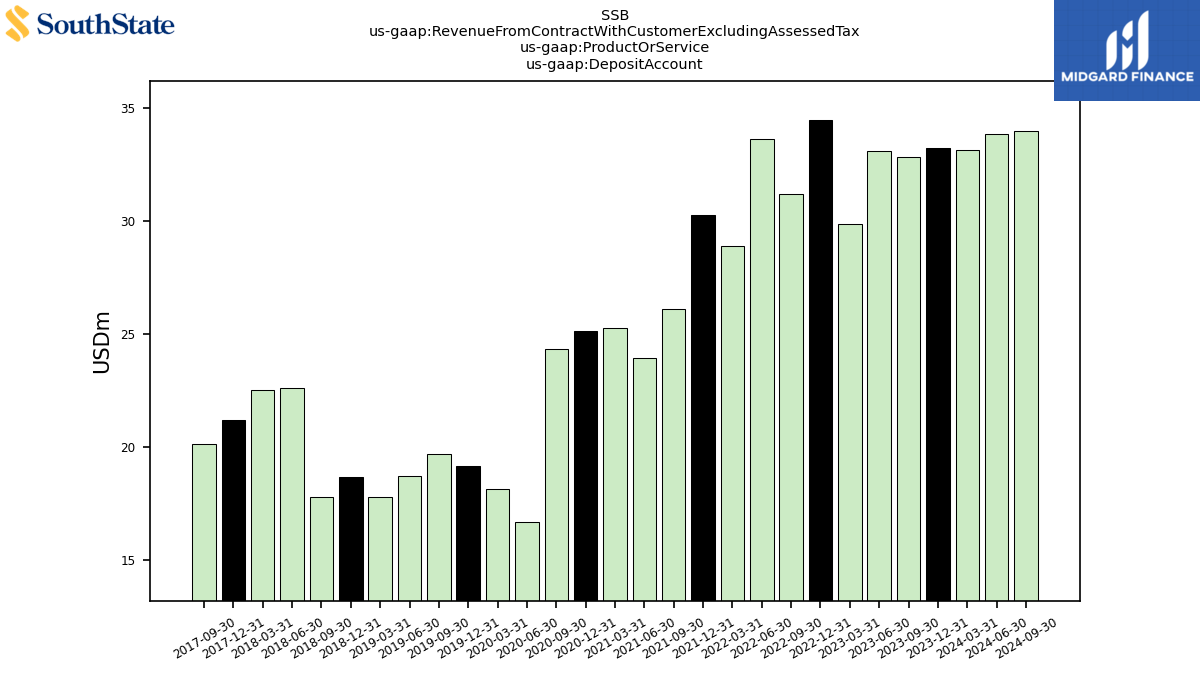
| Deposit Account | 33.23 | 32.83 | 33.10 | 29.86 | 34.48 | 31.19 | 33.66 | 28.90 | 30.29 | 26.13 | 23.94 | 25.28 | 25.15 | 24.35 | 16.68 | 18.14 | 19.16 | 19.73 | 18.74 | |
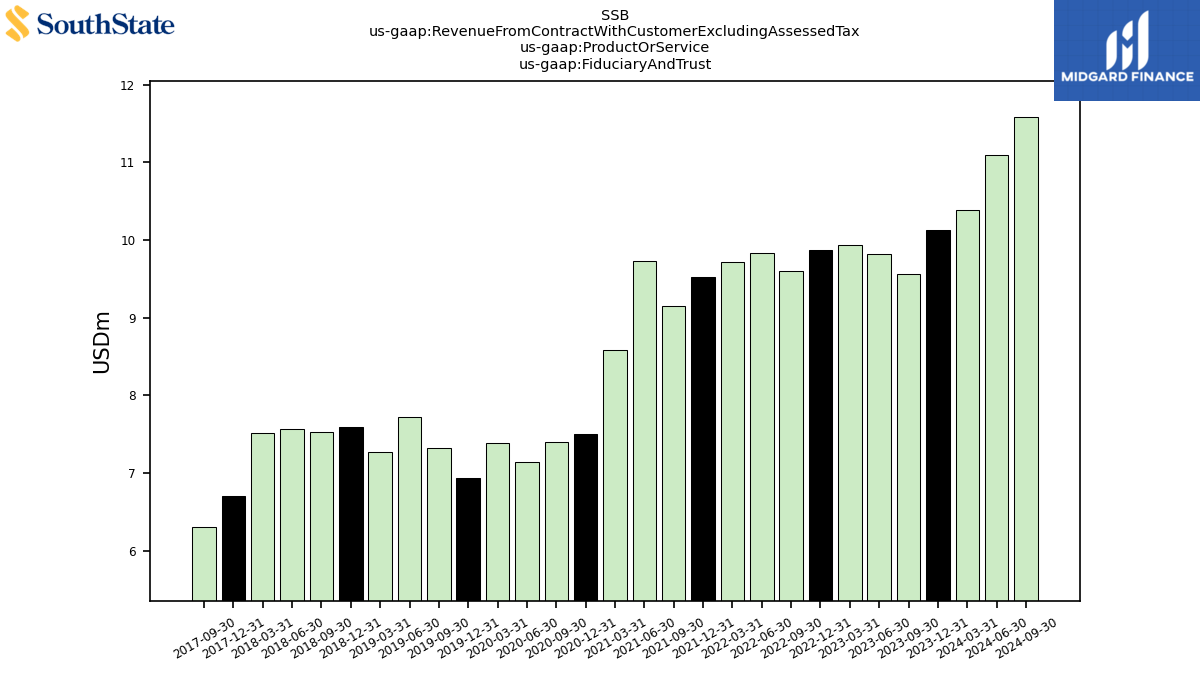
| Fiduciary And Trust | 10.13 | 9.56 | 9.82 | 9.94 | 9.87 | 9.60 | 9.83 | 9.72 | 9.52 | 9.15 | 9.73 | 8.58 | 7.51 | 7.40 | 7.14 | 7.39 | 6.93 | 7.32 | 7.72 | |
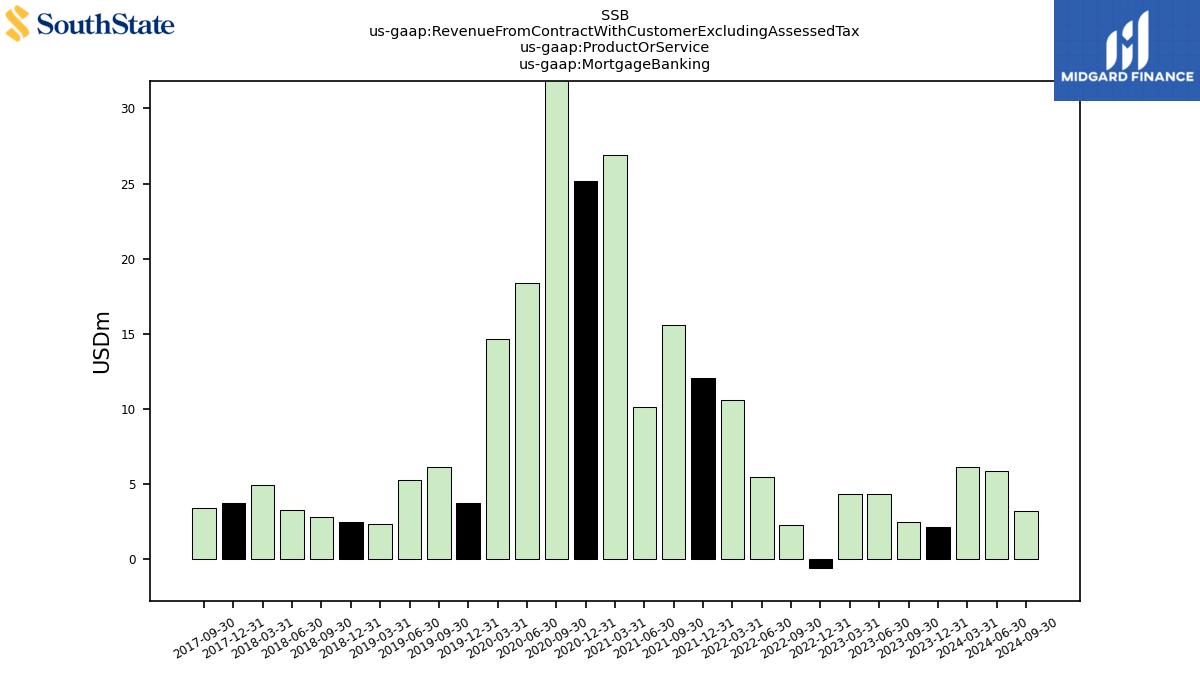
| Mortgage Banking | 2.19 | 2.48 | 4.35 | 4.33 | -0.55 | 2.26 | 5.48 | 10.59 | 12.04 | 15.56 | 10.12 | 26.88 | 25.16 | 48.02 | 18.37 | 14.65 | 3.76 | 6.12 | 5.31 |