
| 2023-12-31 | 2023-09-30 | 2023-06-30 | 2023-03-31 | 2022-12-31 | 2022-09-30 | 2022-06-30 | 2022-03-31 | 2021-12-31 | 2021-09-30 | 2021-06-30 | 2021-03-31 | 2020-12-31 | 2020-09-30 | 2020-06-30 | 2020-03-31 | 2019-12-31 | 2019-09-30 | 2019-06-30 | 2019-03-31 | 2018-12-31 | 2018-09-30 | 2018-06-30 | 2018-03-31 | 2017-12-31 | 2017-09-30 | 2017-06-30 | 2017-03-31 | 2016-12-31 | 2016-09-30 | 2016-06-30 | 2016-03-31 | 2015-12-31 | 2015-09-30 | 2015-06-30 | 2015-03-31 | 2014-12-31 | 2014-09-30 | 2014-06-30 | 2014-03-31 | 2013-12-31 | 2013-09-30 | 2013-06-30 | 2013-03-31 | 2012-12-31 | 2012-09-30 | 2012-06-30 | 2012-03-31 | 2011-12-31 | 2011-09-30 | 2011-06-30 | 2011-03-31 | 2010-12-31 | 2010-09-30 | 2010-06-30 | ||
|---|---|---|---|---|---|---|---|---|---|---|---|---|---|---|---|---|---|---|---|---|---|---|---|---|---|---|---|---|---|---|---|---|---|---|---|---|---|---|---|---|---|---|---|---|---|---|---|---|---|---|---|---|---|---|---|---|
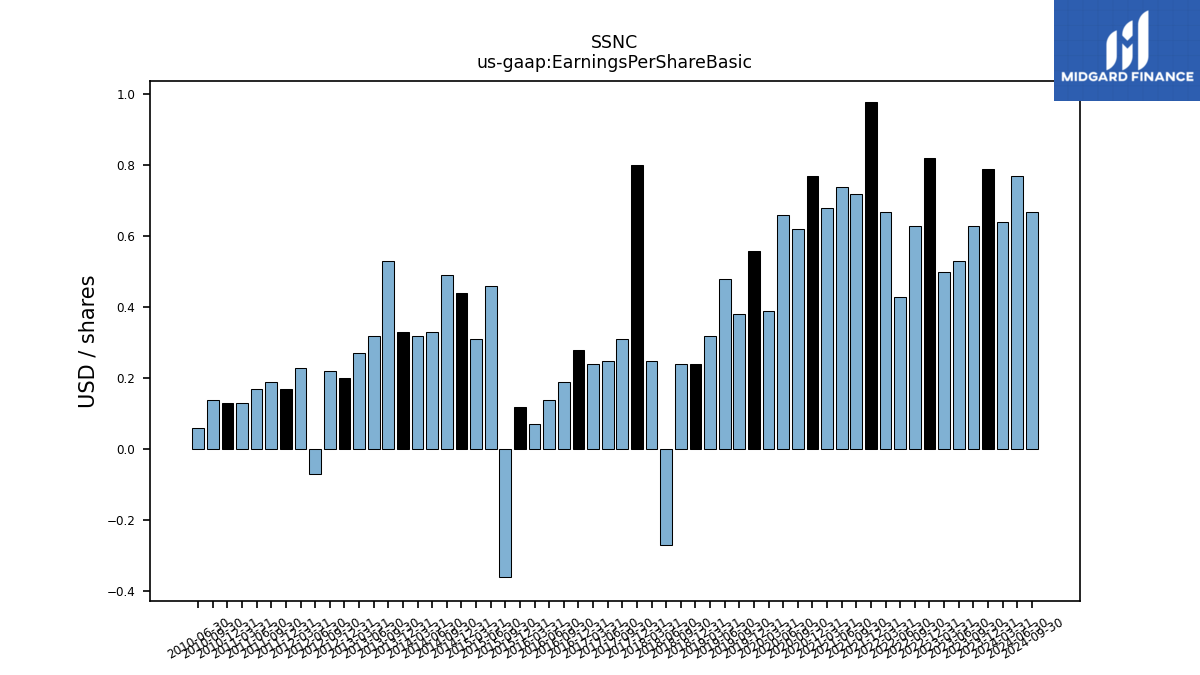
| Earnings Per Share Basic | 0.79 | 0.63 | 0.53 | 0.50 | 0.82 | 0.63 | 0.43 | 0.67 | 0.98 | 0.72 | 0.74 | 0.68 | 0.77 | 0.62 | 0.66 | 0.39 | 0.56 | 0.38 | 0.48 | 0.32 | 0.24 | 0.24 | -0.27 | 0.25 | 0.80 | 0.31 | 0.25 | 0.24 | 0.28 | 0.19 | 0.14 | 0.07 | 0.12 | -0.36 | 0.46 | 0.31 | 0.44 | 0.49 | 0.33 | 0.32 | 0.33 | 0.53 | 0.32 | 0.27 | 0.20 | 0.22 | -0.07 | 0.23 | 0.17 | 0.19 | 0.17 | 0.13 | 0.13 | 0.14 | 0.06 | |
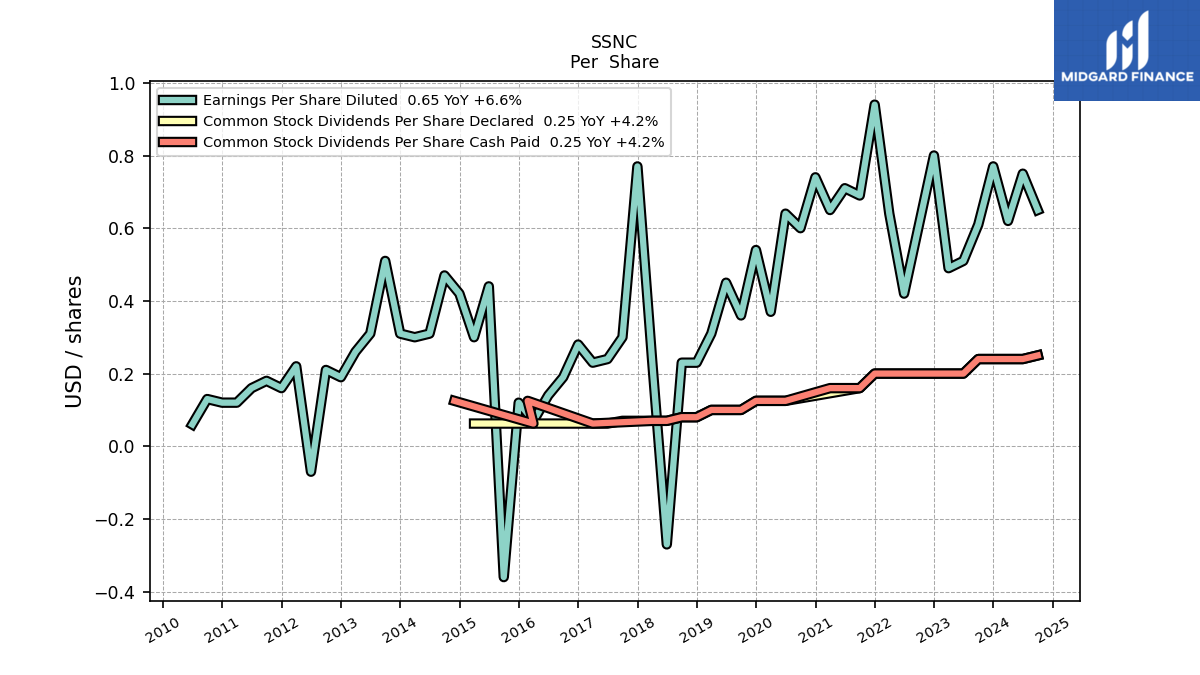
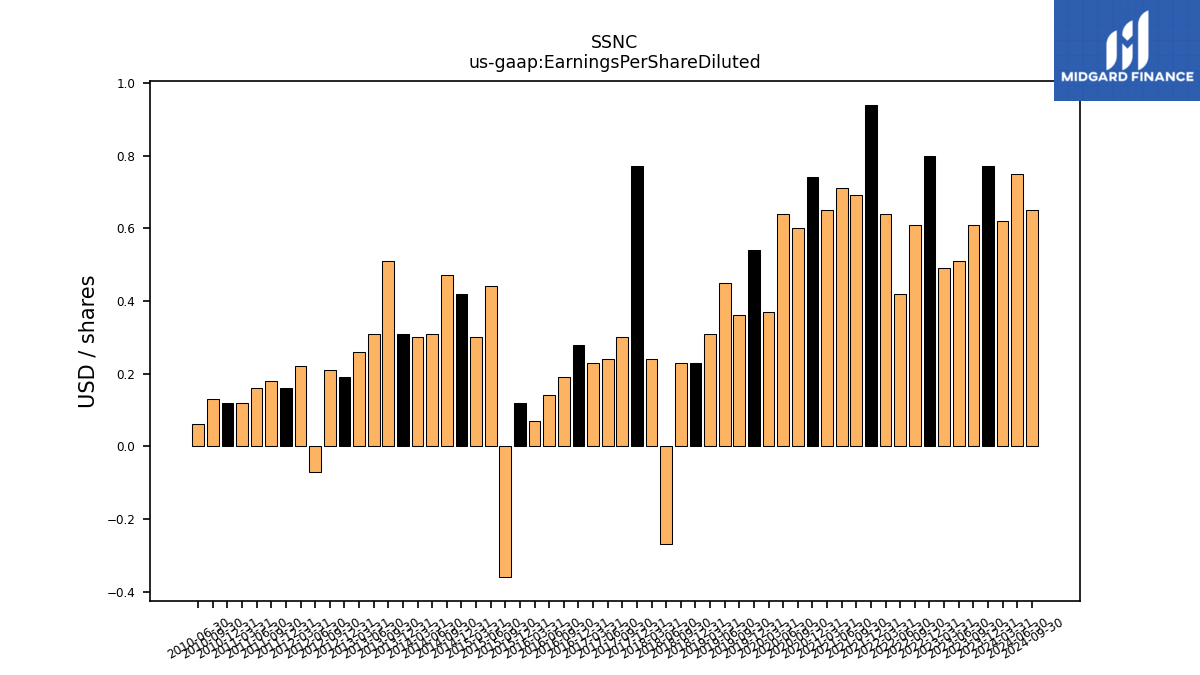
| Earnings Per Share Diluted | 0.77 | 0.61 | 0.51 | 0.49 | 0.80 | 0.61 | 0.42 | 0.64 | 0.94 | 0.69 | 0.71 | 0.65 | 0.74 | 0.60 | 0.64 | 0.37 | 0.54 | 0.36 | 0.45 | 0.31 | 0.23 | 0.23 | -0.27 | 0.24 | 0.77 | 0.30 | 0.24 | 0.23 | 0.28 | 0.19 | 0.14 | 0.07 | 0.12 | -0.36 | 0.44 | 0.30 | 0.42 | 0.47 | 0.31 | 0.30 | 0.31 | 0.51 | 0.31 | 0.26 | 0.19 | 0.21 | -0.07 | 0.22 | 0.16 | 0.18 | 0.16 | 0.12 | 0.12 | 0.13 | 0.06 |
| 2023-12-31 | 2023-09-30 | 2023-06-30 | 2023-03-31 | 2022-12-31 | 2022-09-30 | 2022-06-30 | 2022-03-31 | 2021-12-31 | 2021-09-30 | 2021-06-30 | 2021-03-31 | 2020-12-31 | 2020-09-30 | 2020-06-30 | 2020-03-31 | 2019-12-31 | 2019-09-30 | 2019-06-30 | 2019-03-31 | 2018-12-31 | 2018-09-30 | 2018-06-30 | 2018-03-31 | 2017-12-31 | 2017-09-30 | 2017-06-30 | 2017-03-31 | 2016-12-31 | 2016-09-30 | 2016-06-30 | 2016-03-31 | 2015-12-31 | 2015-09-30 | 2015-06-30 | 2015-03-31 | 2014-12-31 | 2014-09-30 | 2014-06-30 | 2014-03-31 | 2013-12-31 | 2013-09-30 | 2013-06-30 | 2013-03-31 | 2012-12-31 | 2012-09-30 | 2012-06-30 | 2012-03-31 | 2011-12-31 | 2011-09-30 | 2011-06-30 | 2011-03-31 | 2010-12-31 | 2010-09-30 | 2010-06-30 | ||
|---|---|---|---|---|---|---|---|---|---|---|---|---|---|---|---|---|---|---|---|---|---|---|---|---|---|---|---|---|---|---|---|---|---|---|---|---|---|---|---|---|---|---|---|---|---|---|---|---|---|---|---|---|---|---|---|---|
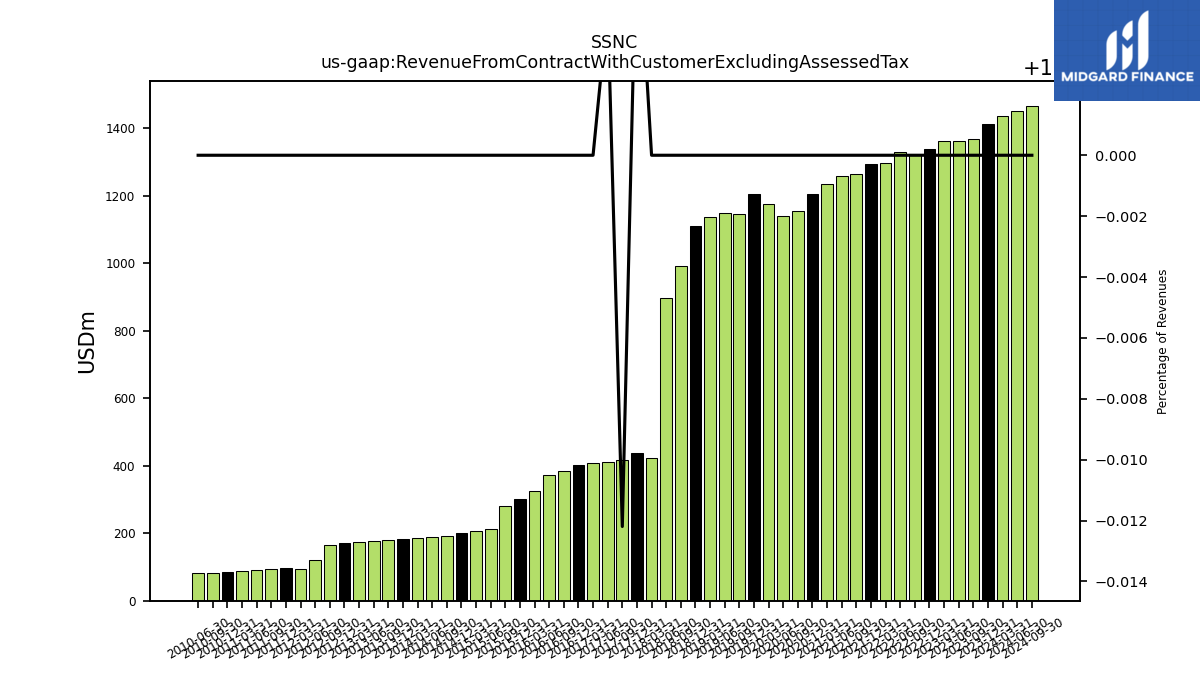
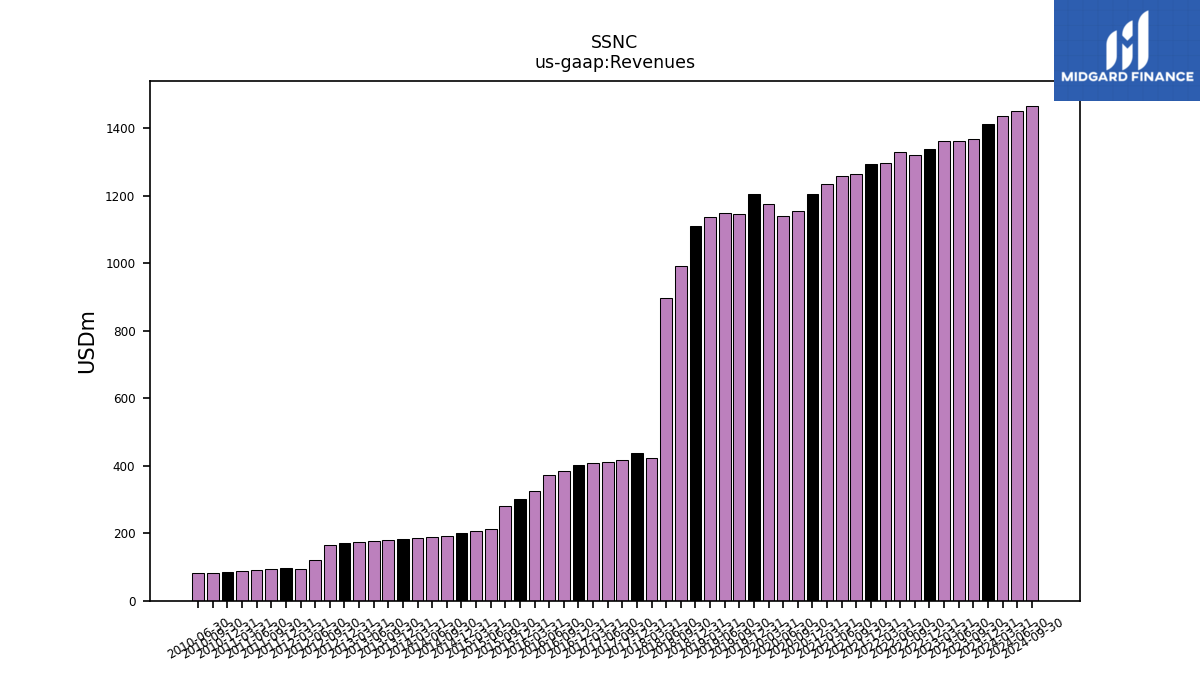
| Revenue From Contract With Customer Excluding Assessed Tax | 1411.60 | 1365.90 | 1362.60 | 1362.70 | 1338.30 | 1321.00 | 1328.70 | 1295.00 | 1294.20 | 1264.40 | 1259.00 | 1233.40 | 1203.40 | 1152.80 | 1138.10 | 1173.60 | 1203.50 | 1144.20 | 1148.00 | 1137.20 | 1111.00 | 992.40 | 895.80 | 421.93 | 438.40 | 418.20 | 411.00 | 407.70 | 400.92 | 383.30 | 373.08 | 324.13 | 300.89 | 280.89 | 212.77 | 205.74 | 200.73 | 192.60 | 188.72 | 185.81 | 182.52 | 179.50 | 177.46 | 173.22 | 171.75 | 165.56 | 120.85 | 93.67 | 95.69 | 94.32 | 91.80 | 89.01 | 86.11 | 83.00 | 81.62 | |
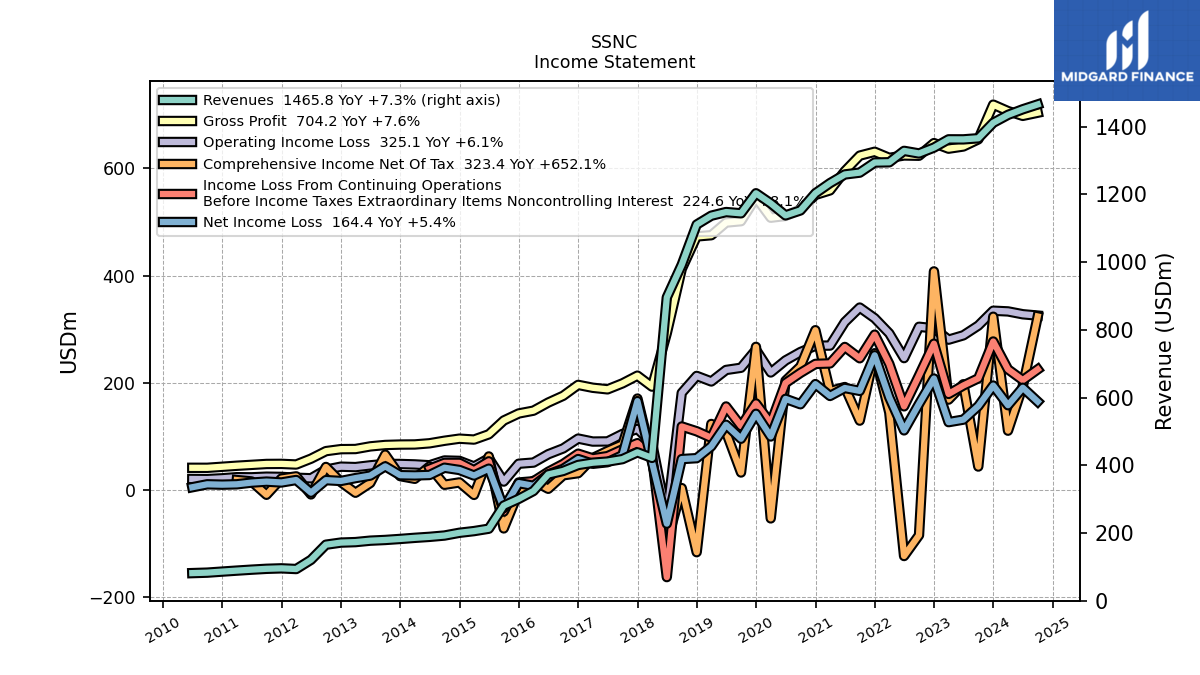
| Revenues | 1411.60 | 1365.90 | 1362.60 | 1362.70 | 1338.30 | 1321.00 | 1328.70 | 1295.00 | 1294.20 | 1264.40 | 1259.00 | 1233.40 | 1203.40 | 1152.80 | 1138.10 | 1173.60 | 1203.50 | 1144.20 | 1148.00 | 1137.20 | 1111.00 | 992.40 | 895.80 | 421.93 | 438.37 | 418.25 | 410.98 | 407.70 | 400.92 | 383.30 | 373.08 | 324.13 | 300.89 | 280.89 | 212.77 | 205.74 | 200.73 | 192.60 | 188.72 | 185.81 | 182.52 | 179.50 | 177.46 | 173.22 | 171.75 | 165.56 | 120.85 | 93.67 | 95.69 | 94.32 | 91.80 | 89.01 | 86.11 | 83.00 | 81.62 | |
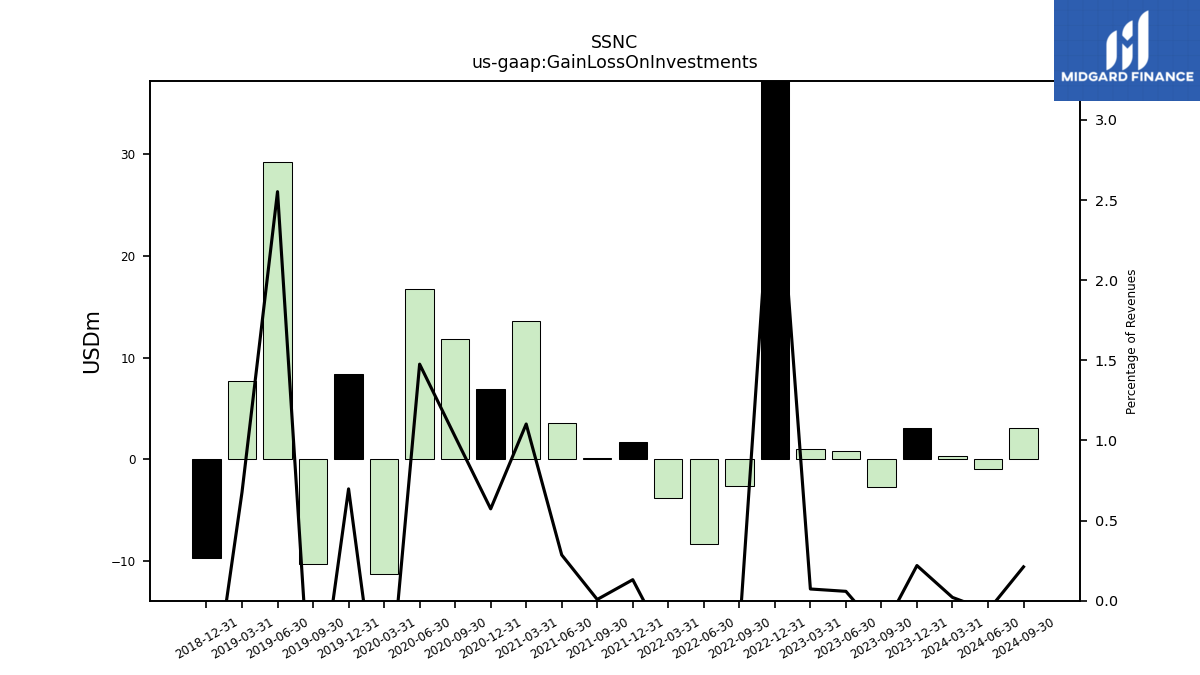
| Gain Loss On Investments | 3.10 | -2.70 | 0.80 | 1.00 | 40.80 | -2.60 | -8.30 | -3.80 | 1.70 | 0.10 | 3.60 | 13.60 | 6.90 | 11.80 | 16.80 | -11.30 | 8.40 | -10.30 | 29.30 | 7.70 | -9.70 | NA | NA | NA | NA | NA | NA | NA | NA | NA | NA | NA | NA | NA | NA | NA | NA | NA | NA | NA | NA | NA | NA | NA | NA | NA | NA | NA | NA | NA | NA | NA | NA | NA | NA | |
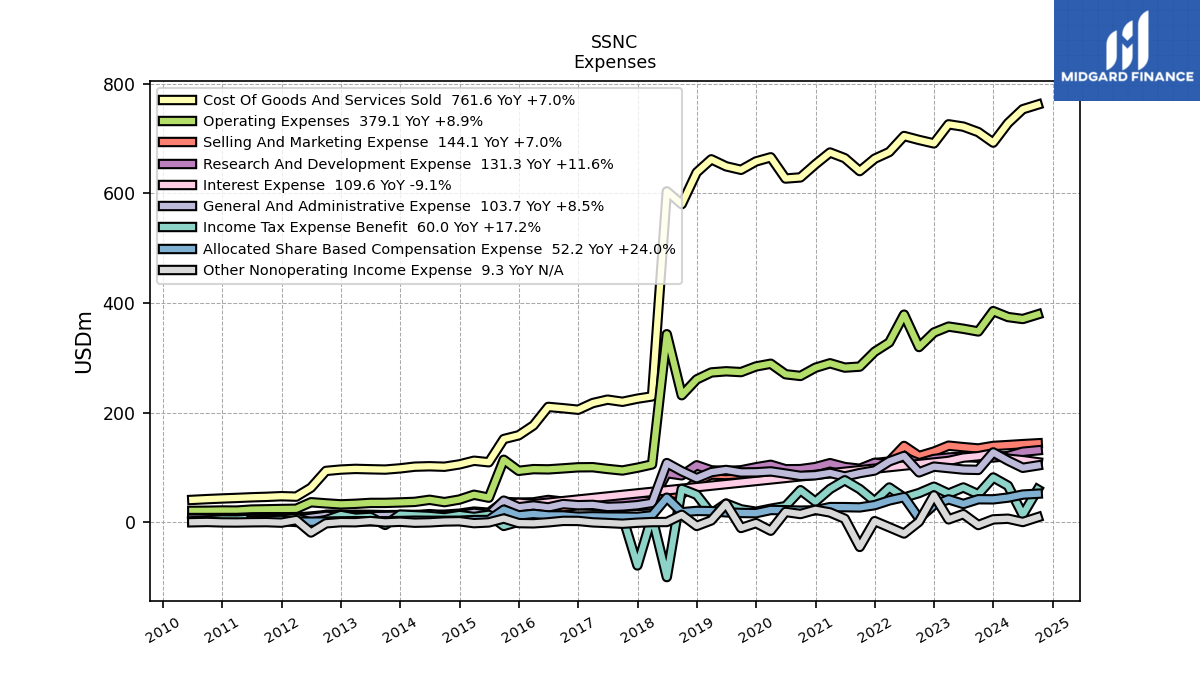
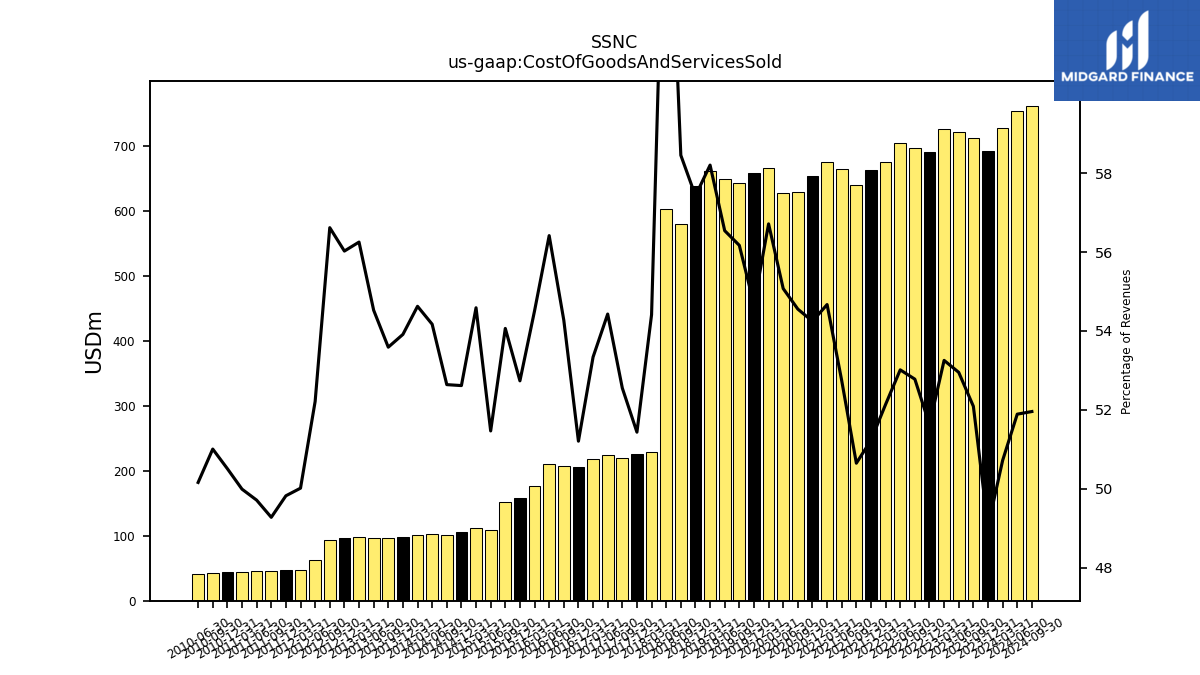
| Cost Of Goods And Services Sold | 692.30 | 711.50 | 721.50 | 725.70 | 690.90 | 697.20 | 704.40 | 675.20 | 663.00 | 640.40 | 664.00 | 674.30 | 652.80 | 628.90 | 626.80 | 665.60 | 658.00 | 642.70 | 649.10 | 661.90 | 638.00 | 580.10 | 603.50 | 229.58 | 225.47 | 219.80 | 223.69 | 217.46 | 205.30 | 208.03 | 210.48 | 176.68 | 158.68 | 151.86 | 109.50 | 112.31 | 105.62 | 101.38 | 102.23 | 101.50 | 98.40 | 96.19 | 96.76 | 97.44 | 96.23 | 93.74 | 63.10 | 46.85 | 47.68 | 46.48 | 45.64 | 44.49 | 43.49 | 42.34 | 40.94 | |
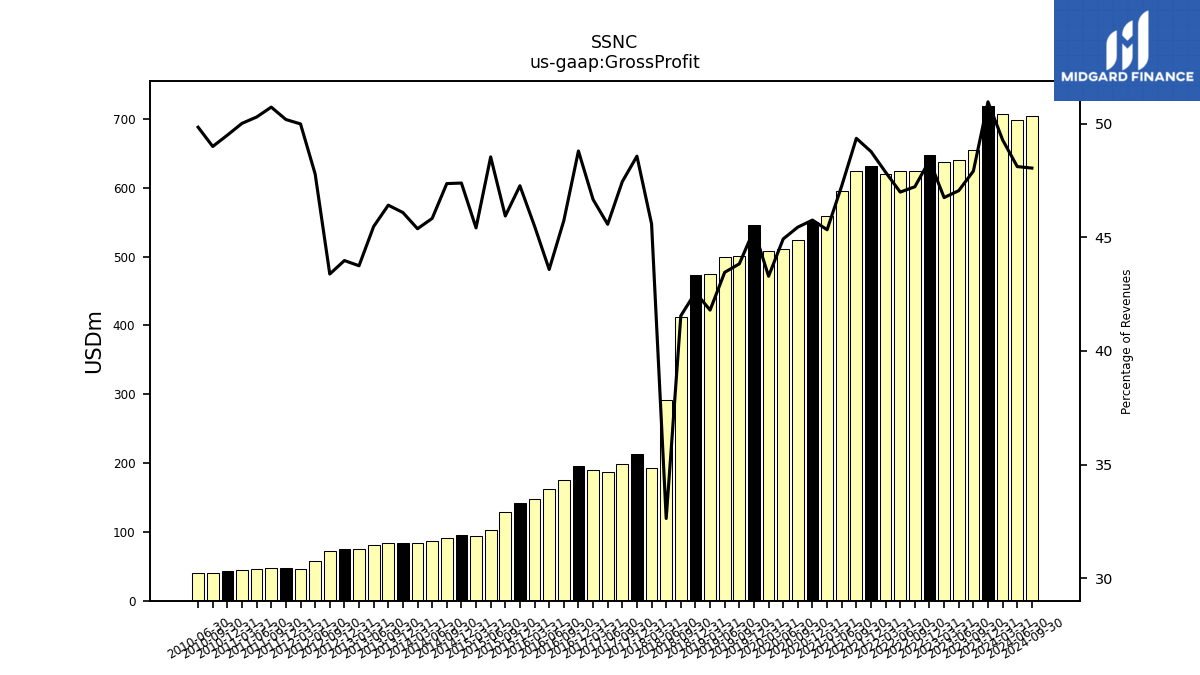
| Gross Profit | 719.30 | 654.40 | 641.10 | 637.00 | 647.40 | 623.80 | 624.30 | 619.80 | 631.20 | 624.00 | 595.00 | 559.10 | 550.60 | 523.90 | 511.30 | 508.00 | 545.50 | 501.50 | 498.90 | 475.30 | 473.00 | 412.30 | 292.30 | 192.35 | 212.89 | 198.45 | 187.29 | 190.24 | 195.62 | 175.28 | 162.60 | 147.45 | 142.21 | 129.03 | 103.27 | 93.43 | 95.11 | 91.22 | 86.49 | 84.31 | 84.12 | 83.31 | 80.70 | 75.78 | 75.53 | 71.82 | 57.75 | 46.82 | 48.02 | 47.84 | 46.17 | 44.51 | 42.62 | 40.67 | 40.68 | |
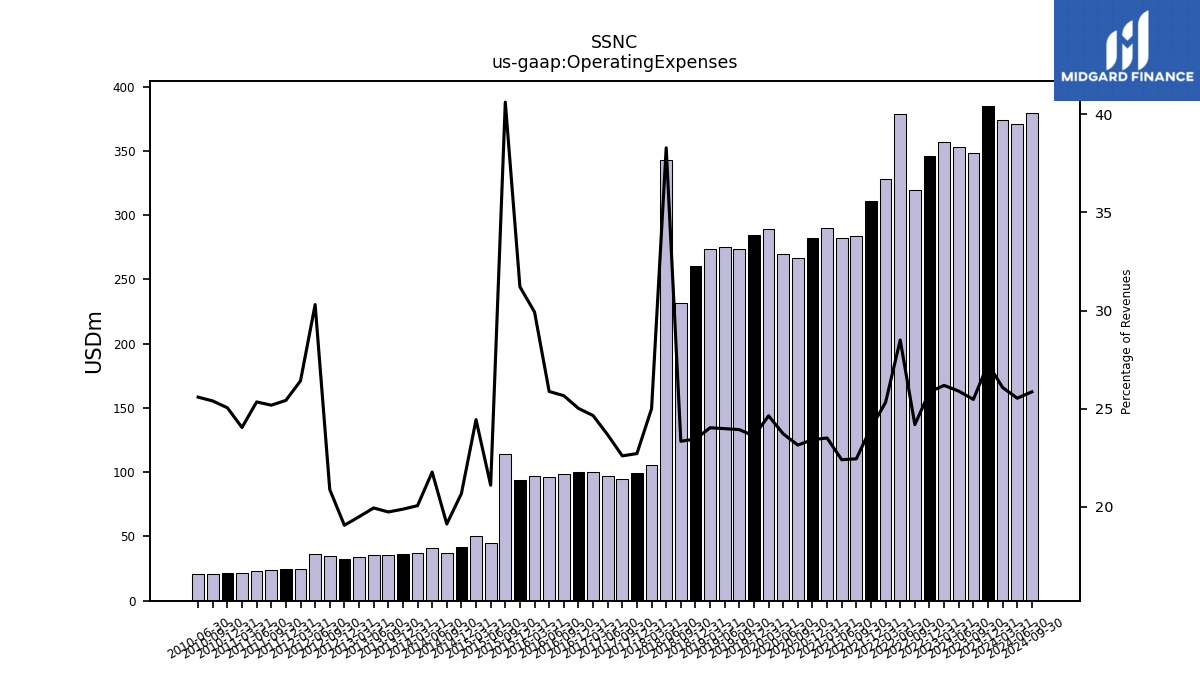
| Operating Expenses | 385.10 | 348.00 | 352.90 | 356.90 | 346.10 | 319.60 | 378.70 | 328.00 | 311.00 | 283.90 | 282.10 | 290.00 | 281.90 | 266.90 | 270.00 | 289.20 | 284.20 | 273.90 | 275.40 | 273.30 | 260.60 | 231.70 | 343.00 | 105.50 | 99.60 | 94.53 | 97.30 | 100.52 | 100.31 | 98.37 | 96.56 | 97.00 | 93.91 | 114.08 | 44.91 | 50.30 | 41.52 | 36.85 | 41.10 | 37.29 | 36.30 | 35.45 | 35.40 | 33.78 | 32.75 | 34.58 | 36.62 | 24.75 | 24.33 | 23.75 | 23.27 | 21.41 | 21.57 | 21.08 | 20.89 | |
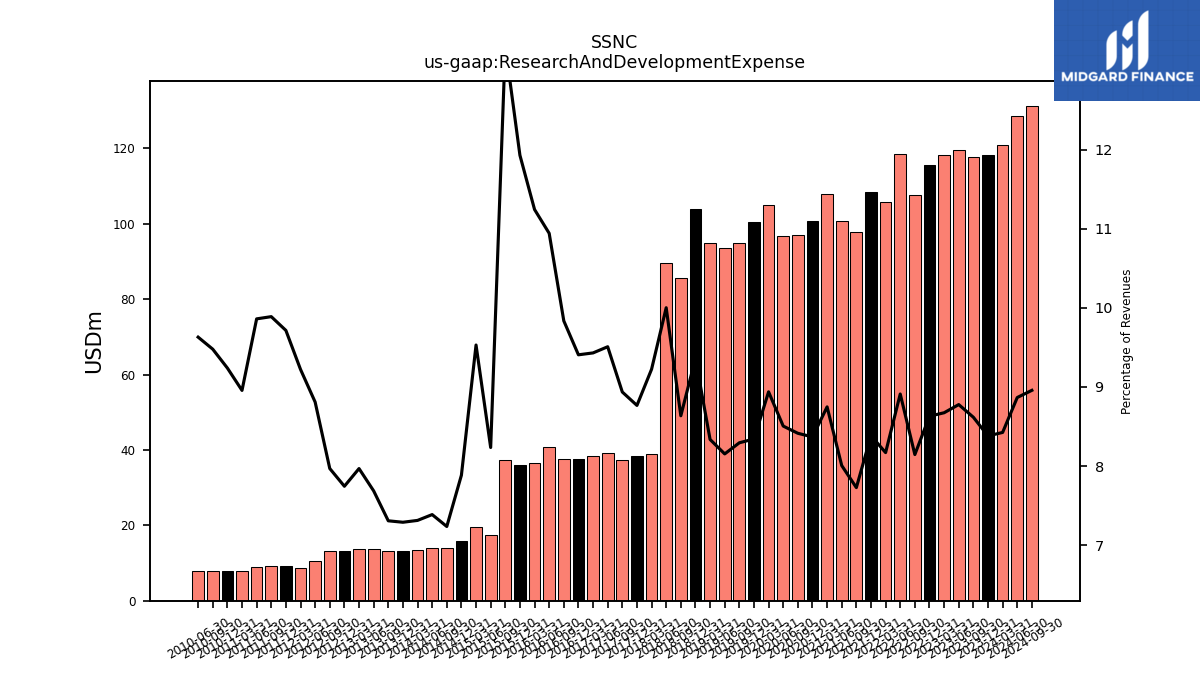
| Research And Development Expense | 118.30 | 117.70 | 119.60 | 118.20 | 115.50 | 107.60 | 118.40 | 105.80 | 108.50 | 97.70 | 100.80 | 107.90 | 100.70 | 97.00 | 96.80 | 104.90 | 100.40 | 94.90 | 93.60 | 94.80 | 104.00 | 85.70 | 89.60 | 38.92 | 38.43 | 37.38 | 39.08 | 38.45 | 37.71 | 37.70 | 40.83 | 36.45 | 35.90 | 37.39 | 17.52 | 19.61 | 15.83 | 13.94 | 13.94 | 13.59 | 13.30 | 13.12 | 13.64 | 13.80 | 13.30 | 13.19 | 10.65 | 8.64 | 9.30 | 9.33 | 9.05 | 7.97 | 7.96 | 7.87 | 7.86 | |
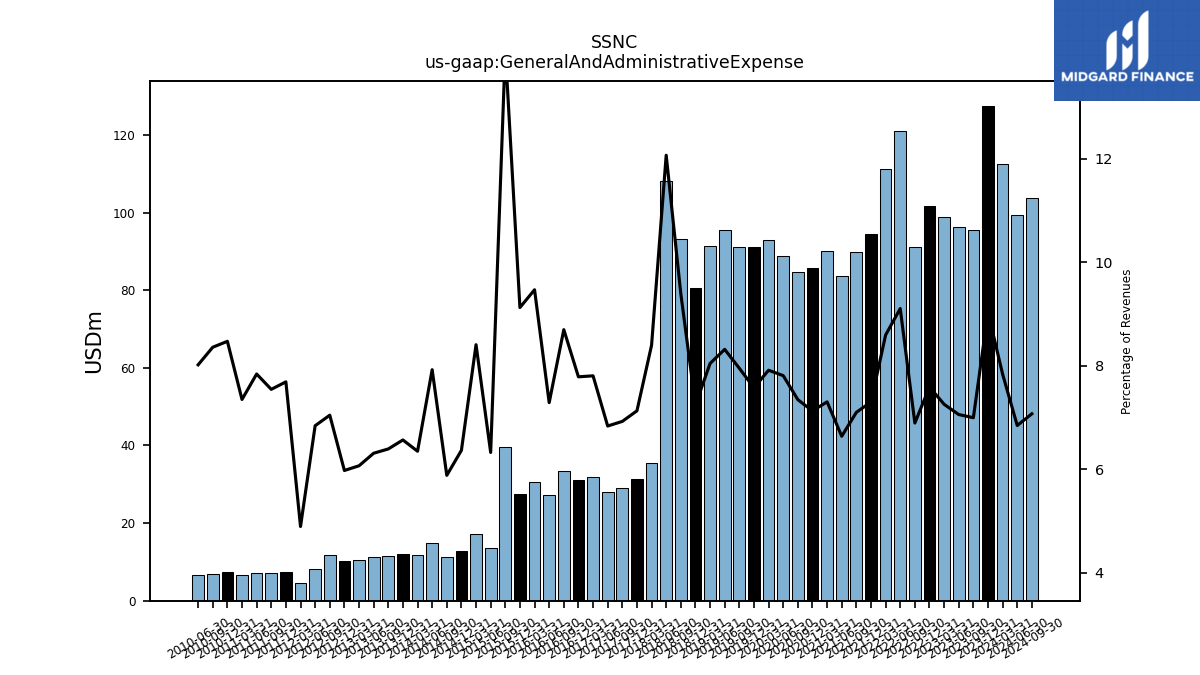
| General And Administrative Expense | 127.50 | 95.60 | 96.20 | 98.90 | 101.60 | 91.10 | 121.00 | 111.30 | 94.50 | 89.80 | 83.60 | 90.10 | 85.80 | 84.70 | 88.90 | 92.90 | 91.20 | 91.00 | 95.50 | 91.50 | 80.50 | 93.20 | 108.10 | 35.43 | 31.26 | 28.98 | 28.10 | 31.83 | 31.23 | 33.34 | 27.20 | 30.70 | 27.46 | 39.61 | 13.46 | 17.30 | 12.78 | 11.34 | 14.96 | 11.80 | 11.99 | 11.48 | 11.20 | 10.52 | 10.27 | 11.67 | 8.27 | 4.59 | 7.36 | 7.12 | 7.20 | 6.54 | 7.30 | 6.94 | 6.55 | |
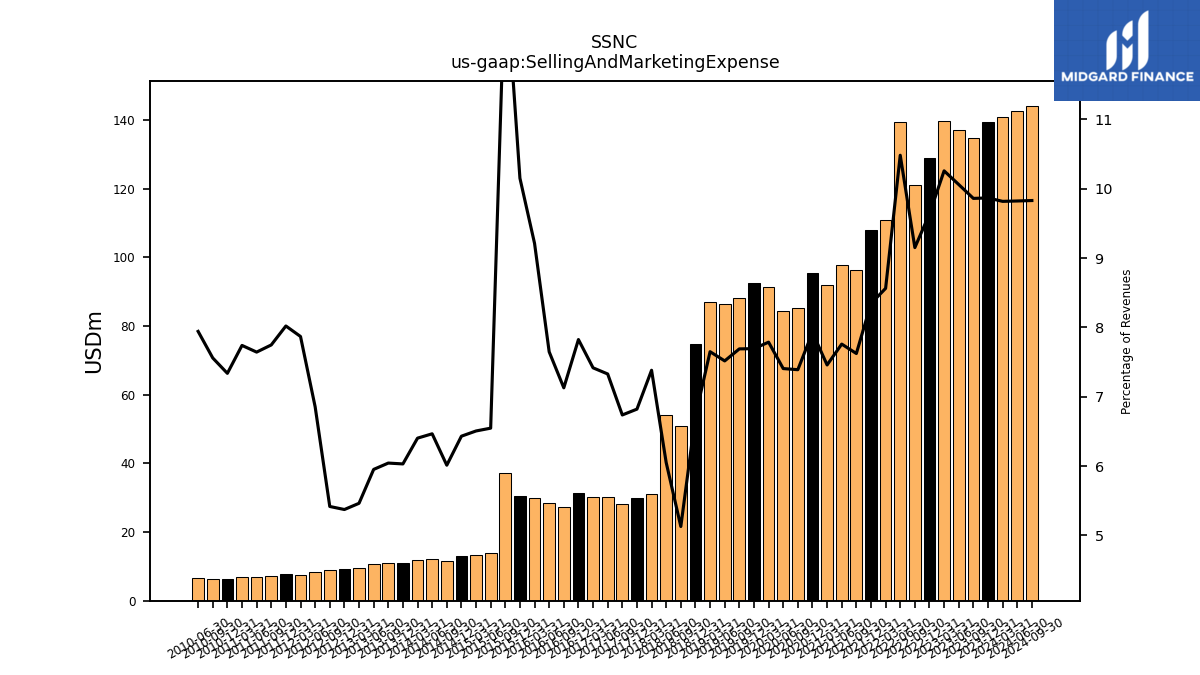
| Selling And Marketing Expense | 139.30 | 134.70 | 137.10 | 139.80 | 129.00 | 120.90 | 139.30 | 110.90 | 108.00 | 96.40 | 97.70 | 92.00 | 95.40 | 85.20 | 84.30 | 91.40 | 92.60 | 88.00 | 86.30 | 87.00 | 74.70 | 50.90 | 54.20 | 31.15 | 29.91 | 28.18 | 30.12 | 30.24 | 31.37 | 27.33 | 28.54 | 29.86 | 30.55 | 37.08 | 13.93 | 13.39 | 12.91 | 11.58 | 12.20 | 11.90 | 11.01 | 10.85 | 10.56 | 9.46 | 9.23 | 8.97 | 8.29 | 7.37 | 7.68 | 7.31 | 7.02 | 6.89 | 6.32 | 6.28 | 6.48 | |
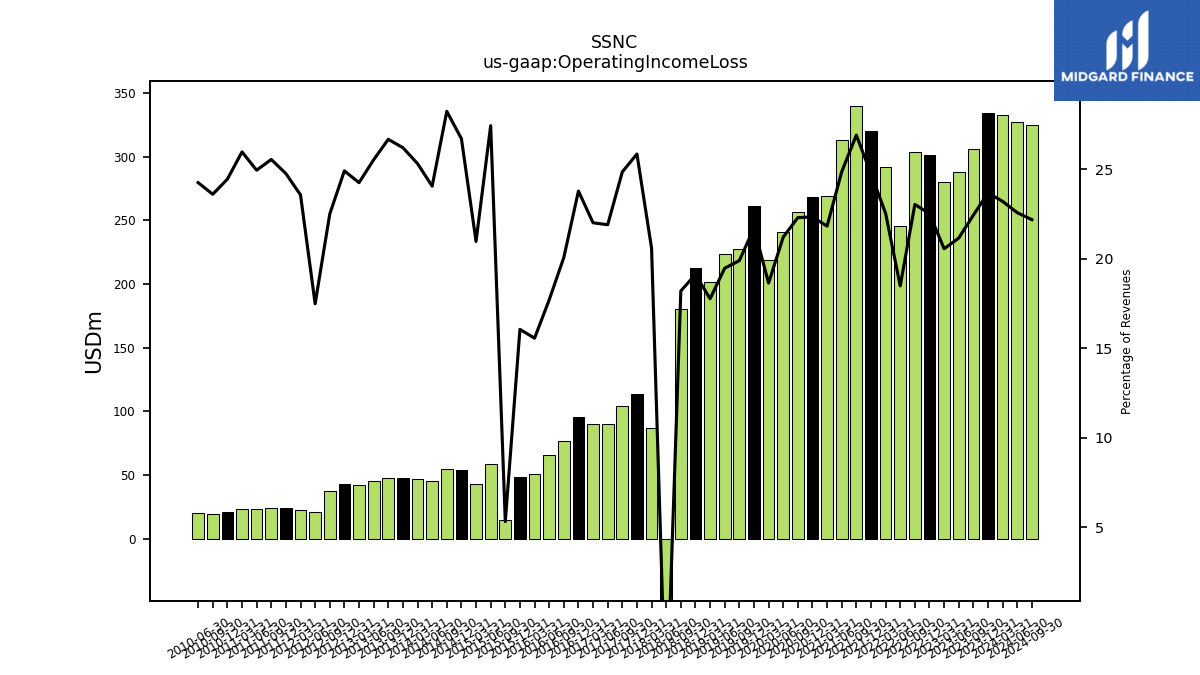
| Operating Income Loss | 334.20 | 306.40 | 288.20 | 280.10 | 301.30 | 304.20 | 245.60 | 291.80 | 320.20 | 340.10 | 312.90 | 269.10 | 268.70 | 257.00 | 241.30 | 218.80 | 261.30 | 227.60 | 223.50 | 202.00 | 212.40 | 180.60 | -50.70 | 86.85 | 113.29 | 103.92 | 89.98 | 89.72 | 95.31 | 76.90 | 66.04 | 50.44 | 48.30 | 14.95 | 58.35 | 43.13 | 53.59 | 54.36 | 45.39 | 47.02 | 47.82 | 47.86 | 45.29 | 42.00 | 42.77 | 37.24 | 21.13 | 22.07 | 23.68 | 24.09 | 22.89 | 23.11 | 21.05 | 19.59 | 19.79 | |
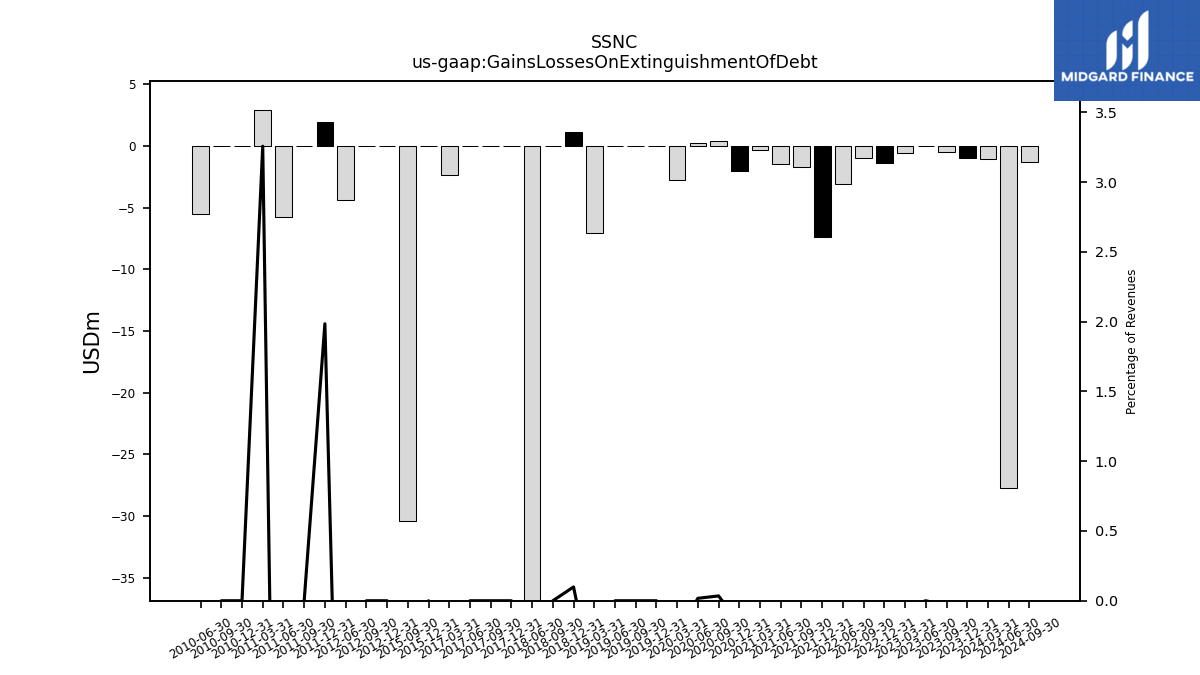
| Gains Losses On Extinguishment Of Debt | -1.00 | -0.50 | 0.00 | -0.60 | -1.40 | -1.00 | -3.10 | NA | -7.40 | -1.70 | -1.50 | -0.30 | -2.00 | 0.40 | 0.20 | -2.80 | 0.00 | 0.00 | 0.00 | -7.10 | 1.10 | 0.00 | -44.40 | NA | 0.00 | 0.00 | 0.00 | -2.33 | NA | NA | NA | NA | 0.00 | -30.42 | NA | NA | NA | NA | NA | NA | NA | NA | NA | NA | 0.00 | 0.00 | -4.36 | NA | 1.90 | 0.00 | -5.78 | 2.90 | 0.00 | 0.00 | -5.48 | |
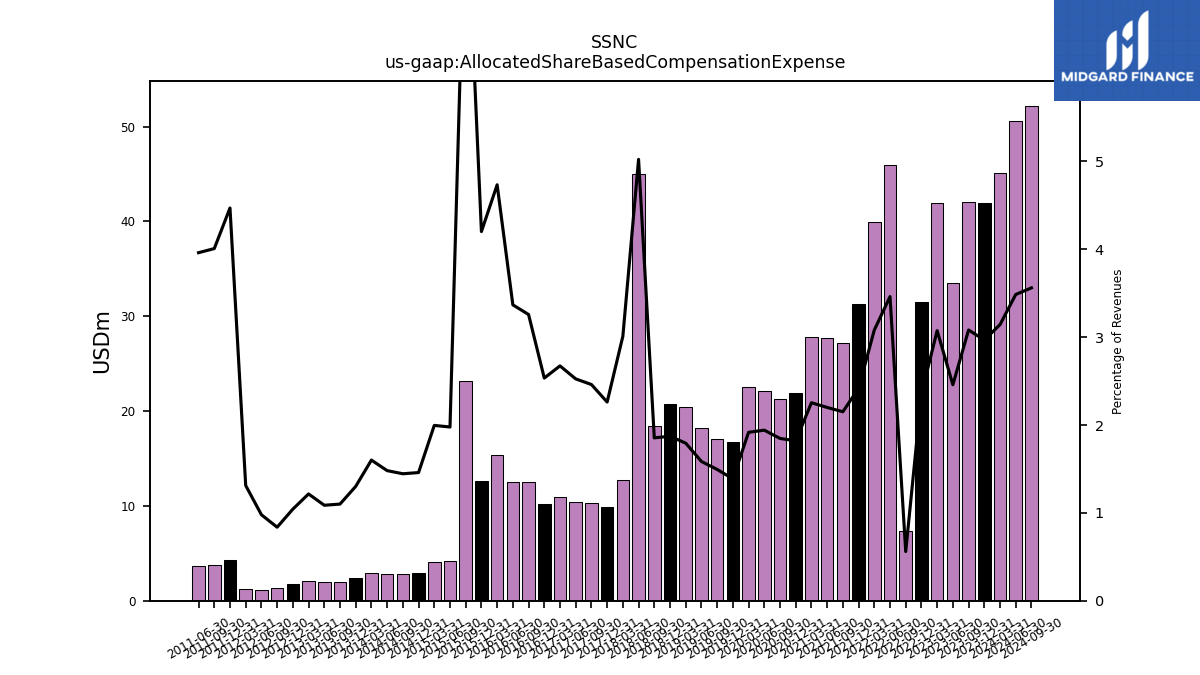
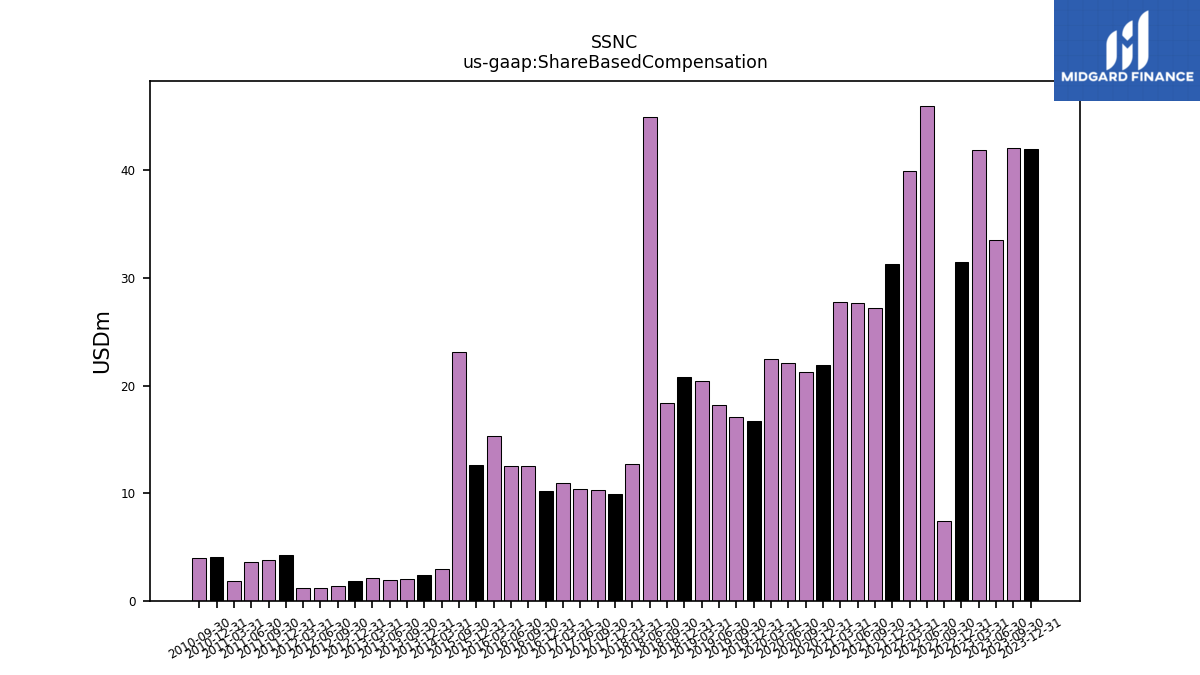
| Allocated Share Based Compensation Expense | 41.90 | 42.10 | 33.50 | 41.90 | 31.50 | 7.40 | 46.00 | 39.90 | 31.30 | 27.20 | 27.70 | 27.80 | 21.90 | 21.30 | 22.10 | 22.50 | 16.70 | 17.10 | 18.20 | 20.40 | 20.80 | 18.40 | 45.00 | 12.70 | 9.91 | 10.29 | 10.38 | 10.90 | 10.16 | 12.49 | 12.57 | 15.35 | 12.64 | 23.12 | 4.21 | 4.11 | 2.93 | 2.78 | 2.79 | 2.98 | 2.38 | 1.98 | 1.93 | 2.11 | 1.79 | 1.39 | 1.18 | 1.23 | 4.28 | 3.78 | 3.64 | NA | NA | NA | NA | |
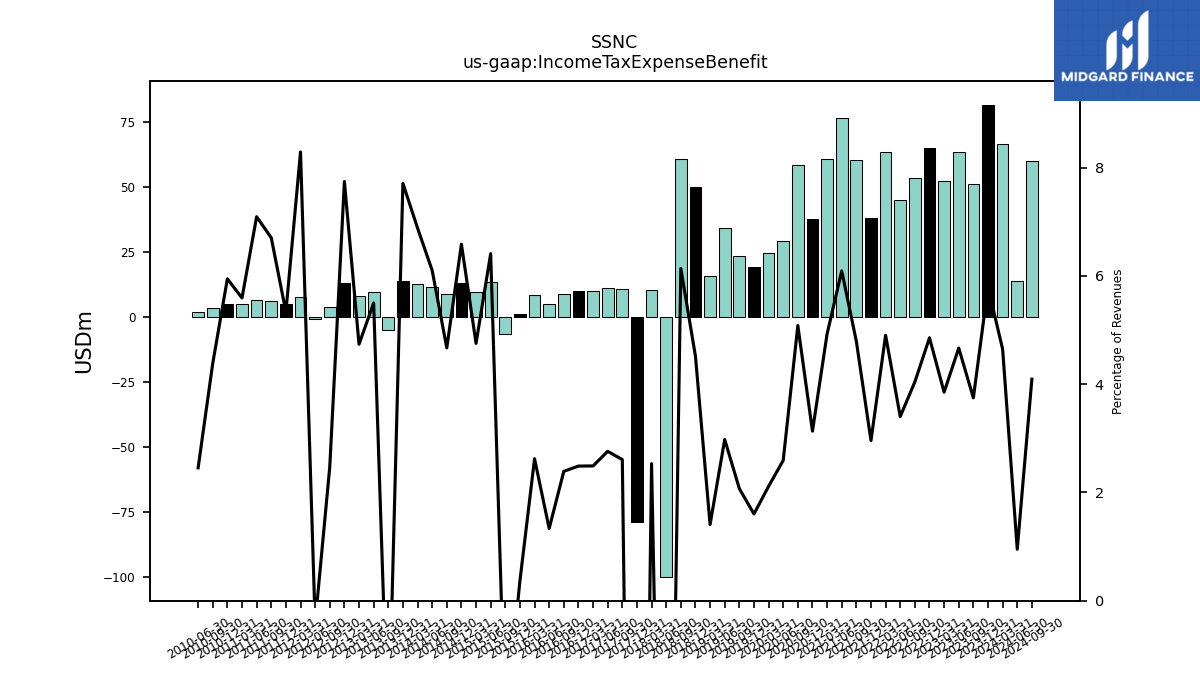
| Income Tax Expense Benefit | 81.80 | 51.20 | 63.60 | 52.50 | 65.00 | 53.40 | 45.20 | 63.50 | 38.30 | 60.60 | 76.70 | 60.80 | 37.70 | 58.60 | 29.50 | 24.80 | 19.30 | 23.70 | 34.20 | 16.00 | 50.20 | 60.90 | -99.90 | 10.68 | -78.63 | 10.90 | 11.34 | 10.15 | 9.97 | 9.16 | 4.98 | 8.50 | 1.11 | -6.55 | 13.64 | 9.78 | 13.22 | 9.00 | 11.52 | 12.79 | 14.07 | -4.75 | 9.76 | 8.21 | 13.30 | 4.10 | -0.50 | 7.76 | 5.10 | 6.32 | 6.51 | 4.98 | 5.12 | 3.64 | 2.00 | |
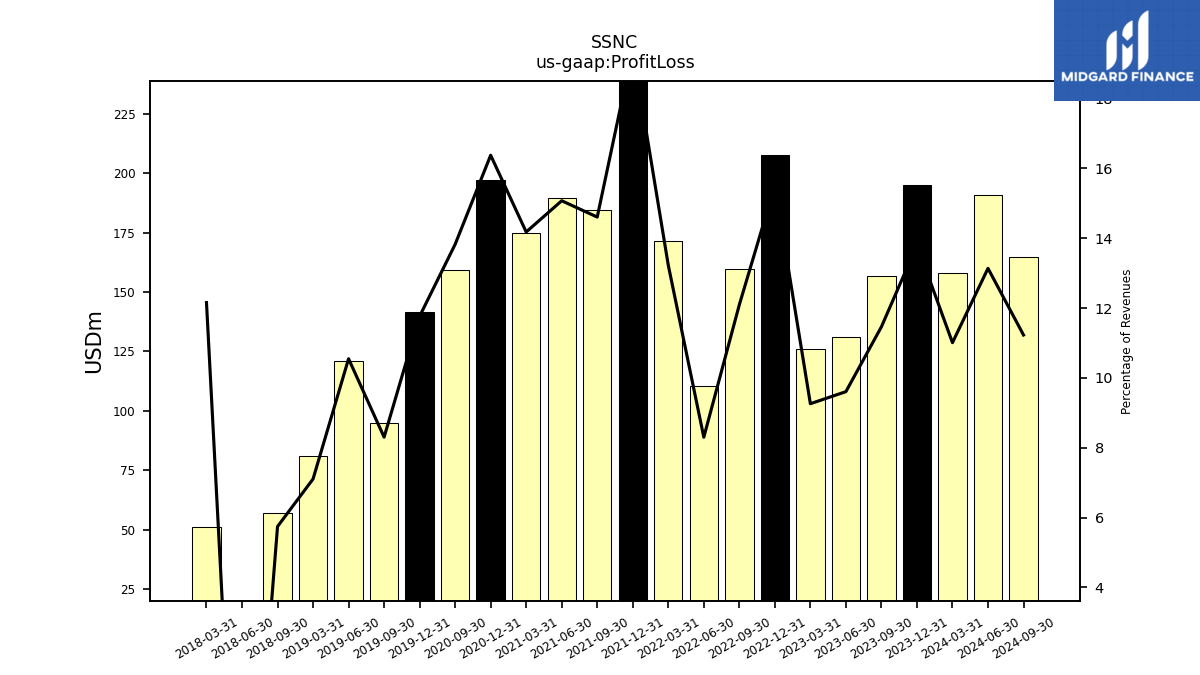
| Profit Loss | 194.90 | 156.60 | 130.90 | 126.20 | 207.60 | 159.80 | 110.30 | 171.30 | 251.20 | 184.70 | 189.80 | 174.90 | 197.10 | 159.40 | NA | NA | 141.60 | 95.00 | 121.10 | 80.80 | NA | 57.00 | -63.80 | 51.30 | NA | NA | NA | NA | NA | NA | NA | NA | NA | NA | NA | NA | NA | NA | NA | NA | NA | NA | NA | NA | NA | NA | NA | NA | NA | NA | NA | NA | NA | NA | NA | |
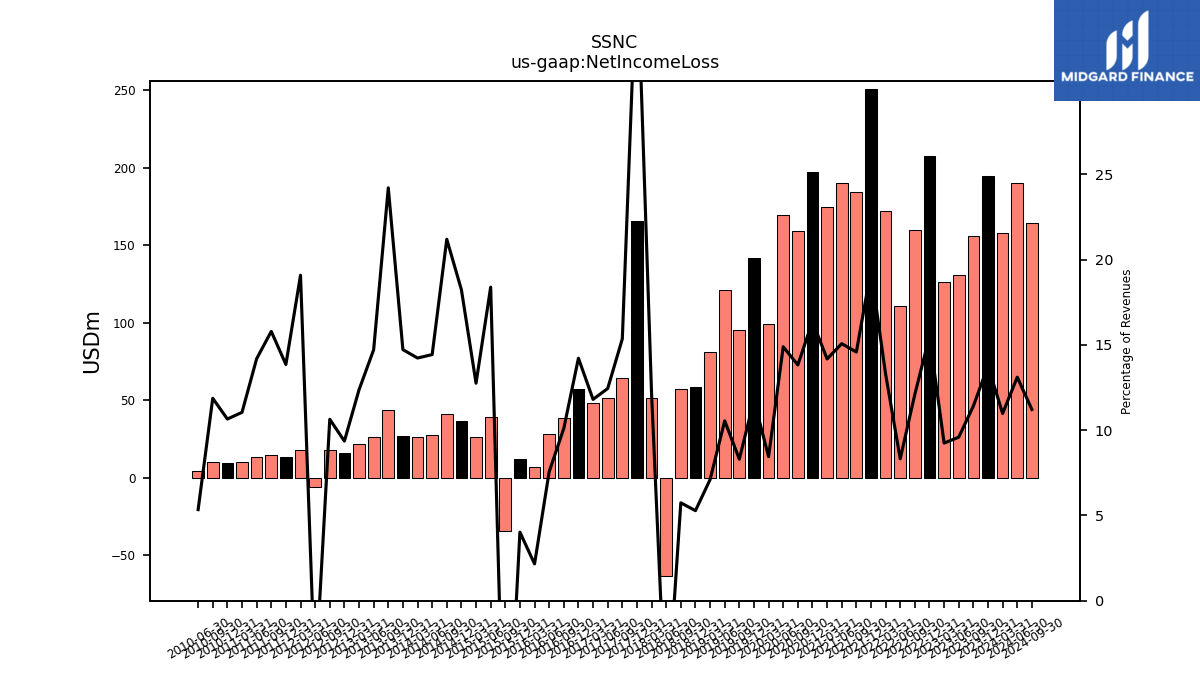
| Net Income Loss | 194.40 | 156.00 | 130.70 | 126.00 | 207.50 | 160.00 | 110.60 | 172.10 | 250.90 | 184.40 | 189.80 | 174.90 | 197.10 | 159.40 | 169.50 | 99.20 | 141.60 | 95.00 | 121.10 | 80.80 | 58.70 | 57.00 | -63.70 | 51.25 | 165.34 | 64.23 | 51.15 | 48.15 | 57.02 | 38.75 | 28.22 | 7.00 | 12.10 | -34.61 | 39.13 | 26.25 | 36.61 | 40.83 | 27.25 | 26.45 | 26.88 | 43.47 | 26.12 | 21.43 | 16.08 | 17.61 | -5.76 | 17.88 | 13.26 | 14.90 | 13.03 | 9.83 | 9.18 | 9.85 | 4.36 | |
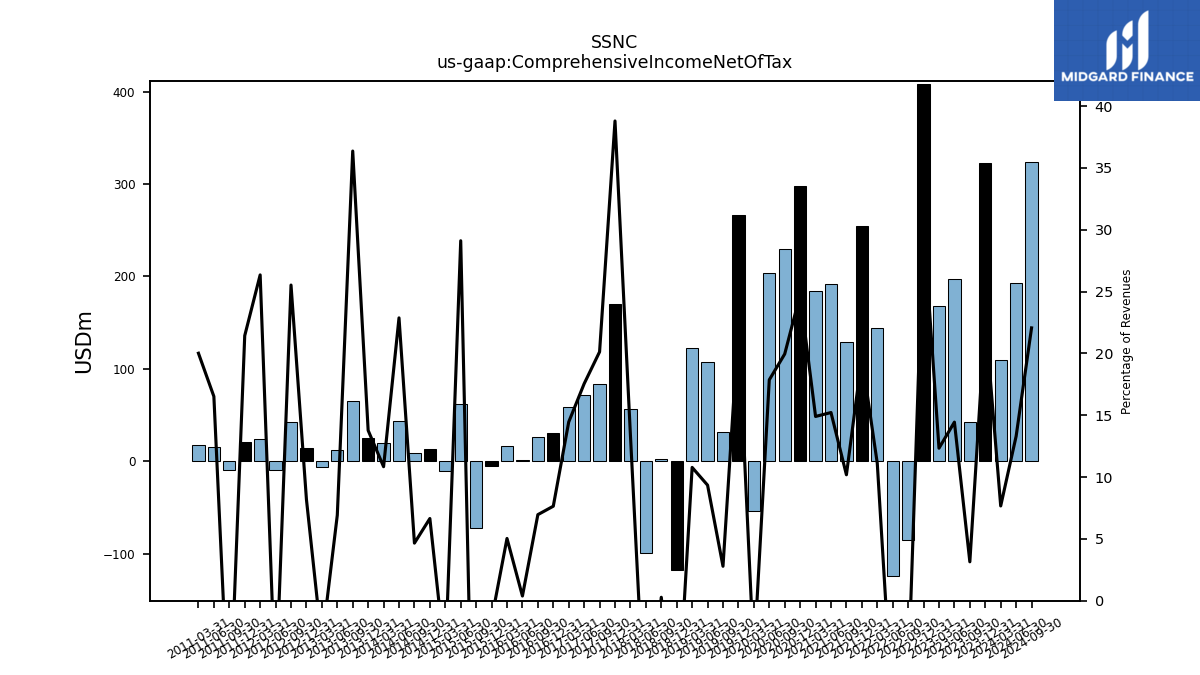
| Comprehensive Income Net Of Tax | 323.00 | 43.00 | 196.80 | 168.10 | 407.70 | -85.30 | -124.20 | 143.90 | 254.80 | 128.80 | 191.60 | 183.80 | 297.80 | 230.00 | 203.30 | -53.90 | 266.70 | 31.90 | 107.30 | 122.60 | -117.00 | 2.80 | -99.40 | 56.47 | 170.06 | 84.18 | 72.12 | 58.93 | 30.65 | 26.69 | 1.43 | 16.33 | -4.54 | -72.61 | 61.94 | -9.97 | 13.35 | 8.98 | 43.17 | 20.14 | 25.14 | 65.27 | 12.29 | -5.95 | 14.07 | 42.26 | -9.09 | 24.68 | 20.51 | -9.76 | 15.17 | 17.82 | NA | NA | NA |
| 2023-12-31 | 2023-09-30 | 2023-06-30 | 2023-03-31 | 2022-12-31 | 2022-09-30 | 2022-06-30 | 2022-03-31 | 2021-12-31 | 2021-09-30 | 2021-06-30 | 2021-03-31 | 2020-12-31 | 2020-09-30 | 2020-06-30 | 2020-03-31 | 2019-12-31 | 2019-09-30 | 2019-06-30 | 2019-03-31 | 2018-12-31 | 2018-09-30 | 2018-06-30 | 2018-03-31 | 2017-12-31 | 2017-09-30 | 2017-06-30 | 2017-03-31 | 2016-12-31 | 2016-09-30 | 2016-06-30 | 2016-03-31 | 2015-12-31 | 2015-09-30 | 2015-06-30 | 2015-03-31 | 2014-12-31 | 2014-09-30 | 2014-06-30 | 2014-03-31 | 2013-12-31 | 2013-09-30 | 2013-06-30 | 2013-03-31 | 2012-12-31 | 2012-09-30 | 2012-06-30 | 2012-03-31 | 2011-12-31 | 2011-09-30 | 2011-06-30 | 2011-03-31 | 2010-12-31 | 2010-09-30 | 2010-06-30 | ||
|---|---|---|---|---|---|---|---|---|---|---|---|---|---|---|---|---|---|---|---|---|---|---|---|---|---|---|---|---|---|---|---|---|---|---|---|---|---|---|---|---|---|---|---|---|---|---|---|---|---|---|---|---|---|---|---|---|
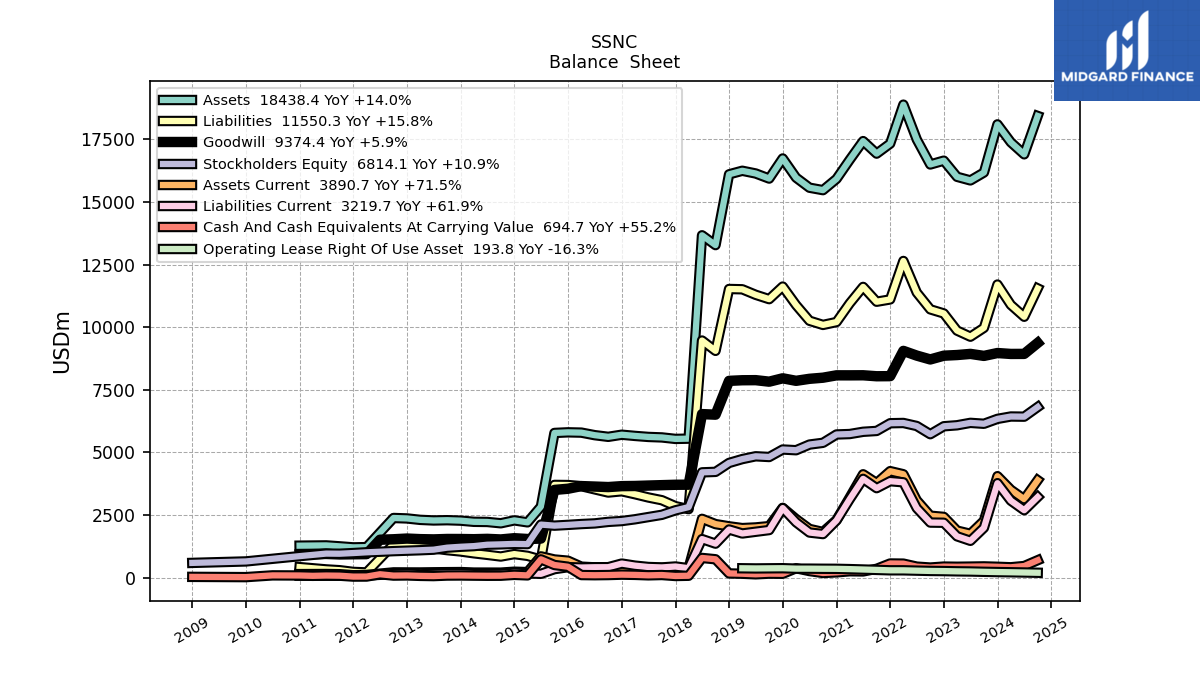
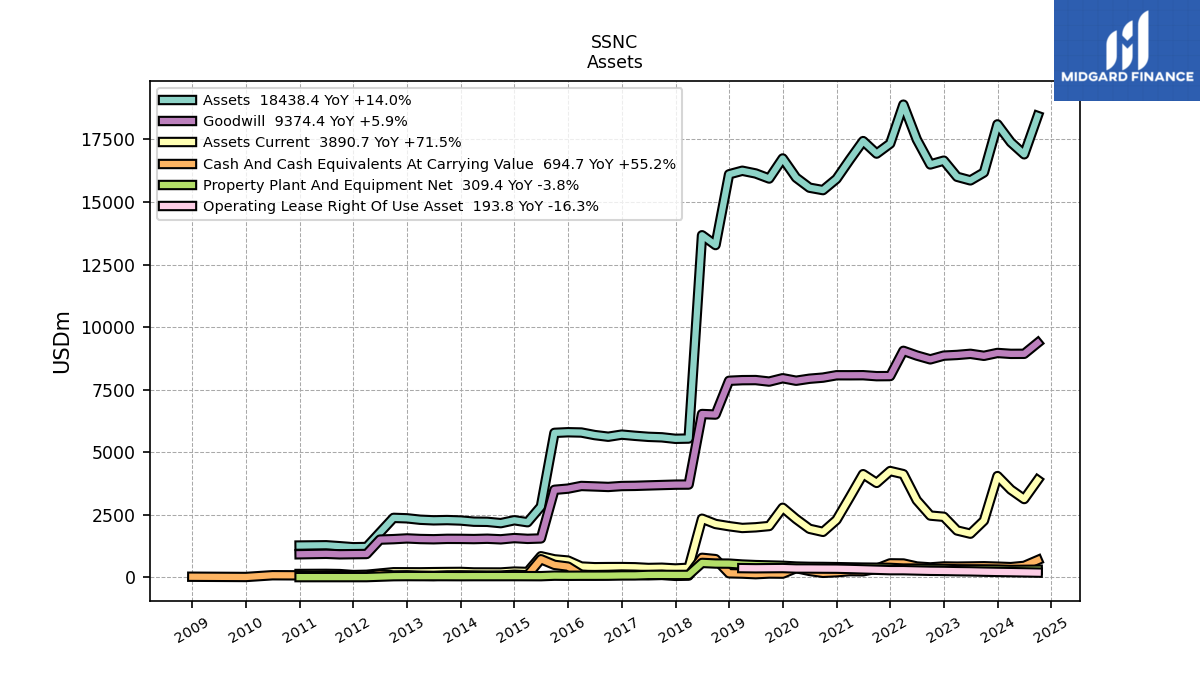
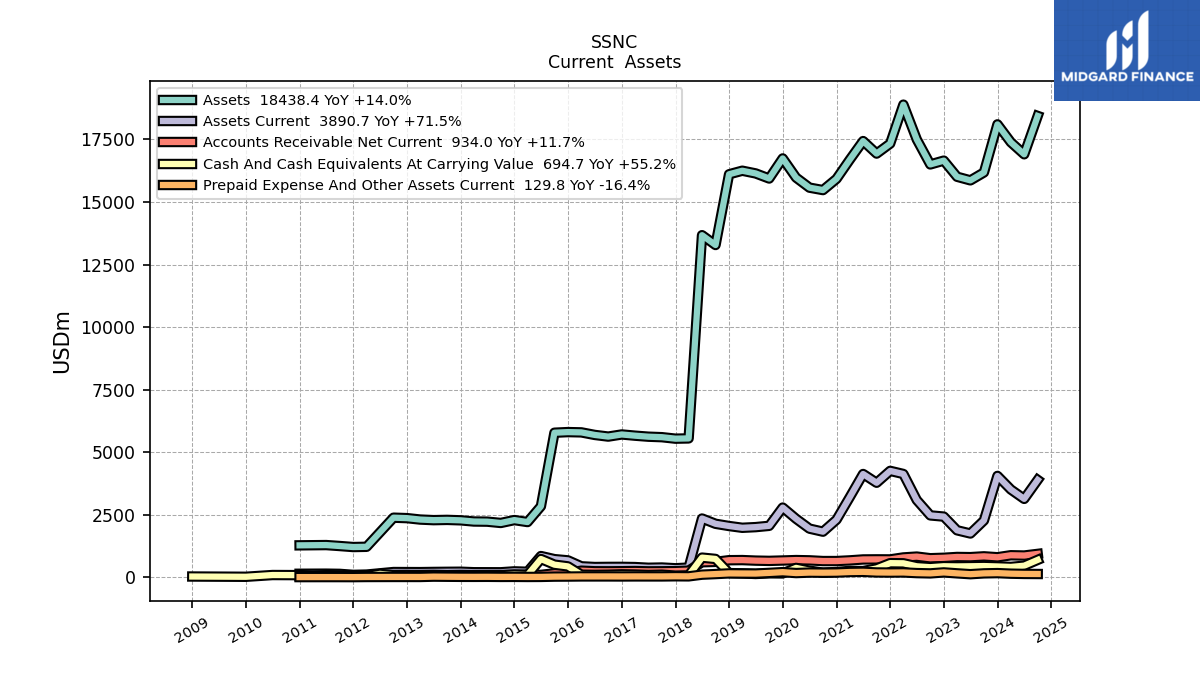
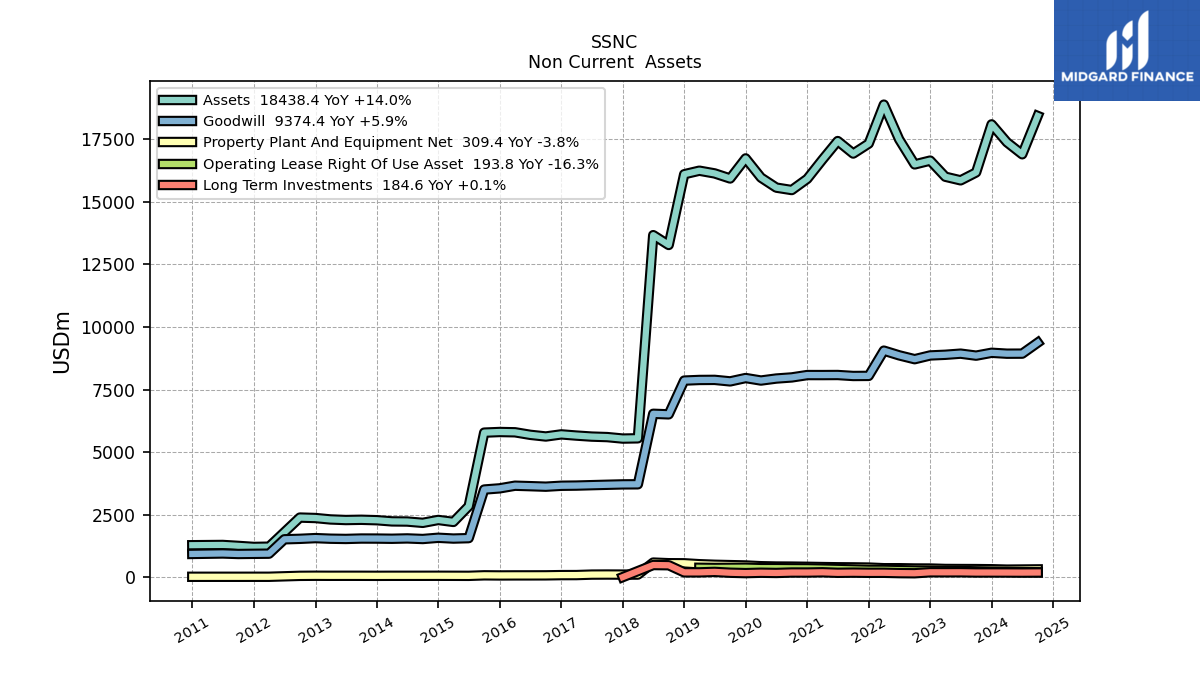
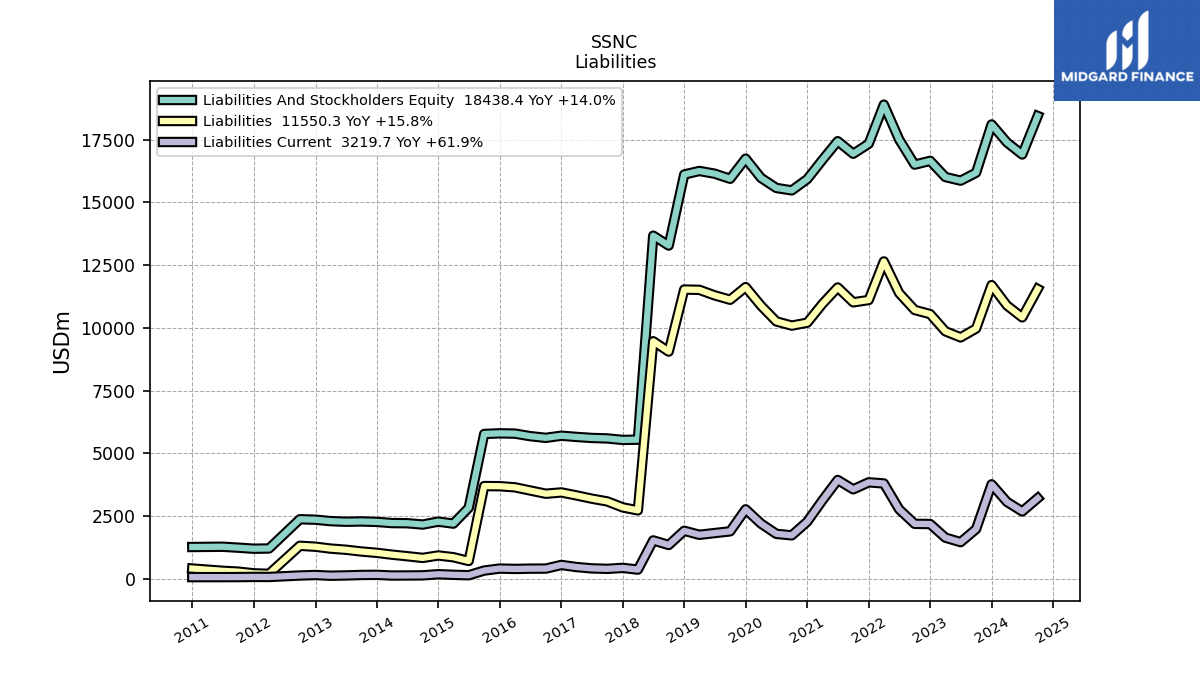
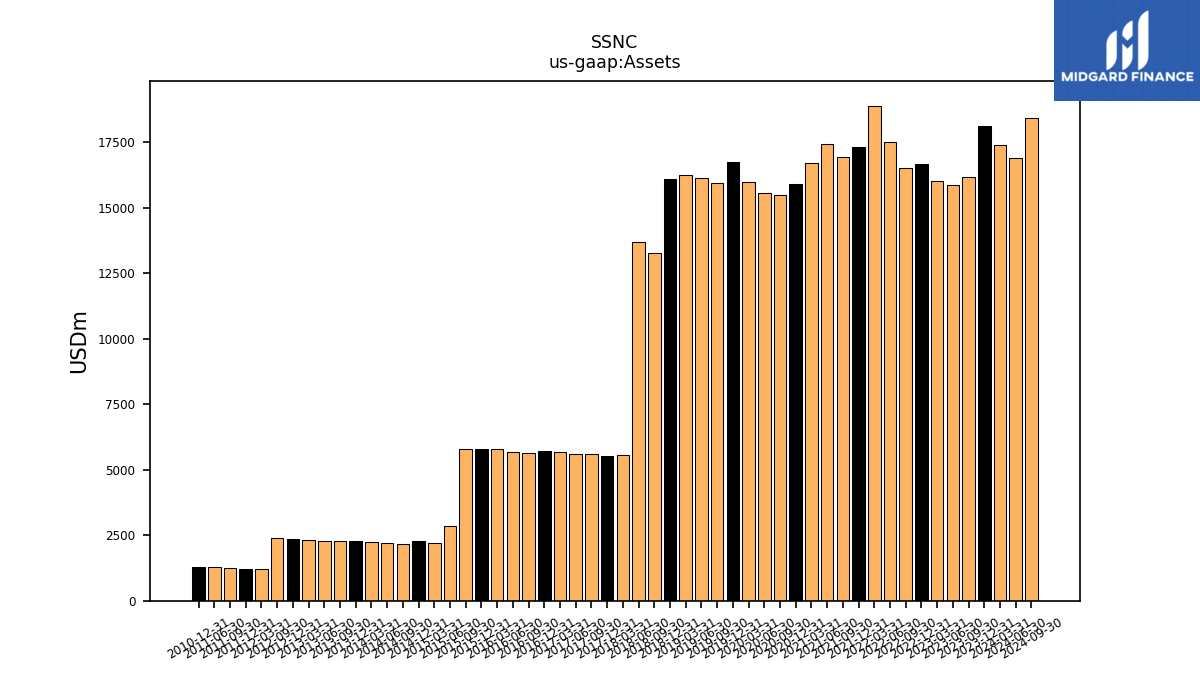
| Assets | 18102.50 | 16180.00 | 15863.50 | 16008.40 | 16653.30 | 16500.60 | 17500.30 | 18891.10 | 17333.00 | 16934.00 | 17435.10 | 16689.10 | 15923.60 | 15475.40 | 15572.90 | 15974.10 | 16741.10 | 15937.60 | 16140.90 | 16249.30 | 16107.50 | 13279.00 | 13673.50 | 5549.58 | 5539.52 | 5598.62 | 5618.40 | 5659.08 | 5706.97 | 5622.46 | 5688.84 | 5790.71 | 5802.24 | 5777.22 | 2836.37 | 2206.74 | 2285.32 | 2169.86 | 2222.43 | 2228.37 | 2275.32 | 2292.83 | 2282.62 | 2306.11 | 2362.91 | 2381.26 | NA | 1217.27 | 1207.61 | 1248.50 | 1286.23 | NA | 1275.73 | NA | NA | |
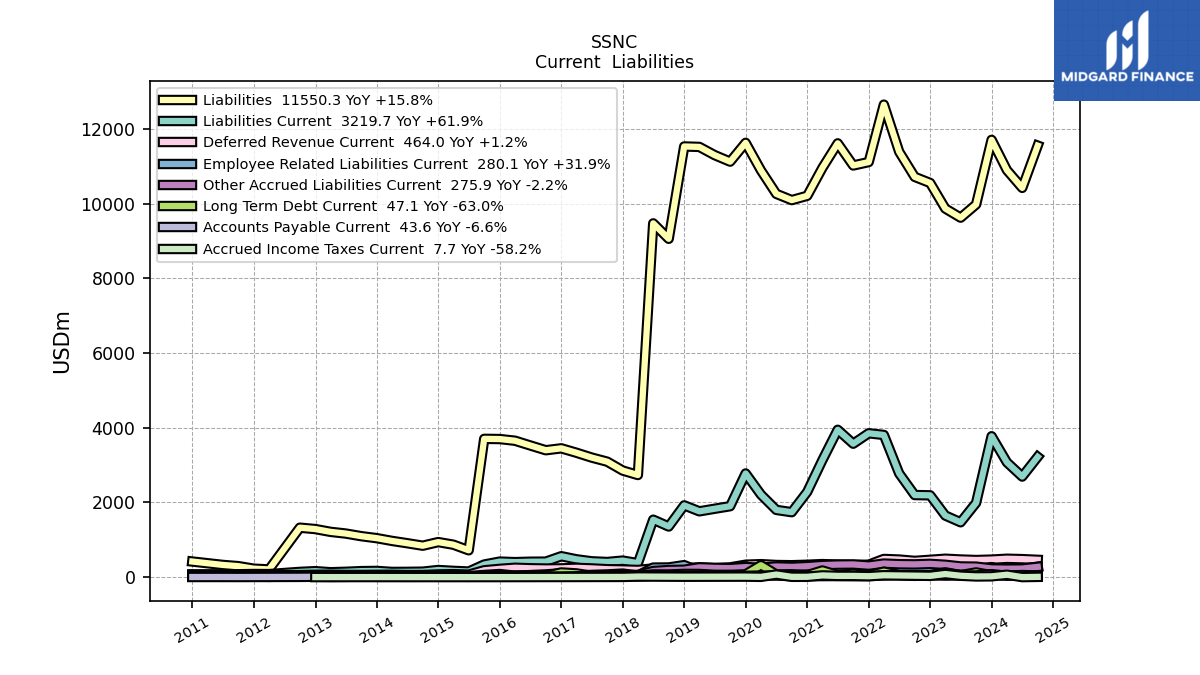
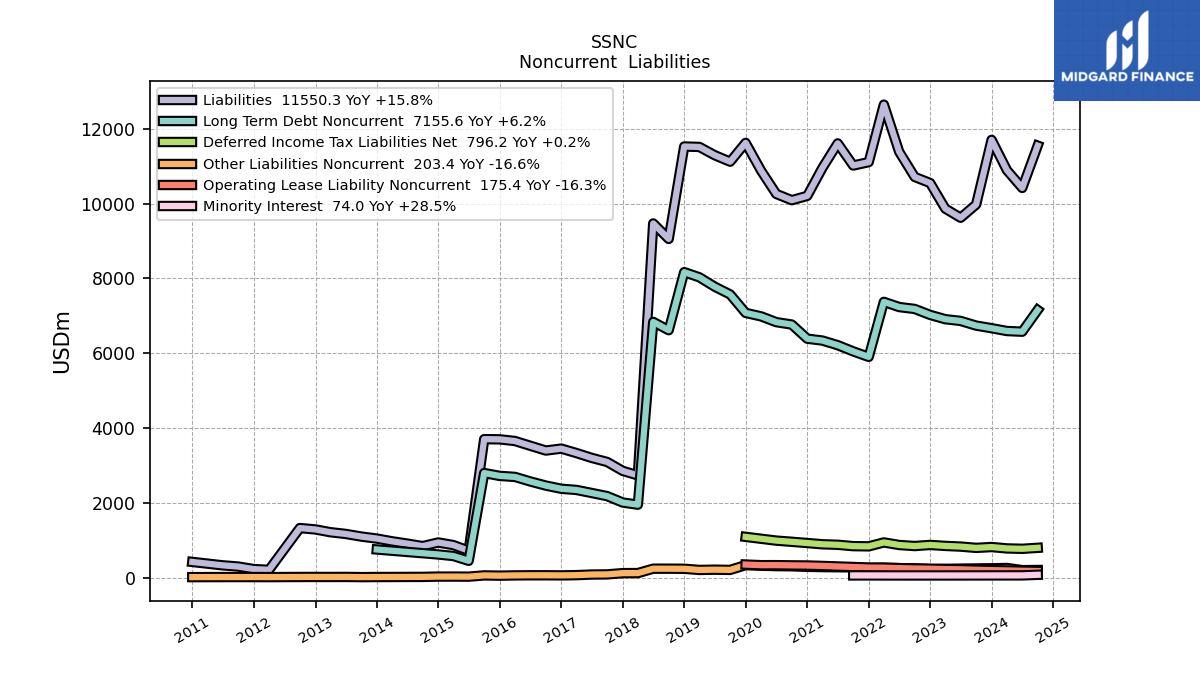
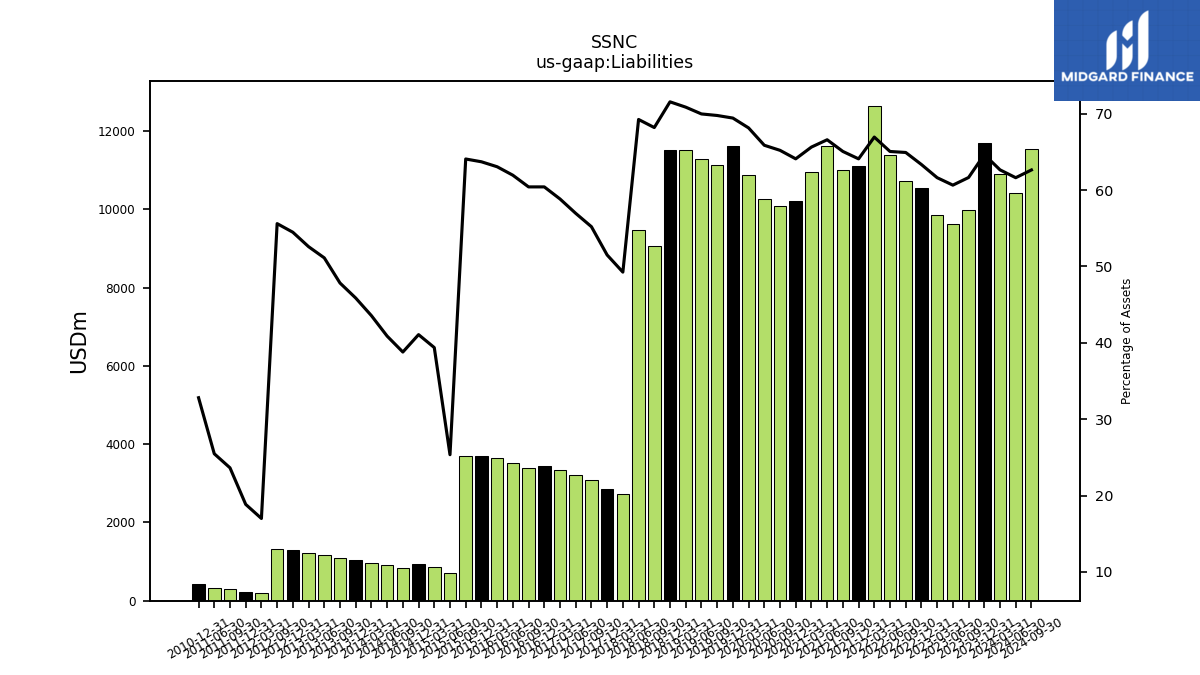
| Liabilities | 11704.80 | 9975.70 | 9621.90 | 9866.00 | 10550.40 | 10714.30 | 11386.10 | 12647.50 | 11109.80 | 11018.60 | 11611.40 | 10954.90 | 10207.10 | 10092.10 | 10259.10 | 10886.50 | 11625.00 | 11121.00 | 11295.40 | 11515.80 | 11527.50 | 9056.00 | 9469.80 | 2733.68 | 2853.13 | 3090.98 | 3200.22 | 3330.01 | 3448.39 | 3397.27 | 3524.41 | 3651.79 | 3696.80 | 3701.98 | 718.86 | 868.97 | 938.65 | 841.76 | 908.49 | 970.62 | 1043.62 | 1096.79 | 1167.05 | 1212.91 | 1287.40 | 1324.32 | NA | 206.82 | 227.50 | 294.99 | 327.59 | NA | 418.54 | NA | NA | |
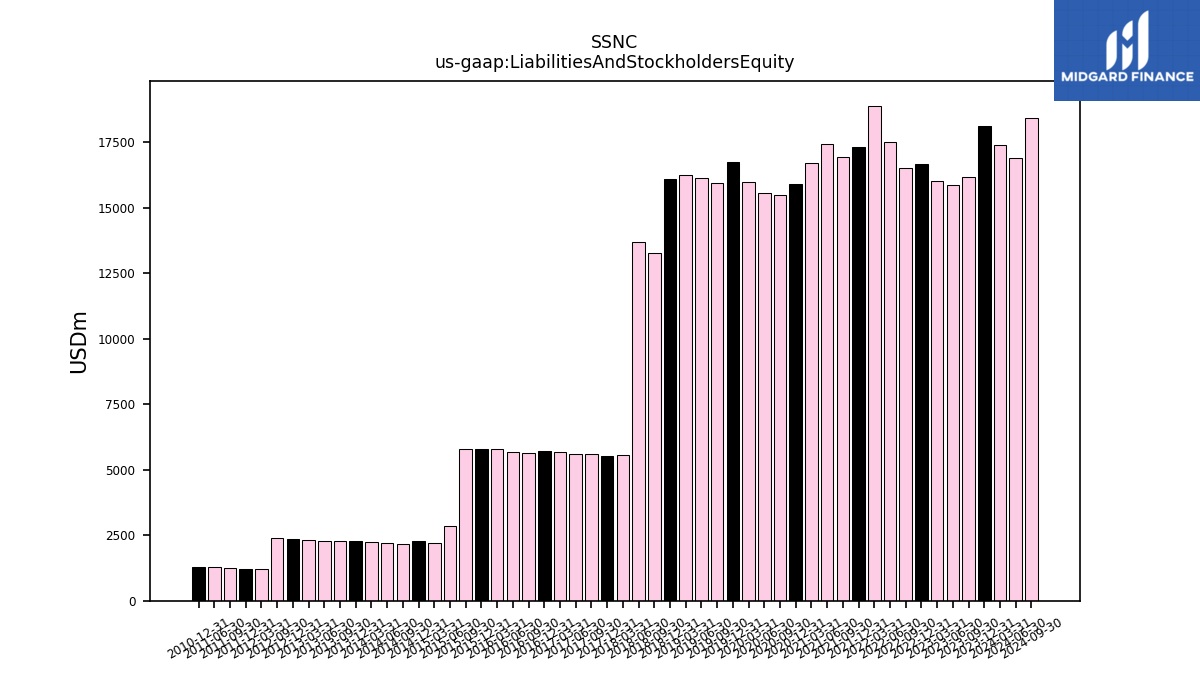
| Liabilities And Stockholders Equity | 18102.50 | 16180.00 | 15863.50 | 16008.40 | 16653.30 | 16500.60 | 17500.30 | 18891.10 | 17333.00 | 16934.00 | 17435.10 | 16689.10 | 15923.60 | 15475.40 | 15572.90 | 15974.10 | 16741.10 | 15937.60 | 16140.90 | 16249.30 | 16107.50 | 13279.00 | 13673.50 | 5549.58 | 5539.52 | 5598.62 | 5618.40 | 5659.08 | 5706.97 | 5622.46 | 5688.84 | 5790.71 | 5802.24 | 5777.22 | 2836.37 | 2206.74 | 2285.32 | 2169.86 | 2222.43 | 2228.37 | 2275.32 | 2292.83 | 2282.62 | 2306.11 | 2362.91 | 2381.26 | NA | 1217.27 | 1207.61 | 1248.50 | 1286.23 | NA | 1275.73 | NA | NA | |
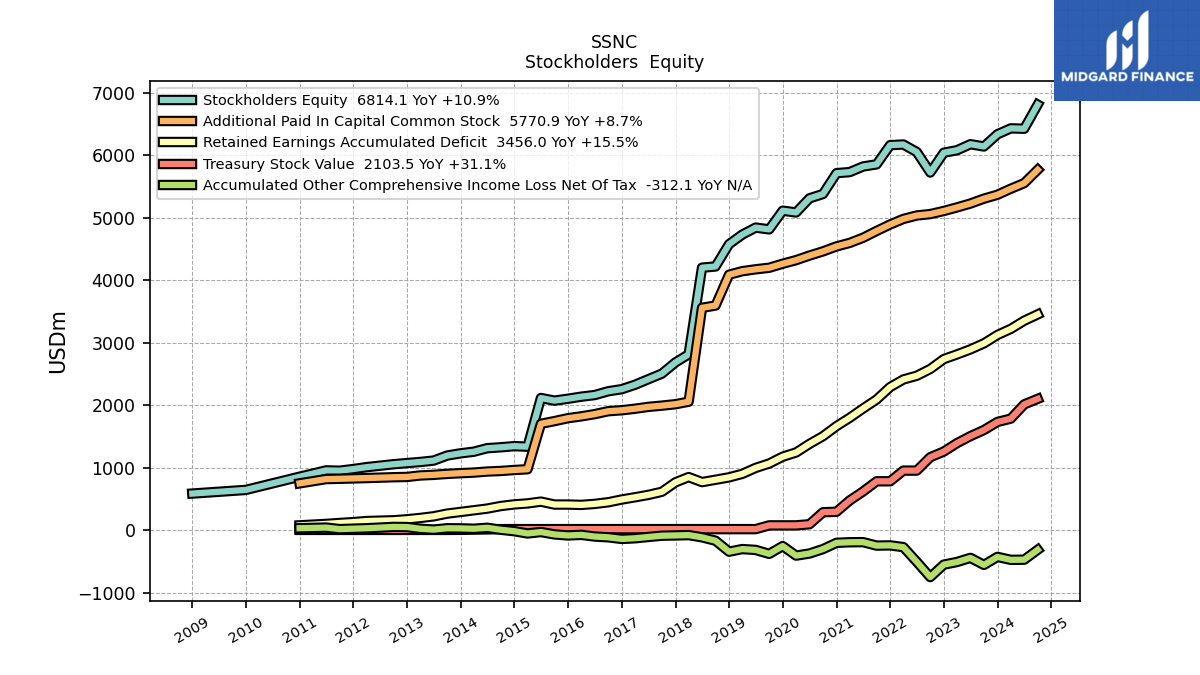
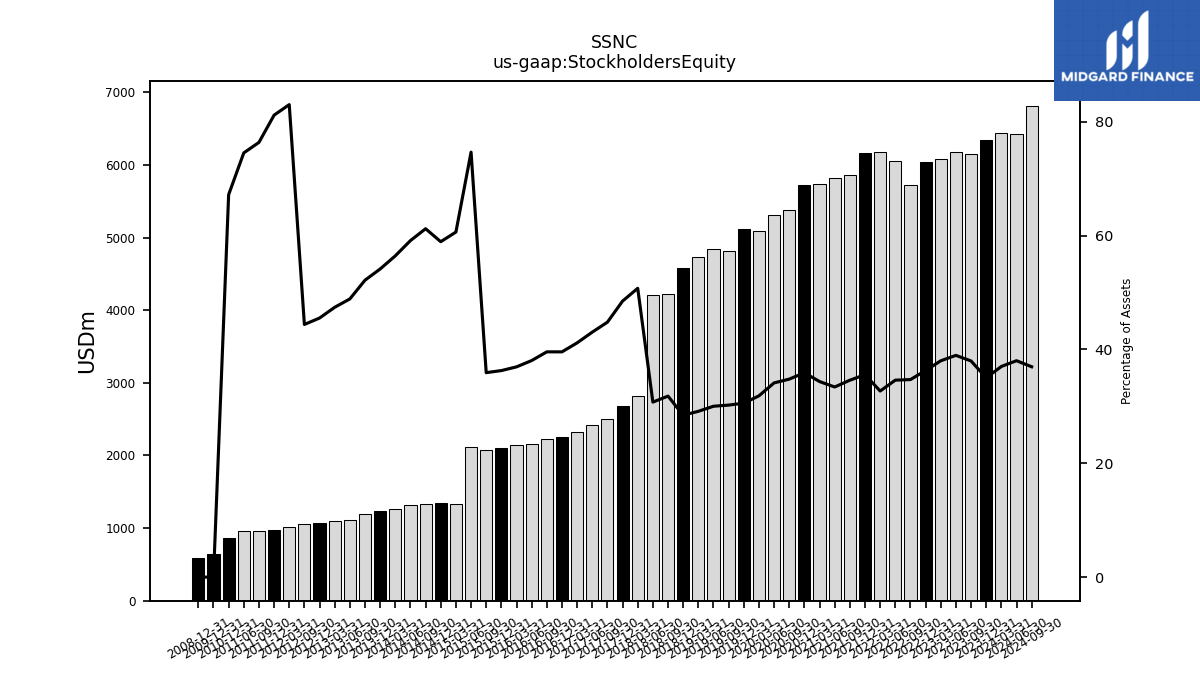
| Stockholders Equity | 6339.60 | 6143.90 | 6180.30 | 6084.00 | 6044.20 | 5727.00 | 6055.40 | 6175.70 | 6165.40 | 5857.90 | 5823.70 | 5734.20 | 5716.50 | 5383.30 | 5313.80 | 5087.60 | 5116.10 | 4816.60 | 4845.50 | 4733.50 | 4580.00 | 4223.00 | 4203.70 | 2815.91 | 2686.39 | 2507.64 | 2418.18 | 2329.07 | 2258.58 | 2225.19 | 2164.43 | 2138.93 | 2105.45 | 2075.25 | 2117.51 | 1337.77 | 1346.67 | 1328.10 | 1313.94 | 1257.75 | 1231.71 | 1196.05 | 1115.57 | 1093.19 | 1075.50 | 1056.95 | NA | 1010.45 | 980.10 | 953.52 | 958.64 | NA | 857.18 | NA | NA |
| 2023-12-31 | 2023-09-30 | 2023-06-30 | 2023-03-31 | 2022-12-31 | 2022-09-30 | 2022-06-30 | 2022-03-31 | 2021-12-31 | 2021-09-30 | 2021-06-30 | 2021-03-31 | 2020-12-31 | 2020-09-30 | 2020-06-30 | 2020-03-31 | 2019-12-31 | 2019-09-30 | 2019-06-30 | 2019-03-31 | 2018-12-31 | 2018-09-30 | 2018-06-30 | 2018-03-31 | 2017-12-31 | 2017-09-30 | 2017-06-30 | 2017-03-31 | 2016-12-31 | 2016-09-30 | 2016-06-30 | 2016-03-31 | 2015-12-31 | 2015-09-30 | 2015-06-30 | 2015-03-31 | 2014-12-31 | 2014-09-30 | 2014-06-30 | 2014-03-31 | 2013-12-31 | 2013-09-30 | 2013-06-30 | 2013-03-31 | 2012-12-31 | 2012-09-30 | 2012-06-30 | 2012-03-31 | 2011-12-31 | 2011-09-30 | 2011-06-30 | 2011-03-31 | 2010-12-31 | 2010-09-30 | 2010-06-30 | ||
|---|---|---|---|---|---|---|---|---|---|---|---|---|---|---|---|---|---|---|---|---|---|---|---|---|---|---|---|---|---|---|---|---|---|---|---|---|---|---|---|---|---|---|---|---|---|---|---|---|---|---|---|---|---|---|---|---|
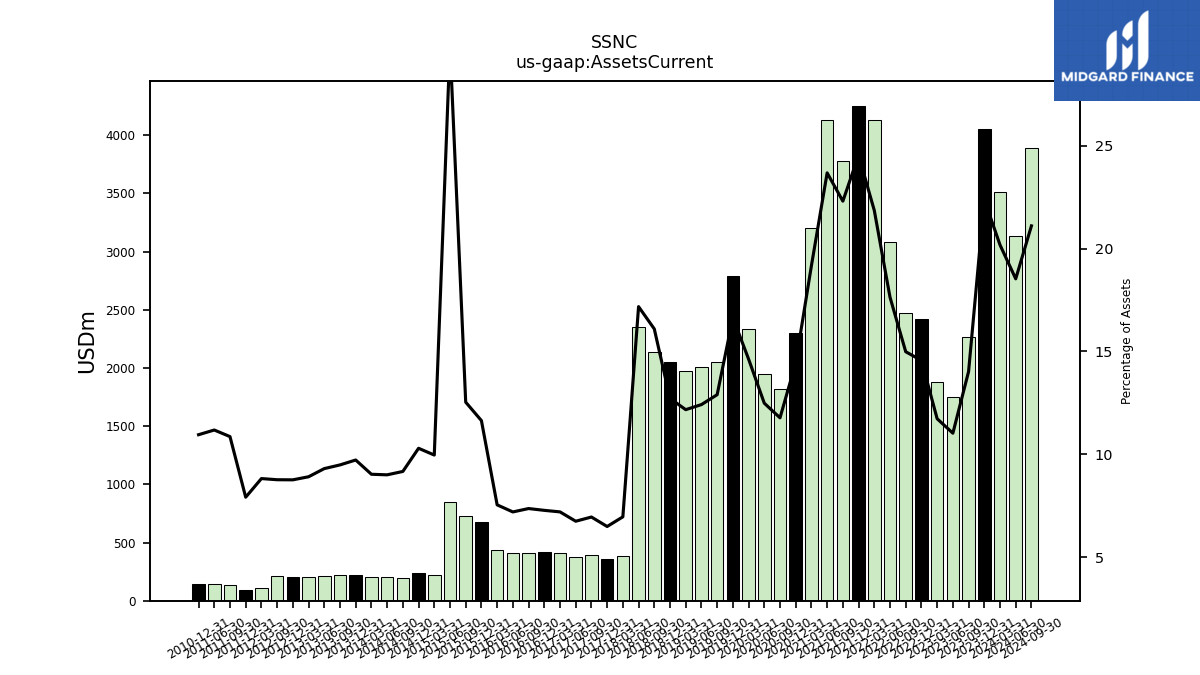
| Assets Current | 4051.50 | 2268.40 | 1748.80 | 1877.20 | 2424.40 | 2472.30 | 3085.90 | 4127.70 | 4252.20 | 3776.40 | 4127.80 | 3199.20 | 2298.50 | 1821.70 | 1943.80 | 2336.70 | 2785.90 | 2055.10 | 2003.70 | 1977.10 | 2048.10 | 2136.80 | 2348.30 | 386.20 | 359.46 | 389.07 | 378.97 | 407.40 | 415.11 | 413.91 | 409.38 | 436.69 | 675.07 | 723.97 | 847.75 | 219.83 | 235.17 | 198.85 | 200.03 | 201.16 | 221.18 | 217.40 | 212.34 | 205.39 | 206.92 | 208.65 | NA | 107.34 | 95.56 | 135.56 | 143.78 | NA | 139.69 | NA | NA | |
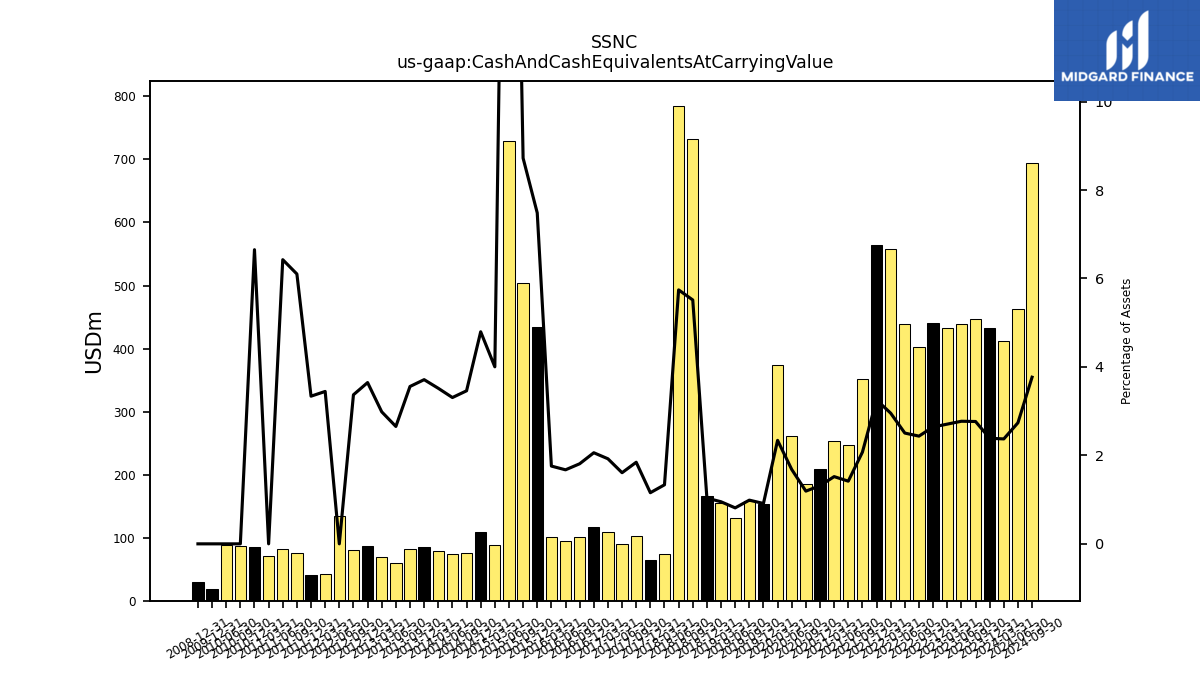
| Cash And Cash Equivalents At Carrying Value | 432.20 | 447.60 | 439.70 | 433.30 | 440.10 | 401.90 | 438.30 | 558.10 | 564.00 | 351.10 | 247.10 | 253.70 | 209.30 | 184.50 | 261.90 | 373.70 | 152.80 | 157.50 | 131.30 | 154.60 | 166.70 | 732.20 | 785.10 | 74.08 | 64.06 | 103.28 | 90.37 | 108.84 | 117.56 | 101.80 | 95.22 | 101.83 | 434.16 | 503.81 | 729.81 | 88.33 | 109.58 | 75.08 | 73.52 | 78.37 | 84.47 | 81.58 | 60.59 | 68.84 | 86.16 | 80.25 | 134.47 | 41.94 | 40.32 | 76.17 | 82.64 | 70.83 | 84.84 | 86.97 | 88.89 | |
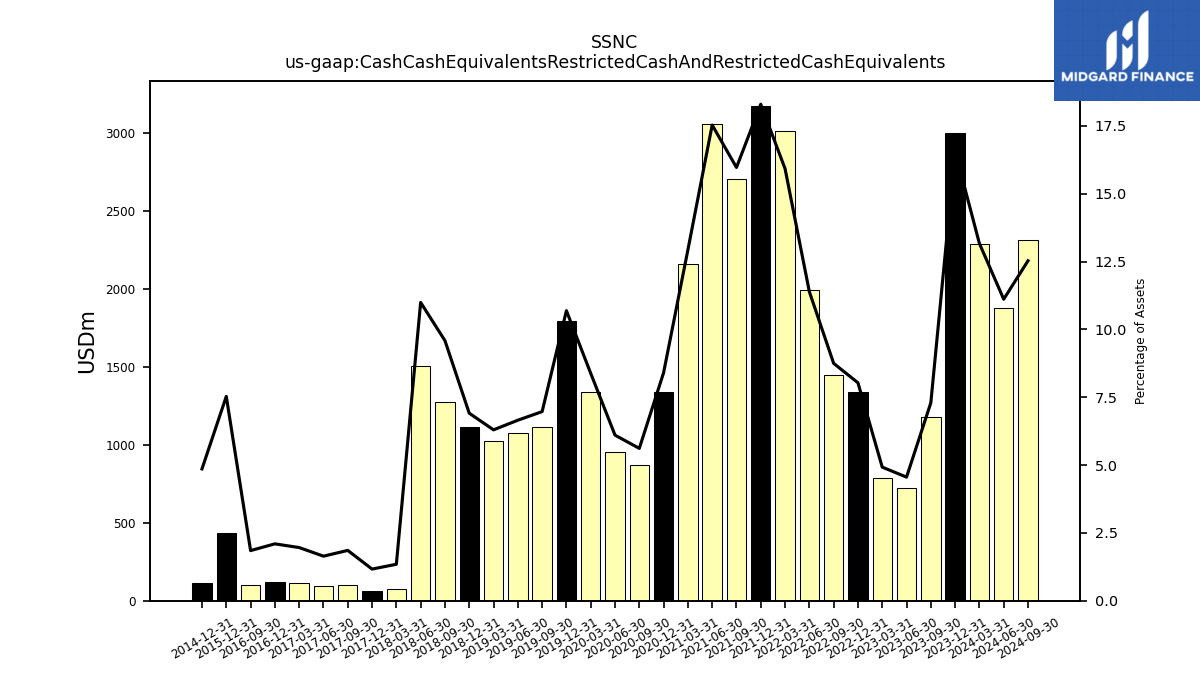
| Cash Cash Equivalents Restricted Cash And Restricted Cash Equivalents | 2998.60 | 1180.40 | 722.80 | 788.20 | 1337.60 | 1443.60 | 1992.80 | 3007.80 | 3171.40 | 2703.90 | 3056.50 | 2157.70 | 1337.90 | 868.90 | 950.50 | 1339.00 | 1789.40 | 1110.90 | 1073.80 | 1023.40 | 1113.30 | 1273.00 | 1503.10 | 74.62 | 64.65 | 103.87 | 92.30 | 110.91 | 119.67 | 103.92 | NA | NA | 436.98 | NA | NA | NA | 111.05 | NA | NA | NA | NA | NA | NA | NA | NA | NA | NA | NA | NA | NA | NA | NA | NA | NA | NA | |
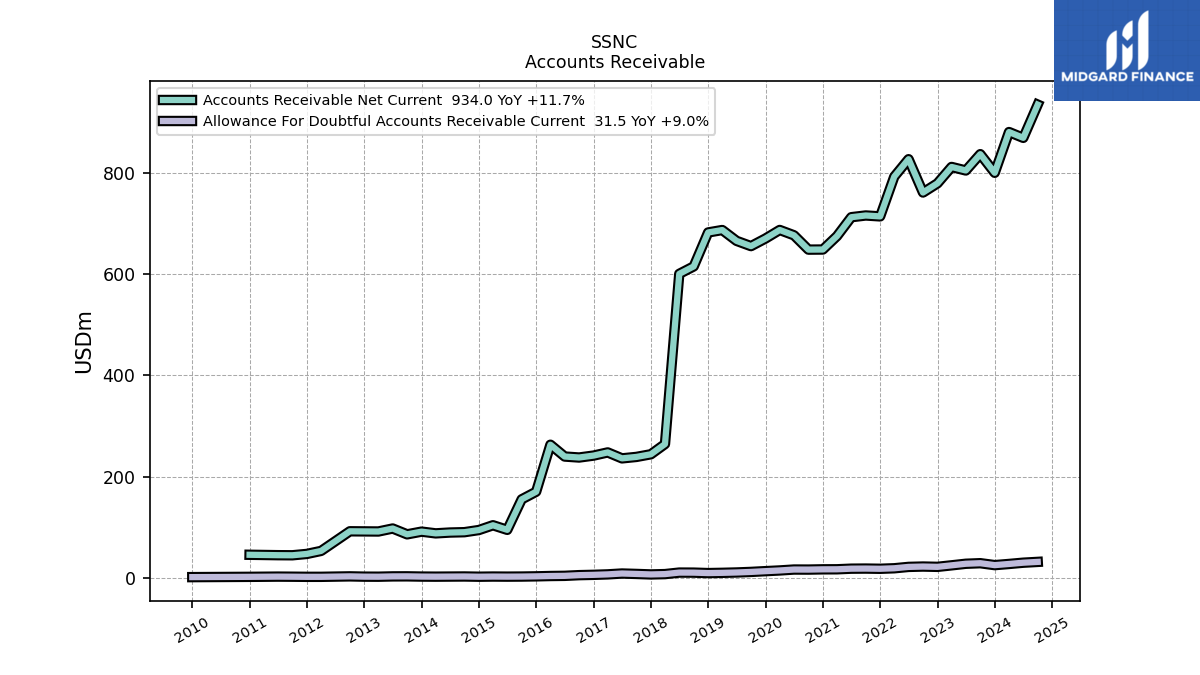
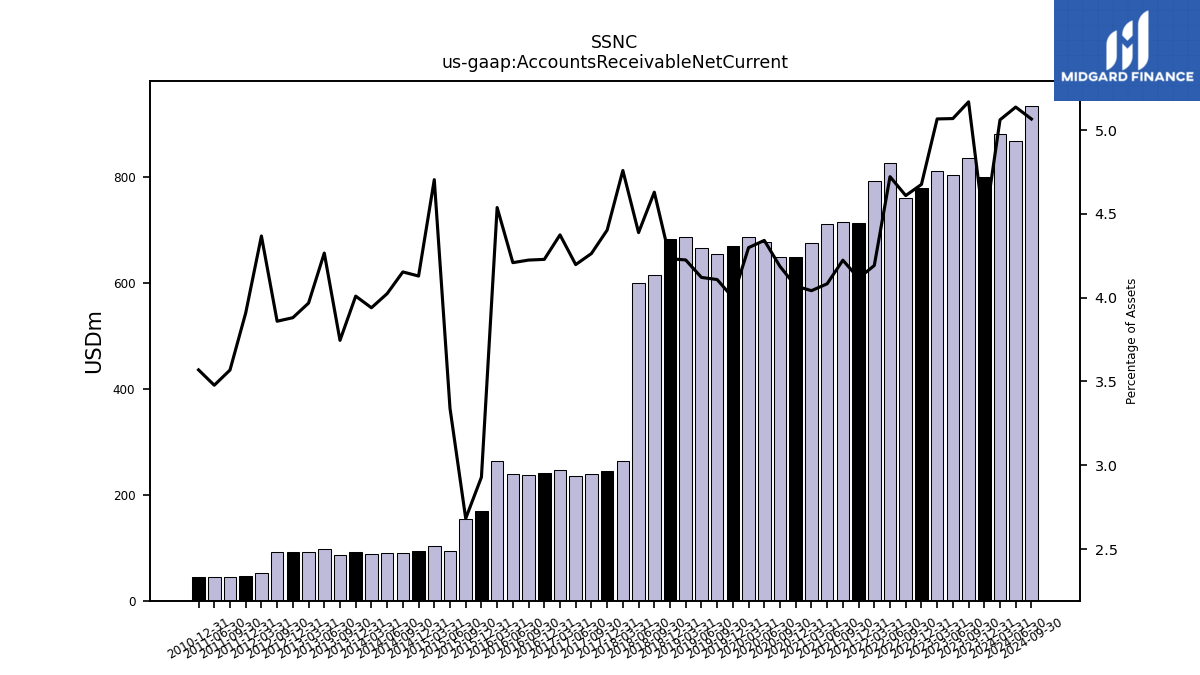
| Accounts Receivable Net Current | 799.40 | 836.20 | 804.00 | 811.00 | 778.60 | 760.50 | 826.30 | 791.90 | 713.40 | 715.20 | 711.80 | 674.50 | 648.00 | 647.80 | 676.10 | 686.60 | 669.70 | 654.70 | 665.10 | 686.50 | 681.70 | 614.70 | 600.00 | 264.08 | 243.90 | 238.68 | 235.81 | 247.55 | 241.31 | 237.50 | 239.43 | 262.75 | 169.95 | 154.98 | 94.73 | 103.80 | 94.36 | 90.12 | 89.43 | 87.79 | 91.22 | 85.87 | 97.37 | 91.50 | 91.69 | 91.90 | NA | 53.17 | 47.20 | 44.55 | 44.73 | NA | 45.53 | NA | NA | |
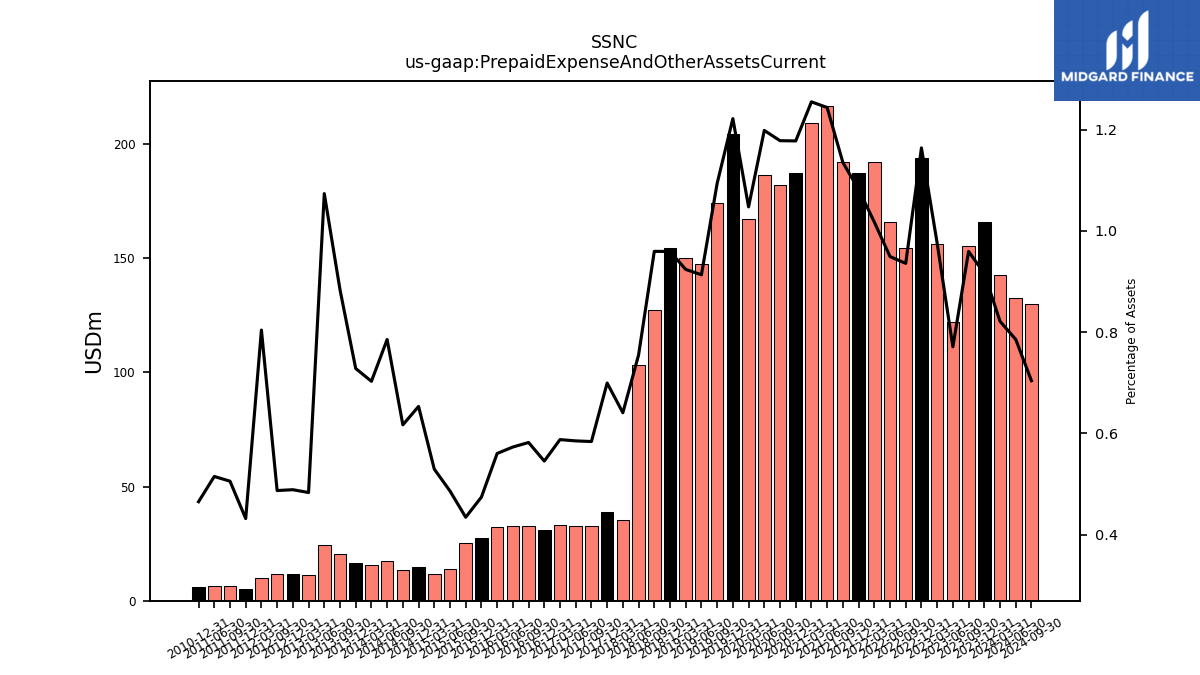
| Prepaid Expense And Other Assets Current | 165.80 | 155.20 | 122.30 | 156.20 | 193.80 | 154.40 | 166.10 | 192.20 | 187.50 | 192.20 | 216.80 | 209.40 | 187.50 | 182.30 | 186.60 | 167.30 | 204.50 | 174.30 | 147.40 | 150.10 | 154.50 | 127.40 | 103.20 | 35.56 | 38.74 | 32.69 | 32.88 | 33.26 | 31.12 | 32.72 | 32.60 | 32.44 | 27.51 | 25.09 | 13.79 | 11.68 | 14.93 | 13.38 | 17.45 | 15.66 | 16.57 | 20.26 | 24.50 | 11.14 | 11.55 | 11.60 | NA | 9.79 | 5.21 | 6.31 | 6.62 | NA | 5.93 | NA | NA |
| 2023-12-31 | 2023-09-30 | 2023-06-30 | 2023-03-31 | 2022-12-31 | 2022-09-30 | 2022-06-30 | 2022-03-31 | 2021-12-31 | 2021-09-30 | 2021-06-30 | 2021-03-31 | 2020-12-31 | 2020-09-30 | 2020-06-30 | 2020-03-31 | 2019-12-31 | 2019-09-30 | 2019-06-30 | 2019-03-31 | 2018-12-31 | 2018-09-30 | 2018-06-30 | 2018-03-31 | 2017-12-31 | 2017-09-30 | 2017-06-30 | 2017-03-31 | 2016-12-31 | 2016-09-30 | 2016-06-30 | 2016-03-31 | 2015-12-31 | 2015-09-30 | 2015-06-30 | 2015-03-31 | 2014-12-31 | 2014-09-30 | 2014-06-30 | 2014-03-31 | 2013-12-31 | 2013-09-30 | 2013-06-30 | 2013-03-31 | 2012-12-31 | 2012-09-30 | 2012-06-30 | 2012-03-31 | 2011-12-31 | 2011-09-30 | 2011-06-30 | 2011-03-31 | 2010-12-31 | 2010-09-30 | 2010-06-30 | ||
|---|---|---|---|---|---|---|---|---|---|---|---|---|---|---|---|---|---|---|---|---|---|---|---|---|---|---|---|---|---|---|---|---|---|---|---|---|---|---|---|---|---|---|---|---|---|---|---|---|---|---|---|---|---|---|---|---|
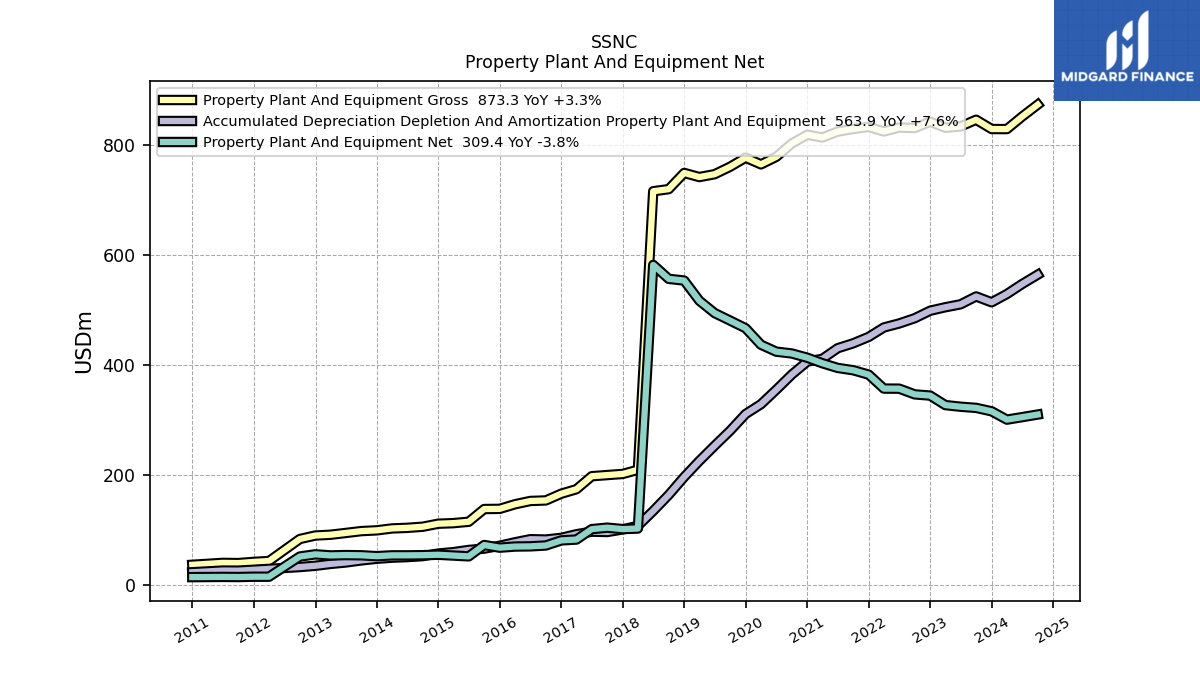
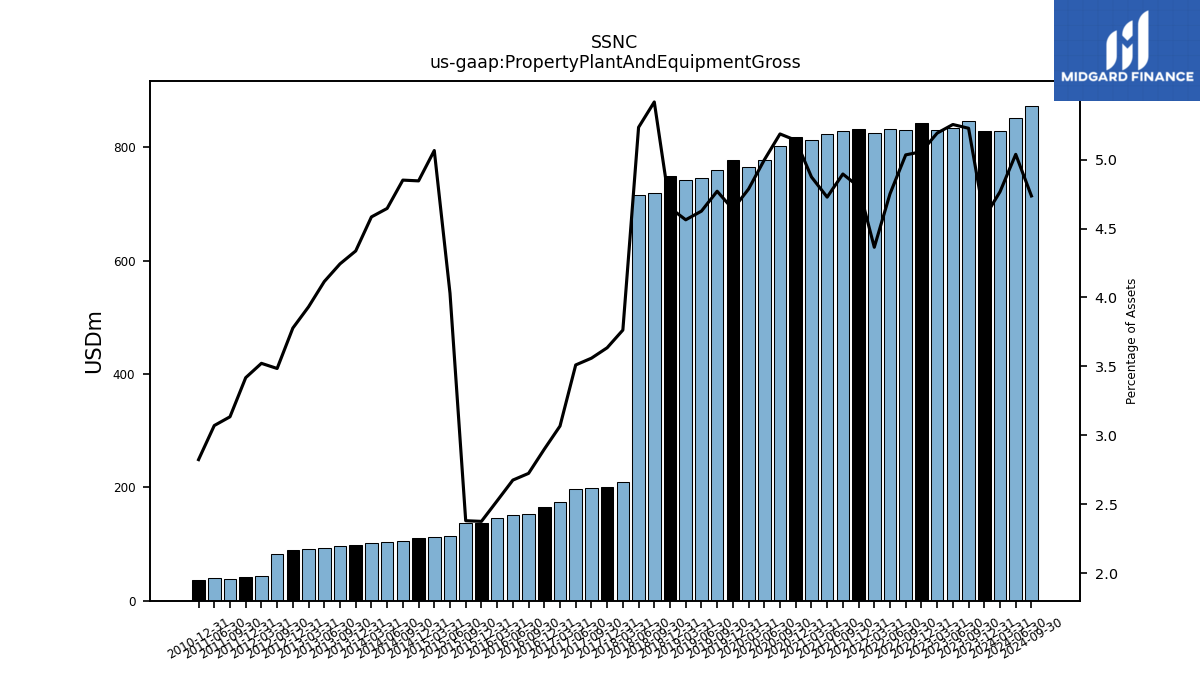
| Property Plant And Equipment Gross | 828.90 | 845.80 | 833.60 | 831.20 | 842.20 | 830.70 | 831.60 | 824.40 | 832.70 | 829.00 | 824.30 | 813.50 | 818.50 | 802.60 | 778.30 | 764.60 | 776.80 | 760.30 | 746.70 | 741.50 | 749.00 | 719.50 | 715.70 | 208.83 | 201.34 | 199.25 | 197.20 | 173.53 | 165.41 | 153.10 | 152.13 | 146.15 | 137.78 | 137.47 | 114.32 | 111.79 | 110.74 | 105.27 | 103.25 | 102.15 | 98.69 | 97.29 | 93.93 | 90.67 | 89.26 | 82.97 | NA | 42.87 | 41.27 | 39.12 | 39.49 | NA | 36.01 | NA | NA | |
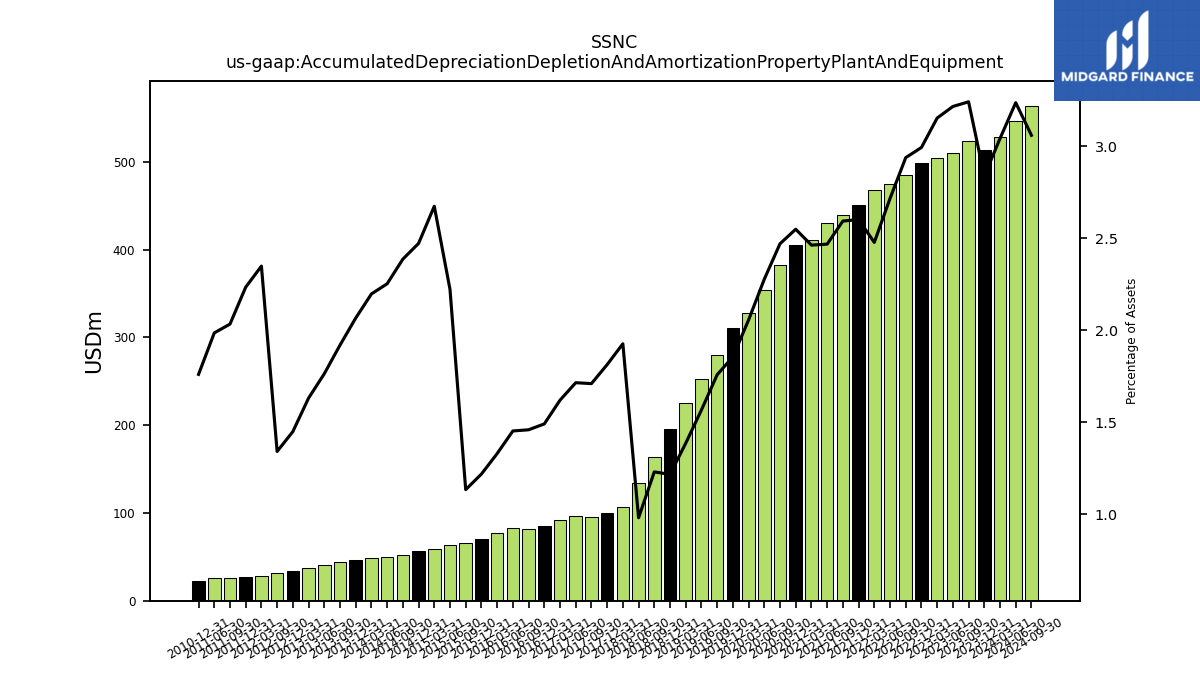
| Accumulated Depreciation Depletion And Amortization Property Plant And Equipment | 513.60 | 524.30 | 510.00 | 504.60 | 498.30 | 484.60 | 475.10 | 467.80 | 450.70 | 439.00 | 430.10 | 410.80 | 405.70 | 382.10 | 354.50 | 328.20 | 310.40 | 280.00 | 252.70 | 225.00 | 195.80 | 163.20 | 134.00 | 106.84 | 100.38 | 95.67 | 96.29 | 91.60 | 85.02 | 81.97 | 82.58 | 76.93 | 70.64 | 65.44 | 63.00 | 58.98 | 56.46 | 51.76 | 50.04 | 48.94 | 46.99 | 43.98 | 40.23 | 37.59 | 34.22 | 31.91 | NA | 28.57 | 26.97 | 25.37 | 25.52 | NA | 22.44 | NA | NA | |
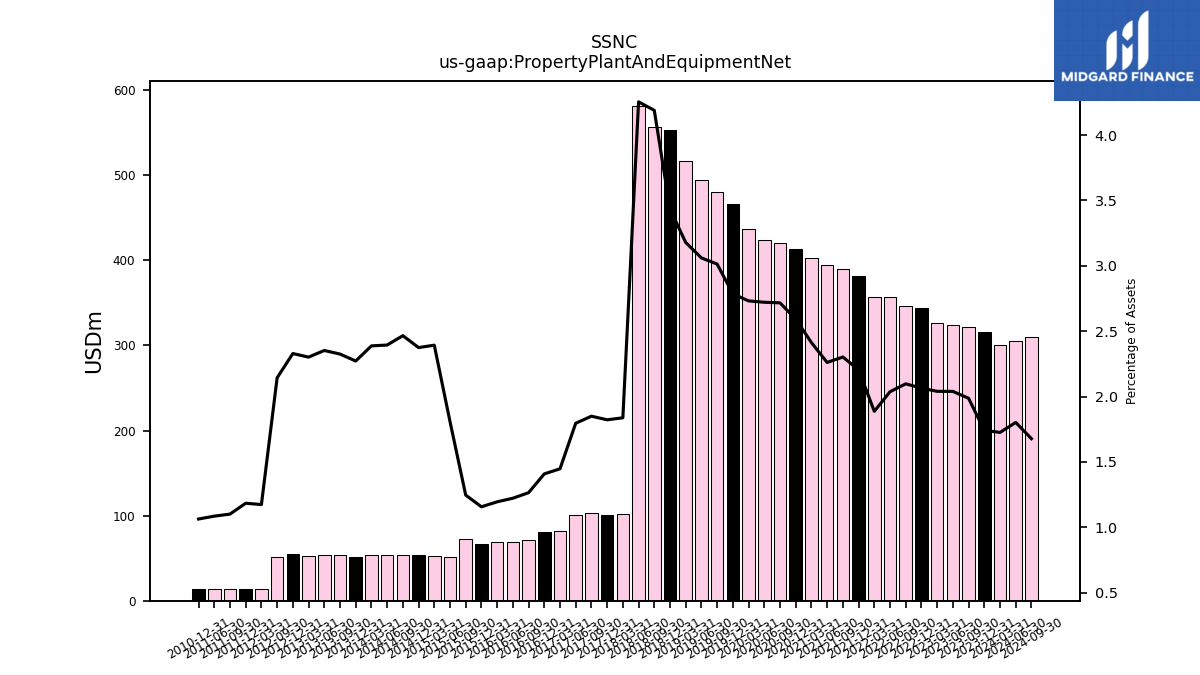
| Property Plant And Equipment Net | 315.30 | 321.50 | 323.60 | 326.60 | 343.90 | 346.10 | 356.50 | 356.60 | 382.00 | 390.00 | 394.20 | 402.70 | 412.80 | 420.50 | 423.80 | 436.40 | 466.40 | 480.30 | 494.00 | 516.50 | 553.20 | 556.30 | 581.70 | 101.99 | 100.96 | 103.58 | 100.91 | 81.93 | 80.39 | 71.13 | 69.56 | 69.21 | 67.14 | 72.03 | 51.32 | 52.81 | 54.28 | 53.51 | 53.21 | 53.21 | 51.70 | 53.32 | 53.70 | 53.08 | 55.04 | 51.05 | NA | 14.29 | 14.30 | 13.75 | 13.96 | NA | 13.57 | NA | NA | |
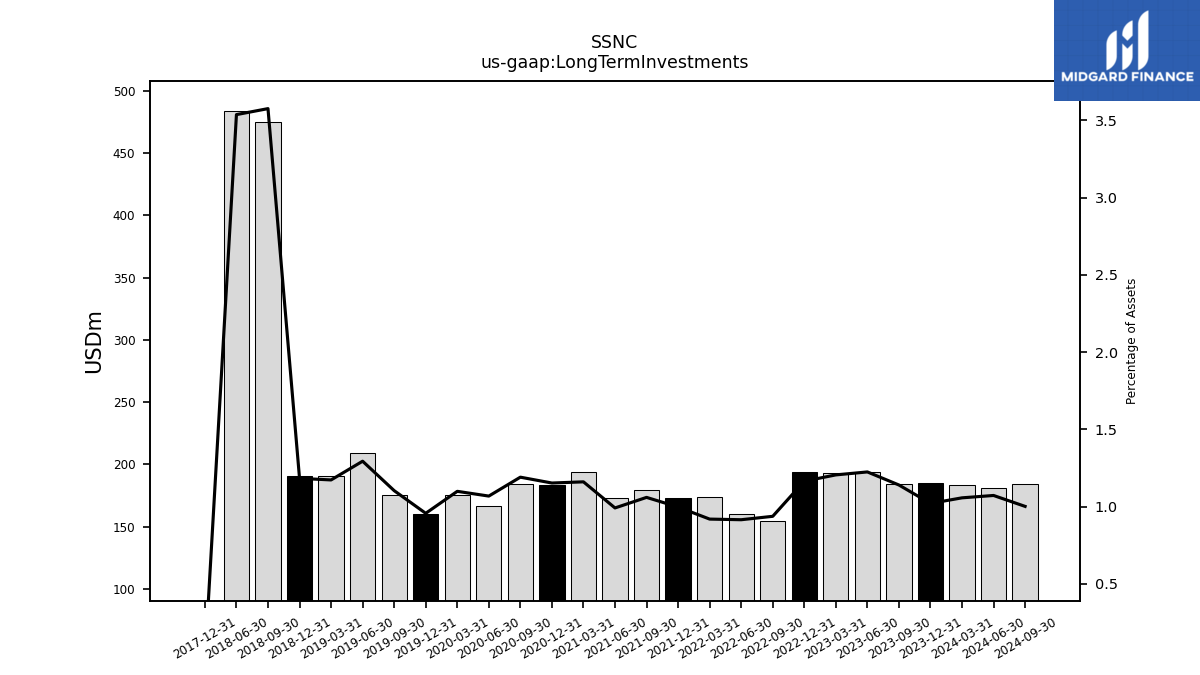
| Long Term Investments | 184.70 | 184.40 | 194.20 | 192.90 | 193.90 | 154.60 | 160.10 | 173.60 | 172.80 | 179.40 | 172.80 | 193.60 | 183.50 | 184.20 | 166.30 | 175.50 | 160.10 | 175.80 | 208.80 | 190.50 | 190.50 | 474.80 | 483.60 | NA | 0.00 | NA | NA | NA | NA | NA | NA | NA | NA | NA | NA | NA | NA | NA | NA | NA | NA | NA | NA | NA | NA | NA | NA | NA | NA | NA | NA | NA | NA | NA | NA | |
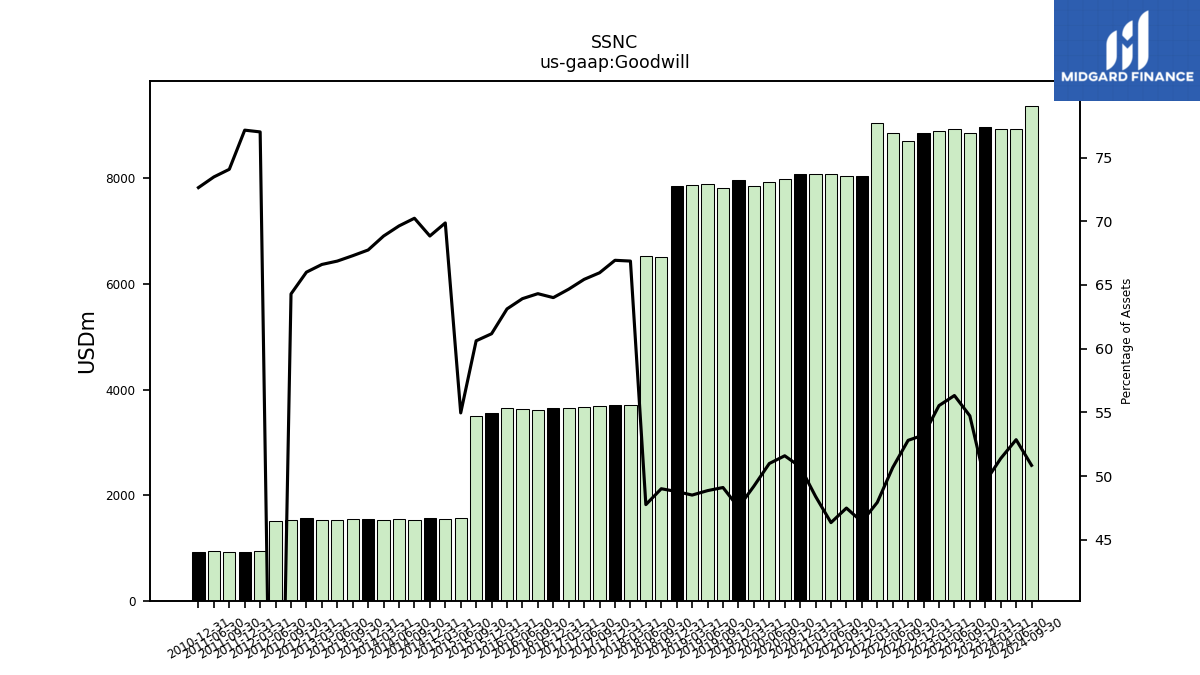
| Goodwill | 8969.50 | 8854.90 | 8934.70 | 8889.60 | 8863.00 | 8713.20 | 8866.80 | 9055.20 | 8045.50 | 8041.90 | 8080.80 | 8078.10 | 8078.70 | 7984.20 | 7939.70 | 7859.70 | 7959.90 | 7825.70 | 7886.10 | 7882.40 | 7858.00 | 6507.60 | 6530.40 | 3711.18 | 3707.82 | 3692.57 | 3676.59 | 3659.63 | 3652.73 | 3616.06 | 3636.49 | 3655.01 | 3549.21 | 3501.89 | 1558.79 | 1541.77 | 1573.23 | 1523.97 | 1547.50 | 1533.94 | 1541.39 | 1542.95 | 1526.43 | 1536.04 | 1559.61 | 1531.01 | 1512.62 | 937.41 | 931.64 | 924.84 | 945.08 | NA | 926.67 | NA | NA | |
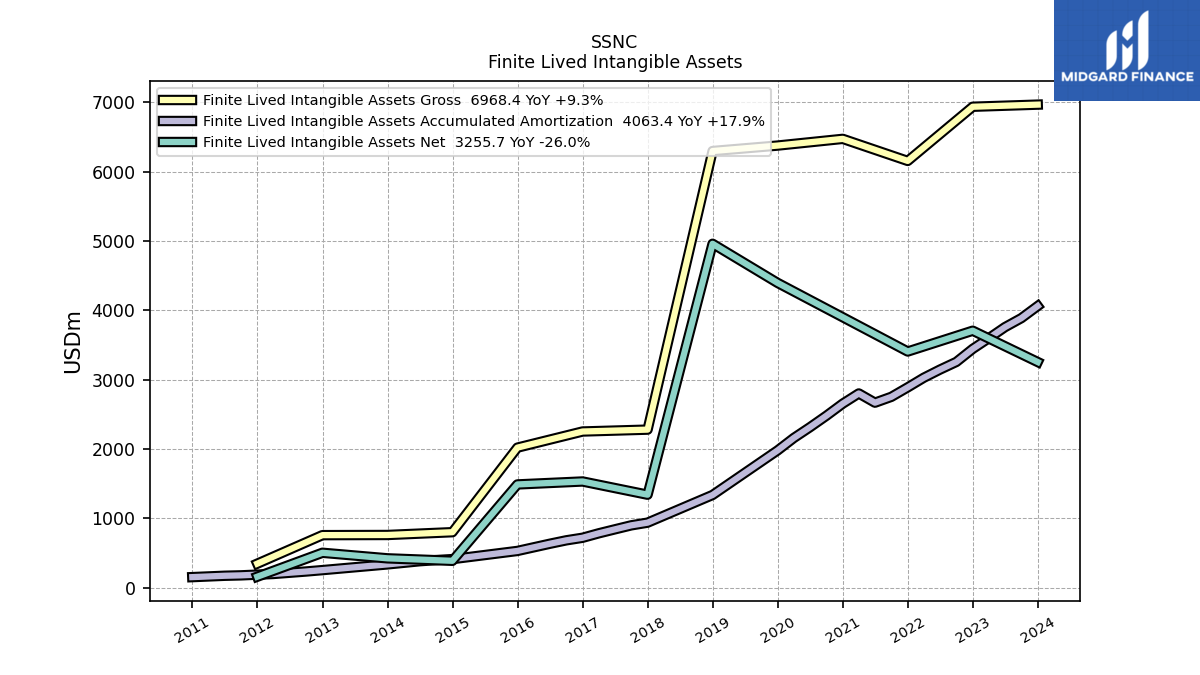
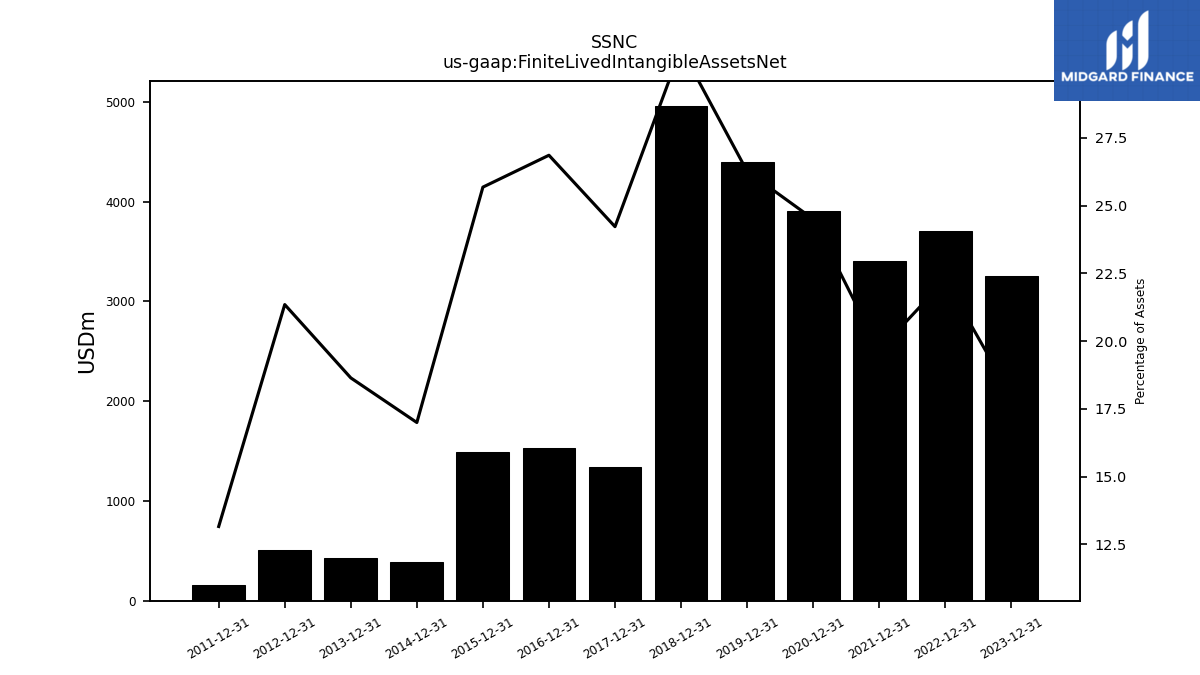
| Finite Lived Intangible Assets Net | 3255.70 | NA | NA | NA | 3707.40 | NA | NA | NA | 3407.20 | NA | NA | NA | 3901.70 | NA | NA | NA | 4397.20 | NA | NA | NA | 4961.30 | NA | NA | NA | 1341.78 | NA | NA | NA | 1532.69 | NA | NA | NA | 1490.04 | NA | NA | NA | 388.43 | NA | NA | NA | 424.19 | NA | NA | NA | 504.43 | NA | NA | NA | 158.93 | NA | NA | NA | NA | NA | NA |
| 2023-12-31 | 2023-09-30 | 2023-06-30 | 2023-03-31 | 2022-12-31 | 2022-09-30 | 2022-06-30 | 2022-03-31 | 2021-12-31 | 2021-09-30 | 2021-06-30 | 2021-03-31 | 2020-12-31 | 2020-09-30 | 2020-06-30 | 2020-03-31 | 2019-12-31 | 2019-09-30 | 2019-06-30 | 2019-03-31 | 2018-12-31 | 2018-09-30 | 2018-06-30 | 2018-03-31 | 2017-12-31 | 2017-09-30 | 2017-06-30 | 2017-03-31 | 2016-12-31 | 2016-09-30 | 2016-06-30 | 2016-03-31 | 2015-12-31 | 2015-09-30 | 2015-06-30 | 2015-03-31 | 2014-12-31 | 2014-09-30 | 2014-06-30 | 2014-03-31 | 2013-12-31 | 2013-09-30 | 2013-06-30 | 2013-03-31 | 2012-12-31 | 2012-09-30 | 2012-06-30 | 2012-03-31 | 2011-12-31 | 2011-09-30 | 2011-06-30 | 2011-03-31 | 2010-12-31 | 2010-09-30 | 2010-06-30 | ||
|---|---|---|---|---|---|---|---|---|---|---|---|---|---|---|---|---|---|---|---|---|---|---|---|---|---|---|---|---|---|---|---|---|---|---|---|---|---|---|---|---|---|---|---|---|---|---|---|---|---|---|---|---|---|---|---|---|
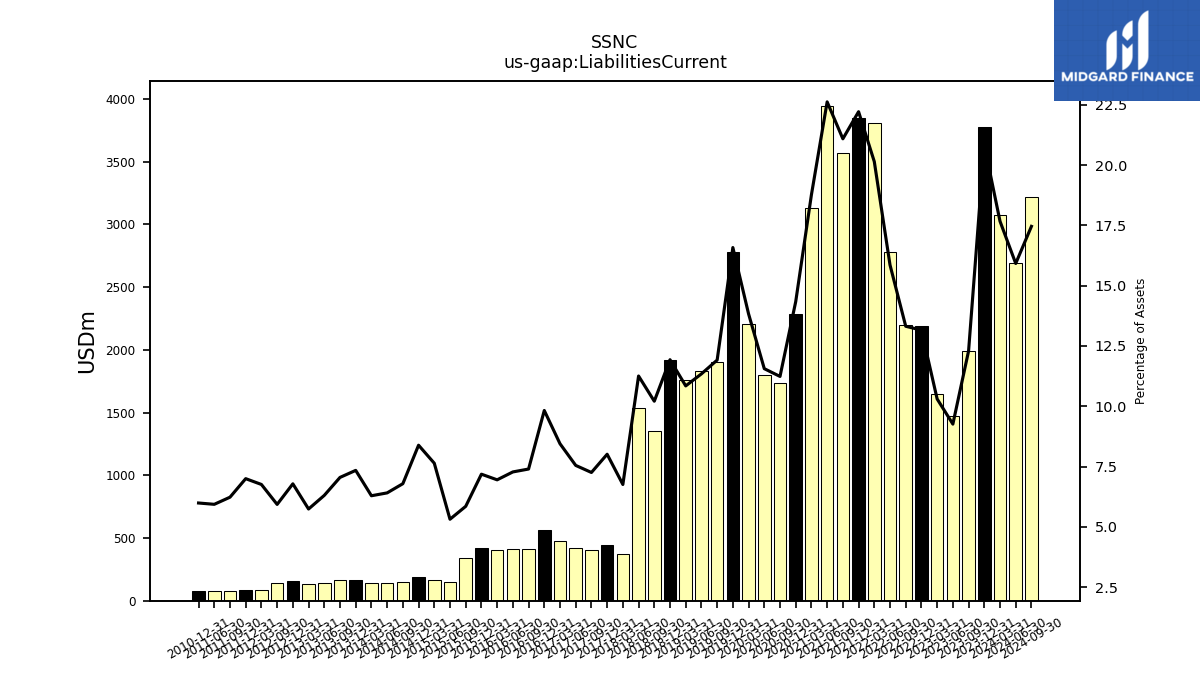
| Liabilities Current | 3771.90 | 1989.10 | 1468.90 | 1649.20 | 2190.80 | 2197.60 | 2775.80 | 3806.10 | 3851.10 | 3571.90 | 3944.80 | 3133.30 | 2283.30 | 1738.90 | 1800.00 | 2209.30 | 2776.20 | 1899.10 | 1830.90 | 1762.10 | 1921.80 | 1355.60 | 1538.80 | 374.87 | 443.66 | 406.07 | 423.97 | 477.92 | 560.62 | 415.82 | 413.88 | 402.33 | 416.72 | 337.88 | 150.70 | 168.52 | 191.59 | 147.28 | 142.37 | 140.10 | 167.00 | 161.59 | 143.87 | 132.31 | 160.25 | 141.16 | NA | 82.23 | 84.49 | 77.75 | 76.30 | NA | 76.37 | NA | NA | |
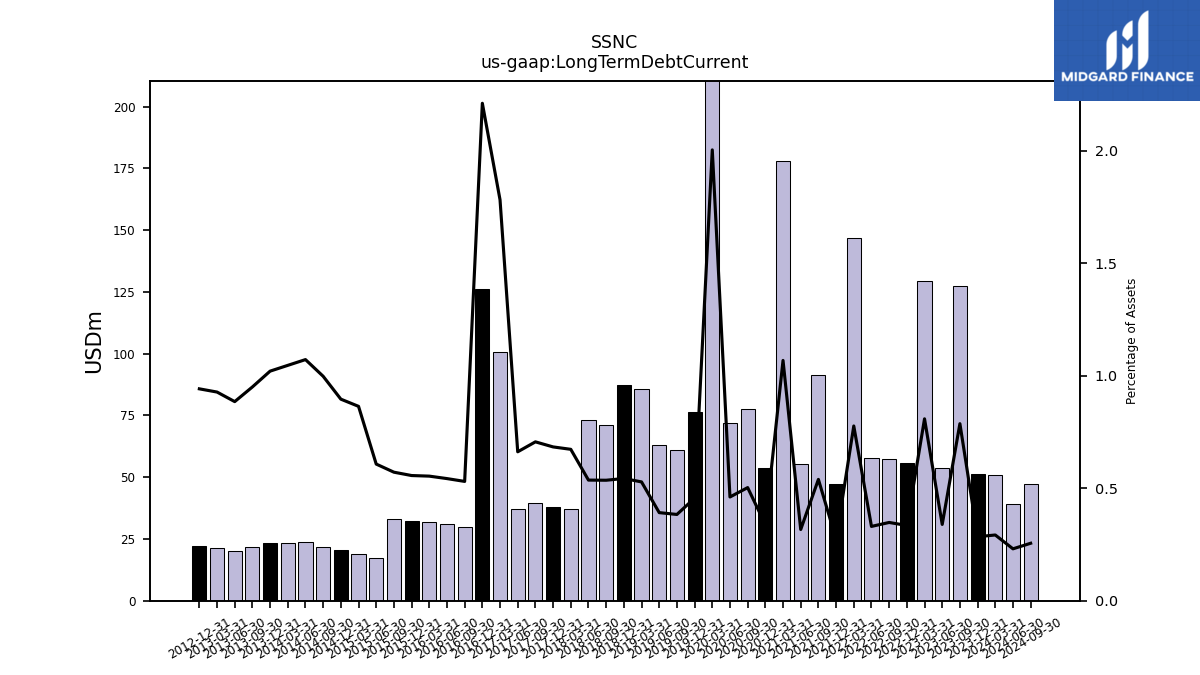
| Long Term Debt Current | 51.50 | 127.30 | 53.80 | 129.40 | 55.70 | 57.40 | 57.80 | 146.70 | 47.40 | 91.30 | 55.20 | 178.20 | 53.90 | 77.80 | 71.80 | 320.00 | 76.30 | 61.10 | 63.20 | 85.80 | 87.50 | 71.10 | 73.30 | 37.34 | 37.86 | 39.53 | 37.18 | 100.81 | 126.14 | 29.81 | 30.88 | 32.06 | 32.28 | 33.00 | 17.22 | 19.06 | 20.47 | 21.64 | 23.81 | 23.31 | 23.21 | 21.78 | 20.20 | 21.38 | 22.25 | NA | NA | NA | NA | NA | NA | NA | NA | NA | NA | |
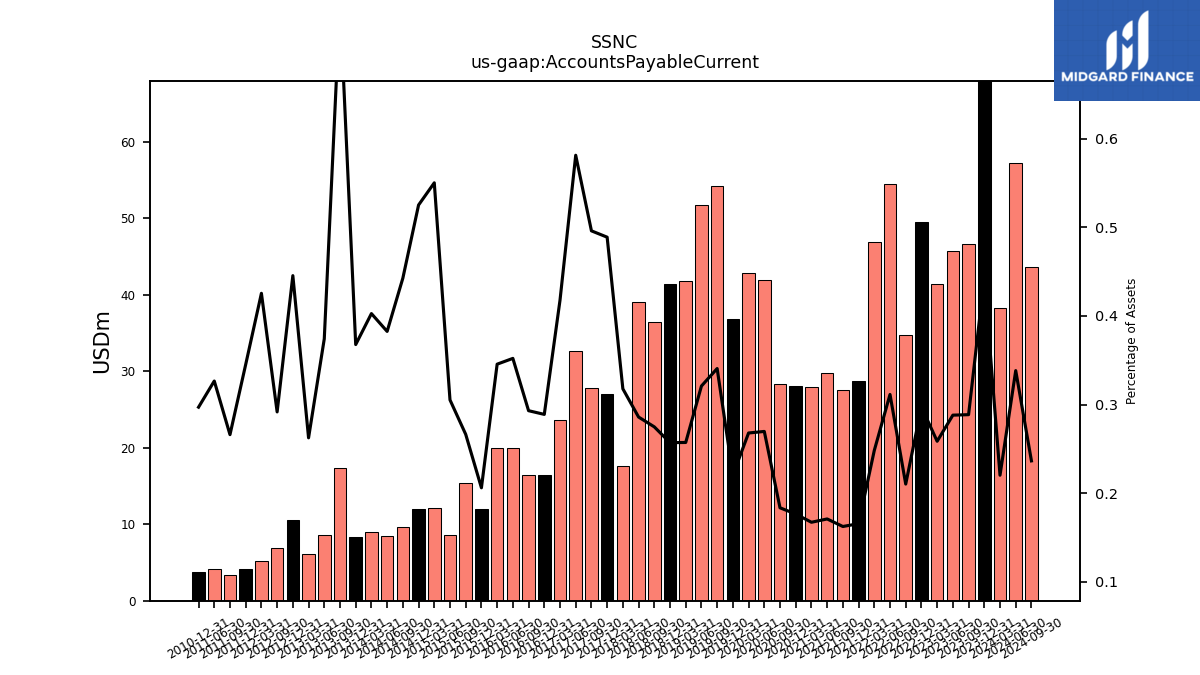
| Accounts Payable Current | 80.30 | 46.70 | 45.70 | 41.40 | 49.50 | 34.70 | 54.50 | 46.90 | 28.70 | 27.50 | 29.80 | 27.90 | 28.10 | 28.40 | 42.00 | 42.80 | 36.90 | 54.30 | 51.80 | 41.80 | 41.40 | 36.50 | 39.10 | 17.64 | 27.09 | 27.78 | 32.67 | 23.64 | 16.49 | 16.48 | 20.03 | 20.01 | 11.96 | 15.39 | 8.66 | 12.14 | 12.00 | 9.61 | 8.50 | 8.97 | 8.37 | 17.30 | 8.54 | 6.05 | 10.53 | 6.95 | NA | 5.18 | 4.17 | 3.32 | 4.20 | NA | 3.79 | NA | NA | |
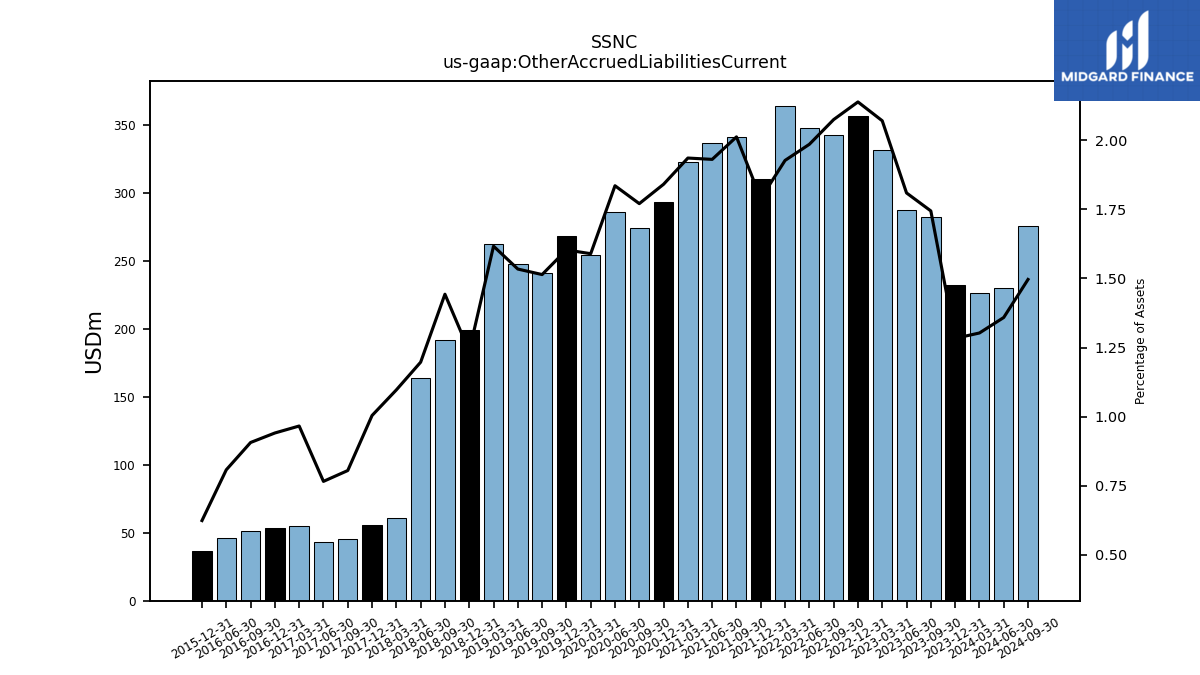
| Other Accrued Liabilities Current | 232.30 | 282.20 | 287.00 | 331.40 | 356.10 | 342.30 | 347.40 | 364.00 | 310.10 | 340.70 | 336.60 | 323.00 | 293.10 | 274.00 | 285.80 | 253.90 | 268.40 | 241.30 | 247.60 | 262.70 | 199.20 | 191.60 | 163.70 | 60.88 | 55.64 | 45.09 | 43.04 | 54.69 | 53.71 | 50.98 | 45.96 | NA | 36.23 | NA | NA | NA | NA | NA | NA | NA | NA | NA | NA | NA | NA | NA | NA | NA | NA | NA | NA | NA | NA | NA | NA | |
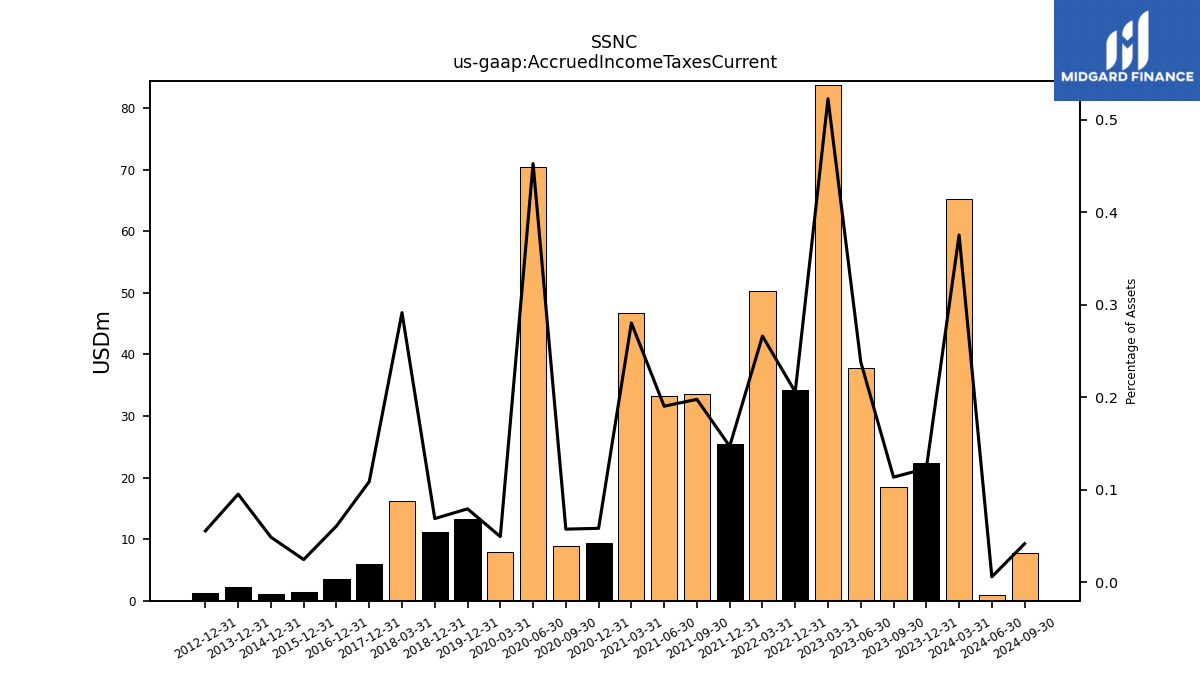
| Accrued Income Taxes Current | 22.30 | 18.40 | 37.80 | 83.70 | 34.30 | NA | NA | 50.30 | 25.50 | 33.50 | 33.20 | 46.80 | 9.30 | 8.90 | 70.50 | 7.90 | 13.30 | NA | NA | NA | 11.10 | NA | NA | 16.18 | 6.03 | NA | NA | NA | 3.47 | NA | NA | NA | 1.43 | NA | NA | NA | 1.12 | NA | NA | NA | 2.17 | NA | NA | NA | 1.31 | NA | NA | NA | NA | NA | NA | NA | NA | NA | NA |
| 2023-12-31 | 2023-09-30 | 2023-06-30 | 2023-03-31 | 2022-12-31 | 2022-09-30 | 2022-06-30 | 2022-03-31 | 2021-12-31 | 2021-09-30 | 2021-06-30 | 2021-03-31 | 2020-12-31 | 2020-09-30 | 2020-06-30 | 2020-03-31 | 2019-12-31 | 2019-09-30 | 2019-06-30 | 2019-03-31 | 2018-12-31 | 2018-09-30 | 2018-06-30 | 2018-03-31 | 2017-12-31 | 2017-09-30 | 2017-06-30 | 2017-03-31 | 2016-12-31 | 2016-09-30 | 2016-06-30 | 2016-03-31 | 2015-12-31 | 2015-09-30 | 2015-06-30 | 2015-03-31 | 2014-12-31 | 2014-09-30 | 2014-06-30 | 2014-03-31 | 2013-12-31 | 2013-09-30 | 2013-06-30 | 2013-03-31 | 2012-12-31 | 2012-09-30 | 2012-06-30 | 2012-03-31 | 2011-12-31 | 2011-09-30 | 2011-06-30 | 2011-03-31 | 2010-12-31 | 2010-09-30 | 2010-06-30 | ||
|---|---|---|---|---|---|---|---|---|---|---|---|---|---|---|---|---|---|---|---|---|---|---|---|---|---|---|---|---|---|---|---|---|---|---|---|---|---|---|---|---|---|---|---|---|---|---|---|---|---|---|---|---|---|---|---|---|
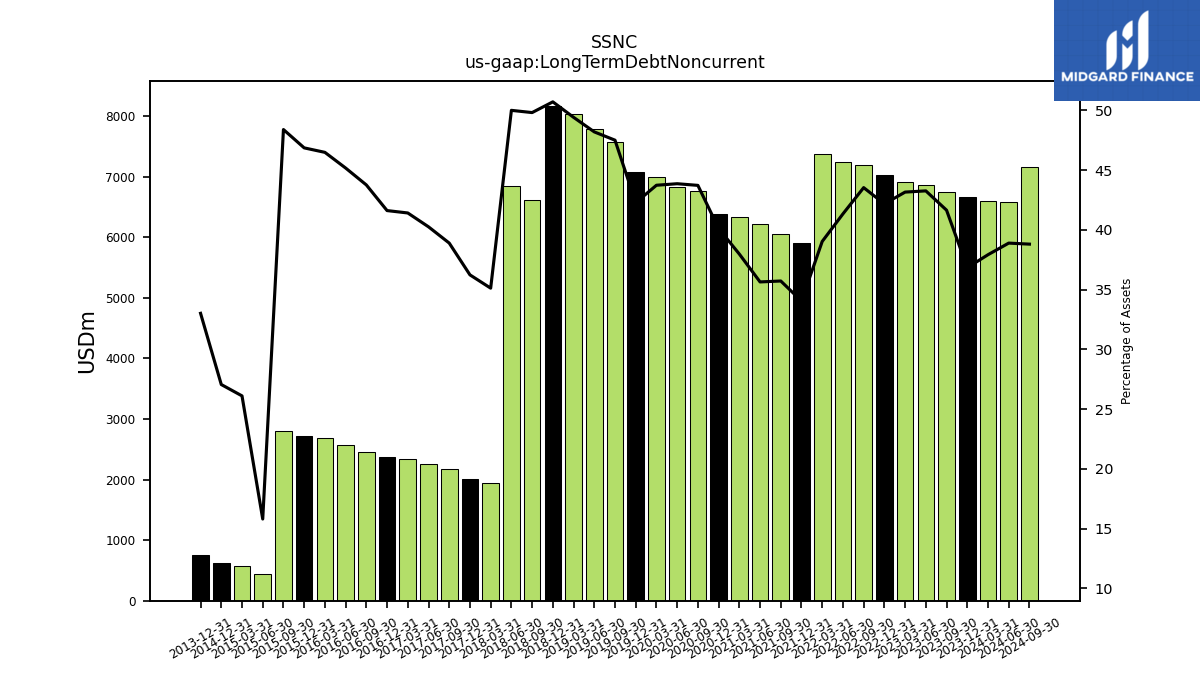
| Long Term Debt Noncurrent | 6668.50 | 6738.70 | 6863.20 | 6909.60 | 7023.90 | 7183.70 | 7234.50 | 7373.70 | 5901.50 | 6049.40 | 6214.90 | 6338.10 | 6388.50 | 6766.50 | 6830.70 | 6986.30 | 7077.80 | 7571.30 | 7779.90 | 8030.30 | 8168.50 | 6615.00 | 6837.00 | 1949.23 | 2007.33 | 2177.68 | 2261.79 | 2343.74 | 2374.99 | 2460.46 | 2569.97 | 2691.96 | 2719.07 | 2795.94 | 448.38 | 576.19 | 618.43 | NA | NA | NA | 751.29 | NA | NA | NA | NA | NA | NA | NA | NA | NA | NA | NA | NA | NA | NA | |
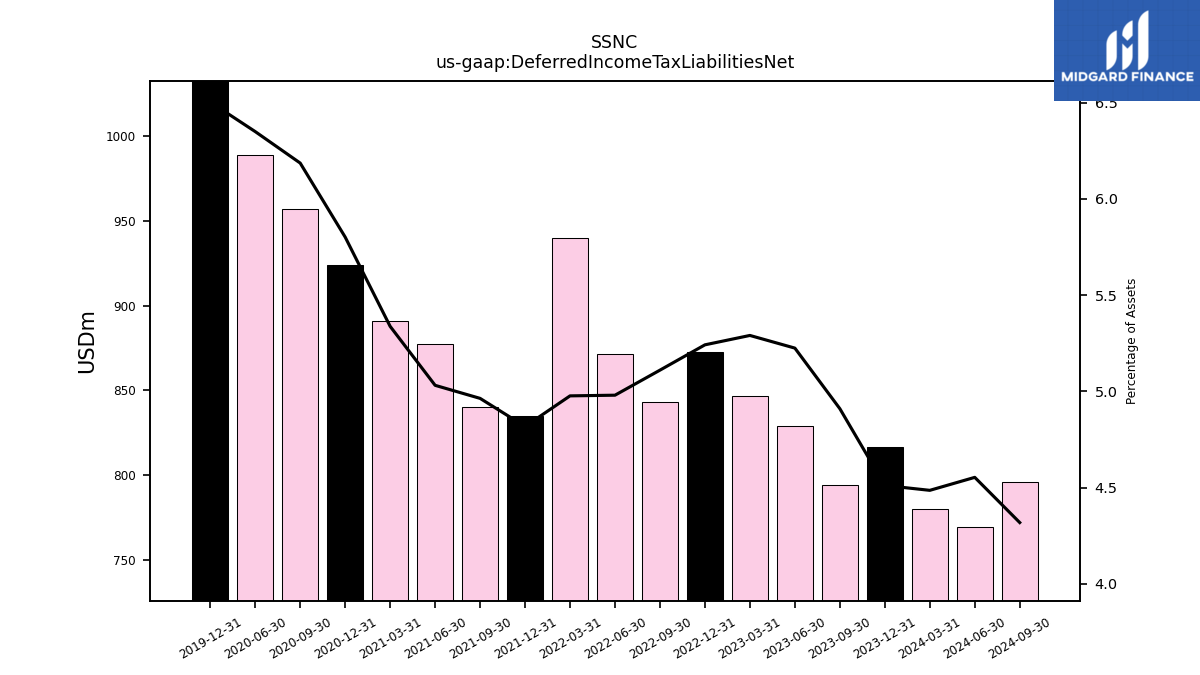
| Deferred Income Tax Liabilities Net | 816.60 | 794.40 | 828.80 | 846.90 | 872.90 | 843.20 | 871.50 | 940.10 | 835.00 | 840.50 | 877.20 | 890.80 | 923.80 | 957.30 | 988.80 | NA | 1088.70 | NA | NA | NA | NA | NA | NA | NA | NA | NA | NA | NA | NA | NA | NA | NA | NA | NA | NA | NA | NA | NA | NA | NA | NA | NA | NA | NA | NA | NA | NA | NA | NA | NA | NA | NA | NA | NA | NA | |
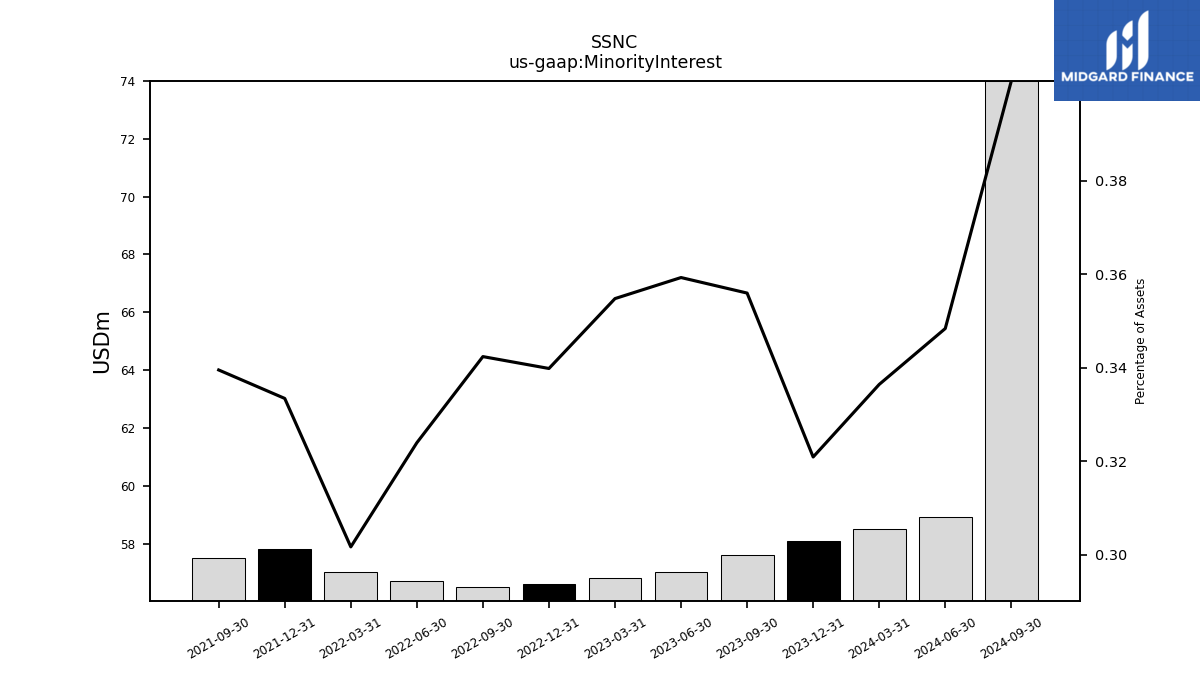
| Minority Interest | 58.10 | 57.60 | 57.00 | 56.80 | 56.60 | 56.50 | 56.70 | 57.00 | 57.80 | 57.50 | NA | NA | NA | NA | NA | NA | NA | NA | NA | NA | NA | NA | NA | NA | NA | NA | NA | NA | NA | NA | NA | NA | NA | NA | NA | NA | NA | NA | NA | NA | NA | NA | NA | NA | NA | NA | NA | NA | NA | NA | NA | NA | NA | NA | NA | |
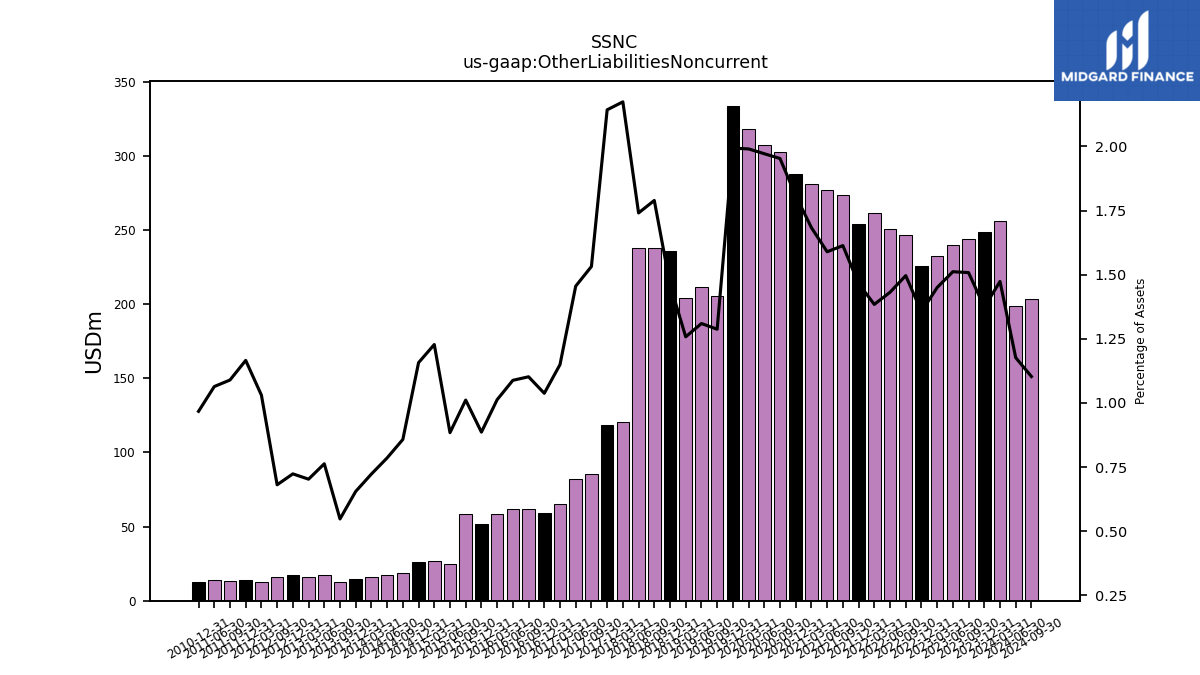
| Other Liabilities Noncurrent | 248.70 | 244.00 | 239.80 | 232.10 | 225.80 | 246.90 | 250.50 | 261.50 | 254.00 | 273.20 | 277.10 | 280.90 | 287.90 | 302.20 | 307.00 | 317.90 | 333.70 | 205.20 | 211.40 | 204.40 | 235.50 | 237.60 | 238.00 | 120.62 | 118.68 | 85.77 | 81.77 | 65.06 | 59.23 | 61.97 | 61.91 | 58.65 | 51.43 | 58.43 | 25.09 | 27.10 | 26.45 | 18.62 | 17.47 | 16.12 | 14.91 | 12.57 | 17.42 | 16.21 | 17.10 | 16.22 | NA | 12.54 | 14.08 | 13.60 | 13.69 | NA | 12.34 | NA | NA | |
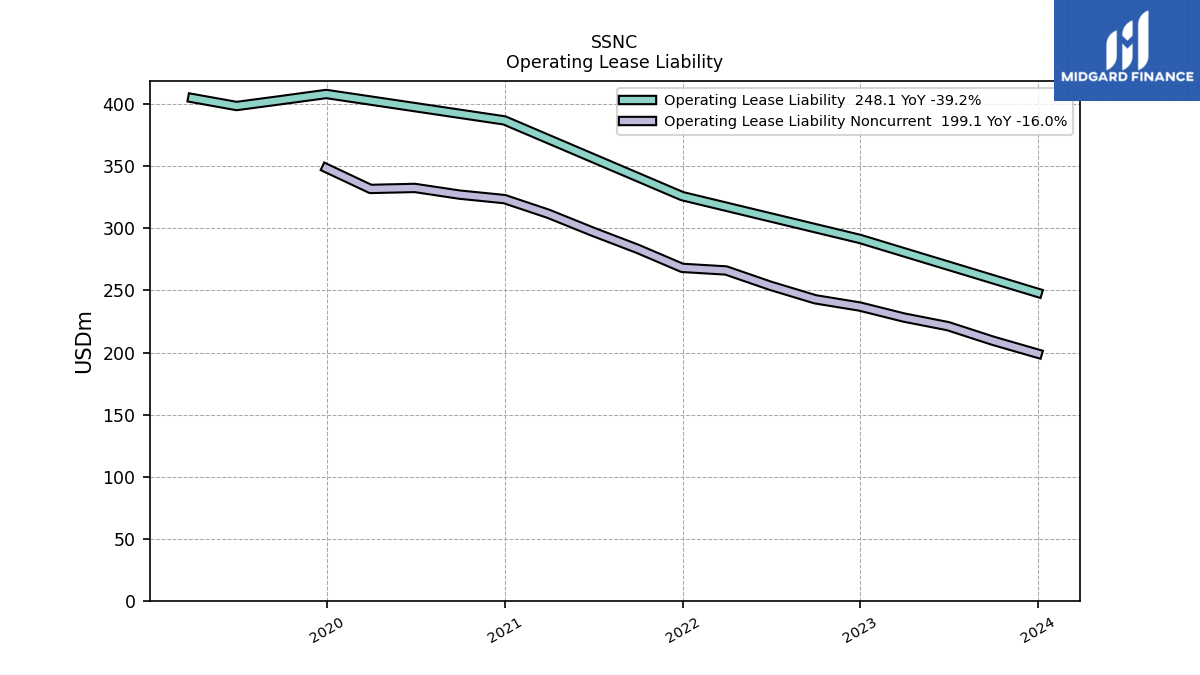
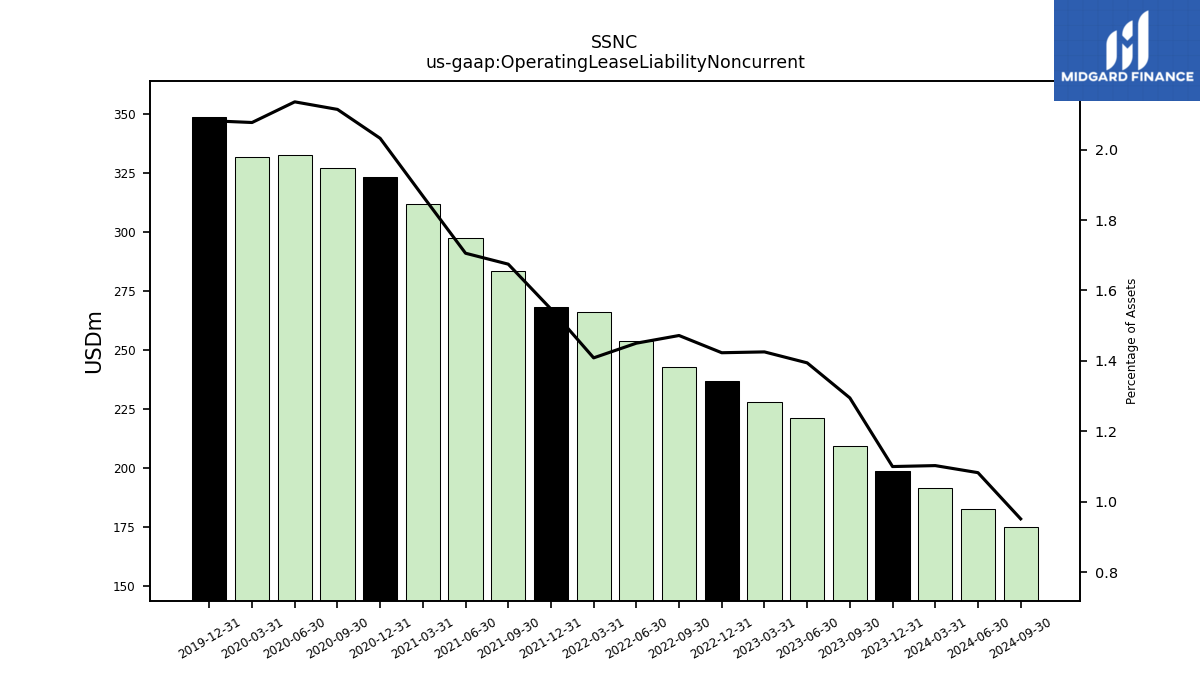
| Operating Lease Liability Noncurrent | 199.10 | 209.50 | 221.20 | 228.20 | 237.00 | 242.90 | 253.80 | 266.10 | 268.20 | 283.60 | 297.40 | 311.80 | 323.60 | 327.20 | 332.60 | 331.80 | 348.60 | NA | NA | NA | NA | NA | NA | NA | NA | NA | NA | NA | NA | NA | NA | NA | NA | NA | NA | NA | NA | NA | NA | NA | NA | NA | NA | NA | NA | NA | NA | NA | NA | NA | NA | NA | NA | NA | NA |
| 2023-12-31 | 2023-09-30 | 2023-06-30 | 2023-03-31 | 2022-12-31 | 2022-09-30 | 2022-06-30 | 2022-03-31 | 2021-12-31 | 2021-09-30 | 2021-06-30 | 2021-03-31 | 2020-12-31 | 2020-09-30 | 2020-06-30 | 2020-03-31 | 2019-12-31 | 2019-09-30 | 2019-06-30 | 2019-03-31 | 2018-12-31 | 2018-09-30 | 2018-06-30 | 2018-03-31 | 2017-12-31 | 2017-09-30 | 2017-06-30 | 2017-03-31 | 2016-12-31 | 2016-09-30 | 2016-06-30 | 2016-03-31 | 2015-12-31 | 2015-09-30 | 2015-06-30 | 2015-03-31 | 2014-12-31 | 2014-09-30 | 2014-06-30 | 2014-03-31 | 2013-12-31 | 2013-09-30 | 2013-06-30 | 2013-03-31 | 2012-12-31 | 2012-09-30 | 2012-06-30 | 2012-03-31 | 2011-12-31 | 2011-09-30 | 2011-06-30 | 2011-03-31 | 2010-12-31 | 2010-09-30 | 2010-06-30 | ||
|---|---|---|---|---|---|---|---|---|---|---|---|---|---|---|---|---|---|---|---|---|---|---|---|---|---|---|---|---|---|---|---|---|---|---|---|---|---|---|---|---|---|---|---|---|---|---|---|---|---|---|---|---|---|---|---|---|
| Stockholders Equity | 6339.60 | 6143.90 | 6180.30 | 6084.00 | 6044.20 | 5727.00 | 6055.40 | 6175.70 | 6165.40 | 5857.90 | 5823.70 | 5734.20 | 5716.50 | 5383.30 | 5313.80 | 5087.60 | 5116.10 | 4816.60 | 4845.50 | 4733.50 | 4580.00 | 4223.00 | 4203.70 | 2815.91 | 2686.39 | 2507.64 | 2418.18 | 2329.07 | 2258.58 | 2225.19 | 2164.43 | 2138.93 | 2105.45 | 2075.25 | 2117.51 | 1337.77 | 1346.67 | 1328.10 | 1313.94 | 1257.75 | 1231.71 | 1196.05 | 1115.57 | 1093.19 | 1075.50 | 1056.95 | NA | 1010.45 | 980.10 | 953.52 | 958.64 | NA | 857.18 | NA | NA | |
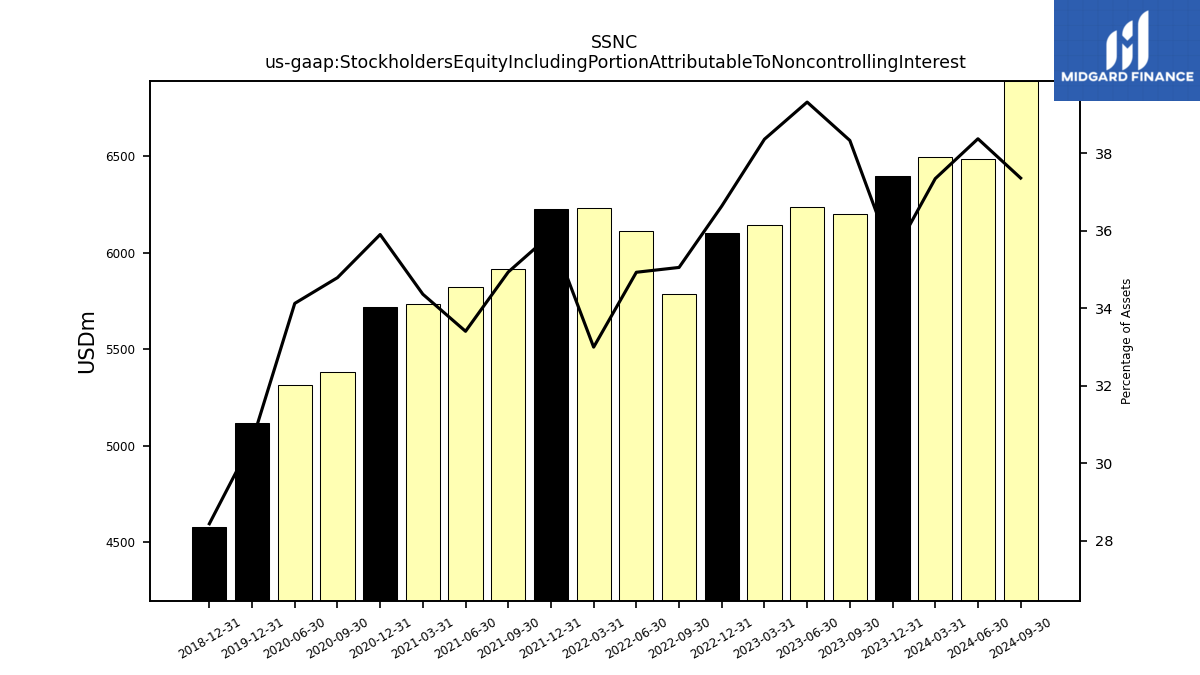
| Stockholders Equity Including Portion Attributable To Noncontrolling Interest | 6397.70 | 6201.50 | 6237.30 | 6140.80 | 6100.80 | 5783.50 | 6112.10 | 6232.70 | 6223.20 | 5915.40 | 5823.70 | 5734.20 | 5716.50 | 5383.30 | 5313.80 | NA | 5116.10 | NA | NA | NA | 4580.00 | NA | NA | NA | NA | NA | NA | NA | NA | NA | NA | NA | NA | NA | NA | NA | NA | NA | NA | NA | NA | NA | NA | NA | NA | NA | NA | NA | NA | NA | NA | NA | NA | NA | NA | |
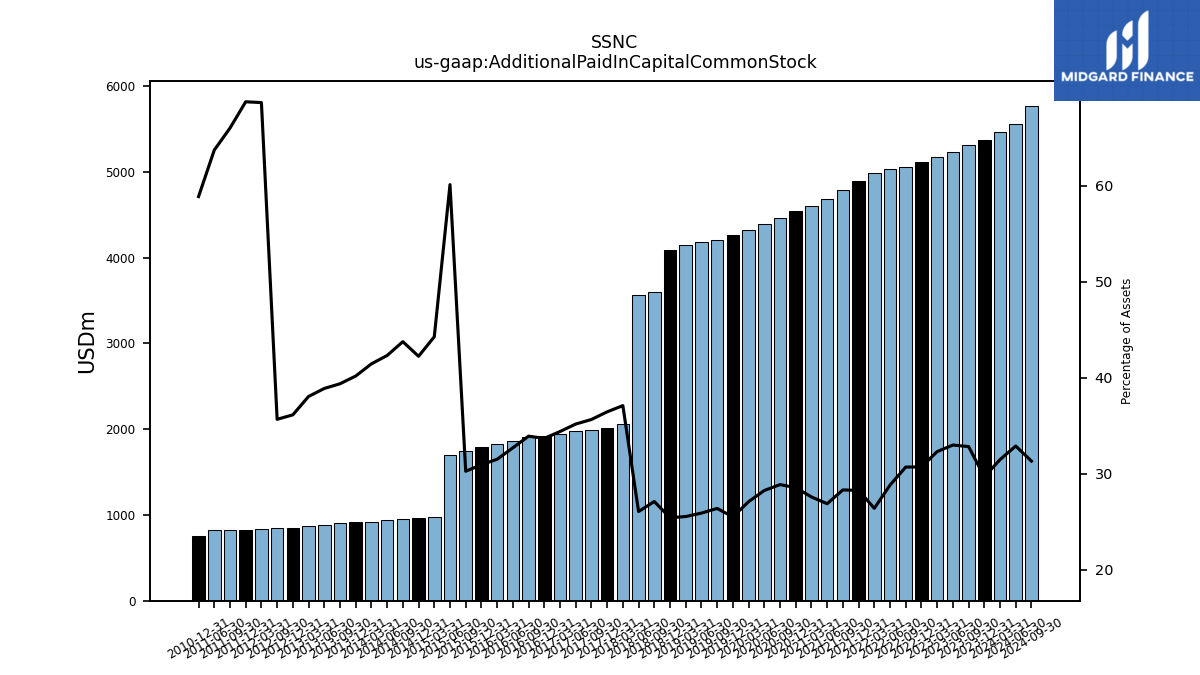
| Additional Paid In Capital Common Stock | 5371.00 | 5308.70 | 5230.60 | 5168.70 | 5111.60 | 5061.70 | 5039.30 | 4984.10 | 4895.70 | 4791.90 | 4682.80 | 4600.50 | 4544.00 | 4464.70 | 4397.40 | 4324.30 | 4266.90 | 4202.40 | 4177.60 | 4147.40 | 4091.40 | 3597.40 | 3561.50 | 2057.76 | 2018.11 | 1994.98 | 1975.31 | 1945.53 | 1921.26 | 1905.83 | 1859.12 | 1823.62 | 1794.12 | 1747.16 | 1704.70 | 976.45 | 964.85 | 949.13 | 940.12 | 923.21 | 913.82 | 902.36 | 887.16 | 877.08 | 853.46 | 848.97 | NA | 835.65 | 829.99 | 823.92 | 819.29 | NA | 750.86 | NA | NA | |
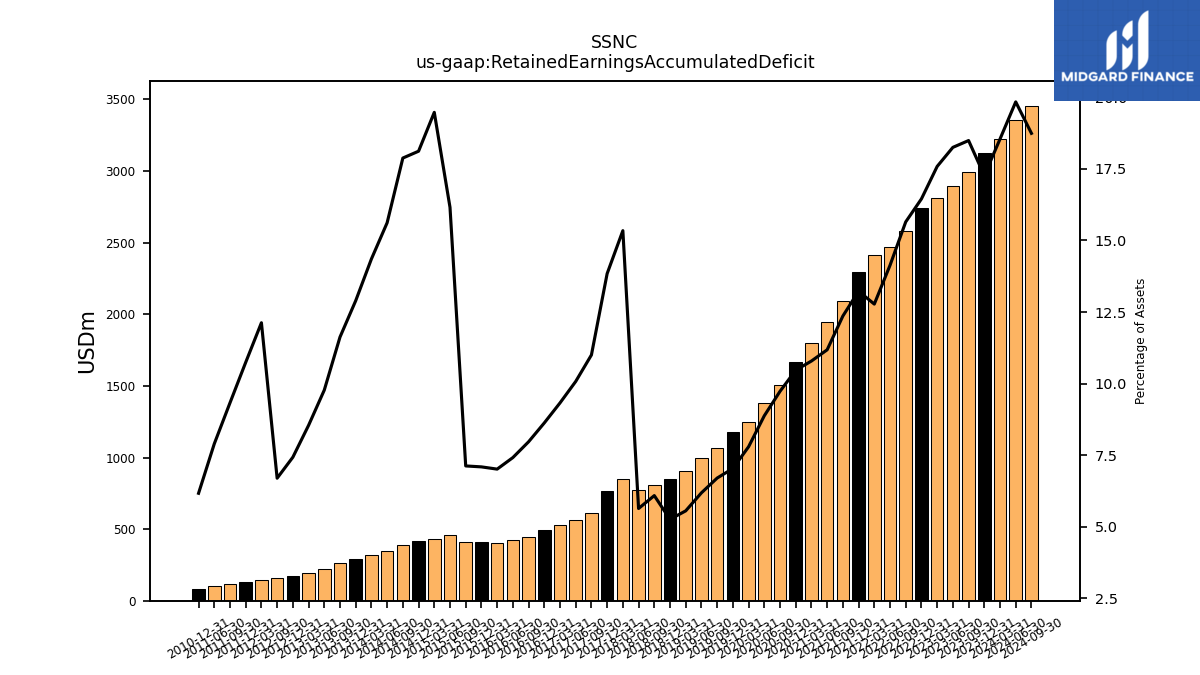
| Retained Earnings Accumulated Deficit | 3126.30 | 2991.90 | 2895.60 | 2815.40 | 2740.10 | 2582.30 | 2473.30 | 2414.00 | 2293.00 | 2093.20 | 1949.60 | 1800.70 | 1667.00 | 1505.90 | 1382.40 | 1245.10 | 1177.90 | 1068.00 | 998.40 | 902.80 | 847.10 | 808.50 | 770.90 | 851.50 | 766.86 | 615.96 | 566.13 | 527.78 | 492.35 | 448.01 | 421.93 | 406.14 | 411.49 | 411.63 | 458.36 | 429.79 | 414.08 | 387.97 | 347.14 | 319.90 | 293.45 | 266.57 | 223.10 | 196.98 | 175.55 | 159.47 | NA | 147.62 | 129.73 | 116.47 | 101.58 | NA | 78.71 | NA | NA | |
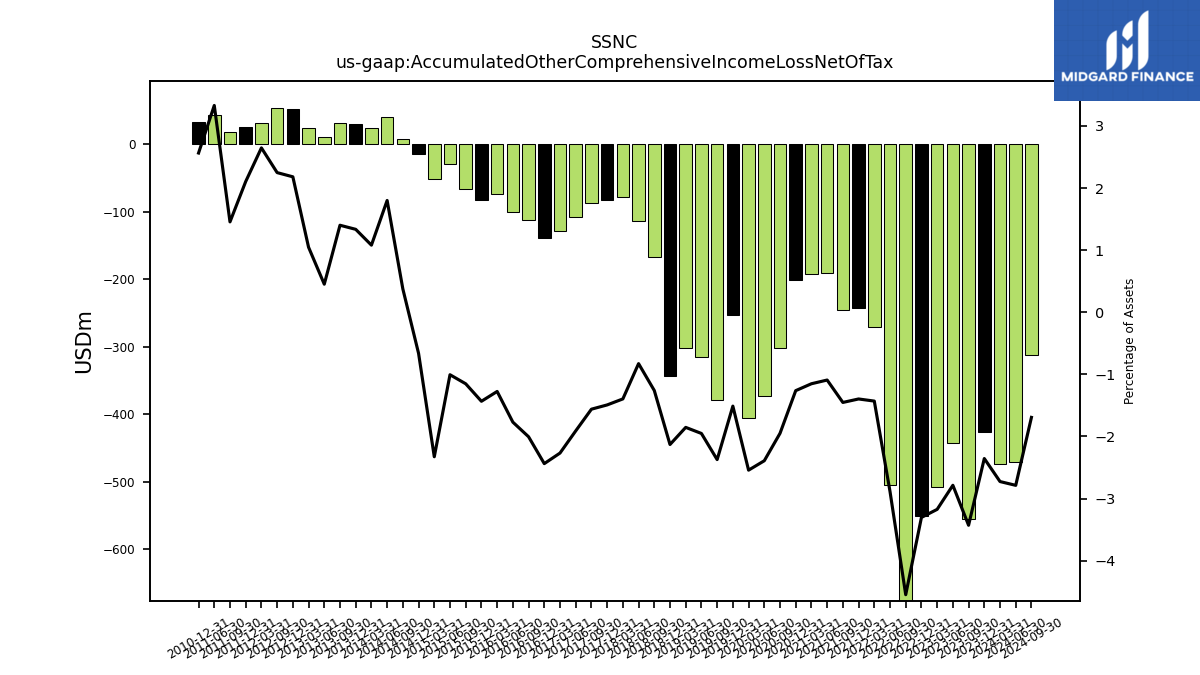
| Accumulated Other Comprehensive Income Loss Net Of Tax | -426.30 | -554.90 | -441.90 | -508.00 | -550.10 | -750.30 | -505.00 | -270.20 | -242.00 | -245.90 | -190.30 | -192.10 | -201.00 | -301.70 | -372.30 | -406.10 | -253.00 | -378.10 | -315.00 | -301.20 | -343.00 | -167.30 | -113.10 | -77.44 | -82.66 | -87.38 | -107.33 | -128.29 | -139.07 | -112.70 | -100.64 | -73.85 | -83.17 | -66.54 | -28.53 | -51.34 | -15.12 | 8.14 | 39.99 | 24.07 | 30.37 | 32.12 | 10.31 | 24.14 | 51.52 | 53.53 | NA | 32.21 | 25.41 | 18.16 | 42.82 | NA | 32.70 | NA | NA | |
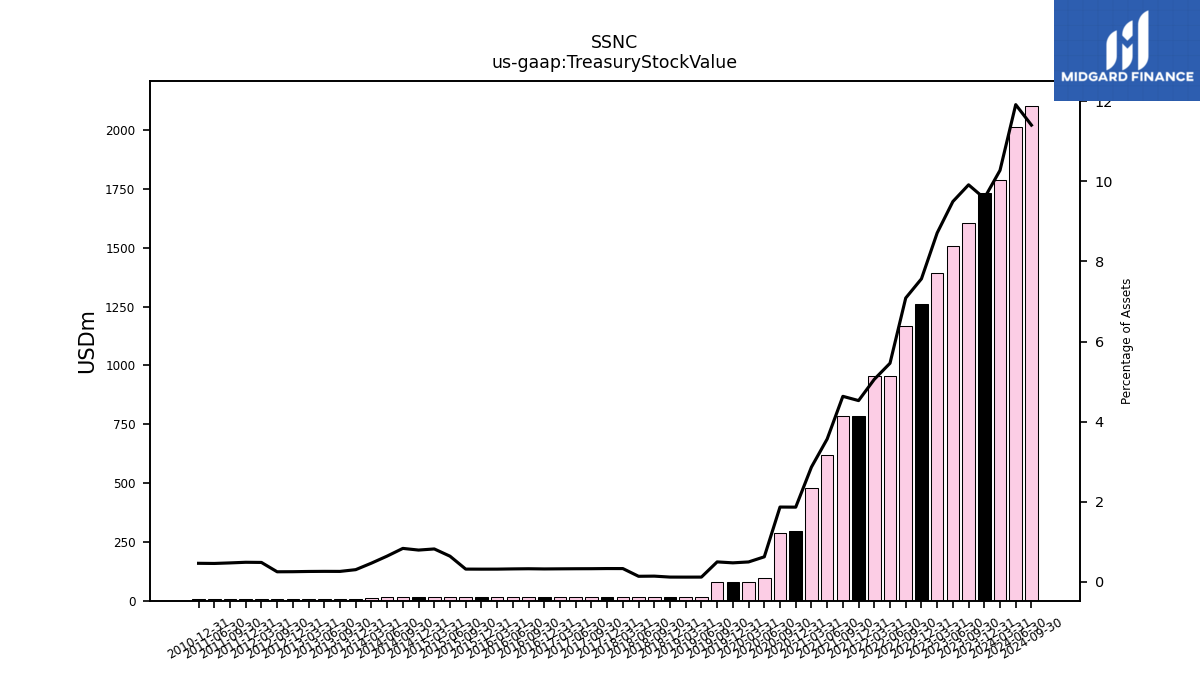
| Treasury Stock Value | 1734.20 | 1604.50 | 1506.70 | 1394.80 | 1260.10 | 1169.40 | 954.90 | 954.90 | 784.00 | 784.00 | 621.10 | 477.50 | 296.10 | 288.20 | 96.30 | 78.30 | 78.30 | 78.30 | 18.00 | 18.00 | 18.00 | 18.00 | 18.00 | 18.00 | 18.00 | 18.00 | 18.00 | 18.00 | 18.00 | 18.00 | 18.00 | 17.98 | 17.98 | 17.98 | 17.98 | 17.98 | 17.98 | 17.99 | 14.15 | 10.25 | 6.76 | 5.82 | 5.82 | 5.82 | 5.82 | 5.82 | NA | 5.82 | 5.82 | 5.82 | 5.82 | NA | 5.82 | NA | NA | |
| Minority Interest | 58.10 | 57.60 | 57.00 | 56.80 | 56.60 | 56.50 | 56.70 | 57.00 | 57.80 | 57.50 | NA | NA | NA | NA | NA | NA | NA | NA | NA | NA | NA | NA | NA | NA | NA | NA | NA | NA | NA | NA | NA | NA | NA | NA | NA | NA | NA | NA | NA | NA | NA | NA | NA | NA | NA | NA | NA | NA | NA | NA | NA | NA | NA | NA | NA | |
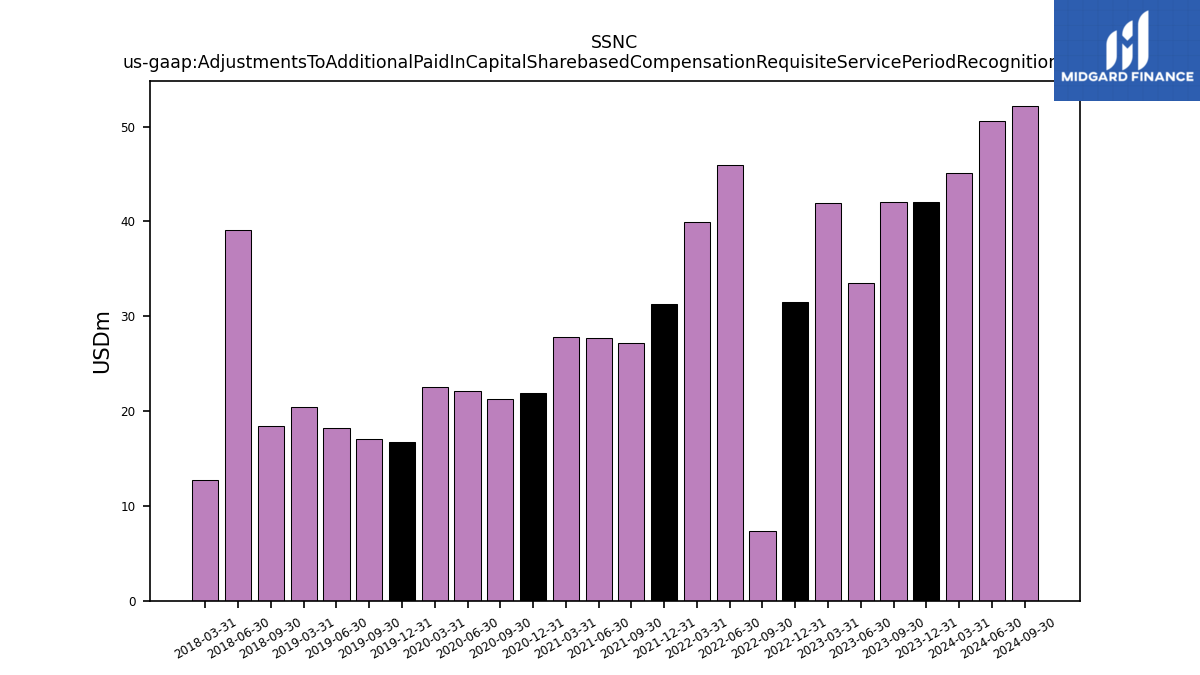
| Adjustments To Additional Paid In Capital Sharebased Compensation Requisite Service Period Recognition Value | 42.00 | 42.10 | 33.50 | 41.90 | 31.50 | 7.40 | 46.00 | 39.90 | 31.30 | 27.20 | 27.70 | 27.80 | 21.90 | 21.30 | 22.10 | 22.50 | 16.70 | 17.10 | 18.20 | 20.40 | NA | 18.40 | 39.10 | 12.70 | NA | NA | NA | NA | NA | NA | NA | NA | NA | NA | NA | NA | NA | NA | NA | NA | NA | NA | NA | NA | NA | NA | NA | NA | NA | NA | NA | NA | NA | NA | NA |
| 2023-12-31 | 2023-09-30 | 2023-06-30 | 2023-03-31 | 2022-12-31 | 2022-09-30 | 2022-06-30 | 2022-03-31 | 2021-12-31 | 2021-09-30 | 2021-06-30 | 2021-03-31 | 2020-12-31 | 2020-09-30 | 2020-06-30 | 2020-03-31 | 2019-12-31 | 2019-09-30 | 2019-06-30 | 2019-03-31 | 2018-12-31 | 2018-09-30 | 2018-06-30 | 2018-03-31 | 2017-12-31 | 2017-09-30 | 2017-06-30 | 2017-03-31 | 2016-12-31 | 2016-09-30 | 2016-06-30 | 2016-03-31 | 2015-12-31 | 2015-09-30 | 2015-06-30 | 2015-03-31 | 2014-12-31 | 2014-09-30 | 2014-06-30 | 2014-03-31 | 2013-12-31 | 2013-09-30 | 2013-06-30 | 2013-03-31 | 2012-12-31 | 2012-09-30 | 2012-06-30 | 2012-03-31 | 2011-12-31 | 2011-09-30 | 2011-06-30 | 2011-03-31 | 2010-12-31 | 2010-09-30 | 2010-06-30 | ||
|---|---|---|---|---|---|---|---|---|---|---|---|---|---|---|---|---|---|---|---|---|---|---|---|---|---|---|---|---|---|---|---|---|---|---|---|---|---|---|---|---|---|---|---|---|---|---|---|---|---|---|---|---|---|---|---|---|
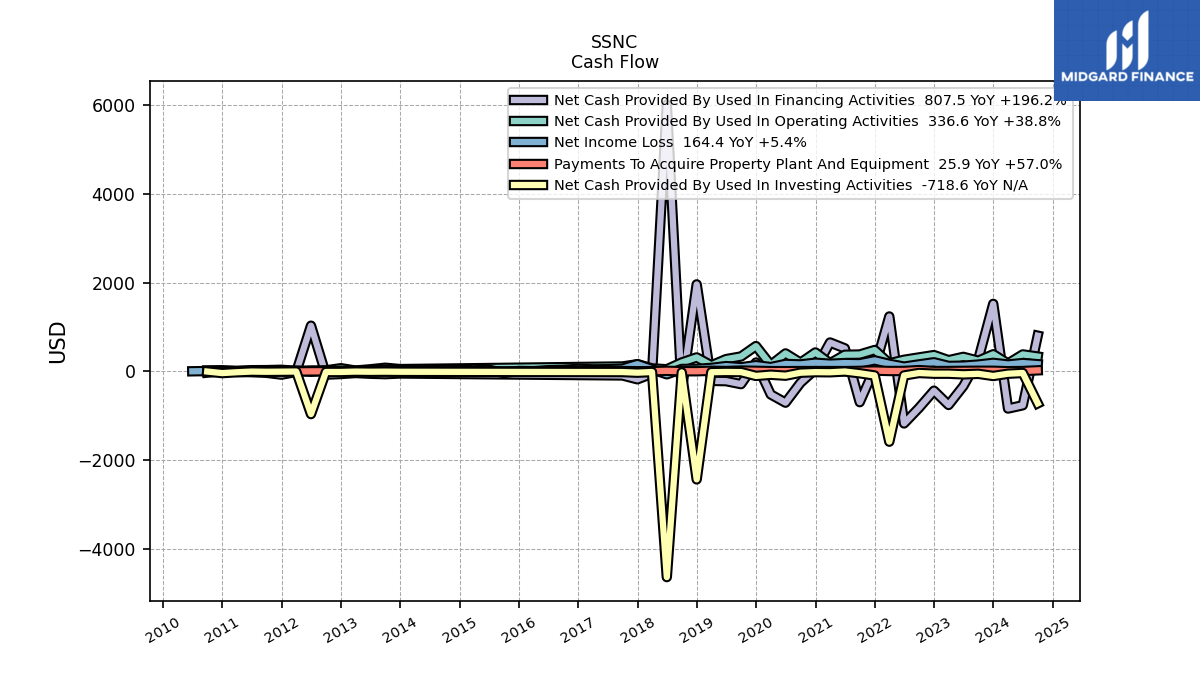
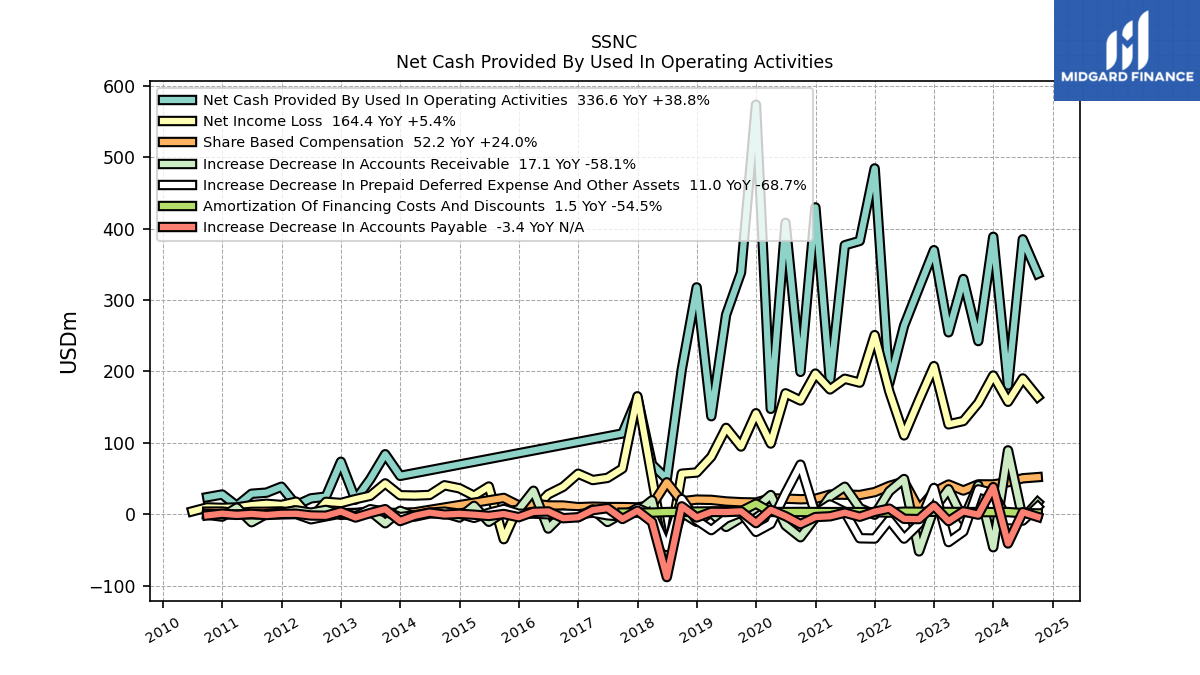
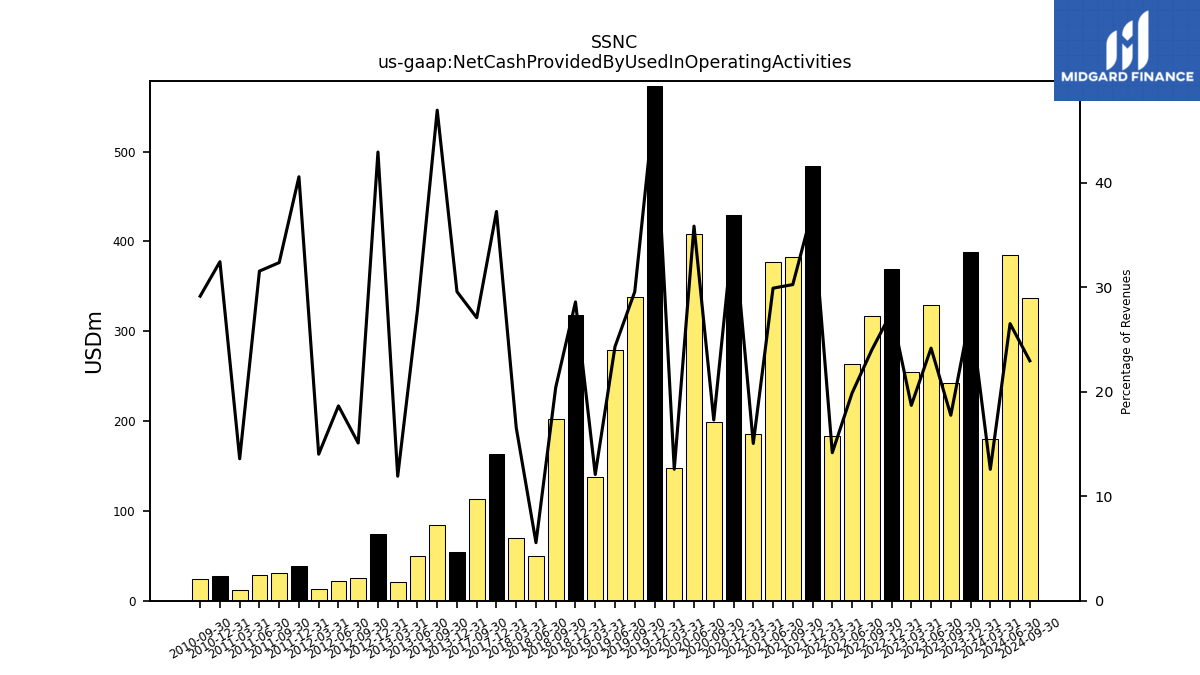
| Net Cash Provided By Used In Operating Activities | 388.40 | 242.50 | 329.40 | 254.80 | 369.70 | 317.10 | 264.00 | 183.50 | 484.10 | 382.60 | 376.60 | 185.70 | 429.60 | 199.40 | 408.00 | 147.70 | 573.30 | 338.40 | 279.20 | 137.40 | 317.70 | 202.70 | 49.80 | 69.90 | 163.30 | 113.30 | NA | NA | NA | NA | NA | NA | NA | NA | NA | NA | NA | NA | NA | NA | 53.99 | 84.27 | 49.36 | 20.64 | 73.76 | 24.99 | 22.54 | 13.14 | 38.83 | 30.52 | 28.96 | 12.09 | 27.94 | 24.20 | NA | |
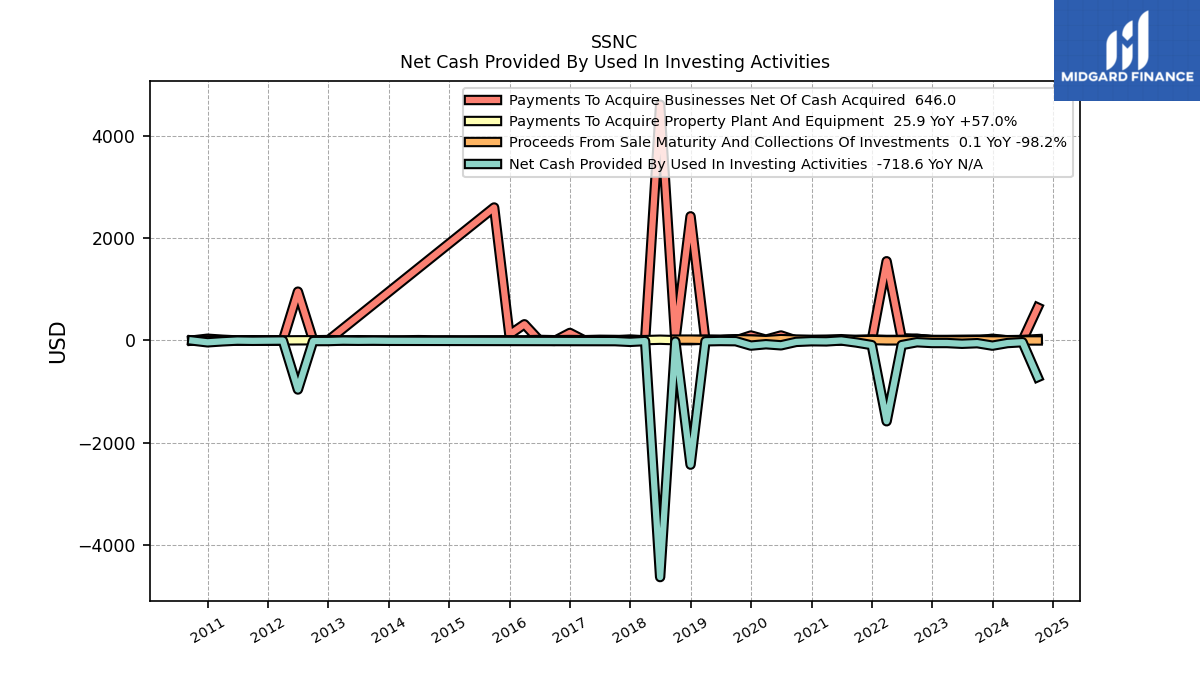
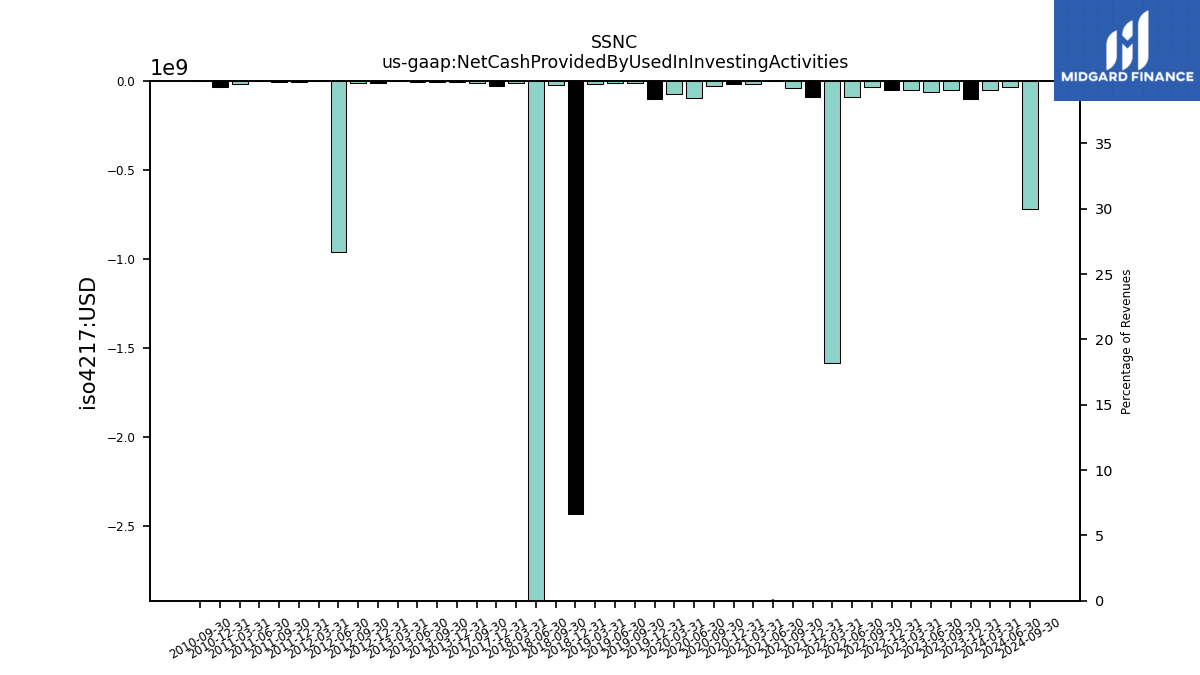
| Net Cash Provided By Used In Investing Activities | -101.30 | -52.70 | -64.60 | -49.80 | -49.80 | -34.20 | -90.10 | -1583.50 | -90.00 | -40.30 | 0.00 | -17.90 | -14.60 | -27.80 | -94.80 | -73.30 | -100.20 | -13.60 | -10.60 | -16.10 | -2433.50 | -20.30 | -4637.50 | -11.30 | -27.20 | -12.90 | NA | NA | NA | NA | NA | NA | NA | NA | NA | NA | NA | NA | NA | NA | -6.47 | -3.35 | -5.86 | -2.24 | -11.06 | -11.32 | -961.34 | -1.25 | -3.79 | -6.59 | -2.10 | -16.88 | -36.34 | -1.10 | NA | |
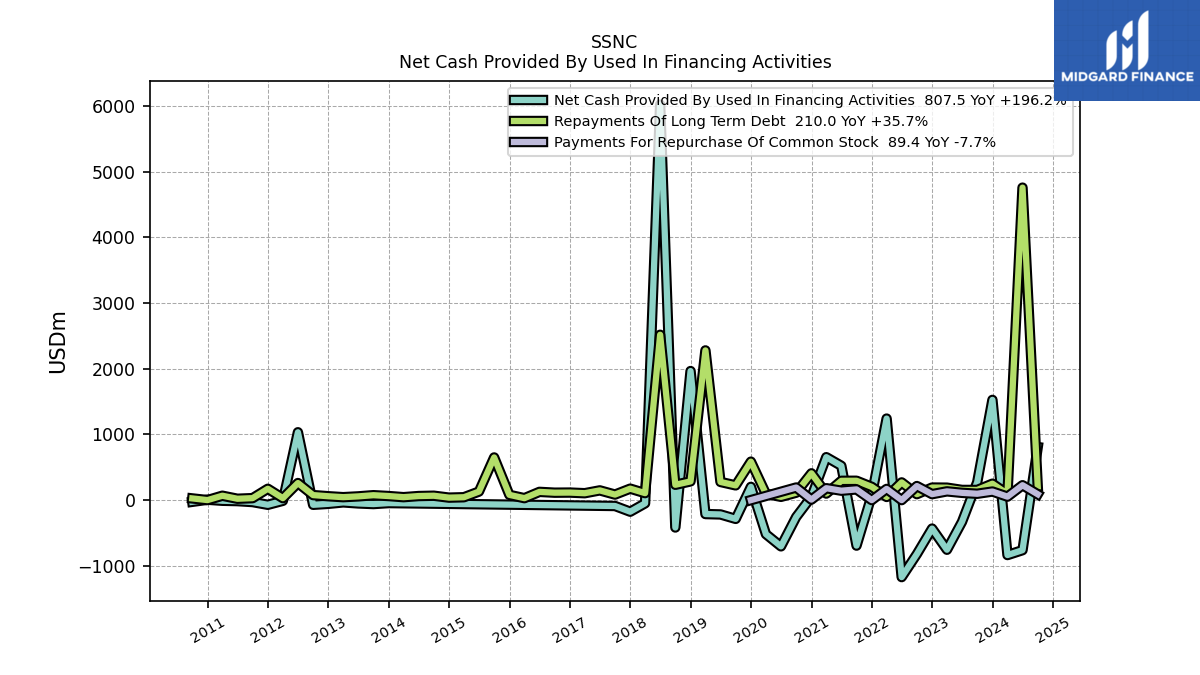
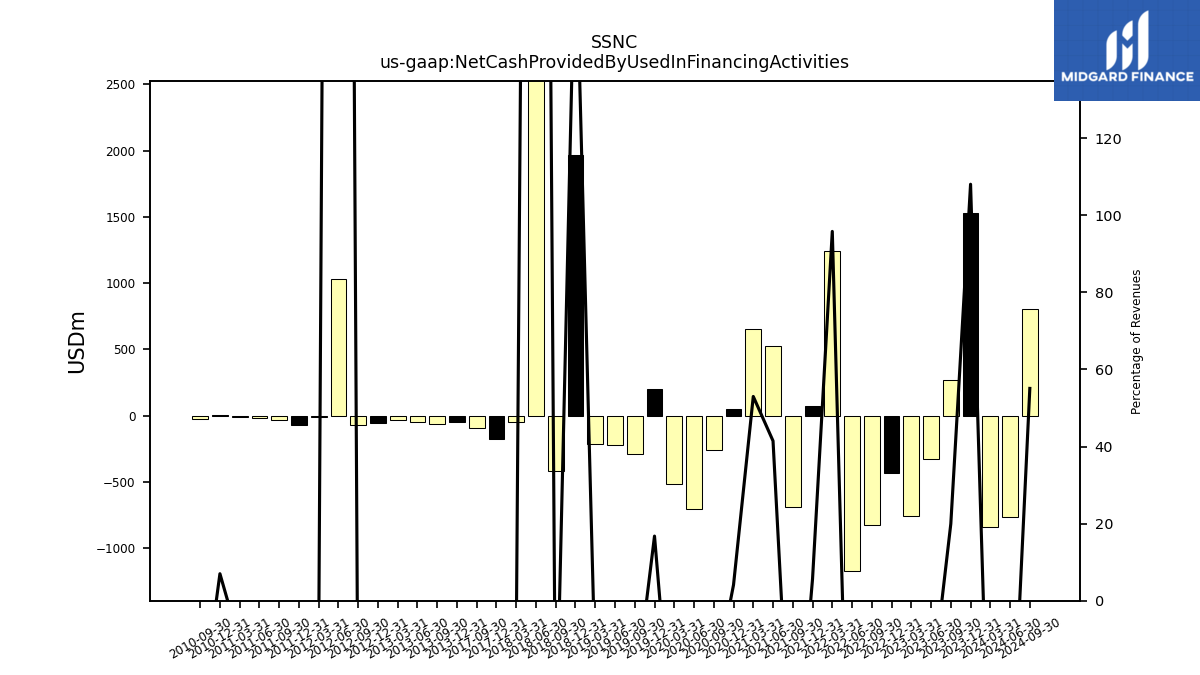
| Net Cash Provided By Used In Financing Activities | 1525.40 | 272.60 | -329.90 | -755.30 | -432.80 | -820.90 | -1171.70 | 1240.90 | 73.20 | -692.30 | 522.10 | 653.70 | 49.60 | -256.60 | -703.40 | -517.70 | 201.90 | -285.50 | -217.90 | -211.90 | 1964.50 | -416.90 | 6018.20 | -48.80 | -176.10 | -89.40 | NA | NA | NA | NA | NA | NA | NA | NA | NA | NA | NA | NA | NA | NA | -45.09 | -59.87 | -50.45 | -34.45 | -56.48 | -71.24 | 1032.81 | -10.57 | -71.04 | -29.53 | -15.08 | -9.71 | 6.04 | -25.72 | NA |
| 2023-12-31 | 2023-09-30 | 2023-06-30 | 2023-03-31 | 2022-12-31 | 2022-09-30 | 2022-06-30 | 2022-03-31 | 2021-12-31 | 2021-09-30 | 2021-06-30 | 2021-03-31 | 2020-12-31 | 2020-09-30 | 2020-06-30 | 2020-03-31 | 2019-12-31 | 2019-09-30 | 2019-06-30 | 2019-03-31 | 2018-12-31 | 2018-09-30 | 2018-06-30 | 2018-03-31 | 2017-12-31 | 2017-09-30 | 2017-06-30 | 2017-03-31 | 2016-12-31 | 2016-09-30 | 2016-06-30 | 2016-03-31 | 2015-12-31 | 2015-09-30 | 2015-06-30 | 2015-03-31 | 2014-12-31 | 2014-09-30 | 2014-06-30 | 2014-03-31 | 2013-12-31 | 2013-09-30 | 2013-06-30 | 2013-03-31 | 2012-12-31 | 2012-09-30 | 2012-06-30 | 2012-03-31 | 2011-12-31 | 2011-09-30 | 2011-06-30 | 2011-03-31 | 2010-12-31 | 2010-09-30 | 2010-06-30 | ||
|---|---|---|---|---|---|---|---|---|---|---|---|---|---|---|---|---|---|---|---|---|---|---|---|---|---|---|---|---|---|---|---|---|---|---|---|---|---|---|---|---|---|---|---|---|---|---|---|---|---|---|---|---|---|---|---|---|
| Net Cash Provided By Used In Operating Activities | 388.40 | 242.50 | 329.40 | 254.80 | 369.70 | 317.10 | 264.00 | 183.50 | 484.10 | 382.60 | 376.60 | 185.70 | 429.60 | 199.40 | 408.00 | 147.70 | 573.30 | 338.40 | 279.20 | 137.40 | 317.70 | 202.70 | 49.80 | 69.90 | 163.30 | 113.30 | NA | NA | NA | NA | NA | NA | NA | NA | NA | NA | NA | NA | NA | NA | 53.99 | 84.27 | 49.36 | 20.64 | 73.76 | 24.99 | 22.54 | 13.14 | 38.83 | 30.52 | 28.96 | 12.09 | 27.94 | 24.20 | NA | |
| Net Income Loss | 194.40 | 156.00 | 130.70 | 126.00 | 207.50 | 160.00 | 110.60 | 172.10 | 250.90 | 184.40 | 189.80 | 174.90 | 197.10 | 159.40 | 169.50 | 99.20 | 141.60 | 95.00 | 121.10 | 80.80 | 58.70 | 57.00 | -63.70 | 51.25 | 165.34 | 64.23 | 51.15 | 48.15 | 57.02 | 38.75 | 28.22 | 7.00 | 12.10 | -34.61 | 39.13 | 26.25 | 36.61 | 40.83 | 27.25 | 26.45 | 26.88 | 43.47 | 26.12 | 21.43 | 16.08 | 17.61 | -5.76 | 17.88 | 13.26 | 14.90 | 13.03 | 9.83 | 9.18 | 9.85 | 4.36 | |
| Profit Loss | 194.90 | 156.60 | 130.90 | 126.20 | 207.60 | 159.80 | 110.30 | 171.30 | 251.20 | 184.70 | 189.80 | 174.90 | 197.10 | 159.40 | NA | NA | 141.60 | 95.00 | 121.10 | 80.80 | NA | 57.00 | -63.80 | 51.30 | NA | NA | NA | NA | NA | NA | NA | NA | NA | NA | NA | NA | NA | NA | NA | NA | NA | NA | NA | NA | NA | NA | NA | NA | NA | NA | NA | NA | NA | NA | NA | |
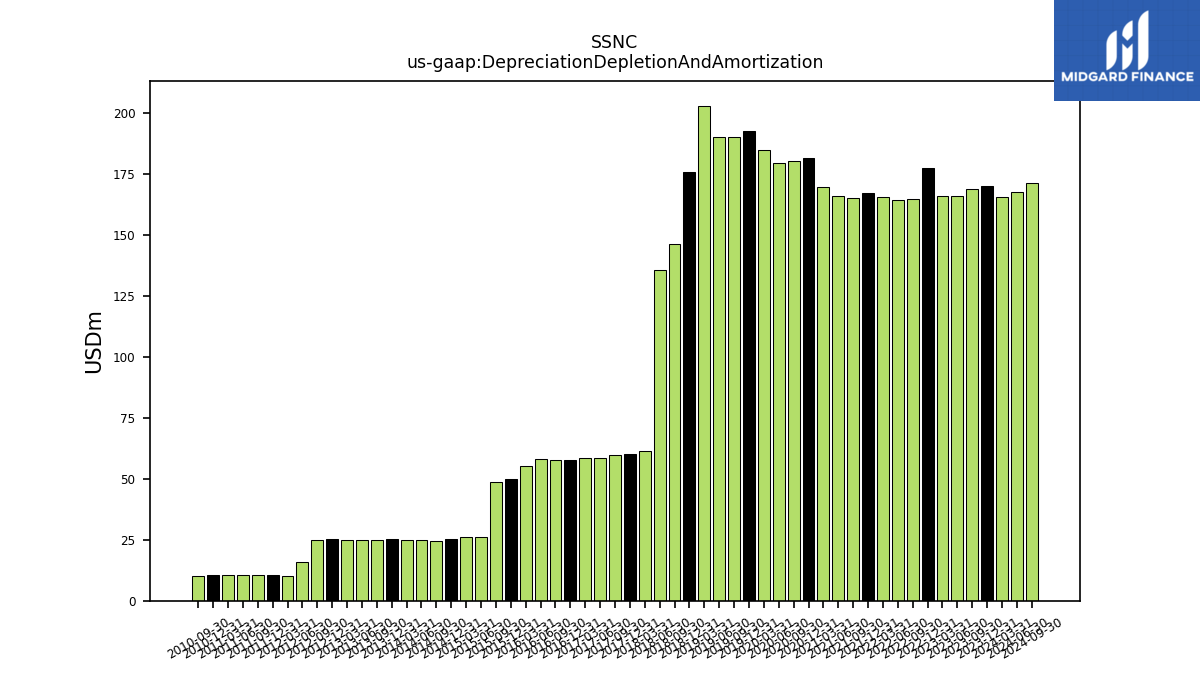
| Depreciation Depletion And Amortization | 170.00 | 168.60 | 165.90 | 165.90 | 177.40 | 164.60 | 164.00 | 165.60 | 167.20 | 164.90 | 165.80 | 169.50 | 181.20 | 180.00 | 179.40 | 184.70 | 192.40 | 190.10 | 189.90 | 202.80 | 175.60 | 146.20 | 135.33 | 61.37 | 60.31 | 59.67 | 58.66 | 58.56 | 57.77 | 57.47 | 58.17 | 55.27 | 49.99 | 48.74 | 26.11 | 26.00 | 25.34 | 24.66 | 24.90 | 24.94 | 25.34 | 24.70 | 24.99 | 24.75 | 25.19 | 24.73 | 15.68 | 10.21 | 10.74 | 10.49 | 10.61 | 10.38 | 10.37 | 10.06 | NA | |
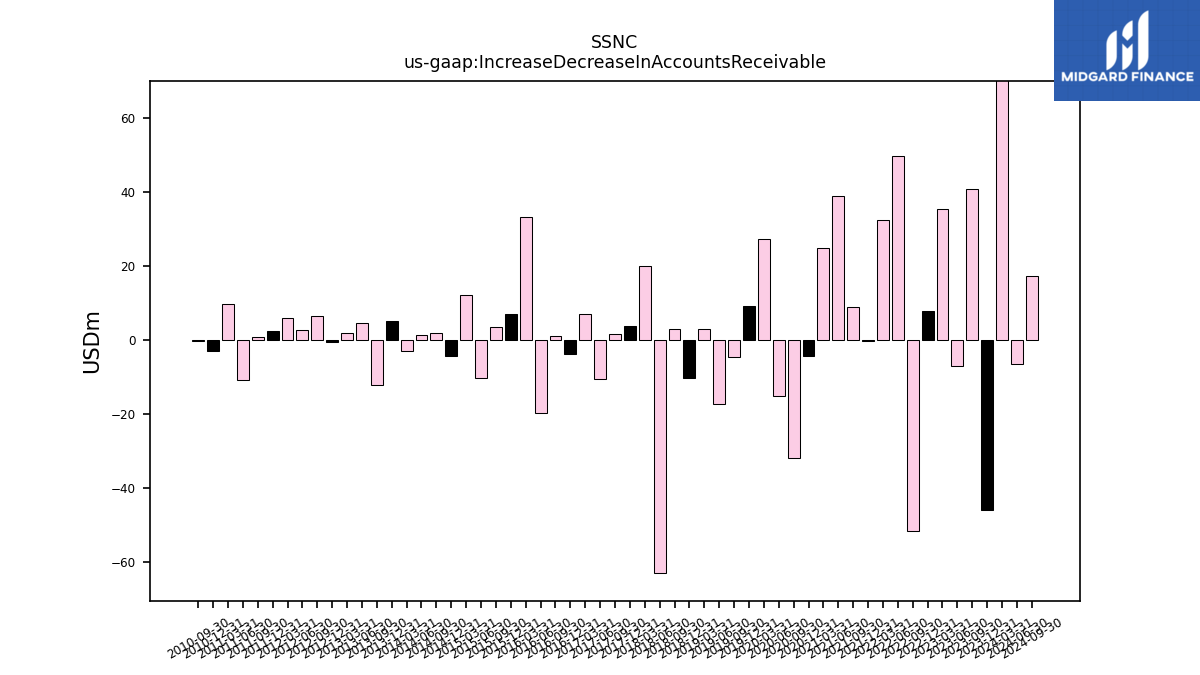
| Increase Decrease In Accounts Receivable | -45.90 | 40.80 | -7.10 | 35.30 | 7.80 | -51.70 | 49.60 | 32.40 | -0.40 | 8.90 | 38.80 | 24.90 | -4.30 | -31.90 | -15.30 | 27.20 | 9.20 | -4.60 | -17.40 | 2.90 | -10.40 | 3.00 | -62.82 | 19.82 | 3.67 | 1.59 | -10.50 | 7.09 | -3.75 | 1.15 | -19.75 | 33.20 | 6.93 | 3.43 | -10.25 | 12.06 | -4.30 | 1.93 | 1.42 | -2.96 | 5.10 | -12.33 | 4.67 | 1.75 | -0.60 | 6.37 | 2.53 | 5.76 | 2.40 | 0.72 | -10.88 | 9.57 | -3.08 | -0.41 | NA | |
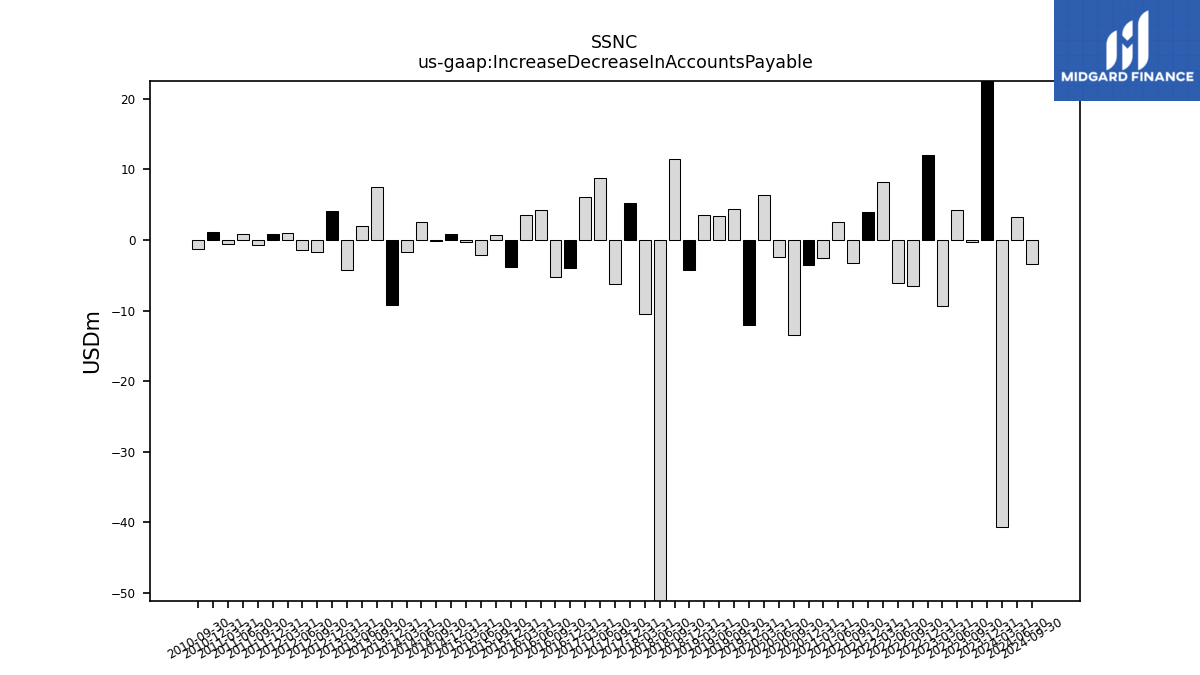
| Increase Decrease In Accounts Payable | 38.30 | -0.30 | 4.30 | -9.30 | 12.00 | -6.50 | -6.10 | 8.20 | 3.90 | -3.20 | 2.50 | -2.60 | -3.60 | -13.50 | -2.40 | 6.40 | -12.10 | 4.40 | 3.40 | 3.60 | -4.20 | 11.40 | -87.65 | -10.55 | 5.24 | -6.30 | 8.79 | 6.11 | -3.91 | -5.26 | 4.28 | 3.59 | -3.83 | 0.65 | -2.07 | -0.33 | 0.89 | -0.15 | 2.55 | -1.76 | -9.22 | 7.44 | 2.02 | -4.27 | 4.08 | -1.78 | -1.44 | 0.97 | 0.81 | -0.78 | 0.81 | -0.57 | 1.11 | -1.29 | NA | |
| Share Based Compensation | 42.00 | 42.10 | 33.50 | 41.90 | 31.50 | 7.40 | 46.00 | 39.90 | 31.30 | 27.20 | 27.70 | 27.80 | 21.90 | 21.30 | 22.10 | 22.50 | 16.70 | 17.10 | 18.20 | 20.40 | 20.80 | 18.40 | 45.00 | 12.70 | 9.91 | 10.29 | 10.38 | 10.90 | 10.16 | 12.49 | 12.57 | 15.35 | 12.64 | 23.12 | NA | NA | NA | NA | NA | 2.98 | 2.38 | 1.98 | 1.93 | 2.11 | 1.79 | 1.39 | 1.18 | 1.23 | 4.28 | 3.78 | 3.64 | 1.80 | 4.07 | 3.95 | NA |
| 2023-12-31 | 2023-09-30 | 2023-06-30 | 2023-03-31 | 2022-12-31 | 2022-09-30 | 2022-06-30 | 2022-03-31 | 2021-12-31 | 2021-09-30 | 2021-06-30 | 2021-03-31 | 2020-12-31 | 2020-09-30 | 2020-06-30 | 2020-03-31 | 2019-12-31 | 2019-09-30 | 2019-06-30 | 2019-03-31 | 2018-12-31 | 2018-09-30 | 2018-06-30 | 2018-03-31 | 2017-12-31 | 2017-09-30 | 2017-06-30 | 2017-03-31 | 2016-12-31 | 2016-09-30 | 2016-06-30 | 2016-03-31 | 2015-12-31 | 2015-09-30 | 2015-06-30 | 2015-03-31 | 2014-12-31 | 2014-09-30 | 2014-06-30 | 2014-03-31 | 2013-12-31 | 2013-09-30 | 2013-06-30 | 2013-03-31 | 2012-12-31 | 2012-09-30 | 2012-06-30 | 2012-03-31 | 2011-12-31 | 2011-09-30 | 2011-06-30 | 2011-03-31 | 2010-12-31 | 2010-09-30 | 2010-06-30 | ||
|---|---|---|---|---|---|---|---|---|---|---|---|---|---|---|---|---|---|---|---|---|---|---|---|---|---|---|---|---|---|---|---|---|---|---|---|---|---|---|---|---|---|---|---|---|---|---|---|---|---|---|---|---|---|---|---|---|
| Net Cash Provided By Used In Investing Activities | -101.30 | -52.70 | -64.60 | -49.80 | -49.80 | -34.20 | -90.10 | -1583.50 | -90.00 | -40.30 | 0.00 | -17.90 | -14.60 | -27.80 | -94.80 | -73.30 | -100.20 | -13.60 | -10.60 | -16.10 | -2433.50 | -20.30 | -4637.50 | -11.30 | -27.20 | -12.90 | NA | NA | NA | NA | NA | NA | NA | NA | NA | NA | NA | NA | NA | NA | -6.47 | -3.35 | -5.86 | -2.24 | -11.06 | -11.32 | -961.34 | -1.25 | -3.79 | -6.59 | -2.10 | -16.88 | -36.34 | -1.10 | NA | |
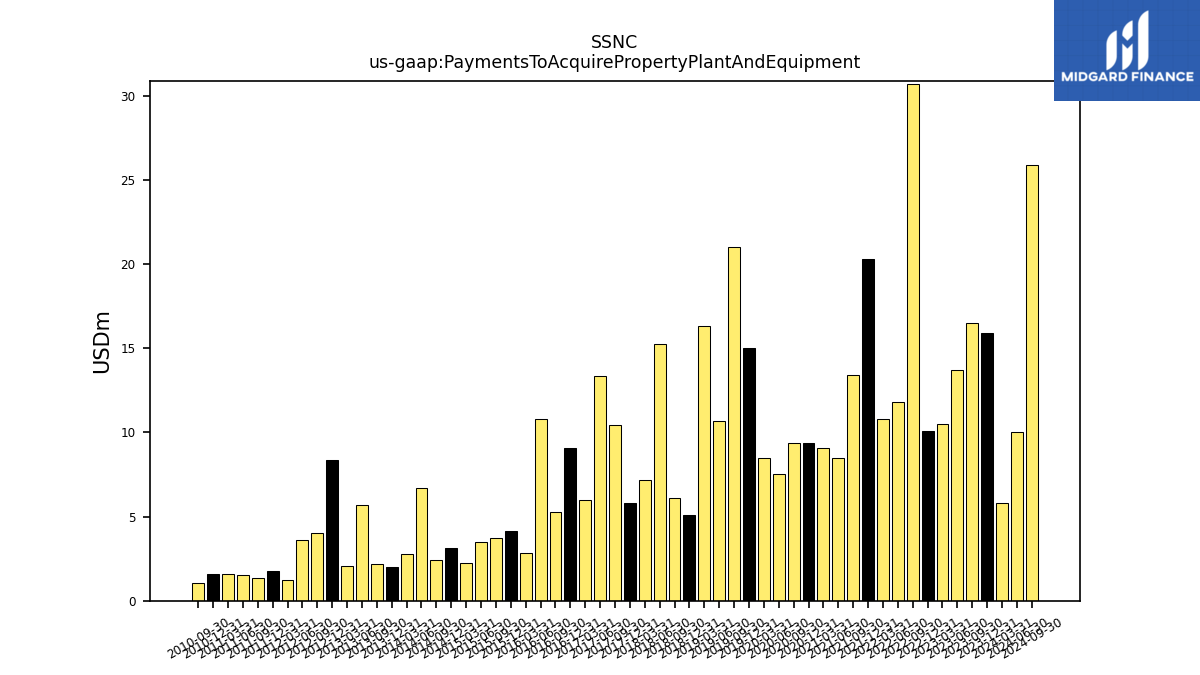
| Payments To Acquire Property Plant And Equipment | 15.90 | 16.50 | 13.70 | 10.50 | 10.10 | 30.70 | 11.80 | 10.80 | 20.30 | 13.40 | 8.50 | 9.10 | 9.40 | 9.40 | 7.50 | 8.50 | 15.00 | 21.00 | 10.70 | 16.30 | 5.10 | 6.10 | 15.24 | 7.16 | 5.79 | 10.41 | 13.38 | 5.99 | 9.06 | 5.28 | 10.79 | 2.81 | 4.14 | 3.71 | 3.50 | 2.25 | 3.16 | 2.42 | 6.70 | 2.76 | 1.99 | 2.21 | 5.68 | 2.04 | 8.35 | 4.02 | 3.58 | 1.23 | 1.78 | 1.33 | 1.54 | 1.57 | 1.57 | 1.03 | NA | |
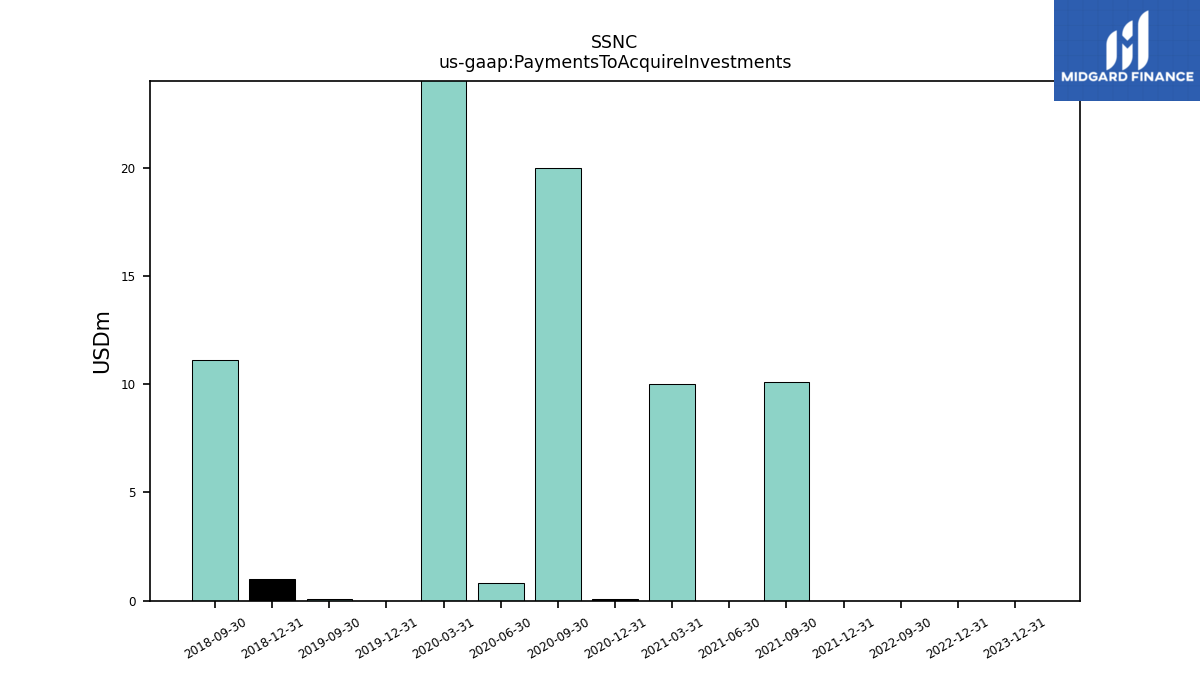
| Payments To Acquire Investments | 0.00 | NA | NA | NA | 0.00 | 0.00 | NA | NA | 0.00 | 10.10 | 0.00 | 10.00 | 0.10 | 20.00 | 0.80 | 40.00 | 0.00 | 0.10 | NA | NA | 1.00 | 11.10 | NA | NA | NA | NA | NA | NA | NA | NA | NA | NA | NA | NA | NA | NA | NA | NA | NA | NA | NA | NA | NA | NA | NA | NA | NA | NA | NA | NA | NA | NA | NA | NA | NA |
| 2023-12-31 | 2023-09-30 | 2023-06-30 | 2023-03-31 | 2022-12-31 | 2022-09-30 | 2022-06-30 | 2022-03-31 | 2021-12-31 | 2021-09-30 | 2021-06-30 | 2021-03-31 | 2020-12-31 | 2020-09-30 | 2020-06-30 | 2020-03-31 | 2019-12-31 | 2019-09-30 | 2019-06-30 | 2019-03-31 | 2018-12-31 | 2018-09-30 | 2018-06-30 | 2018-03-31 | 2017-12-31 | 2017-09-30 | 2017-06-30 | 2017-03-31 | 2016-12-31 | 2016-09-30 | 2016-06-30 | 2016-03-31 | 2015-12-31 | 2015-09-30 | 2015-06-30 | 2015-03-31 | 2014-12-31 | 2014-09-30 | 2014-06-30 | 2014-03-31 | 2013-12-31 | 2013-09-30 | 2013-06-30 | 2013-03-31 | 2012-12-31 | 2012-09-30 | 2012-06-30 | 2012-03-31 | 2011-12-31 | 2011-09-30 | 2011-06-30 | 2011-03-31 | 2010-12-31 | 2010-09-30 | 2010-06-30 | ||
|---|---|---|---|---|---|---|---|---|---|---|---|---|---|---|---|---|---|---|---|---|---|---|---|---|---|---|---|---|---|---|---|---|---|---|---|---|---|---|---|---|---|---|---|---|---|---|---|---|---|---|---|---|---|---|---|---|
| Net Cash Provided By Used In Financing Activities | 1525.40 | 272.60 | -329.90 | -755.30 | -432.80 | -820.90 | -1171.70 | 1240.90 | 73.20 | -692.30 | 522.10 | 653.70 | 49.60 | -256.60 | -703.40 | -517.70 | 201.90 | -285.50 | -217.90 | -211.90 | 1964.50 | -416.90 | 6018.20 | -48.80 | -176.10 | -89.40 | NA | NA | NA | NA | NA | NA | NA | NA | NA | NA | NA | NA | NA | NA | -45.09 | -59.87 | -50.45 | -34.45 | -56.48 | -71.24 | 1032.81 | -10.57 | -71.04 | -29.53 | -15.08 | -9.71 | 6.04 | -25.72 | NA | |
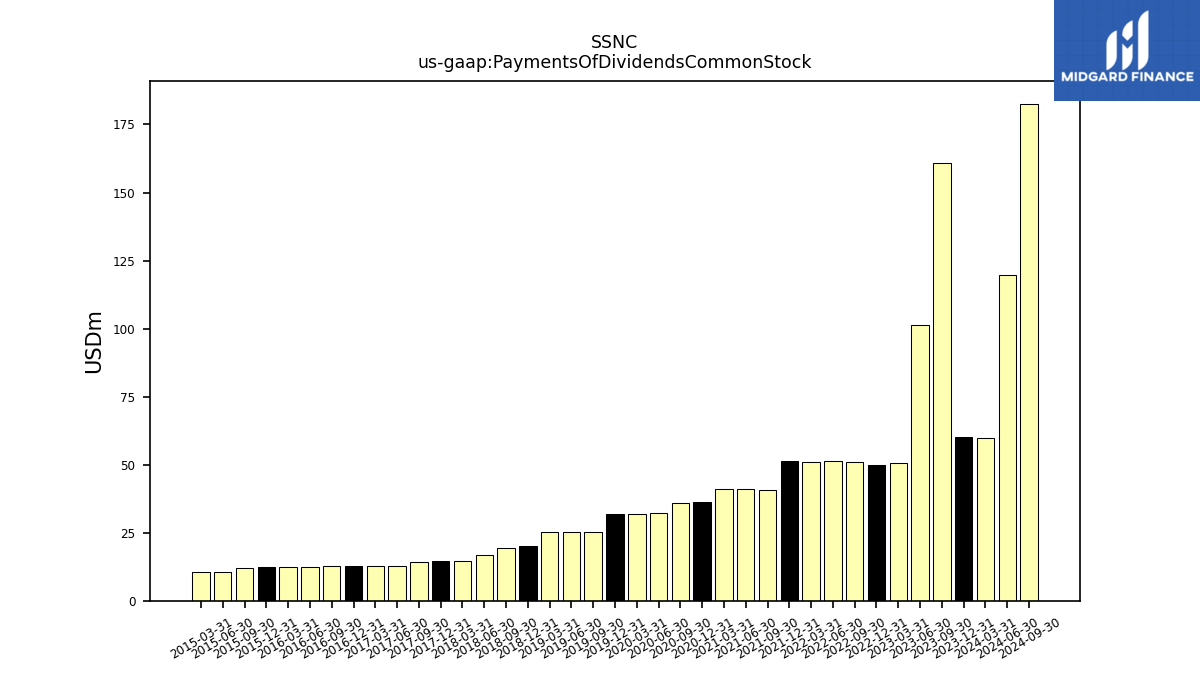
| Payments Of Dividends Common Stock | 60.00 | 59.70 | 50.50 | 50.70 | 49.70 | 51.00 | 51.30 | 51.10 | 51.20 | 40.70 | 40.90 | 41.20 | 36.20 | 35.90 | 32.10 | 31.90 | 31.70 | 25.40 | 25.40 | 25.20 | 20.20 | 19.30 | 16.90 | 14.50 | 14.44 | 14.40 | 12.81 | 12.71 | 12.69 | 12.66 | 12.44 | 12.35 | 12.23 | 12.12 | 10.56 | 10.54 | NA | NA | NA | NA | NA | NA | NA | NA | NA | NA | NA | NA | NA | NA | NA | NA | NA | NA | NA | |
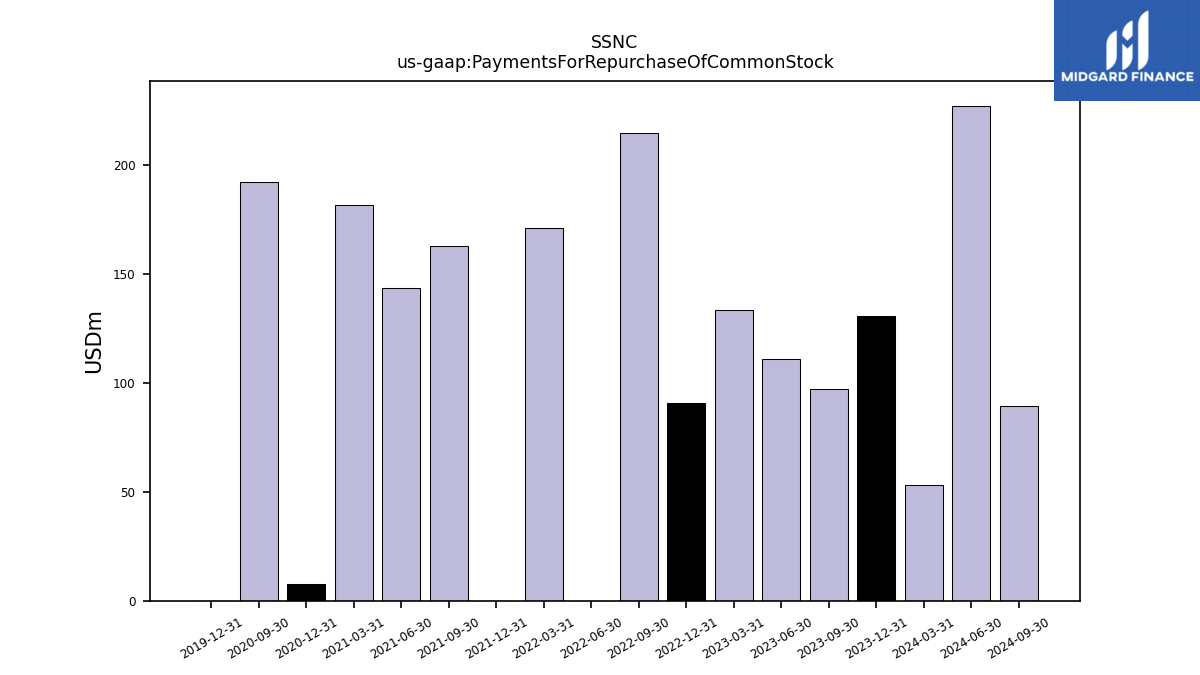
| Payments For Repurchase Of Common Stock | 130.60 | 96.90 | 110.80 | 133.30 | 90.70 | 214.50 | 0.00 | 170.90 | 0.00 | 162.90 | 143.60 | 181.40 | 7.90 | 191.90 | NA | NA | 0.00 | NA | NA | NA | NA | NA | NA | NA | NA | NA | NA | NA | NA | NA | NA | NA | NA | NA | NA | NA | NA | NA | NA | NA | NA | NA | NA | NA | NA | NA | NA | NA | NA | NA | NA | NA | NA | NA | NA |
| 2023-12-31 | 2023-09-30 | 2023-06-30 | 2023-03-31 | 2022-12-31 | 2022-09-30 | 2022-06-30 | 2022-03-31 | 2021-12-31 | 2021-09-30 | 2021-06-30 | 2021-03-31 | 2020-12-31 | 2020-09-30 | 2020-06-30 | 2020-03-31 | 2019-12-31 | 2019-09-30 | 2019-06-30 | 2019-03-31 | 2018-12-31 | 2018-09-30 | 2018-06-30 | 2018-03-31 | 2017-12-31 | 2017-09-30 | 2017-06-30 | 2017-03-31 | 2016-12-31 | 2016-09-30 | 2016-06-30 | 2016-03-31 | 2015-12-31 | 2015-09-30 | 2015-06-30 | 2015-03-31 | 2014-12-31 | 2014-09-30 | 2014-06-30 | 2014-03-31 | 2013-12-31 | 2013-09-30 | 2013-06-30 | 2013-03-31 | 2012-12-31 | 2012-09-30 | 2012-06-30 | 2012-03-31 | 2011-12-31 | 2011-09-30 | 2011-06-30 | 2011-03-31 | 2010-12-31 | 2010-09-30 | 2010-06-30 | ||
|---|---|---|---|---|---|---|---|---|---|---|---|---|---|---|---|---|---|---|---|---|---|---|---|---|---|---|---|---|---|---|---|---|---|---|---|---|---|---|---|---|---|---|---|---|---|---|---|---|---|---|---|---|---|---|---|---|
| Revenues | 1411.60 | 1365.90 | 1362.60 | 1362.70 | 1338.30 | 1321.00 | 1328.70 | 1295.00 | 1294.20 | 1264.40 | 1259.00 | 1233.40 | 1203.40 | 1152.80 | 1138.10 | 1173.60 | 1203.50 | 1144.20 | 1148.00 | 1137.20 | 1111.00 | 992.40 | 895.80 | 421.93 | 438.37 | 418.25 | 410.98 | 407.70 | 400.92 | 383.30 | 373.08 | 324.13 | 300.89 | 280.89 | 212.77 | 205.74 | 200.73 | 192.60 | 188.72 | 185.81 | 182.52 | 179.50 | 177.46 | 173.22 | 171.75 | 165.56 | 120.85 | 93.67 | 95.69 | 94.32 | 91.80 | 89.01 | 86.11 | 83.00 | 81.62 | |
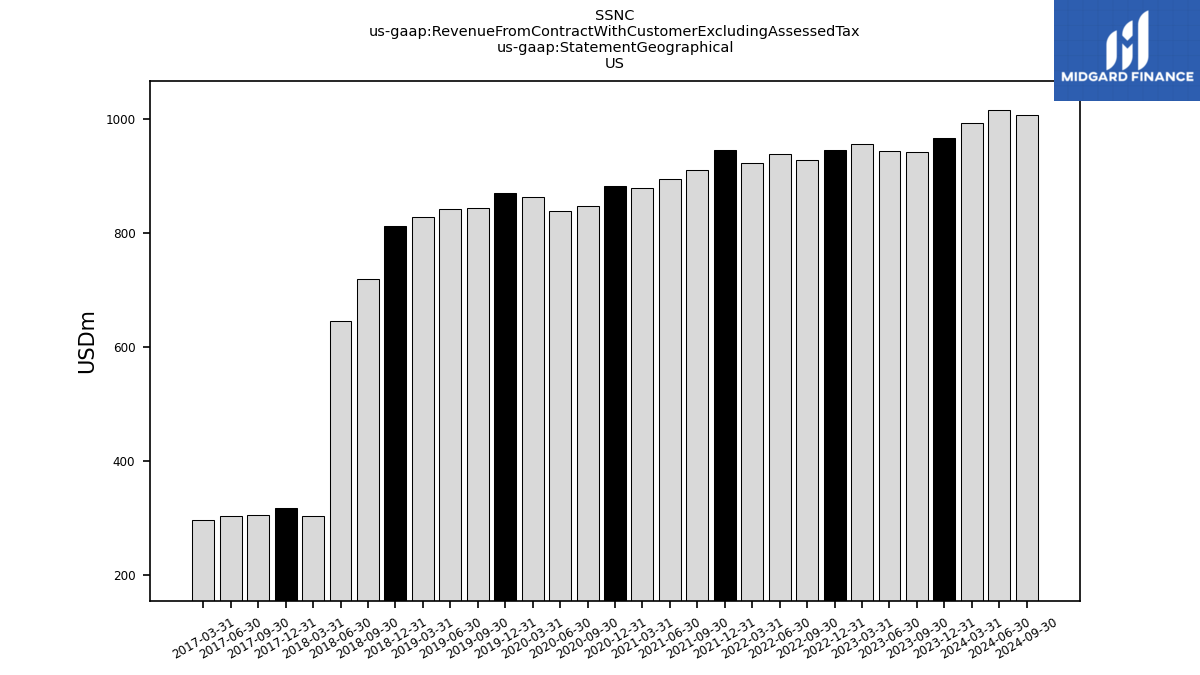
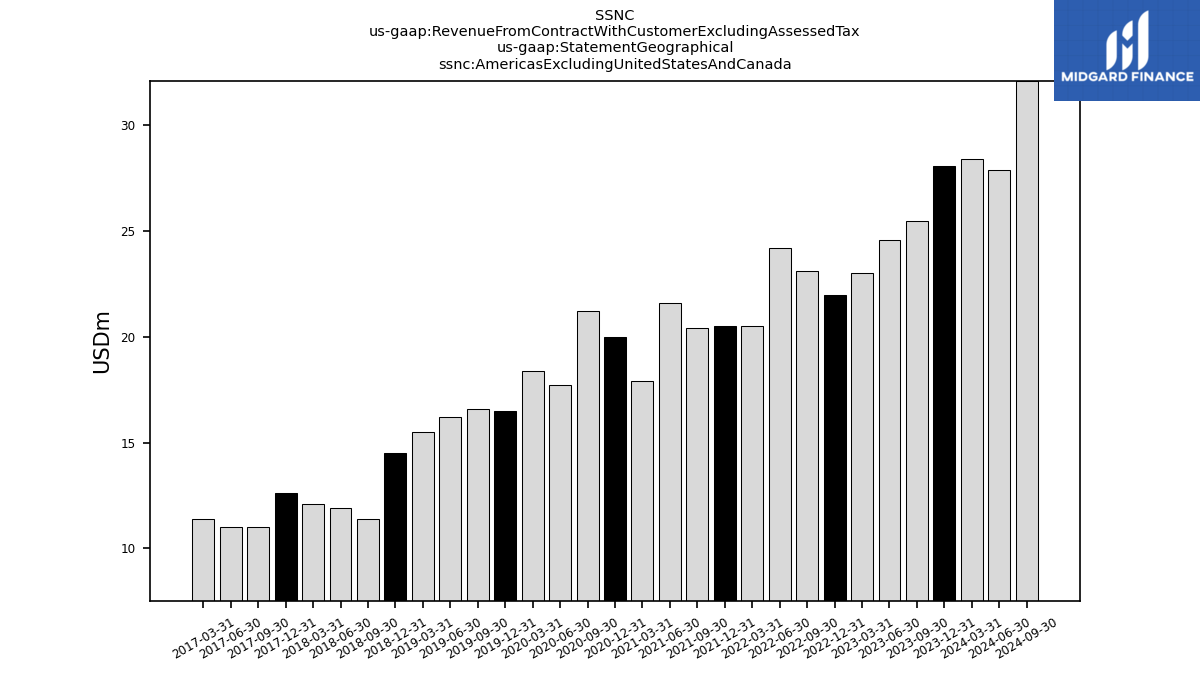
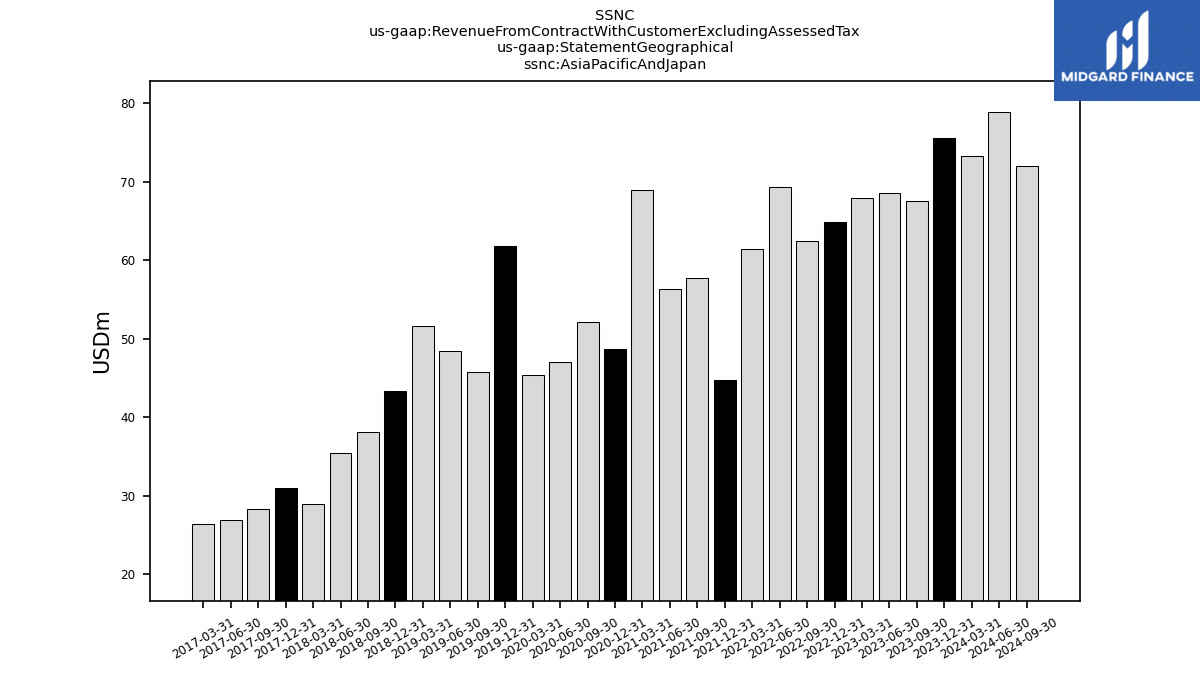
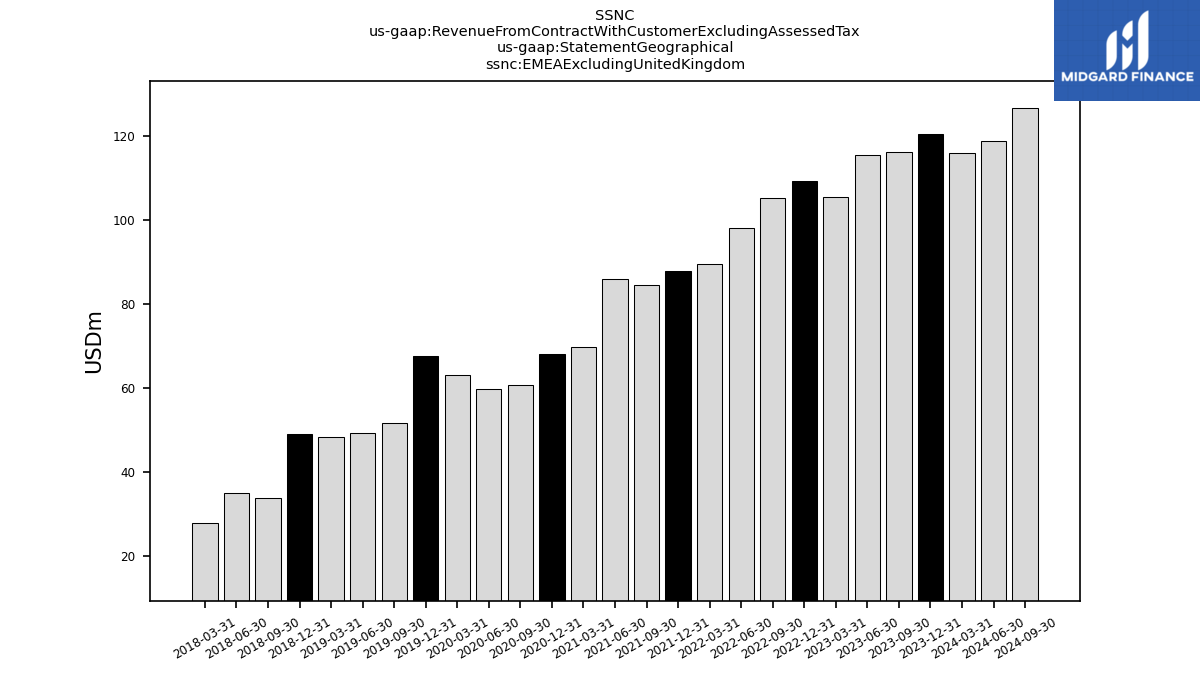
| Revenue From Contract With Customer Excluding Assessed Tax | 1411.60 | 1365.90 | 1362.60 | 1362.70 | 1338.30 | 1321.00 | 1328.70 | 1295.00 | 1294.20 | 1264.40 | 1259.00 | 1233.40 | 1203.40 | 1152.80 | 1138.10 | 1173.60 | 1203.50 | 1144.20 | 1148.00 | 1137.20 | 1111.00 | 992.40 | 895.80 | 421.93 | 438.40 | 418.20 | 411.00 | 407.70 | 400.92 | 383.30 | 373.08 | 324.13 | 300.89 | 280.89 | 212.77 | 205.74 | 200.73 | 192.60 | 188.72 | 185.81 | 182.52 | 179.50 | 177.46 | 173.22 | 171.75 | 165.56 | 120.85 | 93.67 | 95.69 | 94.32 | 91.80 | 89.01 | 86.11 | 83.00 | 81.62 | |
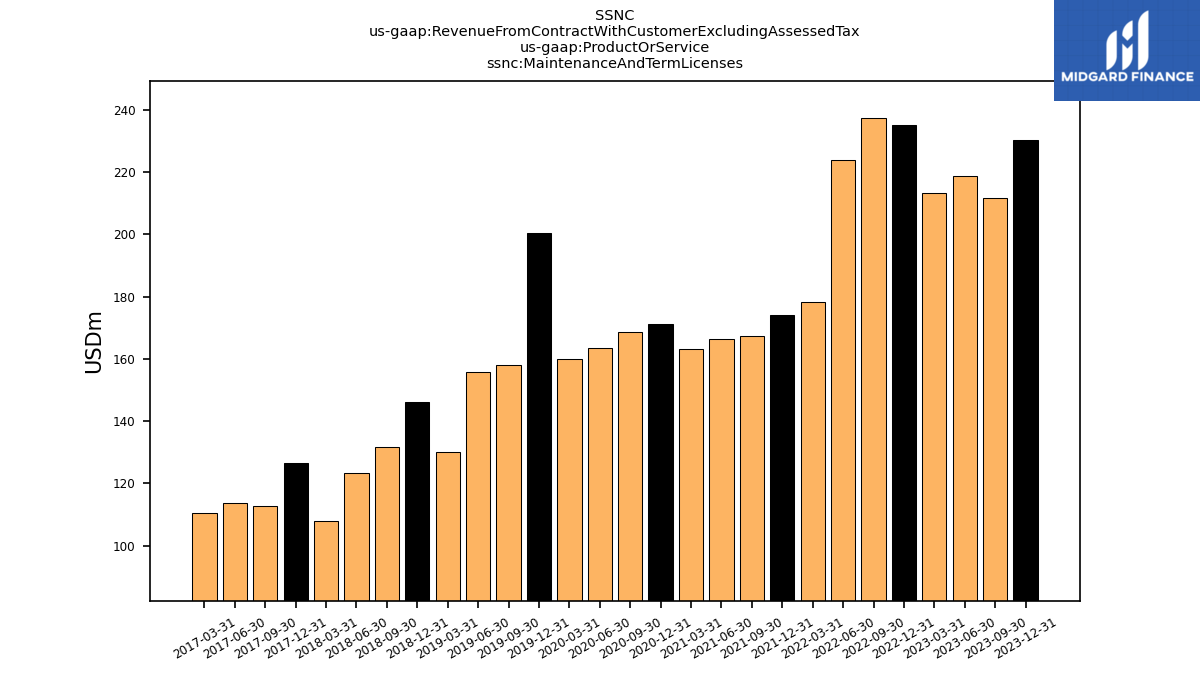
| Maintenance And Term Licenses | 230.20 | 211.60 | 218.60 | 213.30 | 235.20 | 237.40 | 223.80 | 178.30 | 174.20 | 167.30 | 166.50 | 163.20 | 171.10 | 168.70 | 163.50 | 159.80 | 200.30 | 157.90 | 155.90 | 130.10 | 146.20 | 131.70 | 123.20 | 107.76 | 126.60 | 112.80 | 113.60 | 110.56 | NA | NA | NA | NA | NA | NA | NA | NA | NA | NA | NA | NA | NA | NA | NA | NA | NA | NA | NA | NA | NA | NA | NA | NA | NA | NA | NA | |
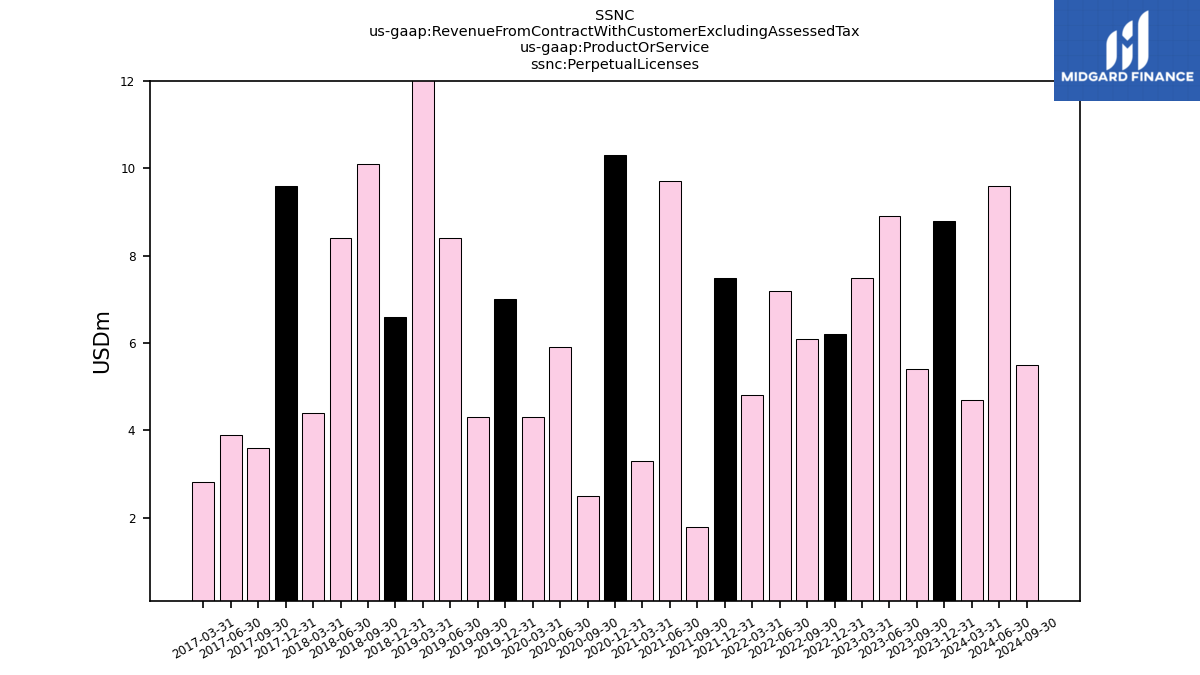
| Perpetual Licenses | 8.80 | 5.40 | 8.90 | 7.50 | 6.20 | 6.10 | 7.20 | 4.80 | 7.50 | 1.80 | 9.70 | 3.30 | 10.30 | 2.50 | 5.90 | 4.30 | 7.00 | 4.30 | 8.40 | 15.10 | 6.60 | 10.10 | 8.40 | 4.40 | 9.60 | 3.60 | 3.90 | 2.83 | NA | NA | NA | NA | NA | NA | NA | NA | NA | NA | NA | NA | NA | NA | NA | NA | NA | NA | NA | NA | NA | NA | NA | NA | NA | NA | NA | |
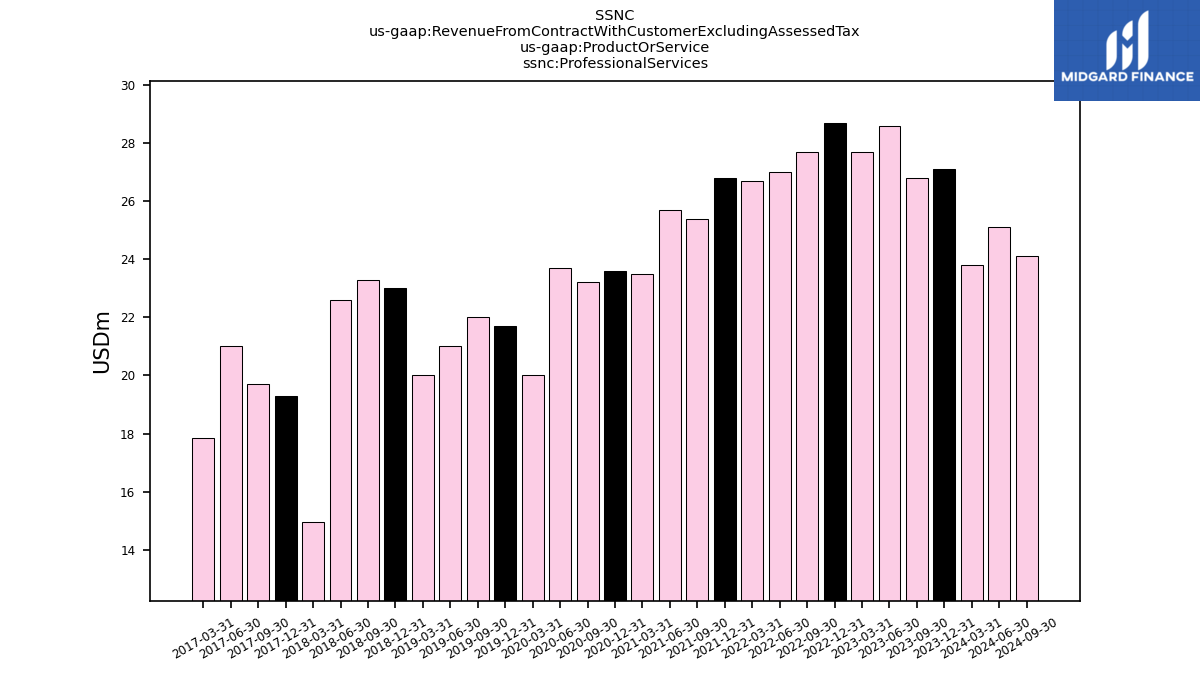
| Professional Services | 27.10 | 26.80 | 28.60 | 27.70 | 28.70 | 27.70 | 27.00 | 26.70 | 26.80 | 25.40 | 25.70 | 23.50 | 23.60 | 23.20 | 23.70 | 20.00 | 21.70 | 22.00 | 21.00 | 20.00 | 23.00 | 23.30 | 22.60 | 14.97 | 19.30 | 19.70 | 21.00 | 17.86 | NA | NA | NA | NA | NA | NA | NA | NA | NA | NA | NA | NA | NA | NA | NA | NA | NA | NA | NA | NA | NA | NA | NA | NA | NA | NA | NA | |
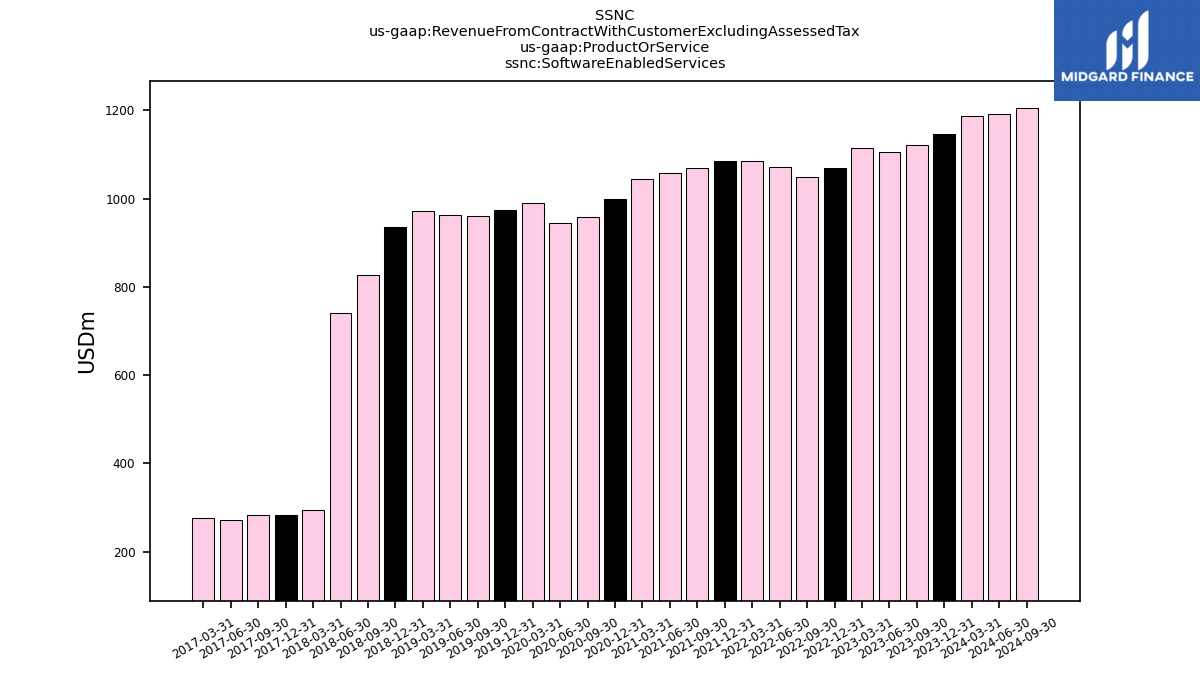
| Software Enabled Services | 1145.50 | 1122.10 | 1106.50 | 1114.20 | 1068.20 | 1049.80 | 1070.70 | 1085.20 | 1085.70 | 1069.90 | 1057.10 | 1043.40 | 998.40 | 958.40 | 945.00 | 989.50 | 974.50 | 960.00 | 962.70 | 972.00 | 935.20 | 827.30 | 741.60 | 294.80 | 282.90 | 282.10 | 272.50 | 276.45 | NA | NA | NA | NA | NA | NA | NA | NA | NA | NA | NA | NA | NA | NA | NA | NA | NA | NA | NA | NA | NA | NA | NA | NA | NA | NA | NA | |
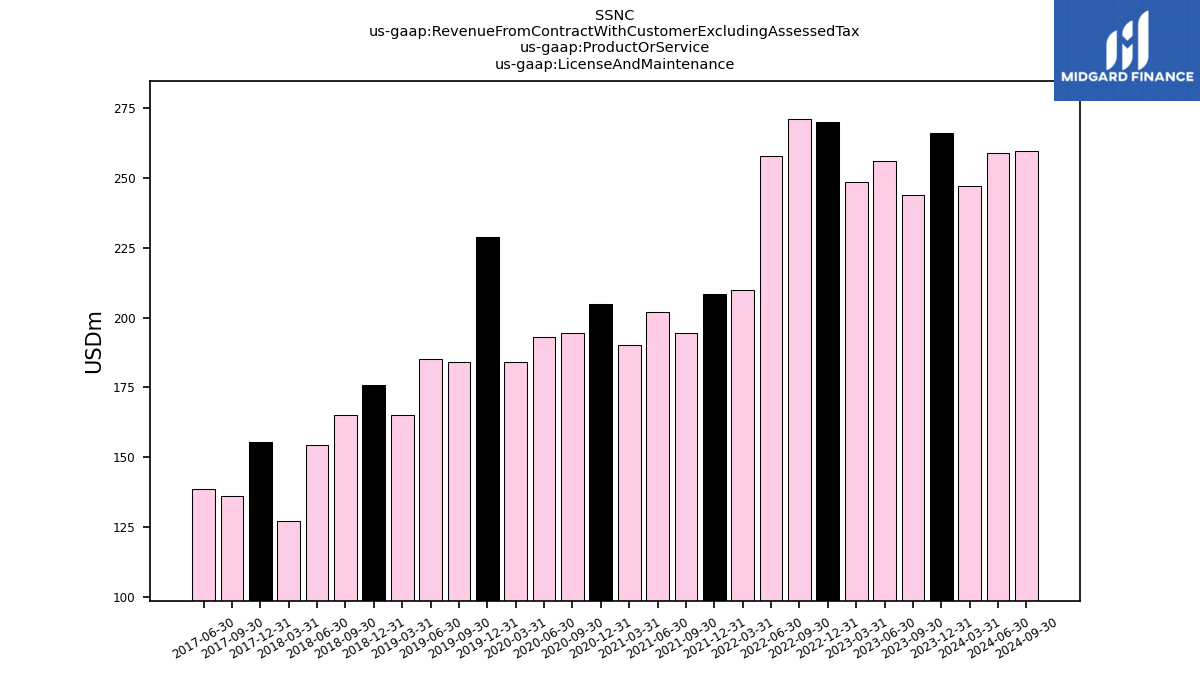
| License And Maintenance | 266.10 | 243.80 | 256.10 | 248.50 | 270.10 | 271.20 | 258.00 | 209.80 | 208.50 | 194.50 | 201.90 | 190.00 | 205.00 | 194.40 | 193.10 | 184.10 | 229.00 | 184.20 | 185.30 | 165.20 | 175.80 | 165.10 | 154.20 | 127.10 | 155.50 | 136.10 | 138.50 | NA | NA | NA | NA | NA | NA | NA | NA | NA | NA | NA | NA | NA | NA | NA | NA | NA | NA | NA | NA | NA | NA | NA | NA | NA | NA | NA | NA | |
| 56.80 | 55.30 | 53.70 | 55.50 | 58.50 | 64.90 | 54.20 | 50.40 | 48.90 | 48.30 | 45.30 | 48.00 | 45.10 | 40.60 | 34.40 | 28.60 | 26.00 | 26.90 | 27.40 | 27.20 | 26.50 | 28.70 | 22.80 | 18.32 | 20.80 | 18.60 | 16.40 | 20.63 | NA | NA | NA | NA | NA | NA | NA | NA | NA | NA | NA | NA | NA | NA | NA | NA | NA | NA | NA | NA | NA | NA | NA | NA | NA | NA | NA | ||
| 165.20 | 160.10 | 157.40 | 155.90 | 139.30 | 138.20 | 145.40 | 150.20 | 146.60 | 143.90 | 155.20 | 150.30 | 139.80 | 132.20 | 141.70 | 156.20 | 161.40 | 160.30 | 164.90 | 166.30 | 165.40 | 161.80 | 144.70 | 32.01 | 31.00 | 28.40 | 28.80 | 27.54 | NA | NA | NA | NA | NA | NA | NA | NA | NA | NA | NA | NA | NA | NA | NA | NA | NA | NA | NA | NA | NA | NA | NA | NA | NA | NA | NA | ||
| US | 965.40 | 941.20 | 942.80 | 954.90 | 944.30 | 927.10 | 937.40 | 923.00 | 945.60 | 909.60 | 894.60 | 878.40 | 881.80 | 846.10 | 837.40 | 862.00 | 870.30 | 843.10 | 841.90 | 828.30 | 812.40 | 718.70 | 646.00 | 302.70 | 316.50 | 305.90 | 303.10 | 296.84 | NA | NA | NA | NA | NA | NA | NA | NA | NA | NA | NA | NA | NA | NA | NA | NA | NA | NA | NA | NA | NA | NA | NA | NA | NA | NA | NA | |
| Americas Excluding United States And Canada | 28.10 | 25.50 | 24.60 | 23.00 | 22.00 | 23.10 | 24.20 | 20.50 | 20.50 | 20.40 | 21.60 | 17.90 | 20.00 | 21.20 | 17.70 | 18.40 | 16.50 | 16.60 | 16.20 | 15.50 | 14.50 | 11.40 | 11.90 | 12.10 | 12.60 | 11.00 | 11.00 | 11.37 | NA | NA | NA | NA | NA | NA | NA | NA | NA | NA | NA | NA | NA | NA | NA | NA | NA | NA | NA | NA | NA | NA | NA | NA | NA | NA | NA | |
| Asia Pacific And Japan | 75.60 | 67.60 | 68.60 | 68.00 | 64.90 | 62.50 | 69.40 | 61.40 | 44.80 | 57.80 | 56.40 | 69.00 | 48.70 | 52.10 | 47.10 | 45.40 | 61.80 | 45.80 | 48.40 | 51.60 | 43.30 | 38.10 | 35.40 | 28.99 | 31.00 | 28.30 | 26.90 | 26.45 | NA | NA | NA | NA | NA | NA | NA | NA | NA | NA | NA | NA | NA | NA | NA | NA | NA | NA | NA | NA | NA | NA | NA | NA | NA | NA | NA | |
| E M E A Excluding United Kingdom | 120.50 | 116.20 | 115.50 | 105.40 | 109.30 | 105.20 | 98.10 | 89.50 | 87.80 | 84.40 | 85.90 | 69.80 | 68.00 | 60.60 | 59.80 | 63.00 | 67.50 | 51.50 | 49.20 | 48.30 | 48.90 | 33.70 | 35.00 | 27.80 | NA | NA | NA | NA | NA | NA | NA | NA | NA | NA | NA | NA | NA | NA | NA | NA | NA | NA | NA | NA | NA | NA | NA | NA | NA | NA | NA | NA | NA | NA | NA |