
| 2023-12-31 | 2023-09-30 | 2023-06-30 | 2023-03-31 | 2022-12-31 | 2022-09-30 | 2022-06-30 | 2022-03-31 | 2021-12-31 | 2021-09-30 | 2021-06-30 | 2021-03-31 | 2020-12-31 | 2020-09-30 | 2020-06-30 | 2020-03-31 | 2019-12-31 | 2019-09-30 | 2019-06-30 | 2019-03-31 | 2018-12-31 | 2018-09-30 | 2018-06-30 | 2018-03-31 | 2017-12-31 | 2017-09-30 | 2017-06-30 | 2017-03-31 | 2016-12-31 | 2016-09-30 | 2016-06-30 | 2016-03-31 | 2015-12-31 | 2015-09-30 | 2015-06-30 | 2015-03-31 | 2014-12-31 | 2014-09-30 | 2014-06-30 | 2014-03-31 | 2013-12-31 | 2013-09-30 | 2013-06-30 | 2013-03-31 | 2012-12-31 | 2012-09-30 | 2012-06-30 | 2012-03-31 | 2011-12-31 | 2011-09-30 | 2011-06-30 | 2011-03-31 | 2010-12-31 | 2010-09-30 | 2010-06-30 | 2010-03-31 | ||
|---|---|---|---|---|---|---|---|---|---|---|---|---|---|---|---|---|---|---|---|---|---|---|---|---|---|---|---|---|---|---|---|---|---|---|---|---|---|---|---|---|---|---|---|---|---|---|---|---|---|---|---|---|---|---|---|---|---|
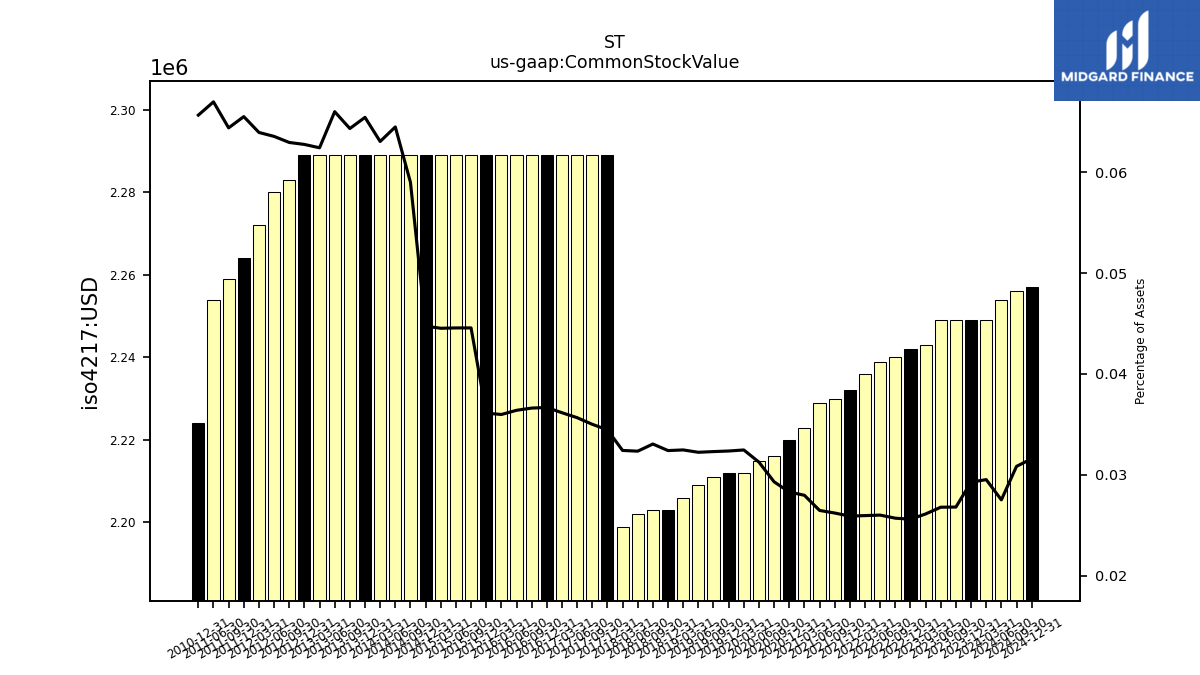
| Common Stock Value | 2.25 | 2.25 | 2.25 | 2.24 | 2.24 | 2.24 | 2.24 | 2.24 | 2.23 | 2.23 | 2.23 | 2.22 | 2.22 | 2.22 | 2.21 | 2.21 | 2.21 | 2.21 | 2.21 | 2.21 | 2.20 | 2.20 | 2.20 | 2.20 | 2.29 | 2.29 | 2.29 | 2.29 | 2.29 | 2.29 | 2.29 | 2.29 | 2.29 | 2.29 | 2.29 | 2.29 | 2.29 | 2.29 | 2.29 | 2.29 | 2.29 | 2.29 | 2.29 | 2.29 | 2.29 | 2.28 | 2.28 | 2.27 | 2.26 | 2.26 | 2.25 | NA | 2.22 | NA | NA | NA | |
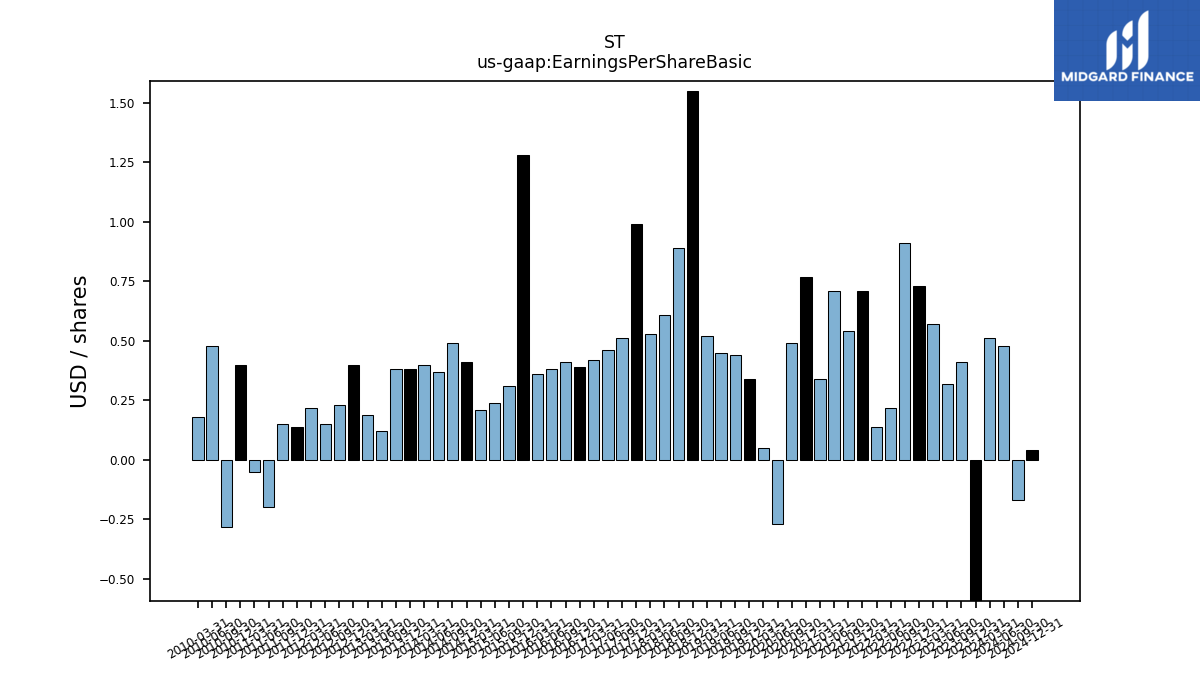
| Earnings Per Share Basic | -1.33 | 0.41 | 0.32 | 0.57 | 0.73 | 0.91 | 0.22 | 0.14 | 0.71 | 0.54 | 0.71 | 0.34 | 0.77 | 0.49 | -0.27 | 0.05 | 0.34 | 0.44 | 0.45 | 0.52 | 1.55 | 0.89 | 0.61 | 0.53 | 0.99 | 0.51 | 0.46 | 0.42 | 0.39 | 0.41 | 0.38 | 0.36 | 1.28 | 0.31 | 0.24 | 0.21 | 0.41 | 0.49 | 0.37 | 0.40 | 0.38 | 0.38 | 0.12 | 0.19 | 0.40 | 0.23 | 0.15 | 0.22 | 0.14 | 0.15 | -0.20 | -0.05 | 0.40 | -0.28 | 0.48 | 0.18 | |
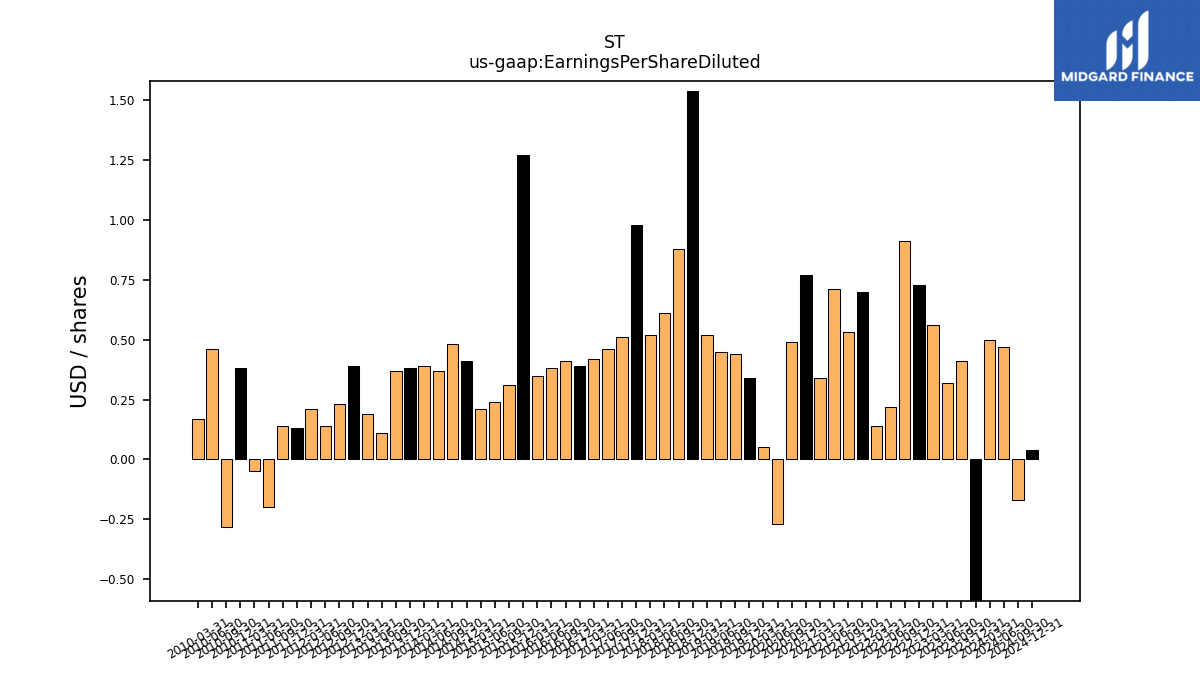
| Earnings Per Share Diluted | -1.33 | 0.41 | 0.32 | 0.56 | 0.73 | 0.91 | 0.22 | 0.14 | 0.70 | 0.53 | 0.71 | 0.34 | 0.77 | 0.49 | -0.27 | 0.05 | 0.34 | 0.44 | 0.45 | 0.52 | 1.54 | 0.88 | 0.61 | 0.52 | 0.98 | 0.51 | 0.46 | 0.42 | 0.39 | 0.41 | 0.38 | 0.35 | 1.27 | 0.31 | 0.24 | 0.21 | 0.41 | 0.48 | 0.37 | 0.39 | 0.38 | 0.37 | 0.11 | 0.19 | 0.39 | 0.23 | 0.14 | 0.21 | 0.13 | 0.14 | -0.20 | -0.05 | 0.38 | -0.28 | 0.46 | 0.17 |
| 2023-12-31 | 2023-09-30 | 2023-06-30 | 2023-03-31 | 2022-12-31 | 2022-09-30 | 2022-06-30 | 2022-03-31 | 2021-12-31 | 2021-09-30 | 2021-06-30 | 2021-03-31 | 2020-12-31 | 2020-09-30 | 2020-06-30 | 2020-03-31 | 2019-12-31 | 2019-09-30 | 2019-06-30 | 2019-03-31 | 2018-12-31 | 2018-09-30 | 2018-06-30 | 2018-03-31 | 2017-12-31 | 2017-09-30 | 2017-06-30 | 2017-03-31 | 2016-12-31 | 2016-09-30 | 2016-06-30 | 2016-03-31 | 2015-12-31 | 2015-09-30 | 2015-06-30 | 2015-03-31 | 2014-12-31 | 2014-09-30 | 2014-06-30 | 2014-03-31 | 2013-12-31 | 2013-09-30 | 2013-06-30 | 2013-03-31 | 2012-12-31 | 2012-09-30 | 2012-06-30 | 2012-03-31 | 2011-12-31 | 2011-09-30 | 2011-06-30 | 2011-03-31 | 2010-12-31 | 2010-09-30 | 2010-06-30 | 2010-03-31 | ||
|---|---|---|---|---|---|---|---|---|---|---|---|---|---|---|---|---|---|---|---|---|---|---|---|---|---|---|---|---|---|---|---|---|---|---|---|---|---|---|---|---|---|---|---|---|---|---|---|---|---|---|---|---|---|---|---|---|---|
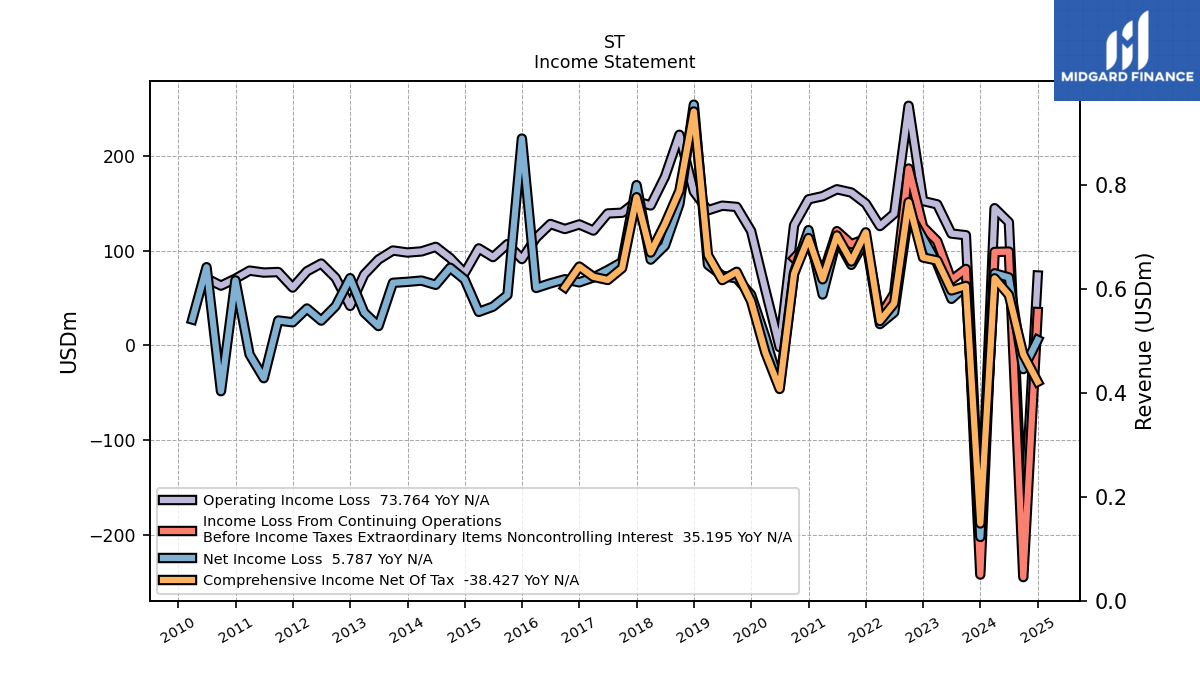
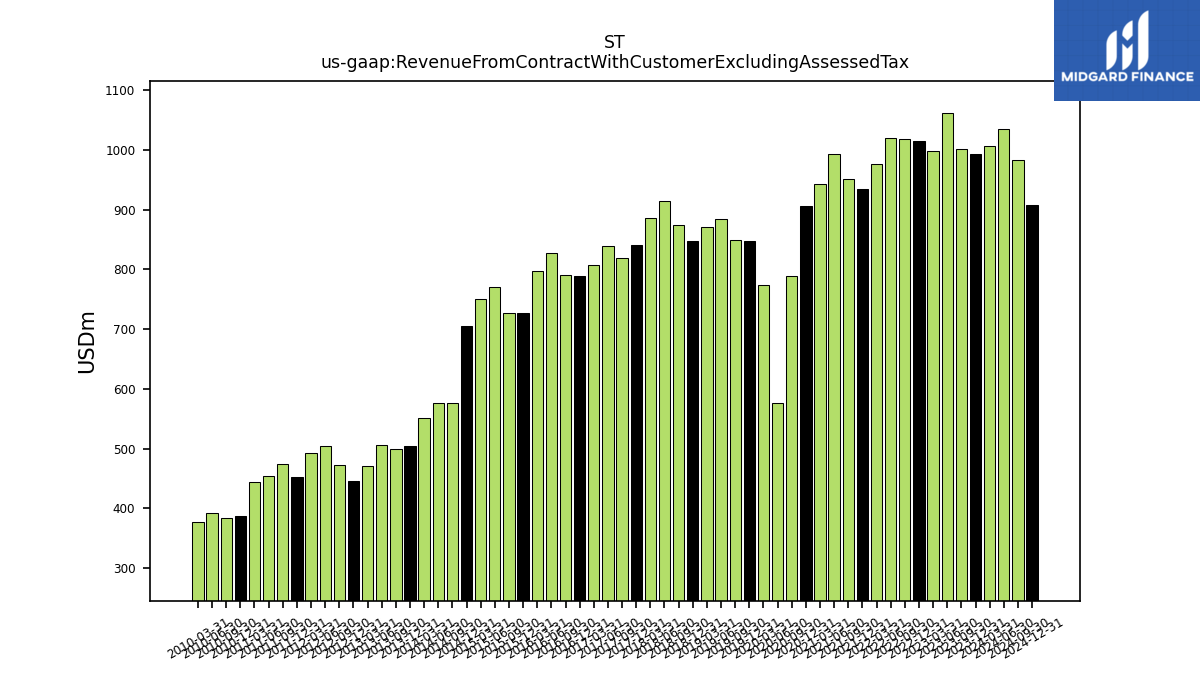
| Revenue From Contract With Customer Excluding Assessed Tax | 992.49 | 1001.30 | 1062.11 | 998.17 | 1014.68 | 1018.27 | 1020.55 | 975.77 | 934.60 | 951.02 | 992.66 | 942.53 | 906.49 | 788.31 | 576.50 | 774.27 | 846.69 | 849.72 | 883.73 | 870.50 | 847.92 | 873.55 | 913.86 | 886.29 | 840.53 | 819.05 | 839.87 | 807.27 | 788.40 | 789.80 | 827.54 | 796.55 | 726.47 | 727.36 | 770.45 | 750.68 | 705.26 | 577.10 | 575.85 | 551.59 | 505.01 | 498.89 | 506.42 | 470.41 | 445.36 | 471.93 | 504.62 | 492.01 | 453.37 | 474.31 | 455.04 | 444.23 | 387.84 | 383.29 | 391.81 | 377.14 | |
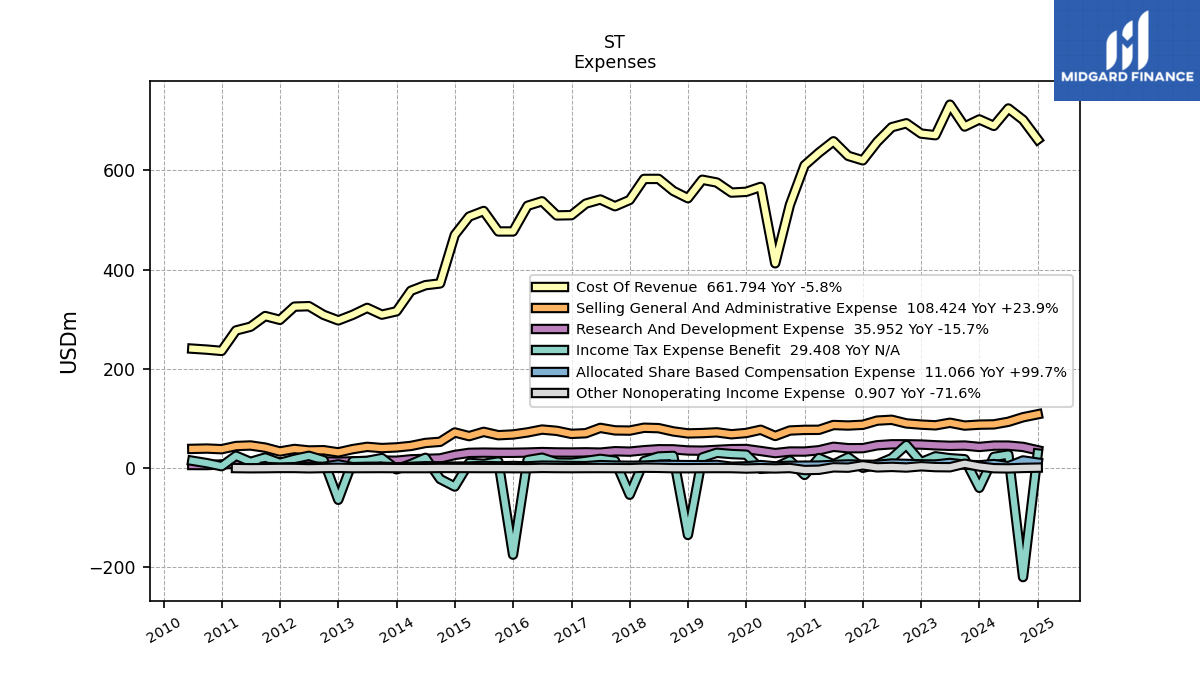
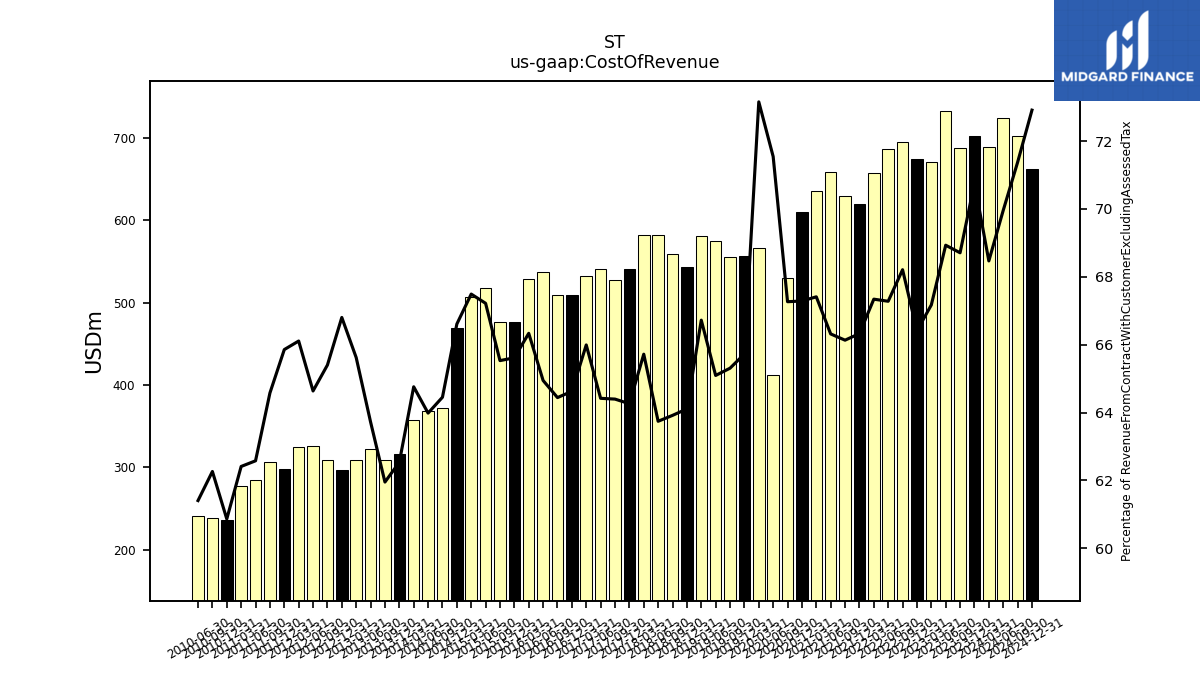
| Cost Of Revenue | 702.29 | 687.96 | 732.11 | 670.47 | 673.83 | 694.53 | 686.60 | 657.08 | 619.88 | 628.92 | 658.28 | 635.35 | 609.94 | 530.25 | 412.44 | 566.41 | 556.48 | 554.91 | 575.24 | 580.81 | 543.56 | 558.33 | 582.51 | 582.46 | 540.12 | 527.43 | 541.03 | 532.73 | 509.50 | 508.94 | 537.44 | 528.38 | 476.66 | 476.63 | 517.88 | 506.63 | 469.75 | 371.94 | 368.45 | 357.20 | 315.81 | 309.06 | 322.70 | 308.68 | 297.50 | 308.64 | 326.16 | 325.25 | 298.56 | 306.29 | 284.75 | 277.25 | 236.05 | 238.65 | 240.59 | NA | |
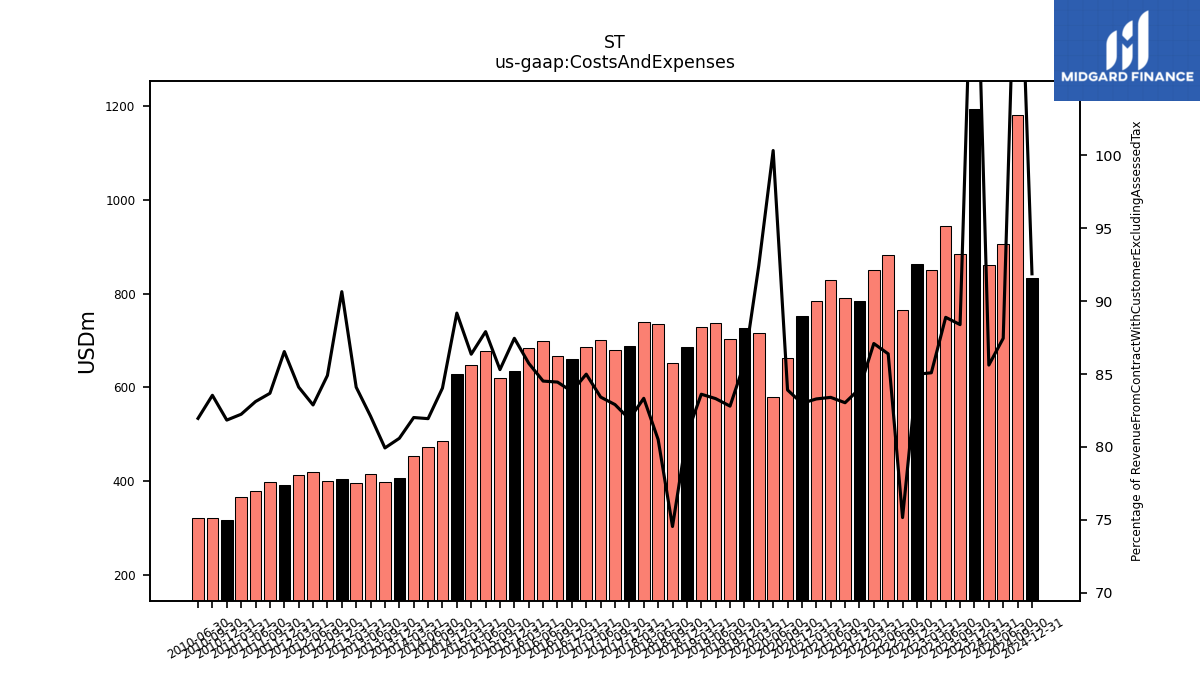
| Costs And Expenses | 1193.93 | 885.04 | 944.10 | 849.33 | 862.31 | 765.37 | 881.61 | 849.84 | 784.90 | 789.68 | 827.90 | 785.07 | 752.33 | 661.47 | 578.37 | 715.67 | 725.97 | 703.58 | 736.29 | 727.90 | 685.56 | 651.23 | 735.80 | 738.62 | 688.52 | 679.05 | 700.65 | 686.12 | 660.75 | 666.99 | 699.43 | 682.96 | 635.31 | 620.48 | 677.29 | 648.29 | 628.94 | 484.98 | 471.88 | 452.42 | 407.02 | 398.79 | 415.83 | 395.61 | 403.71 | 400.69 | 418.24 | 413.81 | 392.35 | 396.90 | 378.21 | 365.36 | 317.43 | 320.22 | 321.13 | NA | |
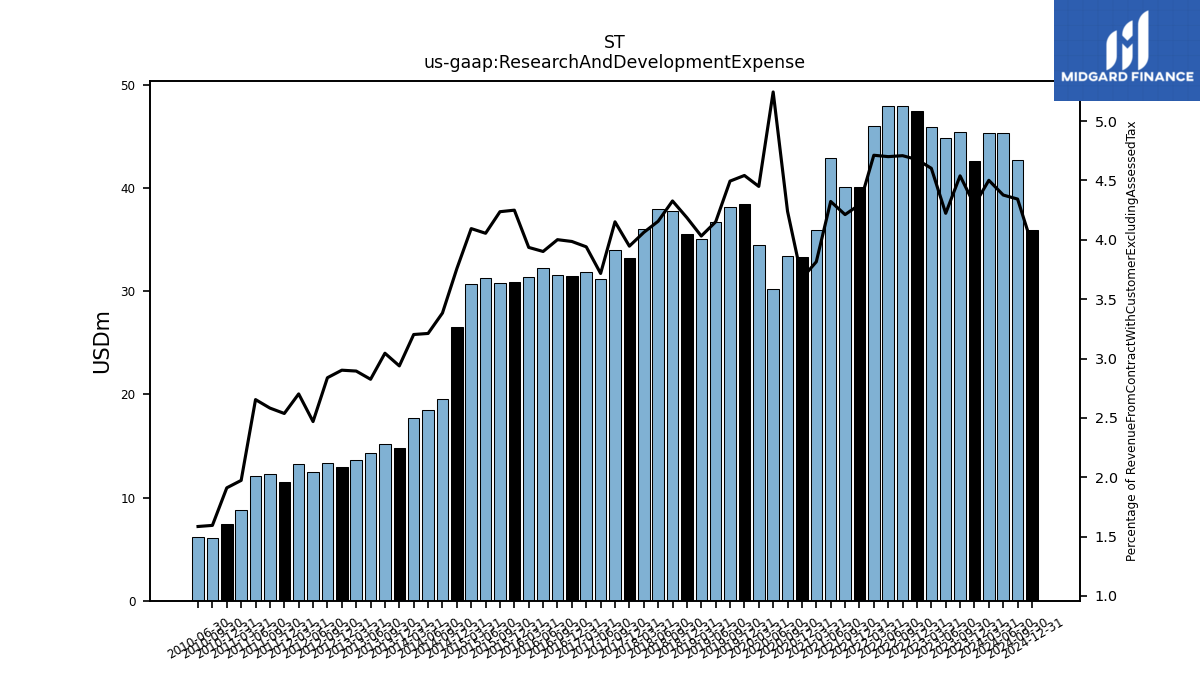
| Research And Development Expense | 42.62 | 45.45 | 44.86 | 45.94 | 47.45 | 47.95 | 47.97 | 45.98 | 40.14 | 40.06 | 42.91 | 35.96 | 33.31 | 33.42 | 30.24 | 34.45 | 38.45 | 38.19 | 36.69 | 35.10 | 35.50 | 37.80 | 37.98 | 36.00 | 33.17 | 34.00 | 31.22 | 31.81 | 31.43 | 31.60 | 32.29 | 31.35 | 30.87 | 30.82 | 31.24 | 30.74 | 26.50 | 19.52 | 18.49 | 17.66 | 14.84 | 15.19 | 14.31 | 13.62 | 12.92 | 13.39 | 12.46 | 13.29 | 11.50 | 12.25 | 12.08 | 8.77 | 7.41 | 6.11 | 6.21 | NA | |
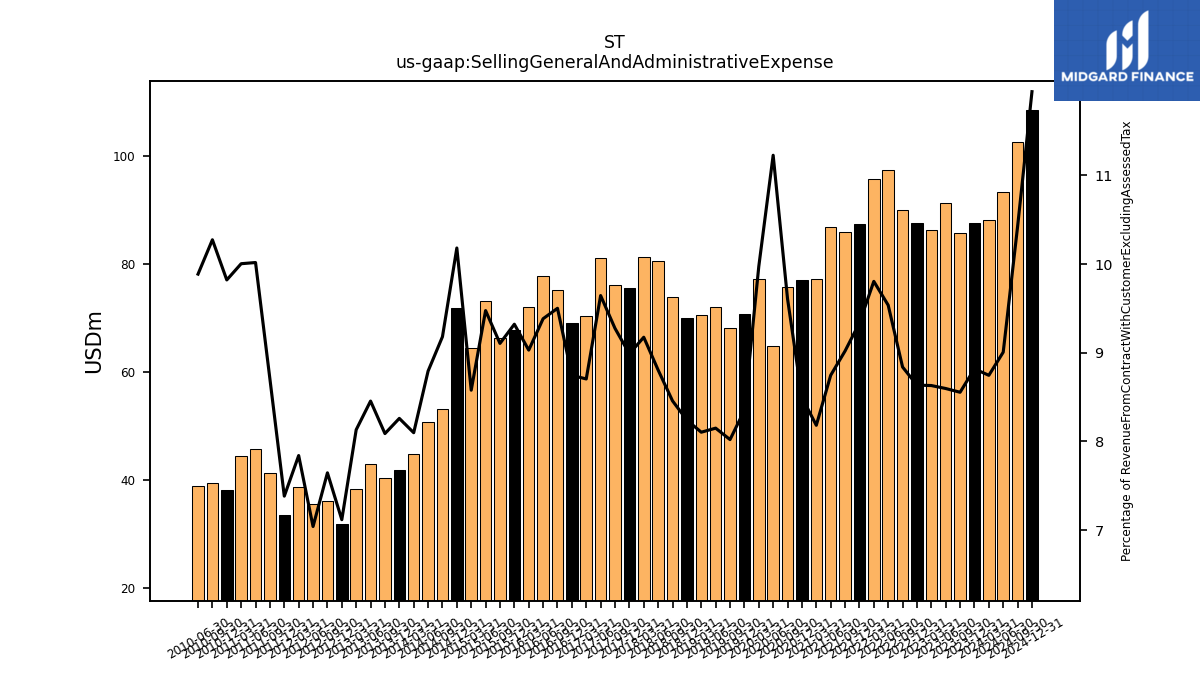
| Selling General And Administrative Expense | 87.53 | 85.66 | 91.31 | 86.15 | 87.62 | 90.01 | 97.33 | 95.68 | 87.26 | 85.78 | 86.82 | 77.12 | 77.03 | 75.75 | 64.73 | 77.22 | 70.71 | 68.16 | 72.03 | 70.55 | 69.88 | 73.89 | 80.47 | 81.32 | 75.56 | 75.97 | 81.01 | 70.27 | 68.95 | 75.05 | 77.66 | 71.93 | 67.72 | 66.23 | 73.01 | 64.40 | 71.81 | 52.98 | 50.64 | 44.67 | 41.72 | 40.35 | 42.82 | 38.25 | 31.70 | 36.09 | 35.53 | 38.58 | 33.47 | 41.29 | 45.59 | 44.44 | 38.09 | 39.38 | 38.74 | NA | |
| Operating Income Loss | -201.44 | 116.26 | 118.01 | 148.84 | 152.37 | 252.90 | 138.94 | 125.93 | 149.69 | 161.34 | 164.75 | 157.45 | 154.16 | 126.84 | -1.87 | 58.60 | 120.72 | 146.13 | 147.44 | 142.60 | 162.36 | 222.32 | 178.06 | 147.68 | 152.01 | 140.00 | 139.22 | 121.15 | 127.65 | 122.81 | 128.12 | 113.59 | 91.16 | 106.88 | 93.16 | 102.39 | 76.32 | 92.12 | 103.98 | 99.18 | 97.99 | 100.10 | 90.59 | 74.80 | 41.65 | 71.24 | 86.38 | 78.20 | 61.02 | 77.41 | 76.83 | 78.87 | 70.42 | 63.07 | 70.68 | NA | |
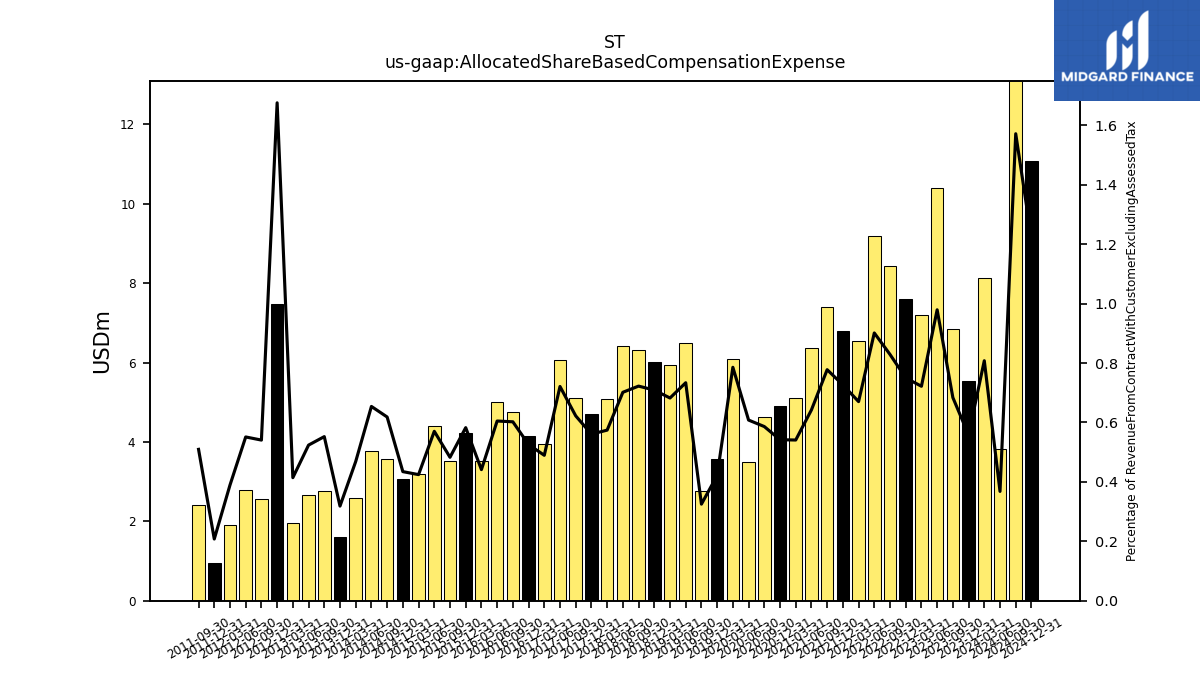
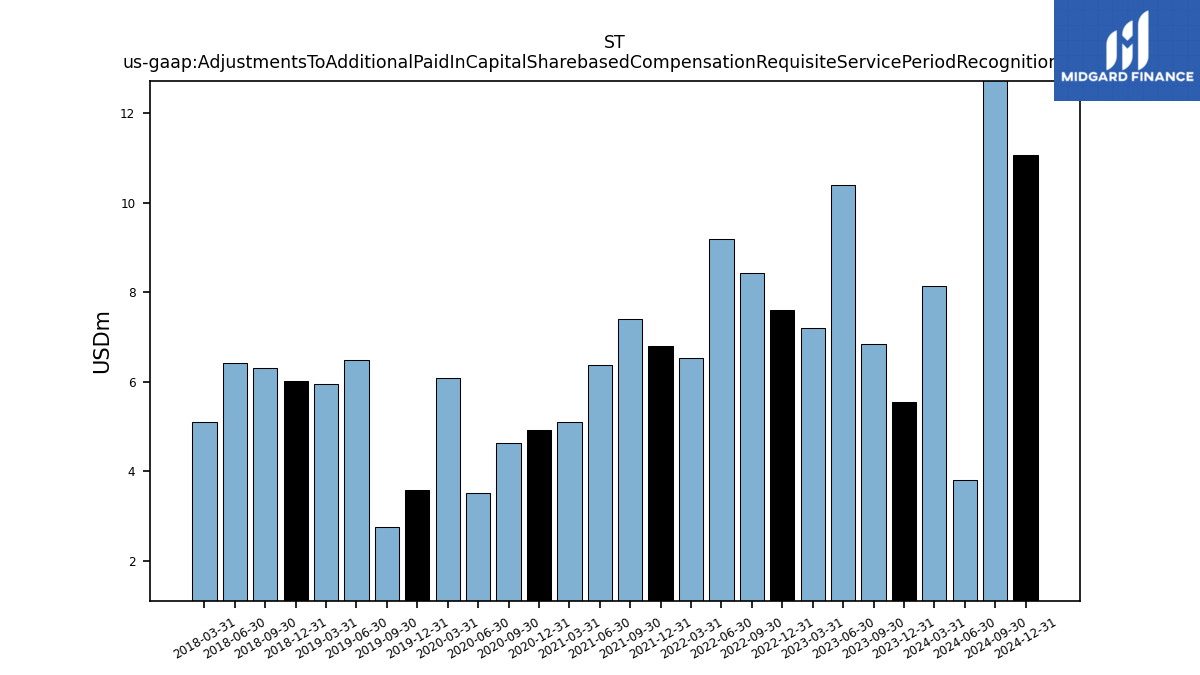
| Allocated Share Based Compensation Expense | 5.54 | 6.85 | 10.40 | 7.21 | 7.61 | 8.44 | 9.20 | 6.54 | 6.79 | 7.40 | 6.38 | 5.10 | 4.91 | 4.62 | 3.51 | 6.08 | 3.57 | 2.76 | 6.49 | 5.94 | 6.01 | 6.31 | 6.41 | 5.09 | 4.71 | 5.10 | 6.06 | 3.95 | 4.15 | 4.76 | 5.01 | 3.52 | 4.23 | 3.51 | 4.39 | 3.19 | 3.06 | 3.57 | 3.77 | 2.58 | 1.61 | 2.76 | 2.65 | 1.95 | 7.46 | 2.55 | 2.78 | 1.92 | 0.94 | 2.42 | NA | NA | NA | NA | NA | NA | |
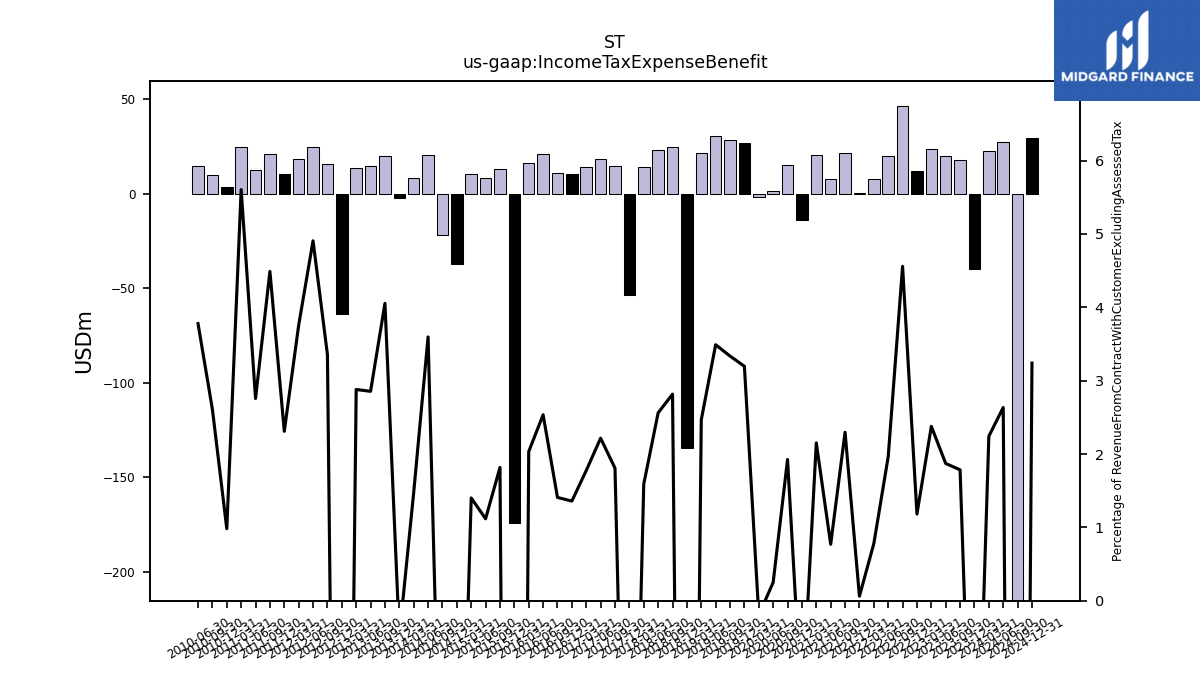
| Income Tax Expense Benefit | -39.72 | 17.87 | 19.87 | 23.73 | 11.99 | 46.42 | 20.02 | 7.59 | 0.58 | 21.84 | 7.64 | 20.28 | -13.75 | 15.18 | 1.44 | -1.52 | 27.06 | 28.34 | 30.84 | 21.47 | -134.71 | 24.60 | 23.40 | 14.10 | -53.67 | 14.80 | 18.61 | 14.33 | 10.71 | 11.12 | 20.98 | 16.20 | -174.41 | 13.21 | 8.61 | 10.52 | -37.19 | -21.98 | 20.71 | 8.14 | -2.41 | 20.22 | 14.46 | 13.55 | -63.90 | 15.84 | 24.76 | 18.48 | 10.47 | 21.29 | 12.54 | 24.89 | 3.81 | 10.00 | 14.80 | NA | |
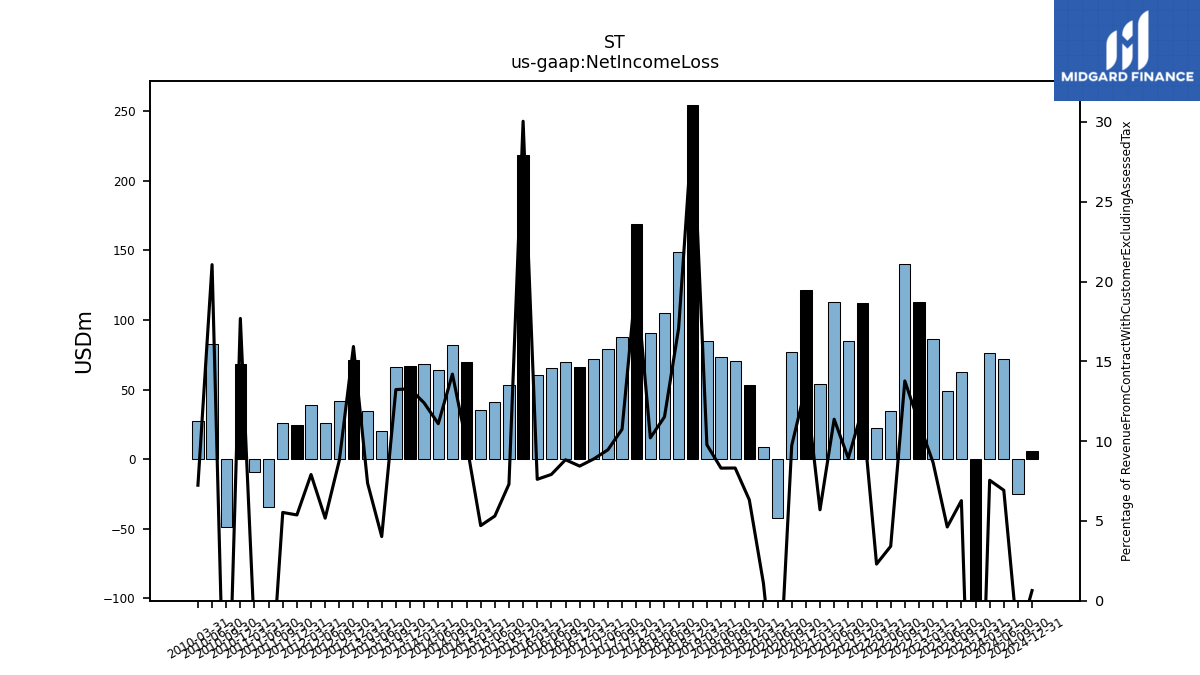
| Net Income Loss | -202.24 | 62.80 | 49.11 | 86.42 | 113.15 | 140.25 | 34.84 | 22.44 | 111.97 | 84.96 | 112.92 | 53.73 | 121.67 | 76.73 | -42.54 | 8.43 | 53.54 | 70.67 | 73.44 | 85.06 | 254.10 | 149.12 | 105.29 | 90.49 | 169.13 | 88.03 | 79.46 | 71.74 | 66.53 | 69.78 | 65.51 | 60.61 | 218.29 | 53.15 | 40.90 | 35.35 | 69.52 | 81.96 | 63.89 | 68.37 | 67.07 | 66.02 | 20.37 | 34.66 | 70.94 | 41.51 | 26.12 | 38.92 | 24.38 | 26.25 | -34.63 | -9.53 | 68.61 | -48.39 | 82.52 | 27.31 | |
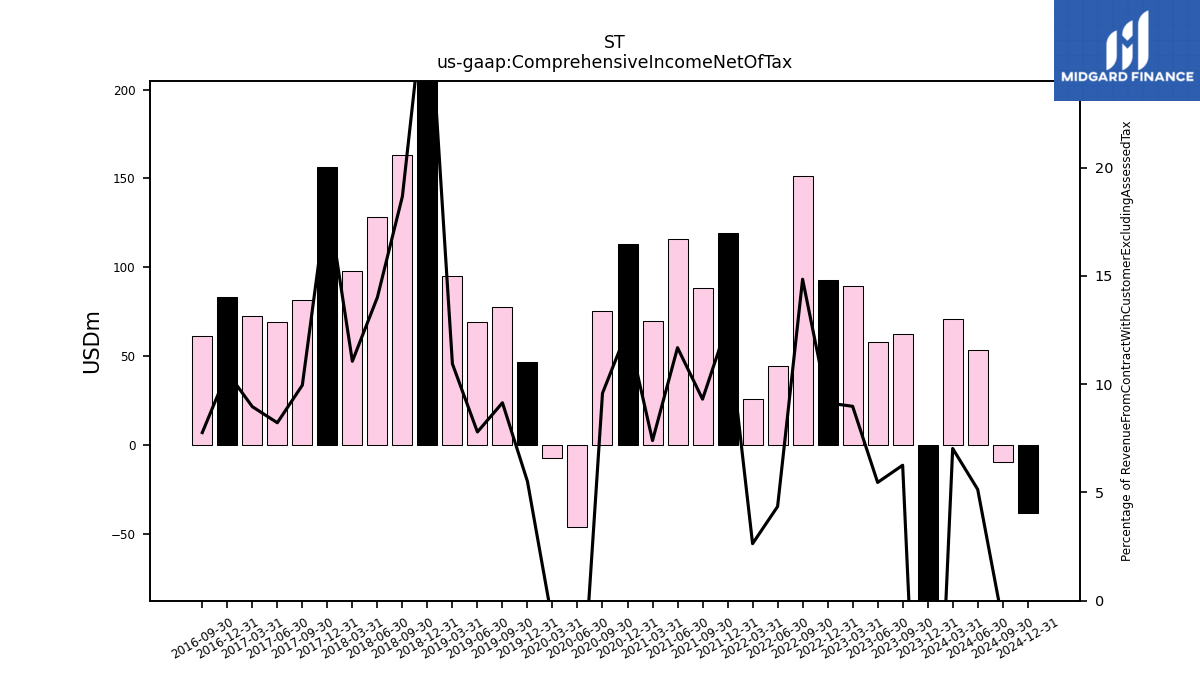
| Comprehensive Income Net Of Tax | -187.97 | 62.65 | 58.02 | 89.62 | 92.70 | 151.16 | 44.40 | 25.72 | 119.32 | 88.53 | 115.99 | 69.72 | 113.28 | 75.55 | -46.04 | -7.56 | 46.65 | 77.67 | 68.87 | 95.21 | 246.88 | 163.07 | 128.02 | 98.01 | 156.36 | 81.53 | 69.02 | 72.35 | 83.17 | 61.32 | NA | NA | NA | NA | NA | NA | NA | NA | NA | NA | NA | NA | NA | NA | NA | NA | NA | NA | NA | NA | NA | NA | NA | NA | NA | NA |
| 2023-12-31 | 2023-09-30 | 2023-06-30 | 2023-03-31 | 2022-12-31 | 2022-09-30 | 2022-06-30 | 2022-03-31 | 2021-12-31 | 2021-09-30 | 2021-06-30 | 2021-03-31 | 2020-12-31 | 2020-09-30 | 2020-06-30 | 2020-03-31 | 2019-12-31 | 2019-09-30 | 2019-06-30 | 2019-03-31 | 2018-12-31 | 2018-09-30 | 2018-06-30 | 2018-03-31 | 2017-12-31 | 2017-09-30 | 2017-06-30 | 2017-03-31 | 2016-12-31 | 2016-09-30 | 2016-06-30 | 2016-03-31 | 2015-12-31 | 2015-09-30 | 2015-06-30 | 2015-03-31 | 2014-12-31 | 2014-09-30 | 2014-06-30 | 2014-03-31 | 2013-12-31 | 2013-09-30 | 2013-06-30 | 2013-03-31 | 2012-12-31 | 2012-09-30 | 2012-06-30 | 2012-03-31 | 2011-12-31 | 2011-09-30 | 2011-06-30 | 2011-03-31 | 2010-12-31 | 2010-09-30 | 2010-06-30 | 2010-03-31 | ||
|---|---|---|---|---|---|---|---|---|---|---|---|---|---|---|---|---|---|---|---|---|---|---|---|---|---|---|---|---|---|---|---|---|---|---|---|---|---|---|---|---|---|---|---|---|---|---|---|---|---|---|---|---|---|---|---|---|---|
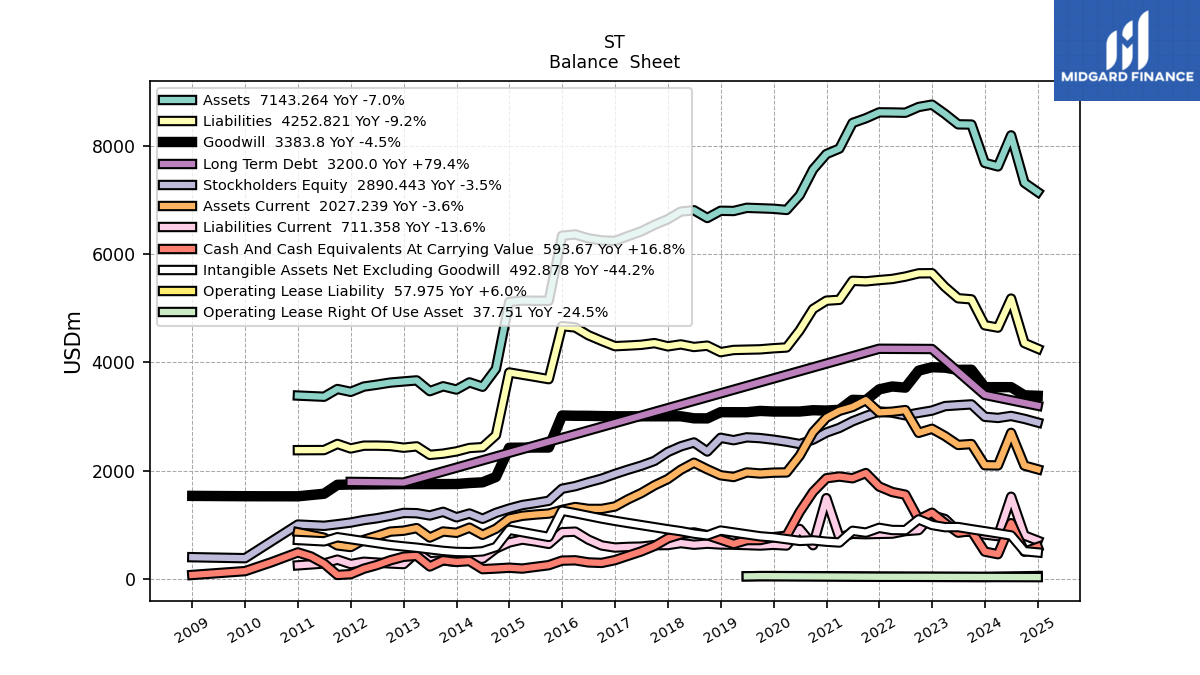
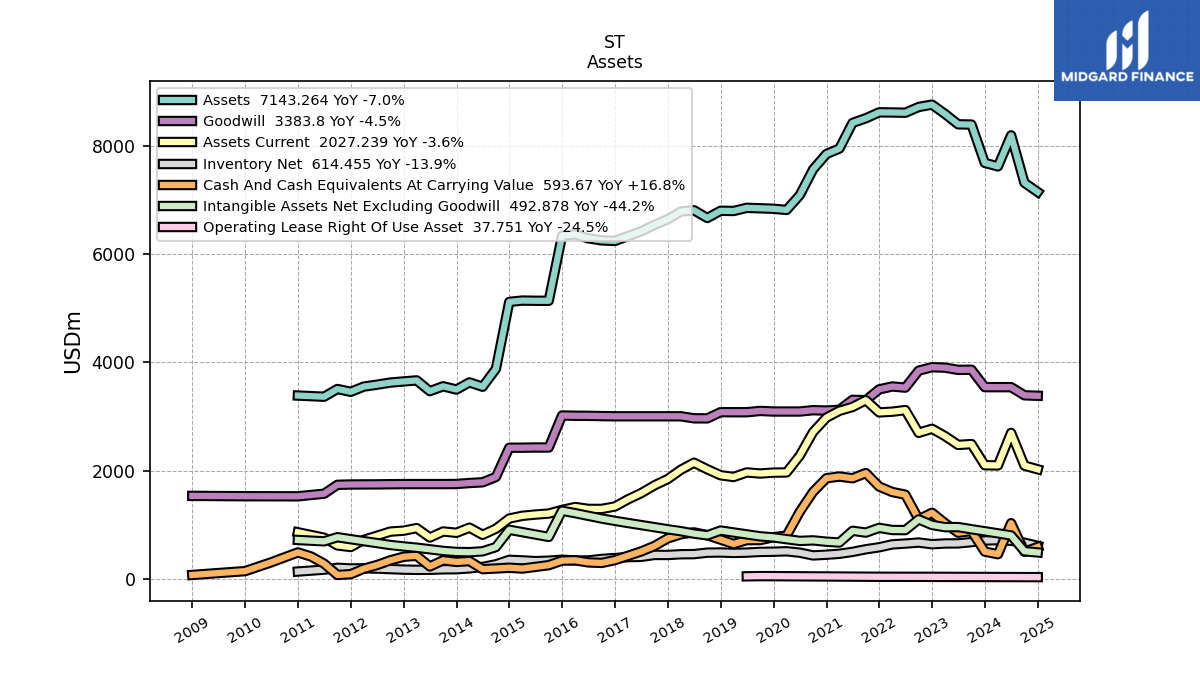
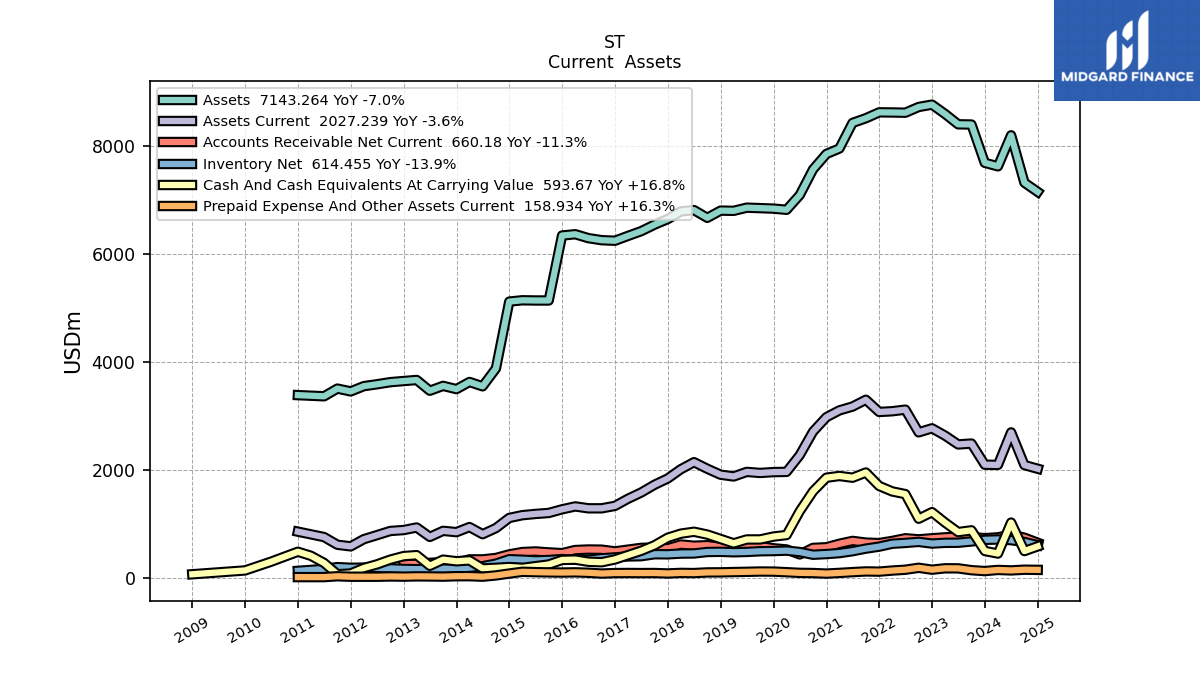
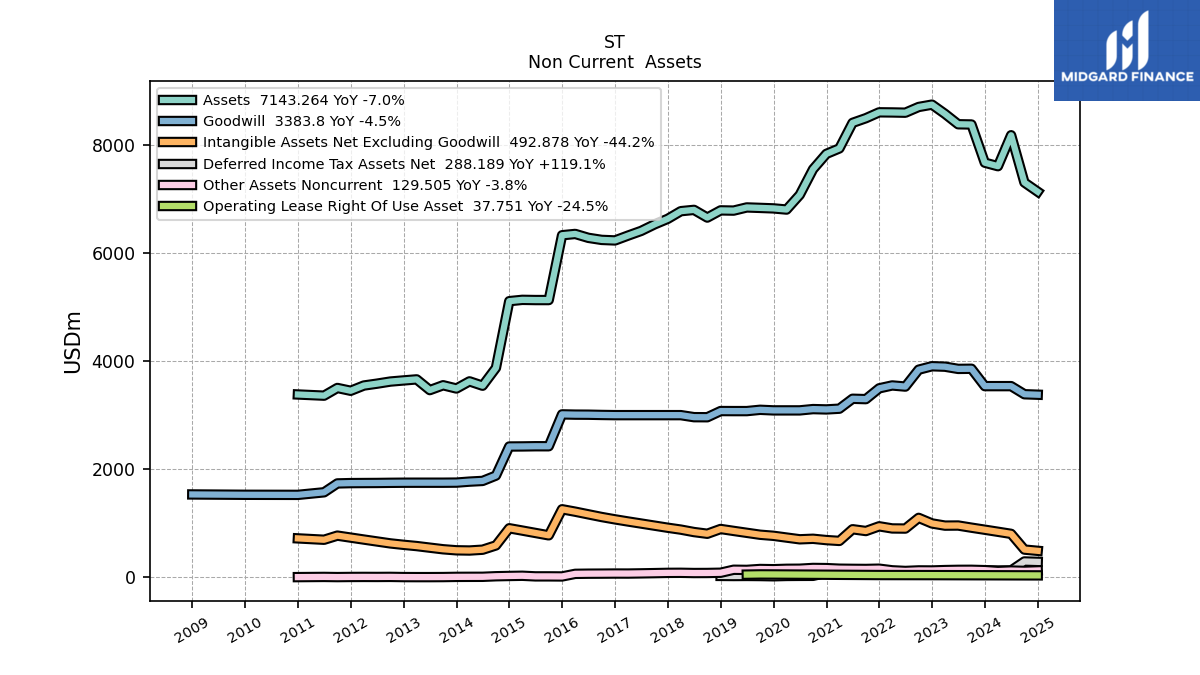
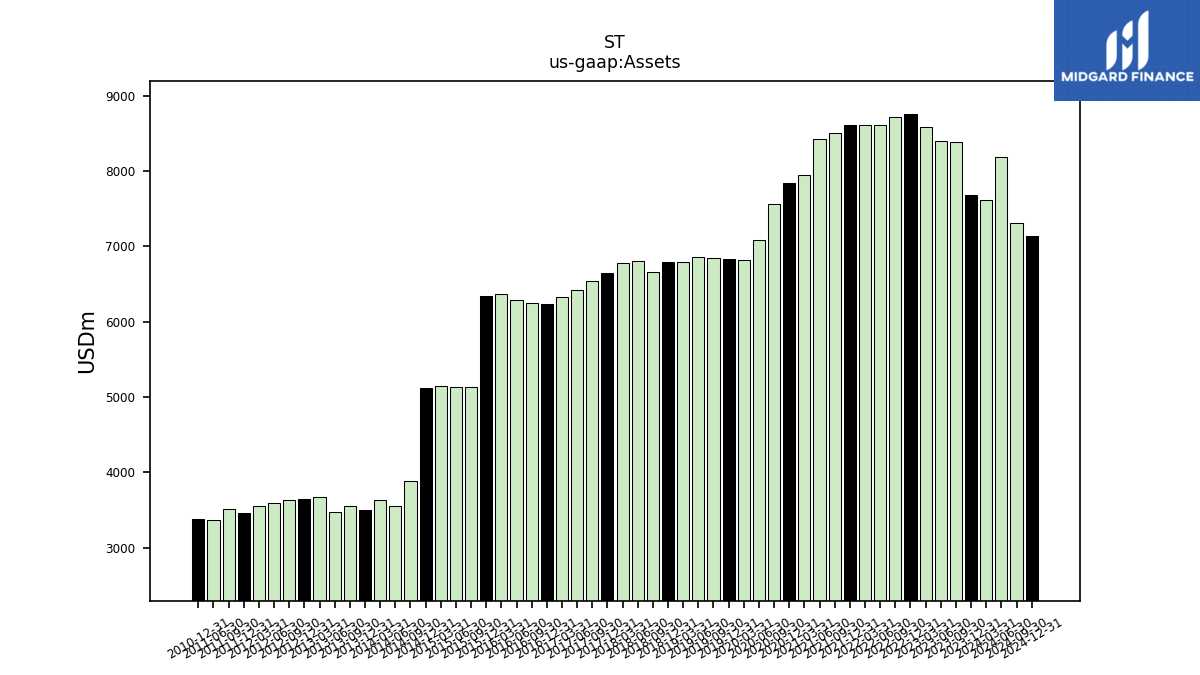
| Assets | 7680.99 | 8388.33 | 8392.60 | 8584.85 | 8756.22 | 8712.62 | 8606.68 | 8611.39 | 8613.77 | 8504.76 | 8418.36 | 7945.19 | 7844.20 | 7559.49 | 7084.89 | 6812.82 | 6834.52 | 6843.57 | 6852.12 | 6793.51 | 6797.69 | 6664.31 | 6806.94 | 6782.88 | 6641.52 | 6537.94 | 6417.62 | 6330.57 | 6240.98 | 6250.99 | 6288.92 | 6361.27 | 6337.26 | 5136.60 | 5136.98 | 5140.73 | 5116.61 | 3880.64 | 3550.22 | 3631.40 | 3498.82 | 3558.97 | 3469.04 | 3667.88 | 3648.39 | 3627.54 | 3588.54 | 3554.03 | 3456.65 | 3508.80 | 3366.33 | NA | 3388.00 | NA | NA | NA | |
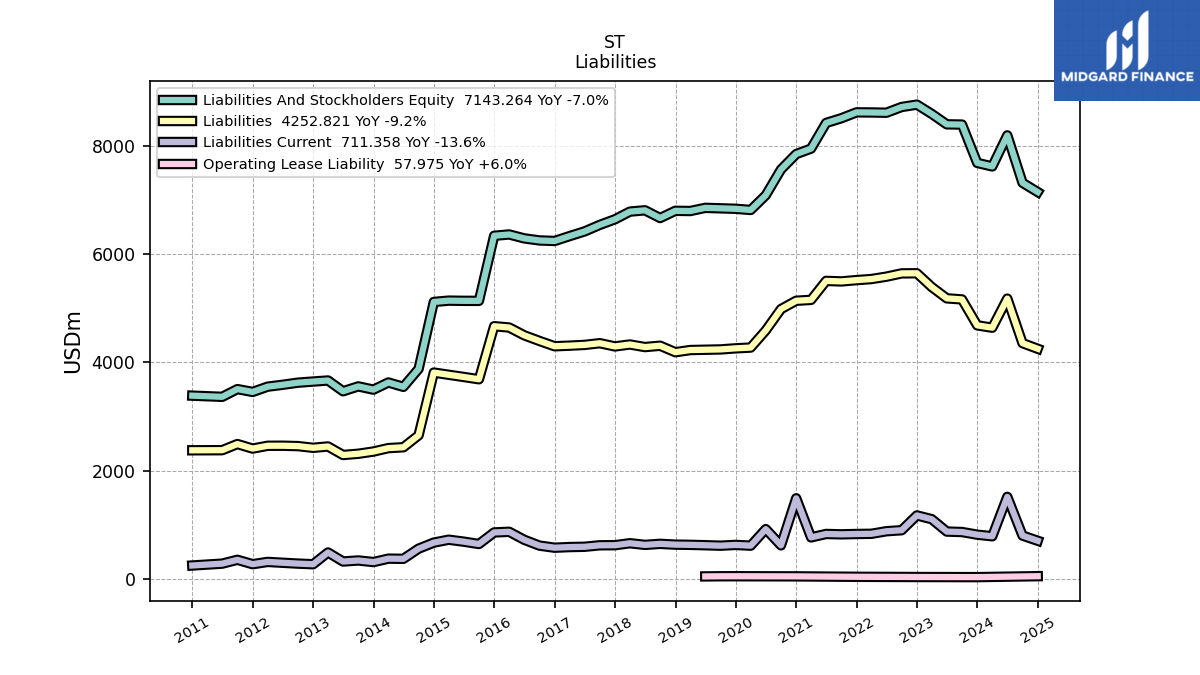
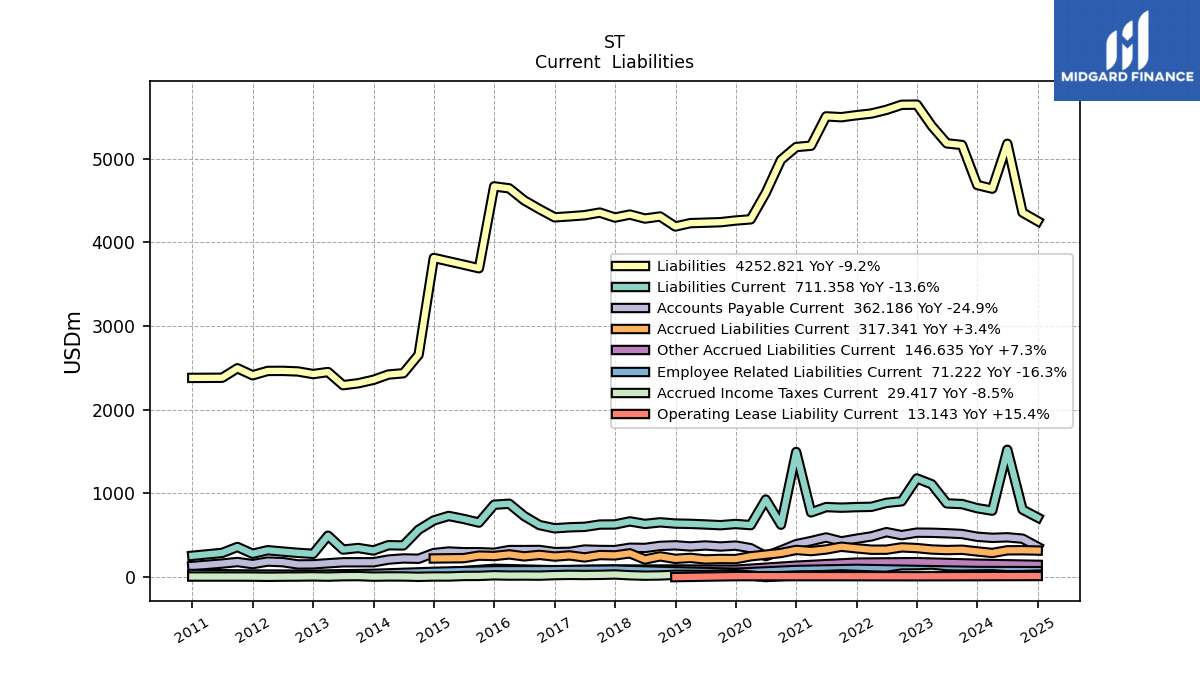
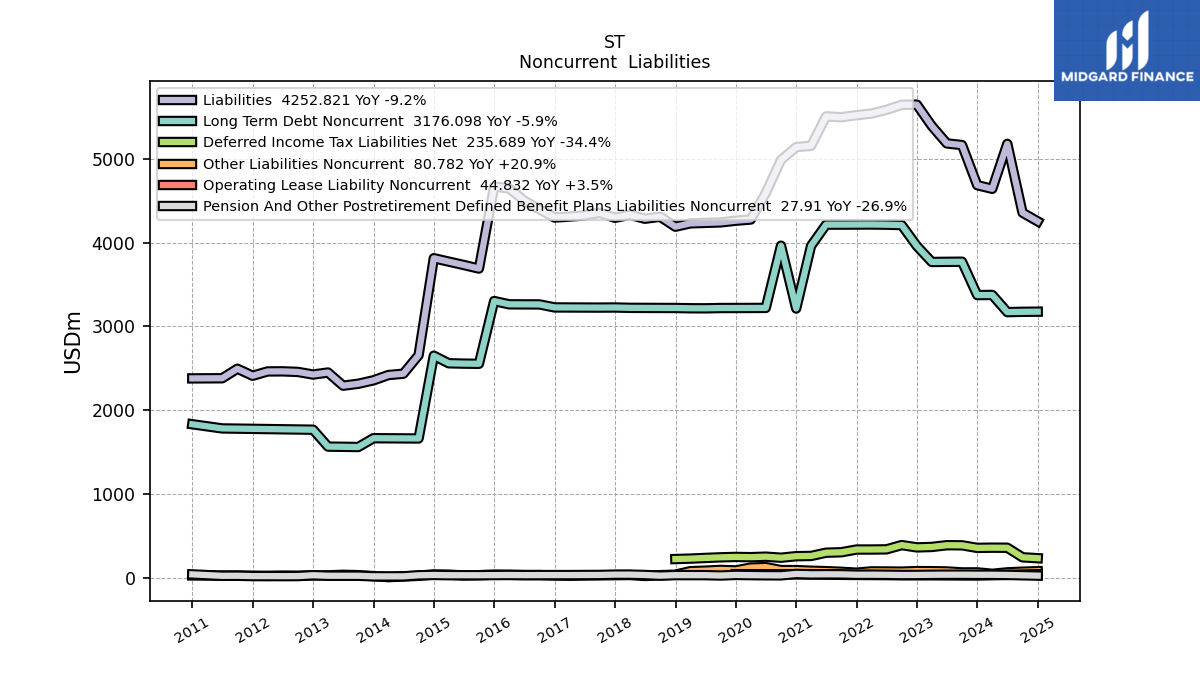
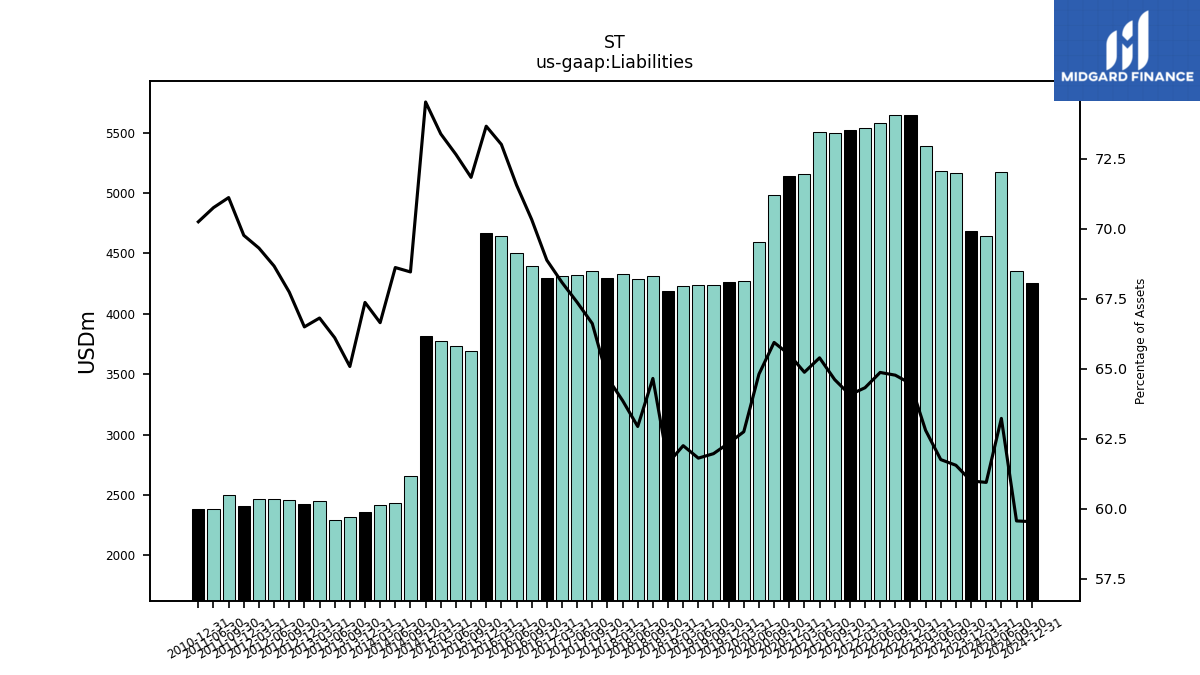
| Liabilities | 4684.71 | 5163.15 | 5182.83 | 5391.36 | 5645.41 | 5643.30 | 5583.09 | 5539.07 | 5519.03 | 5495.14 | 5504.91 | 5154.55 | 5138.72 | 4984.85 | 4591.48 | 4275.02 | 4260.76 | 4240.69 | 4235.05 | 4229.14 | 4189.25 | 4308.82 | 4284.13 | 4331.94 | 4295.90 | 4355.41 | 4324.01 | 4310.31 | 4298.97 | 4396.76 | 4500.96 | 4644.99 | 4668.68 | 3690.21 | 3732.65 | 3773.10 | 3813.72 | 2656.74 | 2436.11 | 2420.23 | 2357.24 | 2316.28 | 2293.41 | 2450.68 | 2426.10 | 2457.36 | 2464.32 | 2463.43 | 2411.70 | 2495.42 | 2382.01 | NA | 2380.22 | NA | NA | NA | |
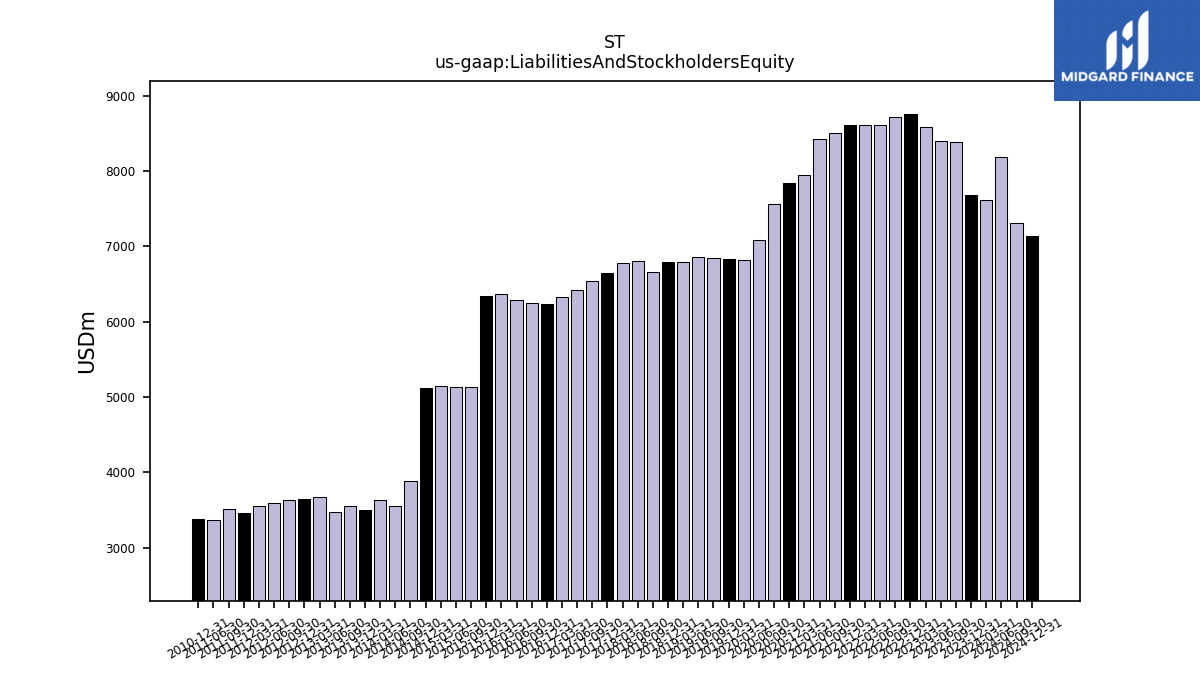
| Liabilities And Stockholders Equity | 7680.99 | 8388.33 | 8392.60 | 8584.85 | 8756.22 | 8712.62 | 8606.68 | 8611.39 | 8613.77 | 8504.76 | 8418.36 | 7945.19 | 7844.20 | 7559.49 | 7084.89 | 6812.82 | 6834.52 | 6843.57 | 6852.12 | 6793.51 | 6797.69 | 6664.31 | 6806.94 | 6782.88 | 6641.52 | 6537.94 | 6417.62 | 6330.57 | 6240.98 | 6250.99 | 6288.92 | 6361.27 | 6337.26 | 5136.60 | 5136.98 | 5140.73 | 5116.61 | 3880.64 | 3550.22 | 3631.40 | 3498.82 | 3558.97 | 3469.04 | 3667.88 | 3648.39 | 3627.54 | 3588.54 | 3554.03 | 3456.65 | 3508.80 | 3366.33 | NA | 3388.00 | NA | NA | NA | |
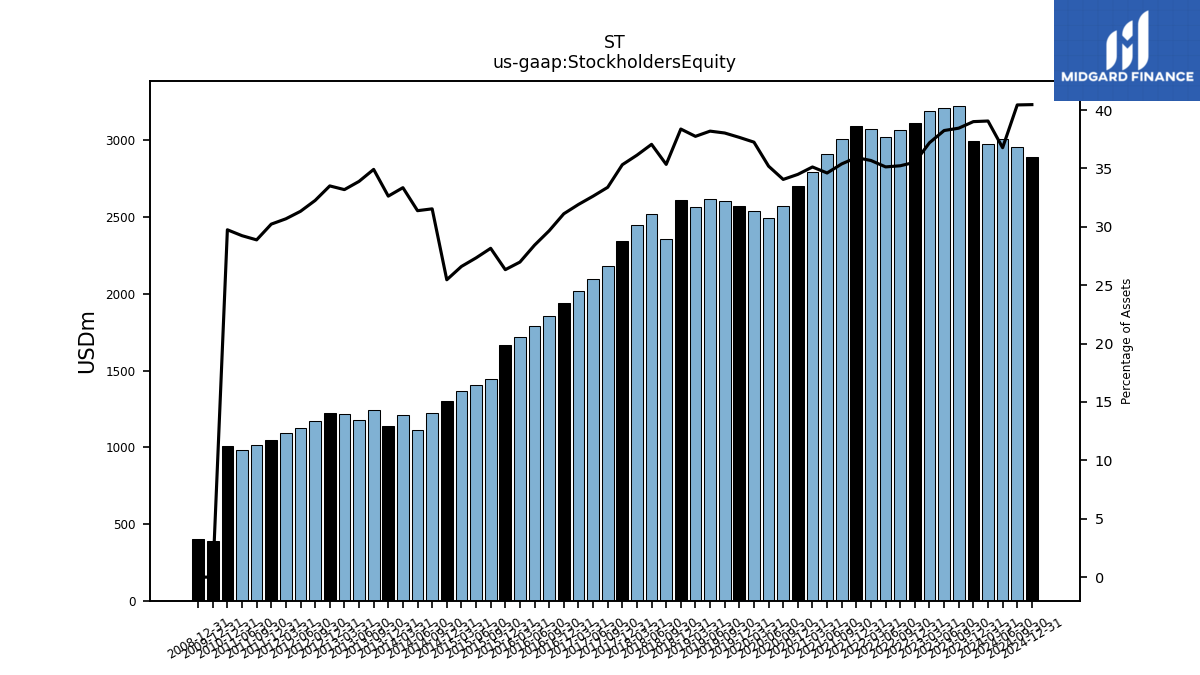
| Stockholders Equity | 2996.28 | 3225.18 | 3209.77 | 3193.49 | 3110.81 | 3069.32 | 3023.58 | 3072.32 | 3094.73 | 3009.62 | 2913.45 | 2790.64 | 2705.49 | 2574.64 | 2493.41 | 2537.80 | 2573.76 | 2602.89 | 2617.06 | 2564.37 | 2608.43 | 2355.50 | 2522.81 | 2450.94 | 2345.63 | 2182.53 | 2093.61 | 2020.26 | 1942.01 | 1854.24 | 1787.96 | 1716.29 | 1668.58 | 1446.40 | 1404.33 | 1367.63 | 1302.89 | 1223.90 | 1114.12 | 1211.17 | 1141.59 | 1242.69 | 1175.63 | 1217.20 | 1222.29 | 1170.18 | 1124.22 | 1090.60 | 1044.95 | 1013.38 | 984.33 | NA | 1007.78 | NA | NA | NA |
| 2023-12-31 | 2023-09-30 | 2023-06-30 | 2023-03-31 | 2022-12-31 | 2022-09-30 | 2022-06-30 | 2022-03-31 | 2021-12-31 | 2021-09-30 | 2021-06-30 | 2021-03-31 | 2020-12-31 | 2020-09-30 | 2020-06-30 | 2020-03-31 | 2019-12-31 | 2019-09-30 | 2019-06-30 | 2019-03-31 | 2018-12-31 | 2018-09-30 | 2018-06-30 | 2018-03-31 | 2017-12-31 | 2017-09-30 | 2017-06-30 | 2017-03-31 | 2016-12-31 | 2016-09-30 | 2016-06-30 | 2016-03-31 | 2015-12-31 | 2015-09-30 | 2015-06-30 | 2015-03-31 | 2014-12-31 | 2014-09-30 | 2014-06-30 | 2014-03-31 | 2013-12-31 | 2013-09-30 | 2013-06-30 | 2013-03-31 | 2012-12-31 | 2012-09-30 | 2012-06-30 | 2012-03-31 | 2011-12-31 | 2011-09-30 | 2011-06-30 | 2011-03-31 | 2010-12-31 | 2010-09-30 | 2010-06-30 | 2010-03-31 | ||
|---|---|---|---|---|---|---|---|---|---|---|---|---|---|---|---|---|---|---|---|---|---|---|---|---|---|---|---|---|---|---|---|---|---|---|---|---|---|---|---|---|---|---|---|---|---|---|---|---|---|---|---|---|---|---|---|---|---|
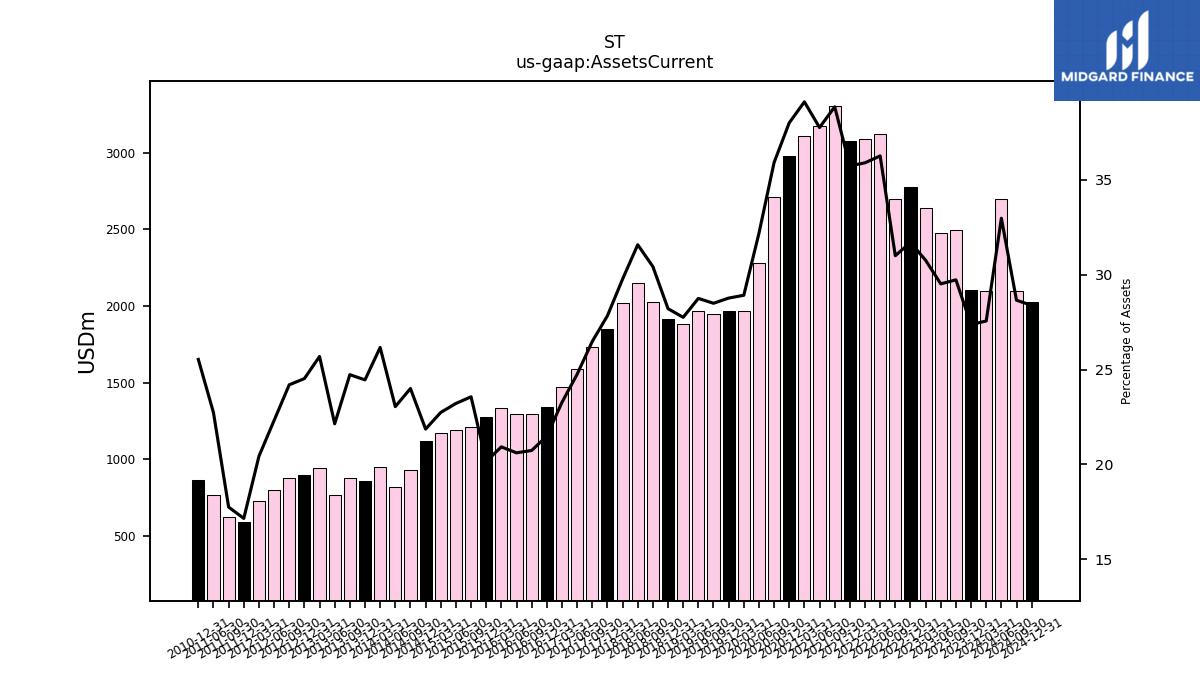
| Assets Current | 2102.40 | 2493.16 | 2476.63 | 2640.20 | 2775.04 | 2700.20 | 3119.73 | 3090.10 | 3076.99 | 3302.66 | 3177.13 | 3106.12 | 2979.97 | 2713.88 | 2279.16 | 1969.55 | 1965.65 | 1949.59 | 1969.58 | 1885.07 | 1917.15 | 2027.20 | 2148.92 | 2018.58 | 1848.29 | 1731.27 | 1588.21 | 1473.28 | 1341.48 | 1296.33 | 1296.32 | 1331.24 | 1277.92 | 1210.41 | 1192.47 | 1169.07 | 1118.76 | 931.33 | 818.19 | 950.05 | 855.63 | 880.09 | 768.17 | 942.20 | 894.68 | 877.72 | 800.87 | 726.29 | 593.17 | 623.06 | 765.08 | NA | 864.99 | NA | NA | NA | |
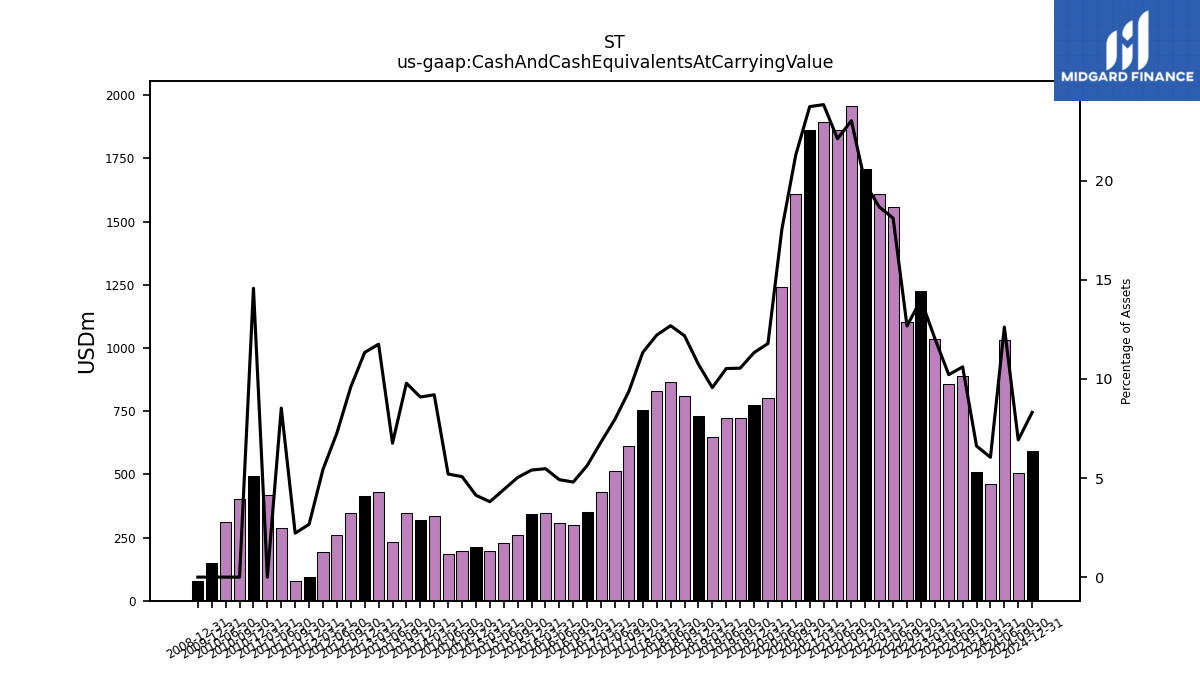
| Cash And Cash Equivalents At Carrying Value | 508.10 | 889.70 | 857.31 | 1034.13 | 1225.52 | 1103.92 | 1558.58 | 1608.48 | 1708.95 | 1958.14 | 1861.77 | 1893.93 | 1861.98 | 1610.19 | 1242.95 | 802.97 | 774.12 | 721.39 | 721.07 | 649.52 | 729.83 | 811.39 | 863.38 | 828.27 | 753.09 | 612.97 | 511.48 | 431.70 | 351.43 | 299.89 | 309.12 | 347.99 | 342.26 | 258.21 | 226.79 | 195.58 | 211.33 | 196.74 | 184.64 | 334.06 | 317.90 | 348.20 | 234.35 | 431.02 | 413.54 | 348.16 | 260.83 | 193.11 | 92.13 | 77.82 | 287.10 | 419.33 | 493.66 | 402.92 | 311.25 | NA | |
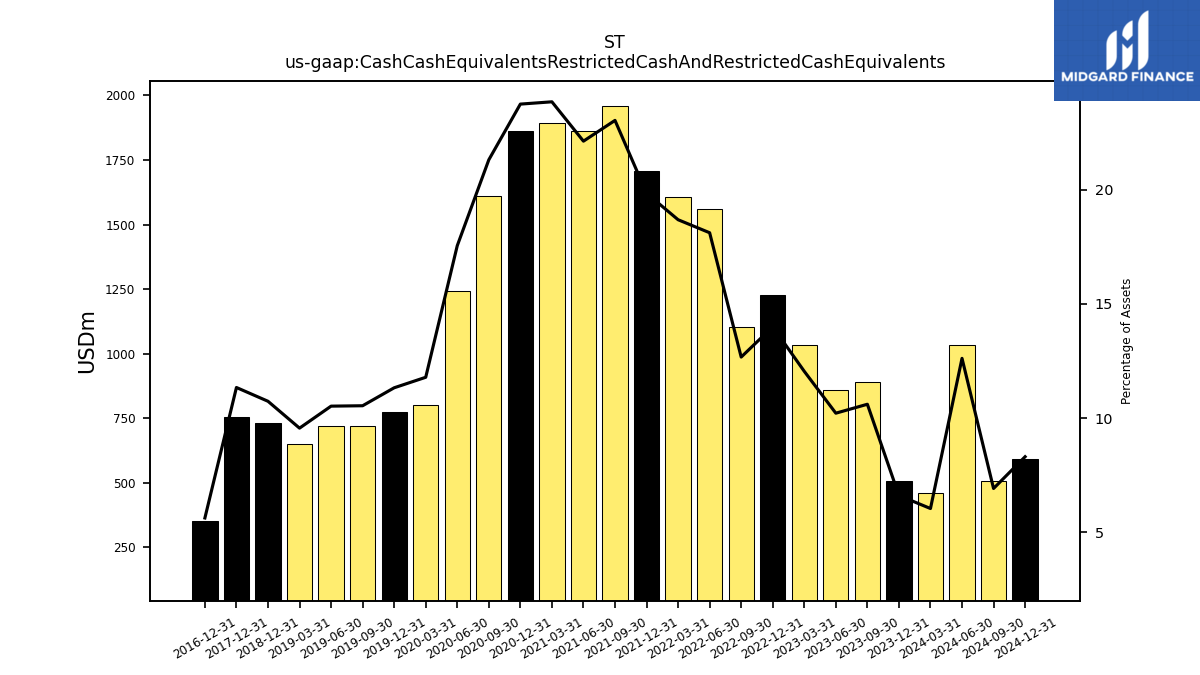
| Cash Cash Equivalents Restricted Cash And Restricted Cash Equivalents | 508.10 | 889.70 | 857.31 | 1034.13 | 1225.52 | 1103.92 | 1558.58 | 1608.48 | 1708.95 | 1958.14 | 1861.77 | 1893.93 | 1861.98 | 1610.19 | 1242.95 | 802.97 | 774.12 | 721.39 | 721.07 | 649.52 | 729.83 | NA | NA | NA | 753.09 | NA | NA | NA | 351.43 | NA | NA | NA | NA | NA | NA | NA | NA | NA | NA | NA | NA | NA | NA | NA | NA | NA | NA | NA | NA | NA | NA | NA | NA | NA | NA | NA | |
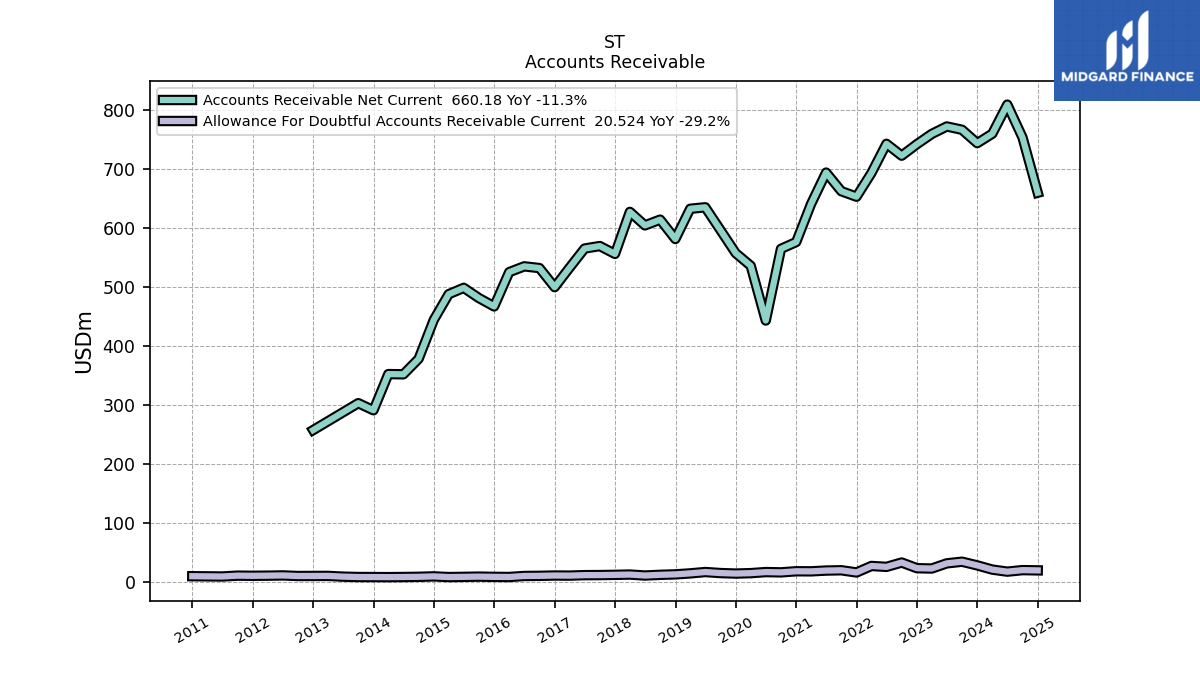
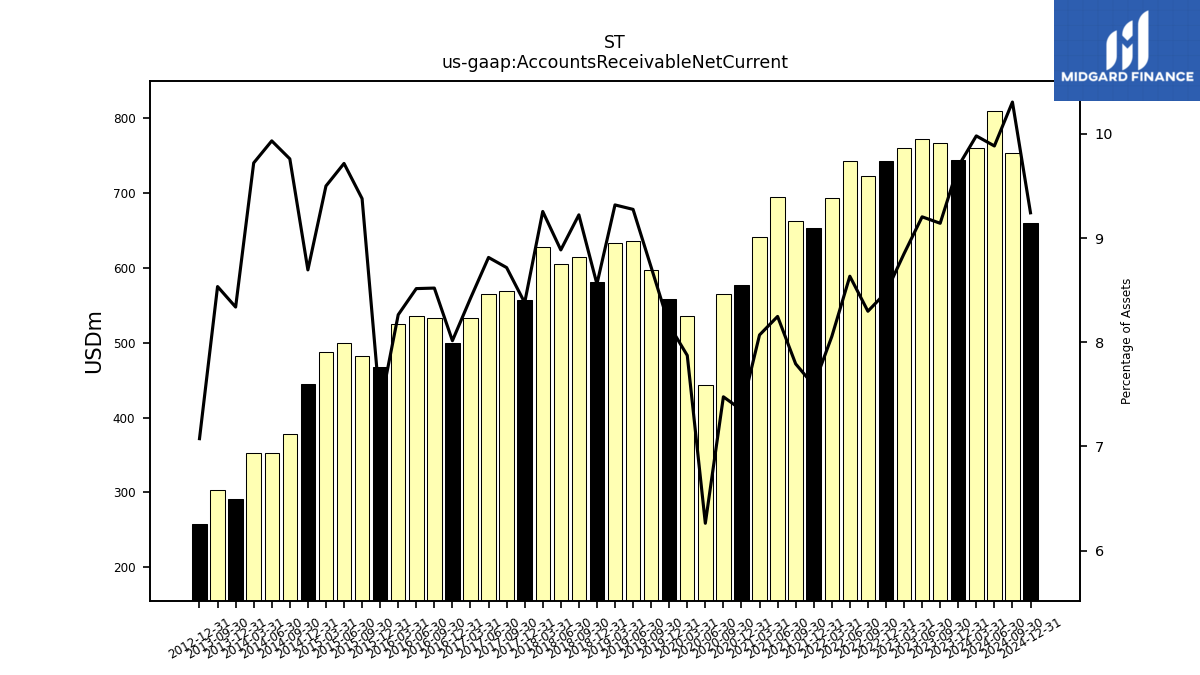
| Accounts Receivable Net Current | 744.13 | 766.84 | 772.43 | 759.75 | 742.38 | 722.93 | 743.05 | 693.57 | 653.44 | 662.75 | 694.32 | 641.16 | 576.65 | 565.18 | 443.71 | 536.42 | 557.87 | 596.81 | 635.54 | 633.01 | 581.77 | 614.62 | 604.86 | 627.75 | 556.54 | 569.88 | 565.64 | 533.13 | 500.21 | 532.57 | 535.49 | 525.68 | 467.57 | 481.74 | 499.10 | 488.33 | 444.85 | 378.75 | 352.62 | 353.00 | 291.72 | 303.74 | NA | NA | 258.11 | NA | NA | NA | NA | NA | NA | NA | NA | NA | NA | NA | |
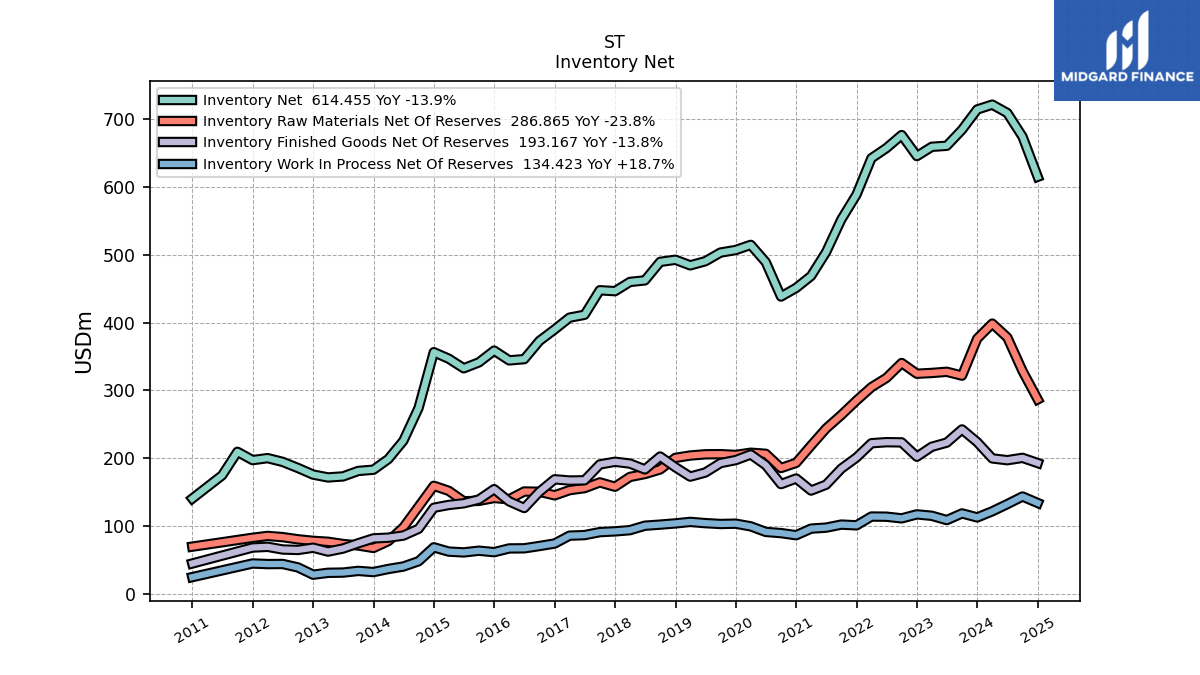
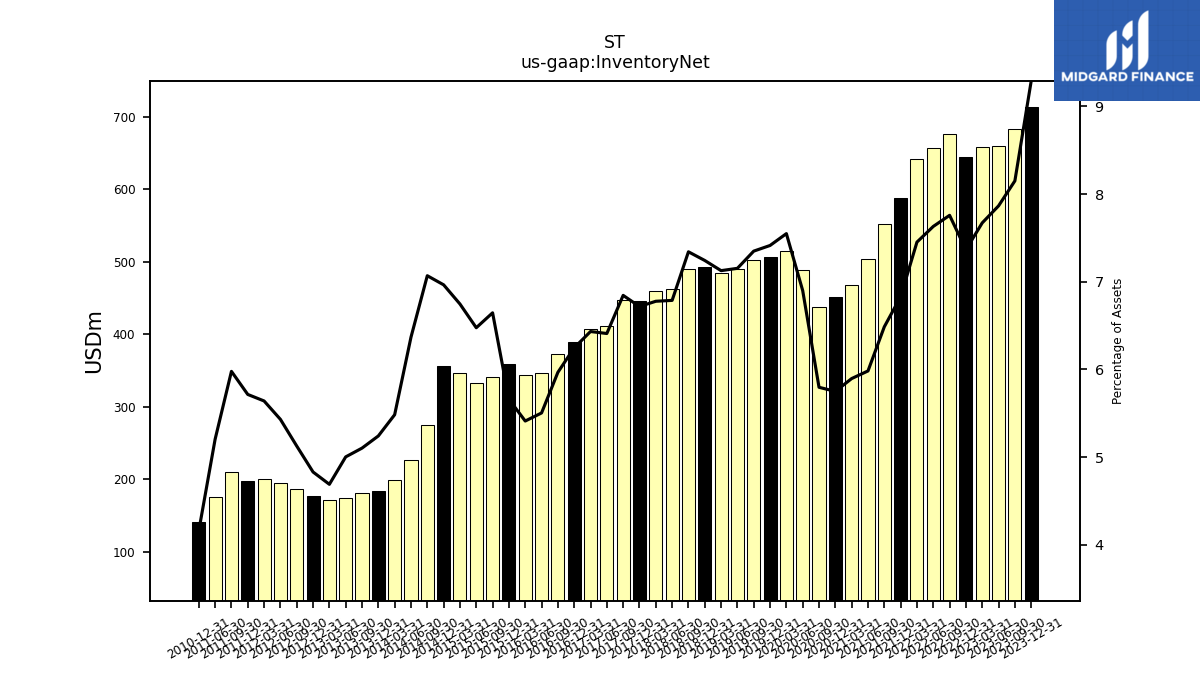
| Inventory Net | 713.49 | 683.65 | 660.08 | 658.56 | 644.88 | 675.86 | 656.74 | 641.71 | 588.23 | 551.63 | 503.64 | 468.45 | 451.00 | 438.19 | 488.81 | 514.27 | 506.68 | 502.94 | 490.12 | 484.14 | 492.32 | 489.25 | 462.01 | 459.70 | 446.13 | 447.49 | 411.35 | 407.20 | 389.84 | 372.97 | 346.12 | 344.25 | 358.70 | 341.36 | 332.65 | 346.80 | 356.36 | 274.31 | 226.06 | 199.13 | 183.40 | 181.60 | 173.55 | 172.02 | 176.23 | 185.97 | 194.89 | 200.46 | 197.54 | 209.76 | 175.19 | NA | 140.95 | NA | NA | NA | |
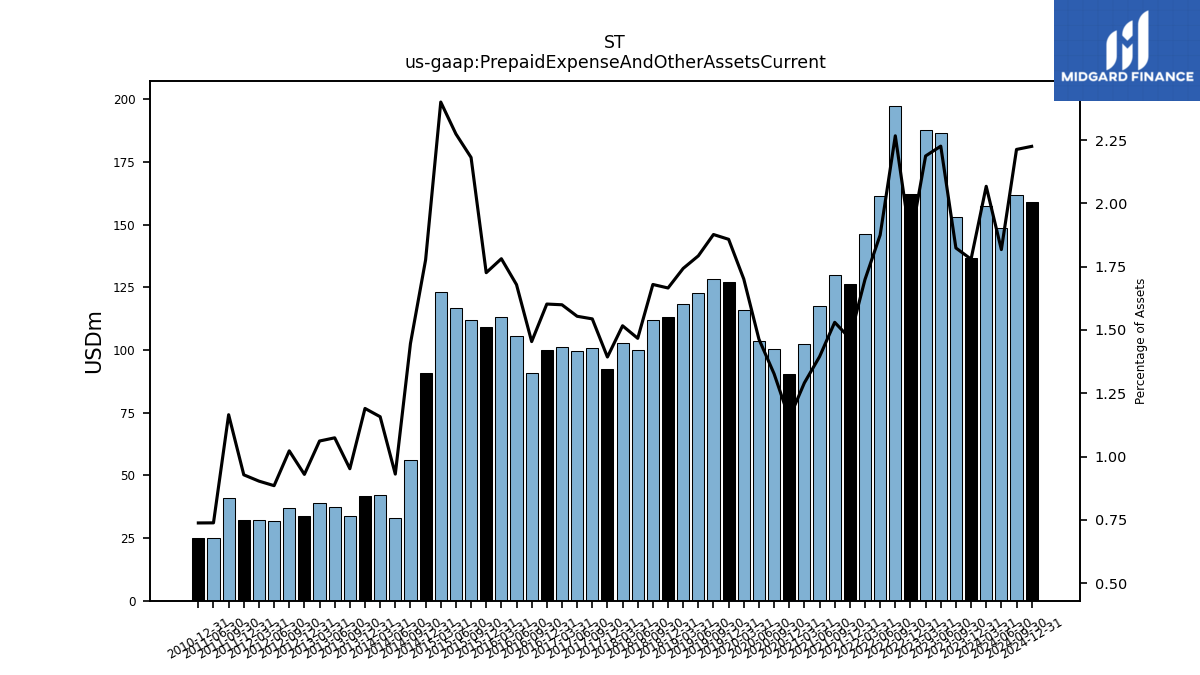
| Prepaid Expense And Other Assets Current | 136.69 | 152.98 | 186.81 | 187.75 | 162.27 | 197.49 | 161.37 | 146.34 | 126.37 | 130.14 | 117.40 | 102.59 | 90.34 | 100.32 | 103.70 | 115.89 | 126.98 | 128.45 | 122.84 | 118.41 | 113.23 | 111.94 | 99.86 | 102.87 | 92.53 | 100.94 | 99.74 | 101.26 | 100.00 | 90.90 | 105.59 | 113.31 | 109.39 | 112.04 | 116.81 | 123.38 | 90.92 | 56.13 | 33.05 | 42.03 | 41.64 | 33.89 | 37.27 | 38.94 | 33.92 | 37.10 | 31.77 | 32.10 | 32.08 | 40.89 | 24.86 | NA | 25.01 | NA | NA | NA |
| 2023-12-31 | 2023-09-30 | 2023-06-30 | 2023-03-31 | 2022-12-31 | 2022-09-30 | 2022-06-30 | 2022-03-31 | 2021-12-31 | 2021-09-30 | 2021-06-30 | 2021-03-31 | 2020-12-31 | 2020-09-30 | 2020-06-30 | 2020-03-31 | 2019-12-31 | 2019-09-30 | 2019-06-30 | 2019-03-31 | 2018-12-31 | 2018-09-30 | 2018-06-30 | 2018-03-31 | 2017-12-31 | 2017-09-30 | 2017-06-30 | 2017-03-31 | 2016-12-31 | 2016-09-30 | 2016-06-30 | 2016-03-31 | 2015-12-31 | 2015-09-30 | 2015-06-30 | 2015-03-31 | 2014-12-31 | 2014-09-30 | 2014-06-30 | 2014-03-31 | 2013-12-31 | 2013-09-30 | 2013-06-30 | 2013-03-31 | 2012-12-31 | 2012-09-30 | 2012-06-30 | 2012-03-31 | 2011-12-31 | 2011-09-30 | 2011-06-30 | 2011-03-31 | 2010-12-31 | 2010-09-30 | 2010-06-30 | 2010-03-31 | ||
|---|---|---|---|---|---|---|---|---|---|---|---|---|---|---|---|---|---|---|---|---|---|---|---|---|---|---|---|---|---|---|---|---|---|---|---|---|---|---|---|---|---|---|---|---|---|---|---|---|---|---|---|---|---|---|---|---|---|
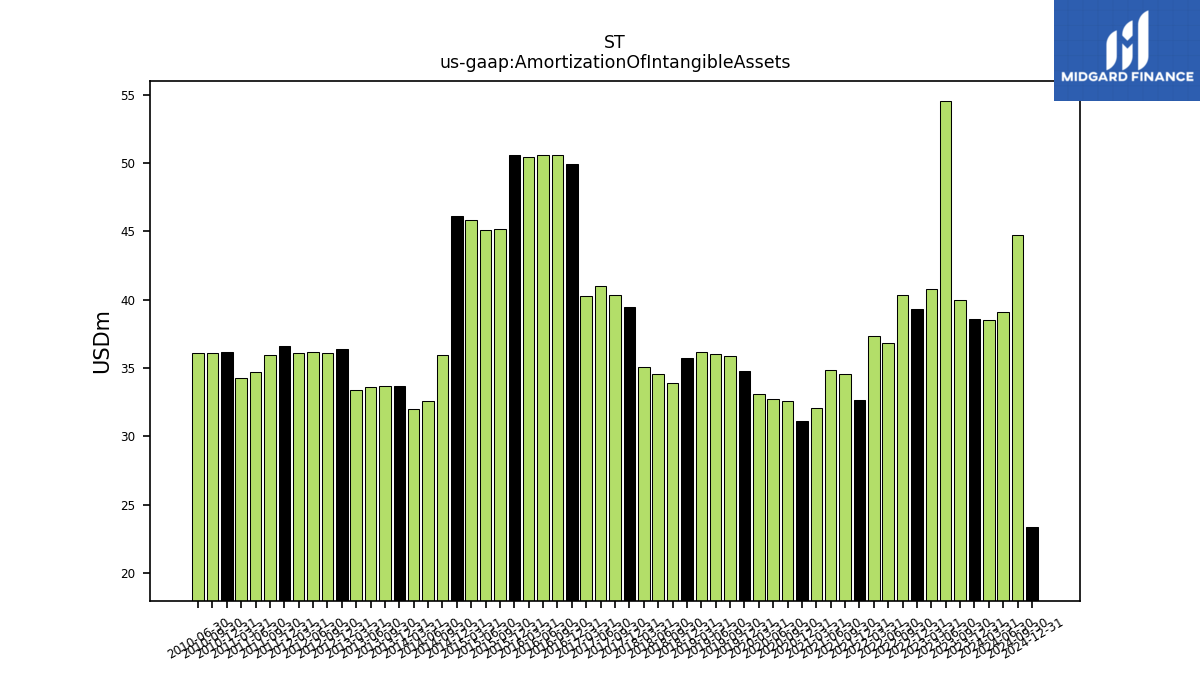
| Amortization Of Intangible Assets | 38.55 | 39.97 | 54.56 | 40.77 | 39.30 | 40.31 | 36.80 | 37.37 | 32.64 | 34.57 | 34.86 | 32.06 | 31.15 | 32.56 | 32.74 | 33.09 | 34.81 | 35.91 | 36.03 | 36.14 | 35.75 | 33.91 | 34.59 | 35.07 | 39.47 | 40.32 | 41.00 | 40.26 | 49.93 | 50.56 | 50.56 | 50.45 | 50.56 | 45.18 | 45.08 | 45.81 | 46.14 | 35.98 | 32.56 | 32.02 | 33.68 | 33.67 | 33.65 | 33.39 | 36.37 | 36.08 | 36.20 | 36.13 | 36.63 | 35.99 | 34.71 | 34.25 | 36.20 | 36.09 | 36.08 | NA | |
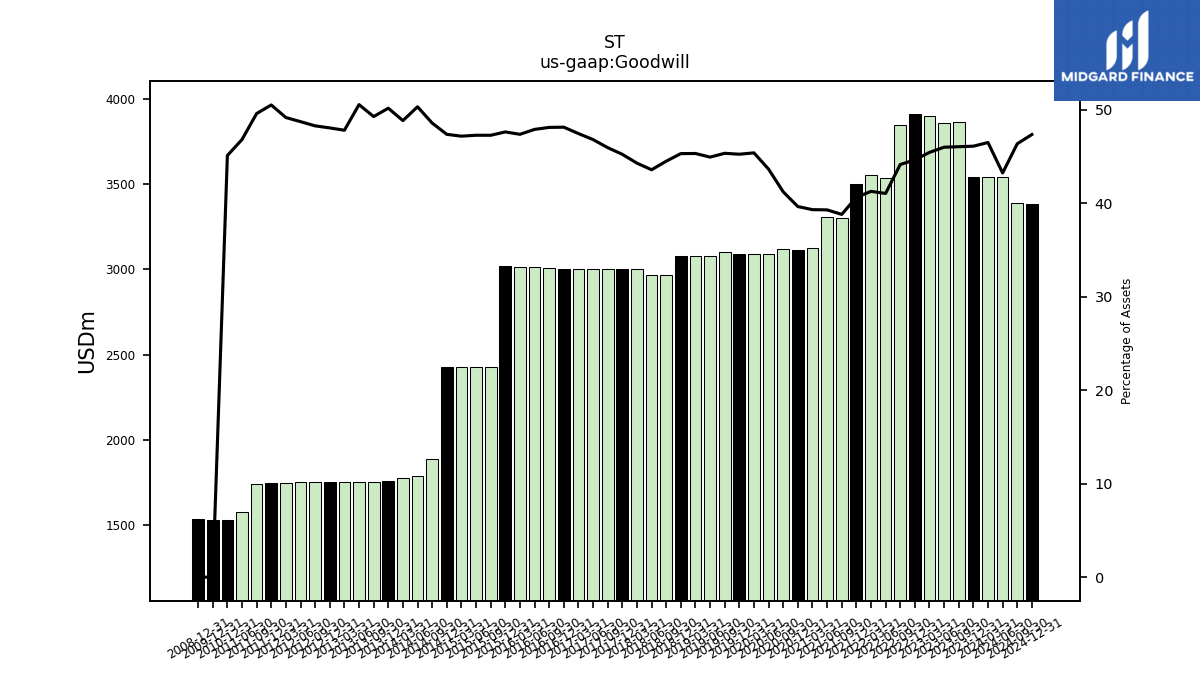
| Goodwill | 3542.77 | 3864.49 | 3861.87 | 3902.86 | 3911.22 | 3847.45 | 3534.44 | 3555.37 | 3502.06 | 3301.95 | 3308.94 | 3124.94 | 3111.35 | 3117.57 | 3093.60 | 3093.60 | 3093.60 | 3104.45 | 3080.39 | 3080.39 | 3081.30 | 2966.66 | 2967.96 | 3005.46 | 3005.46 | 3005.46 | 3005.46 | 3005.46 | 3005.46 | 3008.89 | 3013.69 | 3014.93 | 3019.74 | 2429.16 | 2429.54 | 2426.22 | 2424.80 | 1886.00 | 1787.22 | 1774.35 | 1756.05 | 1754.38 | 1754.38 | 1754.38 | 1754.11 | 1752.14 | 1749.40 | 1748.24 | 1746.82 | 1740.98 | 1576.66 | NA | 1528.95 | NA | NA | NA | |
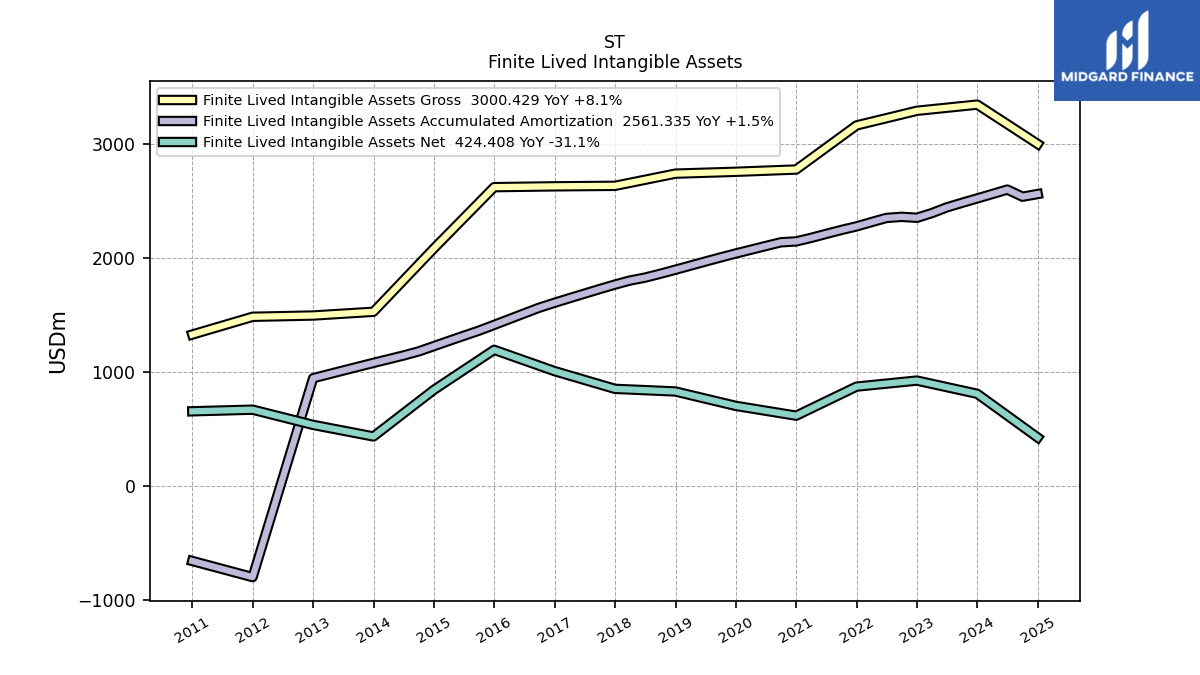
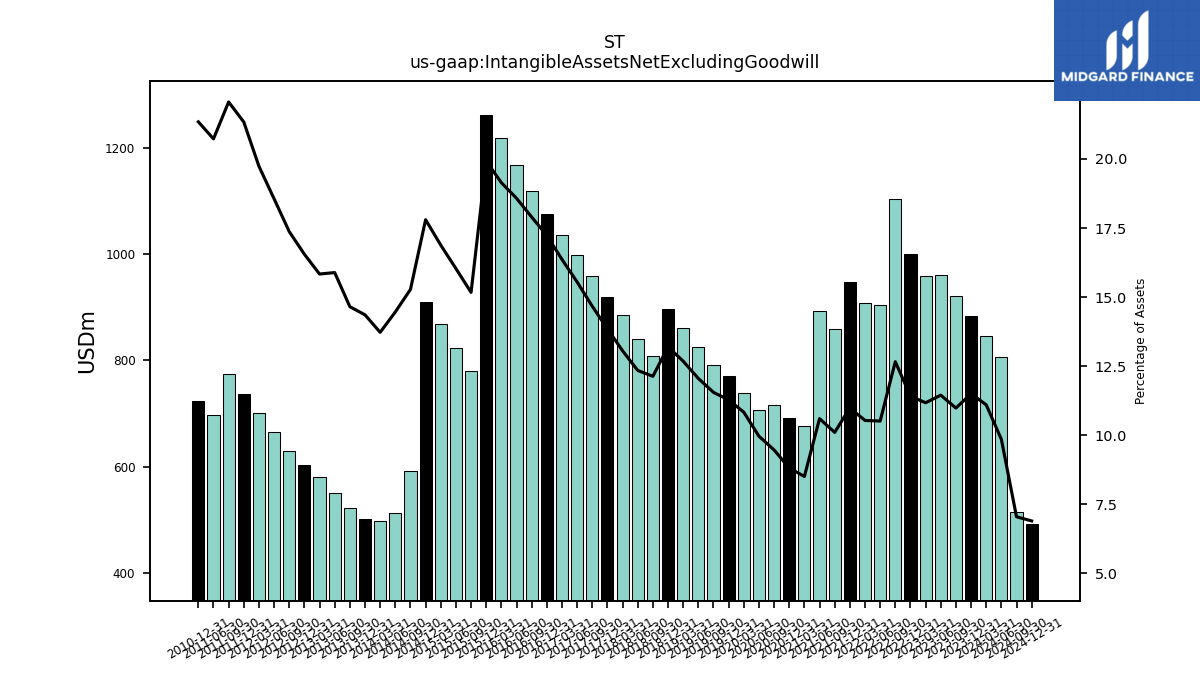
| Intangible Assets Net Excluding Goodwill | 883.67 | 921.44 | 961.18 | 959.47 | 999.72 | 1103.26 | 904.93 | 907.32 | 946.73 | 859.37 | 892.52 | 676.07 | 691.55 | 715.80 | 706.10 | 738.24 | 770.90 | 790.69 | 826.14 | 861.53 | 897.19 | 808.67 | 840.48 | 885.57 | 920.12 | 958.97 | 997.82 | 1036.05 | 1075.43 | 1118.86 | 1168.30 | 1217.72 | 1262.57 | 779.32 | 823.67 | 867.85 | 910.77 | 592.92 | 513.43 | 498.44 | 502.39 | 521.54 | 551.17 | 580.85 | 603.88 | 630.15 | 666.00 | 701.45 | 737.56 | 774.18 | 697.76 | NA | 723.14 | NA | NA | NA | |
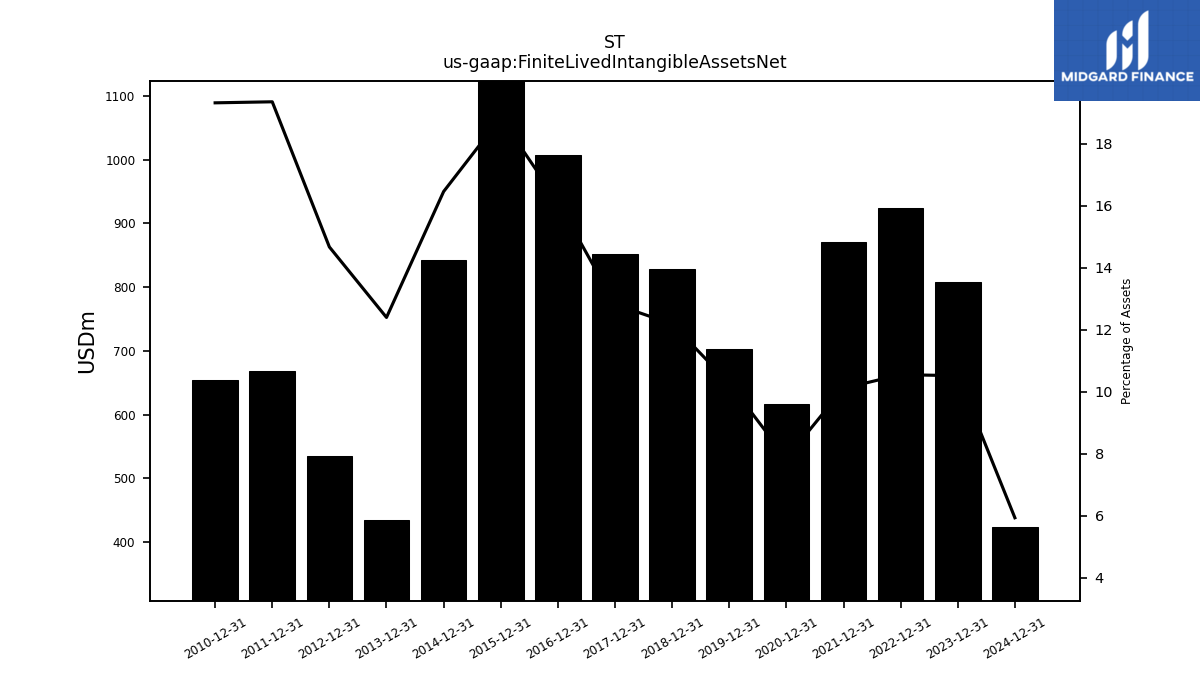
| Finite Lived Intangible Assets Net | 808.30 | NA | NA | NA | 924.35 | NA | NA | NA | 871.36 | NA | NA | NA | 616.18 | NA | NA | NA | 702.43 | NA | NA | NA | 828.72 | NA | NA | NA | 851.65 | NA | NA | NA | 1006.96 | NA | NA | NA | 1194.10 | NA | NA | NA | 842.30 | NA | NA | NA | 433.92 | NA | NA | NA | 535.41 | NA | NA | NA | 669.09 | NA | NA | NA | 654.67 | NA | NA | NA | |
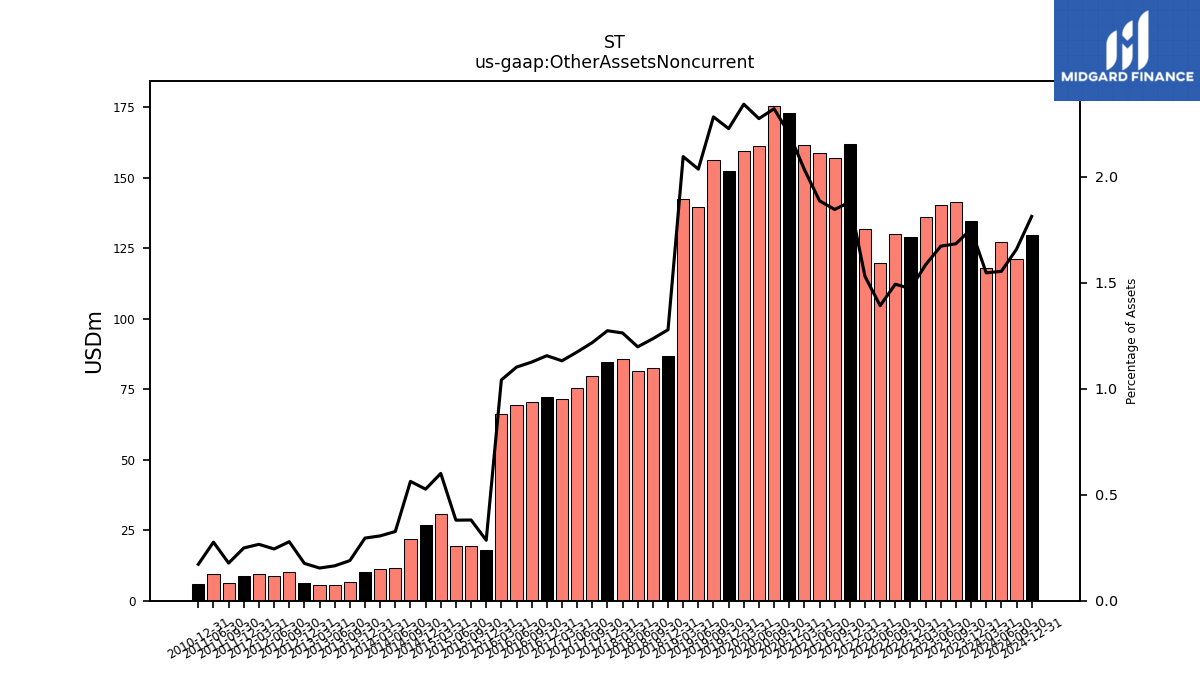
| Other Assets Noncurrent | 134.60 | 141.25 | 140.38 | 136.06 | 128.87 | 130.11 | 119.82 | 131.75 | 162.02 | 156.98 | 158.80 | 161.61 | 172.72 | 175.44 | 161.14 | 159.58 | 152.22 | 156.21 | 139.52 | 142.33 | 86.89 | 82.39 | 81.53 | 85.68 | 84.59 | 79.62 | 75.31 | 71.66 | 72.15 | 70.38 | 69.31 | 66.25 | 18.10 | 19.57 | 19.52 | 30.87 | 26.94 | 21.85 | 11.60 | 11.11 | 10.34 | 6.74 | 5.71 | 5.66 | 6.43 | 10.10 | 8.77 | 9.46 | 8.61 | 6.24 | 9.30 | NA | 5.83 | NA | NA | NA |
| 2023-12-31 | 2023-09-30 | 2023-06-30 | 2023-03-31 | 2022-12-31 | 2022-09-30 | 2022-06-30 | 2022-03-31 | 2021-12-31 | 2021-09-30 | 2021-06-30 | 2021-03-31 | 2020-12-31 | 2020-09-30 | 2020-06-30 | 2020-03-31 | 2019-12-31 | 2019-09-30 | 2019-06-30 | 2019-03-31 | 2018-12-31 | 2018-09-30 | 2018-06-30 | 2018-03-31 | 2017-12-31 | 2017-09-30 | 2017-06-30 | 2017-03-31 | 2016-12-31 | 2016-09-30 | 2016-06-30 | 2016-03-31 | 2015-12-31 | 2015-09-30 | 2015-06-30 | 2015-03-31 | 2014-12-31 | 2014-09-30 | 2014-06-30 | 2014-03-31 | 2013-12-31 | 2013-09-30 | 2013-06-30 | 2013-03-31 | 2012-12-31 | 2012-09-30 | 2012-06-30 | 2012-03-31 | 2011-12-31 | 2011-09-30 | 2011-06-30 | 2011-03-31 | 2010-12-31 | 2010-09-30 | 2010-06-30 | 2010-03-31 | ||
|---|---|---|---|---|---|---|---|---|---|---|---|---|---|---|---|---|---|---|---|---|---|---|---|---|---|---|---|---|---|---|---|---|---|---|---|---|---|---|---|---|---|---|---|---|---|---|---|---|---|---|---|---|---|---|---|---|---|
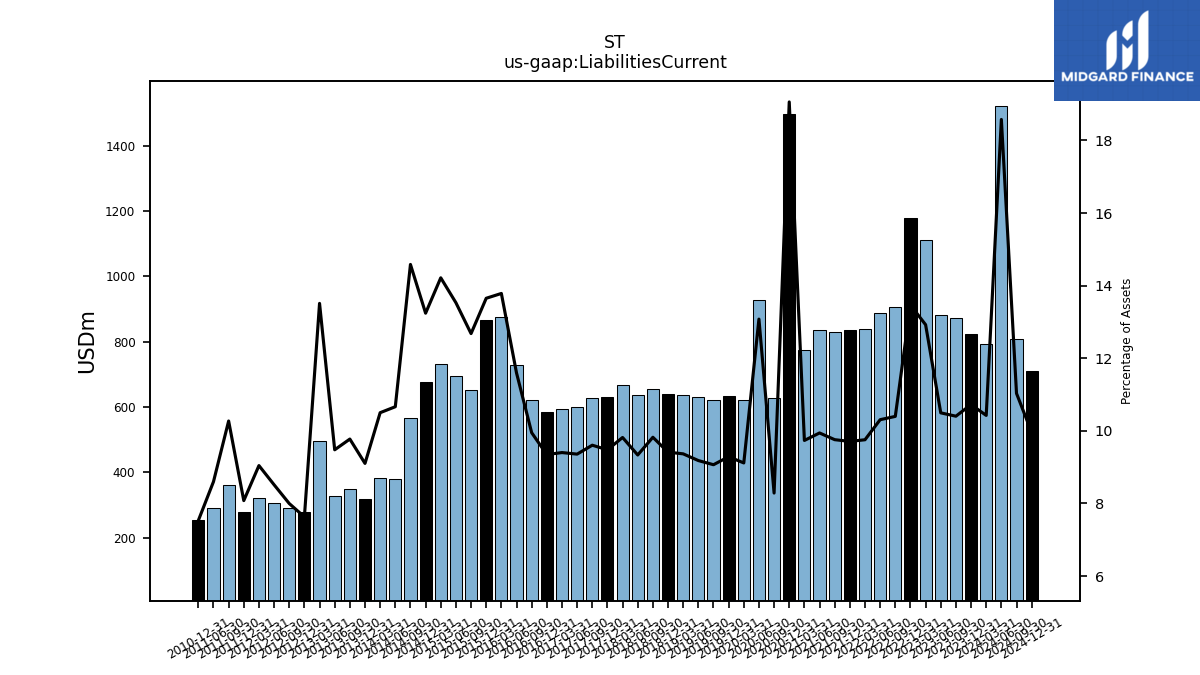
| Liabilities Current | 823.72 | 872.67 | 880.90 | 1109.47 | 1178.97 | 905.97 | 887.13 | 840.04 | 836.26 | 829.82 | 836.93 | 773.52 | 1495.16 | 626.41 | 926.56 | 621.06 | 634.75 | 620.50 | 629.14 | 636.30 | 639.94 | 654.65 | 635.44 | 665.91 | 629.50 | 627.94 | 600.61 | 595.19 | 583.30 | 621.95 | 729.27 | 876.89 | 865.17 | 651.28 | 695.02 | 730.80 | 677.51 | 565.96 | 378.61 | 381.30 | 318.49 | 347.84 | 328.80 | 495.58 | 278.36 | 290.12 | 305.56 | 321.40 | 279.25 | 360.40 | 289.51 | NA | 255.10 | NA | NA | NA | |
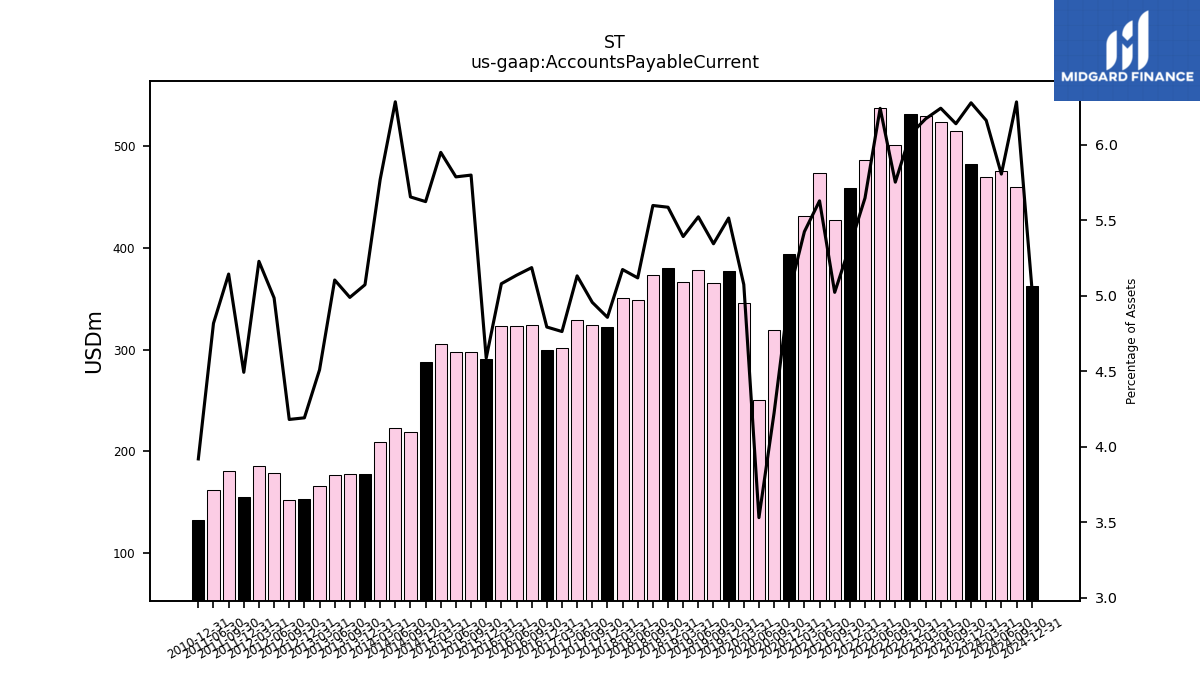
| Accounts Payable Current | 482.30 | 515.10 | 523.97 | 529.94 | 531.57 | 501.30 | 537.26 | 486.43 | 459.09 | 427.27 | 473.93 | 431.08 | 393.91 | 319.42 | 250.22 | 345.79 | 376.97 | 365.82 | 378.50 | 366.41 | 379.82 | 373.14 | 348.48 | 351.00 | 322.67 | 324.12 | 329.40 | 301.61 | 299.20 | 324.27 | 323.06 | 323.21 | 290.78 | 297.94 | 297.36 | 305.93 | 287.80 | 219.48 | 223.16 | 209.55 | 177.54 | 177.61 | 177.11 | 165.44 | 152.96 | 151.70 | 178.96 | 185.85 | 155.35 | 180.53 | 162.21 | NA | 132.83 | NA | NA | NA | |
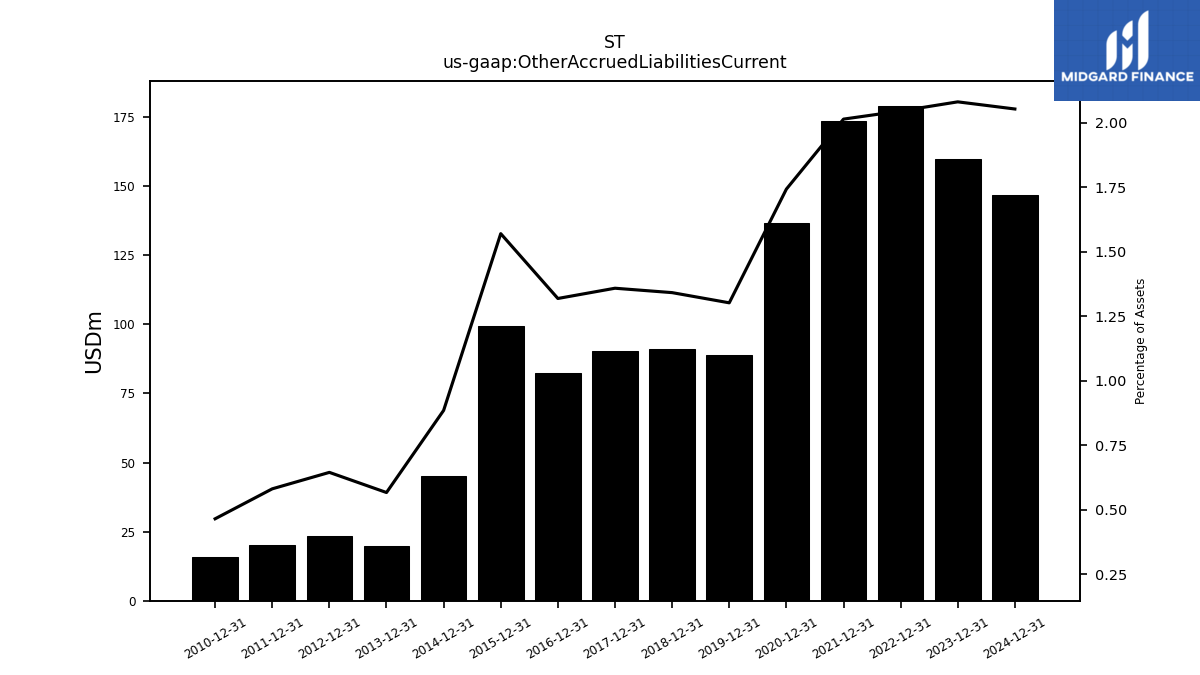
| Other Accrued Liabilities Current | 159.80 | NA | NA | NA | 179.06 | NA | NA | NA | 173.44 | NA | NA | NA | 136.67 | NA | NA | NA | 88.96 | NA | NA | NA | 91.17 | NA | NA | NA | 90.20 | NA | NA | NA | 82.29 | NA | NA | NA | 99.48 | NA | NA | NA | 45.27 | NA | NA | NA | 19.82 | NA | NA | NA | 23.52 | NA | NA | NA | 20.08 | NA | NA | NA | 15.74 | NA | NA | NA | |
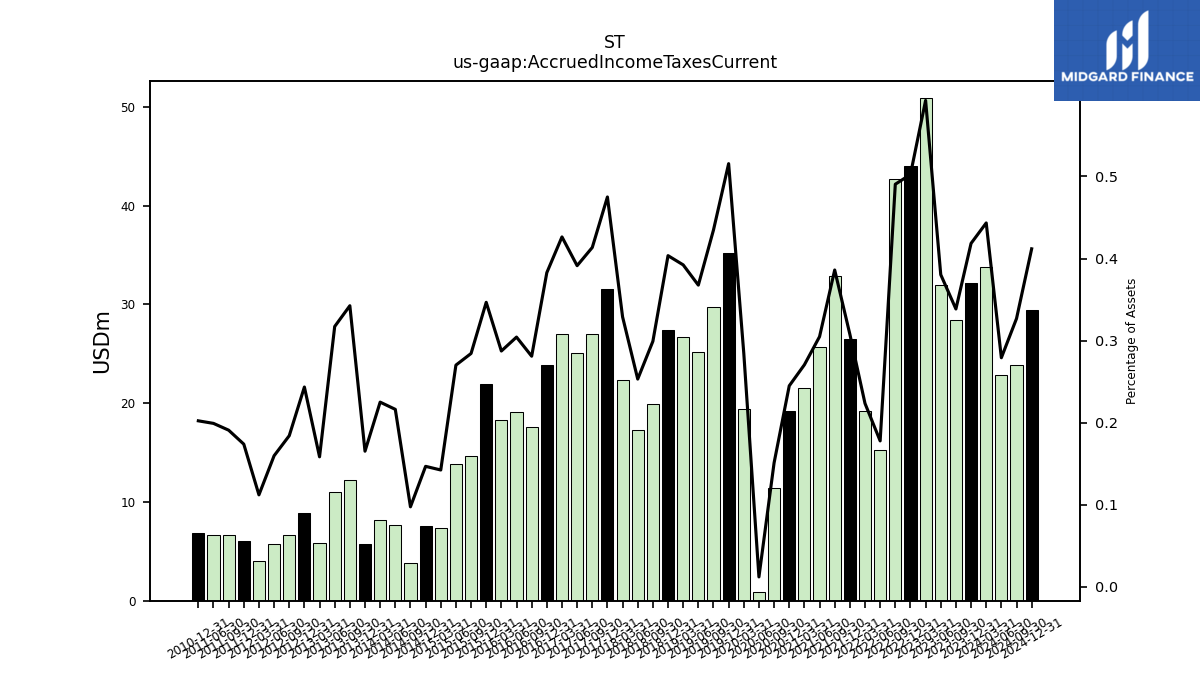
| Accrued Income Taxes Current | 32.14 | 28.40 | 31.92 | 50.87 | 43.99 | 42.73 | 15.31 | 19.25 | 26.52 | 32.83 | 25.66 | 21.50 | 19.21 | 11.43 | 0.87 | 19.39 | 35.23 | 29.75 | 25.19 | 26.65 | 27.43 | 19.94 | 17.23 | 22.31 | 31.54 | 27.03 | 25.11 | 26.99 | 23.89 | 17.57 | 19.14 | 18.28 | 21.97 | 14.61 | 13.88 | 7.32 | 7.52 | 3.79 | 7.68 | 8.17 | 5.79 | 12.19 | 11.00 | 5.81 | 8.88 | 6.68 | 5.73 | 3.99 | 6.01 | 6.70 | 6.71 | NA | 6.86 | NA | NA | NA | |
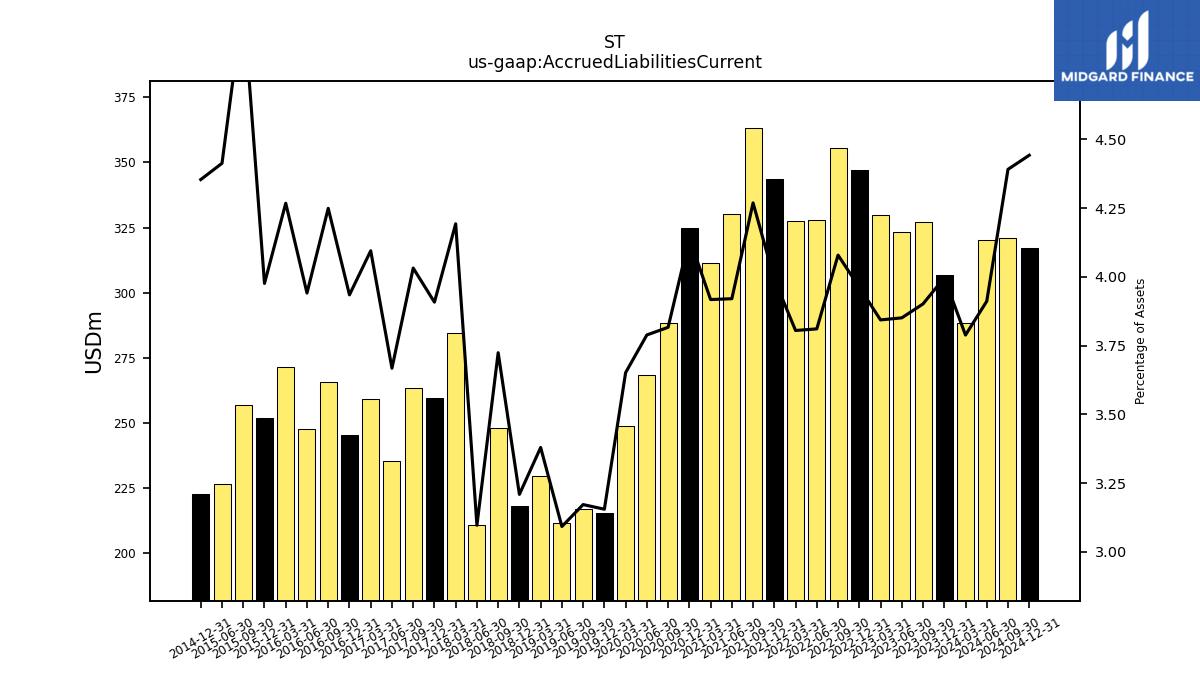
| Accrued Liabilities Current | 307.00 | 327.29 | 323.20 | 329.96 | 346.94 | 355.40 | 327.99 | 327.67 | 343.82 | 363.09 | 330.06 | 311.26 | 324.83 | 288.51 | 268.43 | 248.79 | 215.63 | 217.06 | 211.87 | 229.58 | 218.13 | 248.20 | 210.78 | 284.42 | 259.56 | 263.61 | 235.39 | 259.24 | 245.57 | 265.63 | 247.87 | 271.50 | 251.99 | 256.94 | 226.71 | NA | 222.78 | NA | NA | NA | NA | NA | NA | NA | NA | NA | NA | NA | NA | NA | NA | NA | NA | NA | NA | NA |
| 2023-12-31 | 2023-09-30 | 2023-06-30 | 2023-03-31 | 2022-12-31 | 2022-09-30 | 2022-06-30 | 2022-03-31 | 2021-12-31 | 2021-09-30 | 2021-06-30 | 2021-03-31 | 2020-12-31 | 2020-09-30 | 2020-06-30 | 2020-03-31 | 2019-12-31 | 2019-09-30 | 2019-06-30 | 2019-03-31 | 2018-12-31 | 2018-09-30 | 2018-06-30 | 2018-03-31 | 2017-12-31 | 2017-09-30 | 2017-06-30 | 2017-03-31 | 2016-12-31 | 2016-09-30 | 2016-06-30 | 2016-03-31 | 2015-12-31 | 2015-09-30 | 2015-06-30 | 2015-03-31 | 2014-12-31 | 2014-09-30 | 2014-06-30 | 2014-03-31 | 2013-12-31 | 2013-09-30 | 2013-06-30 | 2013-03-31 | 2012-12-31 | 2012-09-30 | 2012-06-30 | 2012-03-31 | 2011-12-31 | 2011-09-30 | 2011-06-30 | 2011-03-31 | 2010-12-31 | 2010-09-30 | 2010-06-30 | 2010-03-31 | ||
|---|---|---|---|---|---|---|---|---|---|---|---|---|---|---|---|---|---|---|---|---|---|---|---|---|---|---|---|---|---|---|---|---|---|---|---|---|---|---|---|---|---|---|---|---|---|---|---|---|---|---|---|---|---|---|---|---|---|
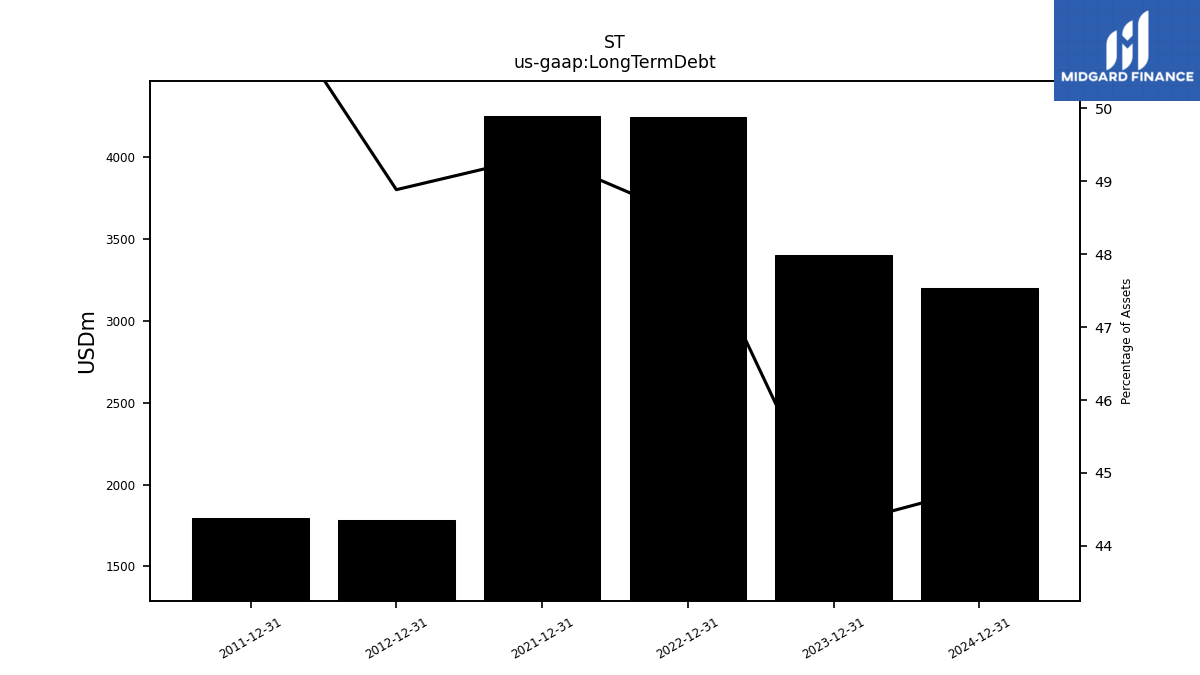
| Long Term Debt | 3400.00 | NA | NA | NA | 4246.83 | NA | NA | NA | 4251.47 | NA | NA | NA | NA | NA | NA | NA | NA | NA | NA | NA | NA | NA | NA | NA | NA | NA | NA | NA | NA | NA | NA | NA | NA | NA | NA | NA | NA | NA | NA | NA | NA | NA | NA | NA | 1783.50 | NA | NA | NA | 1794.50 | NA | NA | NA | NA | NA | NA | NA | |
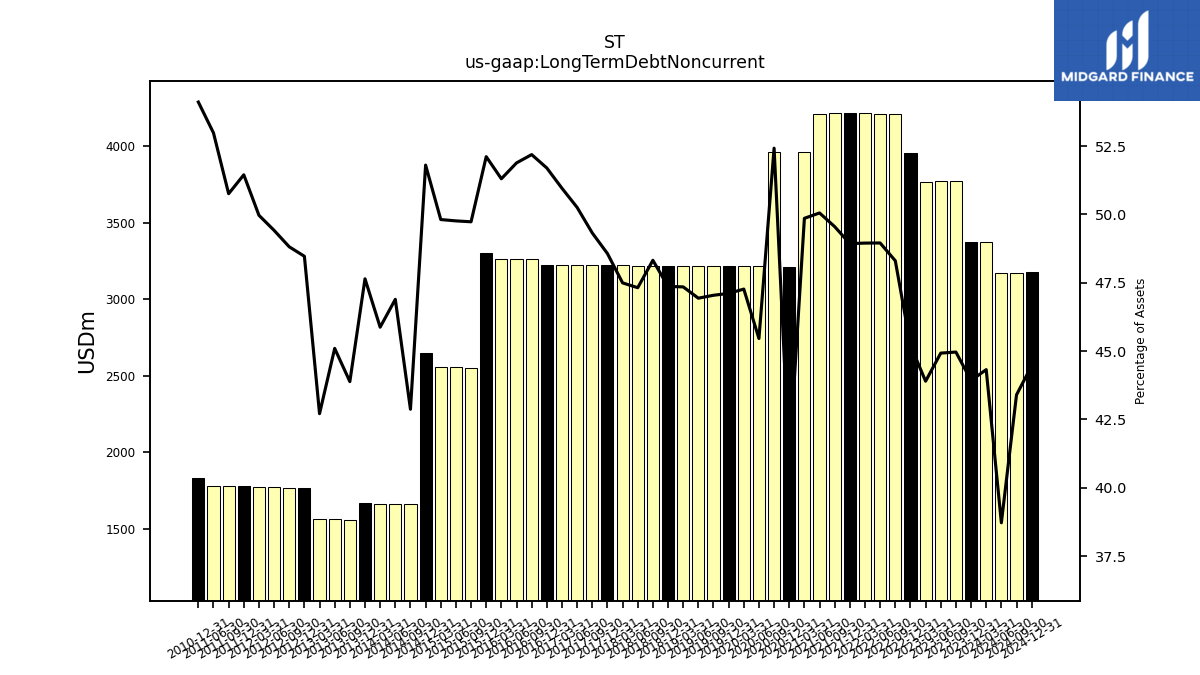
| Long Term Debt Noncurrent | 3373.99 | 3771.81 | 3770.51 | 3768.63 | 3958.93 | 4208.67 | 4213.51 | 4215.51 | 4214.95 | 4214.39 | 4213.83 | 3961.40 | 3213.75 | 3963.08 | 3220.83 | 3220.36 | 3219.89 | 3219.41 | 3216.14 | 3216.73 | 3219.76 | 3220.40 | 3221.04 | 3221.68 | 3225.81 | 3224.68 | 3225.32 | 3225.97 | 3226.58 | 3262.41 | 3263.06 | 3263.69 | 3302.68 | 2554.54 | 2556.40 | 2560.80 | 2650.74 | 1663.71 | 1664.81 | 1665.92 | 1667.02 | 1561.84 | 1564.49 | 1566.57 | 1768.35 | 1770.83 | 1773.38 | 1775.94 | 1778.49 | 1781.05 | 1783.60 | NA | 1833.37 | NA | NA | NA | |
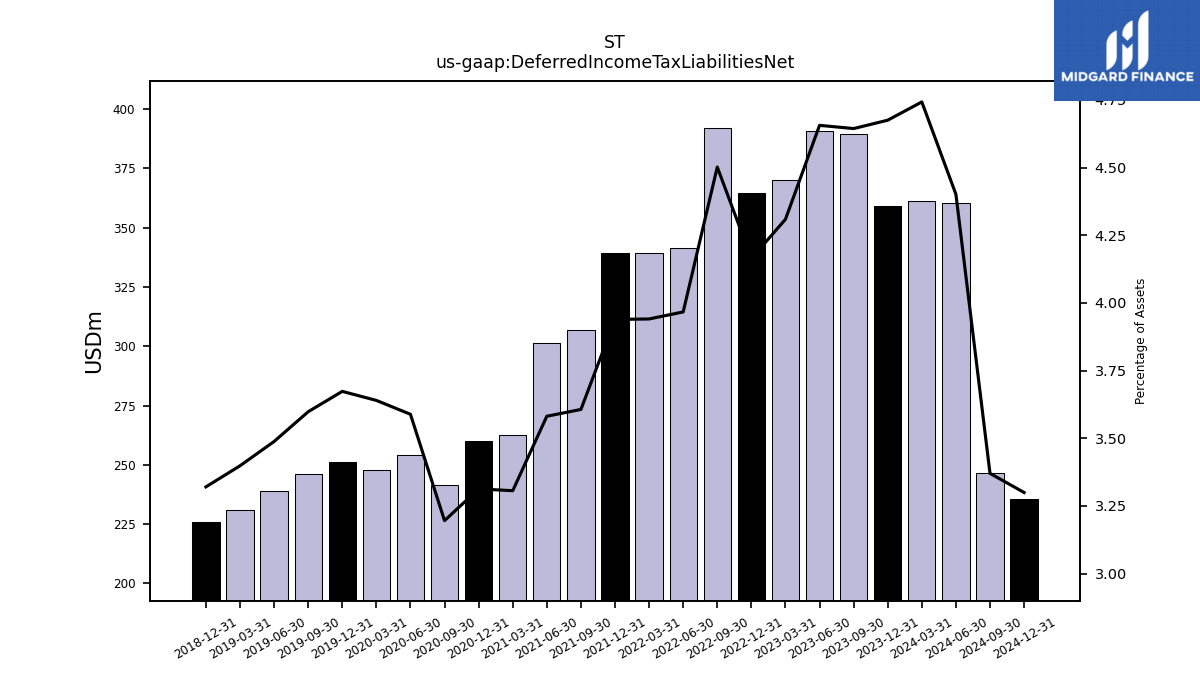
| Deferred Income Tax Liabilities Net | 359.07 | 389.55 | 390.74 | 369.90 | 364.59 | 392.22 | 341.38 | 339.33 | 339.27 | 306.70 | 301.47 | 262.67 | 259.86 | 241.55 | 254.23 | 247.96 | 251.03 | 246.22 | 238.99 | 230.85 | 225.69 | NA | NA | NA | NA | NA | NA | NA | NA | NA | NA | NA | NA | NA | NA | NA | NA | NA | NA | NA | NA | NA | NA | NA | NA | NA | NA | NA | NA | NA | NA | NA | NA | NA | NA | NA | |
| Pension And Other Postretirement Defined Benefit Plans Liabilities Noncurrent | 38.18 | 39.13 | 38.96 | 37.88 | 36.09 | 35.45 | 37.86 | 39.09 | 38.76 | 43.62 | 44.15 | 43.07 | 48.00 | 31.09 | 31.90 | 33.72 | 36.10 | 29.25 | 33.65 | 33.84 | 33.96 | 27.65 | 35.65 | 40.01 | 40.05 | 36.19 | 35.59 | 34.71 | 34.88 | 34.52 | 33.97 | 35.41 | 34.31 | 33.09 | 33.16 | 33.10 | 35.80 | 32.34 | 19.57 | 19.23 | 19.51 | 26.42 | 26.43 | 26.56 | 32.75 | 22.51 | 21.88 | 22.45 | 22.29 | 26.52 | 25.75 | NA | 43.02 | NA | NA | NA | |
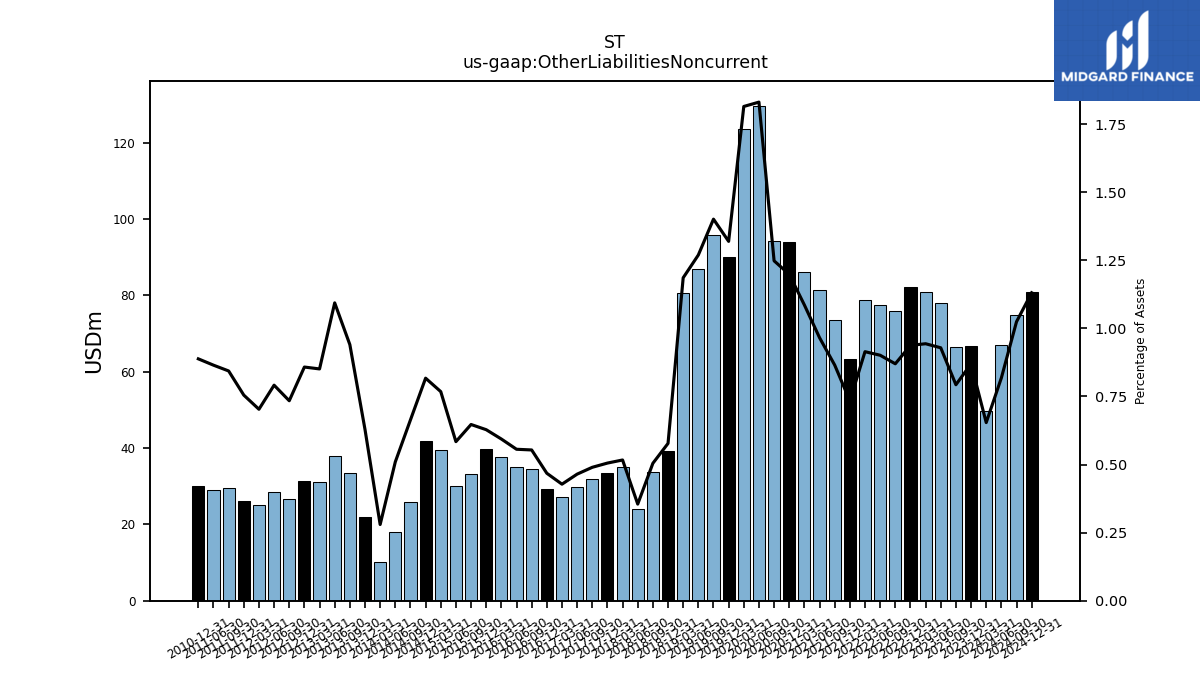
| Other Liabilities Noncurrent | 66.81 | 66.53 | 77.95 | 81.02 | 82.09 | 75.81 | 77.58 | 78.75 | 63.23 | 73.60 | 81.31 | 86.28 | 94.02 | 94.36 | 129.72 | 123.64 | 90.19 | 95.89 | 86.99 | 80.56 | 39.28 | 33.63 | 24.16 | 35.06 | 33.57 | 32.03 | 29.83 | 27.10 | 29.22 | 34.61 | 34.98 | 37.77 | 39.80 | 33.24 | 30.01 | 39.47 | 41.82 | 25.77 | 18.10 | 10.16 | 22.01 | 33.47 | 37.94 | 31.22 | 31.31 | 26.64 | 28.40 | 24.99 | 26.10 | 29.61 | 29.12 | NA | 30.09 | NA | NA | NA | |
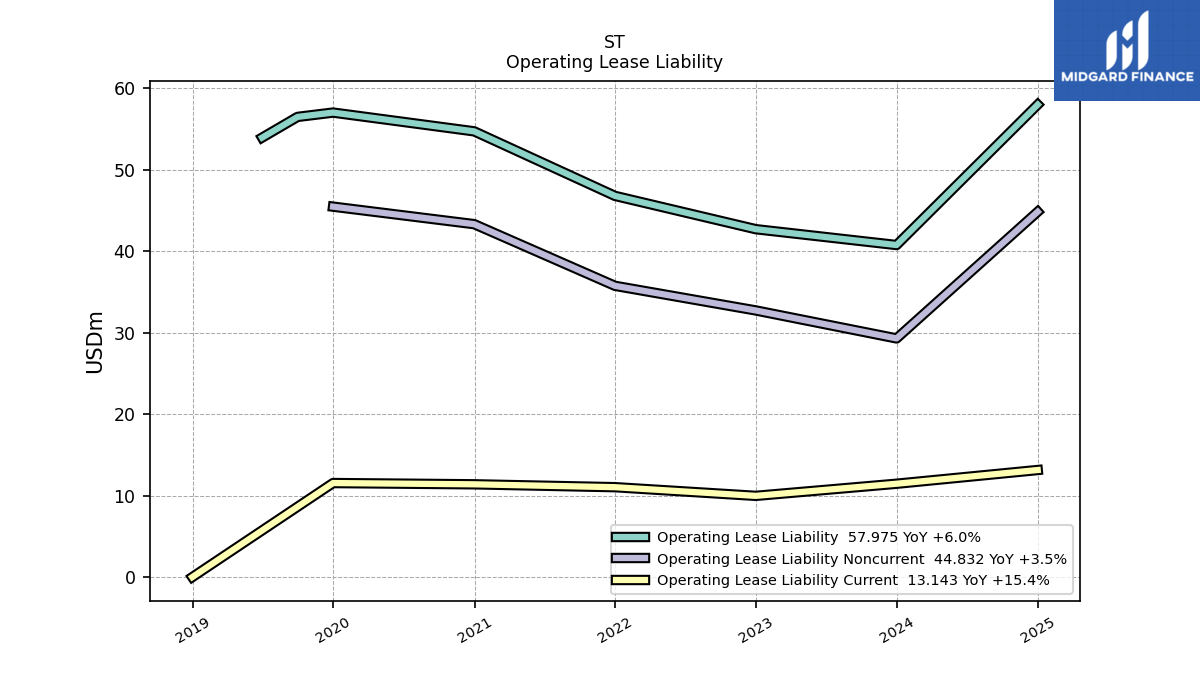
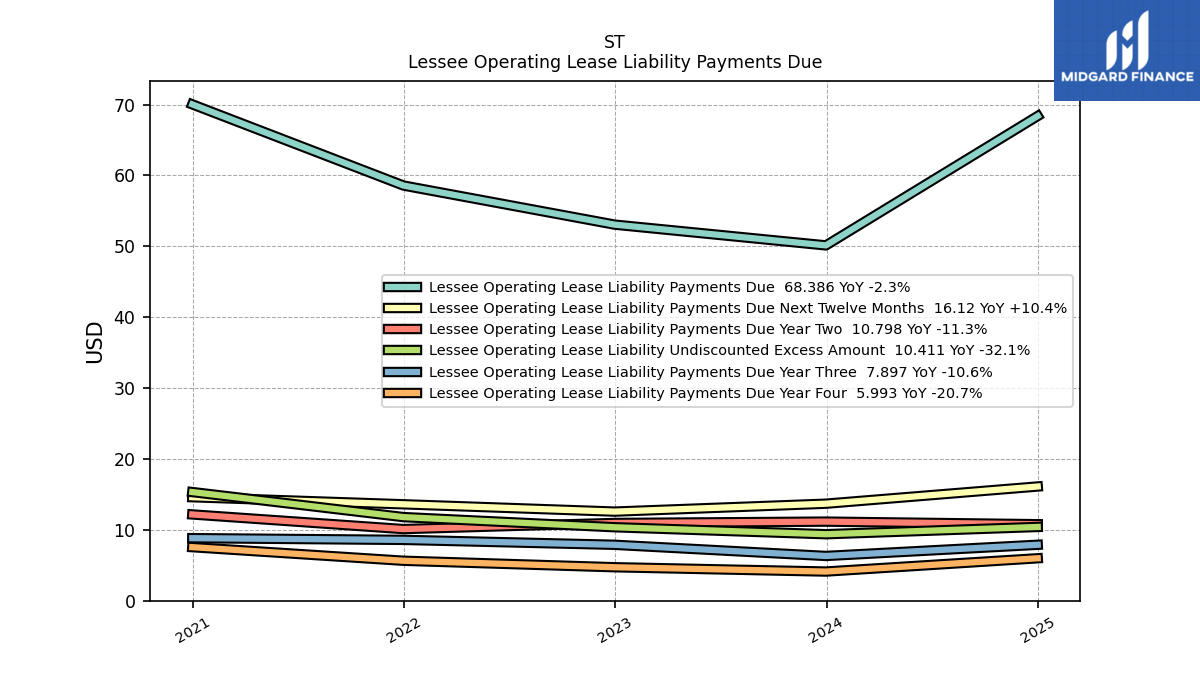
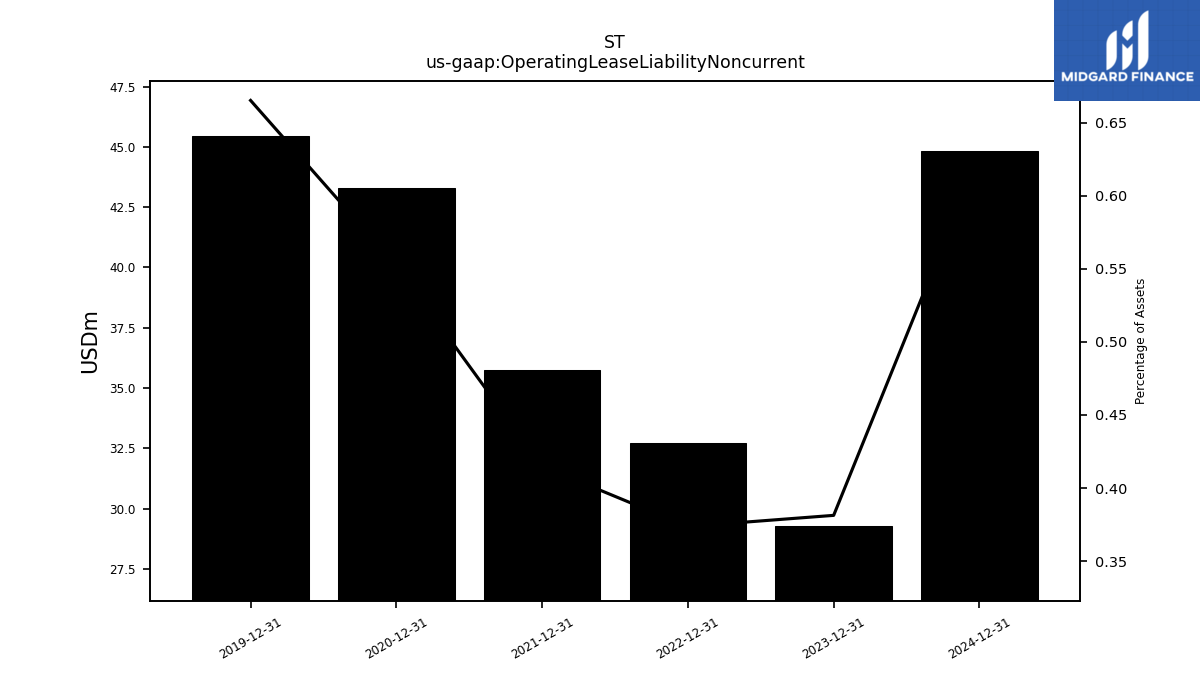
| Operating Lease Liability Noncurrent | 29.29 | NA | NA | NA | 32.72 | NA | NA | NA | 35.74 | NA | NA | NA | 43.31 | NA | NA | NA | 45.46 | NA | NA | NA | NA | NA | NA | NA | NA | NA | NA | NA | NA | NA | NA | NA | NA | NA | NA | NA | NA | NA | NA | NA | NA | NA | NA | NA | NA | NA | NA | NA | NA | NA | NA | NA | NA | NA | NA | NA |
| 2023-12-31 | 2023-09-30 | 2023-06-30 | 2023-03-31 | 2022-12-31 | 2022-09-30 | 2022-06-30 | 2022-03-31 | 2021-12-31 | 2021-09-30 | 2021-06-30 | 2021-03-31 | 2020-12-31 | 2020-09-30 | 2020-06-30 | 2020-03-31 | 2019-12-31 | 2019-09-30 | 2019-06-30 | 2019-03-31 | 2018-12-31 | 2018-09-30 | 2018-06-30 | 2018-03-31 | 2017-12-31 | 2017-09-30 | 2017-06-30 | 2017-03-31 | 2016-12-31 | 2016-09-30 | 2016-06-30 | 2016-03-31 | 2015-12-31 | 2015-09-30 | 2015-06-30 | 2015-03-31 | 2014-12-31 | 2014-09-30 | 2014-06-30 | 2014-03-31 | 2013-12-31 | 2013-09-30 | 2013-06-30 | 2013-03-31 | 2012-12-31 | 2012-09-30 | 2012-06-30 | 2012-03-31 | 2011-12-31 | 2011-09-30 | 2011-06-30 | 2011-03-31 | 2010-12-31 | 2010-09-30 | 2010-06-30 | 2010-03-31 | ||
|---|---|---|---|---|---|---|---|---|---|---|---|---|---|---|---|---|---|---|---|---|---|---|---|---|---|---|---|---|---|---|---|---|---|---|---|---|---|---|---|---|---|---|---|---|---|---|---|---|---|---|---|---|---|---|---|---|---|
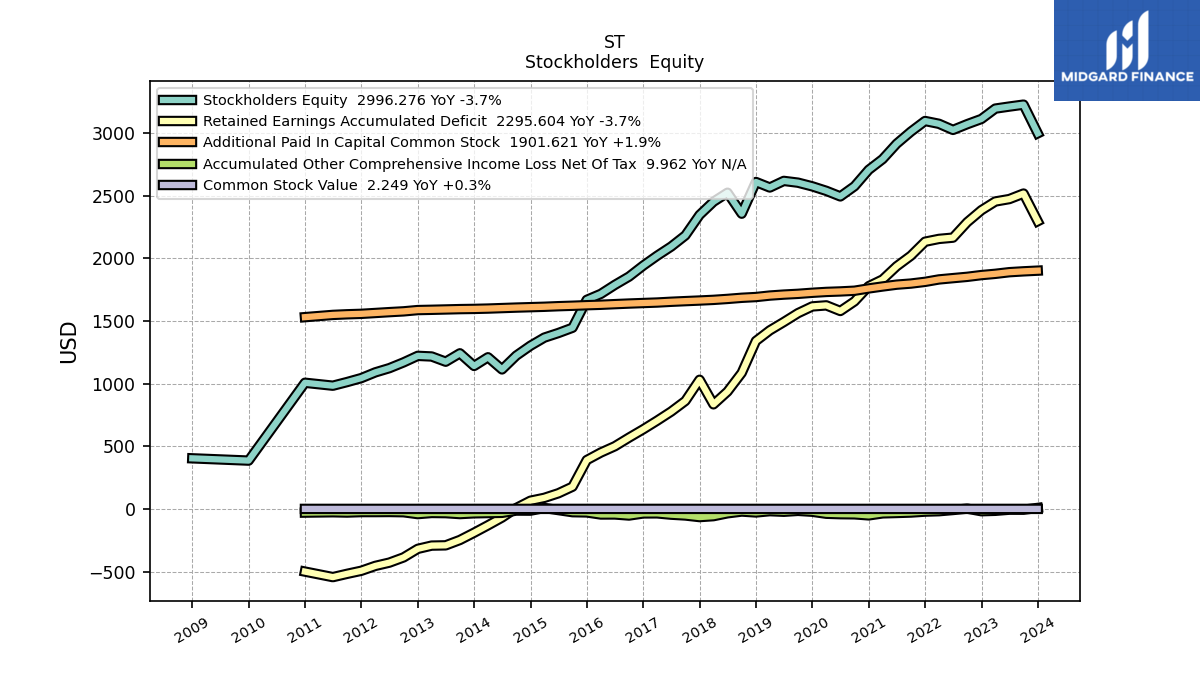
| Stockholders Equity | 2996.28 | 3225.18 | 3209.77 | 3193.49 | 3110.81 | 3069.32 | 3023.58 | 3072.32 | 3094.73 | 3009.62 | 2913.45 | 2790.64 | 2705.49 | 2574.64 | 2493.41 | 2537.80 | 2573.76 | 2602.89 | 2617.06 | 2564.37 | 2608.43 | 2355.50 | 2522.81 | 2450.94 | 2345.63 | 2182.53 | 2093.61 | 2020.26 | 1942.01 | 1854.24 | 1787.96 | 1716.29 | 1668.58 | 1446.40 | 1404.33 | 1367.63 | 1302.89 | 1223.90 | 1114.12 | 1211.17 | 1141.59 | 1242.69 | 1175.63 | 1217.20 | 1222.29 | 1170.18 | 1124.22 | 1090.60 | 1044.95 | 1013.38 | 984.33 | NA | 1007.78 | NA | NA | NA | |
| Common Stock Value | 2.25 | 2.25 | 2.25 | 2.24 | 2.24 | 2.24 | 2.24 | 2.24 | 2.23 | 2.23 | 2.23 | 2.22 | 2.22 | 2.22 | 2.21 | 2.21 | 2.21 | 2.21 | 2.21 | 2.21 | 2.20 | 2.20 | 2.20 | 2.20 | 2.29 | 2.29 | 2.29 | 2.29 | 2.29 | 2.29 | 2.29 | 2.29 | 2.29 | 2.29 | 2.29 | 2.29 | 2.29 | 2.29 | 2.29 | 2.29 | 2.29 | 2.29 | 2.29 | 2.29 | 2.29 | 2.28 | 2.28 | 2.27 | 2.26 | 2.26 | 2.25 | NA | 2.22 | NA | NA | NA | |
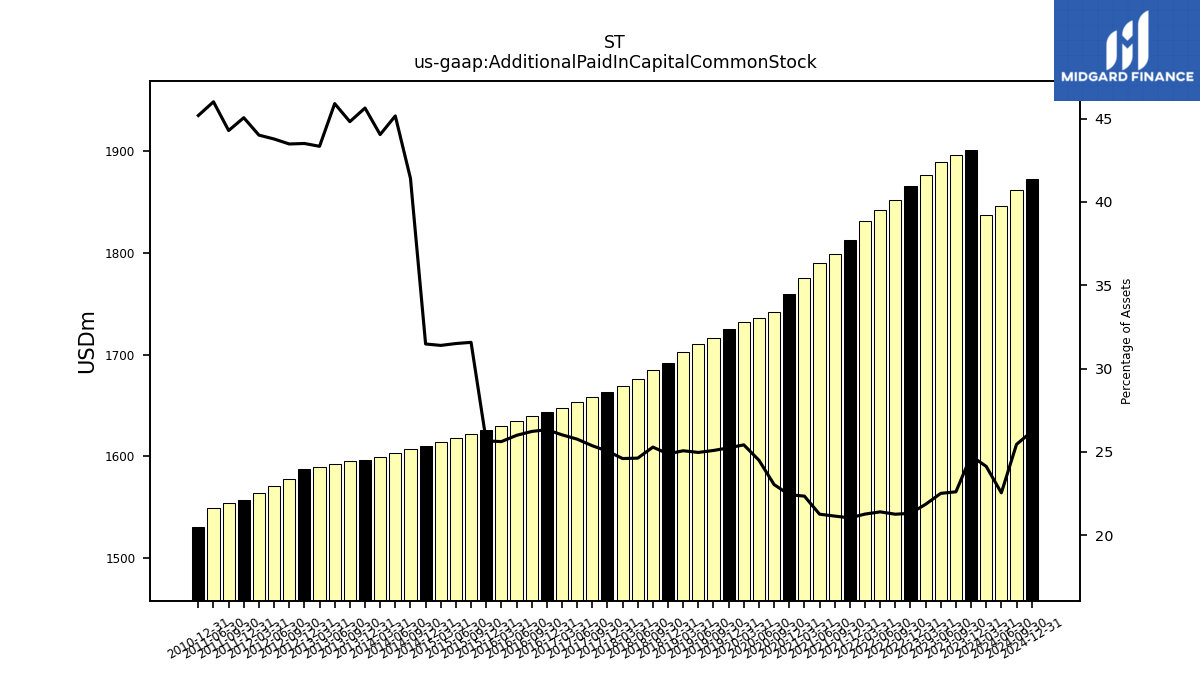
| Additional Paid In Capital Common Stock | 1901.62 | 1896.08 | 1889.23 | 1876.17 | 1866.20 | 1852.25 | 1841.92 | 1831.50 | 1812.24 | 1798.55 | 1789.86 | 1775.32 | 1759.67 | 1741.54 | 1735.83 | 1731.88 | 1725.09 | 1716.68 | 1710.71 | 1702.94 | 1691.19 | 1685.14 | 1676.17 | 1668.58 | 1663.37 | 1658.57 | 1653.46 | 1647.40 | 1643.45 | 1639.30 | 1634.55 | 1629.54 | 1626.02 | 1621.73 | 1618.16 | 1613.59 | 1610.39 | 1607.06 | 1603.16 | 1599.23 | 1596.54 | 1594.92 | 1592.15 | 1589.46 | 1587.20 | 1577.04 | 1570.80 | 1563.97 | 1557.21 | 1553.70 | 1548.66 | NA | 1530.79 | NA | NA | NA | |
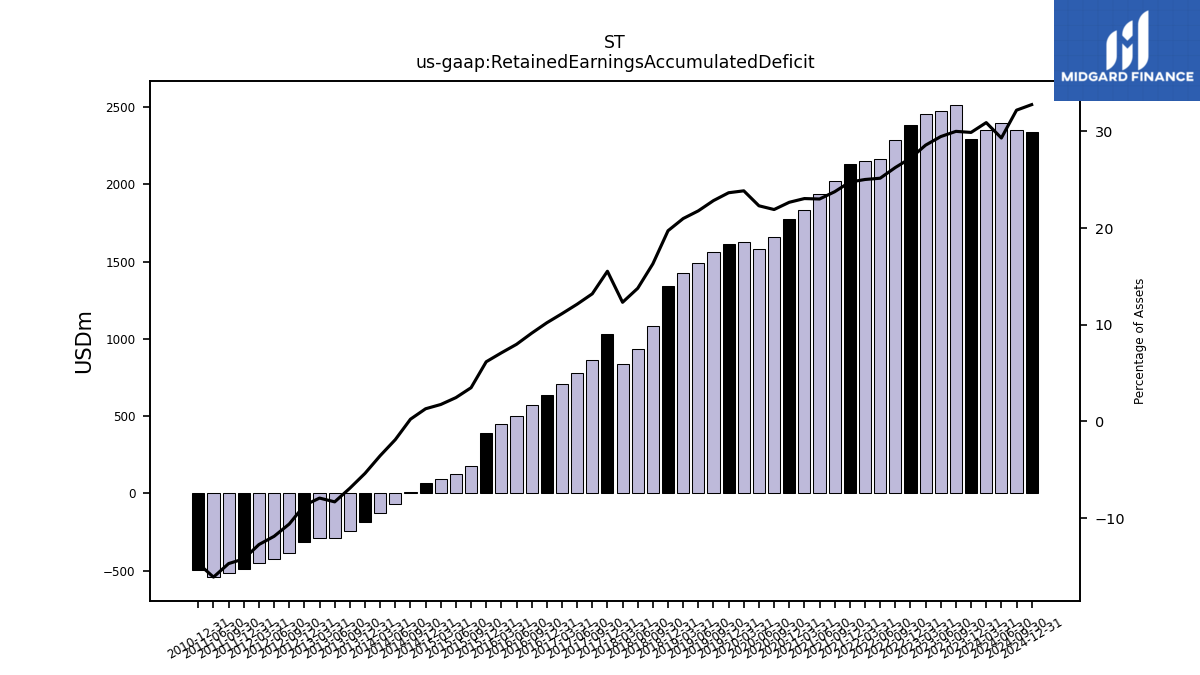
| Retained Earnings Accumulated Deficit | 2295.60 | 2516.22 | 2472.28 | 2452.86 | 2383.34 | 2287.68 | 2164.73 | 2154.56 | 2132.26 | 2020.35 | 1936.43 | 1831.24 | 1777.73 | 1656.64 | 1579.93 | 1624.77 | 1616.36 | 1562.86 | 1492.36 | 1425.43 | 1340.64 | 1086.54 | 937.45 | 835.81 | 1031.61 | 862.95 | 778.21 | 705.62 | 636.84 | 570.63 | 501.70 | 451.38 | 391.25 | 179.31 | 126.72 | 90.24 | 67.23 | 9.12 | -66.66 | -128.62 | -187.79 | -245.68 | -288.36 | -290.49 | -316.37 | -384.62 | -426.13 | -452.25 | -491.16 | -515.54 | -541.79 | NA | -497.64 | NA | NA | NA | |
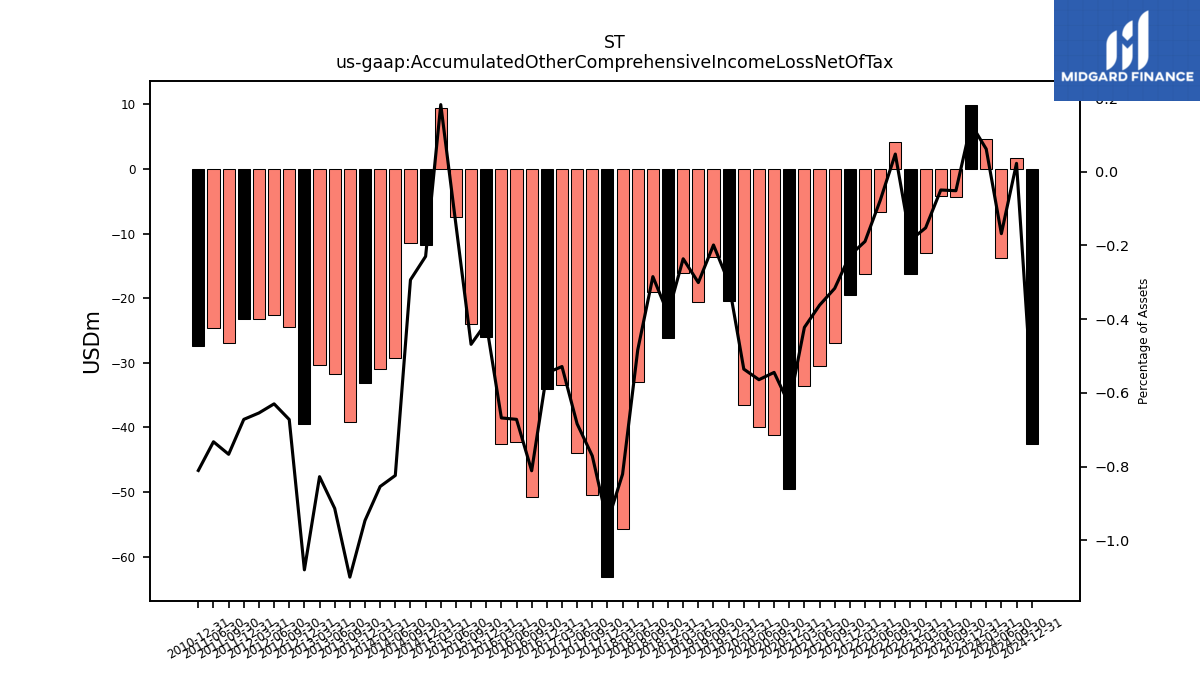
| Accumulated Other Comprehensive Income Loss Net Of Tax | 9.96 | -4.31 | -4.15 | -13.06 | -16.26 | 4.19 | -6.72 | -16.28 | -19.56 | -26.91 | -30.48 | -33.55 | -49.53 | -41.15 | -39.97 | -36.48 | -20.48 | -13.60 | -20.60 | -16.04 | -26.18 | -18.96 | -32.91 | -55.65 | -63.16 | -50.40 | -43.89 | -33.45 | -34.07 | -50.71 | -42.25 | -42.48 | -25.99 | -24.05 | -7.36 | 9.37 | -11.75 | -11.38 | -29.25 | -31.01 | -33.11 | -39.14 | -31.69 | -30.34 | -39.41 | -24.39 | -22.60 | -23.26 | -23.22 | -26.90 | -24.66 | NA | -27.46 | NA | NA | NA | |
| Adjustments To Additional Paid In Capital Sharebased Compensation Requisite Service Period Recognition Value | 5.54 | 6.85 | 10.40 | 7.21 | 7.61 | 8.44 | 9.20 | 6.54 | 6.79 | 7.40 | 6.38 | 5.10 | 4.91 | 4.62 | 3.51 | 6.08 | 3.57 | 2.76 | 6.49 | 5.94 | 6.01 | 6.31 | 6.41 | 5.09 | NA | NA | NA | NA | NA | NA | NA | NA | NA | NA | NA | NA | NA | NA | NA | NA | NA | NA | NA | NA | NA | NA | NA | NA | NA | NA | NA | NA | NA | NA | NA | NA |
| 2023-12-31 | 2023-09-30 | 2023-06-30 | 2023-03-31 | 2022-12-31 | 2022-09-30 | 2022-06-30 | 2022-03-31 | 2021-12-31 | 2021-09-30 | 2021-06-30 | 2021-03-31 | 2020-12-31 | 2020-09-30 | 2020-06-30 | 2020-03-31 | 2019-12-31 | 2019-09-30 | 2019-06-30 | 2019-03-31 | 2018-12-31 | 2018-09-30 | 2018-06-30 | 2018-03-31 | 2017-12-31 | 2017-09-30 | 2017-06-30 | 2017-03-31 | 2016-12-31 | 2016-09-30 | 2016-06-30 | 2016-03-31 | 2015-12-31 | 2015-09-30 | 2015-06-30 | 2015-03-31 | 2014-12-31 | 2014-09-30 | 2014-06-30 | 2014-03-31 | 2013-12-31 | 2013-09-30 | 2013-06-30 | 2013-03-31 | 2012-12-31 | 2012-09-30 | 2012-06-30 | 2012-03-31 | 2011-12-31 | 2011-09-30 | 2011-06-30 | 2011-03-31 | 2010-12-31 | 2010-09-30 | 2010-06-30 | 2010-03-31 | ||
|---|---|---|---|---|---|---|---|---|---|---|---|---|---|---|---|---|---|---|---|---|---|---|---|---|---|---|---|---|---|---|---|---|---|---|---|---|---|---|---|---|---|---|---|---|---|---|---|---|---|---|---|---|---|---|---|---|---|
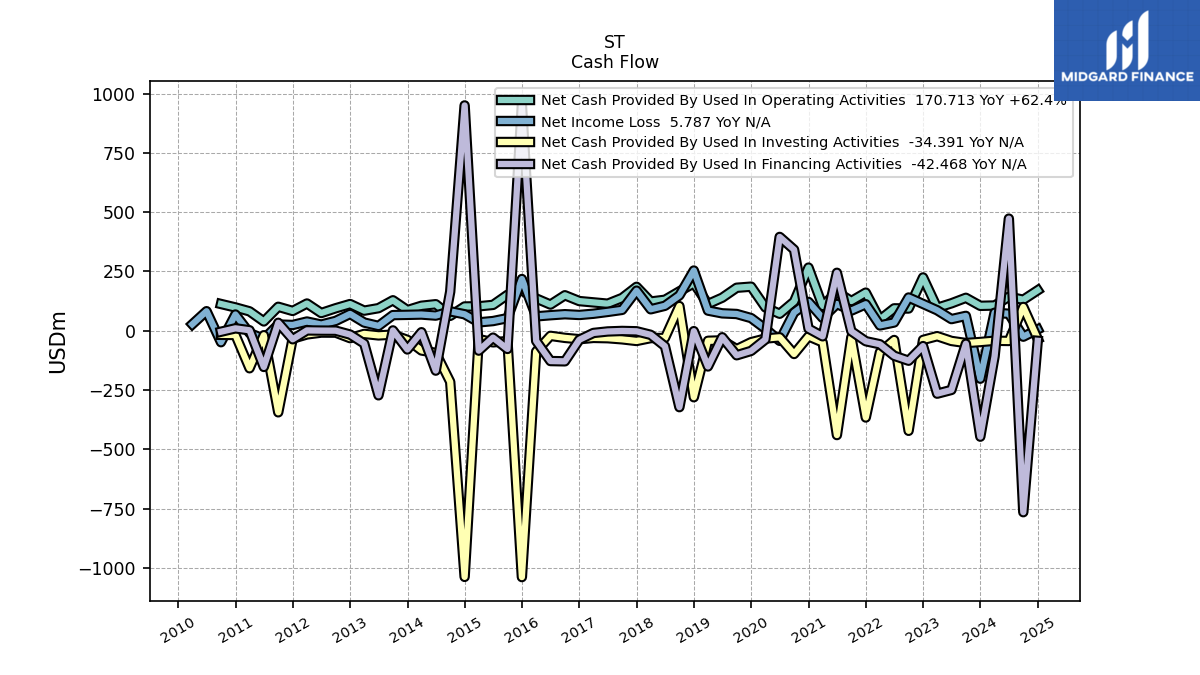
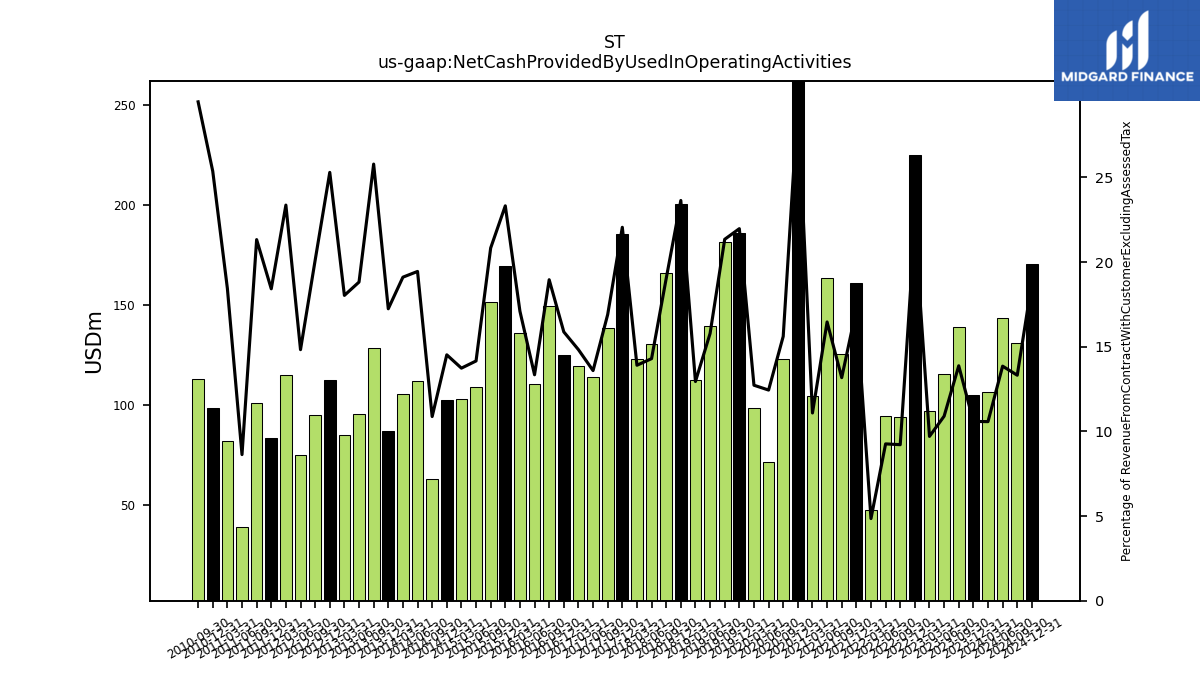
| Net Cash Provided By Used In Operating Activities | 105.10 | 138.94 | 115.75 | 96.89 | 224.86 | 93.84 | 94.53 | 47.35 | 160.93 | 125.30 | 163.42 | 104.51 | 266.44 | 123.07 | 71.73 | 98.54 | 186.03 | 181.36 | 139.47 | 112.69 | 200.42 | 166.23 | 130.66 | 123.25 | 185.37 | 138.43 | 114.15 | 119.70 | 125.17 | 149.72 | 110.43 | 136.20 | 169.42 | 151.51 | 109.09 | 103.11 | 102.42 | 62.77 | 111.98 | 105.40 | 87.07 | 128.64 | 95.30 | 84.82 | 112.66 | 94.88 | 74.82 | 114.95 | 83.51 | 101.15 | 39.27 | 81.93 | 98.37 | 112.92 | NA | NA | |
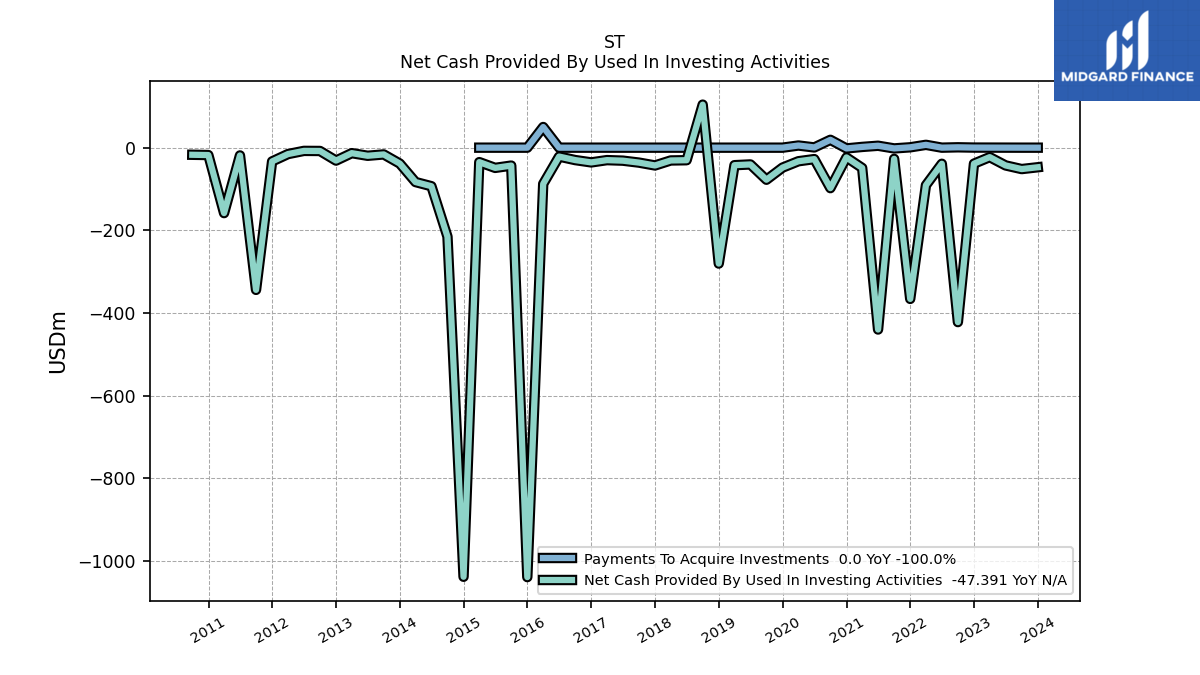
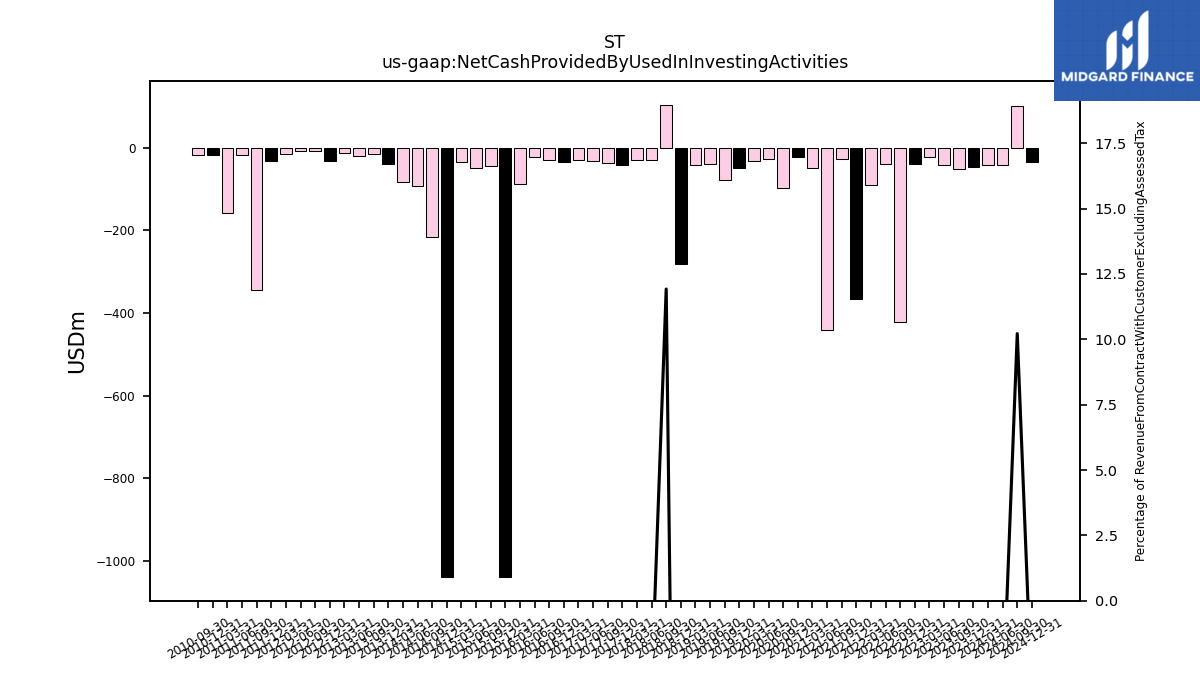
| Net Cash Provided By Used In Investing Activities | -47.39 | -51.78 | -42.95 | -22.88 | -38.68 | -422.10 | -38.93 | -90.85 | -365.99 | -27.00 | -440.07 | -49.04 | -23.62 | -97.97 | -27.66 | -32.84 | -48.25 | -77.60 | -40.55 | -42.37 | -280.47 | 104.16 | -30.36 | -30.94 | -43.05 | -36.13 | -31.42 | -30.12 | -35.63 | -30.02 | -21.53 | -87.59 | -1039.15 | -43.34 | -48.92 | -34.95 | -1038.32 | -215.34 | -93.23 | -83.17 | -38.44 | -16.34 | -19.60 | -13.27 | -31.24 | -8.00 | -7.79 | -15.47 | -33.24 | -344.12 | -18.75 | -158.33 | -17.82 | -17.19 | NA | NA | |
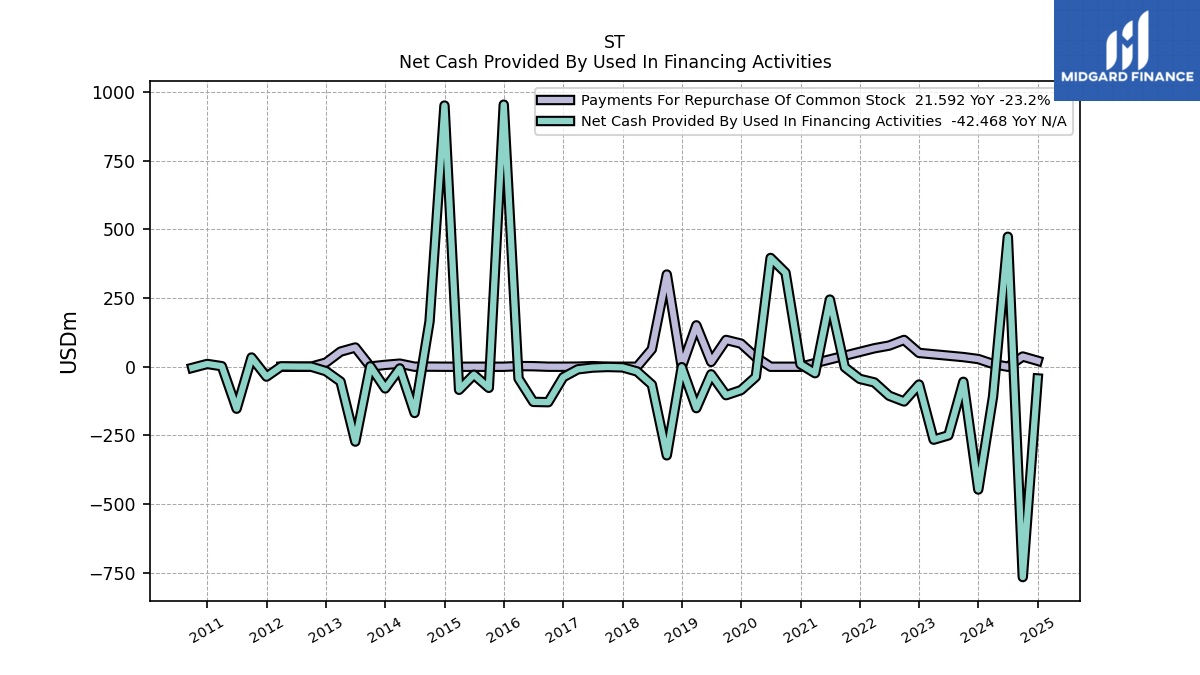
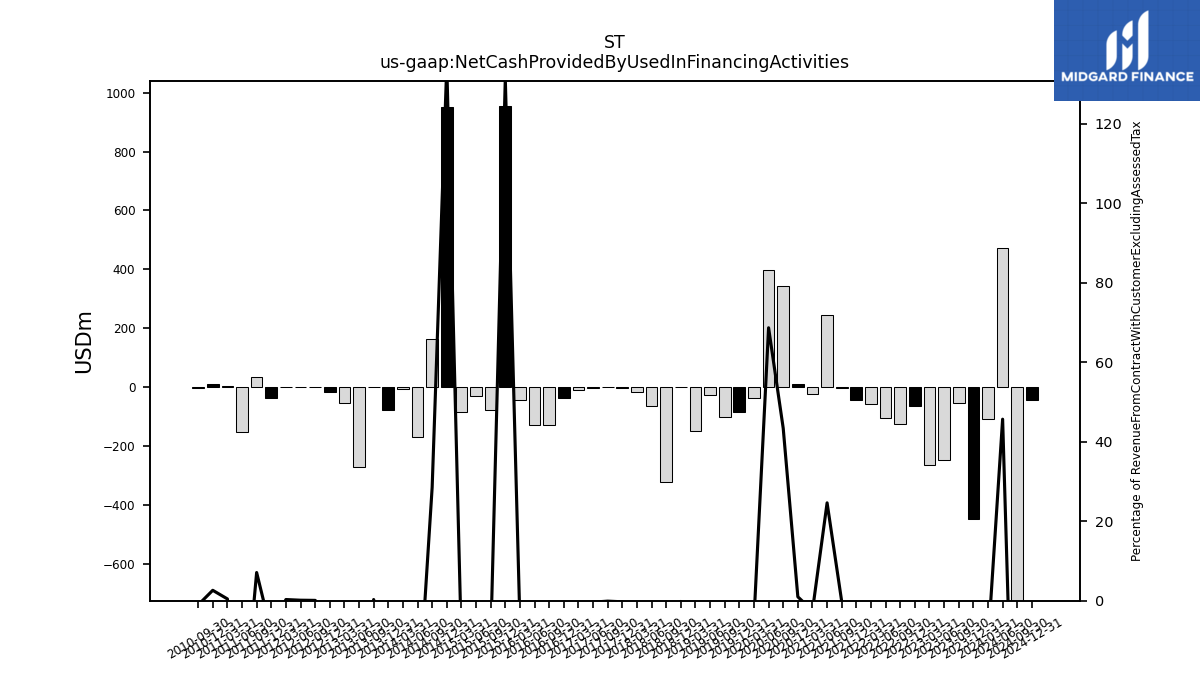
| Net Cash Provided By Used In Financing Activities | -446.78 | -54.76 | -249.62 | -265.39 | -64.58 | -126.40 | -105.50 | -56.98 | -44.12 | -1.92 | 244.49 | -23.53 | 8.98 | 342.15 | 395.91 | -36.86 | -85.05 | -103.45 | -27.36 | -150.64 | -1.52 | -322.37 | -65.18 | -17.14 | -2.20 | -0.81 | -2.94 | -9.31 | -38.00 | -128.94 | -127.76 | -42.88 | 953.79 | -76.76 | -28.95 | -83.90 | 950.49 | 164.67 | -168.18 | -6.06 | -78.93 | 1.56 | -272.38 | -54.07 | -16.04 | 0.44 | 0.70 | 1.50 | -35.96 | 33.69 | -152.74 | 2.07 | 10.20 | -4.06 | NA | NA |
| 2023-12-31 | 2023-09-30 | 2023-06-30 | 2023-03-31 | 2022-12-31 | 2022-09-30 | 2022-06-30 | 2022-03-31 | 2021-12-31 | 2021-09-30 | 2021-06-30 | 2021-03-31 | 2020-12-31 | 2020-09-30 | 2020-06-30 | 2020-03-31 | 2019-12-31 | 2019-09-30 | 2019-06-30 | 2019-03-31 | 2018-12-31 | 2018-09-30 | 2018-06-30 | 2018-03-31 | 2017-12-31 | 2017-09-30 | 2017-06-30 | 2017-03-31 | 2016-12-31 | 2016-09-30 | 2016-06-30 | 2016-03-31 | 2015-12-31 | 2015-09-30 | 2015-06-30 | 2015-03-31 | 2014-12-31 | 2014-09-30 | 2014-06-30 | 2014-03-31 | 2013-12-31 | 2013-09-30 | 2013-06-30 | 2013-03-31 | 2012-12-31 | 2012-09-30 | 2012-06-30 | 2012-03-31 | 2011-12-31 | 2011-09-30 | 2011-06-30 | 2011-03-31 | 2010-12-31 | 2010-09-30 | 2010-06-30 | 2010-03-31 | ||
|---|---|---|---|---|---|---|---|---|---|---|---|---|---|---|---|---|---|---|---|---|---|---|---|---|---|---|---|---|---|---|---|---|---|---|---|---|---|---|---|---|---|---|---|---|---|---|---|---|---|---|---|---|---|---|---|---|---|
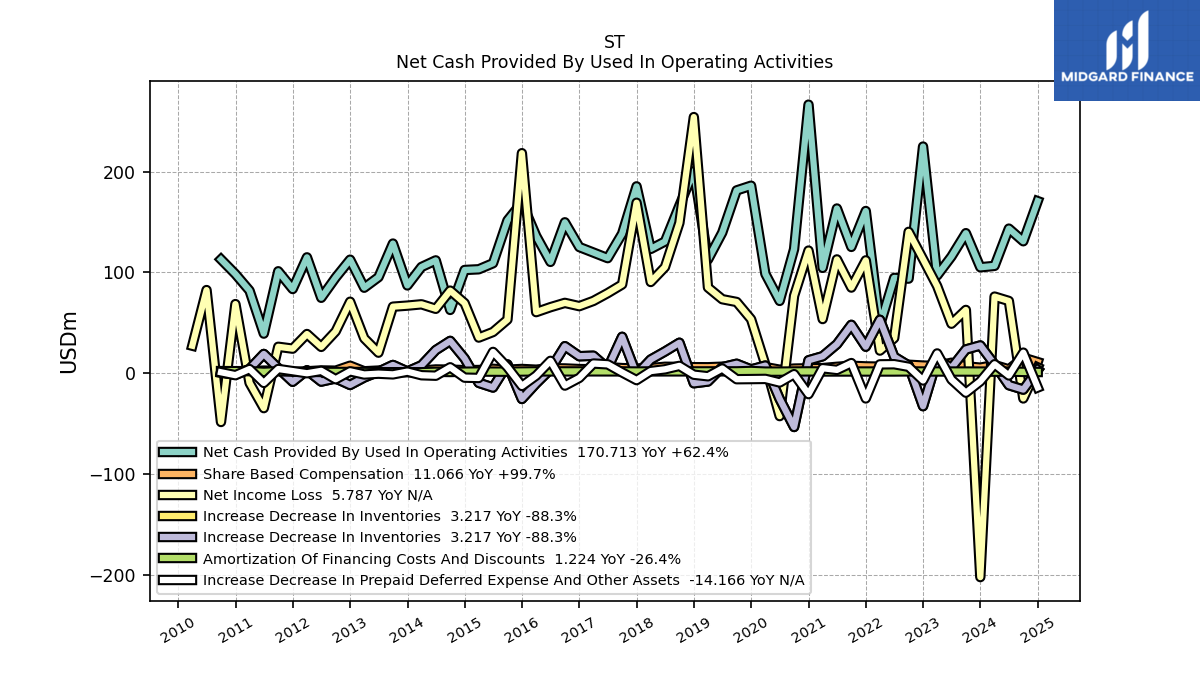
| Net Cash Provided By Used In Operating Activities | 105.10 | 138.94 | 115.75 | 96.89 | 224.86 | 93.84 | 94.53 | 47.35 | 160.93 | 125.30 | 163.42 | 104.51 | 266.44 | 123.07 | 71.73 | 98.54 | 186.03 | 181.36 | 139.47 | 112.69 | 200.42 | 166.23 | 130.66 | 123.25 | 185.37 | 138.43 | 114.15 | 119.70 | 125.17 | 149.72 | 110.43 | 136.20 | 169.42 | 151.51 | 109.09 | 103.11 | 102.42 | 62.77 | 111.98 | 105.40 | 87.07 | 128.64 | 95.30 | 84.82 | 112.66 | 94.88 | 74.82 | 114.95 | 83.51 | 101.15 | 39.27 | 81.93 | 98.37 | 112.92 | NA | NA | |
| Net Income Loss | -202.24 | 62.80 | 49.11 | 86.42 | 113.15 | 140.25 | 34.84 | 22.44 | 111.97 | 84.96 | 112.92 | 53.73 | 121.67 | 76.73 | -42.54 | 8.43 | 53.54 | 70.67 | 73.44 | 85.06 | 254.10 | 149.12 | 105.29 | 90.49 | 169.13 | 88.03 | 79.46 | 71.74 | 66.53 | 69.78 | 65.51 | 60.61 | 218.29 | 53.15 | 40.90 | 35.35 | 69.52 | 81.96 | 63.89 | 68.37 | 67.07 | 66.02 | 20.37 | 34.66 | 70.94 | 41.51 | 26.12 | 38.92 | 24.38 | 26.25 | -34.63 | -9.53 | 68.61 | -48.39 | 82.52 | 27.31 | |
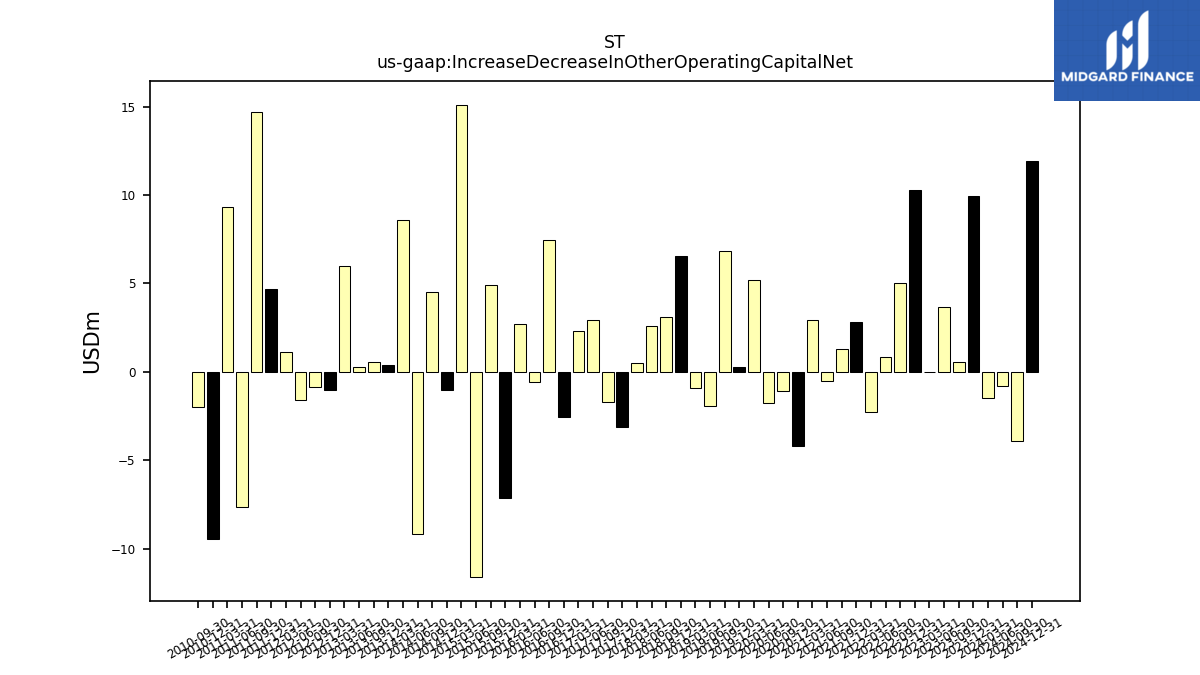
| Increase Decrease In Other Operating Capital Net | 9.96 | 0.54 | 3.65 | -0.03 | 10.28 | 5.03 | 0.82 | -2.25 | 2.82 | 1.28 | -0.52 | 2.95 | -4.21 | -1.08 | -1.76 | 5.19 | 0.27 | 6.83 | -1.95 | -0.91 | 6.54 | 3.13 | 2.60 | 0.48 | -3.09 | -1.71 | 2.96 | 2.31 | -2.57 | 7.46 | -0.59 | 2.71 | -7.11 | 4.89 | -11.60 | 15.11 | -1.02 | 4.52 | -9.14 | 8.61 | 0.39 | 0.55 | 0.25 | 5.98 | -1.00 | -0.87 | -1.56 | 1.15 | 4.71 | 14.69 | -7.65 | 9.30 | -9.43 | -1.96 | NA | NA | |
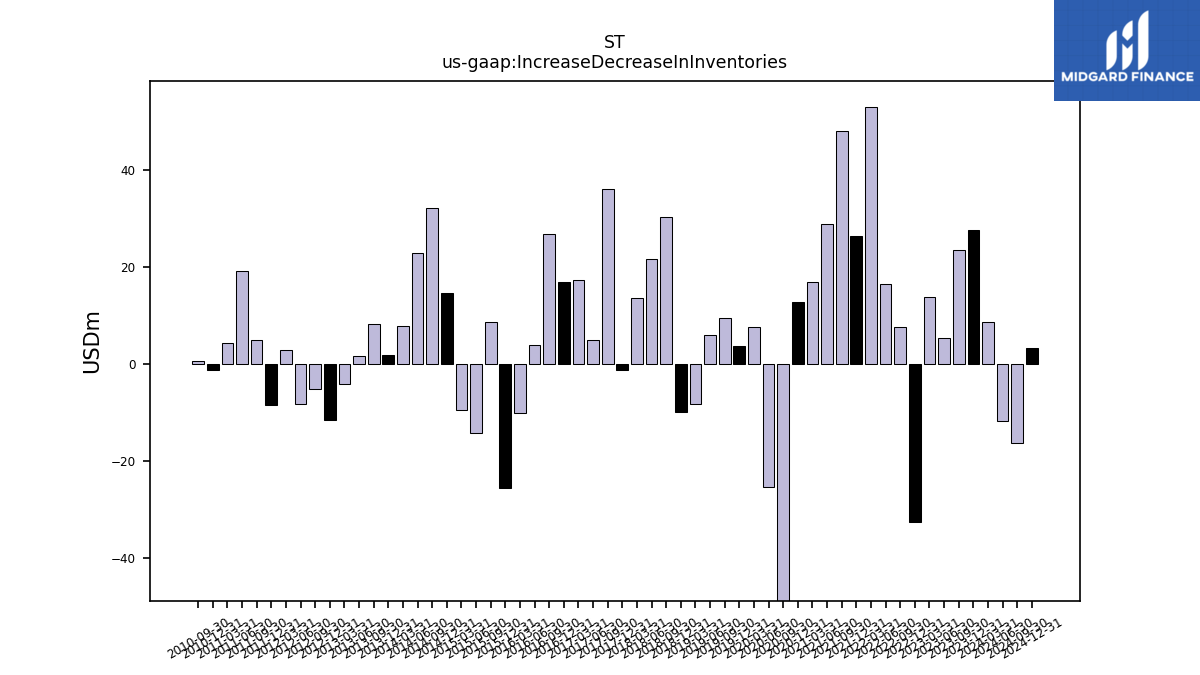
| Increase Decrease In Inventories | 27.55 | 23.56 | 5.35 | 13.69 | -32.70 | 7.68 | 16.38 | 53.00 | 26.31 | 47.99 | 28.81 | 16.86 | 12.82 | -53.34 | -25.47 | 7.60 | 3.73 | 9.39 | 5.99 | -8.18 | -9.93 | 30.24 | 21.56 | 13.57 | -1.36 | 36.13 | 4.99 | 17.35 | 16.88 | 26.85 | 3.88 | -10.11 | -25.56 | 8.71 | -14.15 | -9.53 | 14.61 | 32.07 | 22.92 | 7.87 | 1.79 | 8.23 | 1.53 | -4.21 | -11.64 | -5.10 | -8.28 | 2.92 | -8.47 | 5.02 | 19.14 | 4.22 | -1.35 | 0.67 | NA | NA | |
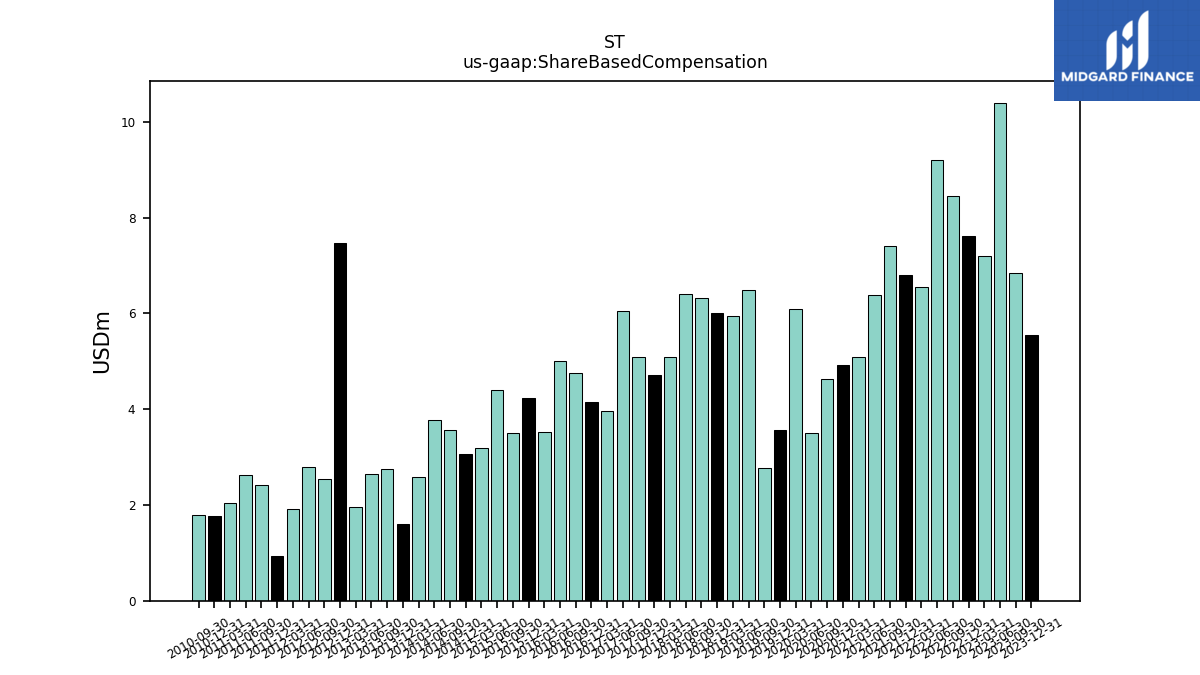
| Share Based Compensation | 5.54 | 6.85 | 10.40 | 7.21 | 7.61 | 8.44 | 9.20 | 6.54 | 6.79 | 7.40 | 6.38 | 5.10 | 4.91 | 4.62 | 3.51 | 6.08 | 3.57 | 2.76 | 6.49 | 5.94 | 6.01 | 6.31 | 6.41 | 5.09 | 4.71 | 5.10 | 6.06 | 3.95 | 4.15 | 4.76 | 5.01 | 3.52 | 4.23 | 3.51 | 4.39 | 3.19 | 3.06 | 3.57 | 3.77 | 2.58 | 1.61 | 2.76 | 2.65 | 1.95 | 7.46 | 2.55 | 2.78 | 1.92 | 0.94 | 2.42 | 2.62 | 2.04 | 1.76 | 1.79 | NA | NA |
| 2023-12-31 | 2023-09-30 | 2023-06-30 | 2023-03-31 | 2022-12-31 | 2022-09-30 | 2022-06-30 | 2022-03-31 | 2021-12-31 | 2021-09-30 | 2021-06-30 | 2021-03-31 | 2020-12-31 | 2020-09-30 | 2020-06-30 | 2020-03-31 | 2019-12-31 | 2019-09-30 | 2019-06-30 | 2019-03-31 | 2018-12-31 | 2018-09-30 | 2018-06-30 | 2018-03-31 | 2017-12-31 | 2017-09-30 | 2017-06-30 | 2017-03-31 | 2016-12-31 | 2016-09-30 | 2016-06-30 | 2016-03-31 | 2015-12-31 | 2015-09-30 | 2015-06-30 | 2015-03-31 | 2014-12-31 | 2014-09-30 | 2014-06-30 | 2014-03-31 | 2013-12-31 | 2013-09-30 | 2013-06-30 | 2013-03-31 | 2012-12-31 | 2012-09-30 | 2012-06-30 | 2012-03-31 | 2011-12-31 | 2011-09-30 | 2011-06-30 | 2011-03-31 | 2010-12-31 | 2010-09-30 | 2010-06-30 | 2010-03-31 | ||
|---|---|---|---|---|---|---|---|---|---|---|---|---|---|---|---|---|---|---|---|---|---|---|---|---|---|---|---|---|---|---|---|---|---|---|---|---|---|---|---|---|---|---|---|---|---|---|---|---|---|---|---|---|---|---|---|---|---|
| Net Cash Provided By Used In Investing Activities | -47.39 | -51.78 | -42.95 | -22.88 | -38.68 | -422.10 | -38.93 | -90.85 | -365.99 | -27.00 | -440.07 | -49.04 | -23.62 | -97.97 | -27.66 | -32.84 | -48.25 | -77.60 | -40.55 | -42.37 | -280.47 | 104.16 | -30.36 | -30.94 | -43.05 | -36.13 | -31.42 | -30.12 | -35.63 | -30.02 | -21.53 | -87.59 | -1039.15 | -43.34 | -48.92 | -34.95 | -1038.32 | -215.34 | -93.23 | -83.17 | -38.44 | -16.34 | -19.60 | -13.27 | -31.24 | -8.00 | -7.79 | -15.47 | -33.24 | -344.12 | -18.75 | -158.33 | -17.82 | -17.19 | NA | NA | |
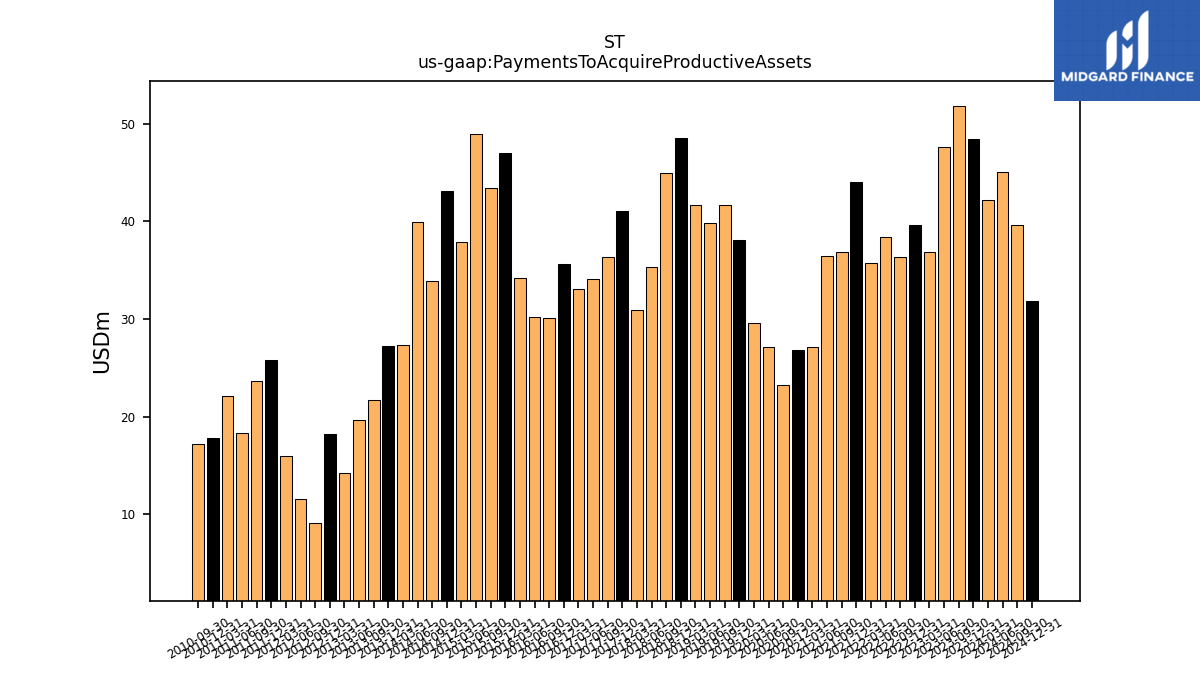
| Payments To Acquire Productive Assets | 48.38 | 51.78 | 47.56 | 36.88 | 39.64 | 36.35 | 38.36 | 35.71 | 43.99 | 36.84 | 36.40 | 27.17 | 26.78 | 23.24 | 27.15 | 29.55 | 38.05 | 41.66 | 39.86 | 41.69 | 48.51 | 44.97 | 35.36 | 30.94 | 41.05 | 36.34 | 34.13 | 33.06 | 35.63 | 30.12 | 30.23 | 34.23 | 46.95 | 43.44 | 48.92 | 37.88 | 43.11 | 33.91 | 39.89 | 27.31 | 27.26 | 21.67 | 19.60 | 14.26 | 18.21 | 9.10 | 11.55 | 15.93 | 25.77 | 23.61 | 18.36 | 22.06 | 17.82 | 17.19 | NA | NA | |
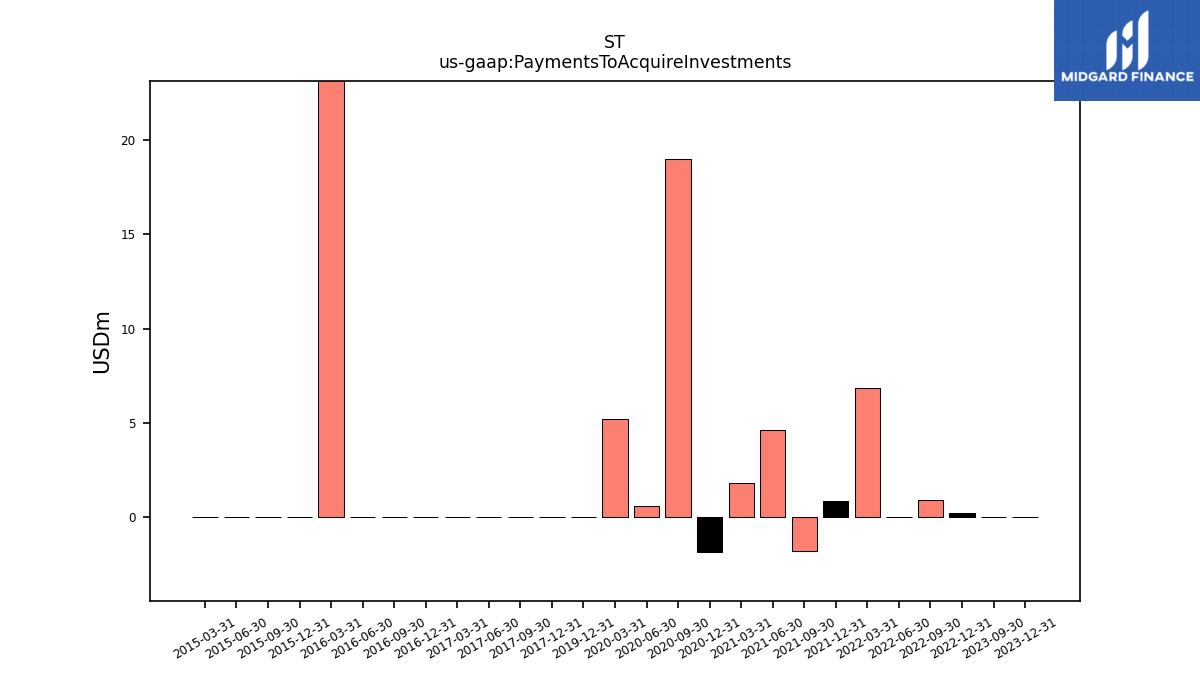
| Payments To Acquire Investments | 0.00 | 0.00 | NA | NA | 0.21 | 0.90 | 0.03 | 6.85 | 0.88 | -1.79 | 4.64 | 1.80 | -1.83 | 18.98 | 0.60 | 5.22 | 0.00 | NA | NA | NA | NA | NA | NA | NA | 0.00 | 0.00 | 0.00 | 0.00 | 0.00 | 0.00 | 0.00 | 50.00 | 0.00 | 0.00 | 0.00 | 0.00 | NA | NA | NA | NA | NA | NA | NA | NA | NA | NA | NA | NA | NA | NA | NA | NA | NA | NA | NA | NA |
| 2023-12-31 | 2023-09-30 | 2023-06-30 | 2023-03-31 | 2022-12-31 | 2022-09-30 | 2022-06-30 | 2022-03-31 | 2021-12-31 | 2021-09-30 | 2021-06-30 | 2021-03-31 | 2020-12-31 | 2020-09-30 | 2020-06-30 | 2020-03-31 | 2019-12-31 | 2019-09-30 | 2019-06-30 | 2019-03-31 | 2018-12-31 | 2018-09-30 | 2018-06-30 | 2018-03-31 | 2017-12-31 | 2017-09-30 | 2017-06-30 | 2017-03-31 | 2016-12-31 | 2016-09-30 | 2016-06-30 | 2016-03-31 | 2015-12-31 | 2015-09-30 | 2015-06-30 | 2015-03-31 | 2014-12-31 | 2014-09-30 | 2014-06-30 | 2014-03-31 | 2013-12-31 | 2013-09-30 | 2013-06-30 | 2013-03-31 | 2012-12-31 | 2012-09-30 | 2012-06-30 | 2012-03-31 | 2011-12-31 | 2011-09-30 | 2011-06-30 | 2011-03-31 | 2010-12-31 | 2010-09-30 | 2010-06-30 | 2010-03-31 | ||
|---|---|---|---|---|---|---|---|---|---|---|---|---|---|---|---|---|---|---|---|---|---|---|---|---|---|---|---|---|---|---|---|---|---|---|---|---|---|---|---|---|---|---|---|---|---|---|---|---|---|---|---|---|---|---|---|---|---|
| Net Cash Provided By Used In Financing Activities | -446.78 | -54.76 | -249.62 | -265.39 | -64.58 | -126.40 | -105.50 | -56.98 | -44.12 | -1.92 | 244.49 | -23.53 | 8.98 | 342.15 | 395.91 | -36.86 | -85.05 | -103.45 | -27.36 | -150.64 | -1.52 | -322.37 | -65.18 | -17.14 | -2.20 | -0.81 | -2.94 | -9.31 | -38.00 | -128.94 | -127.76 | -42.88 | 953.79 | -76.76 | -28.95 | -83.90 | 950.49 | 164.67 | -168.18 | -6.06 | -78.93 | 1.56 | -272.38 | -54.07 | -16.04 | 0.44 | 0.70 | 1.50 | -35.96 | 33.69 | -152.74 | 2.07 | 10.20 | -4.06 | NA | NA | |
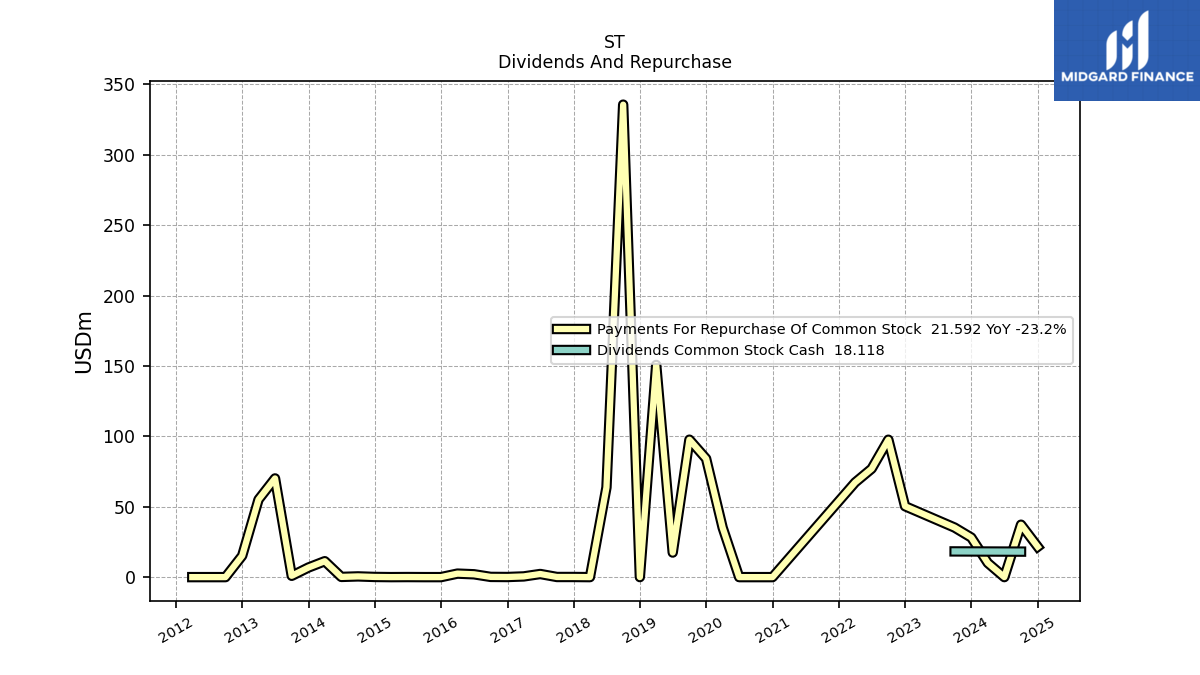
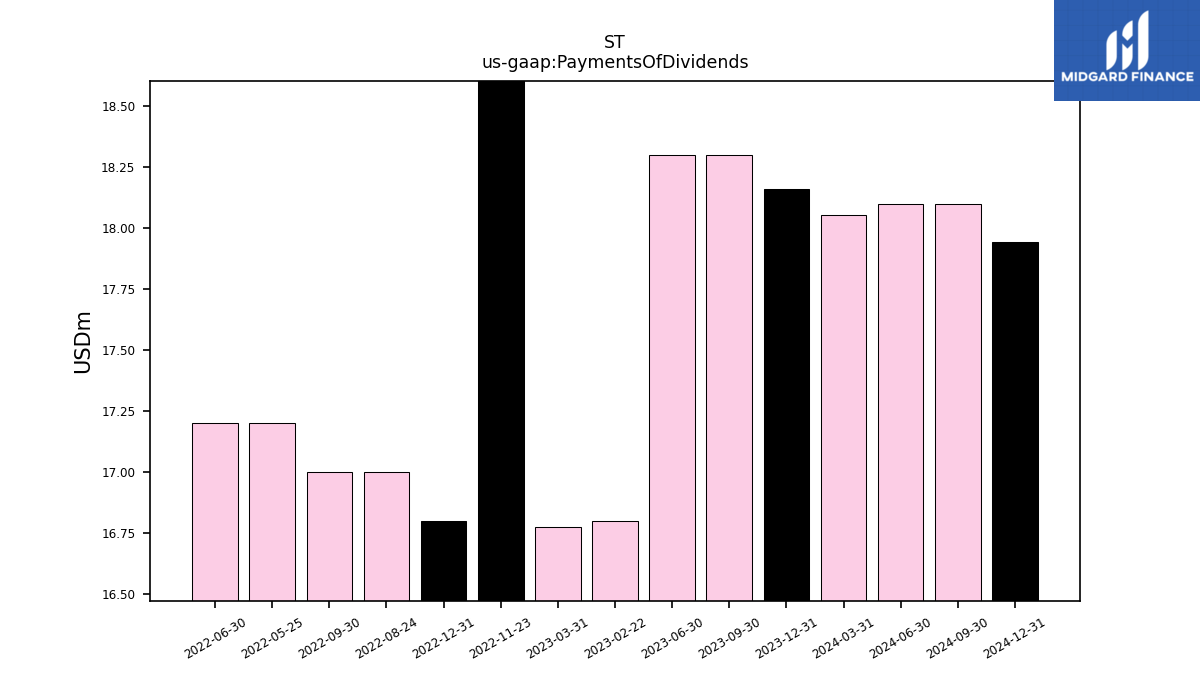
| Payments Of Dividends | 18.16 | 18.30 | 18.30 | 16.78 | 16.80 | 17.00 | 17.20 | NA | NA | NA | NA | NA | NA | NA | NA | NA | NA | NA | NA | NA | NA | NA | NA | NA | NA | NA | NA | NA | NA | NA | NA | NA | NA | NA | NA | NA | NA | NA | NA | NA | NA | NA | NA | NA | NA | NA | NA | NA | NA | NA | NA | NA | NA | NA | NA | NA | |
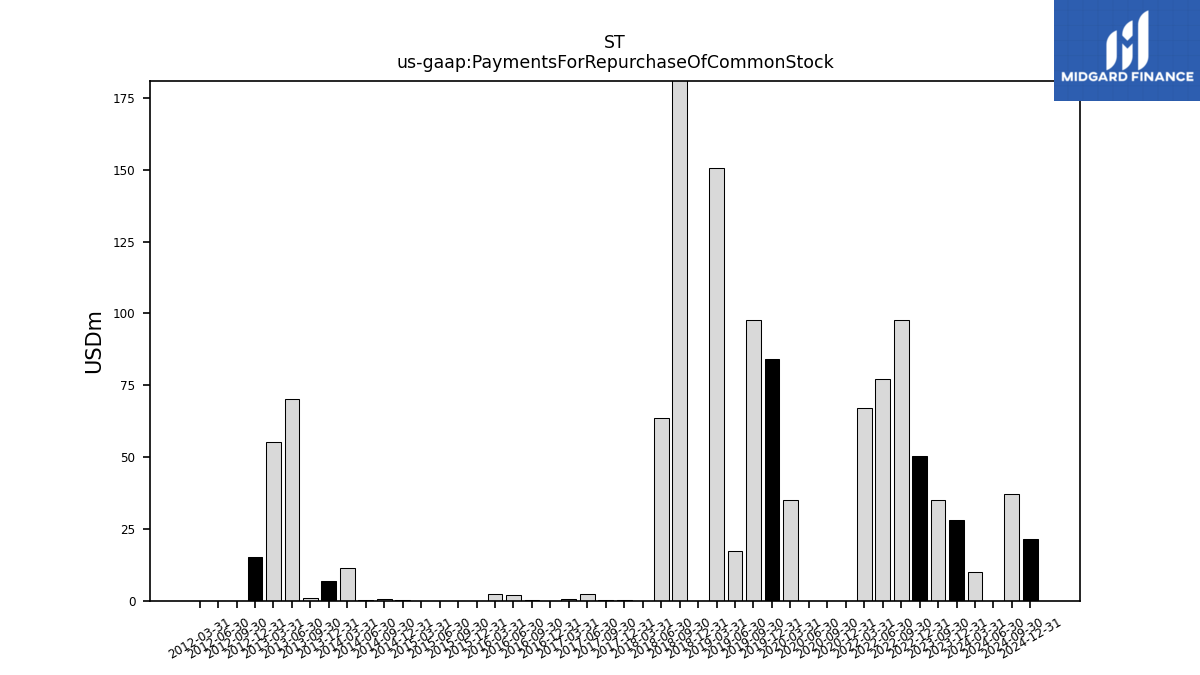
| Payments For Repurchase Of Common Stock | 28.11 | 35.21 | NA | NA | 50.37 | 97.62 | 77.02 | 67.26 | NA | NA | NA | NA | 0.00 | 0.00 | 0.00 | 35.17 | 84.16 | 97.65 | 17.45 | 150.75 | 0.00 | 335.67 | 63.75 | 0.00 | 0.09 | 0.10 | 2.22 | 0.50 | 0.08 | 0.16 | 2.02 | 2.49 | 0.00 | 0.00 | 0.05 | 0.00 | 0.12 | 0.51 | 0.15 | 11.31 | 6.82 | 0.94 | 70.12 | 55.09 | 15.19 | 0.00 | 0.00 | 0.00 | NA | NA | NA | NA | NA | NA | NA | NA |
| 2023-12-31 | 2023-09-30 | 2023-06-30 | 2023-03-31 | 2022-12-31 | 2022-09-30 | 2022-06-30 | 2022-03-31 | 2021-12-31 | 2021-09-30 | 2021-06-30 | 2021-03-31 | 2020-12-31 | 2020-09-30 | 2020-06-30 | 2020-03-31 | 2019-12-31 | 2019-09-30 | 2019-06-30 | 2019-03-31 | 2018-12-31 | 2018-09-30 | 2018-06-30 | 2018-03-31 | 2017-12-31 | 2017-09-30 | 2017-06-30 | 2017-03-31 | 2016-12-31 | 2016-09-30 | 2016-06-30 | 2016-03-31 | 2015-12-31 | 2015-09-30 | 2015-06-30 | 2015-03-31 | 2014-12-31 | 2014-09-30 | 2014-06-30 | 2014-03-31 | 2013-12-31 | 2013-09-30 | 2013-06-30 | 2013-03-31 | 2012-12-31 | 2012-09-30 | 2012-06-30 | 2012-03-31 | 2011-12-31 | 2011-09-30 | 2011-06-30 | 2011-03-31 | 2010-12-31 | 2010-09-30 | 2010-06-30 | 2010-03-31 | ||
|---|---|---|---|---|---|---|---|---|---|---|---|---|---|---|---|---|---|---|---|---|---|---|---|---|---|---|---|---|---|---|---|---|---|---|---|---|---|---|---|---|---|---|---|---|---|---|---|---|---|---|---|---|---|---|---|---|---|
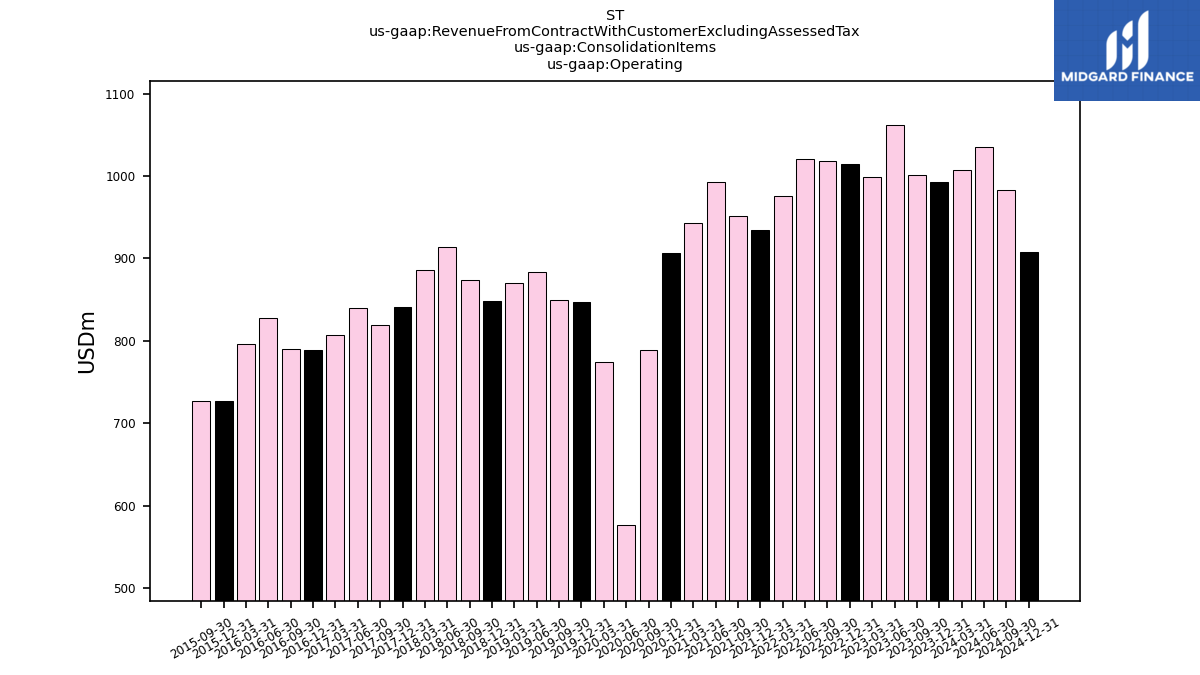
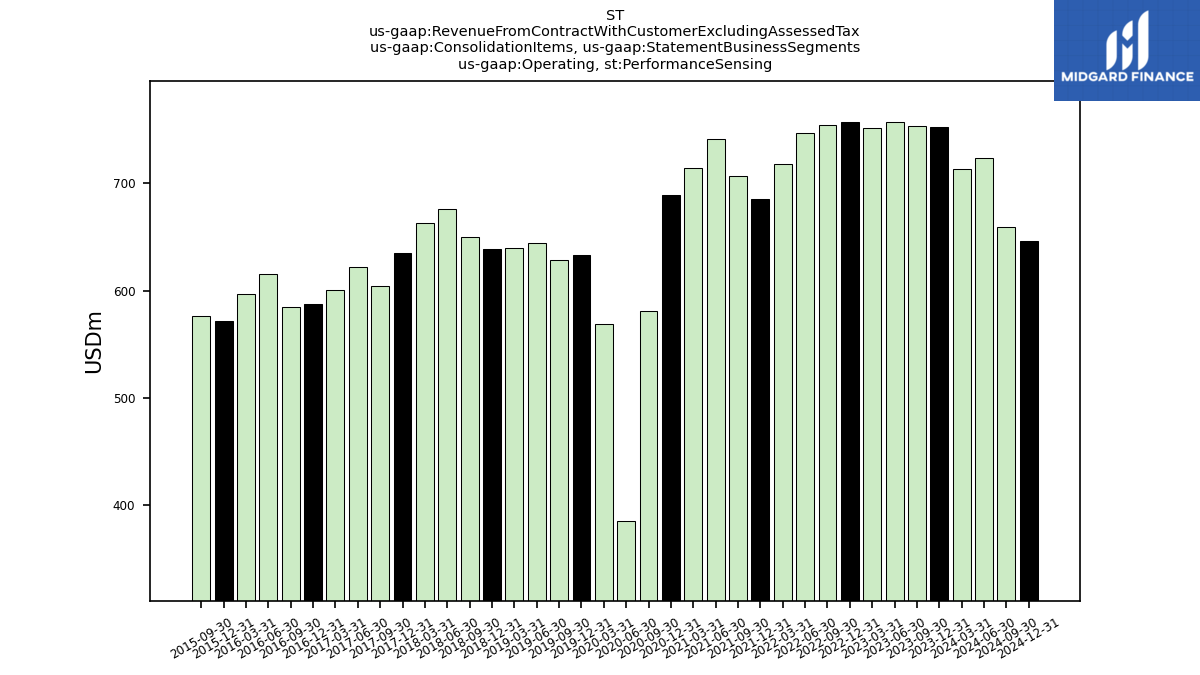
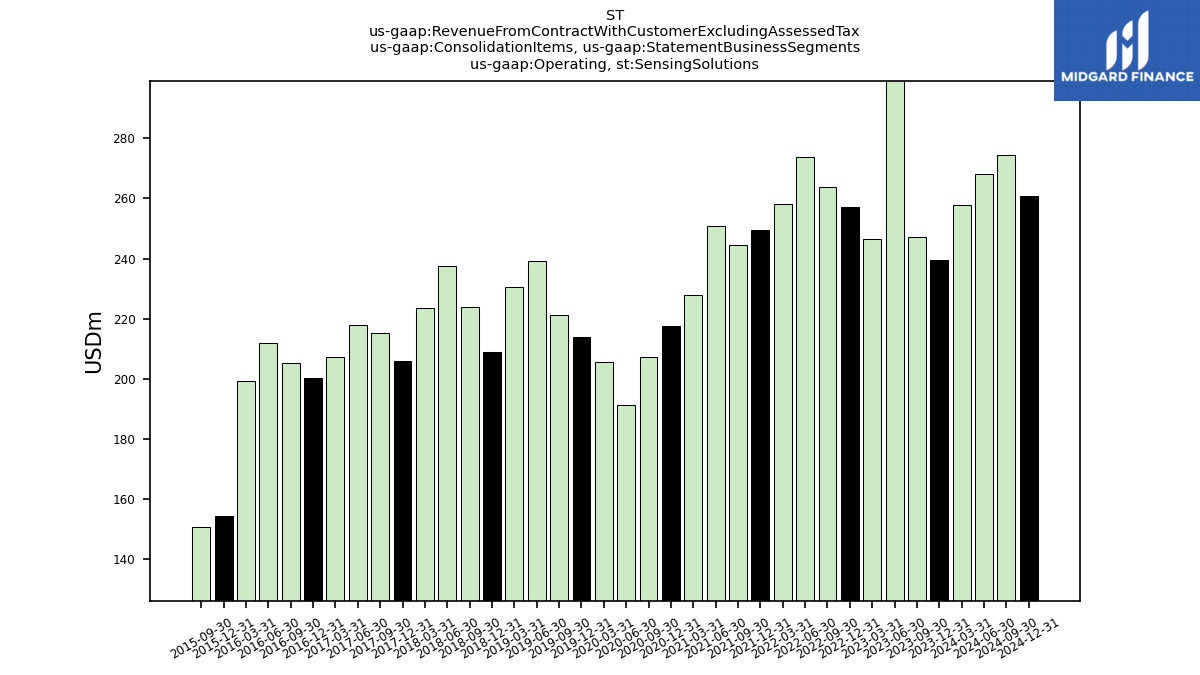
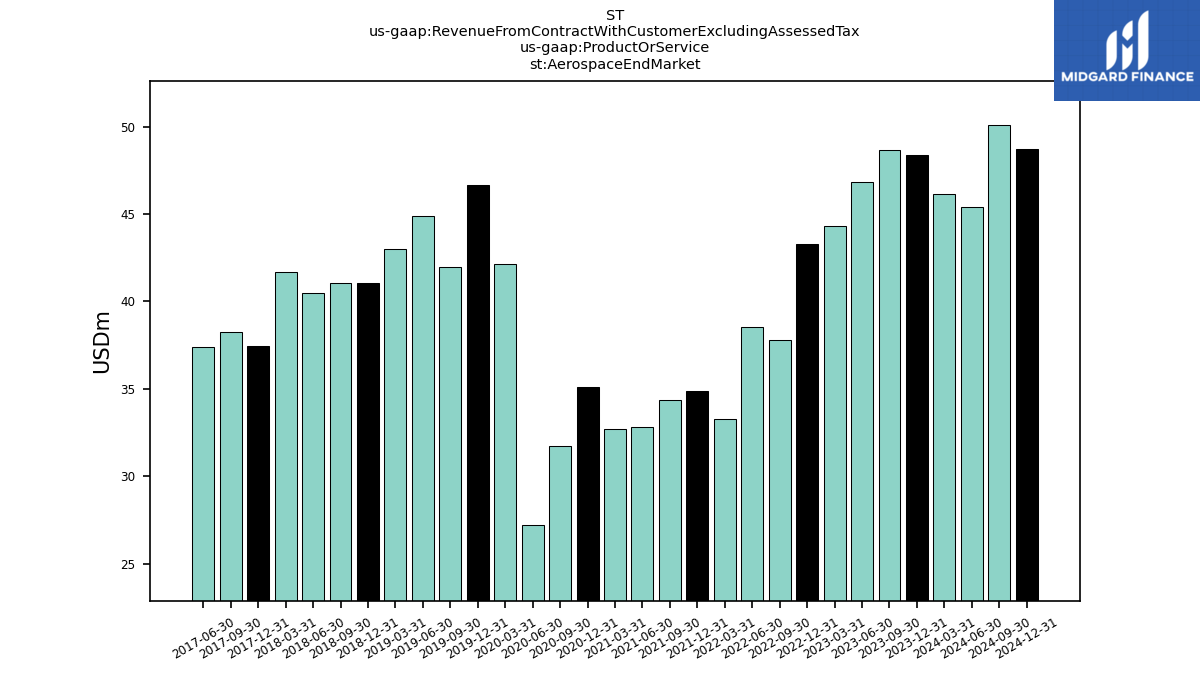
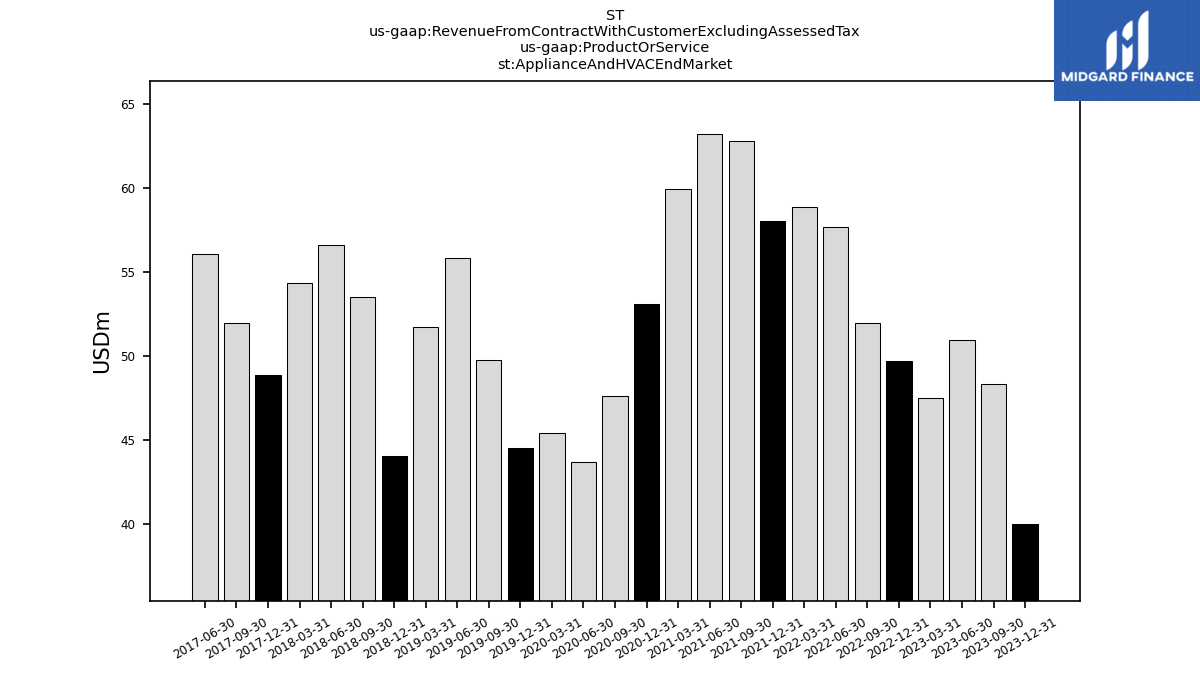
| Revenue From Contract With Customer Excluding Assessed Tax | 992.49 | 1001.30 | 1062.11 | 998.17 | 1014.68 | 1018.27 | 1020.55 | 975.77 | 934.60 | 951.02 | 992.66 | 942.53 | 906.49 | 788.31 | 576.50 | 774.27 | 846.69 | 849.72 | 883.73 | 870.50 | 847.92 | 873.55 | 913.86 | 886.29 | 840.53 | 819.05 | 839.87 | 807.27 | 788.40 | 789.80 | 827.54 | 796.55 | 726.47 | 727.36 | 770.45 | 750.68 | 705.26 | 577.10 | 575.85 | 551.59 | 505.01 | 498.89 | 506.42 | 470.41 | 445.36 | 471.93 | 504.62 | 492.01 | 453.37 | 474.31 | 455.04 | 444.23 | 387.84 | 383.29 | 391.81 | 377.14 | |
| Operating | 992.49 | 1001.30 | 1062.11 | 998.17 | 1014.68 | 1018.27 | 1020.55 | 975.77 | 934.60 | 951.02 | 992.66 | 942.53 | 906.49 | 788.31 | 576.50 | 774.27 | 846.69 | 849.72 | 883.73 | 870.50 | 847.92 | 873.55 | 913.86 | 886.29 | 840.53 | 819.05 | 839.87 | 807.27 | 788.40 | 789.80 | 827.54 | 796.55 | 726.47 | 727.36 | NA | NA | NA | NA | NA | NA | NA | NA | NA | NA | NA | NA | NA | NA | NA | NA | NA | NA | NA | NA | NA | NA | |
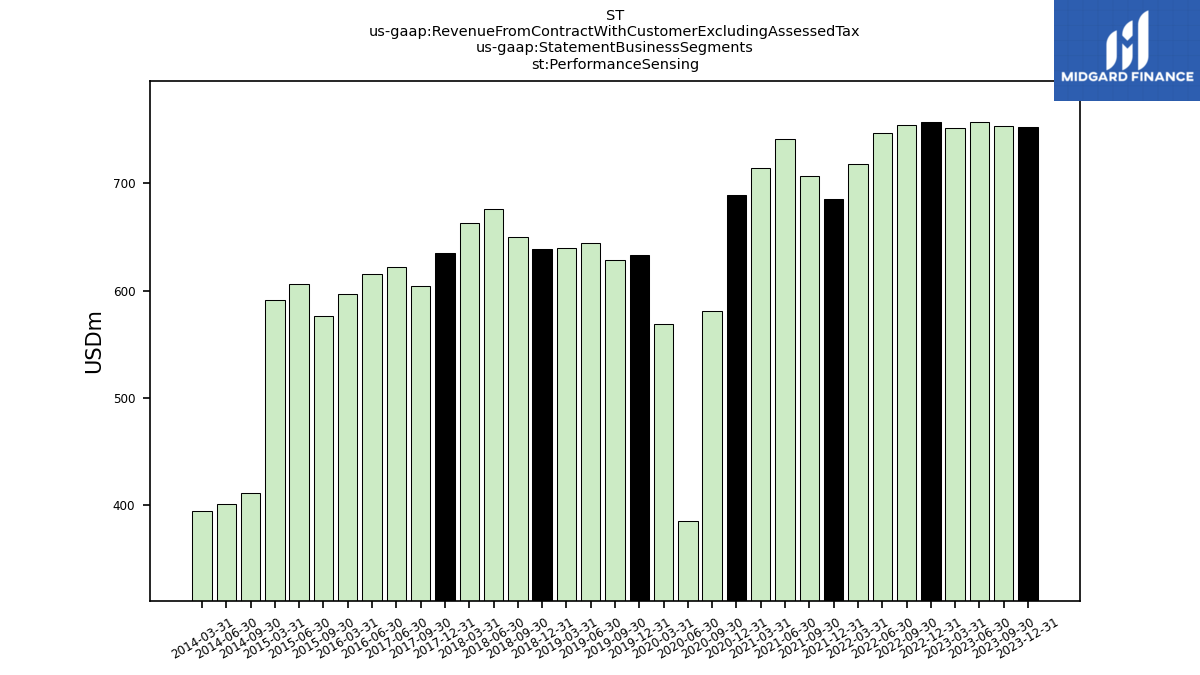
| Operating, Performance Sensing | 753.03 | 753.99 | 757.44 | 751.52 | 757.65 | 754.53 | 746.88 | 717.70 | 685.08 | 706.47 | 741.85 | 714.51 | 688.98 | 580.94 | 385.21 | 568.69 | 632.88 | 628.59 | 644.52 | 640.03 | 638.99 | 649.61 | 676.22 | 662.83 | 634.70 | 603.93 | 621.83 | 600.14 | 587.99 | 584.65 | 615.57 | 597.17 | 572.14 | 576.48 | NA | NA | NA | NA | NA | NA | NA | NA | NA | NA | NA | NA | NA | NA | NA | NA | NA | NA | NA | NA | NA | NA | |
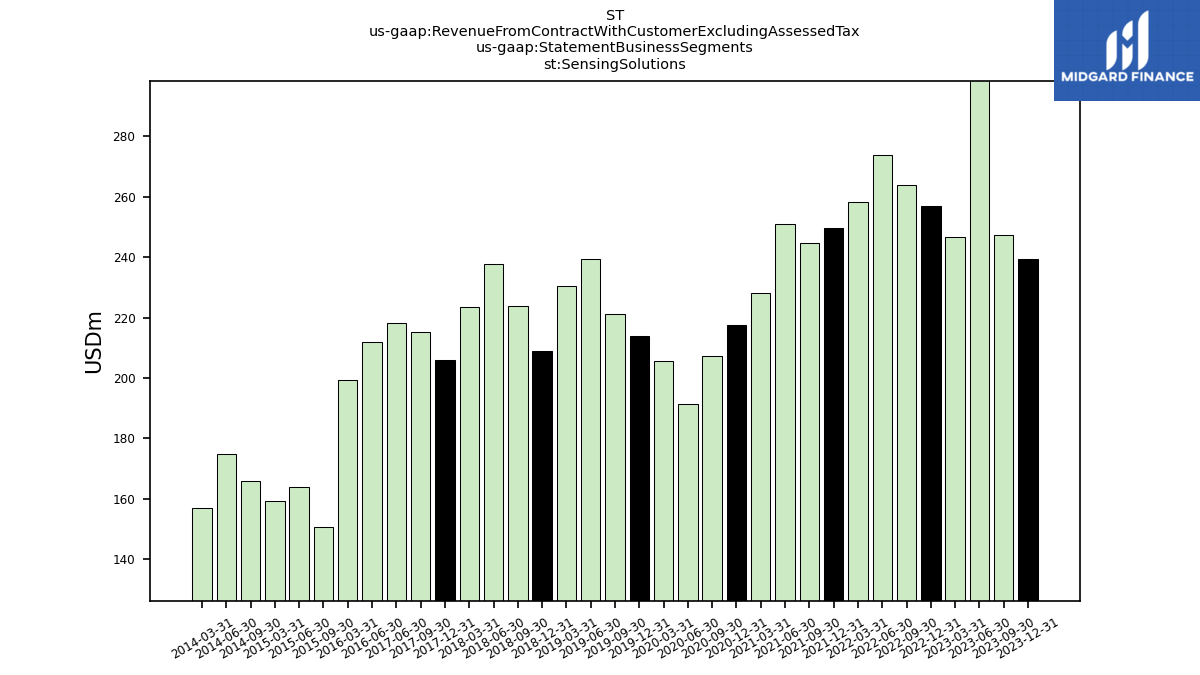
| Operating, Sensing Solutions | 239.47 | 247.31 | 304.67 | 246.65 | 257.03 | 263.74 | 273.67 | 258.07 | 249.52 | 244.56 | 250.81 | 228.02 | 217.51 | 207.38 | 191.30 | 205.58 | 213.81 | 221.12 | 239.21 | 230.47 | 208.93 | 223.94 | 237.64 | 223.46 | 205.84 | 215.12 | 218.04 | 207.13 | 200.41 | 205.15 | 211.97 | 199.37 | 154.33 | 150.88 | NA | NA | NA | NA | NA | NA | NA | NA | NA | NA | NA | NA | NA | NA | NA | NA | NA | NA | NA | NA | NA | NA | |
| Foreign Exchange Forward, Reclassification Out Of Accumulated Other Comprehensive Income, Accumulated Gain Loss Net Cash Flow Hedge Parent | 1.90 | 4.19 | -4.39 | -6.64 | -17.53 | -14.91 | -9.48 | -4.26 | -0.54 | 1.98 | 3.43 | 4.41 | 2.85 | -0.62 | -6.39 | -6.62 | -8.85 | -7.62 | -6.49 | -3.22 | -2.37 | 1.49 | 8.06 | 10.88 | 4.59 | 4.08 | -2.37 | NA | NA | NA | NA | NA | NA | NA | NA | NA | NA | NA | NA | NA | NA | NA | NA | NA | NA | NA | NA | NA | NA | NA | NA | NA | NA | NA | NA | NA | |
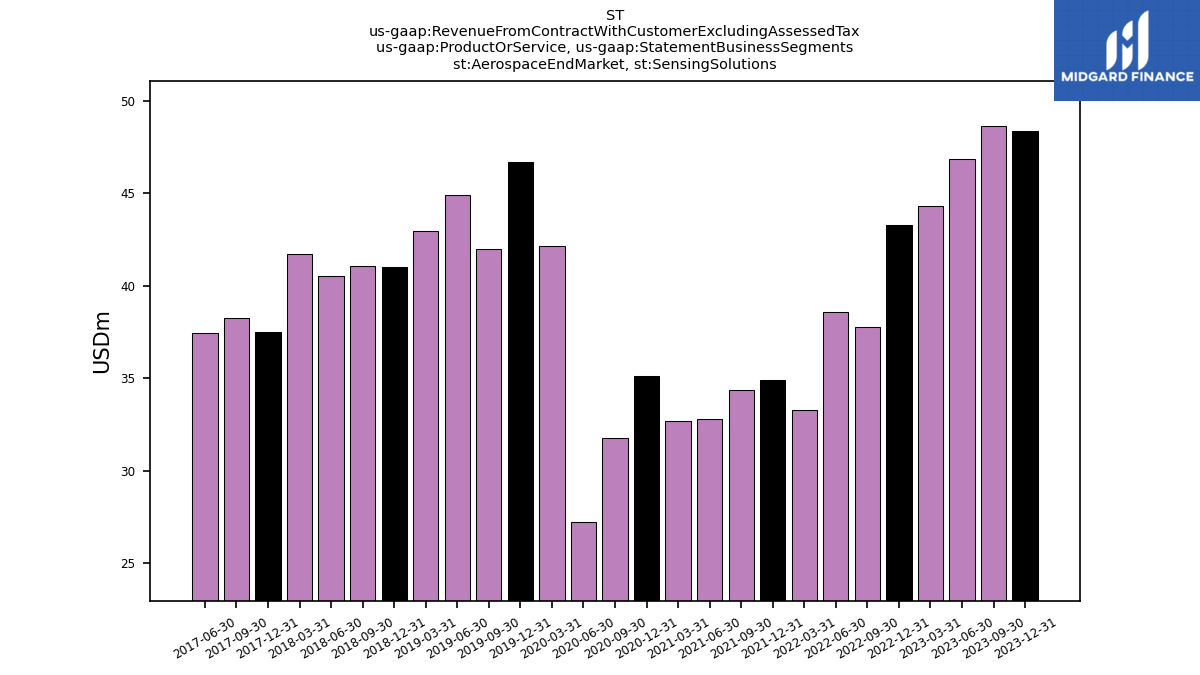
| Aerospace End Market | 48.38 | 48.64 | 46.83 | 44.33 | 43.26 | 37.79 | 38.56 | 33.27 | 34.89 | 34.38 | 32.79 | 32.68 | 35.11 | 31.74 | 27.19 | 42.12 | 46.66 | 41.96 | 44.90 | 42.98 | 41.03 | 41.06 | 40.50 | 41.71 | 37.48 | 38.25 | 37.41 | NA | NA | NA | NA | NA | NA | NA | NA | NA | NA | NA | NA | NA | NA | NA | NA | NA | NA | NA | NA | NA | NA | NA | NA | NA | NA | NA | NA | NA | |
| Appliance And H V A C End Market | 39.99 | 48.32 | 50.95 | 47.47 | 49.69 | 51.93 | 57.67 | 58.83 | 58.04 | 62.79 | 63.19 | 59.92 | 53.08 | 47.62 | 43.69 | 45.40 | 44.48 | 49.72 | 55.83 | 51.70 | 44.05 | 53.51 | 56.61 | 54.32 | 48.83 | 51.98 | 56.08 | NA | NA | NA | NA | NA | NA | NA | NA | NA | NA | NA | NA | NA | NA | NA | NA | NA | NA | NA | NA | NA | NA | NA | NA | NA | NA | NA | NA | NA | |
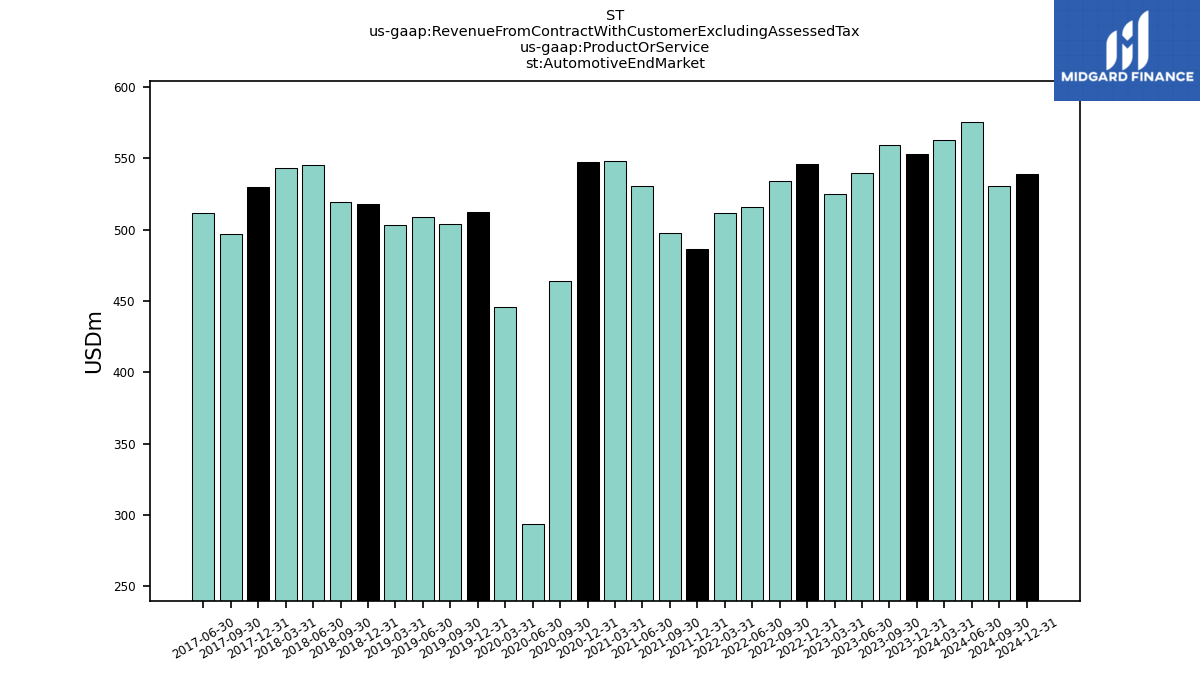
| Automotive End Market | 553.23 | 559.12 | 539.82 | 525.02 | 545.95 | 533.89 | 516.16 | 511.65 | 486.28 | 497.49 | 530.42 | 548.21 | 547.65 | 464.00 | 293.78 | 445.94 | 512.16 | 504.41 | 508.97 | 503.44 | 518.05 | 519.50 | 545.59 | 543.65 | 530.13 | 497.09 | 511.51 | NA | NA | NA | NA | NA | NA | NA | NA | NA | NA | NA | NA | NA | NA | NA | NA | NA | NA | NA | NA | NA | NA | NA | NA | NA | NA | NA | NA | NA | |
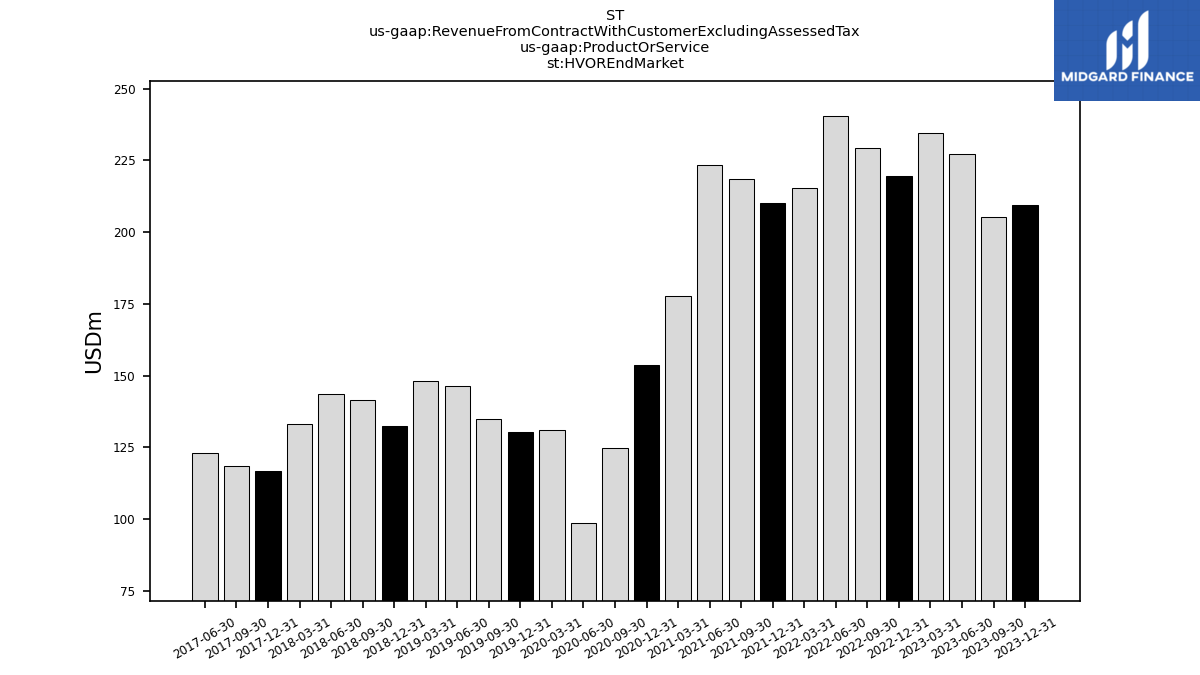
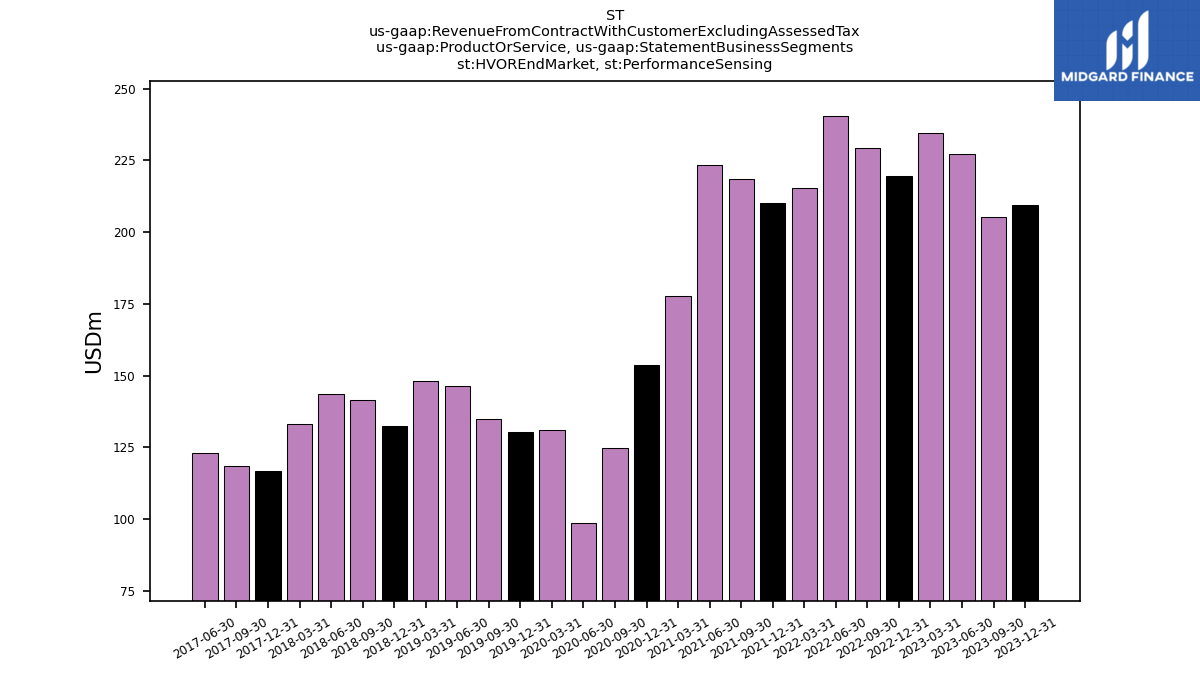
| H V O R End Market | 209.63 | 205.23 | 227.18 | 234.64 | 219.64 | 229.26 | 240.65 | 215.34 | 210.14 | 218.43 | 223.49 | 177.80 | 153.63 | 124.74 | 98.71 | 130.99 | 130.33 | 134.92 | 146.22 | 148.01 | 132.50 | 141.65 | 143.63 | 133.04 | 116.88 | 118.66 | 122.98 | NA | NA | NA | NA | NA | NA | NA | NA | NA | NA | NA | NA | NA | NA | NA | NA | NA | NA | NA | NA | NA | NA | NA | NA | NA | NA | NA | NA | NA | |
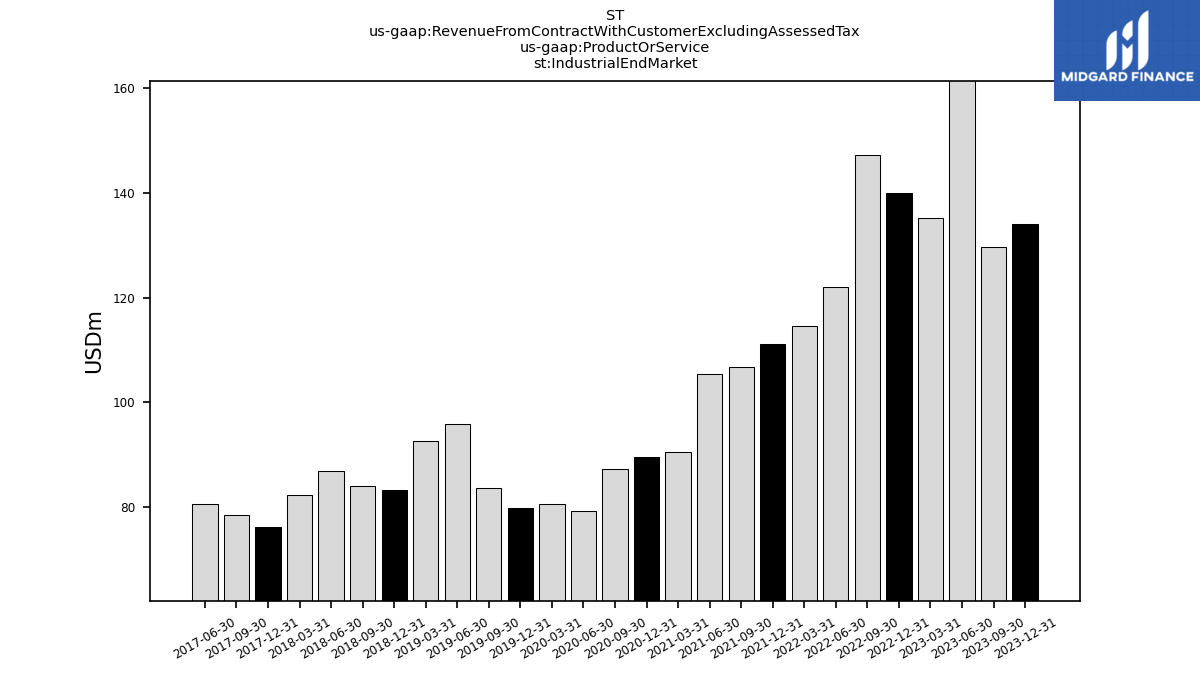
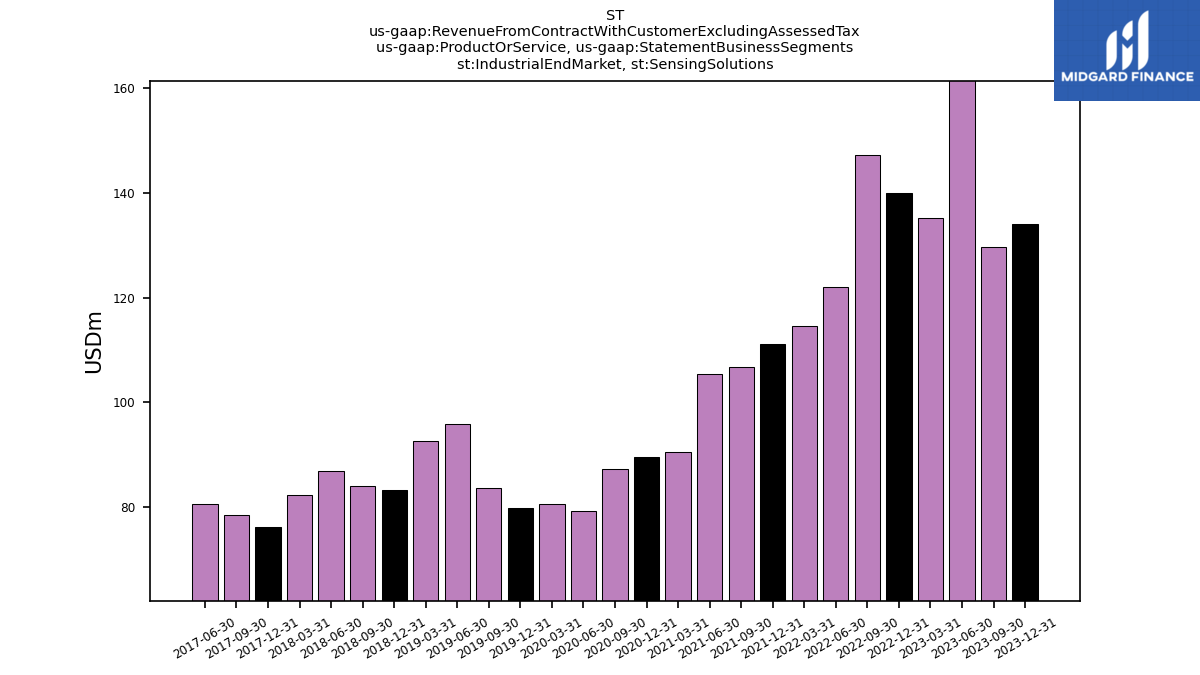
| Industrial End Market | 134.15 | 129.64 | 185.20 | 135.25 | 139.97 | 147.19 | 122.09 | 114.62 | 111.13 | 106.81 | 105.47 | 90.47 | 89.47 | 87.17 | 79.26 | 80.60 | 79.77 | 83.72 | 95.82 | 92.64 | 83.33 | 84.06 | 86.85 | 82.39 | 76.28 | 78.42 | 80.60 | NA | NA | NA | NA | NA | NA | NA | NA | NA | NA | NA | NA | NA | NA | NA | NA | NA | NA | NA | NA | NA | NA | NA | NA | NA | NA | NA | NA | NA | |
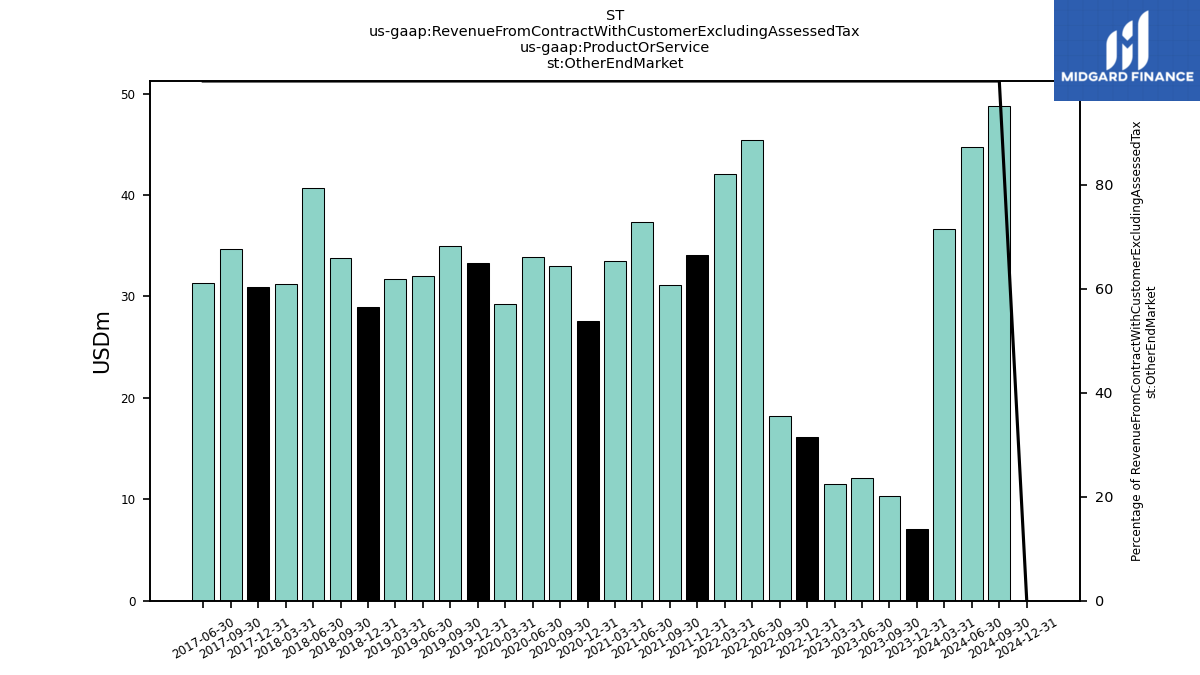
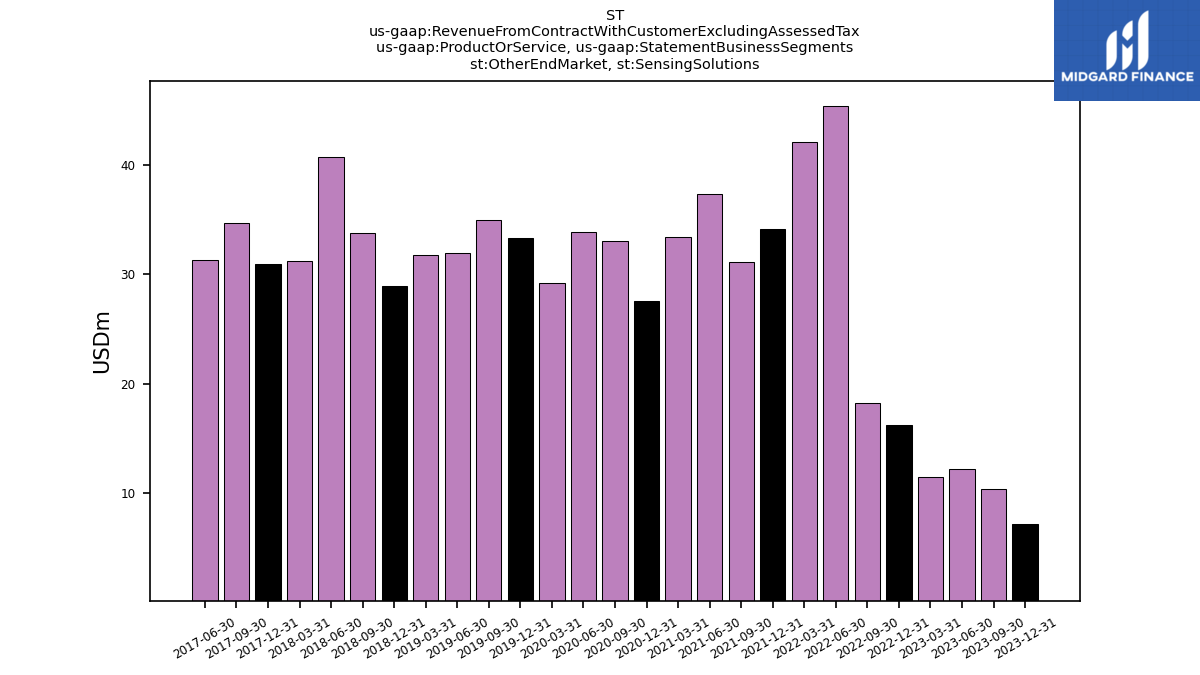
| Other End Market | 7.12 | 10.35 | 12.13 | 11.46 | 16.16 | 18.22 | 45.41 | 42.07 | 34.11 | 31.12 | 37.30 | 33.45 | 27.55 | 33.04 | 33.87 | 29.23 | 33.29 | 34.98 | 31.99 | 31.72 | 28.96 | 33.77 | 40.68 | 31.20 | 30.93 | 34.66 | 31.28 | NA | NA | NA | NA | NA | NA | NA | NA | NA | NA | NA | NA | NA | NA | NA | NA | NA | NA | NA | NA | NA | NA | NA | NA | NA | NA | NA | NA | NA | |
| Aerospace End Market, Sensing Solutions | 48.38 | 48.64 | 46.83 | 44.33 | 43.26 | 37.79 | 38.56 | 33.27 | 34.89 | 34.38 | 32.79 | 32.68 | 35.11 | 31.74 | 27.19 | 42.12 | 46.66 | 41.96 | 44.90 | 42.98 | 41.03 | 41.06 | 40.50 | 41.71 | 37.48 | 38.25 | 37.41 | NA | NA | NA | NA | NA | NA | NA | NA | NA | NA | NA | NA | NA | NA | NA | NA | NA | NA | NA | NA | NA | NA | NA | NA | NA | NA | NA | NA | NA | |
| Appliance And H V A C End Market, Sensing Solutions | 39.99 | 48.32 | 50.95 | 47.47 | 49.69 | 51.93 | 57.67 | 58.83 | 58.04 | 62.79 | 63.19 | 59.92 | 53.08 | 47.62 | 43.69 | 45.40 | 44.48 | 49.72 | 55.83 | 51.70 | 44.05 | 53.51 | 56.61 | 54.32 | 48.83 | 51.98 | 56.08 | NA | NA | NA | NA | NA | NA | NA | NA | NA | NA | NA | NA | NA | NA | NA | NA | NA | NA | NA | NA | NA | NA | NA | NA | NA | NA | NA | NA | NA | |
| Automotive End Market, Performance Sensing | 543.39 | 548.76 | 530.27 | 516.88 | 538.01 | 525.27 | 506.23 | 502.36 | 474.94 | 488.04 | 518.37 | 536.71 | 535.35 | 456.20 | 286.50 | 437.70 | 502.55 | 493.68 | 498.30 | 492.01 | 506.49 | 507.96 | 532.59 | 529.79 | 517.81 | 485.28 | 498.85 | NA | NA | NA | NA | NA | NA | NA | NA | NA | NA | NA | NA | NA | NA | NA | NA | NA | NA | NA | NA | NA | NA | NA | NA | NA | NA | NA | NA | NA | |
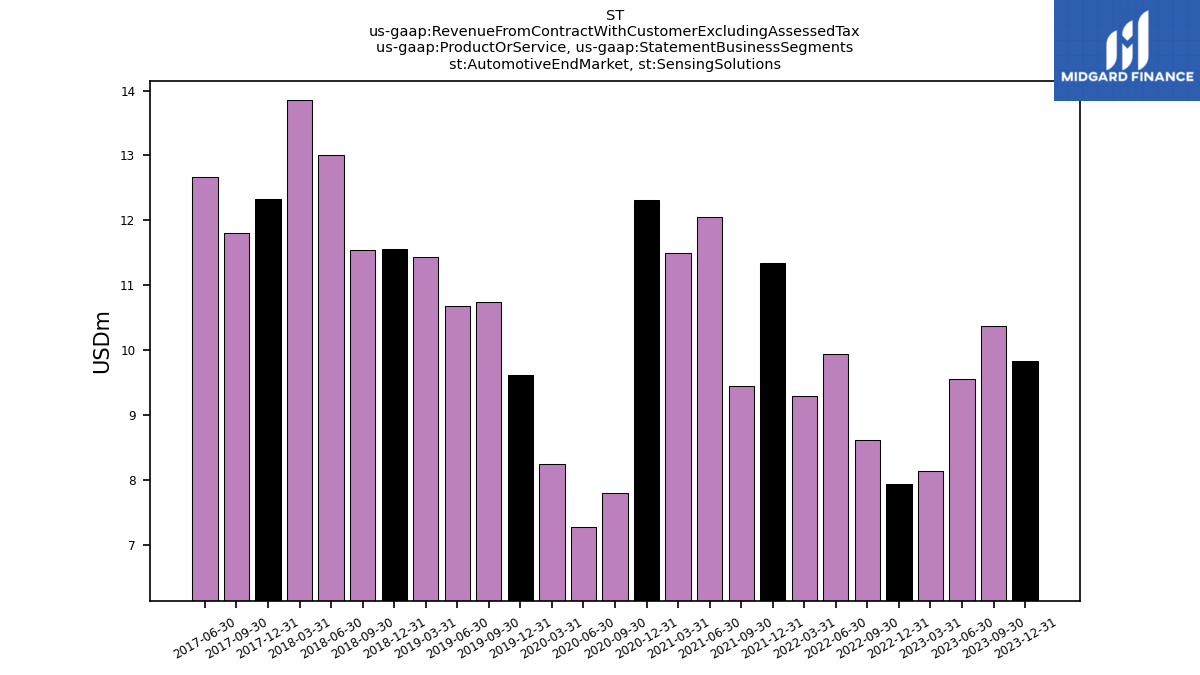
| Automotive End Market, Sensing Solutions | 9.83 | 10.37 | 9.55 | 8.13 | 7.94 | 8.62 | 9.93 | 9.29 | 11.35 | 9.45 | 12.05 | 11.50 | 12.30 | 7.80 | 7.28 | 8.24 | 9.61 | 10.74 | 10.67 | 11.43 | 11.56 | 11.54 | 13.00 | 13.86 | 12.32 | 11.81 | 12.67 | NA | NA | NA | NA | NA | NA | NA | NA | NA | NA | NA | NA | NA | NA | NA | NA | NA | NA | NA | NA | NA | NA | NA | NA | NA | NA | NA | NA | NA | |
| H V O R End Market, Performance Sensing | 209.63 | 205.23 | 227.18 | 234.64 | 219.64 | 229.26 | 240.65 | 215.34 | 210.14 | 218.43 | 223.49 | 177.80 | 153.63 | 124.74 | 98.71 | 130.99 | 130.33 | 134.92 | 146.22 | 148.01 | 132.50 | 141.65 | 143.63 | 133.04 | 116.88 | 118.66 | 122.98 | NA | NA | NA | NA | NA | NA | NA | NA | NA | NA | NA | NA | NA | NA | NA | NA | NA | NA | NA | NA | NA | NA | NA | NA | NA | NA | NA | NA | NA | |
| Industrial End Market, Sensing Solutions | 134.15 | 129.64 | 185.20 | 135.25 | 139.97 | 147.19 | 122.09 | 114.62 | 111.13 | 106.81 | 105.47 | 90.47 | 89.47 | 87.17 | 79.26 | 80.60 | 79.77 | 83.72 | 95.82 | 92.64 | 83.33 | 84.06 | 86.85 | 82.39 | 76.28 | 78.42 | 80.60 | NA | NA | NA | NA | NA | NA | NA | NA | NA | NA | NA | NA | NA | NA | NA | NA | NA | NA | NA | NA | NA | NA | NA | NA | NA | NA | NA | NA | NA | |
| Other End Market, Sensing Solutions | 7.12 | 10.35 | 12.13 | 11.46 | 16.16 | 18.22 | 45.41 | 42.07 | 34.11 | 31.12 | 37.30 | 33.45 | 27.55 | 33.04 | 33.87 | 29.23 | 33.29 | 34.98 | 31.99 | 31.72 | 28.96 | 33.77 | 40.68 | 31.20 | 30.93 | 34.66 | 31.28 | NA | NA | NA | NA | NA | NA | NA | NA | NA | NA | NA | NA | NA | NA | NA | NA | NA | NA | NA | NA | NA | NA | NA | NA | NA | NA | NA | NA | NA | |
| Performance Sensing | 753.03 | 753.99 | 757.44 | 751.52 | 757.65 | 754.53 | 746.88 | 717.70 | 685.08 | 706.47 | 741.85 | 714.51 | 688.98 | 580.94 | 385.21 | 568.69 | 632.88 | 628.59 | 644.52 | 640.03 | 638.99 | 649.61 | 676.22 | 662.83 | 634.70 | 603.93 | 621.83 | NA | NA | NA | 615.57 | 597.17 | NA | 576.48 | 606.35 | 591.25 | NA | 411.08 | 400.85 | 394.63 | NA | NA | NA | NA | NA | NA | NA | NA | NA | NA | NA | NA | NA | NA | NA | NA | |
| Sensing Solutions | 239.47 | 247.31 | 304.67 | 246.65 | 257.03 | 263.74 | 273.67 | 258.07 | 249.52 | 244.56 | 250.81 | 228.02 | 217.51 | 207.38 | 191.30 | 205.58 | 213.81 | 221.12 | 239.21 | 230.47 | 208.93 | 223.94 | 237.64 | 223.46 | 205.84 | 215.12 | 218.04 | NA | NA | NA | 211.97 | 199.37 | NA | 150.88 | 164.09 | 159.43 | NA | 166.02 | 175.01 | 156.97 | NA | NA | NA | NA | NA | NA | NA | NA | NA | NA | NA | NA | NA | NA | NA | NA |