
| 2023-12-31 | 2023-09-30 | 2023-06-30 | 2023-03-31 | 2022-12-31 | 2022-09-30 | 2022-06-30 | 2022-03-31 | 2021-12-31 | 2021-09-30 | 2021-06-30 | 2021-03-31 | 2020-12-31 | 2020-09-30 | 2020-06-30 | 2020-03-31 | 2019-12-31 | 2019-09-30 | 2019-06-30 | 2019-03-31 | 2018-12-31 | 2018-09-30 | 2018-06-30 | 2018-03-31 | 2017-12-31 | 2017-09-30 | 2017-06-30 | 2017-03-31 | 2016-12-31 | 2016-09-30 | 2016-06-30 | 2016-03-31 | 2015-12-31 | 2015-09-30 | 2015-06-30 | 2015-03-31 | 2014-12-31 | 2014-09-30 | 2014-06-30 | 2014-03-31 | 2013-12-31 | 2013-09-30 | 2013-06-30 | 2013-03-31 | 2012-12-31 | 2012-09-30 | 2012-06-30 | 2012-03-31 | 2011-12-31 | 2011-09-30 | 2011-06-30 | 2011-03-31 | 2010-12-31 | 2010-09-30 | 2010-06-30 | 2010-03-31 | ||
|---|---|---|---|---|---|---|---|---|---|---|---|---|---|---|---|---|---|---|---|---|---|---|---|---|---|---|---|---|---|---|---|---|---|---|---|---|---|---|---|---|---|---|---|---|---|---|---|---|---|---|---|---|---|---|---|---|---|
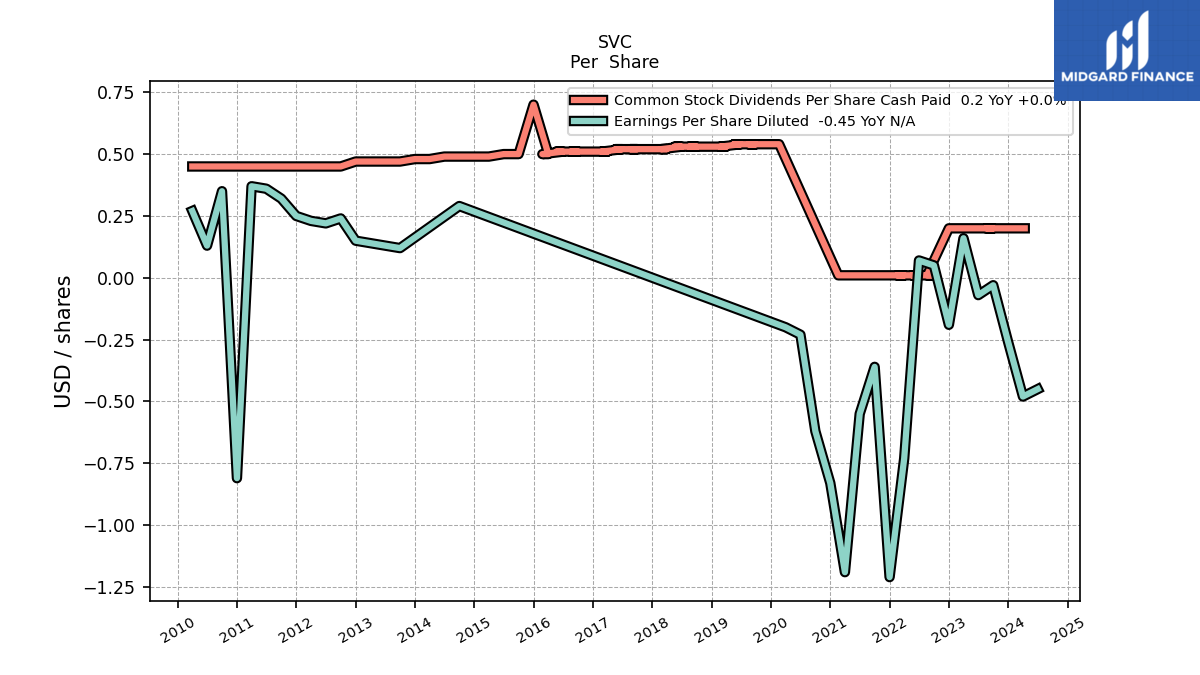
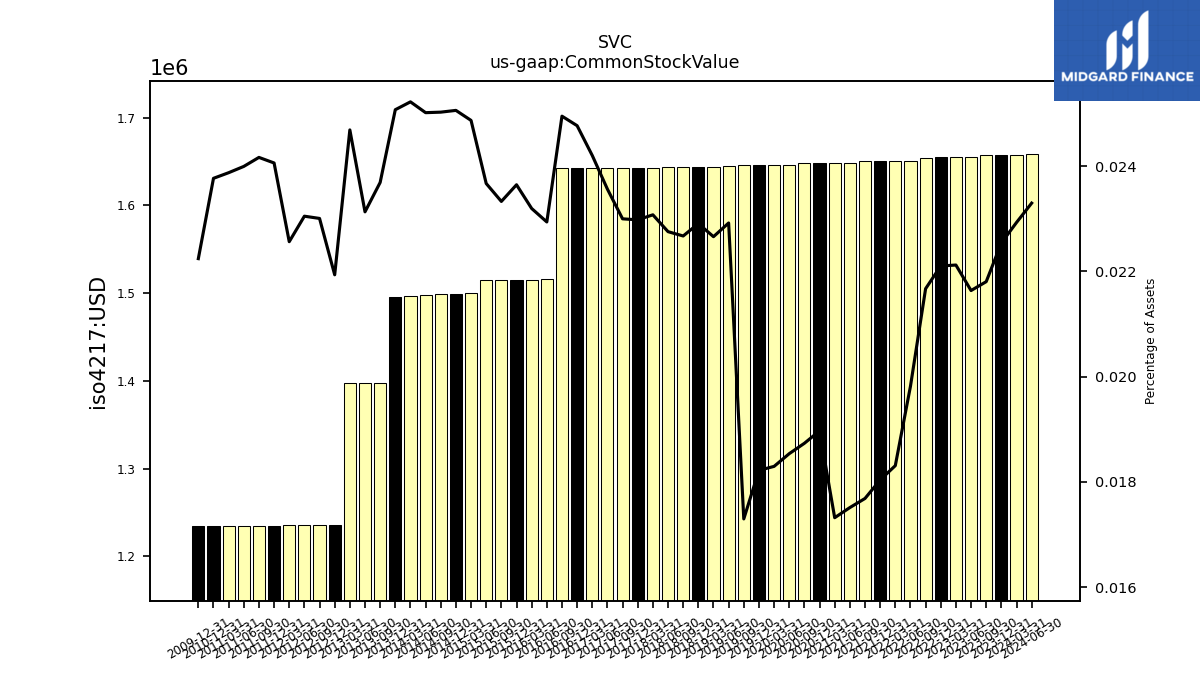
| Common Stock Value | 1.66 | 1.66 | 1.66 | 1.66 | 1.66 | 1.65 | 1.65 | 1.65 | 1.65 | 1.65 | 1.65 | 1.65 | 1.65 | 1.65 | 1.65 | 1.65 | 1.65 | 1.65 | 1.65 | 1.64 | 1.64 | 1.64 | 1.64 | 1.64 | 1.64 | 1.64 | 1.64 | 1.64 | 1.64 | 1.64 | 1.52 | 1.51 | 1.51 | 1.51 | 1.51 | 1.50 | 1.50 | 1.50 | 1.50 | 1.50 | 1.50 | 1.40 | 1.40 | 1.40 | 1.24 | 1.24 | 1.24 | 1.24 | 1.24 | 1.24 | 1.24 | 1.23 | 1.23 | NA | NA | NA | |
| Earnings Per Share Basic | -0.26 | -0.03 | -0.07 | 0.16 | -0.19 | 0.05 | 0.07 | -0.73 | -1.21 | -0.36 | -0.55 | -1.19 | -0.83 | -0.62 | -0.23 | -0.20 | NA | NA | NA | NA | NA | NA | NA | NA | NA | NA | NA | NA | NA | NA | NA | NA | NA | NA | NA | NA | NA | 0.29 | NA | NA | 0.19 | 0.12 | 0.27 | 0.15 | 0.15 | 0.24 | 0.22 | 0.23 | 0.25 | 0.32 | 0.36 | 0.37 | -0.81 | 0.35 | 0.13 | 0.27 | |
| Earnings Per Share Diluted | -0.26 | -0.03 | -0.07 | 0.16 | -0.19 | 0.05 | 0.07 | -0.73 | -1.21 | -0.36 | -0.55 | -1.19 | -0.83 | -0.62 | -0.23 | -0.20 | NA | NA | NA | NA | NA | NA | NA | NA | NA | NA | NA | NA | NA | NA | NA | NA | NA | NA | NA | NA | NA | 0.29 | NA | NA | NA | 0.12 | NA | NA | 0.15 | 0.24 | 0.22 | 0.23 | 0.25 | 0.32 | 0.36 | 0.37 | -0.81 | 0.35 | 0.13 | 0.27 |
| 2023-12-31 | 2023-09-30 | 2023-06-30 | 2023-03-31 | 2022-12-31 | 2022-09-30 | 2022-06-30 | 2022-03-31 | 2021-12-31 | 2021-09-30 | 2021-06-30 | 2021-03-31 | 2020-12-31 | 2020-09-30 | 2020-06-30 | 2020-03-31 | 2019-12-31 | 2019-09-30 | 2019-06-30 | 2019-03-31 | 2018-12-31 | 2018-09-30 | 2018-06-30 | 2018-03-31 | 2017-12-31 | 2017-09-30 | 2017-06-30 | 2017-03-31 | 2016-12-31 | 2016-09-30 | 2016-06-30 | 2016-03-31 | 2015-12-31 | 2015-09-30 | 2015-06-30 | 2015-03-31 | 2014-12-31 | 2014-09-30 | 2014-06-30 | 2014-03-31 | 2013-12-31 | 2013-09-30 | 2013-06-30 | 2013-03-31 | 2012-12-31 | 2012-09-30 | 2012-06-30 | 2012-03-31 | 2011-12-31 | 2011-09-30 | 2011-06-30 | 2011-03-31 | 2010-12-31 | 2010-09-30 | 2010-06-30 | 2010-03-31 | ||
|---|---|---|---|---|---|---|---|---|---|---|---|---|---|---|---|---|---|---|---|---|---|---|---|---|---|---|---|---|---|---|---|---|---|---|---|---|---|---|---|---|---|---|---|---|---|---|---|---|---|---|---|---|---|---|---|---|---|
| Revenue From Contract With Customer Excluding Assessed Tax | 343.38 | 395.53 | 404.33 | 334.80 | 350.50 | 400.45 | 418.98 | 297.41 | 317.21 | 338.38 | 280.13 | 168.95 | 174.52 | 199.72 | 117.36 | 383.50 | 580.91 | 525.29 | 541.22 | 524.91 | 550.80 | 603.15 | 611.95 | 528.63 | 535.14 | 577.59 | 570.60 | 488.60 | 479.28 | 543.52 | 550.30 | 474.12 | 467.44 | 511.89 | 507.07 | 435.51 | 430.53 | 459.64 | 451.90 | 394.25 | 384.79 | 412.27 | 412.32 | 354.47 | 322.31 | 330.07 | 343.18 | 301.42 | 295.85 | 318.69 | 313.81 | 281.98 | 267.79 | 281.20 | 282.39 | 254.11 | |
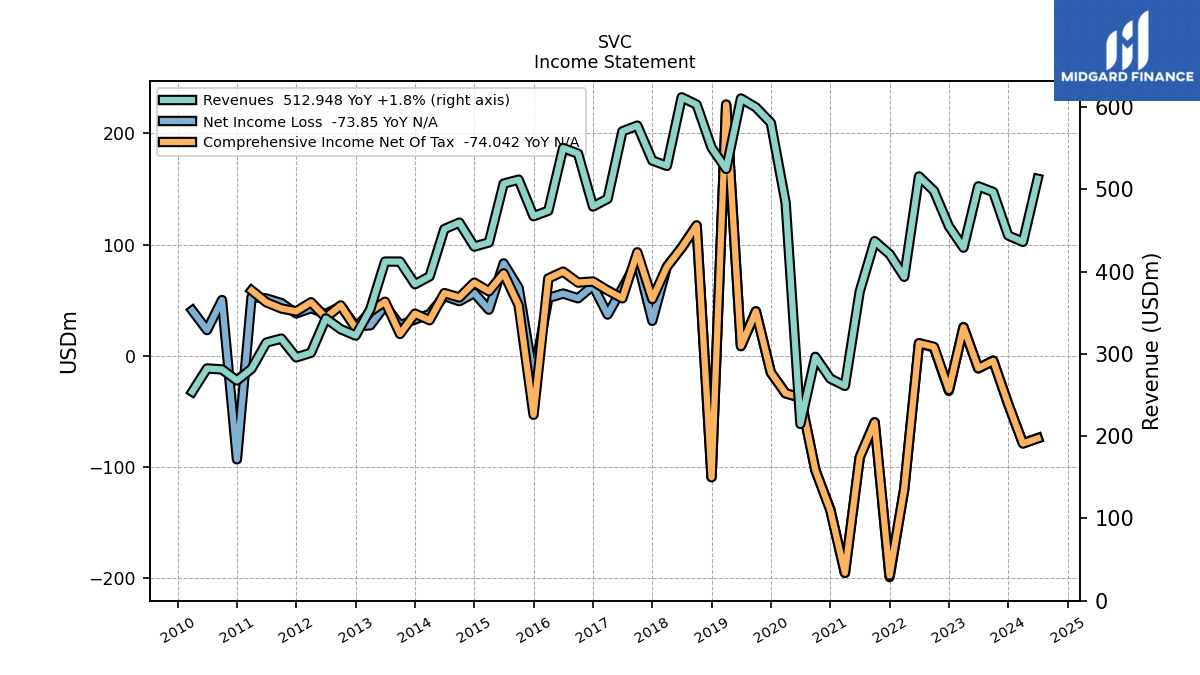
| Revenues | 444.05 | 496.82 | 503.78 | 429.21 | 455.22 | 498.25 | 515.78 | 393.76 | 421.38 | 437.10 | 375.94 | 261.17 | 270.04 | 296.50 | 214.94 | 483.78 | 580.91 | 599.77 | 610.56 | 524.91 | 550.80 | 603.15 | 611.95 | 528.63 | 535.14 | 577.59 | 570.60 | 488.60 | 479.28 | 543.52 | 550.30 | 474.12 | 467.44 | 511.89 | 507.07 | 435.51 | 430.53 | 459.64 | 451.90 | 394.25 | 384.79 | 412.27 | 412.32 | 354.47 | 322.31 | 330.07 | 343.18 | 301.42 | 295.85 | 318.69 | 313.81 | 281.98 | 267.79 | 281.20 | 282.39 | 254.11 | |
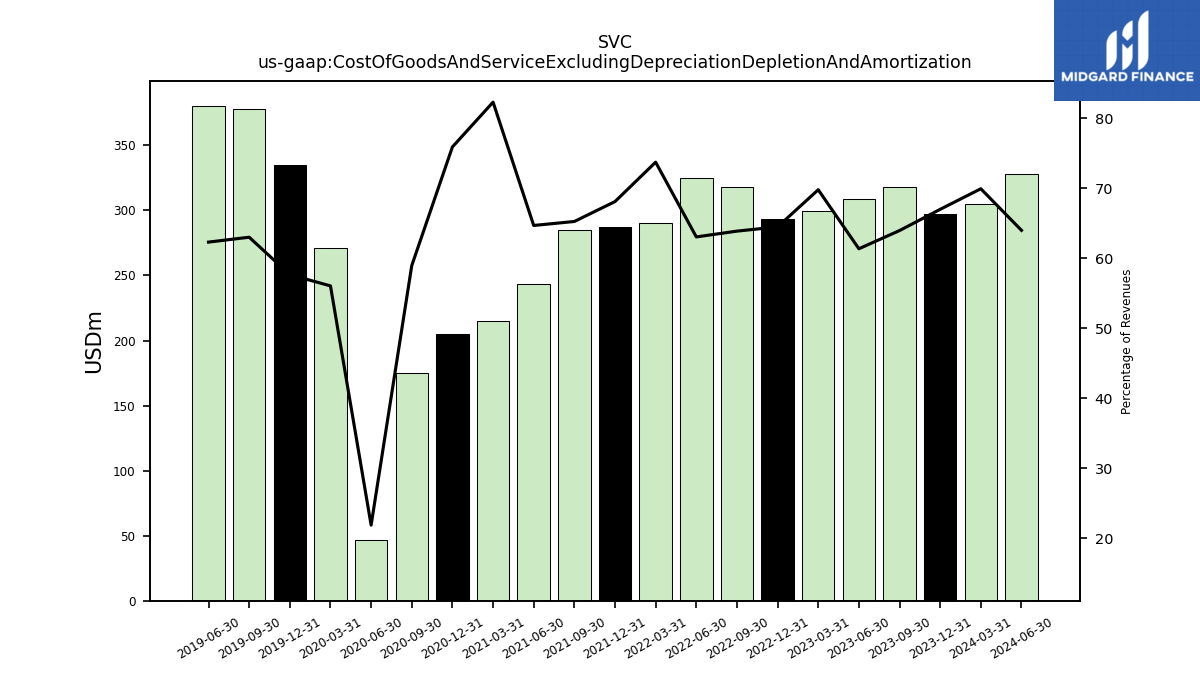
| Cost Of Goods And Service Excluding Depreciation Depletion And Amortization | 297.49 | 317.75 | 309.10 | 299.57 | 293.55 | 318.27 | 325.19 | 290.34 | 286.97 | 285.23 | 243.18 | 214.99 | 205.00 | 174.80 | 46.96 | 271.15 | 334.92 | 377.89 | 380.43 | NA | NA | NA | NA | NA | NA | NA | NA | NA | NA | NA | NA | NA | NA | NA | NA | NA | NA | NA | NA | NA | NA | NA | NA | NA | NA | NA | NA | NA | NA | NA | NA | NA | NA | NA | NA | NA | |
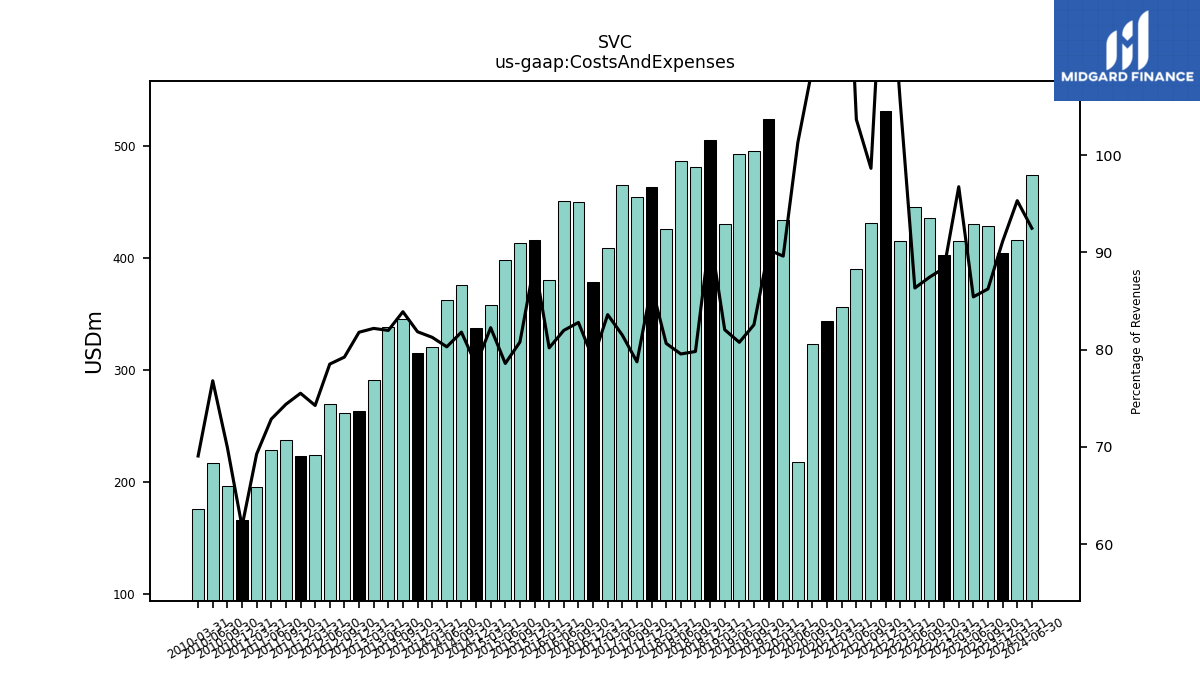
| Costs And Expenses | 404.71 | 428.53 | 430.40 | 415.31 | 402.46 | 435.76 | 445.35 | 415.39 | 531.56 | 431.21 | 389.77 | 356.64 | 343.83 | 323.25 | 217.76 | 433.60 | 524.40 | 495.23 | 493.11 | 430.73 | 505.65 | 481.43 | 486.89 | 426.33 | 463.15 | 454.88 | 465.05 | 408.52 | 378.91 | 450.05 | 451.19 | 380.21 | 415.66 | 413.55 | 398.49 | 358.27 | 337.83 | 376.02 | 362.87 | 320.43 | 314.95 | 345.93 | 338.04 | 291.35 | 263.64 | 261.55 | 269.48 | 223.85 | 223.44 | 237.06 | 228.66 | 195.33 | 165.55 | 196.68 | 216.90 | 175.52 | |
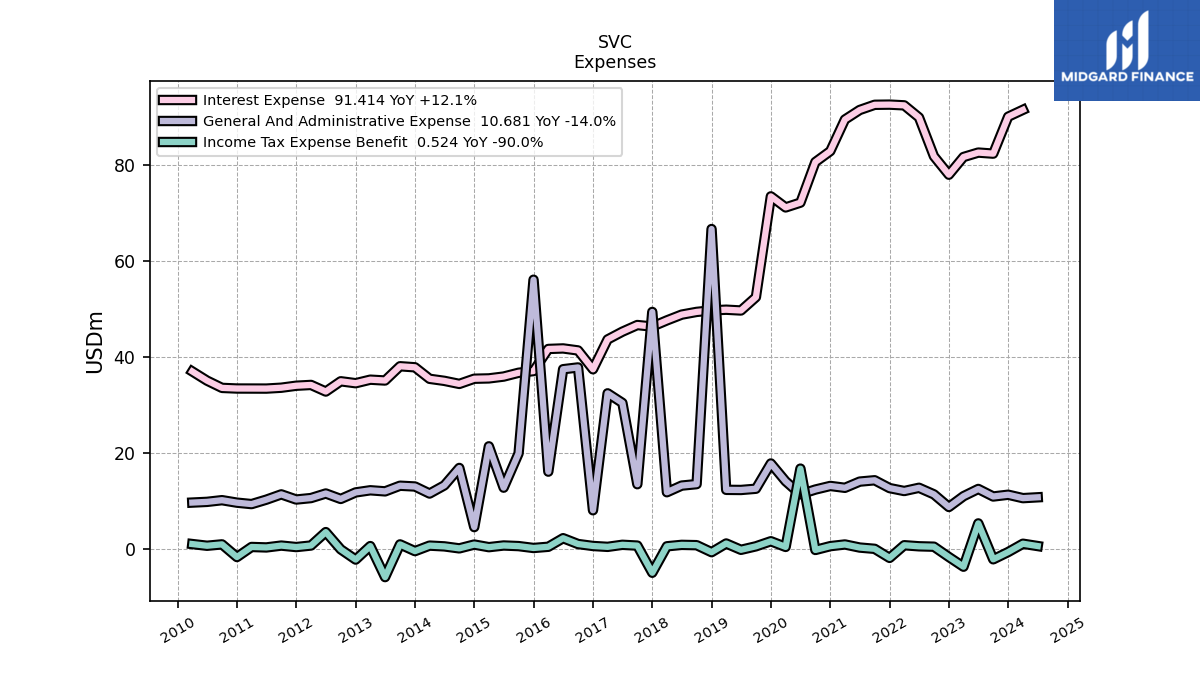
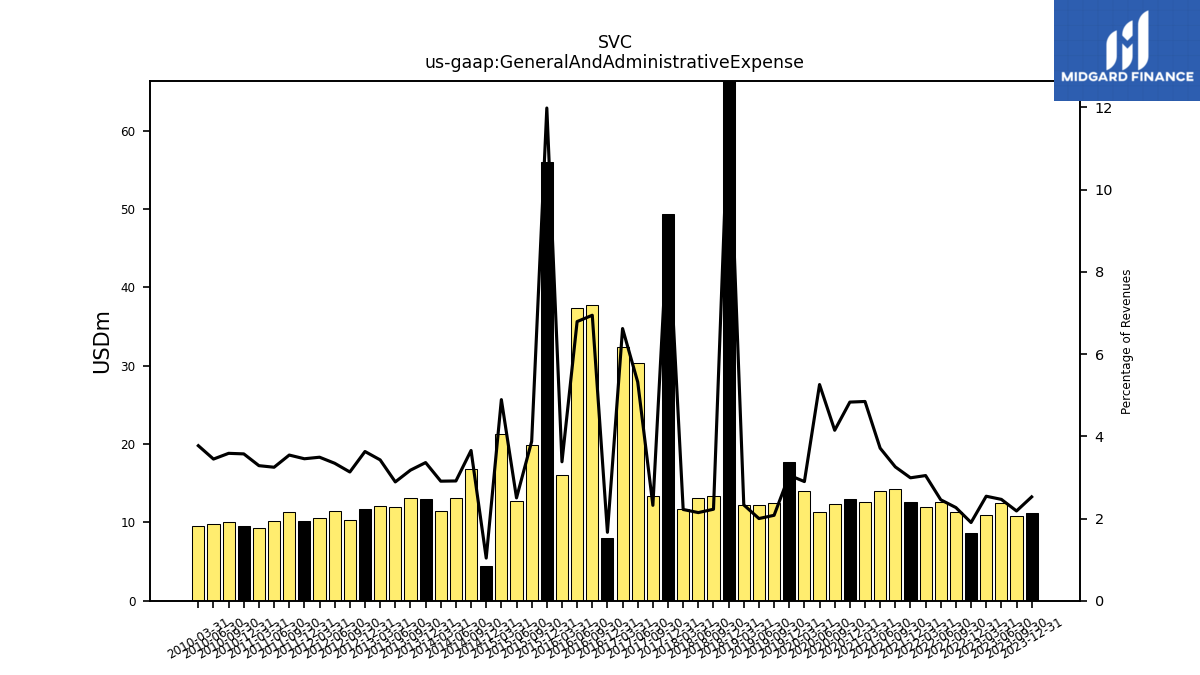
| General And Administrative Expense | 11.22 | 10.85 | 12.42 | 10.91 | 8.66 | 11.29 | 12.66 | 11.99 | 12.60 | 14.23 | 13.95 | 12.66 | 13.05 | 12.29 | 11.30 | 14.02 | 17.73 | 12.46 | 12.21 | 12.23 | 66.58 | 13.43 | 13.12 | 11.73 | 49.30 | 13.40 | 30.35 | 32.35 | 7.98 | 37.74 | 37.37 | 16.02 | 56.02 | 19.83 | 12.69 | 21.30 | 4.47 | 16.80 | 13.17 | 11.46 | 12.93 | 13.09 | 11.92 | 12.14 | 11.70 | 10.34 | 11.47 | 10.52 | 10.22 | 11.29 | 10.19 | 9.26 | 9.56 | 10.08 | 9.73 | 9.58 | |
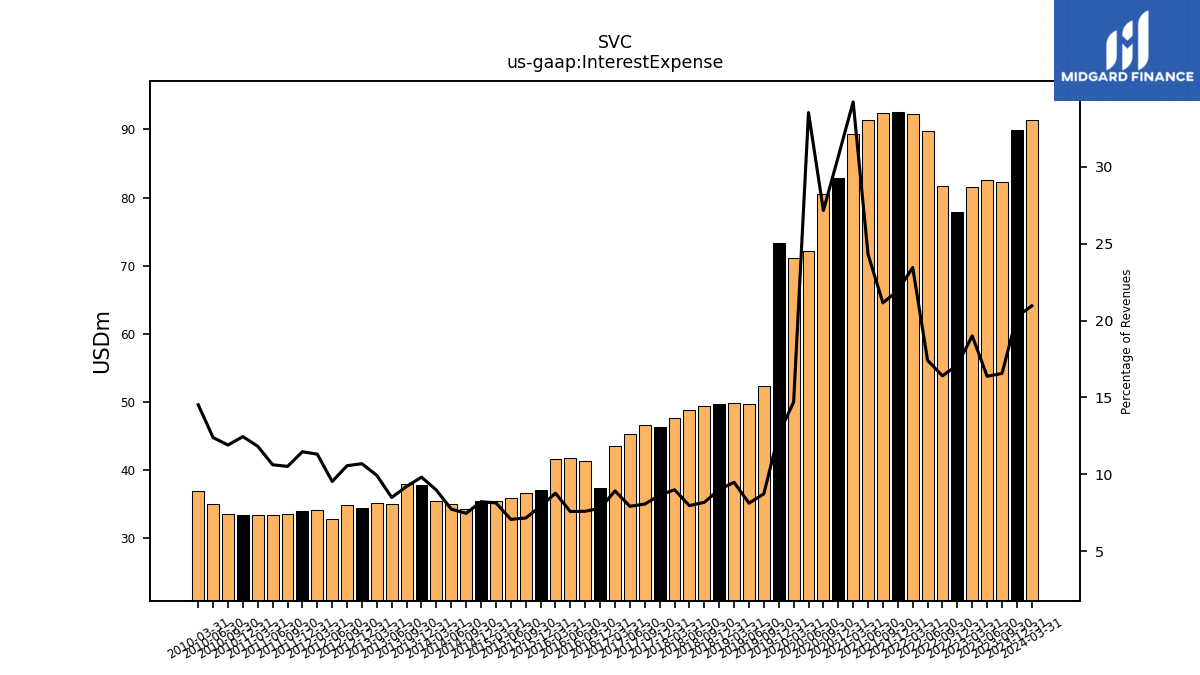
| Interest Expense | 89.98 | 82.28 | 82.50 | 81.58 | 77.89 | 81.74 | 89.82 | 92.34 | 92.49 | 92.46 | 91.38 | 89.39 | 82.81 | 80.53 | 72.07 | 71.08 | 73.38 | 52.38 | 49.60 | 49.77 | 49.62 | 49.31 | 48.74 | 47.54 | 46.25 | 46.57 | 45.19 | 43.57 | 37.35 | 41.28 | 41.70 | 41.59 | 36.98 | 36.63 | 35.84 | 35.45 | 35.38 | 34.30 | 34.94 | 35.37 | 37.77 | 37.99 | 35.01 | 35.19 | 34.45 | 34.85 | 32.71 | 34.09 | 33.93 | 33.51 | 33.33 | 33.34 | 33.34 | 33.48 | 34.99 | 36.91 | |
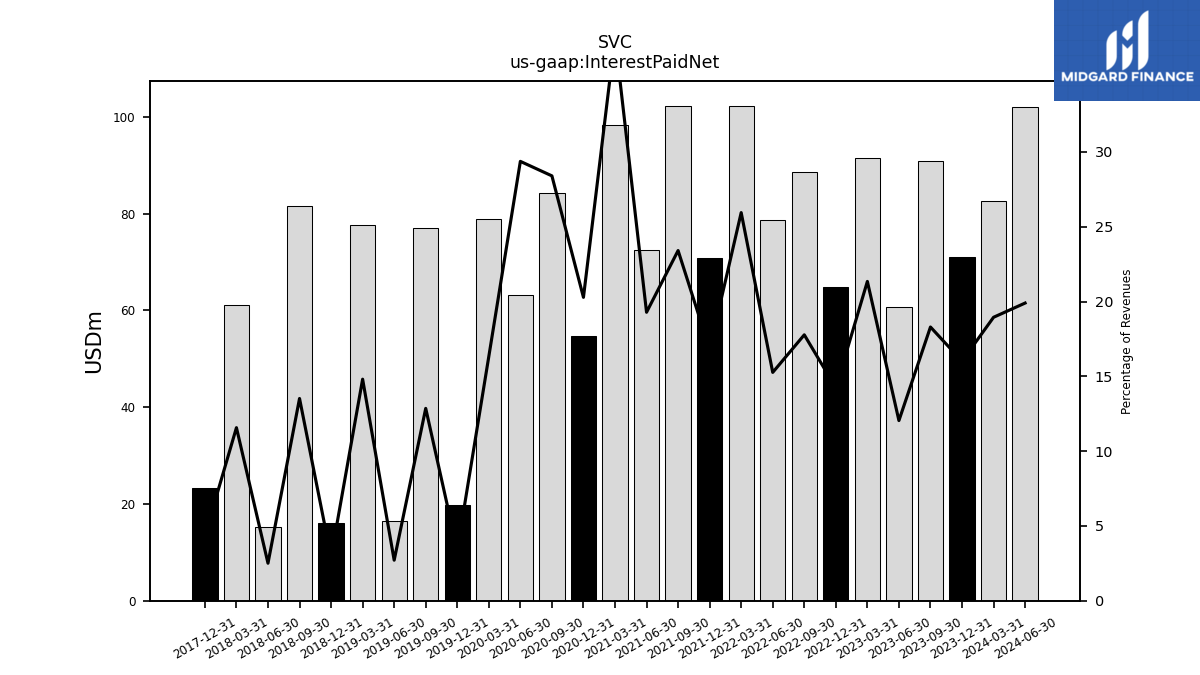
| Interest Paid Net | 71.12 | 90.91 | 60.68 | 91.61 | 64.80 | 88.57 | 78.73 | 102.16 | 70.82 | 102.32 | 72.49 | 98.41 | 54.77 | 84.21 | 63.13 | 78.99 | 19.74 | 77.12 | 16.55 | 77.75 | 16.10 | 81.55 | 15.35 | 61.16 | 23.30 | NA | NA | NA | NA | NA | NA | NA | NA | NA | NA | NA | NA | NA | NA | NA | NA | NA | NA | NA | NA | NA | NA | NA | NA | NA | NA | NA | NA | NA | NA | NA | |
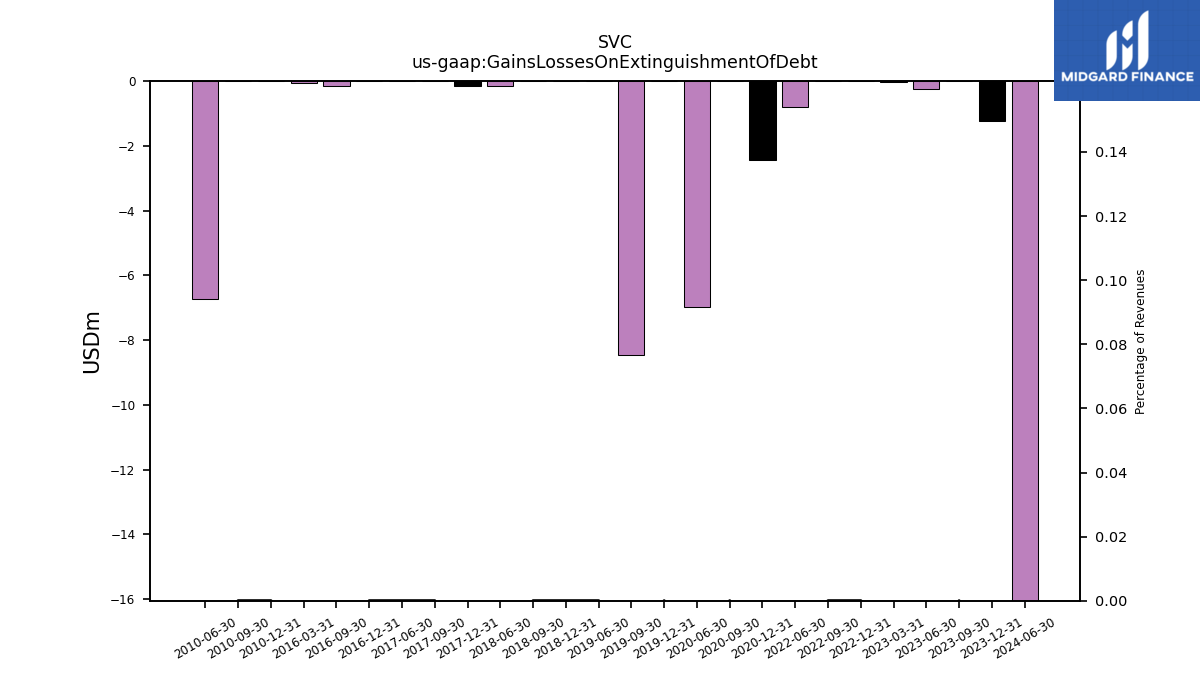
| Gains Losses On Extinguishment Of Debt | -1.24 | 0.00 | -0.24 | -0.04 | 0.00 | 0.00 | -0.79 | NA | NA | NA | NA | NA | -2.42 | 0.00 | -6.97 | NA | 0.00 | -8.45 | 0.00 | NA | 0.00 | 0.00 | -0.16 | NA | -0.15 | 0.00 | 0.00 | NA | 0.00 | -0.16 | NA | -0.07 | NA | NA | NA | NA | NA | NA | NA | NA | NA | NA | NA | NA | NA | NA | NA | NA | NA | NA | NA | NA | 0.00 | 0.00 | -6.72 | NA | |
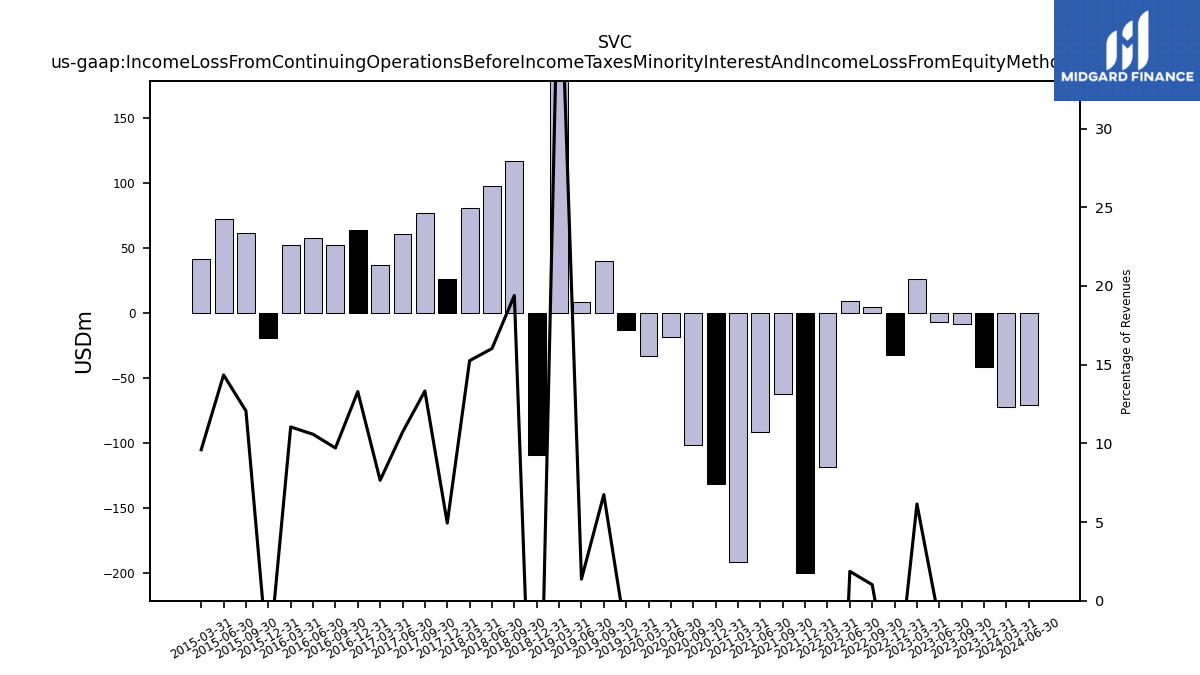
| Income Loss From Continuing Operations Before Income Taxes Minority Interest And Income Loss From Equity Method Investments | -41.50 | -8.23 | -6.55 | 26.39 | -31.75 | 5.09 | 9.63 | -118.41 | -199.75 | -61.93 | -91.63 | -191.29 | -131.63 | -101.57 | -18.47 | -32.59 | -13.14 | 40.46 | 8.39 | 226.44 | -109.25 | 116.98 | 98.05 | 80.63 | 26.43 | 76.97 | 61.11 | 37.40 | 63.69 | 52.75 | 58.20 | 52.35 | -19.32 | 61.72 | 72.75 | 41.80 | NA | NA | NA | NA | NA | NA | NA | NA | NA | NA | NA | NA | NA | NA | NA | NA | NA | NA | NA | NA | |
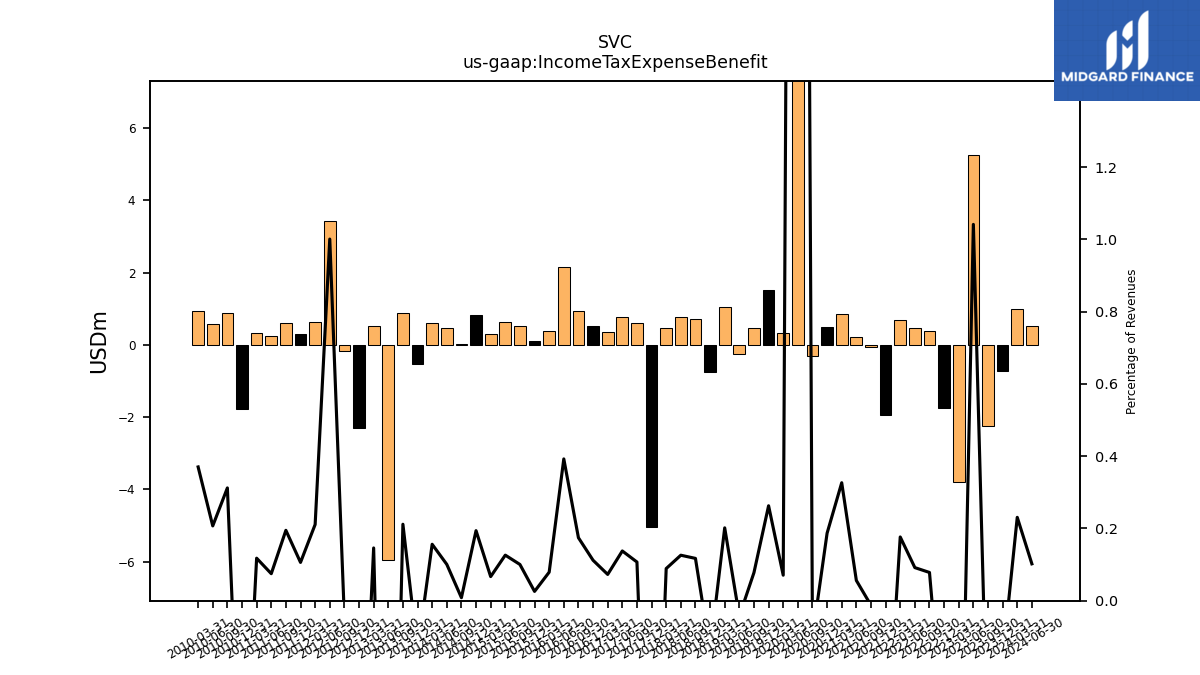
| Income Tax Expense Benefit | -0.72 | -2.24 | 5.25 | -3.78 | -1.76 | 0.39 | 0.47 | 0.69 | -1.95 | -0.06 | 0.21 | 0.85 | 0.51 | -0.30 | 16.66 | 0.34 | 1.53 | 0.47 | -0.26 | 1.06 | -0.75 | 0.71 | 0.77 | 0.47 | -5.04 | 0.62 | 0.79 | 0.36 | 0.54 | 0.95 | 2.16 | 0.38 | 0.12 | 0.51 | 0.64 | 0.29 | 0.83 | 0.04 | 0.46 | 0.62 | -0.54 | 0.87 | -5.95 | 0.52 | -2.30 | -0.16 | 3.44 | 0.64 | 0.31 | 0.62 | 0.23 | 0.33 | -1.77 | 0.88 | 0.58 | 0.94 | |
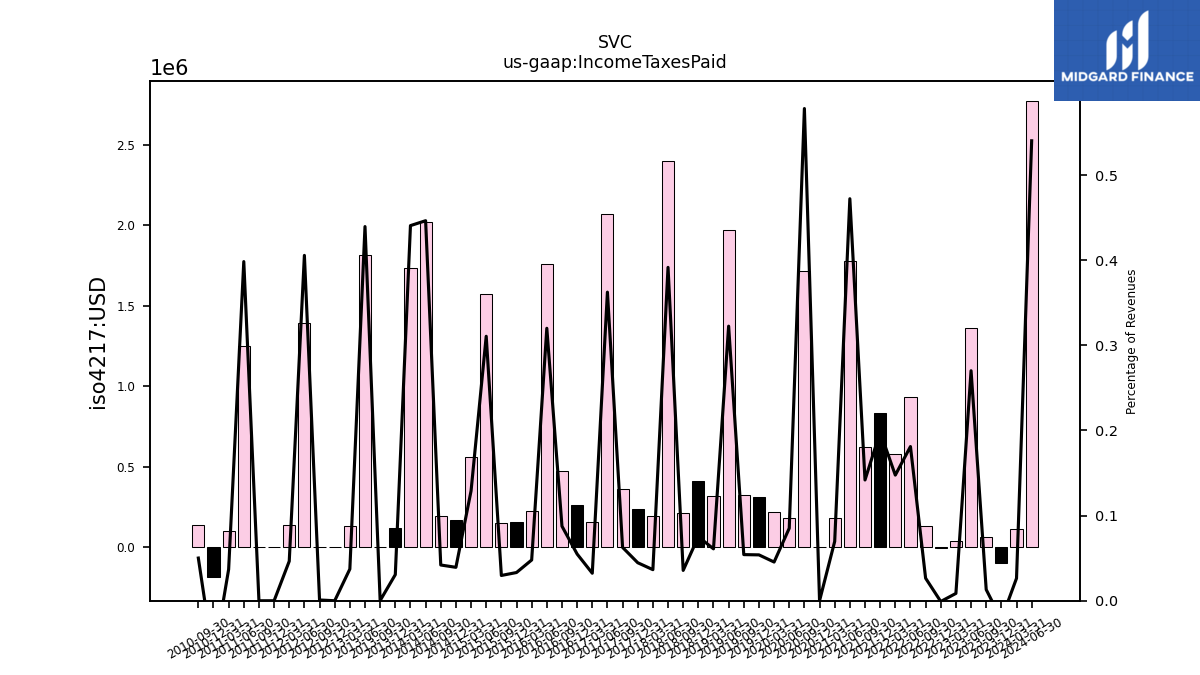
| Income Taxes Paid | -0.10 | 0.07 | 1.36 | 0.04 | -0.00 | 0.13 | 0.93 | 0.58 | 0.83 | 0.62 | 1.77 | 0.18 | 0.00 | 1.71 | 0.18 | 0.22 | 0.31 | 0.33 | 1.97 | 0.32 | 0.41 | 0.21 | 2.40 | 0.19 | 0.24 | 0.36 | 2.07 | 0.16 | 0.26 | 0.48 | 1.76 | 0.23 | 0.15 | 0.15 | 1.57 | 0.56 | 0.17 | 0.19 | 2.02 | 1.74 | 0.12 | 0.00 | 1.81 | 0.13 | 0.00 | 0.00 | 1.39 | 0.14 | 0.00 | 0.00 | 1.25 | 0.10 | -0.18 | 0.14 | NA | NA | |
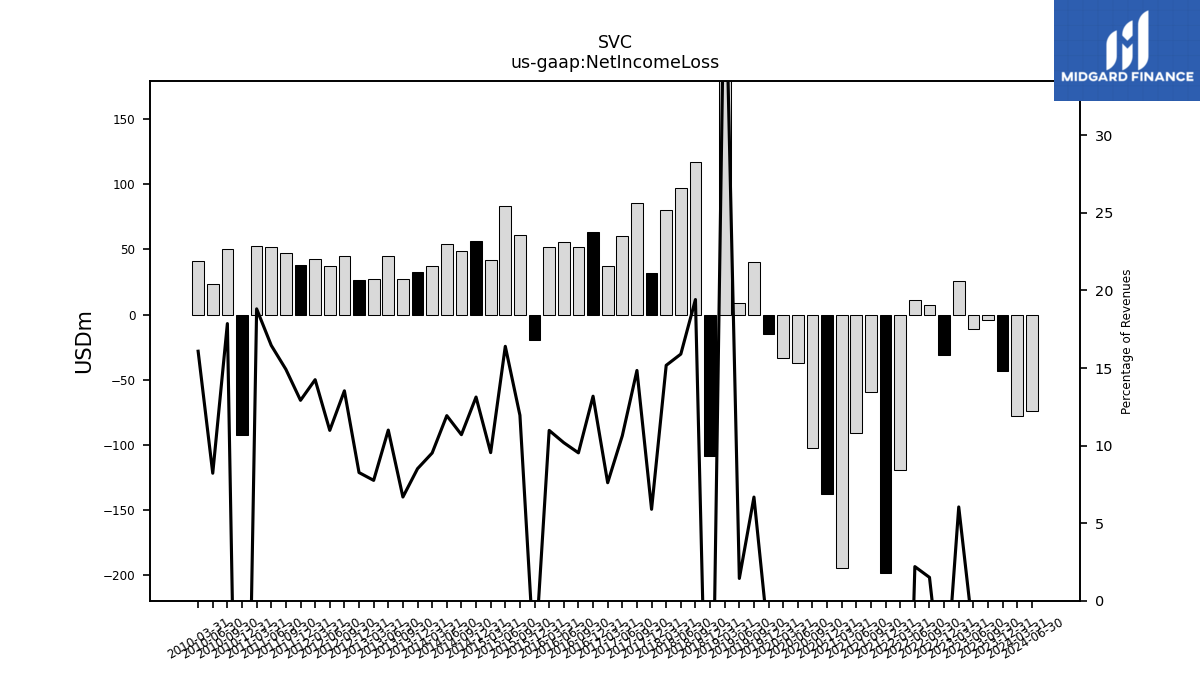
| Net Income Loss | -43.32 | -4.13 | -11.28 | 25.95 | -31.41 | 7.50 | 11.35 | -119.82 | -198.79 | -59.71 | -91.11 | -194.99 | -137.74 | -102.64 | -37.35 | -33.65 | -14.89 | 40.07 | 8.78 | 225.79 | -108.86 | 117.10 | 97.29 | 80.21 | 31.55 | 85.73 | 60.70 | 37.17 | 63.19 | 51.81 | 56.06 | 52.05 | -19.49 | 61.19 | 83.15 | 41.58 | 56.52 | 49.20 | 53.91 | 37.55 | 32.75 | 27.57 | 45.35 | 27.51 | 26.63 | 44.66 | 37.69 | 42.95 | 38.22 | 47.53 | 51.64 | 53.05 | -92.96 | 50.23 | 23.21 | 40.87 | |
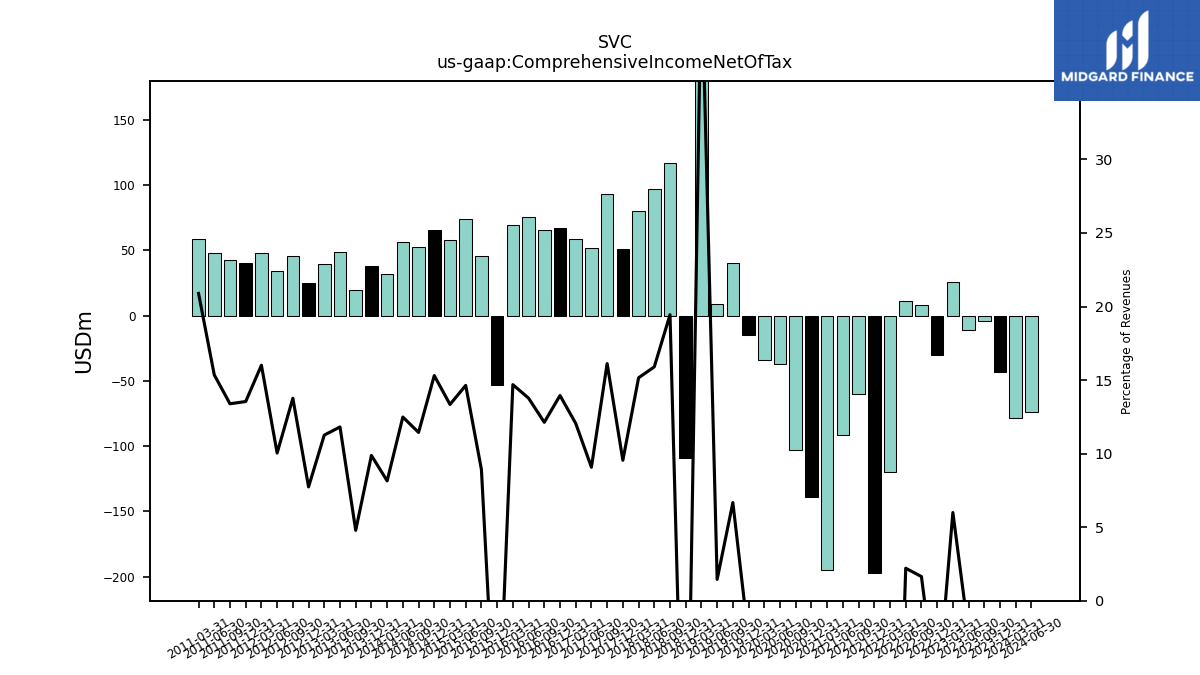
| Comprehensive Income Net Of Tax | -43.14 | -4.37 | -11.06 | 25.74 | -30.54 | 8.18 | 11.40 | -119.82 | -197.25 | -59.71 | -91.11 | -194.99 | -138.56 | -102.58 | -37.35 | -33.65 | -14.89 | 40.03 | 8.85 | 225.85 | -109.02 | 117.27 | 97.30 | 80.11 | 51.10 | 93.12 | 51.79 | 58.91 | 66.86 | 65.92 | 75.78 | 69.65 | -52.90 | 45.66 | 74.22 | 58.11 | 65.89 | 52.58 | 56.44 | 32.13 | 38.00 | 19.73 | 48.71 | 39.92 | 24.95 | 45.43 | 34.46 | 48.26 | 40.06 | 42.67 | 48.18 | 58.90 | NA | NA | NA | NA |
| 2023-12-31 | 2023-09-30 | 2023-06-30 | 2023-03-31 | 2022-12-31 | 2022-09-30 | 2022-06-30 | 2022-03-31 | 2021-12-31 | 2021-09-30 | 2021-06-30 | 2021-03-31 | 2020-12-31 | 2020-09-30 | 2020-06-30 | 2020-03-31 | 2019-12-31 | 2019-09-30 | 2019-06-30 | 2019-03-31 | 2018-12-31 | 2018-09-30 | 2018-06-30 | 2018-03-31 | 2017-12-31 | 2017-09-30 | 2017-06-30 | 2017-03-31 | 2016-12-31 | 2016-09-30 | 2016-06-30 | 2016-03-31 | 2015-12-31 | 2015-09-30 | 2015-06-30 | 2015-03-31 | 2014-12-31 | 2014-09-30 | 2014-06-30 | 2014-03-31 | 2013-12-31 | 2013-09-30 | 2013-06-30 | 2013-03-31 | 2012-12-31 | 2012-09-30 | 2012-06-30 | 2012-03-31 | 2011-12-31 | 2011-09-30 | 2011-06-30 | 2011-03-31 | 2010-12-31 | 2010-09-30 | 2010-06-30 | 2010-03-31 | ||
|---|---|---|---|---|---|---|---|---|---|---|---|---|---|---|---|---|---|---|---|---|---|---|---|---|---|---|---|---|---|---|---|---|---|---|---|---|---|---|---|---|---|---|---|---|---|---|---|---|---|---|---|---|---|---|---|---|---|
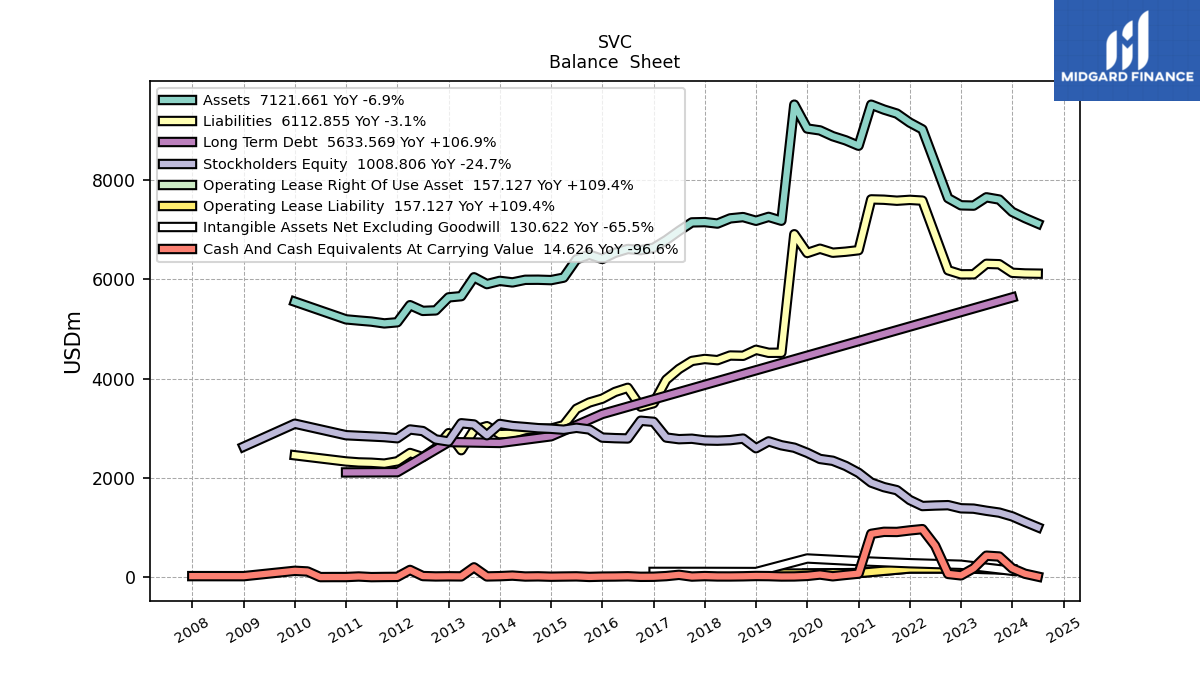
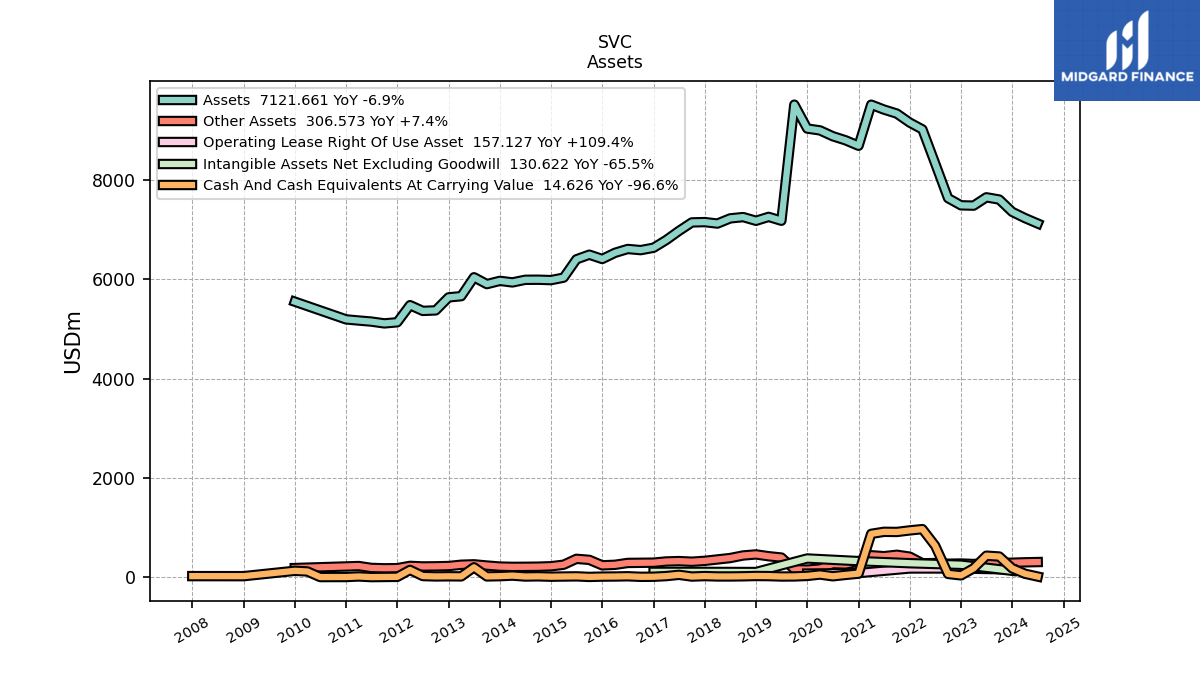
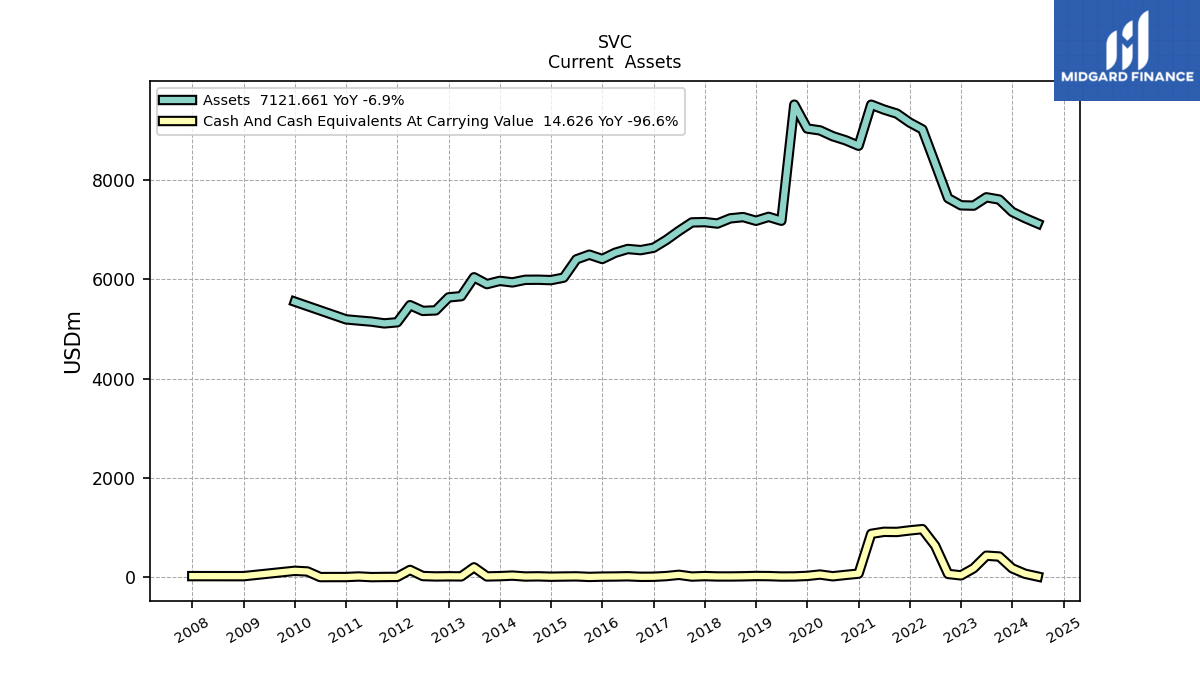
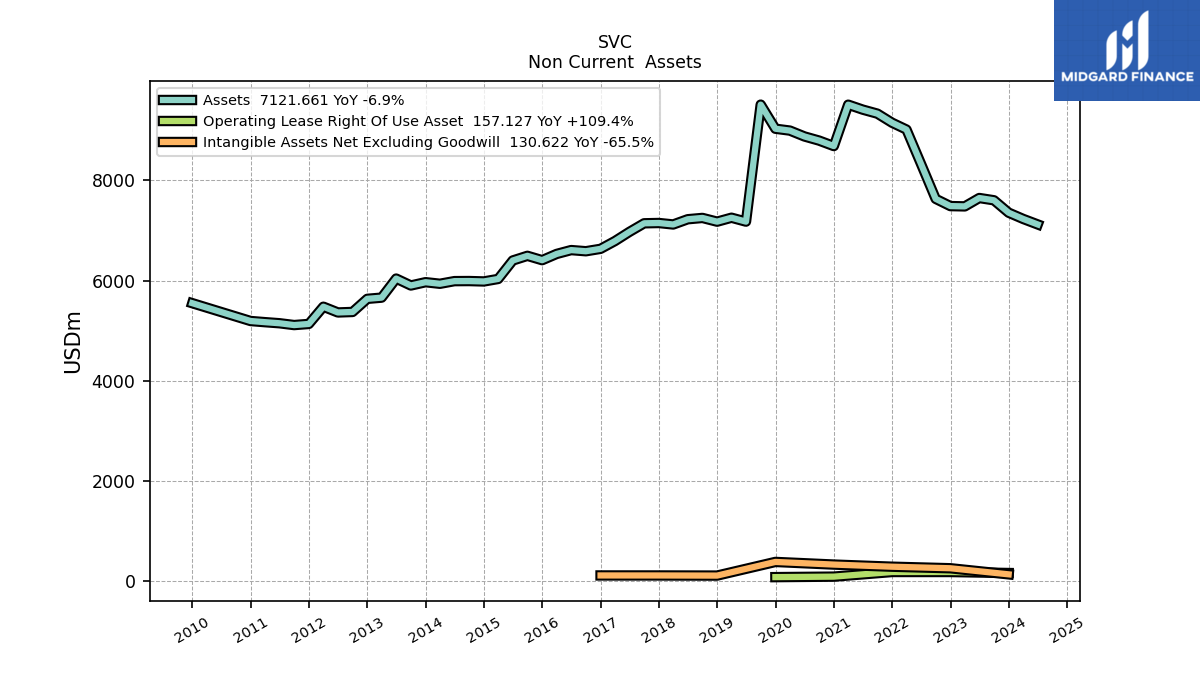
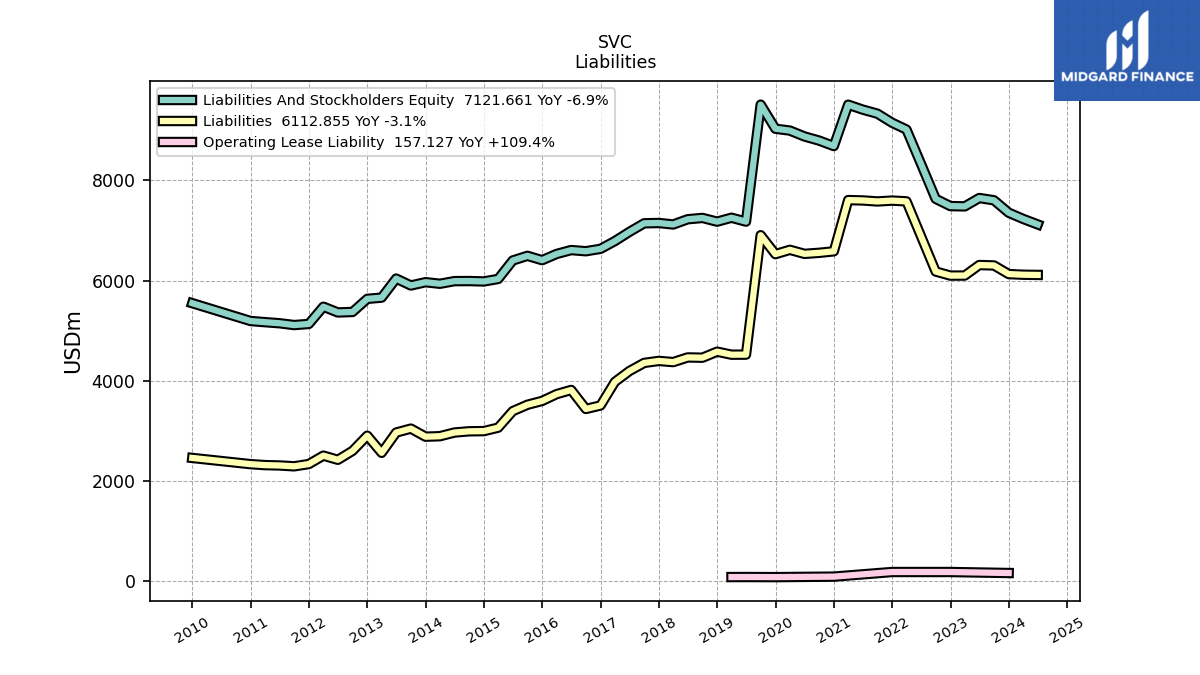
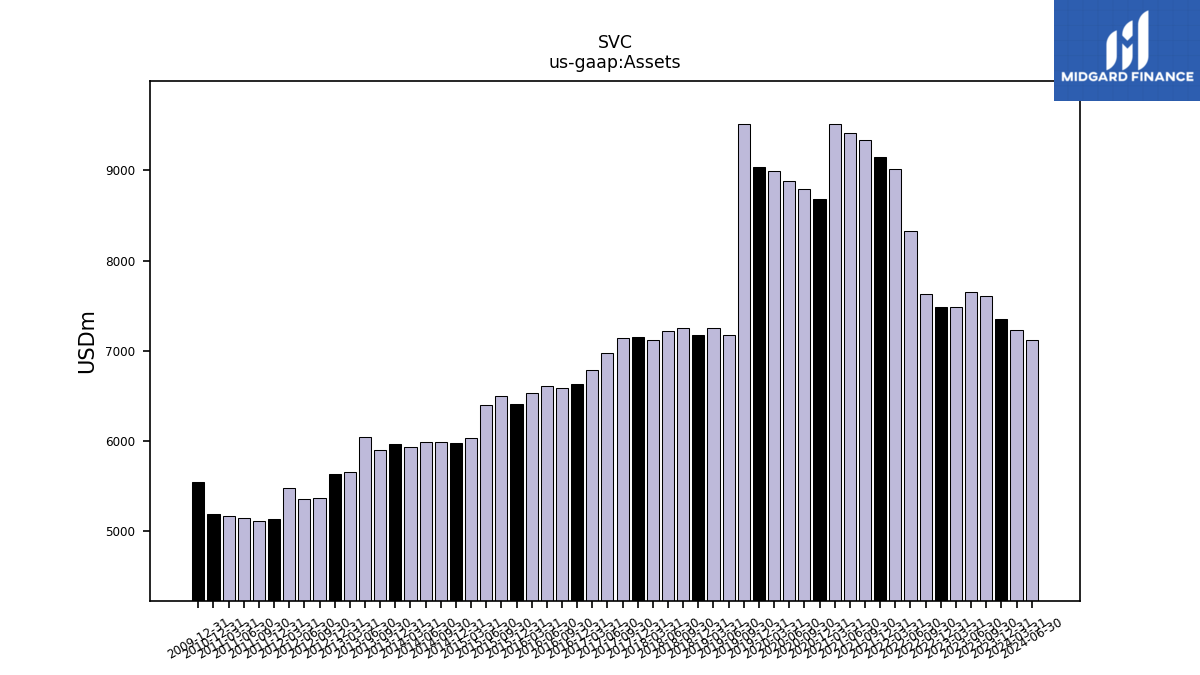
| Assets | 7356.12 | 7604.31 | 7649.65 | 7482.17 | 7488.19 | 7632.71 | 8331.56 | 9017.07 | 9153.32 | 9334.83 | 9415.74 | 9514.51 | 8687.32 | 8796.67 | 8879.55 | 8996.62 | 9033.97 | 9515.50 | 7177.75 | 7255.80 | 7177.08 | 7251.55 | 7225.36 | 7120.87 | 7150.39 | 7144.47 | 6973.45 | 6789.43 | 6634.23 | 6586.13 | 6609.34 | 6532.14 | 6407.60 | 6494.55 | 6401.15 | 6032.41 | 5982.56 | 5990.58 | 5988.93 | 5936.19 | 5967.54 | 5901.86 | 6039.87 | 5659.23 | 5635.12 | 5372.93 | 5362.98 | 5478.02 | 5133.57 | 5111.07 | 5147.51 | 5169.08 | 5192.29 | NA | NA | NA | |
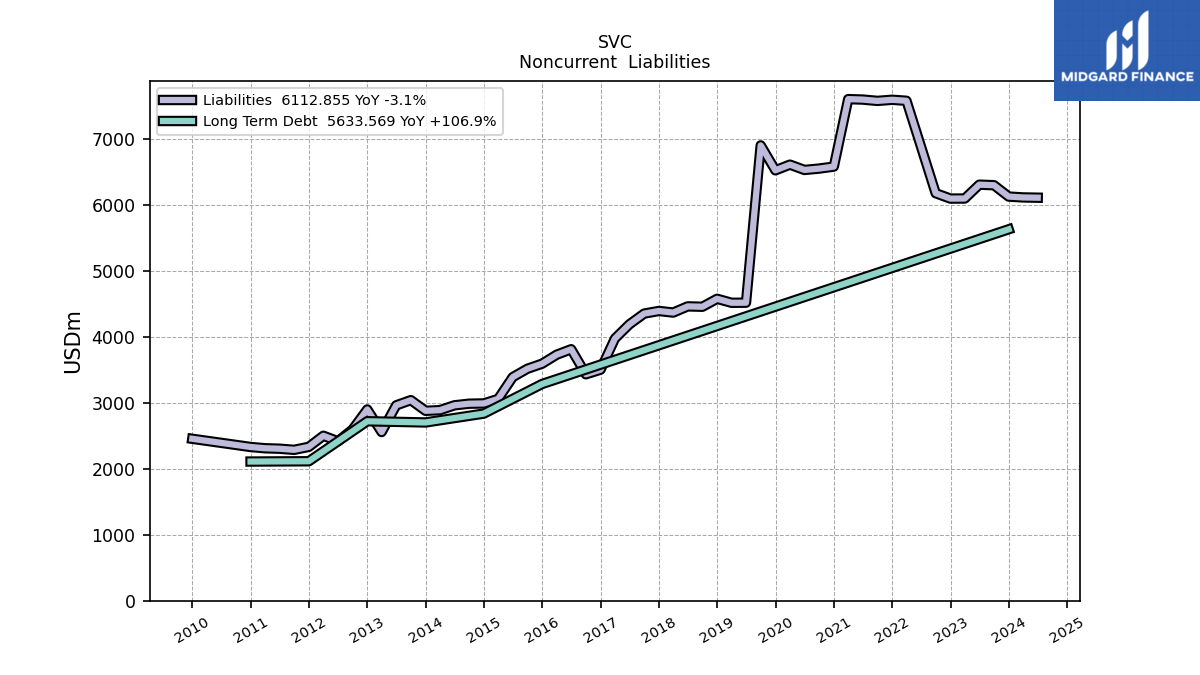
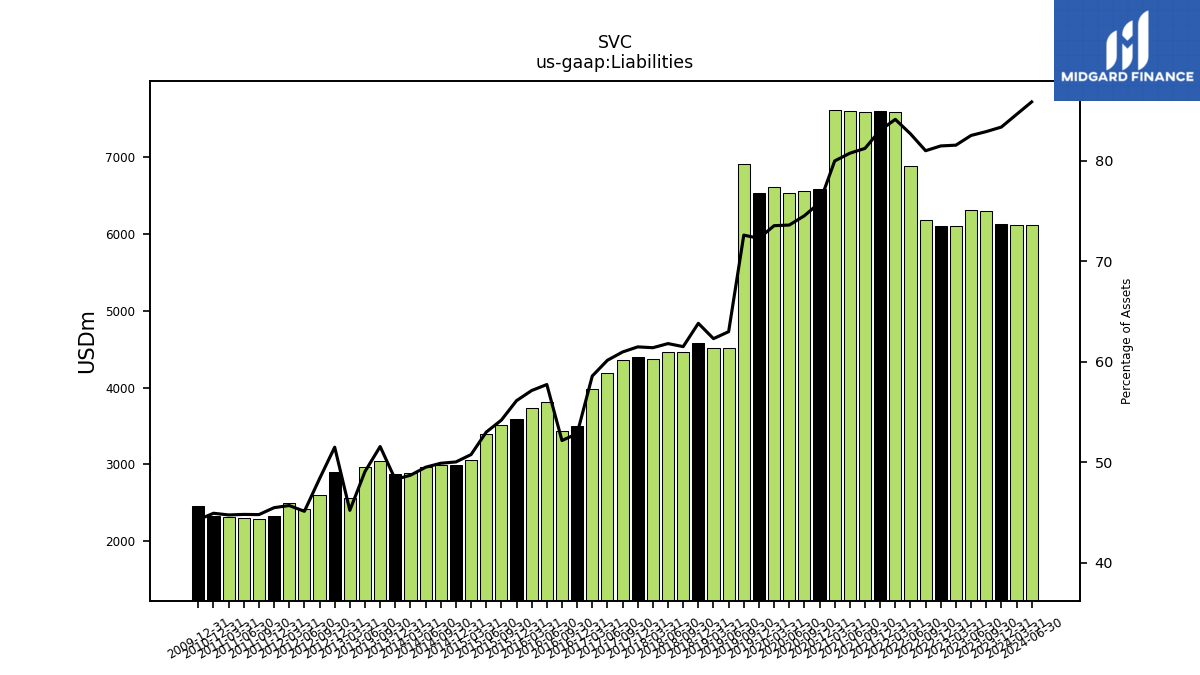
| Liabilities | 6129.98 | 6302.36 | 6310.58 | 6100.26 | 6099.40 | 6180.80 | 6886.69 | 7582.77 | 7598.01 | 7581.09 | 7601.08 | 7607.98 | 6584.53 | 6554.59 | 6533.82 | 6614.36 | 6528.09 | 6906.52 | 4520.30 | 4519.24 | 4579.65 | 4458.98 | 4464.69 | 4370.90 | 4394.96 | 4355.01 | 4193.25 | 3976.35 | 3504.84 | 3434.63 | 3814.83 | 3731.28 | 3595.51 | 3518.72 | 3391.51 | 3061.51 | 2992.41 | 2988.60 | 2964.14 | 2890.71 | 2880.69 | 3042.47 | 2963.59 | 2558.25 | 2901.33 | 2597.93 | 2419.07 | 2502.50 | 2334.27 | 2288.78 | 2305.98 | 2312.96 | 2332.05 | NA | NA | NA | |
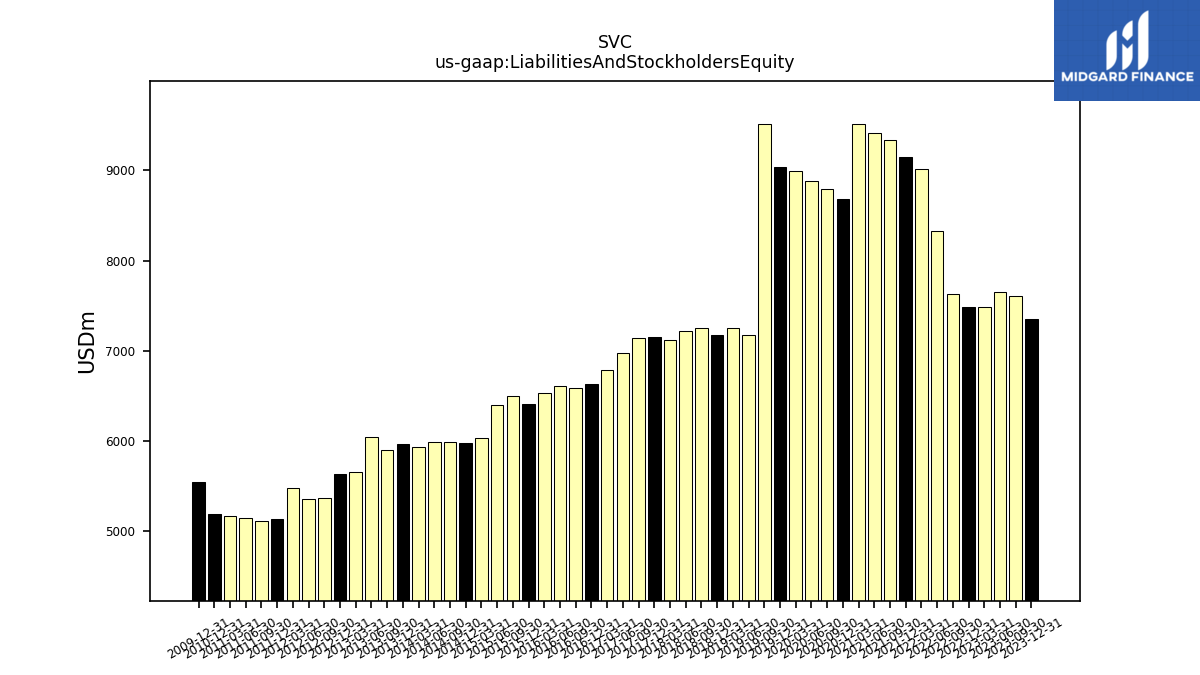
| Liabilities And Stockholders Equity | 7356.12 | 7604.31 | 7649.65 | 7482.17 | 7488.19 | 7632.71 | 8331.56 | 9017.07 | 9153.32 | 9334.83 | 9415.74 | 9514.51 | 8687.32 | 8796.67 | 8879.55 | 8996.62 | 9033.97 | 9515.50 | 7177.75 | 7255.80 | 7177.08 | 7251.55 | 7225.36 | 7120.87 | 7150.39 | 7144.47 | 6973.45 | 6789.43 | 6634.23 | 6586.13 | 6609.34 | 6532.14 | 6407.60 | 6494.55 | 6401.15 | 6032.41 | 5982.56 | 5990.58 | 5988.93 | 5936.19 | 5967.54 | 5901.86 | 6039.87 | 5659.23 | 5635.12 | 5372.93 | 5362.98 | 5478.02 | 5133.57 | 5111.07 | 5147.51 | 5169.08 | 5192.29 | NA | NA | NA | |
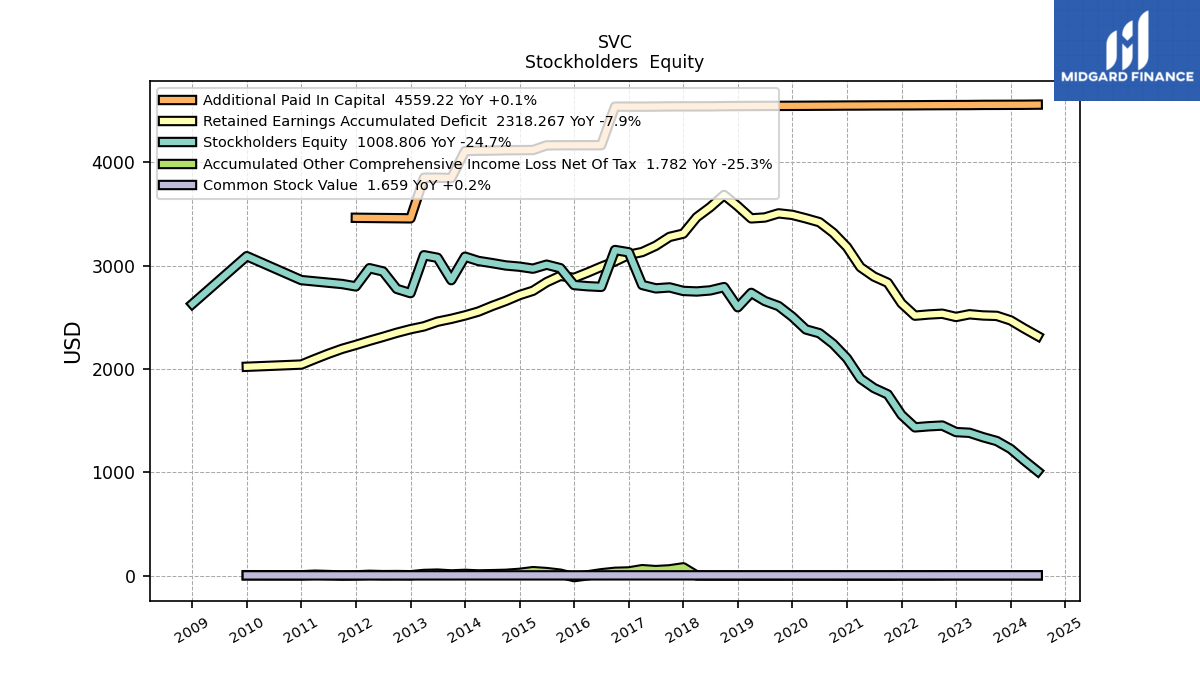
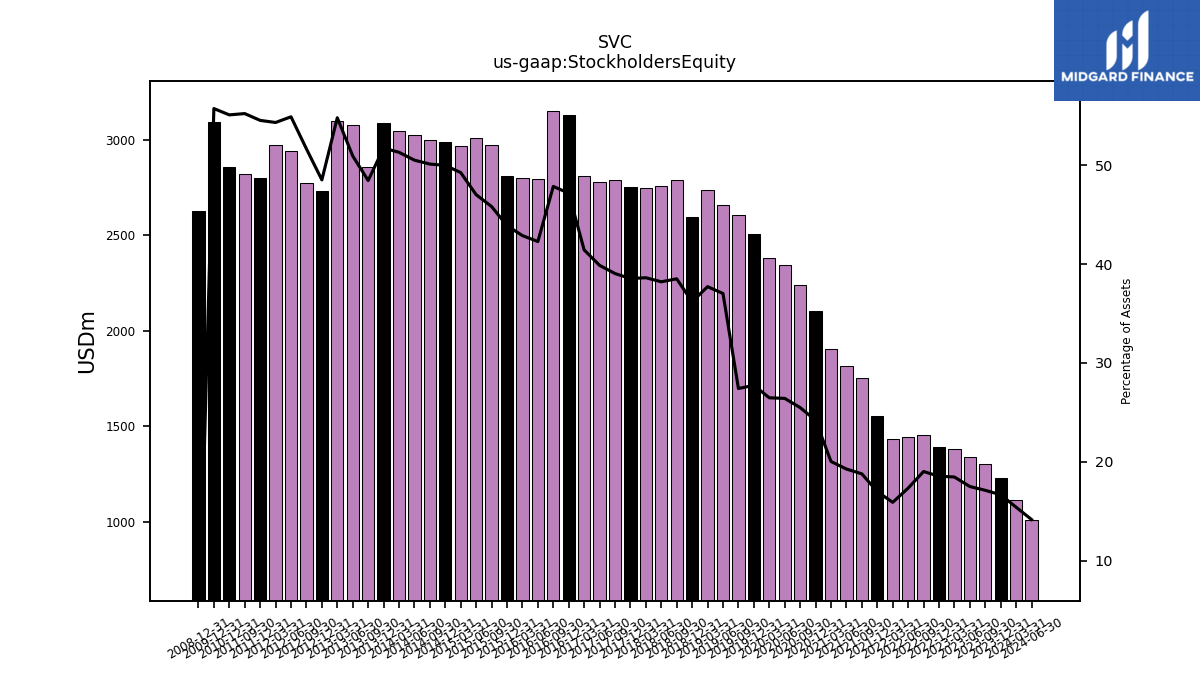
| Stockholders Equity | 1226.13 | 1301.95 | 1339.08 | 1381.90 | 1388.79 | 1451.92 | 1444.87 | 1434.30 | 1555.31 | 1753.74 | 1814.65 | 1906.53 | 2102.79 | 2242.08 | 2345.72 | 2382.27 | 2505.88 | 2608.99 | 2657.44 | 2736.57 | 2597.43 | 2792.57 | 2760.67 | 2749.97 | 2755.42 | 2789.45 | 2780.20 | 2813.09 | 3129.39 | 3151.50 | 2794.51 | 2800.86 | 2812.08 | 2975.83 | 3009.64 | 2970.90 | 2990.15 | 3001.98 | 3024.78 | 3045.48 | 3086.86 | 2859.40 | 3076.29 | 3100.98 | 2733.80 | 2775.00 | 2943.91 | 2975.52 | 2799.30 | 2822.29 | NA | NA | 2860.24 | NA | NA | NA |
| 2023-12-31 | 2023-09-30 | 2023-06-30 | 2023-03-31 | 2022-12-31 | 2022-09-30 | 2022-06-30 | 2022-03-31 | 2021-12-31 | 2021-09-30 | 2021-06-30 | 2021-03-31 | 2020-12-31 | 2020-09-30 | 2020-06-30 | 2020-03-31 | 2019-12-31 | 2019-09-30 | 2019-06-30 | 2019-03-31 | 2018-12-31 | 2018-09-30 | 2018-06-30 | 2018-03-31 | 2017-12-31 | 2017-09-30 | 2017-06-30 | 2017-03-31 | 2016-12-31 | 2016-09-30 | 2016-06-30 | 2016-03-31 | 2015-12-31 | 2015-09-30 | 2015-06-30 | 2015-03-31 | 2014-12-31 | 2014-09-30 | 2014-06-30 | 2014-03-31 | 2013-12-31 | 2013-09-30 | 2013-06-30 | 2013-03-31 | 2012-12-31 | 2012-09-30 | 2012-06-30 | 2012-03-31 | 2011-12-31 | 2011-09-30 | 2011-06-30 | 2011-03-31 | 2010-12-31 | 2010-09-30 | 2010-06-30 | 2010-03-31 | ||
|---|---|---|---|---|---|---|---|---|---|---|---|---|---|---|---|---|---|---|---|---|---|---|---|---|---|---|---|---|---|---|---|---|---|---|---|---|---|---|---|---|---|---|---|---|---|---|---|---|---|---|---|---|---|---|---|---|---|
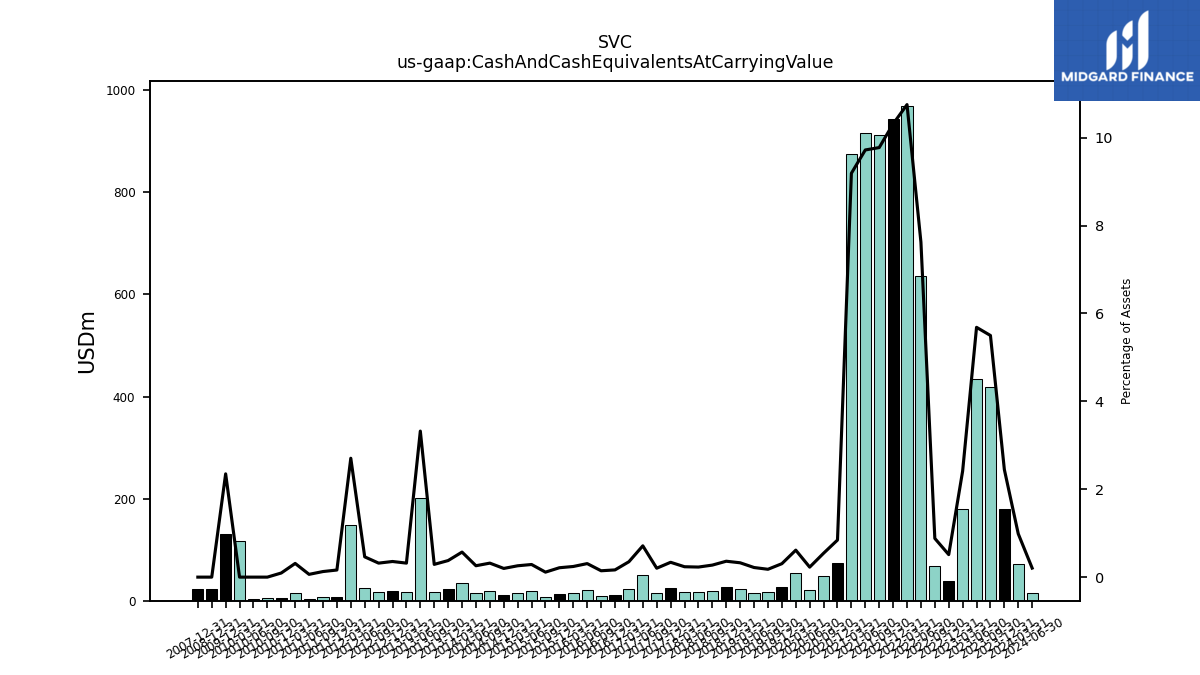
| Cash And Cash Equivalents At Carrying Value | 180.12 | 418.16 | 434.87 | 180.62 | 38.37 | 67.25 | 635.20 | 969.61 | 944.04 | 912.53 | 915.33 | 874.46 | 73.33 | 47.85 | 20.21 | 55.22 | 27.63 | 16.99 | 15.69 | 23.68 | 25.97 | 19.85 | 16.55 | 16.83 | 24.14 | 14.49 | 49.67 | 23.77 | 10.90 | 9.53 | 20.35 | 15.82 | 13.68 | 7.38 | 18.39 | 15.57 | 11.83 | 19.08 | 15.52 | 33.83 | 22.50 | 17.12 | 200.74 | 18.04 | 20.05 | 17.12 | 24.77 | 148.21 | 8.30 | 6.49 | 3.25 | 16.12 | 4.88 | 4.86 | 3.75 | 116.96 | |
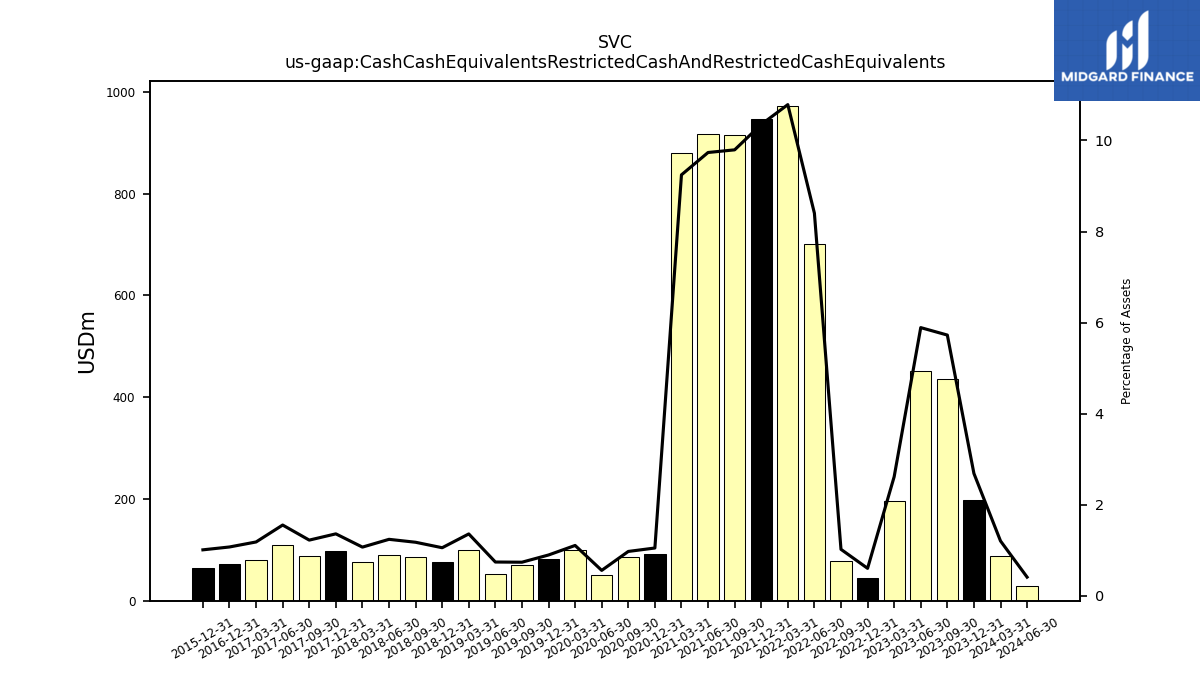
| Cash Cash Equivalents Restricted Cash And Restricted Cash Equivalents | 197.83 | 435.53 | 450.62 | 195.84 | 45.42 | 78.14 | 700.11 | 972.57 | 947.42 | 914.19 | 916.62 | 879.55 | 91.46 | 85.98 | 49.86 | 99.75 | 81.26 | 70.51 | 53.48 | 98.80 | 76.00 | 85.49 | 89.83 | 76.36 | 97.50 | 87.60 | 108.58 | 80.48 | 71.35 | NA | NA | NA | 64.89 | NA | NA | NA | NA | NA | NA | NA | NA | NA | NA | NA | NA | NA | NA | NA | NA | NA | NA | NA | NA | NA | NA | NA | |
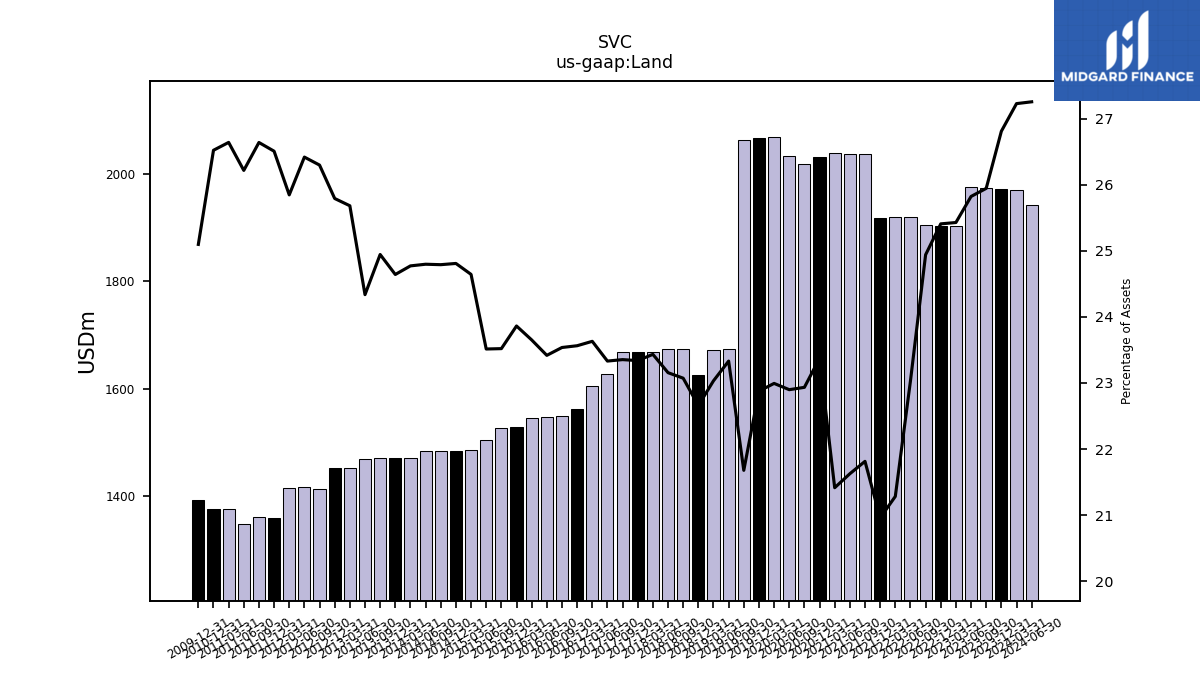
| Land | 1972.14 | 1972.94 | 1975.34 | 1902.59 | 1902.59 | 1903.62 | 1918.84 | 1919.13 | 1918.38 | 2036.30 | 2036.30 | 2037.53 | 2030.44 | 2017.43 | 2033.29 | 2068.64 | 2066.60 | 2062.78 | 1674.65 | 1671.21 | 1626.24 | 1673.11 | 1673.11 | 1668.66 | 1668.80 | 1668.49 | 1627.01 | 1604.37 | 1563.26 | 1550.17 | 1547.77 | 1544.95 | 1529.00 | 1527.50 | 1505.17 | 1486.59 | 1484.21 | 1485.08 | 1485.08 | 1470.51 | 1470.51 | 1472.18 | 1469.91 | 1453.39 | 1453.40 | 1412.94 | 1416.81 | 1415.88 | 1360.77 | 1361.56 | 1349.52 | 1377.07 | 1377.07 | NA | NA | NA |
| 2023-12-31 | 2023-09-30 | 2023-06-30 | 2023-03-31 | 2022-12-31 | 2022-09-30 | 2022-06-30 | 2022-03-31 | 2021-12-31 | 2021-09-30 | 2021-06-30 | 2021-03-31 | 2020-12-31 | 2020-09-30 | 2020-06-30 | 2020-03-31 | 2019-12-31 | 2019-09-30 | 2019-06-30 | 2019-03-31 | 2018-12-31 | 2018-09-30 | 2018-06-30 | 2018-03-31 | 2017-12-31 | 2017-09-30 | 2017-06-30 | 2017-03-31 | 2016-12-31 | 2016-09-30 | 2016-06-30 | 2016-03-31 | 2015-12-31 | 2015-09-30 | 2015-06-30 | 2015-03-31 | 2014-12-31 | 2014-09-30 | 2014-06-30 | 2014-03-31 | 2013-12-31 | 2013-09-30 | 2013-06-30 | 2013-03-31 | 2012-12-31 | 2012-09-30 | 2012-06-30 | 2012-03-31 | 2011-12-31 | 2011-09-30 | 2011-06-30 | 2011-03-31 | 2010-12-31 | 2010-09-30 | 2010-06-30 | 2010-03-31 | ||
|---|---|---|---|---|---|---|---|---|---|---|---|---|---|---|---|---|---|---|---|---|---|---|---|---|---|---|---|---|---|---|---|---|---|---|---|---|---|---|---|---|---|---|---|---|---|---|---|---|---|---|---|---|---|---|---|---|---|
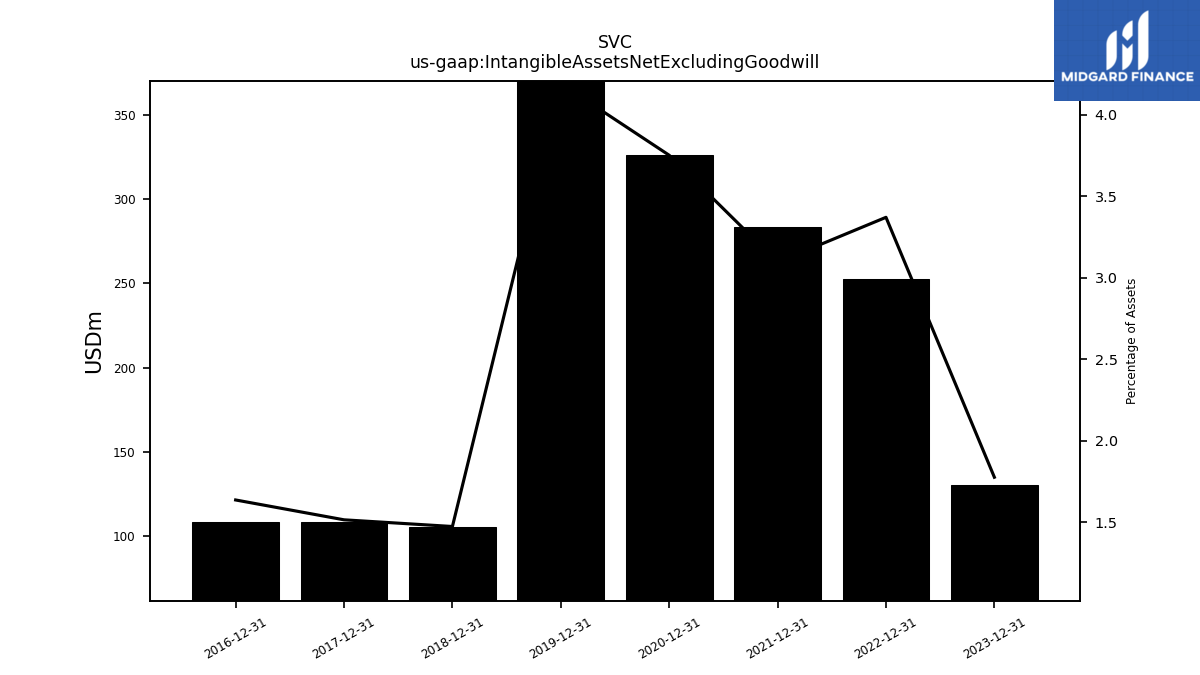
| Intangible Assets Net Excluding Goodwill | 130.62 | NA | NA | NA | 252.36 | NA | NA | NA | 283.24 | NA | NA | NA | 325.85 | NA | NA | NA | 378.55 | NA | NA | NA | 105.75 | NA | NA | NA | 108.29 | NA | NA | NA | 108.55 | NA | NA | NA | NA | NA | NA | NA | NA | NA | NA | NA | NA | NA | NA | NA | NA | NA | NA | NA | NA | NA | NA | NA | NA | NA | NA | NA | |
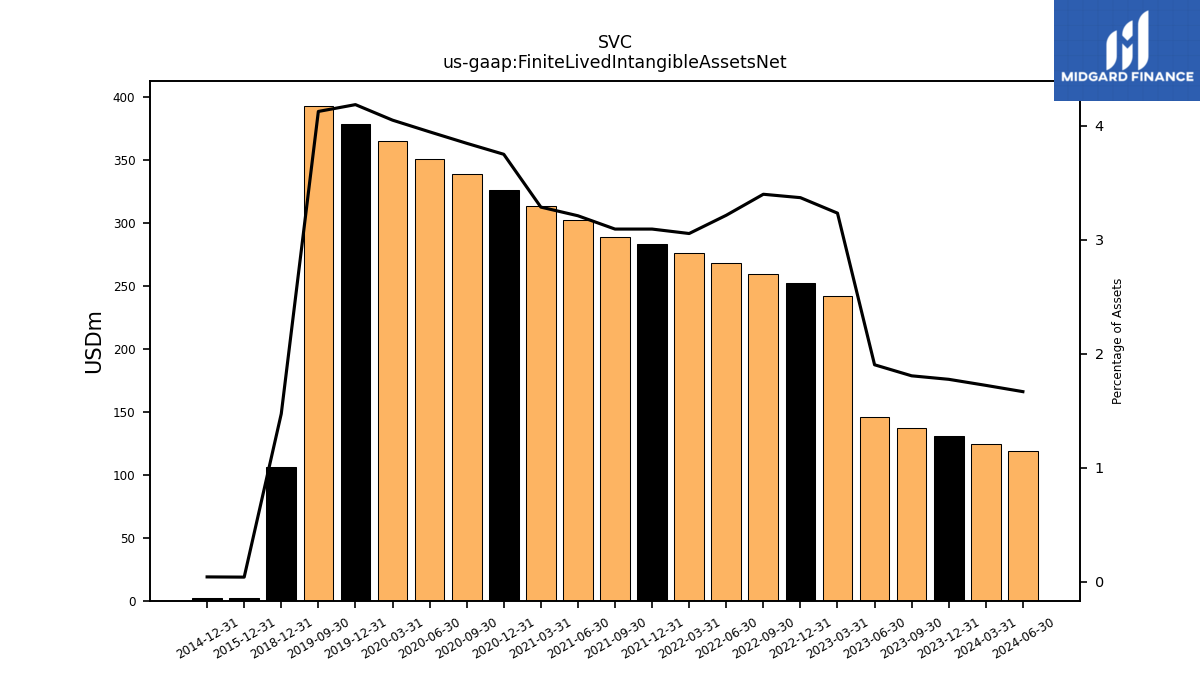
| Finite Lived Intangible Assets Net | 130.62 | 137.37 | 145.60 | 241.99 | 252.36 | 259.50 | 267.90 | 275.50 | 283.24 | 288.85 | 302.36 | 312.76 | 325.85 | 338.43 | 350.55 | 364.40 | 378.22 | 392.67 | NA | NA | 105.75 | NA | NA | NA | NA | NA | NA | NA | NA | NA | NA | NA | 2.54 | NA | NA | NA | 2.48 | NA | NA | NA | NA | NA | NA | NA | NA | NA | NA | NA | NA | NA | NA | NA | NA | NA | NA | NA |
| 2023-12-31 | 2023-09-30 | 2023-06-30 | 2023-03-31 | 2022-12-31 | 2022-09-30 | 2022-06-30 | 2022-03-31 | 2021-12-31 | 2021-09-30 | 2021-06-30 | 2021-03-31 | 2020-12-31 | 2020-09-30 | 2020-06-30 | 2020-03-31 | 2019-12-31 | 2019-09-30 | 2019-06-30 | 2019-03-31 | 2018-12-31 | 2018-09-30 | 2018-06-30 | 2018-03-31 | 2017-12-31 | 2017-09-30 | 2017-06-30 | 2017-03-31 | 2016-12-31 | 2016-09-30 | 2016-06-30 | 2016-03-31 | 2015-12-31 | 2015-09-30 | 2015-06-30 | 2015-03-31 | 2014-12-31 | 2014-09-30 | 2014-06-30 | 2014-03-31 | 2013-12-31 | 2013-09-30 | 2013-06-30 | 2013-03-31 | 2012-12-31 | 2012-09-30 | 2012-06-30 | 2012-03-31 | 2011-12-31 | 2011-09-30 | 2011-06-30 | 2011-03-31 | 2010-12-31 | 2010-09-30 | 2010-06-30 | 2010-03-31 | ||
|---|---|---|---|---|---|---|---|---|---|---|---|---|---|---|---|---|---|---|---|---|---|---|---|---|---|---|---|---|---|---|---|---|---|---|---|---|---|---|---|---|---|---|---|---|---|---|---|---|---|---|---|---|---|---|---|---|---|
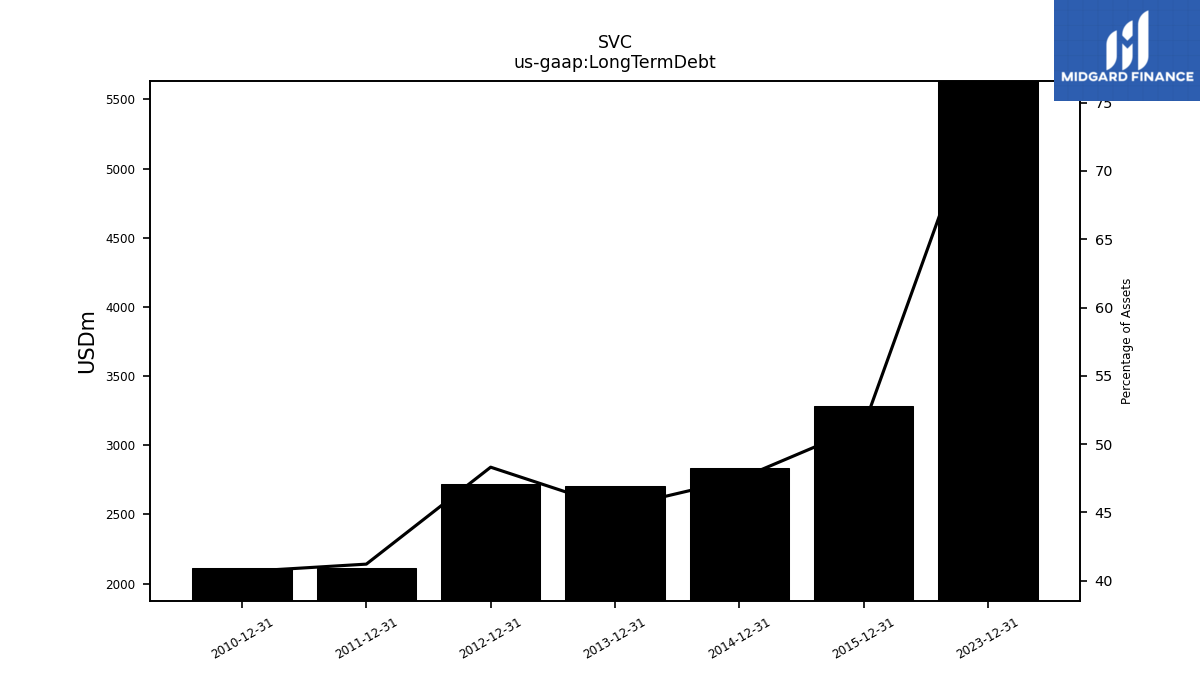
| Long Term Debt | 5633.57 | NA | NA | NA | NA | NA | NA | NA | NA | NA | NA | NA | NA | NA | NA | NA | NA | NA | NA | NA | NA | NA | NA | NA | NA | NA | NA | NA | NA | NA | NA | NA | 3287.47 | NA | NA | NA | 2838.61 | NA | NA | NA | 2704.01 | NA | NA | NA | 2722.36 | NA | NA | NA | 2115.71 | NA | NA | NA | 2111.22 | NA | NA | NA |
| 2023-12-31 | 2023-09-30 | 2023-06-30 | 2023-03-31 | 2022-12-31 | 2022-09-30 | 2022-06-30 | 2022-03-31 | 2021-12-31 | 2021-09-30 | 2021-06-30 | 2021-03-31 | 2020-12-31 | 2020-09-30 | 2020-06-30 | 2020-03-31 | 2019-12-31 | 2019-09-30 | 2019-06-30 | 2019-03-31 | 2018-12-31 | 2018-09-30 | 2018-06-30 | 2018-03-31 | 2017-12-31 | 2017-09-30 | 2017-06-30 | 2017-03-31 | 2016-12-31 | 2016-09-30 | 2016-06-30 | 2016-03-31 | 2015-12-31 | 2015-09-30 | 2015-06-30 | 2015-03-31 | 2014-12-31 | 2014-09-30 | 2014-06-30 | 2014-03-31 | 2013-12-31 | 2013-09-30 | 2013-06-30 | 2013-03-31 | 2012-12-31 | 2012-09-30 | 2012-06-30 | 2012-03-31 | 2011-12-31 | 2011-09-30 | 2011-06-30 | 2011-03-31 | 2010-12-31 | 2010-09-30 | 2010-06-30 | 2010-03-31 | ||
|---|---|---|---|---|---|---|---|---|---|---|---|---|---|---|---|---|---|---|---|---|---|---|---|---|---|---|---|---|---|---|---|---|---|---|---|---|---|---|---|---|---|---|---|---|---|---|---|---|---|---|---|---|---|---|---|---|---|
| Stockholders Equity | 1226.13 | 1301.95 | 1339.08 | 1381.90 | 1388.79 | 1451.92 | 1444.87 | 1434.30 | 1555.31 | 1753.74 | 1814.65 | 1906.53 | 2102.79 | 2242.08 | 2345.72 | 2382.27 | 2505.88 | 2608.99 | 2657.44 | 2736.57 | 2597.43 | 2792.57 | 2760.67 | 2749.97 | 2755.42 | 2789.45 | 2780.20 | 2813.09 | 3129.39 | 3151.50 | 2794.51 | 2800.86 | 2812.08 | 2975.83 | 3009.64 | 2970.90 | 2990.15 | 3001.98 | 3024.78 | 3045.48 | 3086.86 | 2859.40 | 3076.29 | 3100.98 | 2733.80 | 2775.00 | 2943.91 | 2975.52 | 2799.30 | 2822.29 | NA | NA | 2860.24 | NA | NA | NA | |
| Common Stock Value | 1.66 | 1.66 | 1.66 | 1.66 | 1.66 | 1.65 | 1.65 | 1.65 | 1.65 | 1.65 | 1.65 | 1.65 | 1.65 | 1.65 | 1.65 | 1.65 | 1.65 | 1.65 | 1.65 | 1.64 | 1.64 | 1.64 | 1.64 | 1.64 | 1.64 | 1.64 | 1.64 | 1.64 | 1.64 | 1.64 | 1.52 | 1.51 | 1.51 | 1.51 | 1.51 | 1.50 | 1.50 | 1.50 | 1.50 | 1.50 | 1.50 | 1.40 | 1.40 | 1.40 | 1.24 | 1.24 | 1.24 | 1.24 | 1.24 | 1.24 | 1.24 | 1.23 | 1.23 | NA | NA | NA | |
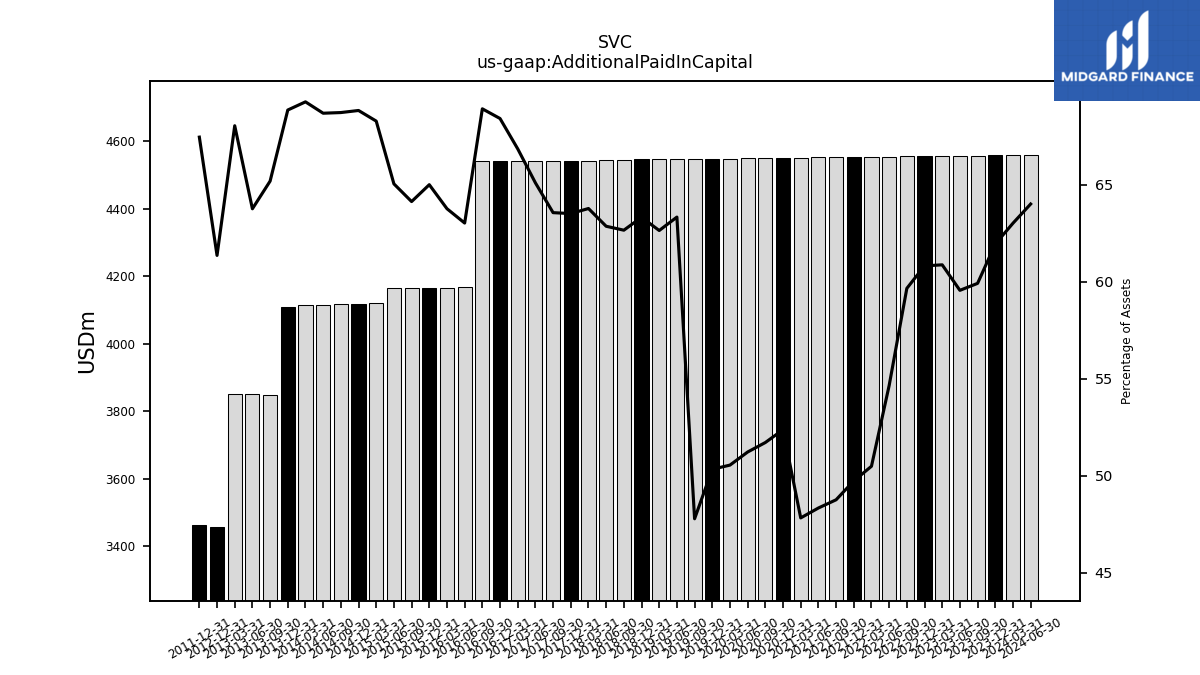
| Additional Paid In Capital | 4557.47 | 4556.99 | 4556.65 | 4555.33 | 4554.86 | 4554.36 | 4553.85 | 4553.02 | 4552.56 | 4552.09 | 4551.64 | 4550.77 | 4550.39 | 4549.47 | 4548.88 | 4548.08 | 4547.53 | 4547.06 | 4546.74 | 4545.92 | 4545.48 | 4544.45 | 4542.71 | 4542.21 | 4542.31 | 4541.98 | 4540.41 | 4539.67 | 4539.67 | 4539.70 | 4166.30 | 4165.98 | 4165.91 | 4165.91 | 4164.47 | 4119.82 | 4118.55 | 4117.65 | 4114.48 | 4113.06 | 4109.60 | 3847.96 | 3851.82 | 3851.46 | 3458.14 | NA | NA | NA | 3463.53 | NA | NA | NA | NA | NA | NA | NA | |
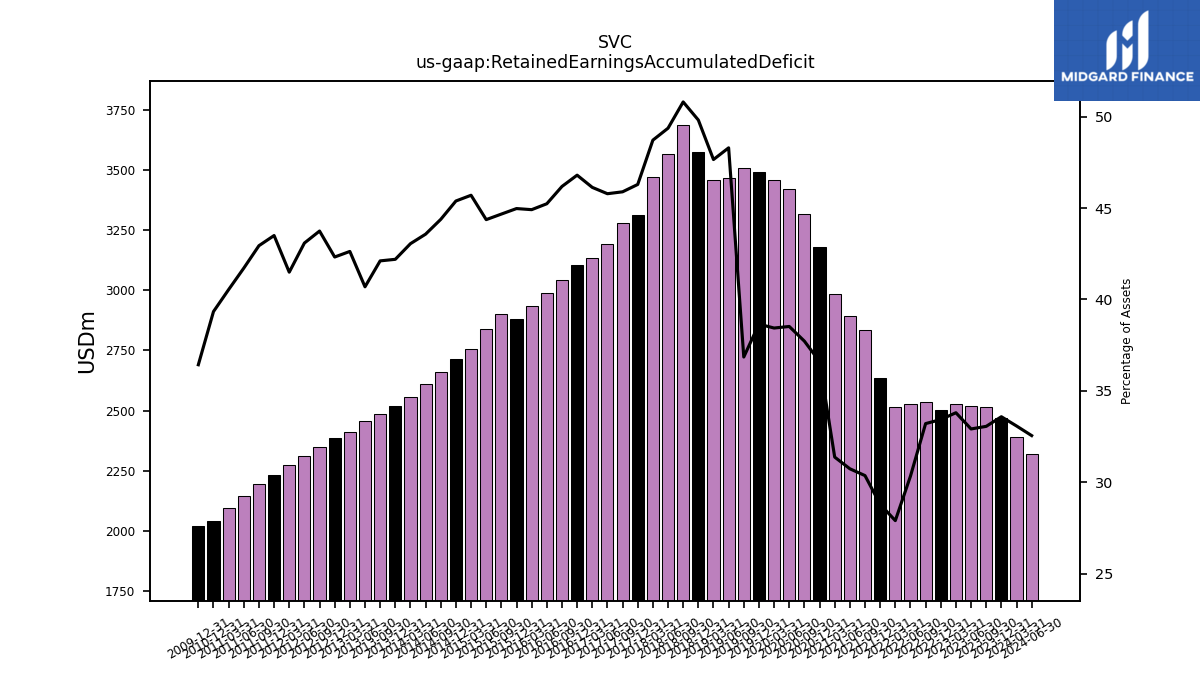
| Retained Earnings Accumulated Deficit | 2470.50 | 2513.82 | 2517.95 | 2529.23 | 2503.28 | 2534.69 | 2527.19 | 2515.84 | 2635.66 | 2834.45 | 2894.16 | 2985.27 | 3180.26 | 3318.00 | 3420.65 | 3457.99 | 3491.64 | 3506.54 | 3466.46 | 3457.68 | 3575.31 | 3684.17 | 3567.07 | 3468.94 | 3310.02 | 3278.47 | 3192.74 | 3132.04 | 3104.77 | 3041.58 | 2989.77 | 2933.71 | 2881.66 | 2901.15 | 2839.97 | 2756.82 | 2715.24 | 2658.72 | 2609.52 | 2555.60 | 2518.05 | 2485.30 | 2457.74 | 2412.38 | 2384.88 | 2350.26 | 2310.64 | 2272.96 | 2232.95 | 2194.74 | 2147.20 | 2095.56 | 2042.51 | NA | NA | NA | |
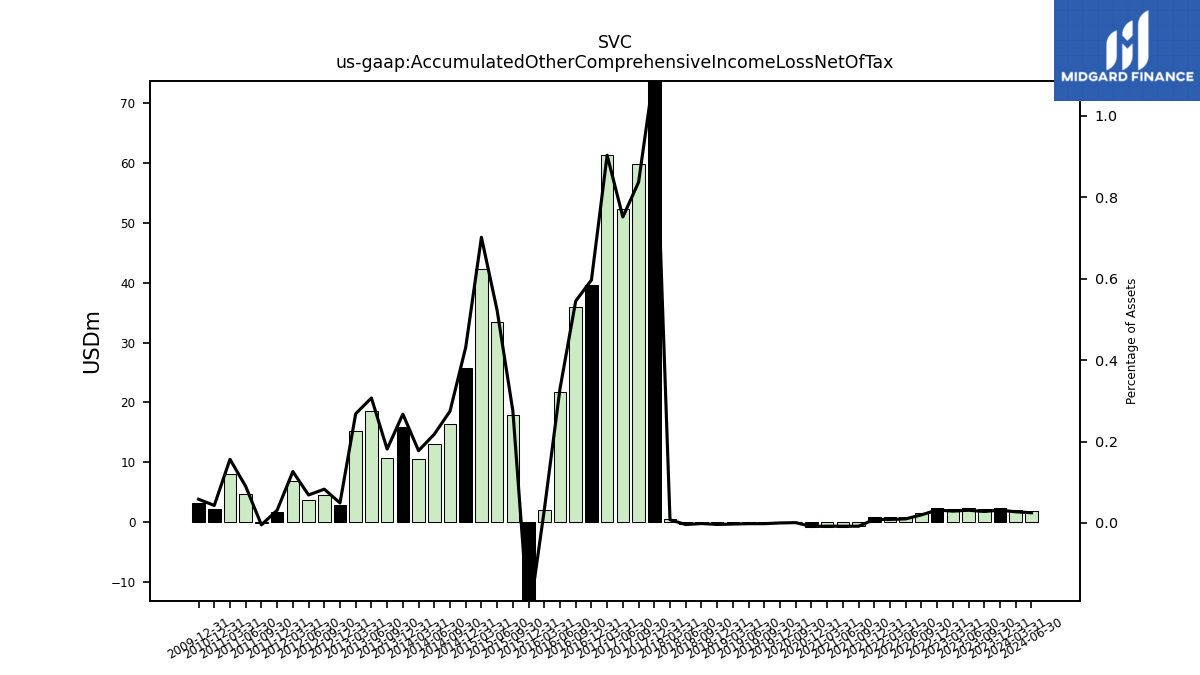
| Accumulated Other Comprehensive Income Loss Net Of Tax | 2.32 | 2.14 | 2.38 | 2.17 | 2.38 | 1.51 | 0.83 | 0.78 | 0.78 | -0.76 | -0.76 | -0.76 | -0.76 | 0.06 | NA | NA | 0.00 | -0.17 | -0.13 | -0.20 | -0.27 | -0.11 | -0.28 | 0.55 | 79.36 | 59.80 | 52.41 | 61.32 | 39.58 | 35.90 | 21.79 | 2.07 | -15.52 | 17.88 | 33.41 | 42.33 | 25.80 | 16.44 | 13.05 | 10.53 | 15.95 | 10.70 | 18.54 | 15.18 | 2.77 | 4.46 | 3.68 | 6.91 | 1.60 | -0.24 | 4.62 | 8.09 | 2.23 | NA | NA | NA |
| 2023-12-31 | 2023-09-30 | 2023-06-30 | 2023-03-31 | 2022-12-31 | 2022-09-30 | 2022-06-30 | 2022-03-31 | 2021-12-31 | 2021-09-30 | 2021-06-30 | 2021-03-31 | 2020-12-31 | 2020-09-30 | 2020-06-30 | 2020-03-31 | 2019-12-31 | 2019-09-30 | 2019-06-30 | 2019-03-31 | 2018-12-31 | 2018-09-30 | 2018-06-30 | 2018-03-31 | 2017-12-31 | 2017-09-30 | 2017-06-30 | 2017-03-31 | 2016-12-31 | 2016-09-30 | 2016-06-30 | 2016-03-31 | 2015-12-31 | 2015-09-30 | 2015-06-30 | 2015-03-31 | 2014-12-31 | 2014-09-30 | 2014-06-30 | 2014-03-31 | 2013-12-31 | 2013-09-30 | 2013-06-30 | 2013-03-31 | 2012-12-31 | 2012-09-30 | 2012-06-30 | 2012-03-31 | 2011-12-31 | 2011-09-30 | 2011-06-30 | 2011-03-31 | 2010-12-31 | 2010-09-30 | 2010-06-30 | 2010-03-31 | ||
|---|---|---|---|---|---|---|---|---|---|---|---|---|---|---|---|---|---|---|---|---|---|---|---|---|---|---|---|---|---|---|---|---|---|---|---|---|---|---|---|---|---|---|---|---|---|---|---|---|---|---|---|---|---|---|---|---|---|
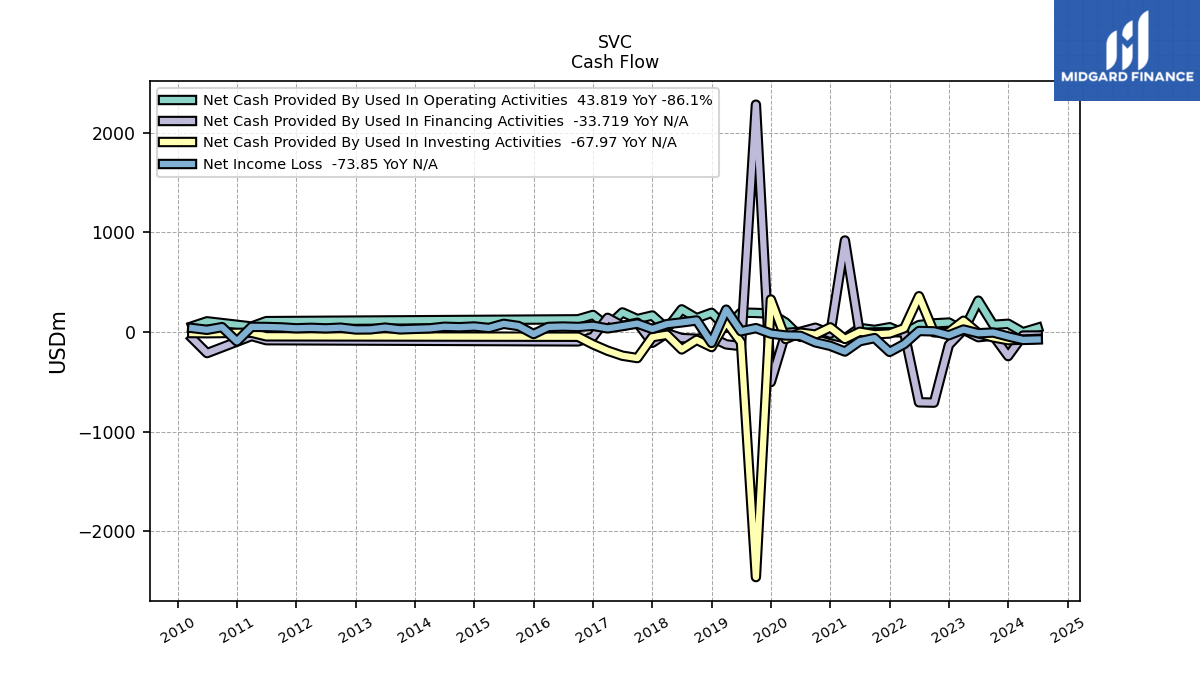
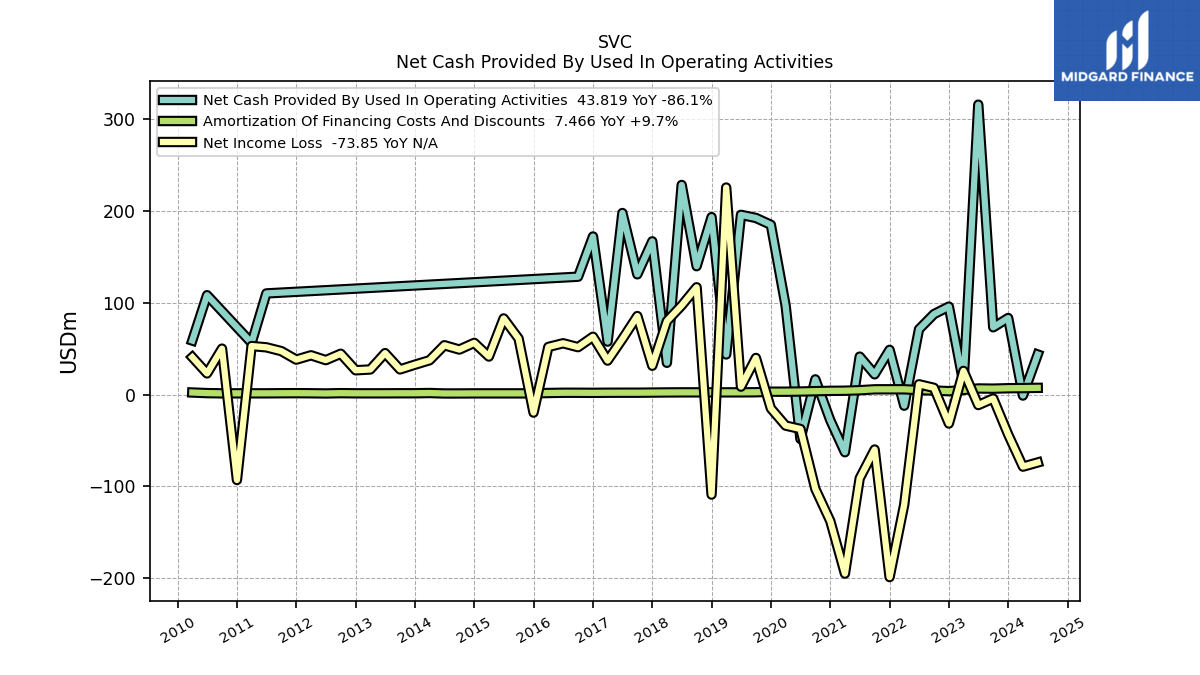
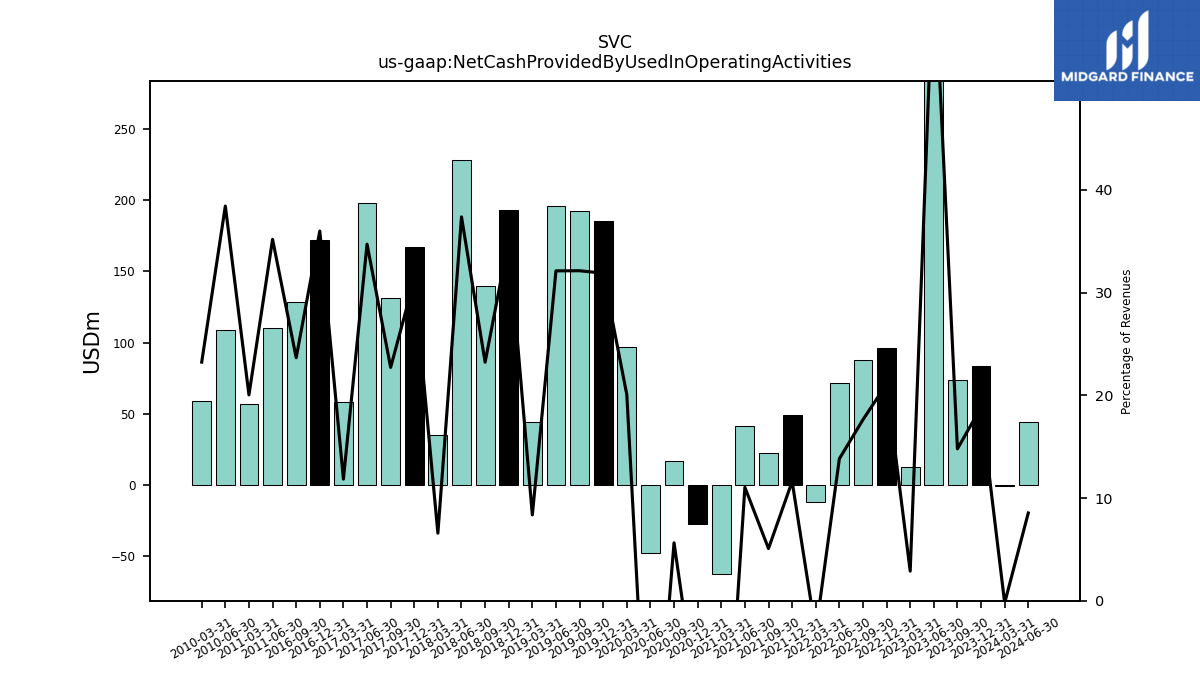
| Net Cash Provided By Used In Operating Activities | 83.59 | 73.45 | 316.13 | 12.37 | 96.01 | 87.82 | 71.28 | -11.98 | 48.90 | 22.21 | 41.52 | -62.72 | -27.92 | 16.73 | -48.22 | 97.02 | 185.19 | 192.63 | 196.03 | 43.87 | 193.55 | 140.03 | 228.61 | 34.76 | 167.17 | 131.18 | 198.02 | 57.85 | 172.44 | 128.58 | NA | NA | NA | NA | NA | NA | NA | NA | NA | NA | NA | NA | NA | NA | NA | NA | NA | NA | NA | NA | 110.39 | 56.49 | NA | NA | 108.48 | 59.02 | |
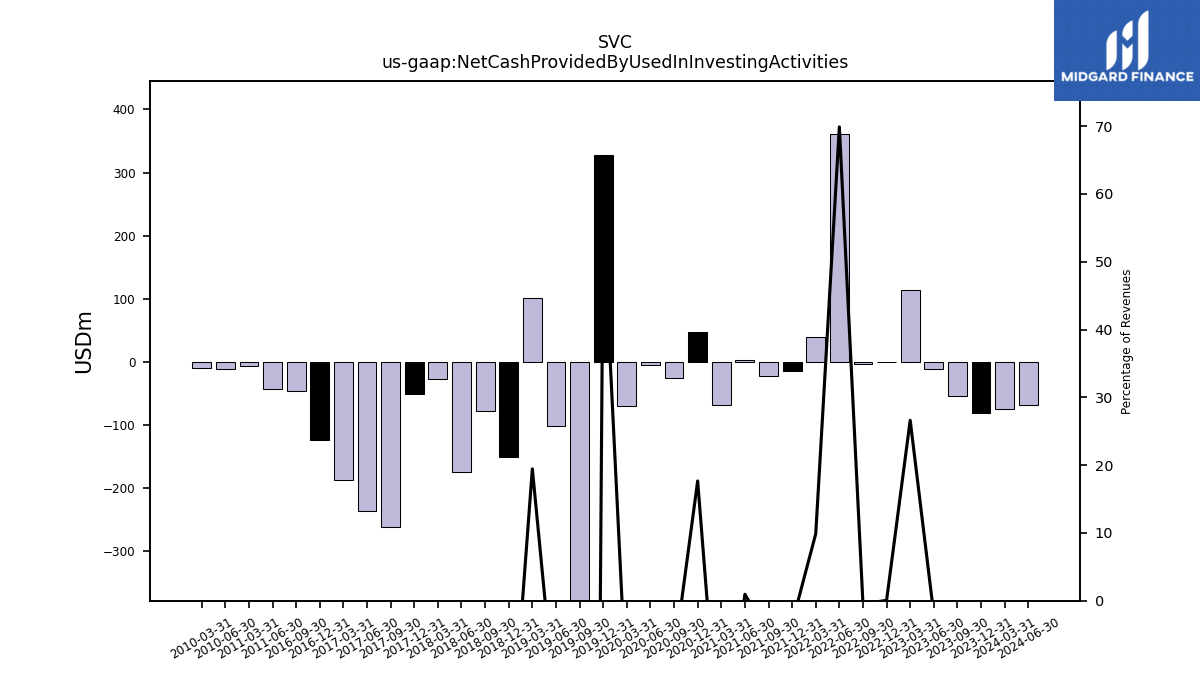
| Net Cash Provided By Used In Investing Activities | -80.54 | -52.99 | -10.29 | 114.25 | 0.27 | -2.36 | 360.47 | 38.87 | -13.96 | -22.13 | 3.59 | -68.81 | 47.71 | -24.76 | -5.15 | -69.61 | 327.44 | -2458.02 | -101.56 | 102.09 | -149.88 | -77.74 | -173.63 | -26.48 | -50.28 | -260.42 | -236.56 | -186.48 | -123.11 | -46.31 | NA | NA | NA | NA | NA | NA | NA | NA | NA | NA | NA | NA | NA | NA | NA | NA | NA | NA | NA | NA | -42.23 | -5.85 | NA | NA | -11.06 | -9.47 | |
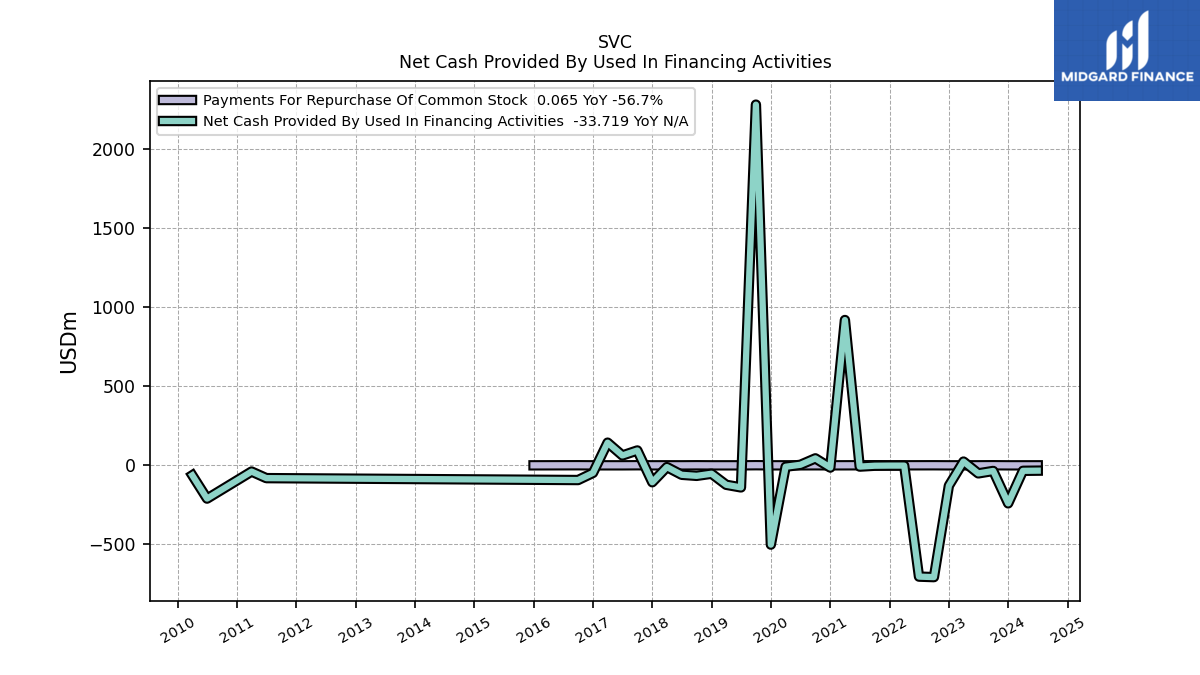
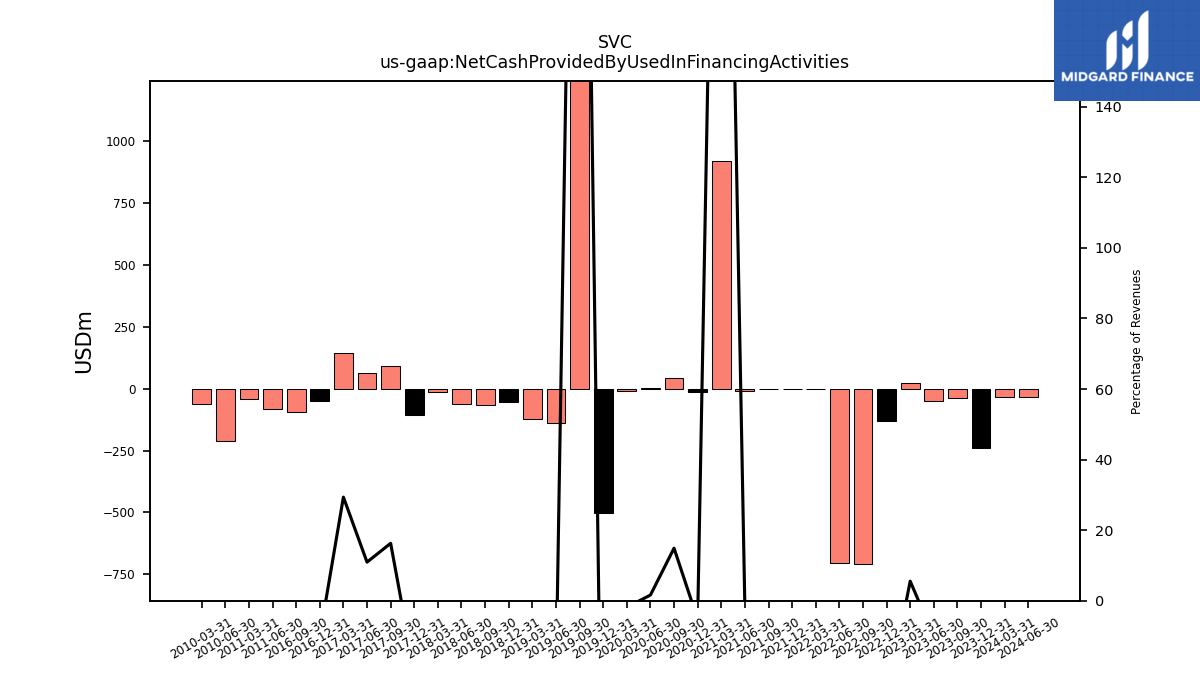
| Net Cash Provided By Used In Financing Activities | -240.75 | -35.56 | -51.05 | 23.79 | -129.00 | -707.43 | -704.22 | -1.73 | -1.72 | -2.51 | -8.03 | 919.62 | -14.31 | 44.15 | 3.47 | -8.91 | -501.88 | 2282.41 | -139.80 | -123.15 | -53.15 | -66.62 | -59.83 | -11.11 | -107.24 | 94.05 | 62.45 | 143.49 | -47.97 | -93.09 | NA | NA | NA | NA | NA | NA | NA | NA | NA | NA | NA | NA | NA | NA | NA | NA | NA | NA | NA | NA | -81.02 | -39.40 | NA | NA | -210.62 | -62.99 |
| 2023-12-31 | 2023-09-30 | 2023-06-30 | 2023-03-31 | 2022-12-31 | 2022-09-30 | 2022-06-30 | 2022-03-31 | 2021-12-31 | 2021-09-30 | 2021-06-30 | 2021-03-31 | 2020-12-31 | 2020-09-30 | 2020-06-30 | 2020-03-31 | 2019-12-31 | 2019-09-30 | 2019-06-30 | 2019-03-31 | 2018-12-31 | 2018-09-30 | 2018-06-30 | 2018-03-31 | 2017-12-31 | 2017-09-30 | 2017-06-30 | 2017-03-31 | 2016-12-31 | 2016-09-30 | 2016-06-30 | 2016-03-31 | 2015-12-31 | 2015-09-30 | 2015-06-30 | 2015-03-31 | 2014-12-31 | 2014-09-30 | 2014-06-30 | 2014-03-31 | 2013-12-31 | 2013-09-30 | 2013-06-30 | 2013-03-31 | 2012-12-31 | 2012-09-30 | 2012-06-30 | 2012-03-31 | 2011-12-31 | 2011-09-30 | 2011-06-30 | 2011-03-31 | 2010-12-31 | 2010-09-30 | 2010-06-30 | 2010-03-31 | ||
|---|---|---|---|---|---|---|---|---|---|---|---|---|---|---|---|---|---|---|---|---|---|---|---|---|---|---|---|---|---|---|---|---|---|---|---|---|---|---|---|---|---|---|---|---|---|---|---|---|---|---|---|---|---|---|---|---|---|
| Net Cash Provided By Used In Operating Activities | 83.59 | 73.45 | 316.13 | 12.37 | 96.01 | 87.82 | 71.28 | -11.98 | 48.90 | 22.21 | 41.52 | -62.72 | -27.92 | 16.73 | -48.22 | 97.02 | 185.19 | 192.63 | 196.03 | 43.87 | 193.55 | 140.03 | 228.61 | 34.76 | 167.17 | 131.18 | 198.02 | 57.85 | 172.44 | 128.58 | NA | NA | NA | NA | NA | NA | NA | NA | NA | NA | NA | NA | NA | NA | NA | NA | NA | NA | NA | NA | 110.39 | 56.49 | NA | NA | 108.48 | 59.02 | |
| Net Income Loss | -43.32 | -4.13 | -11.28 | 25.95 | -31.41 | 7.50 | 11.35 | -119.82 | -198.79 | -59.71 | -91.11 | -194.99 | -137.74 | -102.64 | -37.35 | -33.65 | -14.89 | 40.07 | 8.78 | 225.79 | -108.86 | 117.10 | 97.29 | 80.21 | 31.55 | 85.73 | 60.70 | 37.17 | 63.19 | 51.81 | 56.06 | 52.05 | -19.49 | 61.19 | 83.15 | 41.58 | 56.52 | 49.20 | 53.91 | 37.55 | 32.75 | 27.57 | 45.35 | 27.51 | 26.63 | 44.66 | 37.69 | 42.95 | 38.22 | 47.53 | 51.64 | 53.05 | -92.96 | 50.23 | 23.21 | 40.87 | |
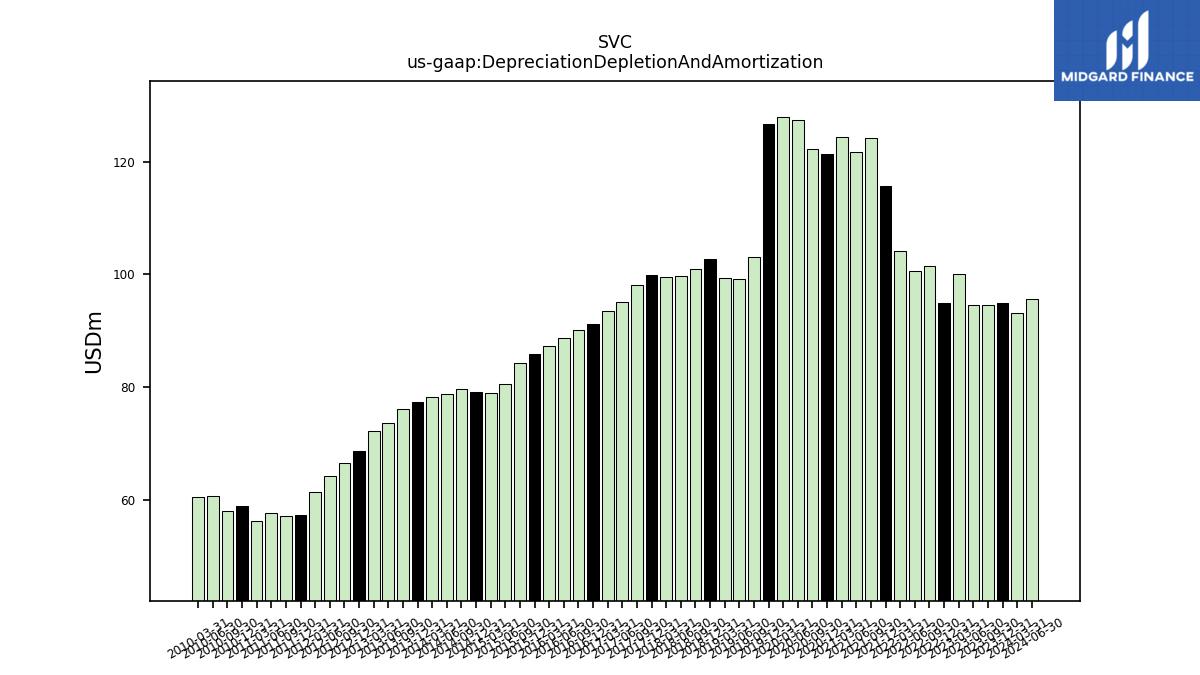
| Depreciation Depletion And Amortization | 94.95 | 94.50 | 94.57 | 100.04 | 94.96 | 101.51 | 100.52 | 104.11 | 115.76 | 124.16 | 121.68 | 124.37 | 121.35 | 122.20 | 127.43 | 127.93 | 126.73 | 103.16 | 99.20 | 99.36 | 102.77 | 101.01 | 99.68 | 99.62 | 99.85 | 98.20 | 95.16 | 93.45 | 91.15 | 90.14 | 88.78 | 87.27 | 85.96 | 84.26 | 80.58 | 78.97 | 79.18 | 79.65 | 78.76 | 78.29 | 77.40 | 76.05 | 73.60 | 72.28 | 68.62 | 66.57 | 64.28 | 61.36 | 57.29 | 57.11 | 57.63 | 56.31 | 58.83 | 58.00 | 60.73 | 60.54 |
| 2023-12-31 | 2023-09-30 | 2023-06-30 | 2023-03-31 | 2022-12-31 | 2022-09-30 | 2022-06-30 | 2022-03-31 | 2021-12-31 | 2021-09-30 | 2021-06-30 | 2021-03-31 | 2020-12-31 | 2020-09-30 | 2020-06-30 | 2020-03-31 | 2019-12-31 | 2019-09-30 | 2019-06-30 | 2019-03-31 | 2018-12-31 | 2018-09-30 | 2018-06-30 | 2018-03-31 | 2017-12-31 | 2017-09-30 | 2017-06-30 | 2017-03-31 | 2016-12-31 | 2016-09-30 | 2016-06-30 | 2016-03-31 | 2015-12-31 | 2015-09-30 | 2015-06-30 | 2015-03-31 | 2014-12-31 | 2014-09-30 | 2014-06-30 | 2014-03-31 | 2013-12-31 | 2013-09-30 | 2013-06-30 | 2013-03-31 | 2012-12-31 | 2012-09-30 | 2012-06-30 | 2012-03-31 | 2011-12-31 | 2011-09-30 | 2011-06-30 | 2011-03-31 | 2010-12-31 | 2010-09-30 | 2010-06-30 | 2010-03-31 | ||
|---|---|---|---|---|---|---|---|---|---|---|---|---|---|---|---|---|---|---|---|---|---|---|---|---|---|---|---|---|---|---|---|---|---|---|---|---|---|---|---|---|---|---|---|---|---|---|---|---|---|---|---|---|---|---|---|---|---|
| Net Cash Provided By Used In Investing Activities | -80.54 | -52.99 | -10.29 | 114.25 | 0.27 | -2.36 | 360.47 | 38.87 | -13.96 | -22.13 | 3.59 | -68.81 | 47.71 | -24.76 | -5.15 | -69.61 | 327.44 | -2458.02 | -101.56 | 102.09 | -149.88 | -77.74 | -173.63 | -26.48 | -50.28 | -260.42 | -236.56 | -186.48 | -123.11 | -46.31 | NA | NA | NA | NA | NA | NA | NA | NA | NA | NA | NA | NA | NA | NA | NA | NA | NA | NA | NA | NA | -42.23 | -5.85 | NA | NA | -11.06 | -9.47 |
| 2023-12-31 | 2023-09-30 | 2023-06-30 | 2023-03-31 | 2022-12-31 | 2022-09-30 | 2022-06-30 | 2022-03-31 | 2021-12-31 | 2021-09-30 | 2021-06-30 | 2021-03-31 | 2020-12-31 | 2020-09-30 | 2020-06-30 | 2020-03-31 | 2019-12-31 | 2019-09-30 | 2019-06-30 | 2019-03-31 | 2018-12-31 | 2018-09-30 | 2018-06-30 | 2018-03-31 | 2017-12-31 | 2017-09-30 | 2017-06-30 | 2017-03-31 | 2016-12-31 | 2016-09-30 | 2016-06-30 | 2016-03-31 | 2015-12-31 | 2015-09-30 | 2015-06-30 | 2015-03-31 | 2014-12-31 | 2014-09-30 | 2014-06-30 | 2014-03-31 | 2013-12-31 | 2013-09-30 | 2013-06-30 | 2013-03-31 | 2012-12-31 | 2012-09-30 | 2012-06-30 | 2012-03-31 | 2011-12-31 | 2011-09-30 | 2011-06-30 | 2011-03-31 | 2010-12-31 | 2010-09-30 | 2010-06-30 | 2010-03-31 | ||
|---|---|---|---|---|---|---|---|---|---|---|---|---|---|---|---|---|---|---|---|---|---|---|---|---|---|---|---|---|---|---|---|---|---|---|---|---|---|---|---|---|---|---|---|---|---|---|---|---|---|---|---|---|---|---|---|---|---|
| Net Cash Provided By Used In Financing Activities | -240.75 | -35.56 | -51.05 | 23.79 | -129.00 | -707.43 | -704.22 | -1.73 | -1.72 | -2.51 | -8.03 | 919.62 | -14.31 | 44.15 | 3.47 | -8.91 | -501.88 | 2282.41 | -139.80 | -123.15 | -53.15 | -66.62 | -59.83 | -11.11 | -107.24 | 94.05 | 62.45 | 143.49 | -47.97 | -93.09 | NA | NA | NA | NA | NA | NA | NA | NA | NA | NA | NA | NA | NA | NA | NA | NA | NA | NA | NA | NA | -81.02 | -39.40 | NA | NA | -210.62 | -62.99 | |
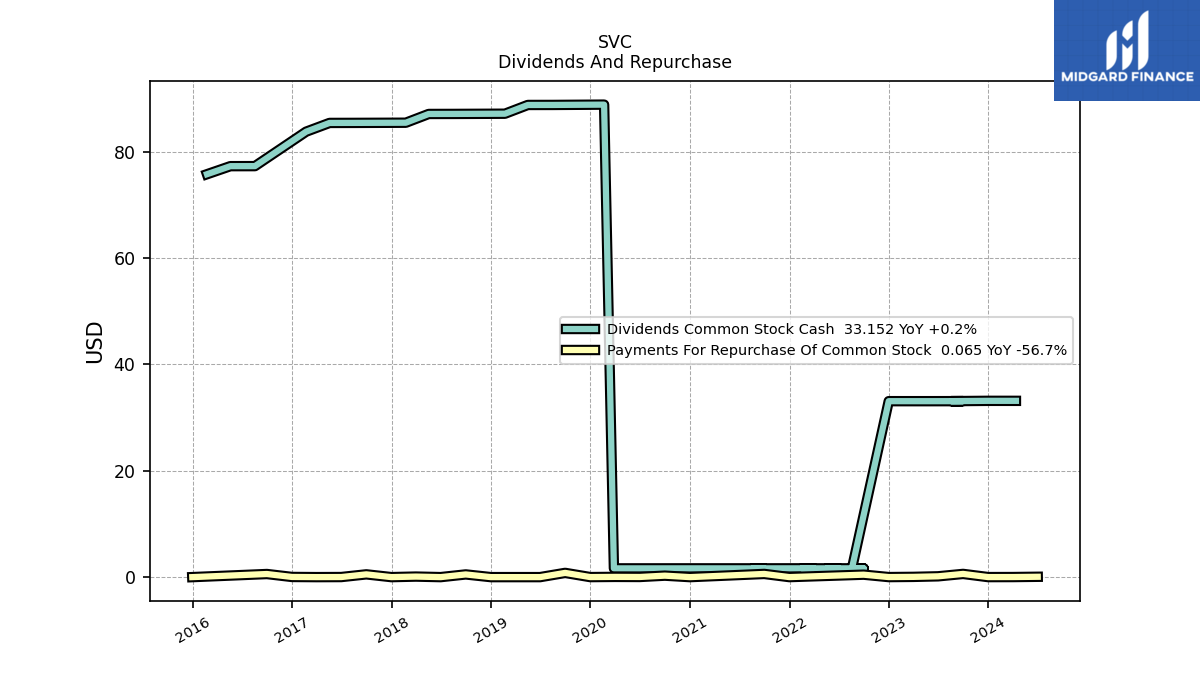
| Payments Of Dividends Common Stock | 33.16 | 33.10 | 33.09 | 33.09 | 33.09 | 1.65 | 1.65 | 1.65 | 1.65 | 1.65 | 1.65 | 1.65 | 1.65 | 1.65 | 1.65 | 88.86 | 88.86 | 88.80 | 88.80 | 87.15 | 87.15 | 87.11 | 87.11 | 85.46 | 85.46 | 85.43 | 85.42 | 83.78 | 83.78 | 77.30 | 77.29 | 75.77 | 75.78 | 75.74 | 74.98 | 73.47 | 73.45 | 73.39 | 73.37 | 71.81 | 67.12 | 65.68 | 65.68 | 58.11 | 58.11 | 55.60 | 55.60 | 55.59 | 55.59 | 55.55 | 55.55 | 55.55 | 55.55 | 55.53 | 55.53 | 55.52 | |
| Payments For Repurchase Of Common Stock | 0.01 | 0.60 | 0.15 | 0.05 | 0.01 | 0.46 | NA | NA | 0.00 | 0.60 | NA | NA | 0.00 | 0.28 | 0.03 | 0.04 | 0.01 | 0.79 | 0.00 | 0.00 | 0.00 | 0.51 | 0.00 | 0.10 | 0.00 | 0.52 | 0.01 | 0.00 | 0.03 | 0.58 | NA | NA | -0.00 | NA | NA | NA | NA | NA | NA | NA | NA | NA | NA | NA | NA | NA | NA | NA | NA | NA | NA | NA | NA | NA | NA | NA |
| 2023-12-31 | 2023-09-30 | 2023-06-30 | 2023-03-31 | 2022-12-31 | 2022-09-30 | 2022-06-30 | 2022-03-31 | 2021-12-31 | 2021-09-30 | 2021-06-30 | 2021-03-31 | 2020-12-31 | 2020-09-30 | 2020-06-30 | 2020-03-31 | 2019-12-31 | 2019-09-30 | 2019-06-30 | 2019-03-31 | 2018-12-31 | 2018-09-30 | 2018-06-30 | 2018-03-31 | 2017-12-31 | 2017-09-30 | 2017-06-30 | 2017-03-31 | 2016-12-31 | 2016-09-30 | 2016-06-30 | 2016-03-31 | 2015-12-31 | 2015-09-30 | 2015-06-30 | 2015-03-31 | 2014-12-31 | 2014-09-30 | 2014-06-30 | 2014-03-31 | 2013-12-31 | 2013-09-30 | 2013-06-30 | 2013-03-31 | 2012-12-31 | 2012-09-30 | 2012-06-30 | 2012-03-31 | 2011-12-31 | 2011-09-30 | 2011-06-30 | 2011-03-31 | 2010-12-31 | 2010-09-30 | 2010-06-30 | 2010-03-31 | ||
|---|---|---|---|---|---|---|---|---|---|---|---|---|---|---|---|---|---|---|---|---|---|---|---|---|---|---|---|---|---|---|---|---|---|---|---|---|---|---|---|---|---|---|---|---|---|---|---|---|---|---|---|---|---|---|---|---|---|
| Revenues | 444.05 | 496.82 | 503.78 | 429.21 | 455.22 | 498.25 | 515.78 | 393.76 | 421.38 | 437.10 | 375.94 | 261.17 | 270.04 | 296.50 | 214.94 | 483.78 | 580.91 | 599.77 | 610.56 | 524.91 | 550.80 | 603.15 | 611.95 | 528.63 | 535.14 | 577.59 | 570.60 | 488.60 | 479.28 | 543.52 | 550.30 | 474.12 | 467.44 | 511.89 | 507.07 | 435.51 | 430.53 | 459.64 | 451.90 | 394.25 | 384.79 | 412.27 | 412.32 | 354.47 | 322.31 | 330.07 | 343.18 | 301.42 | 295.85 | 318.69 | 313.81 | 281.98 | 267.79 | 281.20 | 282.39 | 254.11 | |
| Operating, Net Lease | 100.67 | 101.30 | 99.45 | 94.41 | 104.72 | 97.80 | 96.79 | 96.36 | 103.05 | 98.72 | 95.56 | 91.72 | 96.30 | 96.10 | 95.59 | 99.27 | 107.44 | 68.05 | 63.14 | 63.08 | NA | NA | NA | NA | NA | NA | NA | NA | NA | NA | NA | NA | NA | NA | NA | NA | NA | NA | NA | NA | NA | NA | NA | NA | NA | NA | NA | NA | NA | NA | NA | NA | NA | NA | NA | NA | |
| Revenue From Contract With Customer Excluding Assessed Tax | 343.38 | 395.53 | 404.33 | 334.80 | 350.50 | 400.45 | 418.98 | 297.41 | 317.21 | 338.38 | 280.13 | 168.95 | 174.52 | 199.72 | 117.36 | 383.50 | 580.91 | 525.29 | 541.22 | 524.91 | 550.80 | 603.15 | 611.95 | 528.63 | 535.14 | 577.59 | 570.60 | 488.60 | 479.28 | 543.52 | 550.30 | 474.12 | 467.44 | 511.89 | 507.07 | 435.51 | 430.53 | 459.64 | 451.90 | 394.25 | 384.79 | 412.27 | 412.32 | 354.47 | 322.31 | 330.07 | 343.18 | 301.42 | 295.85 | 318.69 | 313.81 | 281.98 | 267.79 | 281.20 | 282.39 | 254.11 |