
| 2023-12-31 | 2023-09-30 | 2023-06-30 | 2023-03-31 | 2022-12-31 | 2022-09-30 | 2022-06-30 | 2022-03-31 | 2021-12-31 | 2021-09-30 | 2021-06-30 | 2021-03-31 | 2020-12-31 | 2020-09-30 | 2020-06-30 | 2020-03-31 | 2019-12-31 | 2019-09-30 | 2019-06-30 | 2019-03-31 | 2018-12-31 | 2018-09-30 | 2018-06-30 | 2018-03-31 | 2017-12-31 | 2017-09-30 | 2017-06-30 | 2017-03-31 | 2016-12-31 | 2016-09-30 | 2016-06-30 | 2016-03-31 | 2015-12-31 | 2015-09-30 | 2015-06-30 | 2015-03-31 | 2014-12-31 | 2014-09-30 | 2014-06-30 | 2014-03-31 | 2013-12-31 | 2013-09-30 | 2013-06-30 | 2013-03-31 | 2012-12-31 | 2012-09-30 | 2012-06-30 | 2012-03-31 | 2011-12-31 | 2011-09-30 | 2011-06-30 | 2011-03-31 | 2010-12-31 | 2010-09-30 | 2010-06-30 | 2010-03-31 | 2009-12-31 | 2009-09-30 | 2009-06-30 | 2009-03-31 | ||
|---|---|---|---|---|---|---|---|---|---|---|---|---|---|---|---|---|---|---|---|---|---|---|---|---|---|---|---|---|---|---|---|---|---|---|---|---|---|---|---|---|---|---|---|---|---|---|---|---|---|---|---|---|---|---|---|---|---|---|---|---|---|
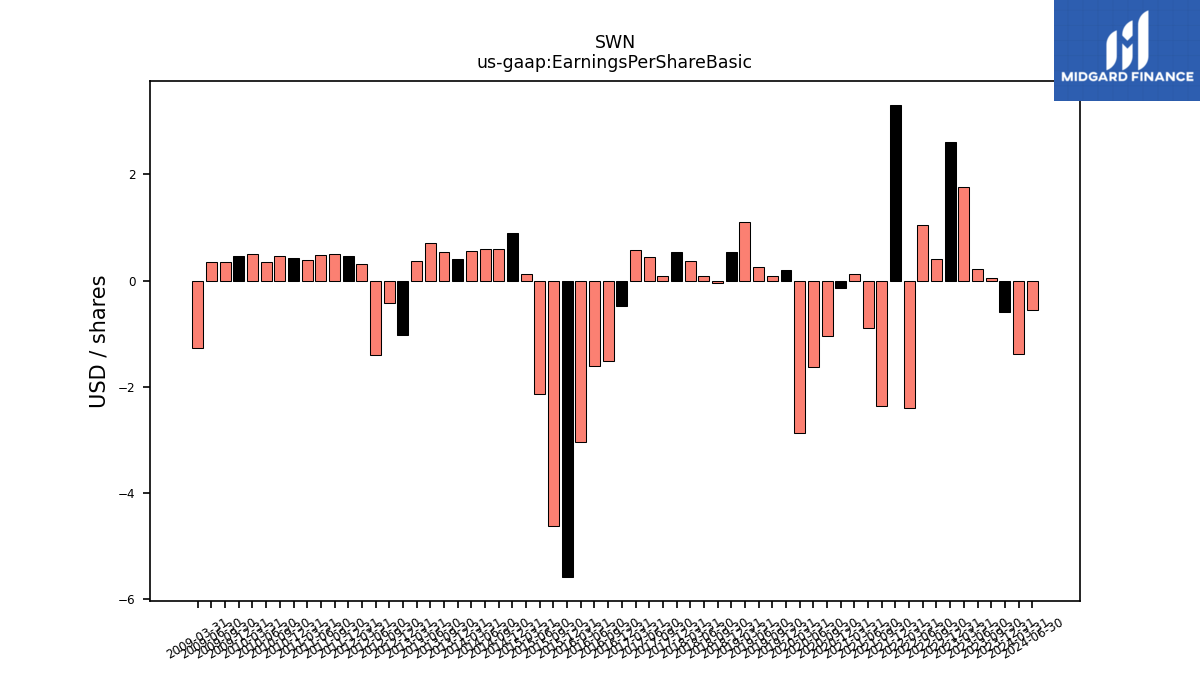
| Earnings Per Share Basic | -0.60 | 0.04 | 0.21 | 1.76 | 2.61 | 0.41 | 1.05 | -2.40 | 3.31 | -2.36 | -0.90 | 0.12 | -0.14 | -1.04 | -1.63 | -2.86 | 0.20 | 0.09 | 0.26 | 1.10 | 0.54 | -0.05 | 0.09 | 0.36 | 0.53 | 0.09 | 0.45 | 0.57 | -0.48 | -1.52 | -1.61 | -3.03 | -5.58 | -4.62 | -2.13 | 0.12 | 0.89 | 0.60 | 0.59 | 0.55 | 0.41 | 0.53 | 0.70 | 0.36 | -1.02 | -0.42 | -1.40 | 0.31 | 0.47 | 0.50 | 0.48 | 0.39 | 0.43 | 0.47 | 0.35 | 0.50 | 0.46 | 0.34 | 0.35 | -1.26 | |
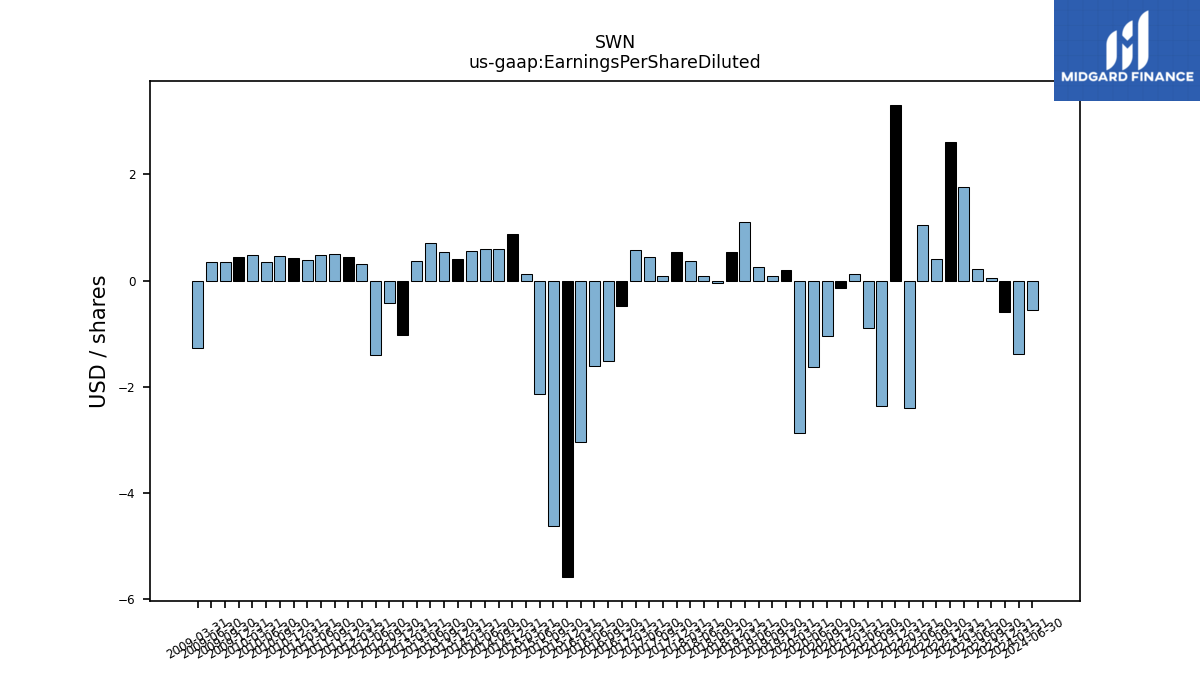
| Earnings Per Share Diluted | -0.60 | 0.04 | 0.21 | 1.76 | 2.60 | 0.40 | 1.05 | -2.40 | 3.31 | -2.36 | -0.90 | 0.12 | -0.14 | -1.04 | -1.63 | -2.86 | 0.20 | 0.09 | 0.26 | 1.10 | 0.54 | -0.05 | 0.09 | 0.36 | 0.53 | 0.09 | 0.45 | 0.57 | -0.48 | -1.52 | -1.61 | -3.03 | -5.58 | -4.62 | -2.13 | 0.12 | 0.88 | 0.60 | 0.59 | 0.55 | 0.41 | 0.53 | 0.70 | 0.36 | -1.02 | -0.42 | -1.40 | 0.31 | 0.45 | 0.50 | 0.48 | 0.39 | 0.43 | 0.46 | 0.35 | 0.49 | 0.45 | 0.34 | 0.35 | -1.26 |
| 2023-12-31 | 2023-09-30 | 2023-06-30 | 2023-03-31 | 2022-12-31 | 2022-09-30 | 2022-06-30 | 2022-03-31 | 2021-12-31 | 2021-09-30 | 2021-06-30 | 2021-03-31 | 2020-12-31 | 2020-09-30 | 2020-06-30 | 2020-03-31 | 2019-12-31 | 2019-09-30 | 2019-06-30 | 2019-03-31 | 2018-12-31 | 2018-09-30 | 2018-06-30 | 2018-03-31 | 2017-12-31 | 2017-09-30 | 2017-06-30 | 2017-03-31 | 2016-12-31 | 2016-09-30 | 2016-06-30 | 2016-03-31 | 2015-12-31 | 2015-09-30 | 2015-06-30 | 2015-03-31 | 2014-12-31 | 2014-09-30 | 2014-06-30 | 2014-03-31 | 2013-12-31 | 2013-09-30 | 2013-06-30 | 2013-03-31 | 2012-12-31 | 2012-09-30 | 2012-06-30 | 2012-03-31 | 2011-12-31 | 2011-09-30 | 2011-06-30 | 2011-03-31 | 2010-12-31 | 2010-09-30 | 2010-06-30 | 2010-03-31 | 2009-12-31 | 2009-09-30 | 2009-06-30 | 2009-03-31 | ||
|---|---|---|---|---|---|---|---|---|---|---|---|---|---|---|---|---|---|---|---|---|---|---|---|---|---|---|---|---|---|---|---|---|---|---|---|---|---|---|---|---|---|---|---|---|---|---|---|---|---|---|---|---|---|---|---|---|---|---|---|---|---|
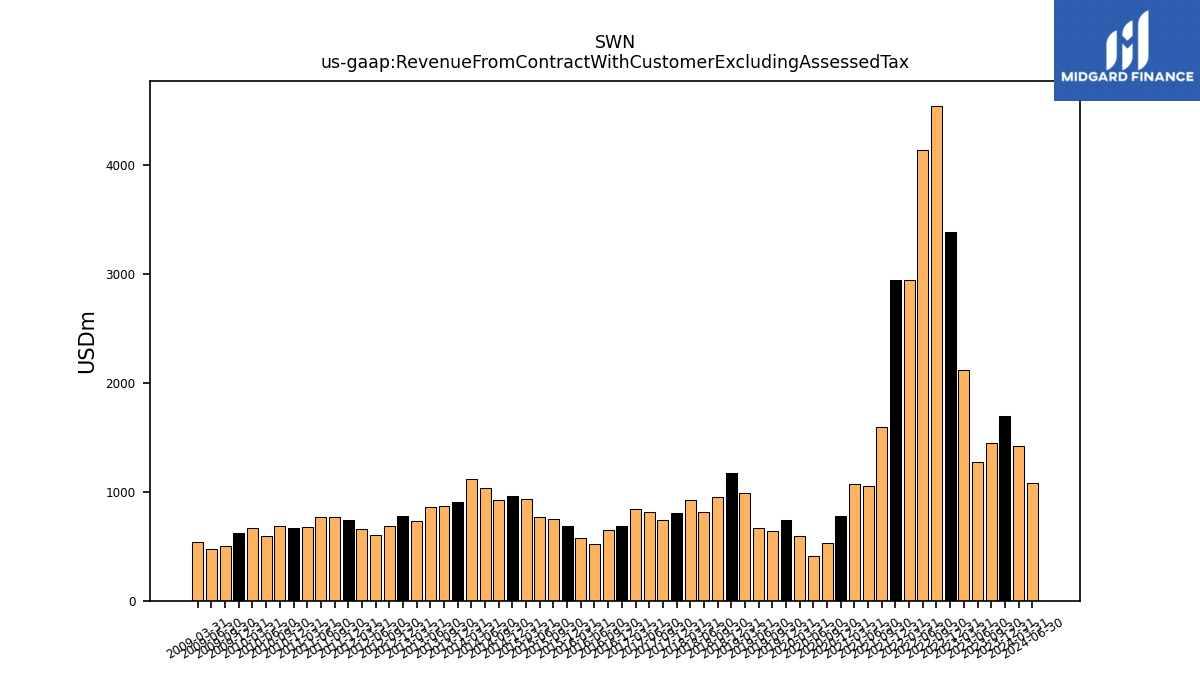
| Revenue From Contract With Customer Excluding Assessed Tax | 1692.00 | 1443.00 | 1269.00 | 2118.00 | 3380.00 | 4541.00 | 4138.00 | 2943.00 | 2947.00 | 1598.00 | 1050.00 | 1072.00 | 779.00 | 527.00 | 410.00 | 592.00 | 745.00 | 636.00 | 667.00 | 990.00 | 1175.00 | 951.00 | 816.00 | 920.00 | 809.00 | 737.00 | 811.00 | 846.00 | 684.00 | 651.00 | 522.00 | 579.00 | 687.00 | 749.00 | 764.00 | 933.00 | 962.00 | 928.00 | 1035.00 | 1112.78 | 907.09 | 868.37 | 862.04 | 733.65 | 773.00 | 685.85 | 599.73 | 656.47 | 744.15 | 767.25 | 765.17 | 676.34 | 670.43 | 682.17 | 589.94 | 668.12 | 624.49 | 502.95 | 477.52 | 540.82 | |
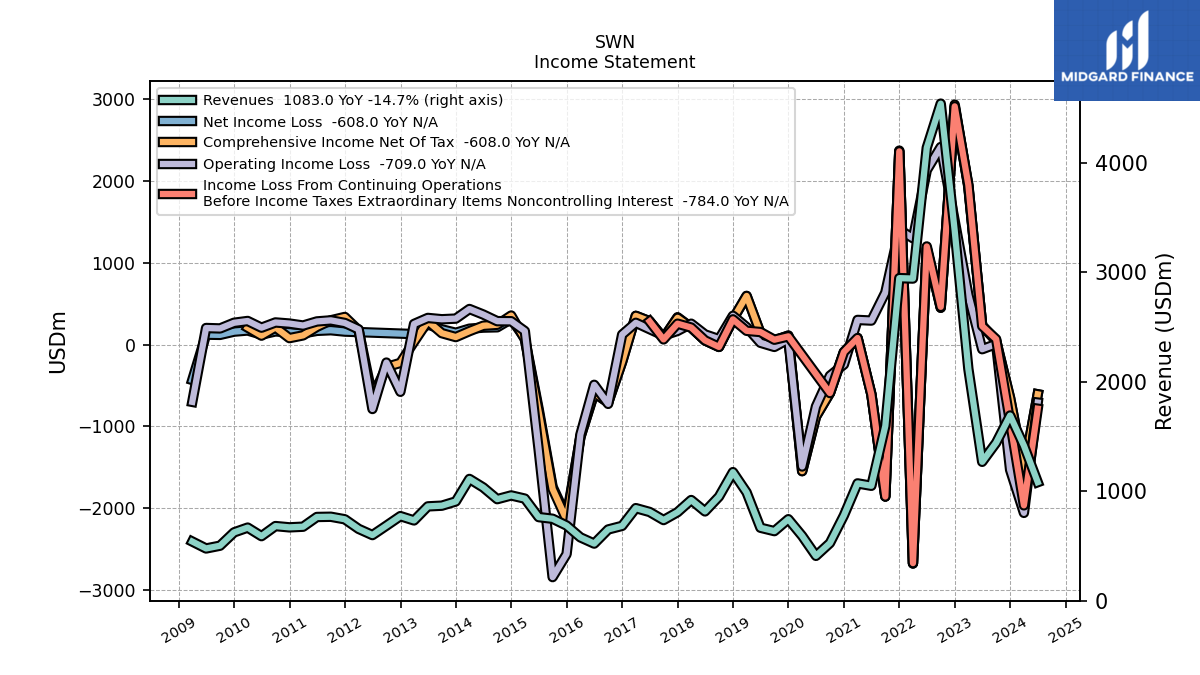
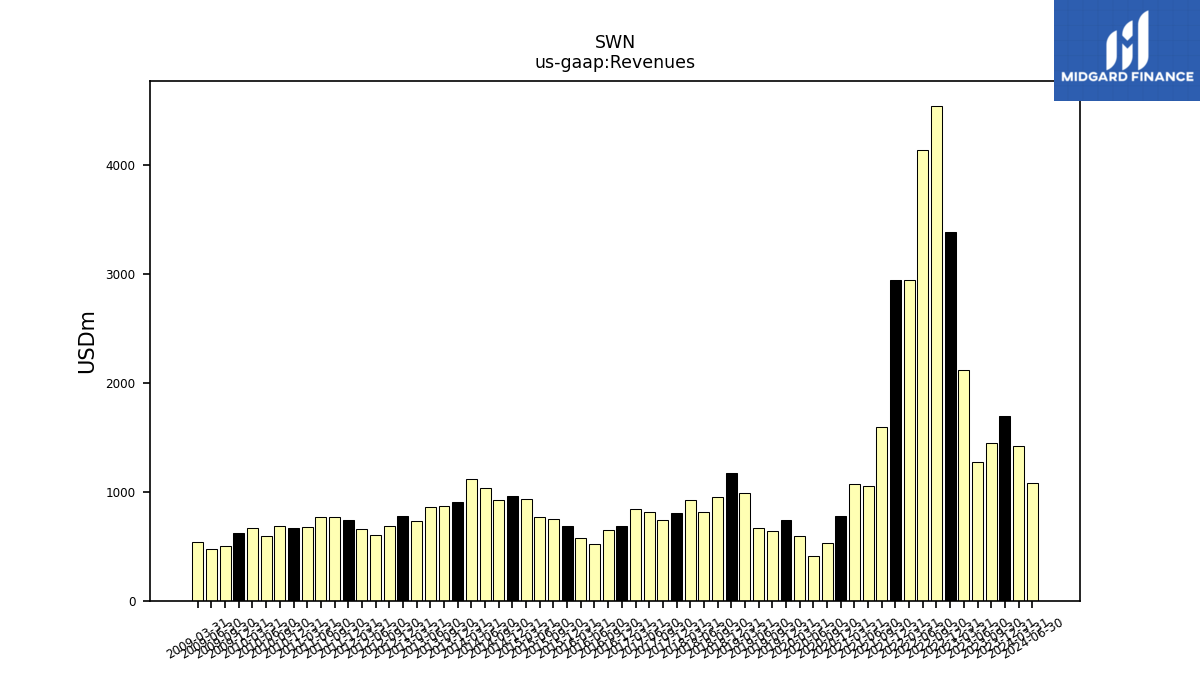
| Revenues | 1692.00 | 1443.00 | 1269.00 | 2118.00 | 3380.00 | 4541.00 | 4138.00 | 2943.00 | 2947.00 | 1598.00 | 1050.00 | 1072.00 | 779.00 | 527.00 | 410.00 | 592.00 | 745.00 | 636.00 | 667.00 | 990.00 | 1175.00 | 951.00 | 816.00 | 920.00 | 809.00 | 737.00 | 811.00 | 846.00 | 684.00 | 651.00 | 522.00 | 579.00 | 687.00 | 749.00 | 764.00 | 933.00 | 962.00 | 928.00 | 1035.00 | 1112.78 | 907.09 | 868.37 | 862.04 | 733.65 | 773.00 | 685.85 | 599.73 | 656.47 | 744.15 | 767.25 | 765.17 | 676.34 | 670.43 | 682.17 | 589.94 | 668.12 | 624.49 | 502.95 | 477.52 | 540.82 | |
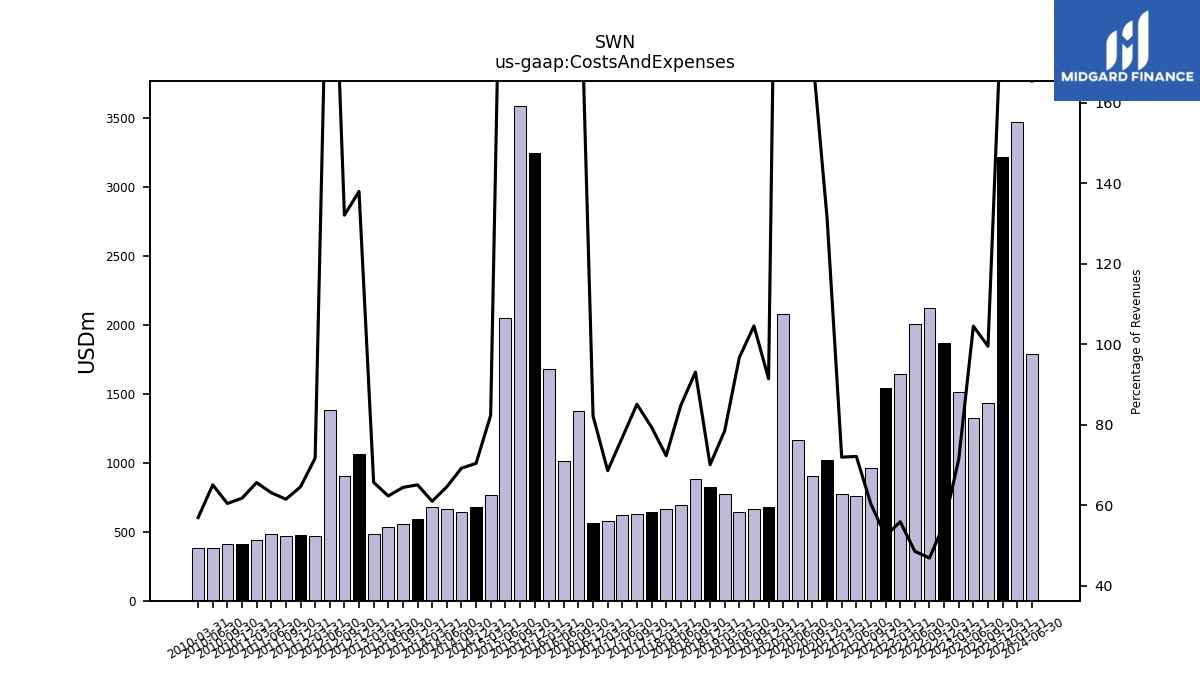
| Costs And Expenses | 3222.00 | 1436.00 | 1326.00 | 1512.00 | 1870.00 | 2127.00 | 2007.00 | 1644.00 | 1542.00 | 962.00 | 757.00 | 771.00 | 1023.00 | 908.00 | 1166.00 | 2082.00 | 681.00 | 665.00 | 645.00 | 777.00 | 823.00 | 885.00 | 692.00 | 665.00 | 642.00 | 627.00 | 623.00 | 580.00 | 562.00 | 1376.00 | 1014.00 | 1679.00 | 3248.00 | 3591.00 | 2048.00 | 768.00 | 677.00 | 642.00 | 668.00 | 678.16 | 589.97 | 559.14 | 536.72 | 481.69 | 1066.69 | 906.05 | 1387.37 | 470.51 | 480.26 | 471.54 | 482.62 | 443.68 | 413.75 | 412.04 | 383.63 | 380.03 | NA | NA | NA | NA | |
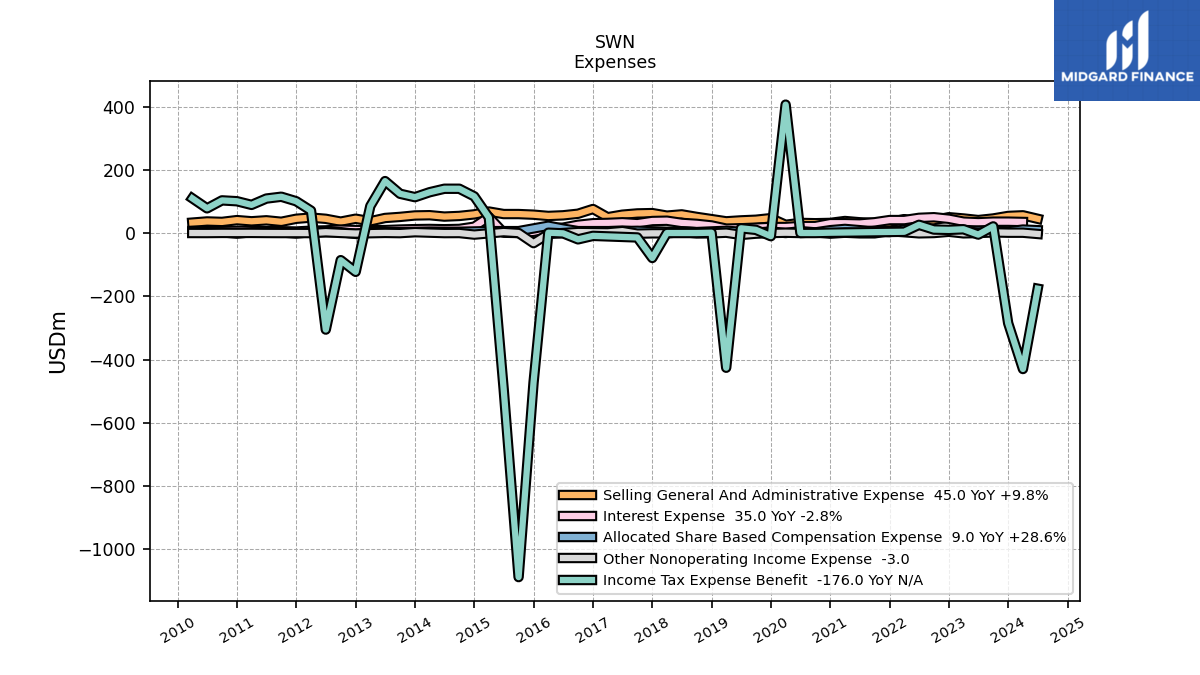
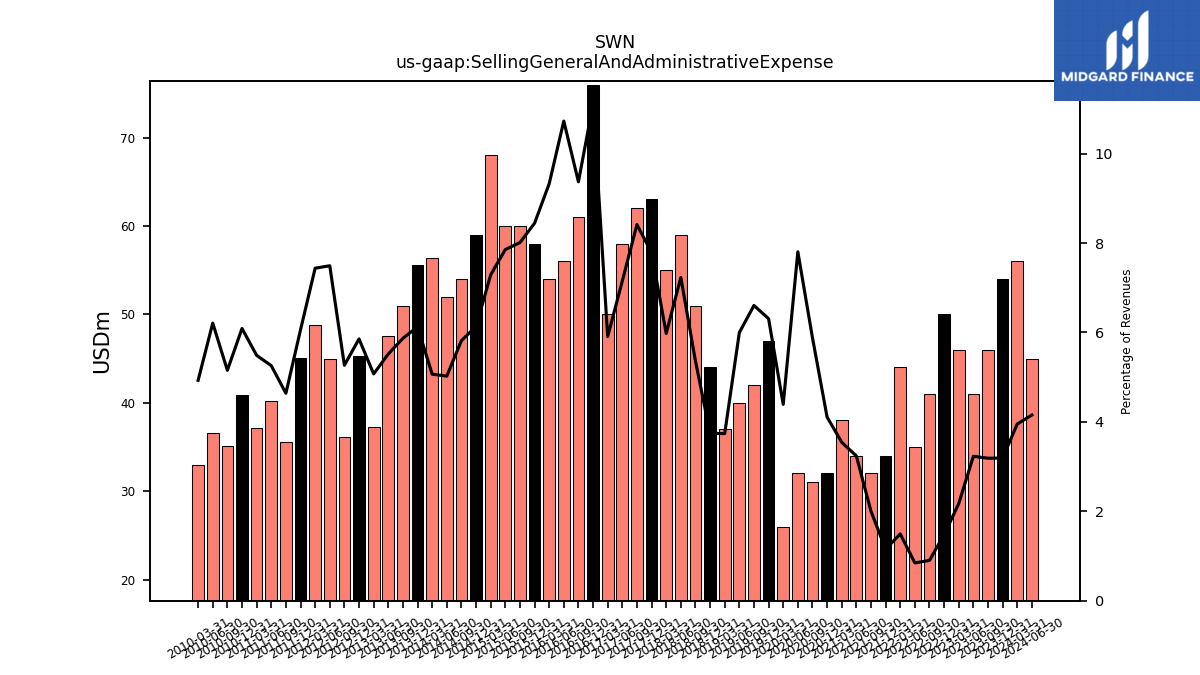
| Selling General And Administrative Expense | 54.00 | 46.00 | 41.00 | 46.00 | 50.00 | 41.00 | 35.00 | 44.00 | 34.00 | 32.00 | 34.00 | 38.00 | 32.00 | 31.00 | 32.00 | 26.00 | 47.00 | 42.00 | 40.00 | 37.00 | 44.00 | 51.00 | 59.00 | 55.00 | 63.00 | 62.00 | 58.00 | 50.00 | 76.00 | 61.00 | 56.00 | 54.00 | 58.00 | 60.00 | 60.00 | 68.00 | 59.00 | 54.00 | 52.00 | 56.39 | 55.56 | 50.97 | 47.57 | 37.22 | 45.27 | 36.12 | 44.93 | 48.83 | 45.09 | 35.60 | 40.24 | 37.12 | 40.83 | 35.16 | 36.63 | 32.94 | NA | NA | NA | NA | |
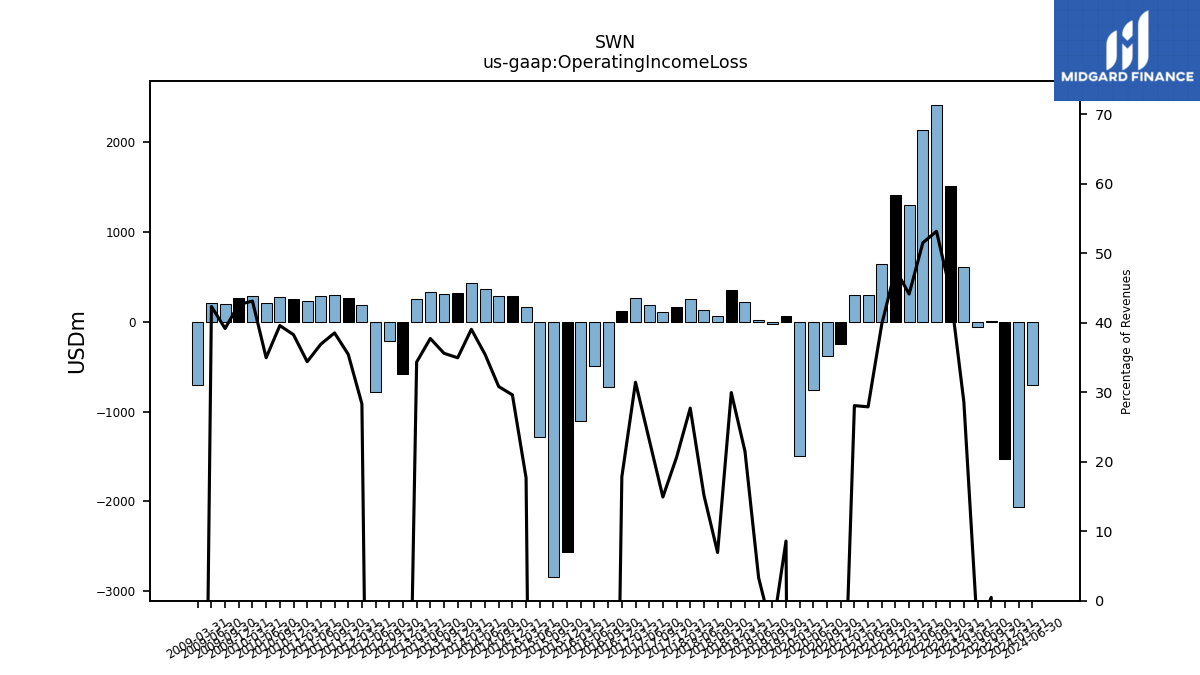
| Operating Income Loss | -1530.00 | 7.00 | -57.00 | 606.00 | 1510.00 | 2414.00 | 2131.00 | 1299.00 | 1405.00 | 636.00 | 293.00 | 301.00 | -244.00 | -381.00 | -756.00 | -1490.00 | 64.00 | -29.00 | 22.00 | 213.00 | 352.00 | 66.00 | 124.00 | 255.00 | 167.00 | 110.00 | 188.00 | 266.00 | 122.00 | -725.00 | -492.00 | -1100.00 | -2561.00 | -2842.00 | -1284.00 | 165.00 | 285.00 | 286.00 | 367.00 | 434.62 | 317.12 | 309.23 | 325.32 | 251.96 | -577.30 | -220.20 | -787.64 | 185.96 | 263.89 | 295.72 | 282.54 | 232.65 | 256.69 | 270.14 | 206.32 | 288.09 | 266.26 | 197.04 | 202.23 | -700.49 | |
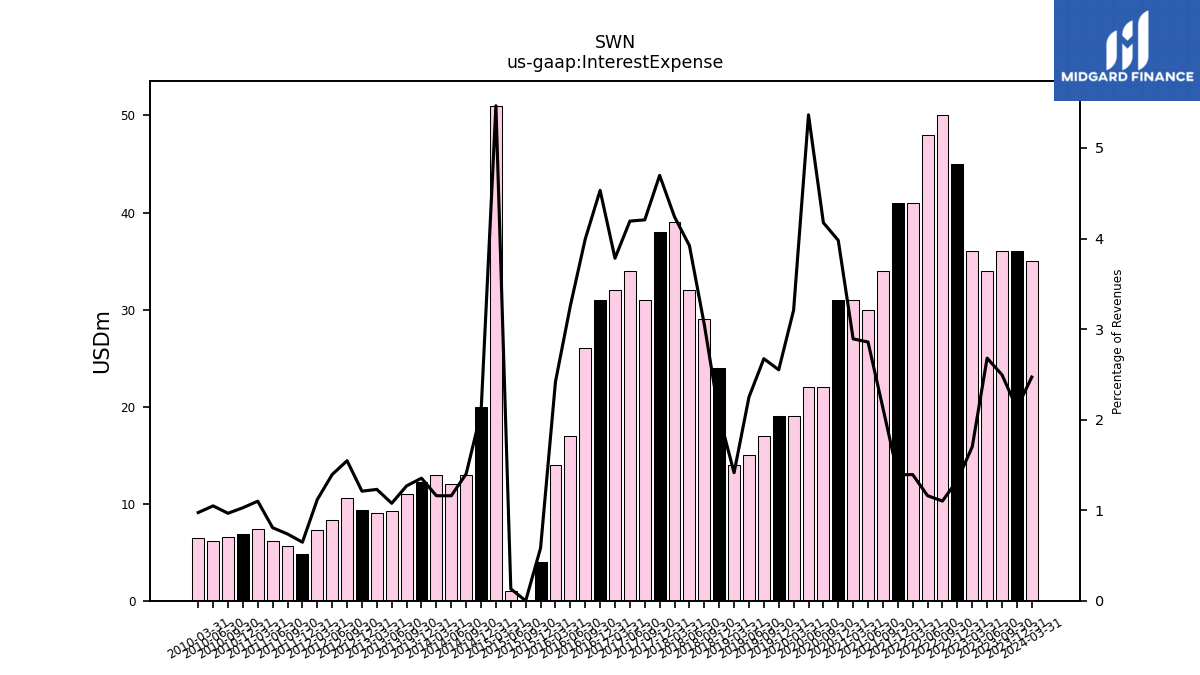
| Interest Expense | 36.00 | 36.00 | 34.00 | 36.00 | 45.00 | 50.00 | 48.00 | 41.00 | 41.00 | 34.00 | 30.00 | 31.00 | 31.00 | 22.00 | 22.00 | 19.00 | 19.00 | 17.00 | 15.00 | 14.00 | 24.00 | 29.00 | 32.00 | 39.00 | 38.00 | 31.00 | 34.00 | 32.00 | 31.00 | 26.00 | 17.00 | 14.00 | 4.00 | 0.00 | 1.00 | 51.00 | 20.00 | 13.00 | 12.00 | 12.91 | 12.28 | 11.02 | 9.28 | 9.02 | 9.35 | 10.61 | 8.36 | 7.34 | 4.81 | 5.66 | 6.17 | 7.44 | 6.89 | 6.59 | 6.18 | 6.51 | NA | NA | NA | NA | |
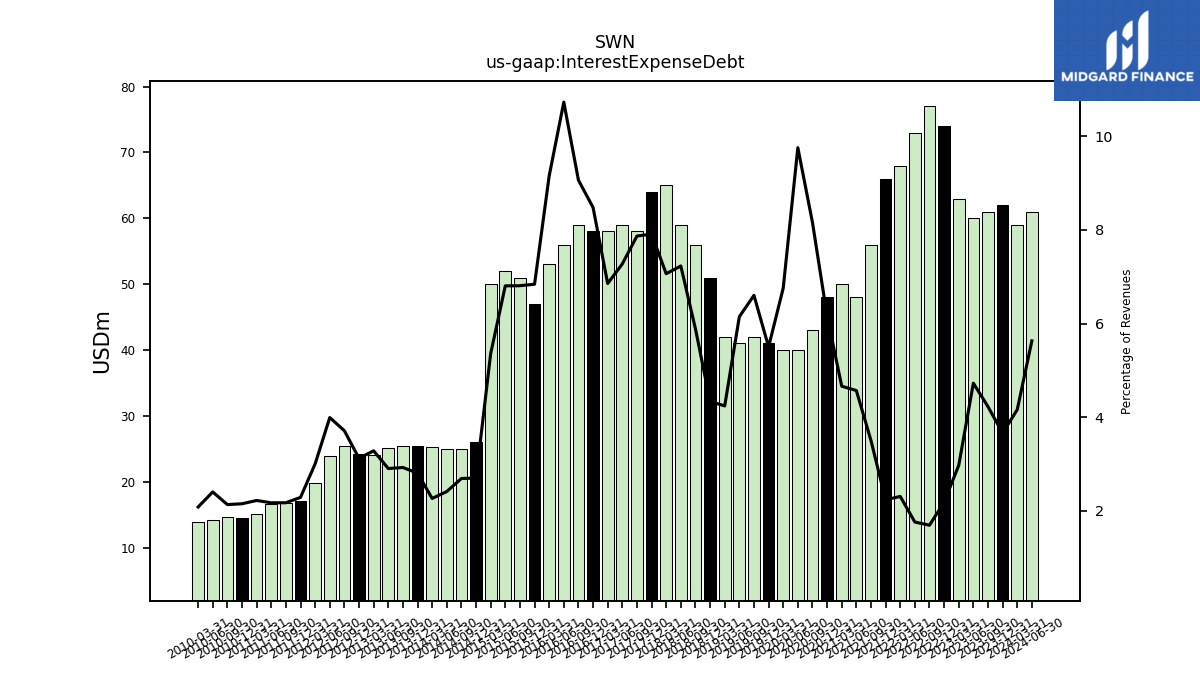
| Interest Expense Debt | 62.00 | 61.00 | 60.00 | 63.00 | 74.00 | 77.00 | 73.00 | 68.00 | 66.00 | 56.00 | 48.00 | 50.00 | 48.00 | 43.00 | 40.00 | 40.00 | 41.00 | 42.00 | 41.00 | 42.00 | 51.00 | 56.00 | 59.00 | 65.00 | 64.00 | 58.00 | 59.00 | 58.00 | 58.00 | 59.00 | 56.00 | 53.00 | 47.00 | 51.00 | 52.00 | 50.00 | 26.00 | 25.00 | 25.00 | 25.23 | 25.47 | 25.43 | 25.05 | 24.10 | 24.14 | 25.46 | 23.96 | 19.73 | 17.04 | 16.70 | 16.64 | 15.04 | 14.44 | 14.57 | 14.20 | 13.93 | NA | NA | NA | NA | |
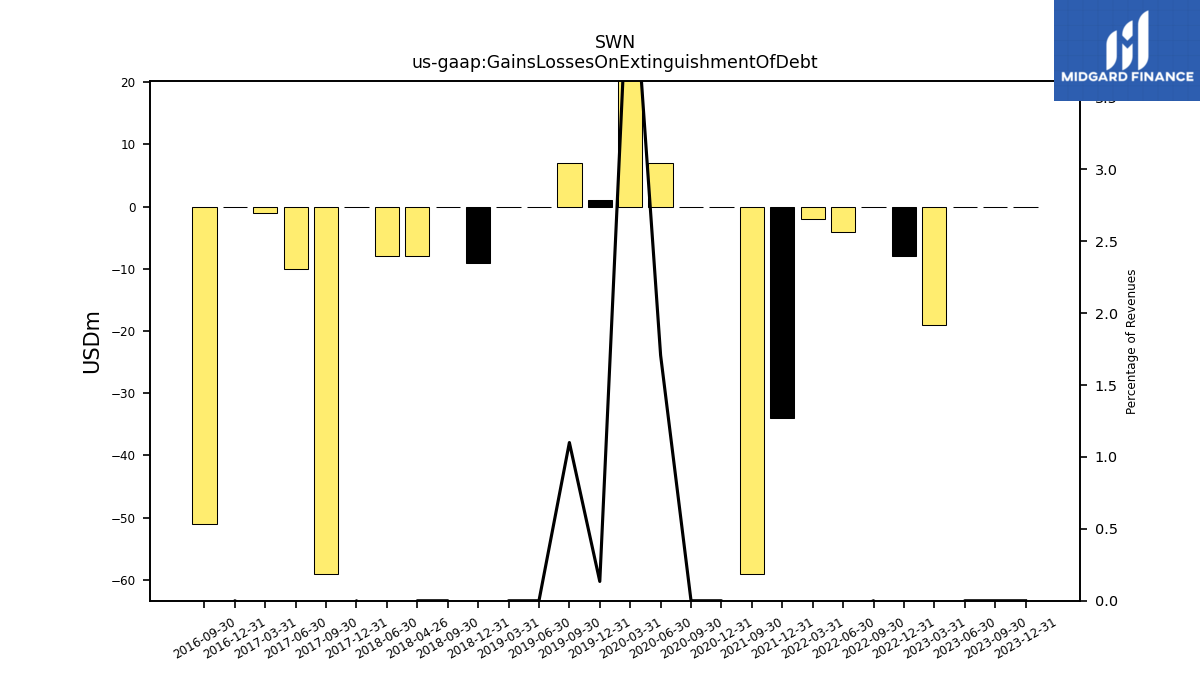
| Gains Losses On Extinguishment Of Debt | 0.00 | 0.00 | 0.00 | -19.00 | -8.00 | 0.00 | -4.00 | -2.00 | -34.00 | -59.00 | NA | NA | 0.00 | 0.00 | 7.00 | 28.00 | 1.00 | 7.00 | 0.00 | 0.00 | -9.00 | 0.00 | -8.00 | NA | 0.00 | -59.00 | -10.00 | -1.00 | 0.00 | -51.00 | NA | NA | NA | NA | NA | NA | NA | NA | NA | NA | NA | NA | NA | NA | NA | NA | NA | NA | NA | NA | NA | NA | NA | NA | NA | NA | NA | NA | NA | NA | |
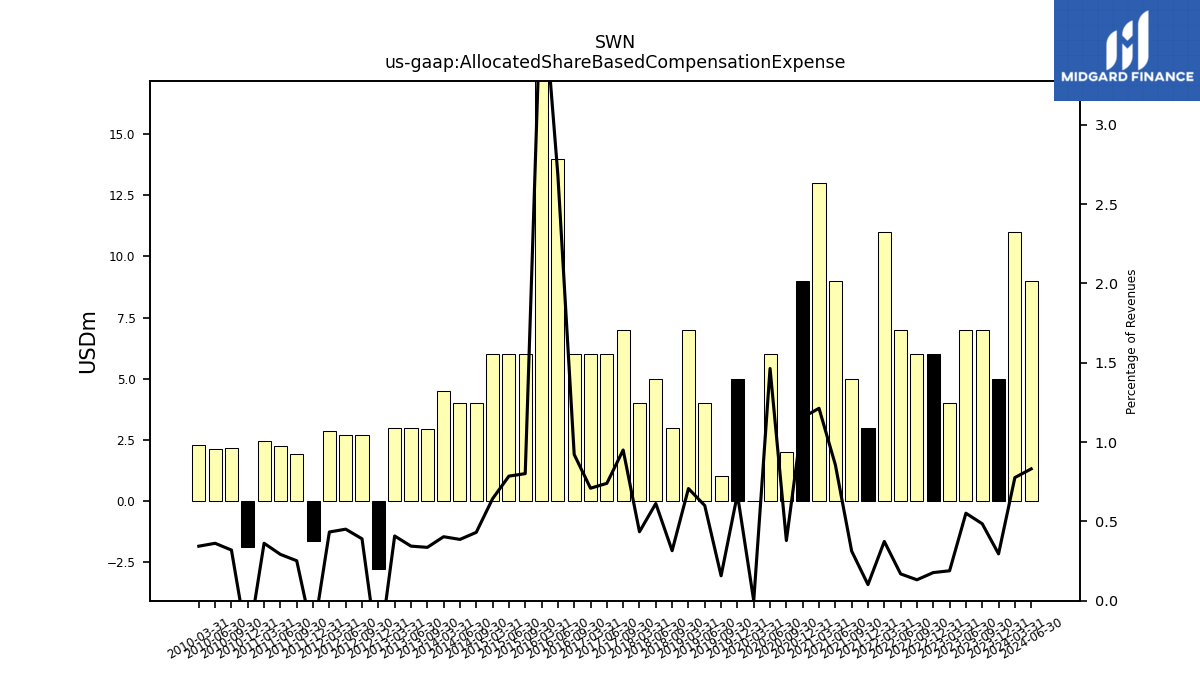
| Allocated Share Based Compensation Expense | 5.00 | 7.00 | 7.00 | 4.00 | 6.00 | 6.00 | 7.00 | 11.00 | 3.00 | 5.00 | 9.00 | 13.00 | 9.00 | 2.00 | 6.00 | 0.00 | 5.00 | 1.00 | 4.00 | 7.00 | NA | 3.00 | 5.00 | 4.00 | NA | 7.00 | 6.00 | 6.00 | NA | 6.00 | 14.00 | 23.00 | NA | 6.00 | 6.00 | 6.00 | NA | 4.00 | 4.00 | 4.49 | NA | 2.92 | 2.97 | 2.99 | -2.80 | 2.68 | 2.71 | 2.84 | -1.66 | 1.93 | 2.24 | 2.45 | -1.91 | 2.18 | 2.14 | 2.30 | NA | NA | NA | NA | |
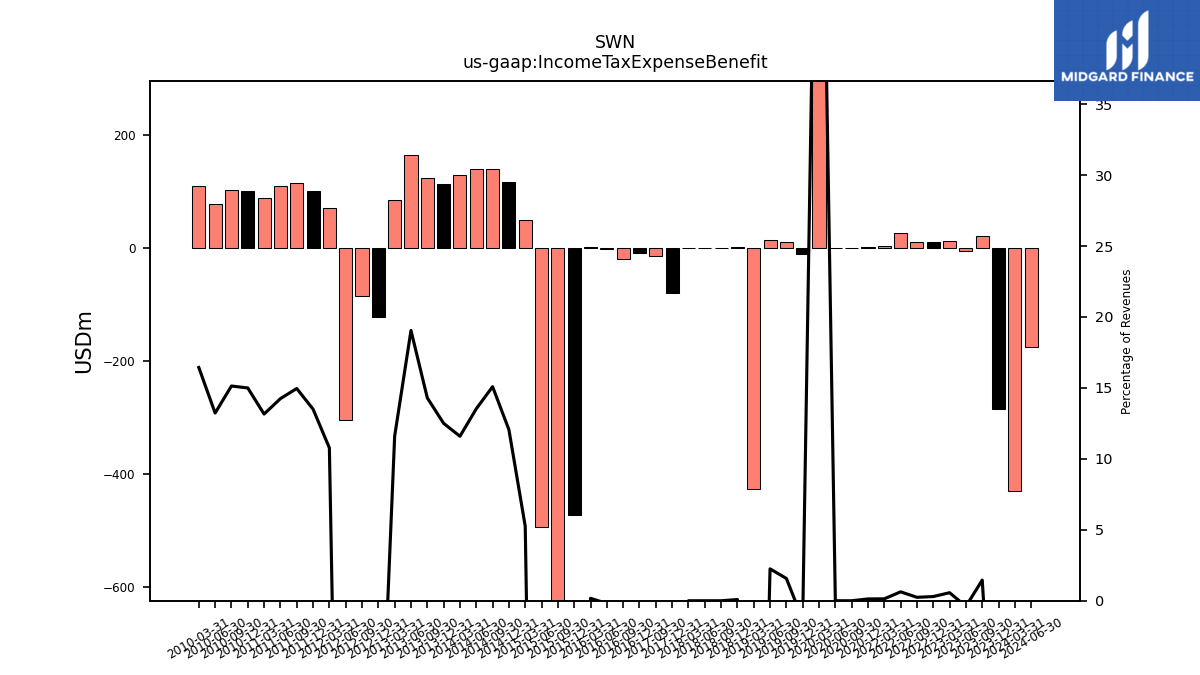
| Income Tax Expense Benefit | -285.00 | 21.00 | -5.00 | 12.00 | 10.00 | 11.00 | 26.00 | 4.00 | NA | NA | NA | NA | 1.00 | 0.00 | 0.00 | 406.00 | -10.00 | 10.00 | 15.00 | -426.00 | 1.00 | 0.00 | 0.00 | 0.00 | -79.00 | -14.00 | NA | NA | -9.00 | -20.00 | -1.00 | 1.00 | -473.00 | -1088.00 | -493.00 | 49.00 | 116.00 | 140.00 | 140.00 | 129.00 | 113.42 | 124.15 | 164.21 | 85.10 | -122.78 | -85.75 | -305.32 | 70.72 | 100.49 | 114.77 | 108.99 | 88.98 | 100.54 | 103.23 | 78.04 | 109.84 | NA | NA | NA | NA | |
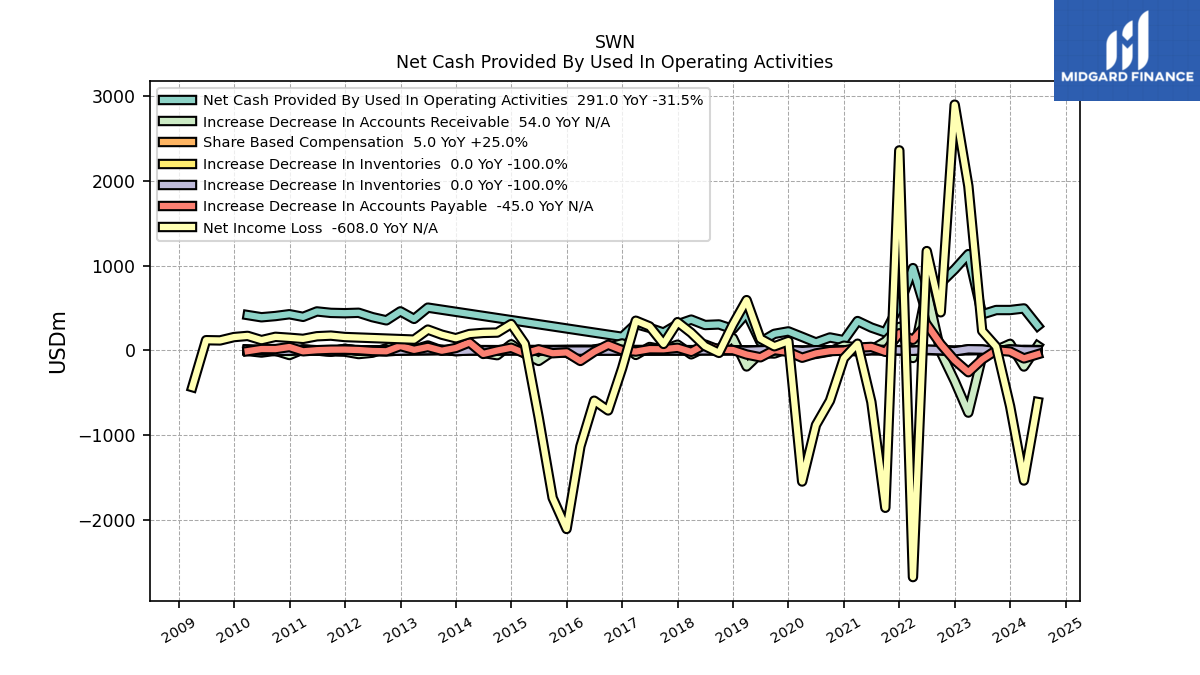
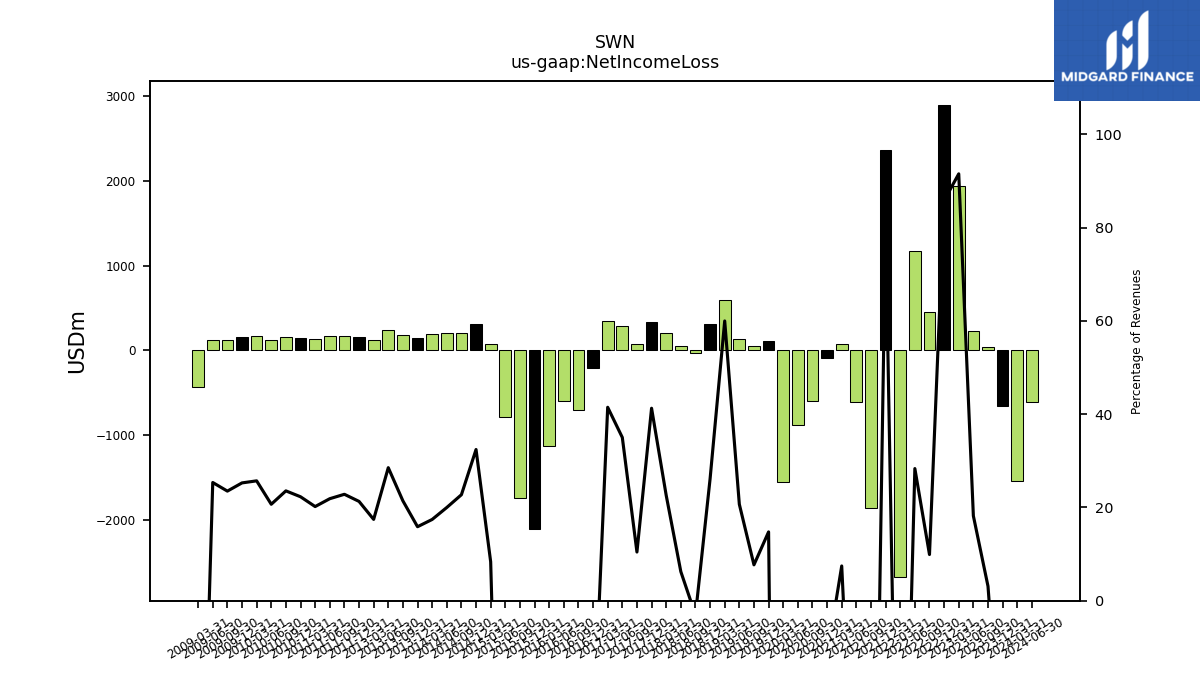
| Net Income Loss | -658.00 | 45.00 | 231.00 | 1939.00 | 2901.00 | 450.00 | 1173.00 | -2675.00 | 2361.00 | -1857.00 | -609.00 | 80.00 | -92.00 | -593.00 | -880.00 | -1547.00 | 110.00 | 49.00 | 138.00 | 594.00 | 307.00 | -29.00 | 51.00 | 208.00 | 334.00 | 77.00 | 284.00 | 351.00 | -210.00 | -708.00 | -593.00 | -1132.00 | -2107.00 | -1739.00 | -788.00 | 78.00 | 312.00 | 211.00 | 207.00 | 194.00 | 144.00 | 186.00 | 246.00 | 128.00 | NA | NA | NA | NA | 158.53 | 175.17 | 167.45 | 136.61 | 149.51 | 160.74 | 122.07 | 171.80 | 157.83 | 118.25 | 121.10 | -432.83 | |
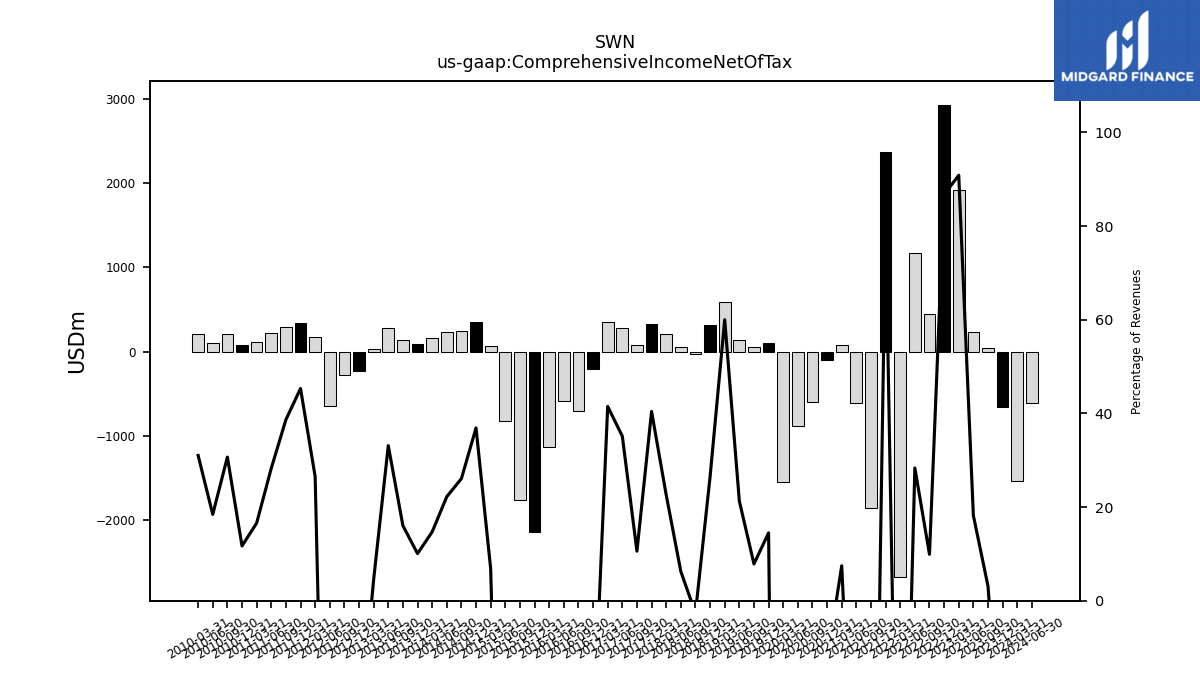
| Comprehensive Income Net Of Tax | -652.00 | 45.00 | 231.00 | 1924.00 | 2932.00 | 450.00 | 1173.00 | -2675.00 | 2370.00 | -1856.00 | -606.00 | 80.00 | -98.00 | -592.00 | -880.00 | -1547.00 | 108.00 | 50.00 | 142.00 | 594.00 | 311.00 | -25.00 | 51.00 | 208.00 | 327.00 | 78.00 | 285.00 | 351.00 | -210.00 | -706.00 | -590.00 | -1128.00 | -2142.00 | -1765.00 | -823.00 | 64.00 | 355.00 | 242.00 | 230.00 | 163.56 | 91.39 | 139.18 | 285.47 | 33.32 | -224.09 | -274.71 | -641.17 | 174.27 | 337.21 | 296.54 | 216.40 | 112.08 | 78.48 | 209.24 | 108.80 | 207.30 | NA | NA | NA | NA |
| 2023-12-31 | 2023-09-30 | 2023-06-30 | 2023-03-31 | 2022-12-31 | 2022-09-30 | 2022-06-30 | 2022-03-31 | 2021-12-31 | 2021-09-30 | 2021-06-30 | 2021-03-31 | 2020-12-31 | 2020-09-30 | 2020-06-30 | 2020-03-31 | 2019-12-31 | 2019-09-30 | 2019-06-30 | 2019-03-31 | 2018-12-31 | 2018-09-30 | 2018-06-30 | 2018-03-31 | 2017-12-31 | 2017-09-30 | 2017-06-30 | 2017-03-31 | 2016-12-31 | 2016-09-30 | 2016-06-30 | 2016-03-31 | 2015-12-31 | 2015-09-30 | 2015-06-30 | 2015-03-31 | 2014-12-31 | 2014-09-30 | 2014-06-30 | 2014-03-31 | 2013-12-31 | 2013-09-30 | 2013-06-30 | 2013-03-31 | 2012-12-31 | 2012-09-30 | 2012-06-30 | 2012-03-31 | 2011-12-31 | 2011-09-30 | 2011-06-30 | 2011-03-31 | 2010-12-31 | 2010-09-30 | 2010-06-30 | 2010-03-31 | 2009-12-31 | 2009-09-30 | 2009-06-30 | 2009-03-31 | ||
|---|---|---|---|---|---|---|---|---|---|---|---|---|---|---|---|---|---|---|---|---|---|---|---|---|---|---|---|---|---|---|---|---|---|---|---|---|---|---|---|---|---|---|---|---|---|---|---|---|---|---|---|---|---|---|---|---|---|---|---|---|---|
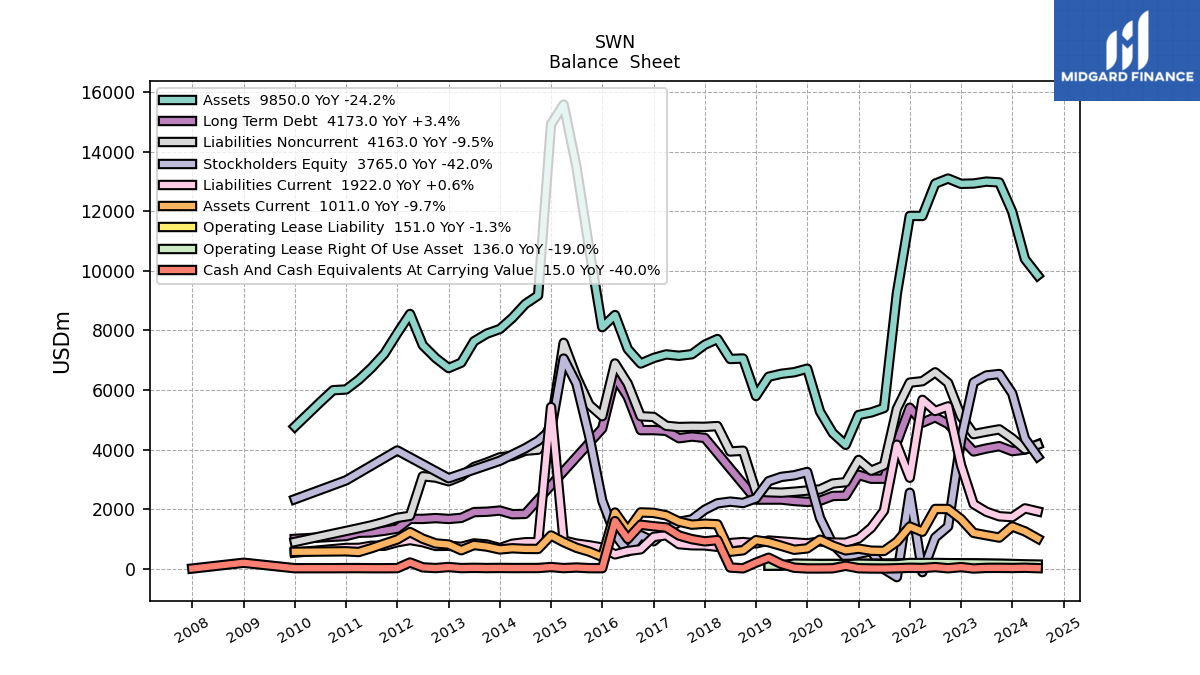
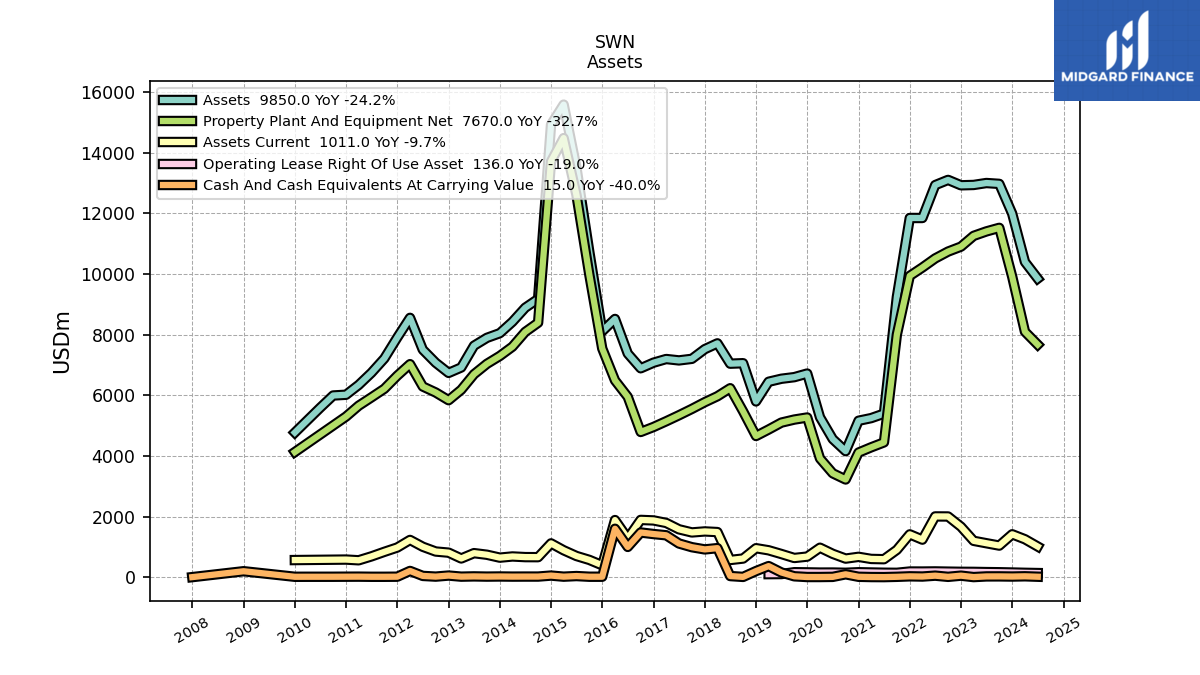
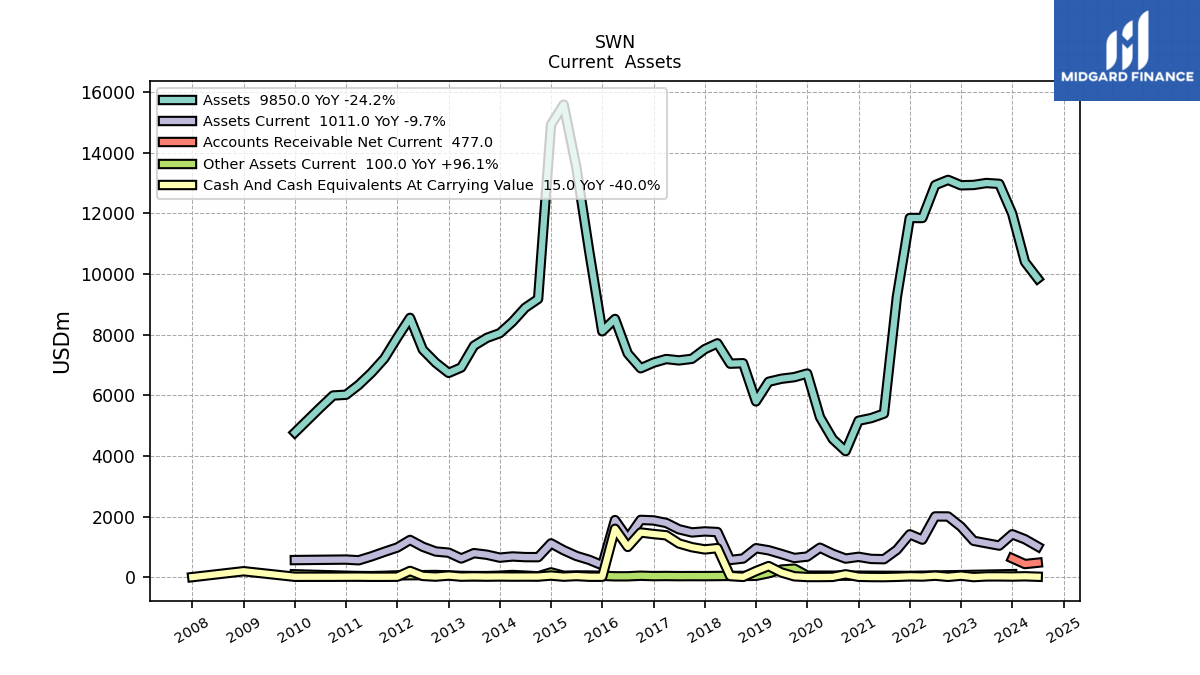
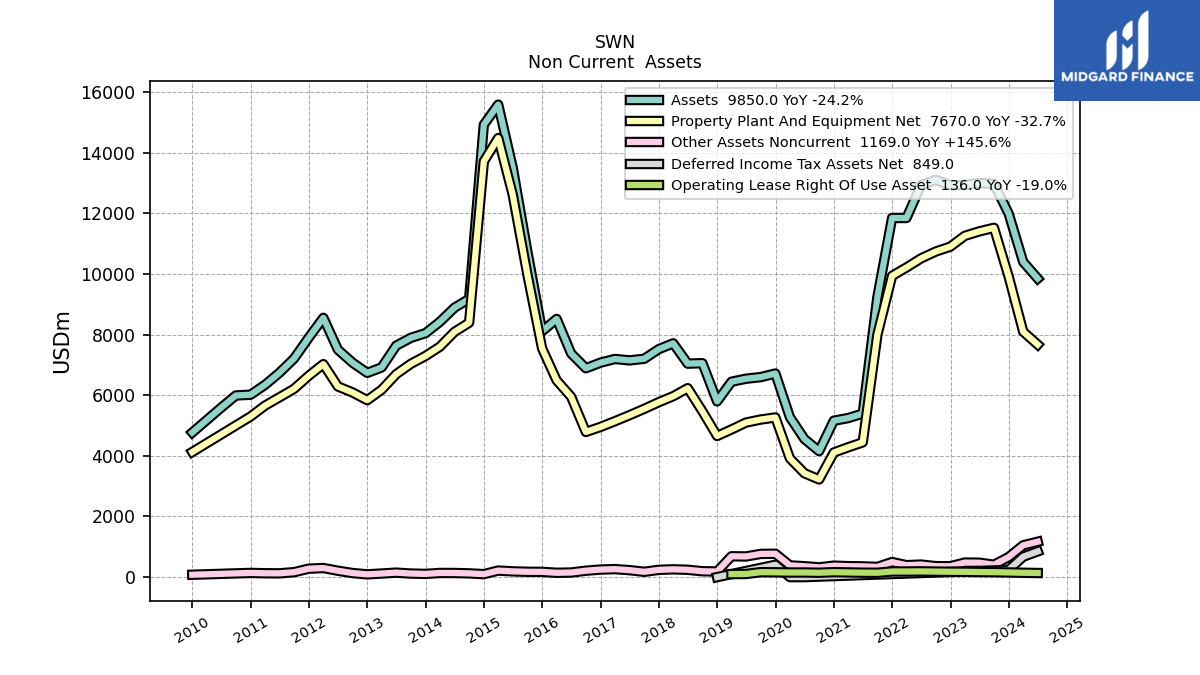
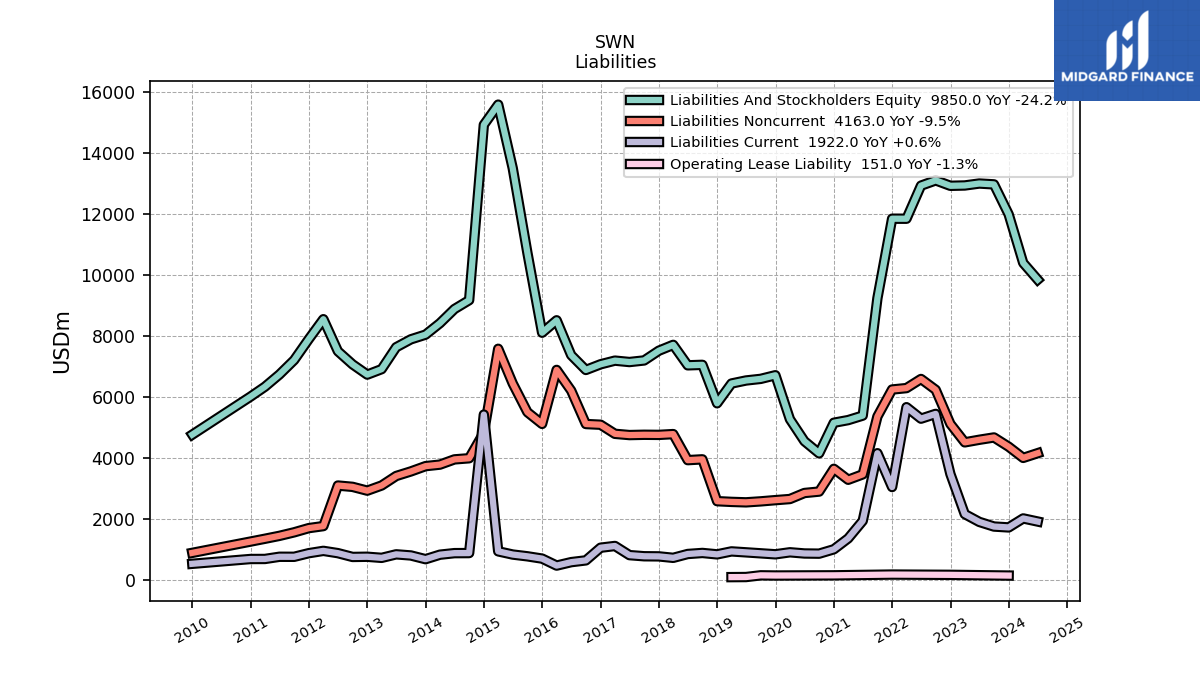
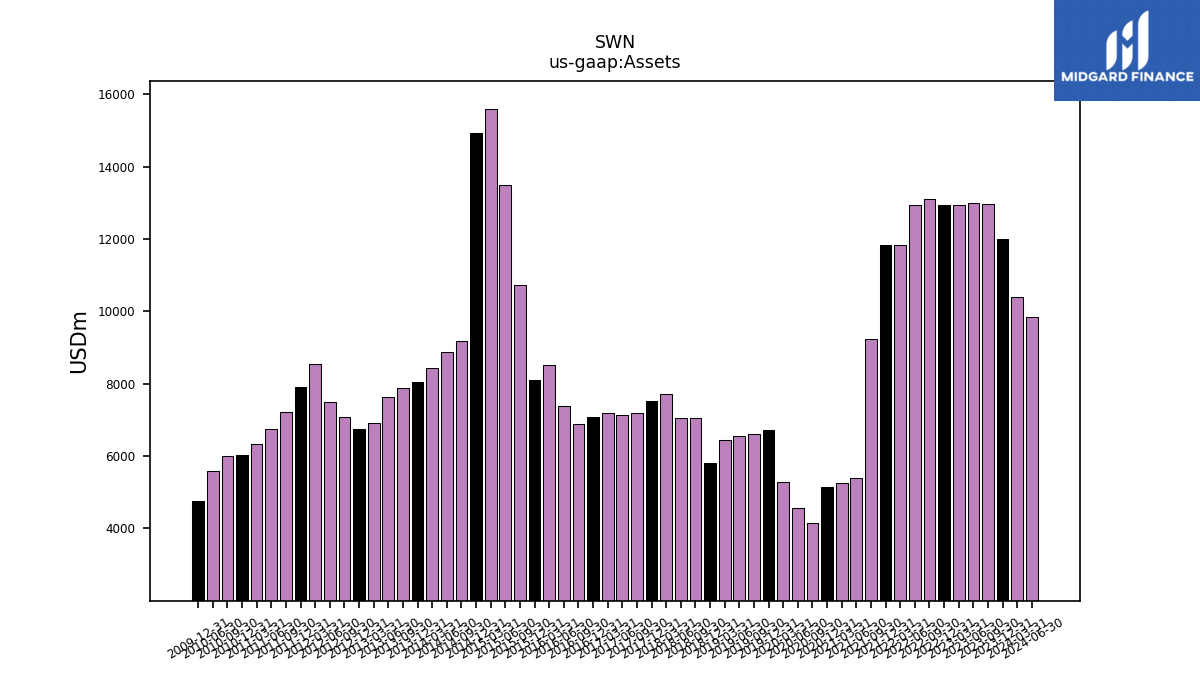
| Assets | 11991.00 | 12973.00 | 13001.00 | 12937.00 | 12926.00 | 13104.00 | 12932.00 | 11847.00 | 11848.00 | 9241.00 | 5394.00 | 5247.00 | 5160.00 | 4157.00 | 4555.00 | 5275.00 | 6717.00 | 6598.00 | 6545.00 | 6446.00 | 5797.00 | 7058.00 | 7042.00 | 7713.00 | 7521.00 | 7202.00 | 7150.00 | 7196.00 | 7076.00 | 6890.00 | 7377.00 | 8518.00 | 8110.00 | 10725.00 | 13504.00 | 15587.00 | 14925.00 | 9177.00 | 8887.00 | 8423.16 | 8047.73 | 7894.39 | 7635.19 | 6916.79 | 6737.53 | 7072.95 | 7503.96 | 8554.16 | 7902.90 | 7214.11 | 6742.10 | 6340.75 | 6017.46 | 5992.72 | 5590.35 | NA | 4770.25 | NA | NA | NA | |
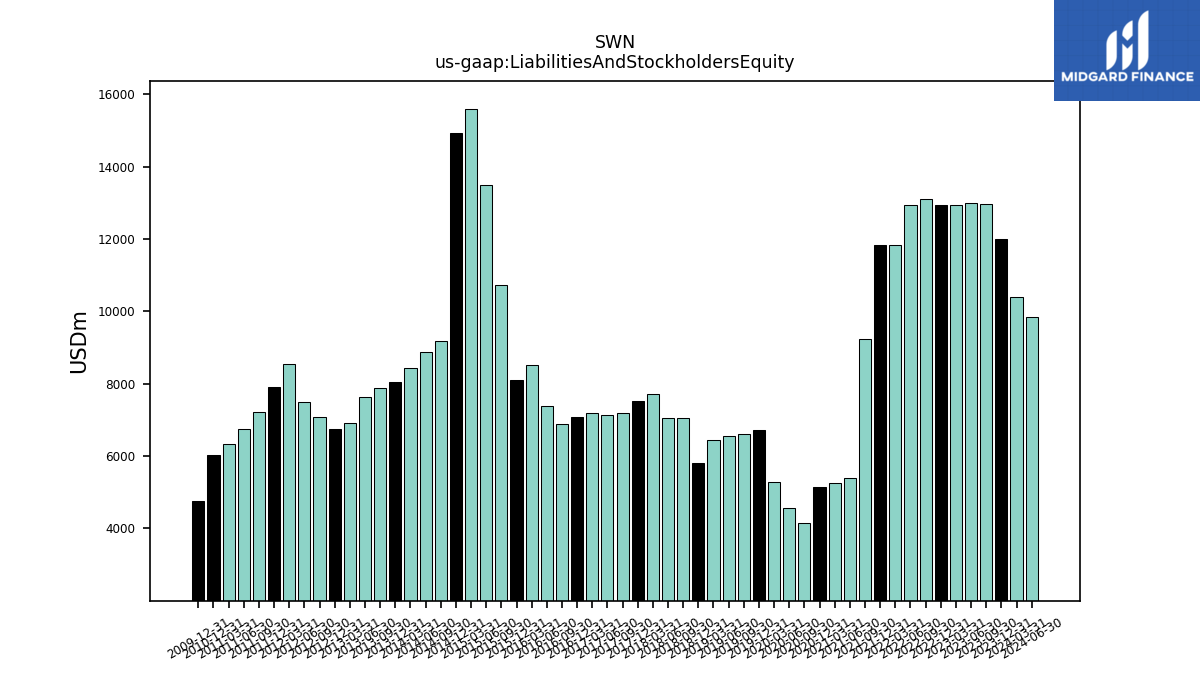
| Liabilities And Stockholders Equity | 11991.00 | 12973.00 | 13001.00 | 12937.00 | 12926.00 | 13104.00 | 12932.00 | 11847.00 | 11848.00 | 9241.00 | 5394.00 | 5247.00 | 5160.00 | 4157.00 | 4555.00 | 5275.00 | 6717.00 | 6598.00 | 6545.00 | 6446.00 | 5797.00 | 7058.00 | 7042.00 | 7713.00 | 7521.00 | 7202.00 | 7150.00 | 7196.00 | 7076.00 | 6890.00 | 7377.00 | 8518.00 | 8110.00 | 10725.00 | 13504.00 | 15587.00 | 14925.00 | 9177.00 | 8887.00 | 8423.16 | 8047.73 | 7894.39 | 7635.19 | 6916.79 | 6737.53 | 7072.95 | 7503.96 | 8554.16 | 7902.90 | 7214.11 | 6742.10 | 6340.75 | 6017.46 | NA | NA | NA | 4770.25 | NA | NA | NA | |
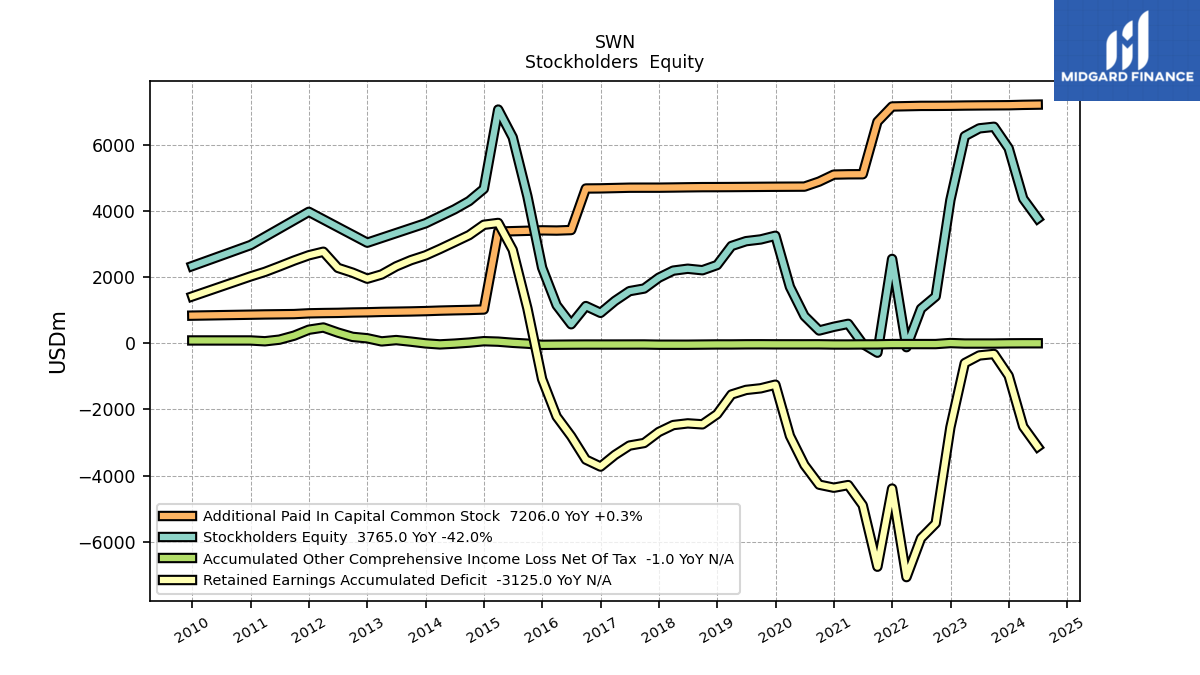
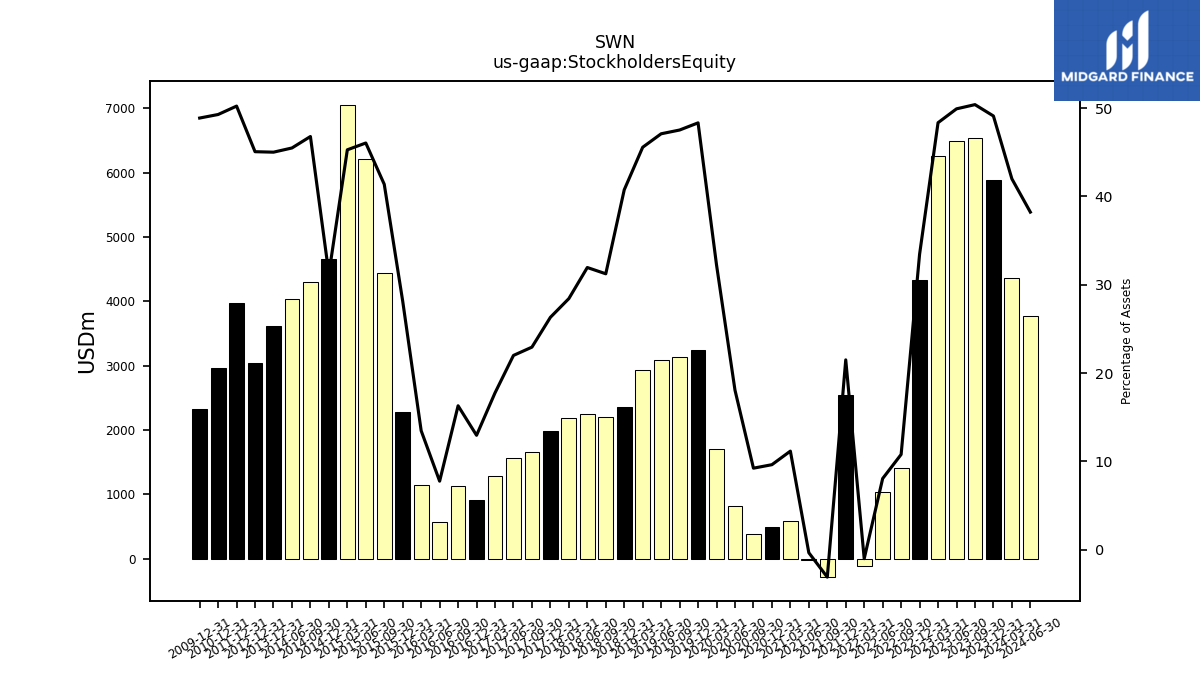
| Stockholders Equity | 5888.00 | 6537.00 | 6489.00 | 6254.00 | 4324.00 | 1414.00 | 1043.00 | -119.00 | 2547.00 | -286.00 | -18.00 | 586.00 | 497.00 | 384.00 | 823.00 | 1701.00 | 3246.00 | 3135.00 | 3082.00 | 2937.00 | 2362.00 | 2205.00 | 2250.00 | 2193.00 | 1979.00 | 1652.00 | 1573.00 | 1278.00 | 917.00 | 1123.00 | 573.00 | 1148.00 | 2282.00 | 4437.00 | 6218.00 | 7057.00 | 4662.00 | 4293.00 | 4042.00 | NA | 3622.00 | NA | NA | NA | 3036.00 | NA | NA | NA | 3969.00 | NA | NA | NA | 2964.88 | NA | NA | NA | 2331.22 | NA | NA | NA |
| 2023-12-31 | 2023-09-30 | 2023-06-30 | 2023-03-31 | 2022-12-31 | 2022-09-30 | 2022-06-30 | 2022-03-31 | 2021-12-31 | 2021-09-30 | 2021-06-30 | 2021-03-31 | 2020-12-31 | 2020-09-30 | 2020-06-30 | 2020-03-31 | 2019-12-31 | 2019-09-30 | 2019-06-30 | 2019-03-31 | 2018-12-31 | 2018-09-30 | 2018-06-30 | 2018-03-31 | 2017-12-31 | 2017-09-30 | 2017-06-30 | 2017-03-31 | 2016-12-31 | 2016-09-30 | 2016-06-30 | 2016-03-31 | 2015-12-31 | 2015-09-30 | 2015-06-30 | 2015-03-31 | 2014-12-31 | 2014-09-30 | 2014-06-30 | 2014-03-31 | 2013-12-31 | 2013-09-30 | 2013-06-30 | 2013-03-31 | 2012-12-31 | 2012-09-30 | 2012-06-30 | 2012-03-31 | 2011-12-31 | 2011-09-30 | 2011-06-30 | 2011-03-31 | 2010-12-31 | 2010-09-30 | 2010-06-30 | 2010-03-31 | 2009-12-31 | 2009-09-30 | 2009-06-30 | 2009-03-31 | ||
|---|---|---|---|---|---|---|---|---|---|---|---|---|---|---|---|---|---|---|---|---|---|---|---|---|---|---|---|---|---|---|---|---|---|---|---|---|---|---|---|---|---|---|---|---|---|---|---|---|---|---|---|---|---|---|---|---|---|---|---|---|---|
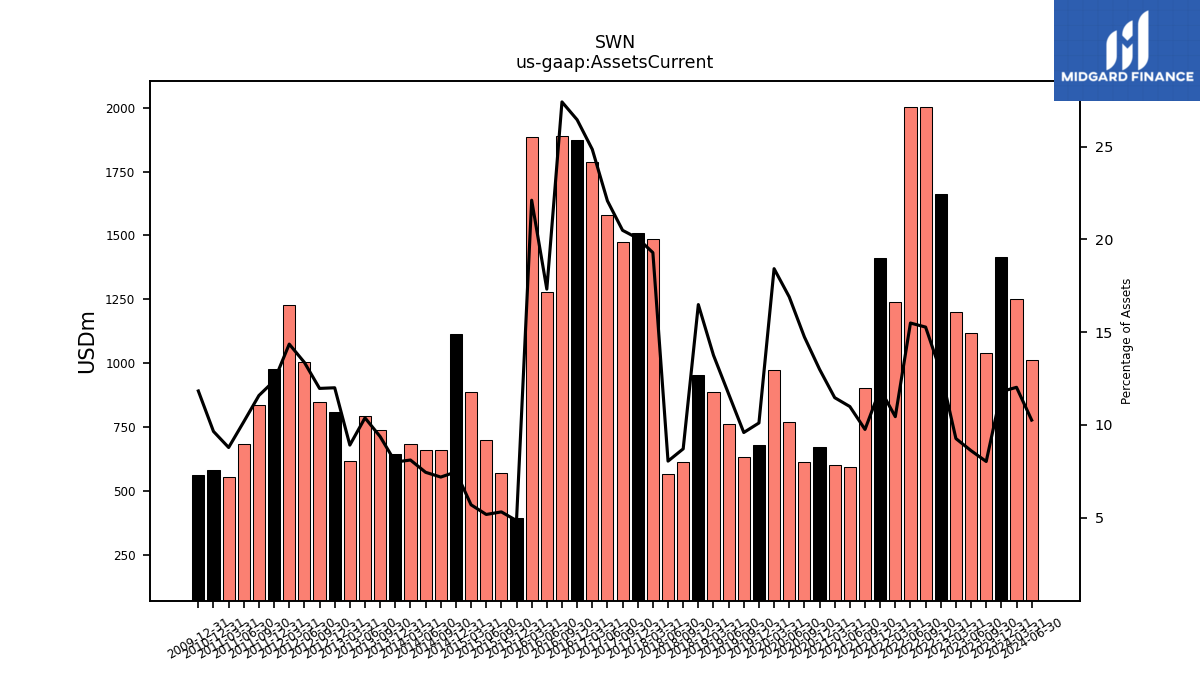
| Assets Current | 1415.00 | 1042.00 | 1120.00 | 1199.00 | 1664.00 | 2002.00 | 2004.00 | 1238.00 | 1413.00 | 902.00 | 593.00 | 602.00 | 671.00 | 613.00 | 770.00 | 972.00 | 679.00 | 633.00 | 764.00 | 887.00 | 956.00 | 615.00 | 567.00 | 1488.00 | 1509.00 | 1476.00 | 1579.00 | 1789.00 | 1872.00 | 1889.00 | 1278.00 | 1884.00 | 393.00 | 570.00 | 699.00 | 888.00 | 1115.00 | 660.00 | 662.00 | 683.10 | 644.17 | 739.98 | 792.83 | 616.81 | 808.91 | 846.75 | 1003.51 | 1228.41 | 978.28 | 836.12 | 686.14 | 557.14 | 580.89 | NA | NA | NA | 564.50 | NA | NA | NA | |
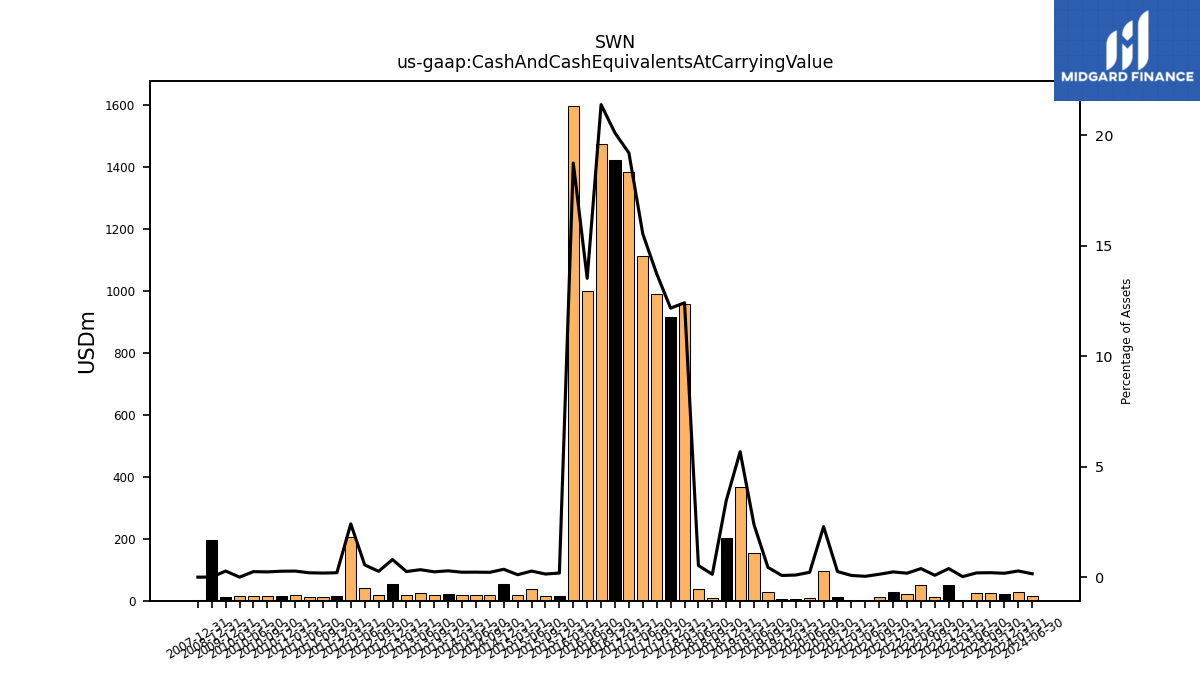
| Cash And Cash Equivalents At Carrying Value | 21.00 | 26.00 | 25.00 | 3.00 | 50.00 | 11.00 | 50.00 | 21.00 | 28.00 | 12.00 | 2.00 | 4.00 | 13.00 | 95.00 | 10.00 | 5.00 | 5.00 | 29.00 | 155.00 | 366.00 | 201.00 | 9.00 | 37.00 | 958.00 | 916.00 | 989.00 | 1111.00 | 1382.00 | 1423.00 | 1474.00 | 998.00 | 1597.00 | 15.00 | 15.00 | 37.00 | 17.00 | 53.00 | 20.00 | 20.00 | 18.72 | 22.94 | 18.95 | 25.68 | 17.51 | 53.58 | 18.56 | 41.50 | 206.17 | 15.63 | 13.29 | 13.28 | 17.39 | 16.05 | 14.20 | 13.95 | 13.90 | 13.18 | NA | NA | NA | |
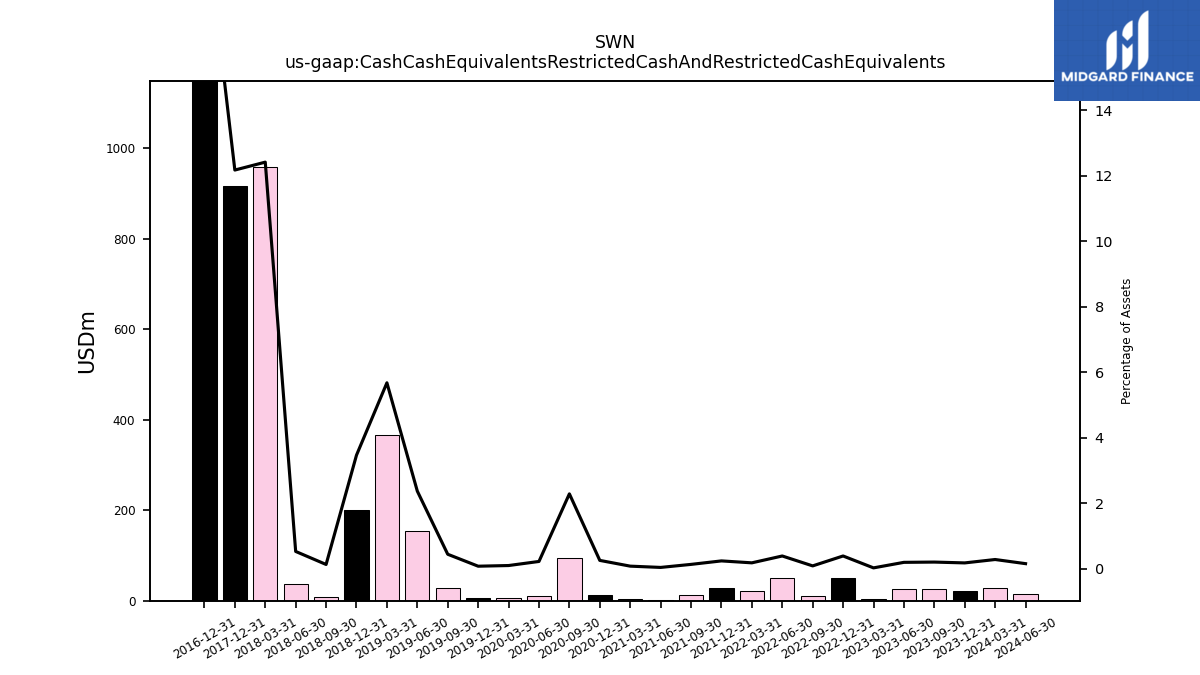
| Cash Cash Equivalents Restricted Cash And Restricted Cash Equivalents | 21.00 | 26.00 | 25.00 | 3.00 | 50.00 | 11.00 | 50.00 | 21.00 | 28.00 | 12.00 | 2.00 | 4.00 | 13.00 | 95.00 | 10.00 | 5.00 | 5.00 | 29.00 | 155.00 | 366.00 | 201.00 | 9.00 | 37.00 | 958.00 | 916.00 | NA | NA | NA | 1423.00 | NA | NA | NA | NA | NA | NA | NA | NA | NA | NA | NA | NA | NA | NA | NA | NA | NA | NA | NA | NA | NA | NA | NA | NA | NA | NA | NA | NA | NA | NA | NA | |
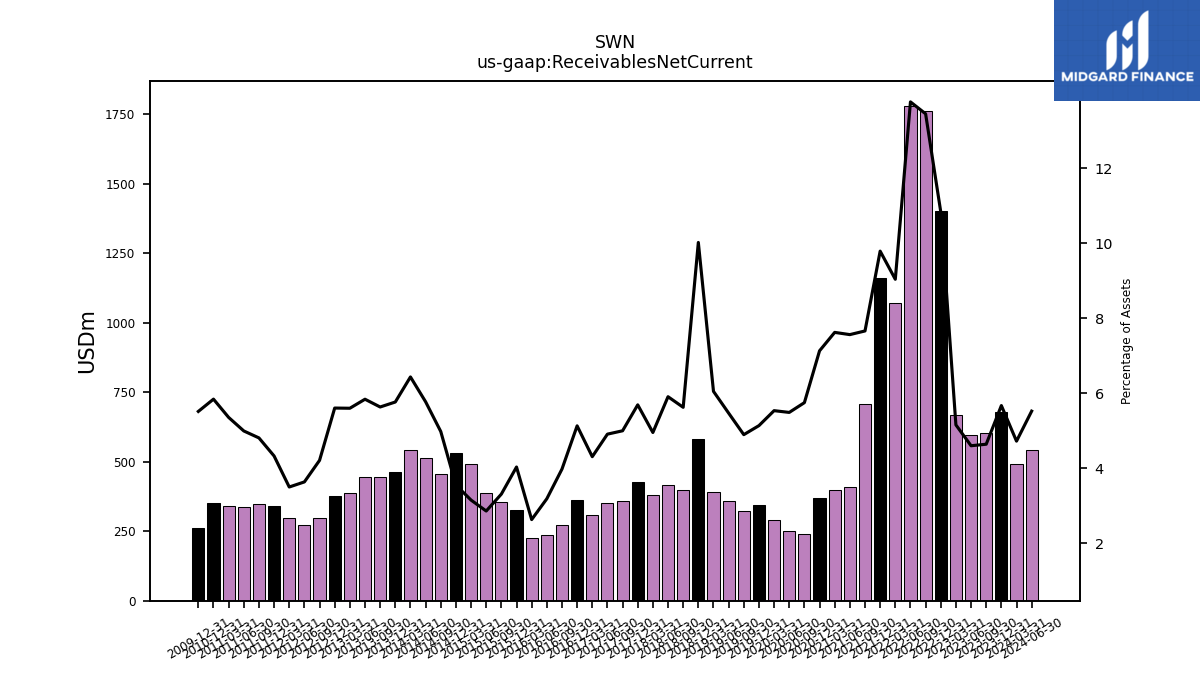
| Receivables Net Current | 680.00 | 602.00 | 598.00 | 667.00 | 1401.00 | 1763.00 | 1781.00 | 1071.00 | 1160.00 | 708.00 | 408.00 | 400.00 | 368.00 | 239.00 | 250.00 | 292.00 | 345.00 | 323.00 | 358.00 | 390.00 | 581.00 | 397.00 | 416.00 | 382.00 | 428.00 | 360.00 | 351.00 | 310.00 | 363.00 | 274.00 | 235.00 | 224.00 | 327.00 | 355.00 | 386.00 | 491.00 | 530.00 | 457.00 | 513.00 | 542.04 | 464.05 | 444.72 | 445.94 | 387.32 | 377.64 | 297.77 | 272.75 | 299.32 | 341.92 | 346.90 | 336.72 | 339.59 | 351.57 | NA | NA | NA | 263.08 | NA | NA | NA | |
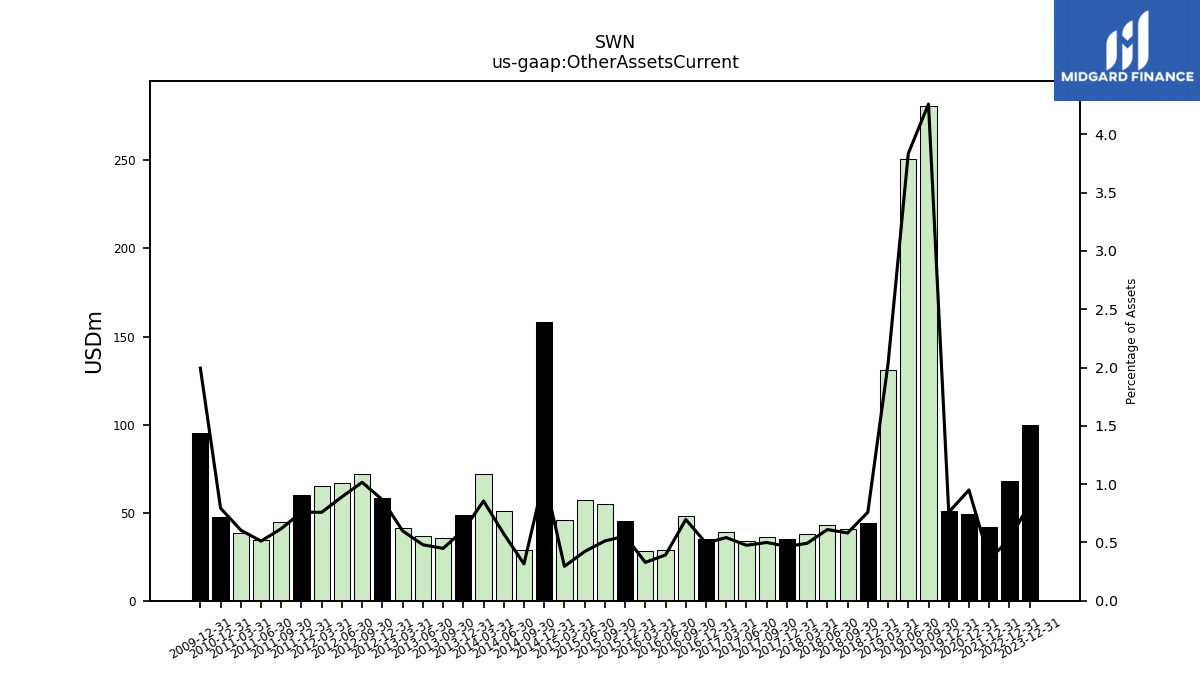
| Other Assets Current | 100.00 | NA | NA | NA | 68.00 | NA | NA | NA | 42.00 | NA | NA | NA | 49.00 | NA | NA | NA | 51.00 | 281.00 | 251.00 | 131.00 | 44.00 | 41.00 | 43.00 | 38.00 | 35.00 | 36.00 | 34.00 | 39.00 | 35.00 | 48.00 | 29.00 | 28.00 | 45.00 | 55.00 | 57.00 | 46.00 | 158.00 | 29.00 | 51.00 | 72.06 | 48.58 | 35.43 | 36.66 | 41.45 | 58.31 | 71.85 | 66.89 | 64.89 | 60.04 | 44.59 | 34.49 | 38.38 | 47.76 | NA | NA | NA | 95.16 | NA | NA | NA |
| 2023-12-31 | 2023-09-30 | 2023-06-30 | 2023-03-31 | 2022-12-31 | 2022-09-30 | 2022-06-30 | 2022-03-31 | 2021-12-31 | 2021-09-30 | 2021-06-30 | 2021-03-31 | 2020-12-31 | 2020-09-30 | 2020-06-30 | 2020-03-31 | 2019-12-31 | 2019-09-30 | 2019-06-30 | 2019-03-31 | 2018-12-31 | 2018-09-30 | 2018-06-30 | 2018-03-31 | 2017-12-31 | 2017-09-30 | 2017-06-30 | 2017-03-31 | 2016-12-31 | 2016-09-30 | 2016-06-30 | 2016-03-31 | 2015-12-31 | 2015-09-30 | 2015-06-30 | 2015-03-31 | 2014-12-31 | 2014-09-30 | 2014-06-30 | 2014-03-31 | 2013-12-31 | 2013-09-30 | 2013-06-30 | 2013-03-31 | 2012-12-31 | 2012-09-30 | 2012-06-30 | 2012-03-31 | 2011-12-31 | 2011-09-30 | 2011-06-30 | 2011-03-31 | 2010-12-31 | 2010-09-30 | 2010-06-30 | 2010-03-31 | 2009-12-31 | 2009-09-30 | 2009-06-30 | 2009-03-31 | ||
|---|---|---|---|---|---|---|---|---|---|---|---|---|---|---|---|---|---|---|---|---|---|---|---|---|---|---|---|---|---|---|---|---|---|---|---|---|---|---|---|---|---|---|---|---|---|---|---|---|---|---|---|---|---|---|---|---|---|---|---|---|---|
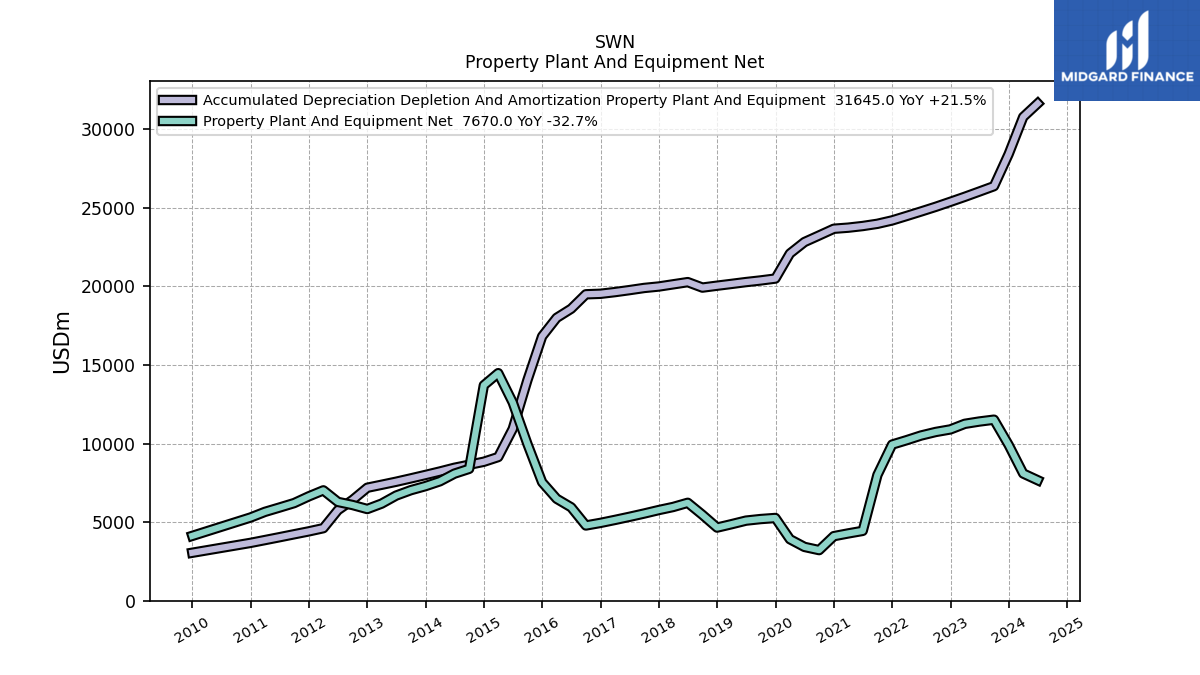
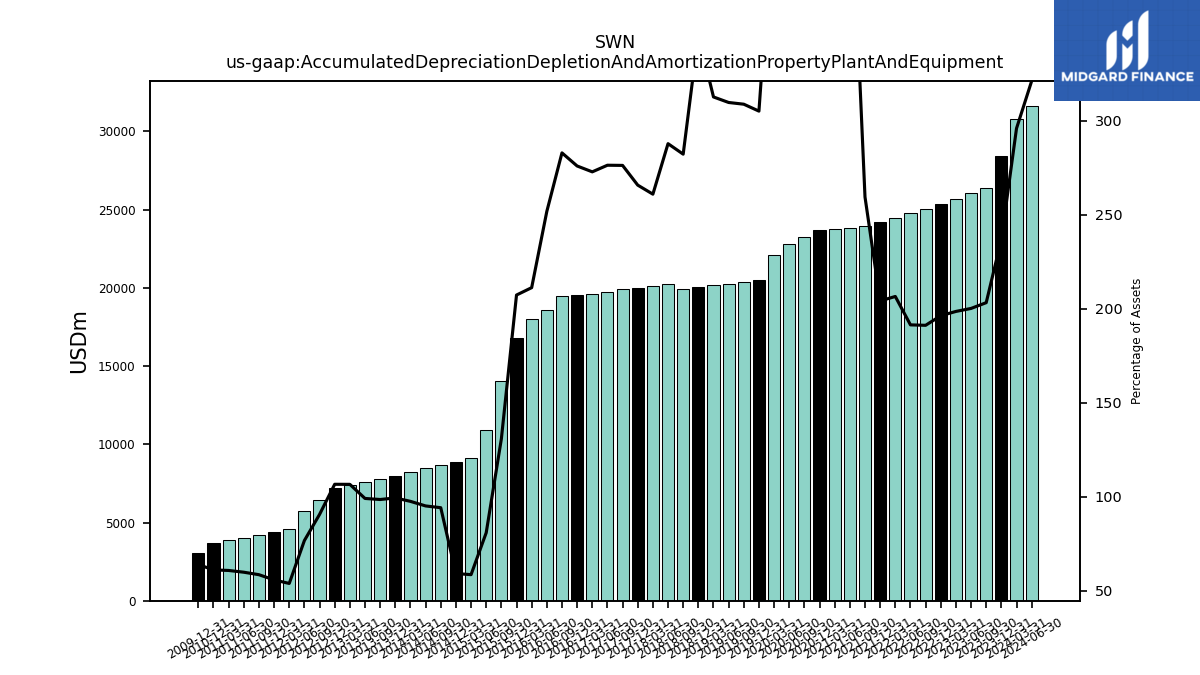
| Accumulated Depreciation Depletion And Amortization Property Plant And Equipment | 28425.00 | 26381.00 | 26039.00 | 25704.00 | 25387.00 | 25068.00 | 24770.00 | 24482.00 | 24202.00 | 23987.00 | 23846.00 | 23741.00 | 23673.00 | 23247.00 | 22825.00 | 22095.00 | 20503.00 | 20383.00 | 20279.00 | 20162.00 | 20049.00 | 19928.00 | 20276.00 | 20136.00 | 19997.00 | 19904.00 | 19767.00 | 19641.00 | 19534.00 | 19501.00 | 18582.00 | 18002.00 | 16821.00 | 14038.00 | 10934.00 | 9144.00 | 8845.00 | 8652.00 | 8462.00 | 8225.39 | 8005.84 | 7786.82 | 7574.13 | 7380.23 | 7191.46 | 6414.95 | 5763.88 | 4617.88 | 4415.34 | 4230.12 | 4042.76 | 3861.05 | 3682.69 | NA | NA | NA | 3054.53 | NA | NA | NA | |
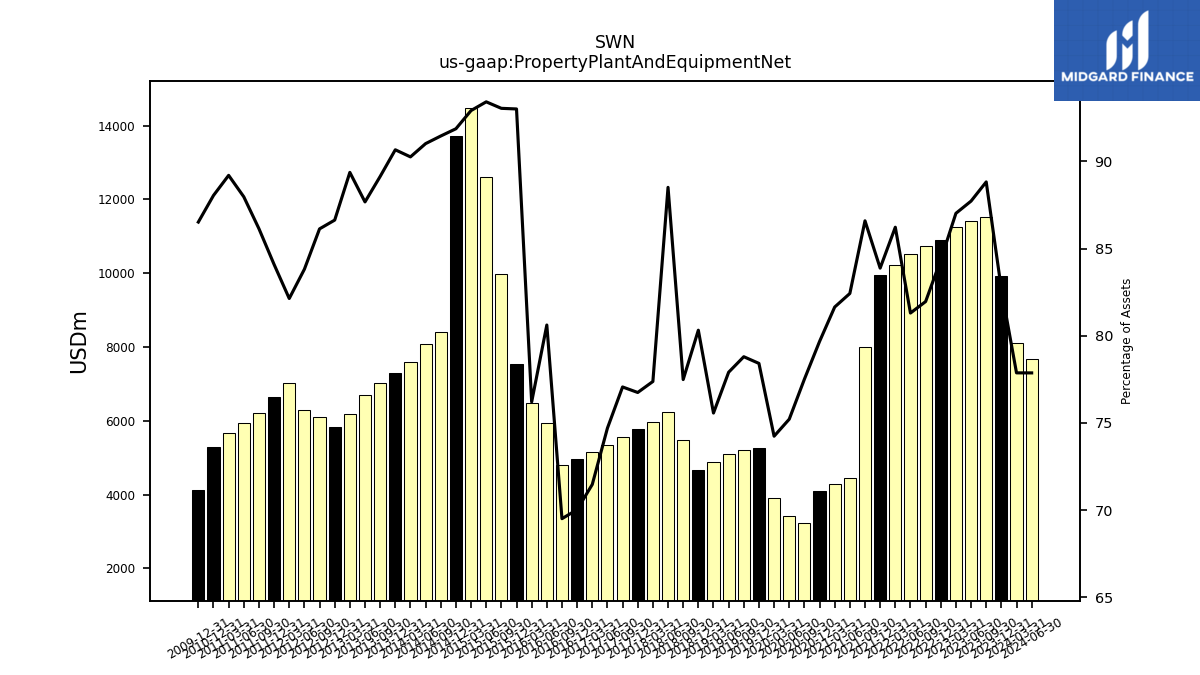
| Property Plant And Equipment Net | 9913.00 | 11523.00 | 11405.00 | 11258.00 | 10903.00 | 10740.00 | 10514.00 | 10215.00 | 9938.00 | 8002.00 | 4446.00 | 4284.00 | 4111.00 | 3222.00 | 3426.00 | 3916.00 | 5267.00 | 5199.00 | 5099.00 | 4871.00 | 4656.00 | 5469.00 | 6233.00 | 5968.00 | 5772.00 | 5550.00 | 5341.00 | 5143.00 | 4955.00 | 4789.00 | 5947.00 | 6491.00 | 7543.00 | 9979.00 | 12615.00 | 14483.00 | 13712.00 | 8393.00 | 8089.00 | 7602.67 | 7296.62 | 7036.73 | 6694.26 | 6181.51 | 5836.98 | 6091.95 | 6289.50 | 7026.07 | 6645.48 | 6214.27 | 5931.07 | 5655.94 | 5298.20 | NA | NA | NA | 4127.25 | NA | NA | NA | |
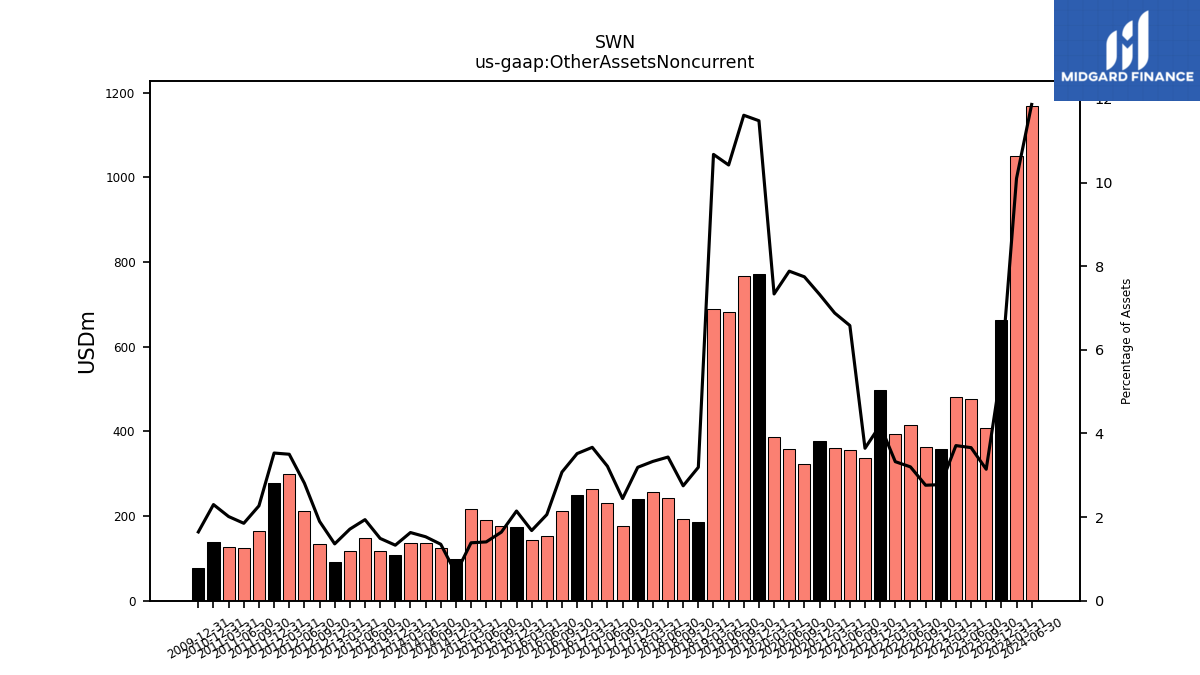
| Other Assets Noncurrent | 663.00 | 408.00 | 476.00 | 480.00 | 359.00 | 362.00 | 414.00 | 394.00 | 497.00 | 337.00 | 355.00 | 361.00 | 378.00 | 322.00 | 359.00 | 387.00 | 771.00 | 766.00 | 682.00 | 688.00 | 185.00 | 194.00 | 242.00 | 257.00 | 240.00 | 176.00 | 230.00 | 264.00 | 249.00 | 212.00 | 152.00 | 143.00 | 174.00 | 176.00 | 190.00 | 216.00 | 98.00 | 124.00 | 136.00 | 137.39 | 106.93 | 117.68 | 148.10 | 118.48 | 91.64 | 134.26 | 210.95 | 299.68 | 279.14 | 163.72 | 124.89 | 127.67 | 138.37 | NA | NA | NA | 78.50 | NA | NA | NA |
| 2023-12-31 | 2023-09-30 | 2023-06-30 | 2023-03-31 | 2022-12-31 | 2022-09-30 | 2022-06-30 | 2022-03-31 | 2021-12-31 | 2021-09-30 | 2021-06-30 | 2021-03-31 | 2020-12-31 | 2020-09-30 | 2020-06-30 | 2020-03-31 | 2019-12-31 | 2019-09-30 | 2019-06-30 | 2019-03-31 | 2018-12-31 | 2018-09-30 | 2018-06-30 | 2018-03-31 | 2017-12-31 | 2017-09-30 | 2017-06-30 | 2017-03-31 | 2016-12-31 | 2016-09-30 | 2016-06-30 | 2016-03-31 | 2015-12-31 | 2015-09-30 | 2015-06-30 | 2015-03-31 | 2014-12-31 | 2014-09-30 | 2014-06-30 | 2014-03-31 | 2013-12-31 | 2013-09-30 | 2013-06-30 | 2013-03-31 | 2012-12-31 | 2012-09-30 | 2012-06-30 | 2012-03-31 | 2011-12-31 | 2011-09-30 | 2011-06-30 | 2011-03-31 | 2010-12-31 | 2010-09-30 | 2010-06-30 | 2010-03-31 | 2009-12-31 | 2009-09-30 | 2009-06-30 | 2009-03-31 | ||
|---|---|---|---|---|---|---|---|---|---|---|---|---|---|---|---|---|---|---|---|---|---|---|---|---|---|---|---|---|---|---|---|---|---|---|---|---|---|---|---|---|---|---|---|---|---|---|---|---|---|---|---|---|---|---|---|---|---|---|---|---|---|
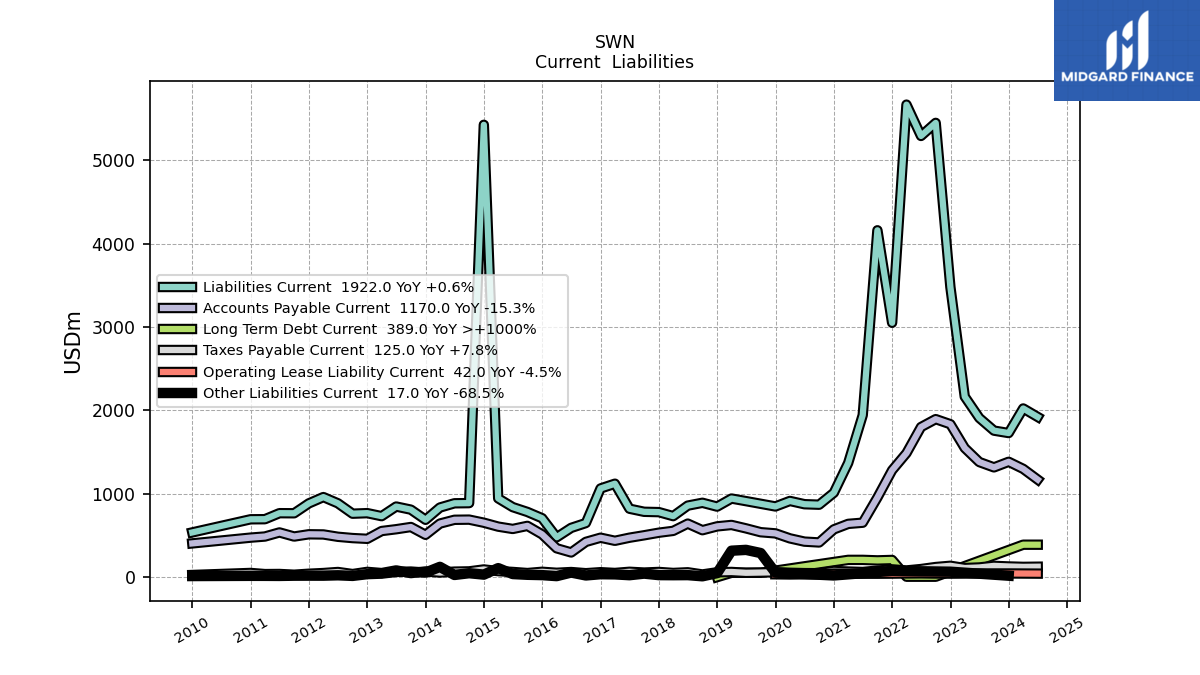
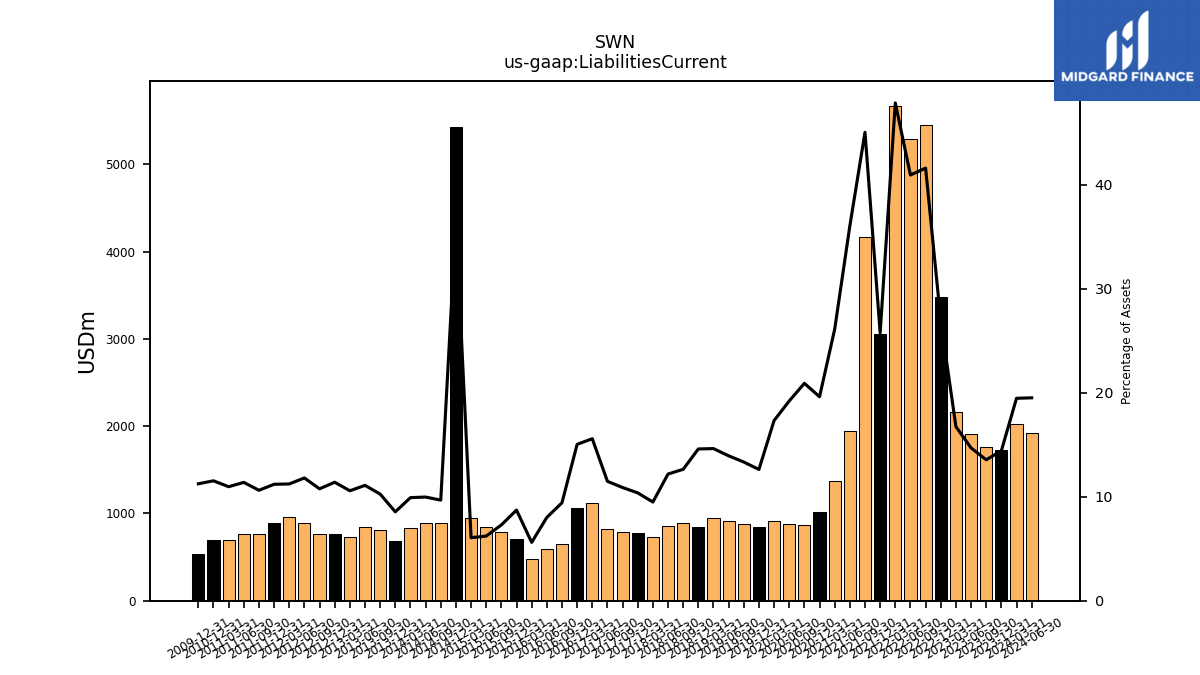
| Liabilities Current | 1729.00 | 1758.00 | 1910.00 | 2166.00 | 3481.00 | 5451.00 | 5294.00 | 5670.00 | 3052.00 | 4162.00 | 1944.00 | 1370.00 | 1012.00 | 869.00 | 875.00 | 914.00 | 848.00 | 880.00 | 912.00 | 943.00 | 846.00 | 892.00 | 858.00 | 732.00 | 780.00 | 784.00 | 821.00 | 1121.00 | 1064.00 | 649.00 | 591.00 | 478.00 | 707.00 | 782.00 | 840.00 | 945.00 | 5428.00 | 888.00 | 886.00 | 835.15 | 688.01 | 809.81 | 847.05 | 731.47 | 767.77 | 761.16 | 885.95 | 960.64 | 884.91 | 766.25 | 767.35 | 695.19 | 693.98 | NA | NA | NA | 536.42 | NA | NA | NA | |
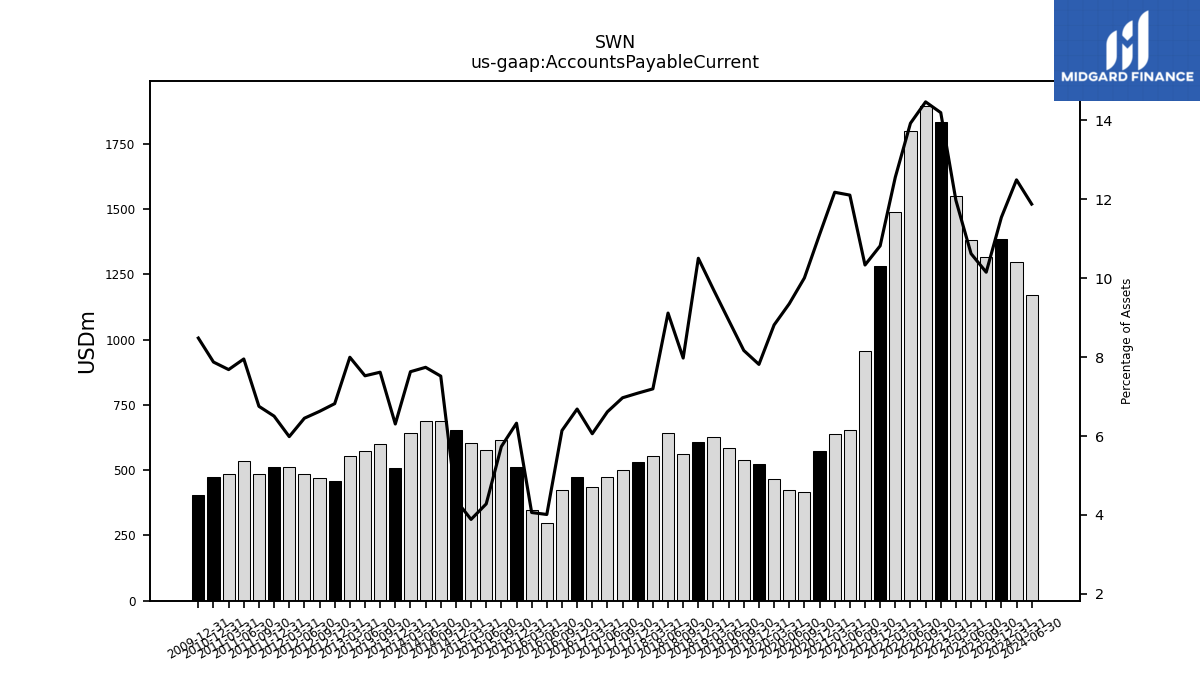
| Accounts Payable Current | 1384.00 | 1317.00 | 1381.00 | 1549.00 | 1835.00 | 1896.00 | 1801.00 | 1488.00 | 1282.00 | 955.00 | 653.00 | 639.00 | 573.00 | 416.00 | 426.00 | 465.00 | 525.00 | 539.00 | 585.00 | 626.00 | 609.00 | 563.00 | 642.00 | 555.00 | 533.00 | 502.00 | 473.00 | 436.00 | 473.00 | 423.00 | 296.00 | 346.00 | 513.00 | 615.00 | 578.00 | 606.00 | 653.00 | 690.00 | 688.00 | 642.74 | 507.47 | 601.41 | 574.71 | 553.15 | 459.57 | 468.65 | 484.15 | 512.02 | 514.07 | 487.19 | 536.21 | 487.25 | 473.89 | NA | NA | NA | 404.69 | NA | NA | NA | |
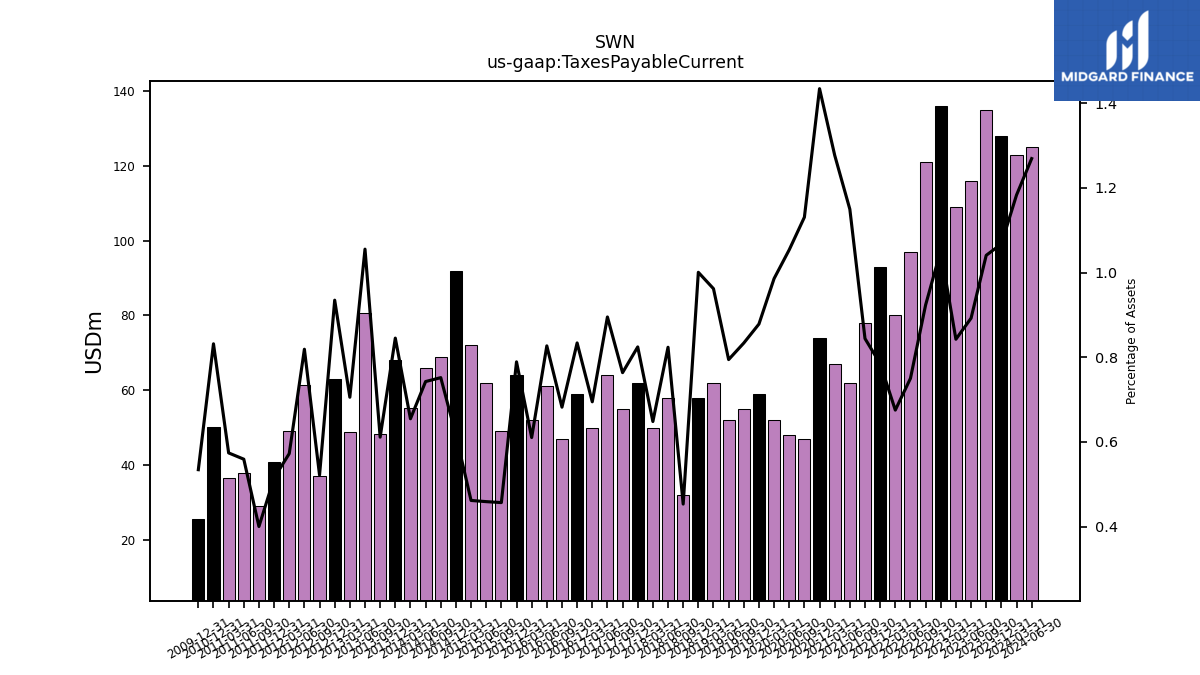
| Taxes Payable Current | 128.00 | 135.00 | 116.00 | 109.00 | 136.00 | 121.00 | 97.00 | 80.00 | 93.00 | 78.00 | 62.00 | 67.00 | 74.00 | 47.00 | 48.00 | 52.00 | 59.00 | 55.00 | 52.00 | 62.00 | 58.00 | 32.00 | 58.00 | 50.00 | 62.00 | 55.00 | 64.00 | 50.00 | 59.00 | 47.00 | 61.00 | 52.00 | 64.00 | 49.00 | 62.00 | 72.00 | 92.00 | 69.00 | 66.00 | 55.16 | 68.02 | 48.26 | 80.57 | 48.80 | 62.98 | 36.90 | 61.45 | 48.98 | 40.69 | 28.89 | 37.71 | 36.41 | 50.05 | NA | NA | NA | 25.50 | NA | NA | NA | |
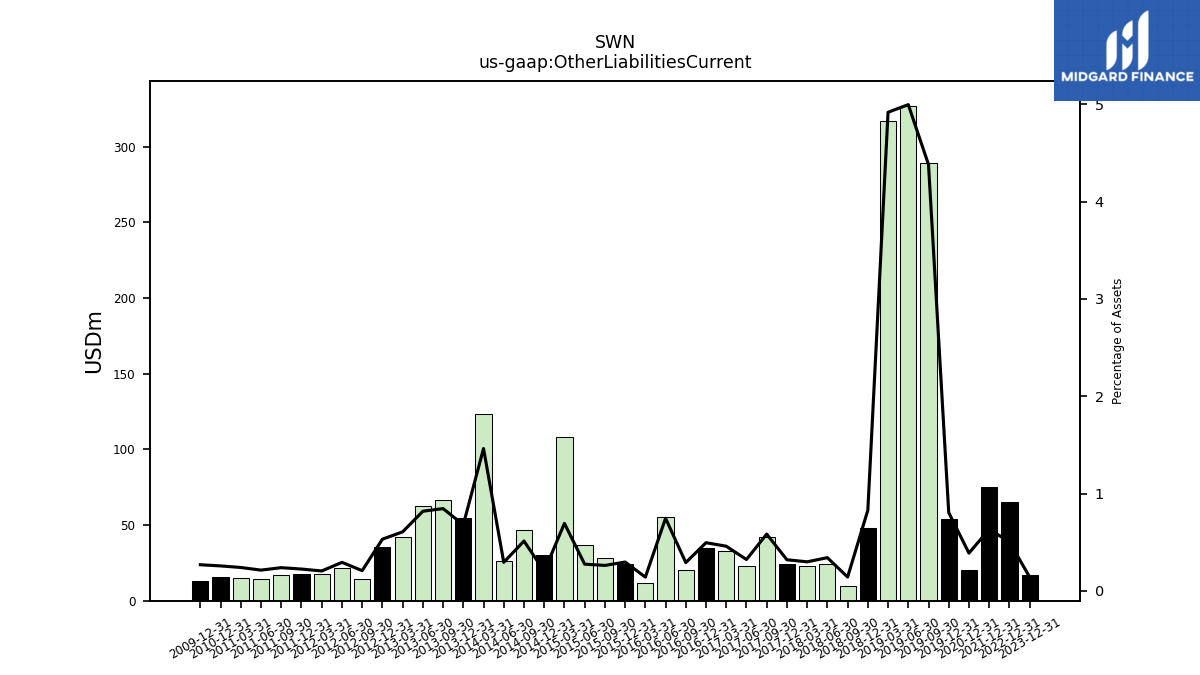
| Other Liabilities Current | 17.00 | NA | NA | NA | 65.00 | NA | NA | NA | 75.00 | NA | NA | NA | 20.00 | NA | NA | NA | 54.00 | 289.00 | 327.00 | 317.00 | 48.00 | 10.00 | 24.00 | 23.00 | 24.00 | 42.00 | 23.00 | 33.00 | 35.00 | 20.00 | 55.00 | 12.00 | 24.00 | 28.00 | 37.00 | 108.00 | 30.00 | 47.00 | 26.00 | 123.15 | 54.69 | 66.69 | 62.44 | 41.90 | 35.75 | 14.69 | 21.95 | 17.46 | 17.68 | 17.17 | 14.35 | 15.21 | 15.41 | NA | NA | NA | 12.79 | NA | NA | NA |
| 2023-12-31 | 2023-09-30 | 2023-06-30 | 2023-03-31 | 2022-12-31 | 2022-09-30 | 2022-06-30 | 2022-03-31 | 2021-12-31 | 2021-09-30 | 2021-06-30 | 2021-03-31 | 2020-12-31 | 2020-09-30 | 2020-06-30 | 2020-03-31 | 2019-12-31 | 2019-09-30 | 2019-06-30 | 2019-03-31 | 2018-12-31 | 2018-09-30 | 2018-06-30 | 2018-03-31 | 2017-12-31 | 2017-09-30 | 2017-06-30 | 2017-03-31 | 2016-12-31 | 2016-09-30 | 2016-06-30 | 2016-03-31 | 2015-12-31 | 2015-09-30 | 2015-06-30 | 2015-03-31 | 2014-12-31 | 2014-09-30 | 2014-06-30 | 2014-03-31 | 2013-12-31 | 2013-09-30 | 2013-06-30 | 2013-03-31 | 2012-12-31 | 2012-09-30 | 2012-06-30 | 2012-03-31 | 2011-12-31 | 2011-09-30 | 2011-06-30 | 2011-03-31 | 2010-12-31 | 2010-09-30 | 2010-06-30 | 2010-03-31 | 2009-12-31 | 2009-09-30 | 2009-06-30 | 2009-03-31 | ||
|---|---|---|---|---|---|---|---|---|---|---|---|---|---|---|---|---|---|---|---|---|---|---|---|---|---|---|---|---|---|---|---|---|---|---|---|---|---|---|---|---|---|---|---|---|---|---|---|---|---|---|---|---|---|---|---|---|---|---|---|---|---|
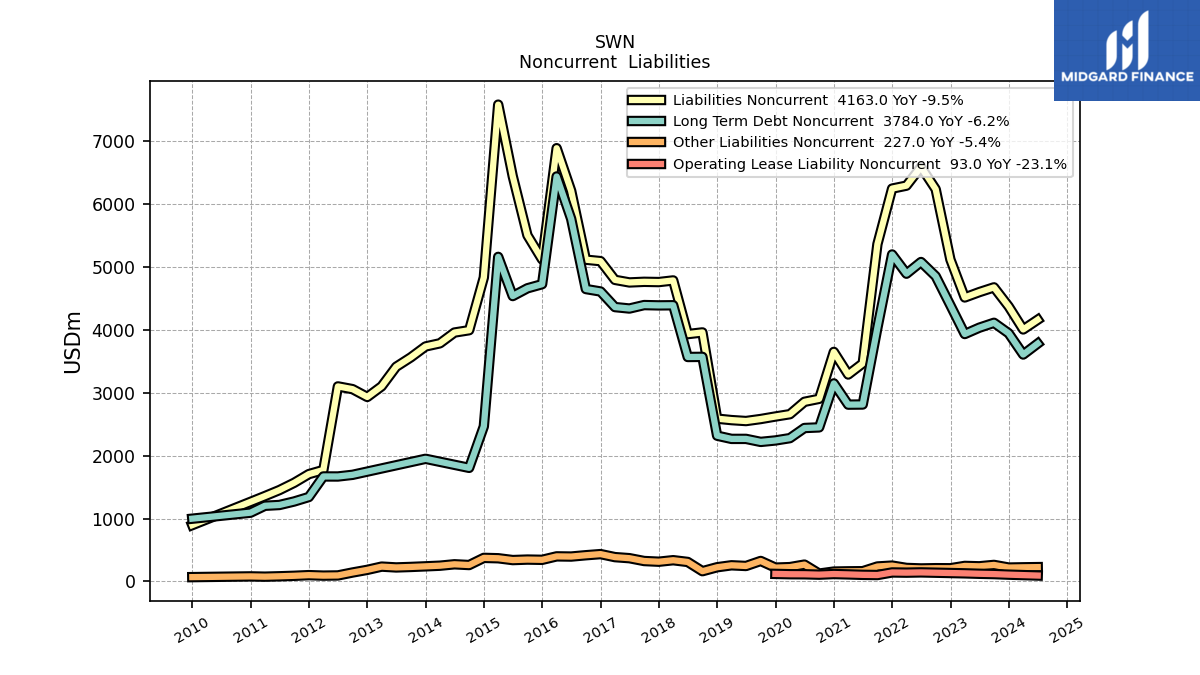
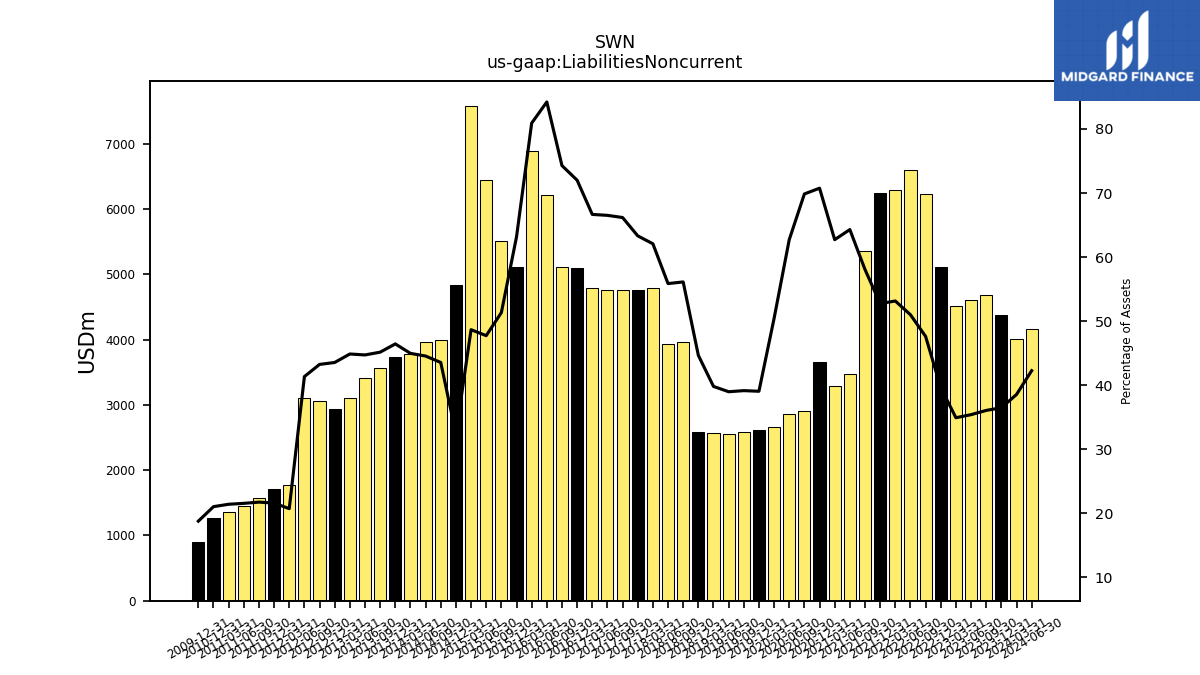
| Liabilities Noncurrent | 4374.00 | 4678.00 | 4602.00 | 4517.00 | 5121.00 | 6239.00 | 6595.00 | 6296.00 | 6249.00 | 5365.00 | 3468.00 | 3291.00 | 3651.00 | 2904.00 | 2857.00 | 2660.00 | 2623.00 | 2583.00 | 2551.00 | 2566.00 | 2589.00 | 3961.00 | 3934.00 | 4788.00 | 4762.00 | 4766.00 | 4756.00 | 4797.00 | 5095.00 | 5118.00 | 6213.00 | 6892.00 | 5121.00 | 5506.00 | 6446.00 | 7585.00 | 4835.00 | 3996.00 | 3959.00 | 3787.57 | 3737.68 | 3564.59 | 3414.54 | 3103.51 | 2933.88 | 3058.51 | 3102.14 | 1772.38 | 1706.58 | 1568.30 | 1452.92 | 1357.36 | 1265.60 | NA | NA | NA | 895.35 | NA | NA | NA | |
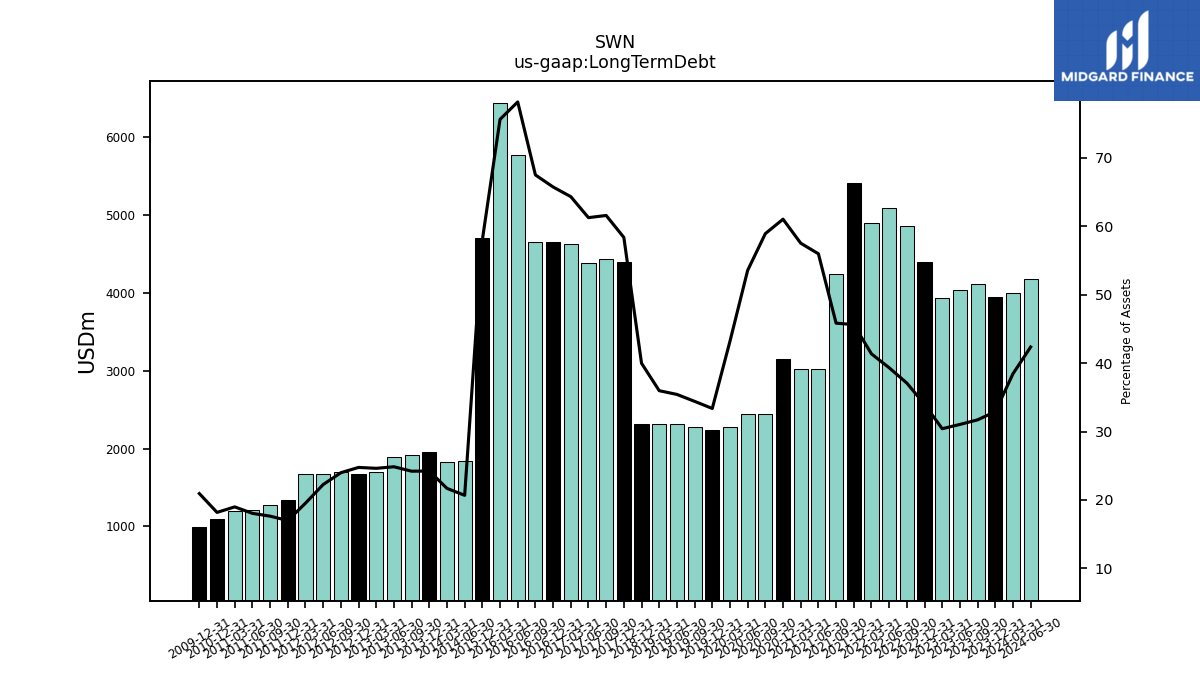
| Long Term Debt | 3947.00 | 4114.00 | 4036.00 | 3935.00 | 4392.00 | 4860.00 | 5086.00 | 4900.00 | 5407.00 | 4237.00 | 3020.00 | 3019.00 | 3150.00 | 2450.00 | 2440.00 | 2279.00 | 2242.00 | 2271.00 | 2319.00 | 2319.00 | 2318.00 | NA | NA | NA | 4391.00 | 4436.00 | 4381.00 | 4630.00 | 4653.00 | 4652.00 | 5768.00 | 6443.00 | 4705.00 | NA | NA | NA | NA | NA | 1838.00 | 1827.43 | 1950.10 | 1911.16 | 1897.73 | 1703.40 | 1668.27 | 1696.54 | 1670.01 | 1670.58 | 1343.30 | 1272.20 | 1216.60 | 1204.10 | 1094.20 | NA | NA | NA | 998.70 | NA | NA | NA | |
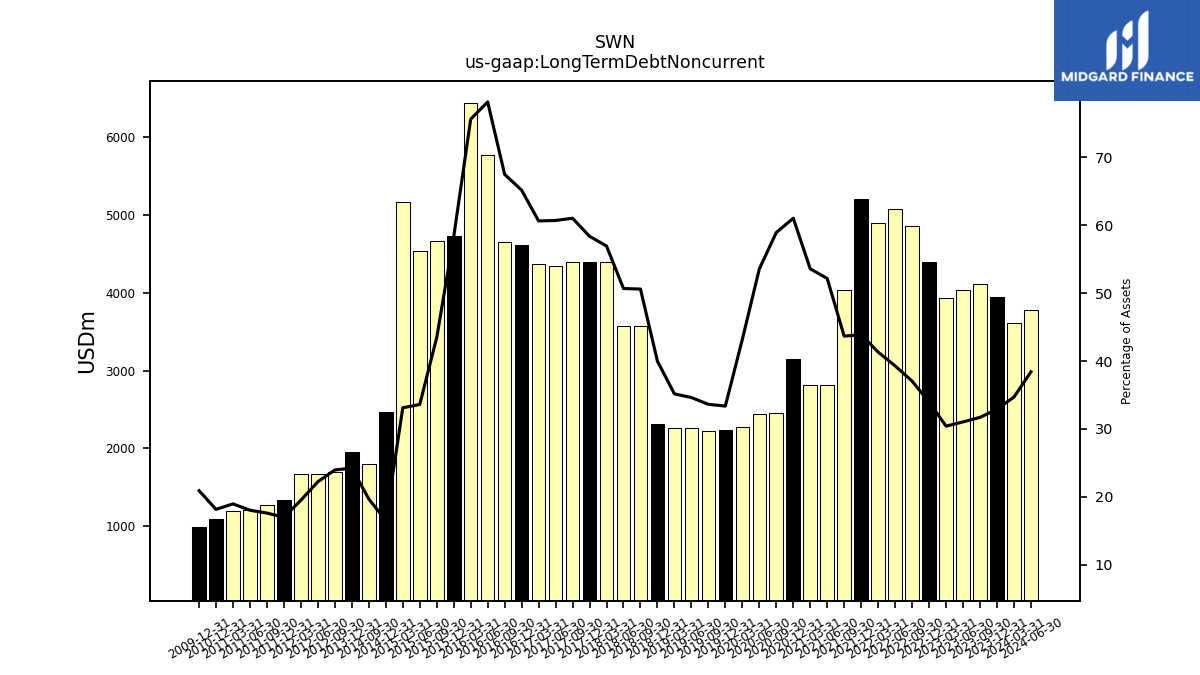
| Long Term Debt Noncurrent | 3947.00 | 4114.00 | 4036.00 | 3935.00 | 4392.00 | 4855.00 | 5081.00 | 4895.00 | 5201.00 | 4036.00 | 2814.00 | 2812.00 | 3150.00 | 2450.00 | 2440.00 | 2279.00 | 2242.00 | 2219.00 | 2267.00 | 2267.00 | 2318.00 | 3572.00 | 3570.00 | 4393.00 | 4391.00 | 4396.00 | 4341.00 | 4364.00 | 4612.00 | 4651.00 | 5767.00 | 6442.00 | 4728.00 | 4663.00 | 4539.00 | 5163.00 | 2466.00 | 1806.00 | NA | NA | 1950.00 | NA | NA | NA | NA | 1695.34 | 1668.81 | 1669.38 | 1342.10 | 1271.00 | 1215.40 | 1202.90 | 1093.00 | NA | NA | NA | 997.50 | NA | NA | NA | |
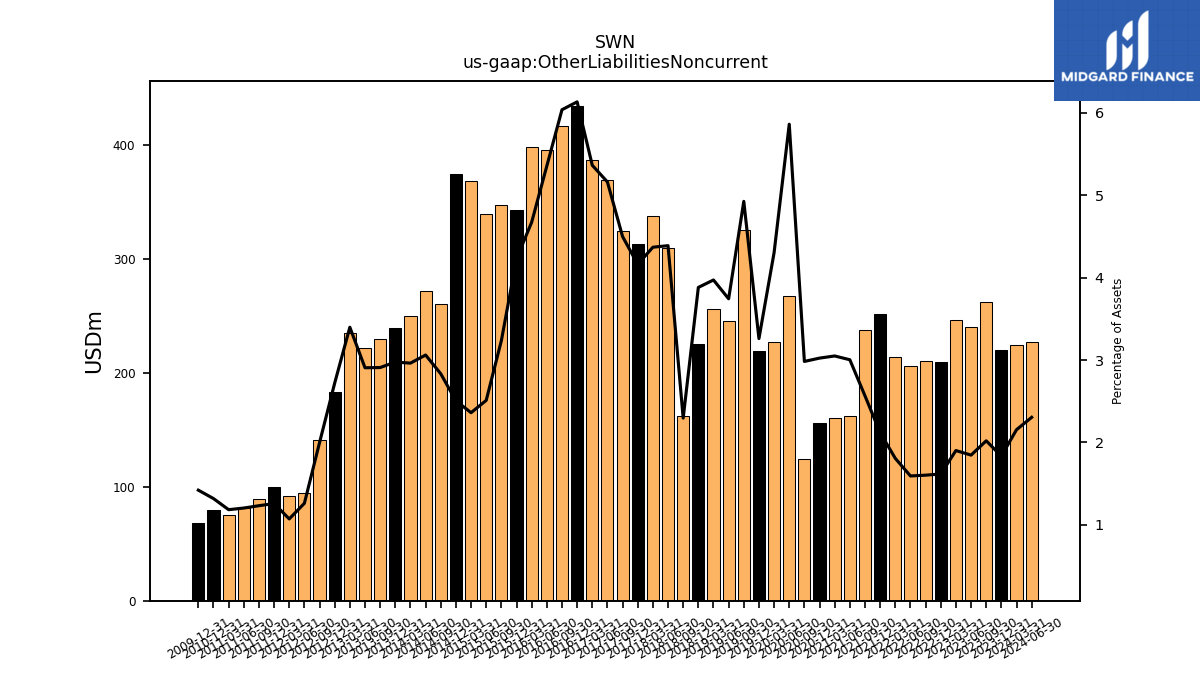
| Other Liabilities Noncurrent | 220.00 | 262.00 | 240.00 | 246.00 | 209.00 | 210.00 | 206.00 | 214.00 | 251.00 | 237.00 | 162.00 | 160.00 | 156.00 | 124.00 | 267.00 | 227.00 | 219.00 | 325.00 | 245.00 | 256.00 | 225.00 | 162.00 | 309.00 | 337.00 | 313.00 | 324.00 | 369.00 | 386.00 | 434.00 | 416.00 | 395.00 | 398.00 | 343.00 | 347.00 | 339.00 | 368.00 | 374.00 | 260.00 | 272.00 | 249.53 | 239.44 | 229.63 | 221.89 | 235.02 | 183.30 | 141.32 | 94.63 | 91.67 | 99.39 | 88.89 | 81.15 | 75.06 | 79.35 | NA | NA | NA | 67.76 | NA | NA | NA | |
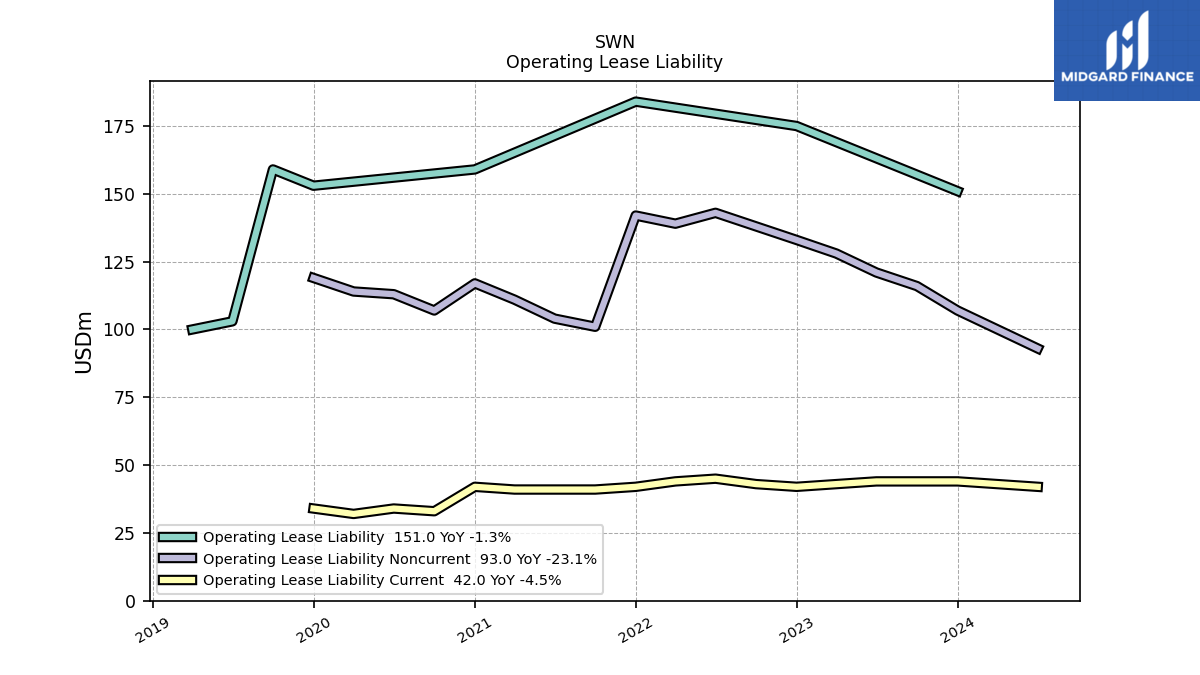
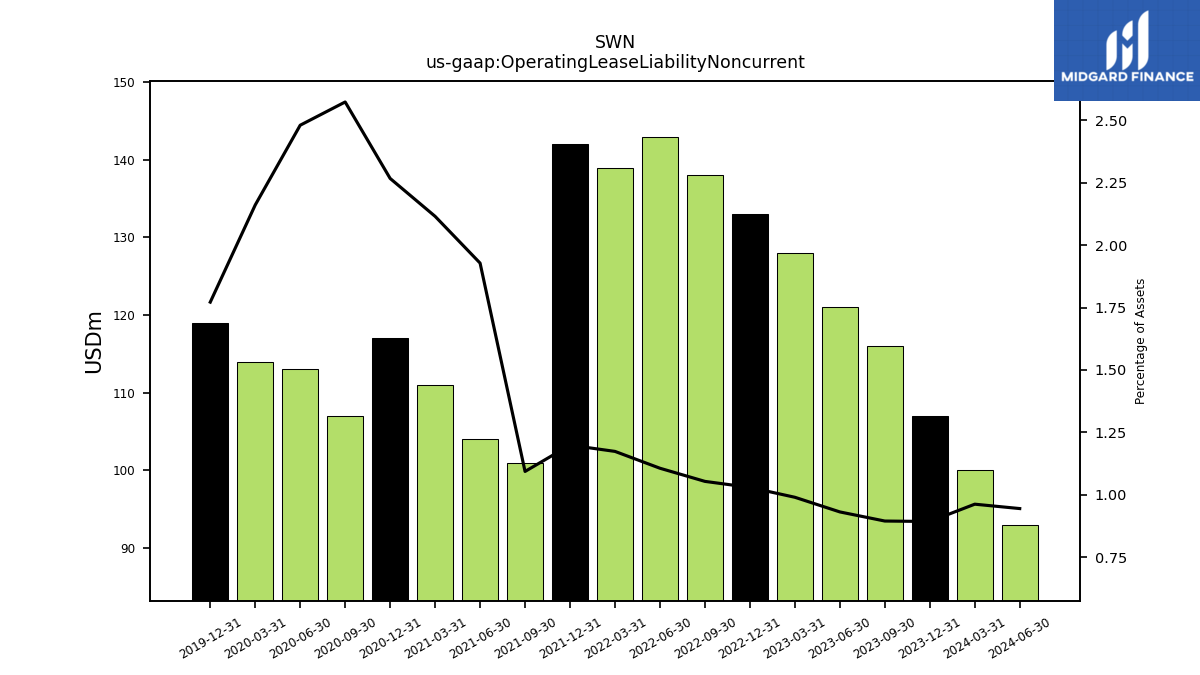
| Operating Lease Liability Noncurrent | 107.00 | 116.00 | 121.00 | 128.00 | 133.00 | 138.00 | 143.00 | 139.00 | 142.00 | 101.00 | 104.00 | 111.00 | 117.00 | 107.00 | 113.00 | 114.00 | 119.00 | NA | NA | NA | NA | NA | NA | NA | NA | NA | NA | NA | NA | NA | NA | NA | NA | NA | NA | NA | NA | NA | NA | NA | NA | NA | NA | NA | NA | NA | NA | NA | NA | NA | NA | NA | NA | NA | NA | NA | NA | NA | NA | NA |
| 2023-12-31 | 2023-09-30 | 2023-06-30 | 2023-03-31 | 2022-12-31 | 2022-09-30 | 2022-06-30 | 2022-03-31 | 2021-12-31 | 2021-09-30 | 2021-06-30 | 2021-03-31 | 2020-12-31 | 2020-09-30 | 2020-06-30 | 2020-03-31 | 2019-12-31 | 2019-09-30 | 2019-06-30 | 2019-03-31 | 2018-12-31 | 2018-09-30 | 2018-06-30 | 2018-03-31 | 2017-12-31 | 2017-09-30 | 2017-06-30 | 2017-03-31 | 2016-12-31 | 2016-09-30 | 2016-06-30 | 2016-03-31 | 2015-12-31 | 2015-09-30 | 2015-06-30 | 2015-03-31 | 2014-12-31 | 2014-09-30 | 2014-06-30 | 2014-03-31 | 2013-12-31 | 2013-09-30 | 2013-06-30 | 2013-03-31 | 2012-12-31 | 2012-09-30 | 2012-06-30 | 2012-03-31 | 2011-12-31 | 2011-09-30 | 2011-06-30 | 2011-03-31 | 2010-12-31 | 2010-09-30 | 2010-06-30 | 2010-03-31 | 2009-12-31 | 2009-09-30 | 2009-06-30 | 2009-03-31 | ||
|---|---|---|---|---|---|---|---|---|---|---|---|---|---|---|---|---|---|---|---|---|---|---|---|---|---|---|---|---|---|---|---|---|---|---|---|---|---|---|---|---|---|---|---|---|---|---|---|---|---|---|---|---|---|---|---|---|---|---|---|---|---|
| Stockholders Equity | 5888.00 | 6537.00 | 6489.00 | 6254.00 | 4324.00 | 1414.00 | 1043.00 | -119.00 | 2547.00 | -286.00 | -18.00 | 586.00 | 497.00 | 384.00 | 823.00 | 1701.00 | 3246.00 | 3135.00 | 3082.00 | 2937.00 | 2362.00 | 2205.00 | 2250.00 | 2193.00 | 1979.00 | 1652.00 | 1573.00 | 1278.00 | 917.00 | 1123.00 | 573.00 | 1148.00 | 2282.00 | 4437.00 | 6218.00 | 7057.00 | 4662.00 | 4293.00 | 4042.00 | NA | 3622.00 | NA | NA | NA | 3036.00 | NA | NA | NA | 3969.00 | NA | NA | NA | 2964.88 | NA | NA | NA | 2331.22 | NA | NA | NA | |
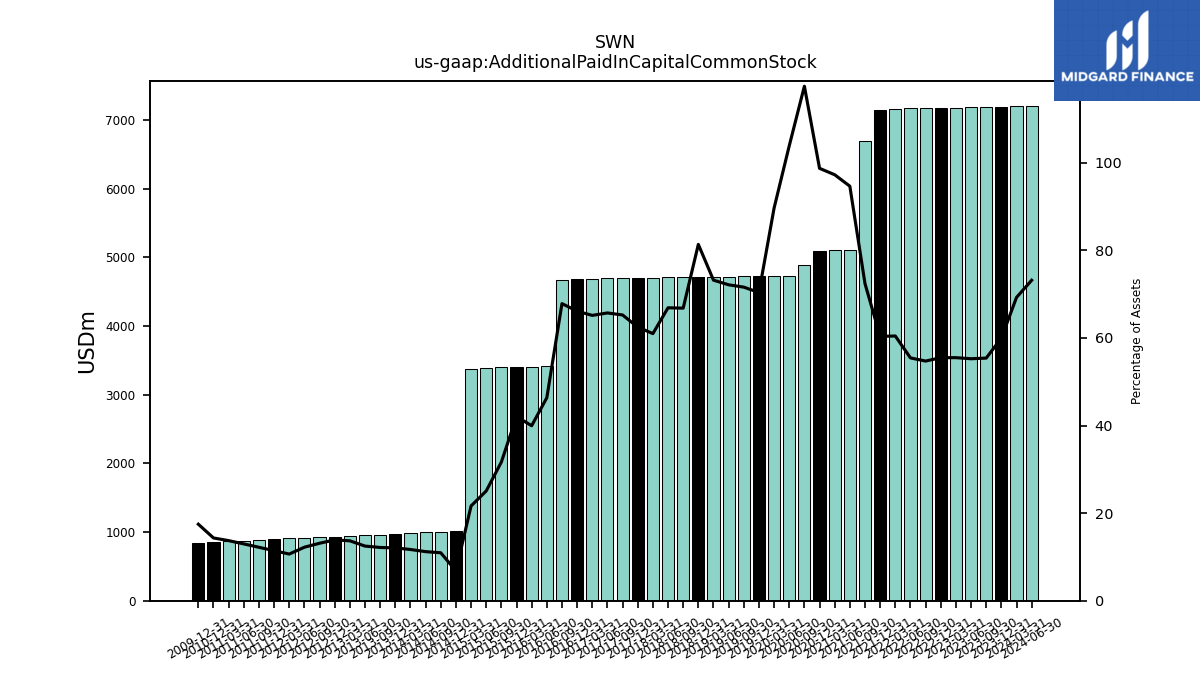
| Additional Paid In Capital Common Stock | 7188.00 | 7185.00 | 7182.00 | 7178.00 | 7172.00 | 7169.00 | 7168.00 | 7159.00 | 7150.00 | 6688.00 | 5104.00 | 5102.00 | 5093.00 | 4882.00 | 4730.00 | 4728.00 | 4726.00 | 4723.00 | 4720.00 | 4717.00 | 4715.00 | 4714.00 | 4709.00 | 4703.00 | 4698.00 | 4698.00 | 4697.00 | 4687.00 | 4677.00 | 4673.00 | 3418.00 | 3403.00 | 3409.00 | 3396.00 | 3384.00 | 3372.00 | 1019.00 | 1005.00 | 996.00 | 985.40 | 970.52 | 960.06 | 952.84 | 946.51 | 934.94 | 928.32 | 916.95 | 911.65 | 903.40 | 880.42 | 874.83 | 870.07 | 862.42 | NA | NA | NA | 833.49 | NA | NA | NA | |
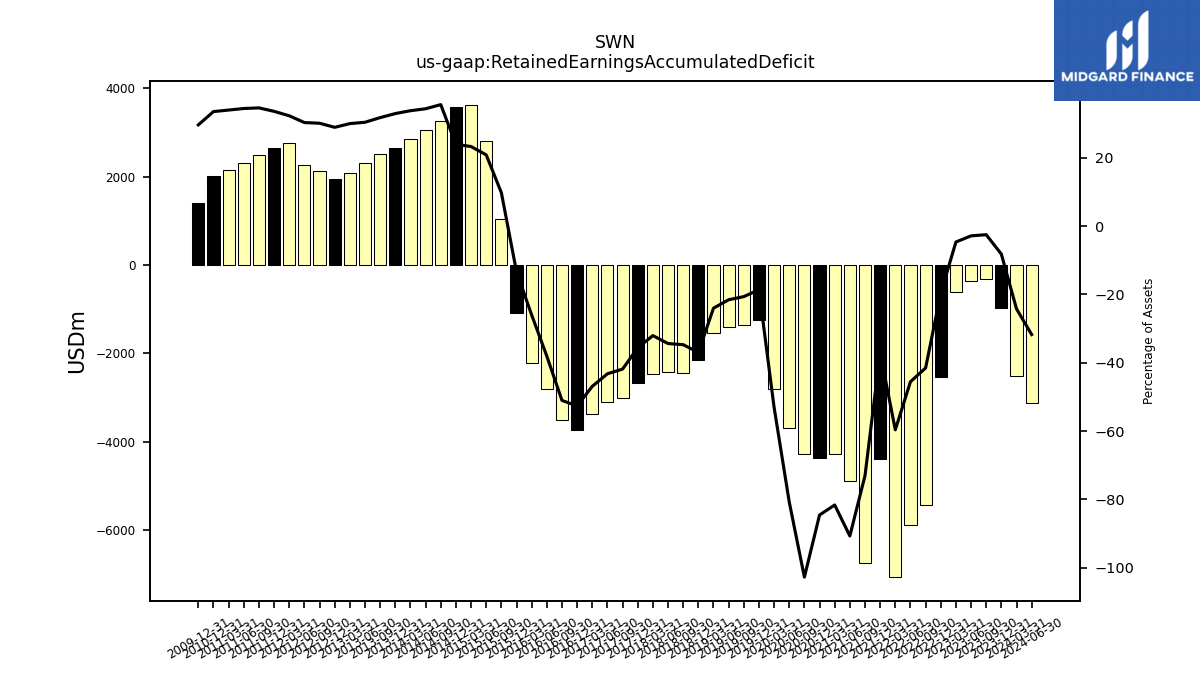
| Retained Earnings Accumulated Deficit | -982.00 | -324.00 | -369.00 | -600.00 | -2539.00 | -5440.00 | -5890.00 | -7063.00 | -4388.00 | -6749.00 | -4892.00 | -4283.00 | -4363.00 | -4271.00 | -3678.00 | -2798.00 | -1251.00 | -1361.00 | -1410.00 | -1548.00 | -2142.00 | -2449.00 | -2420.00 | -2471.00 | -2679.00 | -3013.00 | -3090.00 | -3374.00 | -3725.00 | -3515.00 | -2807.00 | -2214.00 | -1082.00 | 1051.00 | 2818.00 | 3633.00 | 3577.00 | 3265.00 | 3054.00 | 2846.84 | 2652.65 | 2508.16 | 2322.30 | 2076.66 | 1949.15 | 2131.00 | 2275.82 | 2763.92 | 2656.21 | 2497.68 | 2322.51 | 2155.05 | 2018.44 | NA | NA | NA | 1414.33 | NA | NA | NA | |
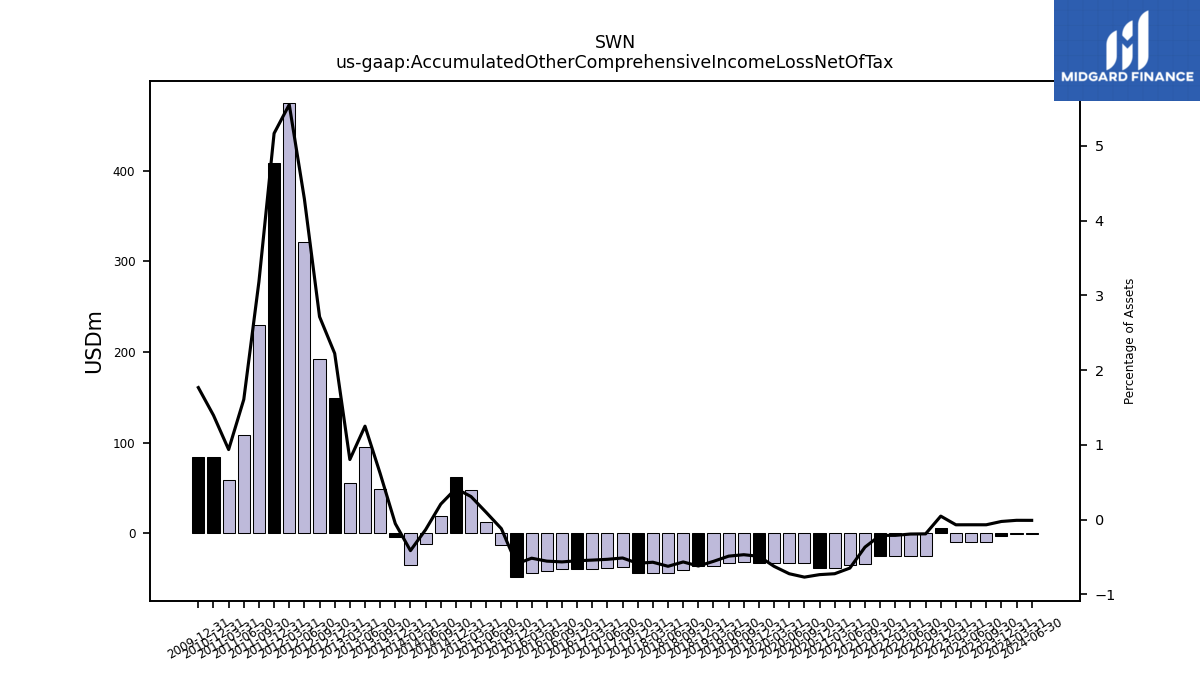
| Accumulated Other Comprehensive Income Loss Net Of Tax | -3.00 | -9.00 | -9.00 | -9.00 | 6.00 | -25.00 | -25.00 | -25.00 | -25.00 | -34.00 | -35.00 | -38.00 | -38.00 | -32.00 | -33.00 | -33.00 | -33.00 | -31.00 | -32.00 | -36.00 | -36.00 | -40.00 | -44.00 | -44.00 | -44.00 | -37.00 | -38.00 | -39.00 | -39.00 | -39.00 | -41.00 | -44.00 | -48.00 | -13.00 | 13.00 | 48.00 | 62.00 | 19.00 | -12.00 | -34.97 | -4.34 | 48.76 | 95.45 | 55.61 | 149.80 | 192.04 | 321.93 | 475.00 | 408.43 | 229.75 | 108.38 | 59.44 | 83.97 | NA | NA | NA | 84.28 | NA | NA | NA |
| 2023-12-31 | 2023-09-30 | 2023-06-30 | 2023-03-31 | 2022-12-31 | 2022-09-30 | 2022-06-30 | 2022-03-31 | 2021-12-31 | 2021-09-30 | 2021-06-30 | 2021-03-31 | 2020-12-31 | 2020-09-30 | 2020-06-30 | 2020-03-31 | 2019-12-31 | 2019-09-30 | 2019-06-30 | 2019-03-31 | 2018-12-31 | 2018-09-30 | 2018-06-30 | 2018-03-31 | 2017-12-31 | 2017-09-30 | 2017-06-30 | 2017-03-31 | 2016-12-31 | 2016-09-30 | 2016-06-30 | 2016-03-31 | 2015-12-31 | 2015-09-30 | 2015-06-30 | 2015-03-31 | 2014-12-31 | 2014-09-30 | 2014-06-30 | 2014-03-31 | 2013-12-31 | 2013-09-30 | 2013-06-30 | 2013-03-31 | 2012-12-31 | 2012-09-30 | 2012-06-30 | 2012-03-31 | 2011-12-31 | 2011-09-30 | 2011-06-30 | 2011-03-31 | 2010-12-31 | 2010-09-30 | 2010-06-30 | 2010-03-31 | 2009-12-31 | 2009-09-30 | 2009-06-30 | 2009-03-31 | ||
|---|---|---|---|---|---|---|---|---|---|---|---|---|---|---|---|---|---|---|---|---|---|---|---|---|---|---|---|---|---|---|---|---|---|---|---|---|---|---|---|---|---|---|---|---|---|---|---|---|---|---|---|---|---|---|---|---|---|---|---|---|---|
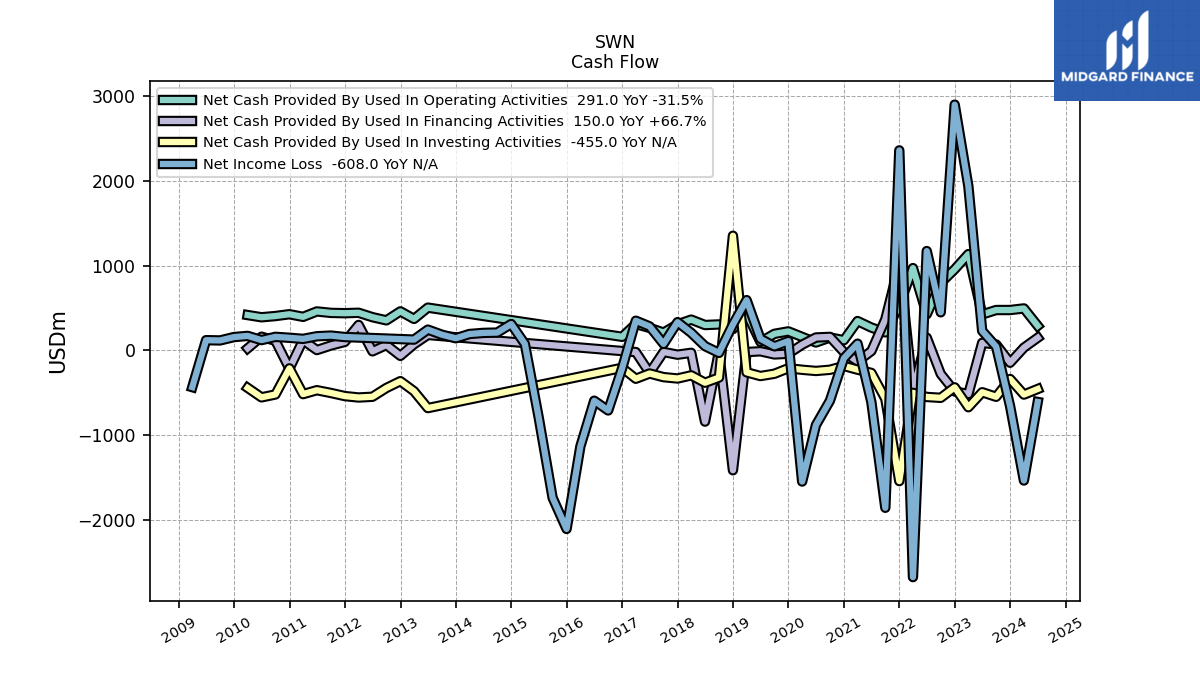
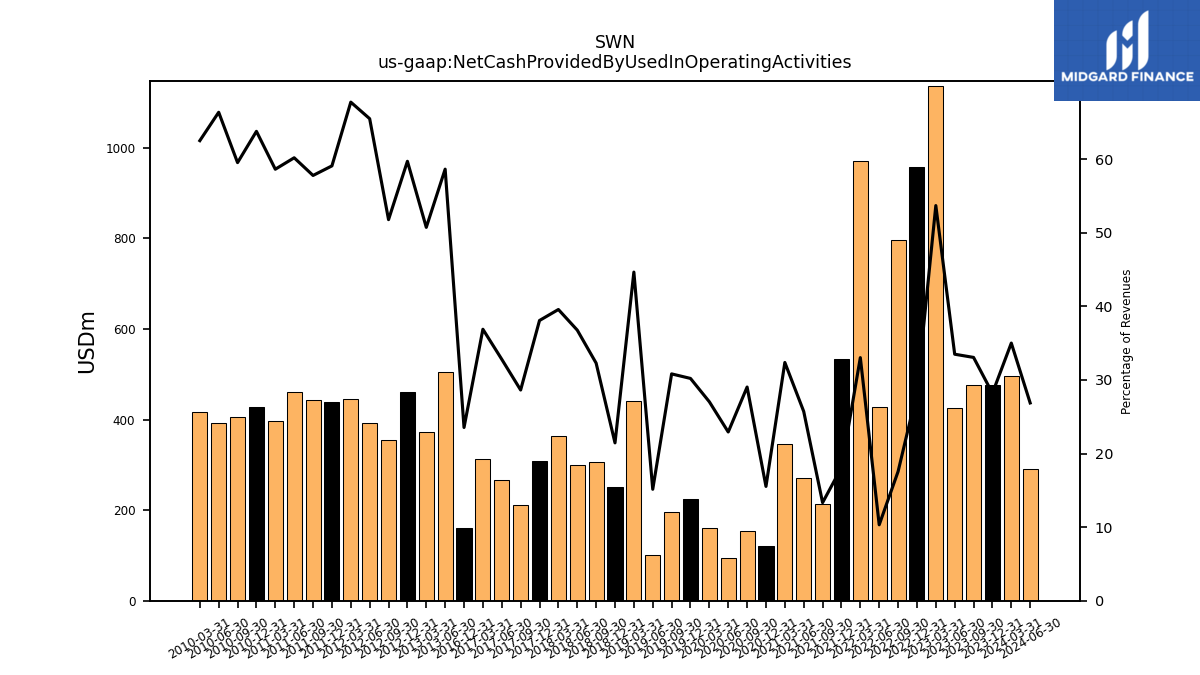
| Net Cash Provided By Used In Operating Activities | 477.00 | 477.00 | 425.00 | 1137.00 | 958.00 | 797.00 | 427.00 | 972.00 | 533.00 | 213.00 | 270.00 | 347.00 | 121.00 | 153.00 | 94.00 | 160.00 | 225.00 | 196.00 | 101.00 | 442.00 | 252.00 | 307.00 | 300.00 | 364.00 | 308.00 | 211.00 | 266.00 | 312.00 | 161.00 | NA | NA | NA | NA | NA | NA | NA | NA | NA | NA | NA | NA | NA | 505.41 | 372.14 | 461.46 | 355.09 | 392.73 | 444.66 | 439.61 | 443.28 | 460.45 | 396.48 | 427.52 | 406.01 | 391.47 | 417.58 | NA | NA | NA | NA | |
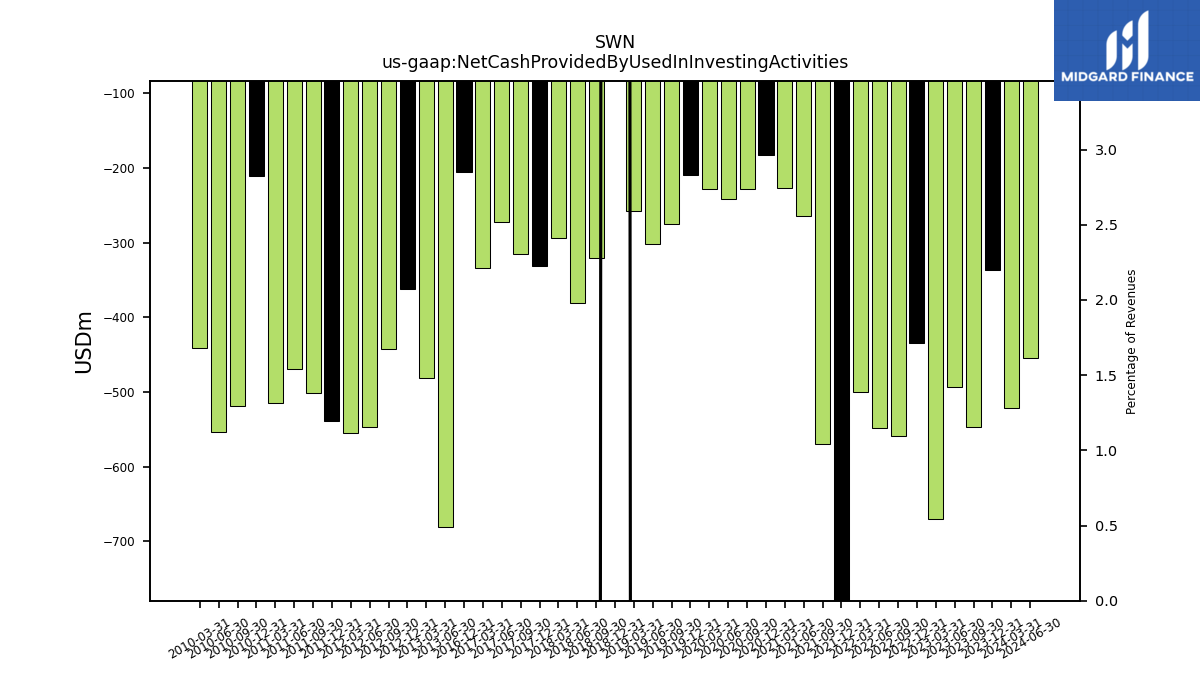
| Net Cash Provided By Used In Investing Activities | -337.00 | -547.00 | -493.00 | -670.00 | -435.00 | -559.00 | -549.00 | -500.00 | -1542.00 | -570.00 | -265.00 | -227.00 | -183.00 | -228.00 | -242.00 | -228.00 | -210.00 | -275.00 | -302.00 | -258.00 | 1354.00 | -320.00 | -381.00 | -294.00 | -331.00 | -315.00 | -272.00 | -334.00 | -205.00 | NA | NA | NA | NA | NA | NA | NA | NA | NA | NA | NA | NA | NA | -680.30 | -481.16 | -362.25 | -442.61 | -546.60 | -555.21 | -538.47 | -501.68 | -469.19 | -515.46 | -211.12 | -519.35 | -553.68 | -441.47 | NA | NA | NA | NA | |
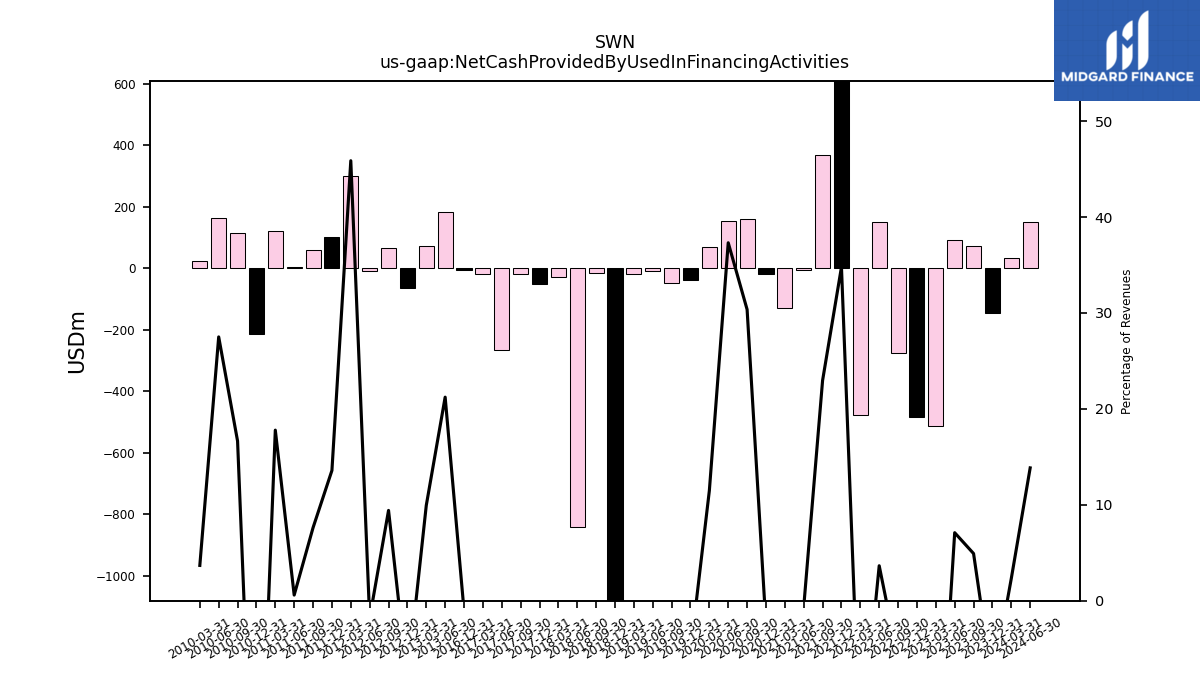
| Net Cash Provided By Used In Financing Activities | -145.00 | 71.00 | 90.00 | -514.00 | -484.00 | -277.00 | 151.00 | -479.00 | 1025.00 | 367.00 | -7.00 | -129.00 | -20.00 | 160.00 | 153.00 | 68.00 | -39.00 | -47.00 | -10.00 | -19.00 | -1414.00 | -15.00 | -840.00 | -28.00 | -50.00 | -18.00 | -265.00 | -19.00 | -7.00 | NA | NA | NA | NA | NA | NA | NA | NA | NA | NA | NA | NA | NA | 182.95 | 72.94 | -64.00 | 64.58 | -10.81 | 301.12 | 101.05 | 58.44 | 4.53 | 120.29 | -214.22 | 113.59 | 162.25 | 24.61 | NA | NA | NA | NA |
| 2023-12-31 | 2023-09-30 | 2023-06-30 | 2023-03-31 | 2022-12-31 | 2022-09-30 | 2022-06-30 | 2022-03-31 | 2021-12-31 | 2021-09-30 | 2021-06-30 | 2021-03-31 | 2020-12-31 | 2020-09-30 | 2020-06-30 | 2020-03-31 | 2019-12-31 | 2019-09-30 | 2019-06-30 | 2019-03-31 | 2018-12-31 | 2018-09-30 | 2018-06-30 | 2018-03-31 | 2017-12-31 | 2017-09-30 | 2017-06-30 | 2017-03-31 | 2016-12-31 | 2016-09-30 | 2016-06-30 | 2016-03-31 | 2015-12-31 | 2015-09-30 | 2015-06-30 | 2015-03-31 | 2014-12-31 | 2014-09-30 | 2014-06-30 | 2014-03-31 | 2013-12-31 | 2013-09-30 | 2013-06-30 | 2013-03-31 | 2012-12-31 | 2012-09-30 | 2012-06-30 | 2012-03-31 | 2011-12-31 | 2011-09-30 | 2011-06-30 | 2011-03-31 | 2010-12-31 | 2010-09-30 | 2010-06-30 | 2010-03-31 | 2009-12-31 | 2009-09-30 | 2009-06-30 | 2009-03-31 | ||
|---|---|---|---|---|---|---|---|---|---|---|---|---|---|---|---|---|---|---|---|---|---|---|---|---|---|---|---|---|---|---|---|---|---|---|---|---|---|---|---|---|---|---|---|---|---|---|---|---|---|---|---|---|---|---|---|---|---|---|---|---|---|
| Net Cash Provided By Used In Operating Activities | 477.00 | 477.00 | 425.00 | 1137.00 | 958.00 | 797.00 | 427.00 | 972.00 | 533.00 | 213.00 | 270.00 | 347.00 | 121.00 | 153.00 | 94.00 | 160.00 | 225.00 | 196.00 | 101.00 | 442.00 | 252.00 | 307.00 | 300.00 | 364.00 | 308.00 | 211.00 | 266.00 | 312.00 | 161.00 | NA | NA | NA | NA | NA | NA | NA | NA | NA | NA | NA | NA | NA | 505.41 | 372.14 | 461.46 | 355.09 | 392.73 | 444.66 | 439.61 | 443.28 | 460.45 | 396.48 | 427.52 | 406.01 | 391.47 | 417.58 | NA | NA | NA | NA | |
| Net Income Loss | -658.00 | 45.00 | 231.00 | 1939.00 | 2901.00 | 450.00 | 1173.00 | -2675.00 | 2361.00 | -1857.00 | -609.00 | 80.00 | -92.00 | -593.00 | -880.00 | -1547.00 | 110.00 | 49.00 | 138.00 | 594.00 | 307.00 | -29.00 | 51.00 | 208.00 | 334.00 | 77.00 | 284.00 | 351.00 | -210.00 | -708.00 | -593.00 | -1132.00 | -2107.00 | -1739.00 | -788.00 | 78.00 | 312.00 | 211.00 | 207.00 | 194.00 | 144.00 | 186.00 | 246.00 | 128.00 | NA | NA | NA | NA | 158.53 | 175.17 | 167.45 | 136.61 | 149.51 | 160.74 | 122.07 | 171.80 | 157.83 | 118.25 | 121.10 | -432.83 | |
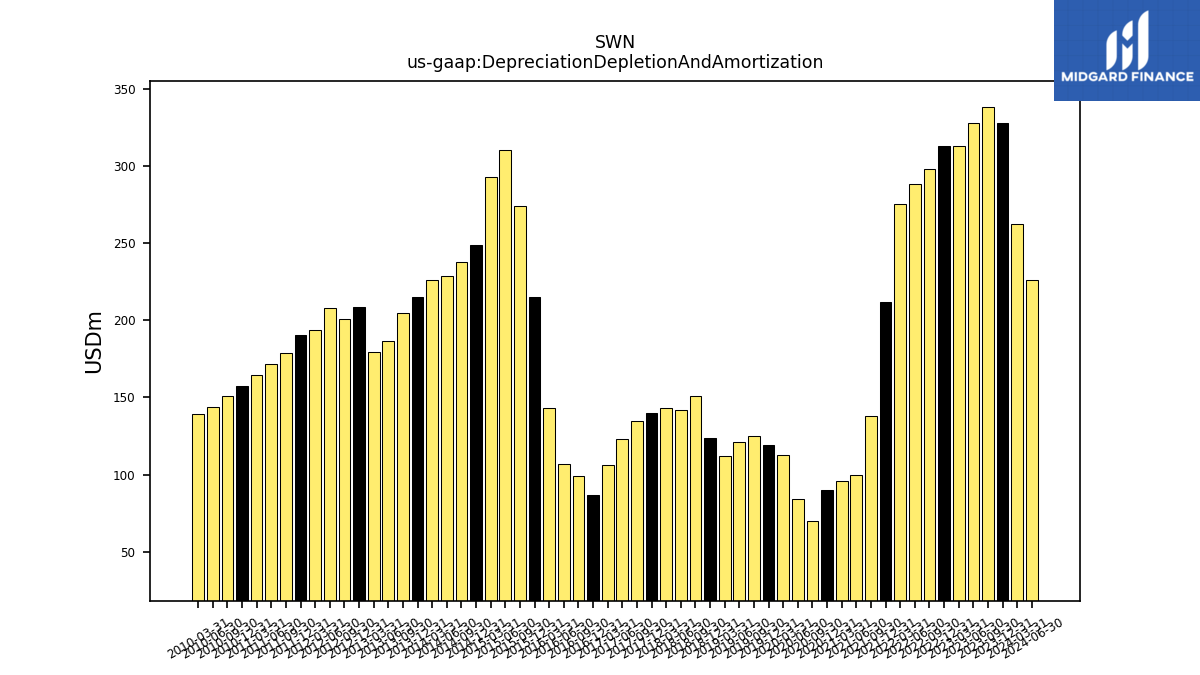
| Depreciation Depletion And Amortization | 328.00 | 338.00 | 328.00 | 313.00 | 313.00 | 298.00 | 288.00 | 275.00 | 212.00 | 138.00 | 100.00 | 96.00 | 90.00 | 70.00 | 84.00 | 113.00 | 119.00 | 125.00 | 121.00 | 112.00 | 124.00 | 151.00 | 142.00 | 143.00 | 140.00 | 135.00 | 123.00 | 106.00 | 87.00 | 99.00 | 107.00 | 143.00 | 215.00 | 274.00 | 310.00 | 293.00 | 249.00 | 238.00 | 228.92 | 226.08 | 215.34 | 204.93 | 186.87 | 179.47 | 208.84 | 200.66 | 207.83 | 193.63 | 190.33 | 179.11 | 171.62 | 164.67 | 157.64 | 151.28 | 144.01 | 139.42 | NA | NA | NA | NA | |
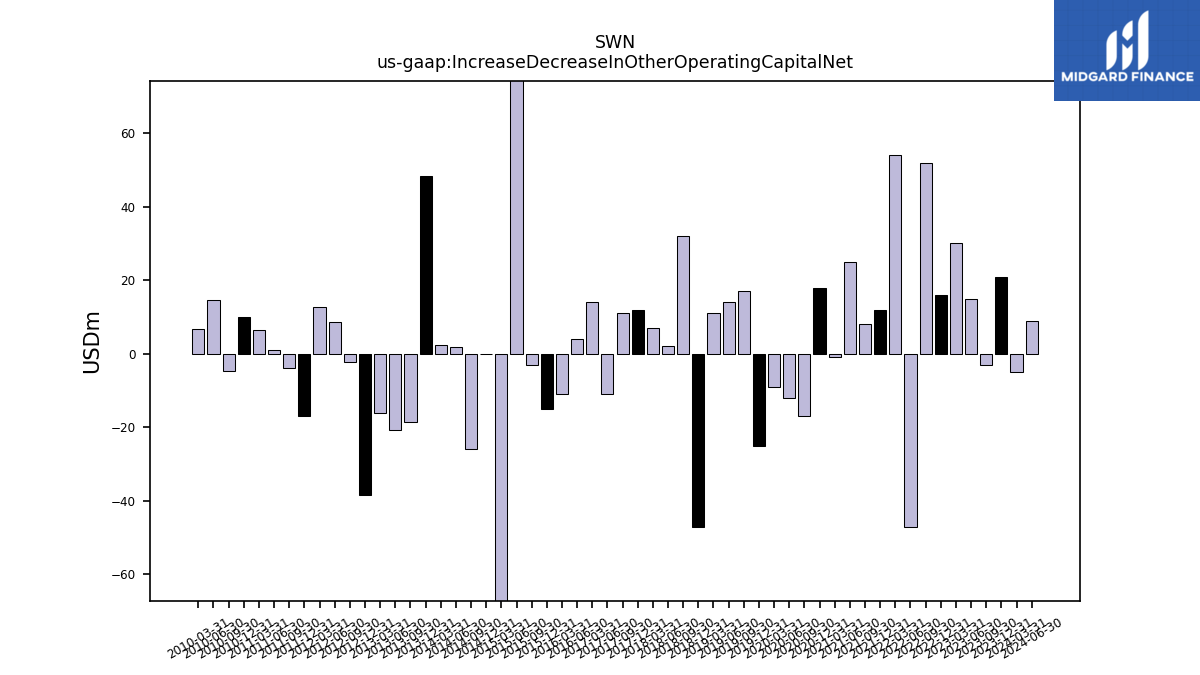
| Increase Decrease In Other Operating Capital Net | 21.00 | -3.00 | 15.00 | 30.00 | 16.00 | 52.00 | -47.00 | 54.00 | 12.00 | 8.00 | 25.00 | -1.00 | 18.00 | -17.00 | -12.00 | -9.00 | -25.00 | 17.00 | 14.00 | 11.00 | -47.00 | 32.00 | 2.00 | 7.00 | 12.00 | 11.00 | -11.00 | 14.00 | NA | NA | 4.00 | -11.00 | -15.00 | -3.00 | 85.00 | -69.00 | 0.00 | -26.00 | 1.75 | 2.25 | 48.44 | -18.47 | -20.68 | -16.04 | -38.45 | -2.13 | 8.57 | 12.81 | -17.00 | -3.88 | 0.96 | 6.54 | 10.01 | -4.66 | 14.50 | 6.63 | NA | NA | NA | NA | |
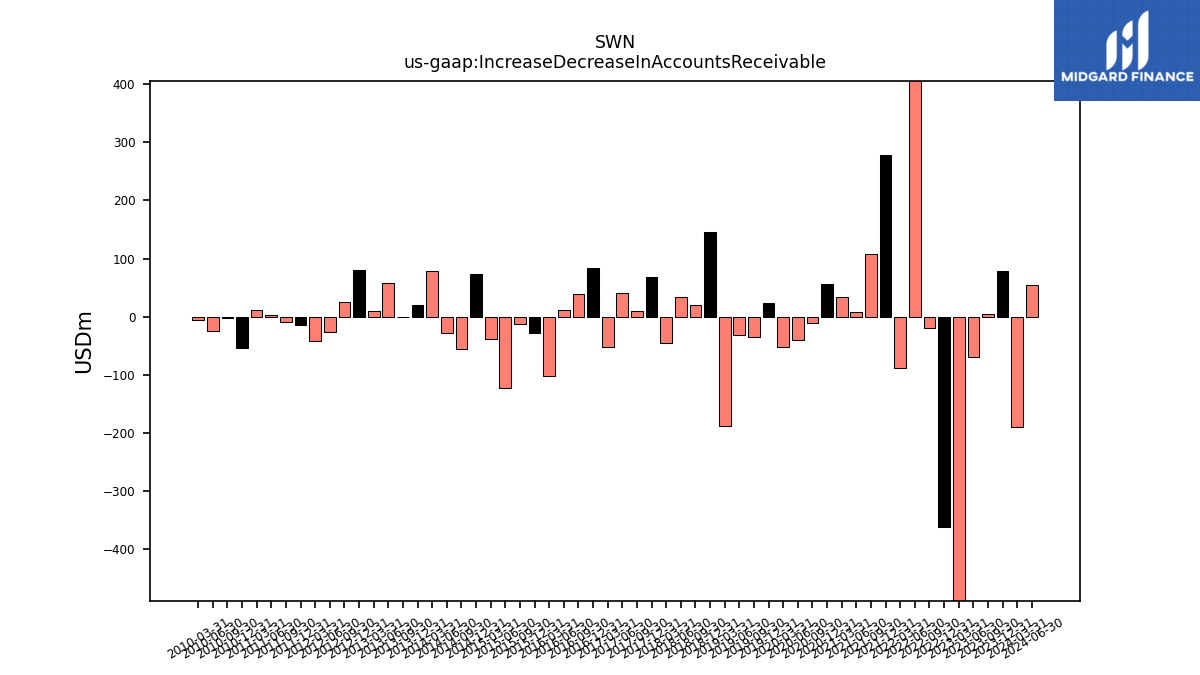
| Increase Decrease In Accounts Receivable | 78.00 | 4.00 | -69.00 | -734.00 | -362.00 | -19.00 | 710.00 | -89.00 | 278.00 | 107.00 | 7.00 | 33.00 | 56.00 | -12.00 | -41.00 | -53.00 | 23.00 | -36.00 | -32.00 | -189.00 | 146.00 | 19.00 | 34.00 | -46.00 | 68.00 | 9.00 | 41.00 | -53.00 | 83.00 | 39.00 | 11.00 | -103.00 | -28.00 | -13.00 | -124.00 | -38.00 | 73.00 | -56.00 | -29.15 | 78.15 | 19.06 | -1.24 | 58.62 | 9.69 | 79.86 | 25.02 | -26.56 | -42.60 | -14.32 | -10.19 | 2.87 | 11.98 | -54.17 | -3.16 | -24.70 | -6.46 | NA | NA | NA | NA | |
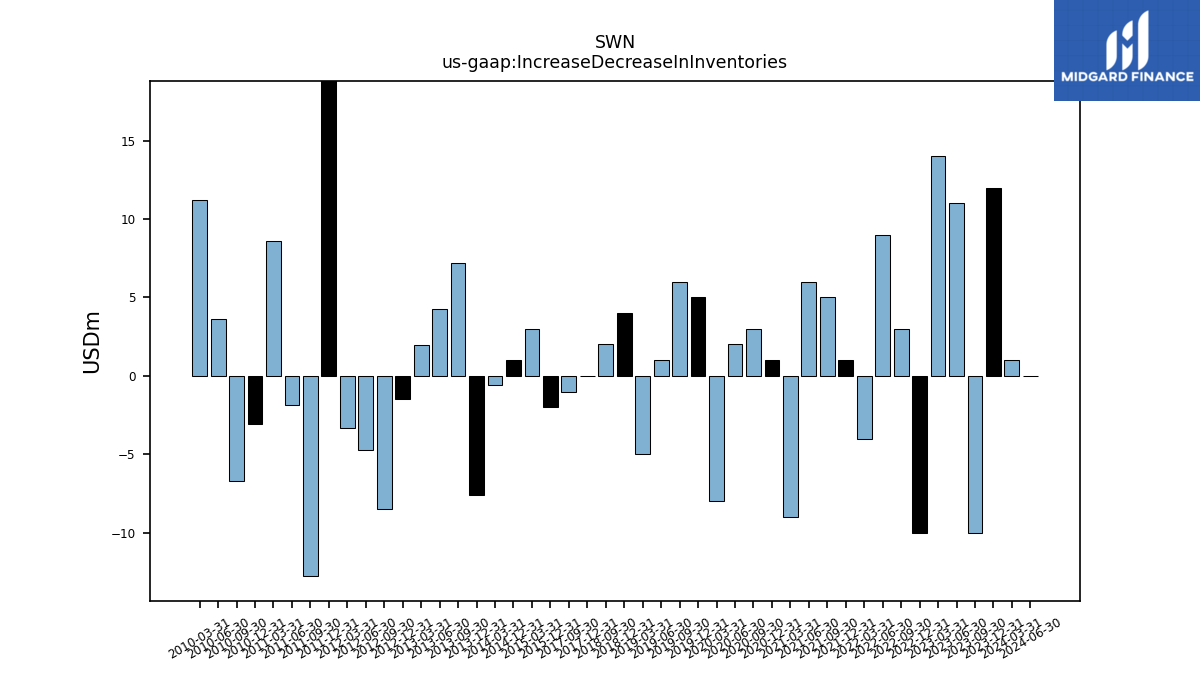
| Increase Decrease In Inventories | 12.00 | -10.00 | 11.00 | 14.00 | -10.00 | 3.00 | 9.00 | -4.00 | 1.00 | 5.00 | 6.00 | -9.00 | 1.00 | 3.00 | 2.00 | -8.00 | 5.00 | 6.00 | 1.00 | -5.00 | 4.00 | 2.00 | NA | NA | 0.00 | -1.00 | NA | NA | NA | NA | NA | NA | -2.00 | NA | NA | 3.00 | 1.00 | NA | NA | -0.56 | -7.60 | 7.23 | 4.28 | 1.94 | -1.50 | -8.52 | -4.75 | -3.33 | 18.97 | -12.75 | -1.86 | 8.62 | -3.06 | -6.68 | 3.60 | 11.23 | NA | NA | NA | NA | |
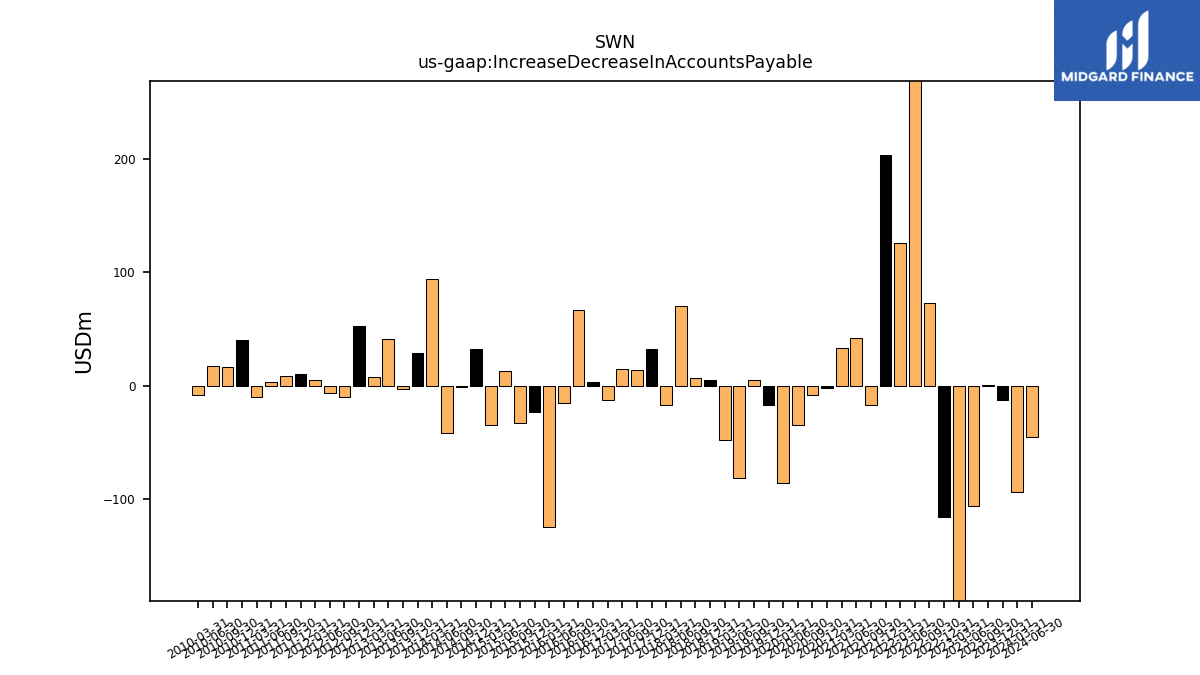
| Increase Decrease In Accounts Payable | -13.00 | 1.00 | -106.00 | -257.00 | -116.00 | 73.00 | 307.00 | 126.00 | 203.00 | -17.00 | 42.00 | 33.00 | -2.00 | -8.00 | -35.00 | -86.00 | -17.00 | 5.00 | -81.00 | -48.00 | 5.00 | 7.00 | 70.00 | -17.00 | 32.00 | 14.00 | 15.00 | -13.00 | 3.00 | 67.00 | -15.00 | -124.00 | -23.00 | -33.00 | 13.00 | -35.00 | 32.00 | -1.00 | -41.35 | 94.35 | 29.04 | -3.00 | 40.88 | 7.31 | 52.33 | -9.70 | -6.26 | 4.91 | 9.95 | 8.92 | 2.97 | -10.35 | 40.69 | 16.16 | 17.00 | -8.08 | NA | NA | NA | NA | |
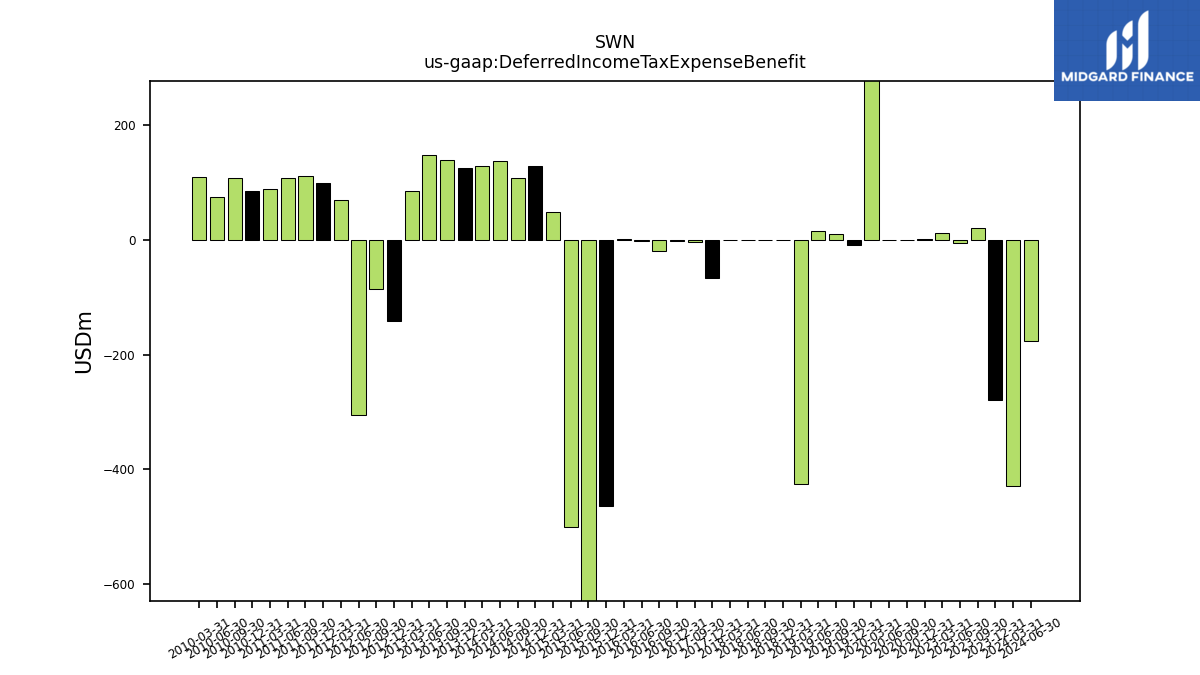
| Deferred Income Tax Expense Benefit | -280.00 | 21.00 | -5.00 | 12.00 | NA | NA | NA | NA | NA | NA | NA | NA | 1.00 | 0.00 | 0.00 | 408.00 | -9.00 | 11.00 | 15.00 | -426.00 | 0.00 | 0.00 | 0.00 | 0.00 | -67.00 | -4.00 | NA | NA | -2.00 | -20.00 | -1.00 | 1.00 | -464.00 | -1088.00 | -500.00 | 49.00 | 129.00 | 108.00 | 137.00 | 129.51 | 124.89 | 140.22 | 147.88 | 84.96 | -141.10 | -85.86 | -305.43 | 70.55 | 99.98 | 111.28 | 108.89 | 88.88 | 86.03 | 108.51 | 75.34 | 109.84 | NA | NA | NA | NA | |
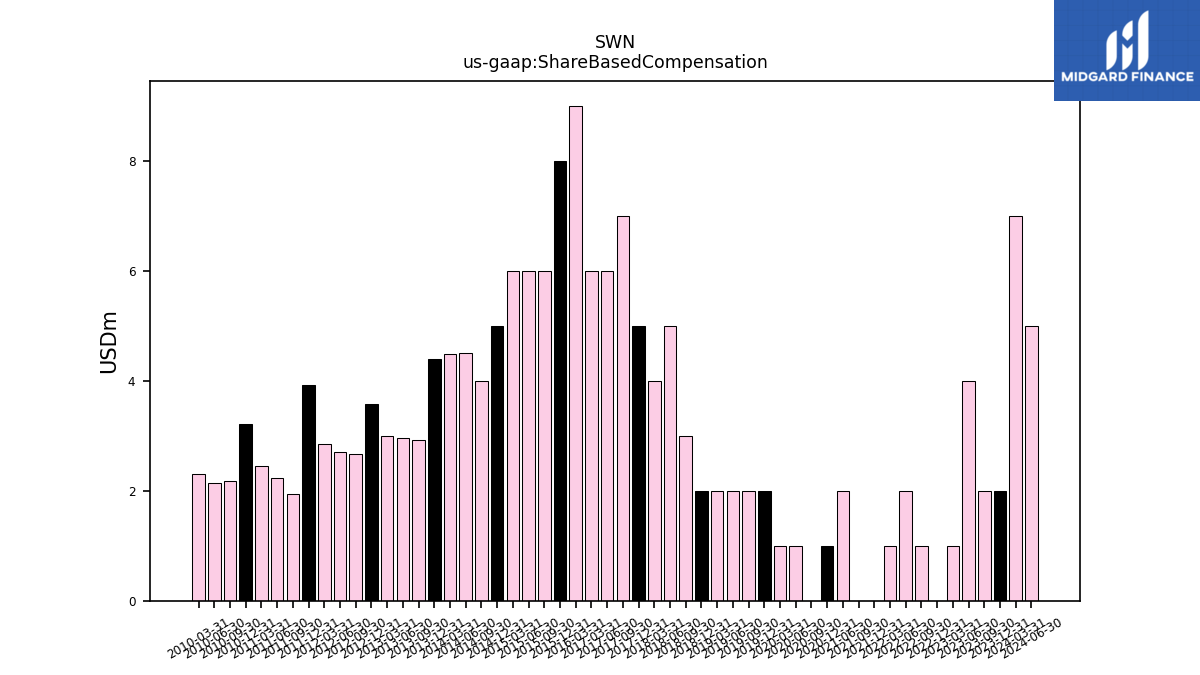
| Share Based Compensation | 2.00 | 2.00 | 4.00 | 1.00 | 0.00 | 1.00 | 2.00 | 1.00 | 0.00 | 0.00 | 2.00 | NA | 1.00 | 0.00 | 1.00 | 1.00 | 2.00 | 2.00 | 2.00 | 2.00 | 2.00 | 3.00 | 5.00 | 4.00 | 5.00 | 7.00 | 6.00 | 6.00 | NA | NA | NA | 9.00 | 8.00 | 6.00 | 6.00 | 6.00 | 5.00 | 4.00 | 4.51 | 4.49 | 4.39 | 2.92 | 2.97 | 2.99 | 3.57 | 2.68 | 2.71 | 2.84 | 3.93 | 1.93 | 2.24 | 2.45 | 3.21 | 2.18 | 2.14 | 2.30 | NA | NA | NA | NA | |
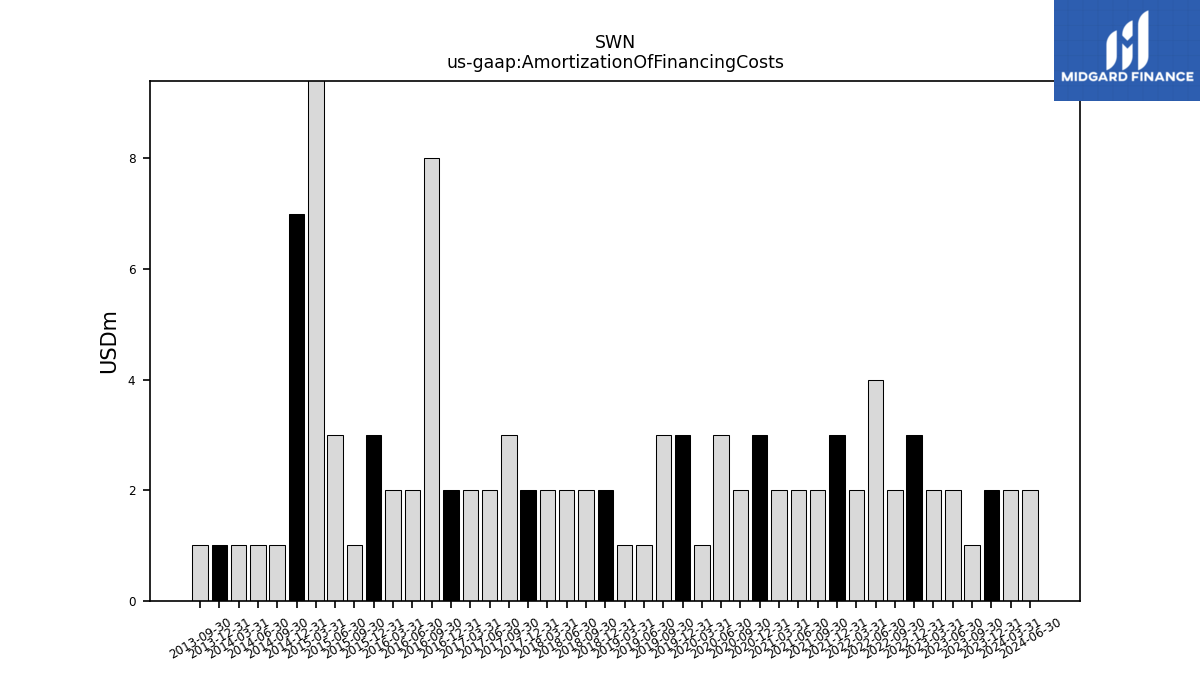
| Amortization Of Financing Costs | 2.00 | 1.00 | 2.00 | 2.00 | 3.00 | 2.00 | 4.00 | 2.00 | 3.00 | 2.00 | 2.00 | 2.00 | 3.00 | 2.00 | 3.00 | 1.00 | 3.00 | 3.00 | 1.00 | 1.00 | 2.00 | 2.00 | 2.00 | 2.00 | 2.00 | 3.00 | 2.00 | 2.00 | 2.00 | 8.00 | 2.00 | 2.00 | 3.00 | 1.00 | 3.00 | 46.00 | 7.00 | 1.00 | 1.00 | 1.00 | 1.00 | 1.00 | NA | NA | NA | NA | NA | NA | NA | NA | NA | NA | NA | NA | NA | NA | NA | NA | NA | NA |
| 2023-12-31 | 2023-09-30 | 2023-06-30 | 2023-03-31 | 2022-12-31 | 2022-09-30 | 2022-06-30 | 2022-03-31 | 2021-12-31 | 2021-09-30 | 2021-06-30 | 2021-03-31 | 2020-12-31 | 2020-09-30 | 2020-06-30 | 2020-03-31 | 2019-12-31 | 2019-09-30 | 2019-06-30 | 2019-03-31 | 2018-12-31 | 2018-09-30 | 2018-06-30 | 2018-03-31 | 2017-12-31 | 2017-09-30 | 2017-06-30 | 2017-03-31 | 2016-12-31 | 2016-09-30 | 2016-06-30 | 2016-03-31 | 2015-12-31 | 2015-09-30 | 2015-06-30 | 2015-03-31 | 2014-12-31 | 2014-09-30 | 2014-06-30 | 2014-03-31 | 2013-12-31 | 2013-09-30 | 2013-06-30 | 2013-03-31 | 2012-12-31 | 2012-09-30 | 2012-06-30 | 2012-03-31 | 2011-12-31 | 2011-09-30 | 2011-06-30 | 2011-03-31 | 2010-12-31 | 2010-09-30 | 2010-06-30 | 2010-03-31 | 2009-12-31 | 2009-09-30 | 2009-06-30 | 2009-03-31 | ||
|---|---|---|---|---|---|---|---|---|---|---|---|---|---|---|---|---|---|---|---|---|---|---|---|---|---|---|---|---|---|---|---|---|---|---|---|---|---|---|---|---|---|---|---|---|---|---|---|---|---|---|---|---|---|---|---|---|---|---|---|---|---|
| Net Cash Provided By Used In Investing Activities | -337.00 | -547.00 | -493.00 | -670.00 | -435.00 | -559.00 | -549.00 | -500.00 | -1542.00 | -570.00 | -265.00 | -227.00 | -183.00 | -228.00 | -242.00 | -228.00 | -210.00 | -275.00 | -302.00 | -258.00 | 1354.00 | -320.00 | -381.00 | -294.00 | -331.00 | -315.00 | -272.00 | -334.00 | -205.00 | NA | NA | NA | NA | NA | NA | NA | NA | NA | NA | NA | NA | NA | -680.30 | -481.16 | -362.25 | -442.61 | -546.60 | -555.21 | -538.47 | -501.68 | -469.19 | -515.46 | -211.12 | -519.35 | -553.68 | -441.47 | NA | NA | NA | NA | |
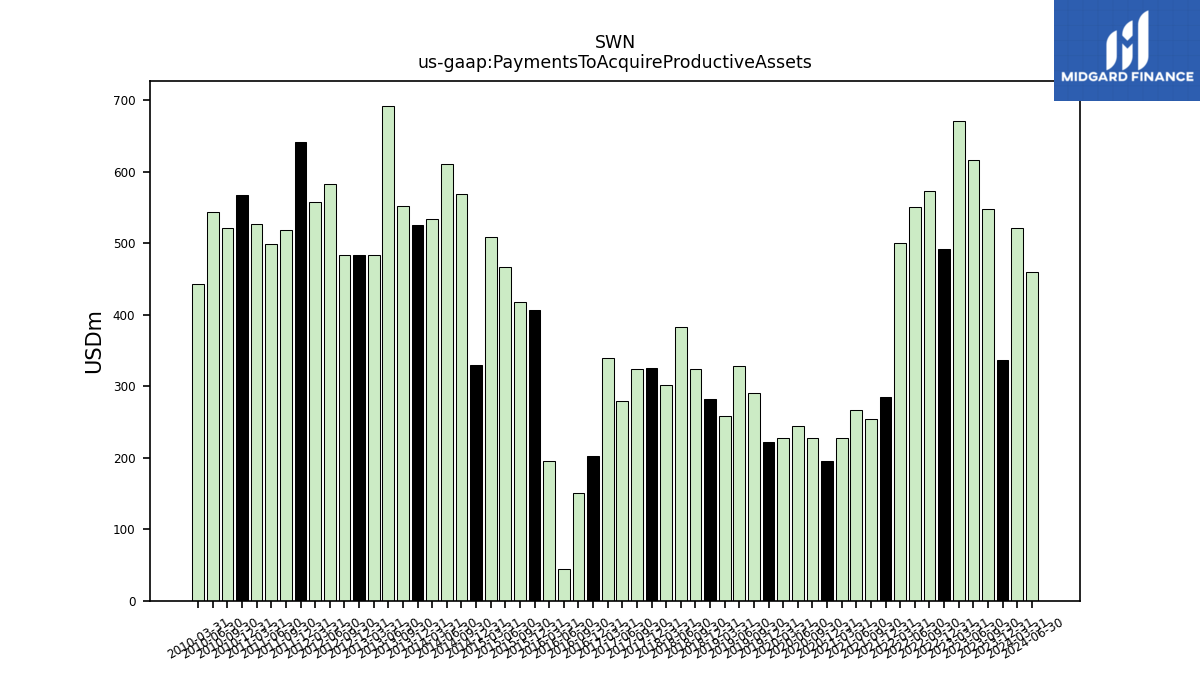
| Payments To Acquire Productive Assets | 337.00 | 547.00 | 616.00 | 670.00 | 492.00 | 573.00 | 550.00 | 500.00 | 285.00 | 254.00 | 266.00 | 227.00 | 196.00 | 228.00 | 244.00 | 228.00 | 222.00 | 291.00 | 328.00 | 258.00 | 282.00 | 324.00 | 382.00 | 302.00 | 325.00 | 324.00 | 279.00 | 340.00 | 202.00 | 150.00 | 45.00 | 196.00 | 406.00 | 418.00 | 466.00 | 508.00 | 330.00 | 569.00 | 610.21 | 533.79 | 525.10 | 551.91 | 692.00 | 483.63 | 484.00 | 483.09 | 583.03 | 557.63 | 640.92 | 518.89 | 498.52 | 526.14 | 567.10 | 520.77 | 543.19 | 442.12 | NA | NA | NA | NA |
| 2023-12-31 | 2023-09-30 | 2023-06-30 | 2023-03-31 | 2022-12-31 | 2022-09-30 | 2022-06-30 | 2022-03-31 | 2021-12-31 | 2021-09-30 | 2021-06-30 | 2021-03-31 | 2020-12-31 | 2020-09-30 | 2020-06-30 | 2020-03-31 | 2019-12-31 | 2019-09-30 | 2019-06-30 | 2019-03-31 | 2018-12-31 | 2018-09-30 | 2018-06-30 | 2018-03-31 | 2017-12-31 | 2017-09-30 | 2017-06-30 | 2017-03-31 | 2016-12-31 | 2016-09-30 | 2016-06-30 | 2016-03-31 | 2015-12-31 | 2015-09-30 | 2015-06-30 | 2015-03-31 | 2014-12-31 | 2014-09-30 | 2014-06-30 | 2014-03-31 | 2013-12-31 | 2013-09-30 | 2013-06-30 | 2013-03-31 | 2012-12-31 | 2012-09-30 | 2012-06-30 | 2012-03-31 | 2011-12-31 | 2011-09-30 | 2011-06-30 | 2011-03-31 | 2010-12-31 | 2010-09-30 | 2010-06-30 | 2010-03-31 | 2009-12-31 | 2009-09-30 | 2009-06-30 | 2009-03-31 | ||
|---|---|---|---|---|---|---|---|---|---|---|---|---|---|---|---|---|---|---|---|---|---|---|---|---|---|---|---|---|---|---|---|---|---|---|---|---|---|---|---|---|---|---|---|---|---|---|---|---|---|---|---|---|---|---|---|---|---|---|---|---|---|
| Net Cash Provided By Used In Financing Activities | -145.00 | 71.00 | 90.00 | -514.00 | -484.00 | -277.00 | 151.00 | -479.00 | 1025.00 | 367.00 | -7.00 | -129.00 | -20.00 | 160.00 | 153.00 | 68.00 | -39.00 | -47.00 | -10.00 | -19.00 | -1414.00 | -15.00 | -840.00 | -28.00 | -50.00 | -18.00 | -265.00 | -19.00 | -7.00 | NA | NA | NA | NA | NA | NA | NA | NA | NA | NA | NA | NA | NA | 182.95 | 72.94 | -64.00 | 64.58 | -10.81 | 301.12 | 101.05 | 58.44 | 4.53 | 120.29 | -214.22 | 113.59 | 162.25 | 24.61 | NA | NA | NA | NA |
| 2023-12-31 | 2023-09-30 | 2023-06-30 | 2023-03-31 | 2022-12-31 | 2022-09-30 | 2022-06-30 | 2022-03-31 | 2021-12-31 | 2021-09-30 | 2021-06-30 | 2021-03-31 | 2020-12-31 | 2020-09-30 | 2020-06-30 | 2020-03-31 | 2019-12-31 | 2019-09-30 | 2019-06-30 | 2019-03-31 | 2018-12-31 | 2018-09-30 | 2018-06-30 | 2018-03-31 | 2017-12-31 | 2017-09-30 | 2017-06-30 | 2017-03-31 | 2016-12-31 | 2016-09-30 | 2016-06-30 | 2016-03-31 | 2015-12-31 | 2015-09-30 | 2015-06-30 | 2015-03-31 | 2014-12-31 | 2014-09-30 | 2014-06-30 | 2014-03-31 | 2013-12-31 | 2013-09-30 | 2013-06-30 | 2013-03-31 | 2012-12-31 | 2012-09-30 | 2012-06-30 | 2012-03-31 | 2011-12-31 | 2011-09-30 | 2011-06-30 | 2011-03-31 | 2010-12-31 | 2010-09-30 | 2010-06-30 | 2010-03-31 | 2009-12-31 | 2009-09-30 | 2009-06-30 | 2009-03-31 | ||
|---|---|---|---|---|---|---|---|---|---|---|---|---|---|---|---|---|---|---|---|---|---|---|---|---|---|---|---|---|---|---|---|---|---|---|---|---|---|---|---|---|---|---|---|---|---|---|---|---|---|---|---|---|---|---|---|---|---|---|---|---|---|
| Revenues | 1692.00 | 1443.00 | 1269.00 | 2118.00 | 3380.00 | 4541.00 | 4138.00 | 2943.00 | 2947.00 | 1598.00 | 1050.00 | 1072.00 | 779.00 | 527.00 | 410.00 | 592.00 | 745.00 | 636.00 | 667.00 | 990.00 | 1175.00 | 951.00 | 816.00 | 920.00 | 809.00 | 737.00 | 811.00 | 846.00 | 684.00 | 651.00 | 522.00 | 579.00 | 687.00 | 749.00 | 764.00 | 933.00 | 962.00 | 928.00 | 1035.00 | 1112.78 | 907.09 | 868.37 | 862.04 | 733.65 | 773.00 | 685.85 | 599.73 | 656.47 | 744.15 | 767.25 | 765.17 | 676.34 | 670.43 | 682.17 | 589.94 | 668.12 | 624.49 | 502.95 | 477.52 | 540.82 | |
| Revenue From Contract With Customer Excluding Assessed Tax | 1692.00 | 1443.00 | 1269.00 | 2118.00 | 3380.00 | 4541.00 | 4138.00 | 2943.00 | 2947.00 | 1598.00 | 1050.00 | 1072.00 | 779.00 | 527.00 | 410.00 | 592.00 | 745.00 | 636.00 | 667.00 | 990.00 | 1175.00 | 951.00 | 816.00 | 920.00 | 809.00 | 737.00 | 811.00 | 846.00 | 684.00 | 651.00 | 522.00 | 579.00 | 687.00 | 749.00 | 764.00 | 933.00 | 962.00 | 928.00 | 1035.00 | 1112.78 | 907.09 | 868.37 | 862.04 | 733.65 | 773.00 | 685.85 | 599.73 | 656.47 | 744.15 | 767.25 | 765.17 | 676.34 | 670.43 | 682.17 | 589.94 | 668.12 | 624.49 | 502.95 | 477.52 | 540.82 | |
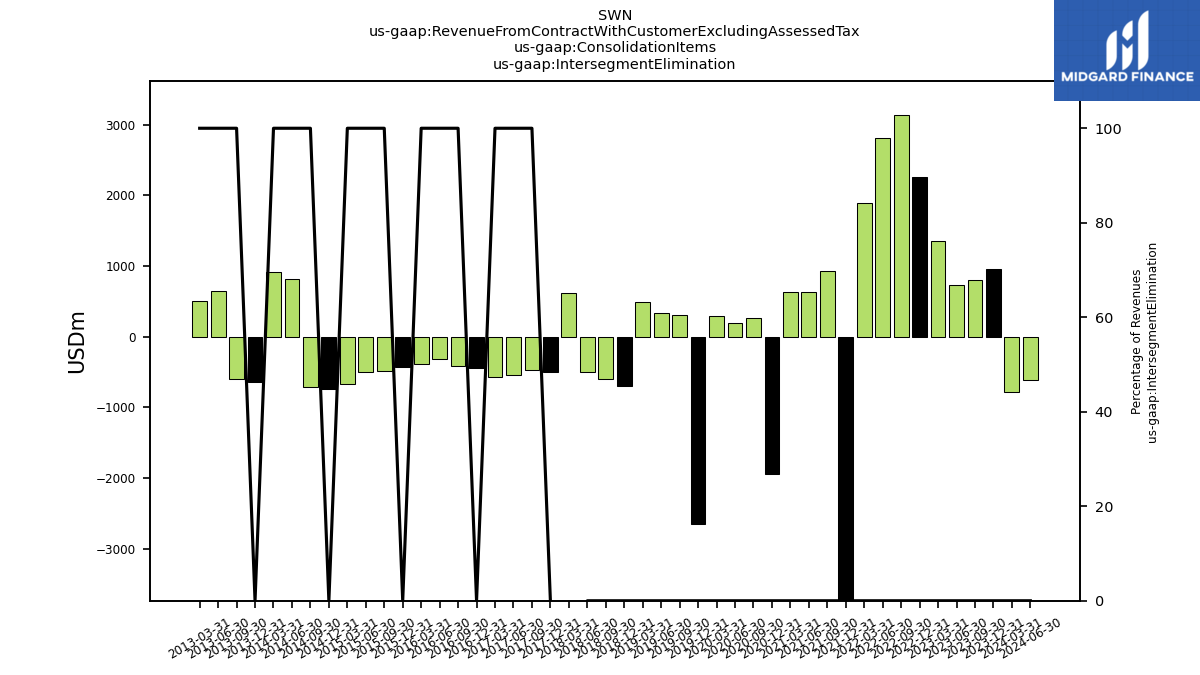
| Intersegment Elimination | 964.00 | 809.00 | 739.00 | 1352.00 | 2254.00 | 3142.00 | 2814.00 | 1886.00 | -6362.00 | 933.00 | 637.00 | 630.00 | -1941.00 | 266.00 | 190.00 | 300.00 | -2642.00 | 304.00 | 330.00 | 493.00 | -700.00 | -594.00 | -501.00 | 613.00 | -502.00 | -467.00 | -537.00 | -575.00 | -438.00 | -409.00 | -321.00 | -378.00 | -421.00 | -486.00 | -492.00 | -661.00 | -732.00 | -710.00 | 821.00 | 918.53 | -636.00 | -602.00 | 643.00 | 498.94 | NA | NA | NA | NA | NA | NA | NA | NA | NA | NA | NA | NA | NA | NA | NA | NA | |
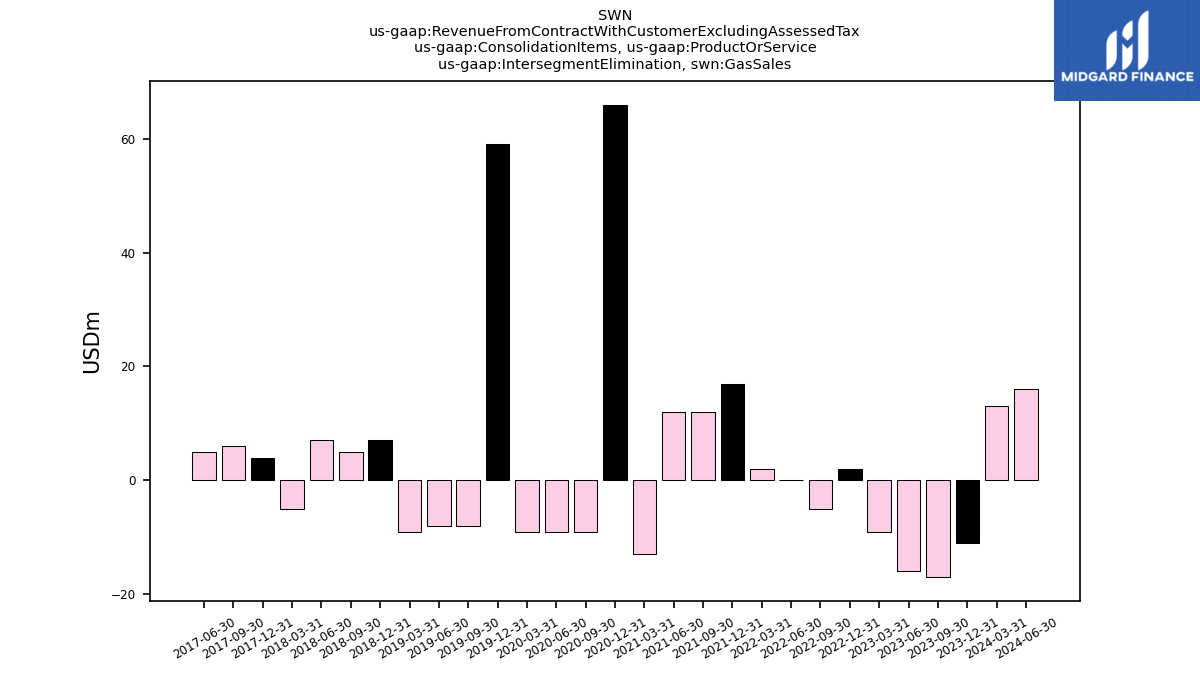
| Intersegment Elimination, Gas Sales | -11.00 | -17.00 | -16.00 | -9.00 | 2.00 | -5.00 | 0.00 | 2.00 | 17.00 | 12.00 | 12.00 | -13.00 | 66.00 | -9.00 | -9.00 | -9.00 | 59.00 | -8.00 | -8.00 | -9.00 | 7.00 | 5.00 | 7.00 | -5.00 | 4.00 | 6.00 | 5.00 | NA | NA | NA | NA | NA | NA | NA | NA | NA | NA | NA | NA | NA | NA | NA | NA | NA | NA | NA | NA | NA | NA | NA | NA | NA | NA | NA | NA | NA | NA | NA | NA | NA | |
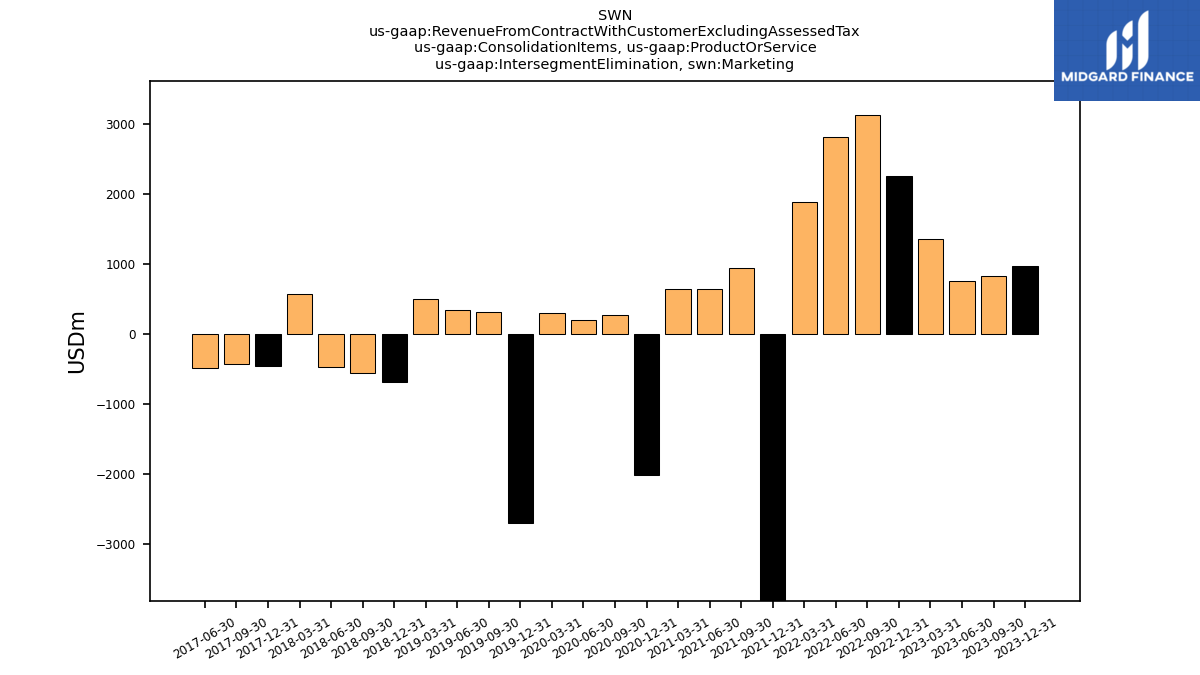
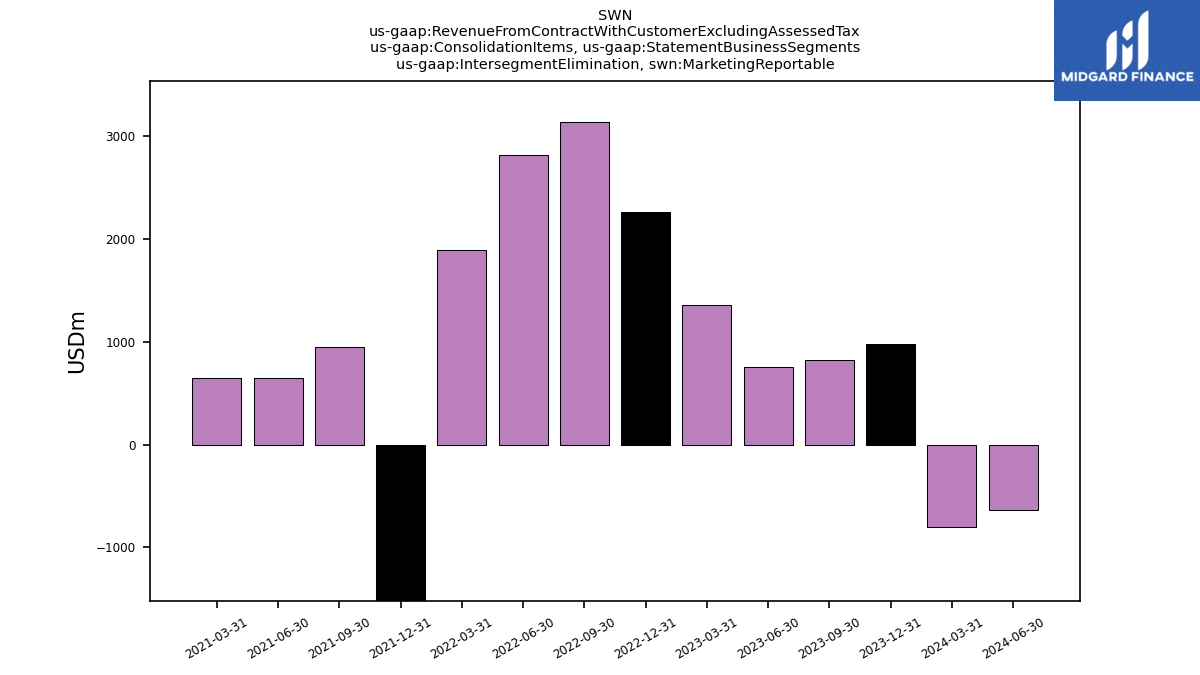
| Intersegment Elimination, Marketing | 978.00 | 826.00 | 756.00 | 1362.00 | 2259.00 | 3138.00 | 2816.00 | 1889.00 | -6465.00 | 947.00 | 651.00 | 644.00 | -2015.00 | 276.00 | 202.00 | 309.00 | -2706.00 | 313.00 | 339.00 | 502.00 | -677.00 | -559.00 | -463.00 | 576.00 | -458.00 | -423.00 | -490.00 | NA | NA | NA | NA | NA | NA | NA | NA | NA | NA | NA | NA | NA | NA | NA | NA | NA | NA | NA | NA | NA | NA | NA | NA | NA | NA | NA | NA | NA | NA | NA | NA | NA | |
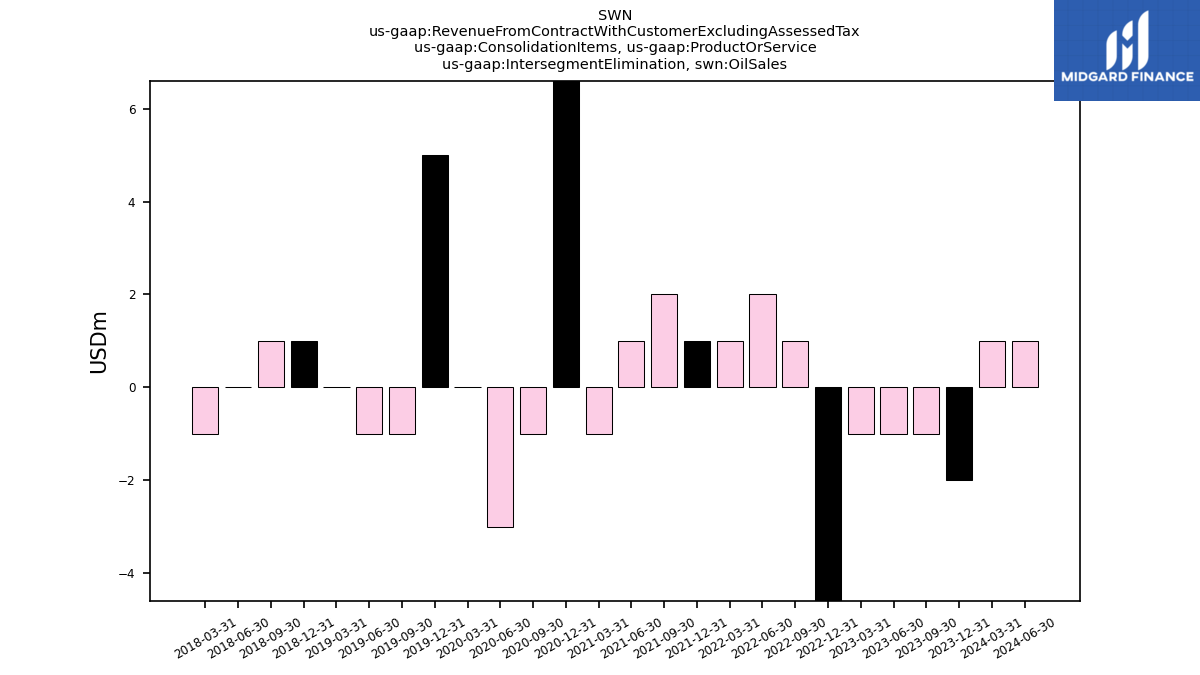
| Intersegment Elimination, Oil Sales | -2.00 | -1.00 | -1.00 | -1.00 | -9.00 | 1.00 | 2.00 | 1.00 | 1.00 | 2.00 | 1.00 | -1.00 | 8.00 | -1.00 | -3.00 | 0.00 | 5.00 | -1.00 | -1.00 | 0.00 | 1.00 | 1.00 | 0.00 | -1.00 | NA | NA | NA | NA | NA | NA | NA | NA | NA | NA | NA | NA | NA | NA | NA | NA | NA | NA | NA | NA | NA | NA | NA | NA | NA | NA | NA | NA | NA | NA | NA | NA | NA | NA | NA | NA | |
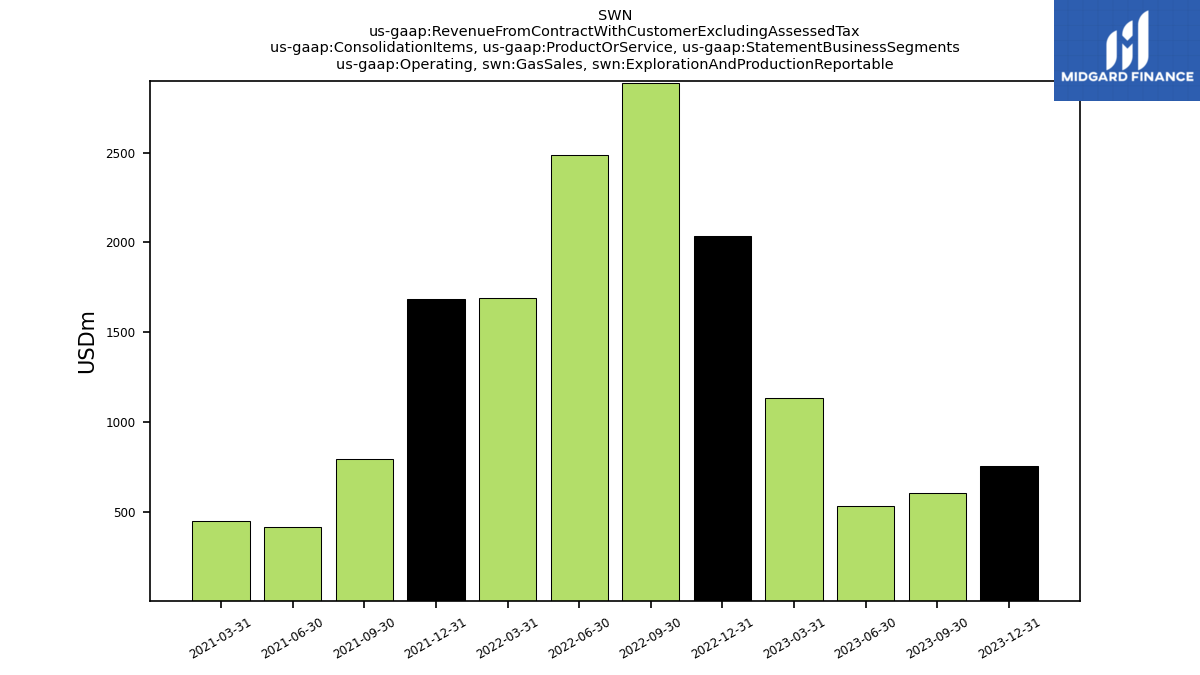
| Operating, Gas Sales, Exploration And Production Reportable | 755.00 | 610.00 | 535.00 | 1136.00 | 2036.00 | 2889.00 | 2485.00 | 1690.00 | 1687.00 | 799.00 | 421.00 | 451.00 | NA | NA | NA | NA | NA | NA | NA | NA | NA | NA | NA | NA | NA | NA | NA | NA | NA | NA | NA | NA | NA | NA | NA | NA | NA | NA | NA | NA | NA | NA | NA | NA | NA | NA | NA | NA | NA | NA | NA | NA | NA | NA | NA | NA | NA | NA | NA | NA | |
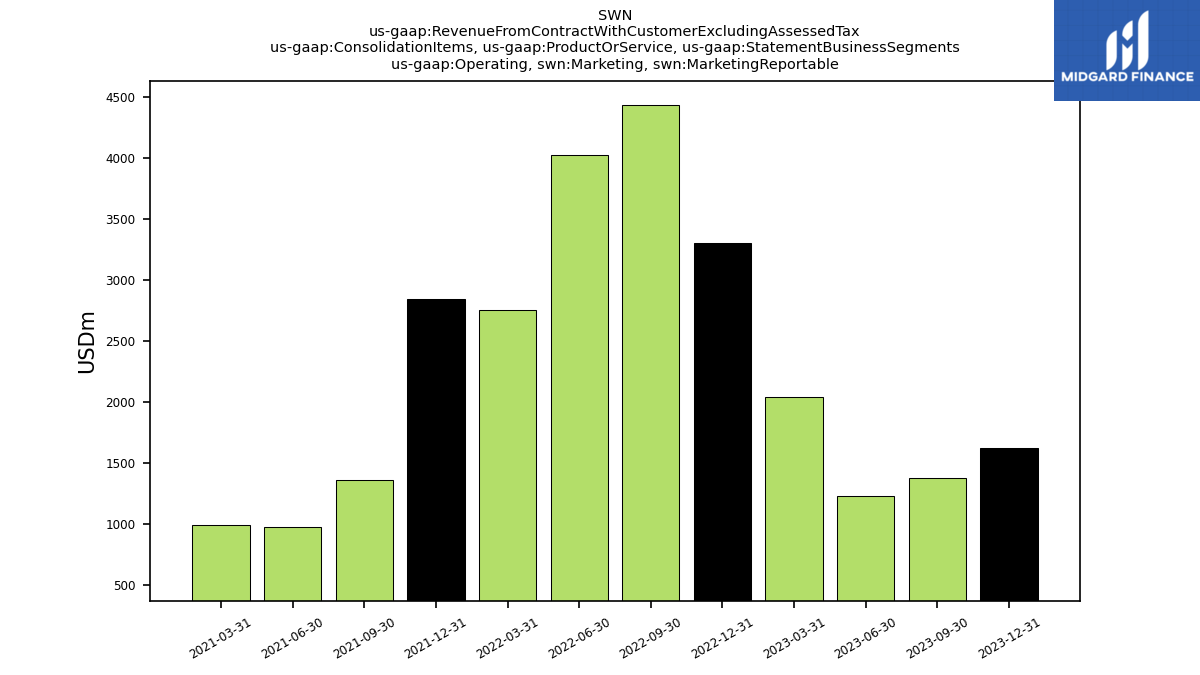
| Operating, Marketing, Marketing Reportable | 1626.00 | 1379.00 | 1231.00 | 2041.00 | 3307.00 | 4436.00 | 4023.00 | 2755.00 | 2842.00 | 1365.00 | 983.00 | 996.00 | NA | NA | NA | NA | NA | NA | NA | NA | NA | NA | NA | NA | NA | NA | NA | NA | NA | NA | NA | NA | NA | NA | NA | NA | NA | NA | NA | NA | NA | NA | NA | NA | NA | NA | NA | NA | NA | NA | NA | NA | NA | NA | NA | NA | NA | NA | NA | NA | |
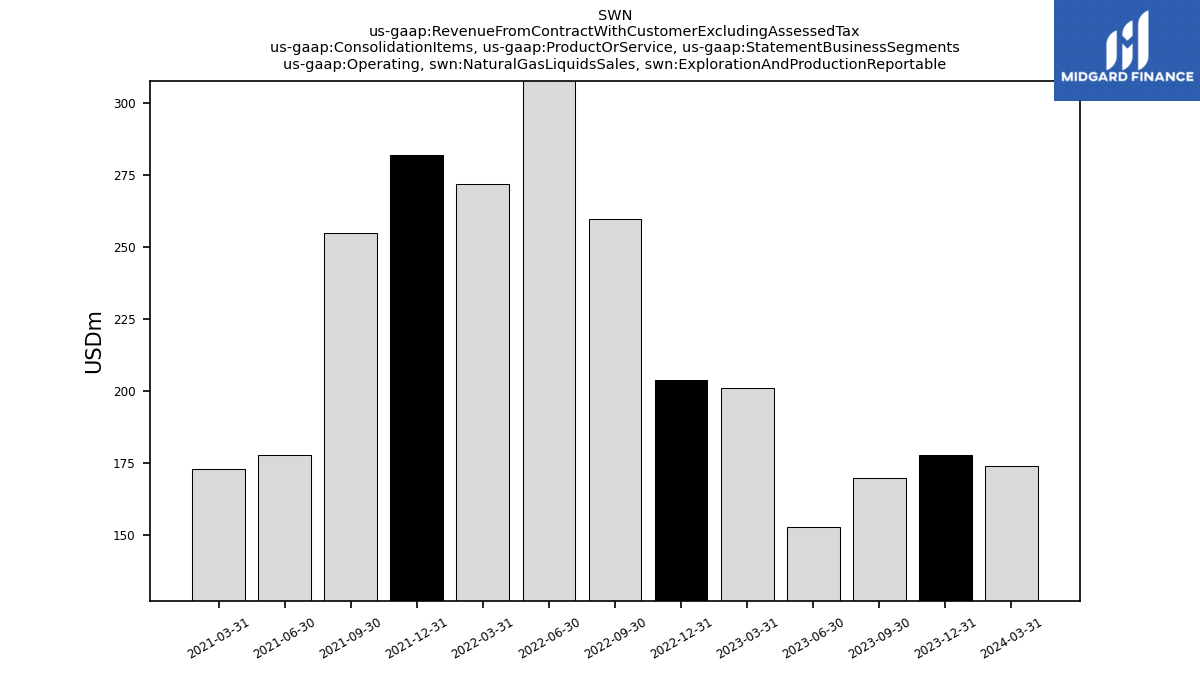
| Operating, Natural Gas Liquids Sales, Exploration And Production Reportable | 178.00 | 170.00 | 153.00 | 201.00 | 204.00 | 260.00 | 310.00 | 272.00 | 282.00 | 255.00 | 178.00 | 173.00 | NA | NA | NA | NA | NA | NA | NA | NA | NA | NA | NA | NA | NA | NA | NA | NA | NA | NA | NA | NA | NA | NA | NA | NA | NA | NA | NA | NA | NA | NA | NA | NA | NA | NA | NA | NA | NA | NA | NA | NA | NA | NA | NA | NA | NA | NA | NA | NA | |
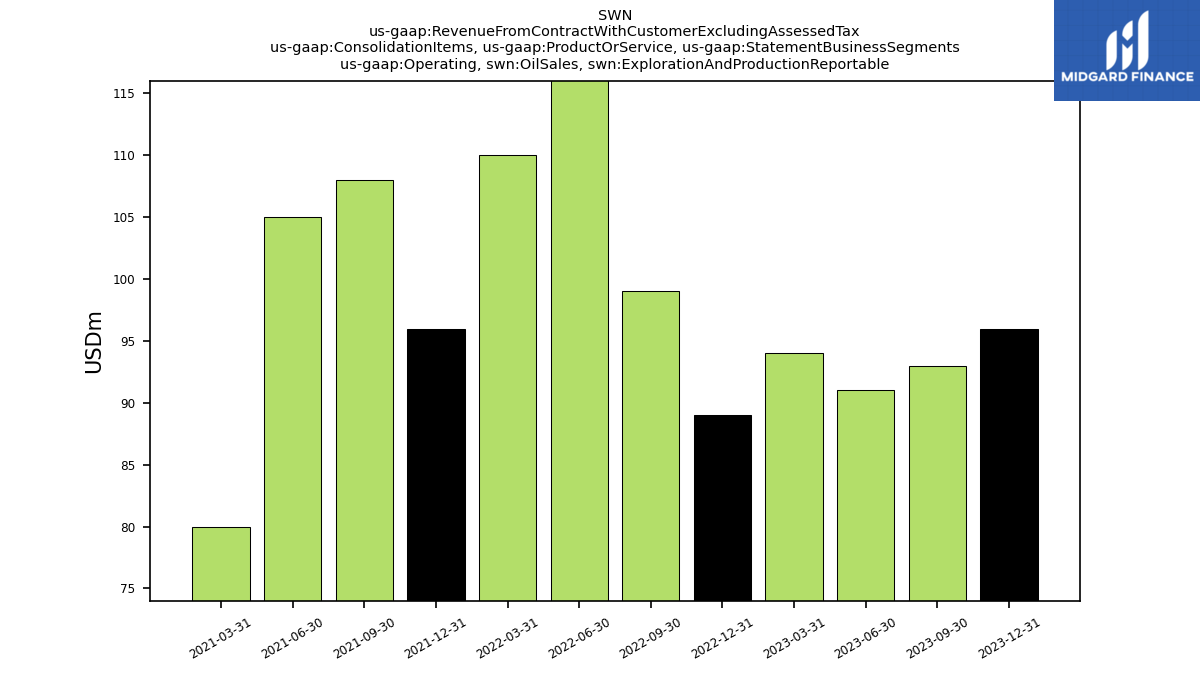
| Operating, Oil Sales, Exploration And Production Reportable | 96.00 | 93.00 | 91.00 | 94.00 | 89.00 | 99.00 | 136.00 | 110.00 | 96.00 | 108.00 | 105.00 | 80.00 | NA | NA | NA | NA | NA | NA | NA | NA | NA | NA | NA | NA | NA | NA | NA | NA | NA | NA | NA | NA | NA | NA | NA | NA | NA | NA | NA | NA | NA | NA | NA | NA | NA | NA | NA | NA | NA | NA | NA | NA | NA | NA | NA | NA | NA | NA | NA | NA | |
| Operating, Other, Exploration And Production Reportable | 1.00 | 0.00 | -2.00 | -2.00 | -2.00 | -1.00 | -2.00 | 2.00 | 1.00 | 3.00 | 0.00 | 1.00 | NA | NA | NA | NA | NA | NA | NA | NA | NA | NA | NA | NA | NA | NA | NA | NA | NA | NA | NA | NA | NA | NA | NA | NA | NA | NA | NA | NA | NA | NA | NA | NA | NA | NA | NA | NA | NA | NA | NA | NA | NA | NA | NA | NA | NA | NA | NA | NA | |
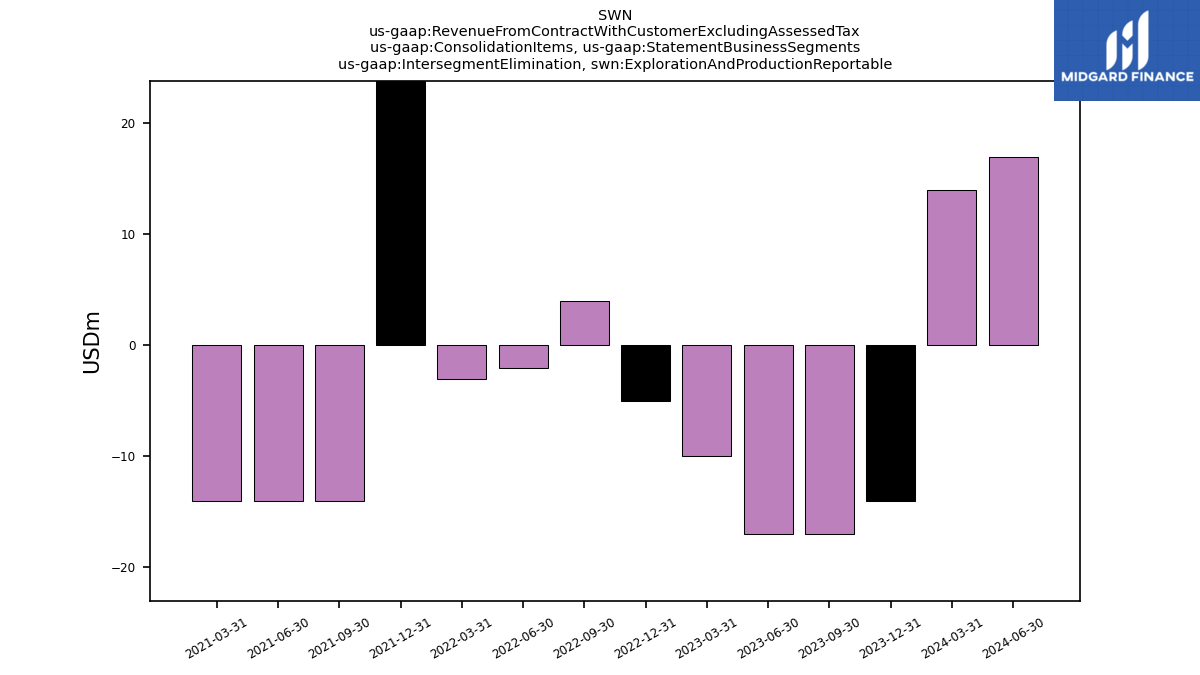
| Intersegment Elimination, Exploration And Production Reportable | -14.00 | -17.00 | -17.00 | -10.00 | -5.00 | 4.00 | -2.00 | -3.00 | 103.00 | -14.00 | -14.00 | -14.00 | NA | NA | NA | NA | NA | NA | NA | NA | NA | NA | NA | NA | NA | NA | NA | NA | NA | NA | NA | NA | NA | NA | NA | NA | NA | NA | NA | NA | NA | NA | NA | NA | NA | NA | NA | NA | NA | NA | NA | NA | NA | NA | NA | NA | NA | NA | NA | NA | |
| Intersegment Elimination, Marketing Reportable | 978.00 | 826.00 | 756.00 | 1362.00 | 2259.00 | 3138.00 | 2816.00 | 1889.00 | -6465.00 | 947.00 | 651.00 | 644.00 | NA | NA | NA | NA | NA | NA | NA | NA | NA | NA | NA | NA | NA | NA | NA | NA | NA | NA | NA | NA | NA | NA | NA | NA | NA | NA | NA | NA | NA | NA | NA | NA | NA | NA | NA | NA | NA | NA | NA | NA | NA | NA | NA | NA | NA | NA | NA | NA | |
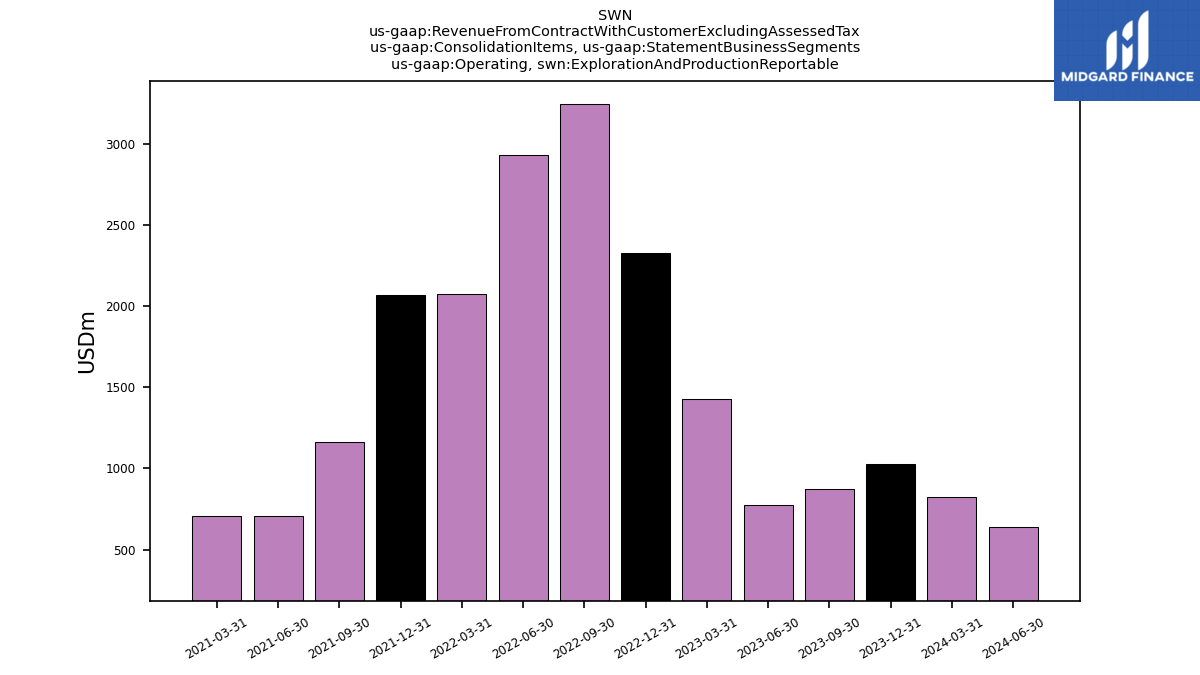
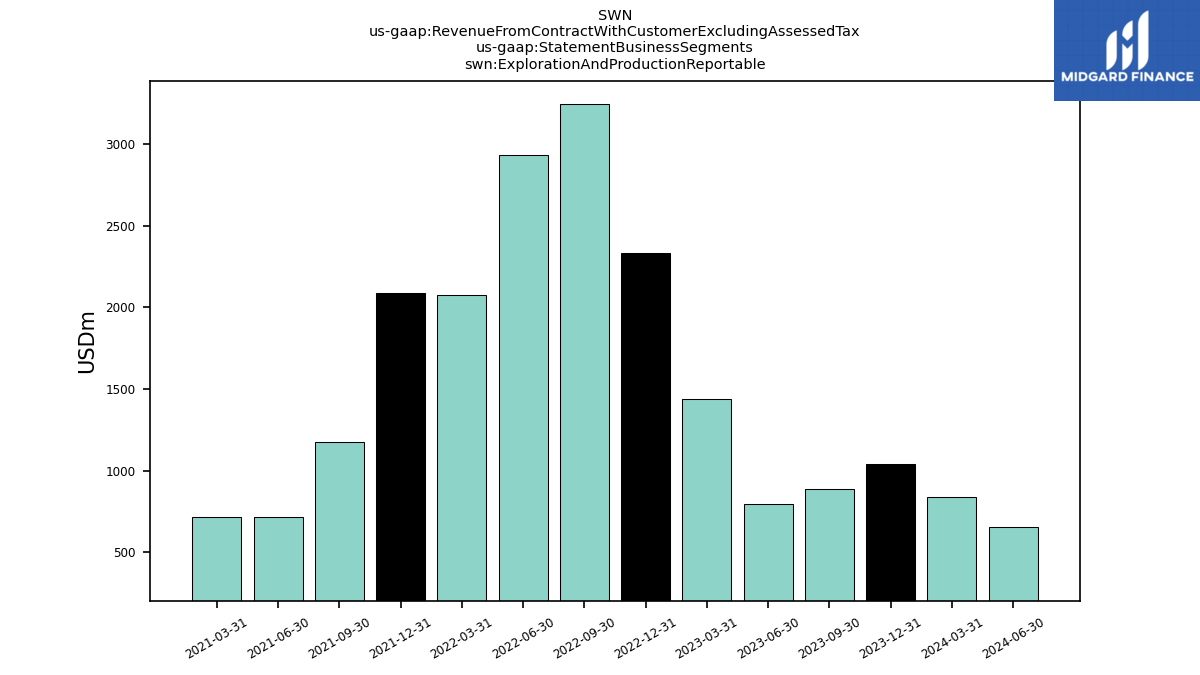
| Operating, Exploration And Production Reportable | 1030.00 | 873.00 | 777.00 | 1429.00 | 2327.00 | 3247.00 | 2929.00 | 2074.00 | 2066.00 | 1165.00 | 704.00 | 705.00 | NA | NA | NA | NA | NA | NA | NA | NA | NA | NA | NA | NA | NA | NA | NA | NA | NA | NA | NA | NA | NA | NA | NA | NA | NA | NA | NA | NA | NA | NA | NA | NA | NA | NA | NA | NA | NA | NA | NA | NA | NA | NA | NA | NA | NA | NA | NA | NA | |
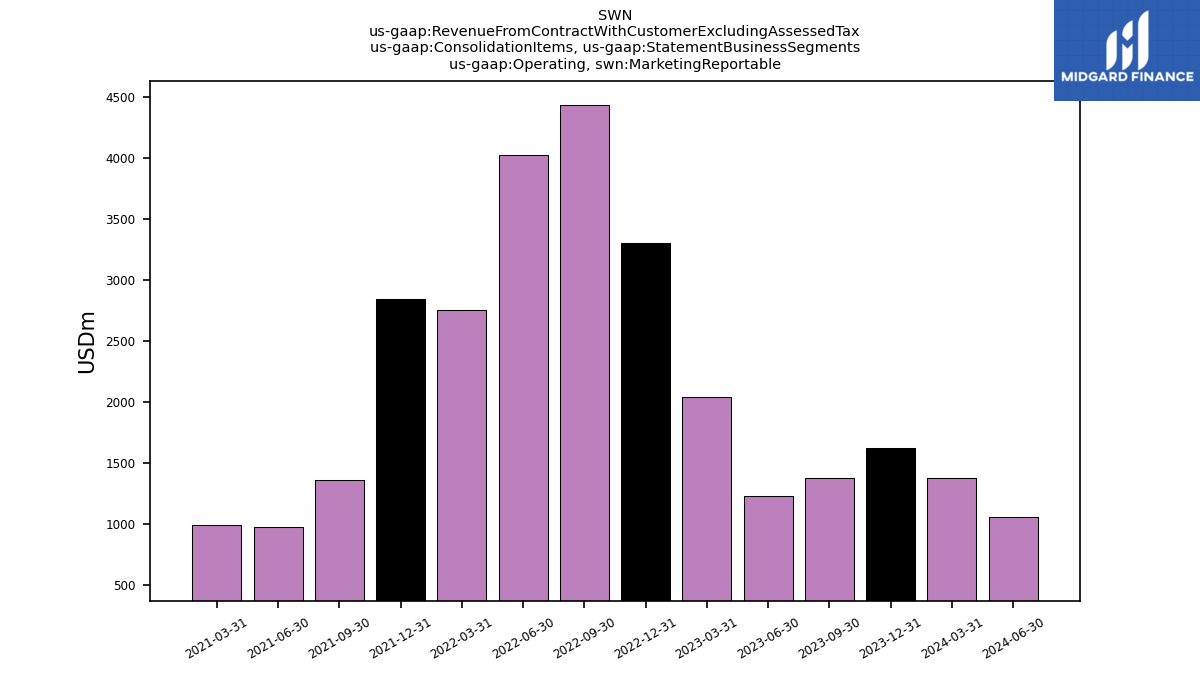
| Operating, Marketing Reportable | 1626.00 | 1379.00 | 1231.00 | 2041.00 | 3307.00 | 4436.00 | 4023.00 | 2755.00 | 2843.00 | 1366.00 | 983.00 | 997.00 | NA | NA | NA | NA | NA | NA | NA | NA | NA | NA | NA | NA | NA | NA | NA | NA | NA | NA | NA | NA | NA | NA | NA | NA | NA | NA | NA | NA | NA | NA | NA | NA | NA | NA | NA | NA | NA | NA | NA | NA | NA | NA | NA | NA | NA | NA | NA | NA | |
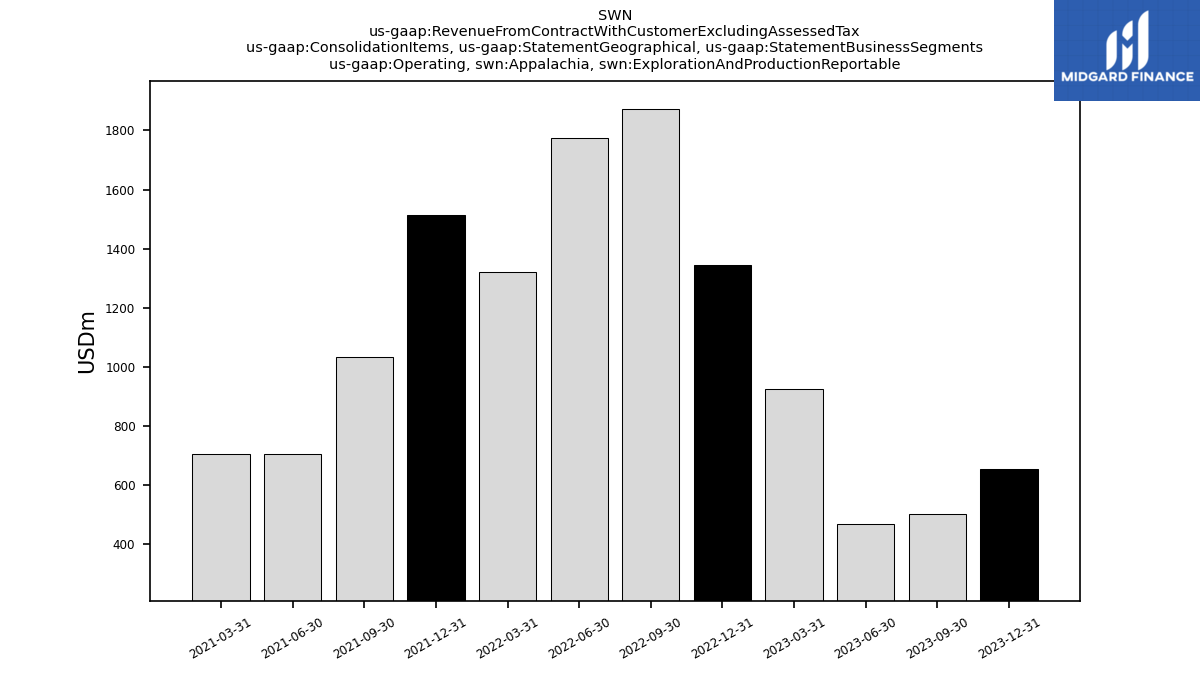
| Operating, Appalachia, Exploration And Production Reportable | 652.00 | 500.00 | 468.00 | 923.00 | 1343.00 | 1874.00 | 1776.00 | 1321.00 | 1514.00 | 1033.00 | 704.00 | 704.00 | NA | NA | NA | NA | NA | NA | NA | NA | NA | NA | NA | NA | NA | NA | NA | NA | NA | NA | NA | NA | NA | NA | NA | NA | NA | NA | NA | NA | NA | NA | NA | NA | NA | NA | NA | NA | NA | NA | NA | NA | NA | NA | NA | NA | NA | NA | NA | NA | |
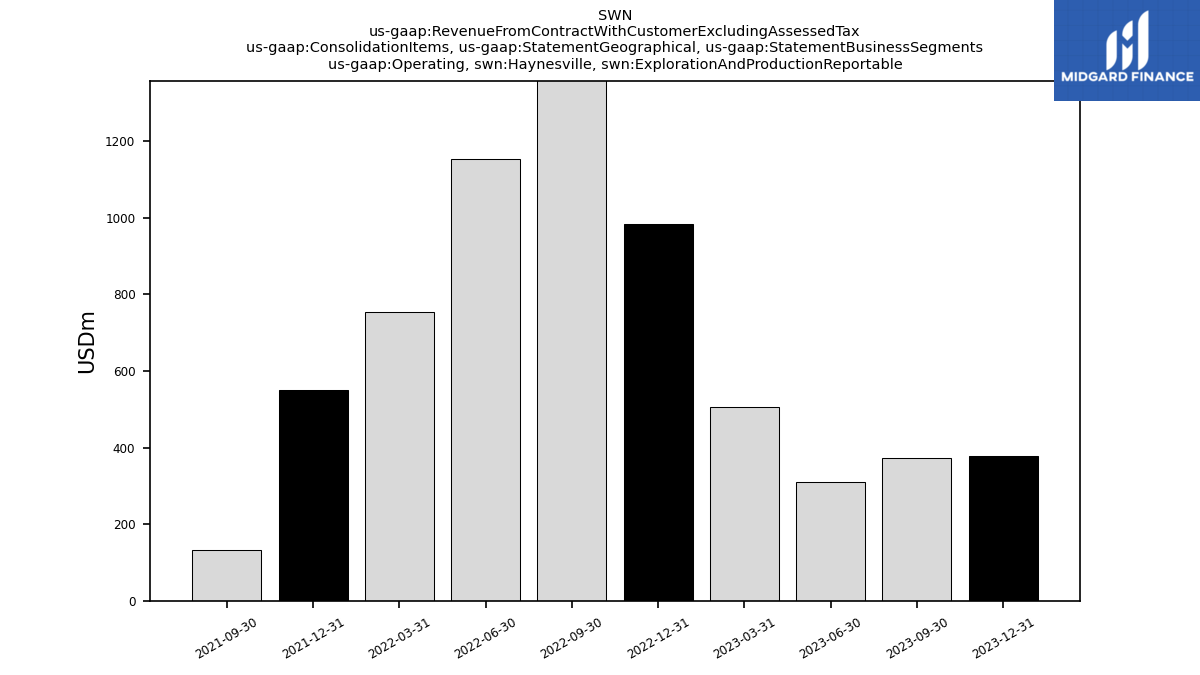
| Operating, Haynesville, Exploration And Production Reportable | 378.00 | 373.00 | 309.00 | 506.00 | 984.00 | 1373.00 | 1153.00 | 753.00 | 550.00 | 132.00 | NA | NA | NA | NA | NA | NA | NA | NA | NA | NA | NA | NA | NA | NA | NA | NA | NA | NA | NA | NA | NA | NA | NA | NA | NA | NA | NA | NA | NA | NA | NA | NA | NA | NA | NA | NA | NA | NA | NA | NA | NA | NA | NA | NA | NA | NA | NA | NA | NA | NA | |
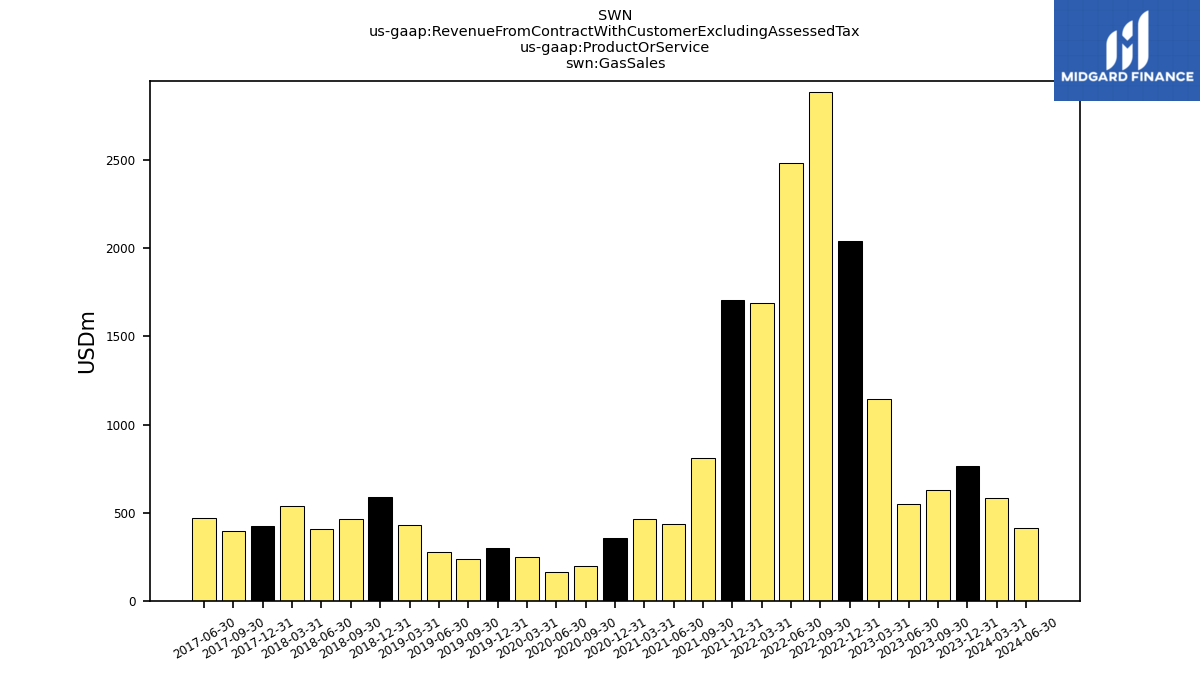
| Gas Sales | 766.00 | 627.00 | 551.00 | 1145.00 | 2040.00 | 2884.00 | 2485.00 | 1692.00 | 1704.00 | 811.00 | 433.00 | 464.00 | 356.00 | 199.00 | 164.00 | 248.00 | 298.00 | 238.00 | 275.00 | 430.00 | 586.00 | 465.00 | 407.00 | 540.00 | 425.00 | 394.00 | 471.00 | NA | NA | NA | NA | NA | NA | NA | NA | NA | NA | NA | NA | NA | NA | NA | NA | NA | NA | NA | NA | NA | NA | NA | NA | NA | NA | NA | NA | NA | NA | NA | NA | NA | |
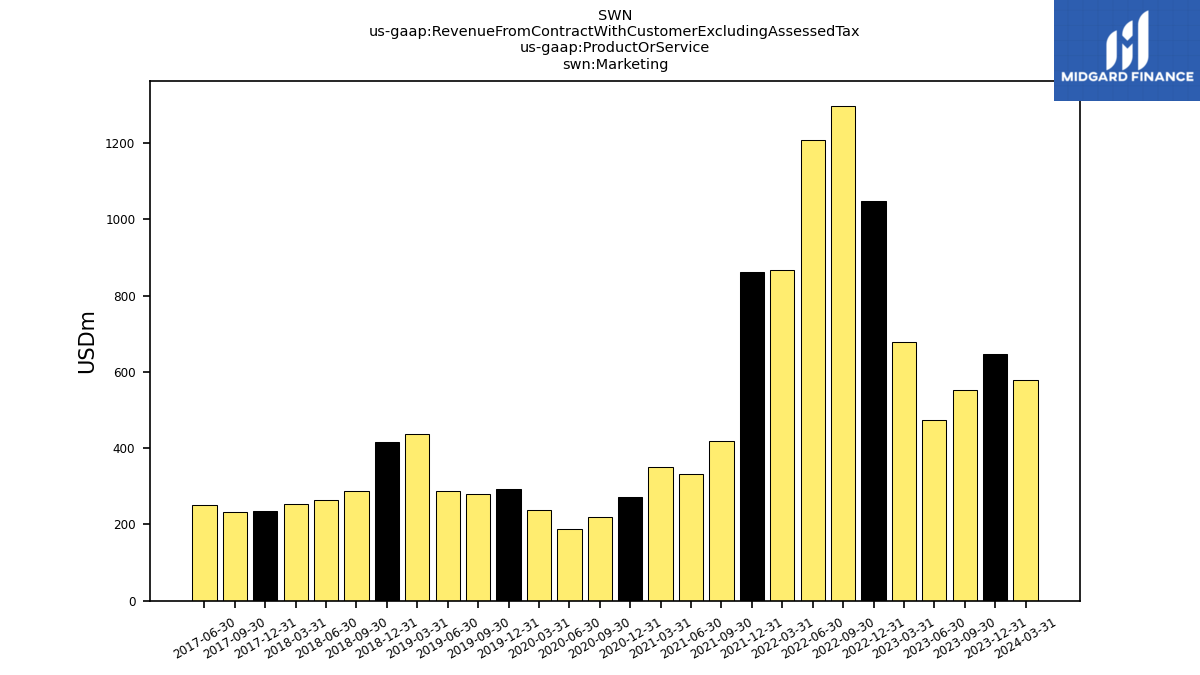
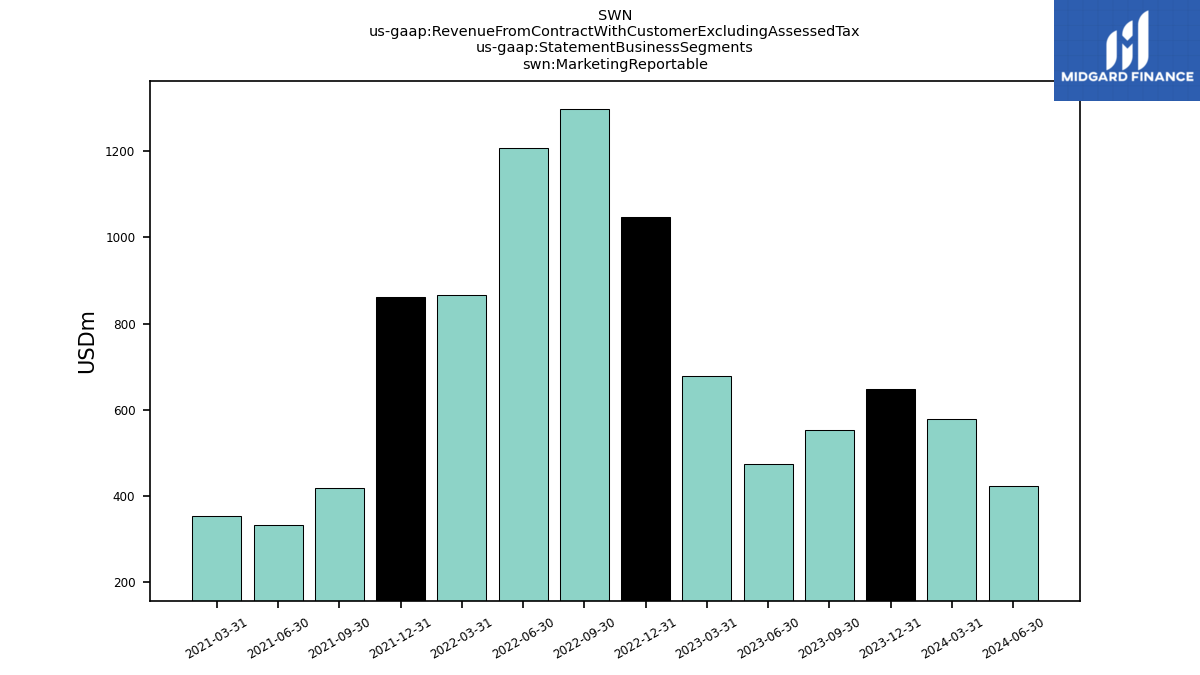
| Marketing | 648.00 | 553.00 | 475.00 | 679.00 | 1048.00 | 1298.00 | 1207.00 | 866.00 | 861.00 | 418.00 | 332.00 | 352.00 | 272.00 | 219.00 | 187.00 | 239.00 | 293.00 | 279.00 | 287.00 | 438.00 | 417.00 | 287.00 | 265.00 | 253.00 | 236.00 | 233.00 | 250.00 | NA | NA | NA | NA | NA | NA | NA | NA | NA | NA | NA | NA | NA | NA | NA | NA | NA | NA | NA | NA | NA | NA | NA | NA | NA | NA | NA | NA | NA | NA | NA | NA | NA | |
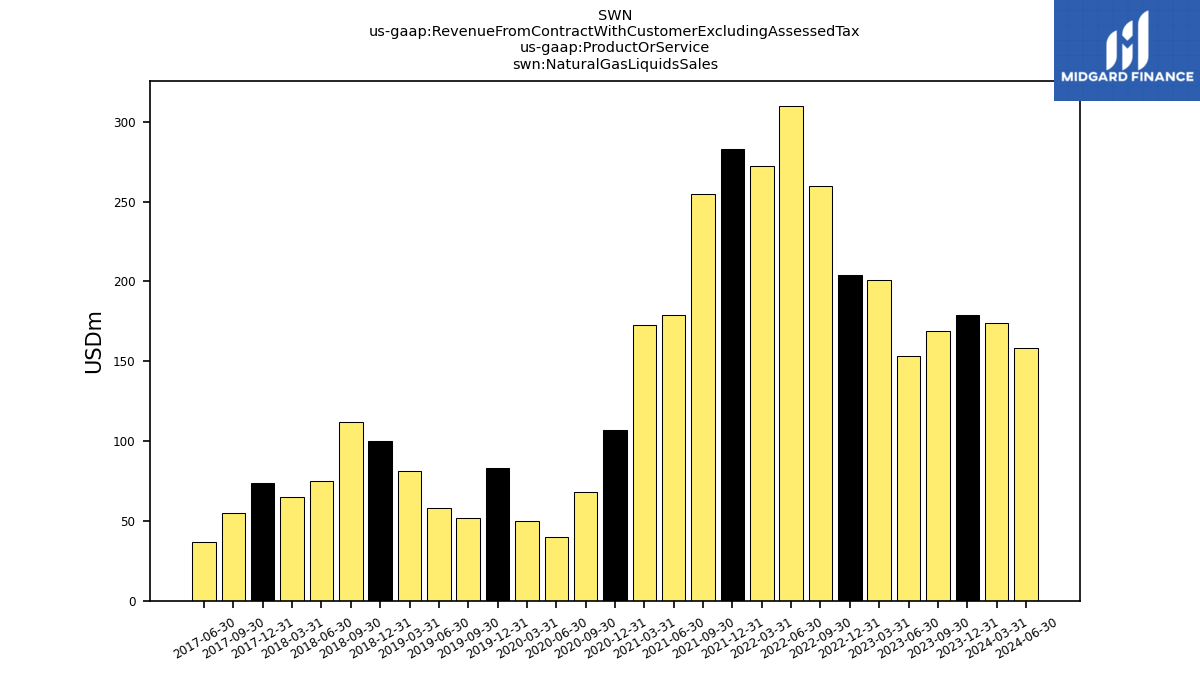
| Natural Gas Liquids Sales | 179.00 | 169.00 | 153.00 | 201.00 | 204.00 | 260.00 | 310.00 | 272.00 | 283.00 | 255.00 | 179.00 | 173.00 | 107.00 | 68.00 | 40.00 | 50.00 | 83.00 | 52.00 | 58.00 | 81.00 | 100.00 | 112.00 | 75.00 | 65.00 | 74.00 | 55.00 | 37.00 | NA | NA | NA | NA | NA | NA | NA | NA | NA | NA | NA | NA | NA | NA | NA | NA | NA | NA | NA | NA | NA | NA | NA | NA | NA | NA | NA | NA | NA | NA | NA | NA | NA | |
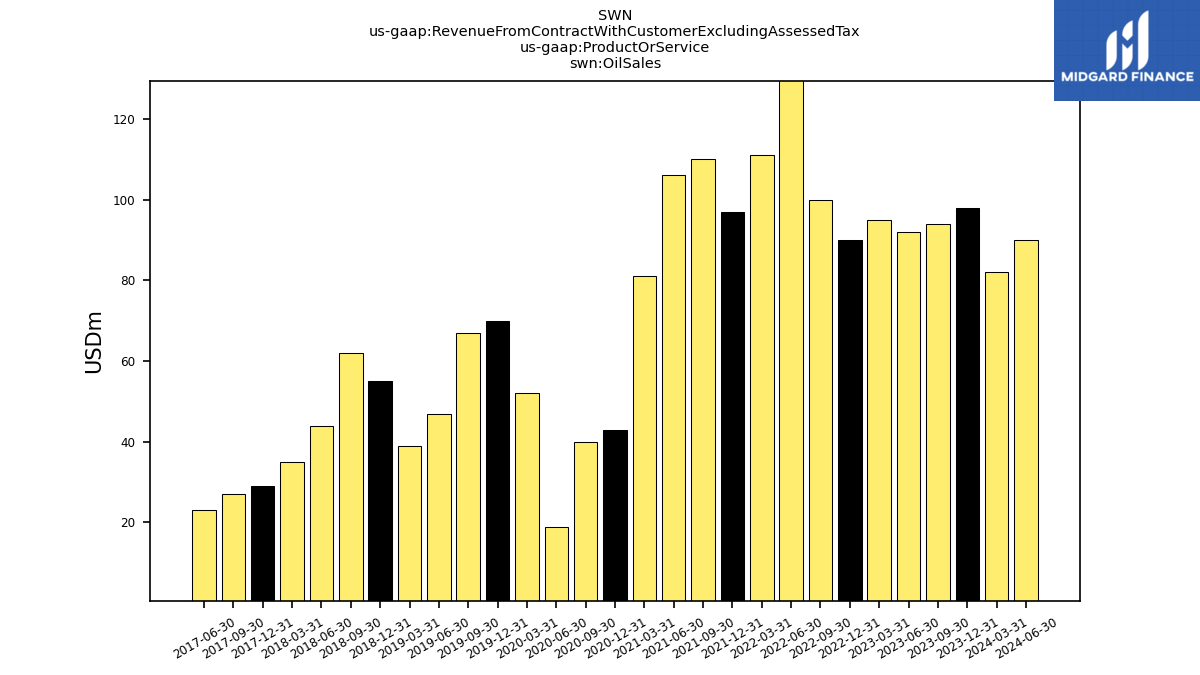
| Oil Sales | 98.00 | 94.00 | 92.00 | 95.00 | 90.00 | 100.00 | 138.00 | 111.00 | 97.00 | 110.00 | 106.00 | 81.00 | 43.00 | 40.00 | 19.00 | 52.00 | 70.00 | 67.00 | 47.00 | 39.00 | 55.00 | 62.00 | 44.00 | 35.00 | 29.00 | 27.00 | 23.00 | NA | NA | NA | NA | NA | NA | NA | NA | NA | NA | NA | NA | NA | NA | NA | NA | NA | NA | NA | NA | NA | NA | NA | NA | NA | NA | NA | NA | NA | NA | NA | NA | NA | |
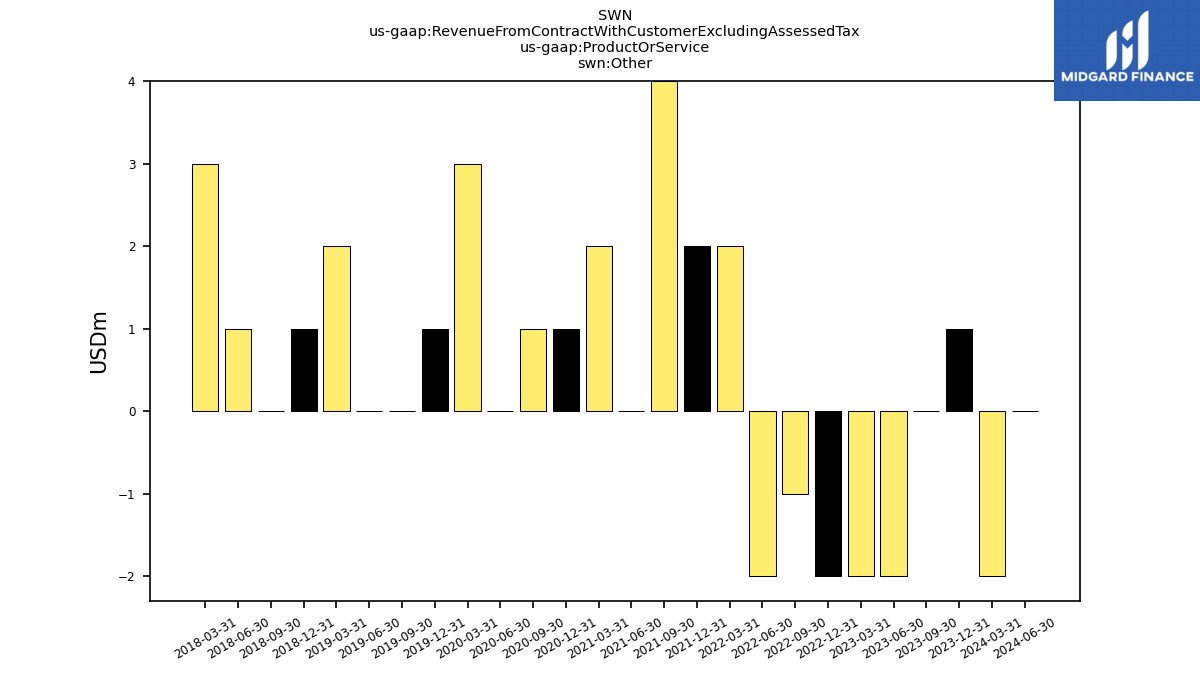
| Other | 1.00 | 0.00 | -2.00 | -2.00 | -2.00 | -1.00 | -2.00 | 2.00 | 2.00 | 4.00 | 0.00 | 2.00 | 1.00 | 1.00 | 0.00 | 3.00 | 1.00 | 0.00 | 0.00 | 2.00 | 1.00 | 0.00 | 1.00 | 3.00 | NA | NA | NA | NA | NA | NA | NA | NA | NA | NA | NA | NA | NA | NA | NA | NA | NA | NA | NA | NA | NA | NA | NA | NA | NA | NA | NA | NA | NA | NA | NA | NA | NA | NA | NA | NA | |
| Exploration And Production Reportable | 1044.00 | 890.00 | 794.00 | 1439.00 | 2332.00 | 3243.00 | 2931.00 | 2077.00 | 2085.00 | 1179.00 | 718.00 | 719.00 | NA | NA | NA | NA | NA | NA | NA | NA | NA | NA | NA | NA | NA | NA | NA | NA | NA | NA | NA | NA | NA | NA | NA | NA | NA | NA | NA | NA | NA | NA | NA | NA | NA | NA | NA | NA | NA | NA | NA | NA | NA | NA | NA | NA | NA | NA | NA | NA | |
| Marketing Reportable | 648.00 | 553.00 | 475.00 | 679.00 | 1048.00 | 1298.00 | 1207.00 | 866.00 | 862.00 | 419.00 | 332.00 | 353.00 | NA | NA | NA | NA | NA | NA | NA | NA | NA | NA | NA | NA | NA | NA | NA | NA | NA | NA | NA | NA | NA | NA | NA | NA | NA | NA | NA | NA | NA | NA | NA | NA | NA | NA | NA | NA | NA | NA | NA | NA | NA | NA | NA | NA | NA | NA | NA | NA |