
| 2023-12-31 | 2023-09-30 | 2023-06-30 | 2023-03-31 | 2022-12-31 | 2022-09-30 | 2022-06-30 | 2022-03-31 | 2021-12-31 | 2021-09-30 | 2021-06-30 | 2021-03-31 | 2020-12-31 | 2020-09-30 | 2020-06-30 | 2020-03-31 | 2019-09-30 | 2019-06-30 | 2019-03-31 | 2018-09-30 | 2018-06-30 | 2018-03-31 | 2017-09-30 | ||
|---|---|---|---|---|---|---|---|---|---|---|---|---|---|---|---|---|---|---|---|---|---|---|---|---|
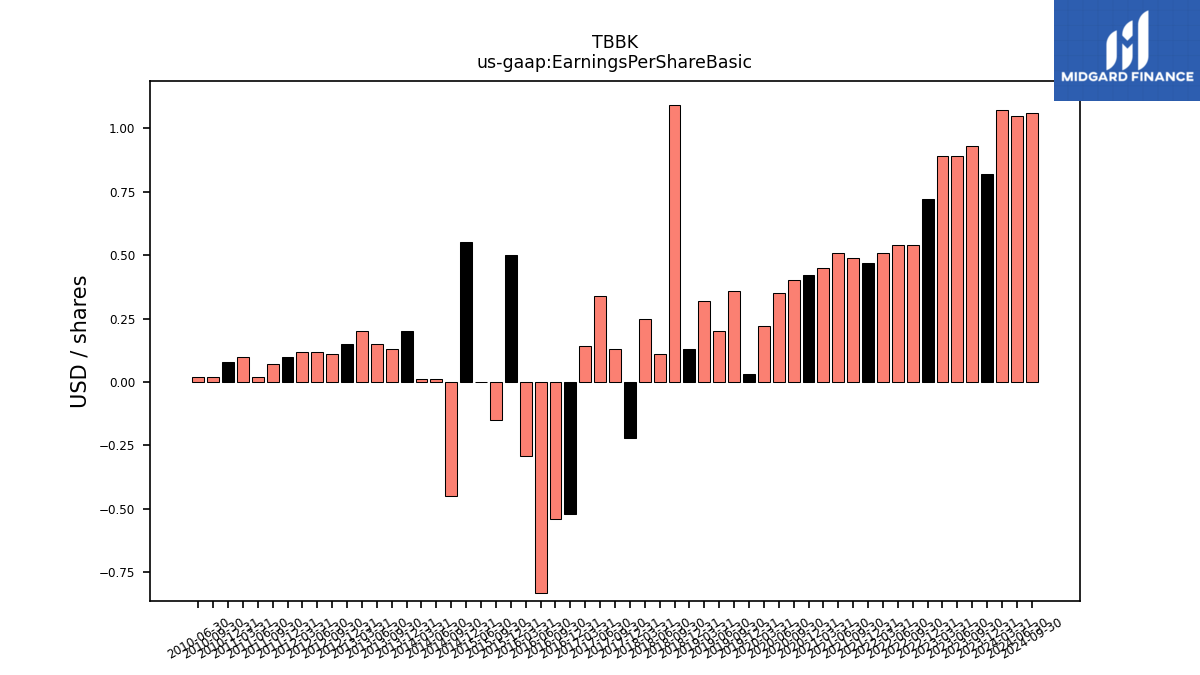
| Earnings Per Share Basic | 0.82 | 0.93 | 0.89 | 0.89 | 0.72 | 0.54 | 0.54 | 0.51 | 0.47 | 0.49 | 0.51 | 0.45 | 0.42 | 0.40 | 0.35 | 0.22 | 0.36 | 0.20 | 0.32 | 1.09 | 0.11 | 0.25 | 0.13 | |
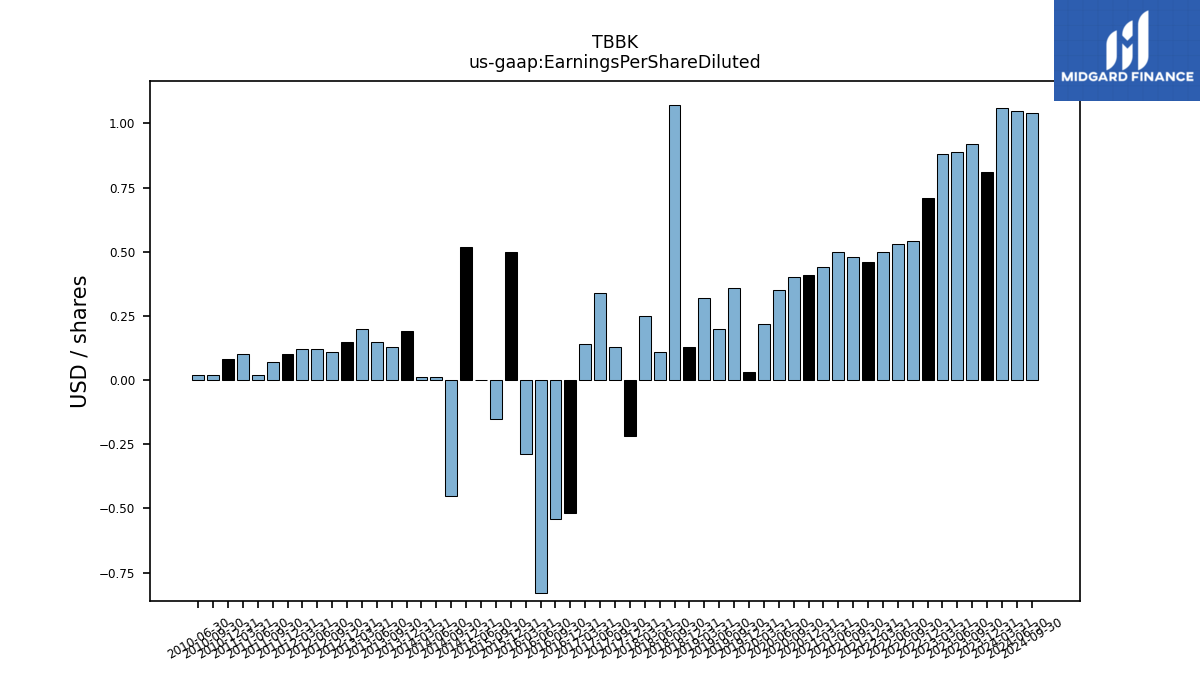
| Earnings Per Share Diluted | 0.81 | 0.92 | 0.89 | 0.88 | 0.71 | 0.54 | 0.53 | 0.50 | 0.46 | 0.48 | 0.50 | 0.44 | 0.41 | 0.40 | 0.35 | 0.22 | 0.36 | 0.20 | 0.32 | 1.07 | 0.11 | 0.25 | 0.13 |
| 2023-12-31 | 2023-09-30 | 2023-06-30 | 2023-03-31 | 2022-12-31 | 2022-09-30 | 2022-06-30 | 2022-03-31 | 2021-12-31 | 2021-09-30 | 2021-06-30 | 2021-03-31 | 2020-12-31 | 2020-09-30 | 2020-06-30 | 2020-03-31 | 2019-09-30 | 2019-06-30 | 2019-03-31 | 2018-09-30 | 2018-06-30 | 2018-03-31 | 2017-09-30 | ||
|---|---|---|---|---|---|---|---|---|---|---|---|---|---|---|---|---|---|---|---|---|---|---|---|---|
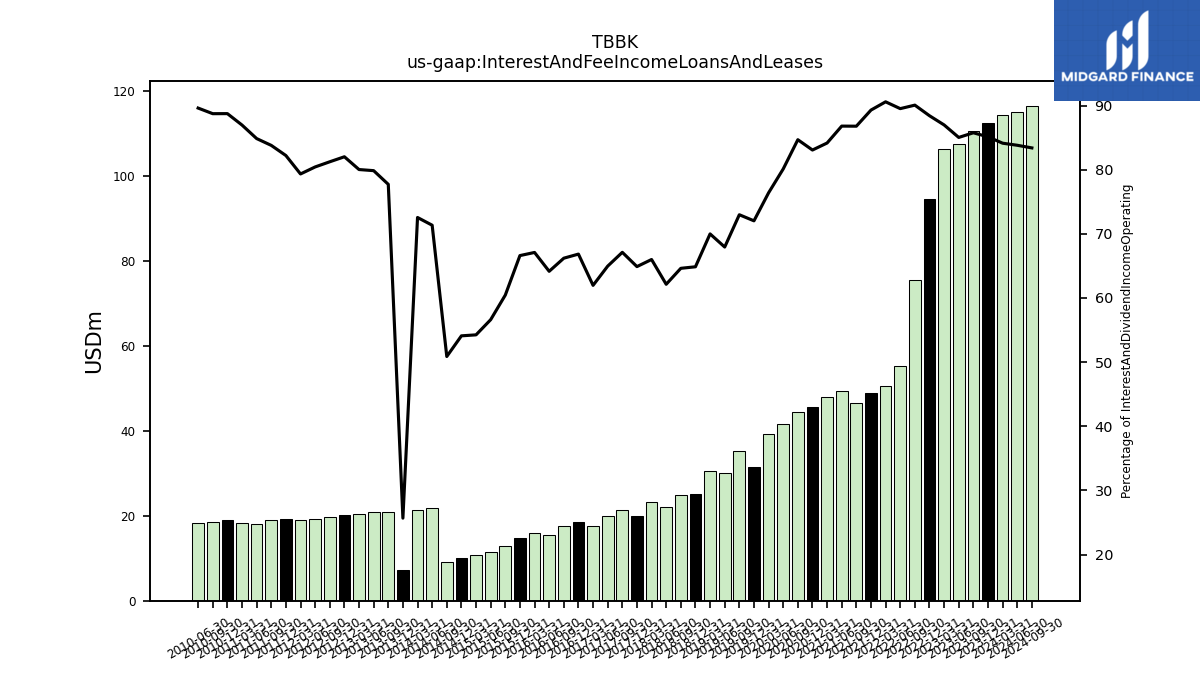
| Interest And Fee Income Loans And Leases | 112.42 | 110.59 | 107.38 | 106.26 | 94.52 | 75.58 | 55.15 | 50.59 | 48.85 | 46.43 | 49.45 | 47.90 | 45.63 | 44.43 | 41.58 | 39.32 | 35.30 | 29.95 | 30.50 | 24.98 | 21.97 | 23.30 | 21.42 | |
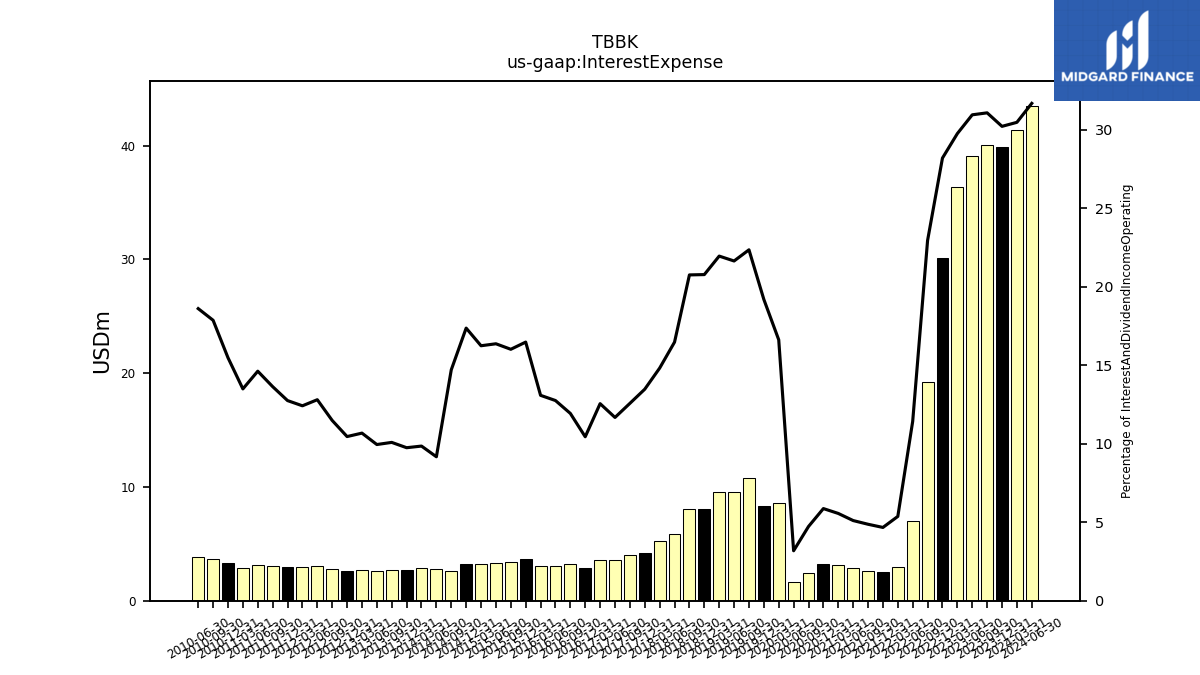
| Interest Expense | 39.91 | 40.09 | 39.09 | 36.36 | 30.15 | 19.26 | 7.04 | 3.00 | 2.56 | 2.61 | 2.91 | 3.17 | 3.23 | 2.48 | 1.65 | 8.55 | 10.81 | 9.54 | 9.57 | 8.02 | 5.83 | 5.23 | 4.01 | |
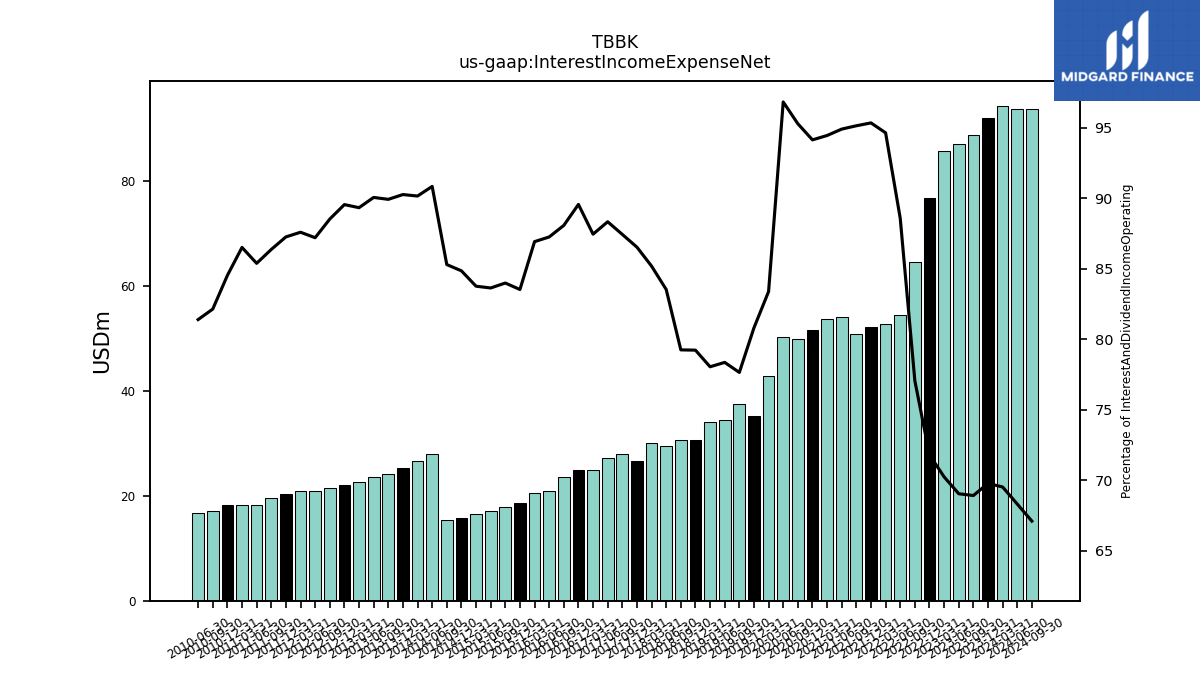
| Interest Income Expense Net | 92.16 | 88.88 | 87.19 | 85.82 | 76.76 | 64.66 | 54.57 | 52.85 | 52.16 | 50.89 | 54.07 | 53.76 | 51.71 | 50.00 | 50.25 | 42.91 | 37.56 | 34.54 | 34.01 | 30.63 | 29.53 | 30.07 | 27.90 | |
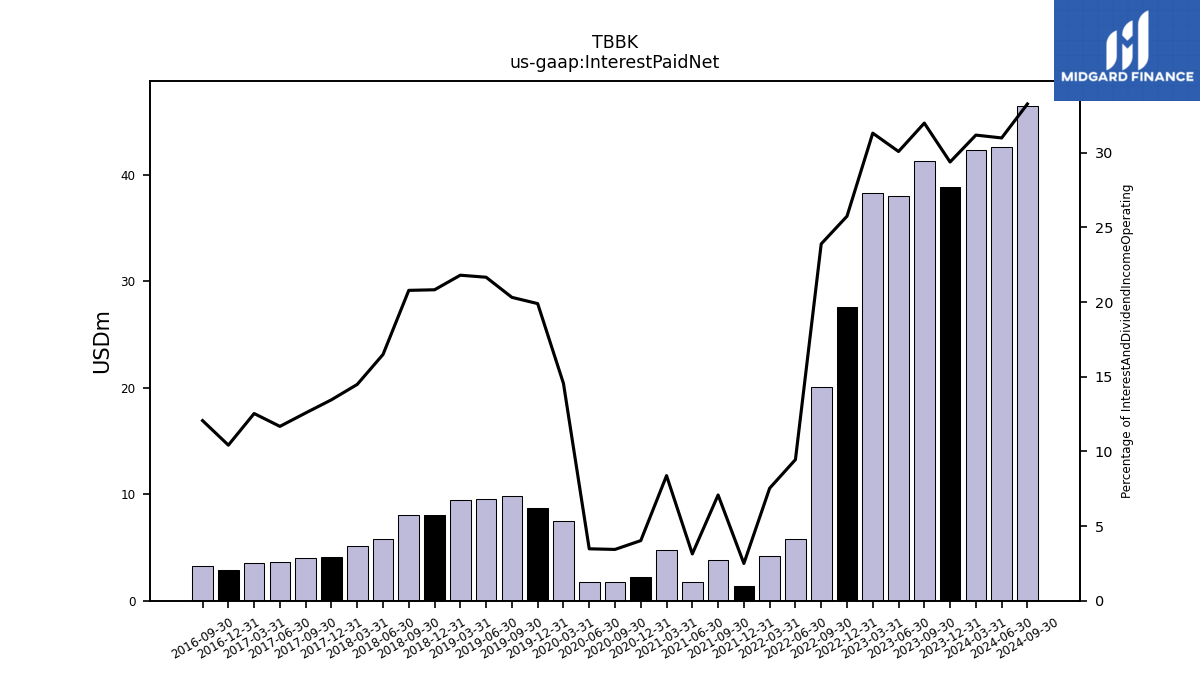
| Interest Paid Net | 38.80 | 41.24 | 37.98 | 38.25 | 27.52 | 20.05 | 5.82 | 4.21 | 1.37 | 3.79 | 1.79 | 4.77 | 2.21 | 1.80 | 1.80 | 7.49 | 9.83 | 9.55 | 9.50 | 8.03 | 5.83 | 5.11 | 4.01 | |
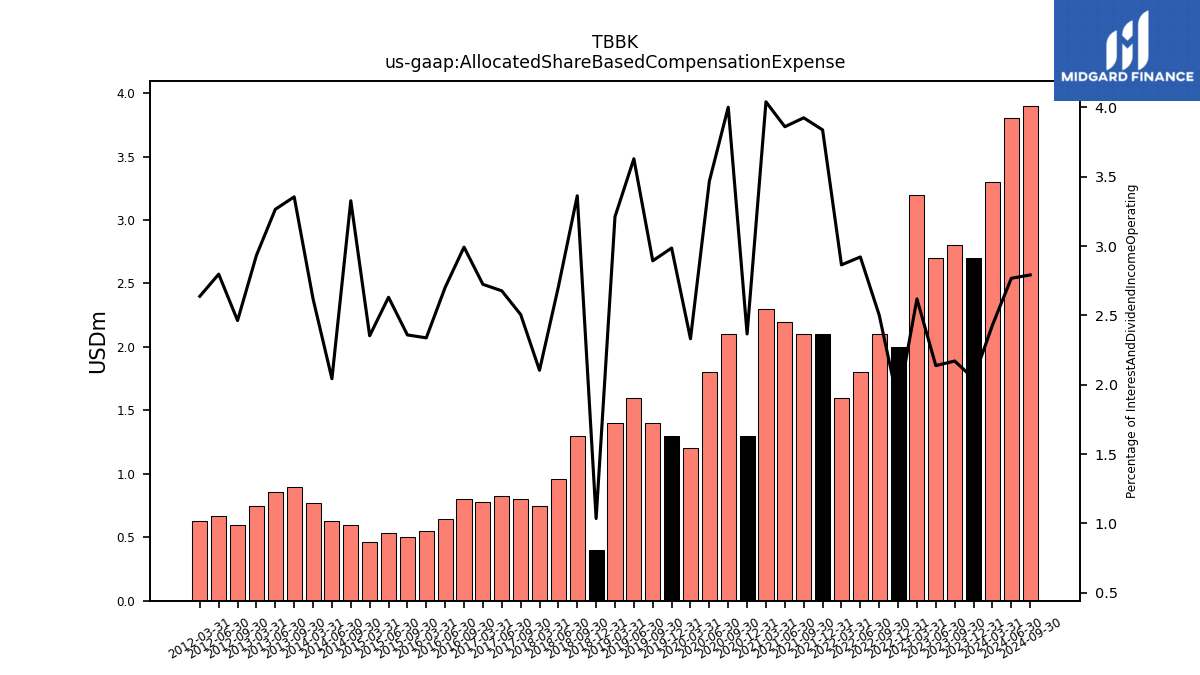
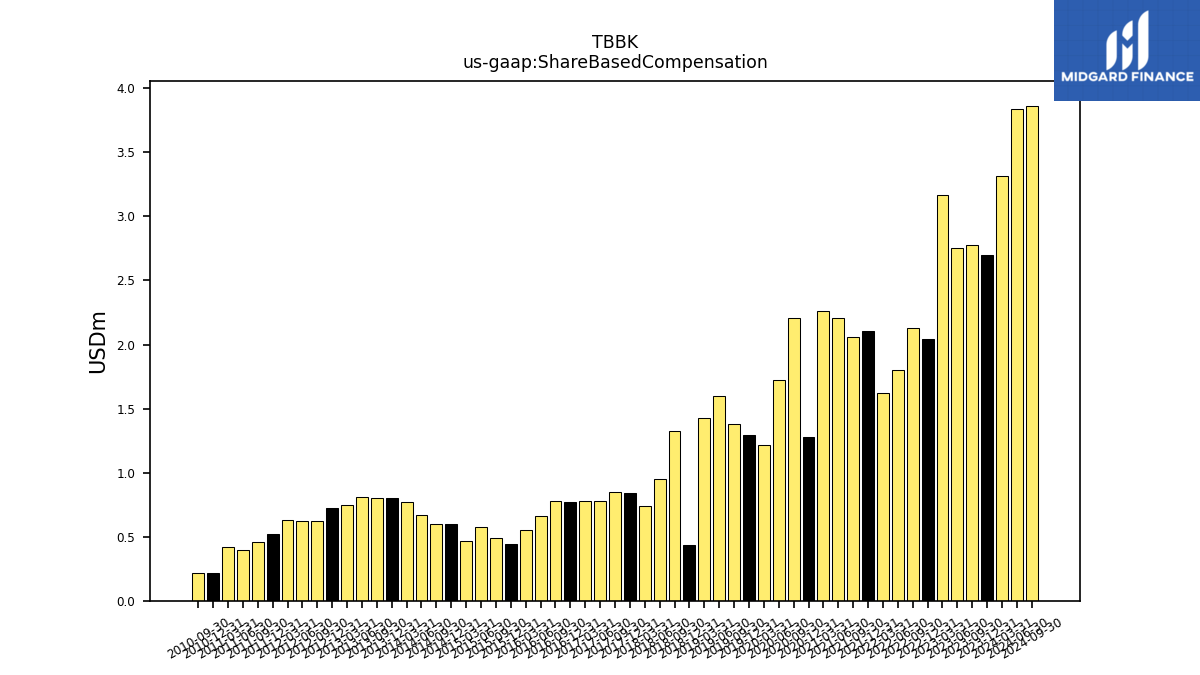
| Allocated Share Based Compensation Expense | 2.70 | 2.80 | 2.70 | 3.20 | 2.00 | 2.10 | 1.80 | 1.60 | 2.10 | 2.10 | 2.20 | 2.30 | 1.30 | 2.10 | 1.80 | 1.20 | 1.40 | 1.60 | 1.40 | 1.30 | 0.96 | 0.74 | 0.80 | |
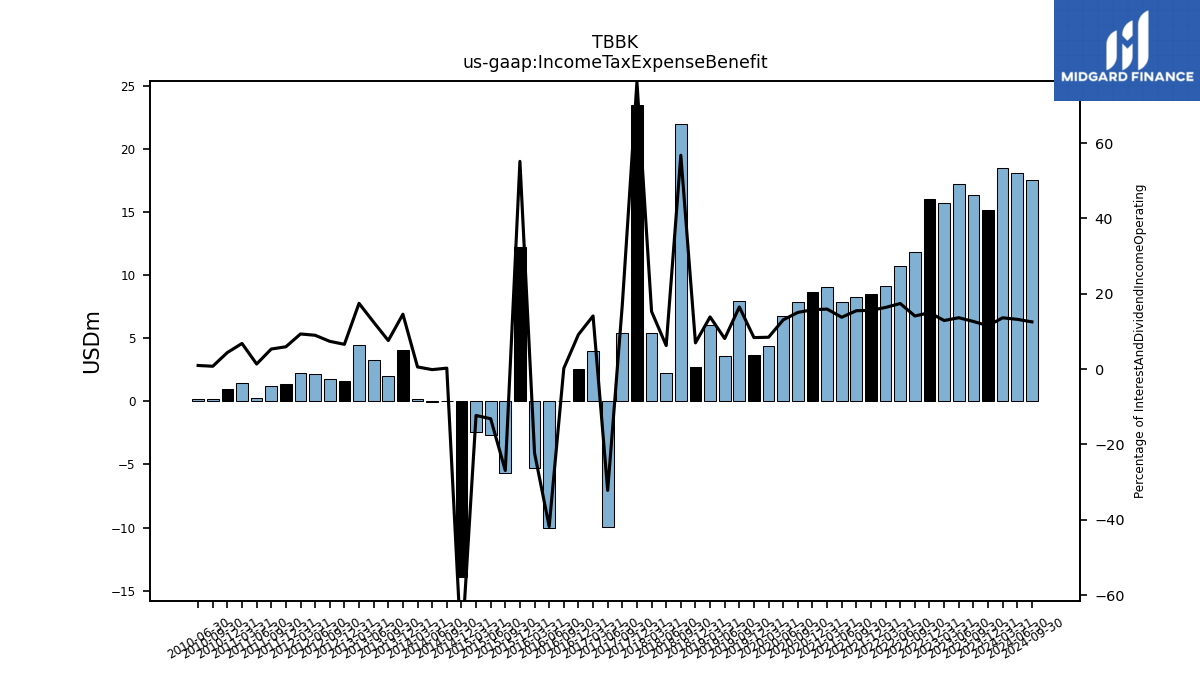
| Income Tax Expense Benefit | 15.20 | 16.31 | 17.22 | 15.75 | 16.01 | 11.83 | 10.72 | 9.14 | 8.53 | 8.29 | 7.84 | 9.07 | 8.65 | 7.89 | 6.79 | 4.35 | 7.97 | 3.58 | 6.04 | 21.94 | 2.21 | 5.40 | 5.46 | |
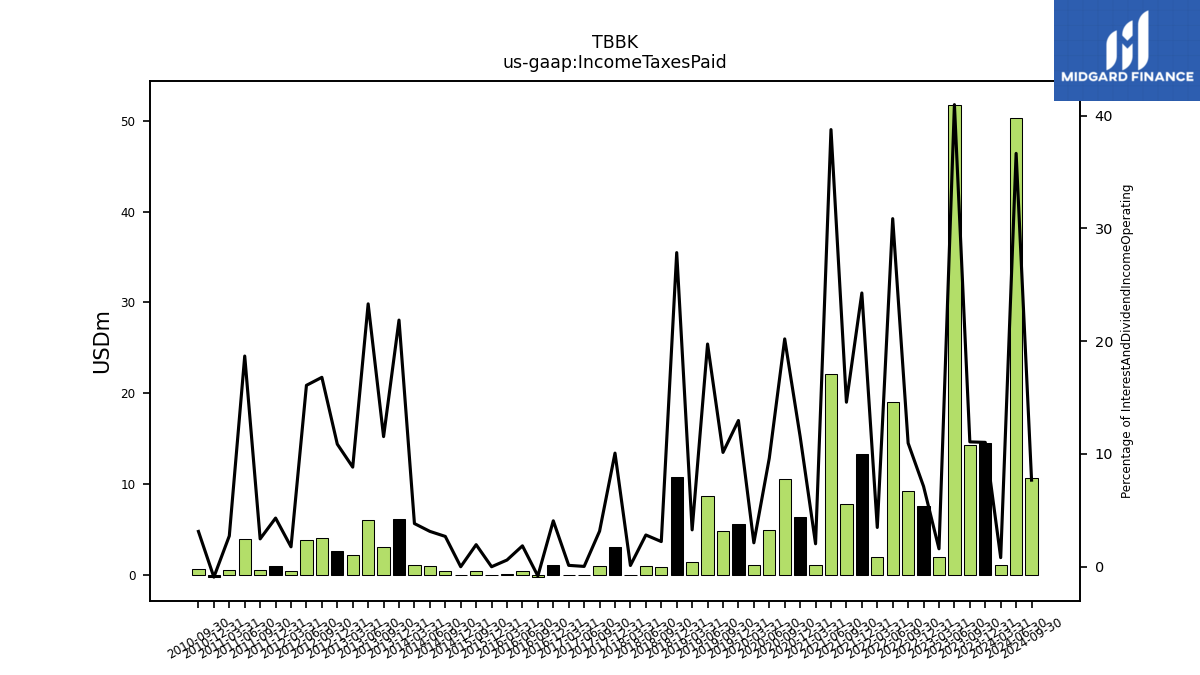
| Income Taxes Paid | 14.57 | 14.28 | 51.76 | 1.94 | 7.62 | 9.20 | 19.02 | 1.95 | 13.28 | 7.81 | 22.09 | 1.16 | 6.35 | 10.60 | 5.00 | 1.09 | 4.91 | 8.71 | 1.43 | 0.86 | 1.00 | 0.04 | 1.01 | |
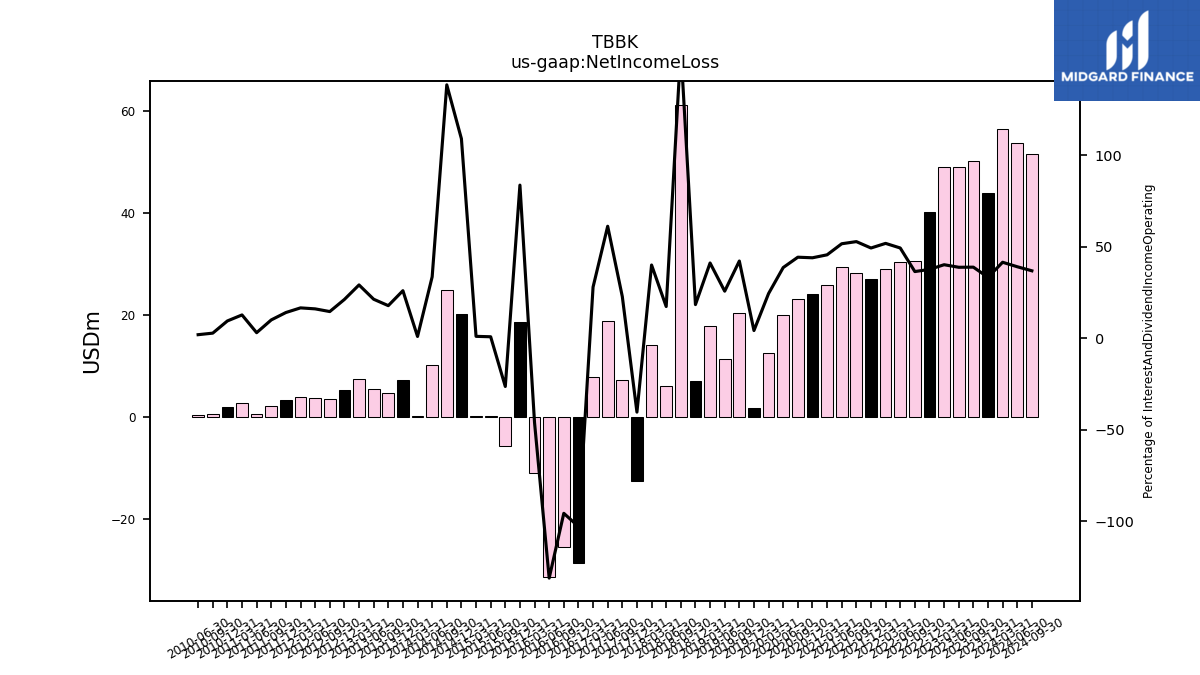
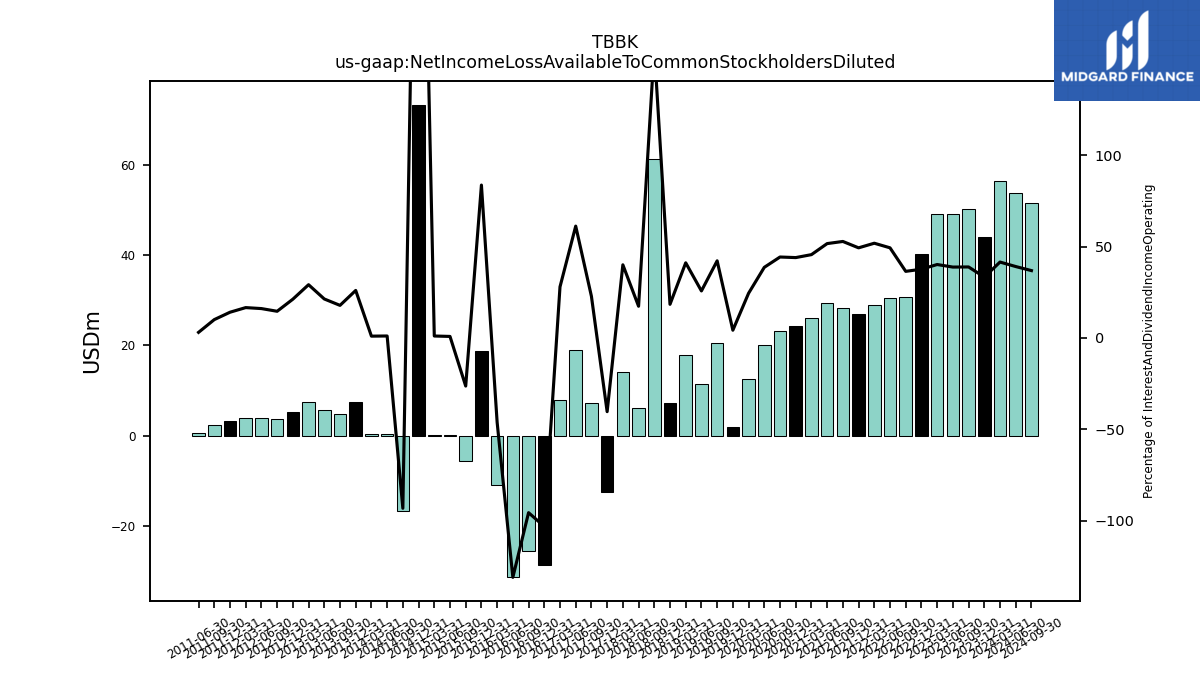
| Net Income Loss | 44.03 | 50.14 | 49.01 | 49.12 | 40.24 | 30.60 | 30.40 | 28.97 | 26.99 | 28.26 | 29.43 | 25.96 | 24.17 | 23.25 | 20.07 | 12.59 | 20.43 | 11.35 | 17.93 | 61.28 | 6.14 | 14.14 | 7.28 | |
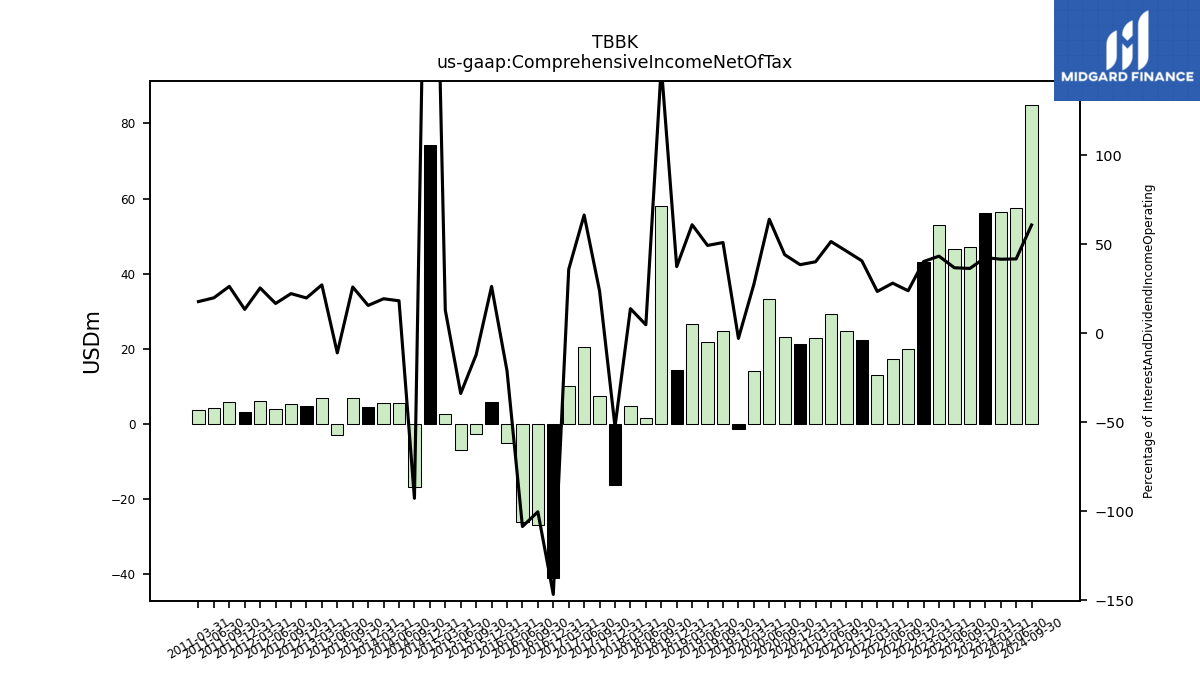
| Comprehensive Income Net Of Tax | 56.15 | 46.99 | 46.51 | 52.94 | 43.09 | 20.07 | 17.36 | 13.14 | 22.28 | 24.71 | 29.38 | 22.87 | 21.18 | 23.17 | 33.25 | 14.14 | 24.66 | 21.76 | 26.58 | 58.00 | 1.71 | 4.89 | 7.59 | |
| Net Income Loss Available To Common Stockholders Diluted | 44.03 | 50.14 | 49.01 | 49.12 | 40.24 | 30.60 | 30.40 | 28.97 | 26.99 | 28.26 | 29.43 | 25.96 | 24.17 | 23.25 | 20.07 | 12.59 | 20.43 | 11.35 | 17.93 | 61.28 | 6.14 | 14.14 | 7.28 | |
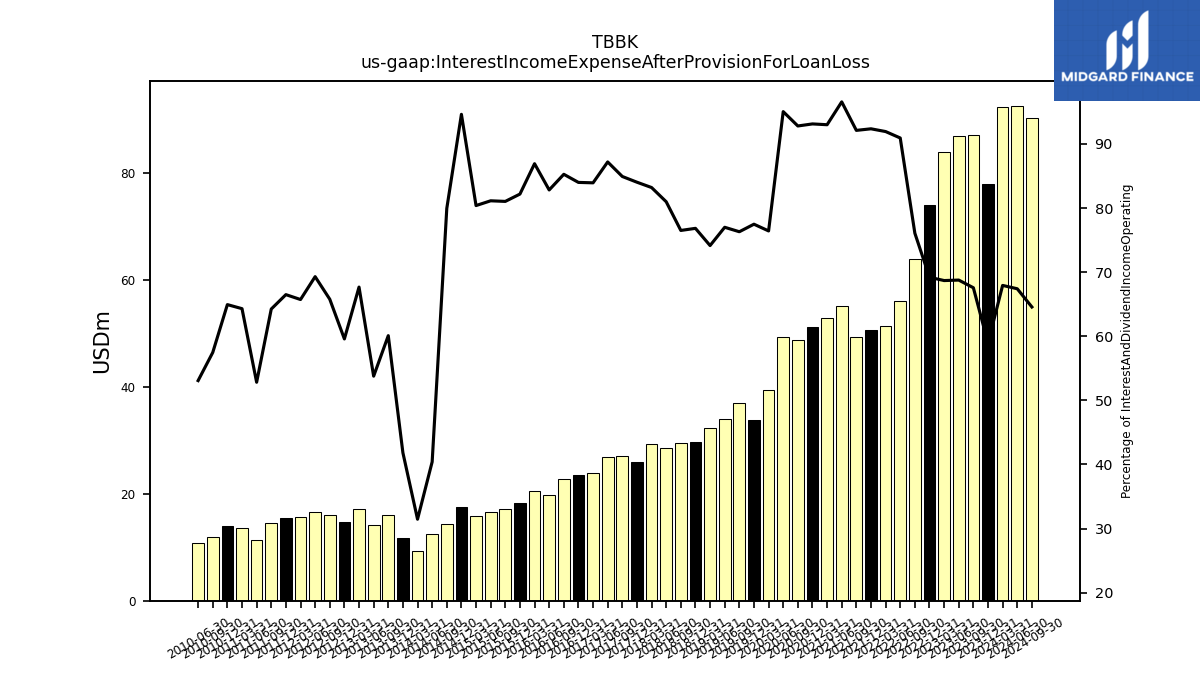
| Interest Income Expense After Provision For Loan Loss | 77.84 | 87.13 | 86.83 | 83.91 | 73.98 | 63.84 | 56.02 | 51.35 | 50.53 | 49.28 | 55.02 | 52.94 | 51.16 | 48.70 | 49.32 | 39.33 | 36.91 | 33.94 | 32.31 | 29.57 | 28.63 | 29.37 | 27.10 | |
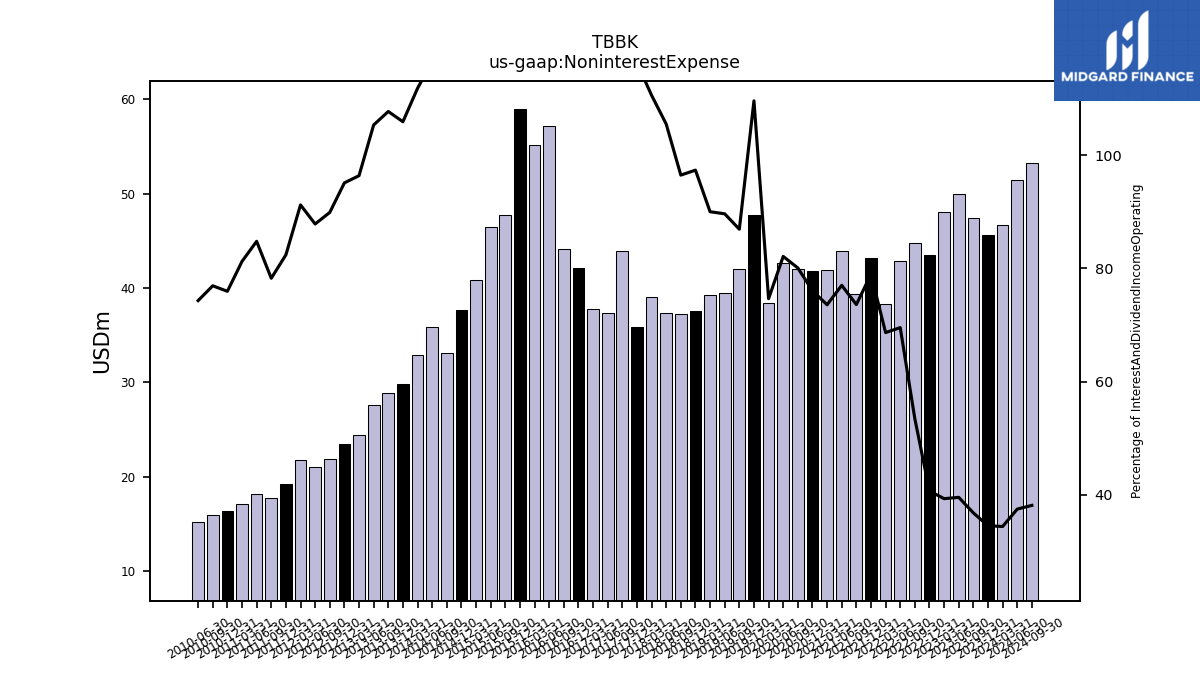
| Noninterest Expense | 45.61 | 47.46 | 49.94 | 48.03 | 43.48 | 44.83 | 42.84 | 38.35 | 43.20 | 39.38 | 43.88 | 41.88 | 41.78 | 42.03 | 42.62 | 38.42 | 42.05 | 39.52 | 39.23 | 37.30 | 37.31 | 39.05 | 43.88 | |
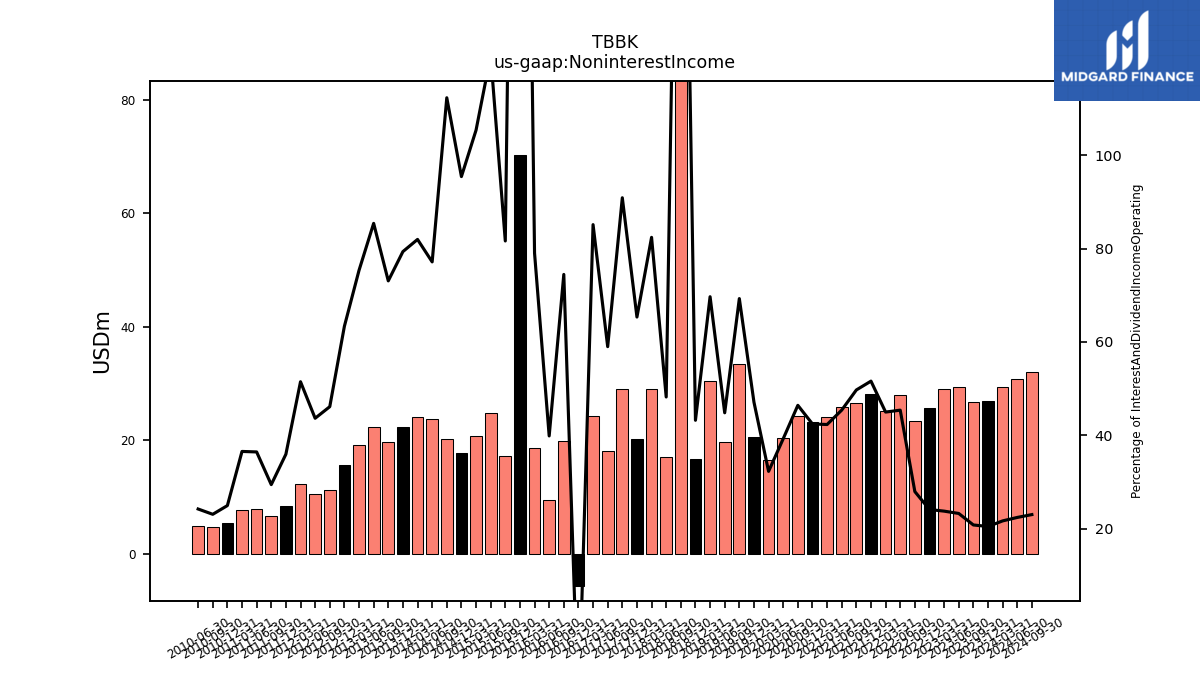
| Noninterest Income | 26.99 | 26.78 | 29.34 | 28.99 | 25.74 | 23.43 | 27.95 | 25.11 | 28.23 | 26.59 | 25.86 | 24.07 | 23.30 | 24.35 | 20.37 | 16.60 | 33.52 | 19.75 | 30.36 | 90.97 | 17.04 | 29.09 | 29.01 |
| 2023-12-31 | 2023-09-30 | 2023-06-30 | 2023-03-31 | 2022-12-31 | 2022-09-30 | 2022-06-30 | 2022-03-31 | 2021-12-31 | 2021-09-30 | 2021-06-30 | 2021-03-31 | 2020-12-31 | 2020-09-30 | 2020-06-30 | 2020-03-31 | 2019-09-30 | 2019-06-30 | 2019-03-31 | 2018-09-30 | 2018-06-30 | 2018-03-31 | 2017-09-30 | ||
|---|---|---|---|---|---|---|---|---|---|---|---|---|---|---|---|---|---|---|---|---|---|---|---|---|
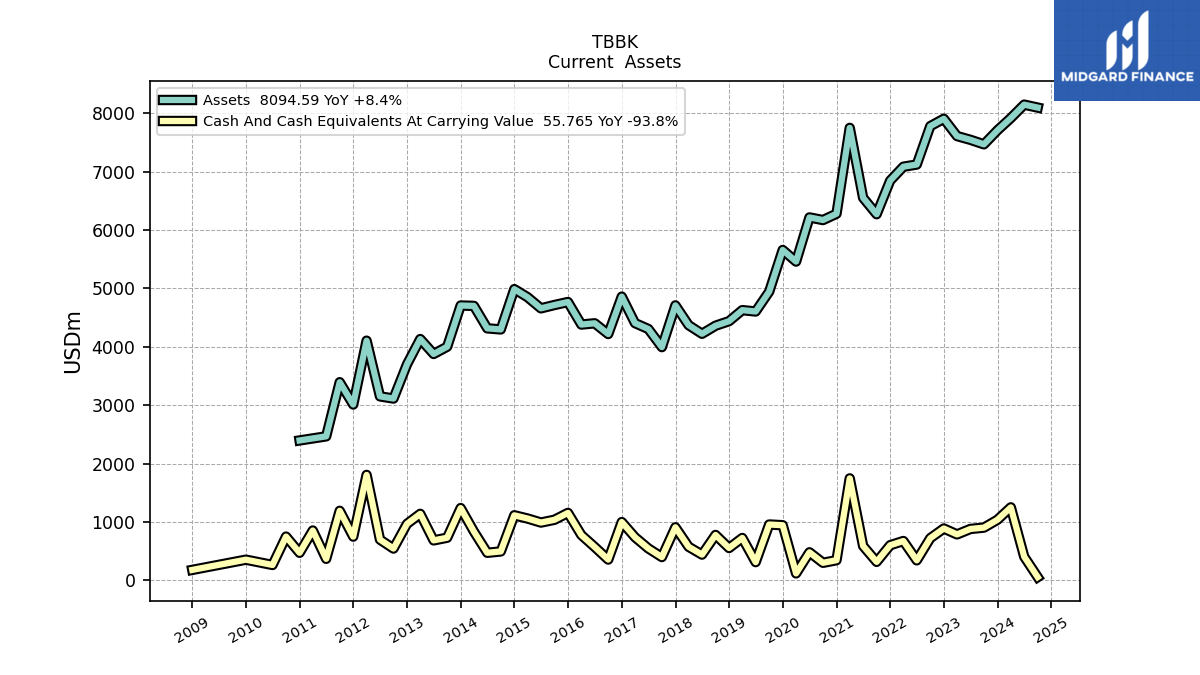
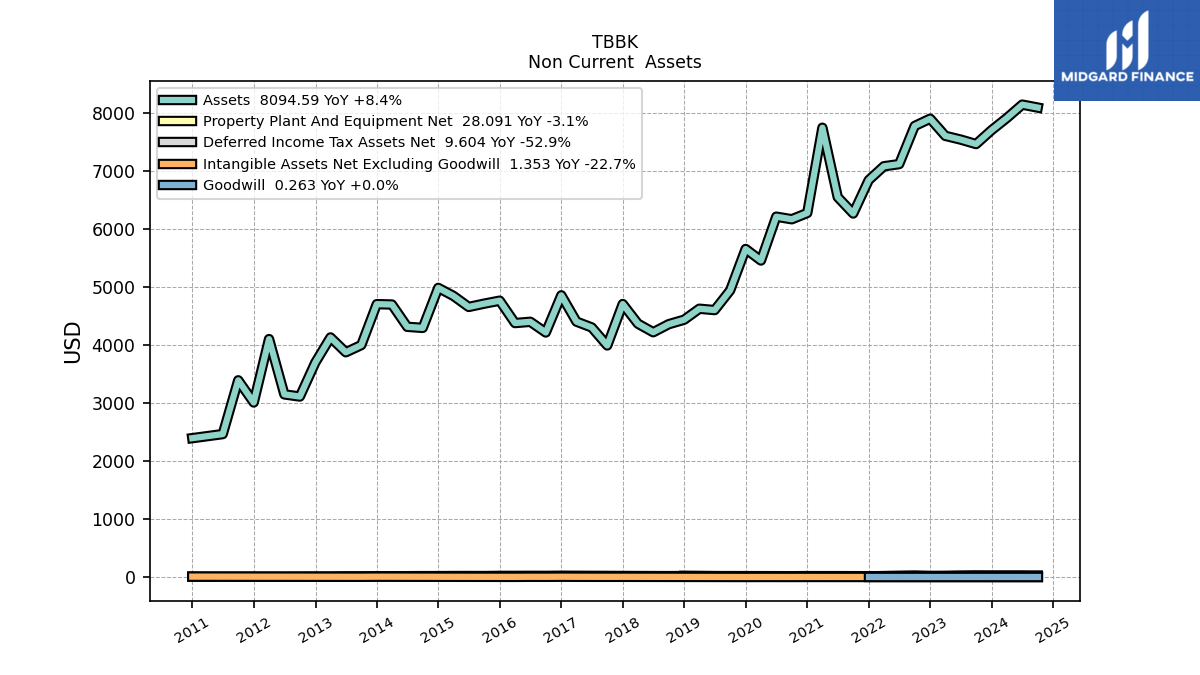
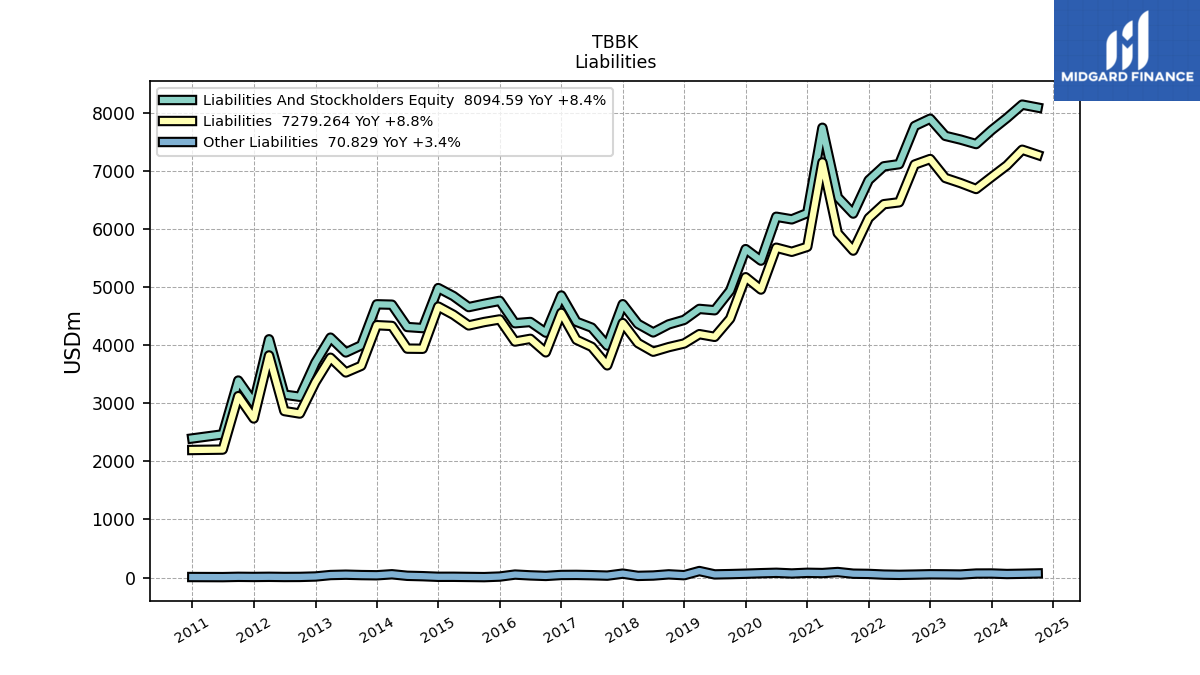
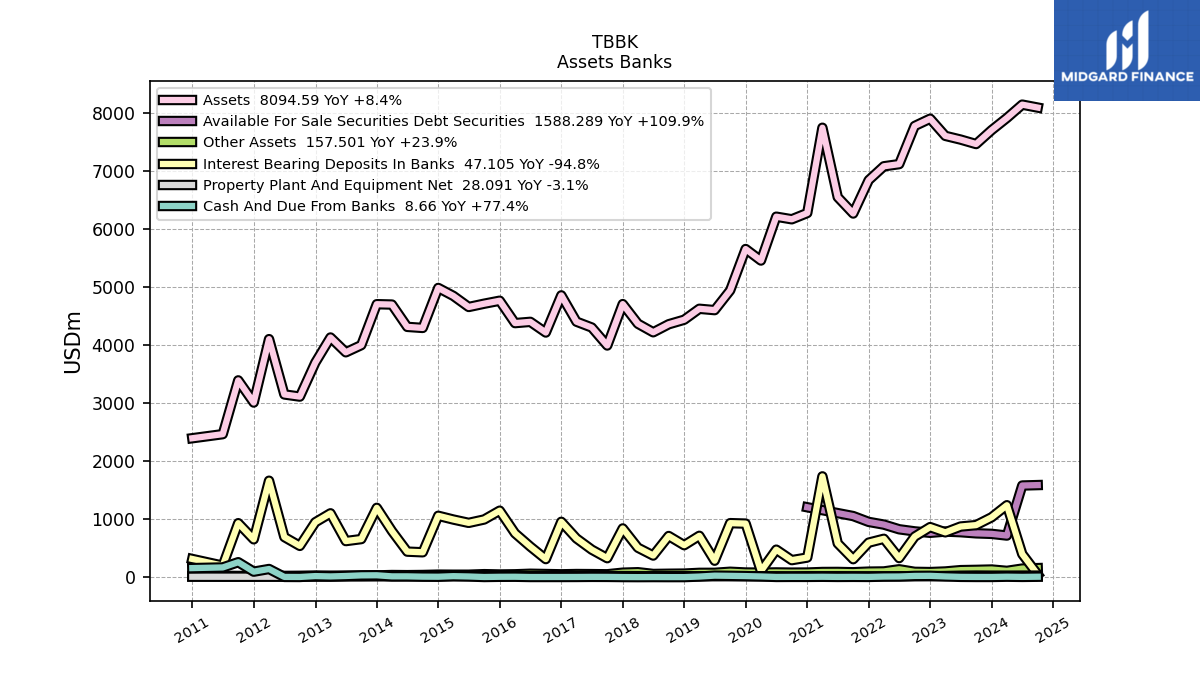
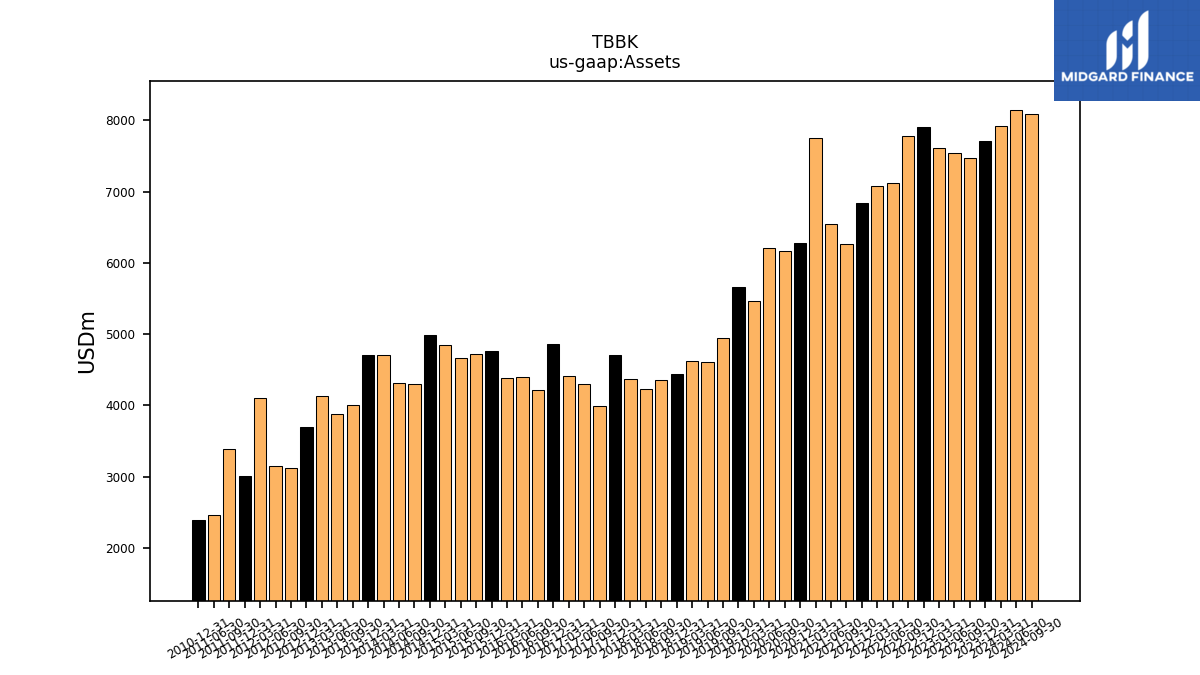
| Assets | 7705.69 | 7465.77 | 7542.91 | 7606.96 | 7903.00 | 7777.07 | 7119.73 | 7082.66 | 6843.24 | 6268.46 | 6550.61 | 7747.34 | 6276.84 | 6169.30 | 6214.04 | 5458.11 | 4943.54 | 4603.57 | 4626.98 | 4360.20 | 4221.87 | 4369.10 | 3993.62 | |
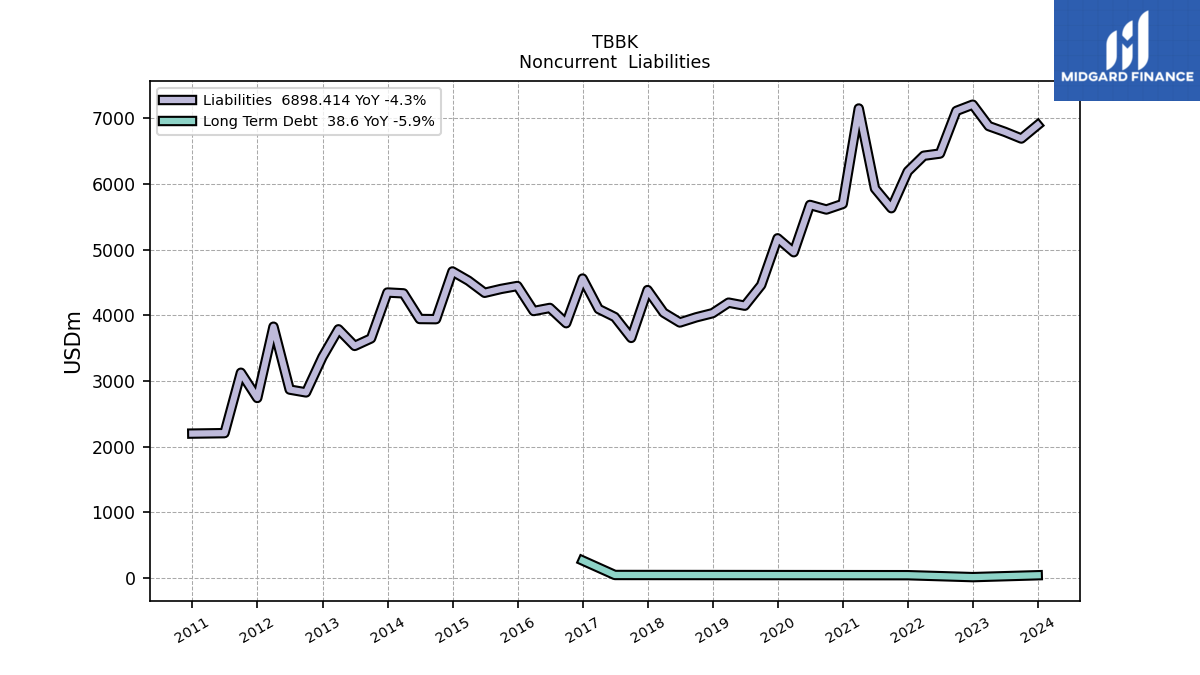
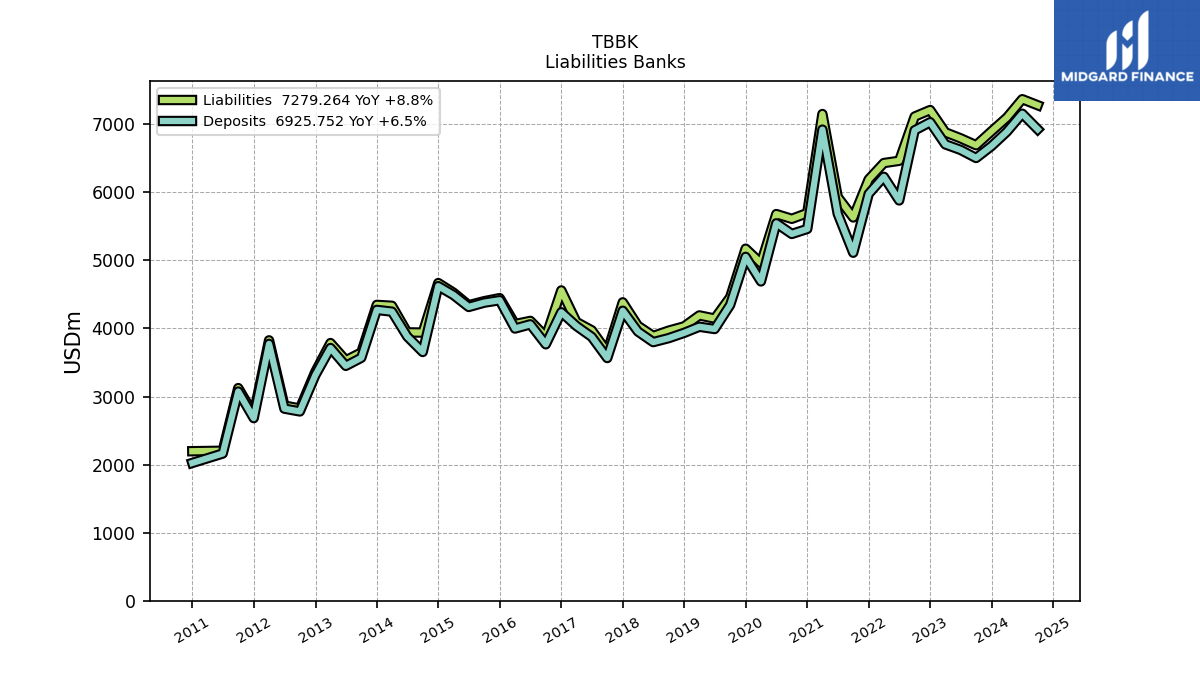
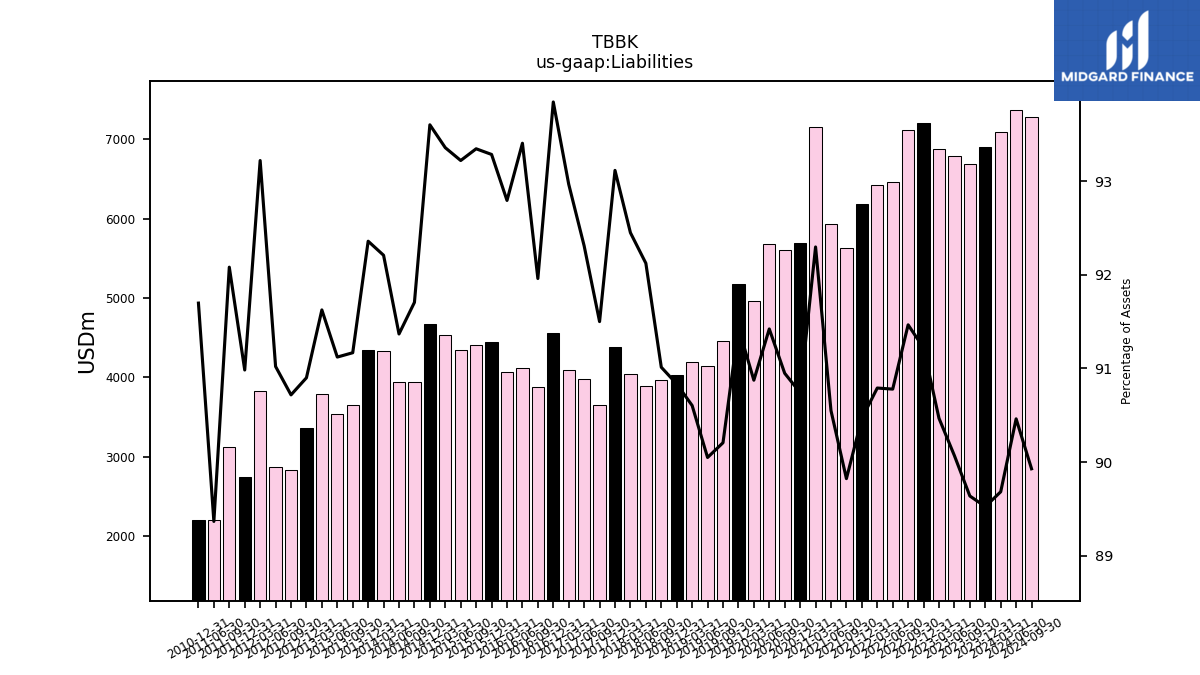
| Liabilities | 6898.41 | 6692.08 | 6793.74 | 6881.81 | 7208.97 | 7113.34 | 6463.20 | 6430.36 | 6190.78 | 5630.49 | 5931.50 | 7150.58 | 5695.68 | 5610.84 | 5680.96 | 4960.00 | 4459.36 | 4145.44 | 4192.20 | 3968.33 | 3889.33 | 4039.21 | 3654.16 | |
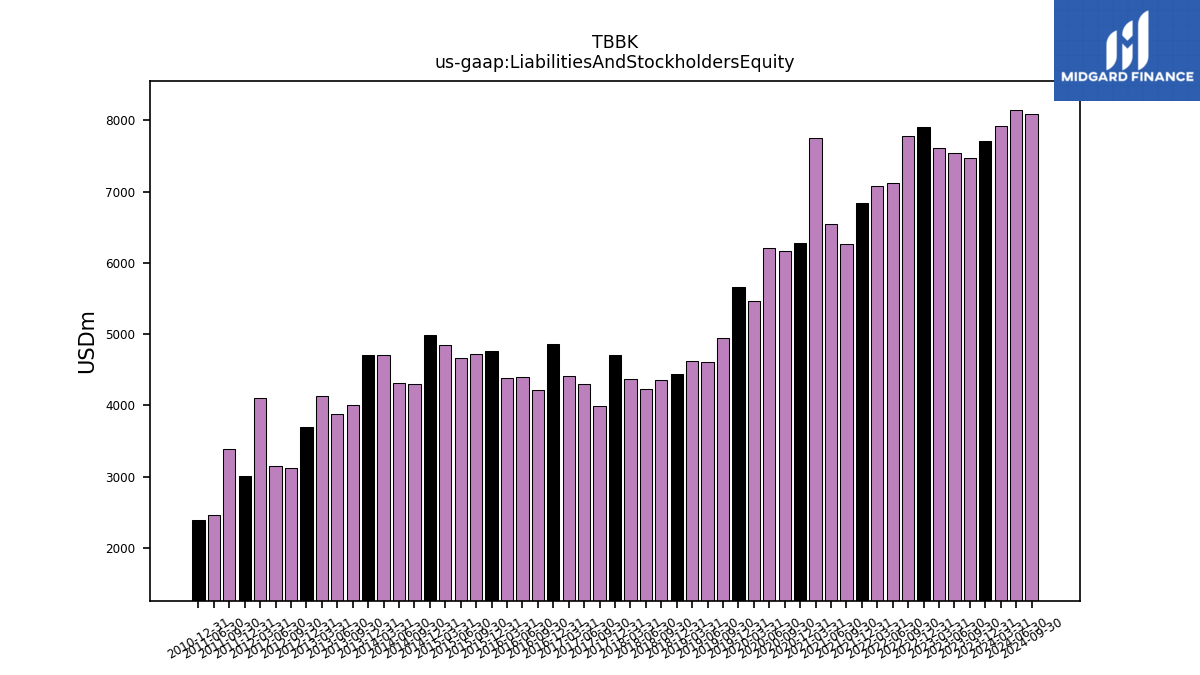
| Liabilities And Stockholders Equity | 7705.69 | 7465.77 | 7542.91 | 7606.96 | 7903.00 | 7777.07 | 7119.73 | 7082.66 | 6843.24 | 6268.46 | 6550.61 | 7747.34 | 6276.84 | 6169.30 | 6214.04 | 5458.11 | 4943.54 | 4603.57 | 4626.98 | 4360.20 | 4221.87 | 4369.10 | 3993.62 | |
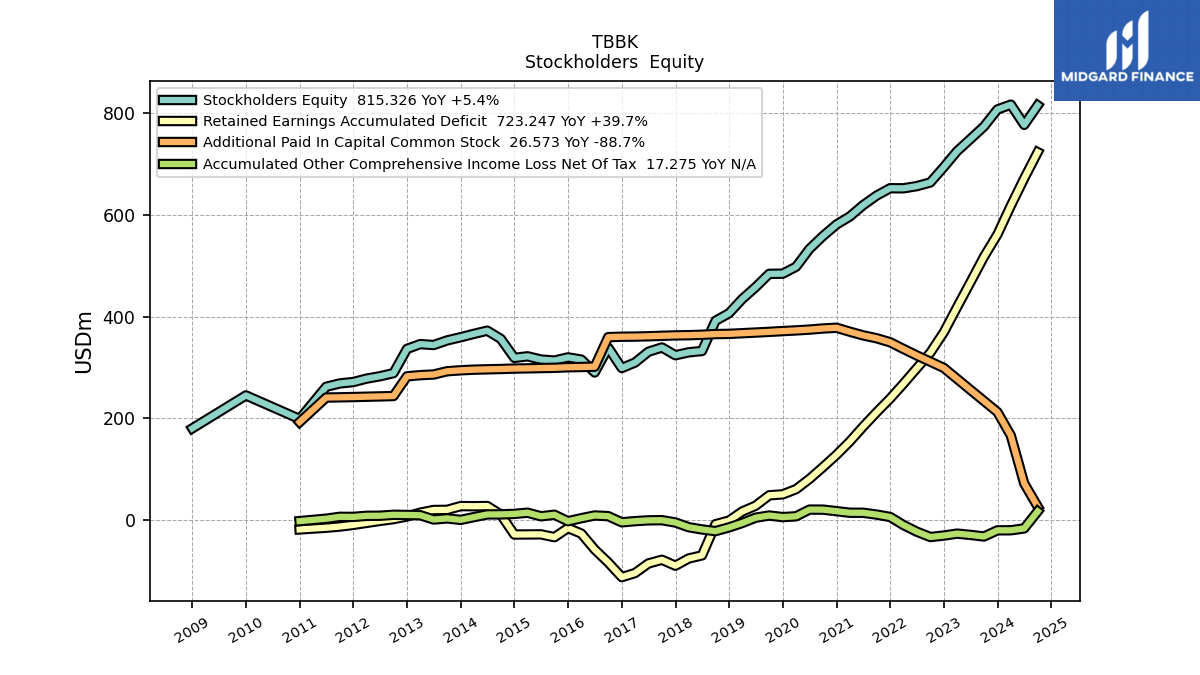
| Stockholders Equity | 807.28 | 773.69 | 749.17 | 725.15 | 694.03 | 663.74 | 656.54 | 652.29 | 652.45 | 637.98 | 619.11 | 596.76 | 581.16 | 558.46 | 533.08 | 498.10 | 484.17 | 458.13 | 434.78 | 391.87 | 332.55 | 329.89 | 339.46 |
| 2023-12-31 | 2023-09-30 | 2023-06-30 | 2023-03-31 | 2022-12-31 | 2022-09-30 | 2022-06-30 | 2022-03-31 | 2021-12-31 | 2021-09-30 | 2021-06-30 | 2021-03-31 | 2020-12-31 | 2020-09-30 | 2020-06-30 | 2020-03-31 | 2019-09-30 | 2019-06-30 | 2019-03-31 | 2018-09-30 | 2018-06-30 | 2018-03-31 | 2017-09-30 | ||
|---|---|---|---|---|---|---|---|---|---|---|---|---|---|---|---|---|---|---|---|---|---|---|---|---|
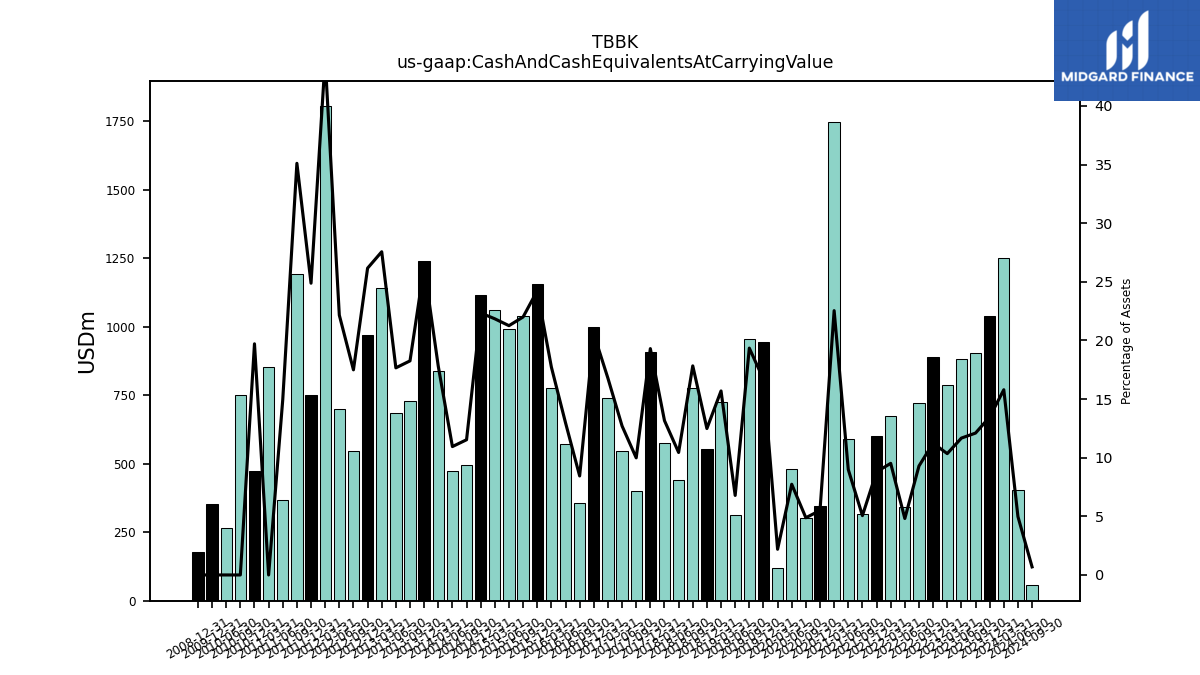
| Cash And Cash Equivalents At Carrying Value | 1038.09 | 903.41 | 880.55 | 787.18 | 888.19 | 722.71 | 342.87 | 674.23 | 601.78 | 317.33 | 588.97 | 1746.59 | 345.51 | 300.98 | 480.72 | 119.59 | 956.51 | 312.27 | 726.19 | 777.58 | 441.05 | 575.16 | 398.93 | |
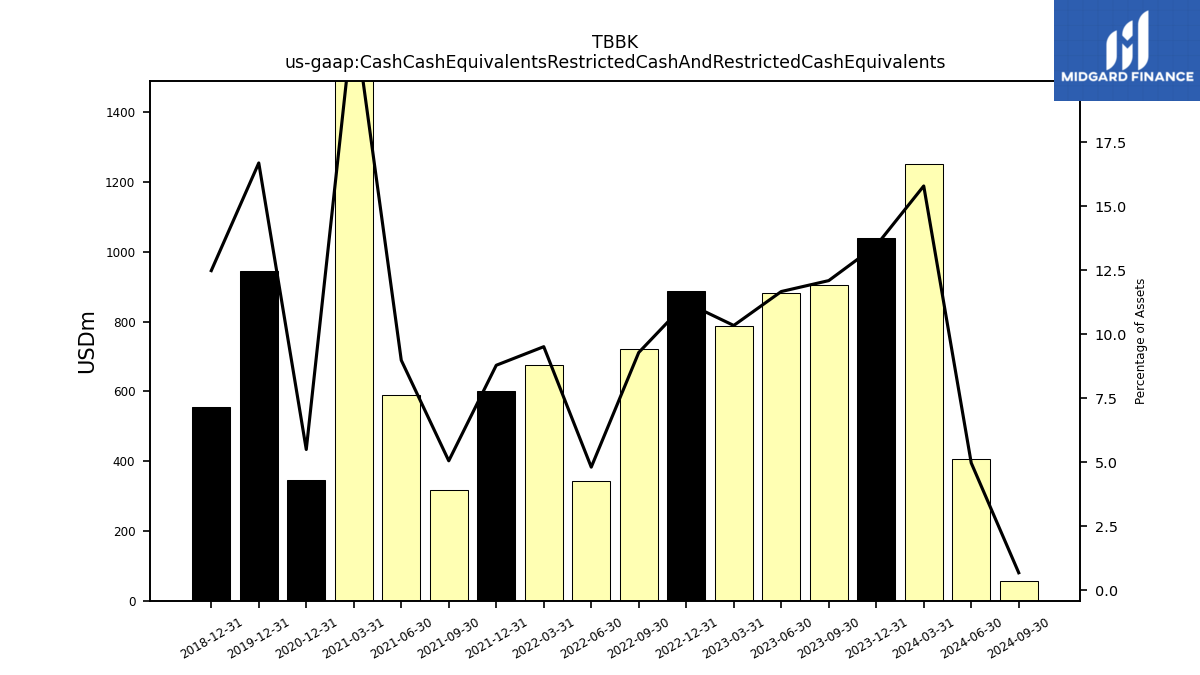
| Cash Cash Equivalents Restricted Cash And Restricted Cash Equivalents | 1038.09 | 903.41 | 880.55 | 787.18 | 888.19 | 722.71 | 342.87 | 674.23 | 601.78 | 317.33 | 588.97 | 1746.59 | 345.51 | NA | NA | NA | NA | NA | NA | NA | NA | NA | NA | |
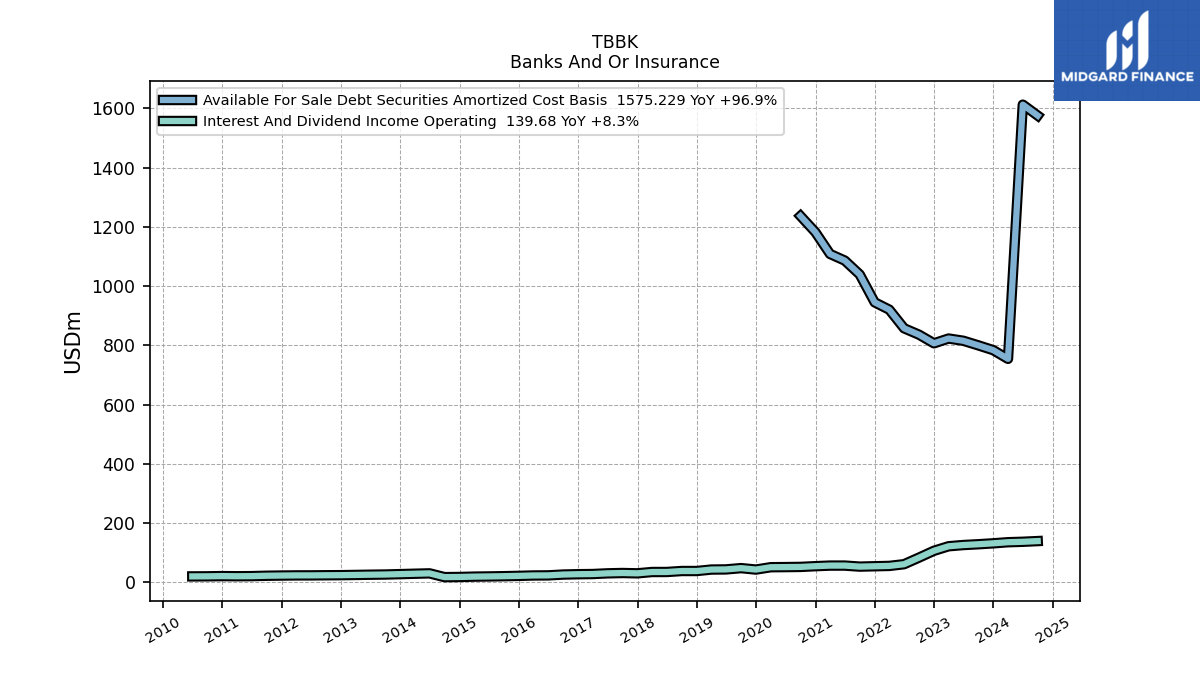
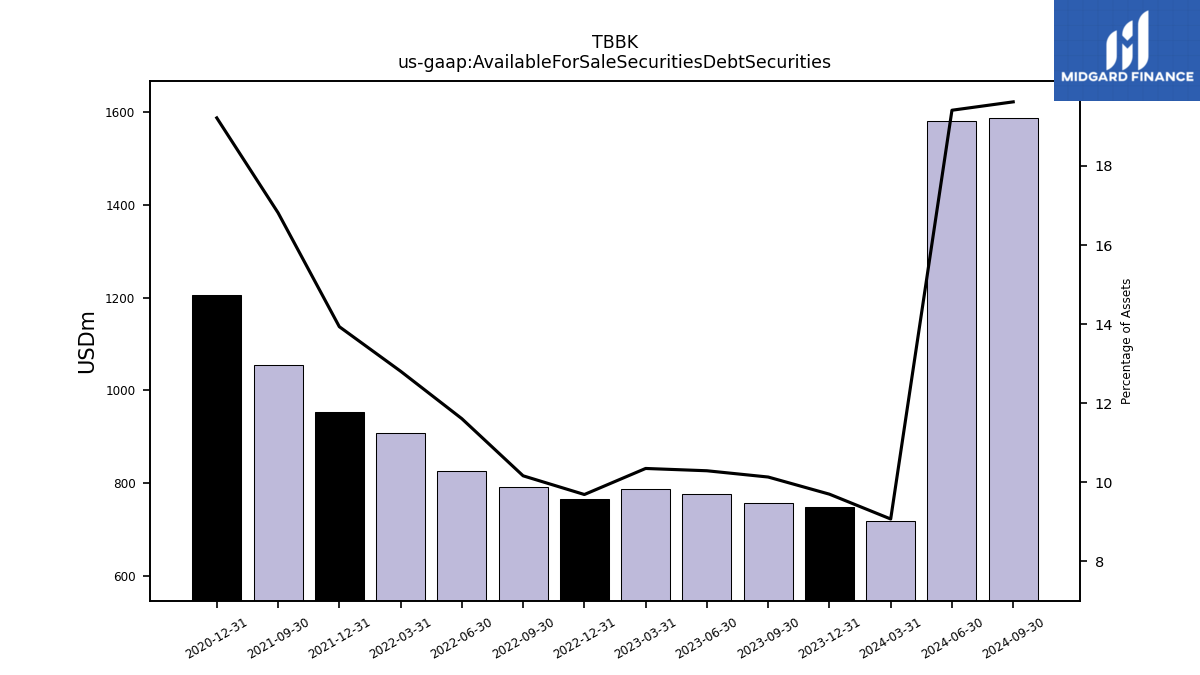
| Available For Sale Securities Debt Securities | 747.53 | 756.64 | 776.41 | 787.43 | 766.02 | 790.59 | 826.62 | 907.34 | 953.71 | 1054.22 | NA | NA | 1206.16 | NA | NA | NA | NA | NA | NA | NA | NA | NA | NA |
| 2023-12-31 | 2023-09-30 | 2023-06-30 | 2023-03-31 | 2022-12-31 | 2022-09-30 | 2022-06-30 | 2022-03-31 | 2021-12-31 | 2021-09-30 | 2021-06-30 | 2021-03-31 | 2020-12-31 | 2020-09-30 | 2020-06-30 | 2020-03-31 | 2019-09-30 | 2019-06-30 | 2019-03-31 | 2018-09-30 | 2018-06-30 | 2018-03-31 | 2017-09-30 | ||
|---|---|---|---|---|---|---|---|---|---|---|---|---|---|---|---|---|---|---|---|---|---|---|---|---|
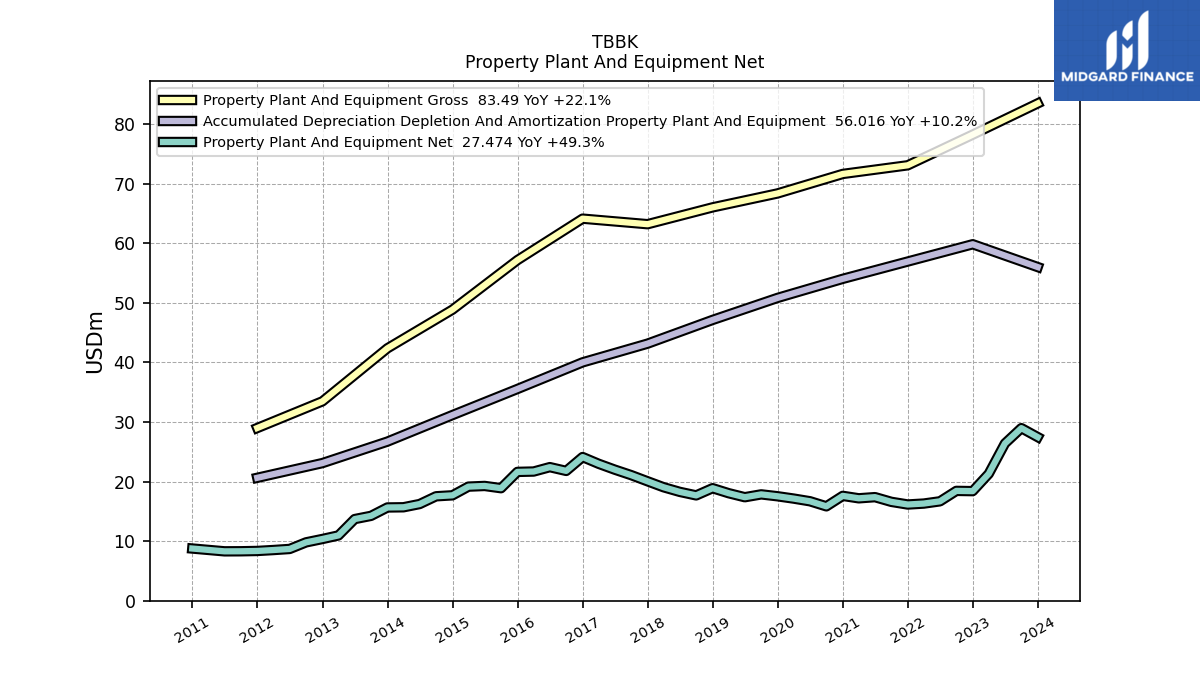
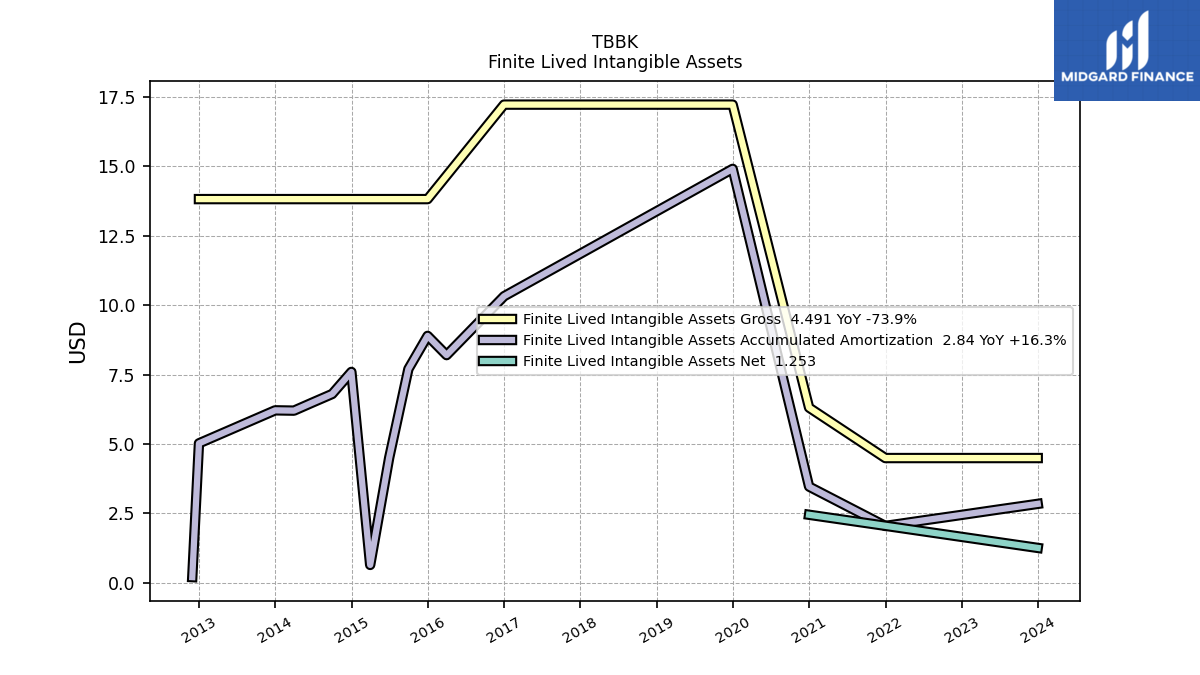
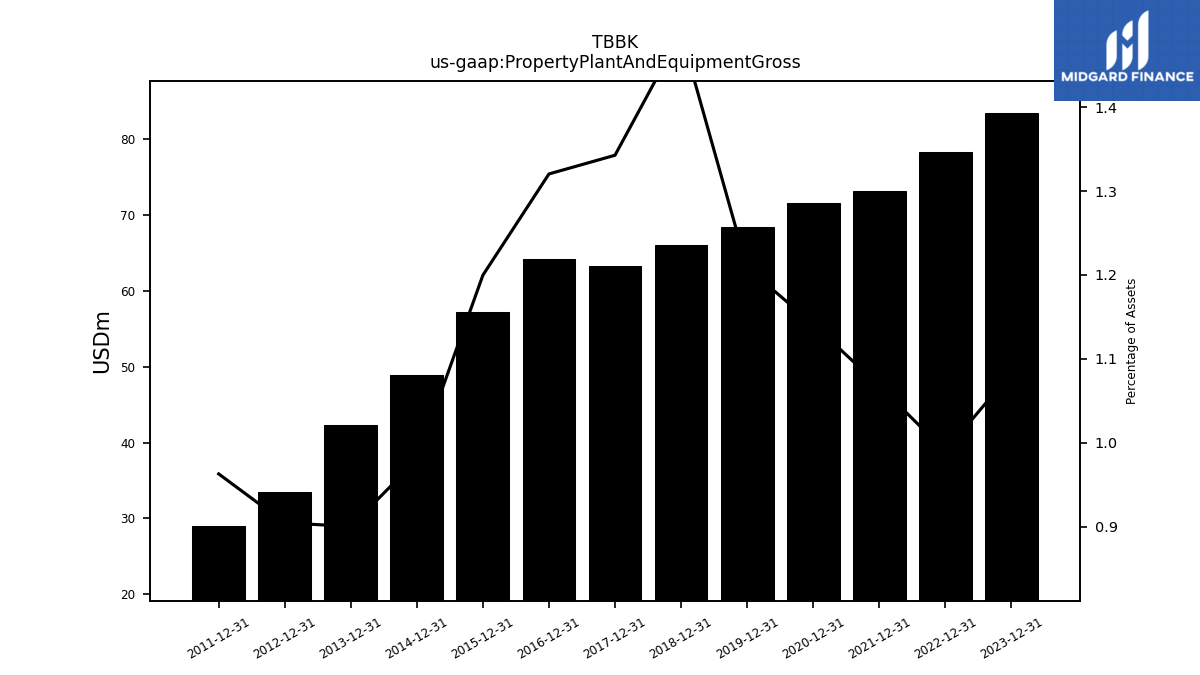
| Property Plant And Equipment Gross | 83.49 | NA | NA | NA | 78.25 | NA | NA | NA | 73.10 | NA | NA | NA | 71.65 | NA | NA | NA | NA | NA | NA | NA | NA | NA | NA | |
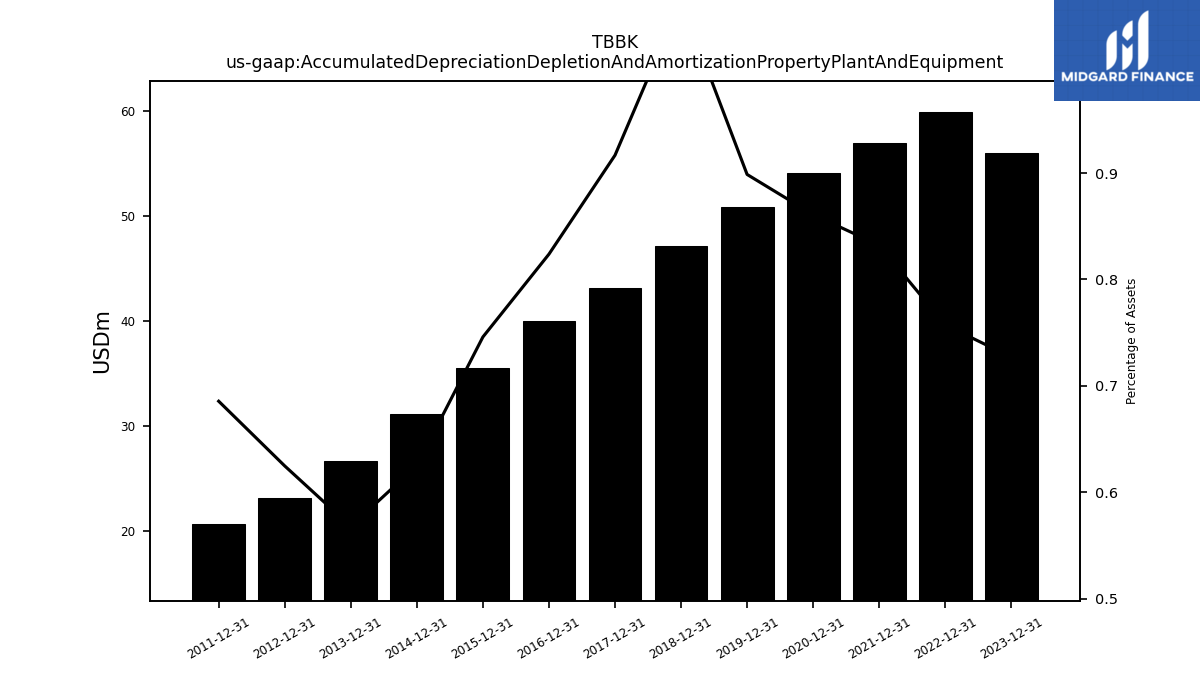
| Accumulated Depreciation Depletion And Amortization Property Plant And Equipment | 56.02 | NA | NA | NA | 59.84 | NA | NA | NA | 56.94 | NA | NA | NA | 54.04 | NA | NA | NA | NA | NA | NA | NA | NA | NA | NA | |
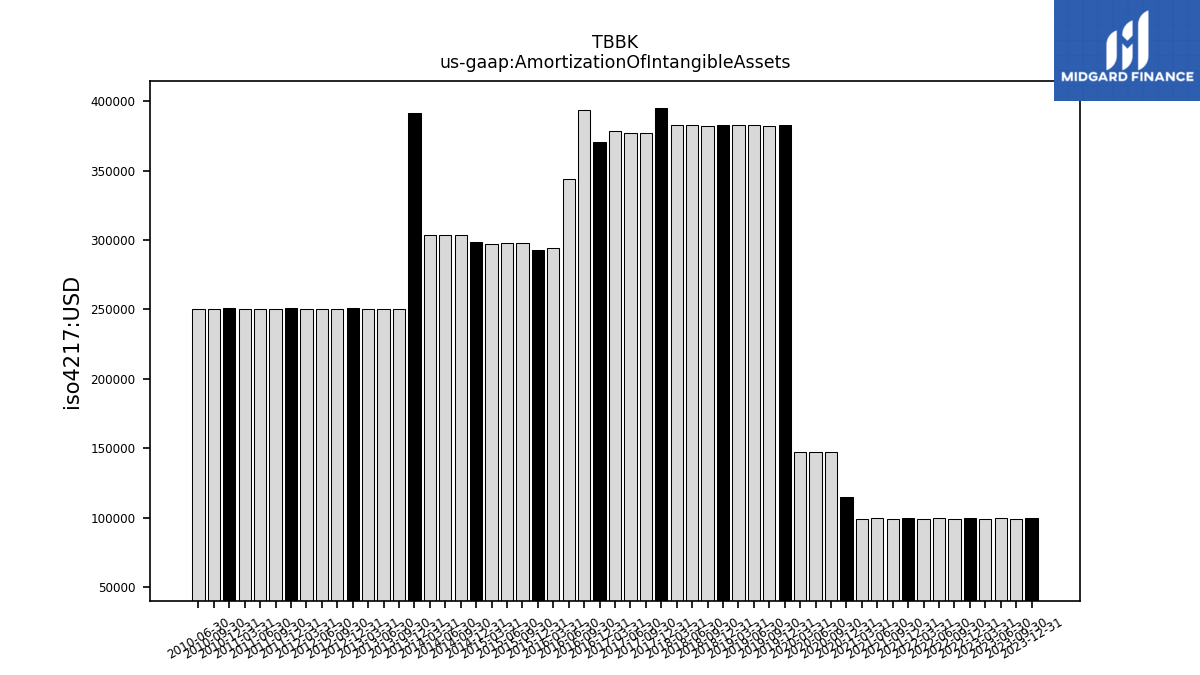
| Amortization Of Intangible Assets | 0.10 | 0.10 | 0.10 | 0.10 | 0.10 | 0.10 | 0.10 | 0.10 | 0.10 | 0.10 | 0.10 | 0.10 | 0.12 | 0.15 | 0.15 | 0.15 | 0.38 | 0.38 | 0.38 | 0.38 | 0.38 | 0.38 | 0.38 | |
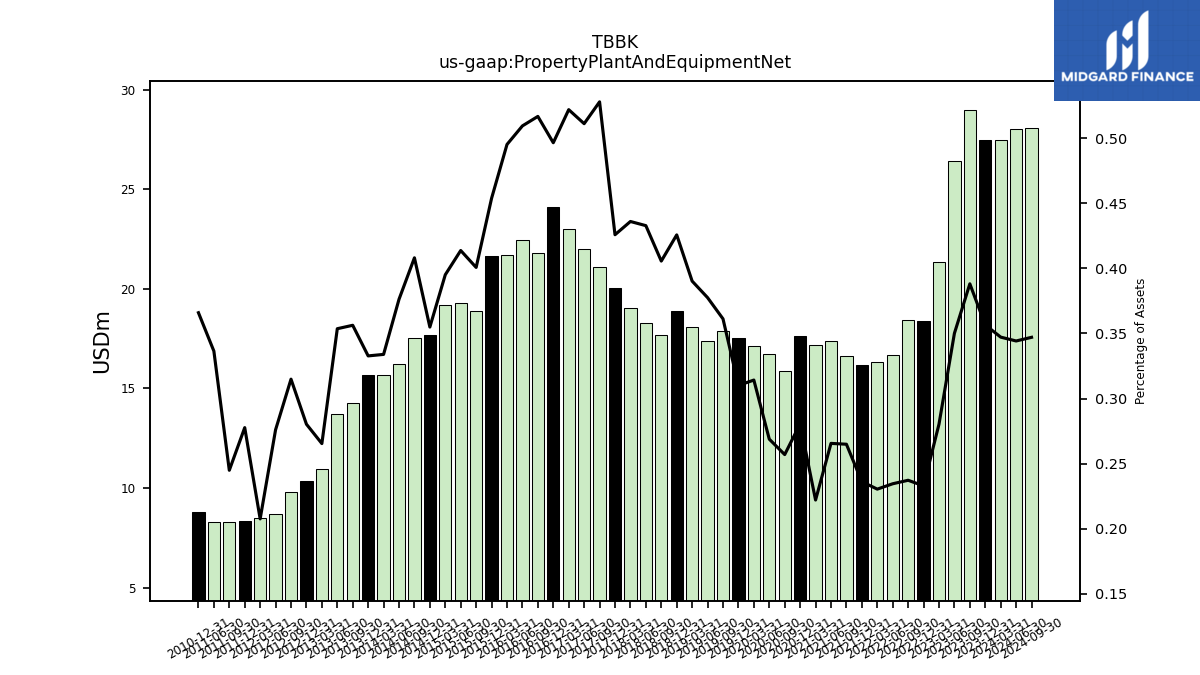
| Property Plant And Equipment Net | 27.47 | 28.98 | 26.41 | 21.32 | 18.40 | 18.44 | 16.69 | 16.31 | 16.16 | 16.60 | 17.39 | 17.20 | 17.61 | 15.85 | 16.70 | 17.15 | 17.86 | 17.38 | 18.06 | 17.69 | 18.27 | 19.05 | 21.09 | |
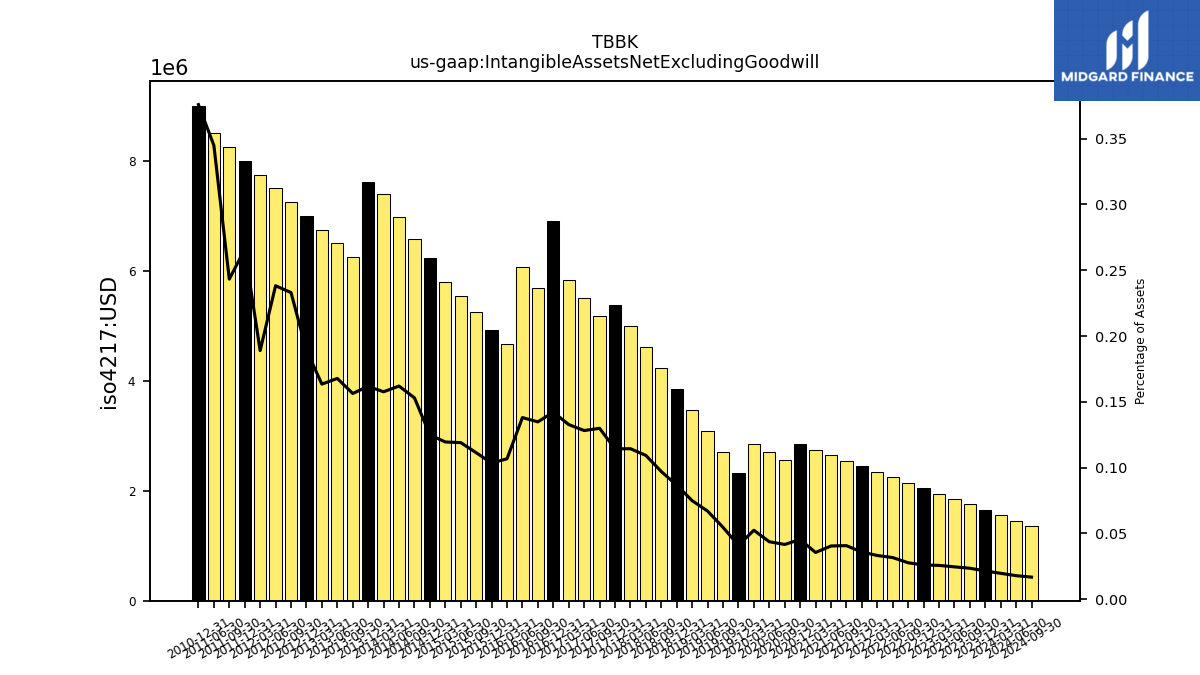
| Intangible Assets Net Excluding Goodwill | 1.65 | 1.75 | 1.85 | 1.95 | 2.05 | 2.15 | 2.25 | 2.35 | 2.45 | 2.55 | 2.65 | 2.75 | 2.85 | 2.56 | 2.71 | 2.86 | 2.70 | 3.08 | 3.46 | 4.23 | 4.61 | 5.00 | 5.18 | |
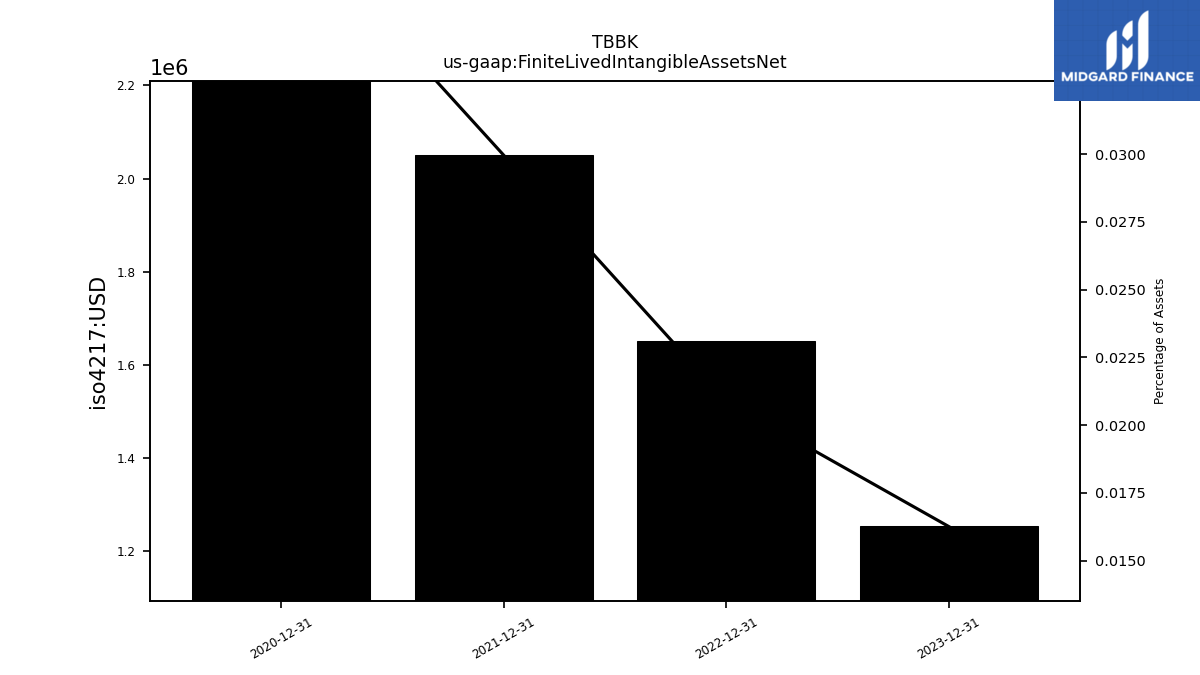
| Finite Lived Intangible Assets Net | 1.25 | NA | NA | NA | 1.65 | NA | NA | NA | 2.05 | NA | NA | NA | 2.45 | NA | NA | NA | NA | NA | NA | NA | NA | NA | NA | |
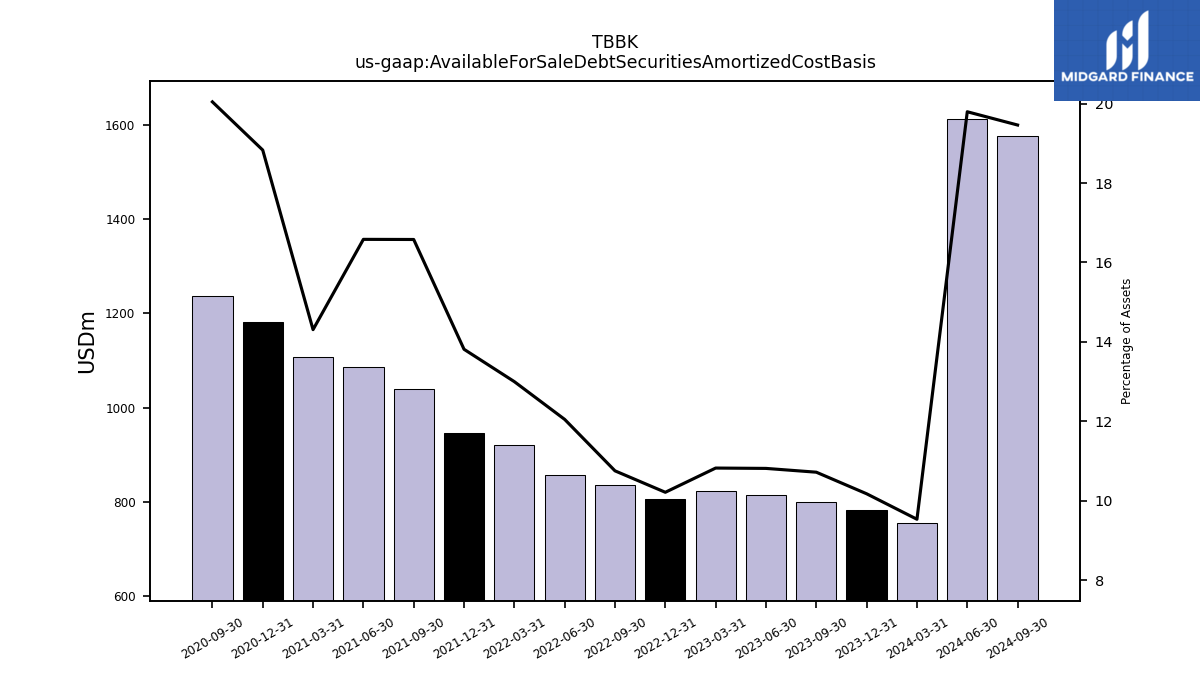
| Available For Sale Debt Securities Amortized Cost Basis | 783.90 | 800.07 | 815.53 | 823.12 | 806.94 | 836.07 | 857.66 | 920.52 | 945.21 | 1039.15 | 1086.14 | 1108.44 | 1181.91 | 1236.55 | NA | NA | NA | NA | NA | NA | NA | NA | NA |
| 2023-12-31 | 2023-09-30 | 2023-06-30 | 2023-03-31 | 2022-12-31 | 2022-09-30 | 2022-06-30 | 2022-03-31 | 2021-12-31 | 2021-09-30 | 2021-06-30 | 2021-03-31 | 2020-12-31 | 2020-09-30 | 2020-06-30 | 2020-03-31 | 2019-09-30 | 2019-06-30 | 2019-03-31 | 2018-09-30 | 2018-06-30 | 2018-03-31 | 2017-09-30 | ||
|---|---|---|---|---|---|---|---|---|---|---|---|---|---|---|---|---|---|---|---|---|---|---|---|---|
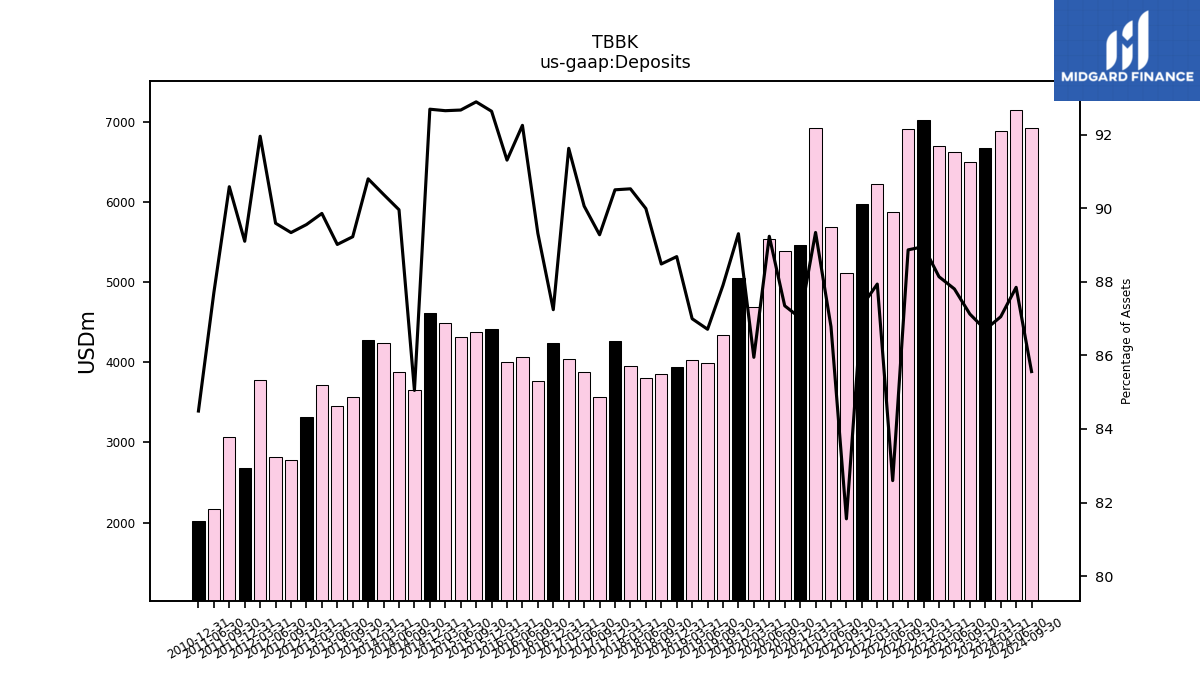
| Deposits | 6680.91 | 6504.47 | 6623.05 | 6704.66 | 7030.11 | 6911.30 | 5880.75 | 6228.32 | 5976.91 | 5112.51 | 5684.71 | 6921.50 | 5462.06 | 5388.76 | 5545.20 | 4691.12 | 4345.70 | 3991.75 | 4025.30 | 3858.06 | 3799.28 | 3955.17 | 3565.39 |
| 2023-12-31 | 2023-09-30 | 2023-06-30 | 2023-03-31 | 2022-12-31 | 2022-09-30 | 2022-06-30 | 2022-03-31 | 2021-12-31 | 2021-09-30 | 2021-06-30 | 2021-03-31 | 2020-12-31 | 2020-09-30 | 2020-06-30 | 2020-03-31 | 2019-09-30 | 2019-06-30 | 2019-03-31 | 2018-09-30 | 2018-06-30 | 2018-03-31 | 2017-09-30 | ||
|---|---|---|---|---|---|---|---|---|---|---|---|---|---|---|---|---|---|---|---|---|---|---|---|---|
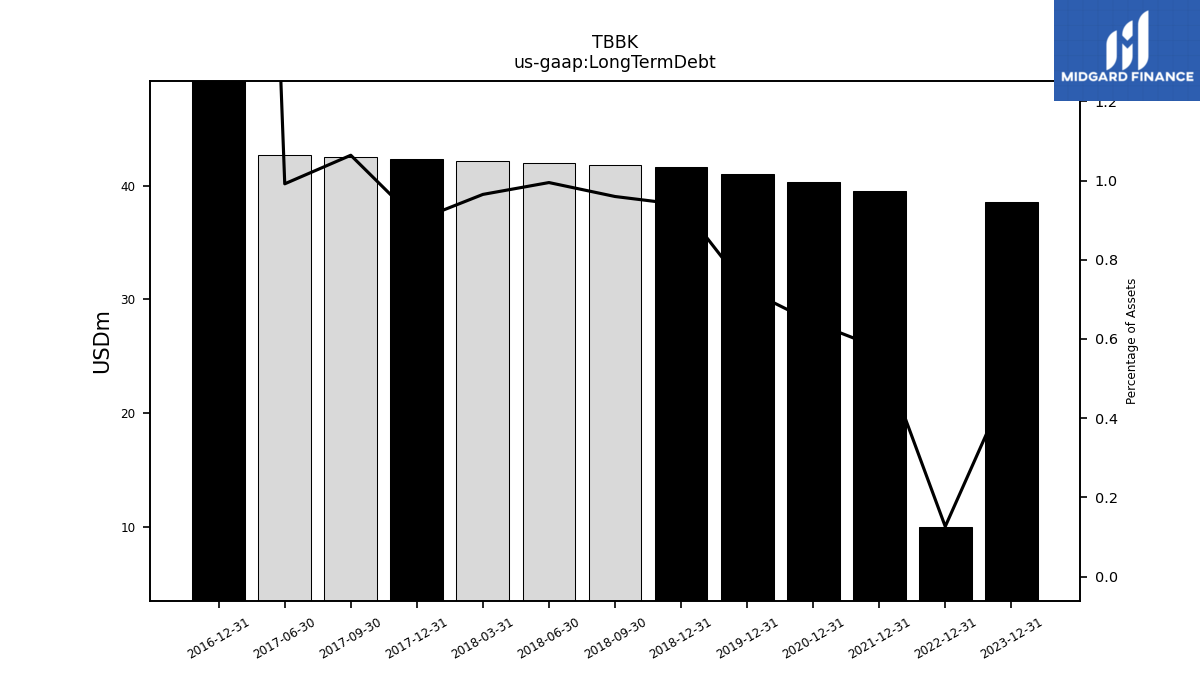
| Long Term Debt | 38.60 | NA | NA | NA | 10.00 | NA | NA | NA | 39.50 | NA | NA | NA | 40.30 | NA | NA | NA | NA | NA | NA | 41.84 | 42.00 | 42.16 | 42.48 |
| 2023-12-31 | 2023-09-30 | 2023-06-30 | 2023-03-31 | 2022-12-31 | 2022-09-30 | 2022-06-30 | 2022-03-31 | 2021-12-31 | 2021-09-30 | 2021-06-30 | 2021-03-31 | 2020-12-31 | 2020-09-30 | 2020-06-30 | 2020-03-31 | 2019-09-30 | 2019-06-30 | 2019-03-31 | 2018-09-30 | 2018-06-30 | 2018-03-31 | 2017-09-30 | ||
|---|---|---|---|---|---|---|---|---|---|---|---|---|---|---|---|---|---|---|---|---|---|---|---|---|
| Stockholders Equity | 807.28 | 773.69 | 749.17 | 725.15 | 694.03 | 663.74 | 656.54 | 652.29 | 652.45 | 637.98 | 619.11 | 596.76 | 581.16 | 558.46 | 533.08 | 498.10 | 484.17 | 458.13 | 434.78 | 391.87 | 332.55 | 329.89 | 339.46 | |
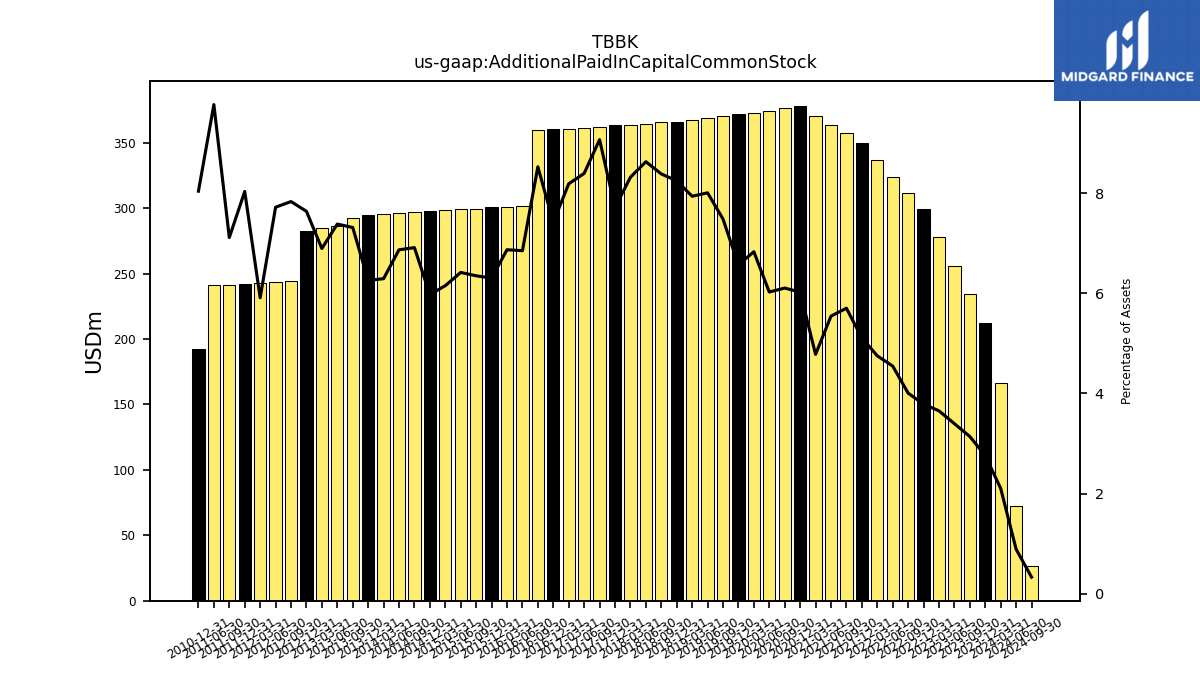
| Additional Paid In Capital Common Stock | 212.43 | 234.32 | 256.12 | 277.81 | 299.28 | 311.57 | 323.77 | 336.60 | 349.69 | 357.53 | 363.24 | 370.48 | 378.22 | 376.75 | 374.58 | 372.98 | 370.11 | 368.77 | 367.48 | 365.75 | 364.46 | 363.61 | 362.34 | |
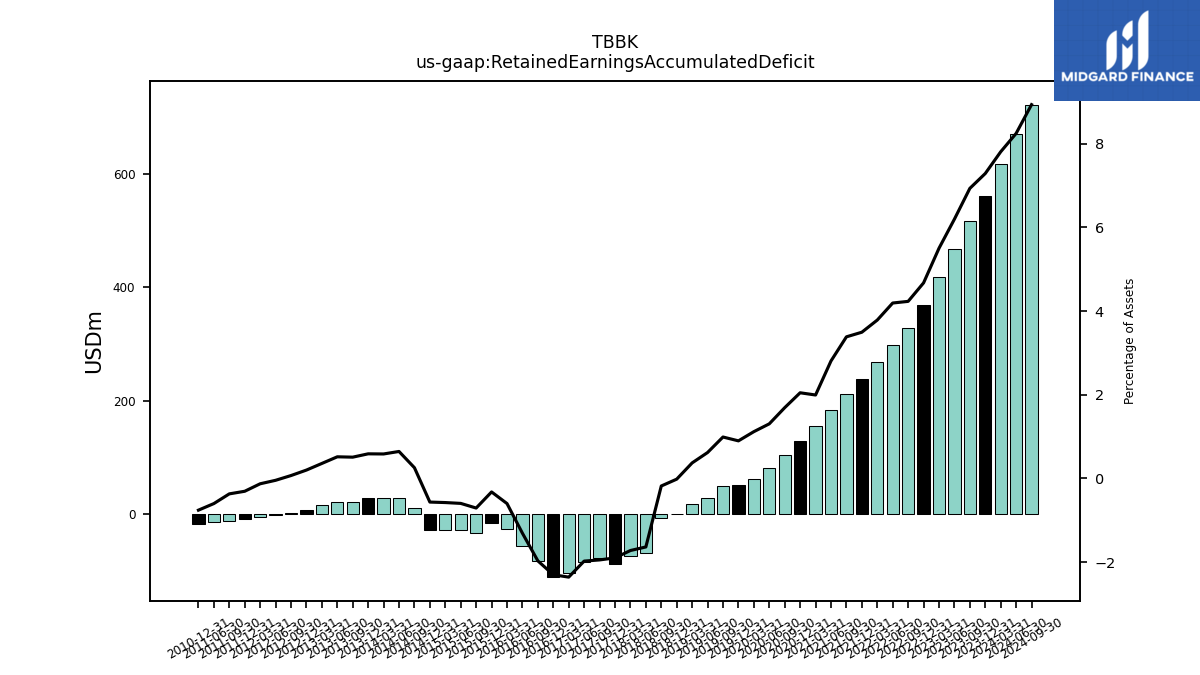
| Retained Earnings Accumulated Deficit | 561.62 | 517.59 | 467.45 | 418.44 | 369.32 | 329.08 | 298.47 | 268.07 | 239.11 | 212.11 | 183.85 | 154.42 | 128.45 | 104.28 | 81.03 | 60.96 | 48.89 | 28.46 | 17.11 | -7.94 | -69.21 | -75.34 | -77.85 | |
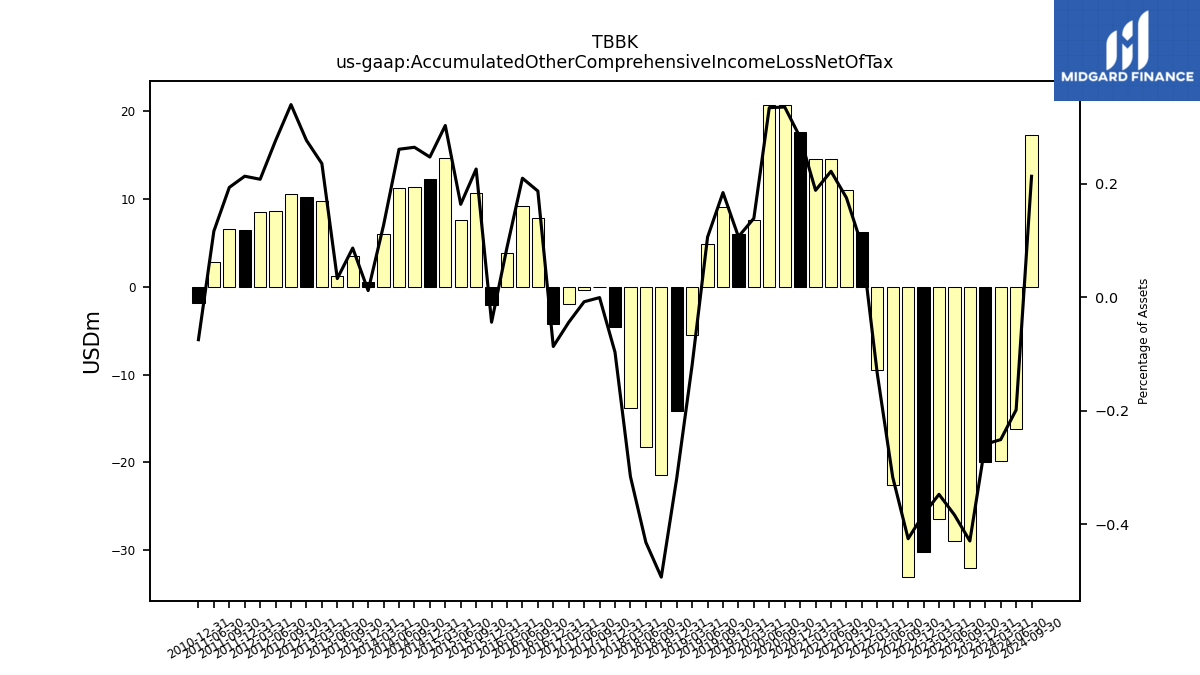
| Accumulated Other Comprehensive Income Loss Net Of Tax | -19.97 | -32.09 | -28.94 | -26.44 | -30.26 | -33.11 | -22.58 | -9.54 | 6.29 | 11.00 | 14.56 | 14.62 | 17.71 | 20.70 | 20.78 | 7.60 | 9.13 | 4.89 | -5.52 | -21.52 | -18.25 | -13.81 | -0.02 |
| 2023-12-31 | 2023-09-30 | 2023-06-30 | 2023-03-31 | 2022-12-31 | 2022-09-30 | 2022-06-30 | 2022-03-31 | 2021-12-31 | 2021-09-30 | 2021-06-30 | 2021-03-31 | 2020-12-31 | 2020-09-30 | 2020-06-30 | 2020-03-31 | 2019-09-30 | 2019-06-30 | 2019-03-31 | 2018-09-30 | 2018-06-30 | 2018-03-31 | 2017-09-30 | ||
|---|---|---|---|---|---|---|---|---|---|---|---|---|---|---|---|---|---|---|---|---|---|---|---|---|
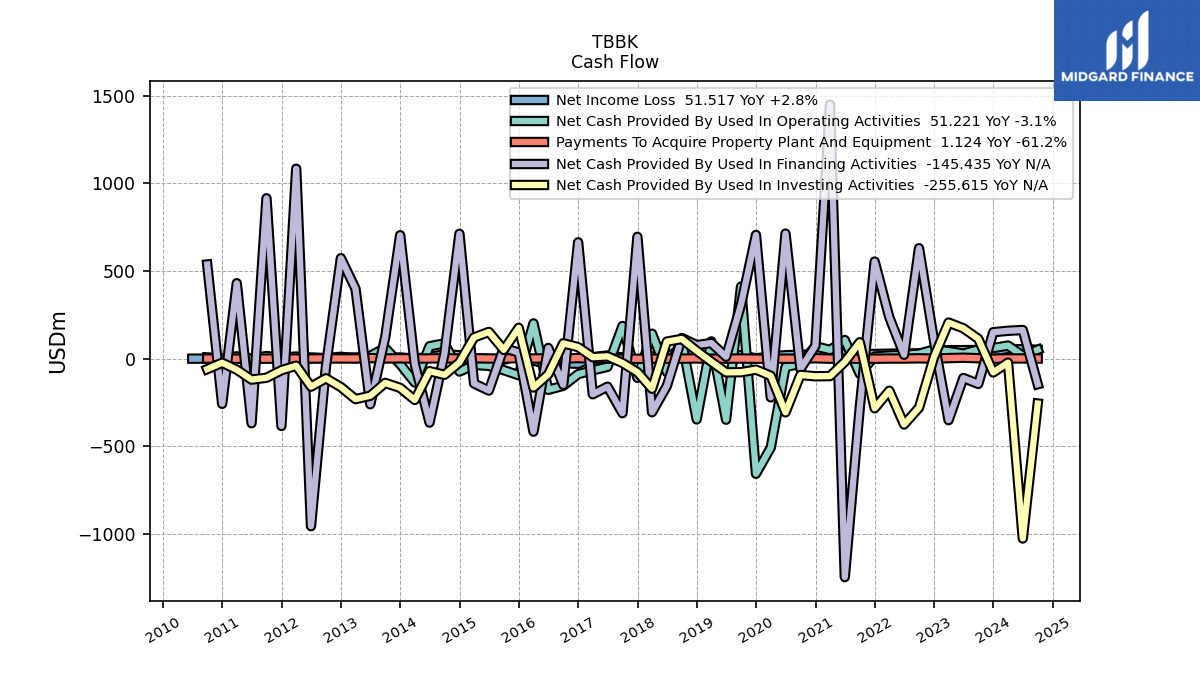
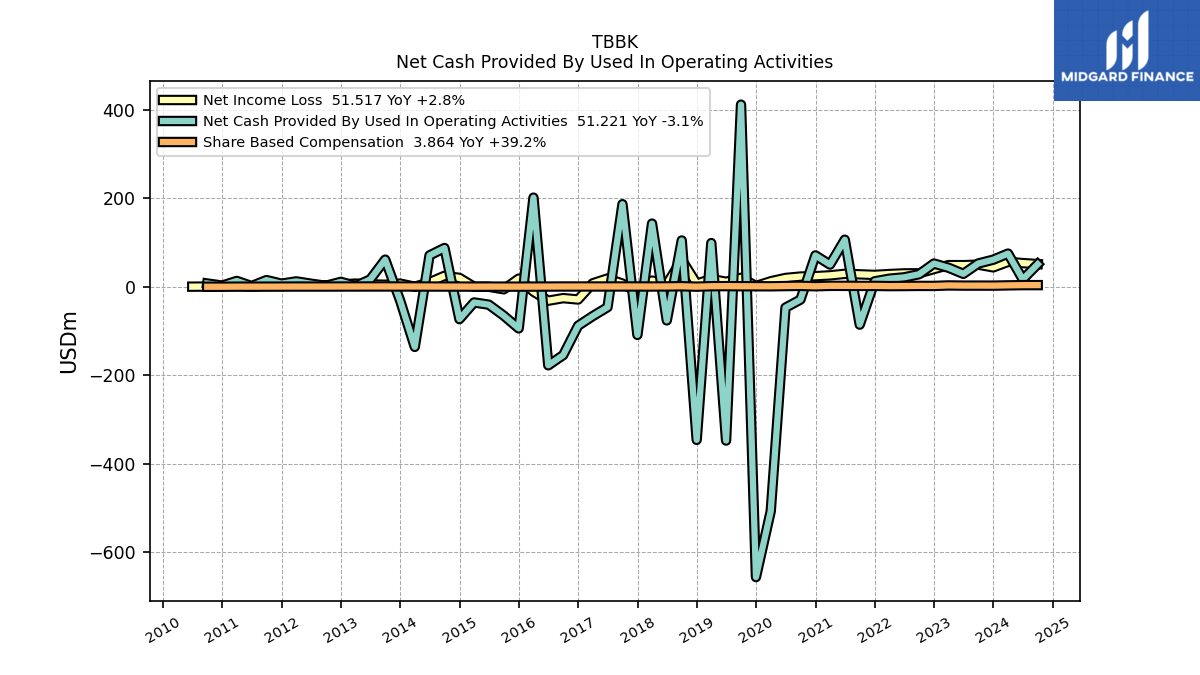
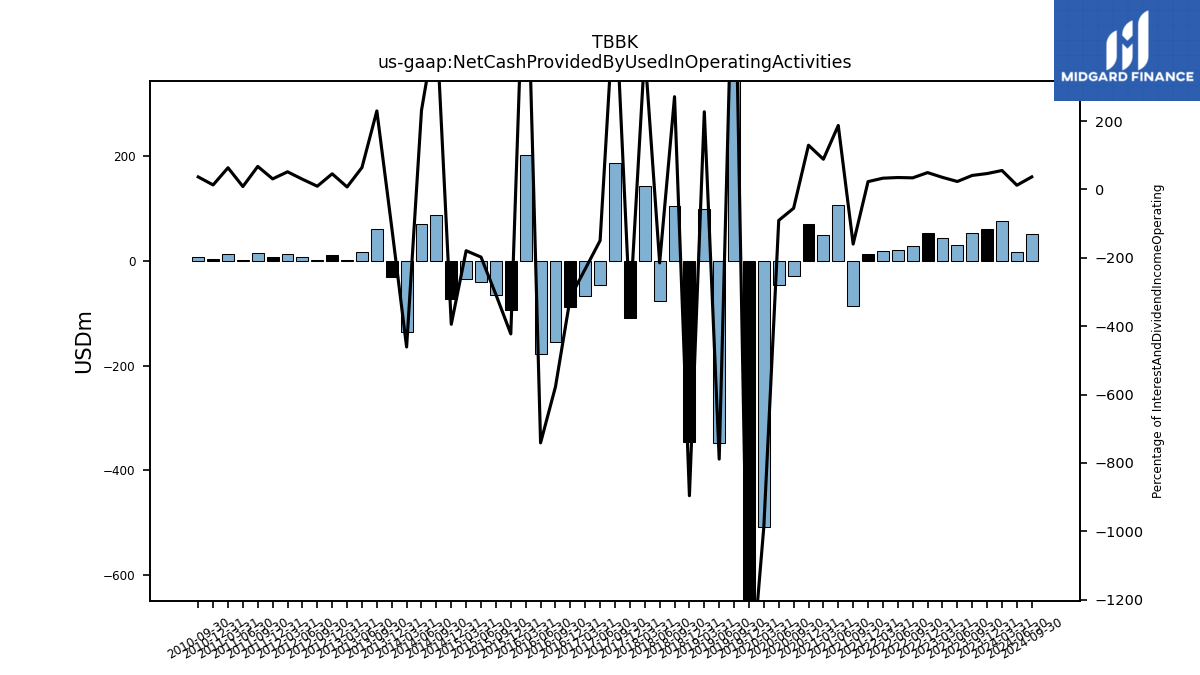
| Net Cash Provided By Used In Operating Activities | 61.35 | 52.85 | 29.38 | 43.13 | 52.67 | 28.45 | 21.48 | 18.39 | 12.50 | -85.51 | 106.61 | 50.29 | 71.07 | -28.85 | -47.01 | -507.39 | 412.02 | -347.69 | 98.98 | 104.87 | -75.96 | 143.04 | 186.93 | |
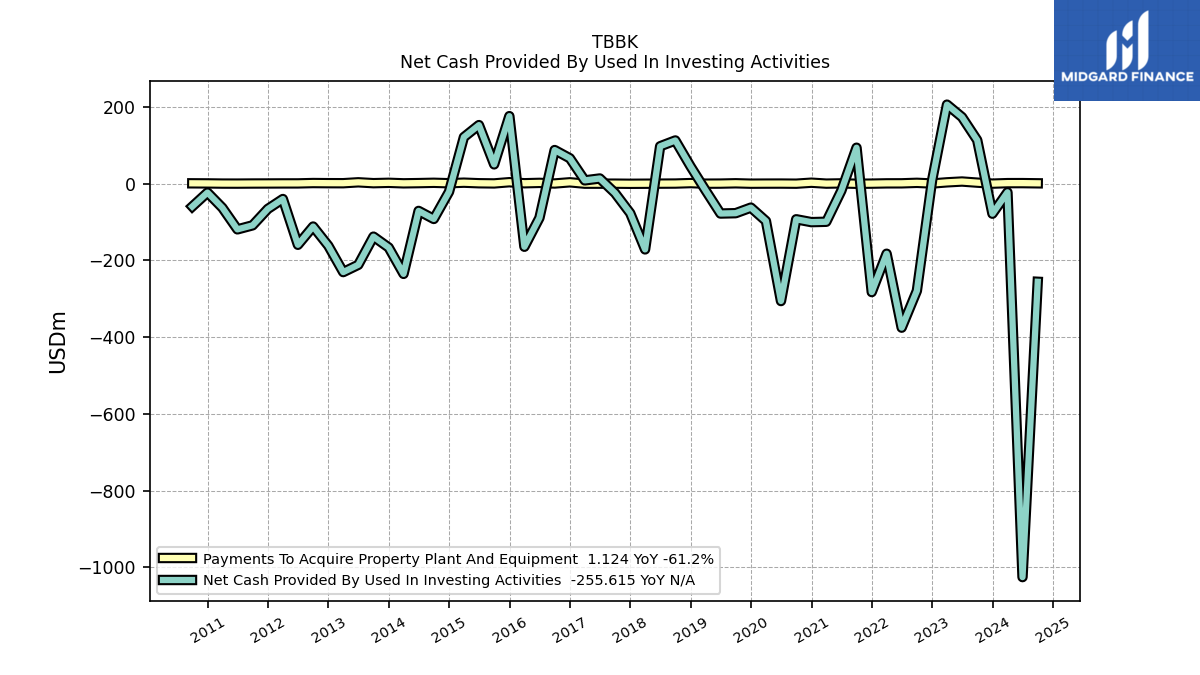
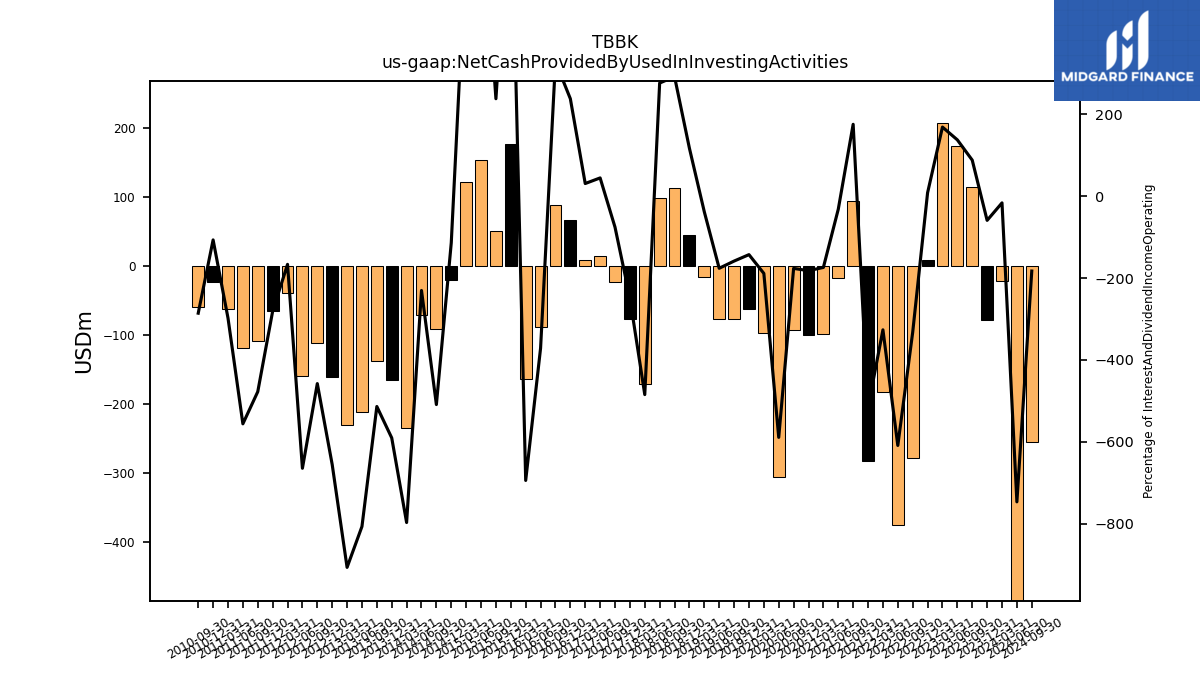
| Net Cash Provided By Used In Investing Activities | -78.11 | 113.60 | 173.76 | 206.31 | 8.84 | -279.15 | -375.34 | -182.44 | -282.54 | 93.97 | -18.20 | -99.12 | -100.08 | -92.61 | -305.94 | -97.16 | -76.74 | -77.68 | -16.68 | 112.89 | 97.76 | -171.22 | -24.14 | |
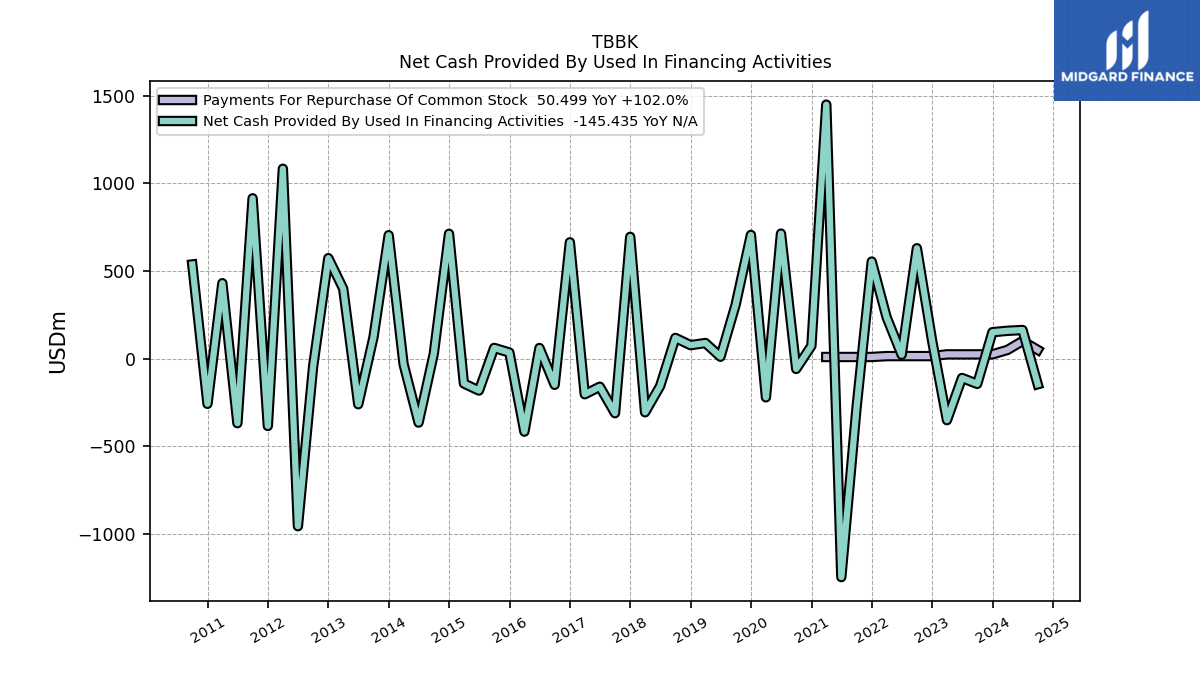
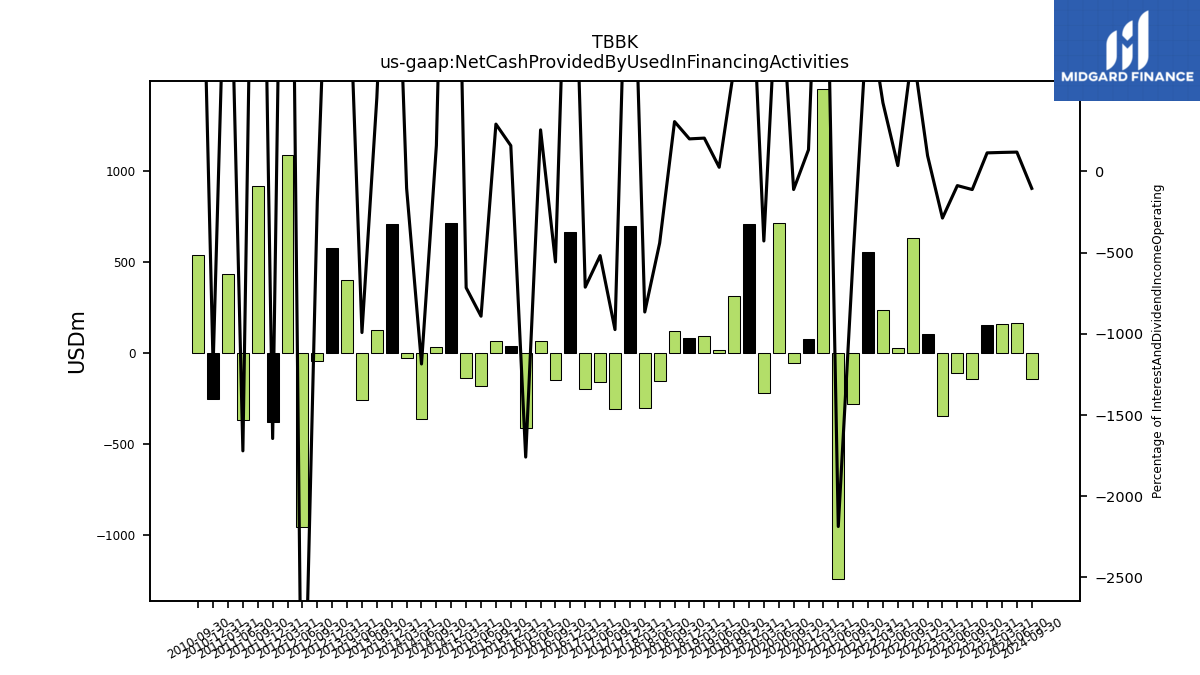
| Net Cash Provided By Used In Financing Activities | 151.44 | -143.58 | -109.78 | -350.45 | 103.97 | 630.55 | 22.51 | 236.50 | 554.49 | -280.10 | -1246.03 | 1449.91 | 73.55 | -58.28 | 714.08 | -220.33 | 308.95 | 11.45 | 89.58 | 118.78 | -155.91 | -305.60 | -310.78 |
| 2023-12-31 | 2023-09-30 | 2023-06-30 | 2023-03-31 | 2022-12-31 | 2022-09-30 | 2022-06-30 | 2022-03-31 | 2021-12-31 | 2021-09-30 | 2021-06-30 | 2021-03-31 | 2020-12-31 | 2020-09-30 | 2020-06-30 | 2020-03-31 | 2019-09-30 | 2019-06-30 | 2019-03-31 | 2018-09-30 | 2018-06-30 | 2018-03-31 | 2017-09-30 | ||
|---|---|---|---|---|---|---|---|---|---|---|---|---|---|---|---|---|---|---|---|---|---|---|---|---|
| Net Cash Provided By Used In Operating Activities | 61.35 | 52.85 | 29.38 | 43.13 | 52.67 | 28.45 | 21.48 | 18.39 | 12.50 | -85.51 | 106.61 | 50.29 | 71.07 | -28.85 | -47.01 | -507.39 | 412.02 | -347.69 | 98.98 | 104.87 | -75.96 | 143.04 | 186.93 | |
| Net Income Loss | 44.03 | 50.14 | 49.01 | 49.12 | 40.24 | 30.60 | 30.40 | 28.97 | 26.99 | 28.26 | 29.43 | 25.96 | 24.17 | 23.25 | 20.07 | 12.59 | 20.43 | 11.35 | 17.93 | 61.28 | 6.14 | 14.14 | 7.28 | |
| Share Based Compensation | 2.70 | 2.77 | 2.75 | 3.17 | 2.04 | 2.13 | 1.80 | 1.62 | 2.10 | 2.06 | 2.21 | 2.26 | 1.28 | 2.21 | 1.72 | 1.22 | 1.38 | 1.59 | 1.42 | 1.32 | 0.95 | 0.74 | 0.85 |
| 2023-12-31 | 2023-09-30 | 2023-06-30 | 2023-03-31 | 2022-12-31 | 2022-09-30 | 2022-06-30 | 2022-03-31 | 2021-12-31 | 2021-09-30 | 2021-06-30 | 2021-03-31 | 2020-12-31 | 2020-09-30 | 2020-06-30 | 2020-03-31 | 2019-09-30 | 2019-06-30 | 2019-03-31 | 2018-09-30 | 2018-06-30 | 2018-03-31 | 2017-09-30 | ||
|---|---|---|---|---|---|---|---|---|---|---|---|---|---|---|---|---|---|---|---|---|---|---|---|---|
| Net Cash Provided By Used In Investing Activities | -78.11 | 113.60 | 173.76 | 206.31 | 8.84 | -279.15 | -375.34 | -182.44 | -282.54 | 93.97 | -18.20 | -99.12 | -100.08 | -92.61 | -305.94 | -97.16 | -76.74 | -77.68 | -16.68 | 112.89 | 97.76 | -171.22 | -24.14 | |
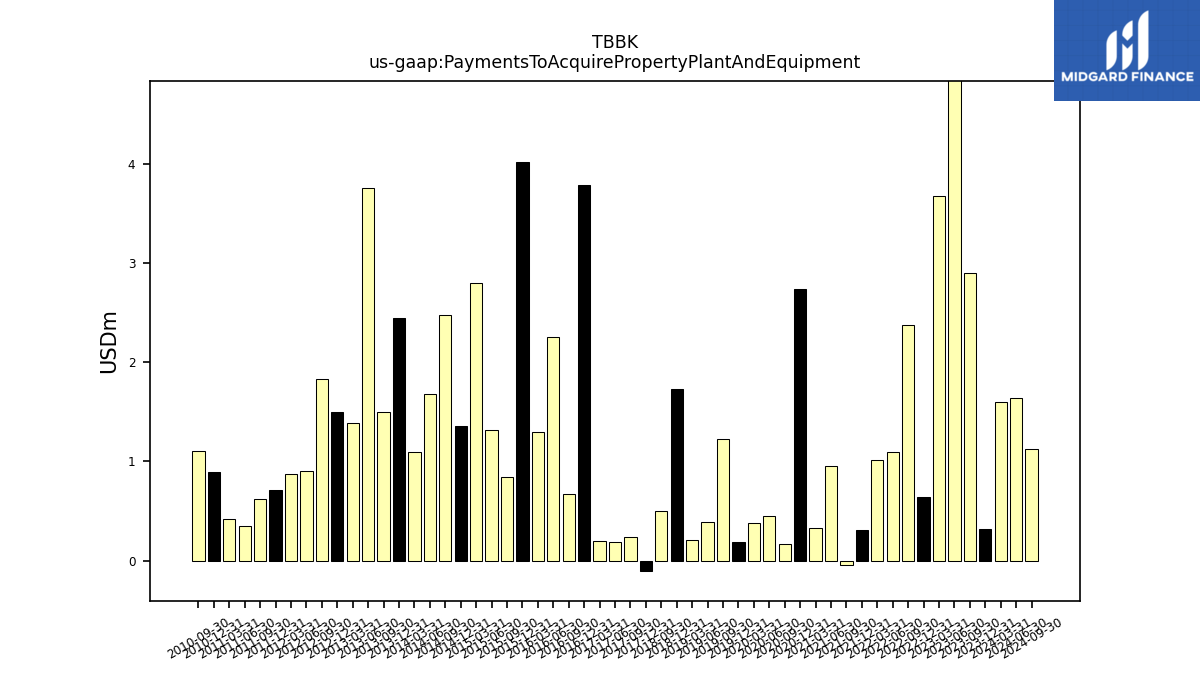
| Payments To Acquire Property Plant And Equipment | 0.32 | 2.90 | 5.80 | 3.67 | 0.64 | 2.38 | 1.10 | 1.02 | 0.31 | -0.05 | 0.95 | 0.33 | 2.74 | 0.17 | 0.45 | 0.38 | 1.23 | 0.39 | 0.21 | 0.50 | NA | NA | 0.24 |
| 2023-12-31 | 2023-09-30 | 2023-06-30 | 2023-03-31 | 2022-12-31 | 2022-09-30 | 2022-06-30 | 2022-03-31 | 2021-12-31 | 2021-09-30 | 2021-06-30 | 2021-03-31 | 2020-12-31 | 2020-09-30 | 2020-06-30 | 2020-03-31 | 2019-09-30 | 2019-06-30 | 2019-03-31 | 2018-09-30 | 2018-06-30 | 2018-03-31 | 2017-09-30 | ||
|---|---|---|---|---|---|---|---|---|---|---|---|---|---|---|---|---|---|---|---|---|---|---|---|---|
| Net Cash Provided By Used In Financing Activities | 151.44 | -143.58 | -109.78 | -350.45 | 103.97 | 630.55 | 22.51 | 236.50 | 554.49 | -280.10 | -1246.03 | 1449.91 | 73.55 | -58.28 | 714.08 | -220.33 | 308.95 | 11.45 | 89.58 | 118.78 | -155.91 | -305.60 | -310.78 | |
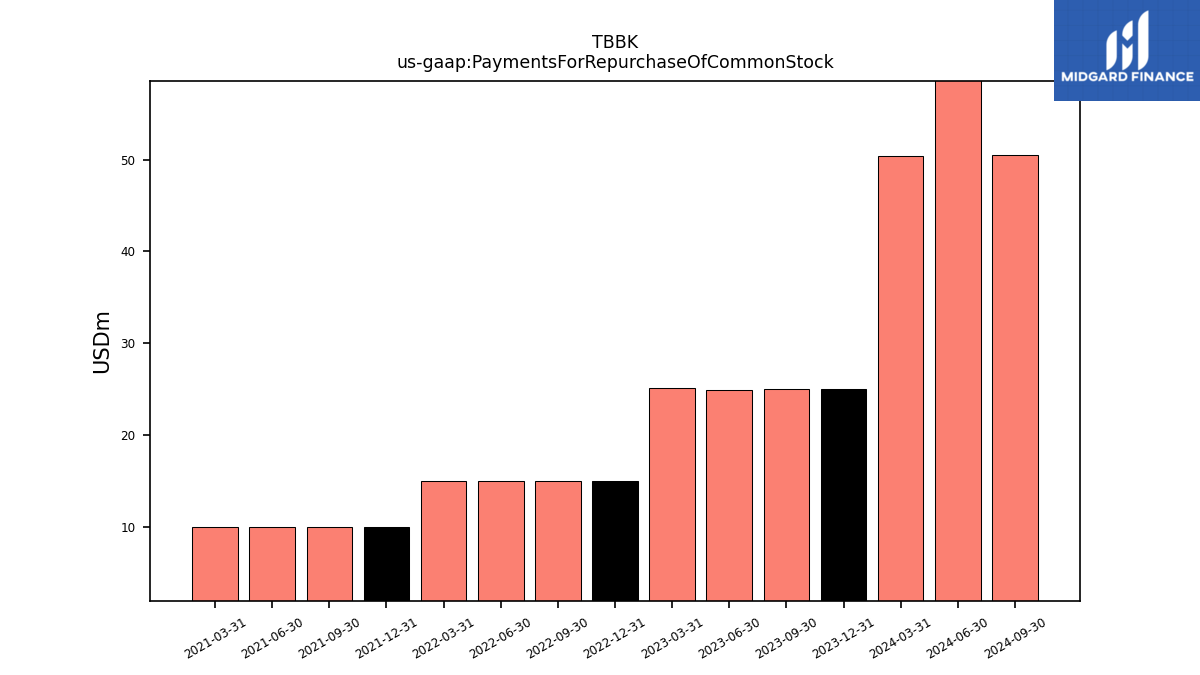
| Payments For Repurchase Of Common Stock | 25.00 | 25.00 | 24.90 | 25.10 | 15.00 | 15.00 | 15.00 | 15.00 | 10.00 | 10.00 | 10.00 | 10.00 | NA | NA | NA | NA | NA | NA | NA | NA | NA | NA | NA |
| 2023-12-31 | 2023-09-30 | 2023-06-30 | 2023-03-31 | 2022-12-31 | 2022-09-30 | 2022-06-30 | 2022-03-31 | 2021-12-31 | 2021-09-30 | 2021-06-30 | 2021-03-31 | 2020-12-31 | 2020-09-30 | 2020-06-30 | 2020-03-31 | 2019-09-30 | 2019-06-30 | 2019-03-31 | 2018-09-30 | 2018-06-30 | 2018-03-31 | 2017-09-30 | ||
|---|---|---|---|---|---|---|---|---|---|---|---|---|---|---|---|---|---|---|---|---|---|---|---|---|
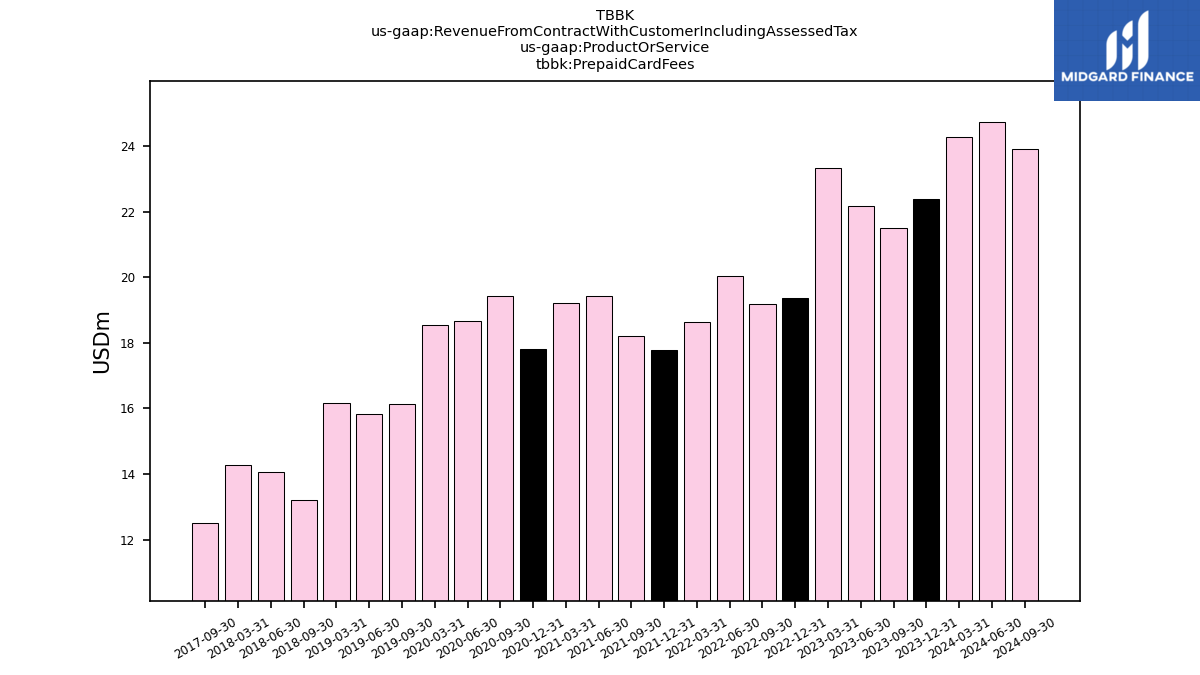
| Prepaid Card Fees | 22.40 | 21.51 | 22.18 | 23.32 | 19.37 | 19.18 | 20.04 | 18.65 | 17.78 | 18.22 | 19.45 | 19.21 | 17.82 | 19.43 | 18.67 | 18.54 | 16.13 | 15.84 | 16.16 | 13.20 | 14.07 | 14.28 | 12.49 | |
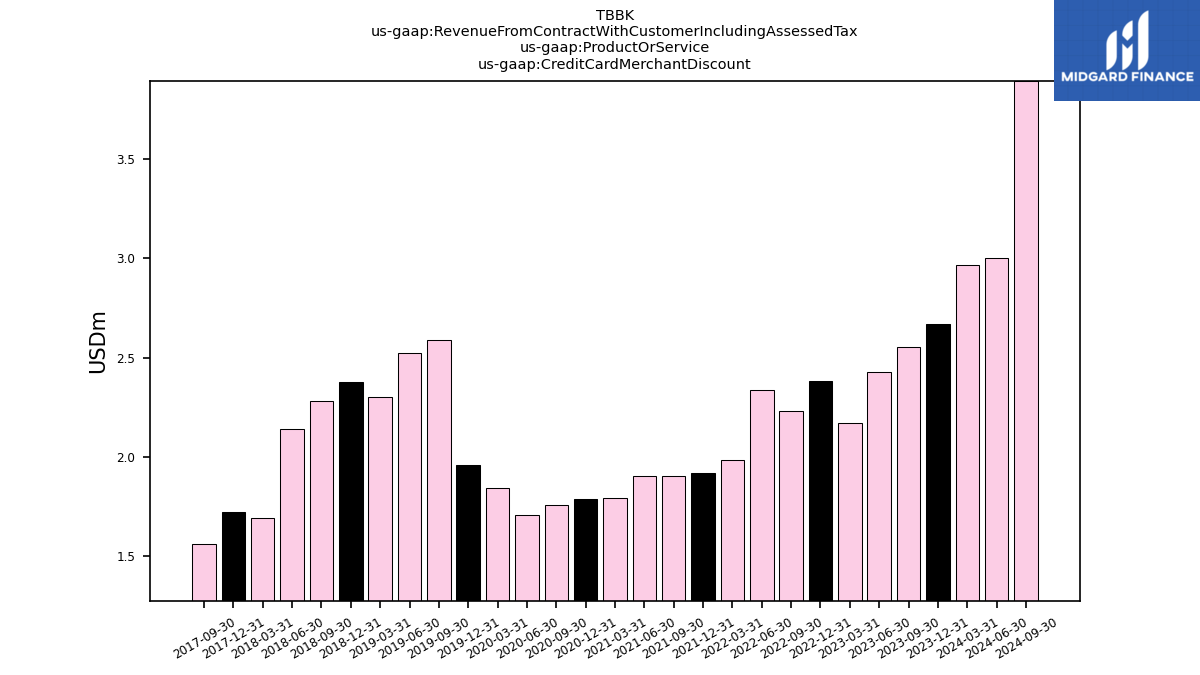
| Credit Card Merchant Discount | 2.67 | 2.55 | 2.43 | 2.17 | 2.38 | 2.23 | 2.34 | 1.98 | 1.92 | 1.91 | 1.90 | 1.80 | 1.79 | 1.76 | 1.71 | 1.85 | 2.59 | 2.52 | 2.30 | 2.28 | 2.14 | 1.69 | 1.56 |
