
| 2023-12-31 | 2023-10-01 | 2023-07-02 | 2023-04-02 | 2023-01-01 | 2022-10-02 | 2022-07-03 | 2022-04-03 | 2022-01-02 | 2021-10-03 | 2021-07-04 | 2021-04-04 | 2021-01-03 | 2020-09-27 | 2020-06-28 | 2020-03-29 | 2019-12-29 | 2019-09-29 | 2019-06-30 | 2019-03-31 | 2018-12-30 | 2018-09-30 | 2018-07-01 | 2018-04-01 | 2017-12-31 | 2017-10-01 | 2017-07-02 | 2017-04-02 | 2017-01-01 | 2016-10-02 | 2016-07-03 | 2016-04-03 | 2016-01-03 | 2015-09-27 | 2015-06-28 | 2015-03-29 | 2014-12-28 | 2014-09-28 | 2014-06-29 | 2014-03-30 | 2013-12-29 | 2013-09-29 | 2013-06-30 | 2013-03-31 | 2012-12-30 | 2012-09-30 | 2012-07-01 | 2012-04-01 | 2012-01-01 | 2011-10-02 | 2011-07-03 | 2011-04-03 | 2011-01-02 | 2010-10-03 | 2010-07-04 | 2010-04-04 | ||
|---|---|---|---|---|---|---|---|---|---|---|---|---|---|---|---|---|---|---|---|---|---|---|---|---|---|---|---|---|---|---|---|---|---|---|---|---|---|---|---|---|---|---|---|---|---|---|---|---|---|---|---|---|---|---|---|---|---|
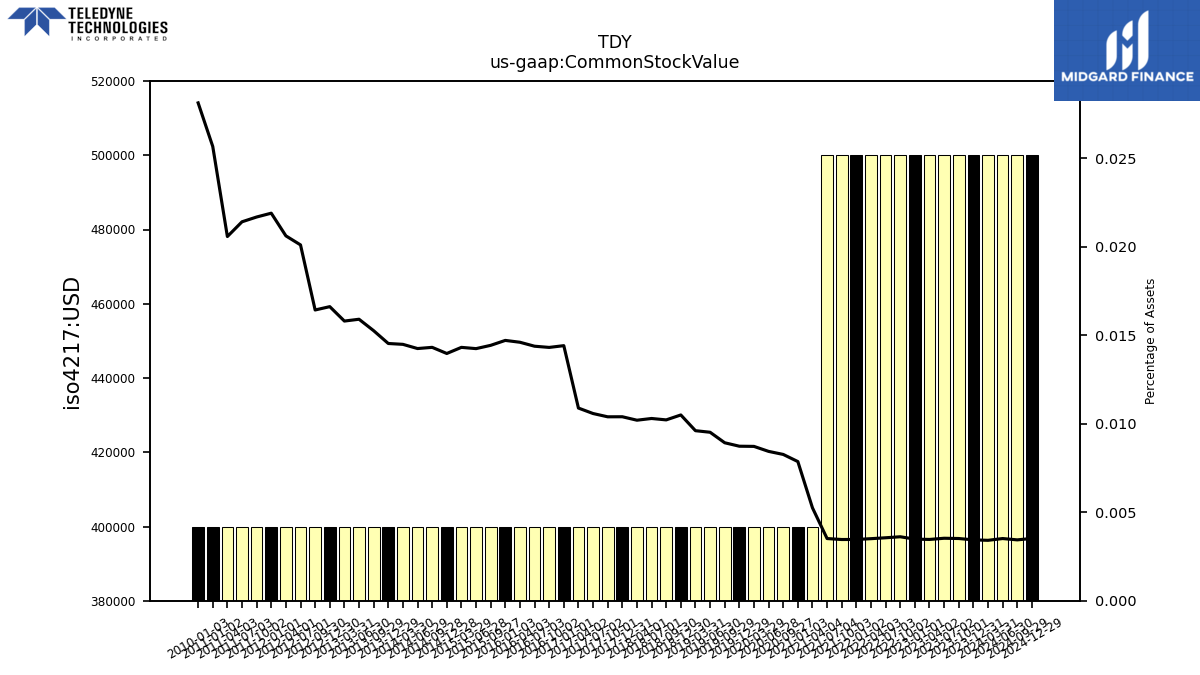
| Common Stock Value | 0.50 | 0.50 | 0.50 | 0.50 | 0.50 | 0.50 | 0.50 | 0.50 | 0.50 | 0.50 | 0.50 | 0.40 | 0.40 | 0.40 | 0.40 | 0.40 | 0.40 | 0.40 | 0.40 | 0.40 | 0.40 | 0.40 | 0.40 | 0.40 | 0.40 | 0.40 | 0.40 | 0.40 | 0.40 | 0.40 | 0.40 | 0.40 | 0.40 | 0.40 | 0.40 | 0.40 | 0.40 | 0.40 | 0.40 | 0.40 | 0.40 | 0.40 | 0.40 | 0.40 | 0.40 | 0.40 | 0.40 | 0.40 | 0.40 | 0.40 | 0.40 | 0.40 | 0.40 | NA | NA | NA | |
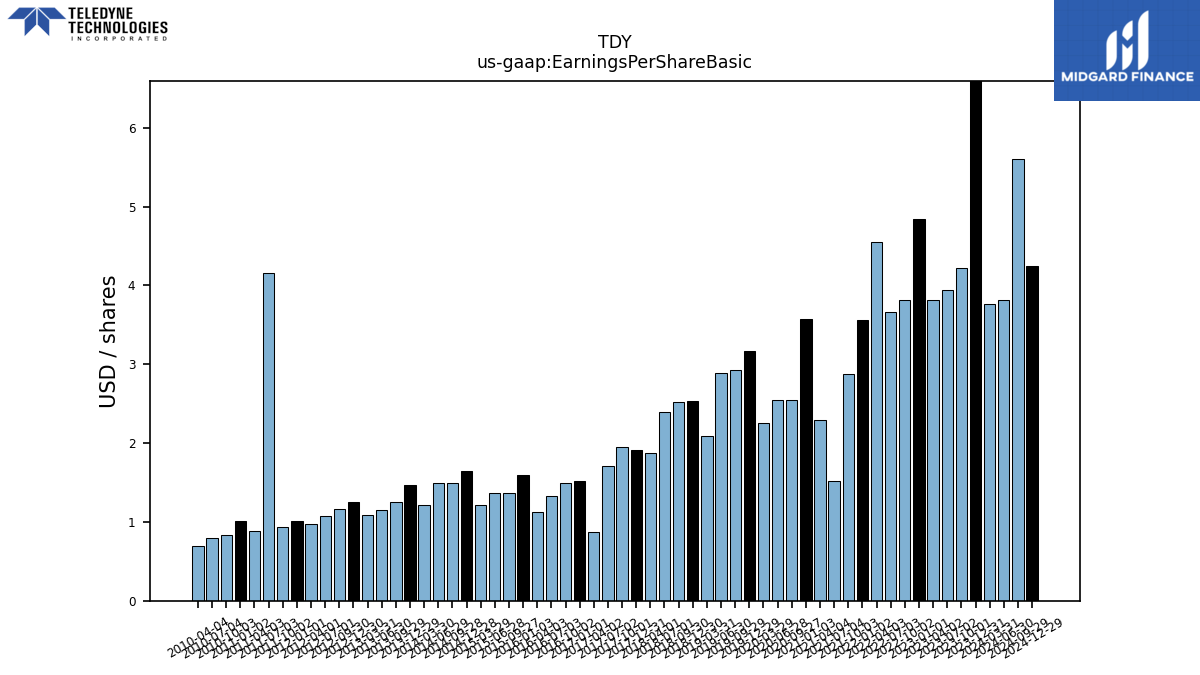
| Earnings Per Share Basic | 6.83 | 4.22 | 3.94 | 3.81 | 4.84 | 3.81 | 3.66 | 4.55 | 3.56 | 2.88 | 1.52 | 2.29 | 3.58 | 2.55 | 2.55 | 2.25 | 3.17 | 2.93 | 2.89 | 2.09 | 2.53 | 2.52 | 2.40 | 1.87 | 1.91 | 1.95 | 1.71 | 0.87 | 1.52 | 1.50 | 1.33 | 1.12 | 1.59 | 1.37 | 1.37 | 1.22 | 1.65 | 1.49 | 1.50 | 1.22 | 1.47 | 1.25 | 1.15 | 1.09 | 1.25 | 1.16 | 1.08 | 0.98 | 1.01 | 0.93 | 4.16 | 0.88 | 1.01 | 0.84 | 0.79 | 0.69 | |
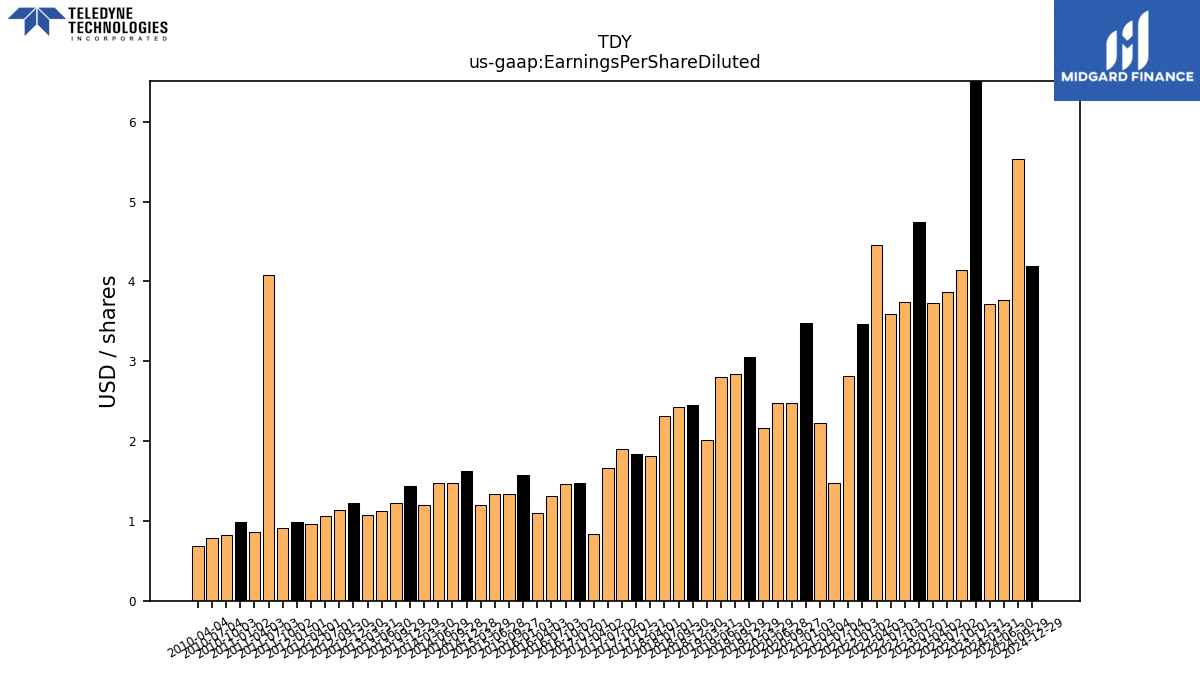
| Earnings Per Share Diluted | 6.74 | 4.15 | 3.87 | 3.73 | 4.74 | 3.74 | 3.59 | 4.46 | 3.47 | 2.81 | 1.48 | 2.23 | 3.48 | 2.48 | 2.48 | 2.17 | 3.06 | 2.84 | 2.80 | 2.02 | 2.45 | 2.43 | 2.32 | 1.81 | 1.84 | 1.90 | 1.66 | 0.84 | 1.48 | 1.46 | 1.31 | 1.10 | 1.57 | 1.34 | 1.34 | 1.20 | 1.62 | 1.47 | 1.47 | 1.20 | 1.44 | 1.23 | 1.13 | 1.07 | 1.23 | 1.14 | 1.06 | 0.96 | 0.99 | 0.91 | 4.08 | 0.86 | 0.99 | 0.82 | 0.78 | 0.68 |
| 2023-12-31 | 2023-10-01 | 2023-07-02 | 2023-04-02 | 2023-01-01 | 2022-10-02 | 2022-07-03 | 2022-04-03 | 2022-01-02 | 2021-10-03 | 2021-07-04 | 2021-04-04 | 2021-01-03 | 2020-09-27 | 2020-06-28 | 2020-03-29 | 2019-12-29 | 2019-09-29 | 2019-06-30 | 2019-03-31 | 2018-12-30 | 2018-09-30 | 2018-07-01 | 2018-04-01 | 2017-12-31 | 2017-10-01 | 2017-07-02 | 2017-04-02 | 2017-01-01 | 2016-10-02 | 2016-07-03 | 2016-04-03 | 2016-01-03 | 2015-09-27 | 2015-06-28 | 2015-03-29 | 2014-12-28 | 2014-09-28 | 2014-06-29 | 2014-03-30 | 2013-12-29 | 2013-09-29 | 2013-06-30 | 2013-03-31 | 2012-12-30 | 2012-09-30 | 2012-07-01 | 2012-04-01 | 2012-01-01 | 2011-10-02 | 2011-07-03 | 2011-04-03 | 2011-01-02 | 2010-10-03 | 2010-07-04 | 2010-04-04 | ||
|---|---|---|---|---|---|---|---|---|---|---|---|---|---|---|---|---|---|---|---|---|---|---|---|---|---|---|---|---|---|---|---|---|---|---|---|---|---|---|---|---|---|---|---|---|---|---|---|---|---|---|---|---|---|---|---|---|---|
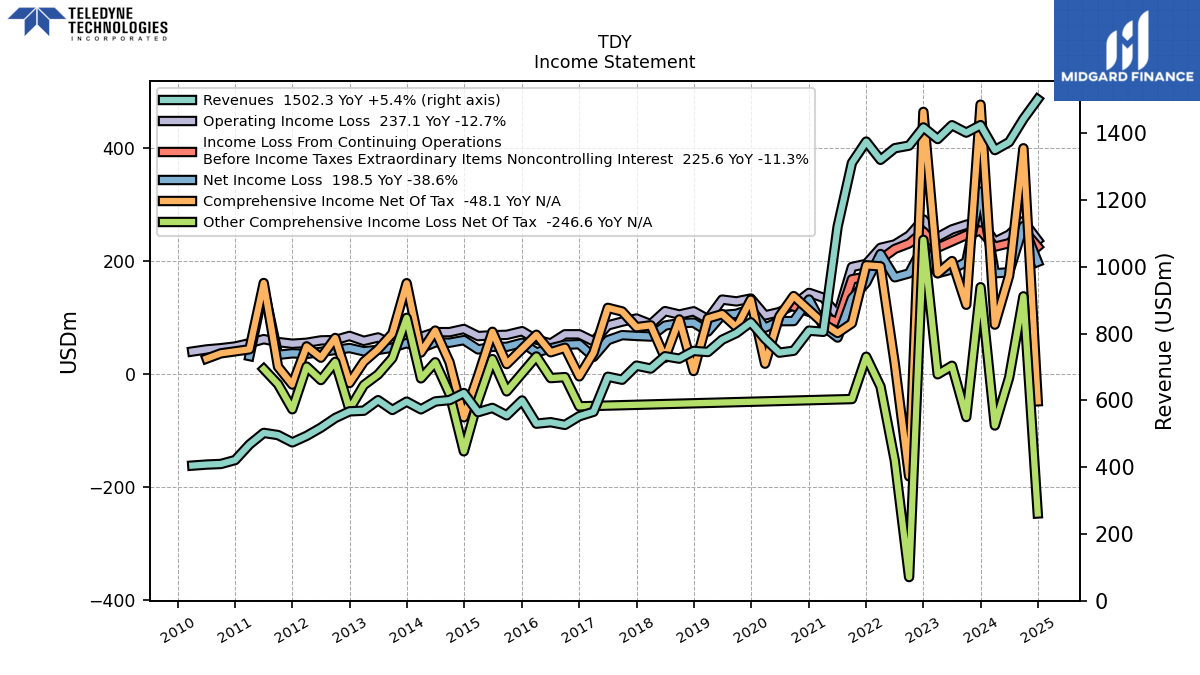
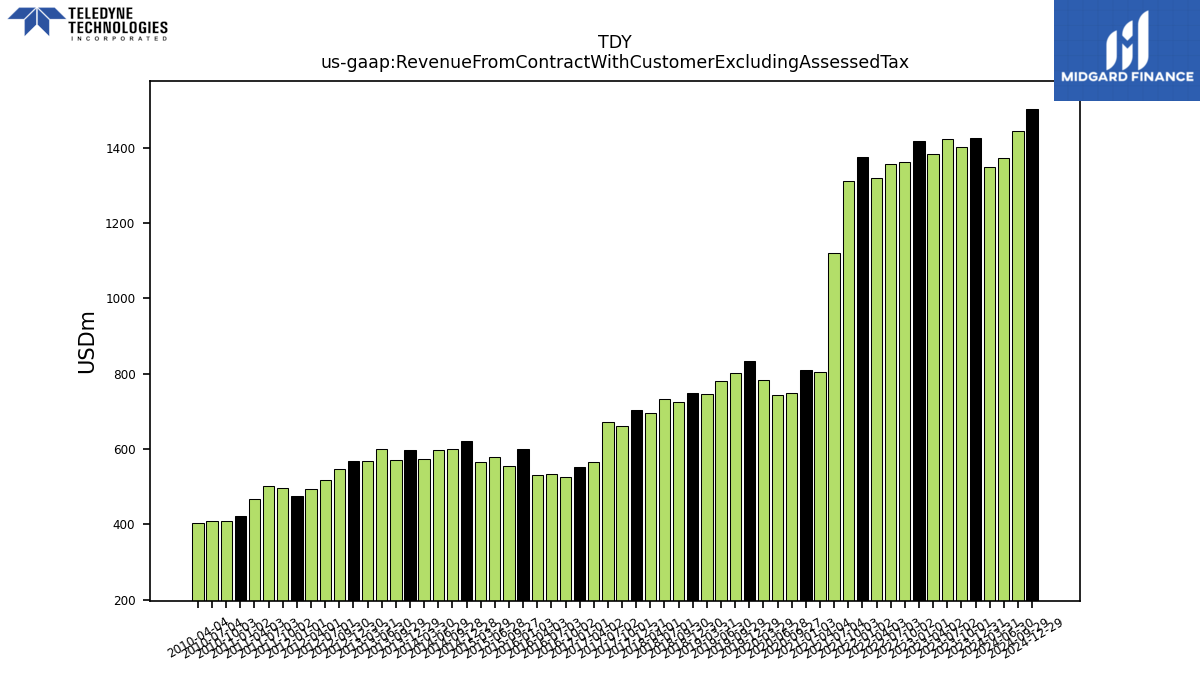
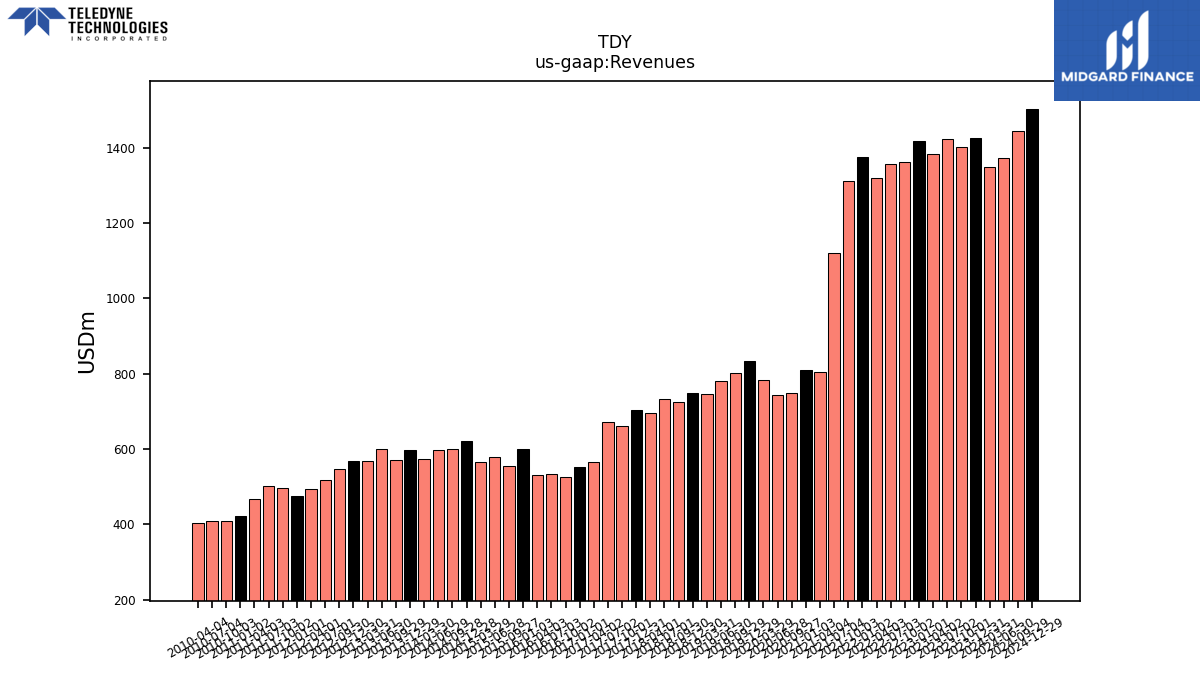
| Revenue From Contract With Customer Excluding Assessed Tax | 1425.00 | 1402.50 | 1424.70 | 1383.30 | 1418.20 | 1363.60 | 1355.80 | 1321.00 | 1375.70 | 1311.90 | 1121.00 | 805.70 | 809.30 | 749.00 | 743.30 | 784.60 | 834.20 | 802.20 | 782.00 | 745.20 | 748.40 | 725.30 | 732.50 | 695.60 | 704.40 | 662.20 | 671.10 | 566.10 | 552.90 | 526.80 | 534.90 | 530.50 | 600.00 | 555.40 | 577.70 | 565.00 | 622.30 | 601.10 | 597.10 | 573.50 | 596.60 | 571.60 | 601.00 | 569.40 | 567.40 | 547.40 | 518.50 | 494.00 | 474.50 | 496.40 | 502.90 | 468.10 | 421.50 | 409.80 | 408.00 | 404.90 | |
| Revenues | 1425.00 | 1402.50 | 1424.70 | 1383.30 | 1418.20 | 1363.60 | 1355.80 | 1321.00 | 1375.70 | 1311.90 | 1121.00 | 805.70 | 809.30 | 749.00 | 743.30 | 784.60 | 834.20 | 802.20 | 782.00 | 745.20 | 748.40 | 725.30 | 732.50 | 695.60 | 704.40 | 662.20 | 671.10 | 566.10 | 552.90 | 526.80 | 534.90 | 530.50 | 600.00 | 555.40 | 577.70 | 565.00 | 622.30 | 601.10 | 597.10 | 573.50 | 596.60 | 571.60 | 601.00 | 569.40 | 567.40 | 547.40 | 518.50 | 494.00 | 474.50 | 496.40 | 502.90 | 468.10 | 421.50 | 409.80 | 408.00 | 404.90 | |
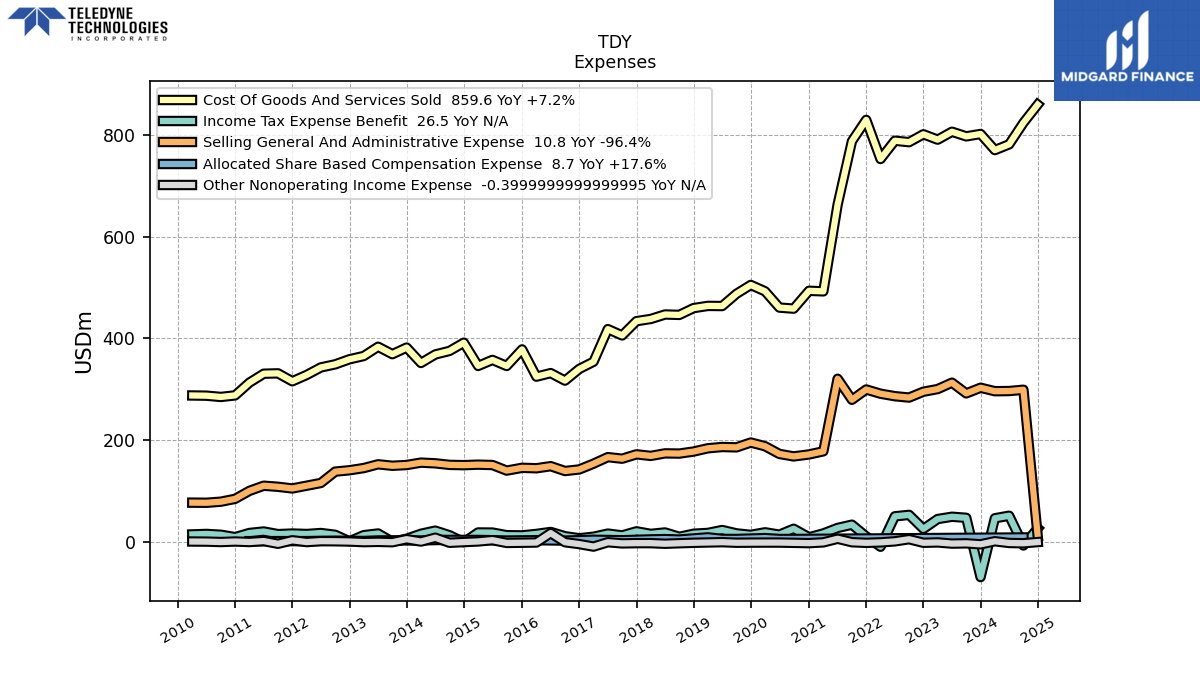
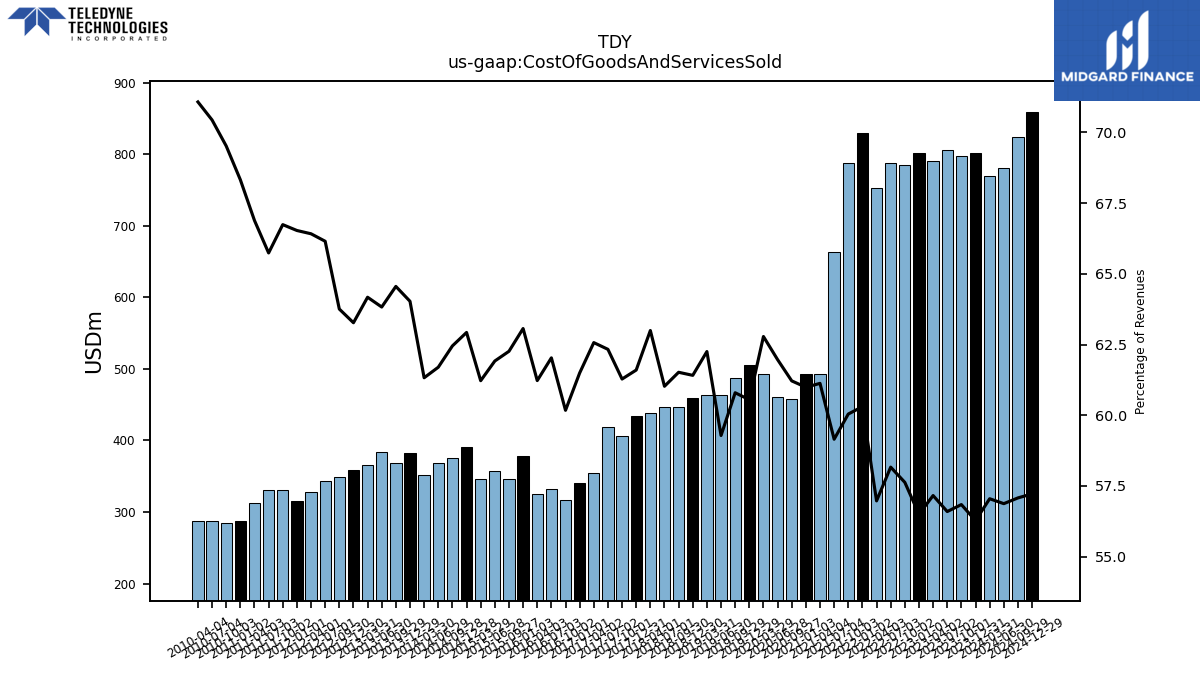
| Cost Of Goods And Services Sold | 801.90 | 797.20 | 806.30 | 790.70 | 801.30 | 785.80 | 788.60 | 752.60 | 829.60 | 787.70 | 663.10 | 492.50 | 493.60 | 458.50 | 460.60 | 492.60 | 505.10 | 487.70 | 463.60 | 463.90 | 459.60 | 446.20 | 447.00 | 438.20 | 433.90 | 405.80 | 418.30 | 354.20 | 340.00 | 317.00 | 331.80 | 324.80 | 378.40 | 345.80 | 357.70 | 345.90 | 391.60 | 375.40 | 368.40 | 351.70 | 382.00 | 369.00 | 383.60 | 365.40 | 359.00 | 349.00 | 343.00 | 328.10 | 315.70 | 331.30 | 330.60 | 313.10 | 288.00 | 284.90 | 287.40 | 287.80 | |
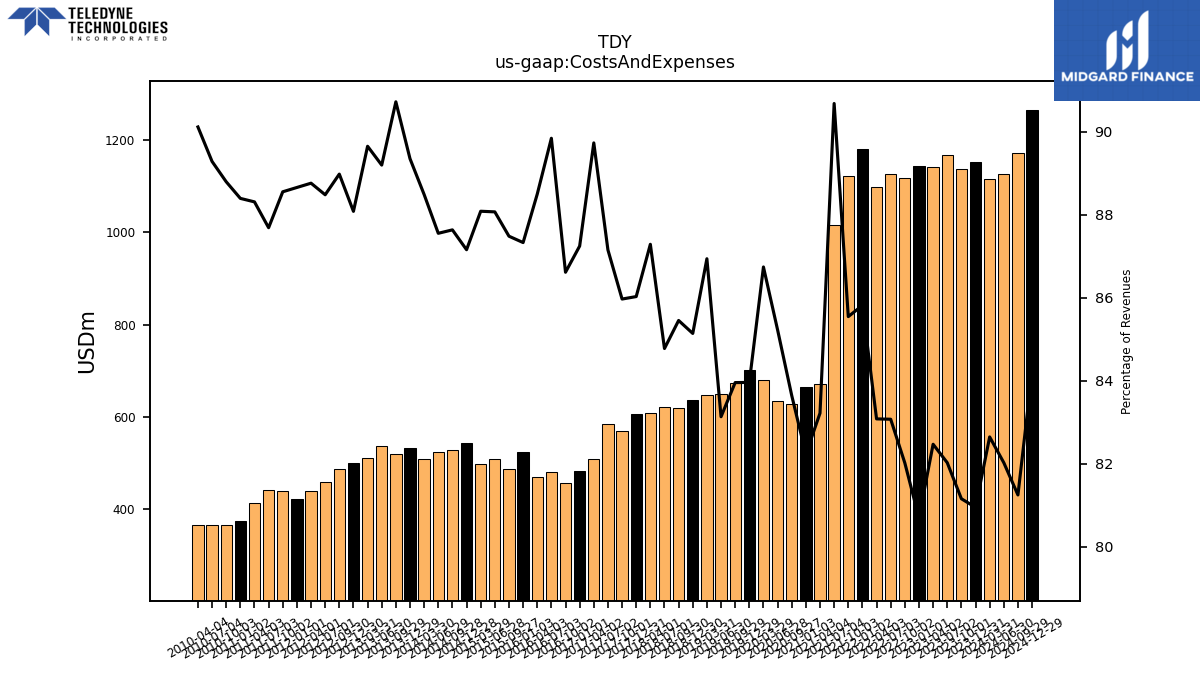
| Costs And Expenses | 1153.50 | 1138.20 | 1168.60 | 1140.80 | 1144.40 | 1118.40 | 1126.30 | 1097.50 | 1180.60 | 1122.30 | 1016.60 | 670.50 | 665.50 | 626.50 | 633.50 | 680.60 | 700.40 | 673.50 | 650.10 | 647.90 | 637.20 | 619.80 | 621.00 | 607.20 | 606.00 | 569.30 | 584.90 | 508.00 | 482.40 | 456.30 | 480.60 | 469.50 | 524.00 | 485.90 | 508.80 | 497.70 | 542.40 | 526.80 | 522.80 | 507.50 | 533.10 | 518.60 | 536.10 | 510.50 | 499.80 | 487.10 | 458.80 | 438.50 | 420.70 | 439.60 | 441.00 | 413.40 | 372.60 | 363.90 | 364.30 | 364.90 | |
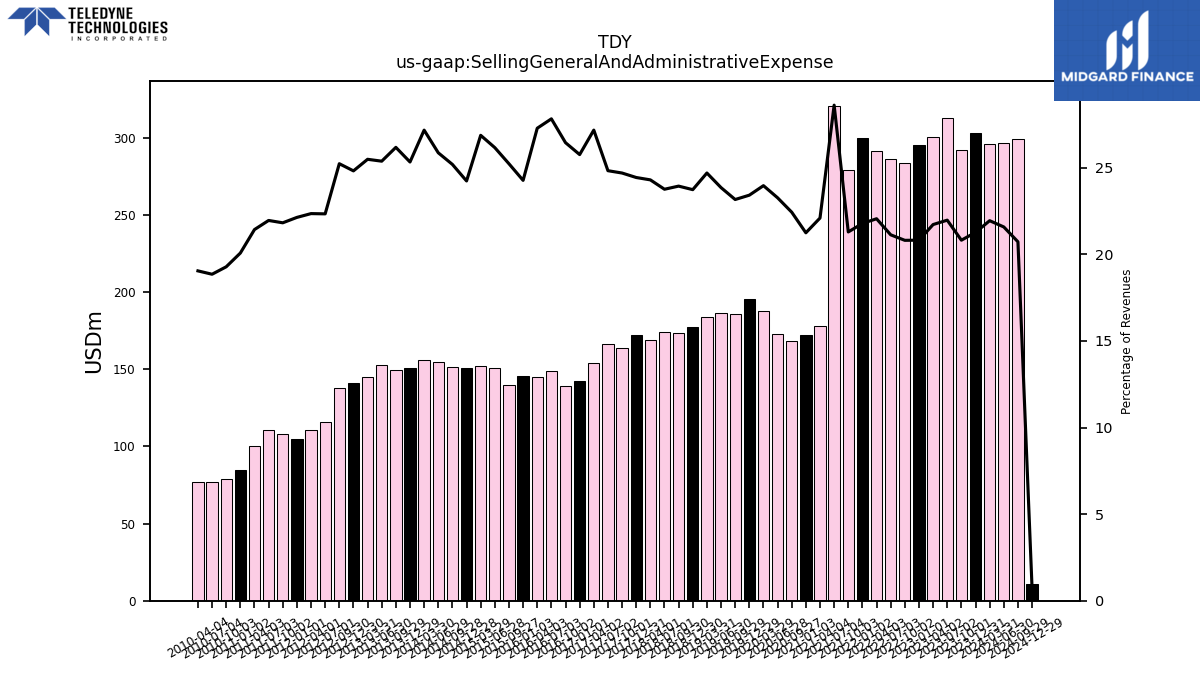
| Selling General And Administrative Expense | 303.00 | 291.90 | 313.00 | 300.40 | 295.20 | 283.70 | 286.40 | 291.30 | 299.60 | 279.30 | 320.70 | 178.00 | 171.90 | 168.00 | 172.90 | 188.00 | 195.30 | 185.80 | 186.50 | 184.00 | 177.60 | 173.60 | 174.00 | 169.00 | 172.10 | 163.50 | 166.60 | 153.80 | 142.40 | 139.30 | 148.80 | 144.70 | 145.60 | 140.10 | 151.10 | 151.80 | 150.80 | 151.40 | 154.40 | 155.80 | 151.10 | 149.60 | 152.50 | 145.10 | 140.80 | 138.10 | 115.80 | 110.40 | 105.00 | 108.30 | 110.40 | 100.30 | 84.60 | 79.00 | 76.90 | 77.10 | |
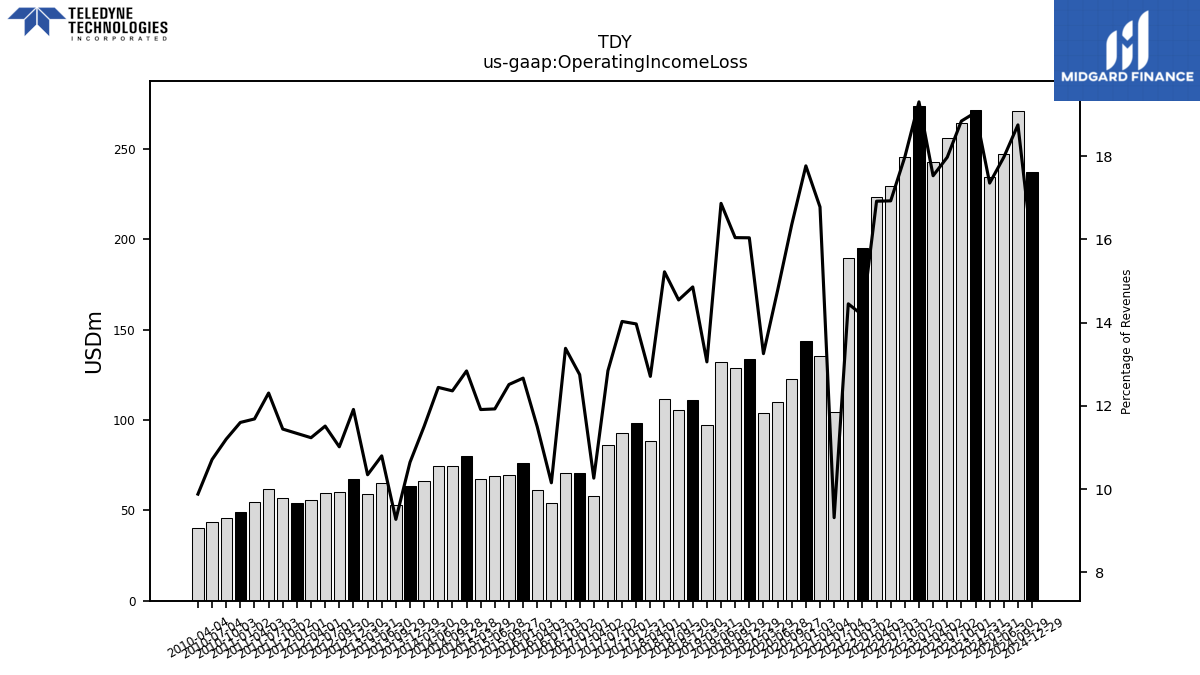
| Operating Income Loss | 271.50 | 264.30 | 256.10 | 242.50 | 273.80 | 245.20 | 229.50 | 223.50 | 195.10 | 189.60 | 104.40 | 135.20 | 143.80 | 122.50 | 109.80 | 104.00 | 133.80 | 128.70 | 131.90 | 97.30 | 111.20 | 105.50 | 111.50 | 88.40 | 98.40 | 92.90 | 86.20 | 58.10 | 70.50 | 70.50 | 54.30 | 61.00 | 76.00 | 69.50 | 68.90 | 67.30 | 79.90 | 74.30 | 74.30 | 66.00 | 63.50 | 53.00 | 64.90 | 58.90 | 67.60 | 60.30 | 59.70 | 55.50 | 53.80 | 56.80 | 61.90 | 54.70 | 48.90 | 45.90 | 43.70 | 40.00 | |
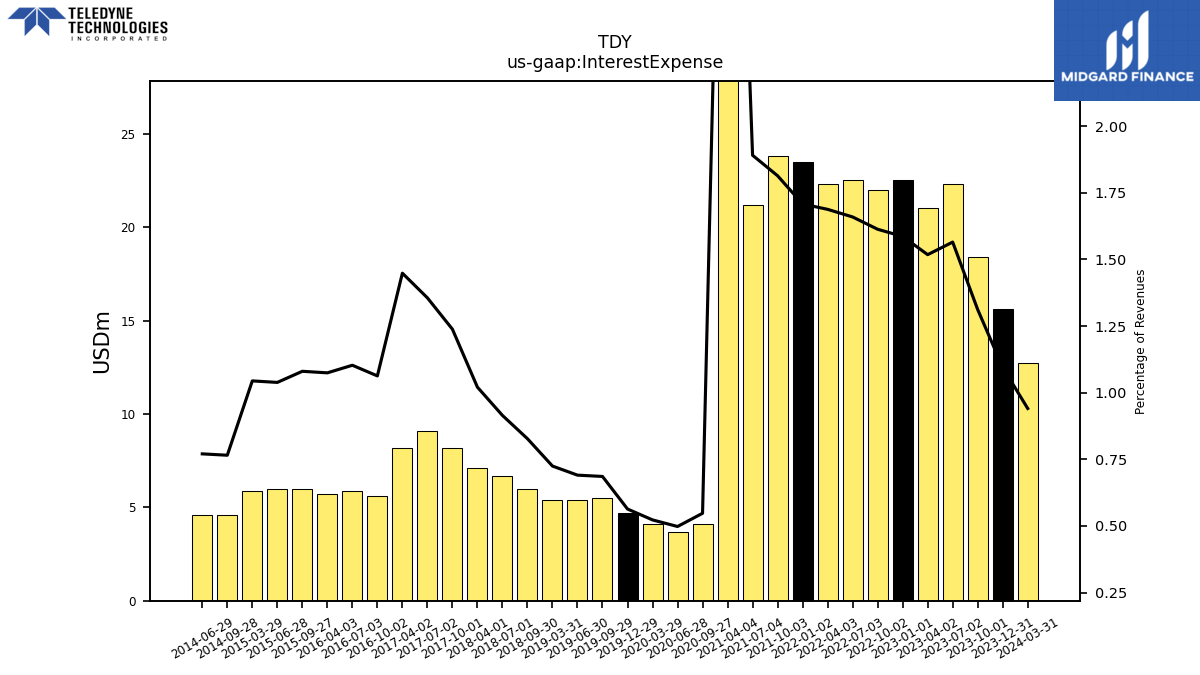
| Interest Expense | 15.60 | 18.40 | 22.30 | 21.00 | 22.50 | 22.00 | 22.50 | 22.30 | 23.50 | 23.80 | 21.20 | 35.70 | NA | 4.10 | 3.70 | 4.10 | 4.70 | 5.50 | 5.40 | 5.40 | NA | 6.00 | 6.70 | 7.10 | NA | 8.20 | 9.10 | 8.20 | NA | 5.60 | 5.90 | 5.70 | NA | 6.00 | 6.00 | 5.90 | NA | 4.60 | 4.60 | NA | NA | NA | NA | NA | NA | NA | NA | NA | NA | NA | NA | NA | NA | NA | NA | NA | |
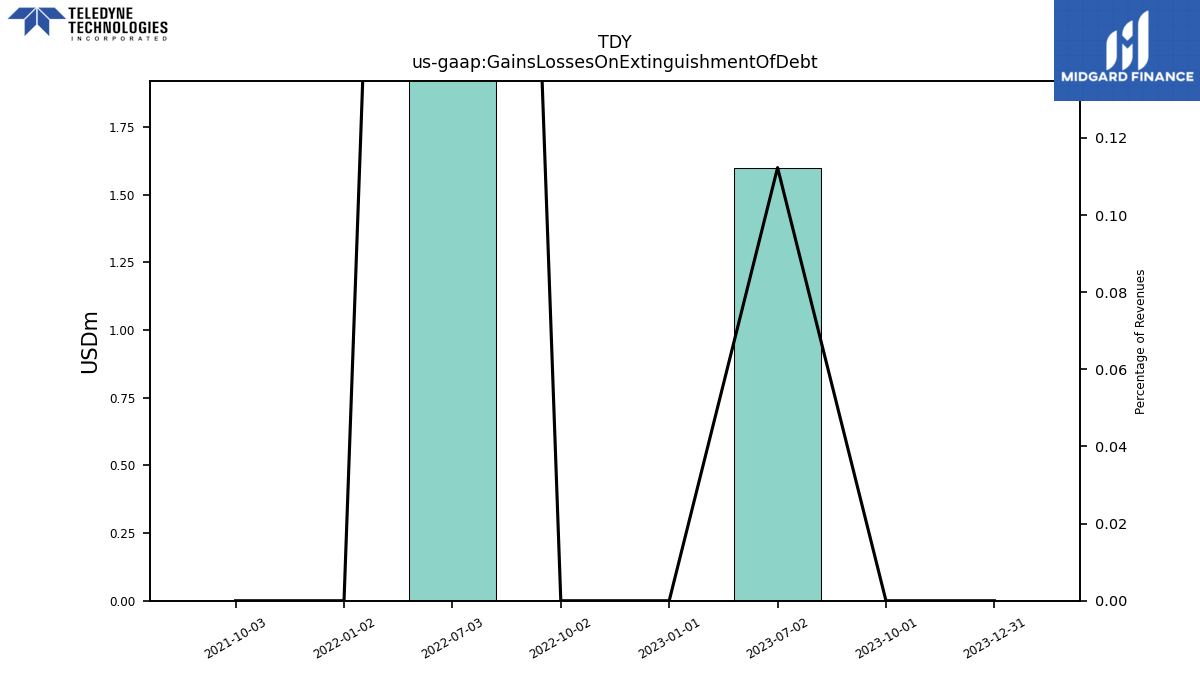
| Gains Losses On Extinguishment Of Debt | 0.00 | 0.00 | 1.60 | NA | 0.00 | 0.00 | 10.60 | NA | 0.00 | 0.00 | NA | NA | NA | NA | NA | NA | NA | NA | NA | NA | NA | NA | NA | NA | NA | NA | NA | NA | NA | NA | NA | NA | NA | NA | NA | NA | NA | NA | NA | NA | NA | NA | NA | NA | NA | NA | NA | NA | NA | NA | NA | NA | NA | NA | NA | NA | |
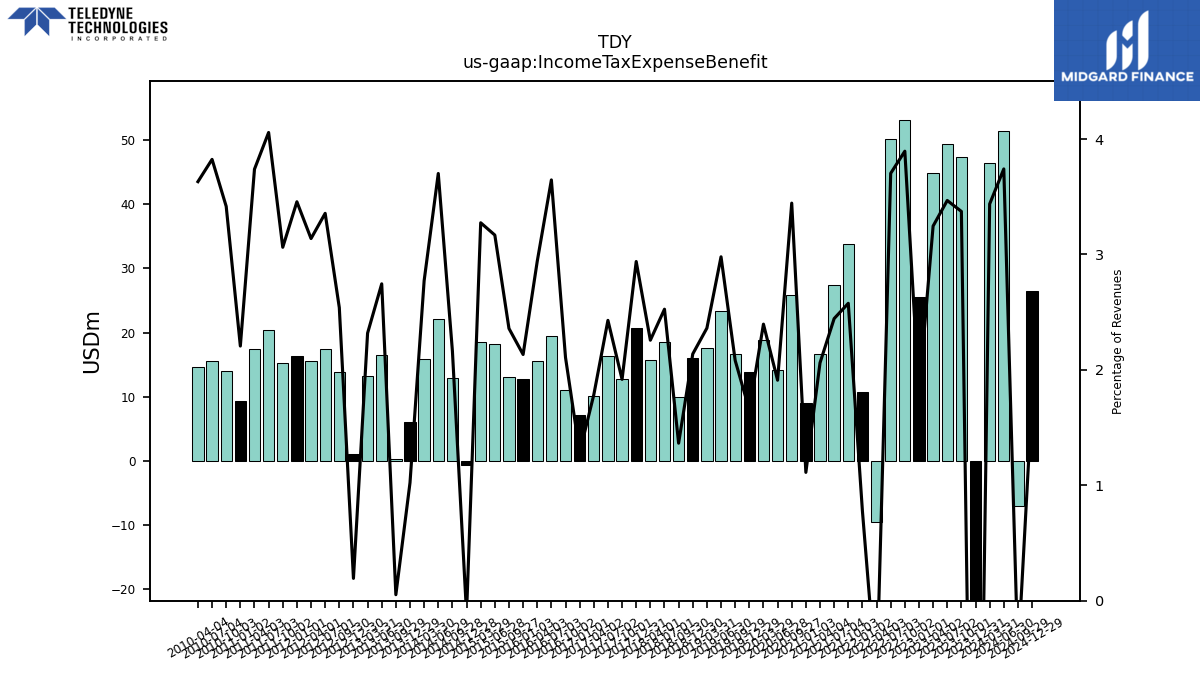
| Income Tax Expense Benefit | -69.30 | 47.30 | 49.40 | 44.90 | 25.50 | 53.10 | 50.20 | -9.60 | 10.70 | 33.80 | 27.40 | 16.60 | 9.00 | 25.80 | 14.20 | 18.80 | 13.80 | 16.70 | 23.30 | 17.60 | 16.00 | 9.90 | 18.50 | 15.70 | 20.70 | 12.70 | 16.30 | 10.10 | 7.10 | 11.10 | 19.50 | 15.60 | 12.80 | 13.10 | 18.30 | 18.50 | -0.70 | 13.00 | 22.10 | 15.90 | 6.10 | 0.30 | 16.50 | 13.20 | 1.10 | 13.90 | 17.40 | 15.50 | 16.40 | 15.20 | 20.40 | 17.50 | 9.30 | 14.00 | 15.60 | 14.70 | |
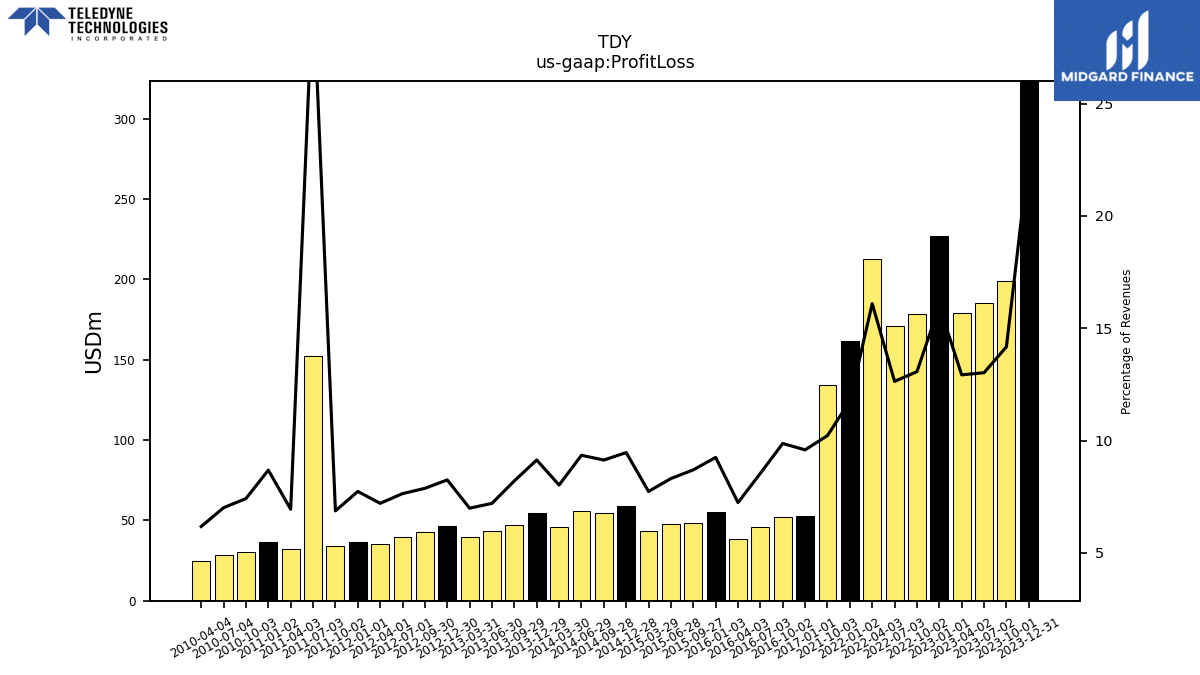
| Profit Loss | 323.50 | 198.80 | 185.50 | 178.80 | 226.80 | 178.20 | 171.30 | 212.60 | 161.80 | 134.10 | NA | NA | NA | NA | NA | NA | NA | NA | NA | NA | NA | NA | NA | NA | NA | NA | NA | NA | 53.00 | 52.00 | 45.70 | 38.40 | 55.50 | 48.30 | 48.00 | 43.70 | 58.90 | 54.90 | 55.80 | 46.00 | 54.50 | 46.90 | 43.30 | 39.80 | 46.80 | 43.10 | 39.60 | 35.60 | 36.70 | 34.10 | 152.40 | 32.50 | 36.60 | 30.40 | 28.60 | 25.00 | |
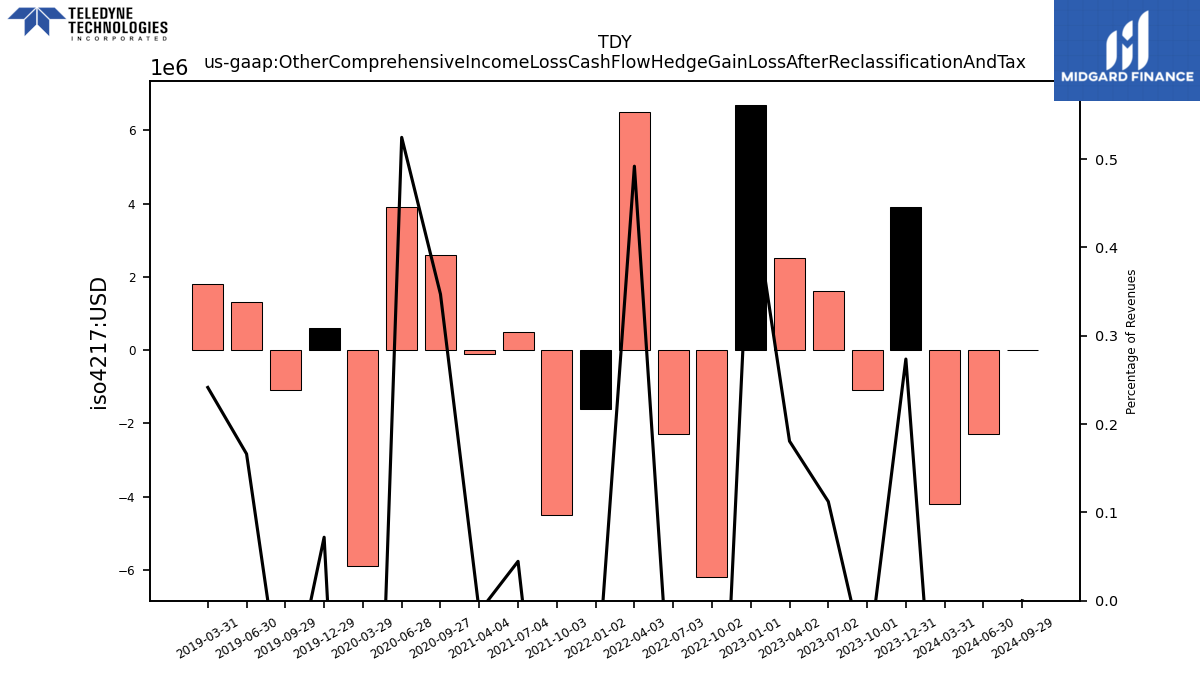
| Other Comprehensive Income Loss Cash Flow Hedge Gain Loss After Reclassification And Tax | 3.90 | -1.10 | 1.60 | 2.50 | 6.70 | -6.20 | -2.30 | 6.50 | -1.60 | -4.50 | 0.50 | -0.10 | NA | 2.60 | 3.90 | -5.90 | 0.60 | -1.10 | 1.30 | 1.80 | NA | NA | NA | NA | NA | NA | NA | NA | NA | NA | NA | NA | NA | NA | NA | NA | NA | NA | NA | NA | NA | NA | NA | NA | NA | NA | NA | NA | NA | NA | NA | NA | NA | NA | NA | NA | |
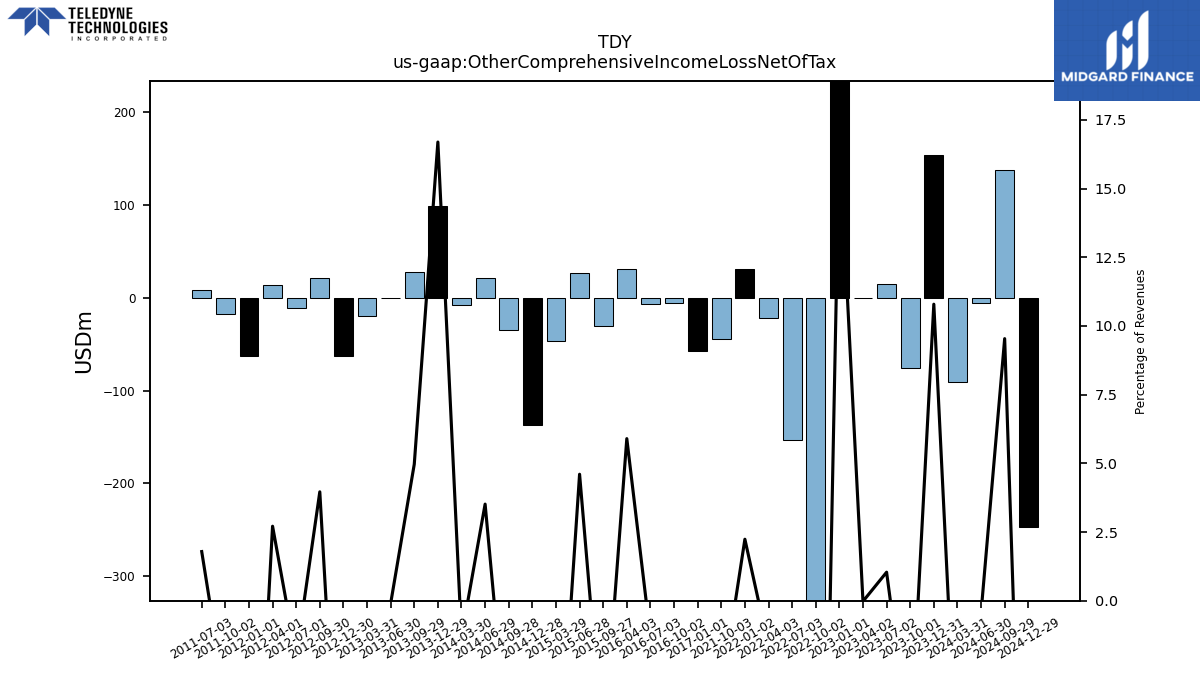
| Other Comprehensive Income Loss Net Of Tax | 153.80 | -75.90 | 14.80 | -0.30 | 237.70 | -359.20 | -153.10 | -21.90 | 30.80 | -44.10 | NA | NA | NA | NA | NA | NA | NA | NA | NA | NA | NA | NA | NA | NA | NA | NA | NA | NA | -57.00 | -5.30 | -7.00 | 31.30 | NA | -30.50 | 26.60 | -46.60 | -136.60 | -34.60 | 21.00 | -7.50 | 99.60 | 28.40 | -0.60 | -19.50 | -62.40 | 21.70 | -10.50 | 13.40 | -62.20 | -17.90 | 9.00 | NA | NA | NA | NA | NA | |
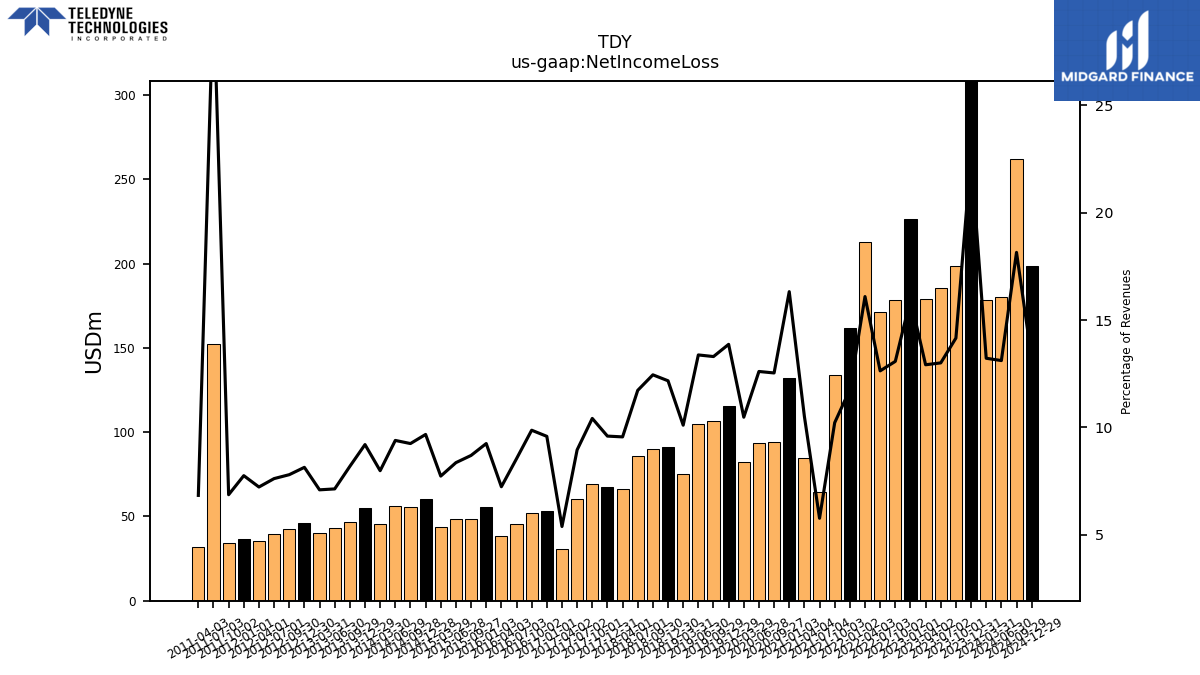
| Net Income Loss | 323.10 | 198.60 | 185.30 | 178.70 | 226.40 | 178.30 | 171.30 | 212.60 | 161.80 | 134.10 | 64.70 | 84.70 | 132.10 | 93.90 | 93.70 | 82.20 | 115.70 | 106.70 | 104.60 | 75.30 | 91.10 | 90.30 | 85.90 | 66.50 | 67.60 | 69.00 | 60.10 | 30.50 | 53.00 | 52.00 | 45.70 | 38.40 | 55.50 | 48.30 | 48.30 | 43.70 | 60.20 | 55.60 | 56.10 | 45.80 | 54.90 | 46.80 | 42.90 | 40.40 | 46.20 | 42.70 | 39.50 | 35.70 | 36.80 | 34.10 | 152.30 | 32.00 | NA | NA | NA | NA | |
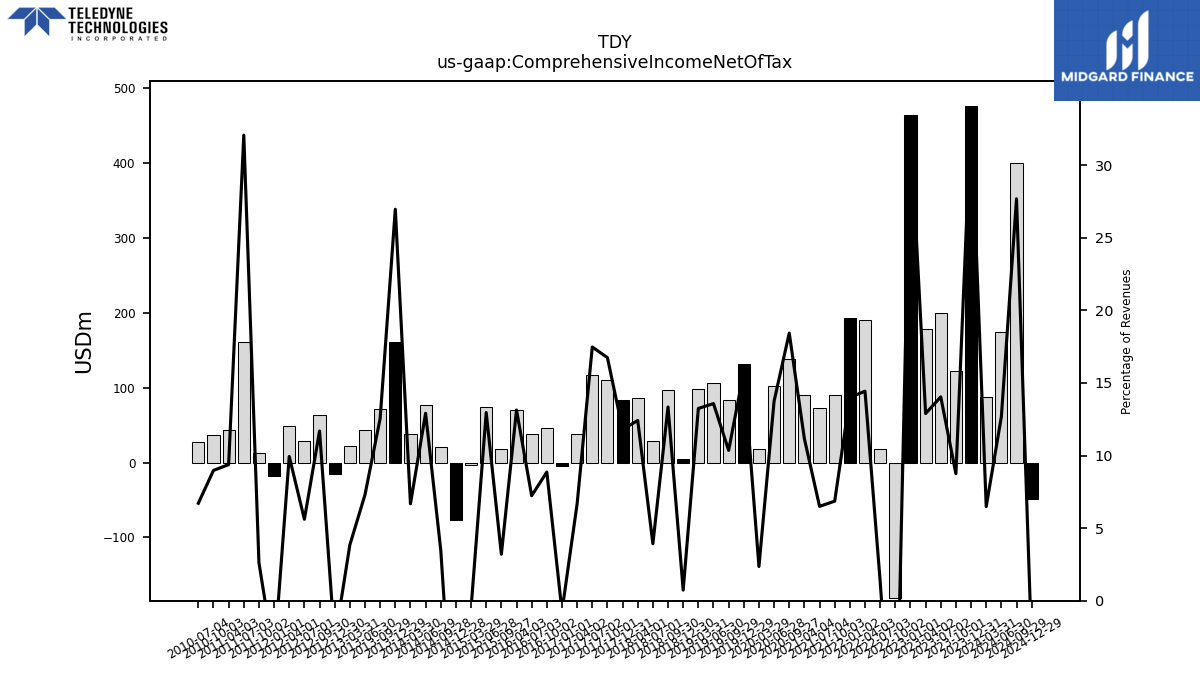
| Comprehensive Income Net Of Tax | 476.90 | 122.70 | 200.10 | 178.40 | 464.10 | -180.90 | 18.20 | 190.70 | 192.60 | 90.00 | 72.90 | 89.90 | NA | 138.10 | 102.20 | 18.50 | 131.70 | 83.10 | 106.20 | 98.70 | 5.50 | 96.80 | 28.80 | 86.40 | 83.10 | 110.90 | 117.30 | 37.80 | -4.00 | 46.70 | 38.70 | 69.70 | NA | 17.80 | 74.90 | -2.90 | -76.40 | 21.00 | 77.10 | 38.30 | 160.90 | 71.80 | 43.90 | 21.90 | -15.80 | 64.00 | 29.10 | 49.10 | -18.50 | 13.00 | 161.30 | 43.90 | NA | 36.80 | 27.40 | NA |
| 2023-12-31 | 2023-10-01 | 2023-07-02 | 2023-04-02 | 2023-01-01 | 2022-10-02 | 2022-07-03 | 2022-04-03 | 2022-01-02 | 2021-10-03 | 2021-07-04 | 2021-04-04 | 2021-01-03 | 2020-09-27 | 2020-06-28 | 2020-03-29 | 2019-12-29 | 2019-09-29 | 2019-06-30 | 2019-03-31 | 2018-12-30 | 2018-09-30 | 2018-07-01 | 2018-04-01 | 2017-12-31 | 2017-10-01 | 2017-07-02 | 2017-04-02 | 2017-01-01 | 2016-10-02 | 2016-07-03 | 2016-04-03 | 2016-01-03 | 2015-09-27 | 2015-06-28 | 2015-03-29 | 2014-12-28 | 2014-09-28 | 2014-06-29 | 2014-03-30 | 2013-12-29 | 2013-09-29 | 2013-06-30 | 2013-03-31 | 2012-12-30 | 2012-09-30 | 2012-07-01 | 2012-04-01 | 2012-01-01 | 2011-10-02 | 2011-07-03 | 2011-04-03 | 2011-01-02 | 2010-10-03 | 2010-07-04 | 2010-04-04 | ||
|---|---|---|---|---|---|---|---|---|---|---|---|---|---|---|---|---|---|---|---|---|---|---|---|---|---|---|---|---|---|---|---|---|---|---|---|---|---|---|---|---|---|---|---|---|---|---|---|---|---|---|---|---|---|---|---|---|---|
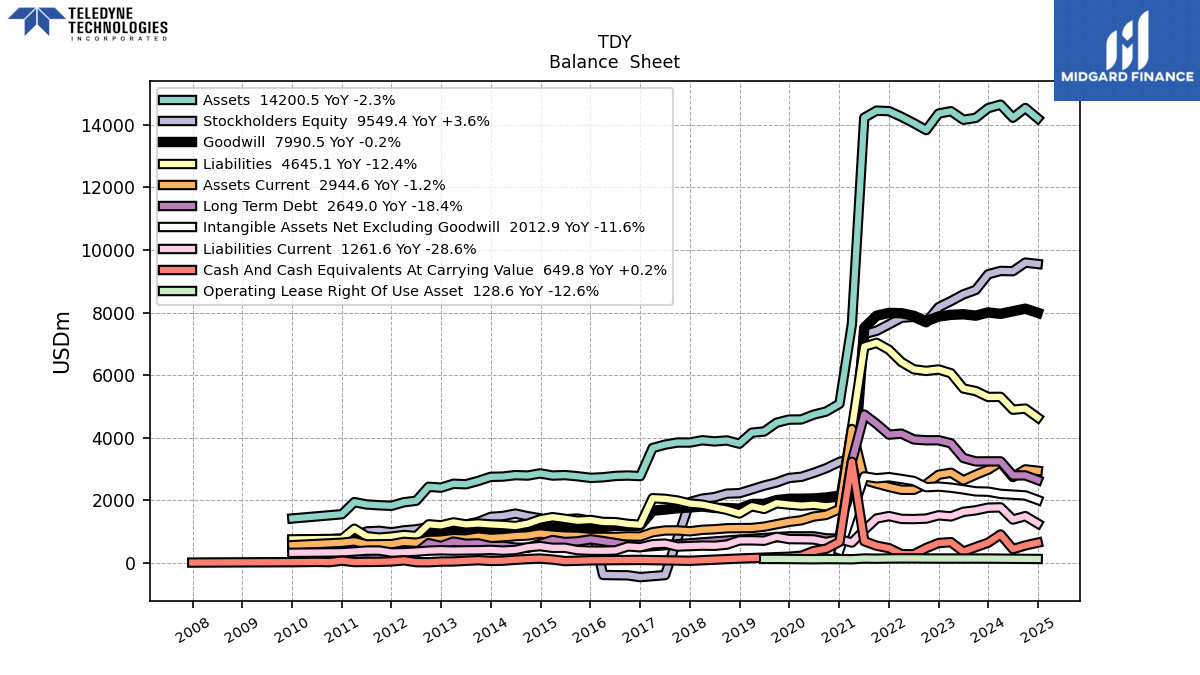
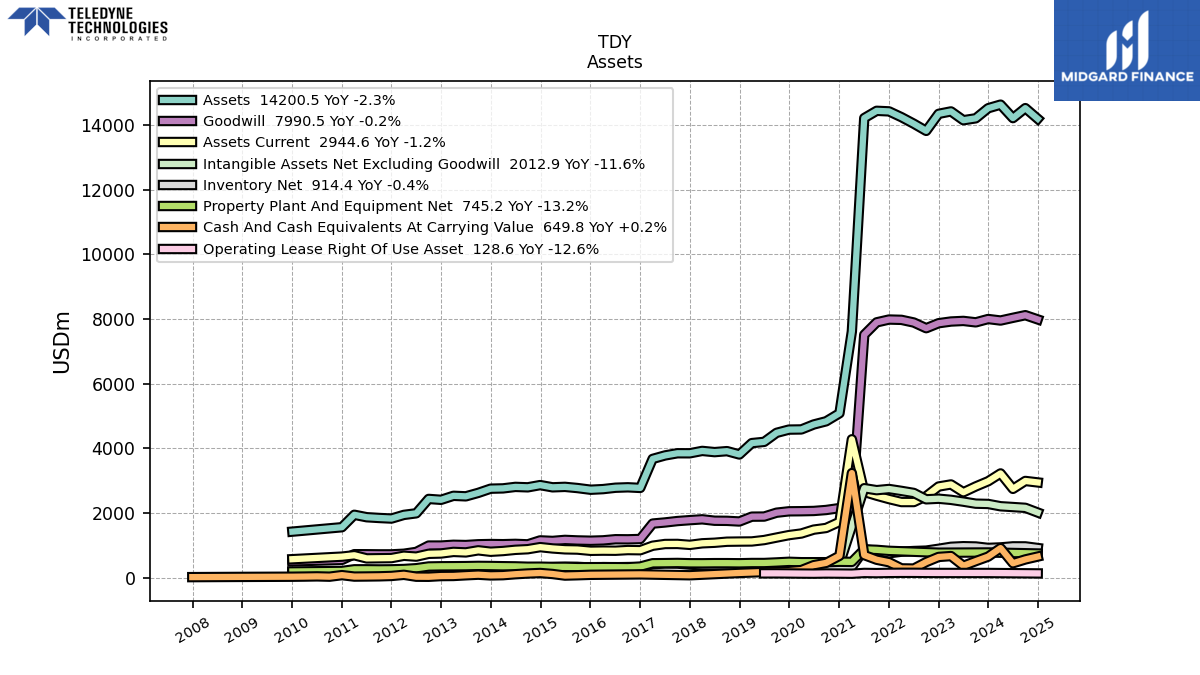
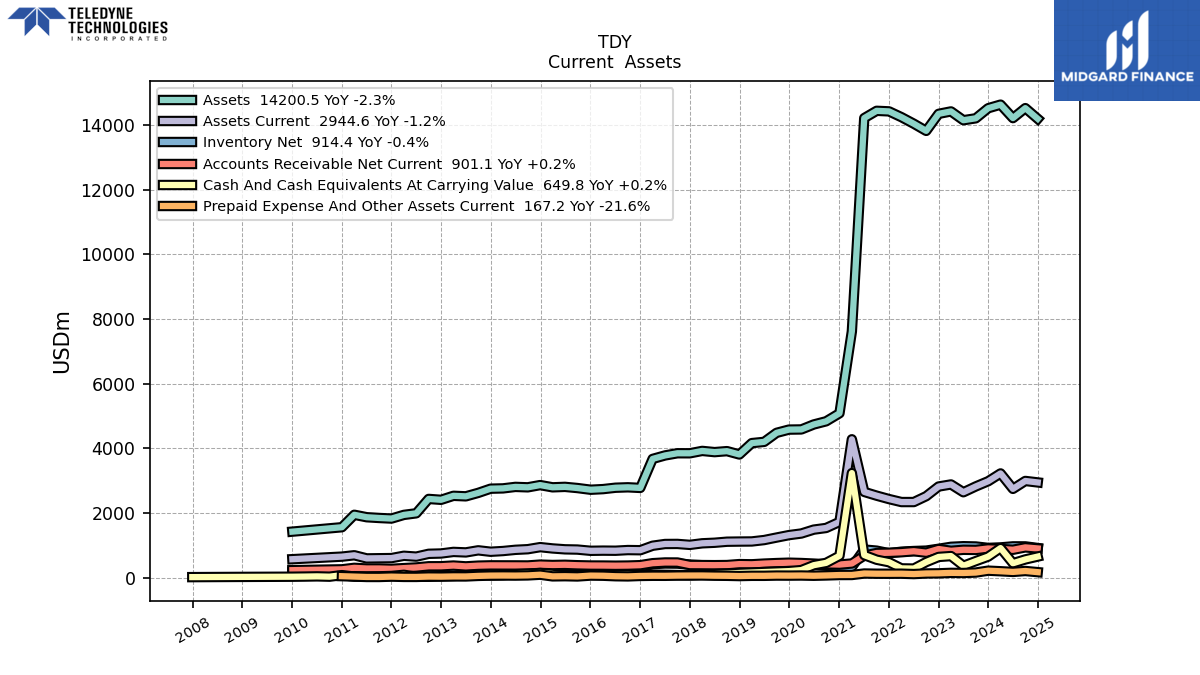
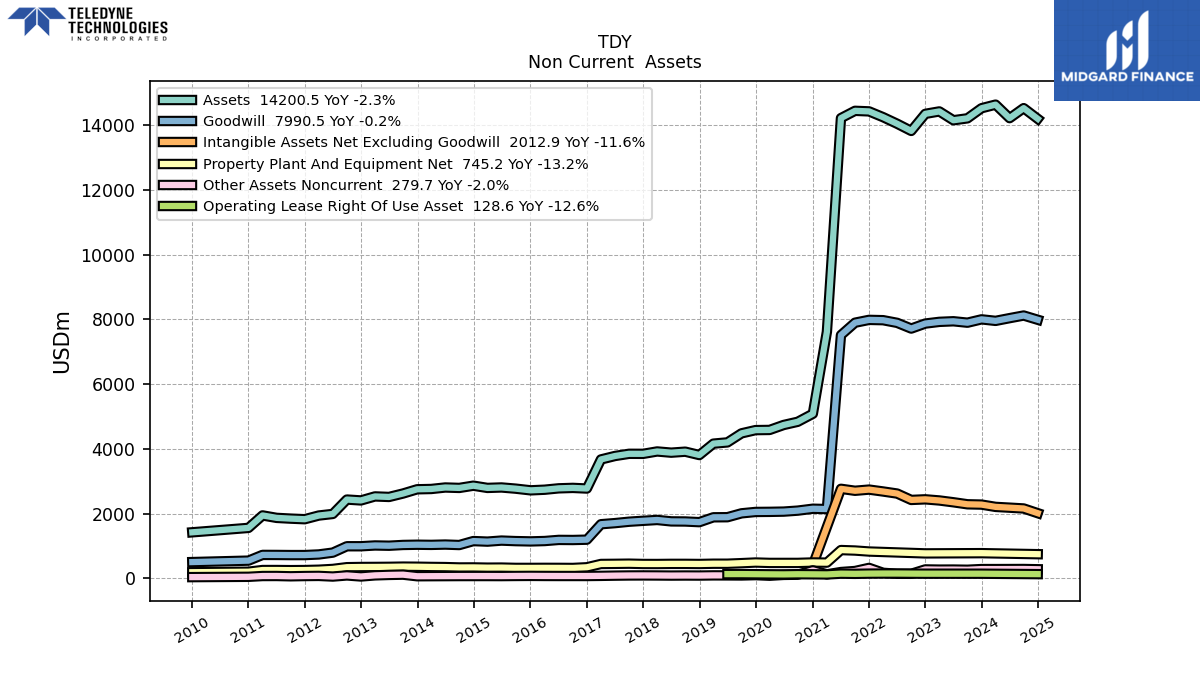
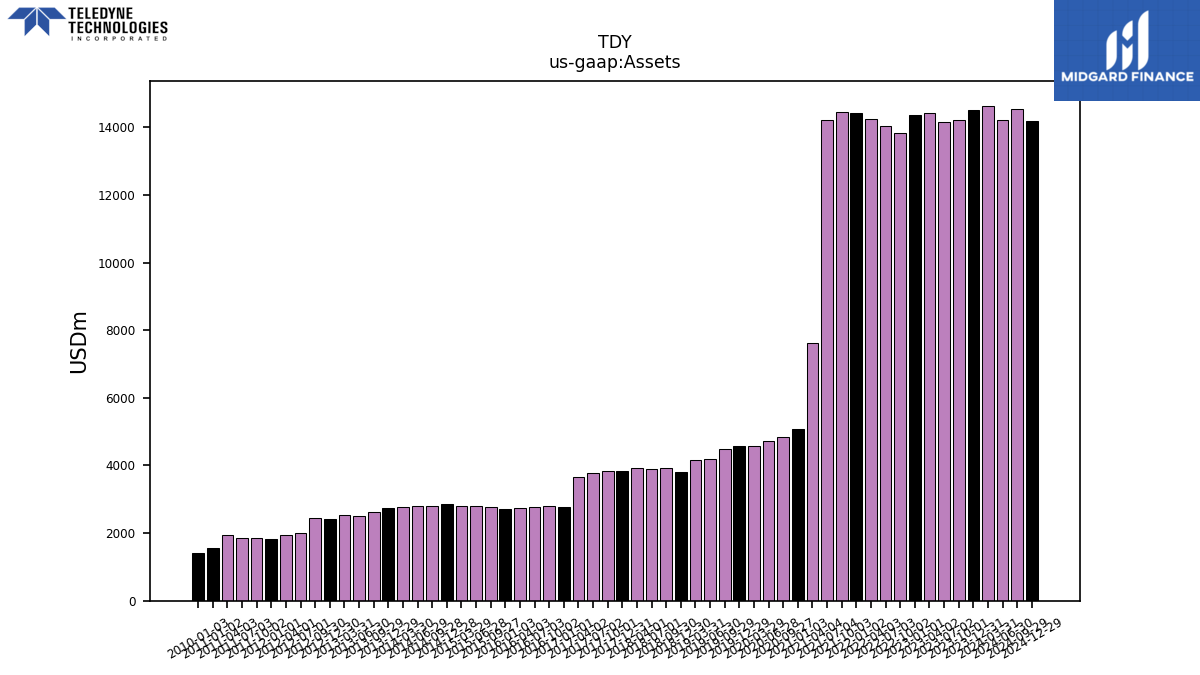
| Assets | 14527.90 | 14215.80 | 14156.30 | 14429.30 | 14354.00 | 13826.40 | 14047.50 | 14251.10 | 14430.30 | 14447.50 | 14222.90 | 7618.40 | 5084.80 | 4837.00 | 4738.20 | 4585.00 | 4579.80 | 4479.60 | 4200.20 | 4161.70 | 3809.30 | 3913.20 | 3882.90 | 3920.10 | 3846.40 | 3847.50 | 3780.10 | 3673.00 | 2774.40 | 2793.70 | 2780.50 | 2737.90 | 2718.50 | 2771.00 | 2807.10 | 2793.10 | 2862.20 | 2792.90 | 2806.20 | 2760.20 | 2751.10 | 2620.70 | 2514.10 | 2530.40 | 2406.40 | 2434.00 | 1988.90 | 1939.60 | 1826.10 | 1844.30 | 1867.60 | 1943.20 | 1557.80 | NA | NA | NA | |
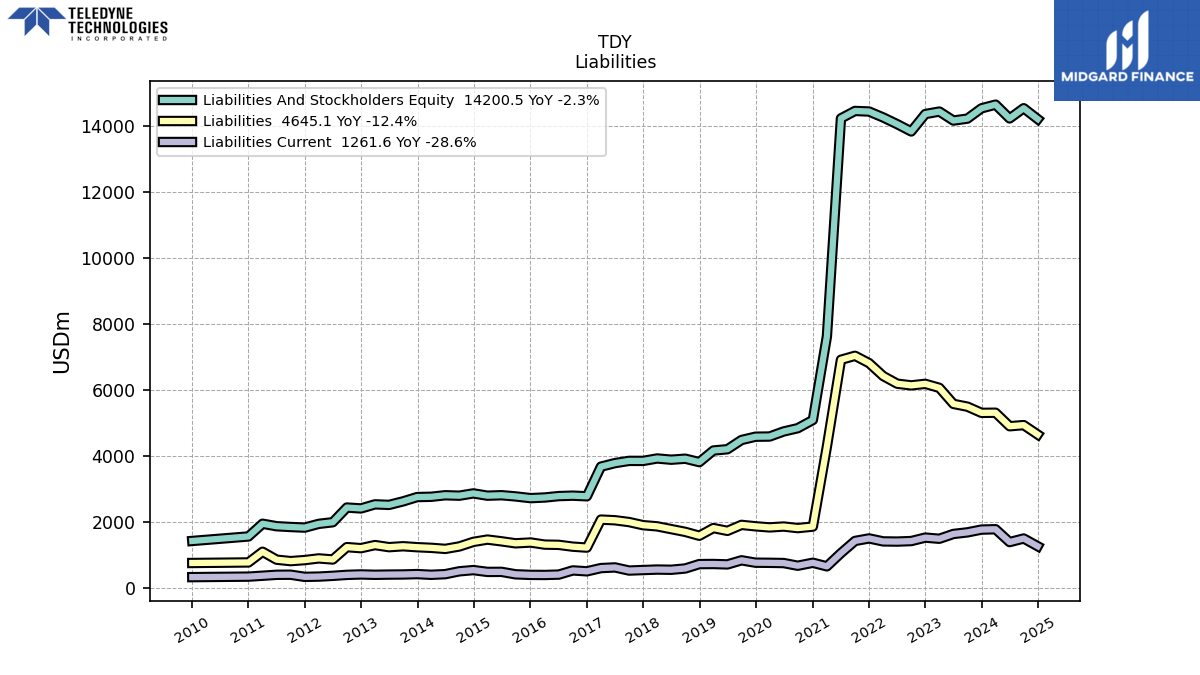
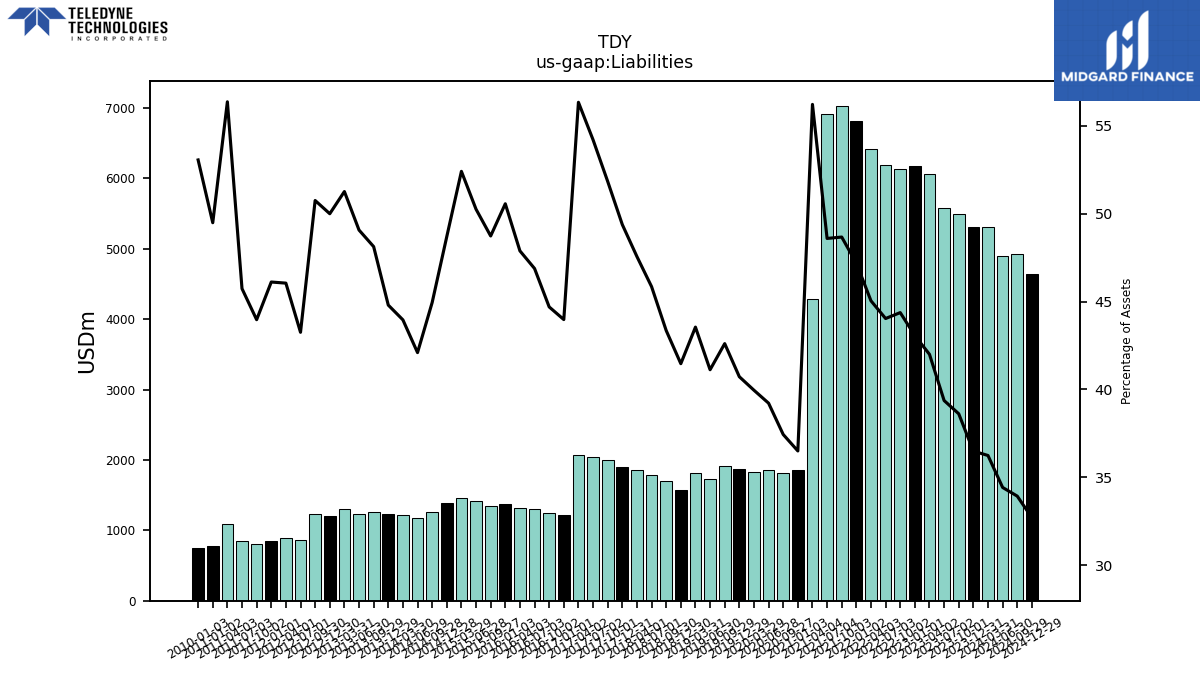
| Liabilities | 5302.10 | 5489.70 | 5573.40 | 6059.90 | 6181.10 | 6134.80 | 6185.60 | 6418.70 | 6808.30 | 7030.90 | 6910.50 | 4282.10 | 1856.20 | 1811.00 | 1858.30 | 1832.00 | 1865.10 | 1908.60 | 1727.20 | 1812.20 | 1579.60 | 1696.40 | 1780.20 | 1864.20 | 1899.10 | 1994.10 | 2048.60 | 2068.90 | 1220.00 | 1248.60 | 1303.40 | 1310.90 | 1374.40 | 1350.20 | 1410.50 | 1463.60 | 1393.70 | 1255.20 | 1181.30 | 1213.30 | 1232.40 | 1261.10 | 1233.50 | 1296.90 | 1203.00 | 1235.10 | 860.20 | 893.10 | 842.00 | 810.90 | 854.10 | 1095.10 | 770.80 | NA | NA | NA | |
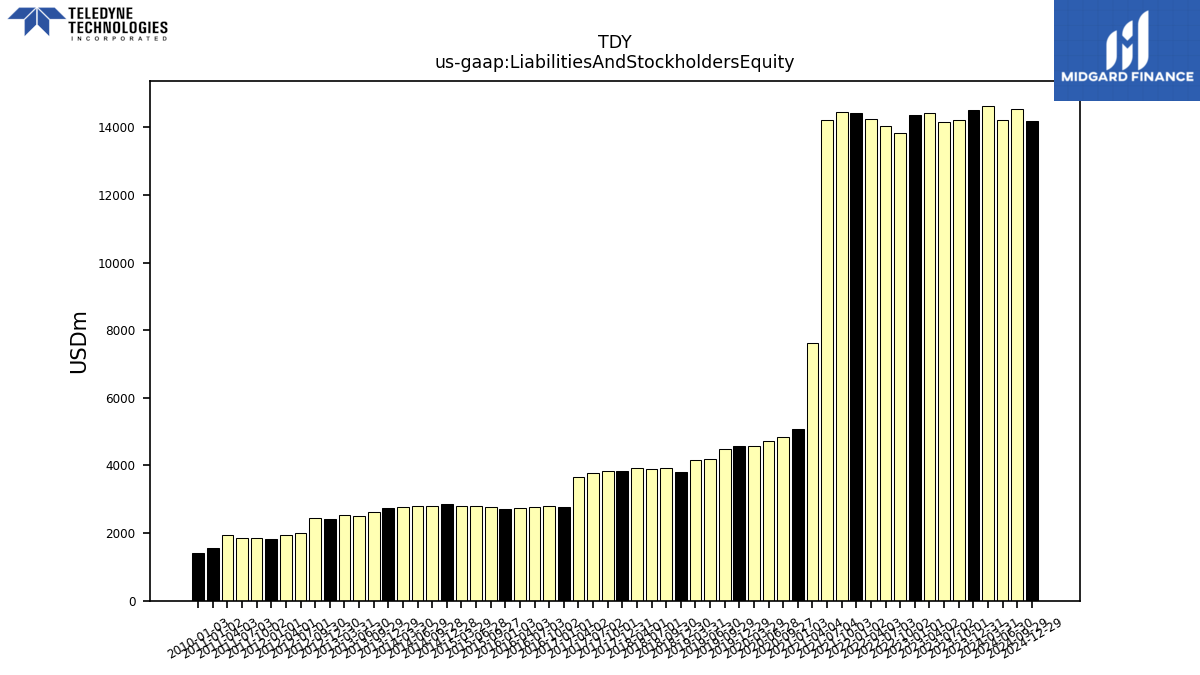
| Liabilities And Stockholders Equity | 14527.90 | 14215.80 | 14156.30 | 14429.30 | 14354.00 | 13826.40 | 14047.50 | 14251.10 | 14430.30 | 14447.50 | 14222.90 | 7618.40 | 5084.80 | 4837.00 | 4738.20 | 4585.00 | 4579.80 | 4479.60 | 4200.20 | 4161.70 | 3809.30 | 3913.20 | 3882.90 | 3920.10 | 3846.40 | 3847.50 | 3780.10 | 3673.00 | 2774.40 | 2793.70 | 2780.50 | 2737.90 | 2718.50 | 2771.00 | 2807.10 | 2793.10 | 2862.20 | 2792.90 | 2806.20 | 2760.20 | 2751.10 | 2620.70 | 2514.10 | 2530.40 | 2406.40 | 2434.00 | 1988.90 | 1939.60 | 1826.10 | 1844.30 | 1867.60 | 1943.20 | 1557.80 | NA | NA | NA | |
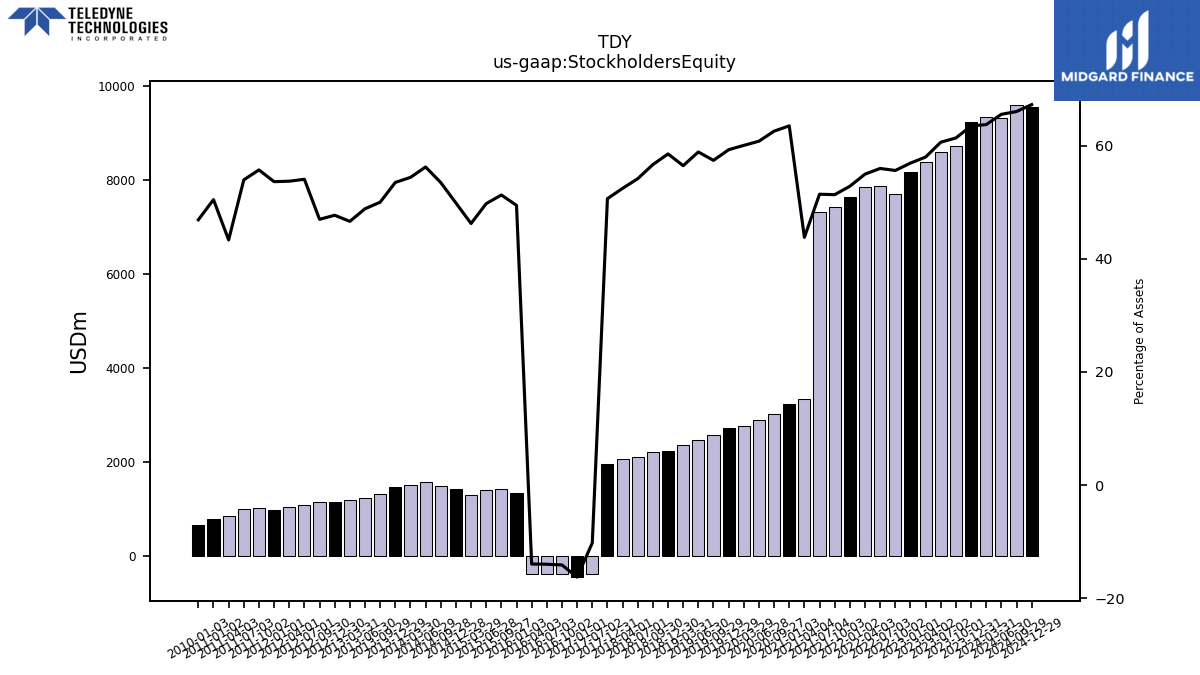
| Stockholders Equity | 9221.20 | 8721.90 | 8579.00 | 8365.70 | 8169.20 | 7688.50 | 7861.90 | 7832.40 | 7622.00 | 7416.60 | 7312.40 | 3336.30 | 3228.60 | 3026.00 | 2879.90 | 2753.00 | 2714.70 | 2571.00 | 2473.00 | 2349.50 | 2229.70 | 2216.80 | 2102.80 | 2055.90 | 1947.30 | NA | -386.70 | NA | -451.20 | -394.20 | -388.90 | -381.90 | 1344.10 | 1420.80 | 1396.60 | 1291.40 | 1427.30 | 1493.40 | 1577.80 | 1501.20 | 1471.70 | 1310.40 | 1227.90 | 1179.50 | 1147.80 | 1143.30 | 1075.10 | 1041.80 | 979.30 | 1027.40 | 1007.50 | 842.20 | 786.00 | NA | NA | NA |
| 2023-12-31 | 2023-10-01 | 2023-07-02 | 2023-04-02 | 2023-01-01 | 2022-10-02 | 2022-07-03 | 2022-04-03 | 2022-01-02 | 2021-10-03 | 2021-07-04 | 2021-04-04 | 2021-01-03 | 2020-09-27 | 2020-06-28 | 2020-03-29 | 2019-12-29 | 2019-09-29 | 2019-06-30 | 2019-03-31 | 2018-12-30 | 2018-09-30 | 2018-07-01 | 2018-04-01 | 2017-12-31 | 2017-10-01 | 2017-07-02 | 2017-04-02 | 2017-01-01 | 2016-10-02 | 2016-07-03 | 2016-04-03 | 2016-01-03 | 2015-09-27 | 2015-06-28 | 2015-03-29 | 2014-12-28 | 2014-09-28 | 2014-06-29 | 2014-03-30 | 2013-12-29 | 2013-09-29 | 2013-06-30 | 2013-03-31 | 2012-12-30 | 2012-09-30 | 2012-07-01 | 2012-04-01 | 2012-01-01 | 2011-10-02 | 2011-07-03 | 2011-04-03 | 2011-01-02 | 2010-10-03 | 2010-07-04 | 2010-04-04 | ||
|---|---|---|---|---|---|---|---|---|---|---|---|---|---|---|---|---|---|---|---|---|---|---|---|---|---|---|---|---|---|---|---|---|---|---|---|---|---|---|---|---|---|---|---|---|---|---|---|---|---|---|---|---|---|---|---|---|---|
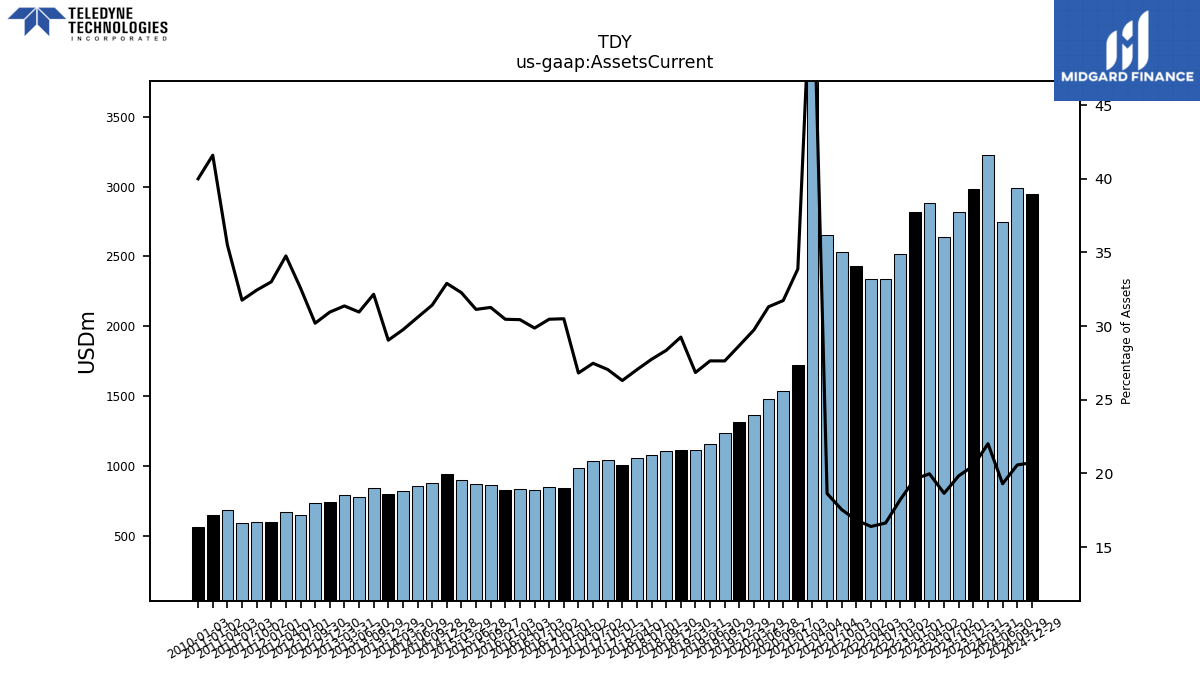
| Assets Current | 2981.40 | 2820.50 | 2640.70 | 2882.40 | 2817.90 | 2519.40 | 2337.40 | 2337.40 | 2429.40 | 2534.90 | 2650.90 | 4280.60 | 1722.60 | 1535.10 | 1483.80 | 1363.80 | 1313.70 | 1238.10 | 1161.00 | 1117.50 | 1114.40 | 1109.60 | 1077.50 | 1060.20 | 1011.90 | 1041.00 | 1038.70 | 985.10 | 846.20 | 851.20 | 830.50 | 833.40 | 828.20 | 866.50 | 874.00 | 901.30 | 941.70 | 877.70 | 858.50 | 821.20 | 799.10 | 842.90 | 778.30 | 793.80 | 744.80 | 735.00 | 648.10 | 674.30 | 602.70 | 598.30 | 593.20 | 690.10 | 648.00 | NA | NA | NA | |
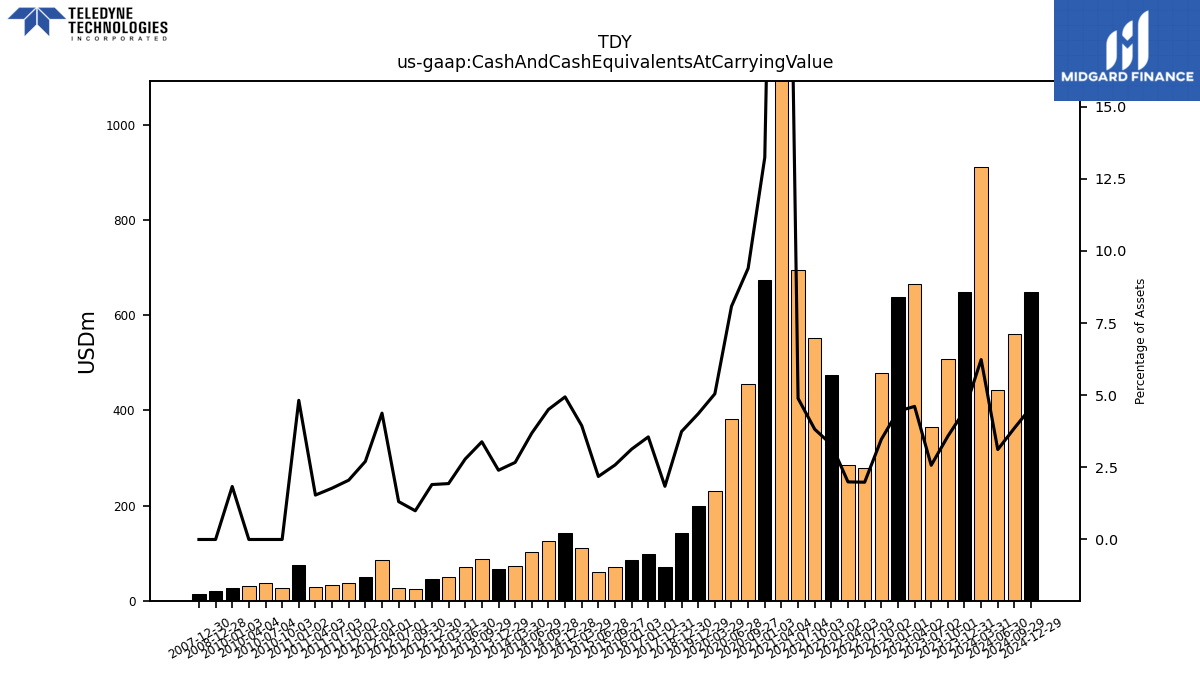
| Cash And Cash Equivalents At Carrying Value | 648.30 | 508.60 | 364.20 | 665.20 | 638.10 | 479.30 | 278.80 | 284.30 | 474.70 | 551.80 | 695.10 | 3234.20 | 673.10 | 454.50 | 382.80 | 231.40 | 199.50 | NA | NA | NA | 142.50 | NA | NA | NA | 70.90 | NA | NA | NA | 98.60 | NA | NA | NA | 85.10 | 71.50 | 61.30 | 110.20 | 141.40 | 125.80 | 103.40 | 73.70 | 66.00 | 88.70 | 70.10 | 49.00 | 45.80 | 24.20 | 26.10 | 84.90 | 49.40 | 37.90 | 33.20 | 29.90 | 75.10 | 27.10 | 36.50 | 30.40 | |
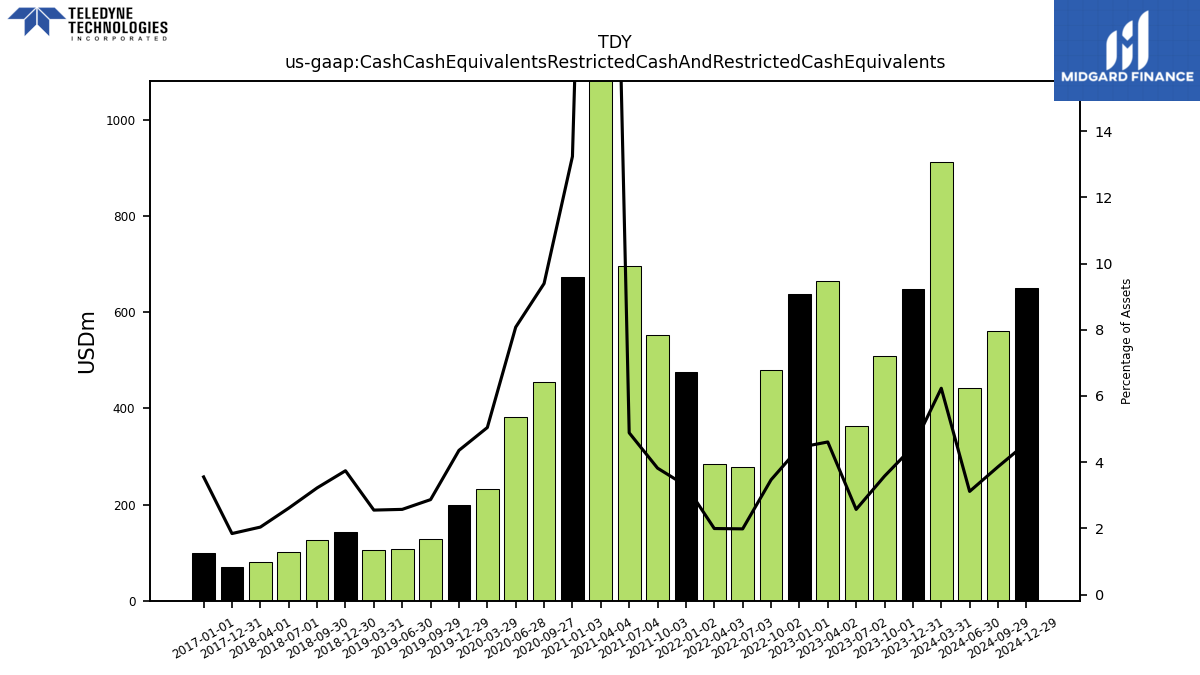
| Cash Cash Equivalents Restricted Cash And Restricted Cash Equivalents | 648.30 | 508.60 | 364.20 | 665.20 | 638.10 | 479.30 | 278.80 | 284.30 | 474.70 | 551.80 | 695.10 | 3234.20 | 673.10 | 454.50 | 382.80 | 231.40 | 199.50 | 128.50 | 108.10 | 106.20 | 142.50 | 126.10 | 101.40 | 79.90 | 70.90 | NA | NA | NA | 98.60 | NA | NA | NA | NA | NA | NA | NA | NA | NA | NA | NA | NA | NA | NA | NA | NA | NA | NA | NA | NA | NA | NA | NA | NA | NA | NA | NA | |
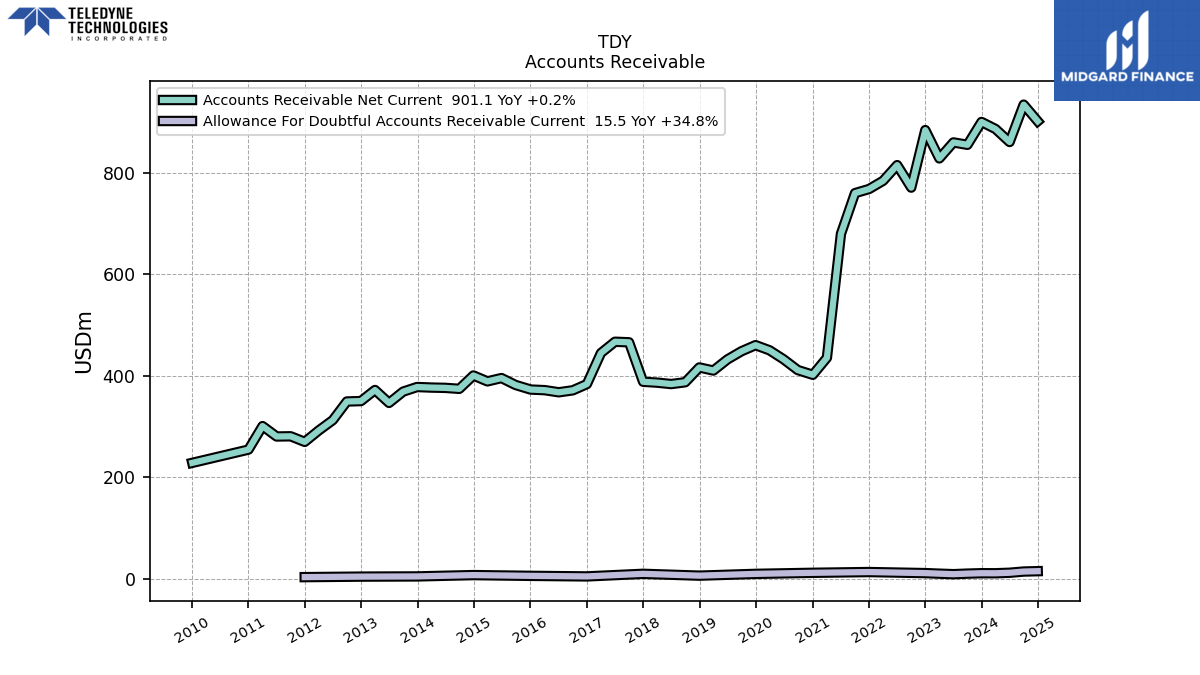
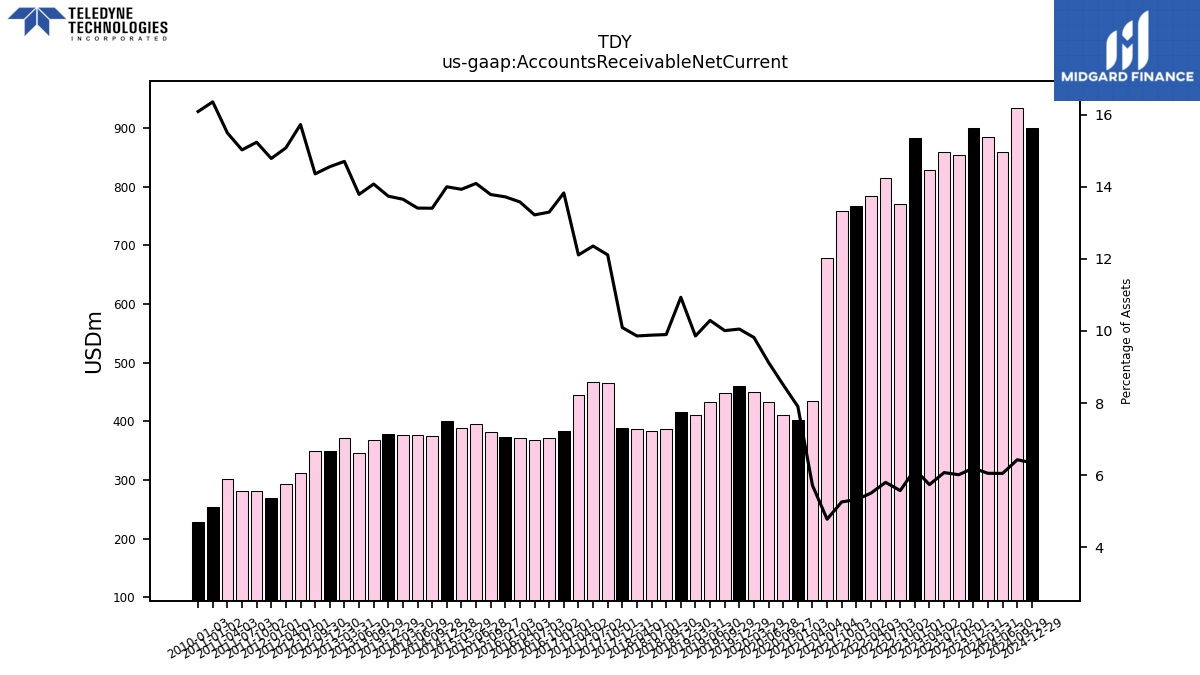
| Accounts Receivable Net Current | 899.70 | 854.70 | 859.40 | 827.90 | 883.70 | 770.40 | 814.70 | 783.90 | 767.70 | 759.60 | 679.50 | 435.50 | 402.00 | 411.40 | 432.40 | 450.20 | 460.40 | 448.40 | 432.30 | 410.40 | 416.50 | 387.40 | 383.80 | 386.60 | 388.30 | 466.00 | 467.10 | 444.80 | 383.70 | 371.50 | 367.60 | 371.80 | 373.00 | 382.00 | 395.60 | 389.10 | 400.70 | 374.40 | 376.30 | 376.90 | 378.00 | 368.90 | 346.70 | 372.10 | 350.30 | 349.50 | 312.80 | 292.50 | 270.00 | 281.00 | 280.60 | 301.10 | 254.80 | NA | NA | NA | |
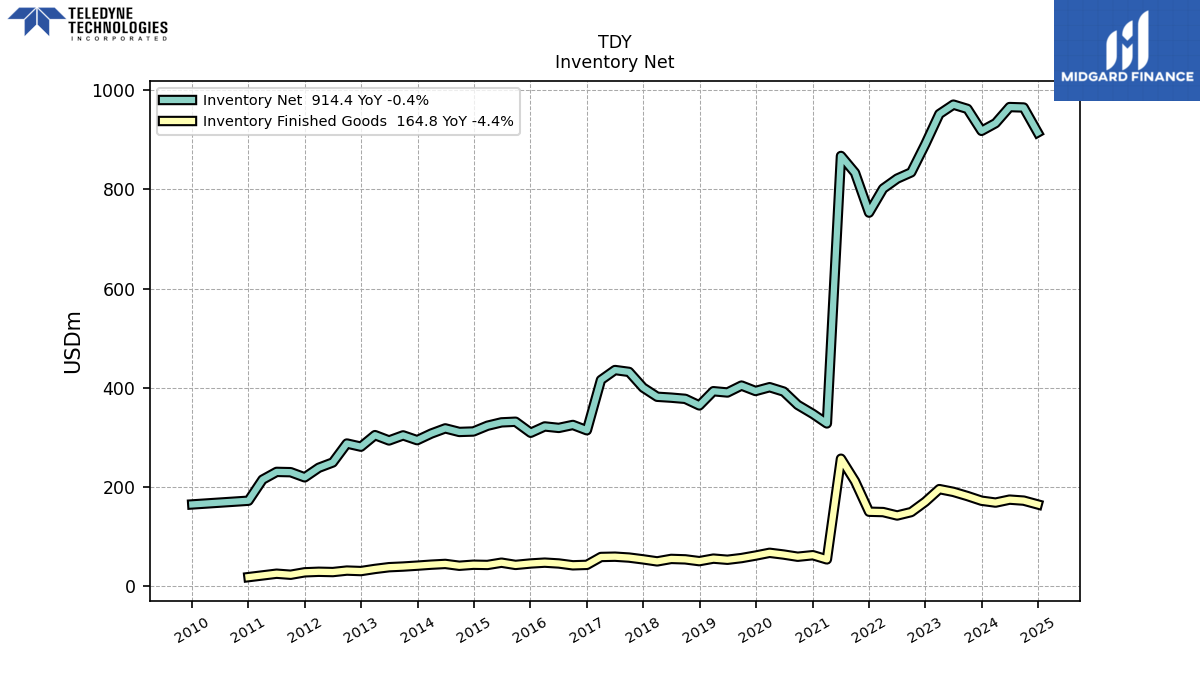
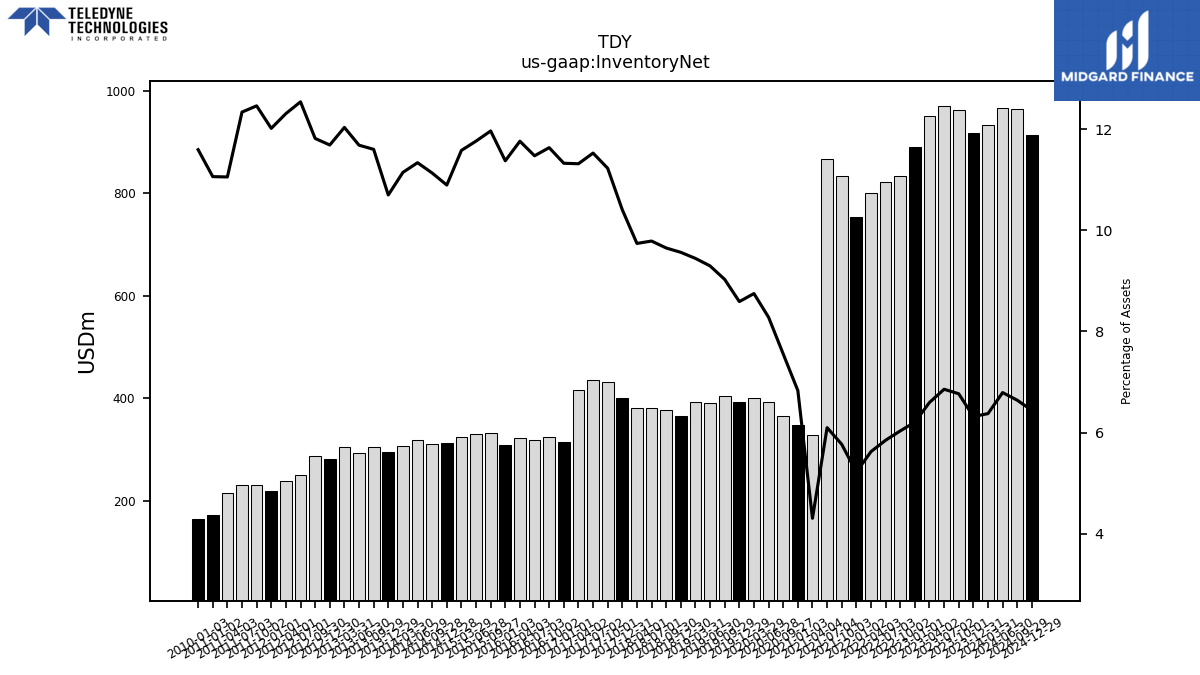
| Inventory Net | 917.70 | 962.00 | 970.60 | 951.70 | 890.70 | 834.10 | 821.50 | 801.30 | 752.90 | 833.20 | 867.20 | 328.00 | 347.30 | 365.40 | 392.30 | 401.10 | 393.40 | 404.40 | 390.40 | 393.00 | 364.30 | 377.60 | 380.00 | 381.80 | 400.20 | 431.90 | 435.70 | 415.60 | 314.20 | 325.00 | 319.00 | 322.00 | 309.20 | 331.50 | 330.20 | 323.40 | 311.80 | 310.90 | 318.10 | 307.60 | 294.30 | 304.00 | 293.70 | 304.50 | 281.20 | 287.60 | 249.40 | 238.70 | 219.40 | 229.80 | 230.40 | 214.80 | 172.30 | NA | NA | NA | |
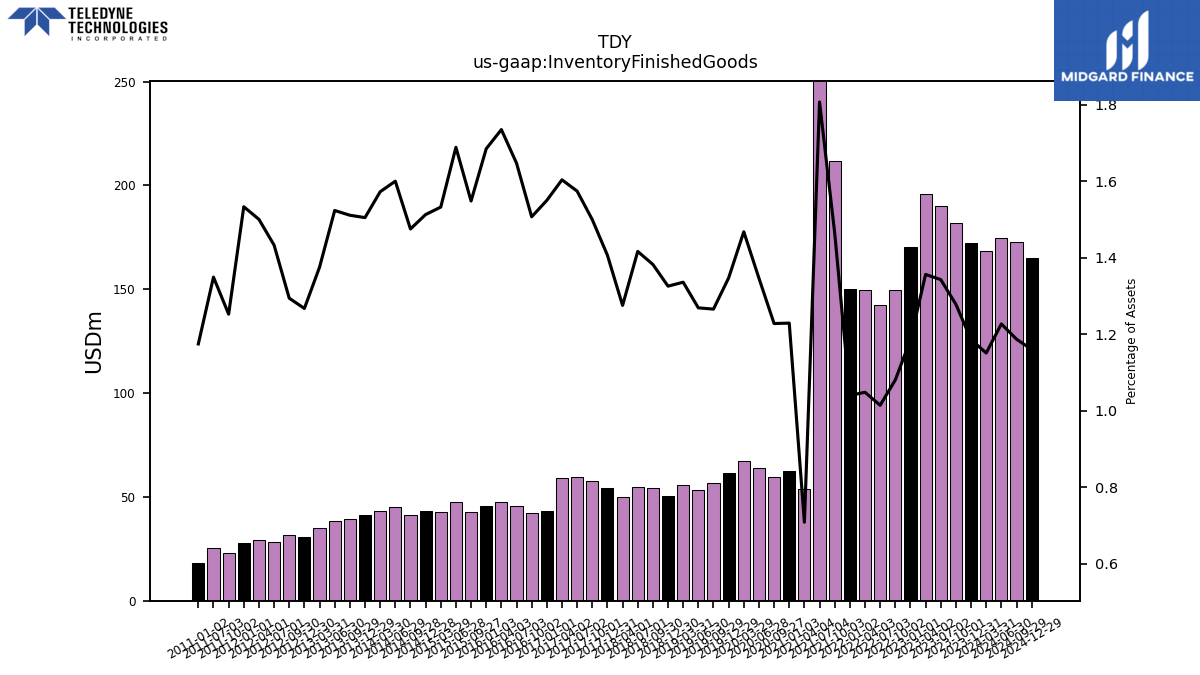
| Inventory Finished Goods | 172.30 | 181.70 | 190.10 | 195.70 | 170.20 | 149.40 | 142.50 | 149.40 | 150.10 | 211.60 | 257.00 | 54.00 | 62.50 | 59.40 | 63.80 | 67.30 | 61.70 | 56.70 | 53.30 | 55.60 | 50.50 | 54.10 | 55.00 | 50.00 | 54.10 | 57.70 | 59.50 | 58.90 | 43.00 | 42.10 | 45.80 | 47.50 | 45.80 | 42.90 | 47.40 | 42.80 | 43.30 | 41.20 | 44.90 | 43.40 | 41.40 | 39.60 | 38.30 | 34.80 | 30.50 | 31.50 | 28.50 | 29.10 | 28.00 | 23.10 | 25.20 | NA | 18.30 | NA | NA | NA | |
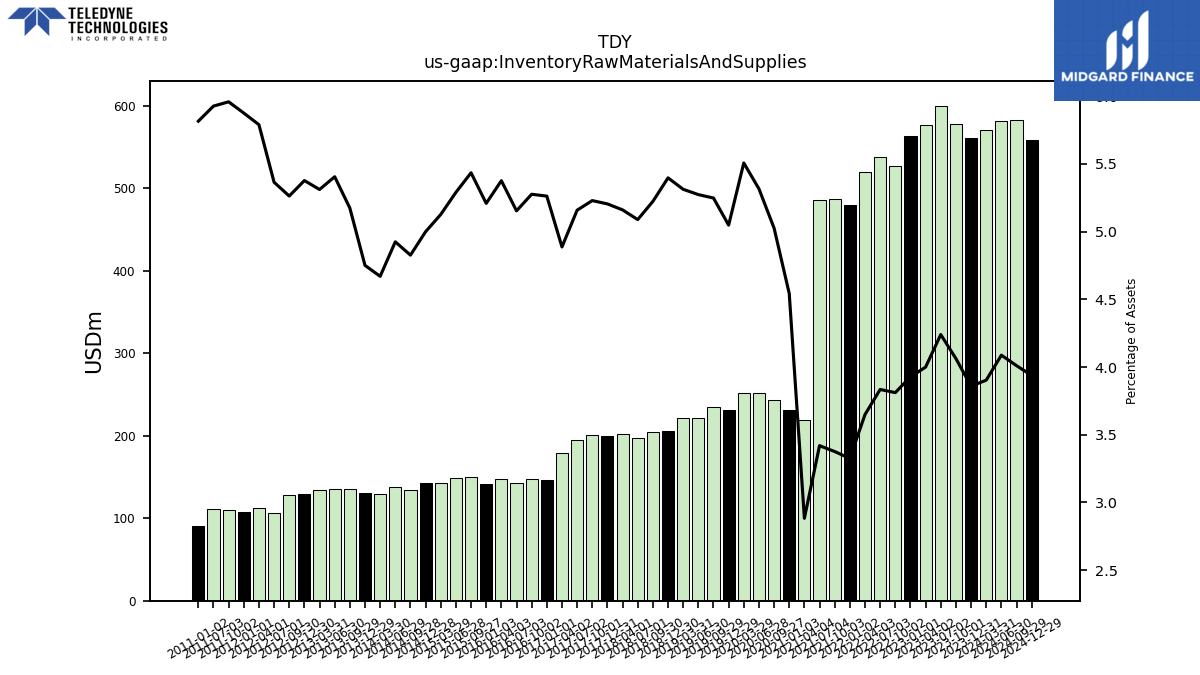
| Inventory Raw Materials And Supplies | 560.60 | 577.50 | 600.20 | 577.10 | 563.70 | 526.90 | 538.60 | 520.00 | 479.80 | 487.70 | 486.30 | 219.60 | 231.00 | 243.10 | 251.90 | 252.50 | 231.20 | 235.10 | 221.50 | 221.10 | 205.60 | 204.40 | 197.60 | 202.30 | 200.20 | 201.20 | 195.00 | 179.50 | 146.00 | 147.40 | 143.30 | 147.20 | 141.60 | 150.60 | 148.50 | 143.20 | 143.10 | 134.80 | 138.20 | 128.90 | 130.70 | 135.60 | 135.90 | 134.40 | 129.40 | 128.10 | 106.70 | 112.30 | 107.30 | 109.90 | 110.70 | NA | 90.60 | NA | NA | NA | |
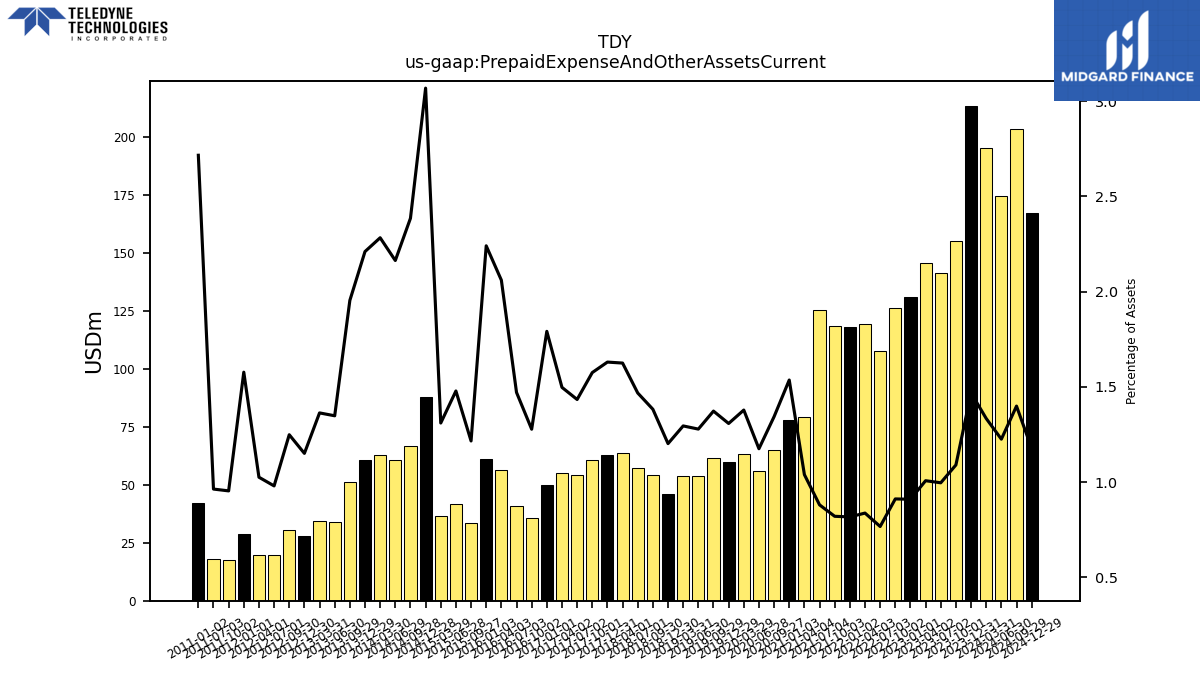
| Prepaid Expense And Other Assets Current | 213.30 | 155.00 | 141.10 | 145.40 | 130.70 | 126.10 | 107.80 | 119.40 | 118.00 | 118.60 | 125.30 | 79.20 | 78.10 | 65.00 | 55.70 | 63.20 | 59.90 | 61.50 | 53.70 | 53.90 | 45.80 | 54.10 | 57.00 | 63.70 | 62.70 | 60.60 | 54.20 | 55.00 | 49.70 | 35.70 | 40.90 | 56.40 | 60.90 | 33.70 | 41.50 | 36.60 | 87.80 | 66.60 | 60.70 | 63.00 | 60.80 | 51.20 | 33.90 | 34.50 | 27.70 | 30.40 | 19.50 | 19.90 | 28.80 | 17.60 | 18.00 | NA | 42.30 | NA | NA | NA |
| 2023-12-31 | 2023-10-01 | 2023-07-02 | 2023-04-02 | 2023-01-01 | 2022-10-02 | 2022-07-03 | 2022-04-03 | 2022-01-02 | 2021-10-03 | 2021-07-04 | 2021-04-04 | 2021-01-03 | 2020-09-27 | 2020-06-28 | 2020-03-29 | 2019-12-29 | 2019-09-29 | 2019-06-30 | 2019-03-31 | 2018-12-30 | 2018-09-30 | 2018-07-01 | 2018-04-01 | 2017-12-31 | 2017-10-01 | 2017-07-02 | 2017-04-02 | 2017-01-01 | 2016-10-02 | 2016-07-03 | 2016-04-03 | 2016-01-03 | 2015-09-27 | 2015-06-28 | 2015-03-29 | 2014-12-28 | 2014-09-28 | 2014-06-29 | 2014-03-30 | 2013-12-29 | 2013-09-29 | 2013-06-30 | 2013-03-31 | 2012-12-30 | 2012-09-30 | 2012-07-01 | 2012-04-01 | 2012-01-01 | 2011-10-02 | 2011-07-03 | 2011-04-03 | 2011-01-02 | 2010-10-03 | 2010-07-04 | 2010-04-04 | ||
|---|---|---|---|---|---|---|---|---|---|---|---|---|---|---|---|---|---|---|---|---|---|---|---|---|---|---|---|---|---|---|---|---|---|---|---|---|---|---|---|---|---|---|---|---|---|---|---|---|---|---|---|---|---|---|---|---|---|
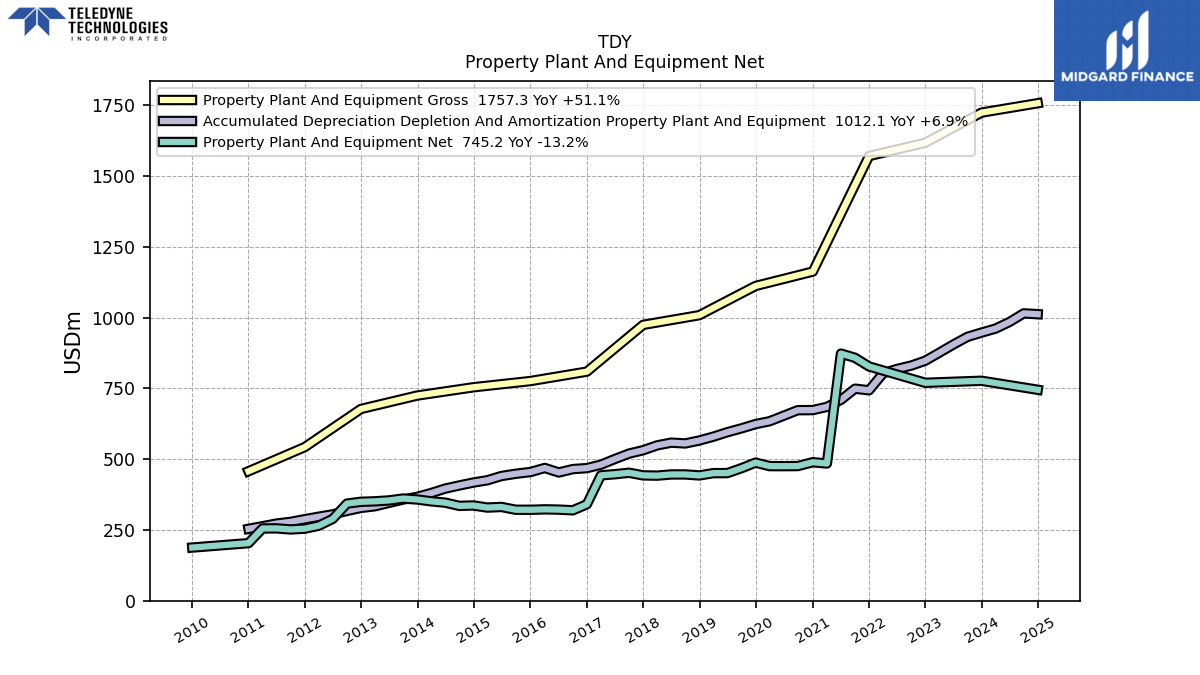
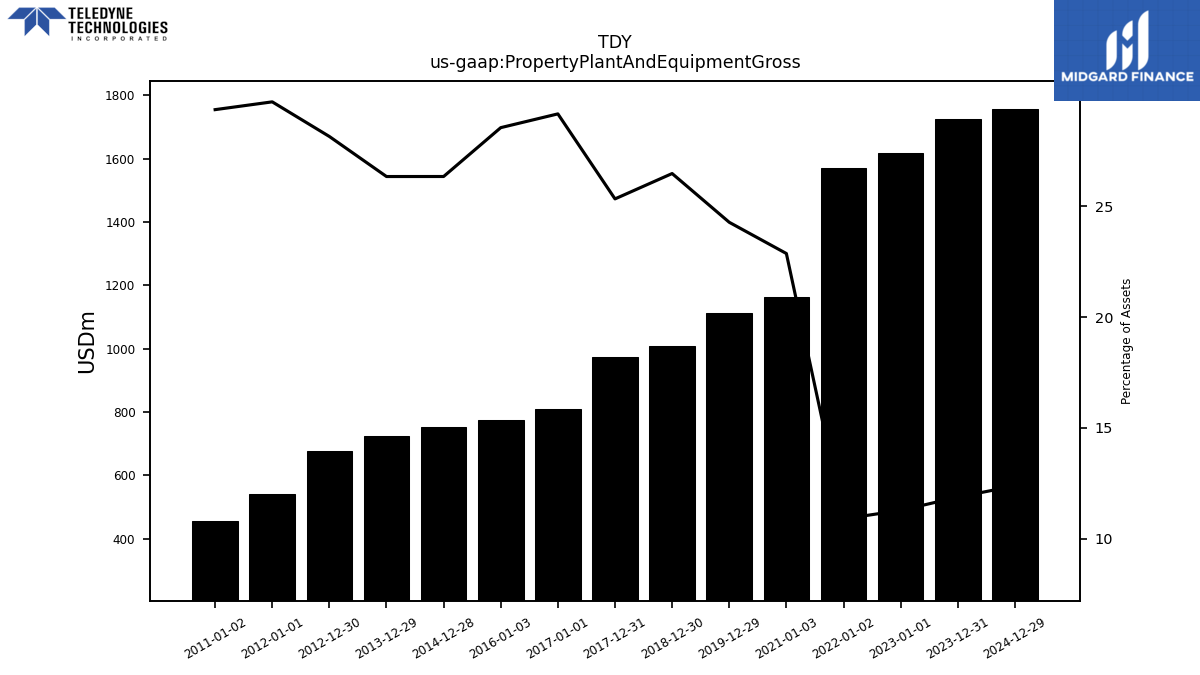
| Property Plant And Equipment Gross | 1724.10 | NA | NA | NA | 1617.60 | NA | NA | NA | 1570.80 | NA | NA | NA | 1162.70 | NA | NA | NA | 1111.80 | NA | NA | NA | 1008.60 | NA | NA | NA | 974.40 | NA | NA | NA | 809.30 | NA | NA | NA | 776.10 | NA | NA | NA | 754.00 | NA | NA | NA | 724.70 | NA | NA | NA | 677.40 | NA | NA | NA | 542.60 | NA | NA | NA | 457.40 | NA | NA | NA | |
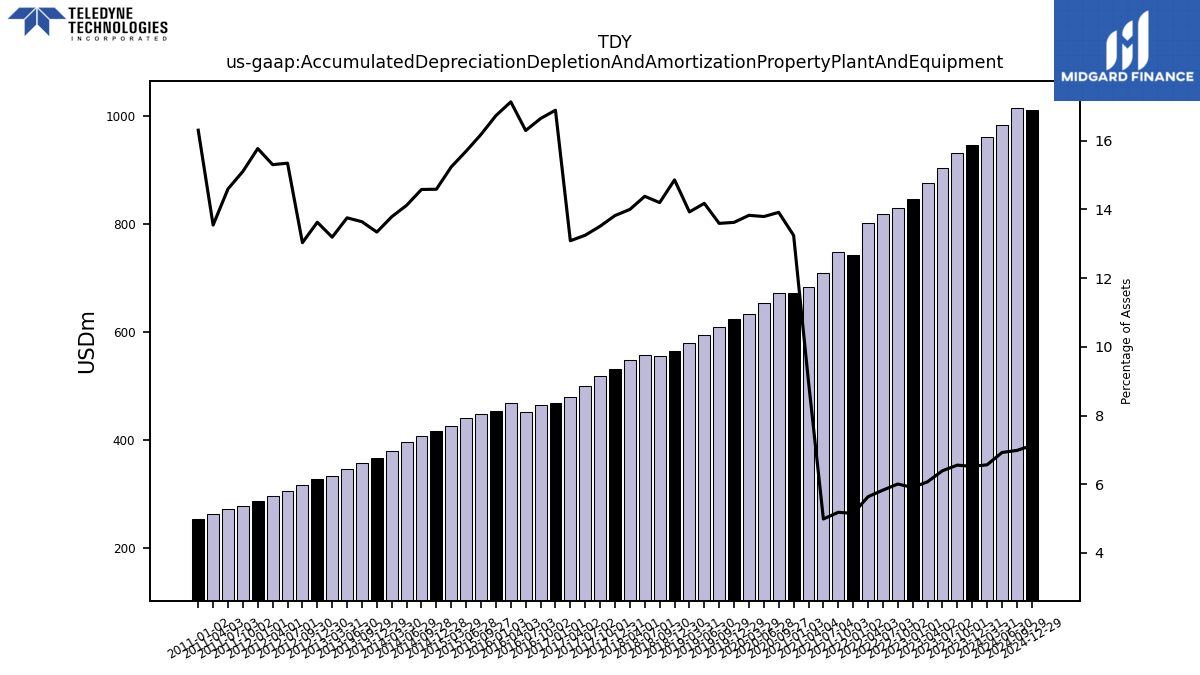
| Accumulated Depreciation Depletion And Amortization Property Plant And Equipment | 947.10 | 932.10 | 905.10 | 876.20 | 847.80 | 830.60 | 818.90 | 803.40 | 743.30 | 749.00 | 709.60 | 684.70 | 673.40 | 673.00 | 653.50 | 634.00 | 623.90 | 608.90 | 595.40 | 579.60 | 566.00 | 555.60 | 558.40 | 548.80 | 531.60 | 519.80 | 500.80 | 480.70 | 468.50 | 465.00 | 453.10 | 469.00 | 454.80 | 448.40 | 440.60 | 425.60 | 417.50 | 407.20 | 396.20 | 380.50 | 367.00 | 357.50 | 345.80 | 333.80 | 327.90 | 317.20 | 305.20 | 296.80 | 288.00 | 278.60 | 272.60 | 263.20 | 254.00 | NA | NA | NA | |
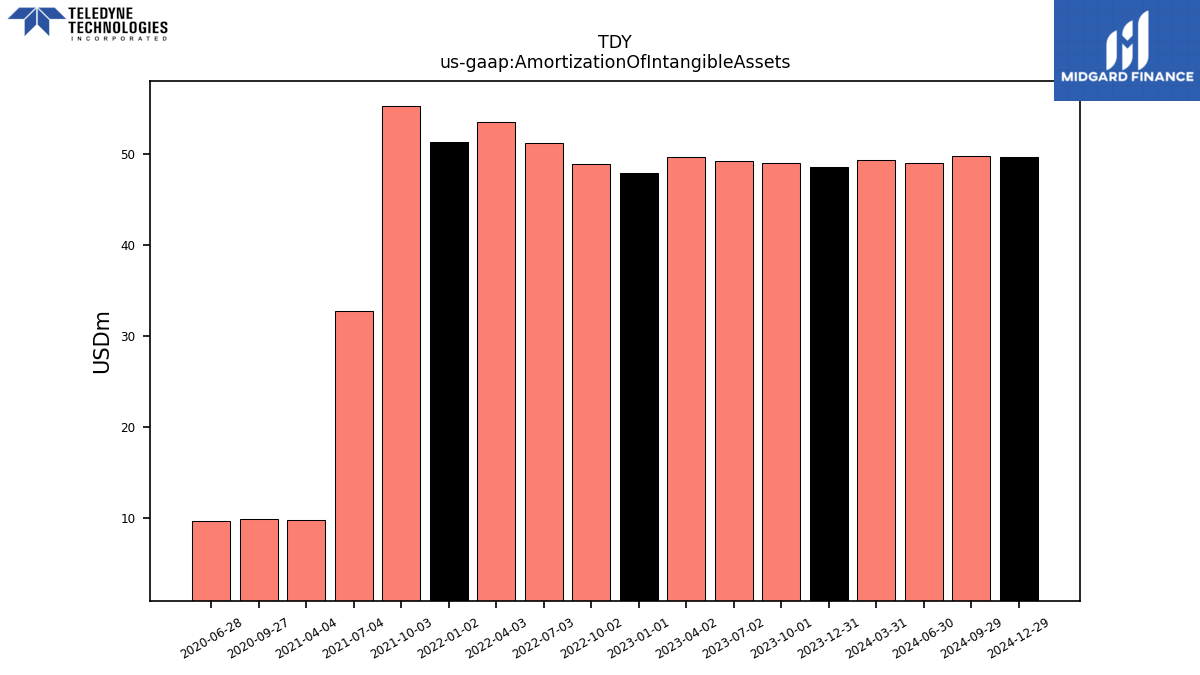
| Amortization Of Intangible Assets | 48.60 | 49.10 | 49.30 | 49.70 | 47.90 | 48.90 | 51.30 | 53.60 | 51.40 | 55.30 | 32.80 | 9.80 | NA | 9.90 | 9.70 | NA | NA | NA | NA | NA | NA | NA | NA | NA | NA | NA | NA | NA | NA | NA | NA | NA | NA | NA | NA | NA | NA | NA | NA | NA | NA | NA | NA | NA | NA | NA | NA | NA | NA | NA | NA | NA | NA | NA | NA | NA | |
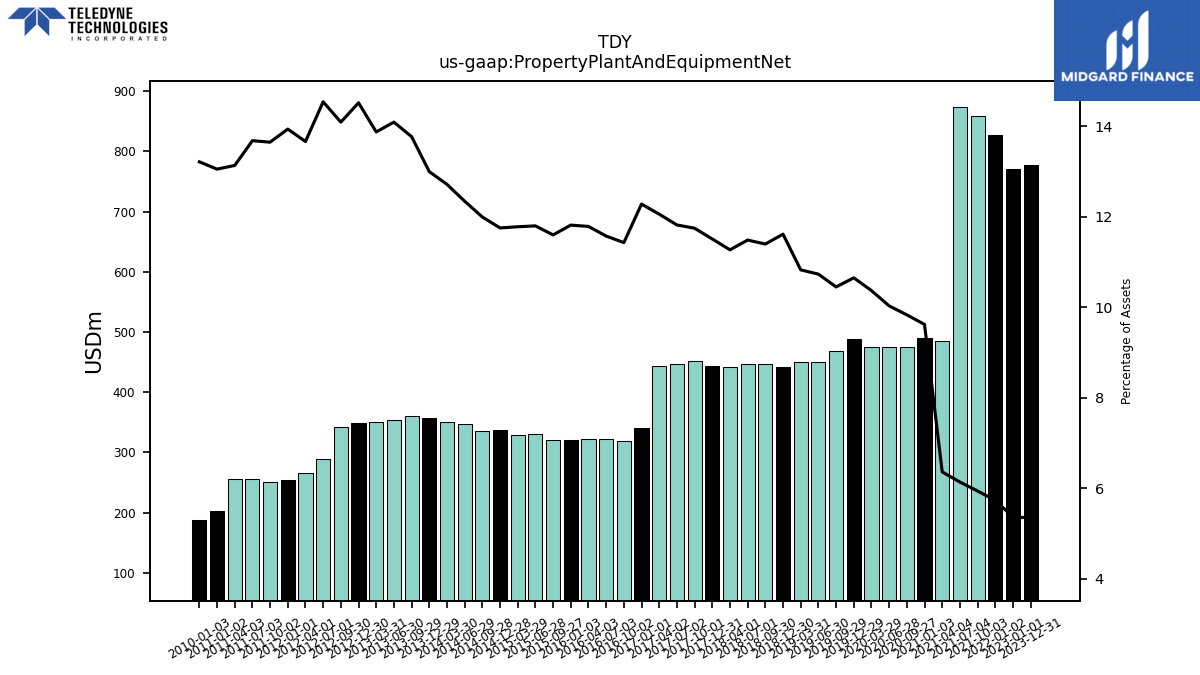
| Property Plant And Equipment Net | 777.00 | NA | NA | NA | 769.80 | NA | NA | NA | 827.50 | 858.10 | 873.00 | 484.70 | 489.30 | 475.70 | 475.40 | 475.50 | 487.90 | 468.20 | 450.90 | 450.70 | 442.60 | 446.10 | 446.10 | 441.90 | 442.80 | 452.10 | 446.90 | 443.00 | 340.80 | 319.40 | 321.90 | 322.80 | 321.30 | 321.50 | 331.30 | 329.10 | 336.50 | 335.10 | 346.50 | 351.10 | 357.70 | 361.00 | 354.40 | 351.20 | 349.50 | 343.10 | 289.30 | 265.10 | 254.60 | 251.80 | 255.60 | 255.30 | 203.40 | NA | NA | NA | |
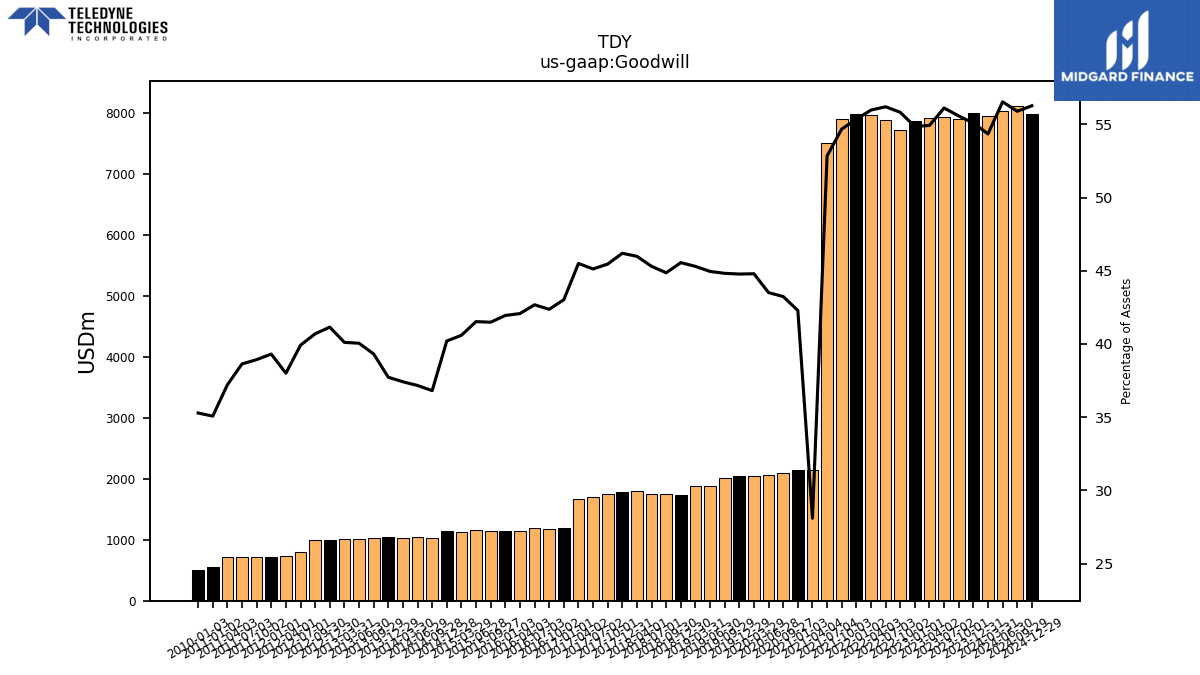
| Goodwill | 8002.80 | 7899.80 | 7943.80 | 7925.50 | 7873.00 | 7718.20 | 7894.60 | 7977.00 | 7986.70 | 7899.50 | 7515.90 | 2140.10 | 2150.00 | 2091.30 | 2061.30 | 2053.70 | 2050.50 | 2007.80 | 1888.00 | 1885.10 | 1735.20 | 1755.50 | 1758.90 | 1802.60 | 1776.70 | 1748.90 | 1705.60 | 1671.00 | 1193.50 | 1183.50 | 1186.50 | 1151.90 | 1140.20 | 1149.50 | 1165.60 | 1133.70 | 1150.60 | 1028.00 | 1042.80 | 1032.70 | 1037.80 | 1030.30 | 1006.80 | 1014.80 | 990.20 | 990.40 | 793.80 | 737.00 | 717.80 | 717.90 | 721.50 | 723.00 | 546.30 | NA | NA | NA | |
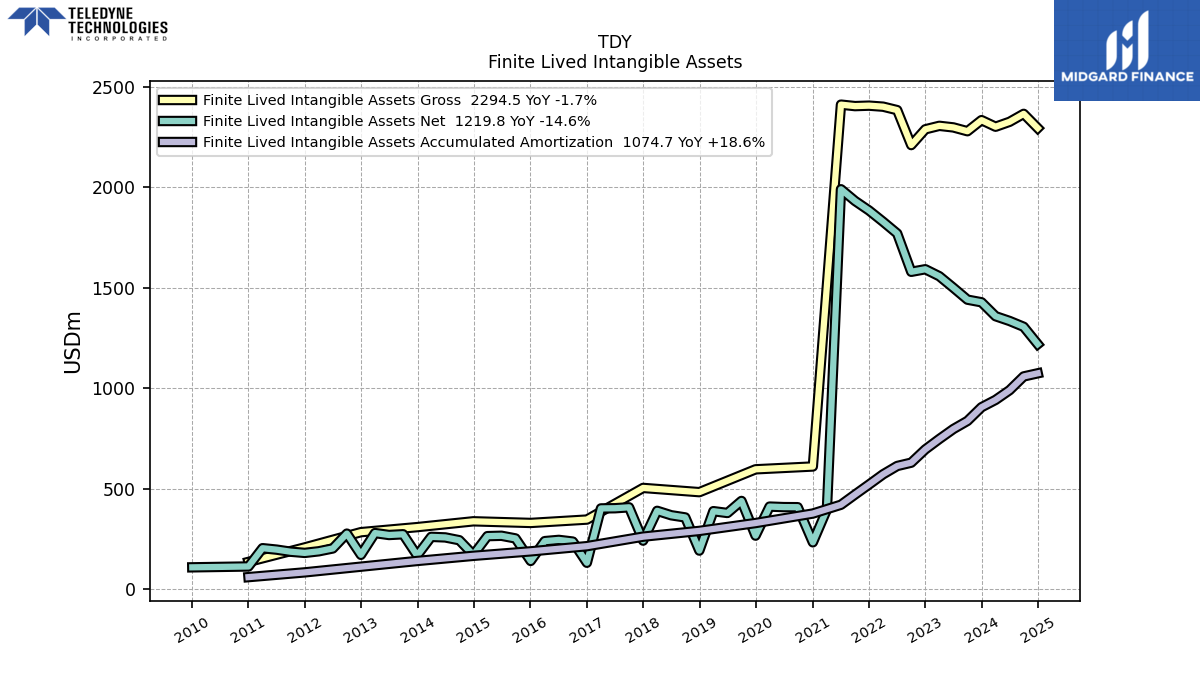
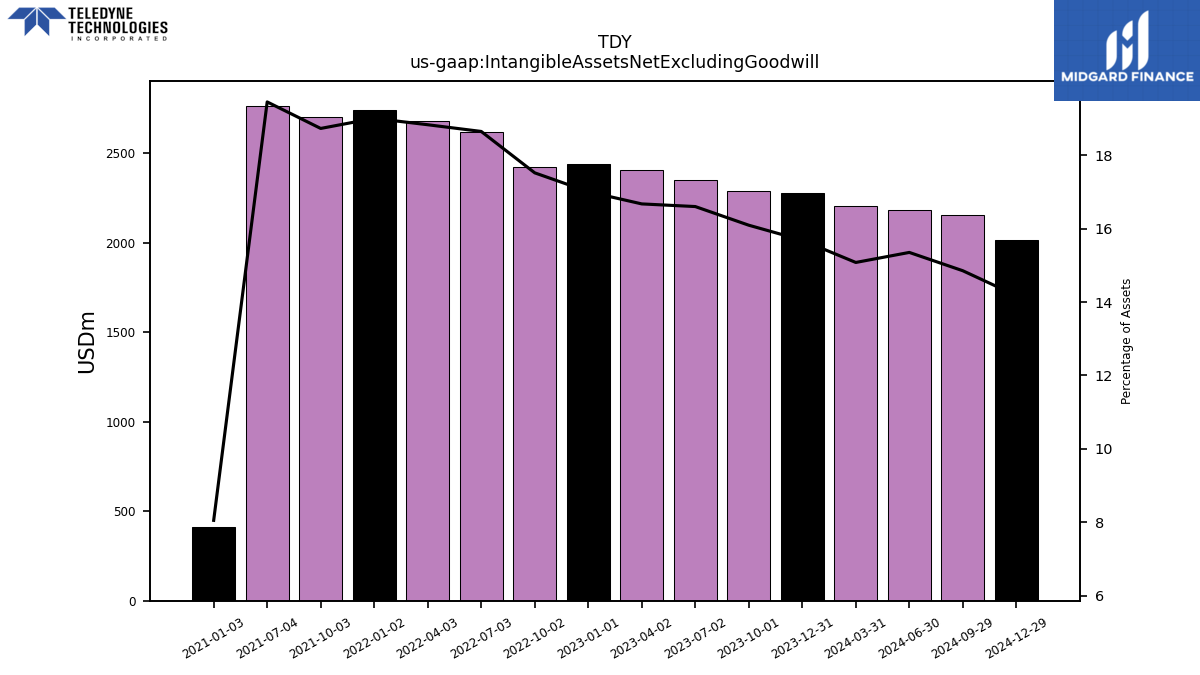
| Intangible Assets Net Excluding Goodwill | 2278.10 | 2287.40 | 2349.70 | 2405.40 | 2440.60 | 2421.80 | 2618.80 | 2682.80 | 2741.60 | 2705.20 | 2765.80 | NA | 409.70 | NA | NA | NA | NA | NA | NA | NA | NA | NA | NA | NA | NA | NA | NA | NA | NA | NA | NA | NA | NA | NA | NA | NA | NA | NA | NA | NA | NA | NA | NA | NA | NA | NA | NA | NA | NA | NA | NA | NA | NA | NA | NA | NA | |
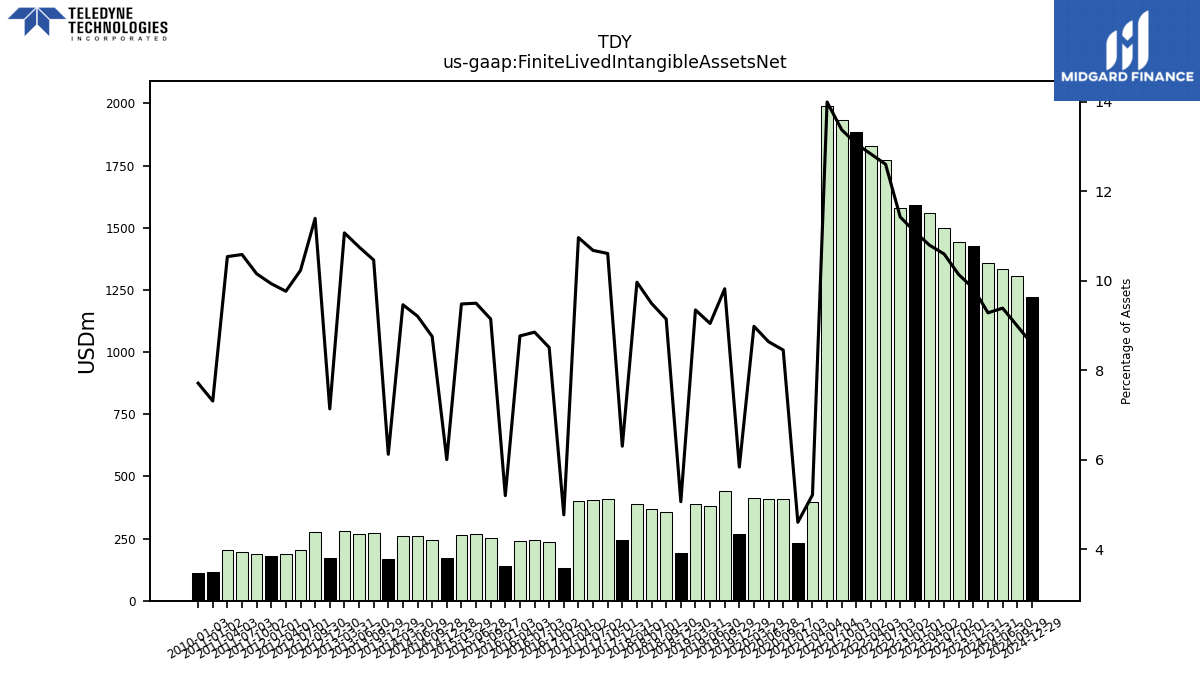
| Finite Lived Intangible Assets Net | 1428.10 | 1441.10 | 1500.20 | 1557.70 | 1592.40 | 1579.70 | 1770.30 | 1828.60 | 1884.50 | 1932.20 | 1990.40 | 397.10 | 234.00 | 408.80 | 409.20 | 411.80 | 267.30 | 439.90 | 379.90 | 389.00 | 192.80 | 357.80 | 368.60 | 390.70 | 242.40 | 408.20 | 403.60 | 402.70 | 132.30 | 237.70 | 246.10 | 240.00 | 141.30 | 253.40 | 266.60 | 264.80 | 171.80 | 244.50 | 258.40 | 261.20 | 168.40 | 274.20 | 270.40 | 280.10 | 171.70 | 277.30 | 203.50 | 189.40 | 181.40 | 187.30 | 197.70 | 204.80 | 113.90 | NA | NA | NA | |
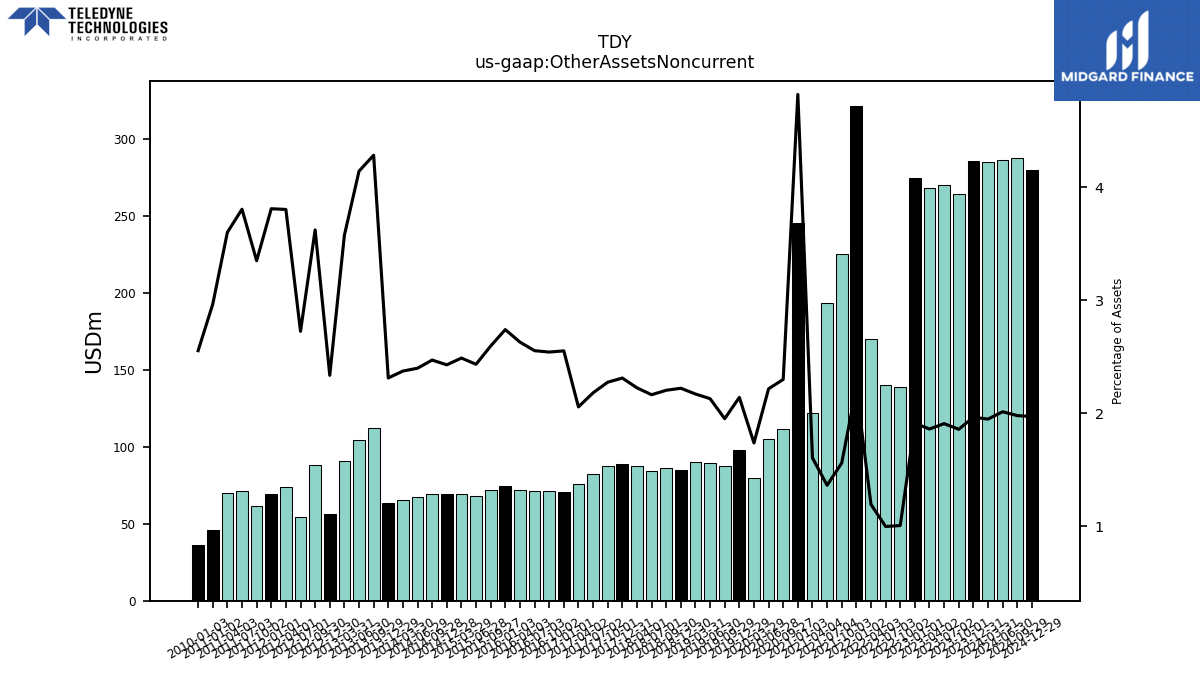
| Other Assets Noncurrent | 285.30 | 264.00 | 270.00 | 268.30 | 274.30 | 138.90 | 139.90 | 169.80 | 321.40 | 225.10 | 193.60 | 122.20 | 245.30 | 111.20 | 105.00 | 79.60 | 98.00 | 87.40 | 89.40 | 90.30 | 84.60 | 86.20 | 84.00 | 87.20 | 88.90 | 87.50 | 82.40 | 75.50 | 70.80 | 71.00 | 71.00 | 72.00 | 74.50 | 71.90 | 68.30 | 69.50 | 69.50 | 69.00 | 67.30 | 65.50 | 63.60 | 112.30 | 104.20 | 90.50 | 56.20 | 88.20 | 54.20 | 73.80 | 69.60 | 61.80 | 71.10 | 70.00 | 46.20 | NA | NA | NA |
| 2023-12-31 | 2023-10-01 | 2023-07-02 | 2023-04-02 | 2023-01-01 | 2022-10-02 | 2022-07-03 | 2022-04-03 | 2022-01-02 | 2021-10-03 | 2021-07-04 | 2021-04-04 | 2021-01-03 | 2020-09-27 | 2020-06-28 | 2020-03-29 | 2019-12-29 | 2019-09-29 | 2019-06-30 | 2019-03-31 | 2018-12-30 | 2018-09-30 | 2018-07-01 | 2018-04-01 | 2017-12-31 | 2017-10-01 | 2017-07-02 | 2017-04-02 | 2017-01-01 | 2016-10-02 | 2016-07-03 | 2016-04-03 | 2016-01-03 | 2015-09-27 | 2015-06-28 | 2015-03-29 | 2014-12-28 | 2014-09-28 | 2014-06-29 | 2014-03-30 | 2013-12-29 | 2013-09-29 | 2013-06-30 | 2013-03-31 | 2012-12-30 | 2012-09-30 | 2012-07-01 | 2012-04-01 | 2012-01-01 | 2011-10-02 | 2011-07-03 | 2011-04-03 | 2011-01-02 | 2010-10-03 | 2010-07-04 | 2010-04-04 | ||
|---|---|---|---|---|---|---|---|---|---|---|---|---|---|---|---|---|---|---|---|---|---|---|---|---|---|---|---|---|---|---|---|---|---|---|---|---|---|---|---|---|---|---|---|---|---|---|---|---|---|---|---|---|---|---|---|---|---|
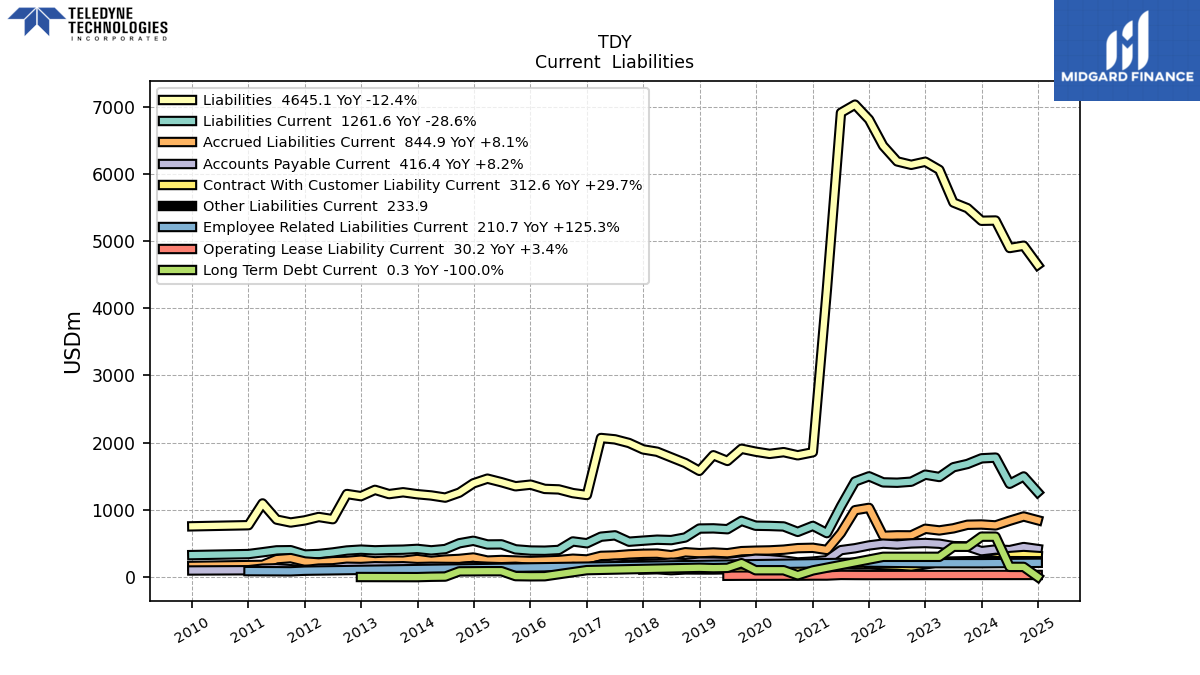
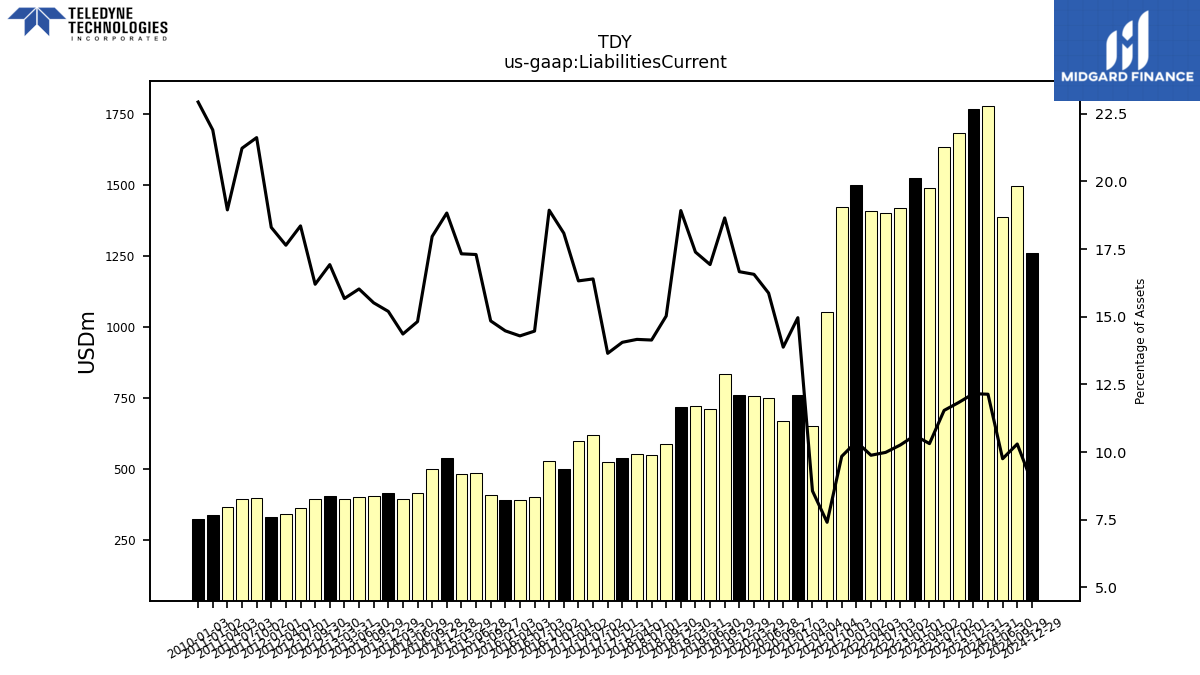
| Liabilities Current | 1766.10 | 1682.10 | 1633.50 | 1488.00 | 1523.40 | 1418.50 | 1403.00 | 1408.30 | 1498.40 | 1421.80 | 1053.30 | 652.40 | 760.90 | 671.20 | 752.20 | 759.60 | 763.20 | 835.50 | 711.00 | 723.70 | 720.80 | 588.00 | 549.00 | 555.20 | 540.60 | 525.10 | 619.80 | 599.60 | 501.80 | 529.00 | 402.30 | 391.30 | 393.60 | 411.40 | 485.60 | 483.90 | 539.00 | 501.80 | 415.90 | 396.40 | 418.10 | 406.60 | 402.90 | 396.60 | 407.30 | 394.30 | 365.10 | 342.20 | 334.20 | 398.70 | 396.40 | 368.20 | 341.20 | NA | NA | NA | |
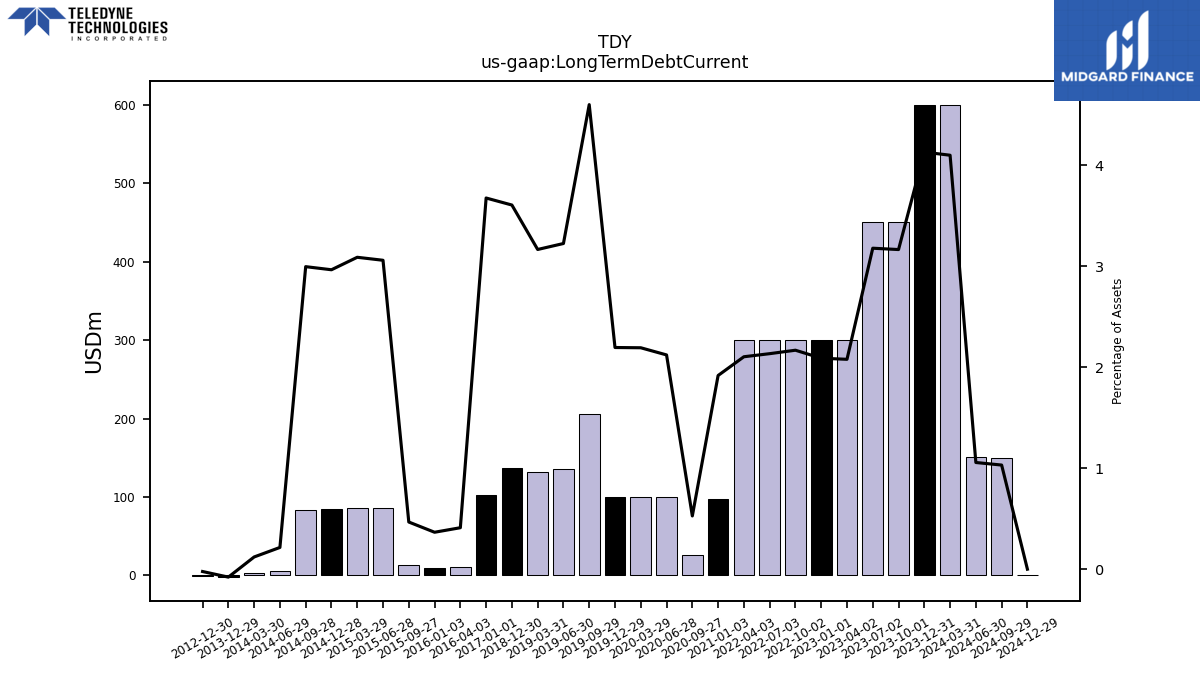
| Long Term Debt Current | 600.10 | 450.10 | 450.10 | 300.10 | 300.10 | 300.00 | 300.00 | 300.00 | NA | NA | NA | NA | 97.60 | 25.60 | 100.60 | 100.60 | 100.60 | 206.10 | 135.50 | 131.80 | 137.40 | NA | NA | NA | NA | NA | NA | NA | 102.00 | NA | NA | 11.30 | 10.00 | 13.00 | 85.90 | 86.30 | 84.90 | 83.70 | 6.10 | 3.40 | -2.10 | NA | NA | NA | -0.50 | NA | NA | NA | NA | NA | NA | NA | NA | NA | NA | NA | |
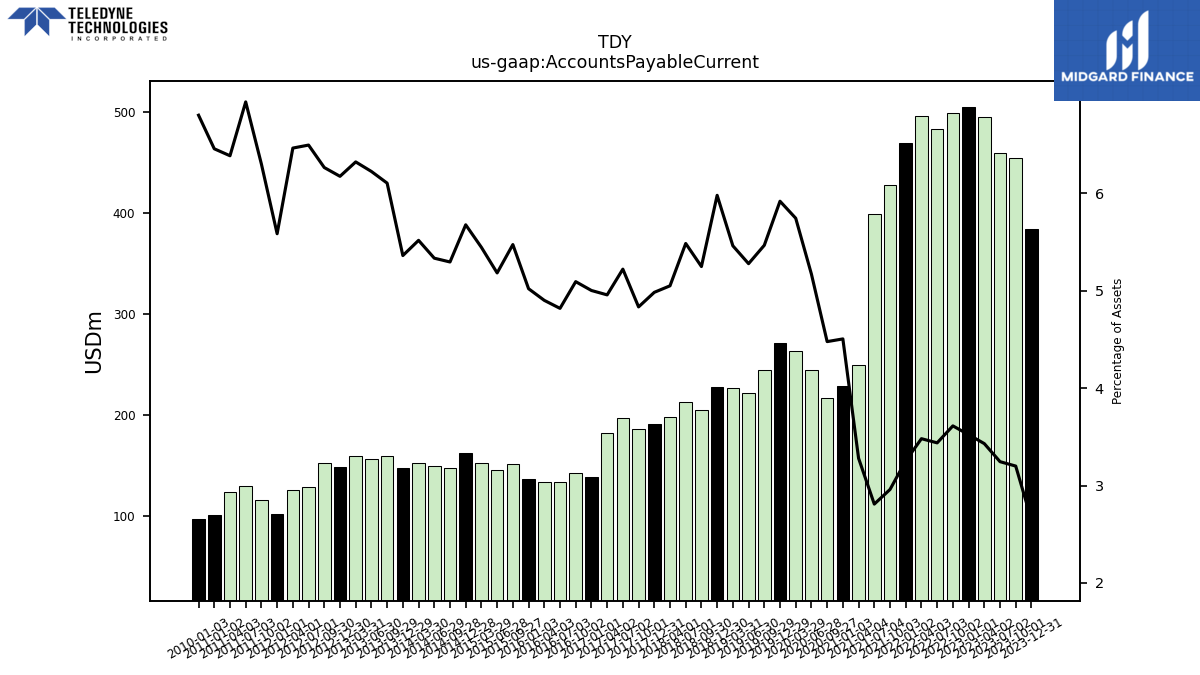
| Accounts Payable Current | 384.70 | 454.90 | 459.40 | 495.00 | 505.70 | 499.50 | 483.00 | 496.10 | 469.50 | 427.60 | 399.60 | 249.90 | 229.10 | 216.60 | 245.00 | 263.40 | 271.10 | 244.90 | 221.70 | 227.30 | 227.80 | 205.40 | 213.00 | 198.00 | 191.70 | 186.00 | 197.40 | 182.10 | 138.80 | 142.30 | 134.00 | 134.20 | 136.50 | 151.70 | 145.50 | 152.10 | 162.50 | 147.90 | 149.70 | 152.30 | 147.50 | 160.00 | 156.50 | 160.00 | 148.60 | 152.50 | 129.20 | 125.40 | 102.00 | 116.20 | 129.60 | 124.10 | 100.60 | NA | NA | NA | |
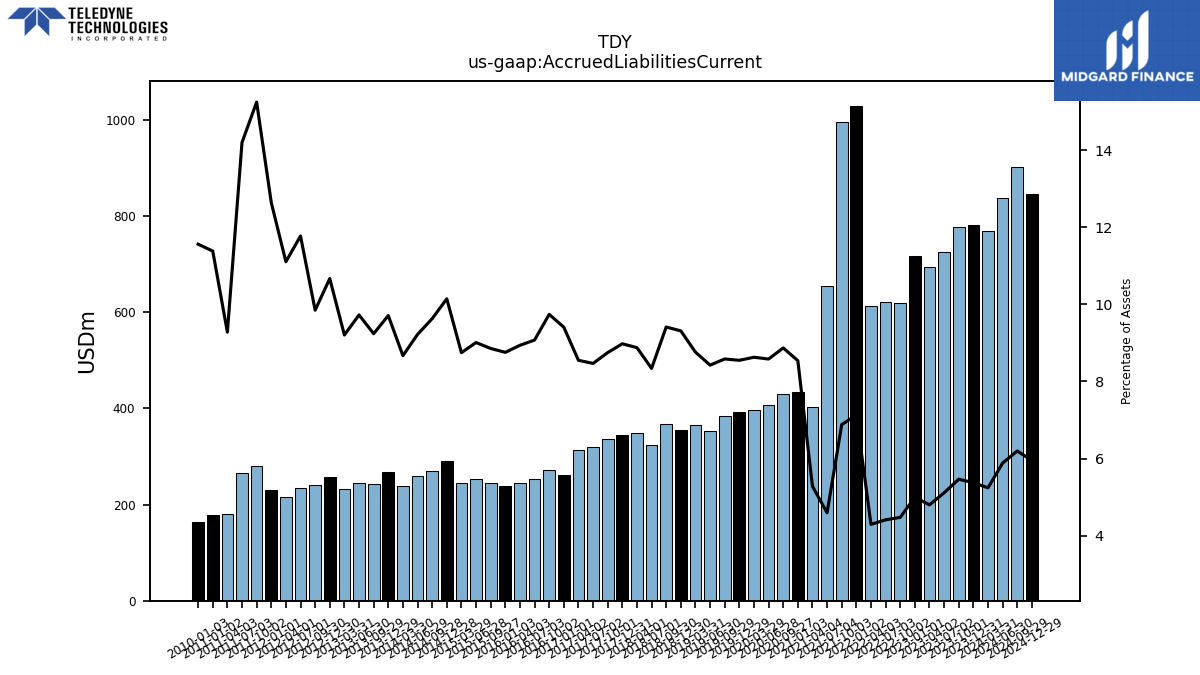
| Accrued Liabilities Current | 781.30 | 777.10 | 724.00 | 692.90 | 717.60 | 619.00 | 620.00 | 612.20 | 1028.90 | 994.20 | 653.70 | 402.50 | 434.20 | 429.00 | 406.60 | 395.60 | 391.50 | 384.50 | 353.80 | 364.60 | 354.70 | 368.30 | 323.80 | 348.00 | 345.30 | 336.60 | 320.10 | 314.00 | 261.00 | 272.10 | 252.30 | 244.70 | 238.00 | 245.40 | 252.90 | 244.30 | 290.30 | 268.90 | 258.70 | 239.30 | 267.10 | 242.10 | 244.50 | 232.90 | 256.70 | 239.70 | 234.10 | 215.40 | 230.80 | 281.10 | 265.10 | 180.30 | 177.30 | NA | NA | NA | |
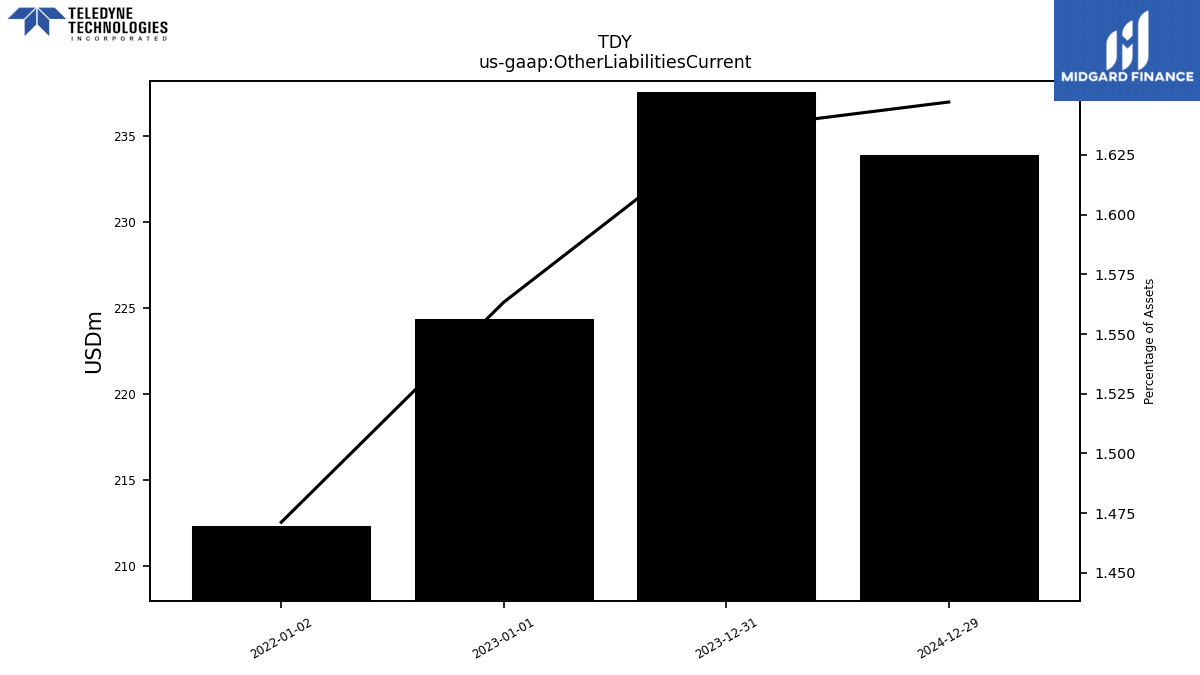
| Other Liabilities Current | 237.60 | NA | NA | NA | 224.40 | NA | NA | NA | 212.30 | NA | NA | NA | NA | NA | NA | NA | NA | NA | NA | NA | NA | NA | NA | NA | NA | NA | NA | NA | NA | NA | NA | NA | NA | NA | NA | NA | NA | NA | NA | NA | NA | NA | NA | NA | NA | NA | NA | NA | NA | NA | NA | NA | NA | NA | NA | NA | |
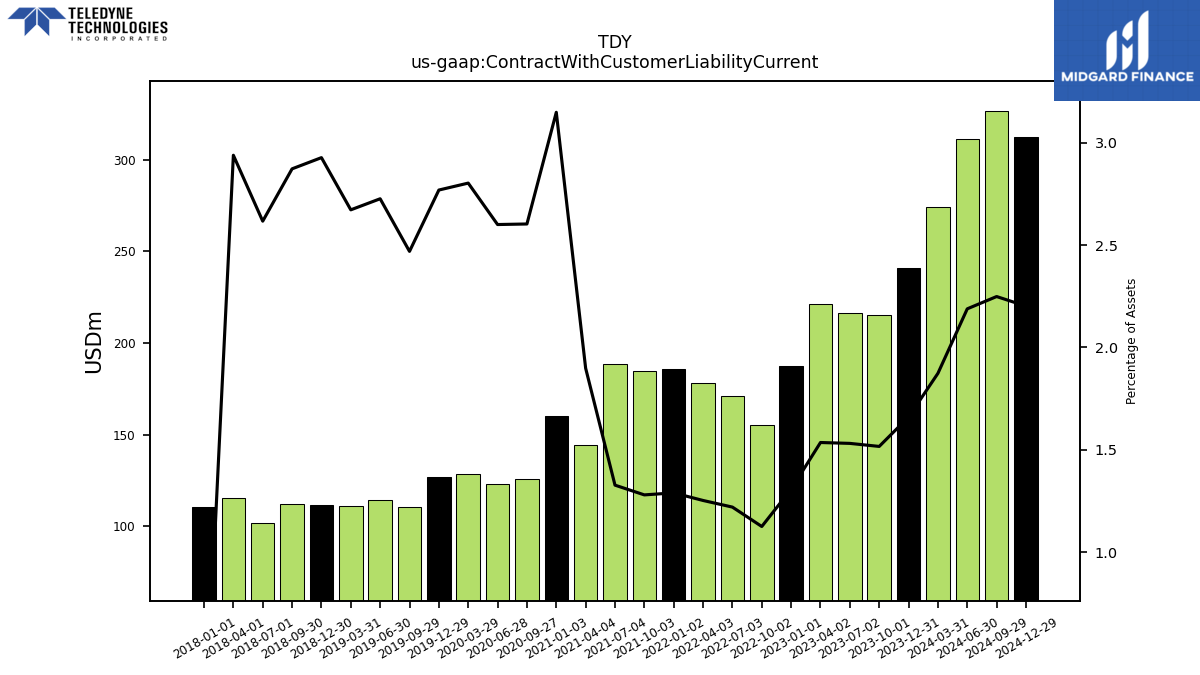
| Contract With Customer Liability Current | 241.10 | 215.50 | 216.70 | 221.50 | 187.60 | 155.50 | 171.30 | 178.40 | 186.00 | 184.80 | 188.70 | 144.60 | 160.10 | 125.90 | 123.20 | 128.50 | 126.80 | 110.60 | 114.50 | 111.20 | 111.50 | 112.40 | 101.60 | 115.20 | NA | NA | NA | NA | NA | NA | NA | NA | NA | NA | NA | NA | NA | NA | NA | NA | NA | NA | NA | NA | NA | NA | NA | NA | NA | NA | NA | NA | NA | NA | NA | NA |
| 2023-12-31 | 2023-10-01 | 2023-07-02 | 2023-04-02 | 2023-01-01 | 2022-10-02 | 2022-07-03 | 2022-04-03 | 2022-01-02 | 2021-10-03 | 2021-07-04 | 2021-04-04 | 2021-01-03 | 2020-09-27 | 2020-06-28 | 2020-03-29 | 2019-12-29 | 2019-09-29 | 2019-06-30 | 2019-03-31 | 2018-12-30 | 2018-09-30 | 2018-07-01 | 2018-04-01 | 2017-12-31 | 2017-10-01 | 2017-07-02 | 2017-04-02 | 2017-01-01 | 2016-10-02 | 2016-07-03 | 2016-04-03 | 2016-01-03 | 2015-09-27 | 2015-06-28 | 2015-03-29 | 2014-12-28 | 2014-09-28 | 2014-06-29 | 2014-03-30 | 2013-12-29 | 2013-09-29 | 2013-06-30 | 2013-03-31 | 2012-12-30 | 2012-09-30 | 2012-07-01 | 2012-04-01 | 2012-01-01 | 2011-10-02 | 2011-07-03 | 2011-04-03 | 2011-01-02 | 2010-10-03 | 2010-07-04 | 2010-04-04 | ||
|---|---|---|---|---|---|---|---|---|---|---|---|---|---|---|---|---|---|---|---|---|---|---|---|---|---|---|---|---|---|---|---|---|---|---|---|---|---|---|---|---|---|---|---|---|---|---|---|---|---|---|---|---|---|---|---|---|---|
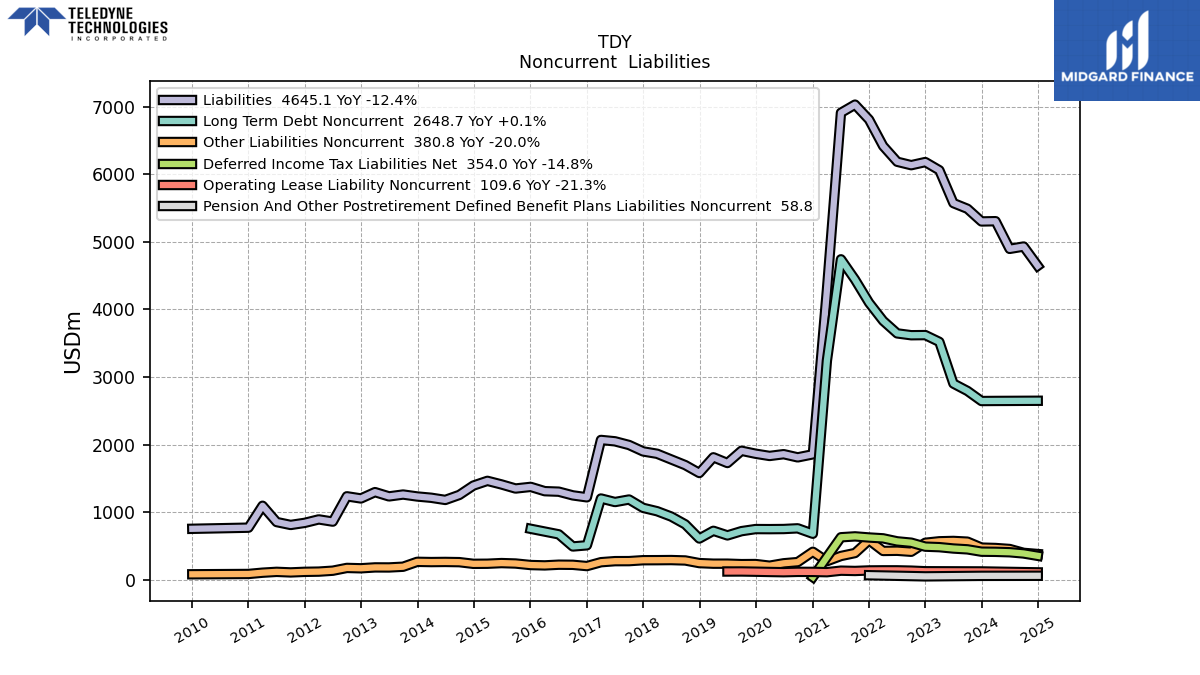
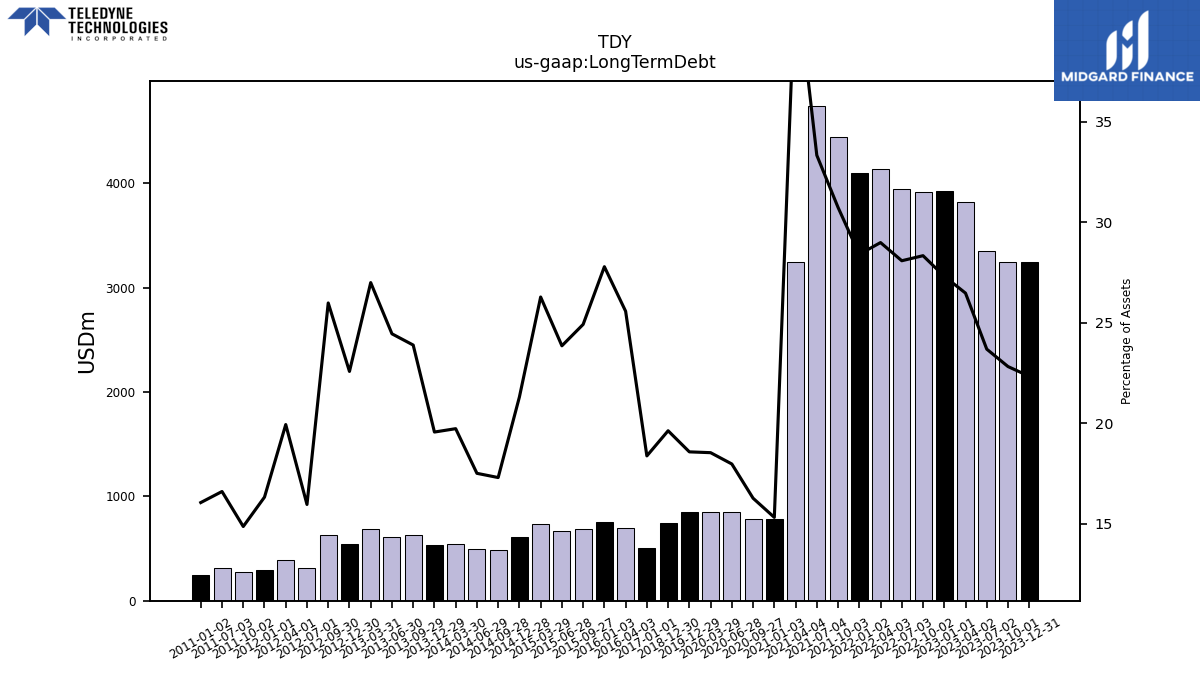
| Long Term Debt | 3244.90 | 3244.10 | 3353.30 | 3820.40 | 3920.60 | 3918.40 | 3945.70 | 4131.80 | 4099.40 | 4441.70 | 4742.00 | 3243.30 | 778.50 | 786.70 | 851.40 | 849.70 | 850.60 | NA | NA | NA | 747.50 | NA | NA | NA | NA | NA | NA | NA | 509.70 | NA | NA | 700.20 | 755.50 | 690.50 | 669.60 | 734.10 | 609.80 | 483.00 | 491.20 | 544.50 | 538.10 | 626.10 | 614.70 | 683.20 | 543.30 | 632.50 | 317.30 | 386.60 | 298.00 | 274.00 | 310.00 | NA | 250.00 | NA | NA | NA | |
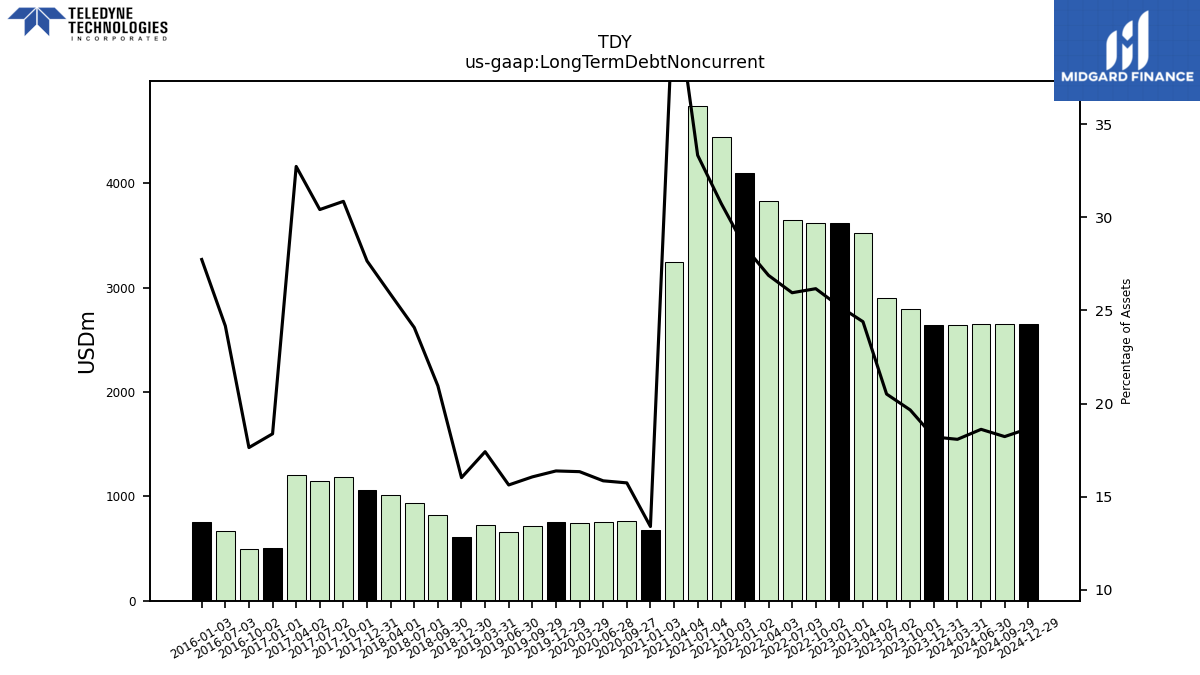
| Long Term Debt Noncurrent | 2644.80 | 2794.00 | 2903.20 | 3520.30 | 3620.50 | 3618.40 | 3645.70 | 3831.80 | 4099.40 | 4441.70 | 4742.00 | 3243.30 | 680.90 | 761.10 | 750.80 | 749.10 | 750.00 | 719.30 | 656.20 | 724.60 | 610.10 | 819.80 | 935.10 | 1013.90 | 1063.90 | 1187.50 | 1150.00 | 1202.50 | 509.70 | 492.60 | 672.00 | NA | 754.10 | NA | NA | NA | NA | NA | NA | NA | NA | NA | NA | NA | NA | NA | NA | NA | NA | NA | NA | NA | NA | NA | NA | NA | |
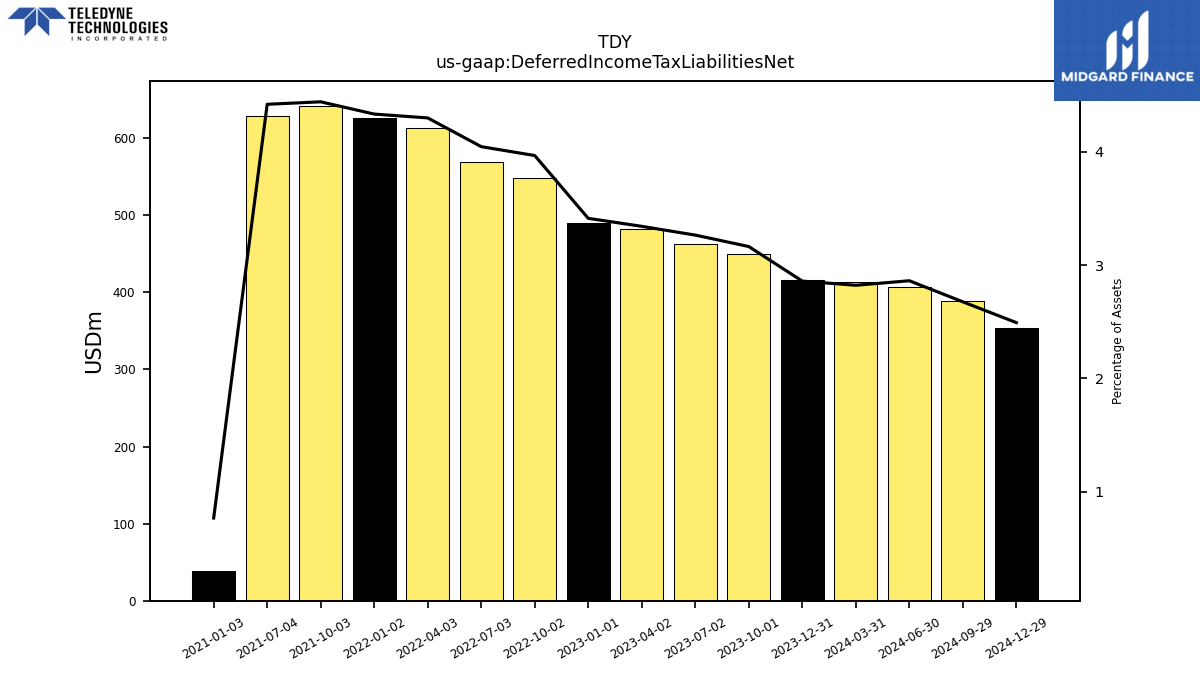
| Deferred Income Tax Liabilities Net | 415.40 | 449.90 | 462.30 | 482.40 | 490.00 | 548.70 | 568.50 | 612.90 | 625.50 | 641.90 | 628.80 | NA | 39.00 | NA | NA | NA | NA | NA | NA | NA | NA | NA | NA | NA | NA | NA | NA | NA | NA | NA | NA | NA | NA | NA | NA | NA | NA | NA | NA | NA | NA | NA | NA | NA | NA | NA | NA | NA | NA | NA | NA | NA | NA | NA | NA | NA | |
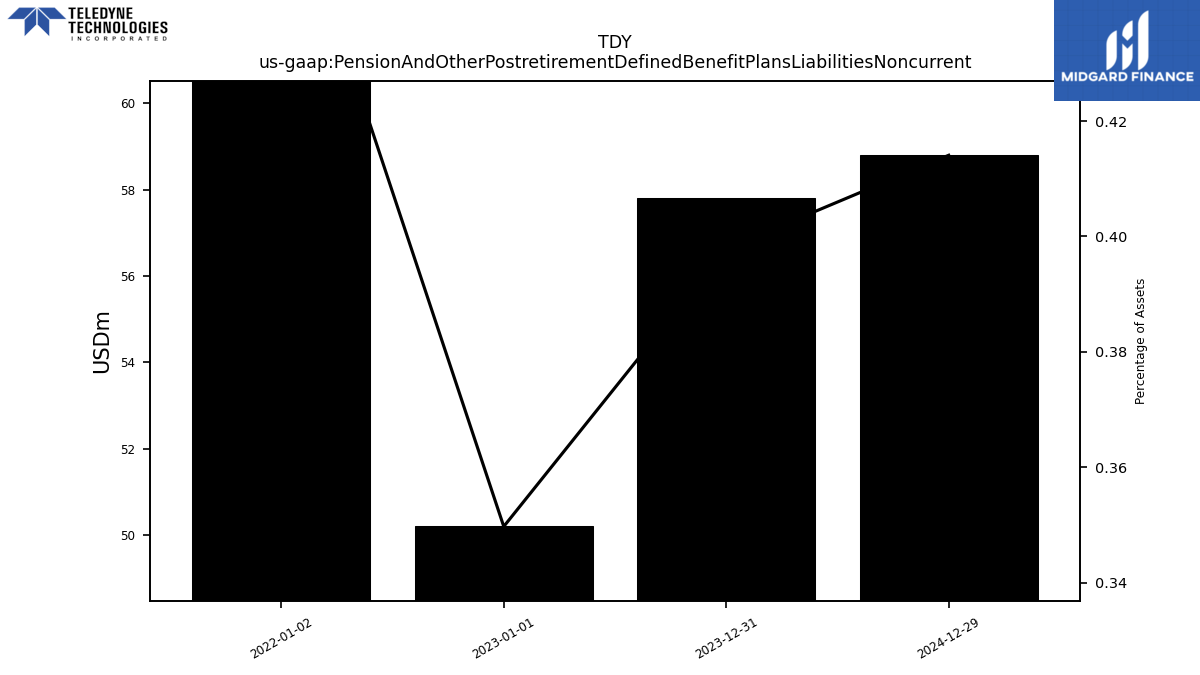
| Pension And Other Postretirement Defined Benefit Plans Liabilities Noncurrent | 57.80 | NA | NA | NA | 50.20 | NA | NA | NA | 67.20 | NA | NA | NA | NA | NA | NA | NA | NA | NA | NA | NA | NA | NA | NA | NA | NA | NA | NA | NA | NA | NA | NA | NA | NA | NA | NA | NA | NA | NA | NA | NA | NA | NA | NA | NA | NA | NA | NA | NA | NA | NA | NA | NA | NA | NA | NA | NA | |
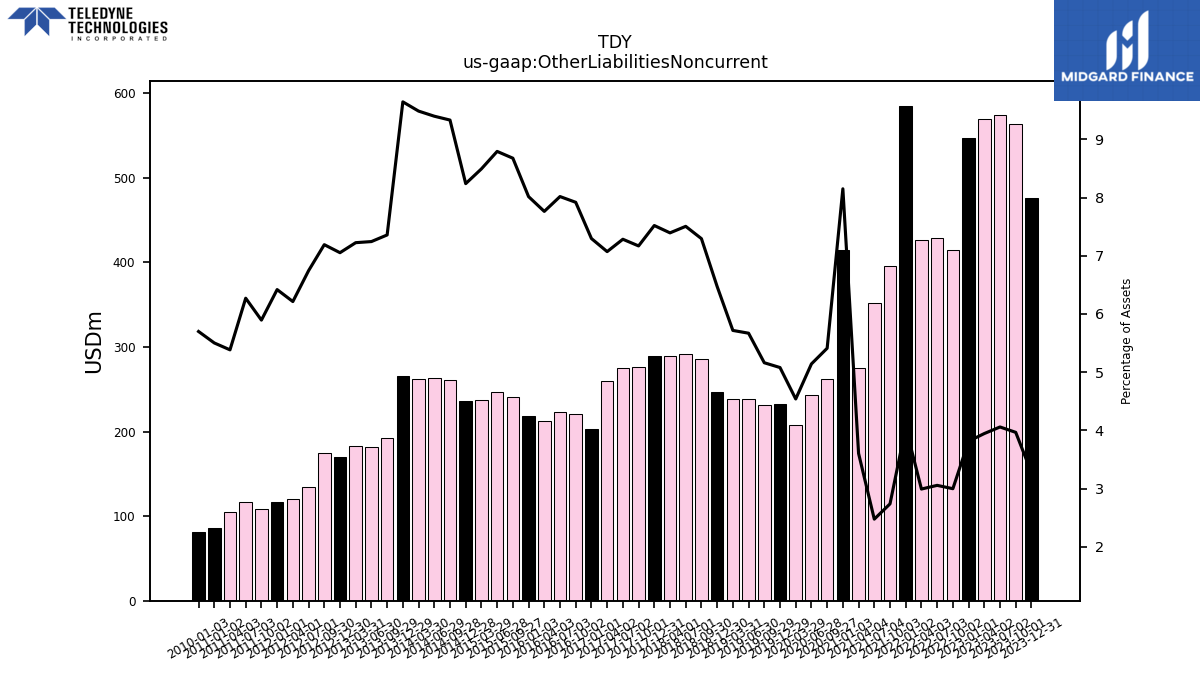
| Other Liabilities Noncurrent | 475.80 | 563.70 | 574.40 | 569.20 | 547.20 | 414.40 | 429.10 | 426.30 | 585.00 | 395.40 | 351.90 | 274.50 | 414.40 | 261.70 | 243.60 | 208.10 | 232.60 | 231.20 | 238.10 | 237.90 | 246.50 | 285.40 | 291.40 | 289.80 | 289.20 | 275.80 | 275.30 | 259.70 | 202.40 | 221.20 | 222.90 | 212.50 | 217.90 | 240.40 | 246.80 | 237.20 | 235.80 | 260.60 | 263.70 | 261.80 | 265.30 | 192.80 | 182.10 | 182.80 | 169.70 | 175.00 | 134.10 | 120.50 | 117.20 | 108.70 | 117.10 | 104.60 | 85.70 | NA | NA | NA | |
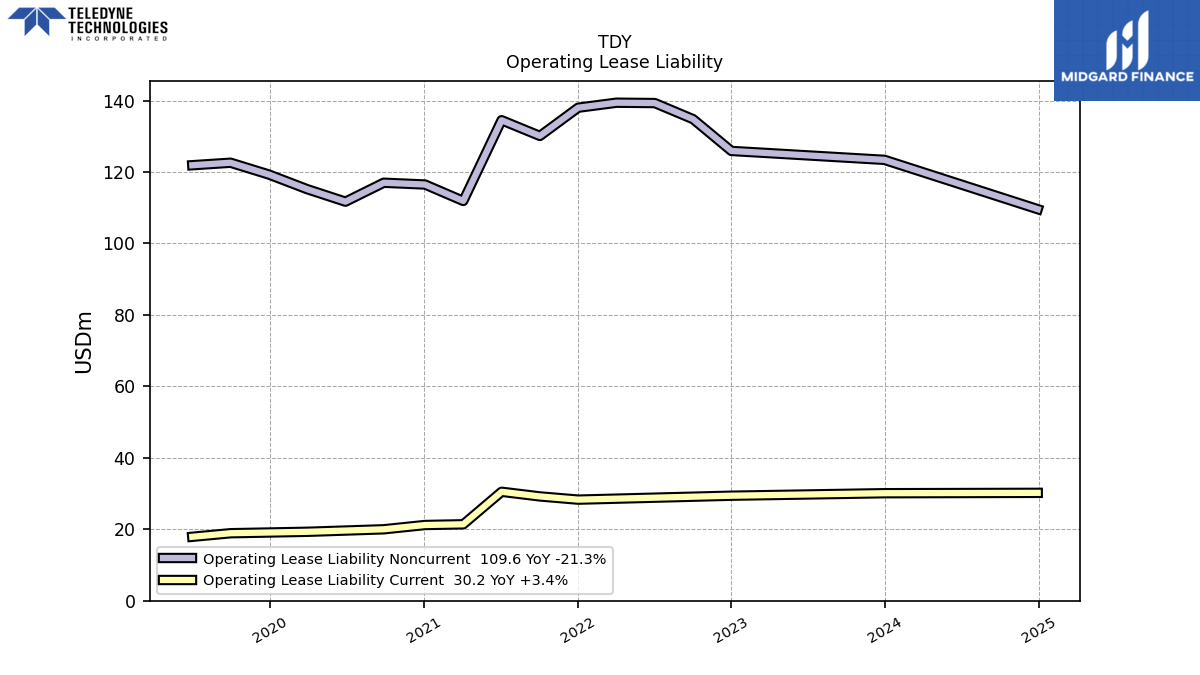
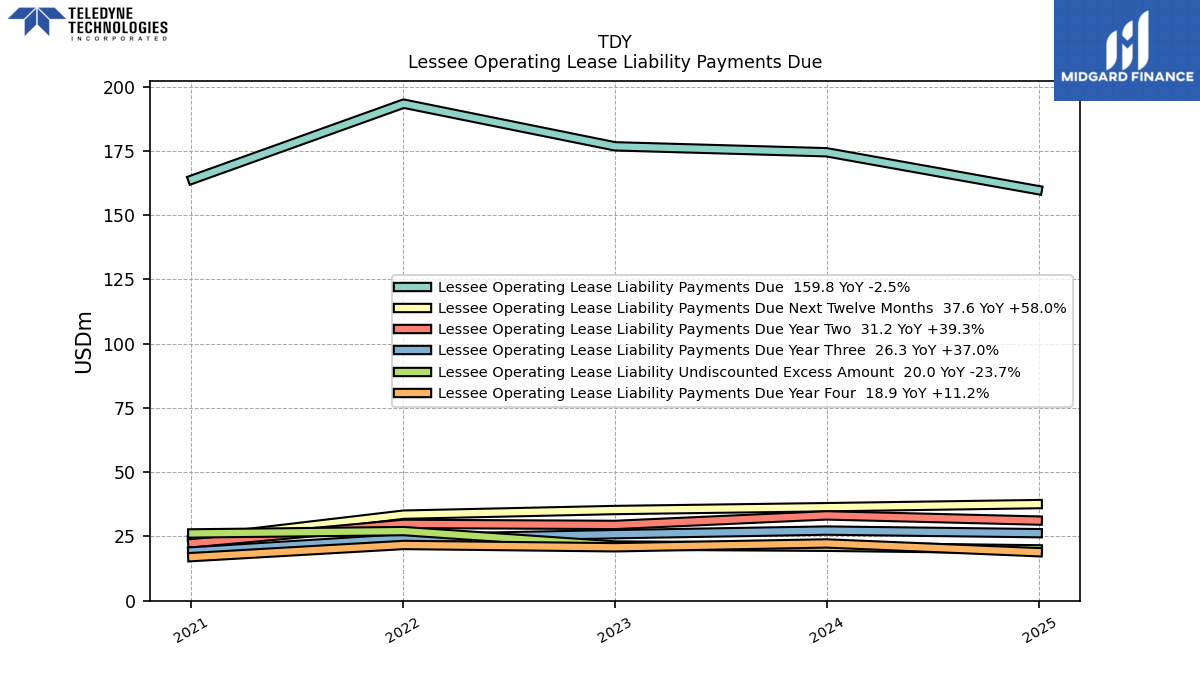
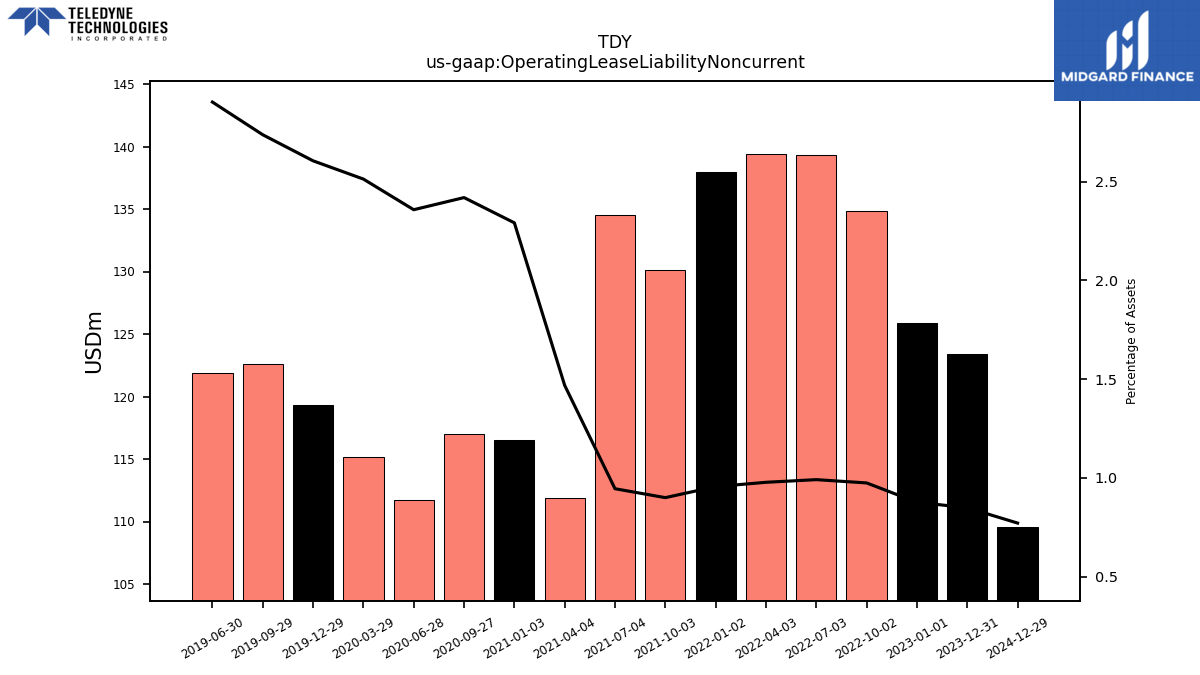
| Operating Lease Liability Noncurrent | 123.40 | NA | NA | NA | 125.90 | 134.80 | 139.30 | 139.40 | 138.00 | 130.10 | 134.50 | 111.90 | 116.50 | 117.00 | 111.70 | 115.20 | 119.30 | 122.60 | 121.90 | NA | NA | NA | NA | NA | NA | NA | NA | NA | NA | NA | NA | NA | NA | NA | NA | NA | NA | NA | NA | NA | NA | NA | NA | NA | NA | NA | NA | NA | NA | NA | NA | NA | NA | NA | NA | NA |
| 2023-12-31 | 2023-10-01 | 2023-07-02 | 2023-04-02 | 2023-01-01 | 2022-10-02 | 2022-07-03 | 2022-04-03 | 2022-01-02 | 2021-10-03 | 2021-07-04 | 2021-04-04 | 2021-01-03 | 2020-09-27 | 2020-06-28 | 2020-03-29 | 2019-12-29 | 2019-09-29 | 2019-06-30 | 2019-03-31 | 2018-12-30 | 2018-09-30 | 2018-07-01 | 2018-04-01 | 2017-12-31 | 2017-10-01 | 2017-07-02 | 2017-04-02 | 2017-01-01 | 2016-10-02 | 2016-07-03 | 2016-04-03 | 2016-01-03 | 2015-09-27 | 2015-06-28 | 2015-03-29 | 2014-12-28 | 2014-09-28 | 2014-06-29 | 2014-03-30 | 2013-12-29 | 2013-09-29 | 2013-06-30 | 2013-03-31 | 2012-12-30 | 2012-09-30 | 2012-07-01 | 2012-04-01 | 2012-01-01 | 2011-10-02 | 2011-07-03 | 2011-04-03 | 2011-01-02 | 2010-10-03 | 2010-07-04 | 2010-04-04 | ||
|---|---|---|---|---|---|---|---|---|---|---|---|---|---|---|---|---|---|---|---|---|---|---|---|---|---|---|---|---|---|---|---|---|---|---|---|---|---|---|---|---|---|---|---|---|---|---|---|---|---|---|---|---|---|---|---|---|---|
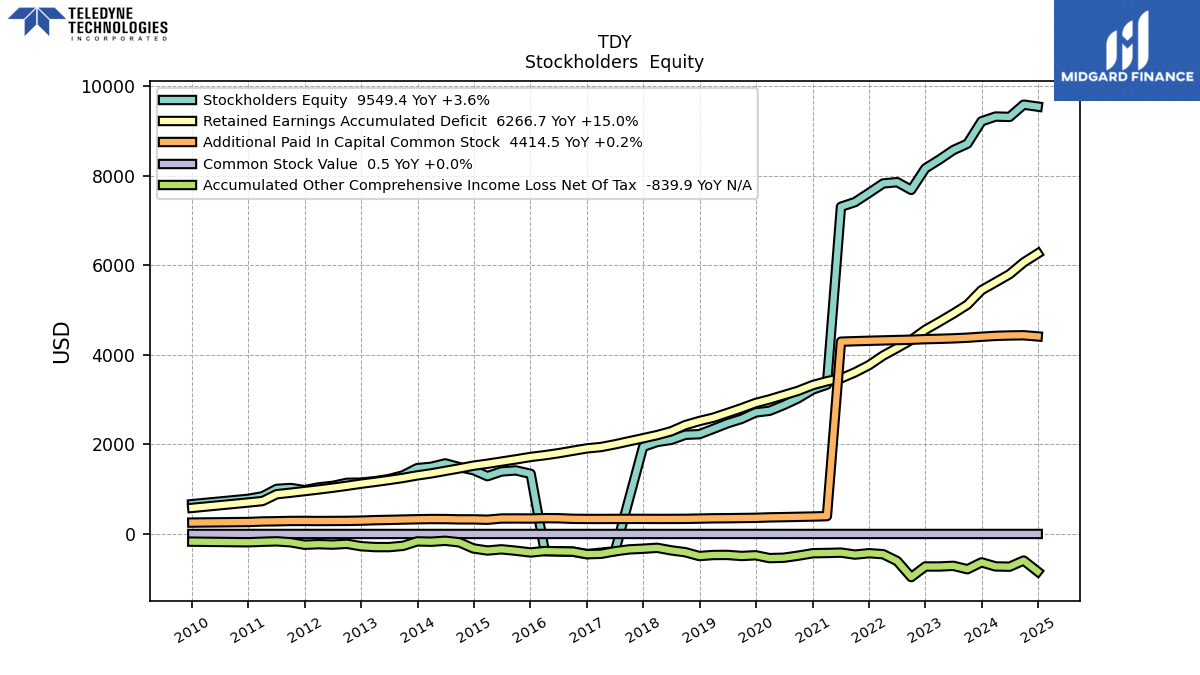
| Stockholders Equity | 9221.20 | 8721.90 | 8579.00 | 8365.70 | 8169.20 | 7688.50 | 7861.90 | 7832.40 | 7622.00 | 7416.60 | 7312.40 | 3336.30 | 3228.60 | 3026.00 | 2879.90 | 2753.00 | 2714.70 | 2571.00 | 2473.00 | 2349.50 | 2229.70 | 2216.80 | 2102.80 | 2055.90 | 1947.30 | NA | -386.70 | NA | -451.20 | -394.20 | -388.90 | -381.90 | 1344.10 | 1420.80 | 1396.60 | 1291.40 | 1427.30 | 1493.40 | 1577.80 | 1501.20 | 1471.70 | 1310.40 | 1227.90 | 1179.50 | 1147.80 | 1143.30 | 1075.10 | 1041.80 | 979.30 | 1027.40 | 1007.50 | 842.20 | 786.00 | NA | NA | NA | |
| Common Stock Value | 0.50 | 0.50 | 0.50 | 0.50 | 0.50 | 0.50 | 0.50 | 0.50 | 0.50 | 0.50 | 0.50 | 0.40 | 0.40 | 0.40 | 0.40 | 0.40 | 0.40 | 0.40 | 0.40 | 0.40 | 0.40 | 0.40 | 0.40 | 0.40 | 0.40 | 0.40 | 0.40 | 0.40 | 0.40 | 0.40 | 0.40 | 0.40 | 0.40 | 0.40 | 0.40 | 0.40 | 0.40 | 0.40 | 0.40 | 0.40 | 0.40 | 0.40 | 0.40 | 0.40 | 0.40 | 0.40 | 0.40 | 0.40 | 0.40 | 0.40 | 0.40 | 0.40 | 0.40 | NA | NA | NA | |
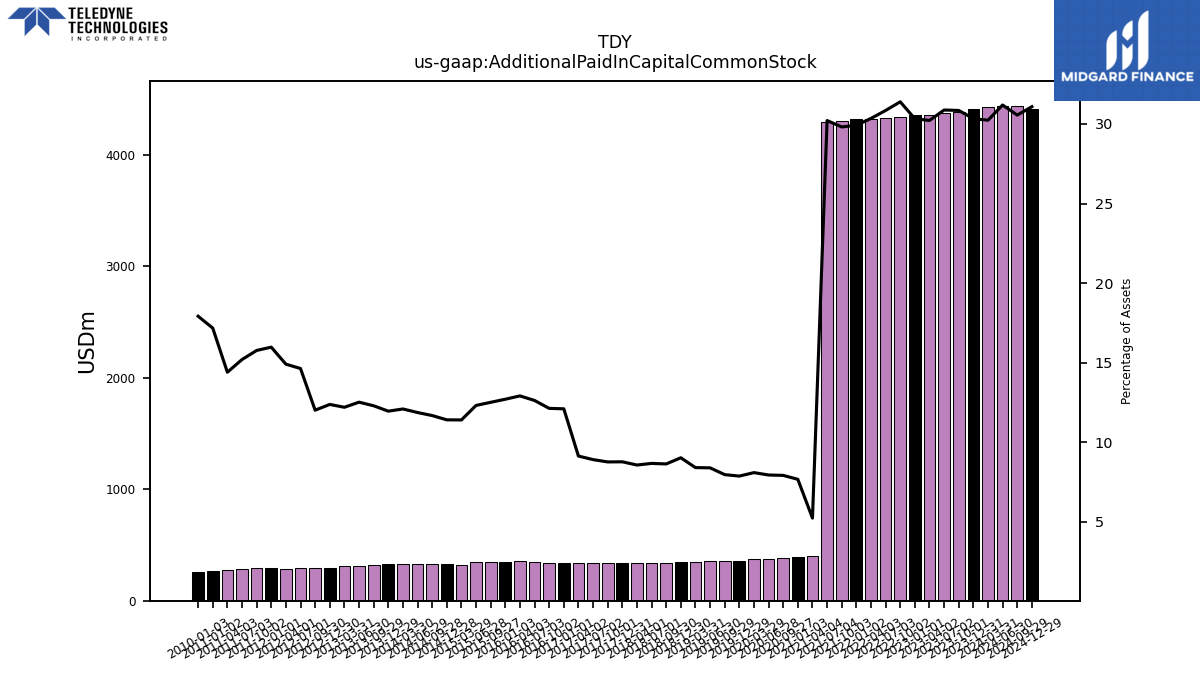
| Additional Paid In Capital Common Stock | 4407.30 | 4385.70 | 4371.20 | 4360.90 | 4353.40 | 4340.60 | 4333.60 | 4325.20 | 4317.10 | 4307.50 | 4297.40 | 398.40 | 389.90 | 382.90 | 376.20 | 370.90 | 360.50 | 356.70 | 352.40 | 349.80 | 343.70 | 337.90 | 336.60 | 335.80 | 337.30 | 337.10 | 336.70 | 335.40 | 335.70 | 338.80 | 351.00 | 353.50 | 345.30 | 346.60 | 345.60 | 318.40 | 326.50 | 326.10 | 333.00 | 333.70 | 328.80 | 322.10 | 314.70 | 308.60 | 297.80 | 292.40 | 291.00 | 289.10 | 291.70 | 290.80 | 283.80 | 279.80 | 267.50 | NA | NA | NA | |
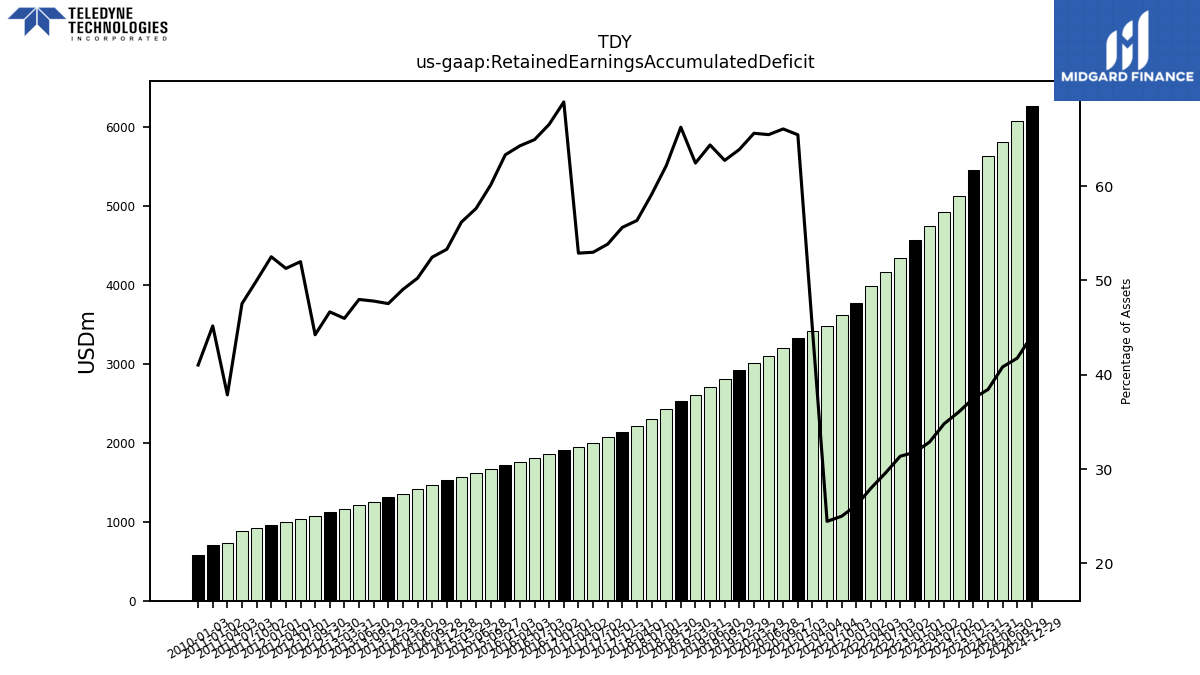
| Retained Earnings Accumulated Deficit | 5447.50 | 5124.40 | 4925.80 | 4740.50 | 4561.80 | 4335.40 | 4157.10 | 3985.80 | 3773.20 | 3611.40 | 3477.30 | 3412.60 | 3327.90 | 3195.80 | 3101.90 | 3008.20 | 2926.00 | 2810.30 | 2703.60 | 2599.00 | 2523.70 | 2432.50 | 2295.30 | 2209.40 | 2139.60 | 2072.00 | 2003.00 | 1942.90 | 1912.40 | 1859.40 | 1805.60 | 1759.90 | 1721.50 | 1666.00 | 1617.70 | 1569.40 | 1525.70 | 1465.40 | 1409.90 | 1353.80 | 1308.00 | 1253.00 | 1206.30 | 1163.40 | 1123.00 | 1076.80 | 1034.10 | 994.60 | 958.90 | 922.00 | 888.00 | 735.70 | 703.70 | NA | NA | NA | |
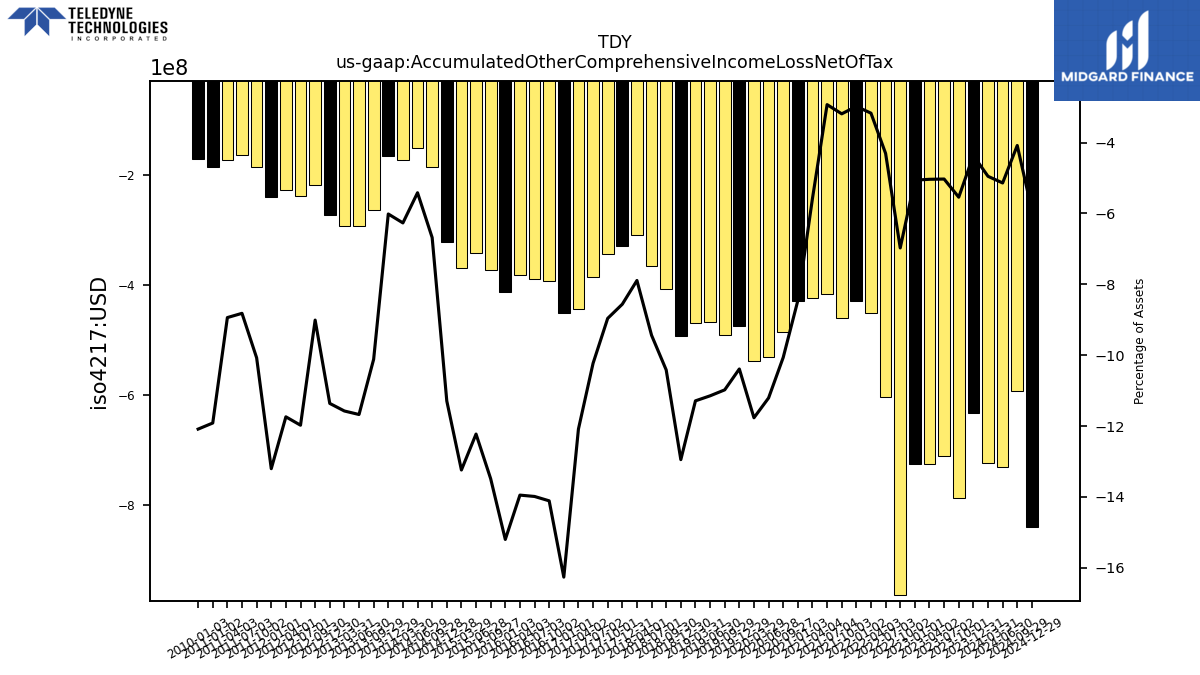
| Accumulated Other Comprehensive Income Loss Net Of Tax | -634.10 | -787.90 | -712.00 | -726.80 | -726.50 | -964.20 | -605.00 | -451.90 | -430.00 | -460.80 | -416.70 | -424.90 | -430.10 | -486.80 | -531.00 | -539.50 | -475.80 | -491.80 | -468.20 | -469.80 | -493.20 | -407.60 | -366.50 | -309.40 | -329.30 | -344.80 | -386.70 | -443.90 | -451.20 | -394.20 | -388.90 | -381.90 | -413.20 | -373.70 | -343.20 | -369.80 | -323.20 | -186.60 | -152.00 | -173.00 | -165.50 | -265.10 | -293.50 | -292.90 | -273.40 | -219.30 | -238.20 | -227.70 | -241.10 | -185.80 | -164.70 | -173.70 | -185.60 | NA | NA | NA |
| 2023-12-31 | 2023-10-01 | 2023-07-02 | 2023-04-02 | 2023-01-01 | 2022-10-02 | 2022-07-03 | 2022-04-03 | 2022-01-02 | 2021-10-03 | 2021-07-04 | 2021-04-04 | 2021-01-03 | 2020-09-27 | 2020-06-28 | 2020-03-29 | 2019-12-29 | 2019-09-29 | 2019-06-30 | 2019-03-31 | 2018-12-30 | 2018-09-30 | 2018-07-01 | 2018-04-01 | 2017-12-31 | 2017-10-01 | 2017-07-02 | 2017-04-02 | 2017-01-01 | 2016-10-02 | 2016-07-03 | 2016-04-03 | 2016-01-03 | 2015-09-27 | 2015-06-28 | 2015-03-29 | 2014-12-28 | 2014-09-28 | 2014-06-29 | 2014-03-30 | 2013-12-29 | 2013-09-29 | 2013-06-30 | 2013-03-31 | 2012-12-30 | 2012-09-30 | 2012-07-01 | 2012-04-01 | 2012-01-01 | 2011-10-02 | 2011-07-03 | 2011-04-03 | 2011-01-02 | 2010-10-03 | 2010-07-04 | 2010-04-04 | ||
|---|---|---|---|---|---|---|---|---|---|---|---|---|---|---|---|---|---|---|---|---|---|---|---|---|---|---|---|---|---|---|---|---|---|---|---|---|---|---|---|---|---|---|---|---|---|---|---|---|---|---|---|---|---|---|---|---|---|
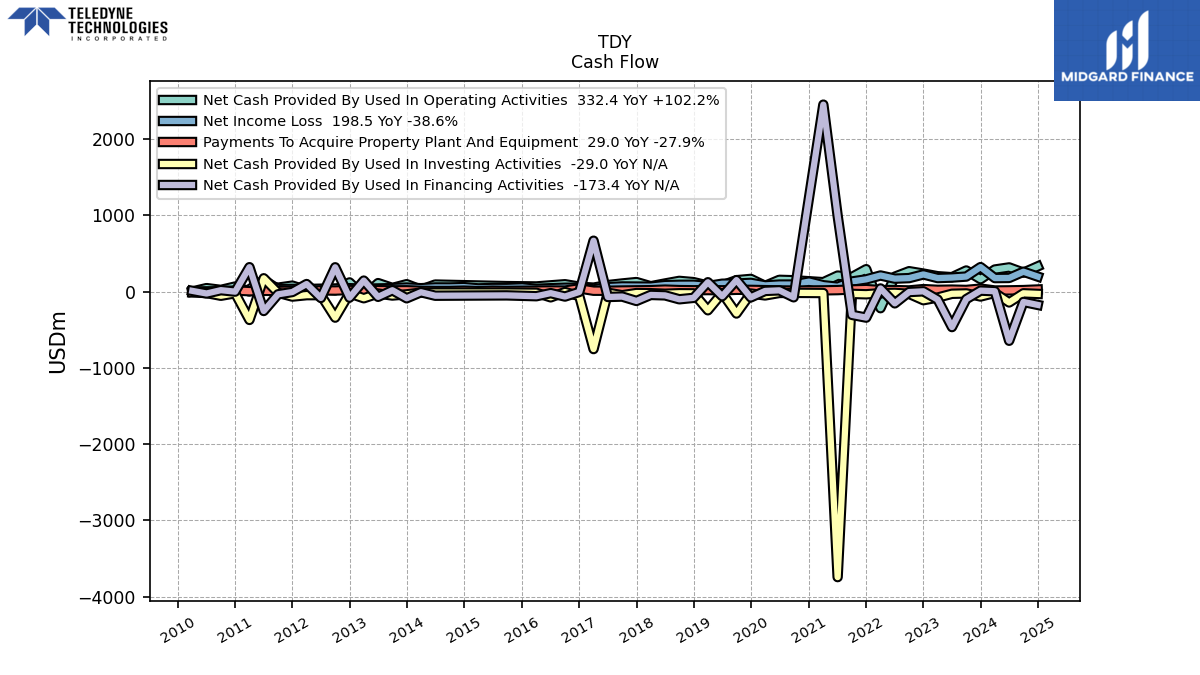
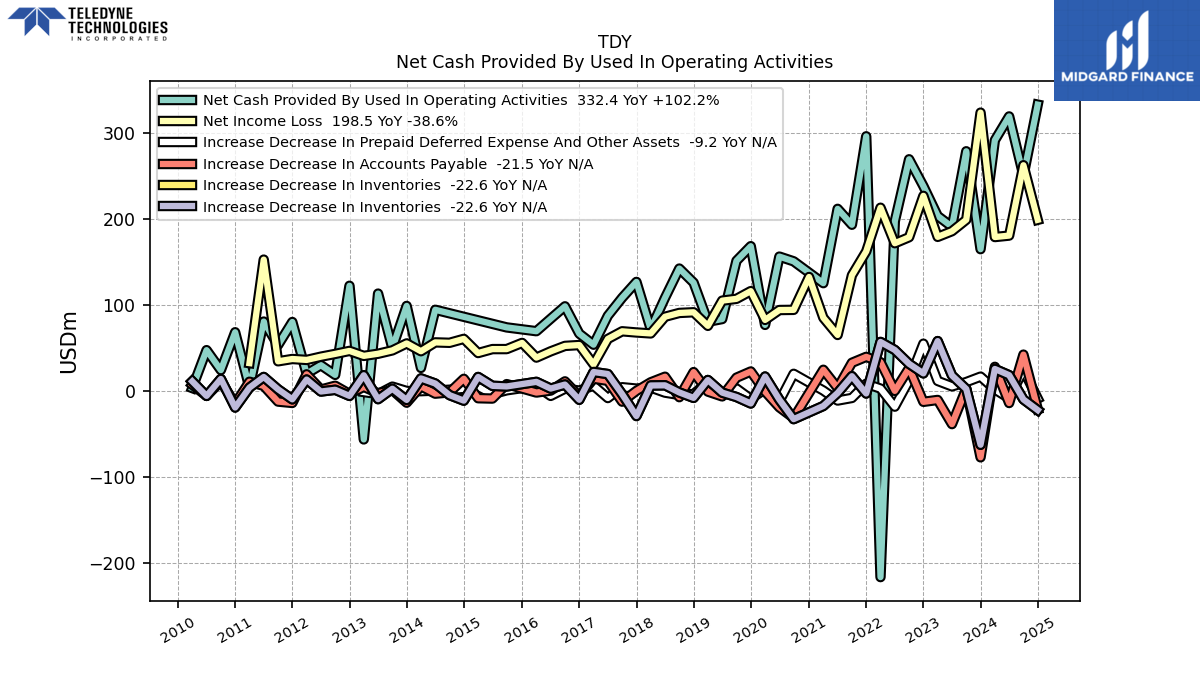
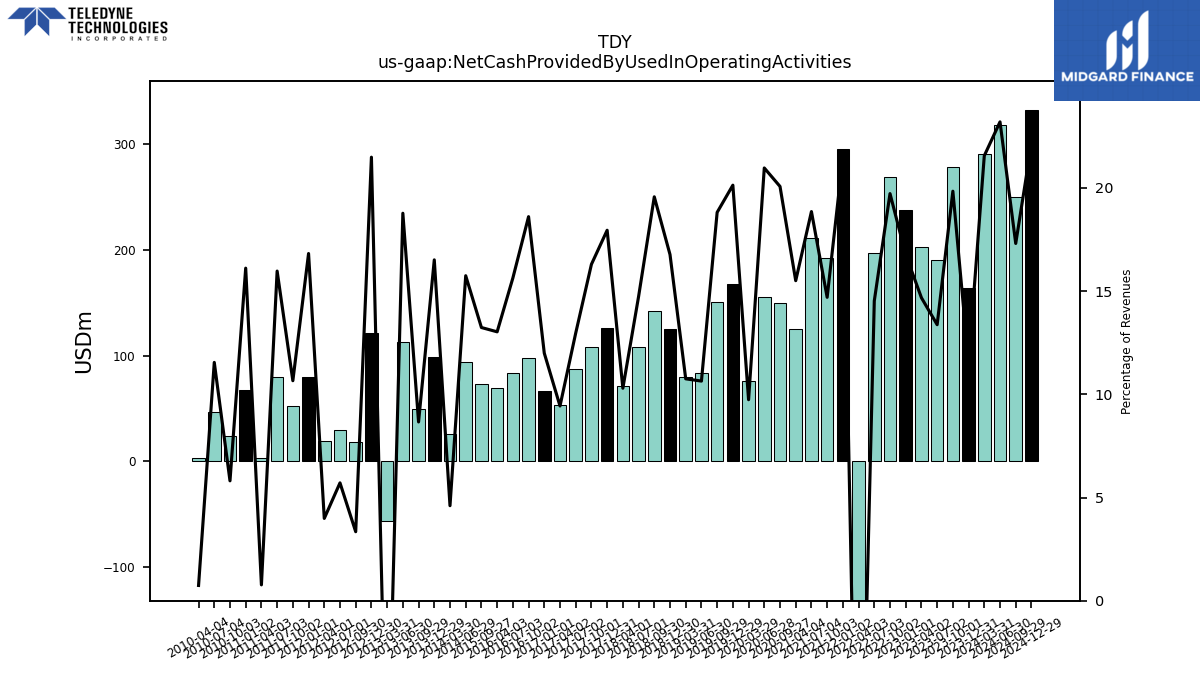
| Net Cash Provided By Used In Operating Activities | 164.40 | 278.20 | 190.50 | 203.00 | 237.70 | 268.90 | 196.90 | -216.70 | 295.60 | 192.80 | 211.30 | 124.90 | NA | 150.30 | 155.80 | 76.40 | 167.90 | 150.90 | 83.20 | 80.10 | 125.50 | 141.90 | 107.90 | 71.60 | 126.40 | 107.90 | 87.00 | 53.40 | 66.30 | 98.00 | 83.60 | 69.10 | NA | 73.50 | NA | NA | NA | NA | 94.00 | 26.40 | 98.50 | 49.50 | 112.80 | -56.70 | 121.90 | 18.30 | 29.60 | 19.70 | 79.80 | 52.90 | 80.30 | 3.60 | 67.90 | 23.80 | 47.10 | 3.00 | |
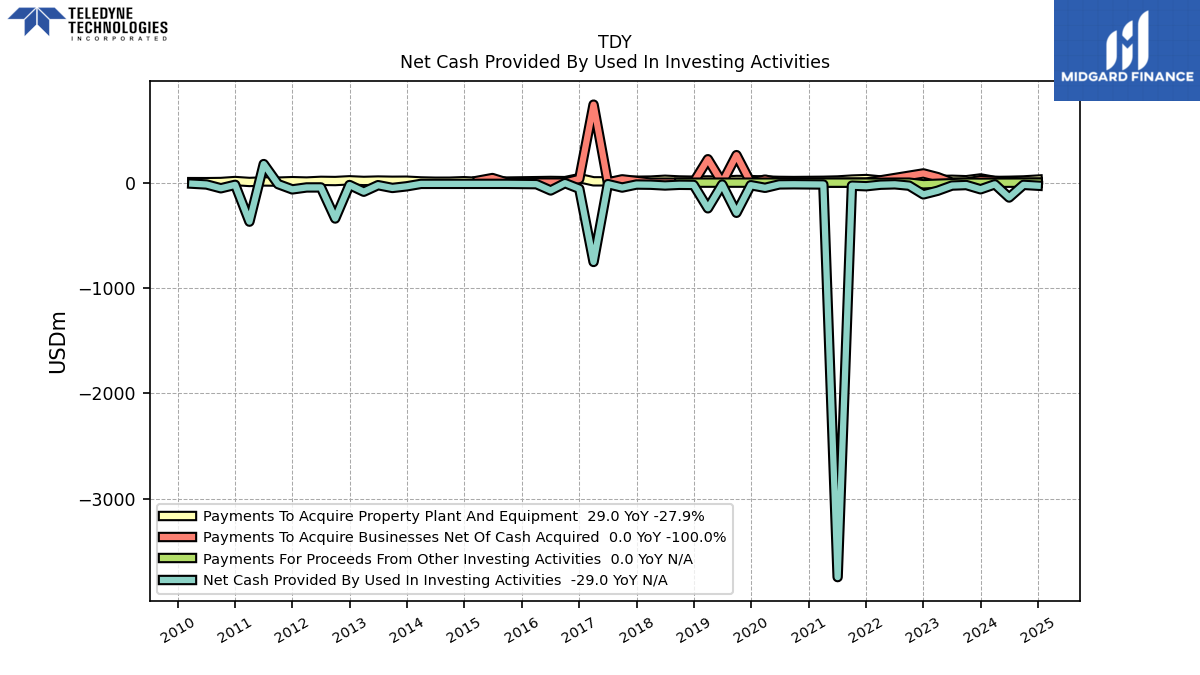
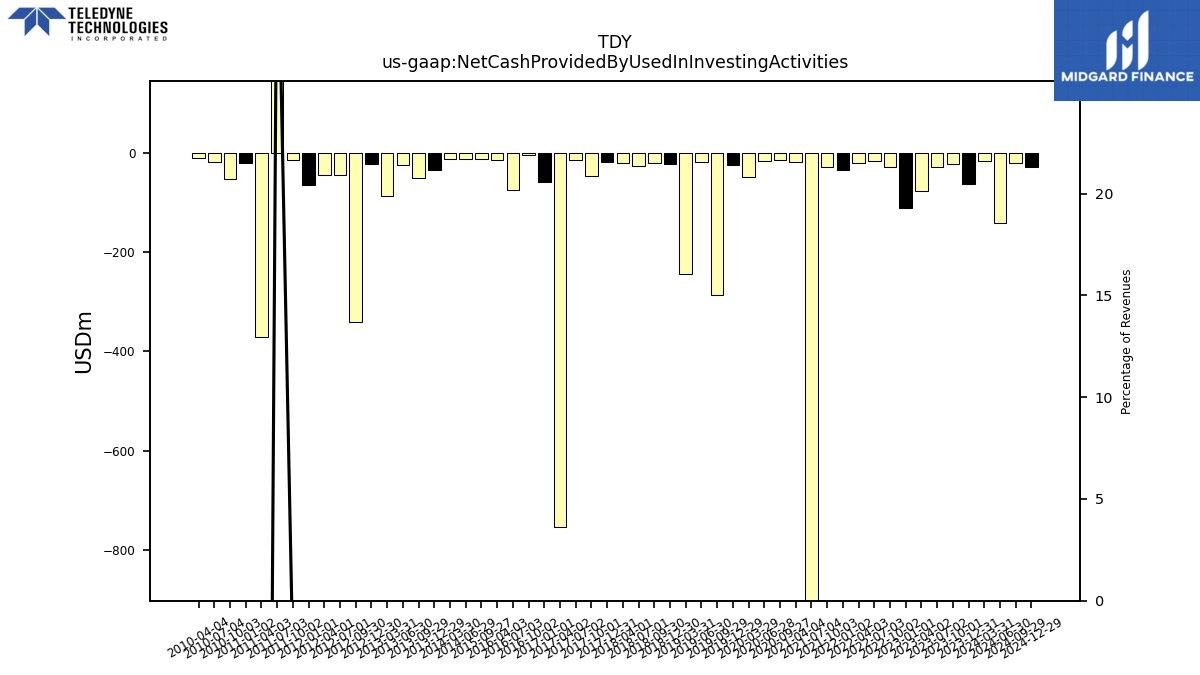
| Net Cash Provided By Used In Investing Activities | -63.00 | -22.80 | -27.60 | -76.90 | -111.50 | -28.50 | -15.80 | -19.60 | -33.90 | -28.60 | -3744.20 | -17.60 | NA | -15.20 | -16.60 | -49.10 | -24.10 | -286.20 | -17.80 | -243.80 | -21.70 | -20.40 | -26.90 | -19.60 | -18.00 | -46.50 | -13.80 | -752.90 | -57.70 | -4.70 | -74.10 | -14.50 | NA | -11.50 | NA | NA | NA | NA | -11.50 | -11.70 | -34.80 | -50.30 | -23.90 | -86.00 | -22.20 | -340.40 | -45.30 | -45.50 | -64.00 | -13.90 | 176.40 | -370.40 | -20.60 | -53.40 | -17.40 | -9.80 | |
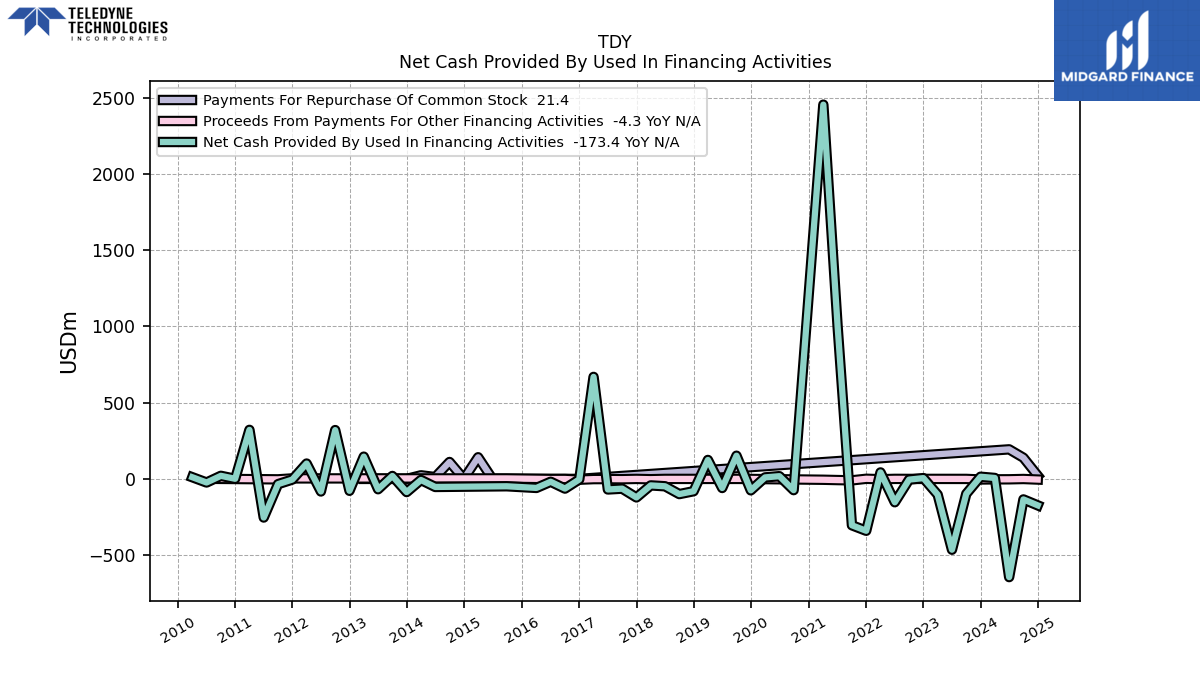
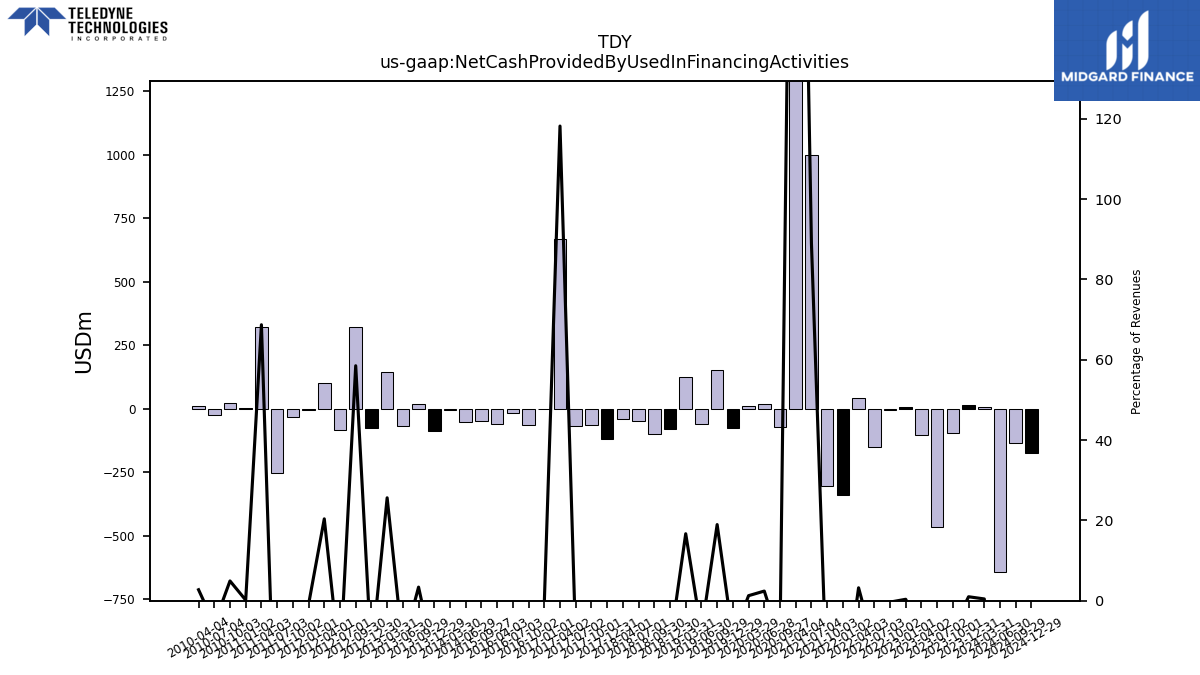
| Net Cash Provided By Used In Financing Activities | 14.20 | -97.90 | -464.40 | -103.40 | 5.20 | -4.60 | -153.20 | 42.60 | -340.20 | -304.10 | 997.40 | 2454.00 | NA | -73.70 | 17.90 | 9.90 | -75.00 | 152.10 | -59.70 | 124.30 | -80.80 | -99.60 | -48.30 | -42.60 | -121.50 | -64.00 | -69.30 | 668.90 | -3.50 | -63.60 | -18.70 | -59.20 | NA | -48.30 | NA | NA | NA | NA | -52.80 | -7.00 | -86.40 | 19.40 | -67.80 | 145.90 | -78.10 | 320.20 | -82.50 | 100.70 | -4.30 | -34.30 | -253.40 | 321.60 | 0.70 | 20.20 | -23.60 | 11.10 |
| 2023-12-31 | 2023-10-01 | 2023-07-02 | 2023-04-02 | 2023-01-01 | 2022-10-02 | 2022-07-03 | 2022-04-03 | 2022-01-02 | 2021-10-03 | 2021-07-04 | 2021-04-04 | 2021-01-03 | 2020-09-27 | 2020-06-28 | 2020-03-29 | 2019-12-29 | 2019-09-29 | 2019-06-30 | 2019-03-31 | 2018-12-30 | 2018-09-30 | 2018-07-01 | 2018-04-01 | 2017-12-31 | 2017-10-01 | 2017-07-02 | 2017-04-02 | 2017-01-01 | 2016-10-02 | 2016-07-03 | 2016-04-03 | 2016-01-03 | 2015-09-27 | 2015-06-28 | 2015-03-29 | 2014-12-28 | 2014-09-28 | 2014-06-29 | 2014-03-30 | 2013-12-29 | 2013-09-29 | 2013-06-30 | 2013-03-31 | 2012-12-30 | 2012-09-30 | 2012-07-01 | 2012-04-01 | 2012-01-01 | 2011-10-02 | 2011-07-03 | 2011-04-03 | 2011-01-02 | 2010-10-03 | 2010-07-04 | 2010-04-04 | ||
|---|---|---|---|---|---|---|---|---|---|---|---|---|---|---|---|---|---|---|---|---|---|---|---|---|---|---|---|---|---|---|---|---|---|---|---|---|---|---|---|---|---|---|---|---|---|---|---|---|---|---|---|---|---|---|---|---|---|
| Net Cash Provided By Used In Operating Activities | 164.40 | 278.20 | 190.50 | 203.00 | 237.70 | 268.90 | 196.90 | -216.70 | 295.60 | 192.80 | 211.30 | 124.90 | NA | 150.30 | 155.80 | 76.40 | 167.90 | 150.90 | 83.20 | 80.10 | 125.50 | 141.90 | 107.90 | 71.60 | 126.40 | 107.90 | 87.00 | 53.40 | 66.30 | 98.00 | 83.60 | 69.10 | NA | 73.50 | NA | NA | NA | NA | 94.00 | 26.40 | 98.50 | 49.50 | 112.80 | -56.70 | 121.90 | 18.30 | 29.60 | 19.70 | 79.80 | 52.90 | 80.30 | 3.60 | 67.90 | 23.80 | 47.10 | 3.00 | |
| Net Income Loss | 323.10 | 198.60 | 185.30 | 178.70 | 226.40 | 178.30 | 171.30 | 212.60 | 161.80 | 134.10 | 64.70 | 84.70 | 132.10 | 93.90 | 93.70 | 82.20 | 115.70 | 106.70 | 104.60 | 75.30 | 91.10 | 90.30 | 85.90 | 66.50 | 67.60 | 69.00 | 60.10 | 30.50 | 53.00 | 52.00 | 45.70 | 38.40 | 55.50 | 48.30 | 48.30 | 43.70 | 60.20 | 55.60 | 56.10 | 45.80 | 54.90 | 46.80 | 42.90 | 40.40 | 46.20 | 42.70 | 39.50 | 35.70 | 36.80 | 34.10 | 152.30 | 32.00 | NA | NA | NA | NA | |
| Profit Loss | 323.50 | 198.80 | 185.50 | 178.80 | 226.80 | 178.20 | 171.30 | 212.60 | 161.80 | 134.10 | NA | NA | NA | NA | NA | NA | NA | NA | NA | NA | NA | NA | NA | NA | NA | NA | NA | NA | 53.00 | 52.00 | 45.70 | 38.40 | 55.50 | 48.30 | 48.00 | 43.70 | 58.90 | 54.90 | 55.80 | 46.00 | 54.50 | 46.90 | 43.30 | 39.80 | 46.80 | 43.10 | 39.60 | 35.60 | 36.70 | 34.10 | 152.40 | 32.50 | 36.60 | 30.40 | 28.60 | 25.00 | |
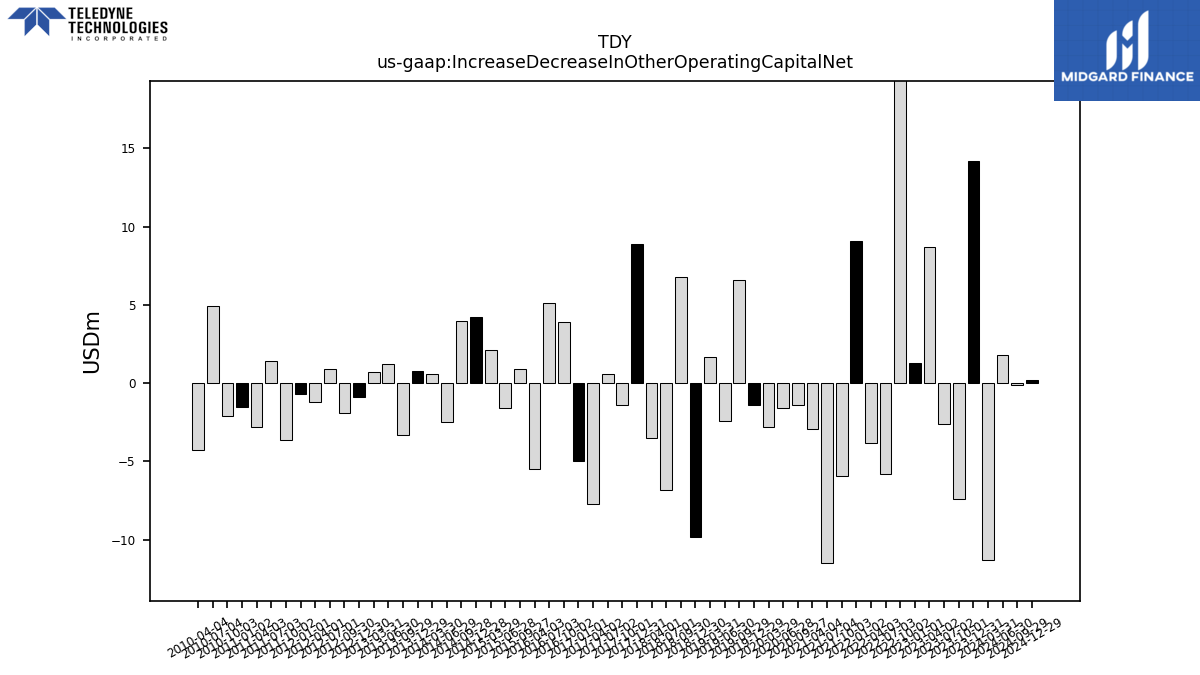
| Increase Decrease In Other Operating Capital Net | 14.20 | -7.40 | -2.60 | 8.70 | 1.30 | 36.50 | -5.80 | -3.80 | 9.10 | -5.90 | -11.50 | -2.90 | NA | -1.40 | -1.60 | -2.80 | -1.40 | 6.60 | -2.40 | 1.70 | -9.80 | 6.80 | -6.80 | -3.50 | 8.90 | -1.40 | 0.60 | -7.70 | -5.00 | 3.90 | 5.10 | -5.50 | NA | 0.90 | -1.60 | 2.10 | 4.20 | 4.00 | -2.50 | 0.60 | 0.80 | -3.30 | 1.20 | 0.70 | -0.90 | -1.90 | 0.90 | -1.20 | -0.70 | -3.60 | 1.40 | -2.80 | -1.50 | -2.10 | 4.90 | -4.30 | |
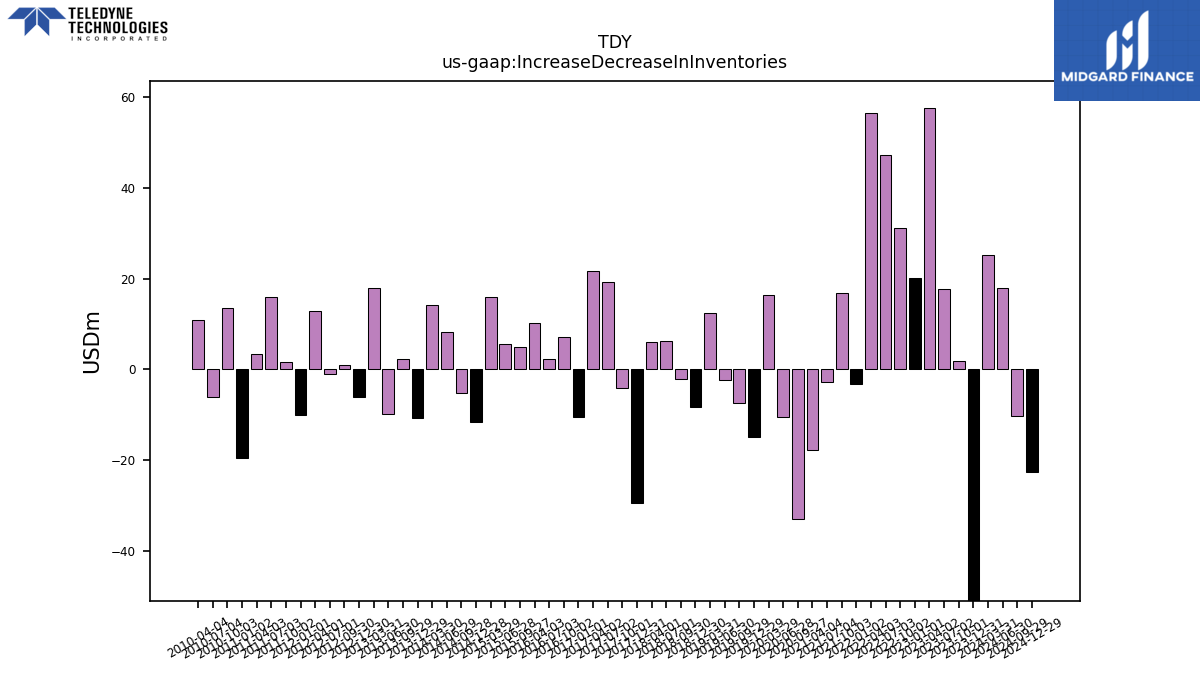
| Increase Decrease In Inventories | -62.90 | 1.90 | 17.70 | 57.60 | 20.10 | 31.20 | 47.30 | 56.60 | -3.30 | 16.80 | -2.70 | -17.80 | NA | -33.10 | -10.40 | 16.40 | -14.90 | -7.40 | -2.30 | 12.40 | -8.40 | -2.10 | 6.20 | 6.00 | -29.50 | -4.10 | 19.30 | 21.70 | -10.60 | 7.10 | 2.40 | 10.20 | NA | 4.90 | 5.60 | 15.90 | -11.60 | -5.20 | 8.30 | 14.20 | -10.80 | 2.20 | -9.90 | 17.90 | -6.10 | 1.00 | -1.00 | 12.90 | -10.10 | 1.60 | 15.90 | 3.50 | -19.60 | 13.60 | -6.10 | 10.80 | |
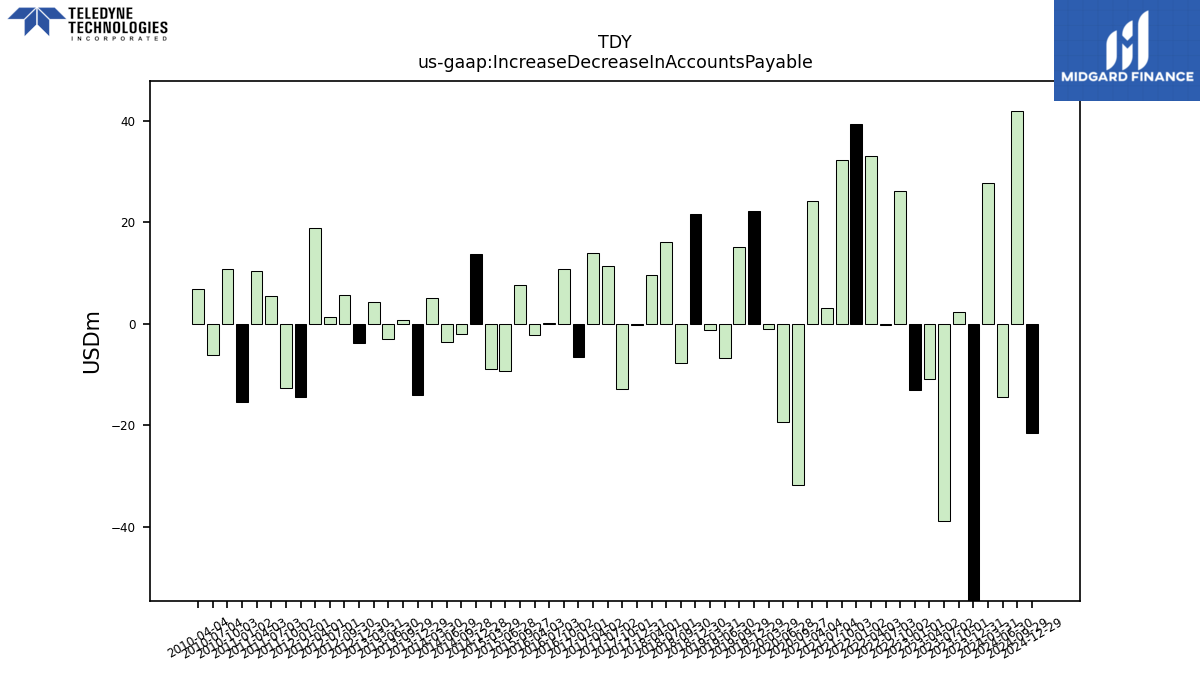
| Increase Decrease In Accounts Payable | -77.50 | 2.30 | -38.90 | -10.80 | -13.00 | 26.10 | -0.30 | 33.10 | 39.30 | 32.40 | 3.10 | 24.30 | NA | -31.80 | -19.40 | -1.00 | 22.30 | 15.10 | -6.70 | -1.10 | 21.60 | -7.60 | 16.20 | 9.70 | -0.20 | -12.80 | 11.40 | 14.00 | -6.60 | 10.80 | 0.10 | -2.20 | NA | 7.60 | -9.20 | -8.80 | 13.80 | -2.00 | -3.50 | 5.10 | -14.00 | 0.80 | -3.00 | 4.40 | -3.70 | 5.70 | 1.30 | 19.00 | -14.30 | -12.70 | 5.50 | 10.40 | -15.30 | 10.80 | -6.10 | 6.90 |
| 2023-12-31 | 2023-10-01 | 2023-07-02 | 2023-04-02 | 2023-01-01 | 2022-10-02 | 2022-07-03 | 2022-04-03 | 2022-01-02 | 2021-10-03 | 2021-07-04 | 2021-04-04 | 2021-01-03 | 2020-09-27 | 2020-06-28 | 2020-03-29 | 2019-12-29 | 2019-09-29 | 2019-06-30 | 2019-03-31 | 2018-12-30 | 2018-09-30 | 2018-07-01 | 2018-04-01 | 2017-12-31 | 2017-10-01 | 2017-07-02 | 2017-04-02 | 2017-01-01 | 2016-10-02 | 2016-07-03 | 2016-04-03 | 2016-01-03 | 2015-09-27 | 2015-06-28 | 2015-03-29 | 2014-12-28 | 2014-09-28 | 2014-06-29 | 2014-03-30 | 2013-12-29 | 2013-09-29 | 2013-06-30 | 2013-03-31 | 2012-12-30 | 2012-09-30 | 2012-07-01 | 2012-04-01 | 2012-01-01 | 2011-10-02 | 2011-07-03 | 2011-04-03 | 2011-01-02 | 2010-10-03 | 2010-07-04 | 2010-04-04 | ||
|---|---|---|---|---|---|---|---|---|---|---|---|---|---|---|---|---|---|---|---|---|---|---|---|---|---|---|---|---|---|---|---|---|---|---|---|---|---|---|---|---|---|---|---|---|---|---|---|---|---|---|---|---|---|---|---|---|---|
| Net Cash Provided By Used In Investing Activities | -63.00 | -22.80 | -27.60 | -76.90 | -111.50 | -28.50 | -15.80 | -19.60 | -33.90 | -28.60 | -3744.20 | -17.60 | NA | -15.20 | -16.60 | -49.10 | -24.10 | -286.20 | -17.80 | -243.80 | -21.70 | -20.40 | -26.90 | -19.60 | -18.00 | -46.50 | -13.80 | -752.90 | -57.70 | -4.70 | -74.10 | -14.50 | NA | -11.50 | NA | NA | NA | NA | -11.50 | -11.70 | -34.80 | -50.30 | -23.90 | -86.00 | -22.20 | -340.40 | -45.30 | -45.50 | -64.00 | -13.90 | 176.40 | -370.40 | -20.60 | -53.40 | -17.40 | -9.80 | |
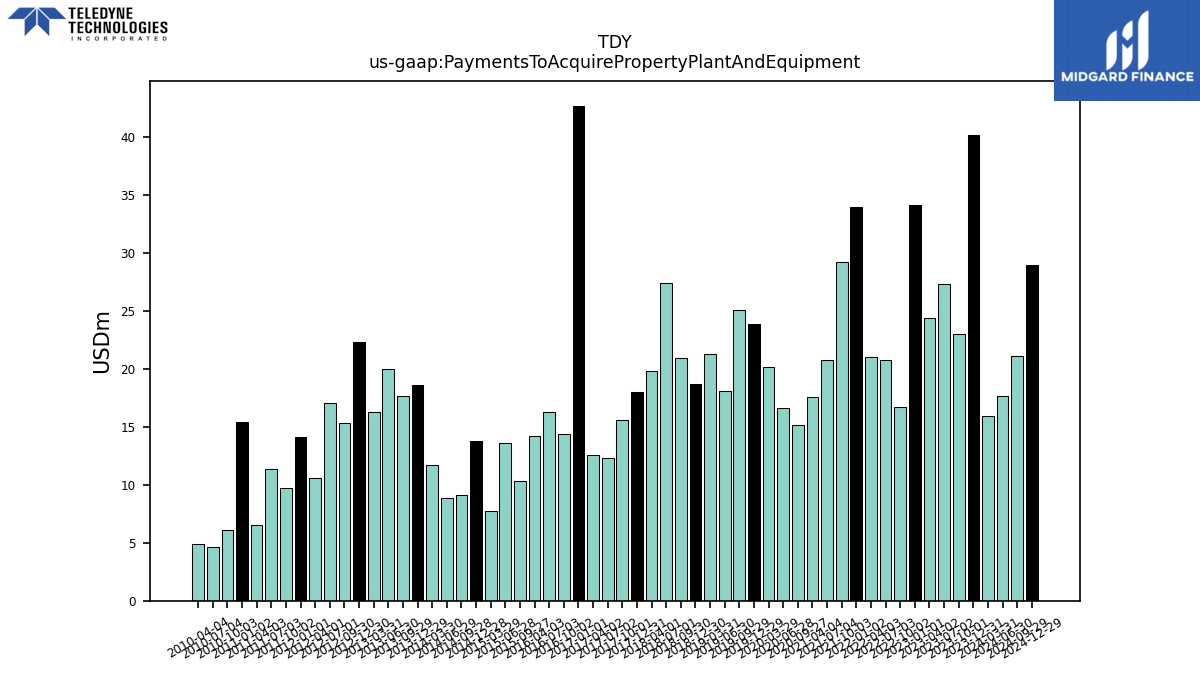
| Payments To Acquire Property Plant And Equipment | 40.20 | 23.00 | 27.30 | 24.40 | 34.10 | 16.70 | 20.80 | 21.00 | 34.00 | 29.20 | 20.80 | 17.60 | NA | 15.20 | 16.60 | 20.20 | 23.90 | 25.10 | 18.10 | 21.30 | 18.70 | 20.90 | 27.40 | 19.80 | 18.00 | 15.60 | 12.30 | 12.60 | 42.70 | 14.40 | 16.30 | 14.20 | NA | 10.30 | 13.60 | 7.70 | 13.80 | 9.10 | 8.90 | 11.70 | 18.60 | 17.70 | 20.00 | 16.30 | 22.30 | 15.30 | 17.10 | 10.60 | 14.10 | 9.70 | 11.40 | 6.50 | 15.40 | 6.10 | 4.60 | 4.90 |
| 2023-12-31 | 2023-10-01 | 2023-07-02 | 2023-04-02 | 2023-01-01 | 2022-10-02 | 2022-07-03 | 2022-04-03 | 2022-01-02 | 2021-10-03 | 2021-07-04 | 2021-04-04 | 2021-01-03 | 2020-09-27 | 2020-06-28 | 2020-03-29 | 2019-12-29 | 2019-09-29 | 2019-06-30 | 2019-03-31 | 2018-12-30 | 2018-09-30 | 2018-07-01 | 2018-04-01 | 2017-12-31 | 2017-10-01 | 2017-07-02 | 2017-04-02 | 2017-01-01 | 2016-10-02 | 2016-07-03 | 2016-04-03 | 2016-01-03 | 2015-09-27 | 2015-06-28 | 2015-03-29 | 2014-12-28 | 2014-09-28 | 2014-06-29 | 2014-03-30 | 2013-12-29 | 2013-09-29 | 2013-06-30 | 2013-03-31 | 2012-12-30 | 2012-09-30 | 2012-07-01 | 2012-04-01 | 2012-01-01 | 2011-10-02 | 2011-07-03 | 2011-04-03 | 2011-01-02 | 2010-10-03 | 2010-07-04 | 2010-04-04 | ||
|---|---|---|---|---|---|---|---|---|---|---|---|---|---|---|---|---|---|---|---|---|---|---|---|---|---|---|---|---|---|---|---|---|---|---|---|---|---|---|---|---|---|---|---|---|---|---|---|---|---|---|---|---|---|---|---|---|---|
| Net Cash Provided By Used In Financing Activities | 14.20 | -97.90 | -464.40 | -103.40 | 5.20 | -4.60 | -153.20 | 42.60 | -340.20 | -304.10 | 997.40 | 2454.00 | NA | -73.70 | 17.90 | 9.90 | -75.00 | 152.10 | -59.70 | 124.30 | -80.80 | -99.60 | -48.30 | -42.60 | -121.50 | -64.00 | -69.30 | 668.90 | -3.50 | -63.60 | -18.70 | -59.20 | NA | -48.30 | NA | NA | NA | NA | -52.80 | -7.00 | -86.40 | 19.40 | -67.80 | 145.90 | -78.10 | 320.20 | -82.50 | 100.70 | -4.30 | -34.30 | -253.40 | 321.60 | 0.70 | 20.20 | -23.60 | 11.10 |
| 2023-12-31 | 2023-10-01 | 2023-07-02 | 2023-04-02 | 2023-01-01 | 2022-10-02 | 2022-07-03 | 2022-04-03 | 2022-01-02 | 2021-10-03 | 2021-07-04 | 2021-04-04 | 2021-01-03 | 2020-09-27 | 2020-06-28 | 2020-03-29 | 2019-12-29 | 2019-09-29 | 2019-06-30 | 2019-03-31 | 2018-12-30 | 2018-09-30 | 2018-07-01 | 2018-04-01 | 2017-12-31 | 2017-10-01 | 2017-07-02 | 2017-04-02 | 2017-01-01 | 2016-10-02 | 2016-07-03 | 2016-04-03 | 2016-01-03 | 2015-09-27 | 2015-06-28 | 2015-03-29 | 2014-12-28 | 2014-09-28 | 2014-06-29 | 2014-03-30 | 2013-12-29 | 2013-09-29 | 2013-06-30 | 2013-03-31 | 2012-12-30 | 2012-09-30 | 2012-07-01 | 2012-04-01 | 2012-01-01 | 2011-10-02 | 2011-07-03 | 2011-04-03 | 2011-01-02 | 2010-10-03 | 2010-07-04 | 2010-04-04 | ||
|---|---|---|---|---|---|---|---|---|---|---|---|---|---|---|---|---|---|---|---|---|---|---|---|---|---|---|---|---|---|---|---|---|---|---|---|---|---|---|---|---|---|---|---|---|---|---|---|---|---|---|---|---|---|---|---|---|---|
| Revenues | 1425.00 | 1402.50 | 1424.70 | 1383.30 | 1418.20 | 1363.60 | 1355.80 | 1321.00 | 1375.70 | 1311.90 | 1121.00 | 805.70 | 809.30 | 749.00 | 743.30 | 784.60 | 834.20 | 802.20 | 782.00 | 745.20 | 748.40 | 725.30 | 732.50 | 695.60 | 704.40 | 662.20 | 671.10 | 566.10 | 552.90 | 526.80 | 534.90 | 530.50 | 600.00 | 555.40 | 577.70 | 565.00 | 622.30 | 601.10 | 597.10 | 573.50 | 596.60 | 571.60 | 601.00 | 569.40 | 567.40 | 547.40 | 518.50 | 494.00 | 474.50 | 496.40 | 502.90 | 468.10 | 421.50 | 409.80 | 408.00 | 404.90 | |
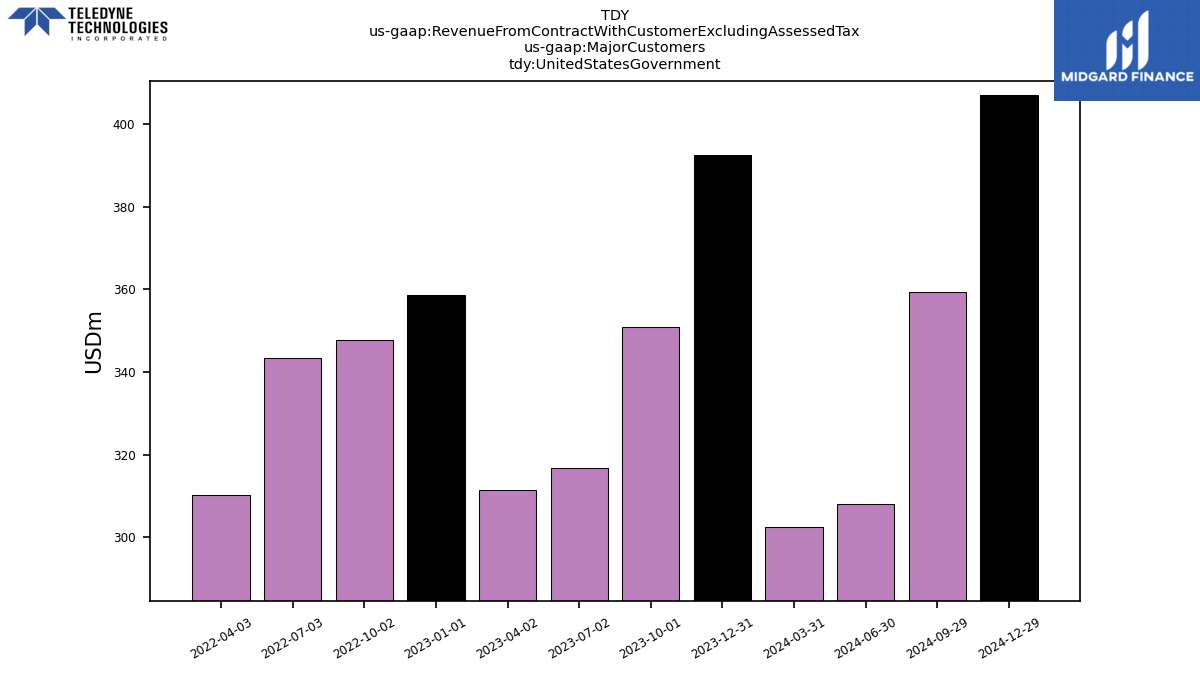
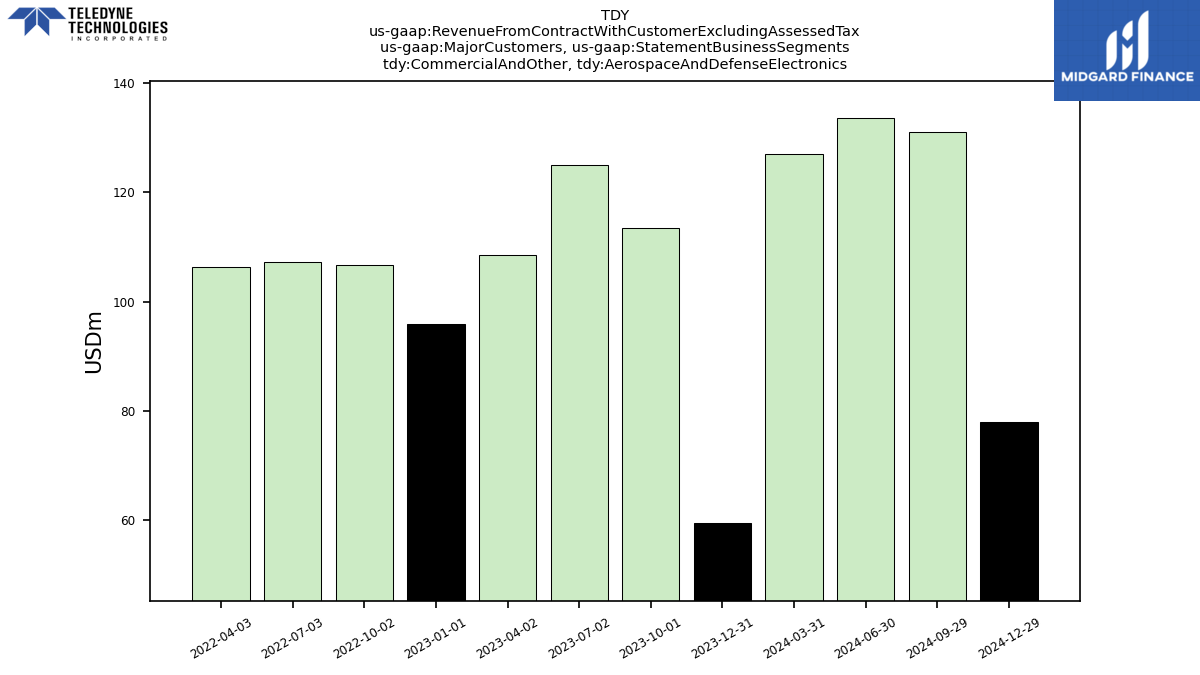
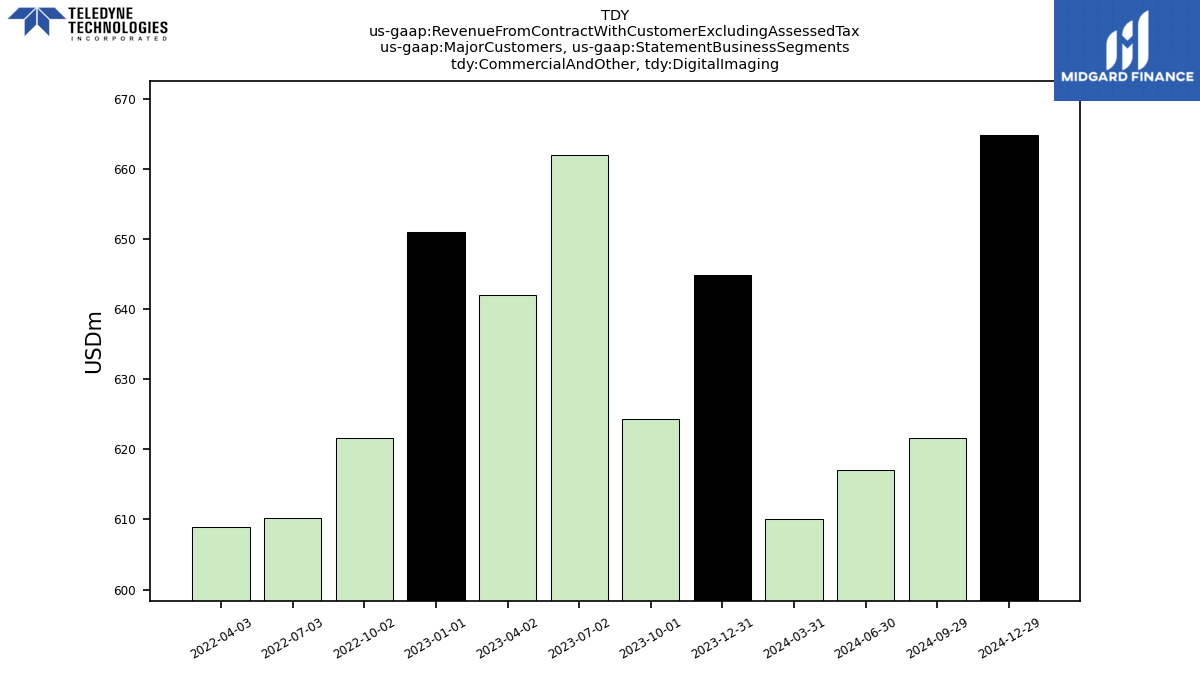
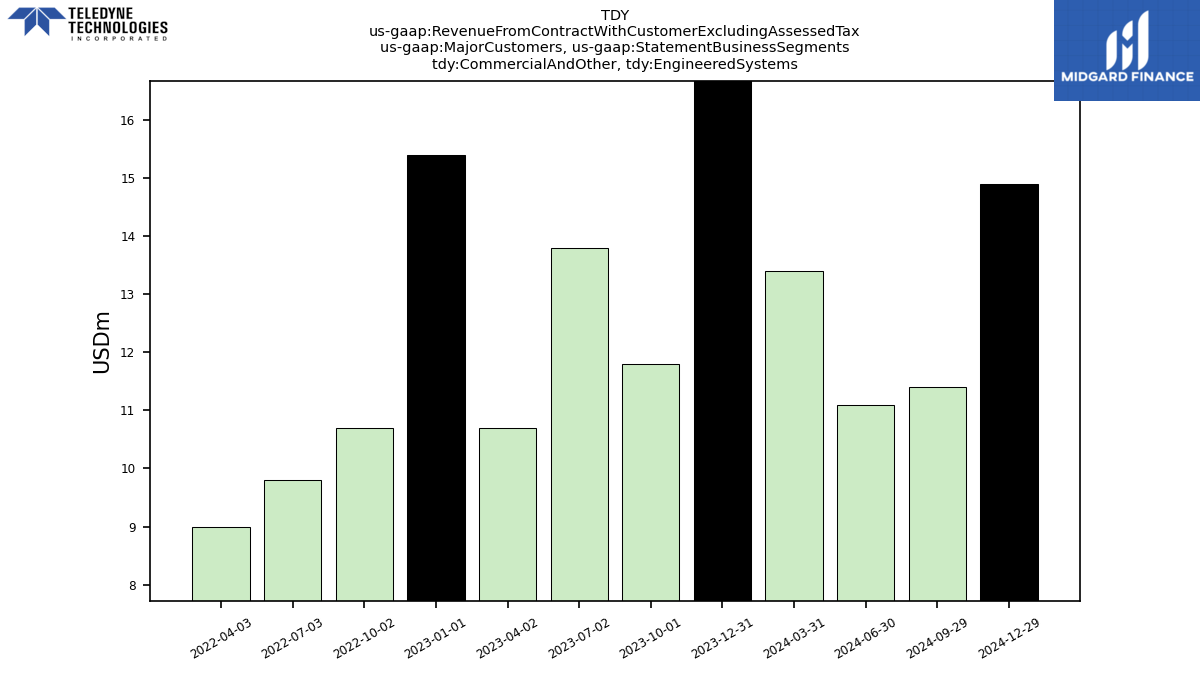
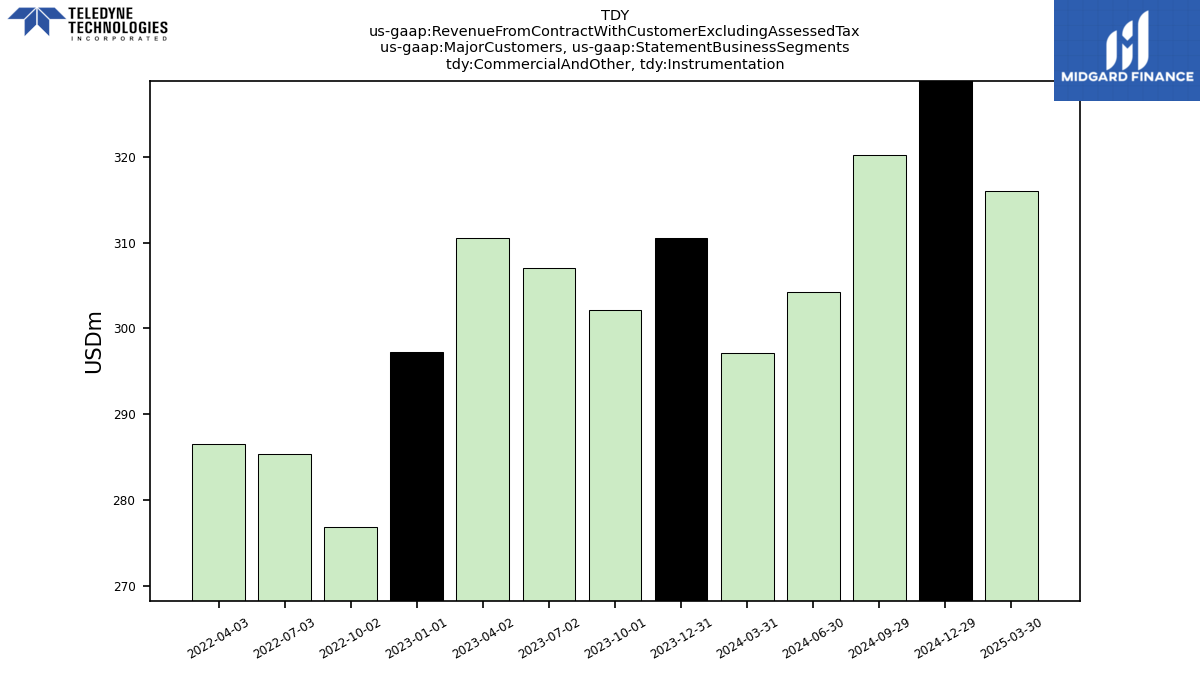
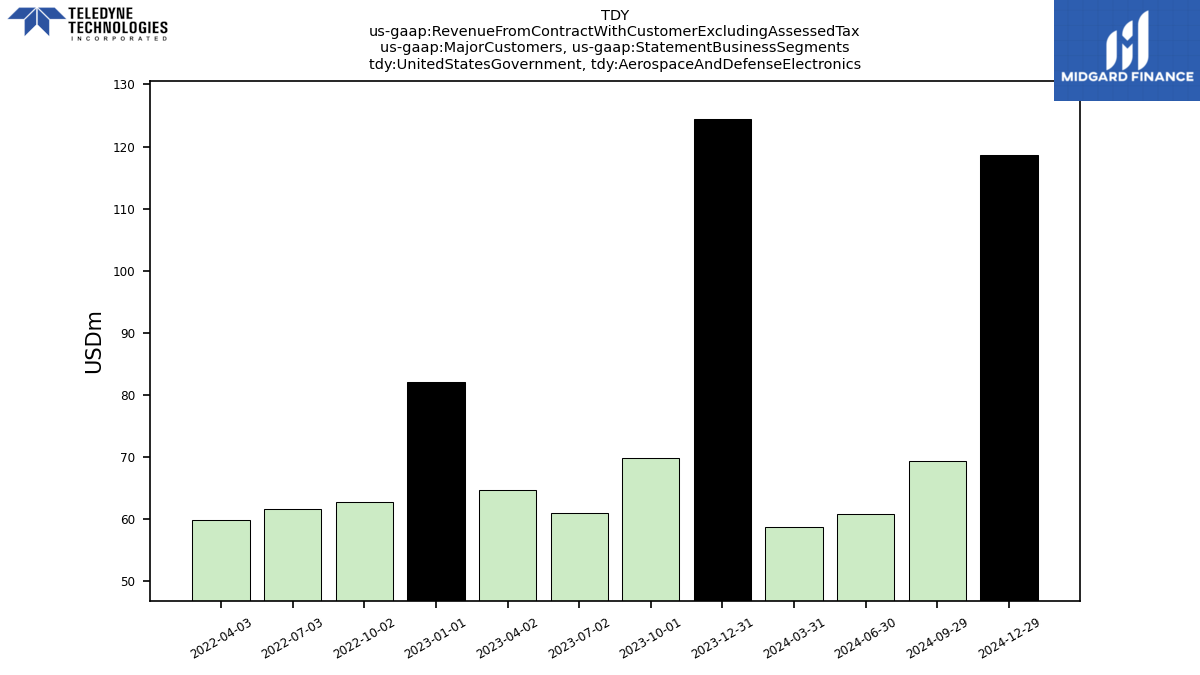
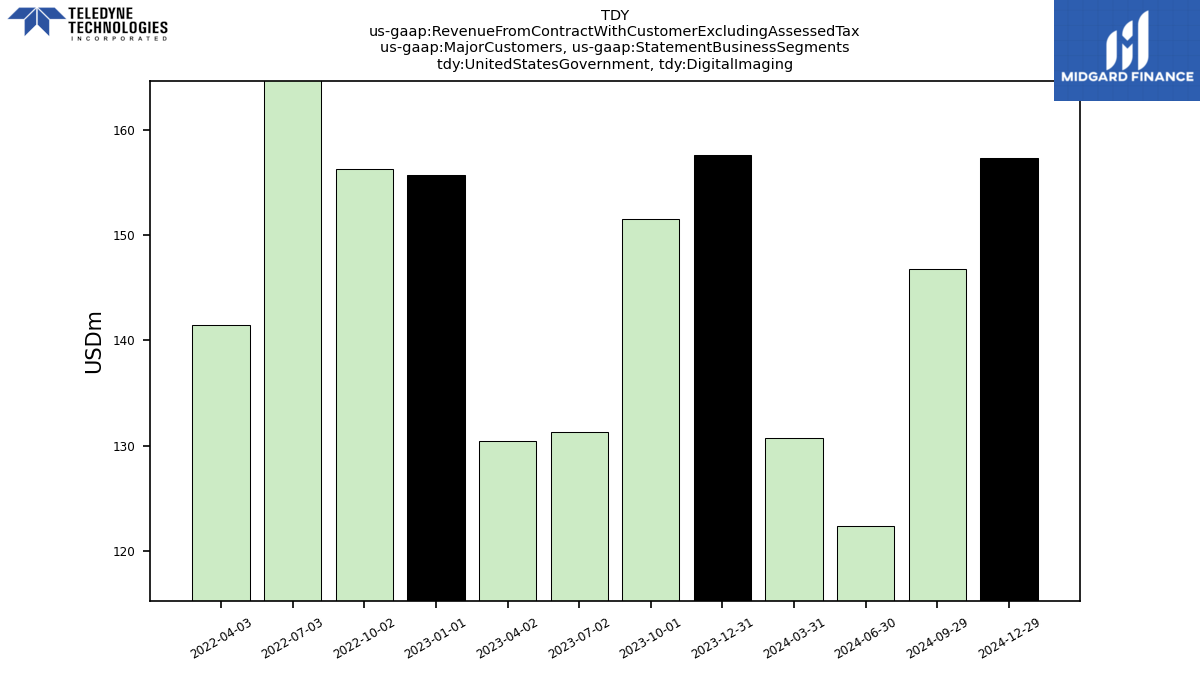
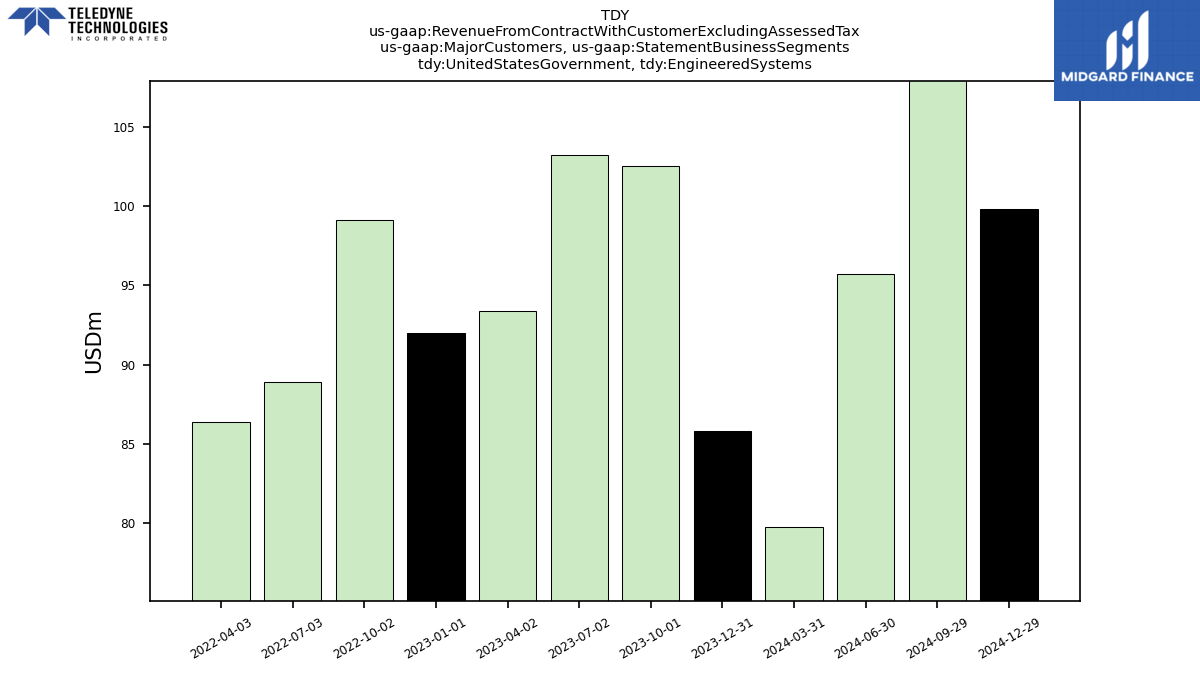
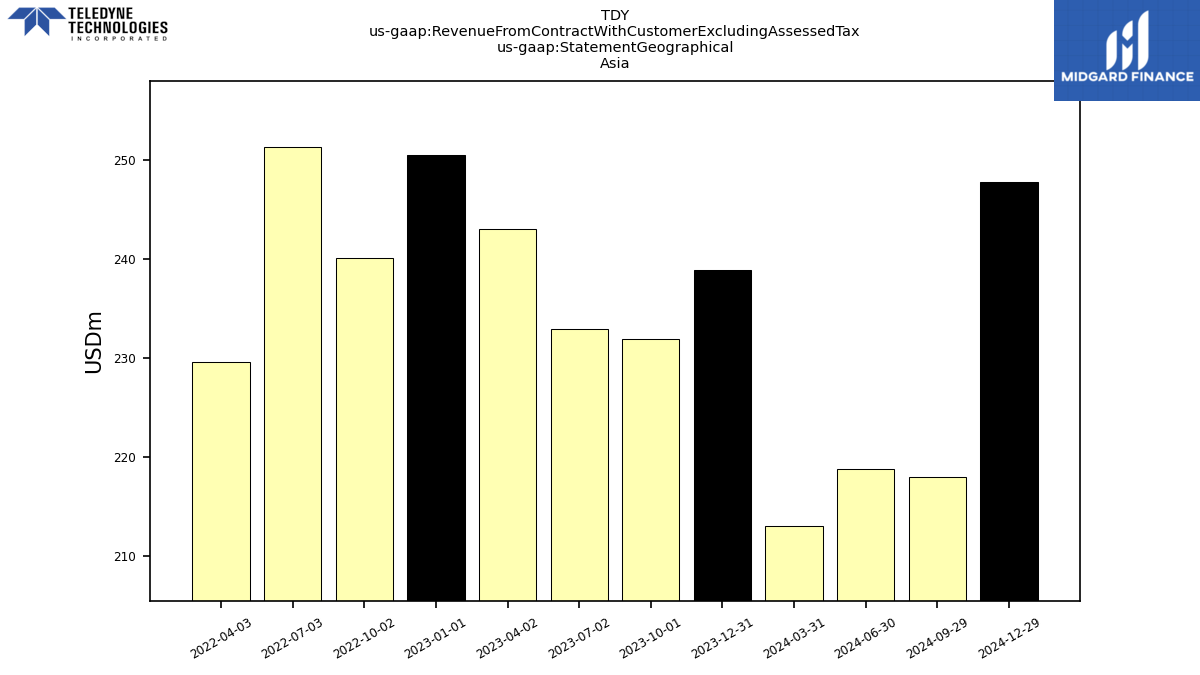
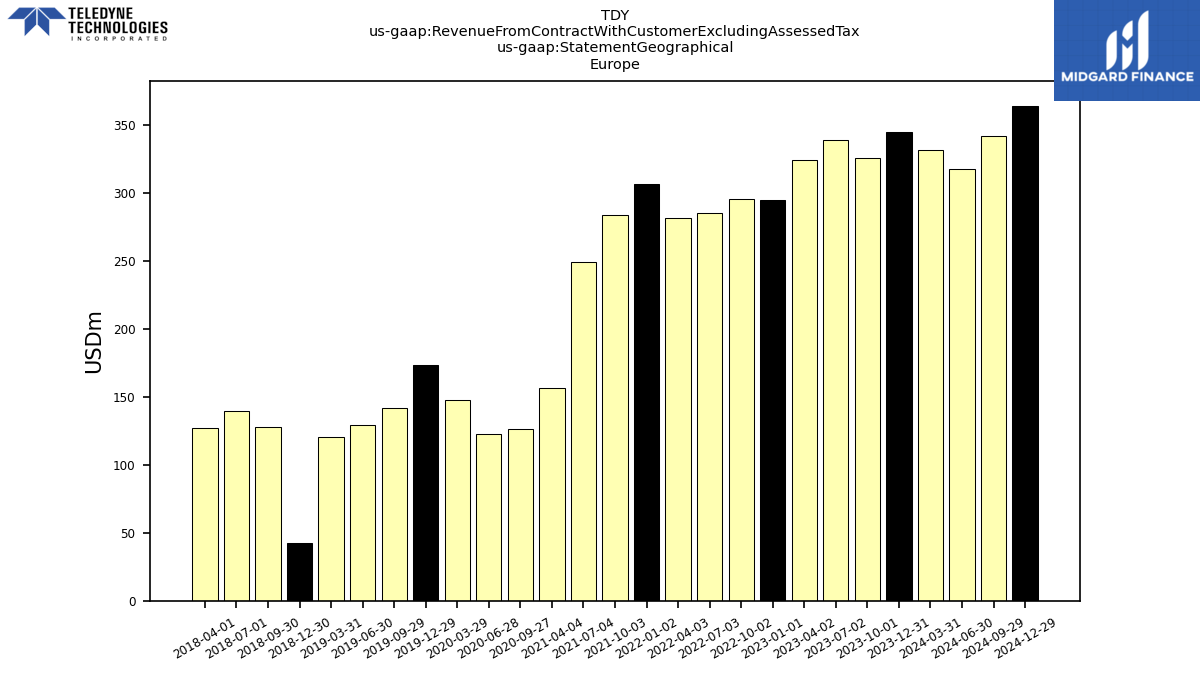
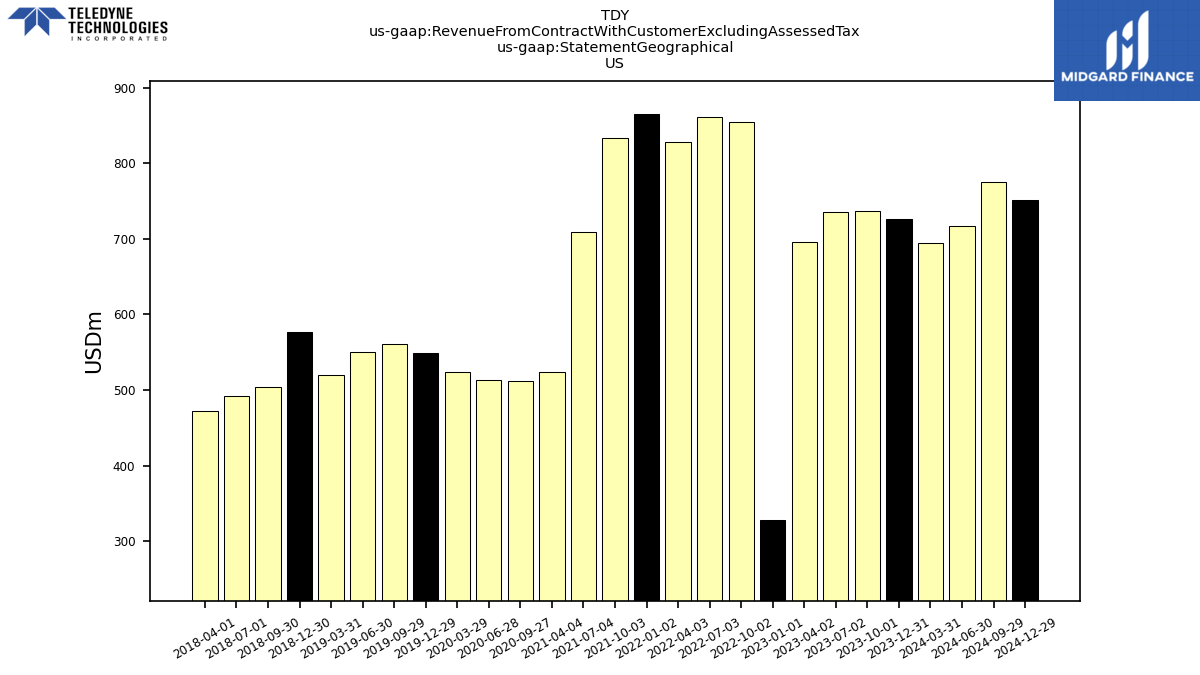
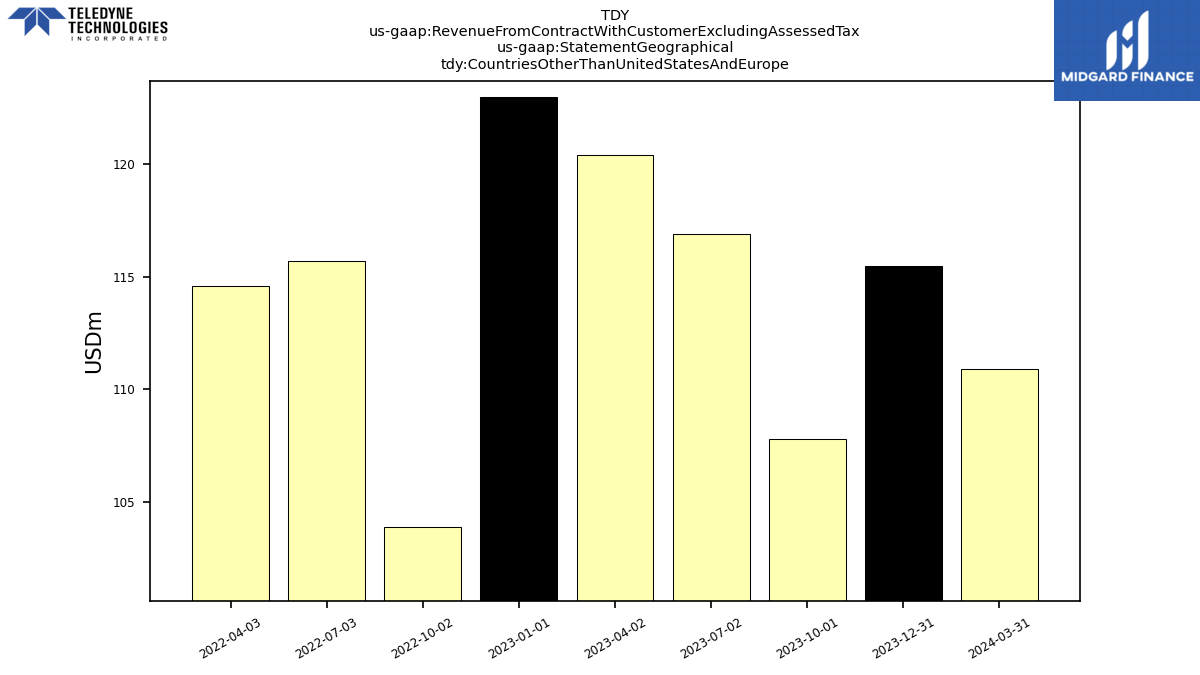
| Revenue From Contract With Customer Excluding Assessed Tax | 1425.00 | 1402.50 | 1424.70 | 1383.30 | 1418.20 | 1363.60 | 1355.80 | 1321.00 | 1375.70 | 1311.90 | 1121.00 | 805.70 | 809.30 | 749.00 | 743.30 | 784.60 | 834.20 | 802.20 | 782.00 | 745.20 | 748.40 | 725.30 | 732.50 | 695.60 | 704.40 | 662.20 | 671.10 | 566.10 | 552.90 | 526.80 | 534.90 | 530.50 | 600.00 | 555.40 | 577.70 | 565.00 | 622.30 | 601.10 | 597.10 | 573.50 | 596.60 | 571.60 | 601.00 | 569.40 | 567.40 | 547.40 | 518.50 | 494.00 | 474.50 | 496.40 | 502.90 | 468.10 | 421.50 | 409.80 | 408.00 | 404.90 | |
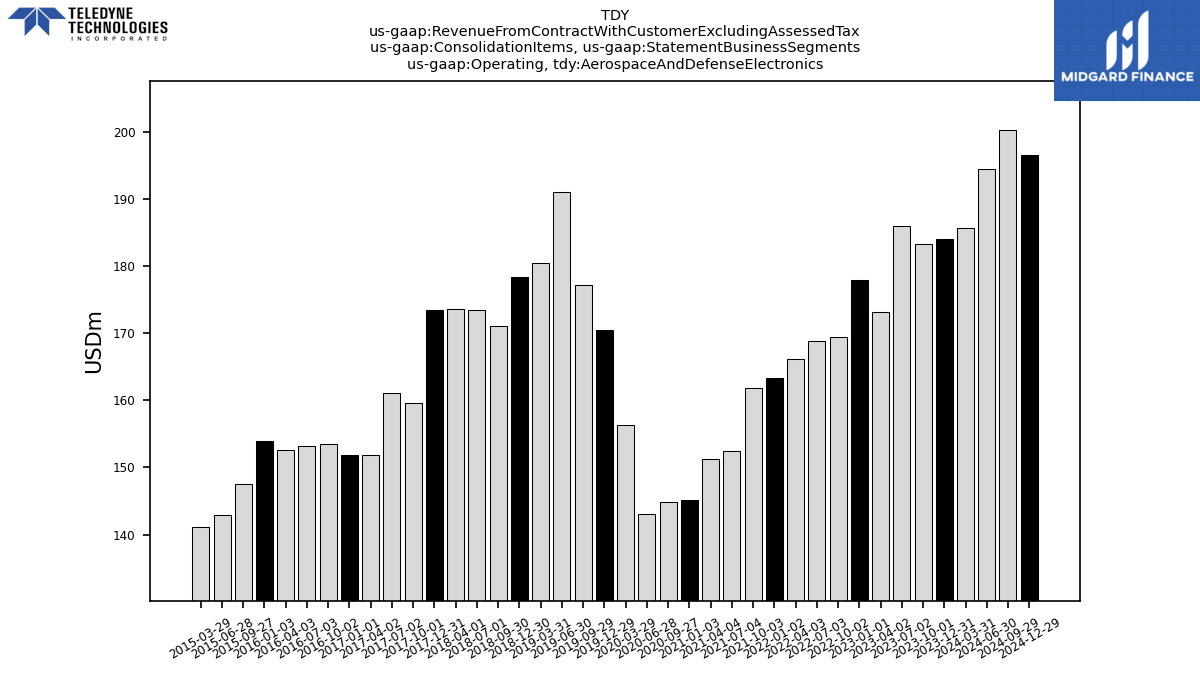
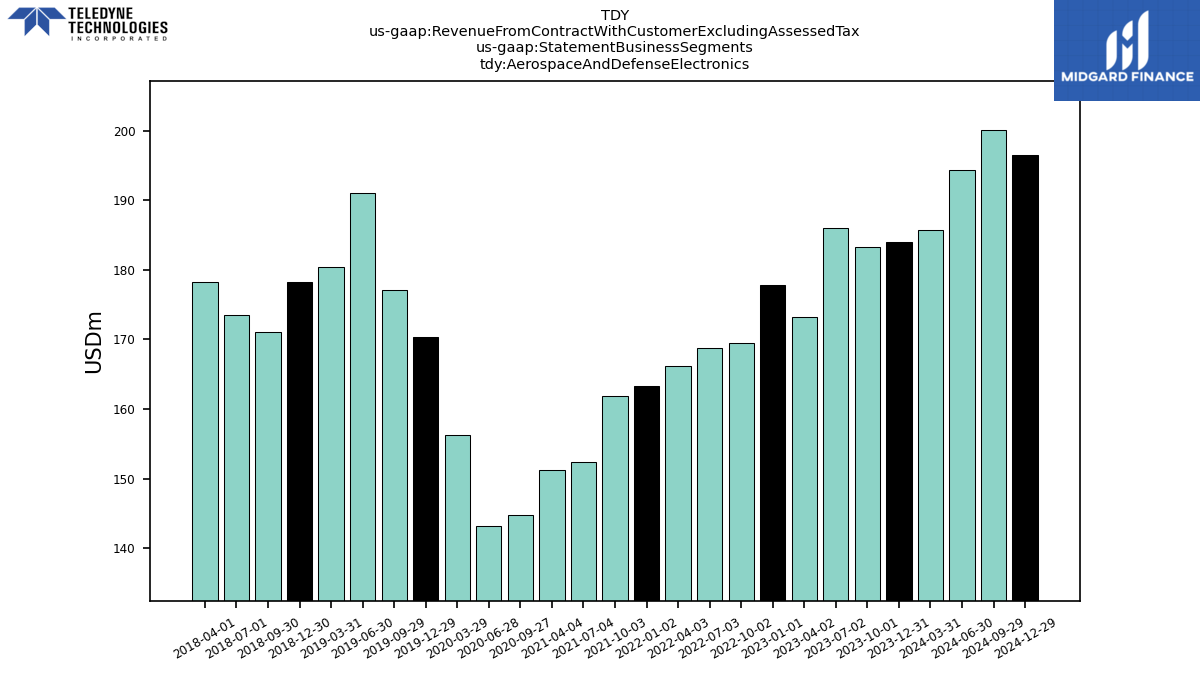
| Operating, Aerospace And Defense Electronics | 184.00 | 183.30 | 186.00 | 173.20 | 177.90 | 169.50 | 168.80 | 166.20 | 163.30 | 161.80 | 152.40 | 151.20 | 145.20 | 144.80 | 143.10 | 156.30 | 170.40 | 177.10 | 191.00 | 180.40 | 178.30 | 171.10 | 173.50 | 173.60 | 173.40 | 159.60 | 161.10 | 151.90 | 151.80 | 153.50 | 153.20 | 152.60 | 153.90 | 147.60 | 142.90 | 141.20 | NA | NA | NA | NA | NA | NA | NA | NA | NA | NA | NA | NA | NA | NA | NA | NA | NA | NA | NA | NA | |
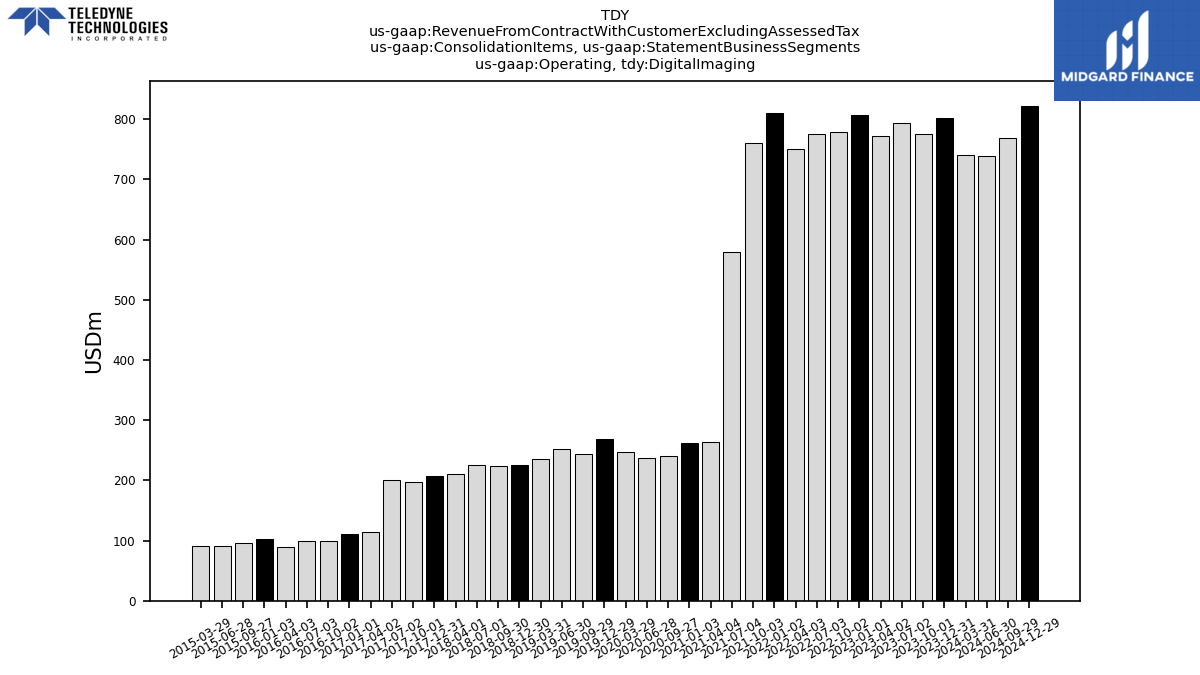
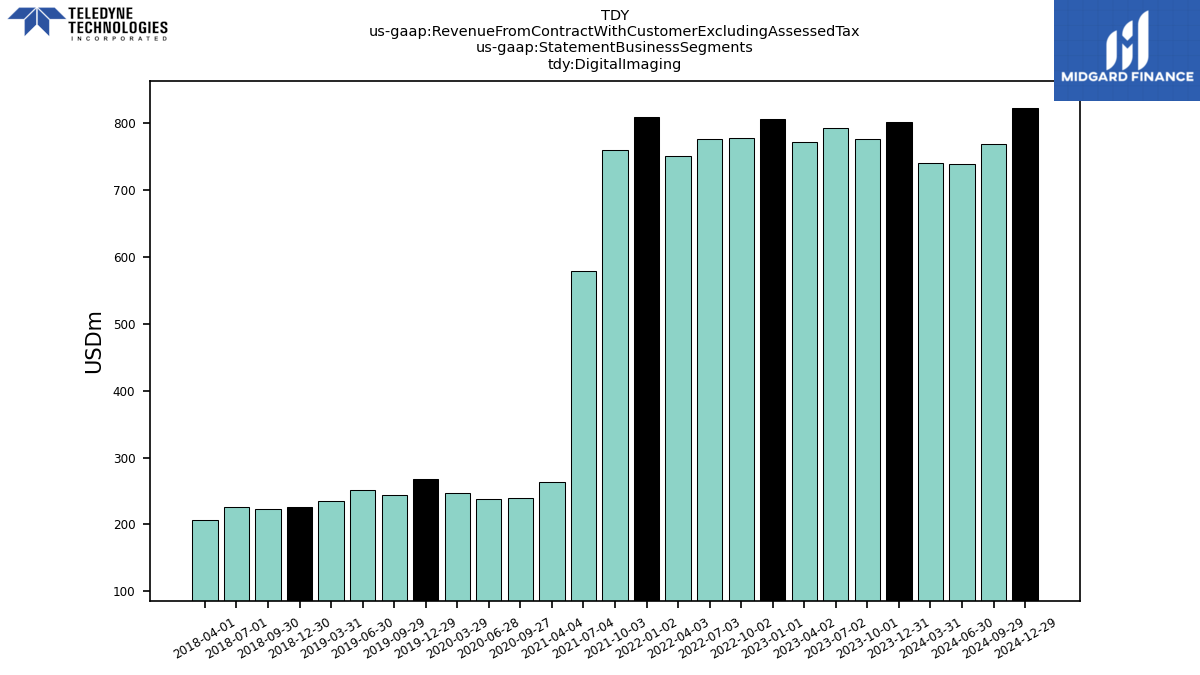
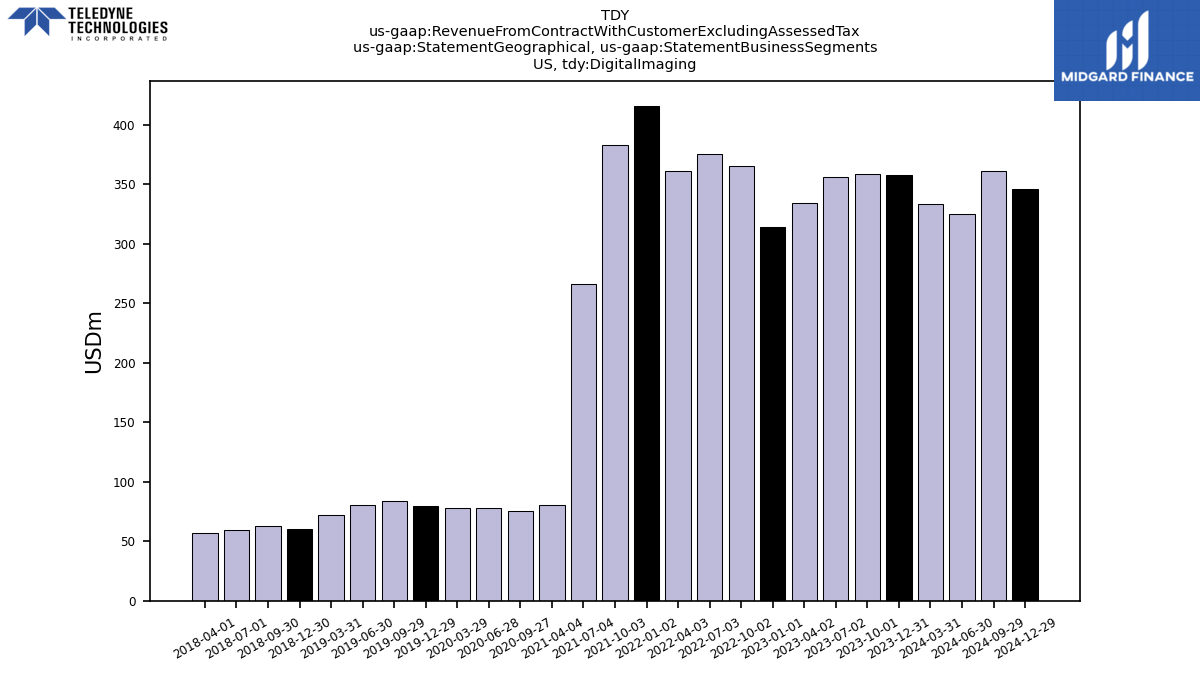
| Operating, Digital Imaging | 802.50 | 775.80 | 793.30 | 772.50 | 806.70 | 777.90 | 775.80 | 750.50 | 809.50 | 760.60 | 579.50 | 263.30 | 262.00 | 239.70 | 237.60 | 246.70 | 268.10 | 244.00 | 251.30 | 235.30 | 225.90 | 223.00 | 225.30 | 211.00 | 206.70 | 197.00 | 200.20 | 113.80 | 110.90 | 98.50 | 99.40 | 89.90 | 102.10 | 95.70 | 90.80 | 90.40 | NA | NA | NA | NA | NA | NA | NA | NA | NA | NA | NA | NA | NA | NA | NA | NA | NA | NA | NA | NA | |
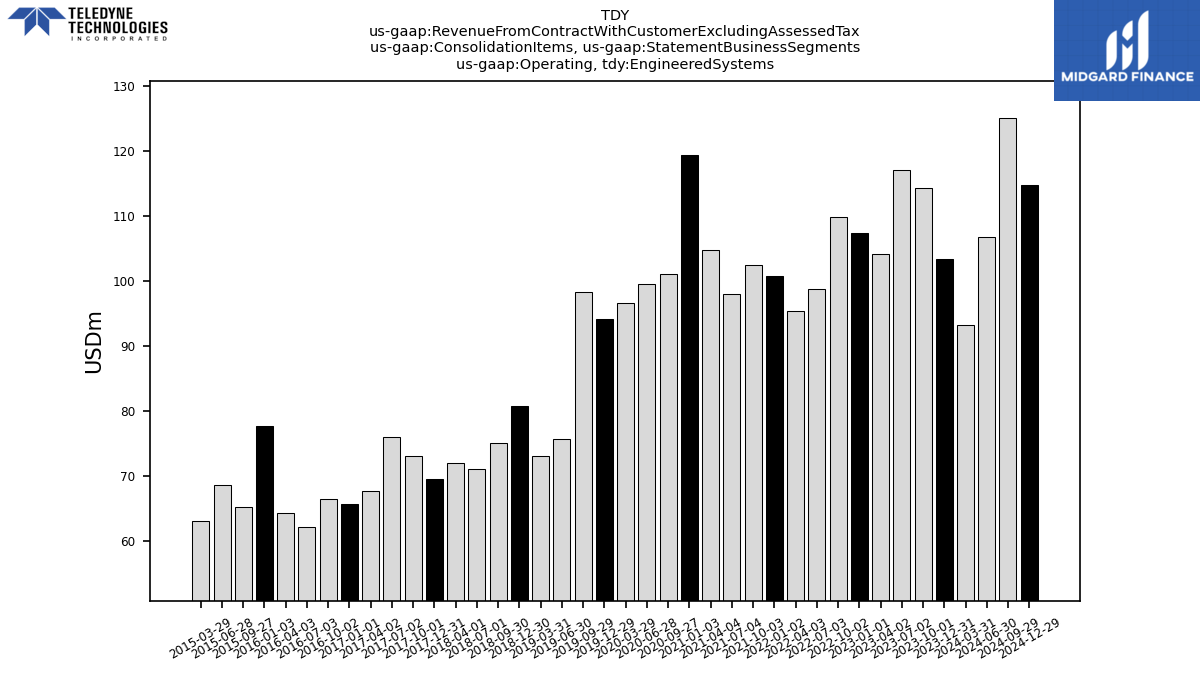
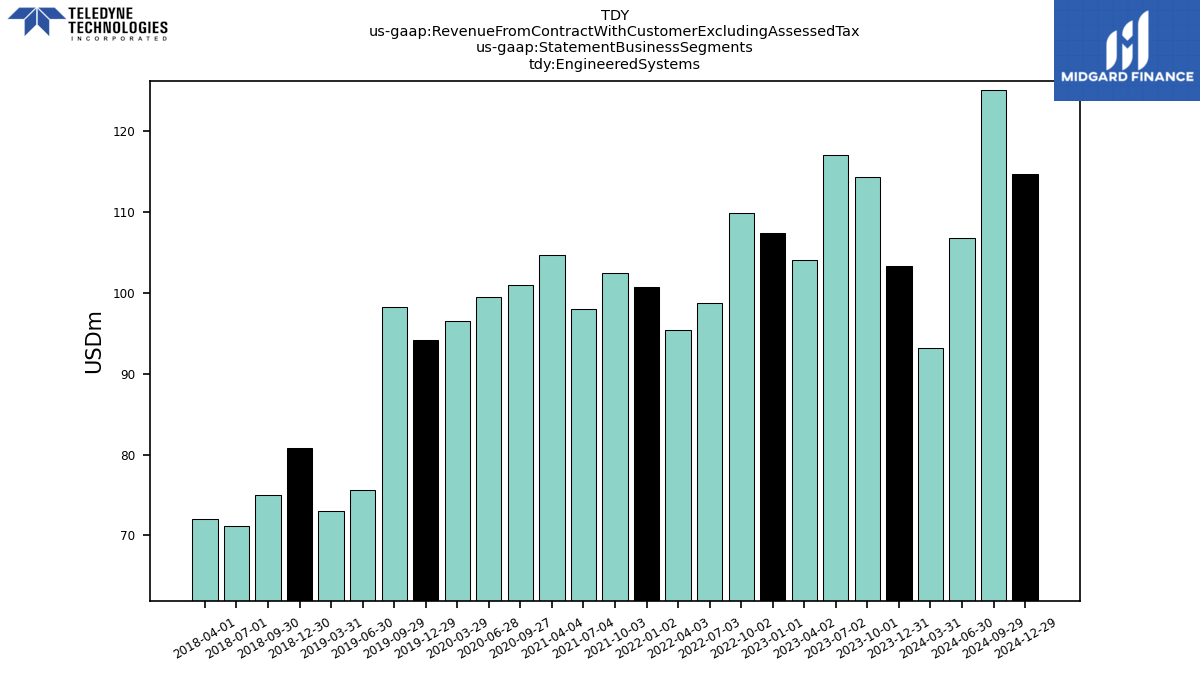
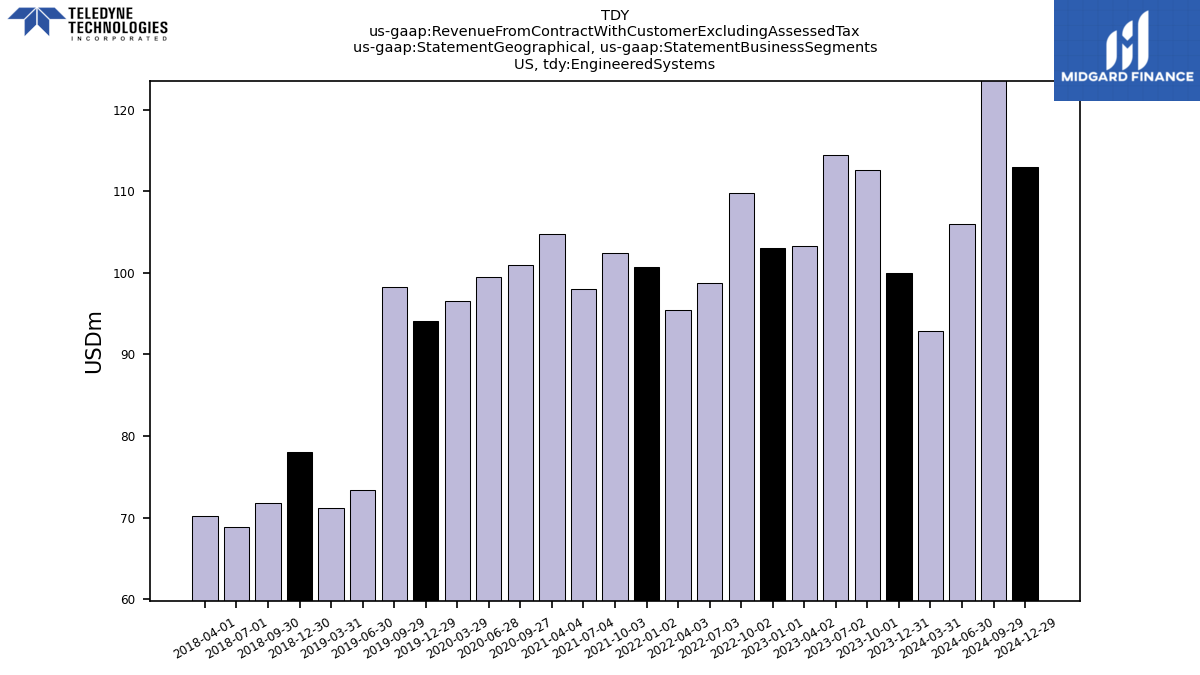
| Operating, Engineered Systems | 103.30 | 114.30 | 117.00 | 104.10 | 107.40 | 109.80 | 98.70 | 95.40 | 100.70 | 102.40 | 98.00 | 104.70 | 119.30 | 101.00 | 99.50 | 96.50 | 94.10 | 98.20 | 75.60 | 73.00 | 80.80 | 75.00 | 71.10 | 72.00 | 69.50 | 73.10 | 76.00 | 67.60 | 65.60 | 66.50 | 62.20 | 64.30 | 77.70 | 65.20 | 68.60 | 63.10 | NA | NA | NA | NA | NA | NA | NA | NA | NA | NA | NA | NA | NA | NA | NA | NA | NA | NA | NA | NA | |
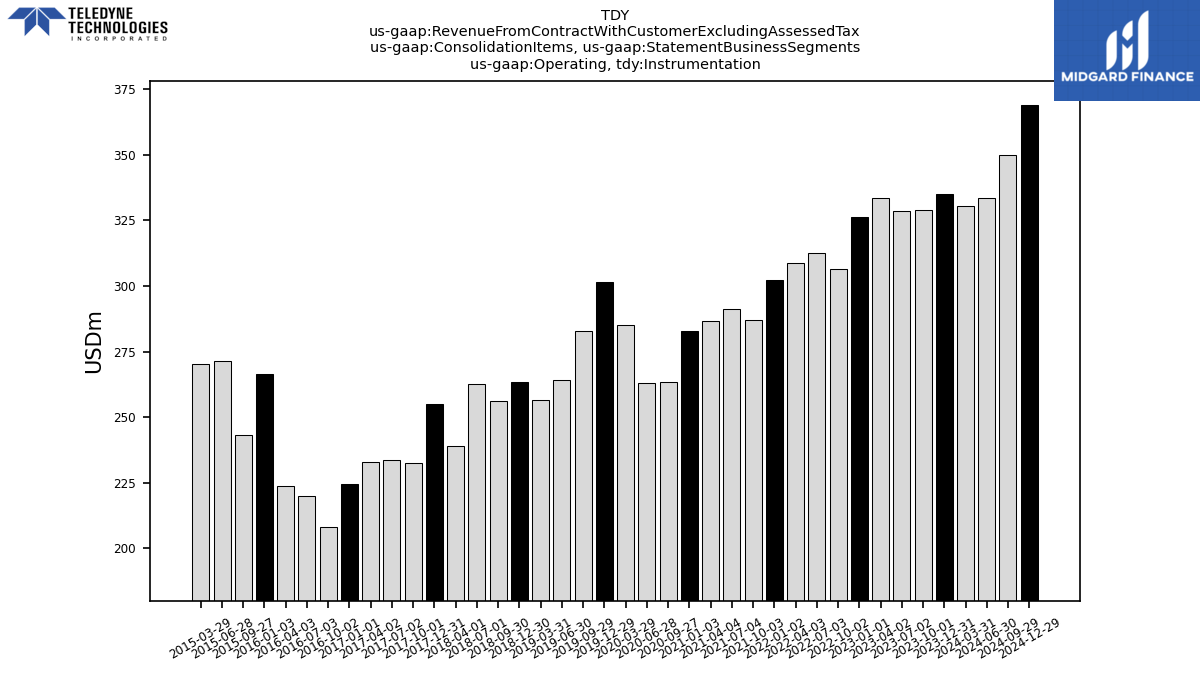
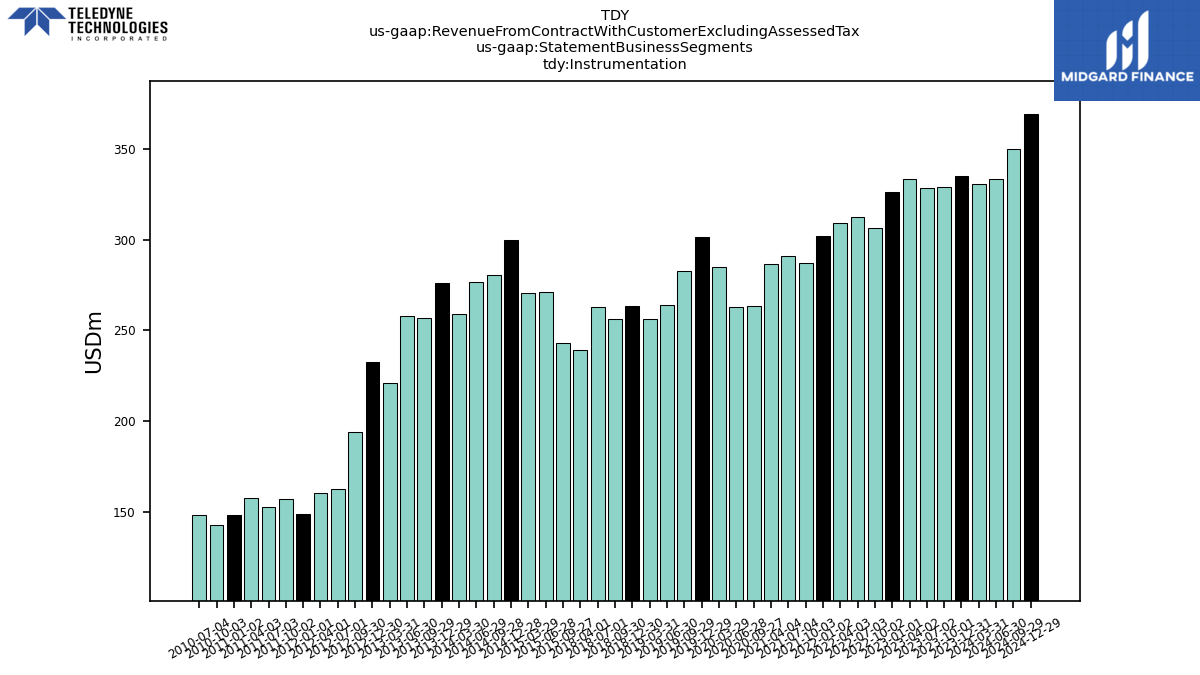
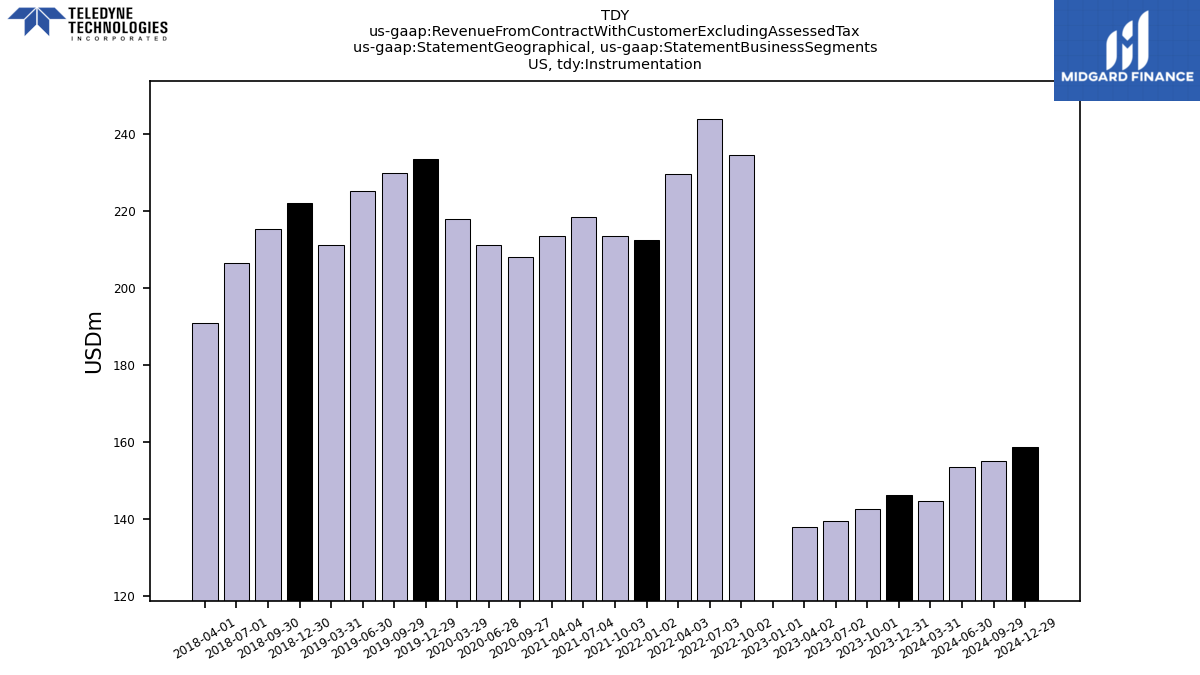
| Operating, Instrumentation | 335.20 | 329.10 | 328.40 | 333.50 | 326.20 | 306.40 | 312.50 | 308.90 | 302.20 | 287.10 | 291.10 | 286.50 | 282.80 | 263.50 | 263.10 | 285.10 | 301.60 | 282.90 | 264.10 | 256.50 | 263.40 | 256.20 | 262.60 | 239.00 | 254.80 | 232.50 | 233.80 | 232.80 | 224.60 | 208.30 | 220.10 | 223.70 | 266.30 | 243.20 | 271.30 | 270.30 | NA | NA | NA | NA | NA | NA | NA | NA | NA | NA | NA | NA | NA | NA | NA | NA | NA | NA | NA | NA | |
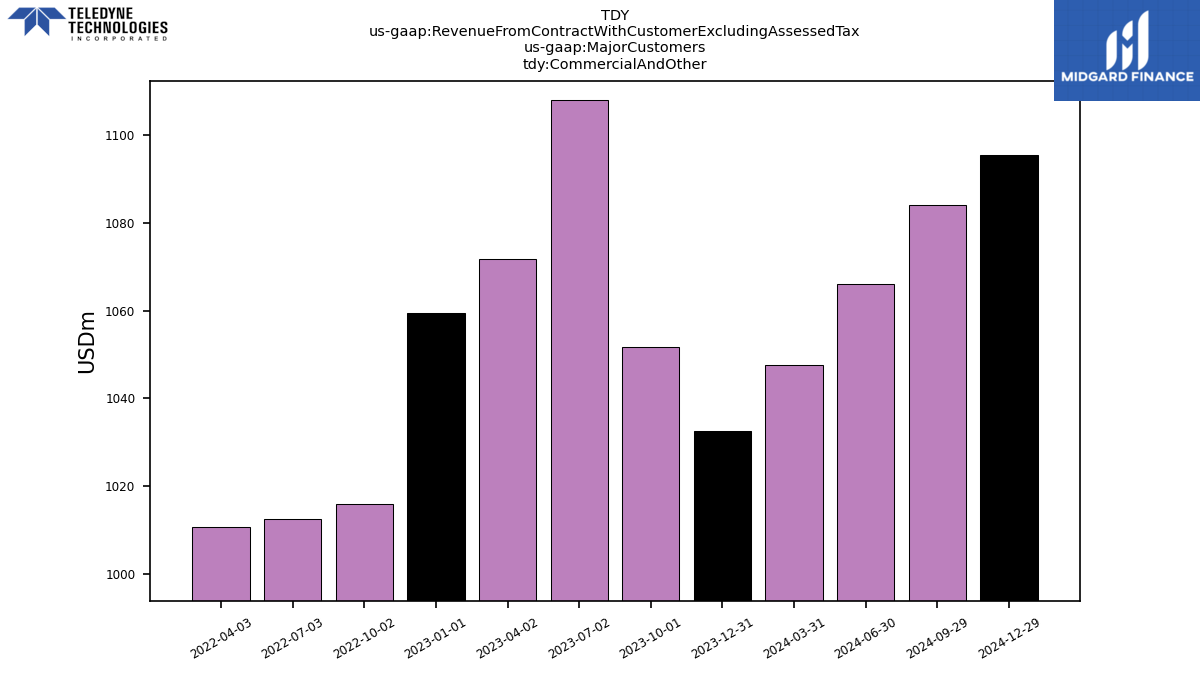
| Commercial And Other | 1032.60 | 1051.70 | 1107.90 | 1071.80 | 1059.50 | 1015.90 | 1012.50 | 1010.80 | NA | NA | NA | NA | NA | NA | NA | NA | NA | NA | NA | NA | NA | NA | NA | NA | NA | NA | NA | NA | NA | NA | NA | NA | NA | NA | NA | NA | NA | NA | NA | NA | NA | NA | NA | NA | NA | NA | NA | NA | NA | NA | NA | NA | NA | NA | NA | NA | |
| United States Government | 392.40 | 350.80 | 316.80 | 311.50 | 358.70 | 347.70 | 343.30 | 310.20 | NA | NA | NA | NA | NA | NA | NA | NA | NA | NA | NA | NA | NA | NA | NA | NA | NA | NA | NA | NA | NA | NA | NA | NA | NA | NA | NA | NA | NA | NA | NA | NA | NA | NA | NA | NA | NA | NA | NA | NA | NA | NA | NA | NA | NA | NA | NA | NA | |
| Commercial And Other, Aerospace And Defense Electronics | 59.60 | 113.50 | 125.00 | 108.50 | 95.90 | 106.70 | 107.20 | 106.30 | NA | NA | NA | NA | NA | NA | NA | NA | NA | NA | NA | NA | NA | NA | NA | NA | NA | NA | NA | NA | NA | NA | NA | NA | NA | NA | NA | NA | NA | NA | NA | NA | NA | NA | NA | NA | NA | NA | NA | NA | NA | NA | NA | NA | NA | NA | NA | NA | |
| Commercial And Other, Digital Imaging | 644.90 | 624.30 | 662.00 | 642.10 | 651.00 | 621.60 | 610.20 | 609.00 | NA | NA | NA | NA | NA | NA | NA | NA | NA | NA | NA | NA | NA | NA | NA | NA | NA | NA | NA | NA | NA | NA | NA | NA | NA | NA | NA | NA | NA | NA | NA | NA | NA | NA | NA | NA | NA | NA | NA | NA | NA | NA | NA | NA | NA | NA | NA | NA | |
| Commercial And Other, Engineered Systems | 17.50 | 11.80 | 13.80 | 10.70 | 15.40 | 10.70 | 9.80 | 9.00 | NA | NA | NA | NA | NA | NA | NA | NA | NA | NA | NA | NA | NA | NA | NA | NA | NA | NA | NA | NA | NA | NA | NA | NA | NA | NA | NA | NA | NA | NA | NA | NA | NA | NA | NA | NA | NA | NA | NA | NA | NA | NA | NA | NA | NA | NA | NA | NA | |
| Commercial And Other, Instrumentation | 310.60 | 302.10 | 307.10 | 310.50 | 297.20 | 276.90 | 285.30 | 286.50 | NA | NA | NA | NA | NA | NA | NA | NA | NA | NA | NA | NA | NA | NA | NA | NA | NA | NA | NA | NA | NA | NA | NA | NA | NA | NA | NA | NA | NA | NA | NA | NA | NA | NA | NA | NA | NA | NA | NA | NA | NA | NA | NA | NA | NA | NA | NA | NA | |
| United States Government, Aerospace And Defense Electronics | 124.40 | 69.80 | 61.00 | 64.70 | 82.00 | 62.80 | 61.60 | 59.90 | NA | NA | NA | NA | NA | NA | NA | NA | NA | NA | NA | NA | NA | NA | NA | NA | NA | NA | NA | NA | NA | NA | NA | NA | NA | NA | NA | NA | NA | NA | NA | NA | NA | NA | NA | NA | NA | NA | NA | NA | NA | NA | NA | NA | NA | NA | NA | NA | |
| United States Government, Digital Imaging | 157.60 | 151.50 | 131.30 | 130.40 | 155.70 | 156.30 | 165.60 | 141.50 | NA | NA | NA | NA | NA | NA | NA | NA | NA | NA | NA | NA | NA | NA | NA | NA | NA | NA | NA | NA | NA | NA | NA | NA | NA | NA | NA | NA | NA | NA | NA | NA | NA | NA | NA | NA | NA | NA | NA | NA | NA | NA | NA | NA | NA | NA | NA | NA | |
| United States Government, Engineered Systems | 85.80 | 102.50 | 103.20 | 93.40 | 92.00 | 99.10 | 88.90 | 86.40 | NA | NA | NA | NA | NA | NA | NA | NA | NA | NA | NA | NA | NA | NA | NA | NA | NA | NA | NA | NA | NA | NA | NA | NA | NA | NA | NA | NA | NA | NA | NA | NA | NA | NA | NA | NA | NA | NA | NA | NA | NA | NA | NA | NA | NA | NA | NA | NA | |
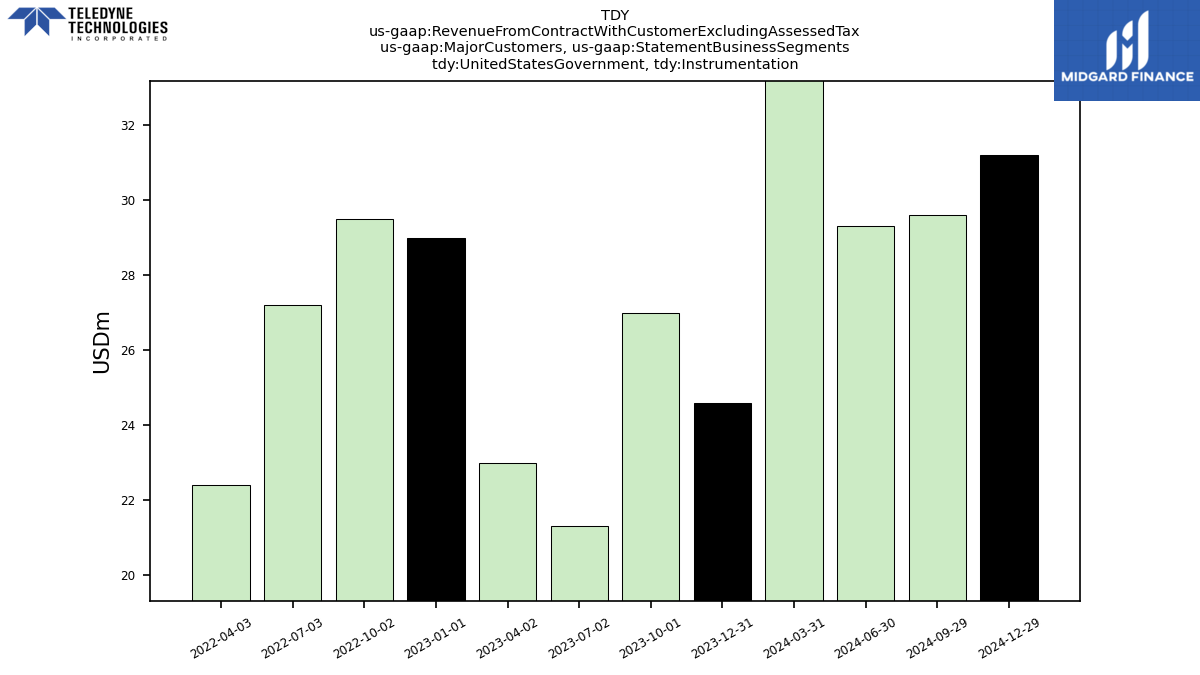
| United States Government, Instrumentation | 24.60 | 27.00 | 21.30 | 23.00 | 29.00 | 29.50 | 27.20 | 22.40 | NA | NA | NA | NA | NA | NA | NA | NA | NA | NA | NA | NA | NA | NA | NA | NA | NA | NA | NA | NA | NA | NA | NA | NA | NA | NA | NA | NA | NA | NA | NA | NA | NA | NA | NA | NA | NA | NA | NA | NA | NA | NA | NA | NA | NA | NA | NA | NA | |
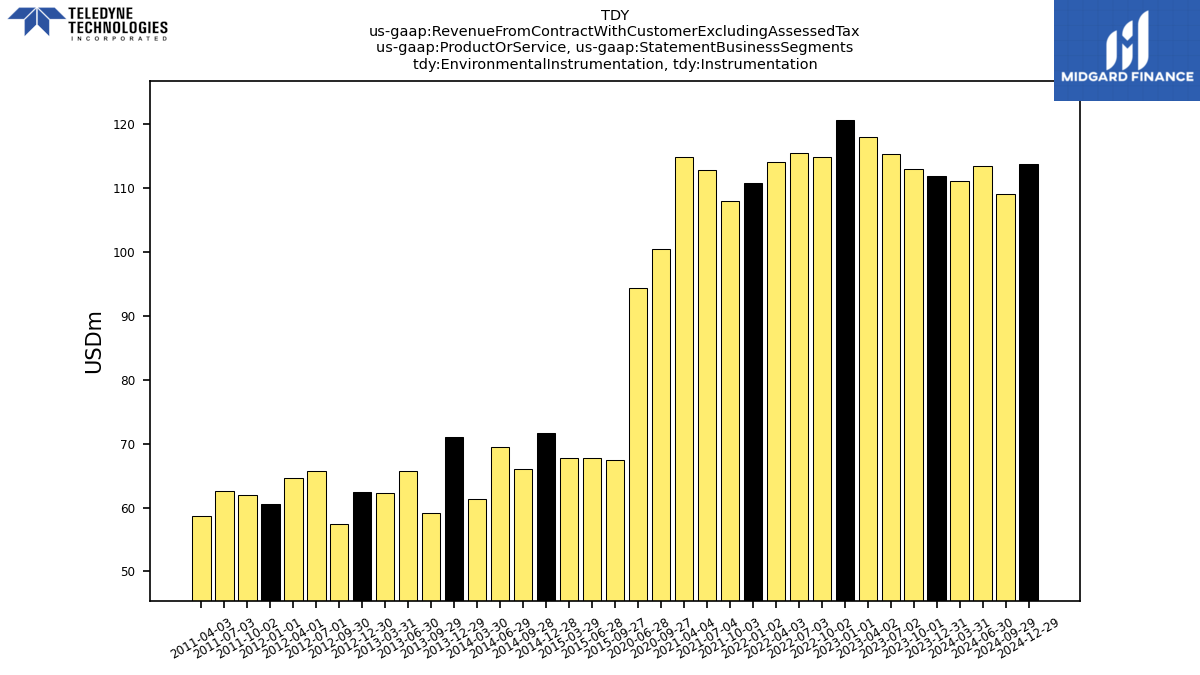
| Environmental Instrumentation, Instrumentation | 111.90 | 113.00 | 115.30 | 117.90 | 120.70 | 114.80 | 115.50 | 114.00 | 110.70 | 108.00 | 112.80 | 114.80 | NA | 100.40 | 94.30 | NA | NA | NA | NA | NA | NA | NA | NA | NA | NA | NA | NA | NA | NA | NA | NA | NA | NA | 67.40 | 67.70 | 67.70 | 71.60 | 66.10 | 69.40 | 61.30 | 71.00 | 59.10 | 65.70 | 62.20 | 62.40 | 57.50 | 65.70 | 64.60 | 60.60 | 61.90 | 62.60 | 58.70 | NA | NA | NA | NA | |
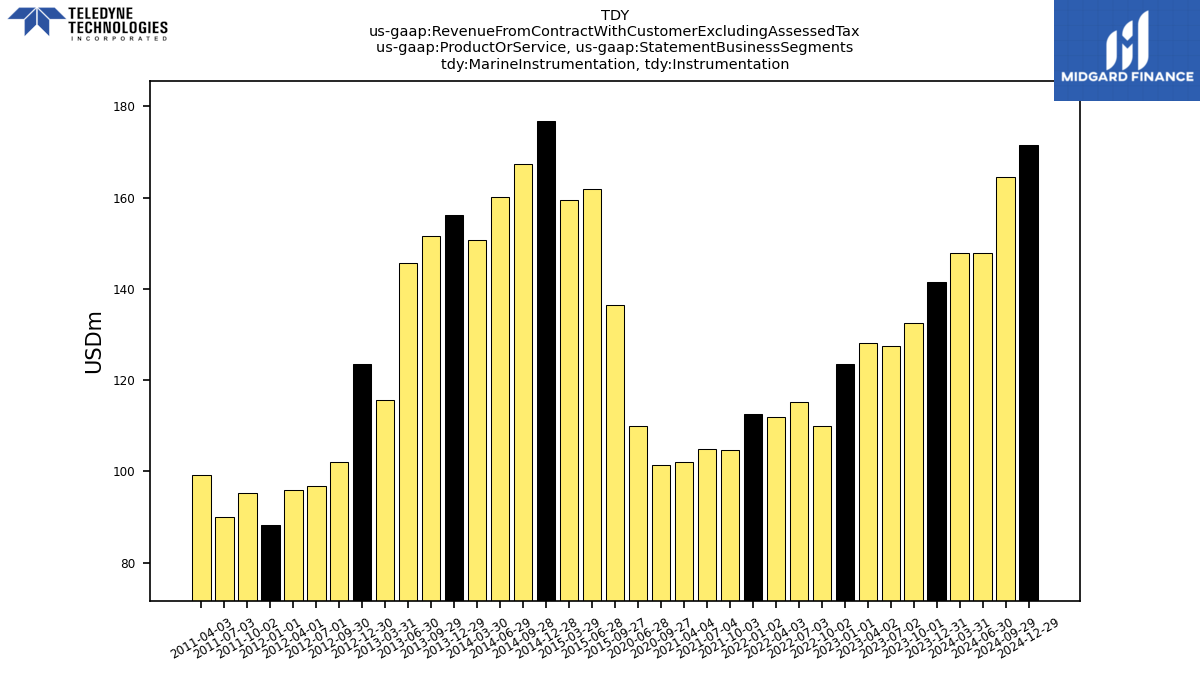
| Marine Instrumentation, Instrumentation | 141.60 | 132.50 | 127.40 | 128.20 | 123.50 | 110.00 | 115.30 | 111.90 | 112.50 | 104.70 | 104.90 | 102.00 | NA | 101.50 | 109.90 | NA | NA | NA | NA | NA | NA | NA | NA | NA | NA | NA | NA | NA | NA | NA | NA | NA | NA | 136.50 | 161.80 | 159.50 | 176.70 | 167.40 | 160.10 | 150.60 | 156.10 | 151.60 | 145.60 | 115.60 | 123.60 | 102.10 | 96.70 | 96.00 | 88.30 | 95.20 | 90.10 | 99.20 | NA | NA | NA | NA | |
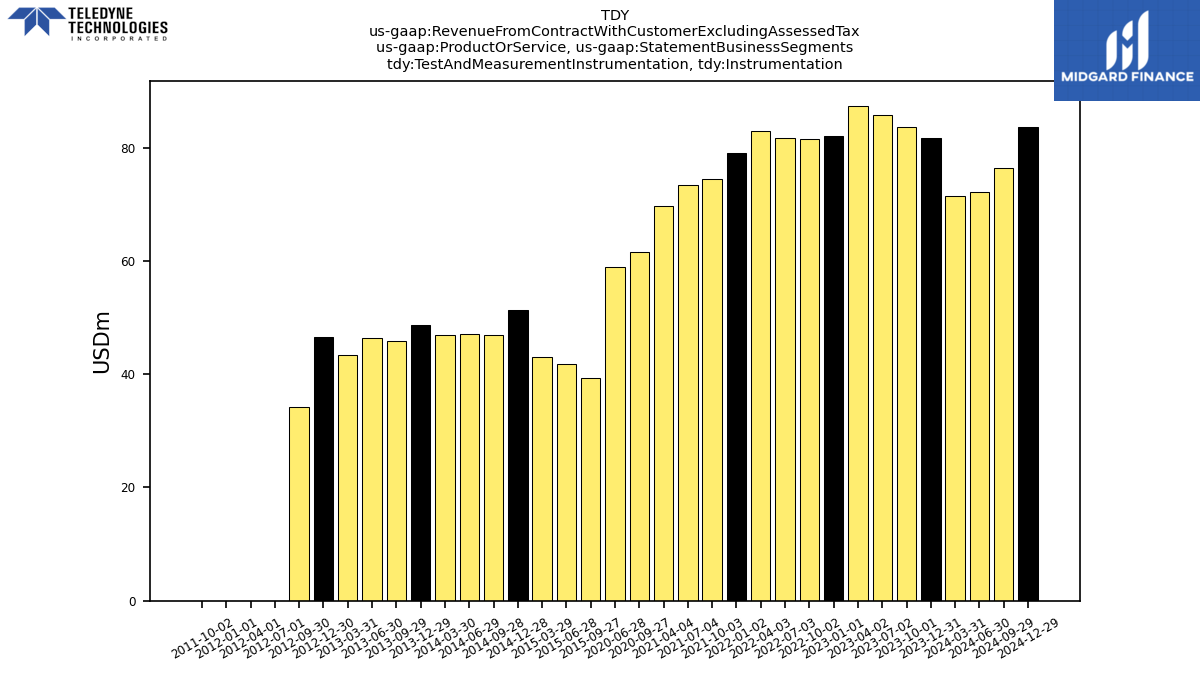
| Test And Measurement Instrumentation, Instrumentation | 81.70 | 83.60 | 85.70 | 87.40 | 82.00 | 81.60 | 81.70 | 83.00 | 79.00 | 74.40 | 73.40 | 69.70 | NA | 61.60 | 58.90 | NA | NA | NA | NA | NA | NA | NA | NA | NA | NA | NA | NA | NA | NA | NA | NA | NA | NA | 39.30 | 41.80 | 43.10 | 51.30 | 46.90 | 47.10 | 47.00 | 48.70 | 45.90 | 46.40 | 43.40 | 46.60 | 34.20 | 0.00 | 0.00 | 0.00 | 0.00 | NA | NA | NA | NA | NA | NA | |
| Aerospace And Defense Electronics | 184.00 | 183.30 | 186.00 | 173.20 | 177.90 | 169.50 | 168.80 | 166.20 | 163.30 | 161.80 | 152.40 | 151.20 | NA | 144.80 | 143.10 | 156.30 | 170.40 | 177.10 | 191.00 | 180.40 | 178.30 | 171.10 | 173.50 | 178.20 | NA | NA | NA | NA | NA | NA | NA | NA | NA | NA | NA | NA | NA | NA | NA | NA | NA | NA | NA | NA | NA | NA | NA | NA | NA | NA | NA | NA | NA | NA | NA | NA | |
| Digital Imaging | 802.50 | 775.80 | 793.30 | 772.50 | 806.70 | 777.90 | 775.80 | 750.50 | 809.50 | 760.60 | 579.50 | 263.30 | NA | 239.70 | 237.60 | 246.70 | 268.10 | 244.00 | 251.30 | 235.30 | 225.90 | 223.00 | 225.30 | 206.40 | NA | NA | NA | NA | NA | NA | NA | NA | NA | NA | NA | NA | NA | NA | NA | NA | NA | NA | NA | NA | NA | NA | NA | NA | NA | NA | NA | NA | NA | NA | NA | NA | |
| Engineered Systems | 103.30 | 114.30 | 117.00 | 104.10 | 107.40 | 109.80 | 98.70 | 95.40 | 100.70 | 102.40 | 98.00 | 104.70 | NA | 101.00 | 99.50 | 96.50 | 94.10 | 98.20 | 75.60 | 73.00 | 80.80 | 75.00 | 71.10 | 72.00 | NA | NA | NA | NA | NA | NA | NA | NA | NA | NA | NA | NA | NA | NA | NA | NA | NA | NA | NA | NA | NA | NA | NA | NA | NA | NA | NA | NA | NA | NA | NA | NA | |
| Instrumentation | 335.20 | 329.10 | 328.40 | 333.50 | 326.20 | 306.40 | 312.50 | 308.90 | 302.20 | 287.10 | 291.10 | 286.50 | NA | 263.50 | 263.10 | 285.10 | 301.60 | 282.90 | 264.10 | 256.50 | 263.40 | 256.20 | 262.60 | 239.00 | NA | NA | NA | NA | NA | NA | NA | NA | NA | 243.20 | 271.30 | 270.30 | 299.60 | 280.40 | 276.60 | 258.90 | 275.80 | 256.60 | 257.70 | 221.20 | 232.60 | 193.80 | 162.40 | 160.60 | 148.90 | 157.10 | 152.70 | 157.90 | 148.10 | 142.50 | 148.20 | NA | |
| 238.90 | 231.90 | 232.90 | 243.10 | 250.50 | 240.10 | 251.30 | 229.60 | NA | NA | NA | NA | NA | NA | NA | NA | NA | NA | NA | NA | NA | NA | NA | NA | NA | NA | NA | NA | NA | NA | NA | NA | NA | NA | NA | NA | NA | NA | NA | NA | NA | NA | NA | NA | NA | NA | NA | NA | NA | NA | NA | NA | NA | NA | NA | NA | ||
| 344.60 | 325.40 | 338.70 | 324.00 | 294.90 | 295.60 | 285.10 | 281.70 | 306.90 | 283.60 | 249.10 | 156.50 | NA | 126.60 | 122.70 | 147.90 | 173.40 | 141.60 | 129.20 | 120.80 | 42.80 | 128.00 | 139.50 | 127.00 | NA | NA | NA | NA | NA | NA | NA | NA | NA | NA | NA | NA | NA | NA | NA | NA | NA | NA | NA | NA | NA | NA | NA | NA | NA | NA | NA | NA | NA | NA | NA | NA | ||
| US | 726.00 | 737.40 | 736.20 | 695.80 | 327.90 | 855.00 | 861.30 | 828.40 | 865.60 | 833.60 | 709.10 | 523.80 | NA | 511.80 | 513.90 | 523.80 | 548.60 | 560.70 | 550.50 | 519.80 | 576.60 | 504.40 | 491.80 | 472.10 | NA | NA | NA | NA | NA | NA | NA | NA | NA | NA | NA | NA | NA | NA | NA | NA | NA | NA | NA | NA | NA | NA | NA | NA | NA | NA | NA | NA | NA | NA | NA | NA | |
| Countries Other Than United States And Europe | 115.50 | 107.80 | 116.90 | 120.40 | 123.00 | 103.90 | 115.70 | 114.60 | NA | NA | NA | NA | NA | NA | NA | NA | NA | NA | NA | NA | NA | NA | NA | NA | NA | NA | NA | NA | NA | NA | NA | NA | NA | NA | NA | NA | NA | NA | NA | NA | NA | NA | NA | NA | NA | NA | NA | NA | NA | NA | NA | NA | NA | NA | NA | NA | |
| , Aerospace And Defense Electronics | 17.60 | 17.00 | 15.50 | 17.00 | 21.40 | 16.60 | 13.10 | 14.20 | NA | NA | NA | NA | NA | NA | NA | NA | NA | NA | NA | NA | NA | NA | NA | NA | NA | NA | NA | NA | NA | NA | NA | NA | NA | NA | NA | NA | NA | NA | NA | NA | NA | NA | NA | NA | NA | NA | NA | NA | NA | NA | NA | NA | NA | NA | NA | NA | |
| , Digital Imaging | 162.10 | 150.00 | 152.40 | 158.40 | 165.70 | 158.80 | 163.70 | 149.60 | NA | NA | NA | NA | NA | NA | NA | NA | NA | NA | NA | NA | NA | NA | NA | NA | NA | NA | NA | NA | NA | NA | NA | NA | NA | NA | NA | NA | NA | NA | NA | NA | NA | NA | NA | NA | NA | NA | NA | NA | NA | NA | NA | NA | NA | NA | NA | NA | |
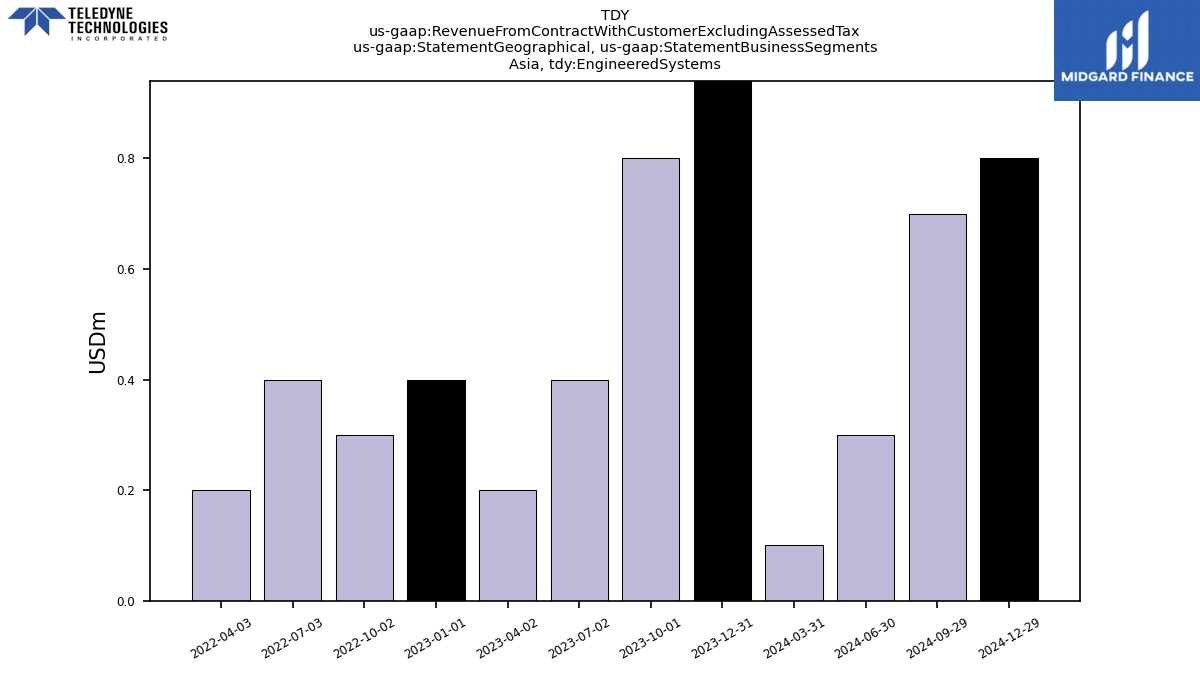
| , Engineered Systems | 2.40 | 0.80 | 0.40 | 0.20 | 0.40 | 0.30 | 0.40 | 0.20 | NA | NA | NA | NA | NA | NA | NA | NA | NA | NA | NA | NA | NA | NA | NA | NA | NA | NA | NA | NA | NA | NA | NA | NA | NA | NA | NA | NA | NA | NA | NA | NA | NA | NA | NA | NA | NA | NA | NA | NA | NA | NA | NA | NA | NA | NA | NA | NA | |
| , Instrumentation | 56.80 | 64.10 | 64.60 | 67.50 | 63.00 | 64.40 | 74.10 | 65.60 | NA | NA | NA | NA | NA | NA | NA | NA | NA | NA | NA | NA | NA | NA | NA | NA | NA | NA | NA | NA | NA | NA | NA | NA | NA | NA | NA | NA | NA | NA | NA | NA | NA | NA | NA | NA | NA | NA | NA | NA | NA | NA | NA | NA | NA | NA | NA | NA | |
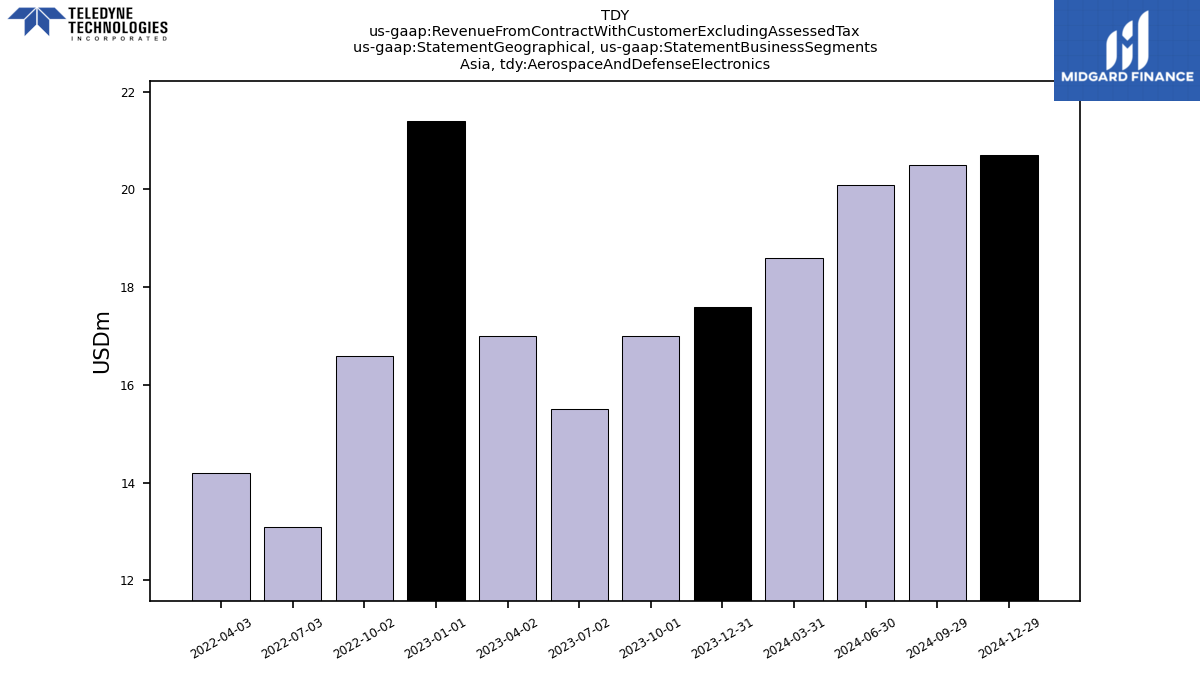
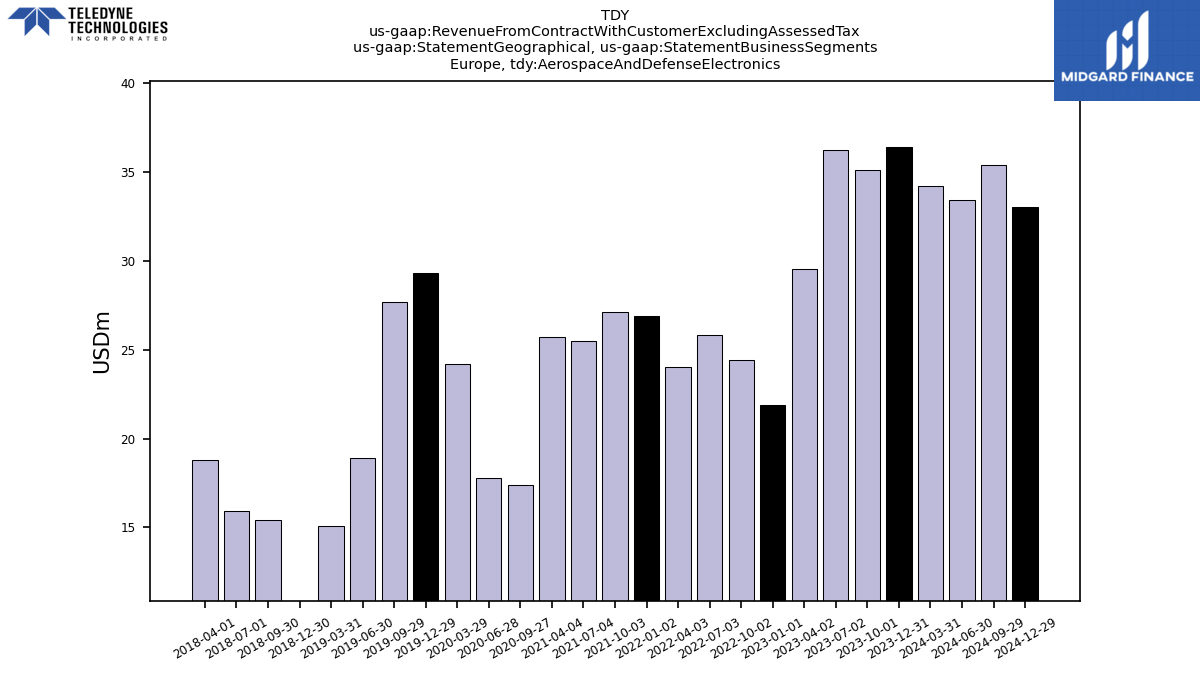
| , Aerospace And Defense Electronics | 36.40 | 35.10 | 36.20 | 29.50 | 21.90 | 24.40 | 25.80 | 24.00 | 26.90 | 27.10 | 25.50 | 25.70 | NA | 17.40 | 17.80 | 24.20 | 29.30 | 27.70 | 18.90 | 15.10 | -37.50 | 15.40 | 15.90 | 18.80 | NA | NA | NA | NA | NA | NA | NA | NA | NA | NA | NA | NA | NA | NA | NA | NA | NA | NA | NA | NA | NA | NA | NA | NA | NA | NA | NA | NA | NA | NA | NA | NA | |
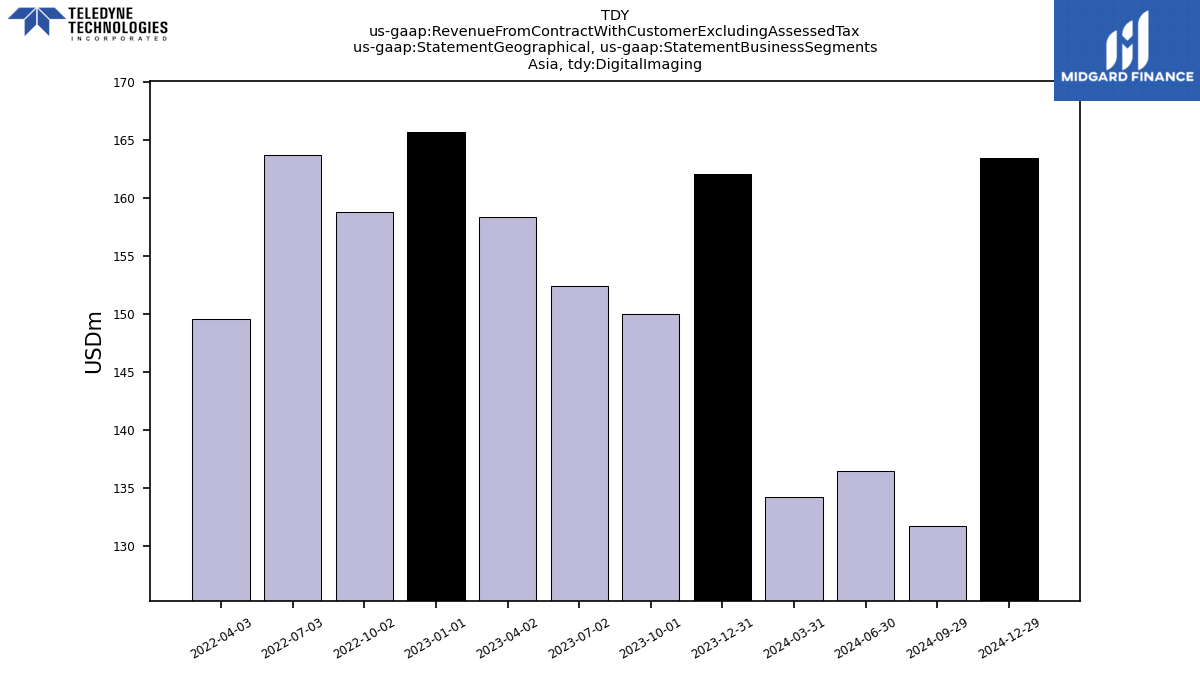
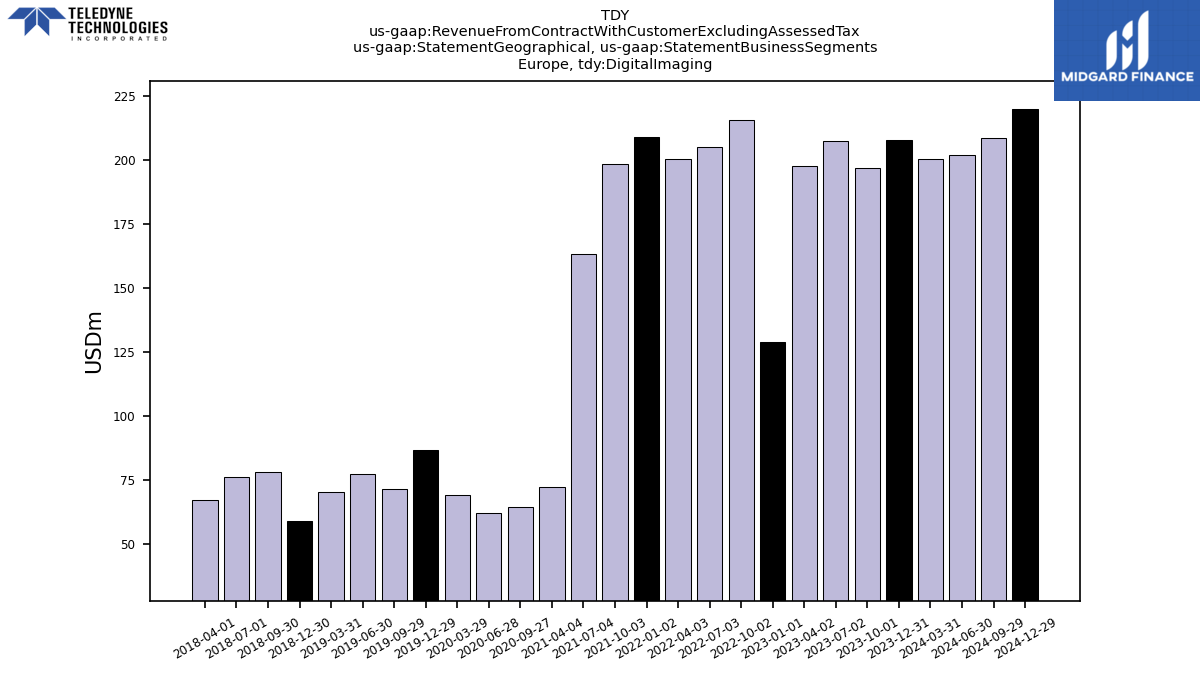
| , Digital Imaging | 207.50 | 196.60 | 207.30 | 197.30 | 128.80 | 215.60 | 204.90 | 200.40 | 209.00 | 198.40 | 163.10 | 72.20 | NA | 64.40 | 61.80 | 68.80 | 86.40 | 71.20 | 77.30 | 70.30 | 59.00 | 78.10 | 76.00 | 67.00 | NA | NA | NA | NA | NA | NA | NA | NA | NA | NA | NA | NA | NA | NA | NA | NA | NA | NA | NA | NA | NA | NA | NA | NA | NA | NA | NA | NA | NA | NA | NA | NA | |
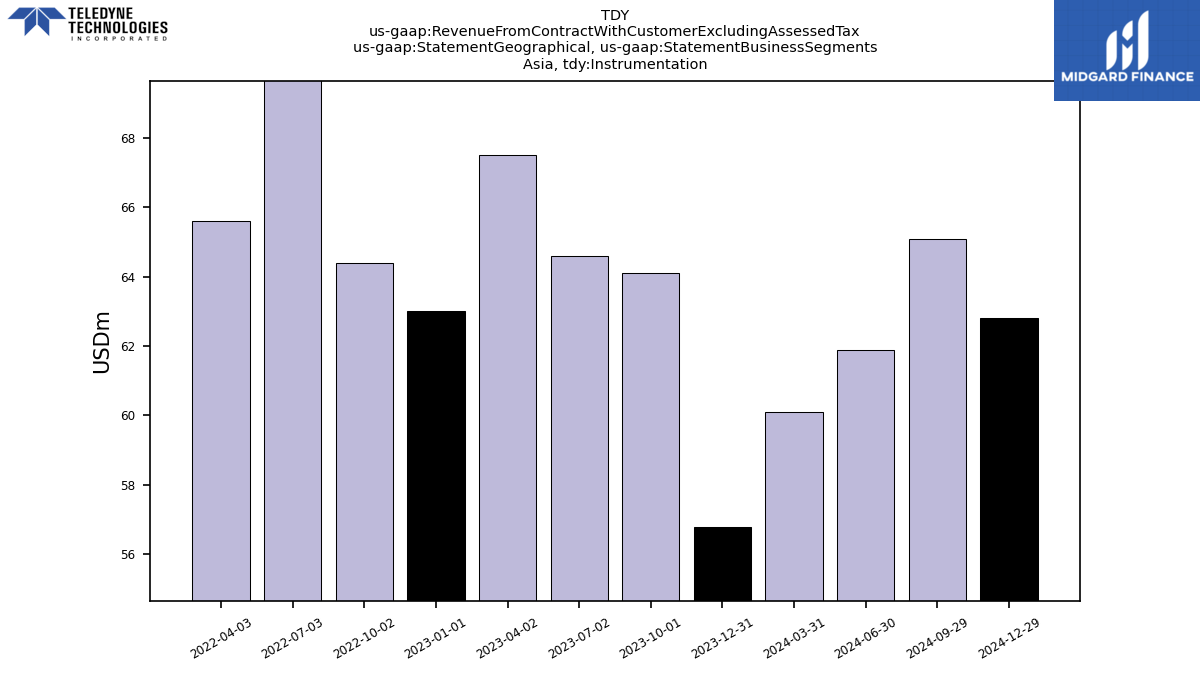
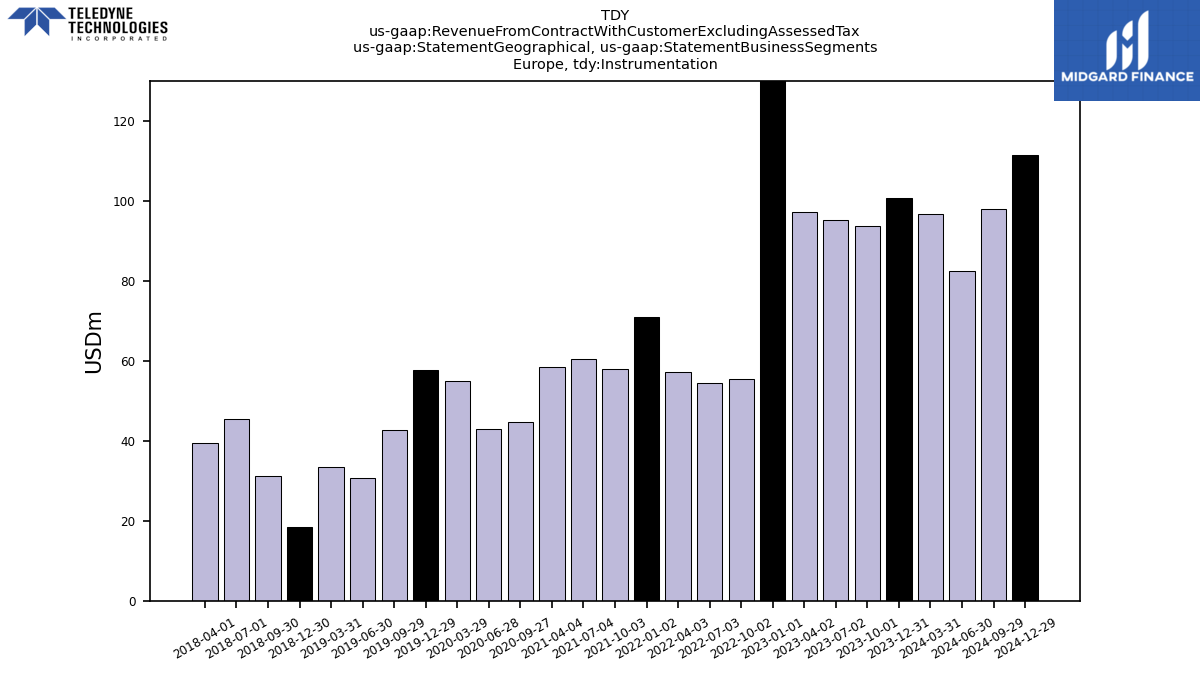
| , Instrumentation | 100.70 | 93.70 | 95.20 | 97.20 | 144.20 | 55.60 | 54.40 | 57.30 | 71.00 | 58.10 | 60.50 | 58.60 | NA | 44.80 | 43.10 | 54.90 | 57.70 | 42.70 | 30.80 | 33.60 | 18.50 | 31.30 | 45.40 | 39.40 | NA | NA | NA | NA | NA | NA | NA | NA | NA | NA | NA | NA | NA | NA | NA | NA | NA | NA | NA | NA | NA | NA | NA | NA | NA | NA | NA | NA | NA | NA | NA | NA | |
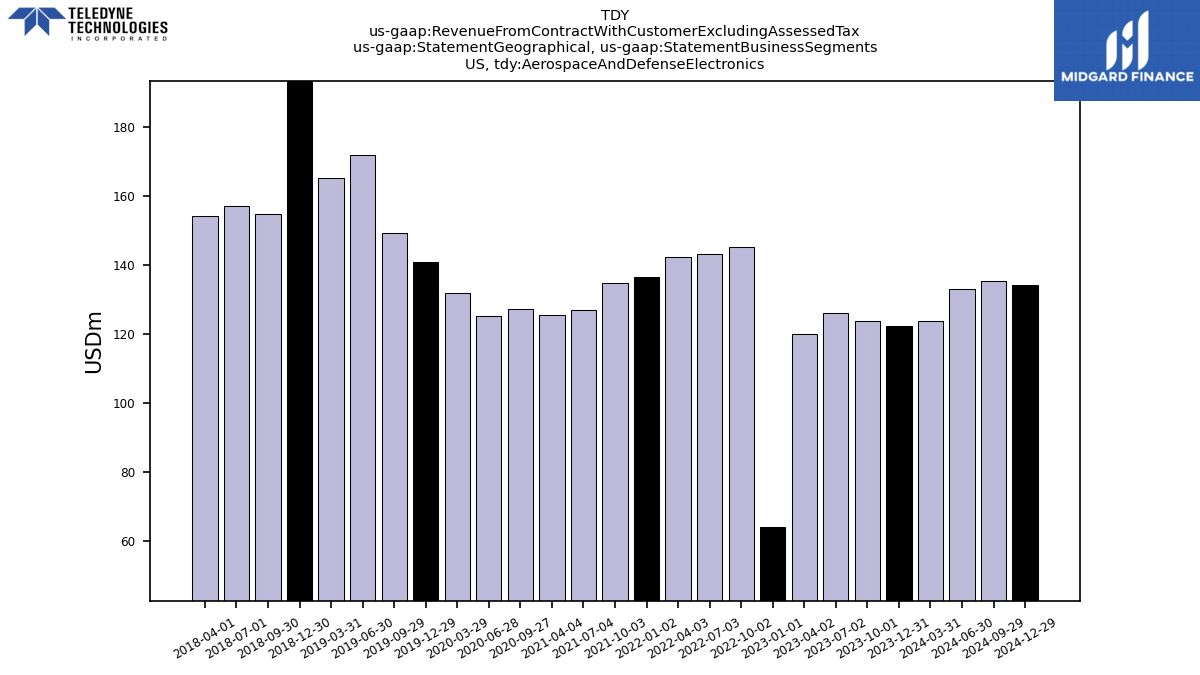
| US, Aerospace And Defense Electronics | 122.20 | 123.70 | 126.00 | 120.10 | 64.30 | 145.10 | 143.00 | 142.20 | 136.40 | 134.70 | 126.90 | 125.50 | NA | 127.30 | 125.10 | 131.90 | 140.90 | 149.20 | 171.70 | 165.10 | 216.00 | 154.60 | 157.00 | 154.10 | NA | NA | NA | NA | NA | NA | NA | NA | NA | NA | NA | NA | NA | NA | NA | NA | NA | NA | NA | NA | NA | NA | NA | NA | NA | NA | NA | NA | NA | NA | NA | NA | |
| US, Digital Imaging | 357.50 | 358.60 | 356.40 | 334.40 | 314.20 | 365.60 | 375.70 | 361.10 | 415.90 | 383.00 | 265.80 | 80.20 | NA | 75.40 | 78.00 | 77.60 | 80.00 | 83.40 | 80.30 | 72.40 | 60.50 | 62.60 | 59.40 | 56.80 | NA | NA | NA | NA | NA | NA | NA | NA | NA | NA | NA | NA | NA | NA | NA | NA | NA | NA | NA | NA | NA | NA | NA | NA | NA | NA | NA | NA | NA | NA | NA | NA | |
| US, Engineered Systems | 100.00 | 112.60 | 114.40 | 103.30 | 103.00 | 109.80 | 98.70 | 95.40 | 100.70 | 102.40 | 98.00 | 104.70 | NA | 101.00 | 99.50 | 96.50 | 94.10 | 98.20 | 73.40 | 71.20 | 78.00 | 71.80 | 68.90 | 70.20 | NA | NA | NA | NA | NA | NA | NA | NA | NA | NA | NA | NA | NA | NA | NA | NA | NA | NA | NA | NA | NA | NA | NA | NA | NA | NA | NA | NA | NA | NA | NA | NA | |
| US, Instrumentation | 146.30 | 142.50 | 139.40 | 138.00 | -153.60 | 234.50 | 243.90 | 229.70 | 212.60 | 213.50 | 218.40 | 213.40 | NA | 208.10 | 211.30 | 217.80 | 233.60 | 229.90 | 225.10 | 211.10 | 222.10 | 215.40 | 206.50 | 191.00 | NA | NA | NA | NA | NA | NA | NA | NA | NA | NA | NA | NA | NA | NA | NA | NA | NA | NA | NA | NA | NA | NA | NA | NA | NA | NA | NA | NA | NA | NA | NA | NA | |
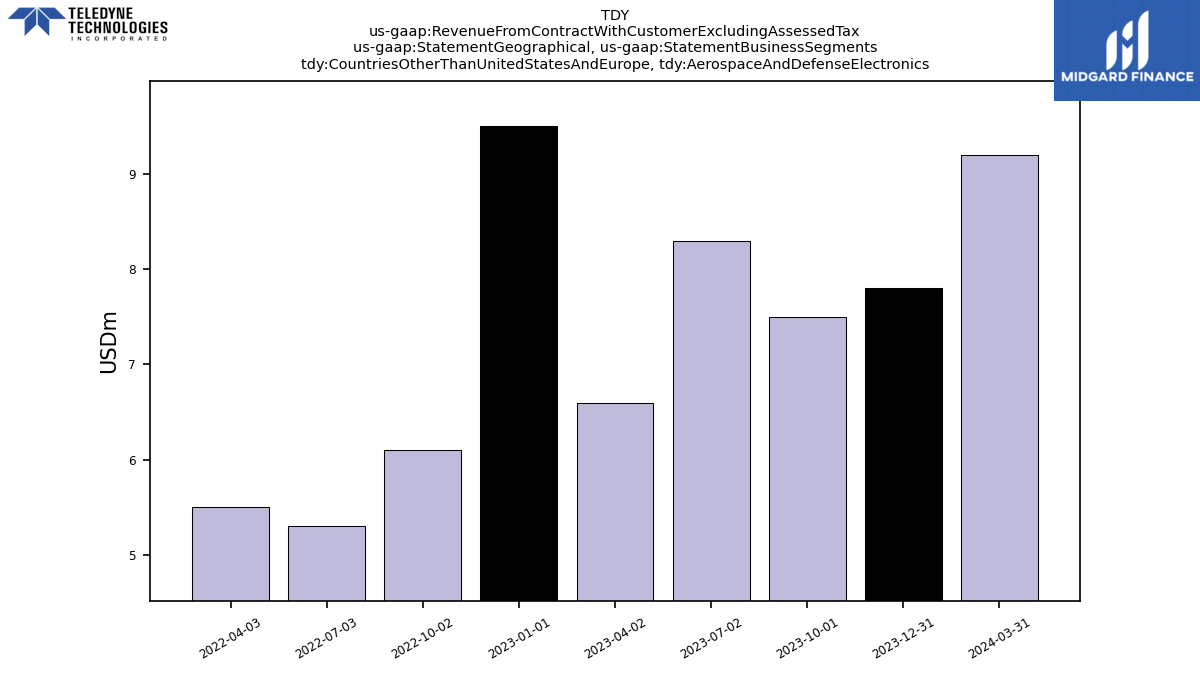
| Countries Other Than United States And Europe, Aerospace And Defense Electronics | 7.80 | 7.50 | 8.30 | 6.60 | 9.50 | 6.10 | 5.30 | 5.50 | NA | NA | NA | NA | NA | NA | NA | NA | NA | NA | NA | NA | NA | NA | NA | NA | NA | NA | NA | NA | NA | NA | NA | NA | NA | NA | NA | NA | NA | NA | NA | NA | NA | NA | NA | NA | NA | NA | NA | NA | NA | NA | NA | NA | NA | NA | NA | NA | |
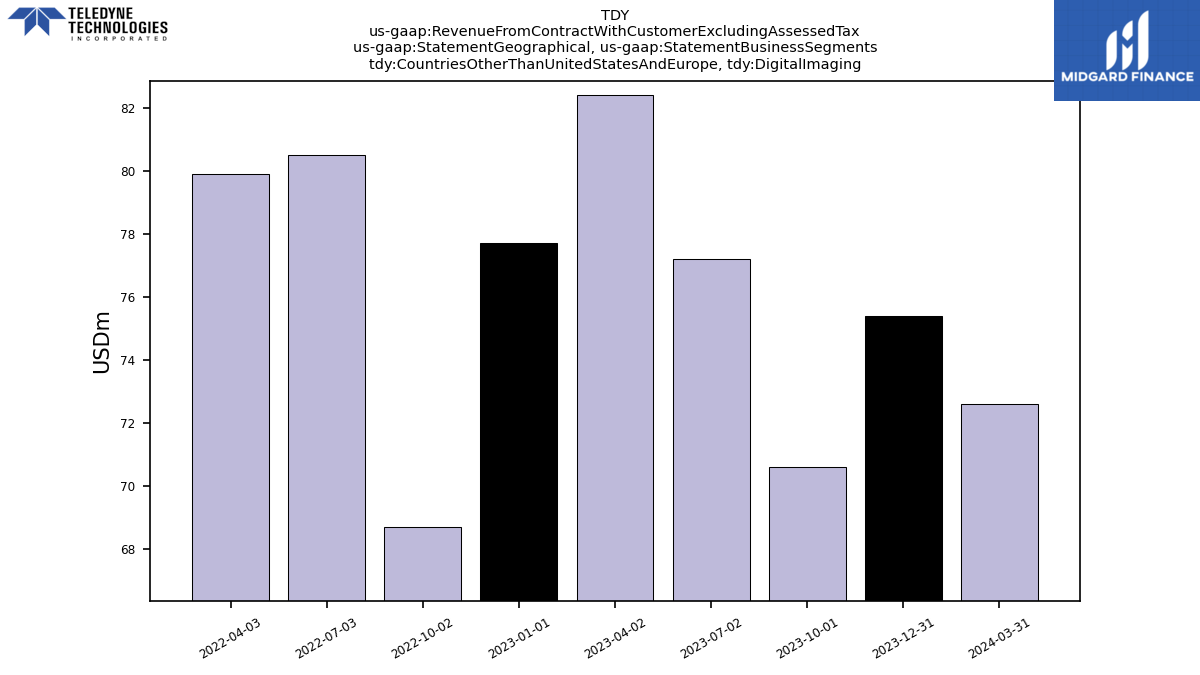
| Countries Other Than United States And Europe, Digital Imaging | 75.40 | 70.60 | 77.20 | 82.40 | 77.70 | 68.70 | 80.50 | 79.90 | NA | NA | NA | NA | NA | NA | NA | NA | NA | NA | NA | NA | NA | NA | NA | NA | NA | NA | NA | NA | NA | NA | NA | NA | NA | NA | NA | NA | NA | NA | NA | NA | NA | NA | NA | NA | NA | NA | NA | NA | NA | NA | NA | NA | NA | NA | NA | NA | |
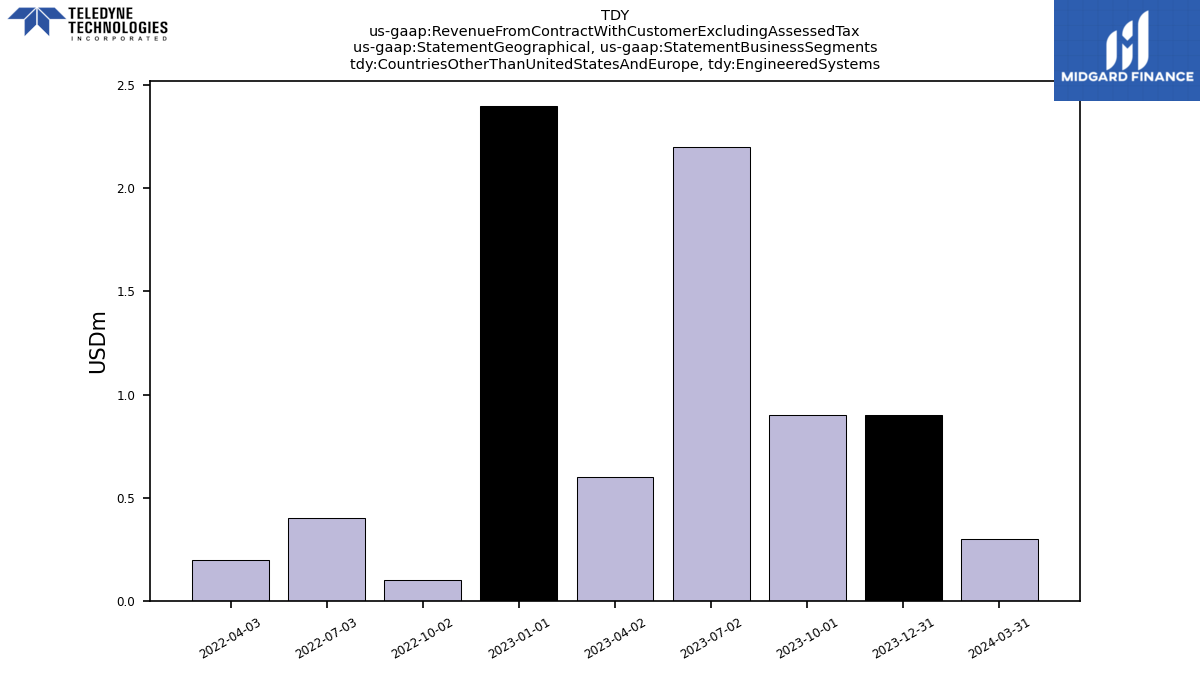
| Countries Other Than United States And Europe, Engineered Systems | 0.90 | 0.90 | 2.20 | 0.60 | 2.40 | 0.10 | 0.40 | 0.20 | NA | NA | NA | NA | NA | NA | NA | NA | NA | NA | NA | NA | NA | NA | NA | NA | NA | NA | NA | NA | NA | NA | NA | NA | NA | NA | NA | NA | NA | NA | NA | NA | NA | NA | NA | NA | NA | NA | NA | NA | NA | NA | NA | NA | NA | NA | NA | NA | |
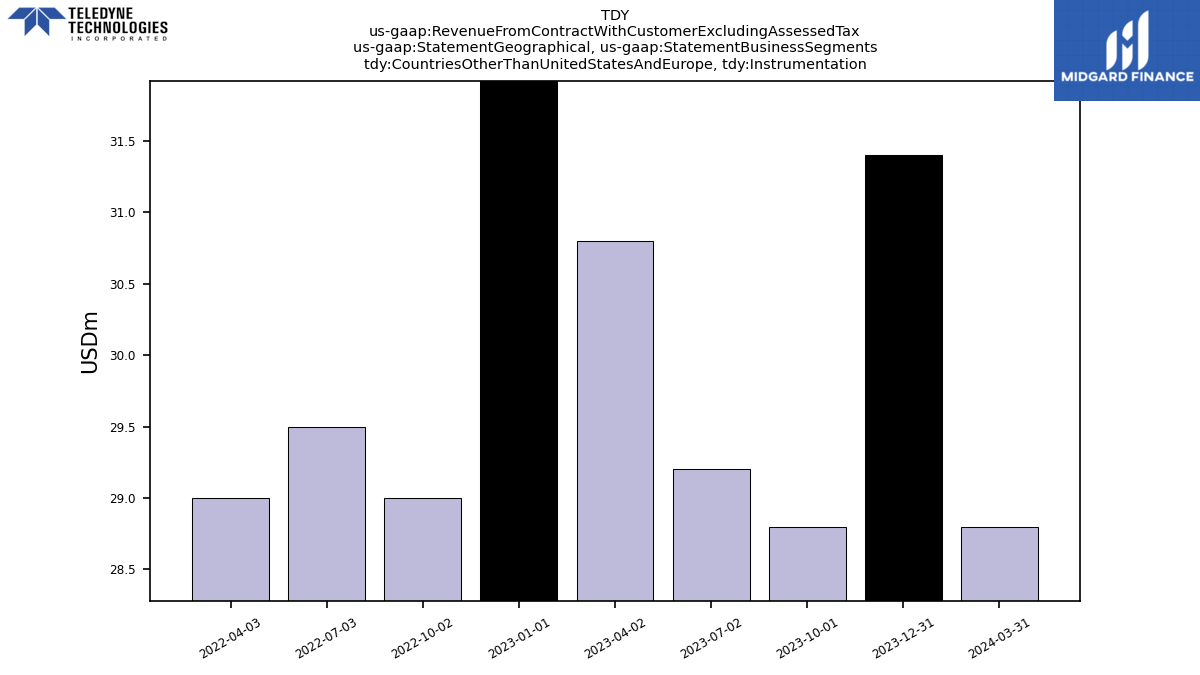
| Countries Other Than United States And Europe, Instrumentation | 31.40 | 28.80 | 29.20 | 30.80 | 33.40 | 29.00 | 29.50 | 29.00 | NA | NA | NA | NA | NA | NA | NA | NA | NA | NA | NA | NA | NA | NA | NA | NA | NA | NA | NA | NA | NA | NA | NA | NA | NA | NA | NA | NA | NA | NA | NA | NA | NA | NA | NA | NA | NA | NA | NA | NA | NA | NA | NA | NA | NA | NA | NA | NA |