
| 2023-09-30 | 2023-06-30 | 2023-03-31 | 2022-12-31 | 2022-09-30 | 2022-06-30 | 2022-03-31 | 2021-12-31 | 2021-09-30 | 2021-06-30 | 2021-03-31 | 2020-12-31 | 2020-09-30 | 2020-06-30 | 2020-03-31 | 2019-12-31 | 2019-09-30 | 2019-06-30 | 2019-03-31 | 2018-12-31 | 2018-09-30 | 2018-06-30 | 2018-03-31 | 2017-12-31 | 2017-09-30 | 2017-06-30 | 2017-03-31 | 2016-12-31 | 2016-09-30 | 2016-06-30 | 2016-03-31 | 2015-12-31 | 2015-09-30 | 2015-06-30 | 2015-03-31 | 2014-12-31 | 2014-09-30 | 2014-06-30 | 2014-03-31 | 2013-12-31 | 2013-09-30 | 2013-06-30 | 2013-03-31 | 2012-12-31 | 2012-09-30 | 2012-06-30 | 2012-03-31 | 2011-12-31 | 2011-09-30 | 2011-06-30 | 2011-03-31 | 2010-12-31 | 2010-09-30 | ||
|---|---|---|---|---|---|---|---|---|---|---|---|---|---|---|---|---|---|---|---|---|---|---|---|---|---|---|---|---|---|---|---|---|---|---|---|---|---|---|---|---|---|---|---|---|---|---|---|---|---|---|---|---|---|---|
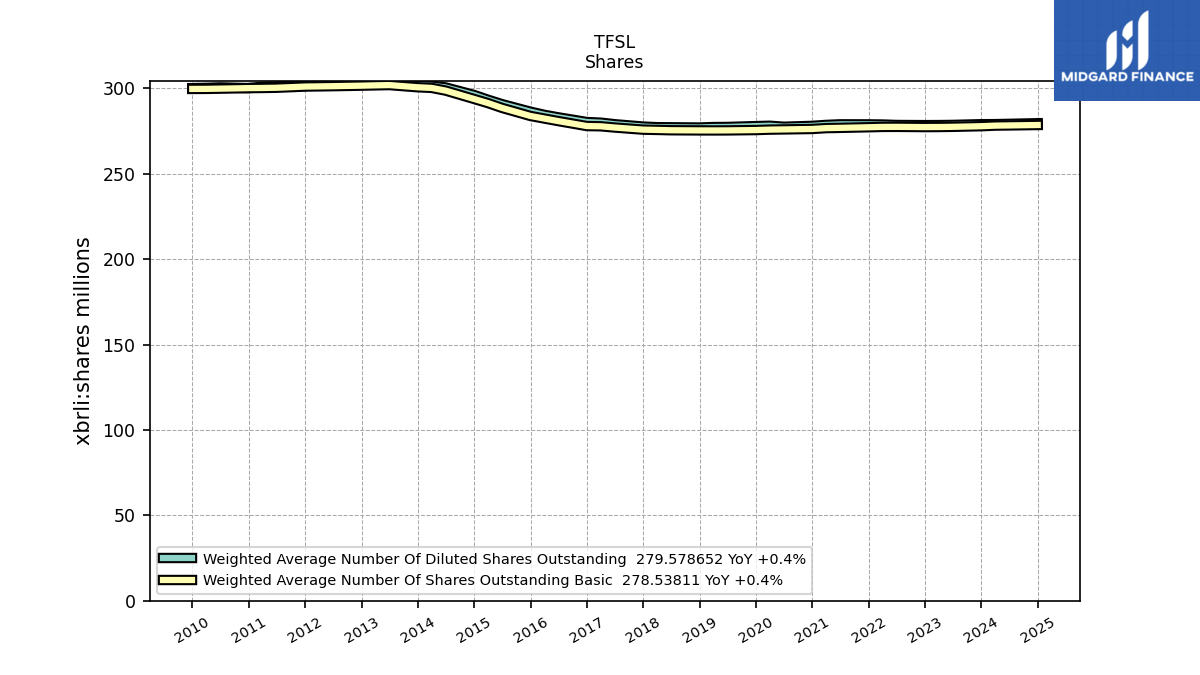
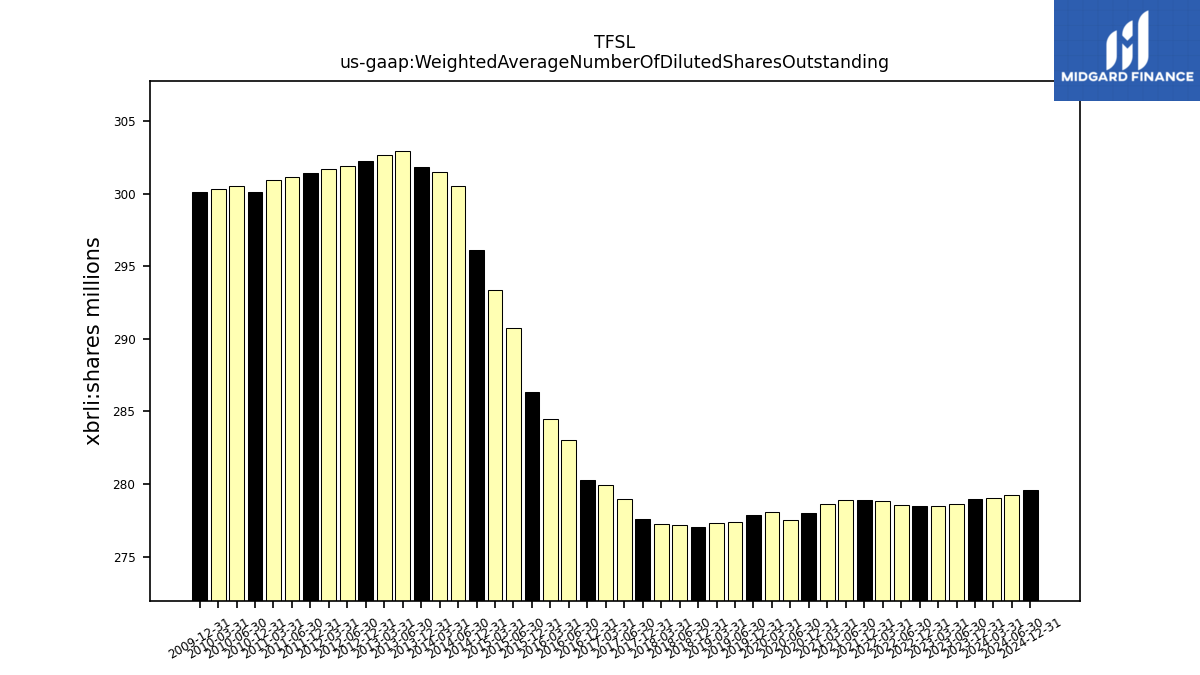
| Weighted Average Number Of Diluted Shares Outstanding | NA | 278.59 | 278.50 | 278.46 | NA | 278.56 | 278.82 | 278.90 | NA | 278.93 | 278.59 | 278.03 | NA | 277.52 | 278.10 | 277.89 | NA | 277.40 | 277.34 | 277.07 | NA | 277.20 | 277.26 | 277.62 | NA | 278.99 | 279.91 | 280.27 | NA | 283.01 | 284.49 | 286.34 | NA | 290.76 | 293.34 | 296.13 | NA | 300.53 | 301.53 | 301.87 | NA | 302.93 | 302.65 | 302.24 | NA | 301.94 | 301.71 | 301.42 | NA | 301.15 | 300.96 | 300.14 | NA | |
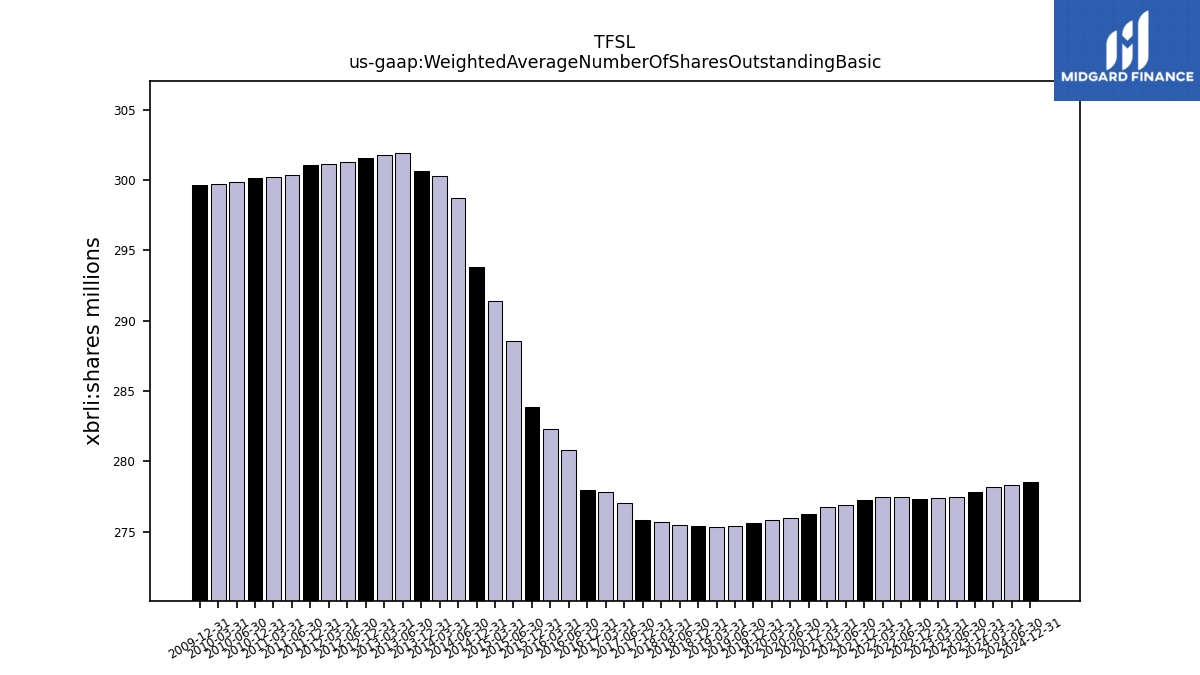
| Weighted Average Number Of Shares Outstanding Basic | NA | 277.47 | 277.36 | 277.32 | NA | 277.45 | 277.42 | 277.23 | NA | 276.86 | 276.72 | 276.22 | NA | 275.96 | 275.84 | 275.58 | NA | 275.38 | 275.36 | 275.38 | NA | 275.47 | 275.66 | 275.82 | NA | 277.06 | 277.79 | 277.93 | NA | 280.82 | 282.31 | 283.83 | NA | 288.55 | 291.38 | 293.80 | NA | 298.68 | 300.26 | 300.63 | NA | 301.91 | 301.75 | 301.58 | NA | 301.27 | 301.15 | 301.04 | NA | 300.35 | 300.22 | 300.14 | NA | |
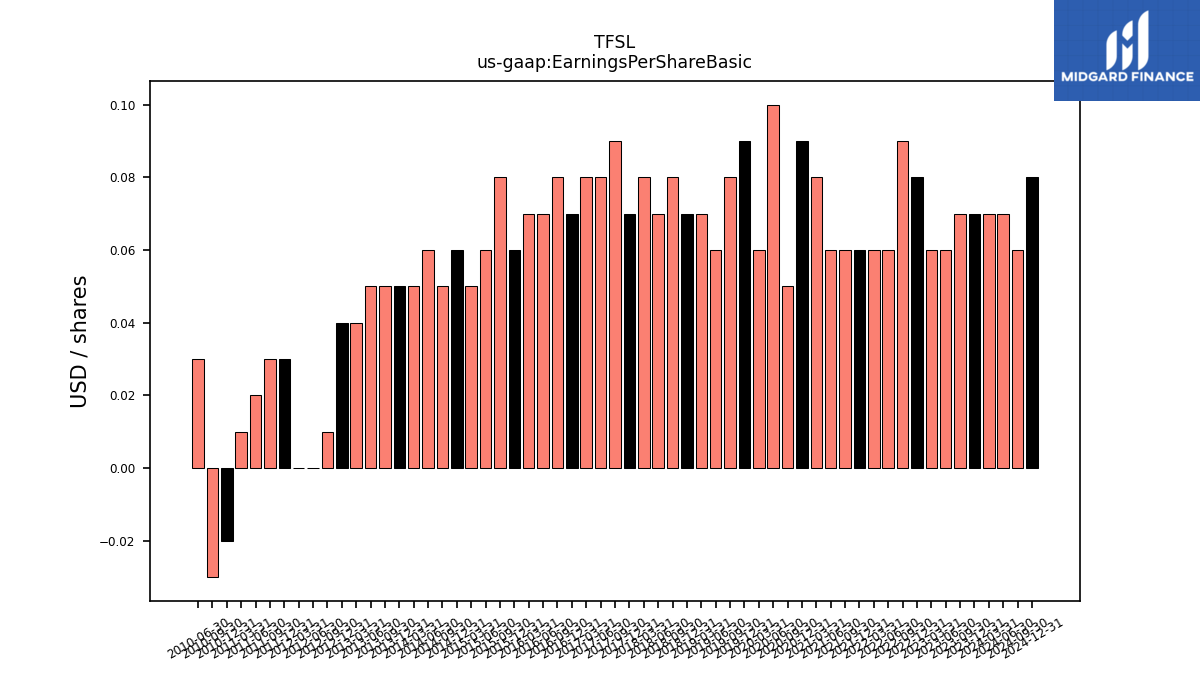
| Earnings Per Share Basic | 0.07 | 0.06 | 0.06 | 0.08 | 0.09 | 0.06 | 0.06 | 0.06 | 0.06 | 0.06 | 0.08 | 0.09 | 0.05 | 0.10 | 0.06 | 0.09 | 0.08 | 0.06 | 0.07 | 0.07 | 0.08 | 0.07 | 0.08 | 0.07 | 0.09 | 0.08 | 0.08 | 0.07 | 0.08 | 0.07 | 0.07 | 0.06 | 0.08 | 0.06 | 0.05 | 0.06 | 0.05 | 0.06 | 0.05 | 0.05 | 0.05 | 0.05 | 0.04 | 0.04 | 0.01 | 0.00 | 0.00 | 0.03 | 0.03 | 0.02 | 0.01 | -0.02 | -0.03 | |
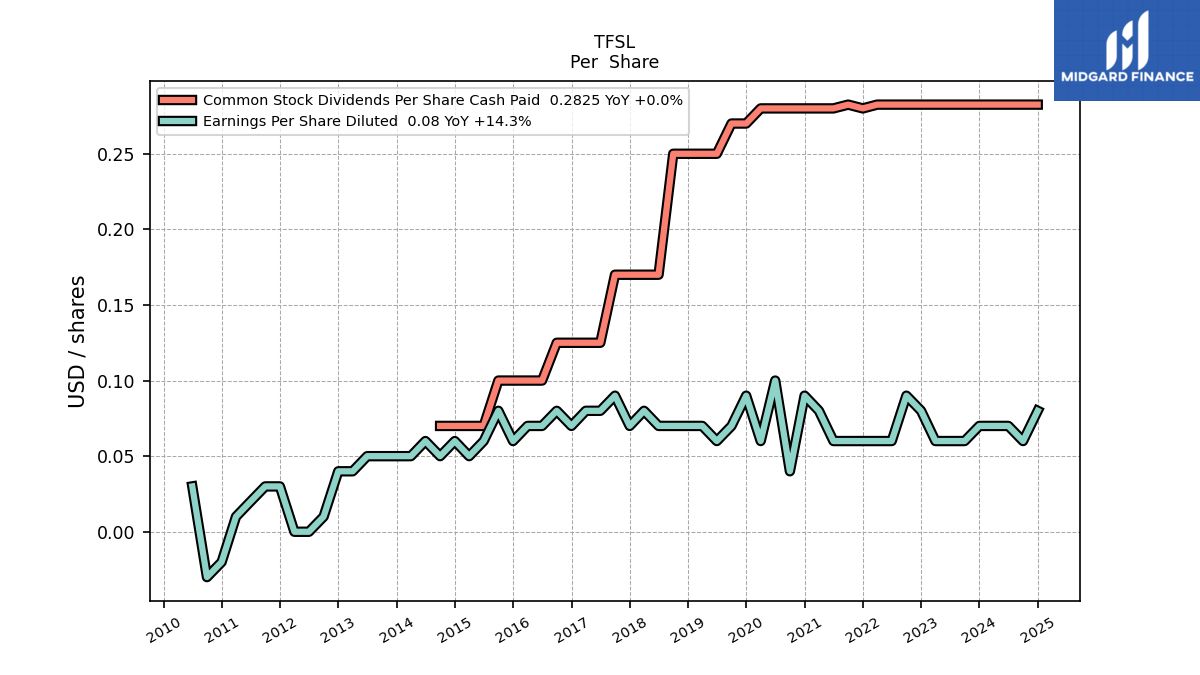
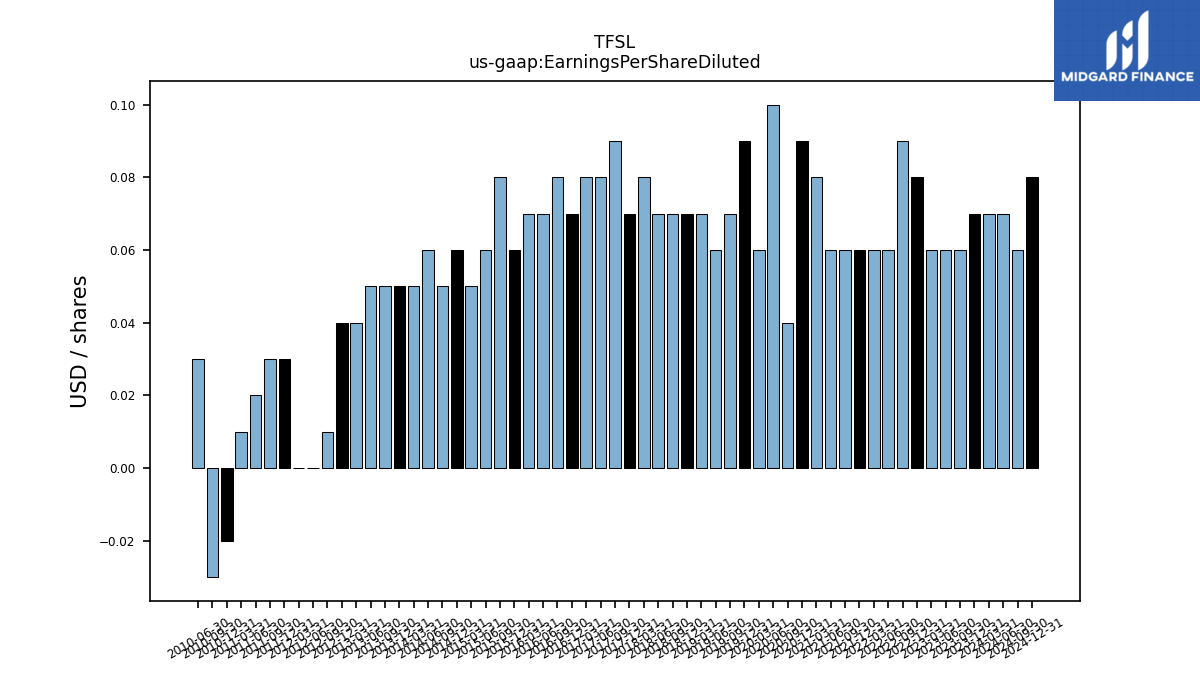
| Earnings Per Share Diluted | 0.06 | 0.06 | 0.06 | 0.08 | 0.09 | 0.06 | 0.06 | 0.06 | 0.06 | 0.06 | 0.08 | 0.09 | 0.04 | 0.10 | 0.06 | 0.09 | 0.07 | 0.06 | 0.07 | 0.07 | 0.07 | 0.07 | 0.08 | 0.07 | 0.09 | 0.08 | 0.08 | 0.07 | 0.08 | 0.07 | 0.07 | 0.06 | 0.08 | 0.06 | 0.05 | 0.06 | 0.05 | 0.06 | 0.05 | 0.05 | 0.05 | 0.05 | 0.04 | 0.04 | 0.01 | 0.00 | 0.00 | 0.03 | 0.03 | 0.02 | 0.01 | -0.02 | -0.03 |
| 2023-09-30 | 2023-06-30 | 2023-03-31 | 2022-12-31 | 2022-09-30 | 2022-06-30 | 2022-03-31 | 2021-12-31 | 2021-09-30 | 2021-06-30 | 2021-03-31 | 2020-12-31 | 2020-09-30 | 2020-06-30 | 2020-03-31 | 2019-12-31 | 2019-09-30 | 2019-06-30 | 2019-03-31 | 2018-12-31 | 2018-09-30 | 2018-06-30 | 2018-03-31 | 2017-12-31 | 2017-09-30 | 2017-06-30 | 2017-03-31 | 2016-12-31 | 2016-09-30 | 2016-06-30 | 2016-03-31 | 2015-12-31 | 2015-09-30 | 2015-06-30 | 2015-03-31 | 2014-12-31 | 2014-09-30 | 2014-06-30 | 2014-03-31 | 2013-12-31 | 2013-09-30 | 2013-06-30 | 2013-03-31 | 2012-12-31 | 2012-09-30 | 2012-06-30 | 2012-03-31 | 2011-12-31 | 2011-09-30 | 2011-06-30 | 2011-03-31 | 2010-12-31 | 2010-09-30 | ||
|---|---|---|---|---|---|---|---|---|---|---|---|---|---|---|---|---|---|---|---|---|---|---|---|---|---|---|---|---|---|---|---|---|---|---|---|---|---|---|---|---|---|---|---|---|---|---|---|---|---|---|---|---|---|---|
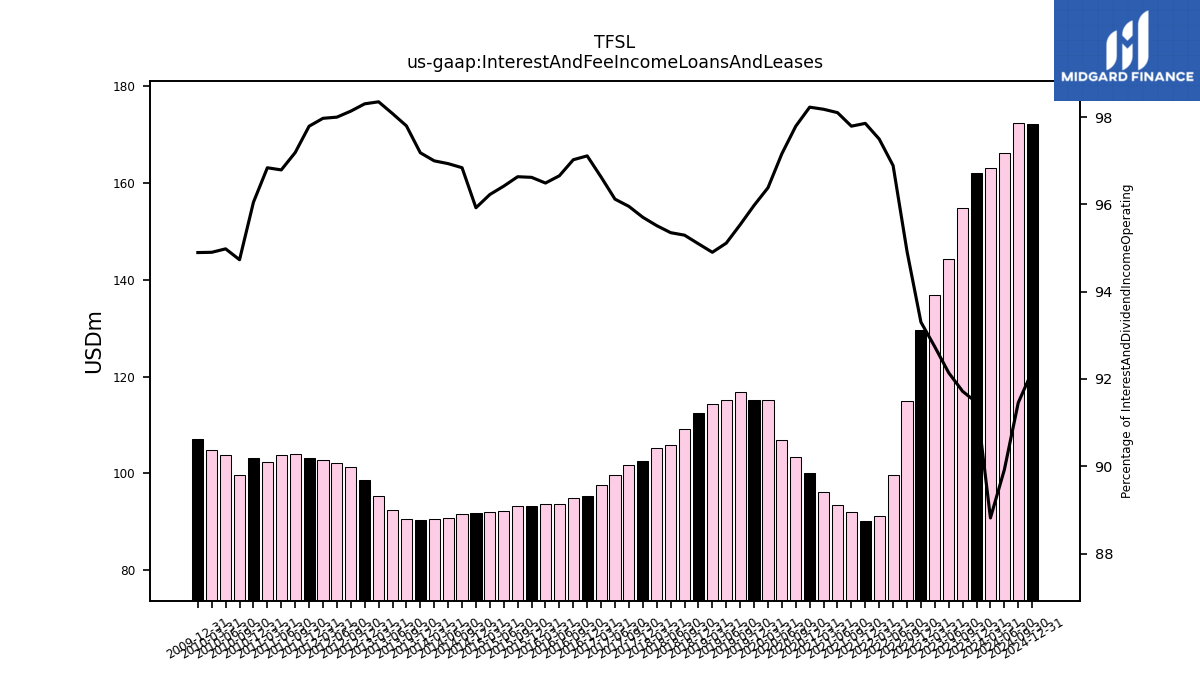
| Interest And Fee Income Loans And Leases | 154.76 | 144.35 | 136.84 | 129.66 | 114.87 | 99.58 | 91.12 | 90.12 | 92.00 | 93.58 | 96.17 | 100.13 | 103.43 | 106.84 | 115.20 | 115.22 | 116.85 | 115.13 | 114.31 | 112.49 | 109.13 | 105.96 | 105.24 | 102.63 | 101.69 | 99.70 | 97.68 | 95.38 | 94.96 | 93.75 | 93.74 | 93.17 | 93.18 | 92.25 | 92.04 | 91.83 | 91.58 | 90.88 | 90.55 | 90.40 | 90.51 | 92.40 | 95.24 | 98.69 | 101.35 | 102.14 | 102.70 | 103.21 | 104.03 | 103.84 | 102.39 | 103.20 | 99.76 | |
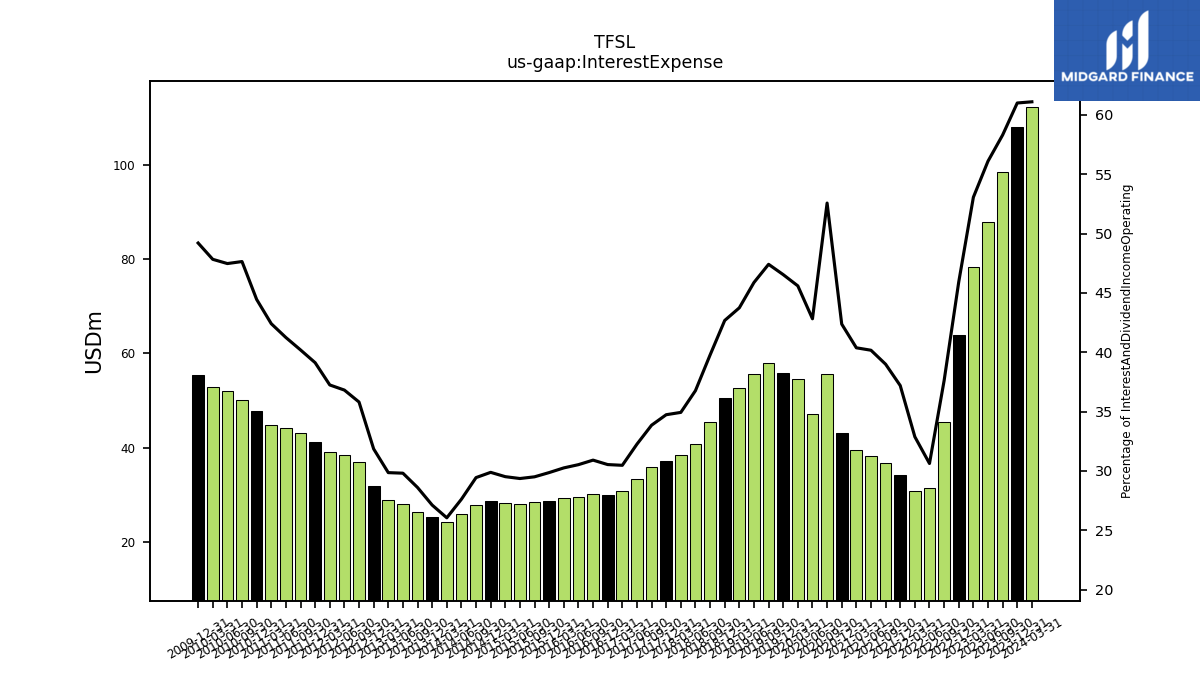
| Interest Expense | 98.38 | 87.88 | 78.28 | 63.81 | 45.50 | 31.47 | 30.72 | 34.25 | 36.68 | 38.31 | 39.54 | 43.19 | 55.60 | 47.08 | 54.49 | 55.87 | 57.98 | 55.52 | 52.68 | 50.48 | 45.54 | 40.84 | 38.48 | 37.24 | 35.87 | 33.45 | 30.80 | 29.98 | 30.25 | 29.60 | 29.39 | 28.79 | 28.44 | 28.08 | 28.23 | 28.60 | 27.83 | 25.88 | 24.31 | 25.22 | 26.47 | 28.08 | 28.91 | 31.97 | 36.97 | 38.36 | 39.03 | 41.28 | 43.02 | 44.24 | 44.83 | 47.76 | 50.17 | |
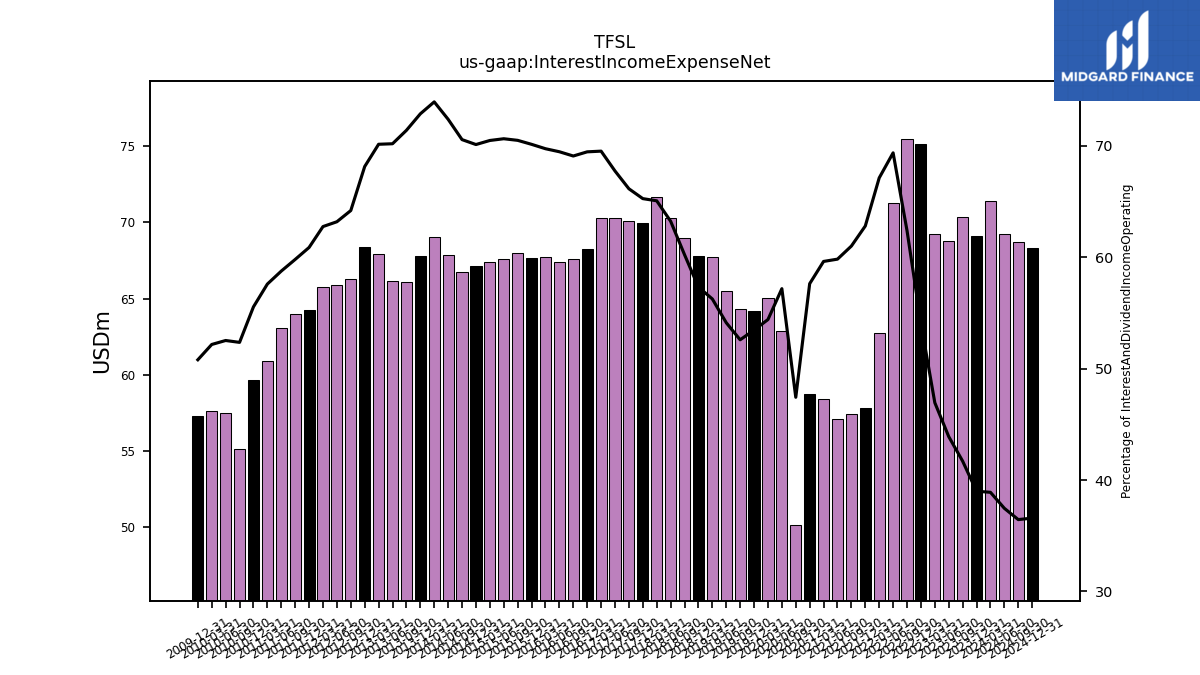
| Interest Income Expense Net | 70.36 | 68.78 | 69.27 | 75.16 | 75.51 | 71.30 | 62.74 | 57.84 | 57.40 | 57.08 | 58.41 | 58.74 | 50.17 | 62.88 | 65.04 | 64.19 | 64.33 | 65.52 | 67.76 | 67.81 | 68.98 | 70.27 | 71.70 | 69.99 | 70.11 | 70.27 | 70.29 | 68.23 | 67.63 | 67.39 | 67.76 | 67.64 | 67.98 | 67.59 | 67.42 | 67.14 | 66.73 | 67.87 | 69.03 | 67.80 | 66.08 | 66.13 | 67.93 | 68.42 | 66.30 | 65.86 | 65.78 | 64.25 | 64.02 | 63.05 | 60.90 | 59.69 | 55.14 | |
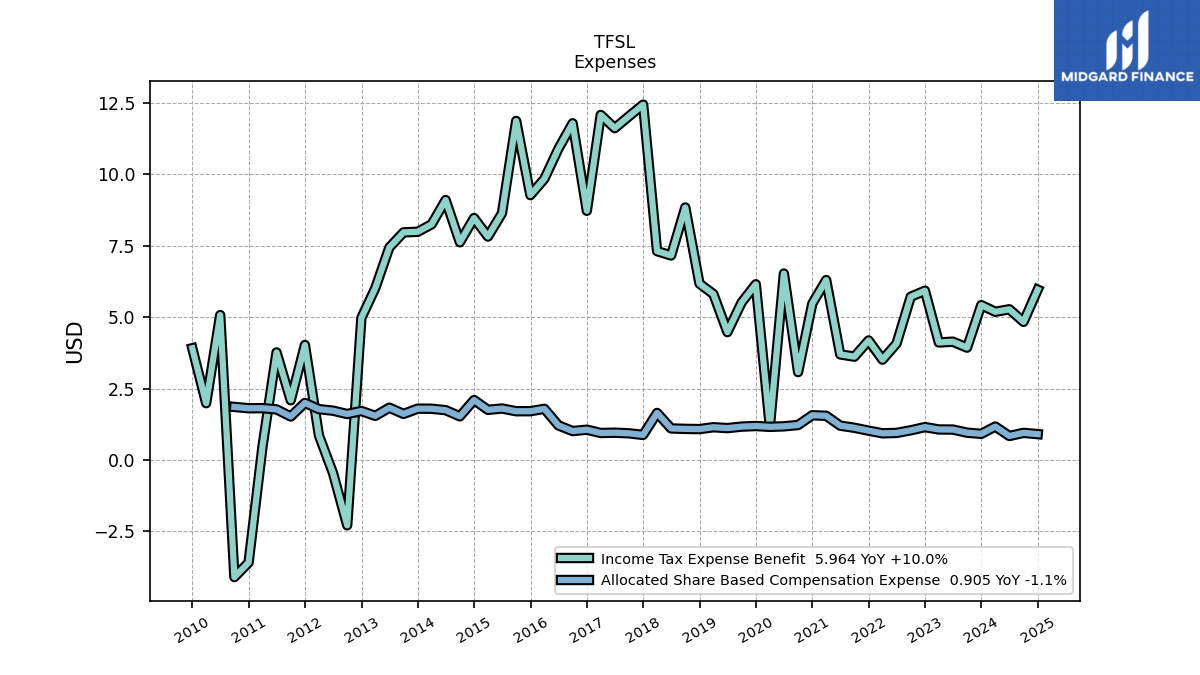
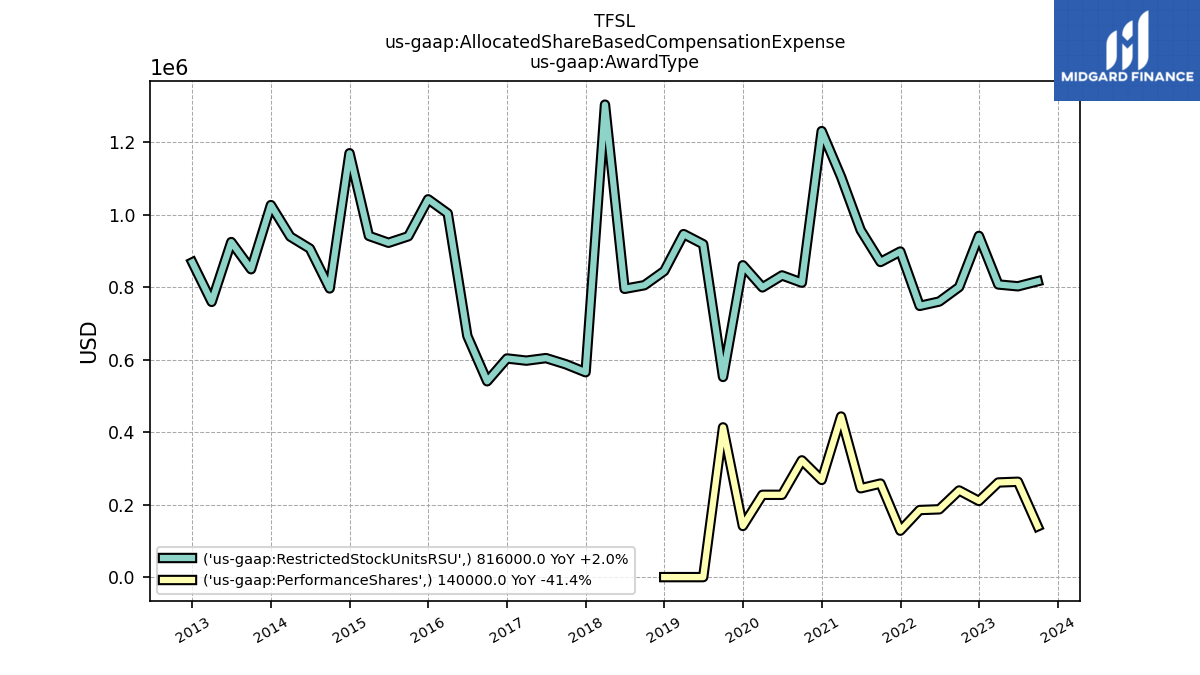
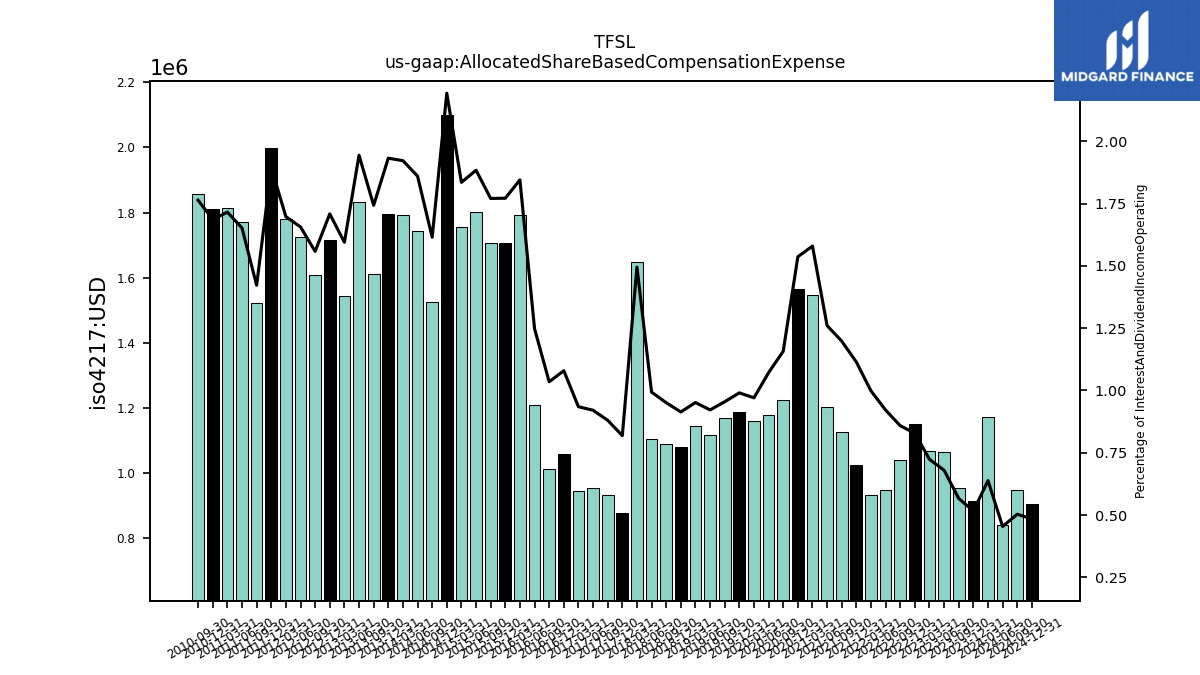
| Allocated Share Based Compensation Expense | 0.96 | 1.06 | 1.07 | 1.15 | 1.04 | 0.95 | 0.93 | 1.03 | 1.13 | 1.20 | 1.55 | 1.57 | 1.22 | 1.18 | 1.16 | 1.19 | 1.17 | 1.12 | 1.15 | 1.08 | 1.09 | 1.10 | 1.65 | 0.88 | 0.93 | 0.95 | 0.94 | 1.06 | 1.01 | 1.21 | 1.79 | 1.71 | 1.71 | 1.80 | 1.75 | 2.10 | 1.53 | 1.74 | 1.79 | 1.80 | 1.61 | 1.83 | 1.54 | 1.72 | 1.61 | 1.73 | 1.78 | 2.00 | 1.52 | 1.77 | 1.81 | 1.81 | 1.86 | |
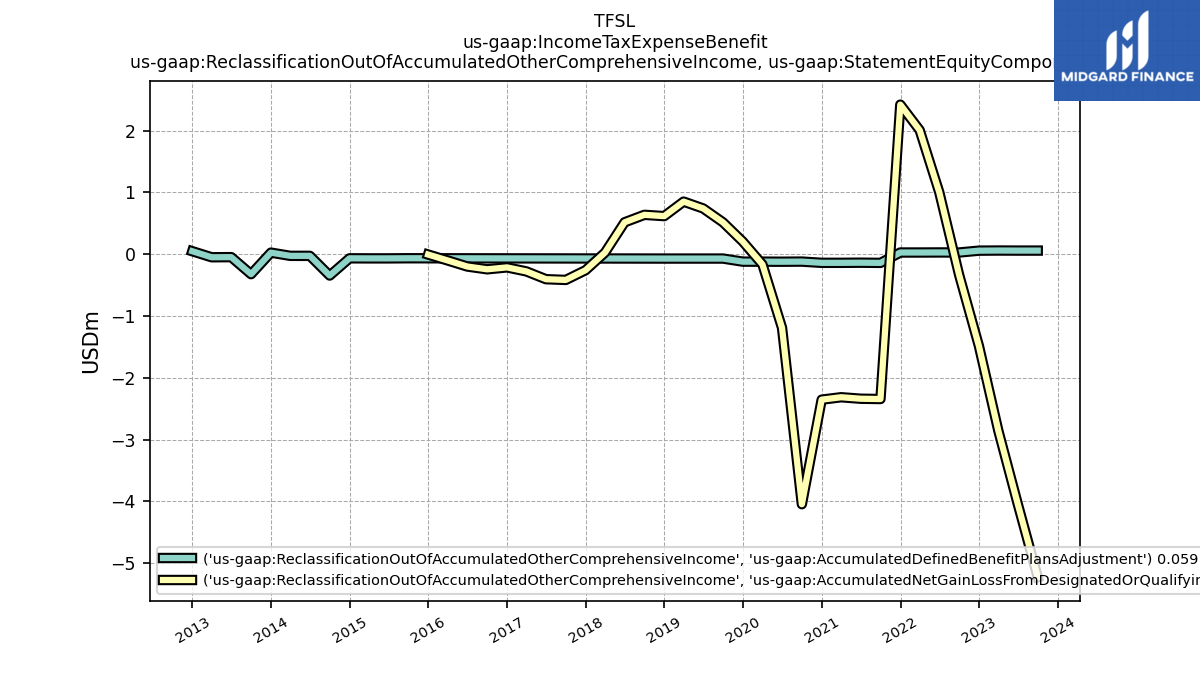
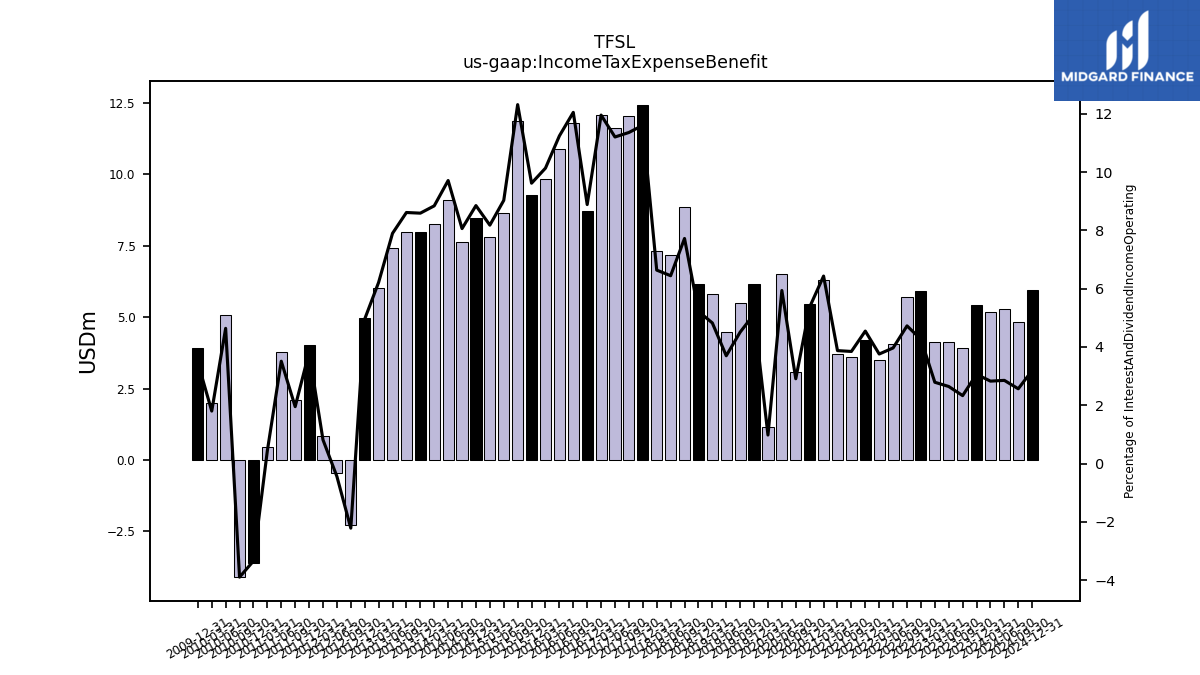
| Income Tax Expense Benefit | 3.93 | 4.14 | 4.12 | 5.93 | 5.72 | 4.08 | 3.51 | 4.18 | 3.62 | 3.70 | 6.30 | 5.47 | 3.08 | 6.53 | 1.17 | 6.15 | 5.51 | 4.48 | 5.81 | 6.17 | 8.84 | 7.16 | 7.31 | 12.44 | 12.04 | 11.62 | 12.08 | 8.73 | 11.79 | 10.90 | 9.85 | 9.27 | 11.87 | 8.64 | 7.82 | 8.47 | 7.62 | 9.10 | 8.25 | 7.99 | 7.97 | 7.44 | 6.02 | 4.98 | -2.29 | -0.46 | 0.85 | 4.03 | 2.09 | 3.77 | 0.47 | -3.59 | -4.10 | |
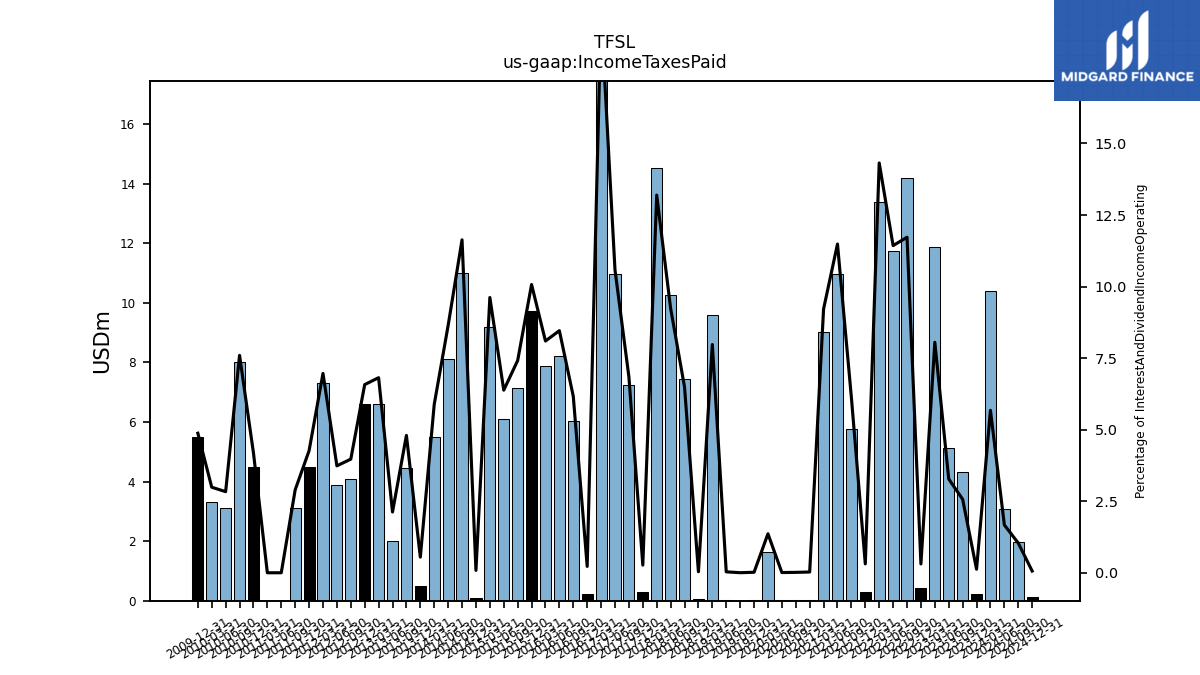
| Income Taxes Paid | 4.33 | 5.13 | 11.88 | 0.43 | 14.19 | 11.75 | 13.38 | 0.29 | 5.76 | 10.96 | 9.03 | 0.03 | 0.01 | 0.01 | 1.63 | 0.02 | 0.00 | 0.04 | 9.61 | 0.04 | 7.43 | 10.27 | 14.54 | 0.29 | 7.25 | 10.97 | 19.76 | 0.22 | 6.03 | 8.21 | 7.87 | 9.71 | 7.15 | 6.10 | 9.20 | 0.08 | 11.00 | 8.10 | 5.49 | 0.51 | 4.44 | 2.00 | 6.60 | 6.60 | 4.10 | 3.89 | 7.30 | 4.50 | 3.10 | 0.00 | 0.00 | 4.50 | 8.00 | |
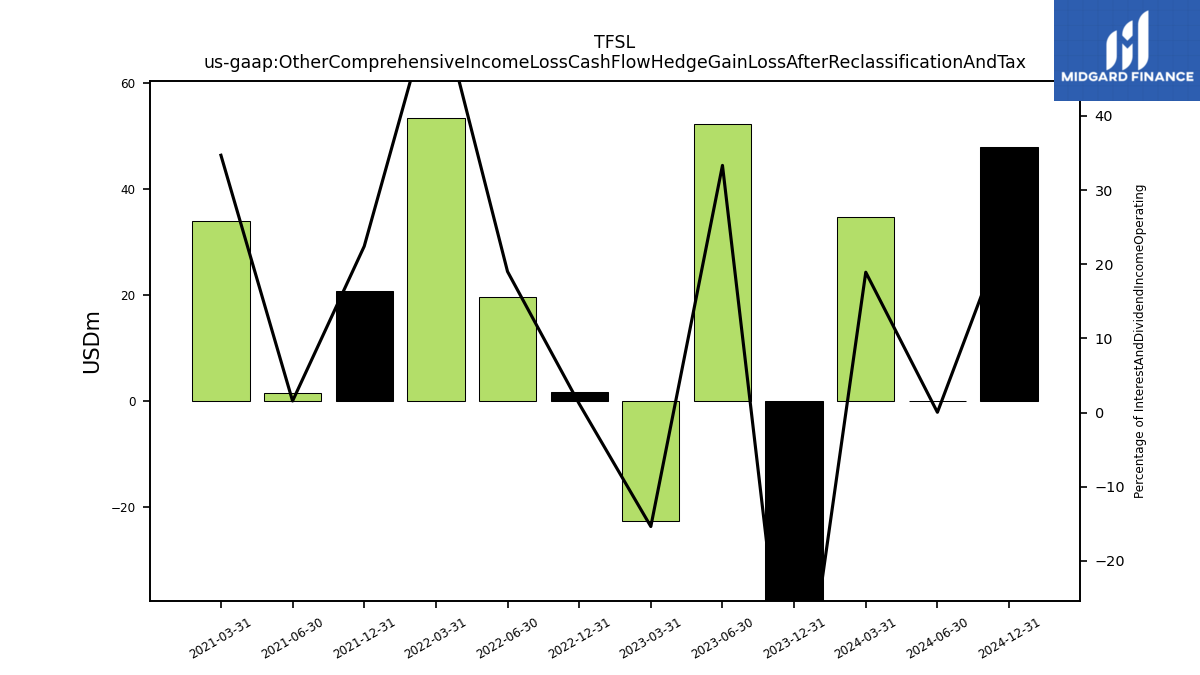
| Other Comprehensive Income Loss Cash Flow Hedge Gain Loss After Reclassification And Tax | NA | 52.22 | -22.69 | 1.64 | NA | 19.54 | 53.29 | 20.65 | NA | 1.49 | 33.99 | NA | NA | NA | NA | NA | NA | NA | NA | NA | NA | NA | NA | NA | NA | NA | NA | NA | NA | NA | NA | NA | NA | NA | NA | NA | NA | NA | NA | NA | NA | NA | NA | NA | NA | NA | NA | NA | NA | NA | NA | NA | NA | |
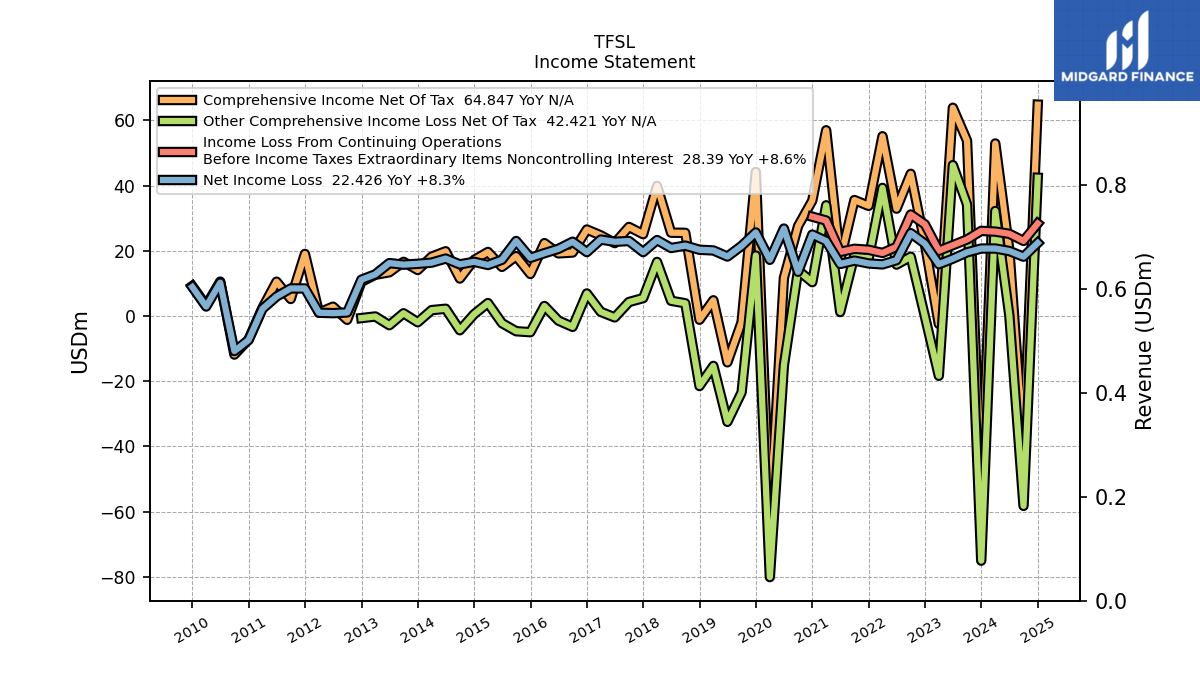
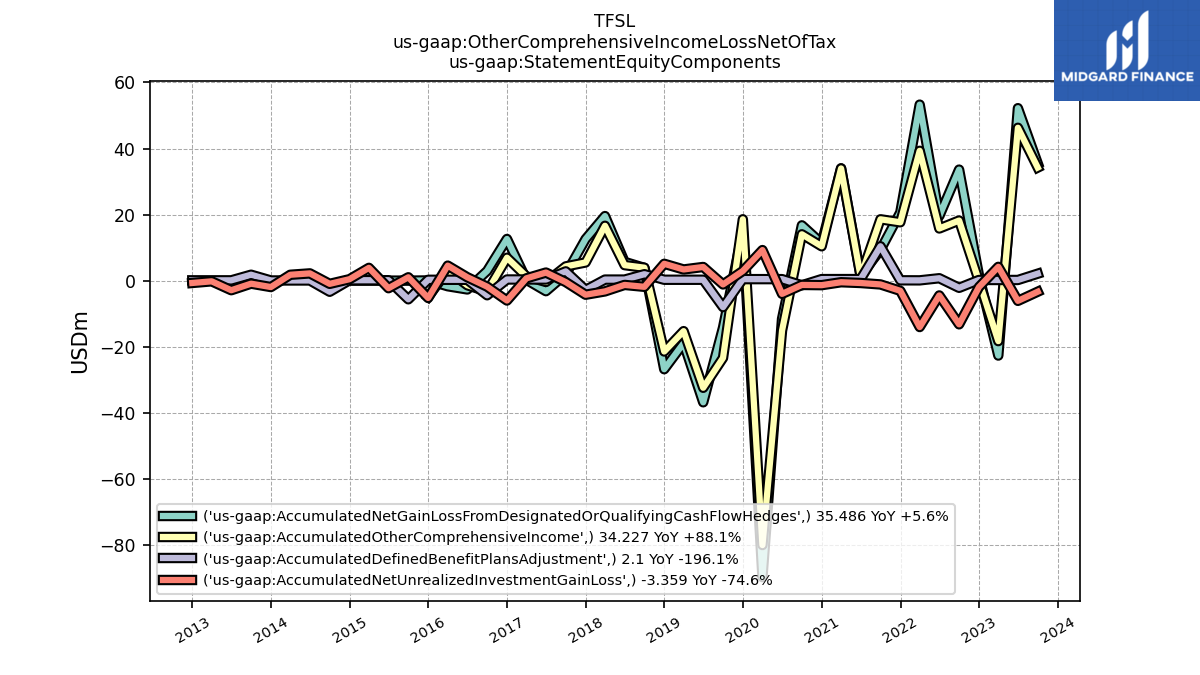
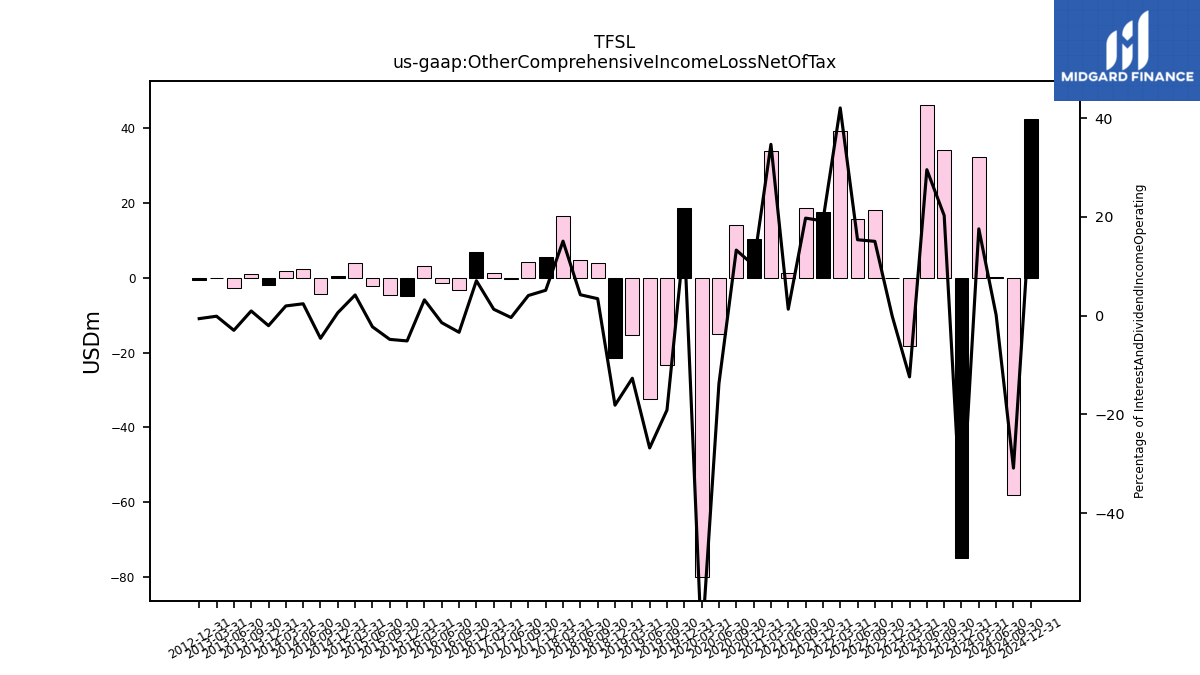
| Other Comprehensive Income Loss Net Of Tax | 34.23 | 46.28 | -18.32 | -0.13 | 18.20 | 15.79 | 39.31 | 17.66 | 18.57 | 1.23 | 33.97 | 10.39 | 14.03 | -15.13 | -80.06 | 18.58 | -23.40 | -32.45 | -15.29 | -21.46 | 3.92 | 4.69 | 16.61 | 5.50 | 4.31 | -0.41 | 1.29 | 6.94 | -3.31 | -1.40 | 3.10 | -4.95 | -4.65 | -2.17 | 3.99 | 0.56 | -4.35 | 2.24 | 1.82 | -1.90 | 0.87 | -2.81 | -0.12 | -0.62 | NA | NA | NA | NA | NA | NA | NA | NA | NA | |
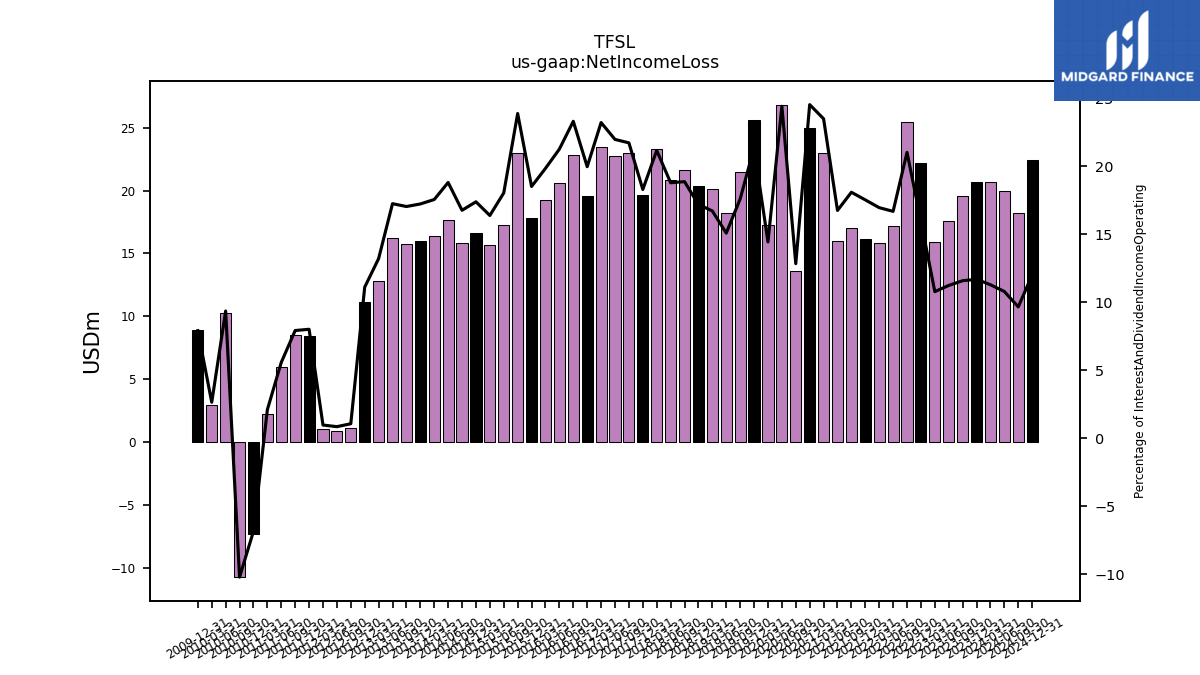
| Net Income Loss | 19.55 | 17.60 | 15.91 | 22.19 | 25.43 | 17.15 | 15.85 | 16.14 | 17.02 | 15.98 | 23.01 | 25.00 | 13.58 | 26.84 | 17.26 | 25.64 | 21.52 | 18.26 | 20.13 | 20.33 | 21.61 | 20.88 | 23.31 | 19.61 | 23.02 | 22.79 | 23.46 | 19.61 | 22.81 | 20.62 | 19.28 | 17.85 | 23.02 | 17.26 | 15.67 | 16.64 | 15.85 | 17.63 | 16.39 | 16.02 | 15.77 | 16.25 | 12.79 | 11.15 | 1.11 | 0.89 | 1.02 | 8.46 | 8.48 | 5.99 | 2.22 | -7.35 | -10.75 | |
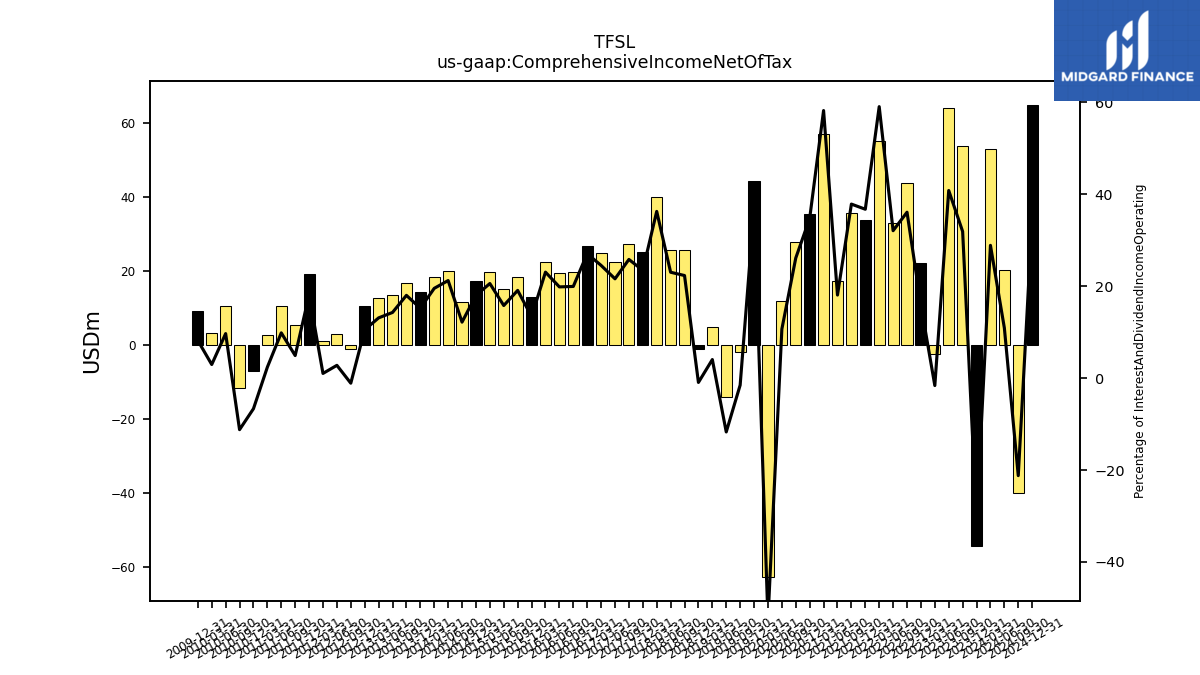
| Comprehensive Income Net Of Tax | 53.77 | 63.89 | -2.41 | 22.07 | 43.63 | 32.93 | 55.15 | 33.80 | 35.58 | 17.21 | 56.98 | 35.39 | 27.61 | 11.71 | -62.81 | 44.22 | -1.89 | -14.19 | 4.84 | -1.13 | 25.52 | 25.57 | 39.92 | 25.11 | 27.33 | 22.38 | 24.76 | 26.55 | 19.49 | 19.22 | 22.37 | 12.90 | 18.37 | 15.09 | 19.66 | 17.20 | 11.50 | 19.87 | 18.21 | 14.12 | 16.64 | 13.44 | 12.67 | 10.53 | -1.16 | 2.88 | 1.05 | 19.07 | 5.24 | 10.54 | 2.51 | -7.17 | -11.81 | |
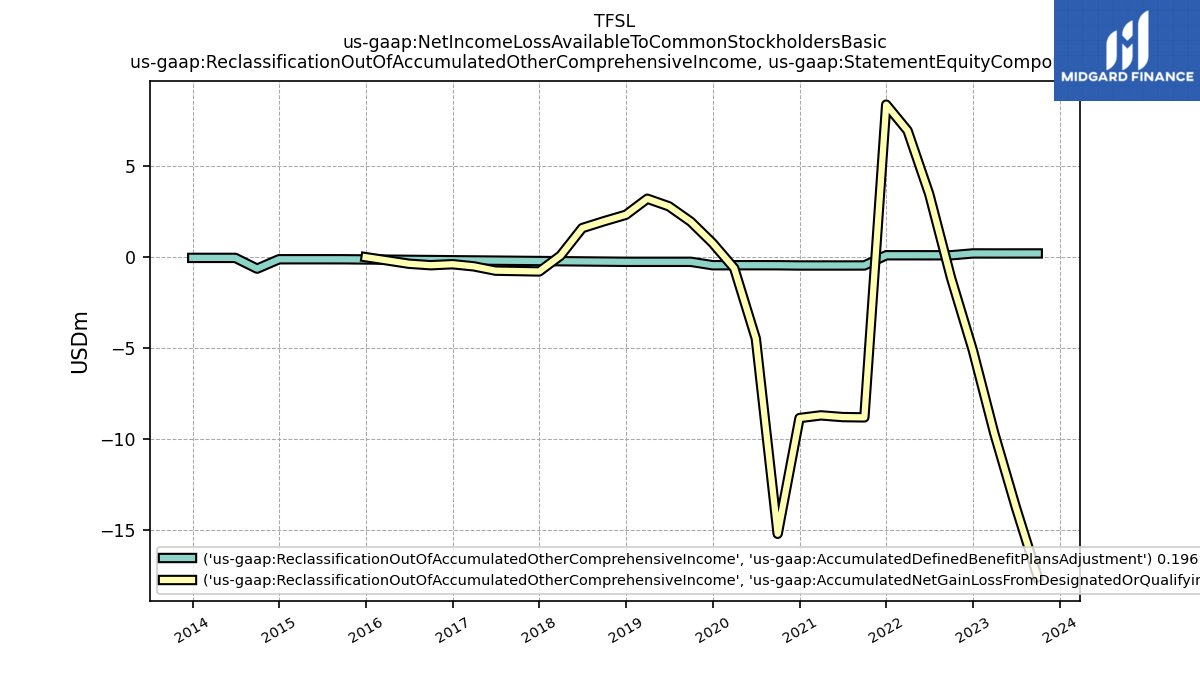
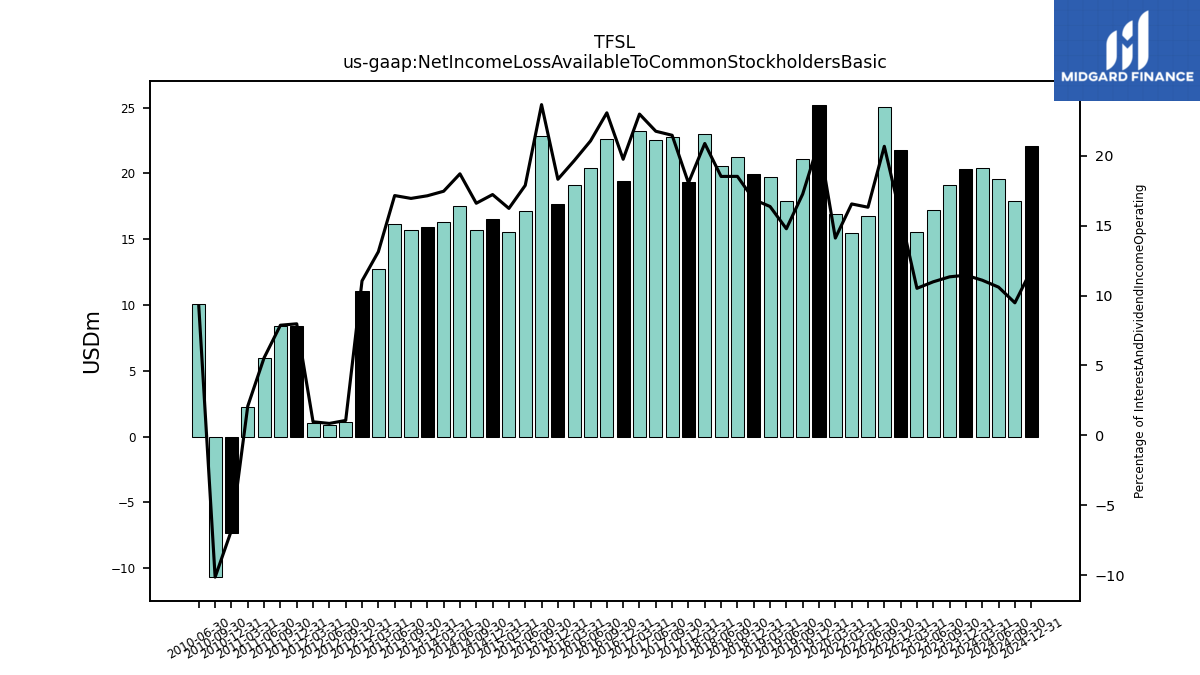
| Net Income Loss Available To Common Stockholders Basic | 19.14 | 17.21 | 15.52 | NA | 25.03 | 16.78 | 15.48 | NA | NA | NA | NA | NA | NA | NA | 16.88 | 25.23 | 21.12 | 17.89 | 19.72 | 19.96 | 21.22 | 20.59 | 23.01 | 19.37 | 22.76 | 22.57 | 23.24 | 19.41 | 22.59 | 20.44 | 19.09 | 17.67 | 22.82 | 17.11 | 15.53 | 16.50 | 15.71 | 17.55 | 16.31 | 15.95 | 15.69 | 16.16 | 12.72 | 11.10 | 1.10 | 0.89 | 1.02 | 8.42 | 8.43 | 5.95 | 2.21 | -7.31 | -10.69 | |
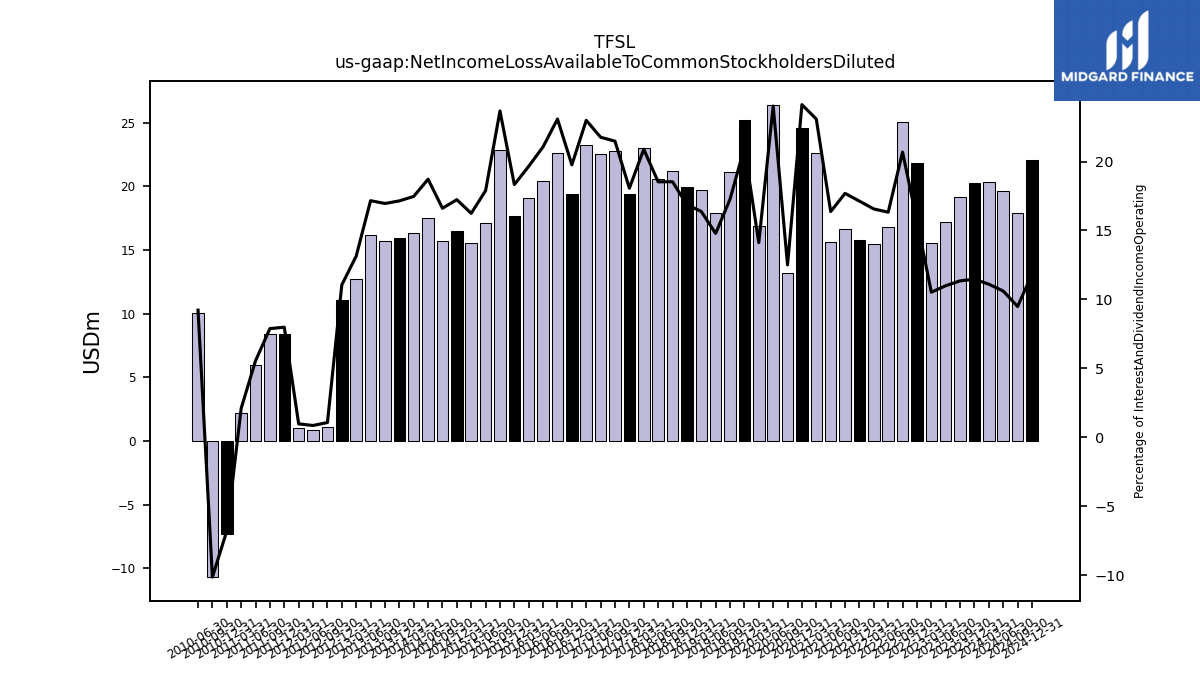
| Net Income Loss Available To Common Stockholders Diluted | 19.14 | 17.21 | 15.52 | 21.80 | 25.03 | 16.78 | 15.48 | 15.77 | 16.64 | 15.61 | 22.61 | 24.59 | 13.22 | 26.42 | 16.88 | 25.23 | 21.12 | 17.89 | 19.72 | 19.96 | 21.22 | 20.59 | 23.01 | 19.37 | 22.76 | 22.57 | 23.24 | 19.41 | 22.59 | 20.44 | 19.09 | 17.67 | 22.82 | 17.11 | 15.53 | 16.50 | 15.71 | 17.55 | 16.31 | 15.95 | 15.69 | 16.16 | 12.72 | 11.10 | 1.10 | 0.89 | 1.02 | 8.42 | 8.43 | 5.95 | 2.21 | -7.31 | -10.69 | |
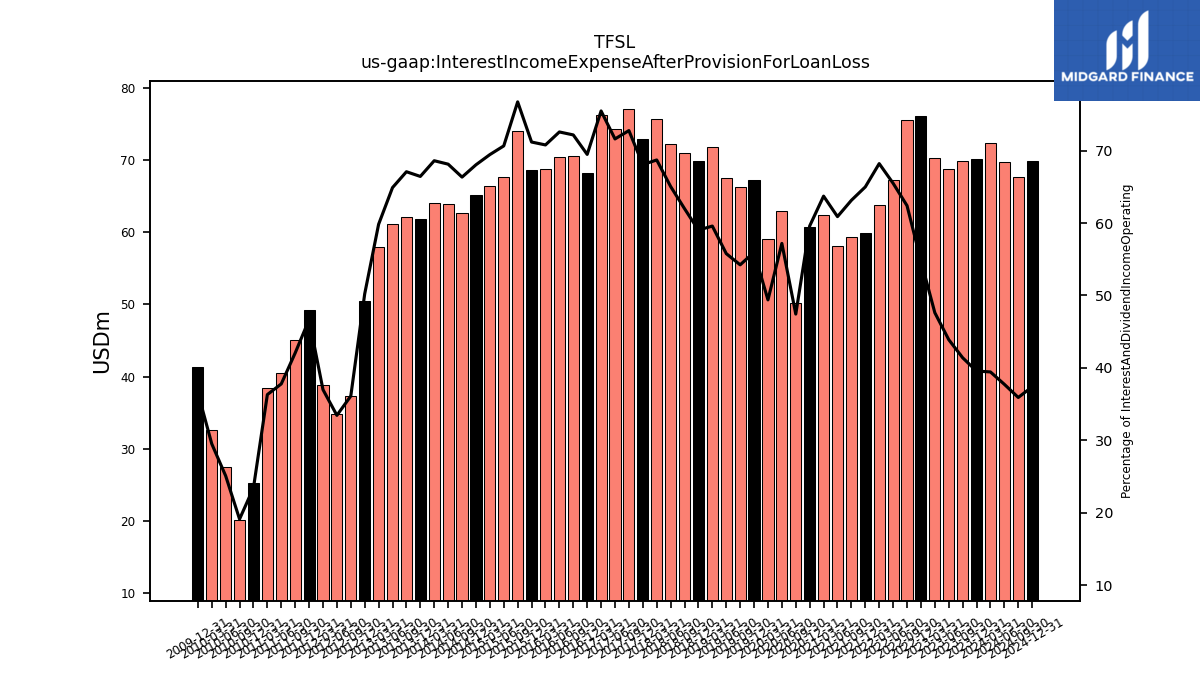
| Interest Income Expense After Provision For Loan Loss | 69.86 | 68.78 | 70.27 | 76.16 | 75.51 | 67.30 | 63.74 | 59.84 | 59.40 | 58.08 | 62.41 | 60.74 | 50.17 | 62.88 | 59.04 | 67.19 | 66.33 | 67.52 | 71.76 | 69.81 | 70.98 | 72.27 | 75.70 | 72.99 | 77.11 | 74.27 | 76.29 | 68.23 | 70.63 | 70.39 | 68.76 | 68.64 | 73.98 | 67.59 | 66.42 | 65.14 | 62.73 | 63.87 | 64.03 | 61.80 | 62.08 | 61.13 | 57.93 | 50.42 | 37.30 | 34.86 | 38.78 | 49.26 | 45.02 | 40.55 | 38.40 | 25.19 | 20.14 | |
| Noninterest Expense | 51.48 | 52.88 | 55.57 | 53.19 | 48.74 | 51.76 | 49.98 | 47.67 | 47.45 | 47.85 | 48.81 | 51.73 | 50.56 | 44.83 | 49.56 | 47.32 | 45.10 | 49.87 | 50.73 | 47.98 | 45.42 | 51.43 | 49.69 | 45.78 | 47.18 | 44.67 | 45.29 | 45.26 | 42.05 | 44.98 | 46.34 | 47.63 | 45.37 | 47.82 | 48.83 | 45.97 | 44.84 | 42.85 | 44.93 | 42.86 | 43.63 | 46.27 | 45.23 | 42.53 | 44.45 | 40.74 | 43.32 | 42.48 | 41.58 | 39.55 | 43.98 | 42.94 | 41.82 | |
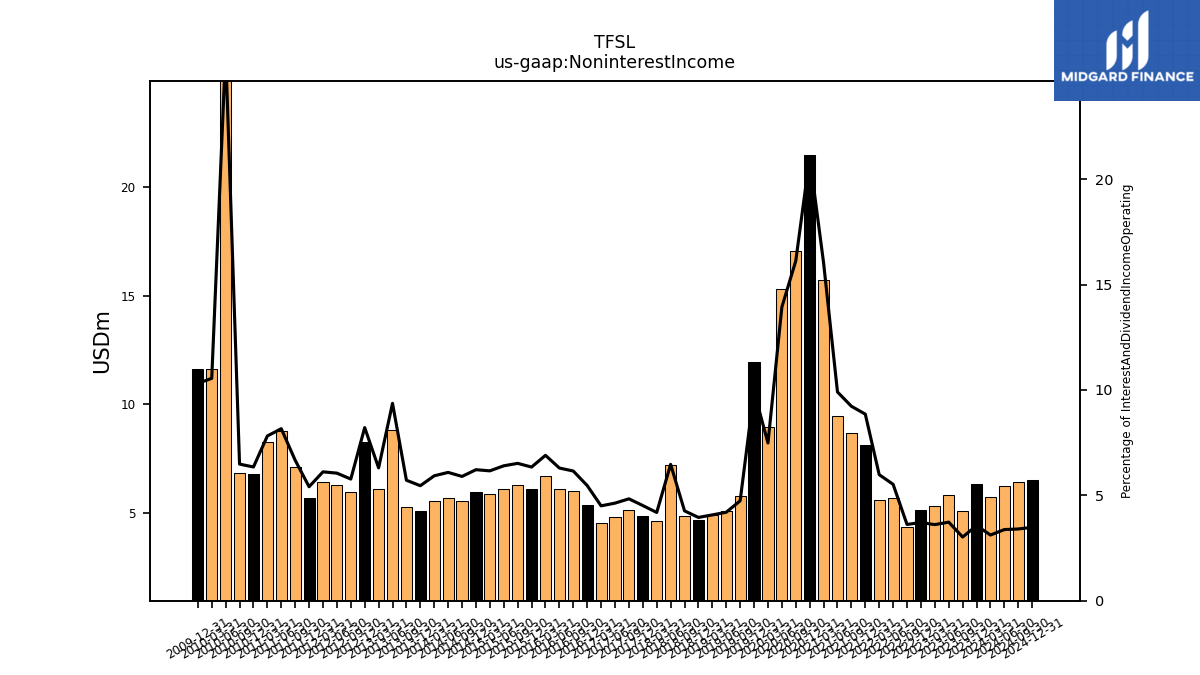
| Noninterest Income | 5.10 | 5.84 | 5.33 | 5.16 | 4.38 | 5.68 | 5.59 | 8.15 | 8.68 | 9.45 | 15.71 | 21.46 | 17.05 | 15.32 | 8.95 | 11.93 | 5.80 | 5.08 | 4.91 | 4.68 | 4.88 | 7.19 | 4.62 | 4.84 | 5.12 | 4.80 | 4.55 | 5.37 | 6.02 | 6.11 | 6.70 | 6.12 | 6.29 | 6.13 | 5.89 | 5.95 | 5.58 | 5.71 | 5.53 | 5.08 | 5.29 | 8.82 | 6.11 | 8.25 | 5.96 | 6.31 | 6.41 | 5.71 | 7.14 | 8.76 | 8.27 | 6.82 | 6.83 |
| 2023-09-30 | 2023-06-30 | 2023-03-31 | 2022-12-31 | 2022-09-30 | 2022-06-30 | 2022-03-31 | 2021-12-31 | 2021-09-30 | 2021-06-30 | 2021-03-31 | 2020-12-31 | 2020-09-30 | 2020-06-30 | 2020-03-31 | 2019-12-31 | 2019-09-30 | 2019-06-30 | 2019-03-31 | 2018-12-31 | 2018-09-30 | 2018-06-30 | 2018-03-31 | 2017-12-31 | 2017-09-30 | 2017-06-30 | 2017-03-31 | 2016-12-31 | 2016-09-30 | 2016-06-30 | 2016-03-31 | 2015-12-31 | 2015-09-30 | 2015-06-30 | 2015-03-31 | 2014-12-31 | 2014-09-30 | 2014-06-30 | 2014-03-31 | 2013-12-31 | 2013-09-30 | 2013-06-30 | 2013-03-31 | 2012-12-31 | 2012-09-30 | 2012-06-30 | 2012-03-31 | 2011-12-31 | 2011-09-30 | 2011-06-30 | 2011-03-31 | 2010-12-31 | 2010-09-30 | ||
|---|---|---|---|---|---|---|---|---|---|---|---|---|---|---|---|---|---|---|---|---|---|---|---|---|---|---|---|---|---|---|---|---|---|---|---|---|---|---|---|---|---|---|---|---|---|---|---|---|---|---|---|---|---|---|
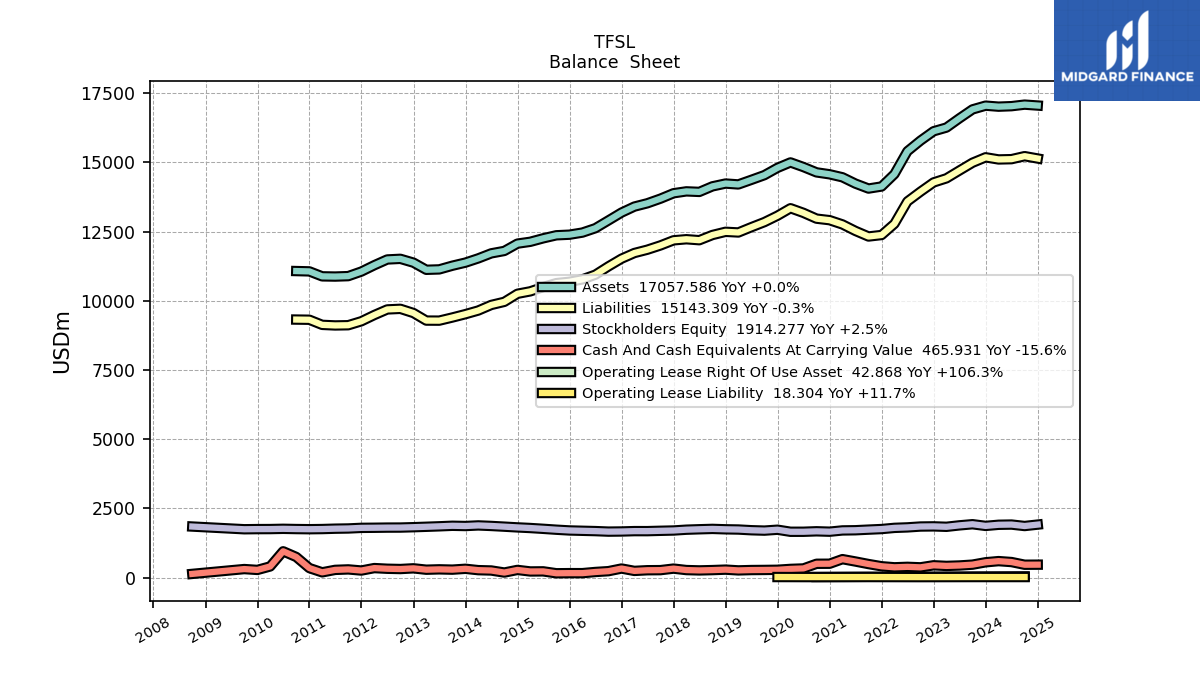
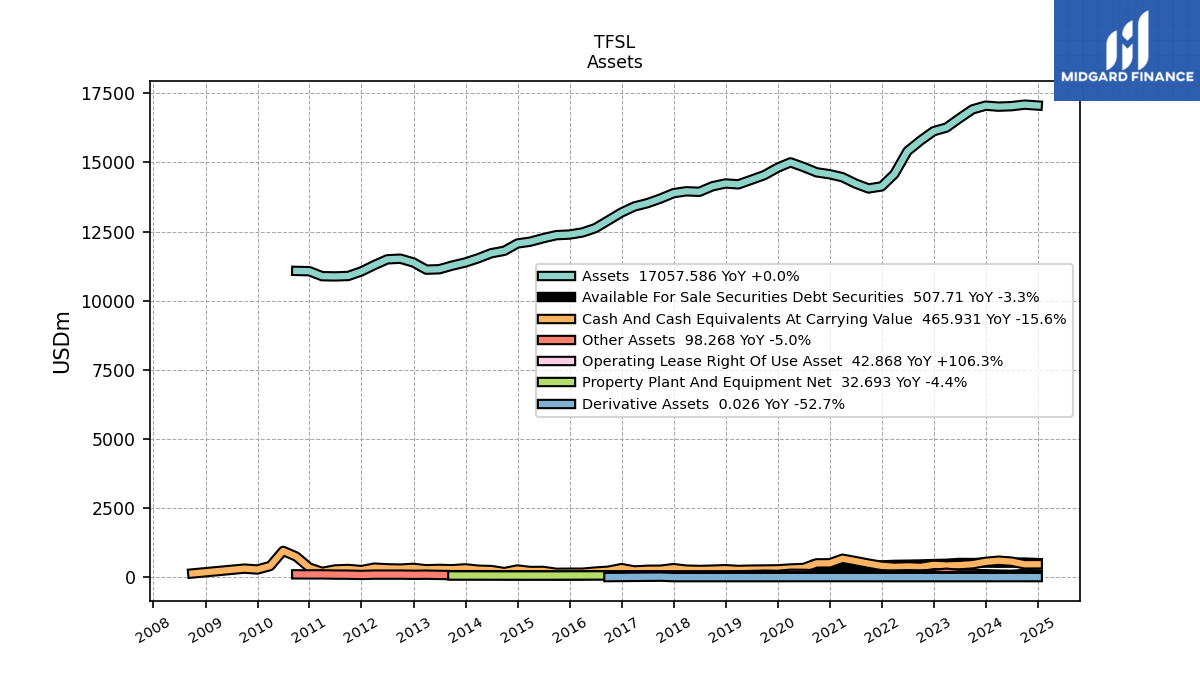
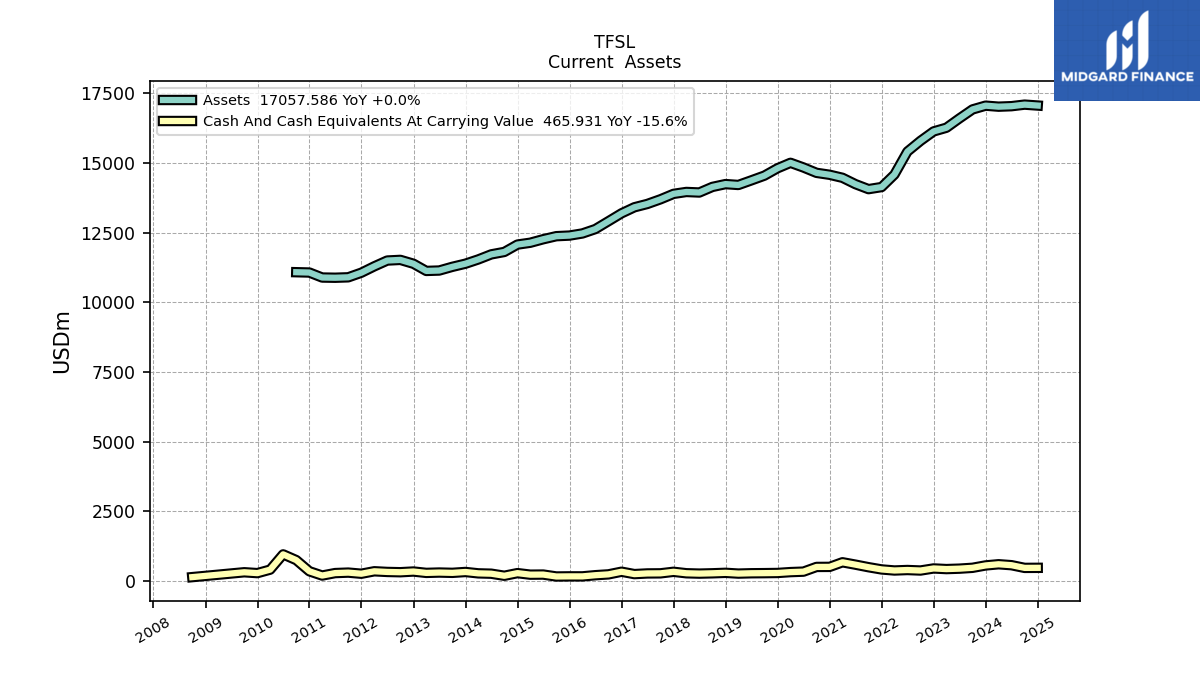
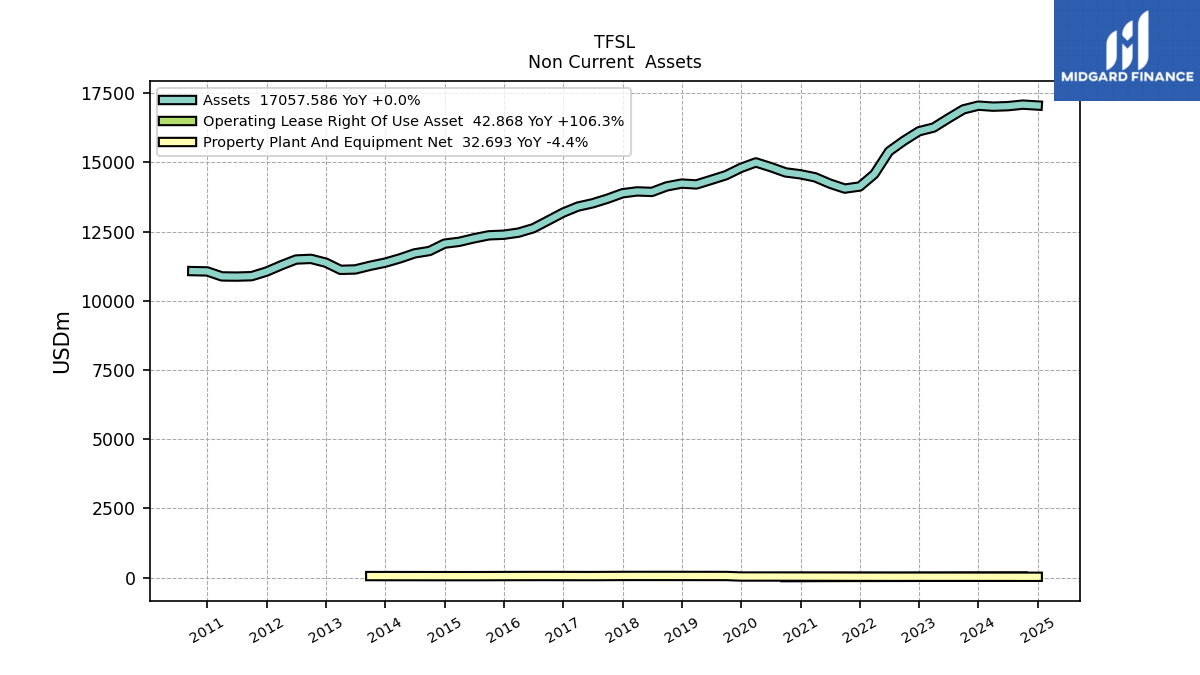
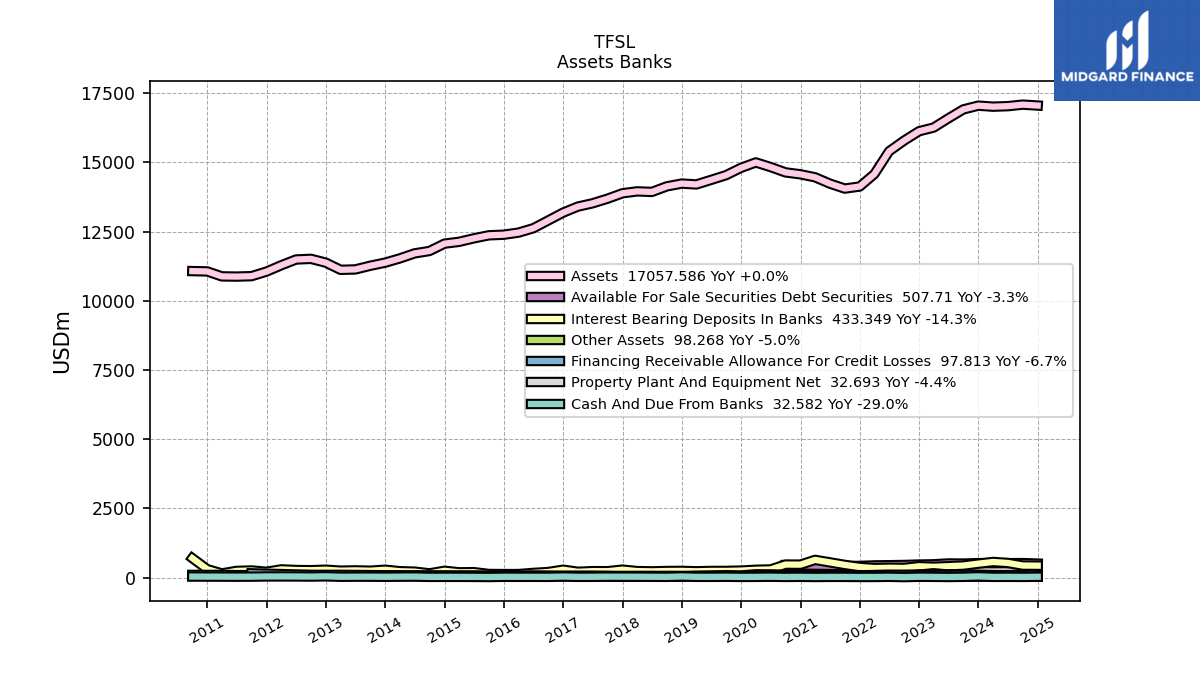
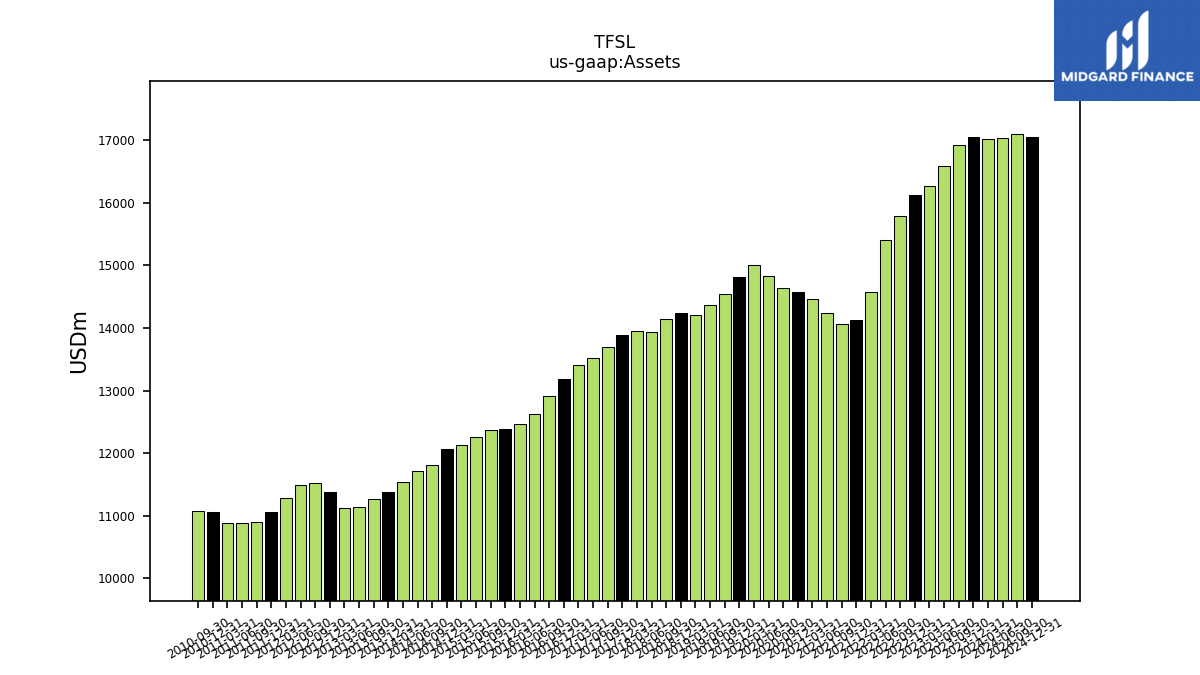
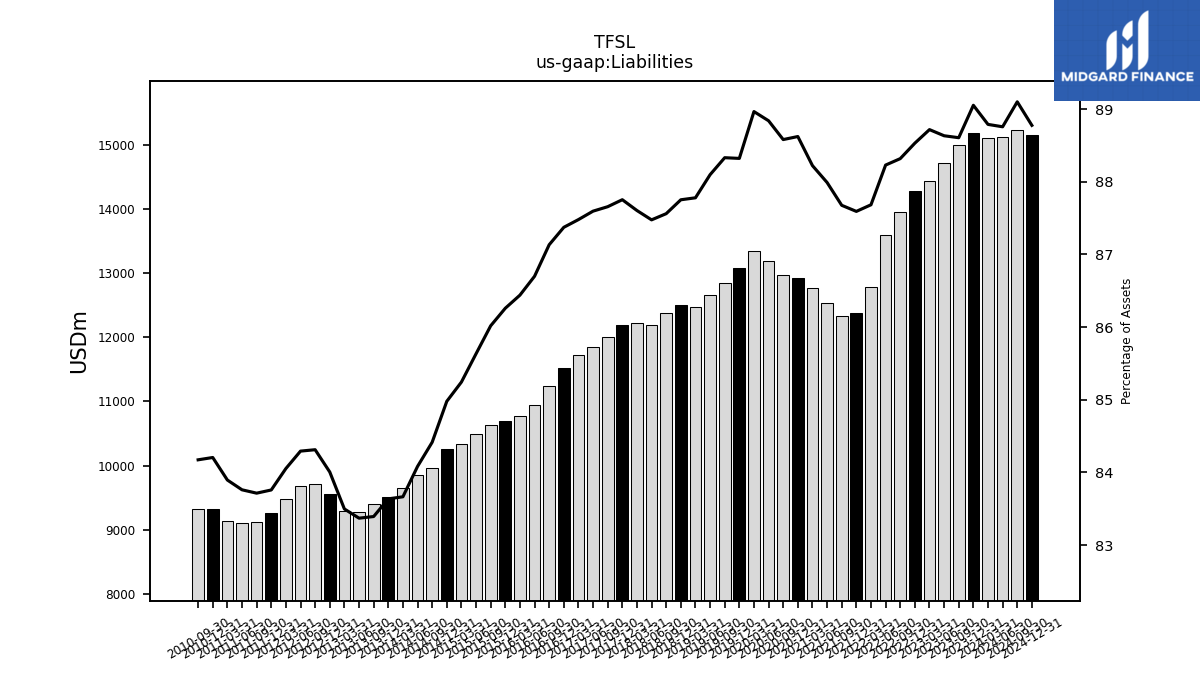
| Assets | 16917.98 | 16594.99 | 16261.68 | 16128.98 | 15789.88 | 15405.21 | 14580.89 | 14132.51 | 14057.45 | 14236.70 | 14464.78 | 14572.83 | 14642.22 | 14834.74 | 15002.34 | 14806.19 | 14542.36 | 14371.74 | 14206.63 | 14238.68 | 14137.33 | 13936.59 | 13956.03 | 13887.88 | 13692.56 | 13525.58 | 13406.19 | 13189.88 | 12906.06 | 12624.35 | 12466.57 | 12390.64 | 12368.89 | 12259.51 | 12133.69 | 12067.84 | 11803.19 | 11716.02 | 11534.44 | 11381.45 | 11269.35 | 11136.54 | 11121.76 | 11379.63 | 11518.12 | 11495.00 | 11286.77 | 11058.13 | 10892.95 | 10877.54 | 10885.06 | 11064.67 | 11076.03 | |
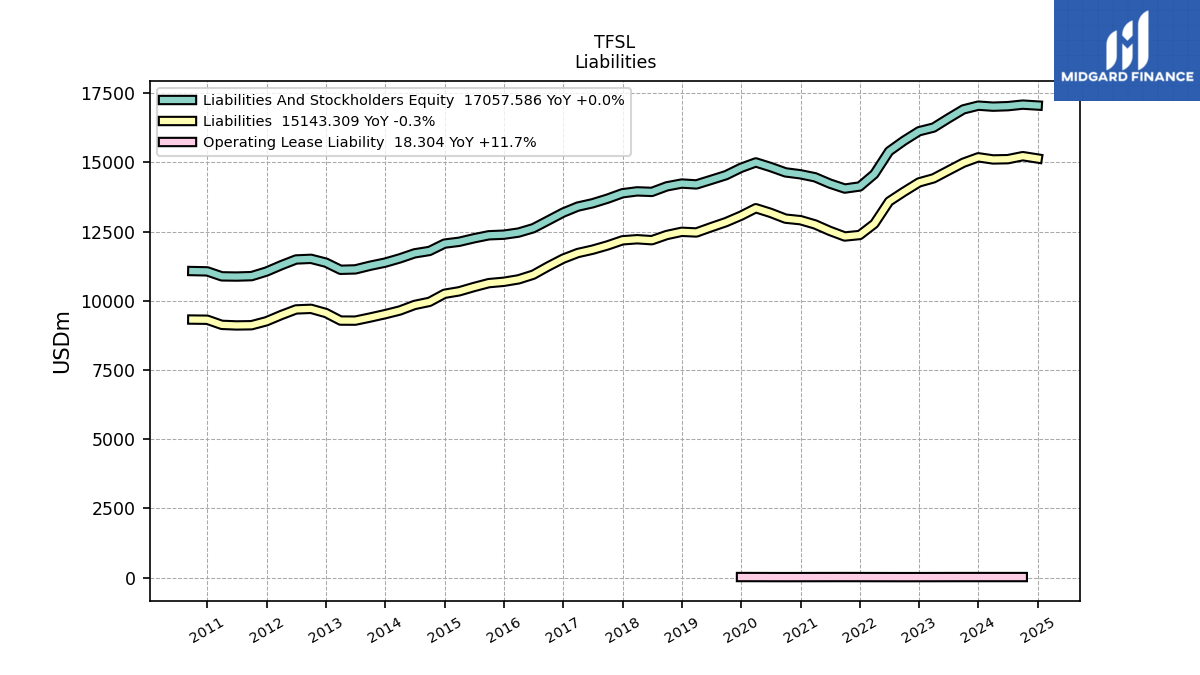
| Liabilities | 14990.62 | 14708.86 | 14427.20 | 14279.39 | 13945.54 | 13592.16 | 12785.14 | 12379.14 | 12325.17 | 12526.99 | 12761.31 | 12915.00 | 12970.37 | 13179.27 | 13347.18 | 13077.24 | 12845.60 | 12661.26 | 12470.64 | 12494.90 | 12378.93 | 12191.30 | 12226.23 | 12187.20 | 12002.60 | 11847.95 | 11727.80 | 11524.54 | 11245.60 | 10945.35 | 10776.16 | 10688.19 | 10639.52 | 10498.23 | 10343.27 | 10255.15 | 9963.74 | 9851.15 | 9650.31 | 9519.01 | 9397.87 | 9284.61 | 9286.38 | 9559.58 | 9711.27 | 9689.56 | 9486.97 | 9262.17 | 9119.02 | 9111.15 | 9132.08 | 9317.10 | 9323.13 | |
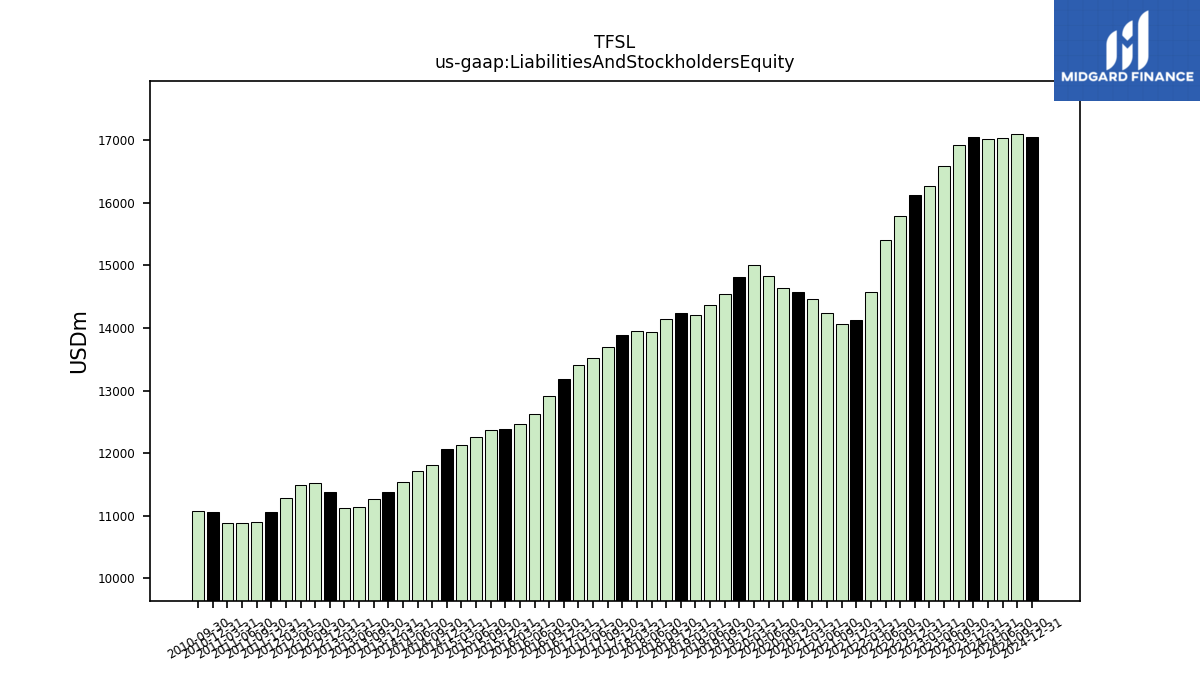
| Liabilities And Stockholders Equity | 16917.98 | 16594.99 | 16261.68 | 16128.98 | 15789.88 | 15405.21 | 14580.89 | 14132.51 | 14057.45 | 14236.70 | 14464.78 | 14572.83 | 14642.22 | 14834.74 | 15002.34 | 14806.19 | 14542.36 | 14371.74 | 14206.63 | 14238.68 | 14137.33 | 13936.59 | 13956.03 | 13887.88 | 13692.56 | 13525.58 | 13406.19 | 13189.88 | 12906.06 | 12624.35 | 12466.57 | 12390.64 | 12368.89 | 12259.51 | 12133.69 | 12067.84 | 11803.19 | 11716.02 | 11534.44 | 11381.45 | 11269.35 | 11136.54 | 11121.76 | 11379.63 | 11518.12 | 11495.00 | 11286.77 | 11058.13 | 10892.95 | 10877.54 | 10885.06 | 11064.67 | 11076.03 | |
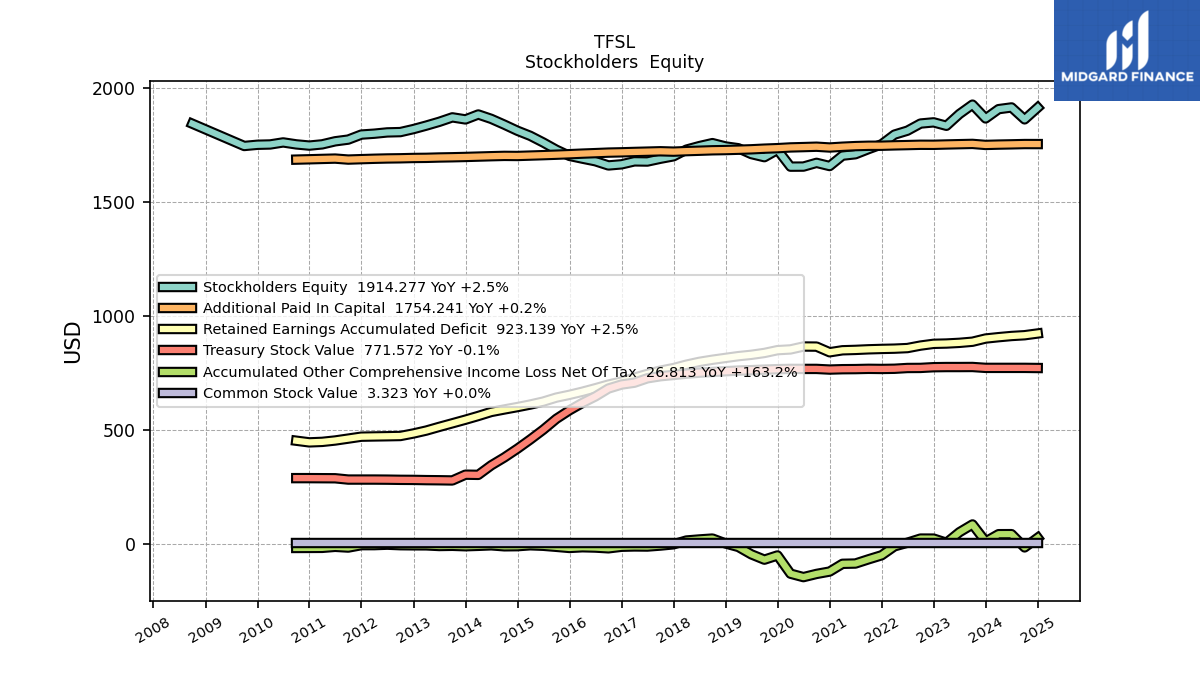
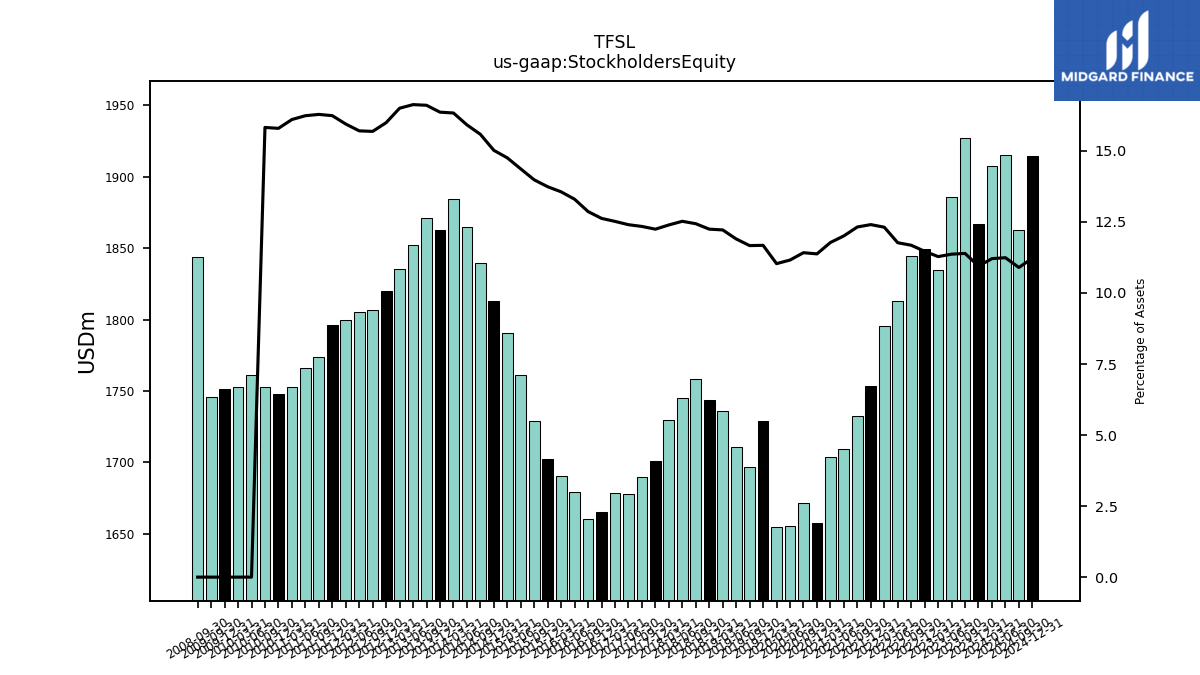
| Stockholders Equity | 1927.36 | 1886.12 | 1834.48 | 1849.59 | 1844.34 | 1813.05 | 1795.75 | 1753.37 | 1732.28 | 1709.72 | 1703.47 | 1657.83 | 1671.85 | 1655.48 | 1655.16 | 1728.95 | 1696.75 | 1710.48 | 1735.98 | 1743.78 | 1758.40 | 1745.29 | 1729.80 | 1700.68 | 1689.96 | 1677.62 | 1678.39 | 1665.33 | 1660.46 | 1679.00 | 1690.41 | 1702.44 | 1729.37 | 1761.28 | 1790.43 | 1812.69 | 1839.46 | 1864.86 | 1884.13 | 1862.44 | 1871.48 | 1851.93 | 1835.38 | 1820.04 | 1806.85 | 1805.44 | 1799.80 | 1795.96 | 1773.92 | 1766.39 | 1752.98 | 1747.58 | 1752.90 |
| 2023-09-30 | 2023-06-30 | 2023-03-31 | 2022-12-31 | 2022-09-30 | 2022-06-30 | 2022-03-31 | 2021-12-31 | 2021-09-30 | 2021-06-30 | 2021-03-31 | 2020-12-31 | 2020-09-30 | 2020-06-30 | 2020-03-31 | 2019-12-31 | 2019-09-30 | 2019-06-30 | 2019-03-31 | 2018-12-31 | 2018-09-30 | 2018-06-30 | 2018-03-31 | 2017-12-31 | 2017-09-30 | 2017-06-30 | 2017-03-31 | 2016-12-31 | 2016-09-30 | 2016-06-30 | 2016-03-31 | 2015-12-31 | 2015-09-30 | 2015-06-30 | 2015-03-31 | 2014-12-31 | 2014-09-30 | 2014-06-30 | 2014-03-31 | 2013-12-31 | 2013-09-30 | 2013-06-30 | 2013-03-31 | 2012-12-31 | 2012-09-30 | 2012-06-30 | 2012-03-31 | 2011-12-31 | 2011-09-30 | 2011-06-30 | 2011-03-31 | 2010-12-31 | 2010-09-30 | ||
|---|---|---|---|---|---|---|---|---|---|---|---|---|---|---|---|---|---|---|---|---|---|---|---|---|---|---|---|---|---|---|---|---|---|---|---|---|---|---|---|---|---|---|---|---|---|---|---|---|---|---|---|---|---|---|
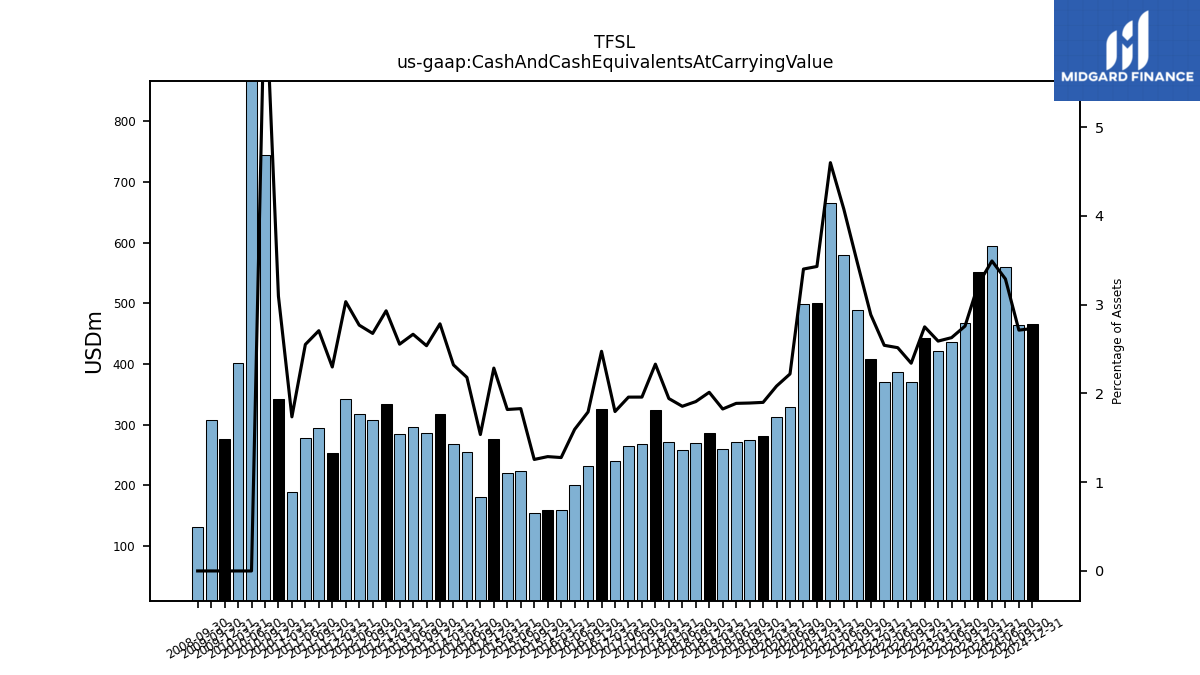
| Cash And Cash Equivalents At Carrying Value | 466.75 | 436.21 | 421.13 | 443.58 | 369.56 | 387.53 | 370.67 | 408.01 | 488.33 | 580.14 | 665.40 | 499.92 | 498.03 | 329.28 | 312.48 | 281.23 | 275.14 | 271.35 | 259.24 | 286.62 | 269.77 | 258.55 | 271.09 | 323.56 | 268.22 | 264.90 | 240.76 | 326.41 | 231.24 | 201.31 | 159.28 | 159.62 | 155.37 | 224.20 | 220.74 | 275.82 | 181.40 | 255.51 | 267.80 | 316.91 | 286.00 | 296.98 | 284.15 | 333.55 | 308.26 | 318.35 | 342.42 | 254.12 | 294.85 | 277.57 | 188.99 | 342.49 | 743.74 | |
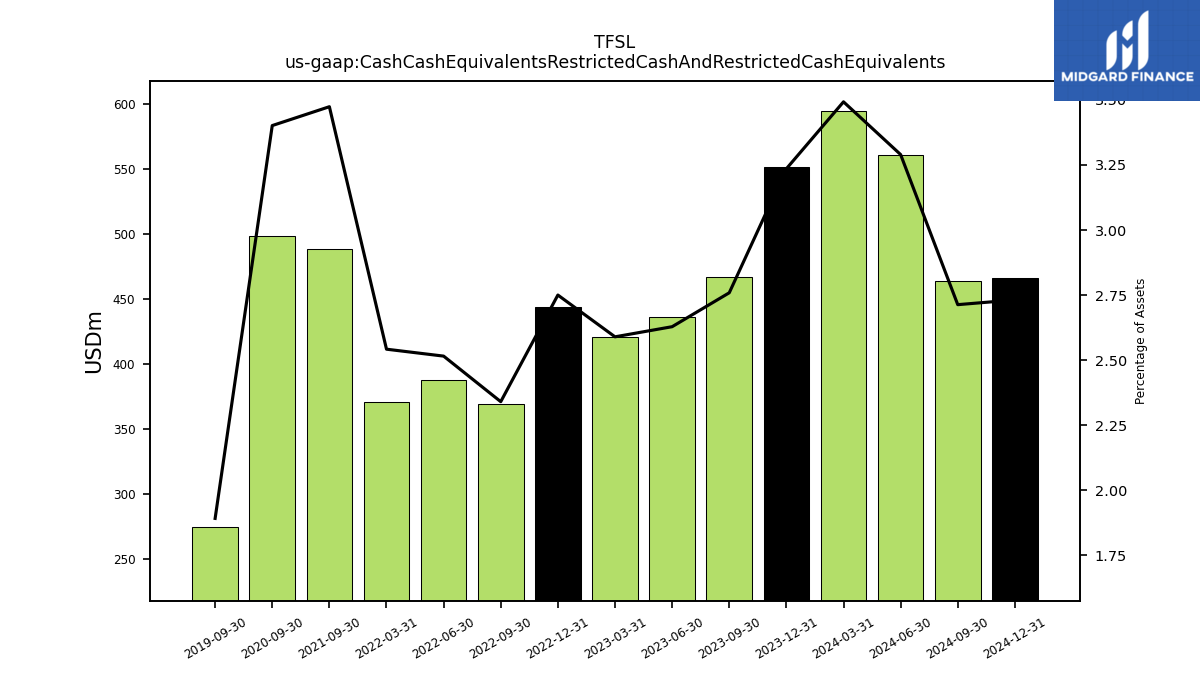
| Cash Cash Equivalents Restricted Cash And Restricted Cash Equivalents | 466.75 | 436.21 | 421.13 | NA | 369.56 | 387.53 | 370.67 | NA | 488.33 | NA | NA | NA | 498.03 | NA | NA | NA | 275.14 | NA | NA | NA | NA | NA | NA | NA | NA | NA | NA | NA | NA | NA | NA | NA | NA | NA | NA | NA | NA | NA | NA | NA | NA | NA | NA | NA | NA | NA | NA | NA | NA | NA | NA | NA | NA | |
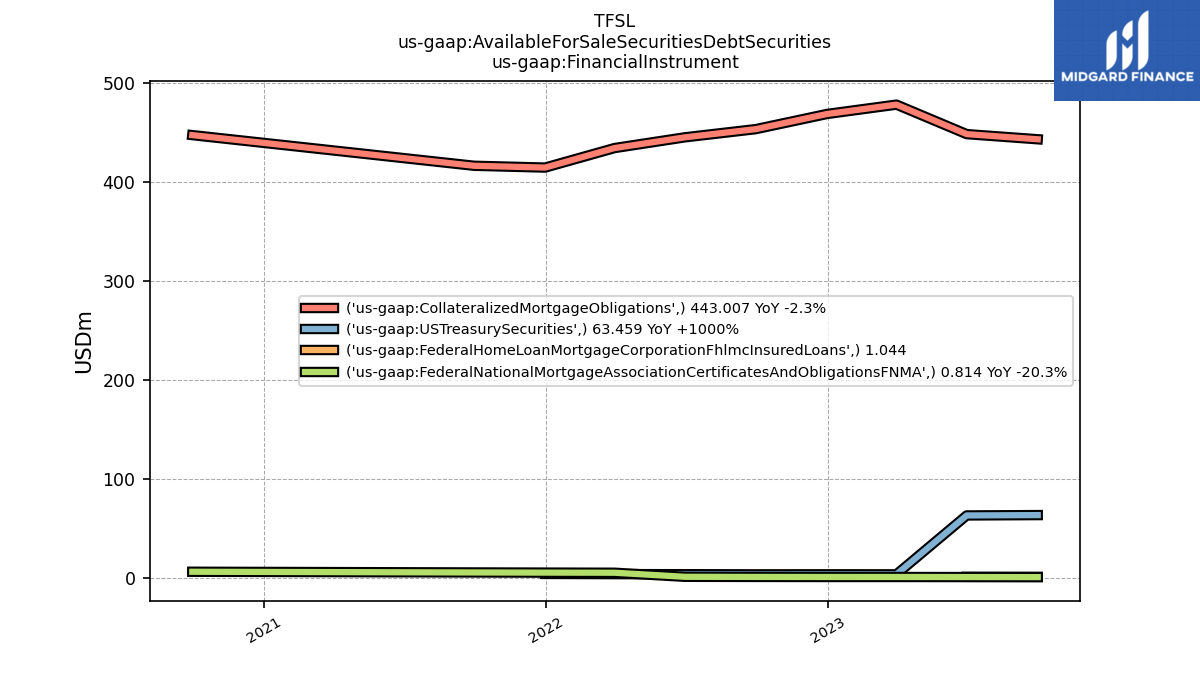
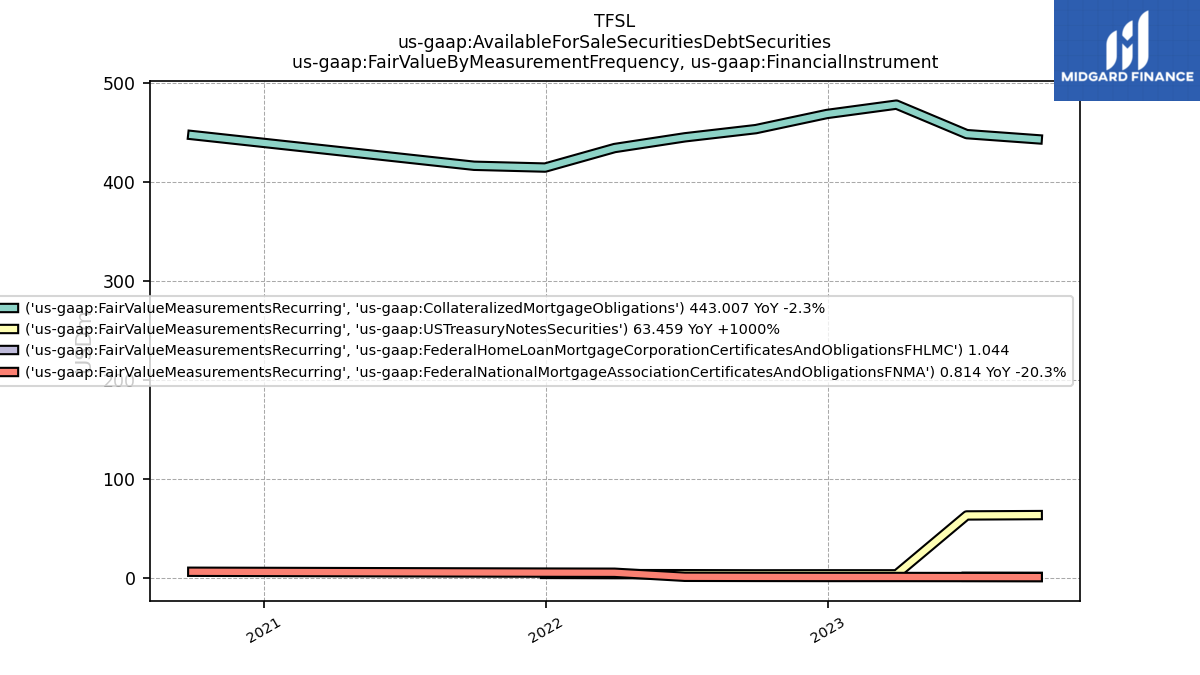
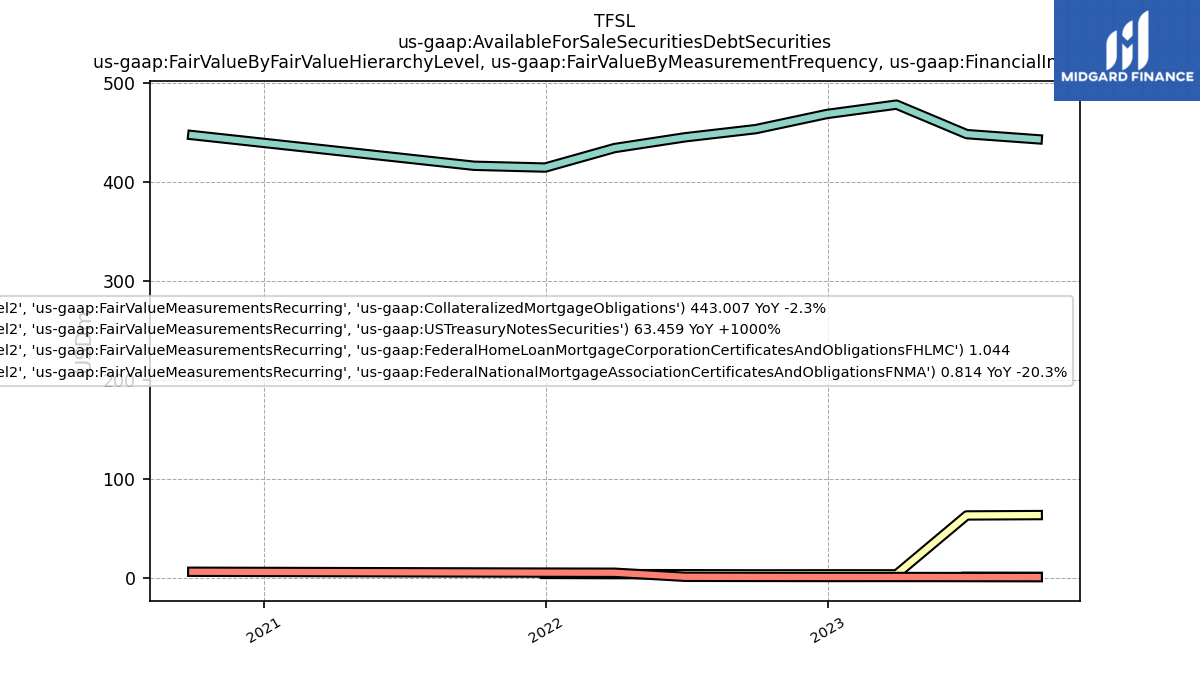
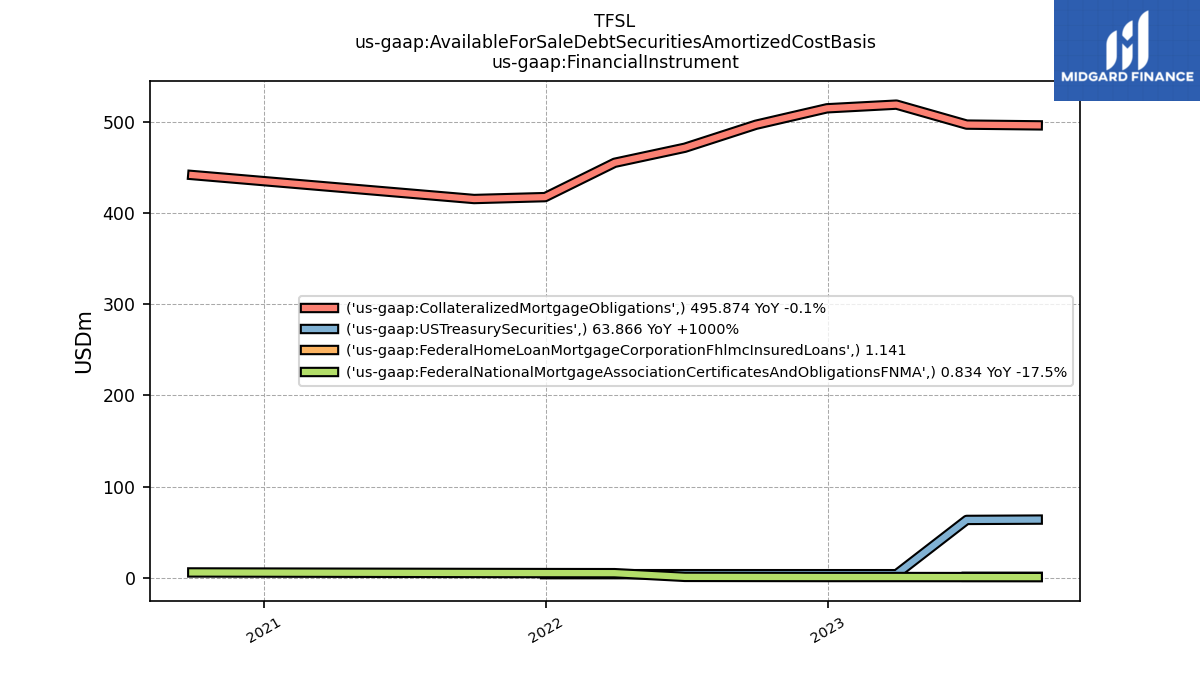
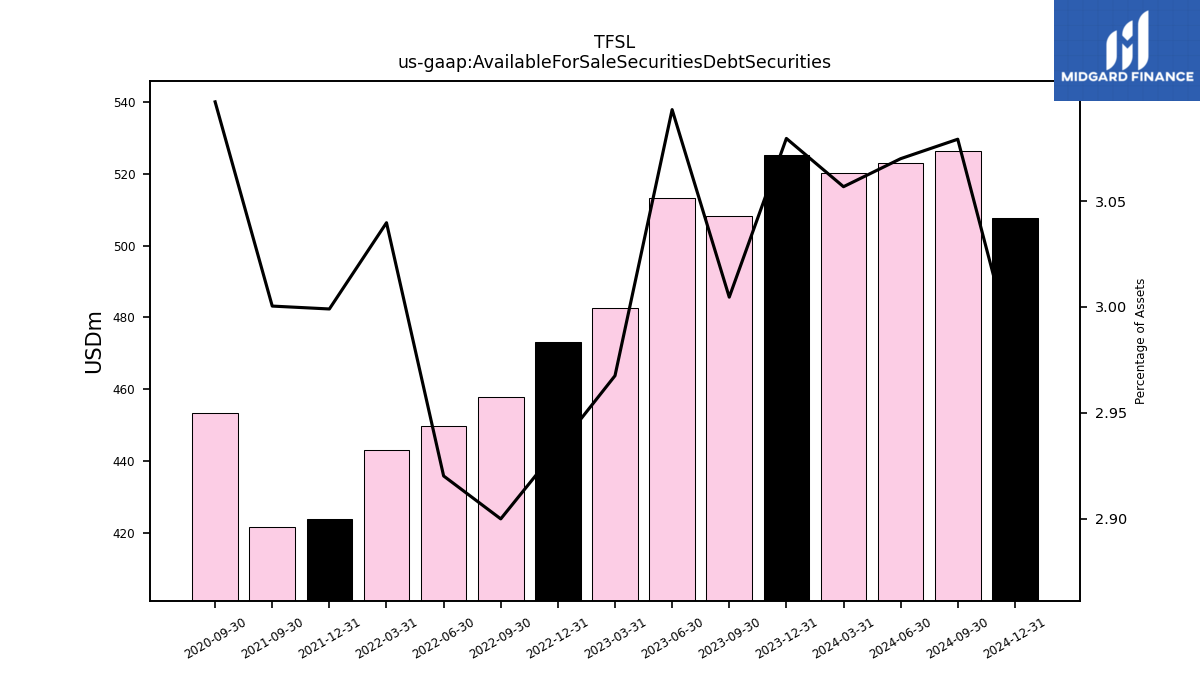
| Available For Sale Securities Debt Securities | 508.32 | 513.30 | 482.58 | 473.13 | 457.91 | 449.87 | 443.22 | 423.84 | 421.78 | NA | NA | NA | 453.44 | NA | NA | NA | NA | NA | NA | NA | NA | NA | NA | NA | NA | NA | NA | NA | NA | NA | NA | NA | NA | NA | NA | NA | NA | NA | NA | NA | NA | NA | NA | NA | NA | NA | NA | NA | NA | NA | NA | NA | NA |
| 2023-09-30 | 2023-06-30 | 2023-03-31 | 2022-12-31 | 2022-09-30 | 2022-06-30 | 2022-03-31 | 2021-12-31 | 2021-09-30 | 2021-06-30 | 2021-03-31 | 2020-12-31 | 2020-09-30 | 2020-06-30 | 2020-03-31 | 2019-12-31 | 2019-09-30 | 2019-06-30 | 2019-03-31 | 2018-12-31 | 2018-09-30 | 2018-06-30 | 2018-03-31 | 2017-12-31 | 2017-09-30 | 2017-06-30 | 2017-03-31 | 2016-12-31 | 2016-09-30 | 2016-06-30 | 2016-03-31 | 2015-12-31 | 2015-09-30 | 2015-06-30 | 2015-03-31 | 2014-12-31 | 2014-09-30 | 2014-06-30 | 2014-03-31 | 2013-12-31 | 2013-09-30 | 2013-06-30 | 2013-03-31 | 2012-12-31 | 2012-09-30 | 2012-06-30 | 2012-03-31 | 2011-12-31 | 2011-09-30 | 2011-06-30 | 2011-03-31 | 2010-12-31 | 2010-09-30 | ||
|---|---|---|---|---|---|---|---|---|---|---|---|---|---|---|---|---|---|---|---|---|---|---|---|---|---|---|---|---|---|---|---|---|---|---|---|---|---|---|---|---|---|---|---|---|---|---|---|---|---|---|---|---|---|---|
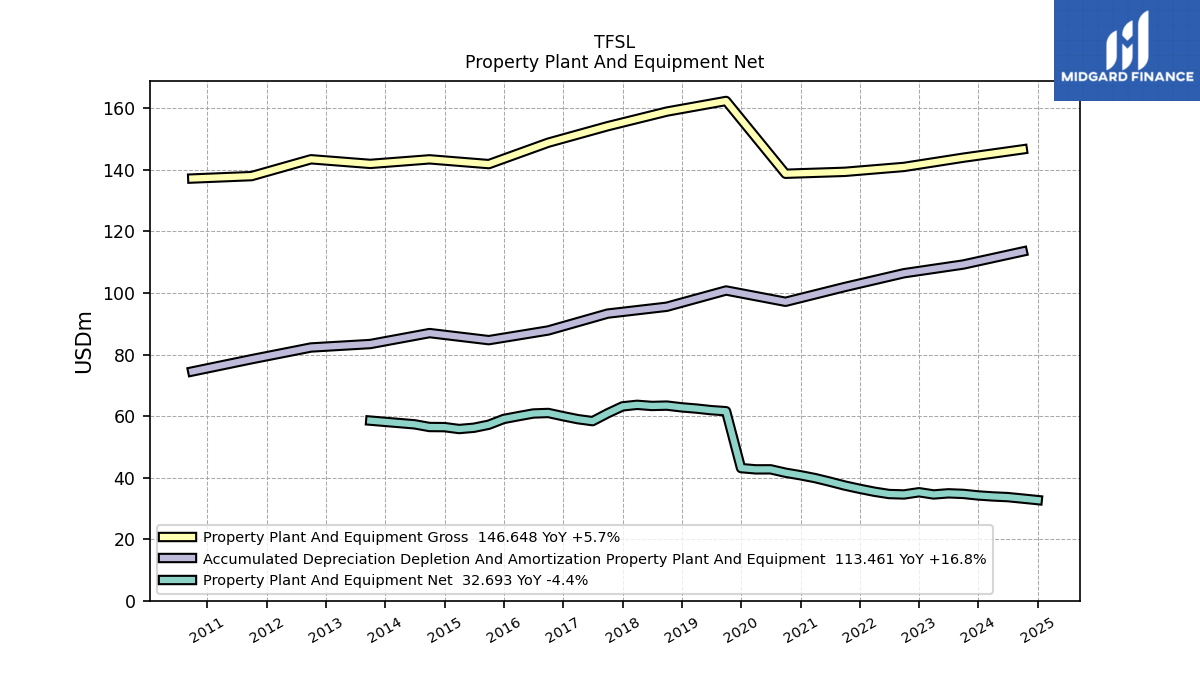
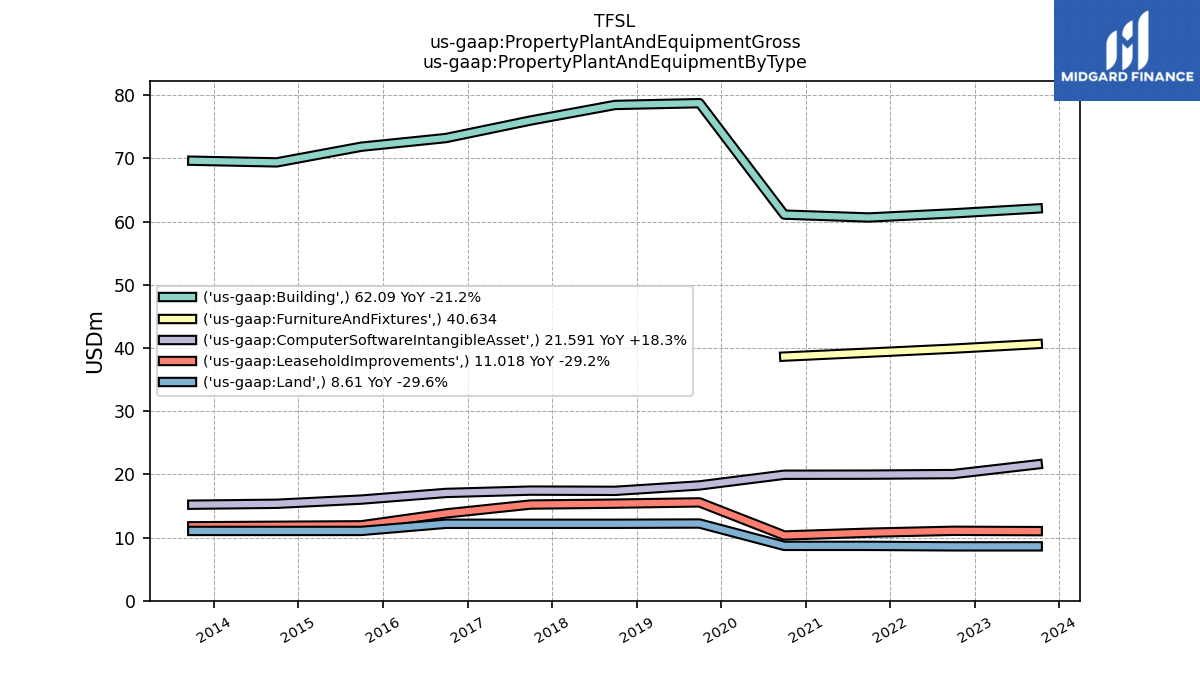
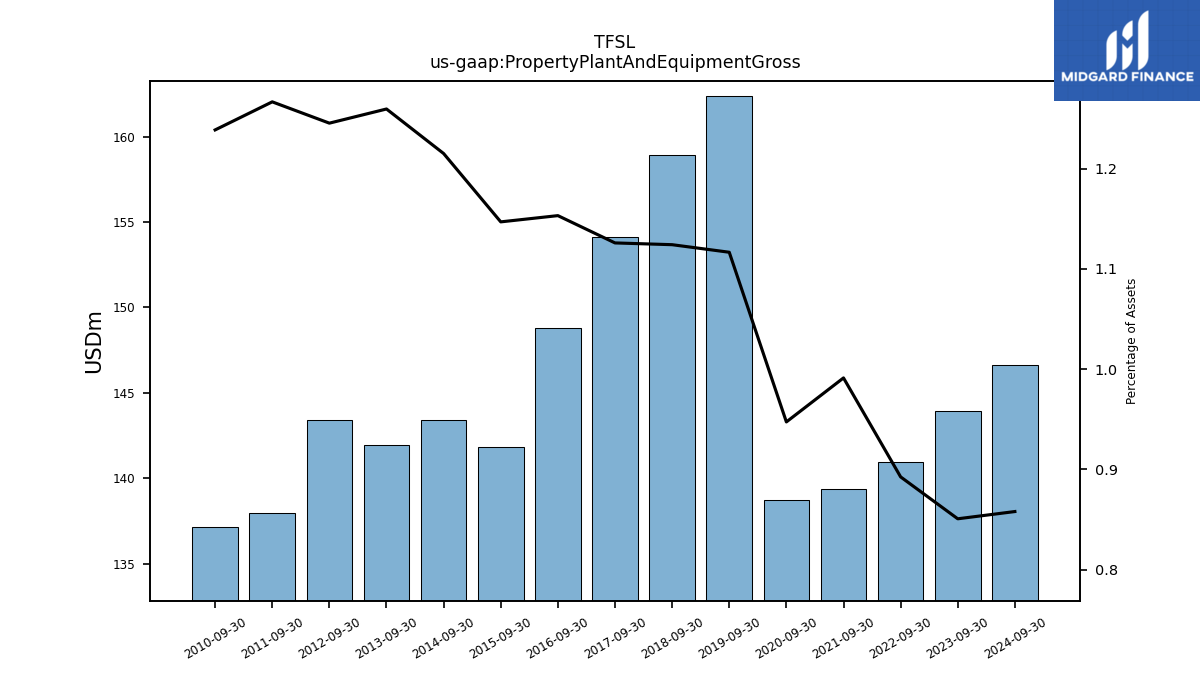
| Property Plant And Equipment Gross | 143.94 | NA | NA | NA | 140.94 | NA | NA | NA | 139.34 | NA | NA | NA | 138.72 | NA | NA | NA | 162.37 | NA | NA | NA | 158.91 | NA | NA | NA | 154.16 | NA | NA | NA | 148.81 | NA | NA | NA | 141.85 | NA | NA | NA | 143.40 | NA | NA | NA | 141.92 | NA | NA | NA | 143.43 | NA | NA | NA | 137.96 | NA | NA | NA | 137.17 | |
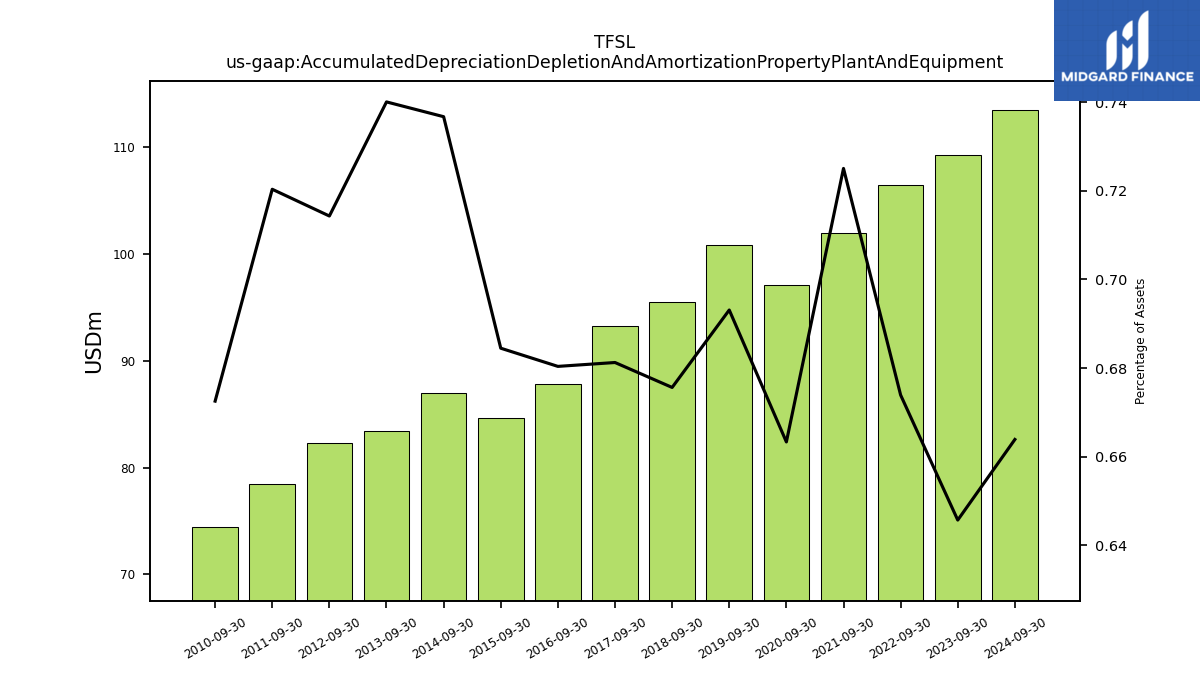
| Accumulated Depreciation Depletion And Amortization Property Plant And Equipment | 109.23 | NA | NA | NA | 106.41 | NA | NA | NA | 101.92 | NA | NA | NA | 97.12 | NA | NA | NA | 100.79 | NA | NA | NA | 95.51 | NA | NA | NA | 93.28 | NA | NA | NA | 87.81 | NA | NA | NA | 84.66 | NA | NA | NA | 86.96 | NA | NA | NA | 83.40 | NA | NA | NA | 82.28 | NA | NA | NA | 78.47 | NA | NA | NA | 74.49 | |
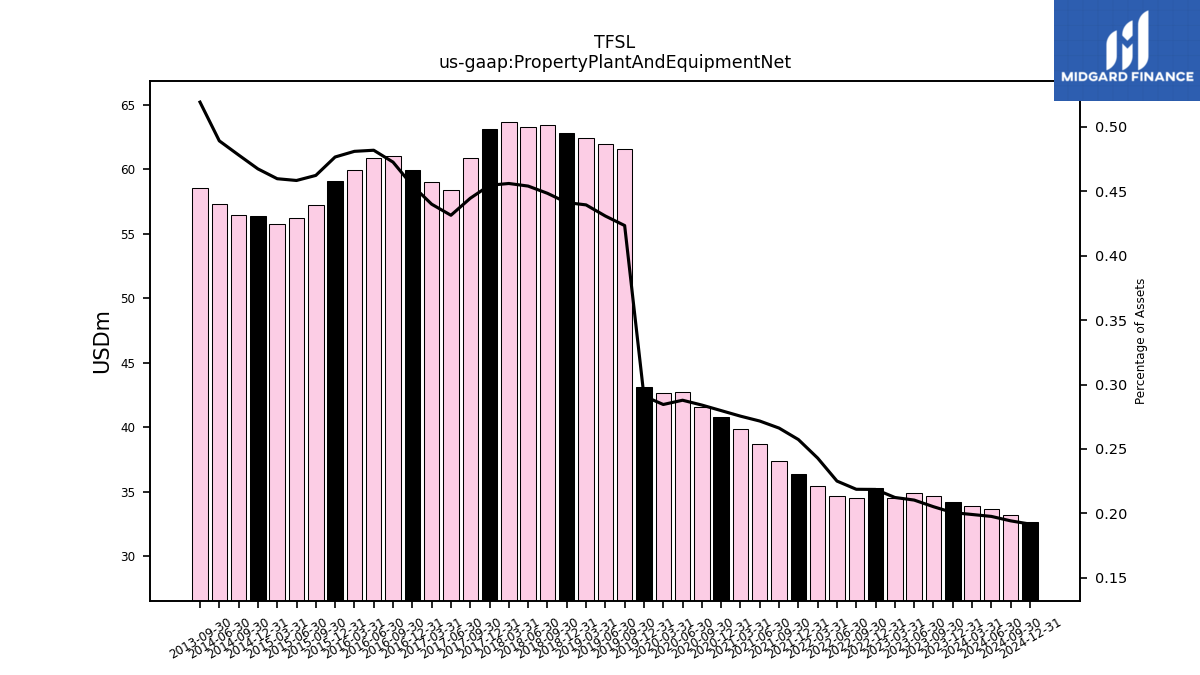
| Property Plant And Equipment Net | 34.71 | 34.90 | 34.53 | 35.25 | 34.53 | 34.67 | 35.42 | 36.36 | 37.42 | 38.68 | 39.84 | 40.77 | 41.59 | 42.70 | 42.68 | 43.09 | 61.58 | 61.92 | 62.43 | 62.83 | 63.40 | 63.28 | 63.65 | 63.14 | 60.88 | 58.35 | 58.99 | 59.95 | 61.00 | 60.84 | 59.97 | 59.06 | 57.19 | 56.20 | 55.79 | 56.41 | 56.44 | 57.31 | NA | NA | 58.52 | NA | NA | NA | NA | NA | NA | NA | NA | NA | NA | NA | NA | |
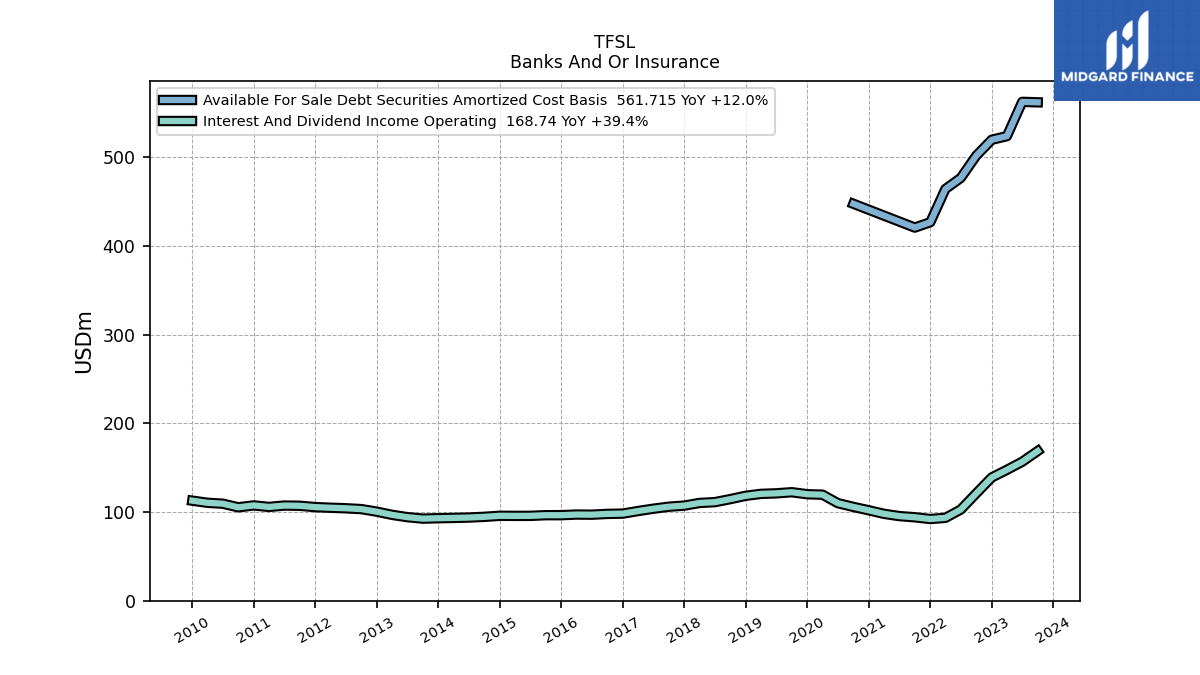
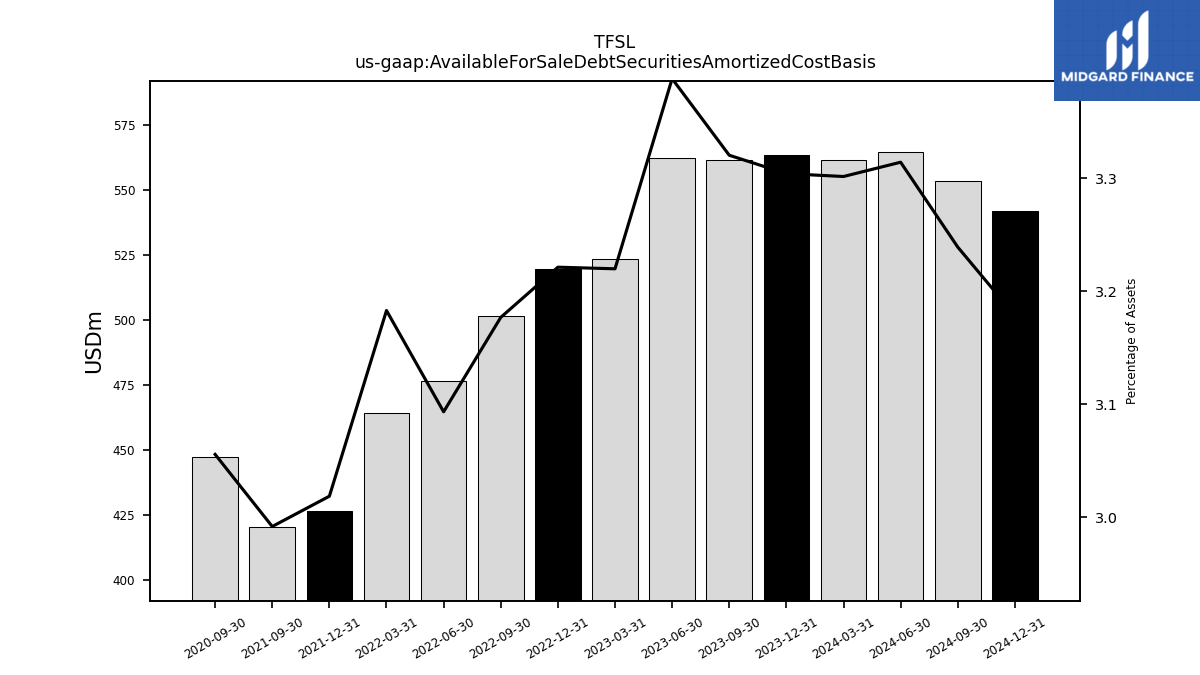
| Available For Sale Debt Securities Amortized Cost Basis | 561.72 | 562.24 | 523.58 | 519.54 | 501.60 | 476.50 | 464.08 | 426.58 | 420.54 | NA | NA | NA | 447.38 | NA | NA | NA | NA | NA | NA | NA | NA | NA | NA | NA | NA | NA | NA | NA | NA | NA | NA | NA | NA | NA | NA | NA | NA | NA | NA | NA | NA | NA | NA | NA | NA | NA | NA | NA | NA | NA | NA | NA | NA |
| 2023-09-30 | 2023-06-30 | 2023-03-31 | 2022-12-31 | 2022-09-30 | 2022-06-30 | 2022-03-31 | 2021-12-31 | 2021-09-30 | 2021-06-30 | 2021-03-31 | 2020-12-31 | 2020-09-30 | 2020-06-30 | 2020-03-31 | 2019-12-31 | 2019-09-30 | 2019-06-30 | 2019-03-31 | 2018-12-31 | 2018-09-30 | 2018-06-30 | 2018-03-31 | 2017-12-31 | 2017-09-30 | 2017-06-30 | 2017-03-31 | 2016-12-31 | 2016-09-30 | 2016-06-30 | 2016-03-31 | 2015-12-31 | 2015-09-30 | 2015-06-30 | 2015-03-31 | 2014-12-31 | 2014-09-30 | 2014-06-30 | 2014-03-31 | 2013-12-31 | 2013-09-30 | 2013-06-30 | 2013-03-31 | 2012-12-31 | 2012-09-30 | 2012-06-30 | 2012-03-31 | 2011-12-31 | 2011-09-30 | 2011-06-30 | 2011-03-31 | 2010-12-31 | 2010-09-30 | ||
|---|---|---|---|---|---|---|---|---|---|---|---|---|---|---|---|---|---|---|---|---|---|---|---|---|---|---|---|---|---|---|---|---|---|---|---|---|---|---|---|---|---|---|---|---|---|---|---|---|---|---|---|---|---|---|
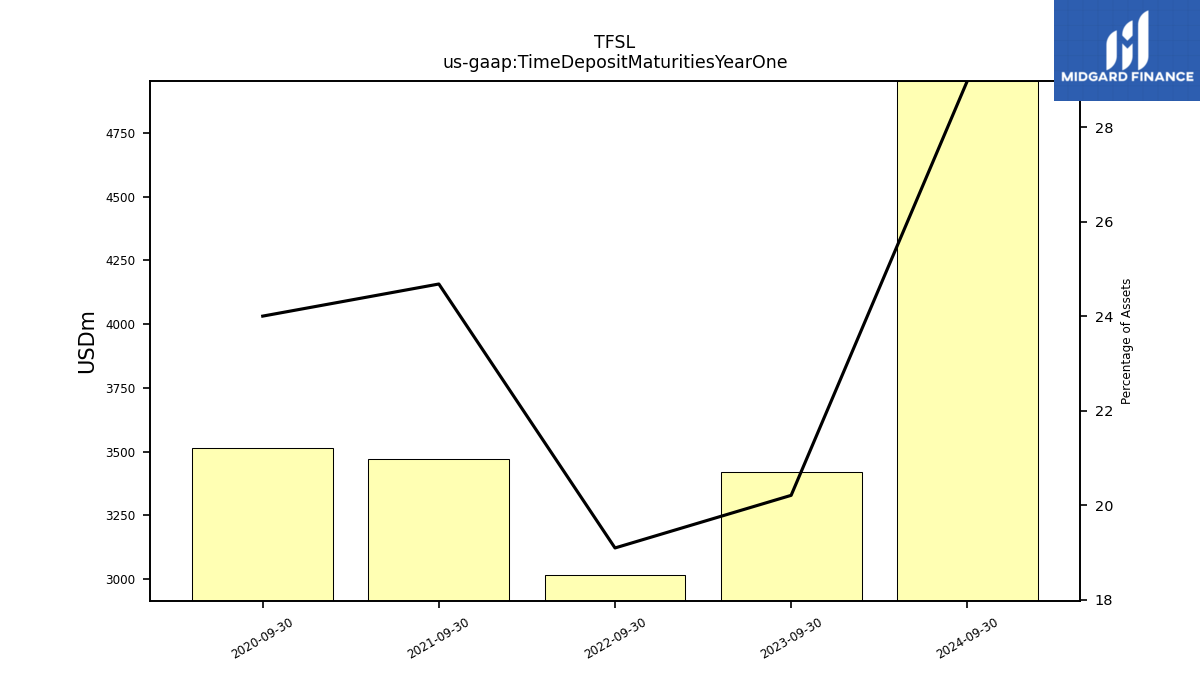
| Time Deposit Maturities Year One | 3419.35 | NA | NA | NA | 3015.51 | NA | NA | NA | 3469.93 | NA | NA | NA | 3514.80 | NA | NA | NA | NA | NA | NA | NA | NA | NA | NA | NA | NA | NA | NA | NA | NA | NA | NA | NA | NA | NA | NA | NA | NA | NA | NA | NA | NA | NA | NA | NA | NA | NA | NA | NA | NA | NA | NA | NA | NA |
| 2023-09-30 | 2023-06-30 | 2023-03-31 | 2022-12-31 | 2022-09-30 | 2022-06-30 | 2022-03-31 | 2021-12-31 | 2021-09-30 | 2021-06-30 | 2021-03-31 | 2020-12-31 | 2020-09-30 | 2020-06-30 | 2020-03-31 | 2019-12-31 | 2019-09-30 | 2019-06-30 | 2019-03-31 | 2018-12-31 | 2018-09-30 | 2018-06-30 | 2018-03-31 | 2017-12-31 | 2017-09-30 | 2017-06-30 | 2017-03-31 | 2016-12-31 | 2016-09-30 | 2016-06-30 | 2016-03-31 | 2015-12-31 | 2015-09-30 | 2015-06-30 | 2015-03-31 | 2014-12-31 | 2014-09-30 | 2014-06-30 | 2014-03-31 | 2013-12-31 | 2013-09-30 | 2013-06-30 | 2013-03-31 | 2012-12-31 | 2012-09-30 | 2012-06-30 | 2012-03-31 | 2011-12-31 | 2011-09-30 | 2011-06-30 | 2011-03-31 | 2010-12-31 | 2010-09-30 | ||
|---|---|---|---|---|---|---|---|---|---|---|---|---|---|---|---|---|---|---|---|---|---|---|---|---|---|---|---|---|---|---|---|---|---|---|---|---|---|---|---|---|---|---|---|---|---|---|---|---|---|---|---|---|---|---|
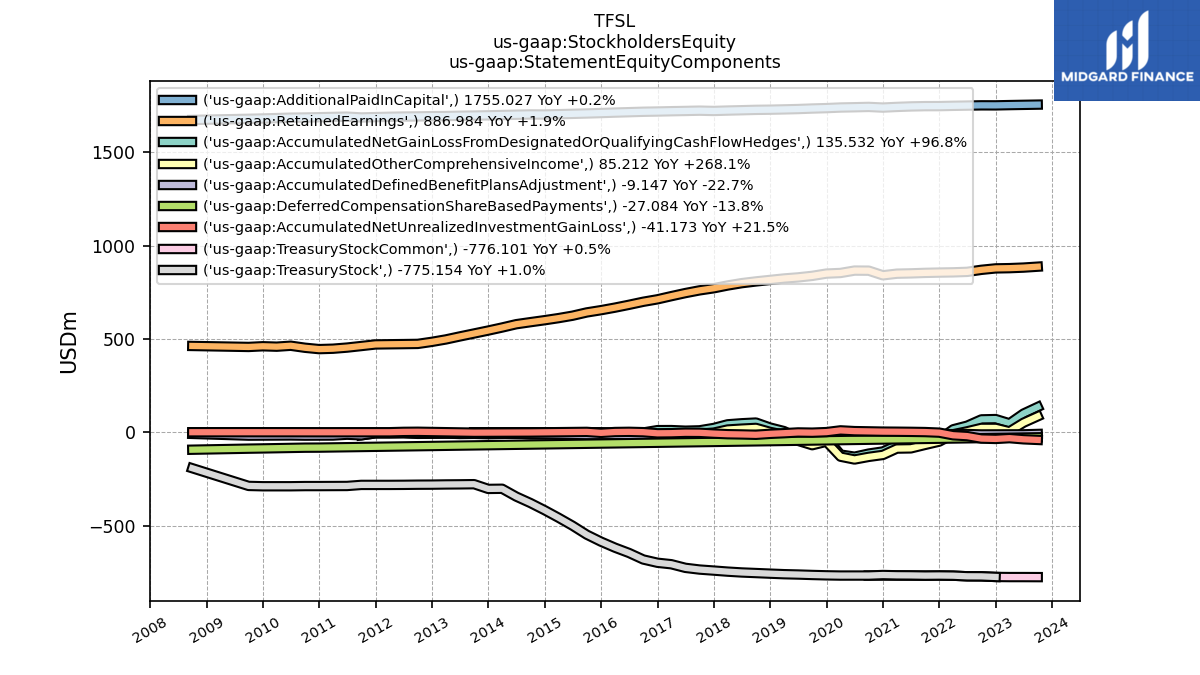
| Stockholders Equity | 1927.36 | 1886.12 | 1834.48 | 1849.59 | 1844.34 | 1813.05 | 1795.75 | 1753.37 | 1732.28 | 1709.72 | 1703.47 | 1657.83 | 1671.85 | 1655.48 | 1655.16 | 1728.95 | 1696.75 | 1710.48 | 1735.98 | 1743.78 | 1758.40 | 1745.29 | 1729.80 | 1700.68 | 1689.96 | 1677.62 | 1678.39 | 1665.33 | 1660.46 | 1679.00 | 1690.41 | 1702.44 | 1729.37 | 1761.28 | 1790.43 | 1812.69 | 1839.46 | 1864.86 | 1884.13 | 1862.44 | 1871.48 | 1851.93 | 1835.38 | 1820.04 | 1806.85 | 1805.44 | 1799.80 | 1795.96 | 1773.92 | 1766.39 | 1752.98 | 1747.58 | 1752.90 | |
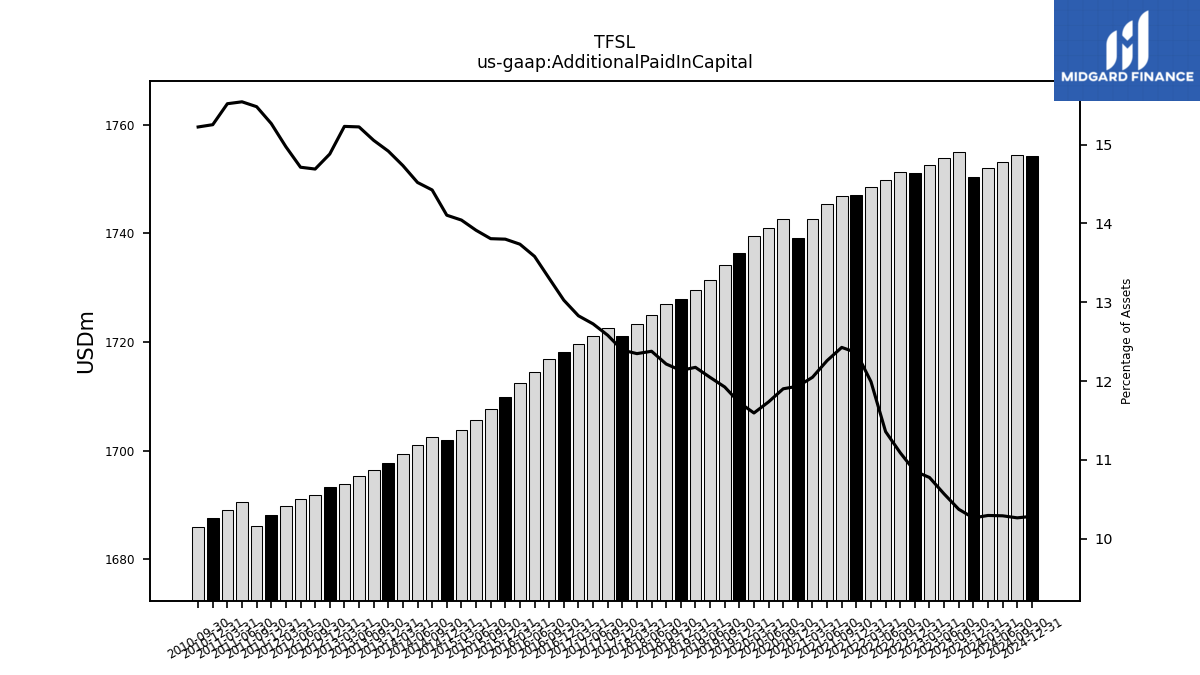
| Additional Paid In Capital | 1755.03 | 1753.80 | 1752.51 | 1751.02 | 1751.22 | 1749.82 | 1748.59 | 1746.99 | 1746.89 | 1745.34 | 1742.68 | 1739.18 | 1742.71 | 1741.00 | 1739.52 | 1736.32 | 1734.15 | 1731.33 | 1729.50 | 1727.91 | 1726.99 | 1725.05 | 1723.25 | 1721.07 | 1722.67 | 1721.15 | 1719.72 | 1718.09 | 1716.82 | 1714.52 | 1712.38 | 1709.87 | 1707.63 | 1705.60 | 1703.79 | 1701.98 | 1702.44 | 1701.00 | 1699.33 | 1697.70 | 1696.37 | 1695.36 | 1693.82 | 1693.24 | 1691.88 | 1691.14 | 1689.81 | 1688.10 | 1686.22 | 1690.56 | 1689.09 | 1687.54 | 1686.06 | |
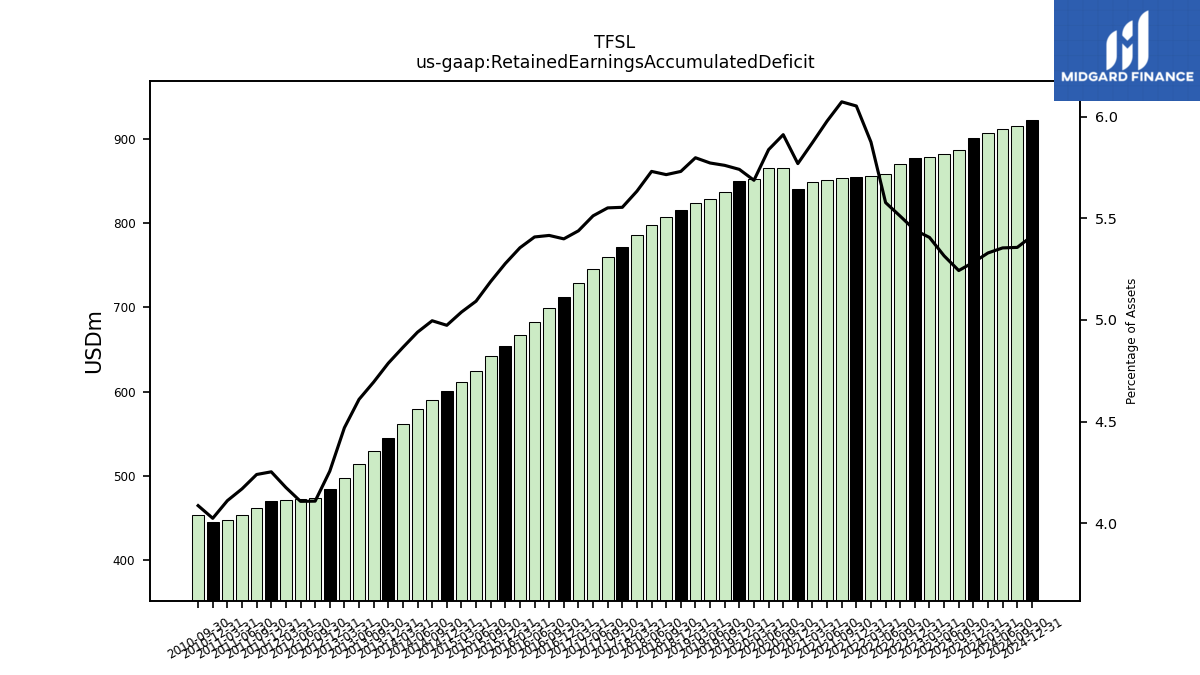
| Retained Earnings Accumulated Deficit | 886.98 | 882.03 | 879.05 | 877.71 | 870.05 | 859.14 | 856.55 | 855.32 | 853.66 | 851.07 | 849.39 | 840.68 | 865.51 | 865.97 | 853.15 | 849.93 | 837.66 | 829.51 | 823.64 | 815.92 | 807.89 | 798.63 | 786.17 | 771.32 | 760.07 | 745.51 | 729.06 | 712.08 | 698.93 | 682.73 | 667.56 | 653.89 | 641.79 | 624.26 | 611.34 | 600.20 | 589.68 | 578.74 | 561.13 | 544.85 | 529.02 | 513.31 | 497.11 | 484.31 | 473.25 | 472.19 | 471.32 | 470.30 | 461.84 | 453.50 | 447.50 | 445.29 | 452.63 | |
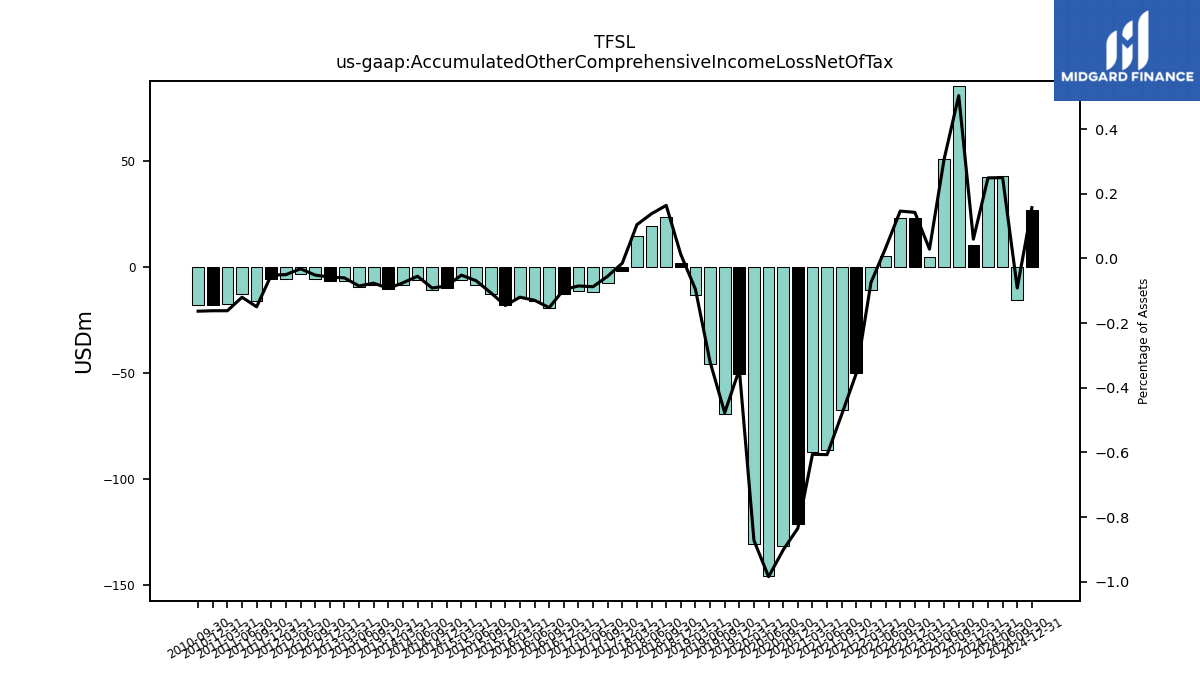
| Accumulated Other Comprehensive Income Loss Net Of Tax | 85.21 | 50.98 | 4.70 | 23.02 | 23.15 | 4.95 | -10.83 | -50.14 | -67.80 | -86.37 | -87.60 | -121.57 | -131.97 | -145.99 | -130.86 | -50.80 | -69.38 | -45.98 | -13.53 | 1.76 | 23.22 | 19.30 | 14.61 | -1.99 | -7.49 | -11.80 | -11.39 | -12.69 | -19.63 | -16.31 | -14.92 | -18.01 | -13.06 | -8.41 | -6.24 | -10.23 | -10.79 | -6.44 | -8.68 | -10.50 | -8.60 | -9.47 | -6.66 | -6.54 | -5.92 | -3.65 | -5.64 | -5.67 | -16.28 | -13.04 | -17.59 | -17.88 | -18.06 | |
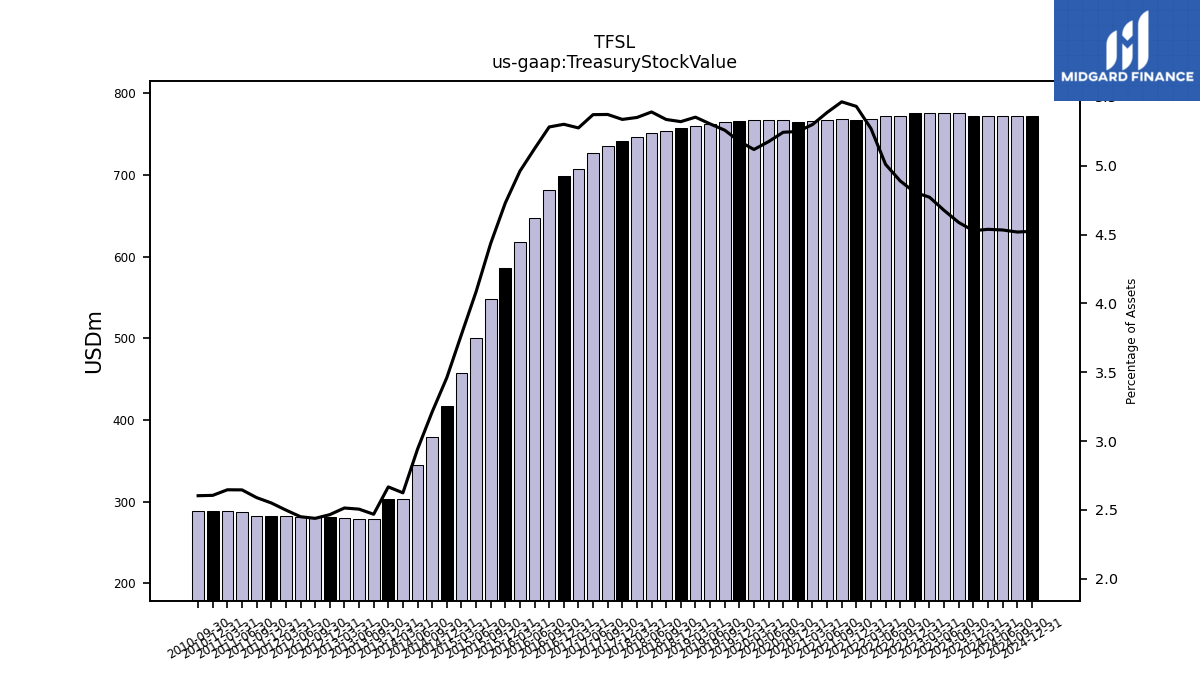
| Treasury Stock Value | NA | 775.85 | 775.85 | 775.15 | 771.99 | 771.68 | 768.30 | 767.46 | 768.03 | 766.82 | 766.41 | 764.77 | 767.65 | 767.65 | 767.72 | 766.49 | 764.59 | 762.20 | 760.37 | 757.46 | 754.27 | 751.17 | 746.64 | 741.03 | 735.53 | 726.40 | 707.07 | 699.13 | 681.57 | 646.76 | 618.36 | 585.96 | 548.56 | 500.67 | 457.86 | 417.58 | 379.11 | 344.59 | 302.72 | 303.60 | 278.21 | 279.09 | 279.63 | 280.62 | 280.94 | 281.73 | 282.09 | 282.09 | 282.09 | 287.80 | 288.08 | 288.35 | 288.37 | |
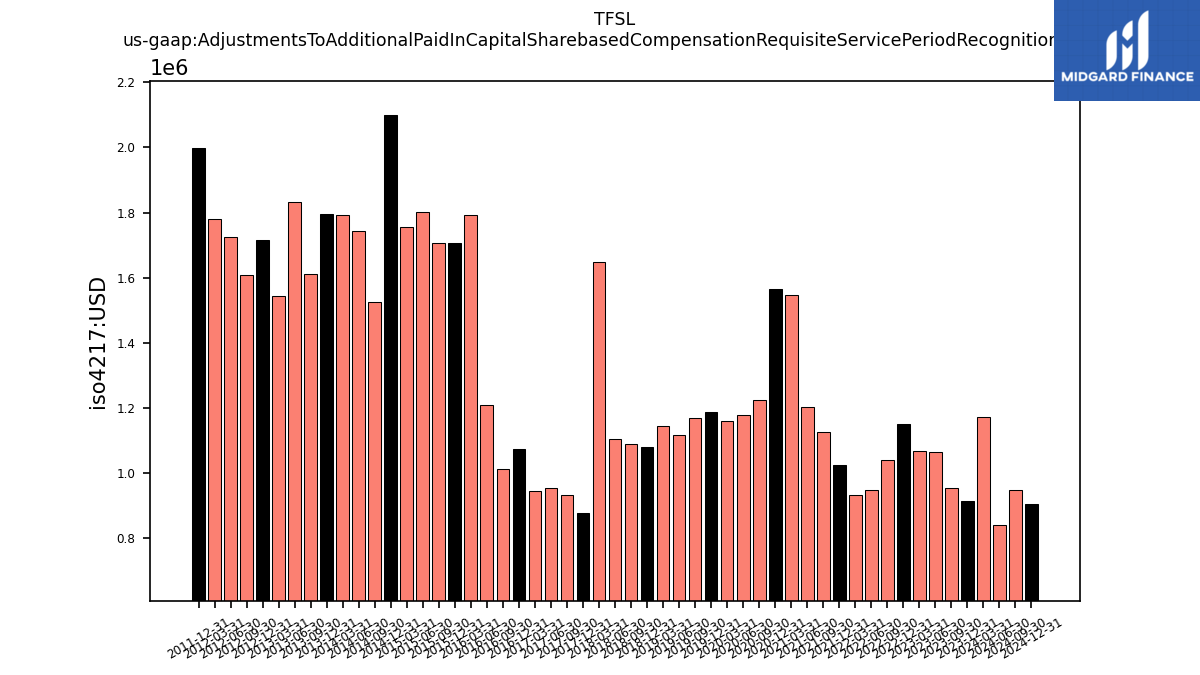
| Adjustments To Additional Paid In Capital Sharebased Compensation Requisite Service Period Recognition Value | 0.96 | 1.06 | 1.07 | 1.15 | 1.04 | 0.95 | 0.93 | 1.03 | 1.13 | 1.20 | 1.55 | 1.57 | 1.22 | 1.18 | 1.16 | 1.19 | 1.17 | 1.12 | 1.15 | 1.08 | 1.09 | 1.10 | 1.65 | 0.88 | 0.93 | 0.96 | 0.94 | 1.07 | 1.01 | 1.21 | 1.79 | 1.71 | 1.71 | 1.80 | 1.75 | 2.10 | 1.53 | 1.74 | 1.79 | 1.80 | 1.61 | 1.83 | 1.54 | 1.72 | 1.61 | 1.73 | 1.78 | 2.00 | NA | NA | NA | NA | NA |
| 2023-09-30 | 2023-06-30 | 2023-03-31 | 2022-12-31 | 2022-09-30 | 2022-06-30 | 2022-03-31 | 2021-12-31 | 2021-09-30 | 2021-06-30 | 2021-03-31 | 2020-12-31 | 2020-09-30 | 2020-06-30 | 2020-03-31 | 2019-12-31 | 2019-09-30 | 2019-06-30 | 2019-03-31 | 2018-12-31 | 2018-09-30 | 2018-06-30 | 2018-03-31 | 2017-12-31 | 2017-09-30 | 2017-06-30 | 2017-03-31 | 2016-12-31 | 2016-09-30 | 2016-06-30 | 2016-03-31 | 2015-12-31 | 2015-09-30 | 2015-06-30 | 2015-03-31 | 2014-12-31 | 2014-09-30 | 2014-06-30 | 2014-03-31 | 2013-12-31 | 2013-09-30 | 2013-06-30 | 2013-03-31 | 2012-12-31 | 2012-09-30 | 2012-06-30 | 2012-03-31 | 2011-12-31 | 2011-09-30 | 2011-06-30 | 2011-03-31 | 2010-12-31 | 2010-09-30 | ||
|---|---|---|---|---|---|---|---|---|---|---|---|---|---|---|---|---|---|---|---|---|---|---|---|---|---|---|---|---|---|---|---|---|---|---|---|---|---|---|---|---|---|---|---|---|---|---|---|---|---|---|---|---|---|---|
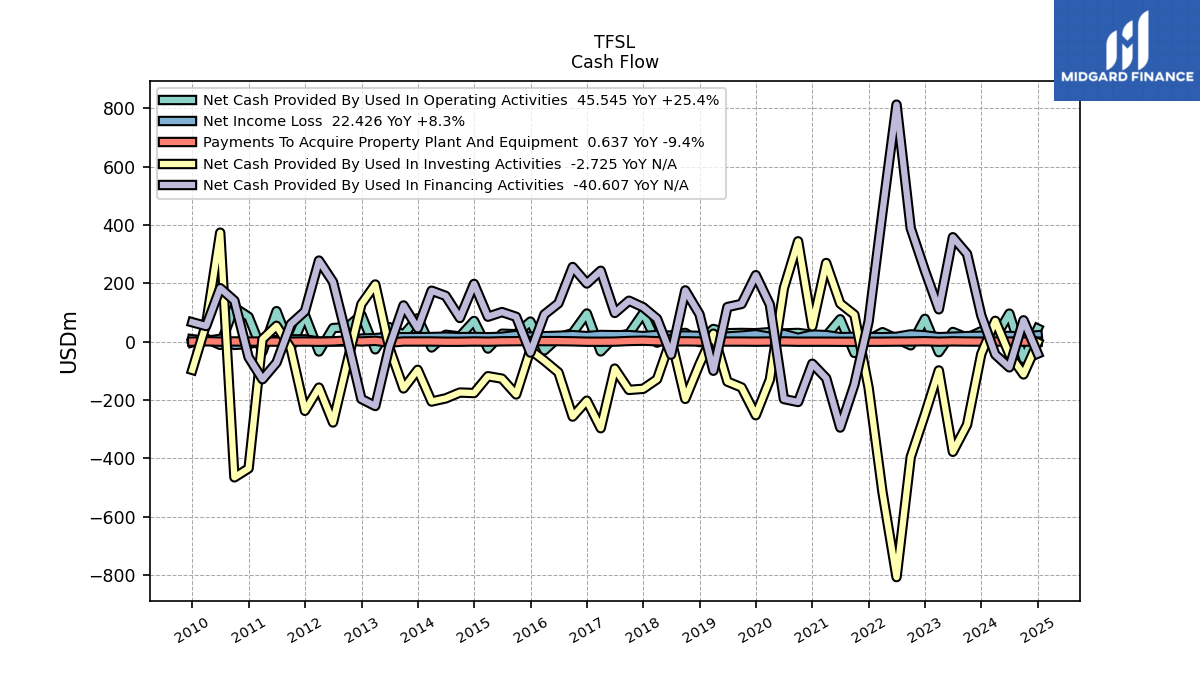
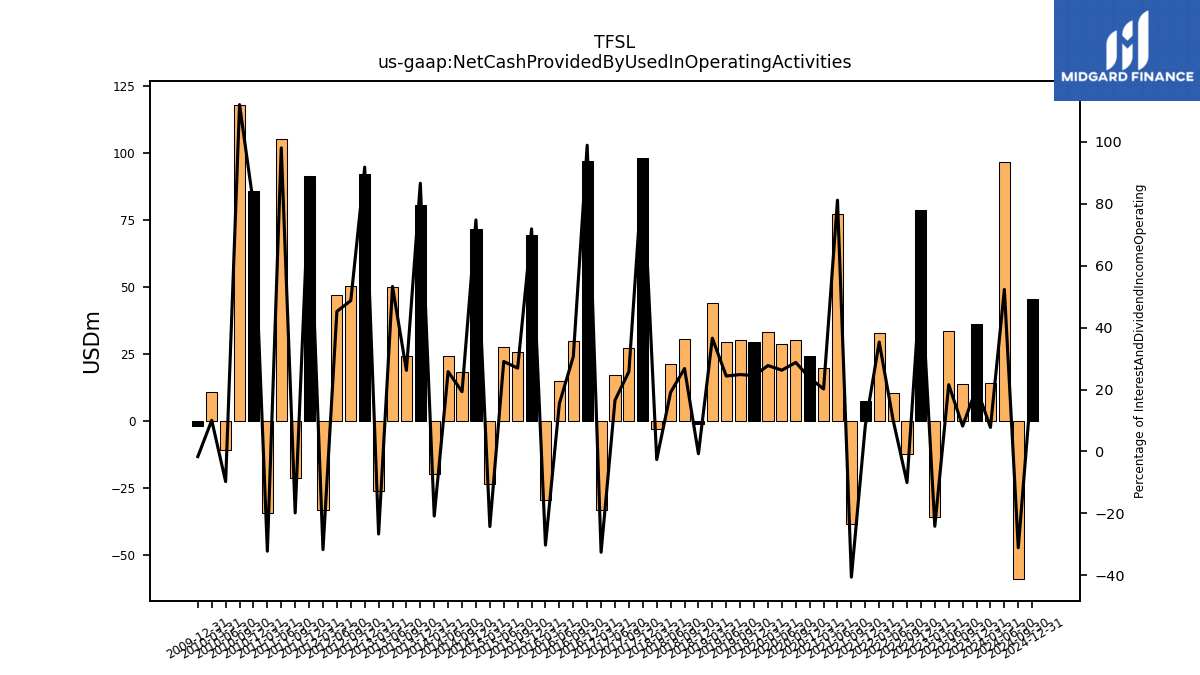
| Net Cash Provided By Used In Operating Activities | 13.83 | 33.77 | -35.68 | 78.81 | -12.18 | 10.44 | 33.01 | 7.66 | -38.21 | 77.43 | 19.75 | 24.18 | 30.40 | 28.86 | 33.15 | 29.39 | 30.37 | 29.48 | 44.05 | -0.90 | 30.66 | 21.22 | -2.90 | 98.02 | 27.34 | 17.13 | -32.94 | 97.16 | 29.95 | 15.03 | -29.39 | 69.33 | 25.93 | 27.80 | -23.21 | 71.58 | 18.25 | 24.16 | -19.50 | 80.59 | 24.24 | 50.20 | -25.84 | 92.21 | 50.32 | 47.13 | -33.25 | 91.42 | -21.27 | 105.20 | -34.08 | 85.72 | 117.98 | |
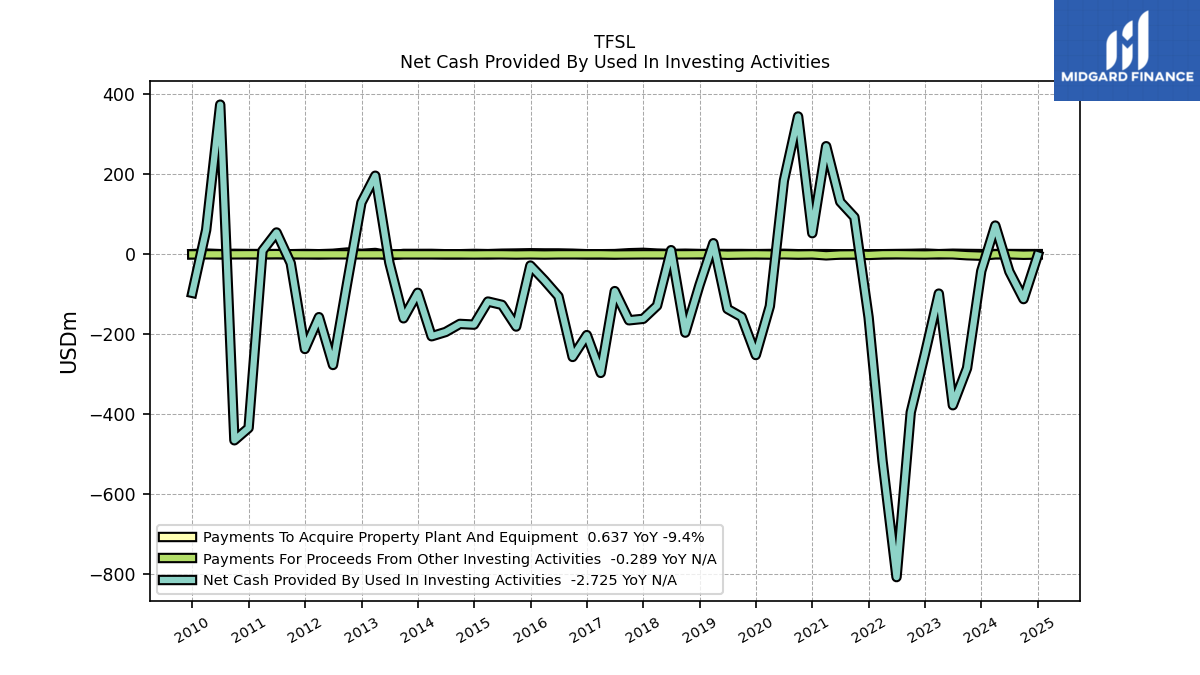
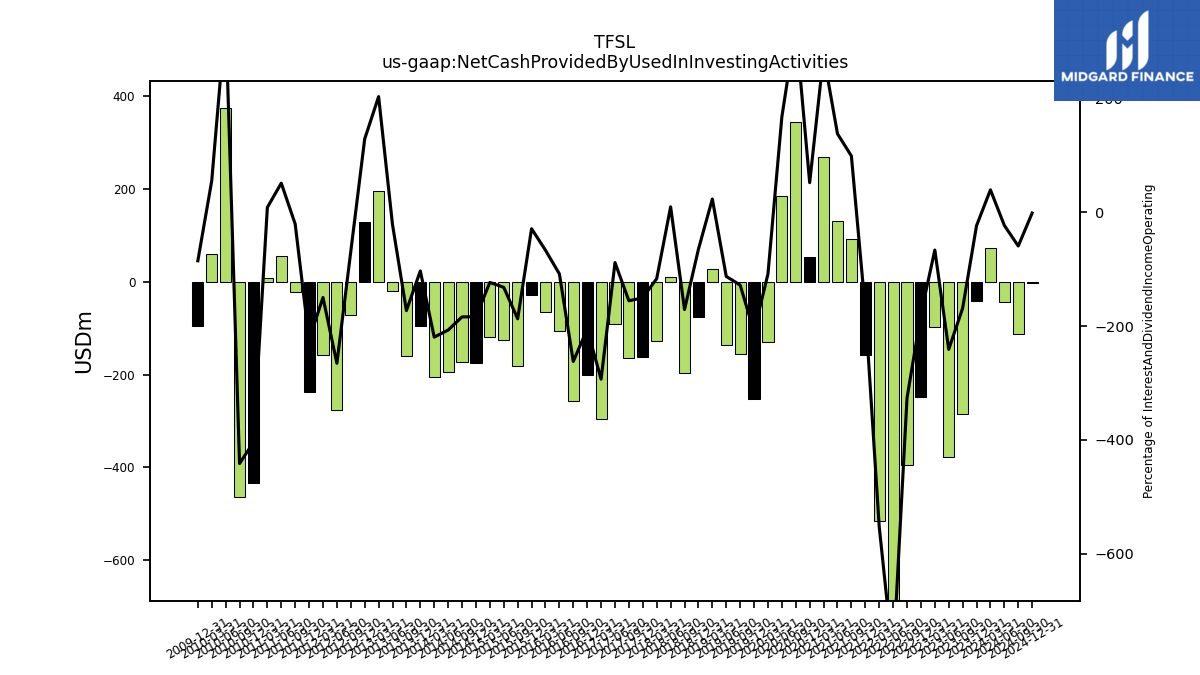
| Net Cash Provided By Used In Investing Activities | -284.53 | -377.17 | -98.10 | -248.83 | -394.99 | -806.74 | -515.81 | -157.56 | 92.85 | 131.36 | 270.33 | 52.82 | 344.64 | 184.21 | -129.53 | -251.74 | -156.45 | -136.48 | 27.84 | -76.89 | -195.71 | 10.47 | -128.44 | -161.18 | -164.85 | -91.80 | -296.36 | -201.80 | -256.48 | -105.08 | -64.86 | -27.96 | -180.49 | -126.27 | -117.94 | -175.70 | -173.87 | -194.04 | -204.76 | -95.98 | -159.91 | -20.59 | 196.54 | 129.15 | -71.19 | -276.57 | -156.98 | -236.62 | -22.08 | 54.70 | 8.98 | -434.00 | -464.77 | |
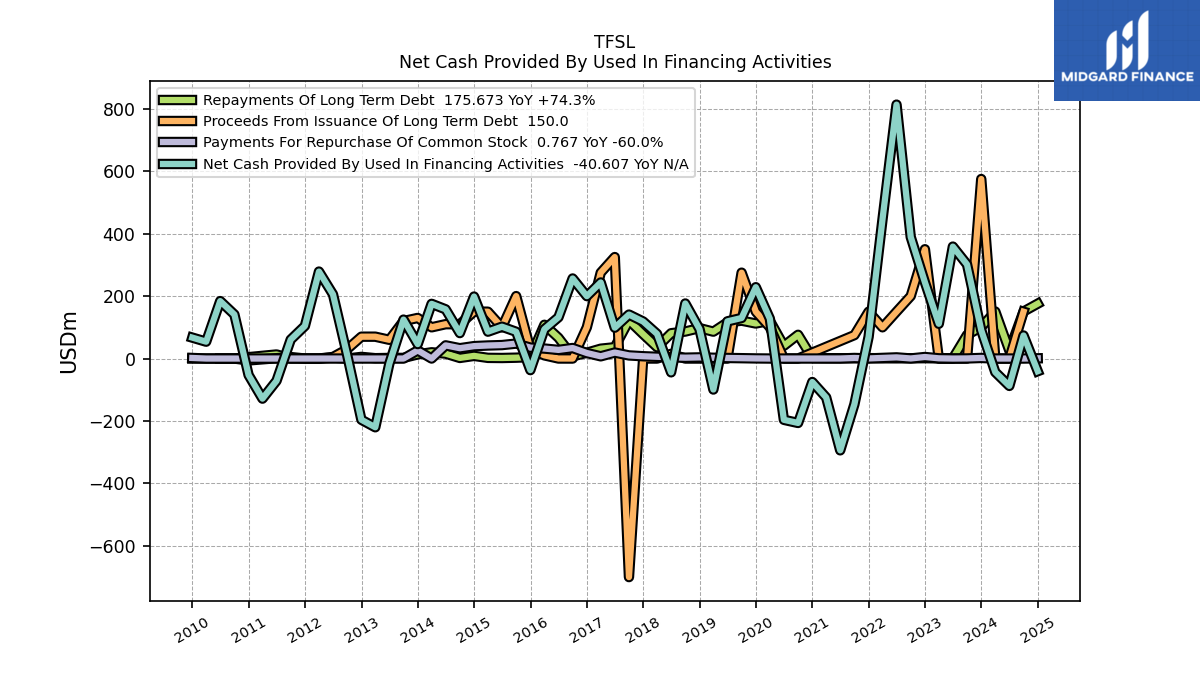
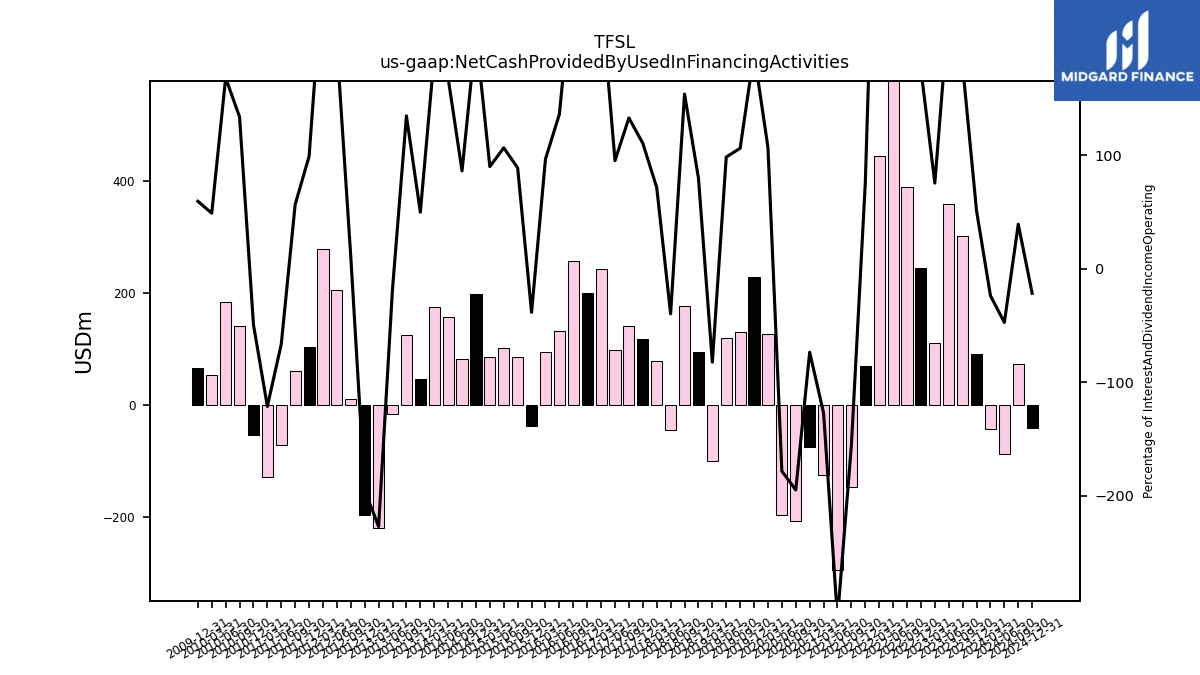
| Net Cash Provided By Used In Financing Activities | 301.24 | 358.49 | 111.33 | 244.04 | 389.20 | 813.16 | 445.46 | 69.58 | -146.47 | -294.04 | -124.60 | -75.11 | -206.29 | -196.27 | 127.64 | 228.44 | 129.88 | 119.11 | -99.26 | 94.62 | 176.28 | -44.23 | 78.86 | 118.50 | 140.83 | 98.81 | 243.65 | 199.81 | 256.45 | 132.08 | 93.92 | -37.12 | 85.72 | 101.94 | 86.07 | 198.53 | 81.51 | 157.58 | 175.15 | 46.31 | 124.69 | -16.78 | -220.11 | -196.06 | 10.78 | 205.37 | 278.53 | 104.47 | 60.62 | -71.33 | -128.40 | -52.96 | 140.97 |
| 2023-09-30 | 2023-06-30 | 2023-03-31 | 2022-12-31 | 2022-09-30 | 2022-06-30 | 2022-03-31 | 2021-12-31 | 2021-09-30 | 2021-06-30 | 2021-03-31 | 2020-12-31 | 2020-09-30 | 2020-06-30 | 2020-03-31 | 2019-12-31 | 2019-09-30 | 2019-06-30 | 2019-03-31 | 2018-12-31 | 2018-09-30 | 2018-06-30 | 2018-03-31 | 2017-12-31 | 2017-09-30 | 2017-06-30 | 2017-03-31 | 2016-12-31 | 2016-09-30 | 2016-06-30 | 2016-03-31 | 2015-12-31 | 2015-09-30 | 2015-06-30 | 2015-03-31 | 2014-12-31 | 2014-09-30 | 2014-06-30 | 2014-03-31 | 2013-12-31 | 2013-09-30 | 2013-06-30 | 2013-03-31 | 2012-12-31 | 2012-09-30 | 2012-06-30 | 2012-03-31 | 2011-12-31 | 2011-09-30 | 2011-06-30 | 2011-03-31 | 2010-12-31 | 2010-09-30 | ||
|---|---|---|---|---|---|---|---|---|---|---|---|---|---|---|---|---|---|---|---|---|---|---|---|---|---|---|---|---|---|---|---|---|---|---|---|---|---|---|---|---|---|---|---|---|---|---|---|---|---|---|---|---|---|---|
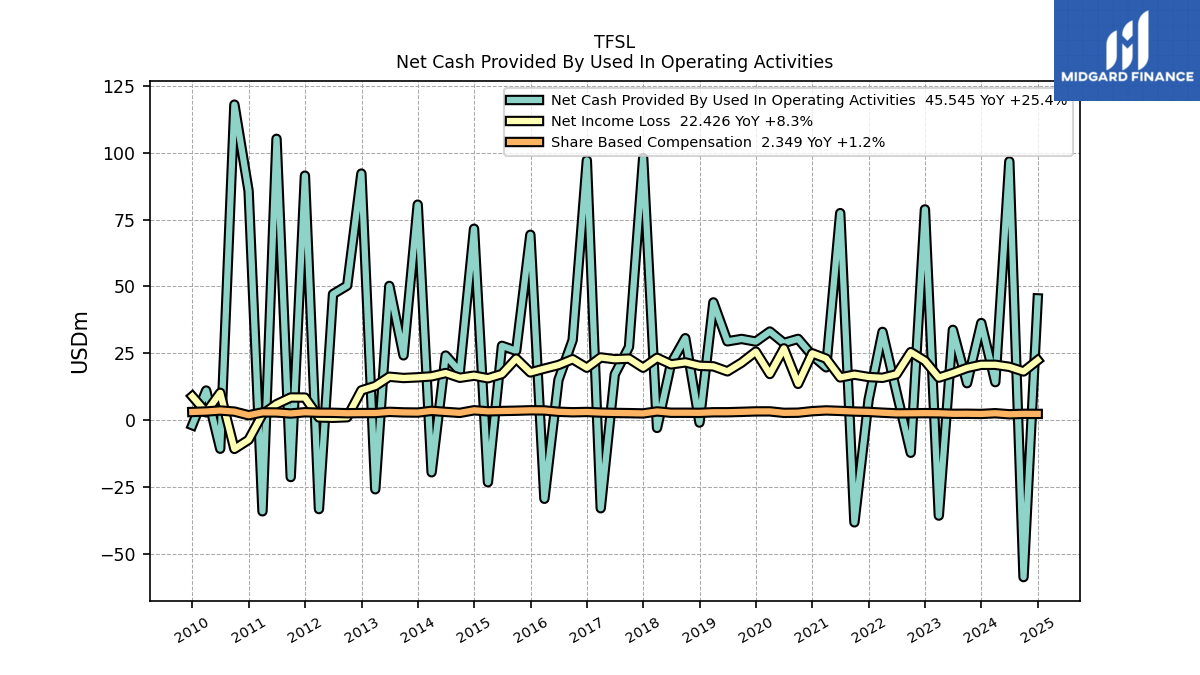
| Net Cash Provided By Used In Operating Activities | 13.83 | 33.77 | -35.68 | 78.81 | -12.18 | 10.44 | 33.01 | 7.66 | -38.21 | 77.43 | 19.75 | 24.18 | 30.40 | 28.86 | 33.15 | 29.39 | 30.37 | 29.48 | 44.05 | -0.90 | 30.66 | 21.22 | -2.90 | 98.02 | 27.34 | 17.13 | -32.94 | 97.16 | 29.95 | 15.03 | -29.39 | 69.33 | 25.93 | 27.80 | -23.21 | 71.58 | 18.25 | 24.16 | -19.50 | 80.59 | 24.24 | 50.20 | -25.84 | 92.21 | 50.32 | 47.13 | -33.25 | 91.42 | -21.27 | 105.20 | -34.08 | 85.72 | 117.98 | |
| Net Income Loss | 19.55 | 17.60 | 15.91 | 22.19 | 25.43 | 17.15 | 15.85 | 16.14 | 17.02 | 15.98 | 23.01 | 25.00 | 13.58 | 26.84 | 17.26 | 25.64 | 21.52 | 18.26 | 20.13 | 20.33 | 21.61 | 20.88 | 23.31 | 19.61 | 23.02 | 22.79 | 23.46 | 19.61 | 22.81 | 20.62 | 19.28 | 17.85 | 23.02 | 17.26 | 15.67 | 16.64 | 15.85 | 17.63 | 16.39 | 16.02 | 15.77 | 16.25 | 12.79 | 11.15 | 1.11 | 0.89 | 1.02 | 8.46 | 8.48 | 5.99 | 2.22 | -7.35 | -10.75 | |
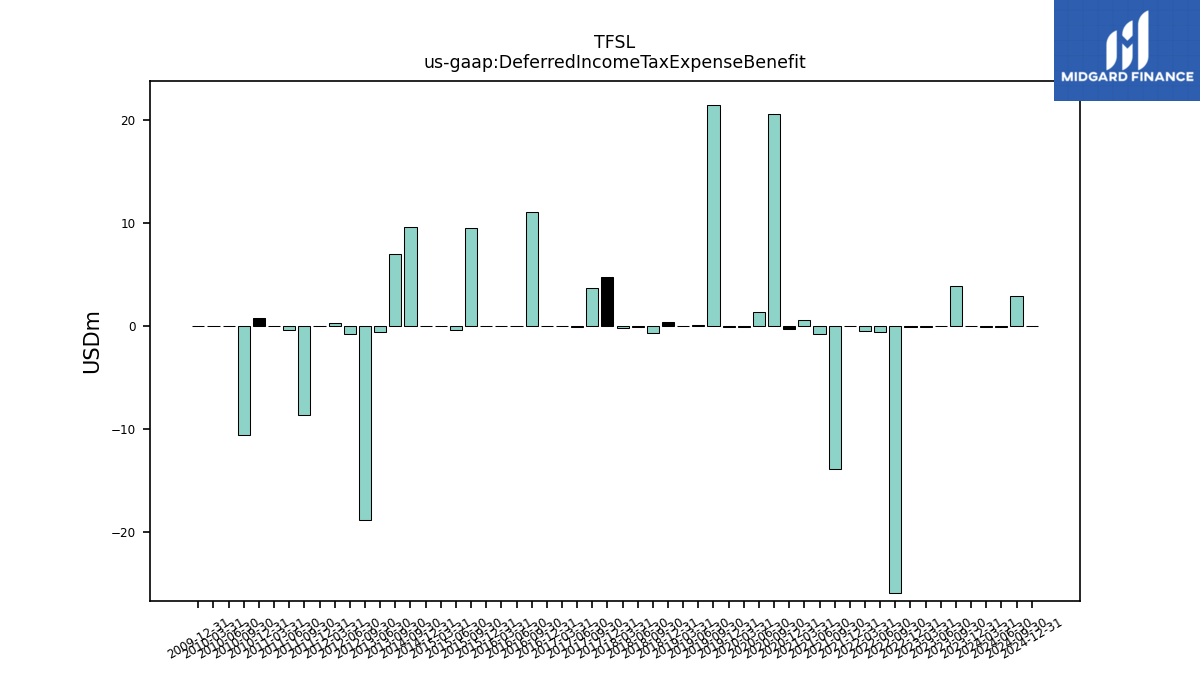
| Deferred Income Tax Expense Benefit | 3.91 | -0.02 | -0.11 | -0.04 | -25.88 | -0.53 | -0.46 | 0.00 | -13.90 | -0.74 | 0.62 | -0.24 | 20.59 | 1.40 | -0.12 | -0.06 | 21.42 | 0.08 | 0.00 | 0.43 | -0.62 | -0.04 | -0.18 | 4.79 | 3.67 | -0.11 | -0.02 | 0.01 | 11.06 | 0.02 | 0.01 | 0.01 | 9.57 | -0.39 | 0.00 | 0.00 | 9.66 | NA | NA | NA | 7.05 | -0.56 | NA | NA | -18.77 | -0.80 | 0.30 | 0.00 | -8.64 | -0.40 | 0.00 | 0.80 | -10.54 | |
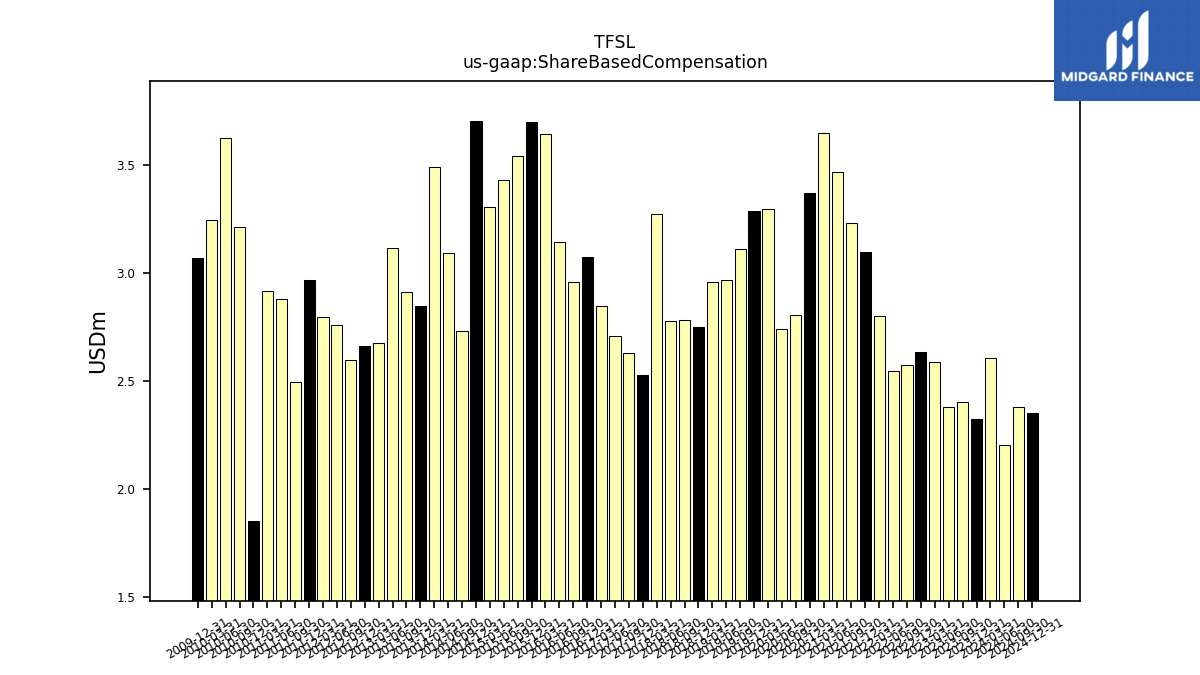
| Share Based Compensation | 2.40 | 2.38 | 2.59 | 2.63 | 2.57 | 2.54 | 2.80 | 3.10 | 3.23 | 3.46 | 3.65 | 3.37 | 2.80 | 2.74 | 3.29 | 3.28 | 3.11 | 2.96 | 2.96 | 2.75 | 2.78 | 2.78 | 3.27 | 2.53 | 2.63 | 2.71 | 2.84 | 3.07 | 2.96 | 3.14 | 3.64 | 3.69 | 3.54 | 3.43 | 3.31 | 3.70 | 2.73 | 3.09 | 3.49 | 2.85 | 2.91 | 3.11 | 2.67 | 2.66 | 2.60 | 2.76 | 2.79 | 2.97 | 2.49 | 2.88 | 2.92 | 1.85 | 3.21 |
| 2023-09-30 | 2023-06-30 | 2023-03-31 | 2022-12-31 | 2022-09-30 | 2022-06-30 | 2022-03-31 | 2021-12-31 | 2021-09-30 | 2021-06-30 | 2021-03-31 | 2020-12-31 | 2020-09-30 | 2020-06-30 | 2020-03-31 | 2019-12-31 | 2019-09-30 | 2019-06-30 | 2019-03-31 | 2018-12-31 | 2018-09-30 | 2018-06-30 | 2018-03-31 | 2017-12-31 | 2017-09-30 | 2017-06-30 | 2017-03-31 | 2016-12-31 | 2016-09-30 | 2016-06-30 | 2016-03-31 | 2015-12-31 | 2015-09-30 | 2015-06-30 | 2015-03-31 | 2014-12-31 | 2014-09-30 | 2014-06-30 | 2014-03-31 | 2013-12-31 | 2013-09-30 | 2013-06-30 | 2013-03-31 | 2012-12-31 | 2012-09-30 | 2012-06-30 | 2012-03-31 | 2011-12-31 | 2011-09-30 | 2011-06-30 | 2011-03-31 | 2010-12-31 | 2010-09-30 | ||
|---|---|---|---|---|---|---|---|---|---|---|---|---|---|---|---|---|---|---|---|---|---|---|---|---|---|---|---|---|---|---|---|---|---|---|---|---|---|---|---|---|---|---|---|---|---|---|---|---|---|---|---|---|---|---|
| Net Cash Provided By Used In Investing Activities | -284.53 | -377.17 | -98.10 | -248.83 | -394.99 | -806.74 | -515.81 | -157.56 | 92.85 | 131.36 | 270.33 | 52.82 | 344.64 | 184.21 | -129.53 | -251.74 | -156.45 | -136.48 | 27.84 | -76.89 | -195.71 | 10.47 | -128.44 | -161.18 | -164.85 | -91.80 | -296.36 | -201.80 | -256.48 | -105.08 | -64.86 | -27.96 | -180.49 | -126.27 | -117.94 | -175.70 | -173.87 | -194.04 | -204.76 | -95.98 | -159.91 | -20.59 | 196.54 | 129.15 | -71.19 | -276.57 | -156.98 | -236.62 | -22.08 | 54.70 | 8.98 | -434.00 | -464.77 | |
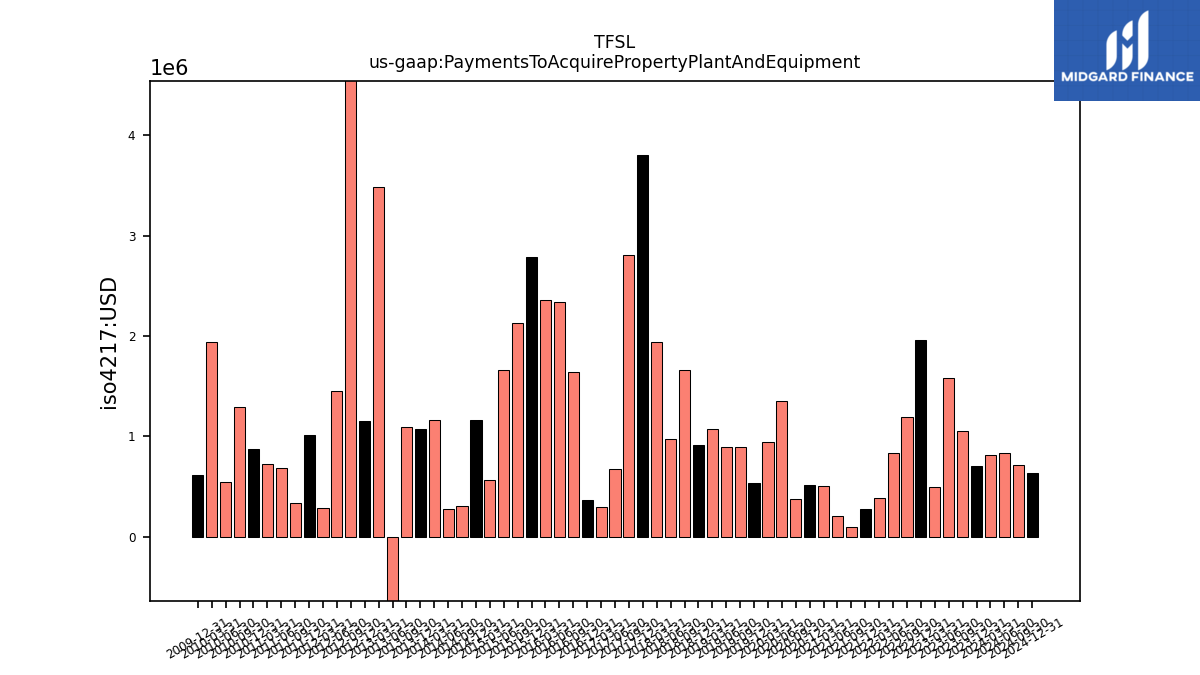
| Payments To Acquire Property Plant And Equipment | 1.05 | 1.58 | 0.50 | 1.96 | 1.20 | 0.84 | 0.38 | 0.28 | 0.10 | 0.21 | 0.51 | 0.52 | 0.38 | 1.35 | 0.95 | 0.54 | 0.89 | 0.90 | 1.08 | 0.92 | 1.66 | 0.97 | 1.94 | 3.80 | 2.81 | 0.68 | 0.30 | 0.36 | 1.65 | 2.34 | 2.36 | 2.78 | 2.13 | 1.66 | 0.57 | 1.16 | 0.31 | 0.28 | 1.16 | 1.07 | 1.09 | -2.92 | 3.49 | 1.16 | 4.58 | 1.46 | 0.29 | 1.01 | 0.34 | 0.68 | 0.72 | 0.87 | 1.30 |
| 2023-09-30 | 2023-06-30 | 2023-03-31 | 2022-12-31 | 2022-09-30 | 2022-06-30 | 2022-03-31 | 2021-12-31 | 2021-09-30 | 2021-06-30 | 2021-03-31 | 2020-12-31 | 2020-09-30 | 2020-06-30 | 2020-03-31 | 2019-12-31 | 2019-09-30 | 2019-06-30 | 2019-03-31 | 2018-12-31 | 2018-09-30 | 2018-06-30 | 2018-03-31 | 2017-12-31 | 2017-09-30 | 2017-06-30 | 2017-03-31 | 2016-12-31 | 2016-09-30 | 2016-06-30 | 2016-03-31 | 2015-12-31 | 2015-09-30 | 2015-06-30 | 2015-03-31 | 2014-12-31 | 2014-09-30 | 2014-06-30 | 2014-03-31 | 2013-12-31 | 2013-09-30 | 2013-06-30 | 2013-03-31 | 2012-12-31 | 2012-09-30 | 2012-06-30 | 2012-03-31 | 2011-12-31 | 2011-09-30 | 2011-06-30 | 2011-03-31 | 2010-12-31 | 2010-09-30 | ||
|---|---|---|---|---|---|---|---|---|---|---|---|---|---|---|---|---|---|---|---|---|---|---|---|---|---|---|---|---|---|---|---|---|---|---|---|---|---|---|---|---|---|---|---|---|---|---|---|---|---|---|---|---|---|---|
| Net Cash Provided By Used In Financing Activities | 301.24 | 358.49 | 111.33 | 244.04 | 389.20 | 813.16 | 445.46 | 69.58 | -146.47 | -294.04 | -124.60 | -75.11 | -206.29 | -196.27 | 127.64 | 228.44 | 129.88 | 119.11 | -99.26 | 94.62 | 176.28 | -44.23 | 78.86 | 118.50 | 140.83 | 98.81 | 243.65 | 199.81 | 256.45 | 132.08 | 93.92 | -37.12 | 85.72 | 101.94 | 86.07 | 198.53 | 81.51 | 157.58 | 175.15 | 46.31 | 124.69 | -16.78 | -220.11 | -196.06 | 10.78 | 205.37 | 278.53 | 104.47 | 60.62 | -71.33 | -128.40 | -52.96 | 140.97 | |
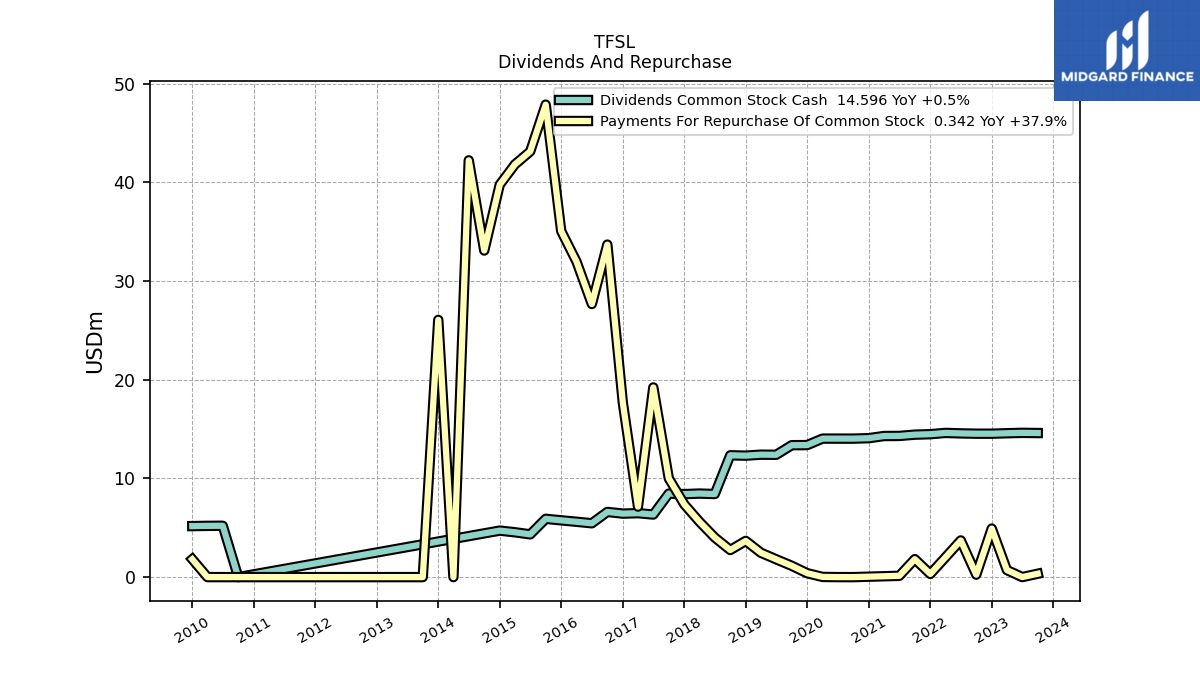
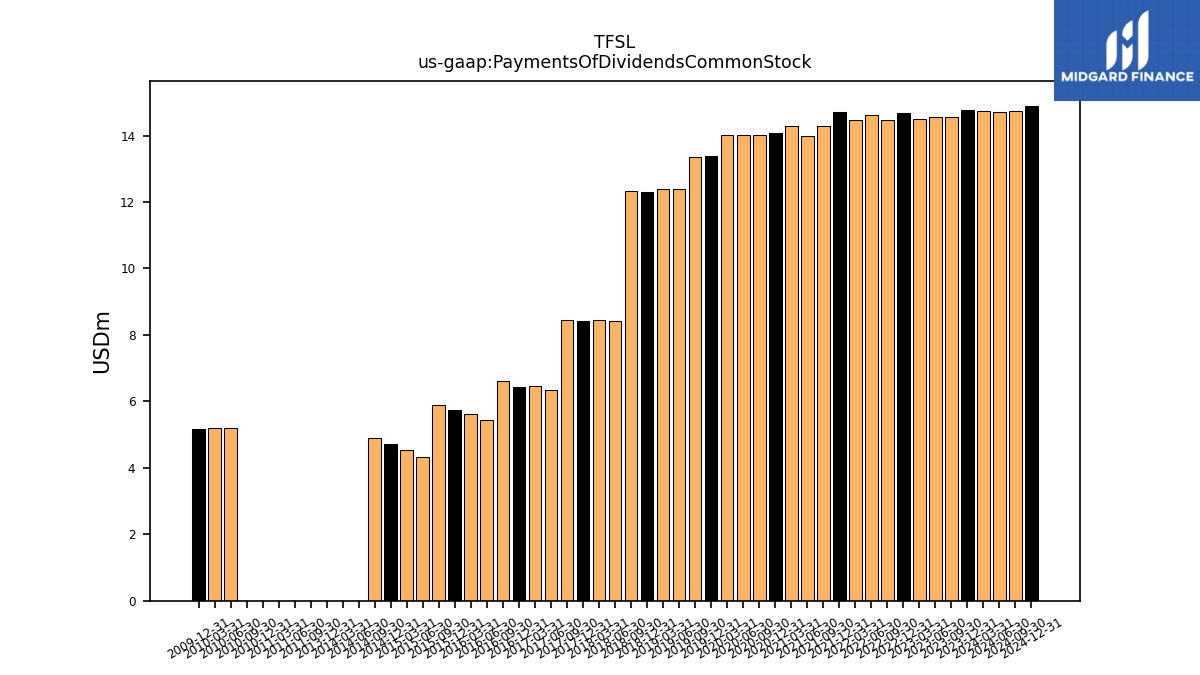
| Payments Of Dividends Common Stock | 14.56 | 14.55 | 14.51 | 14.67 | 14.48 | 14.62 | 14.48 | 14.72 | 14.29 | 13.98 | 14.29 | 14.07 | 14.03 | 14.03 | 14.03 | 13.38 | 13.36 | 12.39 | 12.40 | 12.30 | 12.34 | 8.42 | 8.46 | 8.41 | 8.46 | 6.34 | 6.48 | 6.43 | 6.60 | 5.45 | 5.61 | 5.75 | 5.91 | 4.33 | 4.54 | 4.71 | 4.89 | 0.00 | 0.00 | 0.00 | NA | NA | NA | NA | NA | NA | NA | NA | 0.00 | 0.00 | 0.00 | 0.00 | 0.00 | |
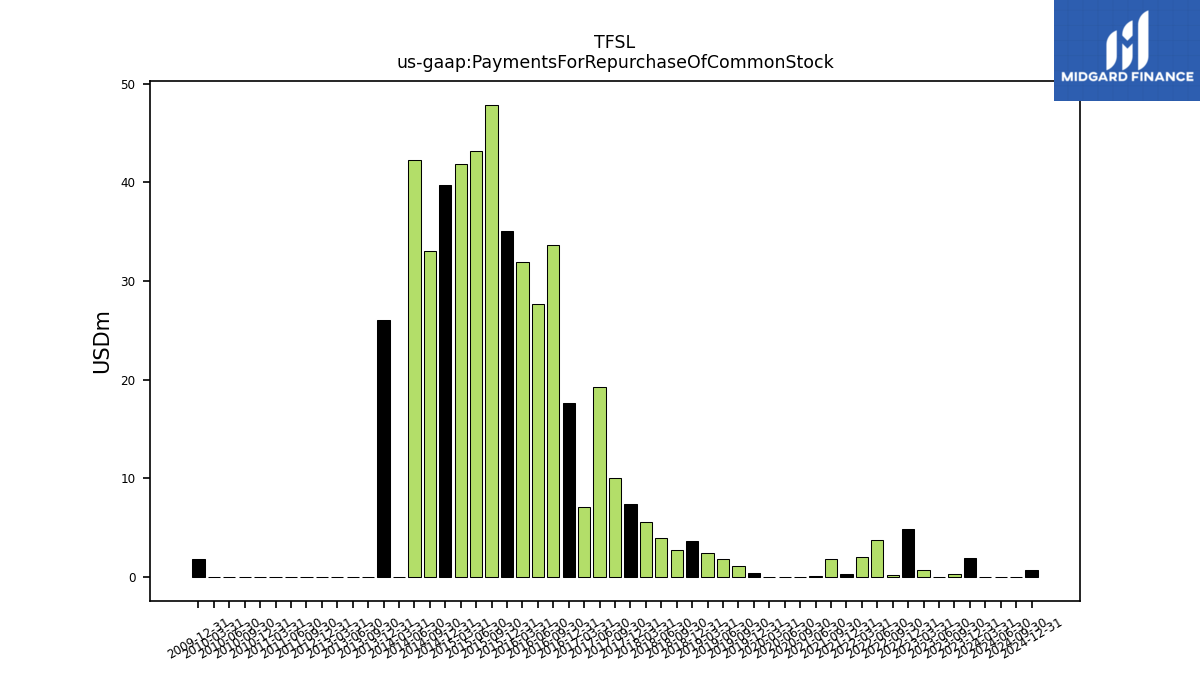
| Payments For Repurchase Of Common Stock | 0.34 | 0.00 | 0.71 | 4.92 | 0.25 | 3.72 | 2.00 | 0.32 | 1.82 | 0.13 | NA | NA | -0.00 | 0.00 | 0.02 | 0.40 | 1.15 | 1.80 | 2.47 | 3.67 | 2.75 | 4.01 | 5.61 | 7.37 | 10.00 | 19.21 | 7.14 | 17.67 | 33.69 | 27.66 | 31.96 | 35.05 | 47.87 | 43.12 | 41.80 | 39.76 | 33.08 | 42.22 | 0.00 | 26.06 | 0.00 | 0.00 | 0.00 | 0.00 | NA | NA | NA | NA | 0.00 | 0.00 | 0.00 | 0.00 | 0.00 |