
| 2023-12-31 | 2023-10-01 | 2023-07-02 | 2023-04-02 | 2022-12-31 | 2022-09-25 | 2022-06-26 | 2022-03-27 | 2021-12-31 | 2021-09-26 | 2021-06-27 | 2021-03-28 | 2020-12-31 | 2020-09-27 | 2020-06-28 | 2020-03-29 | 2019-12-31 | 2019-09-29 | 2019-06-30 | 2019-03-31 | 2018-12-31 | 2018-09-30 | 2018-07-01 | 2018-04-01 | 2017-12-31 | 2017-10-01 | 2017-07-02 | 2017-04-02 | 2016-12-31 | 2016-09-25 | 2016-06-26 | 2016-03-27 | 2015-12-31 | 2015-09-27 | 2015-06-28 | 2015-03-29 | 2014-12-31 | 2014-09-28 | 2014-06-29 | 2014-03-30 | 2013-12-31 | 2013-09-30 | 2013-09-29 | 2013-06-30 | 2013-03-31 | 2012-12-31 | 2012-09-30 | 2012-07-01 | 2012-06-30 | 2012-04-01 | 2012-03-31 | 2011-12-31 | 2011-09-25 | 2011-06-26 | 2011-03-27 | 2010-12-31 | 2010-09-26 | 2010-06-27 | 2010-03-28 | ||
|---|---|---|---|---|---|---|---|---|---|---|---|---|---|---|---|---|---|---|---|---|---|---|---|---|---|---|---|---|---|---|---|---|---|---|---|---|---|---|---|---|---|---|---|---|---|---|---|---|---|---|---|---|---|---|---|---|---|---|---|---|
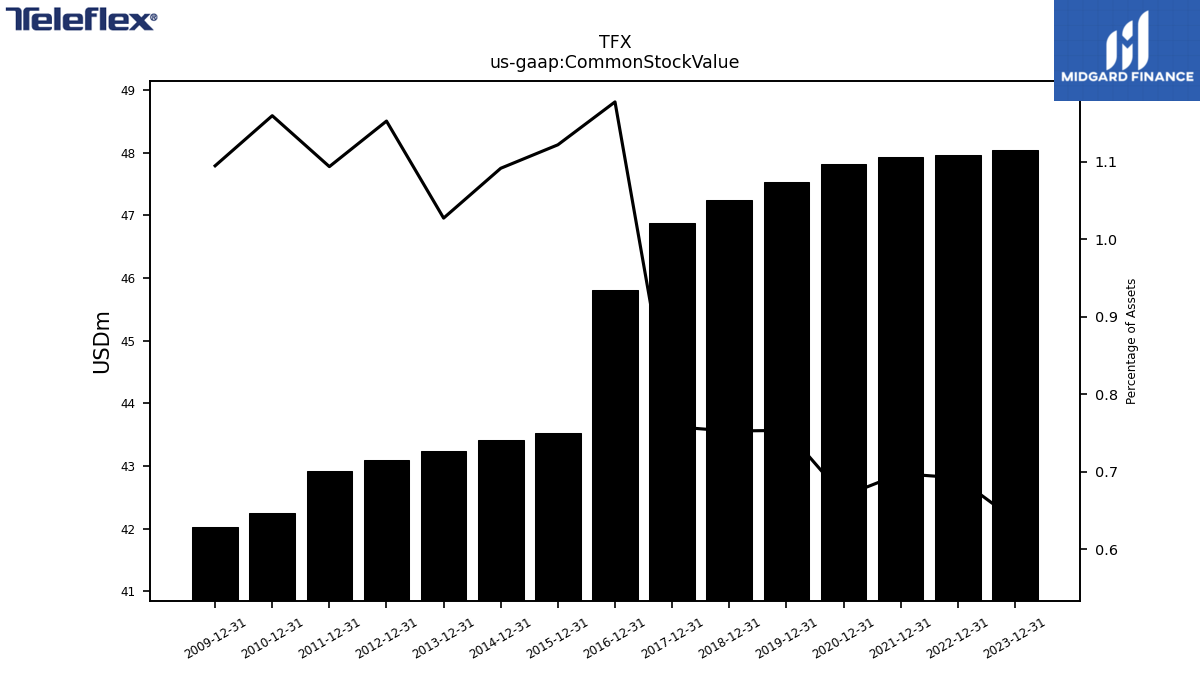
| Common Stock Value | 48.05 | NA | NA | NA | 47.96 | NA | NA | NA | 47.93 | NA | NA | NA | 47.81 | NA | NA | NA | 47.54 | NA | NA | NA | 47.25 | NA | NA | NA | 46.87 | NA | NA | NA | 45.81 | NA | NA | NA | 43.52 | NA | NA | NA | 43.42 | NA | NA | NA | 43.24 | NA | NA | NA | NA | 43.10 | NA | NA | NA | NA | NA | 42.92 | NA | NA | NA | 42.24 | NA | NA | NA | |
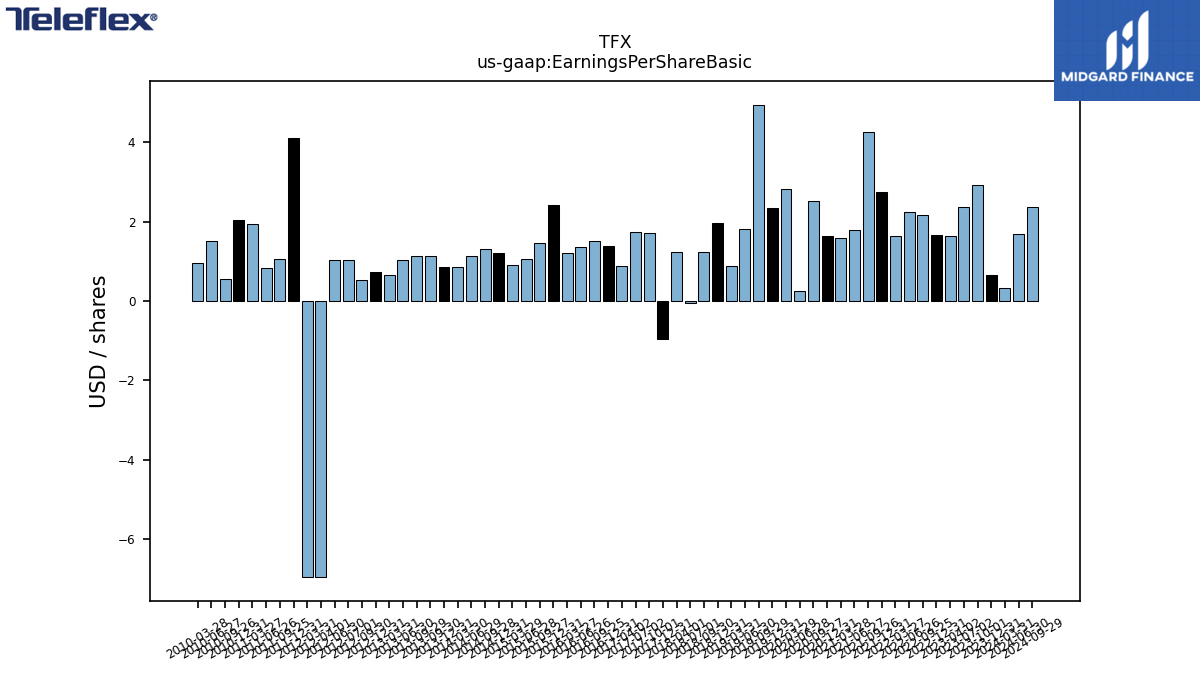
| Earnings Per Share Basic | 0.66 | 2.92 | 2.37 | 1.63 | 1.67 | 2.17 | 2.25 | 1.65 | 2.74 | 4.26 | 1.78 | 1.60 | 1.63 | 2.51 | 0.25 | 2.83 | 2.34 | 4.95 | 1.81 | 0.89 | 1.97 | 1.23 | -0.05 | 1.24 | -0.95 | 1.71 | 1.73 | 0.89 | 1.39 | 1.51 | 1.36 | 1.22 | 2.43 | 1.46 | 1.07 | 0.92 | 1.22 | 1.32 | 1.14 | 0.85 | 0.85 | 1.13 | 1.13 | 1.03 | 0.66 | 0.72 | 0.53 | 1.04 | 1.04 | -6.96 | -6.96 | 4.12 | 1.07 | 0.84 | 1.94 | 2.03 | 0.56 | 1.51 | 0.95 | |
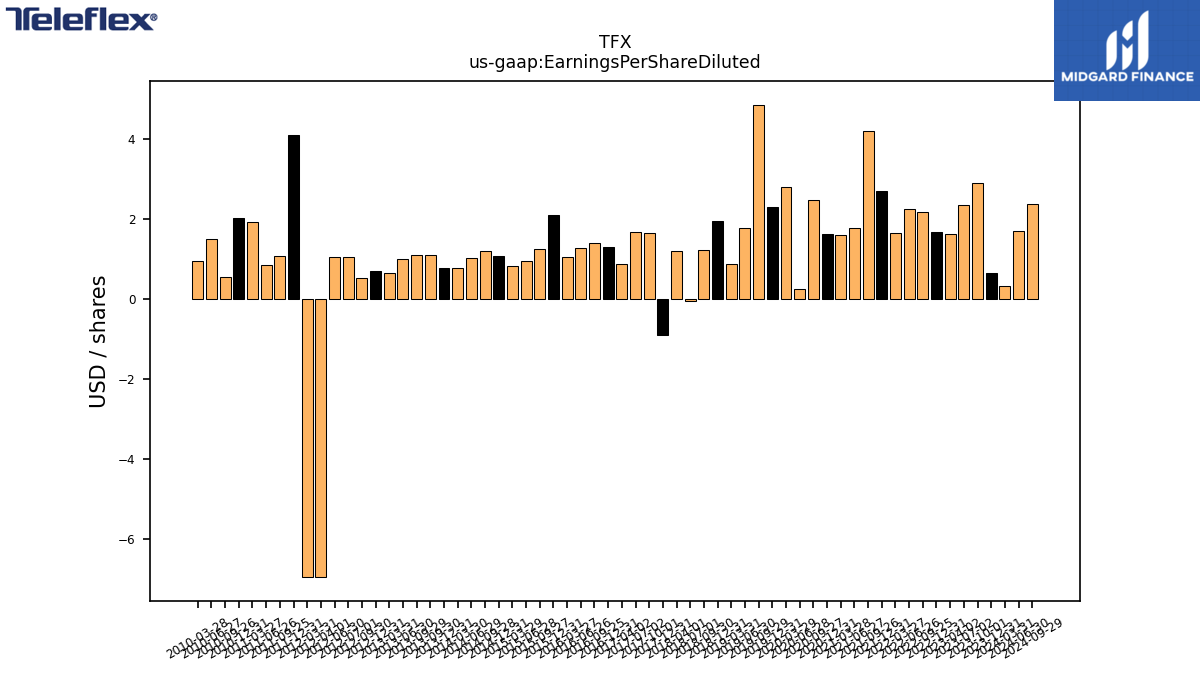
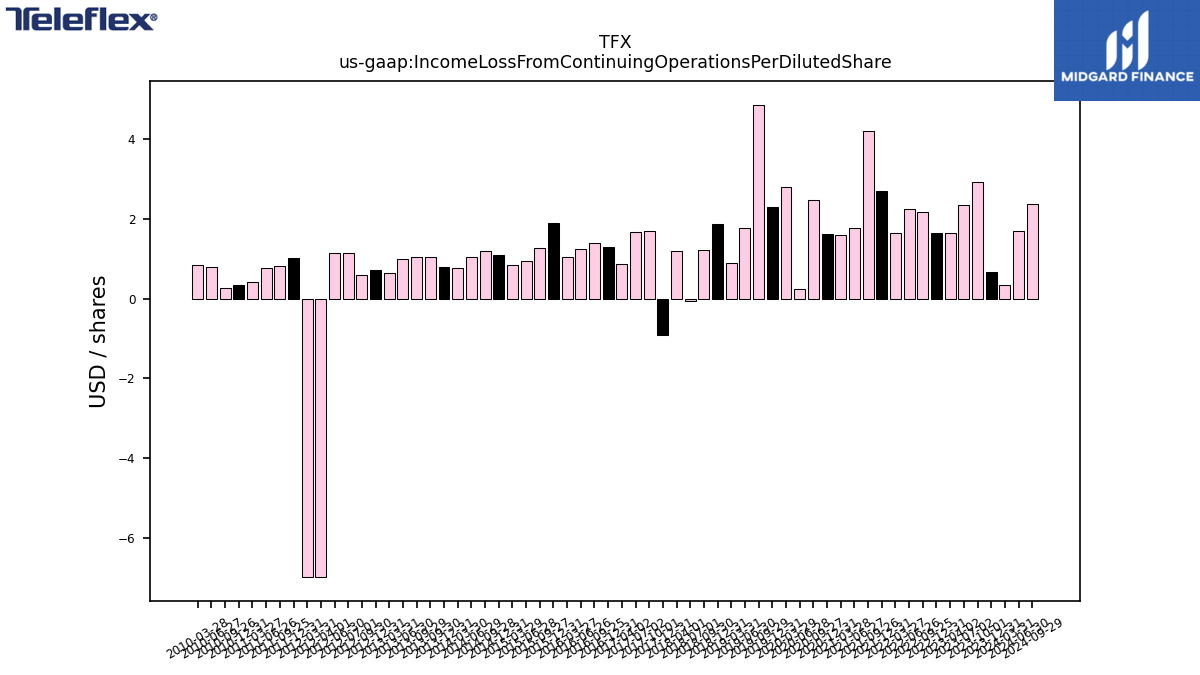
| Earnings Per Share Diluted | 0.65 | 2.90 | 2.35 | 1.62 | 1.67 | 2.16 | 2.23 | 1.63 | 2.70 | 4.20 | 1.76 | 1.58 | 1.61 | 2.46 | 0.24 | 2.78 | 2.29 | 4.85 | 1.77 | 0.87 | 1.93 | 1.21 | -0.05 | 1.20 | -0.91 | 1.65 | 1.67 | 0.86 | 1.30 | 1.40 | 1.26 | 1.04 | 2.09 | 1.25 | 0.93 | 0.81 | 1.07 | 1.18 | 1.02 | 0.76 | 0.77 | 1.08 | 1.08 | 0.98 | 0.63 | 0.70 | 0.52 | 1.04 | 1.04 | -6.96 | -6.96 | 4.10 | 1.07 | 0.83 | 1.92 | 2.01 | 0.55 | 1.49 | 0.94 | |
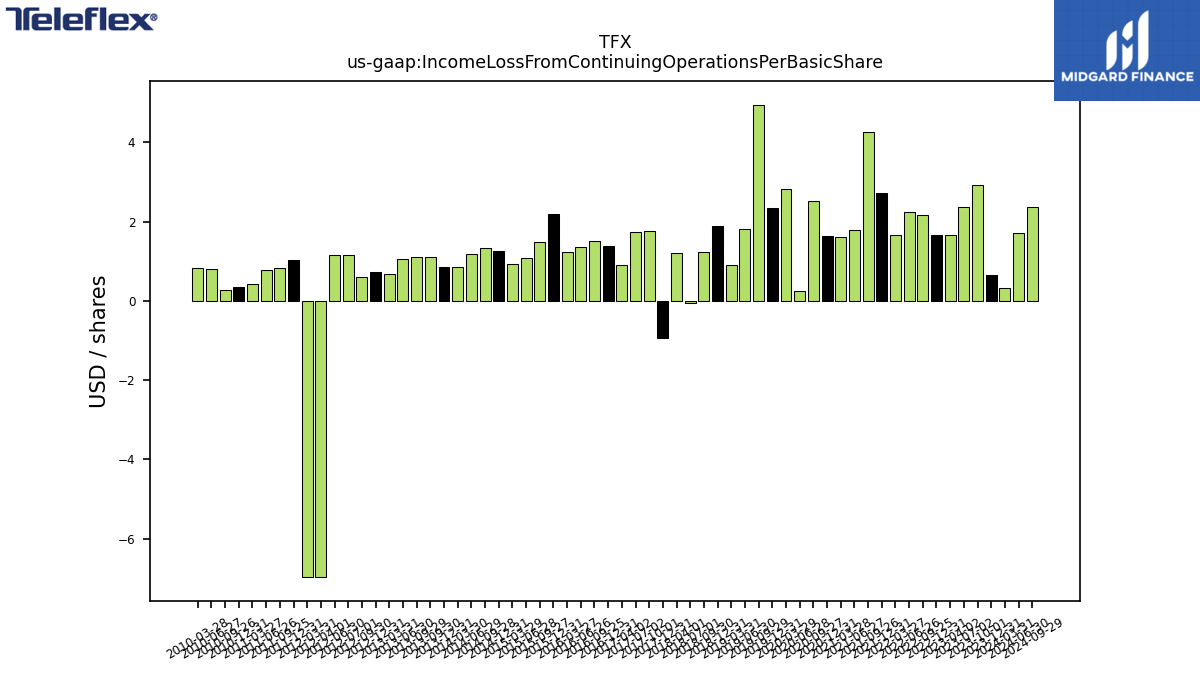
| Income Loss From Continuing Operations Per Basic Share | 0.00 | 0.00 | 0.00 | 0.00 | 0.00 | 0.00 | 0.00 | 0.00 | 0.00 | 0.00 | 0.00 | 0.00 | 0.00 | 0.00 | 0.00 | 0.00 | 0.00 | 0.00 | 0.00 | 0.00 | 0.00 | 0.00 | -0.00 | 0.00 | -0.00 | 0.00 | 0.00 | 0.00 | 0.00 | 0.00 | 0.00 | 0.00 | 0.00 | 0.00 | 0.00 | 0.00 | 0.00 | 0.00 | 0.00 | 0.00 | 0.00 | 0.00 | 0.00 | 0.00 | 0.00 | 0.00 | 0.00 | 0.00 | 0.00 | -0.00 | -0.00 | 0.00 | 0.00 | 0.00 | 0.00 | 0.00 | 0.00 | 0.00 | 0.00 | |
| Income Loss From Continuing Operations Per Diluted Share | 0.00 | 0.00 | 0.00 | 0.00 | 0.00 | 0.00 | 0.00 | 0.00 | 0.00 | 0.00 | 0.00 | 0.00 | 0.00 | 0.00 | 0.00 | 0.00 | 0.00 | 0.00 | 0.00 | 0.00 | 0.00 | 0.00 | -0.00 | 0.00 | -0.00 | 0.00 | 0.00 | 0.00 | 0.00 | 0.00 | 0.00 | 0.00 | 0.00 | 0.00 | 0.00 | 0.00 | 0.00 | 0.00 | 0.00 | 0.00 | 0.00 | 0.00 | 0.00 | 0.00 | 0.00 | 0.00 | 0.00 | 0.00 | 0.00 | -0.00 | -0.00 | 0.00 | 0.00 | 0.00 | 0.00 | 0.00 | 0.00 | 0.00 | 0.00 |
| 2023-12-31 | 2023-10-01 | 2023-07-02 | 2023-04-02 | 2022-12-31 | 2022-09-25 | 2022-06-26 | 2022-03-27 | 2021-12-31 | 2021-09-26 | 2021-06-27 | 2021-03-28 | 2020-12-31 | 2020-09-27 | 2020-06-28 | 2020-03-29 | 2019-12-31 | 2019-09-29 | 2019-06-30 | 2019-03-31 | 2018-12-31 | 2018-09-30 | 2018-07-01 | 2018-04-01 | 2017-12-31 | 2017-10-01 | 2017-07-02 | 2017-04-02 | 2016-12-31 | 2016-09-25 | 2016-06-26 | 2016-03-27 | 2015-12-31 | 2015-09-27 | 2015-06-28 | 2015-03-29 | 2014-12-31 | 2014-09-28 | 2014-06-29 | 2014-03-30 | 2013-12-31 | 2013-09-30 | 2013-09-29 | 2013-06-30 | 2013-03-31 | 2012-12-31 | 2012-09-30 | 2012-07-01 | 2012-06-30 | 2012-04-01 | 2012-03-31 | 2011-12-31 | 2011-09-25 | 2011-06-26 | 2011-03-27 | 2010-12-31 | 2010-09-26 | 2010-06-27 | 2010-03-28 | ||
|---|---|---|---|---|---|---|---|---|---|---|---|---|---|---|---|---|---|---|---|---|---|---|---|---|---|---|---|---|---|---|---|---|---|---|---|---|---|---|---|---|---|---|---|---|---|---|---|---|---|---|---|---|---|---|---|---|---|---|---|---|
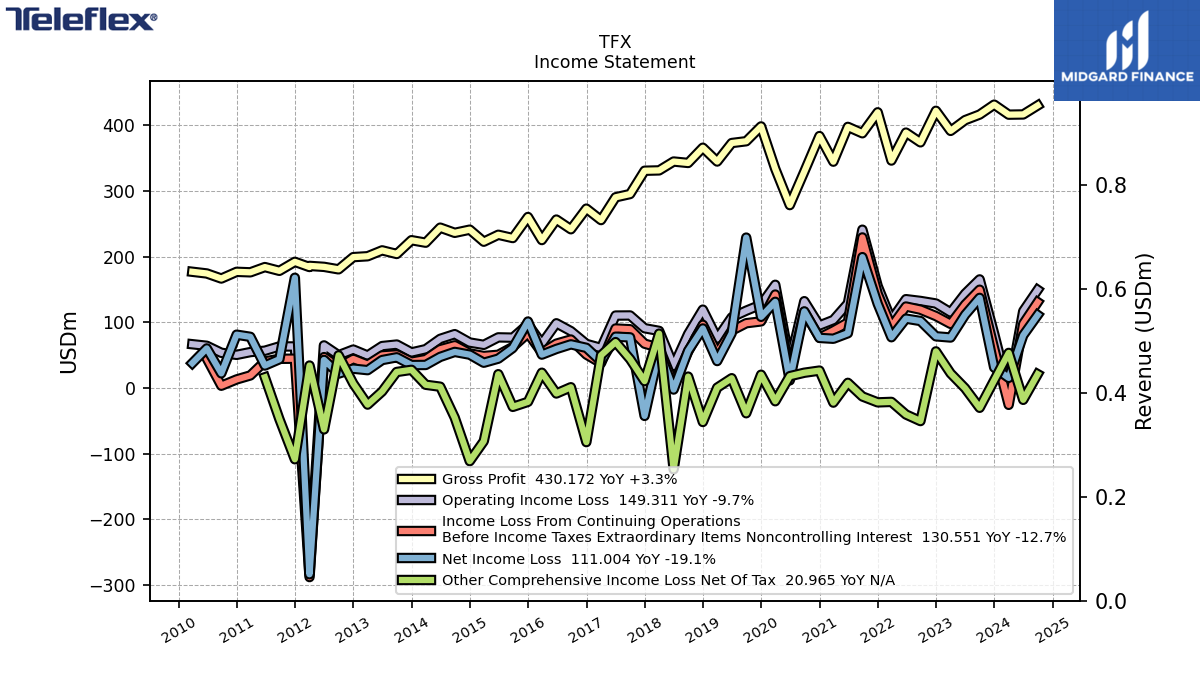
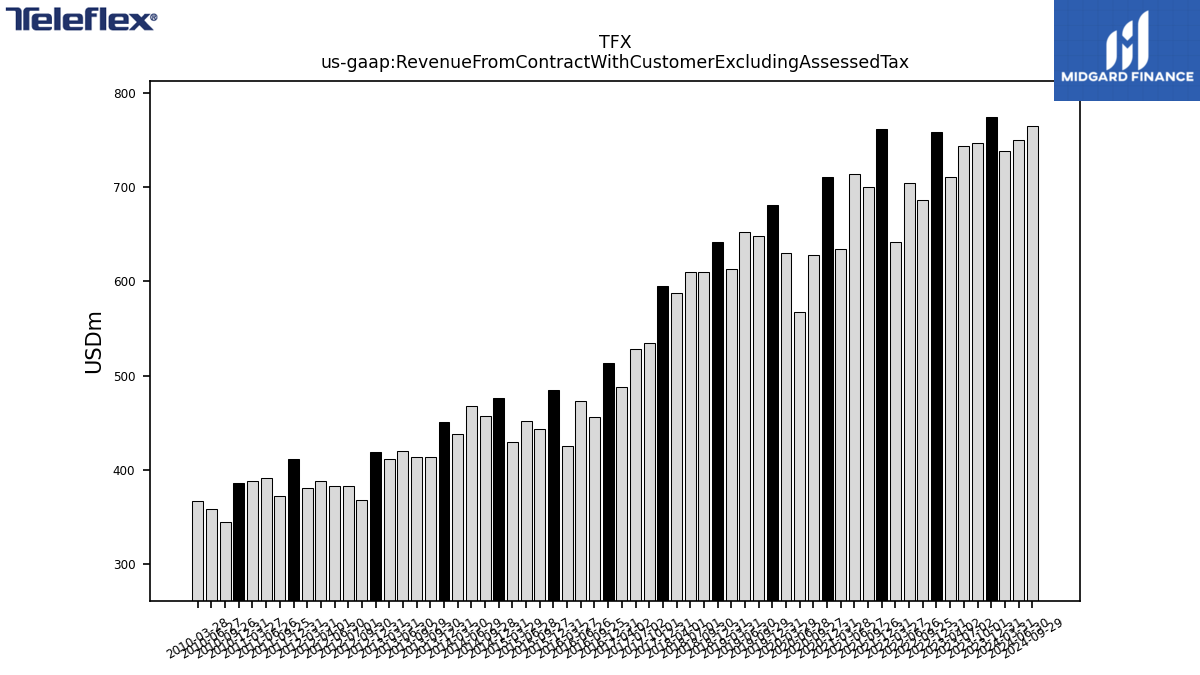
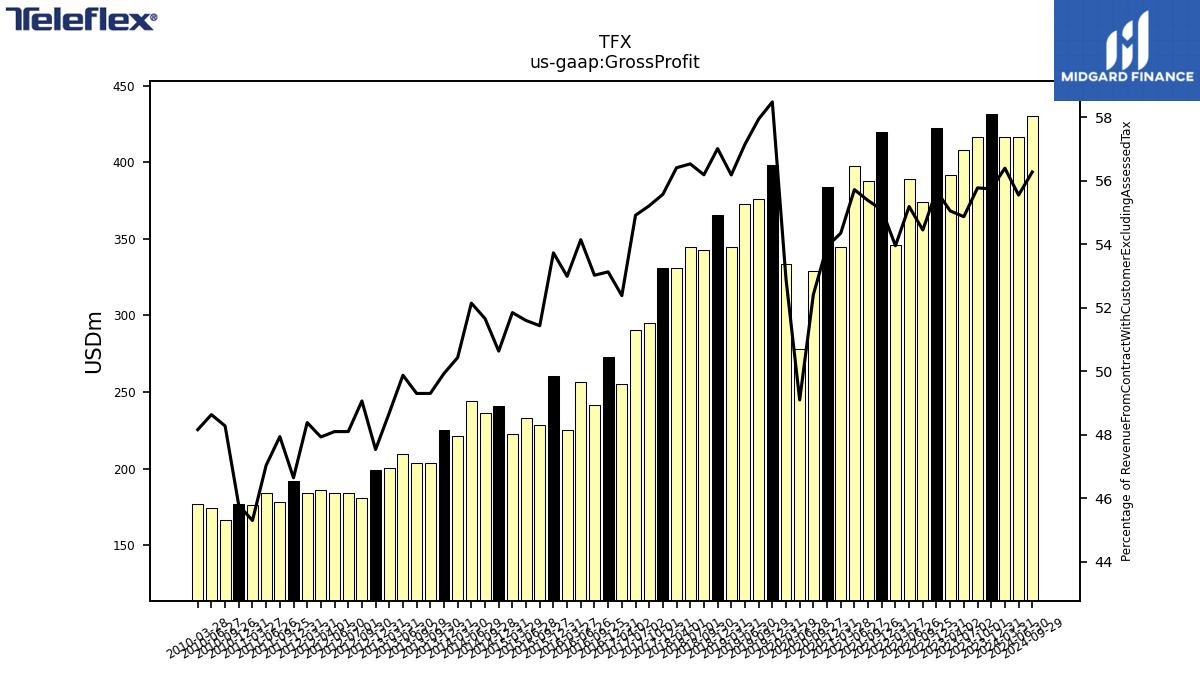
| Revenue From Contract With Customer Excluding Assessed Tax | 773.91 | 746.39 | 743.26 | 710.93 | 758.00 | 686.79 | 704.54 | 641.72 | 761.91 | 700.25 | 713.47 | 633.92 | 711.18 | 628.30 | 567.03 | 630.64 | 680.95 | 648.32 | 652.51 | 613.58 | 641.62 | 609.67 | 609.87 | 587.23 | 595.11 | 534.70 | 528.61 | 487.88 | 513.93 | 455.65 | 473.55 | 424.89 | 484.50 | 443.71 | 452.05 | 429.43 | 476.01 | 457.17 | 468.11 | 438.55 | 450.54 | 413.80 | 413.80 | 420.06 | 411.88 | 419.06 | 368.05 | 383.33 | 383.33 | 387.76 | 380.57 | 411.73 | 371.89 | 391.29 | 388.66 | 386.28 | 345.04 | 358.43 | 367.33 | |
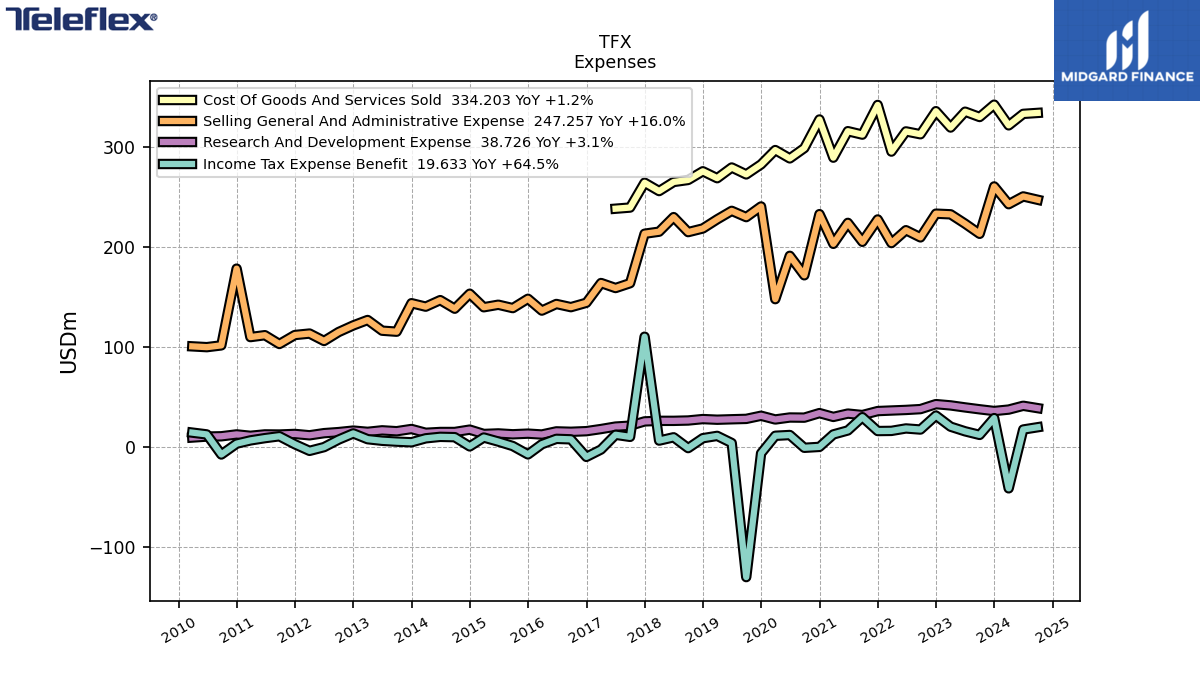
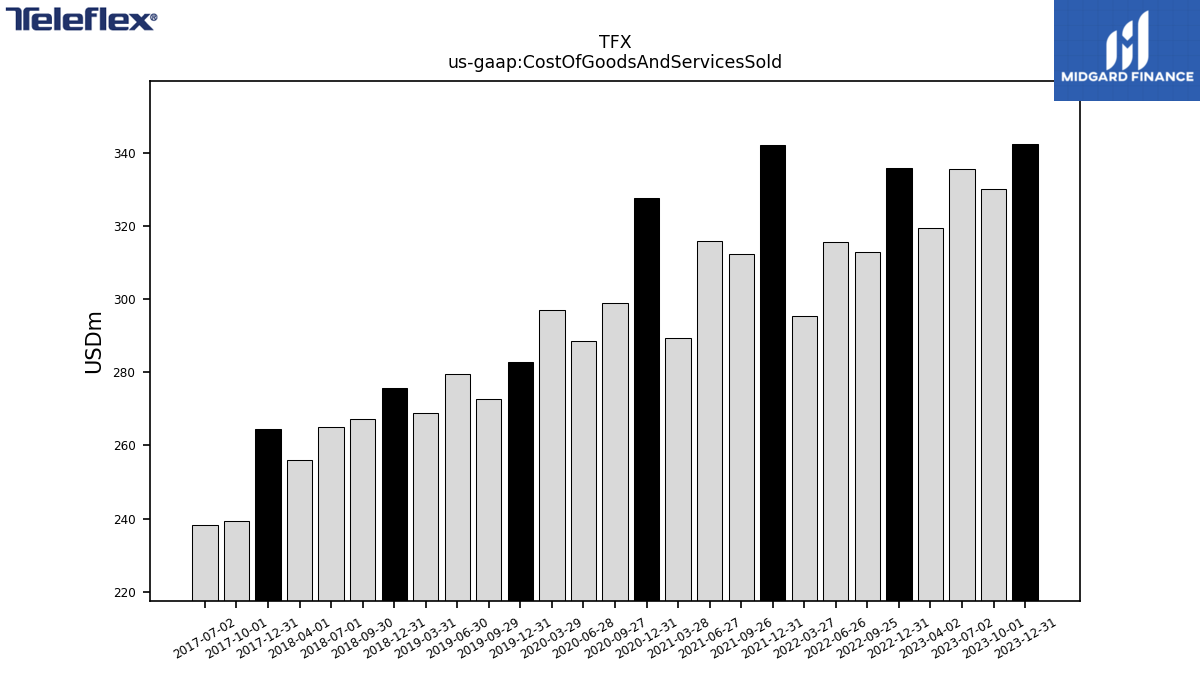
| Cost Of Goods And Services Sold | 342.49 | 330.08 | 335.44 | 319.55 | 335.93 | 312.83 | 315.71 | 295.48 | 342.18 | 312.46 | 315.92 | 289.40 | 327.62 | 298.98 | 288.66 | 297.02 | 282.69 | 272.64 | 279.58 | 268.84 | 275.79 | 267.10 | 265.09 | 255.96 | 264.38 | 239.48 | 238.33 | NA | NA | NA | NA | NA | NA | NA | NA | NA | NA | NA | NA | NA | NA | NA | NA | NA | NA | NA | NA | NA | NA | NA | NA | NA | NA | NA | NA | NA | NA | NA | NA | |
| Gross Profit | 431.42 | 416.31 | 407.82 | 391.38 | 422.07 | 373.95 | 388.83 | 346.23 | 419.73 | 387.79 | 397.56 | 344.53 | 383.55 | 329.32 | 278.37 | 333.62 | 398.27 | 375.68 | 372.92 | 344.74 | 365.82 | 342.57 | 344.78 | 331.27 | 330.73 | 295.23 | 290.28 | 255.56 | 273.05 | 241.60 | 256.40 | 225.15 | 260.32 | 228.21 | 233.24 | 222.64 | 241.01 | 236.17 | 244.09 | 221.16 | 224.94 | 203.99 | 203.99 | 209.49 | 200.52 | 199.18 | 180.57 | 184.36 | 184.36 | 185.84 | 184.11 | 192.03 | 178.27 | 184.03 | 176.04 | 176.79 | 166.56 | 174.30 | 176.90 | |
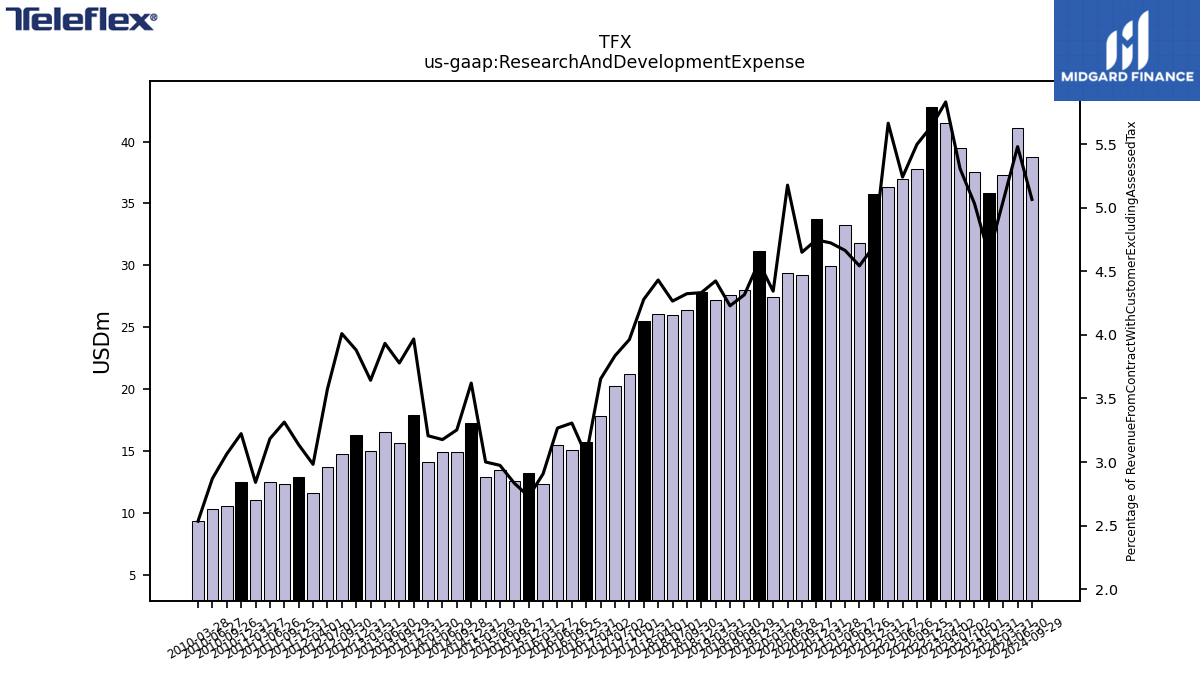
| Research And Development Expense | 35.86 | 37.58 | 39.45 | 41.47 | 42.76 | 37.77 | 36.93 | 36.36 | 35.80 | 31.82 | 33.28 | 29.95 | 33.77 | 29.22 | 29.36 | 27.40 | 31.13 | 27.98 | 27.59 | 27.15 | 27.80 | 26.36 | 26.02 | 26.03 | 25.47 | 21.19 | 20.28 | 17.83 | 15.69 | 15.07 | 15.47 | 12.35 | 13.22 | 12.57 | 13.44 | 12.88 | 17.24 | 14.87 | 14.87 | 14.06 | 17.88 | NA | 15.64 | 16.52 | 15.01 | 16.26 | 14.76 | 13.70 | NA | 11.56 | NA | 12.91 | 12.32 | 12.46 | 11.04 | 12.45 | 10.57 | 10.29 | 9.31 | |
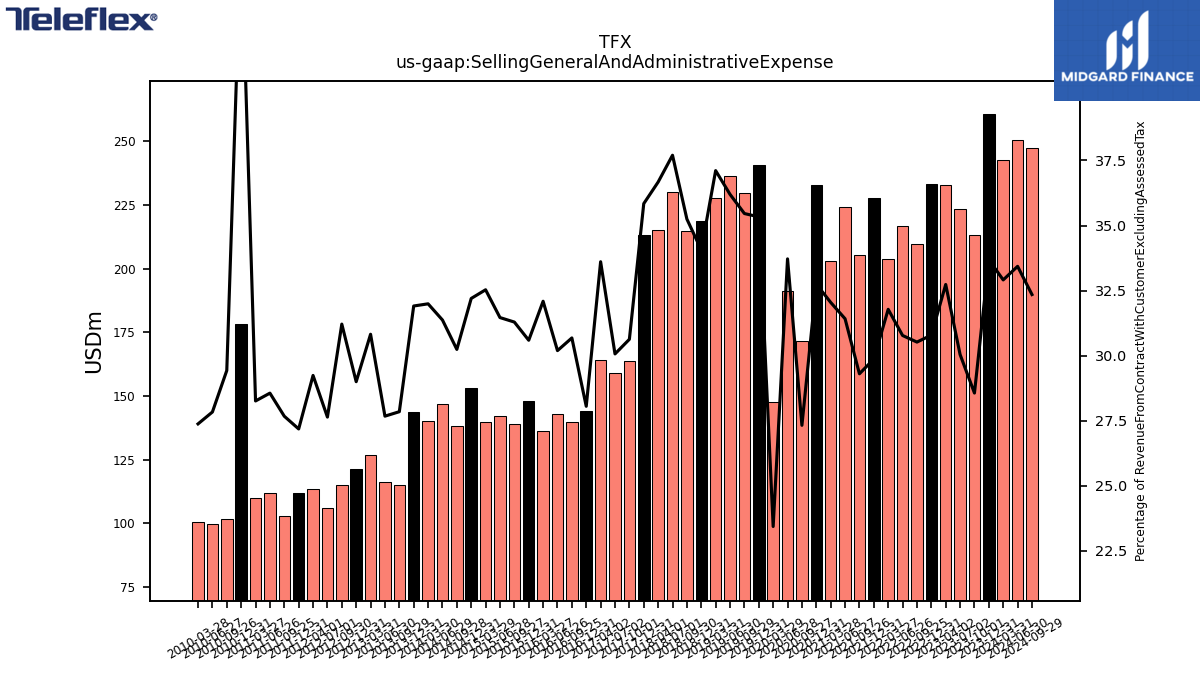
| Selling General And Administrative Expense | 260.65 | 213.19 | 223.31 | 232.72 | 233.38 | 209.62 | 216.82 | 203.93 | 227.58 | 205.19 | 224.16 | 203.15 | 232.91 | 171.67 | 191.19 | 147.80 | 240.60 | 229.90 | 236.19 | 227.69 | 218.54 | 214.89 | 229.92 | 215.34 | 213.29 | 163.77 | 158.93 | 163.97 | 144.18 | 139.80 | 142.98 | 136.35 | 148.22 | 138.84 | 142.23 | 139.70 | 153.26 | 138.25 | 146.84 | 140.30 | 143.76 | NA | 115.23 | 116.25 | 126.95 | 121.52 | 114.88 | 105.95 | NA | 113.38 | NA | 111.92 | 102.91 | 111.75 | 109.83 | 178.36 | 101.54 | 99.77 | 100.57 | |
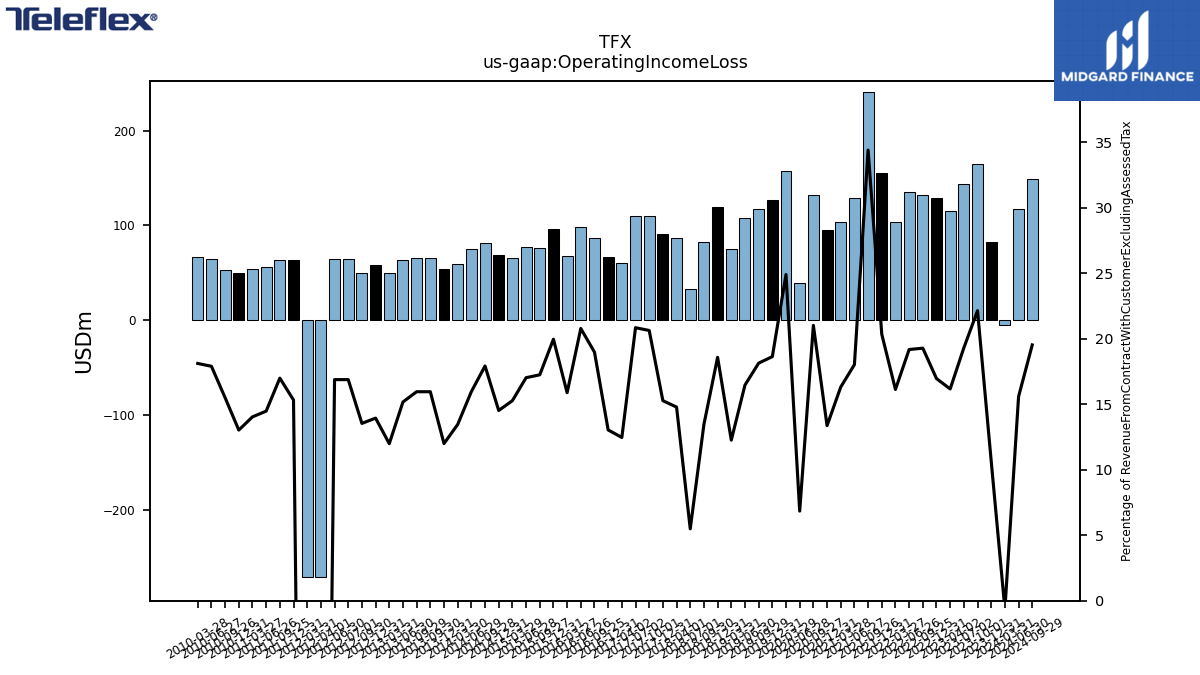
| Operating Income Loss | 82.47 | 165.31 | 143.56 | 114.97 | 128.59 | 132.44 | 135.16 | 103.54 | 155.07 | 240.97 | 128.62 | 103.43 | 95.08 | 132.09 | 38.81 | 157.09 | 126.93 | 117.62 | 107.46 | 75.24 | 119.27 | 82.11 | 33.49 | 86.84 | 90.90 | 110.35 | 110.20 | 60.82 | 67.03 | 86.49 | 98.44 | 67.50 | 96.75 | 76.55 | 76.99 | 65.61 | 69.16 | 81.94 | 74.75 | 59.02 | 54.06 | 66.04 | 66.04 | 63.75 | 49.40 | 58.44 | 49.84 | 64.72 | 64.72 | -270.39 | -270.38 | 63.12 | 63.21 | 56.65 | 54.57 | 50.34 | 53.49 | 64.17 | 66.56 | |
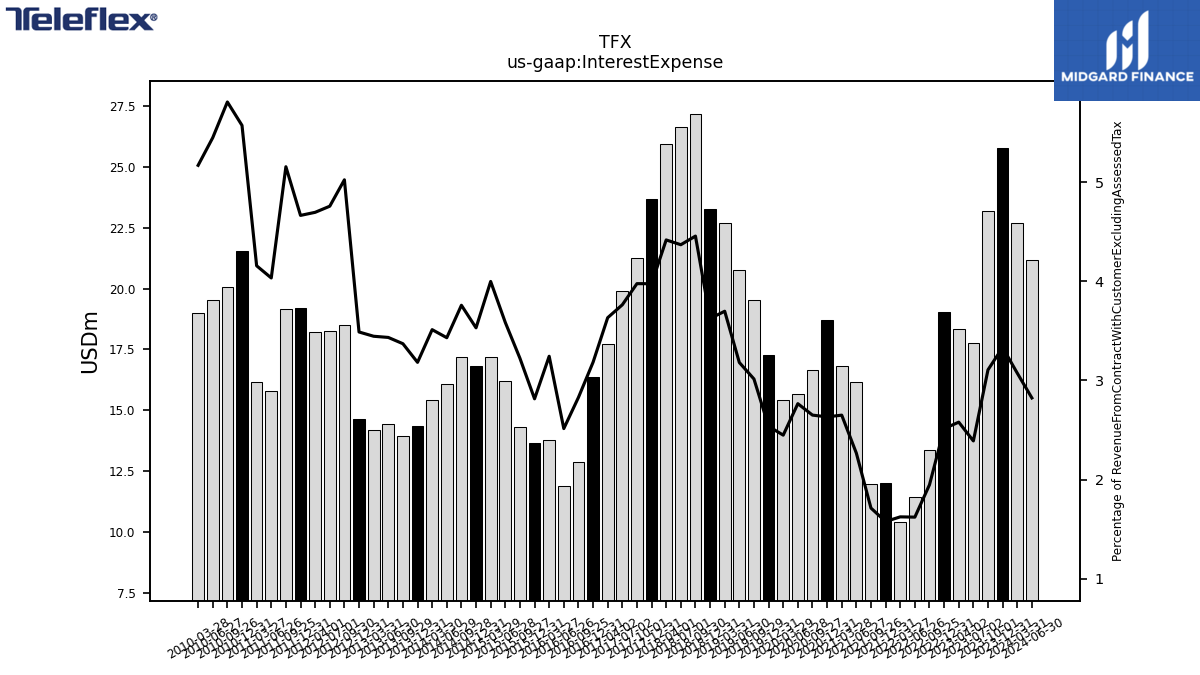
| Interest Expense | 25.79 | 23.19 | 17.76 | 18.34 | 19.05 | 13.38 | 11.42 | 10.42 | 12.01 | 11.99 | 16.17 | 16.80 | 18.72 | 16.65 | 15.68 | 15.44 | 17.27 | 19.55 | 20.76 | 22.69 | 23.26 | 27.17 | 26.65 | 25.94 | 23.66 | 21.26 | 19.89 | 17.73 | 16.36 | 12.89 | 11.91 | 13.78 | 13.64 | 14.31 | 16.21 | 17.17 | 16.81 | 17.18 | 16.06 | 15.40 | 14.34 | NA | 13.95 | 14.43 | 14.19 | 14.62 | 18.49 | 18.24 | NA | 18.21 | NA | 19.21 | 19.18 | 15.79 | 16.16 | 21.53 | 20.05 | 19.53 | 18.99 | |
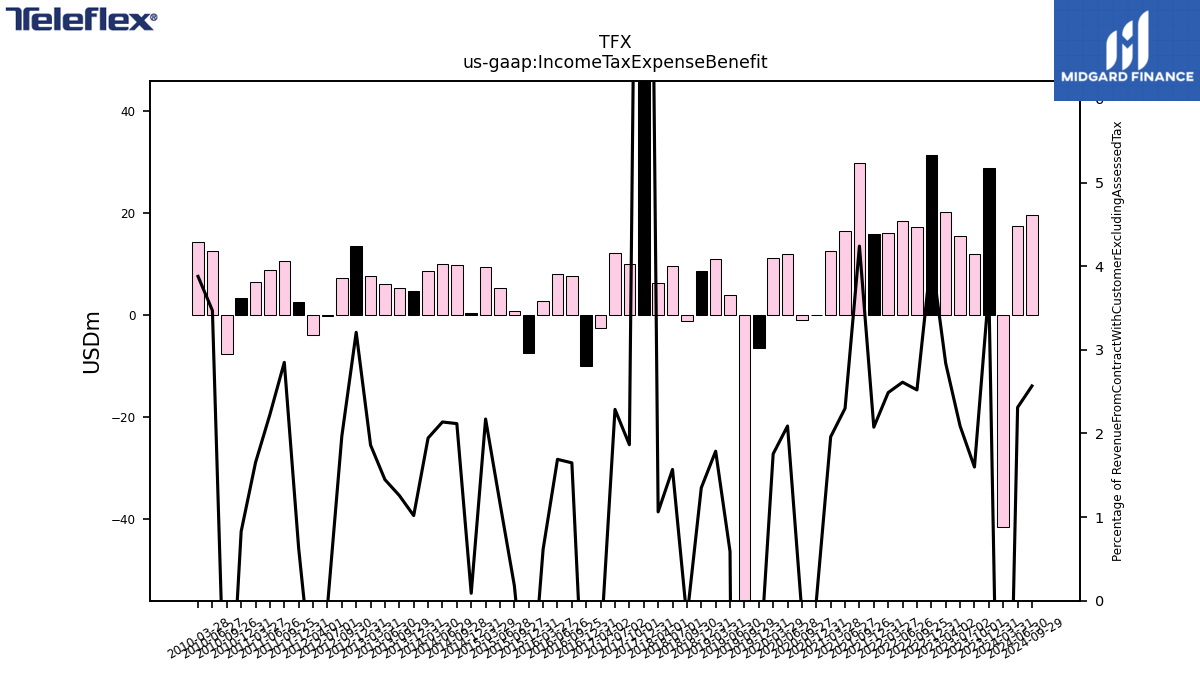
| Income Tax Expense Benefit | 28.79 | 11.94 | 15.53 | 20.18 | 31.30 | 17.32 | 18.41 | 15.97 | 15.81 | 29.70 | 16.41 | 12.43 | -0.04 | -0.95 | 11.85 | 11.07 | -6.51 | -130.38 | 3.84 | 10.97 | 8.66 | -1.29 | 9.58 | 6.24 | 110.24 | 9.98 | 12.10 | -2.67 | -10.06 | 7.51 | 8.01 | 2.61 | -7.58 | 0.80 | 5.28 | 9.33 | 0.43 | 9.68 | 10.01 | 8.53 | 4.59 | NA | 5.21 | 6.08 | 7.67 | 13.45 | 7.24 | -0.28 | NA | -4.02 | NA | 2.58 | 10.60 | 8.71 | 6.43 | 3.20 | -7.68 | 12.44 | 14.25 | |
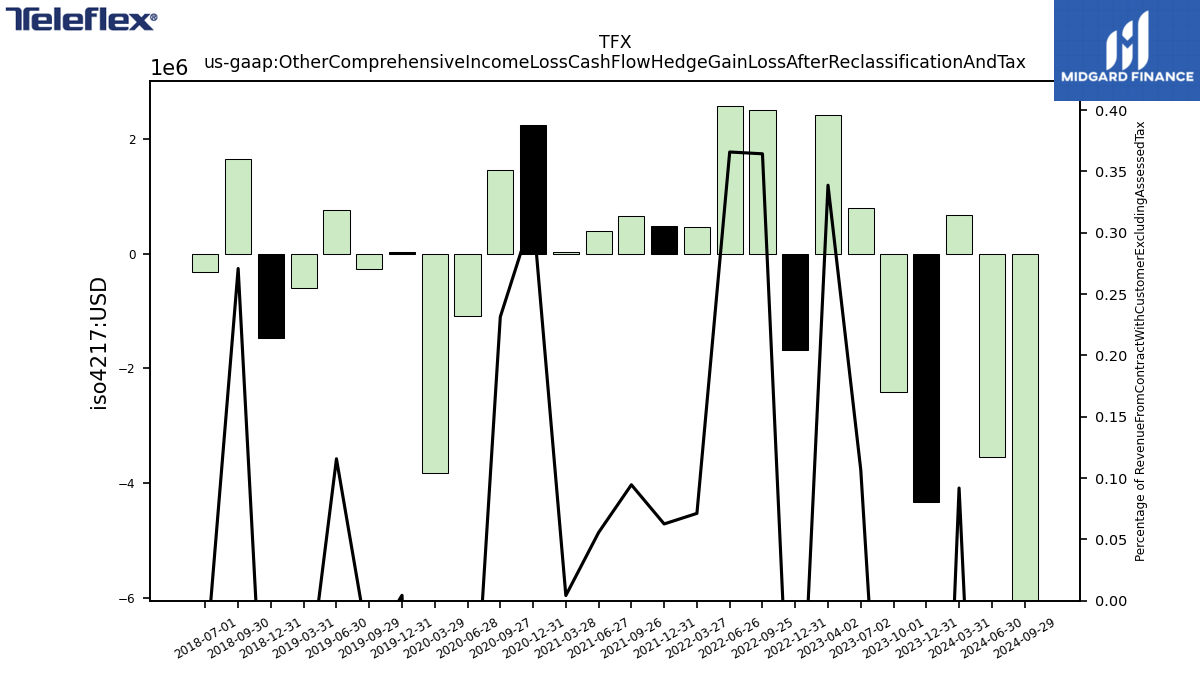
| Other Comprehensive Income Loss Cash Flow Hedge Gain Loss After Reclassification And Tax | -4.32 | -2.41 | 0.79 | 2.41 | -1.69 | 2.50 | 2.58 | 0.46 | 0.48 | 0.66 | 0.40 | 0.03 | 2.24 | 1.45 | -1.09 | -3.82 | 0.03 | -0.26 | 0.76 | -0.60 | -1.48 | 1.65 | -0.33 | NA | NA | NA | NA | NA | NA | NA | NA | NA | NA | NA | NA | NA | NA | NA | NA | NA | NA | NA | NA | NA | NA | NA | NA | NA | NA | NA | NA | NA | NA | NA | NA | NA | NA | NA | NA | |
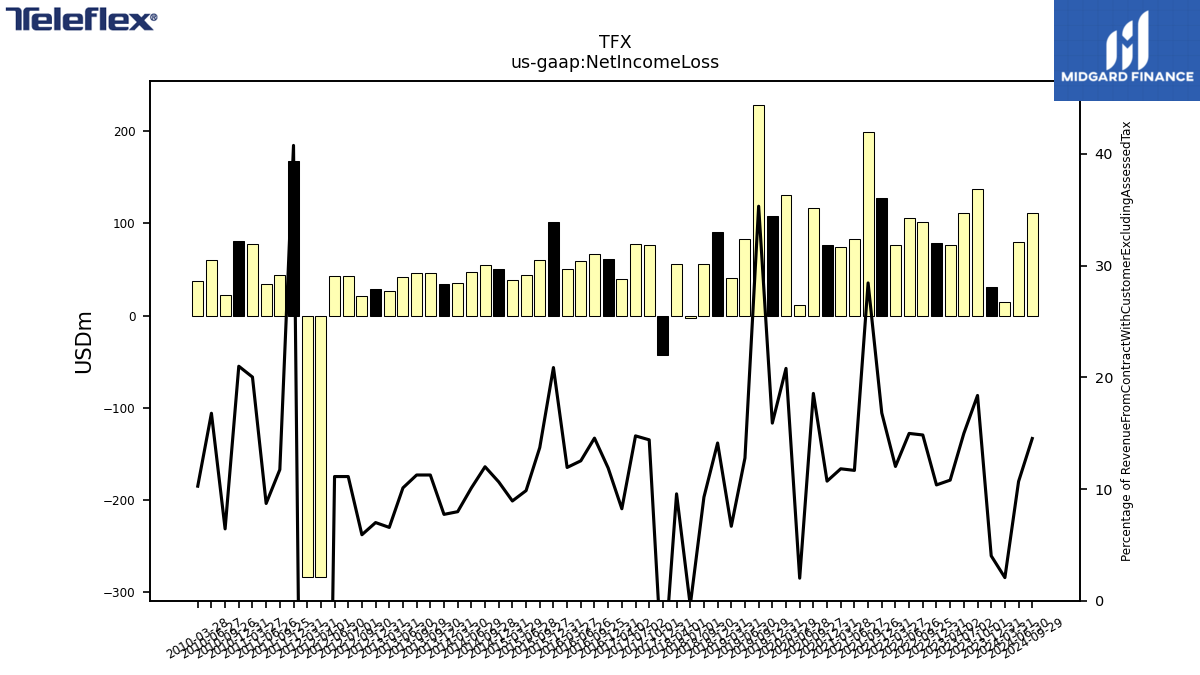
| Net Income Loss | 31.11 | 137.14 | 111.33 | 76.75 | 78.59 | 101.89 | 105.51 | 77.14 | 128.08 | 199.18 | 83.25 | 74.87 | 76.13 | 116.59 | 11.46 | 131.15 | 108.27 | 228.93 | 83.38 | 40.90 | 90.59 | 56.52 | -2.50 | 56.18 | -42.66 | 77.02 | 78.00 | 40.17 | 61.06 | 66.32 | 59.30 | 50.69 | 101.12 | 60.82 | 44.56 | 38.35 | 50.64 | 54.83 | 47.25 | 34.96 | 34.83 | 46.57 | 46.57 | 42.44 | 27.04 | 29.32 | 21.74 | 42.61 | 42.61 | -283.74 | -283.74 | 167.80 | 43.65 | 34.07 | 77.81 | 81.08 | 22.20 | 60.15 | 37.67 |
| 2023-12-31 | 2023-10-01 | 2023-07-02 | 2023-04-02 | 2022-12-31 | 2022-09-25 | 2022-06-26 | 2022-03-27 | 2021-12-31 | 2021-09-26 | 2021-06-27 | 2021-03-28 | 2020-12-31 | 2020-09-27 | 2020-06-28 | 2020-03-29 | 2019-12-31 | 2019-09-29 | 2019-06-30 | 2019-03-31 | 2018-12-31 | 2018-09-30 | 2018-07-01 | 2018-04-01 | 2017-12-31 | 2017-10-01 | 2017-07-02 | 2017-04-02 | 2016-12-31 | 2016-09-25 | 2016-06-26 | 2016-03-27 | 2015-12-31 | 2015-09-27 | 2015-06-28 | 2015-03-29 | 2014-12-31 | 2014-09-28 | 2014-06-29 | 2014-03-30 | 2013-12-31 | 2013-09-30 | 2013-09-29 | 2013-06-30 | 2013-03-31 | 2012-12-31 | 2012-09-30 | 2012-07-01 | 2012-06-30 | 2012-04-01 | 2012-03-31 | 2011-12-31 | 2011-09-25 | 2011-06-26 | 2011-03-27 | 2010-12-31 | 2010-09-26 | 2010-06-27 | 2010-03-28 | ||
|---|---|---|---|---|---|---|---|---|---|---|---|---|---|---|---|---|---|---|---|---|---|---|---|---|---|---|---|---|---|---|---|---|---|---|---|---|---|---|---|---|---|---|---|---|---|---|---|---|---|---|---|---|---|---|---|---|---|---|---|---|
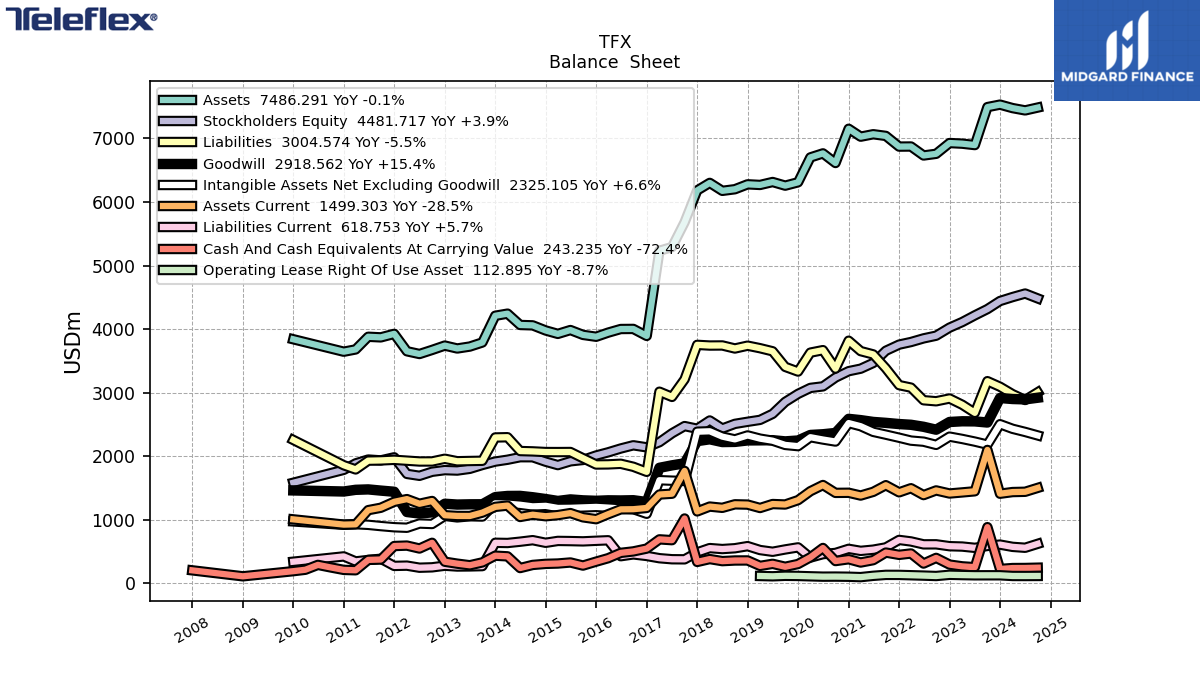
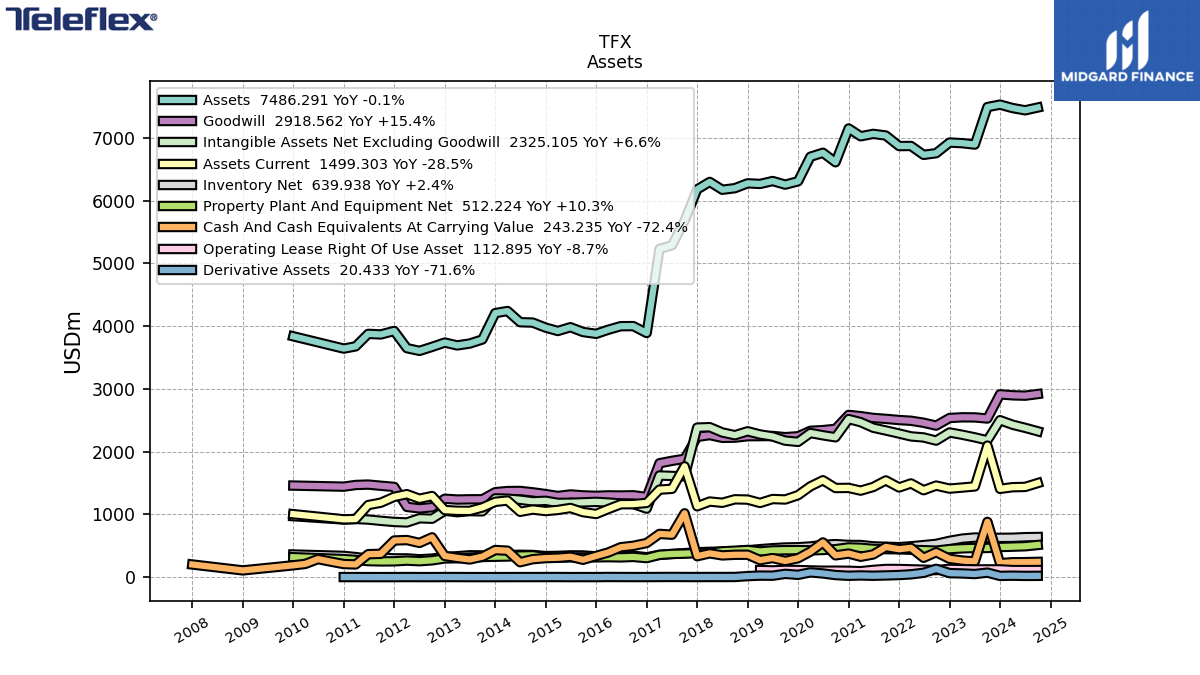
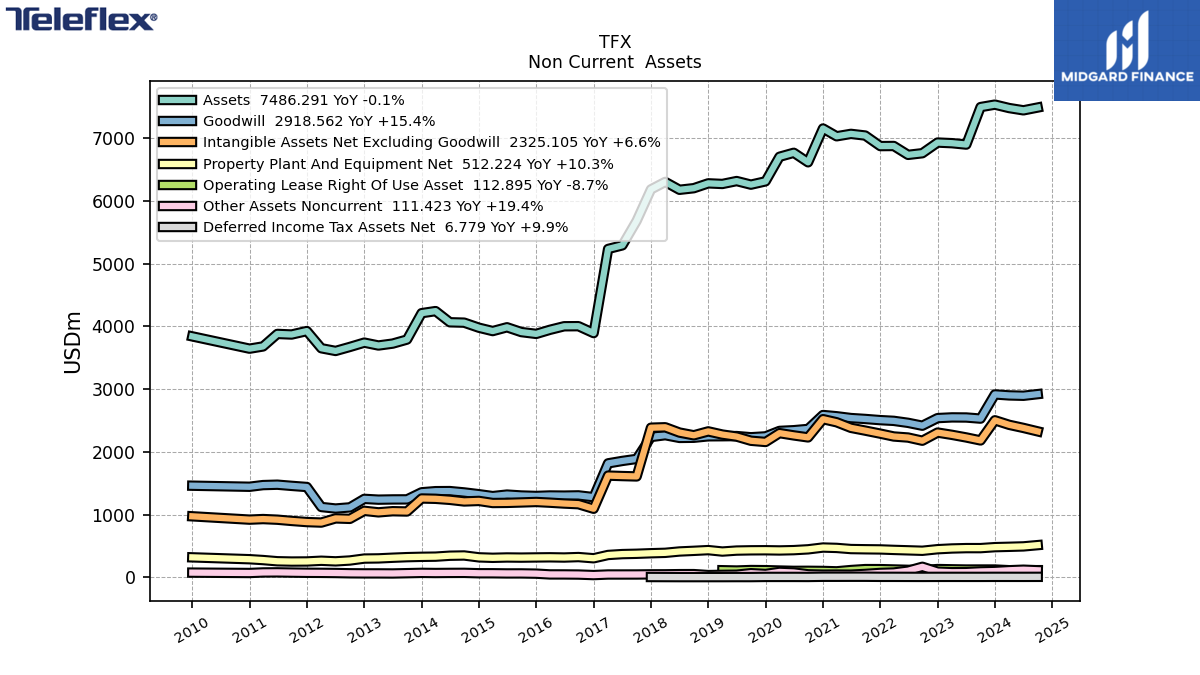
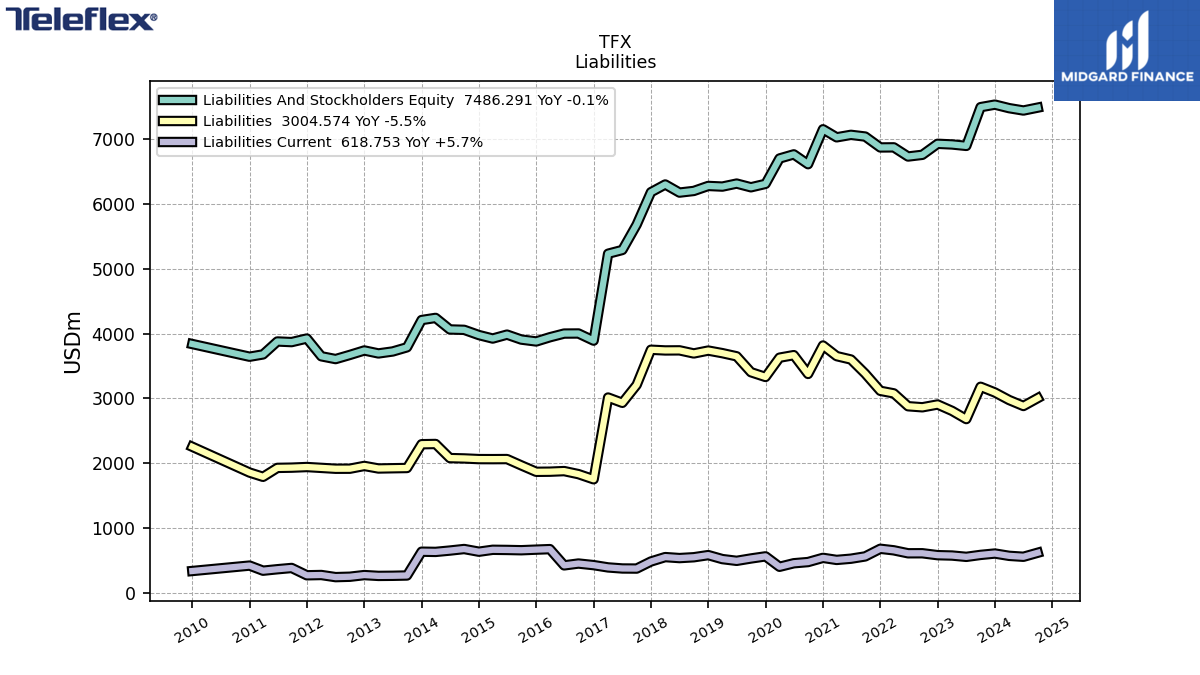
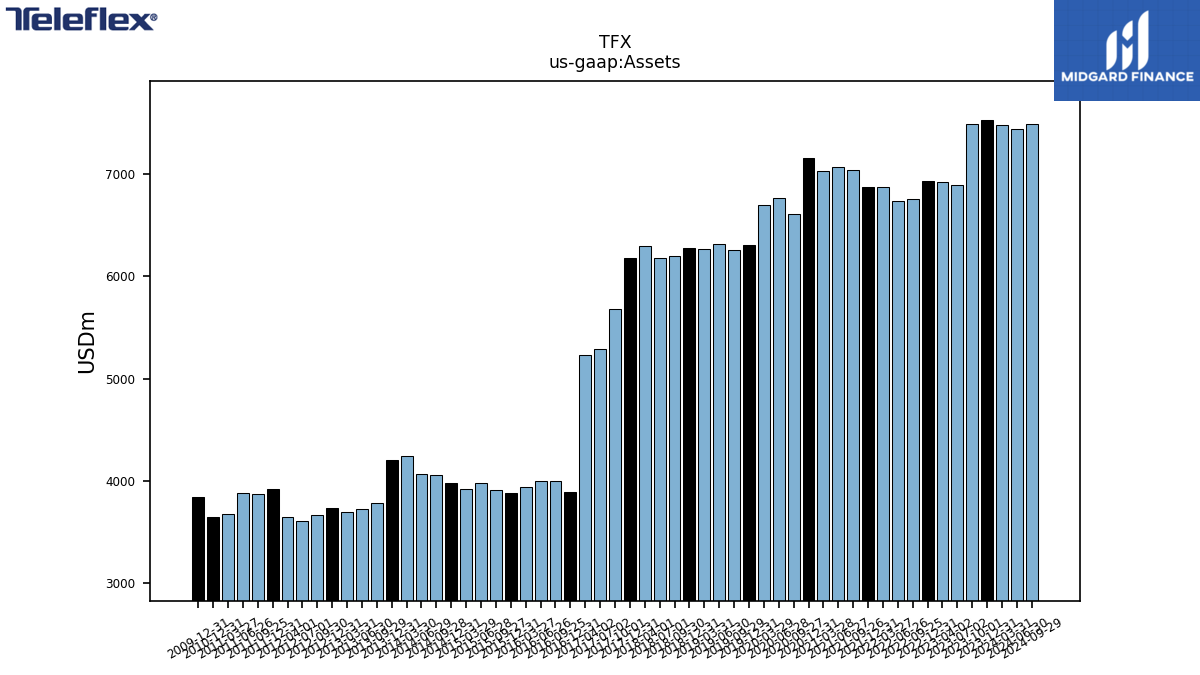
| Assets | 7532.55 | 7493.63 | 6895.73 | 6917.92 | 6928.06 | 6758.09 | 6731.85 | 6873.31 | 6871.72 | 7039.96 | 7066.39 | 7028.02 | 7152.56 | 6613.29 | 6765.13 | 6701.56 | 6309.82 | 6257.18 | 6314.41 | 6268.07 | 6277.99 | 6200.72 | 6175.32 | 6300.60 | 6181.49 | 5680.73 | 5290.02 | 5232.44 | 3891.21 | 4001.67 | 4000.21 | 3943.47 | 3878.52 | 3907.70 | 3984.16 | 3923.59 | 3977.26 | 4057.79 | 4063.83 | 4242.13 | 4209.01 | NA | 3788.36 | 3724.14 | 3693.73 | 3739.50 | 3670.79 | 3606.82 | NA | 3649.89 | NA | 3924.10 | 3868.71 | 3878.23 | 3678.80 | 3643.16 | NA | NA | NA | |
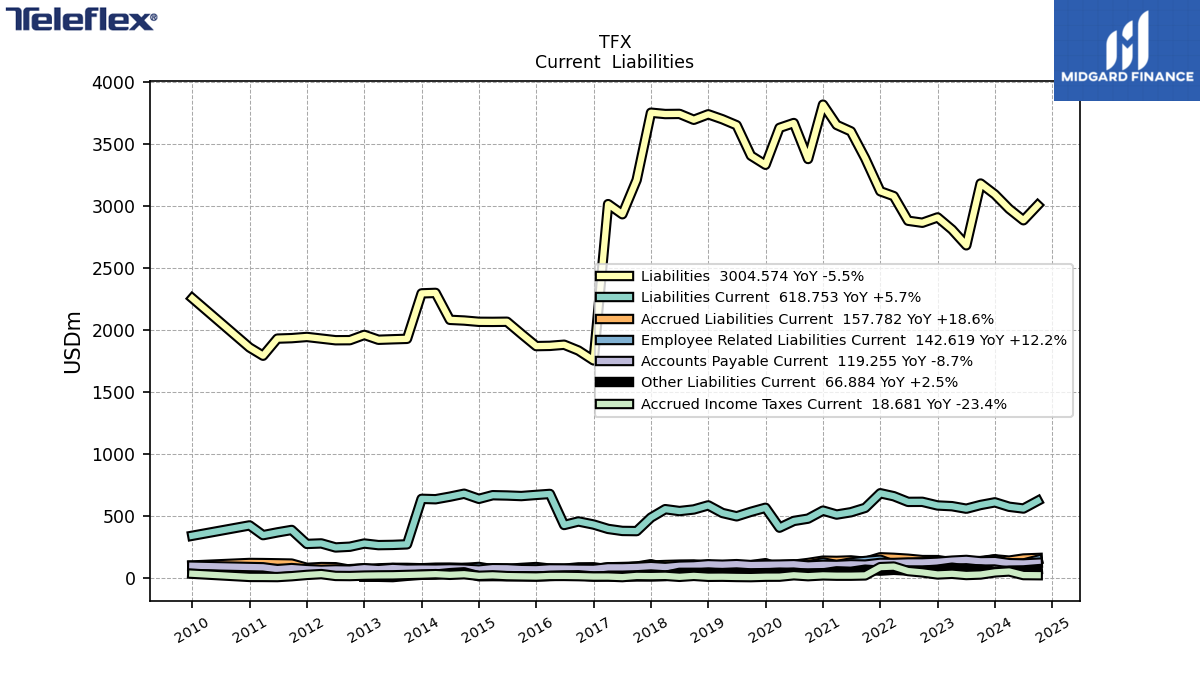
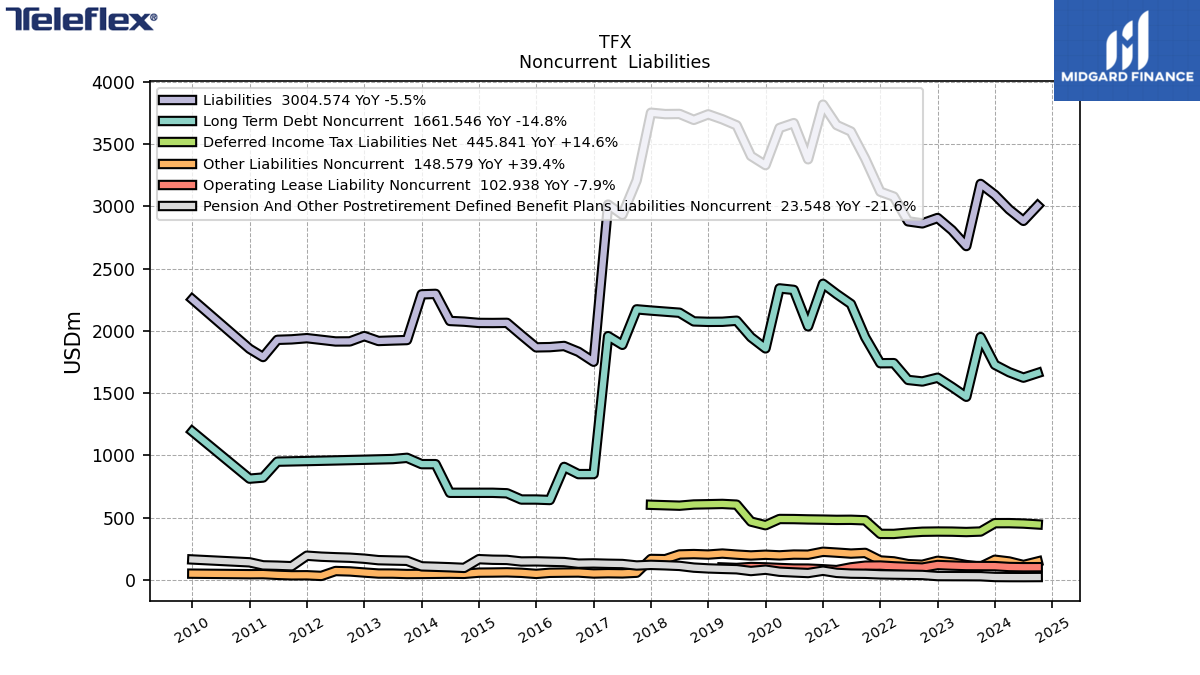
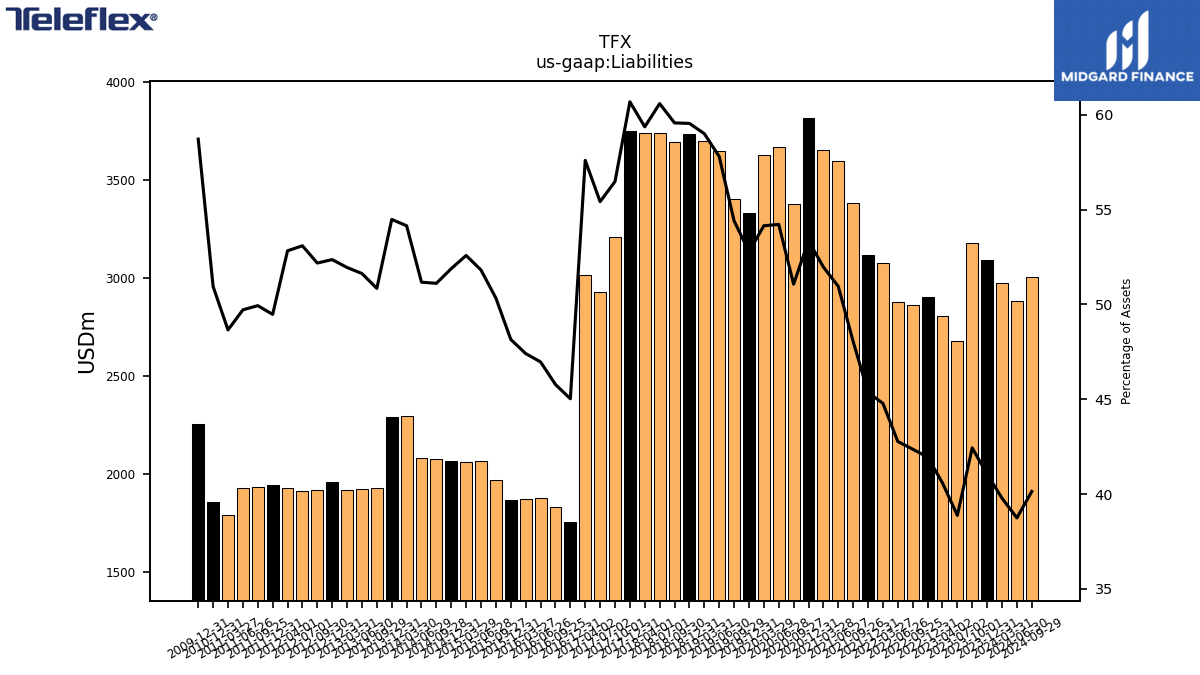
| Liabilities | 3091.56 | 3179.59 | 2680.63 | 2807.67 | 2906.09 | 2862.93 | 2879.12 | 3077.78 | 3116.97 | 3382.09 | 3600.28 | 3652.23 | 3816.10 | 3377.09 | 3667.73 | 3628.54 | 3330.50 | 3404.21 | 3649.57 | 3698.19 | 3738.01 | 3693.66 | 3741.34 | 3740.10 | 3750.96 | 3208.26 | 2931.49 | 3013.53 | 1751.87 | 1831.75 | 1878.64 | 1869.39 | 1867.42 | 1966.64 | 2064.16 | 2062.99 | 2063.56 | 2073.88 | 2079.45 | 2296.91 | 2292.99 | NA | 1926.10 | 1922.61 | 1918.65 | 1957.96 | NA | 1914.81 | NA | 1928.04 | NA | 1941.32 | 1931.71 | 1927.89 | 1789.82 | 1855.88 | NA | NA | NA | |
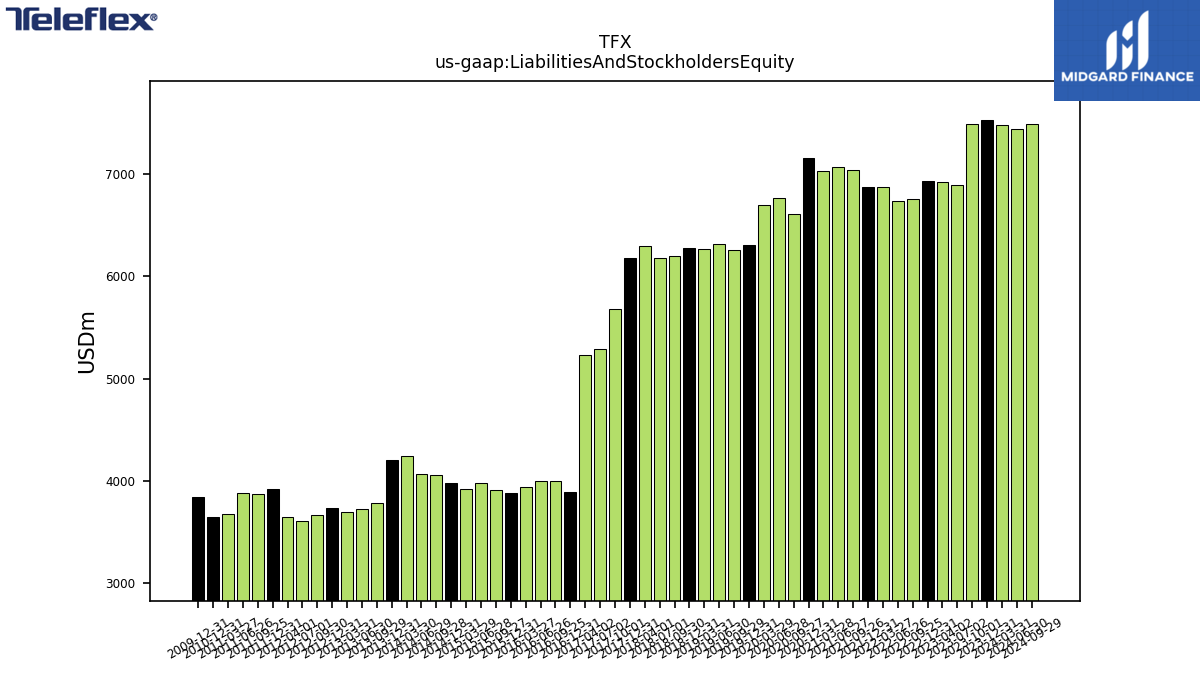
| Liabilities And Stockholders Equity | 7532.55 | 7493.63 | 6895.73 | 6917.92 | 6928.06 | 6758.09 | 6731.85 | 6873.31 | 6871.72 | 7039.96 | 7066.39 | 7028.02 | 7152.56 | 6613.29 | 6765.13 | 6701.56 | 6309.82 | 6257.18 | 6314.41 | 6268.07 | 6277.99 | 6200.72 | 6175.32 | 6300.60 | 6181.49 | 5680.73 | 5290.02 | 5232.44 | 3891.21 | 4001.67 | 4000.21 | 3943.47 | 3878.52 | 3907.70 | 3984.16 | 3923.59 | 3977.26 | 4057.79 | 4063.83 | 4242.13 | 4209.01 | NA | 3788.36 | 3724.14 | 3693.73 | 3739.50 | NA | 3606.82 | NA | 3649.89 | NA | 3924.10 | 3868.71 | 3878.23 | 3678.80 | 3643.16 | NA | NA | NA | |
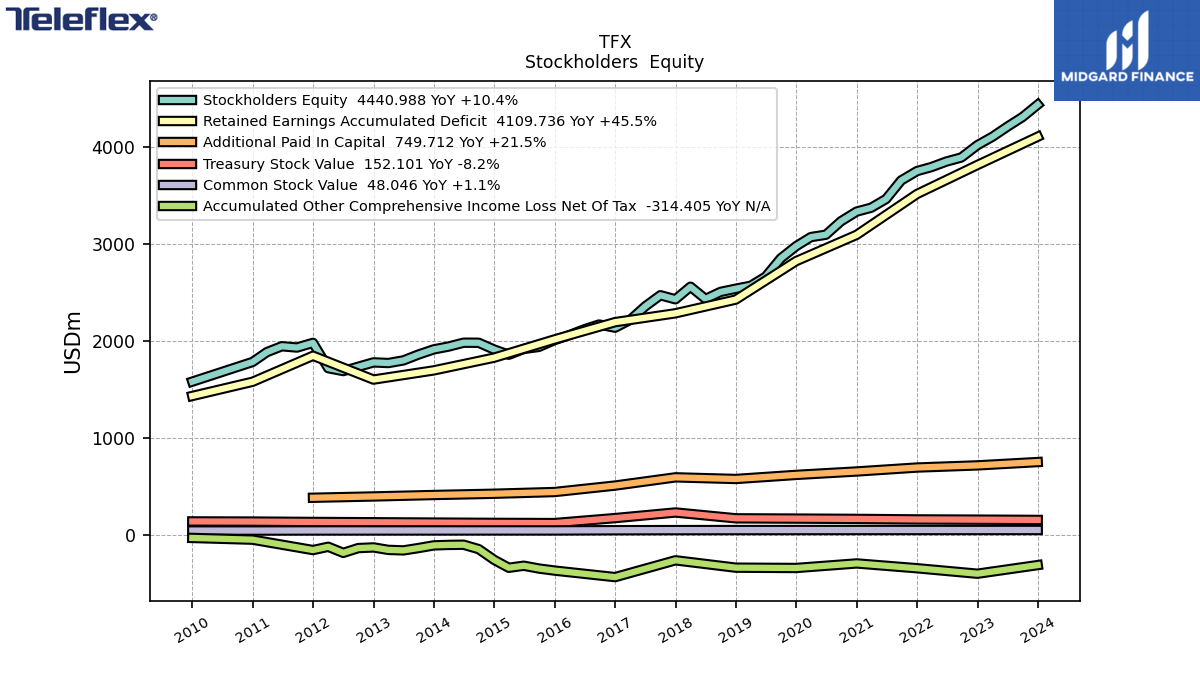
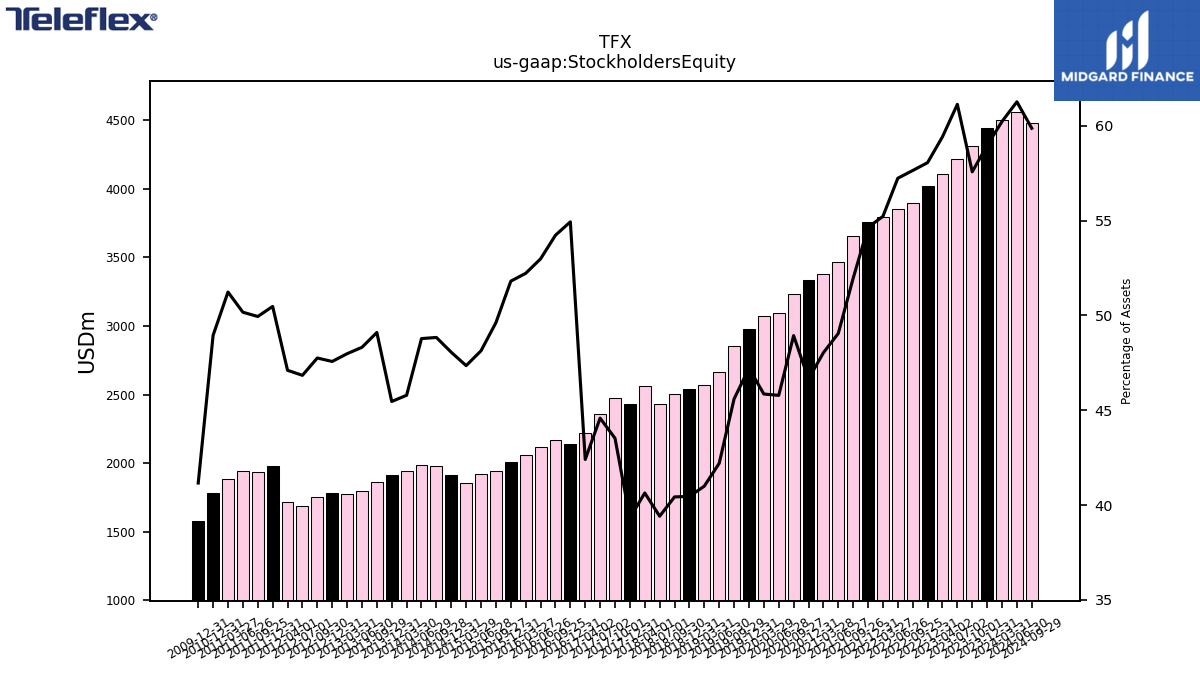
| Stockholders Equity | 4440.99 | 4314.05 | 4215.09 | 4110.25 | 4021.97 | 3895.16 | 3852.73 | 3795.53 | 3754.75 | 3657.87 | 3466.10 | 3375.79 | 3336.46 | 3236.20 | 3097.40 | 3073.02 | 2979.32 | 2852.98 | 2664.84 | 2569.88 | 2539.98 | 2507.07 | 2433.98 | 2560.50 | 2430.53 | 2472.48 | 2358.53 | 2218.90 | 2137.52 | 2169.92 | 2119.35 | 2059.22 | 2009.27 | 1938.89 | 1917.78 | 1857.93 | 1911.31 | 1981.73 | 1982.28 | 1942.49 | 1913.53 | NA | 1860.04 | 1799.43 | 1772.25 | 1778.95 | NA | 1689.47 | NA | 1719.35 | NA | 1980.59 | 1932.15 | 1945.62 | 1884.71 | 1783.38 | NA | NA | NA |
| 2023-12-31 | 2023-10-01 | 2023-07-02 | 2023-04-02 | 2022-12-31 | 2022-09-25 | 2022-06-26 | 2022-03-27 | 2021-12-31 | 2021-09-26 | 2021-06-27 | 2021-03-28 | 2020-12-31 | 2020-09-27 | 2020-06-28 | 2020-03-29 | 2019-12-31 | 2019-09-29 | 2019-06-30 | 2019-03-31 | 2018-12-31 | 2018-09-30 | 2018-07-01 | 2018-04-01 | 2017-12-31 | 2017-10-01 | 2017-07-02 | 2017-04-02 | 2016-12-31 | 2016-09-25 | 2016-06-26 | 2016-03-27 | 2015-12-31 | 2015-09-27 | 2015-06-28 | 2015-03-29 | 2014-12-31 | 2014-09-28 | 2014-06-29 | 2014-03-30 | 2013-12-31 | 2013-09-30 | 2013-09-29 | 2013-06-30 | 2013-03-31 | 2012-12-31 | 2012-09-30 | 2012-07-01 | 2012-06-30 | 2012-04-01 | 2012-03-31 | 2011-12-31 | 2011-09-25 | 2011-06-26 | 2011-03-27 | 2010-12-31 | 2010-09-26 | 2010-06-27 | 2010-03-28 | ||
|---|---|---|---|---|---|---|---|---|---|---|---|---|---|---|---|---|---|---|---|---|---|---|---|---|---|---|---|---|---|---|---|---|---|---|---|---|---|---|---|---|---|---|---|---|---|---|---|---|---|---|---|---|---|---|---|---|---|---|---|---|
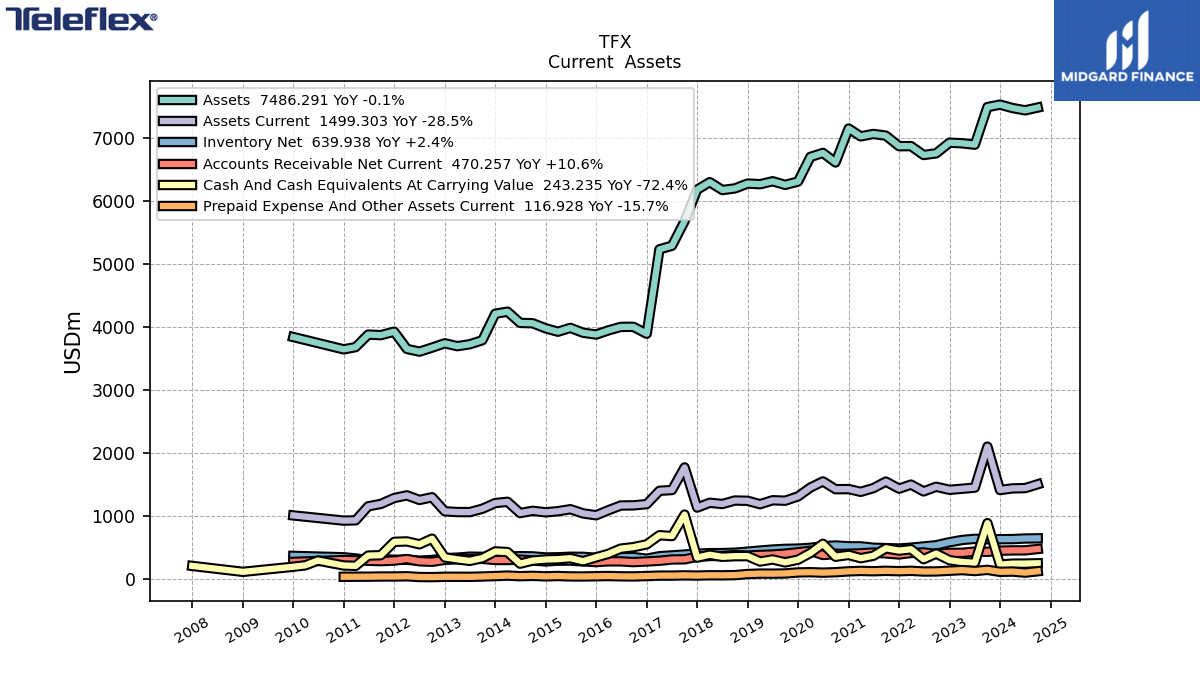
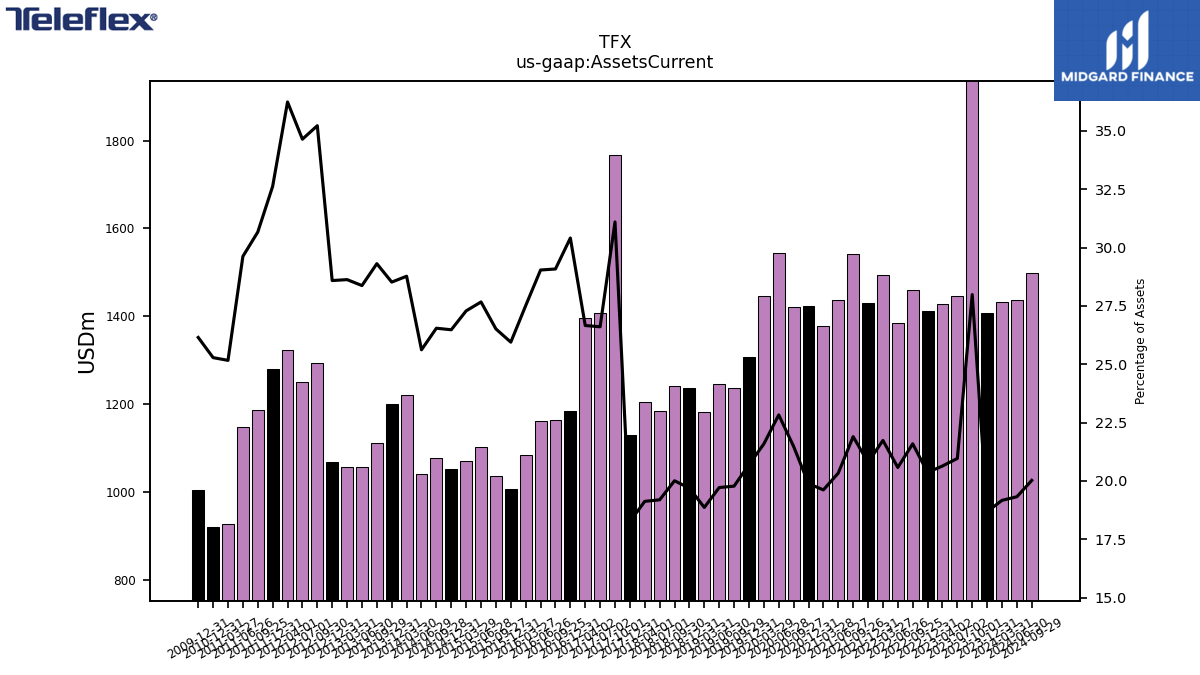
| Assets Current | 1407.41 | 2097.27 | 1445.80 | 1428.05 | 1410.98 | 1459.38 | 1385.35 | 1494.20 | 1429.12 | 1541.84 | 1437.23 | 1378.78 | 1422.42 | 1420.56 | 1544.62 | 1446.79 | 1306.33 | 1237.61 | 1245.14 | 1182.61 | 1236.17 | 1240.81 | 1185.28 | 1205.16 | 1128.81 | 1766.75 | 1407.62 | 1395.13 | 1183.39 | 1163.87 | 1161.72 | 1085.01 | 1006.43 | 1036.15 | 1102.51 | 1070.77 | 1053.21 | 1077.20 | 1041.25 | 1220.62 | 1200.55 | NA | 1110.45 | 1056.71 | 1057.50 | 1069.08 | NA | 1249.63 | NA | 1322.77 | NA | 1280.26 | 1186.43 | 1148.93 | 925.92 | 921.23 | NA | NA | NA | |
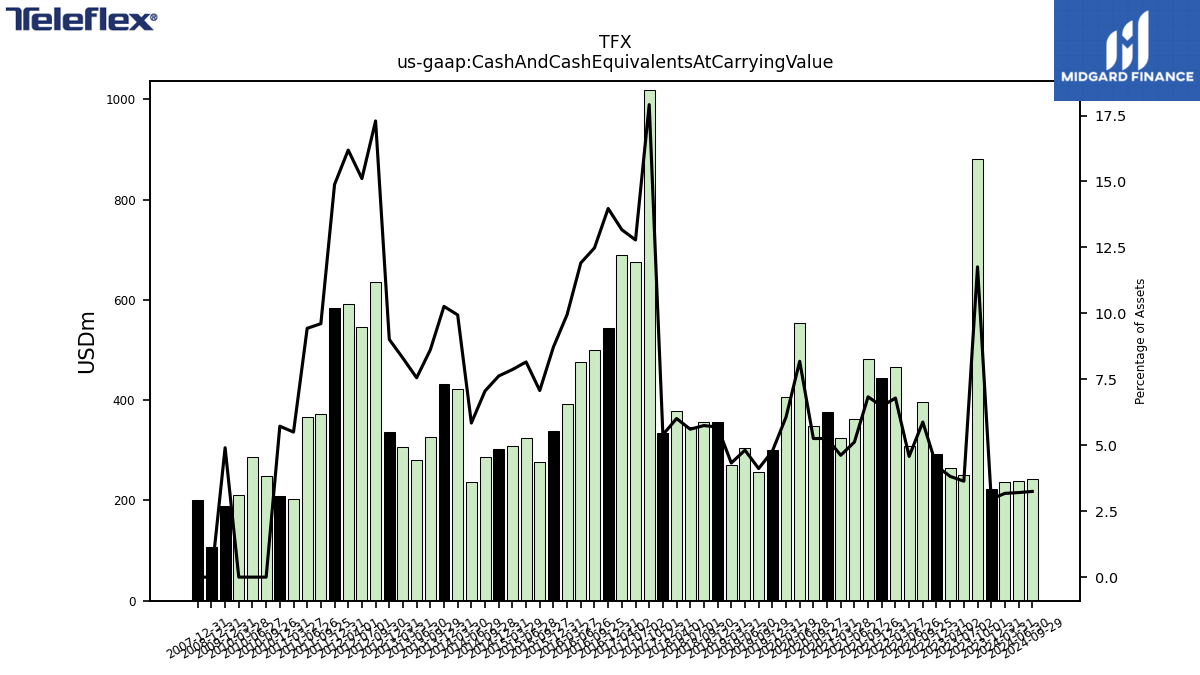
| Cash And Cash Equivalents At Carrying Value | 222.85 | 881.50 | 250.82 | 264.14 | 292.03 | 397.26 | 308.12 | 466.66 | 445.08 | 481.17 | 361.78 | 324.63 | 375.88 | 347.48 | 553.53 | 406.48 | 301.08 | 257.54 | 303.90 | 271.21 | 357.16 | 356.28 | 346.30 | 378.87 | 333.56 | 1017.57 | 676.21 | 689.13 | 543.79 | 499.46 | 476.49 | 392.56 | 338.37 | 276.46 | 325.01 | 308.76 | 303.24 | 286.38 | 237.38 | 421.65 | 431.98 | NA | 326.44 | 281.42 | 306.55 | 337.04 | 634.83 | 544.99 | NA | 590.92 | NA | 584.09 | 371.70 | 365.81 | 202.30 | 208.45 | 247.76 | 287.13 | 210.72 | |
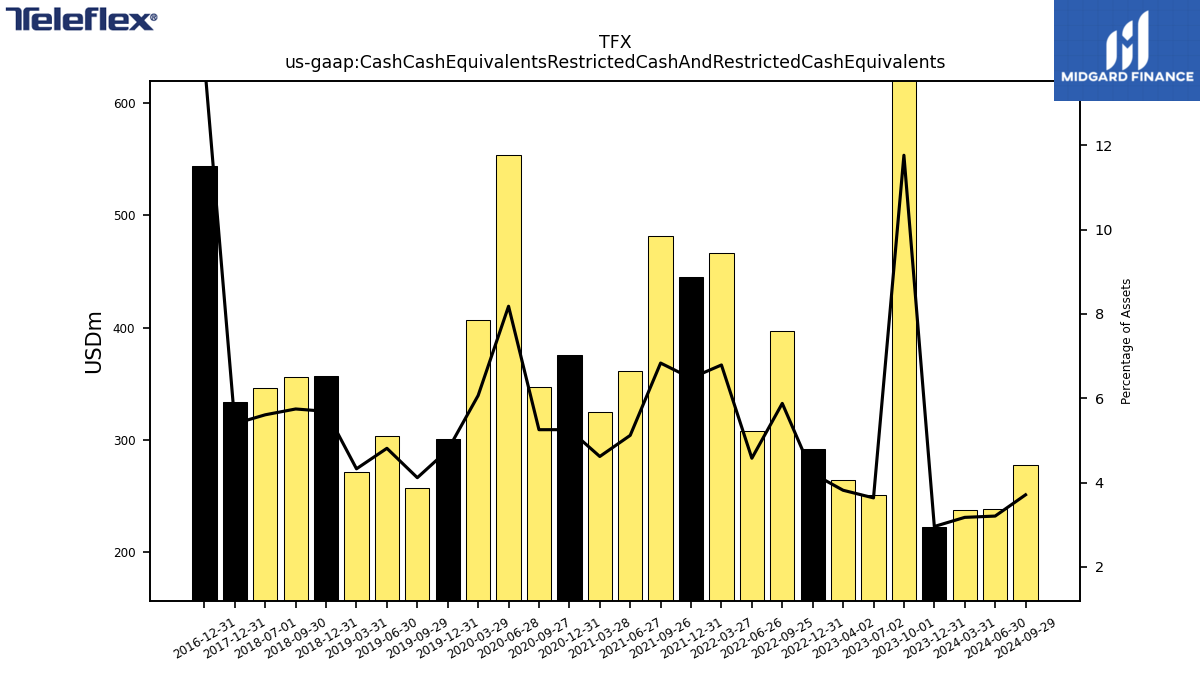
| Cash Cash Equivalents Restricted Cash And Restricted Cash Equivalents | 222.85 | 881.50 | 250.82 | 264.14 | 292.03 | 397.26 | 308.12 | 466.66 | 445.08 | 481.17 | 361.78 | 324.63 | 375.88 | 347.48 | 553.53 | 406.48 | 301.08 | 257.54 | 303.90 | 271.21 | 357.16 | 356.28 | 346.30 | NA | 333.56 | NA | NA | NA | 543.79 | NA | NA | NA | NA | NA | NA | NA | NA | NA | NA | NA | NA | NA | NA | NA | NA | NA | NA | NA | NA | NA | NA | NA | NA | NA | NA | NA | NA | NA | NA | |
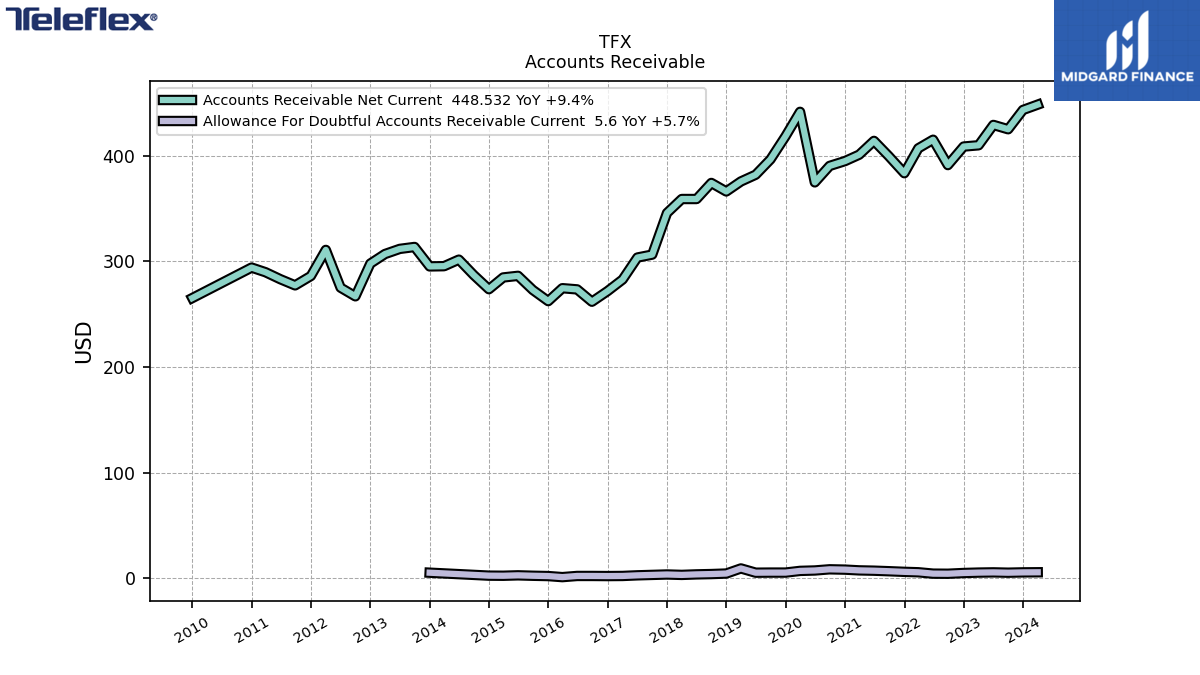
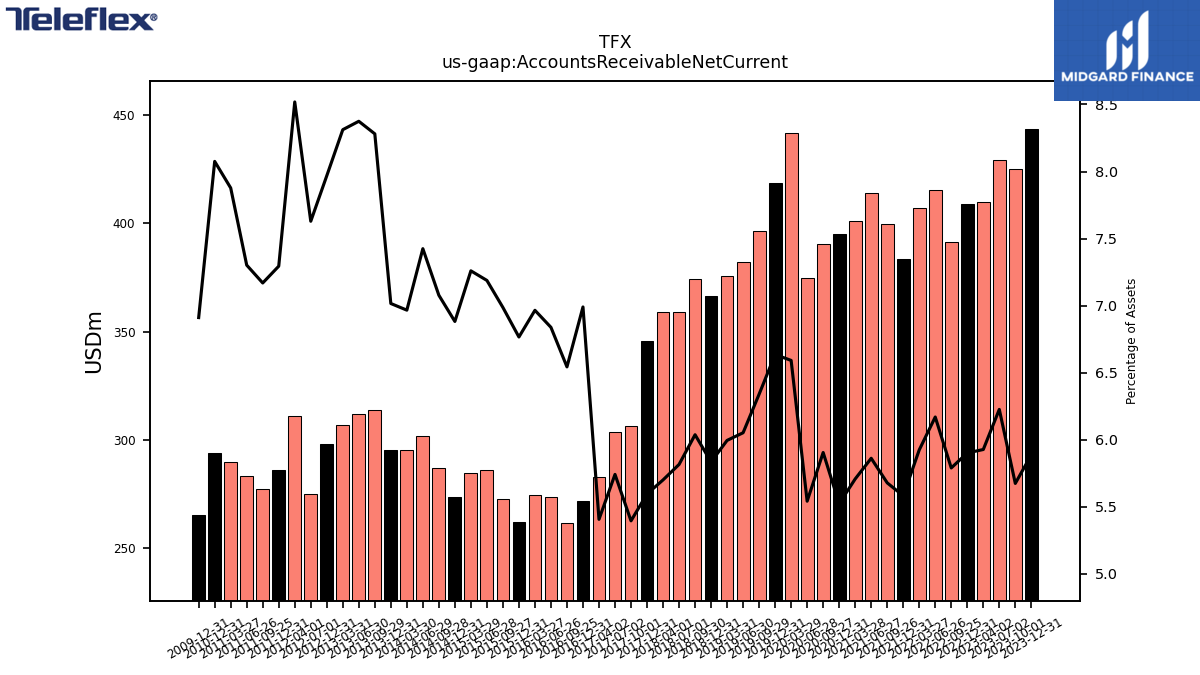
| Accounts Receivable Net Current | 443.47 | 425.19 | 429.31 | 410.02 | 408.83 | 391.25 | 415.30 | 407.16 | 383.57 | 399.74 | 414.19 | 401.11 | 395.07 | 390.48 | 374.89 | 441.71 | 418.67 | 396.66 | 382.14 | 375.76 | 366.29 | 374.34 | 359.12 | 359.14 | 345.88 | 306.47 | 303.70 | 282.87 | 271.99 | 261.83 | 273.53 | 274.66 | 262.42 | 273.00 | 286.37 | 284.83 | 273.70 | 287.18 | 301.72 | 295.51 | 295.29 | NA | 313.71 | 311.88 | 307.02 | 297.98 | NA | 275.17 | NA | 310.93 | NA | 286.23 | 277.34 | 283.18 | 289.79 | 294.20 | NA | NA | NA | |
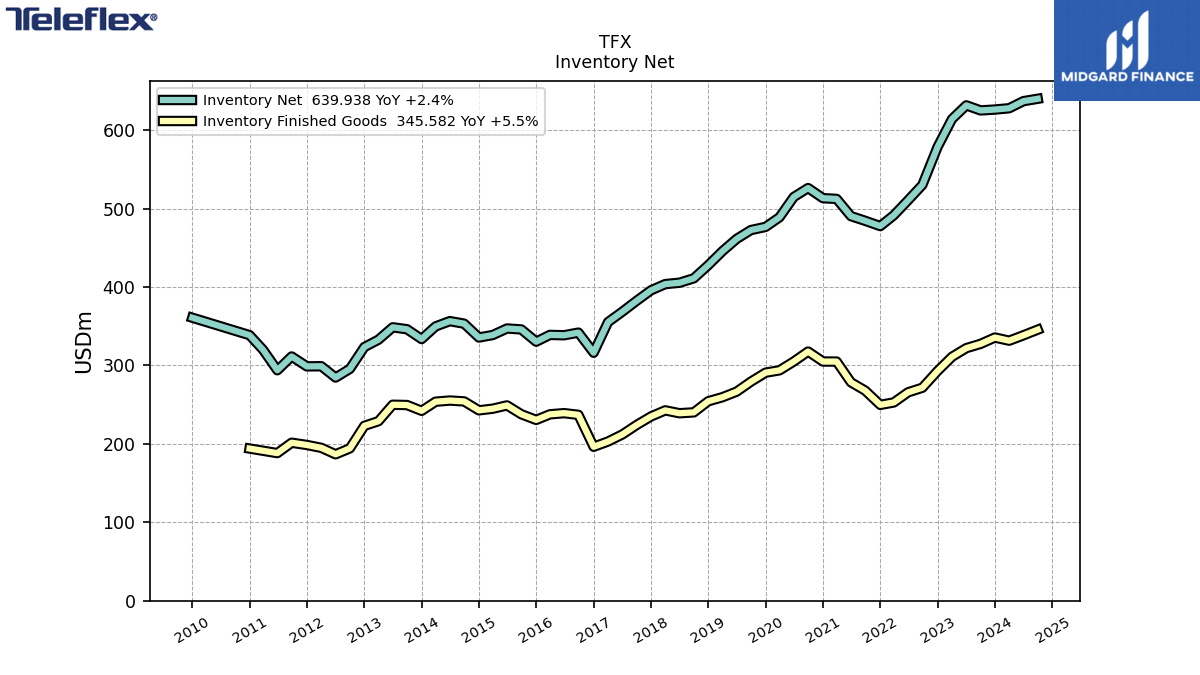
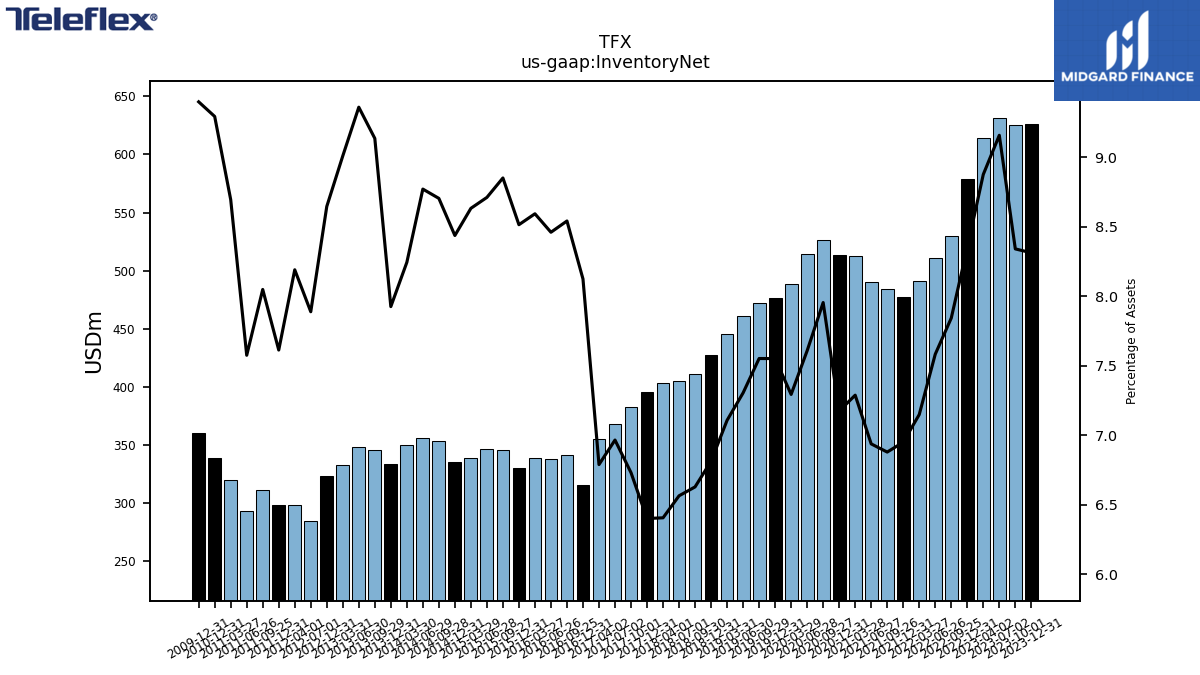
| Inventory Net | 626.22 | 625.08 | 631.55 | 614.11 | 578.51 | 530.09 | 510.53 | 491.42 | 477.64 | 484.35 | 490.32 | 512.28 | 513.20 | 526.12 | 514.75 | 488.86 | 476.56 | 472.59 | 461.32 | 445.57 | 427.78 | 411.07 | 405.43 | 403.68 | 395.74 | 382.42 | 368.53 | 355.29 | 316.17 | 341.83 | 338.46 | 338.91 | 330.27 | 345.90 | 347.10 | 338.74 | 335.59 | 353.23 | 356.47 | 349.75 | 333.62 | NA | 346.12 | 348.61 | 332.82 | 323.35 | NA | 284.56 | NA | 298.97 | NA | 298.77 | 311.42 | 293.82 | 319.90 | 338.60 | NA | NA | NA | |
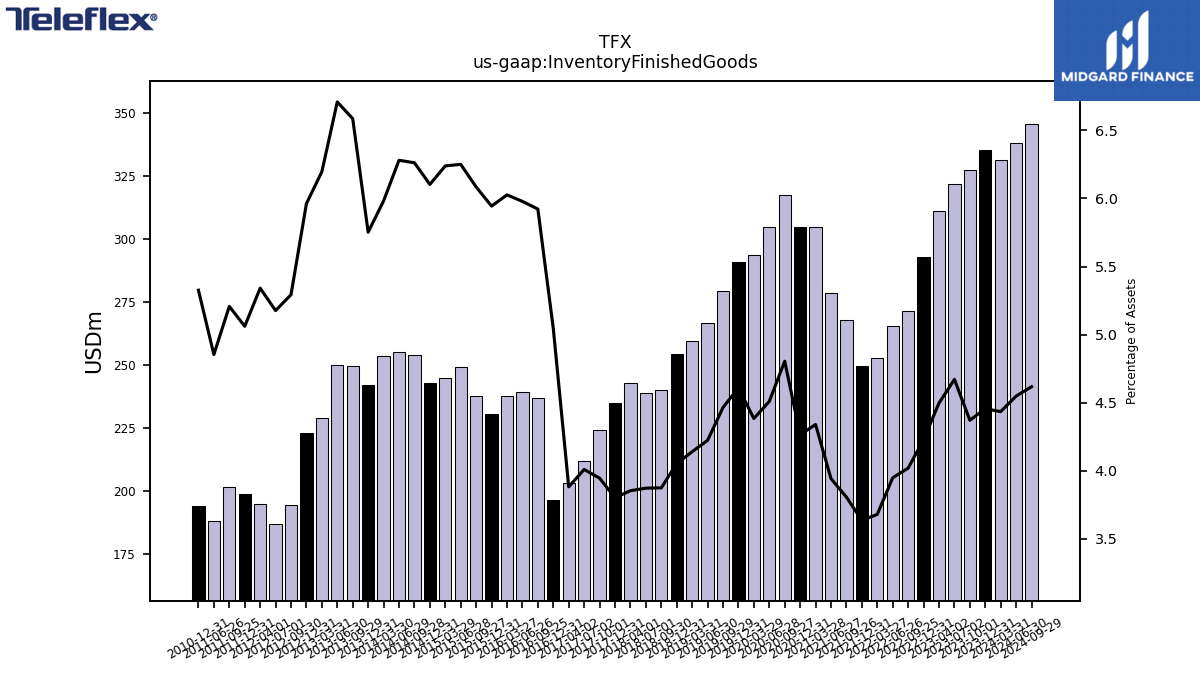
| Inventory Finished Goods | 335.57 | 327.49 | 322.05 | 311.03 | 292.87 | 271.54 | 265.71 | 252.80 | 249.71 | 267.88 | 278.51 | 304.92 | 304.95 | 317.69 | 305.00 | 293.73 | 290.78 | 279.30 | 266.60 | 259.44 | 254.34 | 240.18 | 239.04 | 242.71 | 234.91 | 224.07 | 212.04 | 203.05 | 196.30 | 236.99 | 239.16 | 237.66 | 230.54 | 237.78 | 249.04 | 244.81 | 242.75 | 254.12 | 255.24 | 253.76 | 242.11 | NA | 249.51 | 249.88 | 228.90 | 222.97 | NA | 186.69 | NA | 194.93 | NA | 198.59 | 201.46 | 188.21 | NA | 194.03 | NA | NA | NA | |
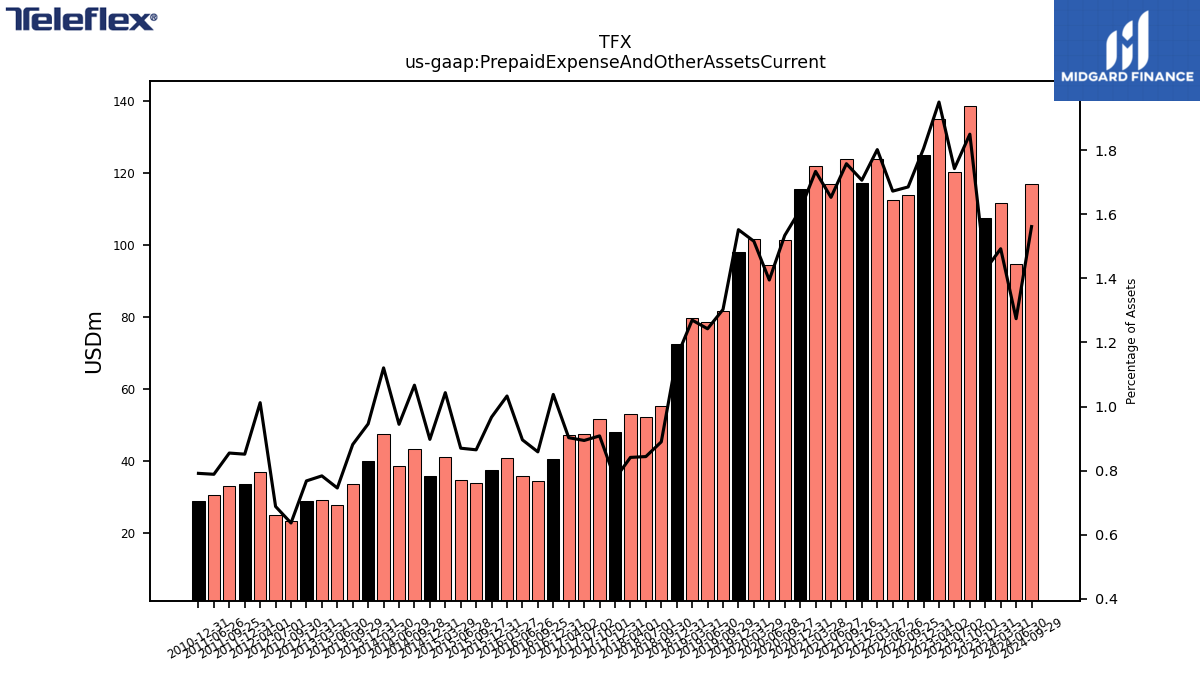
| Prepaid Expense And Other Assets Current | 107.47 | 138.66 | 120.19 | 134.95 | 125.08 | 113.92 | 112.59 | 123.87 | 117.28 | 123.78 | 116.82 | 121.88 | 115.44 | 101.45 | 94.38 | 101.61 | 97.94 | 81.53 | 78.48 | 79.59 | 72.48 | 55.17 | 52.10 | 53.00 | 47.88 | 51.60 | 47.30 | 47.24 | 40.38 | 34.35 | 35.84 | 40.73 | 37.51 | 33.80 | 34.66 | 40.94 | 35.70 | 43.28 | 38.39 | 47.54 | 39.81 | NA | 33.39 | 27.77 | 28.94 | 28.71 | NA | 24.81 | NA | 36.94 | NA | 33.41 | 33.07 | 30.58 | NA | 28.83 | NA | NA | NA | |
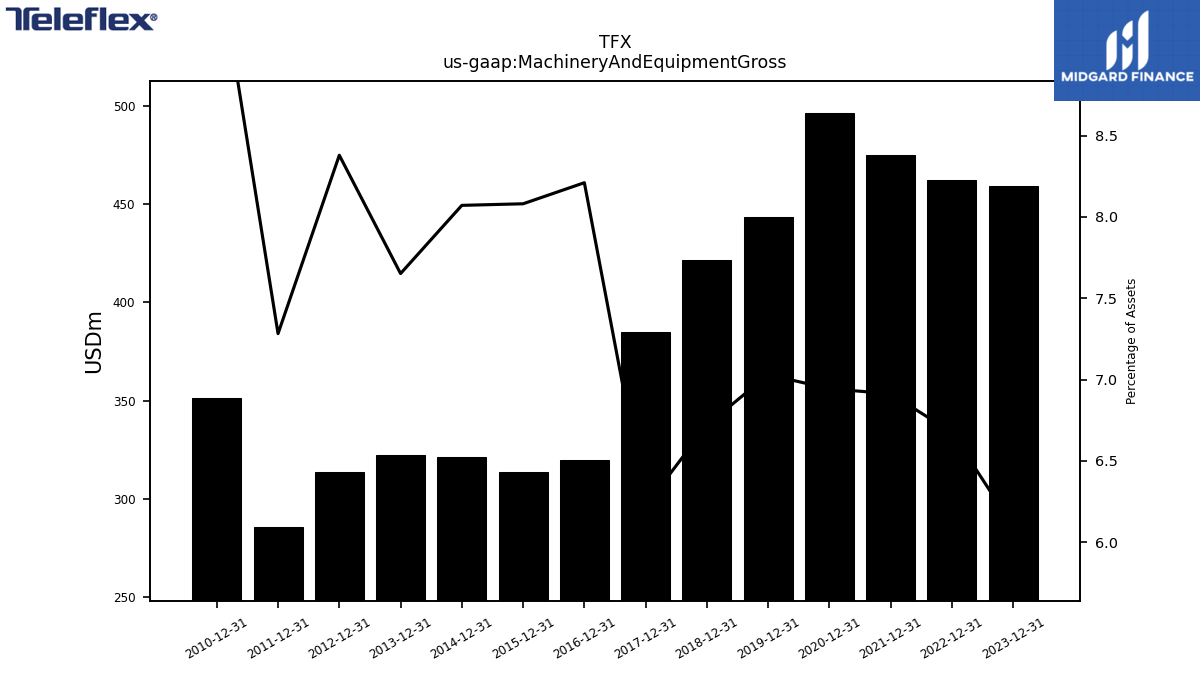
| Machinery And Equipment Gross | 459.27 | NA | NA | NA | 462.45 | NA | NA | NA | 475.04 | NA | NA | NA | 496.66 | NA | NA | NA | 443.61 | NA | NA | NA | 421.87 | NA | NA | NA | 384.71 | NA | NA | NA | 319.47 | NA | NA | NA | 313.40 | NA | NA | NA | 321.00 | NA | NA | NA | 322.06 | NA | NA | NA | NA | 313.32 | NA | NA | NA | NA | NA | 285.77 | NA | NA | NA | 351.26 | NA | NA | NA |
| 2023-12-31 | 2023-10-01 | 2023-07-02 | 2023-04-02 | 2022-12-31 | 2022-09-25 | 2022-06-26 | 2022-03-27 | 2021-12-31 | 2021-09-26 | 2021-06-27 | 2021-03-28 | 2020-12-31 | 2020-09-27 | 2020-06-28 | 2020-03-29 | 2019-12-31 | 2019-09-29 | 2019-06-30 | 2019-03-31 | 2018-12-31 | 2018-09-30 | 2018-07-01 | 2018-04-01 | 2017-12-31 | 2017-10-01 | 2017-07-02 | 2017-04-02 | 2016-12-31 | 2016-09-25 | 2016-06-26 | 2016-03-27 | 2015-12-31 | 2015-09-27 | 2015-06-28 | 2015-03-29 | 2014-12-31 | 2014-09-28 | 2014-06-29 | 2014-03-30 | 2013-12-31 | 2013-09-30 | 2013-09-29 | 2013-06-30 | 2013-03-31 | 2012-12-31 | 2012-09-30 | 2012-07-01 | 2012-06-30 | 2012-04-01 | 2012-03-31 | 2011-12-31 | 2011-09-25 | 2011-06-26 | 2011-03-27 | 2010-12-31 | 2010-09-26 | 2010-06-27 | 2010-03-28 | ||
|---|---|---|---|---|---|---|---|---|---|---|---|---|---|---|---|---|---|---|---|---|---|---|---|---|---|---|---|---|---|---|---|---|---|---|---|---|---|---|---|---|---|---|---|---|---|---|---|---|---|---|---|---|---|---|---|---|---|---|---|---|
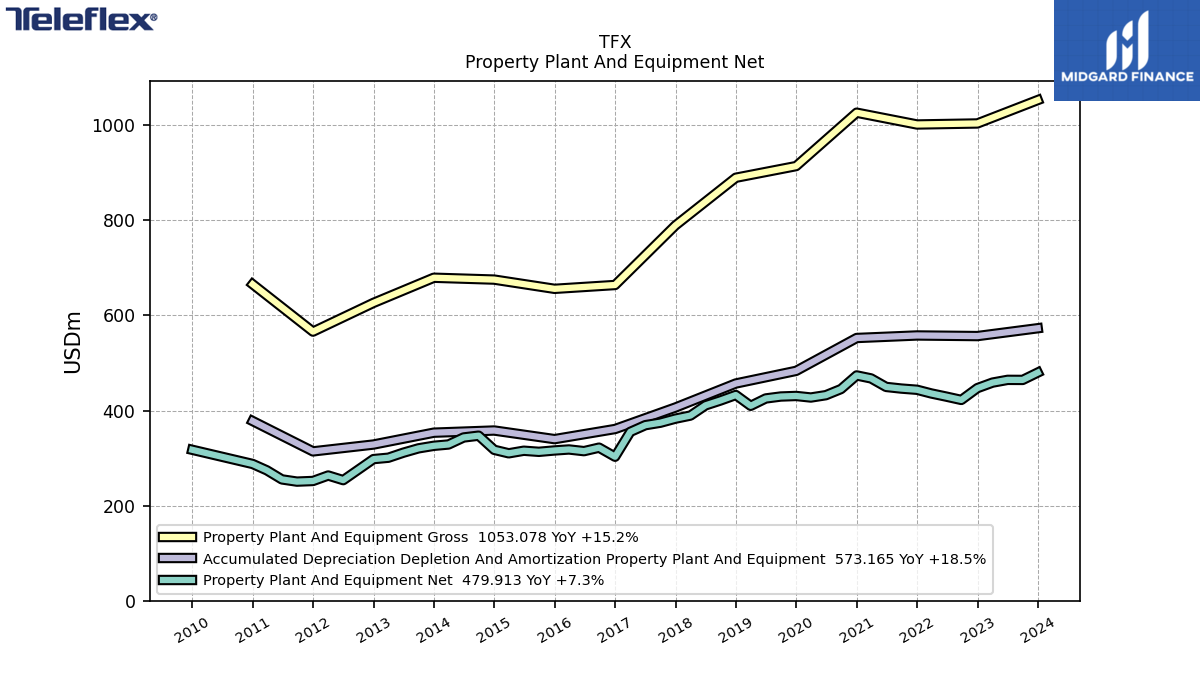
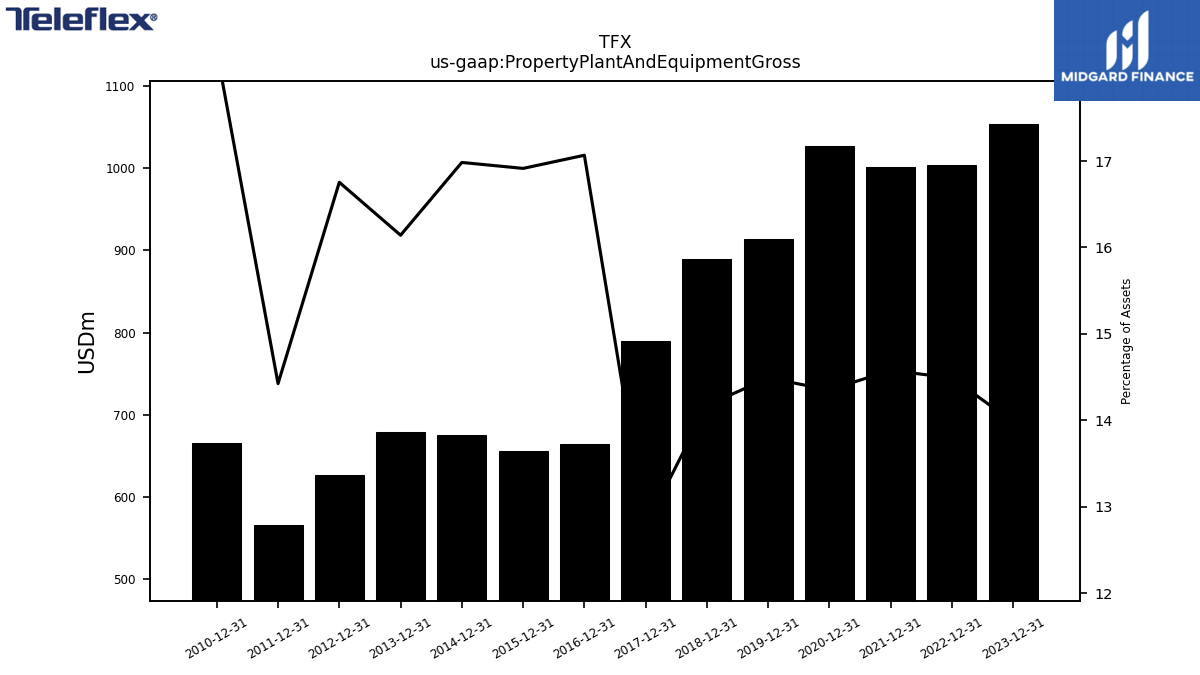
| Property Plant And Equipment Gross | 1053.08 | NA | NA | NA | 1003.89 | NA | NA | NA | 1001.73 | NA | NA | NA | 1026.55 | NA | NA | NA | 914.24 | NA | NA | NA | 889.70 | NA | NA | NA | 789.45 | NA | NA | NA | 664.12 | NA | NA | NA | 656.06 | NA | NA | NA | 675.50 | NA | NA | NA | 679.42 | NA | NA | NA | NA | 626.52 | NA | NA | NA | NA | NA | 566.05 | NA | NA | NA | 665.72 | NA | NA | NA | |
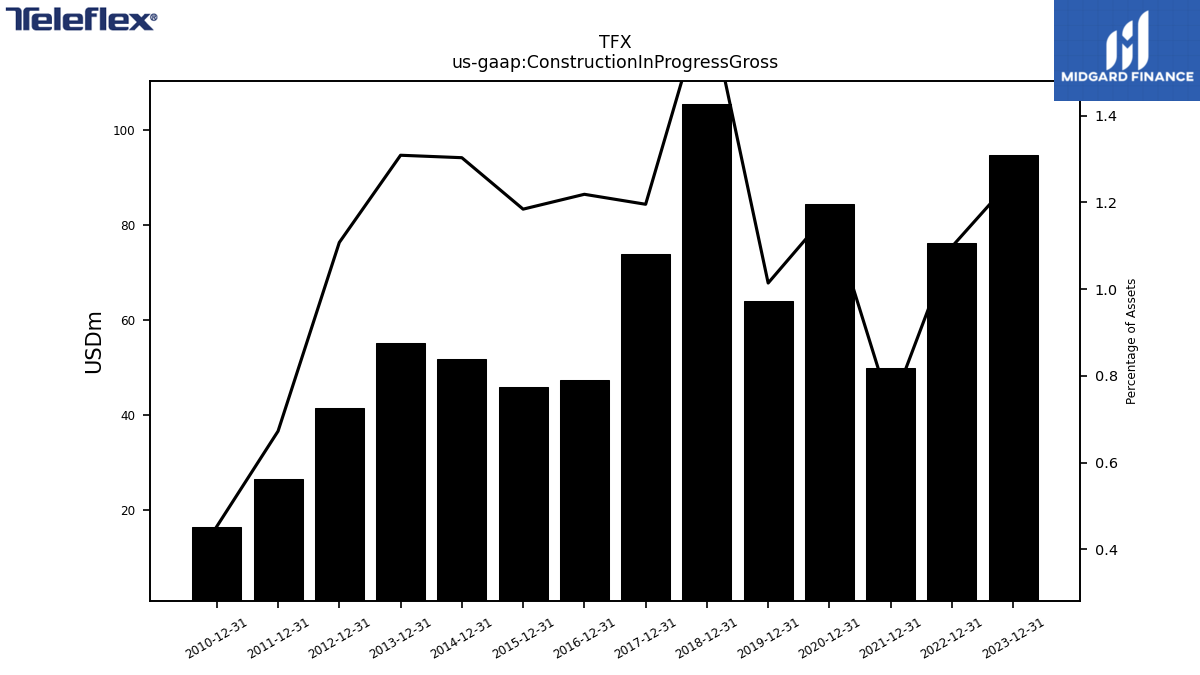
| Construction In Progress Gross | 94.63 | NA | NA | NA | 76.08 | NA | NA | NA | 49.78 | NA | NA | NA | 84.34 | NA | NA | NA | 63.99 | NA | NA | NA | 105.32 | NA | NA | NA | 73.92 | NA | NA | NA | 47.43 | NA | NA | NA | 45.95 | NA | NA | NA | 51.83 | NA | NA | NA | 55.09 | NA | NA | NA | NA | 41.42 | NA | NA | NA | NA | NA | 26.39 | NA | NA | NA | 16.49 | NA | NA | NA | |
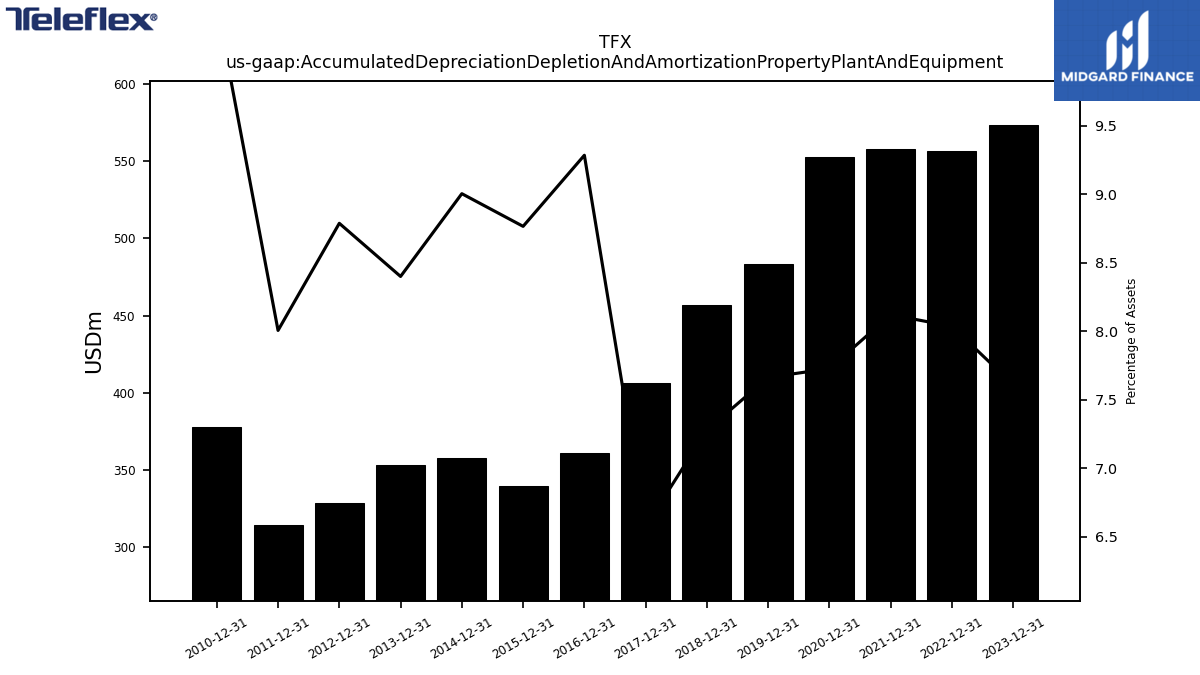
| Accumulated Depreciation Depletion And Amortization Property Plant And Equipment | 573.16 | NA | NA | NA | 556.68 | NA | NA | NA | 557.97 | NA | NA | NA | 552.64 | NA | NA | NA | 483.52 | NA | NA | NA | 456.93 | NA | NA | NA | 406.45 | NA | NA | NA | 361.23 | NA | NA | NA | 339.93 | NA | NA | NA | 358.06 | NA | NA | NA | 353.52 | NA | NA | NA | NA | 328.58 | NA | NA | NA | NA | NA | 314.14 | NA | NA | NA | 378.02 | NA | NA | NA | |
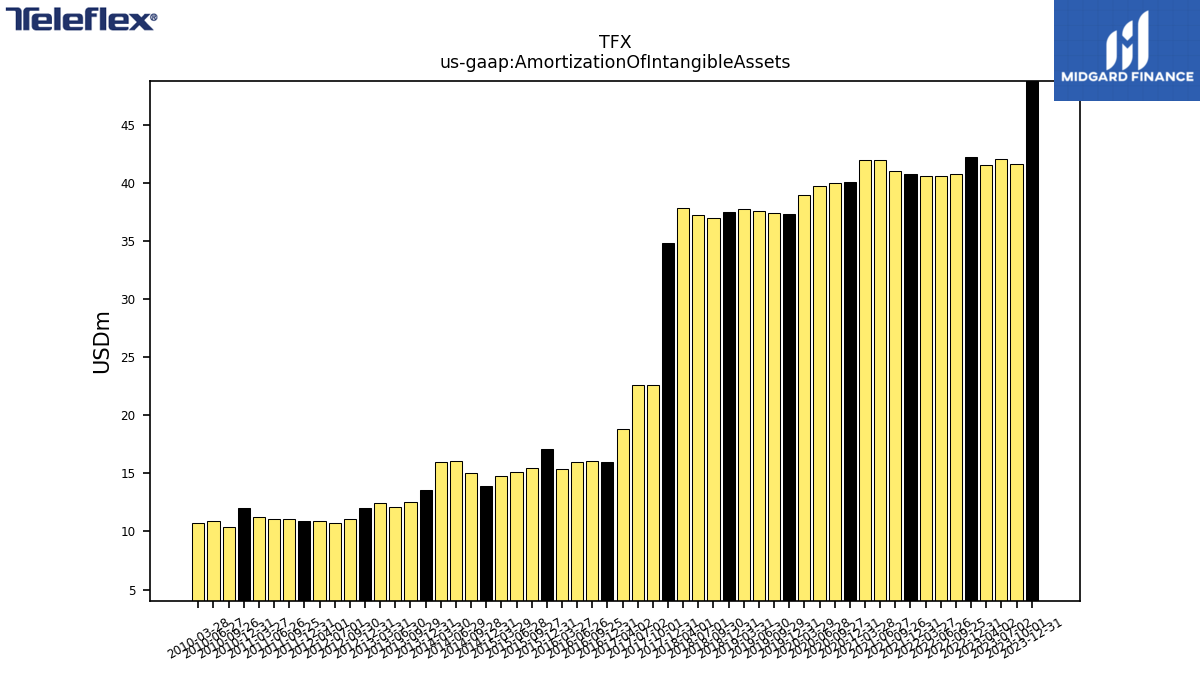
| Amortization Of Intangible Assets | 48.74 | 41.63 | 42.06 | 41.54 | 42.18 | 40.77 | 40.54 | 40.60 | 40.77 | 40.97 | 41.95 | 41.92 | 40.04 | 40.01 | 39.73 | 38.91 | 37.31 | 37.38 | 37.53 | 37.75 | 37.51 | 36.97 | 37.19 | 37.82 | 34.82 | 22.60 | 22.59 | 18.79 | 16.01 | 16.10 | 16.00 | 15.36 | 17.10 | 15.50 | 15.10 | 14.74 | 13.87 | 15.00 | 16.10 | 16.02 | 13.54 | NA | 12.50 | 12.10 | 12.44 | 12.00 | 11.10 | 10.70 | NA | 10.88 | NA | 10.92 | 11.10 | 11.10 | 11.22 | 12.03 | 10.40 | 10.90 | 10.73 | |
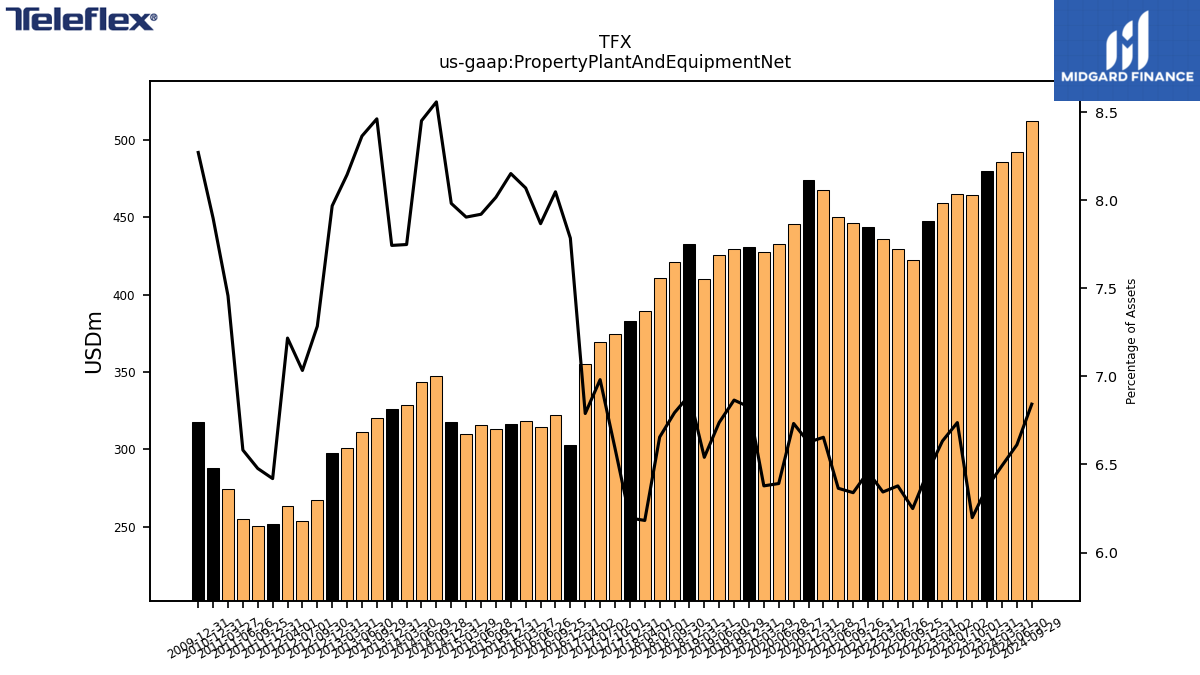
| Property Plant And Equipment Net | 479.91 | 464.47 | 464.61 | 458.86 | 447.20 | 422.36 | 429.37 | 436.02 | 443.76 | 446.32 | 449.75 | 467.65 | 473.91 | 445.24 | 432.40 | 427.45 | 430.72 | 429.57 | 425.48 | 409.96 | 432.77 | 421.26 | 410.98 | 389.52 | 383.00 | 374.46 | 369.30 | 355.23 | 302.90 | 322.02 | 314.67 | 318.18 | 316.12 | 313.24 | 315.54 | 310.11 | 317.44 | 347.23 | 343.41 | 328.68 | 325.90 | NA | 320.54 | 311.46 | 300.83 | 297.94 | NA | 253.68 | NA | 263.42 | NA | 251.91 | 250.58 | 255.25 | 274.33 | 287.70 | NA | NA | NA | |
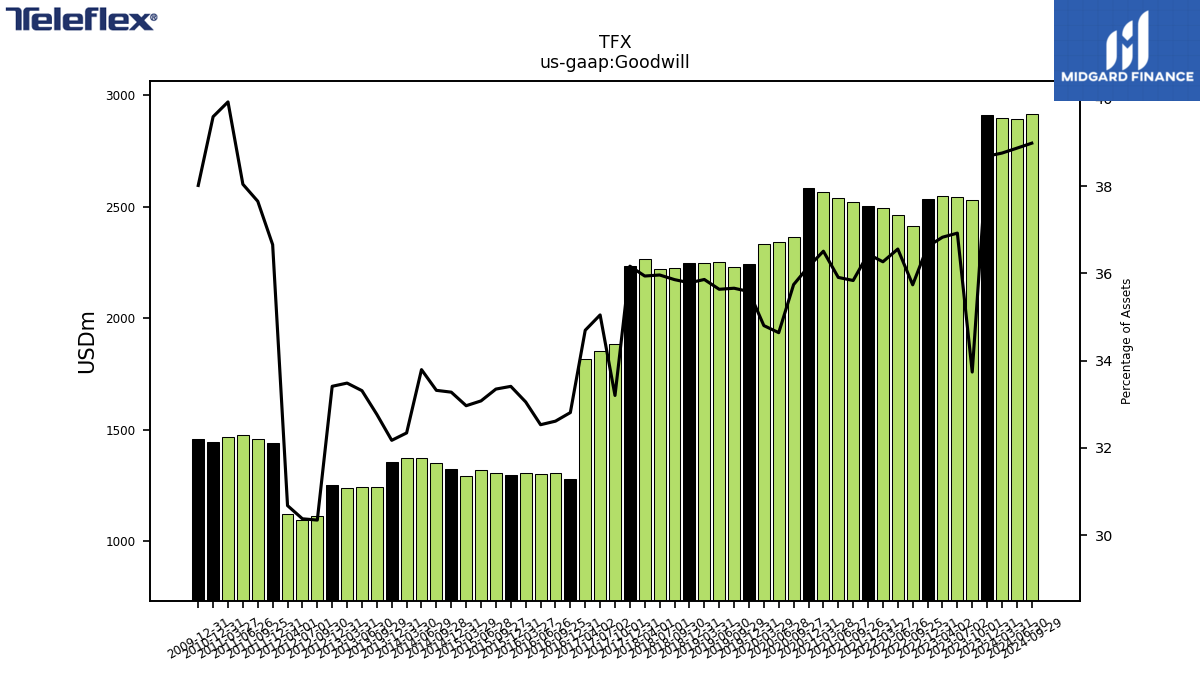
| Goodwill | 2914.05 | 2528.30 | 2546.13 | 2547.84 | 2536.73 | 2415.30 | 2461.08 | 2492.73 | 2504.20 | 2522.95 | 2537.43 | 2565.87 | 2585.97 | 2363.84 | 2343.56 | 2332.41 | 2245.30 | 2231.33 | 2250.22 | 2247.77 | 2246.58 | 2223.43 | 2220.89 | 2264.45 | 2235.59 | 1886.16 | 1854.08 | 1815.50 | 1276.72 | 1305.08 | 1301.35 | 1303.46 | 1295.85 | 1303.17 | 1317.87 | 1293.51 | 1323.55 | 1352.05 | 1373.36 | 1372.06 | 1354.20 | NA | 1241.39 | 1240.59 | 1236.88 | 1249.46 | NA | 1095.59 | NA | 1119.70 | NA | 1438.54 | 1456.71 | 1475.44 | 1468.99 | 1442.41 | NA | NA | NA | |
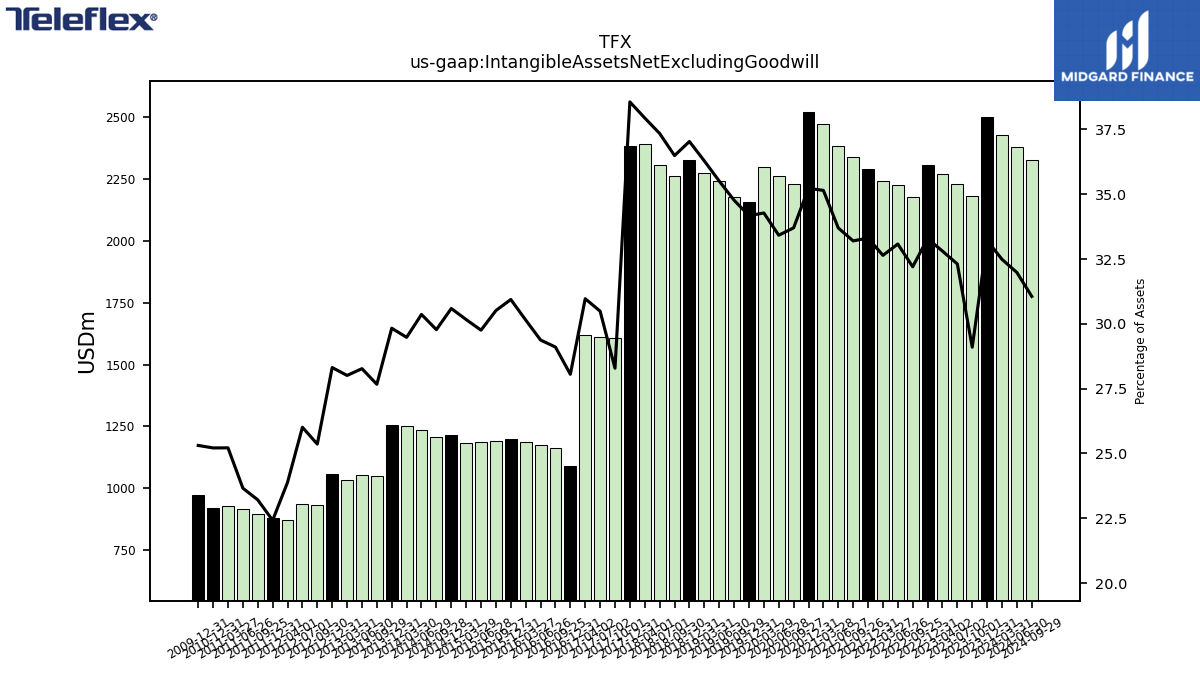
| Intangible Assets Net Excluding Goodwill | 2501.96 | 2180.54 | 2227.95 | 2269.53 | 2306.16 | 2176.26 | 2226.88 | 2243.56 | 2289.07 | 2337.25 | 2381.33 | 2470.24 | 2519.75 | 2228.93 | 2260.86 | 2297.18 | 2156.28 | 2175.67 | 2242.27 | 2274.49 | 2325.05 | 2262.82 | 2306.20 | 2390.55 | 2383.75 | 1606.94 | 1612.90 | 1620.45 | 1091.66 | 1164.64 | 1175.10 | 1188.85 | 1199.97 | 1192.36 | 1185.52 | 1183.55 | 1216.72 | 1208.25 | 1233.90 | 1250.53 | 1255.60 | NA | 1048.15 | 1052.85 | 1034.59 | 1058.79 | NA | 938.13 | NA | 871.71 | NA | 879.79 | 897.85 | 917.55 | 927.64 | 918.52 | NA | NA | NA | |
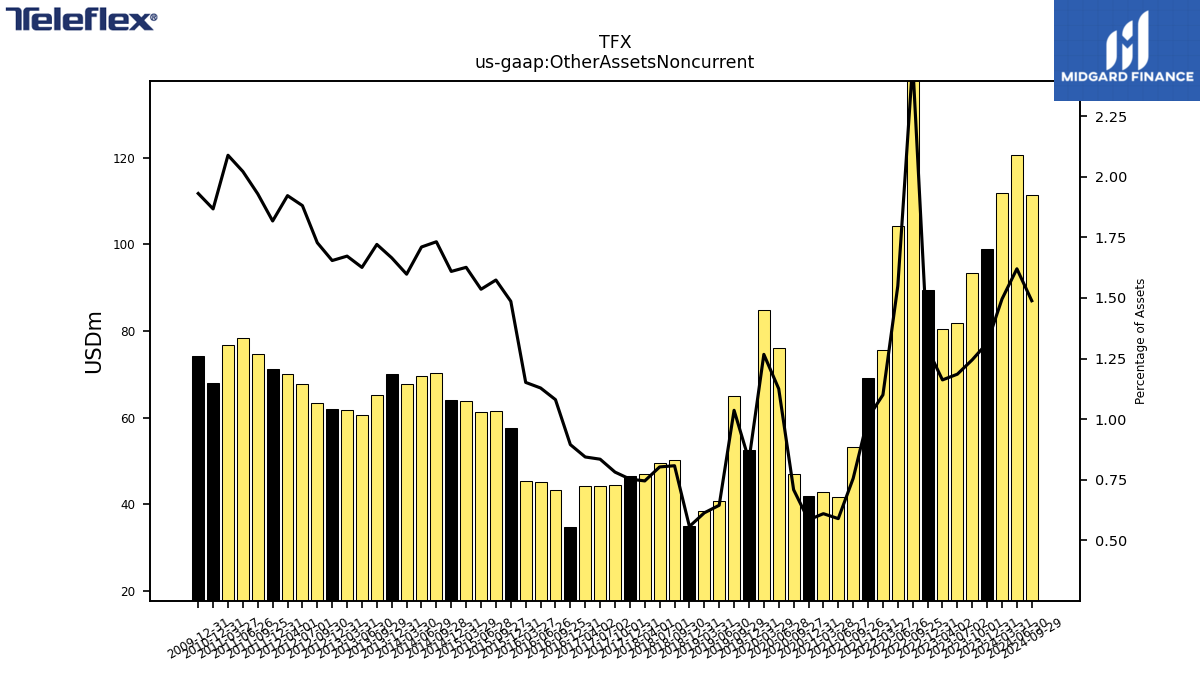
| Other Assets Noncurrent | 98.94 | 93.28 | 81.75 | 80.38 | 89.37 | 166.99 | 104.31 | 75.62 | 69.10 | 53.19 | 41.67 | 42.88 | 41.80 | 46.88 | 76.12 | 84.92 | 52.45 | 64.86 | 40.71 | 38.46 | 34.98 | 50.09 | 49.59 | 46.95 | 46.54 | 44.40 | 44.16 | 44.16 | 34.83 | 43.24 | 45.15 | 45.41 | 57.64 | 61.51 | 61.19 | 63.81 | 64.01 | 70.27 | 69.50 | 67.79 | 70.09 | NA | 65.19 | 60.55 | 61.78 | 61.86 | NA | 67.84 | NA | 70.15 | NA | 71.32 | 74.64 | 78.40 | 76.84 | 68.03 | NA | NA | NA |
| 2023-12-31 | 2023-10-01 | 2023-07-02 | 2023-04-02 | 2022-12-31 | 2022-09-25 | 2022-06-26 | 2022-03-27 | 2021-12-31 | 2021-09-26 | 2021-06-27 | 2021-03-28 | 2020-12-31 | 2020-09-27 | 2020-06-28 | 2020-03-29 | 2019-12-31 | 2019-09-29 | 2019-06-30 | 2019-03-31 | 2018-12-31 | 2018-09-30 | 2018-07-01 | 2018-04-01 | 2017-12-31 | 2017-10-01 | 2017-07-02 | 2017-04-02 | 2016-12-31 | 2016-09-25 | 2016-06-26 | 2016-03-27 | 2015-12-31 | 2015-09-27 | 2015-06-28 | 2015-03-29 | 2014-12-31 | 2014-09-28 | 2014-06-29 | 2014-03-30 | 2013-12-31 | 2013-09-30 | 2013-09-29 | 2013-06-30 | 2013-03-31 | 2012-12-31 | 2012-09-30 | 2012-07-01 | 2012-06-30 | 2012-04-01 | 2012-03-31 | 2011-12-31 | 2011-09-25 | 2011-06-26 | 2011-03-27 | 2010-12-31 | 2010-09-26 | 2010-06-27 | 2010-03-28 | ||
|---|---|---|---|---|---|---|---|---|---|---|---|---|---|---|---|---|---|---|---|---|---|---|---|---|---|---|---|---|---|---|---|---|---|---|---|---|---|---|---|---|---|---|---|---|---|---|---|---|---|---|---|---|---|---|---|---|---|---|---|---|
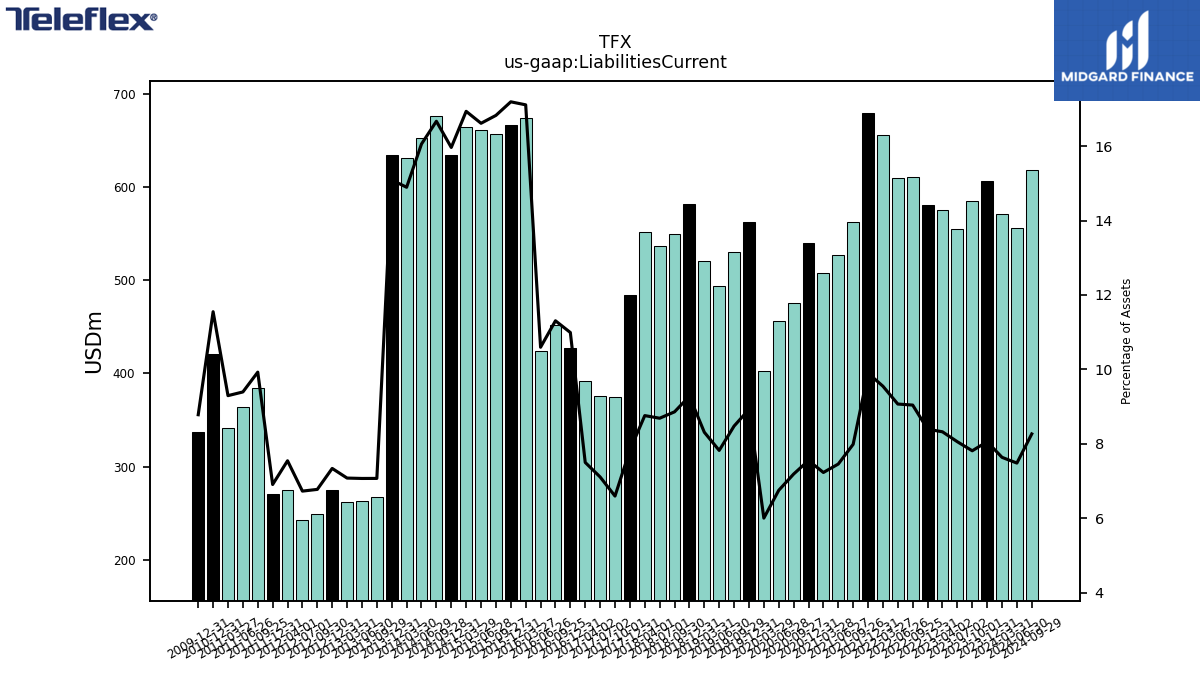
| Liabilities Current | 606.75 | 585.42 | 555.45 | 575.71 | 581.49 | 610.94 | 610.45 | 656.20 | 680.12 | 562.21 | 526.85 | 508.05 | 540.03 | 475.25 | 456.62 | 402.30 | 563.05 | 530.36 | 493.89 | 520.92 | 582.46 | 549.29 | 536.45 | 551.77 | 483.88 | 374.64 | 376.05 | 392.36 | 427.65 | 452.40 | 423.80 | 674.67 | 666.71 | 657.47 | 661.89 | 664.42 | 634.90 | 676.32 | 652.49 | 631.81 | 635.12 | NA | 267.82 | 263.24 | 261.47 | 274.40 | NA | 242.67 | NA | 275.35 | NA | 271.01 | 383.97 | 364.28 | 341.91 | 420.76 | NA | NA | NA | |
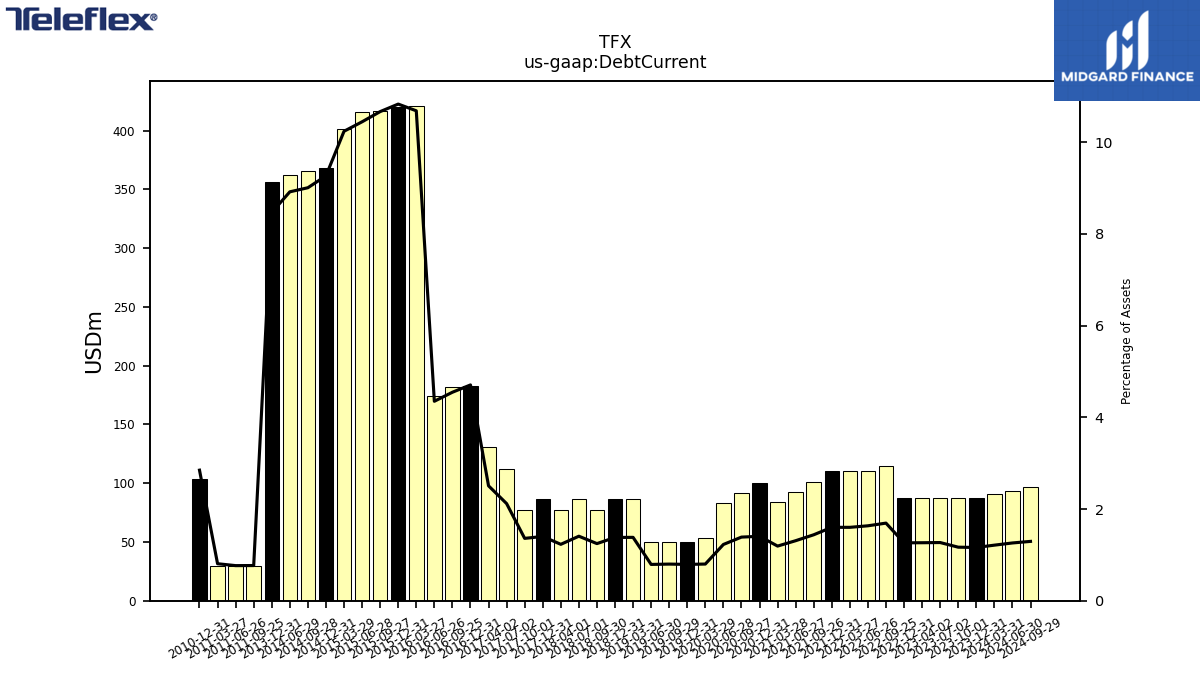
| Debt Current | 87.50 | 87.50 | 87.50 | 87.50 | 87.50 | 114.38 | 110.00 | 110.00 | 110.00 | 101.25 | 92.50 | 83.75 | 100.50 | 91.75 | 83.00 | 53.62 | 50.00 | 50.00 | 50.00 | 86.62 | 86.62 | 77.25 | 86.88 | 77.50 | 86.62 | 77.25 | 112.04 | 131.09 | 183.07 | 181.90 | 173.95 | 421.20 | 419.94 | 416.69 | 415.99 | 401.56 | 368.40 | 365.36 | 362.27 | NA | 356.29 | NA | NA | NA | NA | NA | NA | NA | NA | NA | NA | NA | 29.70 | 29.70 | 29.70 | 103.71 | NA | NA | NA | |
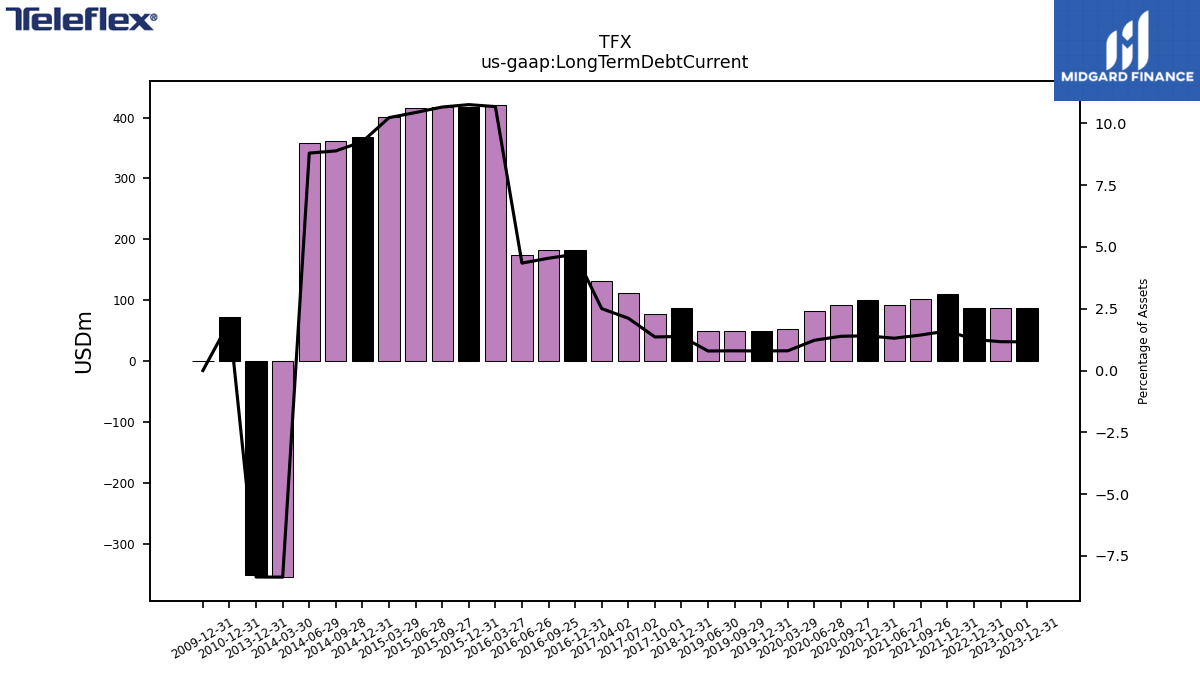
| Long Term Debt Current | 87.50 | 87.50 | NA | NA | 87.50 | NA | NA | NA | 110.00 | 101.25 | 92.50 | NA | 100.50 | 91.75 | 83.00 | 53.62 | 50.00 | 50.00 | 50.00 | NA | 86.62 | NA | NA | NA | NA | 77.25 | 112.04 | 131.09 | 183.07 | 181.90 | 173.95 | 421.20 | 417.35 | 416.69 | 415.99 | 401.56 | 368.40 | 360.66 | 357.57 | -354.56 | -351.59 | NA | NA | NA | NA | NA | NA | NA | NA | NA | NA | NA | NA | NA | NA | 72.50 | NA | NA | NA | |
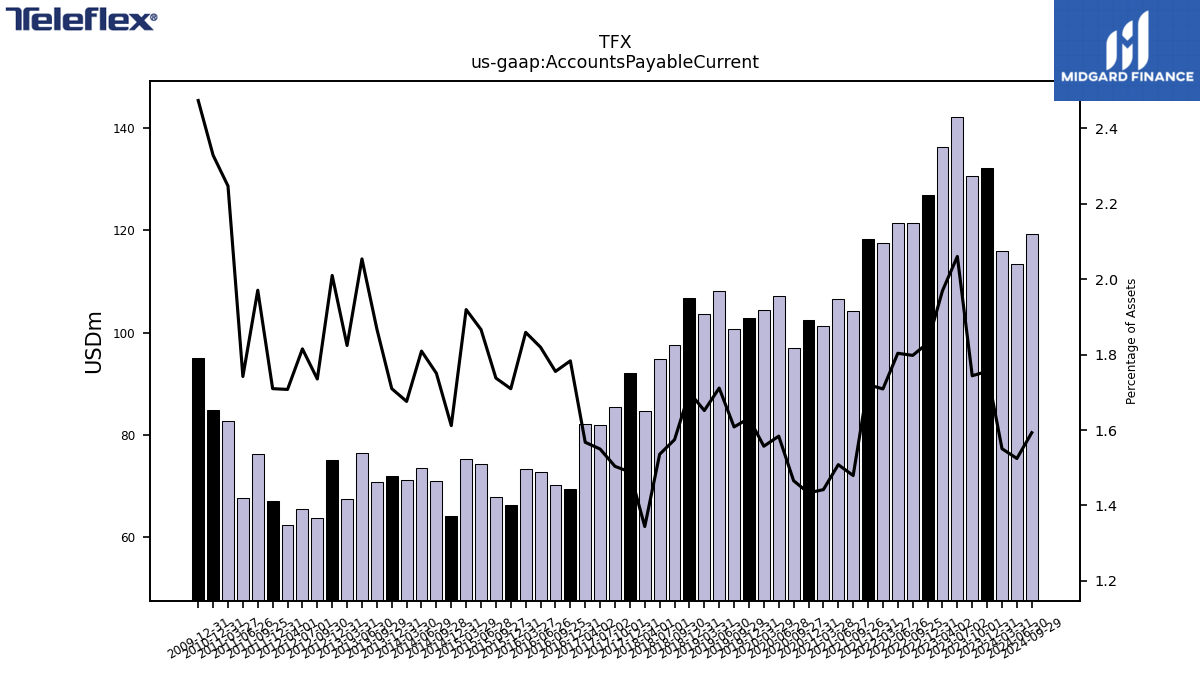
| Accounts Payable Current | 132.25 | 130.69 | 142.08 | 136.24 | 126.81 | 121.51 | 121.42 | 117.46 | 118.24 | 104.14 | 106.57 | 101.34 | 102.52 | 96.92 | 107.14 | 104.35 | 102.92 | 100.63 | 108.06 | 103.53 | 106.71 | 97.63 | 94.83 | 84.69 | 92.03 | 85.42 | 81.97 | 82.02 | 69.40 | 70.25 | 72.79 | 73.31 | 66.31 | 67.91 | 74.36 | 75.31 | 64.10 | 71.03 | 73.53 | 71.09 | 71.97 | NA | 70.78 | 76.49 | 67.38 | 75.17 | NA | 65.47 | NA | 62.33 | NA | 67.09 | 76.25 | 67.56 | 82.67 | 84.85 | NA | NA | NA | |
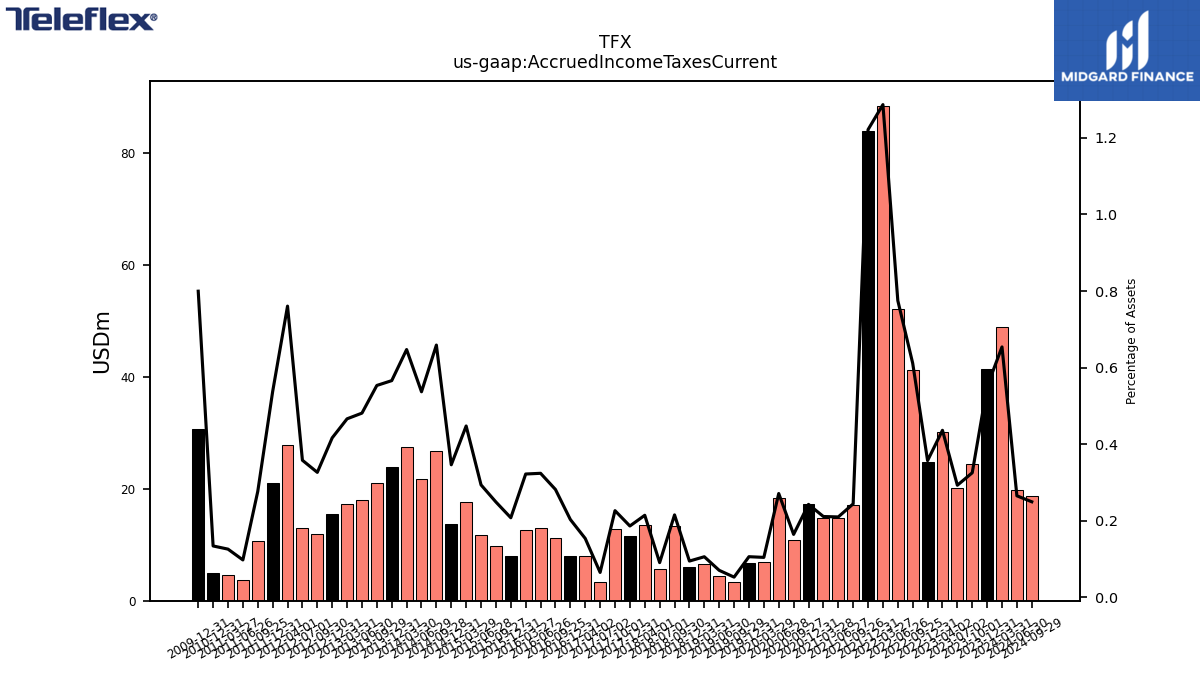
| Accrued Income Taxes Current | 41.45 | 24.38 | 20.18 | 30.18 | 24.74 | 41.32 | 52.17 | 88.45 | 83.94 | 17.18 | 14.84 | 14.83 | 17.36 | 10.87 | 18.34 | 6.99 | 6.69 | 3.30 | 4.45 | 6.64 | 5.94 | 13.35 | 5.60 | 13.50 | 11.51 | 12.86 | 3.44 | 8.04 | 7.91 | 11.27 | 12.96 | 12.70 | 8.06 | 9.73 | 11.70 | 17.56 | 13.77 | 26.73 | 21.82 | 27.45 | 23.82 | NA | 20.96 | 17.92 | 17.22 | 15.57 | NA | 12.91 | NA | 27.76 | NA | 21.08 | 10.70 | 3.79 | 4.63 | 4.89 | NA | NA | NA | |
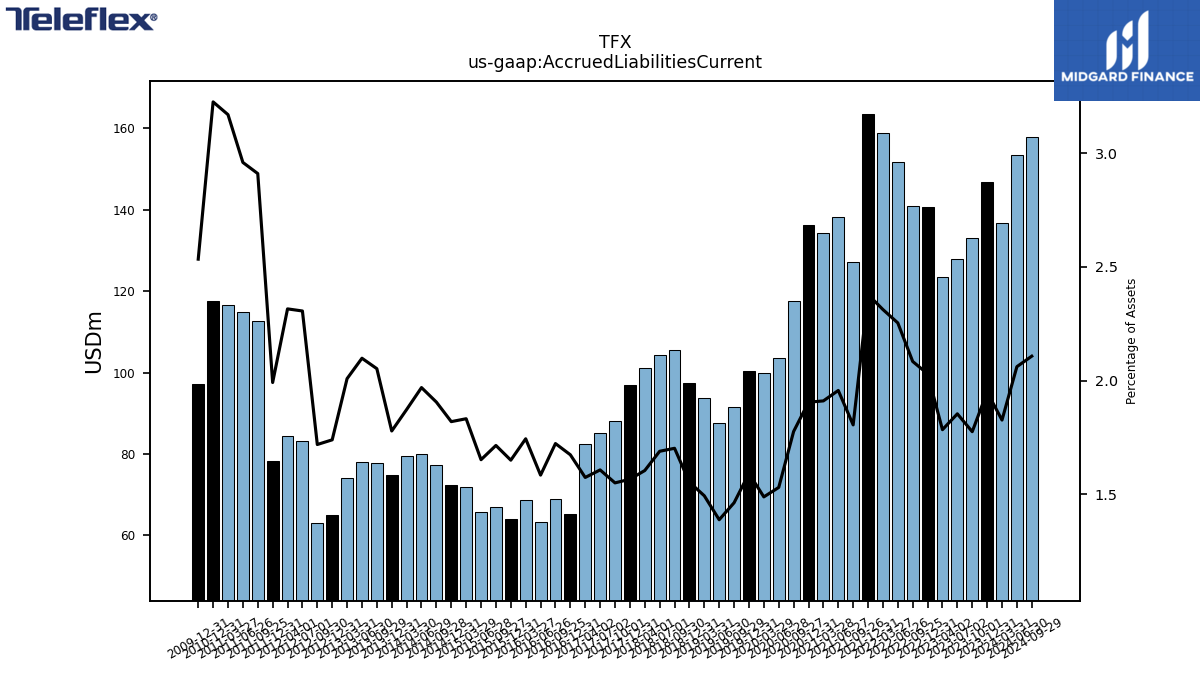
| Accrued Liabilities Current | 146.88 | 133.07 | 127.86 | 123.45 | 140.64 | 140.86 | 151.72 | 158.94 | 163.44 | 127.12 | 138.28 | 134.31 | 136.28 | 117.49 | 103.56 | 99.80 | 100.47 | 91.57 | 87.70 | 93.65 | 97.55 | 105.58 | 104.34 | 101.13 | 96.85 | 88.09 | 85.05 | 82.39 | 65.15 | 68.97 | 63.40 | 68.80 | 64.02 | 67.03 | 65.84 | 71.91 | 72.38 | 77.33 | 80.04 | 79.45 | 74.87 | NA | 77.76 | 78.15 | 74.20 | 65.06 | NA | 83.18 | NA | 84.51 | NA | 78.16 | 112.58 | 114.75 | 116.58 | 117.49 | NA | NA | NA | |
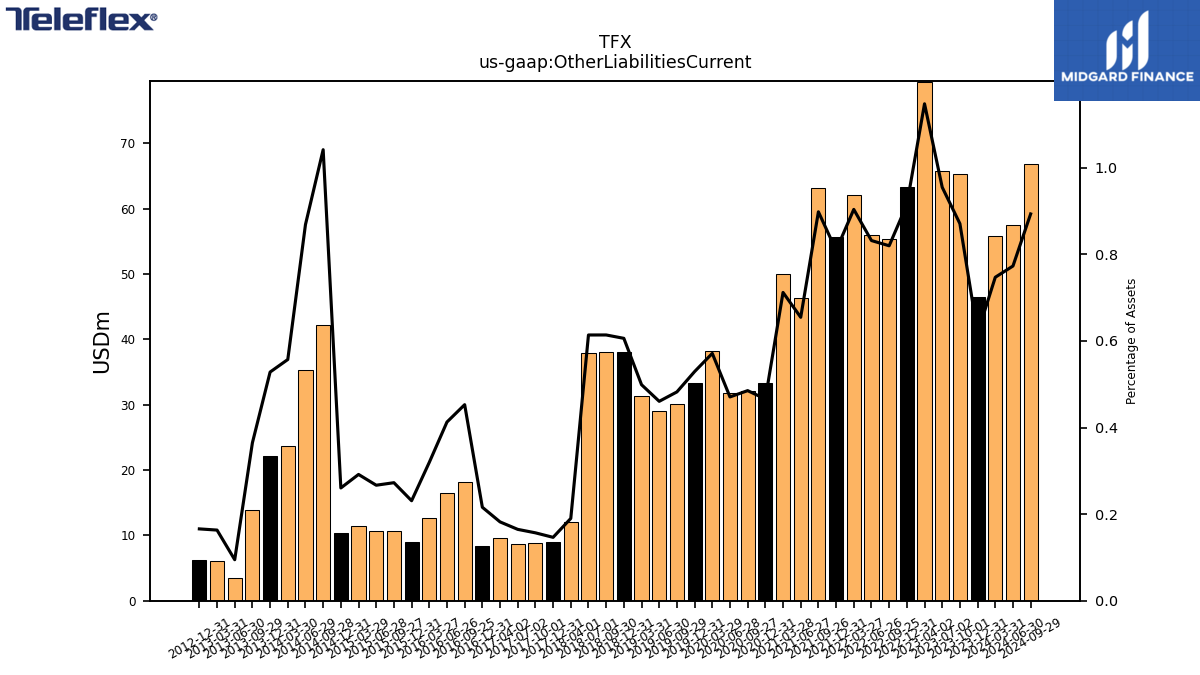
| Other Liabilities Current | 46.55 | 65.27 | 65.85 | 79.40 | 63.38 | 55.41 | 56.00 | 62.12 | 55.63 | 63.24 | 46.27 | 50.04 | 33.33 | 32.09 | 31.85 | 38.29 | 33.40 | 30.18 | 29.08 | 31.28 | 38.05 | 38.06 | 37.91 | 11.98 | 9.05 | 8.91 | 8.72 | 9.53 | 8.40 | 18.12 | 16.51 | 12.60 | 8.96 | 10.65 | 10.63 | 11.45 | 10.36 | 42.27 | 35.31 | 23.64 | 22.23 | NA | 13.82 | 3.53 | 6.03 | 6.21 | NA | NA | NA | NA | NA | NA | NA | NA | NA | NA | NA | NA | NA |
| 2023-12-31 | 2023-10-01 | 2023-07-02 | 2023-04-02 | 2022-12-31 | 2022-09-25 | 2022-06-26 | 2022-03-27 | 2021-12-31 | 2021-09-26 | 2021-06-27 | 2021-03-28 | 2020-12-31 | 2020-09-27 | 2020-06-28 | 2020-03-29 | 2019-12-31 | 2019-09-29 | 2019-06-30 | 2019-03-31 | 2018-12-31 | 2018-09-30 | 2018-07-01 | 2018-04-01 | 2017-12-31 | 2017-10-01 | 2017-07-02 | 2017-04-02 | 2016-12-31 | 2016-09-25 | 2016-06-26 | 2016-03-27 | 2015-12-31 | 2015-09-27 | 2015-06-28 | 2015-03-29 | 2014-12-31 | 2014-09-28 | 2014-06-29 | 2014-03-30 | 2013-12-31 | 2013-09-30 | 2013-09-29 | 2013-06-30 | 2013-03-31 | 2012-12-31 | 2012-09-30 | 2012-07-01 | 2012-06-30 | 2012-04-01 | 2012-03-31 | 2011-12-31 | 2011-09-25 | 2011-06-26 | 2011-03-27 | 2010-12-31 | 2010-09-26 | 2010-06-27 | 2010-03-28 | ||
|---|---|---|---|---|---|---|---|---|---|---|---|---|---|---|---|---|---|---|---|---|---|---|---|---|---|---|---|---|---|---|---|---|---|---|---|---|---|---|---|---|---|---|---|---|---|---|---|---|---|---|---|---|---|---|---|---|---|---|---|---|
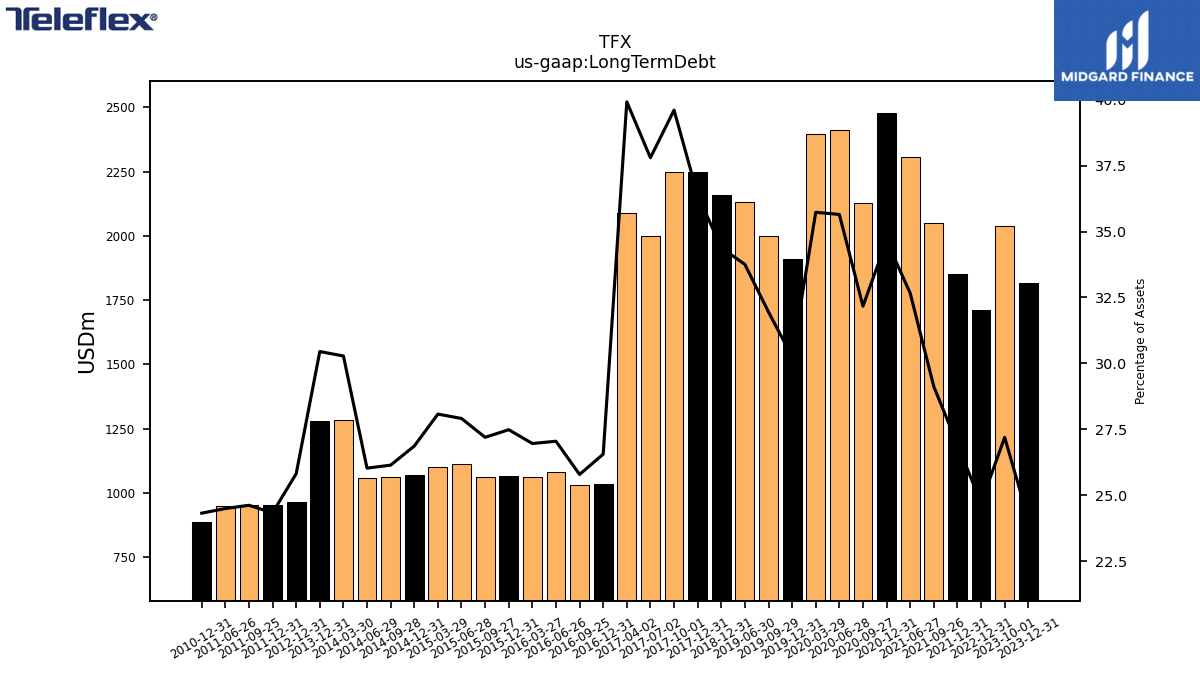
| Long Term Debt | 1815.07 | 2037.62 | NA | NA | 1711.52 | NA | NA | NA | 1850.10 | 2049.92 | 2308.17 | NA | 2478.39 | 2127.57 | 2411.79 | 2394.52 | 1908.94 | 1999.07 | 2131.37 | NA | 2158.82 | NA | NA | NA | 2249.55 | 2250.05 | 1999.76 | 2088.89 | 1033.32 | 1031.86 | 1081.88 | 1063.17 | 1065.94 | 1062.68 | 1111.99 | 1101.57 | 1068.40 | 1060.66 | 1057.57 | 1284.56 | 1281.59 | NA | NA | NA | NA | 965.28 | NA | NA | NA | NA | NA | 954.81 | 952.32 | 949.87 | NA | 885.91 | NA | NA | NA | |
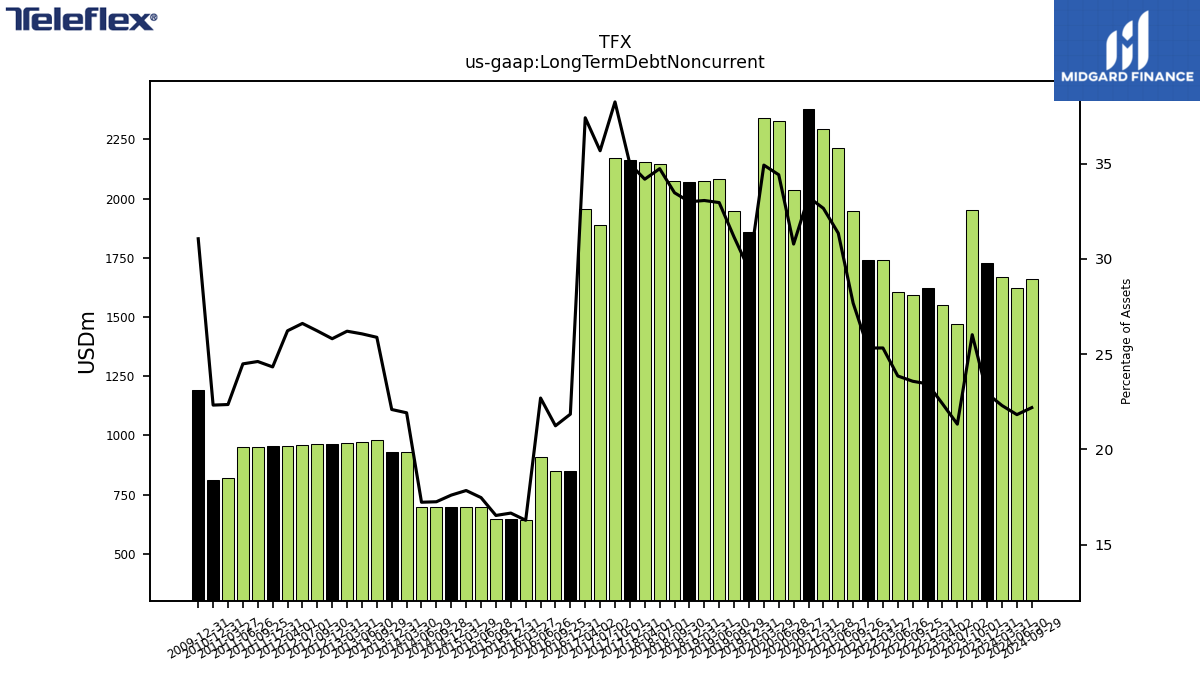
| Long Term Debt Noncurrent | 1727.57 | 1950.12 | 1470.67 | 1549.47 | 1624.02 | 1593.50 | 1605.95 | 1740.78 | 1740.10 | 1948.67 | 2215.67 | 2295.44 | 2377.89 | 2035.82 | 2328.79 | 2340.89 | 1858.94 | 1949.07 | 2081.37 | 2072.94 | 2072.20 | 2075.83 | 2145.47 | 2154.22 | 2162.93 | 2172.80 | 1887.72 | 1957.80 | 850.25 | 849.97 | 907.93 | 641.97 | 646.00 | 646.00 | 696.00 | 700.00 | 700.00 | 700.00 | 700.00 | 930.00 | 930.00 | NA | 980.69 | 970.83 | 968.03 | 965.28 | NA | 959.95 | NA | 957.36 | NA | 954.81 | 952.32 | 949.87 | 822.47 | 813.41 | NA | NA | NA | |
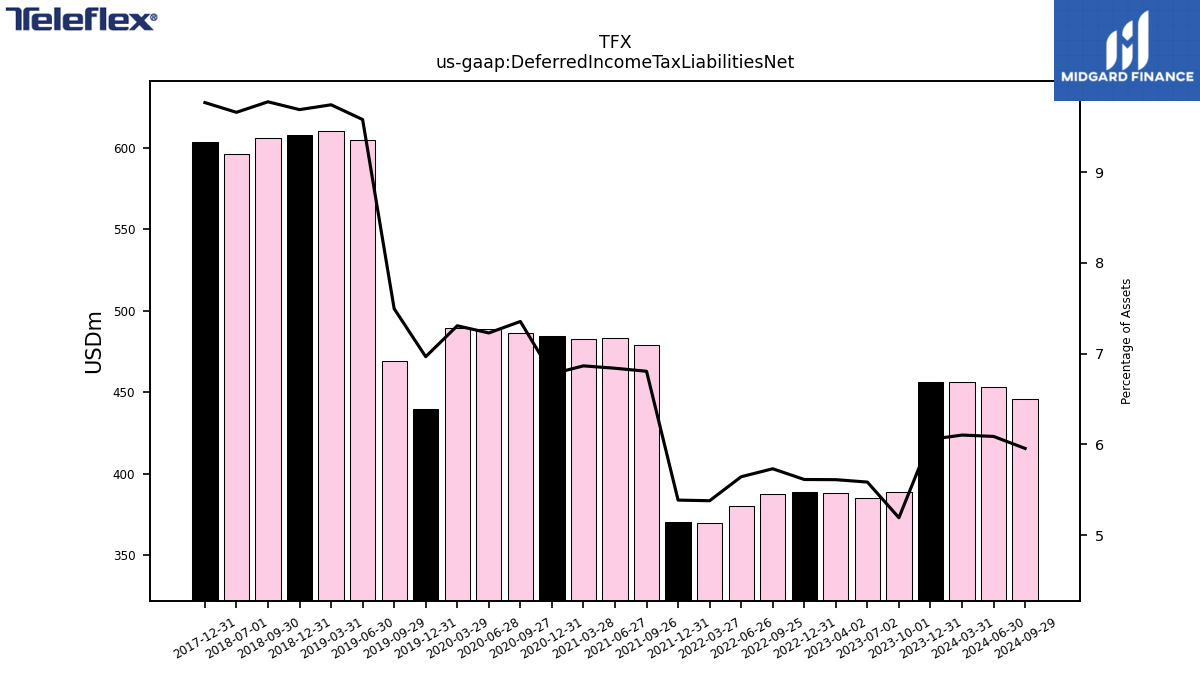
| Deferred Income Tax Liabilities Net | 456.08 | 389.08 | 385.11 | 388.19 | 388.89 | 387.33 | 379.93 | 369.74 | 370.12 | 479.11 | 483.27 | 482.48 | 484.68 | 486.35 | 488.97 | 489.68 | 439.56 | 468.94 | 604.86 | 610.61 | 608.22 | 606.08 | 596.43 | NA | 603.68 | NA | NA | NA | NA | NA | NA | NA | NA | NA | NA | NA | NA | NA | NA | NA | NA | NA | NA | NA | NA | NA | NA | NA | NA | NA | NA | NA | NA | NA | NA | NA | NA | NA | NA | |
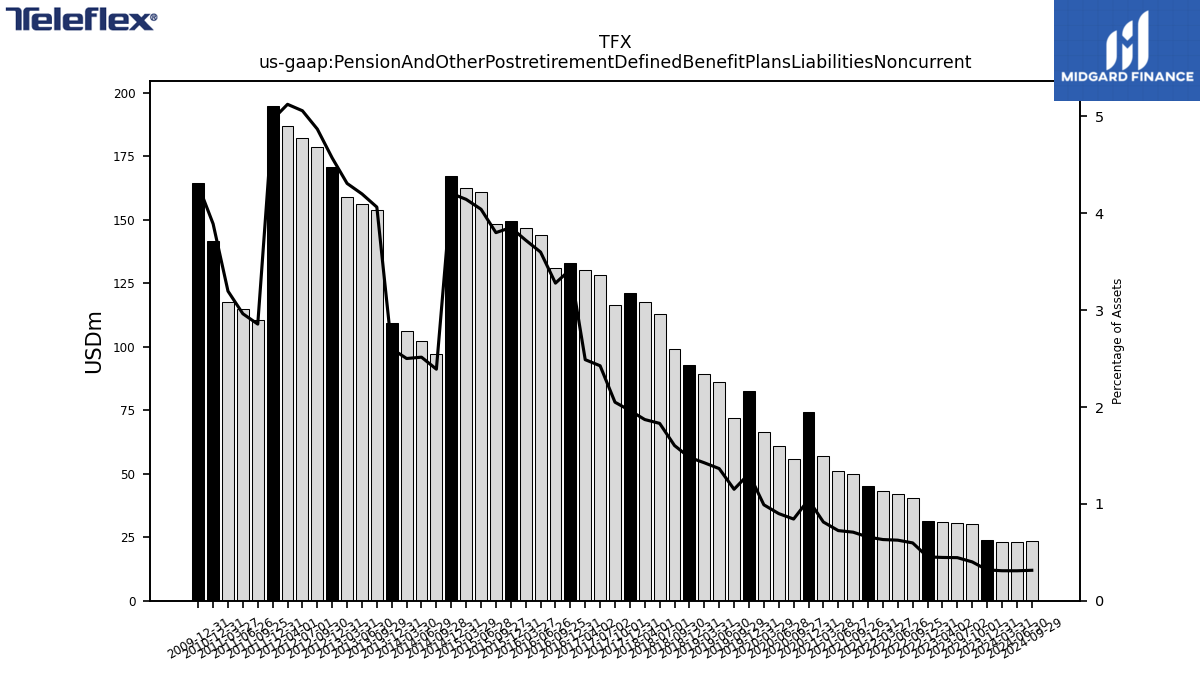
| Pension And Other Postretirement Defined Benefit Plans Liabilities Noncurrent | 23.99 | 30.05 | 30.69 | 30.92 | 31.39 | 40.34 | 42.10 | 43.43 | 45.19 | 49.84 | 51.18 | 57.12 | 74.50 | 55.80 | 60.87 | 66.38 | 82.72 | 72.02 | 86.15 | 89.29 | 92.91 | 99.35 | 113.08 | 117.87 | 121.41 | 116.44 | 128.34 | 130.23 | 133.06 | 131.22 | 143.99 | 146.80 | 149.44 | 148.51 | 161.04 | 162.59 | 167.24 | 97.01 | 102.19 | 106.09 | 109.50 | NA | 153.97 | 156.42 | 159.15 | 170.95 | NA | 182.46 | NA | 187.06 | NA | 194.98 | 110.50 | 114.91 | 117.59 | 141.77 | NA | NA | NA | |
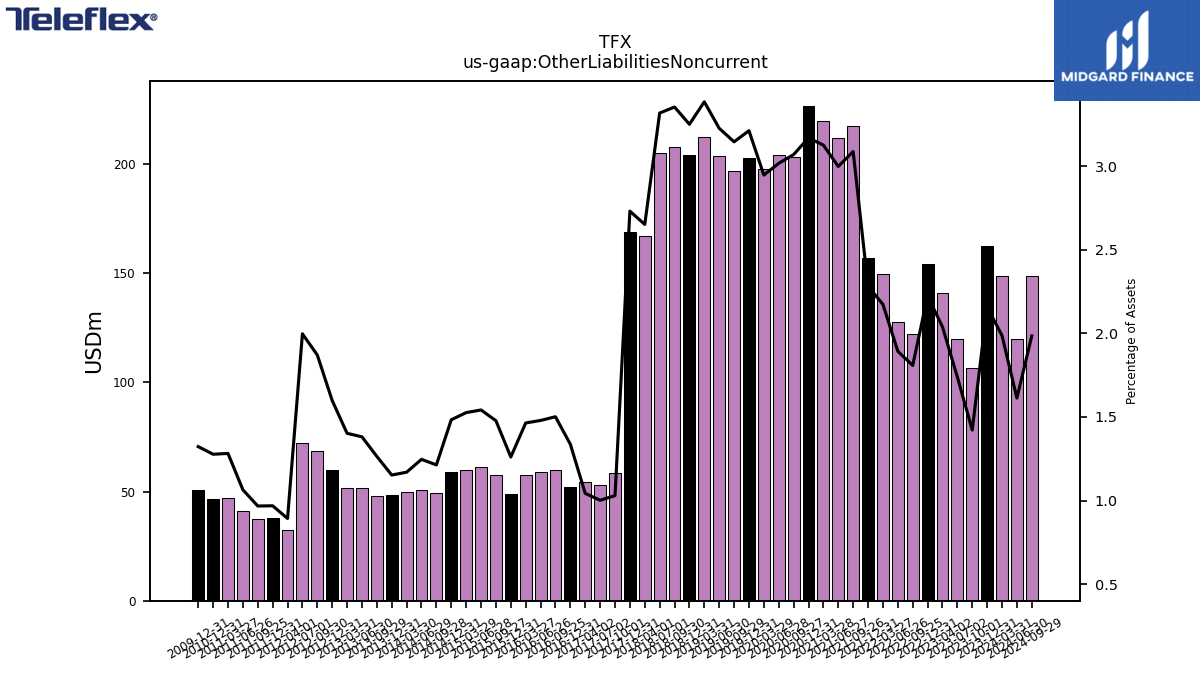
| Other Liabilities Noncurrent | 162.50 | 106.56 | 119.95 | 141.07 | 154.06 | 122.19 | 127.44 | 149.42 | 156.76 | 217.41 | 211.94 | 219.75 | 226.70 | 203.06 | 204.15 | 197.54 | 202.74 | 196.88 | 203.80 | 212.23 | 204.13 | 208.02 | 204.94 | 167.10 | 168.86 | 58.46 | 52.98 | 54.56 | 52.02 | 60.07 | 59.17 | 57.73 | 48.89 | 57.74 | 61.43 | 59.87 | 58.99 | 49.22 | 50.65 | 49.61 | 48.51 | NA | 47.88 | 51.43 | 51.79 | 59.77 | NA | 72.05 | NA | 32.58 | NA | 38.00 | 37.41 | 41.28 | 47.15 | 46.52 | NA | NA | NA | |
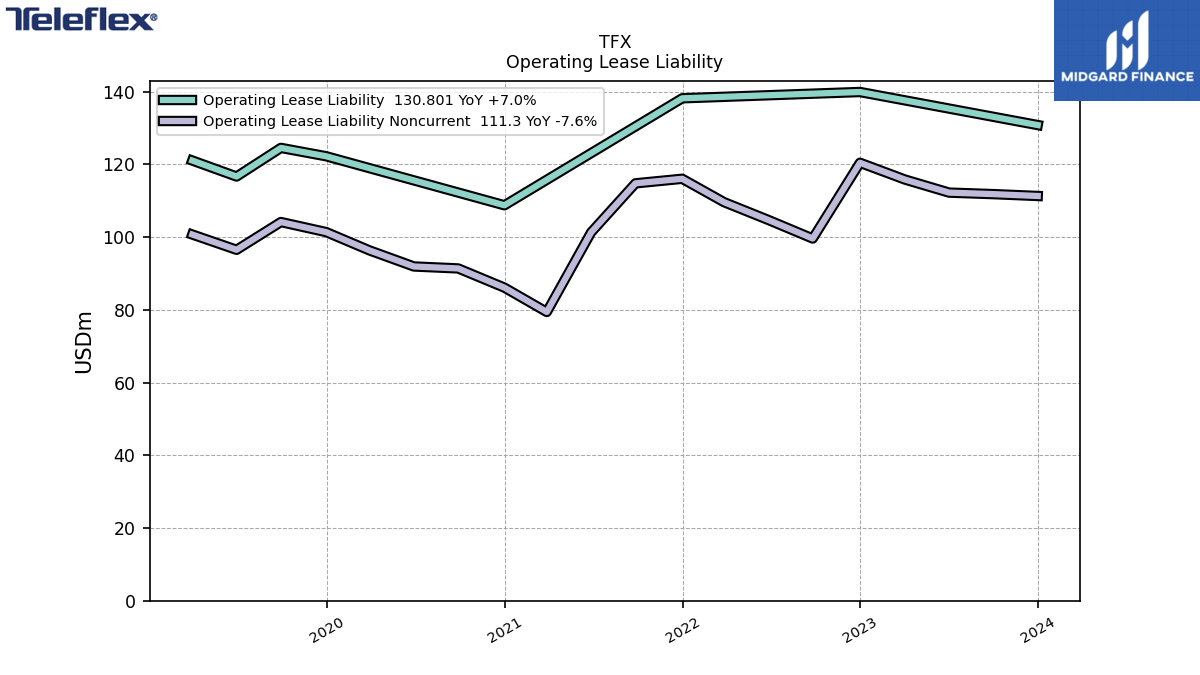
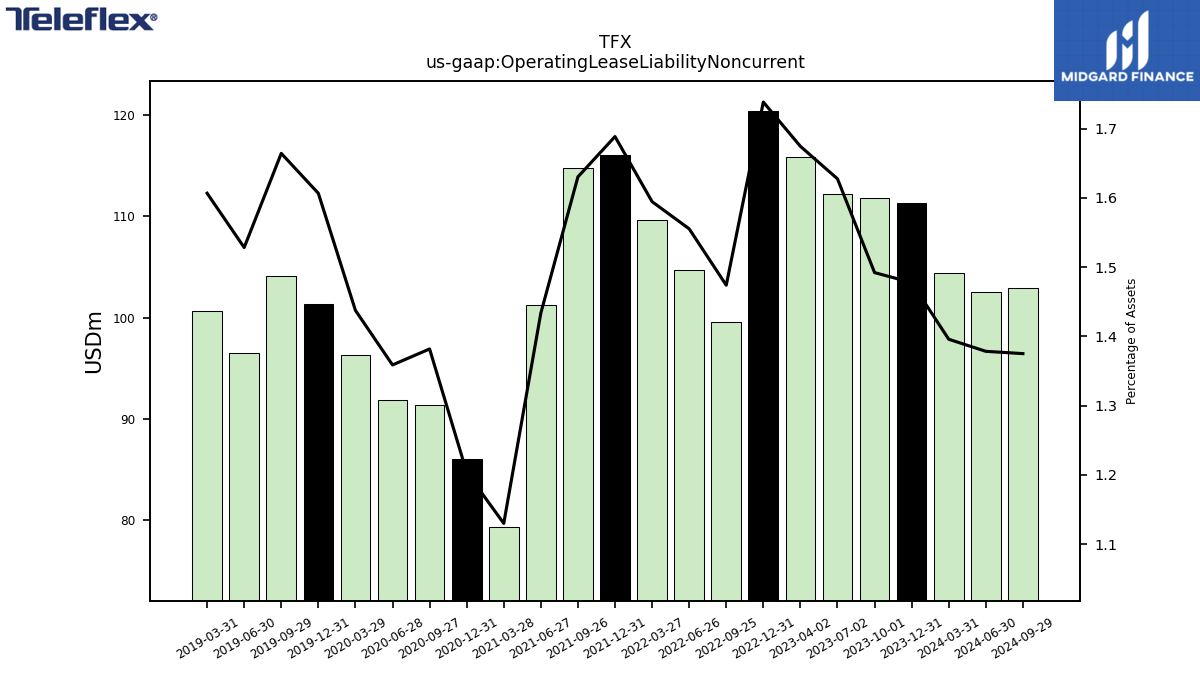
| Operating Lease Liability Noncurrent | 111.30 | 111.81 | 112.23 | 115.84 | 120.44 | 99.61 | 104.70 | 109.60 | 116.03 | 114.78 | 101.30 | 79.40 | 86.10 | 91.38 | 91.92 | 96.33 | 101.37 | 104.14 | 96.50 | 100.71 | NA | NA | NA | NA | NA | NA | NA | NA | NA | NA | NA | NA | NA | NA | NA | NA | NA | NA | NA | NA | NA | NA | NA | NA | NA | NA | NA | NA | NA | NA | NA | NA | NA | NA | NA | NA | NA | NA | NA |
| 2023-12-31 | 2023-10-01 | 2023-07-02 | 2023-04-02 | 2022-12-31 | 2022-09-25 | 2022-06-26 | 2022-03-27 | 2021-12-31 | 2021-09-26 | 2021-06-27 | 2021-03-28 | 2020-12-31 | 2020-09-27 | 2020-06-28 | 2020-03-29 | 2019-12-31 | 2019-09-29 | 2019-06-30 | 2019-03-31 | 2018-12-31 | 2018-09-30 | 2018-07-01 | 2018-04-01 | 2017-12-31 | 2017-10-01 | 2017-07-02 | 2017-04-02 | 2016-12-31 | 2016-09-25 | 2016-06-26 | 2016-03-27 | 2015-12-31 | 2015-09-27 | 2015-06-28 | 2015-03-29 | 2014-12-31 | 2014-09-28 | 2014-06-29 | 2014-03-30 | 2013-12-31 | 2013-09-30 | 2013-09-29 | 2013-06-30 | 2013-03-31 | 2012-12-31 | 2012-09-30 | 2012-07-01 | 2012-06-30 | 2012-04-01 | 2012-03-31 | 2011-12-31 | 2011-09-25 | 2011-06-26 | 2011-03-27 | 2010-12-31 | 2010-09-26 | 2010-06-27 | 2010-03-28 | ||
|---|---|---|---|---|---|---|---|---|---|---|---|---|---|---|---|---|---|---|---|---|---|---|---|---|---|---|---|---|---|---|---|---|---|---|---|---|---|---|---|---|---|---|---|---|---|---|---|---|---|---|---|---|---|---|---|---|---|---|---|---|
| Stockholders Equity | 4440.99 | 4314.05 | 4215.09 | 4110.25 | 4021.97 | 3895.16 | 3852.73 | 3795.53 | 3754.75 | 3657.87 | 3466.10 | 3375.79 | 3336.46 | 3236.20 | 3097.40 | 3073.02 | 2979.32 | 2852.98 | 2664.84 | 2569.88 | 2539.98 | 2507.07 | 2433.98 | 2560.50 | 2430.53 | 2472.48 | 2358.53 | 2218.90 | 2137.52 | 2169.92 | 2119.35 | 2059.22 | 2009.27 | 1938.89 | 1917.78 | 1857.93 | 1911.31 | 1981.73 | 1982.28 | 1942.49 | 1913.53 | NA | 1860.04 | 1799.43 | 1772.25 | 1778.95 | NA | 1689.47 | NA | 1719.35 | NA | 1980.59 | 1932.15 | 1945.62 | 1884.71 | 1783.38 | NA | NA | NA | |
| Common Stock Value | 48.05 | NA | NA | NA | 47.96 | NA | NA | NA | 47.93 | NA | NA | NA | 47.81 | NA | NA | NA | 47.54 | NA | NA | NA | 47.25 | NA | NA | NA | 46.87 | NA | NA | NA | 45.81 | NA | NA | NA | 43.52 | NA | NA | NA | 43.42 | NA | NA | NA | 43.24 | NA | NA | NA | NA | 43.10 | NA | NA | NA | NA | NA | 42.92 | NA | NA | NA | 42.24 | NA | NA | NA | |
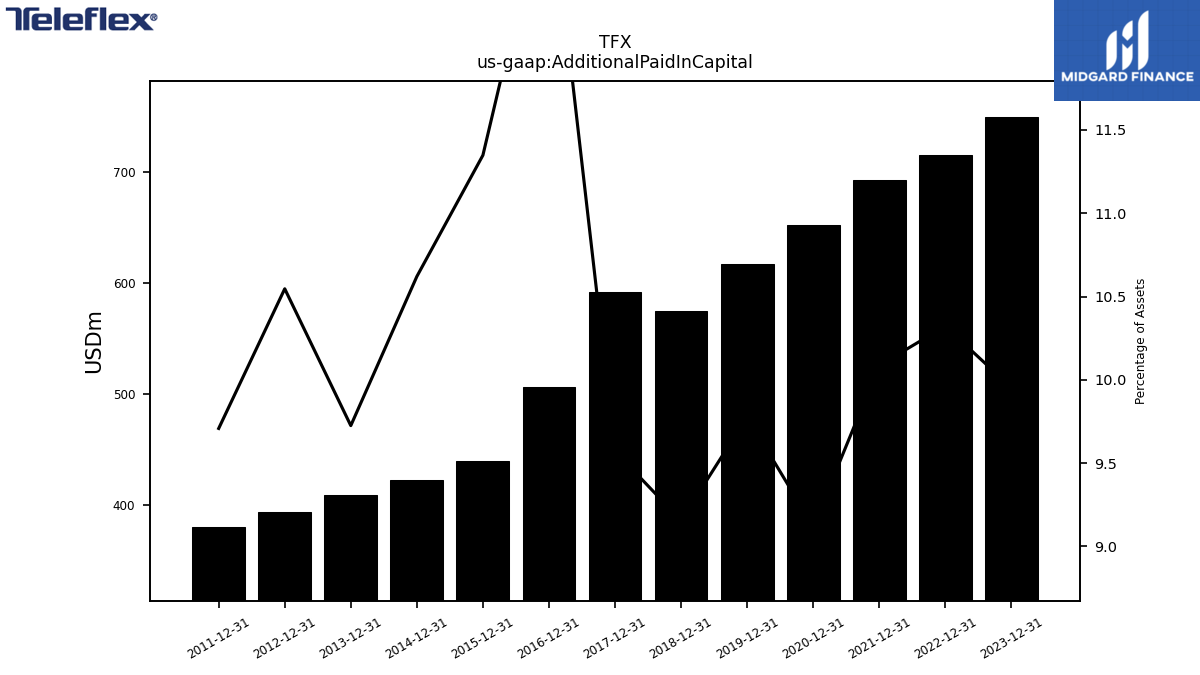
| Additional Paid In Capital | 749.71 | NA | NA | NA | 715.12 | NA | NA | NA | 693.09 | NA | NA | NA | 652.30 | NA | NA | NA | 616.98 | NA | NA | NA | 574.76 | NA | NA | NA | 591.72 | NA | NA | NA | 506.80 | NA | NA | NA | 440.13 | NA | NA | NA | 422.39 | NA | NA | NA | 409.34 | NA | NA | NA | NA | 394.38 | NA | NA | NA | NA | NA | 380.96 | NA | NA | NA | NA | NA | NA | NA | |
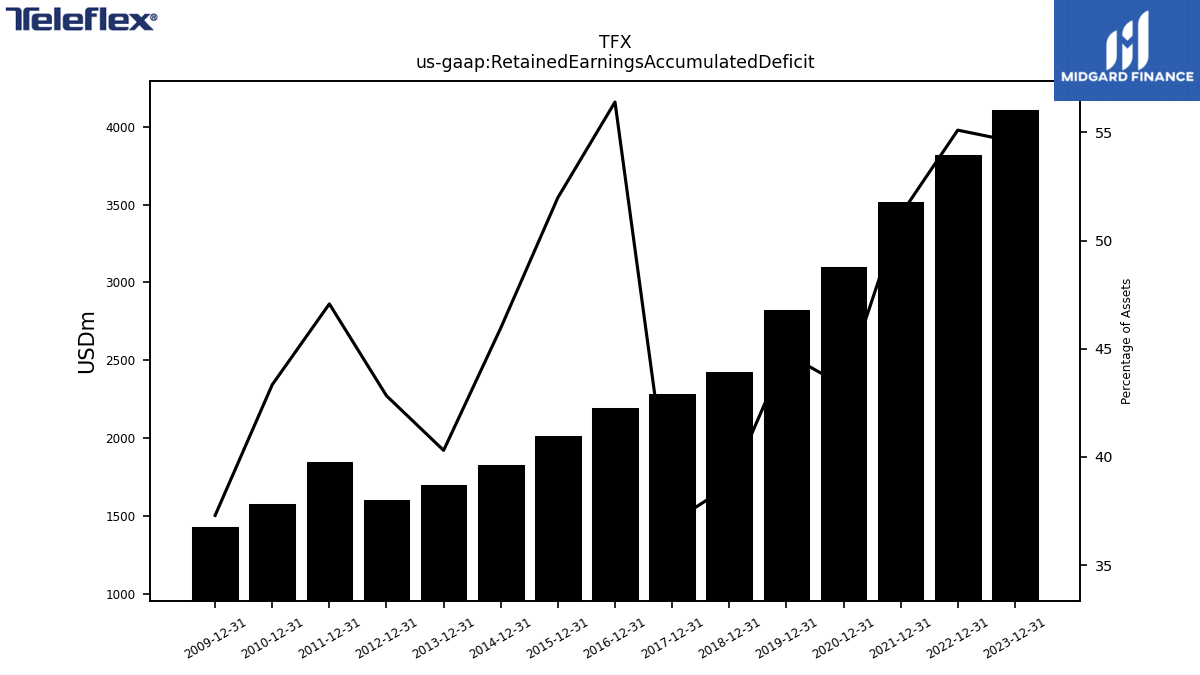
| Retained Earnings Accumulated Deficit | 4109.74 | NA | NA | NA | 3817.30 | NA | NA | NA | 3517.95 | NA | NA | NA | 3096.23 | NA | NA | NA | 2824.92 | NA | NA | NA | 2427.60 | NA | NA | NA | 2285.89 | NA | NA | NA | 2194.59 | NA | NA | NA | 2016.18 | NA | NA | NA | 1827.85 | NA | NA | NA | 1696.42 | NA | NA | NA | NA | 1601.46 | NA | NA | NA | NA | NA | 1847.11 | NA | NA | NA | 1578.91 | NA | NA | NA | |
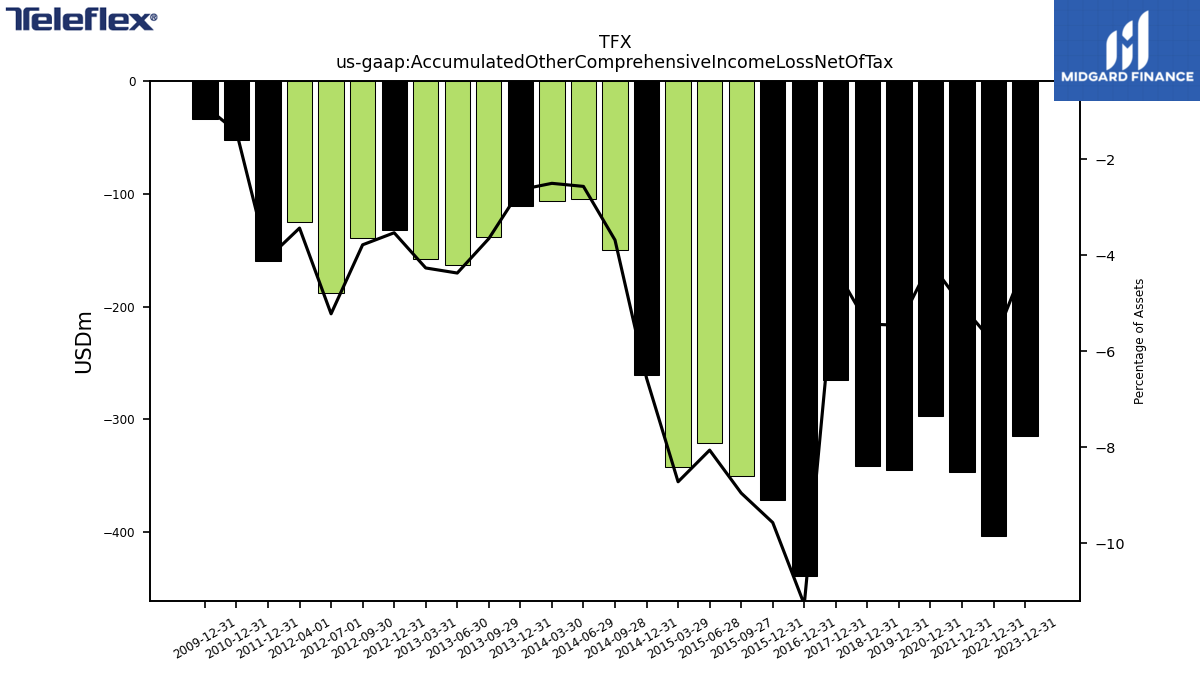
| Accumulated Other Comprehensive Income Loss Net Of Tax | -314.40 | NA | NA | NA | -403.52 | NA | NA | NA | -346.96 | NA | NA | NA | -297.30 | NA | NA | NA | -344.39 | NA | NA | NA | -341.08 | NA | NA | NA | -265.09 | NA | NA | NA | -438.72 | NA | NA | NA | -371.12 | -349.90 | -321.11 | -342.10 | -260.89 | -149.45 | -104.25 | -106.11 | -110.86 | NA | -138.38 | -162.76 | -157.52 | -132.05 | -138.83 | -188.25 | NA | -125.31 | NA | -159.35 | NA | NA | NA | -51.88 | NA | NA | NA | |
| Treasury Stock Value | 152.10 | NA | NA | NA | 154.89 | NA | NA | NA | 157.27 | NA | NA | NA | 162.59 | NA | NA | NA | 165.72 | NA | NA | NA | 168.54 | NA | NA | NA | 228.86 | NA | NA | NA | 170.97 | NA | NA | NA | 119.42 | NA | NA | NA | 121.45 | NA | NA | NA | 124.62 | NA | NA | NA | NA | 127.95 | NA | NA | NA | NA | NA | 131.05 | NA | NA | NA | 135.06 | NA | NA | NA |
| 2023-12-31 | 2023-10-01 | 2023-07-02 | 2023-04-02 | 2022-12-31 | 2022-09-25 | 2022-06-26 | 2022-03-27 | 2021-12-31 | 2021-09-26 | 2021-06-27 | 2021-03-28 | 2020-12-31 | 2020-09-27 | 2020-06-28 | 2020-03-29 | 2019-12-31 | 2019-09-29 | 2019-06-30 | 2019-03-31 | 2018-12-31 | 2018-09-30 | 2018-07-01 | 2018-04-01 | 2017-12-31 | 2017-10-01 | 2017-07-02 | 2017-04-02 | 2016-12-31 | 2016-09-25 | 2016-06-26 | 2016-03-27 | 2015-12-31 | 2015-09-27 | 2015-06-28 | 2015-03-29 | 2014-12-31 | 2014-09-28 | 2014-06-29 | 2014-03-30 | 2013-12-31 | 2013-09-30 | 2013-09-29 | 2013-06-30 | 2013-03-31 | 2012-12-31 | 2012-09-30 | 2012-07-01 | 2012-06-30 | 2012-04-01 | 2012-03-31 | 2011-12-31 | 2011-09-25 | 2011-06-26 | 2011-03-27 | 2010-12-31 | 2010-09-26 | 2010-06-27 | 2010-03-28 | ||
|---|---|---|---|---|---|---|---|---|---|---|---|---|---|---|---|---|---|---|---|---|---|---|---|---|---|---|---|---|---|---|---|---|---|---|---|---|---|---|---|---|---|---|---|---|---|---|---|---|---|---|---|---|---|---|---|---|---|---|---|---|
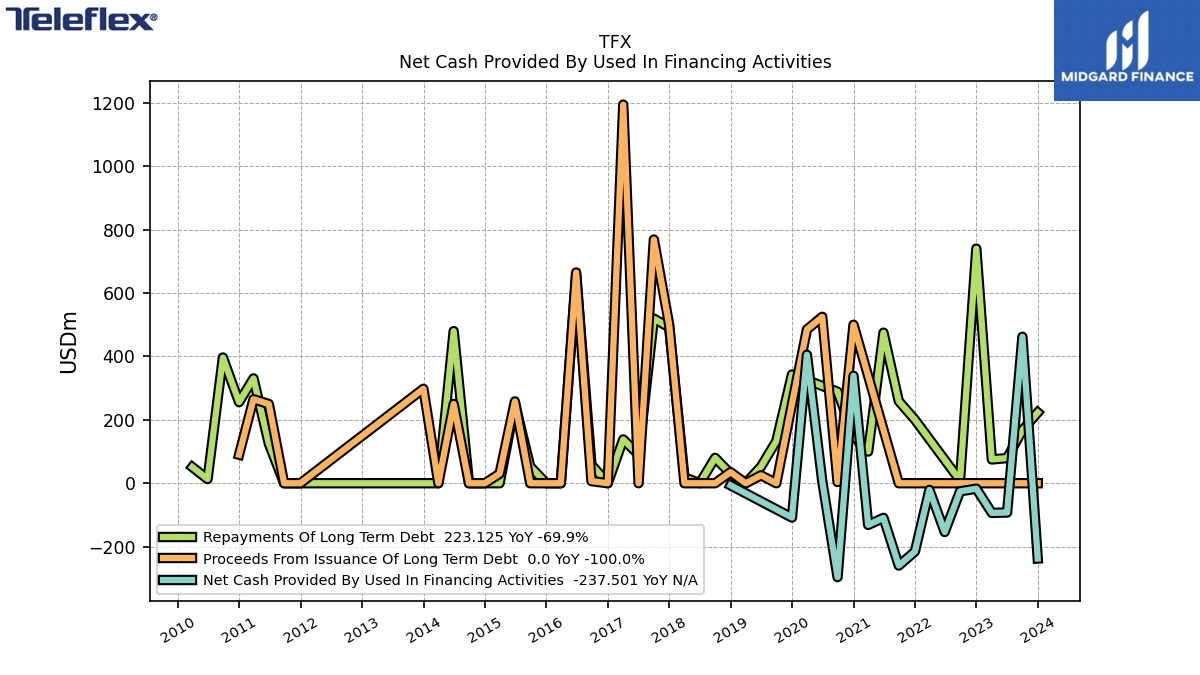
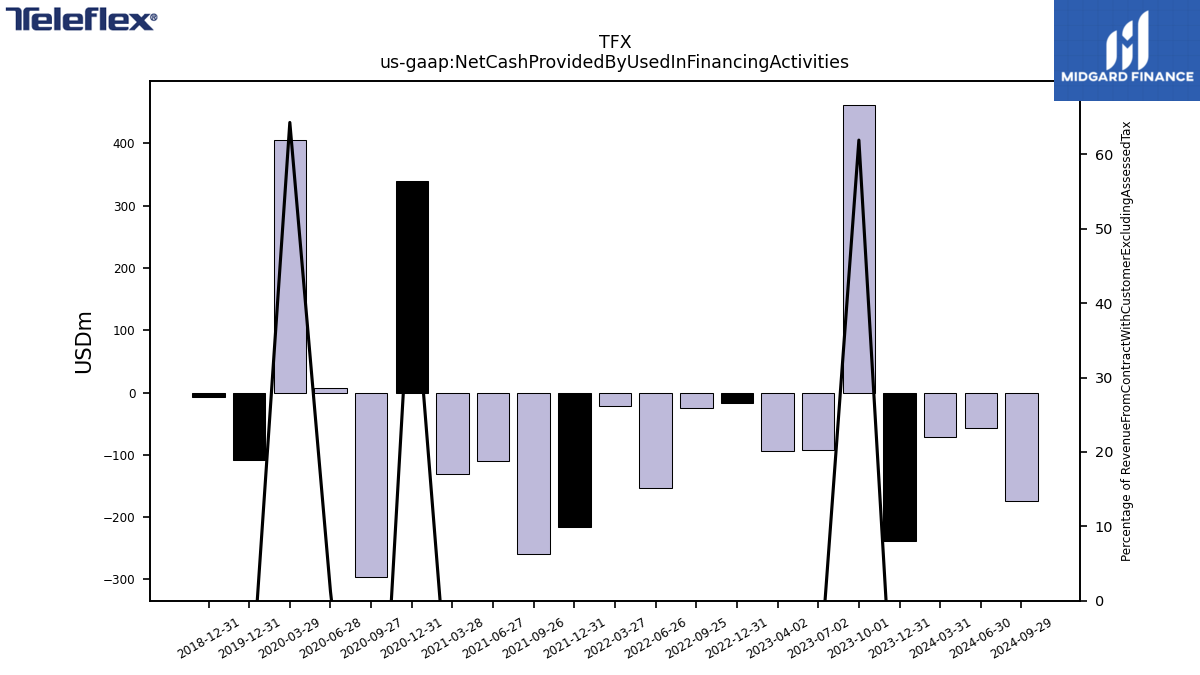
| Net Cash Provided By Used In Financing Activities | -237.50 | 462.03 | -92.40 | -93.59 | -17.13 | -25.60 | -153.81 | -20.96 | -215.41 | -259.70 | -109.22 | -131.50 | 338.94 | -296.22 | 7.11 | 405.33 | -108.31 | NA | NA | NA | -6.73 | NA | NA | NA | NA | NA | NA | NA | NA | NA | NA | NA | NA | NA | NA | NA | NA | NA | NA | NA | NA | NA | NA | NA | NA | NA | NA | NA | NA | NA | NA | NA | NA | NA | NA | NA | NA | NA | NA |
| 2023-12-31 | 2023-10-01 | 2023-07-02 | 2023-04-02 | 2022-12-31 | 2022-09-25 | 2022-06-26 | 2022-03-27 | 2021-12-31 | 2021-09-26 | 2021-06-27 | 2021-03-28 | 2020-12-31 | 2020-09-27 | 2020-06-28 | 2020-03-29 | 2019-12-31 | 2019-09-29 | 2019-06-30 | 2019-03-31 | 2018-12-31 | 2018-09-30 | 2018-07-01 | 2018-04-01 | 2017-12-31 | 2017-10-01 | 2017-07-02 | 2017-04-02 | 2016-12-31 | 2016-09-25 | 2016-06-26 | 2016-03-27 | 2015-12-31 | 2015-09-27 | 2015-06-28 | 2015-03-29 | 2014-12-31 | 2014-09-28 | 2014-06-29 | 2014-03-30 | 2013-12-31 | 2013-09-30 | 2013-09-29 | 2013-06-30 | 2013-03-31 | 2012-12-31 | 2012-09-30 | 2012-07-01 | 2012-06-30 | 2012-04-01 | 2012-03-31 | 2011-12-31 | 2011-09-25 | 2011-06-26 | 2011-03-27 | 2010-12-31 | 2010-09-26 | 2010-06-27 | 2010-03-28 | ||
|---|---|---|---|---|---|---|---|---|---|---|---|---|---|---|---|---|---|---|---|---|---|---|---|---|---|---|---|---|---|---|---|---|---|---|---|---|---|---|---|---|---|---|---|---|---|---|---|---|---|---|---|---|---|---|---|---|---|---|---|---|
| Net Income Loss | 31.11 | 137.14 | 111.33 | 76.75 | 78.59 | 101.89 | 105.51 | 77.14 | 128.08 | 199.18 | 83.25 | 74.87 | 76.13 | 116.59 | 11.46 | 131.15 | 108.27 | 228.93 | 83.38 | 40.90 | 90.59 | 56.52 | -2.50 | 56.18 | -42.66 | 77.02 | 78.00 | 40.17 | 61.06 | 66.32 | 59.30 | 50.69 | 101.12 | 60.82 | 44.56 | 38.35 | 50.64 | 54.83 | 47.25 | 34.96 | 34.83 | 46.57 | 46.57 | 42.44 | 27.04 | 29.32 | 21.74 | 42.61 | 42.61 | -283.74 | -283.74 | 167.80 | 43.65 | 34.07 | 77.81 | 81.08 | 22.20 | 60.15 | 37.67 | |
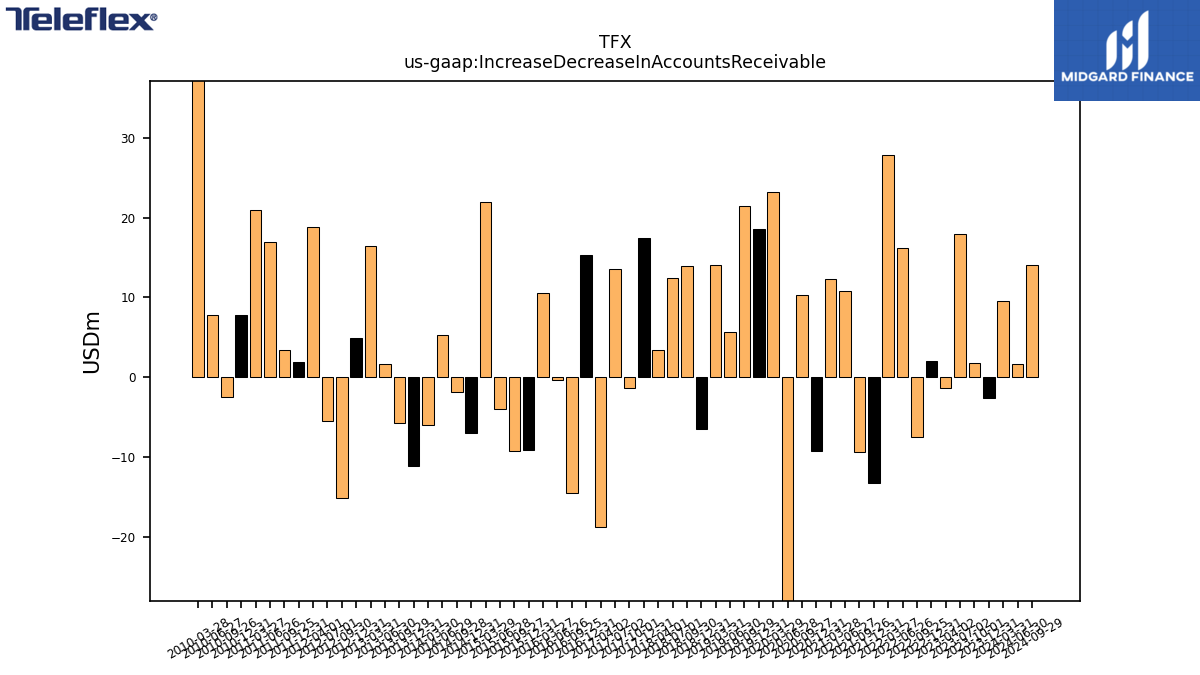
| Increase Decrease In Accounts Receivable | -2.55 | 1.73 | 17.93 | -1.34 | 2.06 | -7.54 | 16.13 | 27.80 | -13.23 | -9.33 | 10.86 | 12.30 | -9.20 | 10.30 | -68.99 | 23.14 | 18.57 | 21.47 | 5.64 | 14.10 | -6.42 | 13.94 | 12.48 | 3.40 | 17.47 | -1.36 | 13.62 | -18.69 | 15.35 | -14.55 | -0.33 | 10.57 | -9.11 | -9.27 | -3.92 | 21.91 | -6.95 | -1.80 | 5.33 | -5.97 | -11.10 | NA | -5.69 | 1.66 | 16.42 | 4.87 | -15.16 | -5.54 | NA | 18.76 | NA | 1.86 | 3.39 | 16.92 | 20.95 | 7.86 | -2.43 | 7.85 | 43.02 | |
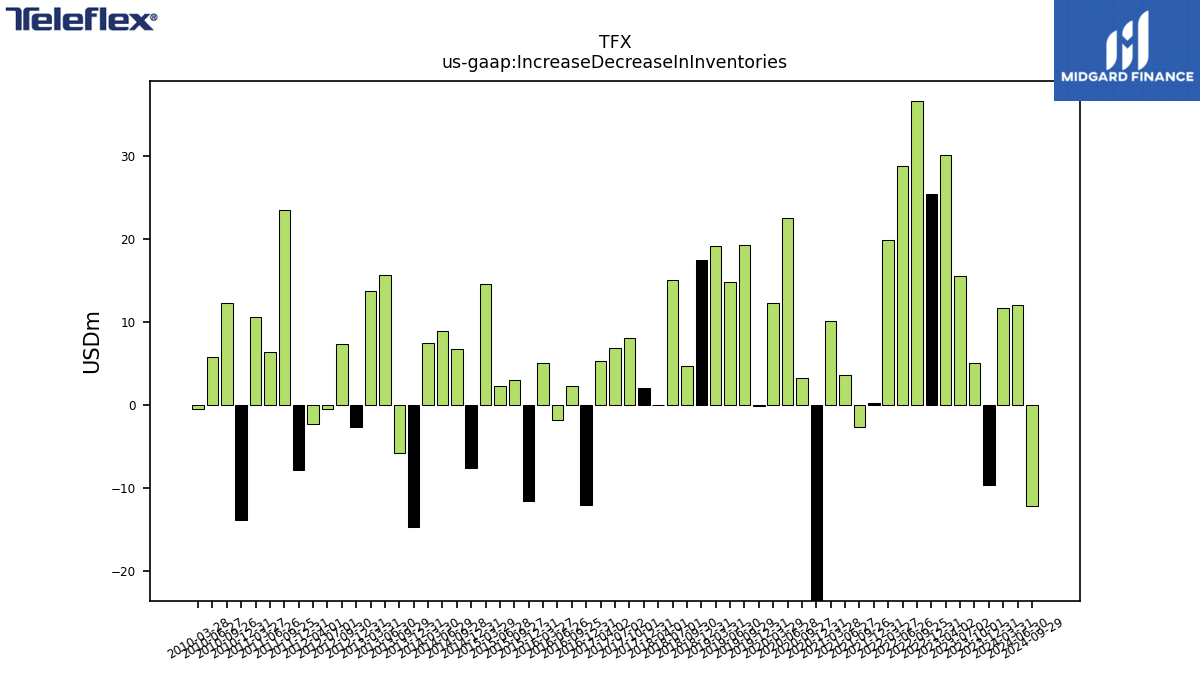
| Increase Decrease In Inventories | -9.63 | 5.07 | 15.53 | 30.10 | 25.39 | 36.61 | 28.83 | 19.85 | 0.19 | -2.70 | 3.57 | 10.07 | -32.60 | 3.22 | 22.53 | 12.35 | -0.09 | 19.29 | 14.77 | 19.20 | 17.53 | 4.65 | 15.05 | -0.03 | 2.11 | 8.07 | 6.87 | 5.32 | -12.03 | 2.33 | -1.82 | 5.10 | -11.53 | 3.01 | 2.32 | 14.58 | -7.55 | 6.70 | 8.91 | 7.47 | -14.64 | NA | -5.78 | 15.66 | 13.69 | -2.65 | 7.32 | -0.45 | NA | -2.25 | NA | -7.88 | 23.44 | 6.44 | 10.66 | -13.86 | 12.29 | 5.75 | -0.49 | |
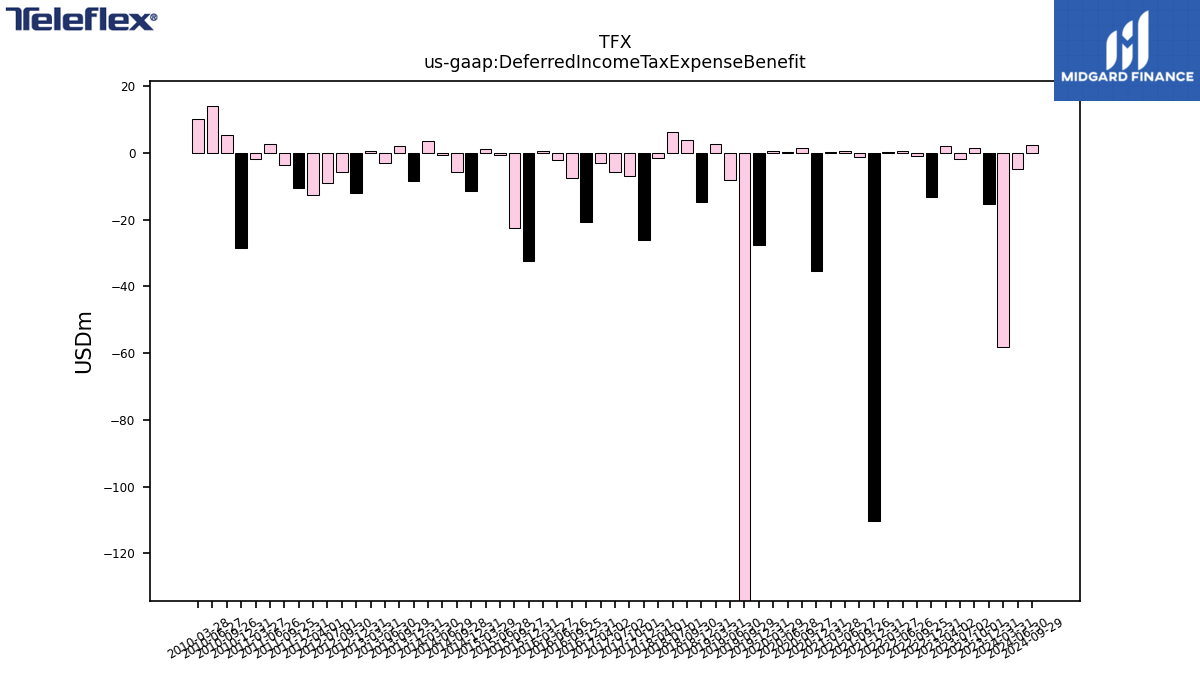
| Deferred Income Tax Expense Benefit | -15.12 | 1.62 | -1.63 | 2.09 | -13.07 | -0.87 | 0.53 | 0.41 | -110.17 | -1.12 | 0.62 | 0.42 | -35.27 | 1.54 | 0.38 | 0.68 | -27.63 | -135.47 | -8.10 | 2.60 | -14.76 | 3.84 | 6.29 | -1.47 | -26.14 | -6.90 | -5.70 | -3.08 | -20.65 | -7.41 | -2.05 | 0.76 | -32.45 | -22.59 | -0.46 | 1.08 | -11.35 | -5.62 | -0.70 | 3.52 | -8.47 | NA | 1.98 | -2.92 | 0.48 | -11.96 | -5.74 | -8.86 | NA | -12.62 | NA | -10.60 | -3.50 | 2.64 | -1.70 | -28.43 | 5.49 | 14.13 | 10.13 | |
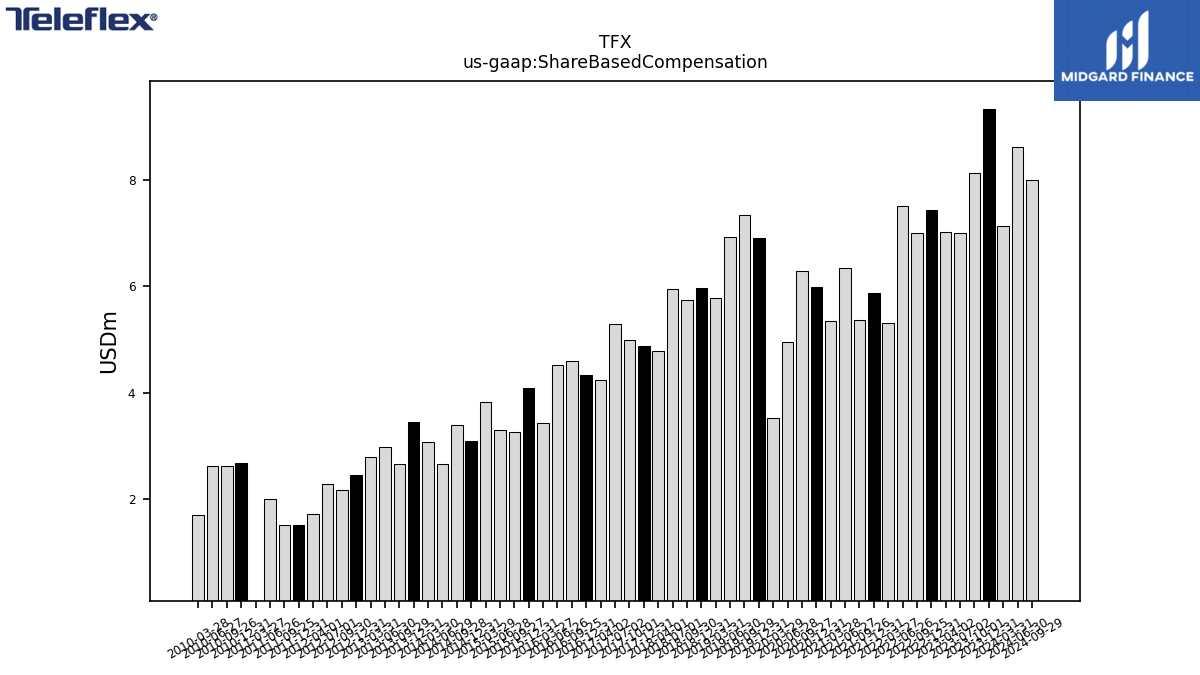
| Share Based Compensation | 9.33 | 8.12 | 7.00 | 7.01 | 7.42 | 7.00 | 7.50 | 5.30 | 5.87 | 5.37 | 6.35 | 5.34 | 5.98 | 6.28 | 4.96 | 3.52 | 6.90 | 7.34 | 6.92 | 5.78 | 5.97 | 5.73 | 5.95 | 4.79 | 4.88 | 4.99 | 5.29 | 4.24 | 4.33 | 4.59 | 4.51 | 3.44 | 4.09 | 3.25 | 3.29 | 3.83 | 3.10 | 3.40 | 2.65 | 3.07 | 3.44 | NA | 2.66 | 2.98 | 2.79 | 2.45 | 2.17 | 2.28 | NA | 1.72 | NA | 1.52 | 1.51 | 2.01 | -1.05 | 2.67 | 2.63 | 2.62 | 1.70 |
| 2023-12-31 | 2023-10-01 | 2023-07-02 | 2023-04-02 | 2022-12-31 | 2022-09-25 | 2022-06-26 | 2022-03-27 | 2021-12-31 | 2021-09-26 | 2021-06-27 | 2021-03-28 | 2020-12-31 | 2020-09-27 | 2020-06-28 | 2020-03-29 | 2019-12-31 | 2019-09-29 | 2019-06-30 | 2019-03-31 | 2018-12-31 | 2018-09-30 | 2018-07-01 | 2018-04-01 | 2017-12-31 | 2017-10-01 | 2017-07-02 | 2017-04-02 | 2016-12-31 | 2016-09-25 | 2016-06-26 | 2016-03-27 | 2015-12-31 | 2015-09-27 | 2015-06-28 | 2015-03-29 | 2014-12-31 | 2014-09-28 | 2014-06-29 | 2014-03-30 | 2013-12-31 | 2013-09-30 | 2013-09-29 | 2013-06-30 | 2013-03-31 | 2012-12-31 | 2012-09-30 | 2012-07-01 | 2012-06-30 | 2012-04-01 | 2012-03-31 | 2011-12-31 | 2011-09-25 | 2011-06-26 | 2011-03-27 | 2010-12-31 | 2010-09-26 | 2010-06-27 | 2010-03-28 | ||
|---|---|---|---|---|---|---|---|---|---|---|---|---|---|---|---|---|---|---|---|---|---|---|---|---|---|---|---|---|---|---|---|---|---|---|---|---|---|---|---|---|---|---|---|---|---|---|---|---|---|---|---|---|---|---|---|---|---|---|---|---|
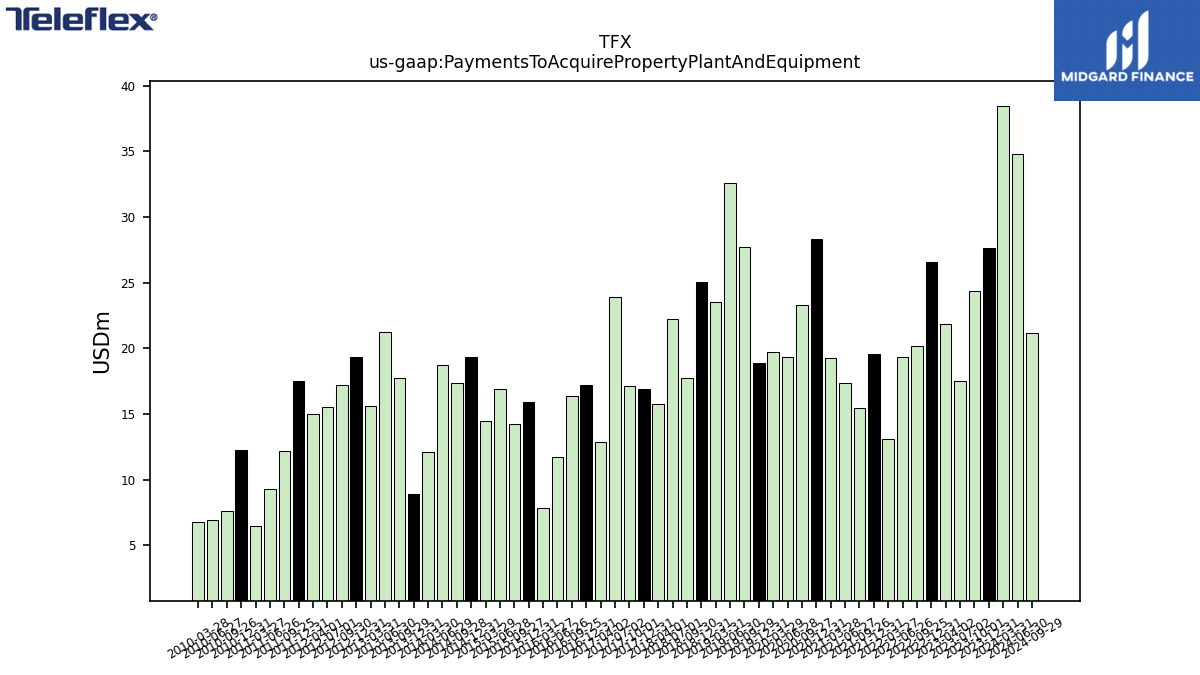
| Payments To Acquire Property Plant And Equipment | 27.67 | 24.39 | 17.54 | 21.84 | 26.54 | 20.20 | 19.37 | 13.08 | 19.53 | 15.43 | 17.38 | 19.28 | 28.32 | 23.32 | 19.37 | 19.68 | 18.90 | 27.69 | 32.61 | 23.49 | 25.04 | 17.75 | 22.26 | 15.75 | 16.93 | 17.14 | 23.94 | 12.89 | 17.22 | 16.38 | 11.71 | 7.82 | 15.88 | 14.24 | 16.88 | 14.45 | 19.35 | 17.37 | 18.74 | 12.11 | 8.94 | NA | 17.74 | 21.26 | 15.63 | 19.30 | 17.20 | 15.56 | NA | 15.03 | NA | 17.53 | 12.28 | 9.29 | 6.44 | 12.27 | 7.61 | 6.92 | 6.74 |
| 2023-12-31 | 2023-10-01 | 2023-07-02 | 2023-04-02 | 2022-12-31 | 2022-09-25 | 2022-06-26 | 2022-03-27 | 2021-12-31 | 2021-09-26 | 2021-06-27 | 2021-03-28 | 2020-12-31 | 2020-09-27 | 2020-06-28 | 2020-03-29 | 2019-12-31 | 2019-09-29 | 2019-06-30 | 2019-03-31 | 2018-12-31 | 2018-09-30 | 2018-07-01 | 2018-04-01 | 2017-12-31 | 2017-10-01 | 2017-07-02 | 2017-04-02 | 2016-12-31 | 2016-09-25 | 2016-06-26 | 2016-03-27 | 2015-12-31 | 2015-09-27 | 2015-06-28 | 2015-03-29 | 2014-12-31 | 2014-09-28 | 2014-06-29 | 2014-03-30 | 2013-12-31 | 2013-09-30 | 2013-09-29 | 2013-06-30 | 2013-03-31 | 2012-12-31 | 2012-09-30 | 2012-07-01 | 2012-06-30 | 2012-04-01 | 2012-03-31 | 2011-12-31 | 2011-09-25 | 2011-06-26 | 2011-03-27 | 2010-12-31 | 2010-09-26 | 2010-06-27 | 2010-03-28 | ||
|---|---|---|---|---|---|---|---|---|---|---|---|---|---|---|---|---|---|---|---|---|---|---|---|---|---|---|---|---|---|---|---|---|---|---|---|---|---|---|---|---|---|---|---|---|---|---|---|---|---|---|---|---|---|---|---|---|---|---|---|---|
| Net Cash Provided By Used In Financing Activities | -237.50 | 462.03 | -92.40 | -93.59 | -17.13 | -25.60 | -153.81 | -20.96 | -215.41 | -259.70 | -109.22 | -131.50 | 338.94 | -296.22 | 7.11 | 405.33 | -108.31 | NA | NA | NA | -6.73 | NA | NA | NA | NA | NA | NA | NA | NA | NA | NA | NA | NA | NA | NA | NA | NA | NA | NA | NA | NA | NA | NA | NA | NA | NA | NA | NA | NA | NA | NA | NA | NA | NA | NA | NA | NA | NA | NA | |
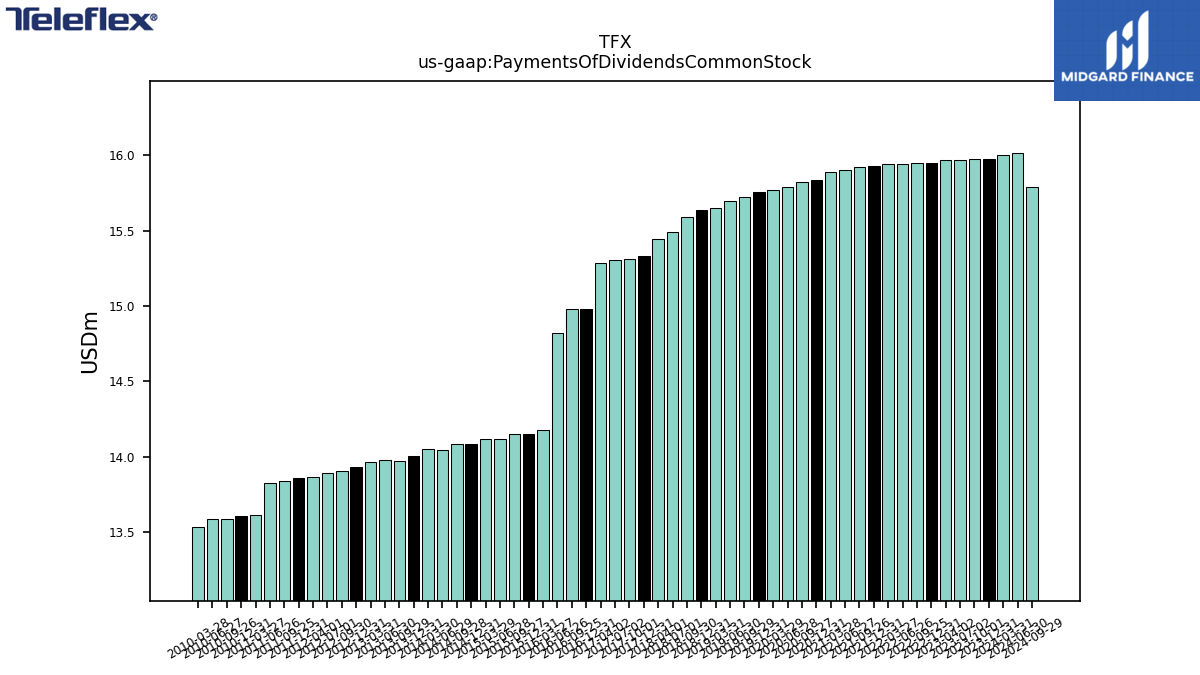
| Payments Of Dividends Common Stock | 15.98 | 15.98 | 15.97 | 15.97 | 15.95 | 15.95 | 15.95 | 15.95 | 15.93 | 15.92 | 15.90 | 15.89 | 15.84 | 15.83 | 15.79 | 15.77 | 15.76 | 15.72 | 15.70 | 15.65 | 15.64 | 15.59 | 15.49 | 15.45 | 15.33 | 15.31 | 15.30 | 15.29 | 14.98 | 14.98 | 14.82 | 14.18 | 14.15 | 14.15 | 14.12 | 14.12 | 14.08 | 14.08 | 14.04 | 14.05 | 14.00 | NA | 13.97 | 13.98 | 13.96 | 13.93 | 13.90 | 13.89 | NA | 13.87 | NA | 13.86 | 13.84 | 13.82 | 13.61 | 13.61 | 13.58 | 13.58 | 13.54 |
| 2023-12-31 | 2023-10-01 | 2023-07-02 | 2023-04-02 | 2022-12-31 | 2022-09-25 | 2022-06-26 | 2022-03-27 | 2021-12-31 | 2021-09-26 | 2021-06-27 | 2021-03-28 | 2020-12-31 | 2020-09-27 | 2020-06-28 | 2020-03-29 | 2019-12-31 | 2019-09-29 | 2019-06-30 | 2019-03-31 | 2018-12-31 | 2018-09-30 | 2018-07-01 | 2018-04-01 | 2017-12-31 | 2017-10-01 | 2017-07-02 | 2017-04-02 | 2016-12-31 | 2016-09-25 | 2016-06-26 | 2016-03-27 | 2015-12-31 | 2015-09-27 | 2015-06-28 | 2015-03-29 | 2014-12-31 | 2014-09-28 | 2014-06-29 | 2014-03-30 | 2013-12-31 | 2013-09-30 | 2013-09-29 | 2013-06-30 | 2013-03-31 | 2012-12-31 | 2012-09-30 | 2012-07-01 | 2012-06-30 | 2012-04-01 | 2012-03-31 | 2011-12-31 | 2011-09-25 | 2011-06-26 | 2011-03-27 | 2010-12-31 | 2010-09-26 | 2010-06-27 | 2010-03-28 | ||
|---|---|---|---|---|---|---|---|---|---|---|---|---|---|---|---|---|---|---|---|---|---|---|---|---|---|---|---|---|---|---|---|---|---|---|---|---|---|---|---|---|---|---|---|---|---|---|---|---|---|---|---|---|---|---|---|---|---|---|---|---|
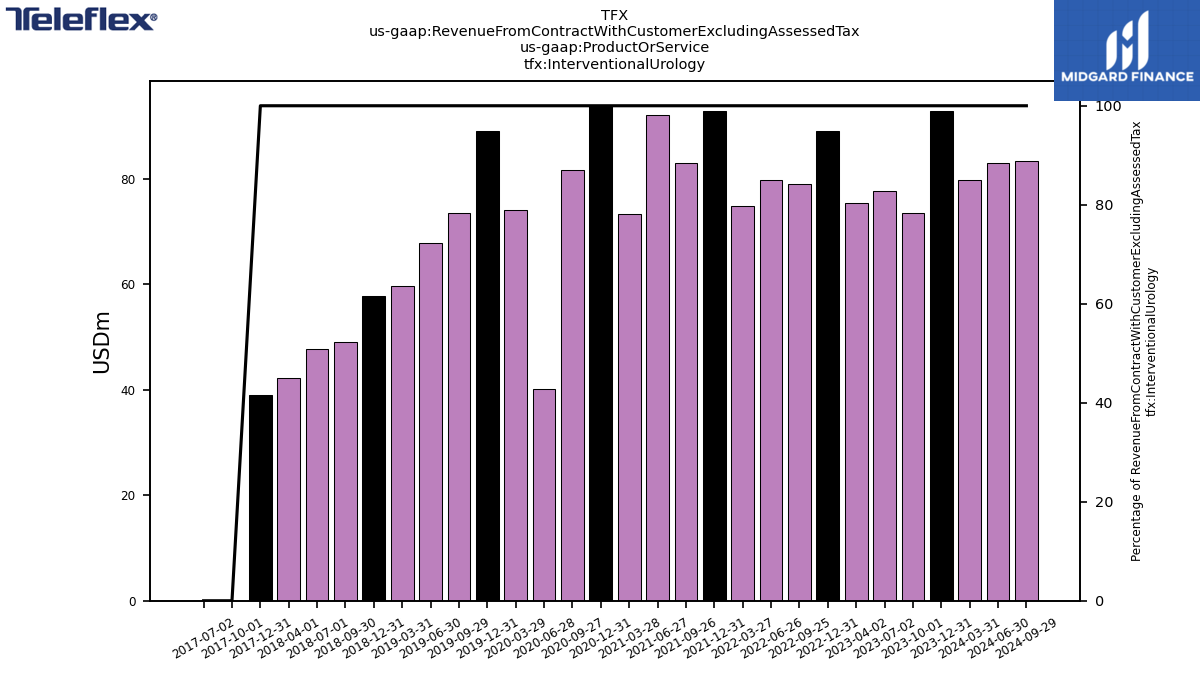
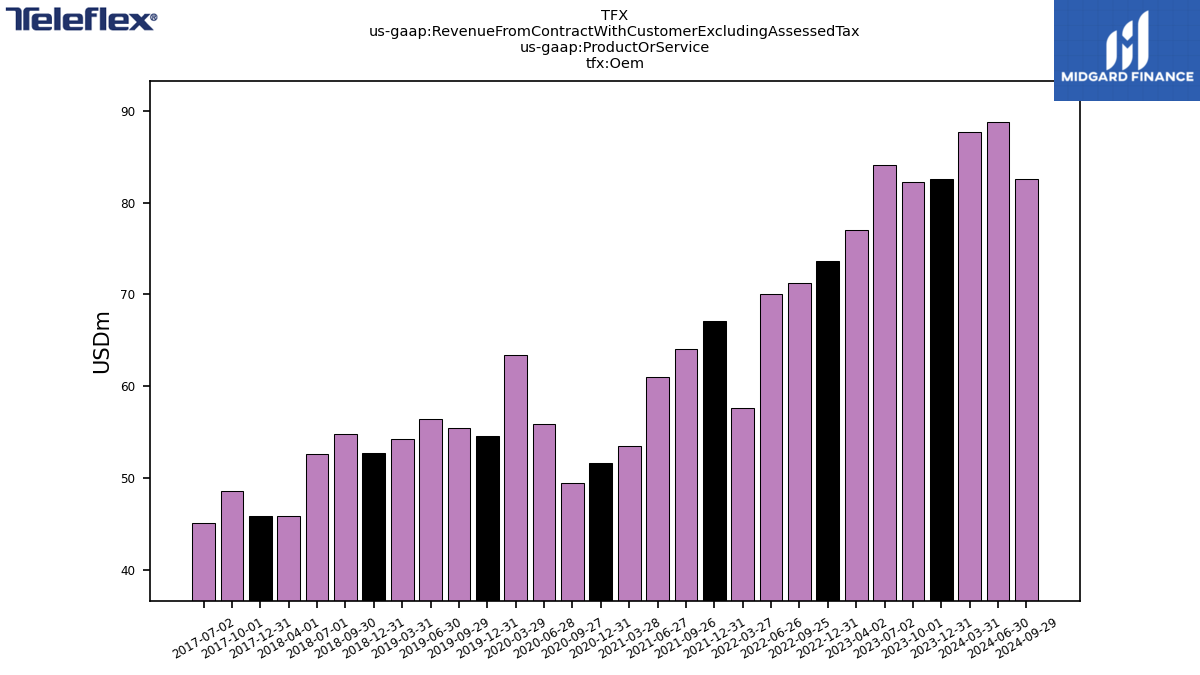
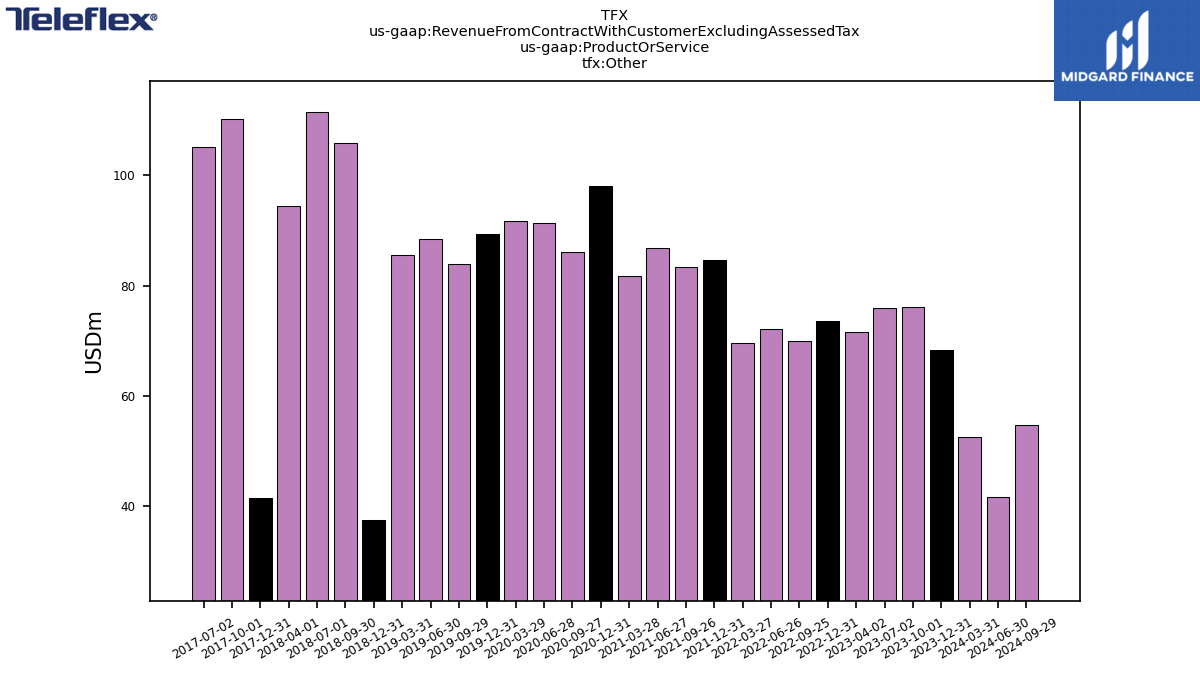
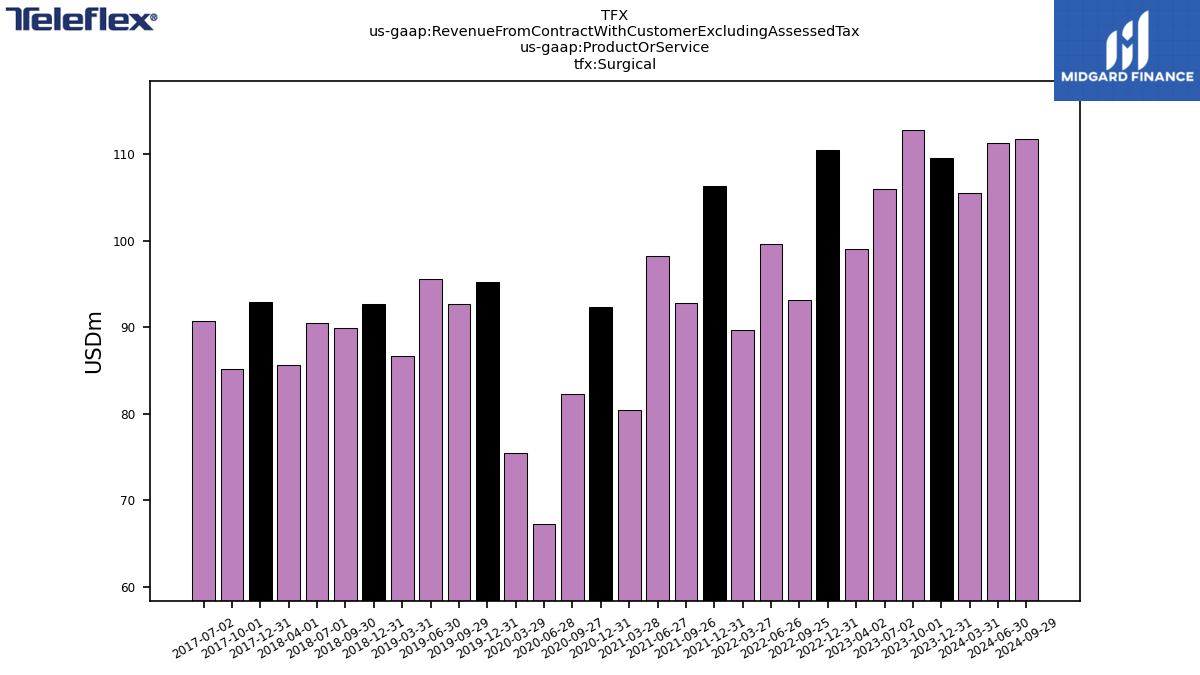
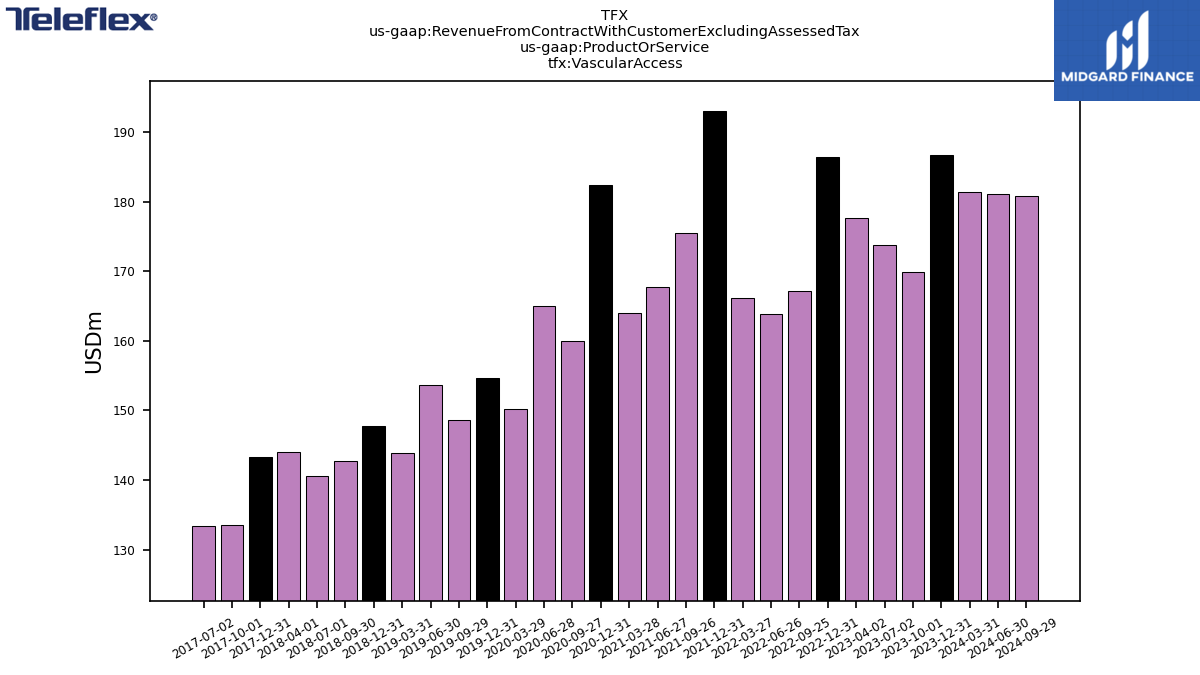
| Revenue From Contract With Customer Excluding Assessed Tax | 773.91 | 746.39 | 743.26 | 710.93 | 758.00 | 686.79 | 704.54 | 641.72 | 761.91 | 700.25 | 713.47 | 633.92 | 711.18 | 628.30 | 567.03 | 630.64 | 680.95 | 648.32 | 652.51 | 613.58 | 641.62 | 609.67 | 609.87 | 587.23 | 595.11 | 534.70 | 528.61 | 487.88 | 513.93 | 455.65 | 473.55 | 424.89 | 484.50 | 443.71 | 452.05 | 429.43 | 476.01 | 457.17 | 468.11 | 438.55 | 450.54 | 413.80 | 413.80 | 420.06 | 411.88 | 419.06 | 368.05 | 383.33 | 383.33 | 387.76 | 380.57 | 411.73 | 371.89 | 391.29 | 388.66 | 386.28 | 345.04 | 358.43 | 367.33 | |
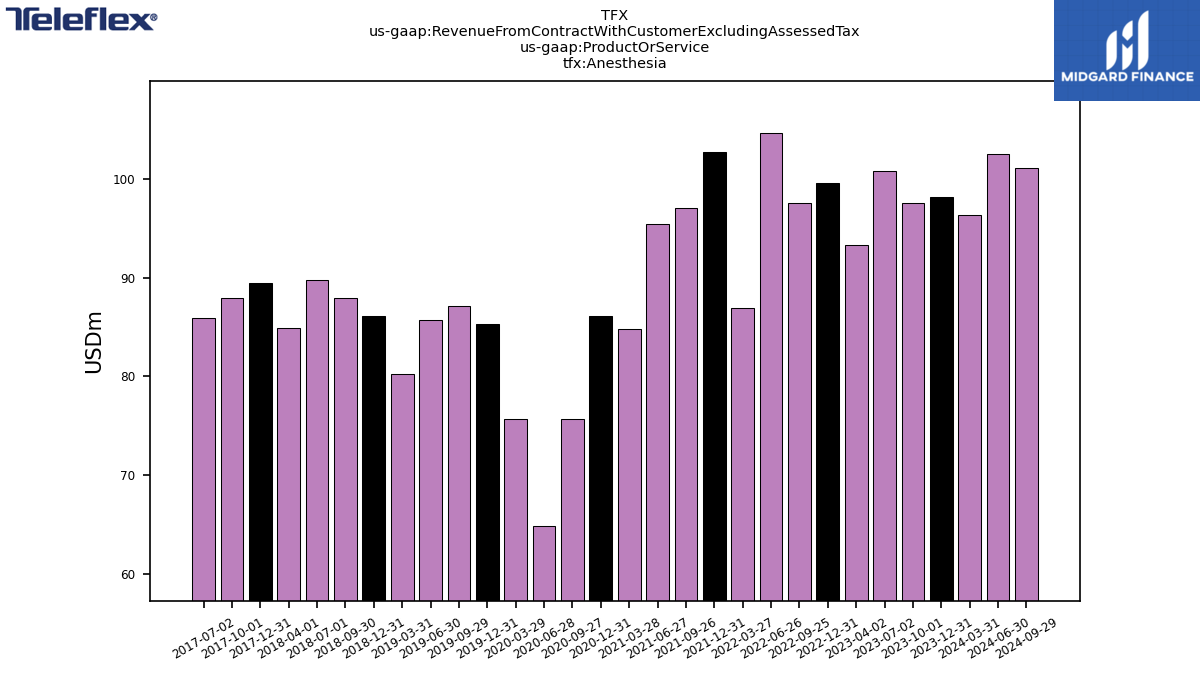
| Anesthesia | 98.17 | 97.61 | 100.84 | 93.33 | 99.63 | 97.61 | 104.69 | 86.96 | 102.78 | 97.07 | 95.43 | 84.86 | 86.09 | 75.65 | 64.87 | 75.70 | 85.31 | 87.12 | 85.72 | 80.25 | 86.17 | 87.97 | 89.81 | 84.92 | 89.49 | 87.96 | 85.94 | NA | NA | NA | NA | NA | NA | NA | NA | NA | NA | NA | NA | NA | NA | NA | NA | NA | NA | NA | NA | NA | NA | NA | NA | NA | NA | NA | NA | NA | NA | NA | NA | |
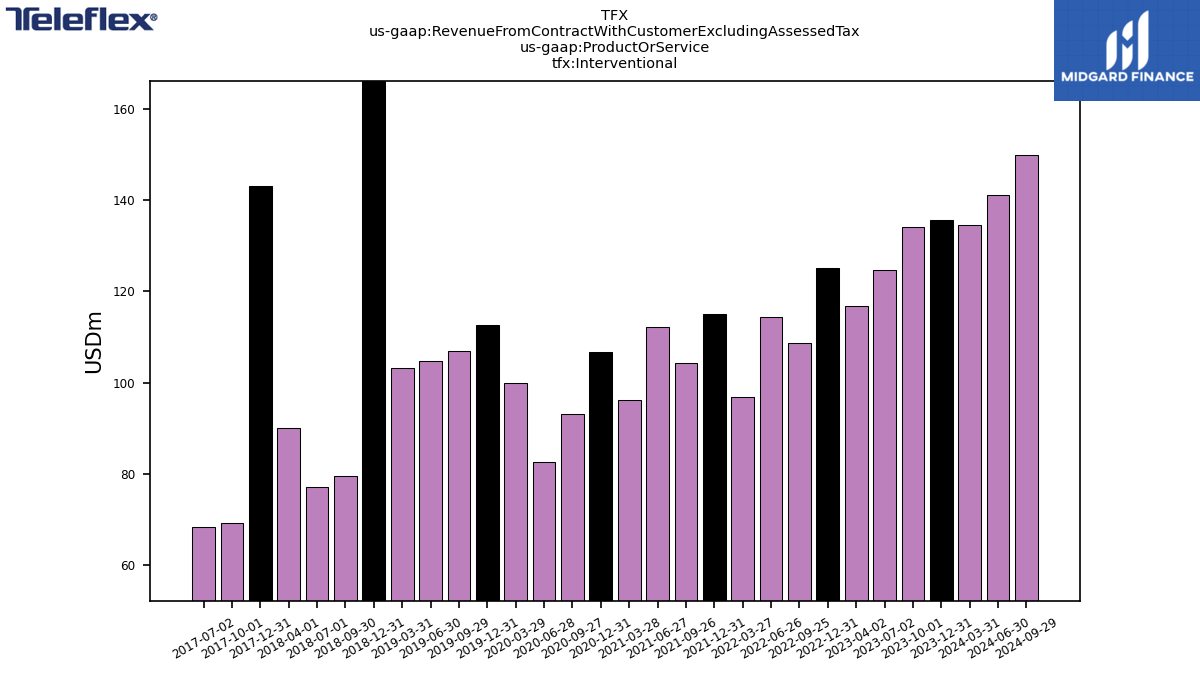
| Interventional | 135.67 | 134.09 | 124.78 | 116.90 | 125.08 | 108.74 | 114.34 | 96.86 | 114.94 | 104.30 | 112.08 | 96.17 | 106.73 | 93.19 | 82.59 | 99.93 | 112.71 | 106.88 | 104.78 | 103.18 | 167.16 | 79.40 | 77.18 | 90.14 | 143.10 | 69.19 | 68.42 | NA | NA | NA | NA | NA | NA | NA | NA | NA | NA | NA | NA | NA | NA | NA | NA | NA | NA | NA | NA | NA | NA | NA | NA | NA | NA | NA | NA | NA | NA | NA | NA | |
| Interventional Urology | 92.97 | 73.62 | 77.82 | 75.38 | 89.15 | 78.97 | 79.82 | 74.89 | 92.95 | 83.11 | 92.24 | 73.36 | 93.91 | 81.77 | 40.09 | 74.19 | 89.14 | 73.63 | 67.95 | 59.73 | 57.77 | 48.99 | 47.67 | 42.30 | 38.96 | 0.00 | 0.00 | NA | NA | NA | NA | NA | NA | NA | NA | NA | NA | NA | NA | NA | NA | NA | NA | NA | NA | NA | NA | NA | NA | NA | NA | NA | NA | NA | NA | NA | NA | NA | NA | |
| Oem | 82.57 | 82.31 | 84.13 | 77.00 | 73.68 | 71.29 | 70.00 | 57.66 | 67.15 | 64.08 | 60.96 | 53.49 | 51.63 | 49.40 | 55.83 | 63.39 | 54.61 | 55.44 | 56.43 | 54.24 | 52.69 | 54.84 | 52.59 | 45.85 | 45.90 | 48.59 | 45.13 | NA | NA | NA | NA | NA | NA | NA | NA | NA | NA | NA | NA | NA | NA | NA | NA | NA | NA | NA | NA | NA | NA | NA | NA | NA | NA | NA | NA | NA | NA | NA | NA | |
| Other | 68.26 | 76.03 | 75.95 | 71.65 | 73.59 | 69.91 | 72.14 | 69.51 | 84.68 | 83.38 | 86.84 | 81.68 | 98.10 | 86.02 | 91.41 | 91.74 | 89.37 | 83.94 | 88.40 | 85.56 | 37.40 | 105.84 | 111.52 | 94.36 | 41.38 | 110.23 | 105.06 | NA | NA | NA | NA | NA | NA | NA | NA | NA | NA | NA | NA | NA | NA | NA | NA | NA | NA | NA | NA | NA | NA | NA | NA | NA | NA | NA | NA | NA | NA | NA | NA | |
| Surgical | 109.58 | 112.81 | 105.95 | 99.02 | 110.45 | 93.12 | 99.64 | 89.70 | 106.35 | 92.83 | 98.19 | 80.39 | 92.27 | 82.22 | 67.28 | 75.43 | 95.16 | 92.62 | 95.57 | 86.72 | 92.66 | 89.91 | 90.49 | 85.62 | 92.90 | 85.21 | 90.74 | NA | NA | NA | NA | NA | NA | NA | NA | NA | NA | NA | NA | NA | NA | NA | NA | NA | NA | NA | NA | NA | NA | NA | NA | NA | NA | NA | NA | NA | NA | NA | NA | |
| Vascular Access | 186.69 | 169.92 | 173.78 | 177.65 | 186.42 | 167.15 | 163.91 | 166.13 | 193.05 | 175.48 | 167.74 | 163.97 | 182.45 | 160.05 | 164.96 | 150.26 | 154.65 | 148.68 | 153.65 | 143.90 | 147.77 | 142.71 | 140.60 | 144.03 | 143.37 | 133.52 | 133.32 | NA | NA | NA | NA | NA | NA | NA | NA | NA | NA | NA | NA | NA | NA | NA | NA | NA | NA | NA | NA | NA | NA | NA | NA | NA | NA | NA | NA | NA | NA | NA | NA |