
| 2023-12-31 | 2023-09-30 | 2023-06-30 | 2023-03-31 | 2022-12-31 | 2022-09-30 | 2022-06-30 | 2022-03-31 | 2021-12-31 | 2021-09-30 | 2021-06-30 | 2021-03-31 | 2020-12-31 | 2020-09-30 | 2020-06-30 | 2020-03-31 | 2019-12-31 | 2019-09-30 | 2019-06-30 | 2019-03-31 | 2018-12-31 | 2018-09-30 | 2018-06-30 | 2018-03-31 | 2017-12-31 | 2017-09-30 | 2017-06-30 | 2017-03-31 | 2016-12-31 | 2016-09-30 | 2016-06-30 | 2016-03-31 | 2015-12-31 | 2015-09-30 | 2015-06-30 | 2015-03-31 | 2014-12-31 | 2014-09-30 | 2014-06-30 | 2014-03-31 | 2013-12-31 | 2013-09-30 | 2013-06-30 | 2013-03-31 | ||
|---|---|---|---|---|---|---|---|---|---|---|---|---|---|---|---|---|---|---|---|---|---|---|---|---|---|---|---|---|---|---|---|---|---|---|---|---|---|---|---|---|---|---|---|---|---|
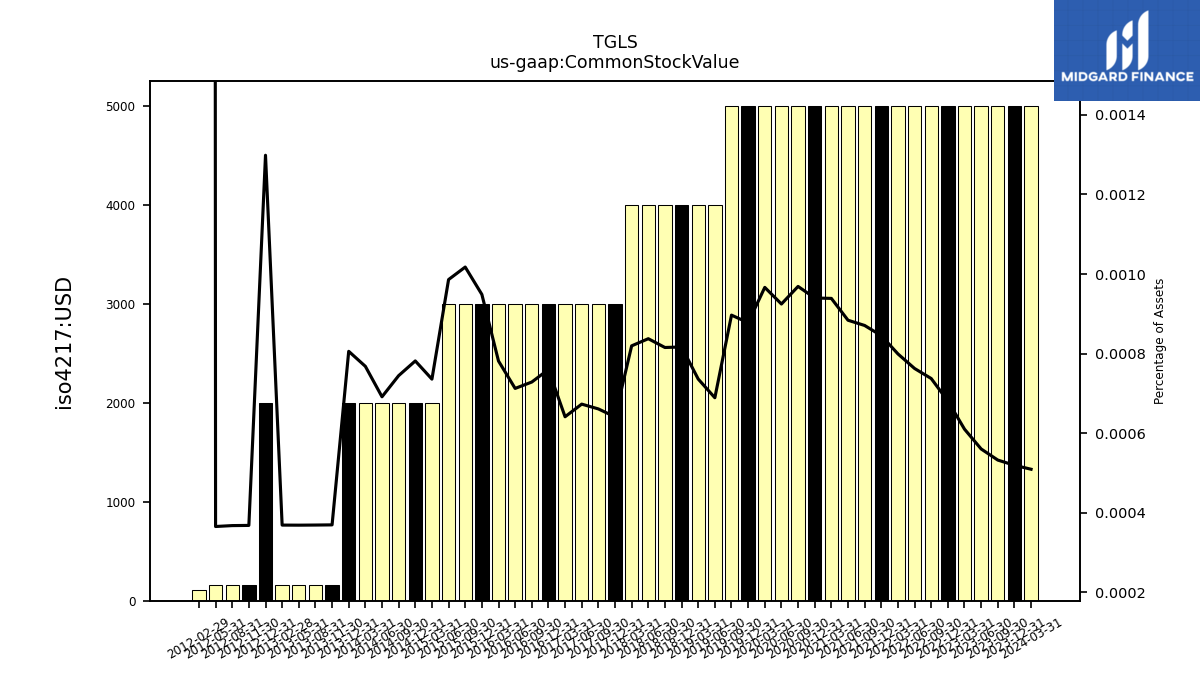
| Common Stock Value | 0.01 | 0.01 | 0.01 | 0.01 | 0.01 | 0.01 | 0.01 | 0.01 | 0.01 | 0.01 | 0.01 | 0.01 | 0.01 | 0.01 | 0.01 | 0.01 | 0.01 | 0.01 | 0.00 | 0.00 | 0.00 | 0.00 | 0.00 | 0.00 | 0.00 | 0.00 | 0.00 | 0.00 | 0.00 | 0.00 | 0.00 | 0.00 | 0.00 | 0.00 | 0.00 | 0.00 | 0.00 | 0.00 | 0.00 | 0.00 | 0.00 | NA | NA | NA |
| 2023-12-31 | 2023-09-30 | 2023-06-30 | 2023-03-31 | 2022-12-31 | 2022-09-30 | 2022-06-30 | 2022-03-31 | 2021-12-31 | 2021-09-30 | 2021-06-30 | 2021-03-31 | 2020-12-31 | 2020-09-30 | 2020-06-30 | 2020-03-31 | 2019-12-31 | 2019-09-30 | 2019-06-30 | 2019-03-31 | 2018-12-31 | 2018-09-30 | 2018-06-30 | 2018-03-31 | 2017-12-31 | 2017-09-30 | 2017-06-30 | 2017-03-31 | 2016-12-31 | 2016-09-30 | 2016-06-30 | 2016-03-31 | 2015-12-31 | 2015-09-30 | 2015-06-30 | 2015-03-31 | 2014-12-31 | 2014-09-30 | 2014-06-30 | 2014-03-31 | 2013-12-31 | 2013-09-30 | 2013-06-30 | 2013-03-31 | ||
|---|---|---|---|---|---|---|---|---|---|---|---|---|---|---|---|---|---|---|---|---|---|---|---|---|---|---|---|---|---|---|---|---|---|---|---|---|---|---|---|---|---|---|---|---|---|
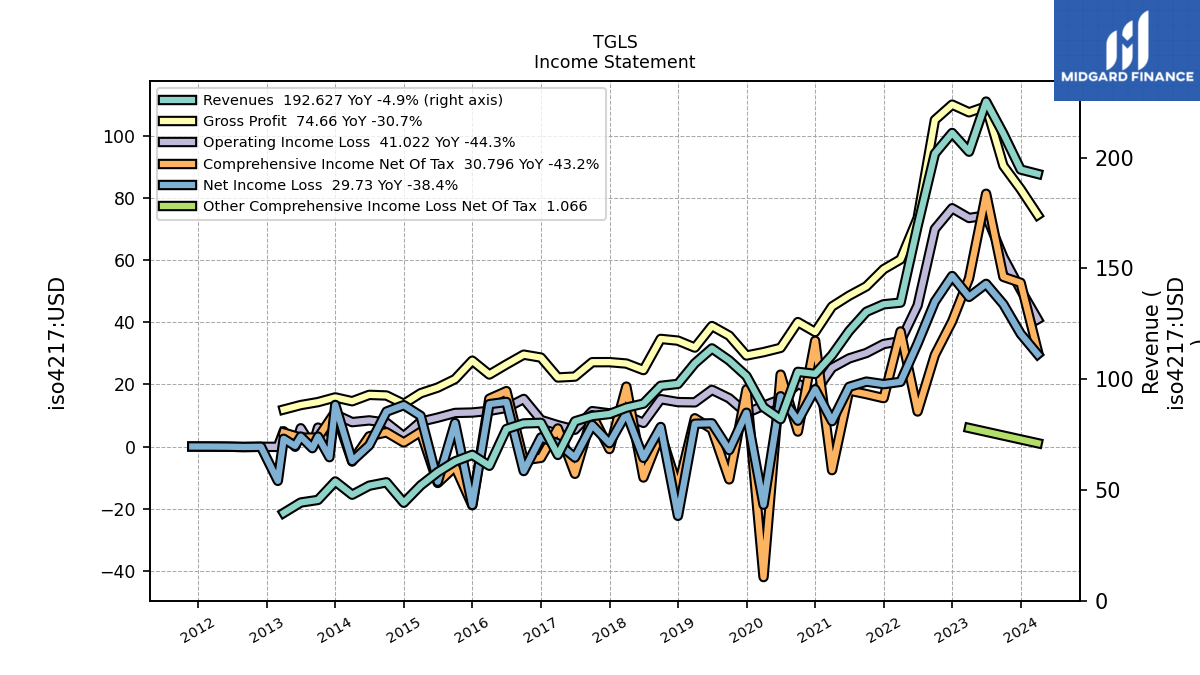
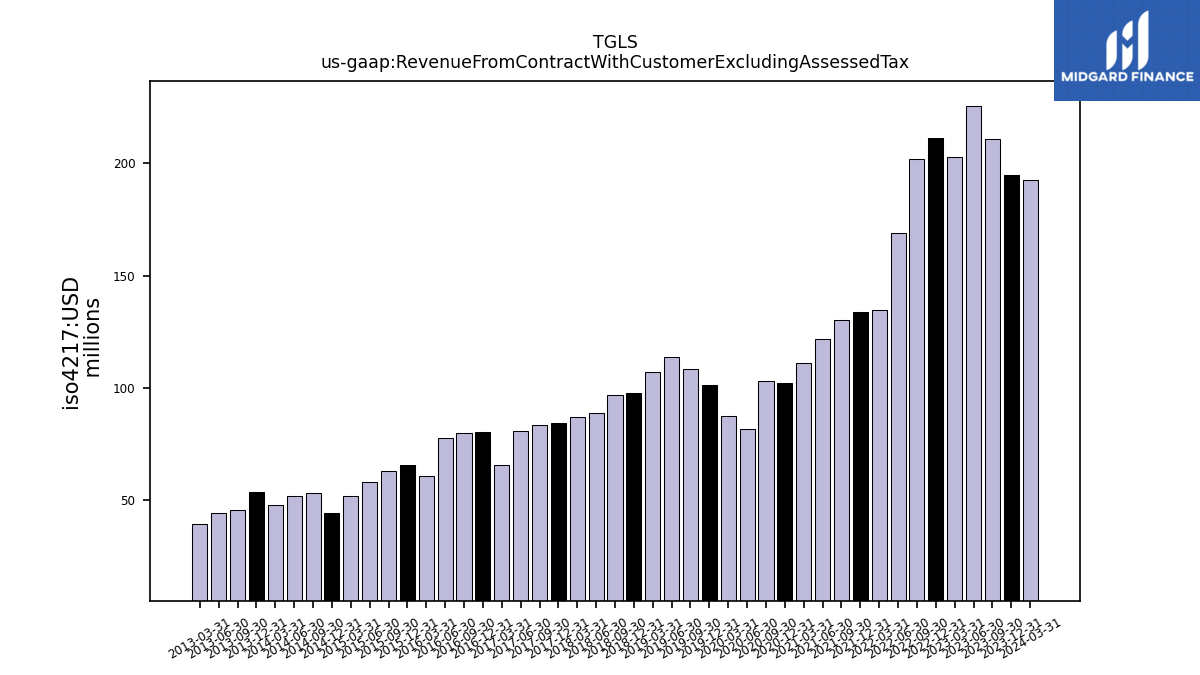
| Revenue From Contract With Customer Excluding Assessed Tax | 194.60 | 210.74 | 225.28 | 202.64 | 211.12 | 201.78 | 169.12 | 134.55 | 133.78 | 130.41 | 121.71 | 110.88 | 102.37 | 103.31 | 81.94 | 87.30 | 101.39 | 108.47 | 113.88 | 107.17 | 97.86 | 96.99 | 88.97 | 87.16 | 84.28 | 83.38 | 80.98 | 65.82 | 80.28 | 80.03 | 77.51 | 60.90 | 65.84 | 62.89 | 58.05 | 52.04 | 44.22 | 53.45 | 51.94 | 47.84 | 53.83 | 45.50 | 44.33 | 39.63 | |
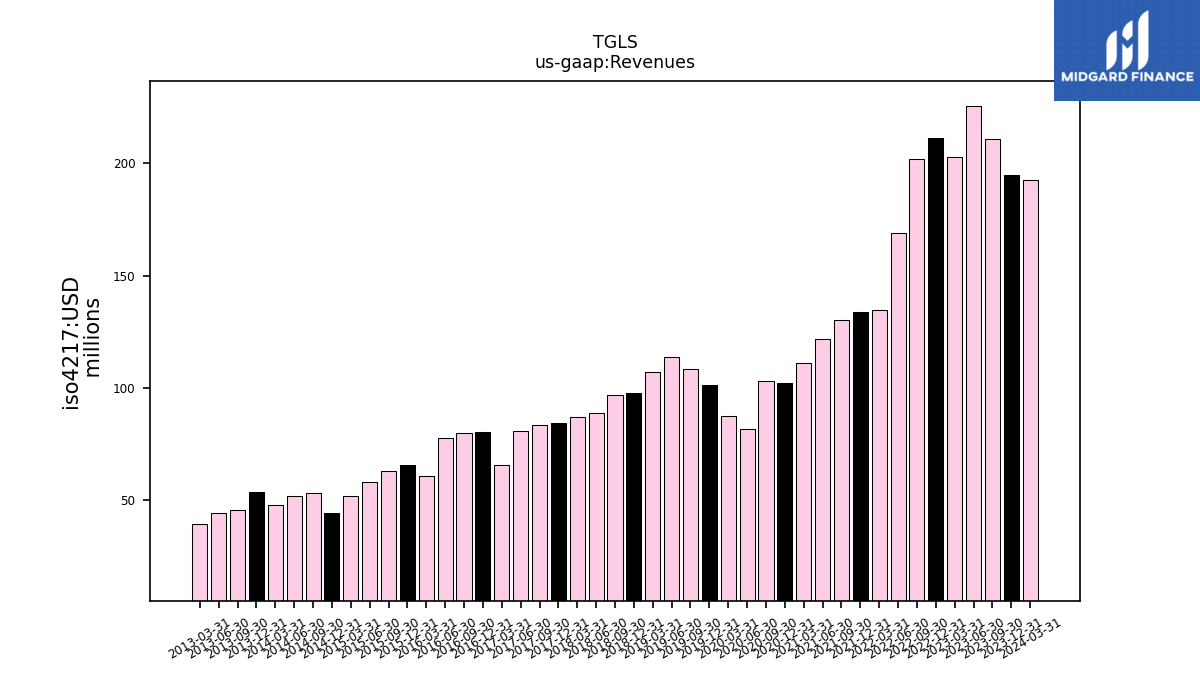
| Revenues | 194.60 | 210.74 | 225.28 | 202.64 | 211.12 | 201.78 | 169.12 | 134.55 | 133.78 | 130.41 | 121.71 | 110.88 | 102.37 | 103.31 | 81.94 | 87.30 | 101.39 | 108.47 | 113.88 | 107.17 | 97.86 | 96.99 | 88.97 | 87.16 | 84.28 | 83.38 | 80.98 | 65.82 | 80.28 | 80.03 | 77.51 | 60.90 | 65.84 | 62.89 | 58.05 | 52.04 | 44.22 | 53.45 | 51.94 | 47.84 | 53.83 | 45.50 | 44.33 | 39.63 | |
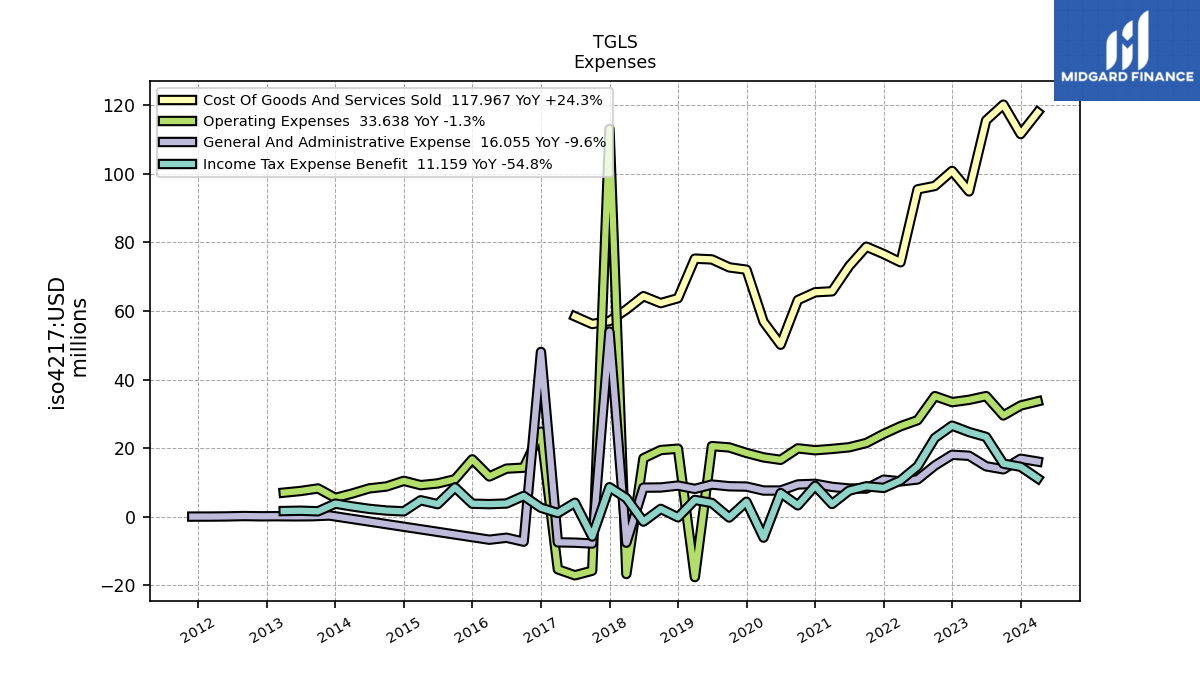
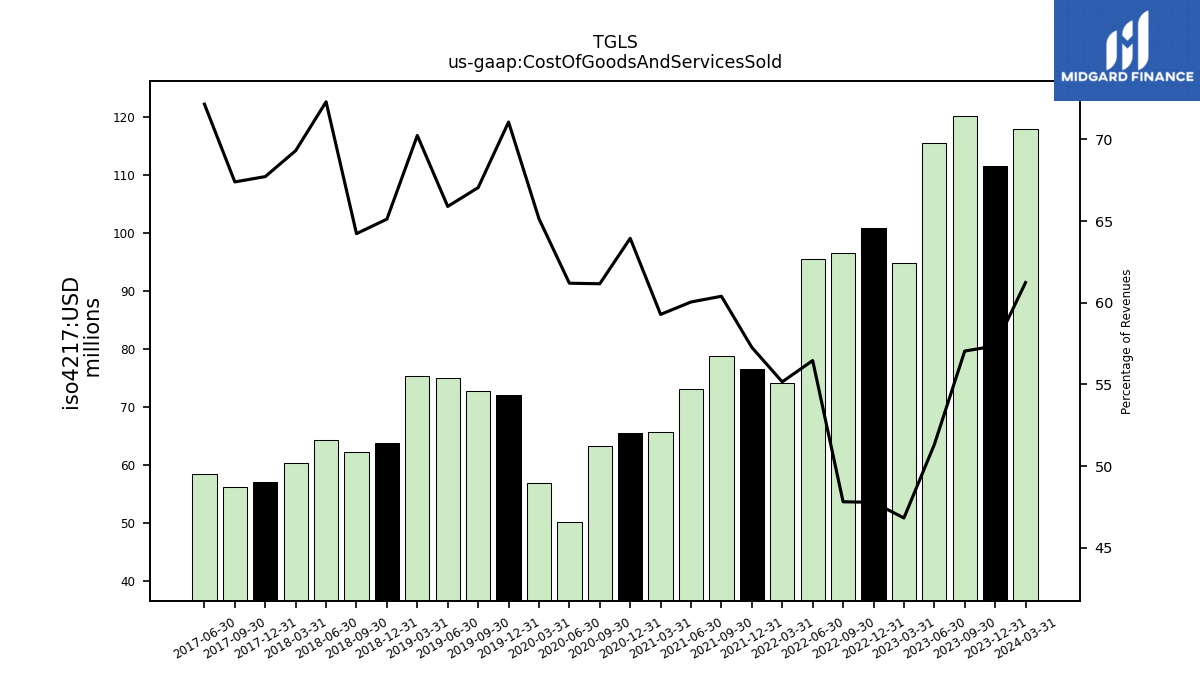
| Cost Of Goods And Services Sold | 111.62 | 120.22 | 115.61 | 94.88 | 100.88 | 96.48 | 95.49 | 74.22 | 76.61 | 78.77 | 73.09 | 65.74 | 65.46 | 63.19 | 50.15 | 56.87 | 72.05 | 72.73 | 75.05 | 75.28 | 63.73 | 62.30 | 64.33 | 60.41 | 57.08 | 56.20 | 58.43 | NA | NA | NA | NA | NA | NA | NA | NA | NA | NA | NA | NA | NA | NA | NA | NA | NA | |
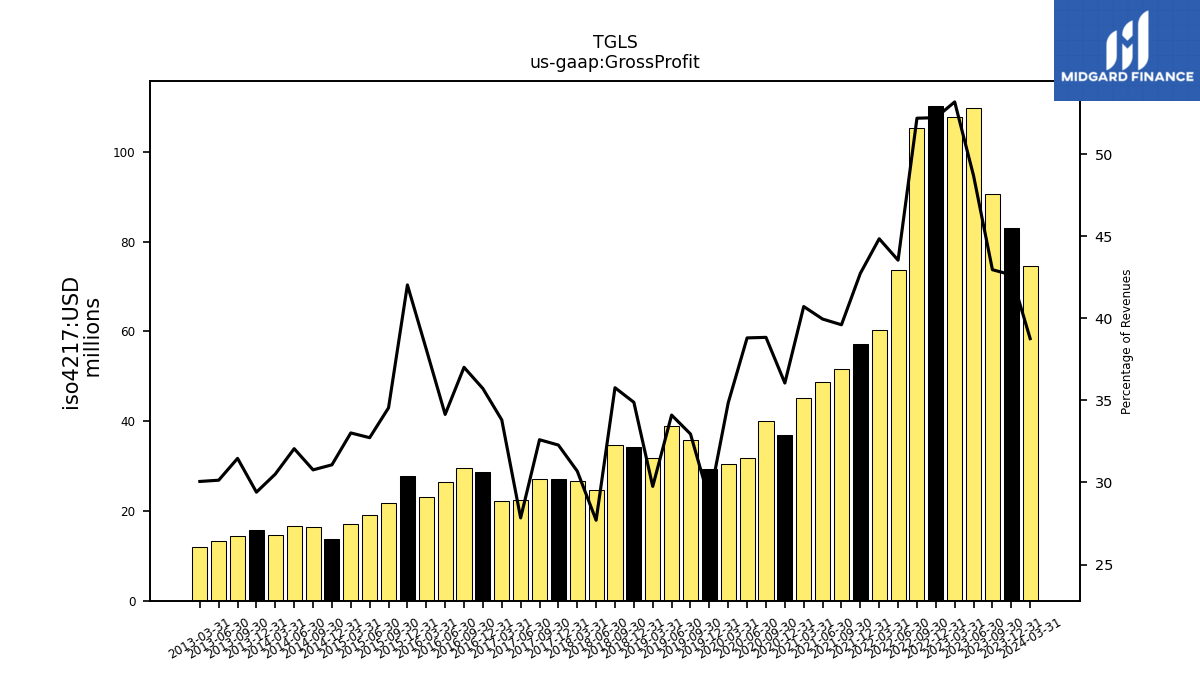
| Gross Profit | 82.98 | 90.53 | 109.67 | 107.75 | 110.24 | 105.30 | 73.63 | 60.33 | 57.17 | 51.65 | 48.63 | 45.14 | 36.91 | 40.12 | 31.80 | 30.43 | 29.34 | 35.74 | 38.84 | 31.89 | 34.13 | 34.69 | 24.64 | 26.75 | 27.20 | 27.18 | 22.54 | 22.25 | 28.67 | 29.62 | 26.46 | 23.21 | 27.68 | 21.73 | 19.00 | 17.18 | 13.74 | 16.45 | 16.65 | 14.60 | 15.83 | 14.32 | 13.36 | 11.91 | |
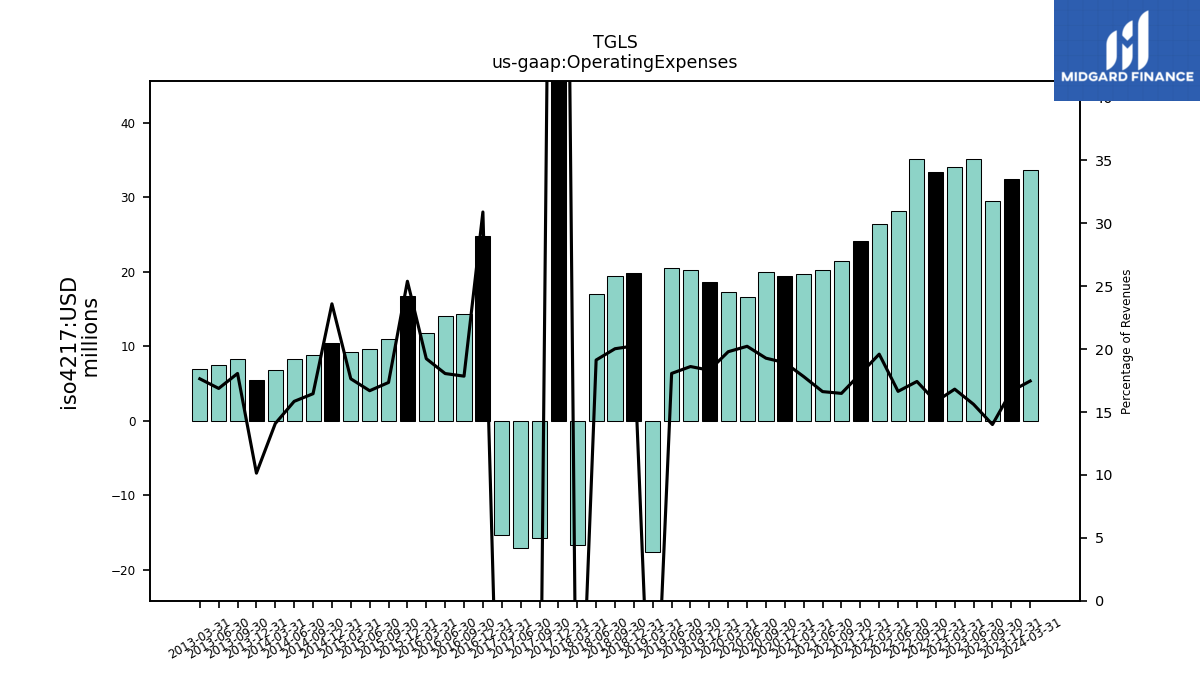
| Operating Expenses | 32.41 | 29.52 | 35.17 | 34.08 | 33.41 | 35.16 | 28.14 | 26.37 | 24.13 | 21.49 | 20.23 | 19.75 | 19.37 | 19.91 | 16.57 | 17.28 | 18.58 | 20.19 | 20.57 | -17.66 | 19.82 | 19.43 | 17.02 | -16.76 | 113.12 | -15.78 | -17.13 | -15.39 | 24.80 | 14.28 | 14.00 | 11.72 | 16.72 | 10.91 | 9.69 | 9.18 | 10.44 | 8.79 | 8.23 | 6.74 | 5.46 | 8.22 | 7.48 | 6.99 | |
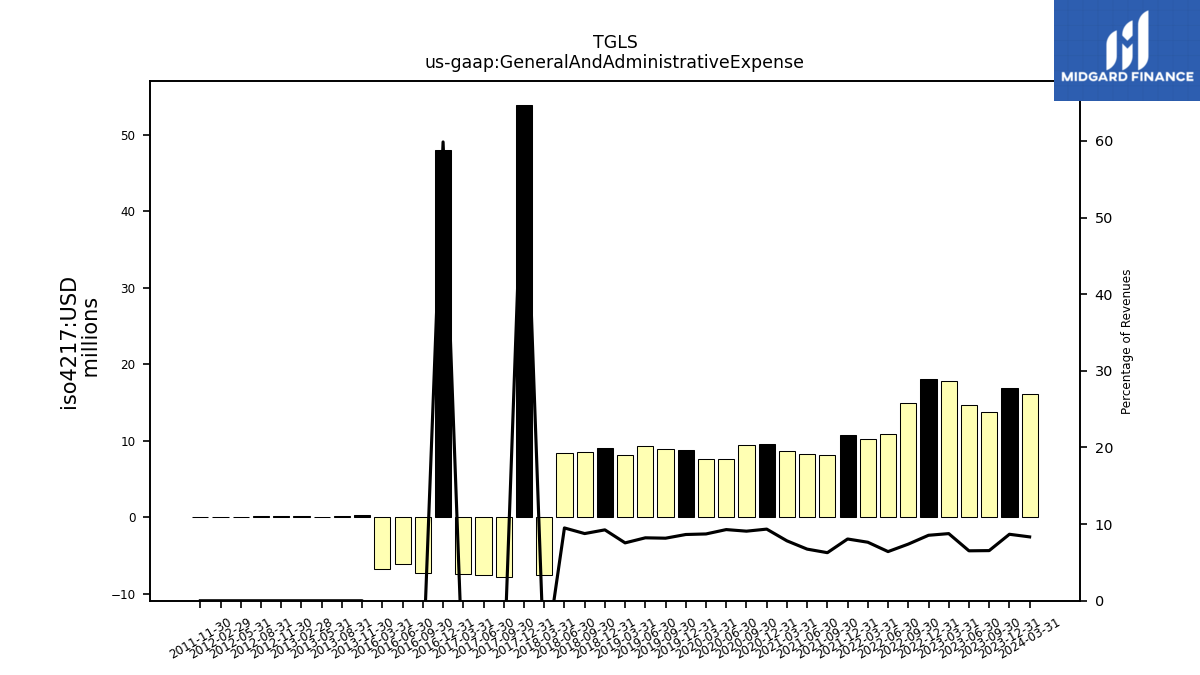
| General And Administrative Expense | 16.88 | 13.79 | 14.68 | 17.75 | 18.04 | 14.91 | 10.85 | 10.28 | 10.78 | 8.18 | 8.20 | 8.67 | 9.57 | 9.38 | 7.61 | 7.61 | 8.77 | 8.86 | 9.35 | 8.09 | 9.05 | 8.50 | 8.45 | -7.62 | 53.99 | -7.85 | -7.60 | -7.50 | 48.07 | -7.32 | -6.16 | -6.74 | NA | NA | NA | NA | NA | NA | NA | NA | NA | NA | NA | NA | |
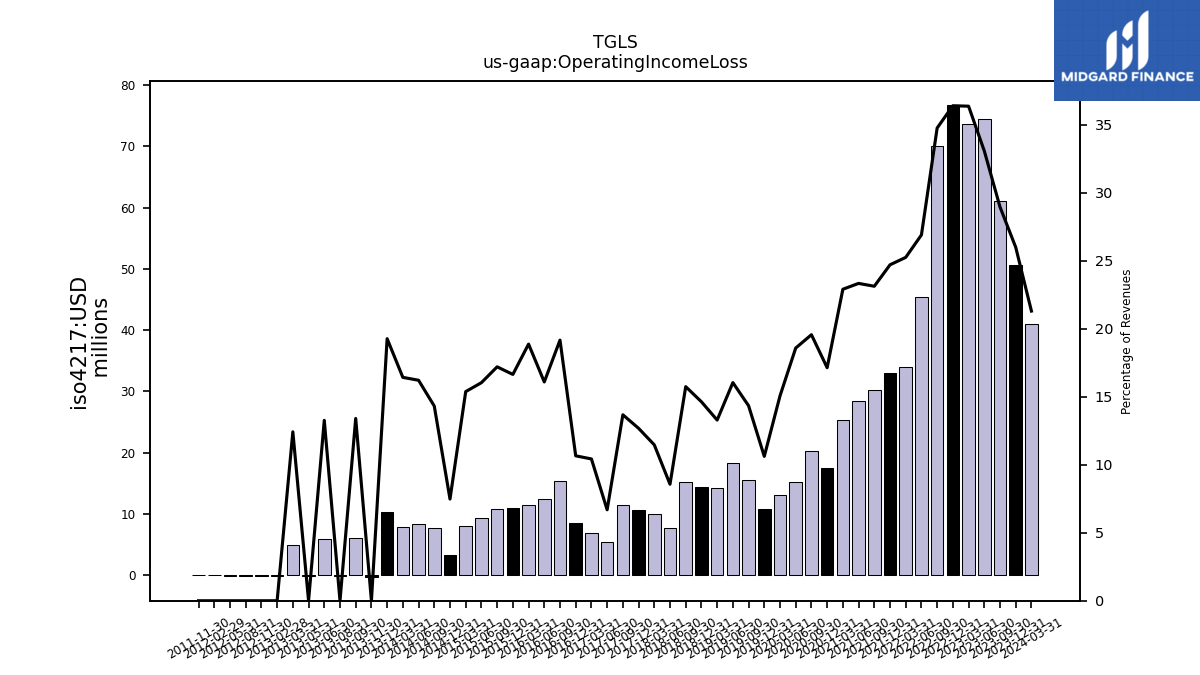
| Operating Income Loss | 50.57 | 61.01 | 74.50 | 73.68 | 76.83 | 70.13 | 45.49 | 33.97 | 33.04 | 30.15 | 28.40 | 25.39 | 17.54 | 20.21 | 15.22 | 13.15 | 10.76 | 15.55 | 18.26 | 14.24 | 14.32 | 15.27 | 7.62 | 9.99 | 10.69 | 11.40 | 5.42 | 6.86 | 8.55 | 15.33 | 12.47 | 11.49 | 10.96 | 10.82 | 9.31 | 8.00 | 3.31 | 7.65 | 8.42 | 7.86 | 10.37 | 6.10 | 5.88 | 4.92 | |
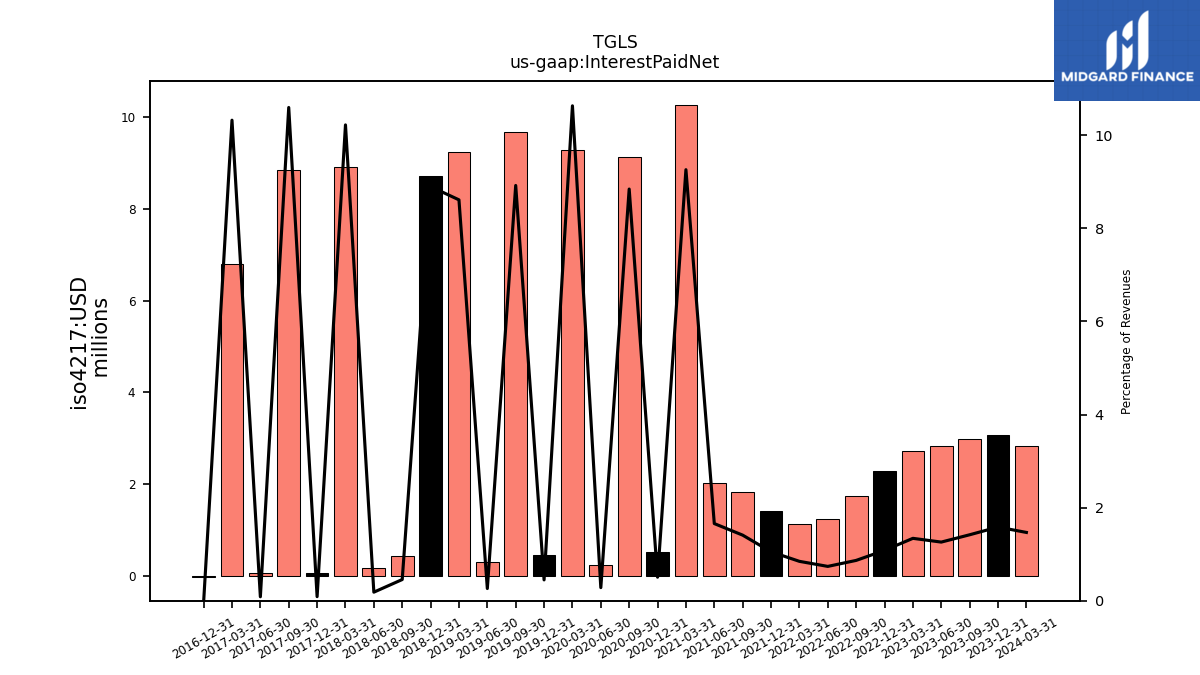
| Interest Paid Net | 3.08 | 2.99 | 2.84 | 2.72 | 2.29 | 1.75 | 1.25 | 1.14 | 1.41 | 1.84 | 2.02 | 10.27 | 0.52 | 9.14 | 0.23 | 9.28 | 0.45 | 9.68 | 0.30 | 9.23 | 8.71 | 0.44 | 0.16 | 8.91 | 0.07 | 8.84 | 0.07 | 6.79 | -0.02 | NA | NA | NA | NA | NA | NA | NA | NA | NA | NA | NA | NA | NA | NA | NA | |
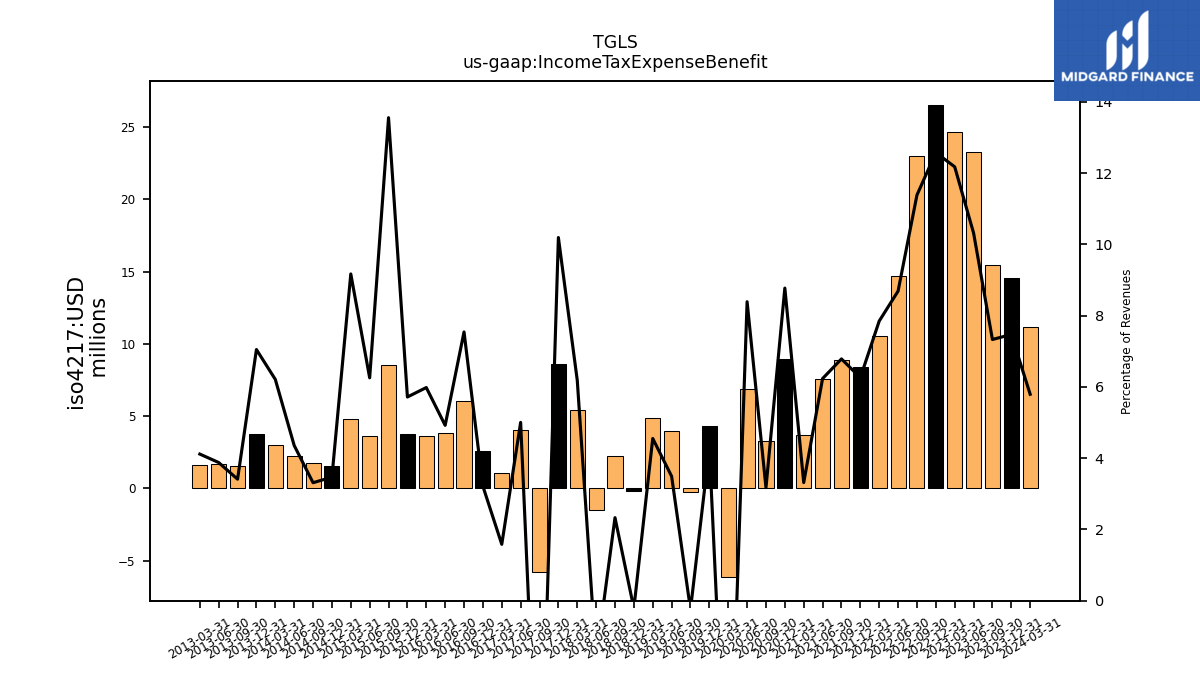
| Income Tax Expense Benefit | 14.54 | 15.45 | 23.25 | 24.67 | 26.54 | 22.97 | 14.69 | 10.56 | 8.37 | 8.85 | 7.59 | 3.68 | 8.98 | 3.28 | 6.88 | -6.13 | 4.34 | -0.27 | 3.98 | 4.88 | -0.21 | 2.26 | -1.47 | 5.39 | 8.59 | -5.81 | 4.05 | 1.04 | 2.58 | 6.04 | 3.81 | 3.64 | 3.76 | 8.52 | 3.63 | 4.77 | 1.53 | 1.77 | 2.26 | 2.97 | 3.79 | 1.55 | 1.72 | 1.63 | |
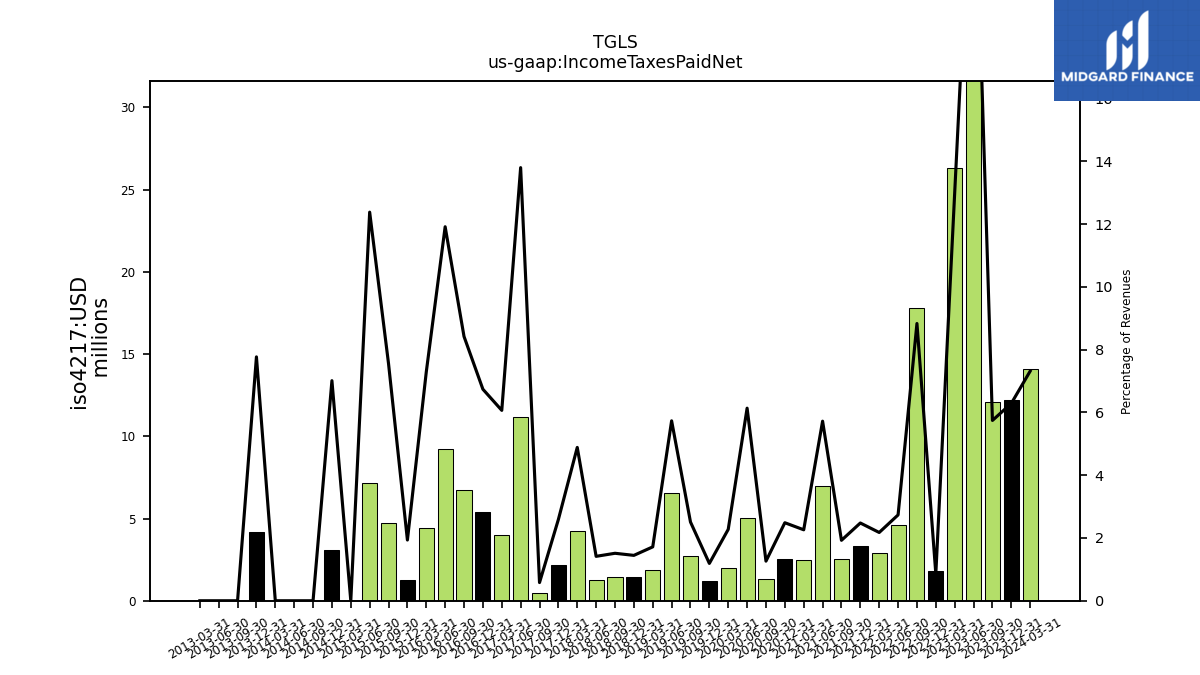
| Income Taxes Paid Net | 12.24 | 12.11 | 56.47 | 26.34 | 1.81 | 17.82 | 4.62 | 2.93 | 3.31 | 2.51 | 6.96 | 2.51 | 2.54 | 1.30 | 5.03 | 1.99 | 1.21 | 2.72 | 6.53 | 1.84 | 1.42 | 1.47 | 1.26 | 4.26 | 2.18 | 0.48 | 11.18 | 3.99 | 5.41 | 6.74 | 9.24 | 4.44 | 1.27 | 4.75 | 7.19 | 0.00 | 3.10 | 0.00 | 0.00 | 0.00 | 4.18 | 0.00 | 0.00 | 0.00 | |
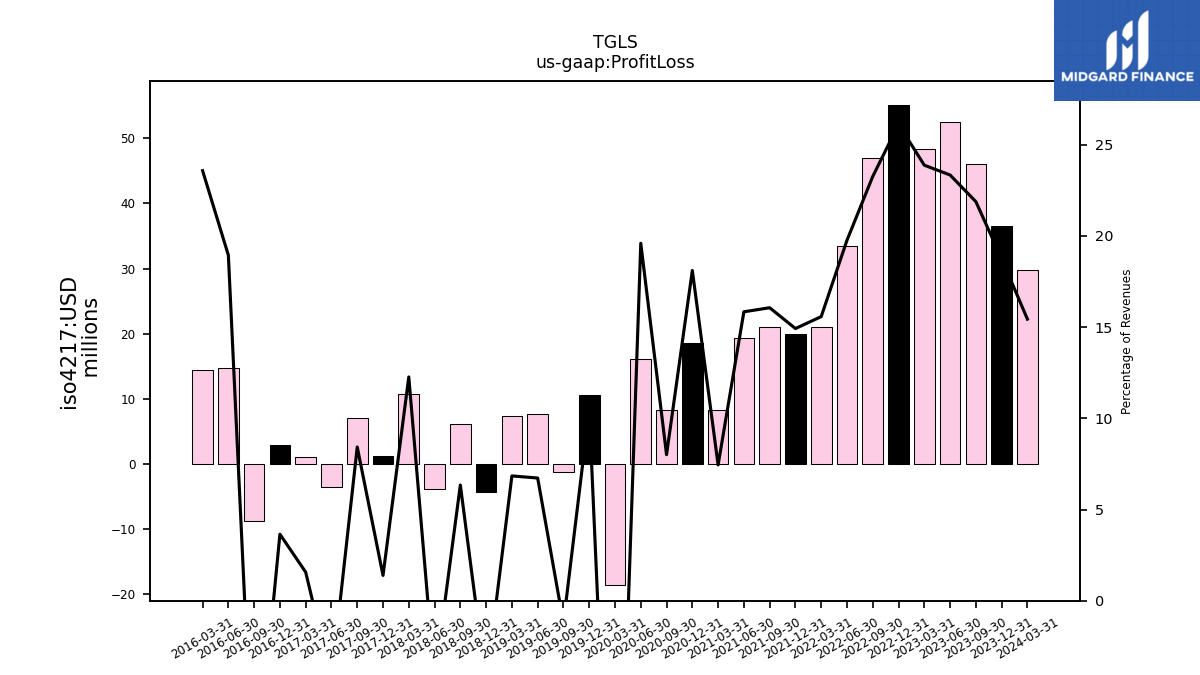
| Profit Loss | 36.48 | 46.09 | 52.56 | 48.37 | 55.12 | 46.92 | 33.41 | 20.95 | 19.96 | 20.94 | 19.27 | 8.25 | 18.53 | 8.27 | 16.05 | -18.67 | 10.60 | -1.32 | 7.66 | 7.33 | -4.42 | 6.15 | -3.87 | 10.69 | 1.17 | 7.03 | -3.50 | 1.03 | 2.93 | -8.78 | 14.68 | 14.36 | NA | NA | NA | NA | NA | NA | NA | NA | NA | NA | NA | NA | |
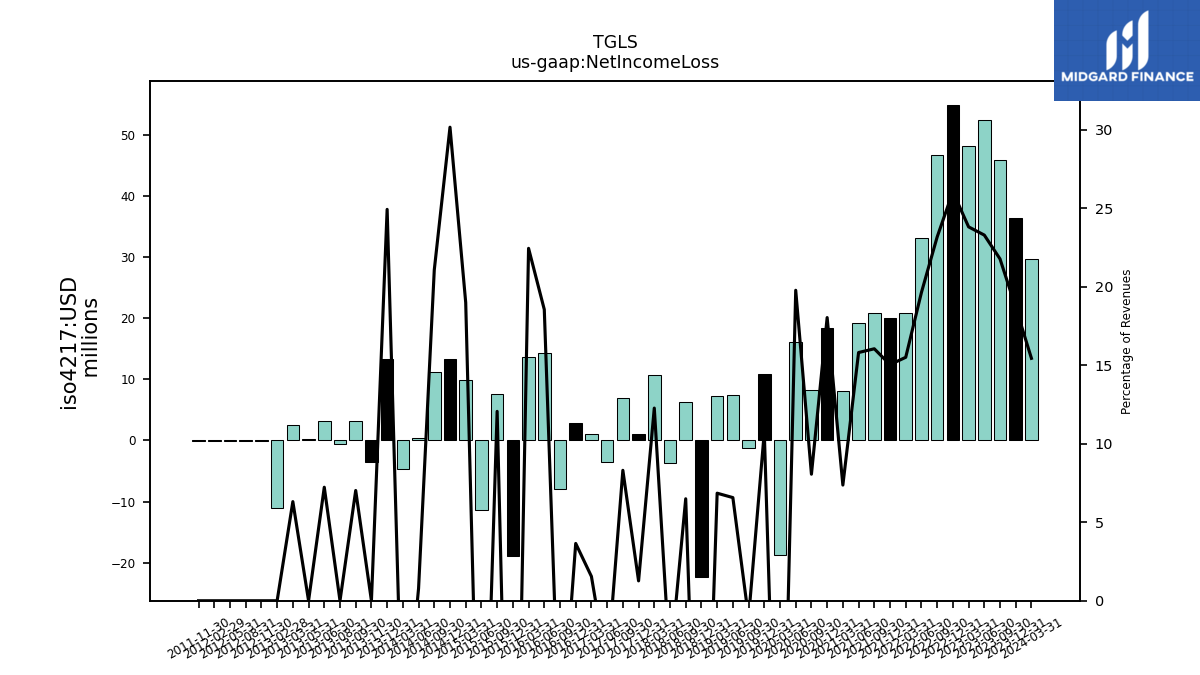
| Net Income Loss | 36.34 | 45.86 | 52.45 | 48.23 | 54.97 | 46.73 | 33.19 | 20.85 | 20.11 | 20.92 | 19.23 | 8.17 | 18.46 | 8.32 | 16.20 | -18.77 | 10.89 | -1.18 | 7.48 | 7.34 | -22.36 | 6.30 | -3.66 | 10.69 | 1.07 | 6.92 | -3.56 | 1.02 | 2.93 | -7.92 | 14.37 | 13.66 | -18.88 | 7.58 | -11.35 | 9.88 | 13.33 | 11.26 | 0.41 | -4.68 | 13.41 | 3.19 | 3.20 | 2.50 | |
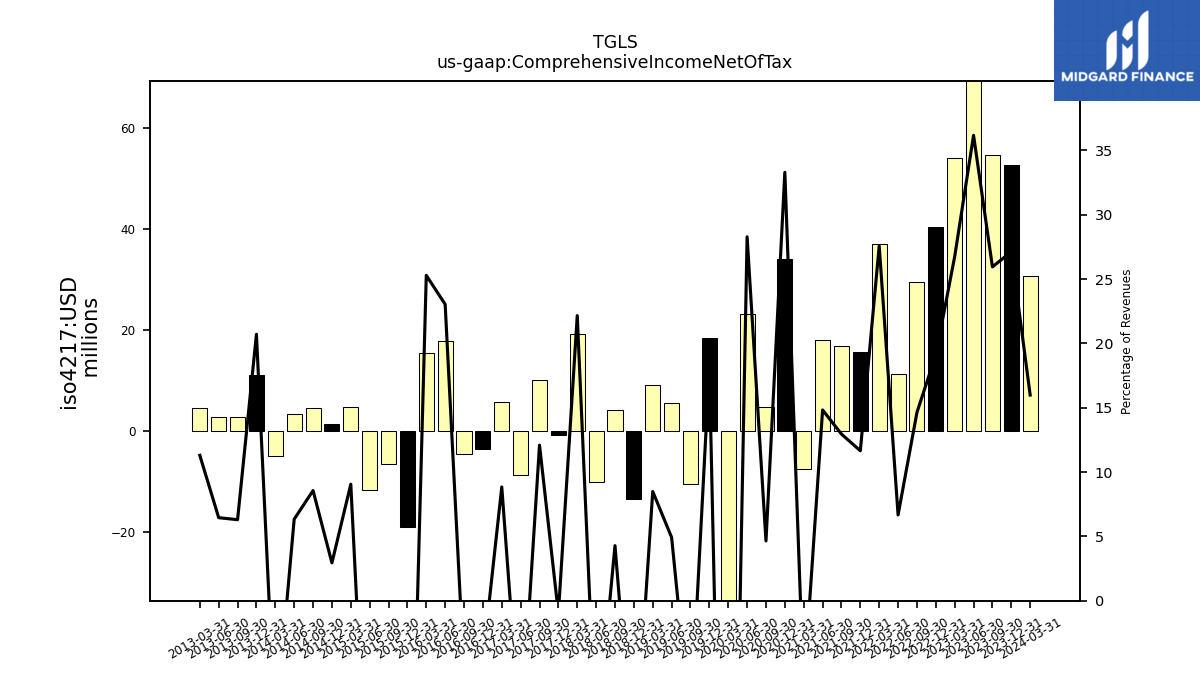
| Comprehensive Income Net Of Tax | 52.80 | 54.69 | 81.51 | 54.21 | 40.38 | 29.54 | 11.28 | 37.11 | 15.60 | 16.90 | 18.05 | -7.63 | 34.09 | 4.80 | 23.18 | -42.12 | 18.40 | -10.60 | 5.61 | 9.10 | -13.39 | 4.15 | -10.01 | 19.32 | -0.82 | 10.09 | -8.81 | 5.82 | -3.65 | -4.46 | 17.86 | 15.41 | -18.93 | -6.53 | -11.76 | 4.71 | 1.30 | 4.58 | 3.29 | -4.86 | 11.15 | 2.87 | 2.86 | 4.48 |
| 2023-12-31 | 2023-09-30 | 2023-06-30 | 2023-03-31 | 2022-12-31 | 2022-09-30 | 2022-06-30 | 2022-03-31 | 2021-12-31 | 2021-09-30 | 2021-06-30 | 2021-03-31 | 2020-12-31 | 2020-09-30 | 2020-06-30 | 2020-03-31 | 2019-12-31 | 2019-09-30 | 2019-06-30 | 2019-03-31 | 2018-12-31 | 2018-09-30 | 2018-06-30 | 2018-03-31 | 2017-12-31 | 2017-09-30 | 2017-06-30 | 2017-03-31 | 2016-12-31 | 2016-09-30 | 2016-06-30 | 2016-03-31 | 2015-12-31 | 2015-09-30 | 2015-06-30 | 2015-03-31 | 2014-12-31 | 2014-09-30 | 2014-06-30 | 2014-03-31 | 2013-12-31 | 2013-09-30 | 2013-06-30 | 2013-03-31 | ||
|---|---|---|---|---|---|---|---|---|---|---|---|---|---|---|---|---|---|---|---|---|---|---|---|---|---|---|---|---|---|---|---|---|---|---|---|---|---|---|---|---|---|---|---|---|---|
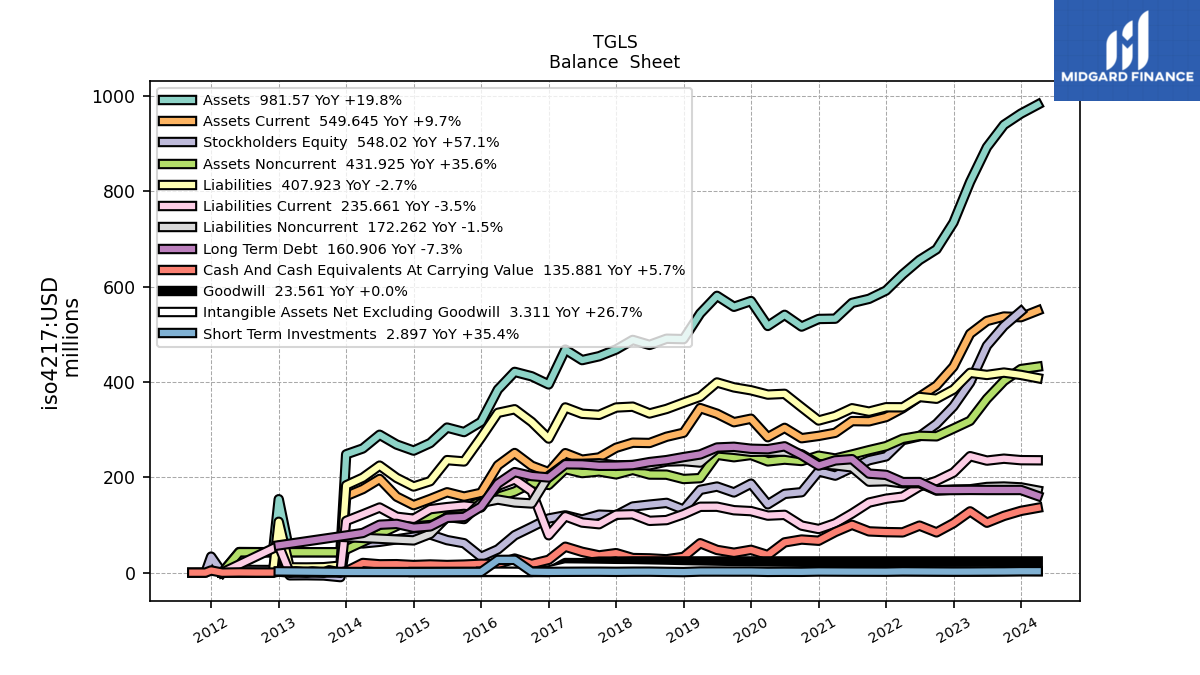
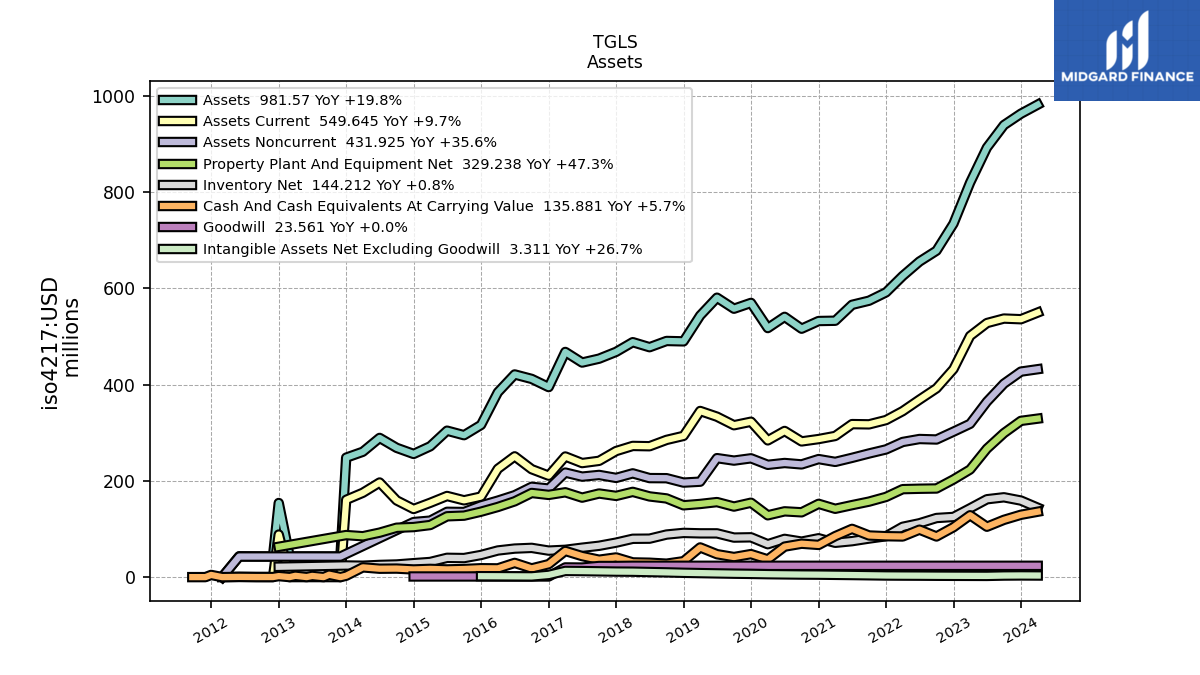
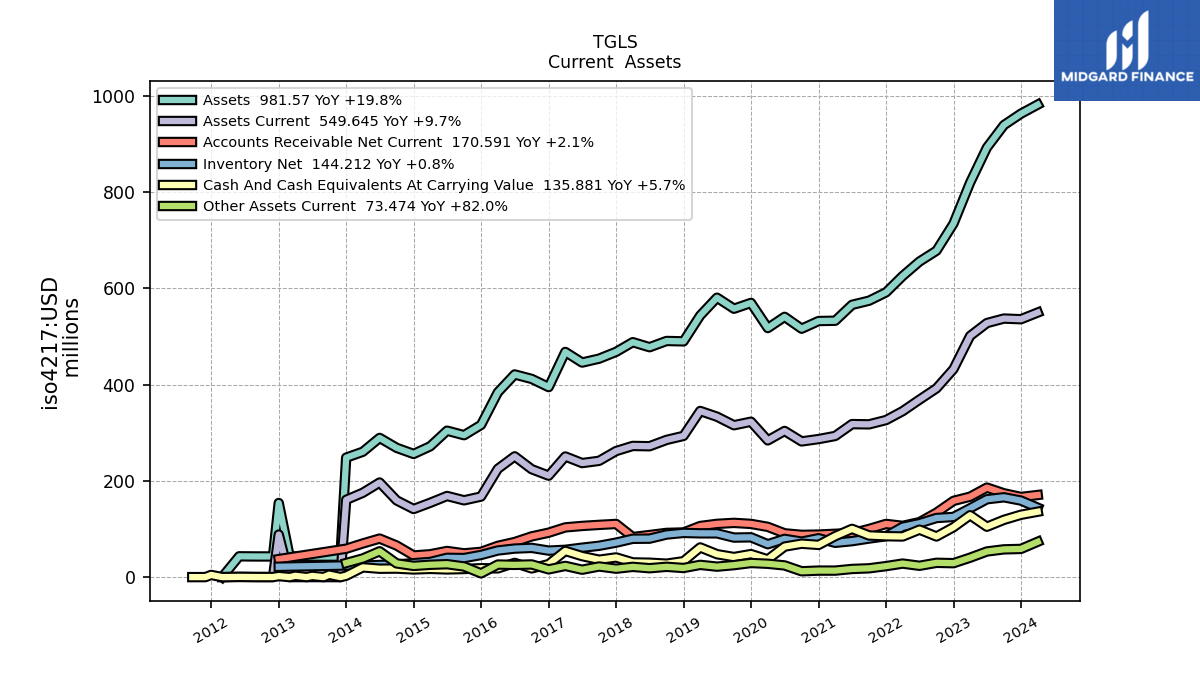
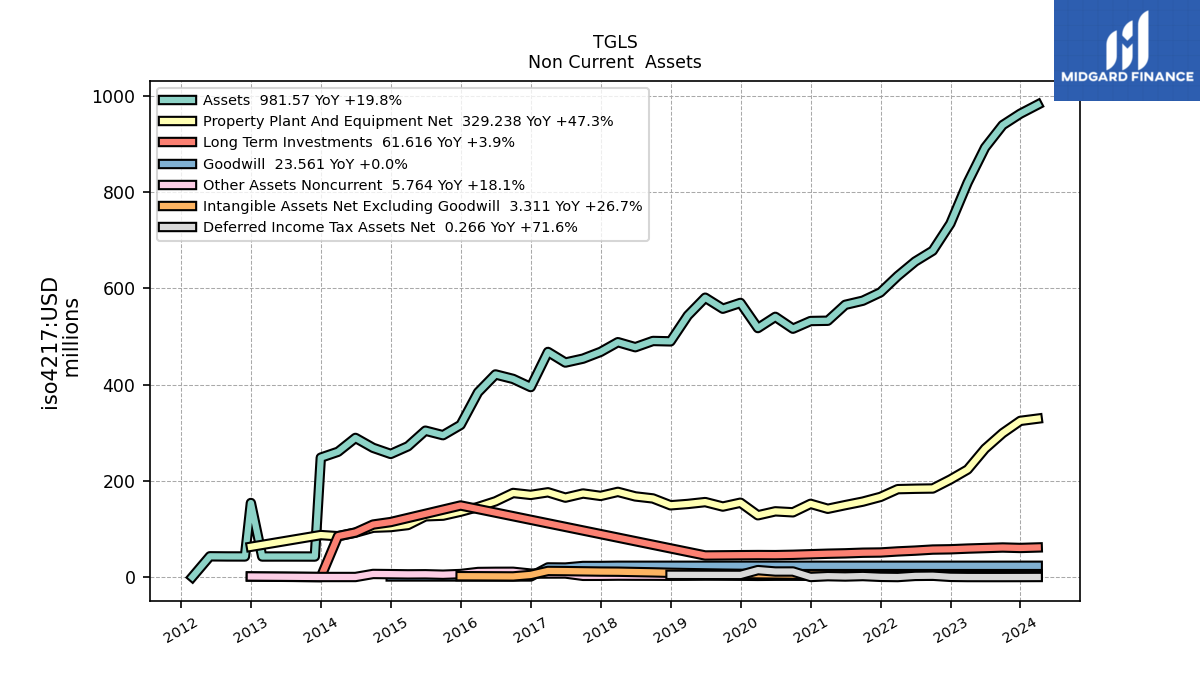
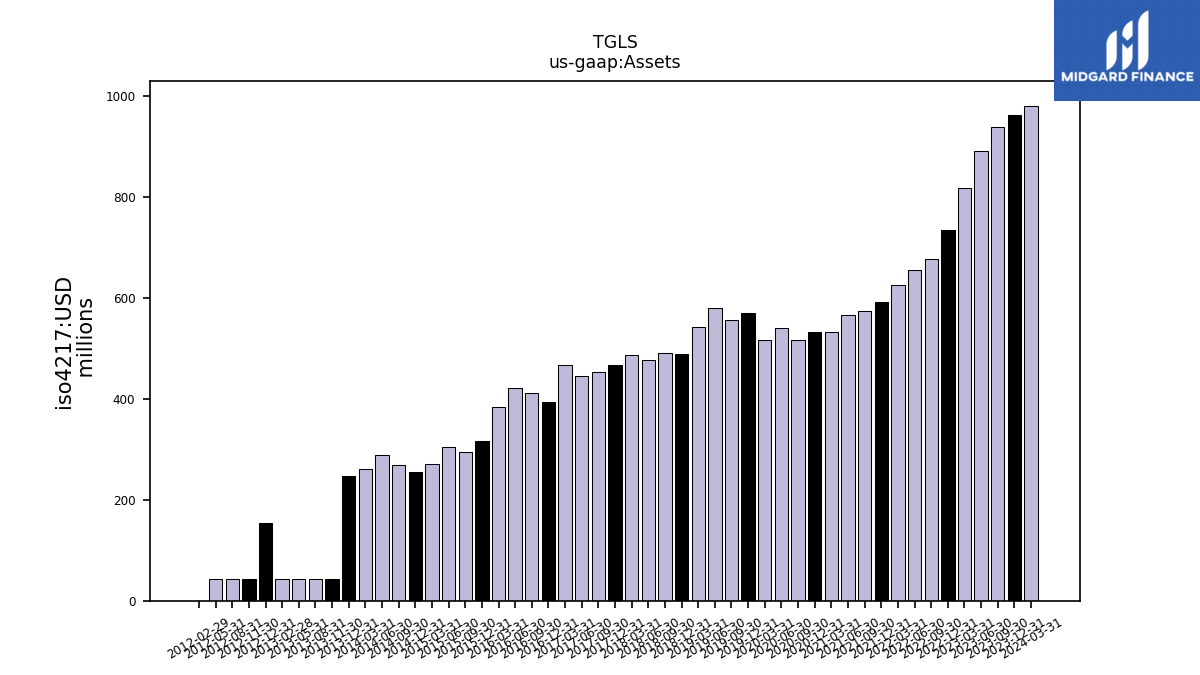
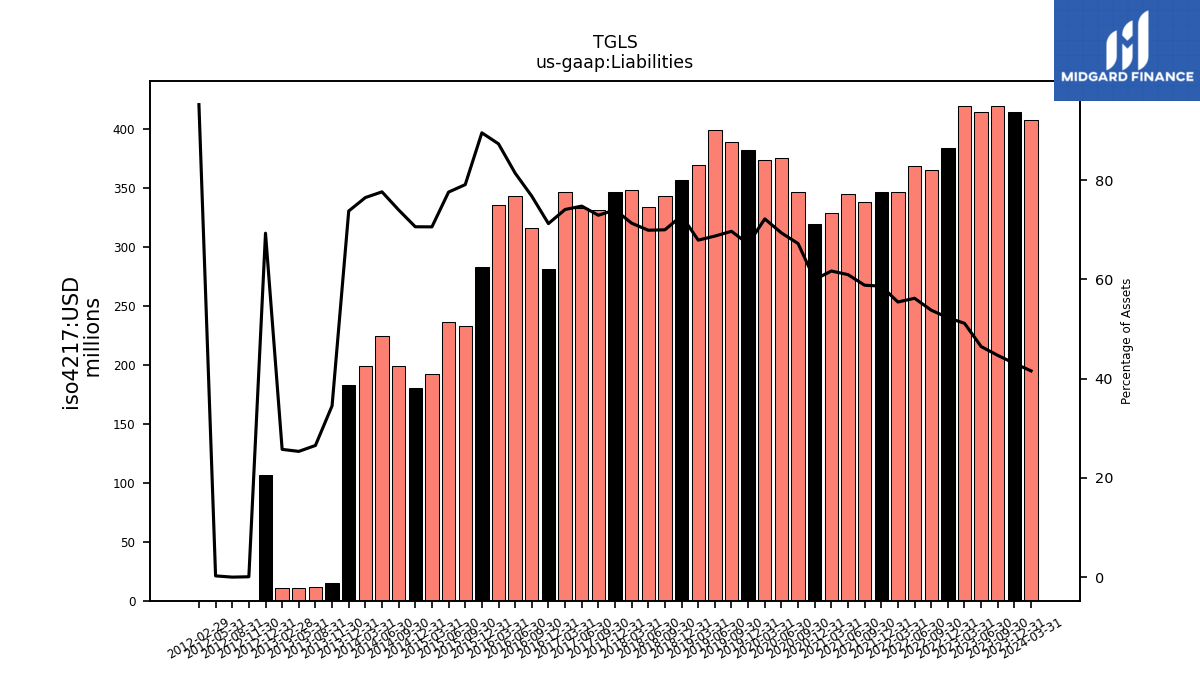
| Assets | 962.72 | 939.06 | 892.27 | 819.46 | 734.31 | 678.08 | 655.61 | 625.57 | 591.56 | 574.24 | 565.68 | 532.61 | 532.02 | 516.07 | 540.74 | 517.36 | 569.67 | 557.59 | 580.49 | 543.42 | 489.77 | 490.57 | 477.64 | 488.10 | 468.00 | 453.86 | 445.73 | 467.82 | 394.73 | 411.77 | 421.05 | 383.90 | 316.20 | 294.83 | 304.23 | 271.80 | 255.89 | 268.60 | 289.22 | 260.40 | 248.21 | NA | NA | NA | |
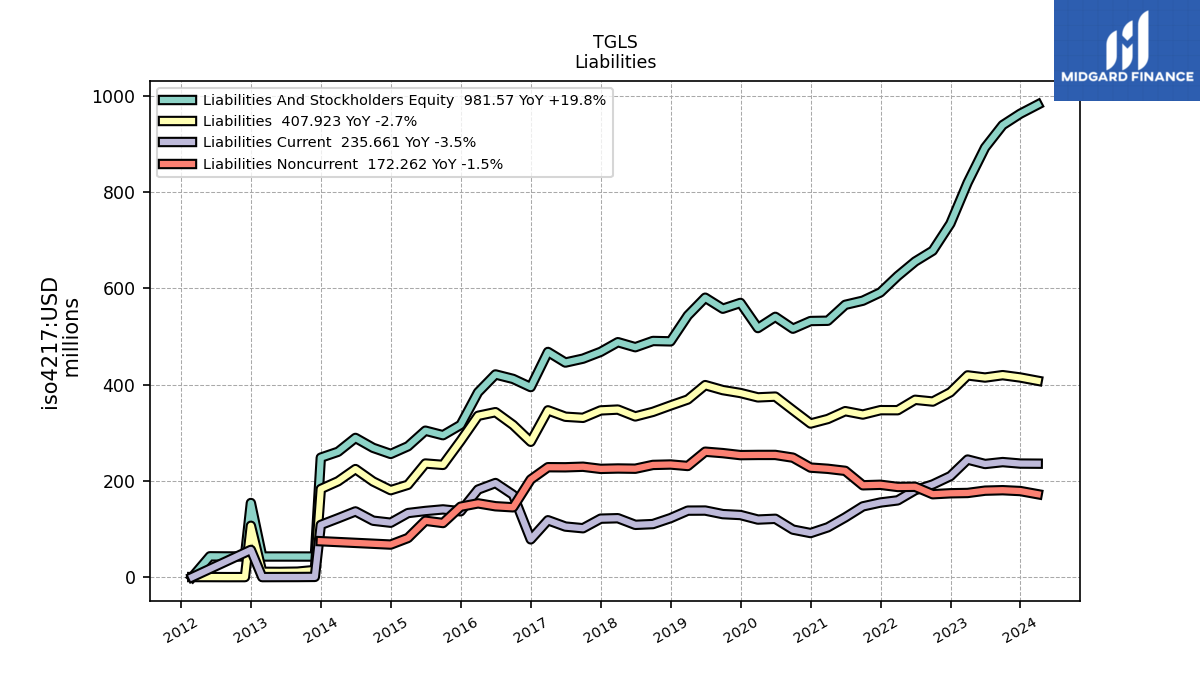
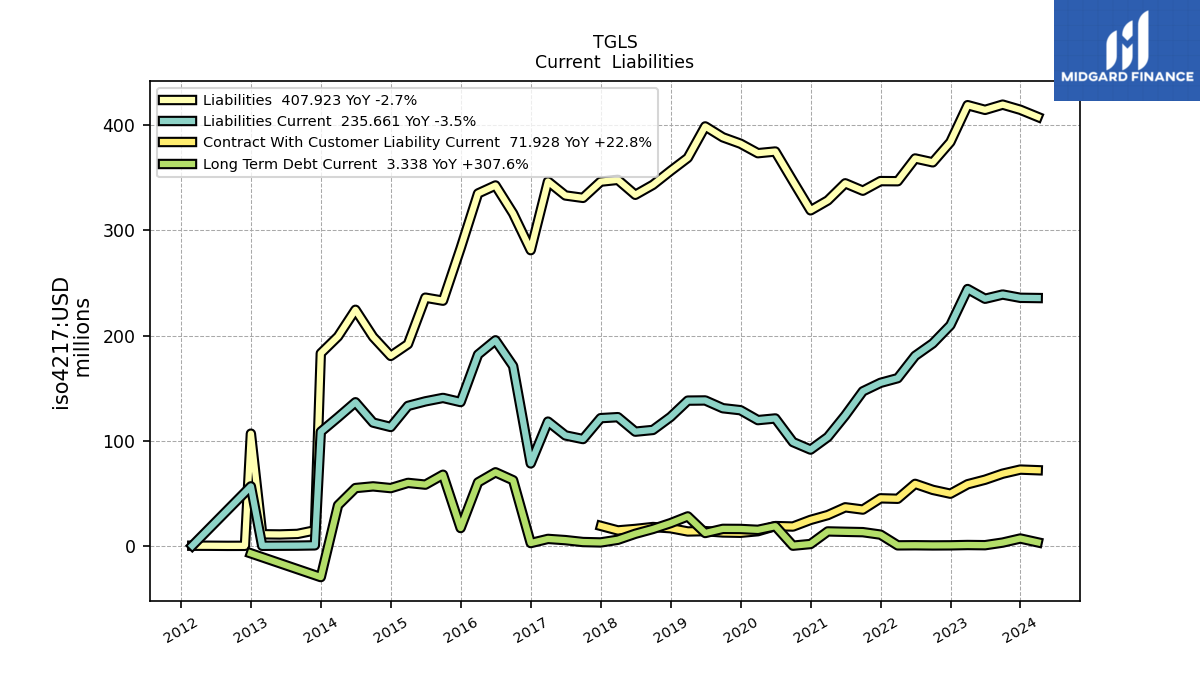
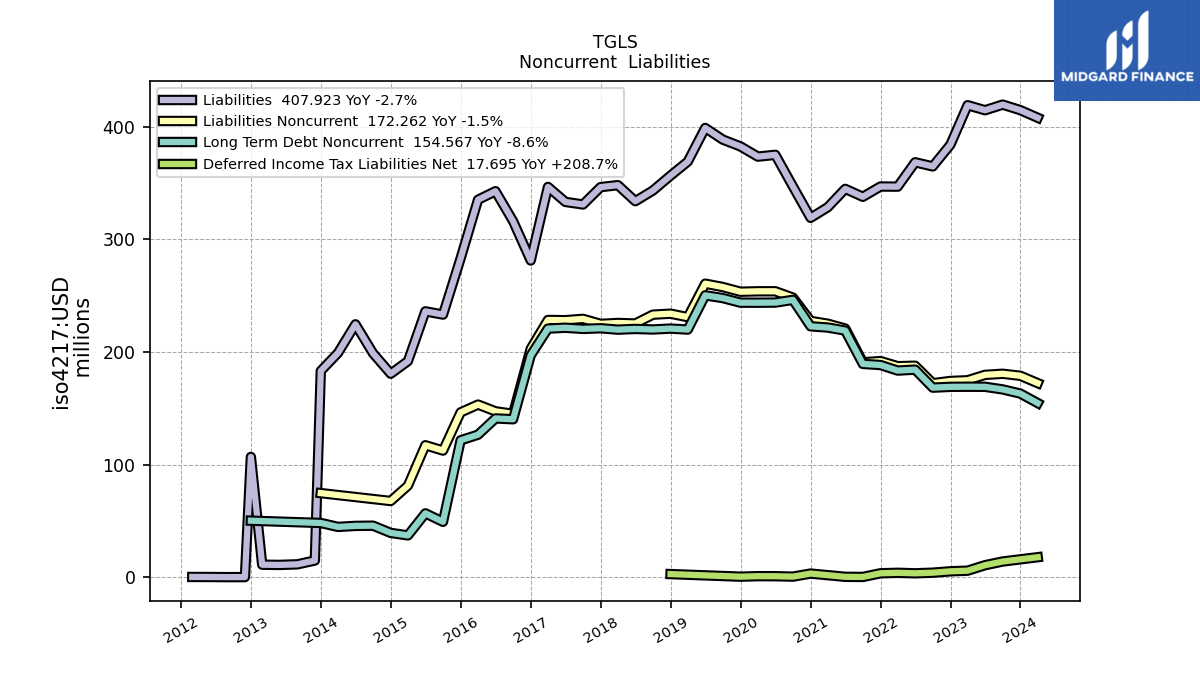
| Liabilities | 414.70 | 419.59 | 414.61 | 419.08 | 383.98 | 364.71 | 368.40 | 346.76 | 346.87 | 337.74 | 344.78 | 328.49 | 319.06 | 346.87 | 375.01 | 373.41 | 382.46 | 388.51 | 398.89 | 368.99 | 356.55 | 343.31 | 333.82 | 348.09 | 346.33 | 330.91 | 333.20 | 346.52 | 281.17 | 316.06 | 342.72 | 335.13 | 283.06 | 233.14 | 236.02 | 191.82 | 180.63 | 198.72 | 224.51 | 199.14 | 183.09 | NA | NA | NA | |
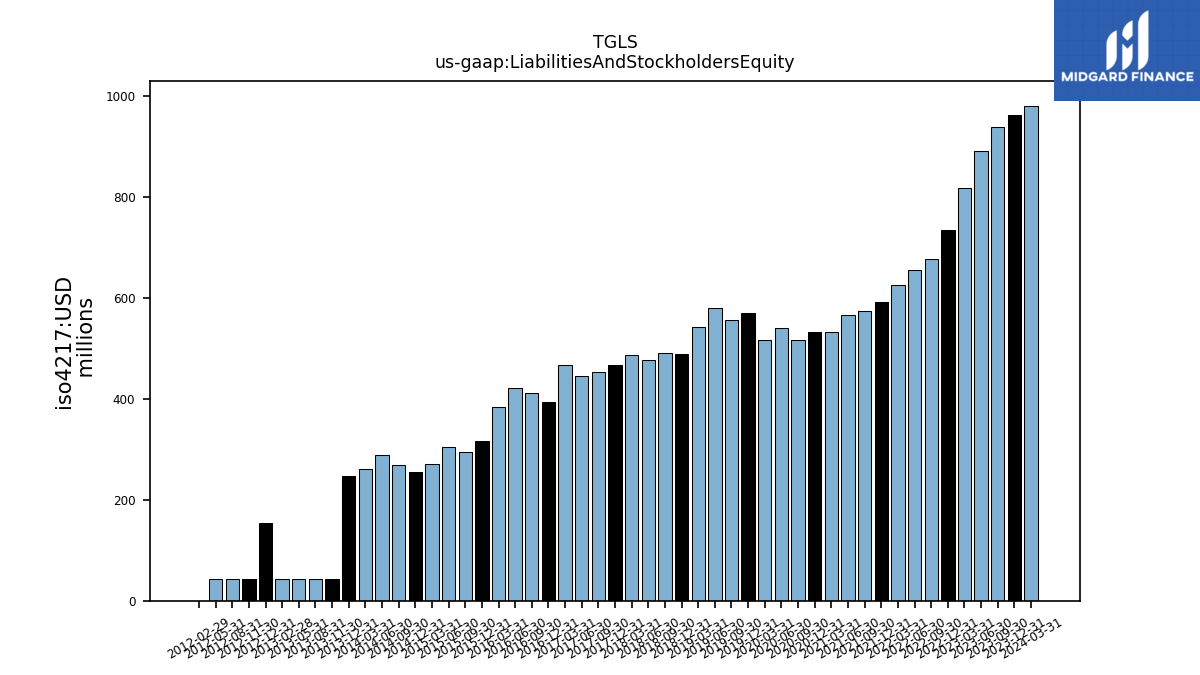
| Liabilities And Stockholders Equity | 962.72 | 939.06 | 892.27 | 819.46 | 734.31 | 678.08 | 655.61 | 625.57 | 591.56 | 574.24 | 565.68 | 532.61 | 532.02 | 516.07 | 540.74 | 517.36 | 569.67 | 557.59 | 580.49 | 543.42 | 489.77 | 490.57 | 477.64 | 488.10 | 468.00 | 453.86 | 445.73 | 467.82 | 394.73 | 411.77 | 421.05 | 383.90 | 316.20 | 294.83 | 304.23 | 271.80 | 255.89 | 268.60 | 289.22 | 260.40 | 248.21 | NA | NA | NA | |
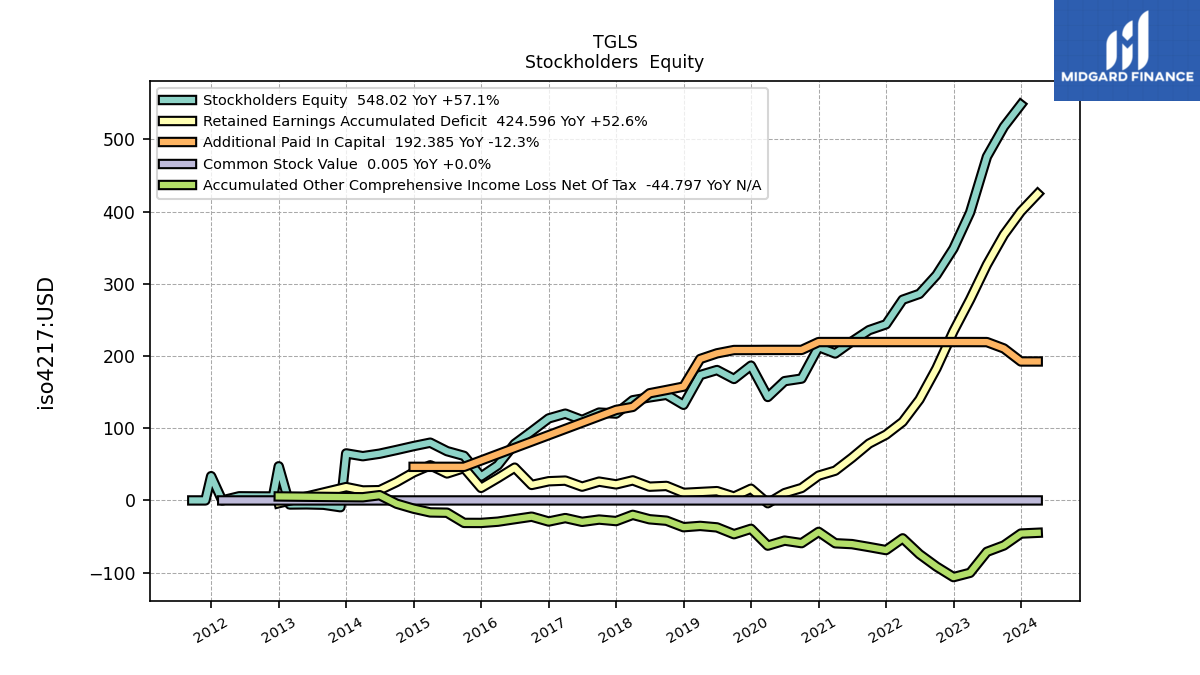
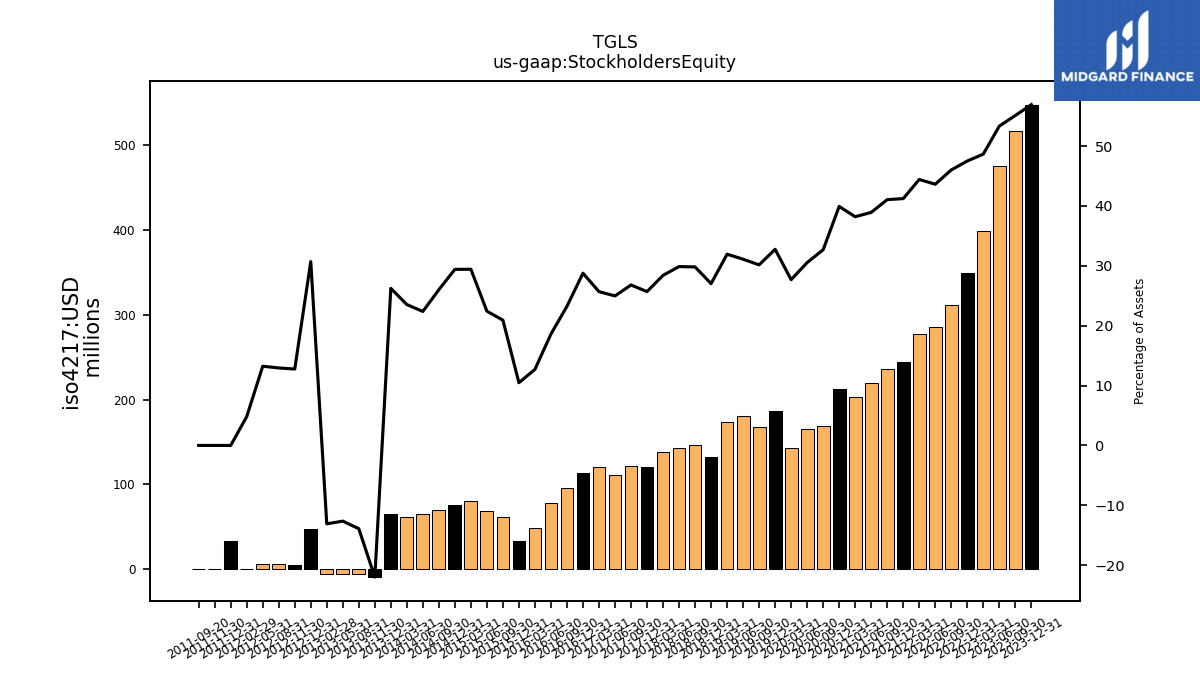
| Stockholders Equity | 548.02 | 517.47 | 475.90 | 398.74 | 348.82 | 312.02 | 286.06 | 277.87 | 243.86 | 235.77 | 220.18 | 203.44 | 212.38 | 168.70 | 165.16 | 143.25 | 186.60 | 168.18 | 180.56 | 173.57 | 132.36 | 146.27 | 142.69 | 138.67 | 120.25 | 121.64 | 111.32 | 120.15 | 113.56 | 95.72 | 78.33 | 48.77 | 33.14 | 61.69 | 68.22 | 79.97 | 75.26 | 69.88 | 64.72 | 61.26 | 65.12 | NA | NA | NA |
| 2023-12-31 | 2023-09-30 | 2023-06-30 | 2023-03-31 | 2022-12-31 | 2022-09-30 | 2022-06-30 | 2022-03-31 | 2021-12-31 | 2021-09-30 | 2021-06-30 | 2021-03-31 | 2020-12-31 | 2020-09-30 | 2020-06-30 | 2020-03-31 | 2019-12-31 | 2019-09-30 | 2019-06-30 | 2019-03-31 | 2018-12-31 | 2018-09-30 | 2018-06-30 | 2018-03-31 | 2017-12-31 | 2017-09-30 | 2017-06-30 | 2017-03-31 | 2016-12-31 | 2016-09-30 | 2016-06-30 | 2016-03-31 | 2015-12-31 | 2015-09-30 | 2015-06-30 | 2015-03-31 | 2014-12-31 | 2014-09-30 | 2014-06-30 | 2014-03-31 | 2013-12-31 | 2013-09-30 | 2013-06-30 | 2013-03-31 | ||
|---|---|---|---|---|---|---|---|---|---|---|---|---|---|---|---|---|---|---|---|---|---|---|---|---|---|---|---|---|---|---|---|---|---|---|---|---|---|---|---|---|---|---|---|---|---|
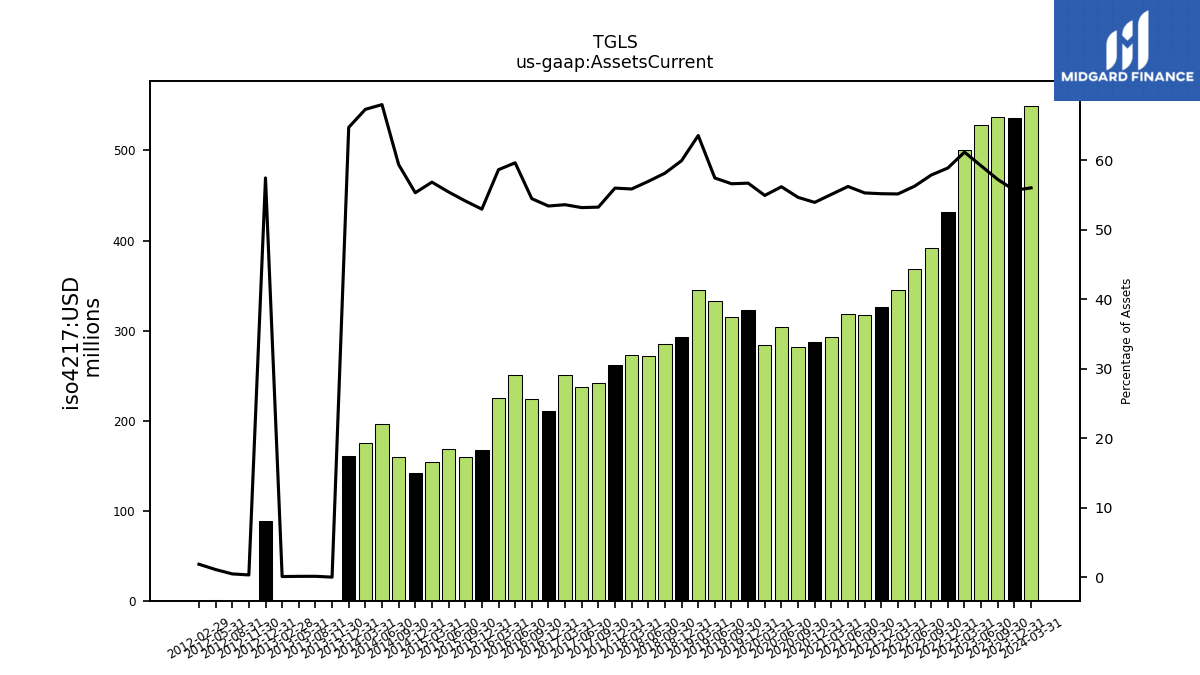
| Assets Current | 535.76 | 537.15 | 527.81 | 500.99 | 432.13 | 392.18 | 368.69 | 344.81 | 326.27 | 317.37 | 317.88 | 293.23 | 286.80 | 281.93 | 303.66 | 284.07 | 322.85 | 315.52 | 333.29 | 345.16 | 293.40 | 285.06 | 271.91 | 272.53 | 261.90 | 241.57 | 236.94 | 250.62 | 210.74 | 224.19 | 250.94 | 224.99 | 167.38 | 159.56 | 168.56 | 154.43 | 141.50 | 159.40 | 196.56 | 175.21 | 160.57 | NA | NA | NA | |
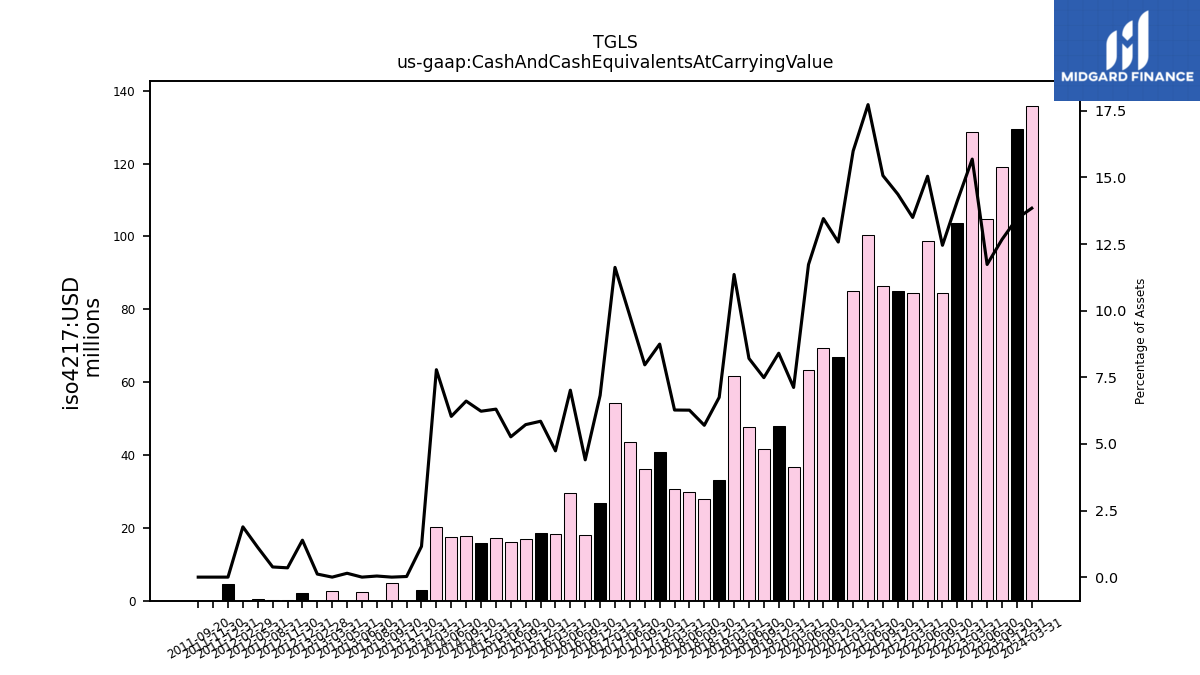
| Cash And Cash Equivalents At Carrying Value | 129.51 | 118.97 | 104.69 | 128.54 | 103.67 | 84.43 | 98.62 | 84.43 | 85.01 | 86.52 | 100.30 | 85.16 | 66.90 | 69.43 | 63.42 | 36.82 | 47.86 | 41.74 | 47.64 | 61.71 | 33.04 | 27.95 | 29.93 | 30.61 | 40.92 | 36.15 | 43.68 | 54.37 | 26.92 | 18.12 | 29.54 | 18.19 | 18.50 | 16.87 | 16.02 | 17.13 | 15.93 | 17.74 | 17.44 | 20.27 | 2.87 | 4.98 | 2.48 | 2.73 | |
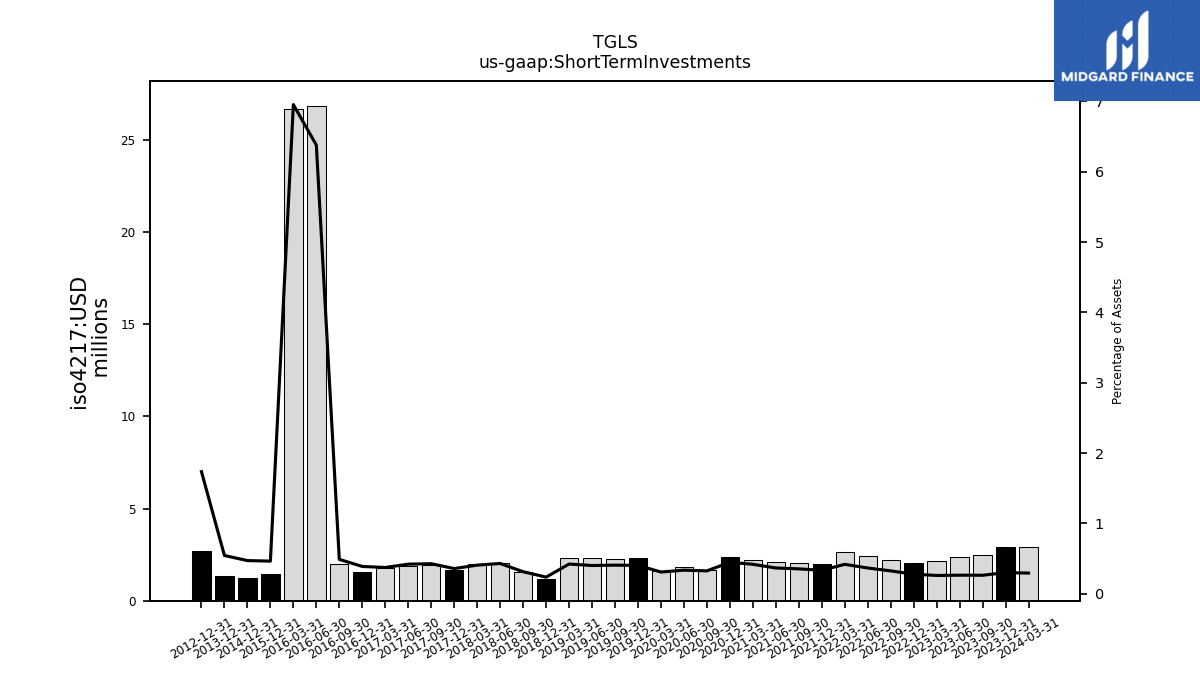
| Short Term Investments | 2.91 | 2.48 | 2.37 | 2.14 | 2.05 | 2.21 | 2.41 | 2.62 | 1.98 | 2.04 | 2.08 | 2.23 | 2.39 | 1.68 | 1.82 | 1.60 | 2.30 | 2.27 | 2.34 | 2.30 | 1.16 | 1.54 | 2.06 | 1.99 | 1.68 | 1.94 | 1.88 | 1.75 | 1.54 | 2.02 | 26.86 | 26.70 | 1.47 | NA | NA | NA | 1.21 | NA | NA | NA | 1.35 | NA | NA | NA | |
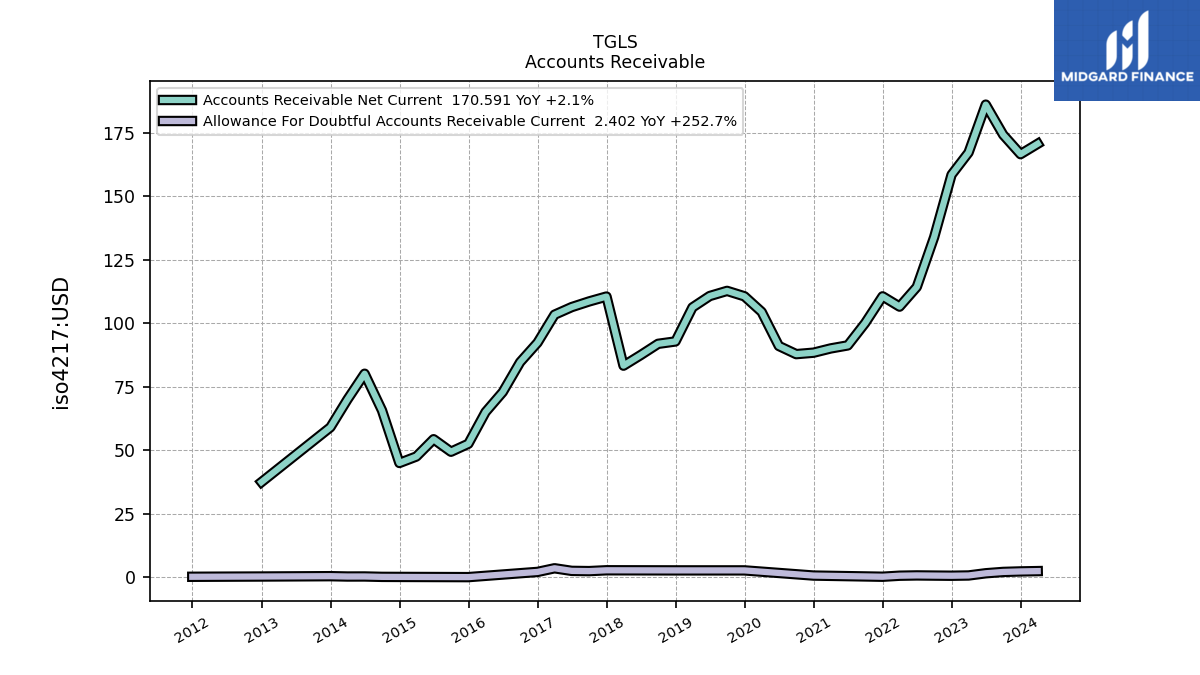
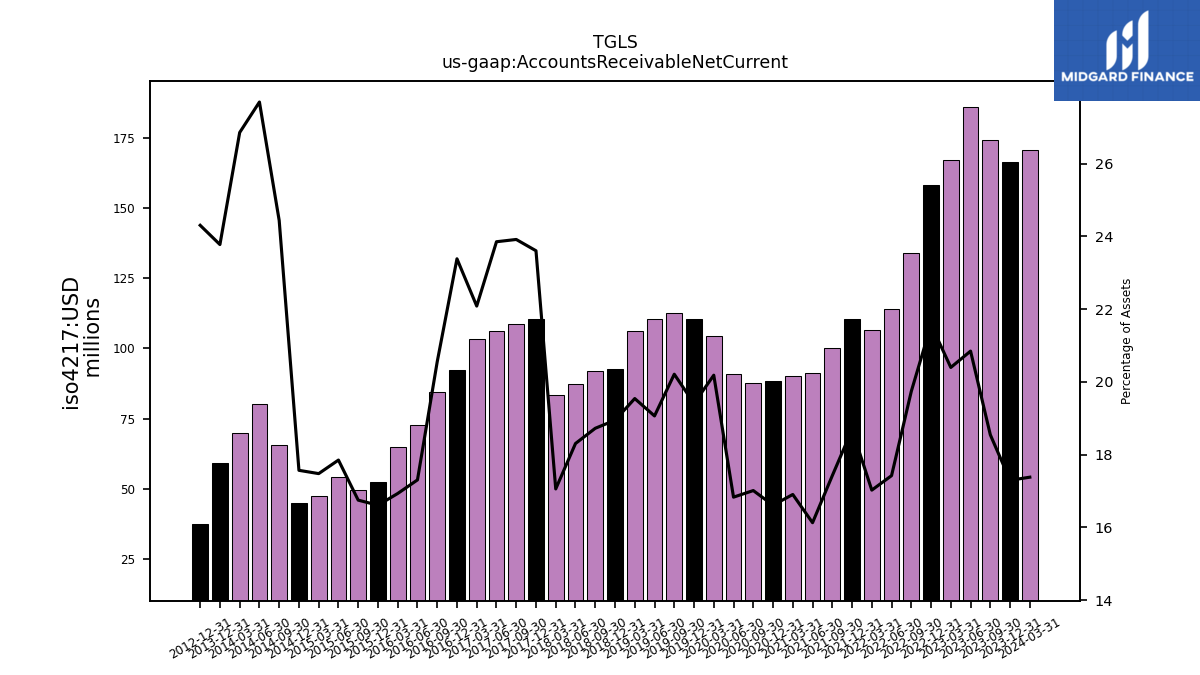
| Accounts Receivable Net Current | 166.50 | 174.15 | 186.00 | 167.14 | 158.40 | 133.85 | 114.22 | 106.50 | 110.54 | 100.04 | 91.23 | 90.03 | 88.37 | 87.79 | 91.01 | 104.42 | 110.56 | 112.69 | 110.66 | 106.19 | 92.79 | 91.85 | 87.43 | 83.25 | 110.46 | 108.54 | 106.31 | 103.31 | 92.30 | 84.63 | 72.86 | 65.00 | 52.52 | 49.38 | 54.31 | 47.50 | 44.95 | 65.63 | 80.09 | 69.93 | 59.01 | NA | NA | NA | |
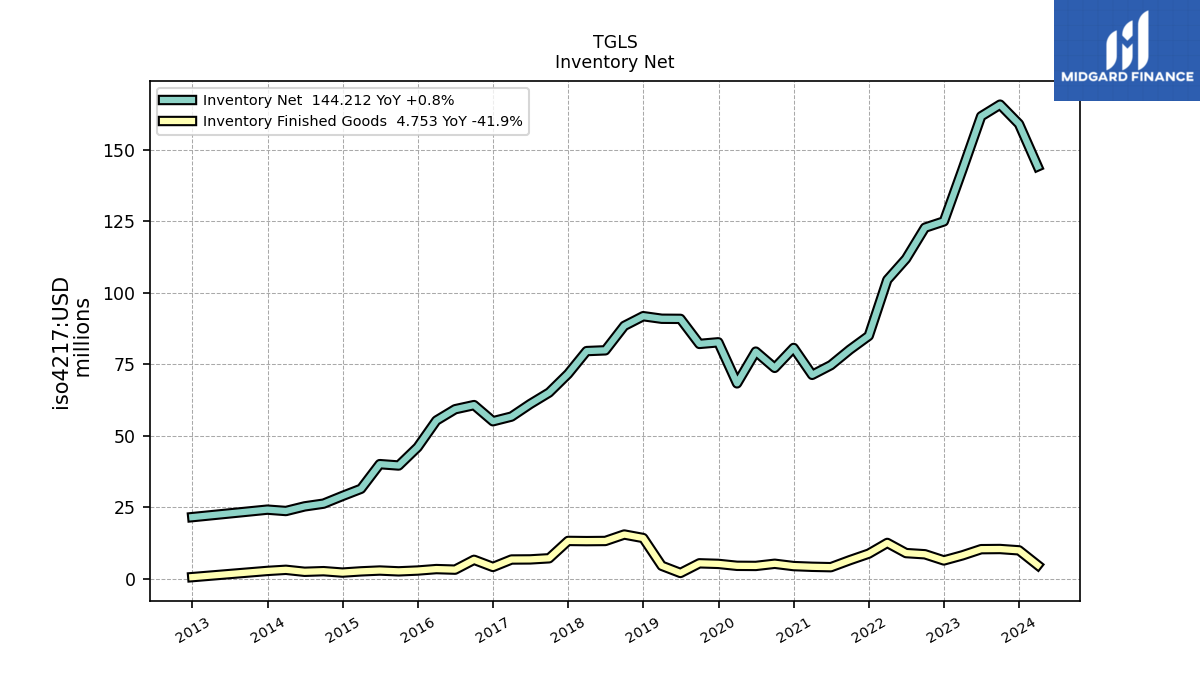
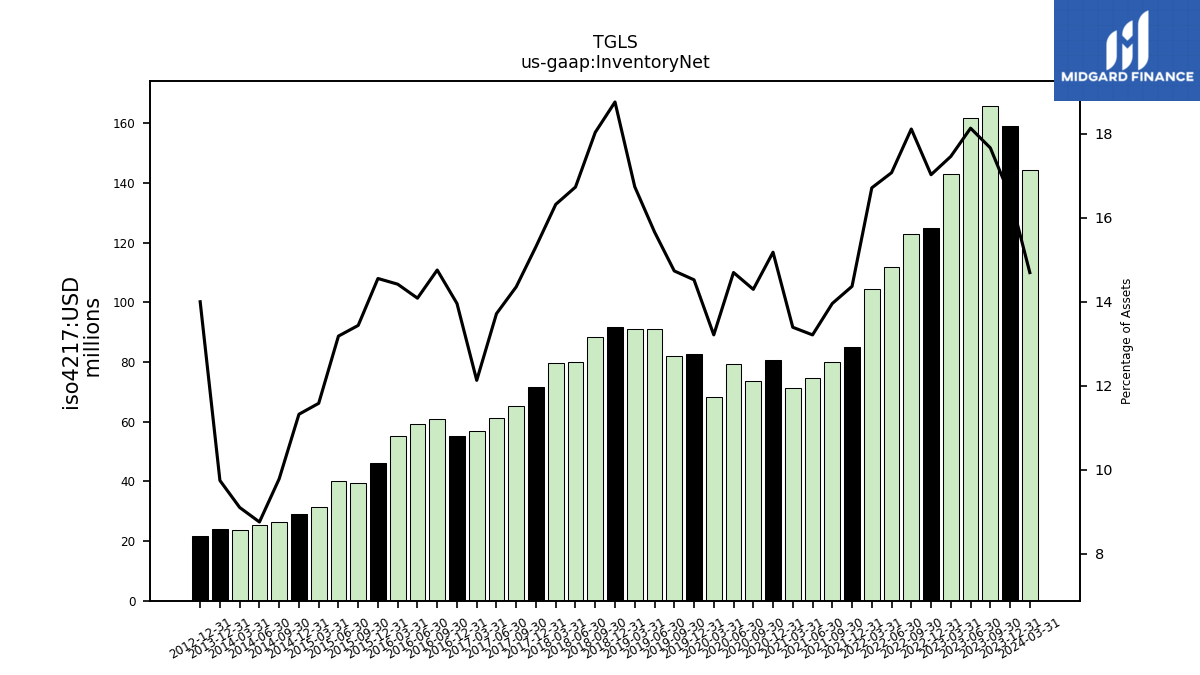
| Inventory Net | 159.07 | 165.85 | 161.77 | 143.06 | 125.00 | 122.80 | 111.91 | 104.53 | 84.97 | 80.14 | 74.72 | 71.32 | 80.74 | 73.76 | 79.45 | 68.34 | 82.71 | 82.14 | 90.91 | 90.95 | 91.85 | 88.45 | 79.90 | 79.64 | 71.66 | 65.14 | 61.13 | 56.73 | 55.09 | 60.75 | 59.30 | 55.34 | 46.01 | 39.61 | 40.10 | 31.47 | 28.96 | 26.28 | 25.32 | 23.70 | 24.18 | NA | NA | NA | |
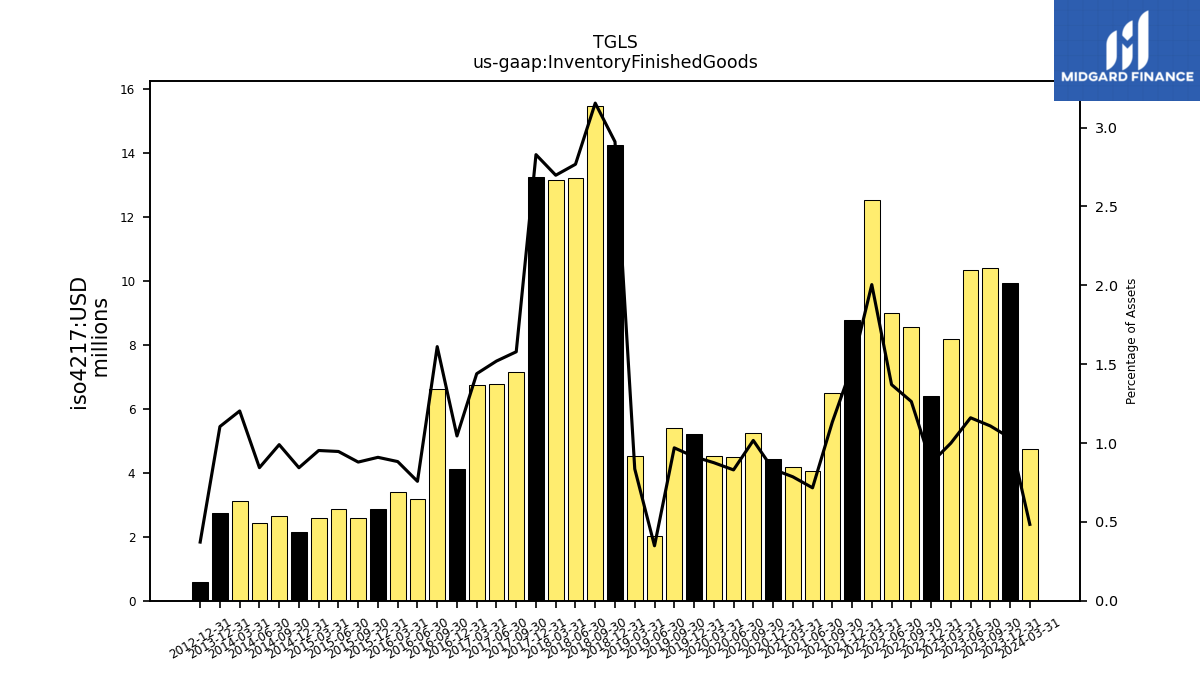
| Inventory Finished Goods | 9.94 | 10.41 | 10.35 | 8.19 | 6.41 | 8.56 | 8.98 | 12.54 | 8.79 | 6.50 | 4.05 | 4.19 | 4.43 | 5.25 | 4.49 | 4.53 | 5.20 | 5.41 | 2.02 | 4.54 | 14.25 | 15.48 | 13.22 | 13.17 | 13.24 | 7.16 | 6.77 | 6.73 | 4.12 | 6.63 | 3.19 | 3.39 | 2.88 | 2.59 | 2.88 | 2.59 | 2.16 | 2.66 | 2.44 | 3.13 | 2.74 | NA | NA | NA | |
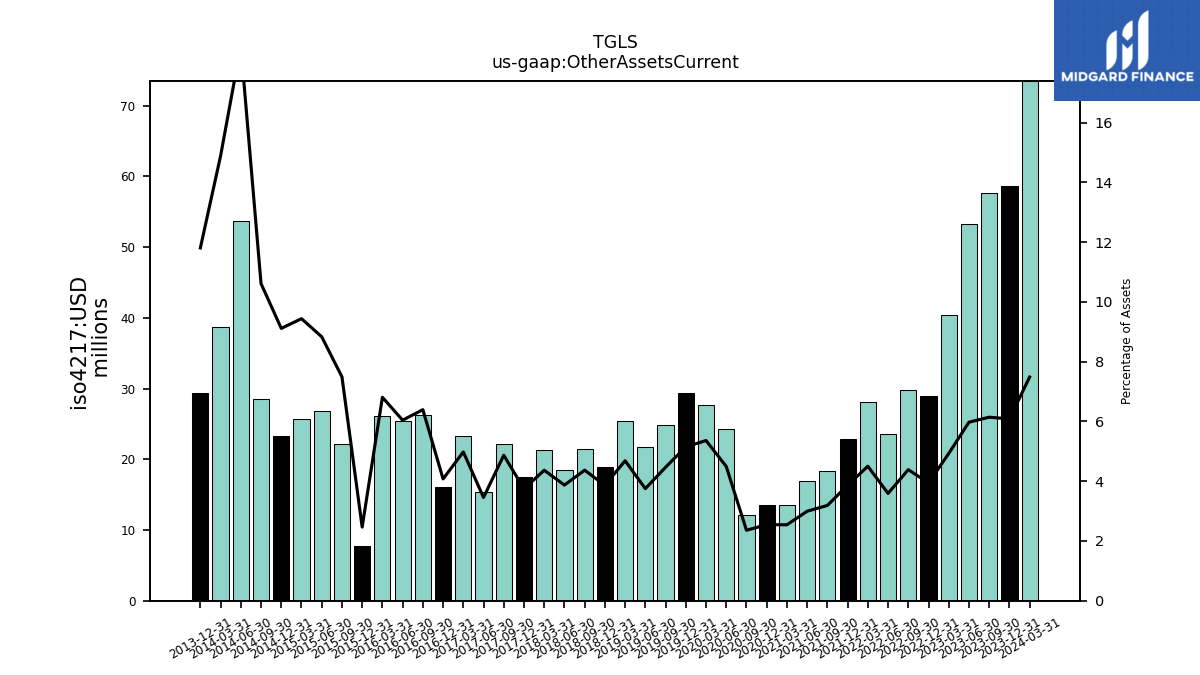
| Other Assets Current | 58.59 | 57.67 | 53.30 | 40.36 | 28.96 | 29.74 | 23.55 | 28.15 | 22.85 | 18.31 | 16.95 | 13.54 | 13.54 | 12.17 | 24.30 | 27.73 | 29.34 | 24.91 | 21.77 | 25.45 | 18.93 | 21.43 | 18.49 | 21.32 | 17.51 | 22.10 | 15.40 | 23.29 | 16.09 | 26.32 | 25.44 | 26.13 | 7.79 | 22.09 | 26.87 | 25.65 | 23.32 | 28.50 | 53.71 | 38.76 | 29.30 | NA | NA | NA |
| 2023-12-31 | 2023-09-30 | 2023-06-30 | 2023-03-31 | 2022-12-31 | 2022-09-30 | 2022-06-30 | 2022-03-31 | 2021-12-31 | 2021-09-30 | 2021-06-30 | 2021-03-31 | 2020-12-31 | 2020-09-30 | 2020-06-30 | 2020-03-31 | 2019-12-31 | 2019-09-30 | 2019-06-30 | 2019-03-31 | 2018-12-31 | 2018-09-30 | 2018-06-30 | 2018-03-31 | 2017-12-31 | 2017-09-30 | 2017-06-30 | 2017-03-31 | 2016-12-31 | 2016-09-30 | 2016-06-30 | 2016-03-31 | 2015-12-31 | 2015-09-30 | 2015-06-30 | 2015-03-31 | 2014-12-31 | 2014-09-30 | 2014-06-30 | 2014-03-31 | 2013-12-31 | 2013-09-30 | 2013-06-30 | 2013-03-31 | ||
|---|---|---|---|---|---|---|---|---|---|---|---|---|---|---|---|---|---|---|---|---|---|---|---|---|---|---|---|---|---|---|---|---|---|---|---|---|---|---|---|---|---|---|---|---|---|
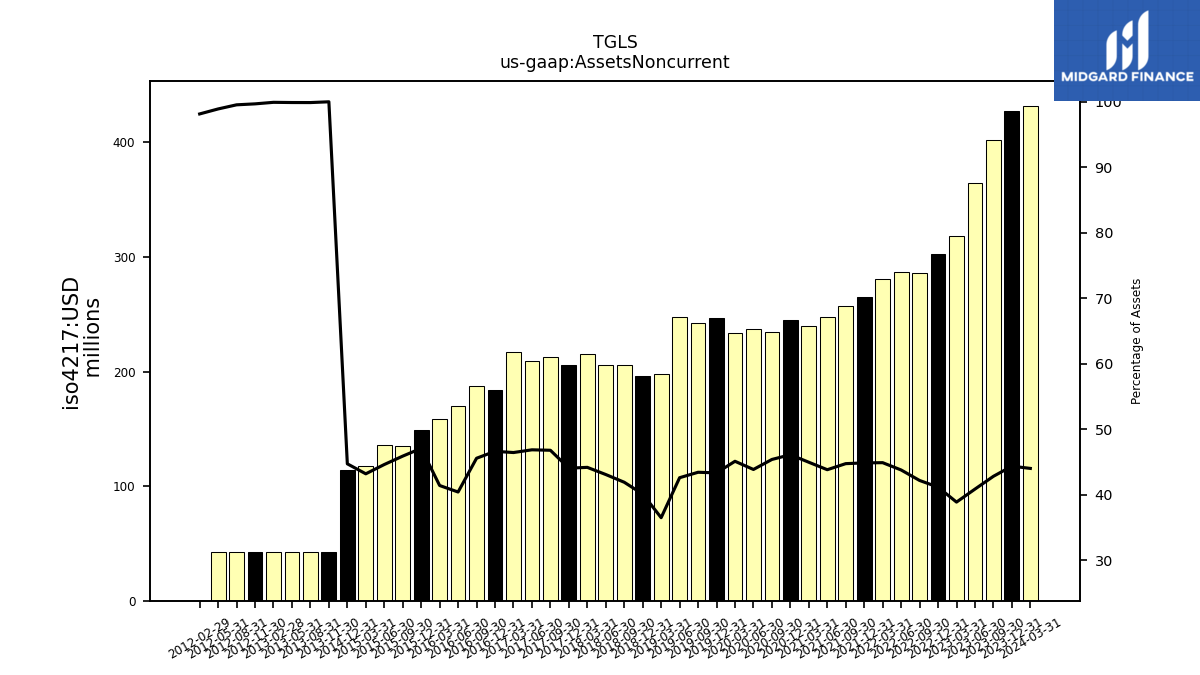
| Assets Noncurrent | 426.96 | 401.91 | 364.45 | 318.47 | 302.17 | 285.90 | 286.92 | 280.76 | 265.29 | 256.87 | 247.80 | 239.38 | 245.22 | 234.15 | 237.08 | 233.29 | 246.82 | 242.07 | 247.20 | 198.26 | 196.38 | 205.51 | 205.72 | 215.57 | 206.10 | 212.29 | 208.79 | 217.20 | 183.99 | 187.58 | 170.11 | 158.91 | 148.82 | 135.27 | 135.68 | 117.36 | 114.39 | NA | NA | NA | NA | NA | NA | NA | |
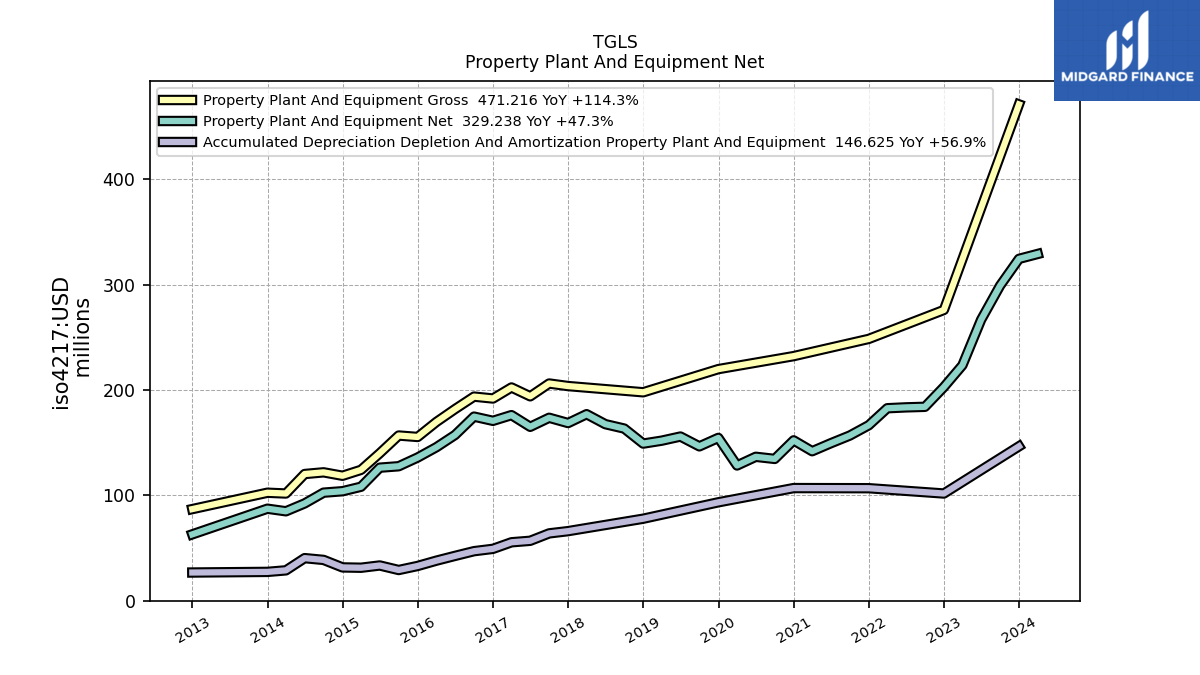
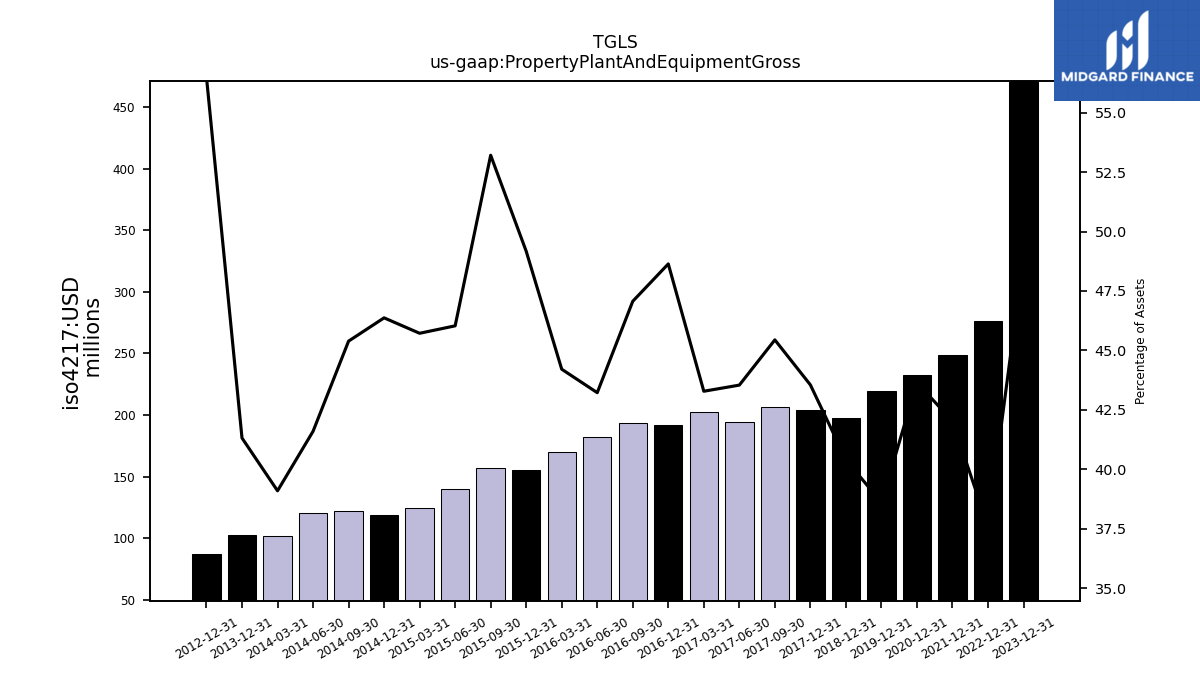
| Property Plant And Equipment Gross | 471.22 | NA | NA | NA | 276.06 | NA | NA | NA | 248.58 | NA | NA | NA | 232.24 | NA | NA | NA | 219.90 | NA | NA | NA | 197.91 | NA | NA | NA | 203.82 | 206.25 | 194.08 | 202.49 | 191.99 | 193.81 | 181.99 | 169.72 | 155.48 | 156.87 | 140.05 | 124.27 | 118.66 | 121.92 | 120.31 | 101.81 | 102.55 | NA | NA | NA | |
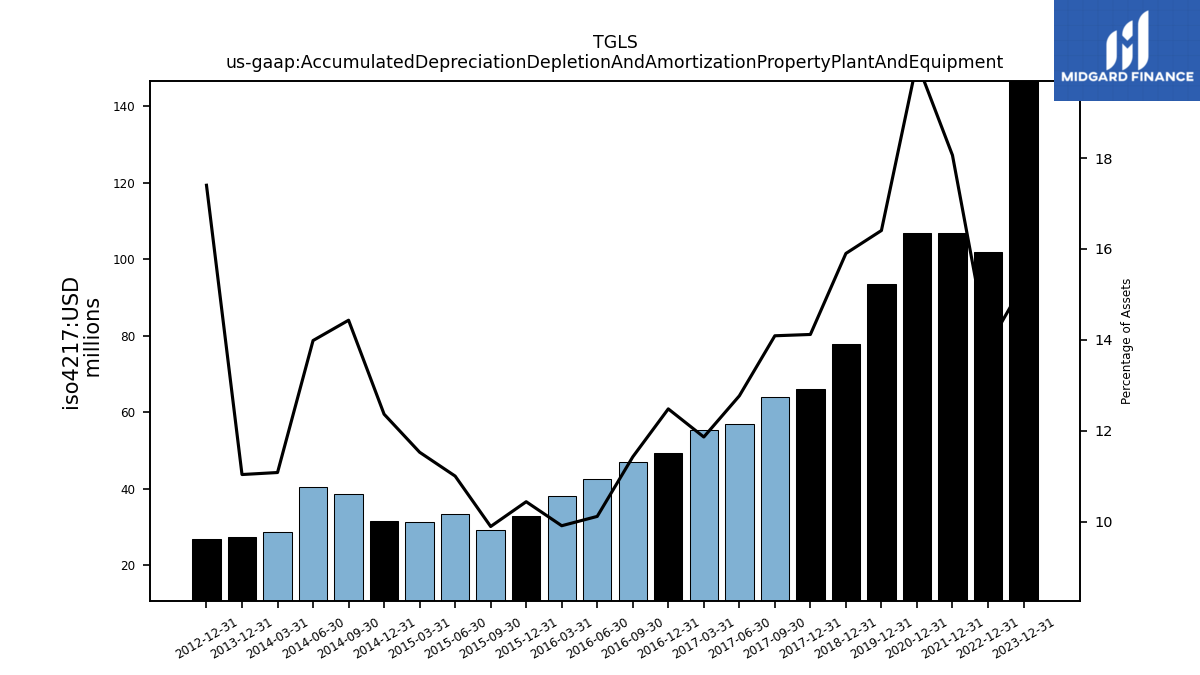
| Accumulated Depreciation Depletion And Amortization Property Plant And Equipment | 146.62 | NA | NA | NA | 101.80 | NA | NA | NA | 106.84 | NA | NA | NA | 106.96 | NA | NA | NA | 93.46 | NA | NA | NA | 77.88 | NA | NA | NA | 66.08 | 63.96 | 56.92 | 55.51 | 49.28 | 47.06 | 42.61 | 38.06 | 33.02 | 29.18 | 33.48 | 31.34 | 31.65 | 38.77 | 40.45 | 28.86 | 27.40 | NA | NA | NA | |
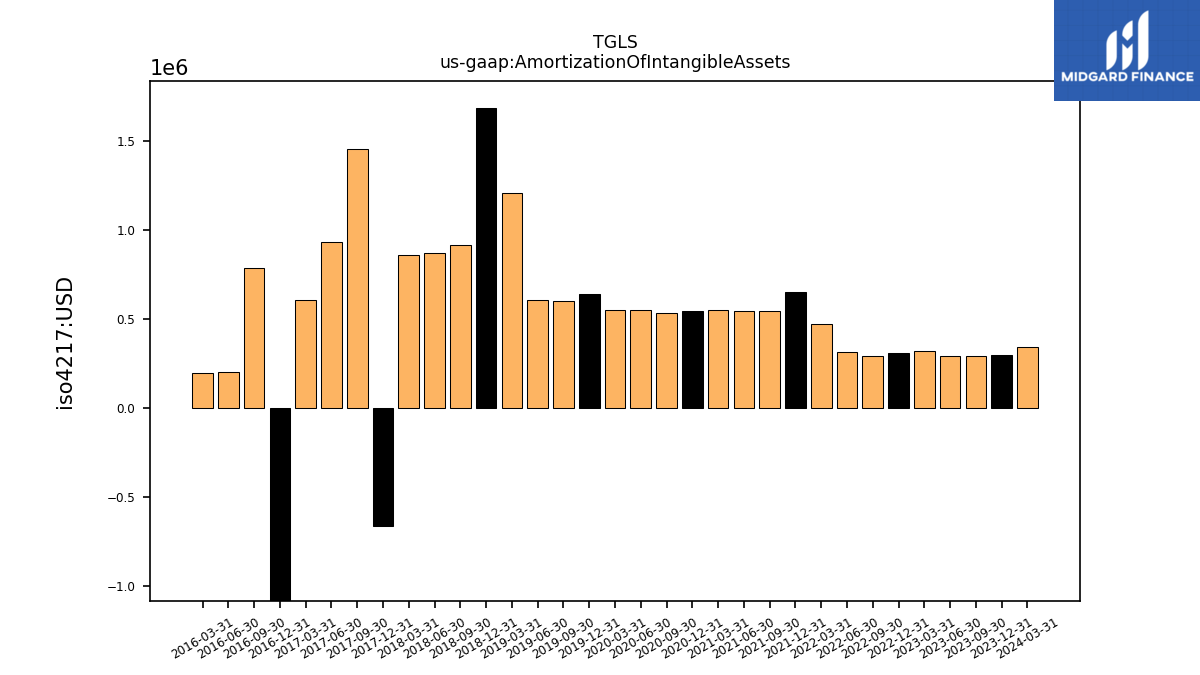
| Amortization Of Intangible Assets | 0.30 | 0.29 | 0.29 | 0.32 | 0.31 | 0.29 | 0.31 | 0.47 | 0.65 | 0.55 | 0.55 | 0.55 | 0.54 | 0.54 | 0.55 | 0.55 | 0.64 | 0.60 | 0.61 | 1.21 | 1.69 | 0.92 | 0.88 | 0.86 | -0.66 | 1.46 | 0.94 | 0.61 | -1.34 | 0.79 | 0.20 | 0.19 | NA | NA | NA | NA | NA | NA | NA | NA | NA | NA | NA | NA | |
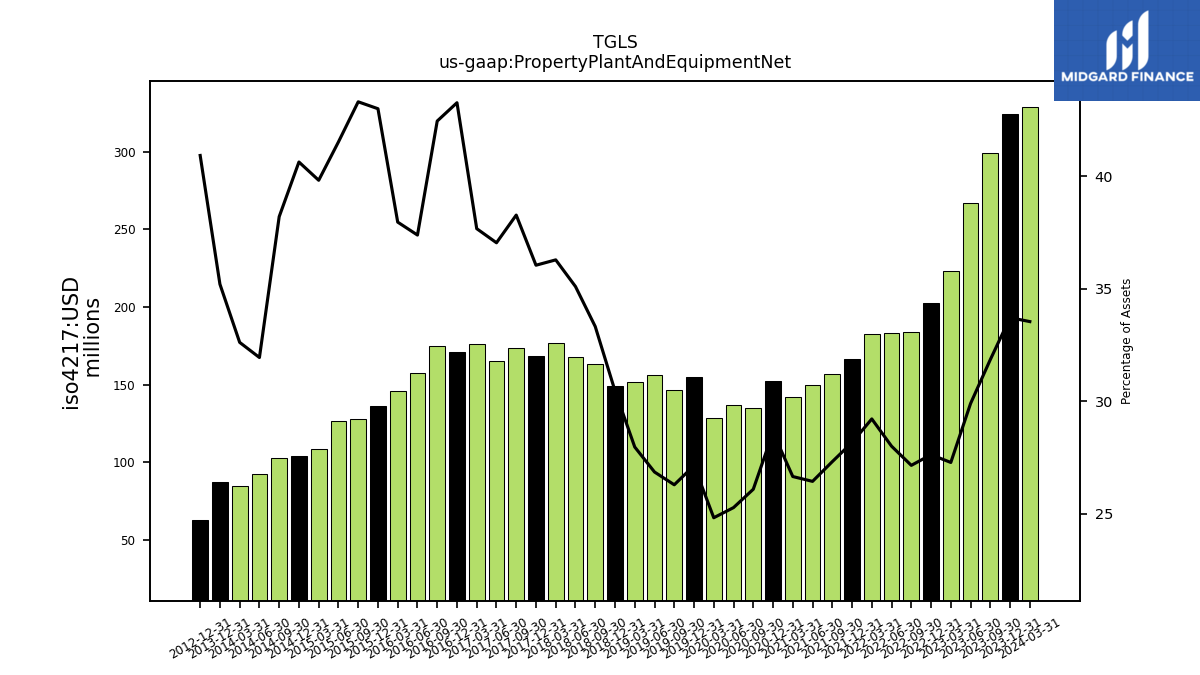
| Property Plant And Equipment Net | 324.59 | 299.12 | 266.78 | 223.55 | 202.87 | 184.11 | 183.59 | 182.76 | 166.63 | 156.86 | 149.57 | 141.97 | 152.27 | 134.64 | 136.67 | 128.43 | 154.61 | 146.58 | 155.90 | 151.98 | 149.20 | 163.47 | 167.65 | 177.11 | 168.70 | 173.72 | 165.12 | 176.24 | 170.80 | 174.82 | 157.42 | 145.74 | 135.97 | 127.69 | 126.34 | 108.24 | 103.98 | 102.62 | 92.39 | 84.94 | 87.38 | NA | NA | NA | |
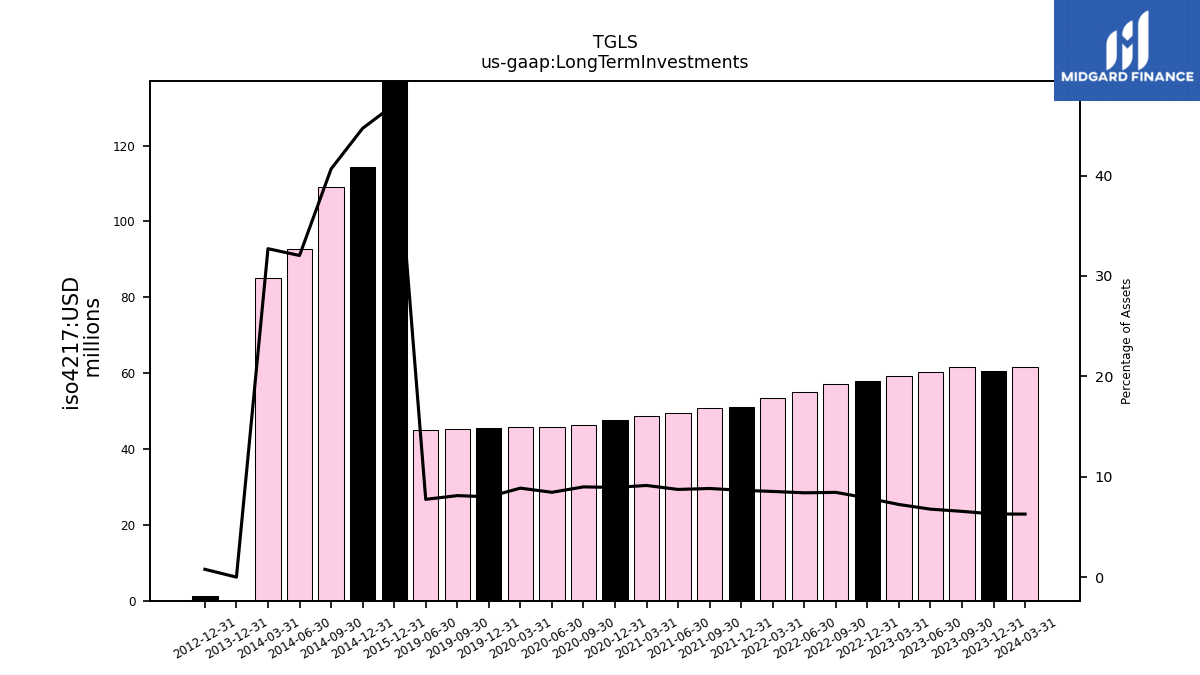
| Long Term Investments | 60.57 | 61.52 | 60.41 | 59.29 | 57.84 | 57.25 | 55.06 | 53.39 | 51.16 | 50.70 | 49.41 | 48.63 | 47.53 | 46.38 | 45.69 | 45.86 | 45.60 | 45.27 | 44.98 | NA | NA | NA | NA | NA | NA | NA | NA | NA | NA | NA | NA | NA | 148.82 | NA | NA | NA | 114.39 | 109.20 | 92.66 | 85.19 | 0.00 | NA | NA | NA | |
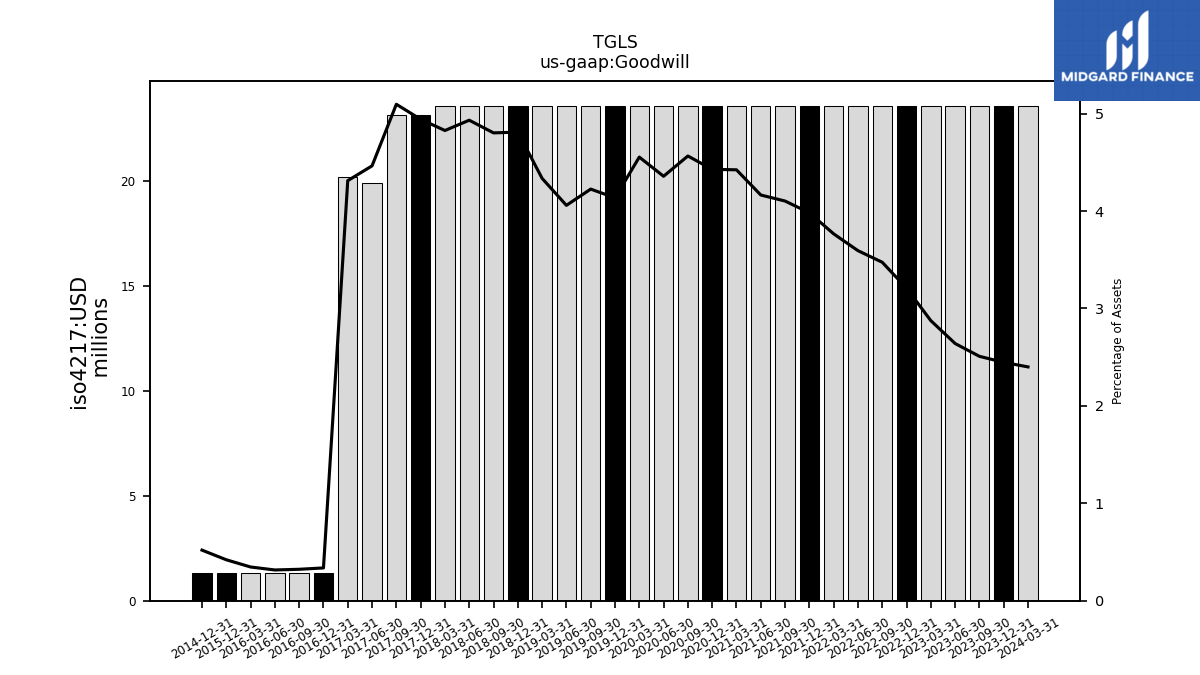
| Goodwill | 23.56 | 23.56 | 23.56 | 23.56 | 23.56 | 23.56 | 23.56 | 23.56 | 23.56 | 23.56 | 23.56 | 23.56 | 23.56 | 23.56 | 23.56 | 23.56 | 23.56 | 23.56 | 23.56 | 23.56 | 23.56 | 23.56 | 23.56 | 23.56 | 23.13 | 23.13 | 19.90 | 20.17 | 1.33 | 1.33 | 1.33 | 1.33 | 1.33 | NA | NA | NA | 1.33 | NA | NA | NA | NA | NA | NA | NA | |
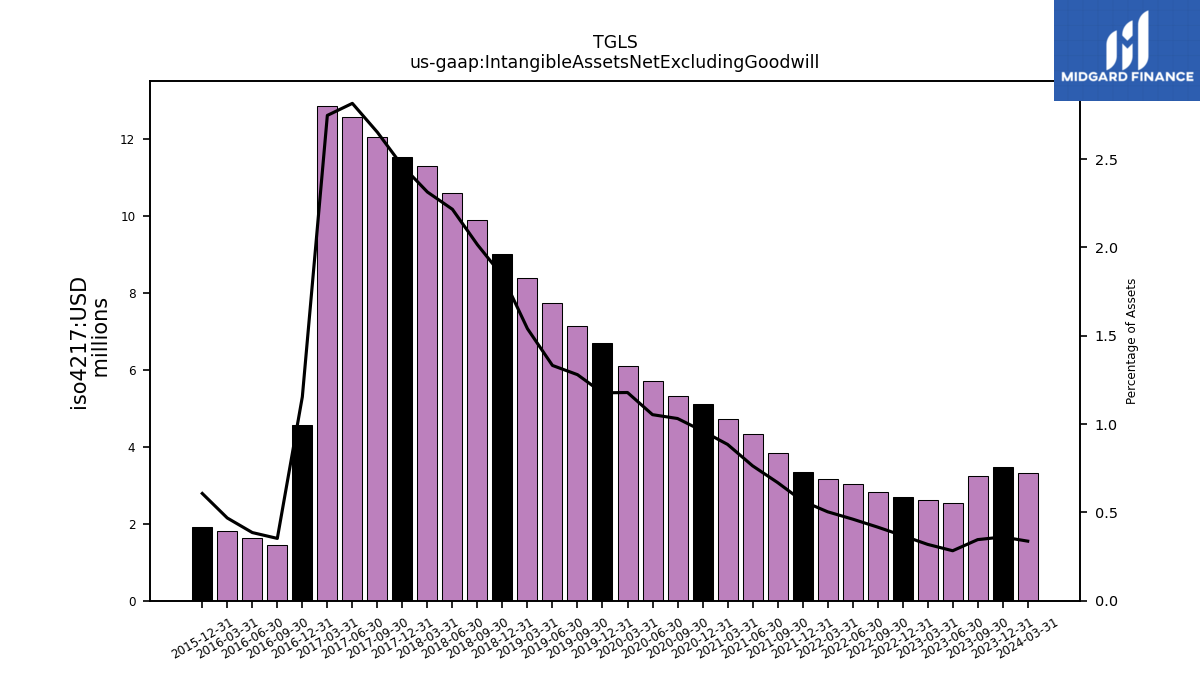
| Intangible Assets Net Excluding Goodwill | 3.48 | 3.25 | 2.52 | 2.61 | 2.71 | 2.83 | 3.03 | 3.15 | 3.34 | 3.84 | 4.32 | 4.71 | 5.11 | 5.32 | 5.70 | 6.10 | 6.70 | 7.13 | 7.73 | 8.37 | 9.01 | 9.89 | 10.58 | 11.29 | 11.52 | 12.04 | 12.55 | 12.85 | 4.55 | 1.45 | 1.62 | 1.80 | 1.92 | NA | NA | NA | NA | NA | NA | NA | NA | NA | NA | NA | |
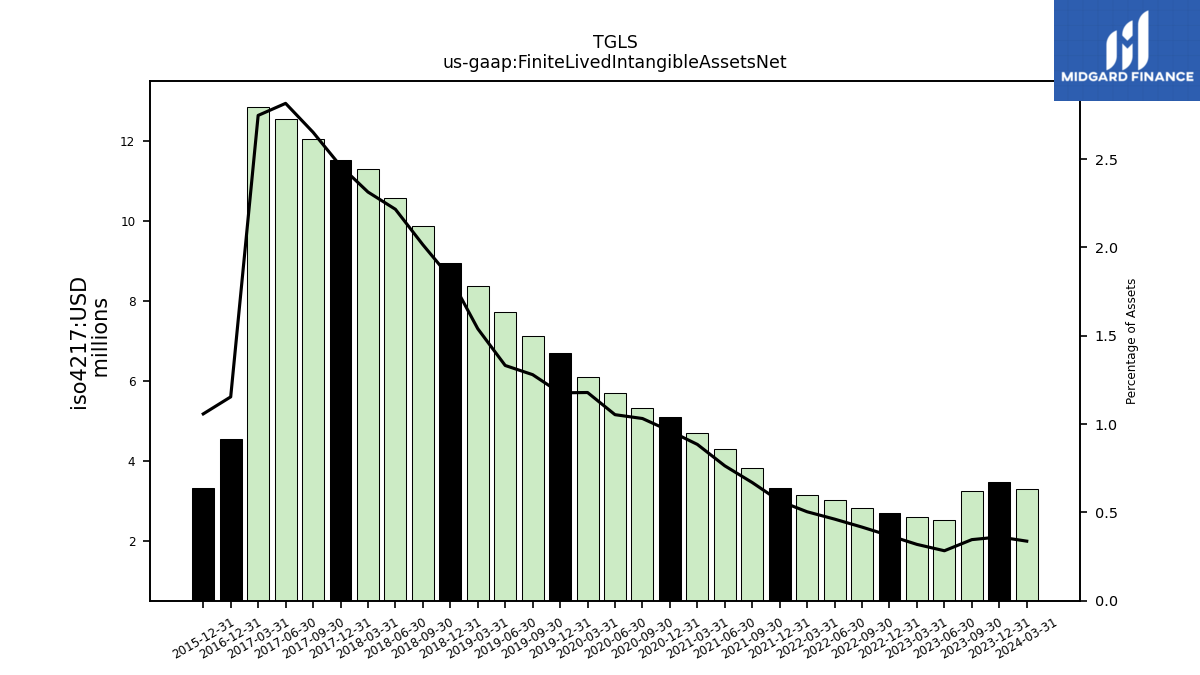
| Finite Lived Intangible Assets Net | 3.48 | 3.25 | 2.52 | 2.61 | 2.71 | 2.83 | 3.03 | 3.15 | 3.34 | 3.84 | 4.32 | 4.71 | 5.11 | 5.32 | 5.70 | 6.10 | 6.70 | 7.13 | 7.73 | 8.37 | 8.95 | 9.89 | 10.58 | 11.29 | 11.52 | 12.04 | 12.55 | 12.85 | 4.55 | NA | NA | NA | 3.34 | NA | NA | NA | NA | NA | NA | NA | NA | NA | NA | NA | |
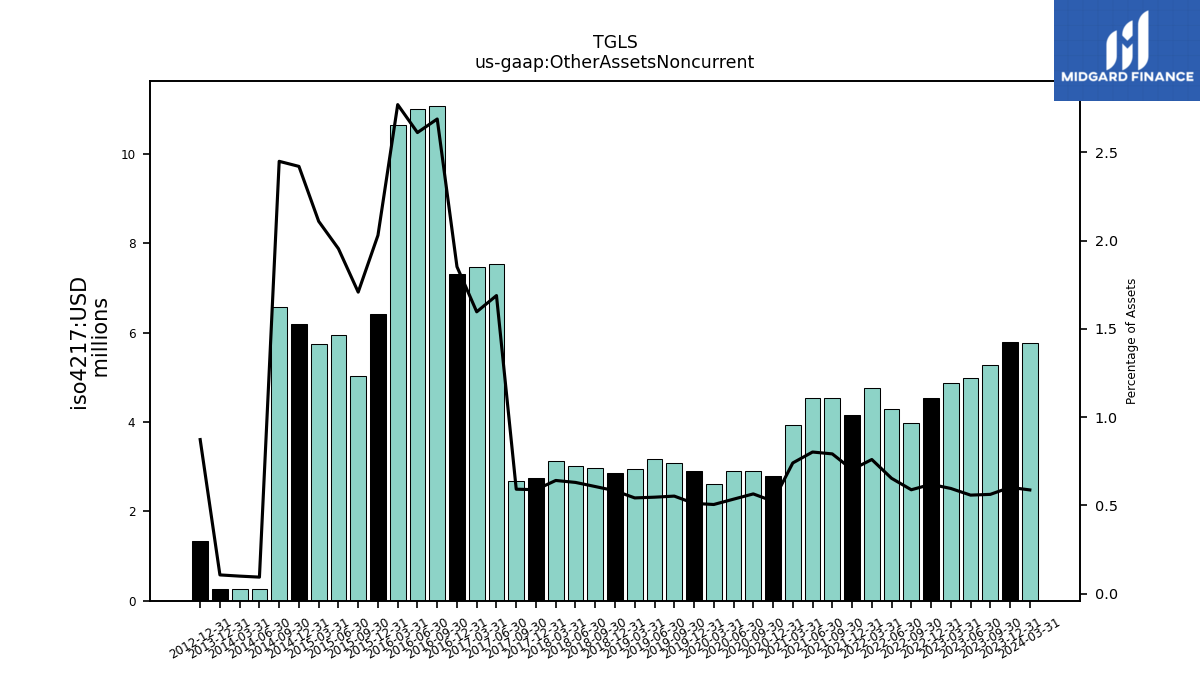
| Other Assets Noncurrent | 5.79 | 5.28 | 4.98 | 4.88 | 4.54 | 3.99 | 4.28 | 4.75 | 4.16 | 4.54 | 4.54 | 3.94 | 2.78 | 2.91 | 2.89 | 2.61 | 2.91 | 3.08 | 3.17 | 2.94 | 2.85 | 2.98 | 3.01 | 3.13 | 2.75 | 2.68 | 7.53 | 7.47 | 7.31 | 11.07 | 11.00 | 10.64 | 6.42 | 5.04 | 5.95 | 5.73 | 6.20 | 6.58 | 0.27 | 0.26 | 0.26 | NA | NA | NA |
| 2023-12-31 | 2023-09-30 | 2023-06-30 | 2023-03-31 | 2022-12-31 | 2022-09-30 | 2022-06-30 | 2022-03-31 | 2021-12-31 | 2021-09-30 | 2021-06-30 | 2021-03-31 | 2020-12-31 | 2020-09-30 | 2020-06-30 | 2020-03-31 | 2019-12-31 | 2019-09-30 | 2019-06-30 | 2019-03-31 | 2018-12-31 | 2018-09-30 | 2018-06-30 | 2018-03-31 | 2017-12-31 | 2017-09-30 | 2017-06-30 | 2017-03-31 | 2016-12-31 | 2016-09-30 | 2016-06-30 | 2016-03-31 | 2015-12-31 | 2015-09-30 | 2015-06-30 | 2015-03-31 | 2014-12-31 | 2014-09-30 | 2014-06-30 | 2014-03-31 | 2013-12-31 | 2013-09-30 | 2013-06-30 | 2013-03-31 | ||
|---|---|---|---|---|---|---|---|---|---|---|---|---|---|---|---|---|---|---|---|---|---|---|---|---|---|---|---|---|---|---|---|---|---|---|---|---|---|---|---|---|---|---|---|---|---|
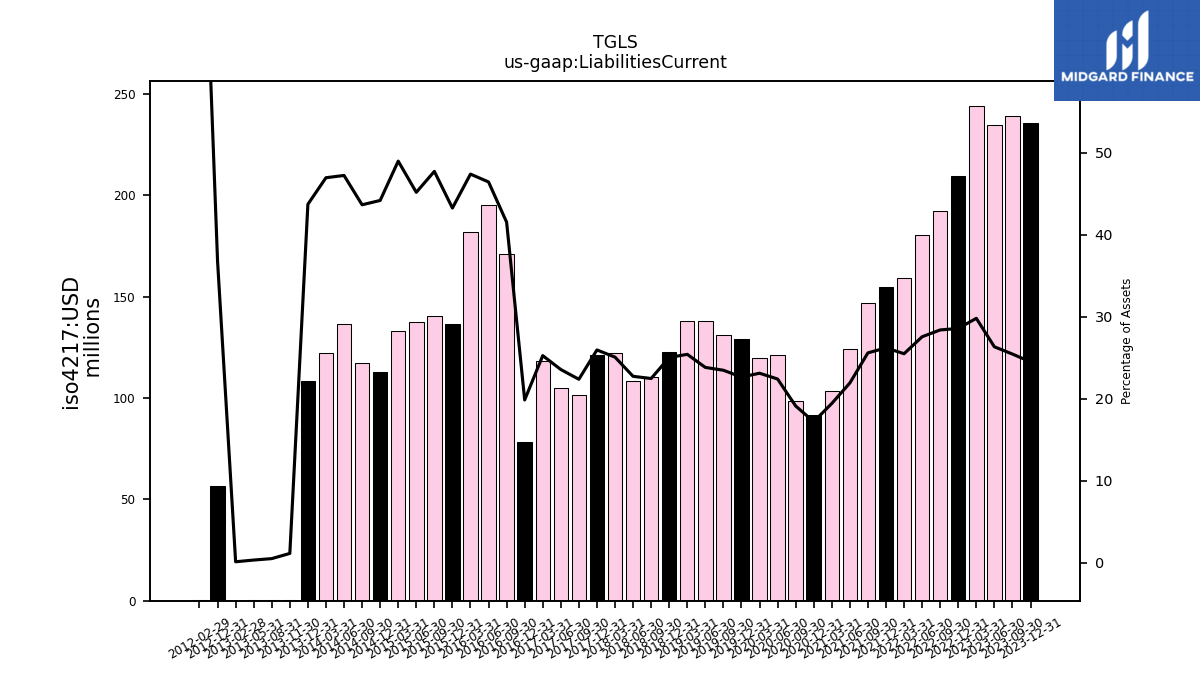
| Liabilities Current | 235.89 | 239.00 | 234.99 | 244.26 | 209.80 | 192.51 | 180.68 | 159.47 | 155.01 | 146.97 | 124.01 | 103.47 | 91.54 | 98.69 | 121.17 | 119.58 | 129.01 | 130.90 | 138.29 | 138.12 | 122.59 | 110.23 | 108.59 | 122.40 | 121.45 | 101.56 | 105.04 | 118.17 | 78.39 | 171.02 | 195.50 | 181.91 | 136.75 | 140.69 | 137.42 | 133.09 | 113.04 | 117.23 | 136.57 | 122.25 | 108.50 | NA | NA | NA | |
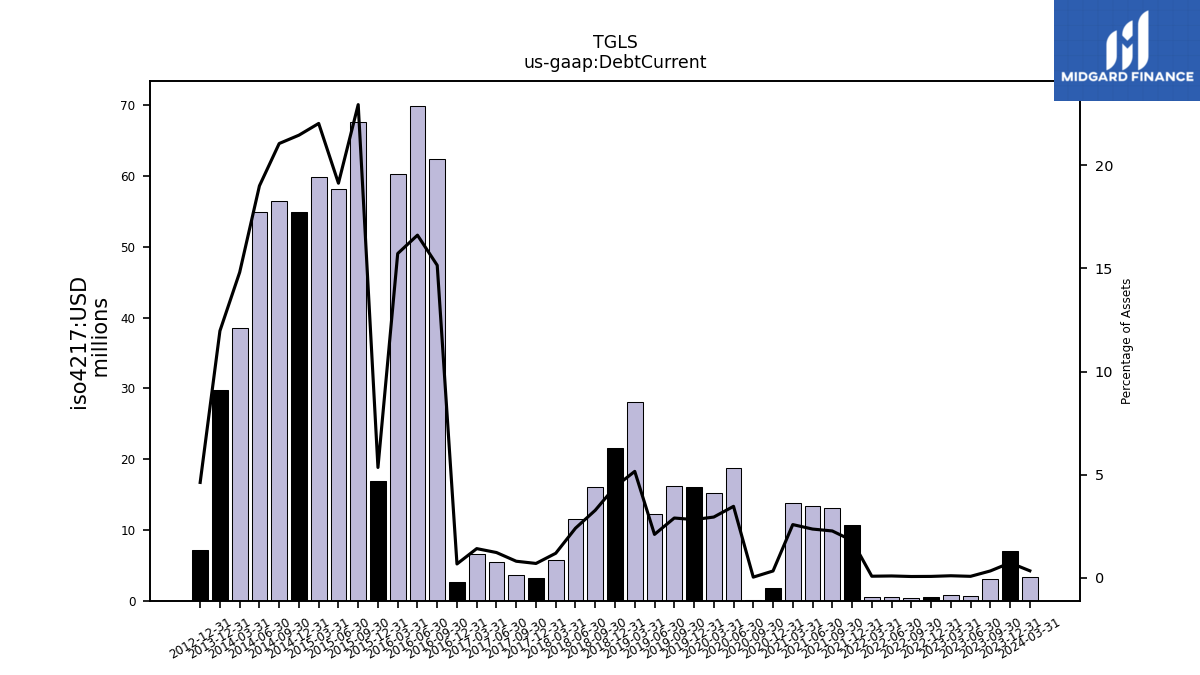
| Debt Current | 7.00 | 3.13 | 0.65 | 0.82 | 0.50 | 0.43 | 0.59 | 0.48 | 10.70 | 13.05 | 13.38 | 13.75 | 1.76 | 0.17 | 18.74 | 15.24 | 16.08 | 16.17 | 12.22 | 28.05 | 21.61 | 16.07 | 11.50 | 5.81 | 3.26 | 3.65 | 5.47 | 6.62 | 2.65 | 62.40 | 69.96 | 60.37 | 16.92 | 67.65 | 58.22 | 59.89 | 54.92 | 56.57 | 54.97 | 38.58 | 29.72 | NA | NA | NA | |
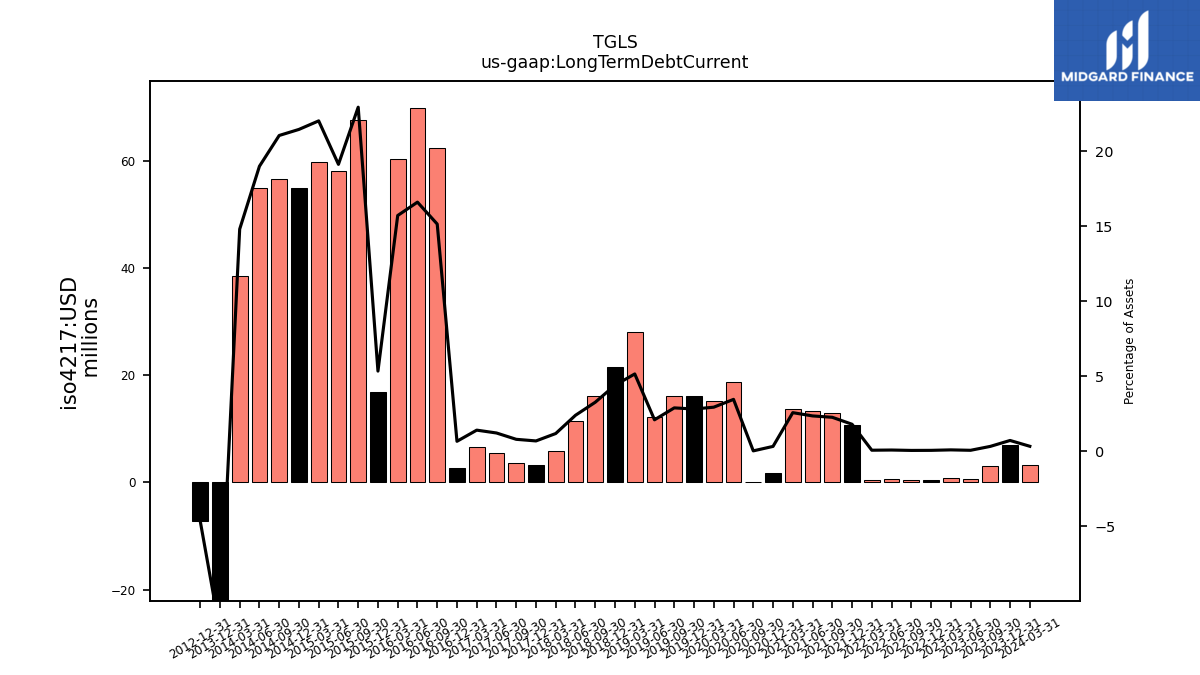
| Long Term Debt Current | 7.00 | 3.13 | 0.65 | 0.82 | 0.50 | 0.43 | 0.59 | 0.48 | 10.70 | 13.05 | 13.38 | 13.75 | 1.76 | 0.17 | 18.74 | 15.24 | 16.08 | 16.17 | 12.22 | 28.05 | 21.61 | 16.07 | 11.50 | 5.81 | 3.26 | 3.65 | 5.47 | 6.62 | 2.65 | 62.40 | 69.96 | 60.37 | 16.92 | 67.65 | 58.22 | 59.89 | 54.92 | 56.57 | 54.97 | 38.58 | -29.72 | NA | NA | NA | |
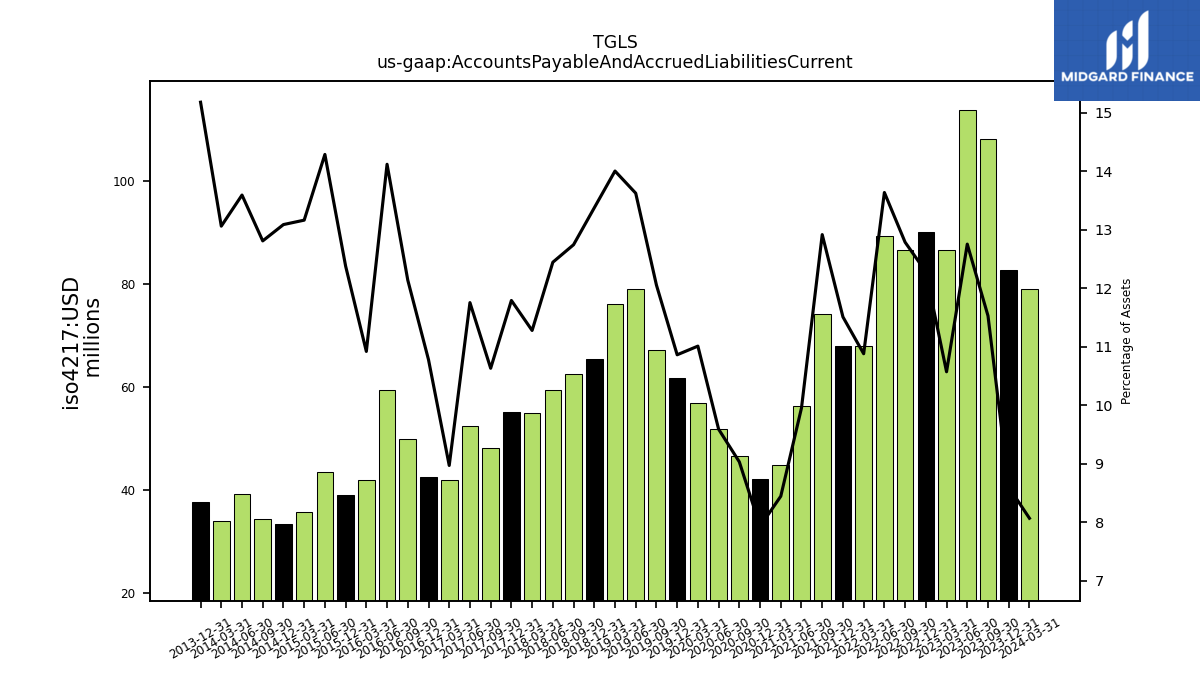
| Accounts Payable And Accrued Liabilities Current | 82.78 | 108.26 | 113.80 | 86.63 | 90.19 | 86.71 | 89.41 | 68.06 | 68.08 | 74.18 | 56.30 | 44.97 | 42.18 | 46.60 | 51.85 | 56.96 | 61.88 | 67.21 | 79.09 | 76.10 | 65.51 | 62.52 | 59.44 | 55.05 | 55.18 | 48.25 | 52.39 | 41.96 | 42.55 | 49.98 | 59.45 | 41.92 | 39.14 | NA | 43.47 | 35.78 | 33.49 | 34.41 | 39.32 | 34.01 | 37.68 | NA | NA | NA | |
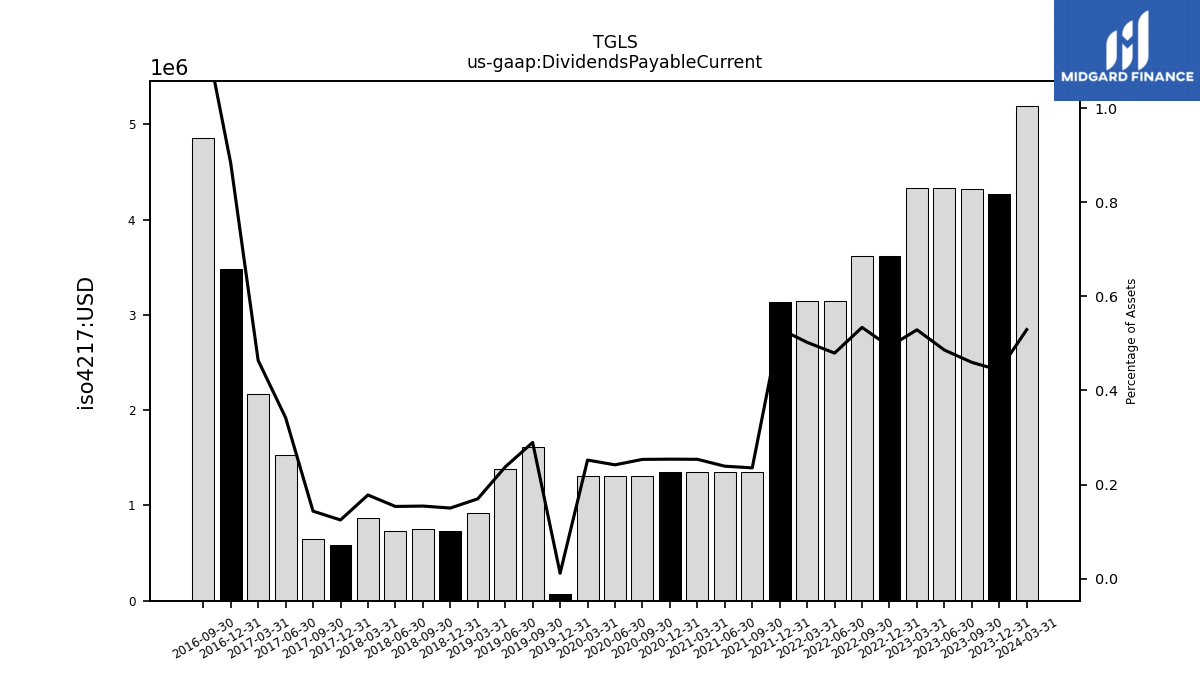
| Dividends Payable Current | 4.26 | 4.32 | 4.34 | 4.33 | 3.62 | 3.62 | 3.14 | 3.14 | 3.14 | 1.35 | 1.35 | 1.35 | 1.35 | 1.31 | 1.31 | 1.30 | 0.07 | 1.61 | 1.38 | 0.92 | 0.74 | 0.76 | 0.73 | 0.87 | 0.58 | 0.65 | 1.53 | 2.17 | 3.49 | 4.86 | NA | NA | NA | NA | NA | NA | NA | NA | NA | NA | NA | NA | NA | NA | |
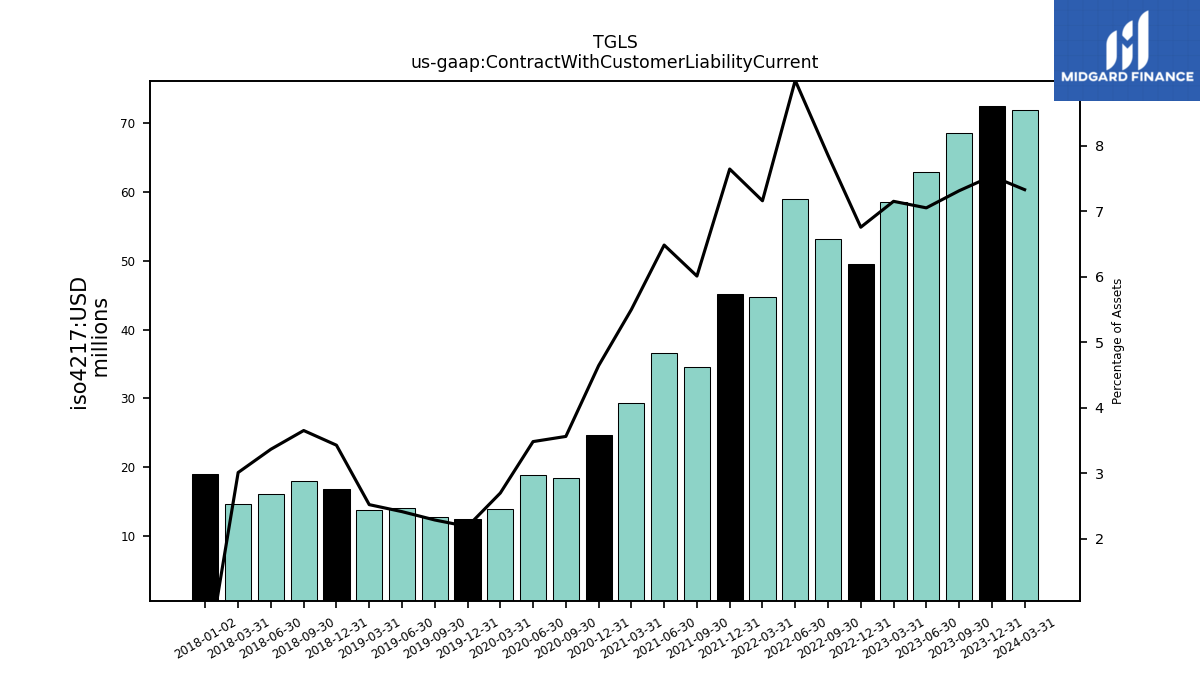
| Contract With Customer Liability Current | 72.54 | 68.65 | 62.91 | 58.59 | 49.60 | 53.25 | 58.97 | 44.78 | 45.21 | 34.51 | 36.67 | 29.29 | 24.69 | 18.38 | 18.83 | 13.96 | 12.46 | 12.75 | 14.01 | 13.70 | 16.79 | 17.91 | 16.08 | 14.70 | NA | NA | NA | NA | NA | NA | NA | NA | NA | NA | NA | NA | NA | NA | NA | NA | NA | NA | NA | NA | |
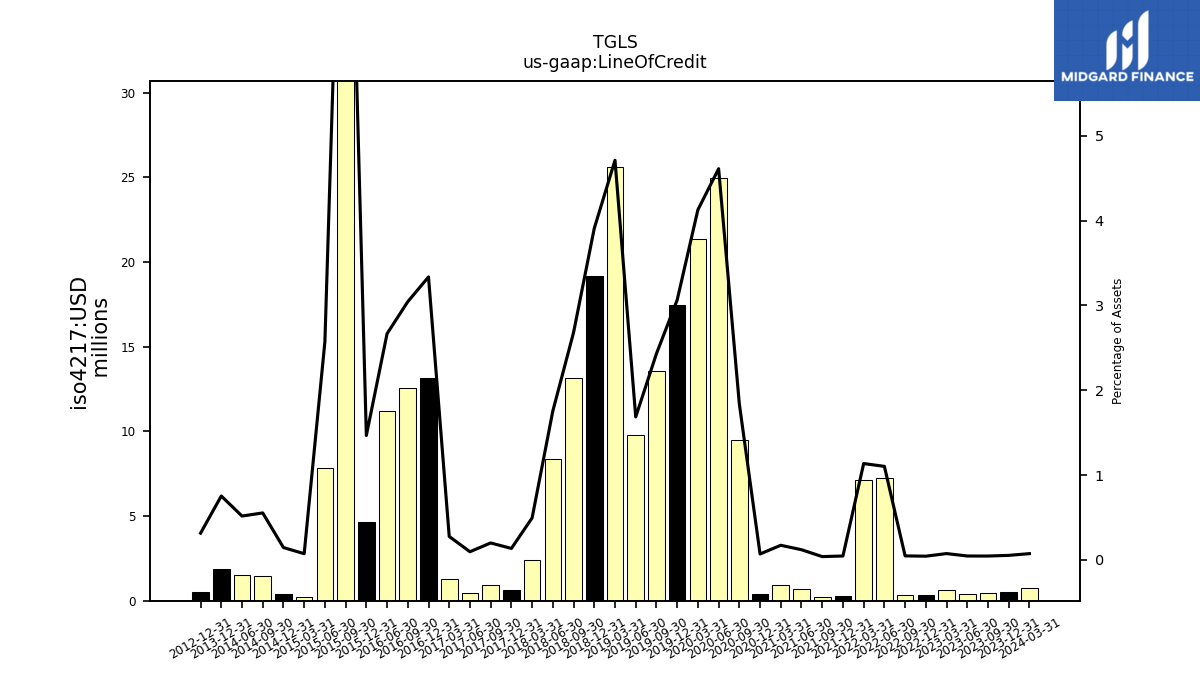
| Line Of Credit | 0.53 | 0.44 | 0.42 | 0.62 | 0.33 | 0.33 | 7.24 | 7.11 | 0.28 | 0.23 | 0.69 | 0.92 | 0.38 | 9.49 | 24.93 | 21.35 | 17.45 | 13.56 | 9.79 | 25.60 | 19.15 | 13.15 | 8.39 | 2.42 | 0.64 | 0.91 | 0.43 | 1.30 | 13.17 | 12.54 | 11.23 | NA | 4.64 | 30.80 | 7.82 | 0.20 | 0.38 | 1.49 | 1.50 | NA | 1.87 | NA | NA | NA |
| 2023-12-31 | 2023-09-30 | 2023-06-30 | 2023-03-31 | 2022-12-31 | 2022-09-30 | 2022-06-30 | 2022-03-31 | 2021-12-31 | 2021-09-30 | 2021-06-30 | 2021-03-31 | 2020-12-31 | 2020-09-30 | 2020-06-30 | 2020-03-31 | 2019-12-31 | 2019-09-30 | 2019-06-30 | 2019-03-31 | 2018-12-31 | 2018-09-30 | 2018-06-30 | 2018-03-31 | 2017-12-31 | 2017-09-30 | 2017-06-30 | 2017-03-31 | 2016-12-31 | 2016-09-30 | 2016-06-30 | 2016-03-31 | 2015-12-31 | 2015-09-30 | 2015-06-30 | 2015-03-31 | 2014-12-31 | 2014-09-30 | 2014-06-30 | 2014-03-31 | 2013-12-31 | 2013-09-30 | 2013-06-30 | 2013-03-31 | ||
|---|---|---|---|---|---|---|---|---|---|---|---|---|---|---|---|---|---|---|---|---|---|---|---|---|---|---|---|---|---|---|---|---|---|---|---|---|---|---|---|---|---|---|---|---|---|
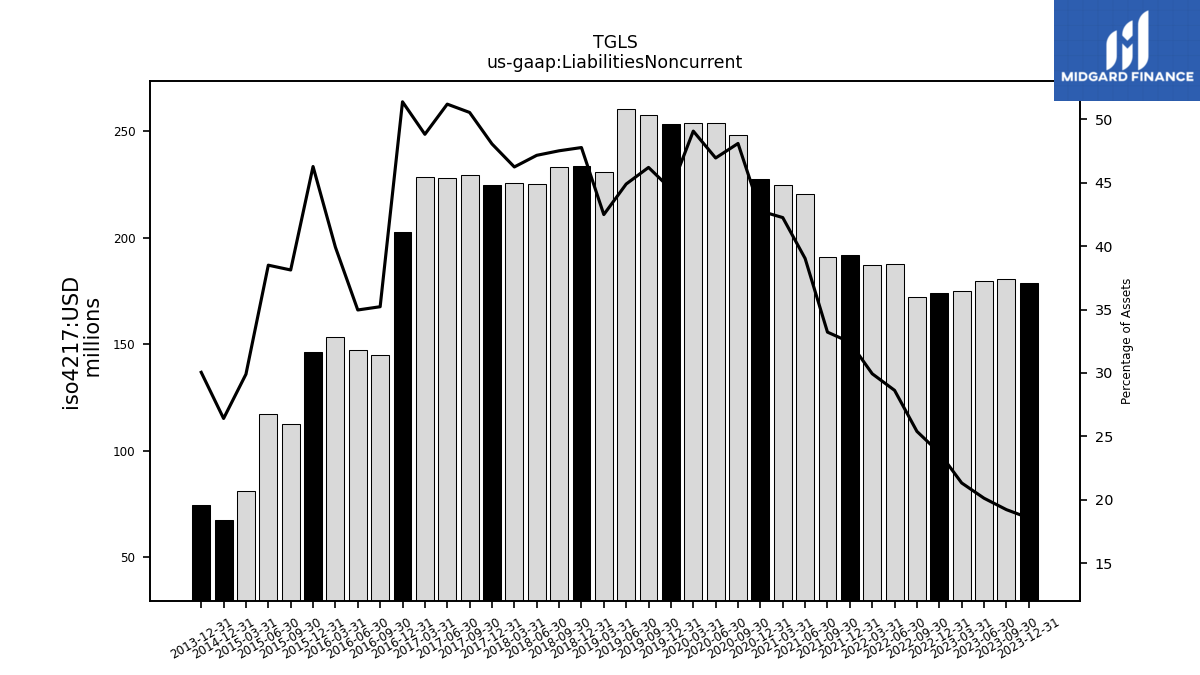
| Liabilities Noncurrent | 178.81 | 180.59 | 179.62 | 174.82 | 174.18 | 172.21 | 187.72 | 187.30 | 191.85 | 190.76 | 220.77 | 225.02 | 227.51 | 248.18 | 253.84 | 253.83 | 253.45 | 257.61 | 260.60 | 230.87 | 233.95 | 233.08 | 225.22 | 225.69 | 224.89 | 229.35 | 228.16 | 228.35 | 202.78 | 145.04 | 147.22 | 153.22 | 146.31 | 112.38 | 117.12 | 81.28 | 67.60 | NA | NA | NA | 74.60 | NA | NA | NA | |
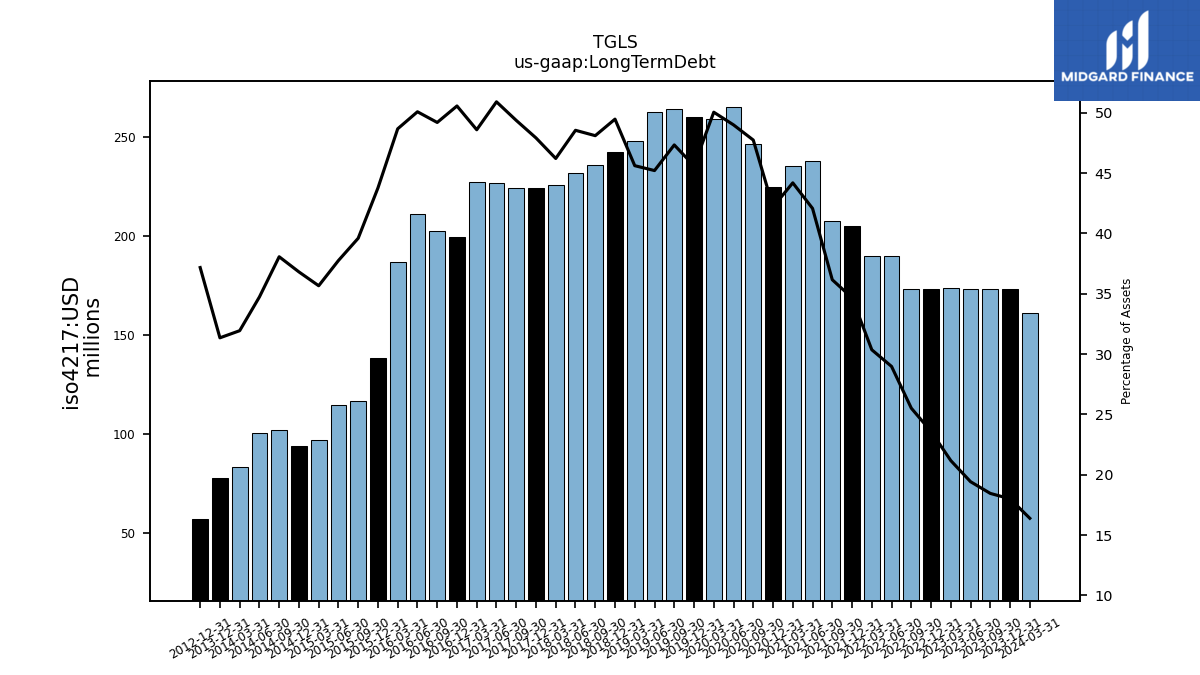
| Long Term Debt | 173.35 | 173.30 | 173.32 | 173.51 | 173.22 | 173.04 | 189.99 | 189.92 | 205.08 | 207.66 | 238.01 | 235.38 | 224.49 | 246.38 | 264.95 | 258.94 | 259.81 | 263.94 | 262.46 | 247.90 | 242.31 | 235.99 | 231.89 | 225.57 | 224.26 | 224.08 | 226.92 | 227.34 | 199.60 | 202.59 | 210.89 | 186.86 | 138.41 | 116.76 | 114.87 | 96.94 | 94.20 | 102.25 | 100.48 | 83.17 | 77.82 | NA | NA | NA | |
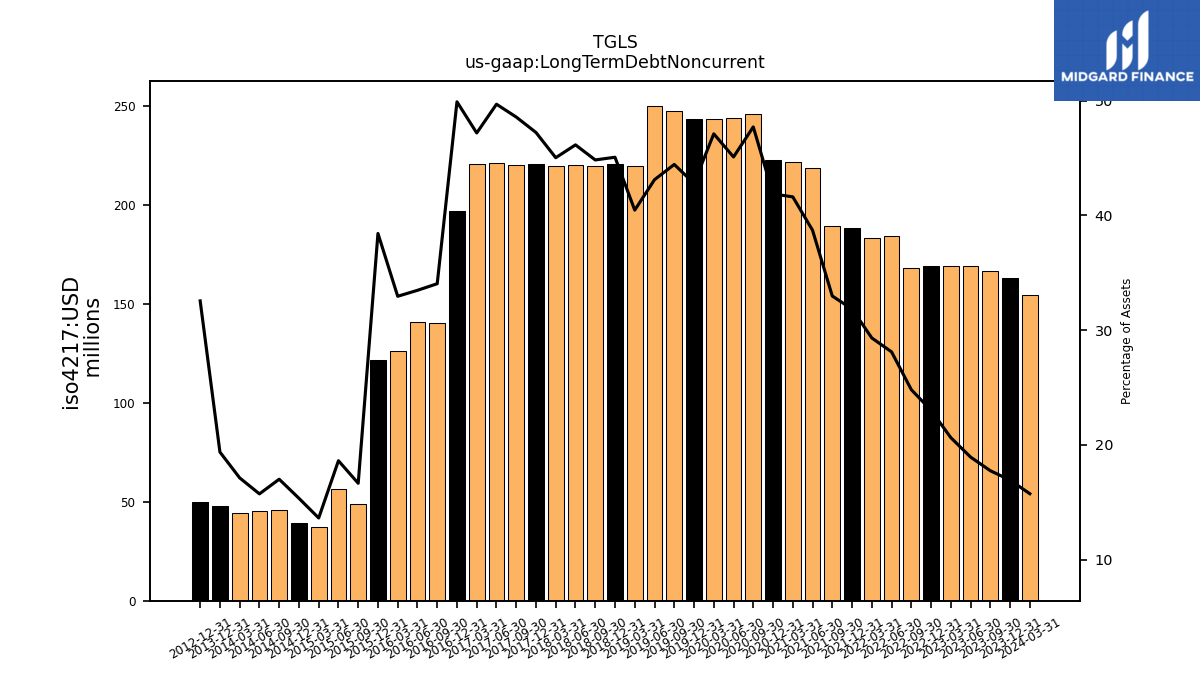
| Long Term Debt Noncurrent | 163.00 | 166.70 | 169.00 | 169.08 | 168.98 | 168.25 | 184.27 | 183.41 | 188.35 | 189.34 | 218.95 | 221.63 | 222.72 | 246.21 | 243.81 | 243.69 | 243.73 | 247.78 | 250.23 | 219.85 | 220.71 | 219.92 | 220.39 | 219.76 | 221.00 | 220.43 | 221.46 | 220.71 | 196.95 | 140.19 | 140.93 | 126.49 | 121.49 | 49.11 | 56.65 | 37.05 | 39.27 | 45.69 | 45.50 | 44.59 | 48.10 | NA | NA | NA | |
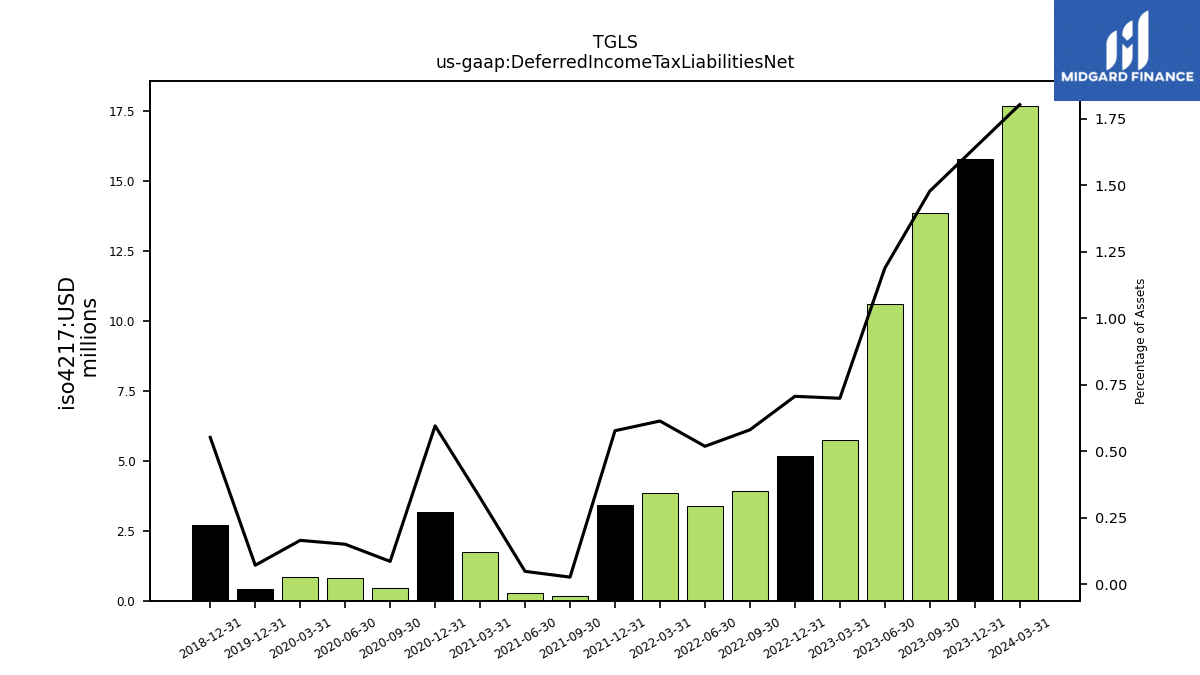
| Deferred Income Tax Liabilities Net | 15.79 | 13.88 | 10.60 | 5.73 | 5.19 | 3.94 | 3.40 | 3.84 | 3.42 | 0.16 | 0.28 | 1.74 | 3.17 | 0.45 | 0.82 | 0.86 | 0.41 | NA | NA | NA | 2.71 | NA | NA | NA | NA | NA | NA | NA | NA | NA | NA | NA | NA | NA | NA | NA | NA | NA | NA | NA | NA | NA | NA | NA |
| 2023-12-31 | 2023-09-30 | 2023-06-30 | 2023-03-31 | 2022-12-31 | 2022-09-30 | 2022-06-30 | 2022-03-31 | 2021-12-31 | 2021-09-30 | 2021-06-30 | 2021-03-31 | 2020-12-31 | 2020-09-30 | 2020-06-30 | 2020-03-31 | 2019-12-31 | 2019-09-30 | 2019-06-30 | 2019-03-31 | 2018-12-31 | 2018-09-30 | 2018-06-30 | 2018-03-31 | 2017-12-31 | 2017-09-30 | 2017-06-30 | 2017-03-31 | 2016-12-31 | 2016-09-30 | 2016-06-30 | 2016-03-31 | 2015-12-31 | 2015-09-30 | 2015-06-30 | 2015-03-31 | 2014-12-31 | 2014-09-30 | 2014-06-30 | 2014-03-31 | 2013-12-31 | 2013-09-30 | 2013-06-30 | 2013-03-31 | ||
|---|---|---|---|---|---|---|---|---|---|---|---|---|---|---|---|---|---|---|---|---|---|---|---|---|---|---|---|---|---|---|---|---|---|---|---|---|---|---|---|---|---|---|---|---|---|
| Stockholders Equity | 548.02 | 517.47 | 475.90 | 398.74 | 348.82 | 312.02 | 286.06 | 277.87 | 243.86 | 235.77 | 220.18 | 203.44 | 212.38 | 168.70 | 165.16 | 143.25 | 186.60 | 168.18 | 180.56 | 173.57 | 132.36 | 146.27 | 142.69 | 138.67 | 120.25 | 121.64 | 111.32 | 120.15 | 113.56 | 95.72 | 78.33 | 48.77 | 33.14 | 61.69 | 68.22 | 79.97 | 75.26 | 69.88 | 64.72 | 61.26 | 65.12 | NA | NA | NA | |
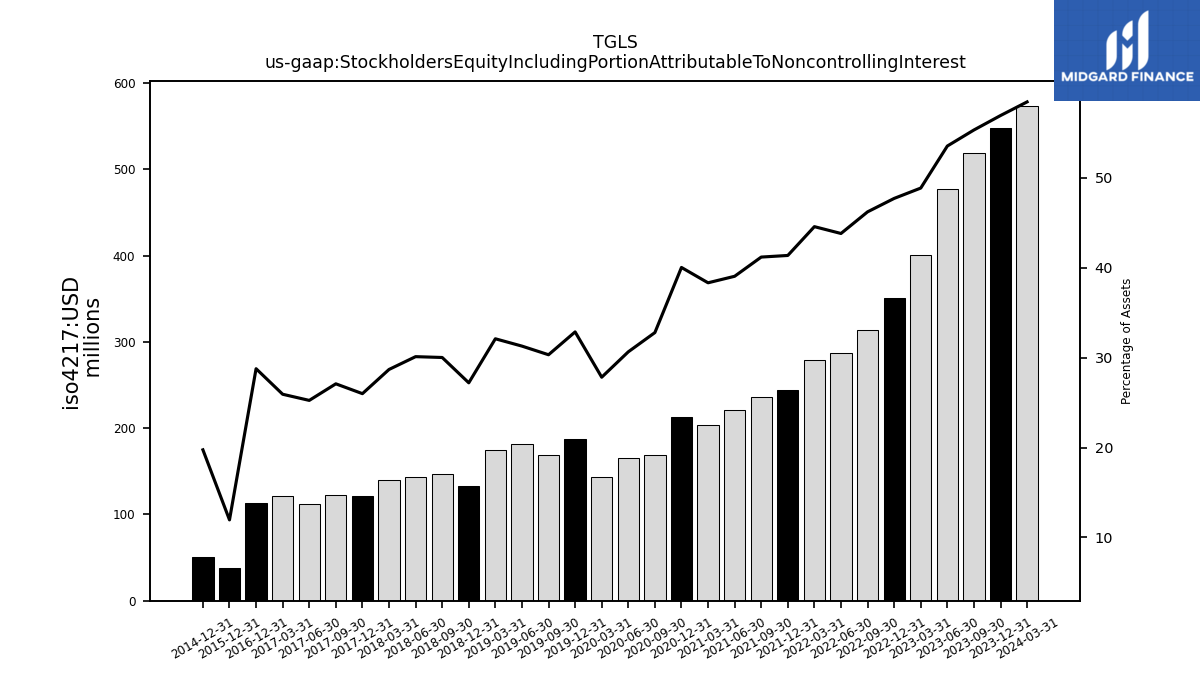
| Stockholders Equity Including Portion Attributable To Noncontrolling Interest | 548.02 | 519.47 | 477.66 | 400.38 | 350.32 | 313.37 | 287.21 | 278.81 | 244.70 | 236.50 | 220.90 | 204.12 | 212.97 | 169.21 | 165.72 | 143.95 | 187.21 | 169.08 | 181.60 | 174.43 | 133.23 | 147.26 | 143.82 | 140.01 | 121.67 | 122.95 | 112.53 | 121.31 | 113.56 | NA | NA | NA | 37.81 | NA | NA | NA | 50.54 | NA | NA | NA | NA | NA | NA | NA | |
| Common Stock Value | 0.01 | 0.01 | 0.01 | 0.01 | 0.01 | 0.01 | 0.01 | 0.01 | 0.01 | 0.01 | 0.01 | 0.01 | 0.01 | 0.01 | 0.01 | 0.01 | 0.01 | 0.01 | 0.00 | 0.00 | 0.00 | 0.00 | 0.00 | 0.00 | 0.00 | 0.00 | 0.00 | 0.00 | 0.00 | 0.00 | 0.00 | 0.00 | 0.00 | 0.00 | 0.00 | 0.00 | 0.00 | 0.00 | 0.00 | 0.00 | 0.00 | NA | NA | NA | |
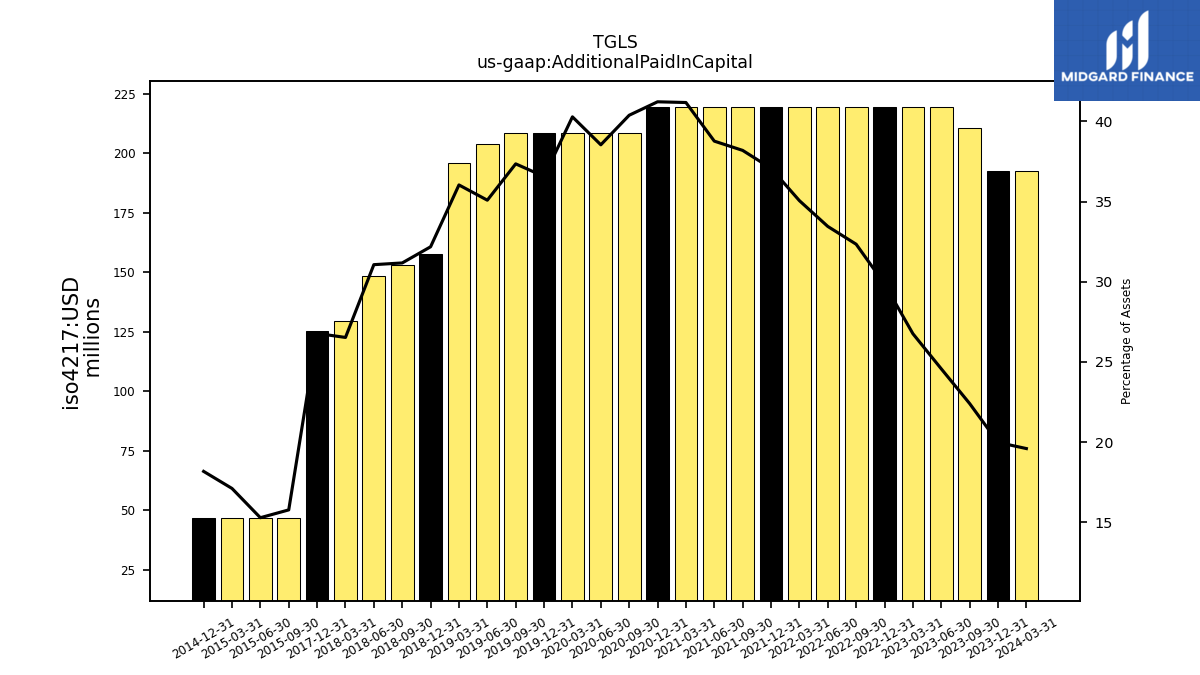
| Additional Paid In Capital | 192.38 | 210.41 | 219.23 | 219.29 | 219.29 | 219.29 | 219.29 | 219.29 | 219.29 | 219.29 | 219.29 | 219.29 | 219.29 | 208.39 | 208.39 | 208.39 | 208.28 | 208.25 | 203.66 | 195.82 | 157.60 | 152.92 | 148.38 | 129.48 | 125.32 | NA | NA | NA | NA | NA | NA | NA | NA | 46.51 | 46.51 | 46.51 | 46.51 | NA | NA | NA | NA | NA | NA | NA | |
| Retained Earnings Accumulated Deficit | 400.04 | 367.93 | 326.35 | 278.20 | 234.25 | 182.86 | 139.71 | 108.80 | 91.05 | 78.71 | 59.10 | 41.18 | 34.33 | 17.18 | 10.13 | -3.90 | 16.21 | 5.32 | 12.87 | 11.67 | 10.44 | 20.07 | 19.03 | 27.77 | 22.21 | 26.02 | 19.10 | 27.46 | 26.55 | 21.42 | 45.39 | 31.02 | 17.35 | 44.92 | 37.34 | 48.69 | 38.81 | 25.48 | 14.21 | 13.81 | 18.49 | NA | NA | NA | |
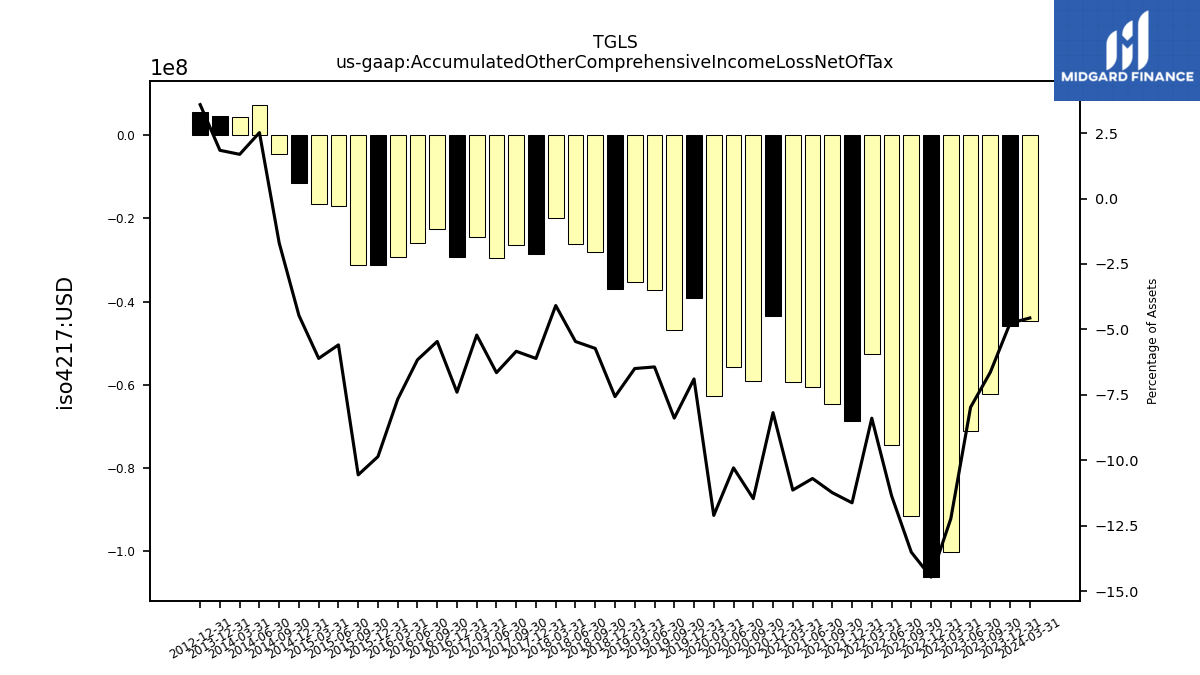
| Accumulated Other Comprehensive Income Loss Net Of Tax | -45.86 | -62.32 | -71.15 | -100.21 | -106.19 | -91.59 | -74.40 | -52.49 | -68.75 | -64.51 | -60.49 | -59.30 | -43.51 | -59.15 | -55.63 | -62.62 | -39.26 | -46.77 | -37.34 | -35.29 | -37.06 | -28.09 | -26.09 | -19.95 | -28.59 | -26.49 | -29.65 | -24.40 | -29.20 | -22.48 | -25.94 | -29.43 | -31.17 | -31.12 | -17.01 | -16.60 | -11.43 | -4.56 | 7.28 | 4.39 | 4.57 | NA | NA | NA |
| 2023-12-31 | 2023-09-30 | 2023-06-30 | 2023-03-31 | 2022-12-31 | 2022-09-30 | 2022-06-30 | 2022-03-31 | 2021-12-31 | 2021-09-30 | 2021-06-30 | 2021-03-31 | 2020-12-31 | 2020-09-30 | 2020-06-30 | 2020-03-31 | 2019-12-31 | 2019-09-30 | 2019-06-30 | 2019-03-31 | 2018-12-31 | 2018-09-30 | 2018-06-30 | 2018-03-31 | 2017-12-31 | 2017-09-30 | 2017-06-30 | 2017-03-31 | 2016-12-31 | 2016-09-30 | 2016-06-30 | 2016-03-31 | 2015-12-31 | 2015-09-30 | 2015-06-30 | 2015-03-31 | 2014-12-31 | 2014-09-30 | 2014-06-30 | 2014-03-31 | 2013-12-31 | 2013-09-30 | 2013-06-30 | 2013-03-31 | ||
|---|---|---|---|---|---|---|---|---|---|---|---|---|---|---|---|---|---|---|---|---|---|---|---|---|---|---|---|---|---|---|---|---|---|---|---|---|---|---|---|---|---|---|---|---|---|
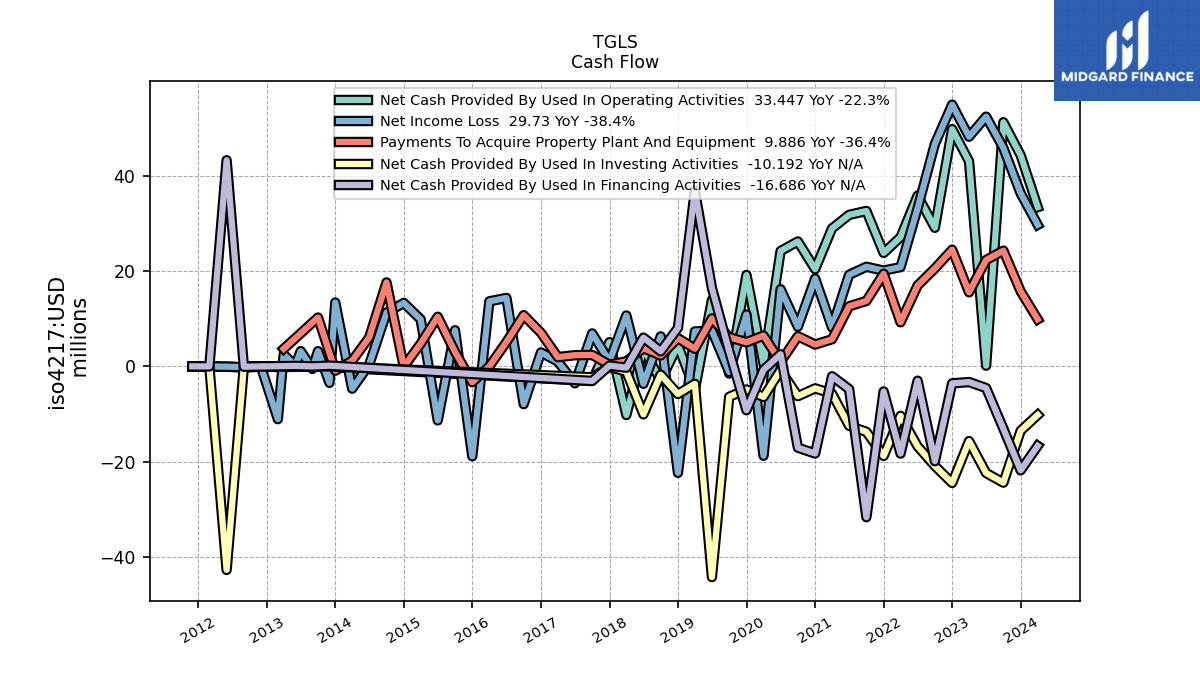
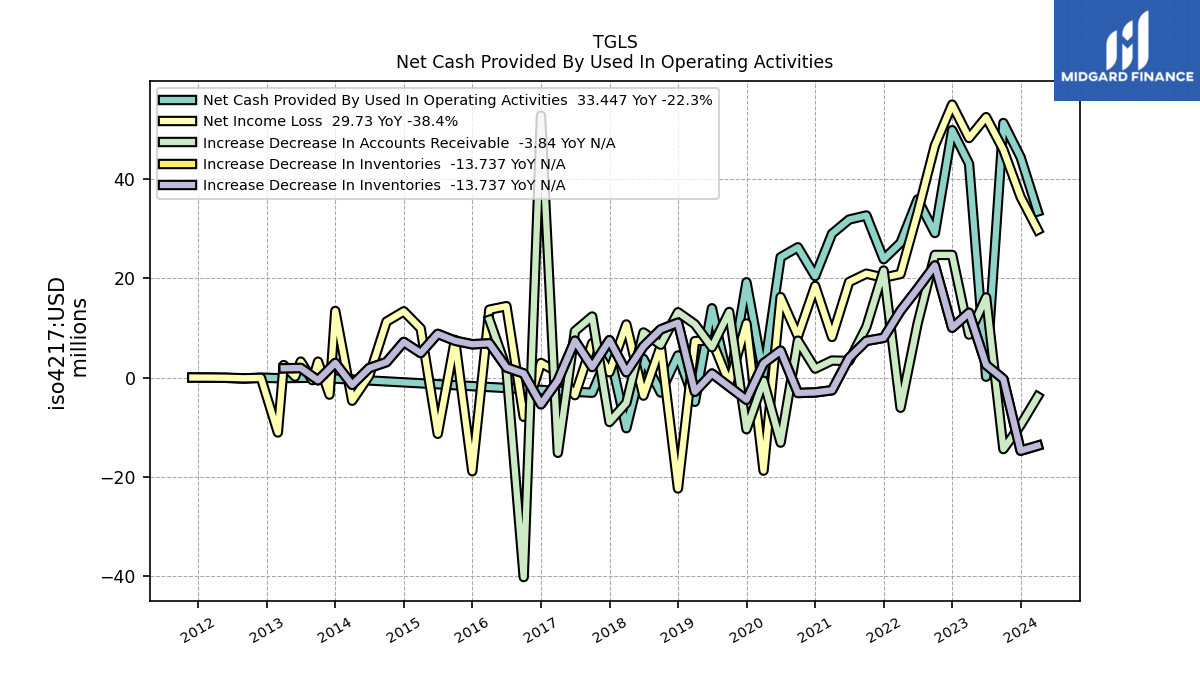
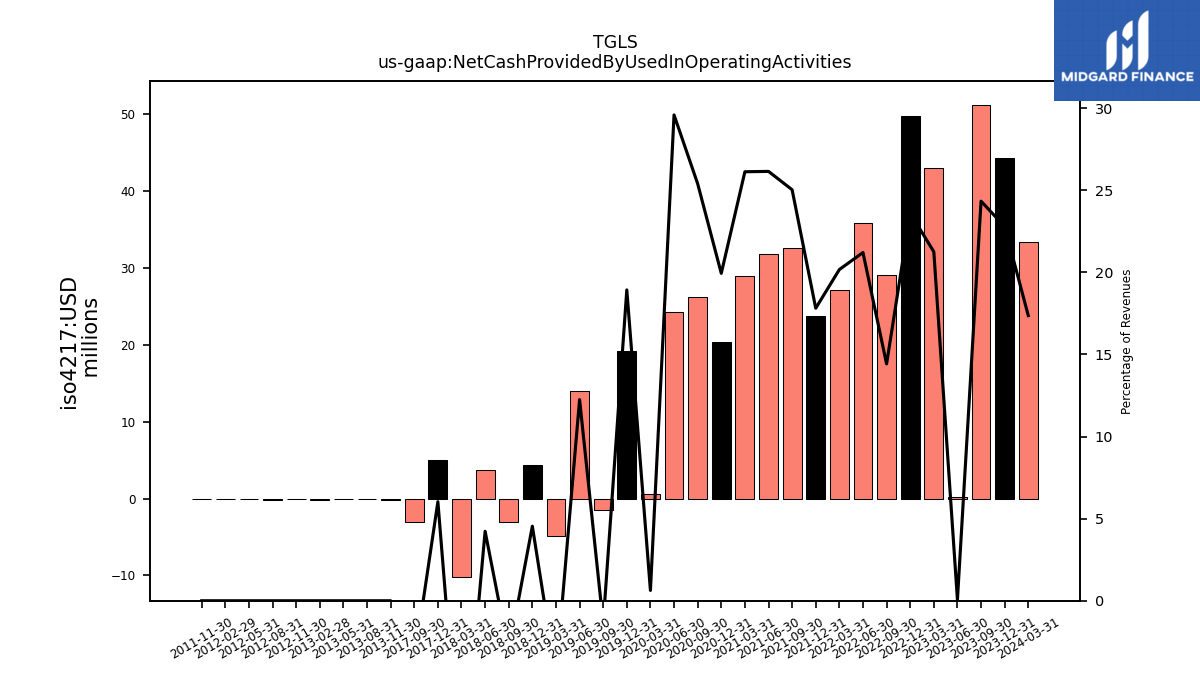
| Net Cash Provided By Used In Operating Activities | 44.34 | 51.27 | 0.15 | 43.06 | 49.82 | 29.10 | 35.86 | 27.14 | 23.83 | 32.64 | 31.82 | 28.96 | 20.41 | 26.23 | 24.24 | 0.55 | 19.19 | -1.50 | 13.95 | -4.90 | 4.44 | -3.02 | 3.76 | -10.21 | 5.08 | -3.07 | NA | NA | NA | NA | NA | NA | NA | NA | NA | NA | NA | NA | NA | NA | NA | NA | NA | NA | |
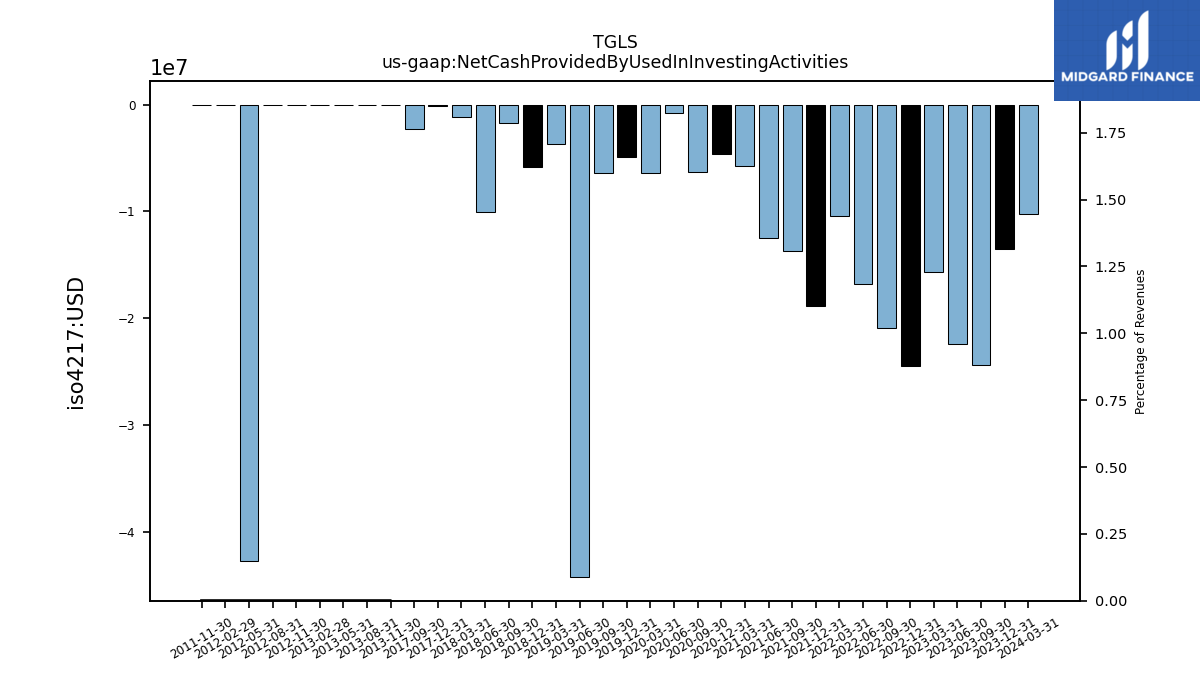
| Net Cash Provided By Used In Investing Activities | -13.52 | -24.42 | -22.39 | -15.69 | -24.48 | -20.92 | -16.79 | -10.39 | -18.81 | -13.74 | -12.47 | -5.74 | -4.61 | -6.25 | -0.79 | -6.41 | -4.85 | -6.38 | -44.26 | -3.66 | -5.80 | -1.75 | -10.07 | -1.11 | -0.10 | -2.30 | NA | NA | NA | NA | NA | NA | NA | NA | NA | NA | NA | NA | NA | NA | NA | NA | NA | NA | |
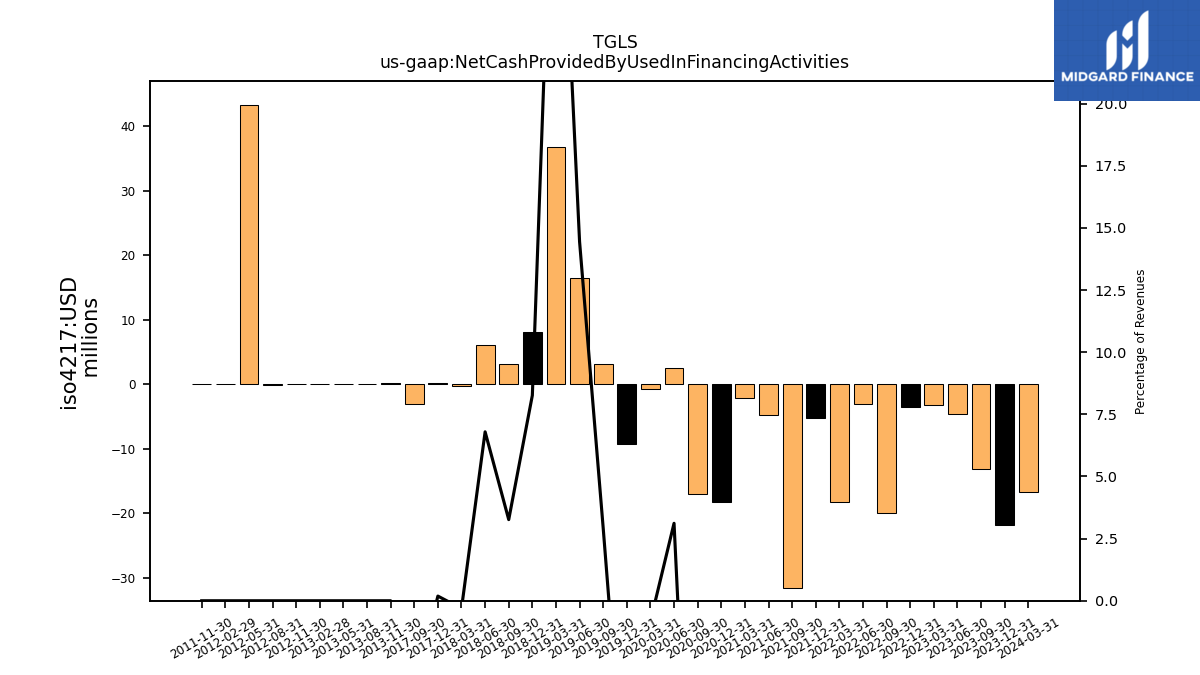
| Net Cash Provided By Used In Financing Activities | -21.84 | -13.10 | -4.54 | -3.29 | -3.56 | -19.91 | -3.00 | -18.32 | -5.27 | -31.67 | -4.78 | -2.07 | -18.30 | -17.07 | 2.55 | -0.72 | -9.21 | 3.17 | 16.45 | 36.85 | 8.09 | 3.17 | 6.05 | -0.27 | 0.16 | -3.06 | NA | NA | NA | NA | NA | NA | NA | NA | NA | NA | NA | NA | NA | NA | NA | NA | NA | NA |
| 2023-12-31 | 2023-09-30 | 2023-06-30 | 2023-03-31 | 2022-12-31 | 2022-09-30 | 2022-06-30 | 2022-03-31 | 2021-12-31 | 2021-09-30 | 2021-06-30 | 2021-03-31 | 2020-12-31 | 2020-09-30 | 2020-06-30 | 2020-03-31 | 2019-12-31 | 2019-09-30 | 2019-06-30 | 2019-03-31 | 2018-12-31 | 2018-09-30 | 2018-06-30 | 2018-03-31 | 2017-12-31 | 2017-09-30 | 2017-06-30 | 2017-03-31 | 2016-12-31 | 2016-09-30 | 2016-06-30 | 2016-03-31 | 2015-12-31 | 2015-09-30 | 2015-06-30 | 2015-03-31 | 2014-12-31 | 2014-09-30 | 2014-06-30 | 2014-03-31 | 2013-12-31 | 2013-09-30 | 2013-06-30 | 2013-03-31 | ||
|---|---|---|---|---|---|---|---|---|---|---|---|---|---|---|---|---|---|---|---|---|---|---|---|---|---|---|---|---|---|---|---|---|---|---|---|---|---|---|---|---|---|---|---|---|---|
| Net Cash Provided By Used In Operating Activities | 44.34 | 51.27 | 0.15 | 43.06 | 49.82 | 29.10 | 35.86 | 27.14 | 23.83 | 32.64 | 31.82 | 28.96 | 20.41 | 26.23 | 24.24 | 0.55 | 19.19 | -1.50 | 13.95 | -4.90 | 4.44 | -3.02 | 3.76 | -10.21 | 5.08 | -3.07 | NA | NA | NA | NA | NA | NA | NA | NA | NA | NA | NA | NA | NA | NA | NA | NA | NA | NA | |
| Net Income Loss | 36.34 | 45.86 | 52.45 | 48.23 | 54.97 | 46.73 | 33.19 | 20.85 | 20.11 | 20.92 | 19.23 | 8.17 | 18.46 | 8.32 | 16.20 | -18.77 | 10.89 | -1.18 | 7.48 | 7.34 | -22.36 | 6.30 | -3.66 | 10.69 | 1.07 | 6.92 | -3.56 | 1.02 | 2.93 | -7.92 | 14.37 | 13.66 | -18.88 | 7.58 | -11.35 | 9.88 | 13.33 | 11.26 | 0.41 | -4.68 | 13.41 | 3.19 | 3.20 | 2.50 | |
| Profit Loss | 36.48 | 46.09 | 52.56 | 48.37 | 55.12 | 46.92 | 33.41 | 20.95 | 19.96 | 20.94 | 19.27 | 8.25 | 18.53 | 8.27 | 16.05 | -18.67 | 10.60 | -1.32 | 7.66 | 7.33 | -4.42 | 6.15 | -3.87 | 10.69 | 1.17 | 7.03 | -3.50 | 1.03 | 2.93 | -8.78 | 14.68 | 14.36 | NA | NA | NA | NA | NA | NA | NA | NA | NA | NA | NA | NA | |
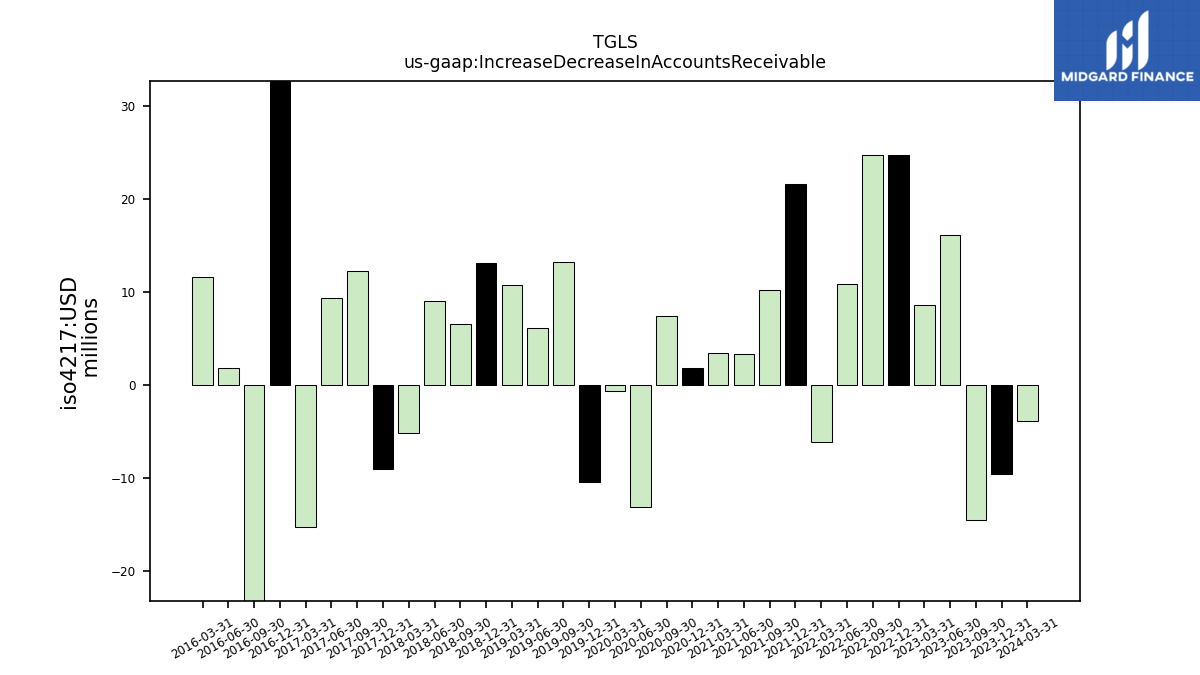
| Increase Decrease In Accounts Receivable | -9.57 | -14.43 | 16.13 | 8.64 | 24.69 | 24.69 | 10.89 | -6.10 | 21.55 | 10.22 | 3.32 | 3.42 | 1.80 | 7.43 | -13.12 | -0.66 | -10.43 | 13.20 | 6.10 | 10.74 | 13.15 | 6.60 | 9.07 | -5.12 | -8.96 | 12.29 | 9.35 | -15.18 | 52.74 | -40.21 | 1.83 | 11.62 | NA | NA | NA | NA | NA | NA | NA | NA | NA | NA | NA | NA | |
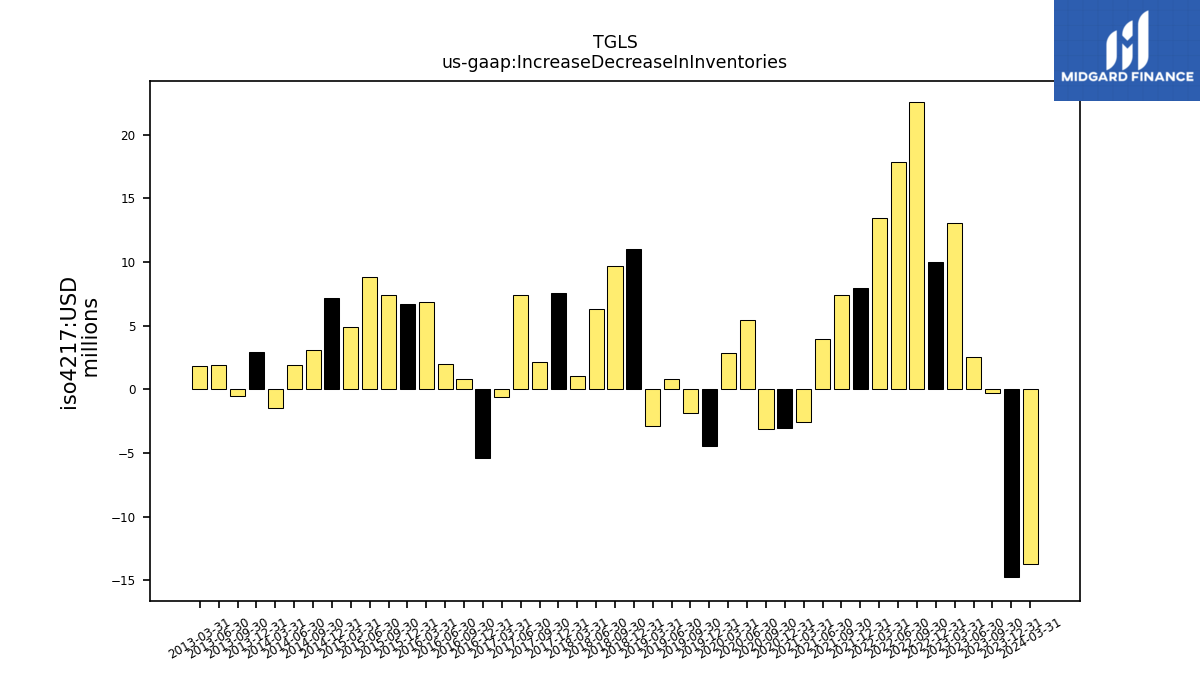
| Increase Decrease In Inventories | -14.75 | -0.31 | 2.54 | 13.05 | 10.03 | 22.57 | 17.89 | 13.45 | 7.99 | 7.38 | 3.95 | -2.56 | -3.01 | -3.12 | 5.40 | 2.85 | -4.48 | -1.86 | 0.79 | -2.87 | 11.04 | 9.70 | 6.27 | 1.06 | 7.52 | 2.11 | 7.41 | -0.60 | -5.39 | 0.81 | 2.01 | 6.88 | 6.69 | 7.41 | 8.79 | 4.93 | 7.16 | 3.10 | 1.91 | -1.48 | 2.94 | -0.56 | 1.92 | 1.85 | |
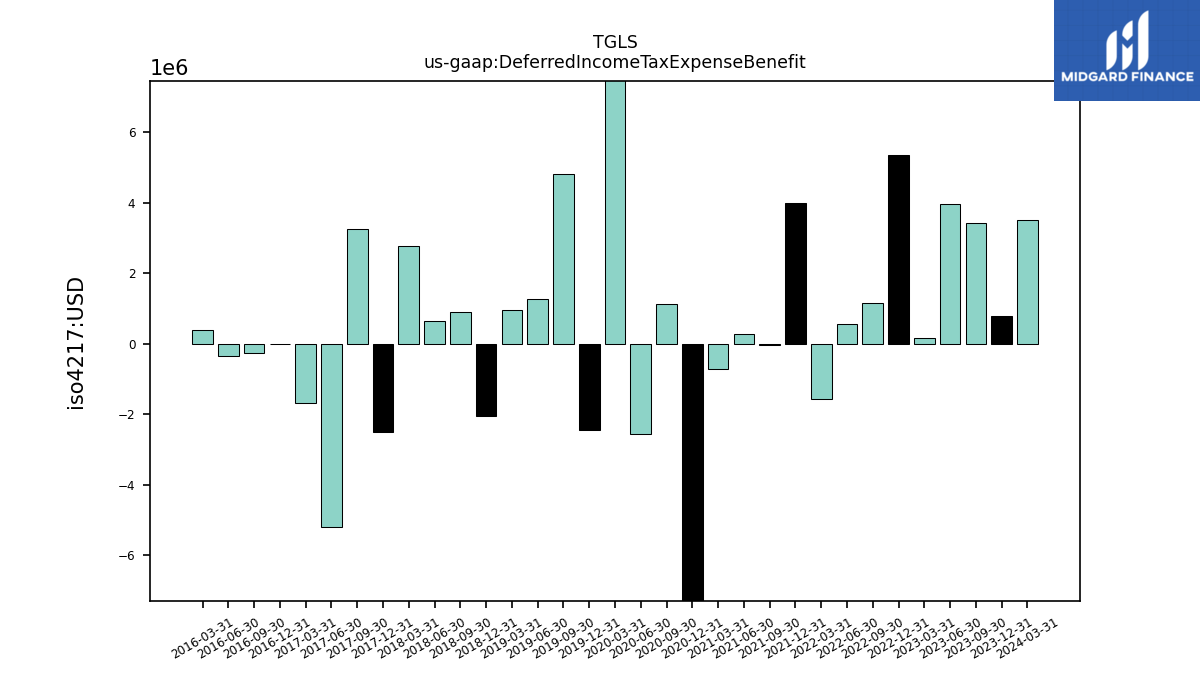
| Deferred Income Tax Expense Benefit | 0.78 | 3.44 | 3.97 | 0.16 | 5.34 | 1.16 | 0.55 | -1.57 | 4.00 | -0.03 | 0.28 | -0.70 | -14.19 | 1.13 | -2.55 | 9.03 | -2.44 | 4.82 | 1.26 | 0.95 | -2.06 | 0.89 | 0.66 | 2.78 | -2.51 | 3.25 | -5.18 | -1.69 | -0.01 | -0.27 | -0.34 | 0.39 | NA | NA | NA | NA | NA | NA | NA | NA | NA | NA | NA | NA |
| 2023-12-31 | 2023-09-30 | 2023-06-30 | 2023-03-31 | 2022-12-31 | 2022-09-30 | 2022-06-30 | 2022-03-31 | 2021-12-31 | 2021-09-30 | 2021-06-30 | 2021-03-31 | 2020-12-31 | 2020-09-30 | 2020-06-30 | 2020-03-31 | 2019-12-31 | 2019-09-30 | 2019-06-30 | 2019-03-31 | 2018-12-31 | 2018-09-30 | 2018-06-30 | 2018-03-31 | 2017-12-31 | 2017-09-30 | 2017-06-30 | 2017-03-31 | 2016-12-31 | 2016-09-30 | 2016-06-30 | 2016-03-31 | 2015-12-31 | 2015-09-30 | 2015-06-30 | 2015-03-31 | 2014-12-31 | 2014-09-30 | 2014-06-30 | 2014-03-31 | 2013-12-31 | 2013-09-30 | 2013-06-30 | 2013-03-31 | ||
|---|---|---|---|---|---|---|---|---|---|---|---|---|---|---|---|---|---|---|---|---|---|---|---|---|---|---|---|---|---|---|---|---|---|---|---|---|---|---|---|---|---|---|---|---|---|
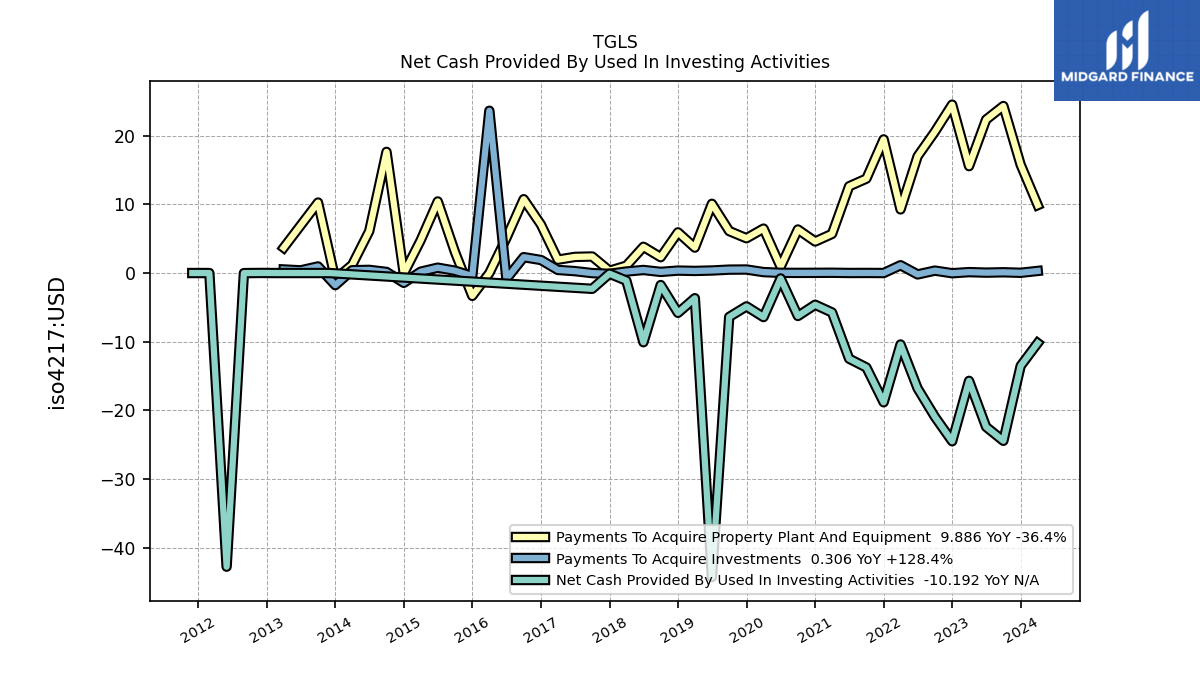
| Net Cash Provided By Used In Investing Activities | -13.52 | -24.42 | -22.39 | -15.69 | -24.48 | -20.92 | -16.79 | -10.39 | -18.81 | -13.74 | -12.47 | -5.74 | -4.61 | -6.25 | -0.79 | -6.41 | -4.85 | -6.38 | -44.26 | -3.66 | -5.80 | -1.75 | -10.07 | -1.11 | -0.10 | -2.30 | NA | NA | NA | NA | NA | NA | NA | NA | NA | NA | NA | NA | NA | NA | NA | NA | NA | NA | |
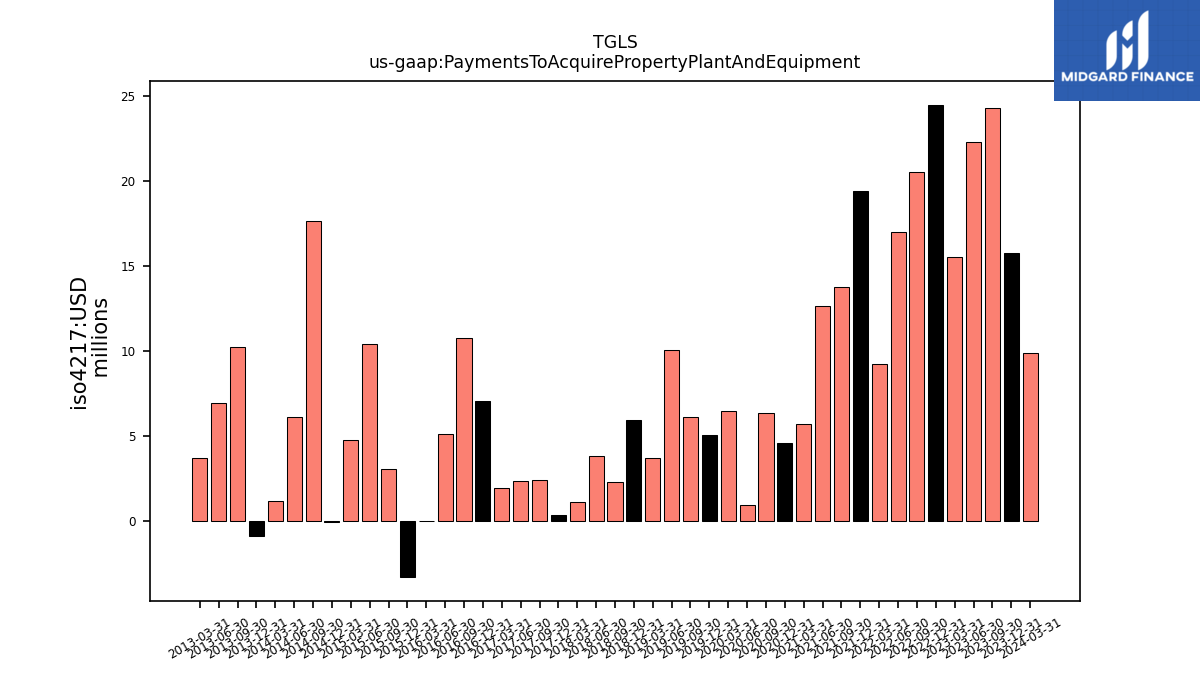
| Payments To Acquire Property Plant And Equipment | 15.77 | 24.31 | 22.33 | 15.55 | 24.51 | 20.57 | 16.99 | 9.26 | 19.45 | 13.74 | 12.63 | 5.70 | 4.59 | 6.34 | 0.93 | 6.47 | 5.07 | 6.11 | 10.08 | 3.70 | 5.92 | 2.31 | 3.82 | 1.07 | 0.33 | 2.41 | 2.35 | 1.95 | 7.04 | 10.75 | 5.11 | 0.00 | -3.33 | 3.04 | 10.42 | 4.77 | -0.07 | 17.64 | 6.10 | 1.19 | -0.90 | 10.26 | 6.95 | 3.69 | |
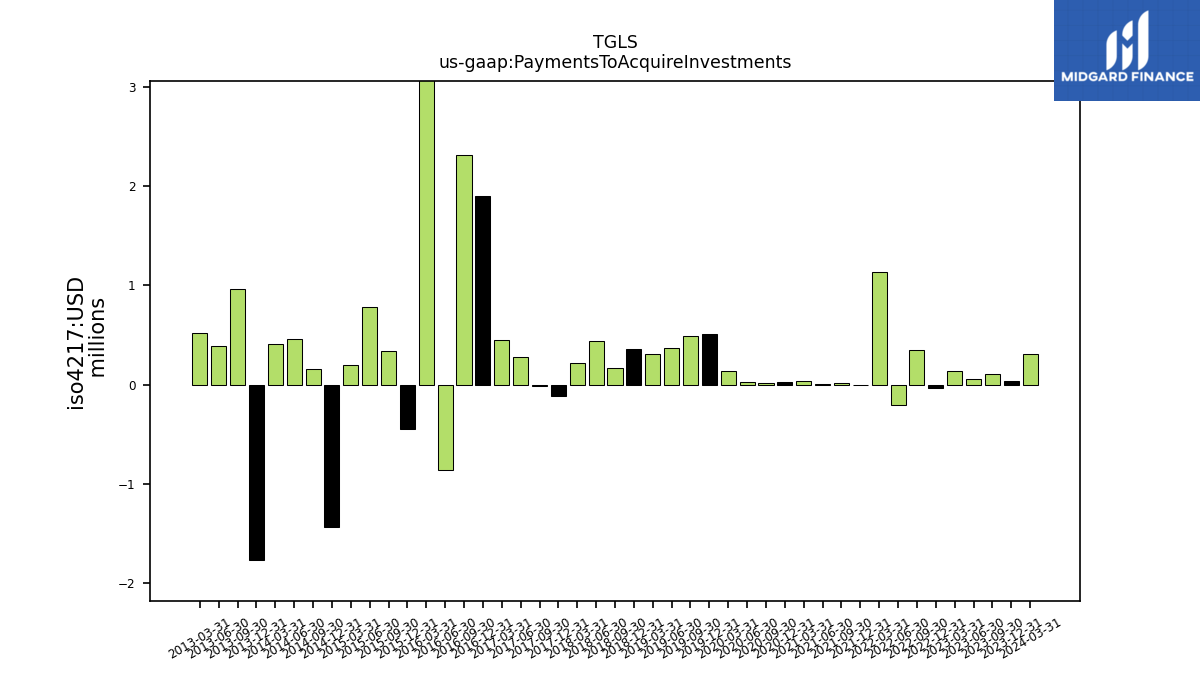
| Payments To Acquire Investments | 0.04 | 0.11 | 0.06 | 0.13 | -0.03 | 0.35 | -0.20 | 1.14 | 0.00 | 0.01 | 0.01 | 0.04 | 0.03 | 0.02 | 0.03 | 0.14 | 0.51 | 0.50 | 0.37 | 0.31 | 0.36 | 0.17 | 0.44 | 0.22 | -0.12 | -0.01 | 0.28 | 0.45 | 1.90 | 2.31 | -0.86 | 23.62 | -0.44 | 0.34 | 0.78 | 0.20 | -1.43 | 0.16 | 0.46 | 0.41 | -1.77 | 0.96 | 0.39 | 0.52 |
| 2023-12-31 | 2023-09-30 | 2023-06-30 | 2023-03-31 | 2022-12-31 | 2022-09-30 | 2022-06-30 | 2022-03-31 | 2021-12-31 | 2021-09-30 | 2021-06-30 | 2021-03-31 | 2020-12-31 | 2020-09-30 | 2020-06-30 | 2020-03-31 | 2019-12-31 | 2019-09-30 | 2019-06-30 | 2019-03-31 | 2018-12-31 | 2018-09-30 | 2018-06-30 | 2018-03-31 | 2017-12-31 | 2017-09-30 | 2017-06-30 | 2017-03-31 | 2016-12-31 | 2016-09-30 | 2016-06-30 | 2016-03-31 | 2015-12-31 | 2015-09-30 | 2015-06-30 | 2015-03-31 | 2014-12-31 | 2014-09-30 | 2014-06-30 | 2014-03-31 | 2013-12-31 | 2013-09-30 | 2013-06-30 | 2013-03-31 | ||
|---|---|---|---|---|---|---|---|---|---|---|---|---|---|---|---|---|---|---|---|---|---|---|---|---|---|---|---|---|---|---|---|---|---|---|---|---|---|---|---|---|---|---|---|---|---|
| Net Cash Provided By Used In Financing Activities | -21.84 | -13.10 | -4.54 | -3.29 | -3.56 | -19.91 | -3.00 | -18.32 | -5.27 | -31.67 | -4.78 | -2.07 | -18.30 | -17.07 | 2.55 | -0.72 | -9.21 | 3.17 | 16.45 | 36.85 | 8.09 | 3.17 | 6.05 | -0.27 | 0.16 | -3.06 | NA | NA | NA | NA | NA | NA | NA | NA | NA | NA | NA | NA | NA | NA | NA | NA | NA | NA | |
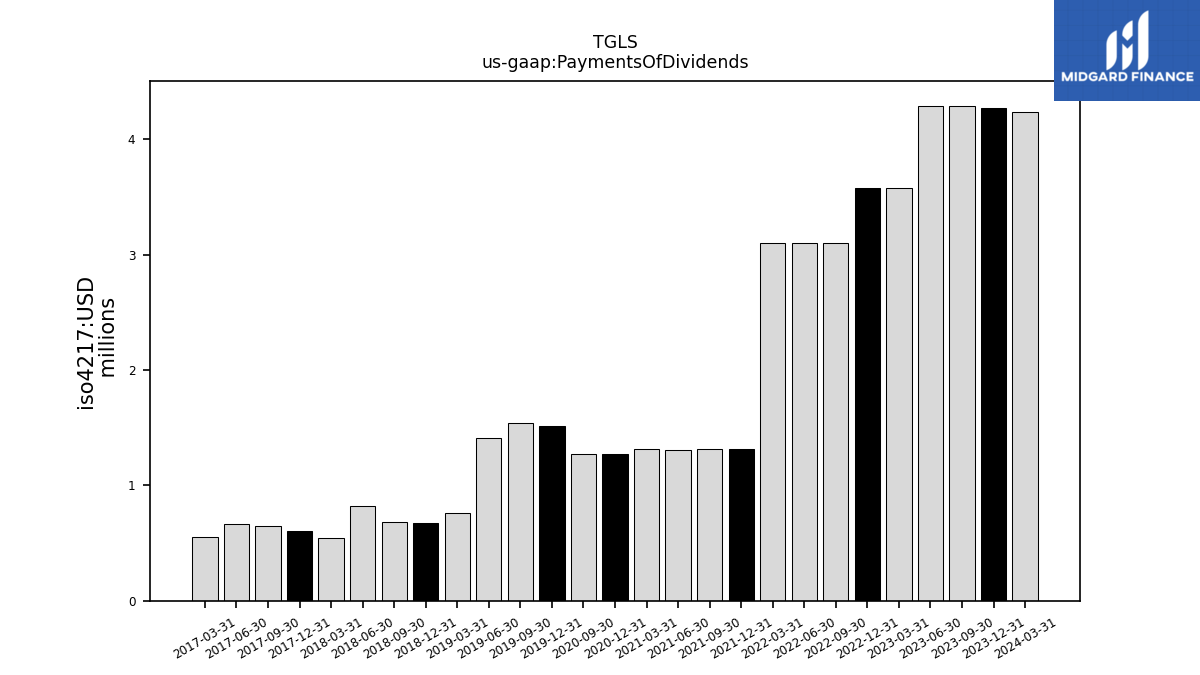
| Payments Of Dividends | 4.27 | 4.29 | 4.29 | 3.58 | 3.58 | 3.10 | 3.10 | 3.10 | 1.31 | 1.31 | 1.31 | 1.31 | 1.27 | 1.27 | NA | NA | 1.51 | 1.54 | 1.41 | 0.76 | 0.67 | 0.69 | 0.82 | 0.54 | 0.61 | 0.65 | 0.67 | 0.55 | NA | NA | NA | NA | NA | NA | NA | NA | NA | NA | NA | NA | NA | NA | NA | NA |
| 2023-12-31 | 2023-09-30 | 2023-06-30 | 2023-03-31 | 2022-12-31 | 2022-09-30 | 2022-06-30 | 2022-03-31 | 2021-12-31 | 2021-09-30 | 2021-06-30 | 2021-03-31 | 2020-12-31 | 2020-09-30 | 2020-06-30 | 2020-03-31 | 2019-12-31 | 2019-09-30 | 2019-06-30 | 2019-03-31 | 2018-12-31 | 2018-09-30 | 2018-06-30 | 2018-03-31 | 2017-12-31 | 2017-09-30 | 2017-06-30 | 2017-03-31 | 2016-12-31 | 2016-09-30 | 2016-06-30 | 2016-03-31 | 2015-12-31 | 2015-09-30 | 2015-06-30 | 2015-03-31 | 2014-12-31 | 2014-09-30 | 2014-06-30 | 2014-03-31 | 2013-12-31 | 2013-09-30 | 2013-06-30 | 2013-03-31 | ||
|---|---|---|---|---|---|---|---|---|---|---|---|---|---|---|---|---|---|---|---|---|---|---|---|---|---|---|---|---|---|---|---|---|---|---|---|---|---|---|---|---|---|---|---|---|---|
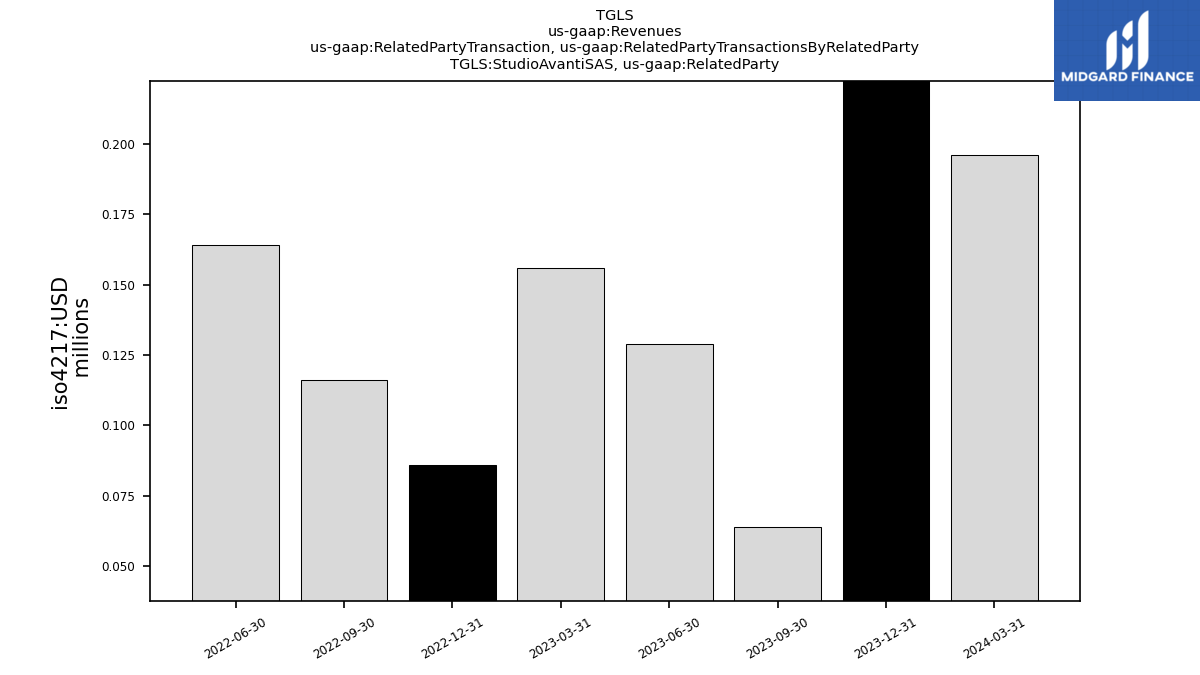
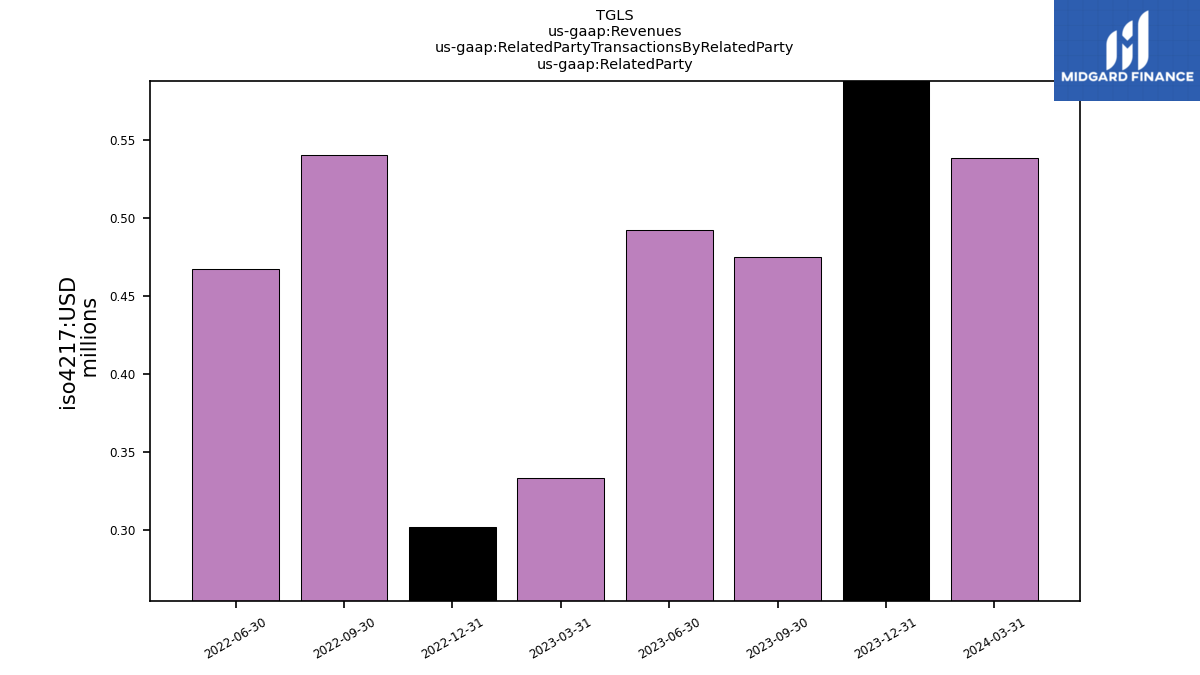
| Revenues | 194.60 | 210.74 | 225.28 | 202.64 | 211.12 | 201.78 | 169.12 | 134.55 | 133.78 | 130.41 | 121.71 | 110.88 | 102.37 | 103.31 | 81.94 | 87.30 | 101.39 | 108.47 | 113.88 | 107.17 | 97.86 | 96.99 | 88.97 | 87.16 | 84.28 | 83.38 | 80.98 | 65.82 | 80.28 | 80.03 | 77.51 | 60.90 | 65.84 | 62.89 | 58.05 | 52.04 | 44.22 | 53.45 | 51.94 | 47.84 | 53.83 | 45.50 | 44.33 | 39.63 | |
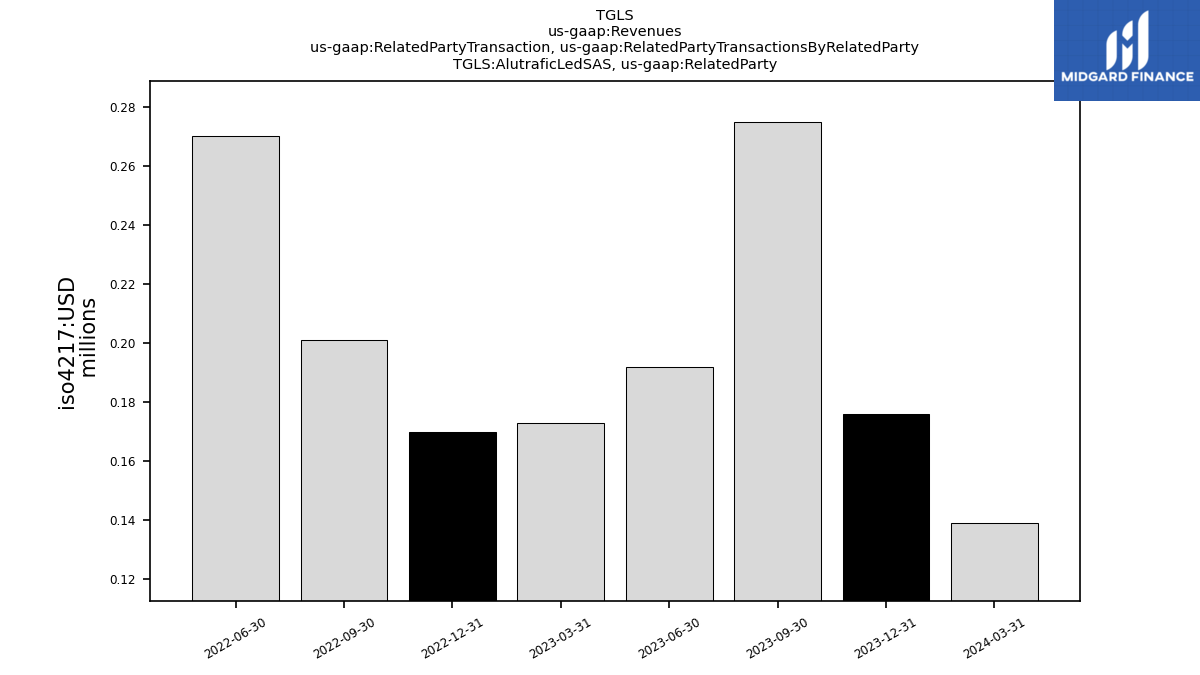
| Alutrafic Led S A S, Related Party | 0.18 | 0.28 | 0.19 | NA | 0.17 | 0.20 | 0.27 | NA | NA | NA | NA | NA | NA | NA | NA | NA | NA | NA | NA | NA | NA | NA | NA | NA | NA | NA | NA | NA | NA | NA | NA | NA | NA | NA | NA | NA | NA | NA | NA | NA | NA | NA | NA | NA | |
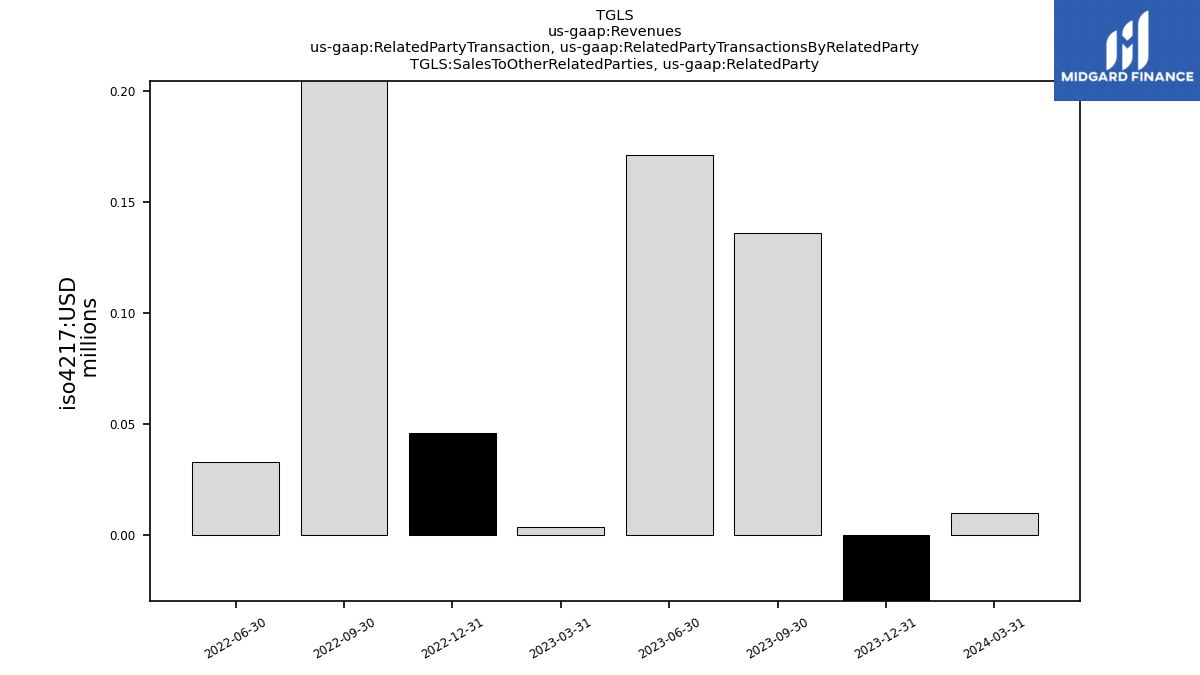
| Sales To Other Related Parties, Related Party | -0.09 | 0.14 | 0.17 | NA | 0.05 | 0.22 | 0.03 | NA | NA | NA | NA | NA | NA | NA | NA | NA | NA | NA | NA | NA | NA | NA | NA | NA | NA | NA | NA | NA | NA | NA | NA | NA | NA | NA | NA | NA | NA | NA | NA | NA | NA | NA | NA | NA | |
| Studio Avanti S A S, Related Party | 0.24 | 0.06 | 0.13 | NA | 0.09 | 0.12 | 0.16 | NA | NA | NA | NA | NA | NA | NA | NA | NA | NA | NA | NA | NA | NA | NA | NA | NA | NA | NA | NA | NA | NA | NA | NA | NA | NA | NA | NA | NA | NA | NA | NA | NA | NA | NA | NA | NA | |
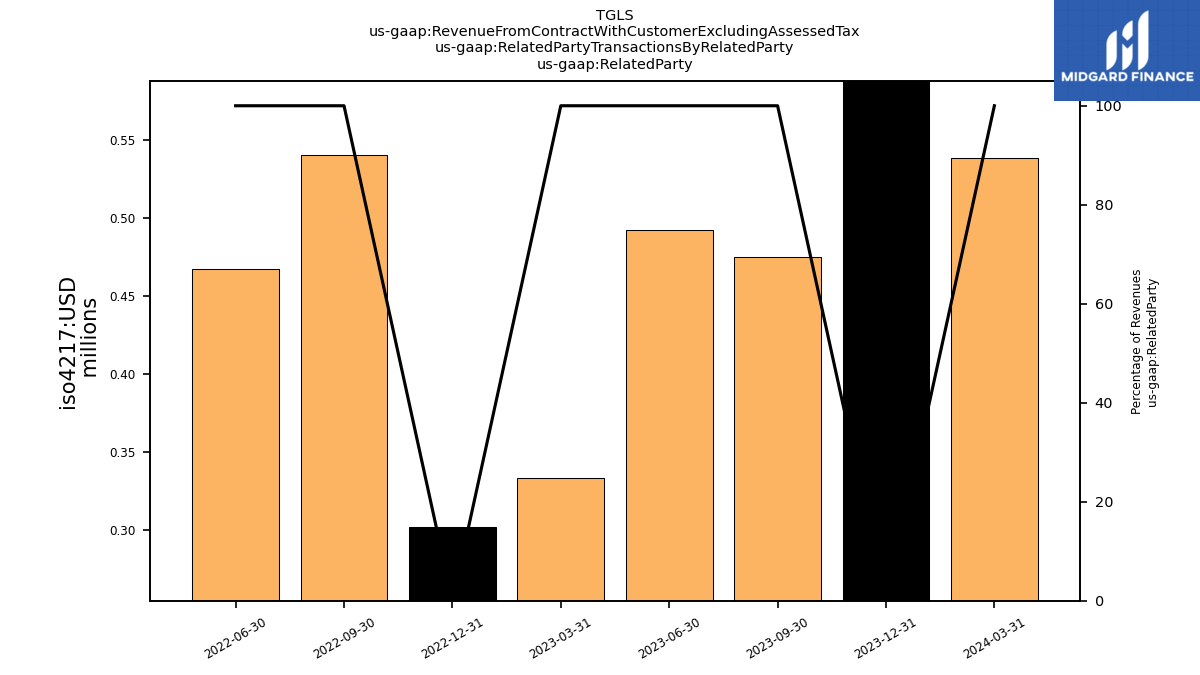
| Related Party | 1.09 | 0.47 | 0.49 | NA | 0.30 | 0.54 | 0.47 | NA | NA | NA | NA | NA | NA | NA | NA | NA | NA | NA | NA | NA | NA | NA | NA | NA | NA | NA | NA | NA | NA | NA | NA | NA | NA | NA | NA | NA | NA | NA | NA | NA | NA | NA | NA | NA | |
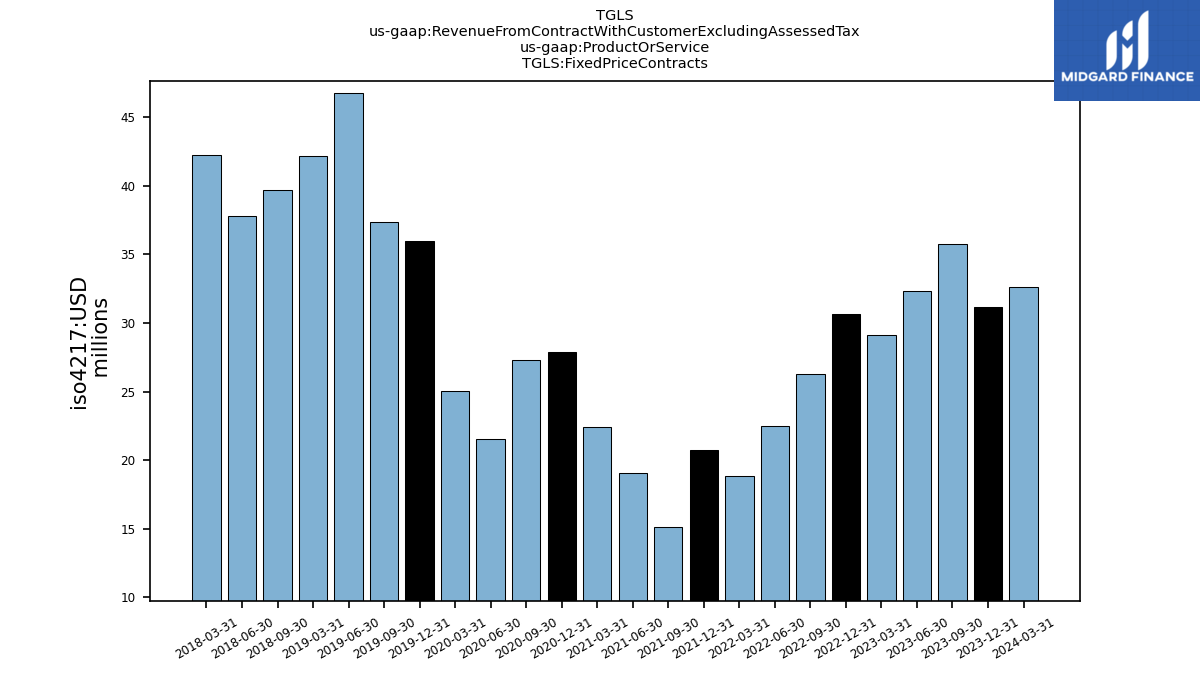
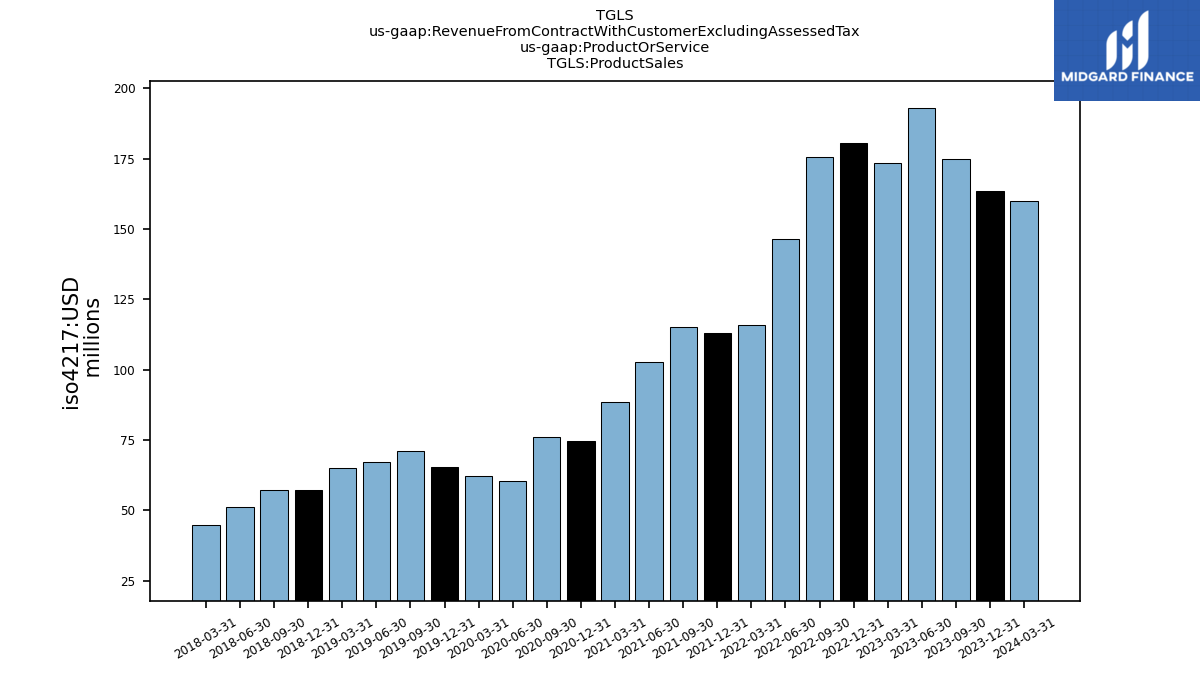
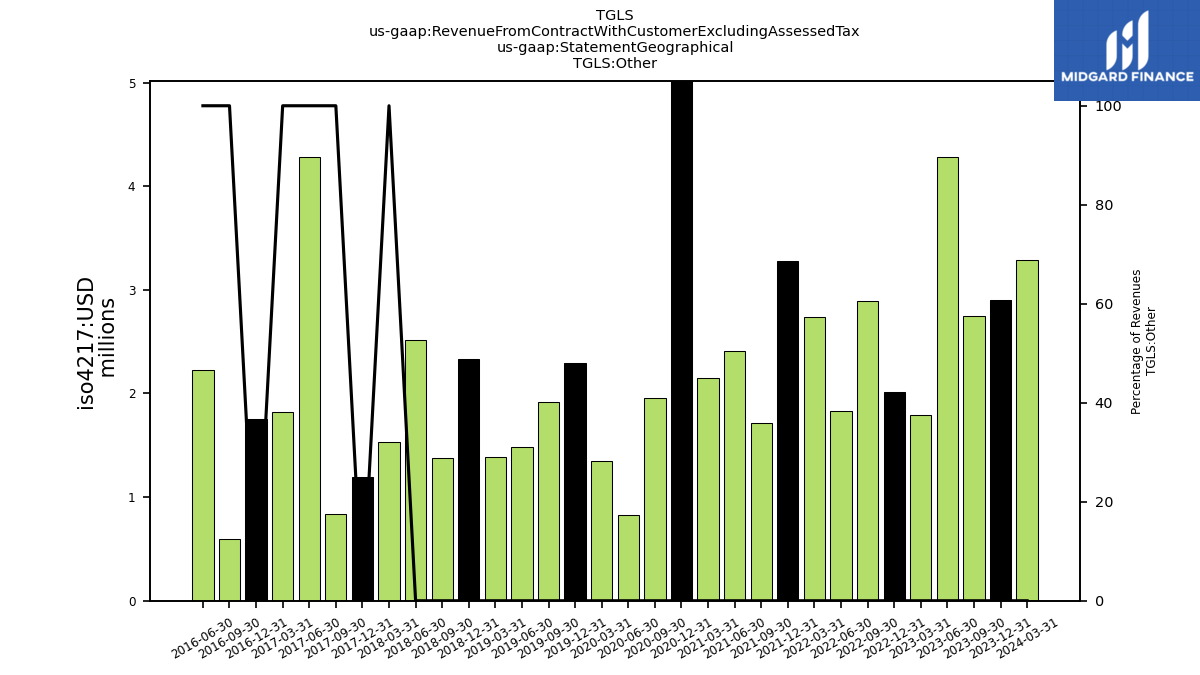
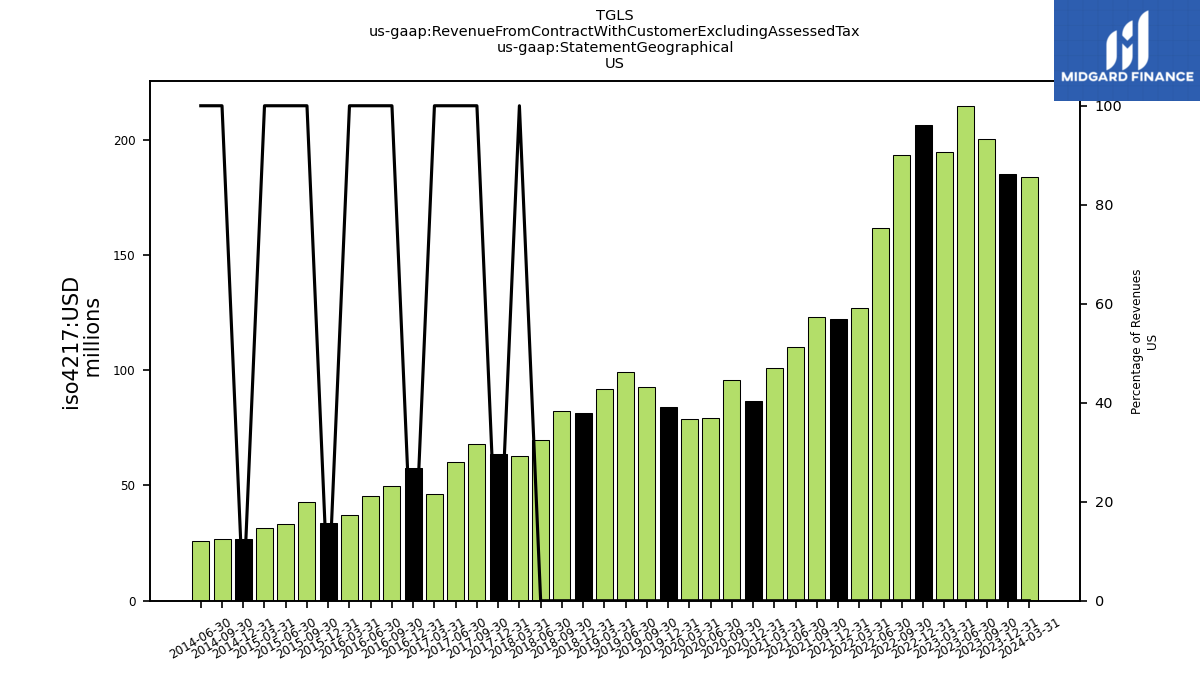
| Revenue From Contract With Customer Excluding Assessed Tax | 194.60 | 210.74 | 225.28 | 202.64 | 211.12 | 201.78 | 169.12 | 134.55 | 133.78 | 130.41 | 121.71 | 110.88 | 102.37 | 103.31 | 81.94 | 87.30 | 101.39 | 108.47 | 113.88 | 107.17 | 97.86 | 96.99 | 88.97 | 87.16 | 84.28 | 83.38 | 80.98 | 65.82 | 80.28 | 80.03 | 77.51 | 60.90 | 65.84 | 62.89 | 58.05 | 52.04 | 44.22 | 53.45 | 51.94 | 47.84 | 53.83 | 45.50 | 44.33 | 39.63 | |
| Fixed Price Contracts | 31.13 | 35.73 | 32.33 | 29.09 | 30.65 | 26.27 | 22.52 | 18.85 | 20.75 | 15.17 | 19.06 | 22.43 | 27.87 | 27.31 | 21.53 | 25.03 | 35.99 | 37.35 | 46.72 | 42.18 | NA | 39.70 | 37.81 | 42.22 | NA | NA | NA | NA | NA | NA | NA | NA | NA | NA | NA | NA | NA | NA | NA | NA | NA | NA | NA | NA | |
| Product Sales | 163.47 | 175.01 | 192.95 | 173.55 | 180.47 | 175.51 | 146.60 | 115.70 | 113.03 | 115.24 | 102.65 | 88.45 | 74.50 | 76.00 | 60.41 | 62.27 | 65.40 | 71.12 | 67.16 | 64.99 | 57.09 | 57.29 | 51.16 | 44.94 | NA | NA | NA | NA | NA | NA | NA | NA | NA | NA | NA | NA | NA | NA | NA | NA | NA | NA | NA | NA | |
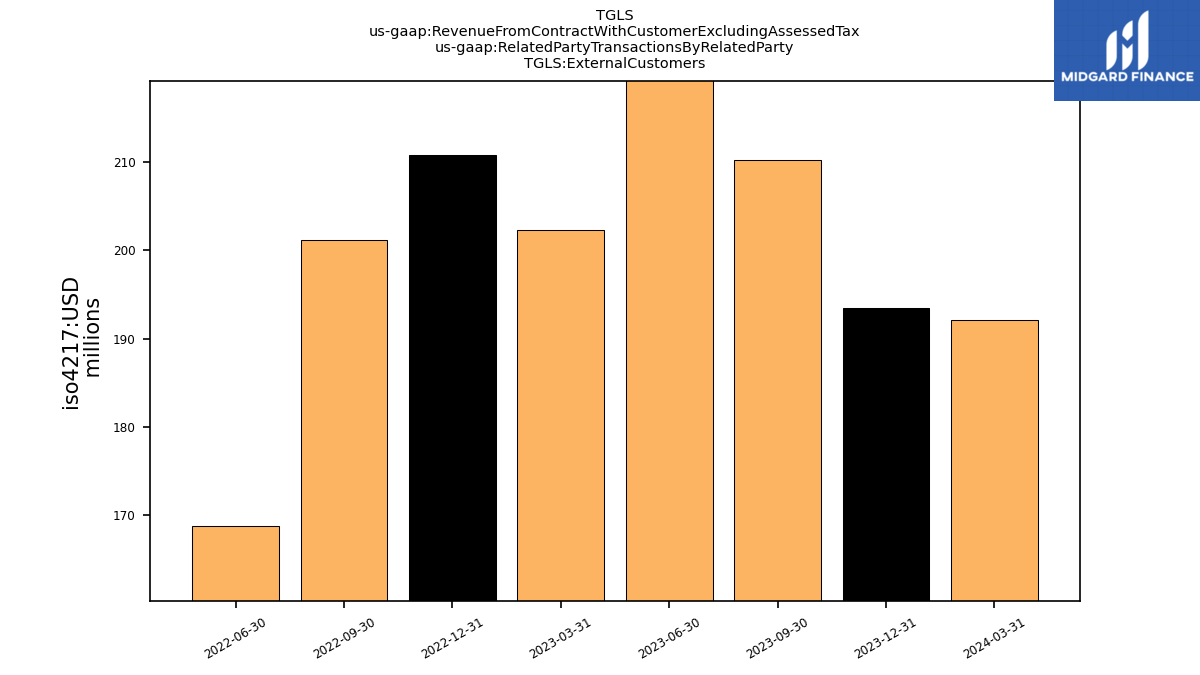
| External Customers | 193.52 | 210.27 | 224.79 | NA | 210.82 | 201.24 | 168.66 | NA | NA | NA | NA | NA | NA | NA | NA | NA | NA | NA | NA | NA | NA | NA | NA | NA | NA | NA | NA | NA | NA | NA | NA | NA | NA | NA | NA | NA | NA | NA | NA | NA | NA | NA | NA | NA | |
| Related Party | 1.09 | 0.47 | 0.49 | NA | 0.30 | 0.54 | 0.47 | NA | NA | NA | NA | NA | NA | NA | NA | NA | NA | NA | NA | NA | NA | NA | NA | NA | NA | NA | NA | NA | NA | NA | NA | NA | NA | NA | NA | NA | NA | NA | NA | NA | NA | NA | NA | NA | |
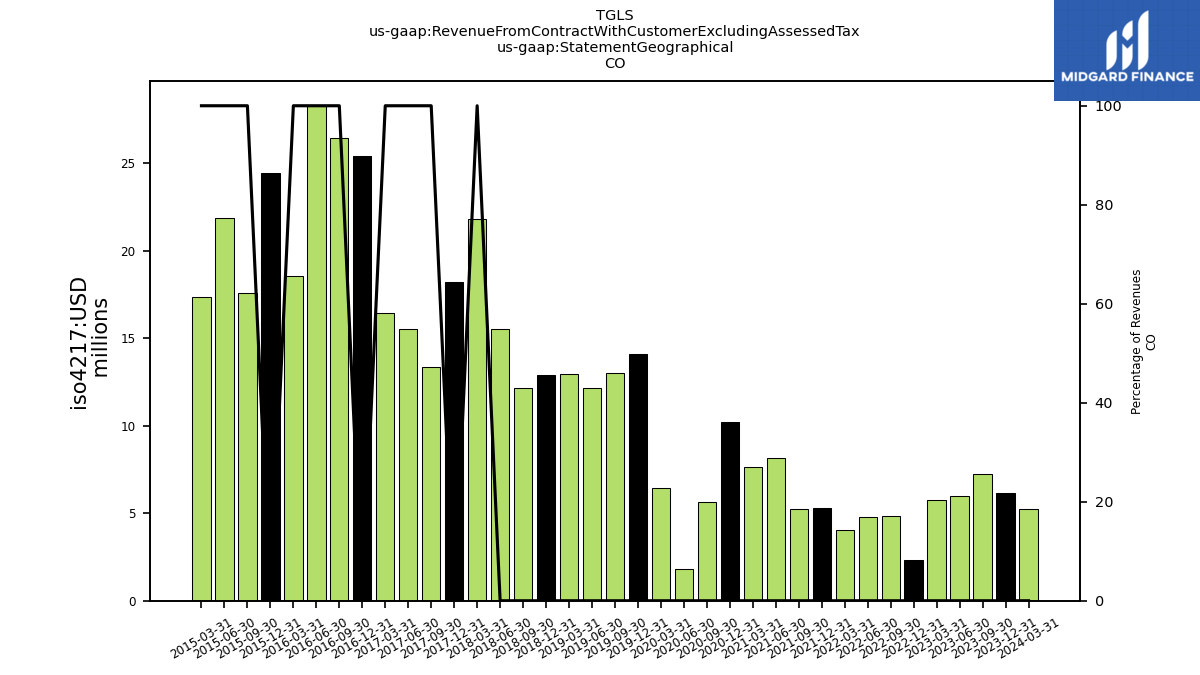
| 6.18 | 7.22 | 5.96 | 5.74 | 2.34 | 4.82 | 4.82 | 4.03 | 5.31 | 5.23 | 8.17 | 7.67 | 10.24 | 5.65 | 1.82 | 6.47 | 14.11 | 13.04 | 12.16 | 12.96 | 12.93 | 12.14 | 15.56 | 21.82 | 18.25 | 13.34 | 15.53 | 16.43 | 25.42 | 26.46 | 28.30 | 18.58 | 24.45 | 17.59 | 21.87 | 17.38 | NA | NA | NA | NA | NA | NA | NA | NA | ||
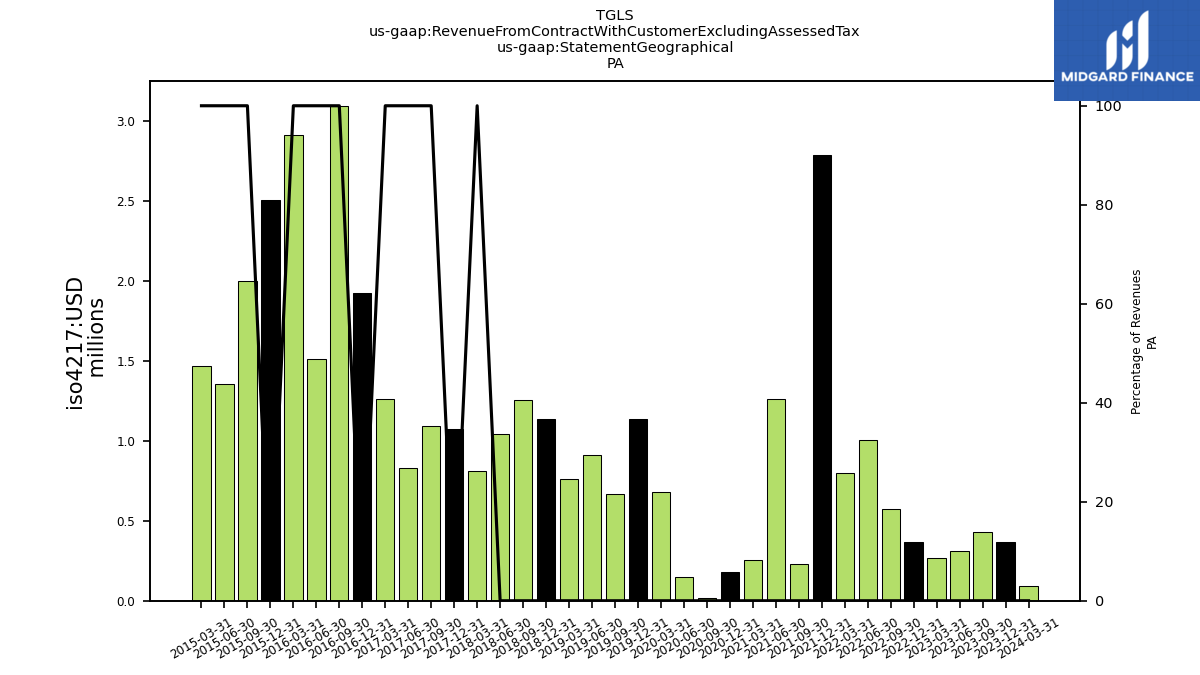
| 0.36 | 0.43 | 0.31 | 0.27 | 0.36 | 0.57 | 1.00 | 0.80 | 2.79 | 0.23 | 1.26 | 0.26 | 0.18 | 0.02 | 0.15 | 0.68 | 1.14 | 0.67 | 0.91 | 0.76 | 1.14 | 1.25 | 1.04 | 0.81 | 1.07 | 1.09 | 0.83 | 1.26 | 1.92 | 3.10 | 1.51 | 2.91 | 2.51 | 2.00 | 1.35 | 1.47 | NA | NA | NA | NA | NA | NA | NA | NA | ||
| Other | 2.90 | 2.75 | 4.28 | 1.79 | 2.02 | 2.89 | 1.83 | 2.74 | 3.28 | 1.71 | 2.41 | 2.15 | 5.15 | 1.96 | 0.82 | 1.35 | 2.30 | 1.92 | 1.48 | 1.38 | 2.33 | 1.38 | 2.52 | 1.53 | 1.20 | 0.83 | 4.28 | 1.82 | 1.76 | 0.60 | 2.23 | NA | NA | NA | NA | NA | NA | NA | NA | NA | NA | NA | NA | NA | |
| US | 185.15 | 200.35 | 214.72 | 194.84 | 206.39 | 193.50 | 161.48 | 126.98 | 122.40 | 123.24 | 109.88 | 100.81 | 86.81 | 95.68 | 79.15 | 78.80 | 83.85 | 92.85 | 99.33 | 92.06 | 81.47 | 82.22 | 69.85 | 62.99 | 63.76 | 68.12 | 60.34 | 46.31 | 57.48 | 49.87 | 45.47 | 37.17 | 33.84 | 42.94 | 33.34 | 31.68 | 26.89 | 26.81 | 26.04 | NA | NA | NA | NA | NA |