
| 2023-12-31 | 2023-09-30 | 2023-06-30 | 2023-03-31 | 2022-12-31 | 2022-09-30 | 2022-06-30 | 2022-03-31 | 2021-12-31 | 2021-09-30 | 2021-06-30 | 2021-03-31 | 2020-12-31 | 2020-09-30 | 2020-06-30 | 2020-03-31 | 2019-12-31 | 2019-09-30 | 2019-06-30 | 2019-03-31 | 2018-12-31 | 2018-09-30 | 2018-06-30 | 2018-03-31 | 2017-12-31 | 2017-09-30 | 2017-06-30 | ||
|---|---|---|---|---|---|---|---|---|---|---|---|---|---|---|---|---|---|---|---|---|---|---|---|---|---|---|---|---|
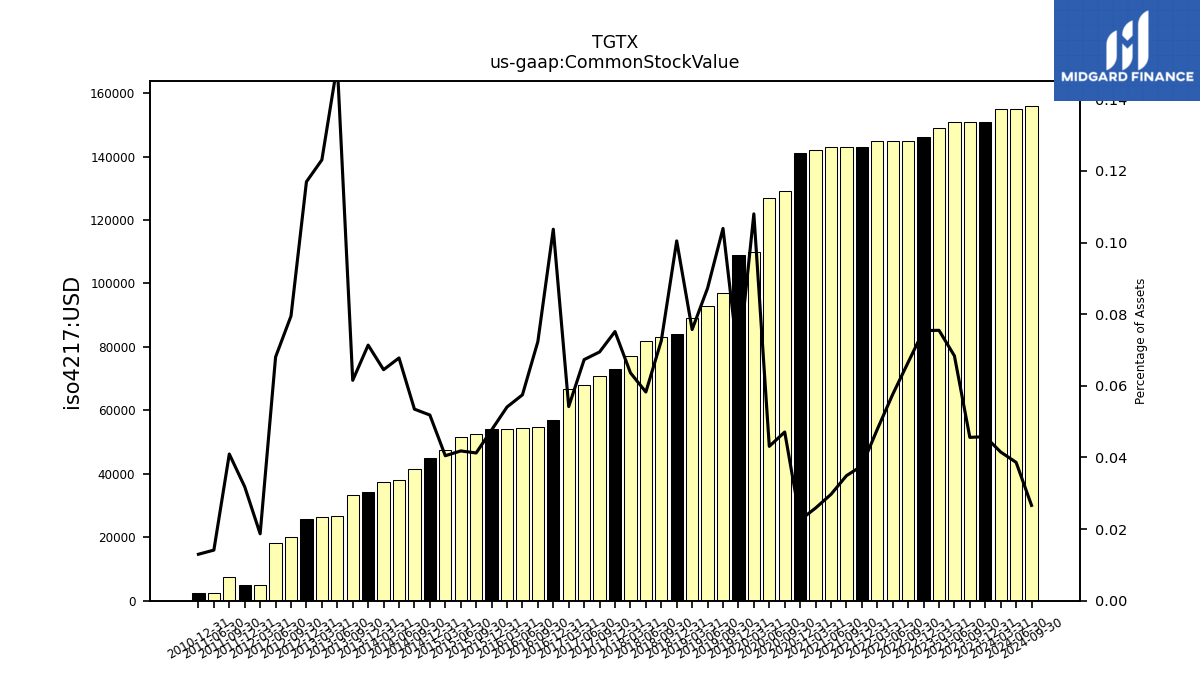
| Common Stock Value | 0.15 | 0.15 | 0.15 | 0.15 | 0.15 | 0.14 | 0.14 | 0.14 | 0.14 | 0.14 | 0.14 | 0.14 | 0.14 | 0.13 | 0.13 | 0.11 | 0.11 | 0.10 | 0.09 | 0.09 | 0.08 | 0.08 | 0.08 | 0.08 | 0.07 | 0.07 | 0.07 |
| 2023-12-31 | 2023-09-30 | 2023-06-30 | 2023-03-31 | 2022-12-31 | 2022-09-30 | 2022-06-30 | 2022-03-31 | 2021-12-31 | 2021-09-30 | 2021-06-30 | 2021-03-31 | 2020-12-31 | 2020-09-30 | 2020-06-30 | 2020-03-31 | 2019-12-31 | 2019-09-30 | 2019-06-30 | 2019-03-31 | 2018-12-31 | 2018-09-30 | 2018-06-30 | 2018-03-31 | 2017-12-31 | 2017-09-30 | 2017-06-30 | ||
|---|---|---|---|---|---|---|---|---|---|---|---|---|---|---|---|---|---|---|---|---|---|---|---|---|---|---|---|---|
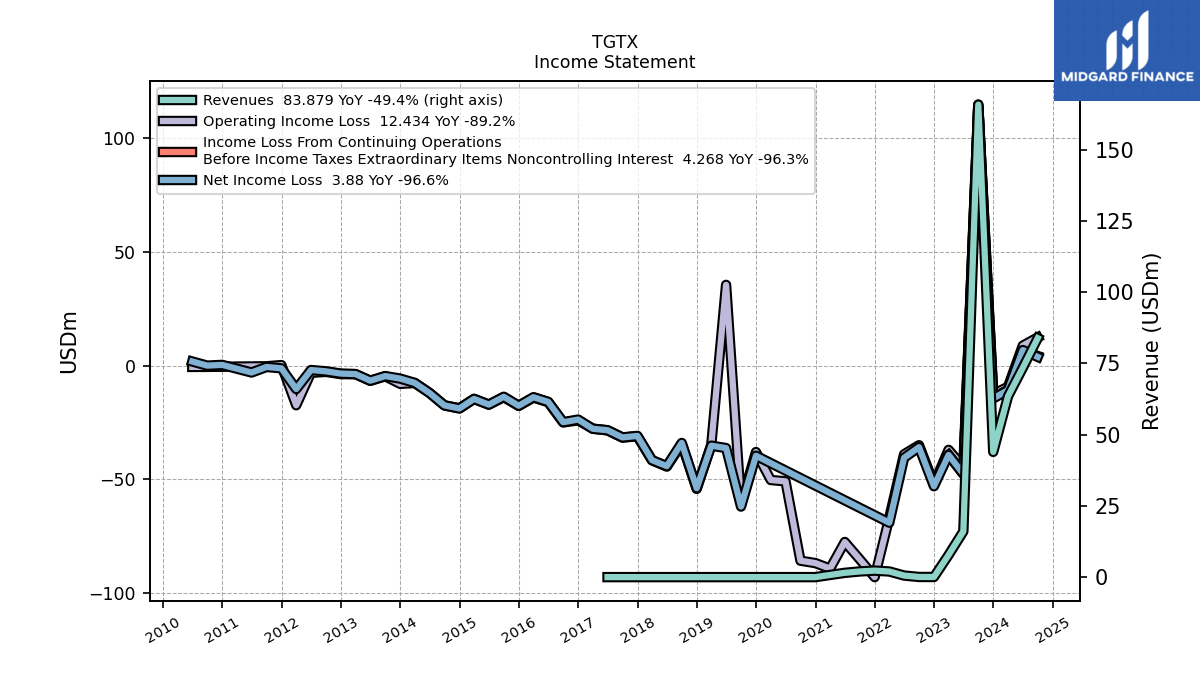
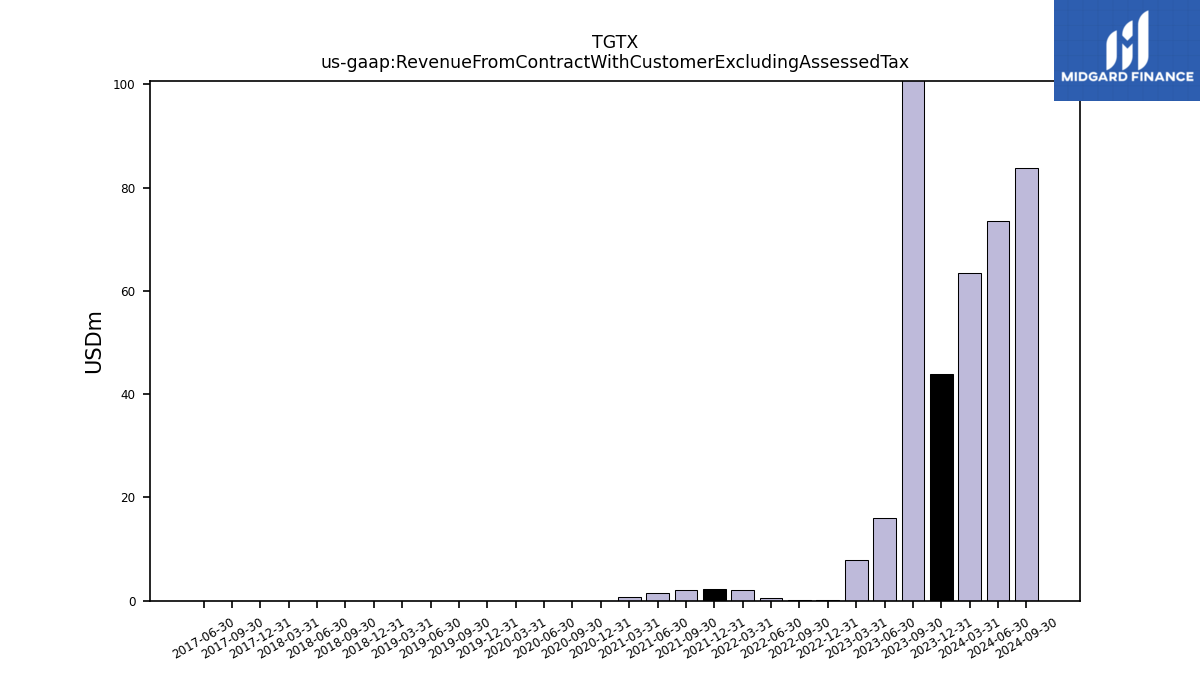
| Revenue From Contract With Customer Excluding Assessed Tax | 43.97 | 165.81 | 16.07 | 7.80 | 0.08 | 0.09 | 0.59 | 2.02 | 2.32 | 2.03 | 1.54 | 0.79 | 0.04 | 0.04 | 0.04 | 0.04 | 0.04 | 0.04 | 0.04 | 0.04 | 0.04 | 0.04 | 0.04 | 0.04 | 0.04 | 0.04 | 0.04 | |
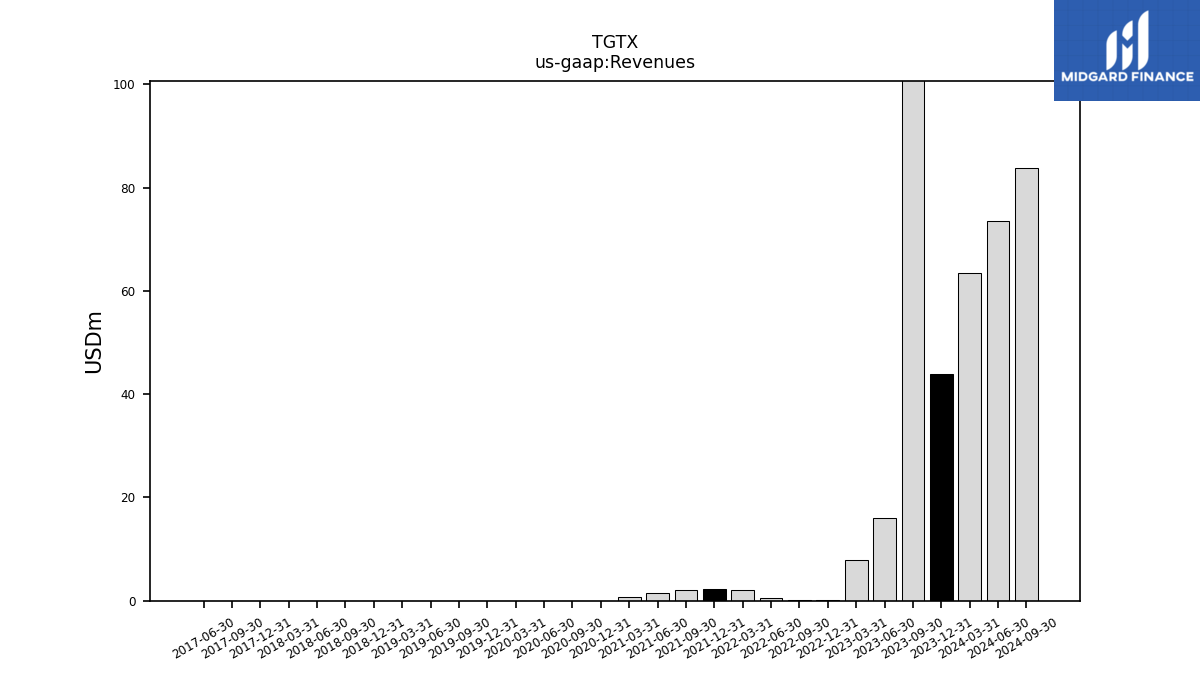
| Revenues | 43.97 | 165.81 | 16.07 | 7.80 | 0.08 | 0.09 | 0.59 | 2.02 | 2.32 | 2.03 | 1.54 | 0.79 | 0.04 | 0.04 | 0.04 | 0.04 | 0.04 | 0.04 | 0.04 | 0.04 | 0.04 | 0.04 | 0.04 | 0.04 | 0.04 | 0.04 | 0.04 | |
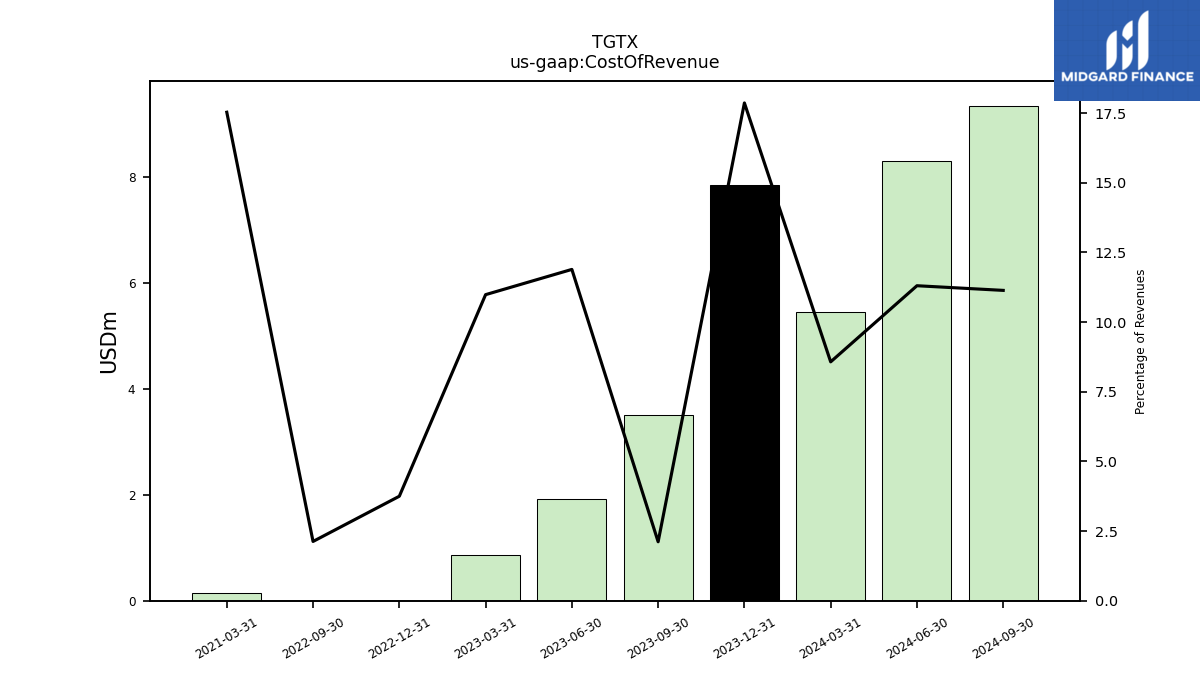
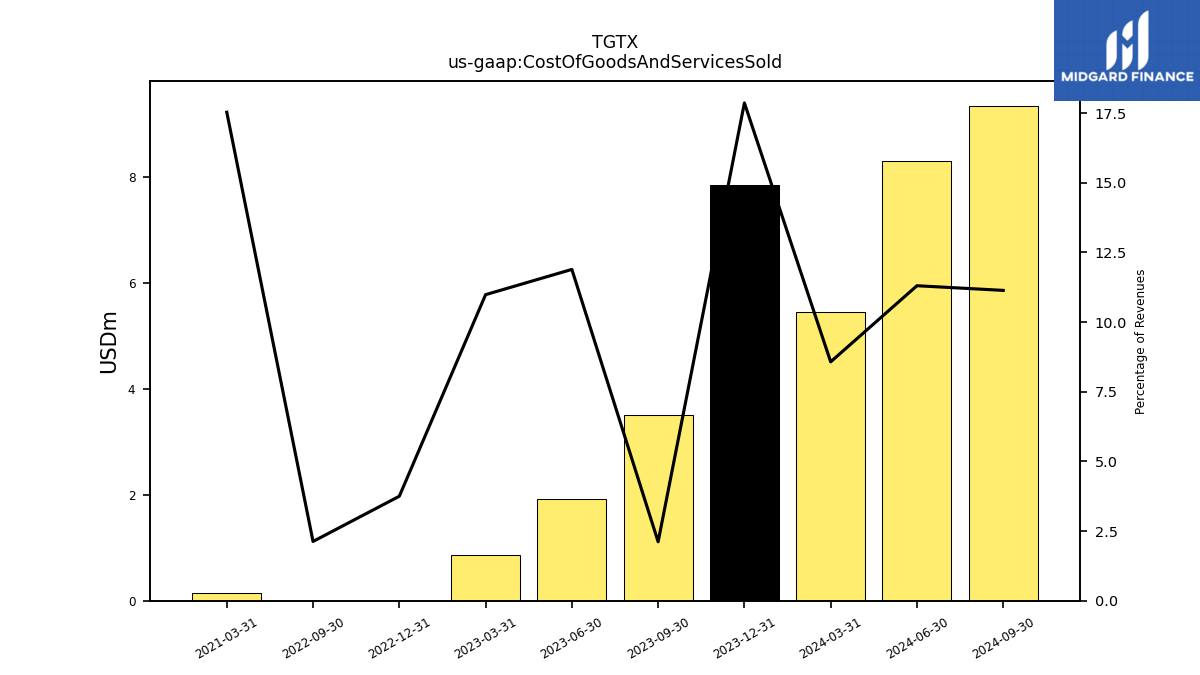
| Cost Of Revenue | 7.85 | 3.51 | NA | NA | 0.00 | 0.00 | NA | NA | NA | NA | NA | 0.14 | NA | NA | NA | NA | NA | NA | NA | NA | NA | NA | NA | NA | NA | NA | NA | |
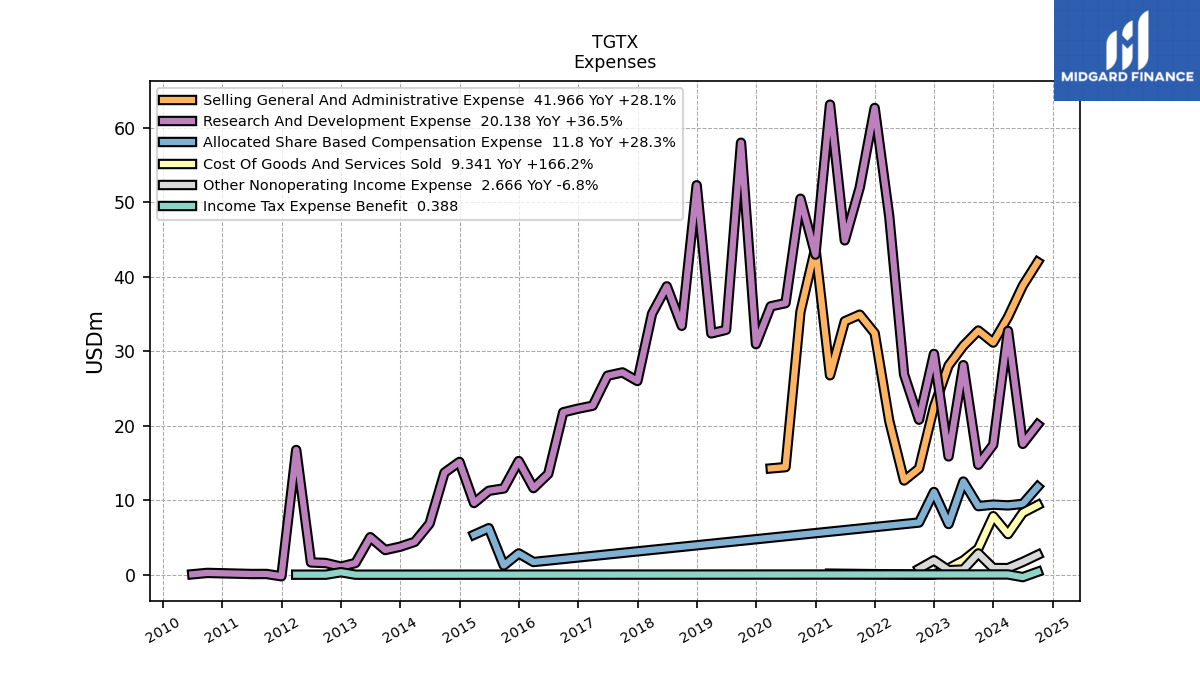
| Cost Of Goods And Services Sold | 7.85 | 3.51 | NA | NA | 0.00 | 0.00 | NA | NA | NA | NA | NA | 0.14 | NA | NA | NA | NA | NA | NA | NA | NA | NA | NA | NA | NA | NA | NA | NA | |
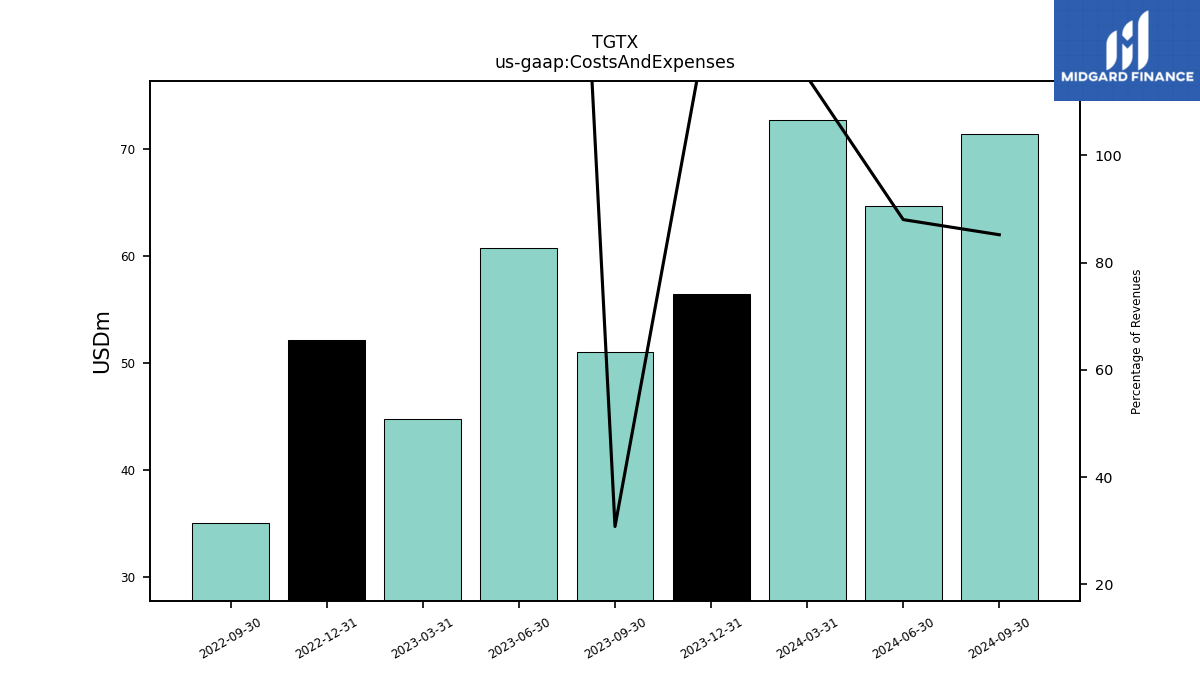
| Costs And Expenses | 56.46 | 51.03 | NA | NA | 52.14 | 35.06 | NA | NA | NA | NA | NA | NA | NA | NA | NA | NA | NA | NA | NA | NA | NA | NA | NA | NA | NA | NA | NA | |
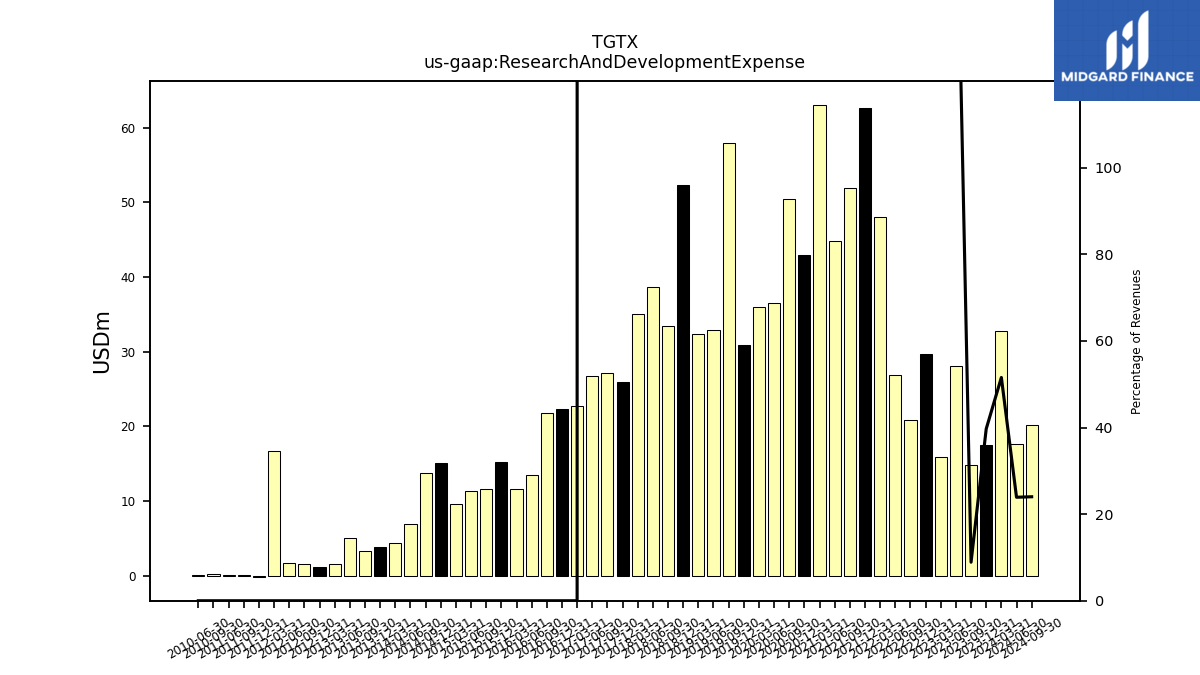
| Research And Development Expense | 17.45 | 14.75 | 28.12 | 15.87 | 29.64 | 20.80 | 26.87 | 48.04 | 62.65 | 51.97 | 44.87 | 63.09 | 42.96 | 50.46 | 36.45 | 36.02 | 30.94 | 57.98 | 32.87 | 32.38 | 52.28 | 33.40 | 38.70 | 35.02 | 26.00 | 27.15 | 26.71 | |
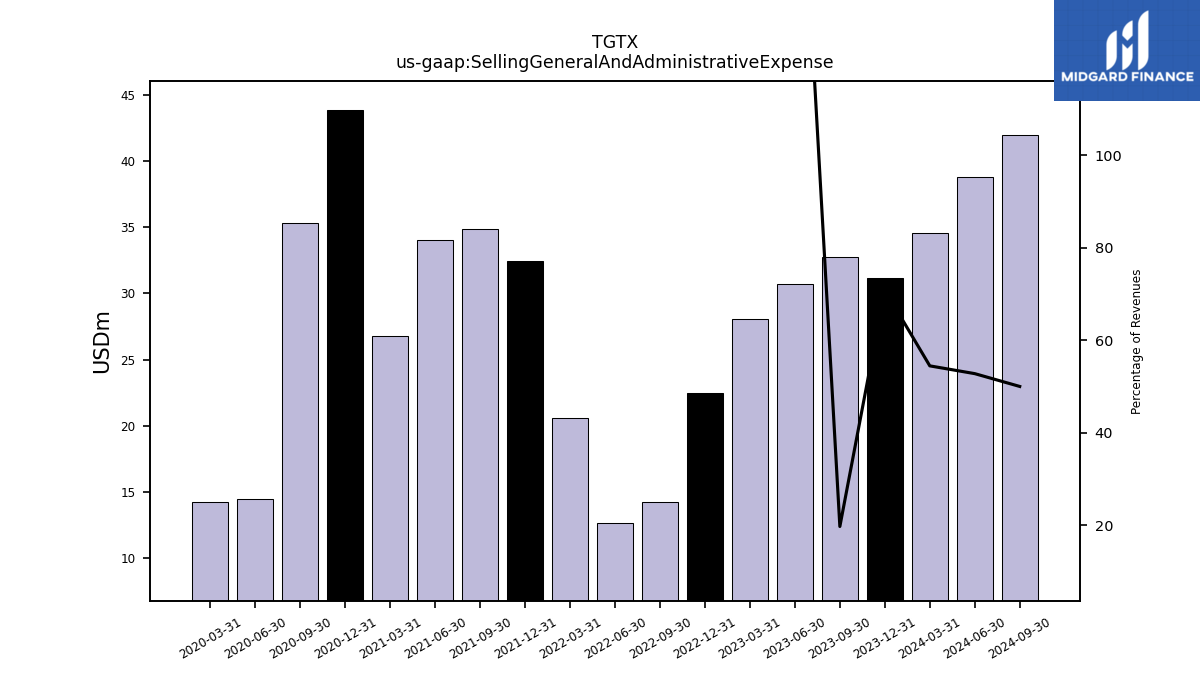
| Selling General And Administrative Expense | 31.15 | 32.77 | 30.71 | 28.07 | 22.50 | 14.25 | 12.64 | 20.61 | 32.41 | 34.90 | 34.02 | 26.76 | 43.86 | 35.30 | 14.43 | 14.26 | NA | NA | NA | NA | NA | NA | NA | NA | NA | NA | NA | |
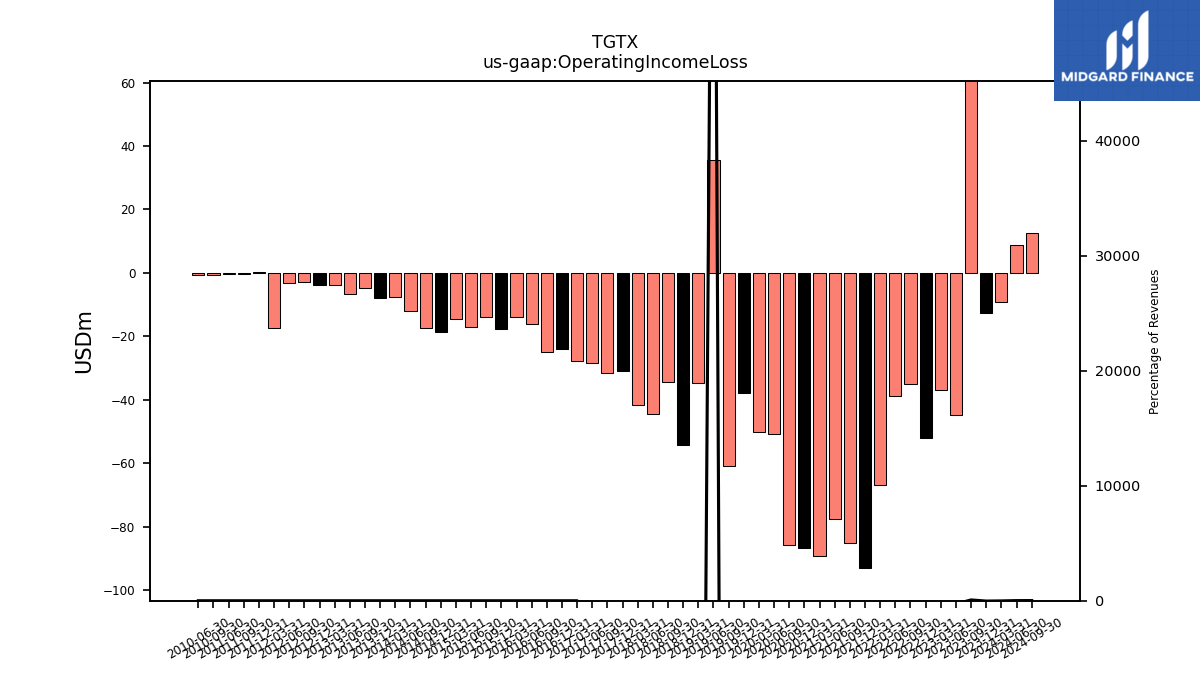
| Operating Income Loss | -12.48 | 114.78 | -44.67 | -36.99 | -52.06 | -34.96 | -38.94 | -66.87 | -92.95 | -85.13 | -77.49 | -89.20 | -86.78 | -85.72 | -50.84 | -50.24 | -37.96 | -60.86 | 35.54 | -34.69 | -54.15 | -34.33 | -44.34 | -41.58 | -31.03 | -31.59 | -28.43 | |
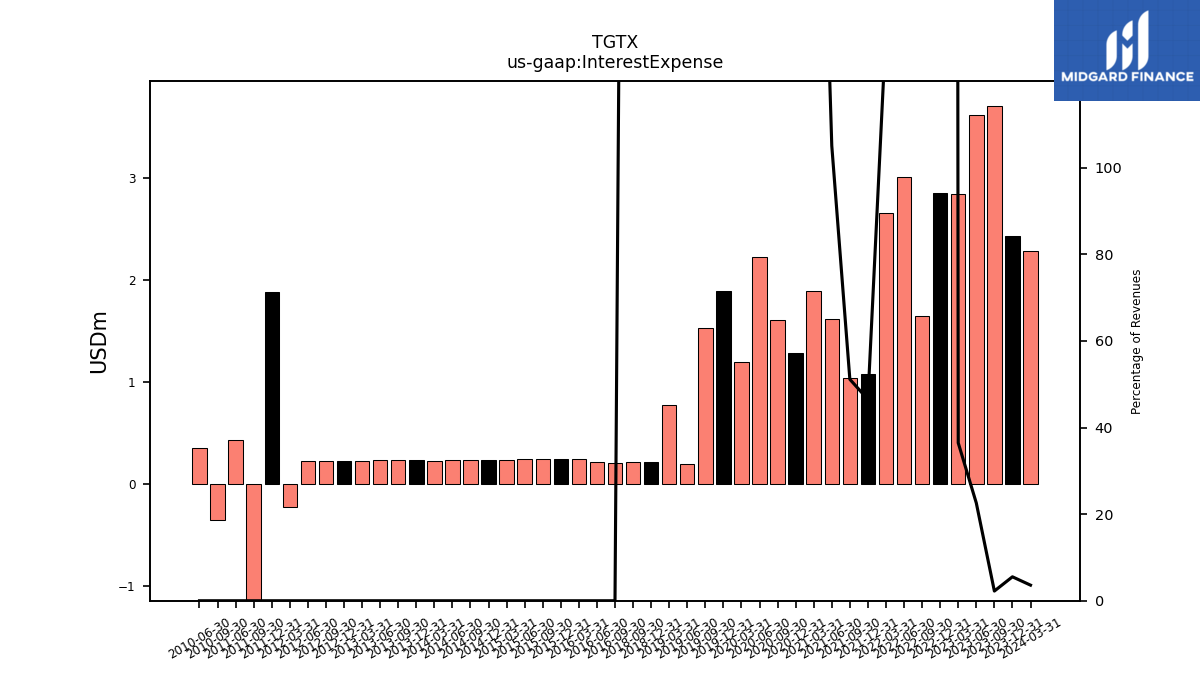
| Interest Expense | 2.43 | 3.71 | 3.63 | 2.84 | 2.86 | 1.65 | 3.02 | 2.66 | 1.08 | 1.04 | 1.62 | 1.90 | 1.29 | 1.61 | 2.23 | 1.20 | 1.90 | 1.54 | 0.20 | 0.77 | 0.22 | 0.22 | NA | NA | NA | NA | NA | |
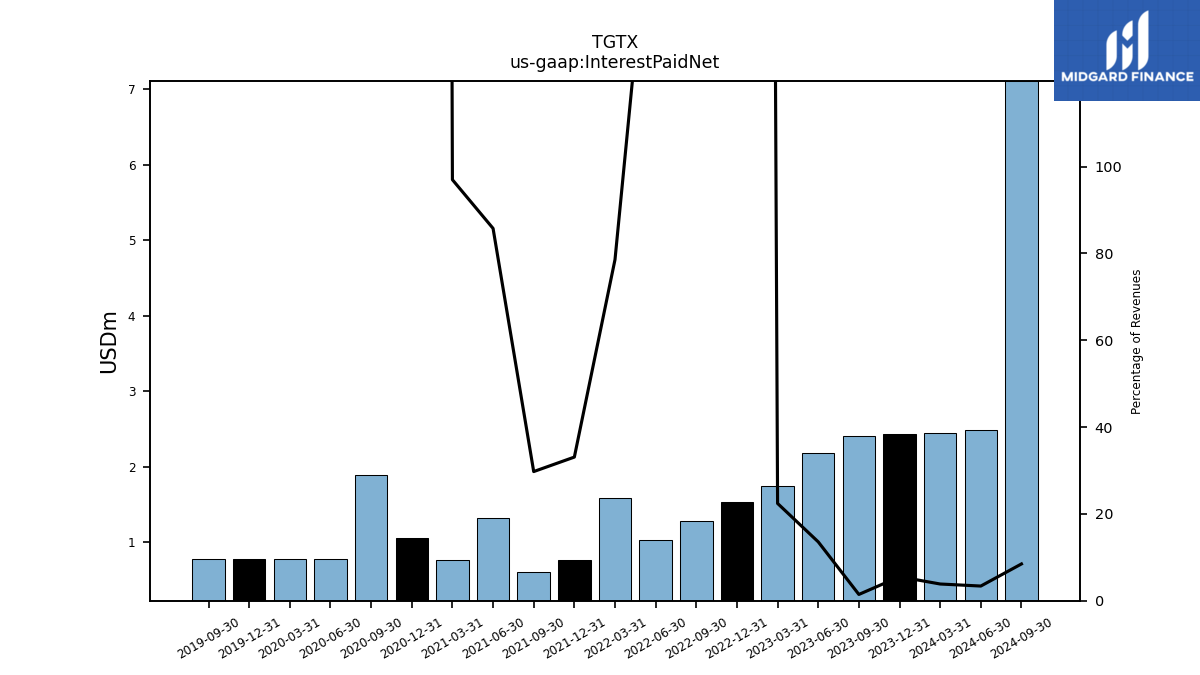
| Interest Paid Net | 2.43 | 2.41 | 2.18 | 1.75 | 1.54 | 1.29 | 1.04 | 1.58 | 0.77 | 0.60 | 1.32 | 0.77 | 1.05 | 1.89 | 0.78 | 0.78 | 0.79 | 0.79 | NA | NA | NA | NA | NA | NA | NA | NA | NA | |
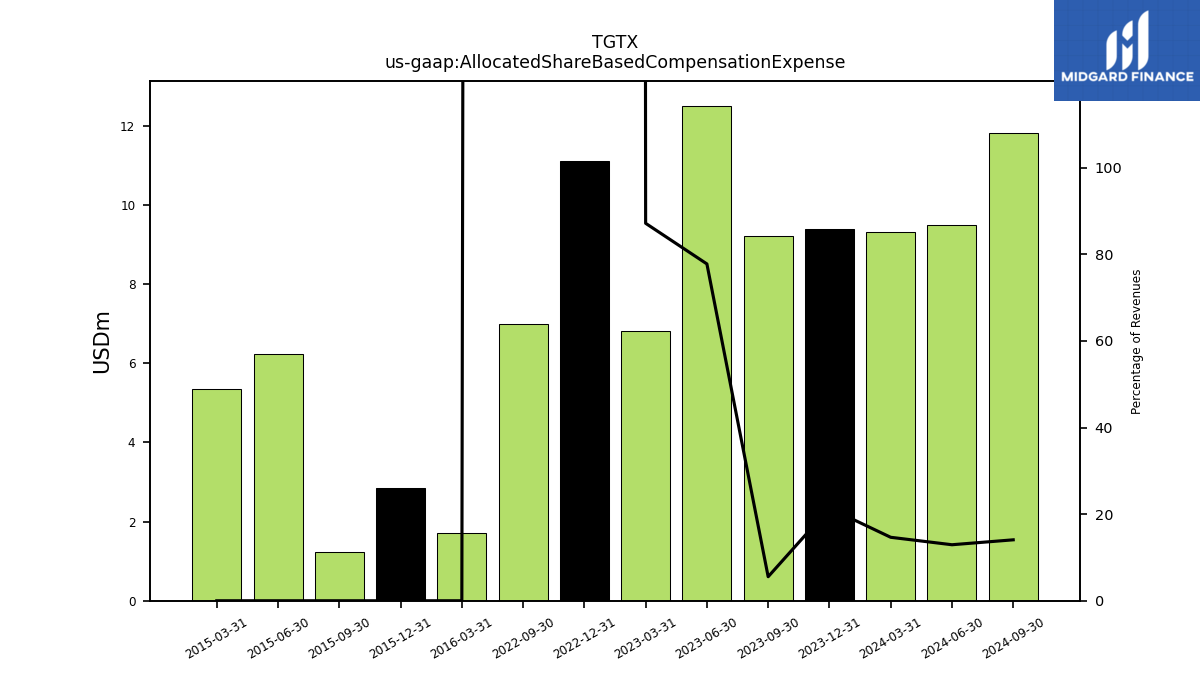
| Allocated Share Based Compensation Expense | 9.40 | 9.20 | NA | NA | 11.10 | 7.00 | NA | NA | NA | NA | NA | NA | NA | NA | NA | NA | NA | NA | NA | NA | NA | NA | NA | NA | NA | NA | NA | |
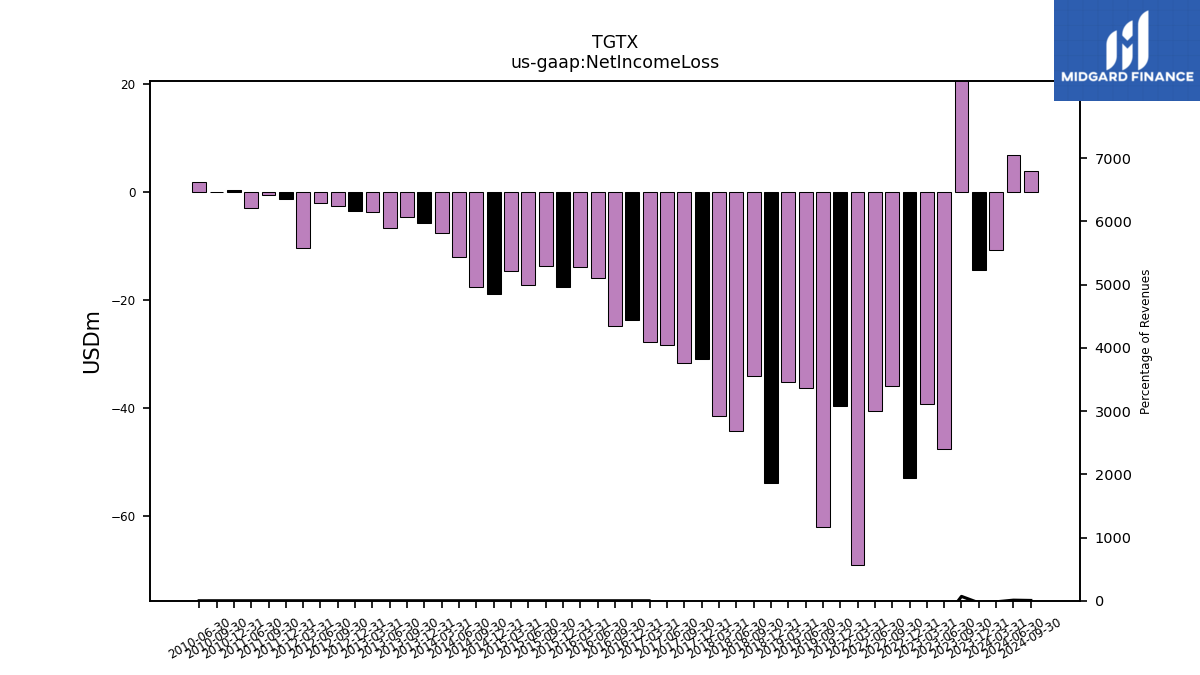
| Net Income Loss | -14.42 | 113.93 | -47.61 | -39.23 | -52.99 | -35.82 | -40.51 | -69.01 | NA | NA | NA | NA | NA | NA | NA | NA | -39.57 | -61.93 | -36.21 | -35.16 | -53.86 | -33.95 | -44.14 | -41.53 | -30.86 | -31.54 | -28.35 |
| 2023-12-31 | 2023-09-30 | 2023-06-30 | 2023-03-31 | 2022-12-31 | 2022-09-30 | 2022-06-30 | 2022-03-31 | 2021-12-31 | 2021-09-30 | 2021-06-30 | 2021-03-31 | 2020-12-31 | 2020-09-30 | 2020-06-30 | 2020-03-31 | 2019-12-31 | 2019-09-30 | 2019-06-30 | 2019-03-31 | 2018-12-31 | 2018-09-30 | 2018-06-30 | 2018-03-31 | 2017-12-31 | 2017-09-30 | 2017-06-30 | ||
|---|---|---|---|---|---|---|---|---|---|---|---|---|---|---|---|---|---|---|---|---|---|---|---|---|---|---|---|---|
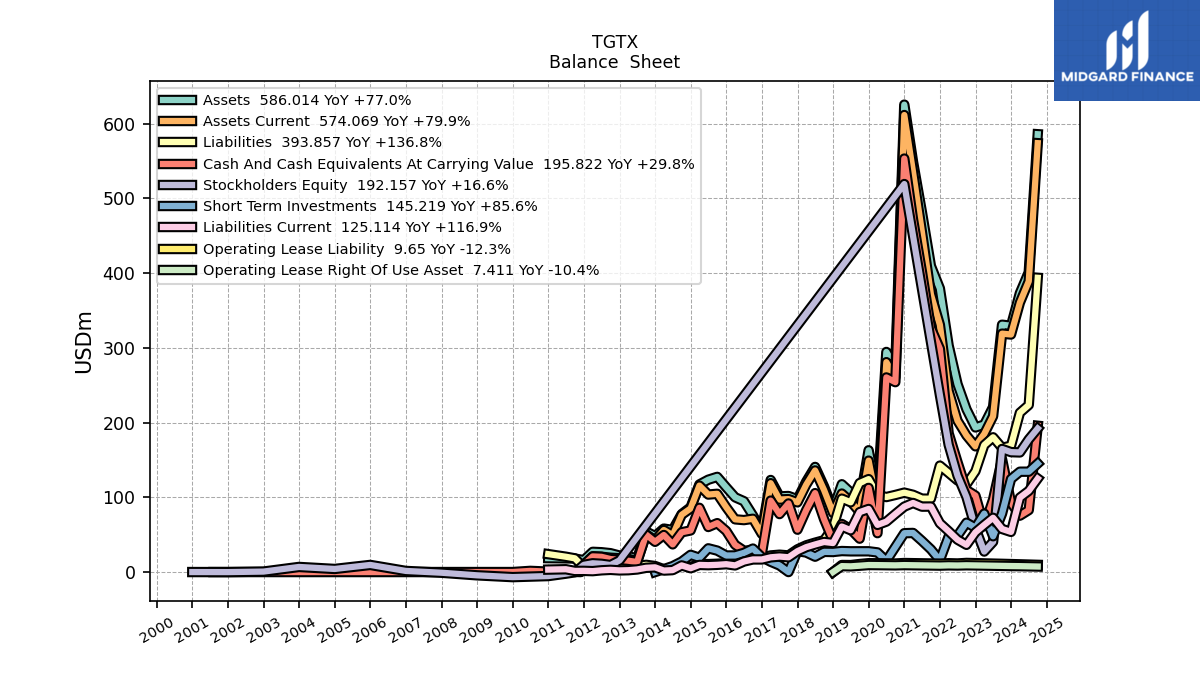
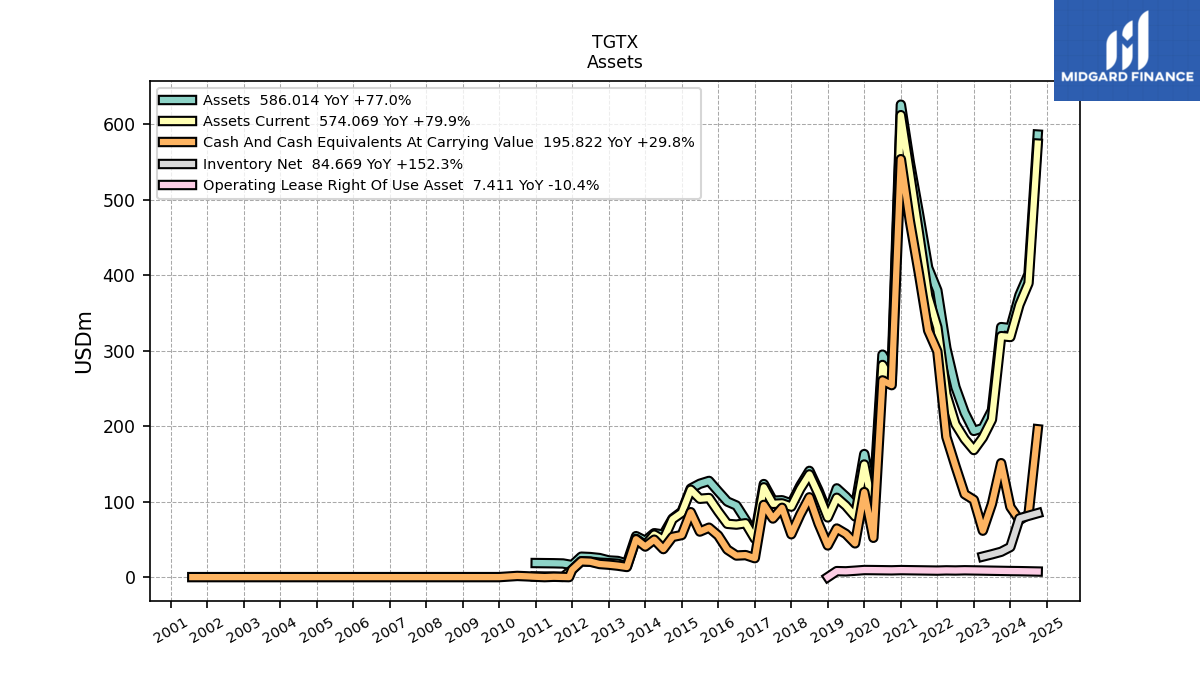
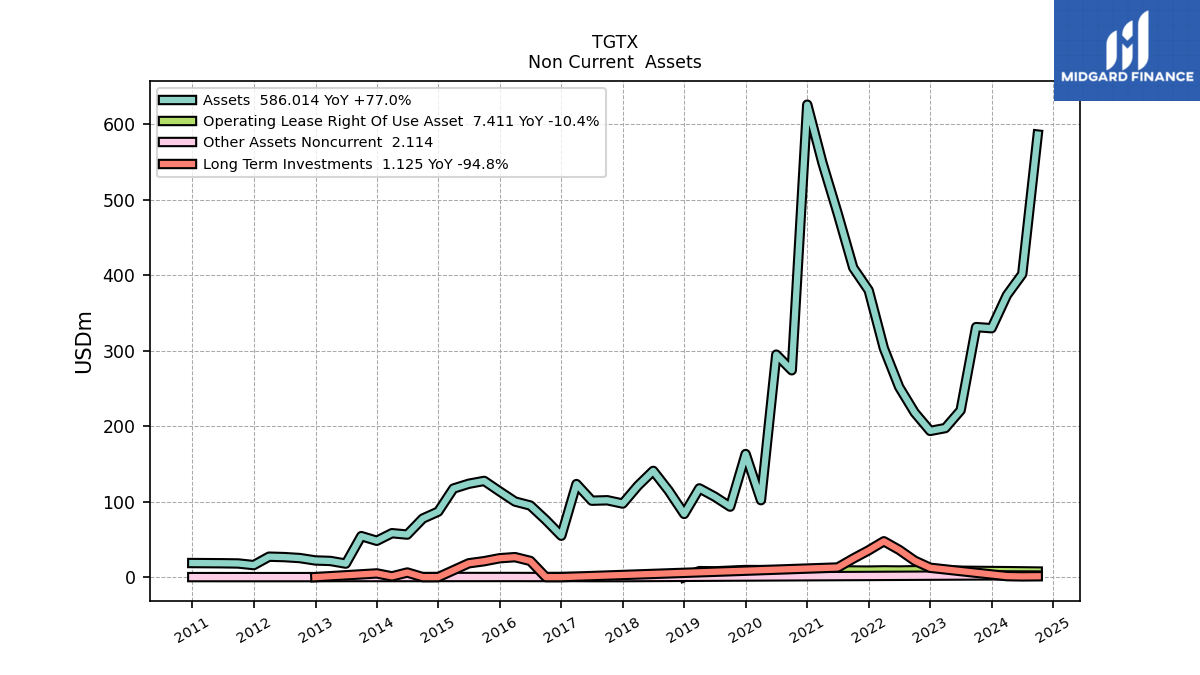
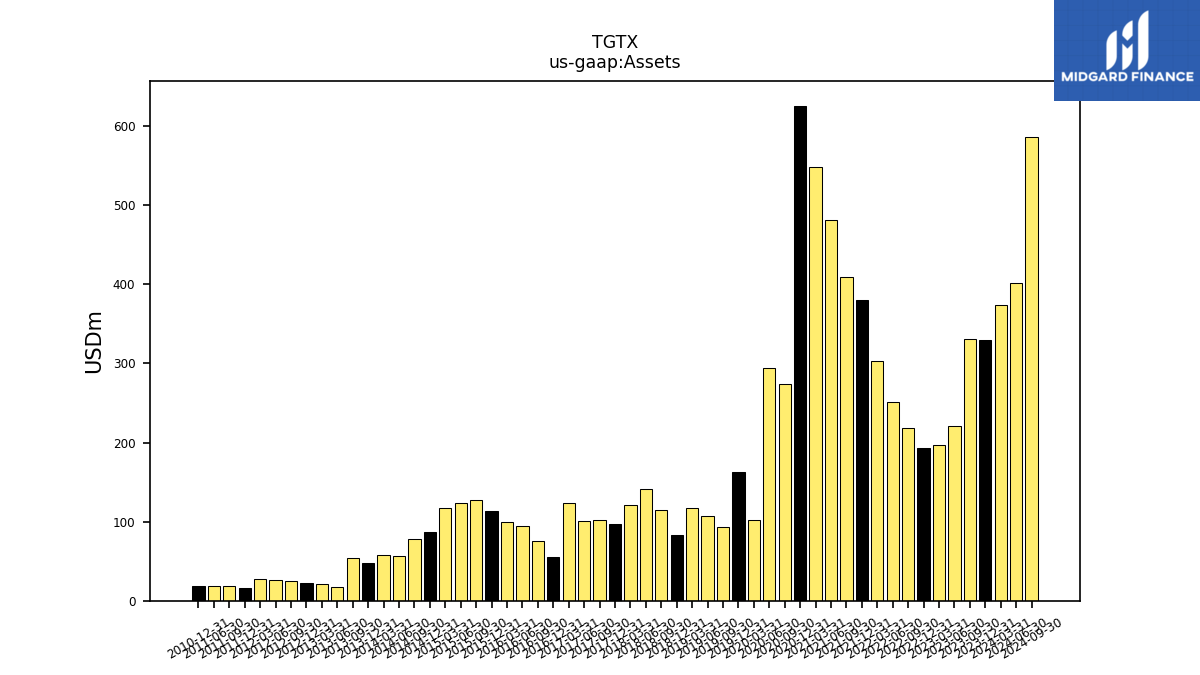
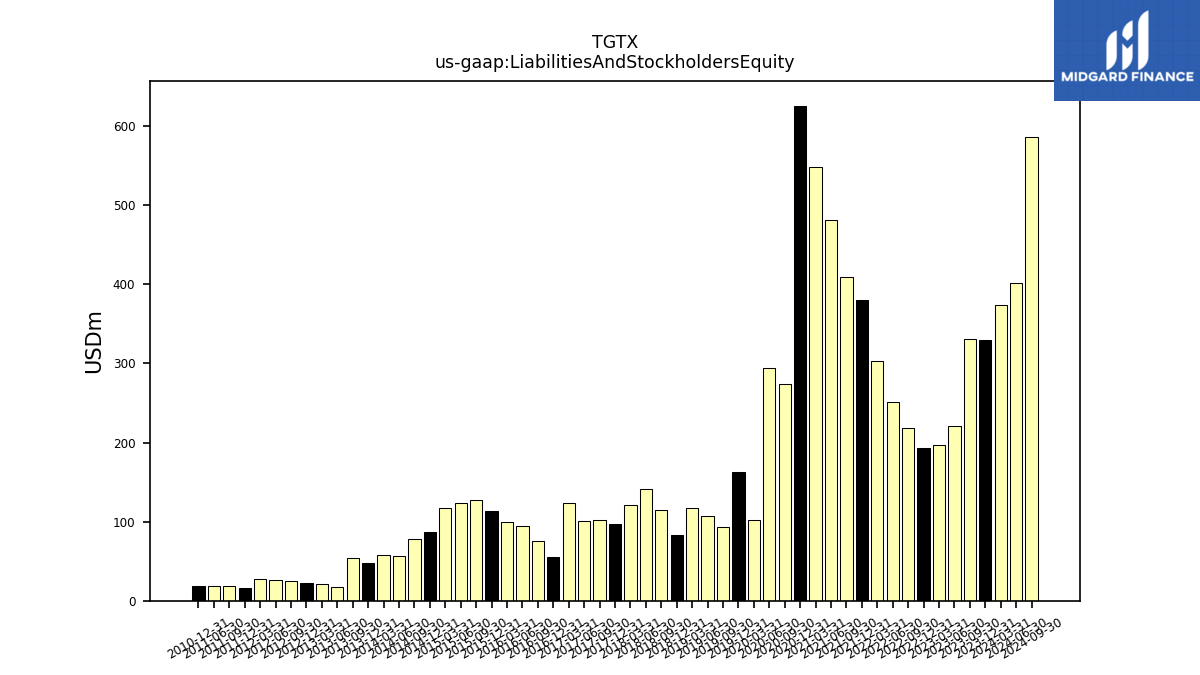
| Assets | 329.59 | 331.07 | 220.85 | 197.36 | 193.57 | 217.89 | 251.67 | 303.03 | 379.63 | 409.69 | 481.40 | 548.70 | 625.64 | 273.86 | 294.62 | 101.85 | 163.01 | 93.33 | 106.58 | 117.54 | 83.62 | 114.37 | 140.72 | 120.99 | 97.38 | 101.78 | 101.20 | |
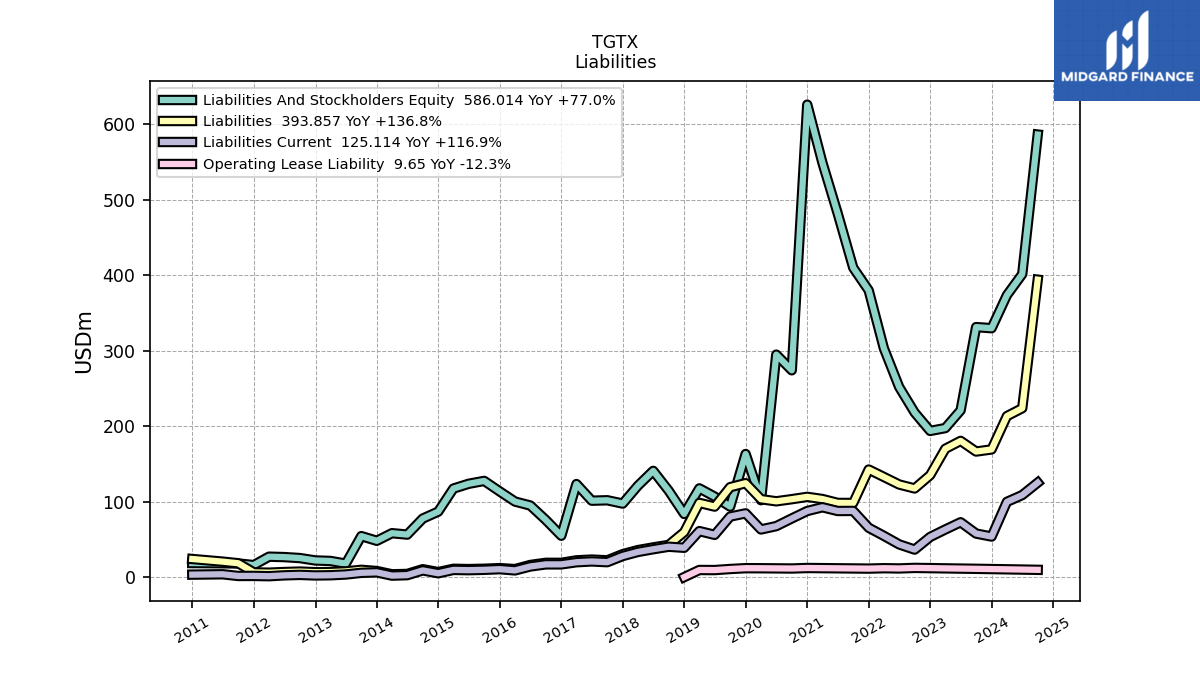
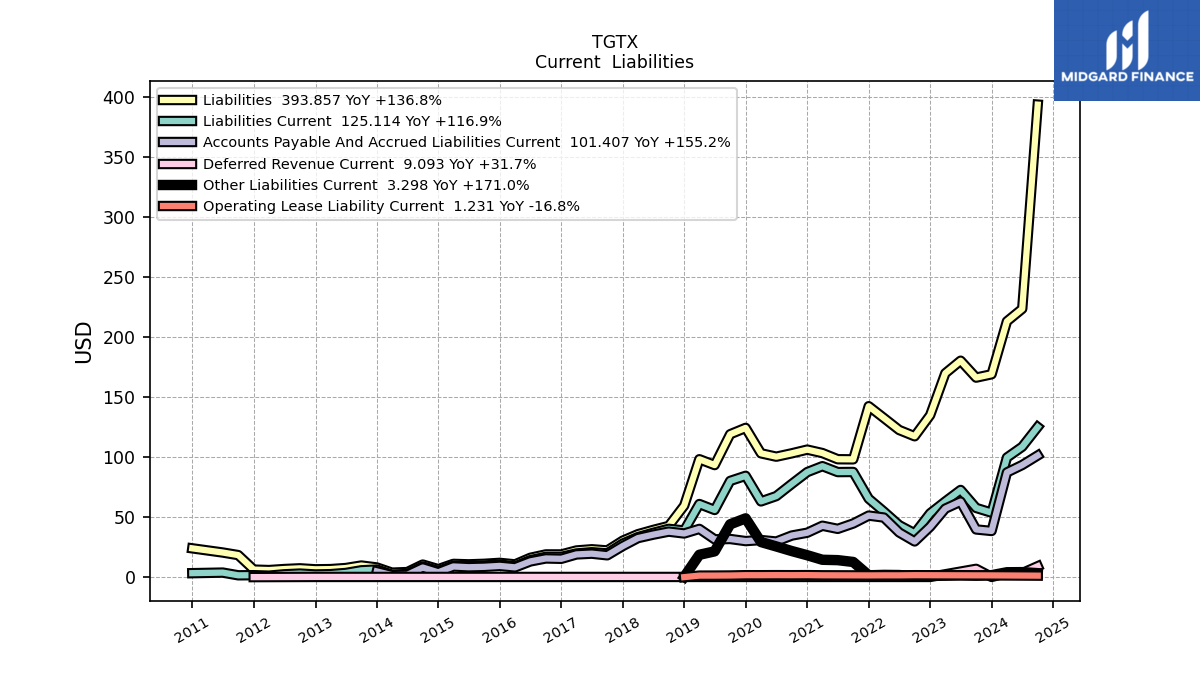
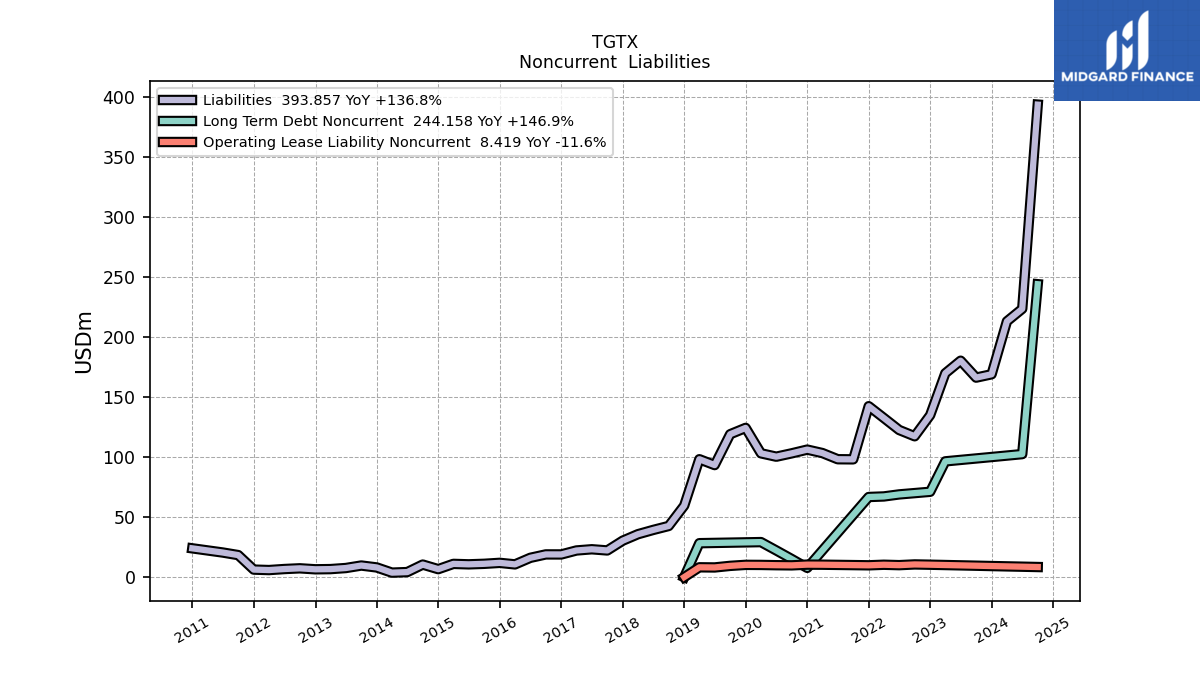
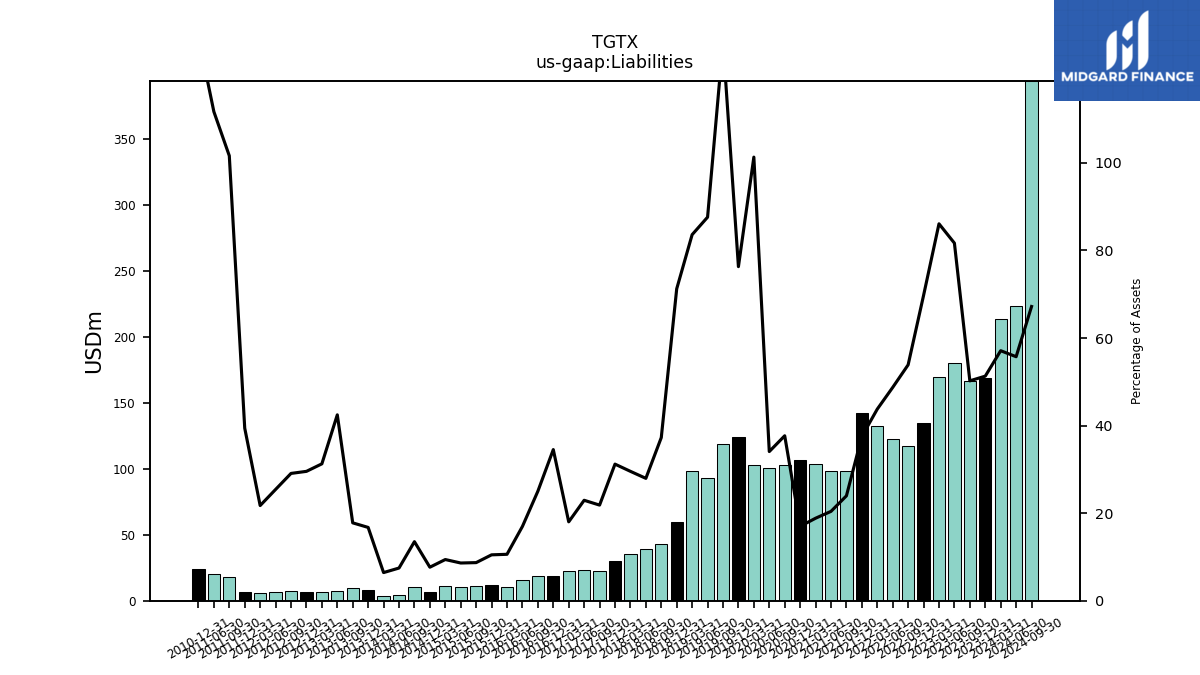
| Liabilities | 169.09 | 166.30 | 180.40 | 169.93 | 134.99 | 117.41 | 122.63 | 132.64 | 142.48 | 98.17 | 98.27 | 103.41 | 106.29 | 103.20 | 100.39 | 103.20 | 124.40 | 119.12 | 93.38 | 98.28 | 59.58 | 42.63 | 39.34 | 35.76 | 30.39 | 22.24 | 23.22 | |
| Liabilities And Stockholders Equity | 329.59 | 331.07 | 220.85 | 197.36 | 193.57 | 217.89 | 251.67 | 303.03 | 379.63 | 409.69 | 481.40 | 548.70 | 625.64 | 273.86 | 294.62 | 101.85 | 163.01 | 93.33 | 106.58 | 117.54 | 83.62 | 114.37 | 140.72 | 120.99 | 97.38 | 101.78 | 101.20 | |
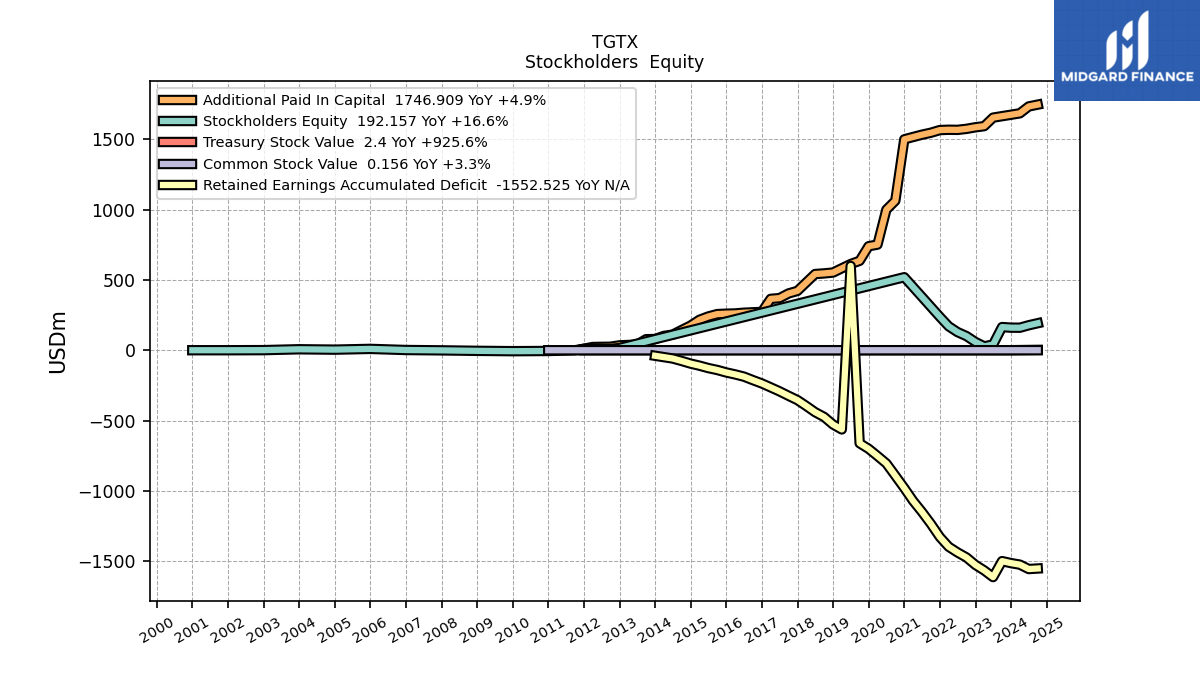
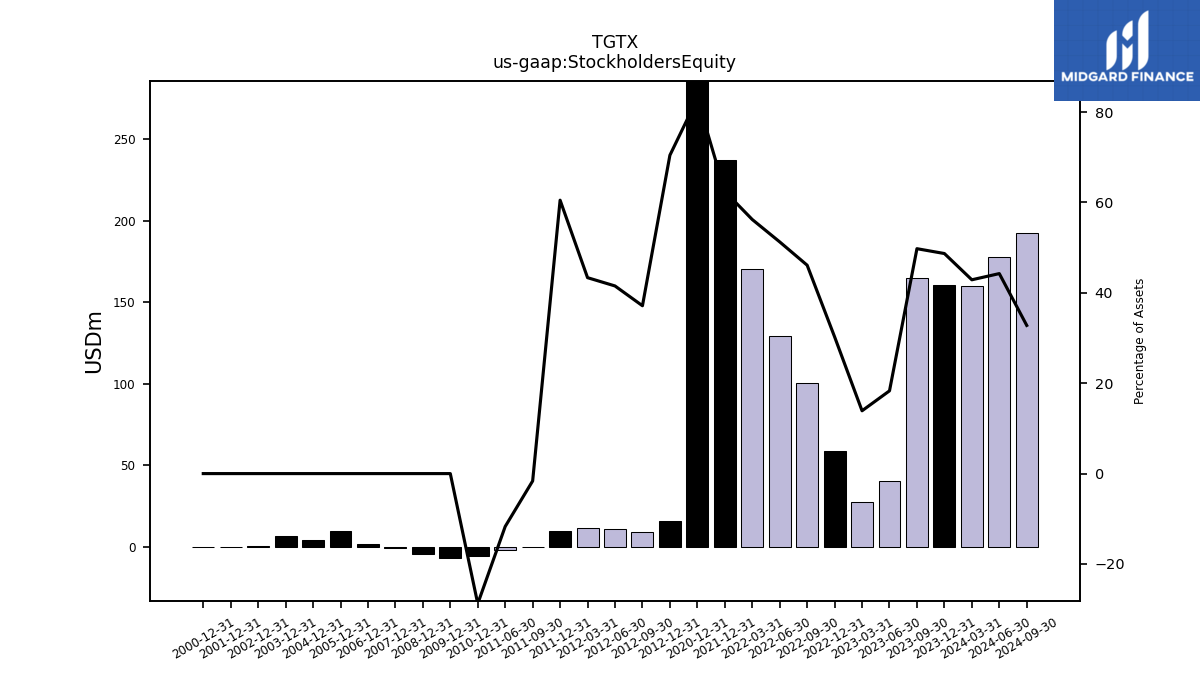
| Stockholders Equity | 160.50 | 164.77 | 40.45 | 27.43 | 58.59 | 100.48 | 129.03 | 170.39 | 237.15 | NA | NA | NA | 519.35 | NA | NA | NA | NA | NA | NA | NA | NA | NA | NA | NA | NA | NA | NA |
| 2023-12-31 | 2023-09-30 | 2023-06-30 | 2023-03-31 | 2022-12-31 | 2022-09-30 | 2022-06-30 | 2022-03-31 | 2021-12-31 | 2021-09-30 | 2021-06-30 | 2021-03-31 | 2020-12-31 | 2020-09-30 | 2020-06-30 | 2020-03-31 | 2019-12-31 | 2019-09-30 | 2019-06-30 | 2019-03-31 | 2018-12-31 | 2018-09-30 | 2018-06-30 | 2018-03-31 | 2017-12-31 | 2017-09-30 | 2017-06-30 | ||
|---|---|---|---|---|---|---|---|---|---|---|---|---|---|---|---|---|---|---|---|---|---|---|---|---|---|---|---|---|
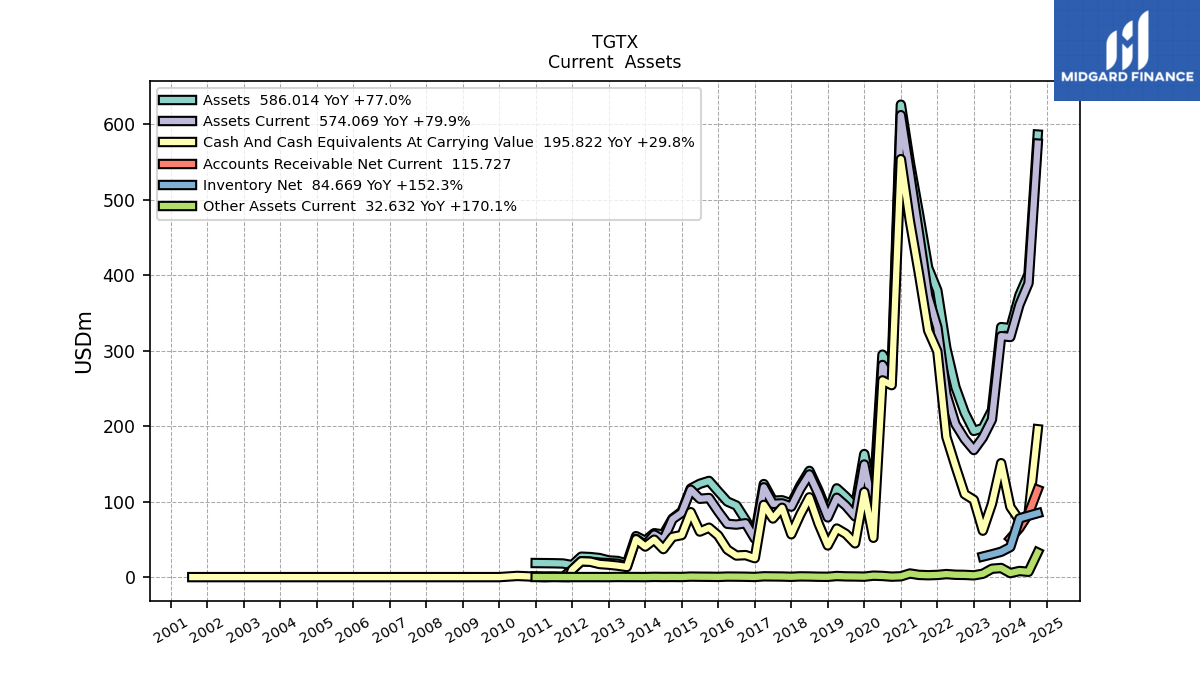
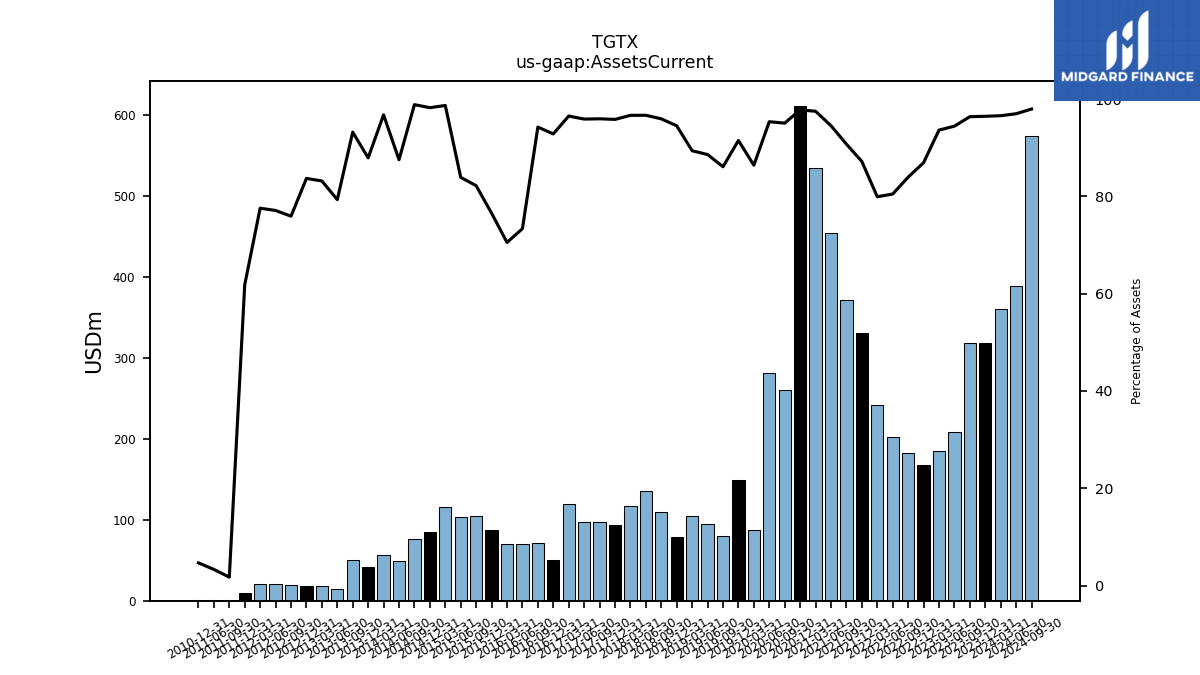
| Assets Current | 317.94 | 319.11 | 208.57 | 184.78 | 168.27 | 182.92 | 202.56 | 242.22 | 330.96 | 371.78 | 455.07 | 535.01 | 611.74 | 260.33 | 280.94 | 88.02 | 149.15 | 80.36 | 94.44 | 105.06 | 79.03 | 109.74 | 136.04 | 116.96 | 93.32 | 97.66 | 97.04 | |
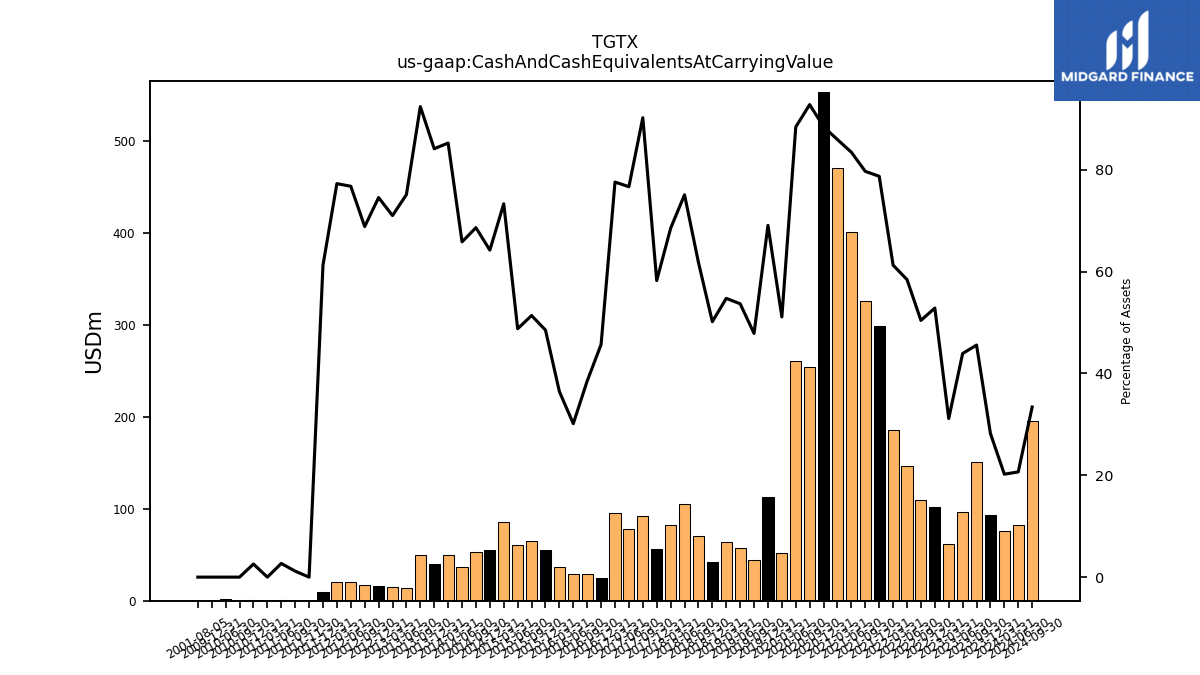
| Cash And Cash Equivalents At Carrying Value | 92.93 | 150.90 | 97.01 | 61.47 | 102.30 | 109.86 | 147.07 | 185.68 | 298.89 | 326.51 | 401.71 | 471.51 | 553.44 | 254.15 | 260.51 | 52.05 | 112.64 | 44.67 | 57.23 | 64.35 | 41.96 | 70.72 | 105.67 | 82.90 | 56.72 | 91.84 | 77.60 | |
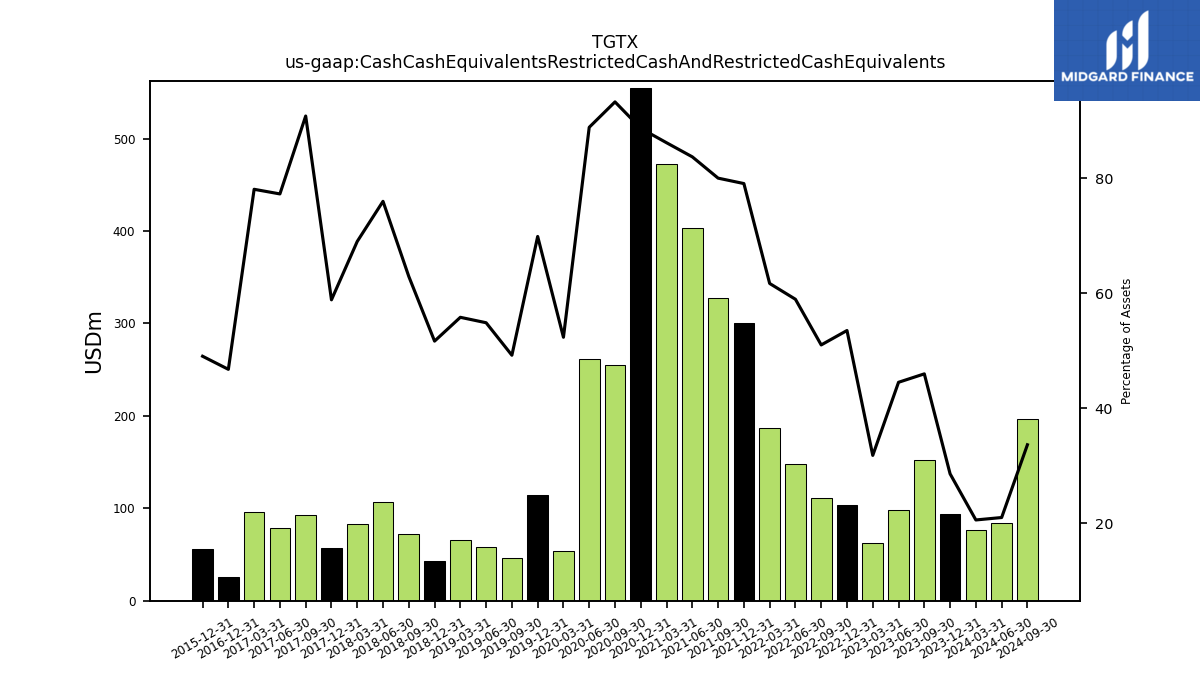
| Cash Cash Equivalents Restricted Cash And Restricted Cash Equivalents | 94.22 | 152.18 | 98.29 | 62.74 | 103.58 | 111.13 | 148.34 | 186.94 | 300.15 | 327.77 | 402.97 | 472.77 | 554.70 | 255.41 | 261.77 | 53.30 | 113.89 | 45.92 | 58.47 | 65.59 | 43.20 | 71.96 | 106.91 | 83.48 | 57.30 | 92.43 | 78.19 | |
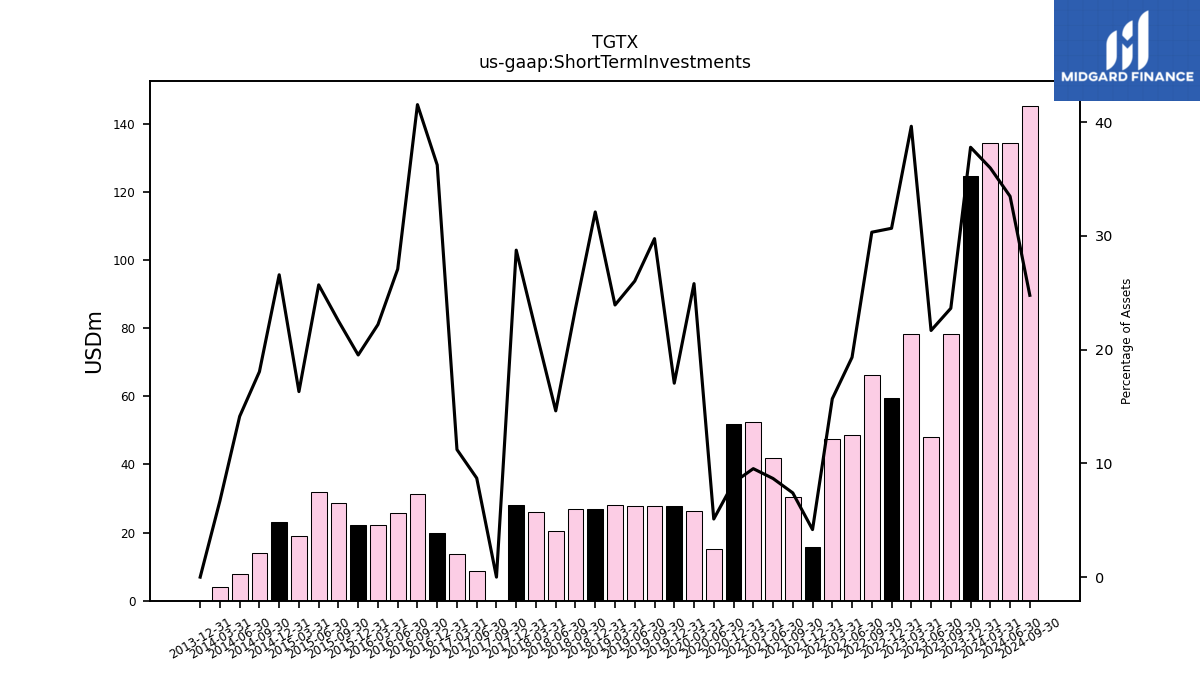
| Short Term Investments | 124.58 | 78.26 | 47.90 | 78.24 | 59.37 | 66.08 | 48.64 | 47.52 | 15.88 | 30.34 | 41.75 | 52.33 | 51.99 | NA | 15.06 | 26.28 | 27.80 | 27.78 | 27.75 | 28.12 | 26.85 | 27.02 | 20.57 | 26.18 | 28.00 | 0.00 | 8.81 | |
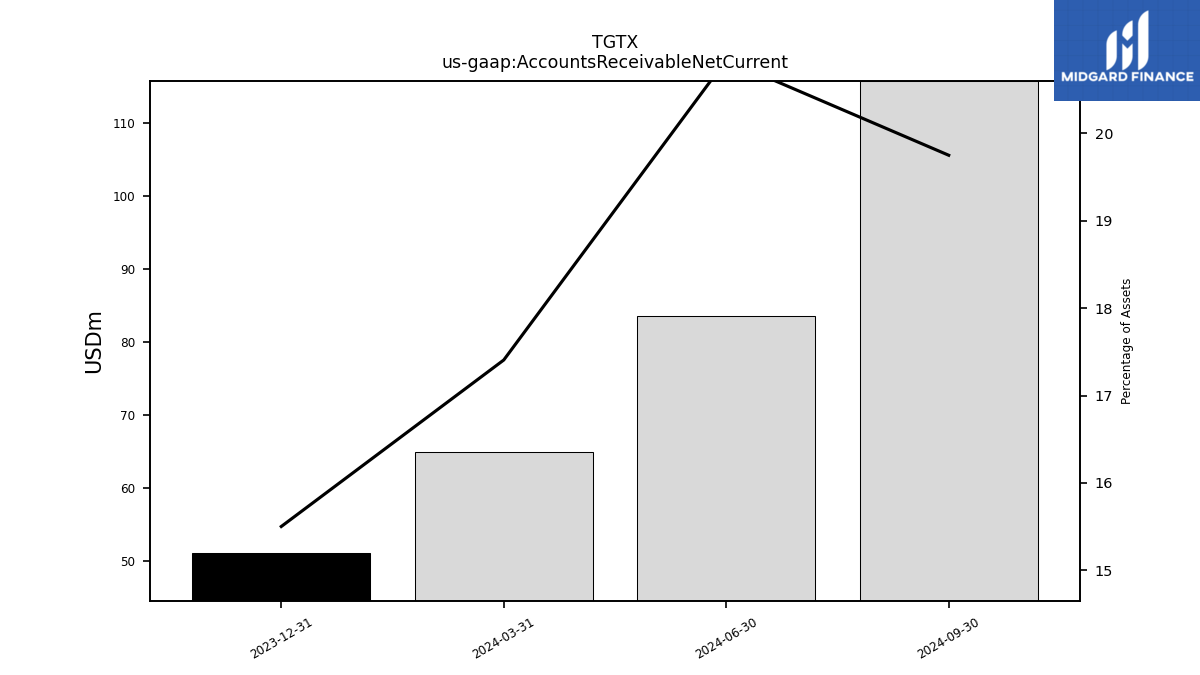
| Accounts Receivable Net Current | 51.09 | NA | NA | NA | NA | NA | NA | NA | NA | NA | NA | NA | NA | NA | NA | NA | NA | NA | NA | NA | NA | NA | NA | NA | NA | NA | NA | |
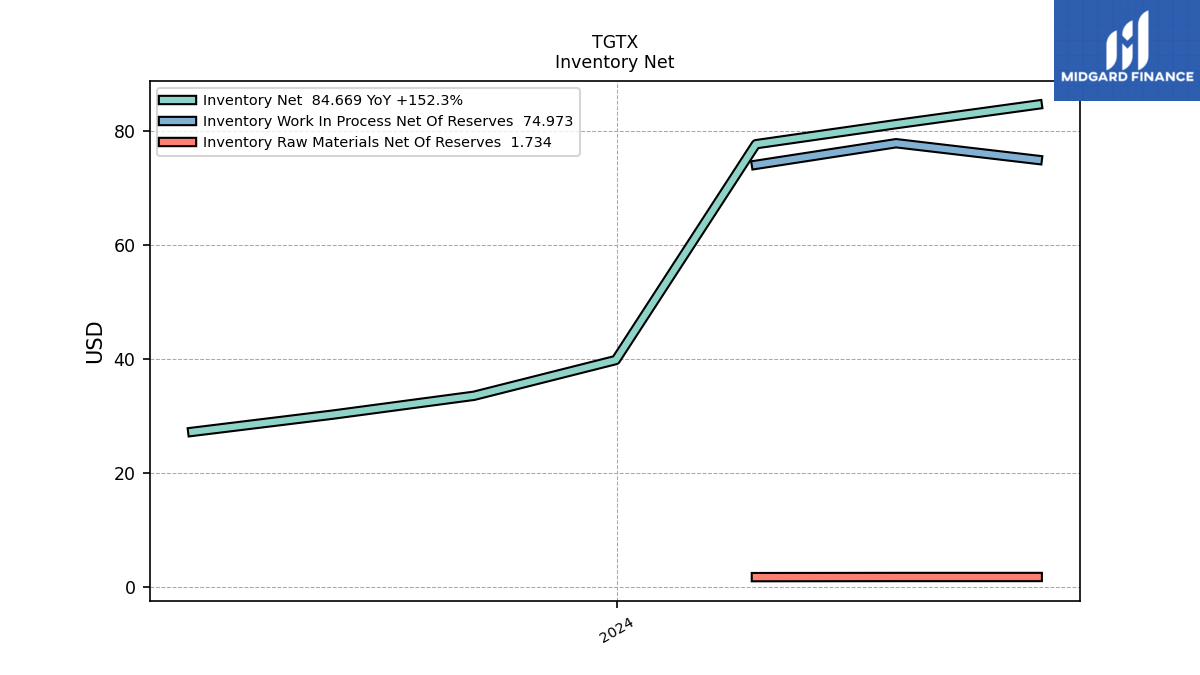
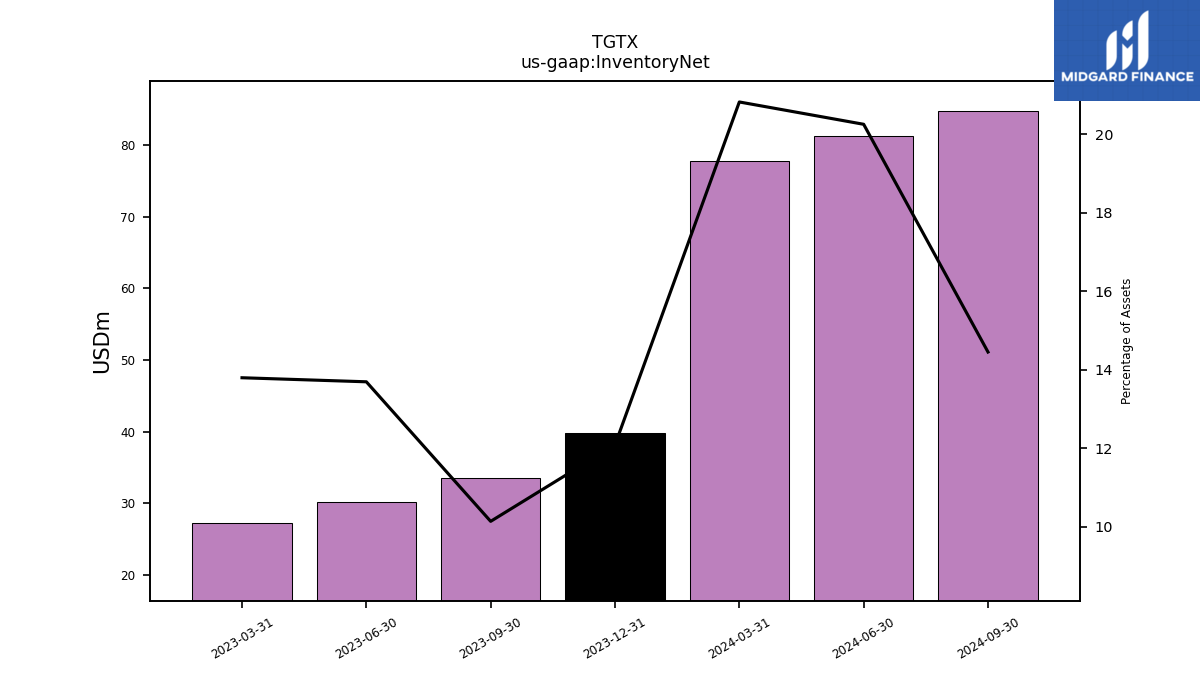
| Inventory Net | 39.82 | 33.55 | 30.23 | 27.22 | NA | NA | NA | NA | NA | NA | NA | NA | NA | NA | NA | NA | NA | NA | NA | NA | NA | NA | NA | NA | NA | NA | NA | |
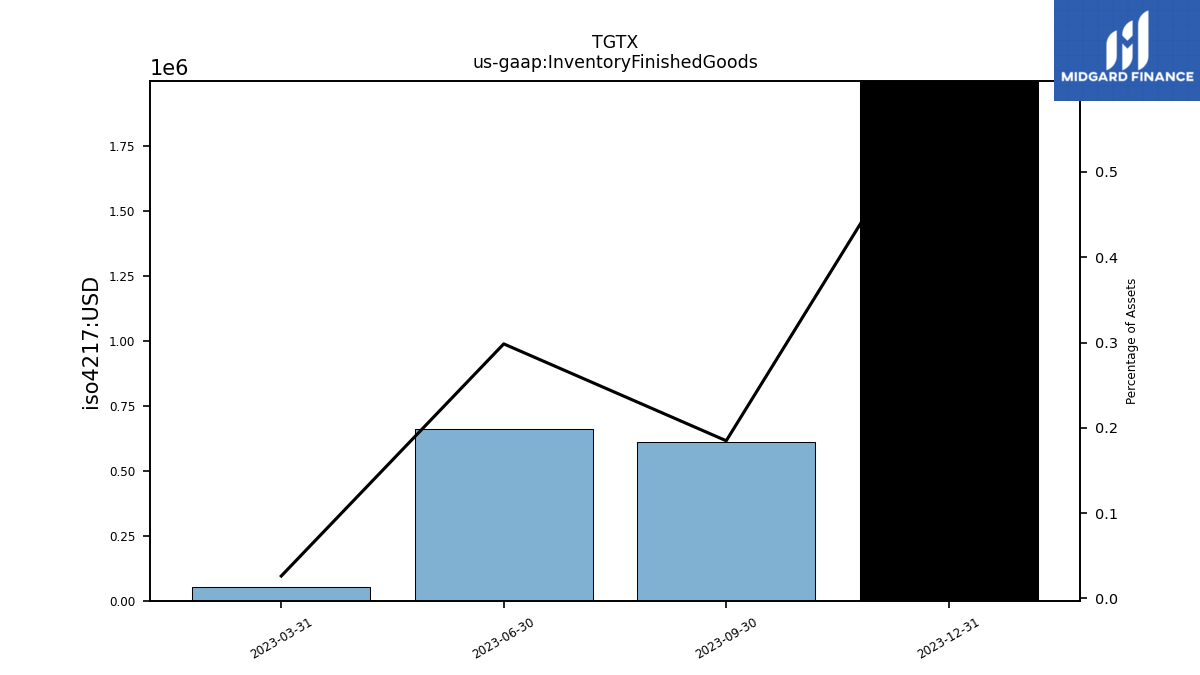
| Inventory Finished Goods | 2.00 | 0.61 | 0.66 | 0.05 | NA | NA | NA | NA | NA | NA | NA | NA | NA | NA | NA | NA | NA | NA | NA | NA | NA | NA | NA | NA | NA | NA | NA | |
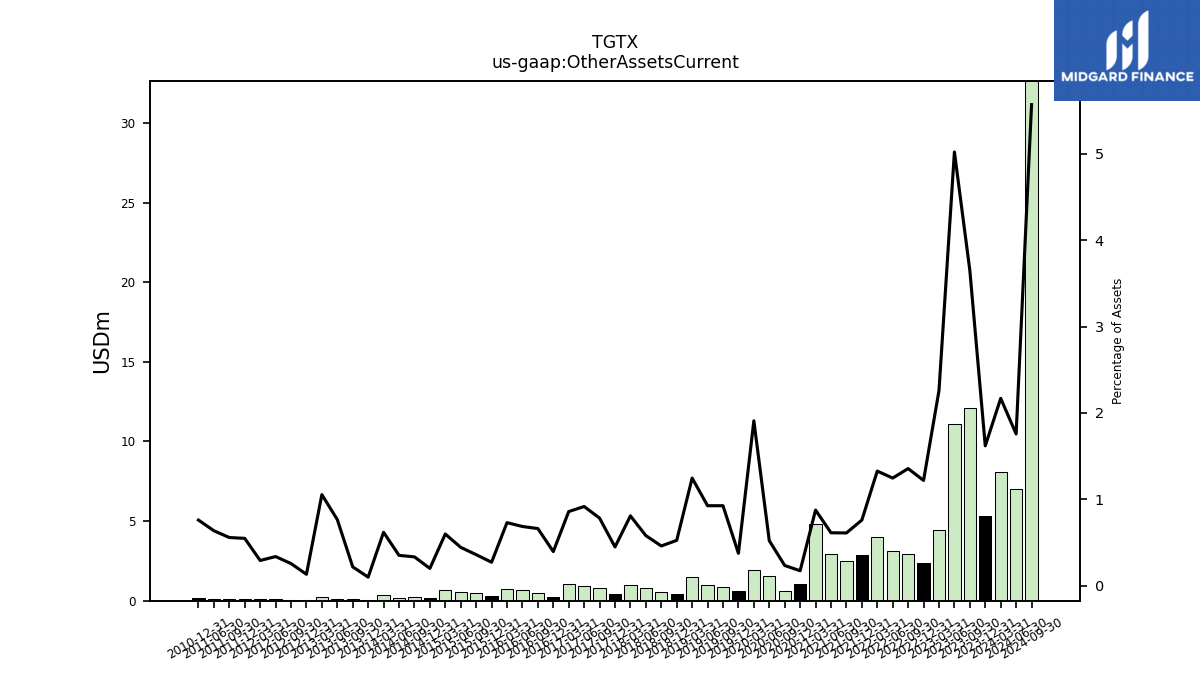
| Other Assets Current | 5.34 | 12.08 | 11.09 | 4.46 | 2.36 | 2.95 | 3.14 | 4.02 | 2.88 | 2.50 | 2.95 | 4.80 | 1.08 | 0.64 | 1.54 | 1.94 | 0.61 | 0.86 | 0.99 | 1.46 | 0.44 | 0.53 | 0.82 | 0.98 | 0.44 | 0.80 | 0.93 |
| 2023-12-31 | 2023-09-30 | 2023-06-30 | 2023-03-31 | 2022-12-31 | 2022-09-30 | 2022-06-30 | 2022-03-31 | 2021-12-31 | 2021-09-30 | 2021-06-30 | 2021-03-31 | 2020-12-31 | 2020-09-30 | 2020-06-30 | 2020-03-31 | 2019-12-31 | 2019-09-30 | 2019-06-30 | 2019-03-31 | 2018-12-31 | 2018-09-30 | 2018-06-30 | 2018-03-31 | 2017-12-31 | 2017-09-30 | 2017-06-30 | ||
|---|---|---|---|---|---|---|---|---|---|---|---|---|---|---|---|---|---|---|---|---|---|---|---|---|---|---|---|---|
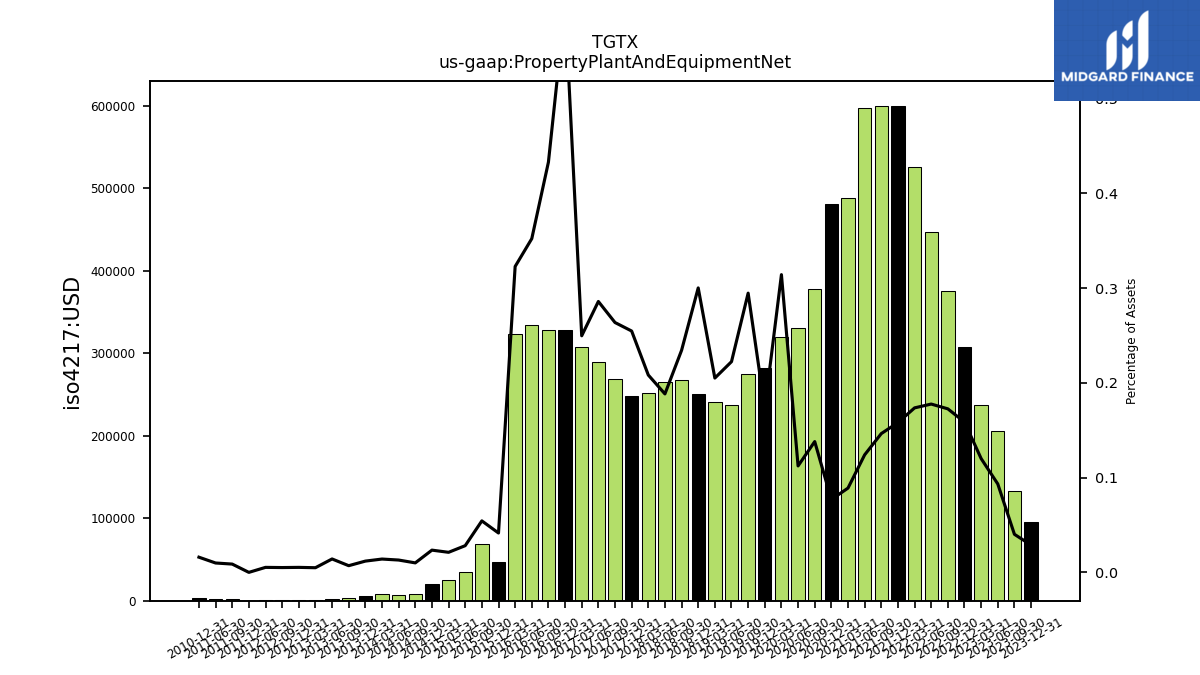
| Property Plant And Equipment Net | 0.10 | 0.13 | 0.21 | 0.24 | 0.31 | 0.38 | 0.45 | 0.53 | 0.60 | 0.60 | 0.60 | 0.49 | 0.48 | 0.38 | 0.33 | 0.32 | 0.28 | 0.28 | 0.24 | 0.24 | 0.25 | 0.27 | 0.27 | 0.25 | 0.25 | 0.27 | 0.29 | |
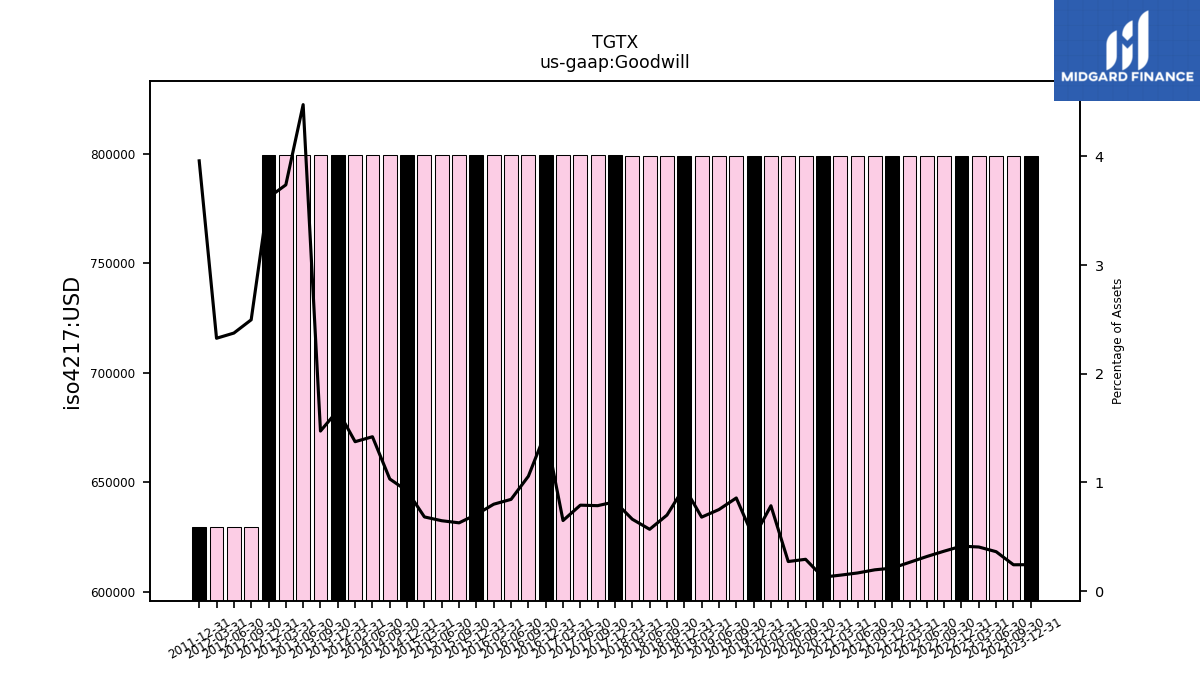
| Goodwill | 0.80 | 0.80 | 0.80 | 0.80 | 0.80 | 0.80 | 0.80 | 0.80 | 0.80 | 0.80 | 0.80 | 0.80 | 0.80 | 0.80 | 0.80 | 0.80 | 0.80 | 0.80 | 0.80 | 0.80 | 0.80 | 0.80 | 0.80 | 0.80 | 0.80 | 0.80 | 0.80 |
| 2023-12-31 | 2023-09-30 | 2023-06-30 | 2023-03-31 | 2022-12-31 | 2022-09-30 | 2022-06-30 | 2022-03-31 | 2021-12-31 | 2021-09-30 | 2021-06-30 | 2021-03-31 | 2020-12-31 | 2020-09-30 | 2020-06-30 | 2020-03-31 | 2019-12-31 | 2019-09-30 | 2019-06-30 | 2019-03-31 | 2018-12-31 | 2018-09-30 | 2018-06-30 | 2018-03-31 | 2017-12-31 | 2017-09-30 | 2017-06-30 | ||
|---|---|---|---|---|---|---|---|---|---|---|---|---|---|---|---|---|---|---|---|---|---|---|---|---|---|---|---|---|
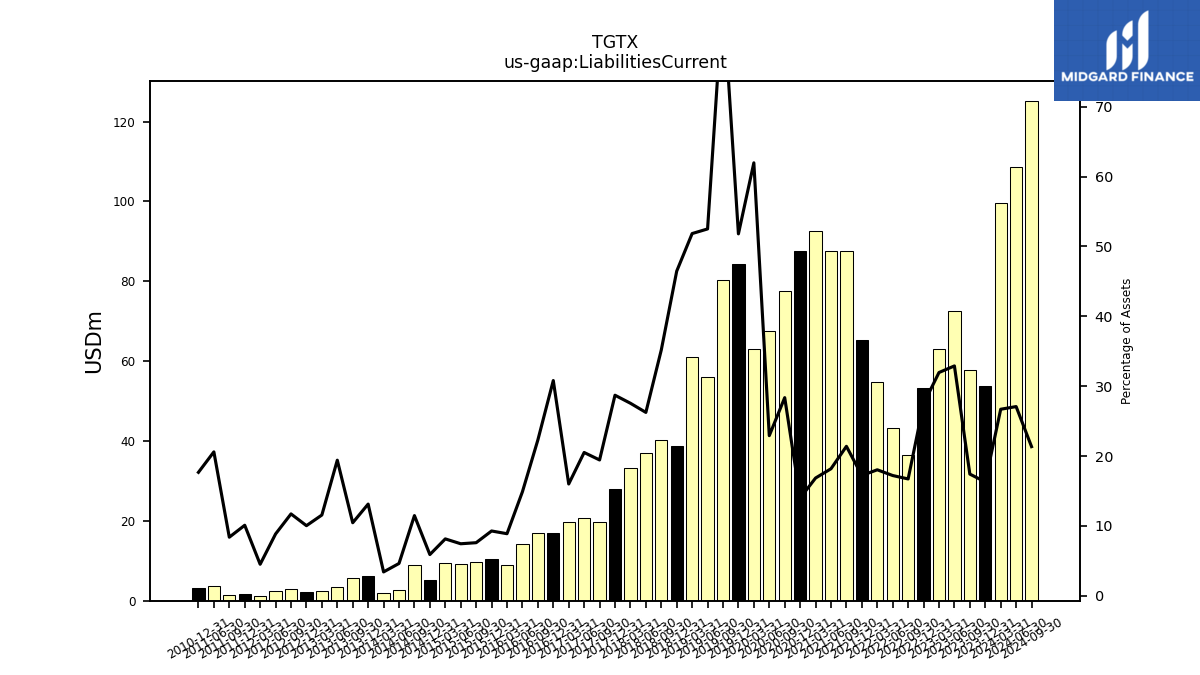
| Liabilities Current | 53.72 | 57.68 | 72.67 | 63.08 | 53.20 | 36.45 | 43.33 | 54.66 | 65.38 | 87.66 | 87.55 | 92.49 | 87.55 | 77.67 | 67.54 | 63.12 | 84.45 | 80.20 | 55.97 | 60.94 | 38.85 | 40.24 | 36.94 | 33.34 | 27.96 | 19.79 | 20.76 | |
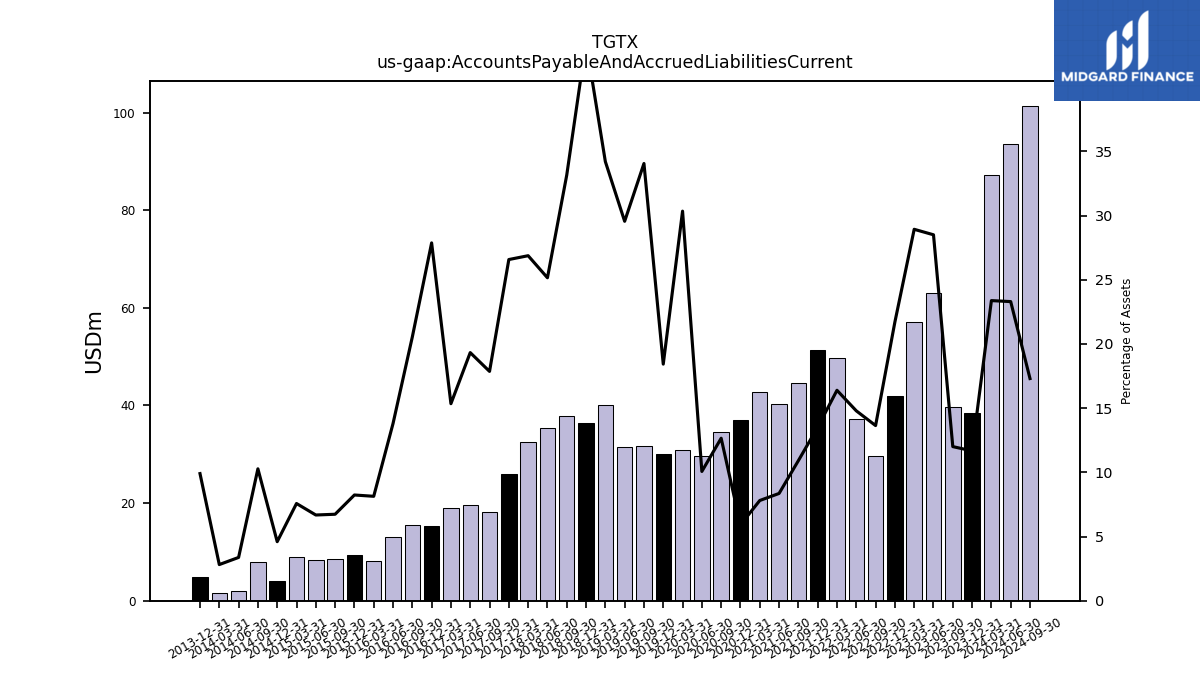
| Accounts Payable And Accrued Liabilities Current | 38.47 | 39.74 | 62.95 | 57.09 | 42.02 | 29.73 | 37.22 | 49.67 | 51.29 | 44.70 | 40.23 | 42.84 | 37.01 | 34.66 | 29.67 | 30.90 | 30.04 | 31.78 | 31.50 | 40.20 | 36.38 | 37.92 | 35.39 | 32.51 | 25.88 | 18.18 | 19.56 | |
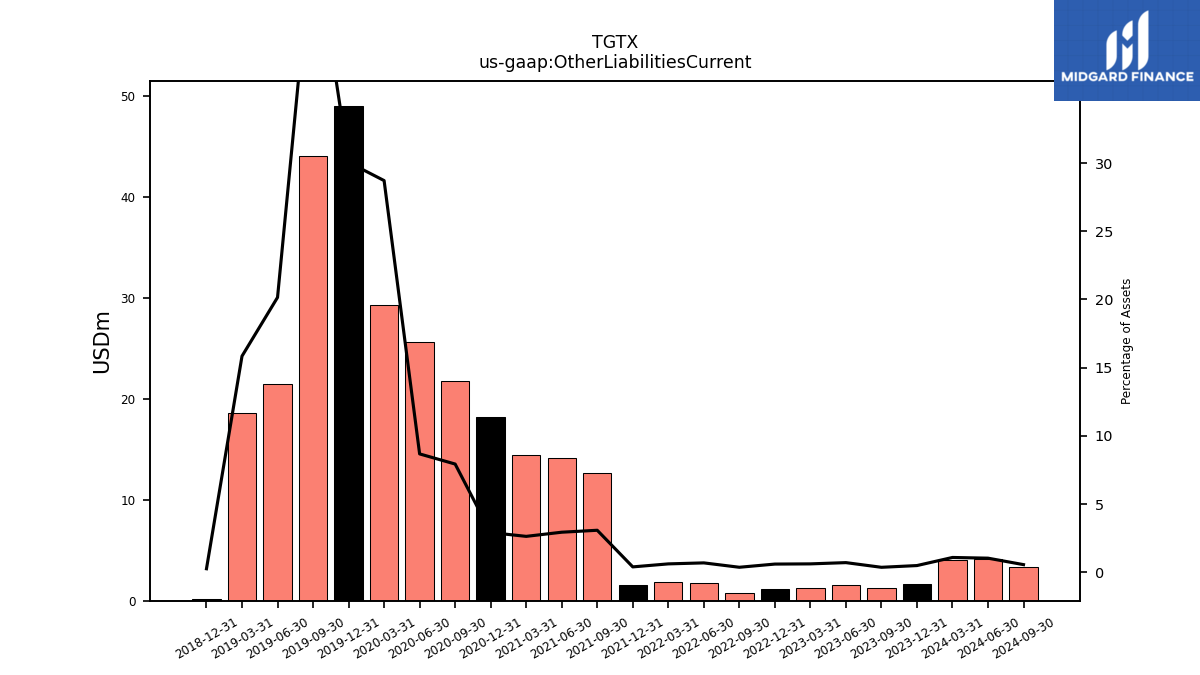
| Other Liabilities Current | 1.63 | 1.22 | 1.57 | 1.22 | 1.17 | 0.81 | 1.74 | 1.87 | 1.51 | 12.63 | 14.15 | 14.46 | 18.24 | 21.73 | 25.57 | 29.25 | 48.99 | 44.03 | 21.48 | 18.63 | 0.22 | NA | NA | NA | NA | NA | NA |
| 2023-12-31 | 2023-09-30 | 2023-06-30 | 2023-03-31 | 2022-12-31 | 2022-09-30 | 2022-06-30 | 2022-03-31 | 2021-12-31 | 2021-09-30 | 2021-06-30 | 2021-03-31 | 2020-12-31 | 2020-09-30 | 2020-06-30 | 2020-03-31 | 2019-12-31 | 2019-09-30 | 2019-06-30 | 2019-03-31 | 2018-12-31 | 2018-09-30 | 2018-06-30 | 2018-03-31 | 2017-12-31 | 2017-09-30 | 2017-06-30 | ||
|---|---|---|---|---|---|---|---|---|---|---|---|---|---|---|---|---|---|---|---|---|---|---|---|---|---|---|---|---|
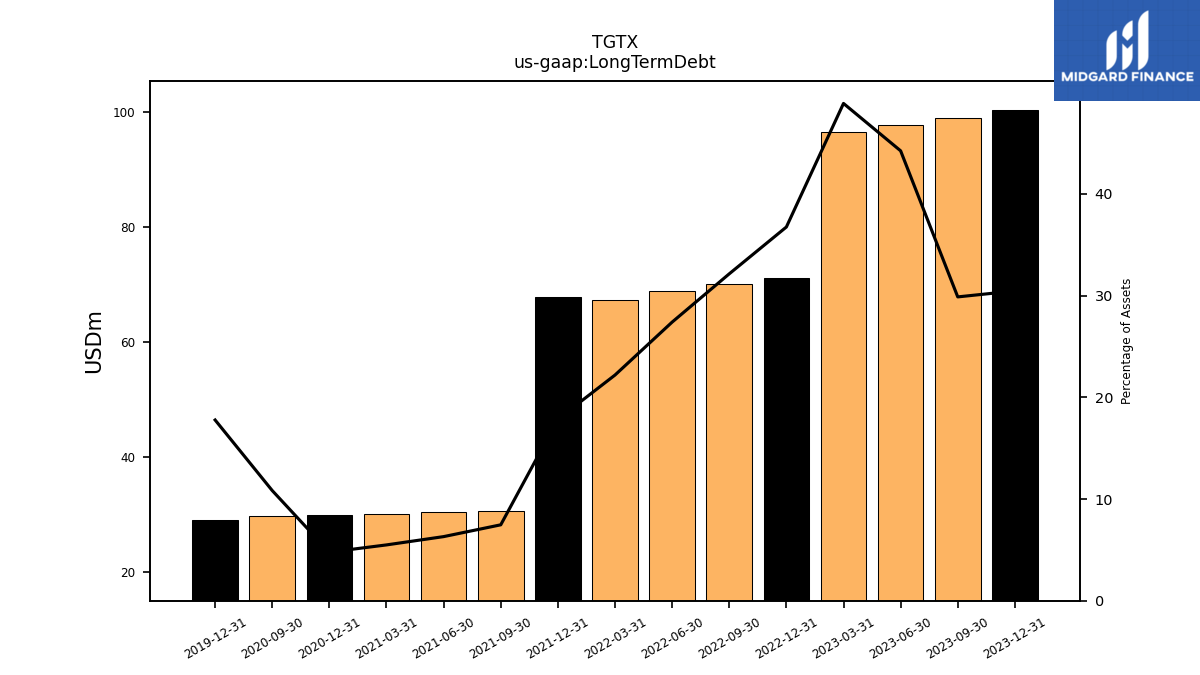
| Long Term Debt | 100.40 | 98.91 | 97.70 | 96.50 | 71.14 | 70.04 | 68.95 | 67.25 | 67.76 | 30.59 | 30.36 | 30.13 | 29.89 | 29.66 | NA | NA | 28.97 | NA | NA | NA | NA | NA | NA | NA | NA | NA | NA | |
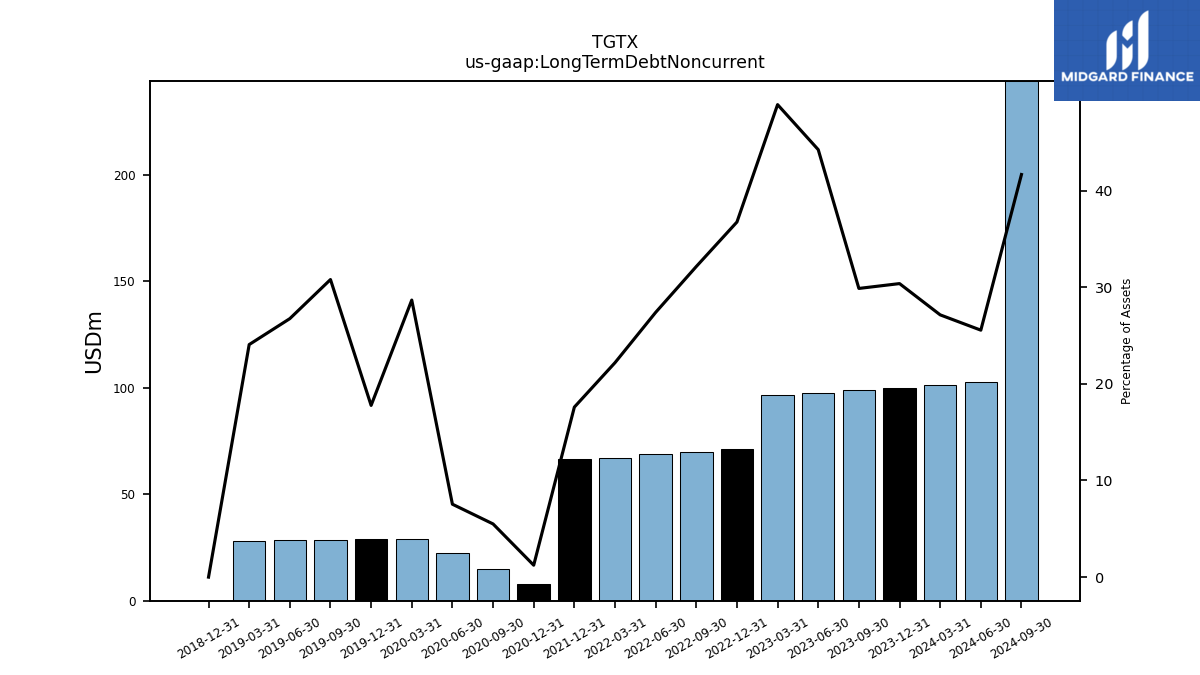
| Long Term Debt Noncurrent | 100.12 | 98.91 | 97.70 | 96.50 | 71.14 | 70.04 | 68.95 | 67.25 | 66.79 | NA | NA | NA | 7.72 | 15.07 | 22.23 | 29.20 | 28.97 | 28.74 | 28.51 | 28.29 | 0.00 | NA | NA | NA | NA | NA | NA | |
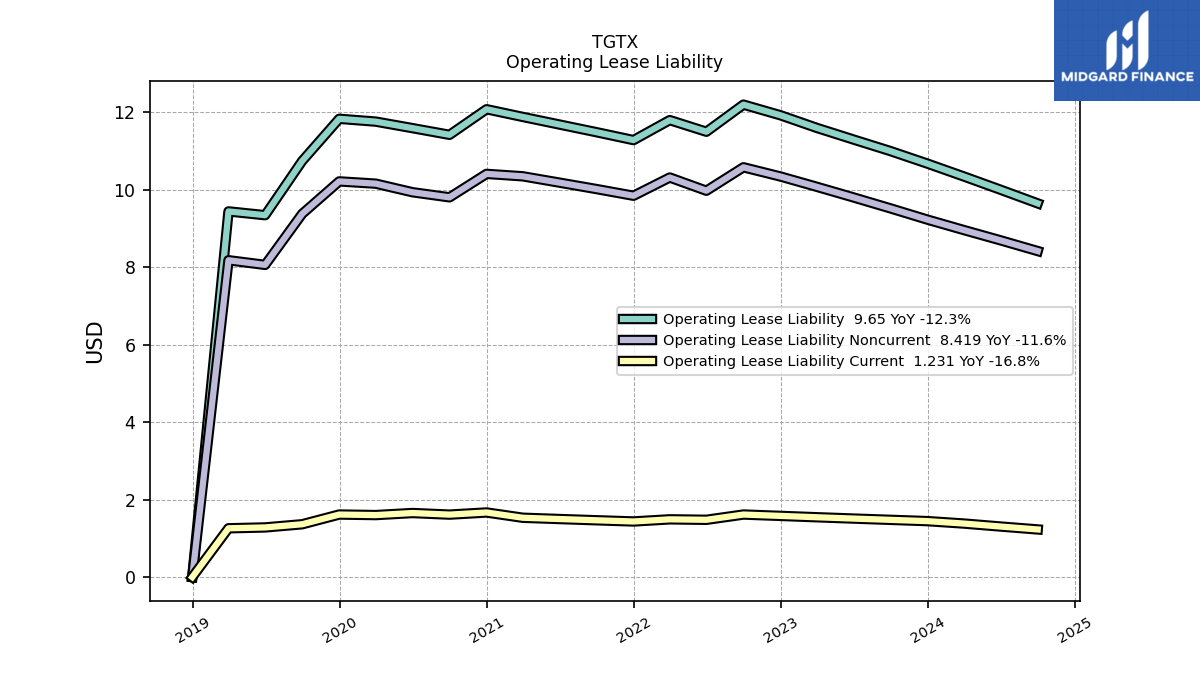
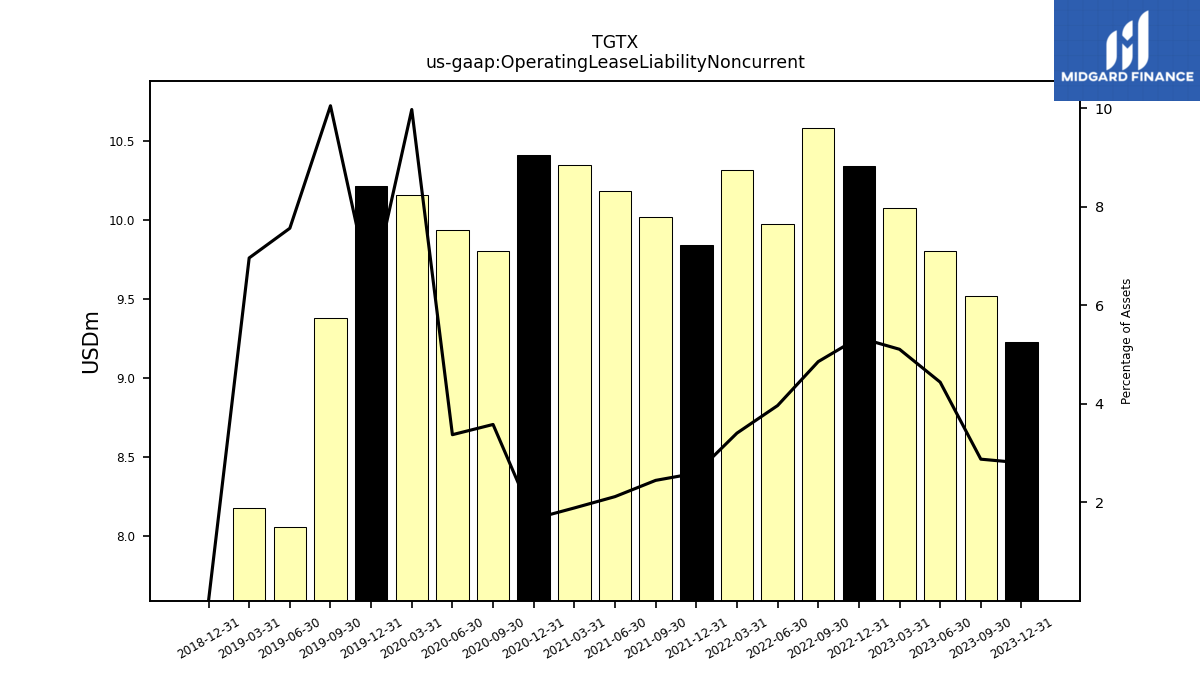
| Operating Lease Liability Noncurrent | 9.23 | 9.52 | 9.80 | 10.08 | 10.34 | 10.58 | 9.98 | 10.32 | 9.85 | 10.02 | 10.19 | 10.35 | 10.41 | 9.81 | 9.94 | 10.16 | 10.22 | 9.38 | 8.06 | 8.18 | 0.00 | NA | NA | NA | NA | NA | NA |
| 2023-12-31 | 2023-09-30 | 2023-06-30 | 2023-03-31 | 2022-12-31 | 2022-09-30 | 2022-06-30 | 2022-03-31 | 2021-12-31 | 2021-09-30 | 2021-06-30 | 2021-03-31 | 2020-12-31 | 2020-09-30 | 2020-06-30 | 2020-03-31 | 2019-12-31 | 2019-09-30 | 2019-06-30 | 2019-03-31 | 2018-12-31 | 2018-09-30 | 2018-06-30 | 2018-03-31 | 2017-12-31 | 2017-09-30 | 2017-06-30 | ||
|---|---|---|---|---|---|---|---|---|---|---|---|---|---|---|---|---|---|---|---|---|---|---|---|---|---|---|---|---|
| Stockholders Equity | 160.50 | 164.77 | 40.45 | 27.43 | 58.59 | 100.48 | 129.03 | 170.39 | 237.15 | NA | NA | NA | 519.35 | NA | NA | NA | NA | NA | NA | NA | NA | NA | NA | NA | NA | NA | NA | |
| Common Stock Value | 0.15 | 0.15 | 0.15 | 0.15 | 0.15 | 0.14 | 0.14 | 0.14 | 0.14 | 0.14 | 0.14 | 0.14 | 0.14 | 0.13 | 0.13 | 0.11 | 0.11 | 0.10 | 0.09 | 0.09 | 0.08 | 0.08 | 0.08 | 0.08 | 0.07 | 0.07 | 0.07 | |
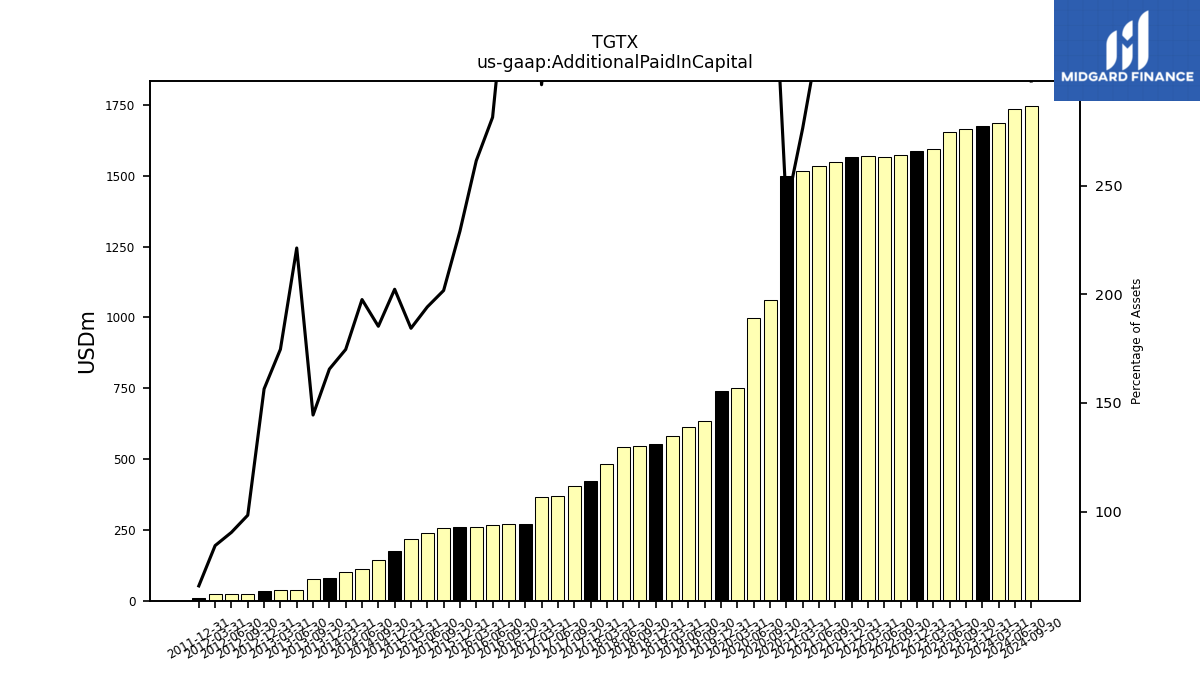
| Additional Paid In Capital | 1674.95 | 1664.80 | 1654.41 | 1593.78 | 1585.71 | 1574.61 | 1567.35 | 1568.19 | 1565.94 | 1546.97 | 1532.94 | 1516.60 | 1500.04 | 1063.14 | 999.55 | 751.10 | 739.96 | 635.99 | 613.06 | 582.90 | 552.53 | 546.38 | 542.06 | 481.78 | 422.02 | 403.71 | 370.61 | |
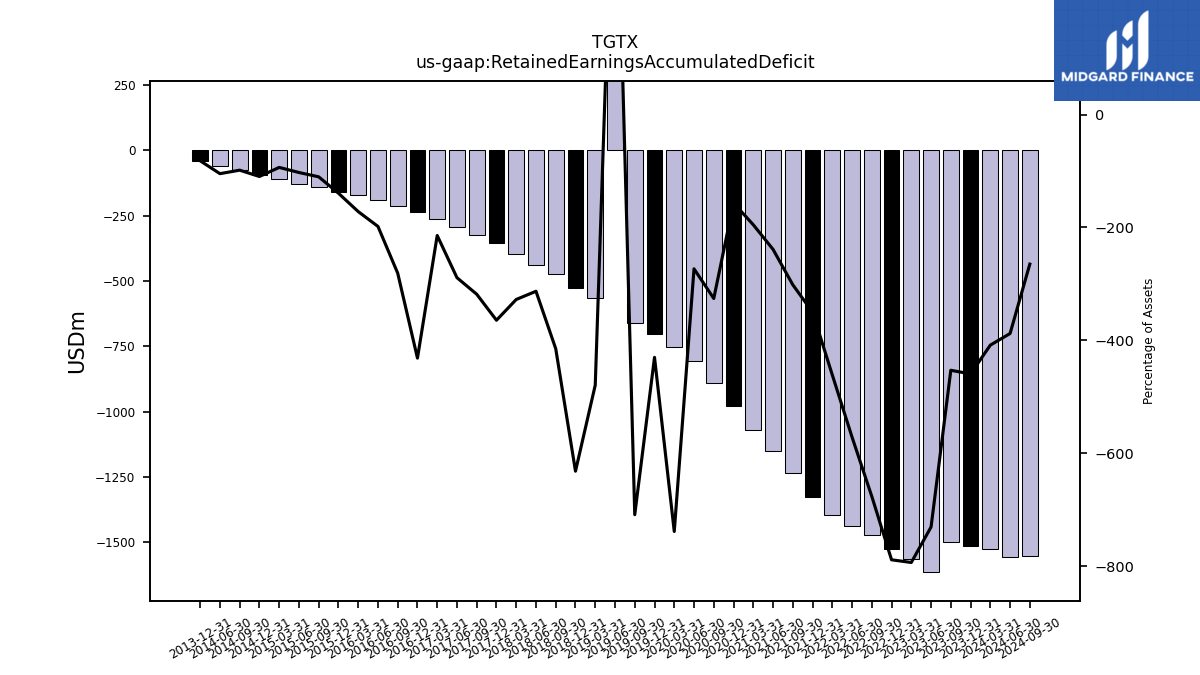
| Retained Earnings Accumulated Deficit | -1514.36 | -1499.94 | -1613.88 | -1566.27 | -1527.03 | -1474.04 | -1438.22 | -1397.71 | -1328.70 | -1235.36 | -1149.72 | -1071.22 | -980.60 | -892.38 | -805.22 | -752.33 | -701.22 | -661.64 | 599.71 | -563.50 | -528.35 | -474.49 | -440.53 | -396.39 | -354.86 | -324.00 | -292.47 | |
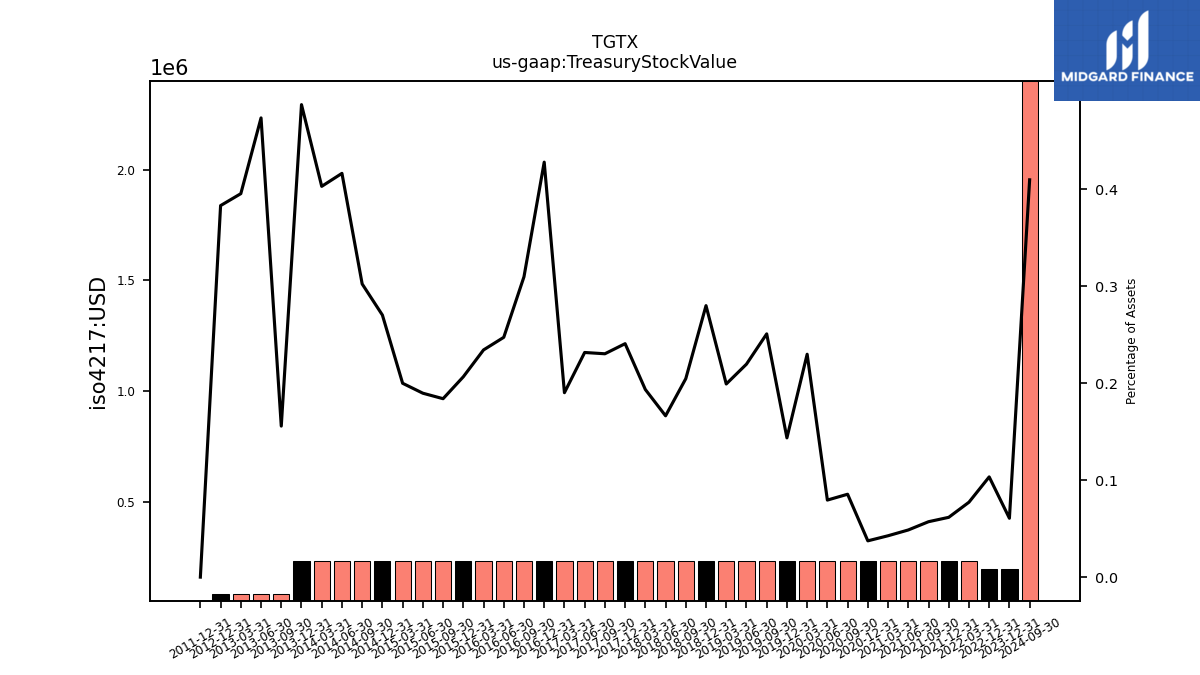
| Treasury Stock Value | 0.20 | NA | NA | NA | 0.20 | NA | NA | 0.23 | 0.23 | 0.23 | 0.23 | 0.23 | 0.23 | 0.23 | 0.23 | 0.23 | 0.23 | 0.23 | 0.23 | 0.23 | 0.23 | 0.23 | 0.23 | 0.23 | 0.23 | 0.23 | 0.23 |
| 2023-12-31 | 2023-09-30 | 2023-06-30 | 2023-03-31 | 2022-12-31 | 2022-09-30 | 2022-06-30 | 2022-03-31 | 2021-12-31 | 2021-09-30 | 2021-06-30 | 2021-03-31 | 2020-12-31 | 2020-09-30 | 2020-06-30 | 2020-03-31 | 2019-12-31 | 2019-09-30 | 2019-06-30 | 2019-03-31 | 2018-12-31 | 2018-09-30 | 2018-06-30 | 2018-03-31 | 2017-12-31 | 2017-09-30 | 2017-06-30 | ||
|---|---|---|---|---|---|---|---|---|---|---|---|---|---|---|---|---|---|---|---|---|---|---|---|---|---|---|---|---|
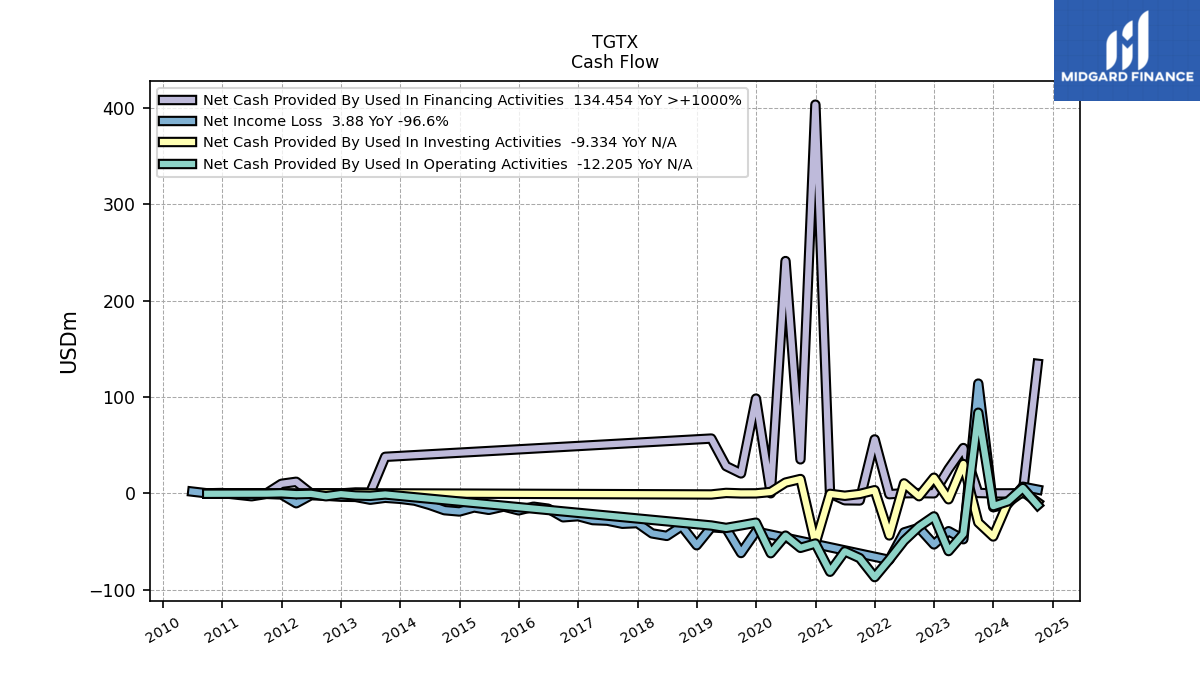
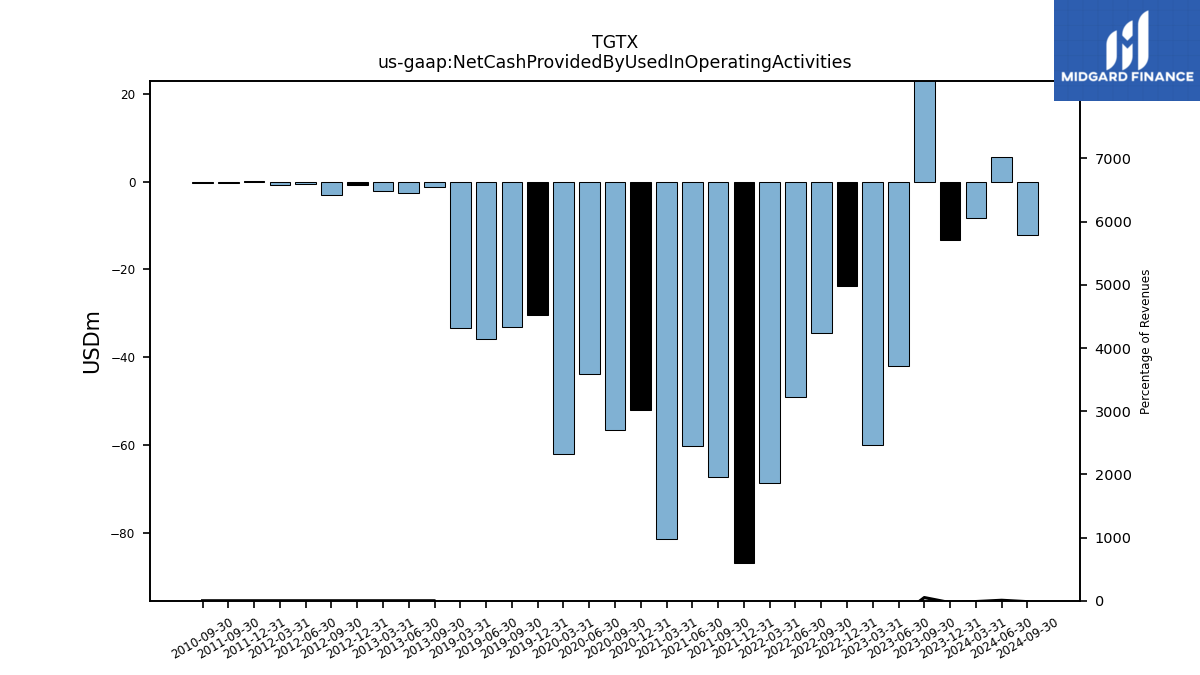
| Net Cash Provided By Used In Operating Activities | -13.21 | 83.70 | -42.01 | -59.90 | -23.87 | -34.49 | -49.12 | -68.69 | -86.91 | -67.20 | -60.17 | -81.36 | -52.03 | -56.53 | -43.83 | -62.12 | -30.39 | -33.20 | -35.86 | -33.35 | NA | NA | NA | NA | NA | NA | NA | |
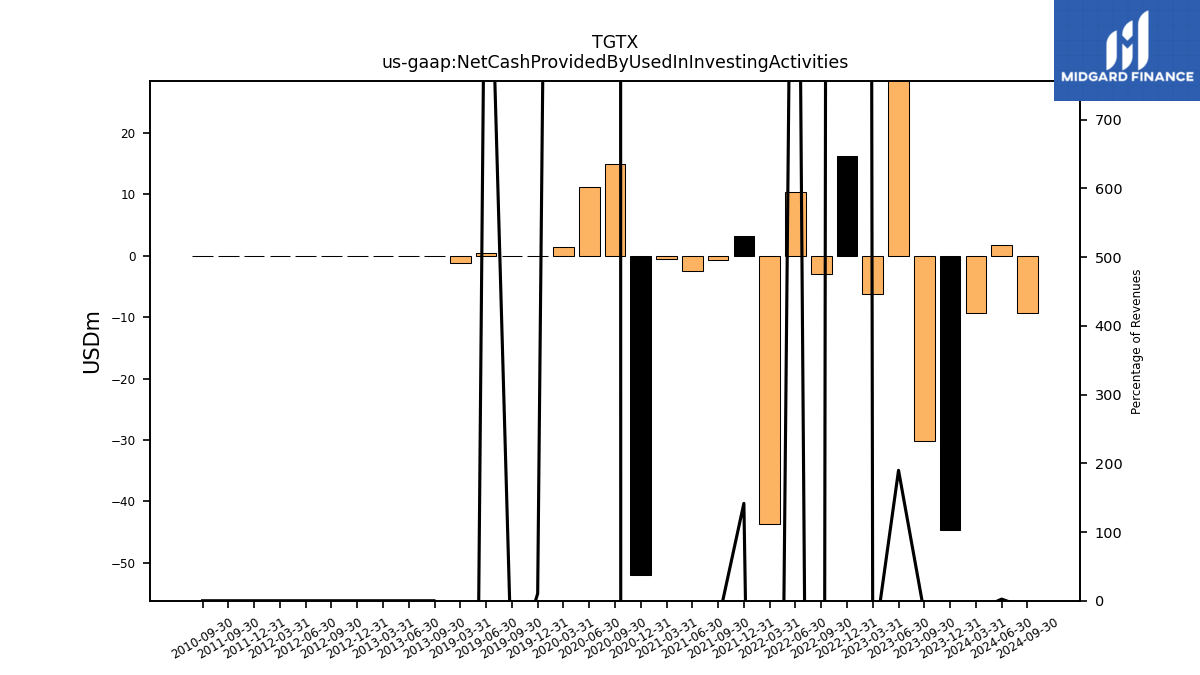
| Net Cash Provided By Used In Investing Activities | -44.76 | -30.23 | 30.50 | -6.17 | 16.27 | -2.99 | 10.38 | -43.67 | 3.29 | -0.63 | -2.48 | -0.51 | -52.08 | 14.91 | 11.21 | 1.45 | 0.00 | -0.04 | 0.46 | -1.14 | NA | NA | NA | NA | NA | NA | NA | |
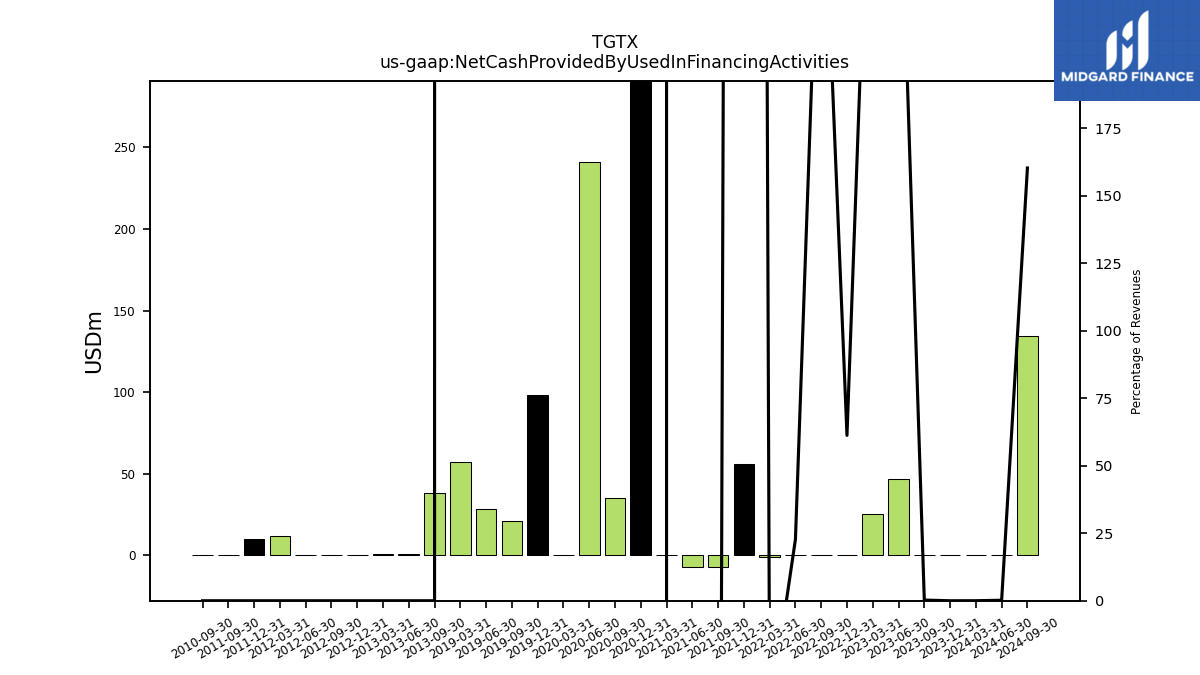
| Net Cash Provided By Used In Financing Activities | -0.00 | 0.42 | 47.05 | 25.24 | 0.05 | 0.28 | 0.14 | -0.85 | 56.00 | -7.36 | -7.16 | -0.06 | 403.39 | 35.27 | 241.09 | 0.08 | 98.35 | 20.70 | 28.28 | 56.88 | NA | NA | NA | NA | NA | NA | NA |
| 2023-12-31 | 2023-09-30 | 2023-06-30 | 2023-03-31 | 2022-12-31 | 2022-09-30 | 2022-06-30 | 2022-03-31 | 2021-12-31 | 2021-09-30 | 2021-06-30 | 2021-03-31 | 2020-12-31 | 2020-09-30 | 2020-06-30 | 2020-03-31 | 2019-12-31 | 2019-09-30 | 2019-06-30 | 2019-03-31 | 2018-12-31 | 2018-09-30 | 2018-06-30 | 2018-03-31 | 2017-12-31 | 2017-09-30 | 2017-06-30 | ||
|---|---|---|---|---|---|---|---|---|---|---|---|---|---|---|---|---|---|---|---|---|---|---|---|---|---|---|---|---|
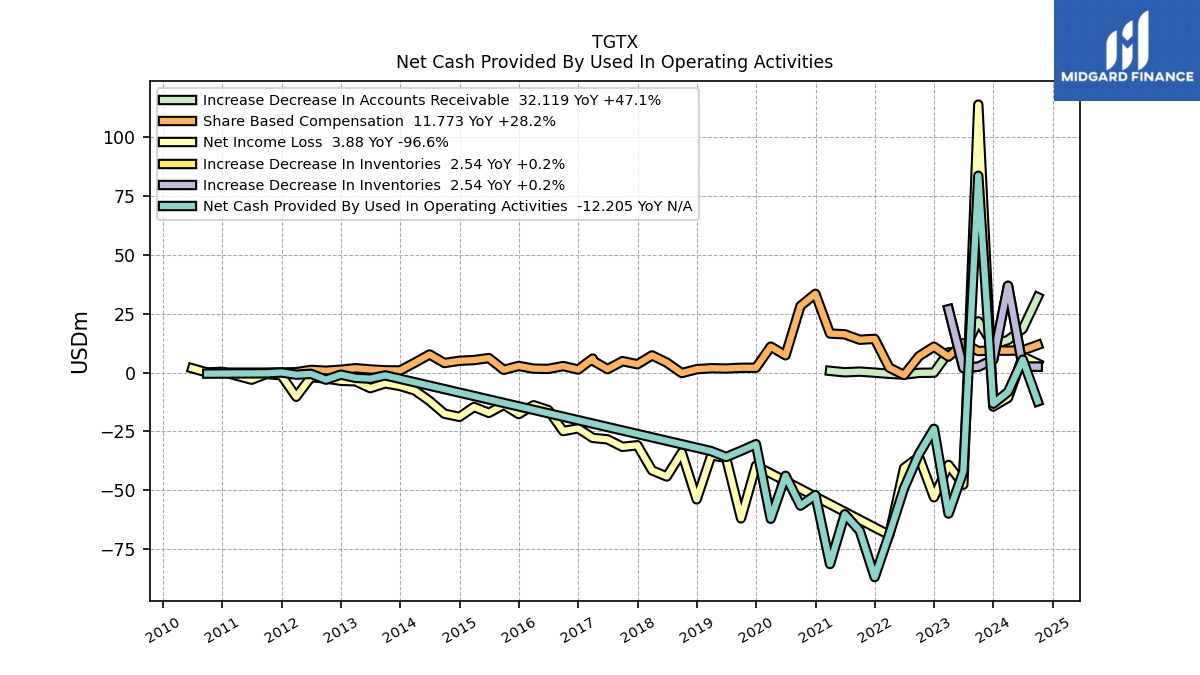
| Net Cash Provided By Used In Operating Activities | -13.21 | 83.70 | -42.01 | -59.90 | -23.87 | -34.49 | -49.12 | -68.69 | -86.91 | -67.20 | -60.17 | -81.36 | -52.03 | -56.53 | -43.83 | -62.12 | -30.39 | -33.20 | -35.86 | -33.35 | NA | NA | NA | NA | NA | NA | NA | |
| Net Income Loss | -14.42 | 113.93 | -47.61 | -39.23 | -52.99 | -35.82 | -40.51 | -69.01 | NA | NA | NA | NA | NA | NA | NA | NA | -39.57 | -61.93 | -36.21 | -35.16 | -53.86 | -33.95 | -44.14 | -41.53 | -30.86 | -31.54 | -28.35 | |
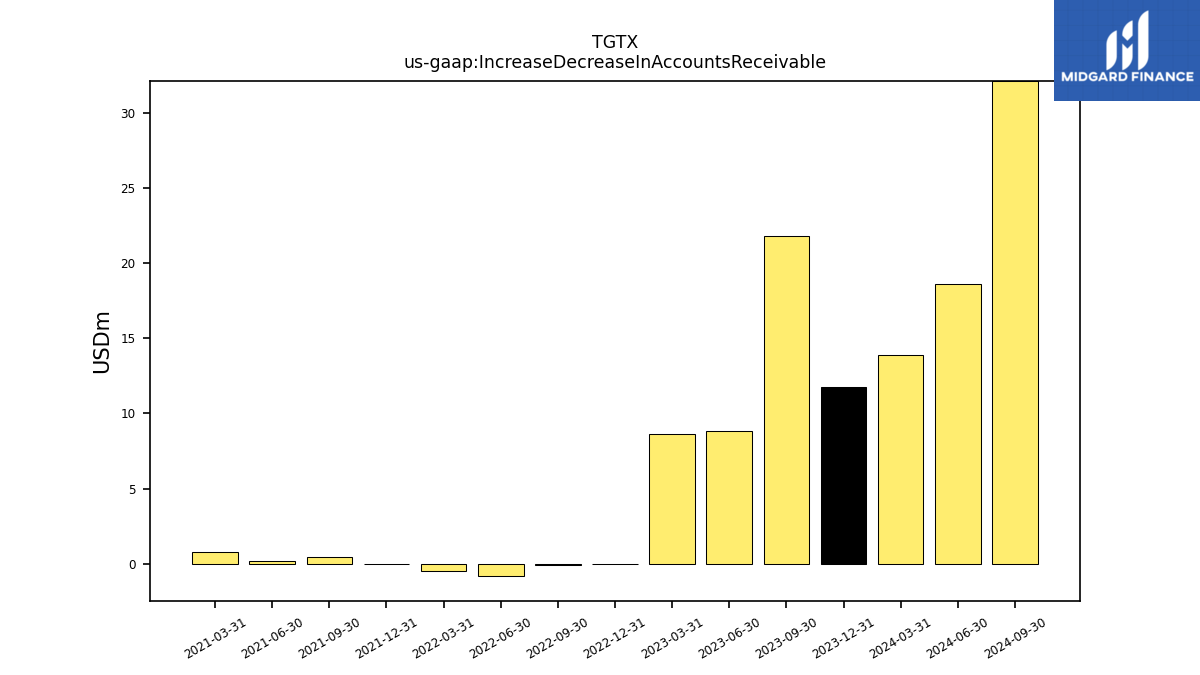
| Increase Decrease In Accounts Receivable | 11.77 | 21.84 | 8.86 | 8.62 | 0.00 | -0.09 | -0.81 | -0.49 | 0.01 | 0.45 | 0.16 | 0.77 | NA | NA | NA | NA | NA | NA | NA | NA | NA | NA | NA | NA | NA | NA | NA | |
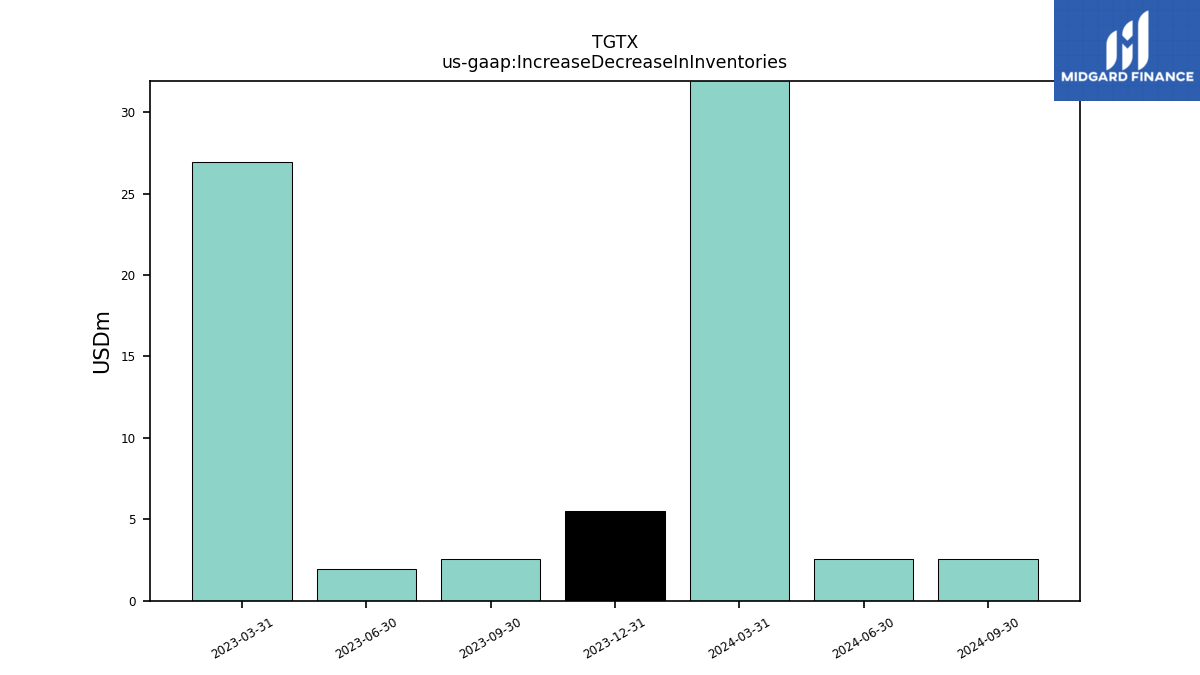
| Increase Decrease In Inventories | 5.51 | 2.54 | 1.97 | 26.92 | NA | NA | NA | NA | NA | NA | NA | NA | NA | NA | NA | NA | NA | NA | NA | NA | NA | NA | NA | NA | NA | NA | NA | |
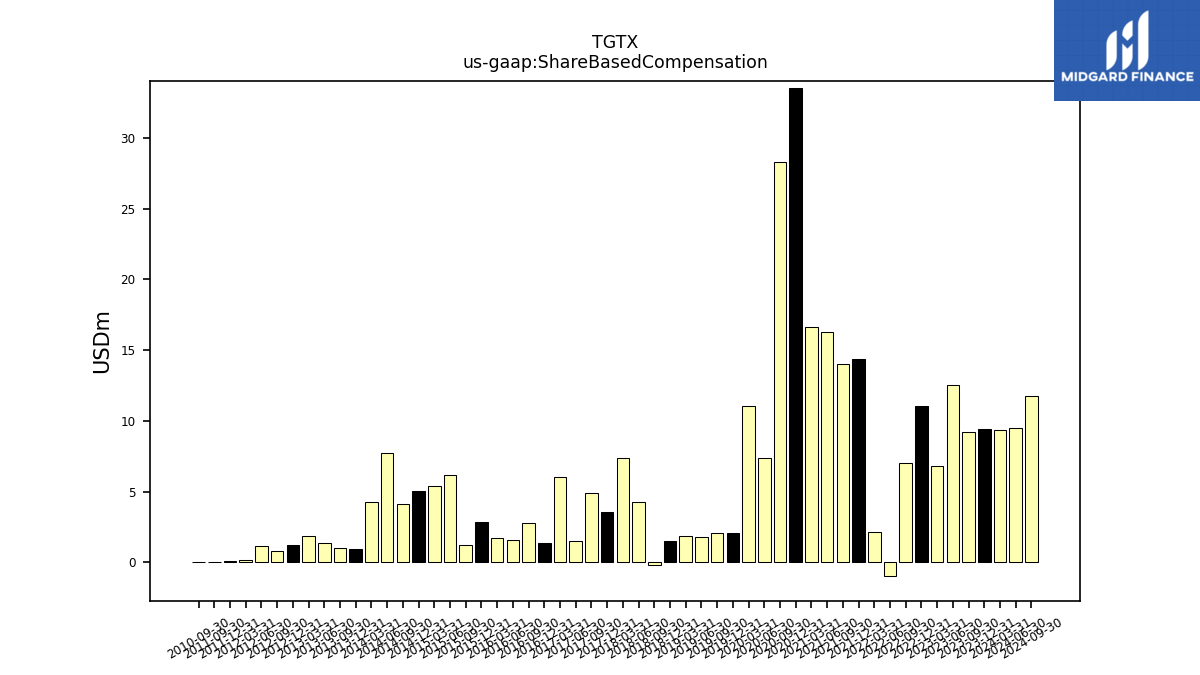
| Share Based Compensation | 9.38 | 9.18 | 12.54 | 6.82 | 11.05 | 7.00 | -1.00 | 2.12 | 14.36 | 14.00 | 16.30 | 16.62 | 33.52 | 28.33 | 7.37 | 11.07 | 2.09 | 2.08 | 1.76 | 1.88 | 1.47 | -0.17 | 4.26 | 7.34 | 3.57 | 4.89 | 1.49 | |
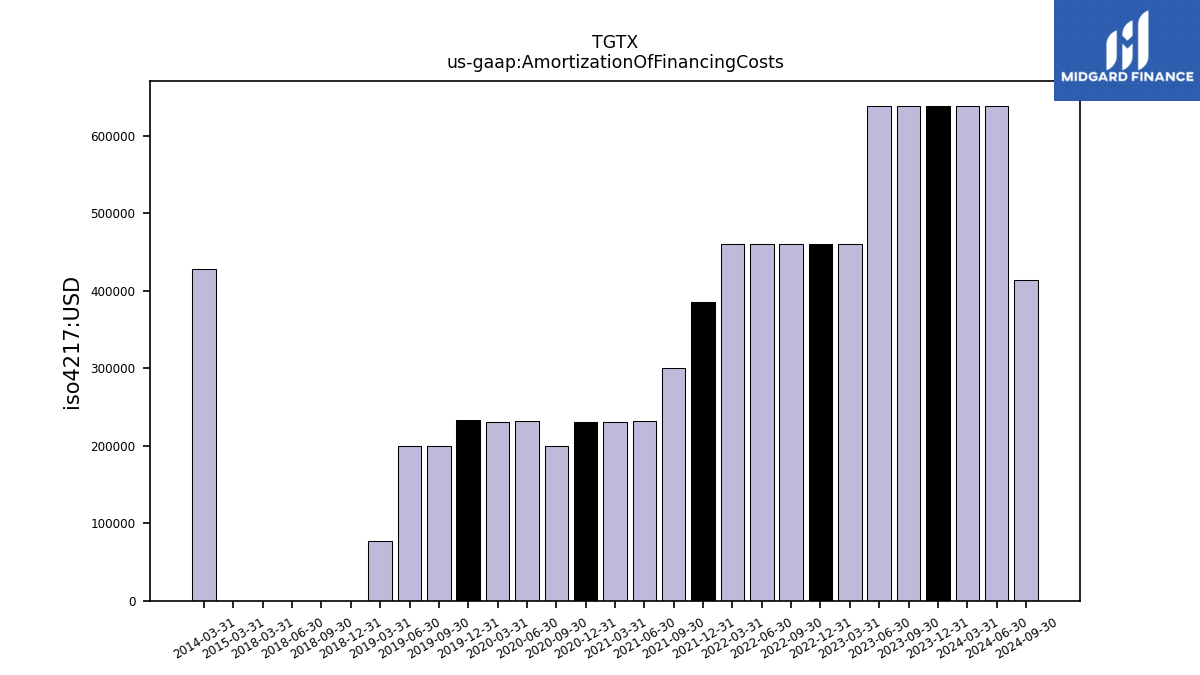
| Amortization Of Financing Costs | 0.64 | 0.64 | 0.64 | 0.46 | 0.46 | 0.46 | 0.46 | 0.46 | 0.39 | 0.30 | 0.23 | 0.23 | 0.23 | 0.20 | 0.23 | 0.23 | 0.23 | 0.20 | 0.20 | 0.08 | 0.00 | 0.00 | 0.00 | 0.00 | NA | NA | NA |
| 2023-12-31 | 2023-09-30 | 2023-06-30 | 2023-03-31 | 2022-12-31 | 2022-09-30 | 2022-06-30 | 2022-03-31 | 2021-12-31 | 2021-09-30 | 2021-06-30 | 2021-03-31 | 2020-12-31 | 2020-09-30 | 2020-06-30 | 2020-03-31 | 2019-12-31 | 2019-09-30 | 2019-06-30 | 2019-03-31 | 2018-12-31 | 2018-09-30 | 2018-06-30 | 2018-03-31 | 2017-12-31 | 2017-09-30 | 2017-06-30 | ||
|---|---|---|---|---|---|---|---|---|---|---|---|---|---|---|---|---|---|---|---|---|---|---|---|---|---|---|---|---|
| Net Cash Provided By Used In Investing Activities | -44.76 | -30.23 | 30.50 | -6.17 | 16.27 | -2.99 | 10.38 | -43.67 | 3.29 | -0.63 | -2.48 | -0.51 | -52.08 | 14.91 | 11.21 | 1.45 | 0.00 | -0.04 | 0.46 | -1.14 | NA | NA | NA | NA | NA | NA | NA |
| 2023-12-31 | 2023-09-30 | 2023-06-30 | 2023-03-31 | 2022-12-31 | 2022-09-30 | 2022-06-30 | 2022-03-31 | 2021-12-31 | 2021-09-30 | 2021-06-30 | 2021-03-31 | 2020-12-31 | 2020-09-30 | 2020-06-30 | 2020-03-31 | 2019-12-31 | 2019-09-30 | 2019-06-30 | 2019-03-31 | 2018-12-31 | 2018-09-30 | 2018-06-30 | 2018-03-31 | 2017-12-31 | 2017-09-30 | 2017-06-30 | ||
|---|---|---|---|---|---|---|---|---|---|---|---|---|---|---|---|---|---|---|---|---|---|---|---|---|---|---|---|---|
| Net Cash Provided By Used In Financing Activities | -0.00 | 0.42 | 47.05 | 25.24 | 0.05 | 0.28 | 0.14 | -0.85 | 56.00 | -7.36 | -7.16 | -0.06 | 403.39 | 35.27 | 241.09 | 0.08 | 98.35 | 20.70 | 28.28 | 56.88 | NA | NA | NA | NA | NA | NA | NA |
| 2023-12-31 | 2023-09-30 | 2023-06-30 | 2023-03-31 | 2022-12-31 | 2022-09-30 | 2022-06-30 | 2022-03-31 | 2021-12-31 | 2021-09-30 | 2021-06-30 | 2021-03-31 | 2020-12-31 | 2020-09-30 | 2020-06-30 | 2020-03-31 | 2019-12-31 | 2019-09-30 | 2019-06-30 | 2019-03-31 | 2018-12-31 | 2018-09-30 | 2018-06-30 | 2018-03-31 | 2017-12-31 | 2017-09-30 | 2017-06-30 | ||
|---|---|---|---|---|---|---|---|---|---|---|---|---|---|---|---|---|---|---|---|---|---|---|---|---|---|---|---|---|
| Revenues | 43.97 | 165.81 | 16.07 | 7.80 | 0.08 | 0.09 | 0.59 | 2.02 | 2.32 | 2.03 | 1.54 | 0.79 | 0.04 | 0.04 | 0.04 | 0.04 | 0.04 | 0.04 | 0.04 | 0.04 | 0.04 | 0.04 | 0.04 | 0.04 | 0.04 | 0.04 | 0.04 | |
| Revenue From Contract With Customer Excluding Assessed Tax | 43.97 | 165.81 | 16.07 | 7.80 | 0.08 | 0.09 | 0.59 | 2.02 | 2.32 | 2.03 | 1.54 | 0.79 | 0.04 | 0.04 | 0.04 | 0.04 | 0.04 | 0.04 | 0.04 | 0.04 | 0.04 | 0.04 | 0.04 | 0.04 | 0.04 | 0.04 | 0.04 | |
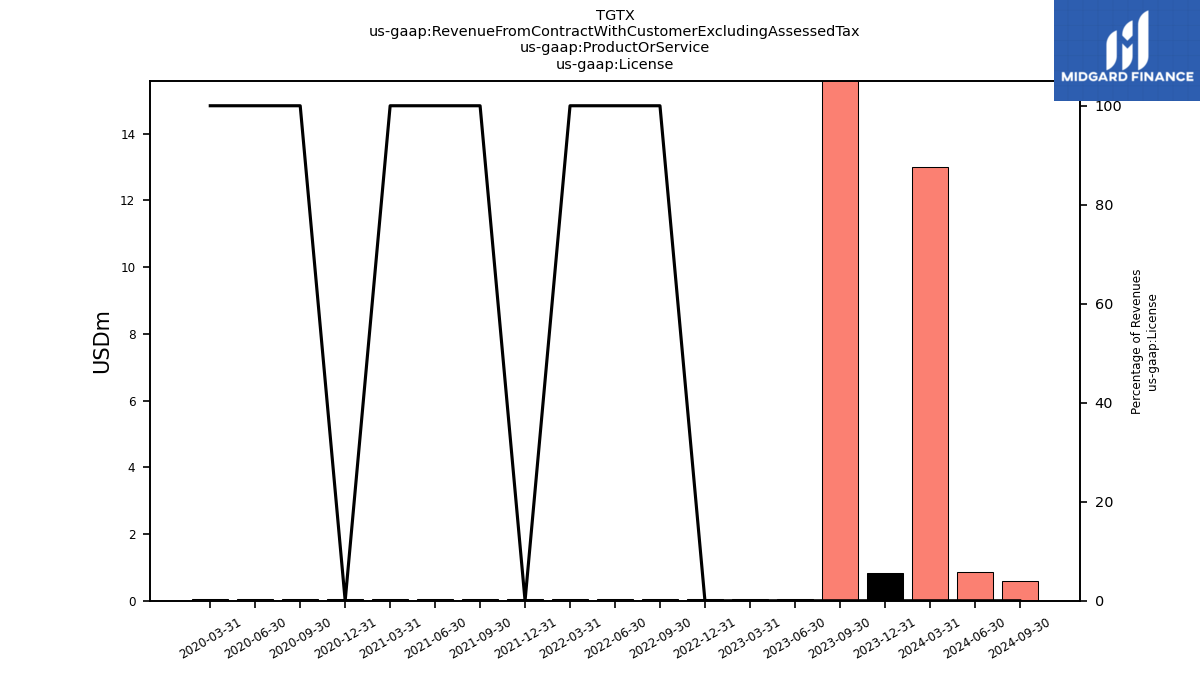
| License | 0.83 | 140.75 | 0.04 | 0.04 | 0.04 | 0.04 | 0.04 | 0.04 | 0.04 | 0.04 | 0.04 | 0.04 | 0.04 | 0.04 | 0.04 | 0.04 | NA | NA | NA | NA | NA | NA | NA | NA | NA | NA | NA | |
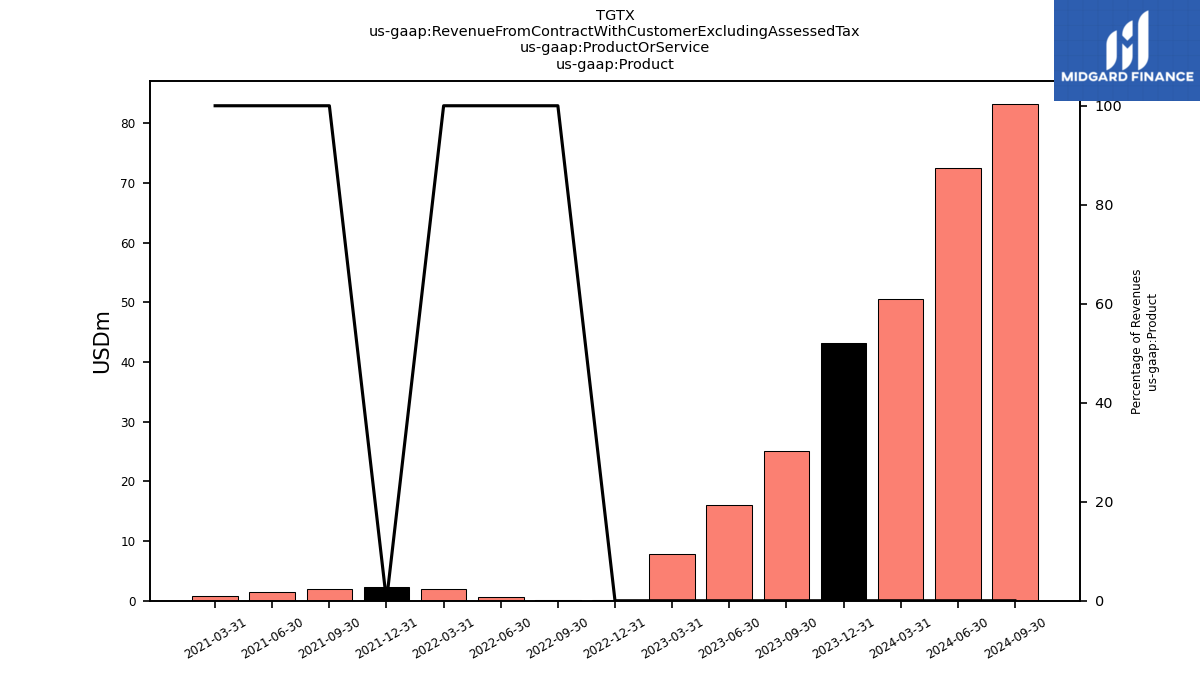
| Product | 43.14 | 25.07 | 16.04 | 7.76 | 0.04 | 0.06 | 0.56 | 1.98 | 2.28 | 1.99 | 1.51 | 0.76 | NA | NA | NA | NA | NA | NA | NA | NA | NA | NA | NA | NA | NA | NA | NA | |
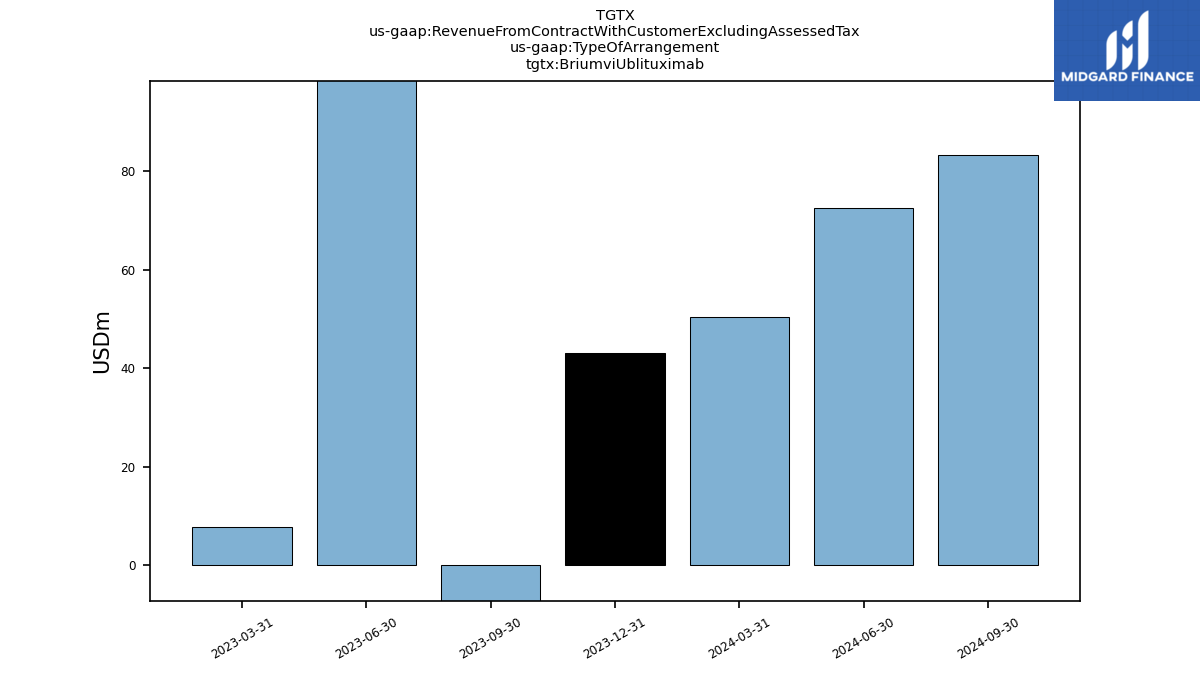
| Briumvi Ublituximab | 43.10 | -23751.10 | 23792.20 | 7.80 | NA | NA | NA | NA | NA | NA | NA | NA | NA | NA | NA | NA | NA | NA | NA | NA | NA | NA | NA | NA | NA | NA | NA | |
| Commercialization Agreement With Neuraxpharm | 0.80 | 0.70 | NA | NA | NA | NA | NA | NA | NA | NA | NA | NA | NA | NA | NA | NA | NA | NA | NA | NA | NA | NA | NA | NA | NA | NA | NA |