
| 2023-12-31 | 2023-09-30 | 2023-06-30 | 2023-03-31 | 2022-12-31 | 2022-09-30 | 2022-06-30 | 2022-03-31 | 2021-12-31 | 2021-09-30 | 2021-06-30 | 2021-03-31 | 2020-12-31 | 2020-09-30 | 2020-06-30 | 2020-03-31 | 2019-12-31 | 2019-09-30 | 2019-06-30 | 2019-03-31 | 2018-12-31 | 2018-09-30 | 2018-06-30 | 2018-03-31 | 2017-12-31 | 2017-09-30 | 2017-06-30 | 2017-03-31 | 2016-12-31 | 2016-09-30 | 2016-06-30 | 2016-03-31 | 2015-12-31 | 2015-09-30 | 2015-06-30 | 2015-03-31 | 2013-12-31 | 2013-09-30 | 2013-06-30 | 2013-03-31 | 2012-09-30 | 2012-06-30 | 2012-03-31 | ||
|---|---|---|---|---|---|---|---|---|---|---|---|---|---|---|---|---|---|---|---|---|---|---|---|---|---|---|---|---|---|---|---|---|---|---|---|---|---|---|---|---|---|---|---|---|
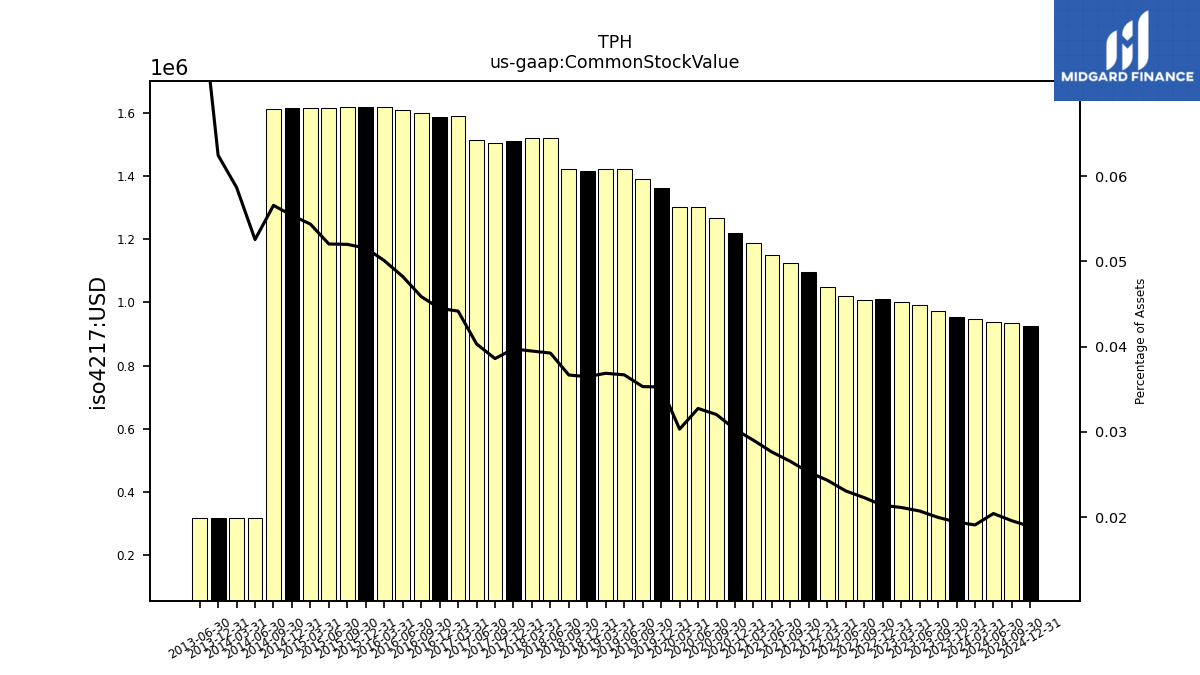
| Common Stock Value | 0.95 | 0.97 | 0.99 | 1.00 | 1.01 | 1.01 | 1.02 | 1.05 | 1.10 | 1.12 | 1.15 | 1.19 | 1.22 | 1.27 | 1.30 | 1.30 | 1.36 | 1.39 | 1.42 | 1.42 | 1.42 | 1.42 | 1.52 | 1.52 | 1.51 | 1.50 | 1.51 | 1.59 | 1.59 | 1.60 | 1.61 | 1.62 | 1.62 | 1.62 | 1.62 | 1.62 | 0.32 | NA | 0.32 | NA | NA | NA | NA | |
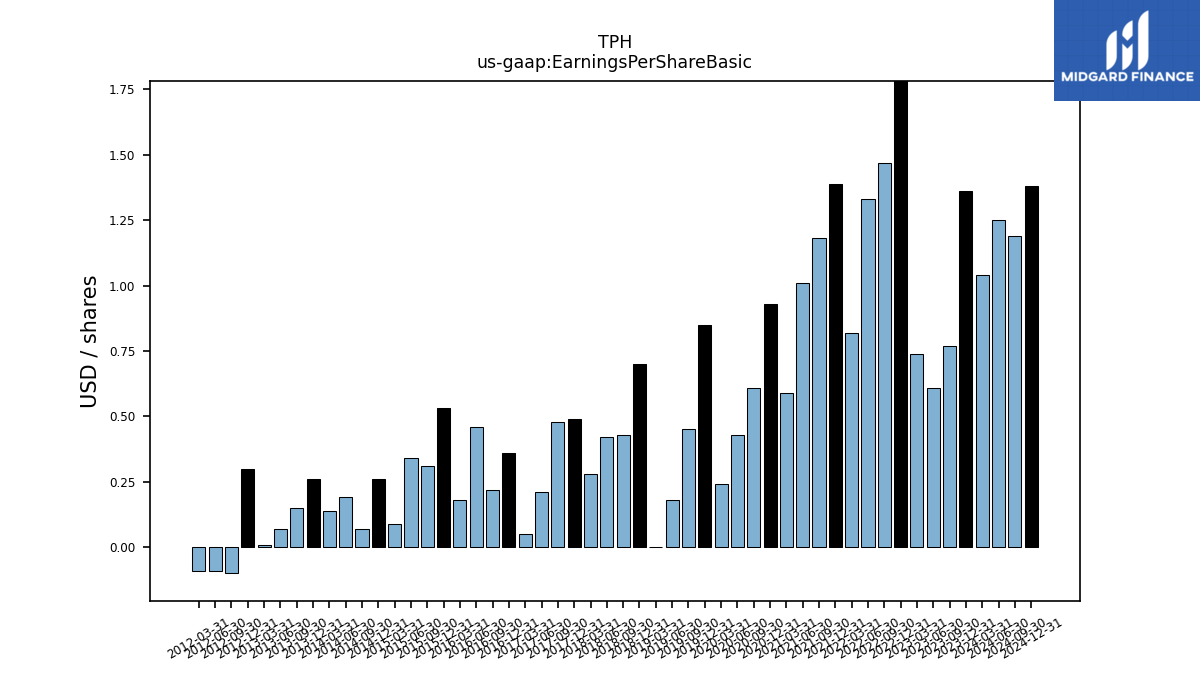
| Earnings Per Share Basic | 1.36 | 0.77 | 0.61 | 0.74 | 2.00 | 1.47 | 1.33 | 0.82 | 1.39 | 1.18 | 1.01 | 0.59 | 0.93 | 0.61 | 0.43 | 0.24 | 0.85 | 0.45 | 0.18 | 0.00 | 0.70 | 0.43 | 0.42 | 0.28 | 0.49 | 0.48 | 0.21 | 0.05 | 0.36 | 0.22 | 0.46 | 0.18 | 0.53 | 0.31 | 0.34 | 0.09 | 0.26 | 0.15 | 0.07 | 0.01 | -0.10 | -0.09 | -0.09 | |
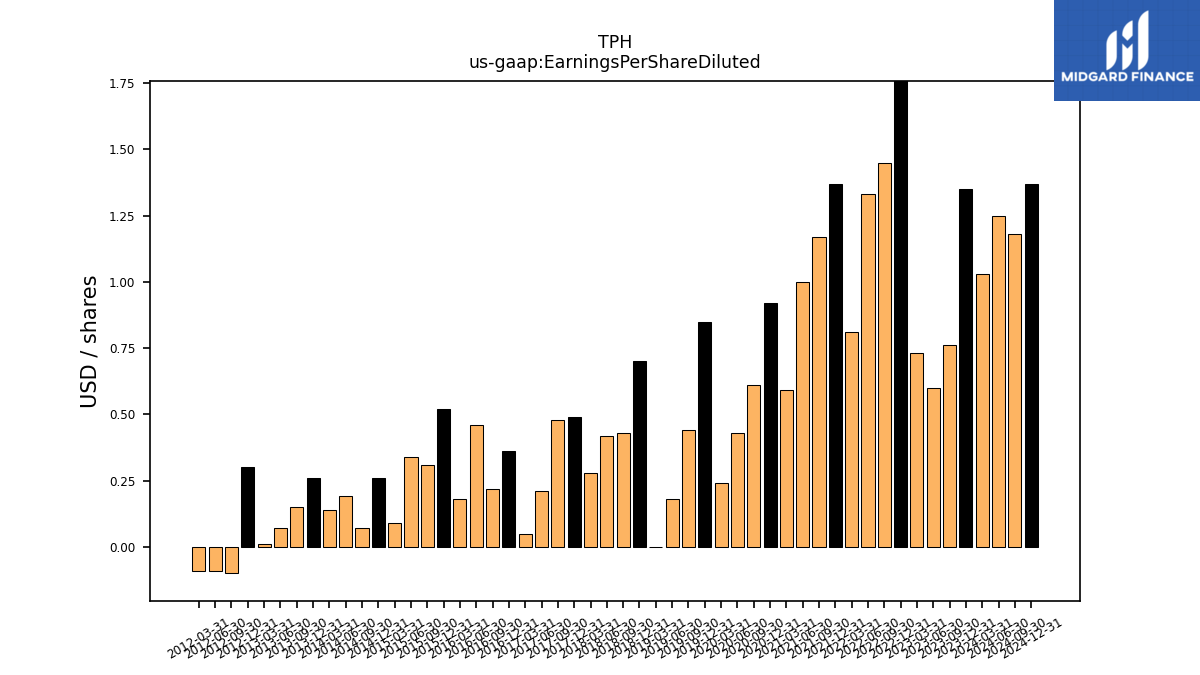
| Earnings Per Share Diluted | 1.35 | 0.76 | 0.60 | 0.73 | 1.97 | 1.45 | 1.33 | 0.81 | 1.37 | 1.17 | 1.00 | 0.59 | 0.92 | 0.61 | 0.43 | 0.24 | 0.85 | 0.44 | 0.18 | 0.00 | 0.70 | 0.43 | 0.42 | 0.28 | 0.49 | 0.48 | 0.21 | 0.05 | 0.36 | 0.22 | 0.46 | 0.18 | 0.52 | 0.31 | 0.34 | 0.09 | 0.26 | 0.15 | 0.07 | 0.01 | -0.10 | -0.09 | -0.09 |
| 2023-12-31 | 2023-09-30 | 2023-06-30 | 2023-03-31 | 2022-12-31 | 2022-09-30 | 2022-06-30 | 2022-03-31 | 2021-12-31 | 2021-09-30 | 2021-06-30 | 2021-03-31 | 2020-12-31 | 2020-09-30 | 2020-06-30 | 2020-03-31 | 2019-12-31 | 2019-09-30 | 2019-06-30 | 2019-03-31 | 2018-12-31 | 2018-09-30 | 2018-06-30 | 2018-03-31 | 2017-12-31 | 2017-09-30 | 2017-06-30 | 2017-03-31 | 2016-12-31 | 2016-09-30 | 2016-06-30 | 2016-03-31 | 2015-12-31 | 2015-09-30 | 2015-06-30 | 2015-03-31 | 2013-12-31 | 2013-09-30 | 2013-06-30 | 2013-03-31 | 2012-09-30 | 2012-06-30 | 2012-03-31 | ||
|---|---|---|---|---|---|---|---|---|---|---|---|---|---|---|---|---|---|---|---|---|---|---|---|---|---|---|---|---|---|---|---|---|---|---|---|---|---|---|---|---|---|---|---|---|
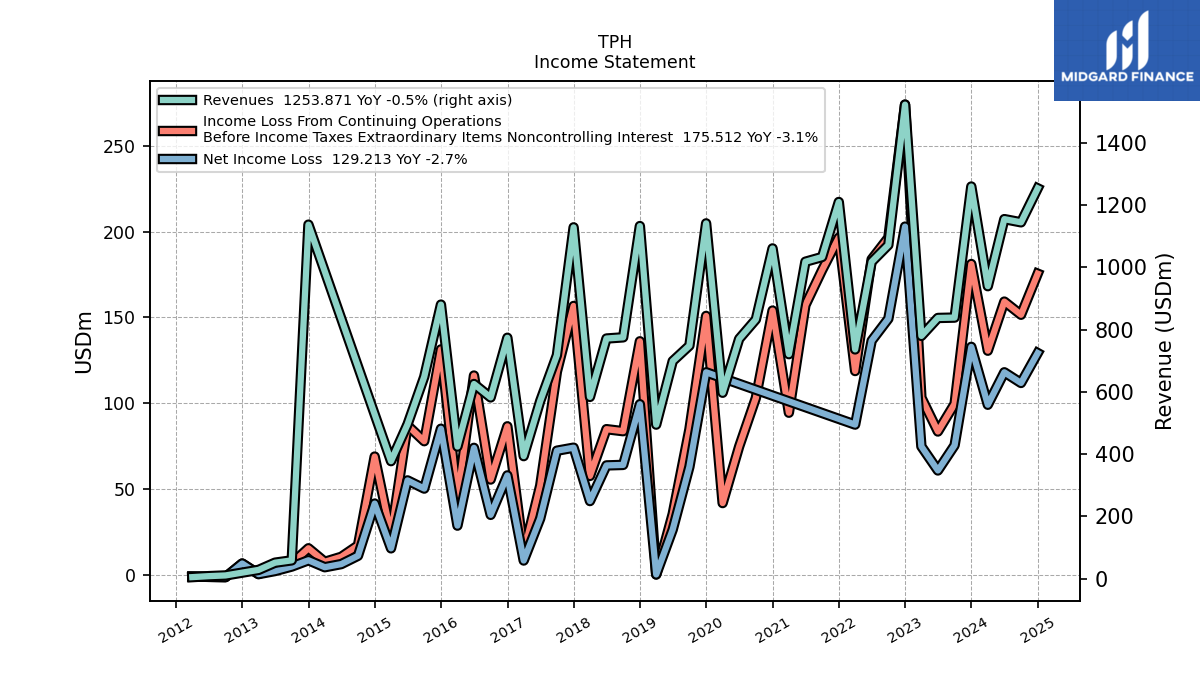
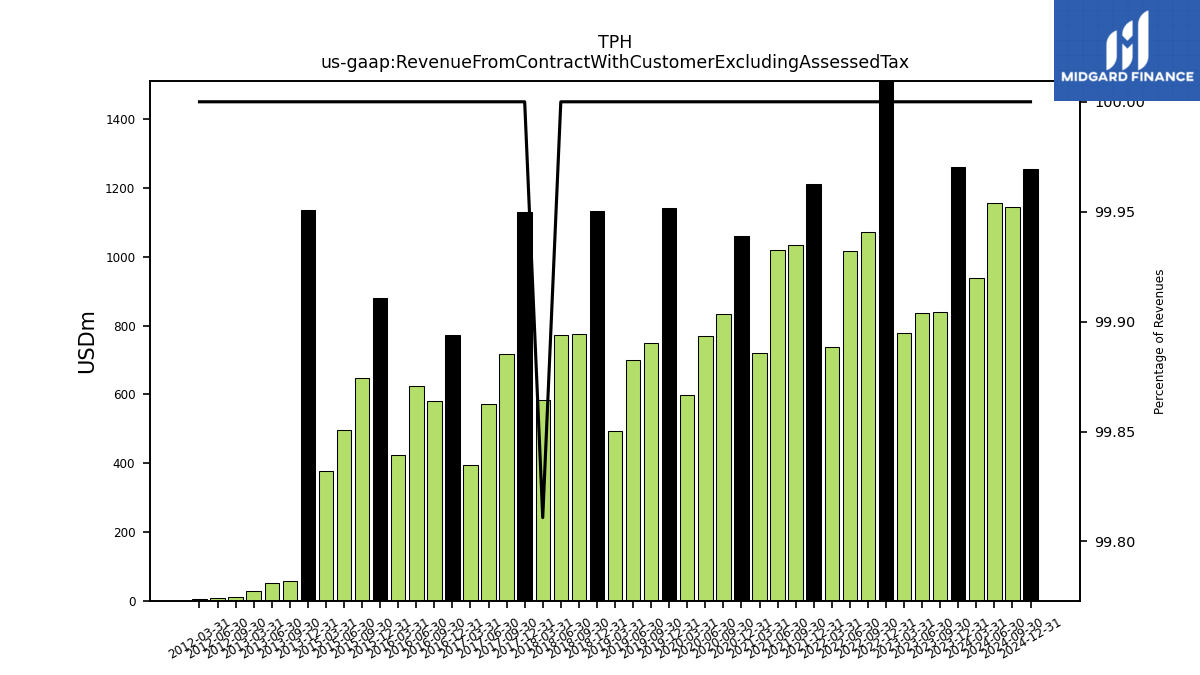
| Revenue From Contract With Customer Excluding Assessed Tax | 1259.70 | 838.52 | 837.33 | 779.66 | 1522.80 | 1071.80 | 1017.69 | 736.24 | 1210.01 | 1033.19 | 1018.06 | 720.97 | 1060.83 | 832.46 | 770.11 | 597.05 | 1141.27 | 748.39 | 698.71 | 494.63 | 1132.70 | 775.07 | 771.30 | 582.57 | 1128.52 | 717.74 | 570.63 | 393.39 | 773.75 | 582.03 | 625.22 | 424.14 | 880.24 | 648.14 | 495.52 | 377.26 | 1137.20 | 58.54 | 51.09 | 27.89 | 10.06 | 7.81 | 4.65 | |
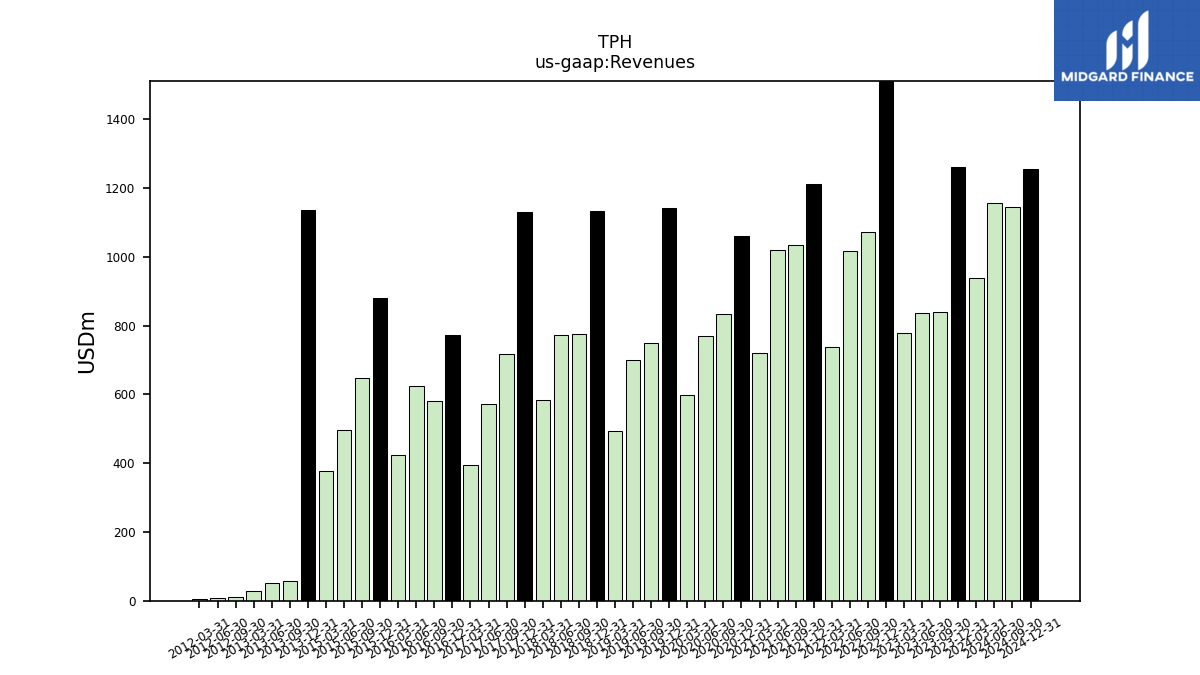
| Revenues | 1259.70 | 838.52 | 837.33 | 779.66 | 1522.80 | 1071.80 | 1017.69 | 736.24 | 1210.01 | 1033.19 | 1018.06 | 720.97 | 1060.83 | 832.46 | 770.11 | 597.05 | 1141.27 | 748.39 | 698.71 | 494.63 | 1132.70 | 775.07 | 771.30 | 583.68 | 1128.52 | 717.74 | 570.63 | 393.39 | 773.75 | 582.03 | 625.22 | 424.14 | 880.24 | 648.14 | 495.52 | 377.26 | 1137.20 | 58.54 | 51.09 | 27.89 | 10.06 | 7.81 | 4.65 | |
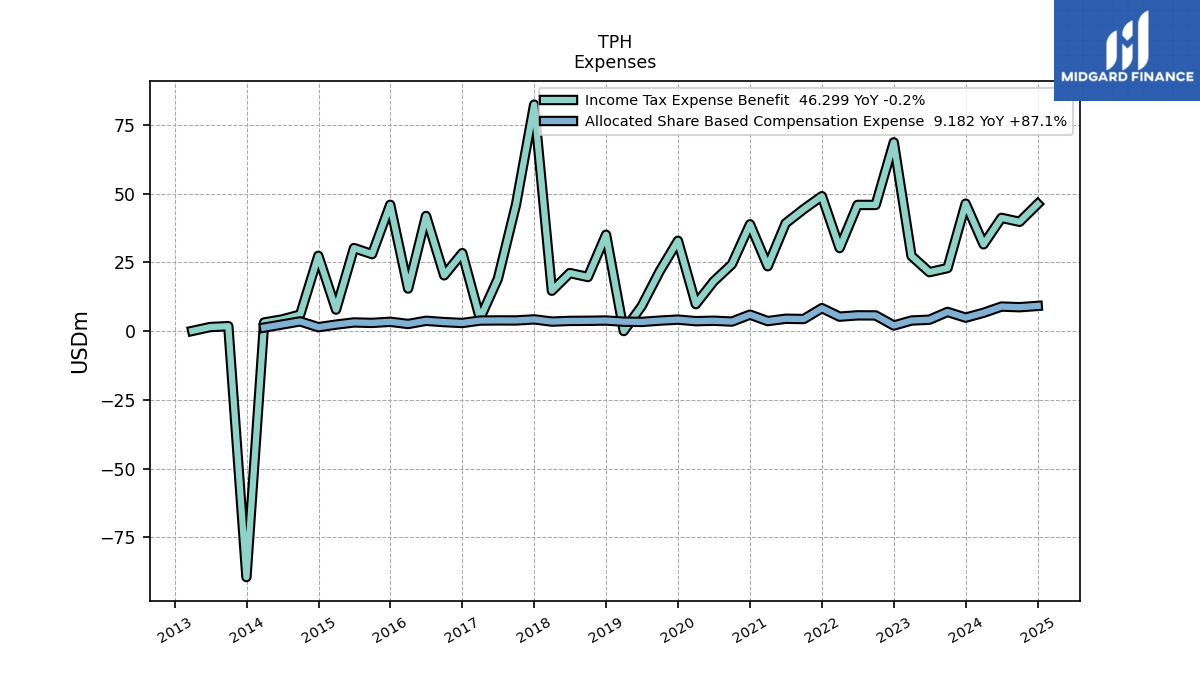
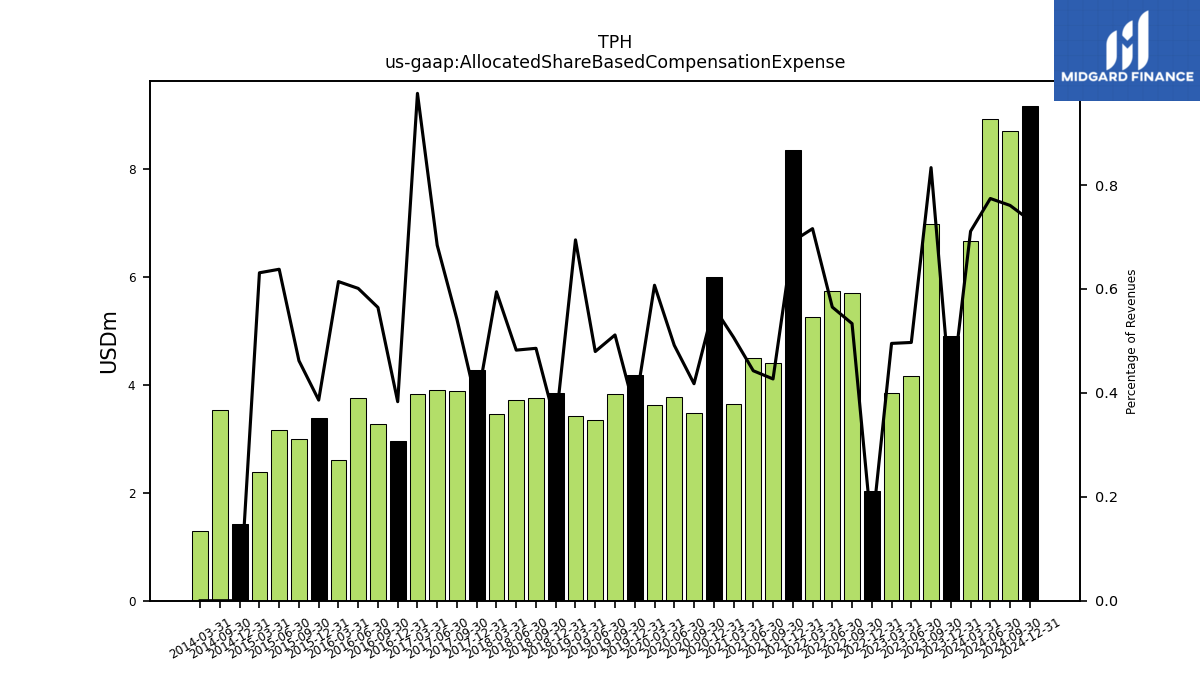
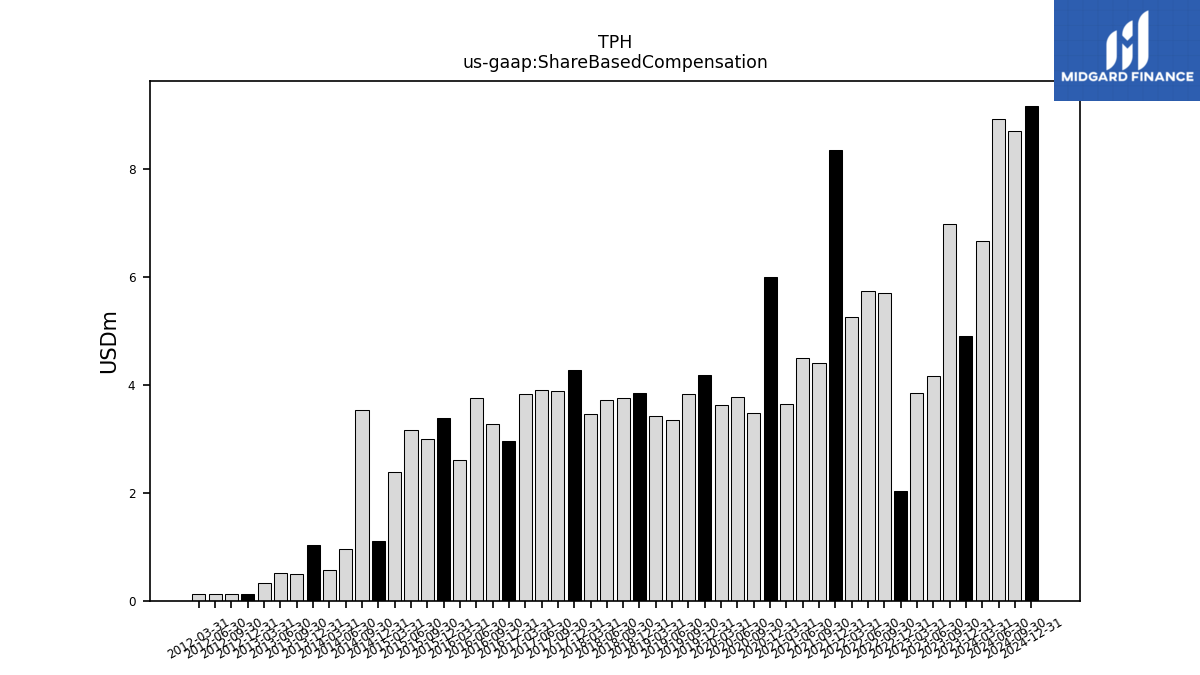
| Allocated Share Based Compensation Expense | 4.91 | 6.99 | 4.16 | 3.86 | 2.04 | 5.72 | 5.75 | 5.27 | 8.37 | 4.41 | 4.51 | 3.66 | 6.00 | 3.48 | 3.79 | 3.62 | 4.19 | 3.83 | 3.35 | 3.44 | 3.86 | 3.77 | 3.72 | 3.47 | 4.28 | 3.89 | 3.90 | 3.84 | 2.96 | 3.29 | 3.76 | 2.60 | 3.40 | 2.99 | 3.16 | 2.38 | NA | NA | NA | NA | NA | NA | NA | |
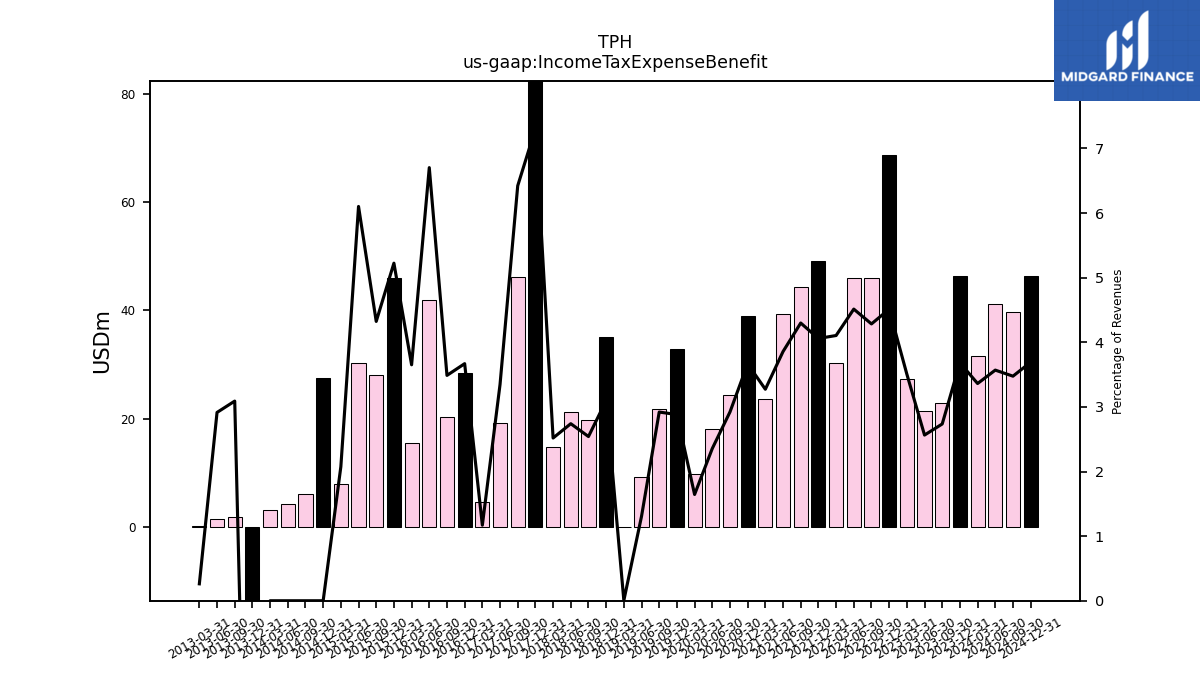
| Income Tax Expense Benefit | 46.40 | 22.94 | 21.47 | 27.35 | 68.72 | 45.92 | 45.94 | 30.23 | 49.12 | 44.41 | 39.27 | 23.60 | 38.88 | 24.32 | 18.14 | 9.82 | 32.89 | 21.86 | 9.13 | 0.02 | 35.09 | 19.70 | 21.14 | 14.70 | 82.44 | 46.10 | 19.10 | 4.60 | 28.39 | 20.30 | 41.91 | 15.49 | 45.99 | 28.02 | 30.24 | 7.83 | -89.53 | 1.81 | 1.49 | 0.07 | NA | NA | NA | |
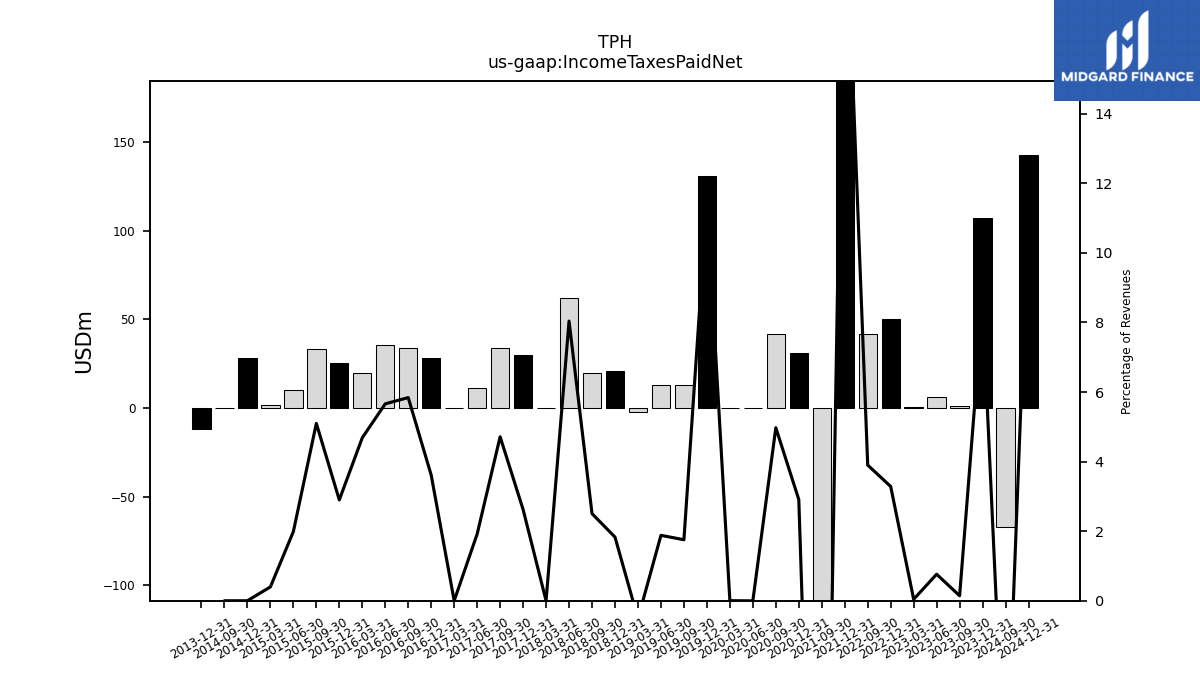
| Income Taxes Paid Net | 107.20 | 1.20 | 6.39 | 0.33 | 50.02 | 41.80 | NA | NA | 253.15 | -177.95 | NA | NA | 30.86 | 41.41 | -0.02 | 0.01 | 131.00 | 13.13 | 13.14 | -2.54 | 20.73 | 19.41 | 62.01 | 0.00 | 29.60 | 33.83 | 10.95 | 0.00 | 27.95 | 34.00 | 35.39 | 19.88 | 25.52 | 33.04 | 9.85 | 1.50 | -11.83 | NA | NA | NA | NA | NA | NA | |
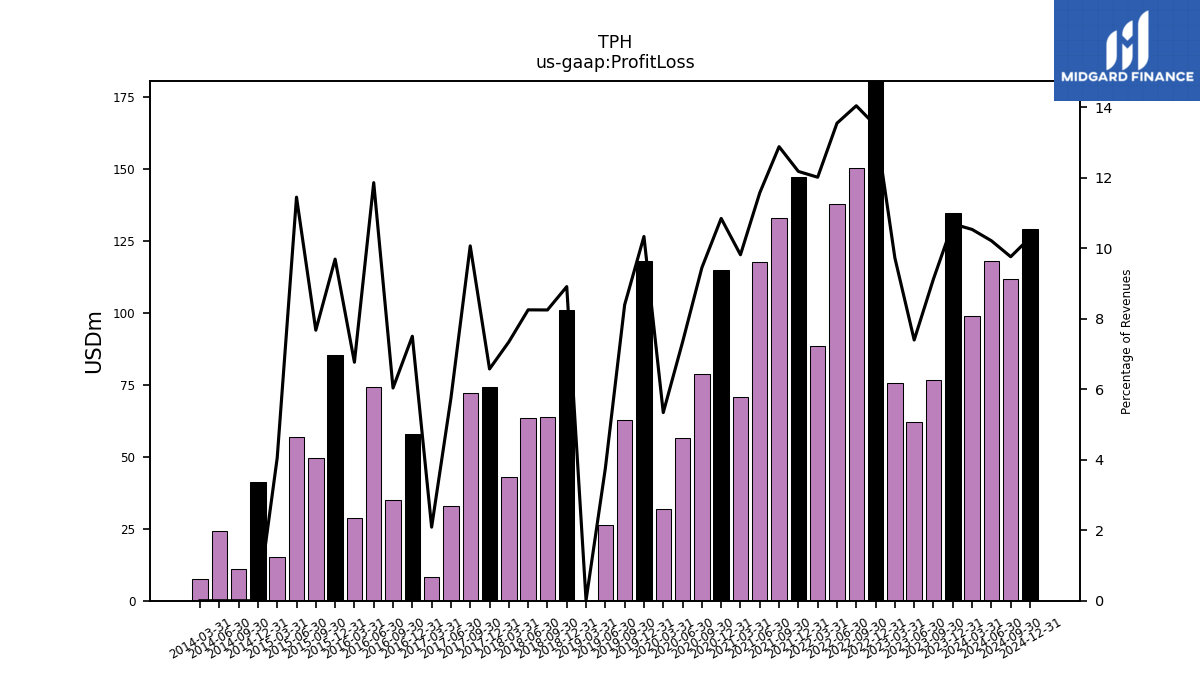
| Profit Loss | 134.76 | 76.61 | 61.97 | 75.86 | 205.40 | 150.58 | 137.94 | 88.50 | 147.44 | 133.16 | 117.87 | 70.80 | 115.11 | 78.68 | 56.53 | 31.88 | 117.99 | 62.86 | 26.26 | 0.07 | 100.98 | 63.97 | 63.68 | 42.88 | 74.24 | 72.29 | 32.80 | 8.22 | 58.09 | 35.15 | 74.19 | 28.71 | 85.35 | 49.77 | 56.76 | 15.30 | NA | NA | NA | NA | NA | NA | NA | |
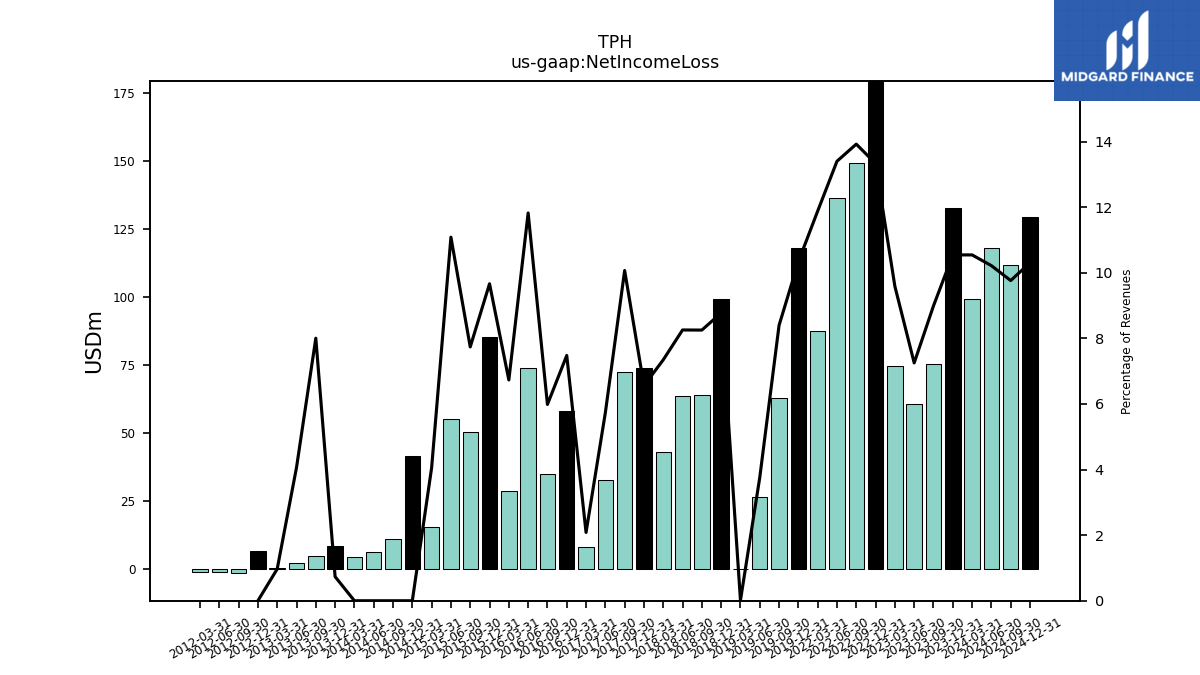
| Net Income Loss | 132.83 | 75.40 | 60.72 | 74.74 | 202.97 | 149.23 | 136.38 | 87.48 | NA | NA | NA | NA | NA | NA | NA | NA | 117.99 | 62.86 | 26.26 | 0.07 | 99.38 | 63.97 | 63.68 | 42.88 | 74.02 | 72.26 | 32.71 | 8.19 | 57.86 | 34.83 | 73.93 | 28.55 | 85.07 | 50.16 | 54.93 | 15.30 | 8.34 | 4.69 | 2.08 | 0.27 | -1.48 | -1.32 | -1.14 | |
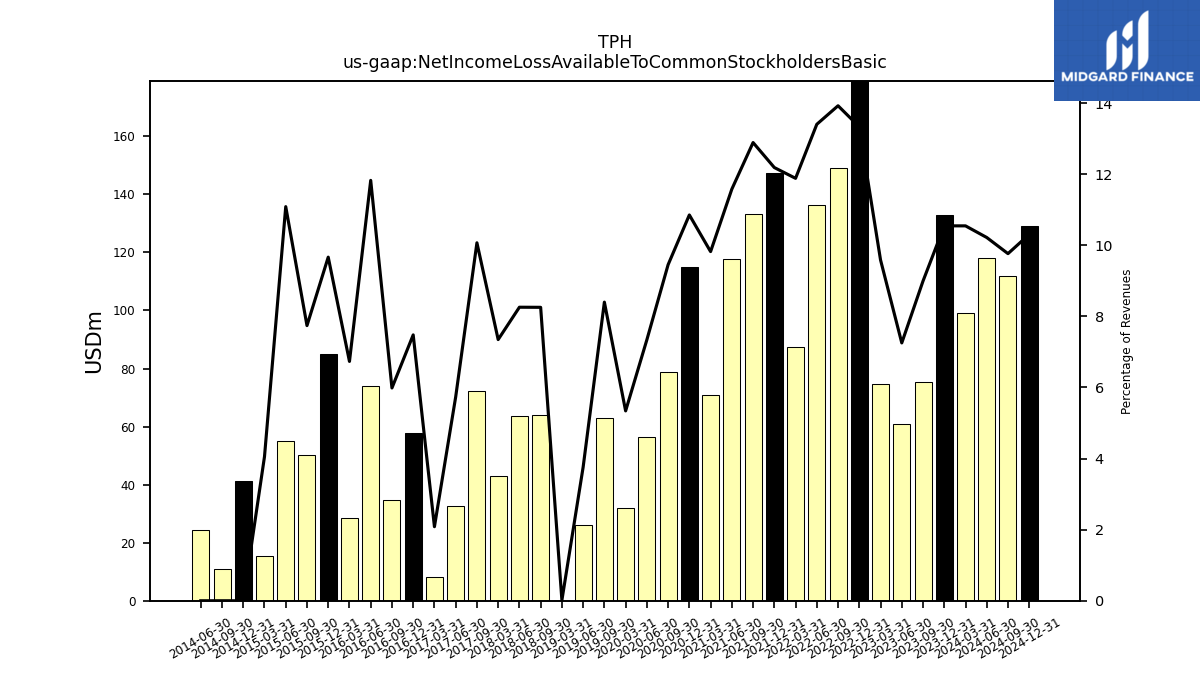
| Net Income Loss Available To Common Stockholders Basic | 132.83 | 75.40 | 60.72 | 74.74 | 202.97 | 149.23 | 136.38 | 87.48 | 147.44 | 133.16 | 117.87 | 70.80 | 115.11 | 78.68 | 56.53 | 31.88 | NA | 62.86 | 26.26 | 0.07 | NA | 63.97 | 63.68 | 42.88 | NA | 72.26 | 32.71 | 8.19 | 57.86 | 34.83 | 73.93 | 28.55 | 85.07 | 50.16 | 54.93 | 15.30 | NA | NA | NA | NA | NA | NA | NA | |
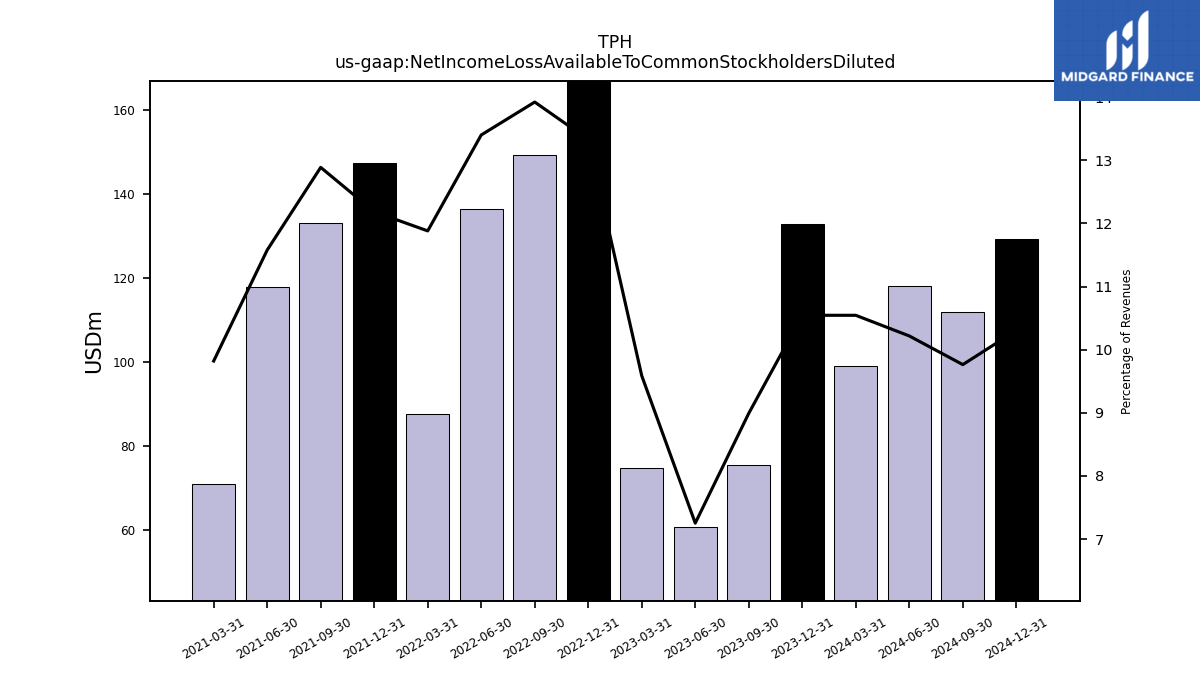
| Net Income Loss Available To Common Stockholders Diluted | 132.83 | 75.40 | 60.72 | 74.74 | 202.97 | 149.23 | 136.38 | 87.48 | 147.44 | 133.16 | 117.87 | 70.80 | NA | NA | NA | NA | NA | NA | NA | NA | NA | NA | NA | NA | NA | NA | NA | NA | NA | NA | NA | NA | NA | NA | NA | NA | NA | NA | NA | NA | NA | NA | NA |
| 2023-12-31 | 2023-09-30 | 2023-06-30 | 2023-03-31 | 2022-12-31 | 2022-09-30 | 2022-06-30 | 2022-03-31 | 2021-12-31 | 2021-09-30 | 2021-06-30 | 2021-03-31 | 2020-12-31 | 2020-09-30 | 2020-06-30 | 2020-03-31 | 2019-12-31 | 2019-09-30 | 2019-06-30 | 2019-03-31 | 2018-12-31 | 2018-09-30 | 2018-06-30 | 2018-03-31 | 2017-12-31 | 2017-09-30 | 2017-06-30 | 2017-03-31 | 2016-12-31 | 2016-09-30 | 2016-06-30 | 2016-03-31 | 2015-12-31 | 2015-09-30 | 2015-06-30 | 2015-03-31 | 2013-12-31 | 2013-09-30 | 2013-06-30 | 2013-03-31 | 2012-09-30 | 2012-06-30 | 2012-03-31 | ||
|---|---|---|---|---|---|---|---|---|---|---|---|---|---|---|---|---|---|---|---|---|---|---|---|---|---|---|---|---|---|---|---|---|---|---|---|---|---|---|---|---|---|---|---|---|
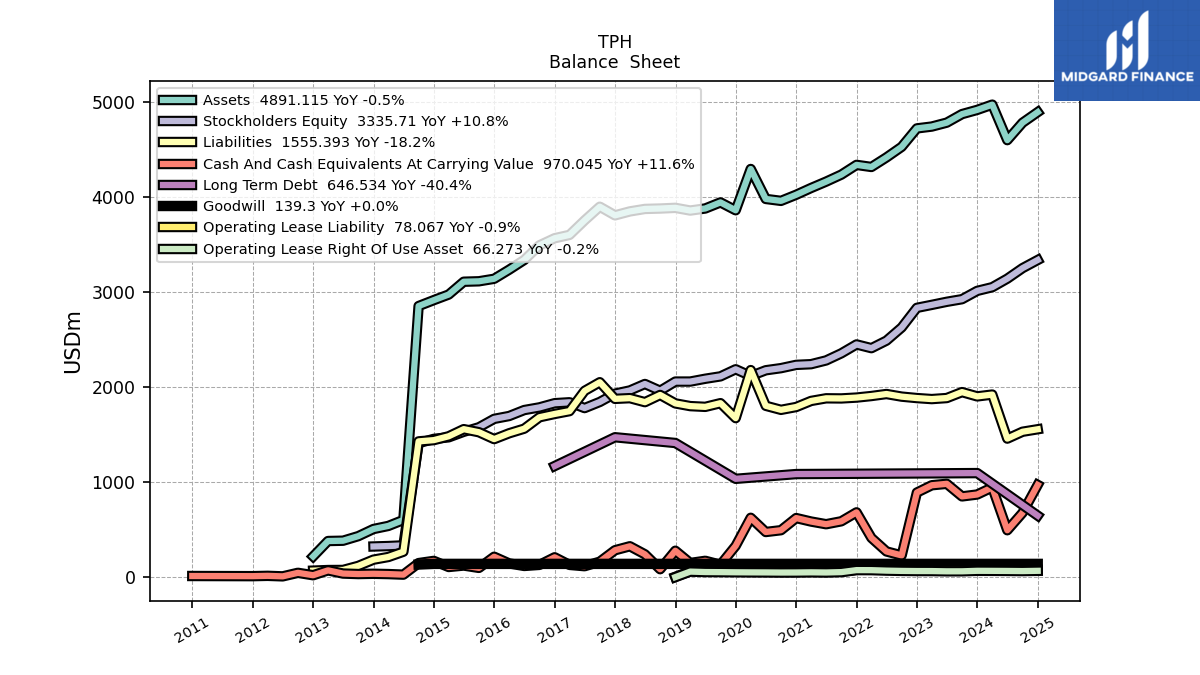
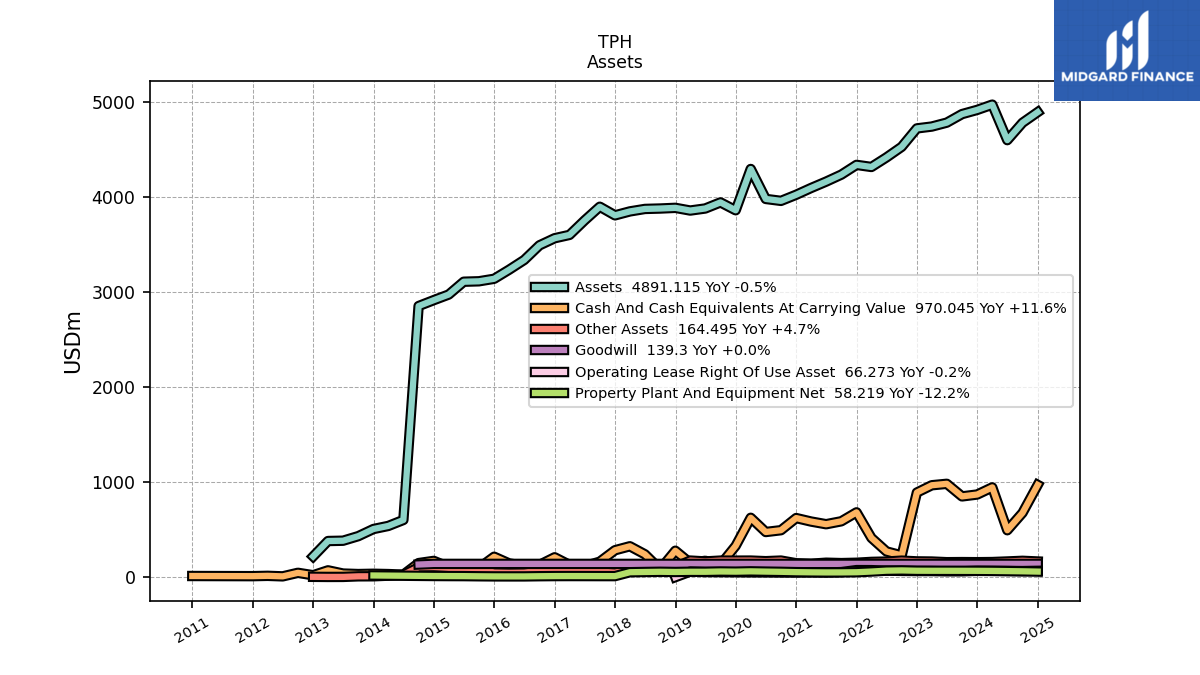
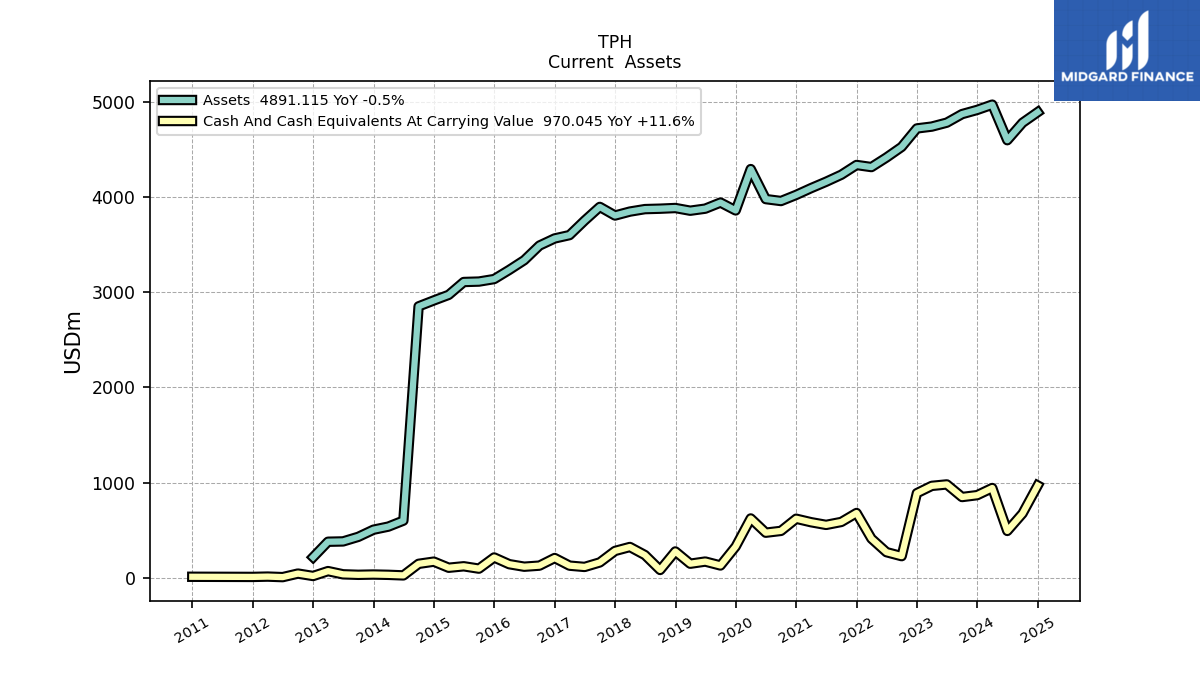
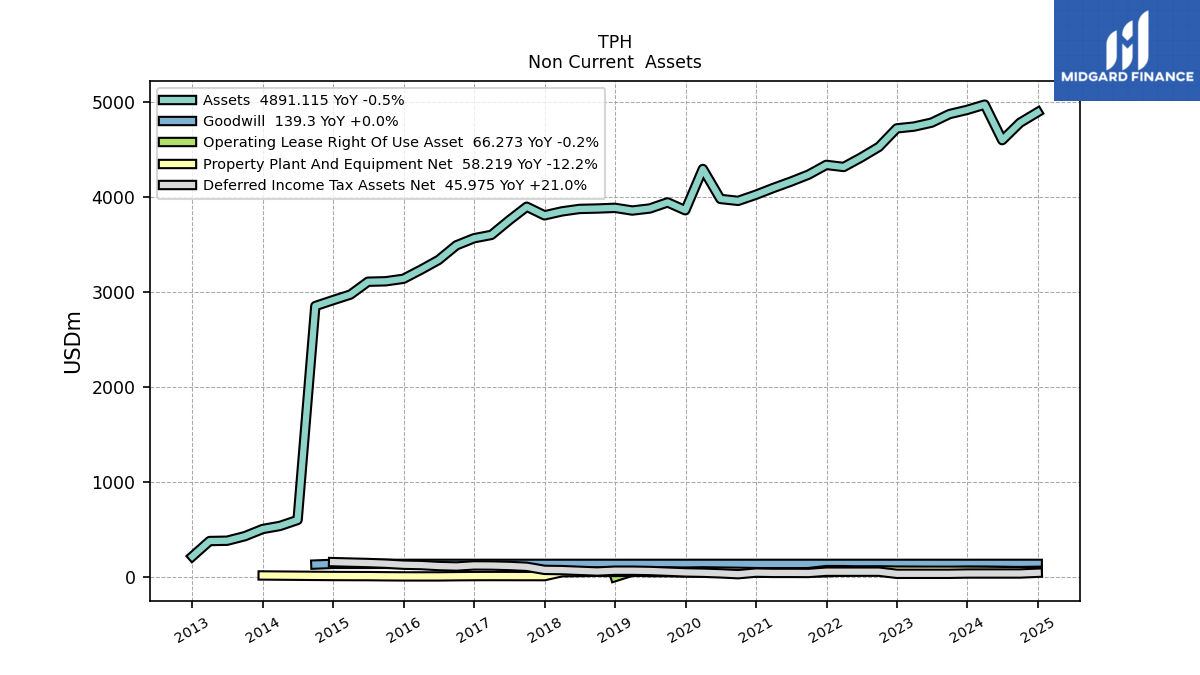
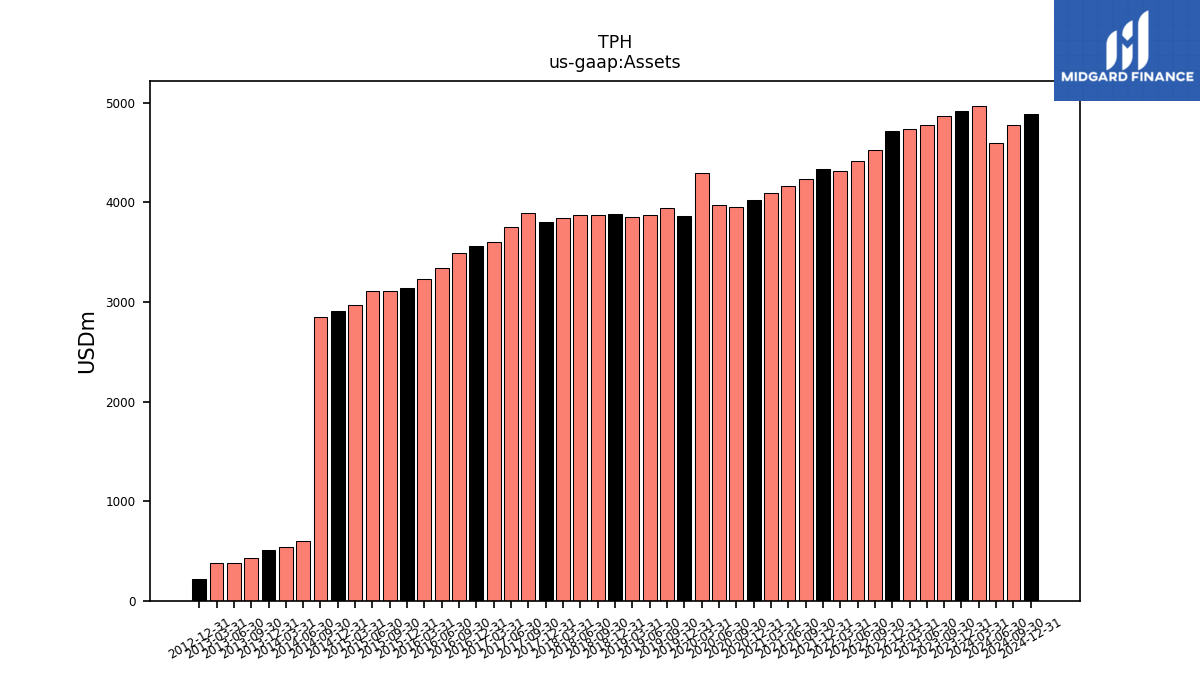
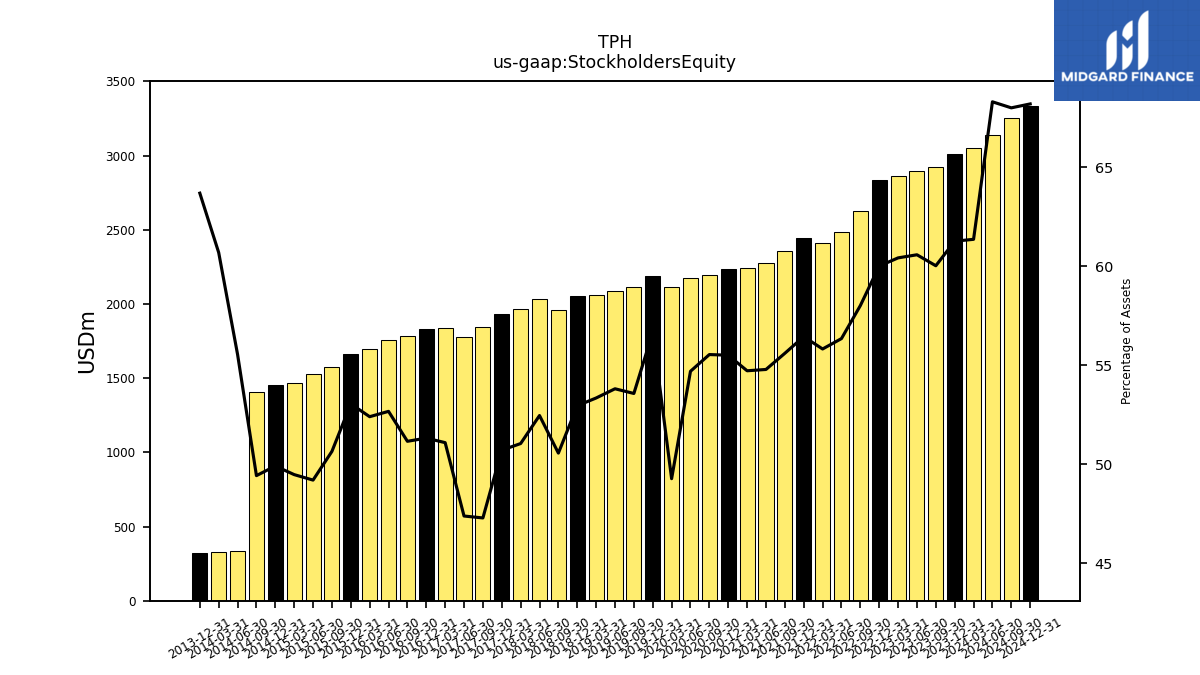
| Assets | 4914.59 | 4870.23 | 4780.56 | 4739.24 | 4719.94 | 4526.04 | 4414.66 | 4314.07 | 4336.22 | 4233.69 | 4160.16 | 4092.95 | 4021.98 | 3957.57 | 3977.90 | 4293.05 | 3858.69 | 3941.47 | 3877.55 | 3855.89 | 3884.20 | 3877.10 | 3872.68 | 3846.76 | 3805.38 | 3896.07 | 3752.00 | 3599.72 | 3564.64 | 3489.90 | 3336.26 | 3234.08 | 3138.07 | 3111.81 | 3107.19 | 2972.25 | 506.04 | 430.97 | 382.96 | 379.71 | NA | NA | NA | |
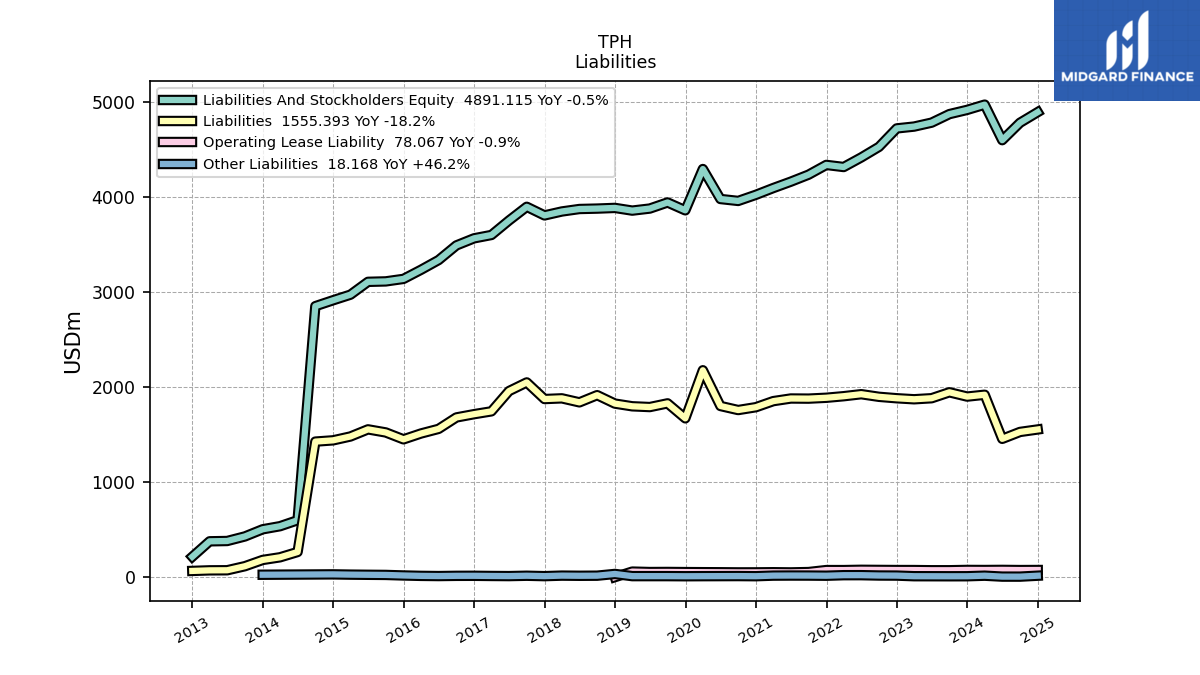
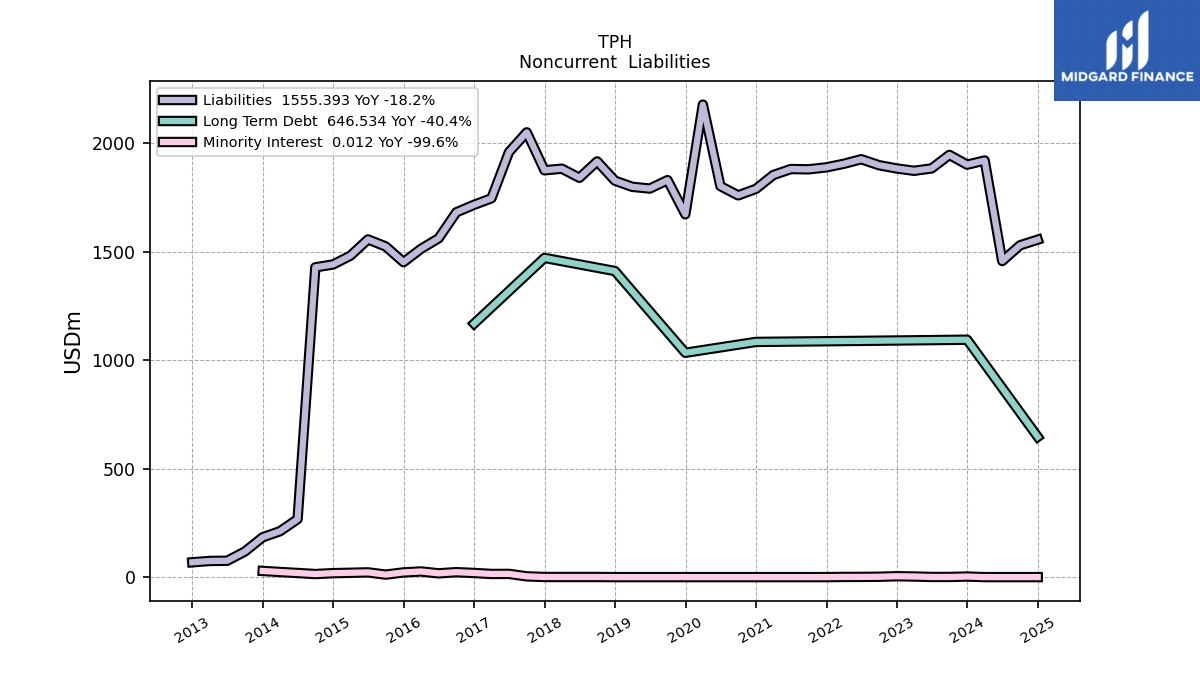
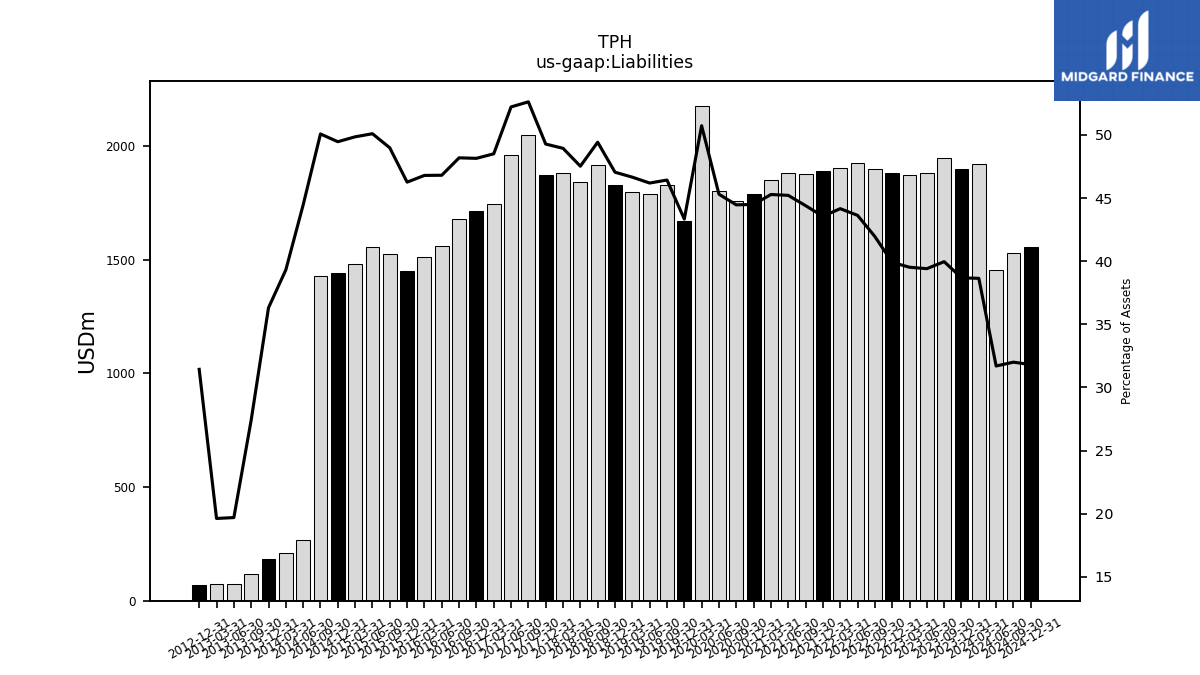
| Liabilities | 1900.95 | 1946.08 | 1883.74 | 1872.76 | 1883.41 | 1898.59 | 1926.04 | 1904.94 | 1888.59 | 1879.54 | 1880.86 | 1853.18 | 1789.43 | 1759.46 | 1802.09 | 2177.76 | 1672.15 | 1829.77 | 1790.91 | 1798.86 | 1827.27 | 1916.10 | 1840.38 | 1882.51 | 1875.05 | 2050.08 | 1959.13 | 1745.92 | 1716.13 | 1681.55 | 1561.48 | 1513.23 | 1451.61 | 1524.08 | 1556.48 | 1481.62 | 183.73 | 118.12 | 75.39 | 74.49 | NA | NA | NA | |
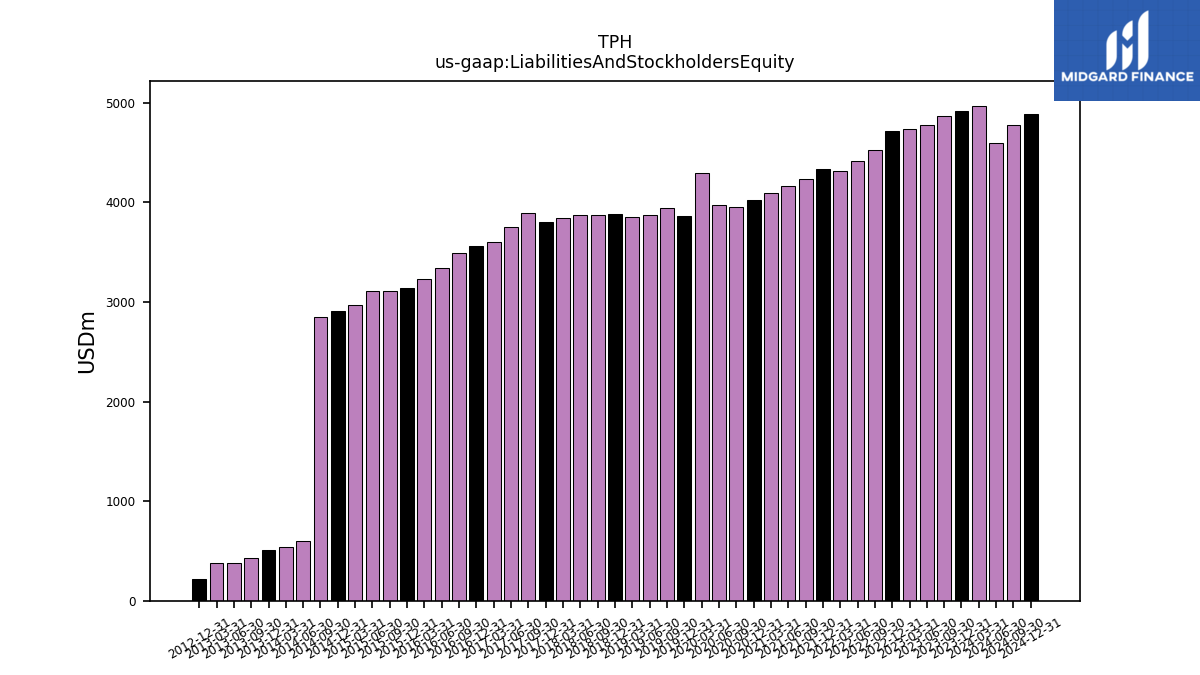
| Liabilities And Stockholders Equity | 4914.59 | 4870.23 | 4780.56 | 4739.24 | 4719.94 | 4526.04 | 4414.66 | 4314.07 | 4336.22 | 4233.69 | 4160.16 | 4092.95 | 4021.98 | 3957.57 | 3977.90 | 4293.05 | 3858.69 | 3941.47 | 3877.55 | 3855.89 | 3884.20 | 3877.10 | 3872.68 | 3846.76 | 3805.38 | 3896.07 | 3752.00 | 3599.72 | 3564.64 | 3489.90 | 3336.26 | 3234.08 | 3138.07 | 3111.81 | 3107.19 | 2972.25 | 506.04 | 430.97 | 382.96 | 379.71 | NA | NA | NA | |
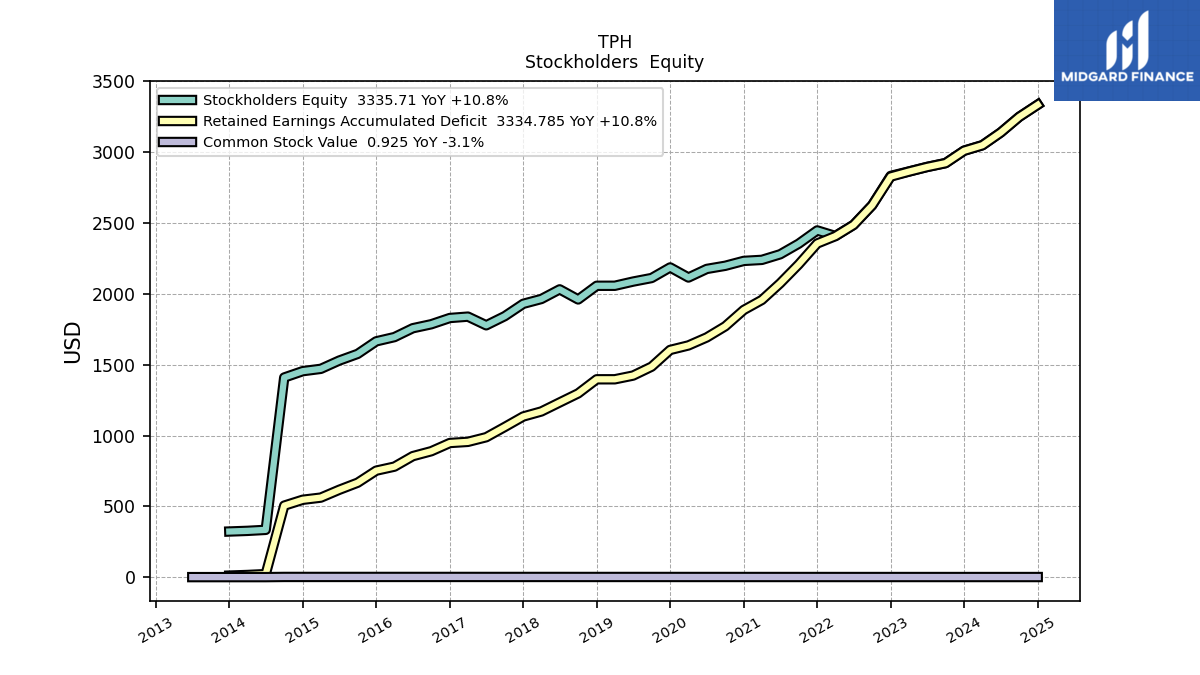
| Stockholders Equity | 3010.96 | 2923.40 | 2896.11 | 2863.62 | 2832.39 | 2625.73 | 2487.57 | 2408.23 | 2447.62 | 2354.14 | 2279.29 | 2239.76 | 2232.54 | 2198.09 | 2175.80 | 2115.28 | 2186.53 | 2111.68 | 2086.63 | 2057.02 | 2056.92 | 1960.40 | 2031.70 | 1963.64 | 1929.72 | 1842.43 | 1777.95 | 1839.17 | 1829.45 | 1785.46 | 1757.30 | 1694.76 | 1664.68 | 1576.18 | 1528.77 | 1470.60 | 322.31 | NA | NA | NA | NA | NA | NA |
| 2023-12-31 | 2023-09-30 | 2023-06-30 | 2023-03-31 | 2022-12-31 | 2022-09-30 | 2022-06-30 | 2022-03-31 | 2021-12-31 | 2021-09-30 | 2021-06-30 | 2021-03-31 | 2020-12-31 | 2020-09-30 | 2020-06-30 | 2020-03-31 | 2019-12-31 | 2019-09-30 | 2019-06-30 | 2019-03-31 | 2018-12-31 | 2018-09-30 | 2018-06-30 | 2018-03-31 | 2017-12-31 | 2017-09-30 | 2017-06-30 | 2017-03-31 | 2016-12-31 | 2016-09-30 | 2016-06-30 | 2016-03-31 | 2015-12-31 | 2015-09-30 | 2015-06-30 | 2015-03-31 | 2013-12-31 | 2013-09-30 | 2013-06-30 | 2013-03-31 | 2012-09-30 | 2012-06-30 | 2012-03-31 | ||
|---|---|---|---|---|---|---|---|---|---|---|---|---|---|---|---|---|---|---|---|---|---|---|---|---|---|---|---|---|---|---|---|---|---|---|---|---|---|---|---|---|---|---|---|---|
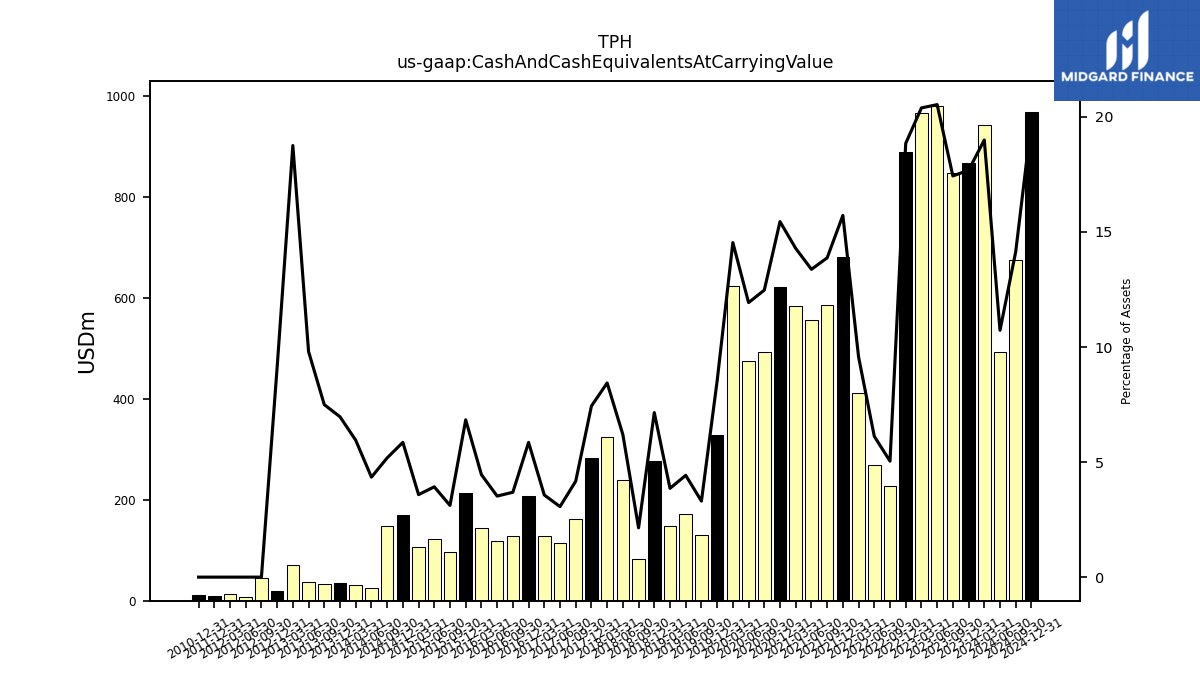
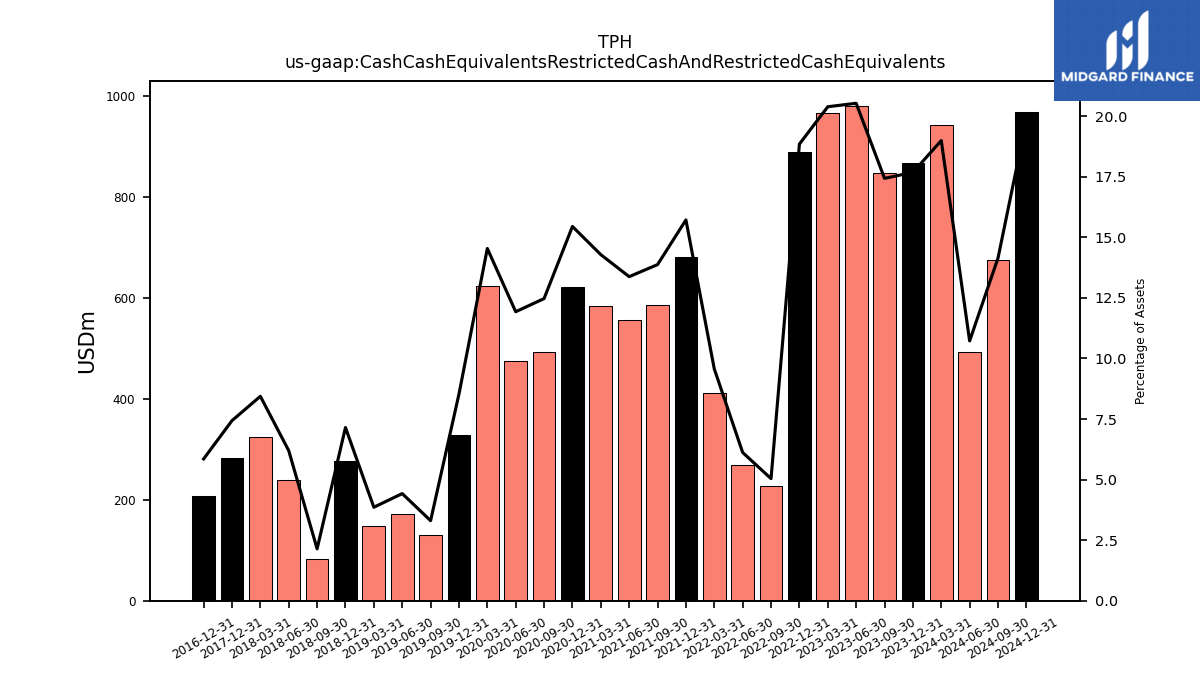
| Cash And Cash Equivalents At Carrying Value | 868.95 | 849.04 | 981.57 | 966.30 | 889.66 | 228.14 | 270.12 | 412.70 | 681.53 | 587.40 | 556.48 | 584.66 | 621.29 | 493.58 | 474.55 | 624.13 | 329.01 | 130.26 | 171.52 | 148.78 | 277.70 | 83.09 | 239.91 | 324.61 | 282.91 | 162.40 | 114.94 | 128.52 | 208.66 | 128.72 | 117.51 | 144.02 | 214.49 | 96.99 | 121.91 | 106.57 | 35.26 | 32.30 | 37.54 | 71.22 | 45.24 | 8.02 | 13.56 | |
| Cash Cash Equivalents Restricted Cash And Restricted Cash Equivalents | 868.95 | 849.04 | 981.57 | 966.30 | 889.66 | 228.14 | 270.12 | 412.70 | 681.53 | 587.40 | 556.48 | 584.66 | 621.29 | 493.58 | 474.55 | 624.13 | 329.01 | 130.26 | 171.52 | 148.78 | 277.70 | 83.09 | 239.91 | 324.61 | 282.91 | NA | NA | NA | 208.66 | NA | NA | NA | NA | NA | NA | NA | NA | NA | NA | NA | NA | NA | NA |
| 2023-12-31 | 2023-09-30 | 2023-06-30 | 2023-03-31 | 2022-12-31 | 2022-09-30 | 2022-06-30 | 2022-03-31 | 2021-12-31 | 2021-09-30 | 2021-06-30 | 2021-03-31 | 2020-12-31 | 2020-09-30 | 2020-06-30 | 2020-03-31 | 2019-12-31 | 2019-09-30 | 2019-06-30 | 2019-03-31 | 2018-12-31 | 2018-09-30 | 2018-06-30 | 2018-03-31 | 2017-12-31 | 2017-09-30 | 2017-06-30 | 2017-03-31 | 2016-12-31 | 2016-09-30 | 2016-06-30 | 2016-03-31 | 2015-12-31 | 2015-09-30 | 2015-06-30 | 2015-03-31 | 2013-12-31 | 2013-09-30 | 2013-06-30 | 2013-03-31 | 2012-09-30 | 2012-06-30 | 2012-03-31 | ||
|---|---|---|---|---|---|---|---|---|---|---|---|---|---|---|---|---|---|---|---|---|---|---|---|---|---|---|---|---|---|---|---|---|---|---|---|---|---|---|---|---|---|---|---|---|
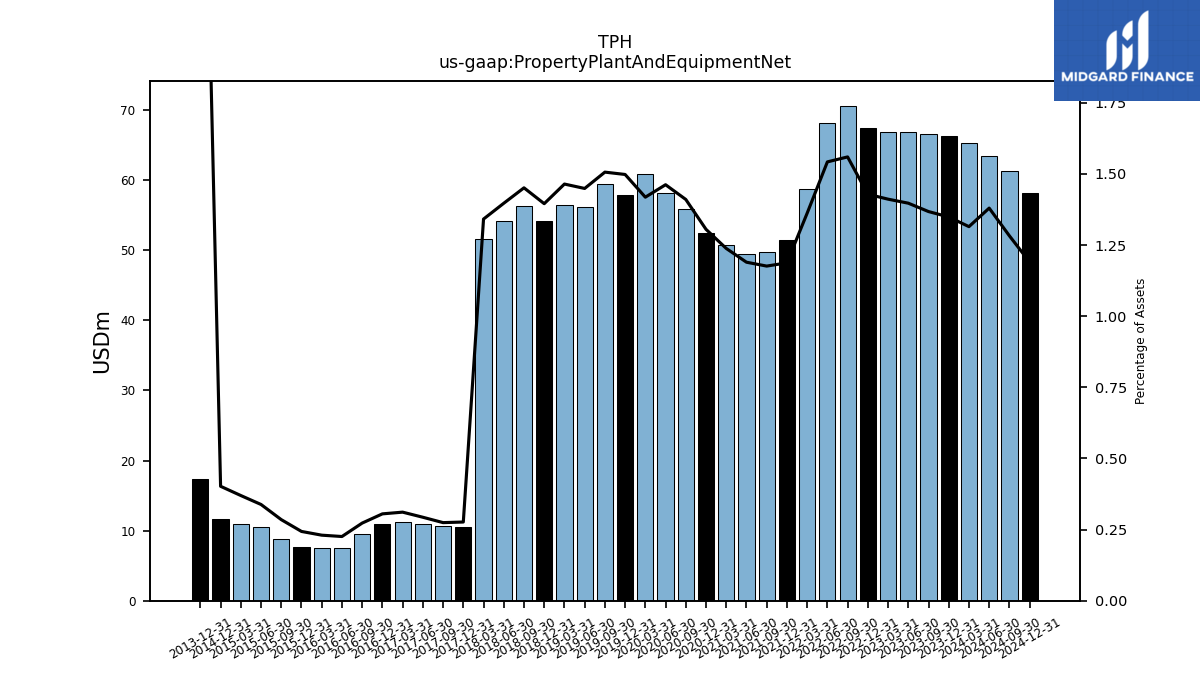
| Property Plant And Equipment Net | 66.28 | 66.61 | 66.79 | 66.88 | 67.43 | 70.59 | 68.08 | 58.75 | 51.49 | 49.79 | 49.49 | 50.67 | 52.49 | 55.81 | 58.16 | 60.88 | 57.80 | 59.37 | 56.18 | 56.46 | 54.20 | 56.26 | 54.09 | 51.60 | 10.53 | 10.70 | 11.01 | 11.21 | 10.88 | 9.53 | 7.53 | 7.45 | 7.64 | 8.87 | 10.51 | 10.99 | 17.39 | NA | NA | NA | NA | NA | NA | |
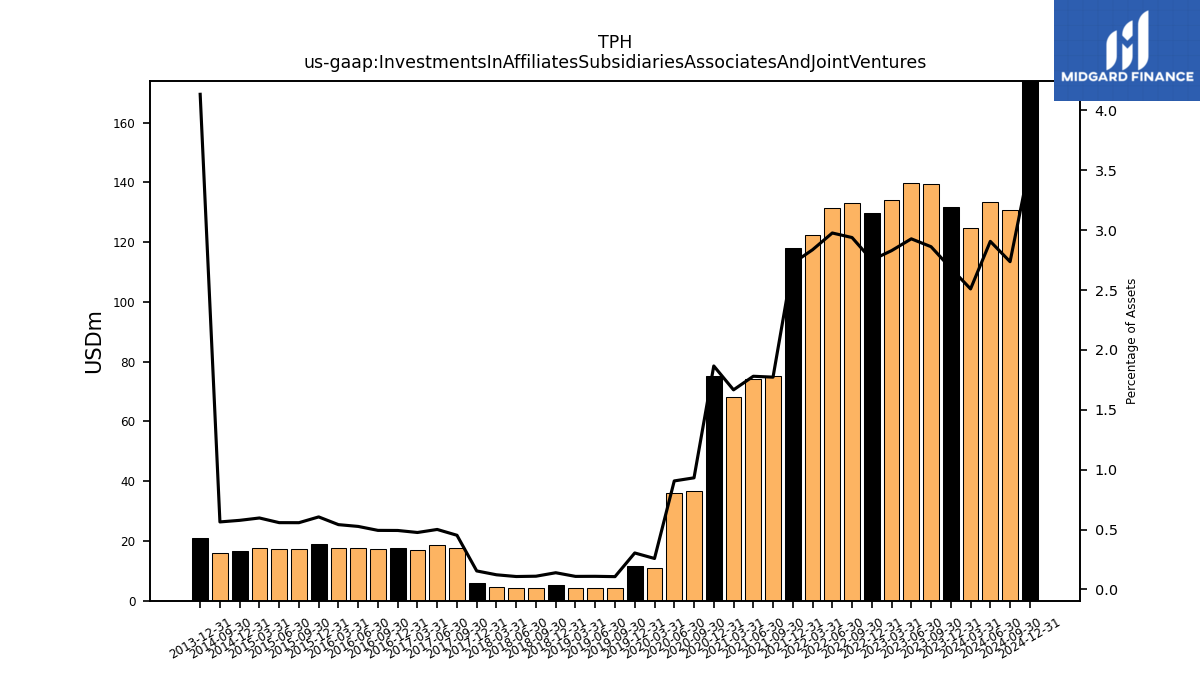
| Investments In Affiliates Subsidiaries Associates And Joint Ventures | 131.82 | 139.38 | 139.96 | 134.07 | 129.84 | 133.00 | 131.40 | 122.37 | 118.09 | 75.05 | 74.05 | 68.21 | 75.06 | 36.88 | 36.04 | 11.09 | 11.74 | 4.21 | 4.24 | 4.19 | 5.41 | 4.28 | 4.17 | 4.70 | 5.87 | 17.62 | 18.79 | 17.11 | 17.55 | 17.20 | 17.55 | 17.49 | 19.00 | 17.34 | 17.32 | 17.73 | 20.92 | NA | NA | NA | NA | NA | NA | |
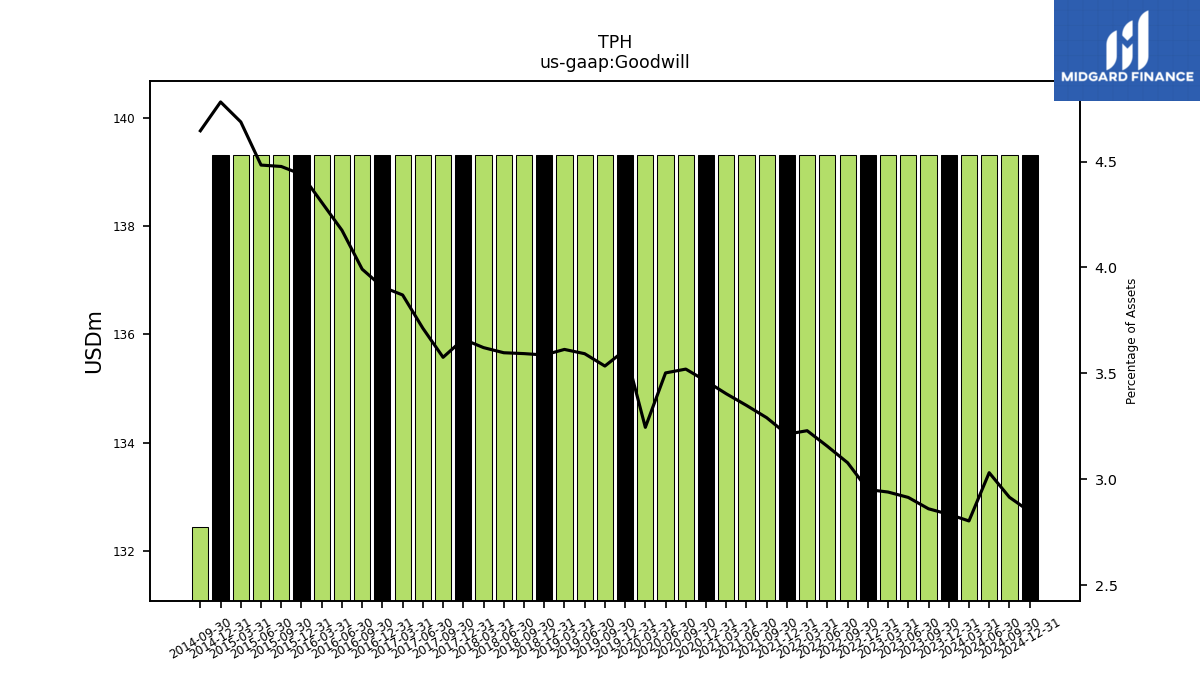
| Goodwill | 139.30 | 139.30 | 139.30 | 139.30 | 139.30 | 139.30 | 139.30 | 139.30 | 139.30 | 139.30 | 139.30 | 139.30 | 139.30 | 139.30 | 139.30 | 139.30 | 139.30 | 139.30 | 139.30 | 139.30 | 139.30 | 139.30 | 139.30 | 139.30 | 139.30 | 139.30 | 139.30 | 139.30 | 139.30 | 139.30 | 139.30 | 139.30 | 139.30 | 139.30 | 139.30 | 139.30 | NA | NA | NA | NA | NA | NA | NA | |
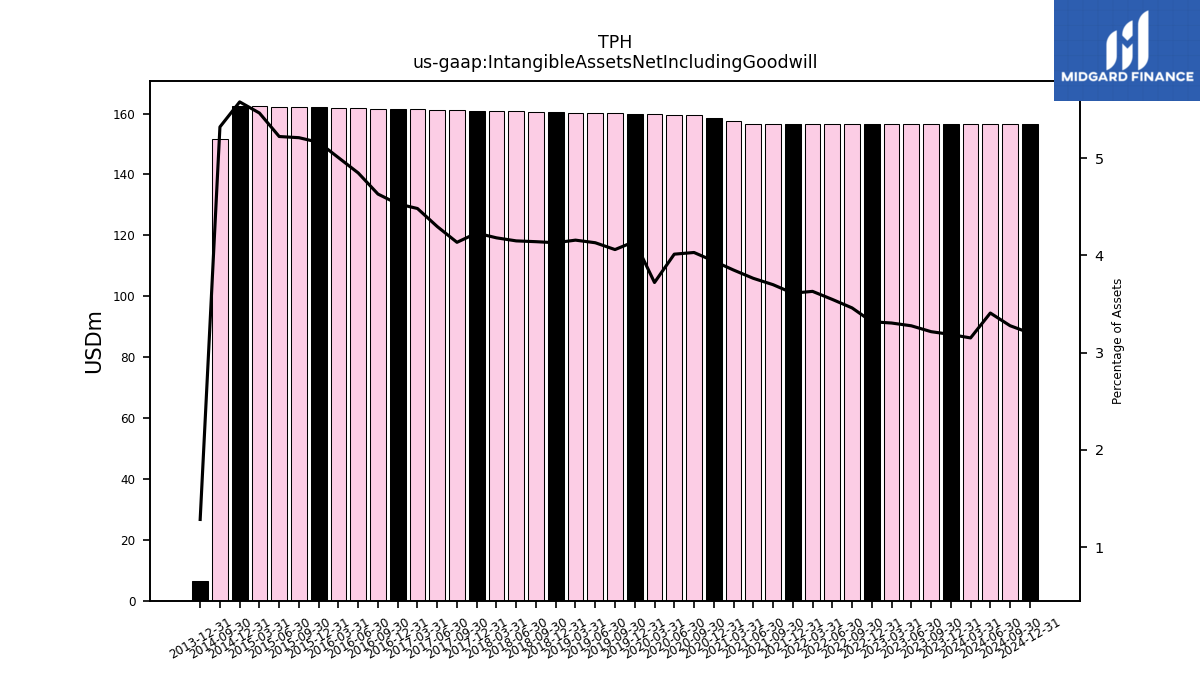
| Intangible Assets Net Including Goodwill | 156.60 | 156.60 | 156.60 | 156.60 | 156.60 | 156.60 | 156.60 | 156.60 | 156.60 | 156.60 | 156.60 | 157.57 | 158.53 | 159.49 | 159.63 | 159.76 | 159.89 | 160.03 | 160.16 | 160.29 | 160.43 | 160.56 | 160.69 | 160.83 | 160.96 | 161.09 | 161.23 | 161.36 | 161.50 | 161.63 | 161.76 | 161.90 | 162.03 | 162.16 | 162.30 | 162.43 | 6.49 | NA | NA | NA | NA | NA | NA |
| 2023-12-31 | 2023-09-30 | 2023-06-30 | 2023-03-31 | 2022-12-31 | 2022-09-30 | 2022-06-30 | 2022-03-31 | 2021-12-31 | 2021-09-30 | 2021-06-30 | 2021-03-31 | 2020-12-31 | 2020-09-30 | 2020-06-30 | 2020-03-31 | 2019-12-31 | 2019-09-30 | 2019-06-30 | 2019-03-31 | 2018-12-31 | 2018-09-30 | 2018-06-30 | 2018-03-31 | 2017-12-31 | 2017-09-30 | 2017-06-30 | 2017-03-31 | 2016-12-31 | 2016-09-30 | 2016-06-30 | 2016-03-31 | 2015-12-31 | 2015-09-30 | 2015-06-30 | 2015-03-31 | 2013-12-31 | 2013-09-30 | 2013-06-30 | 2013-03-31 | 2012-09-30 | 2012-06-30 | 2012-03-31 | ||
|---|---|---|---|---|---|---|---|---|---|---|---|---|---|---|---|---|---|---|---|---|---|---|---|---|---|---|---|---|---|---|---|---|---|---|---|---|---|---|---|---|---|---|---|---|
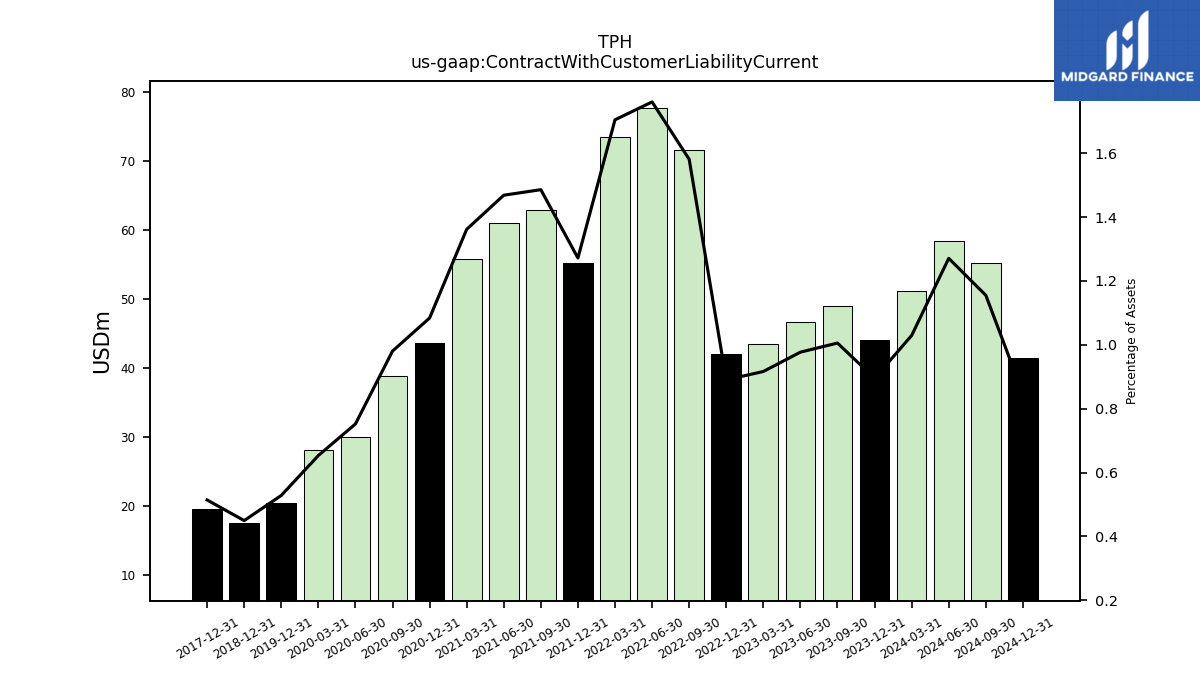
| Contract With Customer Liability Current | 43.99 | 48.98 | 46.71 | 43.44 | 42.03 | 71.57 | 77.73 | 73.55 | 55.16 | 62.91 | 61.10 | 55.74 | 43.60 | 38.80 | 29.93 | 28.05 | 20.39 | NA | NA | NA | 17.46 | NA | NA | NA | 19.57 | NA | NA | NA | NA | NA | NA | NA | NA | NA | NA | NA | NA | NA | NA | NA | NA | NA | NA |
| 2023-12-31 | 2023-09-30 | 2023-06-30 | 2023-03-31 | 2022-12-31 | 2022-09-30 | 2022-06-30 | 2022-03-31 | 2021-12-31 | 2021-09-30 | 2021-06-30 | 2021-03-31 | 2020-12-31 | 2020-09-30 | 2020-06-30 | 2020-03-31 | 2019-12-31 | 2019-09-30 | 2019-06-30 | 2019-03-31 | 2018-12-31 | 2018-09-30 | 2018-06-30 | 2018-03-31 | 2017-12-31 | 2017-09-30 | 2017-06-30 | 2017-03-31 | 2016-12-31 | 2016-09-30 | 2016-06-30 | 2016-03-31 | 2015-12-31 | 2015-09-30 | 2015-06-30 | 2015-03-31 | 2013-12-31 | 2013-09-30 | 2013-06-30 | 2013-03-31 | 2012-09-30 | 2012-06-30 | 2012-03-31 | ||
|---|---|---|---|---|---|---|---|---|---|---|---|---|---|---|---|---|---|---|---|---|---|---|---|---|---|---|---|---|---|---|---|---|---|---|---|---|---|---|---|---|---|---|---|---|
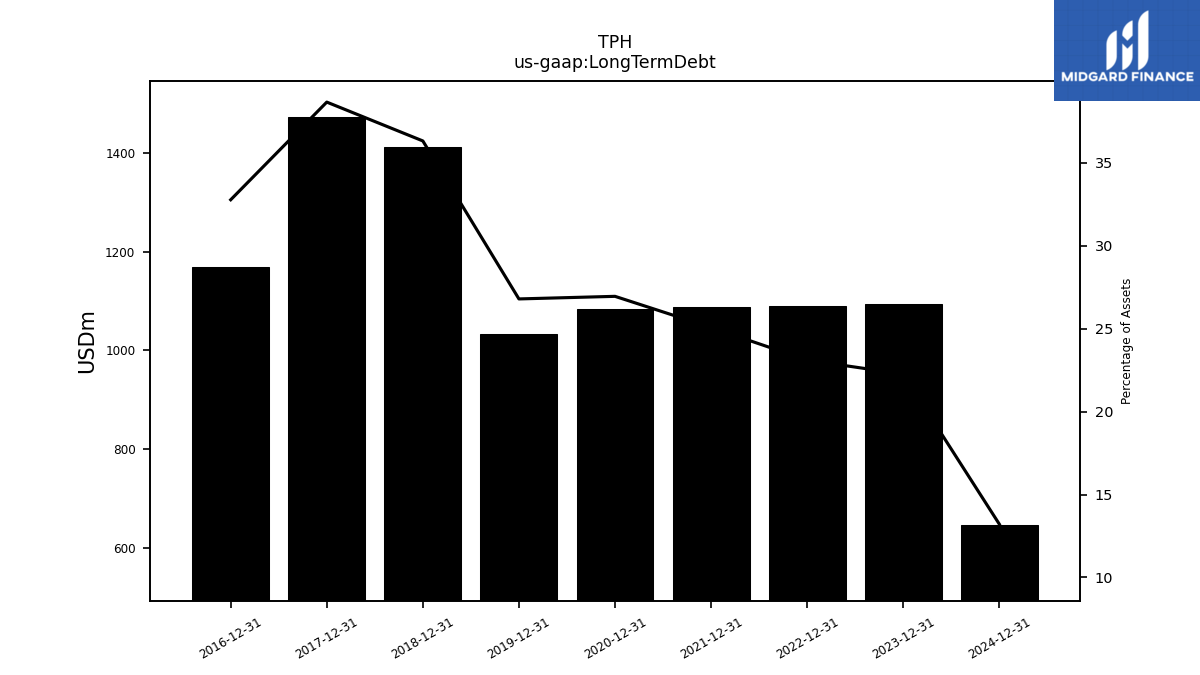
| Long Term Debt | 1094.25 | NA | NA | NA | 1090.62 | NA | NA | NA | 1087.22 | NA | NA | NA | 1084.02 | NA | NA | NA | 1033.98 | NA | NA | NA | 1410.80 | NA | NA | NA | 1471.30 | NA | NA | NA | 1168.31 | NA | NA | NA | NA | NA | NA | NA | NA | NA | NA | NA | NA | NA | NA | |
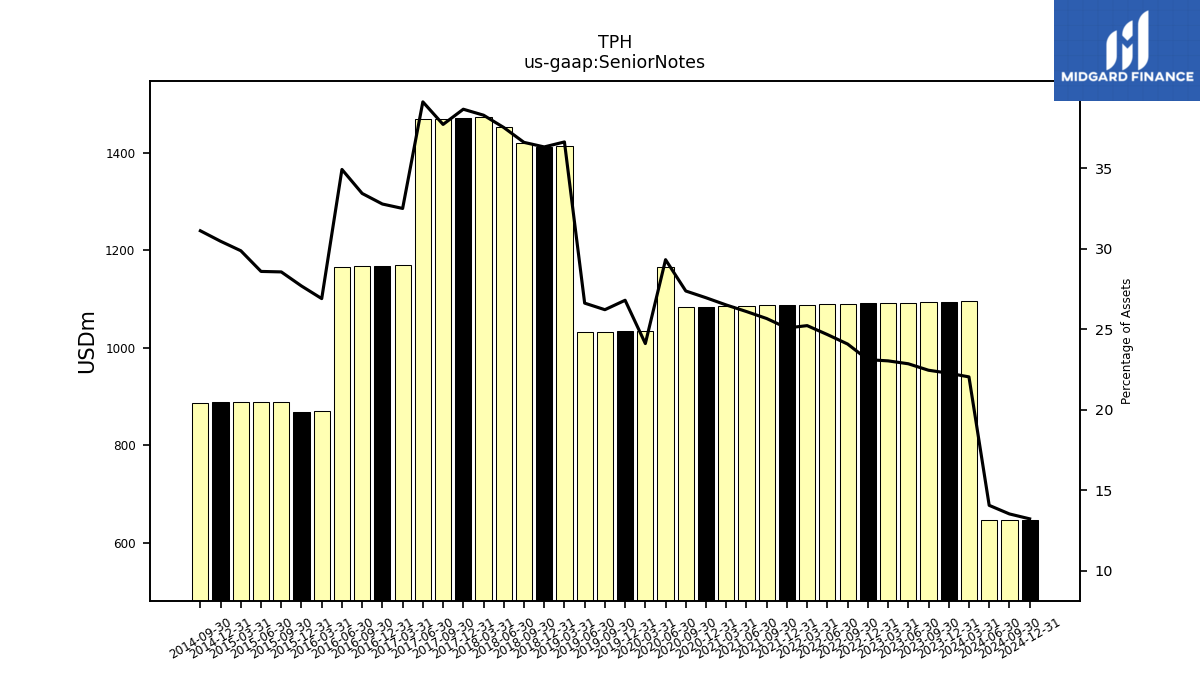
| Senior Notes | 1094.25 | 1093.32 | 1092.41 | 1091.51 | 1090.62 | 1089.75 | 1088.89 | 1088.05 | 1087.22 | 1086.40 | 1085.60 | 1084.80 | 1084.02 | 1083.25 | 1166.19 | 1034.92 | 1033.98 | 1033.06 | 1032.14 | 1412.46 | 1410.80 | 1419.20 | 1453.37 | 1473.07 | 1471.30 | 1469.56 | 1467.86 | 1169.91 | 1168.31 | 1166.72 | 1165.11 | 869.94 | 868.68 | 888.66 | 888.27 | 887.88 | NA | NA | NA | NA | NA | NA | NA | |
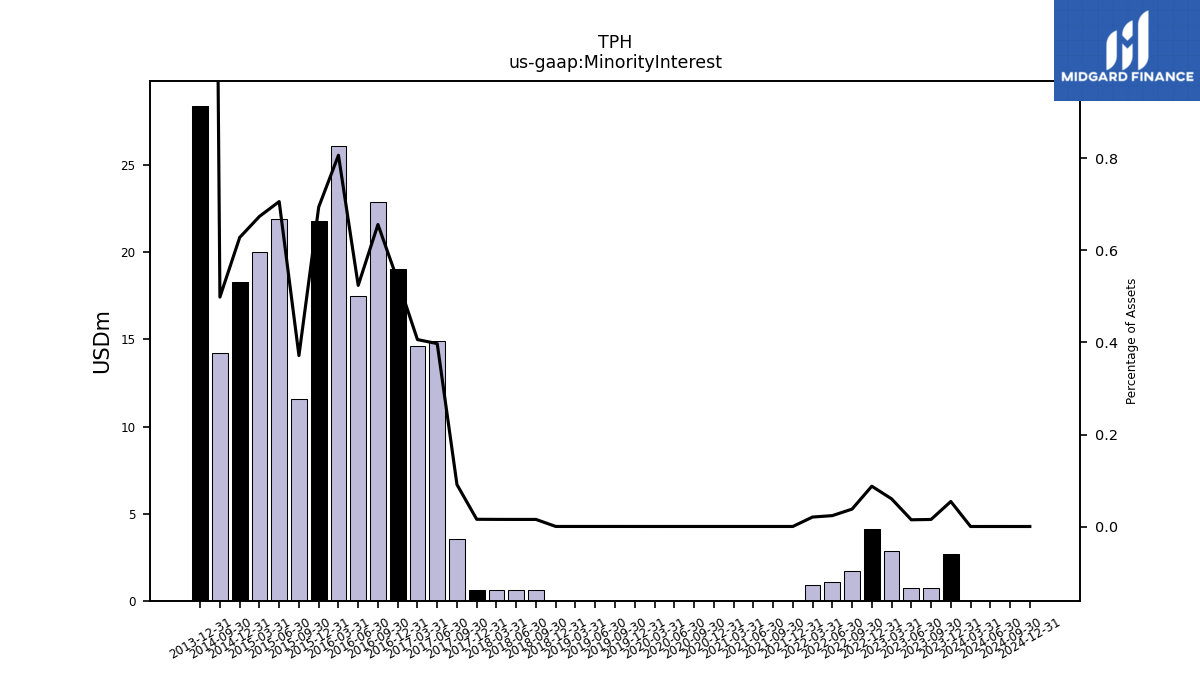
| Minority Interest | 2.68 | 0.76 | 0.71 | 2.86 | 4.14 | 1.72 | 1.05 | 0.90 | 0.01 | 0.01 | 0.01 | 0.01 | 0.01 | 0.01 | 0.01 | 0.01 | 0.01 | 0.01 | 0.01 | 0.01 | 0.01 | 0.60 | 0.60 | 0.60 | 0.60 | 3.55 | 14.91 | 14.62 | 19.06 | 22.90 | 17.48 | 26.09 | 21.78 | 11.56 | 21.94 | 20.02 | 28.42 | NA | NA | NA | NA | NA | NA |
| 2023-12-31 | 2023-09-30 | 2023-06-30 | 2023-03-31 | 2022-12-31 | 2022-09-30 | 2022-06-30 | 2022-03-31 | 2021-12-31 | 2021-09-30 | 2021-06-30 | 2021-03-31 | 2020-12-31 | 2020-09-30 | 2020-06-30 | 2020-03-31 | 2019-12-31 | 2019-09-30 | 2019-06-30 | 2019-03-31 | 2018-12-31 | 2018-09-30 | 2018-06-30 | 2018-03-31 | 2017-12-31 | 2017-09-30 | 2017-06-30 | 2017-03-31 | 2016-12-31 | 2016-09-30 | 2016-06-30 | 2016-03-31 | 2015-12-31 | 2015-09-30 | 2015-06-30 | 2015-03-31 | 2013-12-31 | 2013-09-30 | 2013-06-30 | 2013-03-31 | 2012-09-30 | 2012-06-30 | 2012-03-31 | ||
|---|---|---|---|---|---|---|---|---|---|---|---|---|---|---|---|---|---|---|---|---|---|---|---|---|---|---|---|---|---|---|---|---|---|---|---|---|---|---|---|---|---|---|---|---|
| Stockholders Equity | 3010.96 | 2923.40 | 2896.11 | 2863.62 | 2832.39 | 2625.73 | 2487.57 | 2408.23 | 2447.62 | 2354.14 | 2279.29 | 2239.76 | 2232.54 | 2198.09 | 2175.80 | 2115.28 | 2186.53 | 2111.68 | 2086.63 | 2057.02 | 2056.92 | 1960.40 | 2031.70 | 1963.64 | 1929.72 | 1842.43 | 1777.95 | 1839.17 | 1829.45 | 1785.46 | 1757.30 | 1694.76 | 1664.68 | 1576.18 | 1528.77 | 1470.60 | 322.31 | NA | NA | NA | NA | NA | NA | |
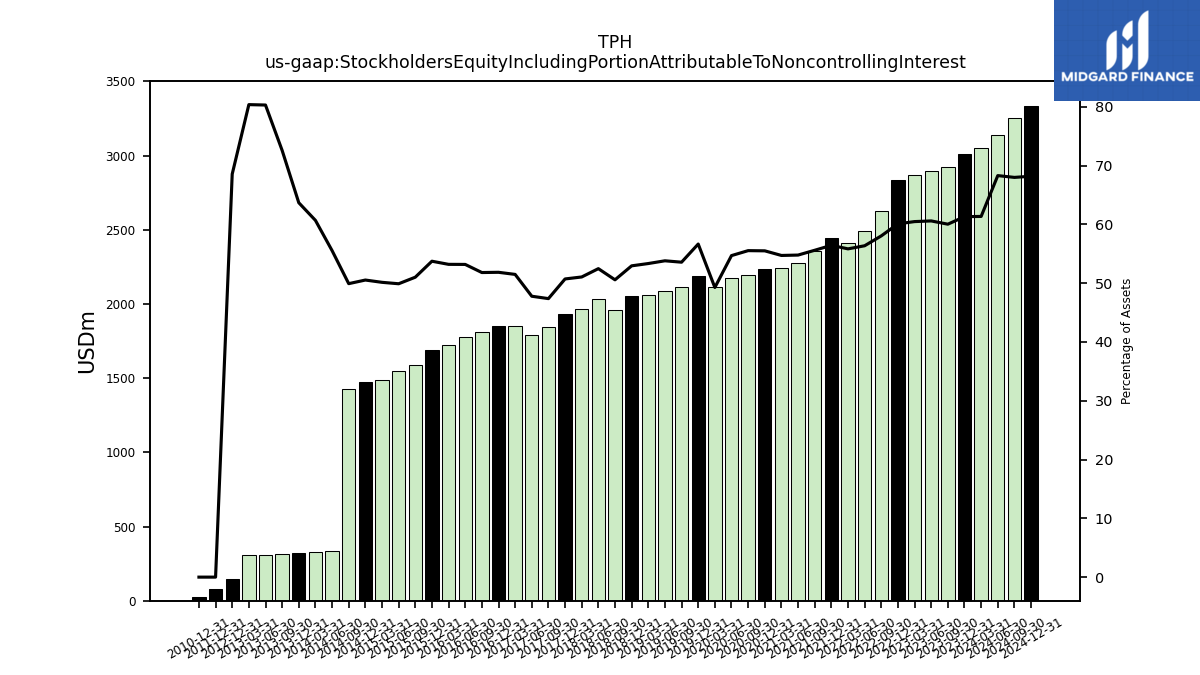
| Stockholders Equity Including Portion Attributable To Noncontrolling Interest | 3013.64 | 2924.15 | 2896.82 | 2866.49 | 2836.53 | 2627.45 | 2488.62 | 2409.13 | 2447.63 | 2354.15 | 2279.30 | 2239.77 | 2232.55 | 2198.10 | 2175.81 | 2115.29 | 2186.54 | 2111.70 | 2086.64 | 2057.04 | 2056.94 | 1961.00 | 2032.31 | 1964.25 | 1930.33 | 1845.98 | 1792.87 | 1853.80 | 1848.51 | 1808.36 | 1774.78 | 1720.84 | 1686.46 | 1587.74 | 1550.71 | 1490.63 | 322.31 | 312.85 | 307.57 | 305.22 | NA | NA | NA | |
| Common Stock Value | 0.95 | 0.97 | 0.99 | 1.00 | 1.01 | 1.01 | 1.02 | 1.05 | 1.10 | 1.12 | 1.15 | 1.19 | 1.22 | 1.27 | 1.30 | 1.30 | 1.36 | 1.39 | 1.42 | 1.42 | 1.42 | 1.42 | 1.52 | 1.52 | 1.51 | 1.50 | 1.51 | 1.59 | 1.59 | 1.60 | 1.61 | 1.62 | 1.62 | 1.62 | 1.62 | 1.62 | 0.32 | NA | 0.32 | NA | NA | NA | NA | |
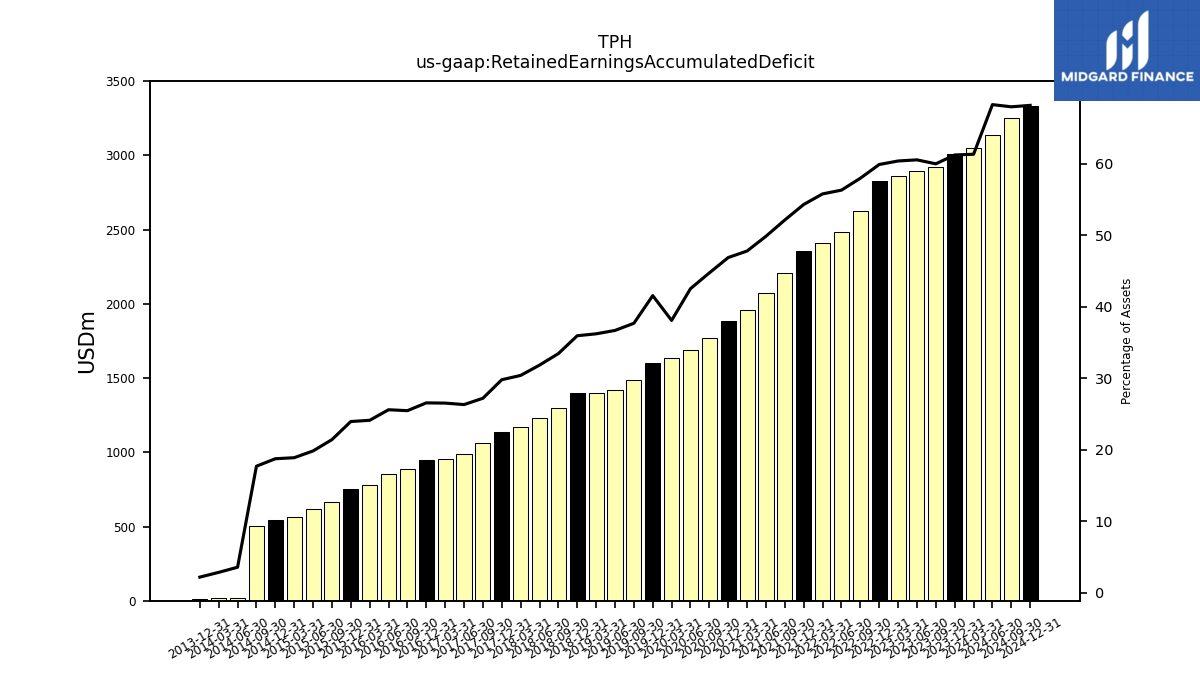
| Retained Earnings Accumulated Deficit | 3010.00 | 2922.42 | 2895.12 | 2862.62 | 2827.69 | 2624.72 | 2486.55 | 2407.18 | 2355.45 | 2208.01 | 2074.85 | 1956.98 | 1886.18 | 1771.07 | 1692.38 | 1635.86 | 1603.97 | 1485.98 | 1423.12 | 1396.86 | 1396.79 | 1297.40 | 1233.44 | 1169.76 | 1134.23 | 1060.21 | 987.95 | 955.23 | 947.04 | 889.18 | 854.34 | 780.42 | 751.87 | 666.80 | 616.63 | 561.70 | 11.11 | NA | NA | NA | NA | NA | NA | |
| Minority Interest | 2.68 | 0.76 | 0.71 | 2.86 | 4.14 | 1.72 | 1.05 | 0.90 | 0.01 | 0.01 | 0.01 | 0.01 | 0.01 | 0.01 | 0.01 | 0.01 | 0.01 | 0.01 | 0.01 | 0.01 | 0.01 | 0.60 | 0.60 | 0.60 | 0.60 | 3.55 | 14.91 | 14.62 | 19.06 | 22.90 | 17.48 | 26.09 | 21.78 | 11.56 | 21.94 | 20.02 | 28.42 | NA | NA | NA | NA | NA | NA | |
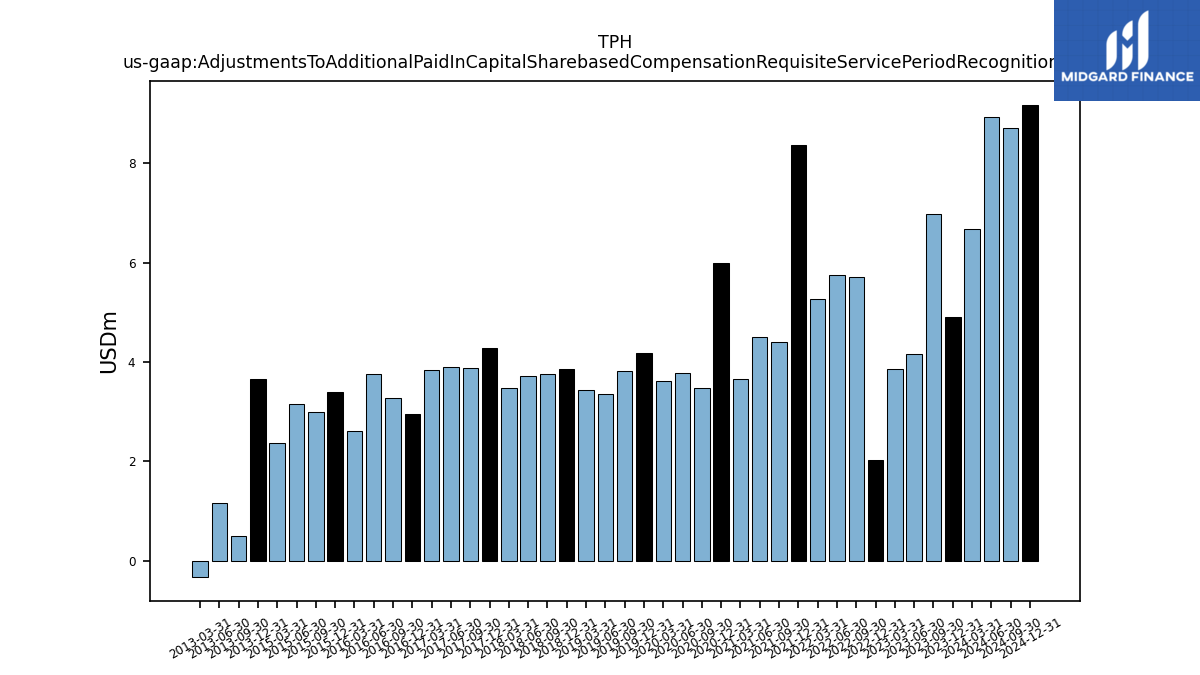
| Adjustments To Additional Paid In Capital Sharebased Compensation Requisite Service Period Recognition Value | 4.91 | 6.99 | 4.16 | 3.86 | 2.04 | 5.72 | 5.75 | 5.27 | 8.37 | 4.41 | 4.51 | 3.66 | 6.00 | 3.48 | 3.79 | 3.62 | 4.19 | 3.83 | 3.35 | 3.44 | 3.86 | 3.77 | 3.72 | 3.47 | 4.28 | 3.89 | 3.90 | 3.84 | 2.96 | 3.29 | 3.76 | 2.60 | 3.40 | 2.99 | 3.16 | 2.38 | 3.66 | 0.50 | 1.17 | -0.33 | NA | NA | NA | |
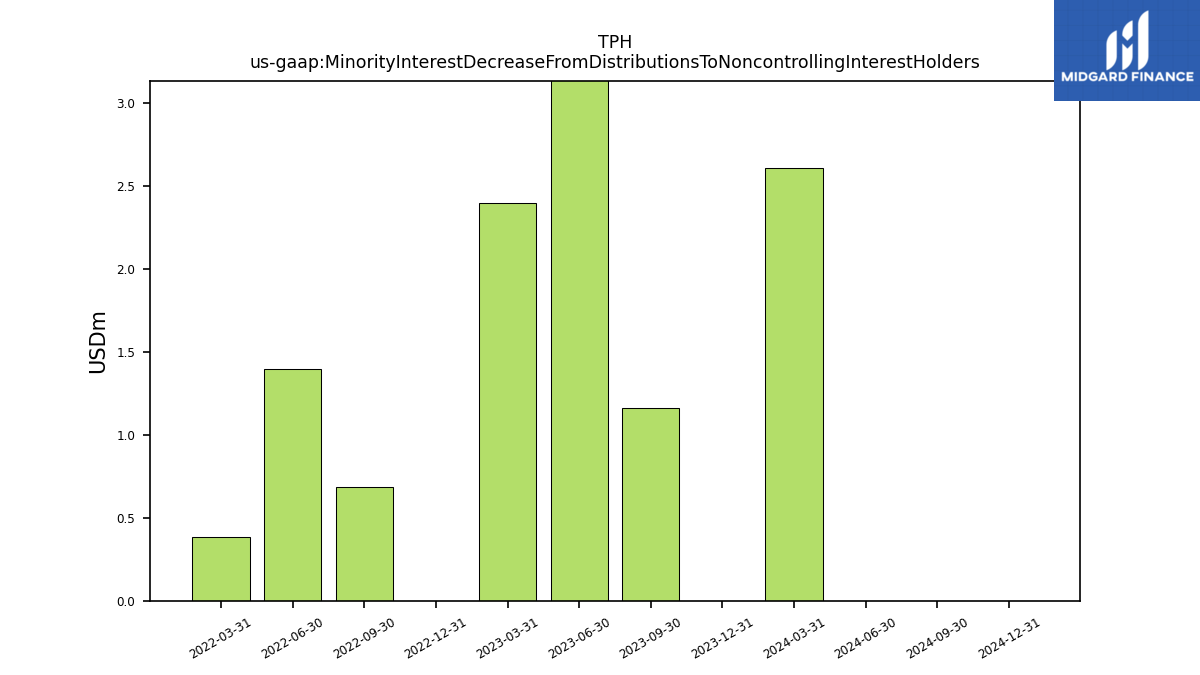
| Minority Interest Decrease From Distributions To Noncontrolling Interest Holders | 0.00 | 1.16 | 3.40 | 2.40 | 0.00 | 0.68 | 1.40 | 0.38 | NA | NA | NA | NA | NA | NA | NA | NA | NA | NA | NA | NA | NA | NA | NA | NA | NA | NA | NA | NA | NA | NA | NA | NA | NA | NA | NA | NA | NA | NA | NA | NA | NA | NA | NA |
| 2023-12-31 | 2023-09-30 | 2023-06-30 | 2023-03-31 | 2022-12-31 | 2022-09-30 | 2022-06-30 | 2022-03-31 | 2021-12-31 | 2021-09-30 | 2021-06-30 | 2021-03-31 | 2020-12-31 | 2020-09-30 | 2020-06-30 | 2020-03-31 | 2019-12-31 | 2019-09-30 | 2019-06-30 | 2019-03-31 | 2018-12-31 | 2018-09-30 | 2018-06-30 | 2018-03-31 | 2017-12-31 | 2017-09-30 | 2017-06-30 | 2017-03-31 | 2016-12-31 | 2016-09-30 | 2016-06-30 | 2016-03-31 | 2015-12-31 | 2015-09-30 | 2015-06-30 | 2015-03-31 | 2013-12-31 | 2013-09-30 | 2013-06-30 | 2013-03-31 | 2012-09-30 | 2012-06-30 | 2012-03-31 | ||
|---|---|---|---|---|---|---|---|---|---|---|---|---|---|---|---|---|---|---|---|---|---|---|---|---|---|---|---|---|---|---|---|---|---|---|---|---|---|---|---|---|---|---|---|---|
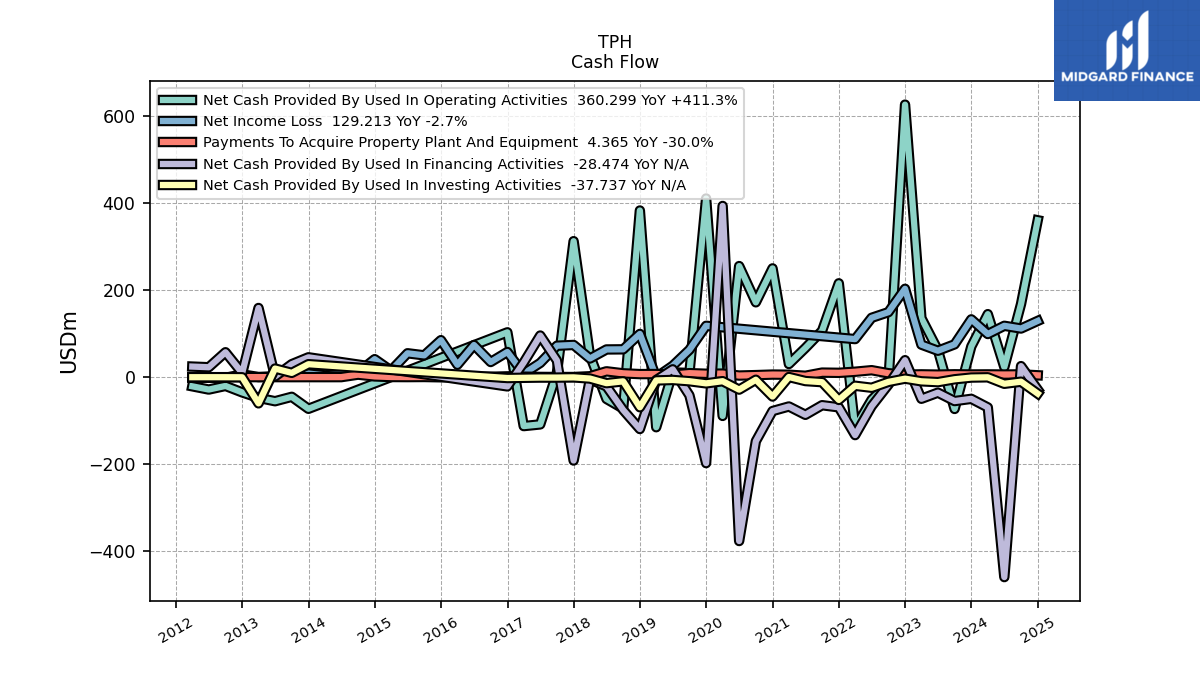
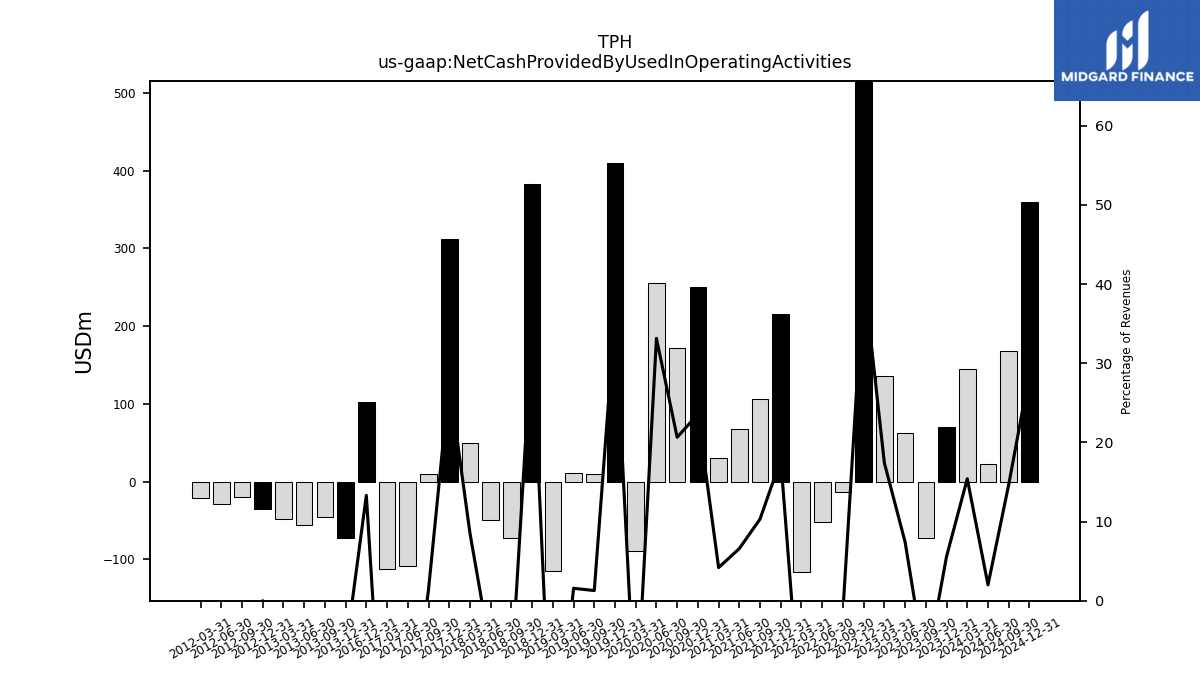
| Net Cash Provided By Used In Operating Activities | 70.46 | -72.94 | 62.09 | 135.64 | 625.83 | -13.73 | -51.72 | -116.11 | 215.57 | 106.66 | 67.10 | 30.20 | 249.85 | 171.91 | 255.20 | -88.97 | 410.29 | 9.63 | 10.99 | -114.92 | 382.75 | -72.04 | -49.94 | 49.89 | 312.33 | 10.04 | -108.41 | -112.29 | 103.00 | NA | NA | NA | NA | NA | NA | NA | -72.57 | -45.05 | -55.18 | -47.42 | -20.06 | -28.38 | -20.93 | |
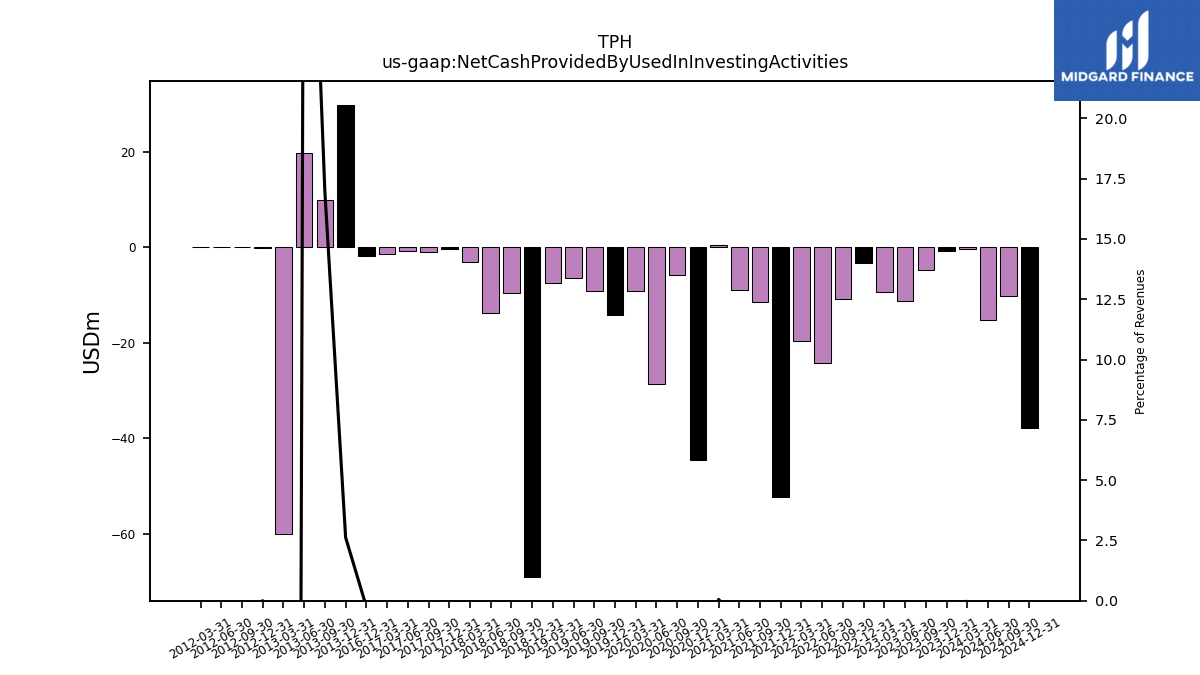
| Net Cash Provided By Used In Investing Activities | -0.85 | -4.78 | -11.34 | -9.45 | -3.38 | -10.80 | -24.25 | -19.69 | -52.25 | -11.42 | -8.87 | 0.40 | -44.46 | -5.88 | -28.55 | -9.15 | -14.20 | -9.25 | -6.36 | -7.45 | -69.06 | -9.49 | -13.74 | -3.12 | -0.44 | -0.89 | -0.85 | -1.40 | -1.92 | NA | NA | NA | NA | NA | NA | NA | 29.87 | 9.92 | 19.84 | -60.13 | -0.04 | -0.02 | -0.04 | |
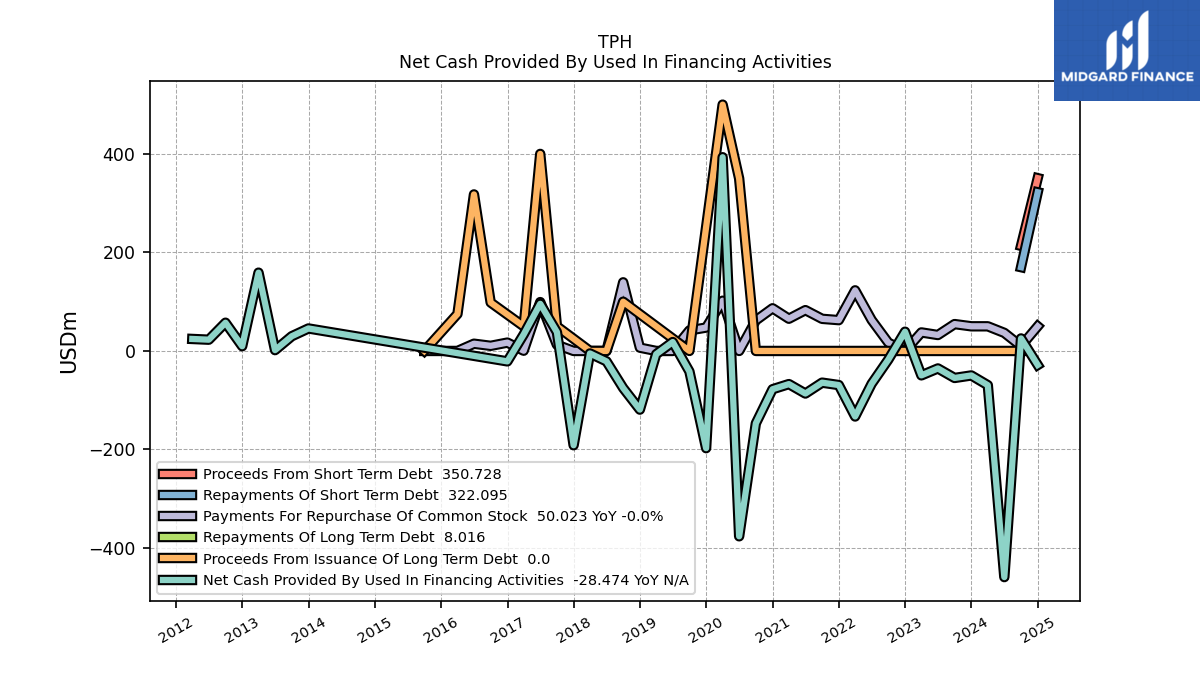
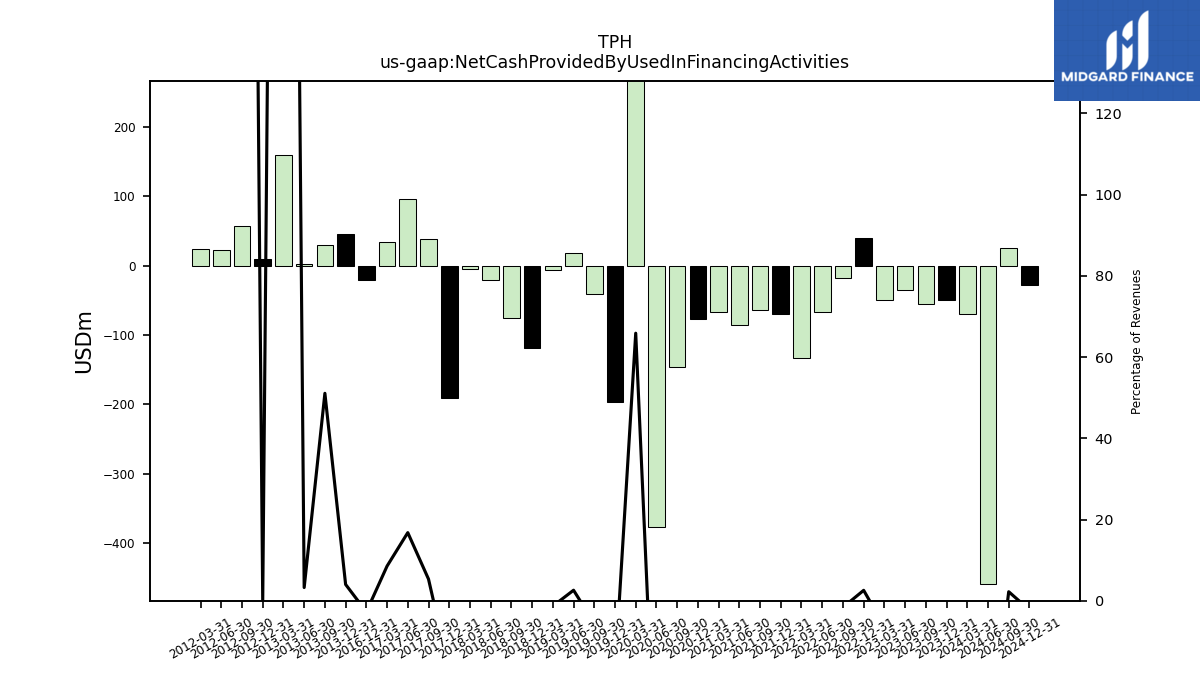
| Net Cash Provided By Used In Financing Activities | -49.70 | -54.81 | -35.49 | -49.55 | 39.07 | -17.46 | -66.61 | -133.02 | -69.20 | -64.32 | -86.42 | -67.23 | -77.68 | -146.99 | -376.24 | 393.24 | -197.34 | -41.63 | 18.11 | -6.54 | -119.08 | -75.28 | -21.03 | -5.08 | -191.37 | 38.30 | 95.69 | 33.55 | -21.14 | NA | NA | NA | NA | NA | NA | NA | 45.66 | 29.89 | 1.66 | 158.94 | 57.32 | 22.86 | 24.37 |
| 2023-12-31 | 2023-09-30 | 2023-06-30 | 2023-03-31 | 2022-12-31 | 2022-09-30 | 2022-06-30 | 2022-03-31 | 2021-12-31 | 2021-09-30 | 2021-06-30 | 2021-03-31 | 2020-12-31 | 2020-09-30 | 2020-06-30 | 2020-03-31 | 2019-12-31 | 2019-09-30 | 2019-06-30 | 2019-03-31 | 2018-12-31 | 2018-09-30 | 2018-06-30 | 2018-03-31 | 2017-12-31 | 2017-09-30 | 2017-06-30 | 2017-03-31 | 2016-12-31 | 2016-09-30 | 2016-06-30 | 2016-03-31 | 2015-12-31 | 2015-09-30 | 2015-06-30 | 2015-03-31 | 2013-12-31 | 2013-09-30 | 2013-06-30 | 2013-03-31 | 2012-09-30 | 2012-06-30 | 2012-03-31 | ||
|---|---|---|---|---|---|---|---|---|---|---|---|---|---|---|---|---|---|---|---|---|---|---|---|---|---|---|---|---|---|---|---|---|---|---|---|---|---|---|---|---|---|---|---|---|
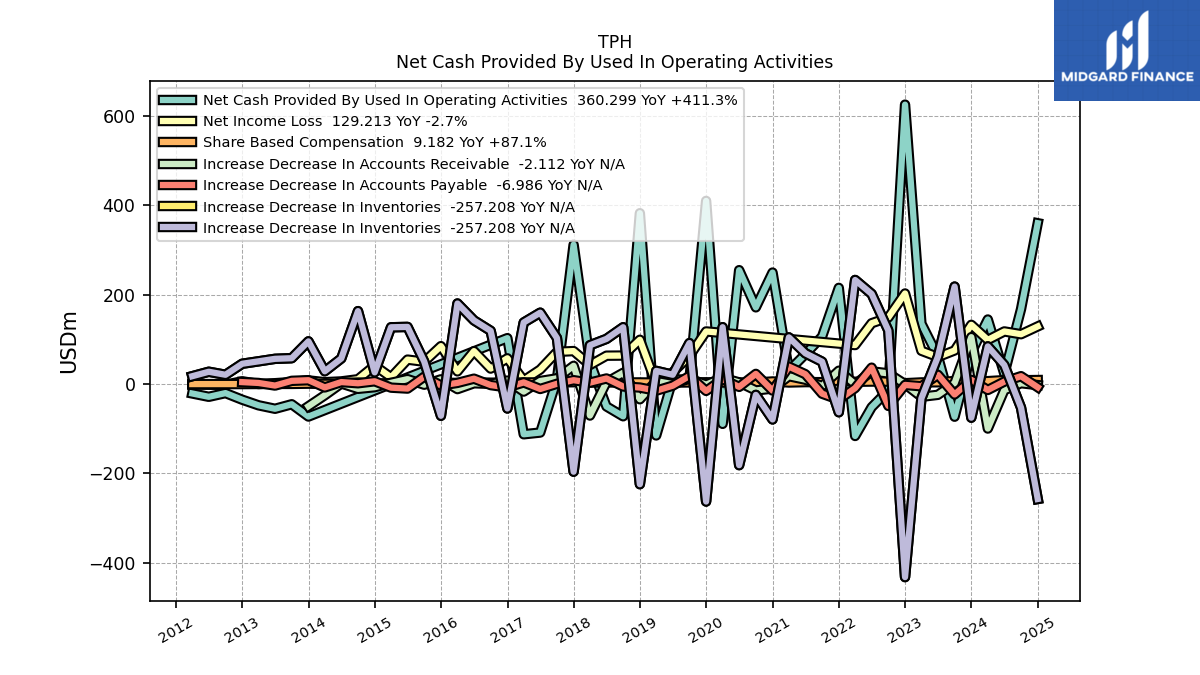
| Net Cash Provided By Used In Operating Activities | 70.46 | -72.94 | 62.09 | 135.64 | 625.83 | -13.73 | -51.72 | -116.11 | 215.57 | 106.66 | 67.10 | 30.20 | 249.85 | 171.91 | 255.20 | -88.97 | 410.29 | 9.63 | 10.99 | -114.92 | 382.75 | -72.04 | -49.94 | 49.89 | 312.33 | 10.04 | -108.41 | -112.29 | 103.00 | NA | NA | NA | NA | NA | NA | NA | -72.57 | -45.05 | -55.18 | -47.42 | -20.06 | -28.38 | -20.93 | |
| Net Income Loss | 132.83 | 75.40 | 60.72 | 74.74 | 202.97 | 149.23 | 136.38 | 87.48 | NA | NA | NA | NA | NA | NA | NA | NA | 117.99 | 62.86 | 26.26 | 0.07 | 99.38 | 63.97 | 63.68 | 42.88 | 74.02 | 72.26 | 32.71 | 8.19 | 57.86 | 34.83 | 73.93 | 28.55 | 85.07 | 50.16 | 54.93 | 15.30 | 8.34 | 4.69 | 2.08 | 0.27 | -1.48 | -1.32 | -1.14 | |
| Profit Loss | 134.76 | 76.61 | 61.97 | 75.86 | 205.40 | 150.58 | 137.94 | 88.50 | 147.44 | 133.16 | 117.87 | 70.80 | 115.11 | 78.68 | 56.53 | 31.88 | 117.99 | 62.86 | 26.26 | 0.07 | 100.98 | 63.97 | 63.68 | 42.88 | 74.24 | 72.29 | 32.80 | 8.22 | 58.09 | 35.15 | 74.19 | 28.71 | 85.35 | 49.77 | 56.76 | 15.30 | NA | NA | NA | NA | NA | NA | NA | |
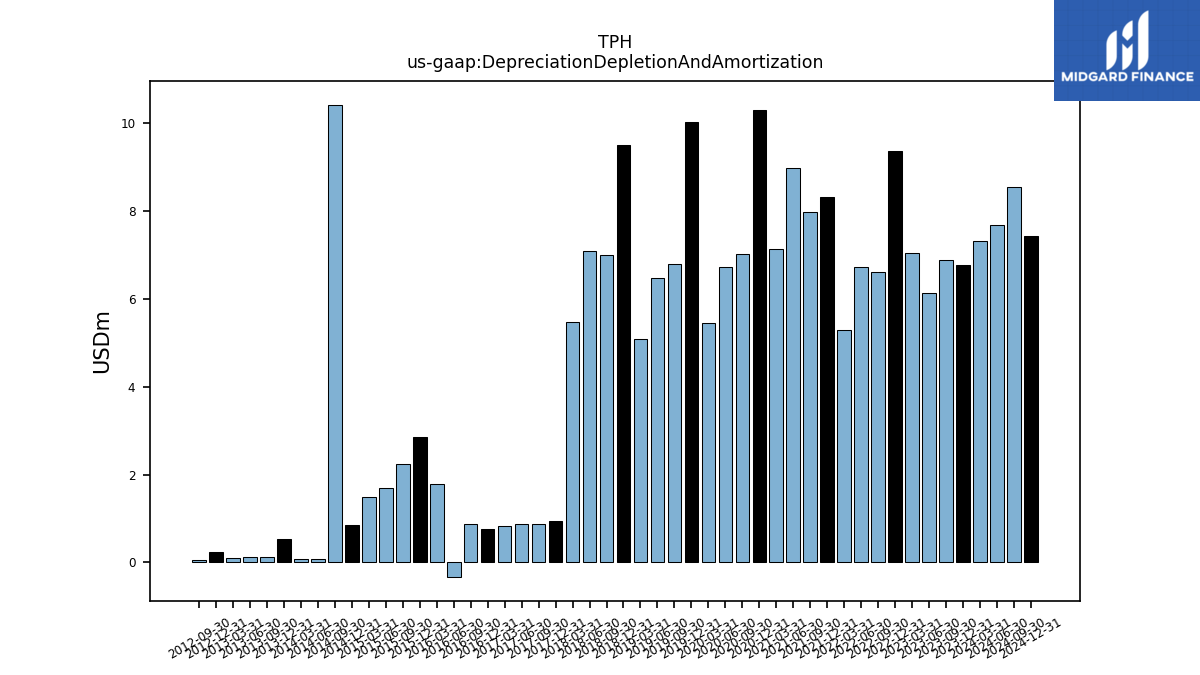
| Depreciation Depletion And Amortization | 6.79 | 6.88 | 6.13 | 7.05 | 9.37 | 6.62 | 6.74 | 5.29 | 8.32 | 7.98 | 8.99 | 7.13 | 10.30 | 7.02 | 6.72 | 5.46 | 10.04 | 6.80 | 6.48 | 5.08 | 9.52 | 7.00 | 7.09 | 5.49 | 0.93 | 0.87 | 0.88 | 0.82 | 0.77 | 0.86 | -0.34 | 1.79 | 2.86 | 2.25 | 1.69 | 1.48 | 0.52 | 0.12 | 0.12 | 0.10 | 0.05 | NA | NA | |
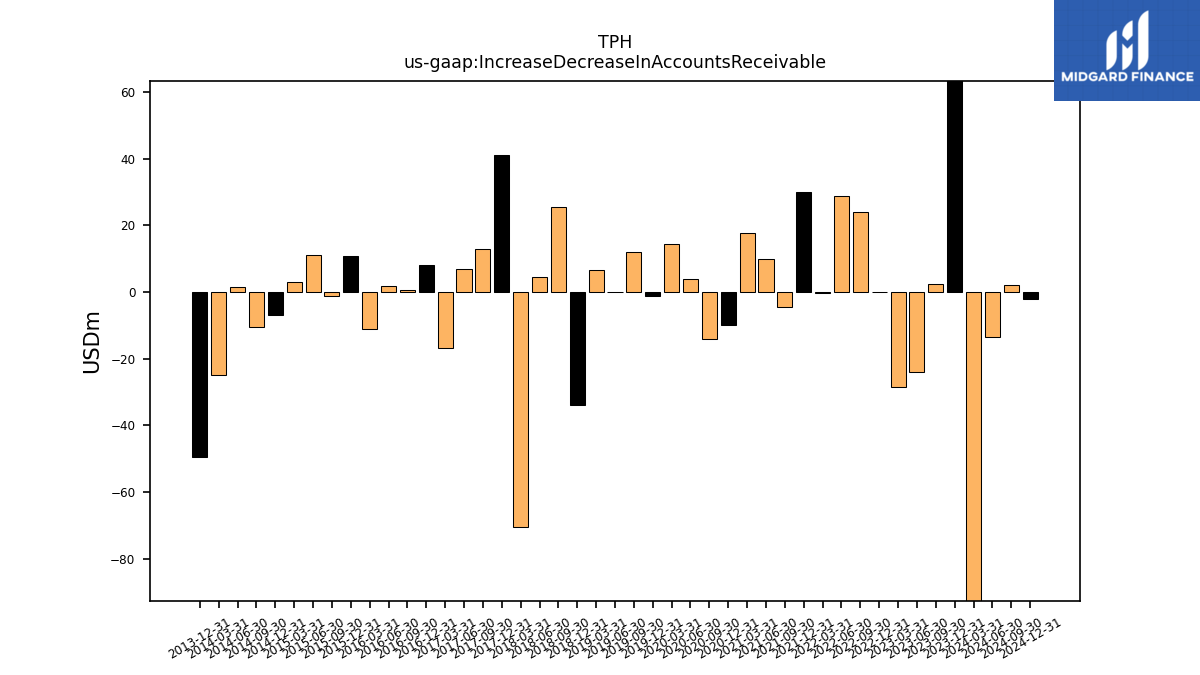
| Increase Decrease In Accounts Receivable | 105.23 | 2.27 | -23.94 | -28.37 | -0.05 | 24.07 | 28.68 | -0.25 | 30.07 | -4.42 | 9.98 | 17.81 | -9.86 | -14.17 | 3.88 | 14.43 | -1.23 | 12.14 | 0.14 | 6.64 | -33.93 | 25.38 | 4.36 | -70.35 | 41.02 | 12.98 | 6.99 | -16.70 | 7.97 | 0.65 | 1.94 | -11.14 | 10.79 | -1.27 | 11.18 | 2.89 | -49.52 | NA | NA | NA | NA | NA | NA | |
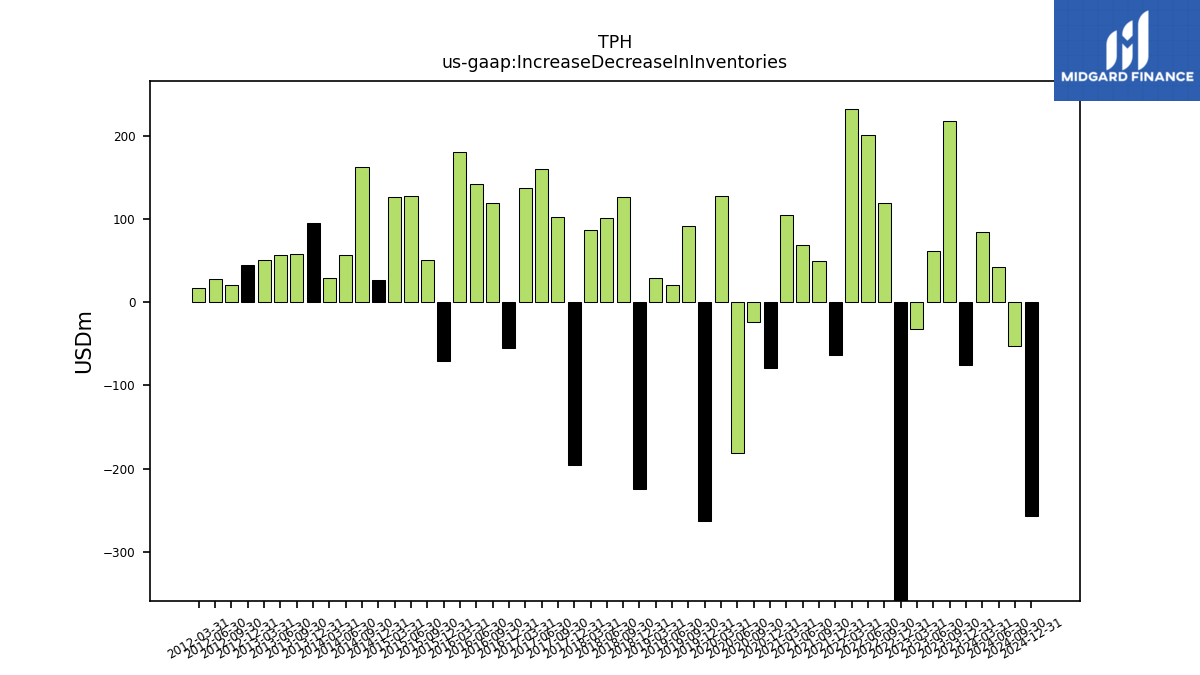
| Increase Decrease In Inventories | -75.12 | 218.39 | 61.42 | -31.96 | -432.12 | 120.04 | 201.98 | 233.24 | -62.96 | 50.23 | 69.04 | 104.70 | -79.03 | -24.12 | -181.41 | 127.51 | -262.87 | 91.90 | 21.00 | 29.70 | -224.07 | 127.42 | 101.30 | 87.11 | -196.09 | 103.31 | 160.00 | 138.01 | -54.53 | 119.37 | 142.76 | 180.54 | -70.86 | 50.47 | 128.11 | 127.30 | 95.76 | 58.05 | 56.67 | 51.08 | 20.95 | 27.73 | 17.77 | |
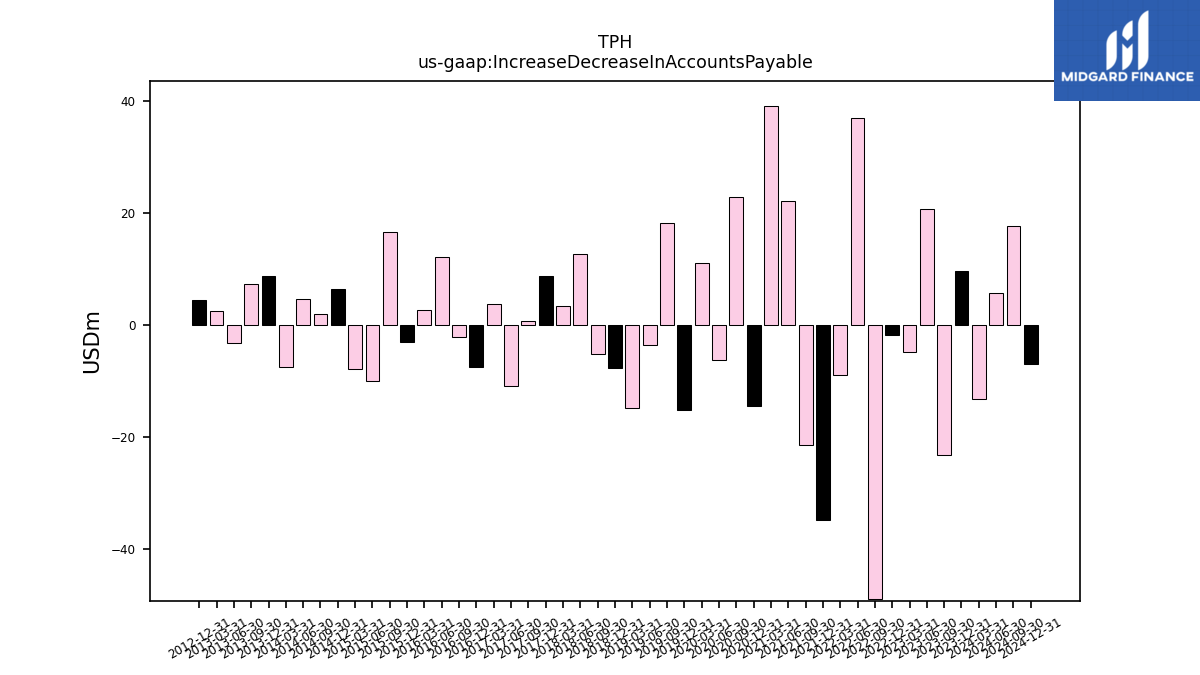
| Increase Decrease In Accounts Payable | 9.60 | -23.16 | 20.84 | -4.78 | -1.78 | -48.83 | 36.93 | -8.84 | -34.84 | -21.44 | 22.24 | 39.21 | -14.37 | 22.98 | -6.19 | 11.15 | -15.16 | 18.19 | -3.51 | -14.71 | -7.62 | -5.22 | 12.69 | 3.38 | 8.83 | 0.79 | -10.86 | 3.86 | -7.42 | -2.15 | 12.22 | 2.76 | -2.91 | 16.74 | -9.99 | -7.87 | 8.80 | 7.38 | -3.22 | 2.62 | NA | NA | NA | |
| Share Based Compensation | 4.91 | 6.99 | 4.16 | 3.86 | 2.04 | 5.72 | 5.75 | 5.27 | 8.37 | 4.41 | 4.51 | 3.66 | 6.00 | 3.48 | 3.79 | 3.62 | 4.19 | 3.83 | 3.35 | 3.44 | 3.86 | 3.77 | 3.72 | 3.47 | 4.28 | 3.89 | 3.90 | 3.84 | 2.96 | 3.29 | 3.76 | 2.60 | 3.40 | 2.99 | 3.16 | 2.38 | 1.03 | 0.50 | 0.52 | 0.33 | 0.12 | 0.12 | 0.12 |
| 2023-12-31 | 2023-09-30 | 2023-06-30 | 2023-03-31 | 2022-12-31 | 2022-09-30 | 2022-06-30 | 2022-03-31 | 2021-12-31 | 2021-09-30 | 2021-06-30 | 2021-03-31 | 2020-12-31 | 2020-09-30 | 2020-06-30 | 2020-03-31 | 2019-12-31 | 2019-09-30 | 2019-06-30 | 2019-03-31 | 2018-12-31 | 2018-09-30 | 2018-06-30 | 2018-03-31 | 2017-12-31 | 2017-09-30 | 2017-06-30 | 2017-03-31 | 2016-12-31 | 2016-09-30 | 2016-06-30 | 2016-03-31 | 2015-12-31 | 2015-09-30 | 2015-06-30 | 2015-03-31 | 2013-12-31 | 2013-09-30 | 2013-06-30 | 2013-03-31 | 2012-09-30 | 2012-06-30 | 2012-03-31 | ||
|---|---|---|---|---|---|---|---|---|---|---|---|---|---|---|---|---|---|---|---|---|---|---|---|---|---|---|---|---|---|---|---|---|---|---|---|---|---|---|---|---|---|---|---|---|
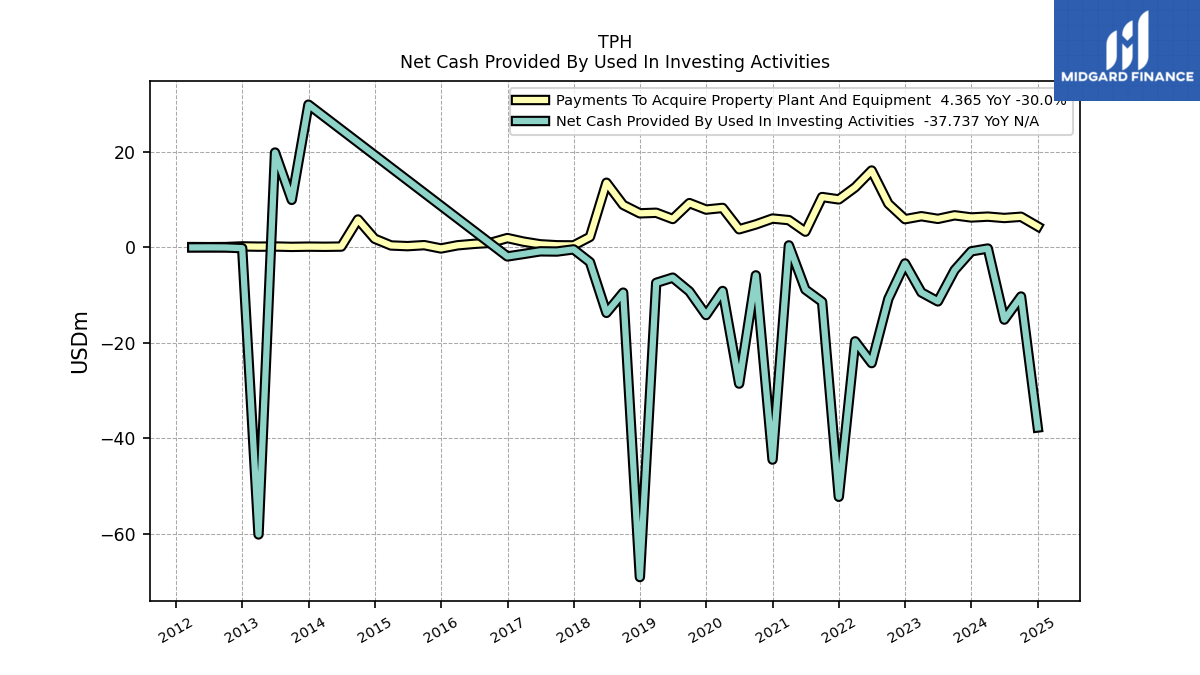
| Net Cash Provided By Used In Investing Activities | -0.85 | -4.78 | -11.34 | -9.45 | -3.38 | -10.80 | -24.25 | -19.69 | -52.25 | -11.42 | -8.87 | 0.40 | -44.46 | -5.88 | -28.55 | -9.15 | -14.20 | -9.25 | -6.36 | -7.45 | -69.06 | -9.49 | -13.74 | -3.12 | -0.44 | -0.89 | -0.85 | -1.40 | -1.92 | NA | NA | NA | NA | NA | NA | NA | 29.87 | 9.92 | 19.84 | -60.13 | -0.04 | -0.02 | -0.04 | |
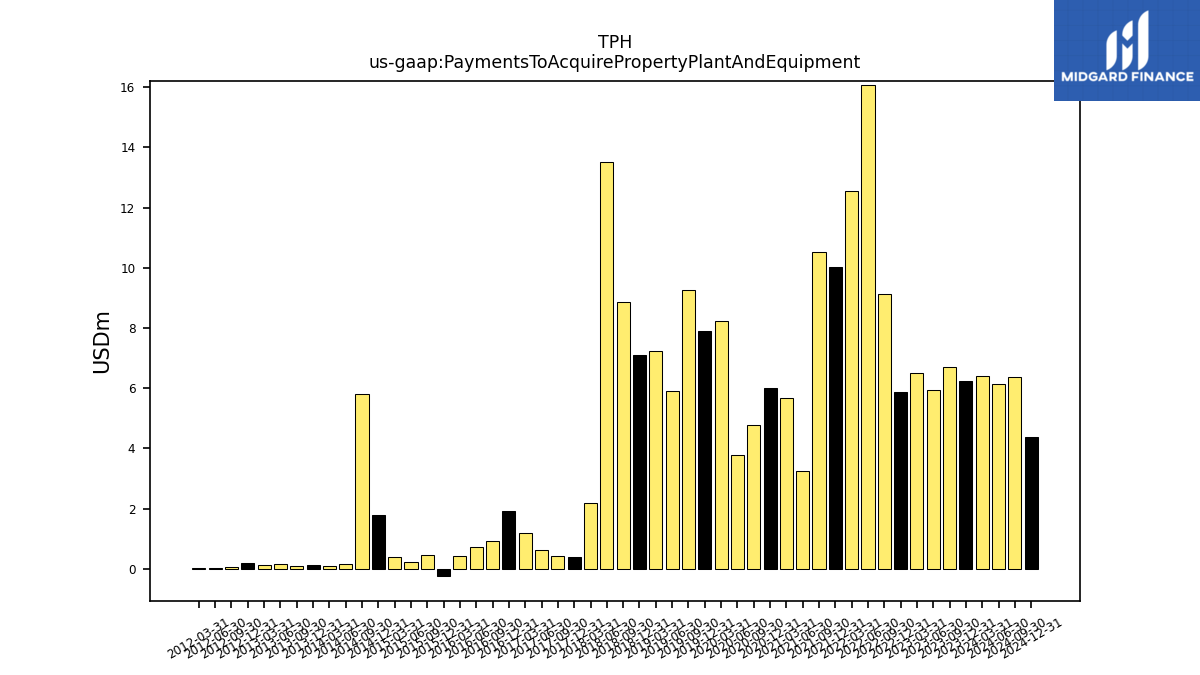
| Payments To Acquire Property Plant And Equipment | 6.24 | 6.69 | 5.94 | 6.50 | 5.88 | 9.12 | 16.07 | 12.55 | 10.02 | 10.52 | 3.26 | 5.68 | 6.01 | 4.78 | 3.76 | 8.24 | 7.89 | 9.25 | 5.92 | 7.22 | 7.10 | 8.87 | 13.51 | 2.17 | 0.39 | 0.42 | 0.62 | 1.17 | 1.93 | 0.93 | 0.71 | 0.41 | -0.25 | 0.45 | 0.23 | 0.38 | 0.13 | 0.08 | 0.16 | 0.13 | 0.04 | 0.02 | 0.04 |
| 2023-12-31 | 2023-09-30 | 2023-06-30 | 2023-03-31 | 2022-12-31 | 2022-09-30 | 2022-06-30 | 2022-03-31 | 2021-12-31 | 2021-09-30 | 2021-06-30 | 2021-03-31 | 2020-12-31 | 2020-09-30 | 2020-06-30 | 2020-03-31 | 2019-12-31 | 2019-09-30 | 2019-06-30 | 2019-03-31 | 2018-12-31 | 2018-09-30 | 2018-06-30 | 2018-03-31 | 2017-12-31 | 2017-09-30 | 2017-06-30 | 2017-03-31 | 2016-12-31 | 2016-09-30 | 2016-06-30 | 2016-03-31 | 2015-12-31 | 2015-09-30 | 2015-06-30 | 2015-03-31 | 2013-12-31 | 2013-09-30 | 2013-06-30 | 2013-03-31 | 2012-09-30 | 2012-06-30 | 2012-03-31 | ||
|---|---|---|---|---|---|---|---|---|---|---|---|---|---|---|---|---|---|---|---|---|---|---|---|---|---|---|---|---|---|---|---|---|---|---|---|---|---|---|---|---|---|---|---|---|
| Net Cash Provided By Used In Financing Activities | -49.70 | -54.81 | -35.49 | -49.55 | 39.07 | -17.46 | -66.61 | -133.02 | -69.20 | -64.32 | -86.42 | -67.23 | -77.68 | -146.99 | -376.24 | 393.24 | -197.34 | -41.63 | 18.11 | -6.54 | -119.08 | -75.28 | -21.03 | -5.08 | -191.37 | 38.30 | 95.69 | 33.55 | -21.14 | NA | NA | NA | NA | NA | NA | NA | 45.66 | 29.89 | 1.66 | 158.94 | 57.32 | 22.86 | 24.37 | |
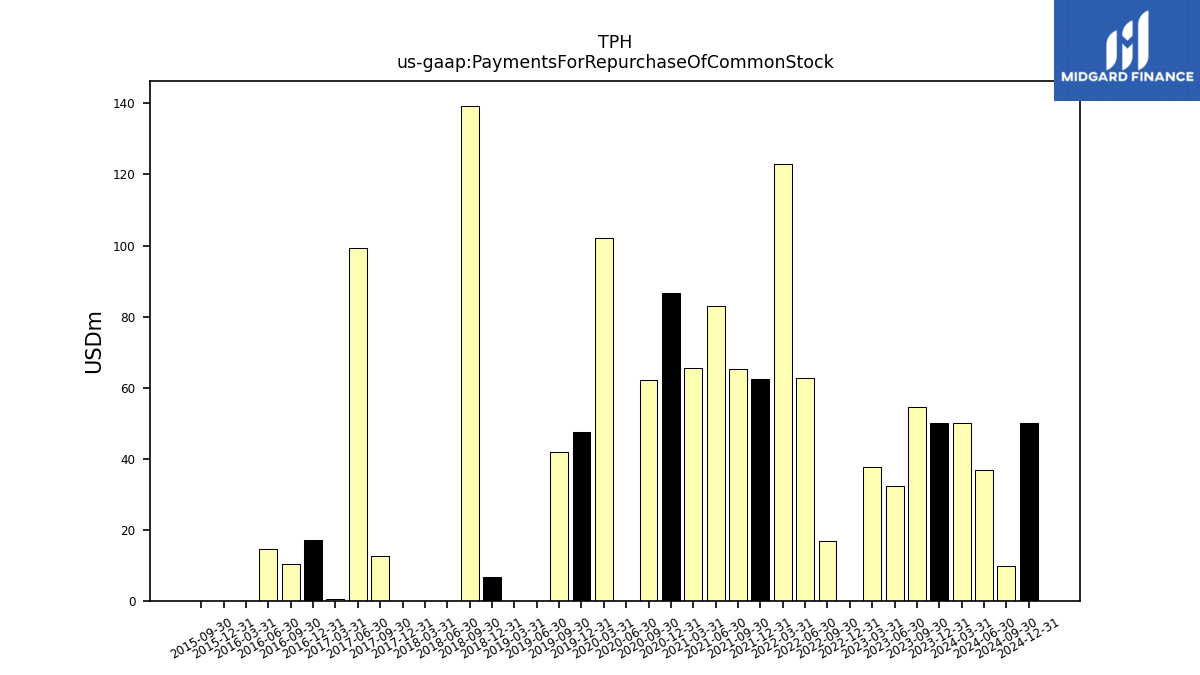
| Payments For Repurchase Of Common Stock | 50.04 | 54.55 | 32.36 | 37.61 | 0.00 | 16.76 | 62.79 | 123.09 | 62.56 | 65.21 | 82.85 | 65.43 | 86.66 | 62.06 | 0.00 | 102.00 | 47.49 | 41.73 | 0.00 | 0.00 | 6.71 | 139.35 | 0.00 | 0.00 | 0.00 | 12.52 | 99.20 | 0.49 | 16.97 | 10.41 | 14.70 | 0.00 | 0.00 | 0.00 | NA | NA | NA | NA | NA | NA | NA | NA | NA |
| 2023-12-31 | 2023-09-30 | 2023-06-30 | 2023-03-31 | 2022-12-31 | 2022-09-30 | 2022-06-30 | 2022-03-31 | 2021-12-31 | 2021-09-30 | 2021-06-30 | 2021-03-31 | 2020-12-31 | 2020-09-30 | 2020-06-30 | 2020-03-31 | 2019-12-31 | 2019-09-30 | 2019-06-30 | 2019-03-31 | 2018-12-31 | 2018-09-30 | 2018-06-30 | 2018-03-31 | 2017-12-31 | 2017-09-30 | 2017-06-30 | 2017-03-31 | 2016-12-31 | 2016-09-30 | 2016-06-30 | 2016-03-31 | 2015-12-31 | 2015-09-30 | 2015-06-30 | 2015-03-31 | 2013-12-31 | 2013-09-30 | 2013-06-30 | 2013-03-31 | 2012-09-30 | 2012-06-30 | 2012-03-31 | ||
|---|---|---|---|---|---|---|---|---|---|---|---|---|---|---|---|---|---|---|---|---|---|---|---|---|---|---|---|---|---|---|---|---|---|---|---|---|---|---|---|---|---|---|---|---|
| Revenues | 1259.70 | 838.52 | 837.33 | 779.66 | 1522.80 | 1071.80 | 1017.69 | 736.24 | 1210.01 | 1033.19 | 1018.06 | 720.97 | 1060.83 | 832.46 | 770.11 | 597.05 | 1141.27 | 748.39 | 698.71 | 494.63 | 1132.70 | 775.07 | 771.30 | 583.68 | 1128.52 | 717.74 | 570.63 | 393.39 | 773.75 | 582.03 | 625.22 | 424.14 | 880.24 | 648.14 | 495.52 | 377.26 | 1137.20 | 58.54 | 51.09 | 27.89 | 10.06 | 7.81 | 4.65 | |
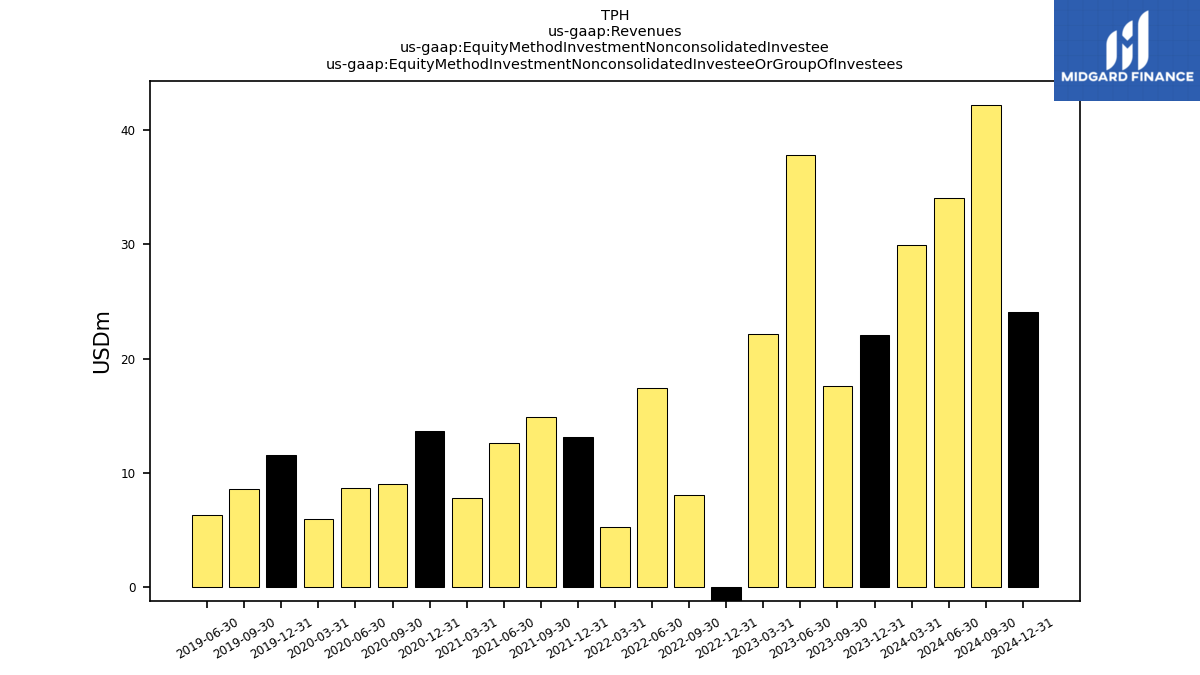
| Equity Method Investment Nonconsolidated Investee Or Group Of Investees | 22.01 | 17.59 | 37.76 | 22.14 | -3.39 | 8.11 | 17.40 | 5.32 | 13.12 | 14.90 | 12.59 | 7.81 | 13.68 | 8.99 | 8.73 | 5.97 | 11.61 | 8.62 | 6.35 | NA | NA | NA | NA | NA | NA | NA | NA | NA | NA | NA | NA | NA | NA | NA | NA | NA | NA | NA | NA | NA | NA | NA | NA | |
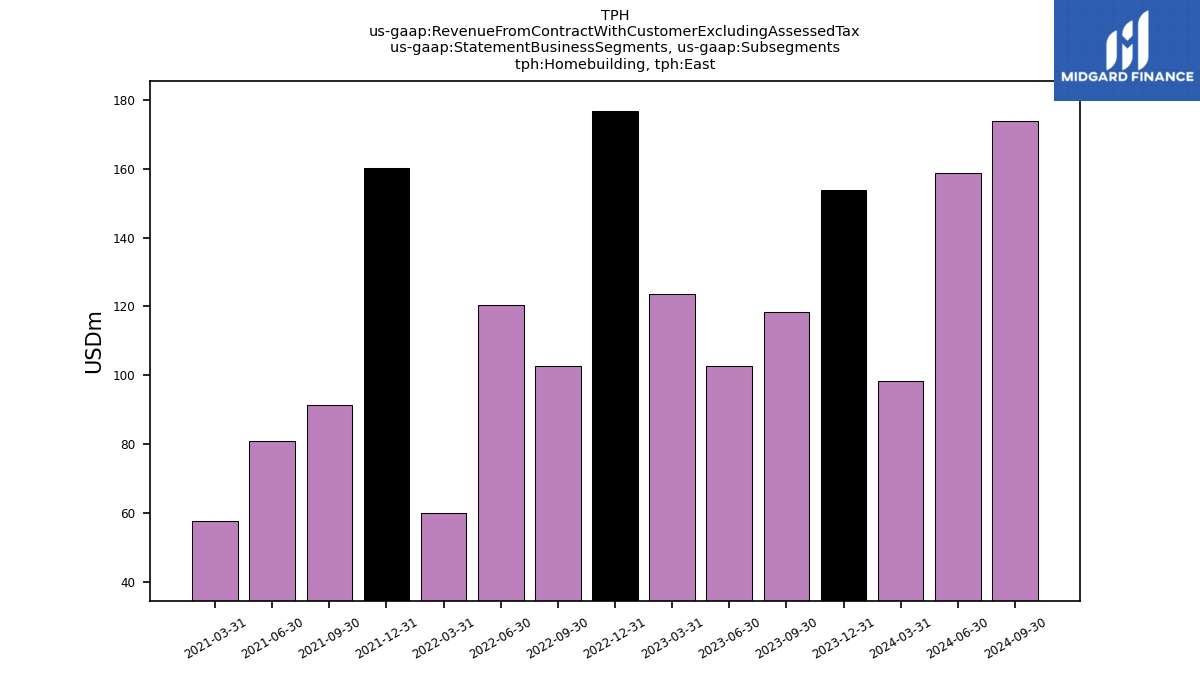
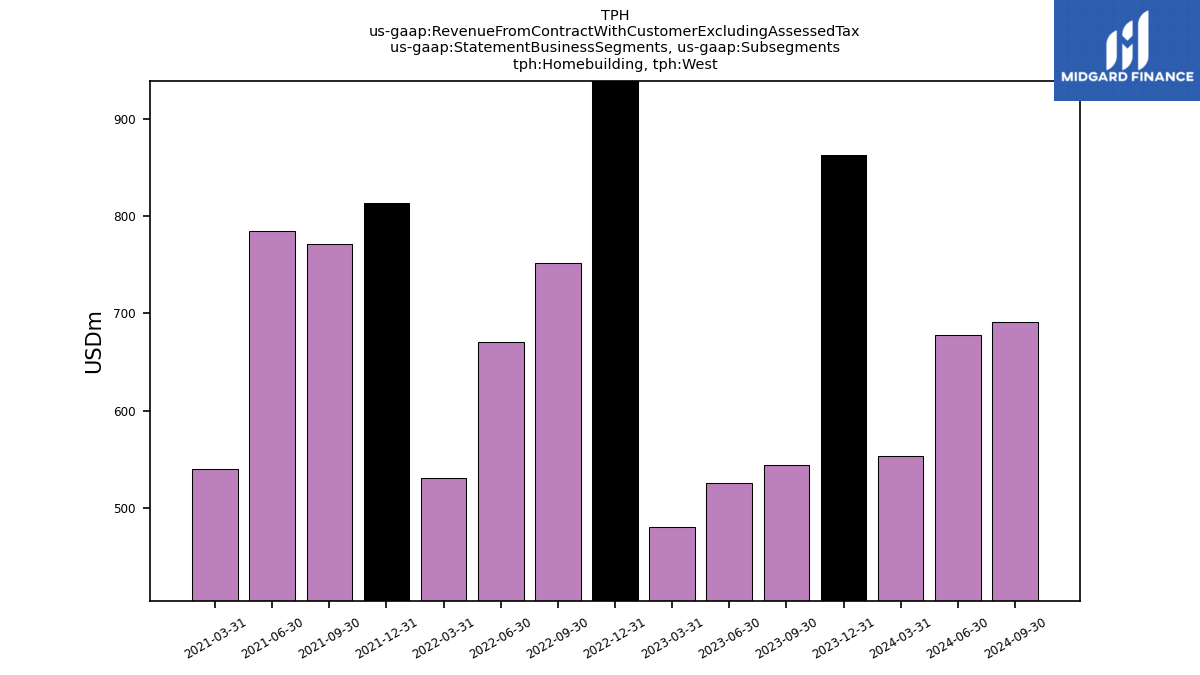
| Revenue From Contract With Customer Excluding Assessed Tax | 1259.70 | 838.52 | 837.33 | 779.66 | 1522.80 | 1071.80 | 1017.69 | 736.24 | 1210.01 | 1033.19 | 1018.06 | 720.97 | 1060.83 | 832.46 | 770.11 | 597.05 | 1141.27 | 748.39 | 698.71 | 494.63 | 1132.70 | 775.07 | 771.30 | 582.57 | 1128.52 | 717.74 | 570.63 | 393.39 | 773.75 | 582.03 | 625.22 | 424.14 | 880.24 | 648.14 | 495.52 | 377.26 | 1137.20 | 58.54 | 51.09 | 27.89 | 10.06 | 7.81 | 4.65 | |
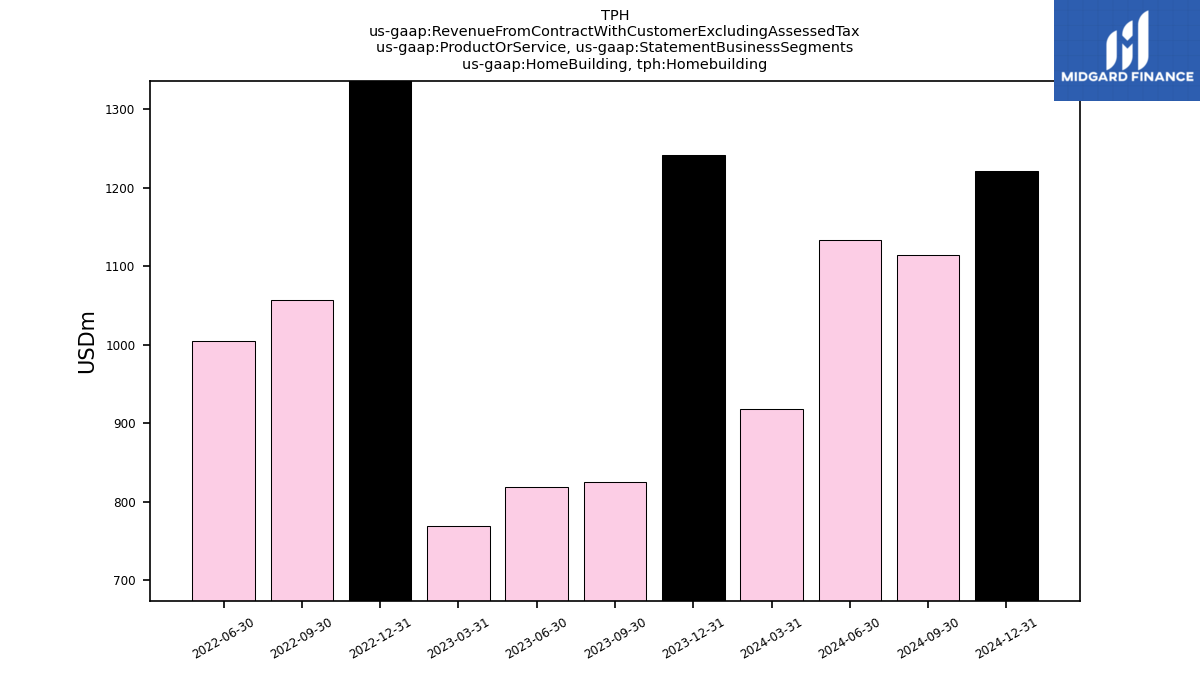
| Home Building, Homebuilding | 1241.26 | 825.29 | 819.08 | NA | 1504.18 | 1057.49 | 1004.64 | NA | NA | NA | NA | NA | NA | NA | NA | NA | NA | NA | NA | NA | NA | NA | NA | NA | NA | NA | NA | NA | NA | NA | NA | NA | NA | NA | NA | NA | NA | NA | NA | NA | NA | NA | NA | |
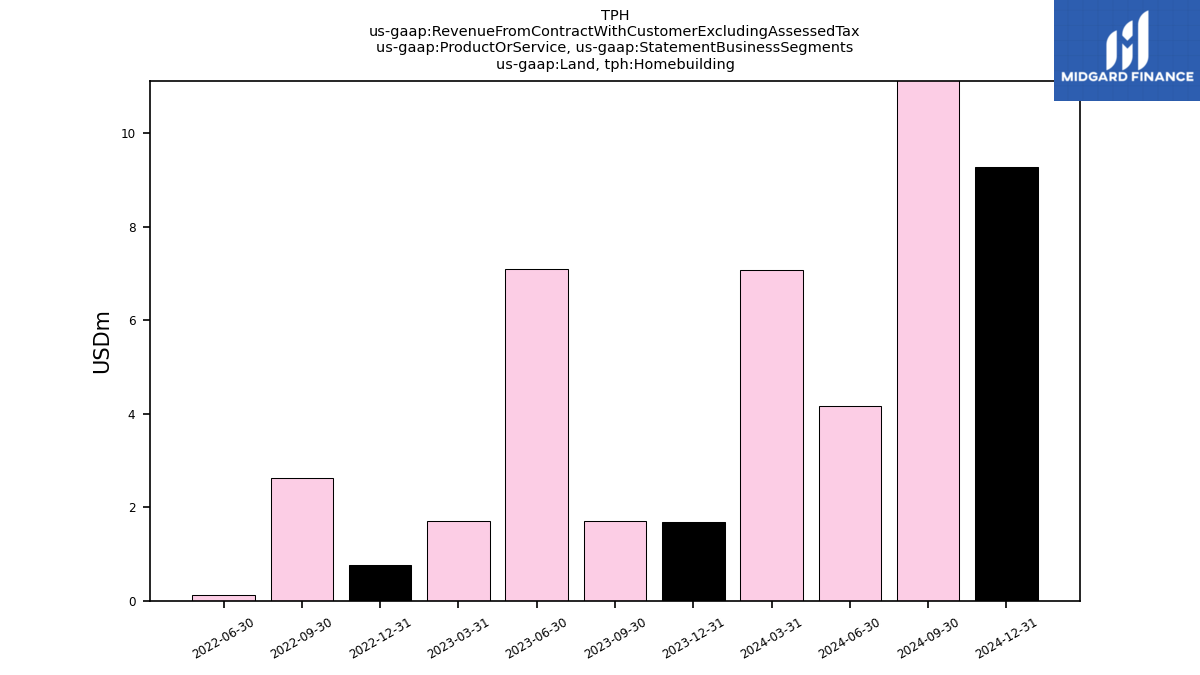
| Land, Homebuilding | 1.69 | 1.71 | 7.09 | NA | 0.77 | 2.63 | 0.11 | NA | NA | NA | NA | NA | NA | NA | NA | NA | NA | NA | NA | NA | NA | NA | NA | NA | NA | NA | NA | NA | NA | NA | NA | NA | NA | NA | NA | NA | NA | NA | NA | NA | NA | NA | NA | |
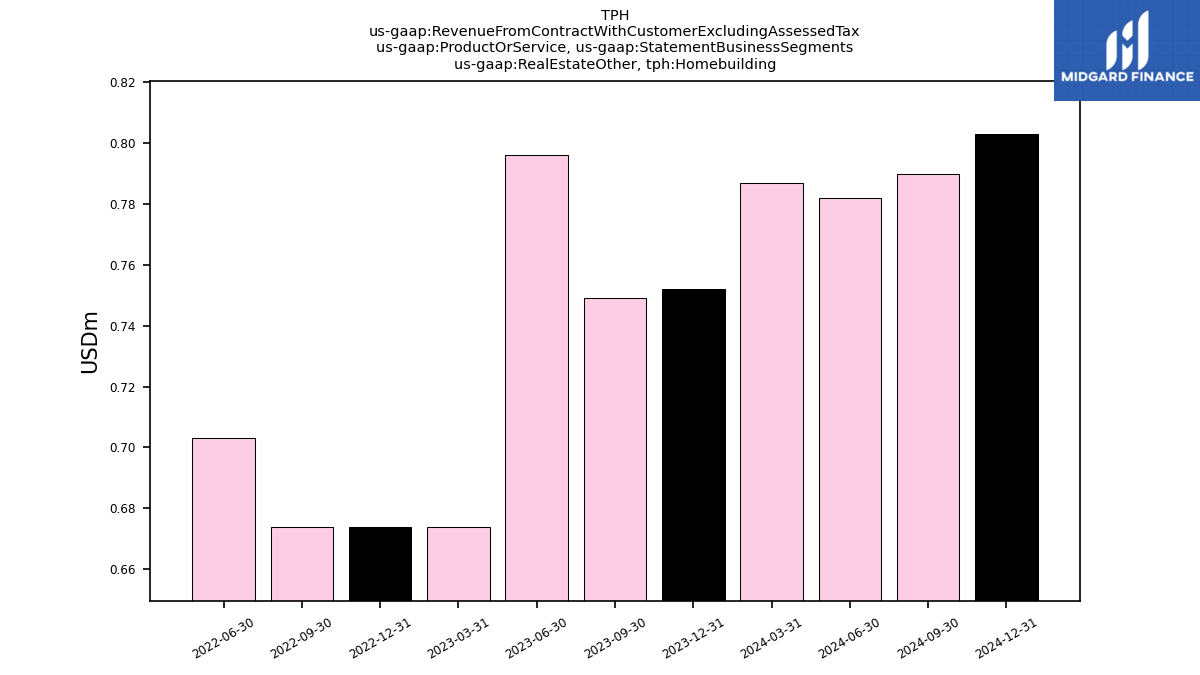
| Real Estate Other, Homebuilding | 0.75 | 0.75 | 0.80 | NA | 0.67 | 0.67 | 0.70 | NA | NA | NA | NA | NA | NA | NA | NA | NA | NA | NA | NA | NA | NA | NA | NA | NA | NA | NA | NA | NA | NA | NA | NA | NA | NA | NA | NA | NA | NA | NA | NA | NA | NA | NA | NA | |
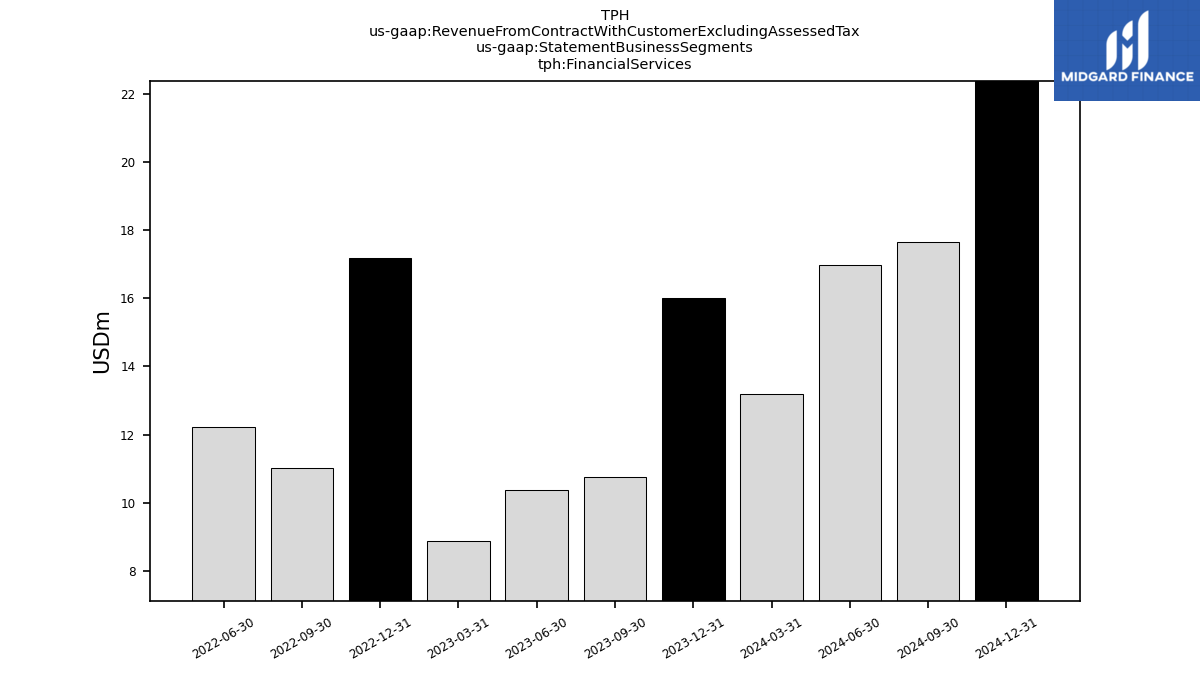
| Financial Services | 16.00 | 10.76 | 10.37 | NA | 17.18 | 11.01 | 12.23 | NA | NA | NA | NA | NA | NA | NA | NA | NA | NA | NA | NA | NA | NA | NA | NA | NA | NA | NA | NA | NA | NA | NA | NA | NA | NA | NA | NA | NA | NA | NA | NA | NA | NA | NA | NA | |
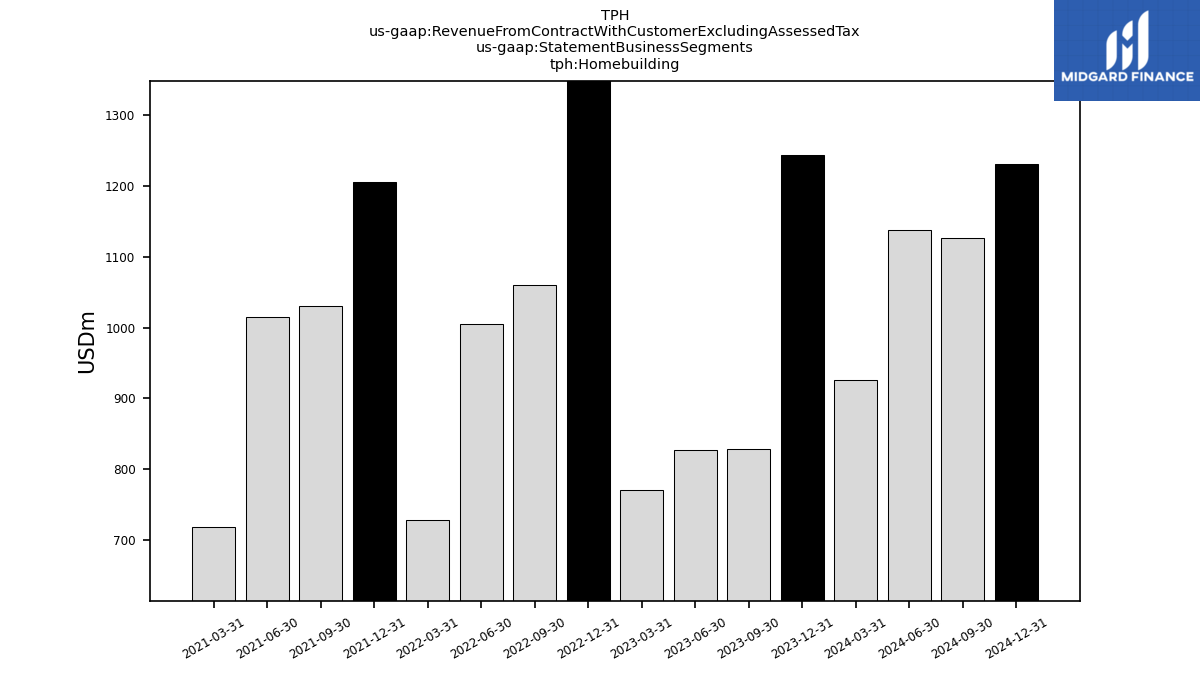
| Homebuilding | 1243.70 | 827.76 | 826.96 | 770.78 | 1505.62 | 1060.79 | 1005.46 | 727.49 | 1206.37 | 1030.18 | 1015.38 | 718.86 | NA | NA | NA | NA | NA | NA | NA | NA | NA | NA | NA | NA | NA | NA | NA | NA | NA | NA | NA | NA | NA | NA | NA | NA | NA | NA | NA | NA | NA | NA | NA | |
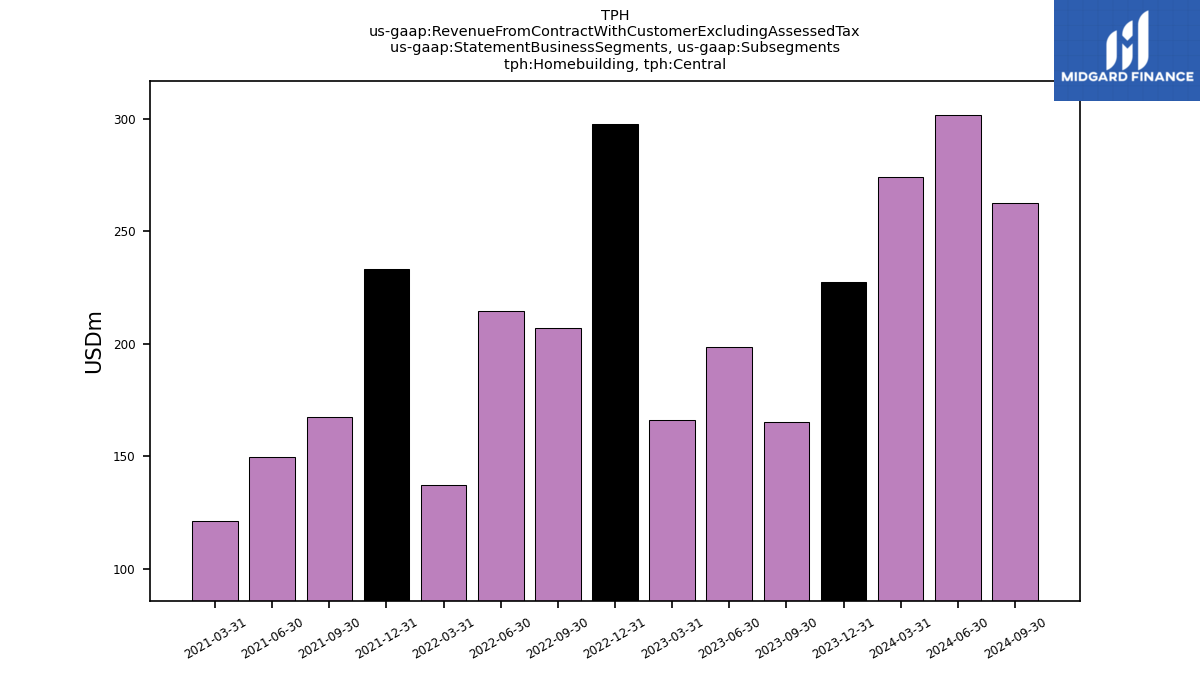
| Homebuilding, Central | 227.35 | 165.32 | 198.49 | 166.14 | 297.67 | 206.86 | 214.40 | 137.10 | 233.19 | 167.27 | 149.62 | 121.12 | NA | NA | NA | NA | NA | NA | NA | NA | NA | NA | NA | NA | NA | NA | NA | NA | NA | NA | NA | NA | NA | NA | NA | NA | NA | NA | NA | NA | NA | NA | NA | |
| Homebuilding, East | 153.94 | 118.27 | 102.67 | 123.70 | 176.72 | 102.71 | 120.37 | 59.90 | 160.32 | 91.34 | 80.81 | 57.70 | NA | NA | NA | NA | NA | NA | NA | NA | NA | NA | NA | NA | NA | NA | NA | NA | NA | NA | NA | NA | NA | NA | NA | NA | NA | NA | NA | NA | NA | NA | NA | |
| Homebuilding, West | 862.41 | 544.17 | 525.80 | 480.94 | 1031.22 | 751.22 | 670.69 | 530.50 | 812.86 | 771.57 | 784.95 | 540.05 | NA | NA | NA | NA | NA | NA | NA | NA | NA | NA | NA | NA | NA | NA | NA | NA | NA | NA | NA | NA | NA | NA | NA | NA | NA | NA | NA | NA | NA | NA | NA |