
| 2023-12-31 | 2023-09-30 | 2023-06-30 | 2023-03-31 | 2022-12-31 | 2022-09-30 | 2022-06-30 | 2022-03-31 | 2021-12-31 | 2021-09-30 | 2021-06-30 | 2021-03-31 | 2020-12-31 | 2020-09-30 | 2020-06-30 | 2020-03-31 | 2019-12-31 | 2019-09-30 | 2019-06-30 | 2019-03-31 | 2018-12-31 | 2018-09-30 | 2018-06-30 | 2018-03-31 | 2017-12-31 | 2017-09-30 | 2017-06-30 | 2017-03-31 | ||
|---|---|---|---|---|---|---|---|---|---|---|---|---|---|---|---|---|---|---|---|---|---|---|---|---|---|---|---|---|---|
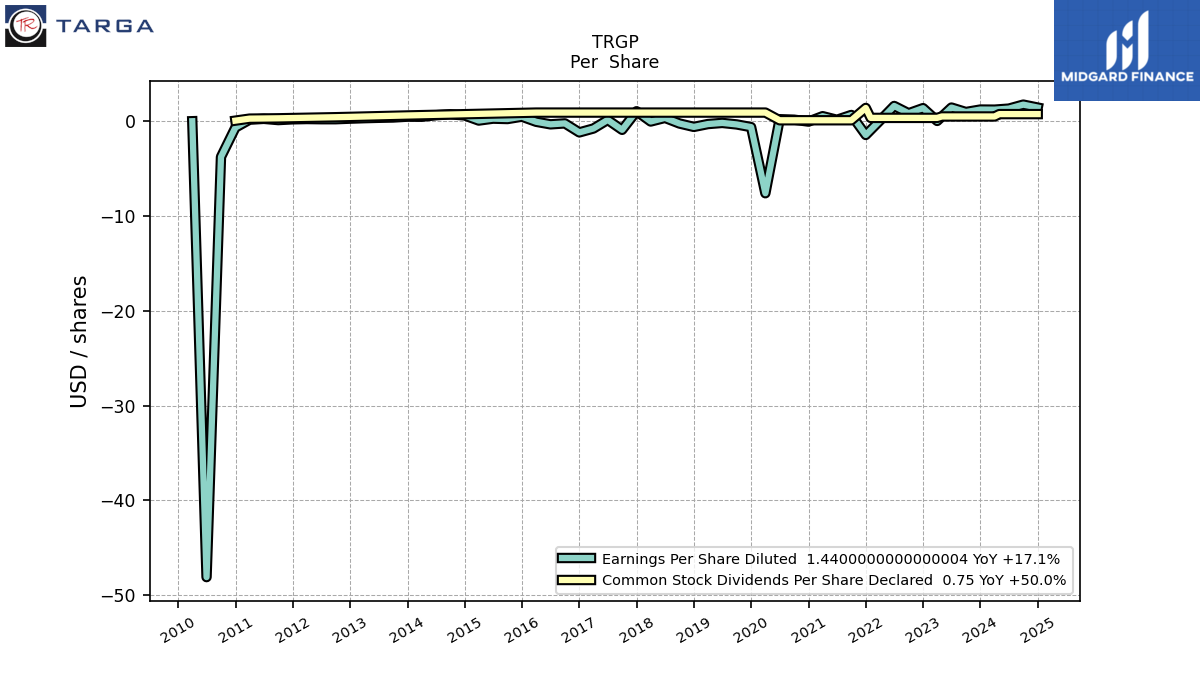
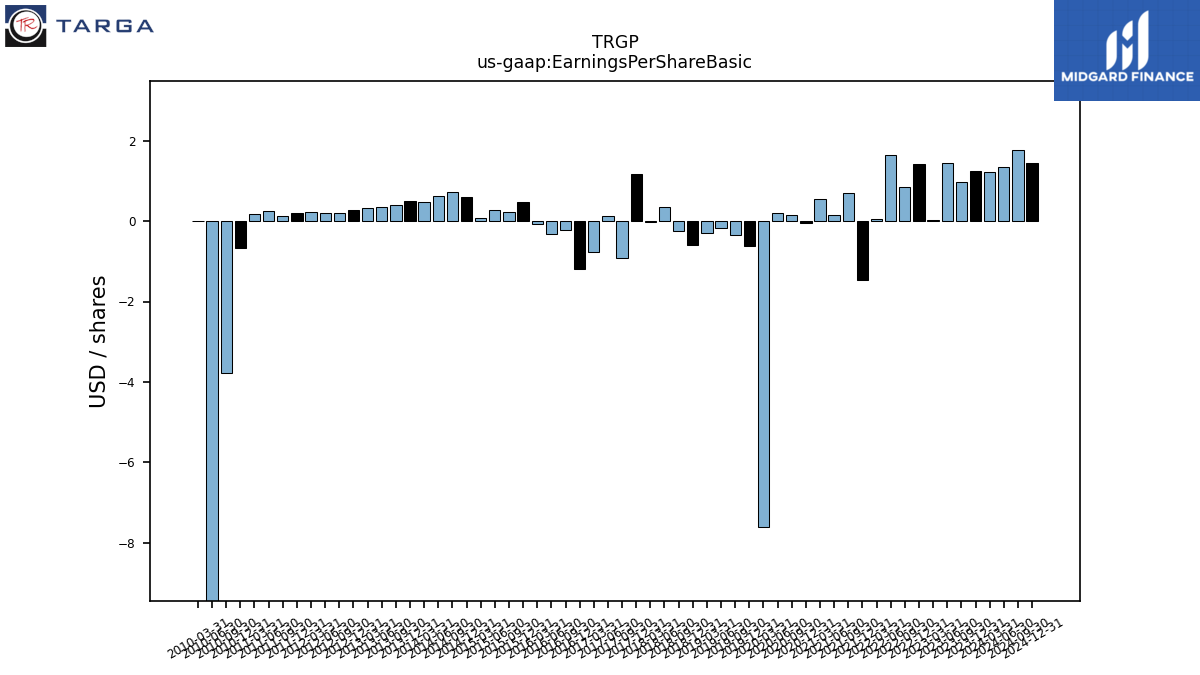
| Earnings Per Share Basic | 1.25 | 0.97 | 1.44 | 0.03 | 1.41 | 0.85 | 1.64 | 0.06 | -1.47 | 0.70 | 0.15 | 0.54 | -0.04 | 0.16 | 0.21 | -7.60 | -0.62 | -0.34 | -0.18 | -0.30 | -0.60 | -0.24 | 0.36 | -0.03 | 1.17 | -0.91 | 0.14 | -0.77 | |
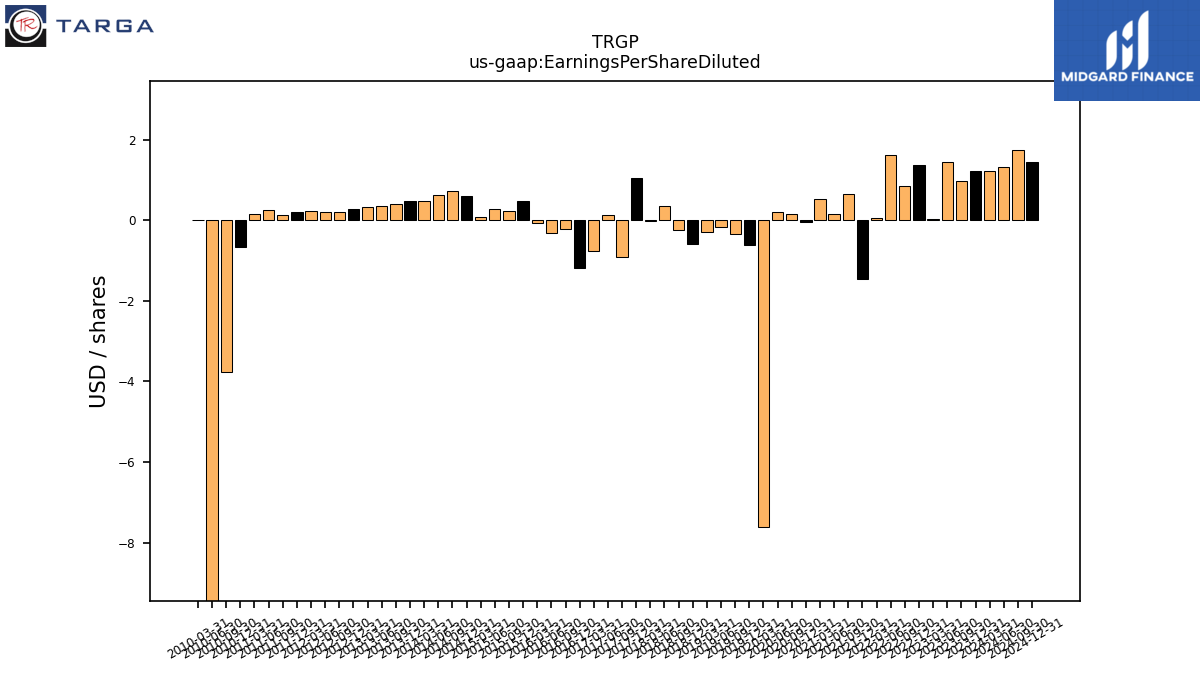
| Earnings Per Share Diluted | 1.23 | 0.97 | 1.44 | 0.03 | 1.38 | 0.84 | 1.61 | 0.06 | -1.45 | 0.66 | 0.15 | 0.53 | -0.04 | 0.16 | 0.21 | -7.60 | -0.62 | -0.34 | -0.18 | -0.30 | -0.60 | -0.24 | 0.35 | -0.03 | 1.05 | -0.91 | 0.14 | -0.77 |
| 2023-12-31 | 2023-09-30 | 2023-06-30 | 2023-03-31 | 2022-12-31 | 2022-09-30 | 2022-06-30 | 2022-03-31 | 2021-12-31 | 2021-09-30 | 2021-06-30 | 2021-03-31 | 2020-12-31 | 2020-09-30 | 2020-06-30 | 2020-03-31 | 2019-12-31 | 2019-09-30 | 2019-06-30 | 2019-03-31 | 2018-12-31 | 2018-09-30 | 2018-06-30 | 2018-03-31 | 2017-12-31 | 2017-09-30 | 2017-06-30 | 2017-03-31 | ||
|---|---|---|---|---|---|---|---|---|---|---|---|---|---|---|---|---|---|---|---|---|---|---|---|---|---|---|---|---|---|
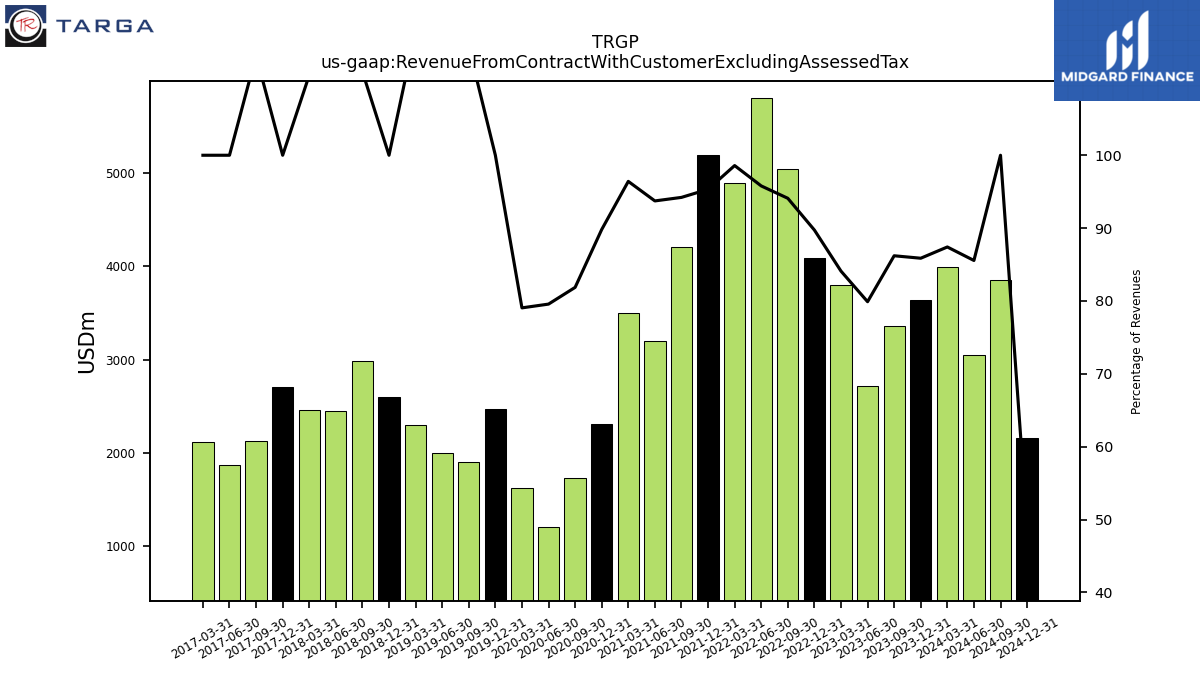
| Revenue From Contract With Customer Excluding Assessed Tax | 3640.40 | 3359.10 | 2719.60 | 3801.80 | 4087.30 | 5043.50 | 5800.90 | 4888.90 | 5187.20 | 4201.80 | 3201.80 | 3502.40 | 2310.60 | 1731.60 | 1212.30 | 1619.80 | 2473.90 | 1902.50 | 1995.30 | 2299.40 | 2597.60 | 2986.40 | 2444.40 | 2455.60 | 2702.80 | 2131.80 | 1867.70 | 2112.60 | |
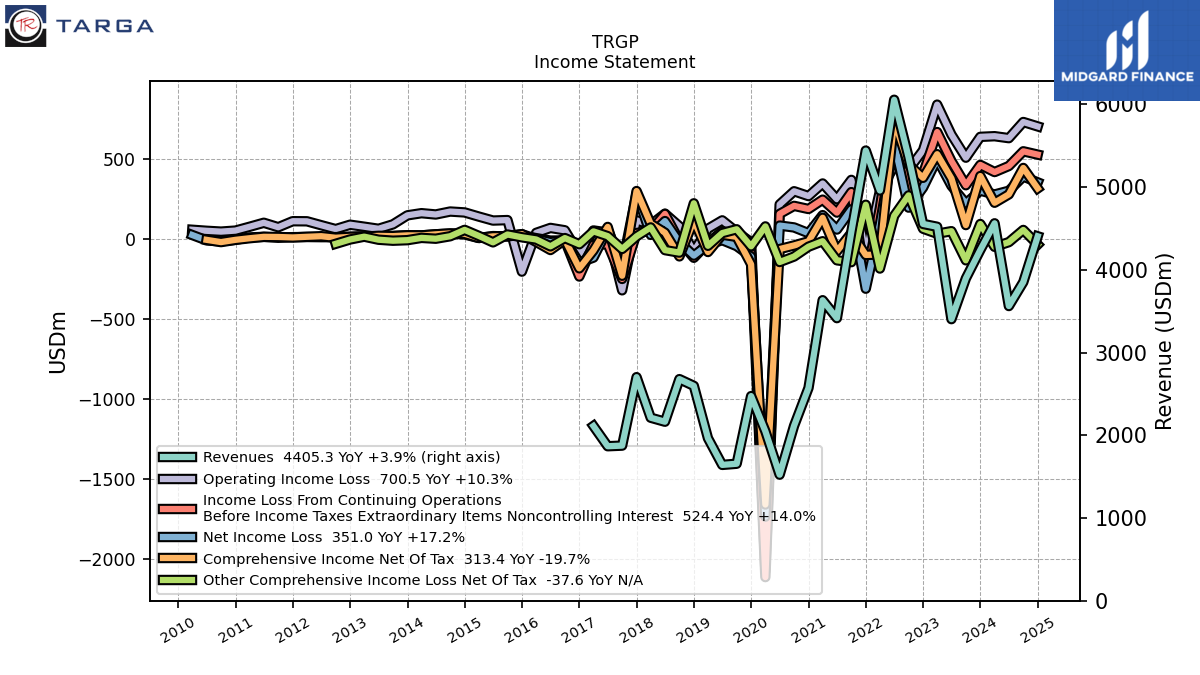
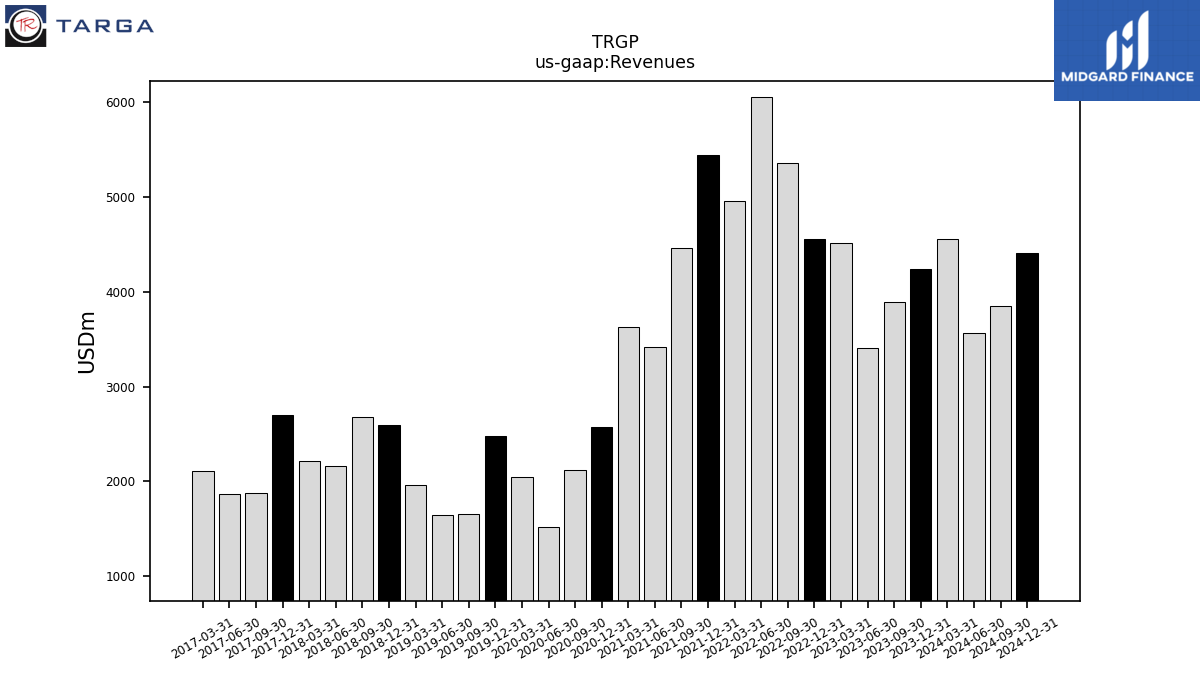
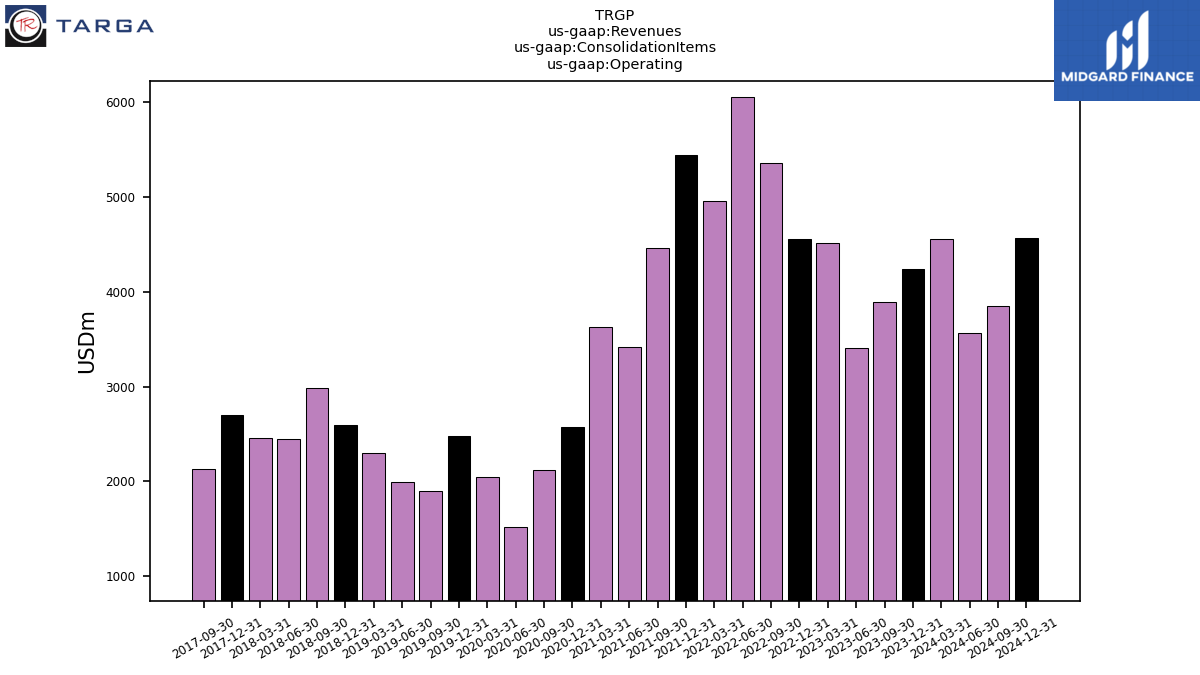
| Revenues | 4239.50 | 3896.60 | 3403.70 | 4520.50 | 4554.80 | 5360.10 | 6055.80 | 4959.10 | 5441.60 | 4459.70 | 3415.90 | 3632.70 | 2572.80 | 2115.10 | 1523.50 | 2048.90 | 2473.90 | 1656.00 | 1642.00 | 1964.70 | 2597.60 | 2679.00 | 2164.00 | 2212.50 | 2702.80 | 1875.10 | 1867.70 | 2112.60 | |
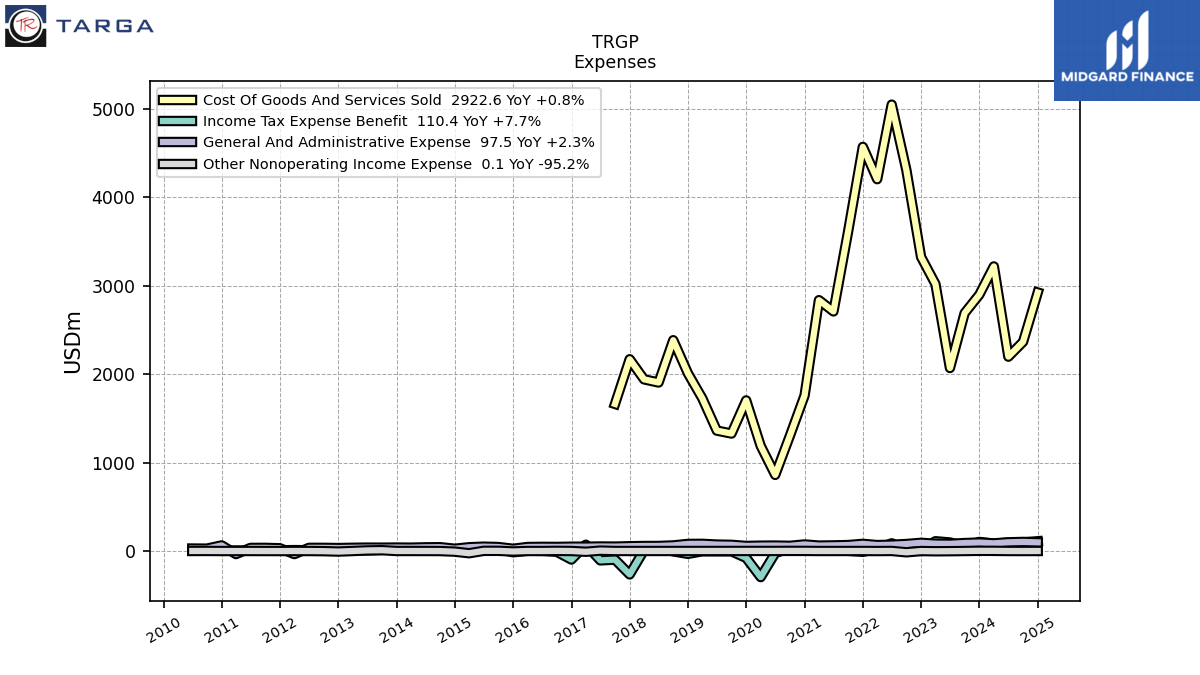
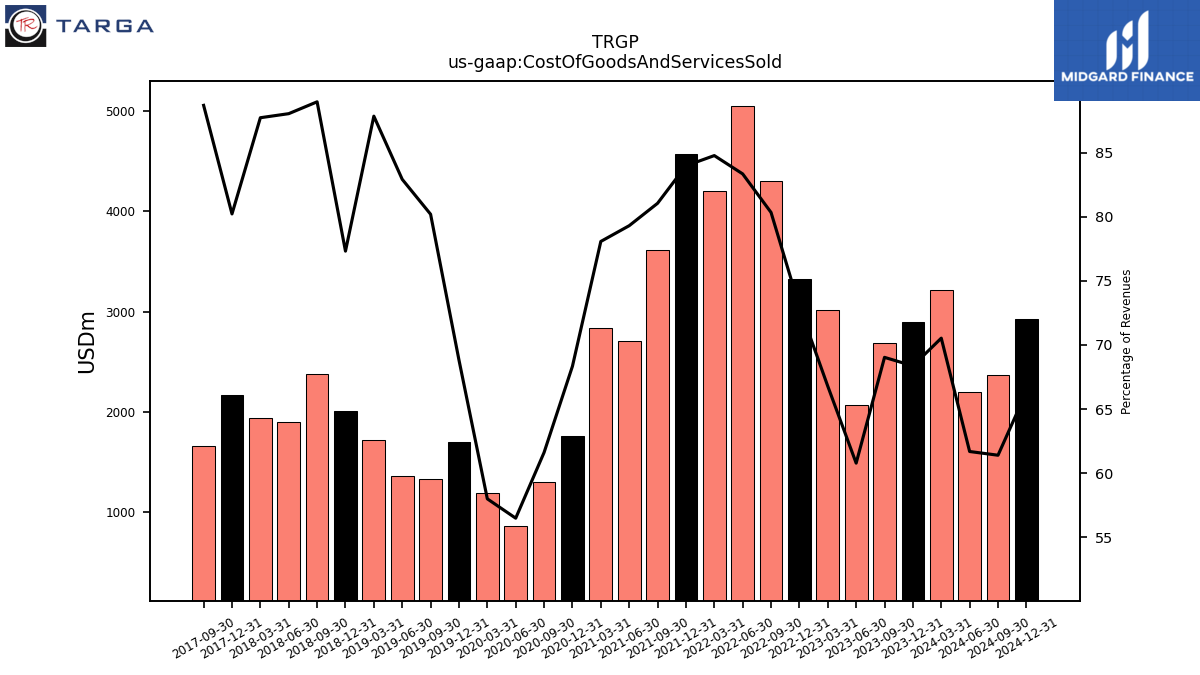
| Cost Of Goods And Services Sold | 2898.50 | 2690.00 | 2068.90 | 3019.00 | 3324.30 | 4306.30 | 5047.30 | 4204.10 | 4569.70 | 3614.70 | 2709.00 | 2836.30 | 1758.30 | 1303.20 | 860.60 | 1188.30 | 1702.80 | 1328.10 | 1361.60 | 1726.00 | 2008.50 | 2383.50 | 1905.30 | 1941.00 | 2168.30 | 1663.10 | NA | NA | |
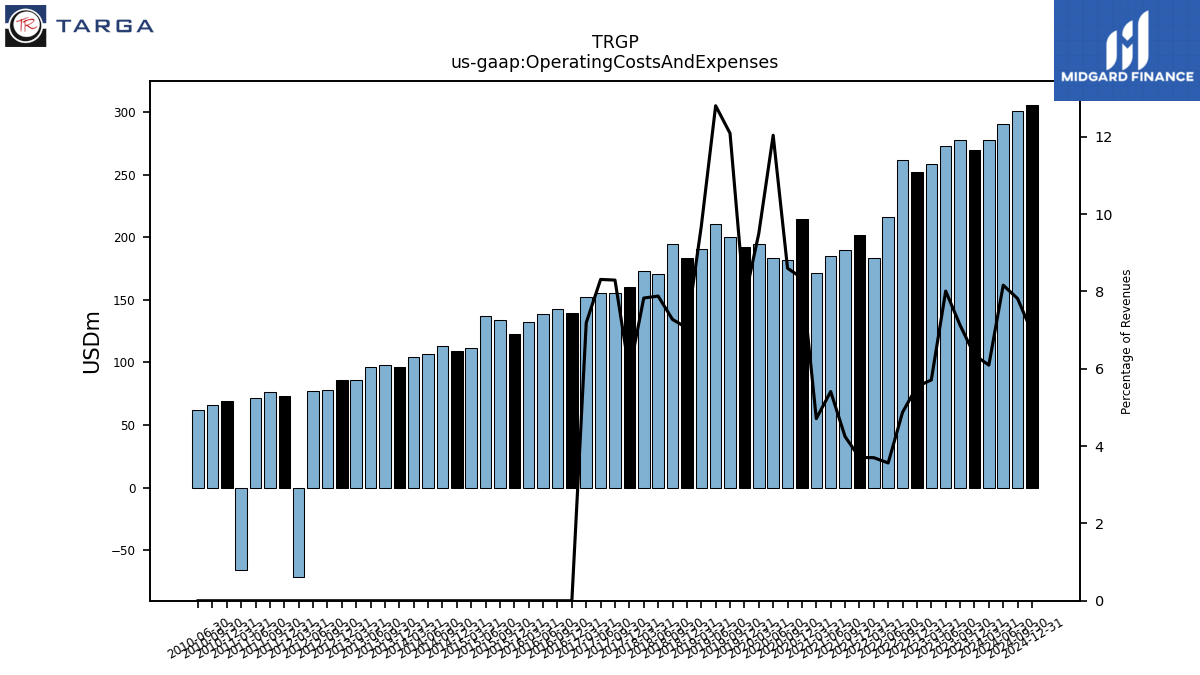
| Operating Costs And Expenses | 269.50 | 277.70 | 272.60 | 258.20 | 252.20 | 261.30 | 215.80 | 183.50 | 201.70 | 189.40 | 184.80 | 171.10 | 214.70 | 181.90 | 183.40 | 194.60 | 192.10 | 200.20 | 210.20 | 190.20 | 183.30 | 194.90 | 170.50 | 173.20 | 160.20 | 155.50 | 155.20 | 151.90 | |
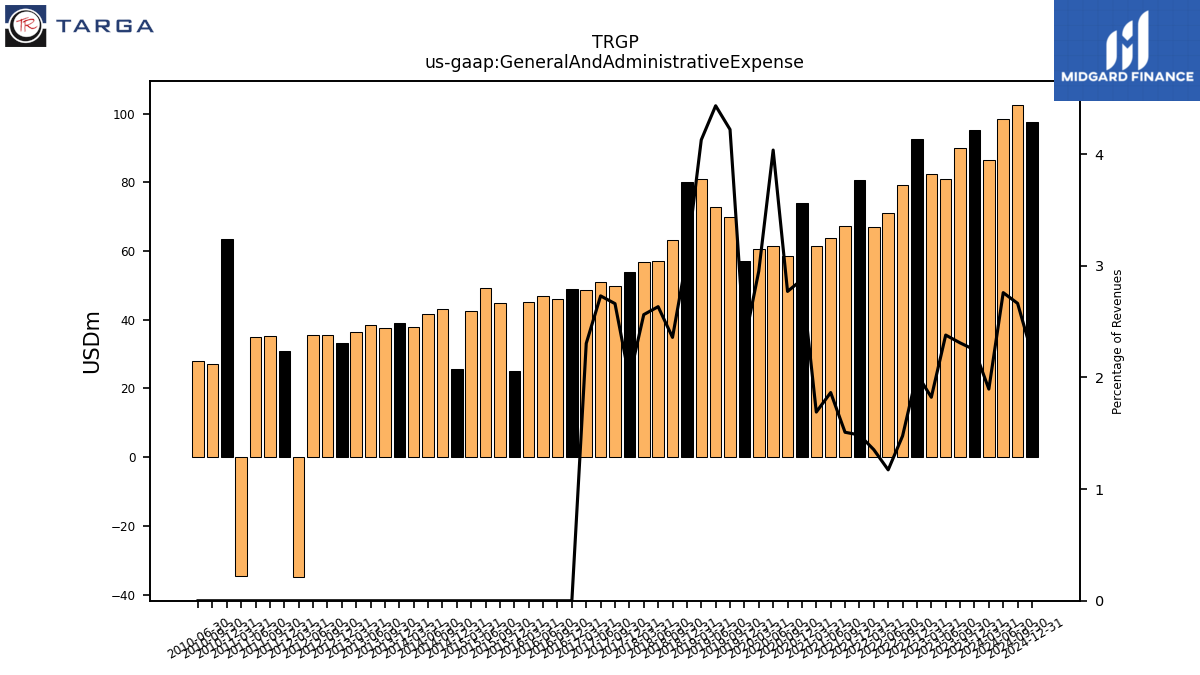
| General And Administrative Expense | 95.30 | 90.00 | 81.00 | 82.40 | 92.50 | 79.10 | 71.00 | 67.10 | 80.80 | 67.30 | 63.70 | 61.40 | 74.00 | 58.60 | 61.50 | 60.50 | 57.20 | 69.90 | 72.80 | 81.10 | 80.00 | 63.20 | 57.00 | 56.70 | 53.90 | 49.90 | 51.00 | 48.70 | |
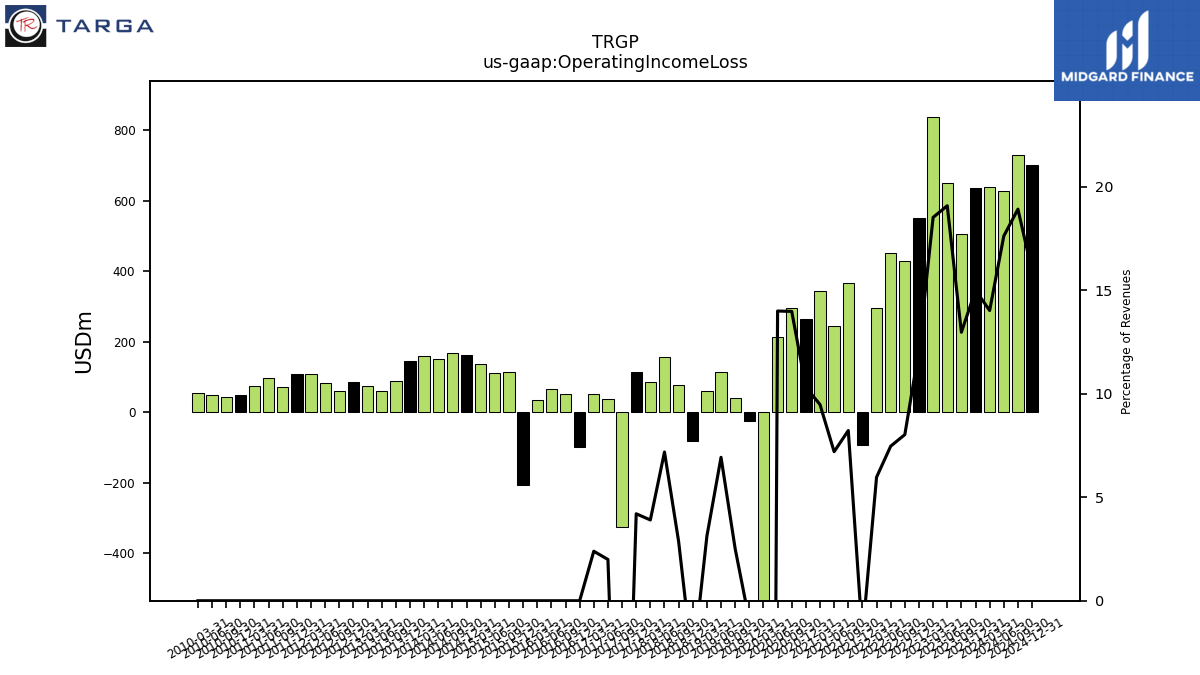
| Operating Income Loss | 635.30 | 505.10 | 649.10 | 836.70 | 551.40 | 430.00 | 451.90 | 295.80 | -91.60 | 366.50 | 245.80 | 344.10 | 265.20 | 295.50 | 213.10 | -2077.50 | -23.70 | 41.60 | 113.70 | 61.30 | -80.90 | 76.70 | 155.40 | 86.30 | 113.50 | -323.60 | 37.20 | 50.50 | |
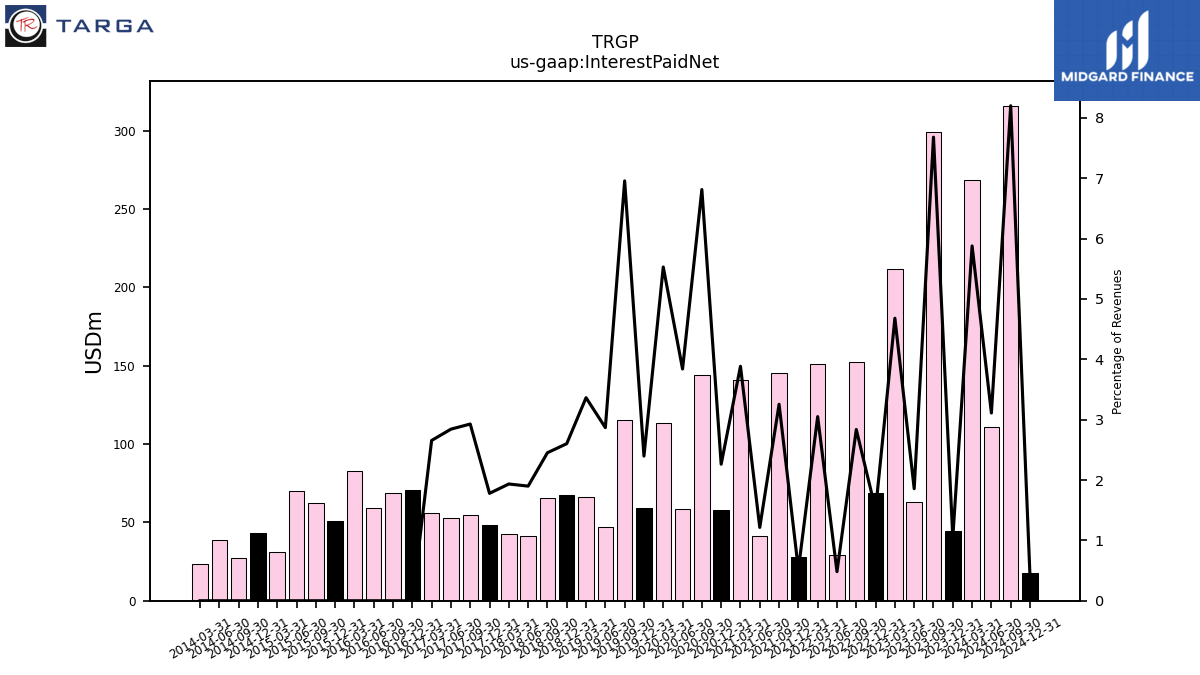
| Interest Paid Net | 44.50 | 299.30 | 63.20 | 211.60 | 68.70 | 152.10 | 29.20 | 151.30 | 28.20 | 145.20 | 41.50 | 141.10 | 58.20 | 144.10 | 58.50 | 113.30 | 59.30 | 115.20 | 47.10 | 66.10 | 67.60 | 65.70 | 41.10 | 42.80 | 48.10 | 54.90 | 53.10 | 56.10 | |
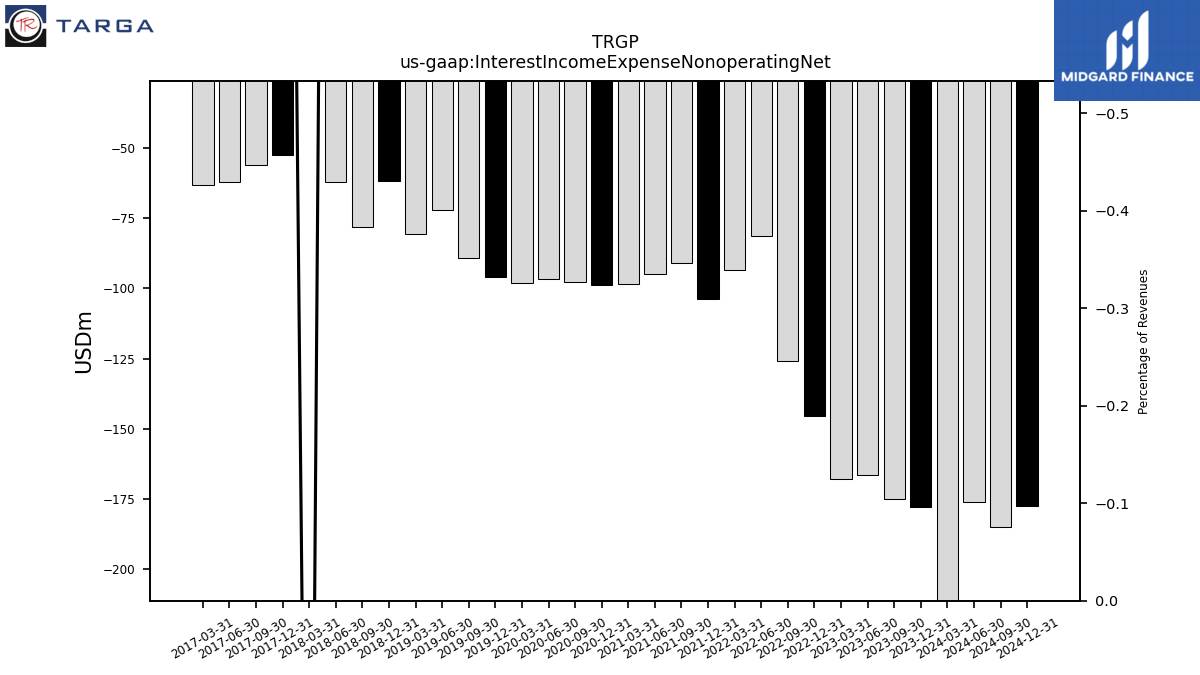
| Interest Income Expense Nonoperating Net | -178.00 | -175.10 | -166.60 | -168.00 | -145.60 | -125.80 | -81.20 | -93.60 | -103.70 | -91.00 | -94.80 | -98.40 | -98.90 | -97.70 | -96.70 | -98.00 | -96.00 | -89.10 | -72.10 | -80.60 | -61.60 | -78.20 | -62.00 | 16.10 | -52.50 | -56.10 | -62.10 | -63.00 | |
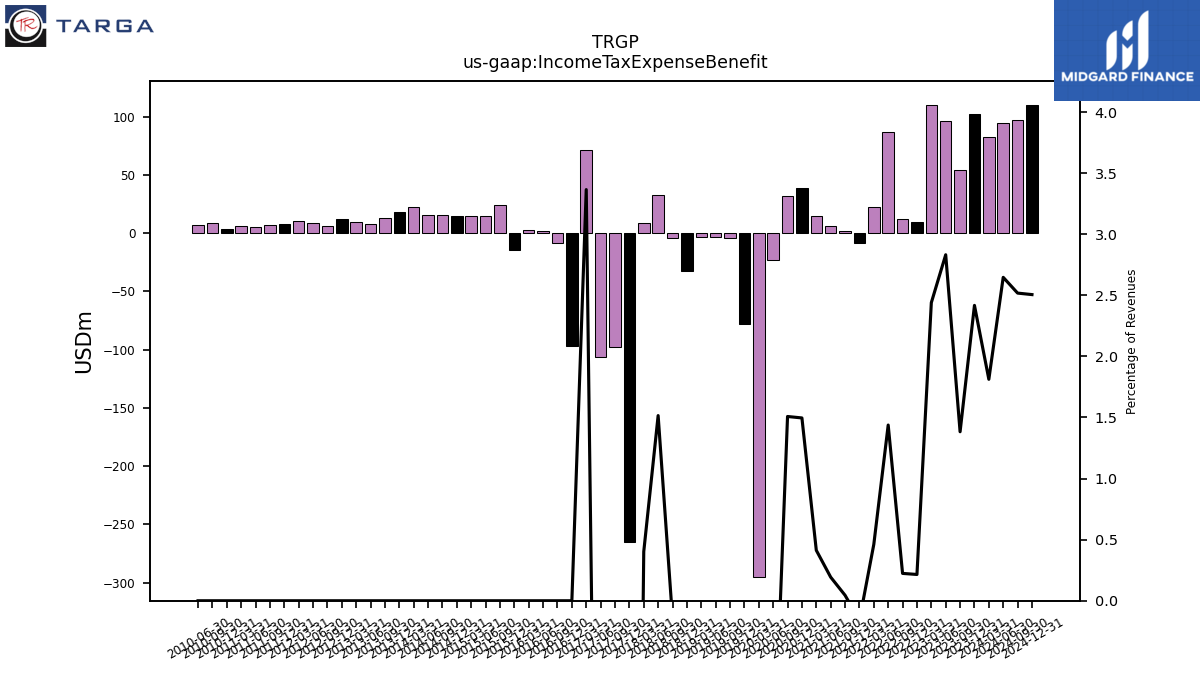
| Income Tax Expense Benefit | 102.50 | 53.90 | 96.40 | 110.30 | 9.80 | 12.00 | 87.10 | 22.90 | -8.70 | 2.00 | 6.60 | 15.00 | 38.50 | 31.90 | -23.20 | -295.30 | -77.90 | -3.80 | -3.30 | -2.90 | -32.20 | -3.90 | 32.80 | 8.90 | -264.80 | -97.40 | -106.00 | 71.10 | |
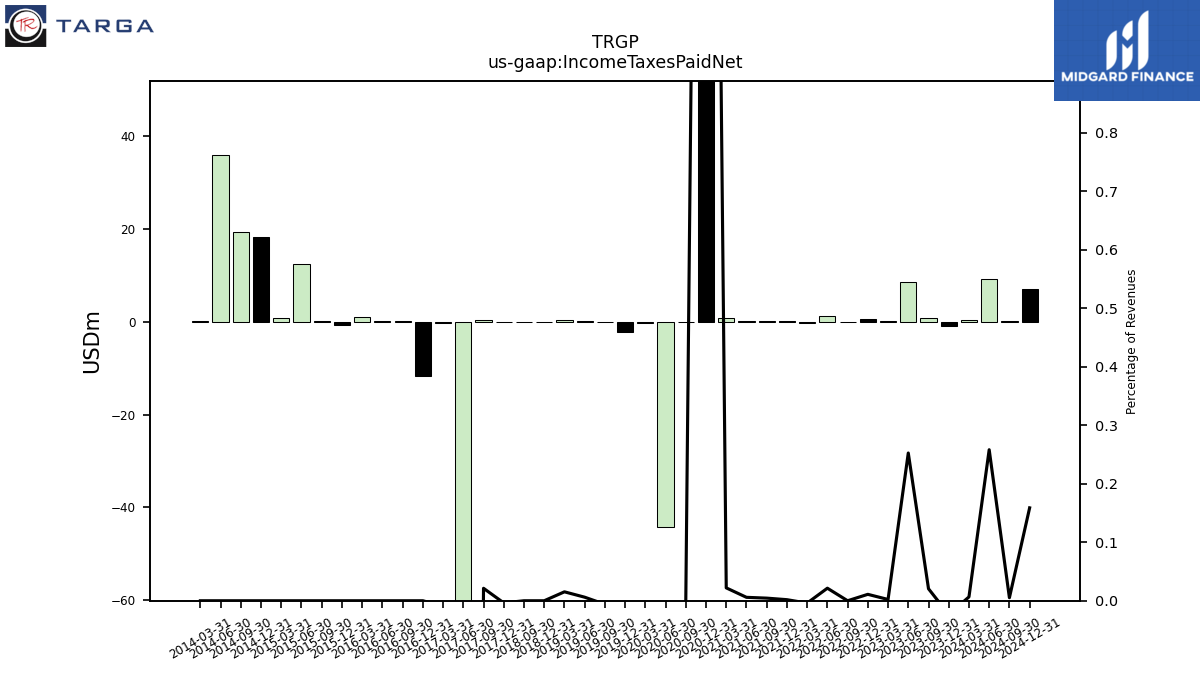
| Income Taxes Paid Net | -1.00 | 0.80 | 8.60 | 0.10 | 0.50 | 0.00 | 1.30 | -0.20 | 0.10 | 0.20 | 0.20 | 0.80 | 88.10 | 0.00 | -44.10 | -0.30 | -2.20 | -0.10 | 0.10 | 0.30 | 0.00 | 0.00 | NA | NA | -0.10 | 0.40 | -67.60 | -0.20 | |
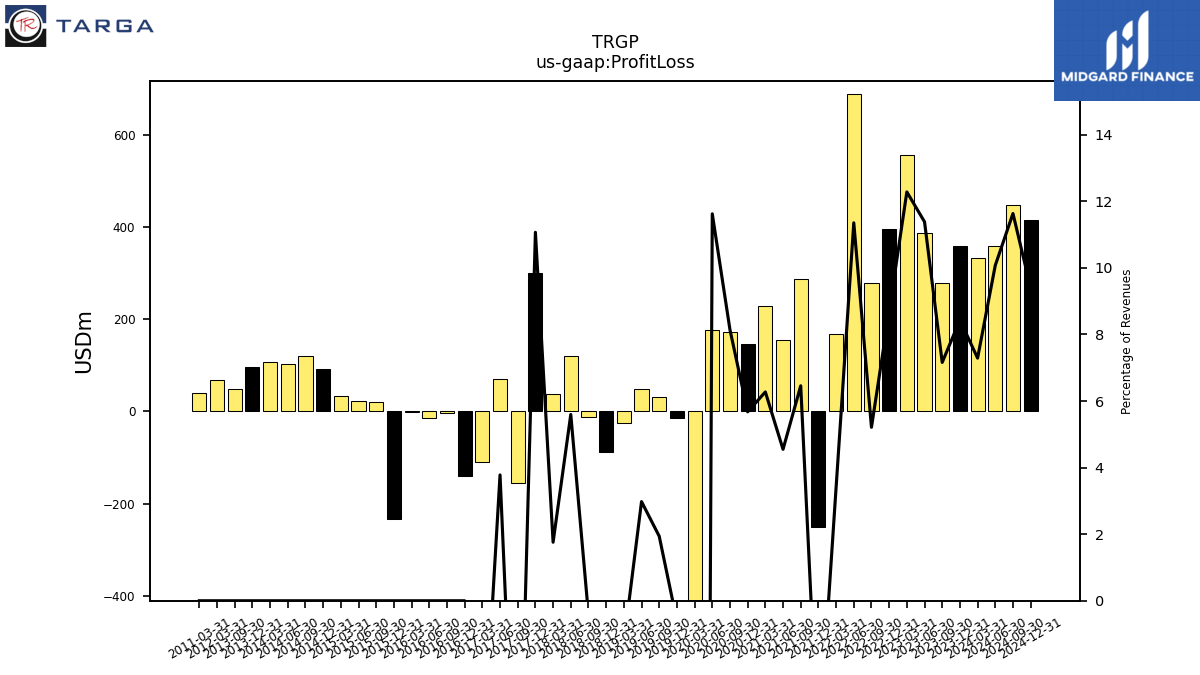
| Profit Loss | 357.60 | 279.00 | 387.50 | 555.20 | 395.90 | 279.30 | 687.60 | 168.60 | -249.20 | 288.00 | 155.40 | 227.90 | 146.00 | 172.20 | 177.10 | -1820.30 | -15.10 | 32.10 | 48.90 | -24.70 | -88.40 | -11.20 | 121.10 | 38.90 | 299.20 | -155.10 | 70.60 | -110.50 | |
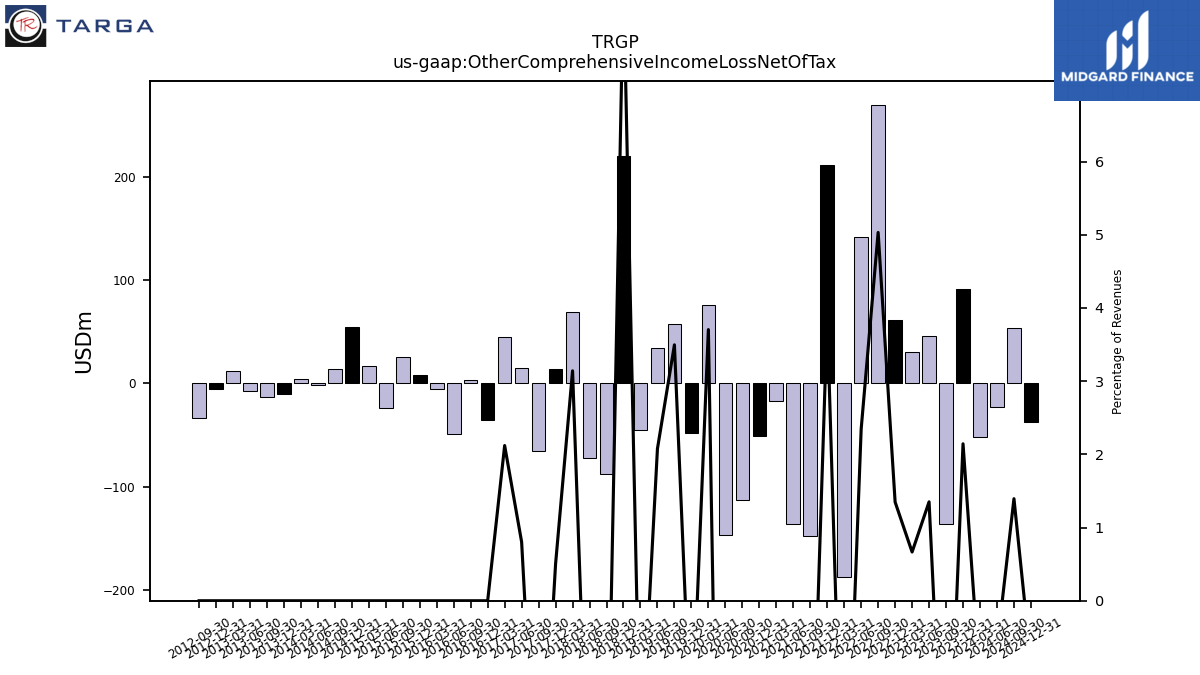
| Other Comprehensive Income Loss Net Of Tax | 90.90 | -136.10 | 46.00 | 30.10 | 61.40 | 269.70 | 142.00 | -187.50 | 211.20 | -147.70 | -136.00 | -16.60 | -51.00 | -112.40 | -146.80 | 75.90 | -48.40 | 57.90 | 34.10 | -45.40 | 220.20 | -87.90 | -72.40 | 69.50 | 13.60 | -65.00 | 15.00 | 44.80 | |
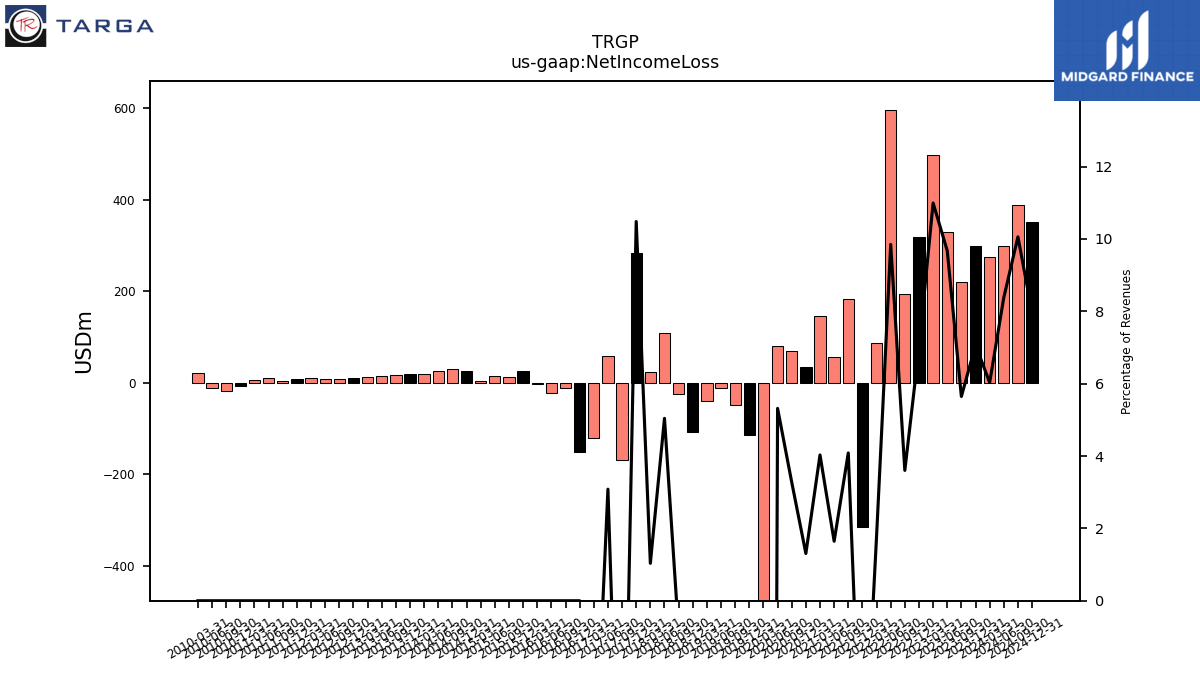
| Net Income Loss | 299.60 | 220.00 | 329.30 | 497.00 | 318.00 | 193.10 | 596.40 | 88.00 | -313.60 | 182.20 | 56.20 | 146.40 | 33.60 | 69.30 | 81.00 | -1737.80 | -112.80 | -47.30 | -10.20 | -38.90 | -106.60 | -23.70 | 109.10 | 22.90 | 283.30 | -167.60 | 57.60 | -119.30 | |
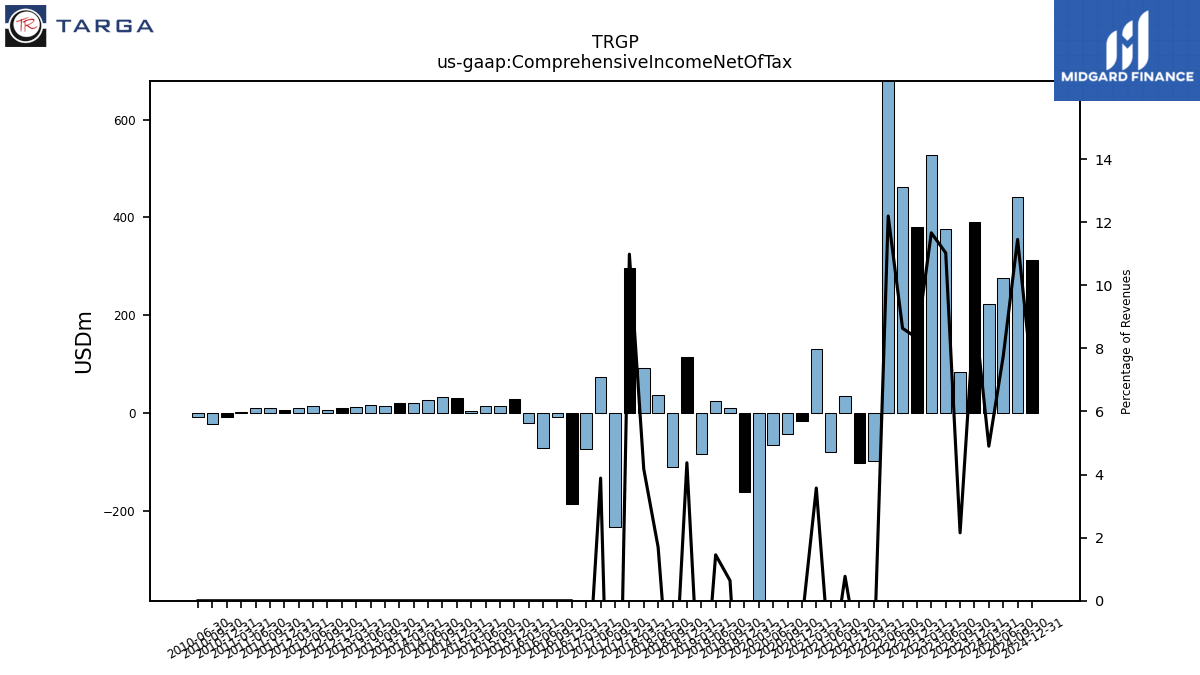
| Comprehensive Income Net Of Tax | 390.50 | 83.90 | 375.30 | 527.10 | 379.40 | 462.80 | 738.40 | -99.50 | -102.40 | 34.50 | -79.80 | 129.80 | -17.40 | -43.10 | -65.80 | -1661.90 | -161.20 | 10.60 | 23.90 | -84.30 | 113.60 | -111.60 | 36.70 | 92.40 | 296.90 | -232.60 | 72.60 | -74.50 | |
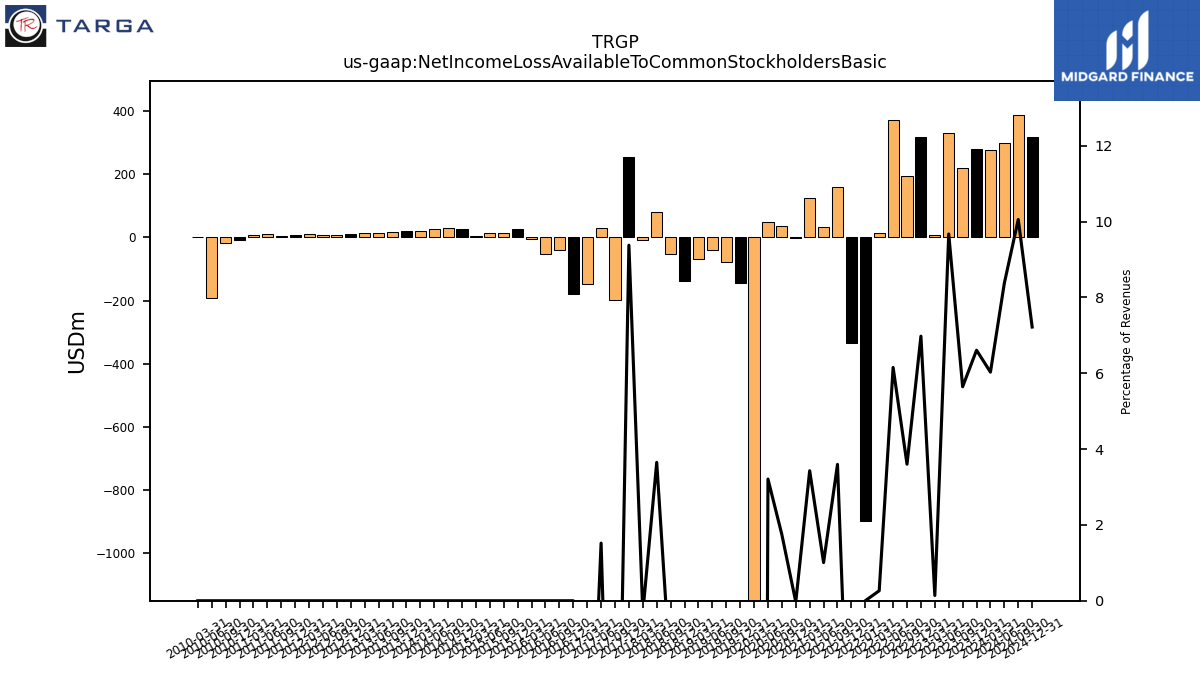
| Net Income Loss Available To Common Stockholders Basic | 280.20 | 220.00 | 329.30 | 6.30 | 317.90 | 193.10 | 372.70 | 13.10 | -335.40 | 160.40 | 34.40 | 124.60 | -0.80 | 36.90 | 48.90 | -1769.70 | -144.50 | -78.60 | -41.20 | -69.70 | -137.30 | -54.00 | 79.00 | -7.00 | 253.50 | -197.00 | 28.40 | -148.30 |
| 2023-12-31 | 2023-09-30 | 2023-06-30 | 2023-03-31 | 2022-12-31 | 2022-09-30 | 2022-06-30 | 2022-03-31 | 2021-12-31 | 2021-09-30 | 2021-06-30 | 2021-03-31 | 2020-12-31 | 2020-09-30 | 2020-06-30 | 2020-03-31 | 2019-12-31 | 2019-09-30 | 2019-06-30 | 2019-03-31 | 2018-12-31 | 2018-09-30 | 2018-06-30 | 2018-03-31 | 2017-12-31 | 2017-09-30 | 2017-06-30 | 2017-03-31 | ||
|---|---|---|---|---|---|---|---|---|---|---|---|---|---|---|---|---|---|---|---|---|---|---|---|---|---|---|---|---|---|
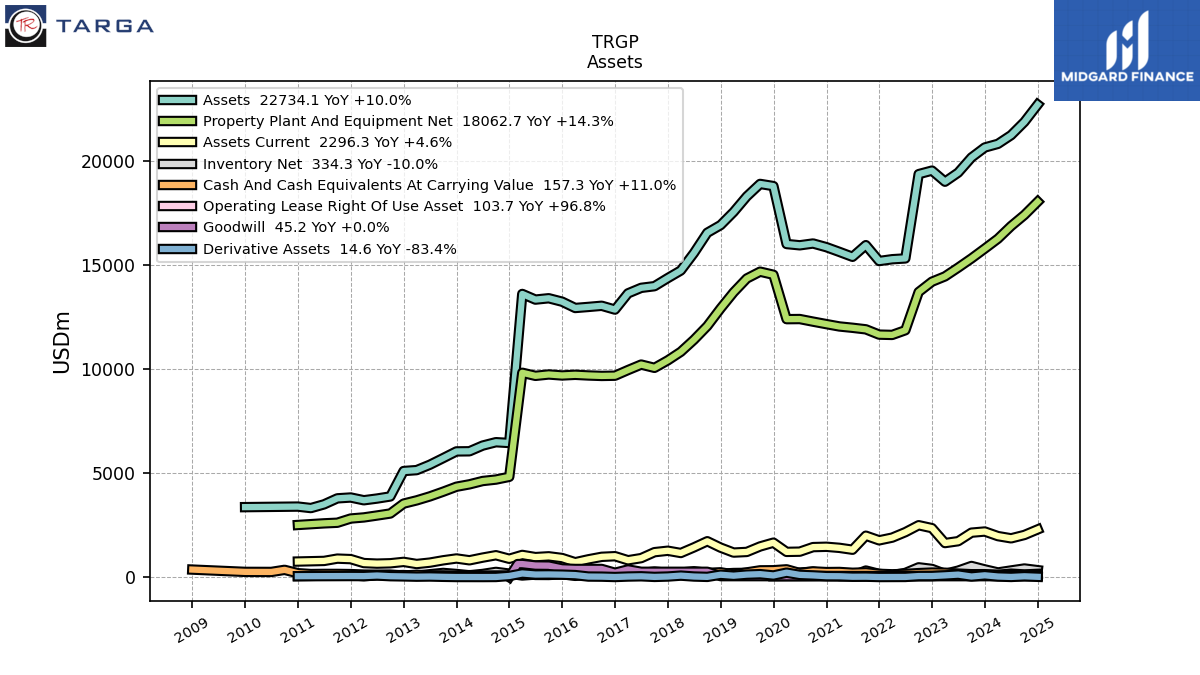
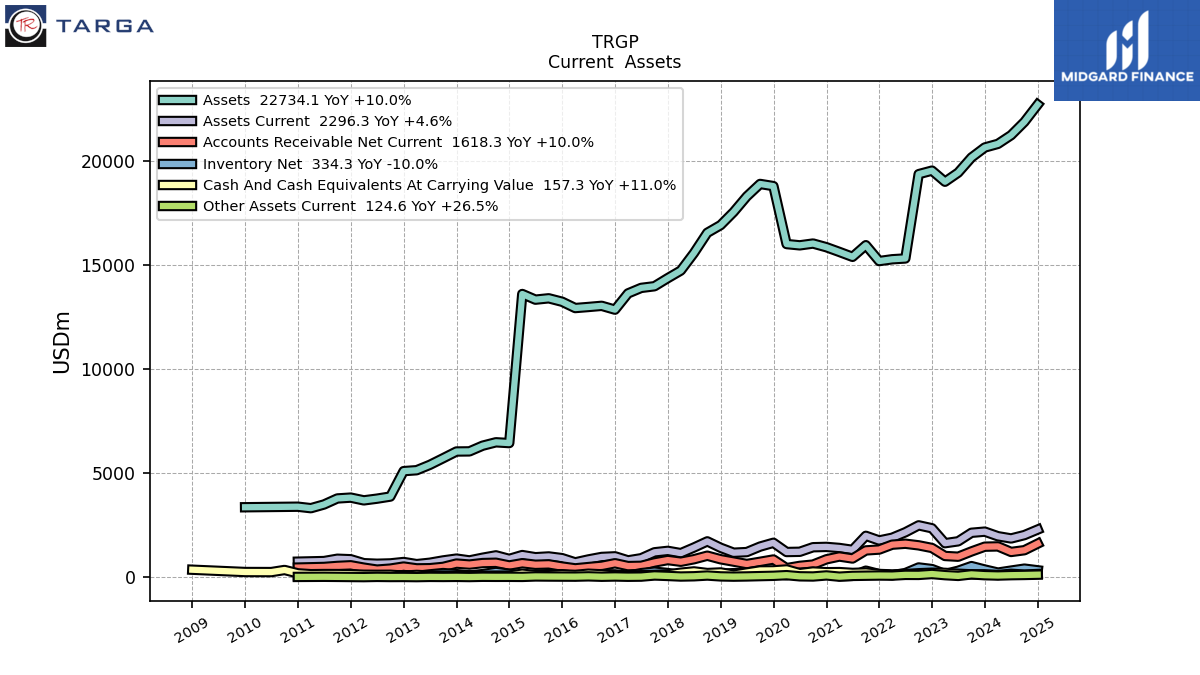
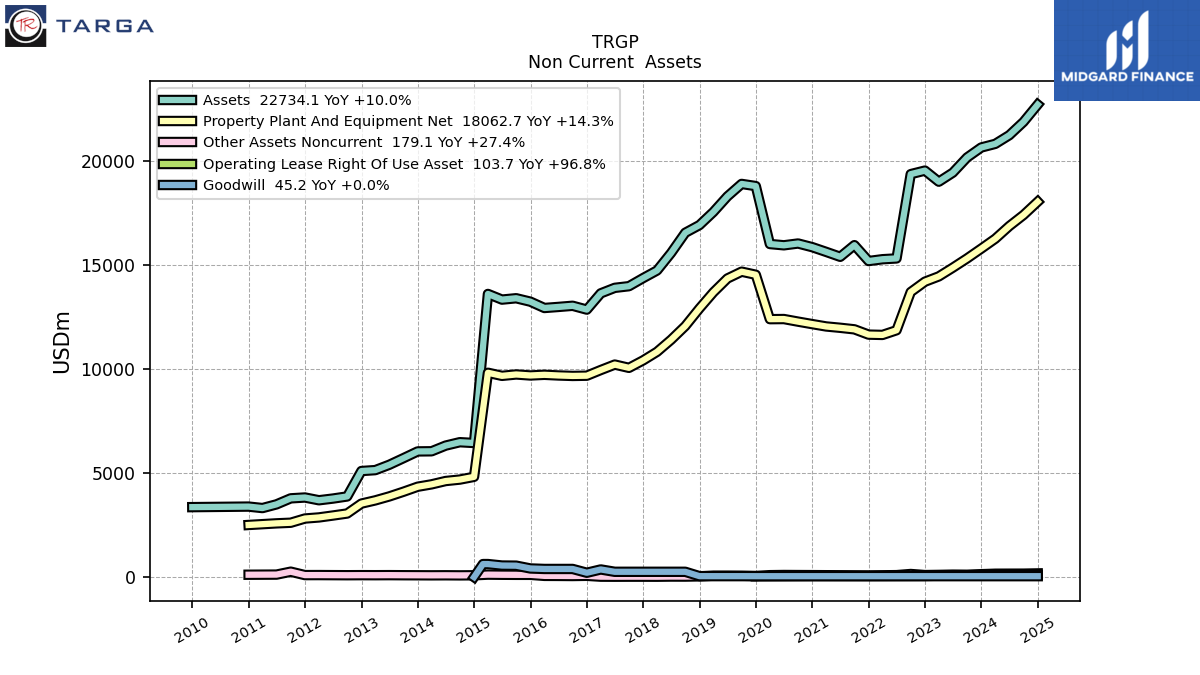
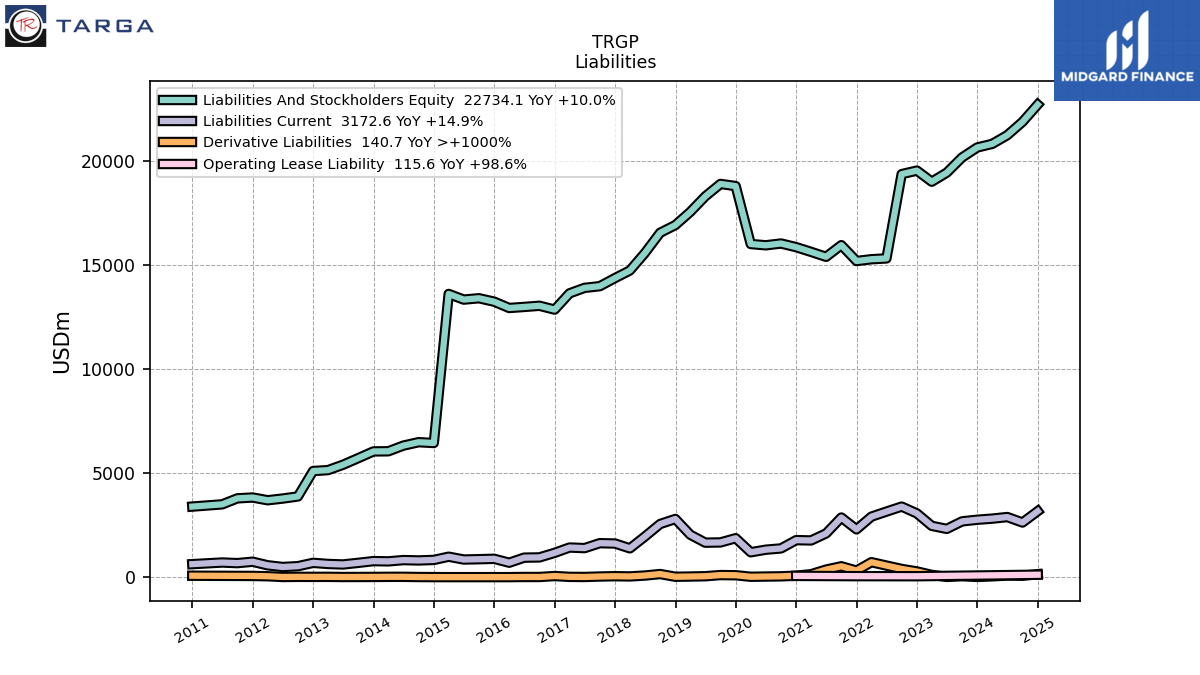
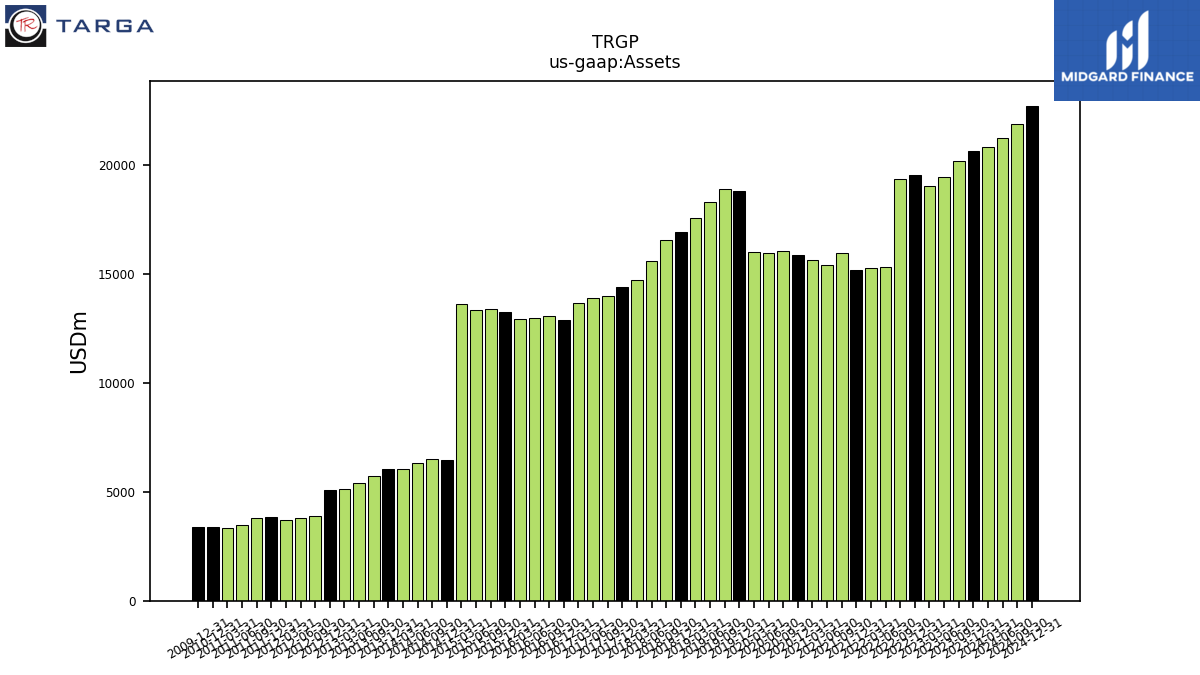
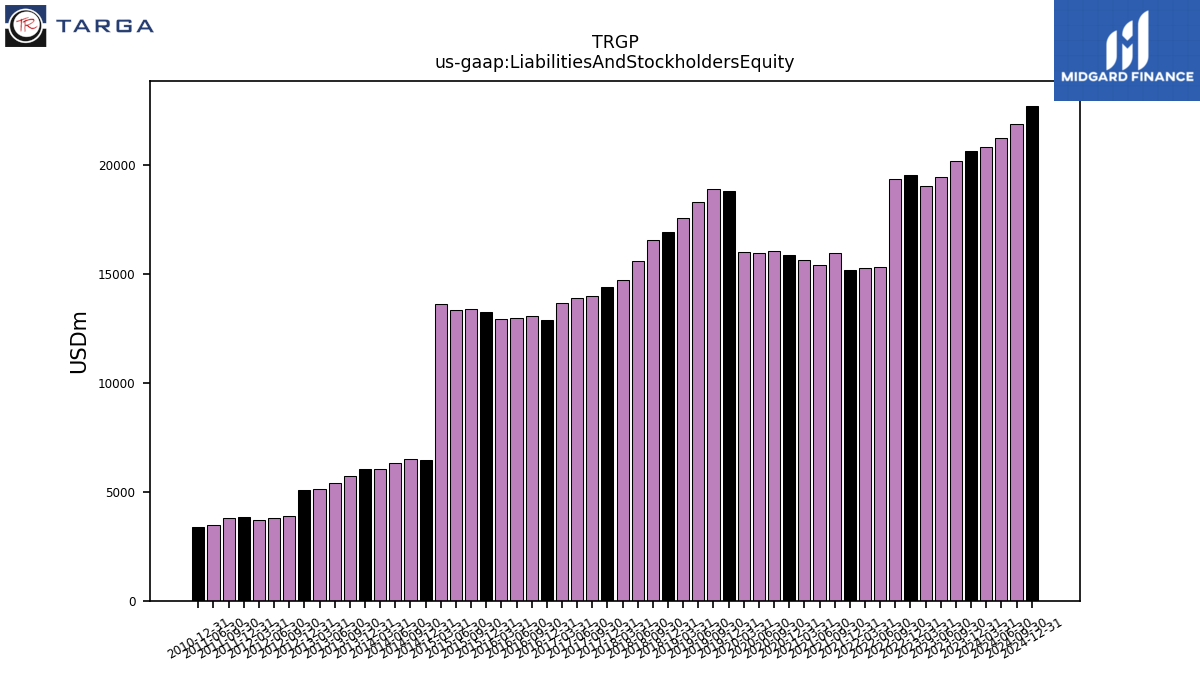
| Assets | 20671.80 | 20189.60 | 19461.80 | 19025.50 | 19560.00 | 19389.90 | 15334.30 | 15295.40 | 15208.20 | 15972.70 | 15411.80 | 15648.40 | 15875.70 | 16052.10 | 15965.40 | 16026.80 | 18815.10 | 18918.50 | 18318.20 | 17569.20 | 16938.20 | 16569.10 | 15596.10 | 14753.20 | 14388.60 | 13998.30 | 13918.40 | 13653.80 | |
| Liabilities And Stockholders Equity | 20671.80 | 20189.60 | 19461.80 | 19025.50 | 19560.00 | 19389.90 | 15334.30 | 15295.40 | 15208.20 | 15972.70 | 15411.80 | 15648.40 | 15875.70 | 16052.10 | 15965.40 | 16026.80 | 18815.10 | 18918.50 | 18318.20 | 17569.20 | 16938.20 | 16569.10 | 15596.10 | 14753.20 | 14388.60 | 13998.30 | 13918.40 | 13653.80 | |
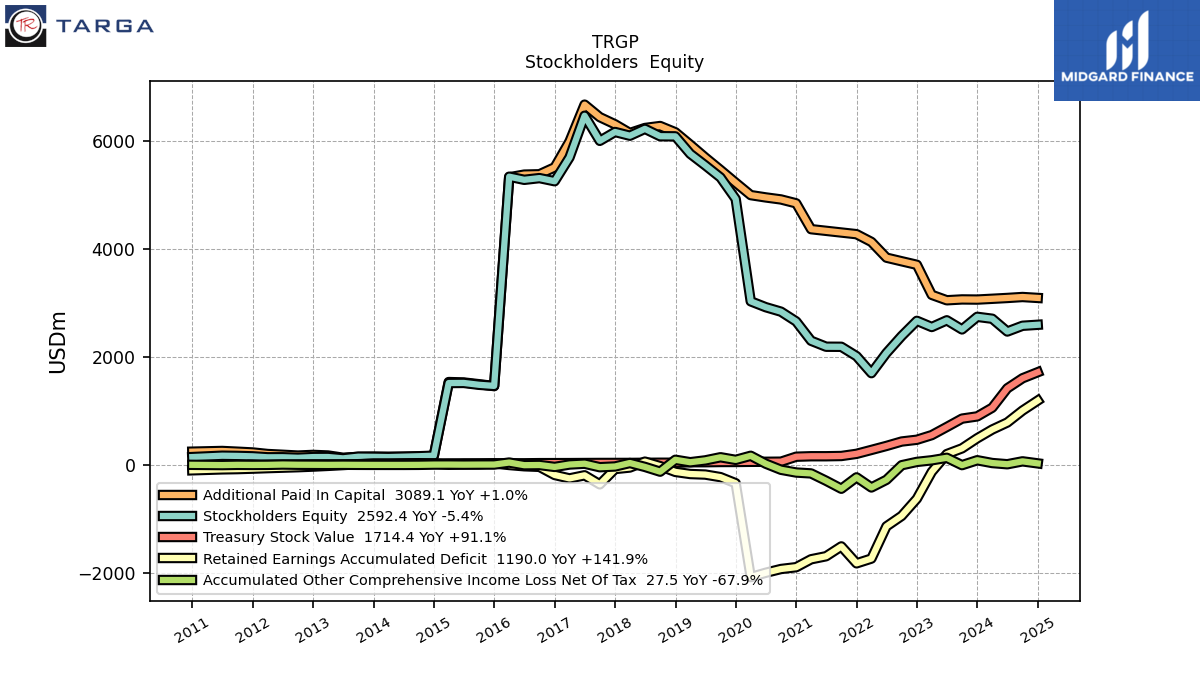
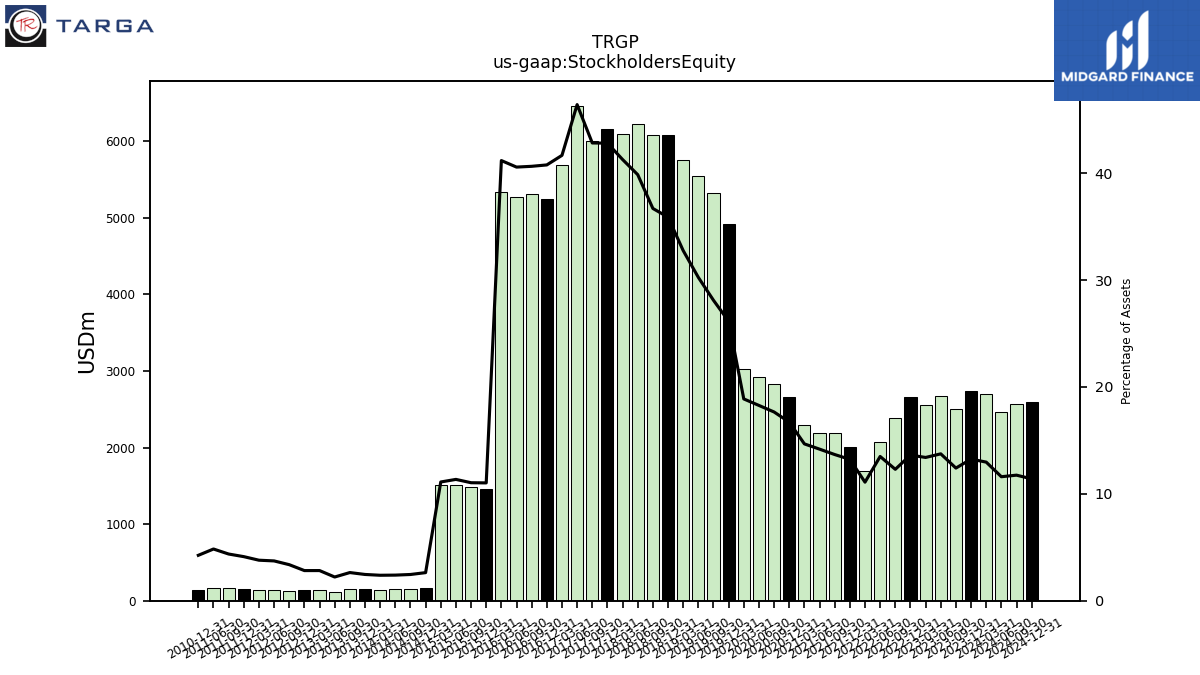
| Stockholders Equity | 2739.70 | 2506.10 | 2675.20 | 2550.70 | 2665.70 | 2384.50 | 2069.90 | 1697.00 | 2011.80 | 2185.10 | 2186.20 | 2296.70 | 2653.90 | 2835.00 | 2917.60 | 3026.30 | 4920.80 | 5318.40 | 5542.30 | 5756.30 | 6079.40 | 6081.40 | 6217.80 | 6090.70 | 6160.30 | 5995.80 | 6460.90 | 5689.90 |
| 2023-12-31 | 2023-09-30 | 2023-06-30 | 2023-03-31 | 2022-12-31 | 2022-09-30 | 2022-06-30 | 2022-03-31 | 2021-12-31 | 2021-09-30 | 2021-06-30 | 2021-03-31 | 2020-12-31 | 2020-09-30 | 2020-06-30 | 2020-03-31 | 2019-12-31 | 2019-09-30 | 2019-06-30 | 2019-03-31 | 2018-12-31 | 2018-09-30 | 2018-06-30 | 2018-03-31 | 2017-12-31 | 2017-09-30 | 2017-06-30 | 2017-03-31 | ||
|---|---|---|---|---|---|---|---|---|---|---|---|---|---|---|---|---|---|---|---|---|---|---|---|---|---|---|---|---|---|
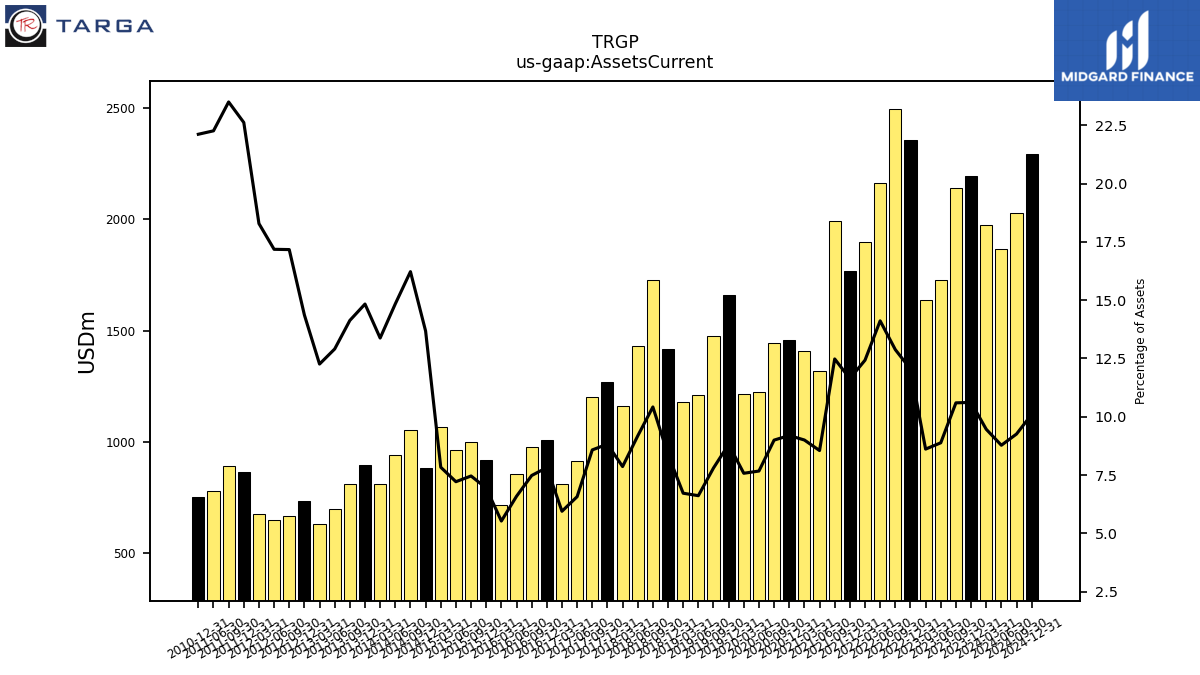
| Assets Current | 2194.60 | 2139.30 | 1728.80 | 1638.80 | 2356.60 | 2497.30 | 2164.10 | 1900.50 | 1769.80 | 1993.30 | 1317.90 | 1408.80 | 1460.30 | 1444.40 | 1225.00 | 1214.30 | 1658.30 | 1476.00 | 1211.90 | 1181.00 | 1418.90 | 1726.40 | 1431.50 | 1160.30 | 1269.90 | 1200.80 | 914.90 | 812.10 | |
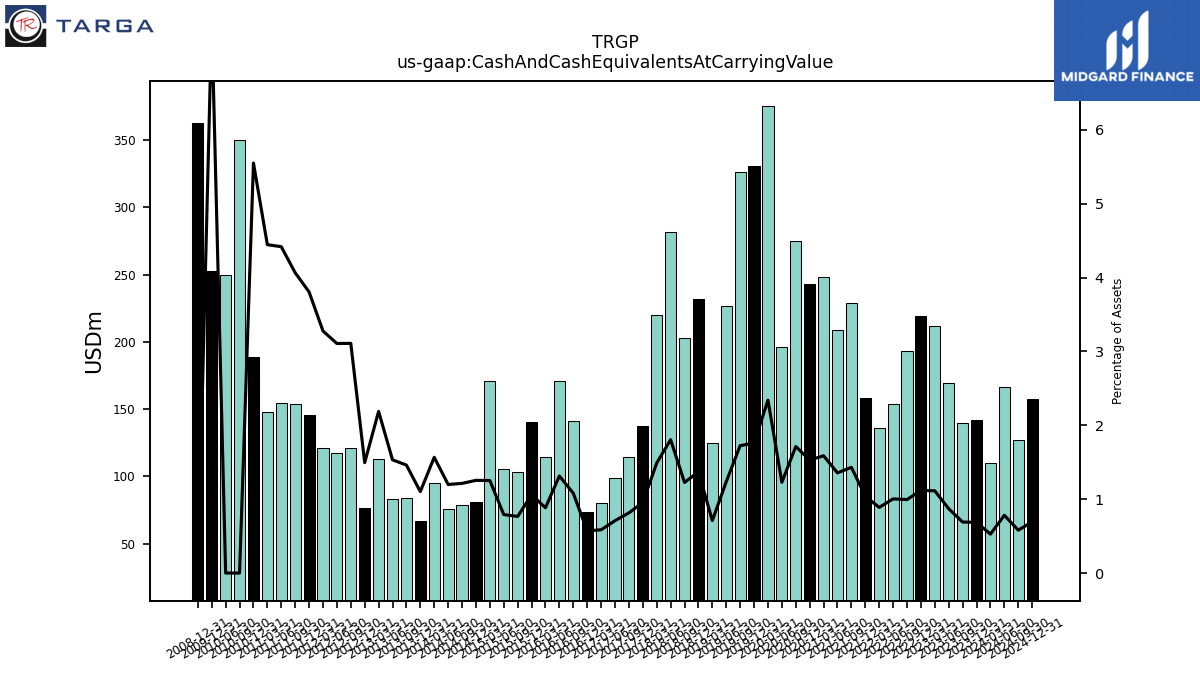
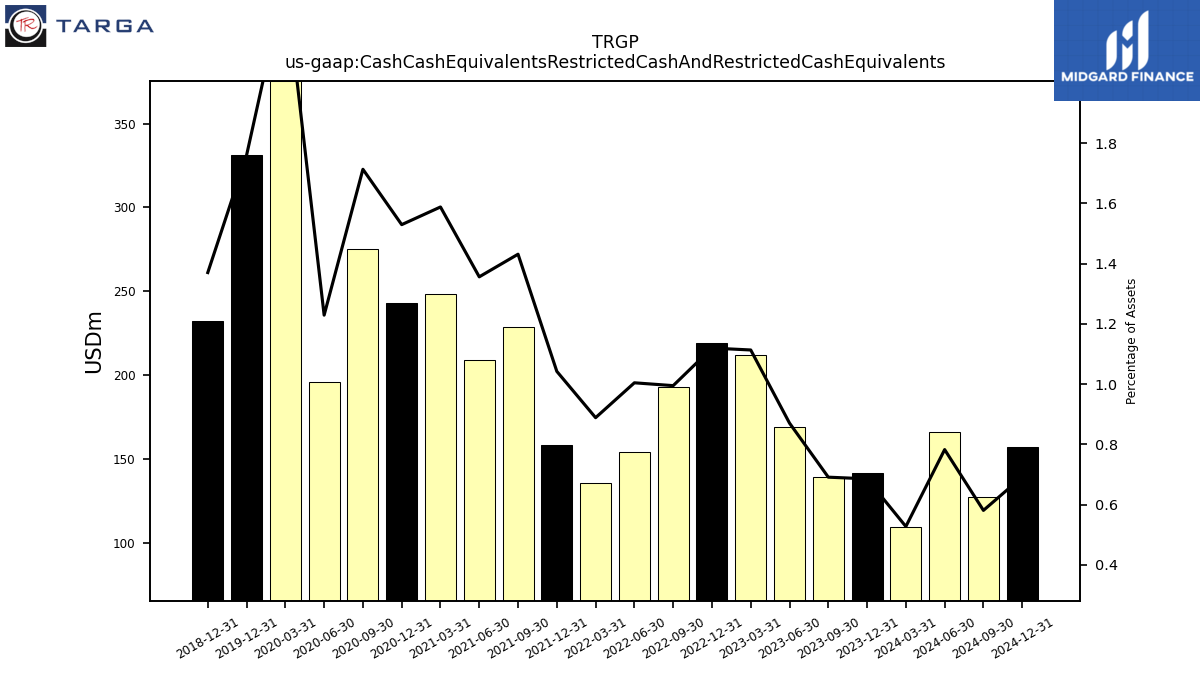
| Cash And Cash Equivalents At Carrying Value | 141.70 | 139.50 | 169.40 | 211.80 | 219.00 | 192.90 | 154.00 | 135.90 | 158.50 | 228.60 | 209.00 | 248.50 | 242.80 | 275.00 | 196.20 | 375.20 | 331.10 | 326.30 | 226.50 | 124.90 | 232.10 | 203.20 | 281.60 | 219.80 | 137.20 | 114.10 | 98.70 | 80.00 | |
| Cash Cash Equivalents Restricted Cash And Restricted Cash Equivalents | 141.70 | 139.50 | 169.40 | 211.80 | 219.00 | 192.90 | 154.00 | 135.90 | 158.50 | 228.60 | 209.00 | 248.50 | 242.80 | 275.00 | 196.20 | 375.20 | 331.10 | NA | NA | NA | 232.10 | NA | NA | NA | NA | NA | NA | NA | |
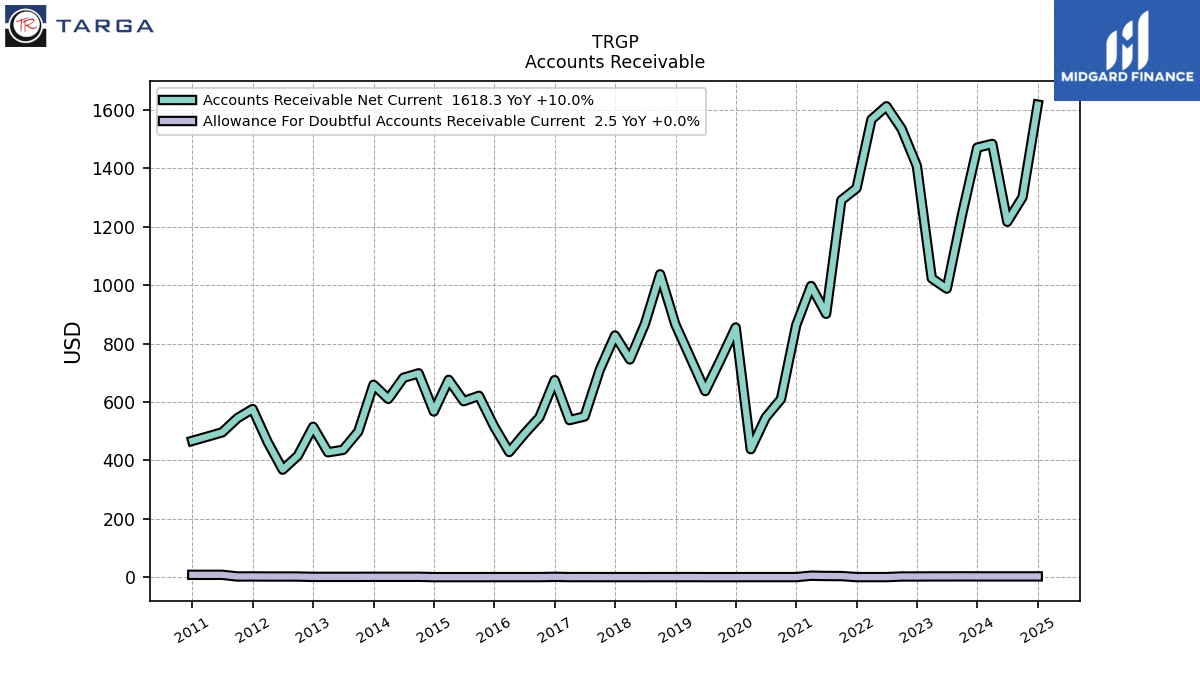
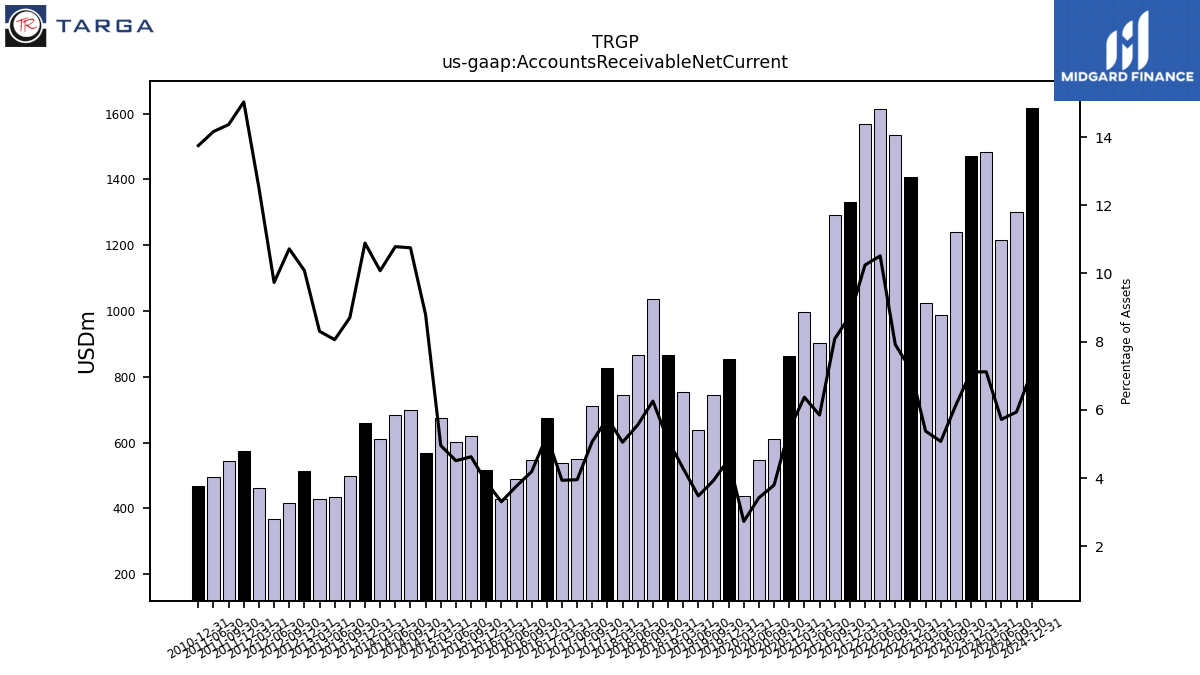
| Accounts Receivable Net Current | 1471.00 | 1241.10 | 988.10 | 1023.40 | 1408.40 | 1534.90 | 1612.60 | 1567.20 | 1331.90 | 1291.00 | 901.80 | 997.10 | 862.80 | 609.80 | 547.20 | 438.10 | 855.00 | 744.00 | 637.20 | 752.80 | 865.50 | 1037.20 | 867.20 | 745.60 | 827.60 | 710.40 | 550.40 | 537.70 | |
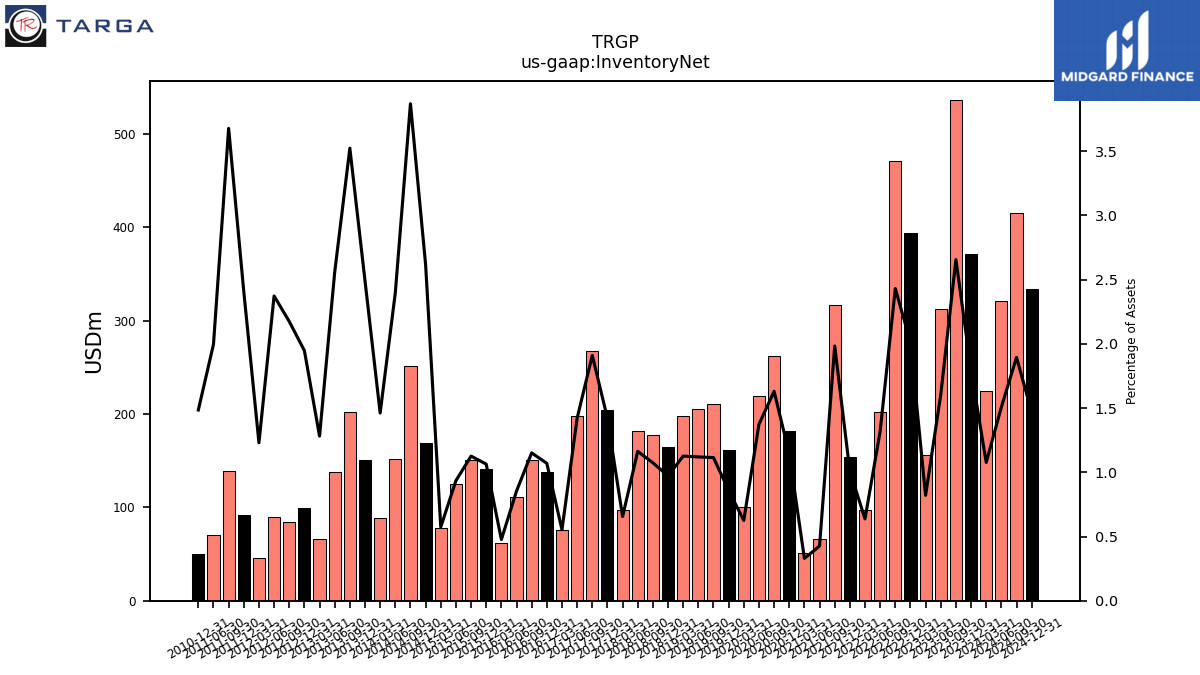
| Inventory Net | 371.50 | 536.20 | 312.30 | 156.20 | 393.80 | 471.30 | 202.20 | 97.50 | 153.40 | 316.80 | 65.60 | 51.60 | 181.50 | 261.70 | 219.30 | 100.20 | 161.50 | 210.90 | 205.10 | 197.90 | 164.70 | 177.90 | 181.40 | 96.70 | 204.50 | 267.40 | 197.70 | 75.50 | |
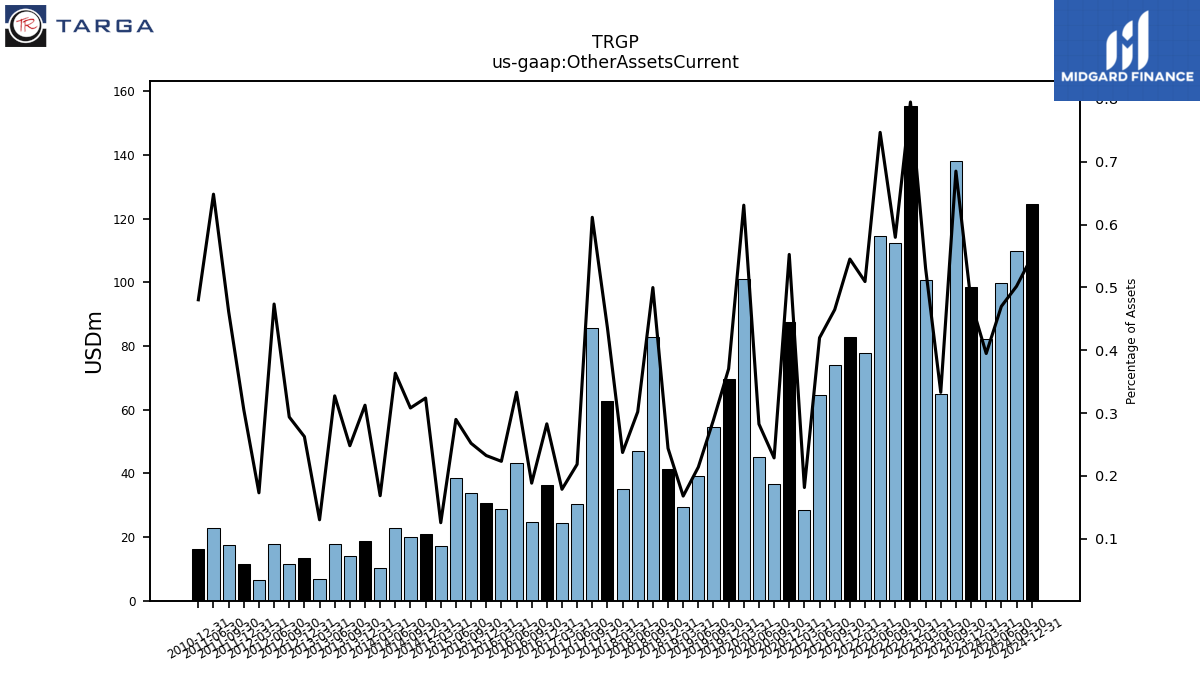
| Other Assets Current | 98.50 | 138.30 | 64.80 | 100.90 | 155.50 | 112.40 | 114.50 | 77.90 | 82.90 | 74.20 | 64.70 | 28.40 | 87.70 | 36.70 | 45.10 | 101.10 | 69.70 | 54.70 | 39.20 | 29.50 | 41.30 | 82.80 | 47.10 | 35.00 | 62.70 | 85.60 | 30.40 | 24.40 |
| 2023-12-31 | 2023-09-30 | 2023-06-30 | 2023-03-31 | 2022-12-31 | 2022-09-30 | 2022-06-30 | 2022-03-31 | 2021-12-31 | 2021-09-30 | 2021-06-30 | 2021-03-31 | 2020-12-31 | 2020-09-30 | 2020-06-30 | 2020-03-31 | 2019-12-31 | 2019-09-30 | 2019-06-30 | 2019-03-31 | 2018-12-31 | 2018-09-30 | 2018-06-30 | 2018-03-31 | 2017-12-31 | 2017-09-30 | 2017-06-30 | 2017-03-31 | ||
|---|---|---|---|---|---|---|---|---|---|---|---|---|---|---|---|---|---|---|---|---|---|---|---|---|---|---|---|---|---|
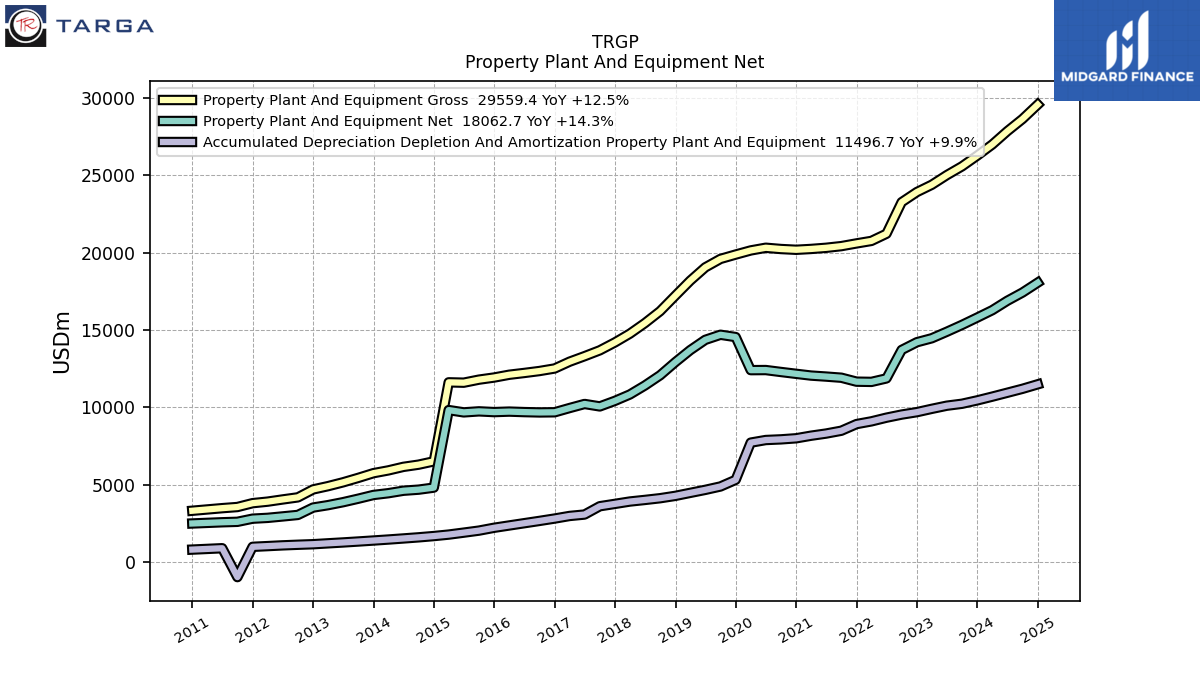
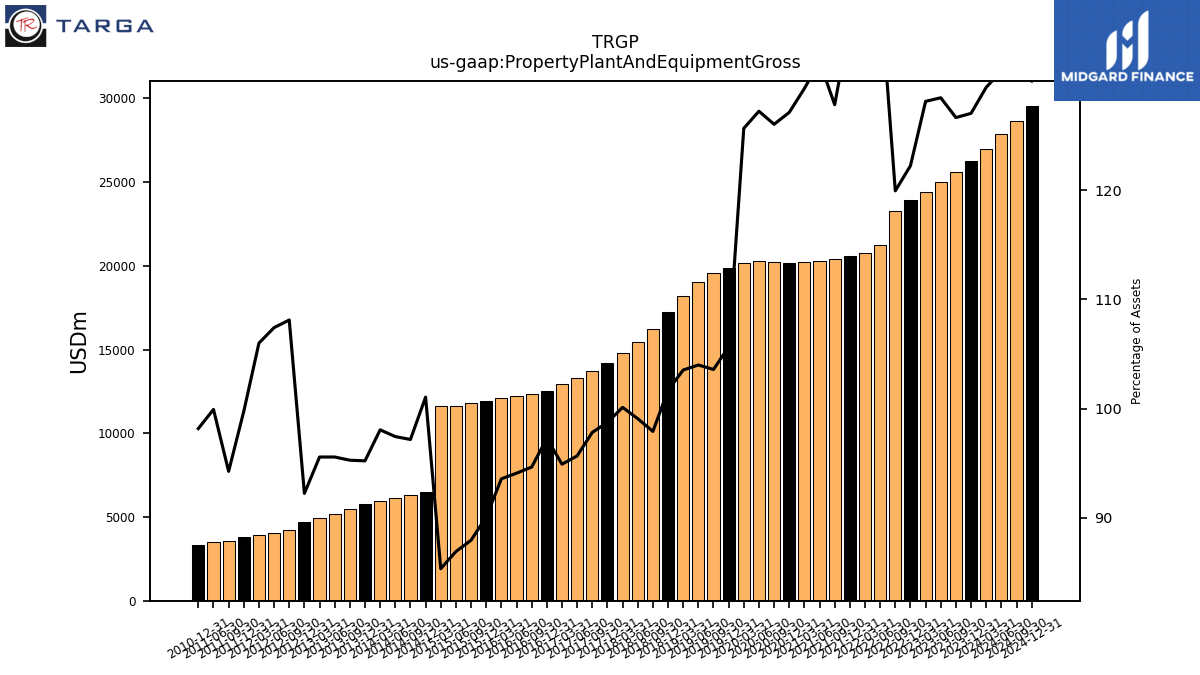
| Property Plant And Equipment Gross | 26265.20 | 25574.20 | 25005.60 | 24382.40 | 23913.20 | 23259.20 | 21220.30 | 20757.30 | 20596.10 | 20421.10 | 20313.10 | 20238.70 | 20185.00 | 20234.30 | 20316.20 | 20142.60 | 19876.80 | 19596.00 | 19048.70 | 18189.30 | 17220.70 | 16221.50 | 15451.00 | 14768.80 | 14205.40 | 13692.00 | 13313.60 | 12957.00 | |
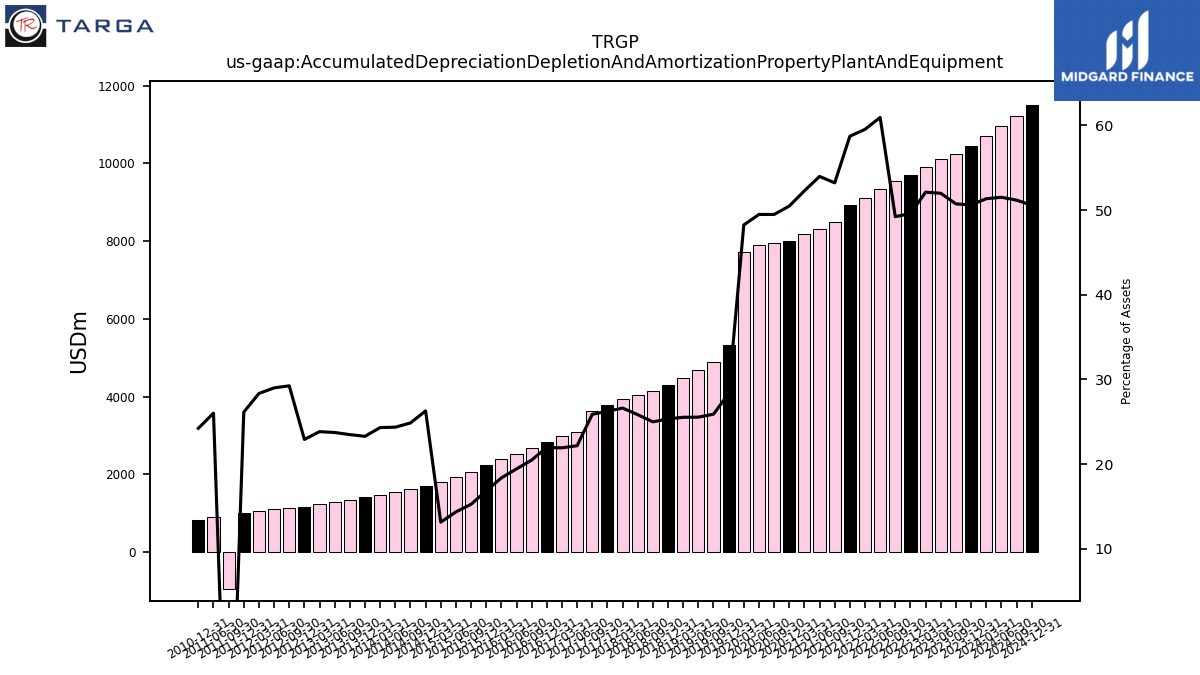
| Accumulated Depreciation Depletion And Amortization Property Plant And Equipment | 10458.80 | 10240.70 | 10115.20 | 9912.40 | 9698.60 | 9542.80 | 9342.00 | 9104.30 | 8928.40 | 8498.70 | 8316.50 | 8178.00 | 8011.40 | 7941.50 | 7898.80 | 7730.80 | 5328.30 | 4899.10 | 4679.90 | 4485.90 | 4292.30 | 4140.60 | 4029.70 | 3927.20 | 3775.40 | 3623.20 | 3086.80 | 2993.60 | |
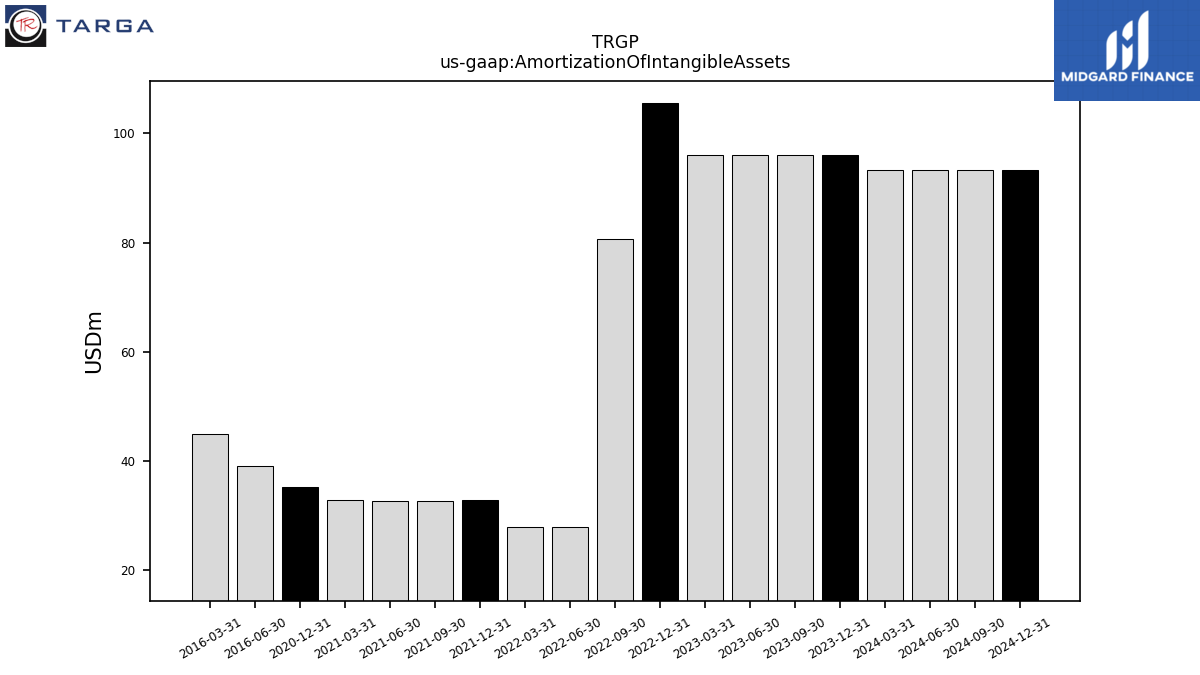
| Amortization Of Intangible Assets | 96.00 | 96.00 | 96.00 | 96.00 | 105.50 | 80.70 | 28.00 | 28.00 | 32.80 | 32.70 | 32.70 | 32.80 | 35.20 | NA | NA | NA | NA | NA | NA | NA | NA | NA | NA | NA | NA | NA | NA | NA | |
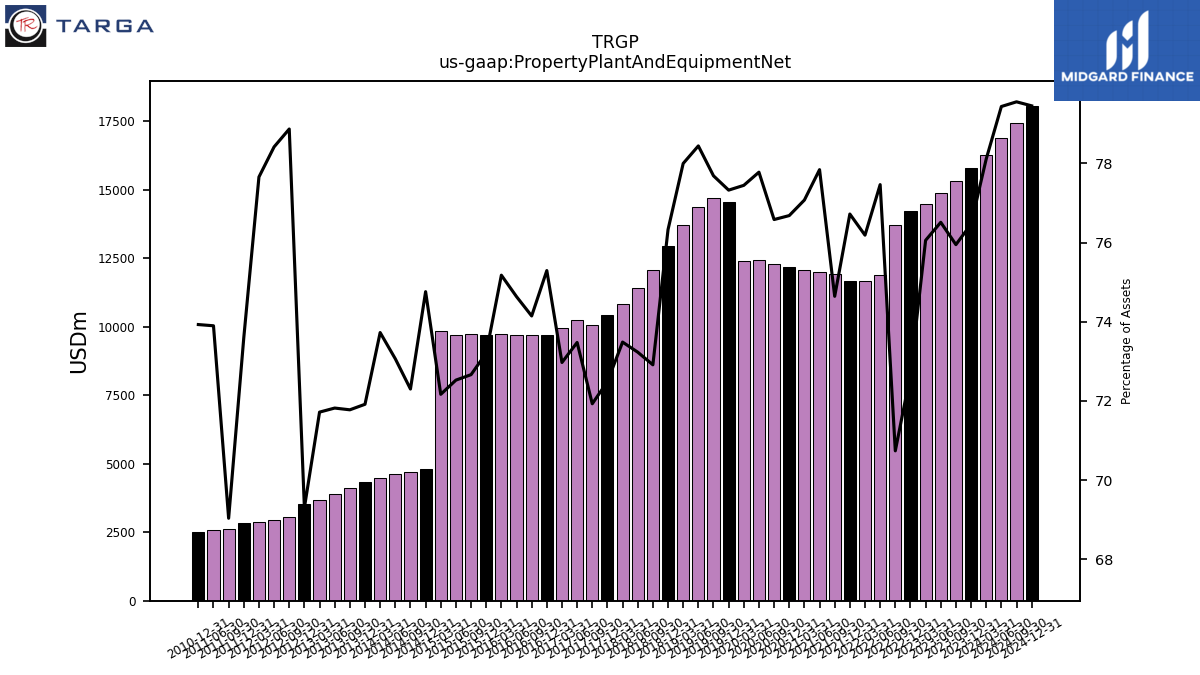
| Property Plant And Equipment Net | 15806.40 | 15333.50 | 14890.40 | 14470.00 | 14214.60 | 13716.40 | 11878.30 | 11653.00 | 11667.70 | 11922.40 | 11996.60 | 12060.70 | 12173.60 | 12292.80 | 12417.40 | 12411.80 | 14548.50 | 14696.90 | 14368.80 | 13703.40 | 12928.40 | 12080.90 | 11421.30 | 10841.60 | 10430.00 | 10068.80 | 10226.80 | 9963.40 | |
| Goodwill | 45.20 | NA | NA | NA | 45.20 | NA | NA | NA | 45.20 | NA | NA | NA | 45.20 | NA | NA | NA | 45.20 | 46.60 | 46.60 | 46.60 | 46.60 | 256.60 | 256.60 | 256.60 | 256.60 | 256.60 | 256.60 | 369.00 | |
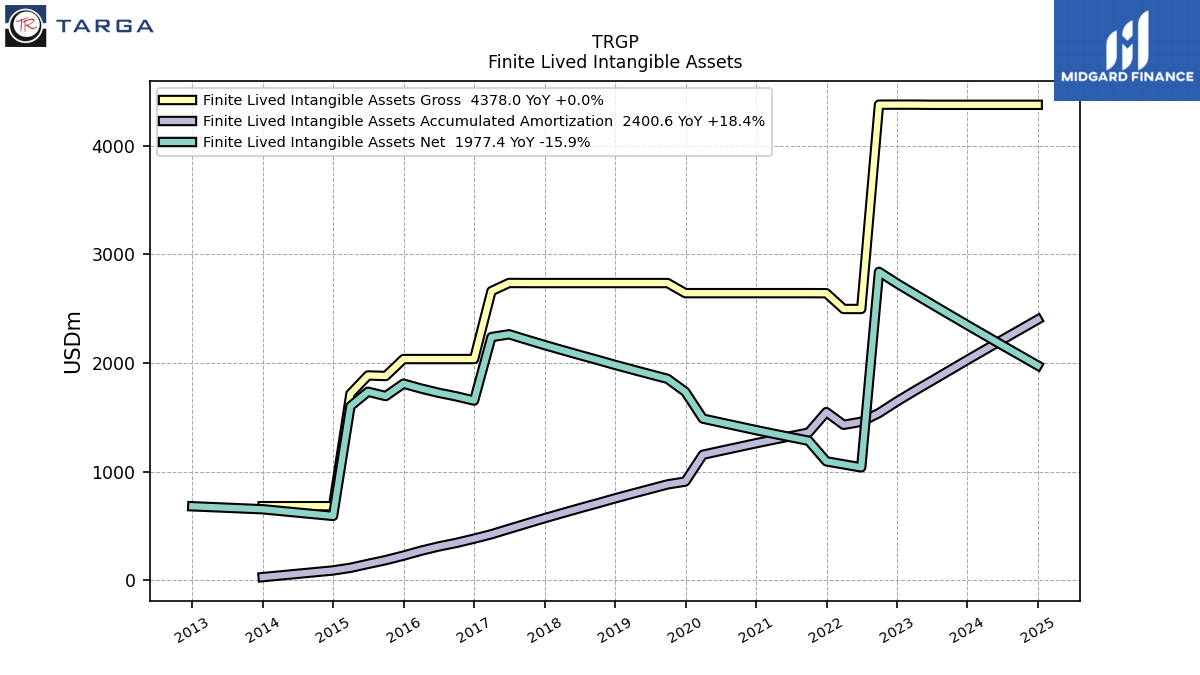
| Finite Lived Intangible Assets Net | 2350.60 | 2446.60 | 2542.60 | 2638.60 | 2734.60 | 2839.70 | 1038.80 | 1066.80 | 1094.80 | 1284.20 | 1316.90 | 1349.60 | 1382.40 | 1417.60 | 1452.80 | 1488.00 | 1735.00 | 1854.40 | 1897.30 | 1940.20 | 1983.20 | 2029.60 | 2074.30 | 2120.10 | 2165.80 | 2214.80 | 2264.70 | 2238.80 | |
| Other Assets Noncurrent | 140.60 | 114.20 | 119.70 | 107.20 | 98.40 | 149.90 | 95.50 | 88.00 | 81.70 | 84.80 | 88.70 | 92.30 | 96.10 | 99.00 | 102.60 | 93.70 | 53.90 | 66.10 | 69.50 | 69.00 | 36.50 | 25.70 | 26.80 | 19.80 | 21.50 | 21.50 | 19.70 | 21.90 |
| 2023-12-31 | 2023-09-30 | 2023-06-30 | 2023-03-31 | 2022-12-31 | 2022-09-30 | 2022-06-30 | 2022-03-31 | 2021-12-31 | 2021-09-30 | 2021-06-30 | 2021-03-31 | 2020-12-31 | 2020-09-30 | 2020-06-30 | 2020-03-31 | 2019-12-31 | 2019-09-30 | 2019-06-30 | 2019-03-31 | 2018-12-31 | 2018-09-30 | 2018-06-30 | 2018-03-31 | 2017-12-31 | 2017-09-30 | 2017-06-30 | 2017-03-31 | ||
|---|---|---|---|---|---|---|---|---|---|---|---|---|---|---|---|---|---|---|---|---|---|---|---|---|---|---|---|---|---|
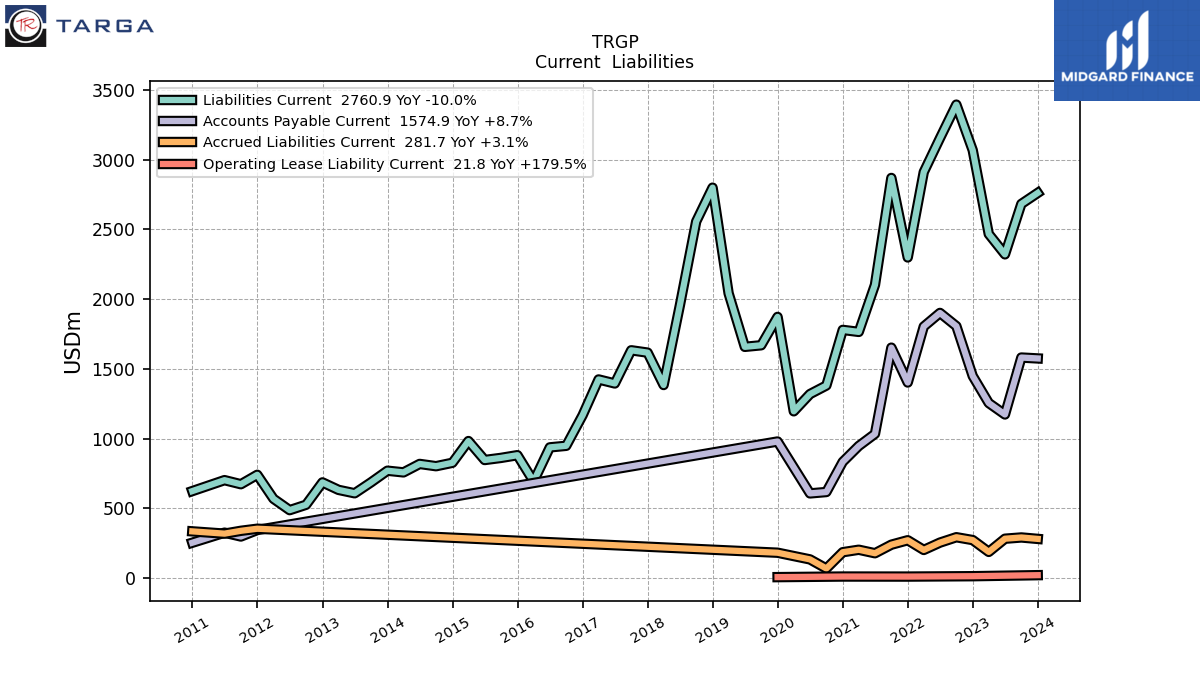
| Liabilities Current | 2760.90 | 2682.10 | 2320.60 | 2466.60 | 3066.70 | 3393.70 | 3153.40 | 2910.40 | 2298.50 | 2868.30 | 2102.10 | 1765.00 | 1779.40 | 1380.90 | 1319.70 | 1196.00 | 1872.60 | 1669.30 | 1658.00 | 2041.60 | 2798.80 | 2556.40 | 1953.30 | 1384.30 | 1616.60 | 1633.30 | 1395.60 | 1424.30 | |
| Accounts Payable Current | 1574.90 | 1581.30 | 1173.30 | 1255.30 | 1448.80 | 1806.40 | 1901.00 | 1803.50 | 1402.30 | 1652.30 | 1034.50 | 947.70 | 833.80 | 617.70 | 607.70 | NA | 979.70 | NA | NA | NA | NA | NA | NA | NA | NA | NA | NA | NA | |
| Accrued Liabilities Current | 281.70 | 292.00 | 283.00 | 188.60 | 273.30 | 293.70 | 255.20 | 202.50 | 272.20 | 240.20 | 178.90 | 204.00 | 186.40 | 69.50 | 134.80 | NA | 182.70 | NA | NA | NA | NA | NA | NA | NA | NA | NA | NA | NA |
| 2023-12-31 | 2023-09-30 | 2023-06-30 | 2023-03-31 | 2022-12-31 | 2022-09-30 | 2022-06-30 | 2022-03-31 | 2021-12-31 | 2021-09-30 | 2021-06-30 | 2021-03-31 | 2020-12-31 | 2020-09-30 | 2020-06-30 | 2020-03-31 | 2019-12-31 | 2019-09-30 | 2019-06-30 | 2019-03-31 | 2018-12-31 | 2018-09-30 | 2018-06-30 | 2018-03-31 | 2017-12-31 | 2017-09-30 | 2017-06-30 | 2017-03-31 | ||
|---|---|---|---|---|---|---|---|---|---|---|---|---|---|---|---|---|---|---|---|---|---|---|---|---|---|---|---|---|---|
| Long Term Debt | 12953.90 | 12920.40 | 12398.80 | 12178.60 | 11536.40 | 11197.80 | 7460.80 | 7248.70 | 6597.20 | 6786.70 | 6975.50 | 7372.70 | 7755.70 | 7914.10 | 7841.50 | 7920.40 | 7822.40 | 7537.70 | 6948.30 | 7436.60 | 6660.30 | 5968.90 | 5572.50 | 5364.20 | 5053.00 | 4897.00 | 4437.60 | 4748.20 | |
| Long Term Debt And Capital Lease Obligations | 12333.20 | 12318.40 | 11812.80 | 11439.60 | 10702.10 | 10431.30 | 7046.20 | 6964.90 | 6434.40 | 6434.10 | 6603.80 | 7090.70 | 7387.10 | 7652.20 | 7579.60 | 7639.80 | 7440.20 | NA | NA | NA | 5632.40 | NA | NA | NA | NA | NA | NA | NA | |
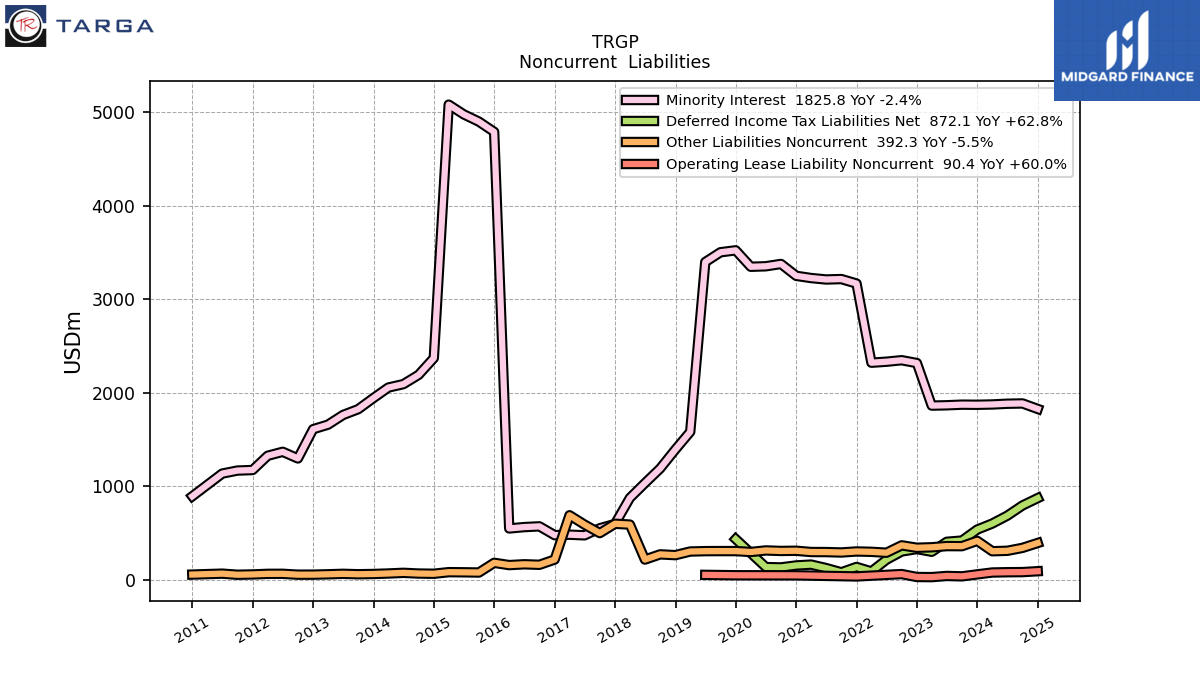
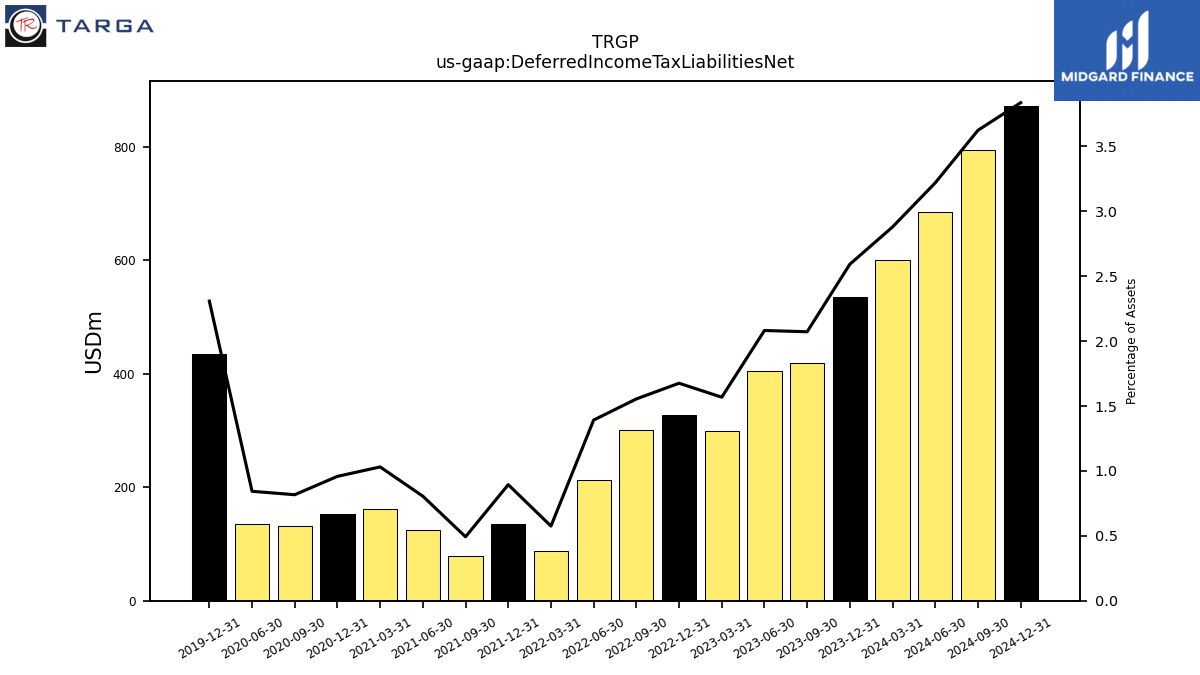
| Deferred Income Tax Liabilities Net | 535.80 | 418.30 | 405.10 | 298.30 | 327.70 | 301.40 | 213.40 | 88.00 | 136.00 | 78.70 | 124.10 | 161.30 | 152.10 | 131.10 | 134.60 | NA | 434.20 | NA | NA | NA | NA | NA | NA | NA | NA | NA | NA | NA | |
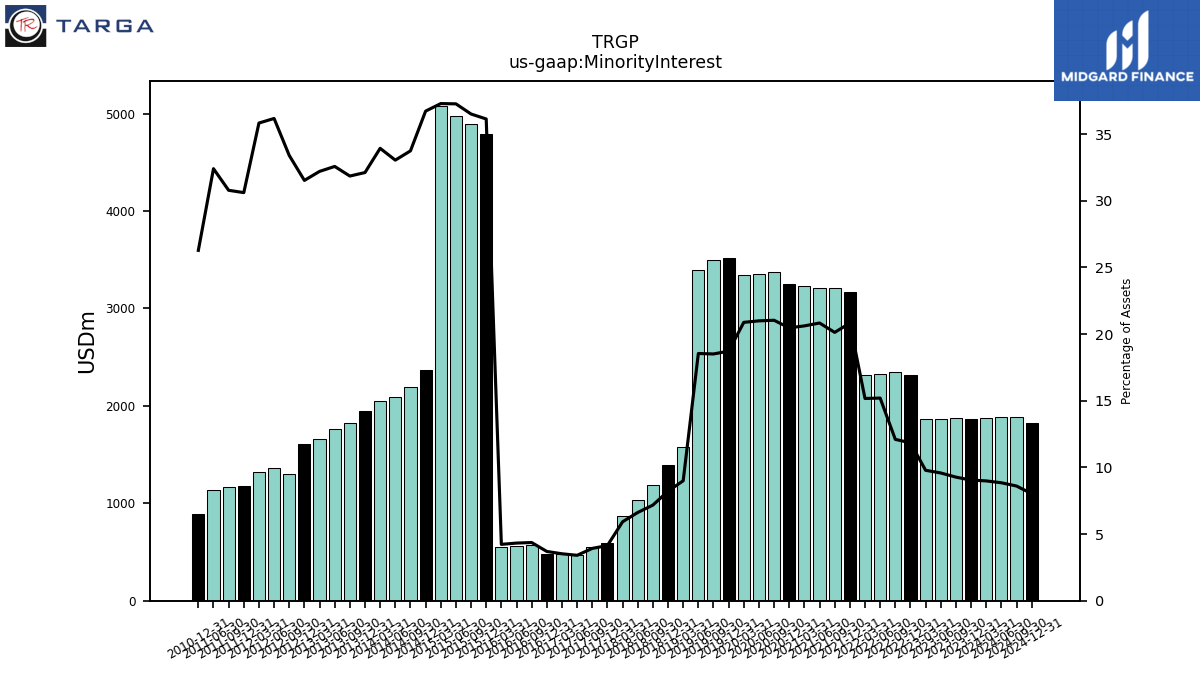
| Minority Interest | 1870.30 | 1871.70 | 1865.00 | 1861.50 | 2316.50 | 2346.90 | 2331.00 | 2320.30 | 3166.90 | 3214.80 | 3210.30 | 3225.70 | 3249.30 | 3376.50 | 3351.50 | 3346.20 | 3522.10 | 3501.50 | 3396.80 | 1581.00 | 1391.40 | 1188.80 | 1032.40 | 873.70 | 595.70 | 549.60 | 474.30 | 481.00 | |
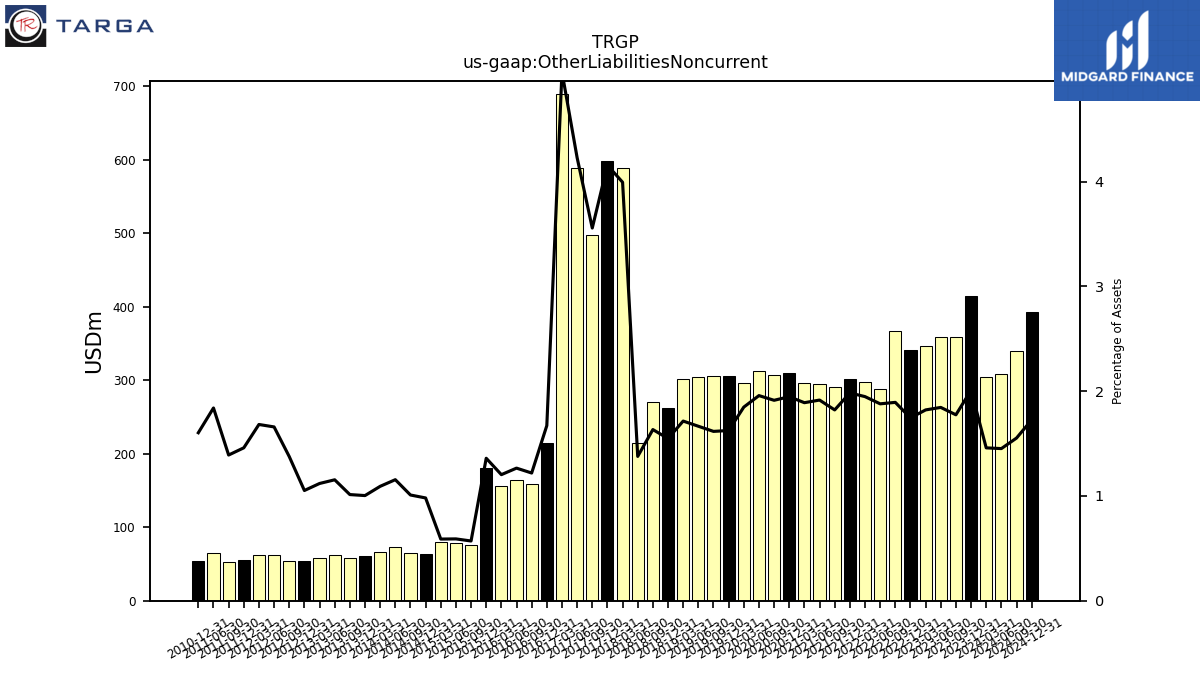
| Other Liabilities Noncurrent | 415.10 | 358.20 | 359.00 | 346.40 | 341.20 | 367.00 | 288.10 | 297.90 | 301.60 | 290.80 | 295.10 | 295.70 | 309.10 | 307.00 | 312.50 | 296.10 | 305.60 | 305.70 | 305.00 | 301.20 | 262.20 | 270.60 | 214.80 | 589.10 | 597.90 | 497.80 | 588.40 | 688.90 | |
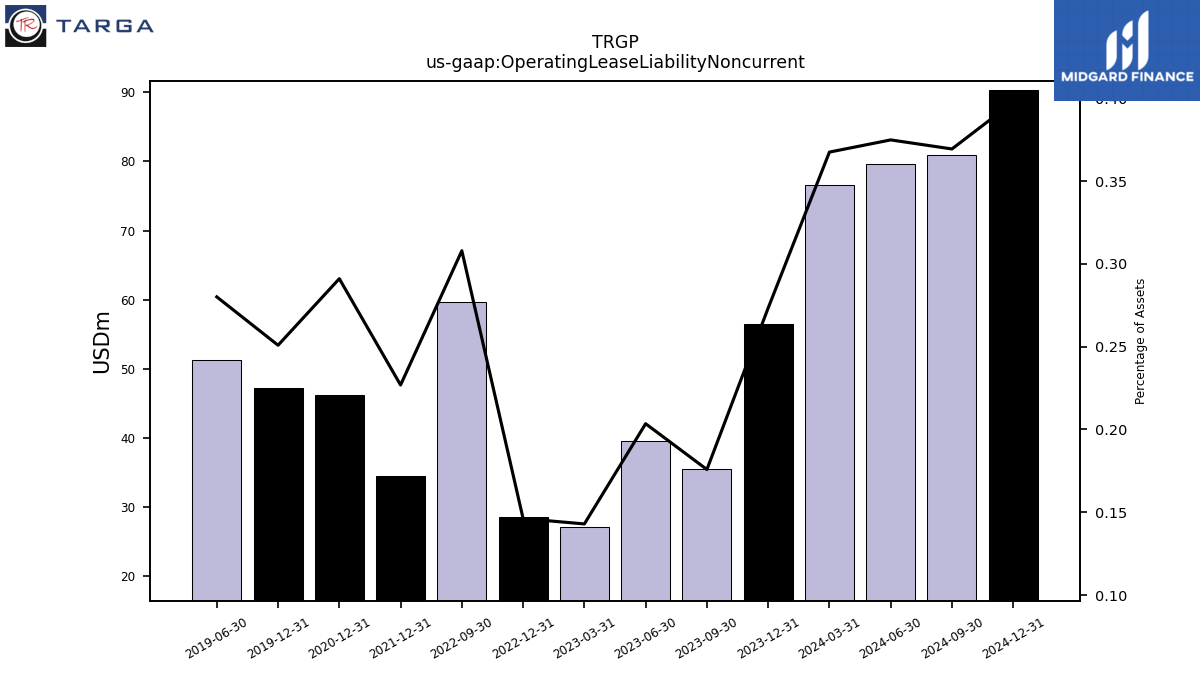
| Operating Lease Liability Noncurrent | 56.50 | 35.50 | 39.60 | 27.20 | 28.60 | 59.70 | NA | NA | 34.50 | NA | NA | NA | 46.20 | NA | NA | NA | 47.20 | NA | 51.30 | NA | NA | NA | NA | NA | NA | NA | NA | NA |
| 2023-12-31 | 2023-09-30 | 2023-06-30 | 2023-03-31 | 2022-12-31 | 2022-09-30 | 2022-06-30 | 2022-03-31 | 2021-12-31 | 2021-09-30 | 2021-06-30 | 2021-03-31 | 2020-12-31 | 2020-09-30 | 2020-06-30 | 2020-03-31 | 2019-12-31 | 2019-09-30 | 2019-06-30 | 2019-03-31 | 2018-12-31 | 2018-09-30 | 2018-06-30 | 2018-03-31 | 2017-12-31 | 2017-09-30 | 2017-06-30 | 2017-03-31 | ||
|---|---|---|---|---|---|---|---|---|---|---|---|---|---|---|---|---|---|---|---|---|---|---|---|---|---|---|---|---|---|
| Stockholders Equity | 2739.70 | 2506.10 | 2675.20 | 2550.70 | 2665.70 | 2384.50 | 2069.90 | 1697.00 | 2011.80 | 2185.10 | 2186.20 | 2296.70 | 2653.90 | 2835.00 | 2917.60 | 3026.30 | 4920.80 | 5318.40 | 5542.30 | 5756.30 | 6079.40 | 6081.40 | 6217.80 | 6090.70 | 6160.30 | 5995.80 | 6460.90 | 5689.90 | |
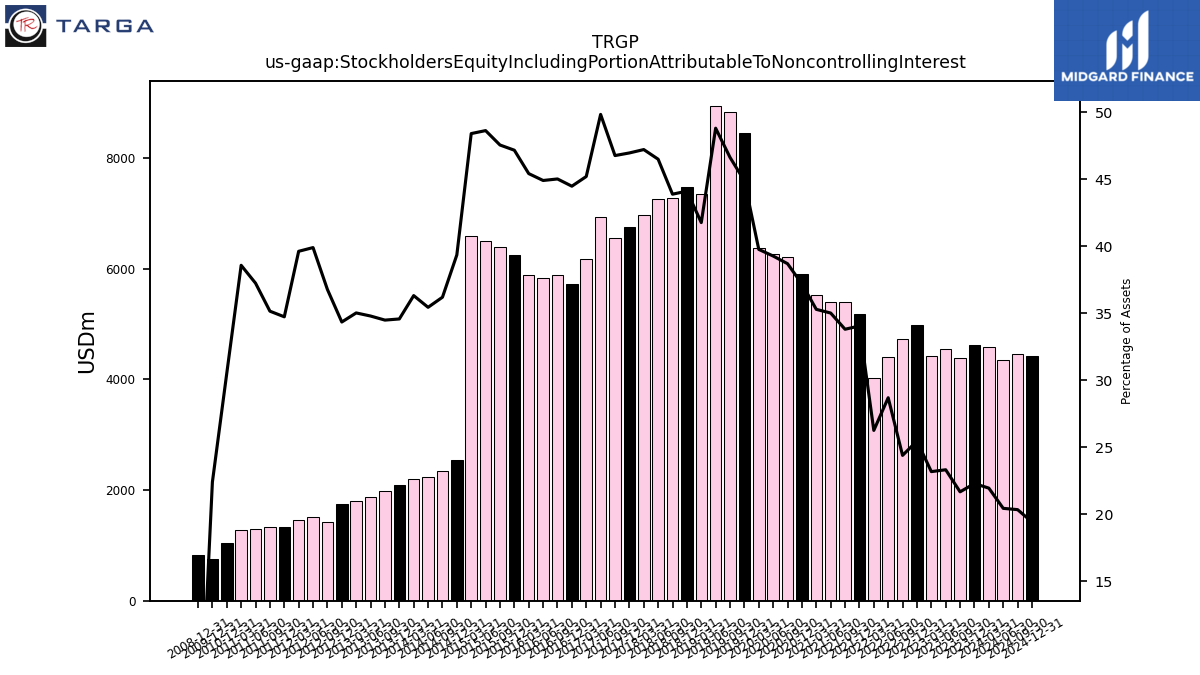
| Stockholders Equity Including Portion Attributable To Noncontrolling Interest | 4610.00 | 4377.80 | 4540.20 | 4412.20 | 4982.20 | 4731.40 | 4400.90 | 4017.30 | 5178.70 | 5399.90 | 5396.50 | 5522.40 | 5903.20 | 6211.50 | 6269.10 | 6372.50 | 8442.90 | 8819.90 | 8939.10 | 7337.30 | 7470.80 | 7270.20 | 7250.20 | 6964.40 | 6756.00 | 6545.40 | 6935.20 | 6170.90 | |
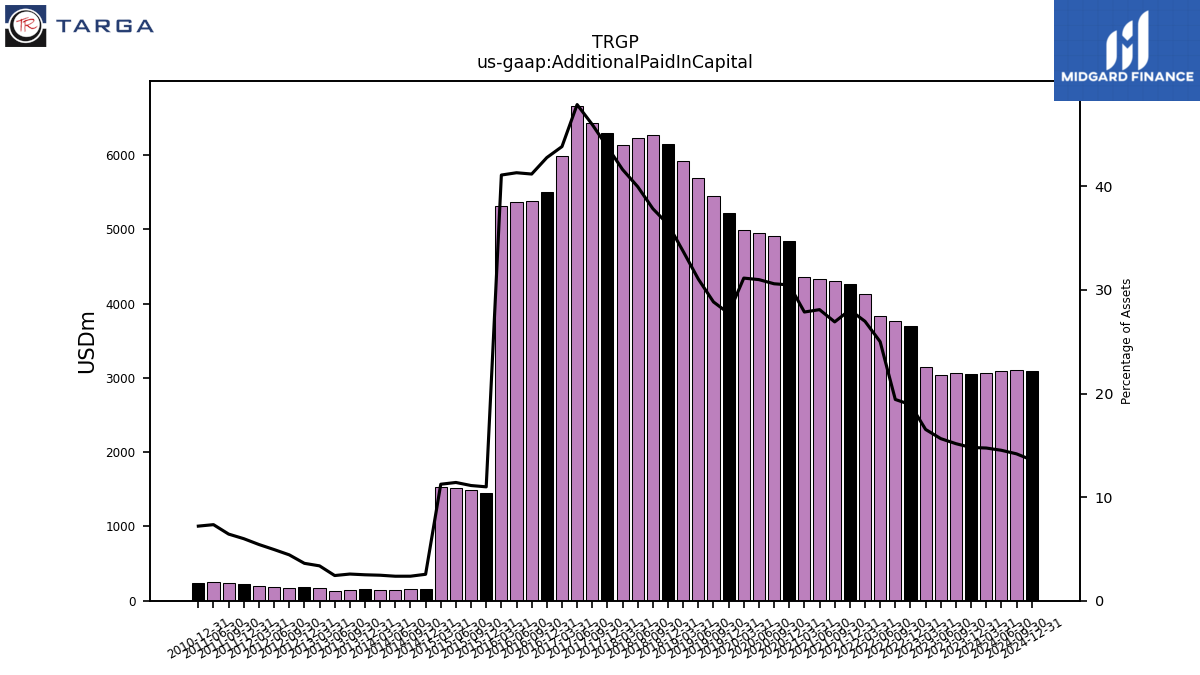
| Additional Paid In Capital | 3058.80 | 3061.50 | 3045.80 | 3146.00 | 3702.30 | 3767.80 | 3834.40 | 4125.80 | 4268.90 | 4299.70 | 4330.80 | 4361.50 | 4839.90 | 4911.70 | 4949.10 | 4991.70 | 5221.20 | 5457.20 | 5687.80 | 5925.70 | 6154.90 | 6270.50 | 6233.70 | 6141.20 | 6302.80 | 6434.90 | 6666.40 | 5986.00 | |
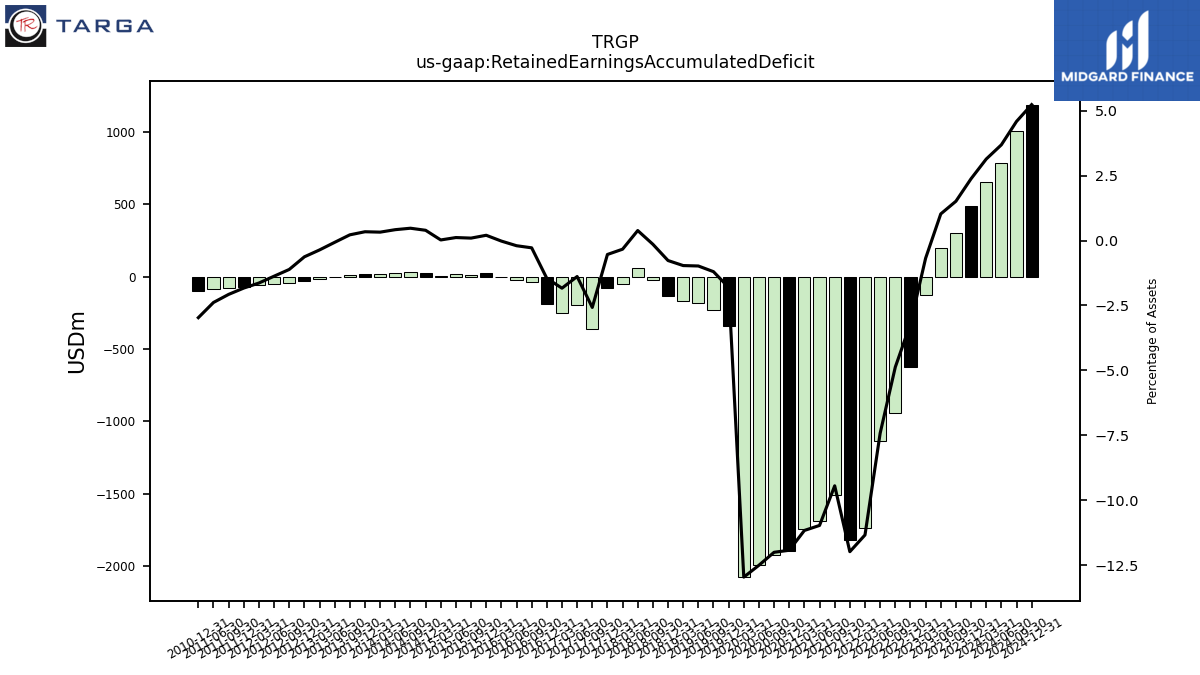
| Retained Earnings Accumulated Deficit | 492.00 | 305.50 | 199.50 | -129.80 | -626.80 | -944.80 | -1137.90 | -1734.30 | -1822.30 | -1508.70 | -1690.90 | -1747.10 | -1893.50 | -1927.10 | -1996.40 | -2077.40 | -339.60 | -226.80 | -179.50 | -169.30 | -130.40 | -23.80 | 60.00 | -49.10 | -77.20 | -360.50 | -192.90 | -250.50 | |
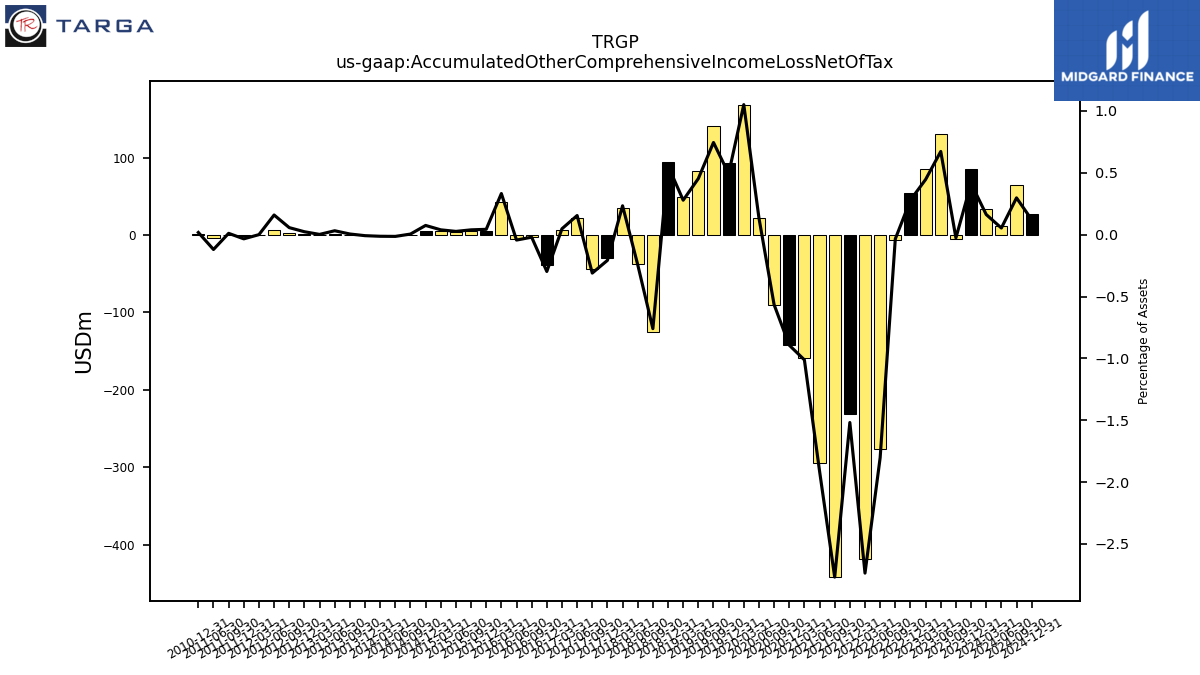
| Accumulated Other Comprehensive Income Loss Net Of Tax | 85.60 | -5.30 | 130.80 | 84.80 | 54.70 | -6.70 | -276.40 | -418.40 | -230.90 | -442.10 | -294.40 | -158.40 | -141.80 | -90.80 | 21.60 | 168.40 | 92.50 | 140.90 | 83.00 | 48.90 | 94.30 | -125.90 | -37.90 | 34.40 | -29.90 | -43.50 | 21.50 | 6.50 | |
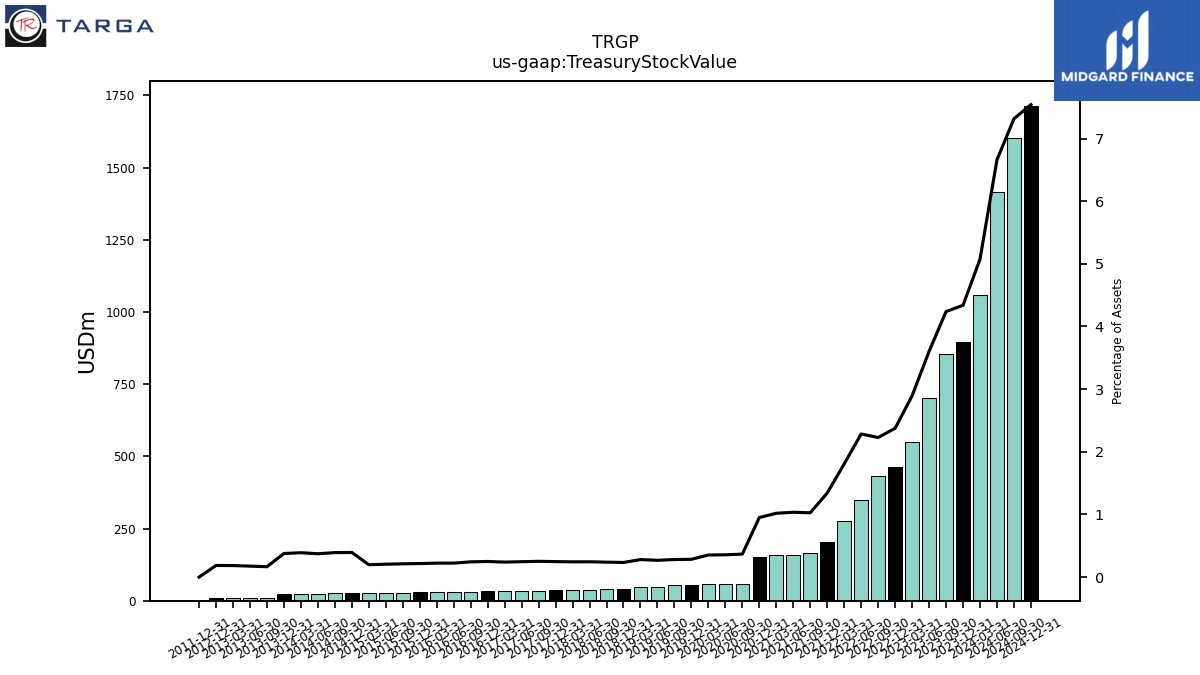
| Treasury Stock Value | 896.90 | 855.80 | 701.10 | 550.50 | 464.70 | 432.00 | 350.40 | 276.30 | 204.10 | 164.00 | 159.50 | 159.50 | 150.90 | 59.00 | 56.90 | 56.60 | 53.50 | 53.10 | 49.20 | 49.20 | 39.60 | 39.60 | 38.20 | 36.00 | 35.60 | 35.30 | 34.30 | 32.70 | |
| Minority Interest | 1870.30 | 1871.70 | 1865.00 | 1861.50 | 2316.50 | 2346.90 | 2331.00 | 2320.30 | 3166.90 | 3214.80 | 3210.30 | 3225.70 | 3249.30 | 3376.50 | 3351.50 | 3346.20 | 3522.10 | 3501.50 | 3396.80 | 1581.00 | 1391.40 | 1188.80 | 1032.40 | 873.70 | 595.70 | 549.60 | 474.30 | 481.00 | |
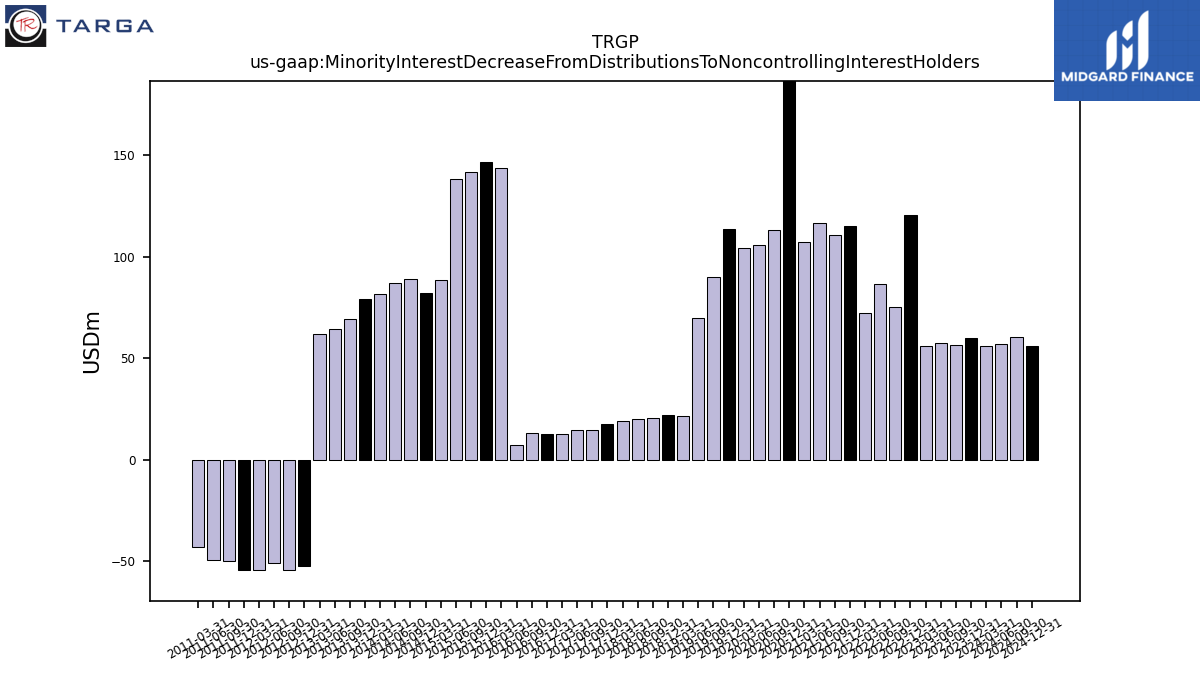
| Minority Interest Decrease From Distributions To Noncontrolling Interest Holders | 60.00 | 56.50 | 57.40 | 56.10 | 120.50 | 75.20 | 86.60 | 72.20 | 114.90 | 110.40 | 116.70 | 107.10 | 247.80 | 113.10 | 105.90 | 104.00 | 113.60 | 90.00 | 69.70 | 21.40 | 22.00 | 20.60 | 20.10 | 19.30 | 17.60 | 14.50 | 14.80 | 12.50 |
| 2023-12-31 | 2023-09-30 | 2023-06-30 | 2023-03-31 | 2022-12-31 | 2022-09-30 | 2022-06-30 | 2022-03-31 | 2021-12-31 | 2021-09-30 | 2021-06-30 | 2021-03-31 | 2020-12-31 | 2020-09-30 | 2020-06-30 | 2020-03-31 | 2019-12-31 | 2019-09-30 | 2019-06-30 | 2019-03-31 | 2018-12-31 | 2018-09-30 | 2018-06-30 | 2018-03-31 | 2017-12-31 | 2017-09-30 | 2017-06-30 | 2017-03-31 | ||
|---|---|---|---|---|---|---|---|---|---|---|---|---|---|---|---|---|---|---|---|---|---|---|---|---|---|---|---|---|---|
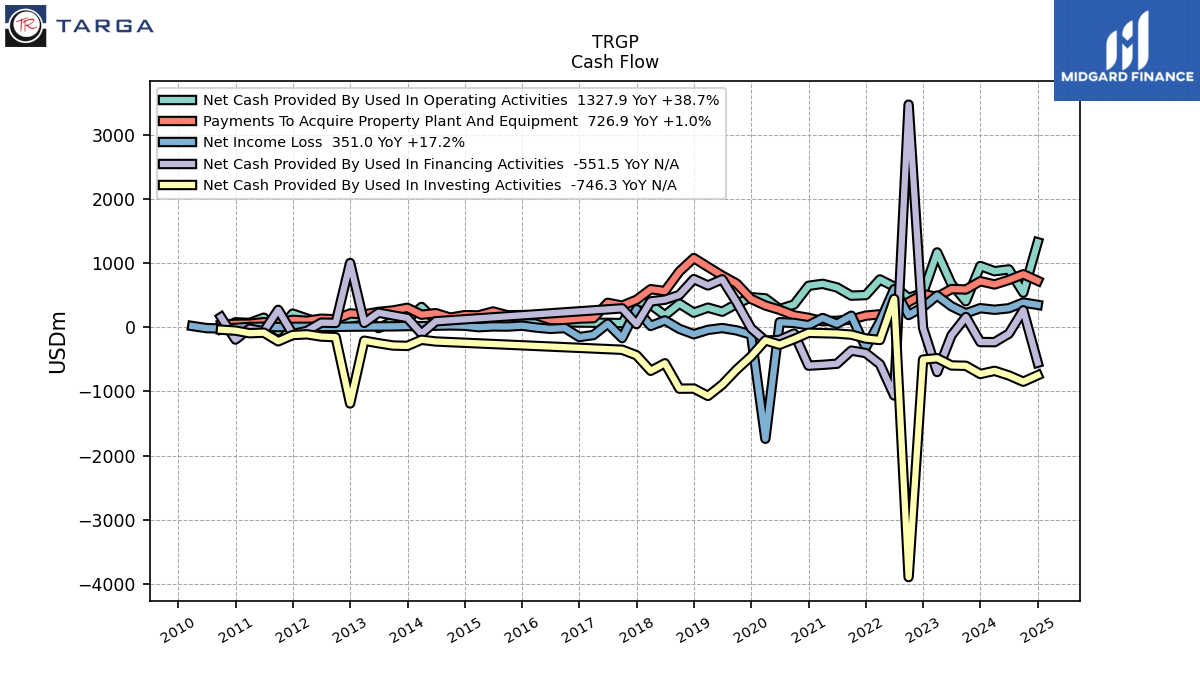
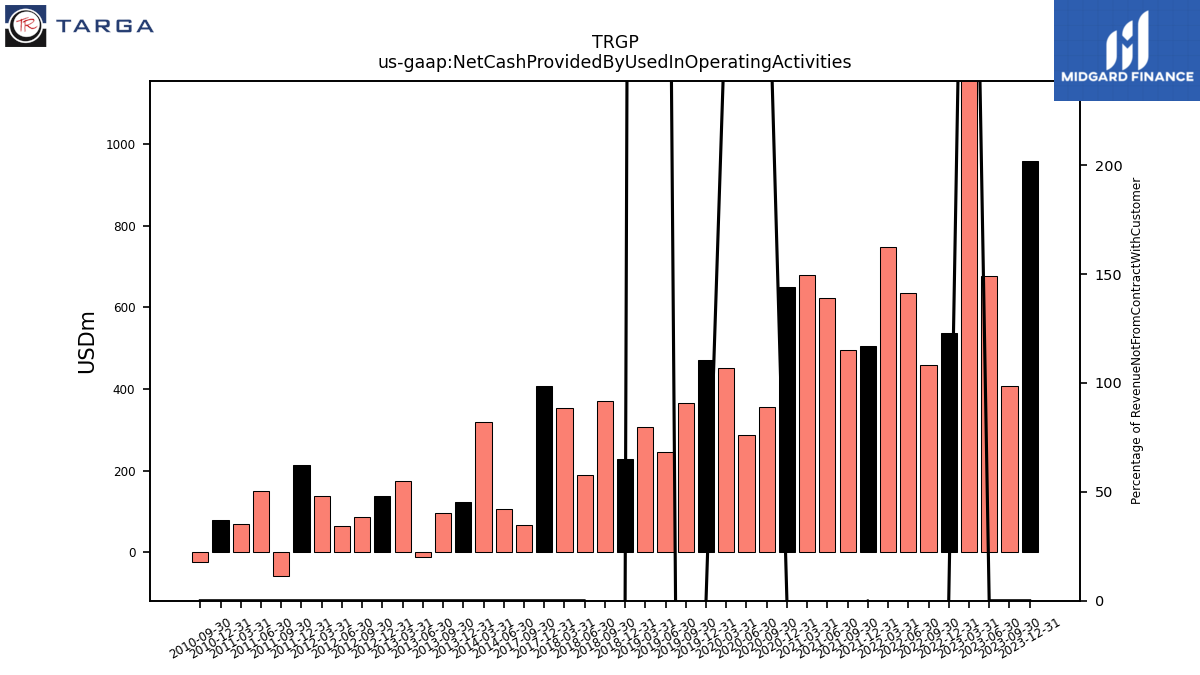
| Net Cash Provided By Used In Operating Activities | 957.70 | 407.30 | 676.80 | 1169.80 | 537.50 | 459.60 | 635.50 | 748.20 | 504.10 | 495.20 | 623.80 | 679.80 | 648.80 | 356.80 | 286.30 | 452.60 | 470.80 | 366.70 | 244.70 | 307.60 | 229.40 | 370.90 | 189.30 | 354.40 | 407.60 | 67.40 | NA | NA | |
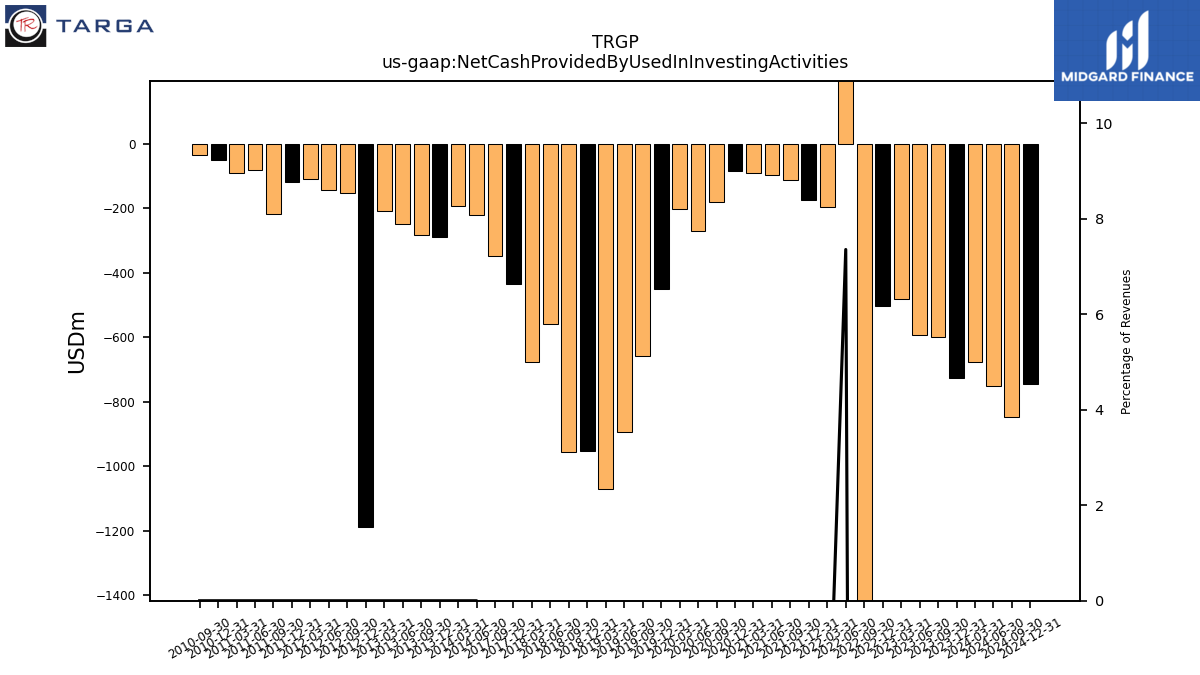
| Net Cash Provided By Used In Investing Activities | -727.00 | -599.20 | -593.80 | -480.80 | -502.10 | -3896.00 | 445.40 | -197.00 | -173.60 | -113.70 | -95.90 | -90.00 | -84.10 | -181.90 | -270.20 | -201.90 | -451.90 | -657.60 | -893.20 | -1069.20 | -954.10 | -955.90 | -559.60 | -677.30 | -435.20 | -348.90 | NA | NA | |
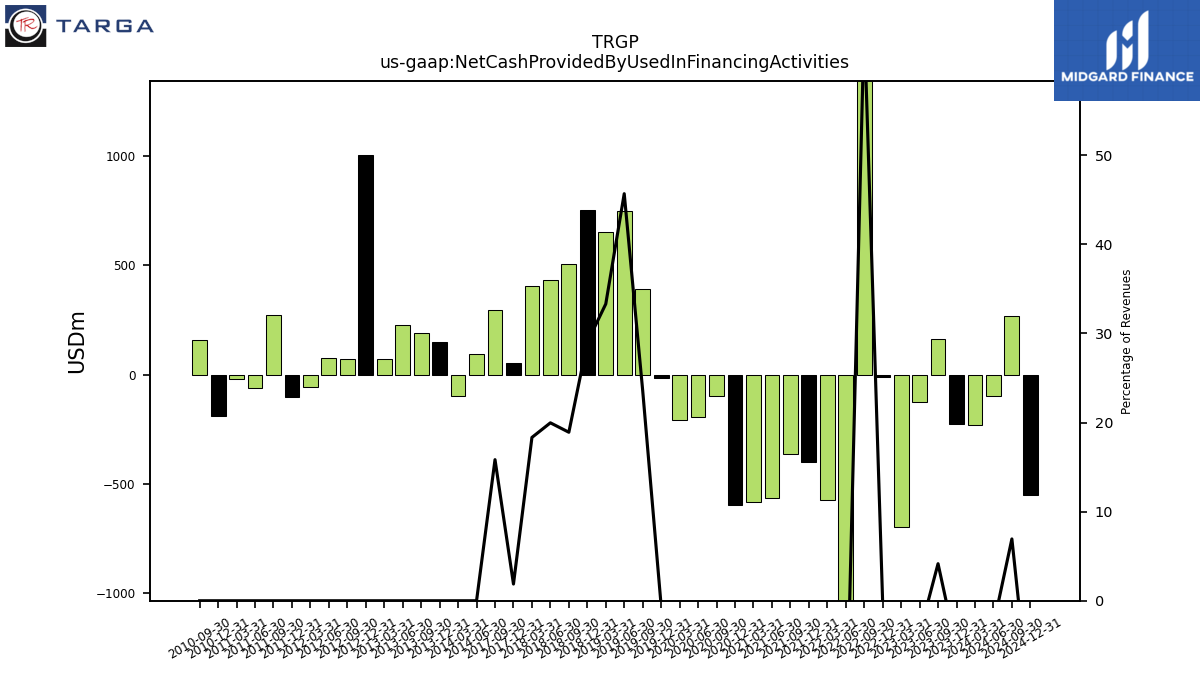
| Net Cash Provided By Used In Financing Activities | -228.50 | 162.00 | -125.40 | -696.20 | -9.30 | 3475.30 | -1062.80 | -573.80 | -400.60 | -361.90 | -567.40 | -584.10 | -596.90 | -96.10 | -195.10 | -206.60 | -14.10 | 390.70 | 750.10 | 654.40 | 753.60 | 506.60 | 432.10 | 405.50 | 50.70 | 296.90 | NA | NA |
| 2023-12-31 | 2023-09-30 | 2023-06-30 | 2023-03-31 | 2022-12-31 | 2022-09-30 | 2022-06-30 | 2022-03-31 | 2021-12-31 | 2021-09-30 | 2021-06-30 | 2021-03-31 | 2020-12-31 | 2020-09-30 | 2020-06-30 | 2020-03-31 | 2019-12-31 | 2019-09-30 | 2019-06-30 | 2019-03-31 | 2018-12-31 | 2018-09-30 | 2018-06-30 | 2018-03-31 | 2017-12-31 | 2017-09-30 | 2017-06-30 | 2017-03-31 | ||
|---|---|---|---|---|---|---|---|---|---|---|---|---|---|---|---|---|---|---|---|---|---|---|---|---|---|---|---|---|---|
| Net Cash Provided By Used In Operating Activities | 957.70 | 407.30 | 676.80 | 1169.80 | 537.50 | 459.60 | 635.50 | 748.20 | 504.10 | 495.20 | 623.80 | 679.80 | 648.80 | 356.80 | 286.30 | 452.60 | 470.80 | 366.70 | 244.70 | 307.60 | 229.40 | 370.90 | 189.30 | 354.40 | 407.60 | 67.40 | NA | NA | |
| Net Income Loss | 299.60 | 220.00 | 329.30 | 497.00 | 318.00 | 193.10 | 596.40 | 88.00 | -313.60 | 182.20 | 56.20 | 146.40 | 33.60 | 69.30 | 81.00 | -1737.80 | -112.80 | -47.30 | -10.20 | -38.90 | -106.60 | -23.70 | 109.10 | 22.90 | 283.30 | -167.60 | 57.60 | -119.30 | |
| Profit Loss | 357.60 | 279.00 | 387.50 | 555.20 | 395.90 | 279.30 | 687.60 | 168.60 | -249.20 | 288.00 | 155.40 | 227.90 | 146.00 | 172.20 | 177.10 | -1820.30 | -15.10 | 32.10 | 48.90 | -24.70 | -88.40 | -11.20 | 121.10 | 38.90 | 299.20 | -155.10 | 70.60 | -110.50 | |
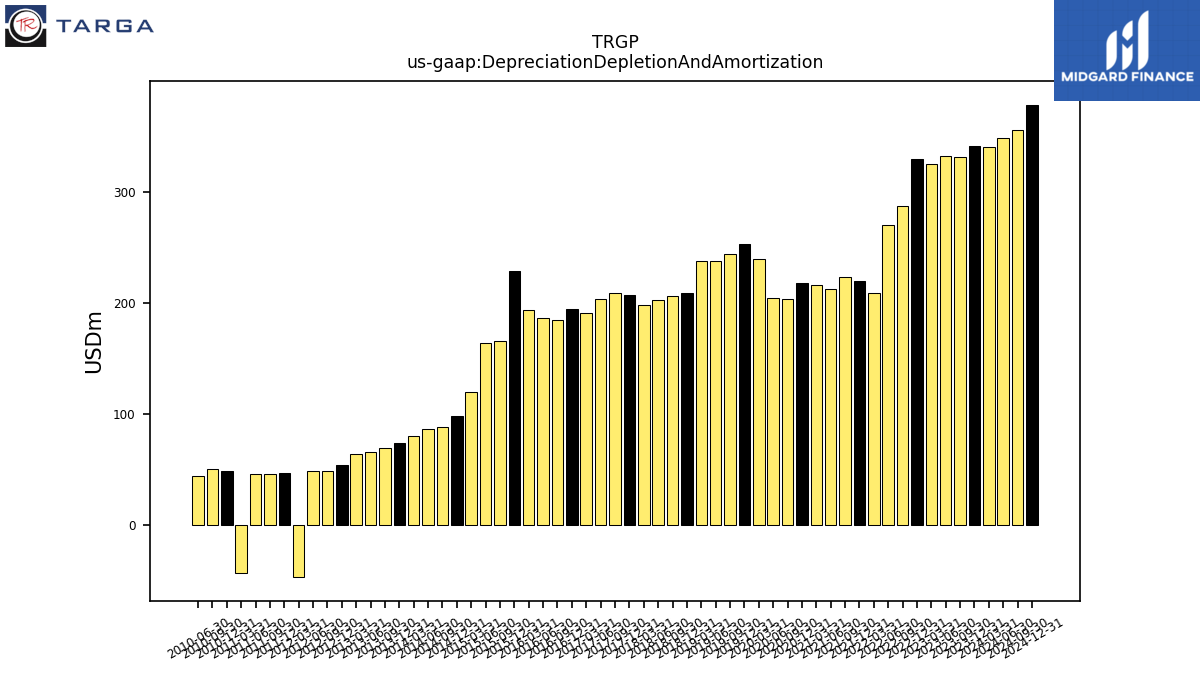
| Depreciation Depletion And Amortization | 341.40 | 331.30 | 332.10 | 324.80 | 329.80 | 287.20 | 269.90 | 209.10 | 219.70 | 222.80 | 211.90 | 216.20 | 217.80 | 203.70 | 204.50 | 239.10 | 252.70 | 244.30 | 237.20 | 237.40 | 208.80 | 206.30 | 202.60 | 198.10 | 206.70 | 208.30 | 203.40 | 191.10 | |
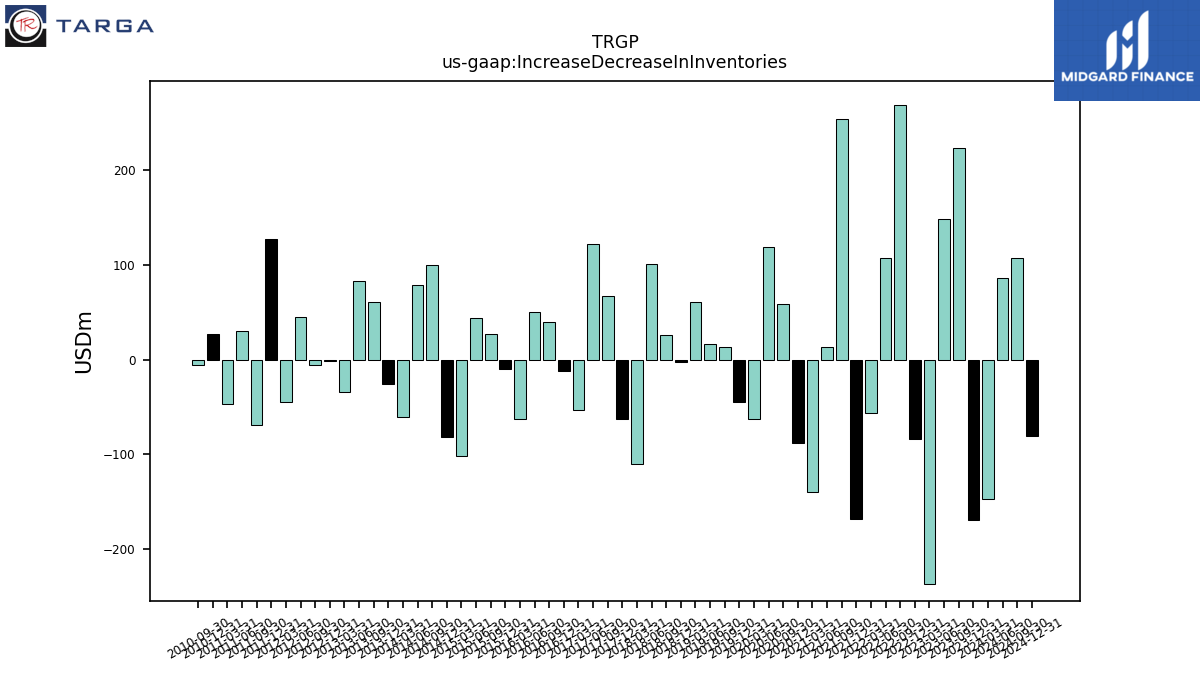
| Increase Decrease In Inventories | -170.10 | 223.30 | 148.30 | -237.50 | -84.30 | 269.30 | 107.10 | -55.90 | -168.60 | 254.20 | 13.70 | -139.90 | -88.10 | 59.10 | 119.00 | -62.30 | -44.70 | 13.00 | 16.10 | 60.60 | -2.70 | 25.90 | 100.90 | -110.20 | -63.20 | 67.80 | 122.30 | -53.70 | |
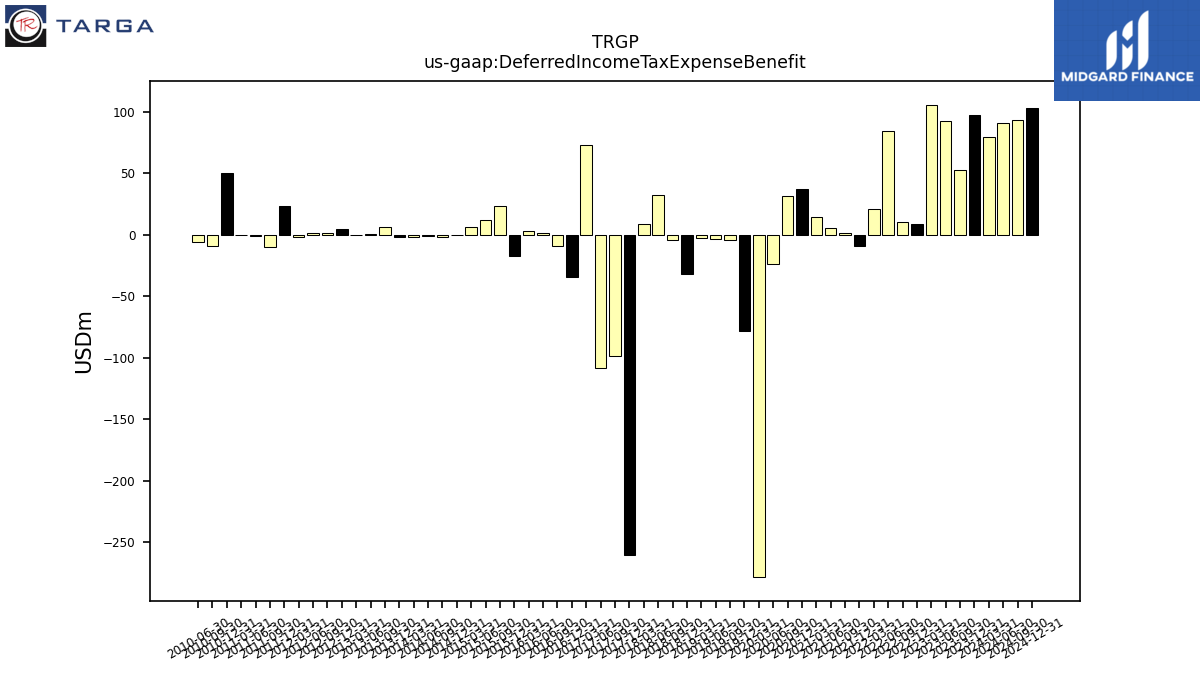
| Deferred Income Tax Expense Benefit | 97.50 | 53.10 | 93.00 | 106.00 | 8.70 | 10.60 | 84.70 | 21.10 | -9.40 | 1.20 | 5.80 | 14.50 | 37.10 | 31.90 | -23.30 | -278.40 | -77.90 | -3.80 | -3.30 | -2.90 | -32.20 | -3.90 | 32.70 | 8.90 | -260.10 | -98.10 | -107.90 | 73.40 | |
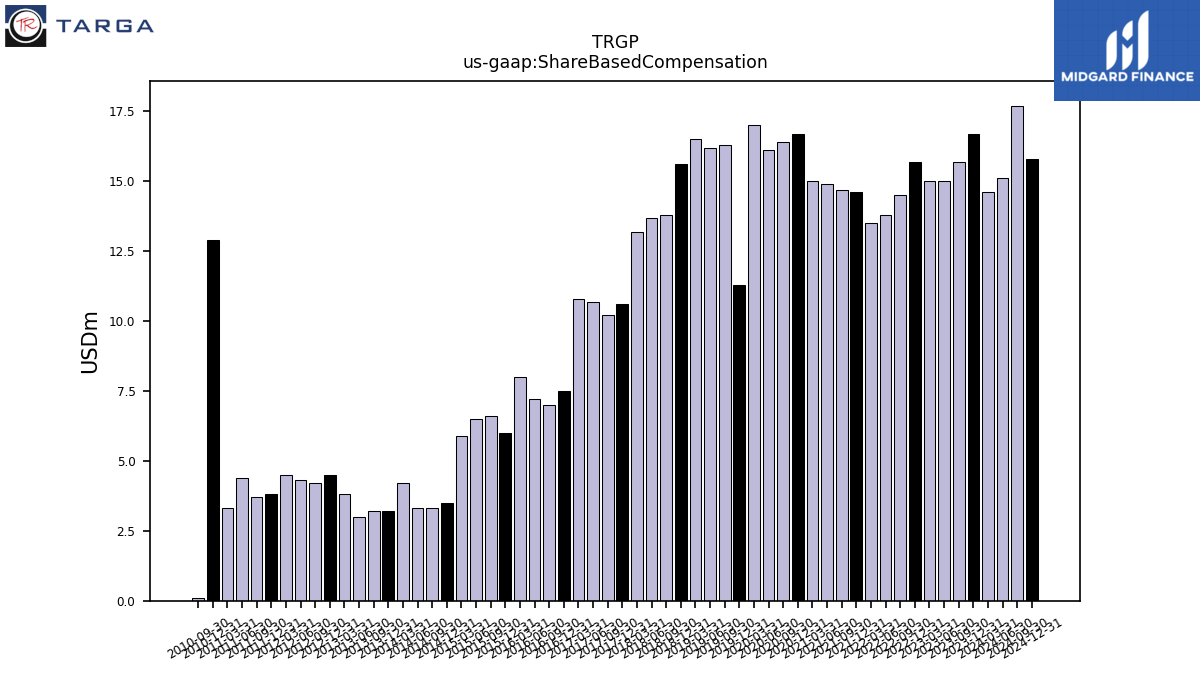
| Share Based Compensation | 16.70 | 15.70 | 15.00 | 15.00 | 15.70 | 14.50 | 13.80 | 13.50 | 14.60 | 14.70 | 14.90 | 15.00 | 16.70 | 16.40 | 16.10 | 17.00 | 11.30 | 16.30 | 16.20 | 16.50 | 15.60 | 13.80 | 13.70 | 13.20 | 10.60 | 10.20 | 10.70 | 10.80 |
| 2023-12-31 | 2023-09-30 | 2023-06-30 | 2023-03-31 | 2022-12-31 | 2022-09-30 | 2022-06-30 | 2022-03-31 | 2021-12-31 | 2021-09-30 | 2021-06-30 | 2021-03-31 | 2020-12-31 | 2020-09-30 | 2020-06-30 | 2020-03-31 | 2019-12-31 | 2019-09-30 | 2019-06-30 | 2019-03-31 | 2018-12-31 | 2018-09-30 | 2018-06-30 | 2018-03-31 | 2017-12-31 | 2017-09-30 | 2017-06-30 | 2017-03-31 | ||
|---|---|---|---|---|---|---|---|---|---|---|---|---|---|---|---|---|---|---|---|---|---|---|---|---|---|---|---|---|---|
| Net Cash Provided By Used In Investing Activities | -727.00 | -599.20 | -593.80 | -480.80 | -502.10 | -3896.00 | 445.40 | -197.00 | -173.60 | -113.70 | -95.90 | -90.00 | -84.10 | -181.90 | -270.20 | -201.90 | -451.90 | -657.60 | -893.20 | -1069.20 | -954.10 | -955.90 | -559.60 | -677.30 | -435.20 | -348.90 | NA | NA | |
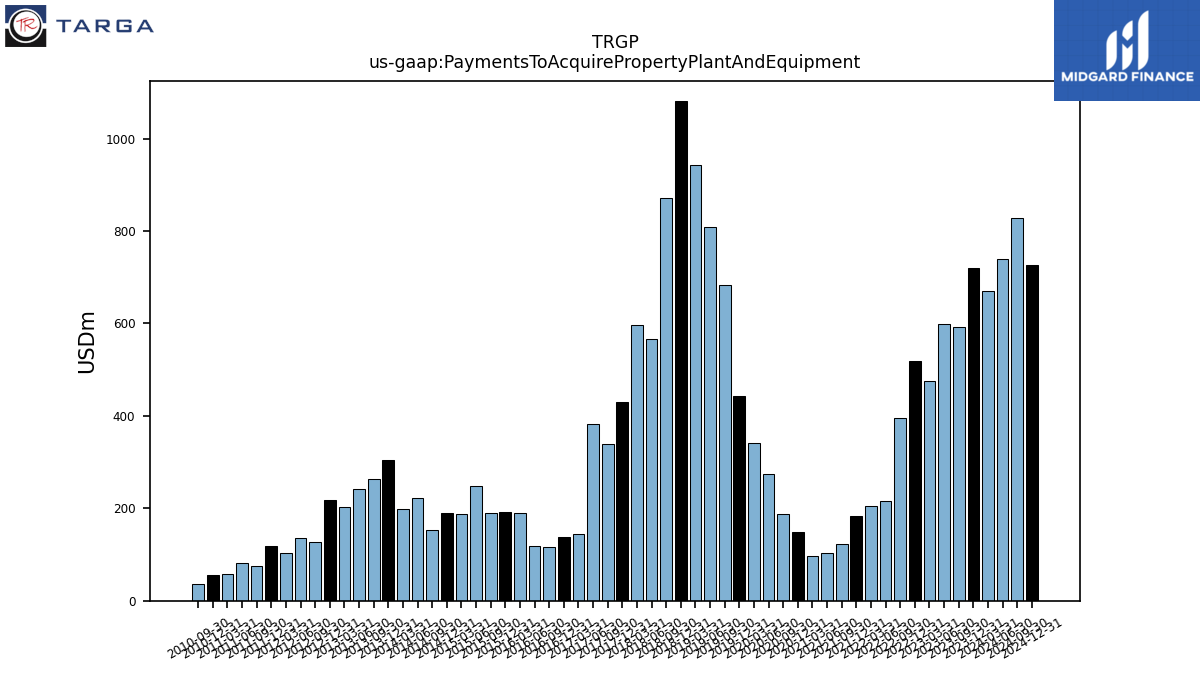
| Payments To Acquire Property Plant And Equipment | 720.00 | 591.70 | 598.00 | 475.70 | 518.90 | 395.90 | 215.10 | 204.40 | 183.50 | 122.70 | 102.70 | 96.20 | 148.50 | 187.20 | 274.20 | 341.70 | 443.70 | 683.10 | 807.70 | 943.30 | 1081.20 | 871.10 | 566.60 | 595.90 | 430.90 | 339.00 | 383.40 | 144.20 |
| 2023-12-31 | 2023-09-30 | 2023-06-30 | 2023-03-31 | 2022-12-31 | 2022-09-30 | 2022-06-30 | 2022-03-31 | 2021-12-31 | 2021-09-30 | 2021-06-30 | 2021-03-31 | 2020-12-31 | 2020-09-30 | 2020-06-30 | 2020-03-31 | 2019-12-31 | 2019-09-30 | 2019-06-30 | 2019-03-31 | 2018-12-31 | 2018-09-30 | 2018-06-30 | 2018-03-31 | 2017-12-31 | 2017-09-30 | 2017-06-30 | 2017-03-31 | ||
|---|---|---|---|---|---|---|---|---|---|---|---|---|---|---|---|---|---|---|---|---|---|---|---|---|---|---|---|---|---|
| Net Cash Provided By Used In Financing Activities | -228.50 | 162.00 | -125.40 | -696.20 | -9.30 | 3475.30 | -1062.80 | -573.80 | -400.60 | -361.90 | -567.40 | -584.10 | -596.90 | -96.10 | -195.10 | -206.60 | -14.10 | 390.70 | 750.10 | 654.40 | 753.60 | 506.60 | 432.10 | 405.50 | 50.70 | 296.90 | NA | NA |
| 2023-12-31 | 2023-09-30 | 2023-06-30 | 2023-03-31 | 2022-12-31 | 2022-09-30 | 2022-06-30 | 2022-03-31 | 2021-12-31 | 2021-09-30 | 2021-06-30 | 2021-03-31 | 2020-12-31 | 2020-09-30 | 2020-06-30 | 2020-03-31 | 2019-12-31 | 2019-09-30 | 2019-06-30 | 2019-03-31 | 2018-12-31 | 2018-09-30 | 2018-06-30 | 2018-03-31 | 2017-12-31 | 2017-09-30 | 2017-06-30 | 2017-03-31 | ||
|---|---|---|---|---|---|---|---|---|---|---|---|---|---|---|---|---|---|---|---|---|---|---|---|---|---|---|---|---|---|
| Revenues | 4239.50 | 3896.60 | 3403.70 | 4520.50 | 4554.80 | 5360.10 | 6055.80 | 4959.10 | 5441.60 | 4459.70 | 3415.90 | 3632.70 | 2572.80 | 2115.10 | 1523.50 | 2048.90 | 2473.90 | 1656.00 | 1642.00 | 1964.70 | 2597.60 | 2679.00 | 2164.00 | 2212.50 | 2702.80 | 1875.10 | 1867.70 | 2112.60 | |
| Operating | 4239.50 | 3896.60 | 3403.70 | 4520.50 | 4554.80 | 5360.10 | 6055.80 | 4959.10 | 5441.60 | 4459.70 | 3415.90 | 3632.70 | 2572.80 | 2115.10 | 1523.50 | 2048.90 | 2473.90 | 1902.50 | 1995.30 | 2299.40 | 2597.70 | 2986.40 | 2444.40 | 2455.60 | 2702.80 | 2131.80 | NA | NA | |
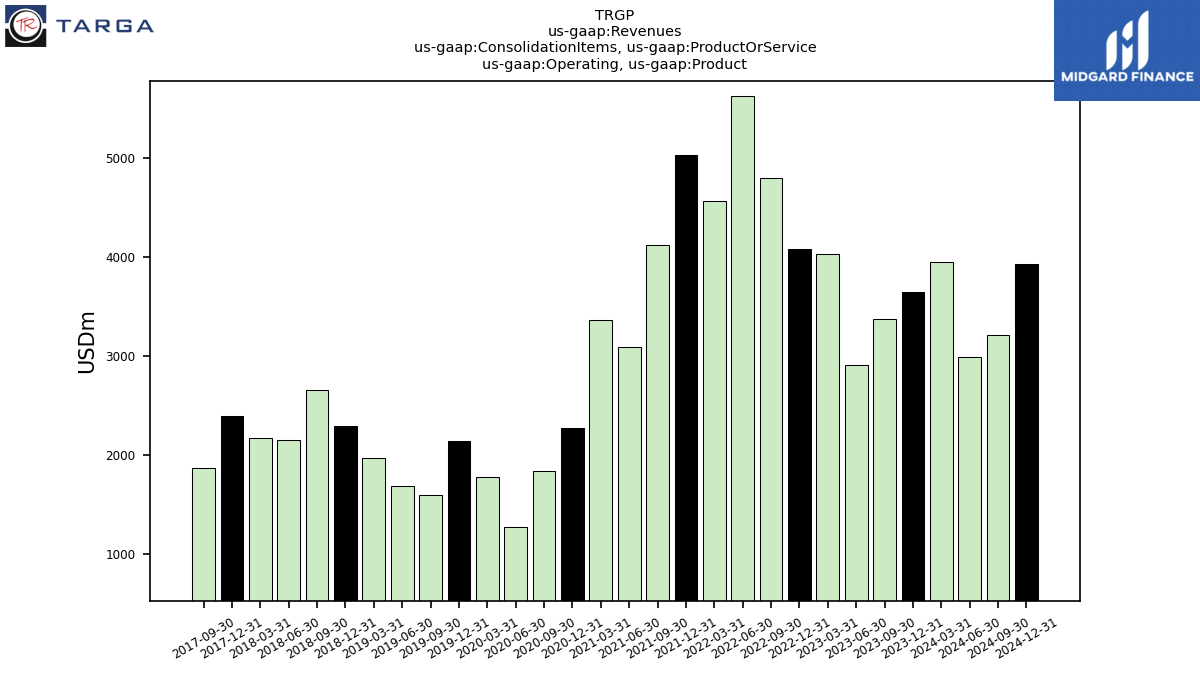
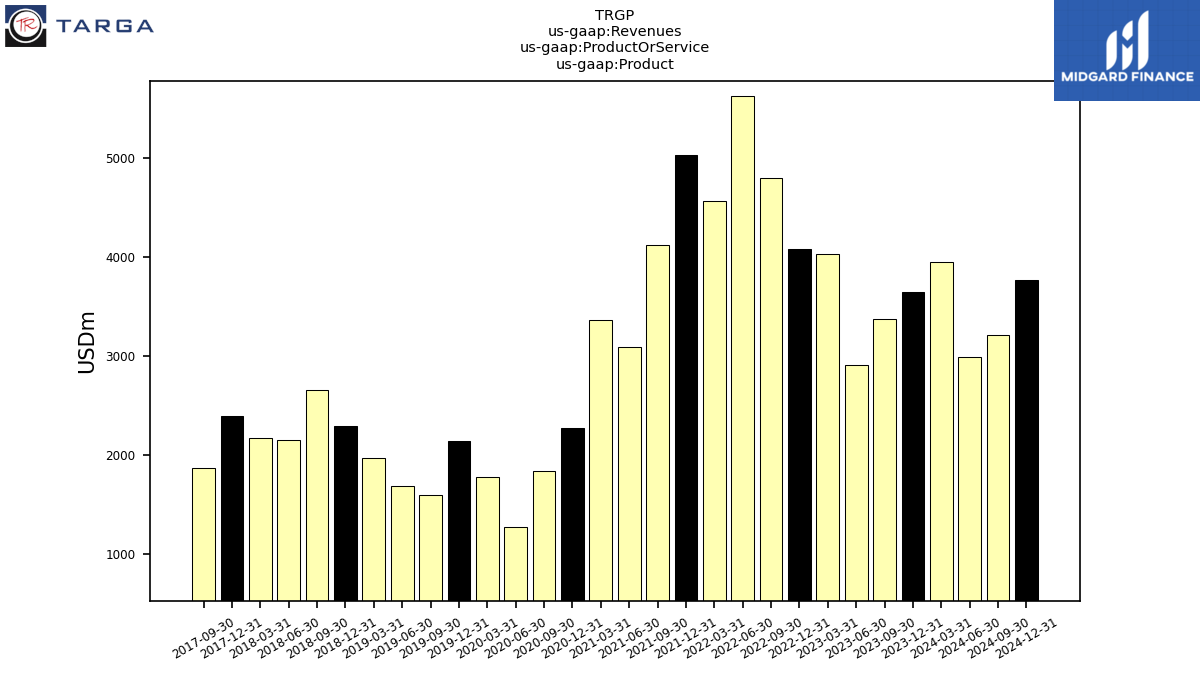
| Operating, Product | 3648.10 | 3374.30 | 2914.60 | 4025.00 | 4075.30 | 4800.30 | 5624.20 | 4566.20 | 5025.20 | 4118.10 | 3091.60 | 3367.70 | 2270.20 | 1840.80 | 1280.60 | 1779.70 | 2139.00 | 1594.20 | 1684.20 | 1976.50 | 2297.30 | 2654.10 | 2154.10 | 2173.70 | 2398.00 | 1871.50 | NA | NA | |
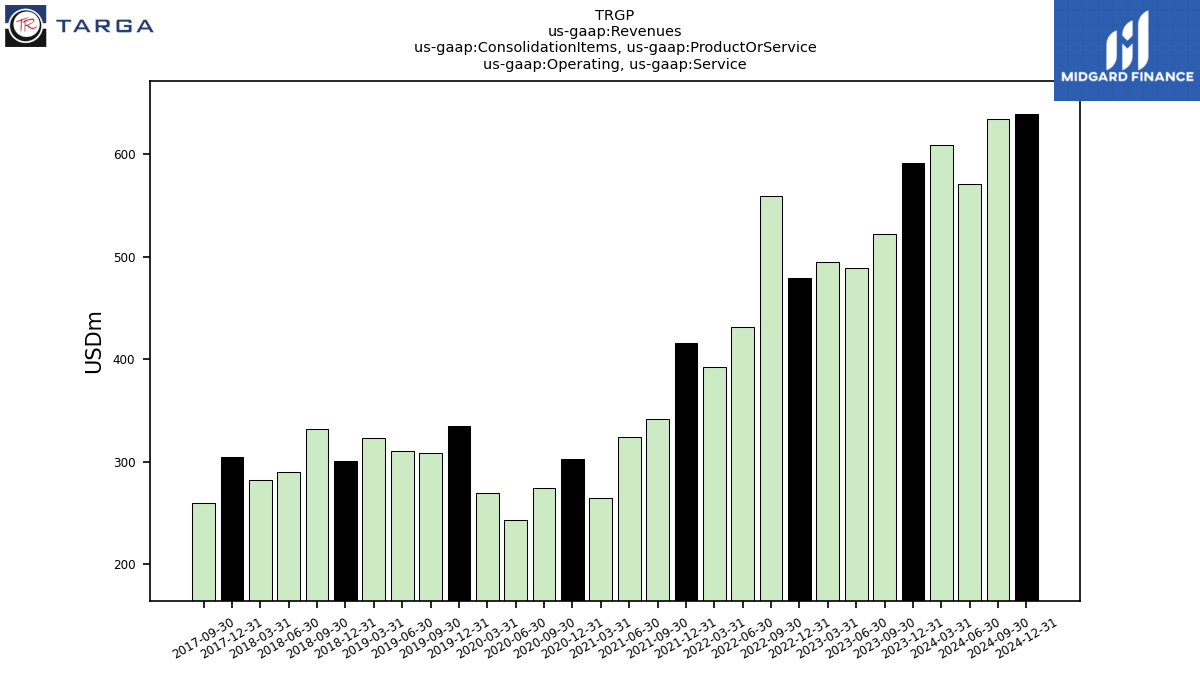
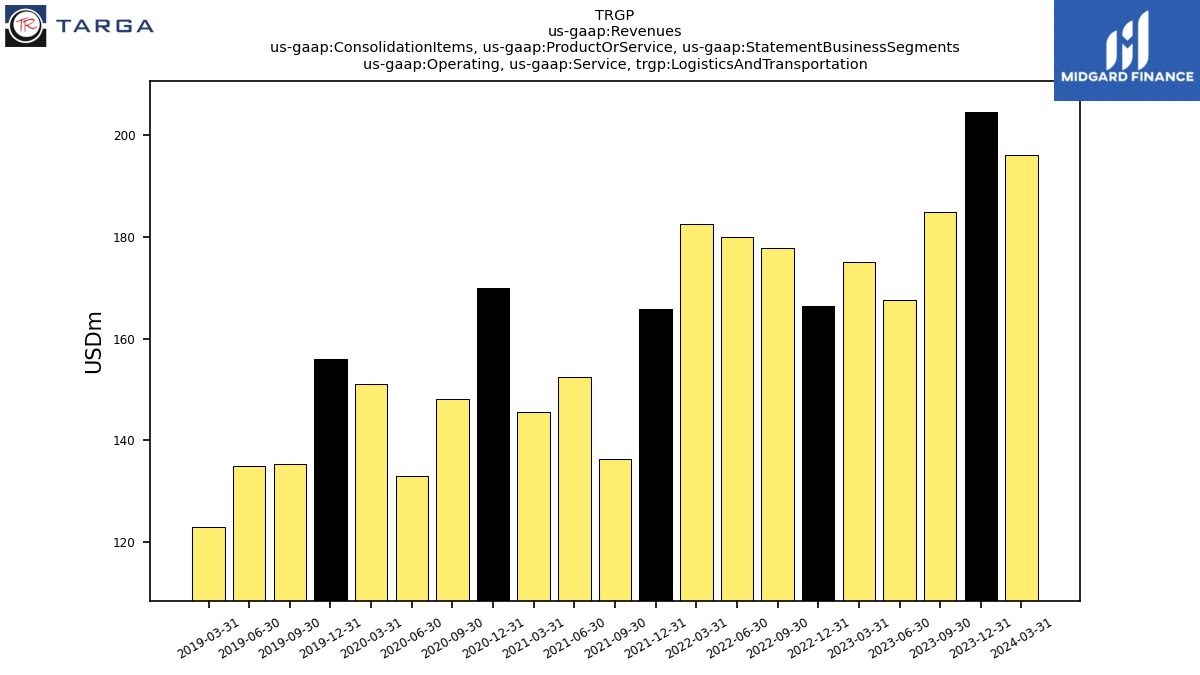
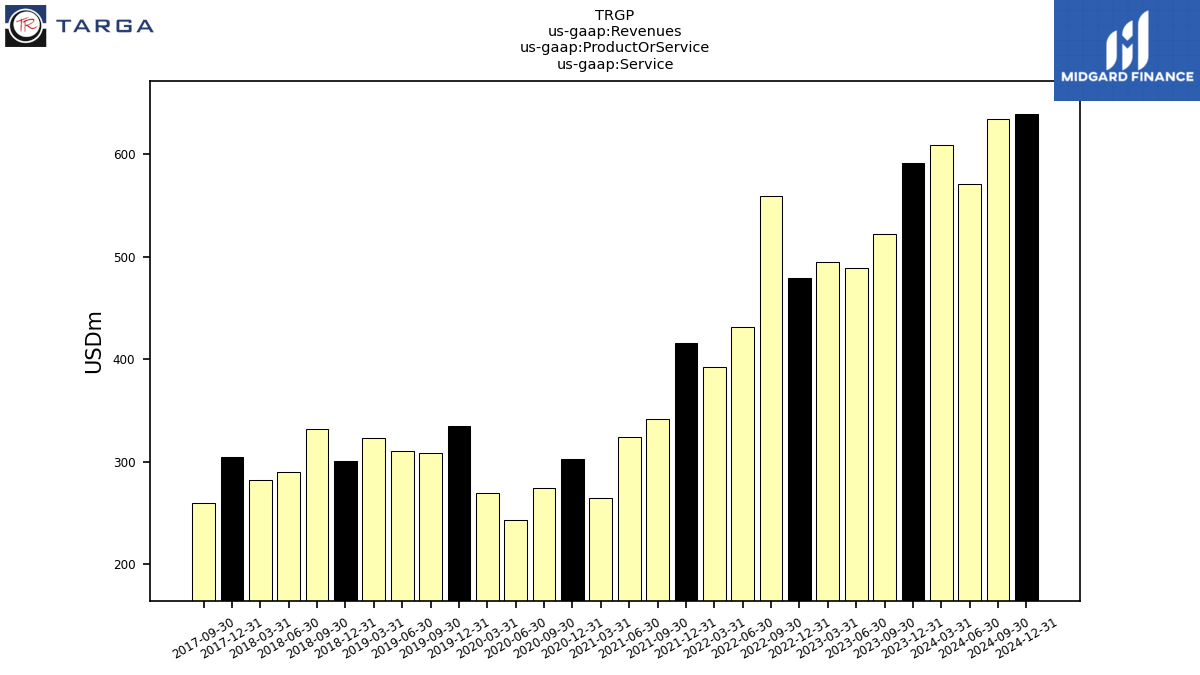
| Operating, Service | 591.40 | 522.30 | 489.10 | 495.50 | 479.50 | 559.80 | 431.60 | 392.90 | 416.40 | 341.60 | 324.30 | 265.00 | 302.60 | 274.30 | 242.90 | 269.20 | 334.90 | 308.30 | 311.10 | 322.90 | 300.40 | 332.30 | 290.30 | 281.90 | 304.80 | 260.30 | NA | NA | |
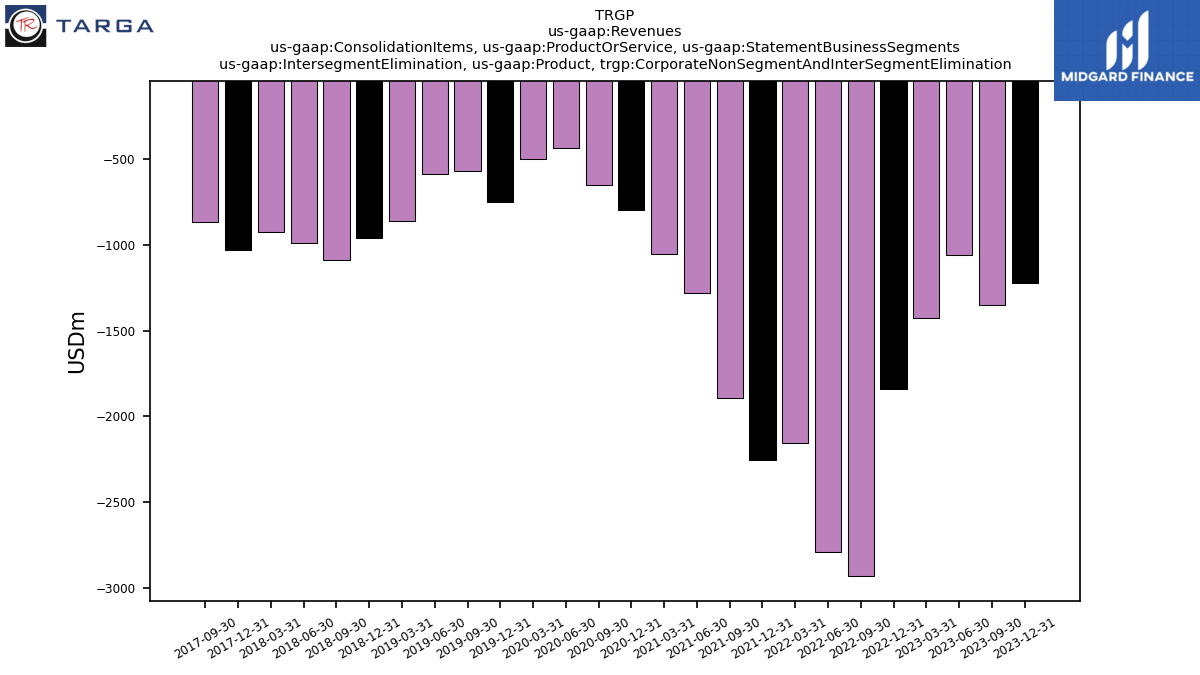
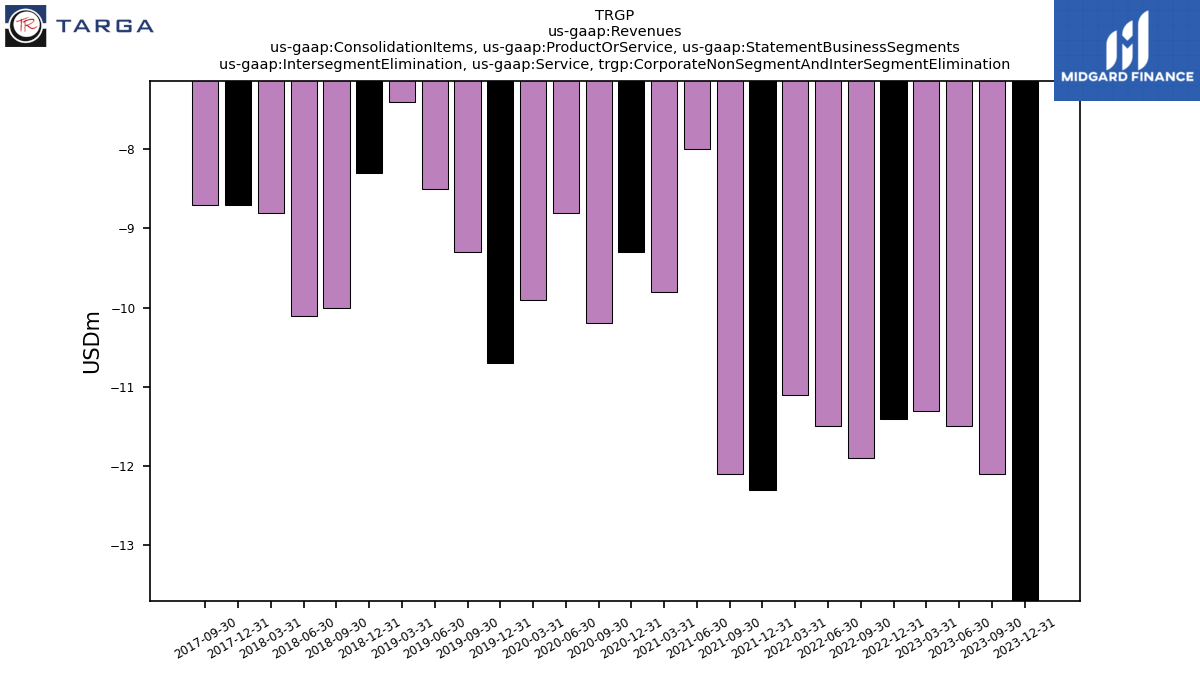
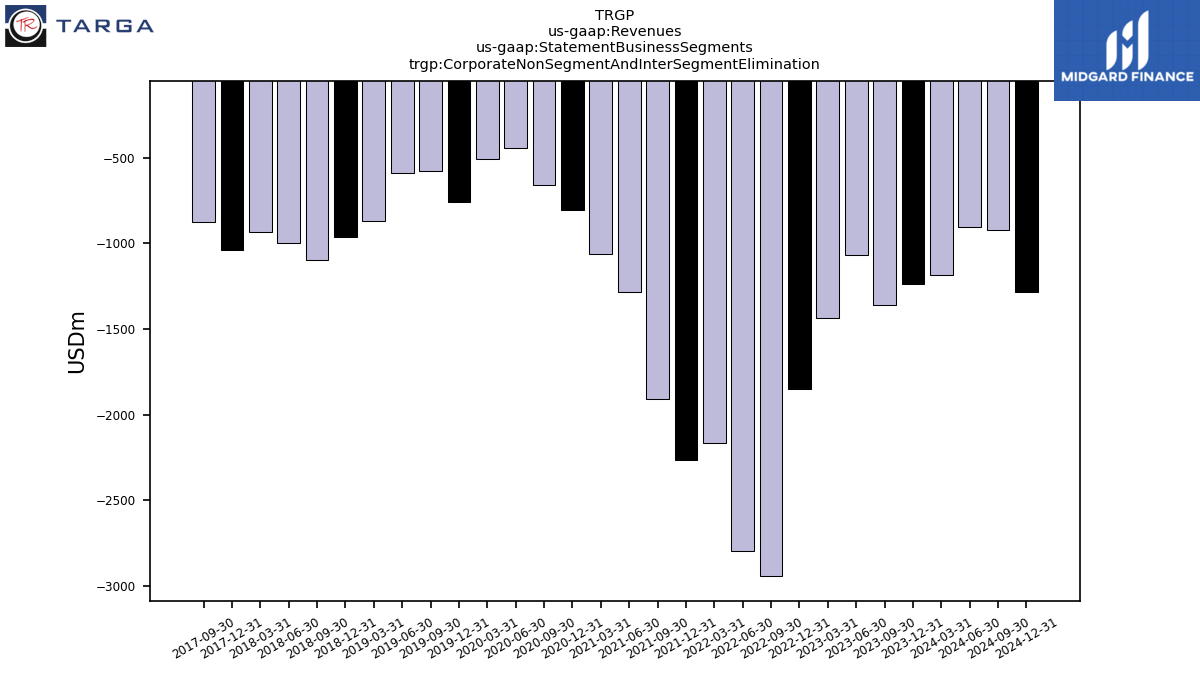
| Intersegment Elimination, Product, Corporate Non Segment And Inter Segment Elimination | -1222.20 | -1347.80 | -1059.00 | -1425.20 | -1839.20 | -2928.90 | -2788.20 | -2154.90 | -2253.50 | -1894.30 | -1277.30 | -1052.20 | -794.70 | -649.30 | -435.30 | -499.70 | -747.10 | -568.90 | -583.30 | -861.20 | -957.20 | -1085.20 | -989.40 | -922.20 | -1029.10 | -864.30 | NA | NA | |
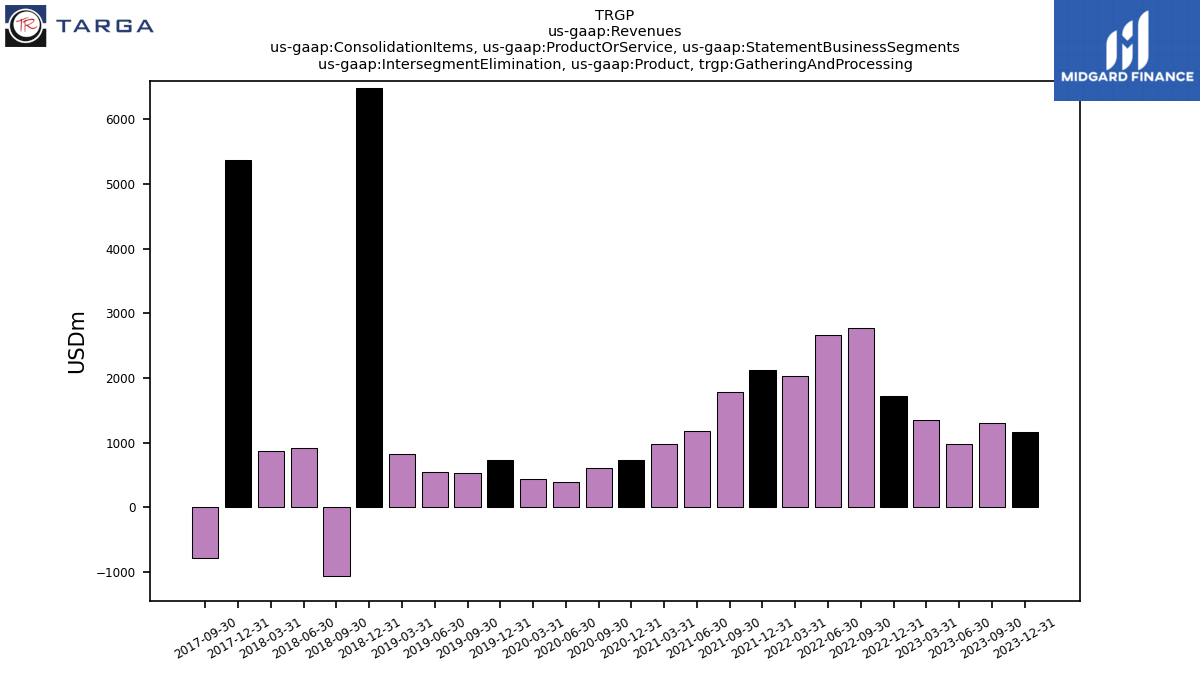
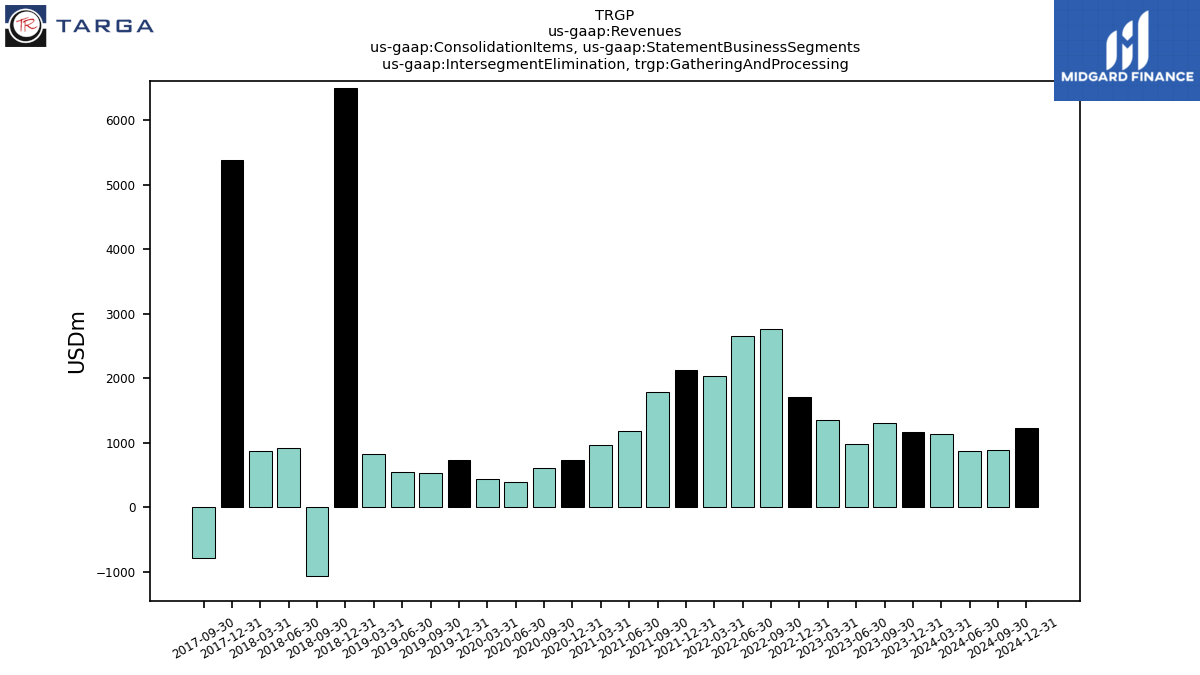
| Intersegment Elimination, Product, Gathering And Processing | 1164.50 | 1298.80 | 976.00 | 1347.00 | 1714.00 | 2768.20 | 2656.60 | 2030.60 | 2127.50 | 1786.00 | 1184.70 | 969.70 | 728.90 | 611.90 | 389.20 | 443.20 | 731.90 | 534.00 | 539.70 | 822.80 | 6484.90 | -1069.70 | 913.00 | 866.50 | 5363.40 | -783.70 | NA | NA | |
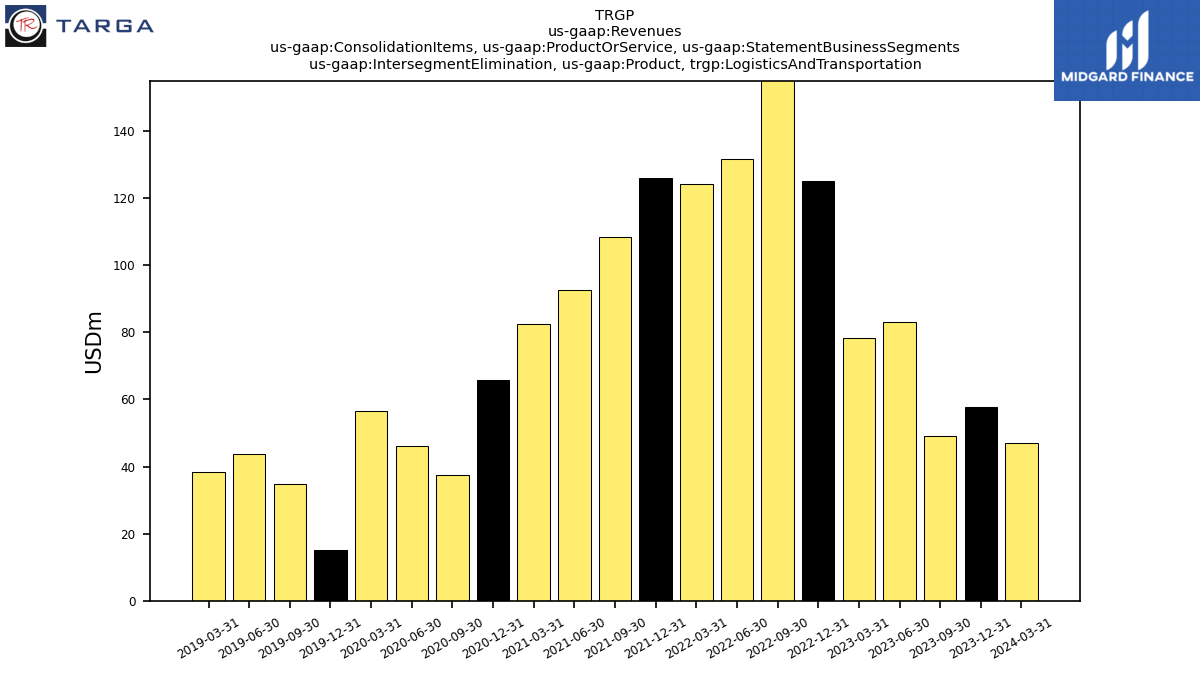
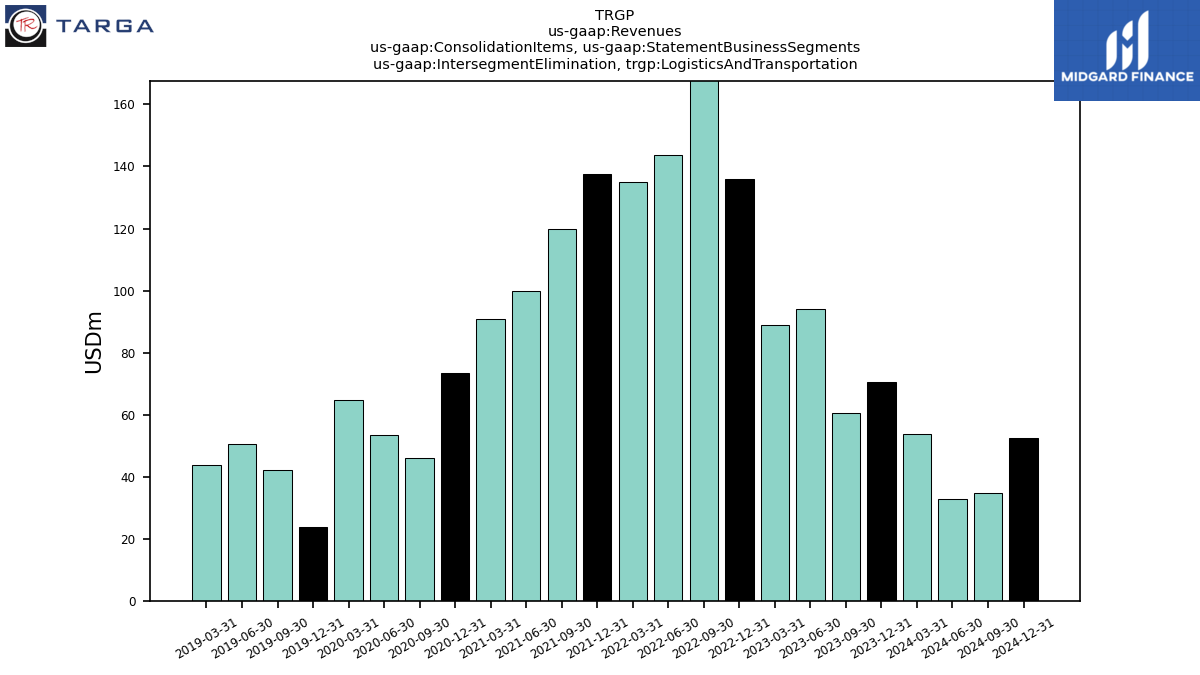
| Intersegment Elimination, Product, Logistics And Transportation | 57.70 | 49.00 | 83.00 | 78.20 | 125.20 | 160.70 | 131.60 | 124.30 | 126.00 | 108.30 | 92.60 | 82.50 | 65.80 | 37.40 | 46.10 | 56.50 | 15.20 | 34.90 | 43.60 | 38.40 | NA | NA | NA | NA | NA | NA | NA | NA | |
| Intersegment Elimination, Service, Corporate Non Segment And Inter Segment Elimination | -13.70 | -12.10 | -11.50 | -11.30 | -11.40 | -11.90 | -11.50 | -11.10 | -12.30 | -12.10 | -8.00 | -9.80 | -9.30 | -10.20 | -8.80 | -9.90 | -10.70 | -9.30 | -8.50 | -7.40 | -8.30 | -10.00 | -10.10 | -8.80 | -8.70 | -8.70 | NA | NA | |
| Intersegment Elimination, Service, Gathering And Processing | 0.90 | 0.60 | 0.60 | 0.50 | 0.50 | 0.30 | -0.50 | 0.30 | 0.70 | 0.60 | 0.60 | 1.60 | 1.60 | 1.70 | 1.50 | 1.70 | 2.10 | 1.90 | 1.50 | 1.90 | 12.60 | -1.50 | 1.70 | 1.90 | 12.00 | -1.70 | NA | NA | |
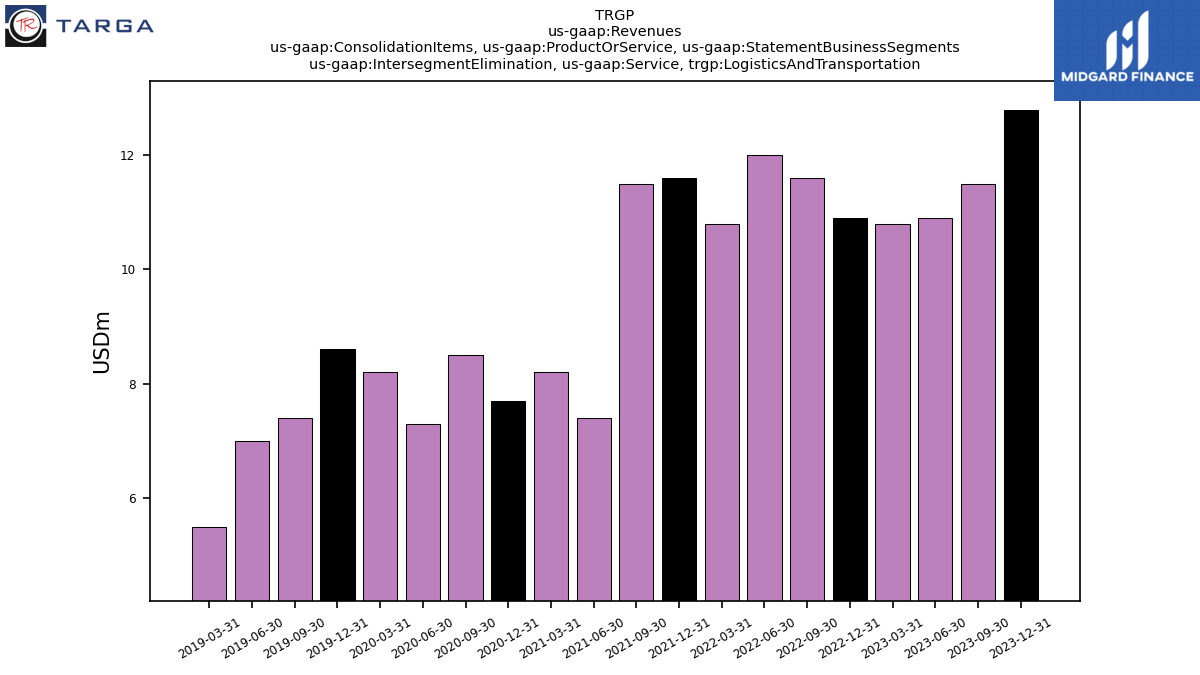
| Intersegment Elimination, Service, Logistics And Transportation | 12.80 | 11.50 | 10.90 | 10.80 | 10.90 | 11.60 | 12.00 | 10.80 | 11.60 | 11.50 | 7.40 | 8.20 | 7.70 | 8.50 | 7.30 | 8.20 | 8.60 | 7.40 | 7.00 | 5.50 | NA | NA | NA | NA | NA | NA | NA | NA | |
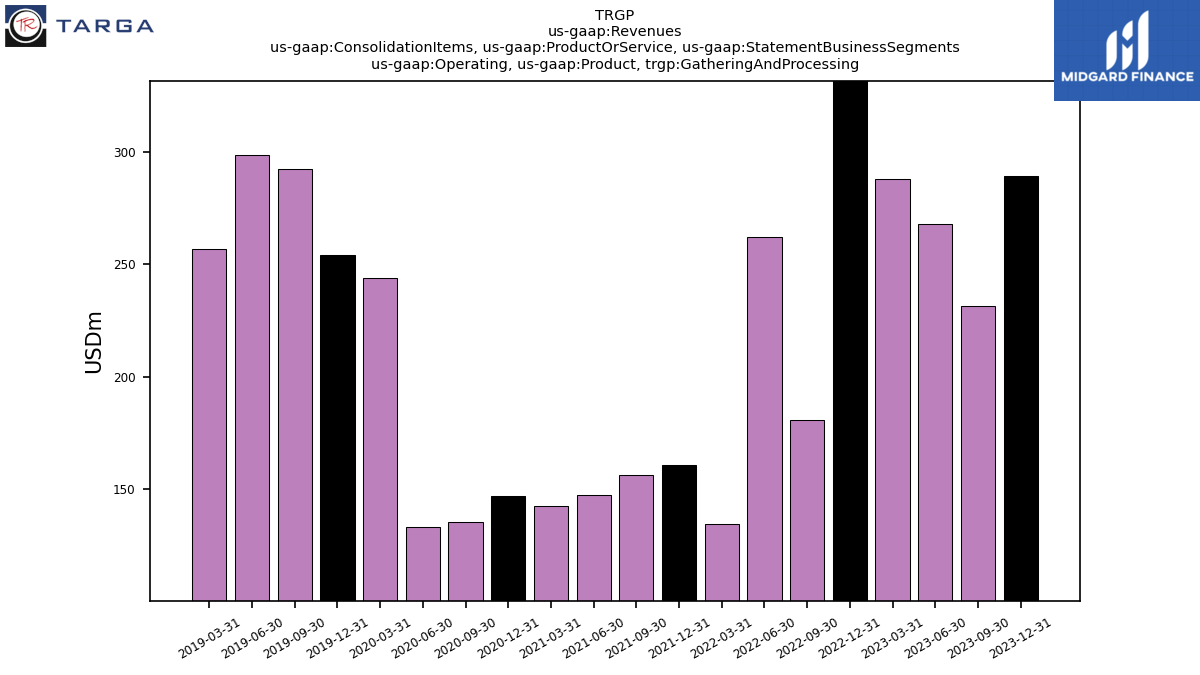
| Operating, Product, Gathering And Processing | 289.00 | 231.30 | 268.00 | 287.90 | 342.70 | 180.70 | 261.90 | 134.60 | 160.60 | 156.20 | 147.30 | 142.70 | 147.00 | 135.70 | 133.50 | 243.80 | 254.20 | 292.30 | 298.40 | 256.90 | NA | NA | NA | NA | NA | NA | NA | NA | |
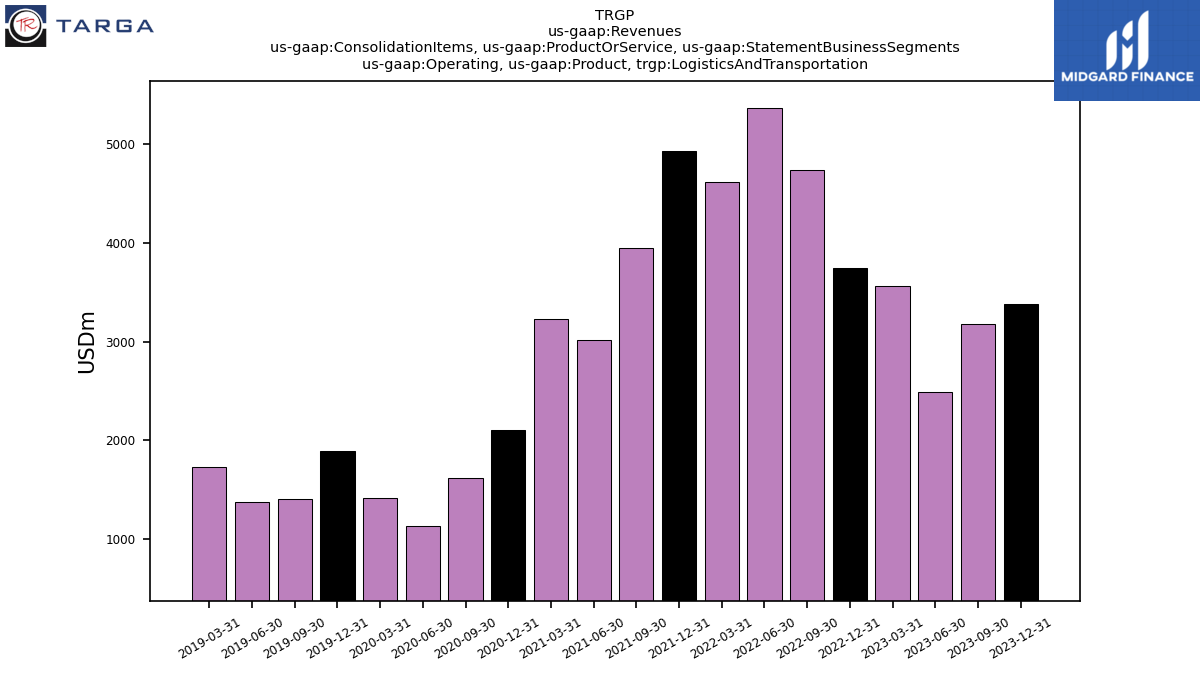
| Operating, Product, Logistics And Transportation | 3377.90 | 3176.50 | 2494.70 | 3561.30 | 3740.10 | 4731.80 | 5366.80 | 4609.90 | 4924.90 | 3948.40 | 3014.80 | 3223.50 | 2109.40 | 1616.50 | 1136.30 | 1419.60 | 1897.60 | 1403.10 | 1378.80 | 1726.80 | NA | NA | NA | NA | NA | NA | NA | NA | |
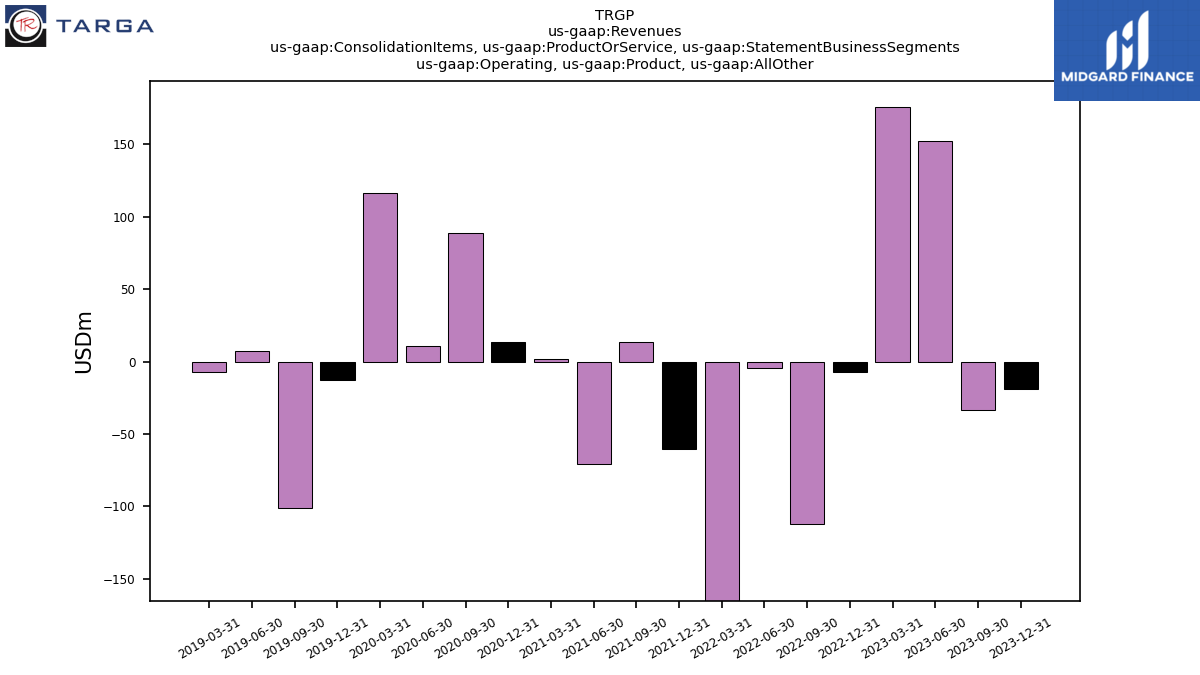
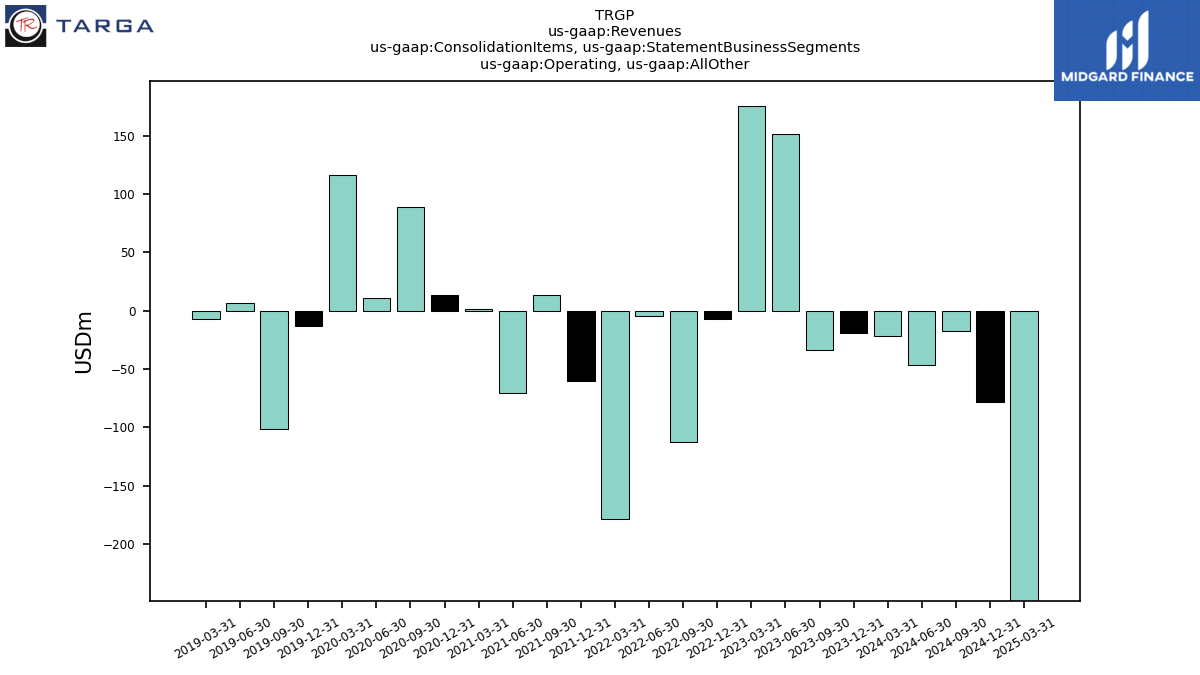
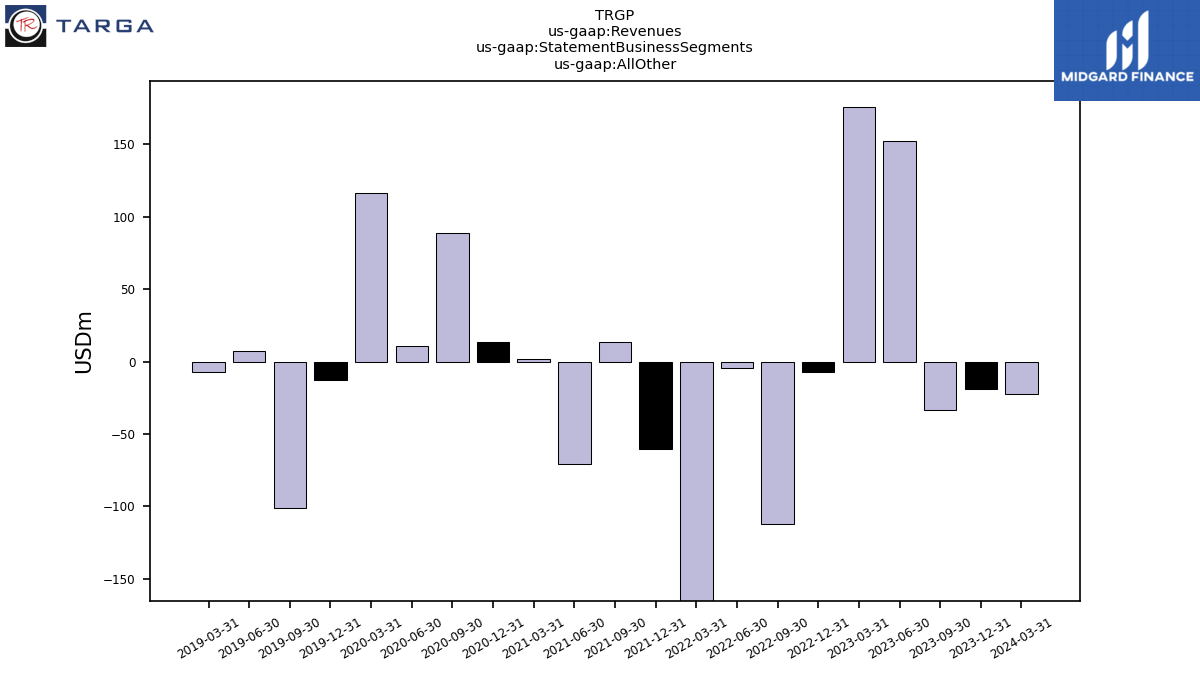
| Operating, Product, All Other | -18.80 | -33.50 | 151.90 | 175.80 | -7.50 | -112.20 | -4.50 | -178.30 | -60.30 | 13.50 | -70.50 | 1.50 | 13.80 | 88.60 | 10.80 | 116.30 | -12.80 | -101.20 | 7.00 | -7.20 | NA | NA | NA | NA | NA | NA | NA | NA | |
| Operating, Service, Gathering And Processing | 386.80 | 337.40 | 321.60 | 320.40 | 313.10 | 382.00 | 251.60 | 210.40 | 250.60 | 205.30 | 171.80 | 119.40 | 132.70 | 126.20 | 110.00 | 118.20 | 178.90 | 173.00 | 176.20 | 199.90 | 178.80 | 199.30 | 176.00 | 161.30 | 167.00 | 148.50 | NA | NA | |
| Operating, Service, Logistics And Transportation | 204.60 | 184.90 | 167.50 | 175.10 | 166.40 | 177.80 | 180.00 | 182.50 | 165.80 | 136.30 | 152.50 | 145.60 | 169.90 | 148.10 | 132.90 | 151.00 | 156.00 | 135.30 | 134.90 | 123.00 | NA | NA | NA | NA | NA | NA | NA | NA | |
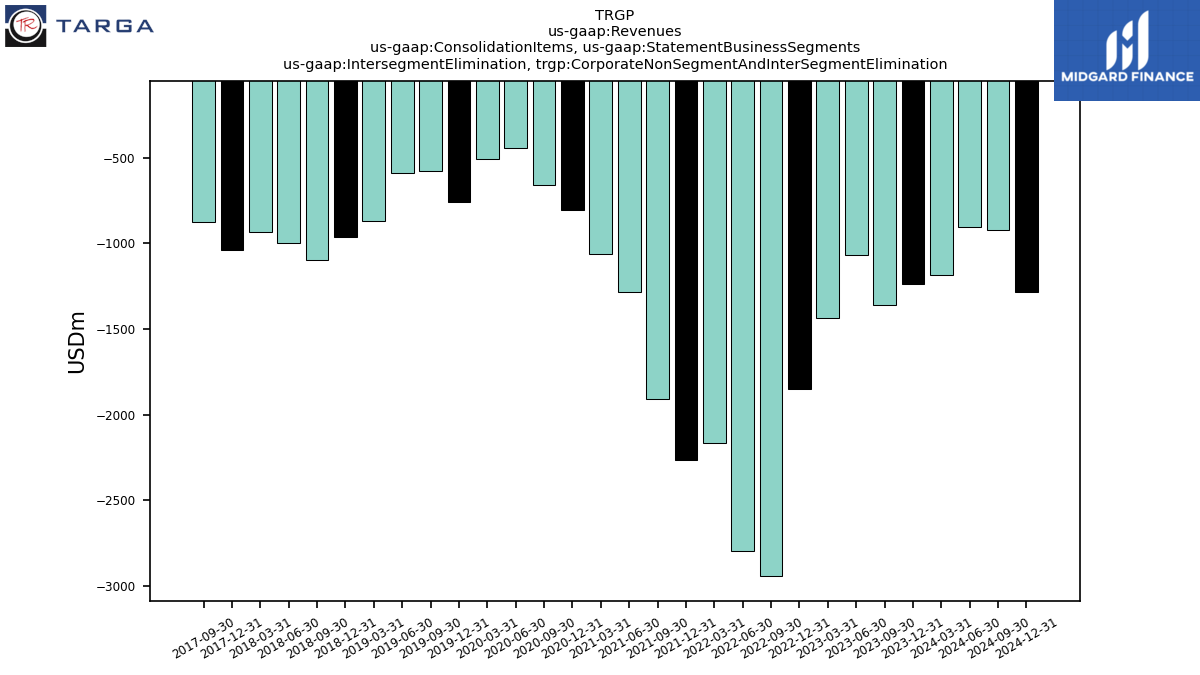
| Intersegment Elimination, Corporate Non Segment And Inter Segment Elimination | -1235.90 | -1359.90 | -1070.50 | -1436.50 | -1850.60 | -2940.80 | -2799.70 | -2166.00 | -2265.80 | -1906.40 | -1285.30 | -1062.00 | -804.00 | -659.50 | -444.10 | -509.60 | -757.80 | -578.20 | -591.80 | -868.60 | -965.50 | -1095.20 | -999.50 | -931.00 | -1037.80 | -873.00 | NA | NA | |
| Intersegment Elimination, Gathering And Processing | 1165.40 | 1299.40 | 976.60 | 1347.50 | 1714.50 | 2768.50 | 2656.10 | 2030.90 | 2128.20 | 1786.60 | 1185.30 | 971.30 | 730.50 | 613.60 | 390.70 | 444.90 | 734.00 | 535.90 | 541.20 | 824.70 | 6497.50 | -1071.20 | 914.70 | 868.40 | 5375.40 | -785.40 | NA | NA | |
| Intersegment Elimination, Logistics And Transportation | 70.50 | 60.50 | 93.90 | 89.00 | 136.10 | 172.30 | 143.60 | 135.10 | 137.60 | 119.80 | 100.00 | 90.70 | 73.50 | 45.90 | 53.40 | 64.70 | 23.80 | 42.30 | 50.60 | 43.90 | NA | NA | NA | NA | NA | NA | NA | NA | |
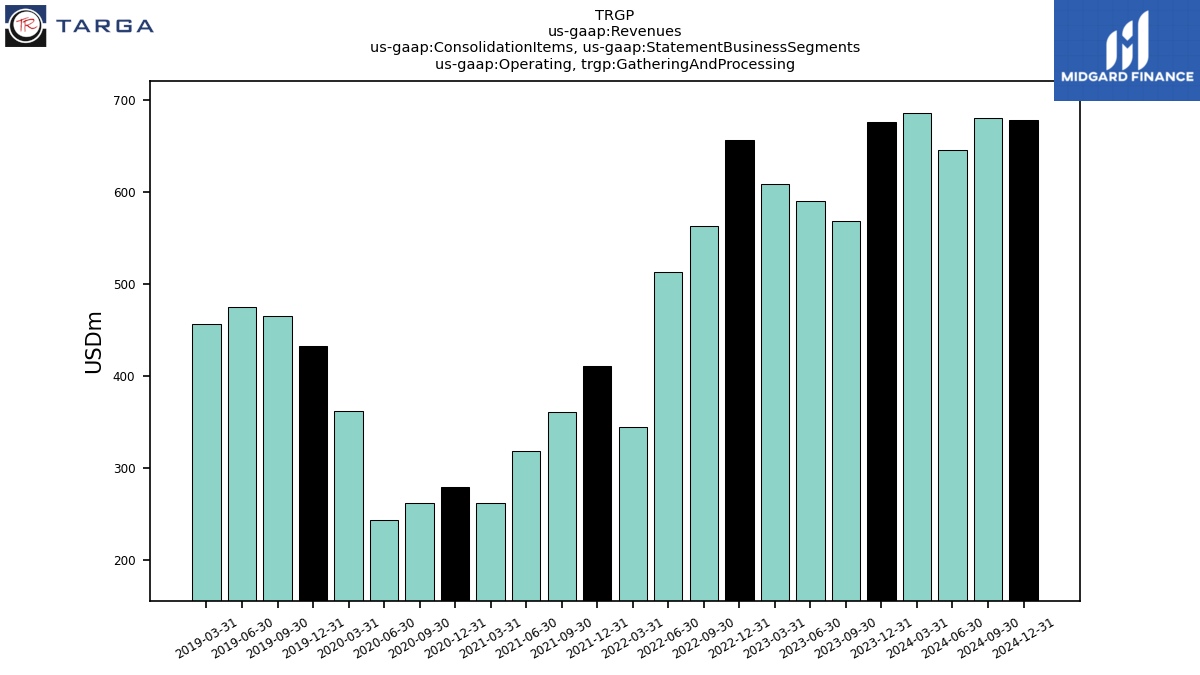
| Operating, Gathering And Processing | 675.80 | 568.70 | 589.60 | 608.30 | 655.80 | 562.70 | 513.50 | 345.00 | 411.20 | 361.50 | 319.10 | 262.10 | 279.70 | 261.90 | 243.50 | 362.00 | 433.10 | 465.30 | 474.60 | 456.80 | NA | NA | NA | NA | NA | NA | NA | NA | |
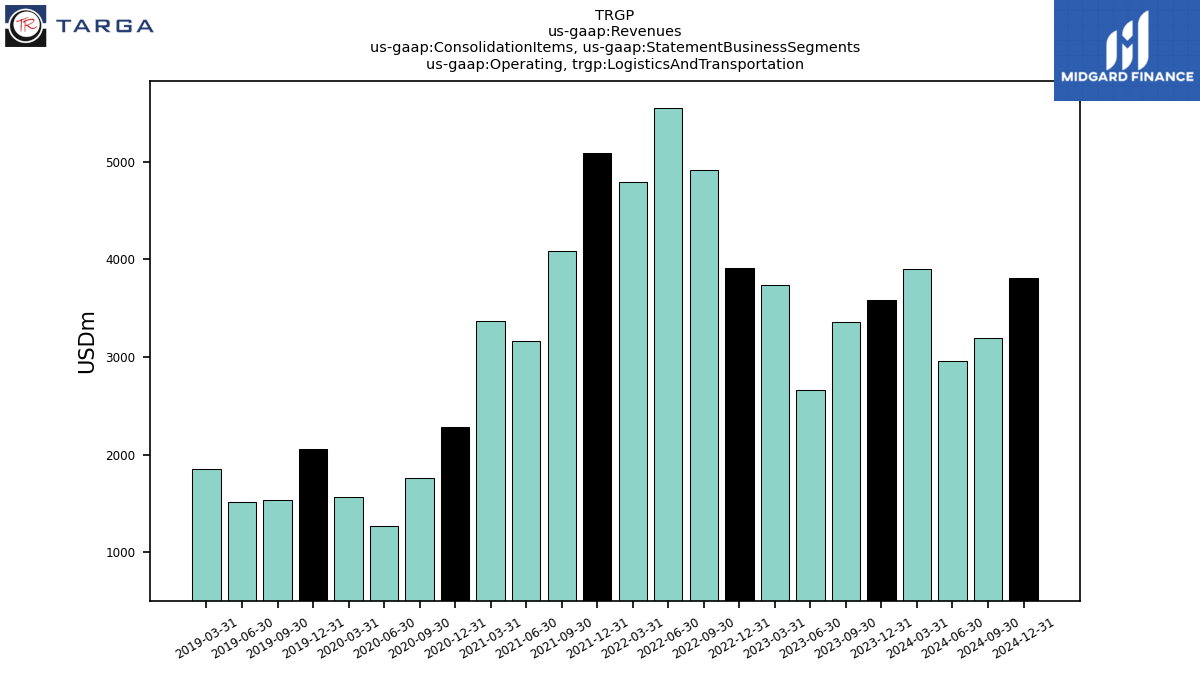
| Operating, Logistics And Transportation | 3582.50 | 3361.40 | 2662.20 | 3736.40 | 3906.50 | 4909.60 | 5546.80 | 4792.40 | 5090.70 | 4084.70 | 3167.30 | 3369.10 | 2279.30 | 1764.60 | 1269.20 | 1570.60 | 2053.60 | 1538.40 | 1513.70 | 1849.80 | NA | NA | NA | NA | NA | NA | NA | NA | |
| Operating, All Other | -18.80 | -33.50 | 151.90 | 175.80 | -7.50 | -112.20 | -4.50 | -178.30 | -60.30 | 13.50 | -70.50 | 1.50 | 13.80 | 88.60 | 10.80 | 116.30 | -12.80 | -101.20 | 7.00 | -7.20 | NA | NA | NA | NA | NA | NA | NA | NA | |
| Product | 3648.10 | 3374.30 | 2914.60 | 4025.00 | 4075.30 | 4800.30 | 5624.20 | 4566.20 | 5025.20 | 4118.10 | 3091.60 | 3367.70 | 2270.20 | 1840.80 | 1280.60 | 1779.70 | 2139.00 | 1594.20 | 1684.20 | 1976.50 | 2297.30 | 2654.10 | 2154.10 | 2173.70 | 2398.00 | 1871.50 | NA | NA | |
| Service | 591.40 | 522.30 | 489.10 | 495.50 | 479.50 | 559.80 | 431.60 | 392.90 | 416.40 | 341.60 | 324.30 | 265.00 | 302.60 | 274.30 | 242.90 | 269.20 | 334.90 | 308.30 | 311.10 | 322.90 | 300.40 | 332.30 | 290.30 | 281.90 | 304.80 | 260.30 | NA | NA | |
| Corporate Non Segment And Inter Segment Elimination | -1235.90 | -1359.90 | -1070.50 | -1436.50 | -1850.60 | -2940.80 | -2799.70 | -2166.00 | -2265.80 | -1906.40 | -1285.30 | -1062.00 | -804.00 | -659.50 | -444.10 | -509.60 | -757.80 | -578.20 | -591.80 | -868.60 | -965.50 | -1095.20 | -999.50 | -931.00 | -1037.80 | -873.00 | NA | NA | |
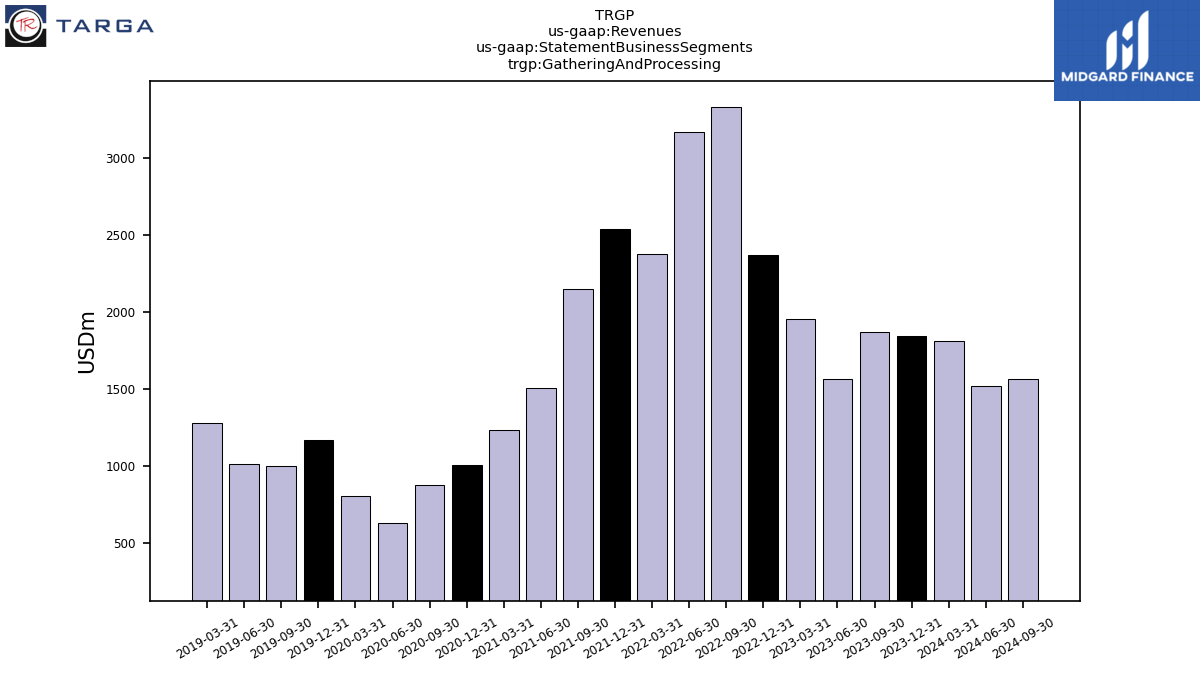
| Gathering And Processing | 1841.20 | 1868.10 | 1566.20 | 1955.80 | 2370.30 | 3331.20 | 3169.60 | 2375.90 | 2539.40 | 2148.10 | 1504.40 | 1233.40 | 1010.20 | 875.50 | 634.20 | 806.90 | 1167.10 | 1001.20 | 1015.80 | 1281.50 | NA | NA | NA | NA | NA | NA | NA | NA | |
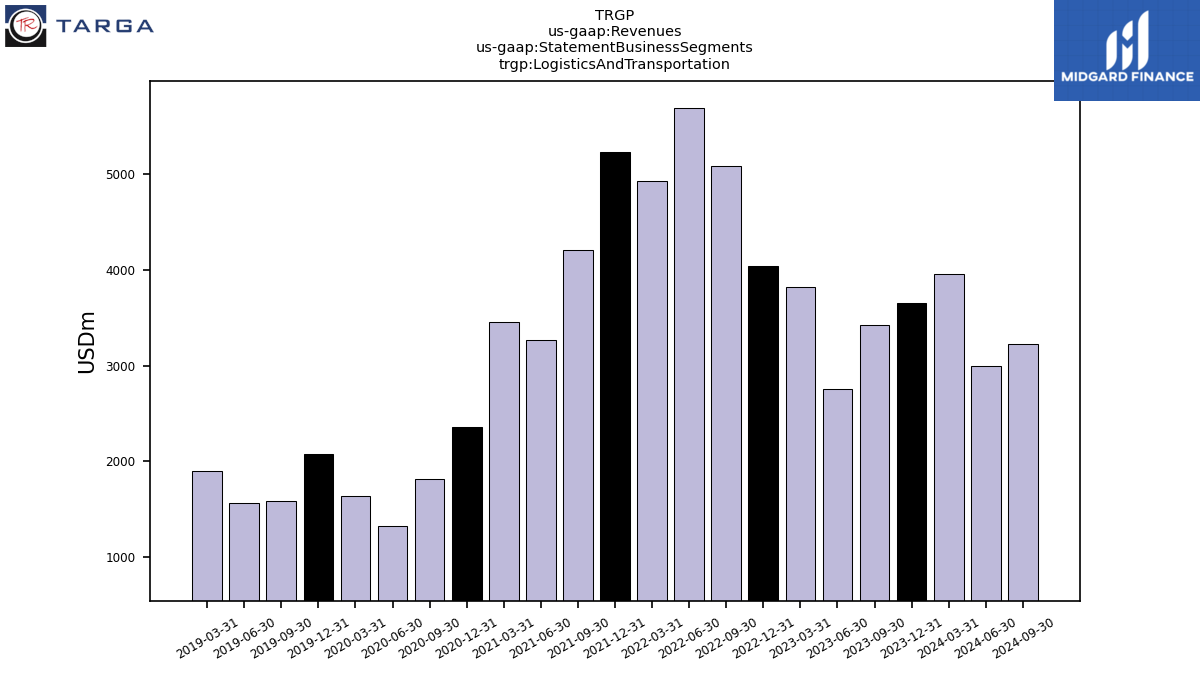
| Logistics And Transportation | 3653.00 | 3421.90 | 2756.10 | 3825.40 | 4042.60 | 5081.90 | 5690.40 | 4927.50 | 5228.30 | 4204.50 | 3267.30 | 3459.80 | 2352.80 | 1810.50 | 1322.60 | 1635.30 | 2077.40 | 1580.70 | 1564.30 | 1893.70 | NA | NA | NA | NA | NA | NA | NA | NA | |
| All Other | -18.80 | -33.50 | 151.90 | 175.80 | -7.50 | -112.20 | -4.50 | -178.30 | -60.30 | 13.50 | -70.50 | 1.50 | 13.80 | 88.60 | 10.80 | 116.30 | -12.80 | -101.20 | 7.00 | -7.20 | NA | NA | NA | NA | NA | NA | NA | NA | |
| Revenue From Contract With Customer Excluding Assessed Tax | 3640.40 | 3359.10 | 2719.60 | 3801.80 | 4087.30 | 5043.50 | 5800.90 | 4888.90 | 5187.20 | 4201.80 | 3201.80 | 3502.40 | 2310.60 | 1731.60 | 1212.30 | 1619.80 | 2473.90 | 1902.50 | 1995.30 | 2299.40 | 2597.60 | 2986.40 | 2444.40 | 2455.60 | 2702.80 | 2131.80 | 1867.70 | 2112.60 | |
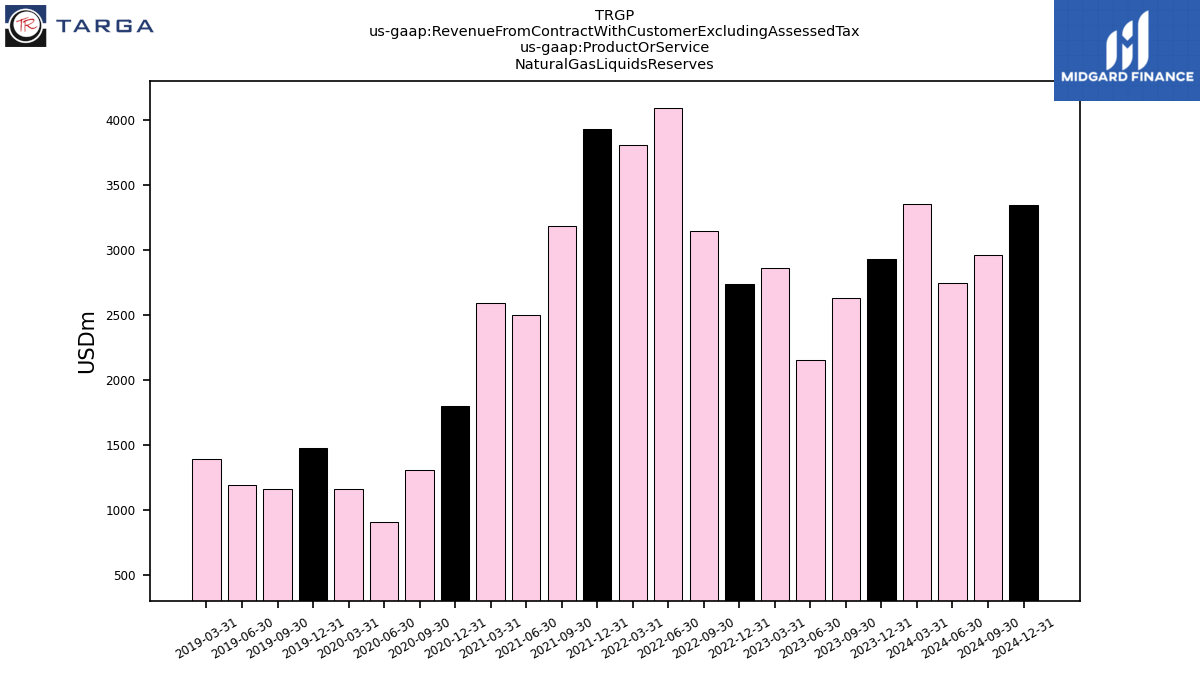
| 2928.60 | 2635.40 | 2151.70 | 2864.50 | 2736.90 | 3145.40 | 4096.40 | 3806.50 | 3932.40 | 3185.00 | 2499.10 | 2594.40 | 1799.30 | 1312.90 | 908.20 | 1161.00 | 1481.40 | 1160.50 | 1195.50 | 1396.60 | NA | NA | NA | NA | NA | NA | NA | NA | ||
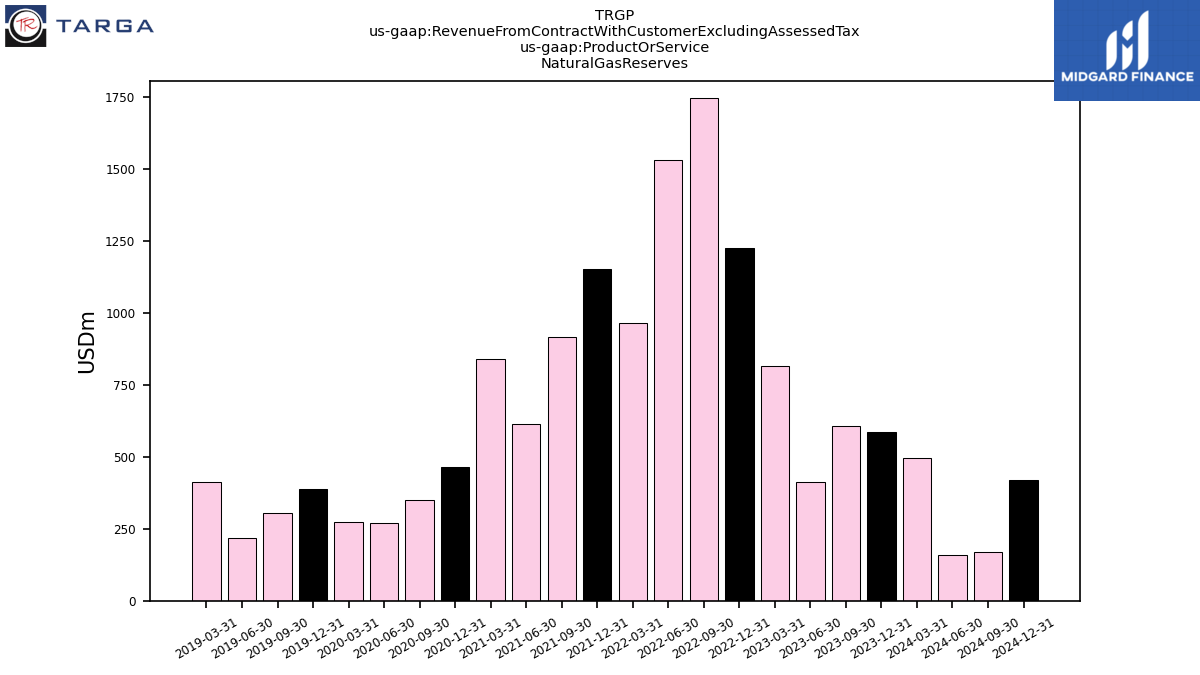
| 585.40 | 606.00 | 413.80 | 816.10 | 1226.10 | 1748.10 | 1531.70 | 964.30 | 1152.60 | 916.10 | 613.80 | 841.40 | 465.10 | 351.10 | 269.70 | 273.30 | 387.50 | 305.30 | 217.60 | 411.30 | NA | NA | NA | NA | NA | NA | NA | NA | ||
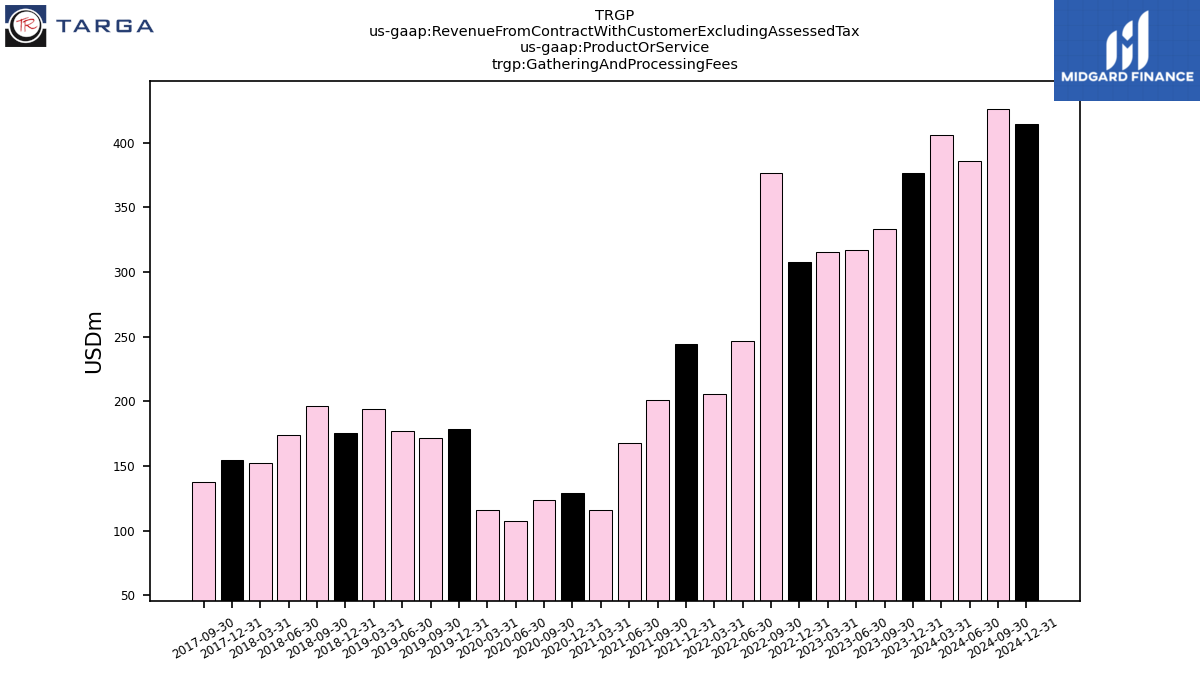
| Gathering And Processing Fees | 376.50 | 333.30 | 317.40 | 315.50 | 307.60 | 376.40 | 247.10 | 206.00 | 244.60 | 201.30 | 168.00 | 116.30 | 128.90 | 123.70 | 107.40 | 115.90 | 178.70 | 171.60 | 177.50 | 194.50 | 175.80 | 196.50 | 173.70 | 152.10 | 154.80 | 138.00 | NA | NA | |
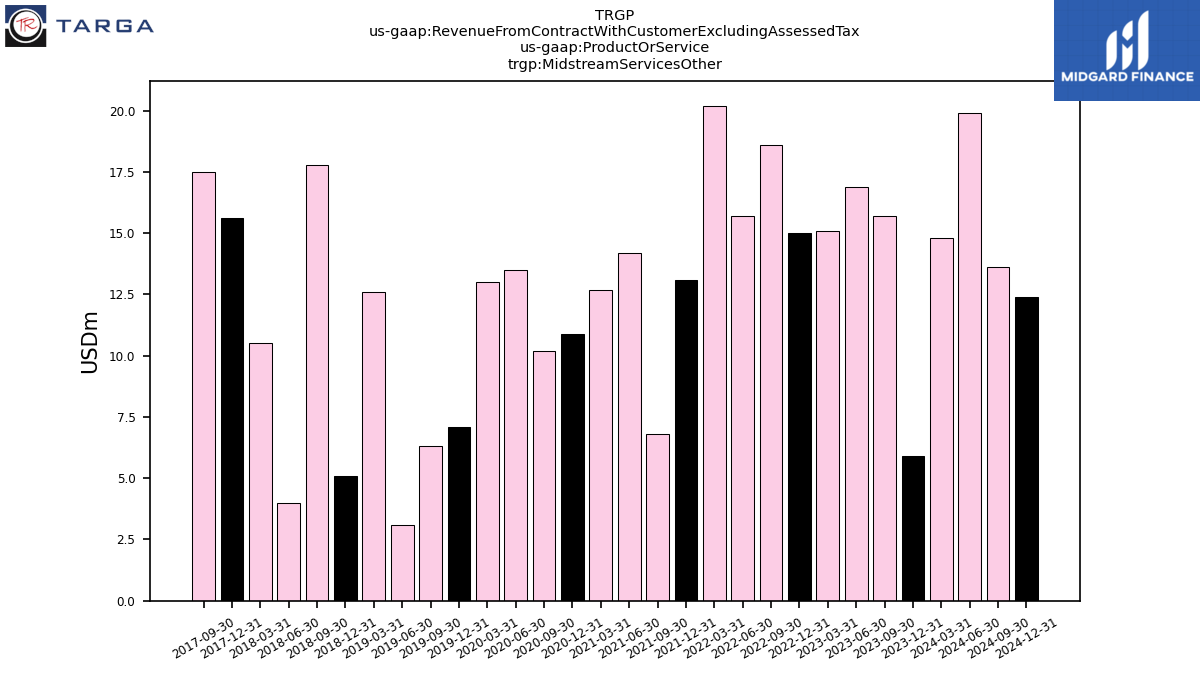
| Midstream Services Other | 5.90 | 15.70 | 16.90 | 15.10 | 15.00 | 18.60 | 15.70 | 20.20 | 13.10 | 6.80 | 14.20 | 12.70 | 10.90 | 10.20 | 13.50 | 13.00 | 7.10 | 6.30 | 3.10 | 12.60 | 5.10 | 17.80 | 4.00 | 10.50 | 15.60 | 17.50 | NA | NA | |
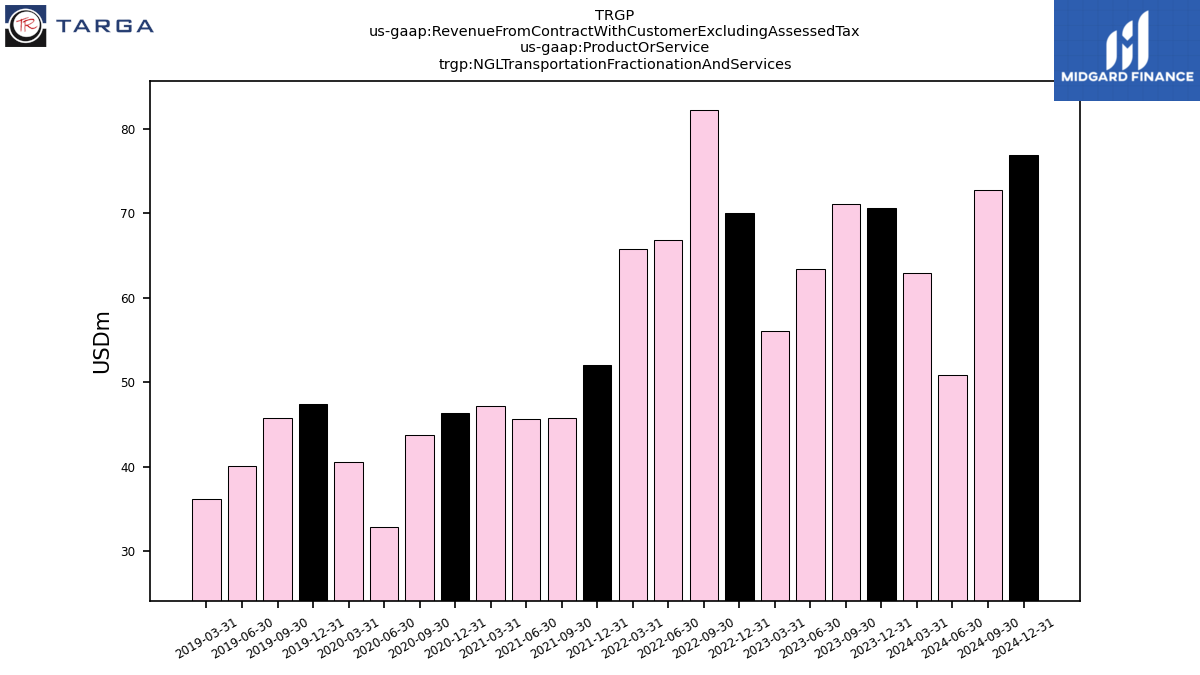
| N G L Transportation Fractionation And Services | 70.60 | 71.10 | 63.40 | 56.10 | 70.00 | 82.30 | 66.90 | 65.80 | 52.10 | 45.80 | 45.60 | 47.20 | 46.40 | 43.80 | 32.90 | 40.60 | 47.40 | 45.80 | 40.10 | 36.20 | NA | NA | NA | NA | NA | NA | NA | NA | |
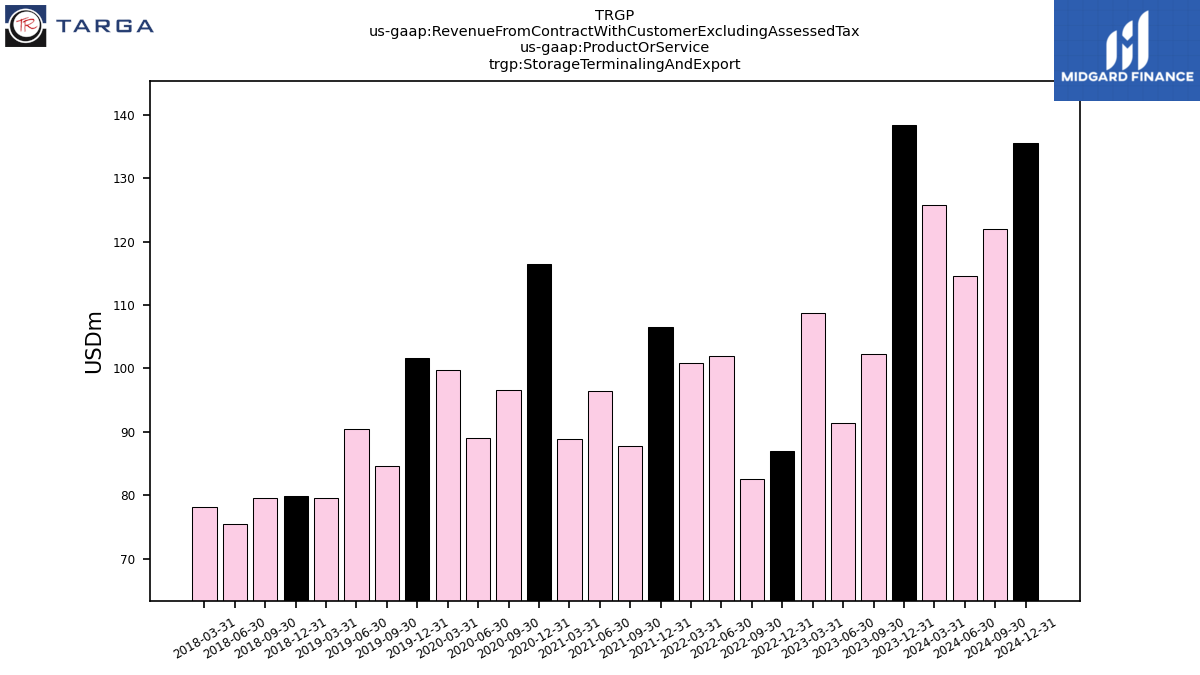
| Storage Terminaling And Export | 138.40 | 102.20 | 91.40 | 108.80 | 86.90 | 82.50 | 101.90 | 100.90 | 106.60 | 87.70 | 96.50 | 88.80 | 116.40 | 96.60 | 89.10 | 99.70 | 101.70 | 84.60 | 90.40 | 79.60 | 79.90 | 79.60 | 75.40 | 78.20 | NA | NA | NA | NA | |
| Oil And Condensate | 126.40 | 117.70 | 154.10 | 121.20 | 124.30 | 150.00 | 172.80 | 118.10 | 102.20 | 100.70 | 88.90 | 66.60 | 46.20 | 54.40 | 27.60 | 135.70 | 227.70 | 178.70 | 172.10 | 137.70 | NA | NA | NA | NA | NA | NA | NA | NA | |
| Service | 591.40 | 522.30 | 489.10 | 495.50 | 479.50 | 559.80 | 431.60 | 392.90 | 416.40 | 341.60 | 324.30 | 265.00 | 302.60 | 274.30 | 242.90 | 269.20 | 334.90 | 308.30 | 311.10 | 322.90 | 300.40 | 332.30 | 290.30 | 281.90 | 304.80 | 260.30 | NA | NA |
