
| 2023-12-31 | 2023-09-30 | 2023-06-30 | 2023-03-31 | 2022-12-31 | 2022-09-30 | 2022-06-30 | 2022-03-31 | 2021-12-31 | 2021-09-30 | 2021-06-30 | 2021-03-31 | 2020-12-31 | 2020-09-30 | 2020-06-30 | 2020-03-31 | 2019-12-31 | 2019-09-30 | 2019-06-30 | 2019-03-31 | 2018-12-31 | 2018-09-30 | 2018-06-30 | 2018-03-31 | 2017-12-31 | 2017-09-30 | 2017-06-30 | 2017-03-31 | 2016-12-31 | 2016-09-30 | 2016-06-30 | 2016-03-31 | 2015-12-31 | 2015-09-30 | 2015-06-30 | 2015-03-31 | 2014-12-31 | 2014-09-30 | 2014-06-30 | 2014-03-31 | 2013-12-31 | 2013-09-30 | 2013-06-30 | 2013-03-31 | 2012-12-31 | 2012-09-30 | 2012-06-30 | 2012-03-31 | 2011-12-31 | 2011-09-30 | 2011-06-30 | 2011-03-31 | 2010-12-31 | 2009-12-31 | ||
|---|---|---|---|---|---|---|---|---|---|---|---|---|---|---|---|---|---|---|---|---|---|---|---|---|---|---|---|---|---|---|---|---|---|---|---|---|---|---|---|---|---|---|---|---|---|---|---|---|---|---|---|---|---|---|---|
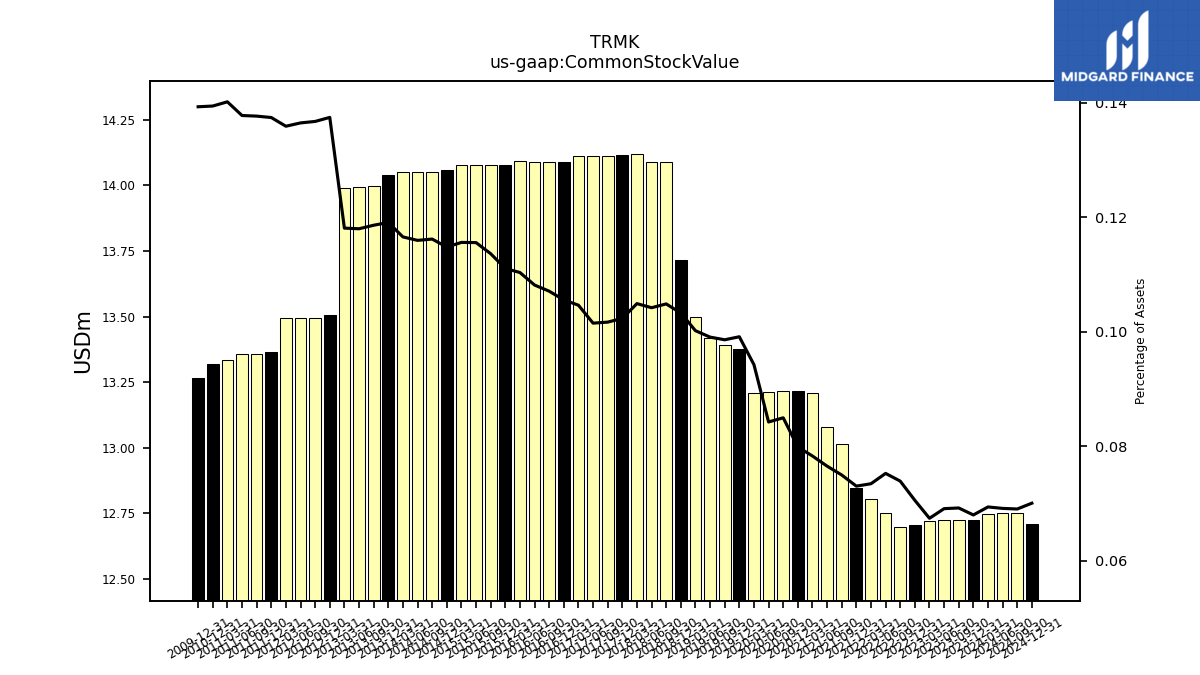
| Common Stock Value | 12.72 | 12.72 | 12.72 | 12.72 | 12.71 | 12.70 | 12.75 | 12.81 | 12.85 | 13.01 | 13.08 | 13.21 | 13.21 | 13.21 | 13.21 | 13.21 | 13.38 | 13.39 | 13.42 | 13.50 | 13.72 | 14.09 | 14.09 | 14.12 | 14.12 | 14.11 | 14.11 | 14.11 | 14.09 | 14.09 | 14.09 | 14.09 | 14.08 | 14.08 | 14.08 | 14.08 | 14.06 | 14.05 | 14.05 | 14.05 | 14.04 | 14.00 | 13.99 | 13.99 | 13.51 | 13.50 | 13.50 | 13.49 | 13.36 | 13.36 | 13.36 | 13.33 | 13.32 | 13.27 | |
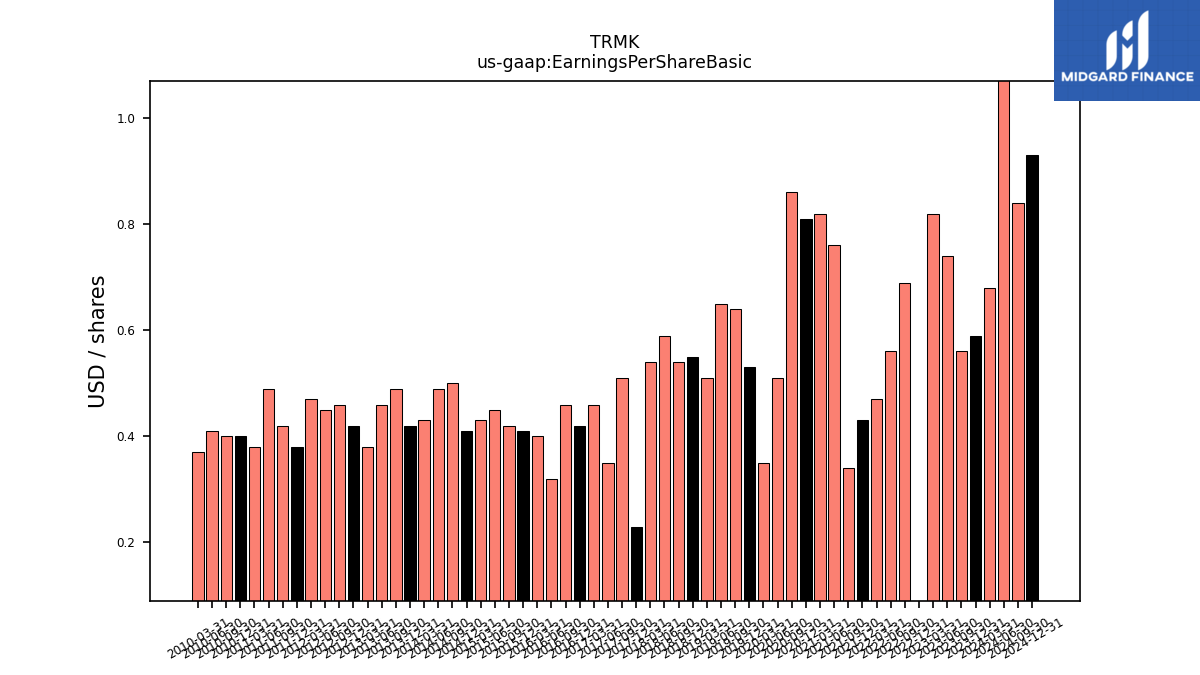
| Earnings Per Share Basic | 0.59 | 0.56 | 0.74 | 0.82 | -0.56 | 0.69 | 0.56 | 0.47 | 0.43 | 0.34 | 0.76 | 0.82 | 0.81 | 0.86 | 0.51 | 0.35 | 0.53 | 0.64 | 0.65 | 0.51 | 0.55 | 0.54 | 0.59 | 0.54 | 0.23 | 0.51 | 0.35 | 0.46 | 0.42 | 0.46 | 0.32 | 0.40 | 0.41 | 0.42 | 0.45 | 0.43 | 0.41 | 0.50 | 0.49 | 0.43 | 0.42 | 0.49 | 0.46 | 0.38 | 0.42 | 0.46 | 0.45 | 0.47 | 0.38 | 0.42 | 0.49 | 0.38 | 0.40 | NA | |
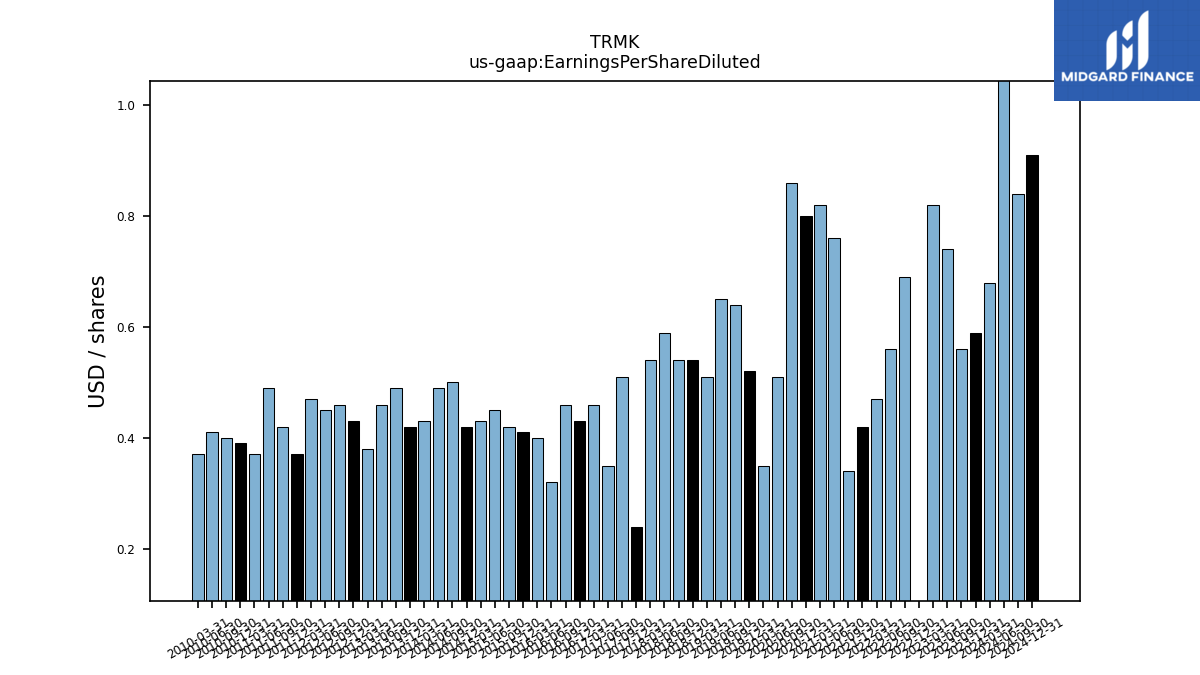
| Earnings Per Share Diluted | 0.59 | 0.56 | 0.74 | 0.82 | -0.55 | 0.69 | 0.56 | 0.47 | 0.42 | 0.34 | 0.76 | 0.82 | 0.80 | 0.86 | 0.51 | 0.35 | 0.52 | 0.64 | 0.65 | 0.51 | 0.54 | 0.54 | 0.59 | 0.54 | 0.24 | 0.51 | 0.35 | 0.46 | 0.43 | 0.46 | 0.32 | 0.40 | 0.41 | 0.42 | 0.45 | 0.43 | 0.42 | 0.50 | 0.49 | 0.43 | 0.42 | 0.49 | 0.46 | 0.38 | 0.43 | 0.46 | 0.45 | 0.47 | 0.37 | 0.42 | 0.49 | 0.37 | 0.39 | NA |
| 2023-12-31 | 2023-09-30 | 2023-06-30 | 2023-03-31 | 2022-12-31 | 2022-09-30 | 2022-06-30 | 2022-03-31 | 2021-12-31 | 2021-09-30 | 2021-06-30 | 2021-03-31 | 2020-12-31 | 2020-09-30 | 2020-06-30 | 2020-03-31 | 2019-12-31 | 2019-09-30 | 2019-06-30 | 2019-03-31 | 2018-12-31 | 2018-09-30 | 2018-06-30 | 2018-03-31 | 2017-12-31 | 2017-09-30 | 2017-06-30 | 2017-03-31 | 2016-12-31 | 2016-09-30 | 2016-06-30 | 2016-03-31 | 2015-12-31 | 2015-09-30 | 2015-06-30 | 2015-03-31 | 2014-12-31 | 2014-09-30 | 2014-06-30 | 2014-03-31 | 2013-12-31 | 2013-09-30 | 2013-06-30 | 2013-03-31 | 2012-12-31 | 2012-09-30 | 2012-06-30 | 2012-03-31 | 2011-12-31 | 2011-09-30 | 2011-06-30 | 2011-03-31 | 2010-12-31 | 2009-12-31 | ||
|---|---|---|---|---|---|---|---|---|---|---|---|---|---|---|---|---|---|---|---|---|---|---|---|---|---|---|---|---|---|---|---|---|---|---|---|---|---|---|---|---|---|---|---|---|---|---|---|---|---|---|---|---|---|---|---|
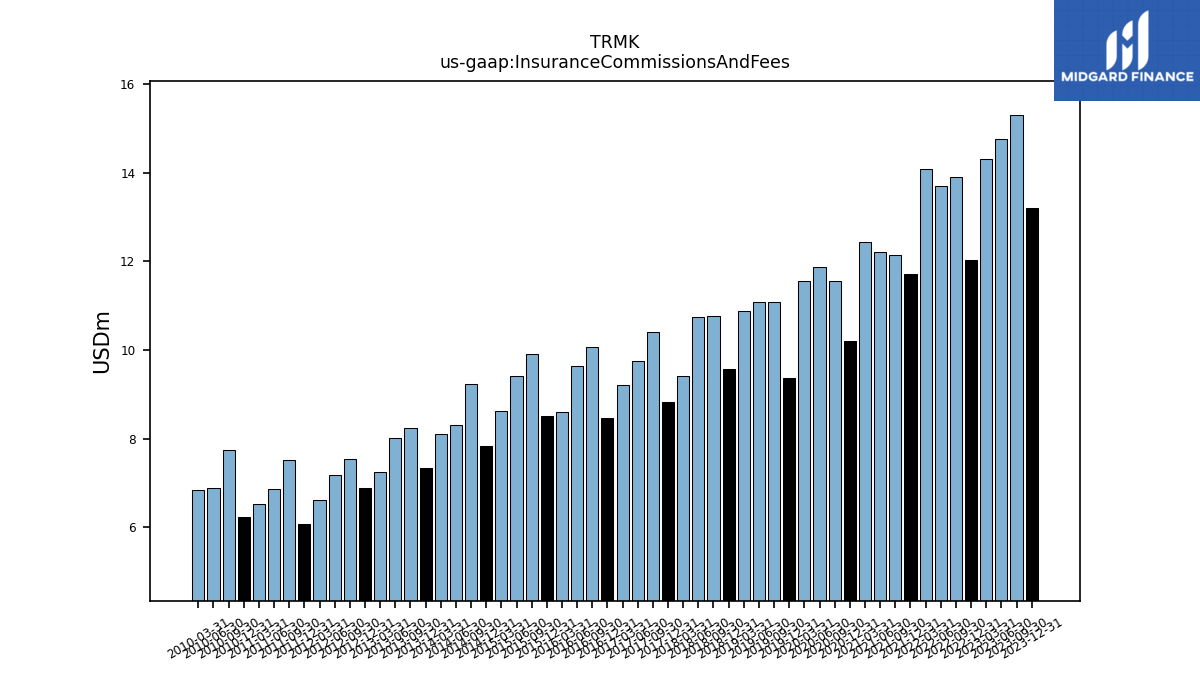
| Insurance Commissions And Fees | 13.20 | 15.30 | 14.76 | 14.30 | 12.02 | 13.91 | 13.70 | 14.09 | 11.72 | 12.13 | 12.22 | 12.45 | 10.20 | 11.56 | 11.87 | 11.55 | 9.36 | 11.07 | 11.09 | 10.87 | 9.56 | 10.77 | 10.73 | 9.42 | 8.81 | 10.40 | 9.74 | 9.21 | 8.46 | 10.07 | 9.64 | 8.59 | 8.50 | 9.91 | 9.40 | 8.62 | 7.83 | 9.24 | 8.30 | 8.10 | 7.34 | 8.23 | 8.01 | 7.24 | 6.89 | 7.53 | 7.18 | 6.61 | 6.08 | 7.52 | 6.86 | 6.51 | 6.22 | NA | |
| Litigation Settlement Expense | 0.00 | 6.50 | NA | NA | NA | NA | NA | NA | NA | NA | NA | NA | NA | NA | NA | NA | NA | NA | NA | NA | NA | NA | NA | NA | NA | NA | NA | NA | NA | NA | NA | NA | NA | NA | NA | NA | NA | NA | NA | NA | NA | NA | NA | NA | NA | NA | NA | NA | NA | NA | NA | NA | NA | NA | |
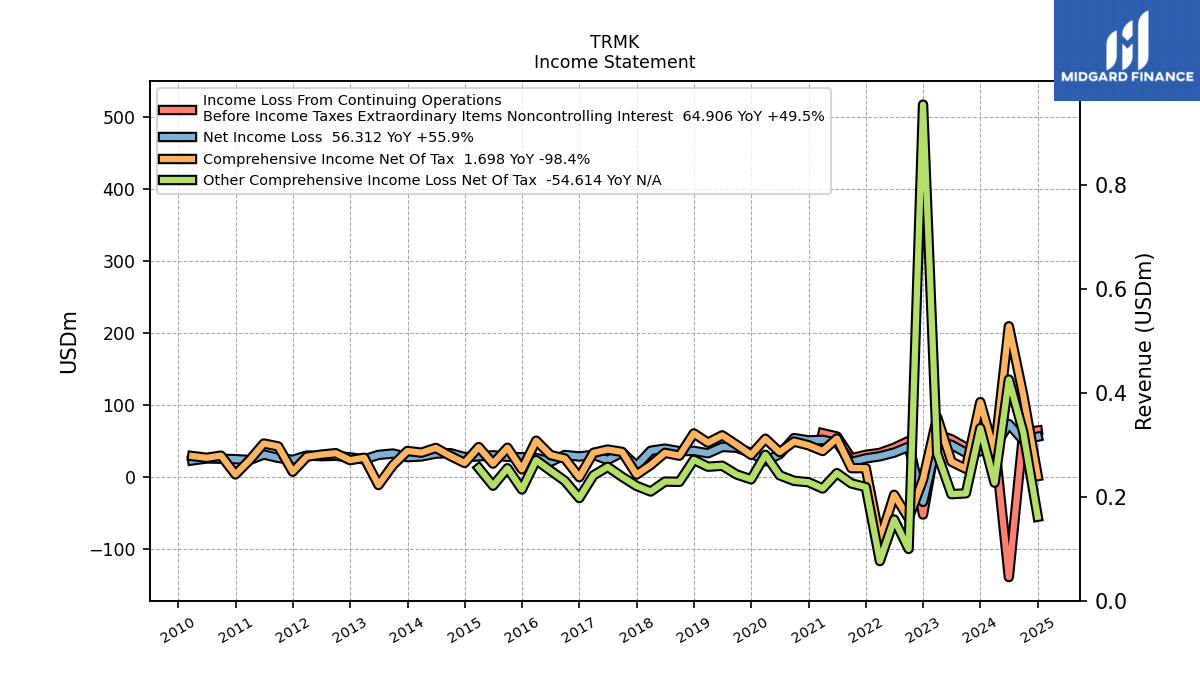
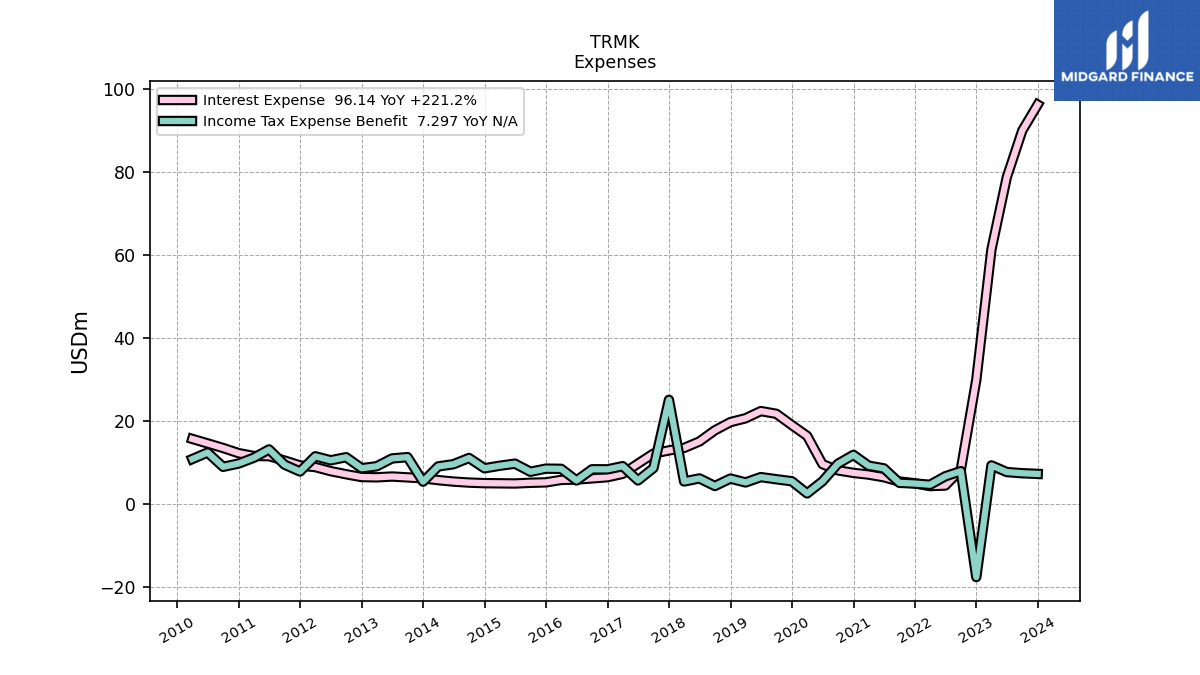
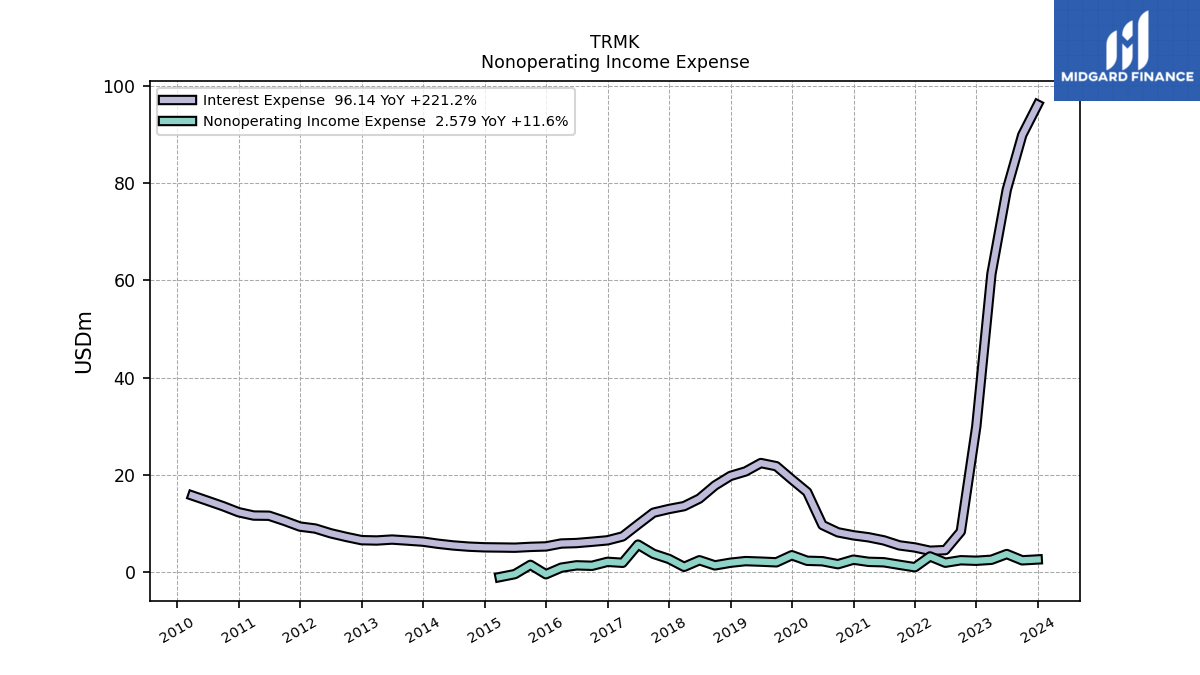
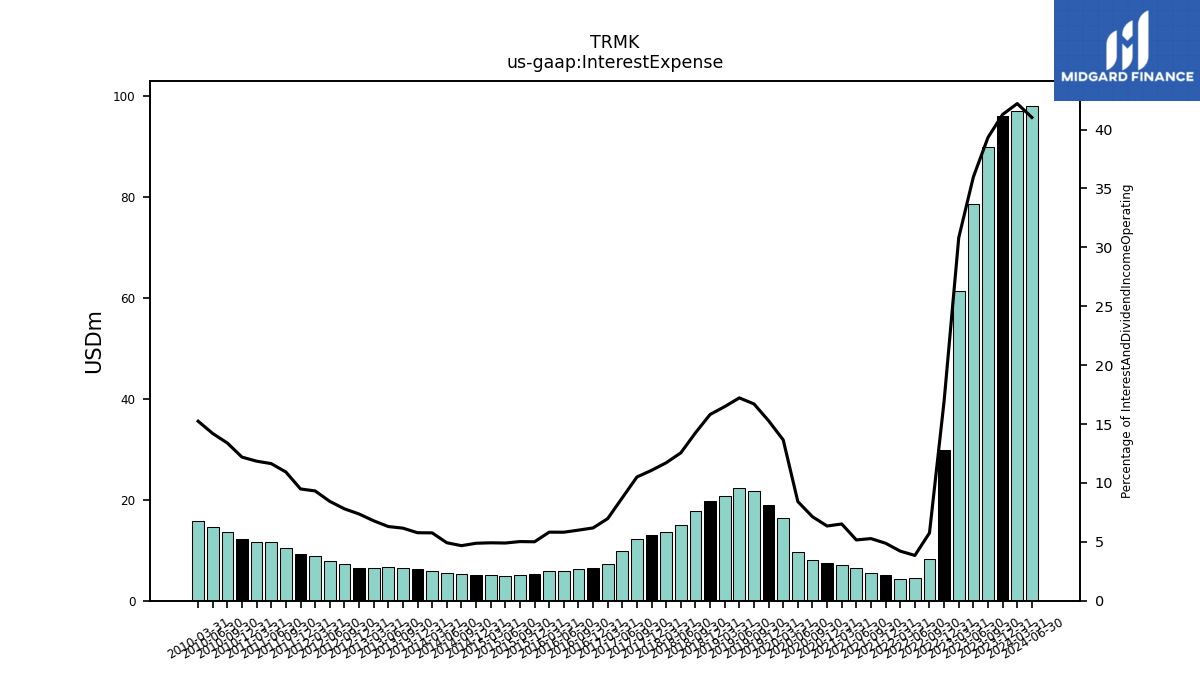
| Interest Expense | 96.14 | 89.89 | 78.62 | 61.30 | 29.93 | 8.32 | 4.51 | 4.37 | 5.05 | 5.47 | 6.50 | 7.14 | 7.55 | 8.16 | 9.65 | 16.44 | 19.05 | 21.76 | 22.41 | 20.68 | 19.76 | 17.79 | 15.10 | 13.55 | 12.96 | 12.20 | 9.77 | 7.32 | 6.51 | 6.22 | 5.95 | 5.86 | 5.26 | 5.16 | 5.00 | 5.04 | 5.08 | 5.21 | 5.46 | 5.80 | 6.24 | 6.46 | 6.67 | 6.48 | 6.55 | 7.22 | 7.97 | 8.94 | 9.34 | 10.51 | 11.57 | 11.61 | 12.30 | NA | |
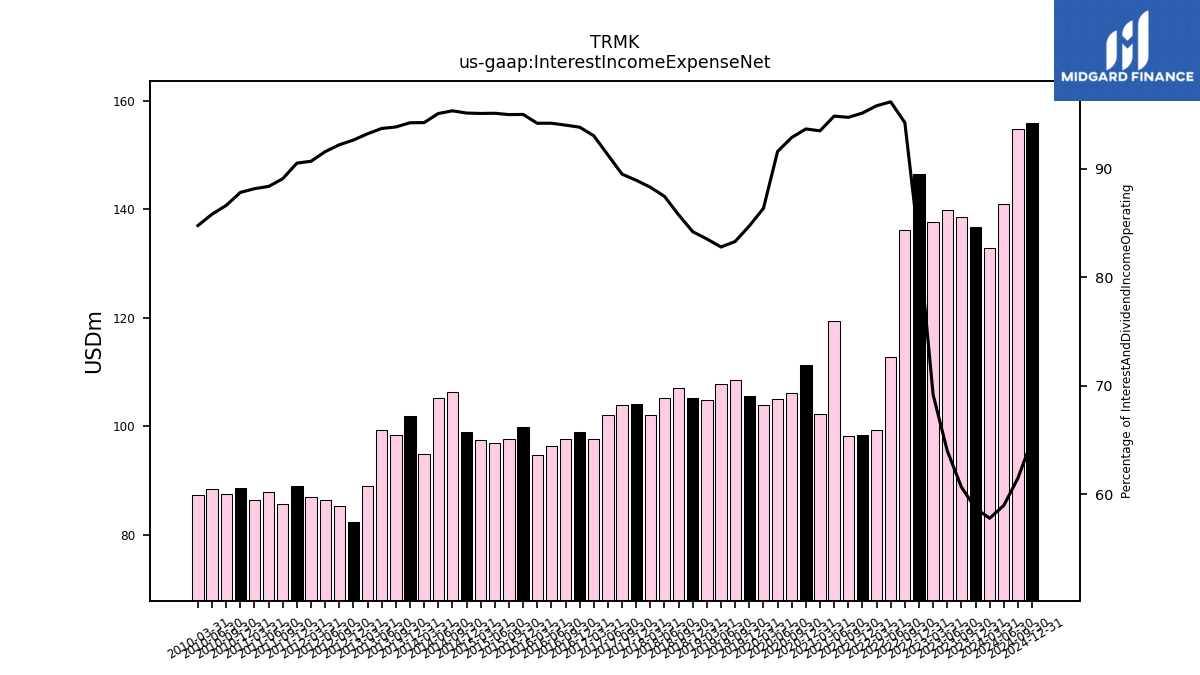
| Interest Income Expense Net | 136.74 | 138.64 | 139.90 | 137.59 | 146.58 | 136.10 | 112.68 | 99.34 | 98.33 | 98.27 | 119.42 | 102.34 | 111.38 | 106.21 | 105.00 | 103.95 | 105.59 | 108.47 | 107.72 | 104.81 | 105.18 | 106.98 | 105.16 | 102.09 | 104.04 | 103.91 | 102.00 | 97.59 | 98.85 | 97.56 | 96.38 | 94.74 | 99.82 | 97.61 | 96.95 | 97.39 | 98.92 | 106.23 | 105.29 | 94.90 | 101.86 | 98.43 | 99.23 | 88.97 | 82.32 | 85.28 | 86.45 | 86.94 | 89.06 | 85.68 | 87.83 | 86.38 | 88.55 | NA | |
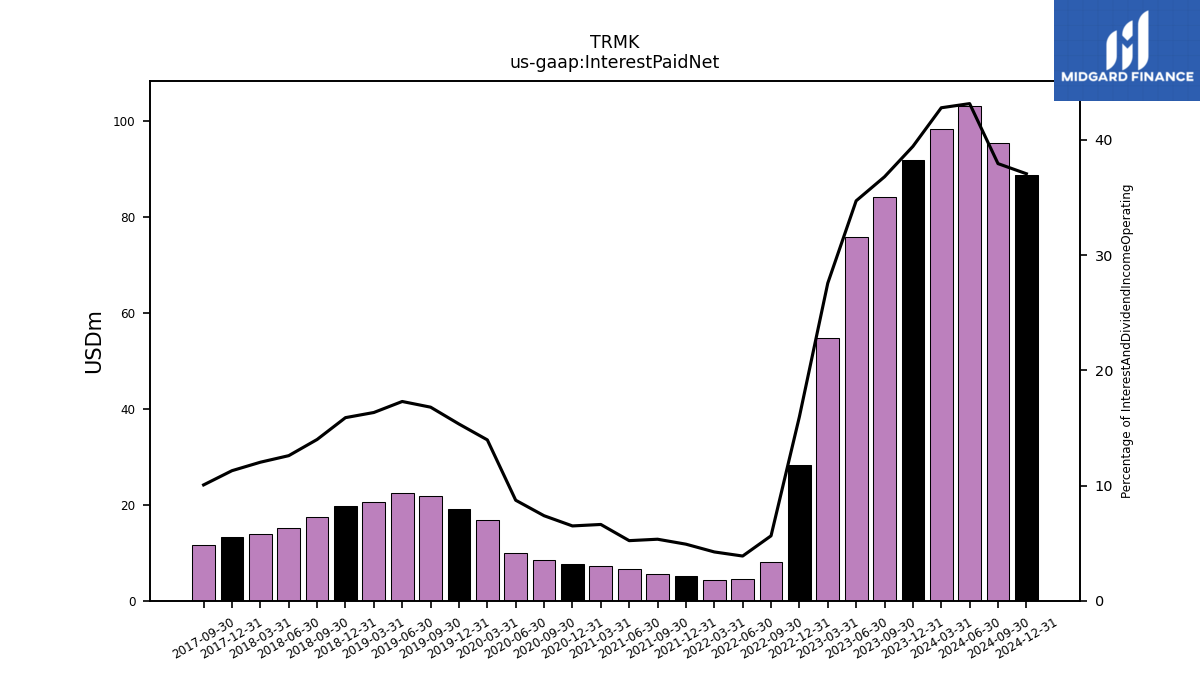
| Interest Paid Net | 91.82 | 84.08 | 75.84 | 54.82 | 28.20 | 8.14 | 4.55 | 4.39 | 5.08 | 5.54 | 6.57 | 7.25 | 7.72 | 8.44 | 10.00 | 16.81 | 19.12 | 21.88 | 22.50 | 20.50 | 19.85 | 17.46 | 15.14 | 13.90 | 13.21 | 11.67 | NA | NA | NA | NA | NA | NA | NA | NA | NA | NA | NA | NA | NA | NA | NA | NA | NA | NA | NA | NA | NA | NA | NA | NA | NA | NA | NA | NA | |
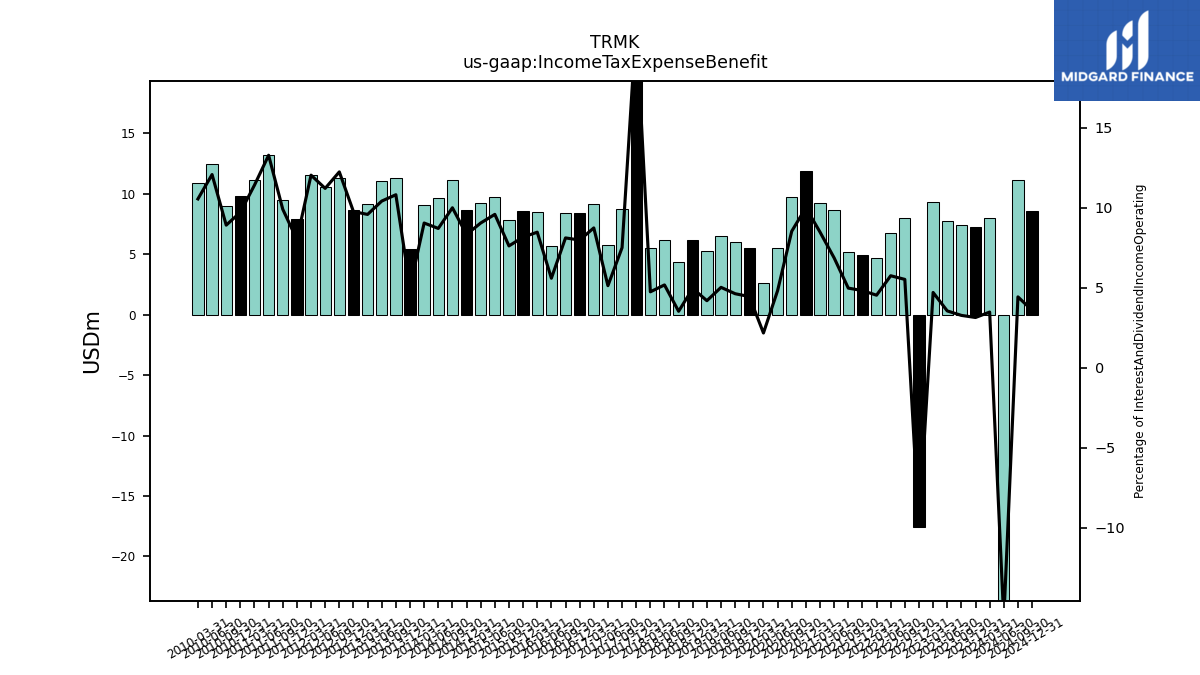
| Income Tax Expense Benefit | 7.30 | 7.46 | 7.75 | 9.34 | -17.53 | 7.96 | 6.73 | 4.70 | 4.98 | 5.16 | 8.64 | 9.28 | 11.88 | 9.75 | 5.52 | 2.61 | 5.54 | 6.02 | 6.53 | 5.25 | 6.18 | 4.39 | 6.22 | 5.48 | 25.12 | 8.71 | 5.73 | 9.16 | 8.40 | 8.41 | 5.72 | 8.52 | 8.57 | 7.82 | 9.77 | 9.26 | 8.65 | 11.14 | 9.63 | 9.10 | 5.44 | 11.34 | 11.02 | 9.14 | 8.67 | 11.32 | 10.58 | 11.54 | 7.88 | 9.53 | 13.20 | 11.18 | 9.79 | NA | |
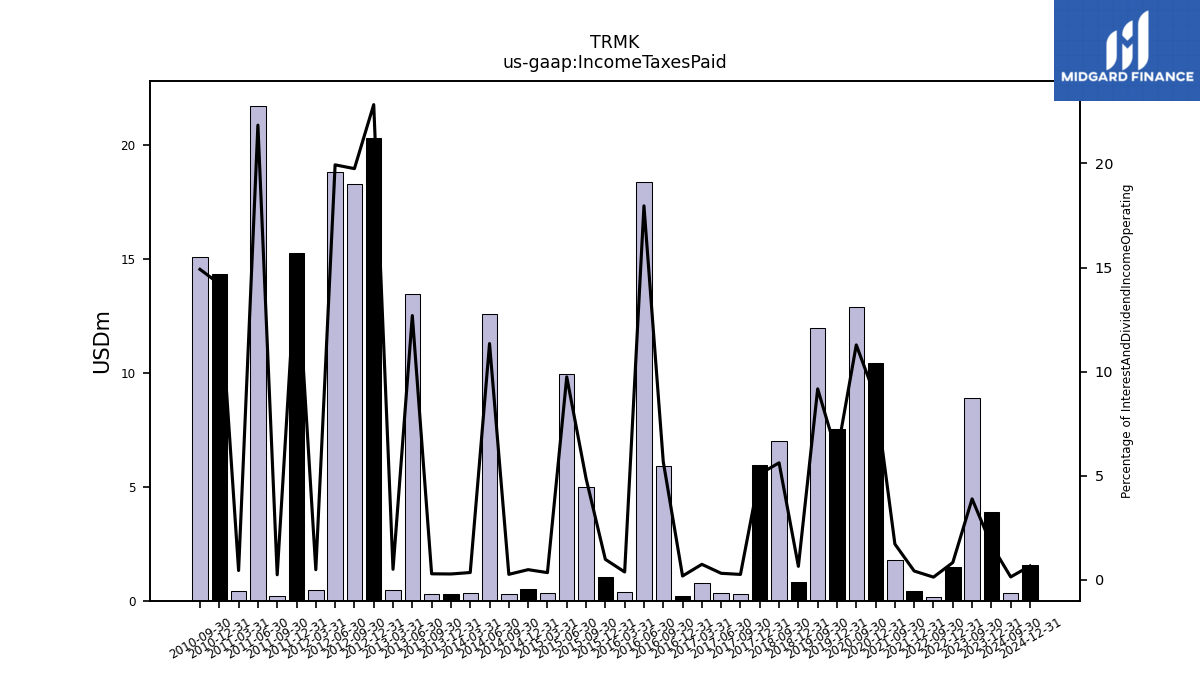
| Income Taxes Paid | 3.90 | 8.88 | NA | NA | 1.46 | 0.18 | NA | NA | 0.43 | 1.78 | NA | NA | 10.44 | 12.90 | NA | NA | 7.53 | 11.94 | NA | NA | 0.81 | 7.01 | NA | NA | 5.95 | 0.30 | 0.35 | 0.78 | 0.19 | 5.89 | 18.38 | 0.38 | 1.03 | 5.00 | 9.94 | 0.35 | 0.51 | 0.29 | 12.56 | 0.35 | 0.30 | 0.30 | 13.44 | 0.48 | 20.28 | 18.27 | 18.82 | 0.47 | 15.23 | 0.23 | 21.71 | 0.43 | 14.34 | NA | |
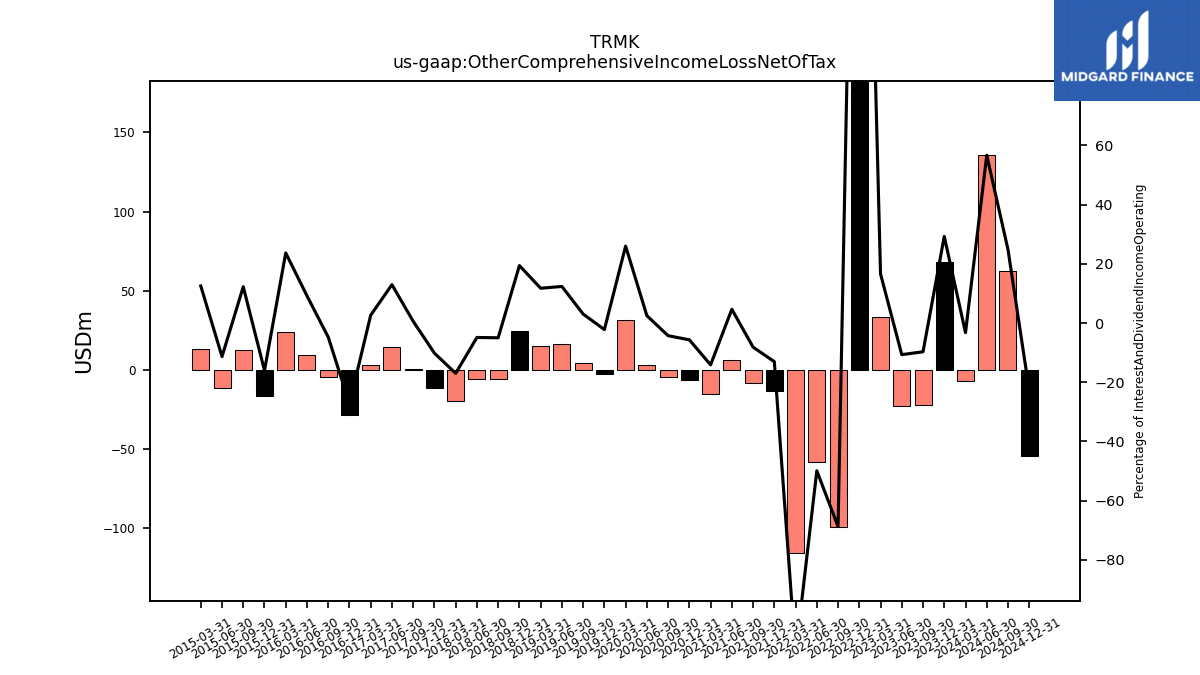
| Other Comprehensive Income Loss Net Of Tax | 68.17 | -22.18 | -23.32 | 33.02 | 516.70 | -99.27 | -58.49 | -116.10 | -13.48 | -8.44 | 5.87 | -15.46 | -6.74 | -4.88 | 2.87 | 31.30 | -2.74 | 3.96 | 16.10 | 14.76 | 24.27 | -6.21 | -5.85 | -19.64 | -11.90 | 0.68 | 14.50 | 2.79 | -28.72 | -4.91 | 9.41 | 23.82 | -16.81 | 12.61 | -11.54 | 12.83 | NA | NA | NA | NA | NA | NA | NA | NA | NA | NA | NA | NA | NA | NA | NA | NA | NA | NA | |
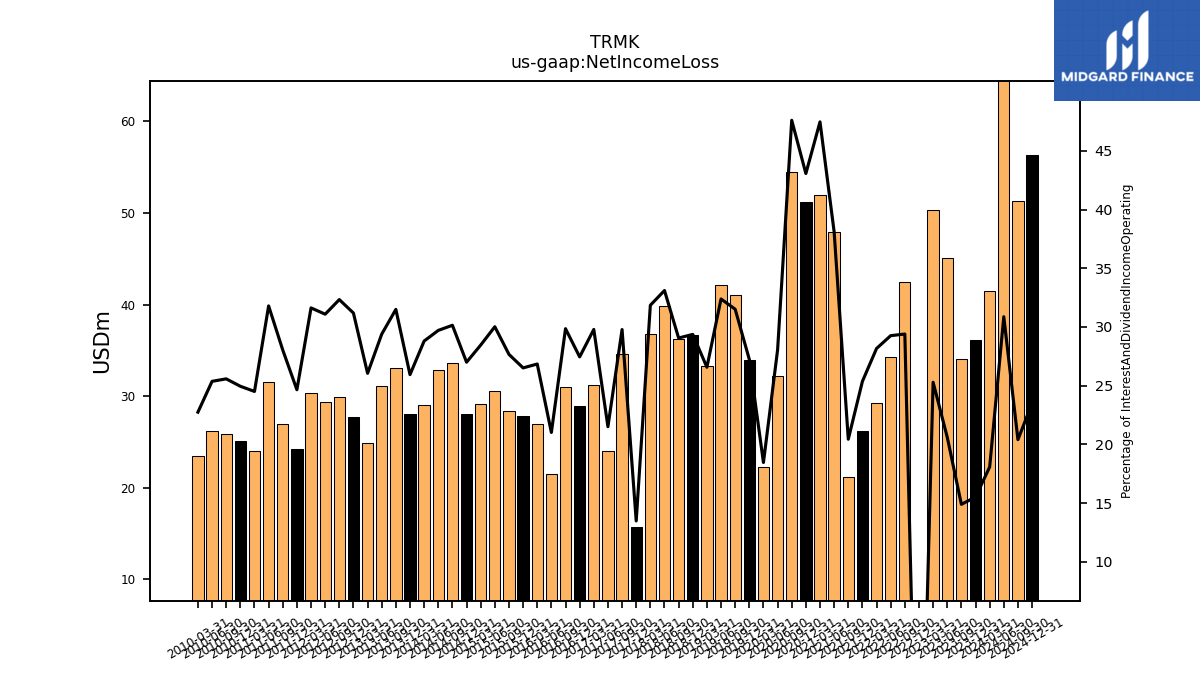
| Net Income Loss | 36.12 | 34.03 | 45.04 | 50.30 | -34.06 | 42.45 | 34.28 | 29.21 | 26.22 | 21.20 | 47.98 | 51.96 | 51.22 | 54.44 | 32.15 | 22.22 | 33.95 | 41.03 | 42.14 | 33.34 | 36.69 | 36.25 | 39.81 | 36.83 | 15.77 | 34.58 | 24.04 | 31.25 | 28.92 | 30.98 | 21.50 | 27.00 | 27.86 | 28.43 | 30.60 | 29.15 | 28.07 | 33.59 | 32.90 | 29.00 | 28.04 | 33.03 | 31.12 | 24.87 | 27.71 | 29.90 | 29.35 | 30.32 | 24.26 | 26.97 | 31.60 | 24.01 | 25.16 | NA | |
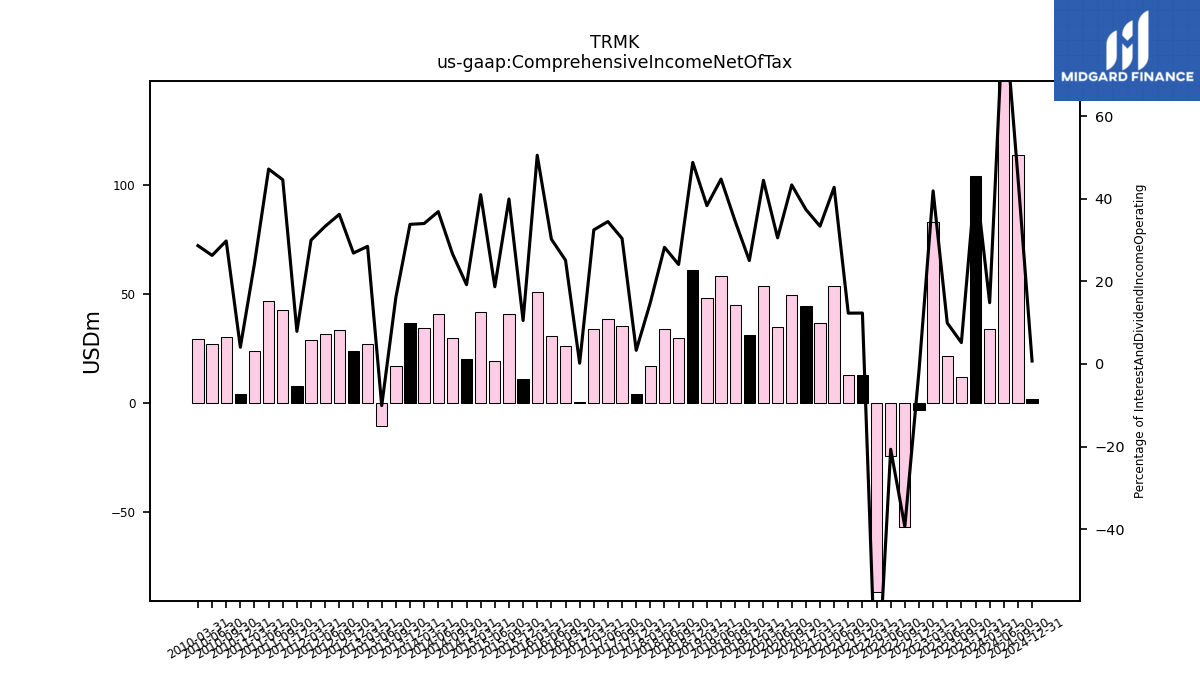
| Comprehensive Income Net Of Tax | 104.29 | 11.85 | 21.71 | 83.32 | -3.05 | -56.81 | -24.20 | -86.89 | 12.74 | 12.76 | 53.85 | 36.51 | 44.48 | 49.56 | 35.02 | 53.52 | 31.20 | 44.99 | 58.24 | 48.10 | 60.95 | 30.05 | 33.96 | 17.19 | 3.87 | 35.26 | 38.53 | 34.04 | 0.20 | 26.07 | 30.91 | 50.82 | 11.04 | 41.04 | 19.06 | 41.98 | 19.95 | 29.78 | 40.84 | 34.24 | 36.53 | 16.90 | -10.68 | 27.18 | 23.86 | 33.50 | 31.47 | 28.74 | 7.77 | 42.90 | 46.90 | 23.82 | 4.09 | NA | |
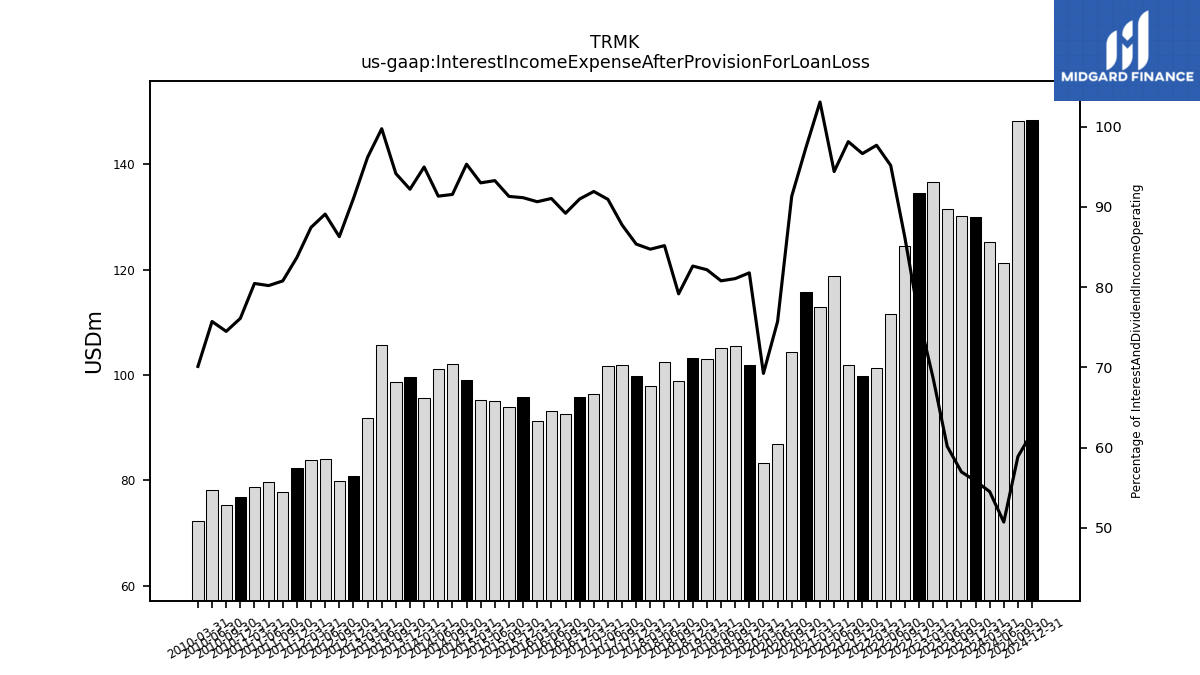
| Interest Income Expense After Provision For Loan Loss | 130.04 | 130.21 | 131.45 | 136.59 | 134.47 | 124.51 | 111.53 | 101.31 | 99.90 | 101.81 | 118.89 | 112.84 | 115.79 | 104.45 | 86.81 | 83.37 | 101.93 | 105.57 | 105.13 | 103.12 | 103.23 | 98.78 | 102.44 | 97.98 | 99.88 | 101.89 | 101.65 | 96.43 | 95.87 | 92.59 | 93.17 | 91.19 | 95.78 | 93.84 | 95.09 | 95.26 | 99.13 | 102.03 | 101.15 | 95.65 | 99.67 | 98.76 | 105.63 | 91.81 | 80.91 | 79.82 | 84.13 | 83.84 | 82.36 | 77.70 | 79.71 | 78.84 | 76.76 | NA | |
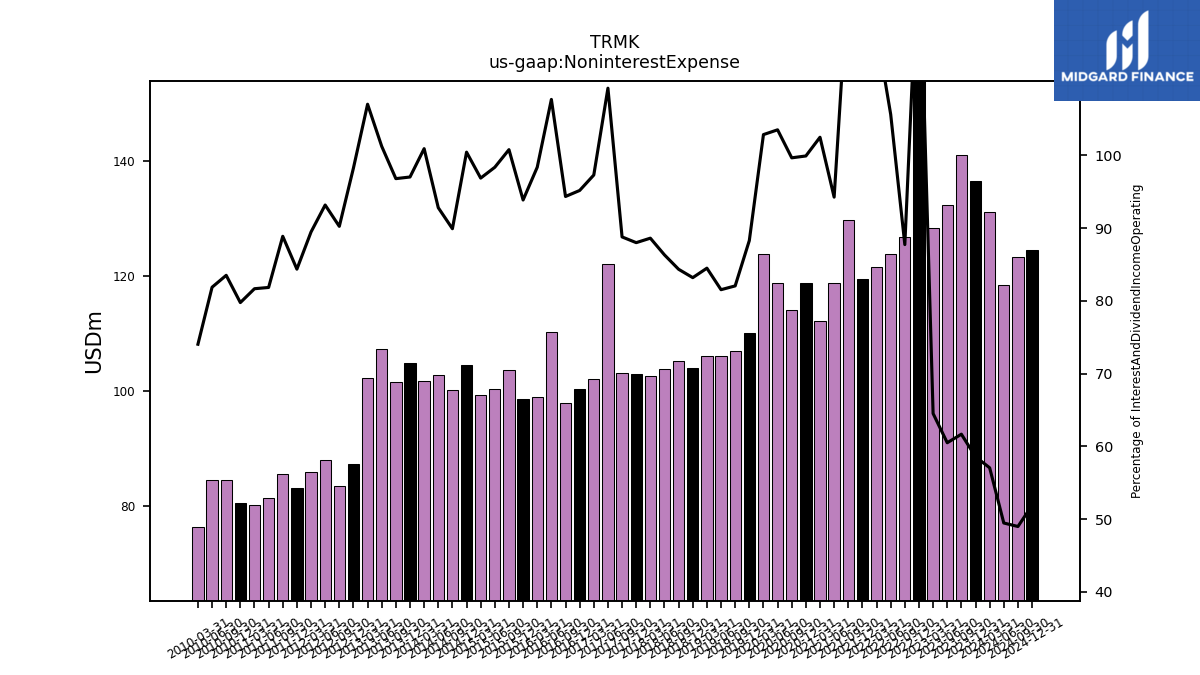
| Noninterest Expense | 136.43 | 140.94 | 132.22 | 128.33 | 231.23 | 126.70 | 123.77 | 121.52 | 119.47 | 129.60 | 118.68 | 112.18 | 118.81 | 113.96 | 118.66 | 123.81 | 110.03 | 106.85 | 106.10 | 106.02 | 103.93 | 105.22 | 103.80 | 102.47 | 102.95 | 103.09 | 122.08 | 102.06 | 100.27 | 97.91 | 110.18 | 98.94 | 98.62 | 103.56 | 100.27 | 99.22 | 104.43 | 100.19 | 102.76 | 101.62 | 104.87 | 101.52 | 107.19 | 102.14 | 87.31 | 83.46 | 87.96 | 85.77 | 83.00 | 85.48 | 81.35 | 80.02 | 80.44 | NA | |
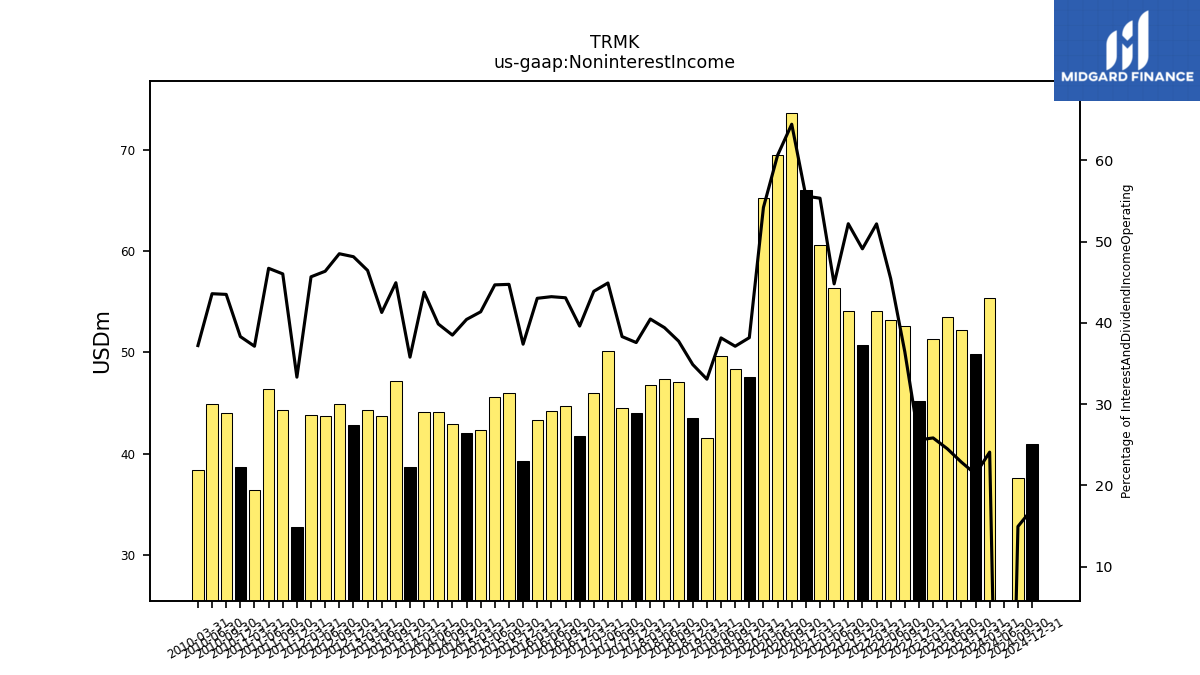
| Noninterest Income | 49.80 | 52.22 | 53.55 | 51.38 | 45.17 | 52.61 | 53.25 | 54.12 | 50.77 | 54.15 | 56.41 | 60.58 | 66.12 | 73.70 | 69.51 | 65.26 | 47.58 | 48.34 | 49.64 | 41.49 | 43.56 | 47.09 | 47.39 | 46.79 | 43.96 | 44.48 | 50.19 | 46.03 | 41.72 | 44.72 | 44.23 | 43.28 | 39.27 | 45.97 | 45.54 | 42.36 | 42.03 | 42.89 | 44.14 | 44.08 | 38.67 | 47.13 | 43.71 | 44.34 | 42.78 | 44.87 | 43.76 | 43.78 | 32.78 | 44.27 | 46.43 | 36.37 | 38.63 | NA |
| 2023-12-31 | 2023-09-30 | 2023-06-30 | 2023-03-31 | 2022-12-31 | 2022-09-30 | 2022-06-30 | 2022-03-31 | 2021-12-31 | 2021-09-30 | 2021-06-30 | 2021-03-31 | 2020-12-31 | 2020-09-30 | 2020-06-30 | 2020-03-31 | 2019-12-31 | 2019-09-30 | 2019-06-30 | 2019-03-31 | 2018-12-31 | 2018-09-30 | 2018-06-30 | 2018-03-31 | 2017-12-31 | 2017-09-30 | 2017-06-30 | 2017-03-31 | 2016-12-31 | 2016-09-30 | 2016-06-30 | 2016-03-31 | 2015-12-31 | 2015-09-30 | 2015-06-30 | 2015-03-31 | 2014-12-31 | 2014-09-30 | 2014-06-30 | 2014-03-31 | 2013-12-31 | 2013-09-30 | 2013-06-30 | 2013-03-31 | 2012-12-31 | 2012-09-30 | 2012-06-30 | 2012-03-31 | 2011-12-31 | 2011-09-30 | 2011-06-30 | 2011-03-31 | 2010-12-31 | 2009-12-31 | ||
|---|---|---|---|---|---|---|---|---|---|---|---|---|---|---|---|---|---|---|---|---|---|---|---|---|---|---|---|---|---|---|---|---|---|---|---|---|---|---|---|---|---|---|---|---|---|---|---|---|---|---|---|---|---|---|---|
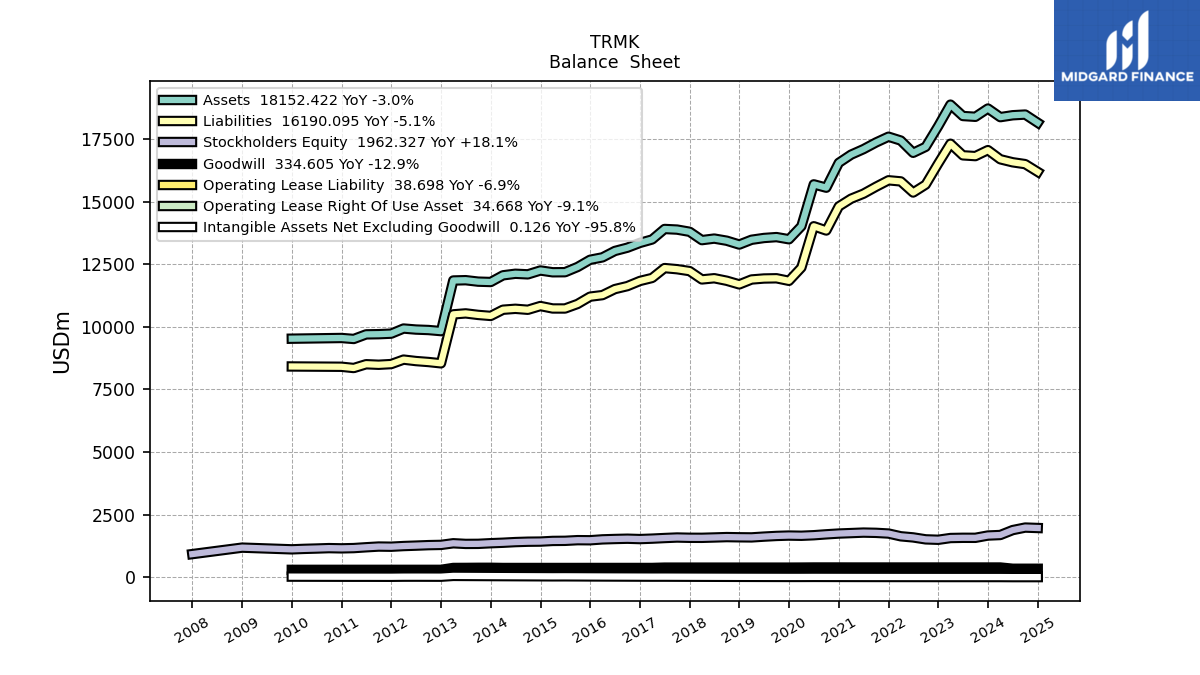
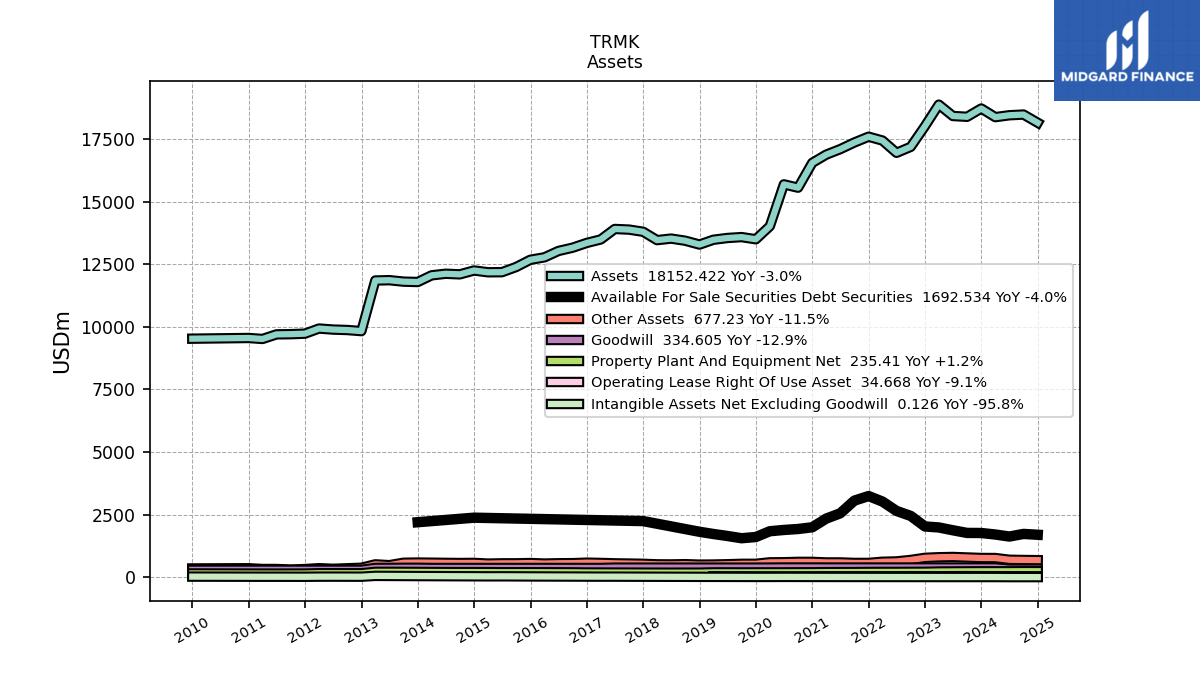
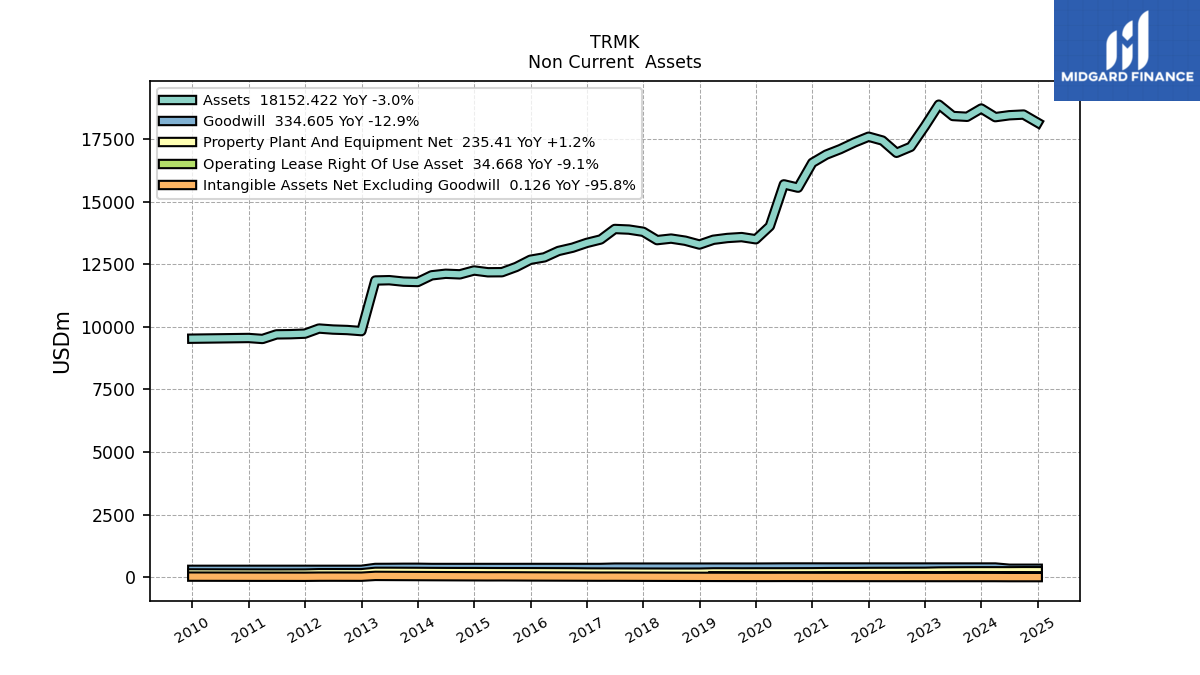
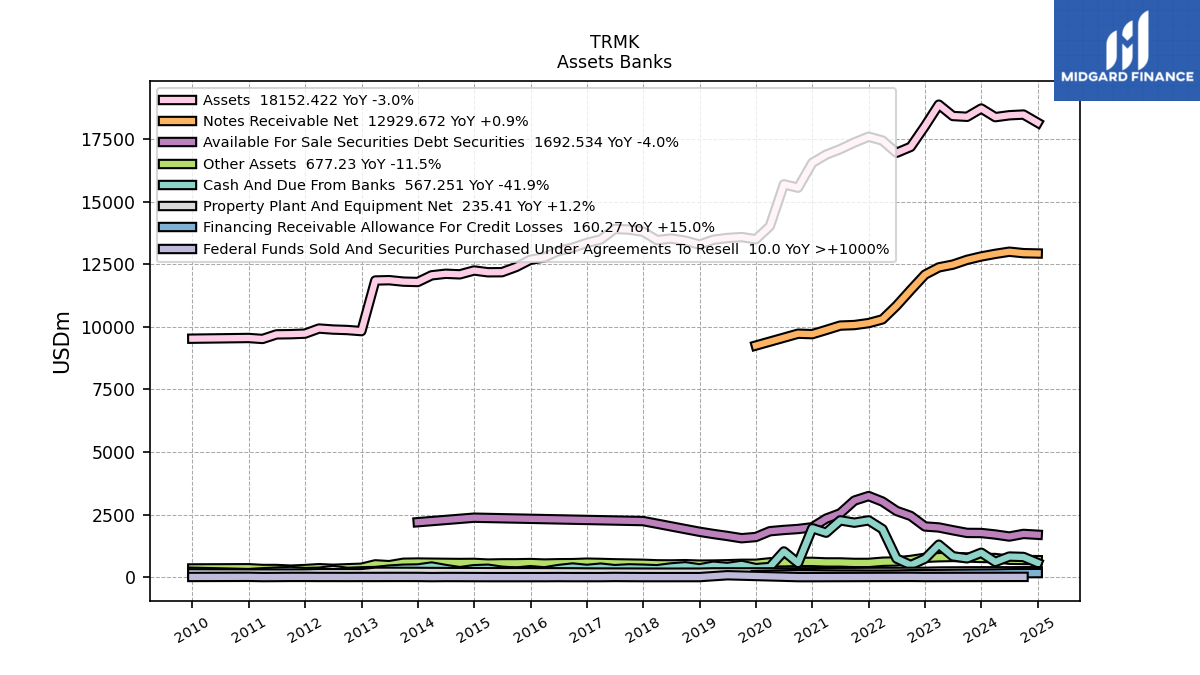
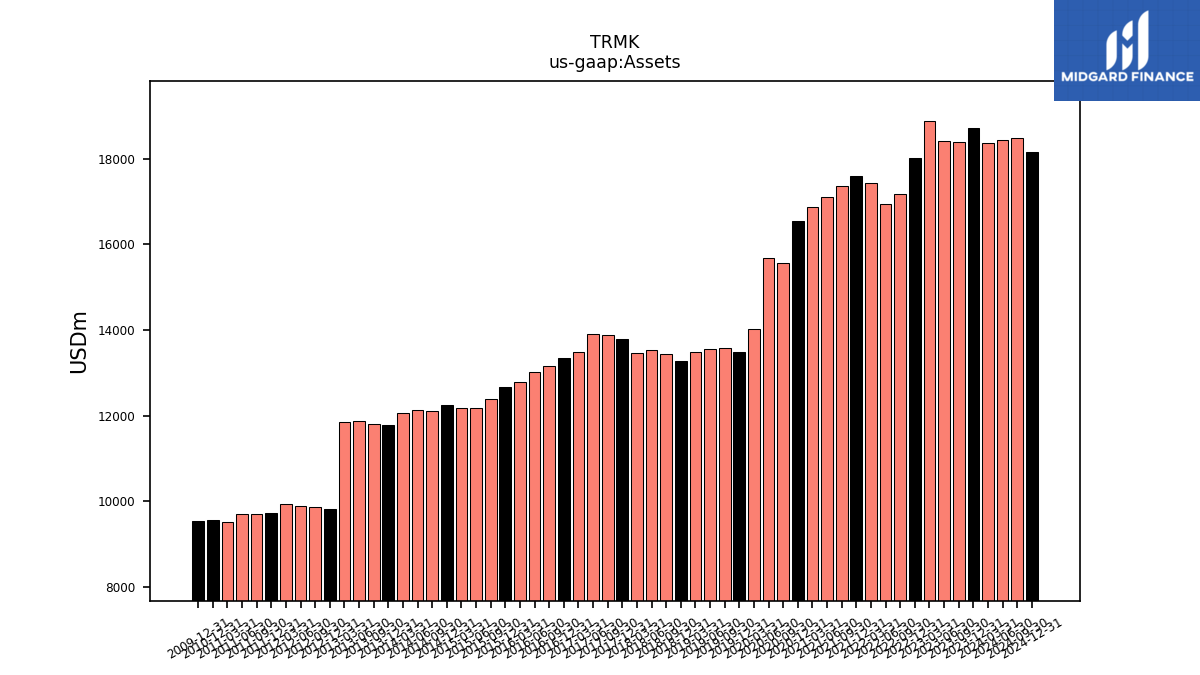
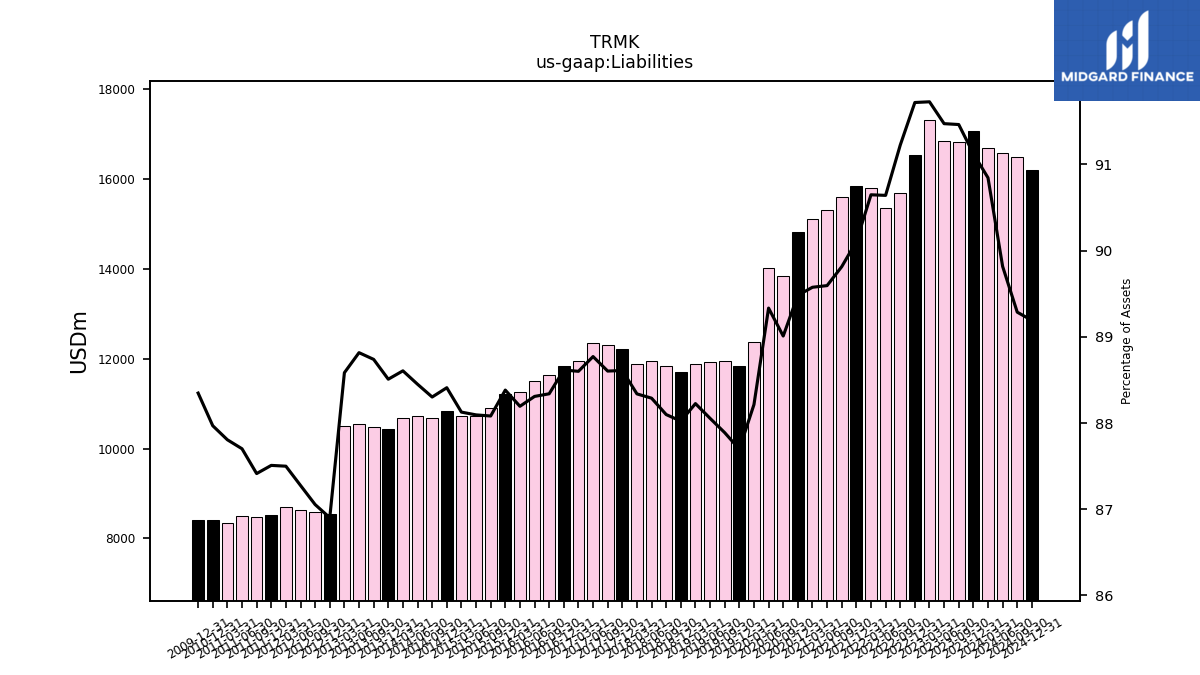
| Assets | 18722.19 | 18390.84 | 18422.63 | 18877.18 | 18015.48 | 17190.63 | 16951.51 | 17441.55 | 17595.64 | 17364.64 | 17098.13 | 16878.31 | 16551.84 | 15558.16 | 15692.08 | 14019.83 | 13497.88 | 13584.79 | 13548.96 | 13478.02 | 13286.46 | 13439.81 | 13525.26 | 13463.44 | 13797.95 | 13884.66 | 13909.14 | 13490.36 | 13352.33 | 13161.54 | 13030.35 | 12775.20 | 12678.90 | 12390.28 | 12182.45 | 12179.16 | 12250.63 | 12096.32 | 12120.00 | 12057.05 | 11790.38 | 11805.20 | 11863.31 | 11850.51 | 9828.67 | 9872.16 | 9890.85 | 9931.59 | 9727.01 | 9705.92 | 9698.45 | 9514.46 | 9553.90 | 9526.02 | |
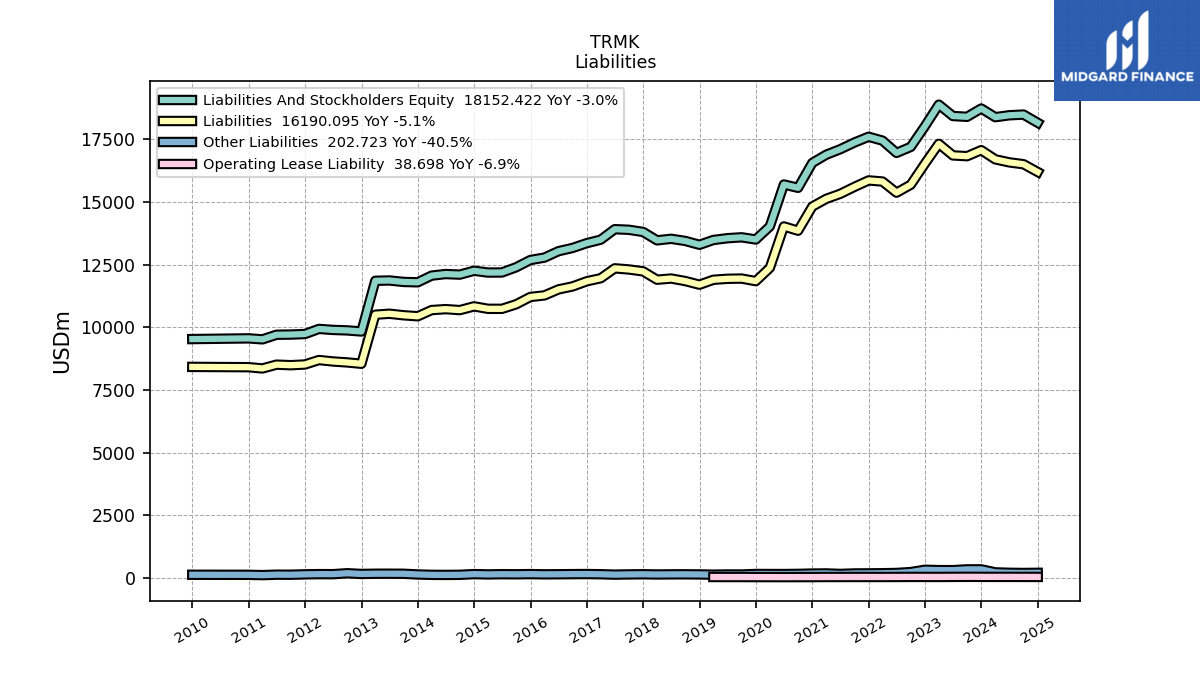
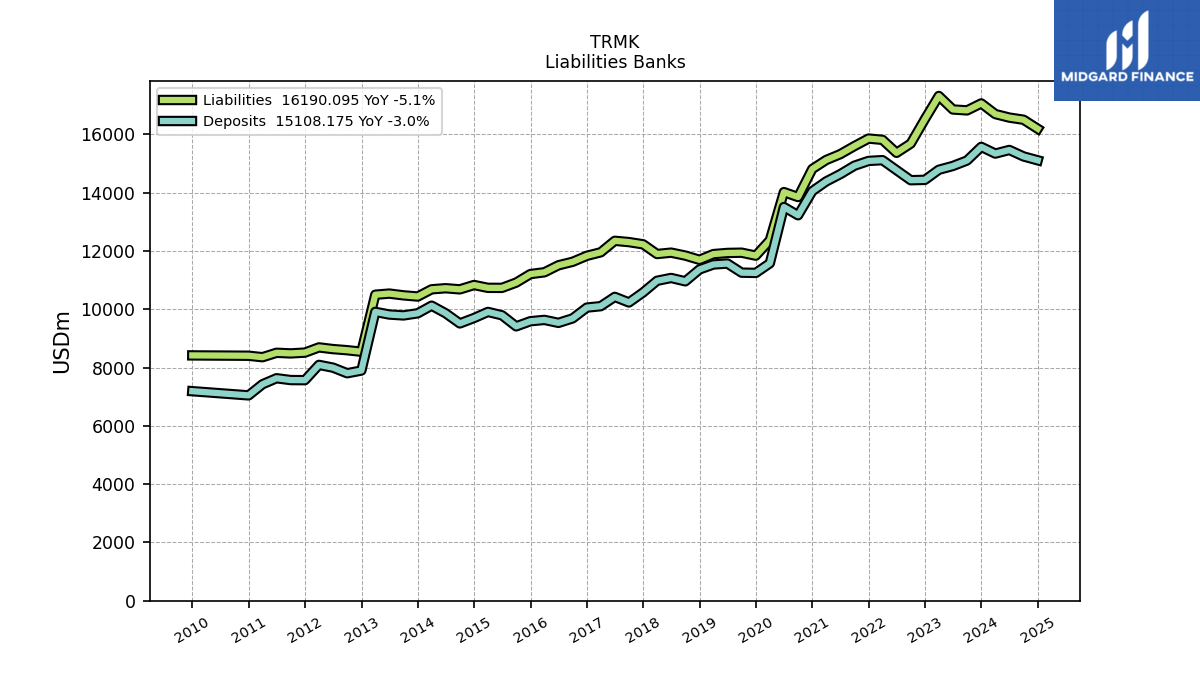
| Liabilities | 17060.34 | 16820.49 | 16851.43 | 17315.08 | 16523.21 | 15681.69 | 15364.81 | 15810.17 | 15854.33 | 15595.70 | 15318.82 | 15118.61 | 14810.72 | 13848.12 | 14018.14 | 12367.43 | 11837.17 | 11939.42 | 11930.41 | 11890.99 | 11695.01 | 11840.21 | 11941.19 | 11893.30 | 12226.25 | 12302.12 | 12347.22 | 11952.40 | 11832.12 | 11626.78 | 11506.88 | 11266.94 | 11205.84 | 10913.52 | 10732.04 | 10733.08 | 10830.69 | 10681.22 | 10720.10 | 10683.16 | 10435.43 | 10475.68 | 10536.49 | 10497.57 | 8541.30 | 8594.14 | 8632.35 | 8690.07 | 8511.97 | 8484.32 | 8505.68 | 8354.23 | 8404.42 | 8415.96 | |
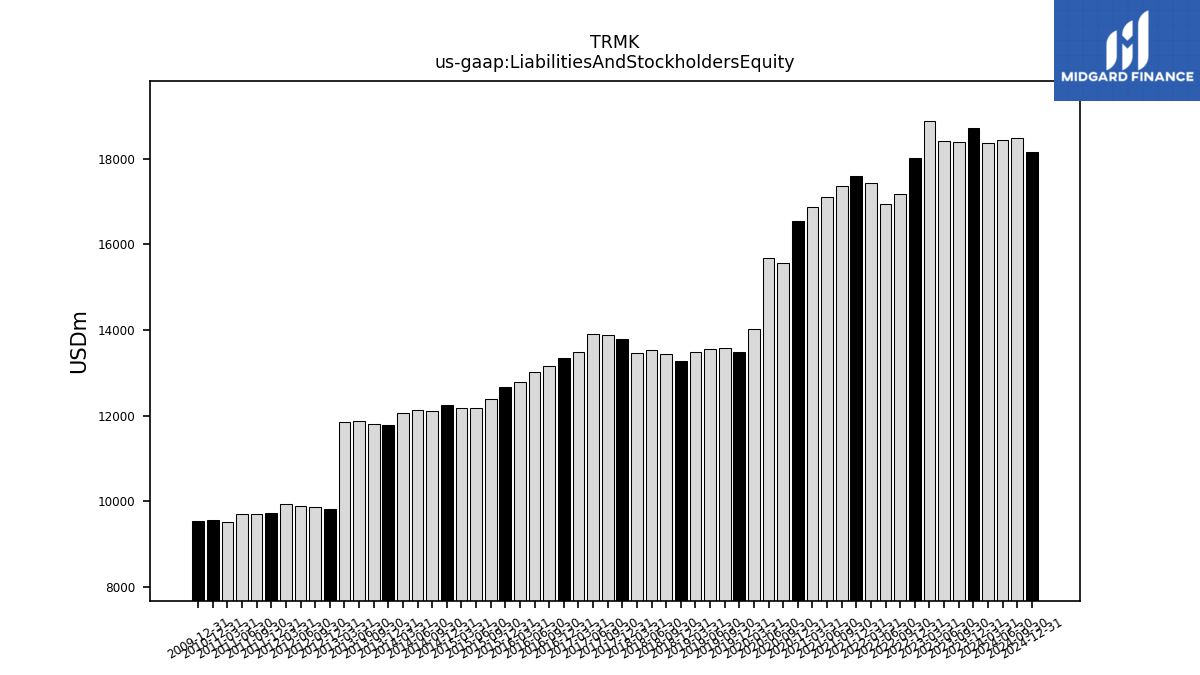
| Liabilities And Stockholders Equity | 18722.19 | 18390.84 | 18422.63 | 18877.18 | 18015.48 | 17190.63 | 16951.51 | 17441.55 | 17595.64 | 17364.64 | 17098.13 | 16878.31 | 16551.84 | 15558.16 | 15692.08 | 14019.83 | 13497.88 | 13584.79 | 13548.96 | 13478.02 | 13286.46 | 13439.81 | 13525.26 | 13463.44 | 13797.95 | 13884.66 | 13909.14 | 13490.36 | 13352.33 | 13161.54 | 13030.35 | 12775.20 | 12678.90 | 12390.28 | 12182.45 | 12179.16 | 12250.63 | 12096.32 | 12120.00 | 12057.05 | 11790.38 | 11805.20 | 11863.31 | 11850.51 | 9828.67 | 9872.16 | 9890.85 | 9931.59 | 9727.01 | 9705.92 | 9698.45 | 9514.46 | 9553.90 | 9526.02 | |
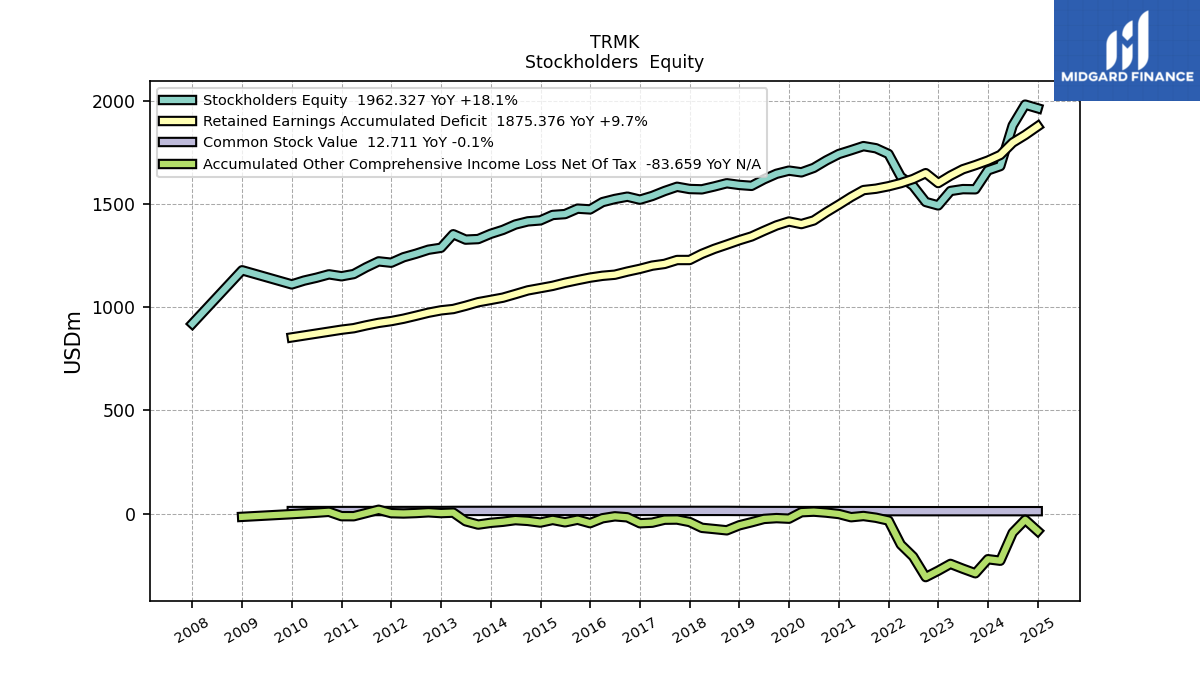
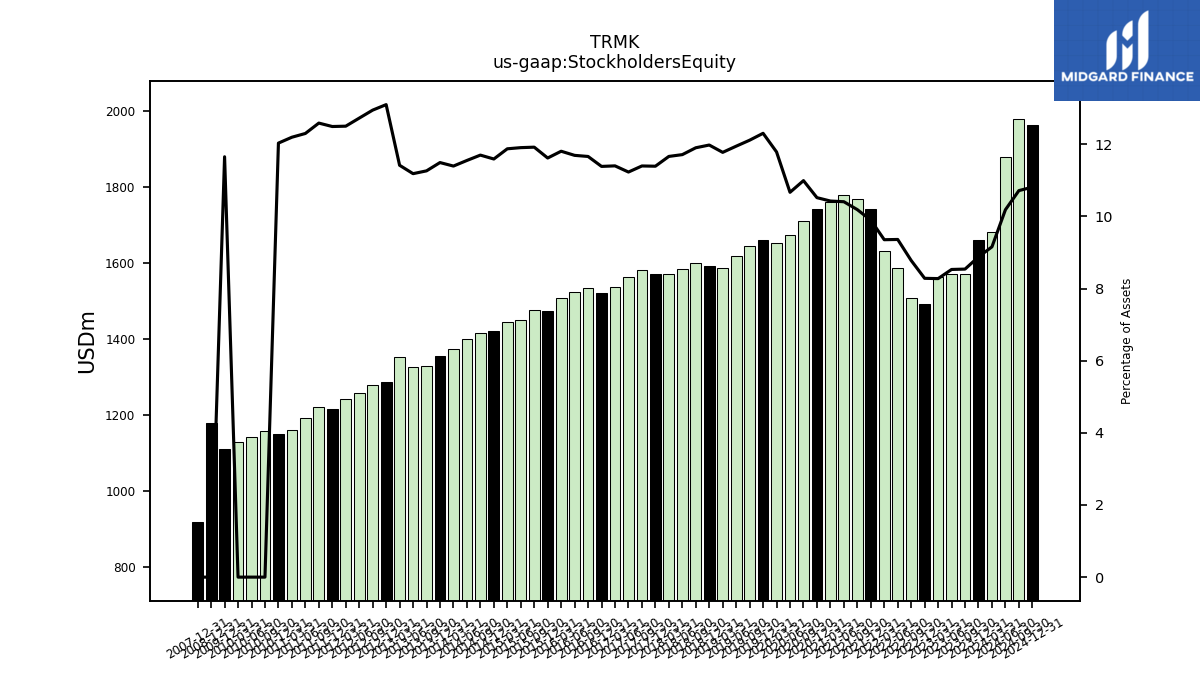
| Stockholders Equity | 1661.85 | 1570.35 | 1571.19 | 1562.10 | 1492.27 | 1508.94 | 1586.70 | 1631.38 | 1741.31 | 1768.95 | 1779.31 | 1759.70 | 1741.12 | 1710.04 | 1673.94 | 1652.40 | 1660.70 | 1645.36 | 1618.55 | 1587.03 | 1591.45 | 1599.60 | 1584.07 | 1570.14 | 1571.70 | 1582.54 | 1561.92 | 1537.96 | 1520.21 | 1534.76 | 1523.47 | 1508.26 | 1473.06 | 1476.76 | 1450.41 | 1446.08 | 1419.94 | 1415.10 | 1399.89 | 1373.89 | 1354.95 | 1329.51 | 1326.82 | 1352.95 | 1287.37 | 1278.02 | 1258.49 | 1241.52 | 1215.04 | 1221.61 | 1192.77 | 1160.23 | 1149.48 | 1110.06 |
| 2023-12-31 | 2023-09-30 | 2023-06-30 | 2023-03-31 | 2022-12-31 | 2022-09-30 | 2022-06-30 | 2022-03-31 | 2021-12-31 | 2021-09-30 | 2021-06-30 | 2021-03-31 | 2020-12-31 | 2020-09-30 | 2020-06-30 | 2020-03-31 | 2019-12-31 | 2019-09-30 | 2019-06-30 | 2019-03-31 | 2018-12-31 | 2018-09-30 | 2018-06-30 | 2018-03-31 | 2017-12-31 | 2017-09-30 | 2017-06-30 | 2017-03-31 | 2016-12-31 | 2016-09-30 | 2016-06-30 | 2016-03-31 | 2015-12-31 | 2015-09-30 | 2015-06-30 | 2015-03-31 | 2014-12-31 | 2014-09-30 | 2014-06-30 | 2014-03-31 | 2013-12-31 | 2013-09-30 | 2013-06-30 | 2013-03-31 | 2012-12-31 | 2012-09-30 | 2012-06-30 | 2012-03-31 | 2011-12-31 | 2011-09-30 | 2011-06-30 | 2011-03-31 | 2010-12-31 | 2009-12-31 | ||
|---|---|---|---|---|---|---|---|---|---|---|---|---|---|---|---|---|---|---|---|---|---|---|---|---|---|---|---|---|---|---|---|---|---|---|---|---|---|---|---|---|---|---|---|---|---|---|---|---|---|---|---|---|---|---|---|
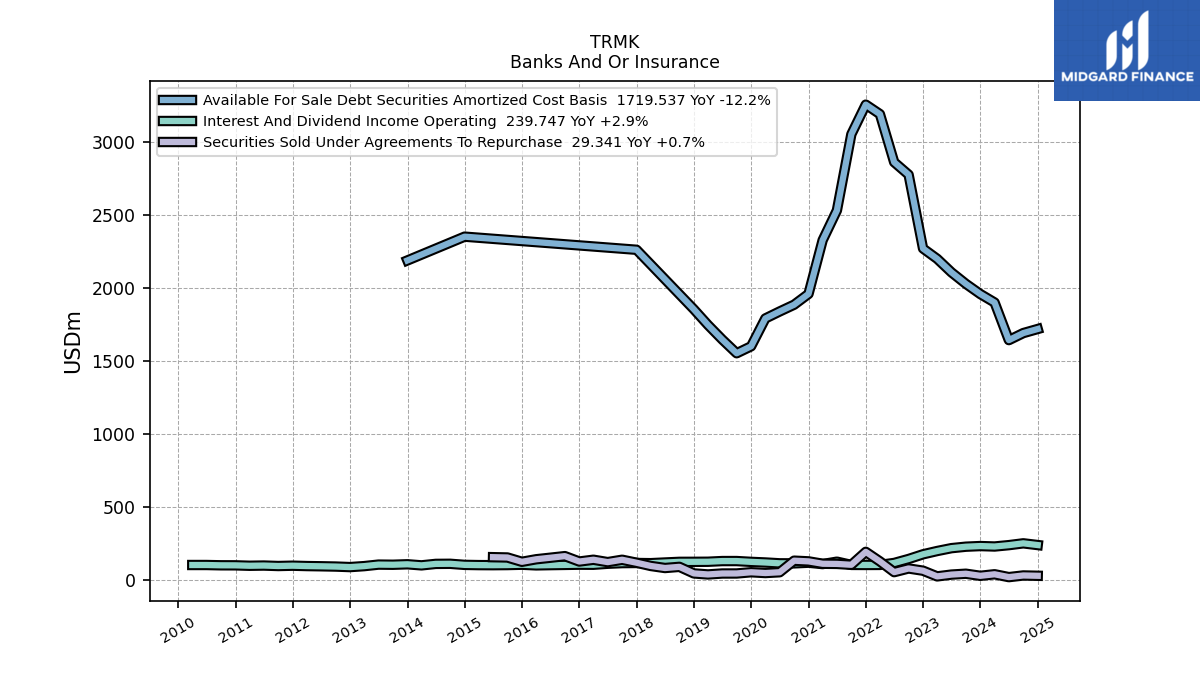
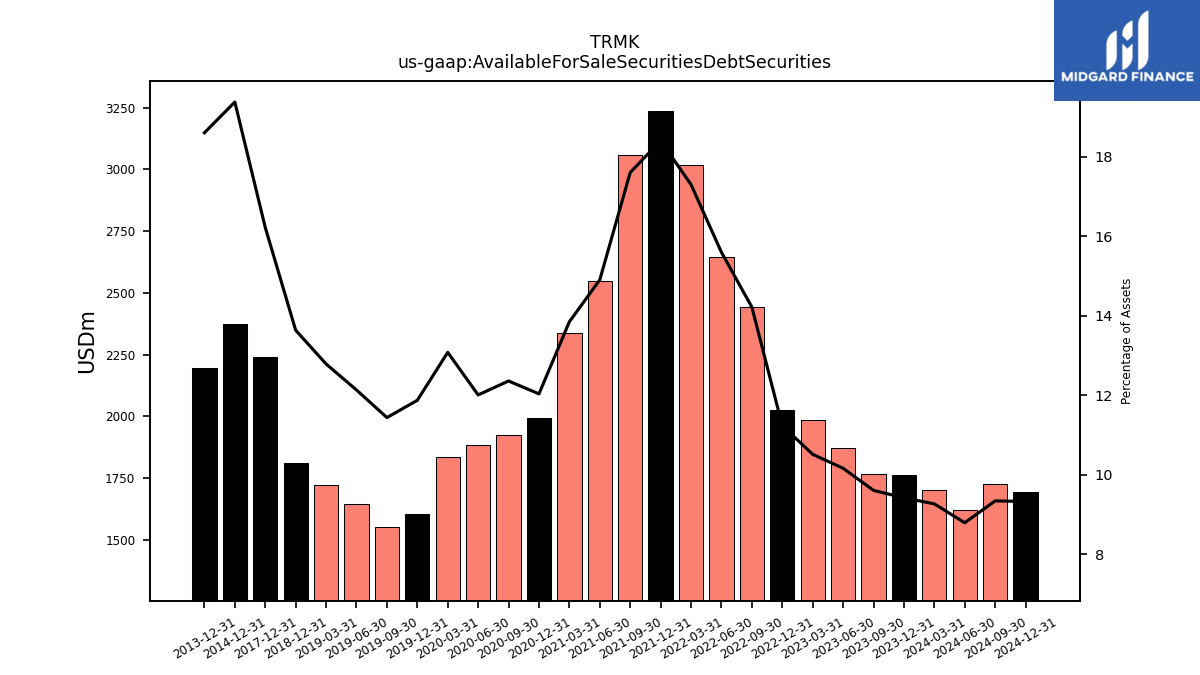
| Available For Sale Securities Debt Securities | 1762.88 | 1766.17 | 1871.88 | 1984.16 | 2024.08 | 2444.49 | 2644.36 | 3018.25 | 3238.88 | 3057.61 | 2548.74 | 2337.68 | 1991.82 | 1922.73 | 1884.15 | 1833.78 | 1602.40 | 1553.70 | 1643.72 | 1723.44 | 1811.81 | NA | NA | NA | 2238.64 | NA | NA | NA | NA | NA | NA | NA | NA | NA | NA | NA | 2374.57 | NA | NA | NA | 2194.15 | NA | NA | NA | NA | NA | NA | NA | NA | NA | NA | NA | NA | NA |
| 2023-12-31 | 2023-09-30 | 2023-06-30 | 2023-03-31 | 2022-12-31 | 2022-09-30 | 2022-06-30 | 2022-03-31 | 2021-12-31 | 2021-09-30 | 2021-06-30 | 2021-03-31 | 2020-12-31 | 2020-09-30 | 2020-06-30 | 2020-03-31 | 2019-12-31 | 2019-09-30 | 2019-06-30 | 2019-03-31 | 2018-12-31 | 2018-09-30 | 2018-06-30 | 2018-03-31 | 2017-12-31 | 2017-09-30 | 2017-06-30 | 2017-03-31 | 2016-12-31 | 2016-09-30 | 2016-06-30 | 2016-03-31 | 2015-12-31 | 2015-09-30 | 2015-06-30 | 2015-03-31 | 2014-12-31 | 2014-09-30 | 2014-06-30 | 2014-03-31 | 2013-12-31 | 2013-09-30 | 2013-06-30 | 2013-03-31 | 2012-12-31 | 2012-09-30 | 2012-06-30 | 2012-03-31 | 2011-12-31 | 2011-09-30 | 2011-06-30 | 2011-03-31 | 2010-12-31 | 2009-12-31 | ||
|---|---|---|---|---|---|---|---|---|---|---|---|---|---|---|---|---|---|---|---|---|---|---|---|---|---|---|---|---|---|---|---|---|---|---|---|---|---|---|---|---|---|---|---|---|---|---|---|---|---|---|---|---|---|---|---|
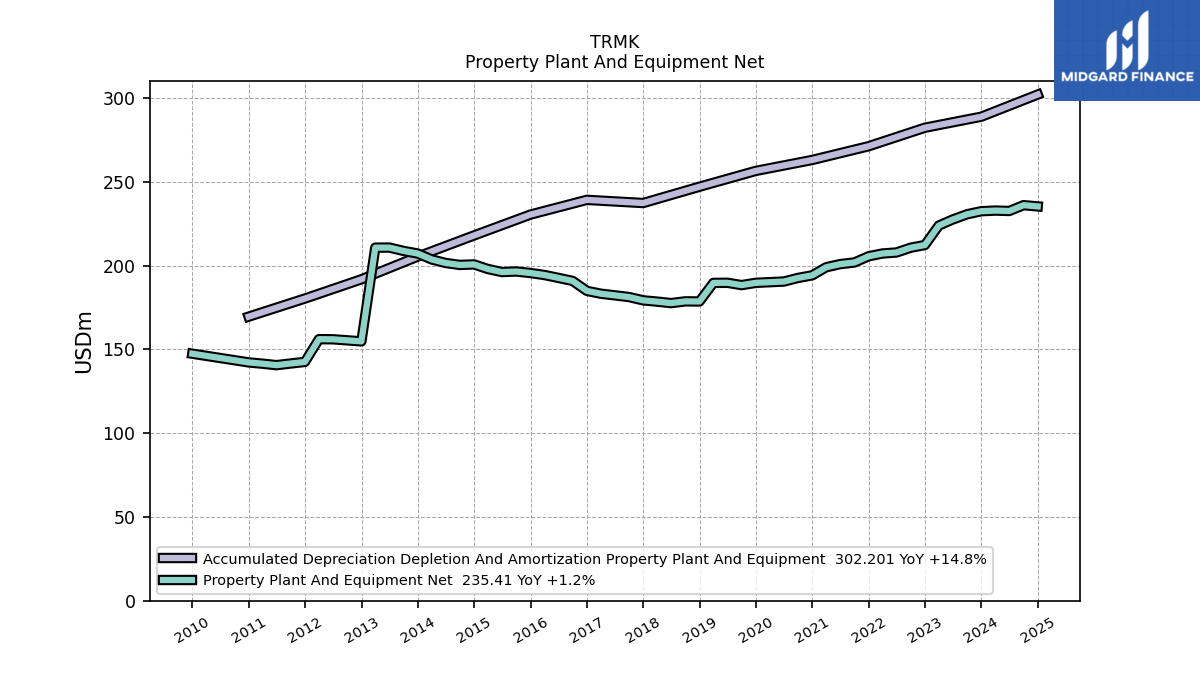
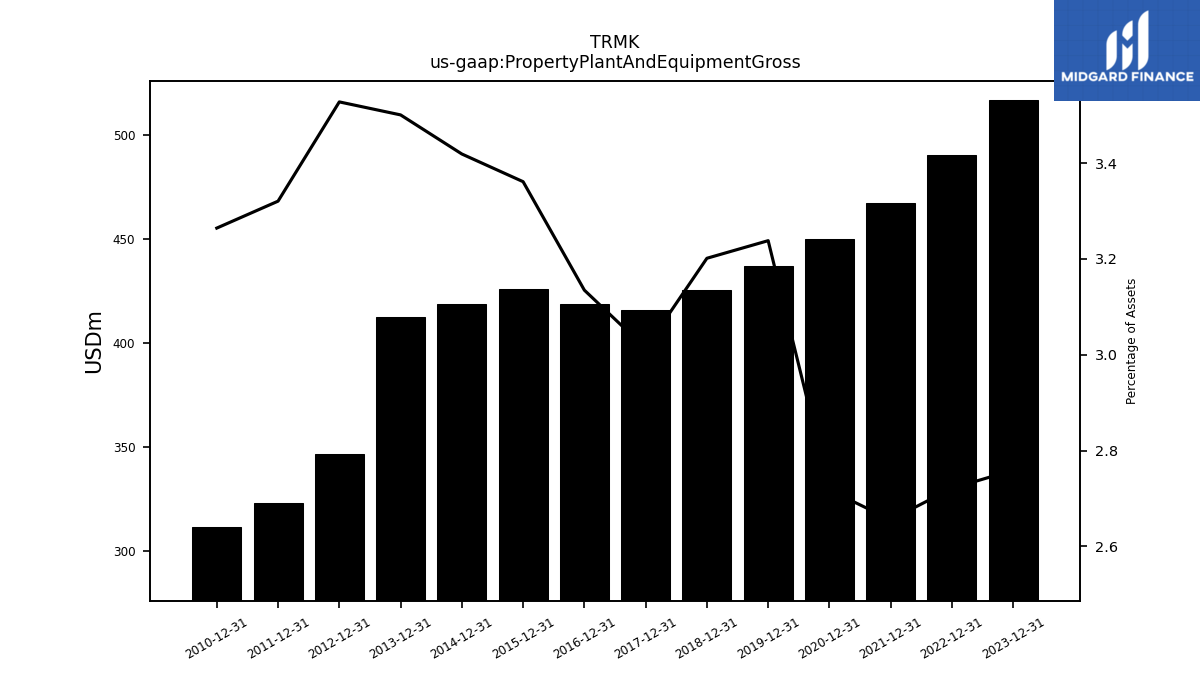
| Property Plant And Equipment Gross | 516.54 | NA | NA | NA | 490.21 | NA | NA | NA | 467.24 | NA | NA | NA | 449.81 | NA | NA | NA | 437.07 | NA | NA | NA | 425.34 | NA | NA | NA | 415.78 | NA | NA | NA | 418.56 | NA | NA | NA | 426.17 | NA | NA | NA | 418.85 | NA | NA | NA | 412.74 | NA | NA | NA | 346.74 | NA | NA | NA | 322.99 | NA | NA | NA | 311.87 | NA | |
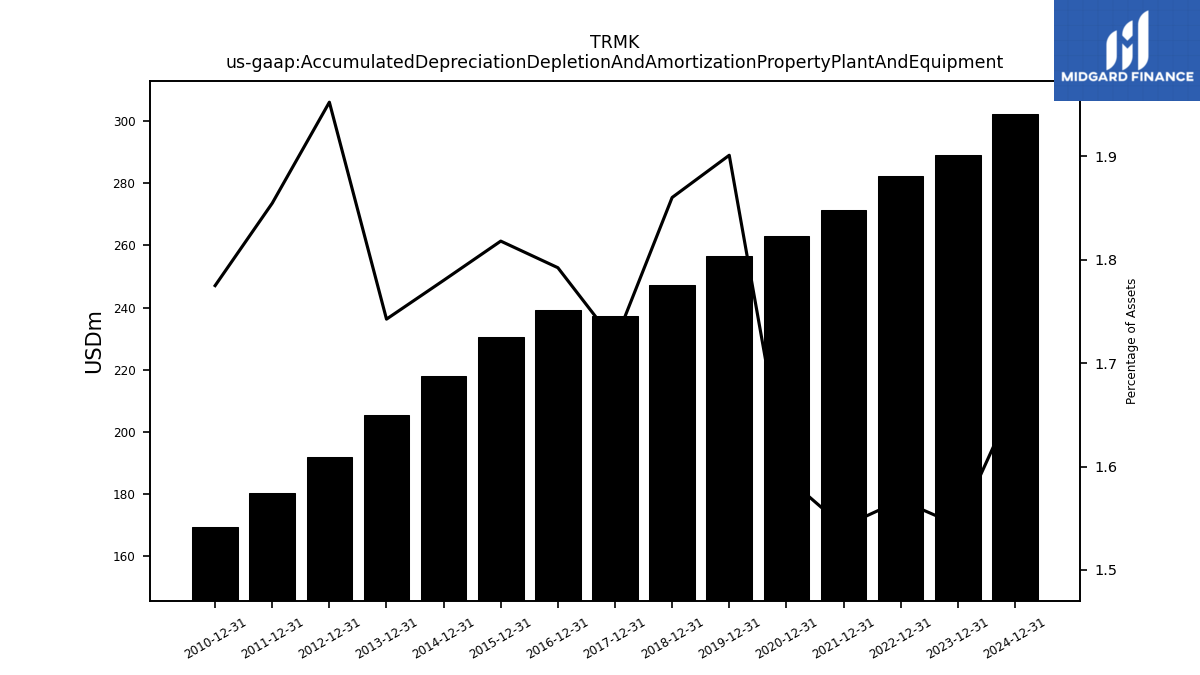
| Accumulated Depreciation Depletion And Amortization Property Plant And Equipment | 288.96 | NA | NA | NA | 282.38 | NA | NA | NA | 271.33 | NA | NA | NA | 263.15 | NA | NA | NA | 256.61 | NA | NA | NA | 247.16 | NA | NA | NA | 237.43 | NA | NA | NA | 239.32 | NA | NA | NA | 230.51 | NA | NA | NA | 218.07 | NA | NA | NA | 205.46 | NA | NA | NA | 191.90 | NA | NA | NA | 180.41 | NA | NA | NA | 169.58 | NA | |
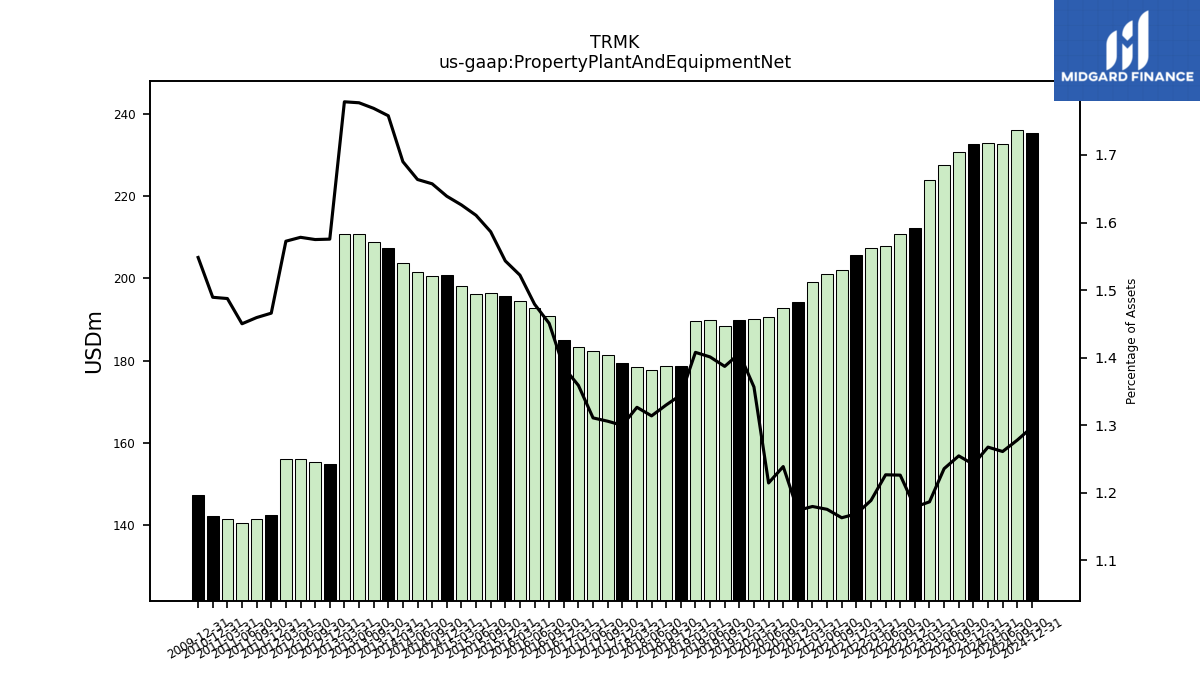
| Property Plant And Equipment Net | 232.54 | 230.72 | 227.63 | 223.97 | 212.37 | 210.76 | 207.91 | 207.30 | 205.64 | 201.94 | 200.97 | 199.10 | 194.28 | 192.72 | 190.57 | 190.18 | 189.79 | 188.42 | 189.82 | 189.74 | 178.67 | 178.74 | 177.69 | 178.58 | 179.34 | 181.31 | 182.31 | 183.31 | 184.99 | 190.93 | 192.73 | 194.45 | 195.66 | 196.56 | 196.22 | 198.04 | 200.78 | 200.47 | 201.64 | 203.77 | 207.28 | 208.84 | 210.84 | 210.79 | 154.84 | 155.47 | 156.09 | 156.16 | 142.58 | 141.64 | 140.64 | 141.52 | 142.29 | 147.49 | |
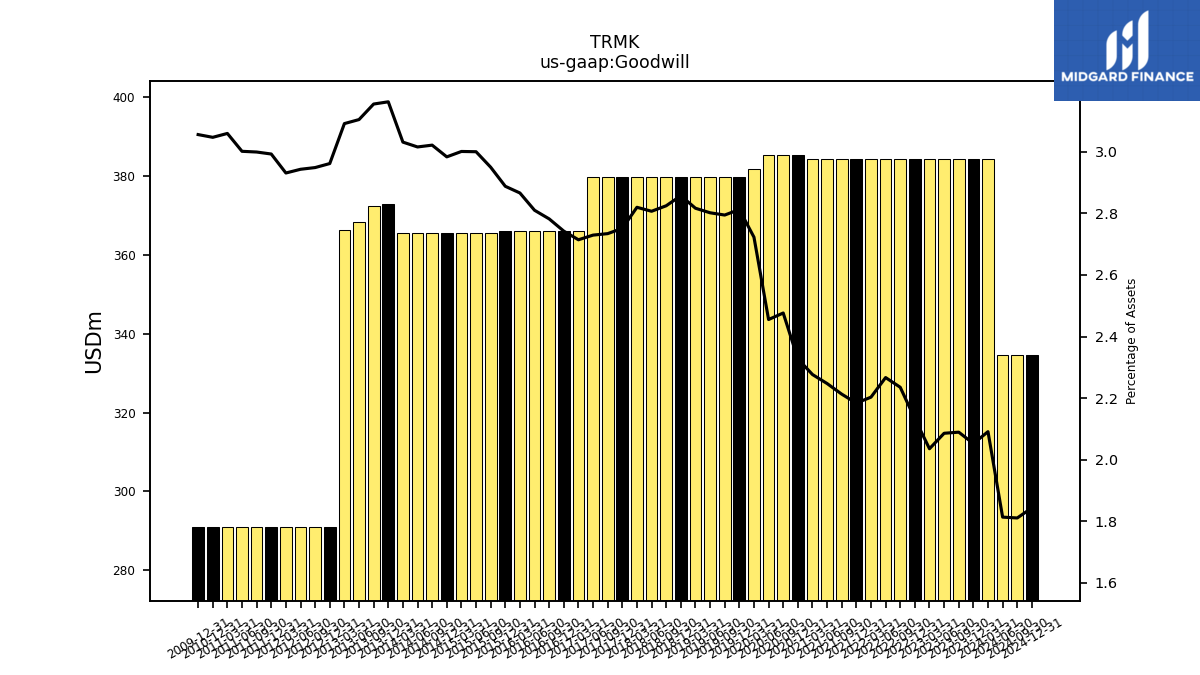
| Goodwill | 384.24 | 384.24 | 384.24 | 384.24 | 384.24 | 384.24 | 384.24 | 384.24 | 384.24 | 384.24 | 384.24 | 384.24 | 385.27 | 385.27 | 385.27 | 381.72 | 379.63 | 379.63 | 379.63 | 379.63 | 379.63 | 379.63 | 379.63 | 379.63 | 379.63 | 379.63 | 379.63 | 366.16 | 366.16 | 366.16 | 366.16 | 366.16 | 366.16 | 365.50 | 365.50 | 365.50 | 365.50 | 365.50 | 365.50 | 365.50 | 372.85 | 372.46 | 368.31 | 366.37 | 291.10 | 291.10 | 291.10 | 291.10 | 291.10 | 291.10 | 291.10 | 291.10 | 291.10 | 291.10 | |
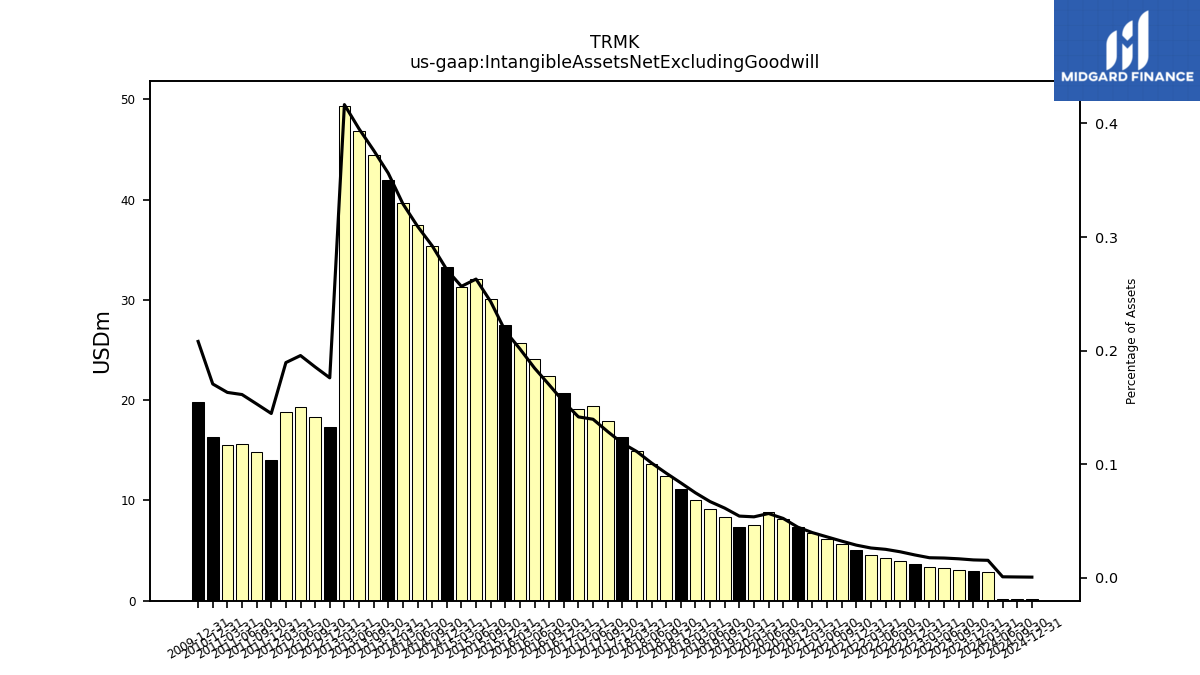
| Intangible Assets Net Excluding Goodwill | 2.96 | 3.09 | 3.22 | 3.35 | 3.64 | 3.95 | 4.26 | 4.59 | 5.07 | 5.62 | 6.17 | 6.72 | 7.39 | 8.14 | 8.89 | 7.54 | 7.34 | 8.35 | 9.10 | 10.09 | 11.11 | 12.39 | 13.68 | 14.96 | 16.36 | 17.88 | 19.42 | 19.12 | 20.68 | 22.37 | 24.06 | 25.75 | 27.55 | 30.13 | 32.04 | 31.25 | 33.23 | 35.36 | 37.51 | 39.70 | 41.99 | 44.42 | 46.89 | 49.36 | 17.31 | 18.33 | 19.36 | 18.82 | 14.08 | 14.86 | 15.65 | 15.53 | 16.31 | 19.82 | |
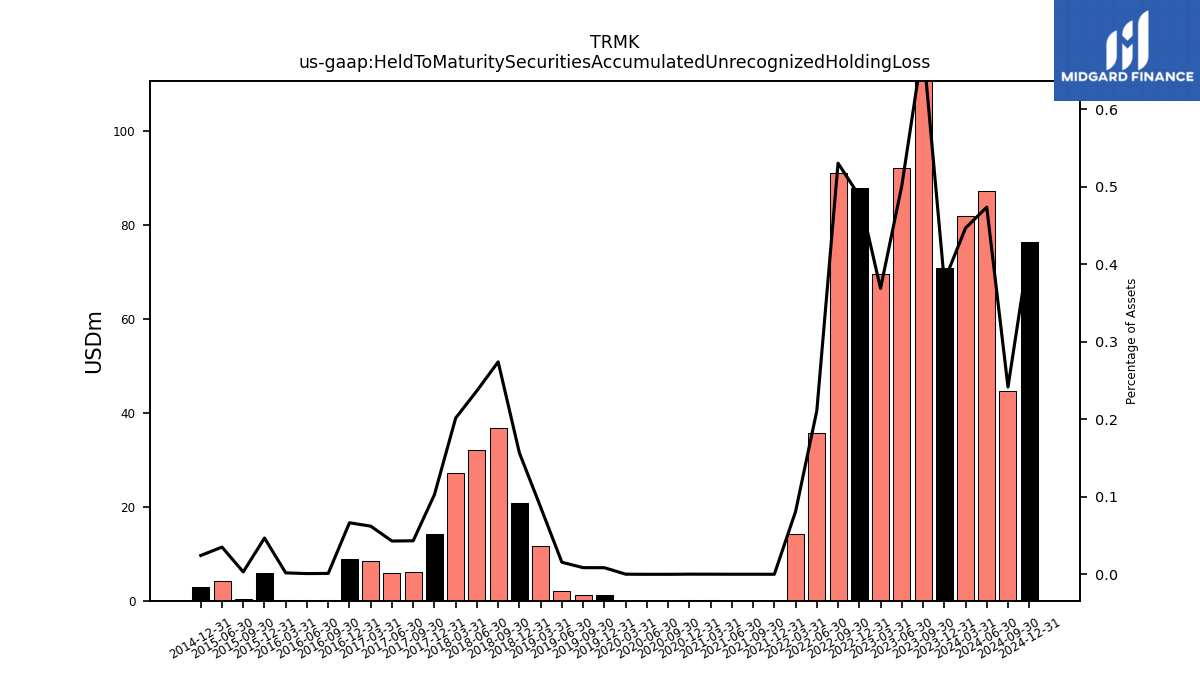
| Held To Maturity Securities Accumulated Unrecognized Holding Loss | 70.83 | 125.42 | 92.30 | 69.62 | 87.96 | 91.16 | 35.76 | 14.14 | 0.04 | 0.04 | 0.04 | 0.06 | 0.06 | 0.03 | 0.03 | 0.05 | 1.17 | 1.19 | 2.12 | 11.69 | 20.82 | 36.84 | 32.04 | 27.16 | 14.19 | 6.03 | 5.99 | 8.40 | 8.90 | 0.17 | 0.14 | 0.26 | 5.96 | 0.40 | 4.30 | NA | 3.00 | NA | NA | NA | NA | NA | NA | NA | NA | NA | NA | NA | NA | NA | NA | NA | NA | NA | |
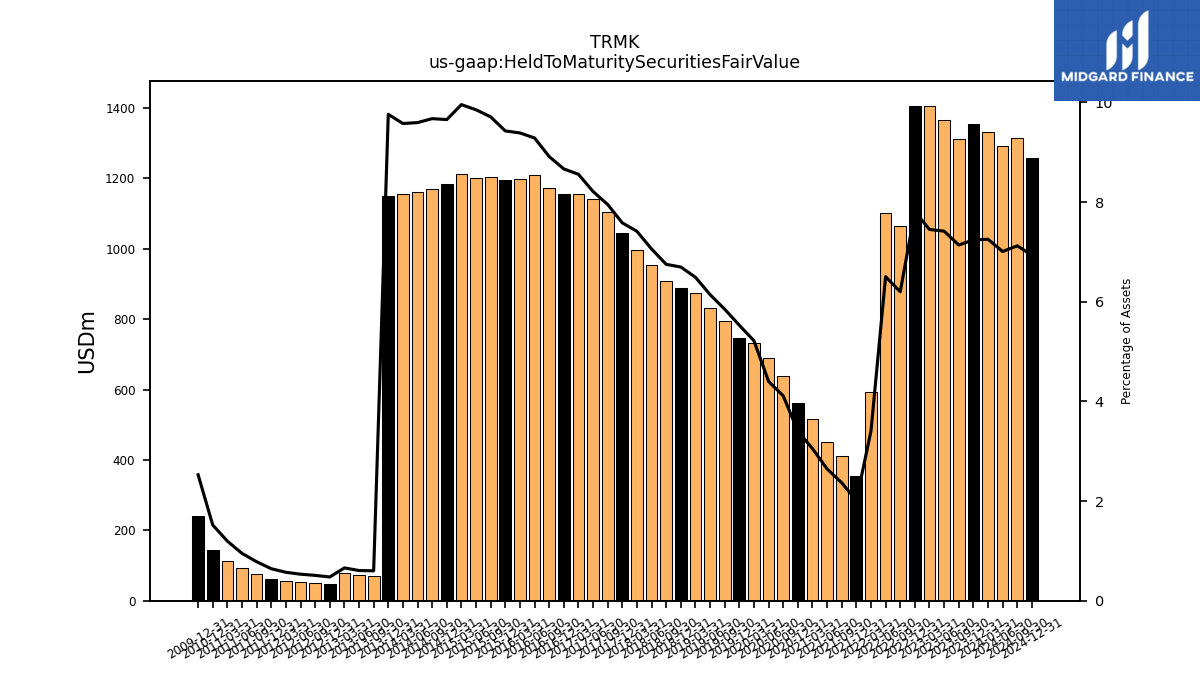
| Held To Maturity Securities Fair Value | 1355.50 | 1312.87 | 1366.38 | 1406.40 | 1406.59 | 1065.83 | 1102.46 | 594.20 | 353.51 | 411.13 | 452.29 | 515.30 | 563.12 | 639.66 | 690.56 | 731.44 | 746.20 | 794.68 | 832.36 | 874.86 | 889.73 | 907.32 | 954.64 | 998.04 | 1046.25 | 1104.03 | 1142.29 | 1154.41 | 1157.05 | 1173.10 | 1210.04 | 1199.21 | 1195.37 | 1203.07 | 1200.22 | 1212.51 | 1182.85 | 1170.21 | 1162.87 | 1154.61 | 1150.83 | 70.95 | 71.93 | 78.10 | 46.89 | 50.27 | 52.67 | 56.71 | 62.52 | 76.01 | 92.15 | 113.83 | 145.14 | 240.67 | |
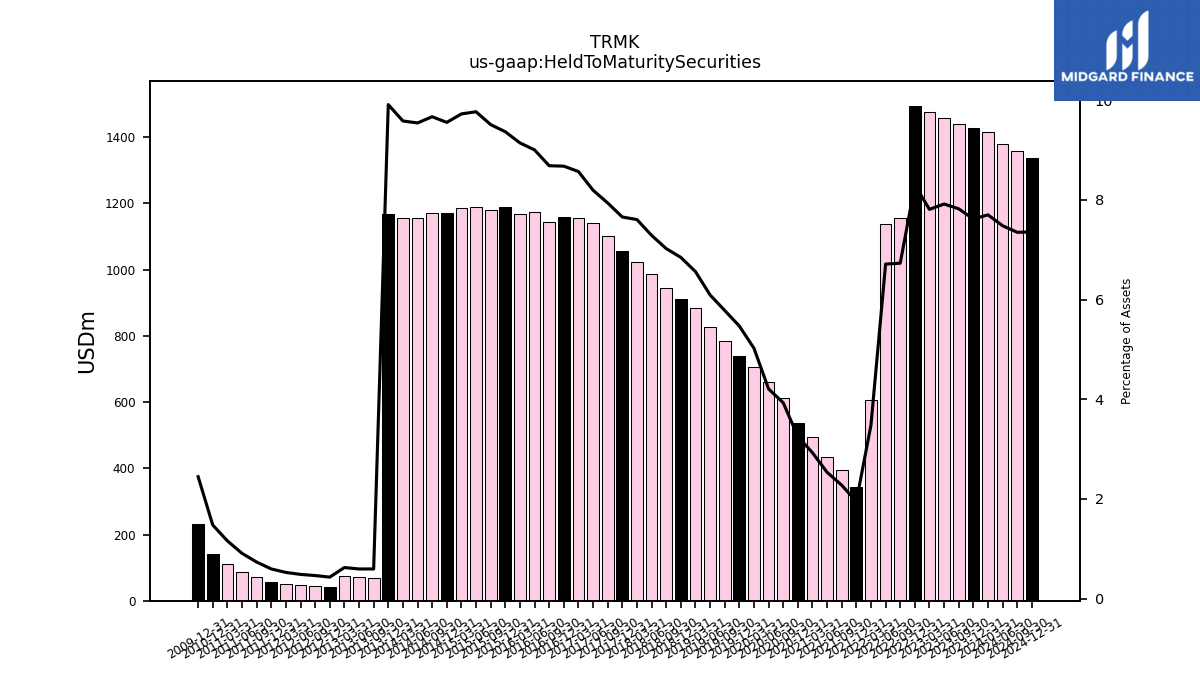
| Held To Maturity Securities | 1426.28 | 1438.29 | 1458.66 | 1474.34 | 1494.51 | 1156.98 | 1137.75 | 607.60 | 342.54 | 394.90 | 433.01 | 493.74 | 538.07 | 611.28 | 660.05 | 704.28 | 738.10 | 785.42 | 825.54 | 884.32 | 909.64 | 943.88 | 985.85 | 1023.98 | 1056.49 | 1102.28 | 1139.75 | 1156.07 | 1158.64 | 1143.23 | 1173.20 | 1168.20 | 1187.82 | 1178.44 | 1190.16 | 1184.55 | 1170.68 | 1169.64 | 1156.79 | 1155.57 | 1168.73 | 69.98 | 70.34 | 73.67 | 42.19 | 45.48 | 47.87 | 52.01 | 57.70 | 71.05 | 87.92 | 110.05 | 140.85 | 232.98 | |
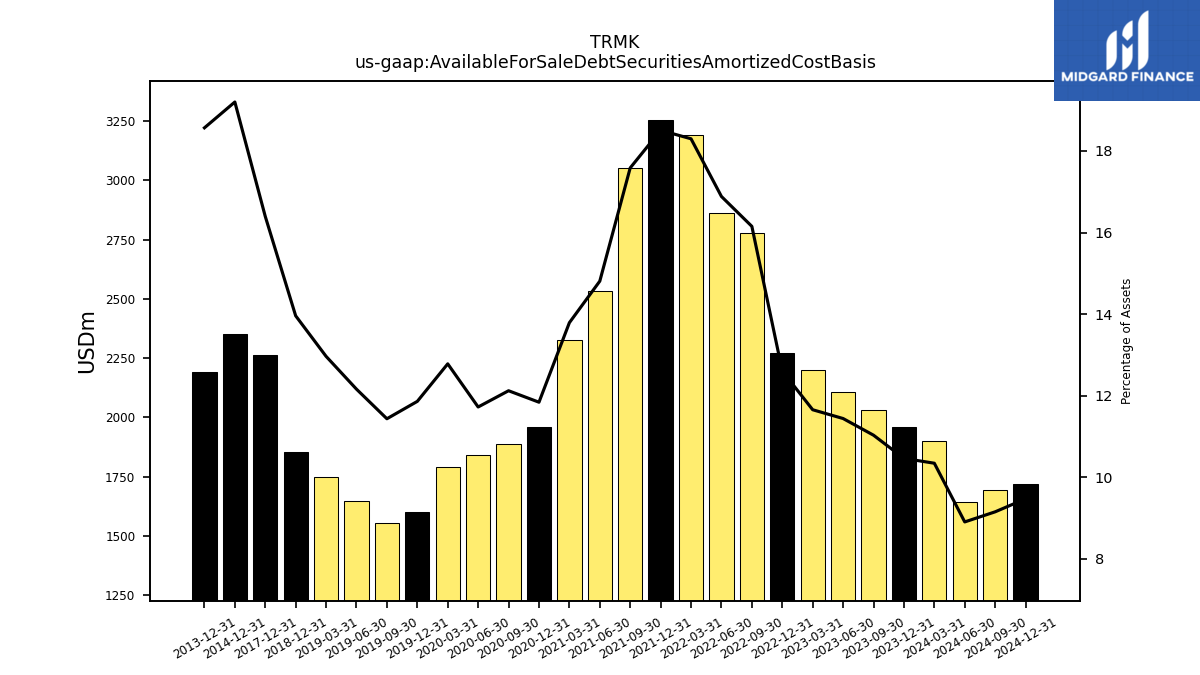
| Available For Sale Debt Securities Amortized Cost Basis | 1959.01 | 2028.86 | 2107.61 | 2200.26 | 2270.71 | 2776.41 | 2861.98 | 3191.33 | 3256.29 | 3053.29 | 2531.89 | 2327.43 | 1959.77 | 1885.86 | 1839.58 | 1791.85 | 1600.98 | 1553.36 | 1647.54 | 1747.34 | 1854.53 | NA | NA | NA | 2262.13 | NA | NA | NA | NA | NA | NA | NA | NA | NA | NA | NA | 2352.01 | NA | NA | NA | 2189.01 | NA | NA | NA | NA | NA | NA | NA | NA | NA | NA | NA | NA | NA | |
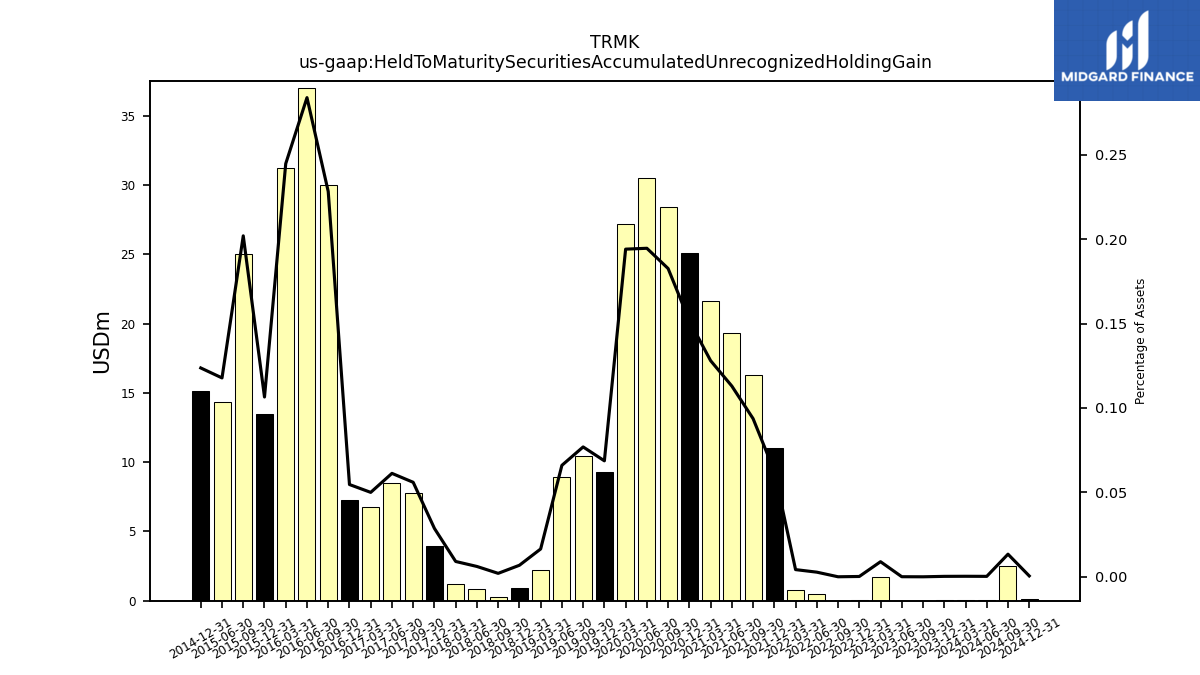
| Held To Maturity Securities Accumulated Unrecognized Holding Gain | 0.05 | 0.00 | 0.01 | 1.69 | 0.04 | 0.01 | 0.47 | 0.74 | 11.01 | 16.27 | 19.32 | 21.61 | 25.10 | 28.41 | 30.54 | 27.21 | 9.27 | 10.45 | 8.95 | 2.22 | 0.91 | 0.28 | 0.83 | 1.22 | 3.95 | 7.77 | 8.52 | 6.75 | 7.30 | 30.04 | 36.98 | 31.27 | 13.50 | 25.03 | 14.35 | NA | 15.16 | NA | NA | NA | NA | NA | NA | NA | NA | NA | NA | NA | NA | NA | NA | NA | NA | NA | |
| Held To Maturity Securities Accumulated Unrecognized Holding Loss | 70.83 | 125.42 | 92.30 | 69.62 | 87.96 | 91.16 | 35.76 | 14.14 | 0.04 | 0.04 | 0.04 | 0.06 | 0.06 | 0.03 | 0.03 | 0.05 | 1.17 | 1.19 | 2.12 | 11.69 | 20.82 | 36.84 | 32.04 | 27.16 | 14.19 | 6.03 | 5.99 | 8.40 | 8.90 | 0.17 | 0.14 | 0.26 | 5.96 | 0.40 | 4.30 | NA | 3.00 | NA | NA | NA | NA | NA | NA | NA | NA | NA | NA | NA | NA | NA | NA | NA | NA | NA | |
| Held To Maturity Securities Debt Maturities After One Through Five Years Fair Value | 29.04 | 27.89 | 28.31 | 0.34 | 0.34 | 0.34 | 1.20 | 4.53 | 4.56 | 4.57 | 5.42 | 7.43 | 7.46 | 10.95 | NA | NA | NA | NA | NA | NA | NA | NA | NA | NA | NA | NA | NA | NA | NA | NA | NA | NA | NA | NA | NA | NA | NA | NA | NA | NA | NA | NA | NA | NA | NA | NA | NA | NA | NA | NA | NA | NA | NA | NA | |
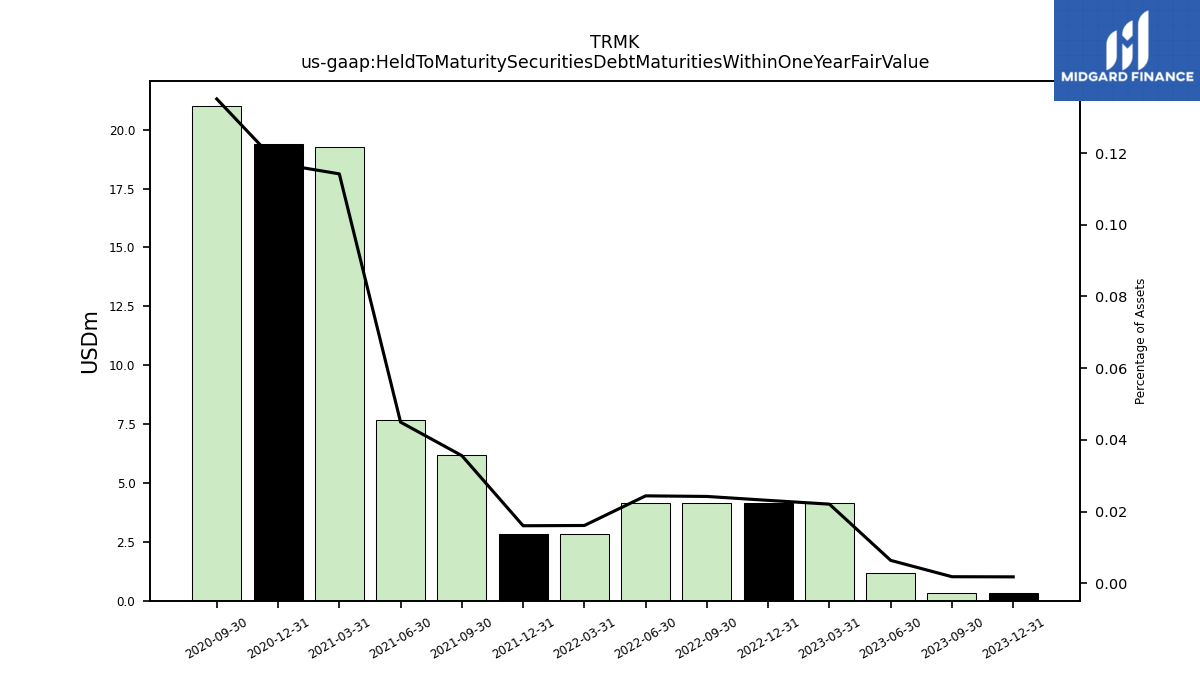
| Held To Maturity Securities Debt Maturities Within One Year Fair Value | 0.34 | 0.34 | 1.18 | 4.17 | 4.17 | 4.17 | 4.14 | 2.81 | 2.83 | 6.19 | 7.69 | 19.27 | 19.37 | 21.02 | NA | NA | NA | NA | NA | NA | NA | NA | NA | NA | NA | NA | NA | NA | NA | NA | NA | NA | NA | NA | NA | NA | NA | NA | NA | NA | NA | NA | NA | NA | NA | NA | NA | NA | NA | NA | NA | NA | NA | NA |
| 2023-12-31 | 2023-09-30 | 2023-06-30 | 2023-03-31 | 2022-12-31 | 2022-09-30 | 2022-06-30 | 2022-03-31 | 2021-12-31 | 2021-09-30 | 2021-06-30 | 2021-03-31 | 2020-12-31 | 2020-09-30 | 2020-06-30 | 2020-03-31 | 2019-12-31 | 2019-09-30 | 2019-06-30 | 2019-03-31 | 2018-12-31 | 2018-09-30 | 2018-06-30 | 2018-03-31 | 2017-12-31 | 2017-09-30 | 2017-06-30 | 2017-03-31 | 2016-12-31 | 2016-09-30 | 2016-06-30 | 2016-03-31 | 2015-12-31 | 2015-09-30 | 2015-06-30 | 2015-03-31 | 2014-12-31 | 2014-09-30 | 2014-06-30 | 2014-03-31 | 2013-12-31 | 2013-09-30 | 2013-06-30 | 2013-03-31 | 2012-12-31 | 2012-09-30 | 2012-06-30 | 2012-03-31 | 2011-12-31 | 2011-09-30 | 2011-06-30 | 2011-03-31 | 2010-12-31 | 2009-12-31 | ||
|---|---|---|---|---|---|---|---|---|---|---|---|---|---|---|---|---|---|---|---|---|---|---|---|---|---|---|---|---|---|---|---|---|---|---|---|---|---|---|---|---|---|---|---|---|---|---|---|---|---|---|---|---|---|---|---|
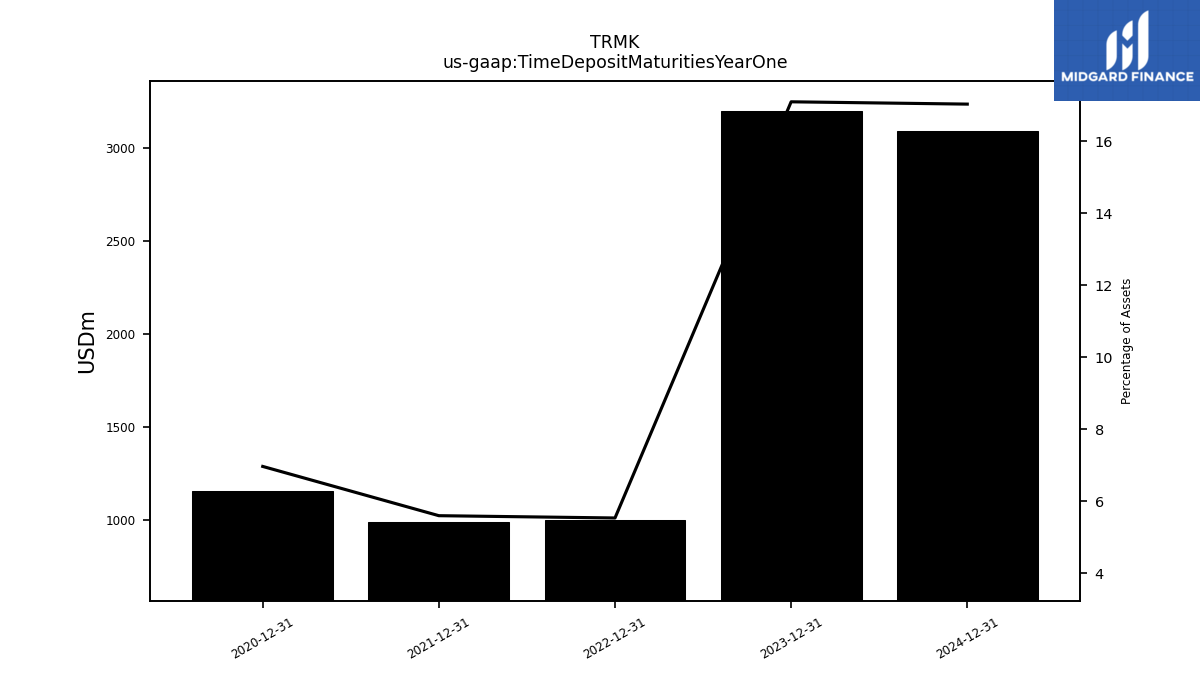
| Time Deposit Maturities Year One | 3199.61 | NA | NA | NA | 996.46 | NA | NA | NA | 984.43 | NA | NA | NA | 1152.49 | NA | NA | NA | NA | NA | NA | NA | NA | NA | NA | NA | NA | NA | NA | NA | NA | NA | NA | NA | NA | NA | NA | NA | NA | NA | NA | NA | NA | NA | NA | NA | NA | NA | NA | NA | NA | NA | NA | NA | NA | NA | |
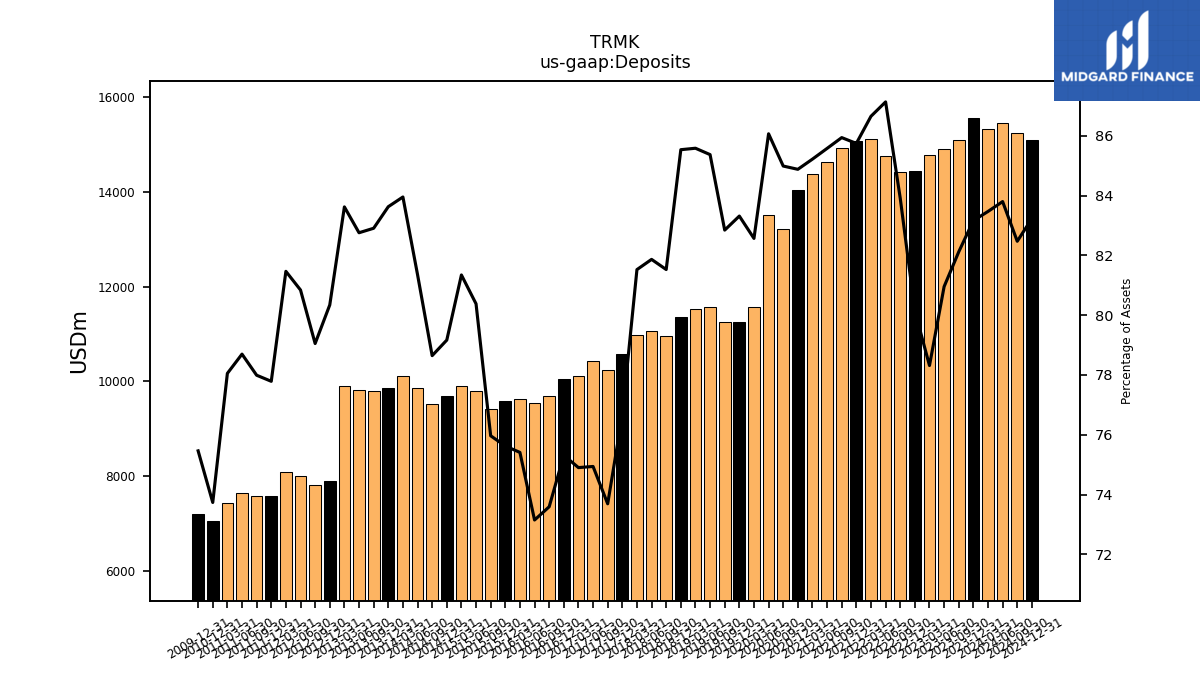
| Deposits | 15569.76 | 15101.92 | 14913.90 | 14783.66 | 14437.65 | 14425.18 | 14770.17 | 15113.29 | 15087.16 | 14922.84 | 14632.08 | 14383.44 | 14048.76 | 13222.41 | 13505.47 | 11575.76 | 11245.56 | 11254.18 | 11566.63 | 11534.82 | 11364.41 | 10956.91 | 11072.43 | 10975.80 | 10577.51 | 10231.74 | 10423.39 | 10104.47 | 10056.01 | 9685.70 | 9531.52 | 9633.64 | 9588.23 | 9412.40 | 9792.17 | 9906.99 | 9698.36 | 9513.23 | 9860.37 | 10122.12 | 9859.90 | 9787.23 | 9817.59 | 9909.43 | 7896.52 | 7804.04 | 7995.86 | 8090.75 | 7566.36 | 7569.72 | 7632.33 | 7426.27 | 7044.57 | 7188.47 |
| 2023-12-31 | 2023-09-30 | 2023-06-30 | 2023-03-31 | 2022-12-31 | 2022-09-30 | 2022-06-30 | 2022-03-31 | 2021-12-31 | 2021-09-30 | 2021-06-30 | 2021-03-31 | 2020-12-31 | 2020-09-30 | 2020-06-30 | 2020-03-31 | 2019-12-31 | 2019-09-30 | 2019-06-30 | 2019-03-31 | 2018-12-31 | 2018-09-30 | 2018-06-30 | 2018-03-31 | 2017-12-31 | 2017-09-30 | 2017-06-30 | 2017-03-31 | 2016-12-31 | 2016-09-30 | 2016-06-30 | 2016-03-31 | 2015-12-31 | 2015-09-30 | 2015-06-30 | 2015-03-31 | 2014-12-31 | 2014-09-30 | 2014-06-30 | 2014-03-31 | 2013-12-31 | 2013-09-30 | 2013-06-30 | 2013-03-31 | 2012-12-31 | 2012-09-30 | 2012-06-30 | 2012-03-31 | 2011-12-31 | 2011-09-30 | 2011-06-30 | 2011-03-31 | 2010-12-31 | 2009-12-31 | ||
|---|---|---|---|---|---|---|---|---|---|---|---|---|---|---|---|---|---|---|---|---|---|---|---|---|---|---|---|---|---|---|---|---|---|---|---|---|---|---|---|---|---|---|---|---|---|---|---|---|---|---|---|---|---|---|---|
| Stockholders Equity | 1661.85 | 1570.35 | 1571.19 | 1562.10 | 1492.27 | 1508.94 | 1586.70 | 1631.38 | 1741.31 | 1768.95 | 1779.31 | 1759.70 | 1741.12 | 1710.04 | 1673.94 | 1652.40 | 1660.70 | 1645.36 | 1618.55 | 1587.03 | 1591.45 | 1599.60 | 1584.07 | 1570.14 | 1571.70 | 1582.54 | 1561.92 | 1537.96 | 1520.21 | 1534.76 | 1523.47 | 1508.26 | 1473.06 | 1476.76 | 1450.41 | 1446.08 | 1419.94 | 1415.10 | 1399.89 | 1373.89 | 1354.95 | 1329.51 | 1326.82 | 1352.95 | 1287.37 | 1278.02 | 1258.49 | 1241.52 | 1215.04 | 1221.61 | 1192.77 | 1160.23 | 1149.48 | 1110.06 | |
| Common Stock Value | 12.72 | 12.72 | 12.72 | 12.72 | 12.71 | 12.70 | 12.75 | 12.81 | 12.85 | 13.01 | 13.08 | 13.21 | 13.21 | 13.21 | 13.21 | 13.21 | 13.38 | 13.39 | 13.42 | 13.50 | 13.72 | 14.09 | 14.09 | 14.12 | 14.12 | 14.11 | 14.11 | 14.11 | 14.09 | 14.09 | 14.09 | 14.09 | 14.08 | 14.08 | 14.08 | 14.08 | 14.06 | 14.05 | 14.05 | 14.05 | 14.04 | 14.00 | 13.99 | 13.99 | 13.51 | 13.50 | 13.50 | 13.49 | 13.36 | 13.36 | 13.36 | 13.33 | 13.32 | 13.27 | |
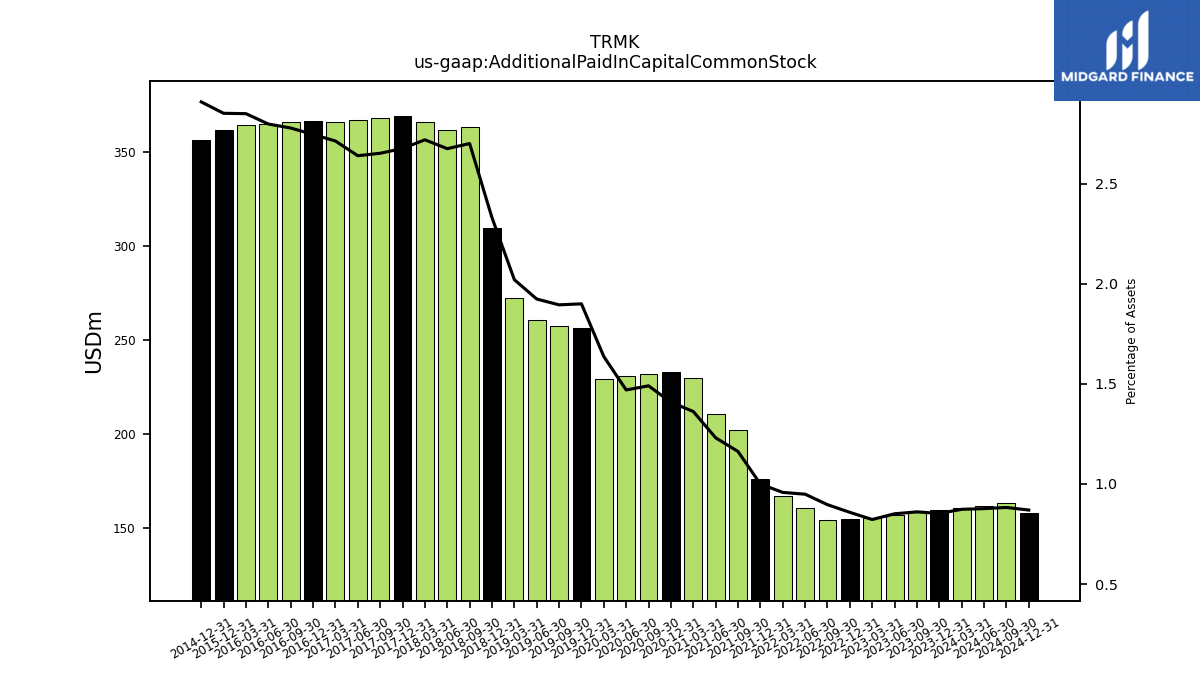
| Additional Paid In Capital Common Stock | 159.69 | 158.32 | 156.83 | 155.30 | 154.65 | 154.15 | 160.88 | 167.09 | 175.91 | 201.84 | 210.42 | 229.89 | 233.12 | 231.84 | 230.61 | 229.40 | 256.40 | 257.37 | 260.62 | 272.27 | 309.55 | 362.87 | 361.71 | 366.02 | 369.12 | 368.13 | 367.07 | 365.95 | 366.56 | 365.55 | 364.52 | 363.98 | 361.47 | NA | NA | NA | 356.24 | NA | NA | NA | NA | NA | NA | NA | NA | NA | NA | NA | NA | NA | NA | NA | NA | NA | |
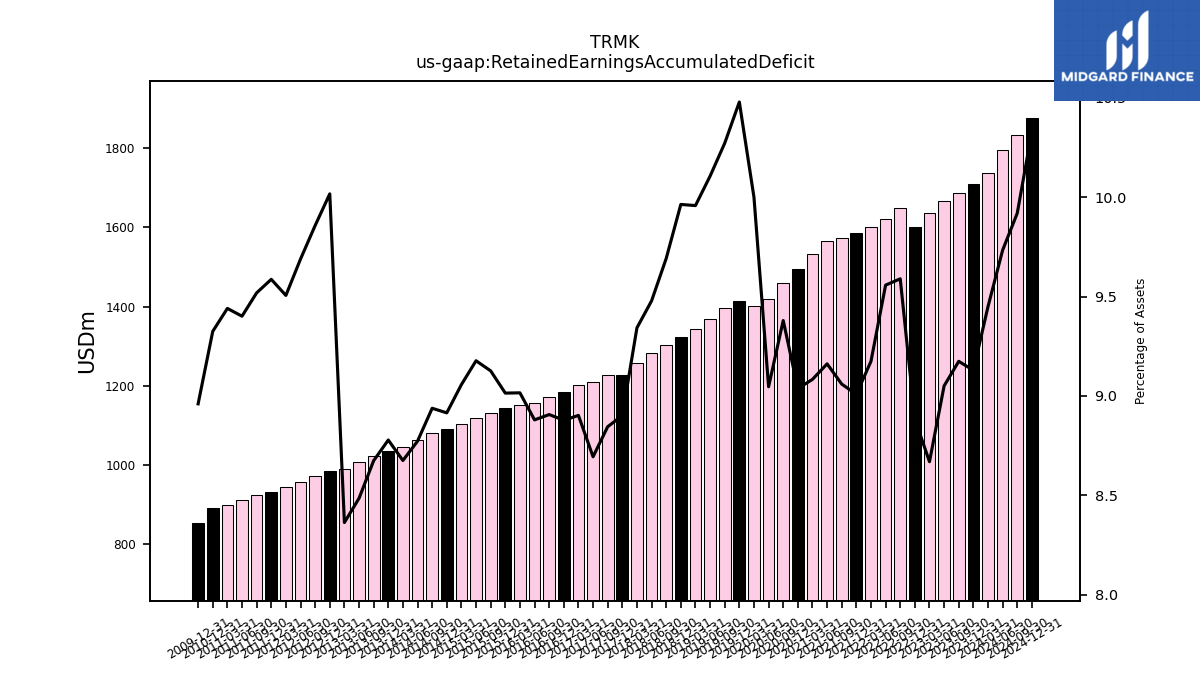
| Retained Earnings Accumulated Deficit | 1709.16 | 1687.20 | 1667.34 | 1636.46 | 1600.32 | 1648.51 | 1620.21 | 1600.14 | 1585.11 | 1573.18 | 1566.45 | 1533.11 | 1495.83 | 1459.31 | 1419.55 | 1402.09 | 1414.53 | 1395.46 | 1369.33 | 1342.18 | 1323.87 | 1302.59 | 1282.01 | 1257.88 | 1228.19 | 1228.12 | 1209.24 | 1200.90 | 1185.35 | 1172.19 | 1157.03 | 1151.76 | 1142.91 | 1130.77 | 1117.99 | 1103.08 | 1092.12 | 1081.16 | 1063.20 | 1045.94 | 1034.97 | 1023.98 | 1006.55 | 991.01 | 984.56 | 973.18 | 958.32 | 944.10 | 932.53 | 923.89 | 911.80 | 898.22 | 890.92 | 853.55 | |
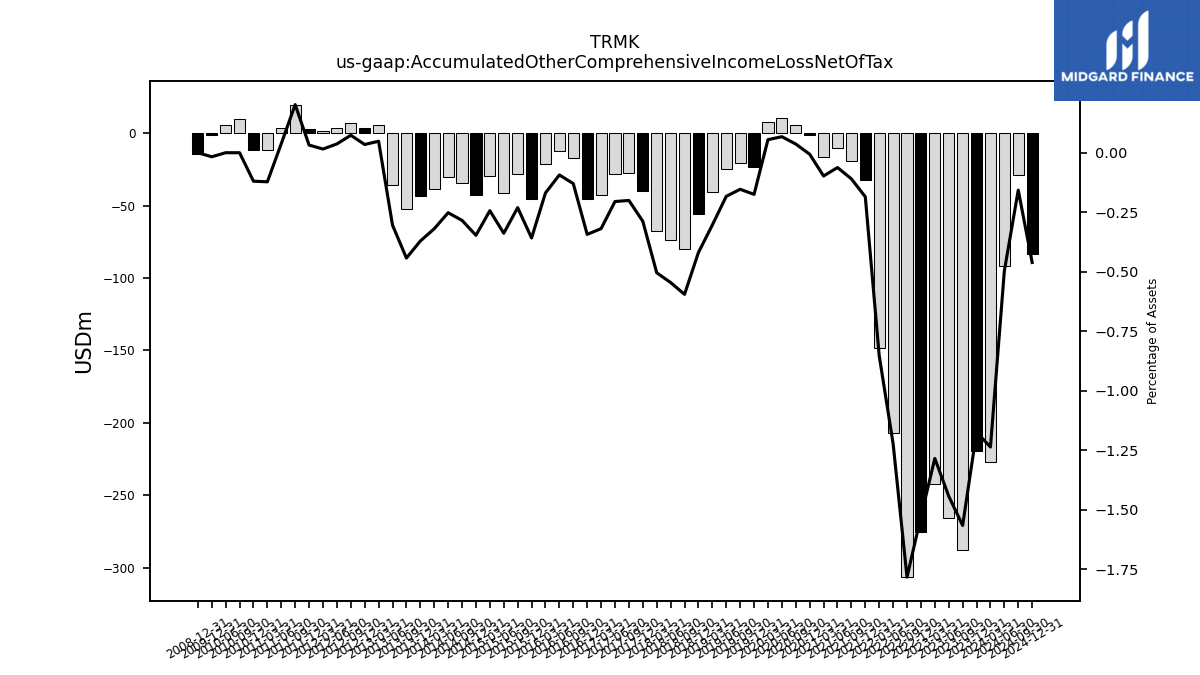
| Accumulated Other Comprehensive Income Loss Net Of Tax | -219.72 | -287.89 | -265.70 | -242.38 | -275.40 | -306.41 | -207.14 | -148.66 | -32.56 | -19.08 | -10.64 | -16.51 | -1.05 | 5.68 | 10.56 | 7.70 | -23.60 | -20.86 | -24.82 | -40.91 | -55.68 | -79.95 | -73.74 | -67.89 | -39.73 | -27.82 | -28.51 | -43.01 | -45.80 | -17.07 | -12.16 | -21.57 | -45.39 | -28.58 | -41.19 | -29.65 | -42.48 | -34.37 | -30.56 | -38.50 | -43.73 | -52.23 | -36.09 | 5.71 | 3.40 | 7.25 | 3.65 | 1.54 | 3.12 | 19.61 | 3.67 | -11.62 | -11.43 | -1.62 |
| 2023-12-31 | 2023-09-30 | 2023-06-30 | 2023-03-31 | 2022-12-31 | 2022-09-30 | 2022-06-30 | 2022-03-31 | 2021-12-31 | 2021-09-30 | 2021-06-30 | 2021-03-31 | 2020-12-31 | 2020-09-30 | 2020-06-30 | 2020-03-31 | 2019-12-31 | 2019-09-30 | 2019-06-30 | 2019-03-31 | 2018-12-31 | 2018-09-30 | 2018-06-30 | 2018-03-31 | 2017-12-31 | 2017-09-30 | 2017-06-30 | 2017-03-31 | 2016-12-31 | 2016-09-30 | 2016-06-30 | 2016-03-31 | 2015-12-31 | 2015-09-30 | 2015-06-30 | 2015-03-31 | 2014-12-31 | 2014-09-30 | 2014-06-30 | 2014-03-31 | 2013-12-31 | 2013-09-30 | 2013-06-30 | 2013-03-31 | 2012-12-31 | 2012-09-30 | 2012-06-30 | 2012-03-31 | 2011-12-31 | 2011-09-30 | 2011-06-30 | 2011-03-31 | 2010-12-31 | 2009-12-31 | ||
|---|---|---|---|---|---|---|---|---|---|---|---|---|---|---|---|---|---|---|---|---|---|---|---|---|---|---|---|---|---|---|---|---|---|---|---|---|---|---|---|---|---|---|---|---|---|---|---|---|---|---|---|---|---|---|---|
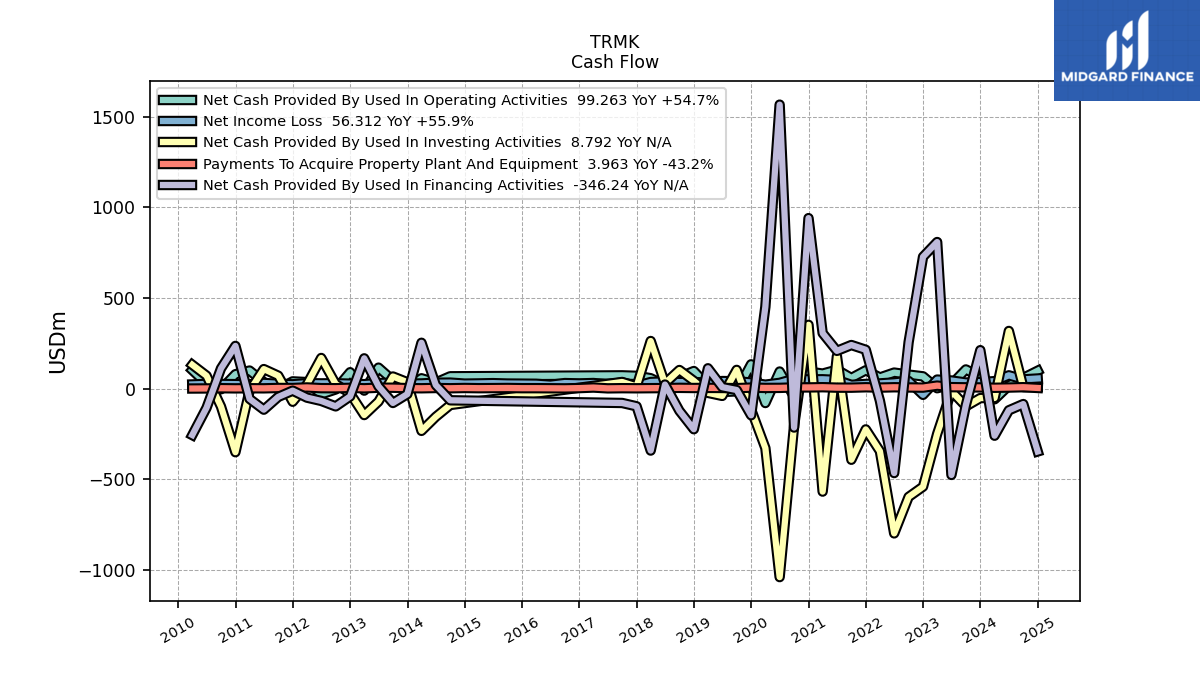
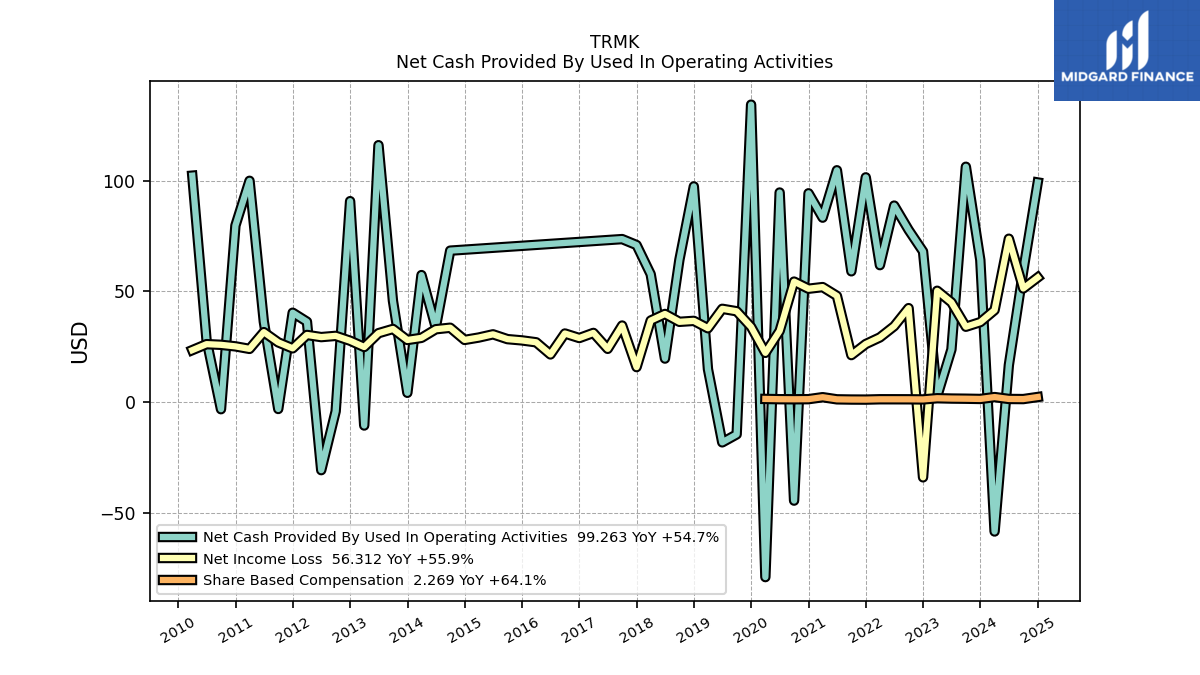
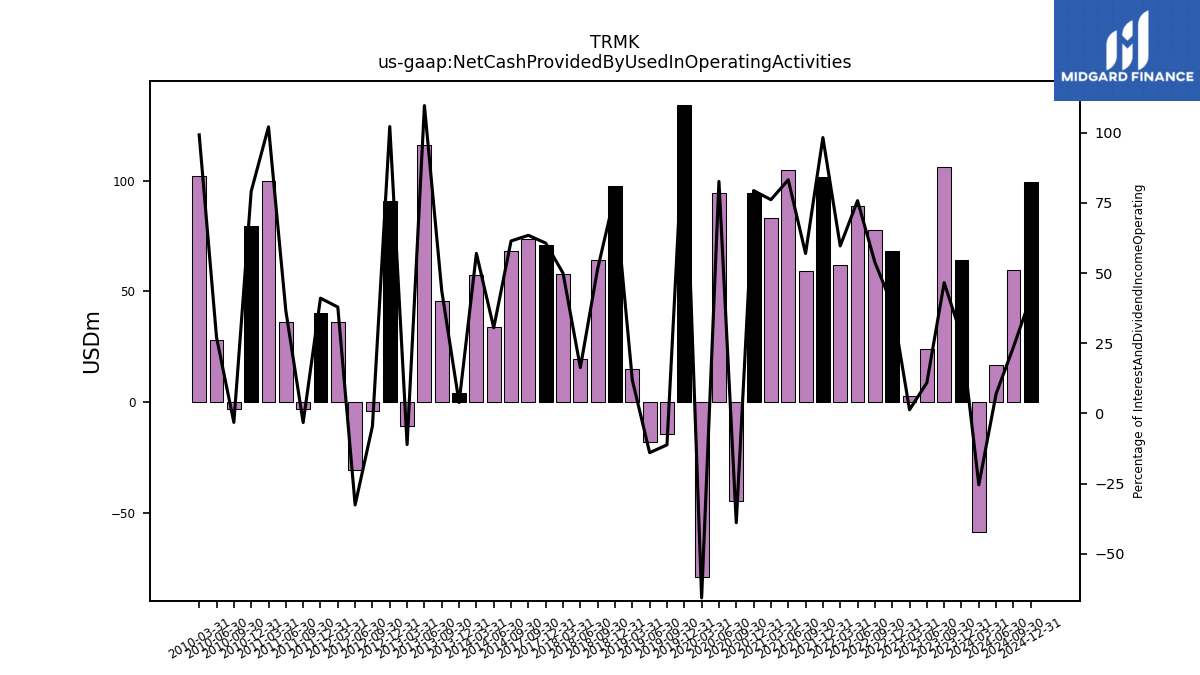
| Net Cash Provided By Used In Operating Activities | 64.19 | 106.37 | 23.78 | 2.56 | 68.05 | 77.80 | 88.80 | 61.87 | 101.57 | 59.08 | 104.78 | 83.34 | 94.37 | -44.58 | 94.72 | -79.16 | 134.45 | -14.63 | -18.24 | 14.87 | 97.48 | 64.31 | 19.63 | 57.77 | 70.97 | 73.66 | NA | NA | NA | NA | NA | NA | NA | NA | NA | NA | NA | 68.44 | 33.75 | 57.40 | 4.16 | 45.78 | 116.12 | -10.63 | 90.82 | -4.20 | -30.81 | 36.32 | 40.38 | -3.15 | 36.35 | 100.02 | 79.76 | NA | |
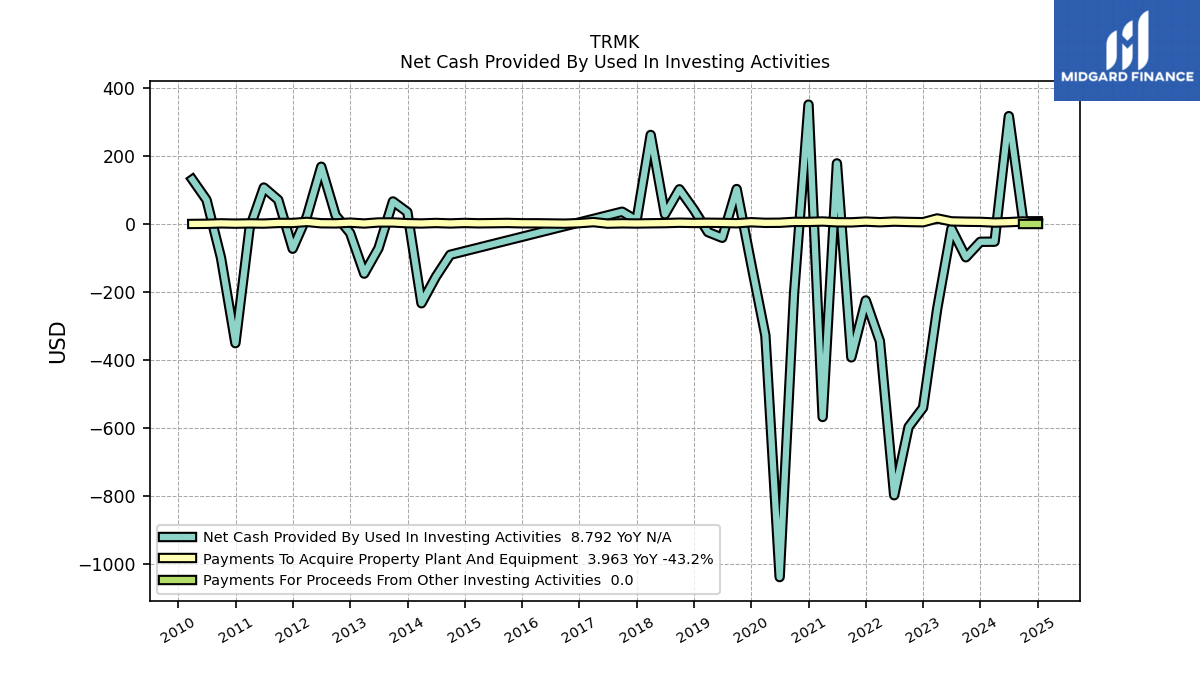
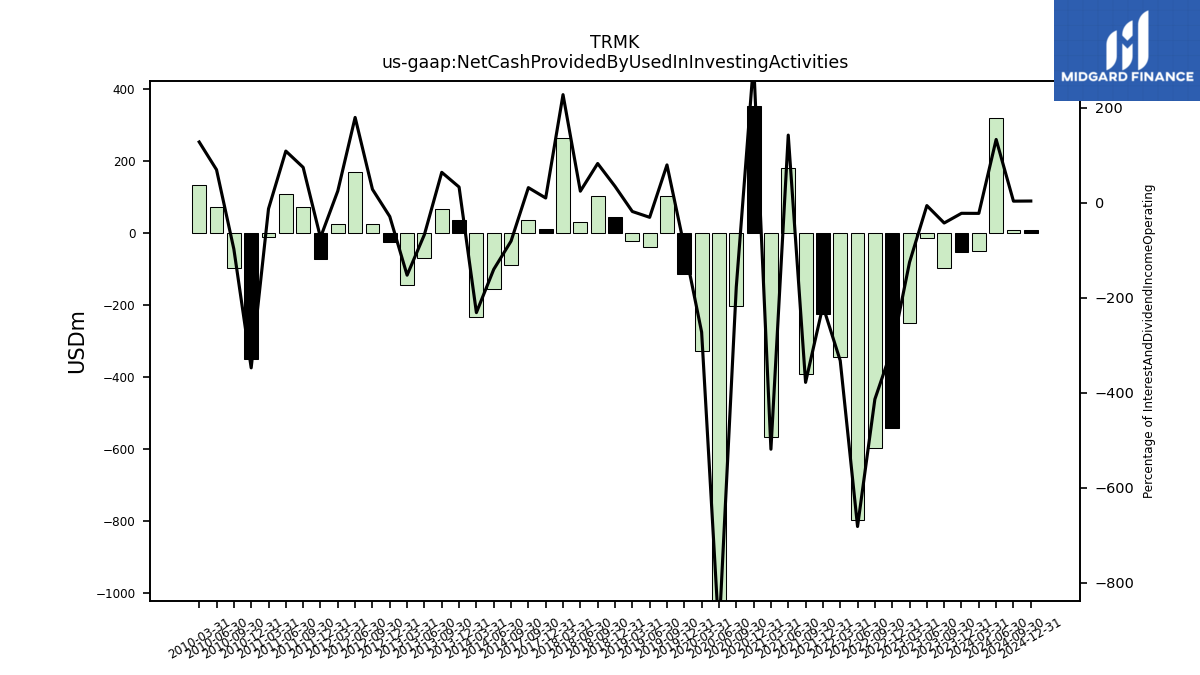
| Net Cash Provided By Used In Investing Activities | -51.65 | -97.29 | -12.93 | -249.31 | -540.50 | -597.04 | -798.34 | -344.53 | -224.45 | -392.12 | 179.33 | -567.78 | 352.46 | -203.08 | -1039.54 | -327.55 | -115.12 | 103.74 | -39.82 | -23.04 | 43.26 | 103.07 | 29.33 | 263.12 | 11.73 | 36.97 | NA | NA | NA | NA | NA | NA | NA | NA | NA | NA | NA | -89.93 | -155.21 | -232.78 | 35.80 | 67.21 | -70.78 | -145.42 | -25.73 | 26.18 | 169.54 | 23.90 | -72.09 | 71.69 | 108.15 | -12.47 | -350.38 | NA | |
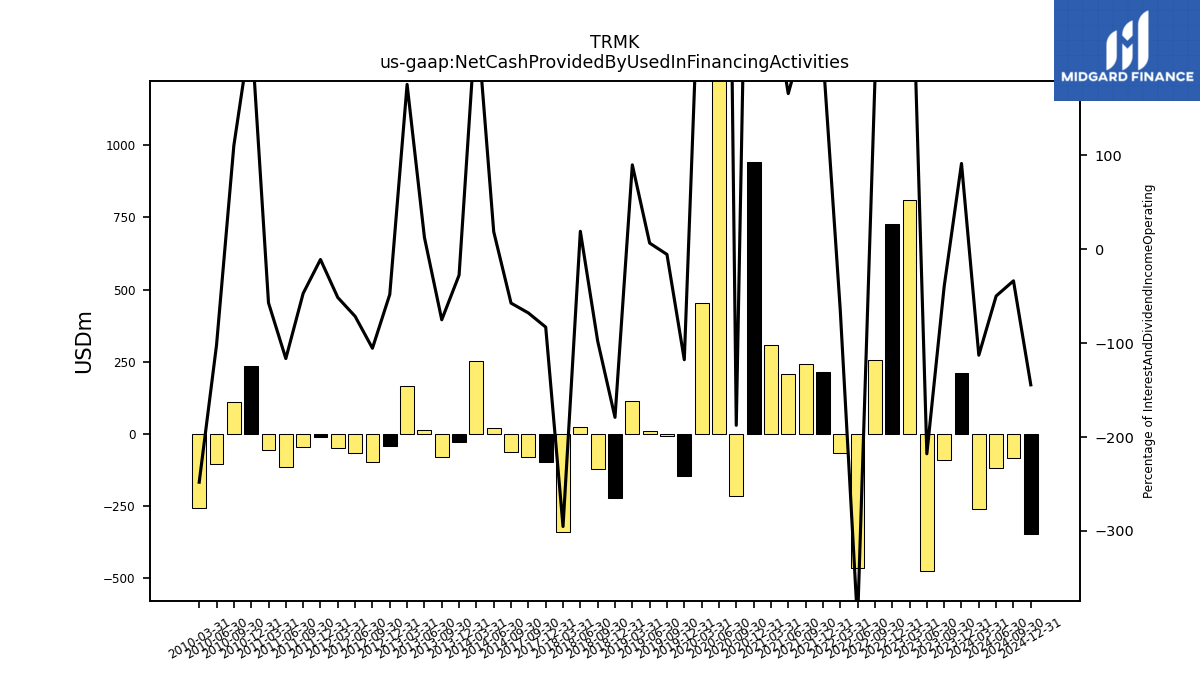
| Net Cash Provided By Used In Financing Activities | 212.51 | -90.64 | -475.94 | 809.11 | 727.60 | 256.42 | -465.56 | -66.61 | 214.65 | 240.87 | 208.58 | 306.47 | 941.08 | -214.39 | 1567.12 | 452.14 | -146.67 | -7.26 | 8.43 | 112.65 | -223.65 | -122.03 | 22.88 | -341.39 | -97.05 | -78.83 | NA | NA | NA | NA | NA | NA | NA | NA | NA | NA | NA | -63.97 | 20.60 | 253.44 | -29.89 | -78.82 | 13.30 | 167.46 | -42.79 | -97.52 | -67.50 | -49.34 | -10.79 | -45.26 | -115.73 | -56.01 | 236.03 | NA |
| 2023-12-31 | 2023-09-30 | 2023-06-30 | 2023-03-31 | 2022-12-31 | 2022-09-30 | 2022-06-30 | 2022-03-31 | 2021-12-31 | 2021-09-30 | 2021-06-30 | 2021-03-31 | 2020-12-31 | 2020-09-30 | 2020-06-30 | 2020-03-31 | 2019-12-31 | 2019-09-30 | 2019-06-30 | 2019-03-31 | 2018-12-31 | 2018-09-30 | 2018-06-30 | 2018-03-31 | 2017-12-31 | 2017-09-30 | 2017-06-30 | 2017-03-31 | 2016-12-31 | 2016-09-30 | 2016-06-30 | 2016-03-31 | 2015-12-31 | 2015-09-30 | 2015-06-30 | 2015-03-31 | 2014-12-31 | 2014-09-30 | 2014-06-30 | 2014-03-31 | 2013-12-31 | 2013-09-30 | 2013-06-30 | 2013-03-31 | 2012-12-31 | 2012-09-30 | 2012-06-30 | 2012-03-31 | 2011-12-31 | 2011-09-30 | 2011-06-30 | 2011-03-31 | 2010-12-31 | 2009-12-31 | ||
|---|---|---|---|---|---|---|---|---|---|---|---|---|---|---|---|---|---|---|---|---|---|---|---|---|---|---|---|---|---|---|---|---|---|---|---|---|---|---|---|---|---|---|---|---|---|---|---|---|---|---|---|---|---|---|---|
| Net Cash Provided By Used In Operating Activities | 64.19 | 106.37 | 23.78 | 2.56 | 68.05 | 77.80 | 88.80 | 61.87 | 101.57 | 59.08 | 104.78 | 83.34 | 94.37 | -44.58 | 94.72 | -79.16 | 134.45 | -14.63 | -18.24 | 14.87 | 97.48 | 64.31 | 19.63 | 57.77 | 70.97 | 73.66 | NA | NA | NA | NA | NA | NA | NA | NA | NA | NA | NA | 68.44 | 33.75 | 57.40 | 4.16 | 45.78 | 116.12 | -10.63 | 90.82 | -4.20 | -30.81 | 36.32 | 40.38 | -3.15 | 36.35 | 100.02 | 79.76 | NA | |
| Net Income Loss | 36.12 | 34.03 | 45.04 | 50.30 | -34.06 | 42.45 | 34.28 | 29.21 | 26.22 | 21.20 | 47.98 | 51.96 | 51.22 | 54.44 | 32.15 | 22.22 | 33.95 | 41.03 | 42.14 | 33.34 | 36.69 | 36.25 | 39.81 | 36.83 | 15.77 | 34.58 | 24.04 | 31.25 | 28.92 | 30.98 | 21.50 | 27.00 | 27.86 | 28.43 | 30.60 | 29.15 | 28.07 | 33.59 | 32.90 | 29.00 | 28.04 | 33.03 | 31.12 | 24.87 | 27.71 | 29.90 | 29.35 | 30.32 | 24.26 | 26.97 | 31.60 | 24.01 | 25.16 | NA | |
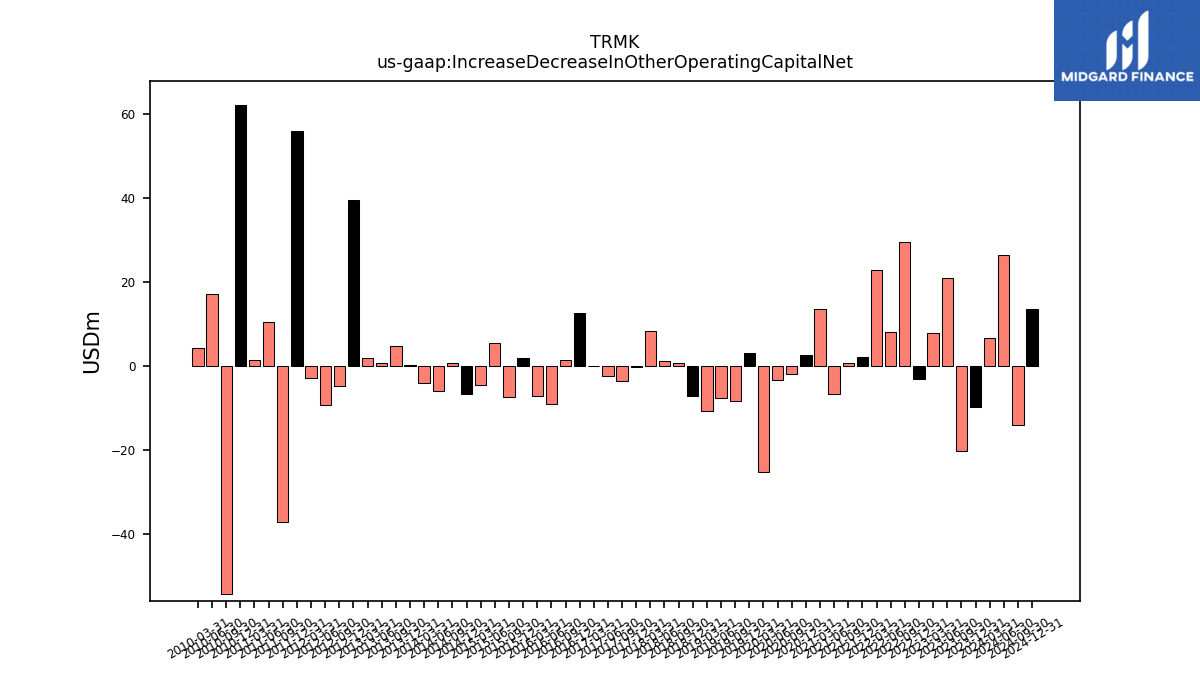
| Increase Decrease In Other Operating Capital Net | -9.71 | -20.26 | 20.83 | 7.95 | -3.16 | 29.50 | 8.16 | 22.86 | 2.05 | 0.68 | -6.77 | 13.64 | 2.67 | -1.92 | -3.33 | -25.12 | 3.04 | -8.38 | -7.69 | -10.81 | -7.25 | 0.79 | 1.12 | 8.36 | -0.15 | -3.69 | -2.50 | -0.09 | 12.60 | 1.49 | -9.03 | -7.08 | 1.93 | -7.34 | 5.57 | -4.55 | -6.79 | 0.60 | -5.99 | -4.16 | 0.13 | 4.79 | 0.70 | 1.90 | 39.55 | -4.72 | -9.33 | -2.99 | 55.99 | -37.22 | 10.46 | 1.48 | 61.97 | NA | |
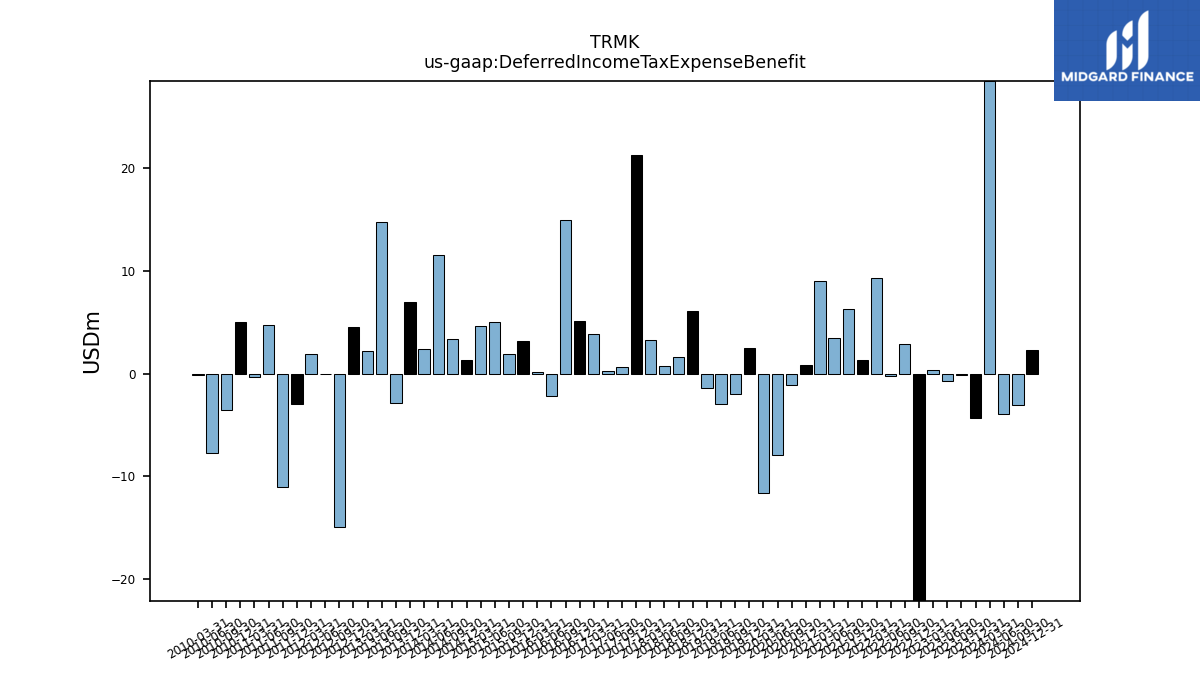
| Deferred Income Tax Expense Benefit | -4.33 | -0.09 | -0.71 | 0.34 | -28.80 | 2.90 | -0.20 | 9.30 | 1.36 | 6.25 | 3.50 | 9.00 | 0.80 | -1.10 | -7.90 | -11.60 | 2.52 | -2.00 | -3.00 | -1.40 | 6.13 | 1.61 | 0.70 | 3.30 | 21.27 | 0.60 | 0.30 | 3.90 | 5.10 | 15.00 | -2.23 | 0.12 | 3.20 | 1.90 | 5.08 | 4.62 | 1.30 | 3.40 | 11.60 | 2.40 | 7.02 | -2.83 | 14.81 | 2.16 | 4.58 | -14.89 | -0.03 | 1.88 | -2.95 | -11.08 | 4.70 | -0.35 | 5.07 | NA | |
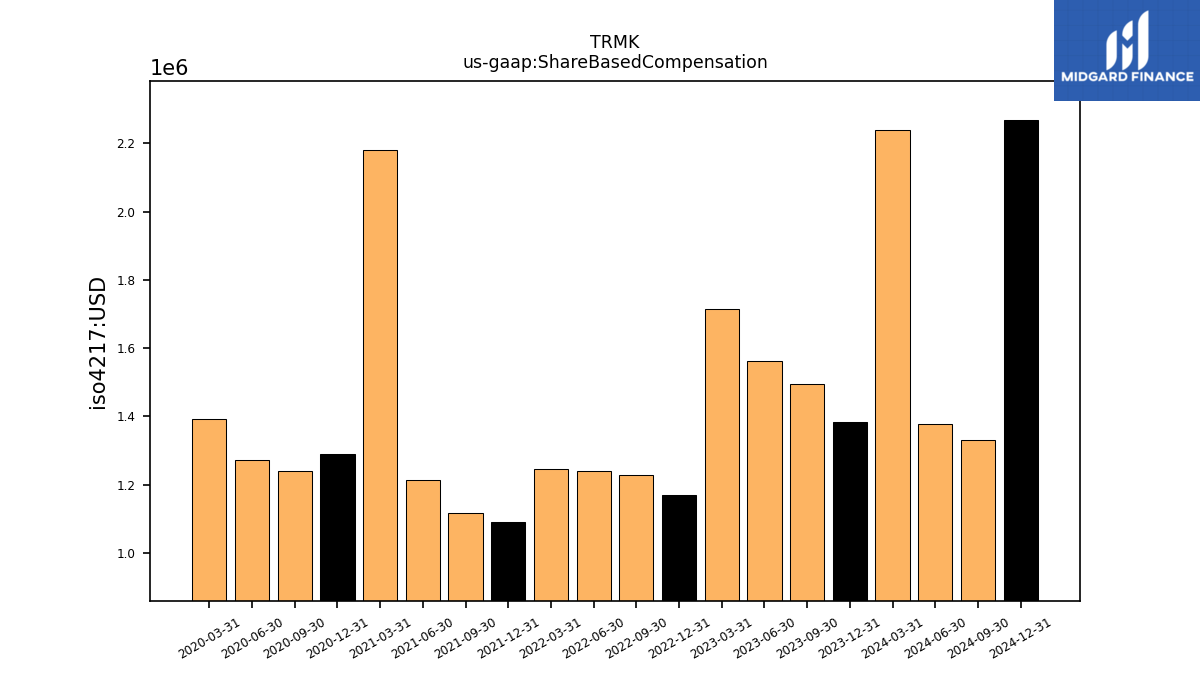
| Share Based Compensation | 1.38 | 1.49 | 1.56 | 1.72 | 1.17 | 1.23 | 1.24 | 1.25 | 1.09 | 1.12 | 1.21 | 2.18 | 1.29 | 1.24 | 1.27 | 1.39 | NA | NA | NA | NA | NA | NA | NA | NA | NA | NA | NA | NA | NA | NA | NA | NA | NA | NA | NA | NA | NA | NA | NA | NA | NA | NA | NA | NA | NA | NA | NA | NA | NA | NA | NA | NA | NA | NA |
| 2023-12-31 | 2023-09-30 | 2023-06-30 | 2023-03-31 | 2022-12-31 | 2022-09-30 | 2022-06-30 | 2022-03-31 | 2021-12-31 | 2021-09-30 | 2021-06-30 | 2021-03-31 | 2020-12-31 | 2020-09-30 | 2020-06-30 | 2020-03-31 | 2019-12-31 | 2019-09-30 | 2019-06-30 | 2019-03-31 | 2018-12-31 | 2018-09-30 | 2018-06-30 | 2018-03-31 | 2017-12-31 | 2017-09-30 | 2017-06-30 | 2017-03-31 | 2016-12-31 | 2016-09-30 | 2016-06-30 | 2016-03-31 | 2015-12-31 | 2015-09-30 | 2015-06-30 | 2015-03-31 | 2014-12-31 | 2014-09-30 | 2014-06-30 | 2014-03-31 | 2013-12-31 | 2013-09-30 | 2013-06-30 | 2013-03-31 | 2012-12-31 | 2012-09-30 | 2012-06-30 | 2012-03-31 | 2011-12-31 | 2011-09-30 | 2011-06-30 | 2011-03-31 | 2010-12-31 | 2009-12-31 | ||
|---|---|---|---|---|---|---|---|---|---|---|---|---|---|---|---|---|---|---|---|---|---|---|---|---|---|---|---|---|---|---|---|---|---|---|---|---|---|---|---|---|---|---|---|---|---|---|---|---|---|---|---|---|---|---|---|
| Net Cash Provided By Used In Investing Activities | -51.65 | -97.29 | -12.93 | -249.31 | -540.50 | -597.04 | -798.34 | -344.53 | -224.45 | -392.12 | 179.33 | -567.78 | 352.46 | -203.08 | -1039.54 | -327.55 | -115.12 | 103.74 | -39.82 | -23.04 | 43.26 | 103.07 | 29.33 | 263.12 | 11.73 | 36.97 | NA | NA | NA | NA | NA | NA | NA | NA | NA | NA | NA | -89.93 | -155.21 | -232.78 | 35.80 | 67.21 | -70.78 | -145.42 | -25.73 | 26.18 | 169.54 | 23.90 | -72.09 | 71.69 | 108.15 | -12.47 | -350.38 | NA | |
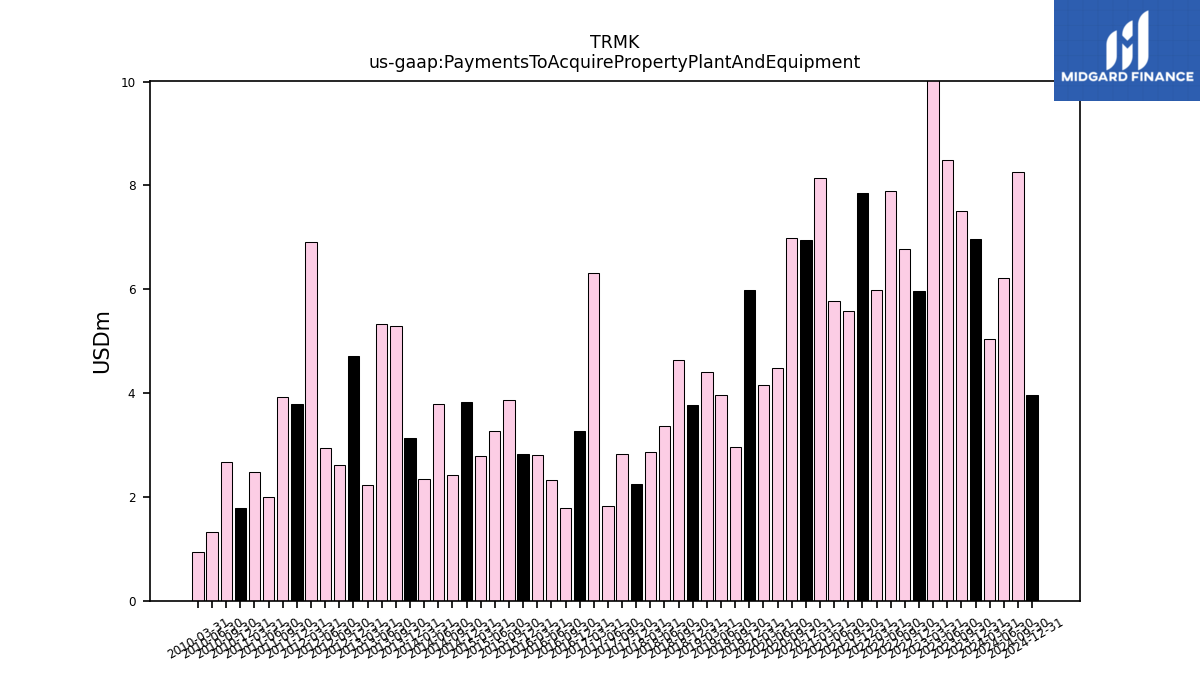
| Payments To Acquire Property Plant And Equipment | 6.98 | 7.51 | 8.50 | 17.09 | 5.97 | 6.78 | 7.89 | 5.99 | 7.86 | 5.58 | 5.77 | 8.15 | 6.94 | 7.00 | 4.48 | 4.15 | 5.99 | 2.96 | 3.96 | 4.41 | 3.77 | 4.65 | 3.36 | 2.86 | 2.26 | 2.82 | 1.82 | 6.32 | 3.28 | 1.79 | 2.32 | 2.81 | 2.82 | 3.87 | 3.27 | 2.79 | 3.83 | 2.42 | 3.79 | 2.34 | 3.13 | 5.30 | 5.33 | 2.23 | 4.71 | 2.62 | 2.94 | 6.91 | 3.79 | 3.92 | 1.99 | 2.49 | 1.80 | NA |
| 2023-12-31 | 2023-09-30 | 2023-06-30 | 2023-03-31 | 2022-12-31 | 2022-09-30 | 2022-06-30 | 2022-03-31 | 2021-12-31 | 2021-09-30 | 2021-06-30 | 2021-03-31 | 2020-12-31 | 2020-09-30 | 2020-06-30 | 2020-03-31 | 2019-12-31 | 2019-09-30 | 2019-06-30 | 2019-03-31 | 2018-12-31 | 2018-09-30 | 2018-06-30 | 2018-03-31 | 2017-12-31 | 2017-09-30 | 2017-06-30 | 2017-03-31 | 2016-12-31 | 2016-09-30 | 2016-06-30 | 2016-03-31 | 2015-12-31 | 2015-09-30 | 2015-06-30 | 2015-03-31 | 2014-12-31 | 2014-09-30 | 2014-06-30 | 2014-03-31 | 2013-12-31 | 2013-09-30 | 2013-06-30 | 2013-03-31 | 2012-12-31 | 2012-09-30 | 2012-06-30 | 2012-03-31 | 2011-12-31 | 2011-09-30 | 2011-06-30 | 2011-03-31 | 2010-12-31 | 2009-12-31 | ||
|---|---|---|---|---|---|---|---|---|---|---|---|---|---|---|---|---|---|---|---|---|---|---|---|---|---|---|---|---|---|---|---|---|---|---|---|---|---|---|---|---|---|---|---|---|---|---|---|---|---|---|---|---|---|---|---|
| Net Cash Provided By Used In Financing Activities | 212.51 | -90.64 | -475.94 | 809.11 | 727.60 | 256.42 | -465.56 | -66.61 | 214.65 | 240.87 | 208.58 | 306.47 | 941.08 | -214.39 | 1567.12 | 452.14 | -146.67 | -7.26 | 8.43 | 112.65 | -223.65 | -122.03 | 22.88 | -341.39 | -97.05 | -78.83 | NA | NA | NA | NA | NA | NA | NA | NA | NA | NA | NA | -63.97 | 20.60 | 253.44 | -29.89 | -78.82 | 13.30 | 167.46 | -42.79 | -97.52 | -67.50 | -49.34 | -10.79 | -45.26 | -115.73 | -56.01 | 236.03 | NA | |
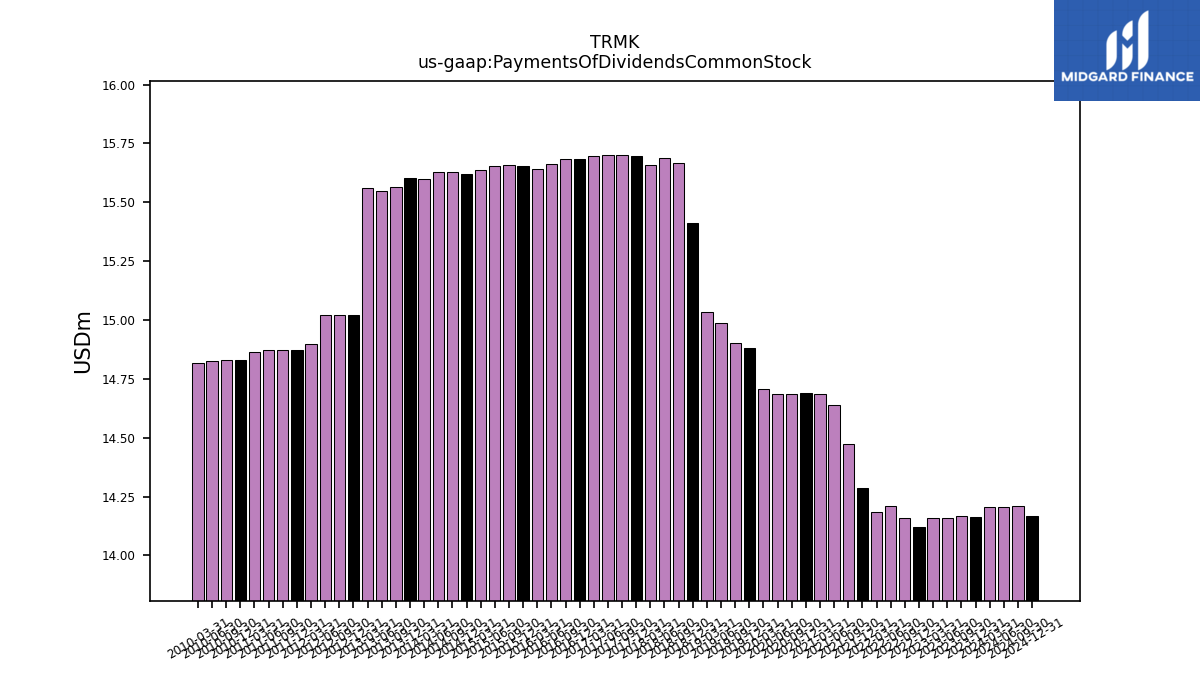
| Payments Of Dividends Common Stock | 14.16 | 14.17 | 14.16 | 14.16 | 14.12 | 14.16 | 14.21 | 14.19 | 14.29 | 14.47 | 14.64 | 14.69 | 14.69 | 14.69 | 14.69 | 14.71 | 14.88 | 14.90 | 14.99 | 15.03 | 15.41 | 15.67 | 15.69 | 15.66 | 15.70 | 15.70 | 15.70 | 15.70 | 15.68 | 15.68 | 15.66 | 15.64 | 15.65 | 15.66 | 15.65 | 15.64 | 15.62 | 15.63 | 15.63 | 15.60 | 15.60 | 15.57 | 15.55 | 15.56 | 15.02 | 15.02 | 15.02 | 14.90 | 14.87 | 14.87 | 14.87 | 14.87 | 14.83 | NA |