
| 2023-12-31 | 2023-09-30 | 2023-06-30 | 2023-03-31 | 2022-12-31 | 2022-09-30 | 2022-06-30 | 2022-03-31 | 2021-12-31 | 2021-09-30 | 2021-06-30 | 2021-03-31 | 2020-12-31 | 2020-09-30 | 2020-06-30 | 2020-03-31 | 2019-12-31 | 2019-09-30 | 2019-06-30 | 2019-03-31 | 2018-12-31 | 2018-09-30 | 2018-06-30 | 2018-03-31 | 2017-12-31 | 2017-09-30 | 2017-06-30 | 2017-03-31 | 2016-12-31 | 2016-09-30 | 2016-06-30 | 2016-03-31 | 2015-12-31 | 2015-09-30 | 2015-06-30 | 2015-03-31 | 2014-12-31 | 2014-09-30 | 2014-06-30 | 2014-03-31 | 2013-12-31 | 2013-09-30 | 2013-06-30 | 2013-03-31 | ||
|---|---|---|---|---|---|---|---|---|---|---|---|---|---|---|---|---|---|---|---|---|---|---|---|---|---|---|---|---|---|---|---|---|---|---|---|---|---|---|---|---|---|---|---|---|---|
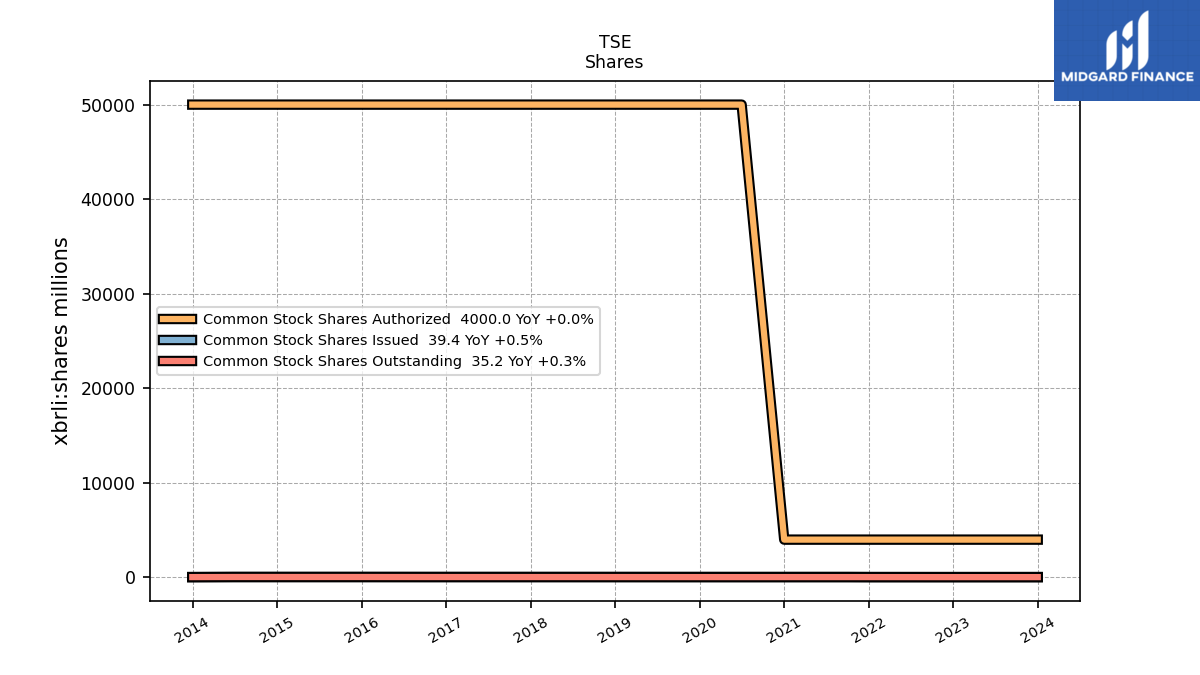
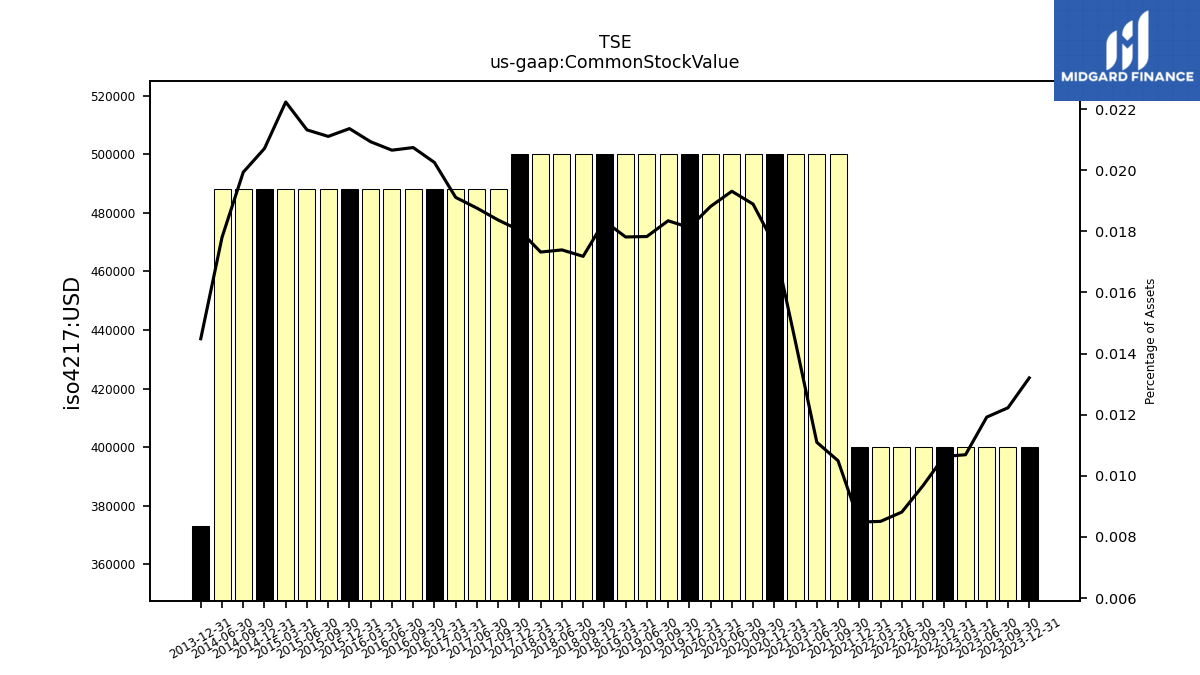
| Common Stock Value | 0.40 | 0.40 | 0.40 | 0.40 | 0.40 | 0.40 | 0.40 | 0.40 | 0.40 | 0.50 | 0.50 | 0.50 | 0.50 | 0.50 | 0.50 | 0.50 | 0.50 | 0.50 | 0.50 | 0.50 | 0.50 | 0.50 | 0.50 | 0.50 | 0.50 | 0.49 | 0.49 | 0.49 | 0.49 | 0.49 | 0.49 | 0.49 | 0.49 | 0.49 | 0.49 | 0.49 | 0.49 | 0.49 | 0.49 | NA | 0.37 | NA | NA | NA | |
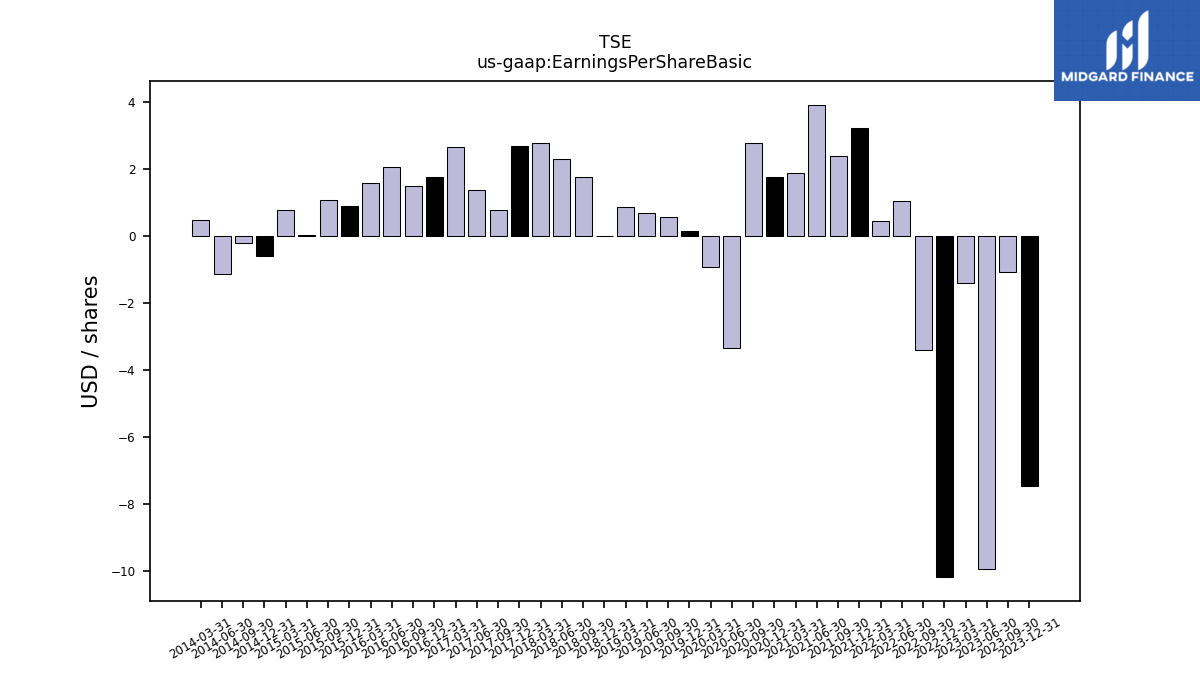
| Earnings Per Share Basic | -7.46 | -1.09 | -9.93 | -1.40 | -10.18 | -3.41 | 1.03 | 0.45 | 3.20 | 2.39 | 3.91 | 1.86 | 1.74 | 2.77 | -3.36 | -0.94 | 0.14 | 0.56 | 0.69 | 0.87 | -0.02 | 1.75 | 2.28 | 2.77 | 2.69 | 0.76 | 1.37 | 2.66 | 1.76 | 1.47 | 2.04 | 1.58 | 0.88 | 1.07 | 0.02 | 0.77 | -0.61 | -0.21 | -1.15 | 0.46 | NA | NA | NA | NA | |
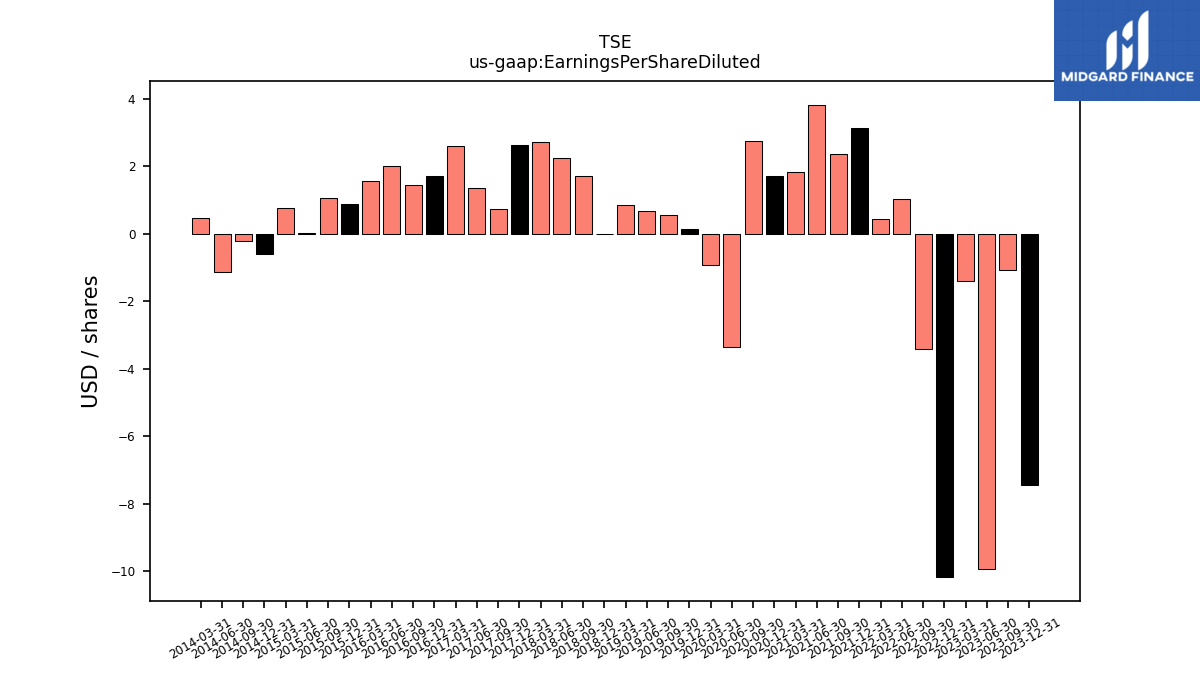
| Earnings Per Share Diluted | -7.46 | -1.09 | -9.93 | -1.40 | -10.18 | -3.41 | 1.01 | 0.44 | 3.14 | 2.36 | 3.82 | 1.81 | 1.71 | 2.75 | -3.36 | -0.94 | 0.14 | 0.56 | 0.68 | 0.86 | -0.02 | 1.72 | 2.24 | 2.71 | 2.63 | 0.74 | 1.34 | 2.59 | 1.72 | 1.43 | 2.00 | 1.56 | 0.88 | 1.06 | 0.02 | 0.77 | -0.61 | -0.21 | -1.15 | 0.46 | NA | NA | NA | NA | |
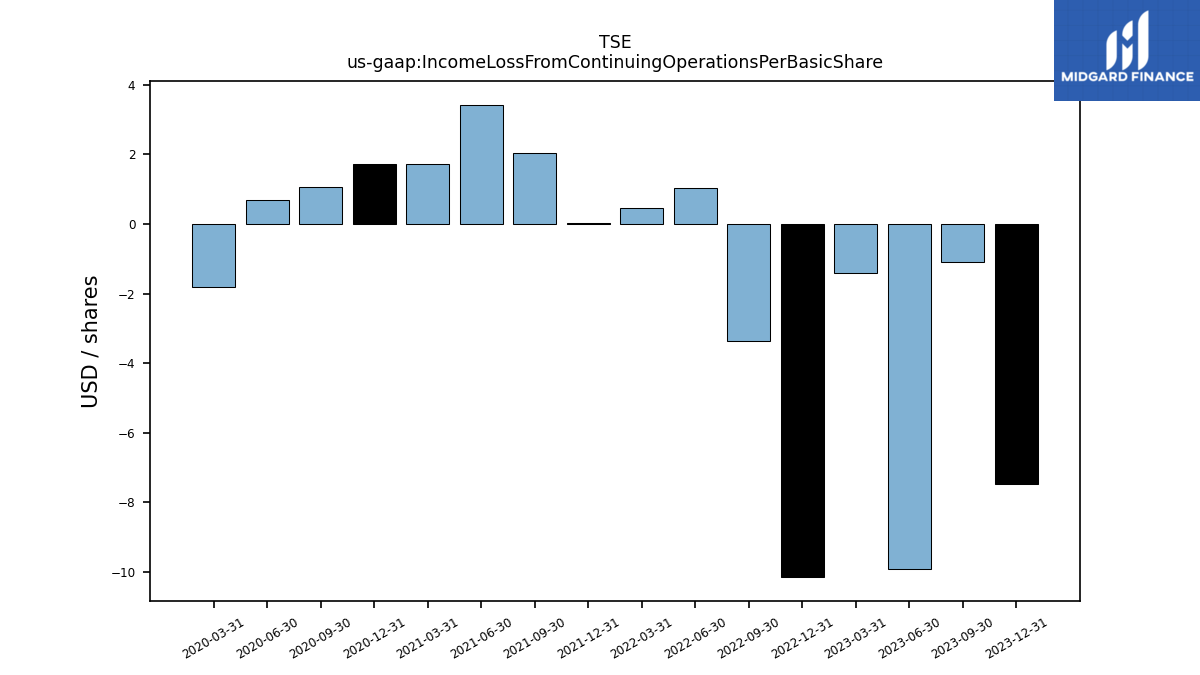
| Income Loss From Continuing Operations Per Basic Share | -0.00 | -0.00 | -0.00 | -0.00 | -0.00 | -0.00 | 0.00 | 0.00 | 0.00 | 0.00 | 0.00 | 0.00 | 0.00 | 0.00 | 0.00 | -0.00 | NA | NA | NA | NA | NA | NA | NA | NA | NA | NA | NA | NA | NA | NA | NA | NA | NA | NA | NA | NA | NA | NA | NA | NA | NA | NA | NA | NA | |
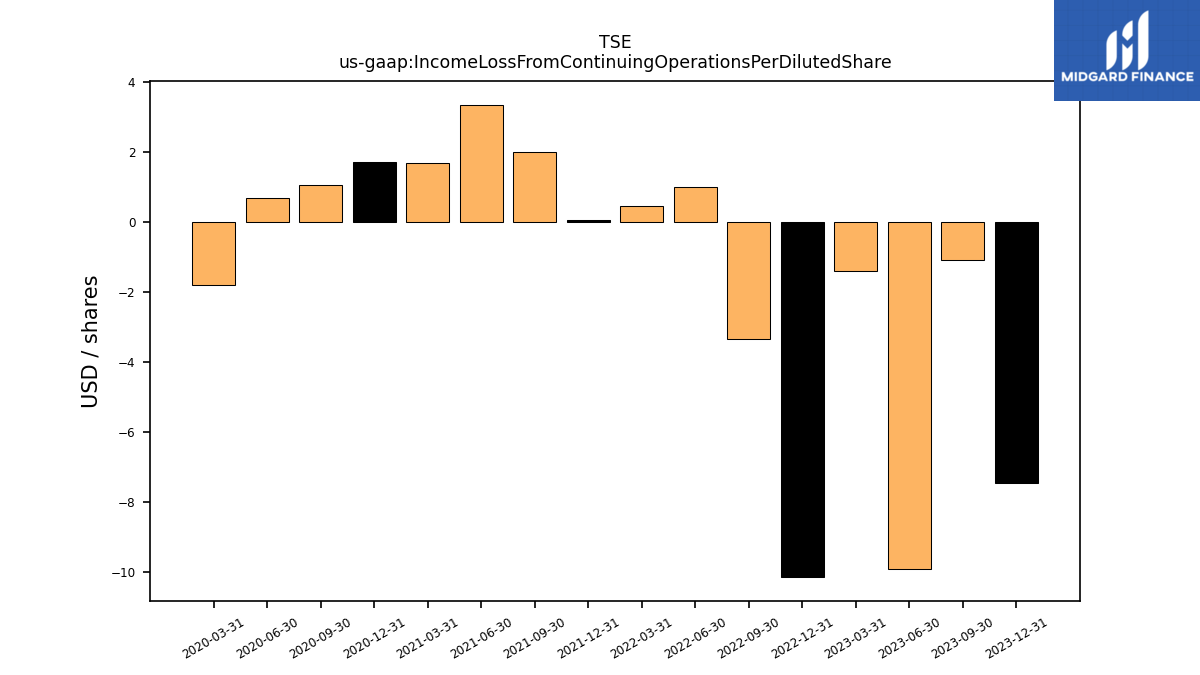
| Income Loss From Continuing Operations Per Diluted Share | -0.00 | -0.00 | -0.00 | -0.00 | -0.00 | -0.00 | 0.00 | 0.00 | 0.00 | 0.00 | 0.00 | 0.00 | 0.00 | 0.00 | 0.00 | -0.00 | NA | NA | NA | NA | NA | NA | NA | NA | NA | NA | NA | NA | NA | NA | NA | NA | NA | NA | NA | NA | NA | NA | NA | NA | NA | NA | NA | NA |
| 2023-12-31 | 2023-09-30 | 2023-06-30 | 2023-03-31 | 2022-12-31 | 2022-09-30 | 2022-06-30 | 2022-03-31 | 2021-12-31 | 2021-09-30 | 2021-06-30 | 2021-03-31 | 2020-12-31 | 2020-09-30 | 2020-06-30 | 2020-03-31 | 2019-12-31 | 2019-09-30 | 2019-06-30 | 2019-03-31 | 2018-12-31 | 2018-09-30 | 2018-06-30 | 2018-03-31 | 2017-12-31 | 2017-09-30 | 2017-06-30 | 2017-03-31 | 2016-12-31 | 2016-09-30 | 2016-06-30 | 2016-03-31 | 2015-12-31 | 2015-09-30 | 2015-06-30 | 2015-03-31 | 2014-12-31 | 2014-09-30 | 2014-06-30 | 2014-03-31 | 2013-12-31 | 2013-09-30 | 2013-06-30 | 2013-03-31 | ||
|---|---|---|---|---|---|---|---|---|---|---|---|---|---|---|---|---|---|---|---|---|---|---|---|---|---|---|---|---|---|---|---|---|---|---|---|---|---|---|---|---|---|---|---|---|---|
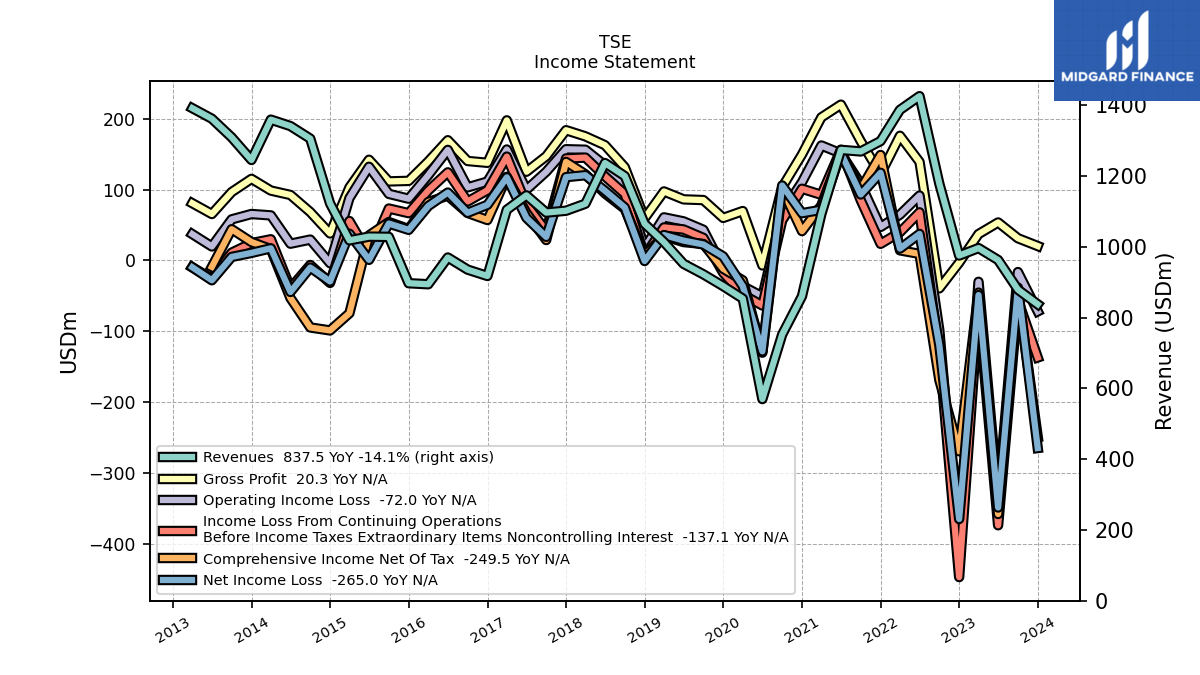
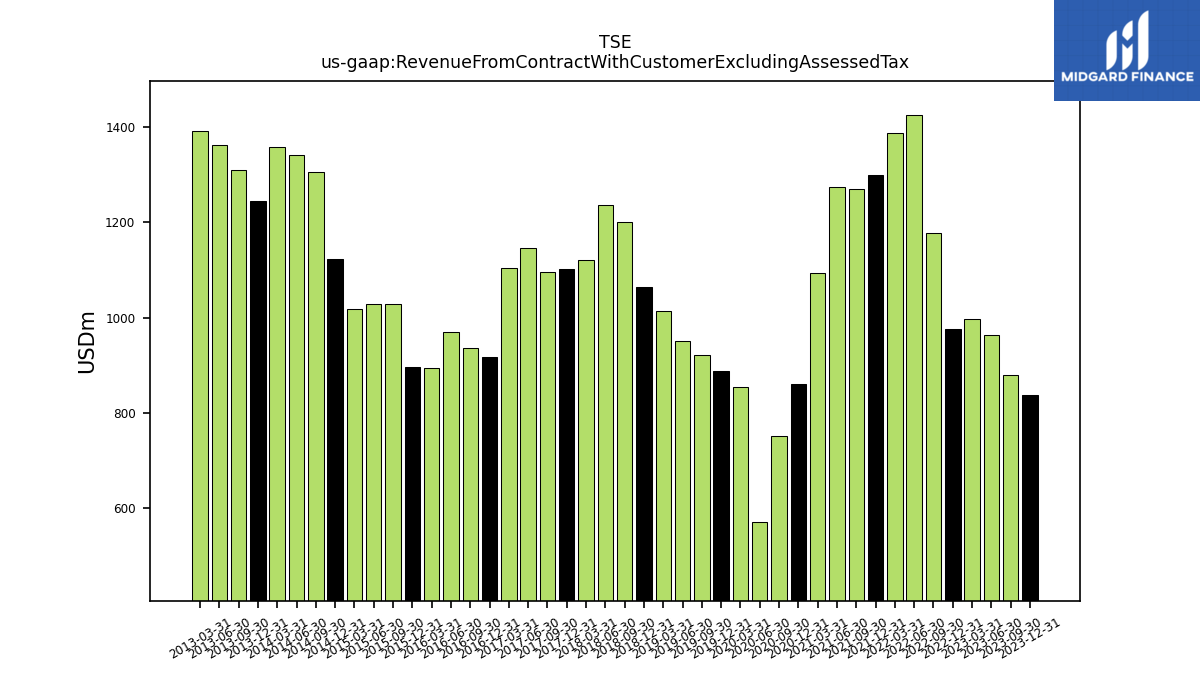
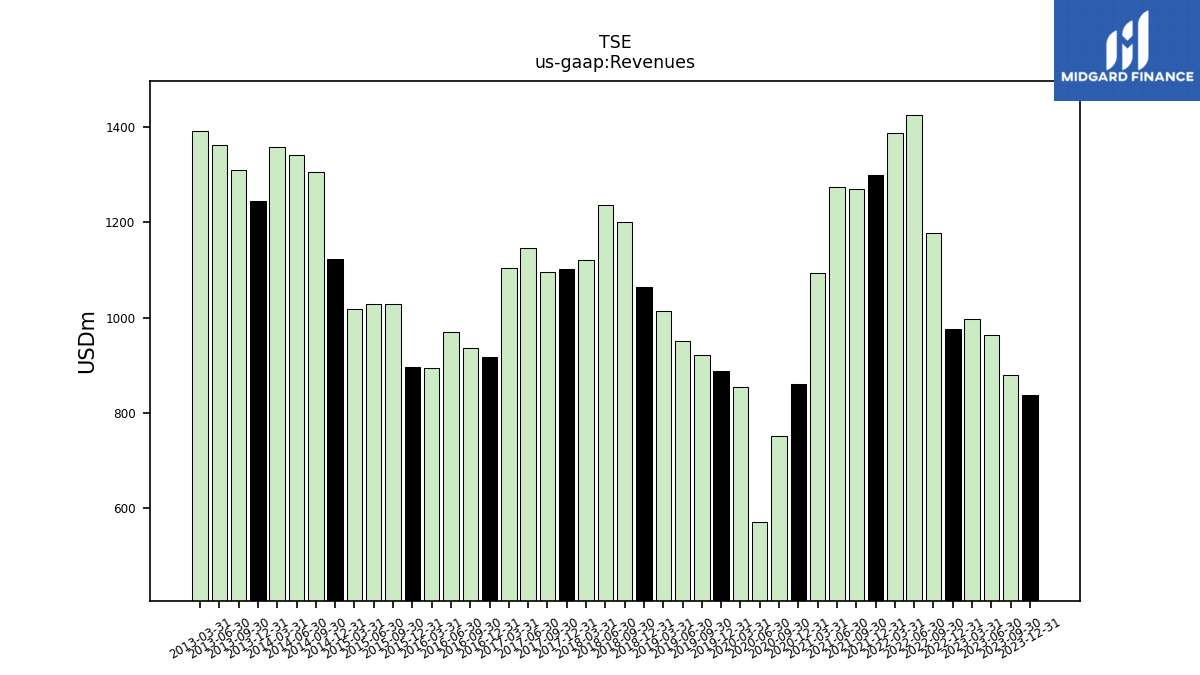
| Revenue From Contract With Customer Excluding Assessed Tax | 837.50 | 879.00 | 962.60 | 996.30 | 975.20 | 1178.10 | 1425.50 | 1386.70 | 1298.50 | 1269.30 | 1273.70 | 1092.60 | 860.20 | 752.10 | 569.70 | 853.50 | 888.80 | 922.10 | 951.80 | 1013.10 | 1065.00 | 1199.70 | 1236.60 | 1121.60 | 1101.80 | 1096.60 | 1145.20 | 1104.50 | 917.45 | 935.41 | 969.69 | 894.08 | 897.01 | 1027.95 | 1028.67 | 1018.26 | 1122.40 | 1305.49 | 1340.93 | 1359.13 | 1245.11 | 1308.96 | 1361.76 | 1391.59 | |
| Revenues | 837.50 | 879.00 | 962.60 | 996.30 | 975.20 | 1178.10 | 1425.50 | 1386.70 | 1298.50 | 1269.30 | 1273.70 | 1092.60 | 860.20 | 752.10 | 569.70 | 853.50 | 888.80 | 922.10 | 951.80 | 1013.10 | 1065.00 | 1199.70 | 1236.60 | 1121.60 | 1101.80 | 1096.60 | 1145.20 | 1104.50 | 917.45 | 935.41 | 969.69 | 894.08 | 897.01 | 1027.95 | 1028.67 | 1018.26 | 1122.40 | 1305.49 | 1340.93 | 1359.13 | 1245.11 | 1308.96 | 1361.76 | 1391.59 | |
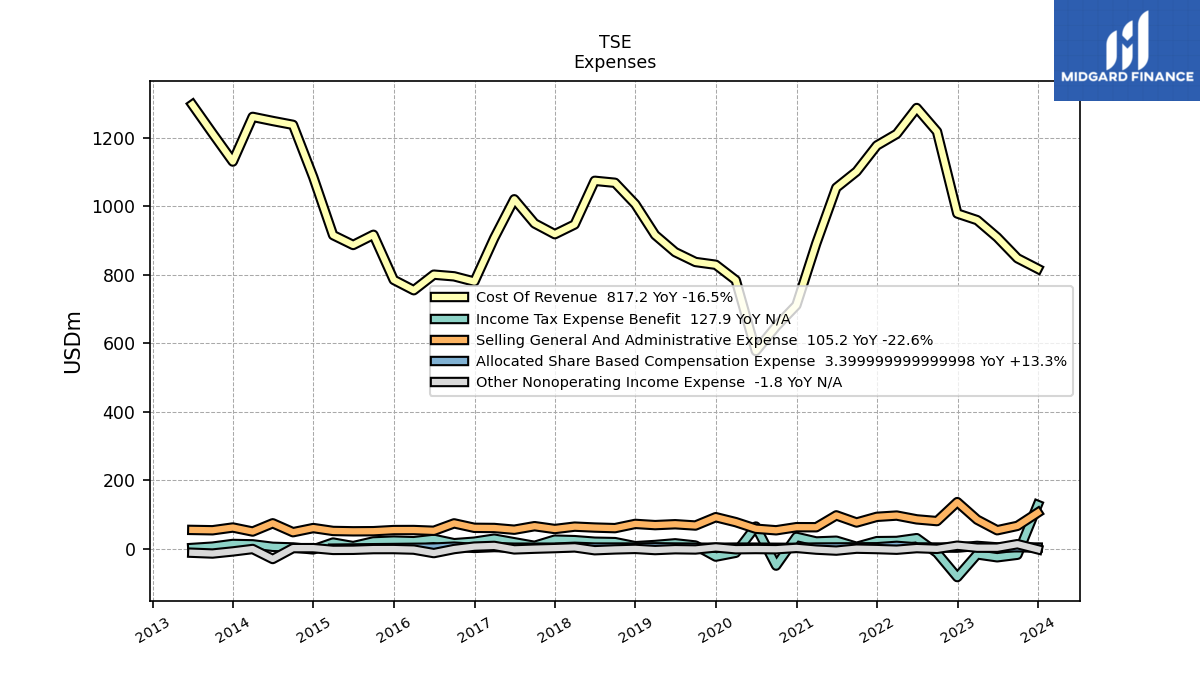
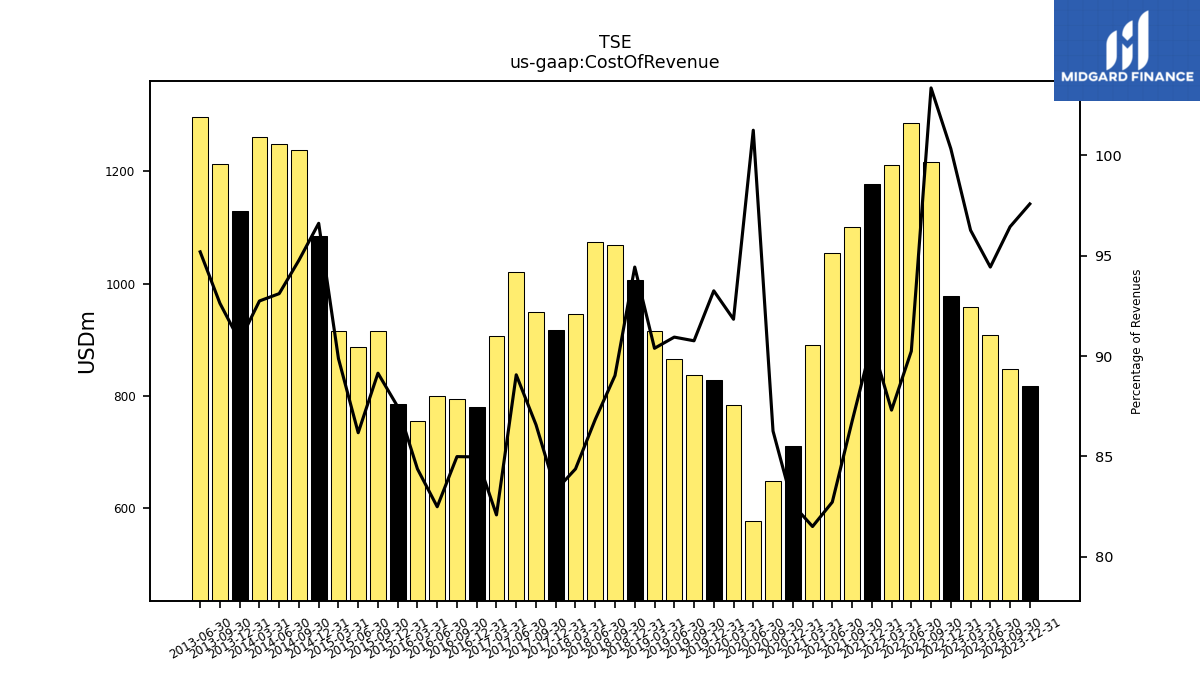
| Cost Of Revenue | 817.20 | 847.70 | 909.00 | 959.10 | 978.40 | 1217.60 | 1286.40 | 1210.70 | 1176.90 | 1101.00 | 1053.70 | 890.60 | 710.60 | 648.80 | 576.80 | 783.80 | 828.80 | 836.90 | 865.60 | 915.70 | 1005.70 | 1068.10 | 1073.90 | 946.40 | 917.96 | 949.46 | 1019.99 | 906.69 | 779.62 | 795.03 | 799.95 | 754.41 | 784.69 | 916.39 | 886.54 | 915.19 | 1084.36 | 1237.26 | 1248.53 | 1260.50 | 1129.93 | 1212.44 | 1296.25 | NA | |
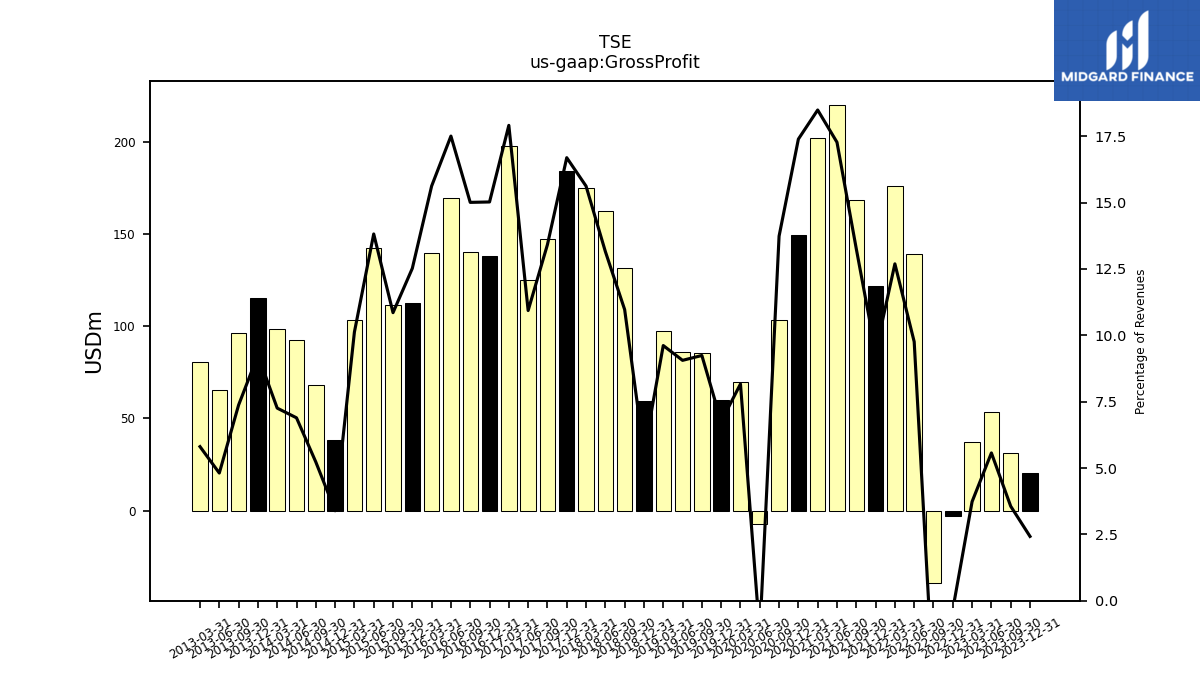
| Gross Profit | 20.30 | 31.30 | 53.60 | 37.20 | -3.20 | -39.50 | 139.10 | 176.00 | 121.60 | 168.30 | 220.00 | 202.00 | 149.60 | 103.30 | -7.10 | 69.70 | 60.00 | 85.20 | 86.20 | 97.40 | 59.30 | 131.60 | 162.70 | 175.20 | 183.90 | 147.12 | 125.21 | 197.80 | 137.83 | 140.38 | 169.74 | 139.67 | 112.32 | 111.56 | 142.14 | 103.08 | 38.05 | 68.24 | 92.41 | 98.63 | 115.18 | 96.52 | 65.51 | 80.80 | |
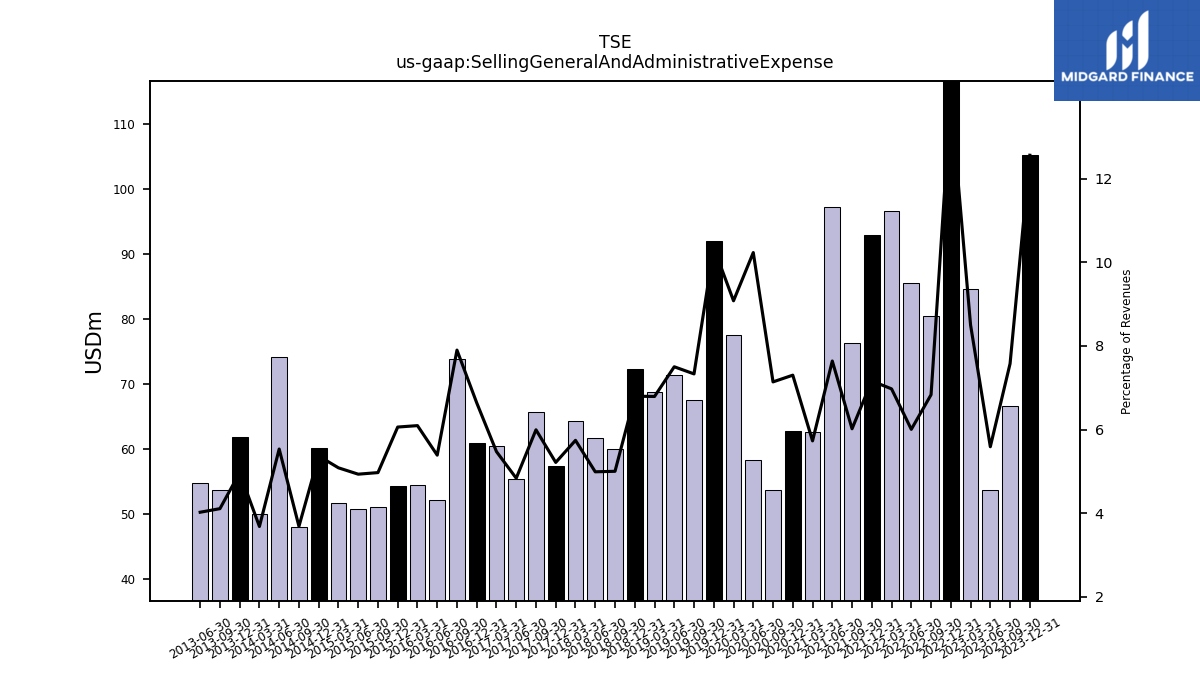
| Selling General And Administrative Expense | 105.20 | 66.60 | 53.80 | 84.70 | 136.00 | 80.50 | 85.60 | 96.70 | 93.00 | 76.40 | 97.30 | 62.60 | 62.80 | 53.70 | 58.30 | 77.50 | 92.00 | 67.60 | 71.40 | 68.80 | 72.40 | 60.00 | 61.70 | 64.40 | 57.45 | 65.73 | 55.38 | 60.44 | 60.91 | 73.90 | 52.25 | 54.49 | 54.36 | 51.09 | 50.74 | 51.77 | 60.23 | 48.11 | 74.21 | 50.03 | 61.85 | 53.77 | 54.77 | NA | |
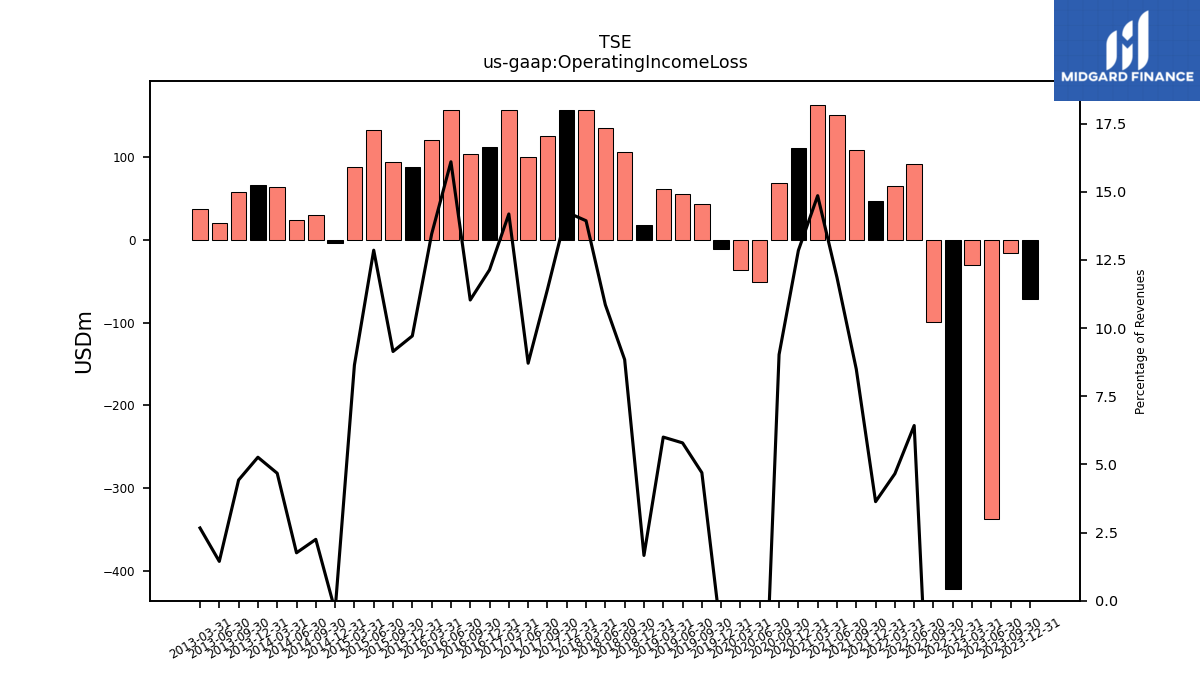
| Operating Income Loss | -72.00 | -16.40 | -336.80 | -30.20 | -420.90 | -99.10 | 91.60 | 64.60 | 47.20 | 107.80 | 151.00 | 162.30 | 110.50 | 67.90 | -51.00 | -36.30 | -11.20 | 43.30 | 55.10 | 60.80 | 17.70 | 106.10 | 134.20 | 156.30 | 157.00 | 125.20 | 99.75 | 156.66 | 111.34 | 103.17 | 156.09 | 120.21 | 87.11 | 93.96 | 132.24 | 88.01 | -4.04 | 29.39 | 23.58 | 63.55 | 65.52 | 57.96 | 19.66 | 37.14 | |
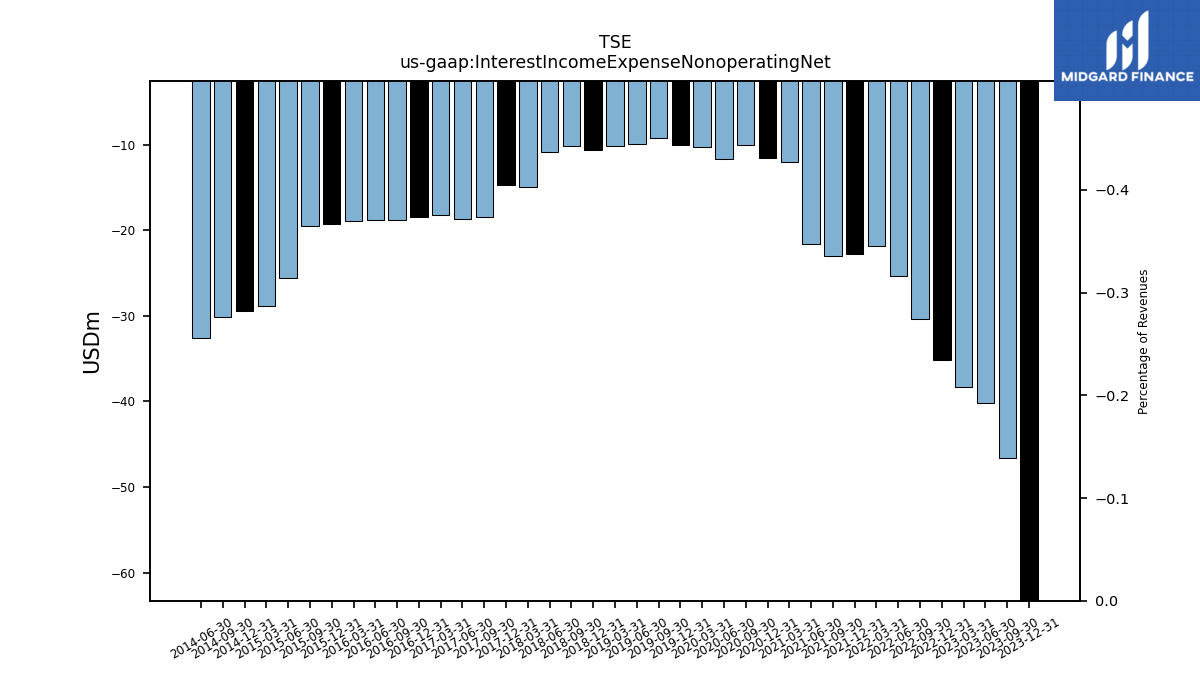
| Interest Income Expense Nonoperating Net | -63.30 | -46.60 | -40.20 | -38.30 | -35.20 | -30.40 | -25.40 | -21.90 | -22.80 | -23.00 | -21.60 | -12.00 | -11.60 | -10.00 | -11.70 | -10.30 | -10.00 | -9.20 | -9.90 | -10.20 | -10.60 | -10.10 | -10.80 | -14.90 | -14.74 | -18.44 | -18.72 | -18.20 | -18.43 | -18.83 | -18.81 | -18.90 | -19.25 | -19.49 | -25.60 | -28.86 | -29.41 | -30.10 | -32.60 | NA | NA | NA | NA | NA | |
| Gains Losses On Extinguishment Of Debt | 0.00 | -6.30 | NA | NA | 0.00 | 0.80 | NA | NA | NA | NA | -0.50 | NA | NA | NA | NA | NA | NA | NA | NA | NA | 0.00 | 0.00 | -0.20 | NA | -0.04 | -65.26 | NA | NA | NA | NA | NA | NA | 0.00 | 0.00 | -95.15 | NA | 0.00 | -7.39 | NA | NA | 0.00 | 0.00 | NA | NA | |
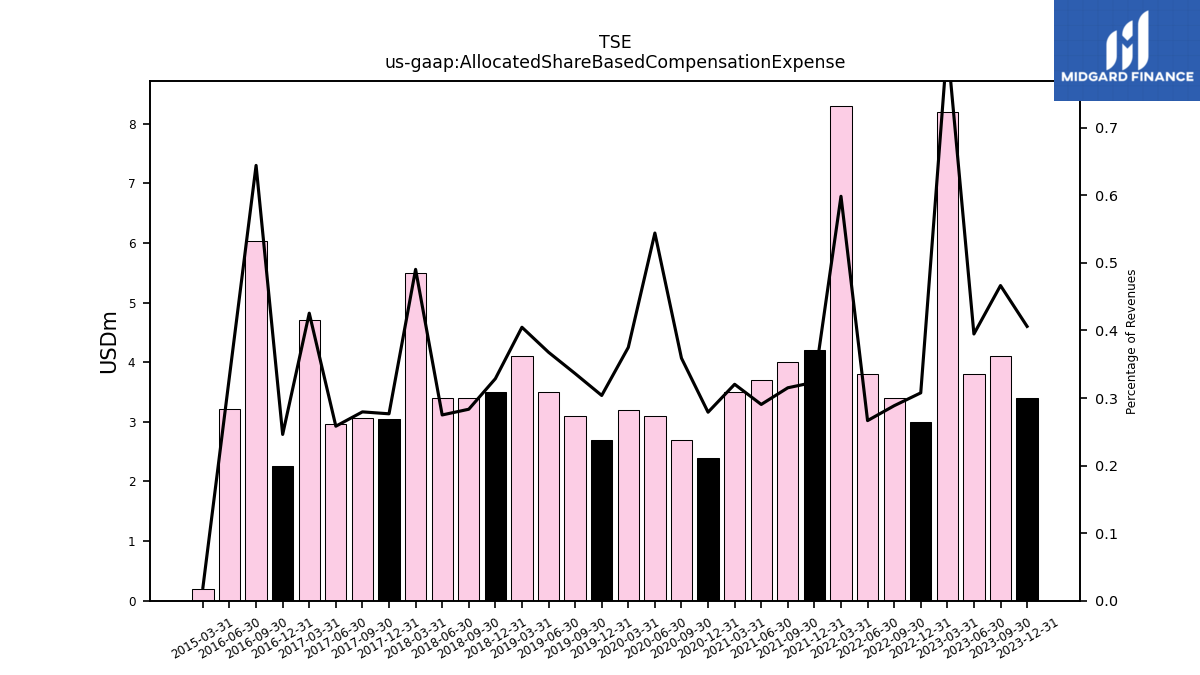
| Allocated Share Based Compensation Expense | 3.40 | 4.10 | 3.80 | 8.20 | 3.00 | 3.40 | 3.80 | 8.30 | 4.20 | 4.00 | 3.70 | 3.50 | 2.40 | 2.70 | 3.10 | 3.20 | 2.70 | 3.10 | 3.50 | 4.10 | 3.50 | 3.40 | 3.40 | 5.50 | 3.05 | 3.06 | 2.96 | 4.70 | 2.26 | 6.03 | 3.22 | NA | NA | NA | NA | 0.20 | NA | NA | NA | NA | NA | NA | NA | NA | |
| Income Tax Expense Benefit | 127.90 | -17.70 | -25.10 | -16.70 | -83.00 | -12.10 | 30.80 | 22.60 | 22.00 | 5.50 | 23.30 | 21.10 | 34.50 | -49.50 | 64.70 | -11.90 | -23.20 | 9.30 | 15.70 | 10.80 | 7.30 | 19.20 | 20.40 | 24.90 | 26.40 | 8.30 | 18.80 | 29.30 | 20.50 | 16.00 | 28.60 | 21.90 | 23.61 | 21.20 | 7.50 | 17.90 | -2.13 | 3.65 | 5.45 | 12.75 | 13.80 | 6.00 | 2.15 | NA | |
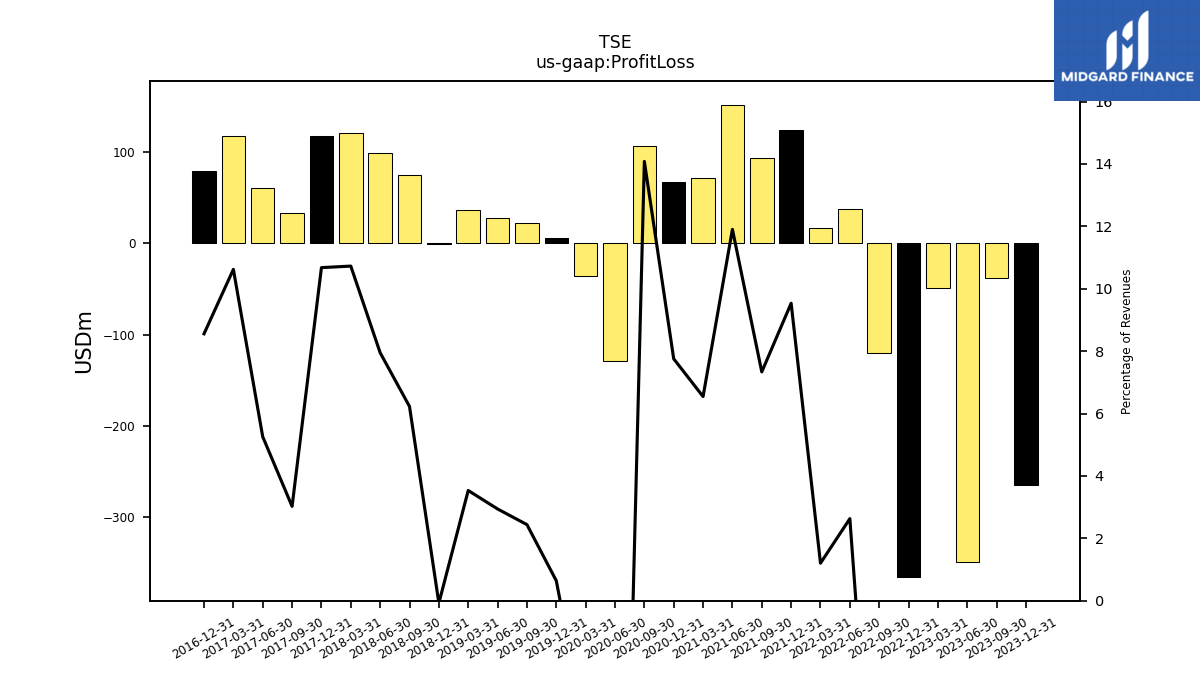
| Profit Loss | -265.00 | -38.40 | -349.00 | -48.90 | -365.30 | -119.80 | 37.50 | 16.70 | 123.80 | 93.10 | 151.60 | 71.50 | 66.70 | 105.90 | -128.40 | -36.30 | 5.70 | 22.50 | 28.00 | 35.80 | -0.80 | 74.70 | 98.30 | 120.30 | 117.63 | 33.17 | 60.20 | 117.30 | 78.50 | NA | NA | NA | NA | NA | NA | NA | NA | NA | NA | NA | NA | NA | NA | NA | |
| Net Income Loss | -265.00 | -38.40 | -349.00 | -48.90 | -365.30 | -119.80 | 37.40 | 16.70 | 123.80 | 93.10 | 151.60 | 71.50 | 66.70 | 105.80 | -128.40 | -36.30 | 5.70 | 22.50 | 28.00 | 35.80 | -0.90 | 74.70 | 98.30 | 120.30 | 117.60 | 33.22 | 60.16 | 117.29 | 78.51 | 67.25 | 95.80 | 76.75 | 43.13 | 52.05 | 0.76 | 37.70 | -29.69 | -10.11 | -44.62 | 17.09 | 10.59 | 4.94 | -28.06 | -9.68 | |
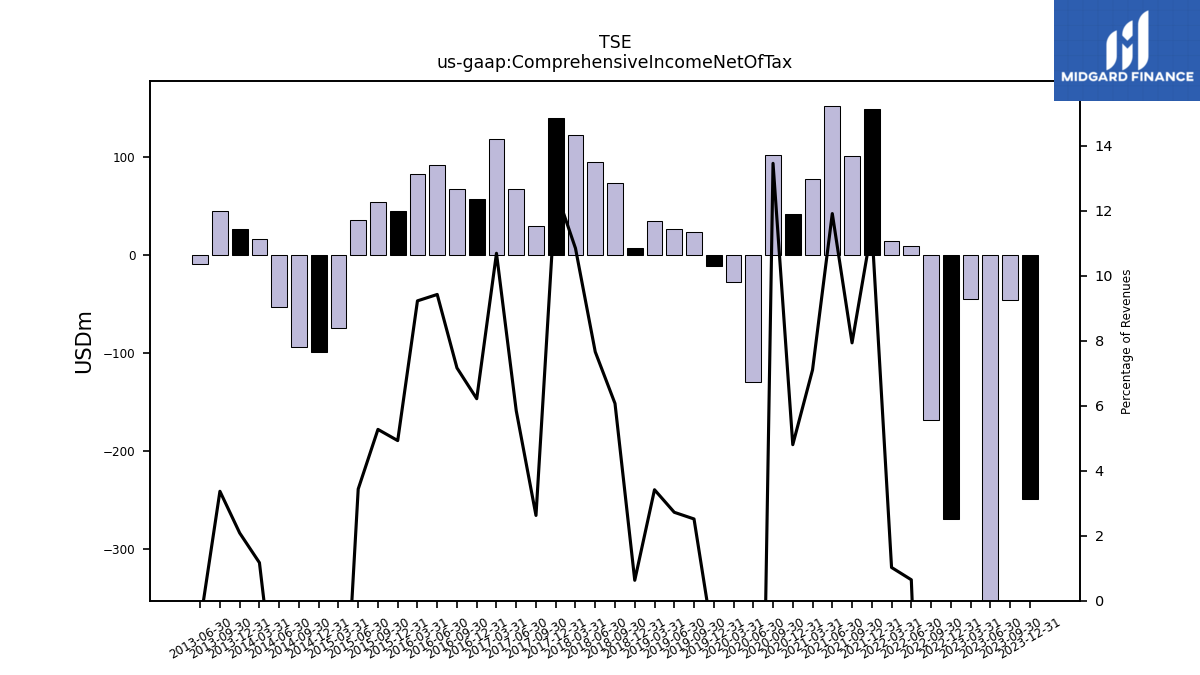
| Comprehensive Income Net Of Tax | -249.50 | -46.40 | -358.20 | -45.50 | -269.60 | -168.90 | 9.20 | 14.20 | 148.90 | 100.70 | 151.70 | 77.60 | 41.30 | 101.20 | -130.30 | -28.10 | -11.80 | 23.20 | 25.90 | 34.60 | 6.70 | 72.80 | 94.70 | 121.60 | 139.10 | 28.78 | 66.96 | 118.06 | 57.03 | 67.00 | 91.37 | 82.48 | 44.20 | 54.18 | 35.35 | -74.58 | -98.93 | -94.69 | -53.21 | 15.90 | 25.96 | 44.08 | -9.15 | NA | |
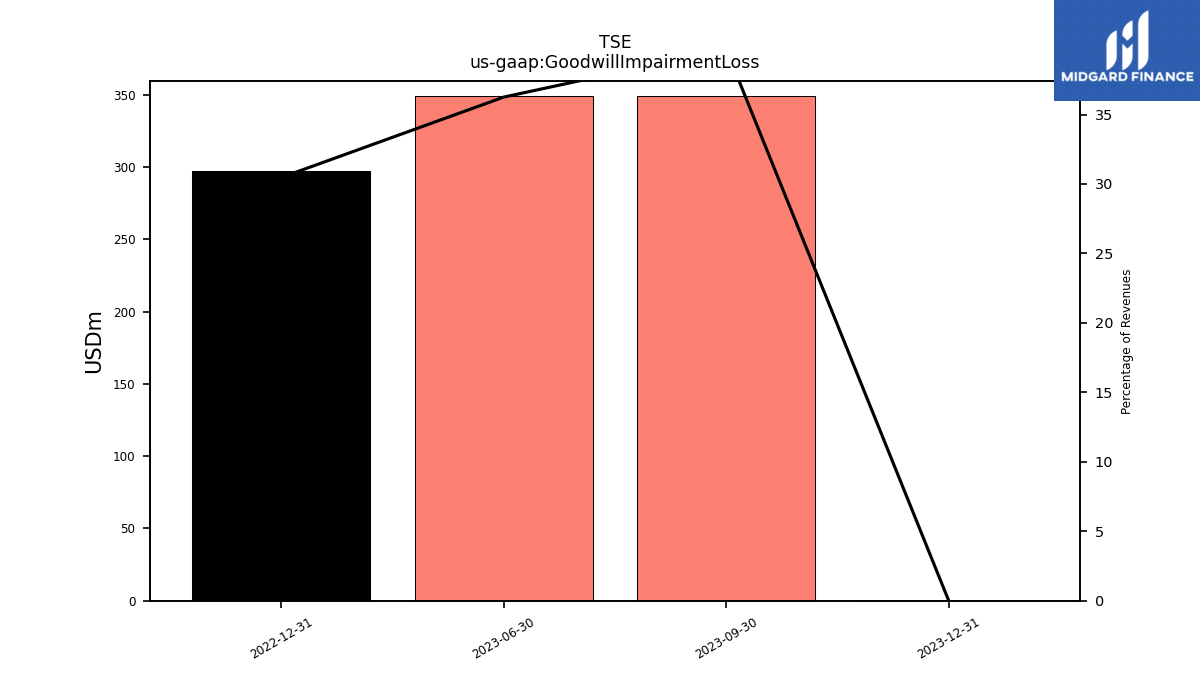
| Goodwill Impairment Loss | 0.00 | 349.00 | 349.00 | NA | 297.10 | NA | NA | NA | NA | NA | NA | NA | NA | NA | NA | NA | NA | NA | NA | NA | NA | NA | NA | NA | NA | NA | NA | NA | NA | NA | NA | NA | NA | NA | NA | NA | NA | NA | NA | NA | NA | NA | NA | NA |
| 2023-12-31 | 2023-09-30 | 2023-06-30 | 2023-03-31 | 2022-12-31 | 2022-09-30 | 2022-06-30 | 2022-03-31 | 2021-12-31 | 2021-09-30 | 2021-06-30 | 2021-03-31 | 2020-12-31 | 2020-09-30 | 2020-06-30 | 2020-03-31 | 2019-12-31 | 2019-09-30 | 2019-06-30 | 2019-03-31 | 2018-12-31 | 2018-09-30 | 2018-06-30 | 2018-03-31 | 2017-12-31 | 2017-09-30 | 2017-06-30 | 2017-03-31 | 2016-12-31 | 2016-09-30 | 2016-06-30 | 2016-03-31 | 2015-12-31 | 2015-09-30 | 2015-06-30 | 2015-03-31 | 2014-12-31 | 2014-09-30 | 2014-06-30 | 2014-03-31 | 2013-12-31 | 2013-09-30 | 2013-06-30 | 2013-03-31 | ||
|---|---|---|---|---|---|---|---|---|---|---|---|---|---|---|---|---|---|---|---|---|---|---|---|---|---|---|---|---|---|---|---|---|---|---|---|---|---|---|---|---|---|---|---|---|---|
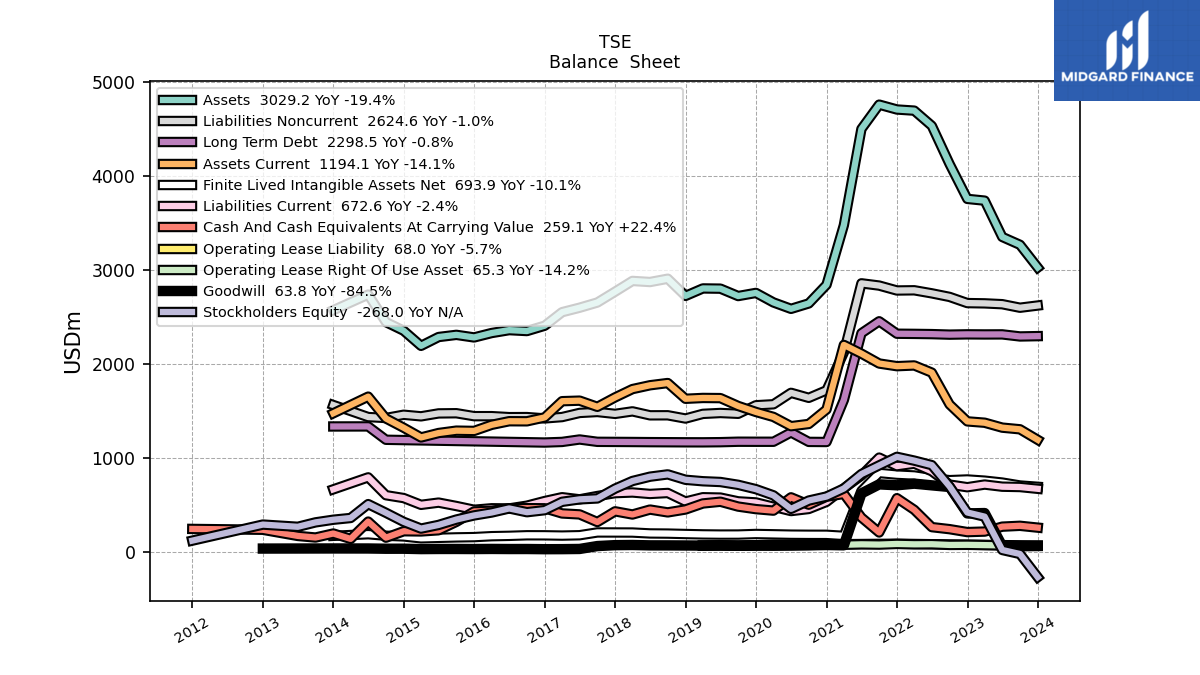
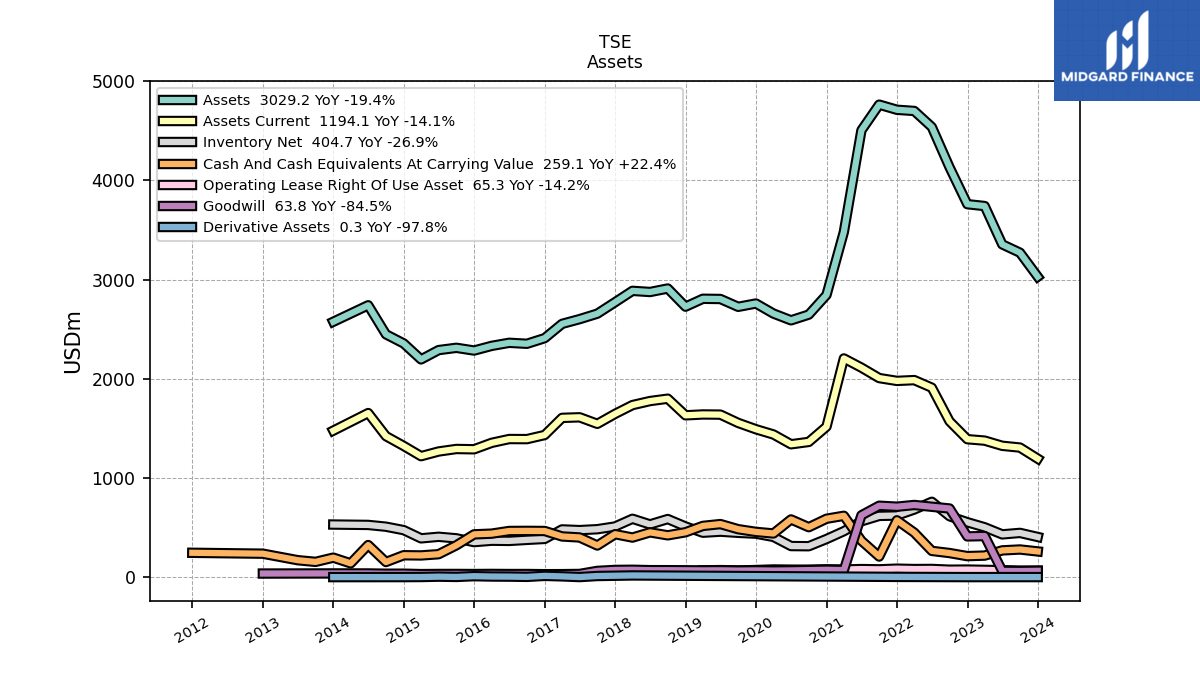
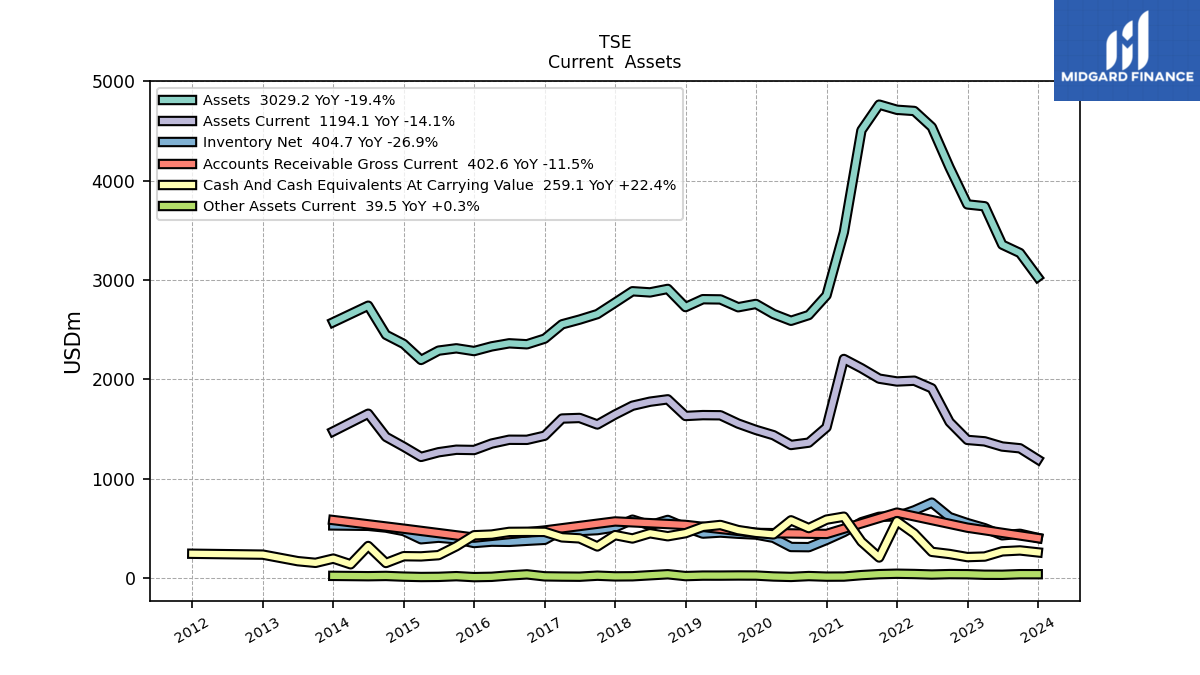
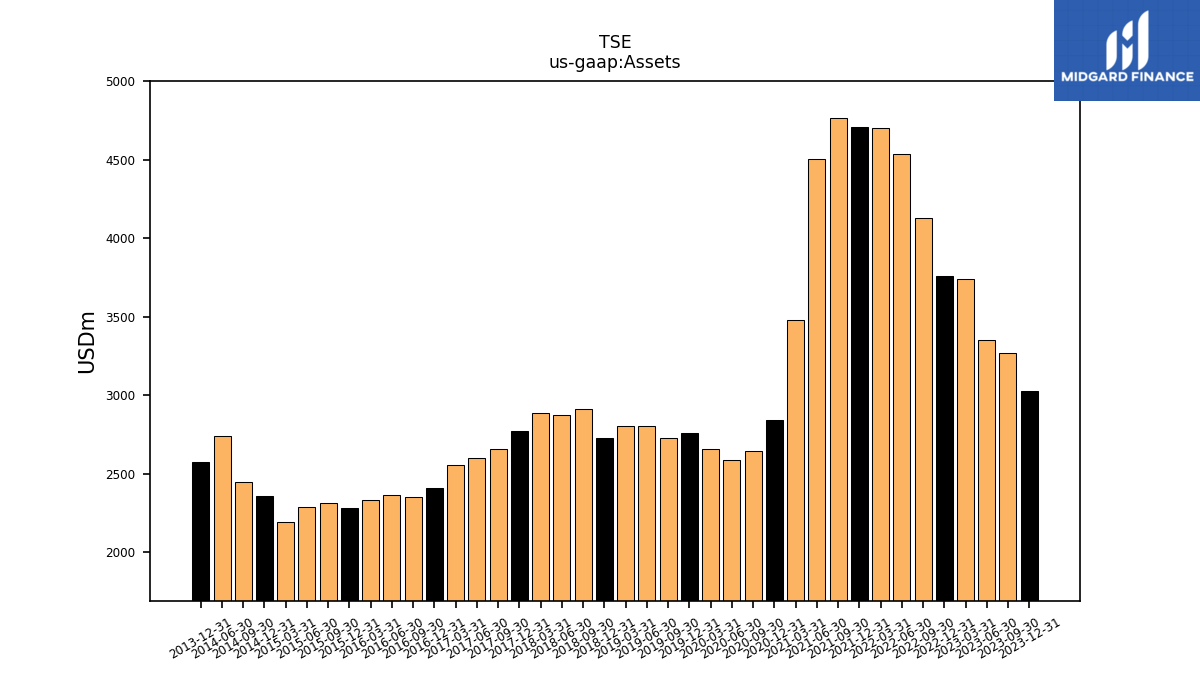
| Assets | 3029.20 | 3271.20 | 3355.00 | 3741.50 | 3760.20 | 4131.90 | 4538.10 | 4700.10 | 4712.20 | 4764.10 | 4504.70 | 3480.10 | 2845.20 | 2646.80 | 2589.20 | 2657.40 | 2758.80 | 2725.40 | 2804.20 | 2806.50 | 2726.80 | 2910.00 | 2874.80 | 2886.40 | 2772.00 | 2656.55 | 2601.25 | 2553.60 | 2409.49 | 2352.78 | 2362.63 | 2331.64 | 2284.57 | 2312.14 | 2289.06 | 2195.10 | 2356.12 | 2448.08 | 2741.12 | NA | 2574.78 | NA | NA | NA | |
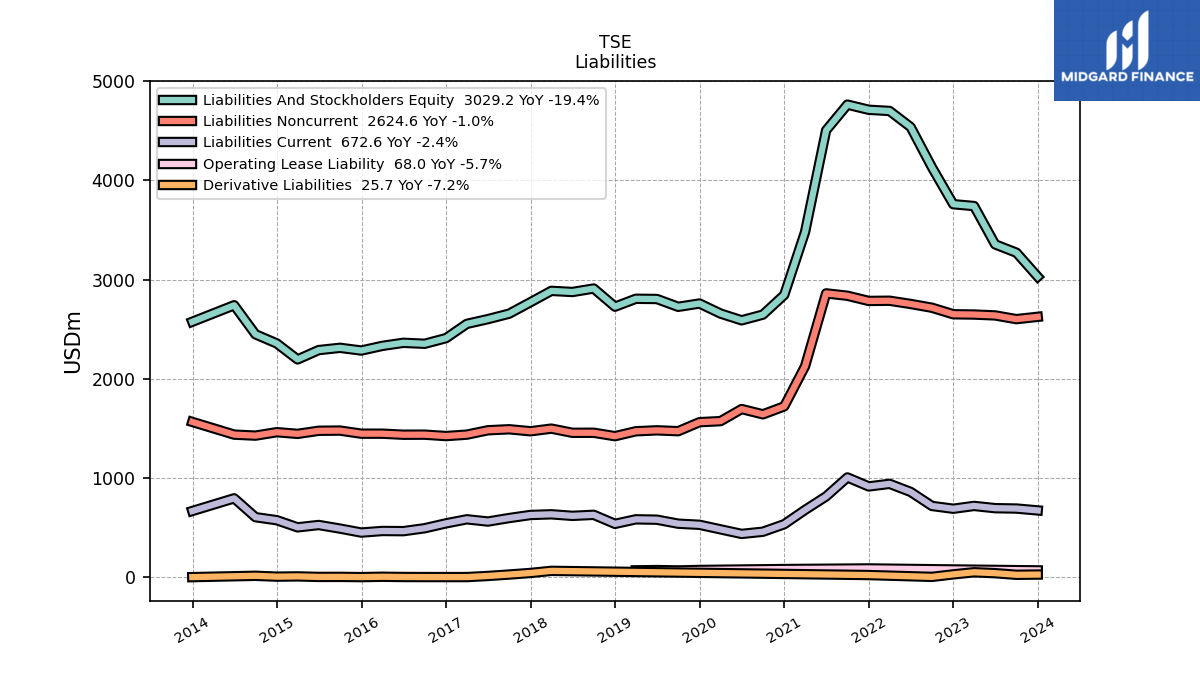
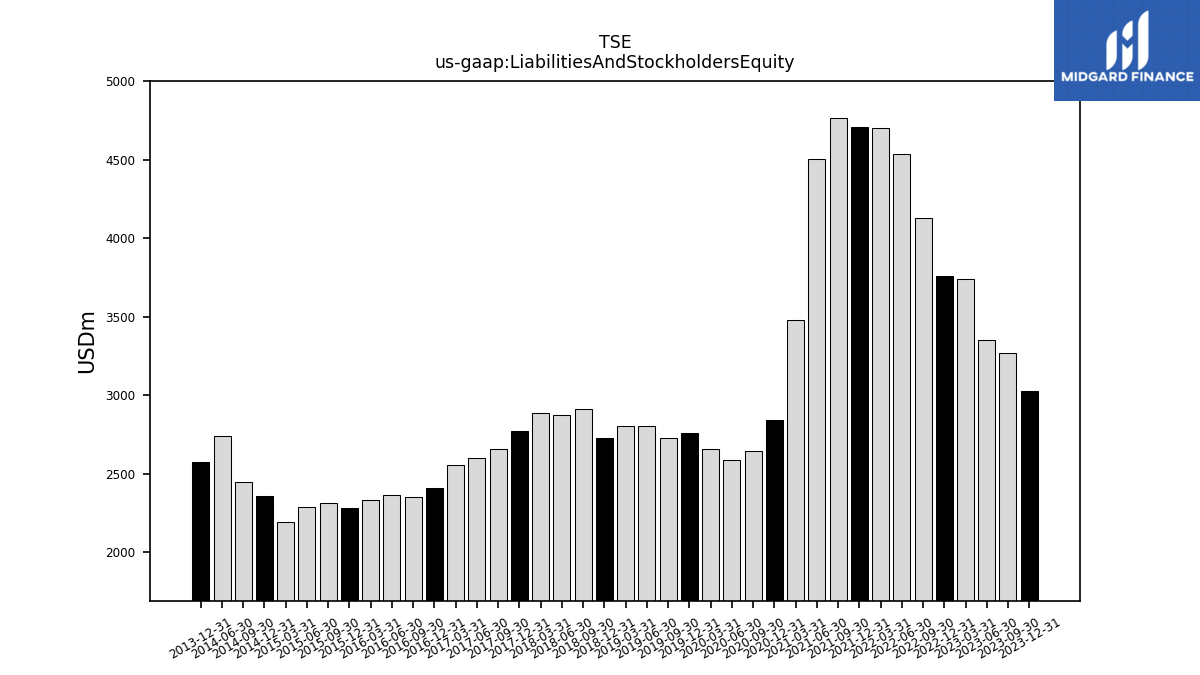
| Liabilities And Stockholders Equity | 3029.20 | 3271.20 | 3355.00 | 3741.50 | 3760.20 | 4131.90 | 4538.10 | 4700.10 | 4712.20 | 4764.10 | 4504.70 | 3480.10 | 2845.20 | 2646.80 | 2589.20 | 2657.40 | 2758.80 | 2725.40 | 2804.20 | 2806.50 | 2726.80 | 2910.00 | 2874.80 | 2886.40 | 2772.00 | 2656.55 | 2601.25 | 2553.60 | 2409.49 | 2352.78 | 2362.63 | 2331.64 | 2284.57 | 2312.14 | 2289.06 | 2195.10 | 2356.12 | 2448.08 | 2741.12 | NA | 2574.78 | NA | NA | NA | |
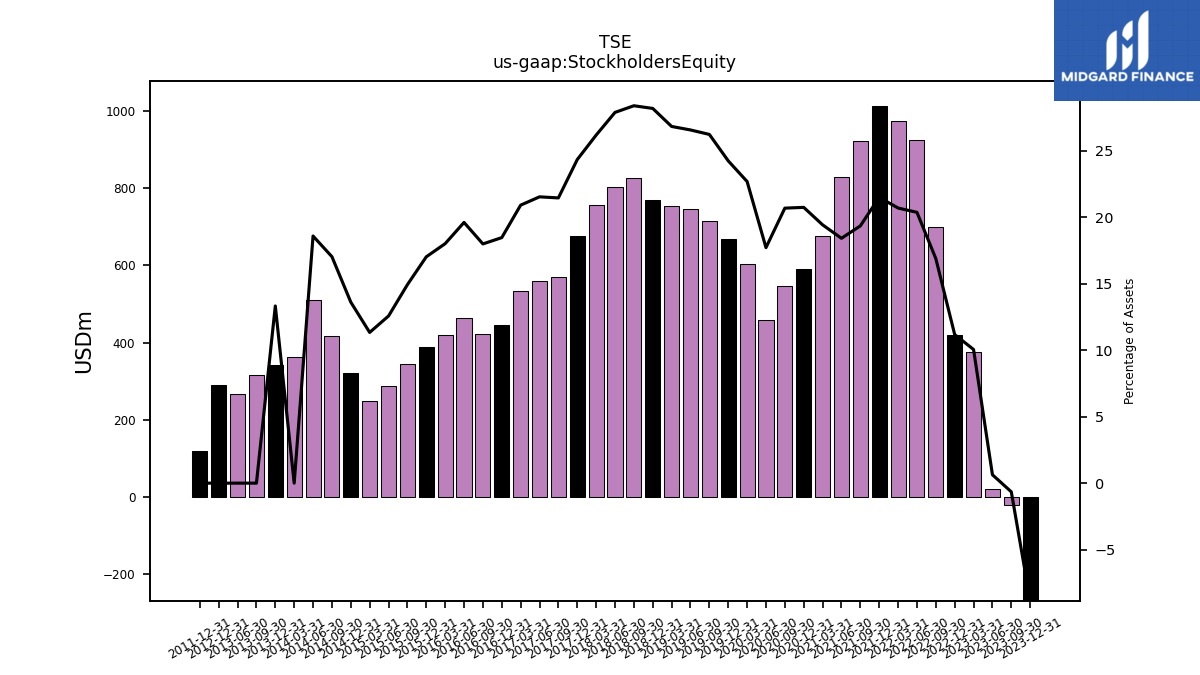
| Stockholders Equity | -268.00 | -21.40 | 21.20 | 376.20 | 420.30 | 698.10 | 924.60 | 972.80 | 1013.10 | 922.00 | 829.80 | 676.30 | 590.30 | 547.60 | 458.80 | 603.00 | 668.90 | 715.00 | 745.10 | 753.10 | 768.70 | 826.20 | 801.80 | 755.70 | 674.80 | 570.04 | 560.27 | 534.08 | 445.05 | 423.44 | 463.41 | 420.08 | 389.01 | 345.25 | 287.85 | 248.91 | 320.87 | 417.07 | 509.61 | 361.80 | 343.20 | 315.11 | 268.00 | NA |
| 2023-12-31 | 2023-09-30 | 2023-06-30 | 2023-03-31 | 2022-12-31 | 2022-09-30 | 2022-06-30 | 2022-03-31 | 2021-12-31 | 2021-09-30 | 2021-06-30 | 2021-03-31 | 2020-12-31 | 2020-09-30 | 2020-06-30 | 2020-03-31 | 2019-12-31 | 2019-09-30 | 2019-06-30 | 2019-03-31 | 2018-12-31 | 2018-09-30 | 2018-06-30 | 2018-03-31 | 2017-12-31 | 2017-09-30 | 2017-06-30 | 2017-03-31 | 2016-12-31 | 2016-09-30 | 2016-06-30 | 2016-03-31 | 2015-12-31 | 2015-09-30 | 2015-06-30 | 2015-03-31 | 2014-12-31 | 2014-09-30 | 2014-06-30 | 2014-03-31 | 2013-12-31 | 2013-09-30 | 2013-06-30 | 2013-03-31 | ||
|---|---|---|---|---|---|---|---|---|---|---|---|---|---|---|---|---|---|---|---|---|---|---|---|---|---|---|---|---|---|---|---|---|---|---|---|---|---|---|---|---|---|---|---|---|---|
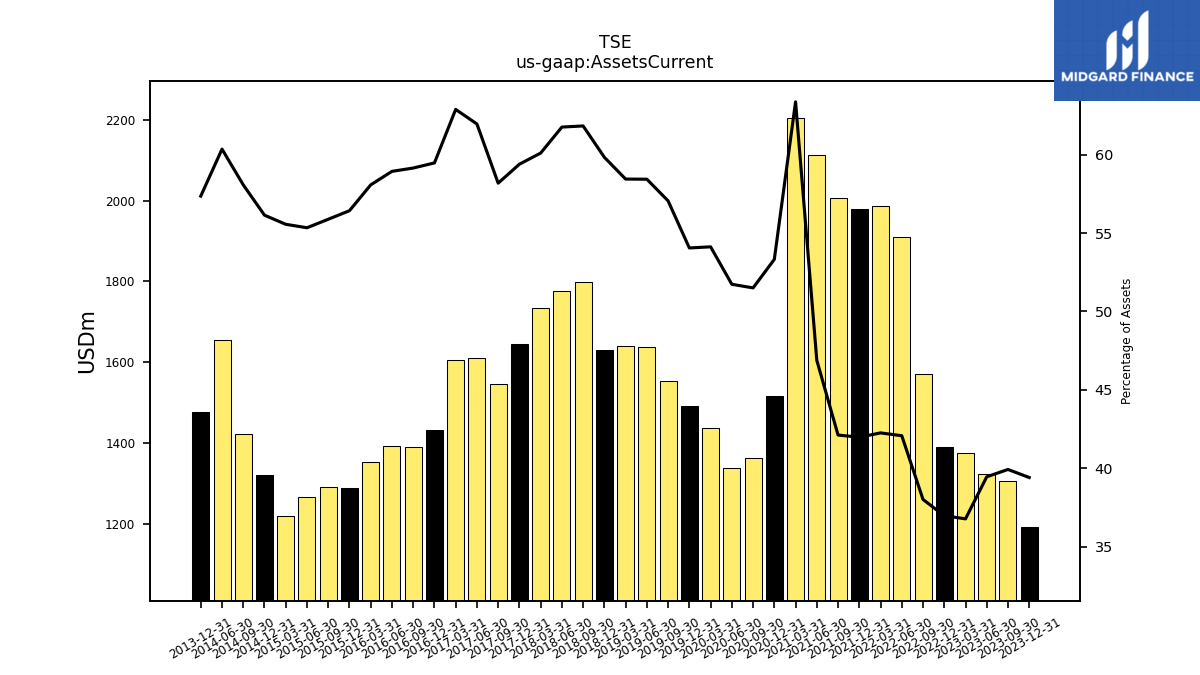
| Assets Current | 1194.10 | 1306.30 | 1324.10 | 1376.30 | 1390.70 | 1571.00 | 1909.80 | 1986.40 | 1978.50 | 2007.00 | 2112.10 | 2205.00 | 1517.10 | 1363.20 | 1339.50 | 1438.20 | 1491.10 | 1554.80 | 1638.50 | 1640.10 | 1631.30 | 1799.10 | 1775.30 | 1734.60 | 1646.20 | 1545.55 | 1611.49 | 1605.65 | 1432.89 | 1391.49 | 1392.31 | 1353.94 | 1289.03 | 1291.97 | 1266.69 | 1219.54 | 1322.66 | 1421.60 | 1654.21 | NA | 1476.75 | NA | NA | NA | |
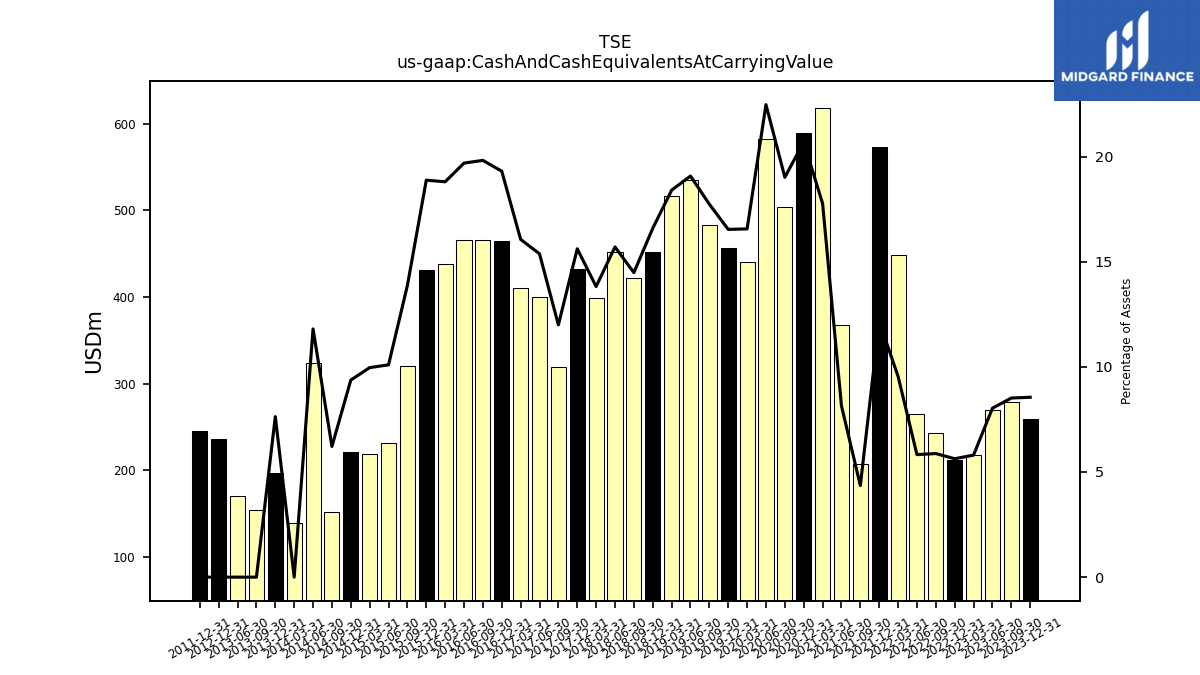
| Cash And Cash Equivalents At Carrying Value | 259.10 | 278.60 | 269.50 | 217.10 | 211.70 | 242.80 | 264.40 | 448.70 | 573.00 | 207.50 | 367.00 | 618.40 | 588.70 | 503.30 | 581.80 | 440.10 | 456.20 | 483.30 | 534.90 | 516.40 | 452.30 | 421.40 | 451.40 | 398.90 | 432.80 | 318.70 | 399.93 | 410.14 | 465.11 | 466.29 | 465.21 | 438.39 | 431.26 | 320.77 | 231.10 | 218.70 | 220.79 | 152.13 | 323.54 | 139.09 | 196.50 | 153.73 | 170.62 | NA | |
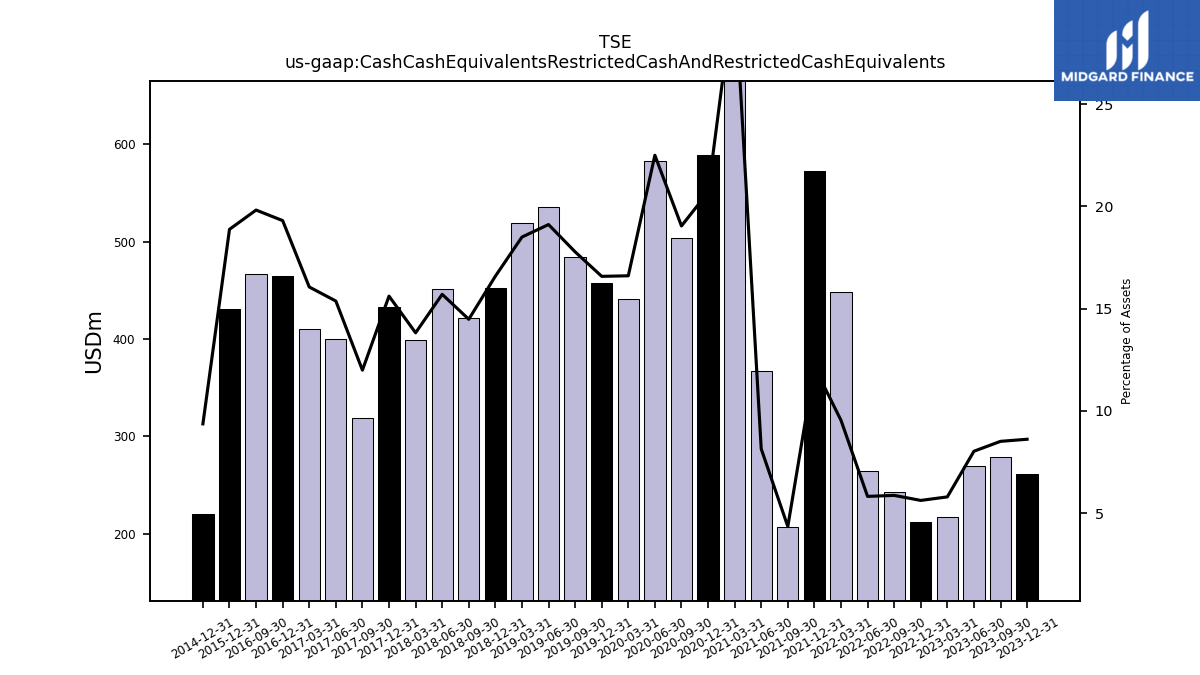
| Cash Cash Equivalents Restricted Cash And Restricted Cash Equivalents | 261.10 | 278.60 | 269.50 | 217.10 | 211.70 | 242.80 | 264.40 | 448.70 | 573.00 | 207.50 | 367.00 | 1068.40 | 588.70 | 504.00 | 582.50 | 441.30 | 457.40 | 484.50 | 535.90 | 519.20 | 452.30 | 421.40 | 451.40 | 398.90 | 432.80 | 318.70 | 399.90 | 410.10 | 465.11 | 466.29 | NA | NA | 431.26 | NA | NA | NA | 220.80 | NA | NA | NA | NA | NA | NA | NA | |
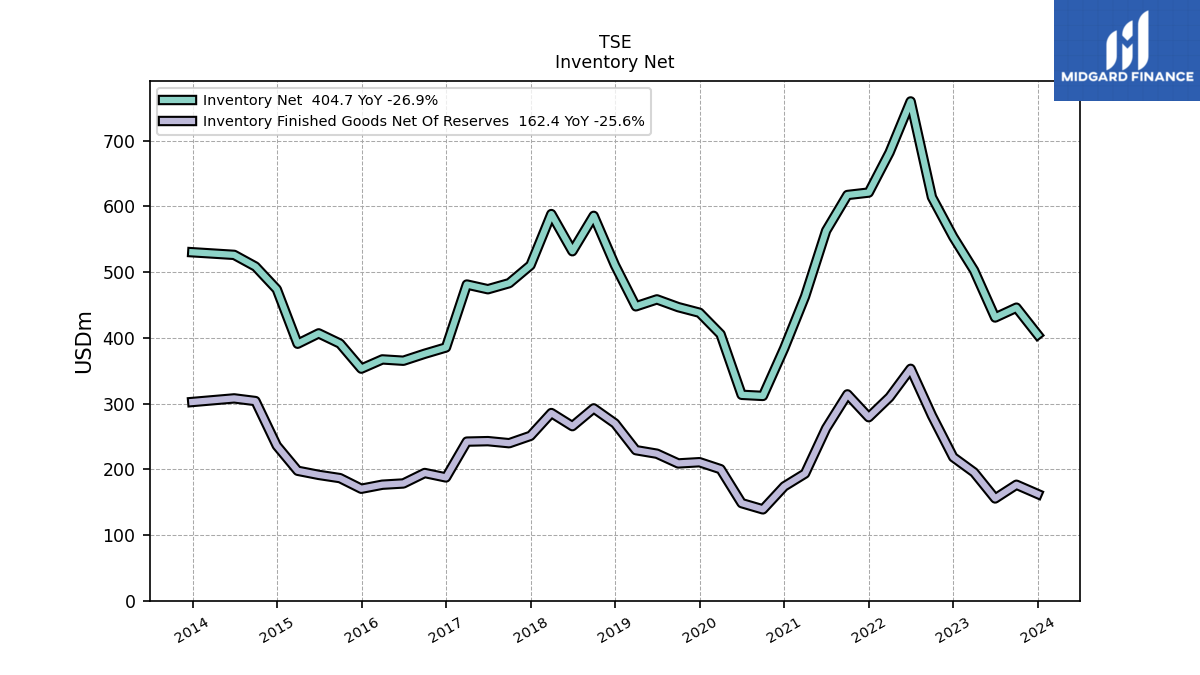
| Inventory Net | 404.70 | 445.90 | 430.90 | 502.60 | 553.60 | 614.00 | 759.70 | 682.00 | 621.00 | 617.30 | 562.90 | 463.00 | 384.10 | 311.60 | 313.30 | 405.50 | 438.20 | 446.70 | 458.50 | 447.90 | 510.40 | 585.60 | 531.70 | 588.30 | 510.40 | 483.16 | 473.94 | 481.11 | 385.35 | 375.75 | 365.14 | 367.16 | 353.10 | 391.25 | 406.80 | 390.97 | 473.86 | 508.47 | 526.20 | NA | 530.19 | NA | NA | NA | |
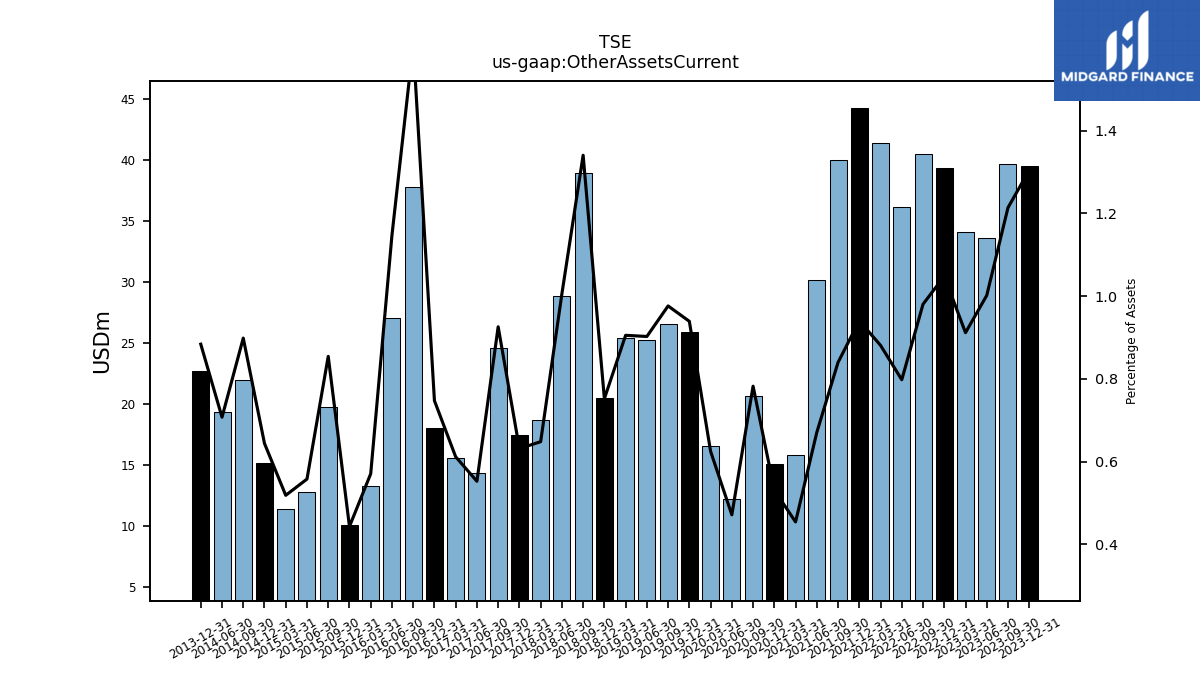
| Other Assets Current | 39.50 | 39.70 | 33.60 | 34.10 | 39.40 | 40.50 | 36.20 | 41.40 | 44.30 | 40.00 | 30.20 | 15.80 | 15.10 | 20.70 | 12.20 | 16.60 | 25.90 | 26.60 | 25.30 | 25.40 | 20.50 | 39.00 | 28.90 | 18.70 | 17.50 | 24.59 | 14.37 | 15.61 | 18.00 | 37.83 | 27.10 | 13.30 | 10.12 | 19.75 | 12.76 | 11.38 | 15.16 | 21.99 | 19.38 | NA | 22.75 | NA | NA | NA |
| 2023-12-31 | 2023-09-30 | 2023-06-30 | 2023-03-31 | 2022-12-31 | 2022-09-30 | 2022-06-30 | 2022-03-31 | 2021-12-31 | 2021-09-30 | 2021-06-30 | 2021-03-31 | 2020-12-31 | 2020-09-30 | 2020-06-30 | 2020-03-31 | 2019-12-31 | 2019-09-30 | 2019-06-30 | 2019-03-31 | 2018-12-31 | 2018-09-30 | 2018-06-30 | 2018-03-31 | 2017-12-31 | 2017-09-30 | 2017-06-30 | 2017-03-31 | 2016-12-31 | 2016-09-30 | 2016-06-30 | 2016-03-31 | 2015-12-31 | 2015-09-30 | 2015-06-30 | 2015-03-31 | 2014-12-31 | 2014-09-30 | 2014-06-30 | 2014-03-31 | 2013-12-31 | 2013-09-30 | 2013-06-30 | 2013-03-31 | ||
|---|---|---|---|---|---|---|---|---|---|---|---|---|---|---|---|---|---|---|---|---|---|---|---|---|---|---|---|---|---|---|---|---|---|---|---|---|---|---|---|---|---|---|---|---|---|
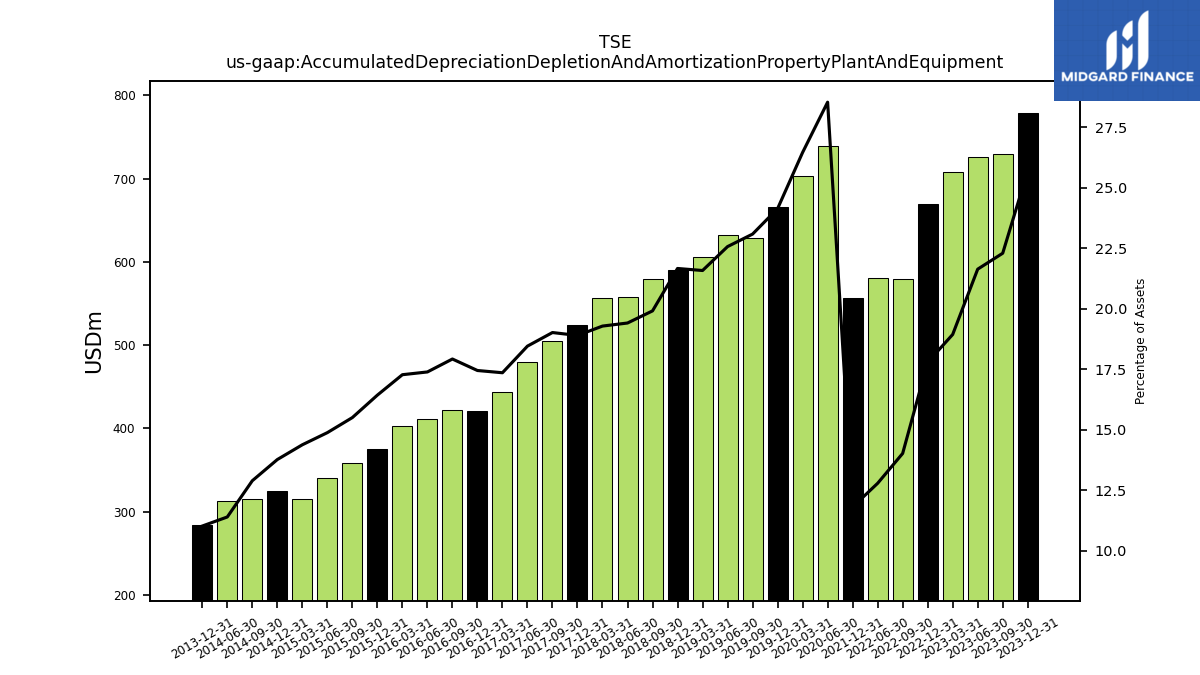
| Accumulated Depreciation Depletion And Amortization Property Plant And Equipment | 778.20 | 729.10 | 725.70 | 708.40 | 668.80 | 579.30 | 580.30 | NA | 556.50 | NA | NA | NA | NA | NA | 738.60 | 702.90 | 665.70 | 629.00 | 632.70 | 605.50 | 590.60 | 579.30 | 557.90 | 556.50 | 523.70 | 505.10 | 479.98 | 443.12 | 420.34 | 421.61 | 410.75 | 402.71 | 375.31 | 358.42 | 340.59 | 315.61 | 324.38 | 315.63 | 312.38 | NA | 283.80 | NA | NA | NA | |
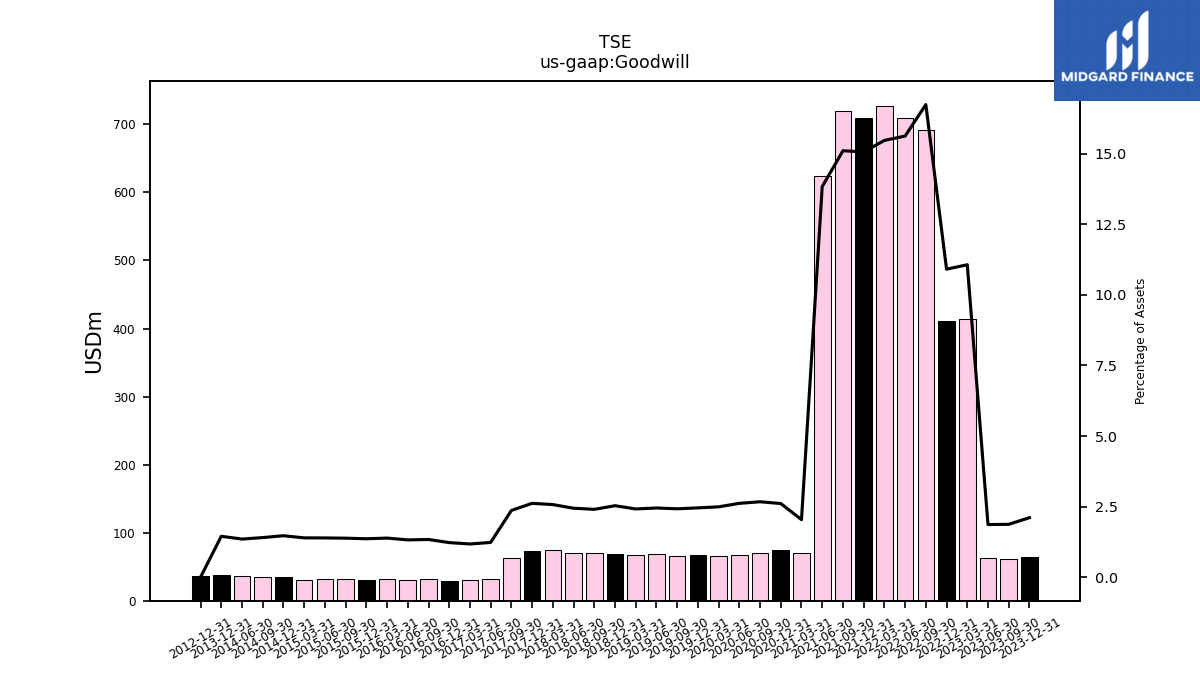
| Goodwill | 63.80 | 61.20 | 62.50 | 414.20 | 410.40 | 691.90 | 709.40 | 727.40 | 710.10 | 719.90 | 623.50 | 70.90 | 74.20 | 70.70 | 67.70 | 66.20 | 67.70 | 66.00 | 68.70 | 67.80 | 69.00 | 69.90 | 70.20 | 74.20 | 72.50 | 62.77 | 31.99 | 29.99 | 29.48 | 31.38 | 31.17 | 32.26 | 31.06 | 31.92 | 31.79 | 30.54 | 34.57 | 34.32 | 36.97 | NA | 37.27 | NA | NA | NA | |
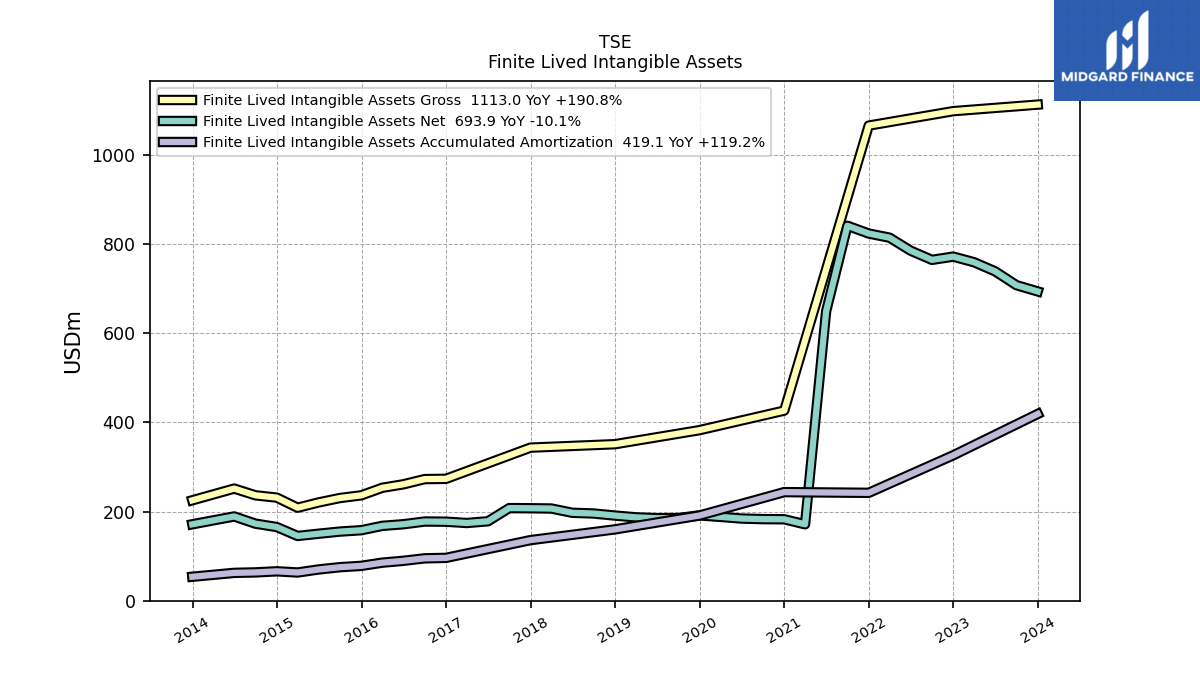
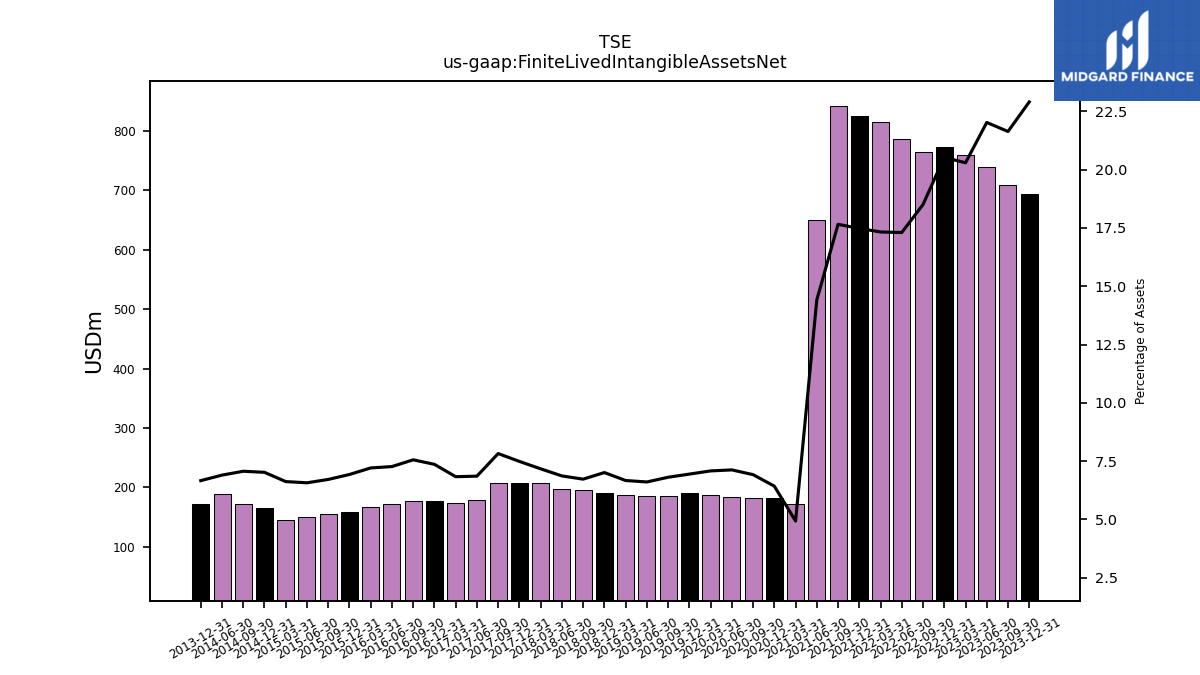
| Finite Lived Intangible Assets Net | 693.90 | 707.90 | 739.00 | 759.40 | 772.00 | 764.70 | 785.30 | 814.50 | 823.80 | 841.20 | 649.40 | 171.50 | 182.80 | 183.10 | 184.40 | 188.10 | 191.50 | 185.50 | 185.20 | 187.10 | 191.10 | 195.70 | 197.30 | 206.90 | 207.50 | 207.82 | 178.27 | 174.42 | 177.34 | 177.74 | 171.64 | 168.01 | 158.22 | 155.19 | 150.36 | 145.33 | 165.36 | 172.92 | 189.08 | NA | 171.51 | NA | NA | NA |
| 2023-12-31 | 2023-09-30 | 2023-06-30 | 2023-03-31 | 2022-12-31 | 2022-09-30 | 2022-06-30 | 2022-03-31 | 2021-12-31 | 2021-09-30 | 2021-06-30 | 2021-03-31 | 2020-12-31 | 2020-09-30 | 2020-06-30 | 2020-03-31 | 2019-12-31 | 2019-09-30 | 2019-06-30 | 2019-03-31 | 2018-12-31 | 2018-09-30 | 2018-06-30 | 2018-03-31 | 2017-12-31 | 2017-09-30 | 2017-06-30 | 2017-03-31 | 2016-12-31 | 2016-09-30 | 2016-06-30 | 2016-03-31 | 2015-12-31 | 2015-09-30 | 2015-06-30 | 2015-03-31 | 2014-12-31 | 2014-09-30 | 2014-06-30 | 2014-03-31 | 2013-12-31 | 2013-09-30 | 2013-06-30 | 2013-03-31 | ||
|---|---|---|---|---|---|---|---|---|---|---|---|---|---|---|---|---|---|---|---|---|---|---|---|---|---|---|---|---|---|---|---|---|---|---|---|---|---|---|---|---|---|---|---|---|---|
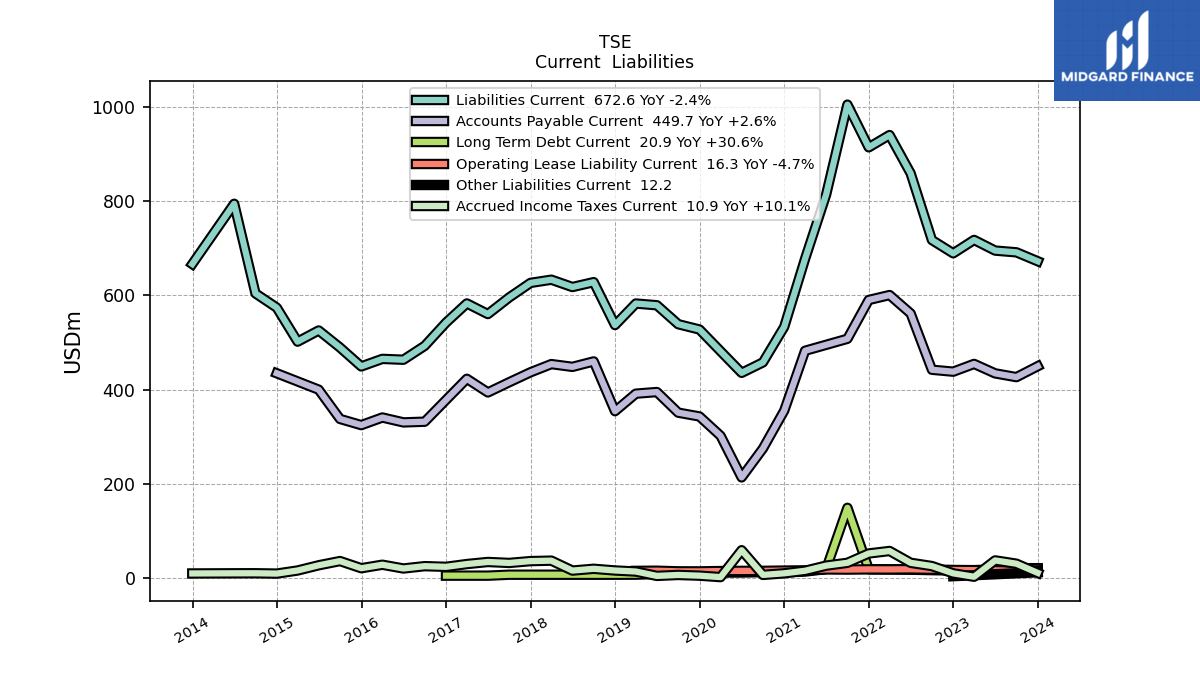
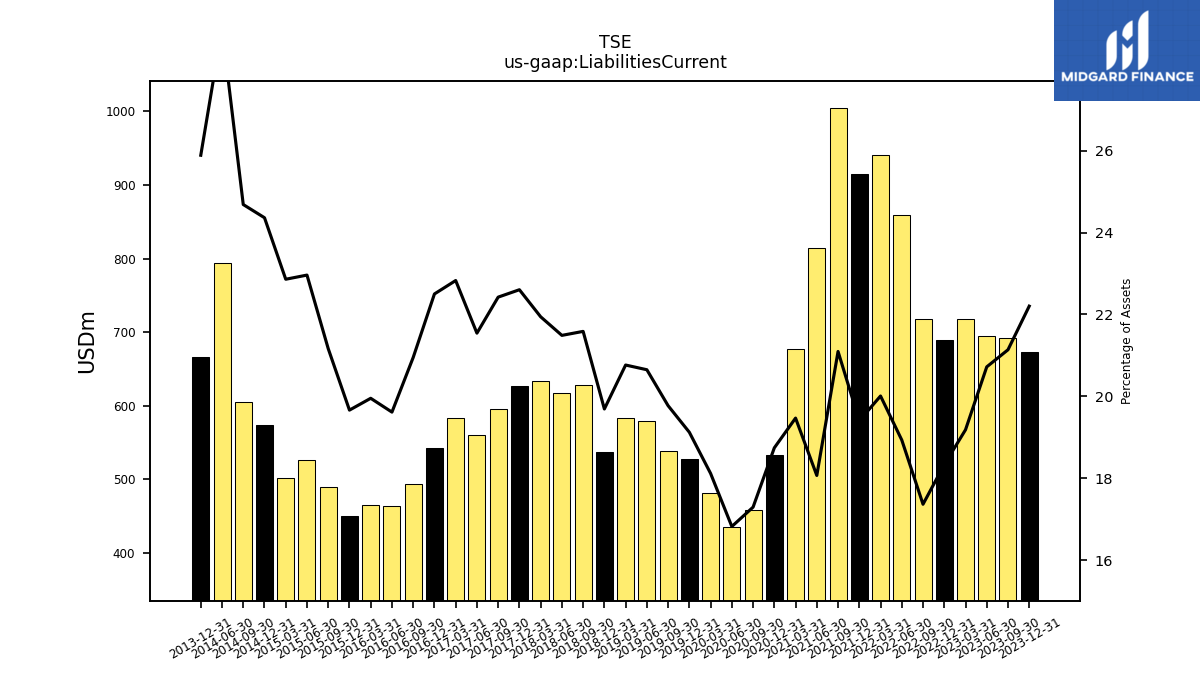
| Liabilities Current | 672.60 | 691.50 | 695.20 | 717.80 | 689.40 | 717.60 | 859.30 | 940.50 | 914.40 | 1005.10 | 814.00 | 677.60 | 533.30 | 457.80 | 435.60 | 481.50 | 527.60 | 538.90 | 579.10 | 582.80 | 537.00 | 628.20 | 617.80 | 633.40 | 626.60 | 595.70 | 560.42 | 582.97 | 542.17 | 492.94 | 463.47 | 465.25 | 449.27 | 489.39 | 525.62 | 501.81 | 574.00 | 604.31 | 794.60 | NA | 666.56 | NA | NA | NA | |
| Long Term Debt Current | 20.90 | 20.90 | 18.50 | 16.60 | 16.00 | 16.70 | 17.70 | 18.20 | 18.50 | 149.10 | 19.10 | 13.70 | 12.30 | 12.50 | 11.70 | 11.50 | 11.10 | 11.50 | 8.70 | 7.10 | 7.00 | 7.00 | 7.00 | 7.00 | 7.00 | 7.00 | 5.00 | 5.00 | 5.00 | NA | NA | NA | NA | NA | NA | NA | NA | NA | NA | NA | NA | NA | NA | NA | |
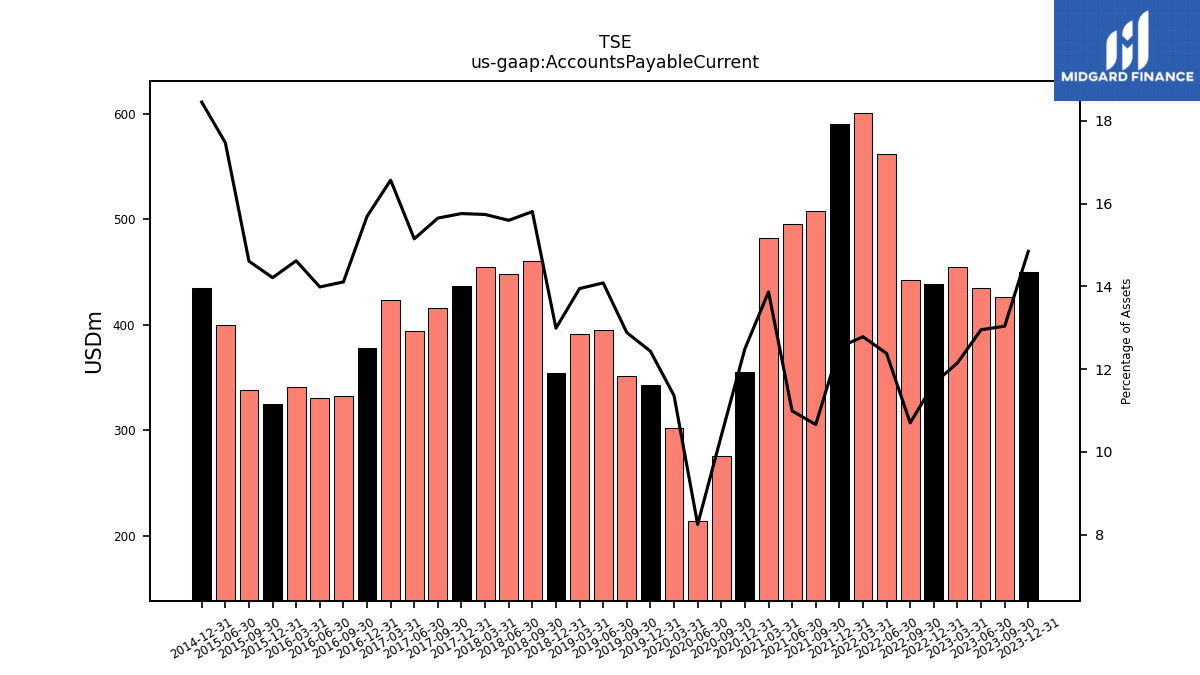
| Accounts Payable Current | 449.70 | 426.50 | 434.50 | 454.60 | 438.10 | 442.20 | 561.70 | 600.80 | 590.30 | 507.90 | 495.10 | 482.50 | 355.40 | 275.00 | 213.60 | 301.90 | 343.00 | 351.10 | 394.90 | 391.40 | 354.20 | 459.90 | 448.30 | 454.20 | 436.80 | 415.71 | 394.03 | 423.00 | 378.03 | 331.89 | 330.41 | 340.80 | 324.63 | 337.76 | 399.91 | NA | 434.69 | NA | NA | NA | NA | NA | NA | NA | |
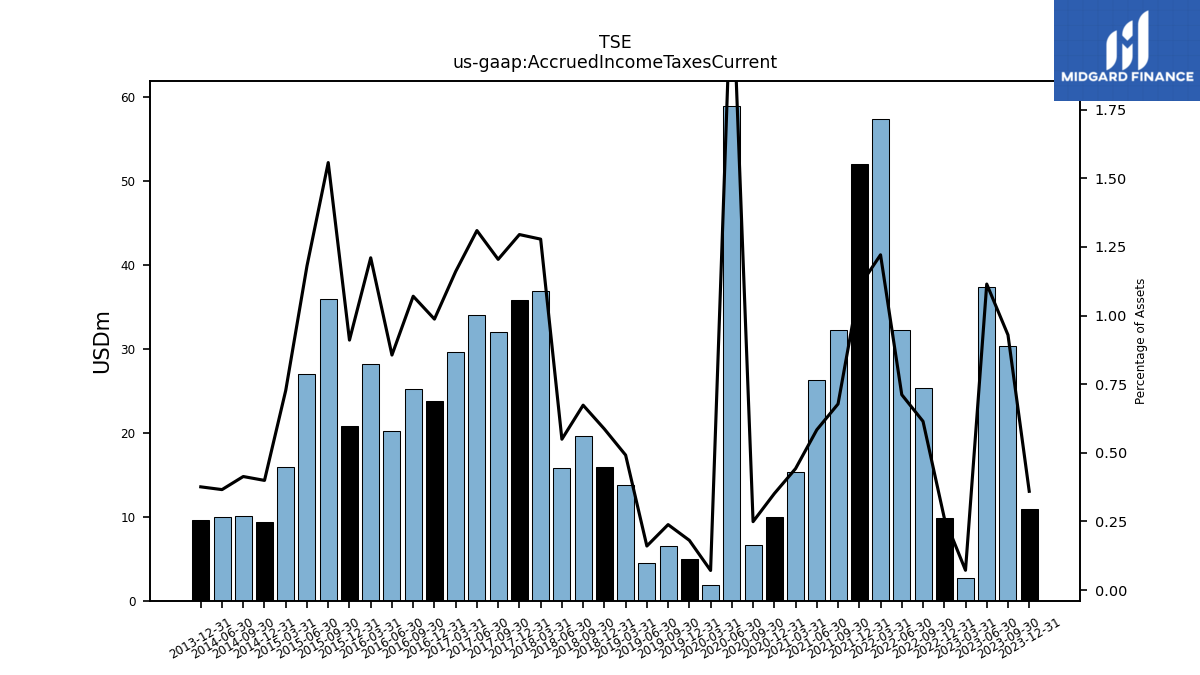
| Accrued Income Taxes Current | 10.90 | 30.40 | 37.40 | 2.70 | 9.90 | 25.40 | 32.30 | 57.40 | 52.10 | 32.30 | 26.30 | 15.40 | 10.00 | 6.60 | 59.00 | 1.90 | 5.00 | 6.50 | 4.50 | 13.80 | 16.00 | 19.60 | 15.80 | 36.90 | 35.90 | 32.01 | 34.07 | 29.64 | 23.78 | 25.18 | 20.23 | 28.22 | 20.80 | 36.01 | 27.03 | 15.97 | 9.41 | 10.13 | 10.03 | NA | 9.68 | NA | NA | NA | |
| Other Liabilities Current | 12.20 | NA | NA | NA | 3.90 | NA | NA | NA | NA | NA | NA | NA | NA | NA | NA | NA | NA | NA | NA | NA | NA | NA | NA | NA | NA | NA | NA | NA | NA | NA | NA | NA | NA | NA | NA | NA | NA | NA | NA | NA | NA | NA | NA | NA |
| 2023-12-31 | 2023-09-30 | 2023-06-30 | 2023-03-31 | 2022-12-31 | 2022-09-30 | 2022-06-30 | 2022-03-31 | 2021-12-31 | 2021-09-30 | 2021-06-30 | 2021-03-31 | 2020-12-31 | 2020-09-30 | 2020-06-30 | 2020-03-31 | 2019-12-31 | 2019-09-30 | 2019-06-30 | 2019-03-31 | 2018-12-31 | 2018-09-30 | 2018-06-30 | 2018-03-31 | 2017-12-31 | 2017-09-30 | 2017-06-30 | 2017-03-31 | 2016-12-31 | 2016-09-30 | 2016-06-30 | 2016-03-31 | 2015-12-31 | 2015-09-30 | 2015-06-30 | 2015-03-31 | 2014-12-31 | 2014-09-30 | 2014-06-30 | 2014-03-31 | 2013-12-31 | 2013-09-30 | 2013-06-30 | 2013-03-31 | ||
|---|---|---|---|---|---|---|---|---|---|---|---|---|---|---|---|---|---|---|---|---|---|---|---|---|---|---|---|---|---|---|---|---|---|---|---|---|---|---|---|---|---|---|---|---|---|
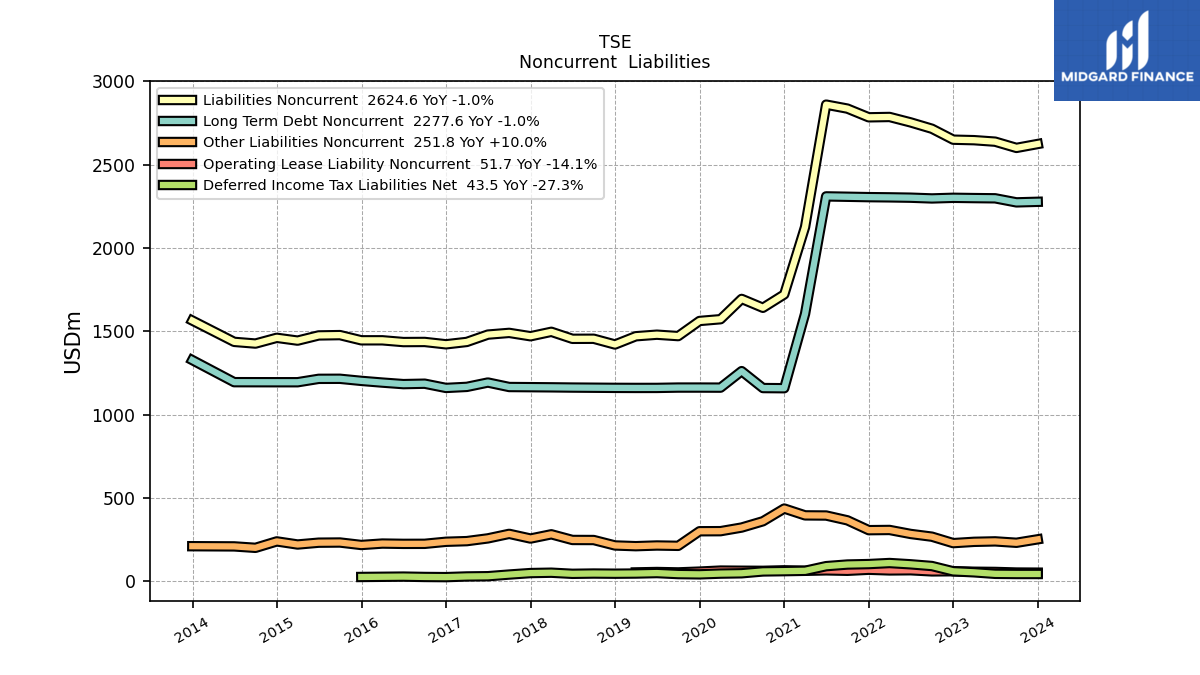
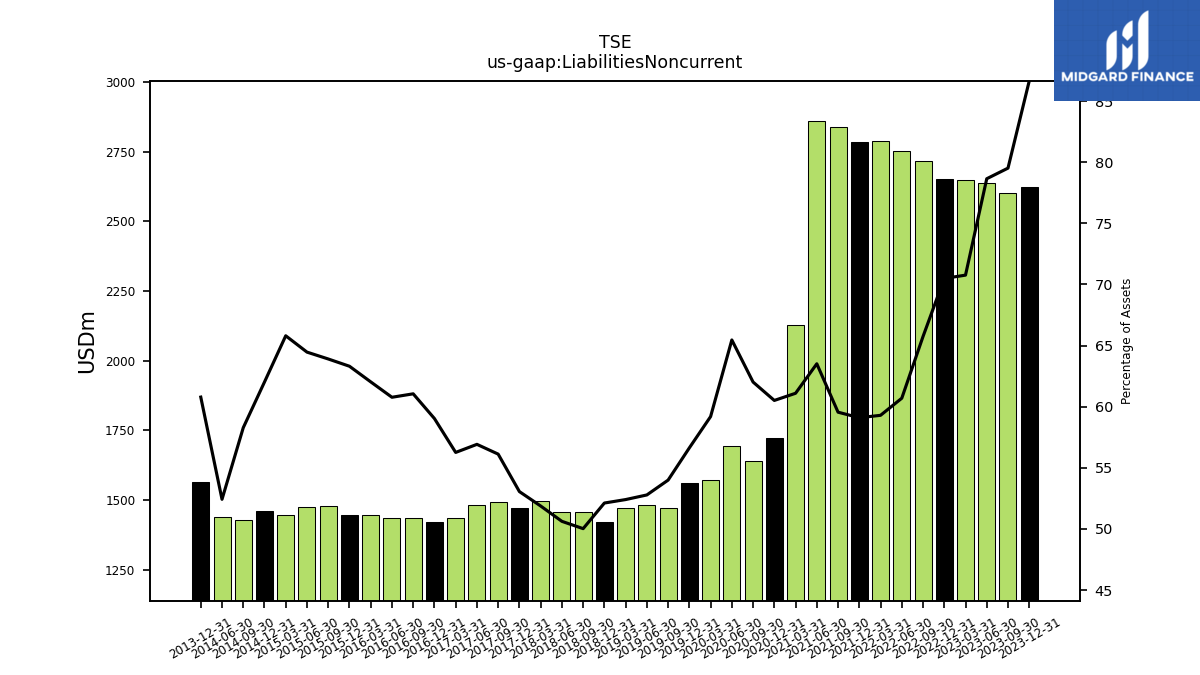
| Liabilities Noncurrent | 2624.60 | 2601.10 | 2638.60 | 2647.50 | 2650.50 | 2716.20 | 2754.20 | 2786.80 | 2784.70 | 2837.00 | 2860.90 | 2126.20 | 1721.60 | 1641.40 | 1694.80 | 1572.90 | 1562.30 | 1471.50 | 1480.00 | 1470.60 | 1421.10 | 1455.60 | 1455.20 | 1497.30 | 1470.60 | 1490.81 | 1480.56 | 1436.56 | 1422.27 | 1436.40 | 1435.74 | 1446.30 | 1446.29 | 1477.50 | 1475.58 | 1444.37 | 1461.25 | 1426.70 | 1436.91 | NA | 1565.02 | NA | NA | NA | |
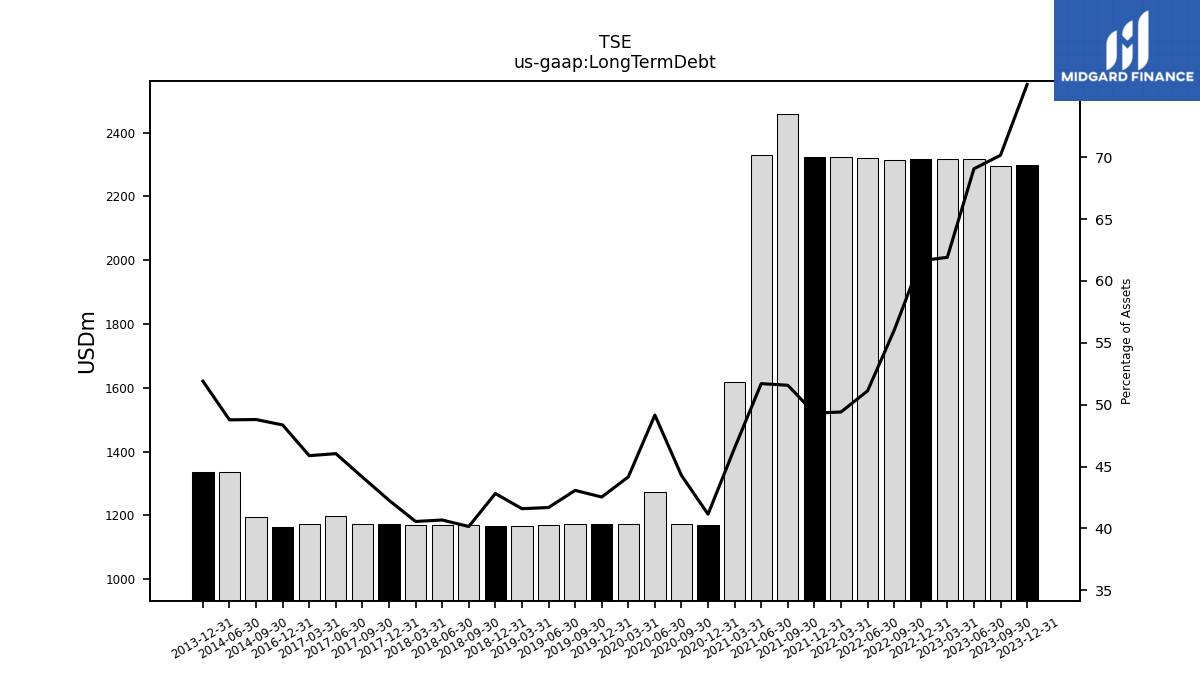
| Long Term Debt | 2298.50 | 2295.10 | 2317.10 | 2316.50 | 2317.60 | 2314.50 | 2320.00 | 2322.50 | 2324.10 | 2457.00 | 2329.20 | 1618.80 | 1171.00 | 1172.20 | 1273.00 | 1173.70 | 1173.70 | 1174.10 | 1169.20 | 1167.50 | 1167.80 | 1168.70 | 1169.60 | 1171.00 | 1172.00 | 1172.92 | 1197.84 | 1171.75 | 1165.37 | NA | NA | NA | NA | NA | NA | NA | NA | 1194.80 | 1337.08 | NA | 1336.42 | NA | NA | NA | |
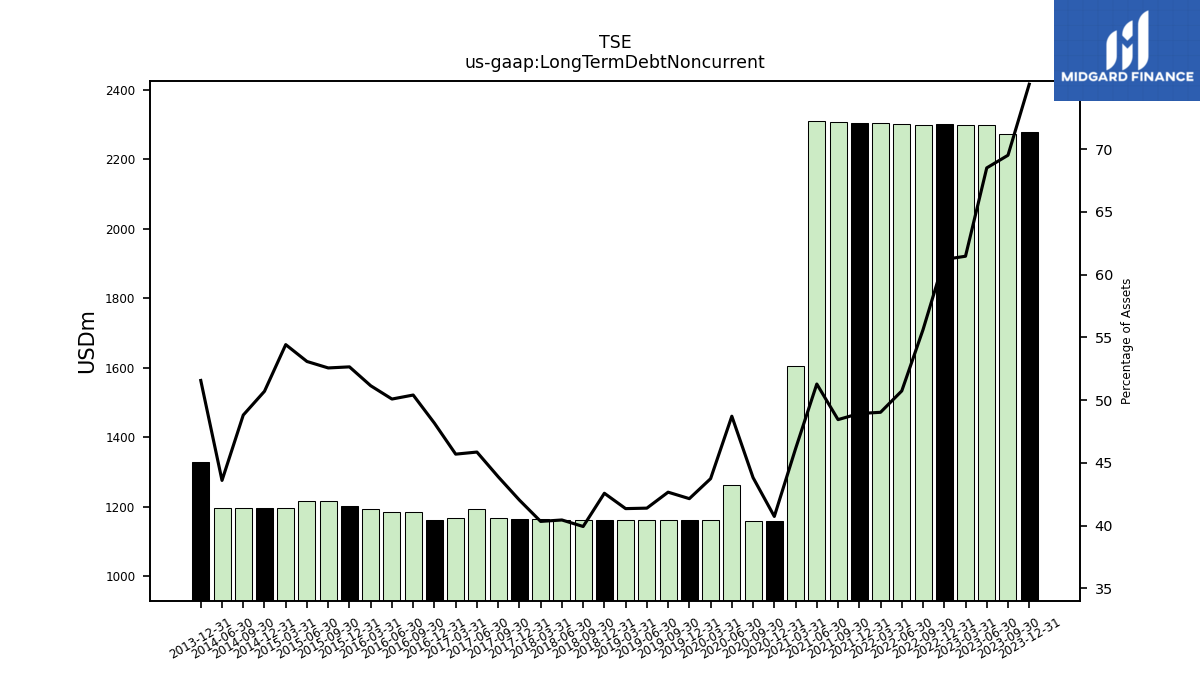
| Long Term Debt Noncurrent | 2277.60 | 2274.20 | 2298.60 | 2299.90 | 2301.60 | 2297.80 | 2302.30 | 2304.30 | 2305.60 | 2307.90 | 2310.10 | 1605.10 | 1158.70 | 1159.70 | 1261.30 | 1162.20 | 1162.60 | 1162.60 | 1160.50 | 1160.40 | 1160.80 | 1161.70 | 1162.60 | 1164.00 | 1165.00 | 1165.92 | 1192.84 | 1166.75 | 1160.37 | 1185.87 | 1183.29 | 1192.50 | 1202.80 | 1215.33 | 1214.99 | 1194.62 | 1194.65 | 1194.80 | 1195.03 | NA | 1327.67 | NA | NA | NA | |
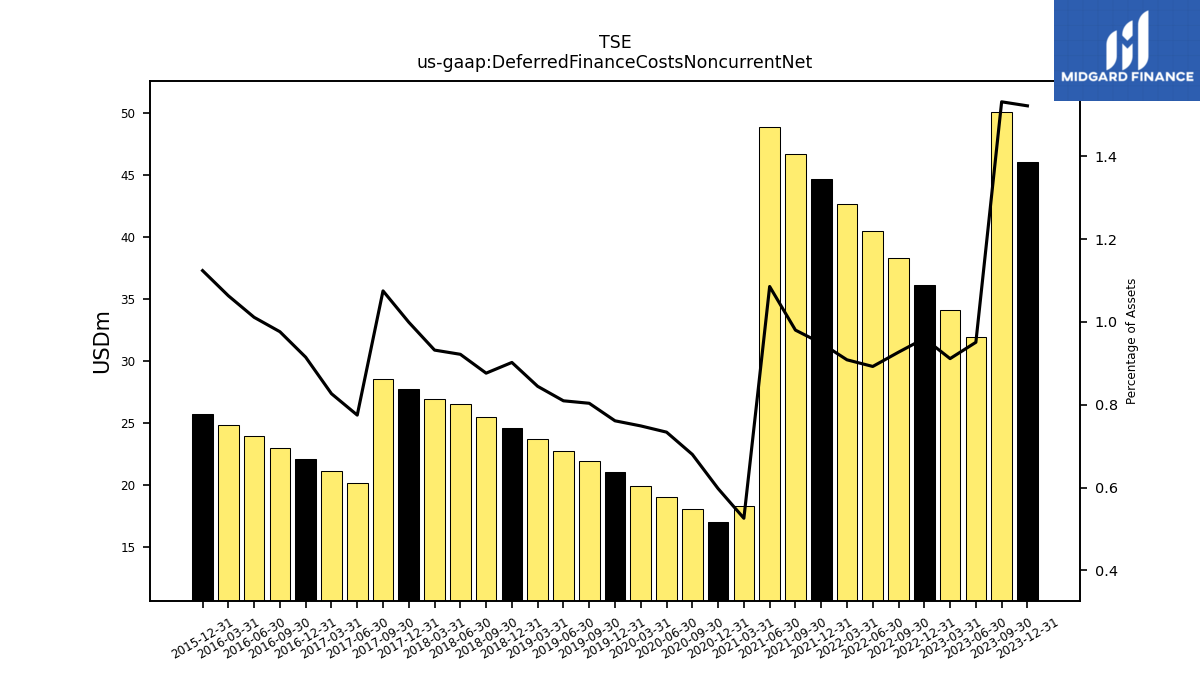
| Deferred Finance Costs Noncurrent Net | 46.10 | 50.10 | 31.90 | 34.10 | 36.10 | 38.30 | 40.50 | 42.70 | 44.70 | 46.70 | 48.90 | 18.30 | 17.00 | 18.00 | 19.00 | 19.90 | 21.00 | 21.90 | 22.70 | 23.70 | 24.60 | 25.50 | 26.50 | 26.90 | 27.70 | 28.56 | 20.16 | 21.11 | 22.04 | 22.97 | 23.89 | 24.79 | 25.68 | NA | NA | NA | NA | NA | NA | NA | NA | NA | NA | NA | |
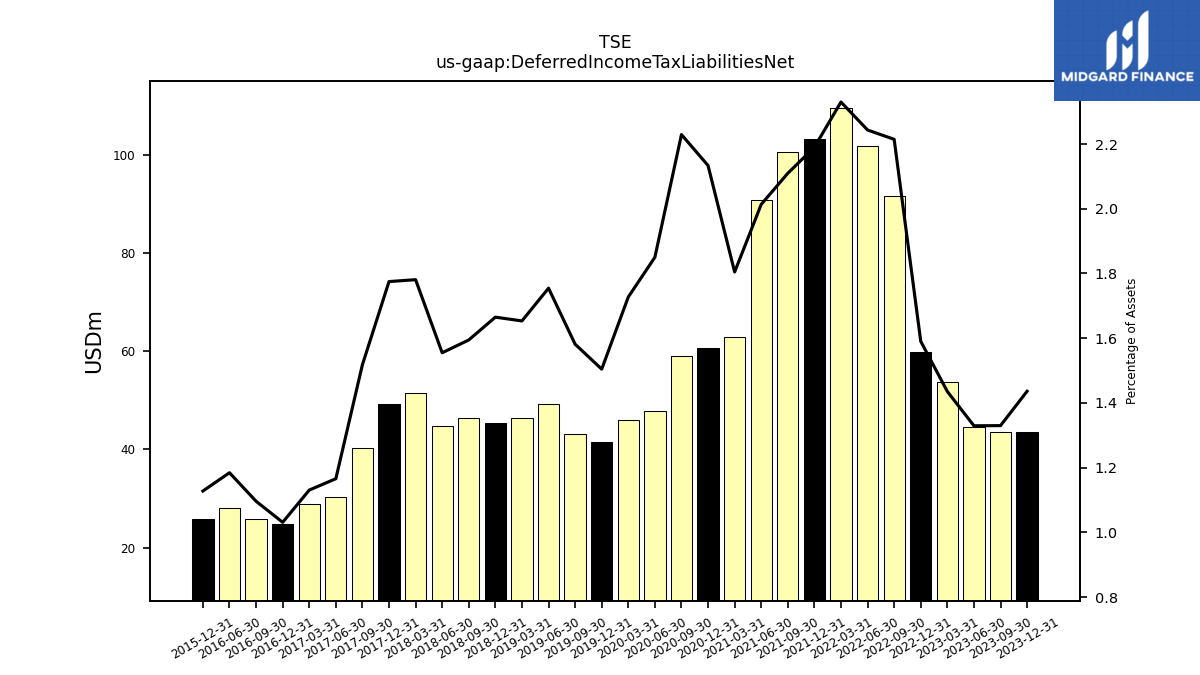
| Deferred Income Tax Liabilities Net | 43.50 | 43.50 | 44.60 | 53.70 | 59.80 | 91.50 | 101.80 | 109.50 | 103.20 | 100.50 | 90.70 | 62.80 | 60.70 | 59.00 | 47.90 | 45.90 | 41.50 | 43.10 | 49.20 | 46.40 | 45.40 | 46.40 | 44.70 | 51.40 | 49.20 | 40.33 | 30.32 | 28.87 | 24.84 | 25.79 | 27.98 | NA | 25.76 | NA | NA | NA | NA | NA | NA | NA | NA | NA | NA | NA | |
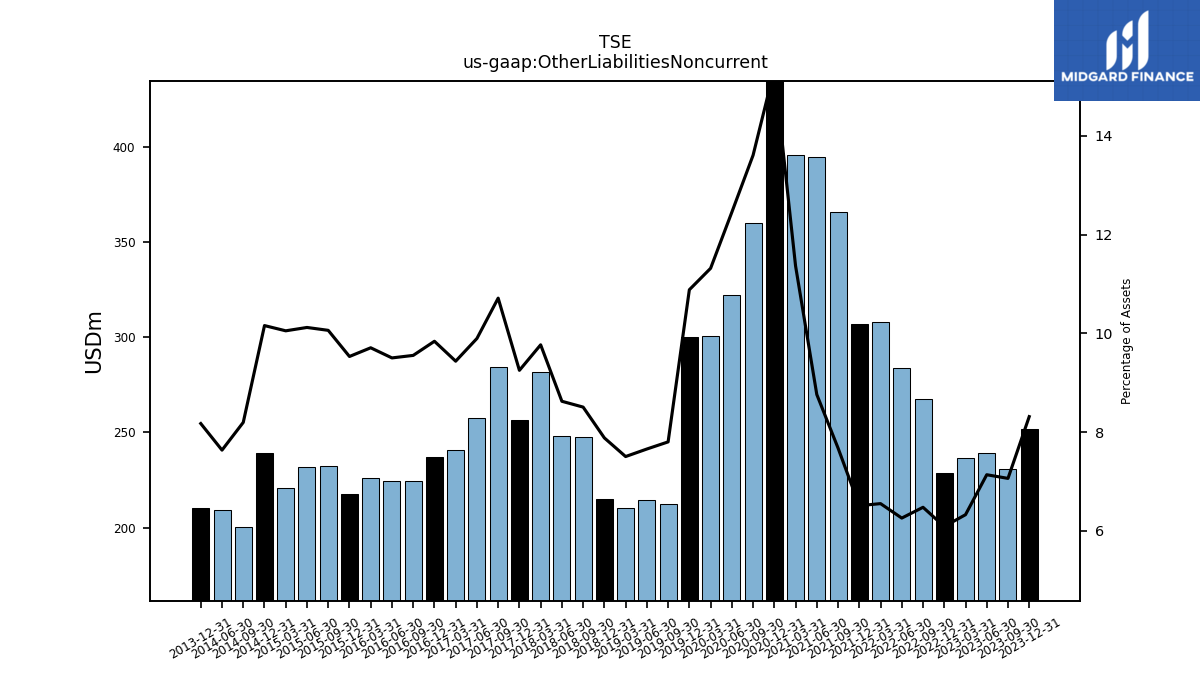
| Other Liabilities Noncurrent | 251.80 | 231.00 | 239.40 | 236.70 | 228.90 | 267.60 | 284.00 | 307.90 | 306.70 | 365.70 | 394.60 | 395.50 | 436.50 | 360.10 | 322.40 | 300.70 | 300.20 | 212.60 | 214.70 | 210.60 | 214.90 | 247.50 | 247.90 | 281.90 | 256.40 | 284.55 | 257.39 | 240.94 | 237.05 | 224.74 | 224.48 | 226.32 | 217.73 | 232.59 | 231.61 | 220.61 | 239.29 | 200.64 | 209.26 | NA | 210.42 | NA | NA | NA | |
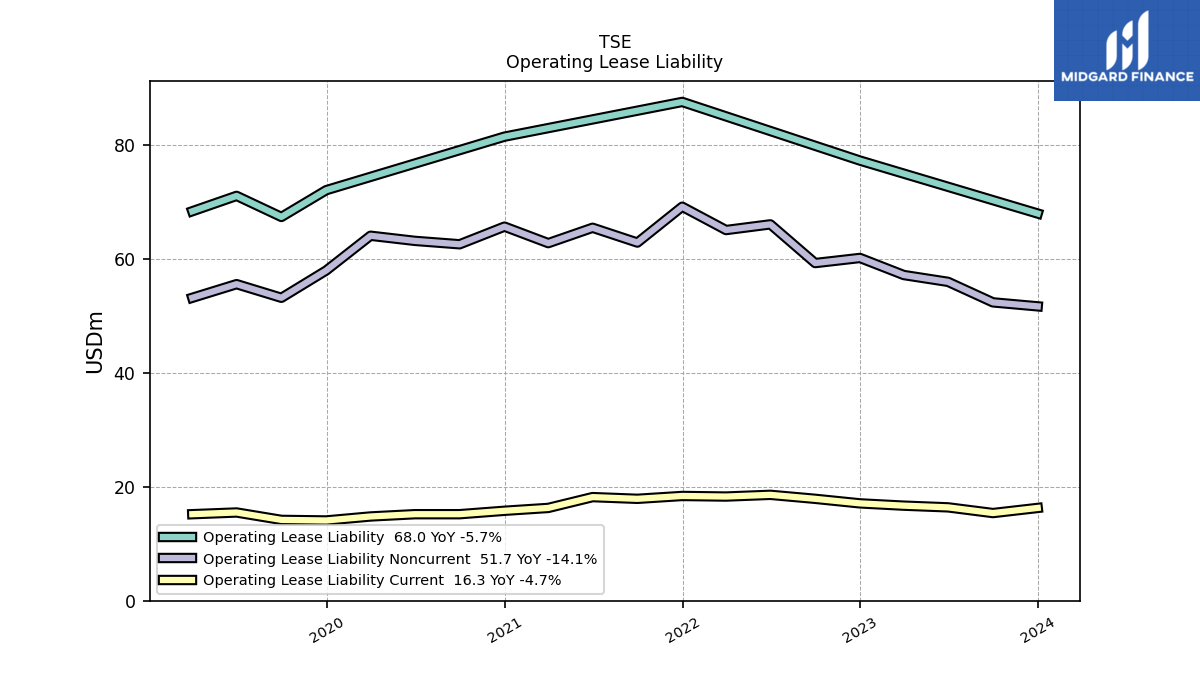
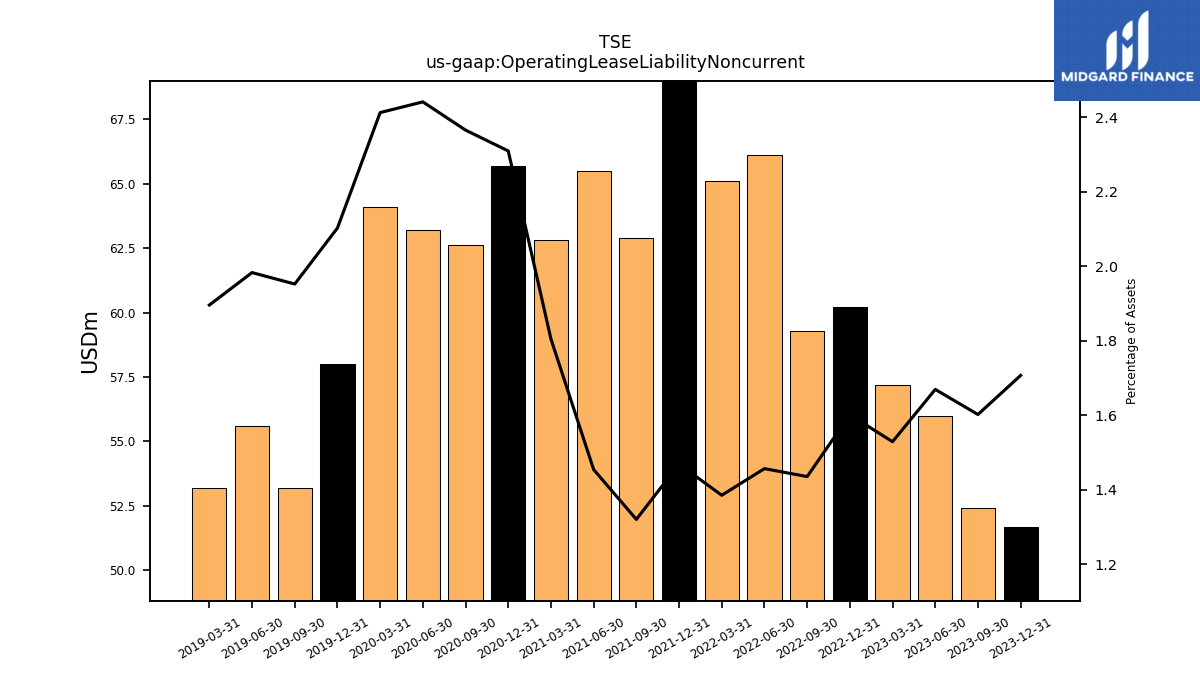
| Operating Lease Liability Noncurrent | 51.70 | 52.40 | 56.00 | 57.20 | 60.20 | 59.30 | 66.10 | 65.10 | 69.20 | 62.90 | 65.50 | 62.80 | 65.70 | 62.60 | 63.20 | 64.10 | 58.00 | 53.20 | 55.60 | 53.20 | NA | NA | NA | NA | NA | NA | NA | NA | NA | NA | NA | NA | NA | NA | NA | NA | NA | NA | NA | NA | NA | NA | NA | NA |
| 2023-12-31 | 2023-09-30 | 2023-06-30 | 2023-03-31 | 2022-12-31 | 2022-09-30 | 2022-06-30 | 2022-03-31 | 2021-12-31 | 2021-09-30 | 2021-06-30 | 2021-03-31 | 2020-12-31 | 2020-09-30 | 2020-06-30 | 2020-03-31 | 2019-12-31 | 2019-09-30 | 2019-06-30 | 2019-03-31 | 2018-12-31 | 2018-09-30 | 2018-06-30 | 2018-03-31 | 2017-12-31 | 2017-09-30 | 2017-06-30 | 2017-03-31 | 2016-12-31 | 2016-09-30 | 2016-06-30 | 2016-03-31 | 2015-12-31 | 2015-09-30 | 2015-06-30 | 2015-03-31 | 2014-12-31 | 2014-09-30 | 2014-06-30 | 2014-03-31 | 2013-12-31 | 2013-09-30 | 2013-06-30 | 2013-03-31 | ||
|---|---|---|---|---|---|---|---|---|---|---|---|---|---|---|---|---|---|---|---|---|---|---|---|---|---|---|---|---|---|---|---|---|---|---|---|---|---|---|---|---|---|---|---|---|---|
| Stockholders Equity | -268.00 | -21.40 | 21.20 | 376.20 | 420.30 | 698.10 | 924.60 | 972.80 | 1013.10 | 922.00 | 829.80 | 676.30 | 590.30 | 547.60 | 458.80 | 603.00 | 668.90 | 715.00 | 745.10 | 753.10 | 768.70 | 826.20 | 801.80 | 755.70 | 674.80 | 570.04 | 560.27 | 534.08 | 445.05 | 423.44 | 463.41 | 420.08 | 389.01 | 345.25 | 287.85 | 248.91 | 320.87 | 417.07 | 509.61 | 361.80 | 343.20 | 315.11 | 268.00 | NA | |
| Common Stock Value | 0.40 | 0.40 | 0.40 | 0.40 | 0.40 | 0.40 | 0.40 | 0.40 | 0.40 | 0.50 | 0.50 | 0.50 | 0.50 | 0.50 | 0.50 | 0.50 | 0.50 | 0.50 | 0.50 | 0.50 | 0.50 | 0.50 | 0.50 | 0.50 | 0.50 | 0.49 | 0.49 | 0.49 | 0.49 | 0.49 | 0.49 | 0.49 | 0.49 | 0.49 | 0.49 | 0.49 | 0.49 | 0.49 | 0.49 | NA | 0.37 | NA | NA | NA | |
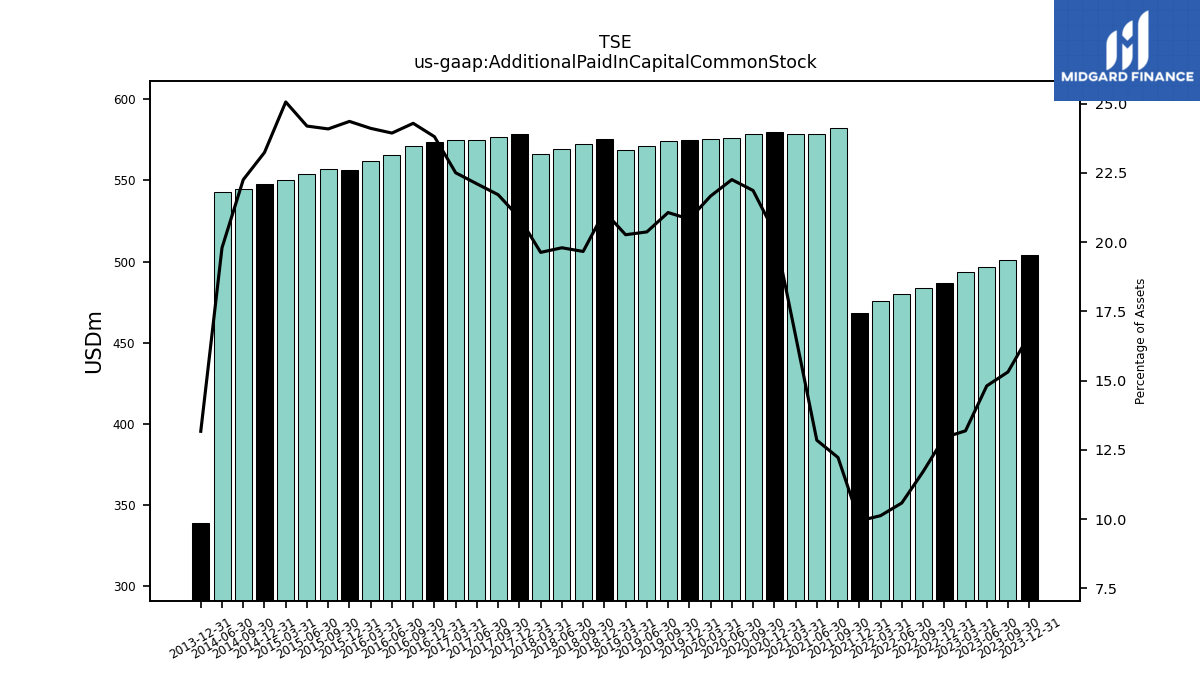
| Additional Paid In Capital Common Stock | 504.20 | 500.90 | 496.80 | 493.30 | 486.70 | 483.70 | 480.10 | 475.70 | 468.10 | 582.20 | 578.70 | 578.50 | 579.60 | 578.70 | 576.30 | 575.70 | 574.70 | 574.20 | 571.20 | 568.80 | 575.40 | 572.20 | 569.10 | 566.60 | 578.80 | 576.79 | 575.01 | 574.67 | 573.66 | 571.50 | 565.59 | 562.12 | 556.53 | 556.96 | 553.75 | 550.15 | 547.53 | 544.81 | 542.65 | NA | 339.06 | NA | NA | NA | |
| Retained Earnings Accumulated Deficit | -443.00 | -177.60 | -138.90 | 210.40 | 264.50 | 641.00 | 772.00 | 746.40 | 741.80 | 1036.40 | 955.80 | 807.30 | 739.20 | 675.60 | 585.40 | 729.20 | 781.00 | 791.00 | 784.10 | 772.40 | 753.20 | 770.90 | 713.40 | 632.40 | 527.90 | 423.46 | 406.27 | 362.15 | 258.54 | 193.28 | 139.43 | 58.46 | -18.29 | -61.42 | -113.48 | -114.23 | -151.94 | -122.25 | -112.14 | NA | -84.60 | NA | NA | NA | |
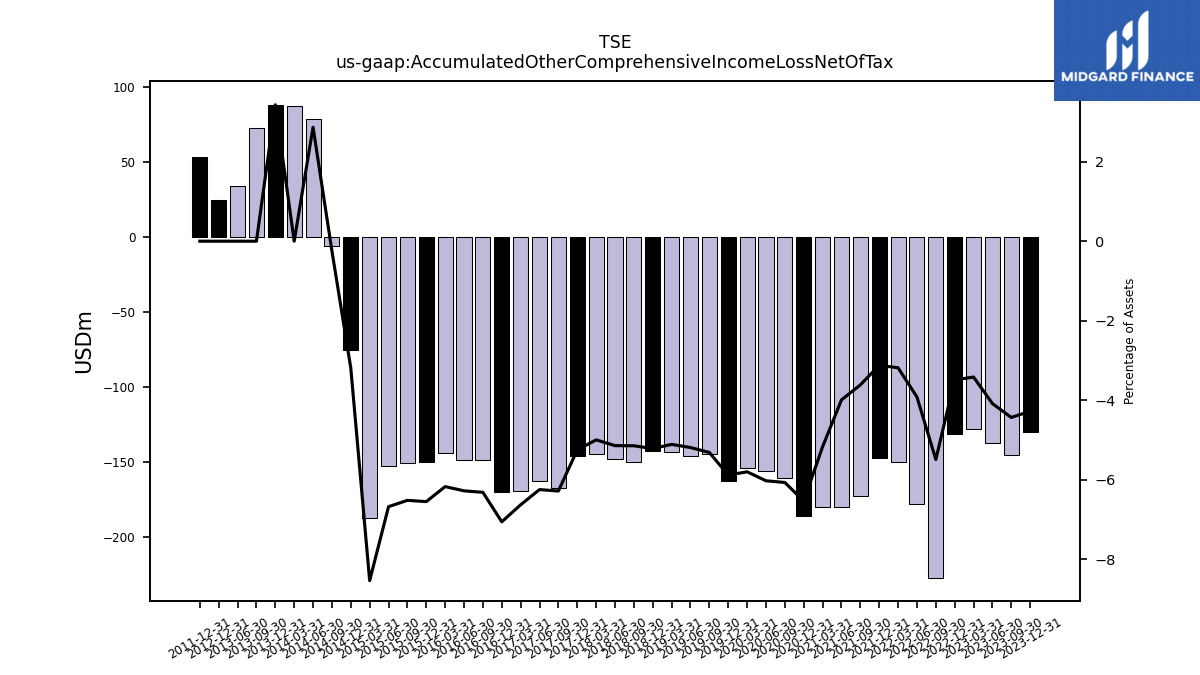
| Accumulated Other Comprehensive Income Loss Net Of Tax | -129.60 | -145.10 | -137.10 | -127.90 | -131.30 | -227.00 | -177.90 | -149.70 | -147.20 | -172.30 | -179.90 | -180.00 | -186.10 | -160.70 | -156.10 | -154.20 | -162.40 | -144.90 | -145.60 | -143.50 | -142.30 | -149.80 | -147.90 | -144.30 | -145.60 | -167.02 | -162.58 | -169.39 | -170.15 | -148.68 | -148.42 | -143.98 | -149.72 | -150.78 | -152.91 | -187.50 | -75.22 | -5.98 | 78.61 | 87.20 | 88.38 | 73.01 | 33.87 | NA |
| 2023-12-31 | 2023-09-30 | 2023-06-30 | 2023-03-31 | 2022-12-31 | 2022-09-30 | 2022-06-30 | 2022-03-31 | 2021-12-31 | 2021-09-30 | 2021-06-30 | 2021-03-31 | 2020-12-31 | 2020-09-30 | 2020-06-30 | 2020-03-31 | 2019-12-31 | 2019-09-30 | 2019-06-30 | 2019-03-31 | 2018-12-31 | 2018-09-30 | 2018-06-30 | 2018-03-31 | 2017-12-31 | 2017-09-30 | 2017-06-30 | 2017-03-31 | 2016-12-31 | 2016-09-30 | 2016-06-30 | 2016-03-31 | 2015-12-31 | 2015-09-30 | 2015-06-30 | 2015-03-31 | 2014-12-31 | 2014-09-30 | 2014-06-30 | 2014-03-31 | 2013-12-31 | 2013-09-30 | 2013-06-30 | 2013-03-31 | ||
|---|---|---|---|---|---|---|---|---|---|---|---|---|---|---|---|---|---|---|---|---|---|---|---|---|---|---|---|---|---|---|---|---|---|---|---|---|---|---|---|---|---|---|---|---|---|
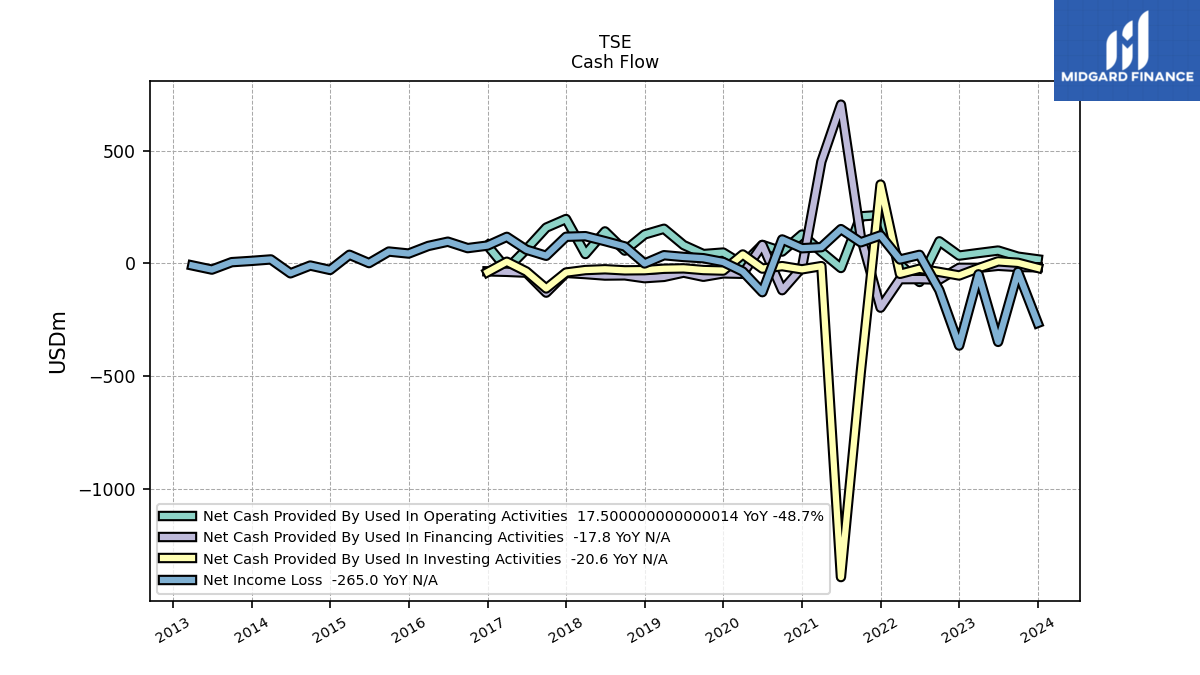
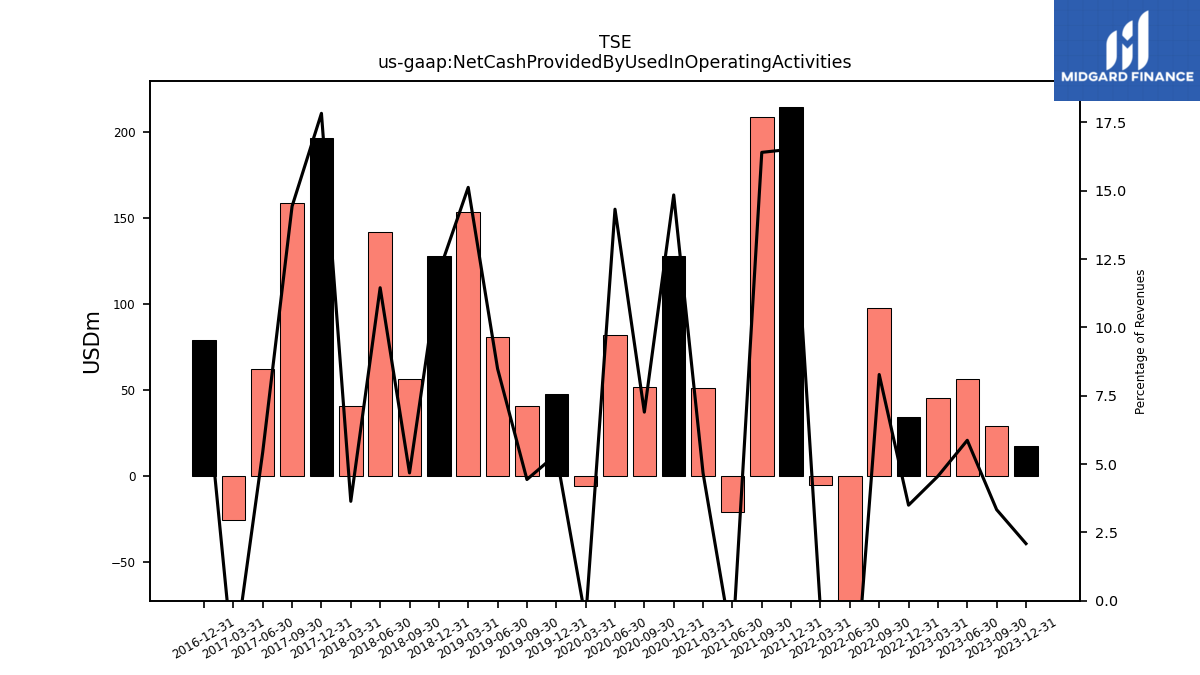
| Net Cash Provided By Used In Operating Activities | 17.50 | 29.30 | 56.50 | 45.40 | 34.10 | 97.50 | -83.10 | -5.00 | 214.50 | 208.20 | -21.00 | 51.00 | 127.70 | 51.90 | 81.60 | -5.80 | 47.60 | 40.90 | 80.80 | 153.20 | 128.00 | 56.10 | 141.60 | 40.80 | 196.46 | 158.25 | 62.30 | -25.70 | 79.00 | NA | NA | NA | NA | NA | NA | NA | NA | NA | NA | NA | NA | NA | NA | NA | |
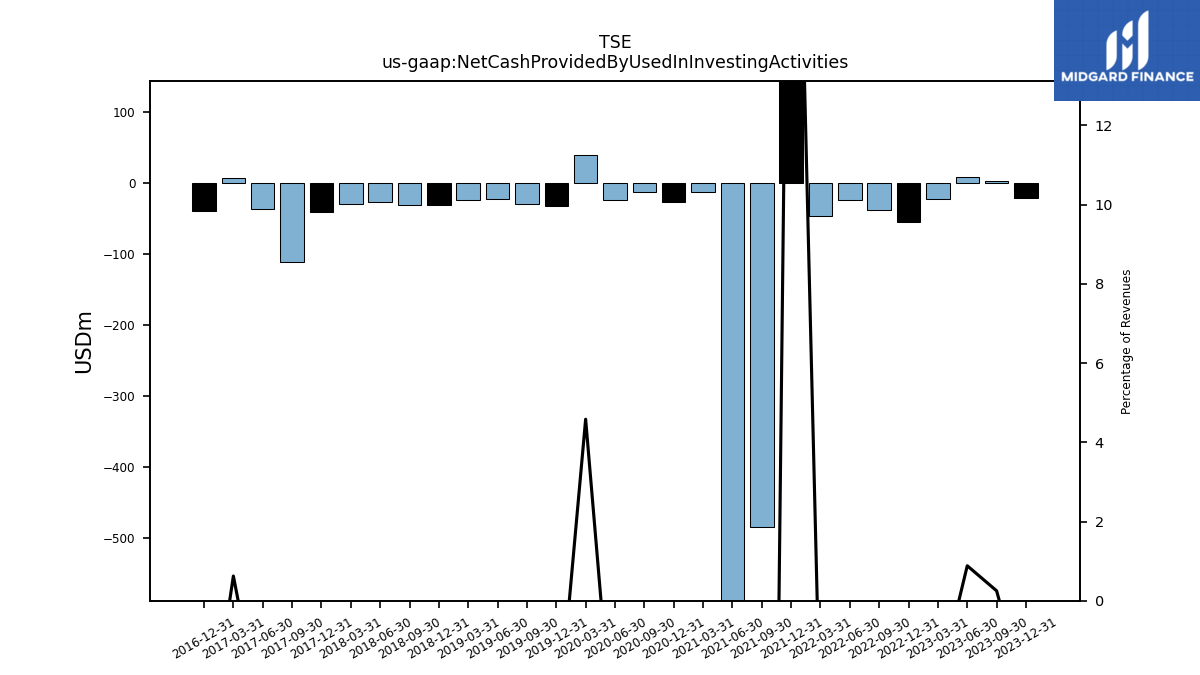
| Net Cash Provided By Used In Investing Activities | -20.60 | 2.20 | 8.50 | -21.80 | -54.20 | -38.60 | -24.20 | -47.00 | 349.40 | -483.60 | -1392.90 | -12.60 | -26.90 | -12.70 | -23.70 | 39.10 | -32.40 | -30.00 | -22.60 | -24.30 | -30.60 | -31.40 | -26.60 | -30.10 | -41.10 | -111.80 | -36.60 | 6.90 | -39.60 | NA | NA | NA | NA | NA | NA | NA | NA | NA | NA | NA | NA | NA | NA | NA | |
| Net Cash Provided By Used In Financing Activities | -17.80 | -16.50 | -11.20 | -20.50 | -20.20 | -72.70 | -70.20 | -70.60 | -197.10 | 117.90 | 704.10 | 450.80 | -19.20 | -119.50 | 81.10 | -46.70 | -44.90 | -59.90 | -41.50 | -60.40 | -66.10 | -53.60 | -54.50 | -48.00 | -42.80 | -130.40 | -41.80 | -38.00 | -35.85 | NA | NA | NA | NA | NA | NA | NA | NA | NA | NA | NA | NA | NA | NA | NA |
| 2023-12-31 | 2023-09-30 | 2023-06-30 | 2023-03-31 | 2022-12-31 | 2022-09-30 | 2022-06-30 | 2022-03-31 | 2021-12-31 | 2021-09-30 | 2021-06-30 | 2021-03-31 | 2020-12-31 | 2020-09-30 | 2020-06-30 | 2020-03-31 | 2019-12-31 | 2019-09-30 | 2019-06-30 | 2019-03-31 | 2018-12-31 | 2018-09-30 | 2018-06-30 | 2018-03-31 | 2017-12-31 | 2017-09-30 | 2017-06-30 | 2017-03-31 | 2016-12-31 | 2016-09-30 | 2016-06-30 | 2016-03-31 | 2015-12-31 | 2015-09-30 | 2015-06-30 | 2015-03-31 | 2014-12-31 | 2014-09-30 | 2014-06-30 | 2014-03-31 | 2013-12-31 | 2013-09-30 | 2013-06-30 | 2013-03-31 | ||
|---|---|---|---|---|---|---|---|---|---|---|---|---|---|---|---|---|---|---|---|---|---|---|---|---|---|---|---|---|---|---|---|---|---|---|---|---|---|---|---|---|---|---|---|---|---|
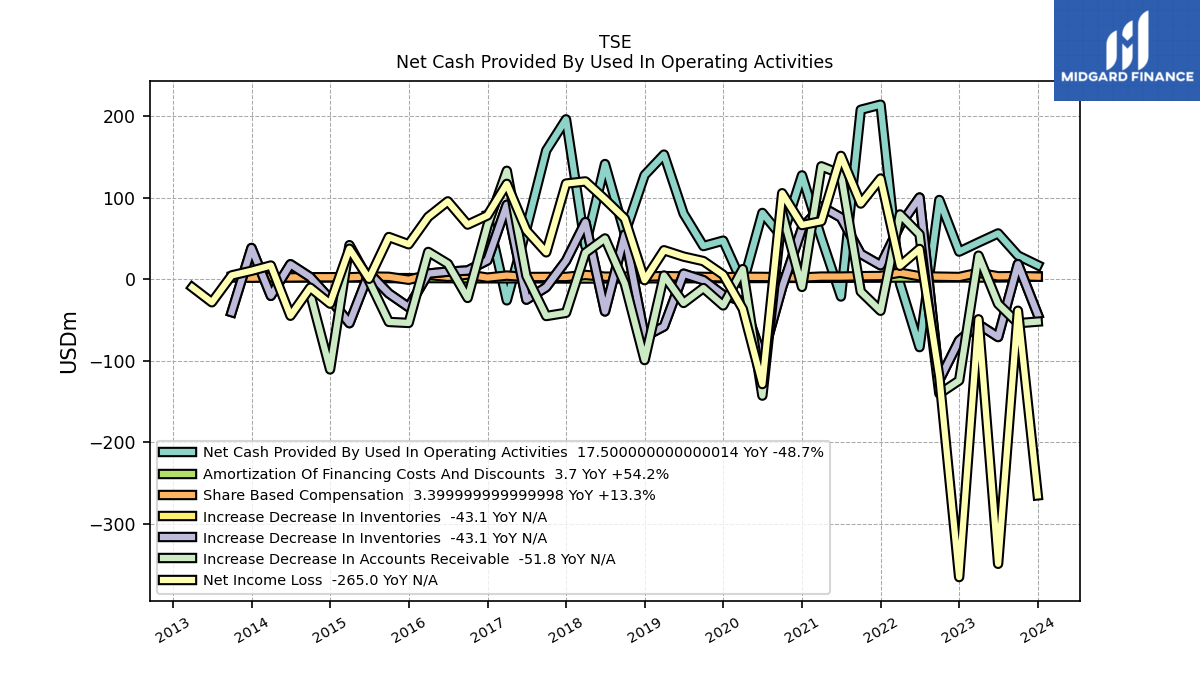
| Net Cash Provided By Used In Operating Activities | 17.50 | 29.30 | 56.50 | 45.40 | 34.10 | 97.50 | -83.10 | -5.00 | 214.50 | 208.20 | -21.00 | 51.00 | 127.70 | 51.90 | 81.60 | -5.80 | 47.60 | 40.90 | 80.80 | 153.20 | 128.00 | 56.10 | 141.60 | 40.80 | 196.46 | 158.25 | 62.30 | -25.70 | 79.00 | NA | NA | NA | NA | NA | NA | NA | NA | NA | NA | NA | NA | NA | NA | NA | |
| Net Income Loss | -265.00 | -38.40 | -349.00 | -48.90 | -365.30 | -119.80 | 37.40 | 16.70 | 123.80 | 93.10 | 151.60 | 71.50 | 66.70 | 105.80 | -128.40 | -36.30 | 5.70 | 22.50 | 28.00 | 35.80 | -0.90 | 74.70 | 98.30 | 120.30 | 117.60 | 33.22 | 60.16 | 117.29 | 78.51 | 67.25 | 95.80 | 76.75 | 43.13 | 52.05 | 0.76 | 37.70 | -29.69 | -10.11 | -44.62 | 17.09 | 10.59 | 4.94 | -28.06 | -9.68 | |
| Profit Loss | -265.00 | -38.40 | -349.00 | -48.90 | -365.30 | -119.80 | 37.50 | 16.70 | 123.80 | 93.10 | 151.60 | 71.50 | 66.70 | 105.90 | -128.40 | -36.30 | 5.70 | 22.50 | 28.00 | 35.80 | -0.80 | 74.70 | 98.30 | 120.30 | 117.63 | 33.17 | 60.20 | 117.30 | 78.50 | NA | NA | NA | NA | NA | NA | NA | NA | NA | NA | NA | NA | NA | NA | NA | |
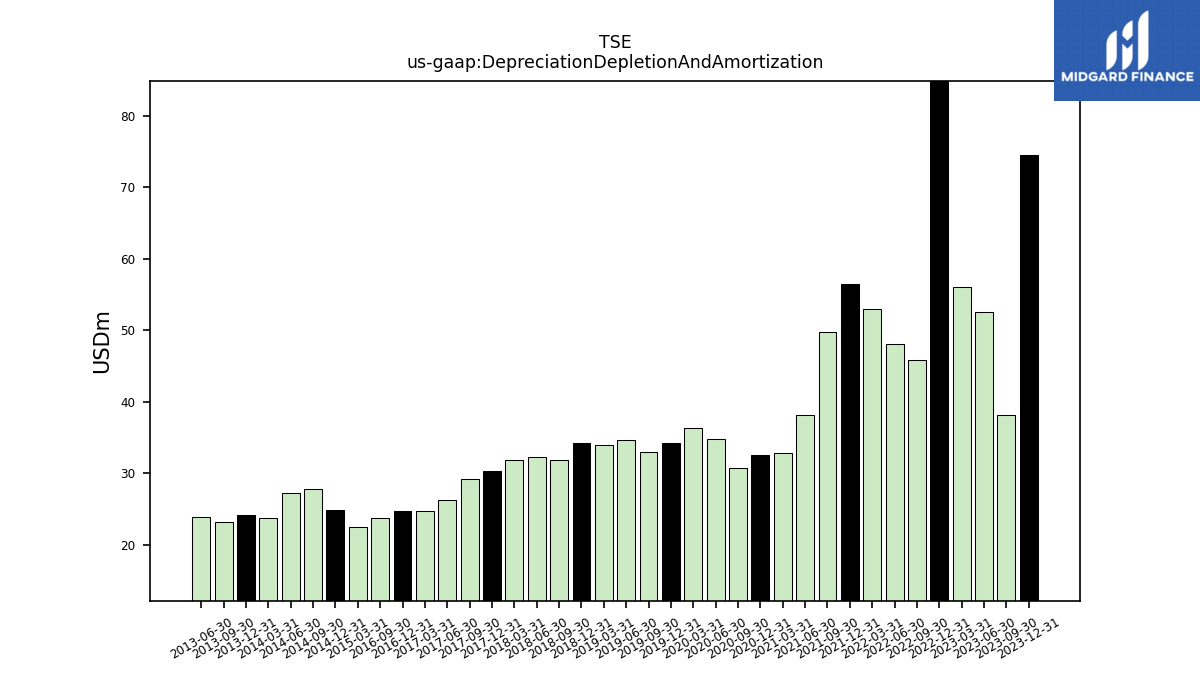
| Depreciation Depletion And Amortization | 74.50 | 38.20 | 52.50 | 56.00 | 89.80 | 45.90 | 48.10 | 53.00 | 56.50 | 49.80 | 38.10 | 32.90 | 32.50 | 30.70 | 34.80 | 36.40 | 34.30 | 33.00 | 34.70 | 33.90 | 34.20 | 31.80 | 32.30 | 31.90 | 30.38 | 29.18 | 26.30 | 24.70 | 24.66 | 23.77 | NA | NA | NA | NA | NA | 22.55 | 24.91 | 27.86 | 27.21 | 23.73 | 24.16 | 23.24 | 23.93 | NA | |
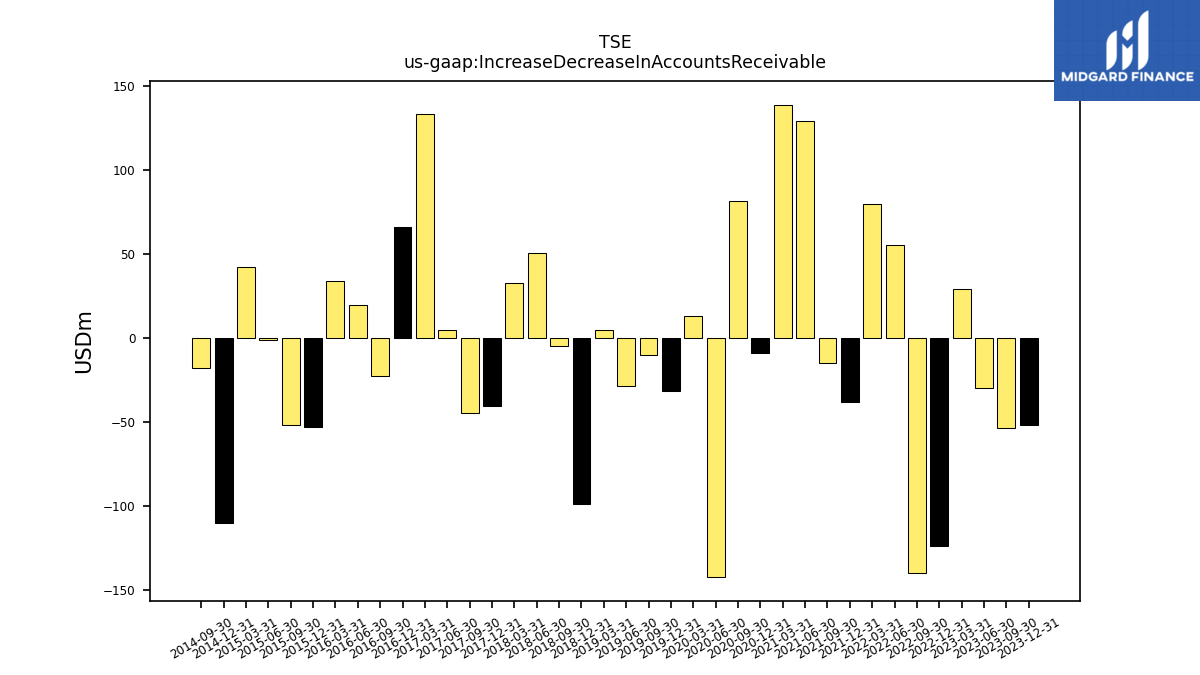
| Increase Decrease In Accounts Receivable | -51.80 | -53.70 | -30.00 | 29.20 | -124.00 | -140.20 | 55.30 | 79.80 | -38.50 | -14.90 | 129.20 | 138.80 | -9.20 | 81.70 | -142.60 | 12.70 | -31.90 | -10.60 | -28.90 | 4.80 | -99.00 | -5.20 | 50.30 | 32.70 | -40.98 | -44.92 | 4.38 | 133.31 | 66.17 | -22.73 | 19.22 | 33.73 | -53.40 | -52.16 | -1.66 | 42.09 | -110.50 | -17.86 | NA | NA | NA | NA | NA | NA | |
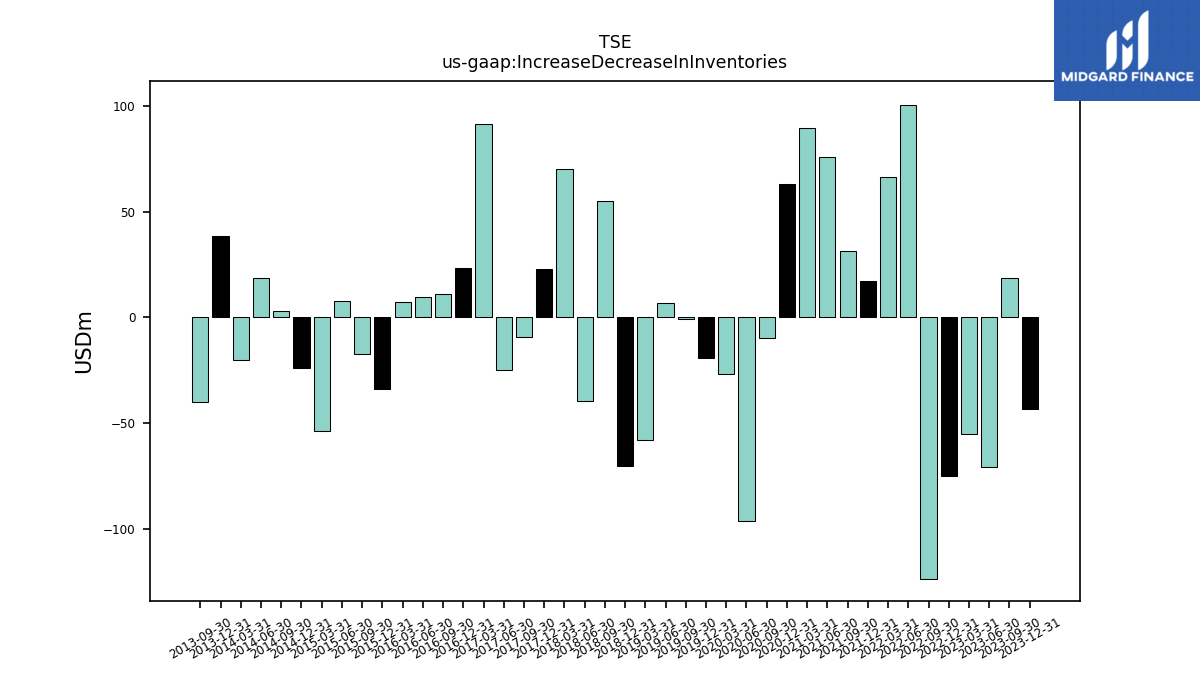
| Increase Decrease In Inventories | -43.10 | 18.80 | -70.70 | -55.10 | -74.90 | -123.60 | 100.50 | 66.20 | 17.40 | 31.30 | 75.90 | 89.50 | 62.80 | -9.50 | -96.30 | -26.80 | -19.10 | -0.90 | 7.00 | -57.70 | -70.10 | 55.10 | -39.30 | 70.30 | 22.89 | -9.49 | -24.82 | 91.62 | 23.36 | 10.92 | 9.52 | 7.16 | -34.03 | -17.23 | 7.83 | -53.72 | -23.96 | 2.87 | 18.64 | -20.15 | 38.58 | -40.14 | NA | NA | |
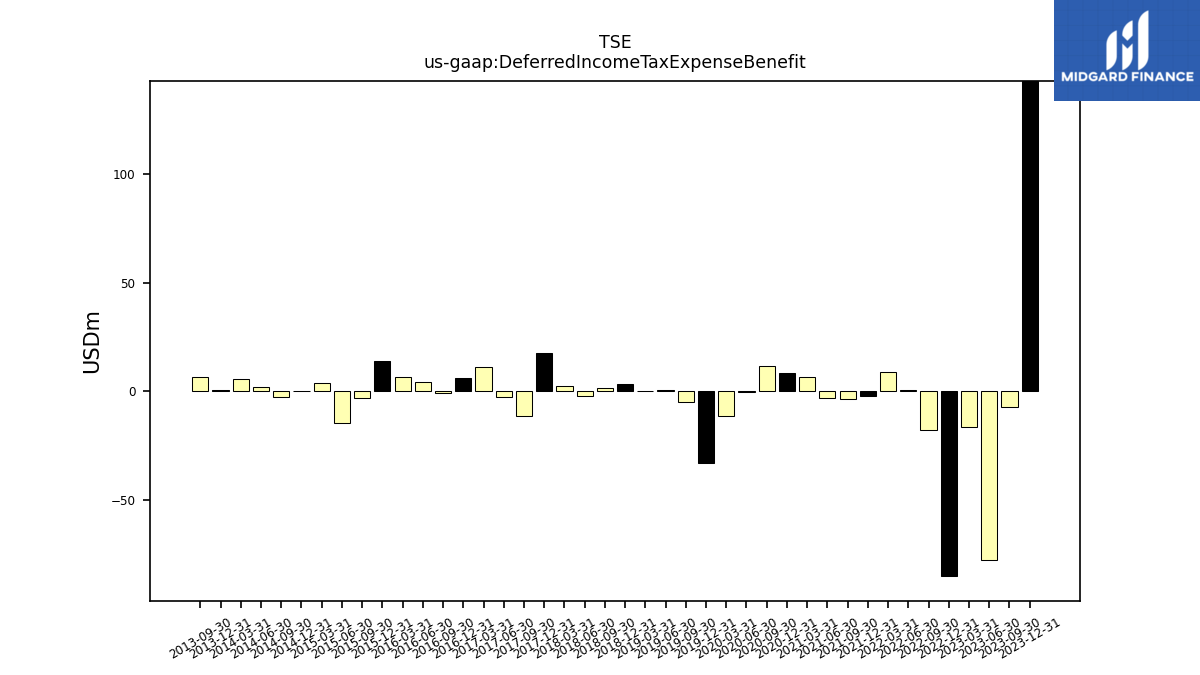
| Deferred Income Tax Expense Benefit | 142.90 | -7.40 | -77.50 | -16.60 | -85.30 | -17.80 | 0.80 | 9.00 | -2.30 | -3.40 | -3.00 | 6.60 | 8.30 | 11.70 | -0.50 | -11.50 | -32.90 | -4.80 | 0.40 | -0.10 | 3.20 | 1.70 | -2.10 | 2.50 | 17.44 | -11.50 | -2.42 | 11.28 | 6.19 | -0.79 | 4.27 | 6.42 | 13.74 | -3.20 | -14.39 | 3.77 | 0.12 | -2.74 | 2.00 | 5.46 | 0.36 | 6.75 | NA | NA | |
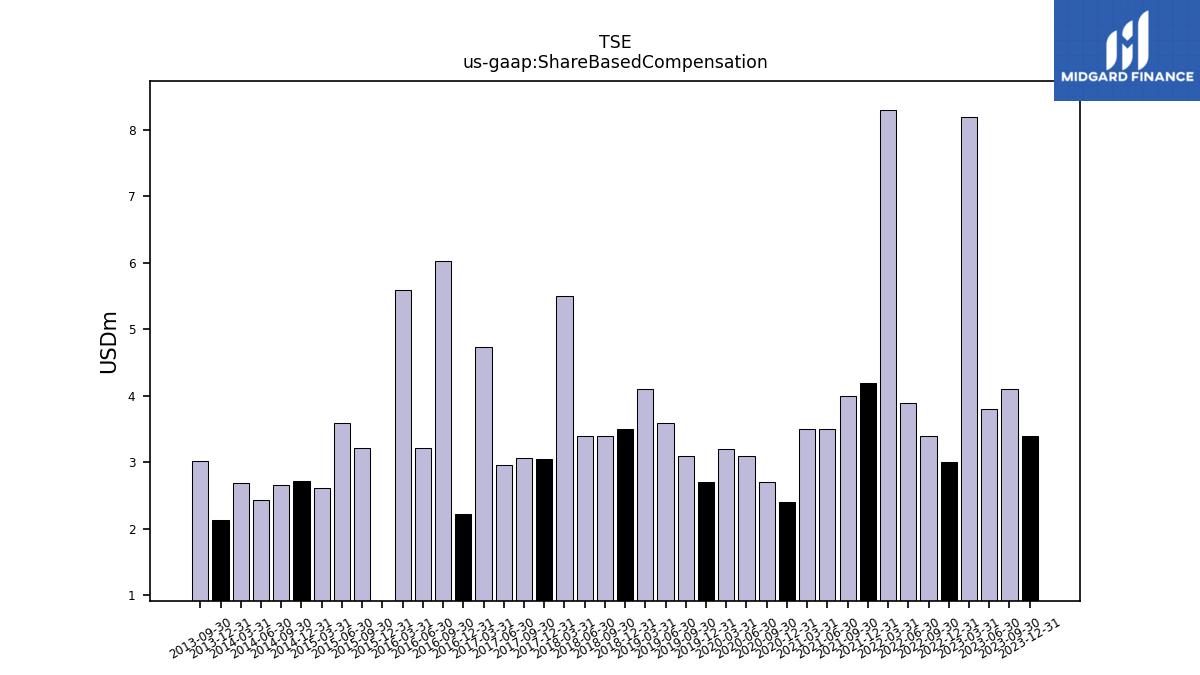
| Share Based Compensation | 3.40 | 4.10 | 3.80 | 8.20 | 3.00 | 3.40 | 3.90 | 8.30 | 4.20 | 4.00 | 3.50 | 3.50 | 2.40 | 2.70 | 3.10 | 3.20 | 2.70 | 3.10 | 3.60 | 4.10 | 3.50 | 3.40 | 3.40 | 5.50 | 3.05 | 3.06 | 2.96 | 4.73 | 2.22 | 6.03 | 3.22 | 5.59 | -0.43 | 3.21 | 3.60 | 2.62 | 2.72 | 2.66 | 2.43 | 2.69 | 2.13 | 3.03 | NA | NA |
| 2023-12-31 | 2023-09-30 | 2023-06-30 | 2023-03-31 | 2022-12-31 | 2022-09-30 | 2022-06-30 | 2022-03-31 | 2021-12-31 | 2021-09-30 | 2021-06-30 | 2021-03-31 | 2020-12-31 | 2020-09-30 | 2020-06-30 | 2020-03-31 | 2019-12-31 | 2019-09-30 | 2019-06-30 | 2019-03-31 | 2018-12-31 | 2018-09-30 | 2018-06-30 | 2018-03-31 | 2017-12-31 | 2017-09-30 | 2017-06-30 | 2017-03-31 | 2016-12-31 | 2016-09-30 | 2016-06-30 | 2016-03-31 | 2015-12-31 | 2015-09-30 | 2015-06-30 | 2015-03-31 | 2014-12-31 | 2014-09-30 | 2014-06-30 | 2014-03-31 | 2013-12-31 | 2013-09-30 | 2013-06-30 | 2013-03-31 | ||
|---|---|---|---|---|---|---|---|---|---|---|---|---|---|---|---|---|---|---|---|---|---|---|---|---|---|---|---|---|---|---|---|---|---|---|---|---|---|---|---|---|---|---|---|---|---|
| Net Cash Provided By Used In Investing Activities | -20.60 | 2.20 | 8.50 | -21.80 | -54.20 | -38.60 | -24.20 | -47.00 | 349.40 | -483.60 | -1392.90 | -12.60 | -26.90 | -12.70 | -23.70 | 39.10 | -32.40 | -30.00 | -22.60 | -24.30 | -30.60 | -31.40 | -26.60 | -30.10 | -41.10 | -111.80 | -36.60 | 6.90 | -39.60 | NA | NA | NA | NA | NA | NA | NA | NA | NA | NA | NA | NA | NA | NA | NA | |
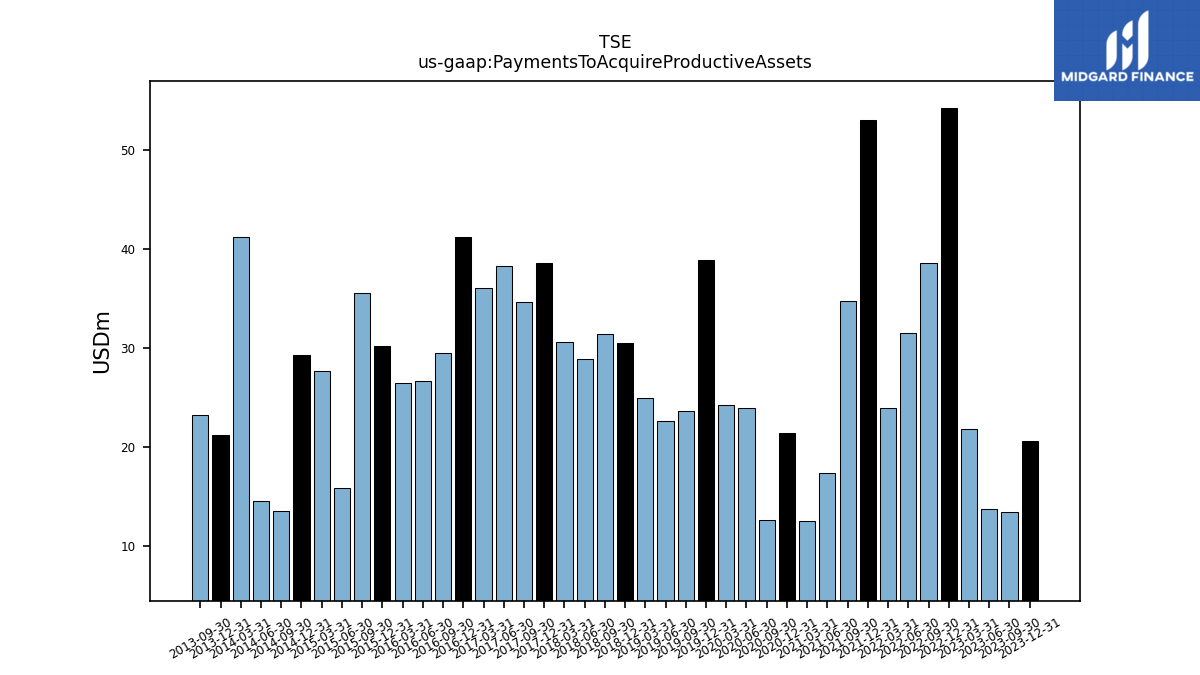
| Payments To Acquire Productive Assets | 20.60 | 13.50 | 13.80 | 21.80 | 54.20 | 38.60 | 31.50 | 23.90 | 53.00 | 34.70 | 17.40 | 12.60 | 21.40 | 12.70 | 23.90 | 24.30 | 38.90 | 23.60 | 22.60 | 25.00 | 30.50 | 31.40 | 28.90 | 30.60 | 38.52 | 34.59 | 38.24 | 36.04 | 41.20 | 29.52 | 26.72 | 26.44 | 30.18 | 35.49 | 15.92 | 27.67 | 29.34 | 13.53 | 14.60 | 41.14 | 21.23 | 23.20 | NA | NA |
| 2023-12-31 | 2023-09-30 | 2023-06-30 | 2023-03-31 | 2022-12-31 | 2022-09-30 | 2022-06-30 | 2022-03-31 | 2021-12-31 | 2021-09-30 | 2021-06-30 | 2021-03-31 | 2020-12-31 | 2020-09-30 | 2020-06-30 | 2020-03-31 | 2019-12-31 | 2019-09-30 | 2019-06-30 | 2019-03-31 | 2018-12-31 | 2018-09-30 | 2018-06-30 | 2018-03-31 | 2017-12-31 | 2017-09-30 | 2017-06-30 | 2017-03-31 | 2016-12-31 | 2016-09-30 | 2016-06-30 | 2016-03-31 | 2015-12-31 | 2015-09-30 | 2015-06-30 | 2015-03-31 | 2014-12-31 | 2014-09-30 | 2014-06-30 | 2014-03-31 | 2013-12-31 | 2013-09-30 | 2013-06-30 | 2013-03-31 | ||
|---|---|---|---|---|---|---|---|---|---|---|---|---|---|---|---|---|---|---|---|---|---|---|---|---|---|---|---|---|---|---|---|---|---|---|---|---|---|---|---|---|---|---|---|---|---|
| Net Cash Provided By Used In Financing Activities | -17.80 | -16.50 | -11.20 | -20.50 | -20.20 | -72.70 | -70.20 | -70.60 | -197.10 | 117.90 | 704.10 | 450.80 | -19.20 | -119.50 | 81.10 | -46.70 | -44.90 | -59.90 | -41.50 | -60.40 | -66.10 | -53.60 | -54.50 | -48.00 | -42.80 | -130.40 | -41.80 | -38.00 | -35.85 | NA | NA | NA | NA | NA | NA | NA | NA | NA | NA | NA | NA | NA | NA | NA | |
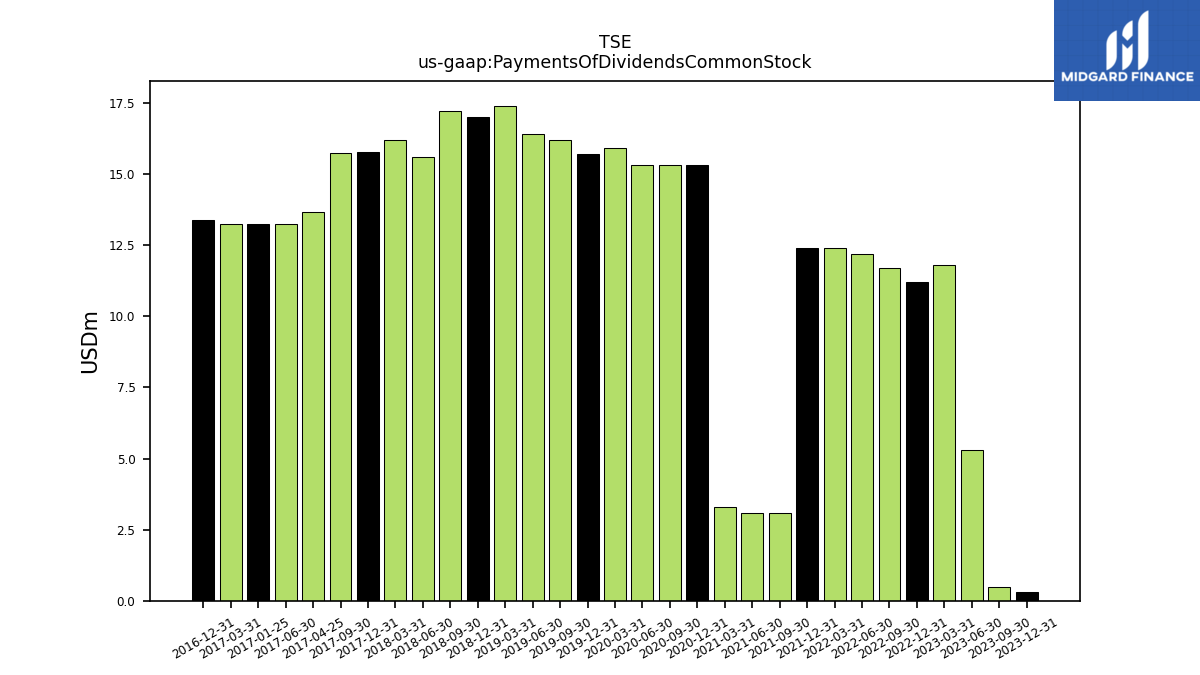
| Payments Of Dividends Common Stock | 0.30 | 0.50 | 5.30 | 11.80 | 11.20 | 11.70 | 12.20 | 12.40 | 12.40 | 3.10 | 3.10 | 3.30 | 15.30 | 15.30 | 15.30 | 15.90 | 15.70 | 16.20 | 16.40 | 17.40 | 17.00 | 17.20 | 15.60 | 16.20 | 15.77 | 15.73 | 13.25 | 13.25 | 13.38 | NA | NA | NA | NA | NA | NA | NA | NA | NA | NA | NA | NA | NA | NA | NA |
| 2023-12-31 | 2023-09-30 | 2023-06-30 | 2023-03-31 | 2022-12-31 | 2022-09-30 | 2022-06-30 | 2022-03-31 | 2021-12-31 | 2021-09-30 | 2021-06-30 | 2021-03-31 | 2020-12-31 | 2020-09-30 | 2020-06-30 | 2020-03-31 | 2019-12-31 | 2019-09-30 | 2019-06-30 | 2019-03-31 | 2018-12-31 | 2018-09-30 | 2018-06-30 | 2018-03-31 | 2017-12-31 | 2017-09-30 | 2017-06-30 | 2017-03-31 | 2016-12-31 | 2016-09-30 | 2016-06-30 | 2016-03-31 | 2015-12-31 | 2015-09-30 | 2015-06-30 | 2015-03-31 | 2014-12-31 | 2014-09-30 | 2014-06-30 | 2014-03-31 | 2013-12-31 | 2013-09-30 | 2013-06-30 | 2013-03-31 | ||
|---|---|---|---|---|---|---|---|---|---|---|---|---|---|---|---|---|---|---|---|---|---|---|---|---|---|---|---|---|---|---|---|---|---|---|---|---|---|---|---|---|---|---|---|---|---|
| Revenues | 837.50 | 879.00 | 962.60 | 996.30 | 975.20 | 1178.10 | 1425.50 | 1386.70 | 1298.50 | 1269.30 | 1273.70 | 1092.60 | 860.20 | 752.10 | 569.70 | 853.50 | 888.80 | 922.10 | 951.80 | 1013.10 | 1065.00 | 1199.70 | 1236.60 | 1121.60 | 1101.80 | 1096.60 | 1145.20 | 1104.50 | 917.45 | 935.41 | 969.69 | 894.08 | 897.01 | 1027.95 | 1028.67 | 1018.26 | 1122.40 | 1305.49 | 1340.93 | 1359.13 | 1245.11 | 1308.96 | 1361.76 | 1391.59 | |
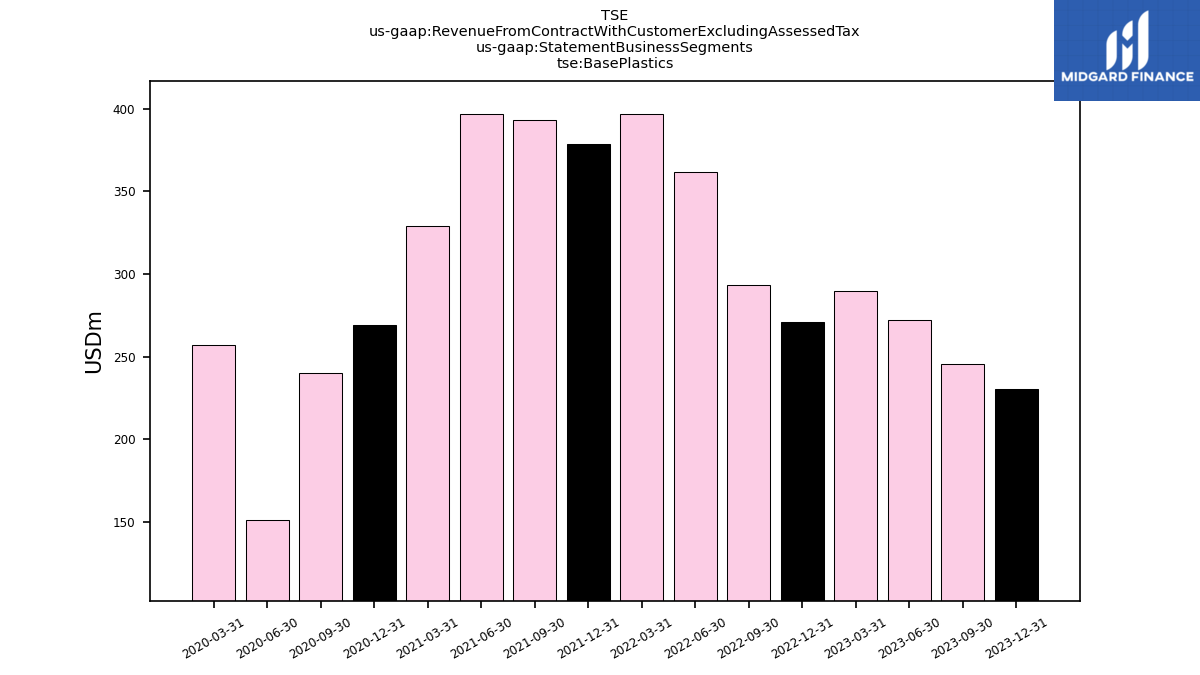
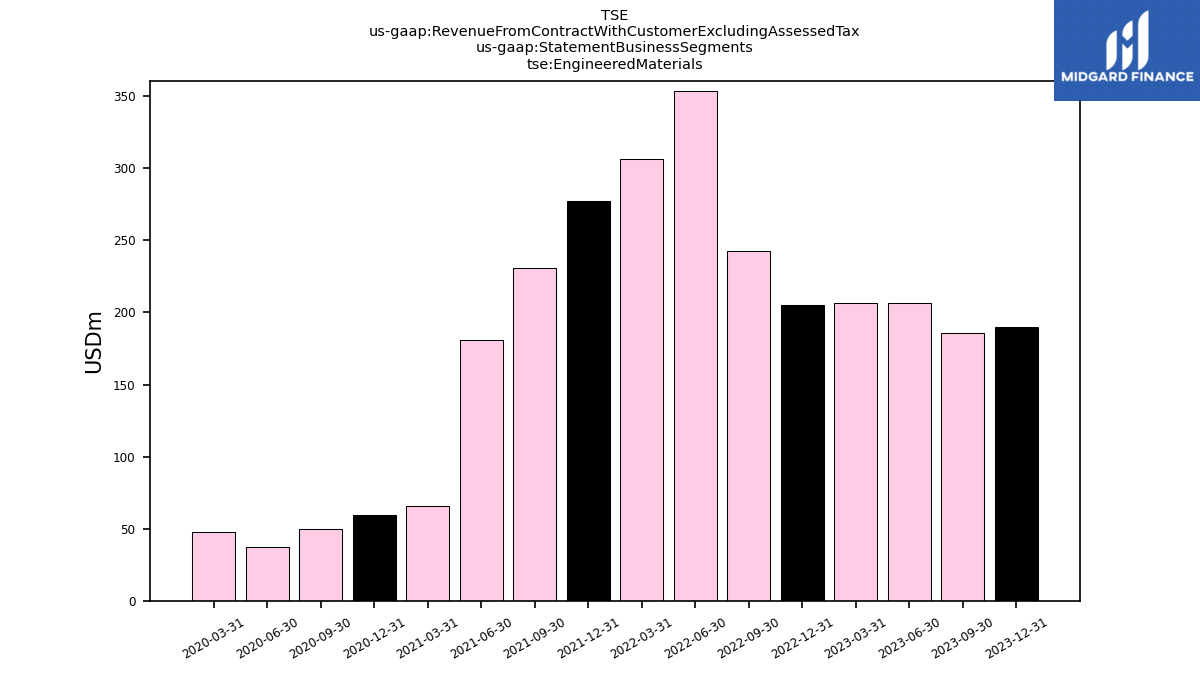
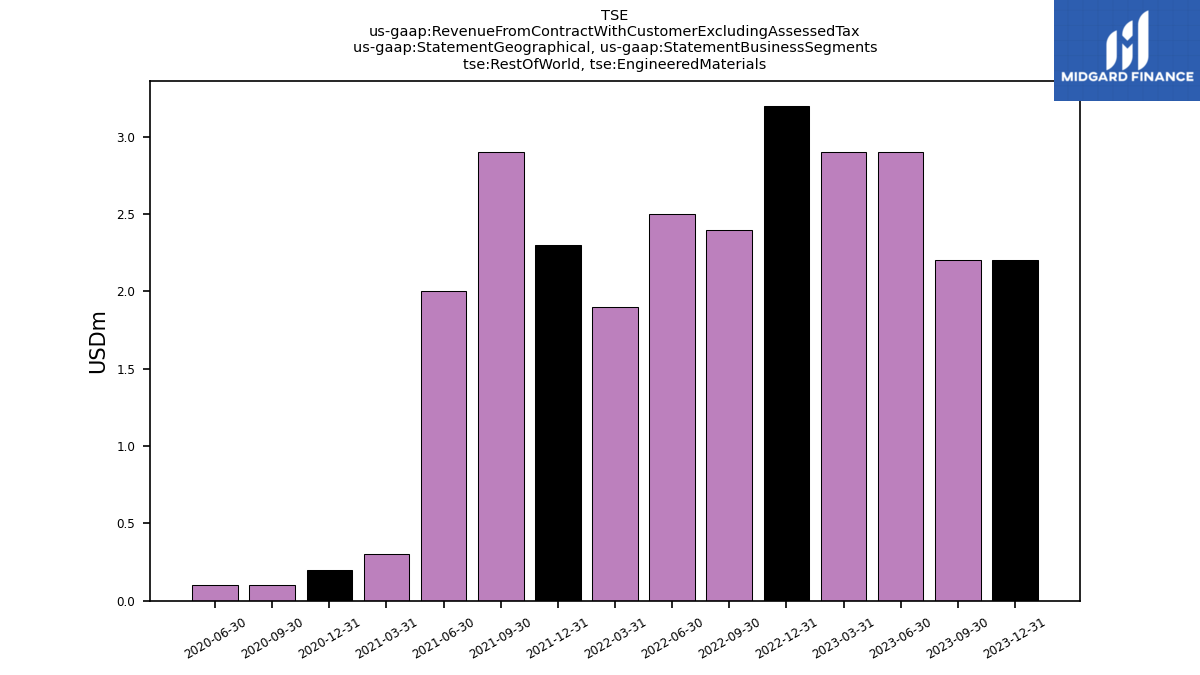
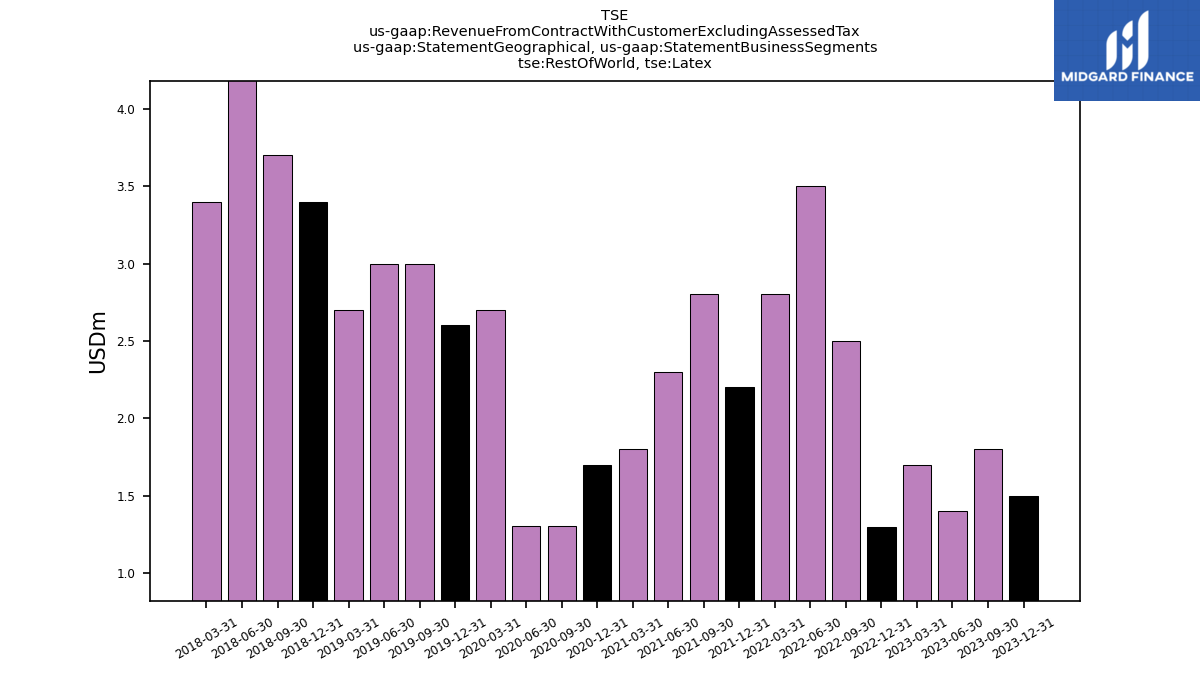
| Revenue From Contract With Customer Excluding Assessed Tax | 837.50 | 879.00 | 962.60 | 996.30 | 975.20 | 1178.10 | 1425.50 | 1386.70 | 1298.50 | 1269.30 | 1273.70 | 1092.60 | 860.20 | 752.10 | 569.70 | 853.50 | 888.80 | 922.10 | 951.80 | 1013.10 | 1065.00 | 1199.70 | 1236.60 | 1121.60 | 1101.80 | 1096.60 | 1145.20 | 1104.50 | 917.45 | 935.41 | 969.69 | 894.08 | 897.01 | 1027.95 | 1028.67 | 1018.26 | 1122.40 | 1305.49 | 1340.93 | 1359.13 | 1245.11 | 1308.96 | 1361.76 | 1391.59 | |
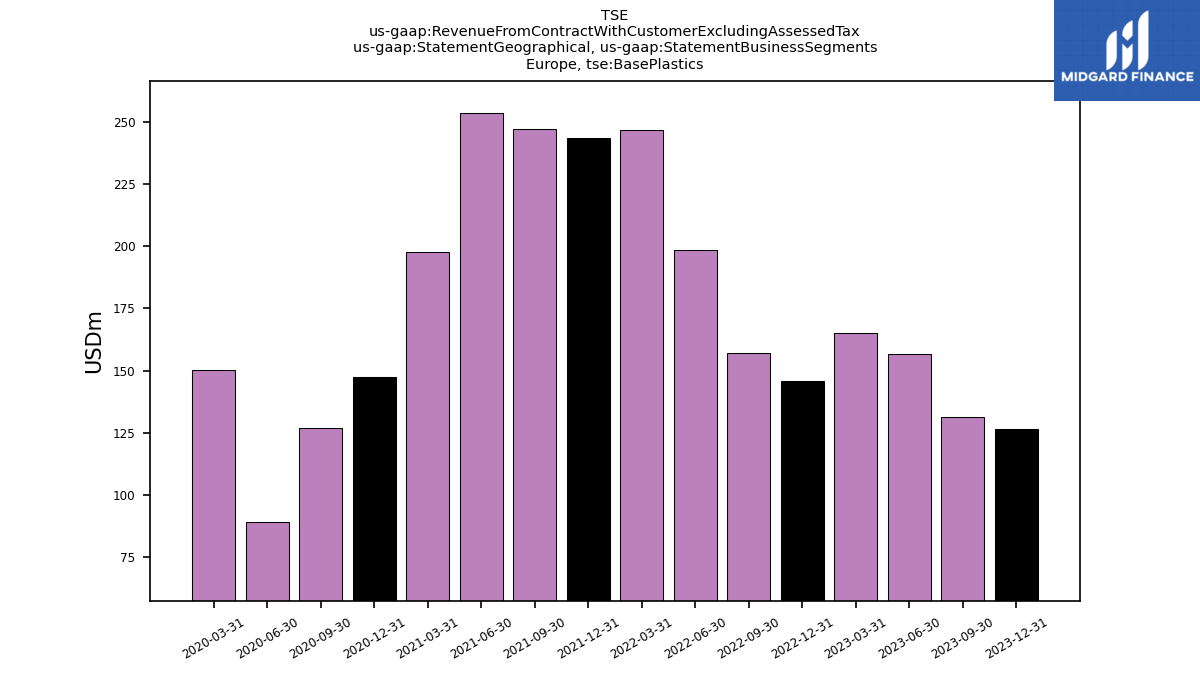
| Base Plastics | 230.70 | 245.80 | 272.10 | 289.90 | 271.20 | 293.40 | 361.90 | 396.50 | 378.60 | 393.30 | 396.90 | 328.90 | 269.10 | 240.10 | 151.50 | 257.40 | NA | NA | NA | NA | NA | NA | NA | NA | NA | NA | NA | NA | NA | NA | NA | NA | NA | NA | NA | NA | NA | NA | NA | NA | NA | NA | NA | NA | |
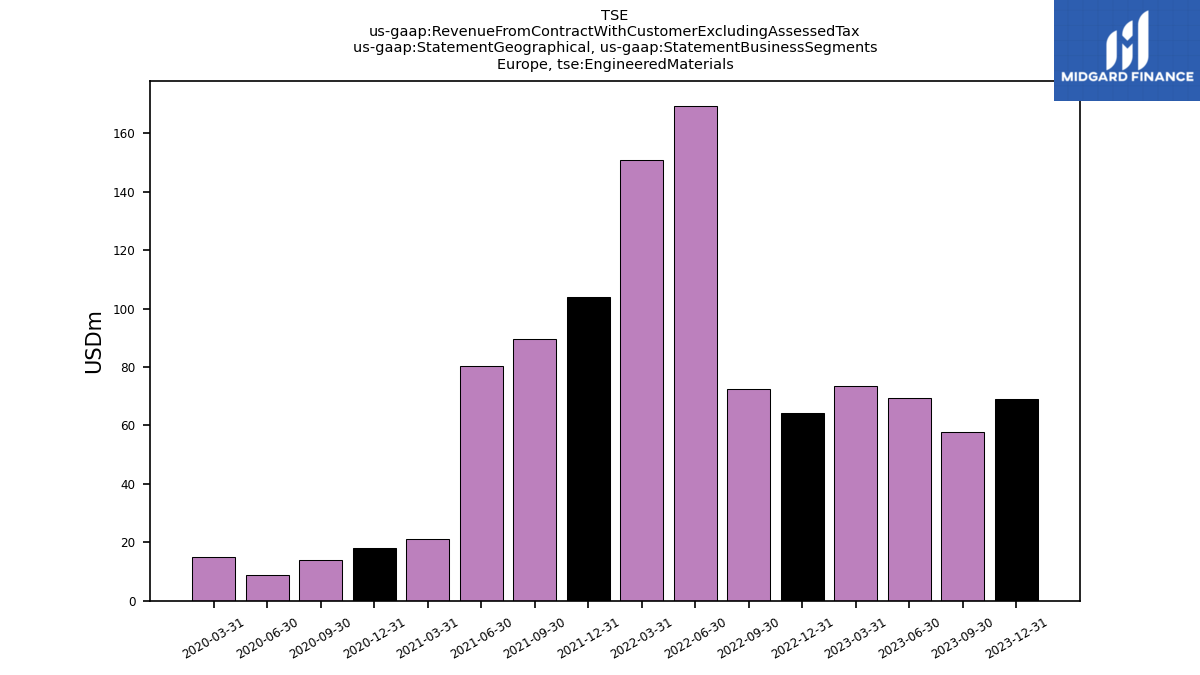
| Engineered Materials | 190.20 | 186.00 | 206.20 | 206.20 | 205.20 | 242.70 | 353.70 | 306.70 | 277.50 | 230.80 | 181.00 | 65.80 | 59.60 | 50.00 | 37.50 | 47.70 | NA | NA | NA | NA | NA | NA | NA | NA | NA | NA | NA | NA | NA | NA | NA | NA | NA | NA | NA | NA | NA | NA | NA | NA | NA | NA | NA | NA | |
| Feedstocks | 35.40 | 50.10 | 37.50 | 43.00 | 28.20 | 53.40 | 96.60 | 70.30 | 72.80 | 54.80 | 71.30 | 55.90 | 36.50 | 32.00 | 23.60 | 44.80 | 68.70 | 65.80 | 54.90 | 66.80 | 78.90 | 131.00 | 102.10 | 74.60 | NA | NA | NA | 86.90 | NA | NA | NA | NA | NA | NA | NA | NA | NA | NA | NA | NA | NA | NA | NA | NA | |
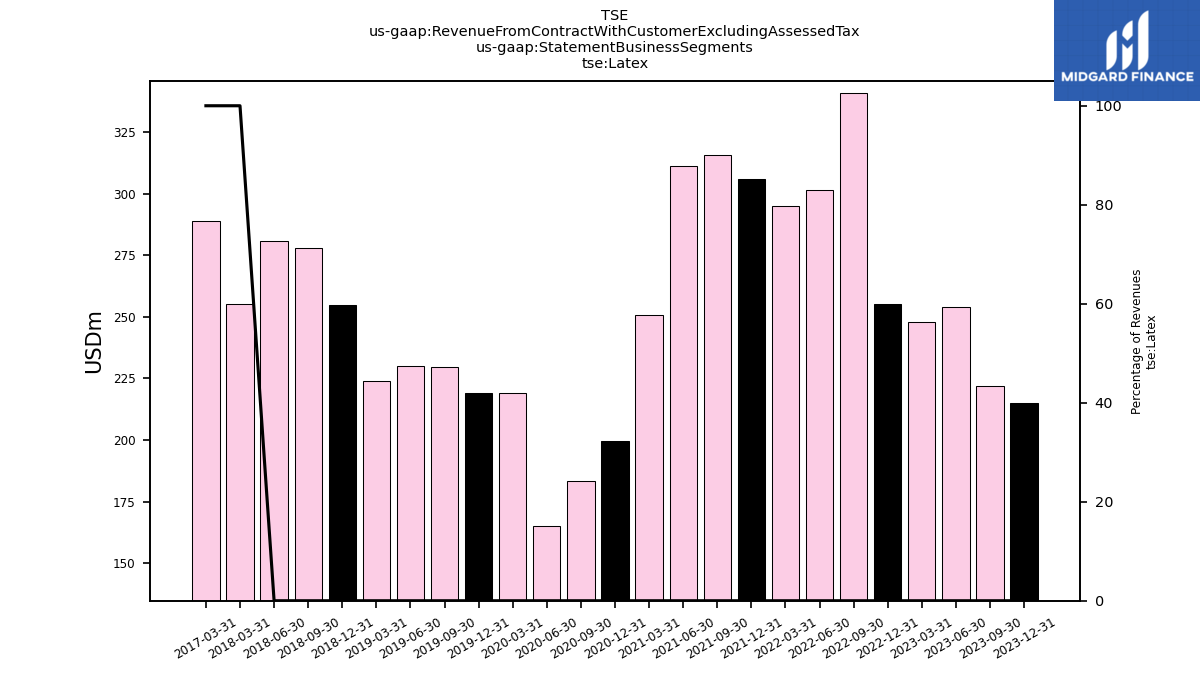
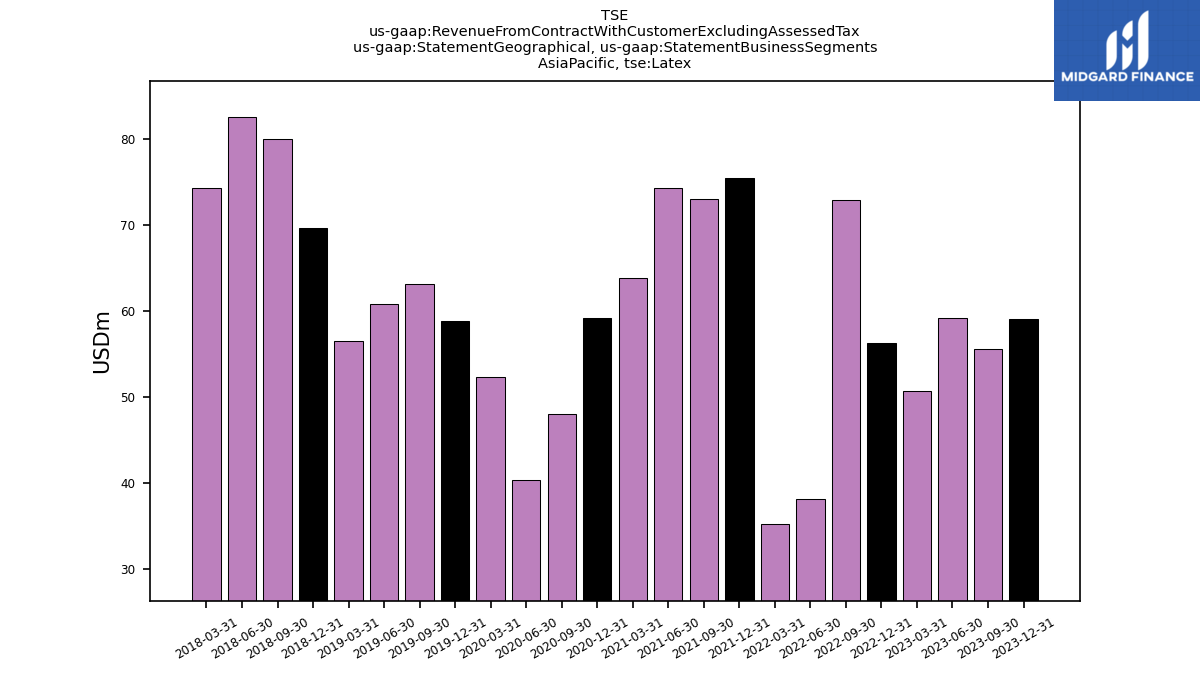
| Latex | 215.00 | 222.00 | 254.00 | 248.10 | 255.20 | 340.90 | 301.30 | 295.20 | 305.80 | 315.60 | 311.20 | 250.90 | 199.80 | 183.20 | 164.90 | 219.10 | 219.00 | 229.70 | 230.20 | 223.90 | 254.80 | 278.00 | 280.80 | 255.30 | NA | NA | NA | 288.90 | NA | NA | NA | NA | NA | NA | NA | NA | NA | NA | NA | NA | NA | NA | NA | NA | |
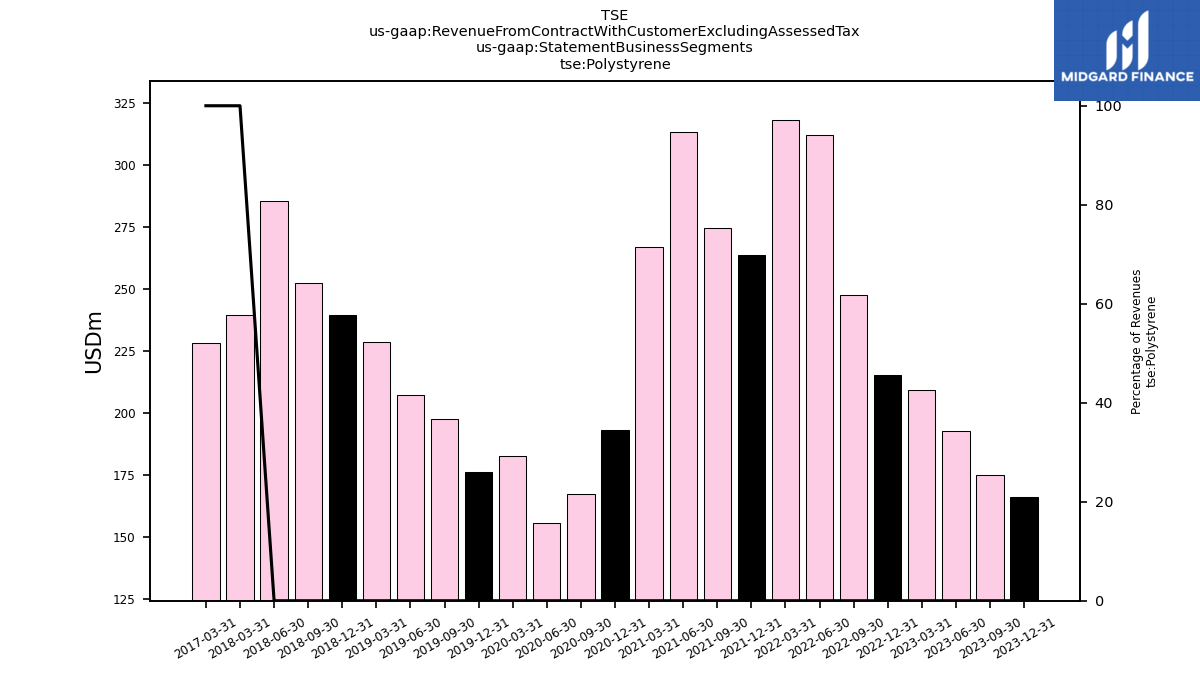
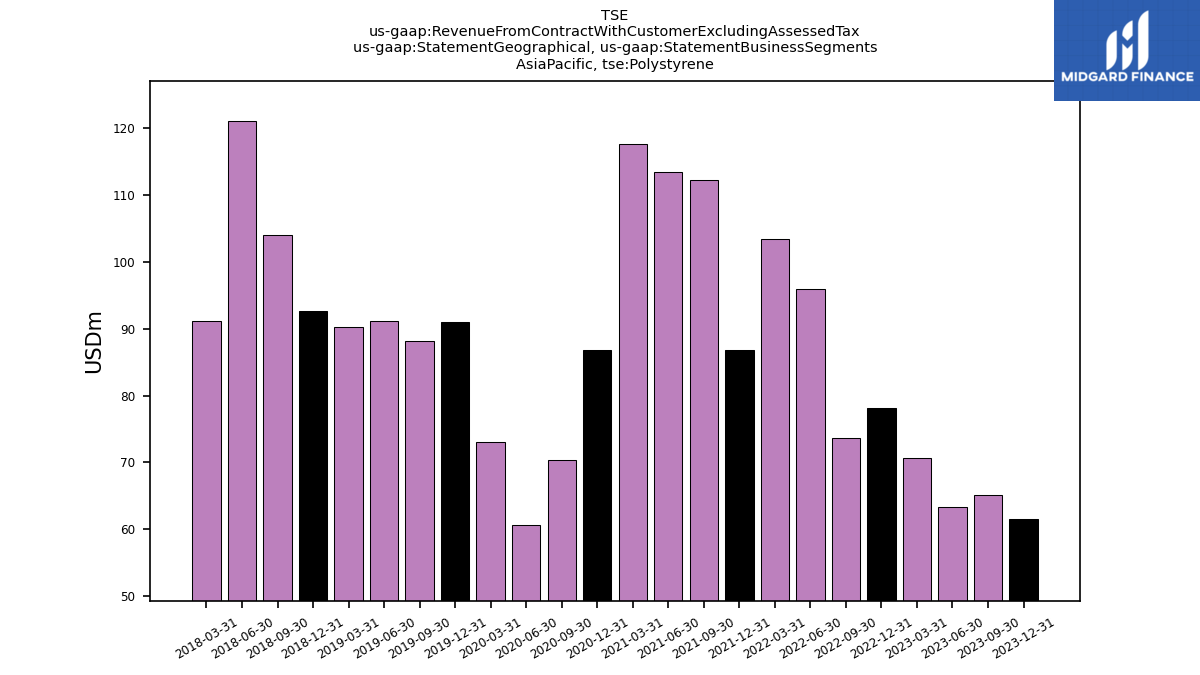
| Polystyrene | 166.20 | 175.10 | 192.80 | 209.10 | 215.40 | 247.70 | 312.00 | 318.00 | 263.80 | 274.80 | 313.30 | 266.90 | 193.00 | 167.30 | 155.80 | 182.80 | 176.20 | 197.60 | 207.10 | 228.50 | 239.60 | 252.30 | 285.60 | 239.60 | NA | NA | NA | 228.40 | NA | NA | NA | NA | NA | NA | NA | NA | NA | NA | NA | NA | NA | NA | NA | NA | |
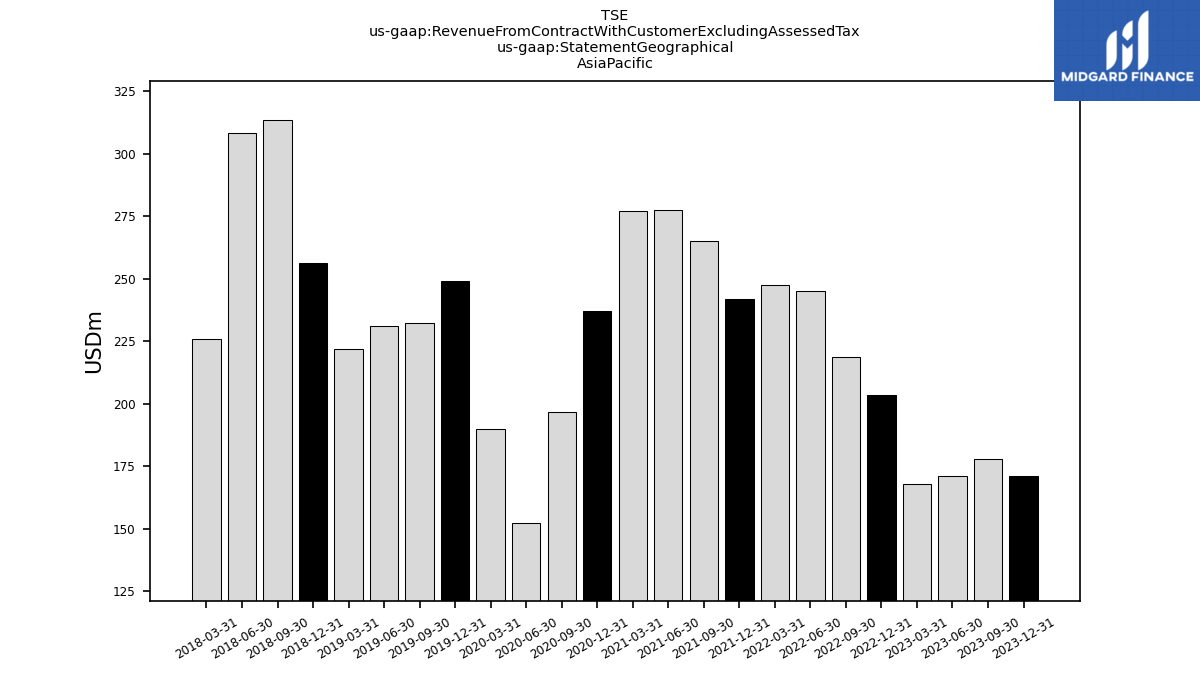
| 171.00 | 178.00 | 171.30 | 168.00 | 203.40 | 218.80 | 245.10 | 247.60 | 241.80 | 265.00 | 277.50 | 277.10 | 237.00 | 196.60 | 152.40 | 190.00 | 249.20 | 232.50 | 231.00 | 222.00 | 256.40 | 313.50 | 308.40 | 225.80 | NA | NA | NA | NA | NA | NA | NA | NA | NA | NA | NA | NA | NA | NA | NA | NA | NA | NA | NA | NA | ||
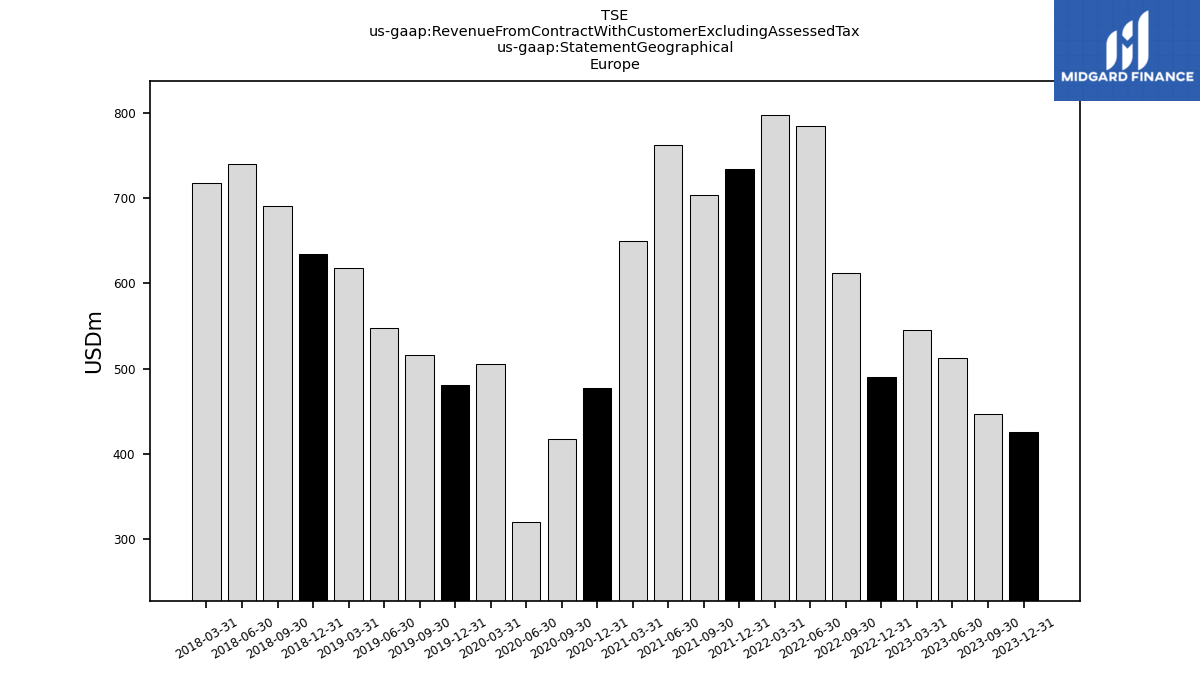
| 425.80 | 446.30 | 512.80 | 544.80 | 490.30 | 612.60 | 784.70 | 797.20 | 733.80 | 703.80 | 762.40 | 649.70 | 477.30 | 417.70 | 320.70 | 505.60 | 481.30 | 516.20 | 547.70 | 618.00 | 634.50 | 690.90 | 739.50 | 717.80 | NA | NA | NA | NA | NA | NA | NA | NA | NA | NA | NA | NA | NA | NA | NA | NA | NA | NA | NA | NA | ||
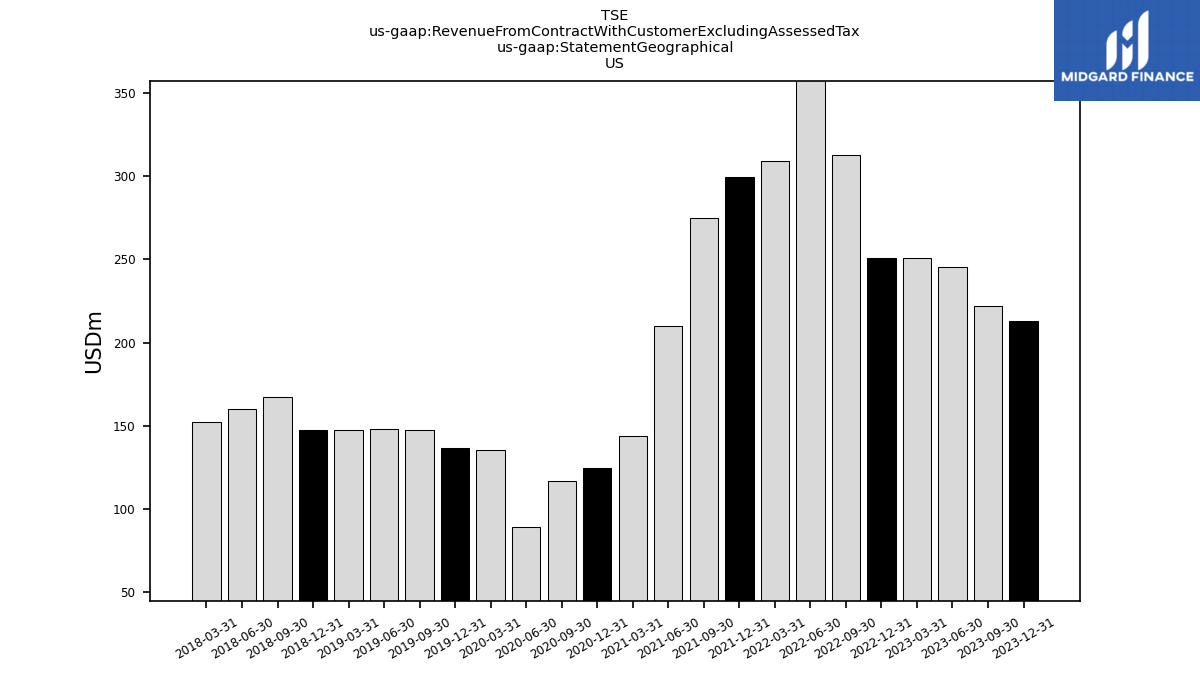
| US | 212.90 | 222.00 | 245.30 | 250.80 | 250.90 | 312.50 | 363.90 | 309.00 | 299.20 | 275.00 | 209.90 | 144.00 | 124.70 | 116.80 | 89.60 | 135.40 | 137.00 | 147.50 | 148.00 | 147.80 | 147.50 | 167.30 | 160.40 | 152.30 | NA | NA | NA | NA | NA | NA | NA | NA | NA | NA | NA | NA | NA | NA | NA | NA | NA | NA | NA | NA | |
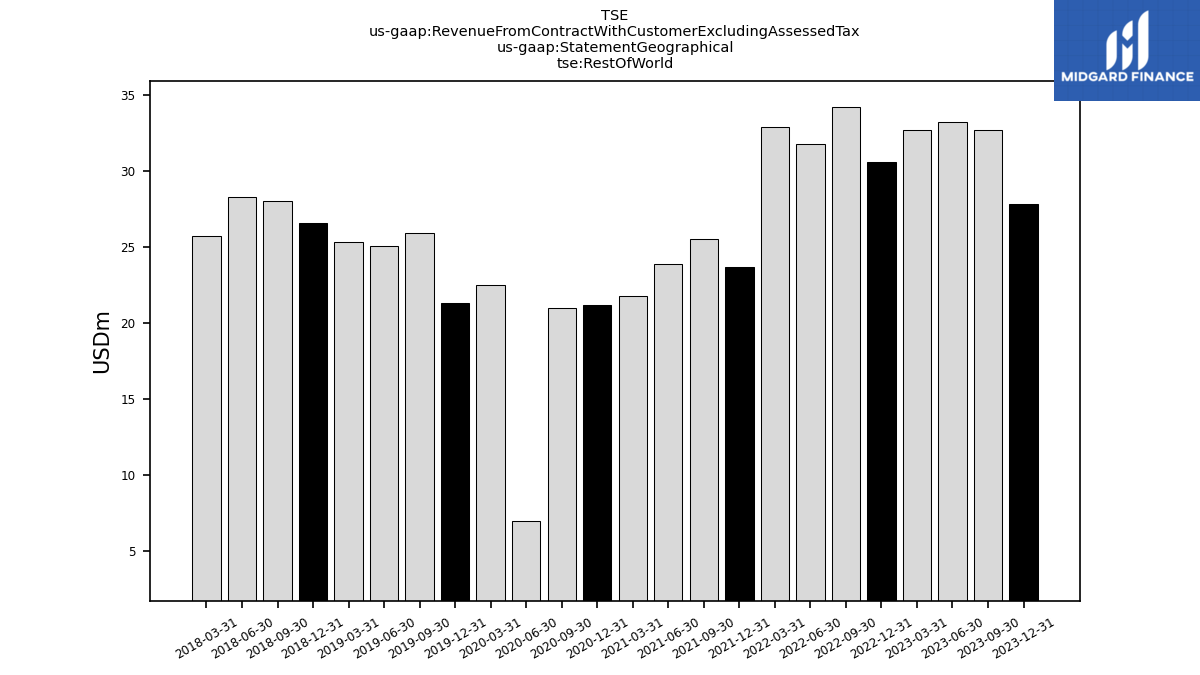
| Rest Of World | 27.80 | 32.70 | 33.20 | 32.70 | 30.60 | 34.20 | 31.80 | 32.90 | 23.70 | 25.50 | 23.90 | 21.80 | 21.20 | 21.00 | 7.00 | 22.50 | 21.30 | 25.90 | 25.10 | 25.30 | 26.60 | 28.00 | 28.30 | 25.70 | NA | NA | NA | NA | NA | NA | NA | NA | NA | NA | NA | NA | NA | NA | NA | NA | NA | NA | NA | NA | |
| , Base Plastics | 27.40 | 31.50 | 23.10 | 27.80 | 35.00 | 33.30 | 31.60 | 37.20 | 34.10 | 43.90 | 51.90 | 48.80 | 42.40 | 40.90 | 26.80 | 26.80 | NA | NA | NA | NA | NA | NA | NA | NA | NA | NA | NA | NA | NA | NA | NA | NA | NA | NA | NA | NA | NA | NA | NA | NA | NA | NA | NA | NA | |
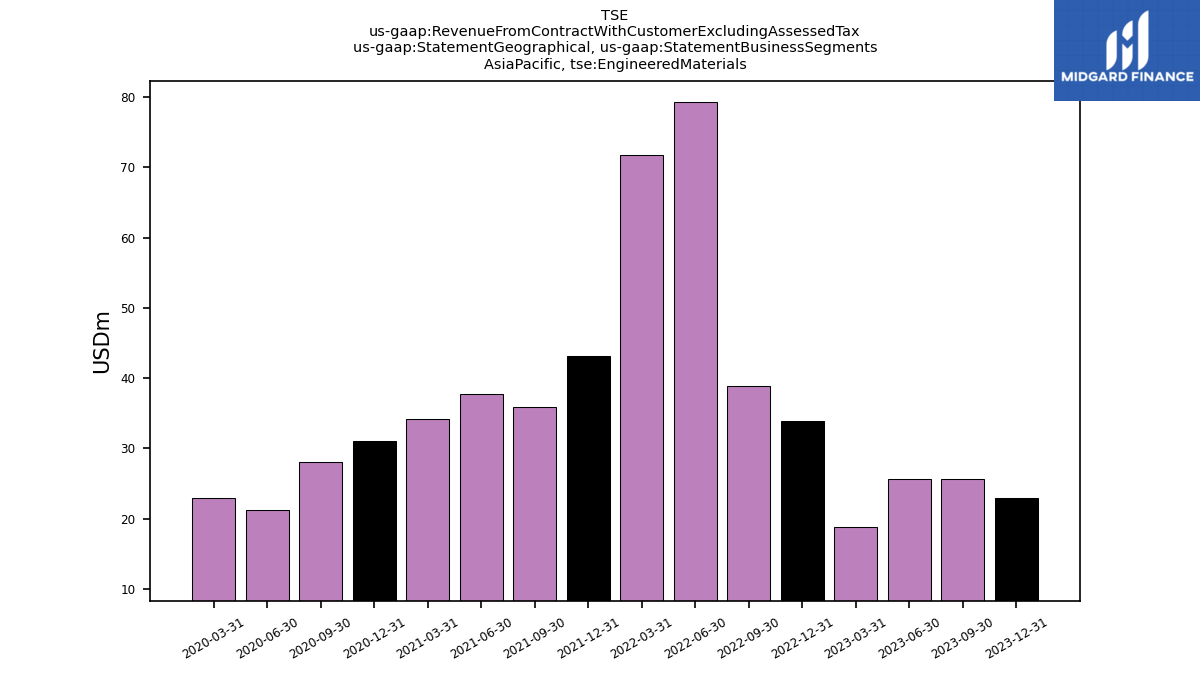
| , Engineered Materials | 22.90 | 25.70 | 25.70 | 18.90 | 33.90 | 38.90 | 79.30 | 71.70 | 43.10 | 35.90 | 37.80 | 34.20 | 31.00 | 28.10 | 21.30 | 22.90 | NA | NA | NA | NA | NA | NA | NA | NA | NA | NA | NA | NA | NA | NA | NA | NA | NA | NA | NA | NA | NA | NA | NA | NA | NA | NA | NA | NA | |
| , Latex | 59.10 | 55.60 | 59.20 | 50.70 | 56.30 | 72.90 | 38.20 | 35.30 | 75.50 | 73.00 | 74.30 | 63.80 | 59.20 | 48.10 | 40.40 | 52.30 | 58.90 | 63.10 | 60.80 | 56.50 | 69.70 | 80.00 | 82.60 | 74.30 | NA | NA | NA | NA | NA | NA | NA | NA | NA | NA | NA | NA | NA | NA | NA | NA | NA | NA | NA | NA | |
| , Polystyrene | 61.60 | 65.20 | 63.30 | 70.60 | 78.20 | 73.70 | 96.00 | 103.40 | 86.80 | 112.20 | 113.50 | 117.60 | 86.80 | 70.40 | 60.70 | 73.00 | 91.00 | 88.10 | 91.20 | 90.30 | 92.70 | 104.00 | 121.00 | 91.20 | NA | NA | NA | NA | NA | NA | NA | NA | NA | NA | NA | NA | NA | NA | NA | NA | NA | NA | NA | NA | |
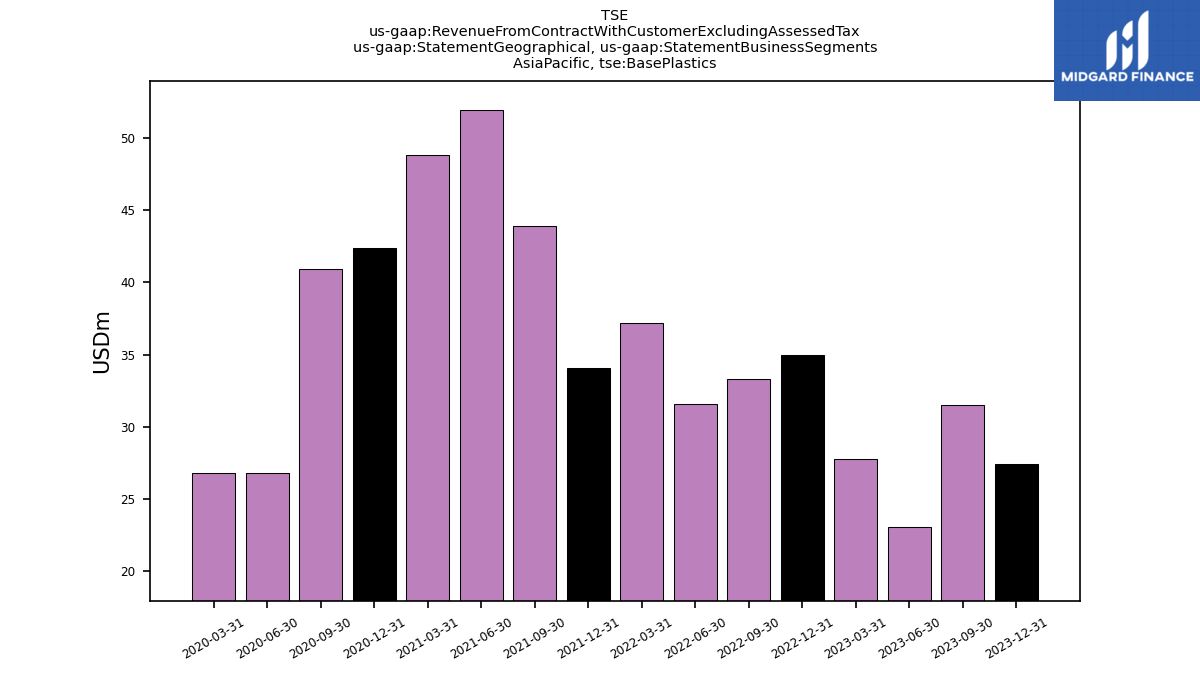
| , Base Plastics | 126.60 | 131.50 | 156.60 | 165.30 | 146.00 | 157.10 | 198.50 | 246.60 | 243.60 | 247.30 | 253.80 | 197.90 | 147.60 | 126.80 | 89.10 | 150.10 | NA | NA | NA | NA | NA | NA | NA | NA | NA | NA | NA | NA | NA | NA | NA | NA | NA | NA | NA | NA | NA | NA | NA | NA | NA | NA | NA | NA | |
| , Engineered Materials | 69.00 | 57.70 | 69.30 | 73.50 | 64.30 | 72.50 | 169.40 | 150.90 | 104.10 | 89.60 | 80.30 | 21.00 | 17.90 | 13.80 | 8.70 | 14.90 | NA | NA | NA | NA | NA | NA | NA | NA | NA | NA | NA | NA | NA | NA | NA | NA | NA | NA | NA | NA | NA | NA | NA | NA | NA | NA | NA | NA | |
| , Feedstocks | 31.90 | 46.60 | 34.40 | 39.40 | 24.70 | 48.90 | 92.00 | 66.40 | 66.90 | 50.80 | 68.00 | 52.50 | 31.60 | 25.10 | 20.60 | 29.10 | 37.40 | 37.80 | 33.20 | 40.50 | 37.20 | 61.20 | 55.30 | 57.90 | NA | NA | NA | NA | NA | NA | NA | NA | NA | NA | NA | NA | NA | NA | NA | NA | NA | NA | NA | NA | |
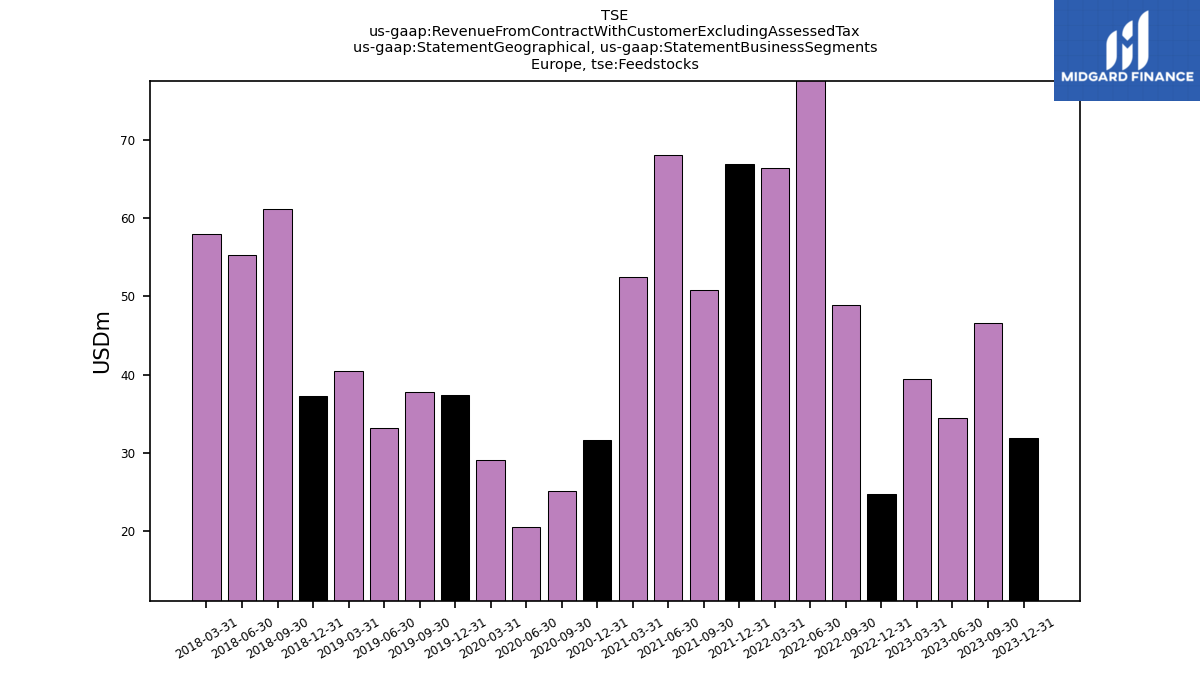
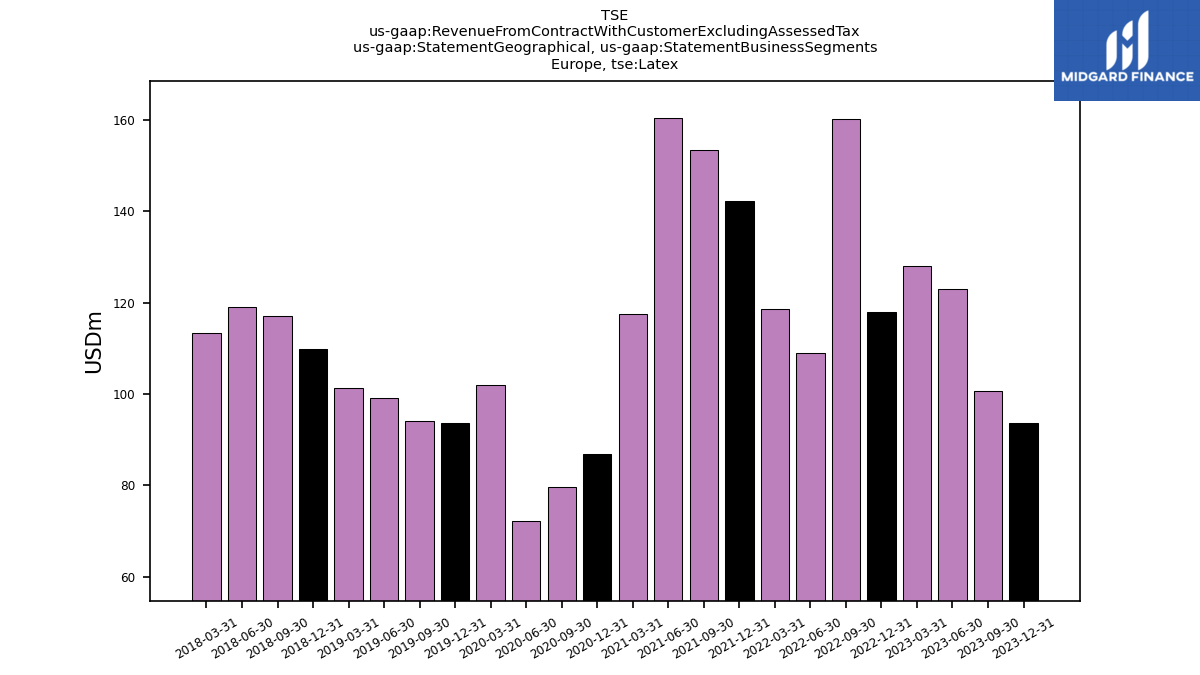
| , Latex | 93.70 | 100.60 | 123.00 | 128.10 | 118.00 | 160.10 | 108.90 | 118.70 | 142.20 | 153.50 | 160.50 | 117.50 | 86.90 | 79.70 | 72.30 | 101.90 | 93.70 | 94.20 | 99.20 | 101.40 | 109.80 | 117.00 | 119.10 | 113.30 | NA | NA | NA | NA | NA | NA | NA | NA | NA | NA | NA | NA | NA | NA | NA | NA | NA | NA | NA | NA | |
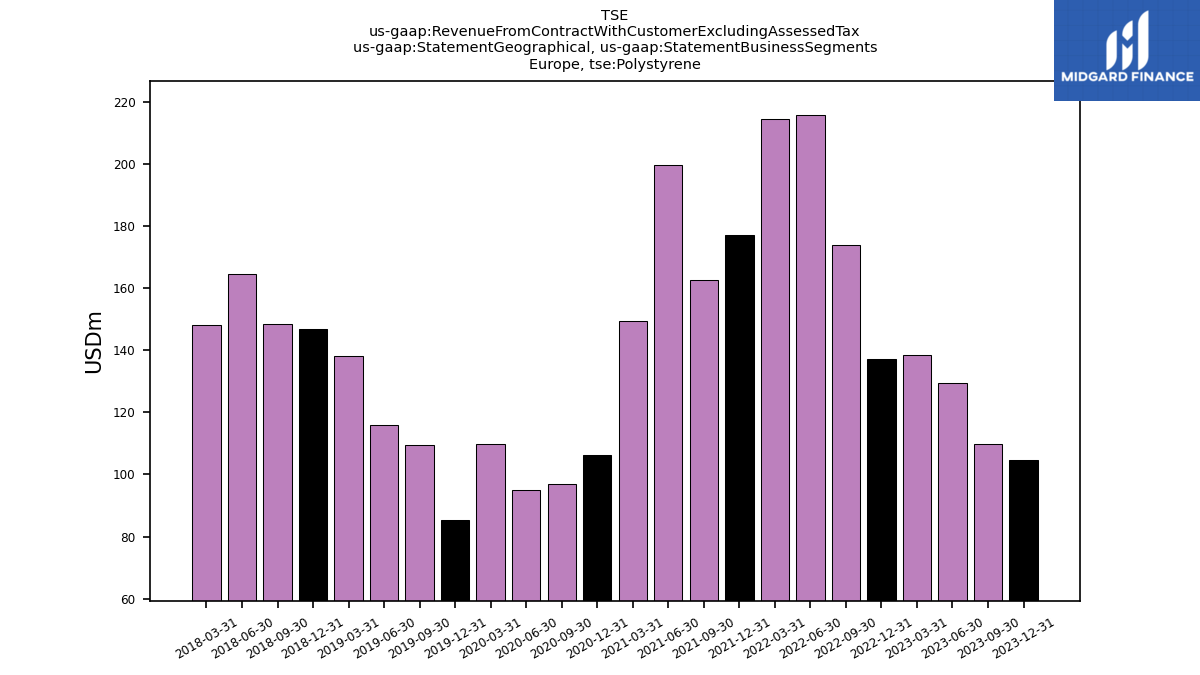
| , Polystyrene | 104.60 | 109.90 | 129.50 | 138.50 | 137.30 | 174.00 | 215.90 | 214.60 | 177.00 | 162.60 | 199.80 | 149.30 | 106.20 | 96.90 | 95.10 | 109.80 | 85.20 | 109.50 | 115.90 | 138.20 | 146.90 | 148.30 | 164.60 | 148.20 | NA | NA | NA | NA | NA | NA | NA | NA | NA | NA | NA | NA | NA | NA | NA | NA | NA | NA | NA | NA | |
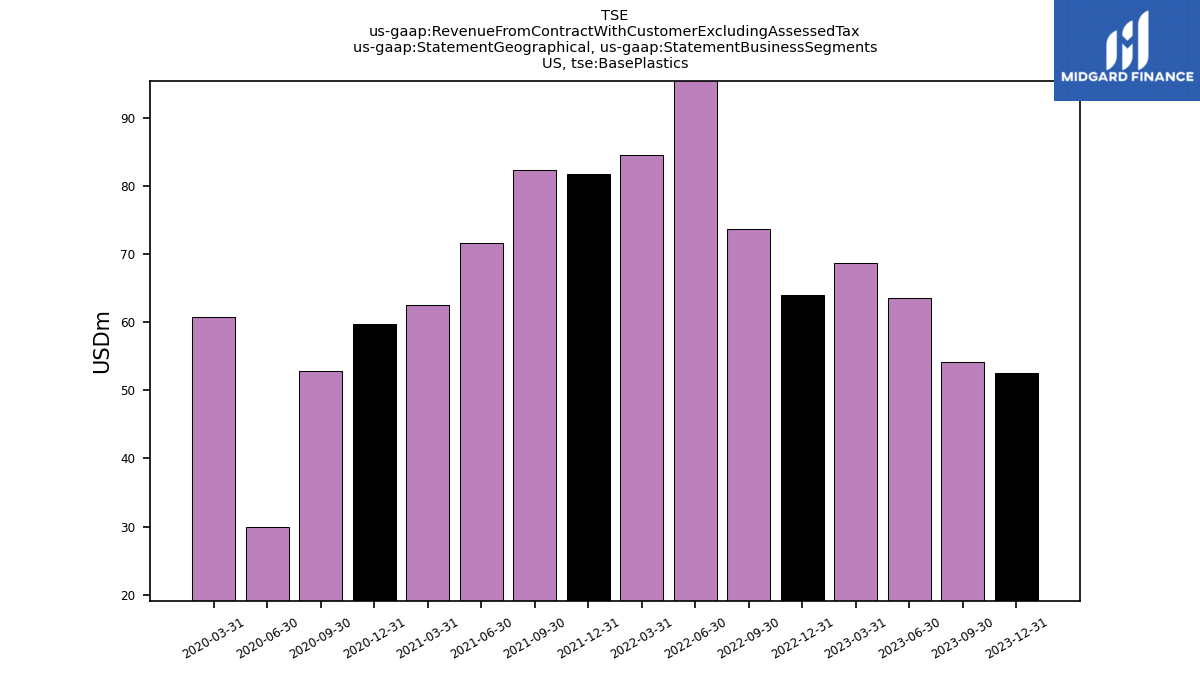
| US, Base Plastics | 52.60 | 54.10 | 63.50 | 68.70 | 64.00 | 73.70 | 106.10 | 84.50 | 81.70 | 82.30 | 71.60 | 62.50 | 59.80 | 52.80 | 30.00 | 60.70 | NA | NA | NA | NA | NA | NA | NA | NA | NA | NA | NA | NA | NA | NA | NA | NA | NA | NA | NA | NA | NA | NA | NA | NA | NA | NA | NA | NA | |
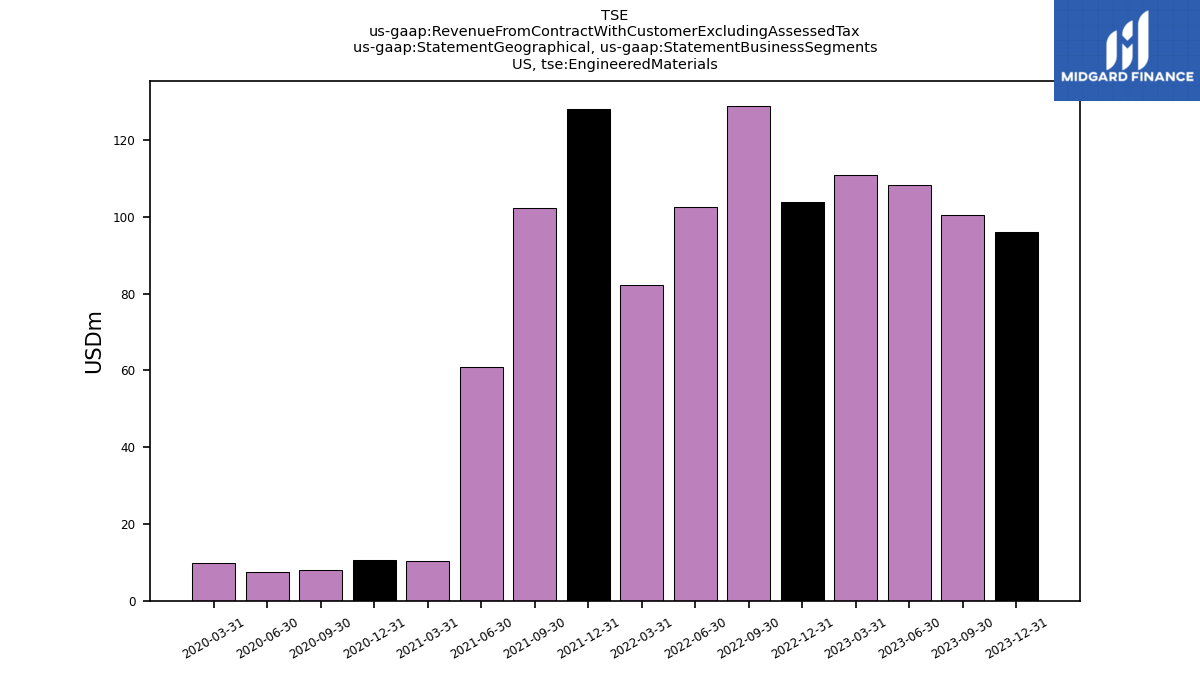
| US, Engineered Materials | 96.10 | 100.40 | 108.30 | 110.90 | 103.80 | 128.90 | 102.50 | 82.20 | 128.00 | 102.40 | 60.90 | 10.30 | 10.50 | 8.00 | 7.40 | 9.90 | NA | NA | NA | NA | NA | NA | NA | NA | NA | NA | NA | NA | NA | NA | NA | NA | NA | NA | NA | NA | NA | NA | NA | NA | NA | NA | NA | NA | |
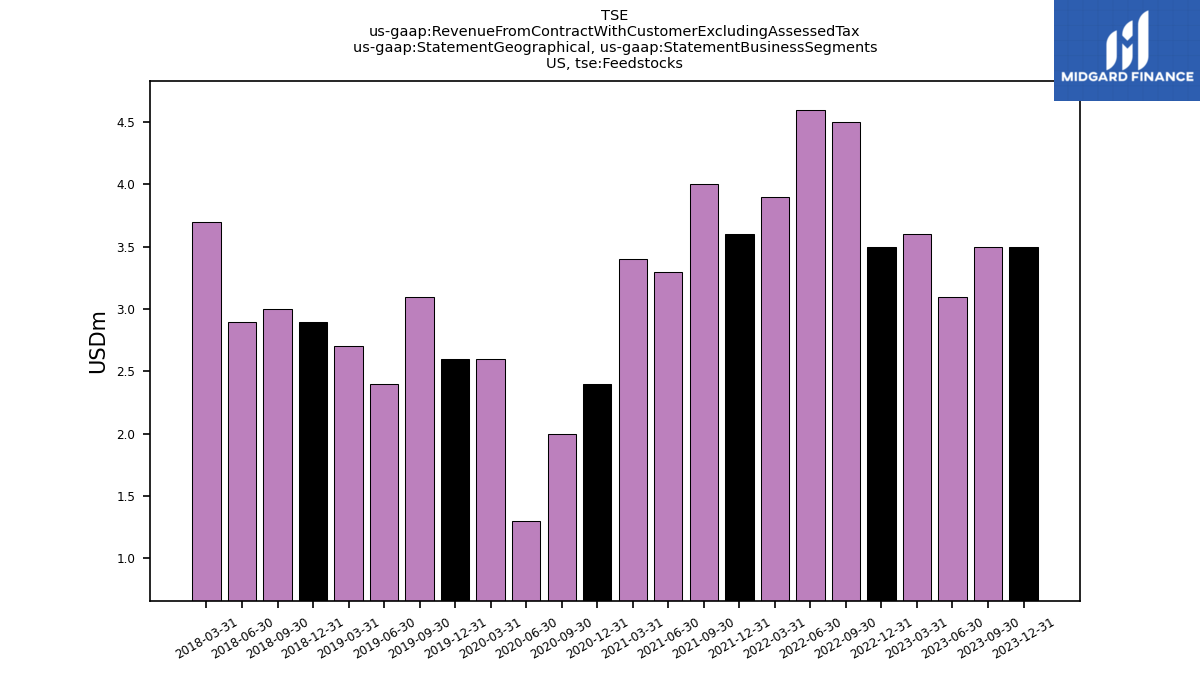
| US, Feedstocks | 3.50 | 3.50 | 3.10 | 3.60 | 3.50 | 4.50 | 4.60 | 3.90 | 3.60 | 4.00 | 3.30 | 3.40 | 2.40 | 2.00 | 1.30 | 2.60 | 2.60 | 3.10 | 2.40 | 2.70 | 2.90 | 3.00 | 2.90 | 3.70 | NA | NA | NA | NA | NA | NA | NA | NA | NA | NA | NA | NA | NA | NA | NA | NA | NA | NA | NA | NA | |
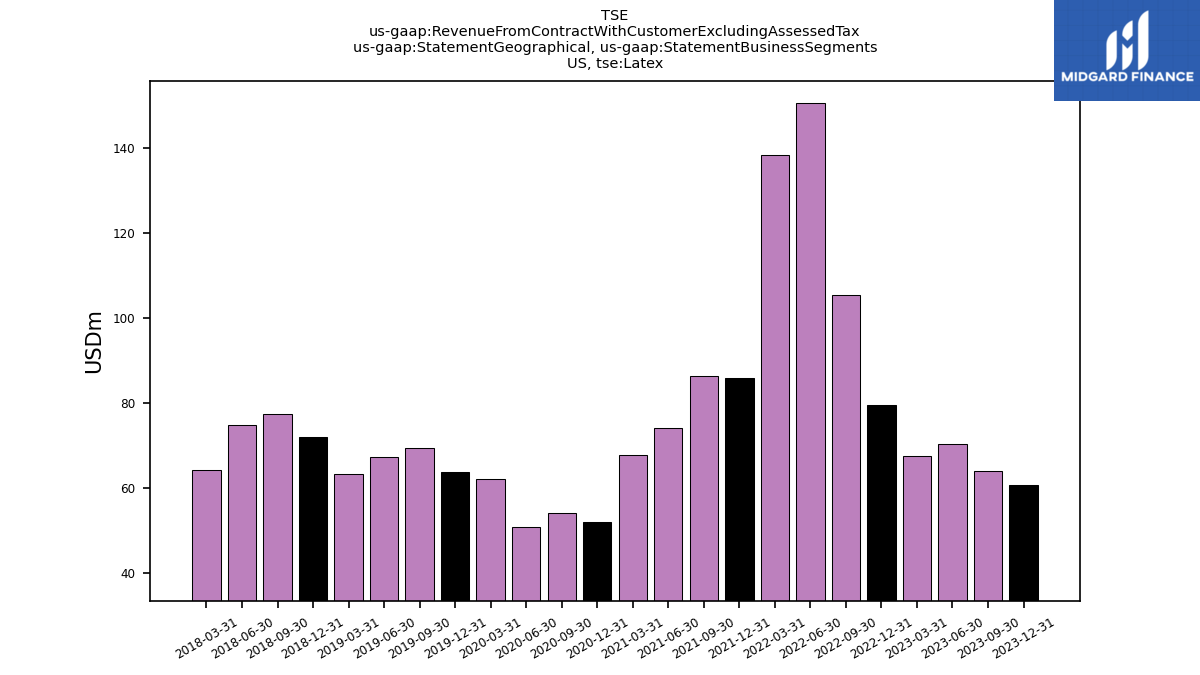
| US, Latex | 60.70 | 64.00 | 70.40 | 67.60 | 79.60 | 105.40 | 150.70 | 138.40 | 85.90 | 86.30 | 74.10 | 67.80 | 52.00 | 54.10 | 50.90 | 62.20 | 63.80 | 69.40 | 67.20 | 63.30 | 71.90 | 77.30 | 74.80 | 64.30 | NA | NA | NA | NA | NA | NA | NA | NA | NA | NA | NA | NA | NA | NA | NA | NA | NA | NA | NA | NA | |
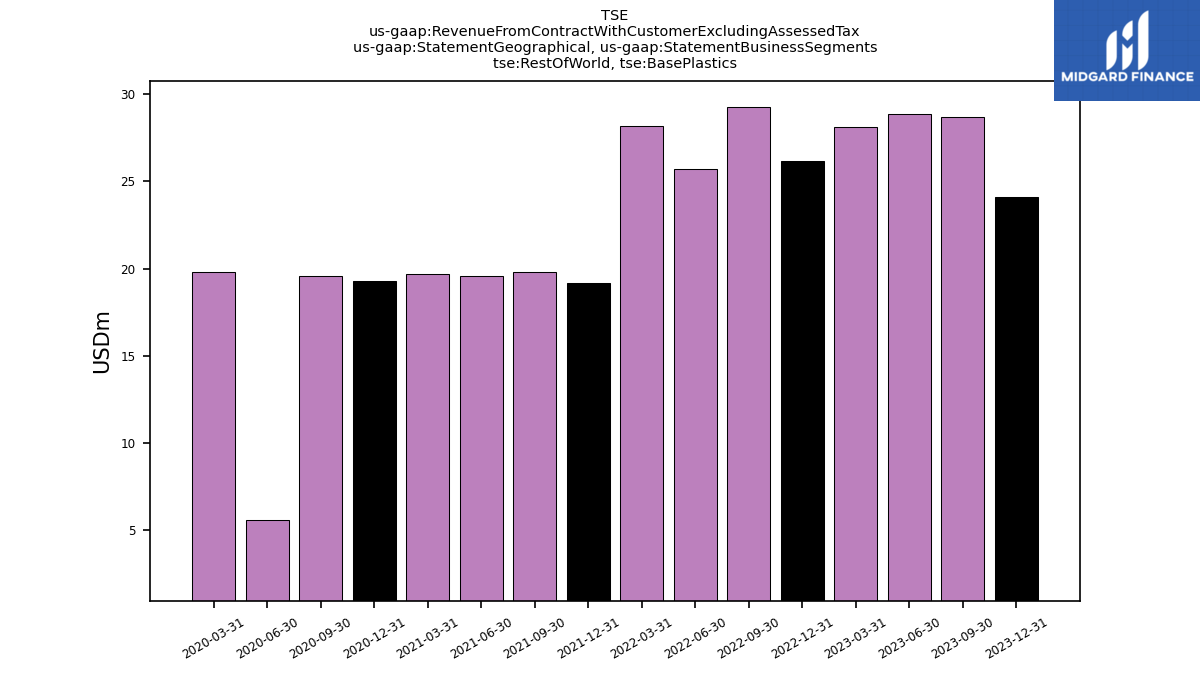
| Rest Of World, Base Plastics | 24.10 | 28.70 | 28.90 | 28.10 | 26.20 | 29.30 | 25.70 | 28.20 | 19.20 | 19.80 | 19.60 | 19.70 | 19.30 | 19.60 | 5.60 | 19.80 | NA | NA | NA | NA | NA | NA | NA | NA | NA | NA | NA | NA | NA | NA | NA | NA | NA | NA | NA | NA | NA | NA | NA | NA | NA | NA | NA | NA | |
| Rest Of World, Engineered Materials | 2.20 | 2.20 | 2.90 | 2.90 | 3.20 | 2.40 | 2.50 | 1.90 | 2.30 | 2.90 | 2.00 | 0.30 | 0.20 | 0.10 | 0.10 | NA | NA | NA | NA | NA | NA | NA | NA | NA | NA | NA | NA | NA | NA | NA | NA | NA | NA | NA | NA | NA | NA | NA | NA | NA | NA | NA | NA | NA | |
| Rest Of World, Latex | 1.50 | 1.80 | 1.40 | 1.70 | 1.30 | 2.50 | 3.50 | 2.80 | 2.20 | 2.80 | 2.30 | 1.80 | 1.70 | 1.30 | 1.30 | 2.70 | 2.60 | 3.00 | 3.00 | 2.70 | 3.40 | 3.70 | 4.30 | 3.40 | NA | NA | NA | NA | NA | NA | NA | NA | NA | NA | NA | NA | NA | NA | NA | NA | NA | NA | NA | NA |


