
| 2024-02-02 | 2023-10-31 | 2023-08-04 | 2023-05-05 | 2023-02-03 | 2022-10-31 | 2022-07-29 | 2022-04-29 | 2022-01-28 | 2021-10-31 | 2021-07-30 | 2021-04-30 | 2021-01-29 | 2020-10-31 | 2020-07-31 | 2020-05-01 | 2020-01-31 | 2019-10-31 | 2019-08-02 | 2019-05-03 | 2019-02-01 | 2018-10-31 | 2018-08-03 | 2018-05-04 | 2018-02-02 | 2017-10-31 | 2017-08-04 | 2017-05-05 | 2017-02-03 | 2016-10-31 | 2016-07-29 | 2016-04-29 | 2016-01-29 | 2015-10-31 | 2015-07-31 | 2015-05-01 | 2015-01-30 | 2014-10-31 | 2014-08-01 | 2014-05-02 | 2014-01-31 | 2013-10-31 | 2013-08-02 | 2013-05-03 | 2013-02-01 | 2012-10-31 | 2012-08-03 | 2012-05-04 | 2012-02-03 | 2011-10-31 | 2011-07-29 | 2011-04-29 | 2011-01-28 | 2010-10-31 | 2010-07-30 | 2010-04-30 | 2010-01-29 | ||
|---|---|---|---|---|---|---|---|---|---|---|---|---|---|---|---|---|---|---|---|---|---|---|---|---|---|---|---|---|---|---|---|---|---|---|---|---|---|---|---|---|---|---|---|---|---|---|---|---|---|---|---|---|---|---|---|---|---|---|
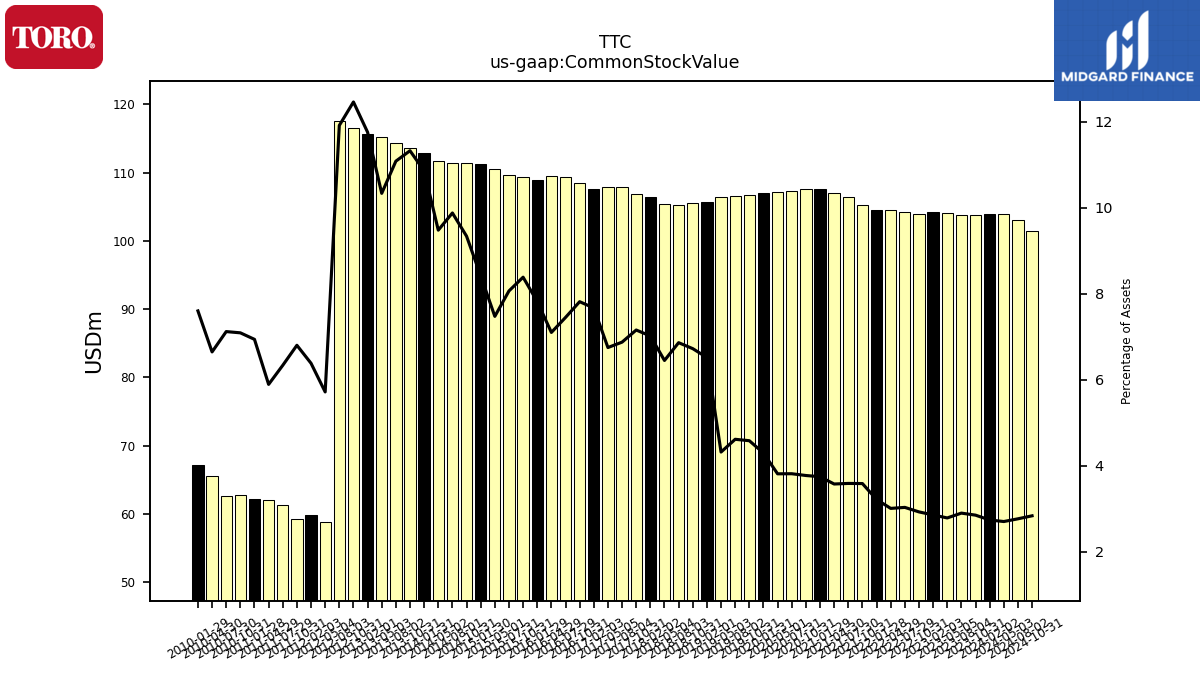
| Common Stock Value | 104.00 | 103.80 | 103.83 | 104.14 | 104.28 | 103.97 | 104.19 | 104.57 | 104.53 | 105.21 | 106.44 | 107.04 | 107.61 | 107.58 | 107.26 | 107.11 | 106.98 | 106.74 | 106.55 | 106.43 | 105.75 | 105.60 | 105.30 | 105.46 | 106.44 | 106.88 | 107.88 | 107.88 | 107.58 | 108.43 | 109.29 | 109.52 | 108.97 | 109.30 | 109.67 | 110.53 | 111.29 | 111.36 | 111.41 | 111.77 | 112.87 | 113.58 | 114.29 | 115.23 | 115.71 | 116.53 | 117.54 | 58.83 | 59.80 | 59.21 | 61.28 | 62.00 | 62.21 | 62.79 | 62.62 | 65.53 | 67.23 | |
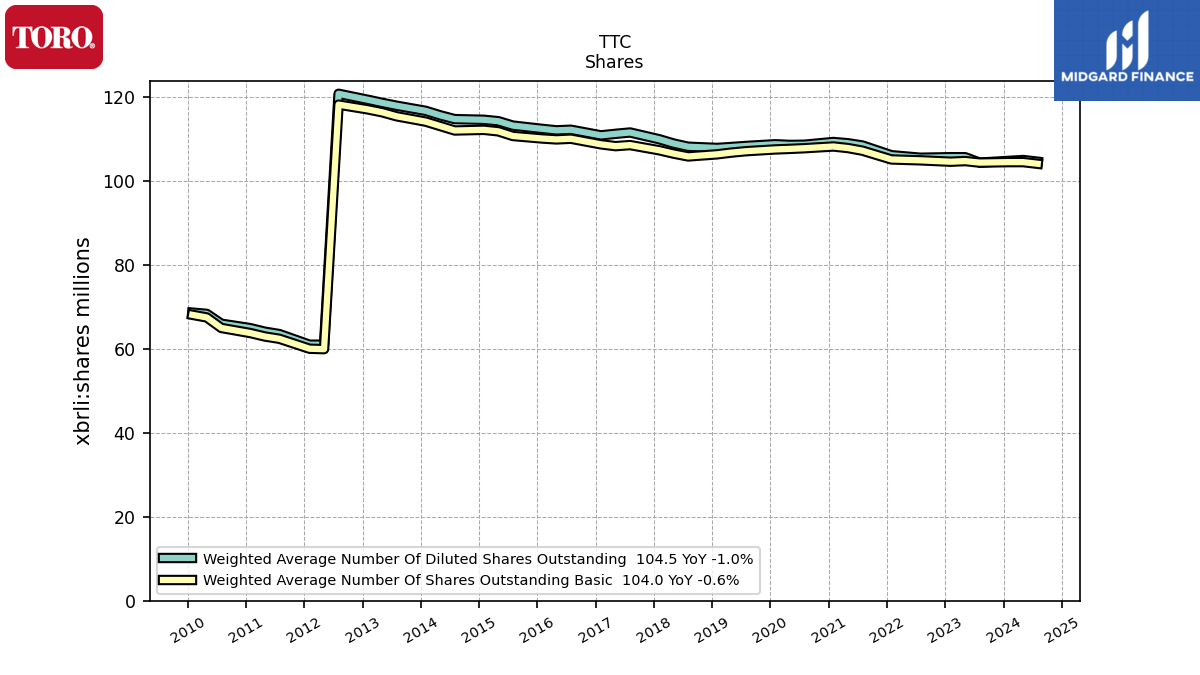
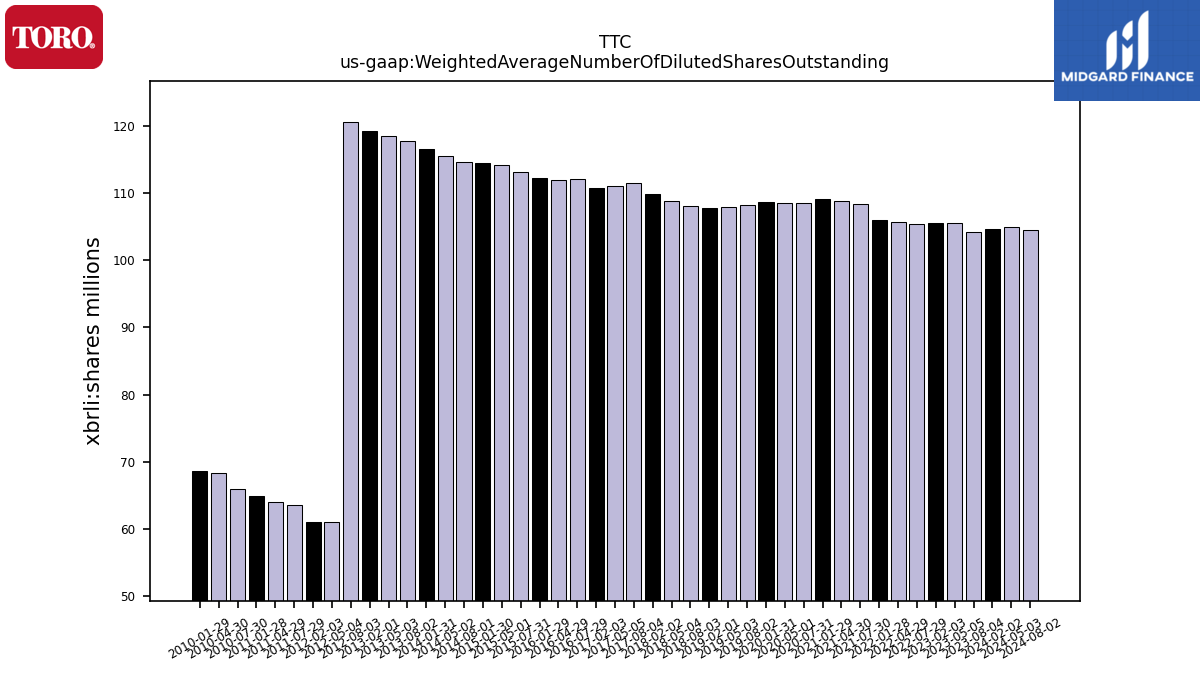
| Weighted Average Number Of Diluted Shares Outstanding | 104.70 | NA | 104.29 | 105.57 | 105.58 | NA | 105.45 | 105.75 | 106.05 | NA | 108.36 | 108.90 | 109.19 | NA | 108.54 | 108.50 | 108.66 | NA | 108.25 | 108.01 | 107.78 | NA | 108.07 | 108.83 | 109.86 | NA | 111.46 | 111.14 | 110.77 | NA | 112.11 | 111.97 | 112.33 | NA | 113.10 | 114.15 | 114.48 | NA | 114.64 | 115.55 | 116.61 | NA | 117.83 | 118.51 | 119.26 | NA | 120.67 | 60.96 | 60.95 | NA | 63.48 | 64.04 | 64.89 | NA | 65.94 | 68.28 | 68.59 | |
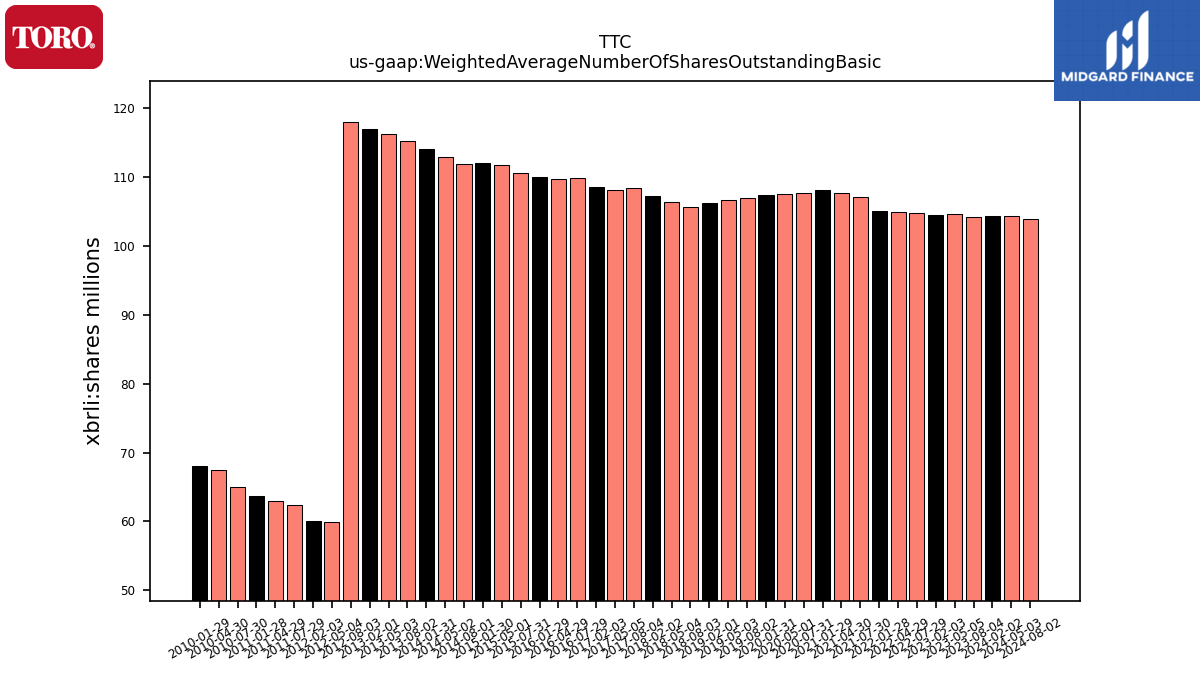
| Weighted Average Number Of Shares Outstanding Basic | 104.40 | NA | 104.29 | 104.65 | 104.50 | NA | 104.83 | 104.93 | 105.04 | NA | 107.13 | 107.75 | 108.12 | NA | 107.71 | 107.55 | 107.42 | NA | 107.00 | 106.68 | 106.26 | NA | 105.75 | 106.42 | 107.22 | NA | 108.46 | 108.20 | 108.63 | NA | 109.97 | 109.81 | 110.03 | NA | 110.62 | 111.73 | 112.09 | NA | 111.93 | 112.99 | 114.04 | NA | 115.31 | 116.26 | 116.96 | NA | 118.09 | 59.88 | 59.99 | NA | 62.35 | 62.89 | 63.72 | NA | 64.93 | 67.43 | 68.06 | |
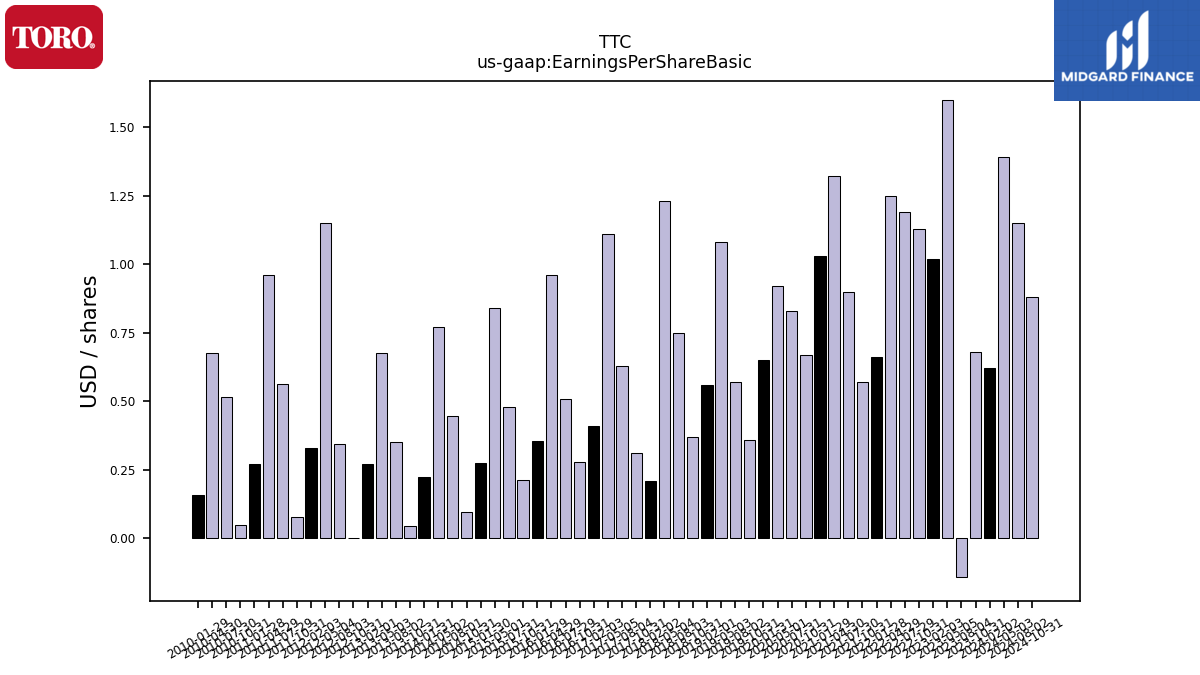
| Earnings Per Share Basic | 0.62 | 0.68 | -0.14 | 1.60 | 1.02 | 1.13 | 1.19 | 1.25 | 0.66 | 0.57 | 0.90 | 1.32 | 1.03 | 0.67 | 0.83 | 0.92 | 0.65 | 0.36 | 0.57 | 1.08 | 0.56 | 0.37 | 0.75 | 1.23 | 0.21 | 0.31 | 0.63 | 1.11 | 0.41 | 0.28 | 0.51 | 0.96 | 0.35 | 0.21 | 0.48 | 0.84 | 0.28 | 0.10 | 0.45 | 0.77 | 0.23 | 0.04 | 0.35 | 0.68 | 0.27 | 0.00 | 0.34 | 1.15 | 0.33 | 0.08 | 0.56 | 0.96 | 0.27 | 0.05 | 0.52 | 0.68 | 0.16 | |
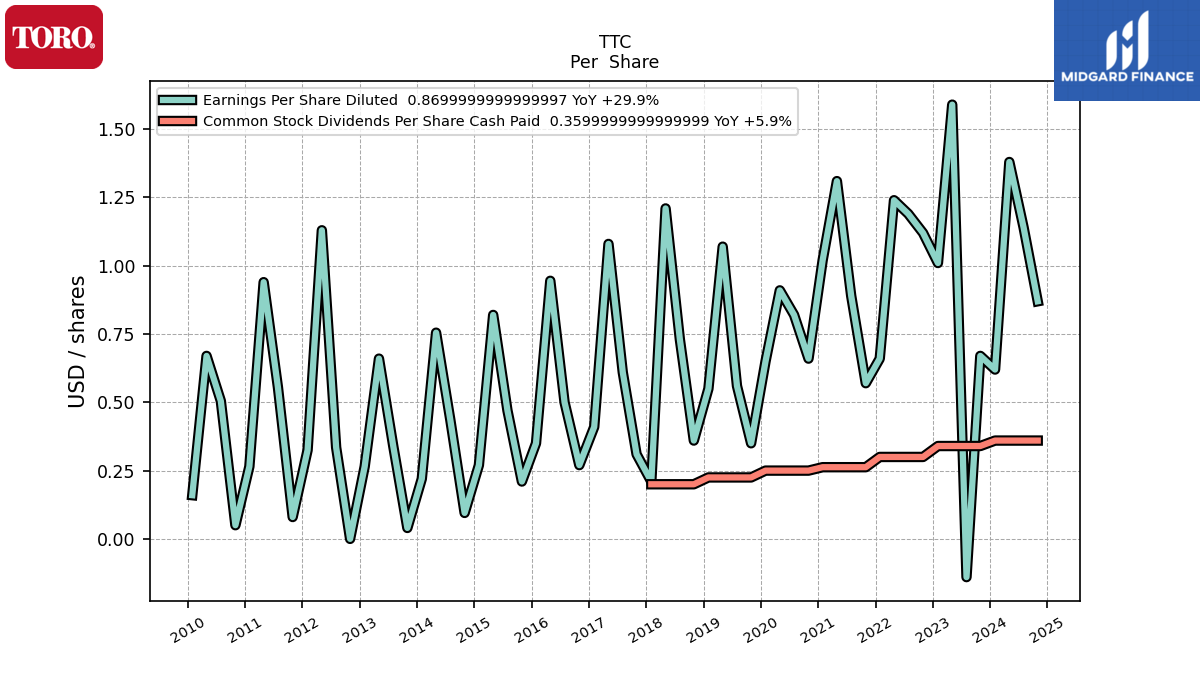
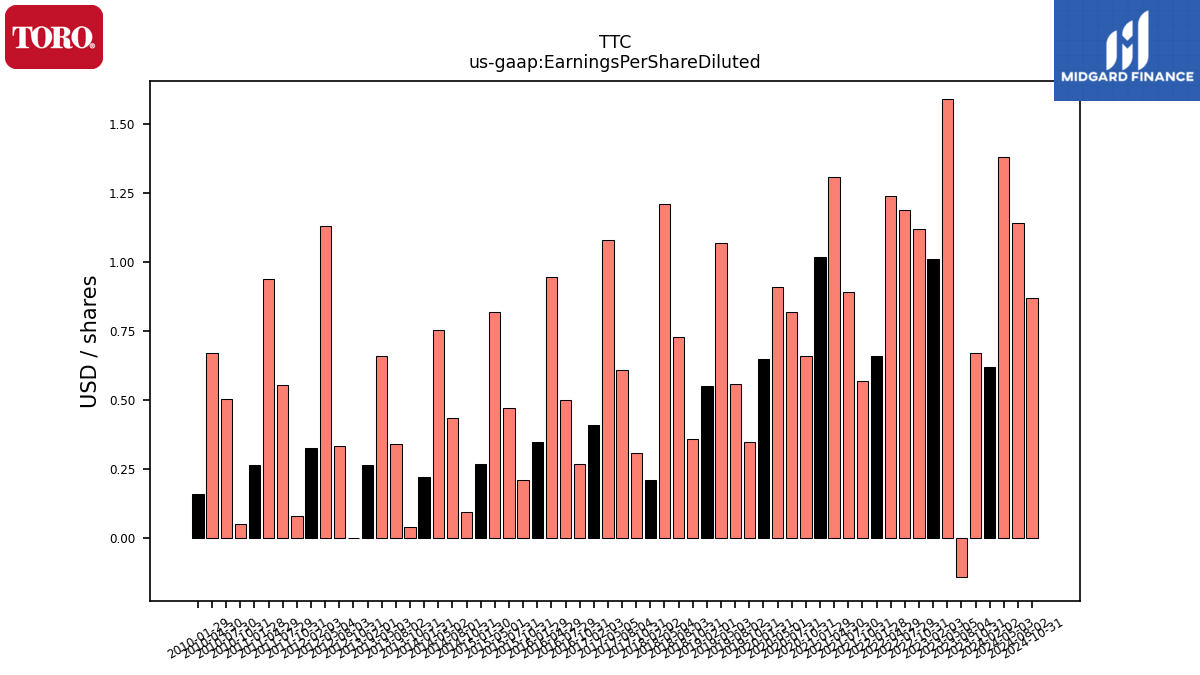
| Earnings Per Share Diluted | 0.62 | 0.67 | -0.14 | 1.59 | 1.01 | 1.12 | 1.19 | 1.24 | 0.66 | 0.57 | 0.89 | 1.31 | 1.02 | 0.66 | 0.82 | 0.91 | 0.65 | 0.35 | 0.56 | 1.07 | 0.55 | 0.36 | 0.73 | 1.21 | 0.21 | 0.31 | 0.61 | 1.08 | 0.41 | 0.27 | 0.50 | 0.94 | 0.35 | 0.21 | 0.47 | 0.82 | 0.27 | 0.10 | 0.43 | 0.76 | 0.22 | 0.04 | 0.34 | 0.66 | 0.27 | 0.00 | 0.34 | 1.13 | 0.33 | 0.08 | 0.56 | 0.94 | 0.27 | 0.05 | 0.51 | 0.67 | 0.16 |
| 2024-02-02 | 2023-10-31 | 2023-08-04 | 2023-05-05 | 2023-02-03 | 2022-10-31 | 2022-07-29 | 2022-04-29 | 2022-01-28 | 2021-10-31 | 2021-07-30 | 2021-04-30 | 2021-01-29 | 2020-10-31 | 2020-07-31 | 2020-05-01 | 2020-01-31 | 2019-10-31 | 2019-08-02 | 2019-05-03 | 2019-02-01 | 2018-10-31 | 2018-08-03 | 2018-05-04 | 2018-02-02 | 2017-10-31 | 2017-08-04 | 2017-05-05 | 2017-02-03 | 2016-10-31 | 2016-07-29 | 2016-04-29 | 2016-01-29 | 2015-10-31 | 2015-07-31 | 2015-05-01 | 2015-01-30 | 2014-10-31 | 2014-08-01 | 2014-05-02 | 2014-01-31 | 2013-10-31 | 2013-08-02 | 2013-05-03 | 2013-02-01 | 2012-10-31 | 2012-08-03 | 2012-05-04 | 2012-02-03 | 2011-10-31 | 2011-07-29 | 2011-04-29 | 2011-01-28 | 2010-10-31 | 2010-07-30 | 2010-04-30 | 2010-01-29 | ||
|---|---|---|---|---|---|---|---|---|---|---|---|---|---|---|---|---|---|---|---|---|---|---|---|---|---|---|---|---|---|---|---|---|---|---|---|---|---|---|---|---|---|---|---|---|---|---|---|---|---|---|---|---|---|---|---|---|---|---|
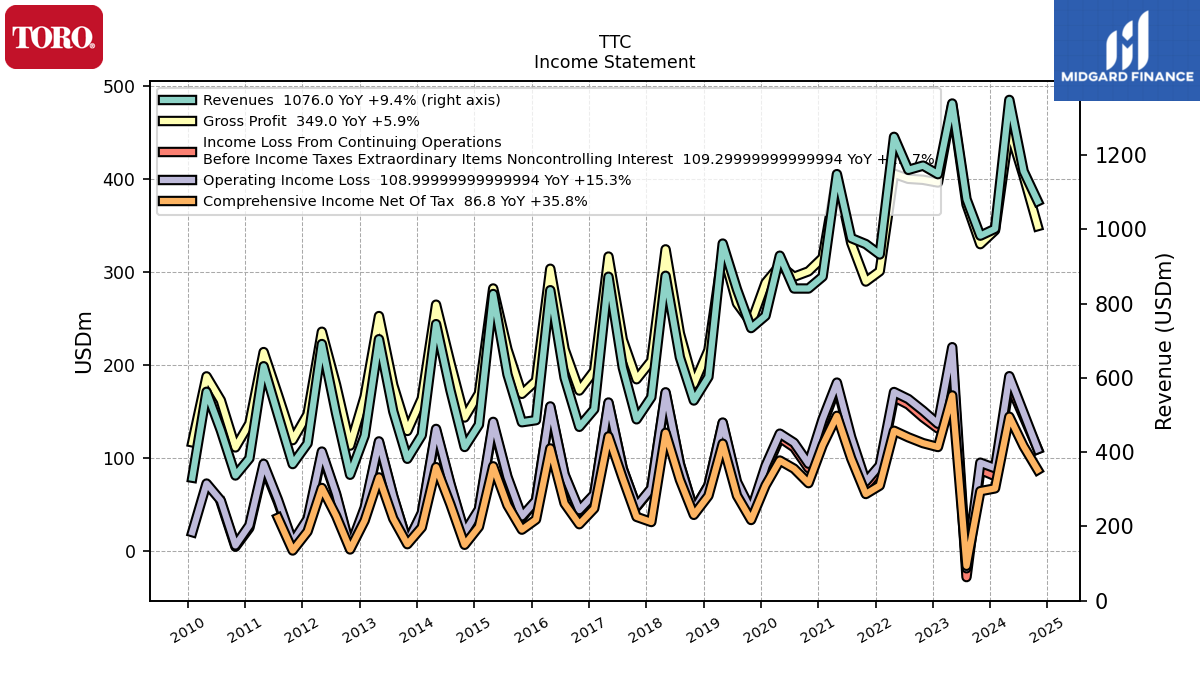
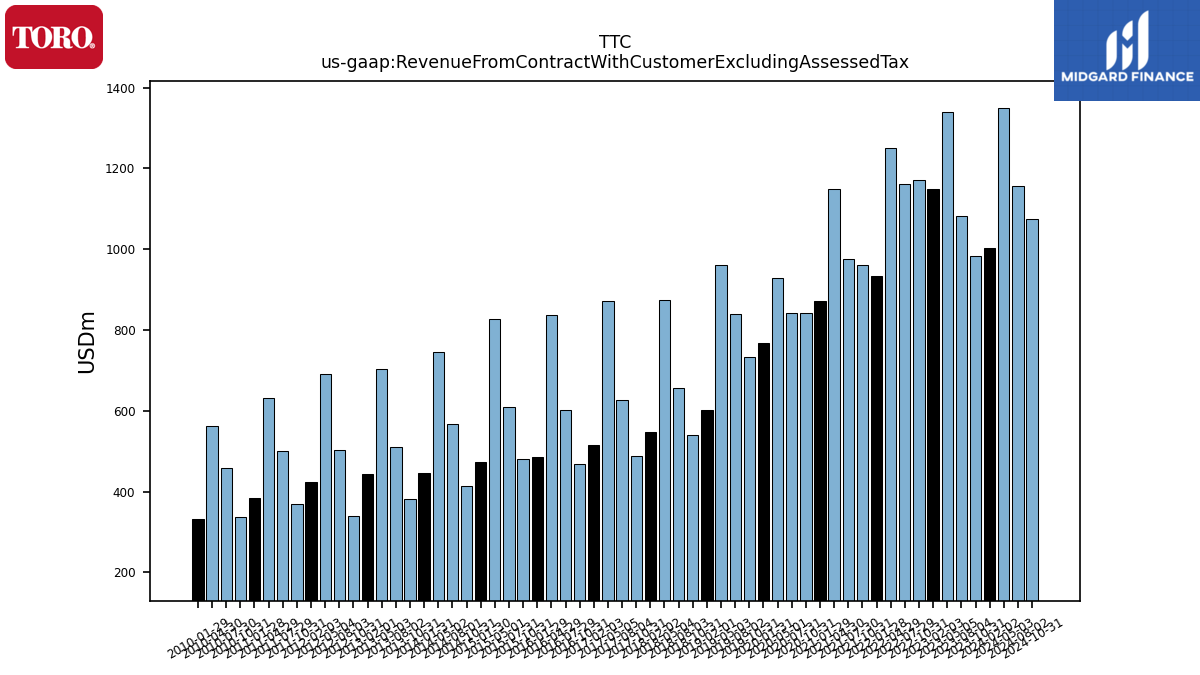
| Revenue From Contract With Customer Excluding Assessed Tax | 1001.90 | 983.25 | 1081.78 | 1339.33 | 1148.84 | 1171.98 | 1160.55 | 1249.48 | 932.65 | 960.65 | 976.84 | 1149.11 | 872.99 | 840.96 | 840.97 | 929.40 | 767.48 | 734.38 | 838.71 | 962.04 | 602.96 | 539.30 | 655.82 | 875.28 | 548.25 | 488.63 | 627.94 | 872.77 | 515.84 | 468.36 | 600.98 | 836.44 | 486.40 | 480.81 | 609.62 | 826.24 | 474.21 | 414.14 | 567.54 | 745.03 | 445.98 | 382.37 | 509.92 | 704.49 | 444.66 | 339.29 | 504.08 | 691.49 | 423.83 | 368.09 | 501.05 | 631.60 | 383.21 | 337.31 | 458.89 | 562.82 | 331.36 | |
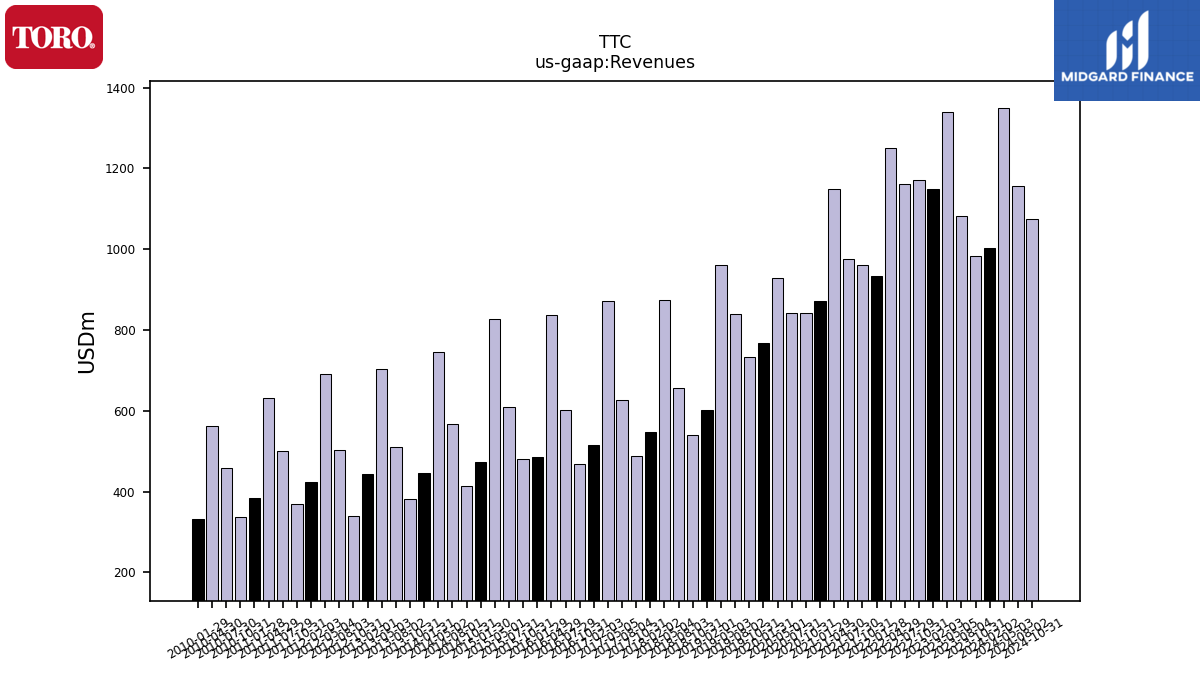
| Revenues | 1001.90 | 983.25 | 1081.78 | 1339.33 | 1148.84 | 1171.98 | 1160.55 | 1249.48 | 932.65 | 960.65 | 976.84 | 1149.11 | 872.99 | 840.96 | 840.97 | 929.40 | 767.48 | 734.38 | 838.71 | 962.04 | 602.96 | 539.30 | 655.82 | 875.28 | 548.25 | 488.63 | 627.94 | 872.77 | 515.84 | 468.36 | 600.98 | 836.44 | 486.40 | 480.81 | 609.62 | 826.24 | 474.21 | 414.14 | 567.54 | 745.03 | 445.98 | 382.37 | 509.92 | 704.49 | 444.66 | 339.29 | 504.08 | 691.49 | 423.83 | 368.09 | 501.05 | 631.60 | 383.21 | 337.31 | 458.89 | 562.82 | 331.36 | |
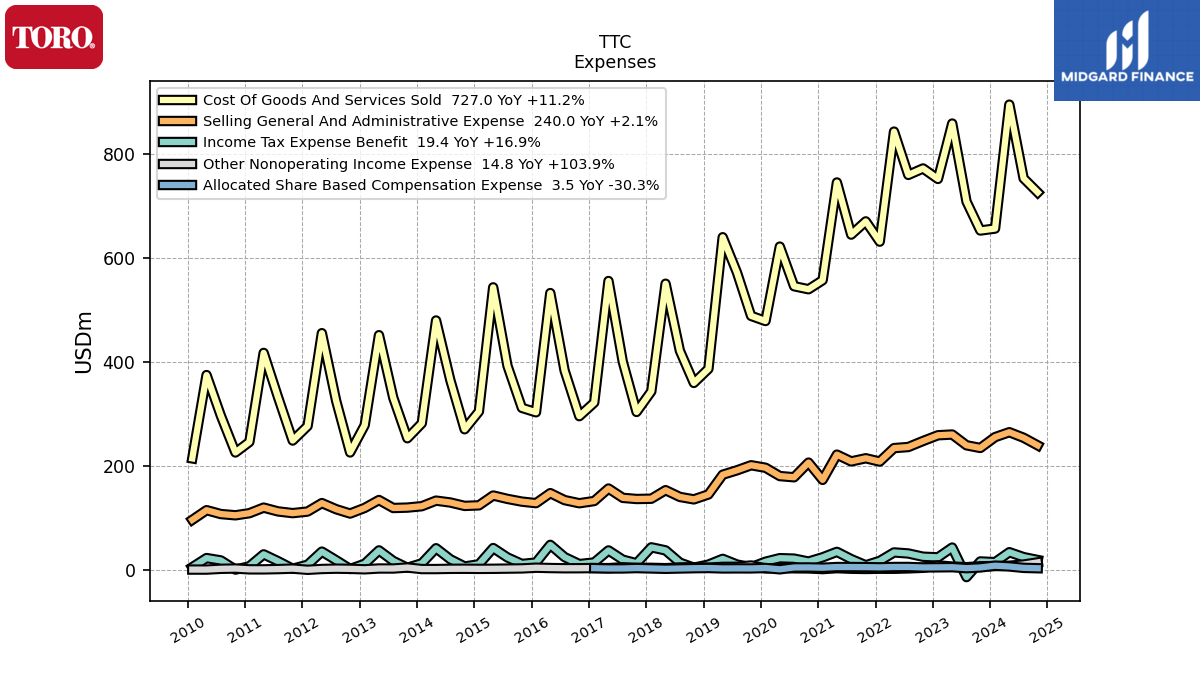
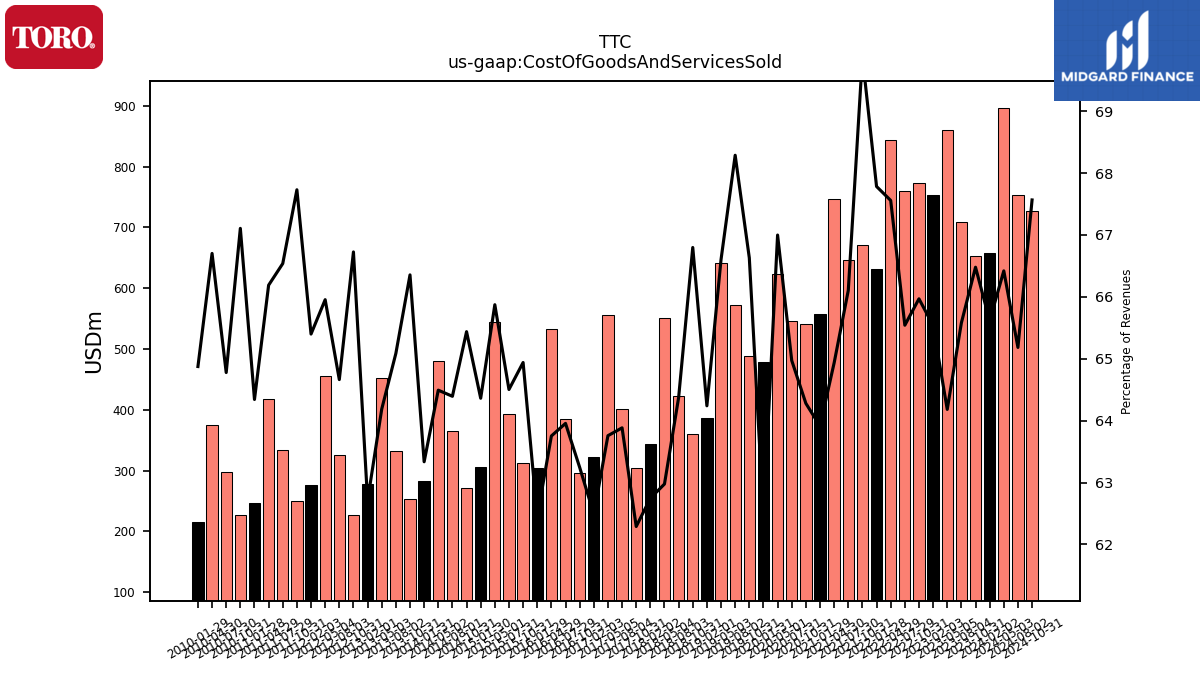
| Cost Of Goods And Services Sold | 657.40 | 653.65 | 709.43 | 859.61 | 752.92 | 773.14 | 760.64 | 844.11 | 632.17 | 671.27 | 645.72 | 746.15 | 557.95 | 540.56 | 546.40 | 622.68 | 479.39 | 489.31 | 572.73 | 640.74 | 387.34 | 360.24 | 422.17 | 551.22 | 344.01 | 304.37 | 401.16 | 556.45 | 322.36 | 296.22 | 384.36 | 533.25 | 303.74 | 312.23 | 393.23 | 544.27 | 305.21 | 271.00 | 365.46 | 480.49 | 282.47 | 253.72 | 331.89 | 452.19 | 278.84 | 226.40 | 325.95 | 456.06 | 277.18 | 249.31 | 333.38 | 418.05 | 246.57 | 226.36 | 297.26 | 375.41 | 214.97 | |
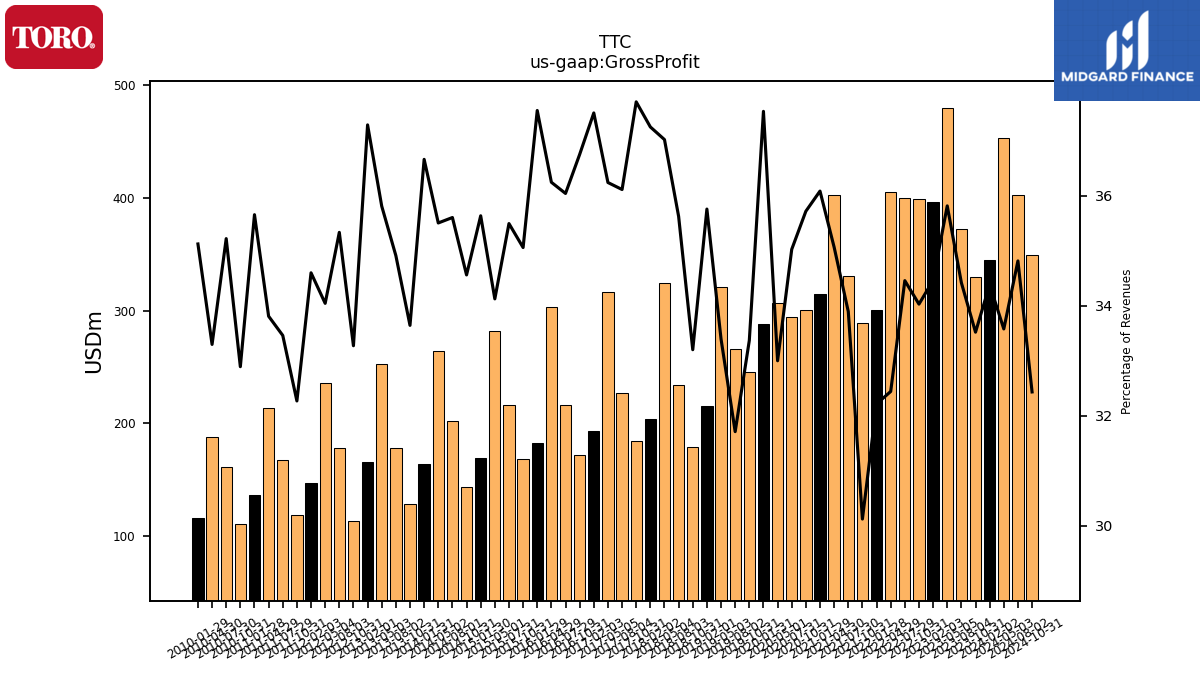
| Gross Profit | 344.50 | 329.60 | 372.35 | 479.72 | 395.92 | 398.85 | 399.91 | 405.37 | 300.48 | 289.39 | 331.12 | 402.95 | 315.04 | 300.39 | 294.57 | 306.72 | 288.09 | 245.07 | 265.98 | 321.30 | 215.62 | 179.06 | 233.65 | 324.06 | 204.24 | 184.26 | 226.78 | 316.31 | 193.48 | 172.14 | 216.62 | 303.19 | 182.65 | 168.57 | 216.39 | 281.97 | 169.00 | 143.14 | 202.08 | 264.54 | 163.51 | 128.65 | 178.03 | 252.30 | 165.82 | 112.90 | 178.12 | 235.42 | 146.65 | 118.79 | 167.66 | 213.55 | 136.65 | 110.95 | 161.63 | 187.41 | 116.39 | |
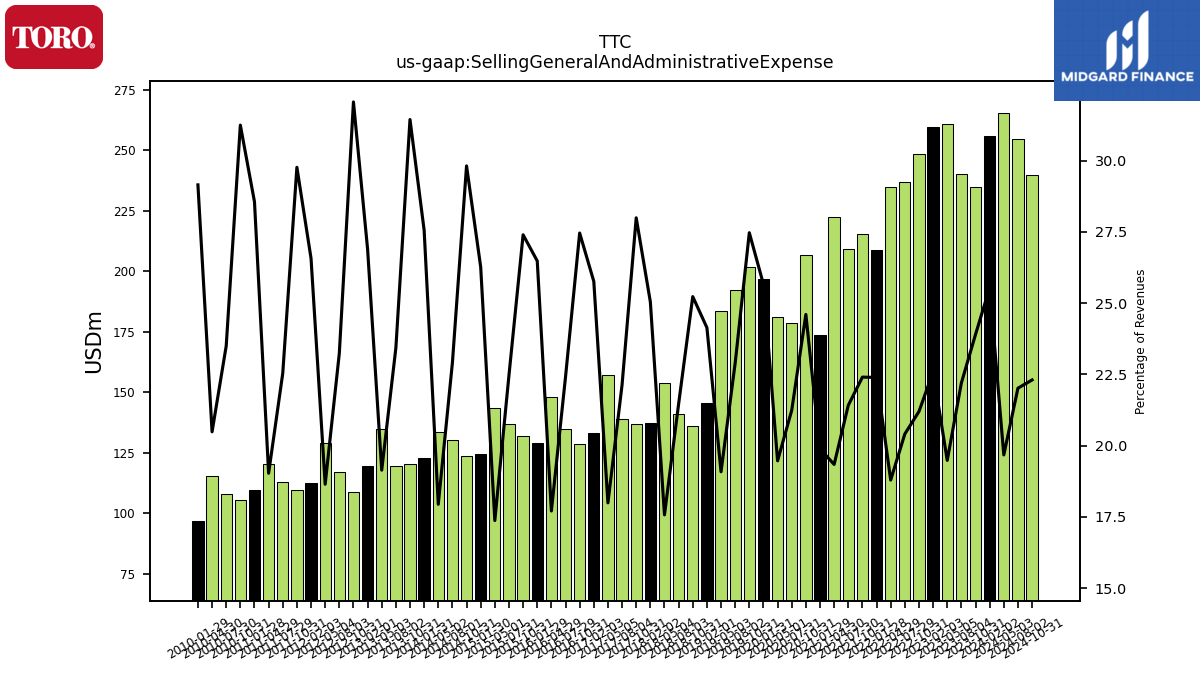
| Selling General And Administrative Expense | 255.90 | 235.01 | 240.16 | 260.93 | 259.50 | 248.43 | 236.86 | 234.79 | 208.85 | 215.23 | 209.18 | 222.24 | 173.57 | 206.91 | 178.62 | 180.92 | 196.96 | 201.76 | 192.04 | 183.57 | 145.56 | 136.07 | 140.76 | 153.78 | 137.32 | 136.80 | 139.00 | 157.02 | 132.91 | 128.62 | 134.66 | 148.10 | 128.81 | 131.74 | 136.99 | 143.52 | 124.58 | 123.49 | 130.04 | 133.66 | 122.92 | 120.24 | 119.45 | 134.83 | 119.61 | 108.79 | 117.14 | 128.92 | 112.63 | 109.58 | 112.94 | 120.20 | 109.44 | 105.41 | 107.82 | 115.29 | 96.60 | |
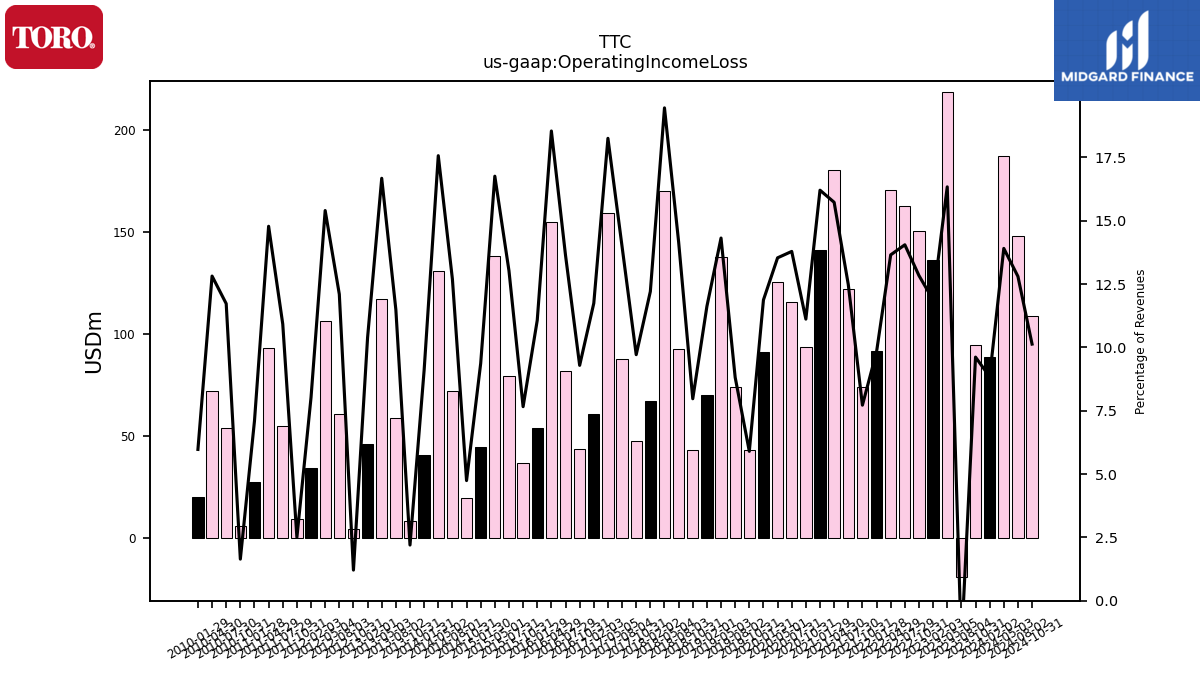
| Operating Income Loss | 88.60 | 94.55 | -19.07 | 218.80 | 136.43 | 150.41 | 163.05 | 170.58 | 91.63 | 74.16 | 121.94 | 180.72 | 141.47 | 93.48 | 115.95 | 125.80 | 91.13 | 43.31 | 73.94 | 137.72 | 70.05 | 43.00 | 92.89 | 170.27 | 66.92 | 47.46 | 87.78 | 159.30 | 60.57 | 43.51 | 81.95 | 155.09 | 53.84 | 36.83 | 79.41 | 138.46 | 44.42 | 19.64 | 72.04 | 130.88 | 40.60 | 8.41 | 58.58 | 117.47 | 46.20 | 4.11 | 60.98 | 106.50 | 34.02 | 9.21 | 54.72 | 93.36 | 27.20 | 5.54 | 53.81 | 72.12 | 19.79 | |
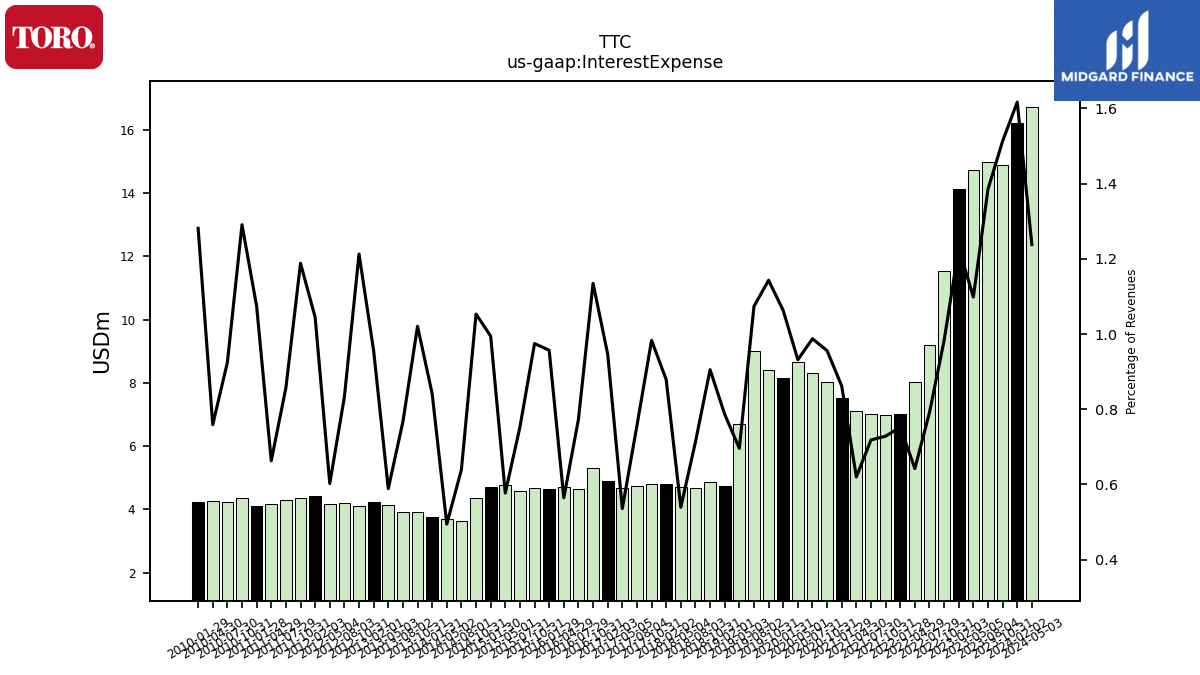
| Interest Expense | 16.20 | 14.88 | 14.99 | 14.71 | 14.12 | 11.52 | 9.18 | 8.02 | 7.01 | 7.00 | 7.02 | 7.12 | 7.52 | 8.04 | 8.30 | 8.66 | 8.16 | 8.39 | 9.00 | 6.69 | 4.74 | 4.88 | 4.68 | 4.72 | 4.82 | 4.80 | 4.75 | 4.68 | 4.88 | 5.32 | 4.65 | 4.72 | 4.65 | 4.69 | 4.59 | 4.77 | 4.72 | 4.36 | 3.63 | 3.68 | 3.75 | 3.90 | 3.91 | 4.15 | 4.25 | 4.12 | 4.20 | 4.17 | 4.43 | 4.37 | 4.29 | 4.19 | 4.12 | 4.35 | 4.24 | 4.27 | 4.25 | |
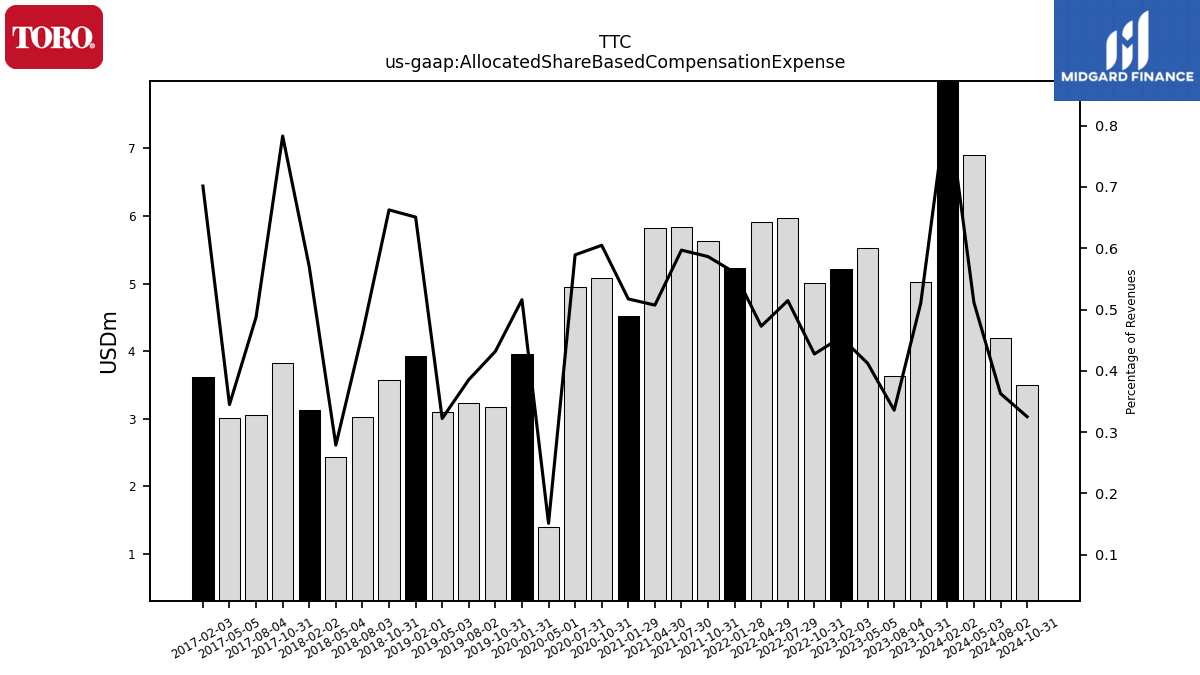
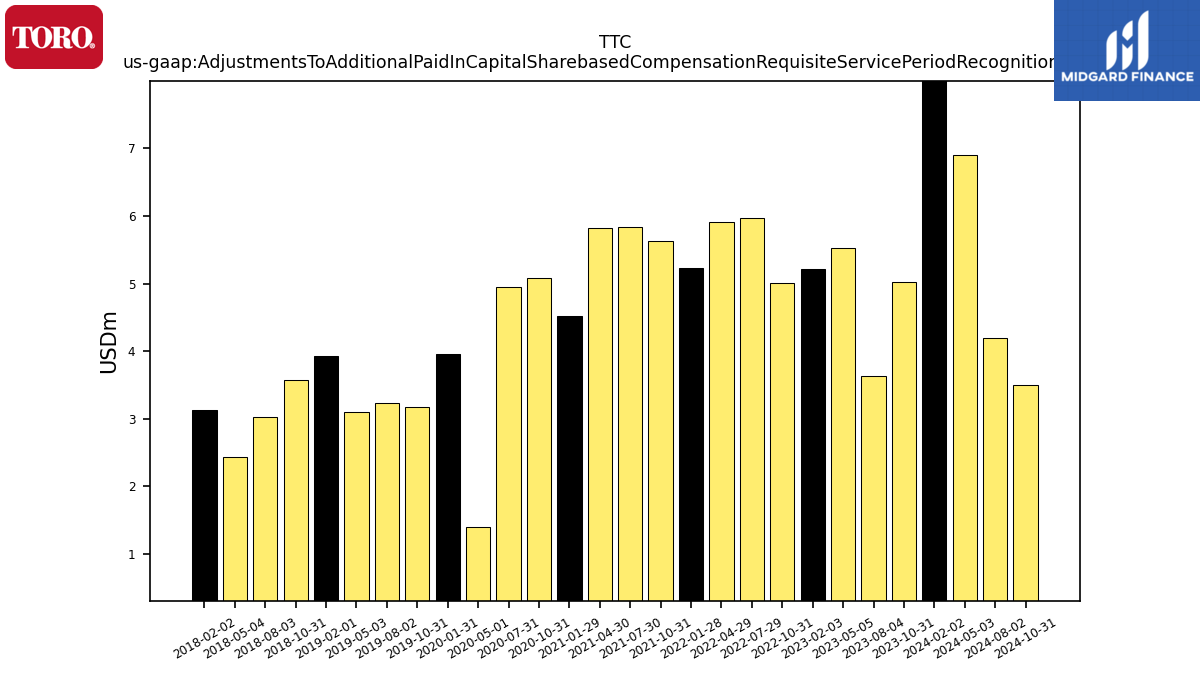
| Allocated Share Based Compensation Expense | 8.40 | 5.02 | 3.63 | 5.52 | 5.22 | 5.01 | 5.97 | 5.91 | 5.22 | 5.63 | 5.83 | 5.83 | 4.52 | 5.09 | 4.96 | 1.41 | 3.96 | 3.17 | 3.23 | 3.10 | 3.92 | 3.57 | 3.02 | 2.44 | 3.12 | 3.83 | 3.06 | 3.01 | 3.62 | NA | NA | NA | NA | NA | NA | NA | NA | NA | NA | NA | NA | NA | NA | NA | NA | NA | NA | NA | NA | NA | NA | NA | NA | NA | NA | NA | NA | |
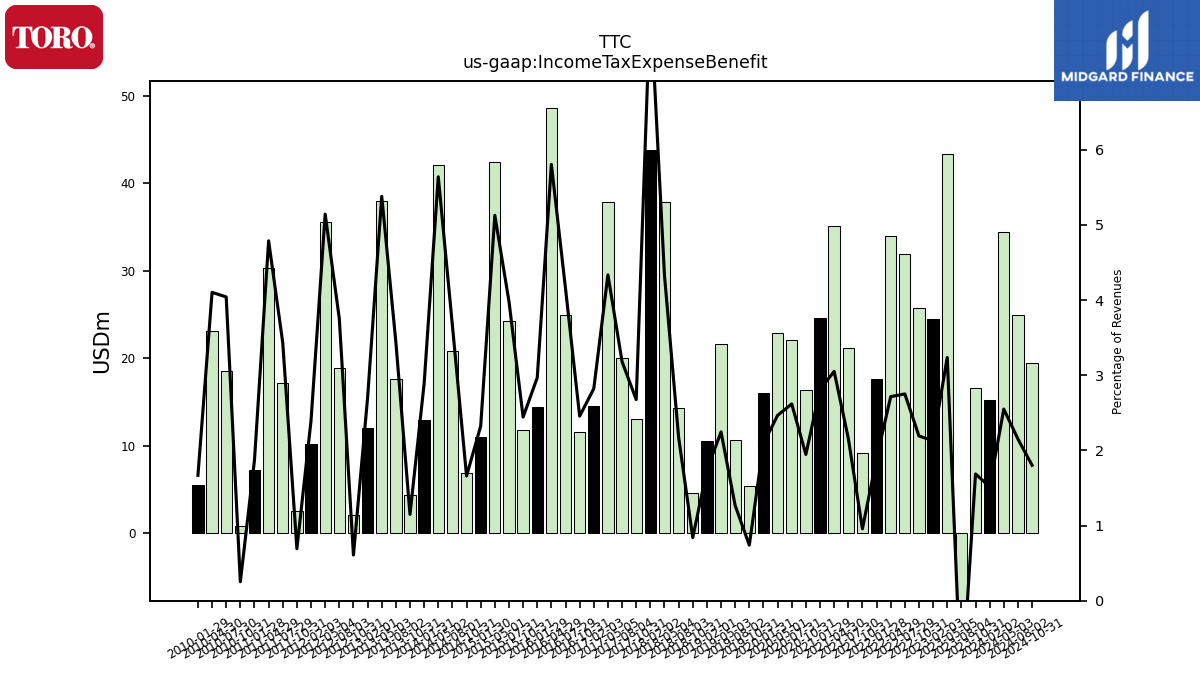
| Income Tax Expense Benefit | 15.20 | 16.59 | -13.60 | 43.35 | 24.45 | 25.70 | 31.94 | 33.93 | 17.64 | 9.19 | 21.13 | 35.07 | 24.55 | 16.37 | 22.02 | 22.93 | 16.05 | 5.43 | 10.63 | 21.61 | 10.48 | 4.53 | 14.27 | 37.88 | 43.78 | 13.08 | 19.98 | 37.85 | 14.56 | 11.50 | 24.96 | 48.56 | 14.44 | 11.75 | 24.29 | 42.37 | 11.02 | 6.87 | 20.79 | 42.03 | 12.89 | 4.39 | 17.56 | 37.91 | 12.00 | 2.06 | 18.92 | 35.57 | 10.16 | 2.55 | 17.20 | 30.25 | 7.17 | 0.85 | 18.55 | 23.10 | 5.53 | |
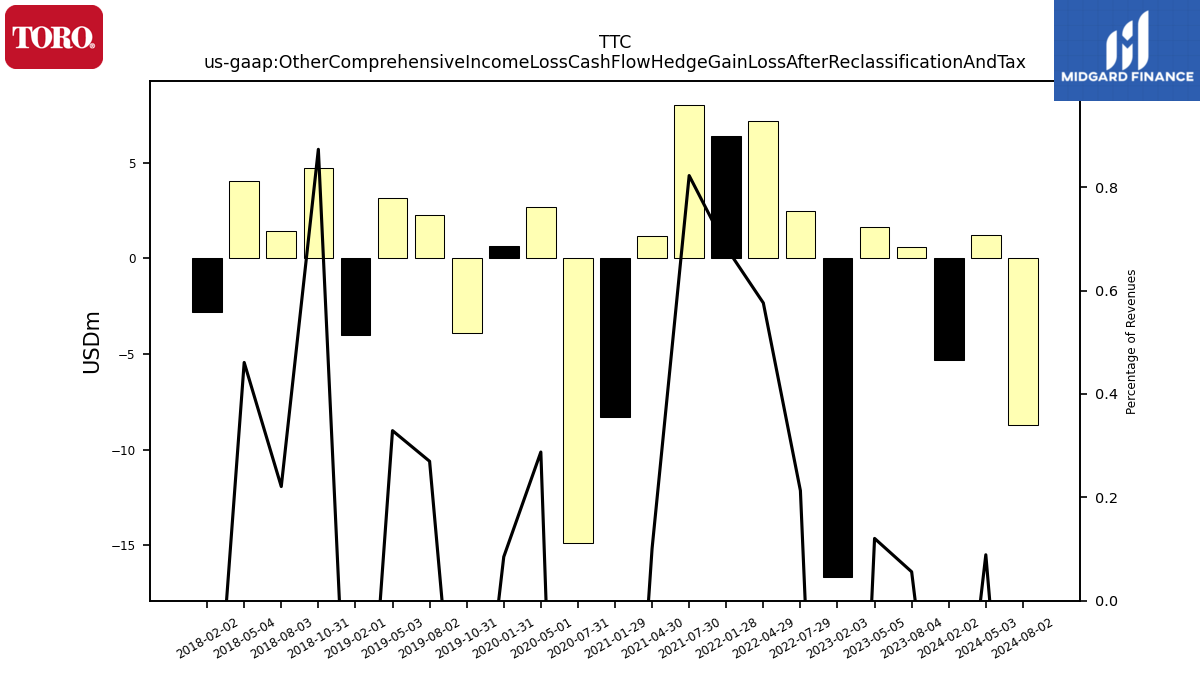
| Other Comprehensive Income Loss Cash Flow Hedge Gain Loss After Reclassification And Tax | -5.30 | NA | 0.61 | 1.61 | -16.66 | NA | 2.47 | 7.20 | 6.37 | NA | 8.04 | 1.16 | -8.31 | NA | -14.88 | 2.67 | 0.65 | -3.92 | 2.26 | 3.17 | -4.01 | 4.71 | 1.45 | 4.04 | -2.78 | NA | NA | NA | NA | NA | NA | NA | NA | NA | NA | NA | NA | NA | NA | NA | NA | NA | NA | NA | NA | NA | NA | NA | NA | NA | NA | NA | NA | NA | NA | NA | NA | |
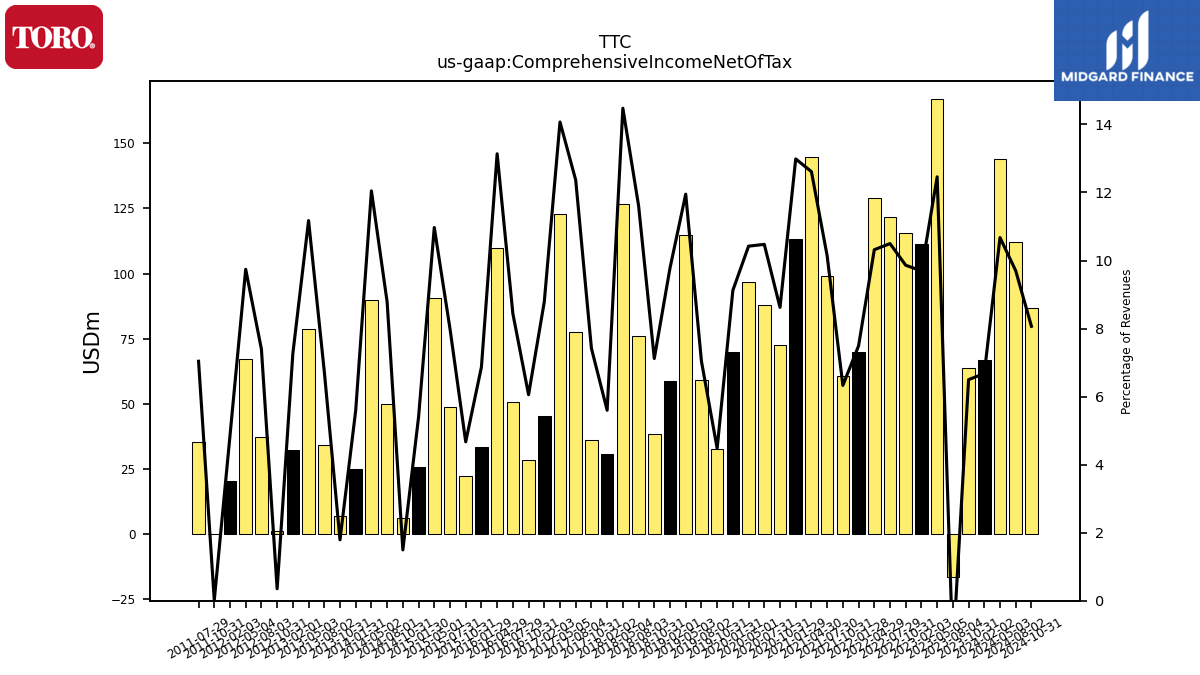
| Comprehensive Income Net Of Tax | 66.90 | 63.91 | -16.37 | 166.88 | 111.38 | 115.58 | 121.83 | 128.92 | 69.89 | 60.80 | 99.04 | 144.94 | 113.37 | 72.51 | 88.09 | 96.86 | 70.02 | 32.88 | 59.05 | 114.97 | 58.96 | 38.40 | 76.17 | 126.72 | 30.70 | 36.25 | 77.64 | 122.82 | 45.33 | 28.36 | 50.74 | 109.89 | 33.41 | 22.46 | 48.73 | 90.66 | 25.60 | 6.19 | 49.84 | 89.75 | 24.95 | 6.84 | 34.39 | 78.72 | 32.30 | 1.19 | 37.28 | 67.36 | 20.56 | 0.06 | 35.27 | NA | NA | NA | NA | NA | NA | |
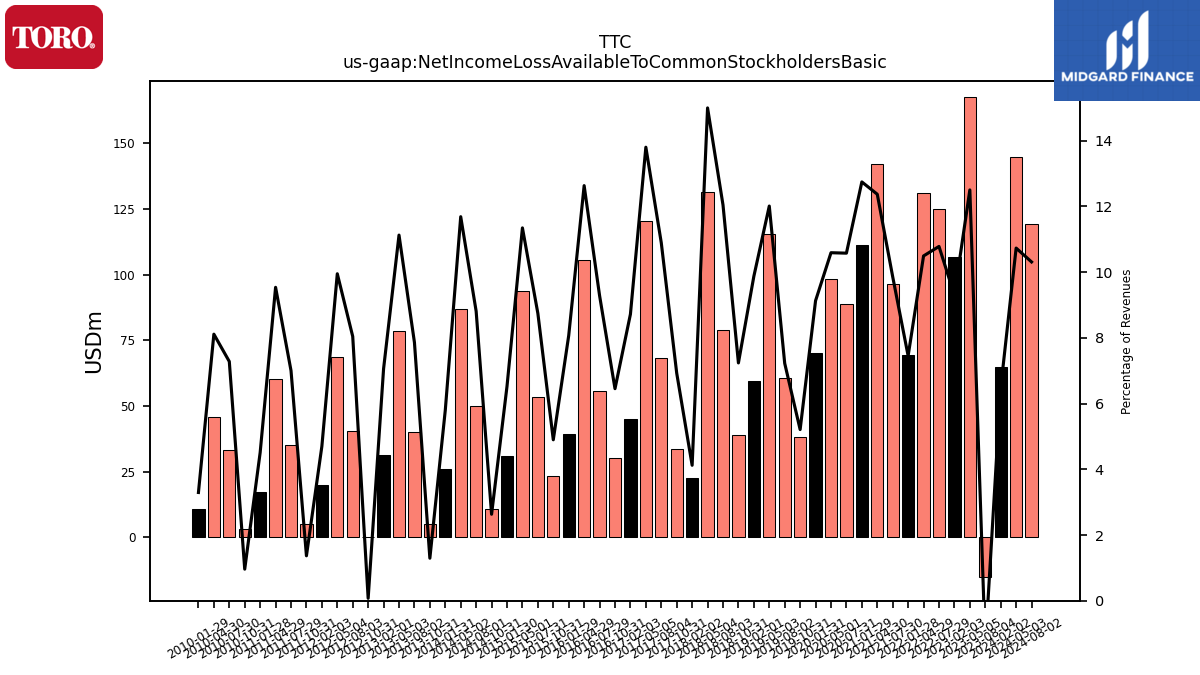
| Net Income Loss Available To Common Stockholders Basic | 64.90 | NA | -14.96 | 167.47 | 106.86 | NA | 125.15 | 131.12 | 69.51 | NA | 96.32 | 142.17 | 111.28 | NA | 88.97 | 98.45 | 70.09 | 38.27 | 60.61 | 115.57 | 59.54 | 39.04 | 79.01 | 131.29 | 22.60 | 33.85 | 68.40 | 120.47 | 44.99 | 30.23 | 55.82 | 105.68 | 39.26 | 23.55 | 53.32 | 93.76 | 30.95 | 10.90 | 50.01 | 87.09 | 25.87 | 4.95 | 40.10 | 78.40 | 31.40 | 0.25 | 40.55 | 68.82 | 19.92 | 5.04 | 35.09 | 60.25 | 17.28 | 3.24 | 33.41 | 45.66 | 10.92 |
| 2024-02-02 | 2023-10-31 | 2023-08-04 | 2023-05-05 | 2023-02-03 | 2022-10-31 | 2022-07-29 | 2022-04-29 | 2022-01-28 | 2021-10-31 | 2021-07-30 | 2021-04-30 | 2021-01-29 | 2020-10-31 | 2020-07-31 | 2020-05-01 | 2020-01-31 | 2019-10-31 | 2019-08-02 | 2019-05-03 | 2019-02-01 | 2018-10-31 | 2018-08-03 | 2018-05-04 | 2018-02-02 | 2017-10-31 | 2017-08-04 | 2017-05-05 | 2017-02-03 | 2016-10-31 | 2016-07-29 | 2016-04-29 | 2016-01-29 | 2015-10-31 | 2015-07-31 | 2015-05-01 | 2015-01-30 | 2014-10-31 | 2014-08-01 | 2014-05-02 | 2014-01-31 | 2013-10-31 | 2013-08-02 | 2013-05-03 | 2013-02-01 | 2012-10-31 | 2012-08-03 | 2012-05-04 | 2012-02-03 | 2011-10-31 | 2011-07-29 | 2011-04-29 | 2011-01-28 | 2010-10-31 | 2010-07-30 | 2010-04-30 | 2010-01-29 | ||
|---|---|---|---|---|---|---|---|---|---|---|---|---|---|---|---|---|---|---|---|---|---|---|---|---|---|---|---|---|---|---|---|---|---|---|---|---|---|---|---|---|---|---|---|---|---|---|---|---|---|---|---|---|---|---|---|---|---|---|
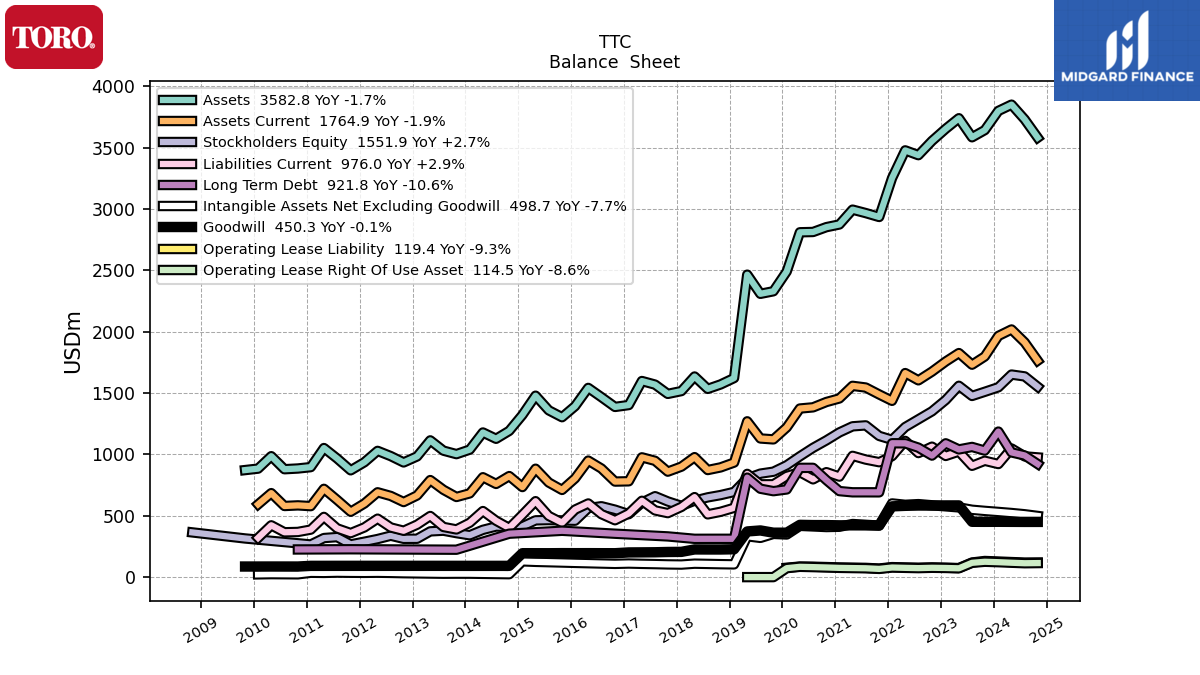
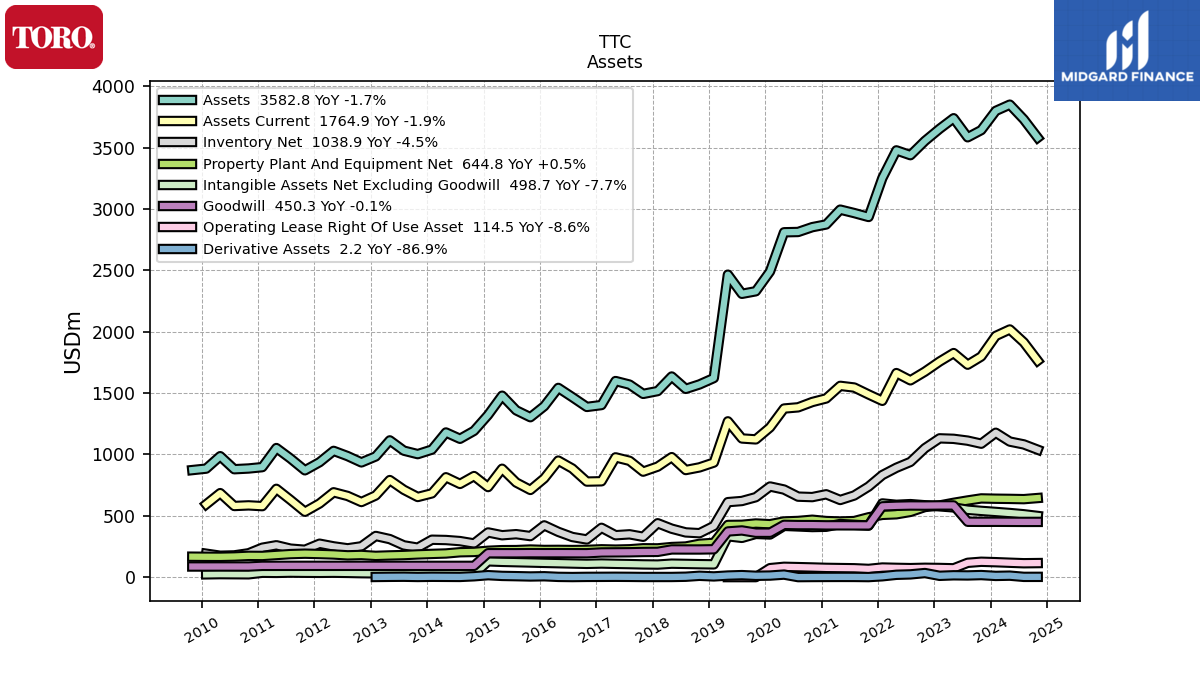
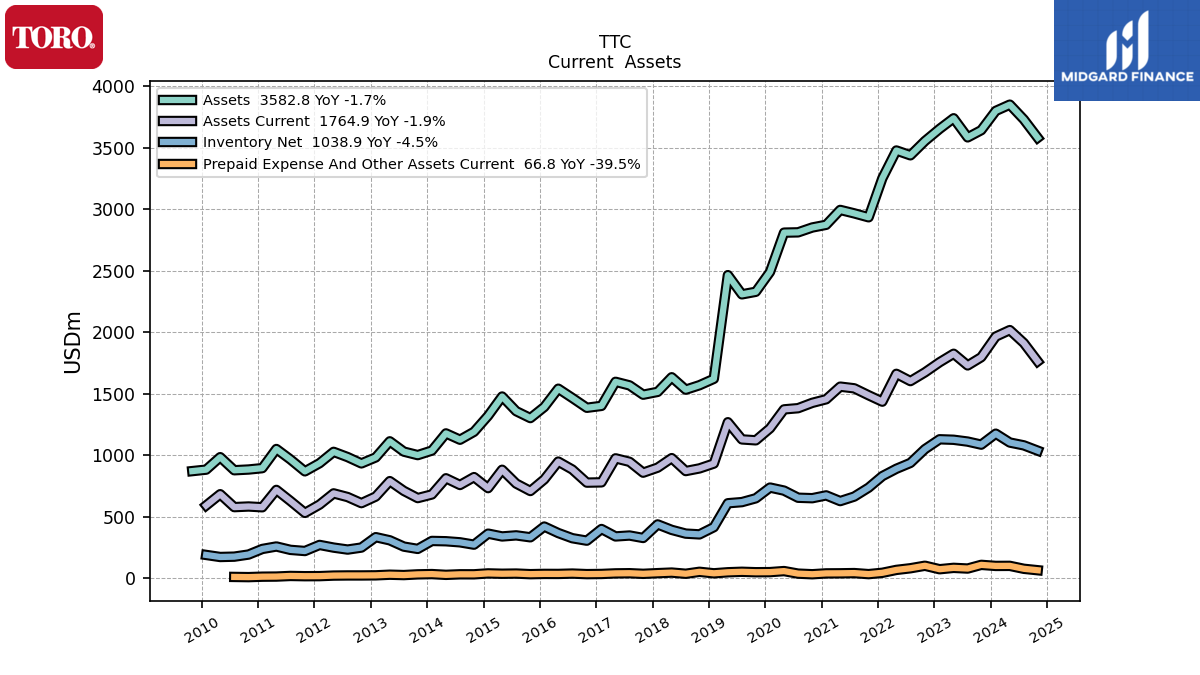
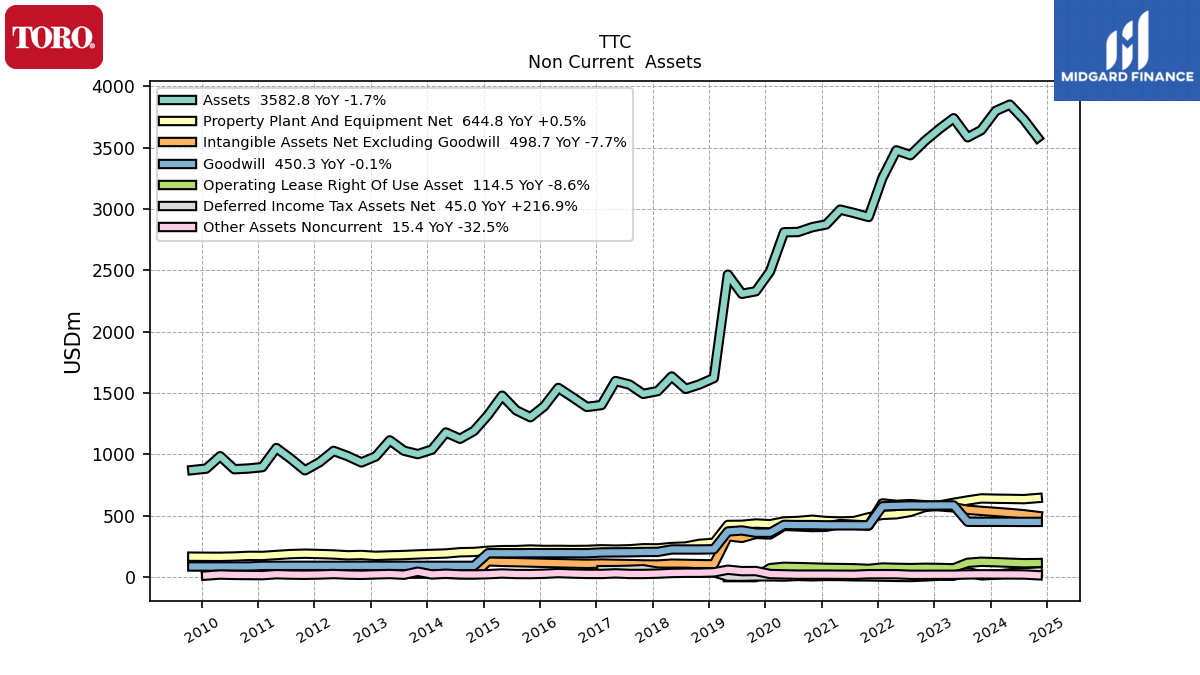
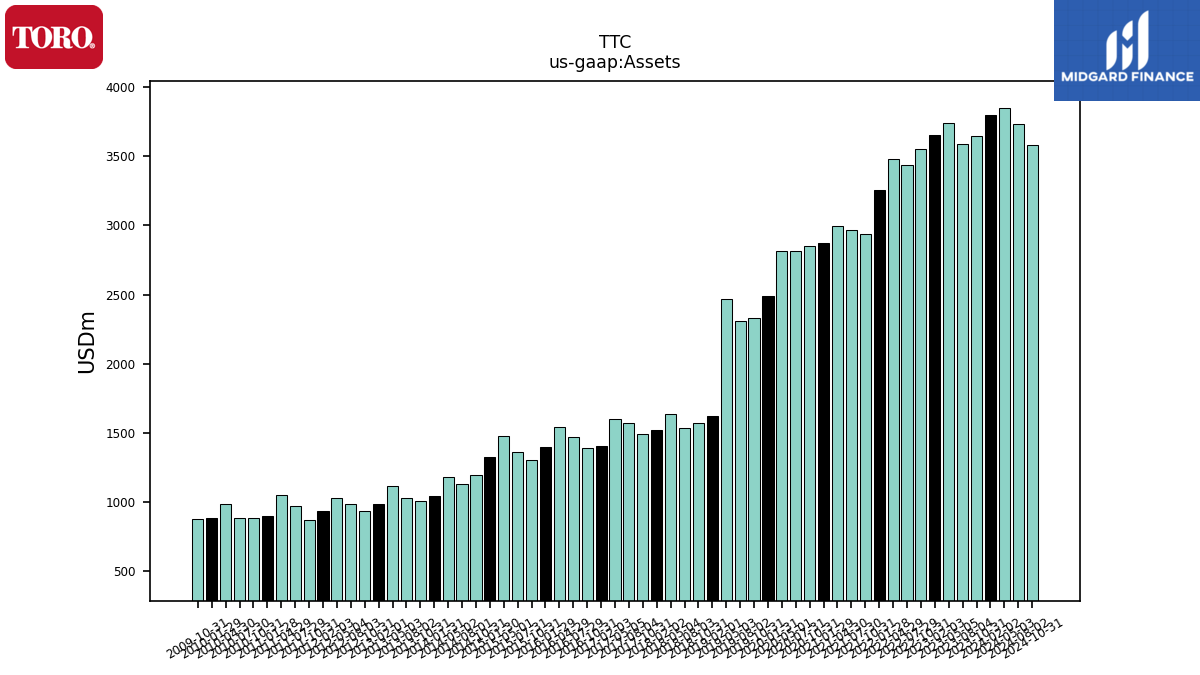
| Assets | 3801.10 | 3644.30 | 3585.89 | 3741.38 | 3654.95 | 3556.00 | 3439.95 | 3479.31 | 3253.05 | 2936.14 | 2968.05 | 2996.11 | 2875.14 | 2853.23 | 2813.86 | 2811.47 | 2491.61 | 2330.55 | 2309.73 | 2466.00 | 1622.81 | 1570.98 | 1534.76 | 1635.75 | 1516.81 | 1493.79 | 1569.54 | 1598.76 | 1402.91 | 1387.52 | 1467.46 | 1542.74 | 1393.83 | 1303.66 | 1359.95 | 1479.13 | 1322.17 | 1192.41 | 1127.83 | 1179.25 | 1039.60 | 1002.75 | 1031.13 | 1114.95 | 984.14 | 935.20 | 986.53 | 1029.35 | 937.01 | 870.66 | 967.55 | 1052.53 | 896.71 | 885.62 | 879.65 | 985.99 | 884.63 | |
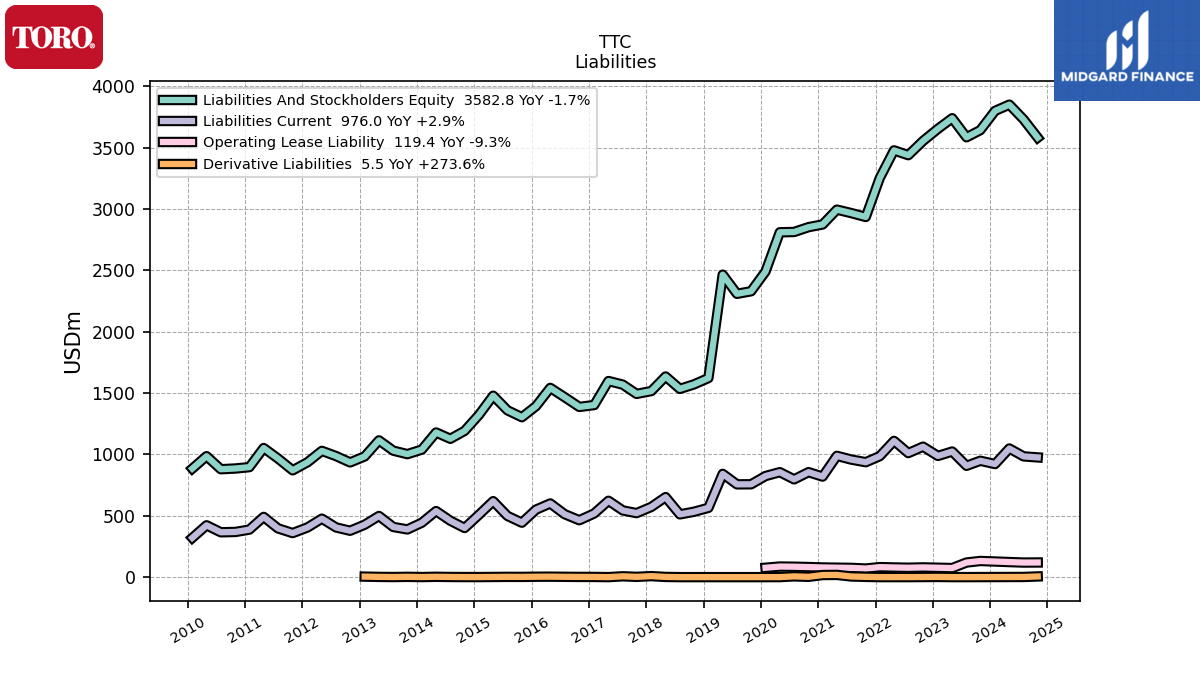
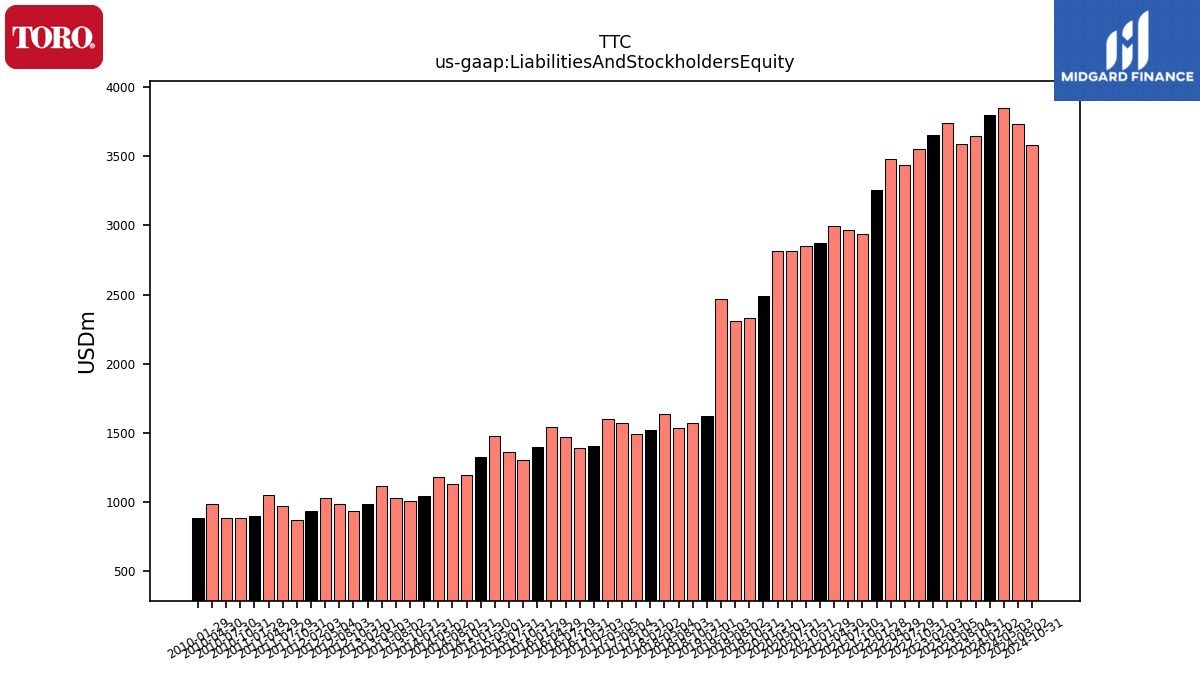
| Liabilities And Stockholders Equity | 3801.10 | 3644.30 | 3585.89 | 3741.38 | 3654.95 | 3556.00 | 3439.95 | 3479.31 | 3253.05 | 2936.14 | 2968.05 | 2996.11 | 2875.14 | 2853.23 | 2813.86 | 2811.47 | 2491.61 | 2330.55 | 2309.73 | 2466.00 | 1622.81 | 1570.98 | 1534.76 | 1635.75 | 1516.81 | 1493.79 | 1569.54 | 1598.76 | 1402.91 | 1387.52 | 1467.46 | 1542.74 | 1393.83 | 1303.66 | 1359.95 | 1479.13 | 1322.17 | 1192.41 | 1127.83 | 1179.25 | 1039.60 | 1002.75 | 1031.13 | 1114.95 | 984.14 | 935.20 | 986.53 | 1029.35 | 937.01 | 870.66 | 967.55 | 1052.53 | 896.71 | 885.62 | 879.65 | 985.99 | 884.63 | |
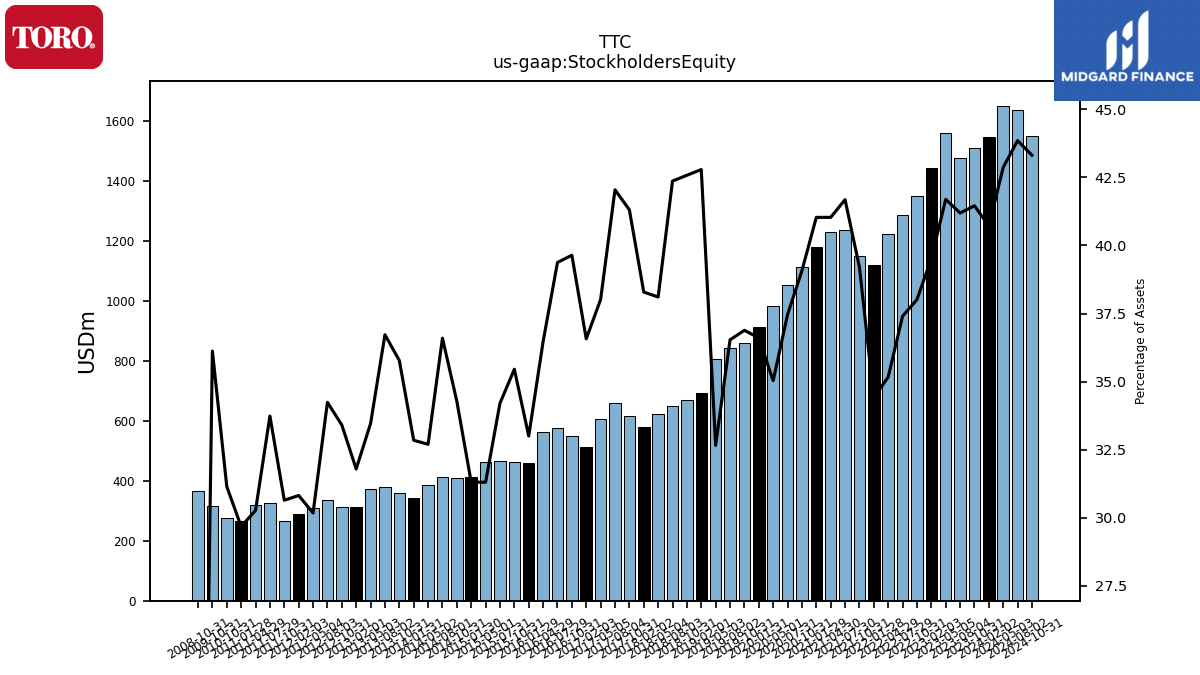
| Stockholders Equity | 1547.90 | 1510.90 | 1477.08 | 1560.00 | 1444.17 | 1351.70 | 1286.60 | 1223.52 | 1119.55 | 1151.13 | 1237.18 | 1229.42 | 1179.72 | 1114.83 | 1054.03 | 984.95 | 912.05 | 859.58 | 843.82 | 805.28 | 694.40 | 668.92 | 650.24 | 623.33 | 580.78 | 617.09 | 659.92 | 607.77 | 513.04 | 550.03 | 577.85 | 562.61 | 459.93 | 462.17 | 465.17 | 463.00 | 413.84 | 408.73 | 412.73 | 385.55 | 341.44 | 358.74 | 378.62 | 373.04 | 312.84 | 312.40 | 337.75 | 310.57 | 288.73 | 266.77 | 326.38 | 318.54 | 266.10 | 275.81 | NA | NA | NA |
| 2024-02-02 | 2023-10-31 | 2023-08-04 | 2023-05-05 | 2023-02-03 | 2022-10-31 | 2022-07-29 | 2022-04-29 | 2022-01-28 | 2021-10-31 | 2021-07-30 | 2021-04-30 | 2021-01-29 | 2020-10-31 | 2020-07-31 | 2020-05-01 | 2020-01-31 | 2019-10-31 | 2019-08-02 | 2019-05-03 | 2019-02-01 | 2018-10-31 | 2018-08-03 | 2018-05-04 | 2018-02-02 | 2017-10-31 | 2017-08-04 | 2017-05-05 | 2017-02-03 | 2016-10-31 | 2016-07-29 | 2016-04-29 | 2016-01-29 | 2015-10-31 | 2015-07-31 | 2015-05-01 | 2015-01-30 | 2014-10-31 | 2014-08-01 | 2014-05-02 | 2014-01-31 | 2013-10-31 | 2013-08-02 | 2013-05-03 | 2013-02-01 | 2012-10-31 | 2012-08-03 | 2012-05-04 | 2012-02-03 | 2011-10-31 | 2011-07-29 | 2011-04-29 | 2011-01-28 | 2010-10-31 | 2010-07-30 | 2010-04-30 | 2010-01-29 | ||
|---|---|---|---|---|---|---|---|---|---|---|---|---|---|---|---|---|---|---|---|---|---|---|---|---|---|---|---|---|---|---|---|---|---|---|---|---|---|---|---|---|---|---|---|---|---|---|---|---|---|---|---|---|---|---|---|---|---|---|
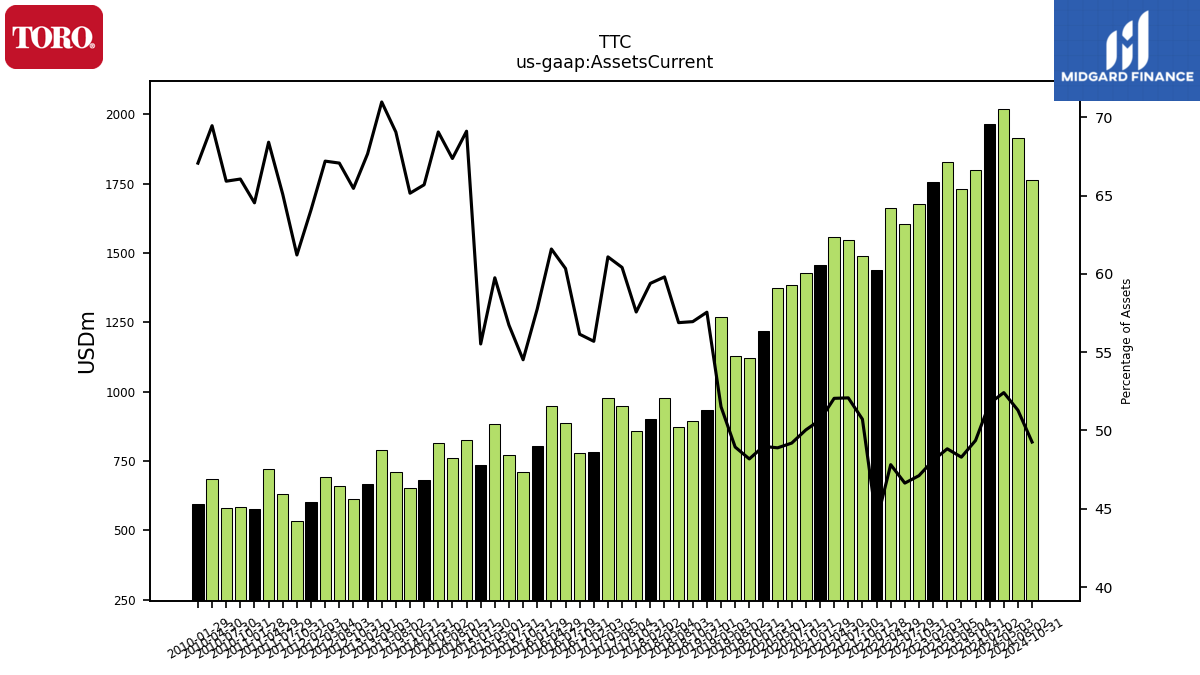
| Assets Current | 1966.50 | 1798.80 | 1731.79 | 1826.83 | 1757.69 | 1675.35 | 1604.36 | 1663.68 | 1437.26 | 1489.18 | 1545.79 | 1559.49 | 1456.74 | 1427.65 | 1384.25 | 1374.55 | 1220.51 | 1122.89 | 1130.40 | 1270.27 | 933.93 | 894.64 | 873.02 | 978.23 | 900.85 | 859.89 | 948.15 | 976.56 | 781.32 | 779.01 | 885.47 | 950.11 | 805.09 | 710.68 | 771.42 | 883.75 | 734.09 | 824.04 | 759.75 | 814.35 | 682.87 | 653.27 | 712.01 | 791.31 | 665.89 | 612.13 | 661.67 | 691.68 | 600.47 | 532.88 | 629.65 | 719.98 | 578.69 | 584.97 | 579.82 | 684.85 | 593.30 | |
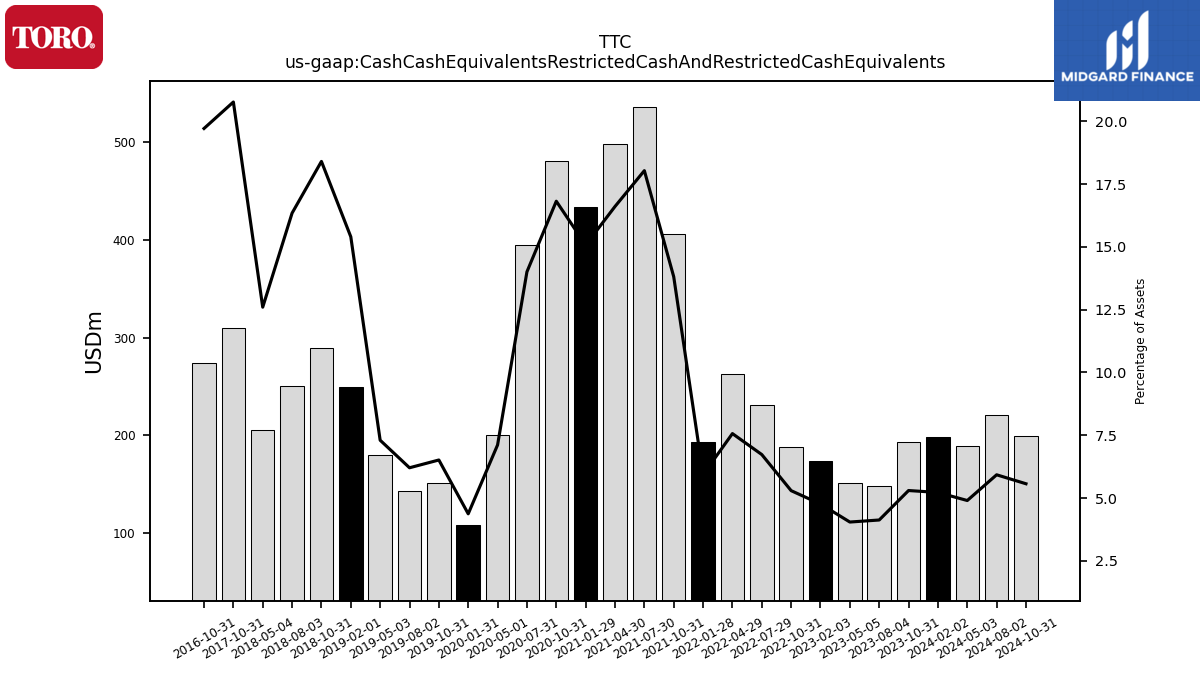
| Cash Cash Equivalents Restricted Cash And Restricted Cash Equivalents | 198.50 | 193.10 | 147.93 | 151.30 | 174.04 | 188.25 | 231.56 | 263.23 | 192.96 | 405.61 | 535.33 | 497.63 | 433.39 | 479.89 | 394.14 | 200.00 | 108.91 | 151.83 | 143.32 | 180.08 | 249.97 | 289.12 | 250.87 | 206.10 | NA | 310.26 | NA | NA | NA | 273.56 | NA | NA | NA | NA | NA | NA | NA | NA | NA | NA | NA | NA | NA | NA | NA | NA | NA | NA | NA | NA | NA | NA | NA | NA | NA | NA | NA | |
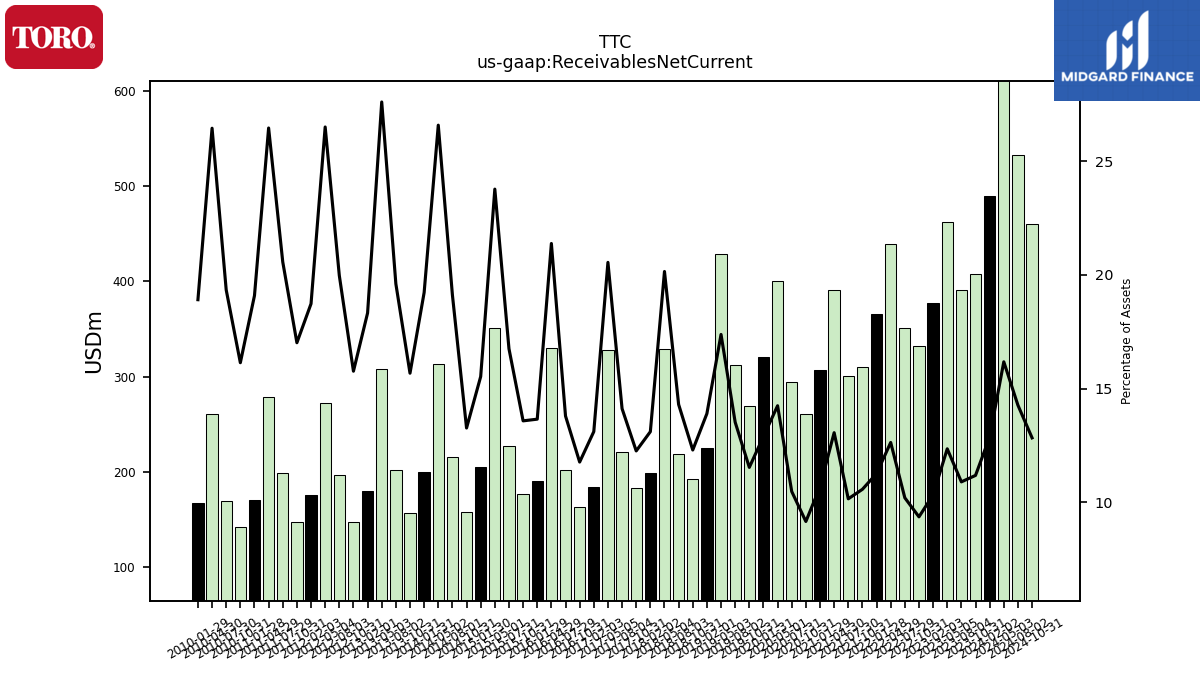
| Receivables Net Current | 489.10 | 407.40 | 390.68 | 461.98 | 377.26 | 332.71 | 350.66 | 439.33 | 366.27 | 310.28 | 301.23 | 391.24 | 306.87 | 261.13 | 294.67 | 400.44 | 321.19 | 268.77 | 312.24 | 428.57 | 225.53 | 193.18 | 219.47 | 329.57 | 198.74 | 183.07 | 221.55 | 328.52 | 183.85 | 163.26 | 202.39 | 329.84 | 190.30 | 177.01 | 227.81 | 351.60 | 205.29 | 158.16 | 215.59 | 313.49 | 199.83 | 157.17 | 202.15 | 307.77 | 180.32 | 147.41 | 197.02 | 272.82 | 175.50 | 148.14 | 199.01 | 278.49 | 171.16 | 142.90 | 170.10 | 260.79 | 167.26 | |
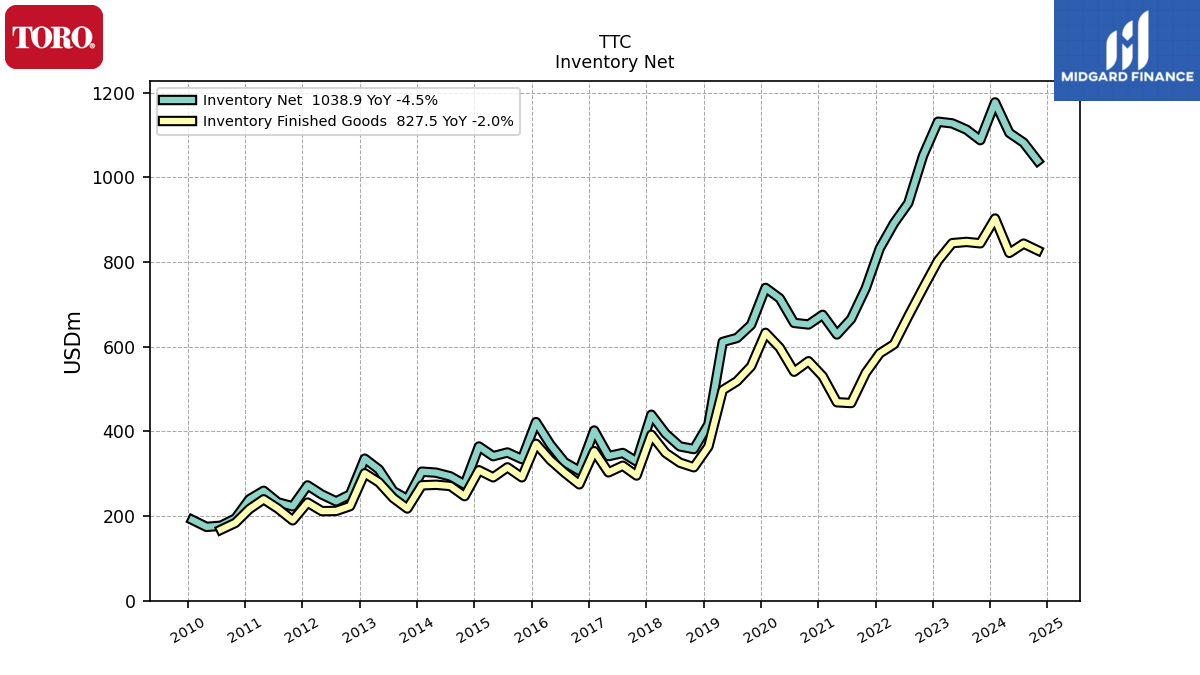
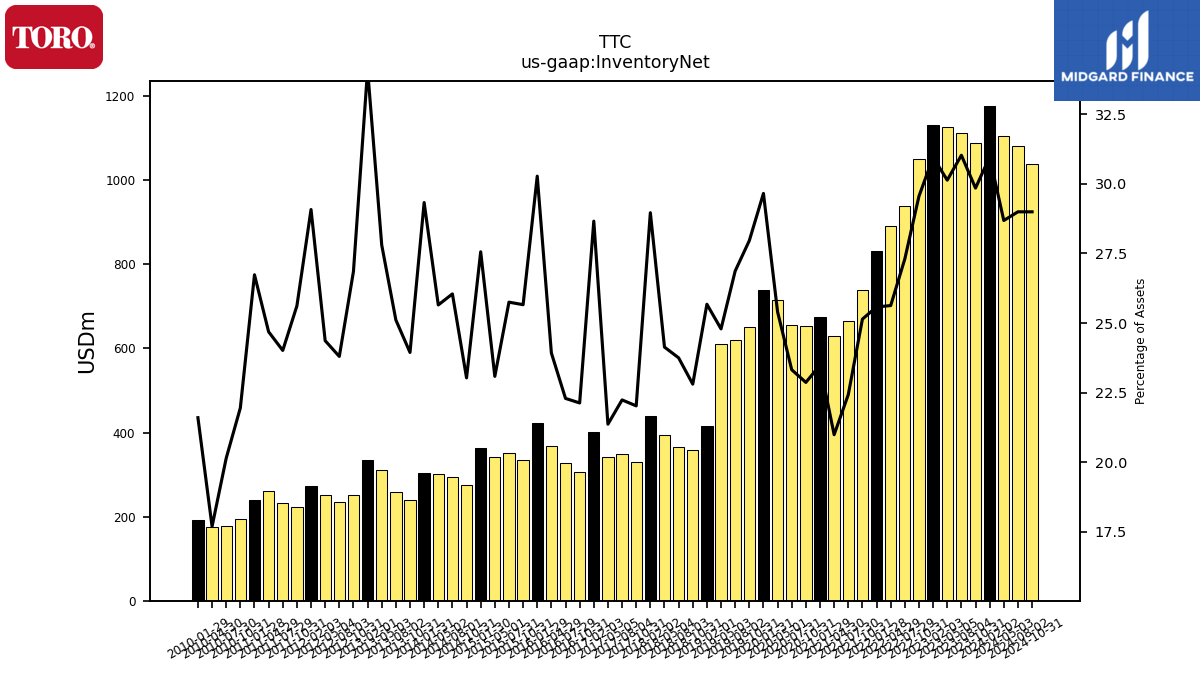
| Inventory Net | 1177.10 | 1087.80 | 1112.69 | 1127.47 | 1131.44 | 1051.11 | 939.27 | 891.68 | 832.07 | 738.17 | 665.65 | 628.81 | 675.31 | 652.43 | 656.21 | 714.17 | 738.96 | 651.66 | 620.61 | 611.33 | 416.65 | 358.26 | 364.50 | 394.80 | 439.34 | 328.99 | 349.02 | 341.58 | 402.10 | 307.03 | 327.11 | 369.07 | 422.04 | 334.51 | 350.19 | 341.44 | 364.39 | 274.60 | 293.76 | 302.48 | 304.92 | 240.09 | 258.93 | 310.00 | 335.70 | 251.12 | 234.79 | 250.80 | 272.47 | 223.03 | 232.36 | 259.83 | 239.73 | 194.40 | 177.19 | 174.41 | 191.07 | |
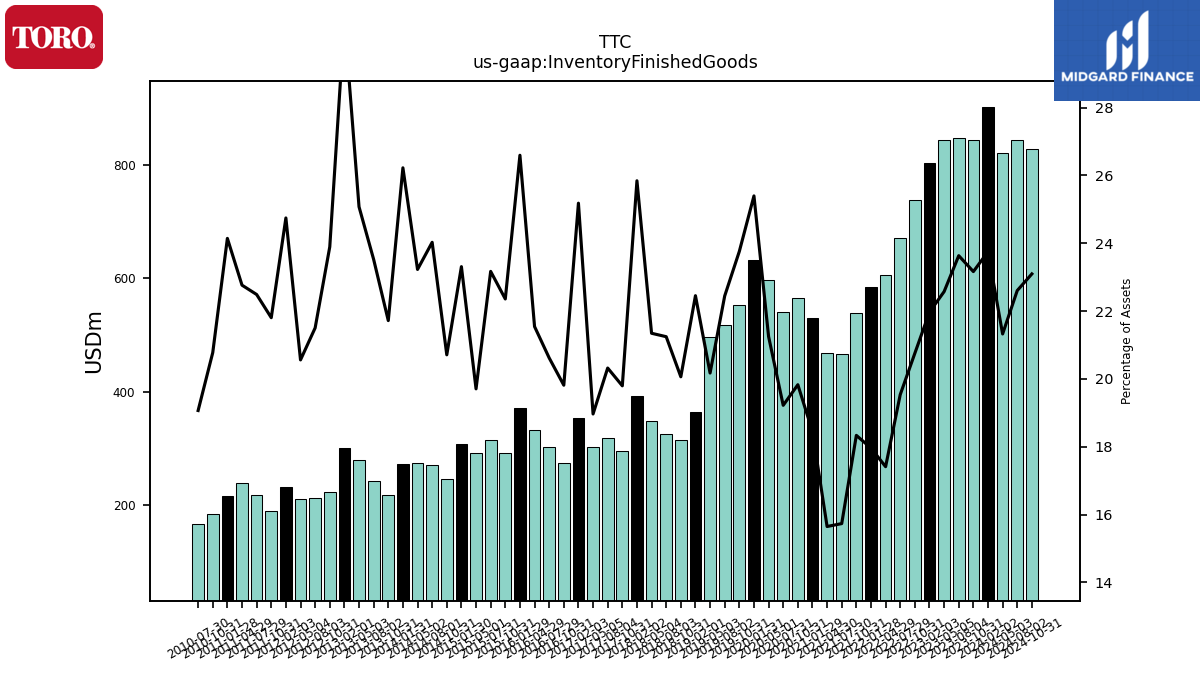
| Inventory Finished Goods | 902.80 | 844.20 | 847.49 | 844.60 | 803.03 | 738.10 | 672.04 | 605.78 | 584.27 | 538.33 | 466.96 | 468.81 | 530.41 | 565.76 | 540.84 | 597.43 | 632.80 | 553.77 | 518.47 | 497.47 | 364.39 | 315.18 | 326.06 | 349.17 | 391.99 | 295.72 | 318.94 | 303.21 | 353.29 | 274.93 | 302.57 | 332.37 | 370.70 | 291.47 | 315.11 | 291.48 | 308.21 | 246.95 | 271.00 | 273.92 | 272.64 | 217.80 | 242.56 | 279.59 | 301.13 | 223.46 | 212.14 | 211.64 | 231.88 | 189.85 | 217.59 | 239.60 | 216.50 | 183.99 | 167.73 | NA | NA | |
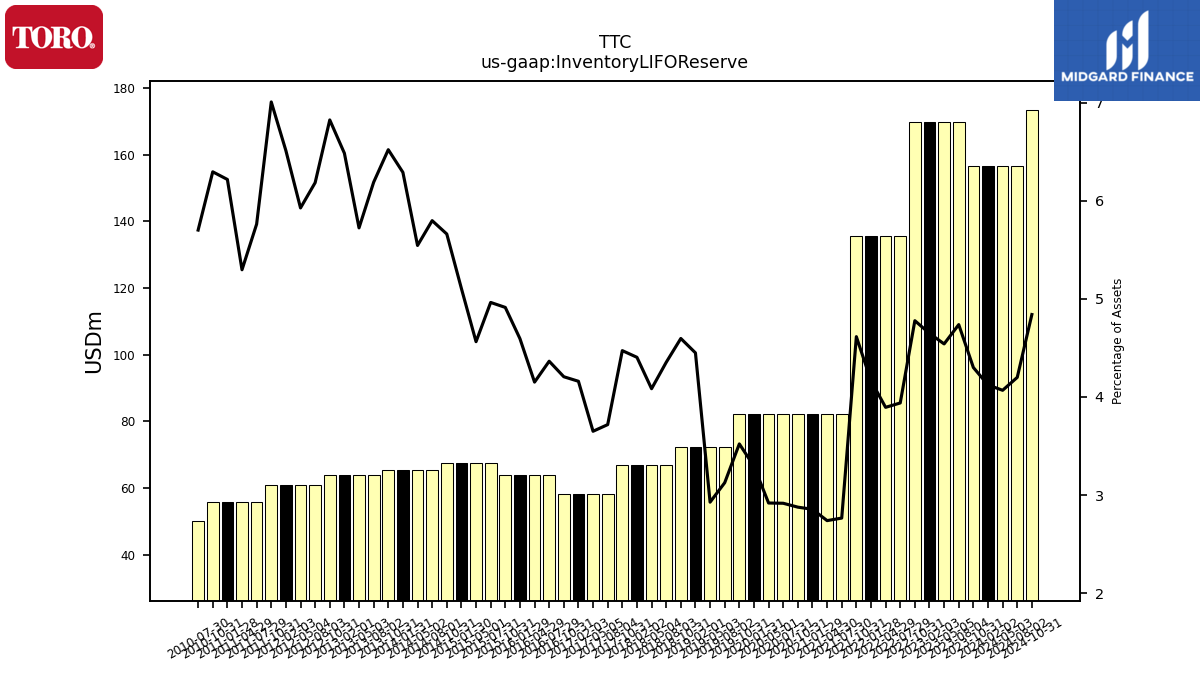
| Inventory L I F O Reserve | 156.70 | 156.70 | 169.87 | 169.87 | 169.87 | 169.87 | 135.49 | 135.49 | 135.49 | 135.49 | 82.09 | 82.09 | 82.09 | 82.09 | 82.07 | 82.07 | 82.07 | 82.07 | 72.20 | 72.20 | 72.20 | 72.20 | 66.80 | 66.80 | 66.80 | 66.80 | 58.36 | 58.36 | 58.36 | 58.36 | 64.04 | 64.04 | 64.04 | 64.04 | 67.50 | 67.50 | 67.50 | 67.50 | 65.38 | 65.38 | 65.38 | 65.38 | 63.81 | 63.81 | 63.81 | 63.81 | 61.00 | 61.00 | 61.00 | 61.00 | 55.74 | 55.74 | 55.74 | 55.74 | 50.14 | NA | NA | |
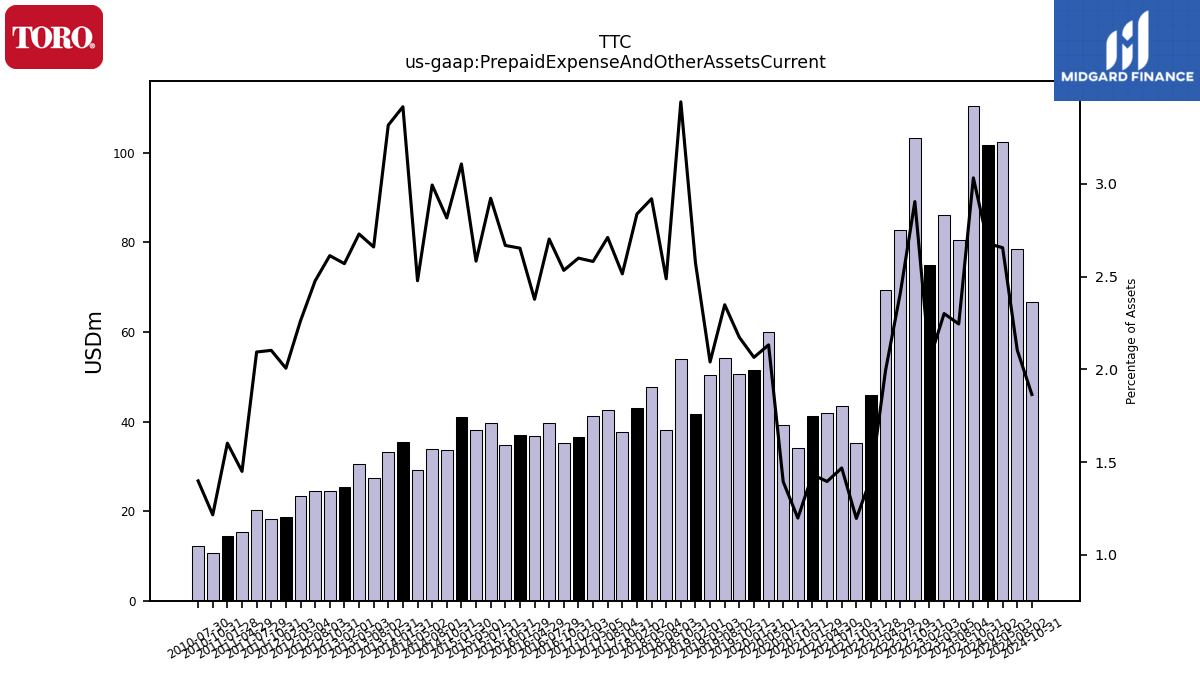
| Prepaid Expense And Other Assets Current | 101.80 | 110.50 | 80.49 | 86.08 | 74.96 | 103.28 | 82.86 | 69.43 | 45.96 | 35.12 | 43.58 | 41.81 | 41.18 | 34.19 | 39.23 | 59.94 | 51.44 | 50.63 | 54.23 | 50.30 | 41.79 | 54.08 | 38.19 | 47.76 | 43.04 | 37.56 | 42.55 | 41.27 | 36.47 | 35.16 | 39.66 | 36.68 | 36.98 | 34.78 | 39.74 | 38.21 | 41.08 | 33.58 | 33.76 | 29.22 | 35.51 | 33.26 | 27.43 | 30.43 | 25.29 | 24.44 | 24.44 | 23.28 | 18.80 | 18.30 | 20.26 | 15.26 | 14.37 | 10.77 | 12.30 | NA | NA |
| 2024-02-02 | 2023-10-31 | 2023-08-04 | 2023-05-05 | 2023-02-03 | 2022-10-31 | 2022-07-29 | 2022-04-29 | 2022-01-28 | 2021-10-31 | 2021-07-30 | 2021-04-30 | 2021-01-29 | 2020-10-31 | 2020-07-31 | 2020-05-01 | 2020-01-31 | 2019-10-31 | 2019-08-02 | 2019-05-03 | 2019-02-01 | 2018-10-31 | 2018-08-03 | 2018-05-04 | 2018-02-02 | 2017-10-31 | 2017-08-04 | 2017-05-05 | 2017-02-03 | 2016-10-31 | 2016-07-29 | 2016-04-29 | 2016-01-29 | 2015-10-31 | 2015-07-31 | 2015-05-01 | 2015-01-30 | 2014-10-31 | 2014-08-01 | 2014-05-02 | 2014-01-31 | 2013-10-31 | 2013-08-02 | 2013-05-03 | 2013-02-01 | 2012-10-31 | 2012-08-03 | 2012-05-04 | 2012-02-03 | 2011-10-31 | 2011-07-29 | 2011-04-29 | 2011-01-28 | 2010-10-31 | 2010-07-30 | 2010-04-30 | 2010-01-29 | ||
|---|---|---|---|---|---|---|---|---|---|---|---|---|---|---|---|---|---|---|---|---|---|---|---|---|---|---|---|---|---|---|---|---|---|---|---|---|---|---|---|---|---|---|---|---|---|---|---|---|---|---|---|---|---|---|---|---|---|---|
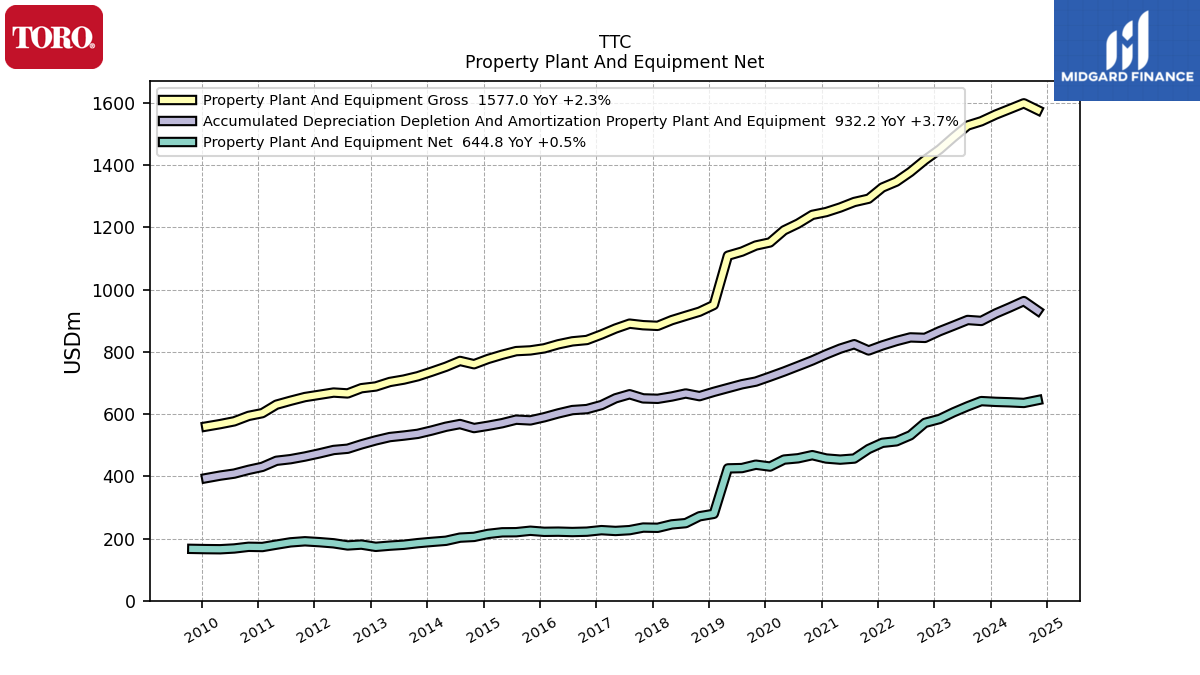
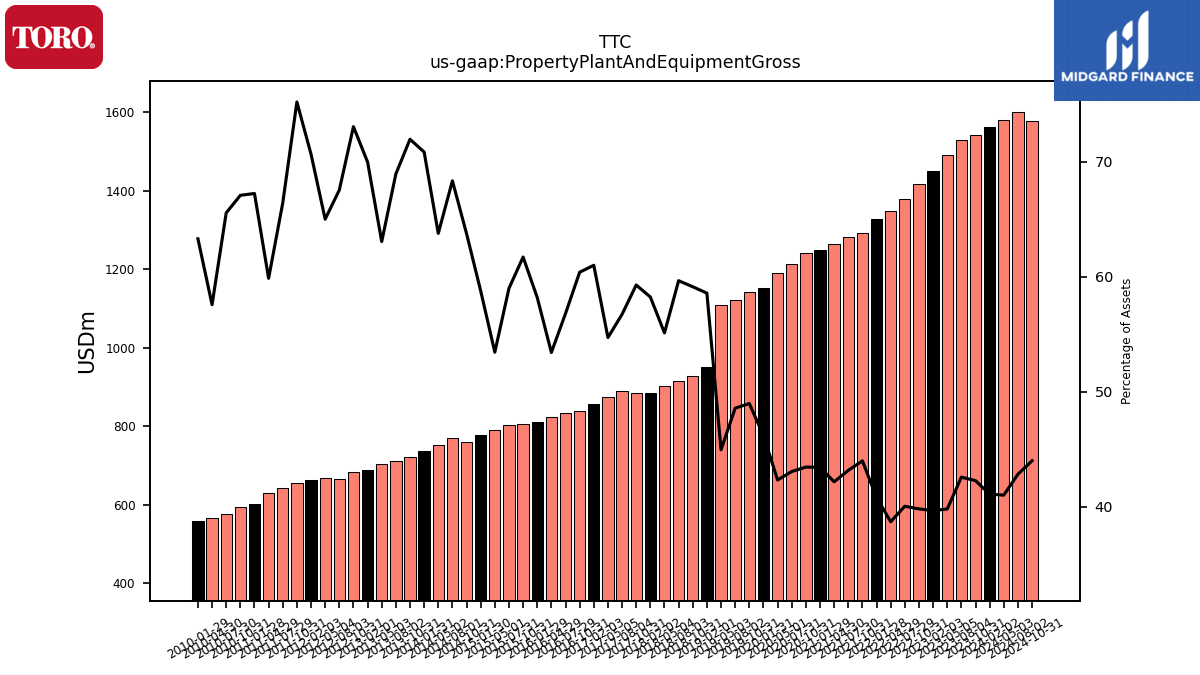
| Property Plant And Equipment Gross | 1562.60 | 1541.00 | 1527.35 | 1489.97 | 1450.50 | 1416.48 | 1378.21 | 1347.09 | 1328.07 | 1292.09 | 1281.55 | 1263.87 | 1249.21 | 1240.16 | 1212.23 | 1190.50 | 1151.61 | 1141.70 | 1122.15 | 1108.98 | 950.64 | 928.98 | 915.67 | 901.77 | 883.46 | 885.61 | 890.59 | 874.91 | 855.83 | 838.04 | 833.66 | 824.21 | 811.22 | 804.60 | 802.30 | 790.57 | 777.12 | 760.19 | 770.76 | 752.04 | 736.45 | 721.50 | 710.83 | 703.10 | 688.65 | 683.11 | 666.30 | 669.16 | 662.03 | 654.65 | 642.64 | 630.13 | 602.95 | 594.07 | 576.64 | 567.73 | 560.00 | |
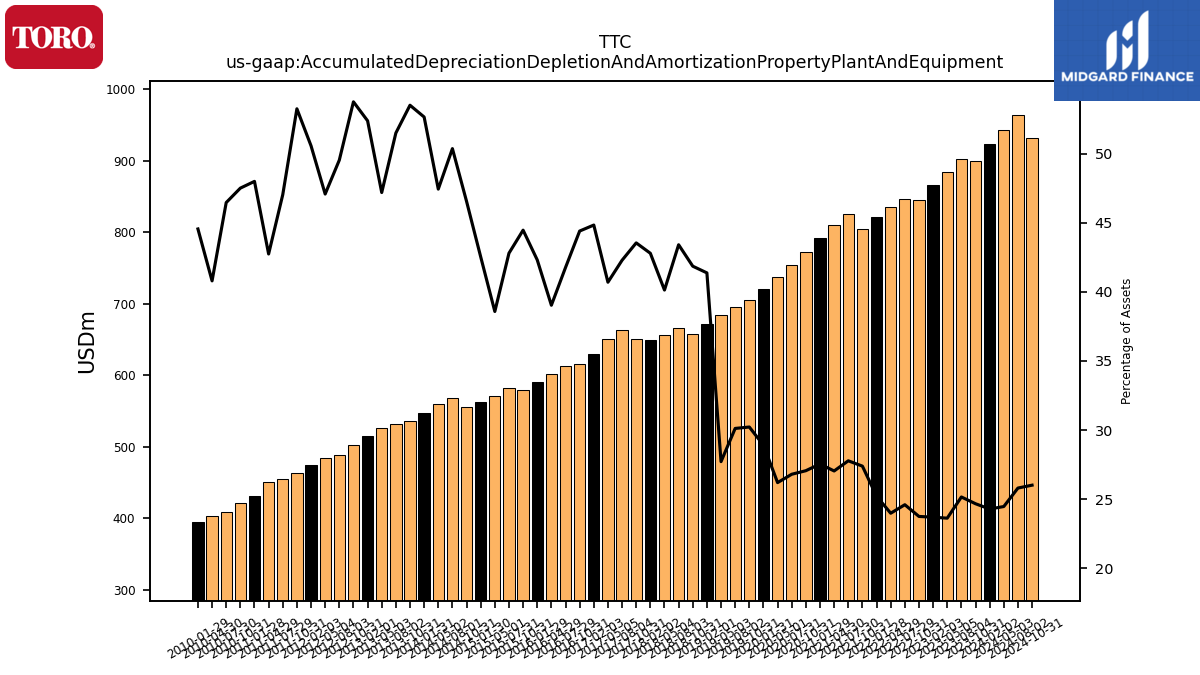
| Accumulated Depreciation Depletion And Amortization Property Plant And Equipment | 923.40 | 899.30 | 902.39 | 884.20 | 866.35 | 844.82 | 846.39 | 834.66 | 820.52 | 804.36 | 824.55 | 810.32 | 792.07 | 772.24 | 754.34 | 736.74 | 720.36 | 704.38 | 695.74 | 683.60 | 671.37 | 657.52 | 666.16 | 656.42 | 649.01 | 650.38 | 663.66 | 650.63 | 628.91 | 616.00 | 612.79 | 602.14 | 589.70 | 579.60 | 581.98 | 570.63 | 562.33 | 555.00 | 567.93 | 559.29 | 547.26 | 536.41 | 530.88 | 526.04 | 515.38 | 502.58 | 488.58 | 484.54 | 473.76 | 463.51 | 454.99 | 449.81 | 430.30 | 420.66 | 408.64 | 402.21 | 394.07 | |
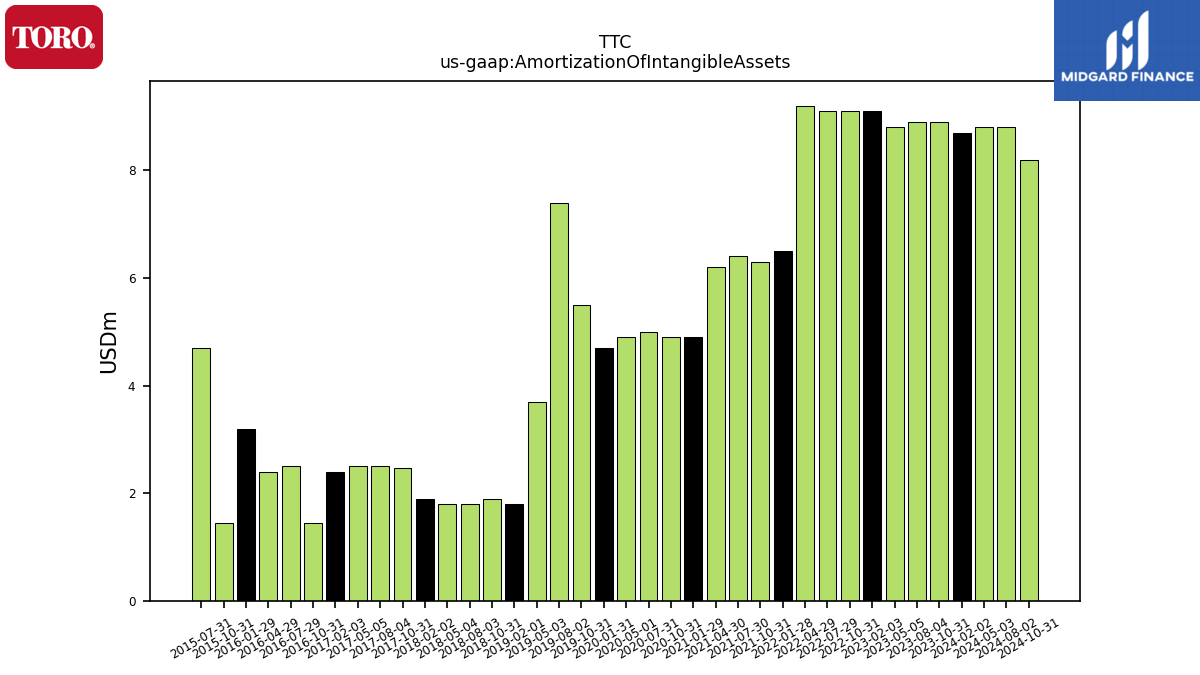
| Amortization Of Intangible Assets | 8.70 | 8.90 | 8.90 | 8.80 | 9.10 | 9.10 | 9.10 | 9.20 | 6.50 | 6.30 | 6.40 | 6.20 | 4.90 | 4.90 | 5.00 | 4.90 | 4.70 | 5.50 | 7.40 | 3.70 | 1.80 | 1.90 | 1.80 | 1.80 | 1.90 | 2.48 | 2.50 | 2.50 | 2.40 | 1.45 | 2.50 | 2.40 | 3.20 | 1.44 | 4.70 | NA | NA | NA | NA | NA | NA | NA | NA | NA | NA | NA | NA | NA | NA | NA | NA | NA | NA | NA | NA | NA | NA | |
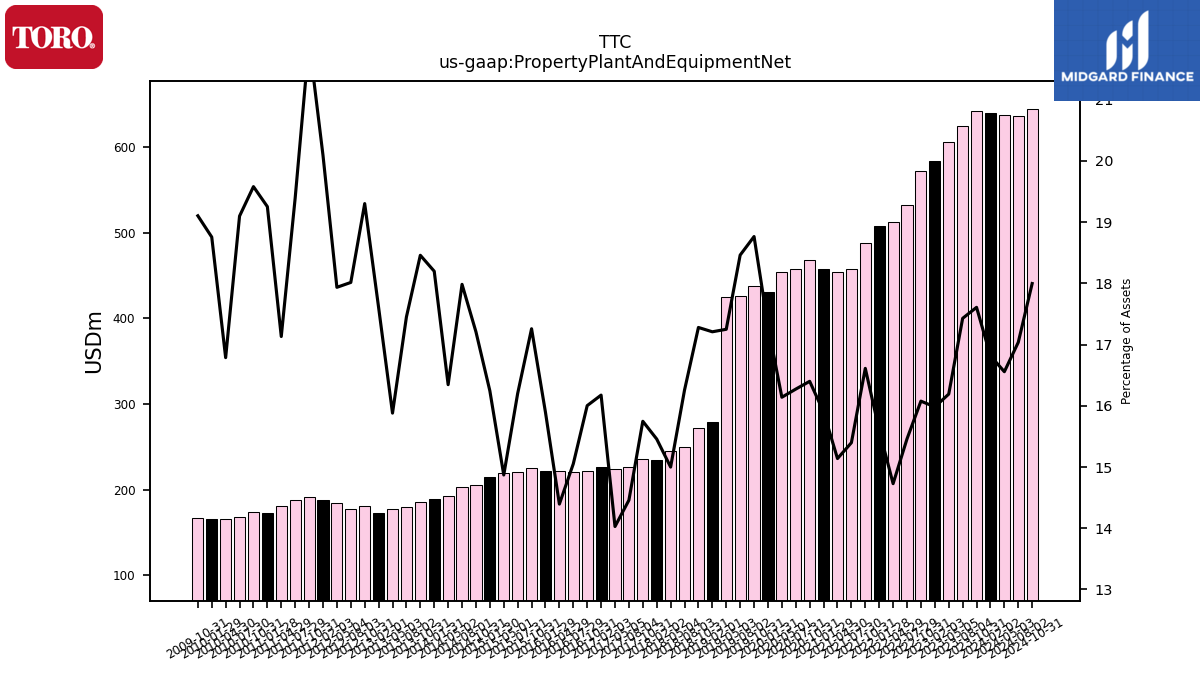
| Property Plant And Equipment Net | 639.20 | 641.70 | 624.96 | 605.77 | 584.15 | 571.66 | 531.82 | 512.43 | 507.55 | 487.73 | 456.99 | 453.55 | 457.15 | 467.92 | 457.89 | 453.76 | 431.25 | 437.32 | 426.42 | 425.38 | 279.27 | 271.46 | 249.50 | 245.35 | 234.45 | 235.23 | 226.93 | 224.28 | 226.92 | 222.04 | 220.88 | 222.07 | 221.52 | 225.00 | 220.32 | 219.94 | 214.78 | 205.19 | 202.83 | 192.75 | 189.19 | 185.10 | 179.94 | 177.06 | 173.27 | 180.52 | 177.72 | 184.62 | 188.27 | 191.14 | 187.65 | 180.31 | 172.65 | 173.41 | 168.00 | 165.51 | 165.93 | |
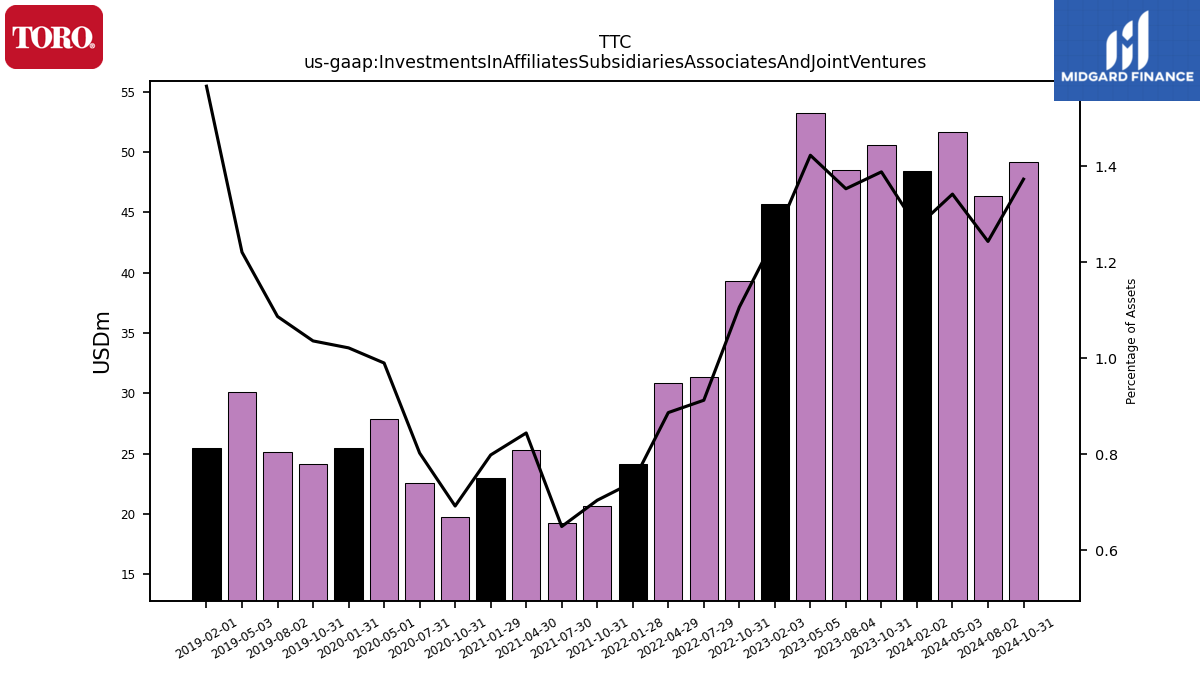
| Investments In Affiliates Subsidiaries Associates And Joint Ventures | 48.40 | 50.60 | 48.53 | 53.24 | 45.73 | 39.35 | 31.39 | 30.85 | 24.12 | 20.67 | 19.27 | 25.30 | 22.95 | 19.75 | 22.58 | 27.84 | 25.45 | 24.15 | 25.11 | 30.11 | 25.43 | NA | NA | NA | NA | NA | NA | NA | NA | NA | NA | NA | NA | NA | NA | NA | NA | NA | NA | NA | NA | NA | NA | NA | NA | NA | NA | NA | NA | NA | NA | NA | NA | NA | NA | NA | NA | |
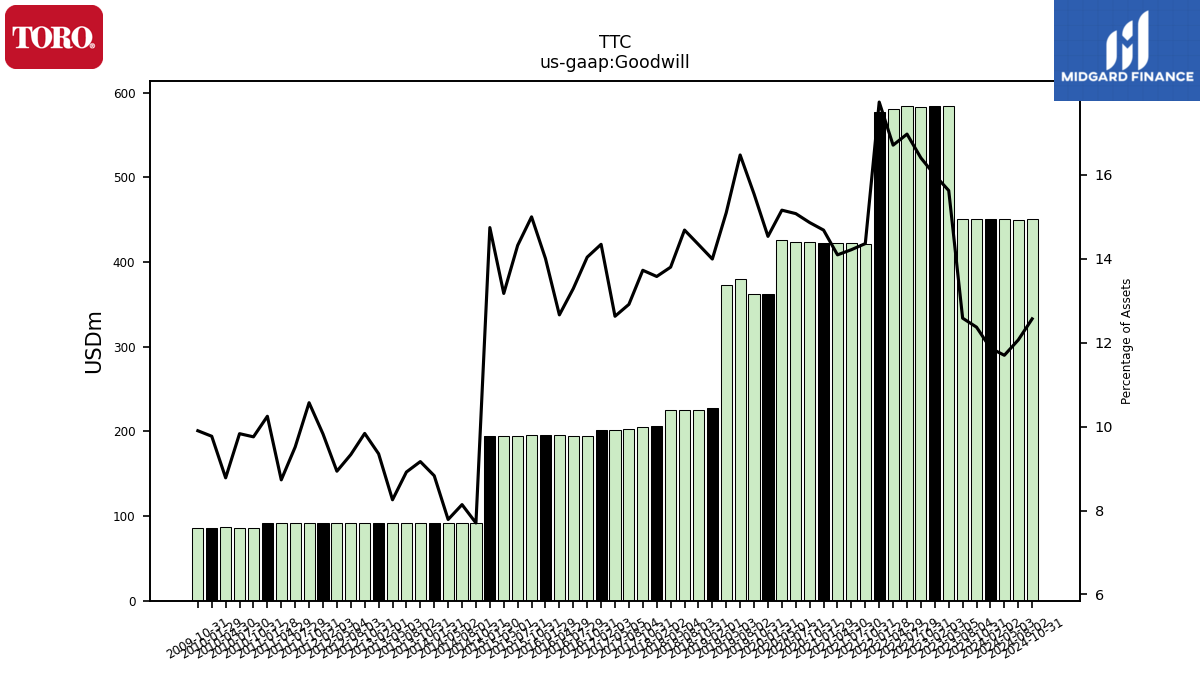
| Goodwill | 451.20 | 450.80 | 451.26 | 584.61 | 584.55 | 583.30 | 583.80 | 581.32 | 576.94 | 421.68 | 421.96 | 422.25 | 422.16 | 424.07 | 424.23 | 426.18 | 362.14 | 362.25 | 380.50 | 372.34 | 227.09 | 225.29 | 225.37 | 225.74 | 205.95 | 205.03 | 202.68 | 201.91 | 201.25 | 194.78 | 195.02 | 195.36 | 195.22 | 195.53 | 194.73 | 194.85 | 194.93 | 91.85 | 91.81 | 91.81 | 91.79 | 91.91 | 91.95 | 92.05 | 92.04 | 92.00 | 92.07 | 91.99 | 92.06 | 92.02 | 92.05 | 91.89 | 91.88 | 86.40 | 86.48 | 86.56 | 86.43 | |
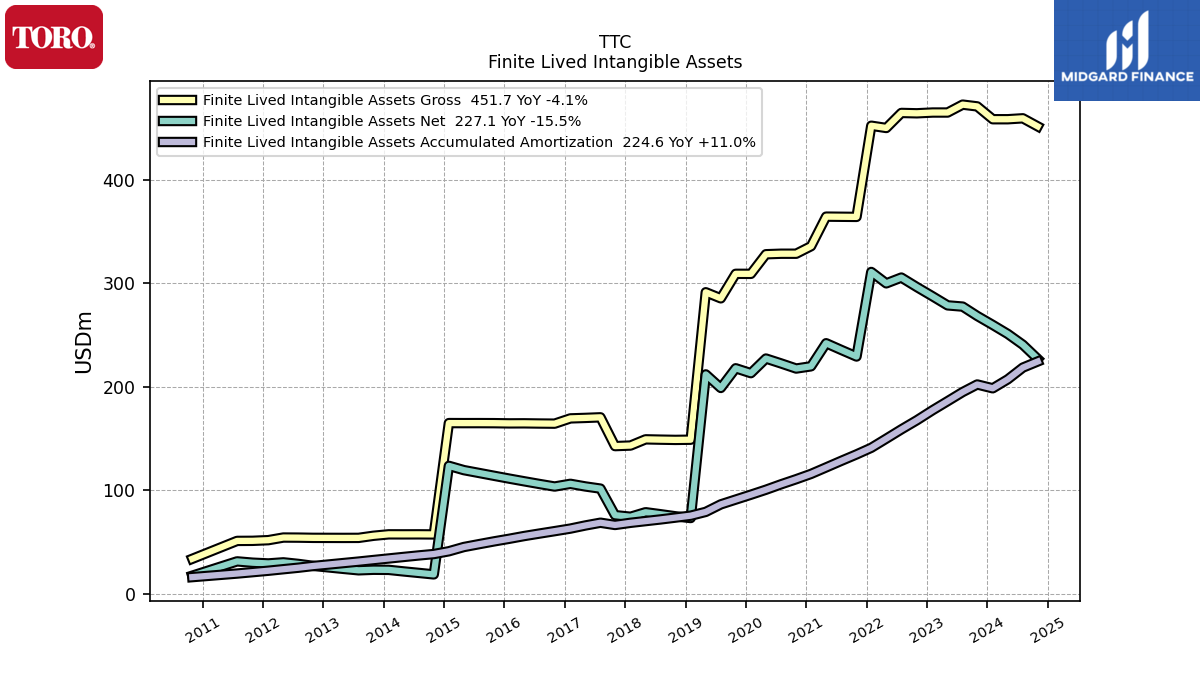
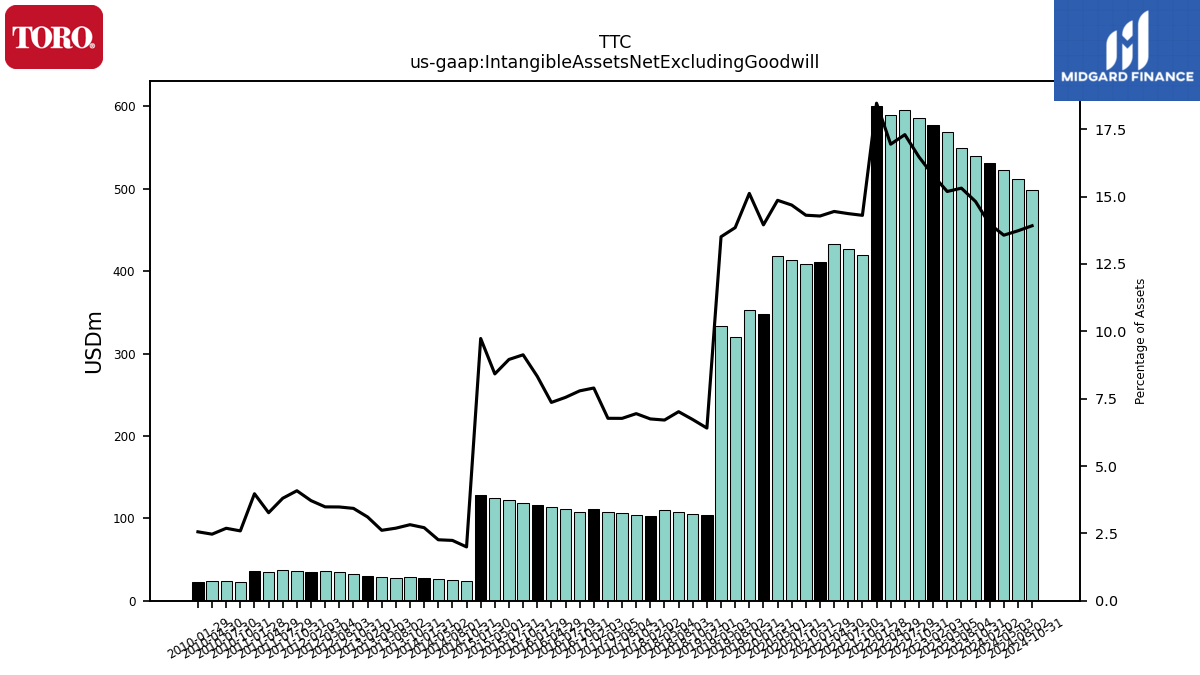
| Intangible Assets Net Excluding Goodwill | 531.50 | 540.10 | 549.19 | 568.36 | 577.06 | 585.83 | 595.14 | 589.61 | 600.80 | 420.04 | 426.50 | 432.93 | 410.59 | 408.31 | 413.27 | 417.89 | 347.64 | 352.37 | 319.89 | 333.18 | 104.02 | 105.65 | 107.70 | 109.71 | 102.37 | 103.74 | 106.26 | 108.27 | 110.78 | 108.09 | 110.78 | 113.57 | 116.12 | 119.01 | 121.80 | 124.54 | 128.70 | 23.83 | 25.26 | 26.69 | 28.20 | 28.31 | 27.78 | 29.15 | 30.61 | 32.06 | 34.34 | 35.87 | 34.82 | 35.55 | 36.81 | 34.39 | 35.62 | 22.96 | 23.67 | 24.37 | 22.64 | |
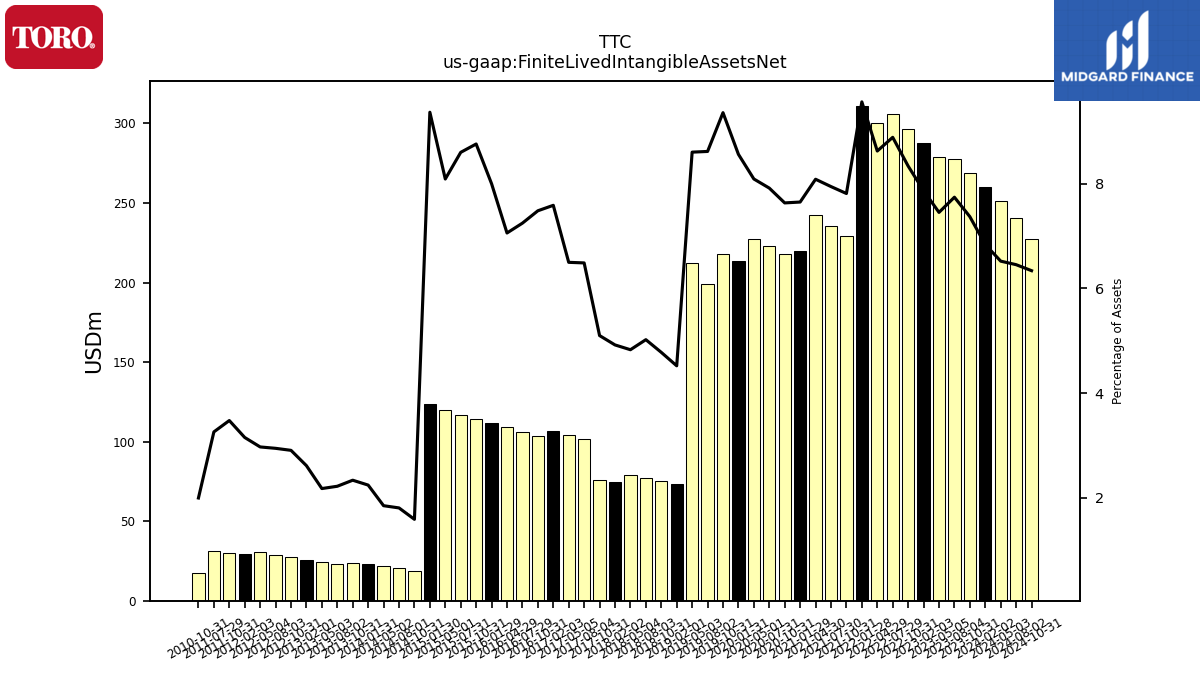
| Finite Lived Intangible Assets Net | 259.90 | 268.60 | 277.62 | 278.81 | 287.55 | 296.48 | 305.67 | 300.07 | 311.09 | 229.40 | 235.82 | 242.24 | 219.94 | 217.79 | 222.75 | 227.46 | 213.32 | 218.06 | 199.01 | 212.15 | 73.38 | 75.07 | 77.06 | 78.99 | 74.63 | 76.17 | 101.82 | 103.89 | 106.44 | 103.83 | 106.34 | 108.89 | 111.50 | 114.18 | 116.94 | 119.66 | 123.82 | 18.95 | 20.38 | 21.81 | 23.32 | 23.43 | 22.90 | 24.27 | 25.73 | 27.18 | 29.06 | 30.59 | 29.54 | 30.27 | 31.53 | NA | NA | 17.68 | NA | NA | NA | |
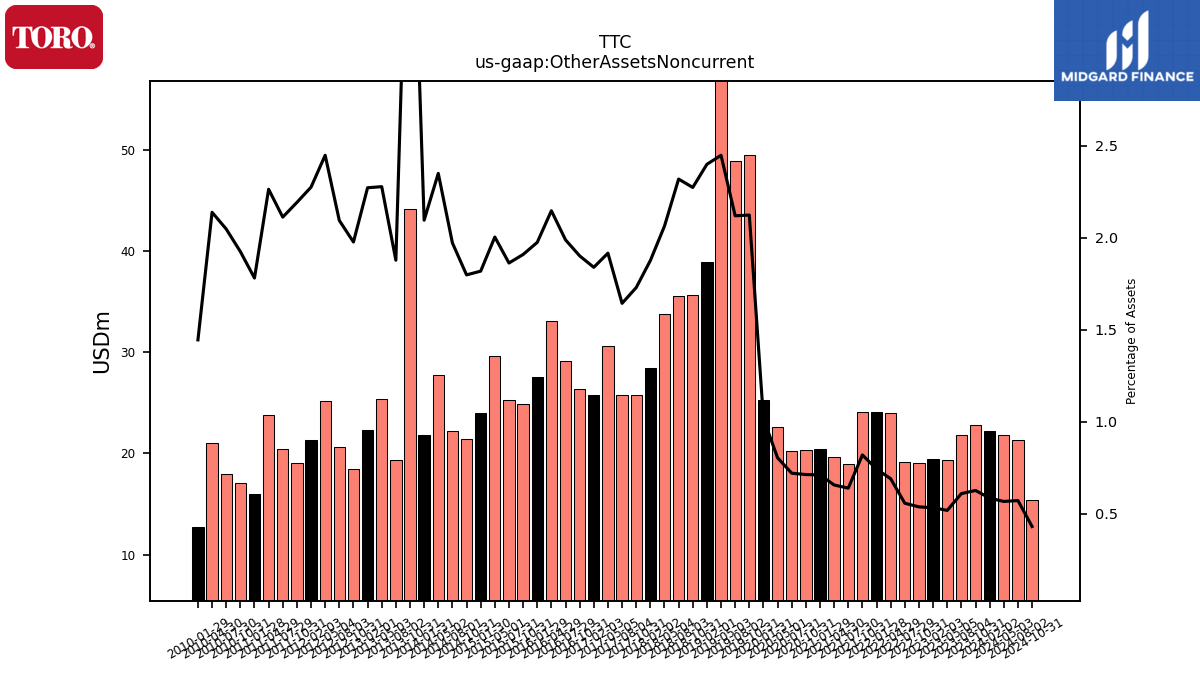
| Other Assets Noncurrent | 22.20 | 22.80 | 21.82 | 19.36 | 19.45 | 19.08 | 19.13 | 23.98 | 24.13 | 24.04 | 18.94 | 19.64 | 20.42 | 20.32 | 20.24 | 22.58 | 25.32 | 49.46 | 48.92 | 60.34 | 38.91 | 35.70 | 35.57 | 33.73 | 28.44 | 25.82 | 25.78 | 30.62 | 25.79 | 26.37 | 29.16 | 33.10 | 27.51 | 24.87 | 25.32 | 29.62 | 24.03 | 21.43 | 22.23 | 27.70 | 21.77 | 44.16 | 19.35 | 25.38 | 22.35 | 18.48 | 20.65 | 25.19 | 21.30 | 19.07 | 20.42 | 23.81 | 15.96 | 17.04 | 18.00 | 21.07 | 12.77 |
| 2024-02-02 | 2023-10-31 | 2023-08-04 | 2023-05-05 | 2023-02-03 | 2022-10-31 | 2022-07-29 | 2022-04-29 | 2022-01-28 | 2021-10-31 | 2021-07-30 | 2021-04-30 | 2021-01-29 | 2020-10-31 | 2020-07-31 | 2020-05-01 | 2020-01-31 | 2019-10-31 | 2019-08-02 | 2019-05-03 | 2019-02-01 | 2018-10-31 | 2018-08-03 | 2018-05-04 | 2018-02-02 | 2017-10-31 | 2017-08-04 | 2017-05-05 | 2017-02-03 | 2016-10-31 | 2016-07-29 | 2016-04-29 | 2016-01-29 | 2015-10-31 | 2015-07-31 | 2015-05-01 | 2015-01-30 | 2014-10-31 | 2014-08-01 | 2014-05-02 | 2014-01-31 | 2013-10-31 | 2013-08-02 | 2013-05-03 | 2013-02-01 | 2012-10-31 | 2012-08-03 | 2012-05-04 | 2012-02-03 | 2011-10-31 | 2011-07-29 | 2011-04-29 | 2011-01-28 | 2010-10-31 | 2010-07-30 | 2010-04-30 | 2010-01-29 | ||
|---|---|---|---|---|---|---|---|---|---|---|---|---|---|---|---|---|---|---|---|---|---|---|---|---|---|---|---|---|---|---|---|---|---|---|---|---|---|---|---|---|---|---|---|---|---|---|---|---|---|---|---|---|---|---|---|---|---|---|
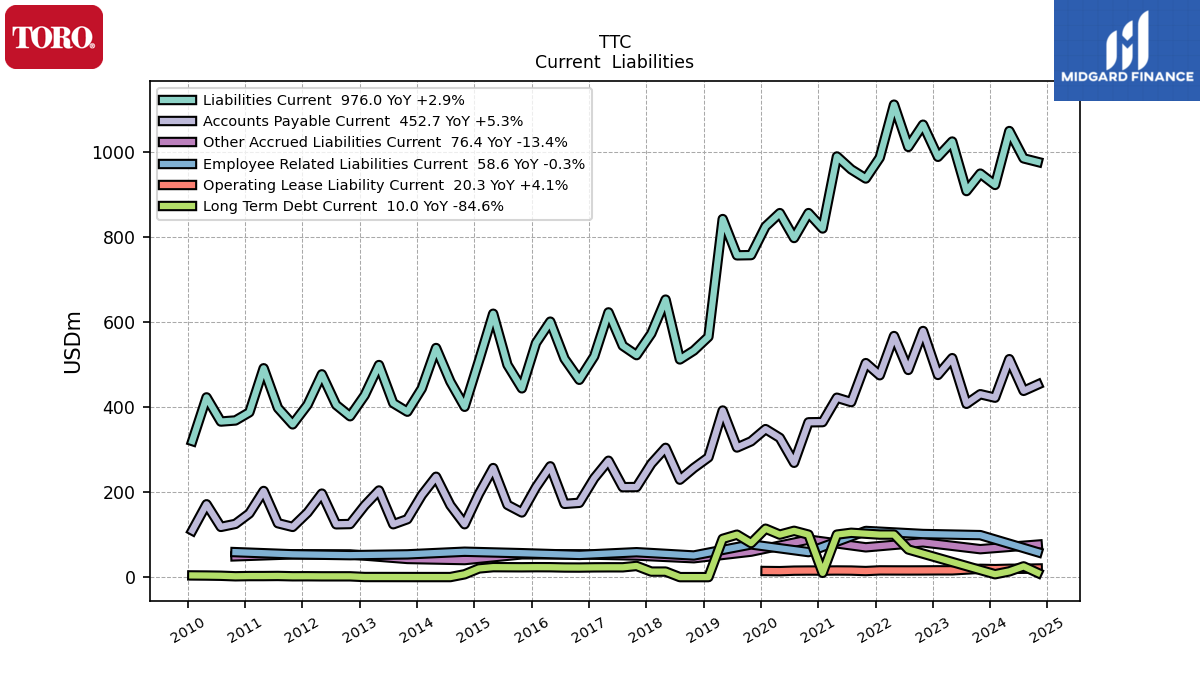
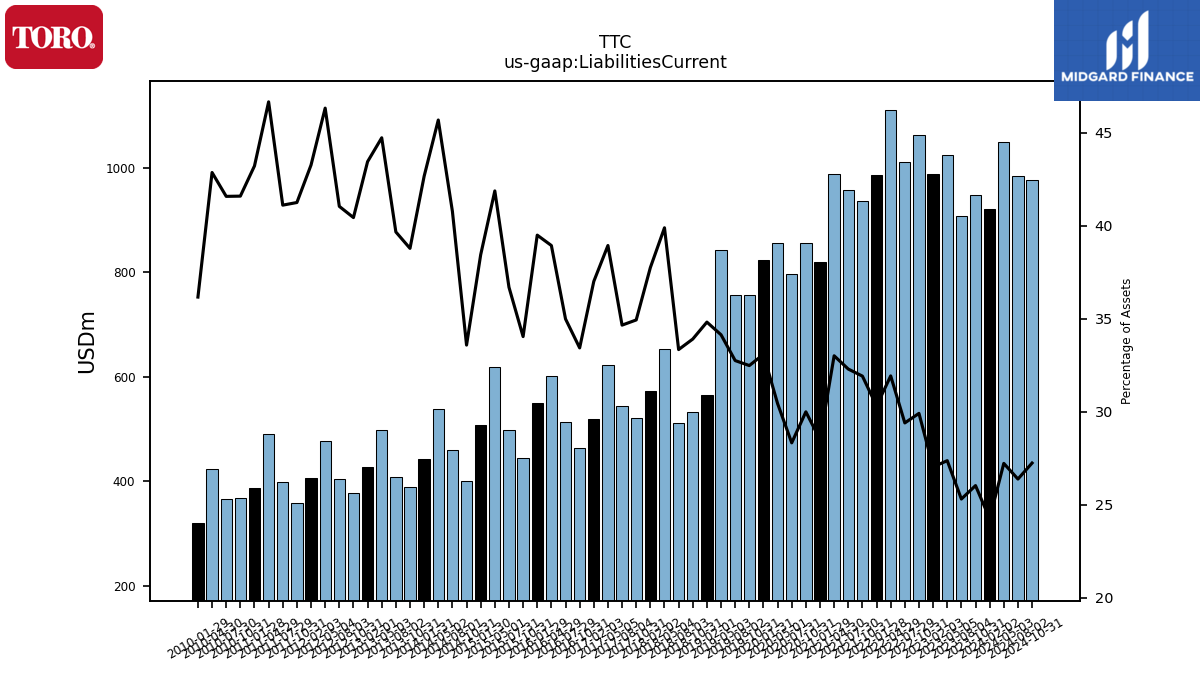
| Liabilities Current | 921.90 | 948.60 | 907.50 | 1024.00 | 987.97 | 1063.61 | 1011.26 | 1110.73 | 986.06 | 937.02 | 958.44 | 988.90 | 819.54 | 855.80 | 797.11 | 855.73 | 824.31 | 756.97 | 756.40 | 841.77 | 564.98 | 532.63 | 511.68 | 652.41 | 572.49 | 521.80 | 543.89 | 622.41 | 519.12 | 463.84 | 513.41 | 600.60 | 550.41 | 443.73 | 498.97 | 619.24 | 508.21 | 400.42 | 459.75 | 538.63 | 443.43 | 388.85 | 408.95 | 498.61 | 427.49 | 378.12 | 404.82 | 476.74 | 405.31 | 359.08 | 397.67 | 491.03 | 387.45 | 368.28 | 365.69 | 422.54 | 319.89 | |
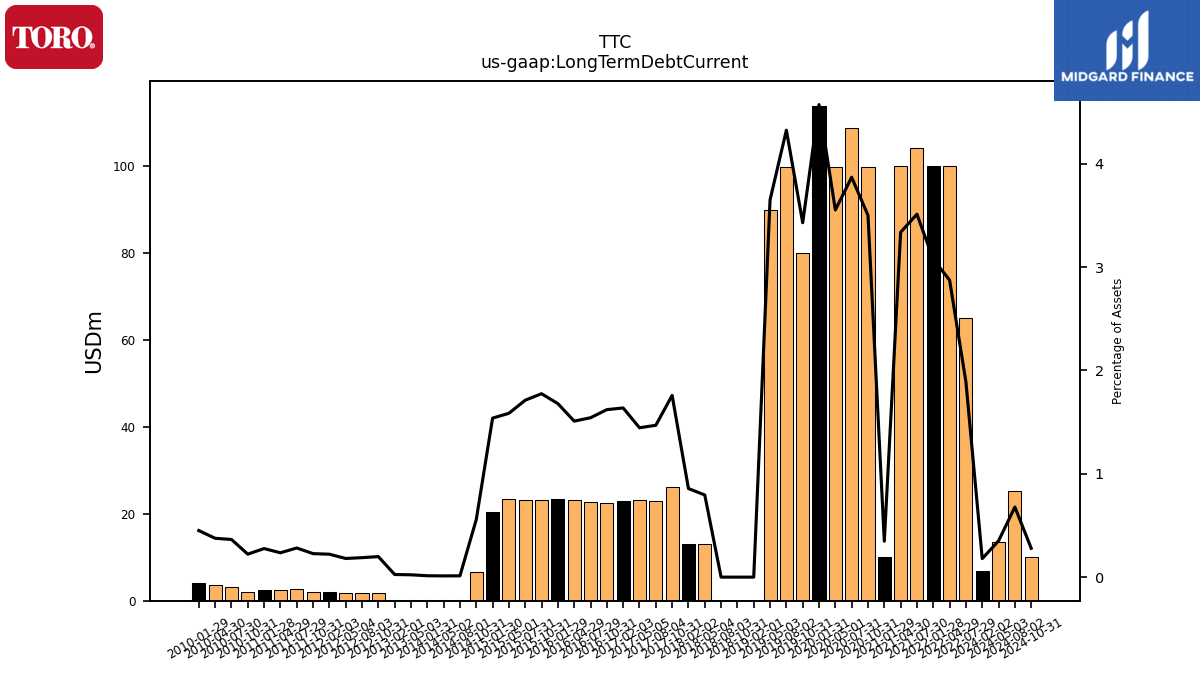
| Long Term Debt Current | 6.80 | NA | NA | NA | NA | NA | 65.00 | 100.00 | 100.00 | NA | 104.22 | 99.96 | 9.99 | 99.87 | 108.87 | 99.87 | 113.90 | 79.91 | 99.88 | 90.00 | 0.00 | 0.00 | 0.00 | 13.00 | 13.00 | 26.26 | 23.06 | 23.11 | 22.96 | 22.48 | 22.63 | 23.29 | 23.40 | 23.13 | 23.28 | 23.44 | 20.34 | 6.64 | 0.14 | 0.14 | 0.14 | NA | NA | 0.25 | 0.25 | 1.86 | 1.86 | 1.86 | 2.08 | 1.98 | 2.73 | 2.48 | 2.48 | 1.97 | 3.21 | 3.71 | 3.98 | |
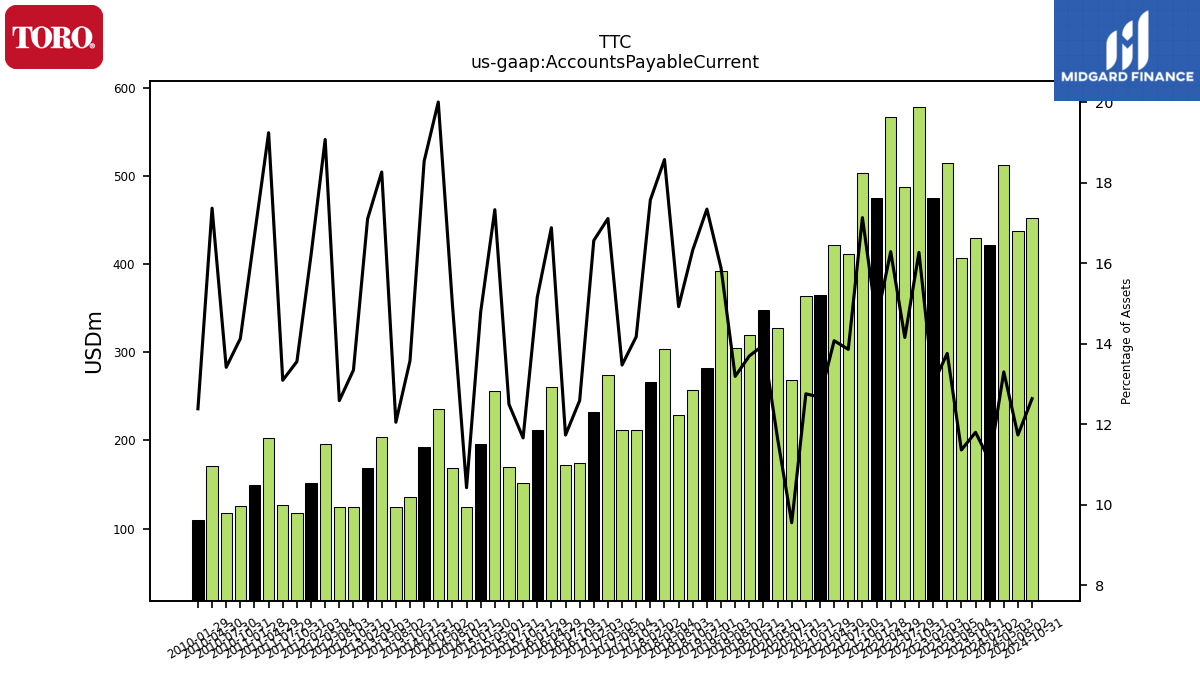
| Accounts Payable Current | 421.80 | 430.00 | 407.37 | 514.82 | 475.22 | 578.62 | 487.03 | 566.77 | 474.48 | 503.12 | 411.41 | 421.74 | 364.36 | 363.95 | 268.75 | 327.35 | 348.00 | 319.23 | 304.66 | 391.69 | 281.53 | 256.57 | 229.04 | 303.91 | 266.59 | 211.75 | 211.45 | 273.60 | 232.44 | 174.67 | 172.16 | 260.50 | 211.22 | 152.02 | 169.93 | 256.39 | 195.57 | 124.27 | 168.96 | 235.97 | 192.73 | 136.16 | 124.24 | 203.71 | 168.33 | 124.81 | 124.17 | 196.38 | 151.84 | 118.04 | 126.69 | 202.59 | 149.70 | 125.14 | 118.01 | 171.28 | 109.56 | |
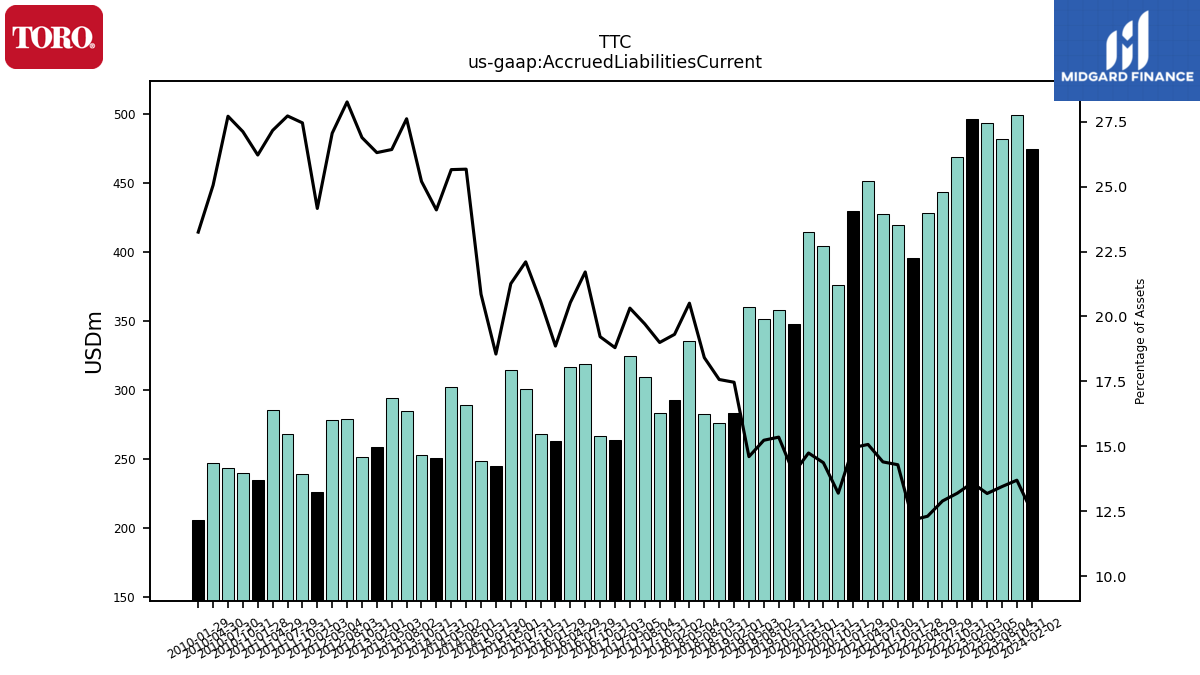
| Accrued Liabilities Current | 474.50 | 499.10 | 482.30 | 493.26 | 496.79 | 469.24 | 443.56 | 428.23 | 395.74 | 419.62 | 427.41 | 451.58 | 429.82 | 376.52 | 404.31 | 414.50 | 348.03 | 357.83 | 351.87 | 360.08 | 283.45 | 276.06 | 282.63 | 335.50 | 292.90 | 283.79 | 309.38 | 324.88 | 263.72 | 266.69 | 318.63 | 316.81 | 262.89 | 268.36 | 300.58 | 314.50 | 245.30 | 248.69 | 289.52 | 302.51 | 250.56 | 252.69 | 284.70 | 294.65 | 258.91 | 251.46 | 278.80 | 278.49 | 226.37 | 239.03 | 268.20 | 285.90 | 235.08 | 240.14 | 243.74 | 247.04 | 205.65 |
| 2024-02-02 | 2023-10-31 | 2023-08-04 | 2023-05-05 | 2023-02-03 | 2022-10-31 | 2022-07-29 | 2022-04-29 | 2022-01-28 | 2021-10-31 | 2021-07-30 | 2021-04-30 | 2021-01-29 | 2020-10-31 | 2020-07-31 | 2020-05-01 | 2020-01-31 | 2019-10-31 | 2019-08-02 | 2019-05-03 | 2019-02-01 | 2018-10-31 | 2018-08-03 | 2018-05-04 | 2018-02-02 | 2017-10-31 | 2017-08-04 | 2017-05-05 | 2017-02-03 | 2016-10-31 | 2016-07-29 | 2016-04-29 | 2016-01-29 | 2015-10-31 | 2015-07-31 | 2015-05-01 | 2015-01-30 | 2014-10-31 | 2014-08-01 | 2014-05-02 | 2014-01-31 | 2013-10-31 | 2013-08-02 | 2013-05-03 | 2013-02-01 | 2012-10-31 | 2012-08-03 | 2012-05-04 | 2012-02-03 | 2011-10-31 | 2011-07-29 | 2011-04-29 | 2011-01-28 | 2010-10-31 | 2010-07-30 | 2010-04-30 | 2010-01-29 | ||
|---|---|---|---|---|---|---|---|---|---|---|---|---|---|---|---|---|---|---|---|---|---|---|---|---|---|---|---|---|---|---|---|---|---|---|---|---|---|---|---|---|---|---|---|---|---|---|---|---|---|---|---|---|---|---|---|---|---|---|
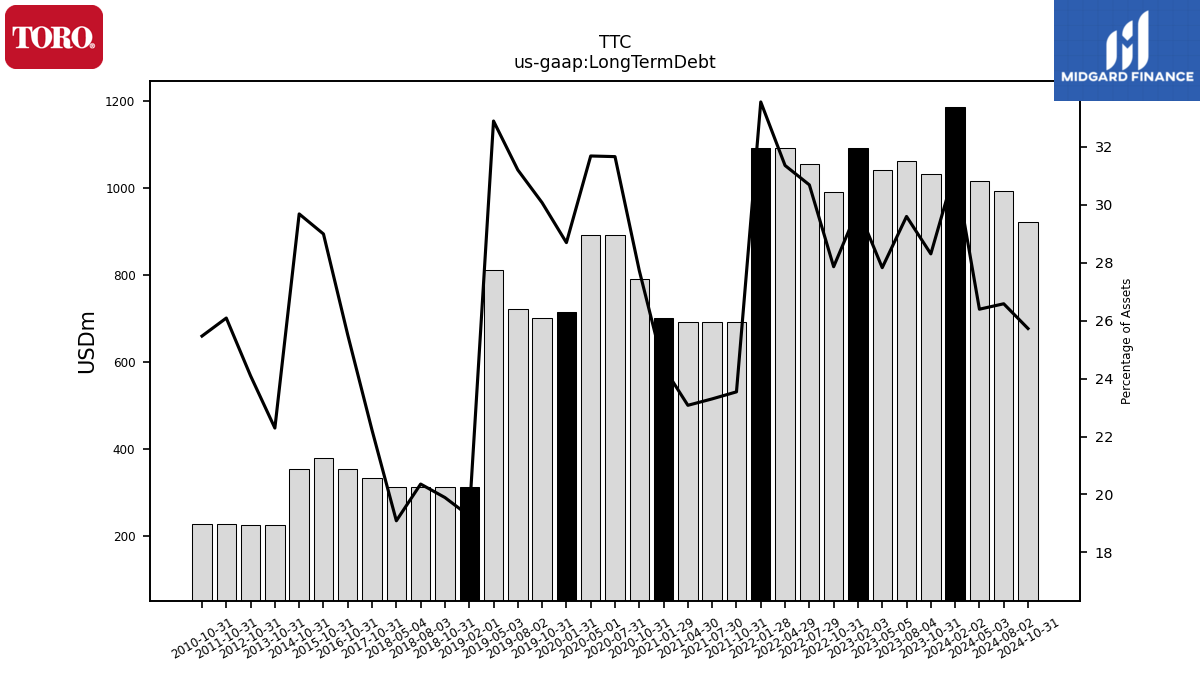
| Long Term Debt | 1186.60 | 1031.50 | 1061.31 | 1041.16 | 1091.02 | 990.77 | 1055.62 | 1090.97 | 1091.35 | 691.24 | 691.56 | 691.46 | 701.35 | 791.12 | 890.90 | 890.78 | 714.92 | 700.81 | 720.68 | 811.08 | 312.55 | 312.55 | 312.48 | 312.30 | NA | 331.89 | NA | NA | NA | 353.91 | NA | NA | NA | 377.95 | NA | NA | NA | 353.96 | NA | NA | NA | 223.54 | NA | NA | NA | 225.34 | NA | NA | NA | 227.16 | NA | NA | NA | 225.55 | NA | NA | NA | |
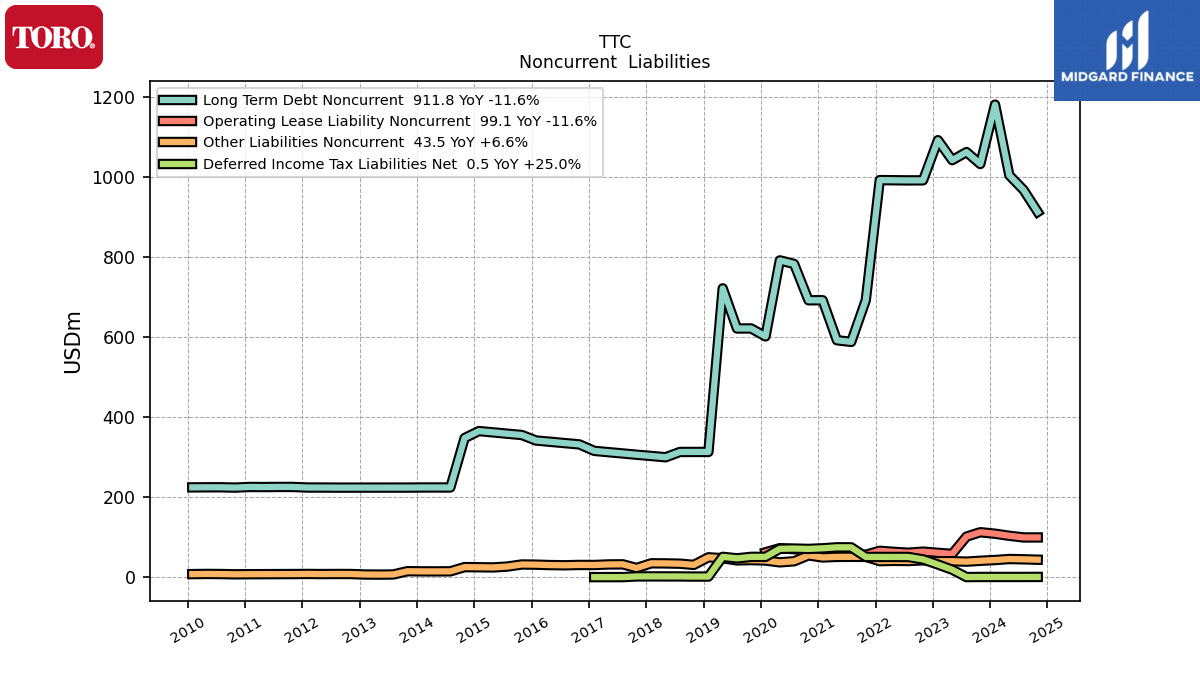
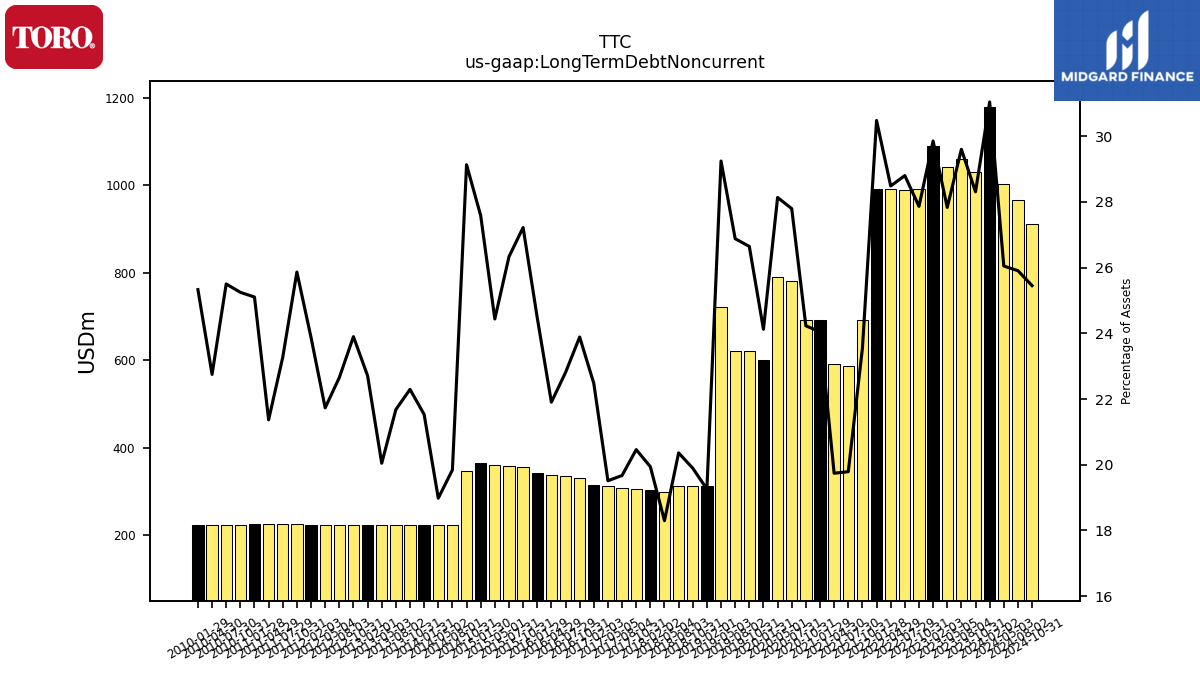
| Long Term Debt Noncurrent | 1179.80 | 1031.50 | 1061.31 | 1041.16 | 1091.02 | 990.77 | 990.62 | 990.97 | 991.35 | 691.24 | 587.35 | 591.50 | 691.36 | 691.25 | 782.04 | 790.91 | 601.02 | 620.90 | 620.80 | 721.08 | 312.55 | 312.55 | 312.48 | 299.30 | 302.46 | 305.63 | 308.79 | 311.96 | 315.31 | 331.42 | 334.66 | 337.91 | 341.13 | 354.82 | 358.05 | 361.43 | 364.66 | 347.32 | 223.80 | 223.85 | 223.84 | 223.54 | 223.53 | 223.51 | 223.50 | 223.48 | 223.47 | 223.70 | 223.69 | 225.18 | 225.16 | 224.90 | 225.10 | 223.58 | 224.31 | 224.30 | 224.06 | |
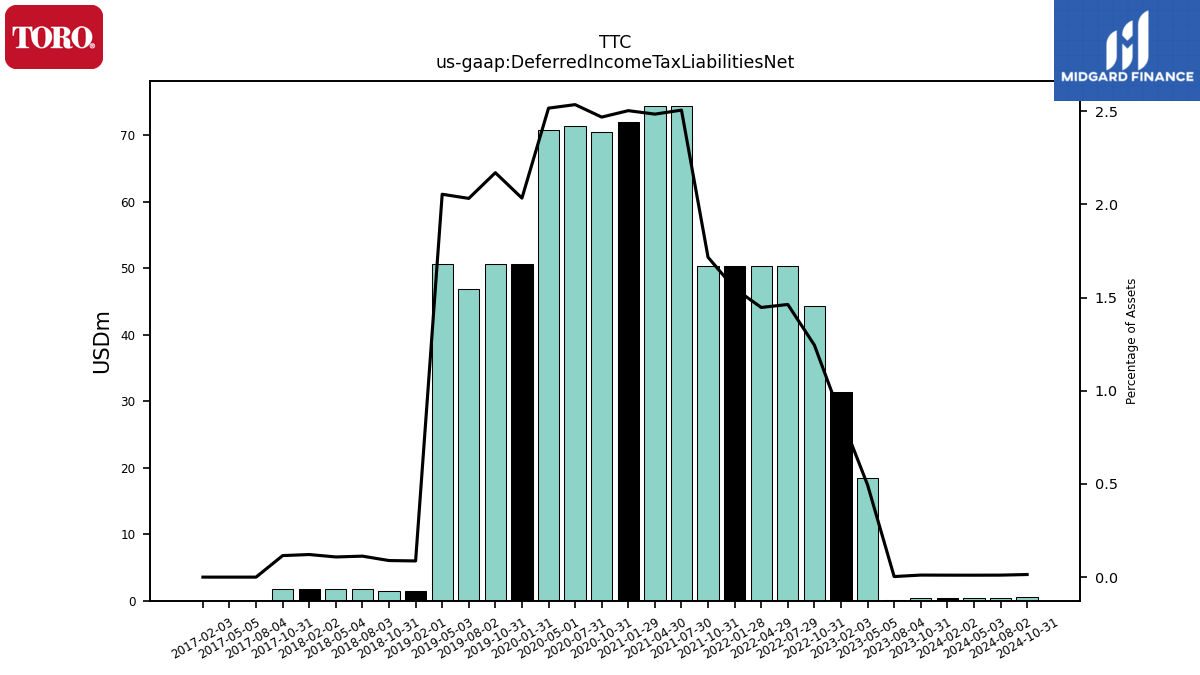
| Deferred Income Tax Liabilities Net | 0.40 | 0.40 | 0.11 | 18.52 | 31.44 | 44.27 | 50.33 | 50.35 | 50.38 | 50.40 | 74.38 | 74.44 | 71.97 | 70.44 | 71.35 | 70.75 | 50.68 | 50.58 | 46.94 | 50.66 | 1.41 | 1.40 | 1.73 | 1.77 | 1.84 | 1.73 | 0.00 | 0.00 | 0.00 | NA | NA | NA | NA | NA | NA | NA | NA | NA | NA | NA | NA | NA | NA | NA | NA | NA | NA | NA | NA | NA | NA | NA | NA | NA | NA | NA | NA | |
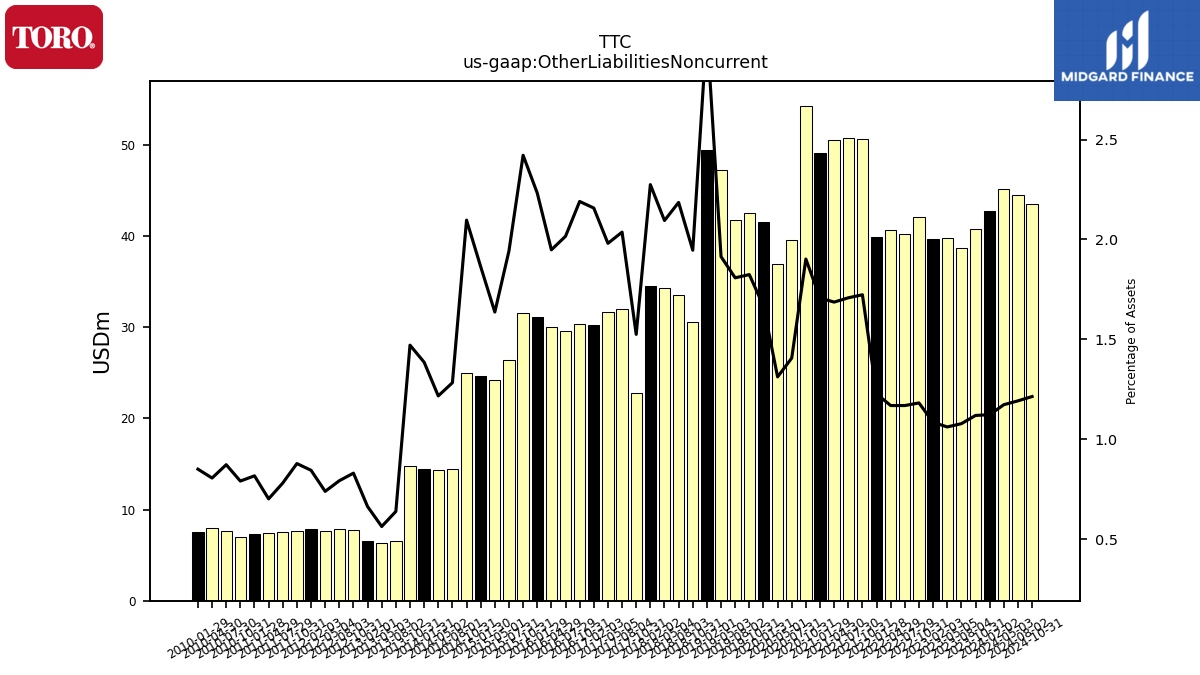
| Other Liabilities Noncurrent | 42.70 | 40.80 | 38.67 | 39.73 | 39.66 | 42.04 | 40.22 | 40.68 | 39.94 | 50.60 | 50.70 | 50.54 | 49.08 | 54.28 | 39.59 | 36.90 | 41.55 | 42.52 | 41.76 | 47.20 | 49.48 | 30.58 | 33.54 | 34.27 | 34.50 | 22.78 | 31.97 | 31.67 | 30.27 | 30.39 | 29.59 | 30.06 | 31.12 | 31.57 | 26.42 | 24.21 | 24.65 | 25.00 | 14.47 | 14.36 | 14.41 | 14.75 | 6.59 | 6.29 | 6.53 | 7.77 | 7.82 | 7.61 | 7.92 | 7.65 | 7.56 | 7.39 | 7.33 | 7.01 | 7.68 | 7.95 | 7.53 | |
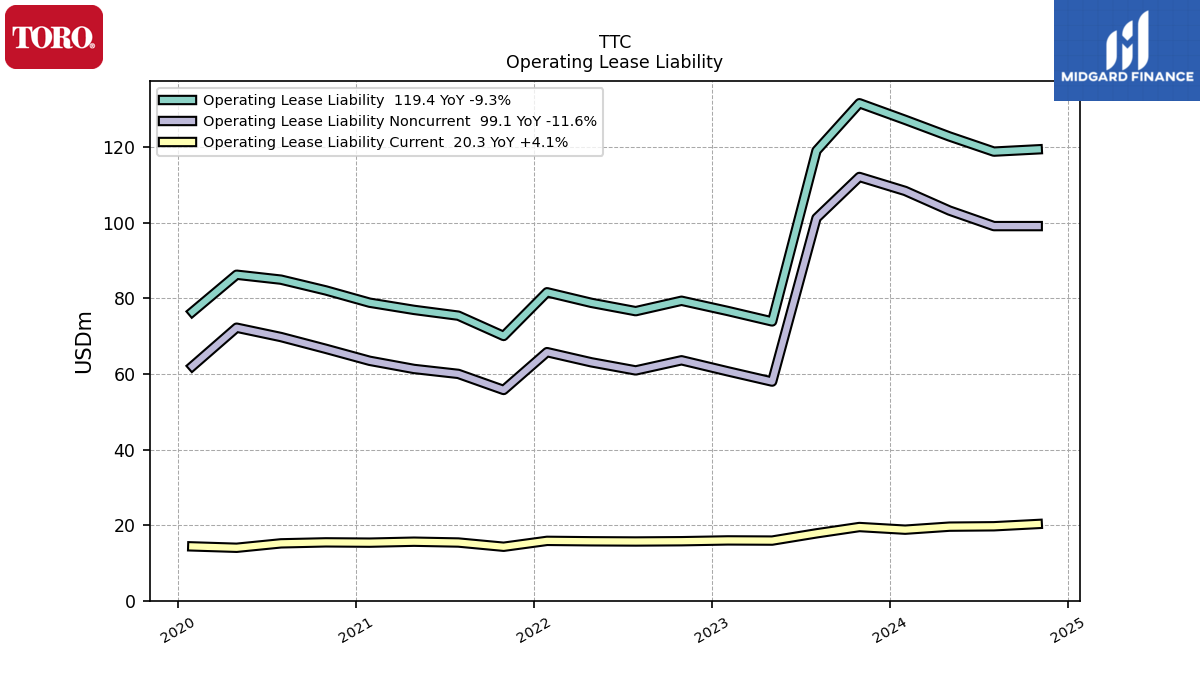
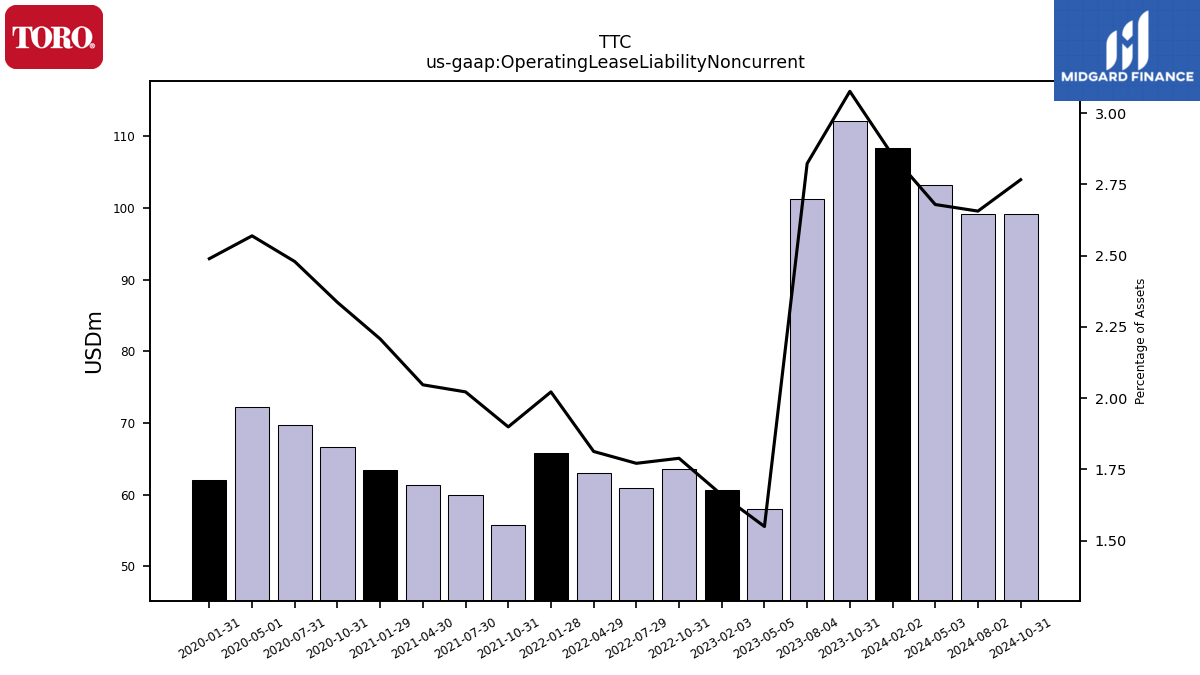
| Operating Lease Liability Noncurrent | 108.40 | 112.10 | 101.22 | 57.97 | 60.68 | 63.60 | 60.92 | 63.07 | 65.76 | 55.75 | 60.00 | 61.31 | 63.47 | 66.64 | 69.75 | 72.23 | 62.02 | NA | NA | NA | NA | NA | NA | NA | NA | NA | NA | NA | NA | NA | NA | NA | NA | NA | NA | NA | NA | NA | NA | NA | NA | NA | NA | NA | NA | NA | NA | NA | NA | NA | NA | NA | NA | NA | NA | NA | NA |
| 2024-02-02 | 2023-10-31 | 2023-08-04 | 2023-05-05 | 2023-02-03 | 2022-10-31 | 2022-07-29 | 2022-04-29 | 2022-01-28 | 2021-10-31 | 2021-07-30 | 2021-04-30 | 2021-01-29 | 2020-10-31 | 2020-07-31 | 2020-05-01 | 2020-01-31 | 2019-10-31 | 2019-08-02 | 2019-05-03 | 2019-02-01 | 2018-10-31 | 2018-08-03 | 2018-05-04 | 2018-02-02 | 2017-10-31 | 2017-08-04 | 2017-05-05 | 2017-02-03 | 2016-10-31 | 2016-07-29 | 2016-04-29 | 2016-01-29 | 2015-10-31 | 2015-07-31 | 2015-05-01 | 2015-01-30 | 2014-10-31 | 2014-08-01 | 2014-05-02 | 2014-01-31 | 2013-10-31 | 2013-08-02 | 2013-05-03 | 2013-02-01 | 2012-10-31 | 2012-08-03 | 2012-05-04 | 2012-02-03 | 2011-10-31 | 2011-07-29 | 2011-04-29 | 2011-01-28 | 2010-10-31 | 2010-07-30 | 2010-04-30 | 2010-01-29 | ||
|---|---|---|---|---|---|---|---|---|---|---|---|---|---|---|---|---|---|---|---|---|---|---|---|---|---|---|---|---|---|---|---|---|---|---|---|---|---|---|---|---|---|---|---|---|---|---|---|---|---|---|---|---|---|---|---|---|---|---|
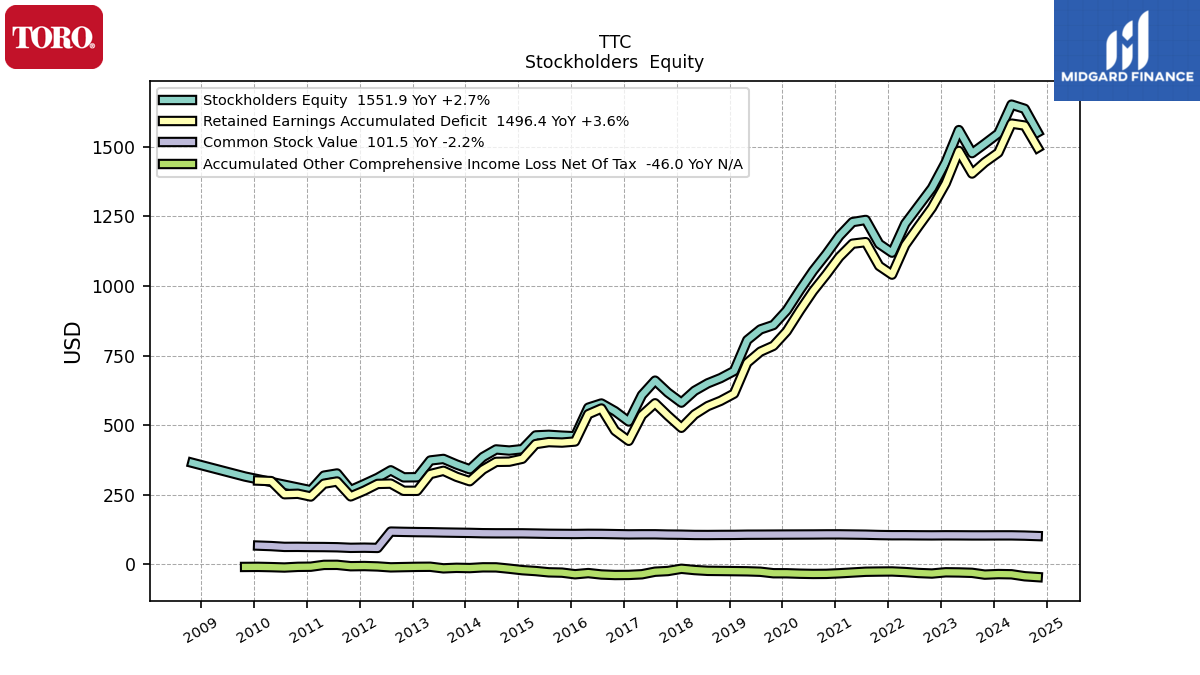
| Stockholders Equity | 1547.90 | 1510.90 | 1477.08 | 1560.00 | 1444.17 | 1351.70 | 1286.60 | 1223.52 | 1119.55 | 1151.13 | 1237.18 | 1229.42 | 1179.72 | 1114.83 | 1054.03 | 984.95 | 912.05 | 859.58 | 843.82 | 805.28 | 694.40 | 668.92 | 650.24 | 623.33 | 580.78 | 617.09 | 659.92 | 607.77 | 513.04 | 550.03 | 577.85 | 562.61 | 459.93 | 462.17 | 465.17 | 463.00 | 413.84 | 408.73 | 412.73 | 385.55 | 341.44 | 358.74 | 378.62 | 373.04 | 312.84 | 312.40 | 337.75 | 310.57 | 288.73 | 266.77 | 326.38 | 318.54 | 266.10 | 275.81 | NA | NA | NA | |
| Common Stock Value | 104.00 | 103.80 | 103.83 | 104.14 | 104.28 | 103.97 | 104.19 | 104.57 | 104.53 | 105.21 | 106.44 | 107.04 | 107.61 | 107.58 | 107.26 | 107.11 | 106.98 | 106.74 | 106.55 | 106.43 | 105.75 | 105.60 | 105.30 | 105.46 | 106.44 | 106.88 | 107.88 | 107.88 | 107.58 | 108.43 | 109.29 | 109.52 | 108.97 | 109.30 | 109.67 | 110.53 | 111.29 | 111.36 | 111.41 | 111.77 | 112.87 | 113.58 | 114.29 | 115.23 | 115.71 | 116.53 | 117.54 | 58.83 | 59.80 | 59.21 | 61.28 | 62.00 | 62.21 | 62.79 | 62.62 | 65.53 | 67.23 | |
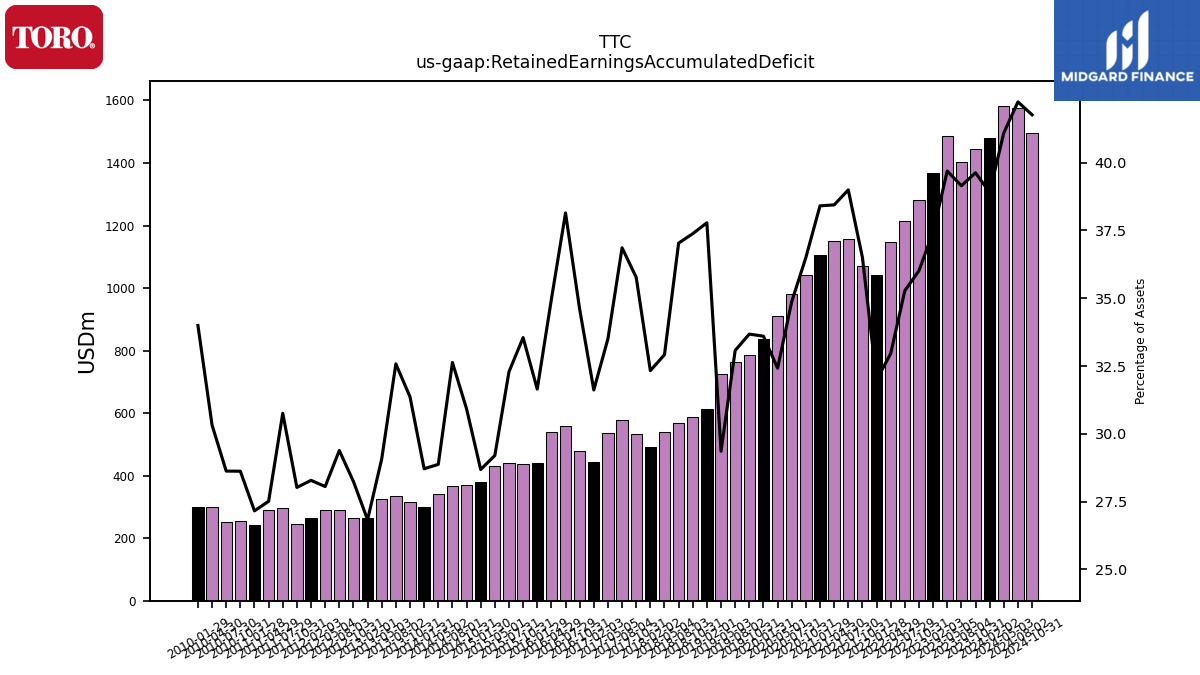
| Retained Earnings Accumulated Deficit | 1478.90 | 1444.10 | 1403.84 | 1485.05 | 1368.49 | 1280.86 | 1213.55 | 1146.77 | 1040.63 | 1071.92 | 1157.43 | 1151.79 | 1104.29 | 1041.51 | 981.34 | 911.54 | 837.19 | 784.88 | 763.94 | 723.96 | 613.16 | 587.25 | 568.38 | 538.47 | 490.37 | 534.33 | 578.56 | 535.65 | 443.56 | 480.04 | 559.78 | 539.33 | 441.14 | 437.36 | 439.08 | 431.90 | 379.25 | 368.75 | 368.02 | 340.48 | 298.49 | 314.52 | 335.94 | 324.18 | 264.06 | 264.11 | 289.89 | 288.80 | 265.02 | 243.99 | 297.59 | 289.57 | 243.54 | 253.48 | 251.81 | 298.96 | 300.75 | |
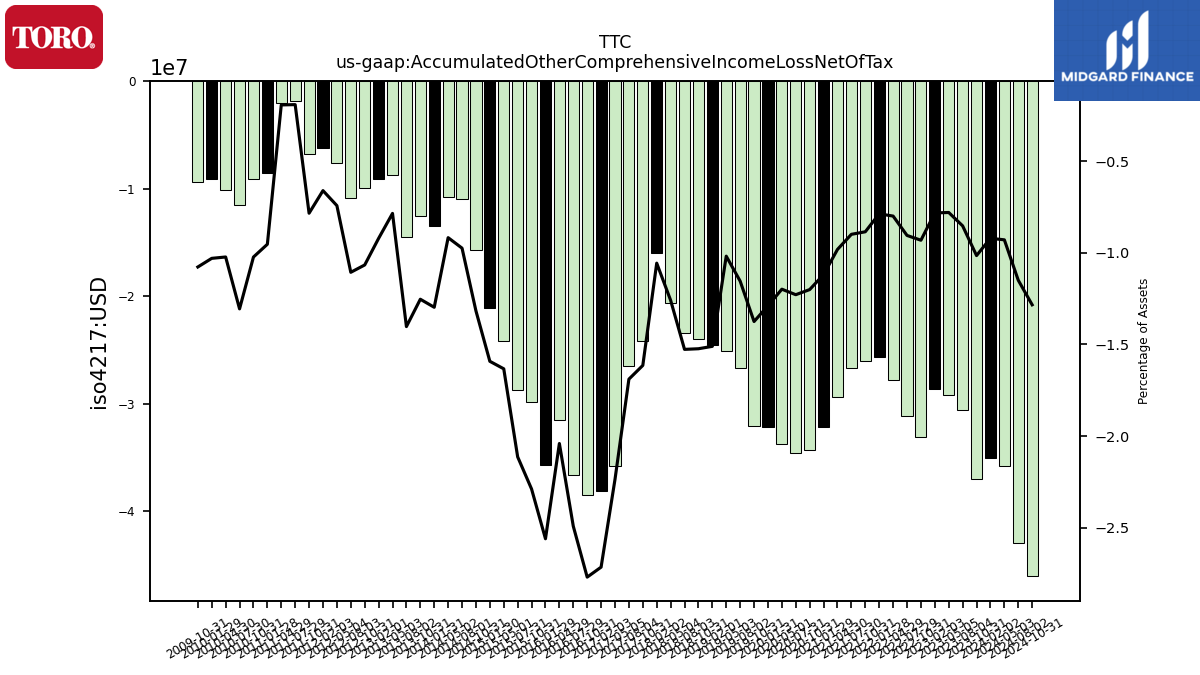
| Accumulated Other Comprehensive Income Loss Net Of Tax | -35.00 | -37.00 | -30.59 | -29.18 | -28.61 | -33.12 | -31.14 | -27.82 | -25.61 | -26.00 | -26.69 | -29.41 | -32.18 | -34.26 | -34.58 | -33.70 | -32.12 | -32.05 | -26.67 | -25.12 | -24.52 | -23.94 | -23.44 | -20.60 | -16.03 | -24.12 | -26.52 | -35.76 | -38.10 | -38.44 | -36.57 | -31.48 | -35.69 | -29.84 | -28.75 | -24.16 | -21.05 | -15.71 | -10.99 | -10.82 | -13.49 | -12.57 | -14.46 | -8.75 | -9.07 | -9.97 | -10.92 | -7.64 | -6.19 | -6.83 | -1.85 | -2.03 | -8.55 | -9.06 | -11.49 | -10.09 | -9.12 | |
| Adjustments To Additional Paid In Capital Sharebased Compensation Requisite Service Period Recognition Value | 8.40 | 5.02 | 3.63 | 5.52 | 5.22 | 5.01 | 5.97 | 5.91 | 5.22 | 5.63 | 5.83 | 5.83 | 4.52 | 5.09 | 4.96 | 1.41 | 3.96 | 3.17 | 3.23 | 3.10 | 3.92 | 3.57 | 3.02 | 2.44 | 3.12 | NA | NA | NA | NA | NA | NA | NA | NA | NA | NA | NA | NA | NA | NA | NA | NA | NA | NA | NA | NA | NA | NA | NA | NA | NA | NA | NA | NA | NA | NA | NA | NA |
| 2024-02-02 | 2023-10-31 | 2023-08-04 | 2023-05-05 | 2023-02-03 | 2022-10-31 | 2022-07-29 | 2022-04-29 | 2022-01-28 | 2021-10-31 | 2021-07-30 | 2021-04-30 | 2021-01-29 | 2020-10-31 | 2020-07-31 | 2020-05-01 | 2020-01-31 | 2019-10-31 | 2019-08-02 | 2019-05-03 | 2019-02-01 | 2018-10-31 | 2018-08-03 | 2018-05-04 | 2018-02-02 | 2017-10-31 | 2017-08-04 | 2017-05-05 | 2017-02-03 | 2016-10-31 | 2016-07-29 | 2016-04-29 | 2016-01-29 | 2015-10-31 | 2015-07-31 | 2015-05-01 | 2015-01-30 | 2014-10-31 | 2014-08-01 | 2014-05-02 | 2014-01-31 | 2013-10-31 | 2013-08-02 | 2013-05-03 | 2013-02-01 | 2012-10-31 | 2012-08-03 | 2012-05-04 | 2012-02-03 | 2011-10-31 | 2011-07-29 | 2011-04-29 | 2011-01-28 | 2010-10-31 | 2010-07-30 | 2010-04-30 | 2010-01-29 | ||
|---|---|---|---|---|---|---|---|---|---|---|---|---|---|---|---|---|---|---|---|---|---|---|---|---|---|---|---|---|---|---|---|---|---|---|---|---|---|---|---|---|---|---|---|---|---|---|---|---|---|---|---|---|---|---|---|---|---|---|
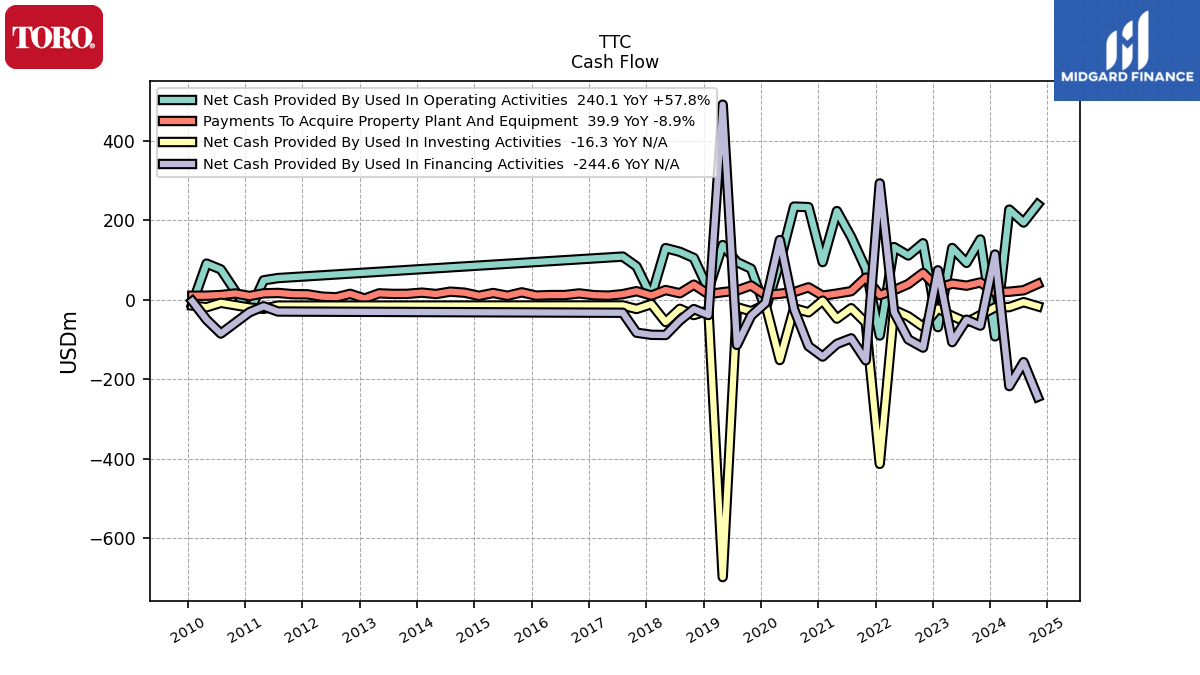
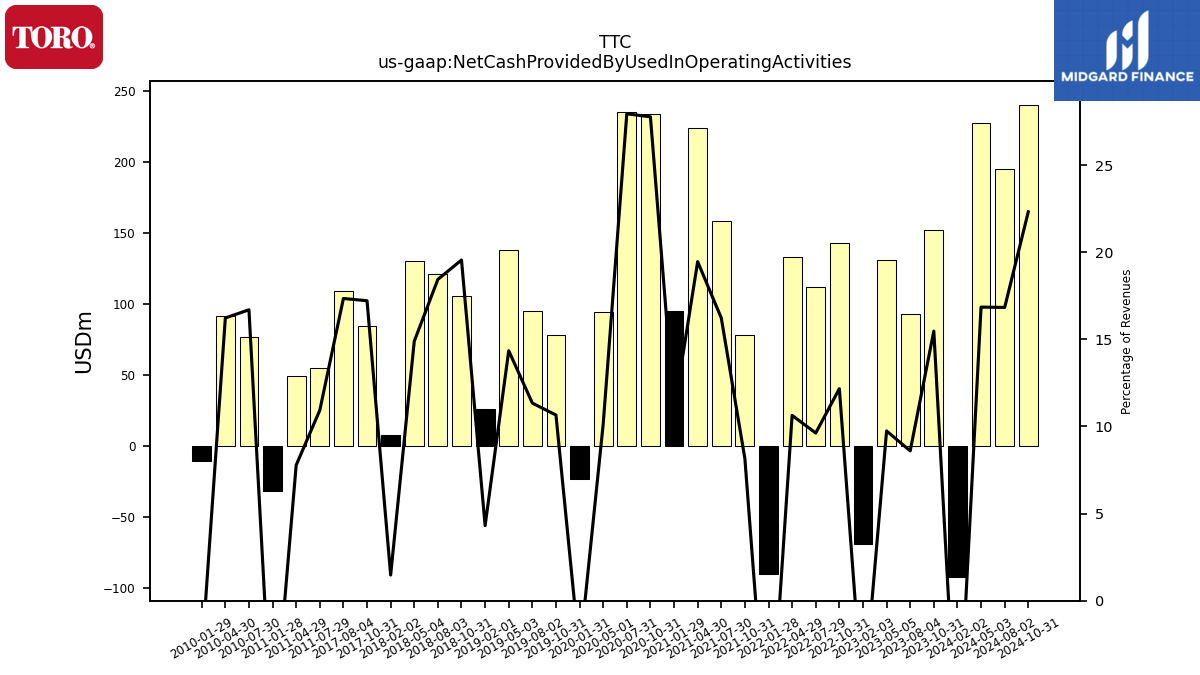
| Net Cash Provided By Used In Operating Activities | -92.20 | 152.13 | 93.03 | 130.49 | -68.85 | 142.61 | 111.70 | 132.91 | -90.04 | 78.33 | 158.52 | 223.59 | 95.03 | 233.50 | 234.99 | 94.18 | -23.30 | 78.26 | 95.12 | 138.00 | 25.98 | 105.44 | 120.94 | 130.34 | 8.10 | 84.11 | 108.91 | NA | NA | NA | NA | NA | NA | NA | NA | NA | NA | NA | NA | NA | NA | NA | NA | NA | NA | NA | NA | NA | NA | NA | 54.77 | 49.14 | -31.44 | NA | 76.61 | 91.32 | -10.54 | |
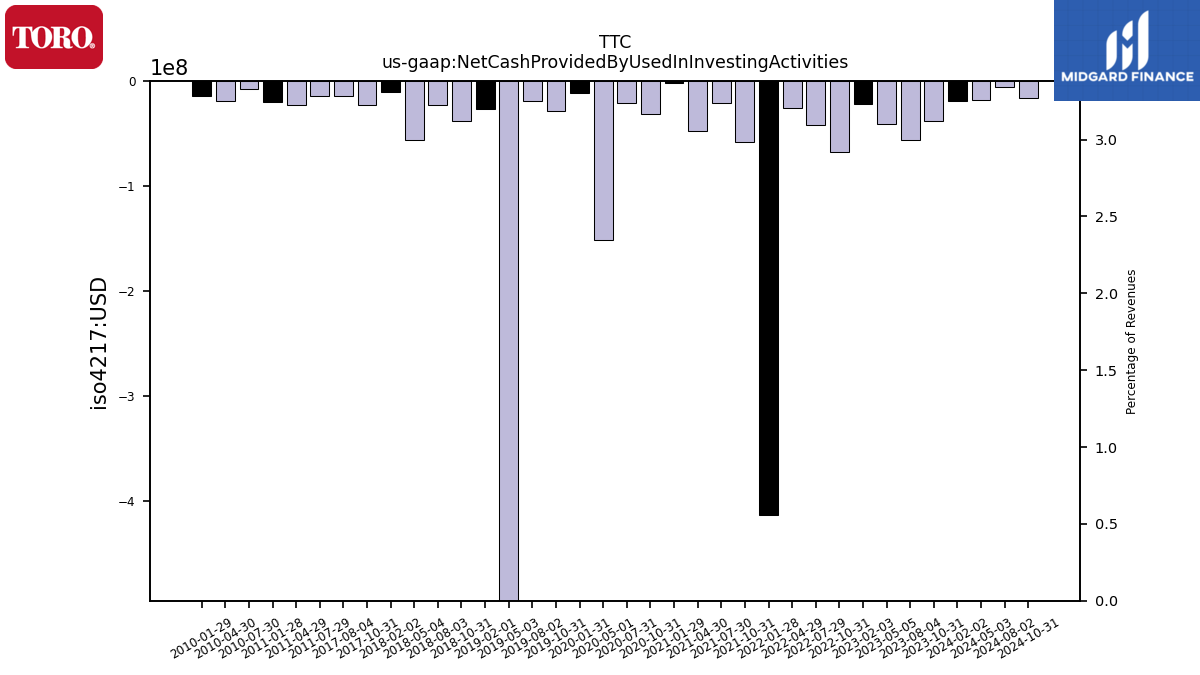
| Net Cash Provided By Used In Investing Activities | -19.10 | -38.54 | -56.50 | -40.70 | -21.95 | -67.67 | -41.66 | -25.55 | -413.37 | -57.76 | -21.17 | -47.44 | -2.09 | -31.43 | -21.10 | -151.76 | -11.80 | -28.80 | -18.59 | -698.72 | -26.82 | -38.37 | -22.66 | -56.12 | -10.78 | -23.08 | -14.22 | NA | NA | NA | NA | NA | NA | NA | NA | NA | NA | NA | NA | NA | NA | NA | NA | NA | NA | NA | NA | NA | NA | NA | -14.67 | -22.66 | -19.56 | NA | -7.61 | -18.72 | -14.52 | |
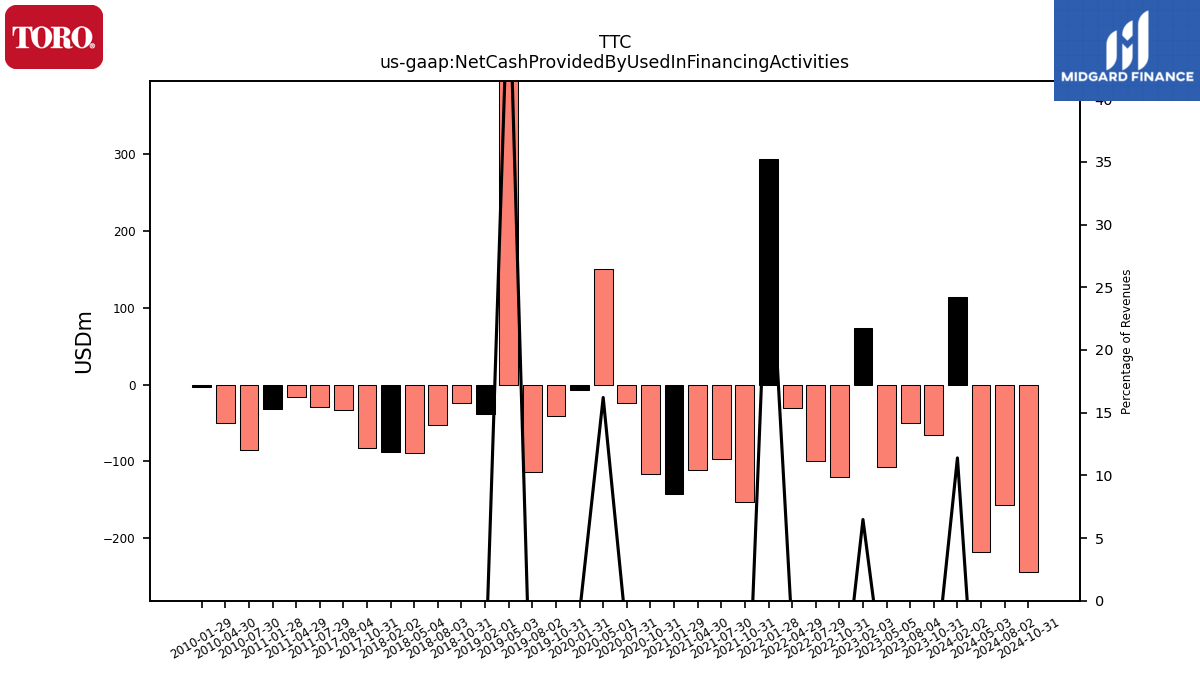
| Net Cash Provided By Used In Financing Activities | 114.10 | -65.08 | -50.18 | -106.63 | 74.39 | -120.49 | -99.72 | -30.86 | 293.30 | -152.48 | -97.11 | -111.07 | -142.99 | -116.80 | -23.97 | 150.63 | -7.51 | -40.30 | -113.74 | 491.81 | -38.27 | -23.31 | -51.92 | -88.69 | -88.15 | -82.88 | -32.61 | NA | NA | NA | NA | NA | NA | NA | NA | NA | NA | NA | NA | NA | NA | NA | NA | NA | NA | NA | NA | NA | NA | NA | -29.52 | -16.40 | -31.34 | NA | -85.00 | -50.05 | -3.50 |
| 2024-02-02 | 2023-10-31 | 2023-08-04 | 2023-05-05 | 2023-02-03 | 2022-10-31 | 2022-07-29 | 2022-04-29 | 2022-01-28 | 2021-10-31 | 2021-07-30 | 2021-04-30 | 2021-01-29 | 2020-10-31 | 2020-07-31 | 2020-05-01 | 2020-01-31 | 2019-10-31 | 2019-08-02 | 2019-05-03 | 2019-02-01 | 2018-10-31 | 2018-08-03 | 2018-05-04 | 2018-02-02 | 2017-10-31 | 2017-08-04 | 2017-05-05 | 2017-02-03 | 2016-10-31 | 2016-07-29 | 2016-04-29 | 2016-01-29 | 2015-10-31 | 2015-07-31 | 2015-05-01 | 2015-01-30 | 2014-10-31 | 2014-08-01 | 2014-05-02 | 2014-01-31 | 2013-10-31 | 2013-08-02 | 2013-05-03 | 2013-02-01 | 2012-10-31 | 2012-08-03 | 2012-05-04 | 2012-02-03 | 2011-10-31 | 2011-07-29 | 2011-04-29 | 2011-01-28 | 2010-10-31 | 2010-07-30 | 2010-04-30 | 2010-01-29 | ||
|---|---|---|---|---|---|---|---|---|---|---|---|---|---|---|---|---|---|---|---|---|---|---|---|---|---|---|---|---|---|---|---|---|---|---|---|---|---|---|---|---|---|---|---|---|---|---|---|---|---|---|---|---|---|---|---|---|---|---|
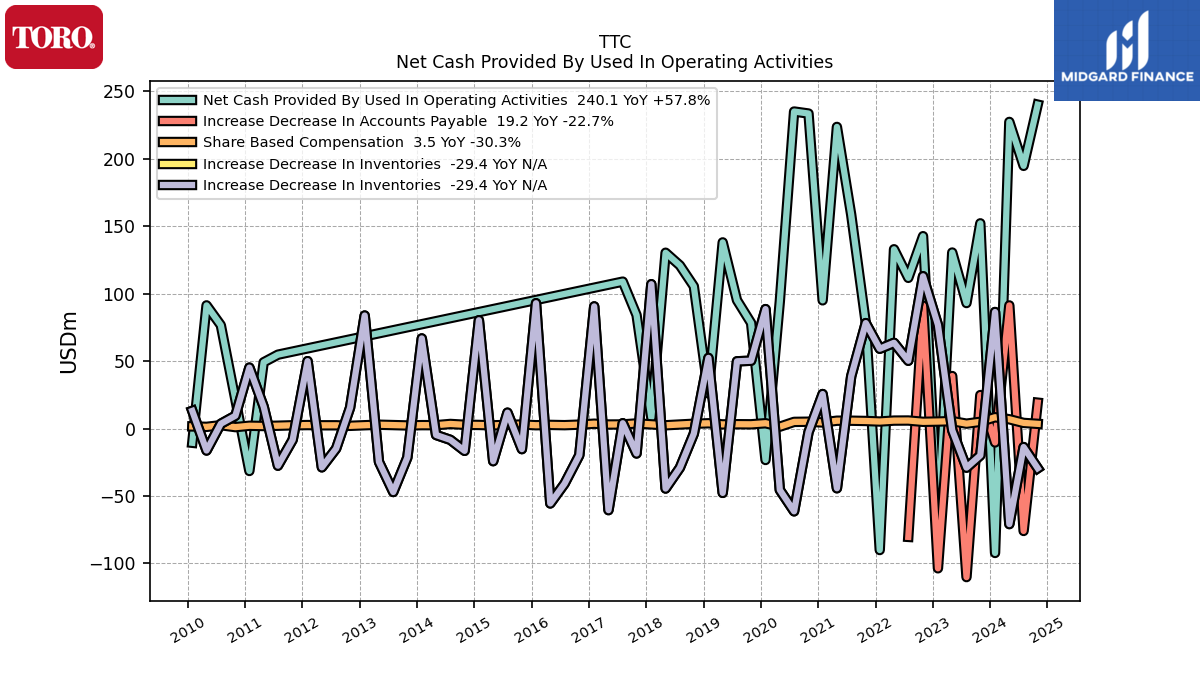
| Net Cash Provided By Used In Operating Activities | -92.20 | 152.13 | 93.03 | 130.49 | -68.85 | 142.61 | 111.70 | 132.91 | -90.04 | 78.33 | 158.52 | 223.59 | 95.03 | 233.50 | 234.99 | 94.18 | -23.30 | 78.26 | 95.12 | 138.00 | 25.98 | 105.44 | 120.94 | 130.34 | 8.10 | 84.11 | 108.91 | NA | NA | NA | NA | NA | NA | NA | NA | NA | NA | NA | NA | NA | NA | NA | NA | NA | NA | NA | NA | NA | NA | NA | 54.77 | 49.14 | -31.44 | NA | 76.61 | 91.32 | -10.54 | |
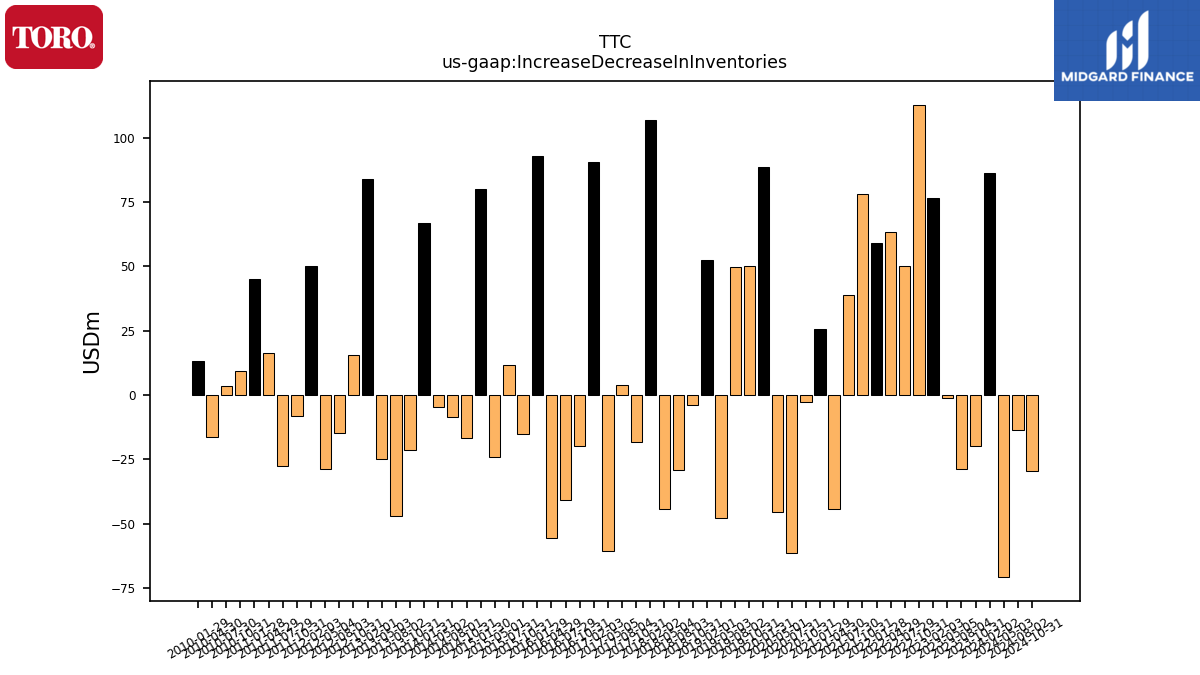
| Increase Decrease In Inventories | 86.40 | -19.88 | -28.96 | -1.23 | 76.77 | 112.89 | 50.27 | 63.56 | 59.17 | 78.19 | 38.73 | -44.25 | 25.59 | -2.71 | -61.34 | -45.46 | 88.56 | 50.29 | 49.86 | -47.70 | 52.38 | -3.78 | -29.02 | -44.44 | 107.02 | -18.46 | 3.97 | -60.46 | 90.56 | -19.76 | -40.85 | -55.50 | 92.92 | -15.25 | 11.80 | -24.18 | 80.28 | -16.53 | -8.36 | -4.75 | 66.83 | -21.42 | -47.03 | -24.71 | 83.79 | 15.54 | -14.84 | -28.73 | 50.00 | -8.31 | -27.52 | 16.30 | 45.20 | 9.52 | 3.56 | -16.26 | 13.10 | |
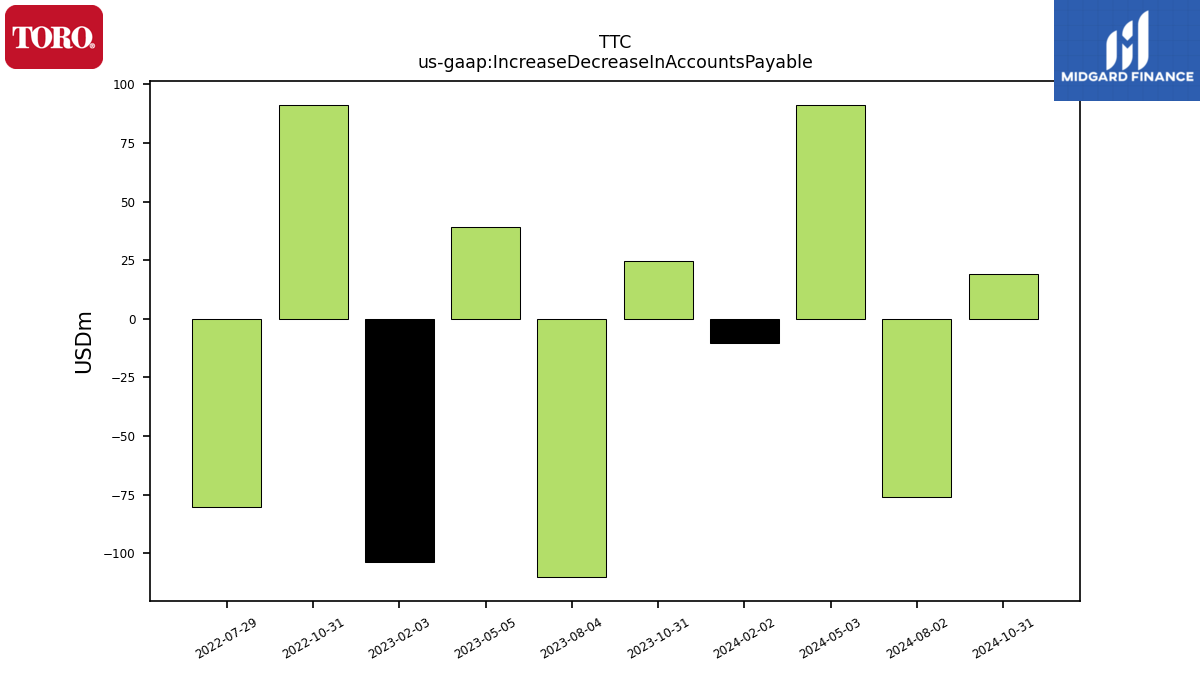
| Increase Decrease In Accounts Payable | -10.30 | 24.84 | -110.10 | 38.96 | -103.60 | 91.16 | -80.29 | NA | NA | NA | NA | NA | NA | NA | NA | NA | NA | NA | NA | NA | NA | NA | NA | NA | NA | NA | NA | NA | NA | NA | NA | NA | NA | NA | NA | NA | NA | NA | NA | NA | NA | NA | NA | NA | NA | NA | NA | NA | NA | NA | NA | NA | NA | NA | NA | NA | NA | |
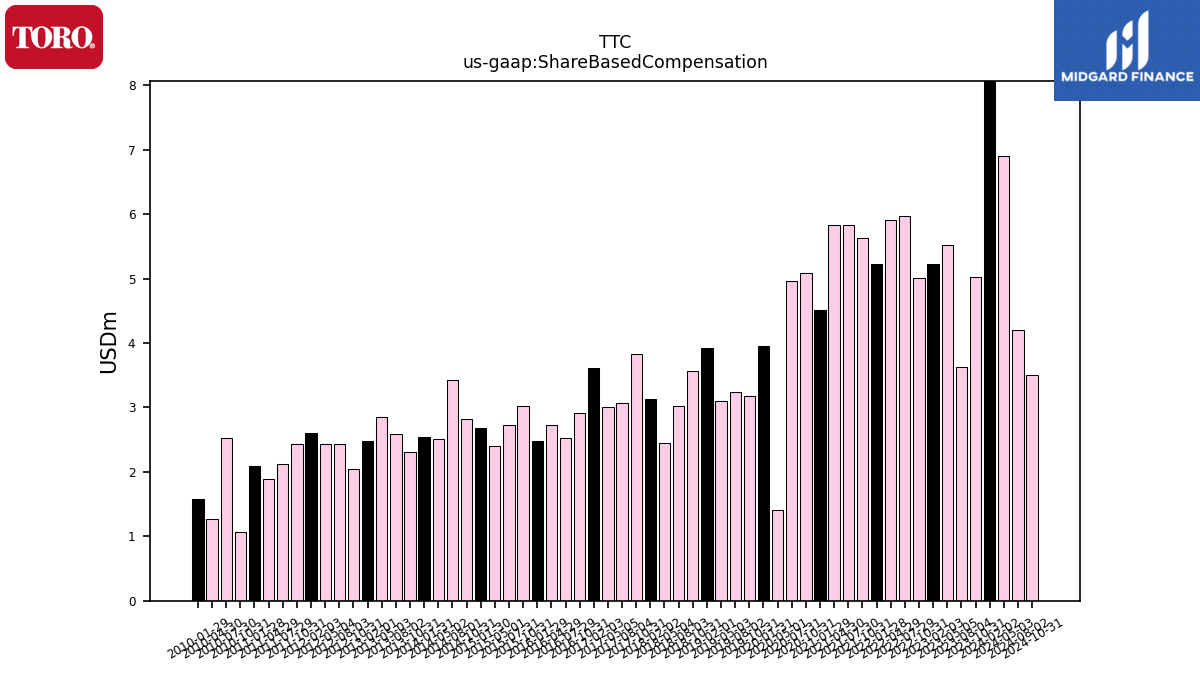
| Share Based Compensation | 8.40 | 5.02 | 3.63 | 5.52 | 5.22 | 5.01 | 5.97 | 5.91 | 5.22 | 5.63 | 5.83 | 5.83 | 4.52 | 5.09 | 4.96 | 1.41 | 3.96 | 3.17 | 3.23 | 3.10 | 3.92 | 3.57 | 3.02 | 2.44 | 3.12 | 3.83 | 3.06 | 3.01 | 3.62 | 2.91 | 2.53 | 2.72 | 2.48 | 3.02 | 2.73 | 2.41 | 2.68 | 2.81 | 3.43 | 2.51 | 2.54 | 2.31 | 2.59 | 2.86 | 2.48 | 2.04 | 2.43 | 2.43 | 2.60 | 2.44 | 2.12 | 1.88 | 2.09 | 1.07 | 2.52 | 1.27 | 1.58 |
| 2024-02-02 | 2023-10-31 | 2023-08-04 | 2023-05-05 | 2023-02-03 | 2022-10-31 | 2022-07-29 | 2022-04-29 | 2022-01-28 | 2021-10-31 | 2021-07-30 | 2021-04-30 | 2021-01-29 | 2020-10-31 | 2020-07-31 | 2020-05-01 | 2020-01-31 | 2019-10-31 | 2019-08-02 | 2019-05-03 | 2019-02-01 | 2018-10-31 | 2018-08-03 | 2018-05-04 | 2018-02-02 | 2017-10-31 | 2017-08-04 | 2017-05-05 | 2017-02-03 | 2016-10-31 | 2016-07-29 | 2016-04-29 | 2016-01-29 | 2015-10-31 | 2015-07-31 | 2015-05-01 | 2015-01-30 | 2014-10-31 | 2014-08-01 | 2014-05-02 | 2014-01-31 | 2013-10-31 | 2013-08-02 | 2013-05-03 | 2013-02-01 | 2012-10-31 | 2012-08-03 | 2012-05-04 | 2012-02-03 | 2011-10-31 | 2011-07-29 | 2011-04-29 | 2011-01-28 | 2010-10-31 | 2010-07-30 | 2010-04-30 | 2010-01-29 | ||
|---|---|---|---|---|---|---|---|---|---|---|---|---|---|---|---|---|---|---|---|---|---|---|---|---|---|---|---|---|---|---|---|---|---|---|---|---|---|---|---|---|---|---|---|---|---|---|---|---|---|---|---|---|---|---|---|---|---|---|
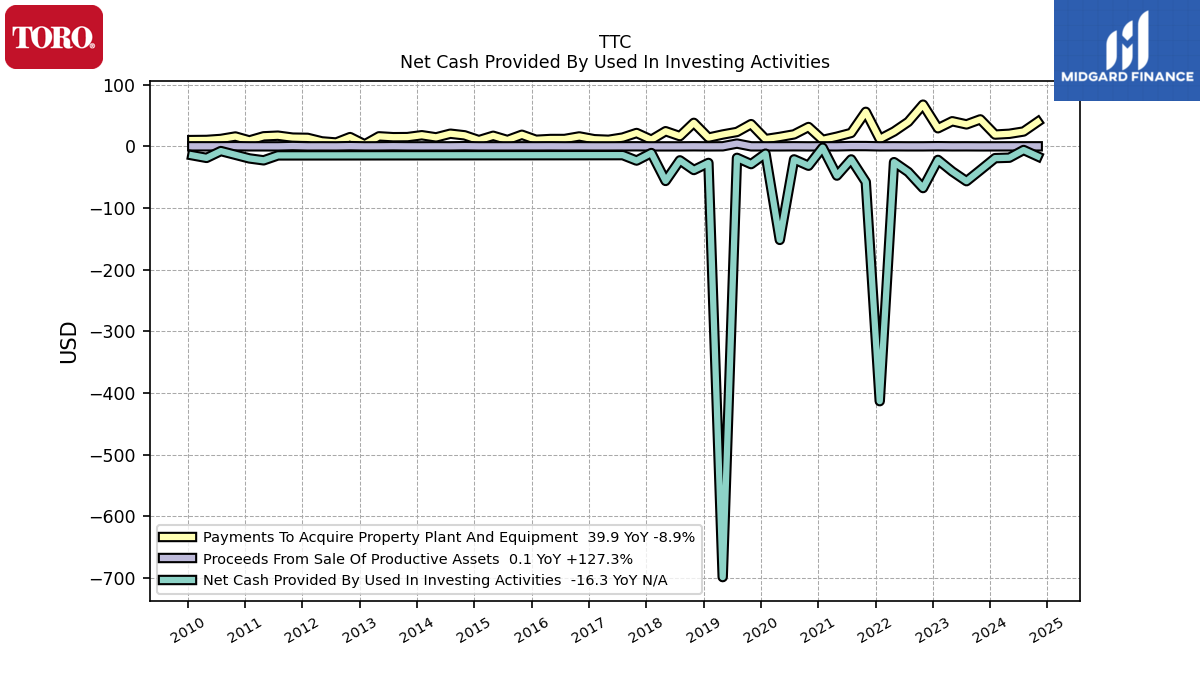
| Net Cash Provided By Used In Investing Activities | -19.10 | -38.54 | -56.50 | -40.70 | -21.95 | -67.67 | -41.66 | -25.55 | -413.37 | -57.76 | -21.17 | -47.44 | -2.09 | -31.43 | -21.10 | -151.76 | -11.80 | -28.80 | -18.59 | -698.72 | -26.82 | -38.37 | -22.66 | -56.12 | -10.78 | -23.08 | -14.22 | NA | NA | NA | NA | NA | NA | NA | NA | NA | NA | NA | NA | NA | NA | NA | NA | NA | NA | NA | NA | NA | NA | NA | -14.67 | -22.66 | -19.56 | NA | -7.61 | -18.72 | -14.52 | |
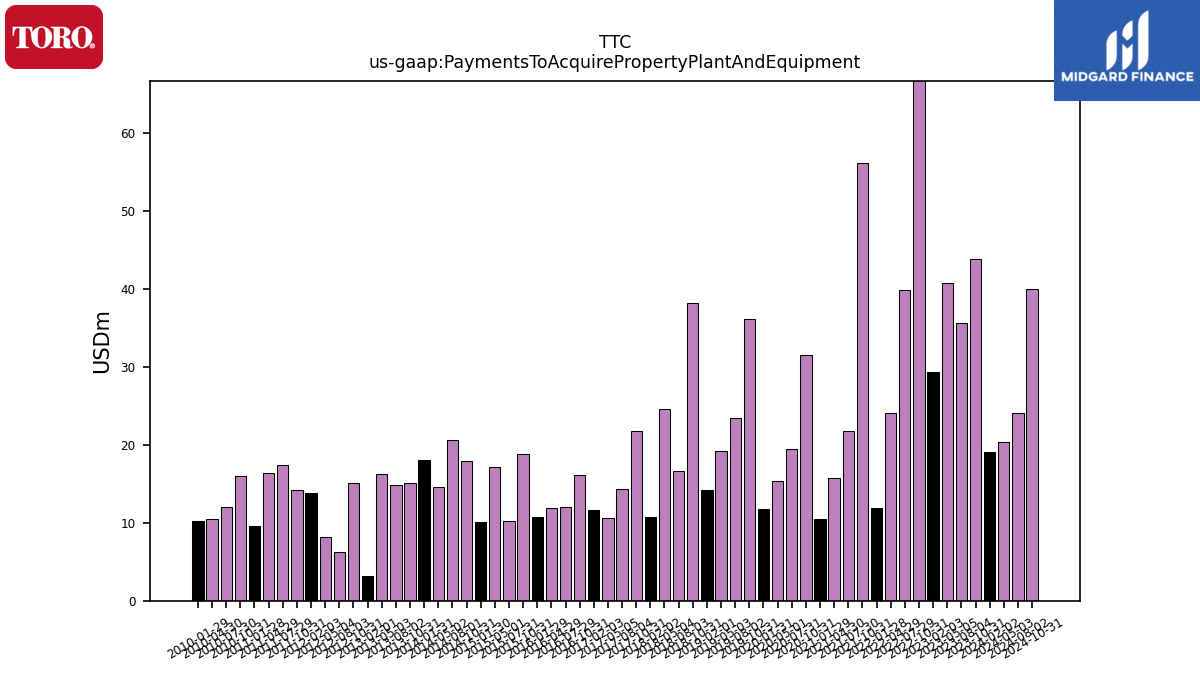
| Payments To Acquire Property Plant And Equipment | 19.10 | 43.80 | 35.62 | 40.75 | 29.33 | 67.71 | 39.80 | 24.07 | 11.90 | 56.05 | 21.76 | 15.69 | 10.50 | 31.44 | 19.46 | 15.35 | 11.82 | 36.08 | 23.38 | 19.24 | 14.18 | 38.19 | 16.57 | 24.58 | 10.78 | 21.70 | 14.30 | 10.65 | 11.62 | 16.12 | 11.98 | 11.94 | 10.68 | 18.83 | 10.28 | 17.16 | 10.10 | 17.91 | 20.55 | 14.60 | 18.09 | 15.04 | 14.88 | 16.27 | 3.23 | 15.08 | 6.25 | 8.11 | 13.80 | 14.18 | 17.34 | 16.32 | 9.61 | 16.01 | 12.04 | 10.43 | 10.22 |
| 2024-02-02 | 2023-10-31 | 2023-08-04 | 2023-05-05 | 2023-02-03 | 2022-10-31 | 2022-07-29 | 2022-04-29 | 2022-01-28 | 2021-10-31 | 2021-07-30 | 2021-04-30 | 2021-01-29 | 2020-10-31 | 2020-07-31 | 2020-05-01 | 2020-01-31 | 2019-10-31 | 2019-08-02 | 2019-05-03 | 2019-02-01 | 2018-10-31 | 2018-08-03 | 2018-05-04 | 2018-02-02 | 2017-10-31 | 2017-08-04 | 2017-05-05 | 2017-02-03 | 2016-10-31 | 2016-07-29 | 2016-04-29 | 2016-01-29 | 2015-10-31 | 2015-07-31 | 2015-05-01 | 2015-01-30 | 2014-10-31 | 2014-08-01 | 2014-05-02 | 2014-01-31 | 2013-10-31 | 2013-08-02 | 2013-05-03 | 2013-02-01 | 2012-10-31 | 2012-08-03 | 2012-05-04 | 2012-02-03 | 2011-10-31 | 2011-07-29 | 2011-04-29 | 2011-01-28 | 2010-10-31 | 2010-07-30 | 2010-04-30 | 2010-01-29 | ||
|---|---|---|---|---|---|---|---|---|---|---|---|---|---|---|---|---|---|---|---|---|---|---|---|---|---|---|---|---|---|---|---|---|---|---|---|---|---|---|---|---|---|---|---|---|---|---|---|---|---|---|---|---|---|---|---|---|---|---|
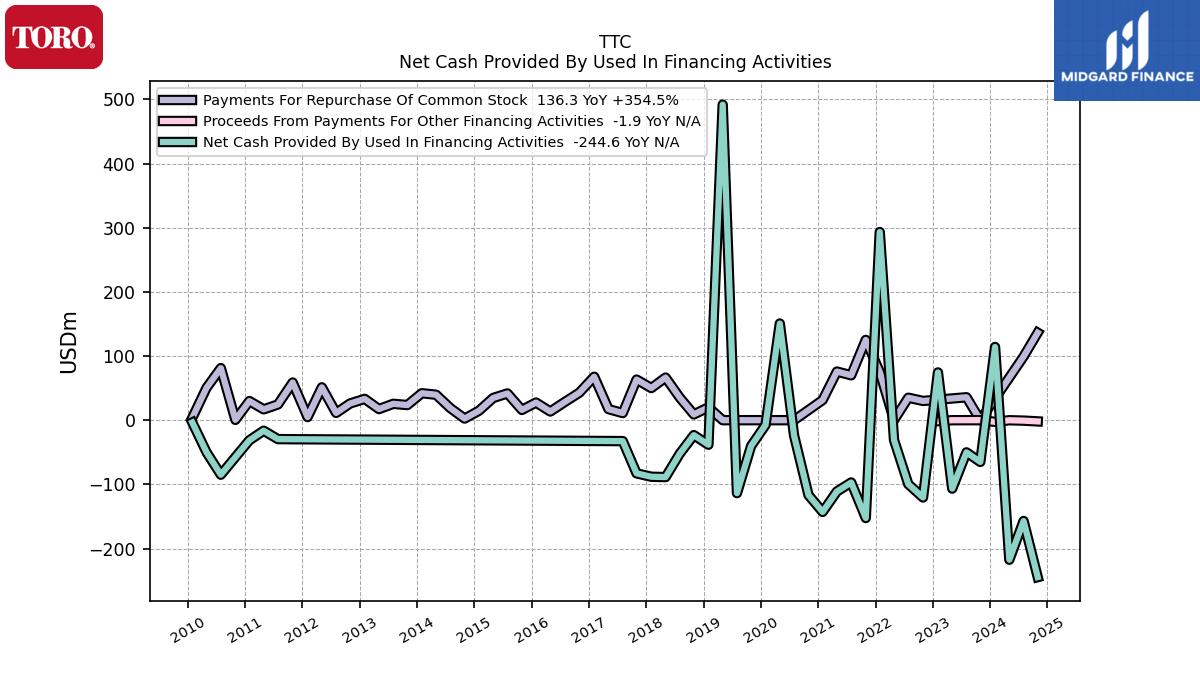
| Net Cash Provided By Used In Financing Activities | 114.10 | -65.08 | -50.18 | -106.63 | 74.39 | -120.49 | -99.72 | -30.86 | 293.30 | -152.48 | -97.11 | -111.07 | -142.99 | -116.80 | -23.97 | 150.63 | -7.51 | -40.30 | -113.74 | 491.81 | -38.27 | -23.31 | -51.92 | -88.69 | -88.15 | -82.88 | -32.61 | NA | NA | NA | NA | NA | NA | NA | NA | NA | NA | NA | NA | NA | NA | NA | NA | NA | NA | NA | NA | NA | NA | NA | -29.52 | -16.40 | -31.34 | NA | -85.00 | -50.05 | -3.50 | |
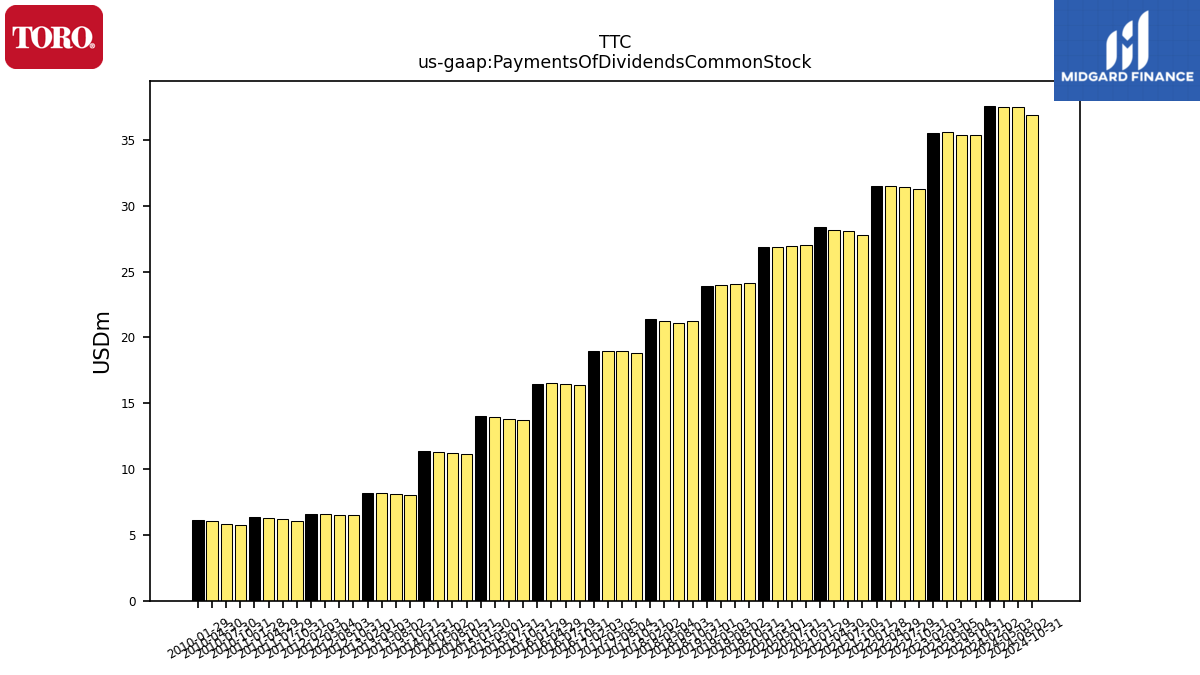
| Payments Of Dividends Common Stock | 37.60 | 35.40 | 35.41 | 35.57 | 35.52 | 31.31 | 31.45 | 31.48 | 31.47 | 27.76 | 28.07 | 28.19 | 28.41 | 27.02 | 26.94 | 26.89 | 26.86 | 24.12 | 24.08 | 24.01 | 23.92 | 21.22 | 21.13 | 21.25 | 21.43 | 18.83 | 18.99 | 18.94 | 18.99 | 16.40 | 16.48 | 16.51 | 16.50 | 13.76 | 13.82 | 13.96 | 14.01 | 11.18 | 11.20 | 11.29 | 11.38 | 8.05 | 8.09 | 8.17 | 8.20 | 6.48 | 6.52 | 6.62 | 6.61 | 6.08 | 6.21 | 6.29 | 6.39 | 5.72 | 5.79 | 6.08 | 6.13 |
| 2024-02-02 | 2023-10-31 | 2023-08-04 | 2023-05-05 | 2023-02-03 | 2022-10-31 | 2022-07-29 | 2022-04-29 | 2022-01-28 | 2021-10-31 | 2021-07-30 | 2021-04-30 | 2021-01-29 | 2020-10-31 | 2020-07-31 | 2020-05-01 | 2020-01-31 | 2019-10-31 | 2019-08-02 | 2019-05-03 | 2019-02-01 | 2018-10-31 | 2018-08-03 | 2018-05-04 | 2018-02-02 | 2017-10-31 | 2017-08-04 | 2017-05-05 | 2017-02-03 | 2016-10-31 | 2016-07-29 | 2016-04-29 | 2016-01-29 | 2015-10-31 | 2015-07-31 | 2015-05-01 | 2015-01-30 | 2014-10-31 | 2014-08-01 | 2014-05-02 | 2014-01-31 | 2013-10-31 | 2013-08-02 | 2013-05-03 | 2013-02-01 | 2012-10-31 | 2012-08-03 | 2012-05-04 | 2012-02-03 | 2011-10-31 | 2011-07-29 | 2011-04-29 | 2011-01-28 | 2010-10-31 | 2010-07-30 | 2010-04-30 | 2010-01-29 | ||
|---|---|---|---|---|---|---|---|---|---|---|---|---|---|---|---|---|---|---|---|---|---|---|---|---|---|---|---|---|---|---|---|---|---|---|---|---|---|---|---|---|---|---|---|---|---|---|---|---|---|---|---|---|---|---|---|---|---|---|
| Revenues | 1001.90 | 983.25 | 1081.78 | 1339.33 | 1148.84 | 1171.98 | 1160.55 | 1249.48 | 932.65 | 960.65 | 976.84 | 1149.11 | 872.99 | 840.96 | 840.97 | 929.40 | 767.48 | 734.38 | 838.71 | 962.04 | 602.96 | 539.30 | 655.82 | 875.28 | 548.25 | 488.63 | 627.94 | 872.77 | 515.84 | 468.36 | 600.98 | 836.44 | 486.40 | 480.81 | 609.62 | 826.24 | 474.21 | 414.14 | 567.54 | 745.03 | 445.98 | 382.37 | 509.92 | 704.49 | 444.66 | 339.29 | 504.08 | 691.49 | 423.83 | 368.09 | 501.05 | 631.60 | 383.21 | 337.31 | 458.89 | 562.82 | 331.36 | |
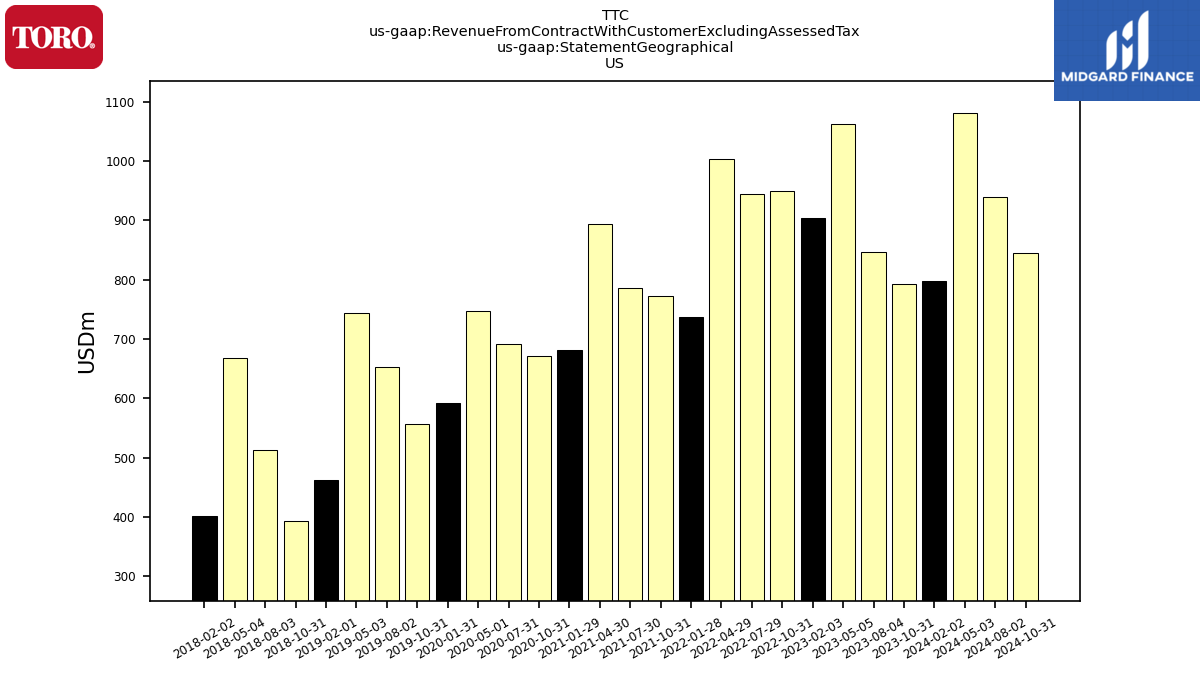
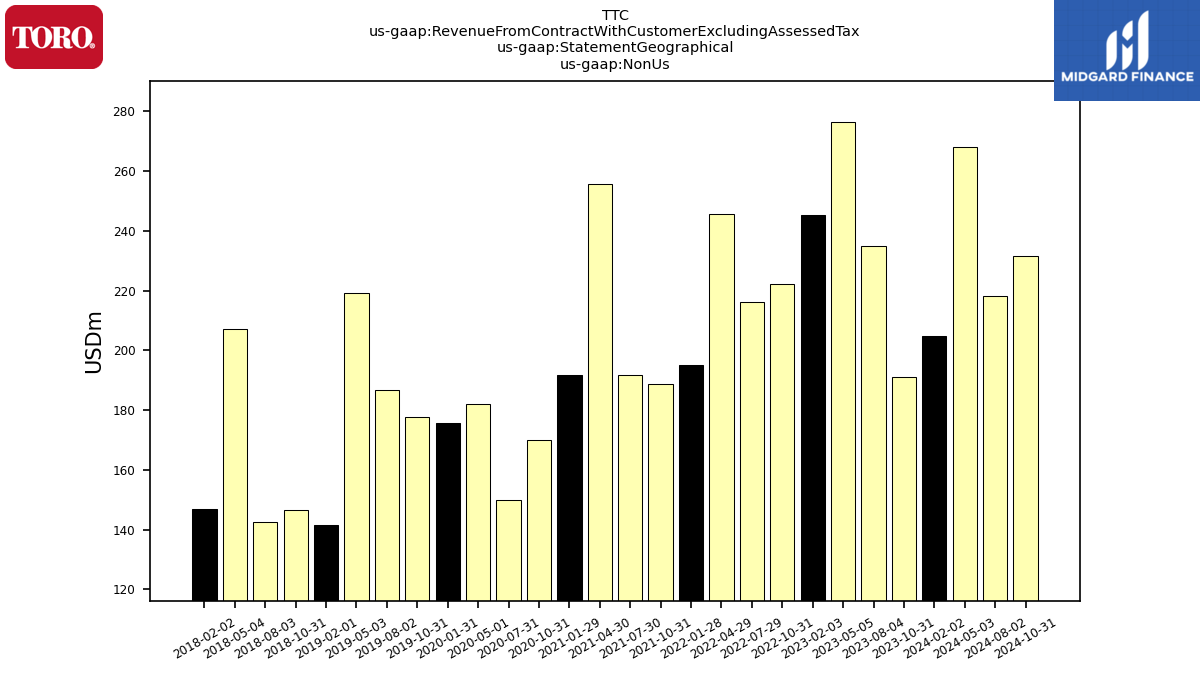
| Revenue From Contract With Customer Excluding Assessed Tax | 1001.90 | 983.25 | 1081.78 | 1339.33 | 1148.84 | 1171.98 | 1160.55 | 1249.48 | 932.65 | 960.65 | 976.84 | 1149.11 | 872.99 | 840.96 | 840.97 | 929.40 | 767.48 | 734.38 | 838.71 | 962.04 | 602.96 | 539.30 | 655.82 | 875.28 | 548.25 | 488.63 | 627.94 | 872.77 | 515.84 | 468.36 | 600.98 | 836.44 | 486.40 | 480.81 | 609.62 | 826.24 | 474.21 | 414.14 | 567.54 | 745.03 | 445.98 | 382.37 | 509.92 | 704.49 | 444.66 | 339.29 | 504.08 | 691.49 | 423.83 | 368.09 | 501.05 | 631.60 | 383.21 | 337.31 | 458.89 | 562.82 | 331.36 | |
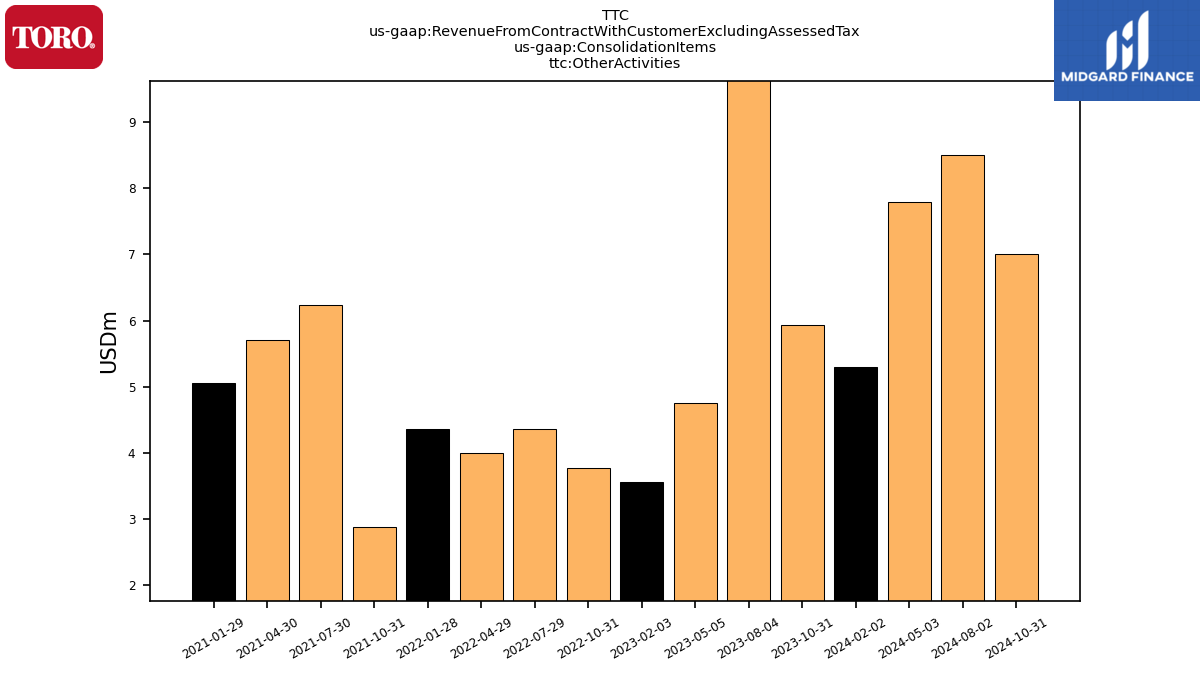
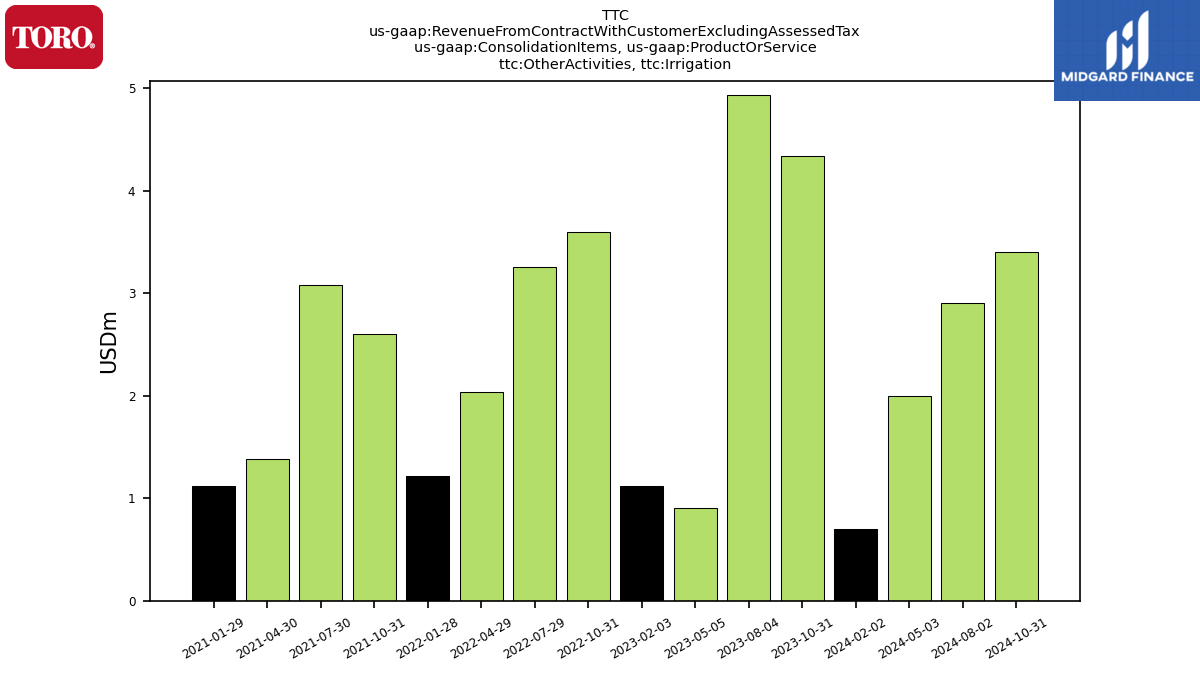
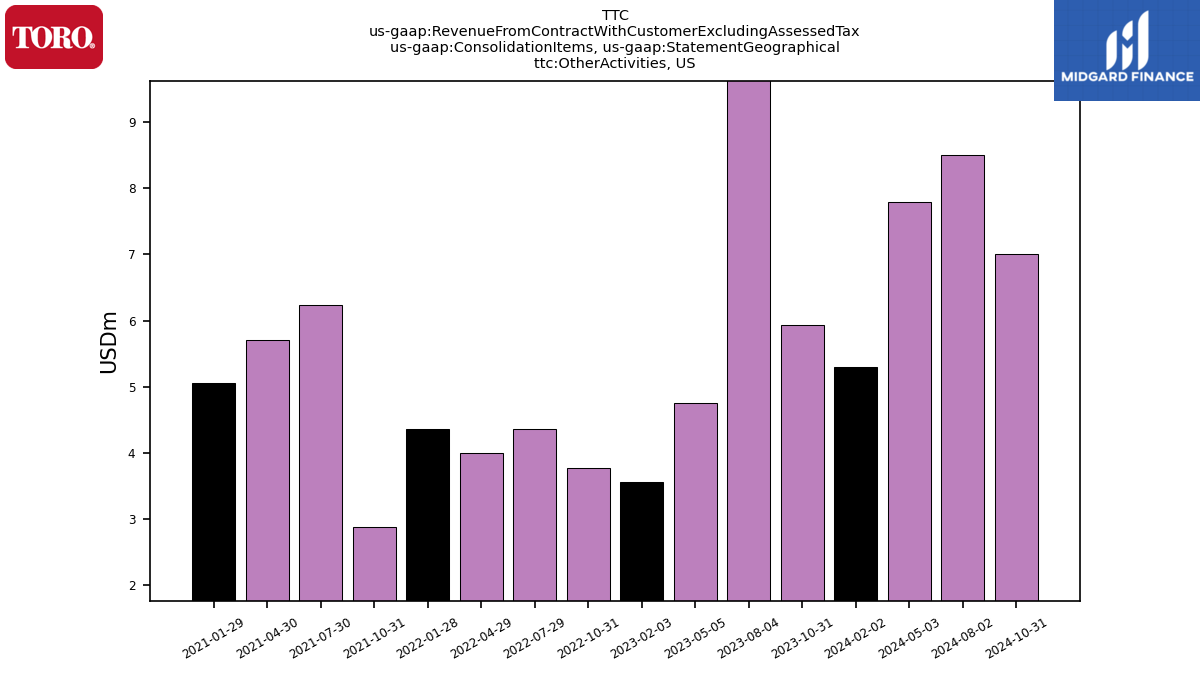
| Other Activities | 5.30 | 5.93 | 10.15 | 4.76 | 3.56 | 3.78 | 4.36 | 3.99 | 4.36 | 2.89 | 6.24 | 5.71 | 5.06 | NA | NA | NA | NA | NA | NA | NA | NA | NA | NA | NA | NA | NA | NA | NA | NA | NA | NA | NA | NA | NA | NA | NA | NA | NA | NA | NA | NA | NA | NA | NA | NA | NA | NA | NA | NA | NA | NA | NA | NA | NA | NA | NA | NA | |
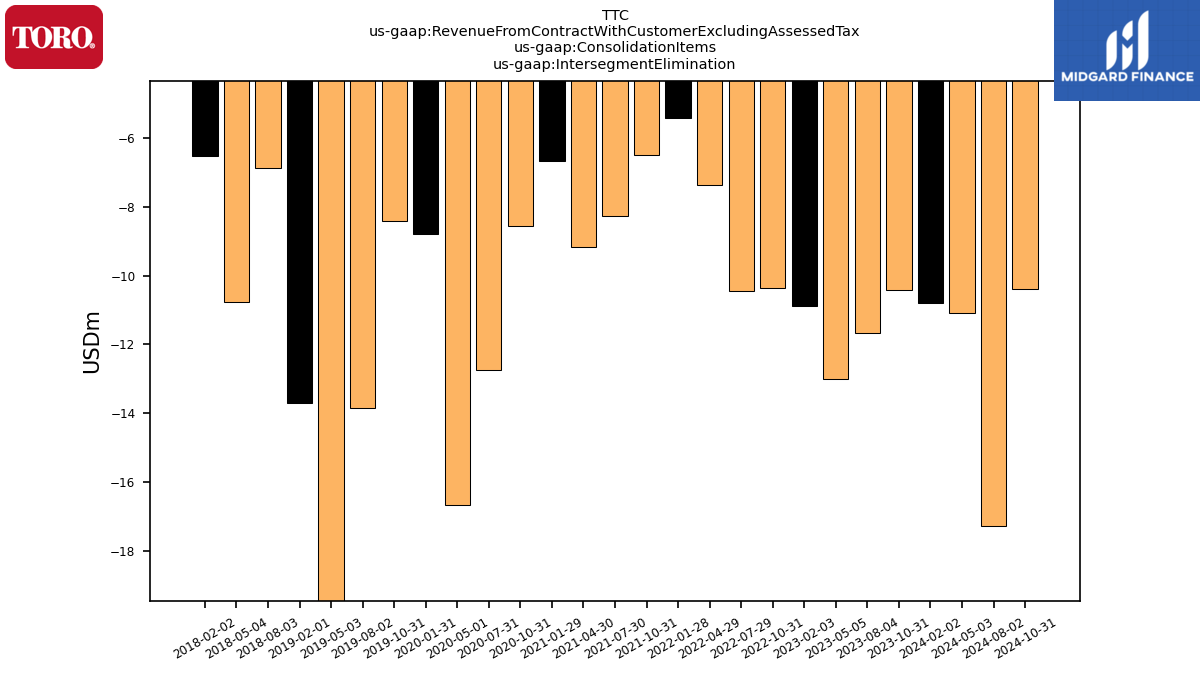
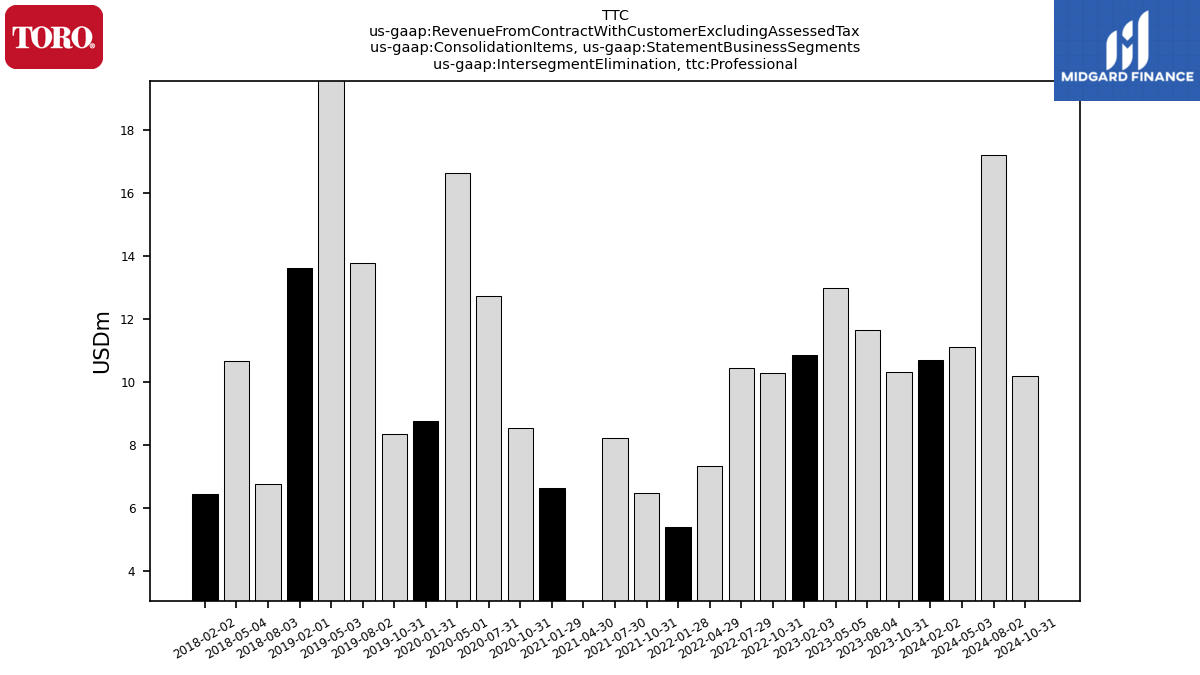
| Intersegment Elimination | -10.80 | -10.43 | -11.68 | -13.00 | -10.89 | -10.35 | -10.45 | -7.37 | -5.43 | -6.50 | -8.25 | -9.16 | -6.66 | -8.55 | -12.76 | -16.68 | -8.80 | -8.40 | -13.86 | -23.80 | -13.71 | NA | -6.86 | -10.77 | -6.51 | NA | NA | NA | NA | NA | NA | NA | NA | NA | NA | NA | NA | NA | NA | NA | NA | NA | NA | NA | NA | NA | NA | NA | NA | NA | NA | NA | NA | NA | NA | NA | NA | |
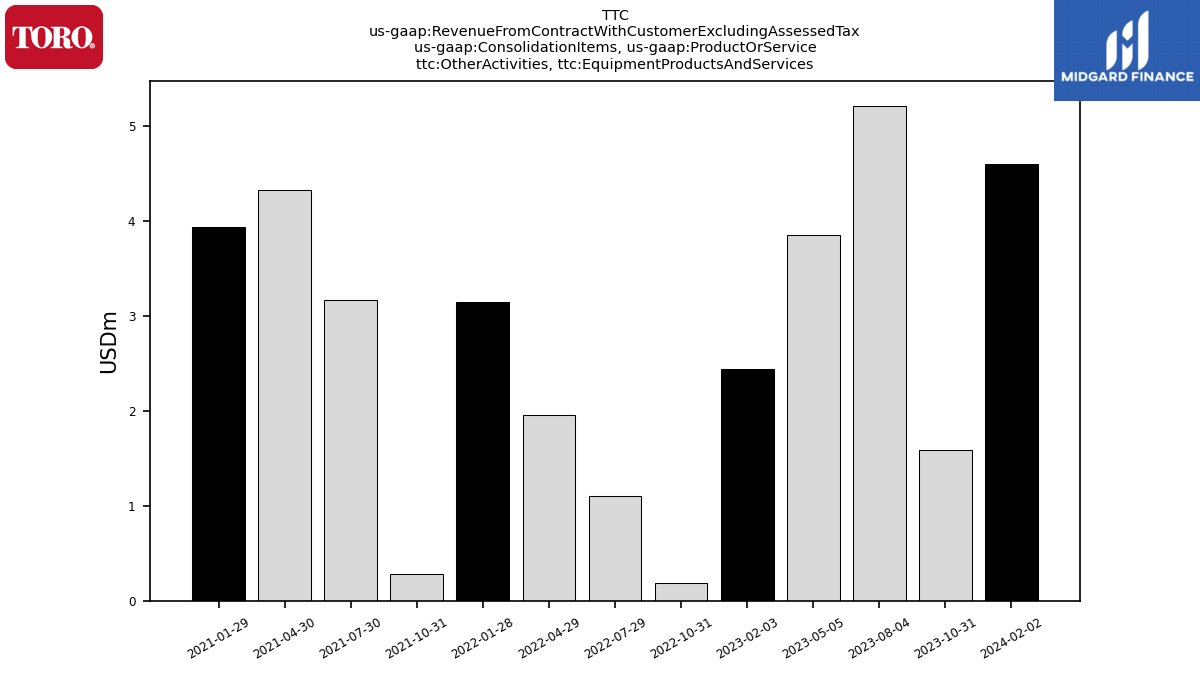
| Other Activities, Equipment Products And Services | 4.60 | 1.59 | 5.21 | 3.85 | 2.44 | 0.18 | 1.10 | 1.96 | 3.15 | 0.28 | 3.16 | 4.33 | 3.94 | NA | NA | NA | NA | NA | NA | NA | NA | NA | NA | NA | NA | NA | NA | NA | NA | NA | NA | NA | NA | NA | NA | NA | NA | NA | NA | NA | NA | NA | NA | NA | NA | NA | NA | NA | NA | NA | NA | NA | NA | NA | NA | NA | NA | |
| Other Activities, Irrigation | 0.70 | 4.34 | 4.93 | 0.90 | 1.12 | 3.60 | 3.25 | 2.04 | 1.22 | 2.60 | 3.08 | 1.38 | 1.12 | NA | NA | NA | NA | NA | NA | NA | NA | NA | NA | NA | NA | NA | NA | NA | NA | NA | NA | NA | NA | NA | NA | NA | NA | NA | NA | NA | NA | NA | NA | NA | NA | NA | NA | NA | NA | NA | NA | NA | NA | NA | NA | NA | NA | |
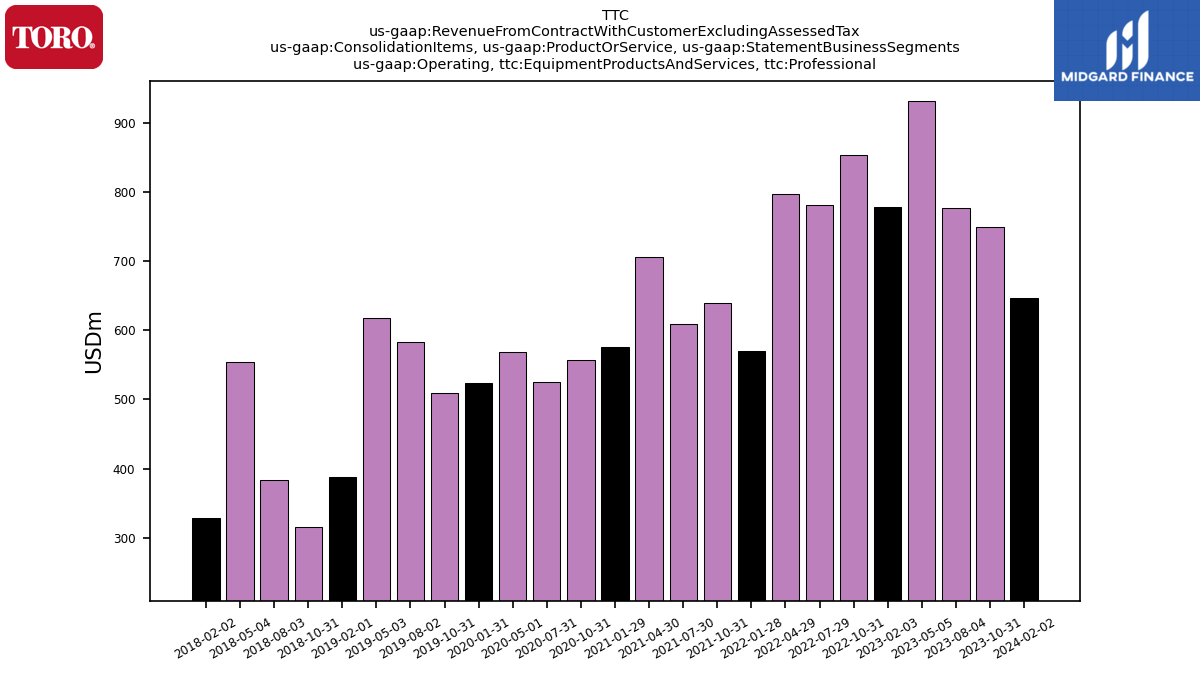
| Operating, Equipment Products And Services, Professional | 647.00 | 749.95 | 777.28 | 931.41 | 778.25 | 853.43 | 780.74 | 797.94 | 570.87 | 639.64 | 609.02 | 706.34 | 575.77 | 557.46 | 525.28 | 569.14 | 523.91 | 509.38 | 582.93 | 618.10 | 387.55 | 316.23 | 383.08 | 554.07 | 328.64 | NA | NA | NA | NA | NA | NA | NA | NA | NA | NA | NA | NA | NA | NA | NA | NA | NA | NA | NA | NA | NA | NA | NA | NA | NA | NA | NA | NA | NA | NA | NA | NA | |
| Operating, Equipment Products And Services, Residential | 231.90 | 136.43 | 169.07 | 260.27 | 253.43 | 215.66 | 265.47 | 313.48 | 244.59 | 214.11 | 247.15 | 308.65 | 205.92 | 178.85 | 199.01 | 257.40 | 152.46 | 125.74 | 143.81 | 225.46 | 133.51 | 123.19 | 161.40 | 203.93 | 129.31 | NA | NA | NA | NA | NA | NA | NA | NA | NA | NA | NA | NA | NA | NA | NA | NA | NA | NA | NA | NA | NA | NA | NA | NA | NA | NA | NA | NA | NA | NA | NA | NA | |
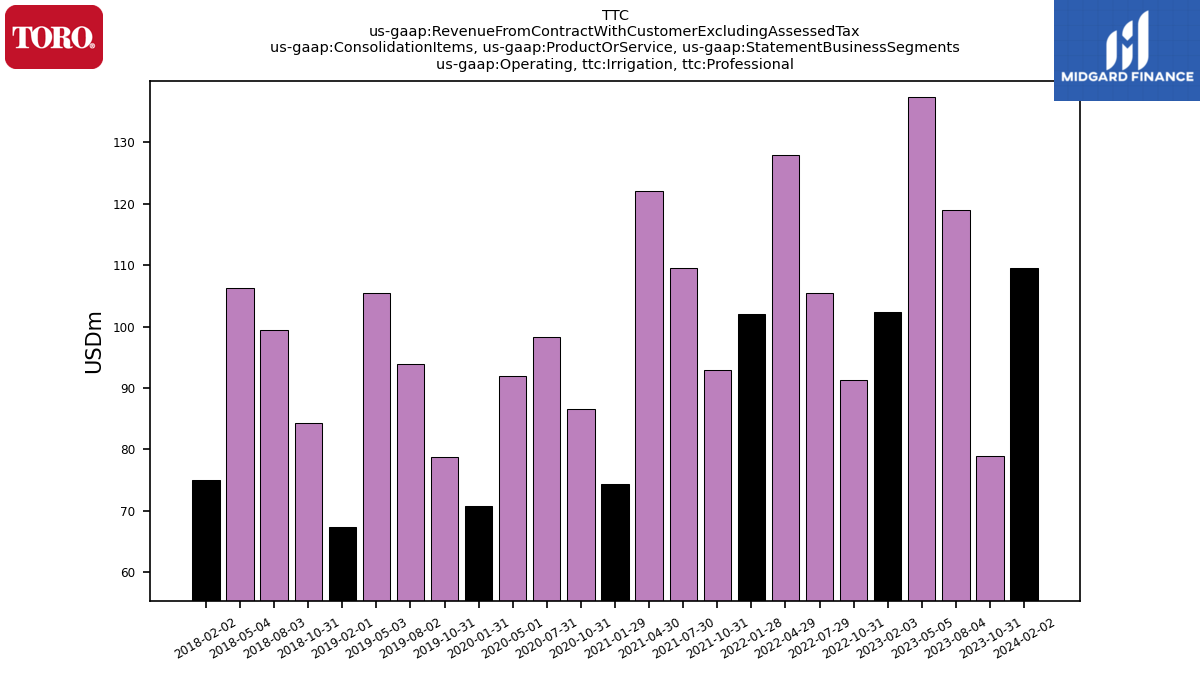
| Operating, Irrigation, Professional | 109.50 | 78.93 | 119.04 | 137.32 | 102.41 | 91.25 | 105.49 | 127.87 | 102.01 | 92.90 | 109.45 | 122.02 | 74.45 | 86.57 | 98.33 | 91.94 | 70.81 | 78.80 | 93.82 | 105.41 | 67.46 | 84.23 | 99.41 | 106.31 | 75.03 | NA | NA | NA | NA | NA | NA | NA | NA | NA | NA | NA | NA | NA | NA | NA | NA | NA | NA | NA | NA | NA | NA | NA | NA | NA | NA | NA | NA | NA | NA | NA | NA | |
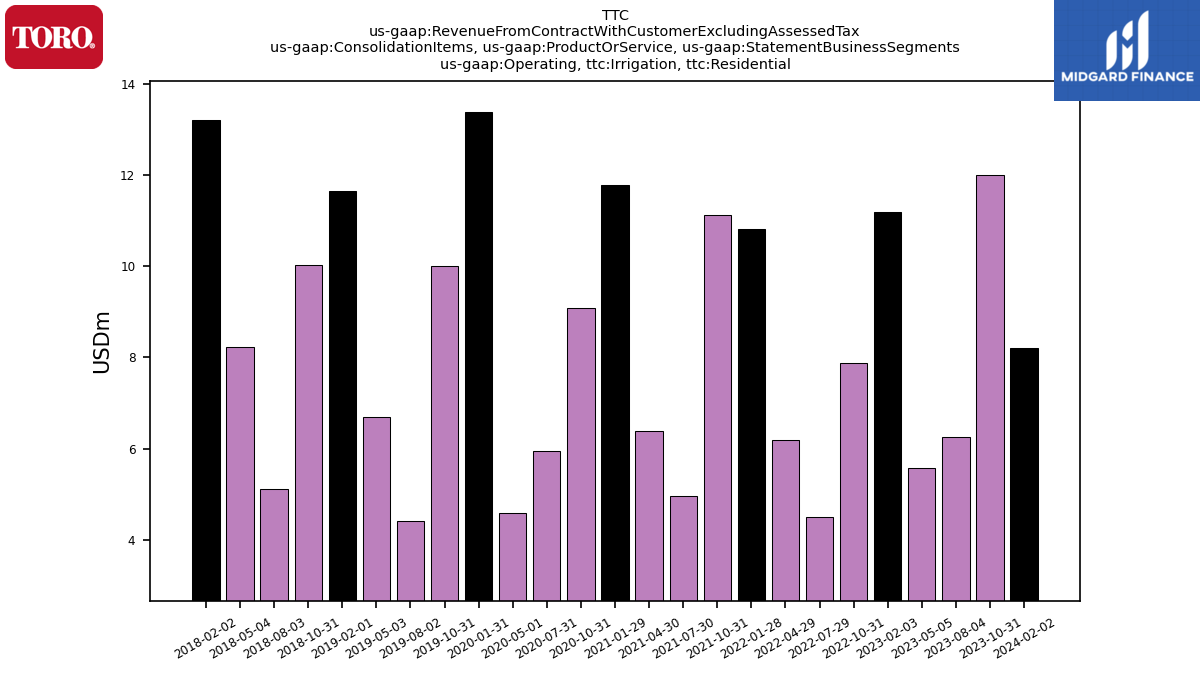
| Operating, Irrigation, Residential | 8.20 | 12.01 | 6.24 | 5.57 | 11.18 | 7.87 | 4.49 | 6.20 | 10.81 | 11.12 | 4.96 | 6.39 | 11.78 | 9.09 | 5.95 | 4.60 | 13.39 | 9.99 | 4.42 | 6.69 | 11.65 | 10.03 | 5.12 | 8.24 | 13.20 | NA | NA | NA | NA | NA | NA | NA | NA | NA | NA | NA | NA | NA | NA | NA | NA | NA | NA | NA | NA | NA | NA | NA | NA | NA | NA | NA | NA | NA | NA | NA | NA | |
| Intersegment Elimination, Professional | 10.70 | 10.33 | 11.64 | 12.98 | 10.86 | 10.29 | 10.44 | 7.35 | 5.42 | 6.50 | 8.24 | -9.15 | 6.64 | 8.55 | 12.74 | 16.64 | 8.77 | 8.35 | 13.78 | 23.72 | 13.61 | NA | 6.77 | 10.66 | 6.46 | NA | NA | NA | NA | NA | NA | NA | NA | NA | NA | NA | NA | NA | NA | NA | NA | NA | NA | NA | NA | NA | NA | NA | NA | NA | NA | NA | NA | NA | NA | NA | NA | |
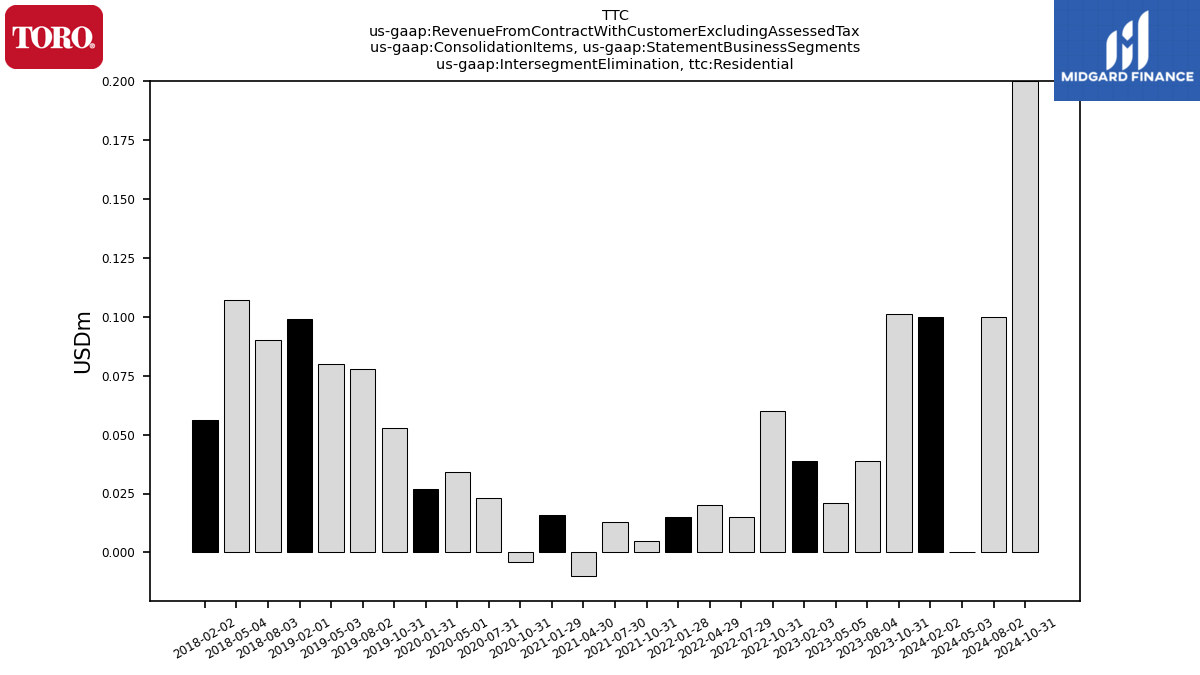
| Intersegment Elimination, Residential | 0.10 | 0.10 | 0.04 | 0.02 | 0.04 | 0.06 | 0.01 | 0.02 | 0.01 | 0.01 | 0.01 | -0.01 | 0.02 | -0.00 | 0.02 | 0.03 | 0.03 | 0.05 | 0.08 | 0.08 | 0.10 | NA | 0.09 | 0.11 | 0.06 | NA | NA | NA | NA | NA | NA | NA | NA | NA | NA | NA | NA | NA | NA | NA | NA | NA | NA | NA | NA | NA | NA | NA | NA | NA | NA | NA | NA | NA | NA | NA | NA | |
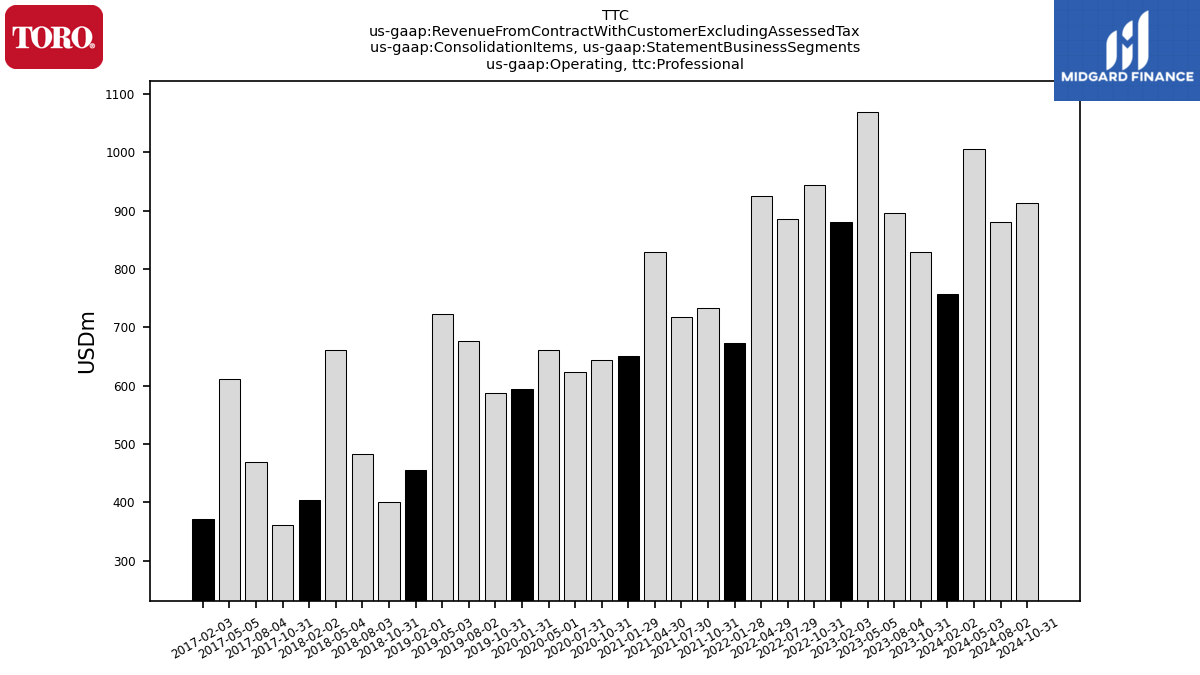
| Operating, Professional | 756.50 | 828.89 | 896.32 | 1068.73 | 880.66 | 944.68 | 886.23 | 925.81 | 672.88 | 732.54 | 718.48 | 828.36 | 650.22 | 644.03 | 623.62 | 661.09 | 594.72 | 588.18 | 676.76 | 723.51 | 455.01 | 400.46 | 482.49 | 660.37 | 403.67 | 360.44 | 468.56 | 610.90 | 371.81 | NA | NA | NA | NA | NA | NA | NA | NA | NA | NA | NA | NA | NA | NA | NA | NA | NA | NA | NA | NA | NA | NA | NA | NA | NA | NA | NA | NA | |
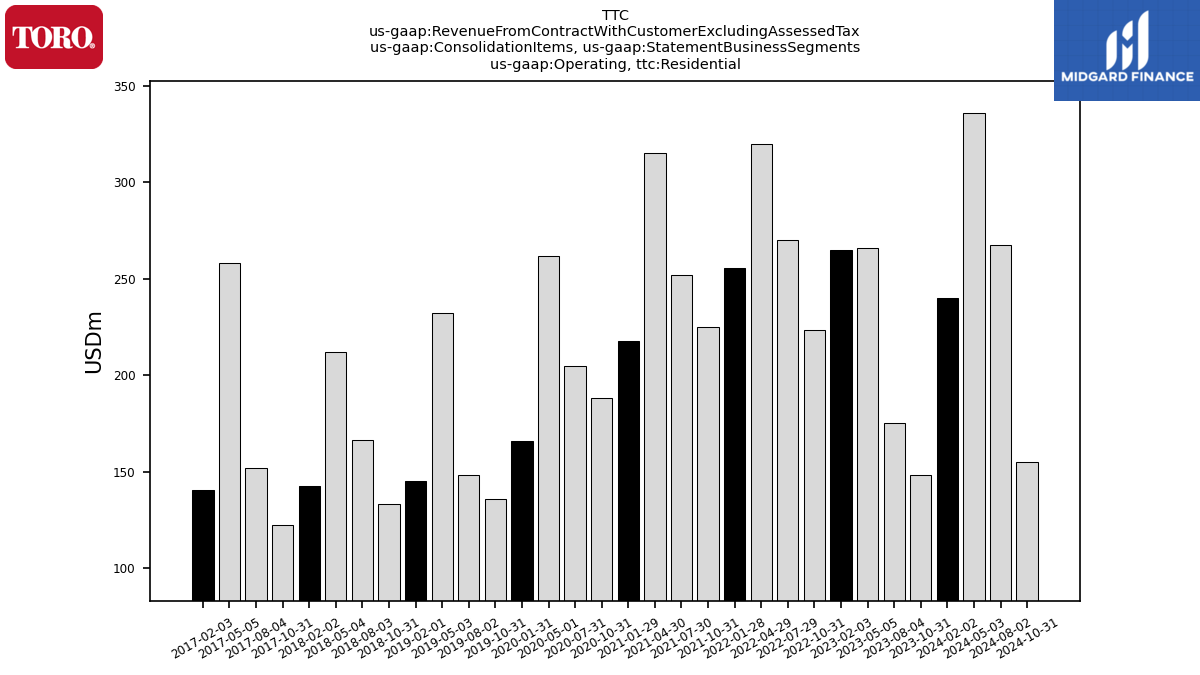
| Operating, Residential | 240.10 | 148.44 | 175.31 | 265.84 | 264.62 | 223.53 | 269.96 | 319.68 | 255.40 | 225.22 | 252.12 | 315.04 | 217.70 | 187.94 | 204.96 | 262.00 | 165.85 | 135.74 | 148.23 | 232.15 | 145.16 | 133.22 | 166.51 | 212.17 | 142.51 | 122.60 | 152.13 | 258.13 | 140.39 | NA | NA | NA | NA | NA | NA | NA | NA | NA | NA | NA | NA | NA | NA | NA | NA | NA | NA | NA | NA | NA | NA | NA | NA | NA | NA | NA | NA | |
| Other Activities,US | 5.30 | 5.93 | 10.15 | 4.76 | 3.56 | 3.78 | 4.36 | 3.99 | 4.36 | 2.89 | 6.24 | 5.71 | 5.06 | NA | NA | NA | NA | NA | NA | NA | NA | NA | NA | NA | NA | NA | NA | NA | NA | NA | NA | NA | NA | NA | NA | NA | NA | NA | NA | NA | NA | NA | NA | NA | NA | NA | NA | NA | NA | NA | NA | NA | NA | NA | NA | NA | NA | |
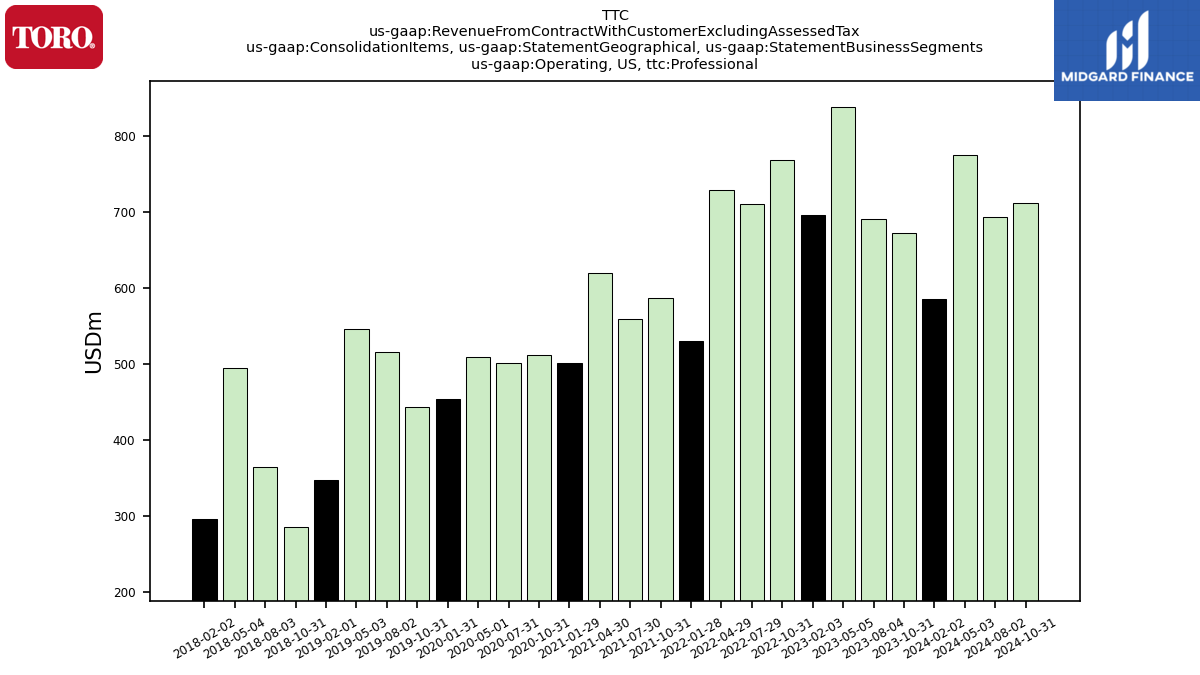
| Operating,US, Professional | 586.10 | 673.00 | 690.81 | 838.19 | 696.49 | 767.93 | 710.39 | 728.81 | 530.73 | 586.91 | 559.91 | 620.21 | 501.86 | 512.30 | 500.83 | 509.28 | 454.40 | 443.10 | 515.44 | 546.41 | 348.10 | 286.43 | 364.68 | 495.02 | 295.69 | NA | NA | NA | NA | NA | NA | NA | NA | NA | NA | NA | NA | NA | NA | NA | NA | NA | NA | NA | NA | NA | NA | NA | NA | NA | NA | NA | NA | NA | NA | NA | NA | |
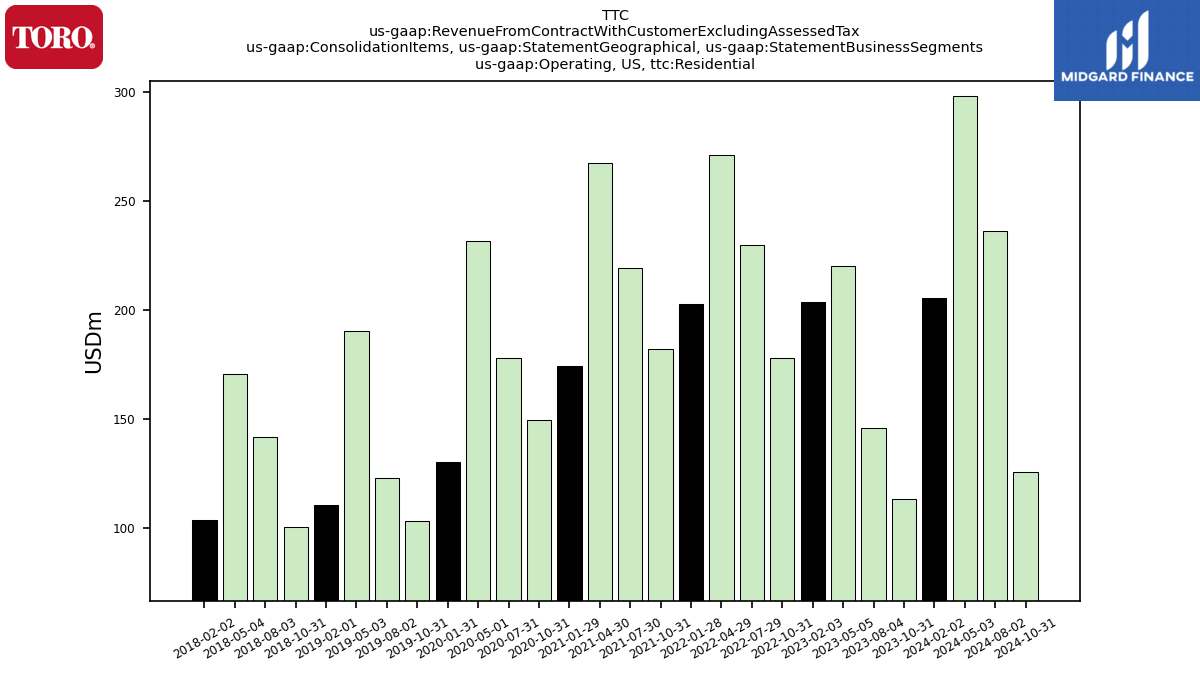
| Operating,US, Residential | 205.50 | 113.31 | 145.86 | 219.99 | 203.44 | 177.91 | 229.67 | 271.00 | 202.57 | 182.15 | 219.02 | 267.61 | 174.38 | 149.56 | 177.73 | 231.76 | 130.34 | 103.22 | 122.84 | 190.16 | 110.52 | 100.58 | 141.79 | 170.45 | 103.70 | NA | NA | NA | NA | NA | NA | NA | NA | NA | NA | NA | NA | NA | NA | NA | NA | NA | NA | NA | NA | NA | NA | NA | NA | NA | NA | NA | NA | NA | NA | NA | NA | |
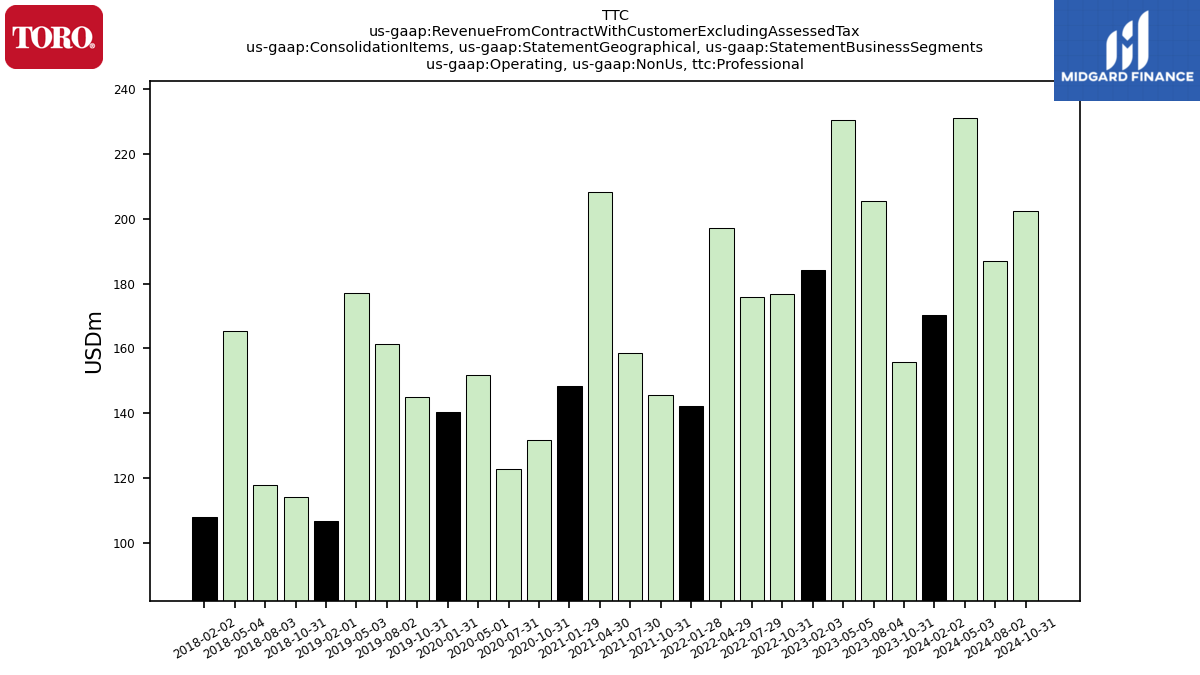
| Operating, Non Us, Professional | 170.40 | 155.88 | 205.51 | 230.54 | 184.17 | 176.75 | 175.85 | 197.00 | 142.15 | 145.64 | 158.57 | 208.15 | 148.36 | 131.73 | 122.79 | 151.81 | 140.32 | 145.08 | 161.32 | 177.09 | 106.90 | 114.04 | 117.81 | 165.36 | 107.98 | NA | NA | NA | NA | NA | NA | NA | NA | NA | NA | NA | NA | NA | NA | NA | NA | NA | NA | NA | NA | NA | NA | NA | NA | NA | NA | NA | NA | NA | NA | NA | NA | |
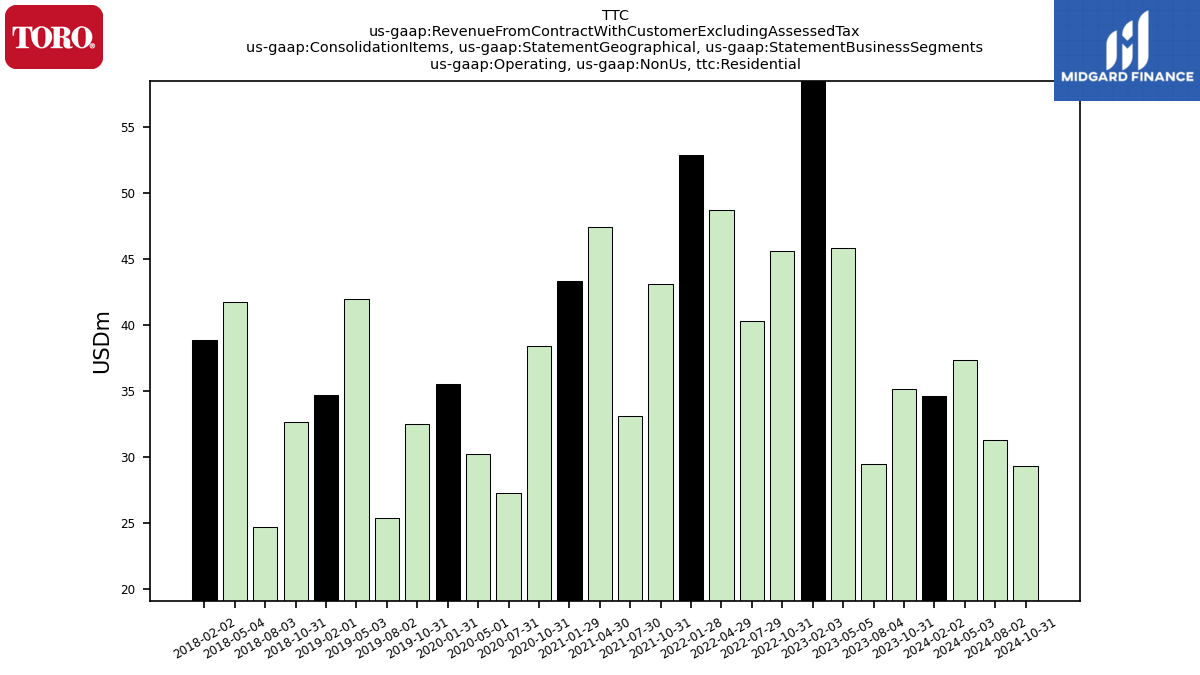
| Operating, Non Us, Residential | 34.60 | 35.13 | 29.45 | 45.85 | 61.17 | 45.62 | 40.30 | 48.67 | 52.84 | 43.07 | 33.09 | 47.42 | 43.32 | 38.38 | 27.23 | 30.23 | 35.51 | 32.52 | 25.39 | 41.98 | 34.64 | 32.65 | 24.72 | 41.72 | 38.81 | NA | NA | NA | NA | NA | NA | NA | NA | NA | NA | NA | NA | NA | NA | NA | NA | NA | NA | NA | NA | NA | NA | NA | NA | NA | NA | NA | NA | NA | NA | NA | NA | |
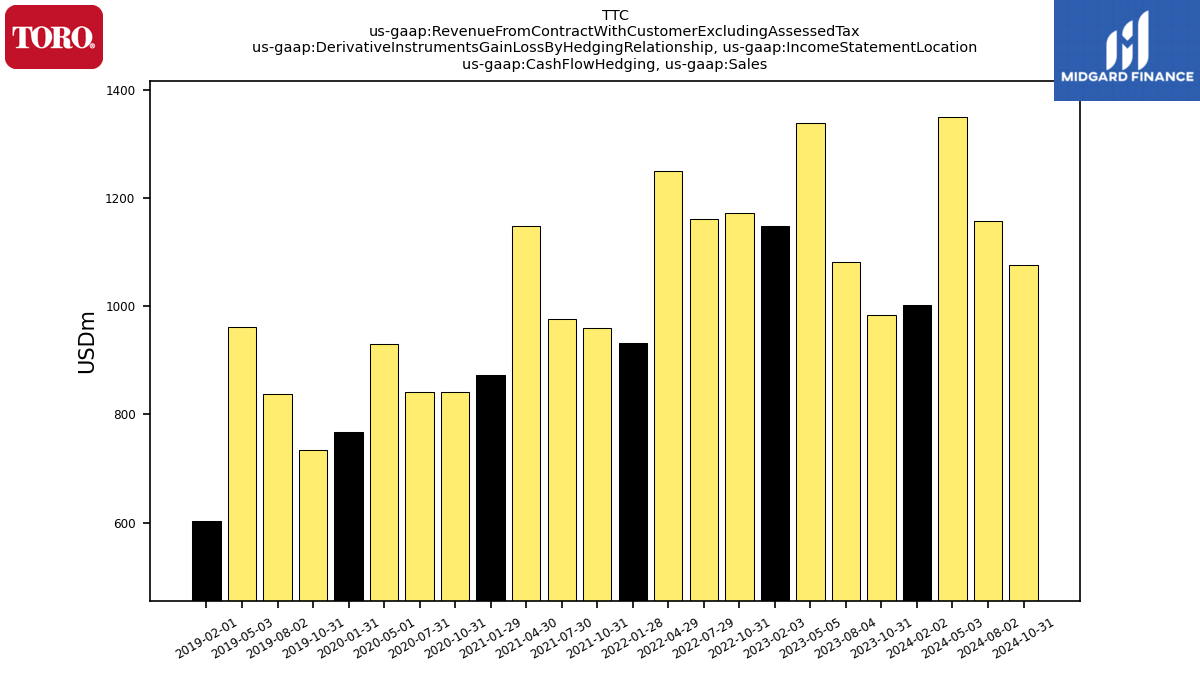
| Cash Flow Hedging, Sales | 1001.90 | 983.25 | 1081.78 | 1339.33 | 1148.84 | 1171.98 | 1160.55 | 1249.48 | 932.65 | 960.65 | 976.84 | 1149.11 | 872.99 | 840.96 | 840.97 | 929.40 | 767.48 | 734.38 | 838.71 | 962.04 | 602.96 | NA | NA | NA | NA | NA | NA | NA | NA | NA | NA | NA | NA | NA | NA | NA | NA | NA | NA | NA | NA | NA | NA | NA | NA | NA | NA | NA | NA | NA | NA | NA | NA | NA | NA | NA | NA | |
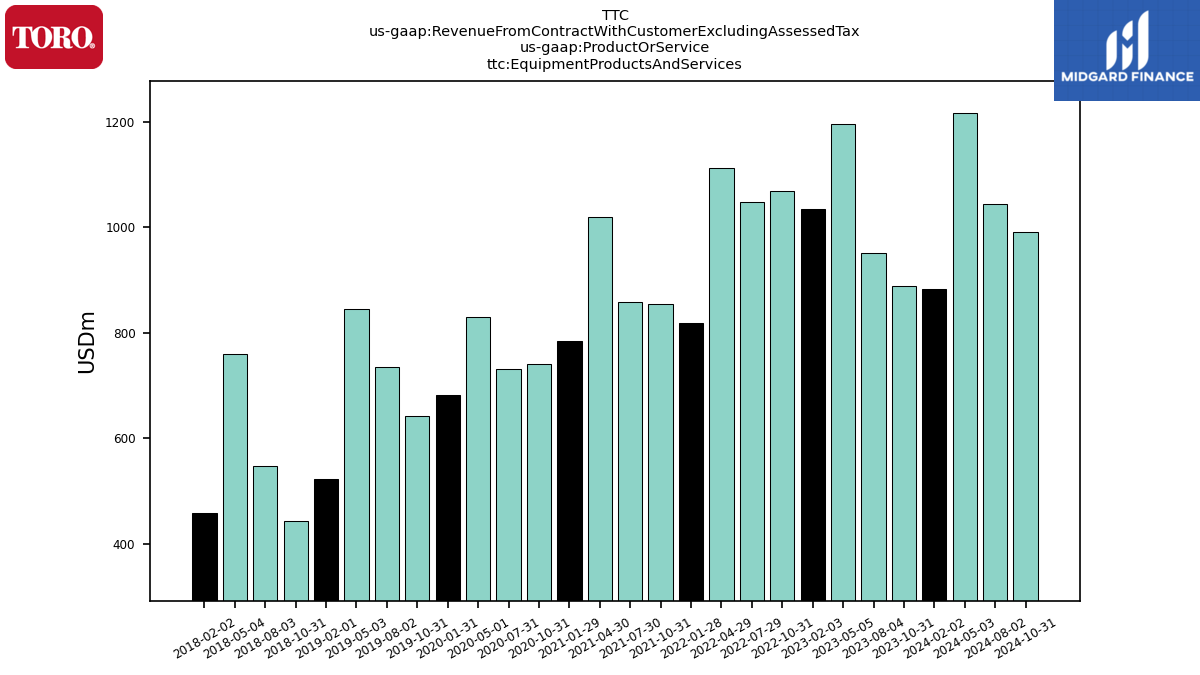
| Equipment Products And Services | 883.50 | 887.97 | 951.57 | 1195.53 | 1034.13 | 1069.27 | 1047.31 | 1113.38 | 818.61 | 854.03 | 859.34 | 1019.32 | 785.64 | 741.70 | 731.33 | 830.38 | 681.89 | 642.96 | 735.73 | 846.22 | 523.03 | 443.04 | 548.30 | 759.49 | 459.22 | NA | NA | NA | NA | NA | NA | NA | NA | NA | NA | NA | NA | NA | NA | NA | NA | NA | NA | NA | NA | NA | NA | NA | NA | NA | NA | NA | NA | NA | NA | NA | NA | |
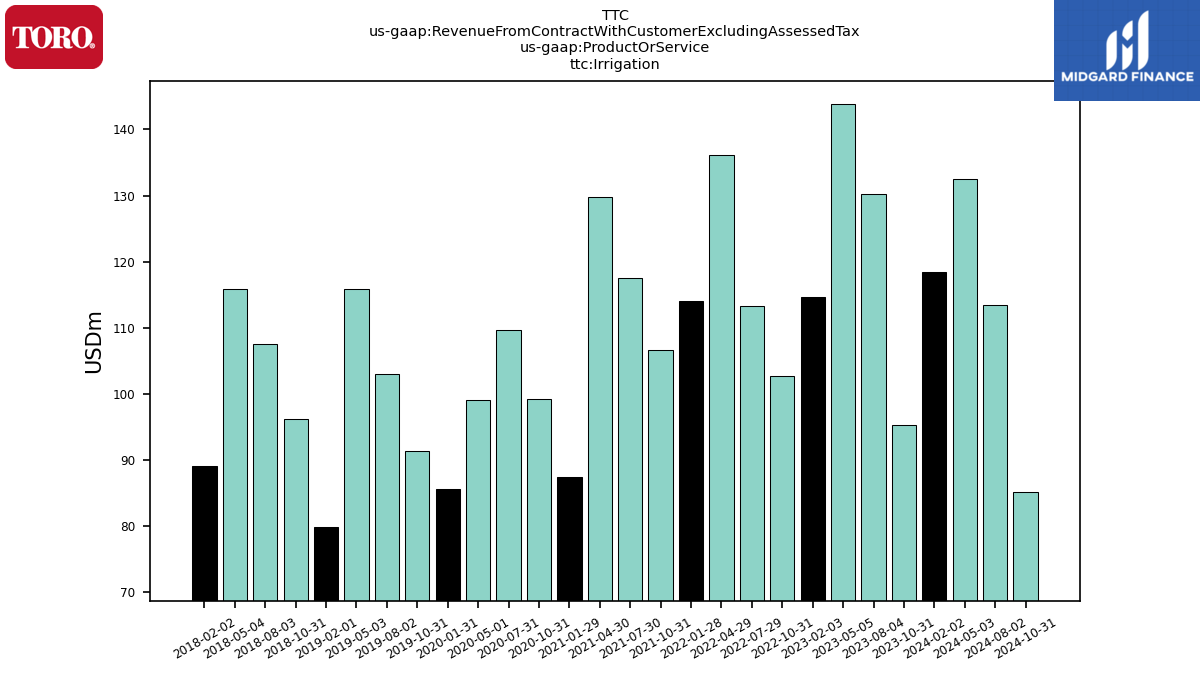
| Irrigation | 118.40 | 95.28 | 130.22 | 143.79 | 114.71 | 102.72 | 113.24 | 136.10 | 114.04 | 106.62 | 117.50 | 129.79 | 87.35 | 99.26 | 109.65 | 99.02 | 85.59 | 91.42 | 102.98 | 115.82 | 79.93 | 96.26 | 107.52 | 115.79 | 89.03 | NA | NA | NA | NA | NA | NA | NA | NA | NA | NA | NA | NA | NA | NA | NA | NA | NA | NA | NA | NA | NA | NA | NA | NA | NA | NA | NA | NA | NA | NA | NA | NA | |
| US | 796.90 | 792.24 | 846.82 | 1062.94 | 903.50 | 949.62 | 944.41 | 1003.81 | 737.66 | 771.95 | 785.17 | 893.53 | 681.30 | 670.84 | 690.96 | 747.35 | 591.65 | 556.78 | 652.00 | 742.96 | 461.41 | 392.62 | 513.29 | 668.20 | 401.46 | NA | NA | NA | NA | NA | NA | NA | NA | NA | NA | NA | NA | NA | NA | NA | NA | NA | NA | NA | NA | NA | NA | NA | NA | NA | NA | NA | NA | NA | NA | NA | NA | |
| Non Us | 205.00 | 191.01 | 234.96 | 276.38 | 245.34 | 222.37 | 216.14 | 245.67 | 194.99 | 188.71 | 191.66 | 255.57 | 191.68 | 170.12 | 150.01 | 182.04 | 175.84 | 177.60 | 186.71 | 219.08 | 141.54 | 146.69 | 142.53 | 207.08 | 146.79 | NA | NA | NA | NA | NA | NA | NA | NA | NA | NA | NA | NA | NA | NA | NA | NA | NA | NA | NA | NA | NA | NA | NA | NA | NA | NA | NA | NA | NA | NA | NA | NA |