
| 2024-01-01 | 2023-10-02 | 2023-07-03 | 2023-04-03 | 2023-01-02 | 2022-10-03 | 2022-07-04 | 2022-04-04 | 2021-09-27 | 2021-06-28 | 2021-03-29 | 2020-12-28 | 2020-09-28 | 2020-06-29 | 2020-03-30 | 2019-12-30 | 2019-09-30 | 2019-07-01 | 2019-04-01 | 2018-12-31 | 2018-10-01 | 2018-07-02 | 2018-04-02 | 2018-01-01 | 2017-10-02 | 2017-07-03 | 2017-04-03 | 2016-09-26 | 2016-06-27 | 2016-03-28 | 2015-12-28 | 2015-09-28 | 2015-06-29 | 2015-03-30 | 2014-12-29 | 2014-09-29 | 2014-06-30 | 2014-03-31 | 2013-12-30 | 2013-09-30 | 2013-07-01 | 2013-04-01 | 2012-12-31 | 2012-09-24 | 2012-06-25 | 2012-03-26 | 2011-12-31 | 2011-09-26 | 2011-06-27 | 2011-03-28 | 2010-12-31 | 2010-09-27 | 2010-06-28 | ||
|---|---|---|---|---|---|---|---|---|---|---|---|---|---|---|---|---|---|---|---|---|---|---|---|---|---|---|---|---|---|---|---|---|---|---|---|---|---|---|---|---|---|---|---|---|---|---|---|---|---|---|---|---|---|---|
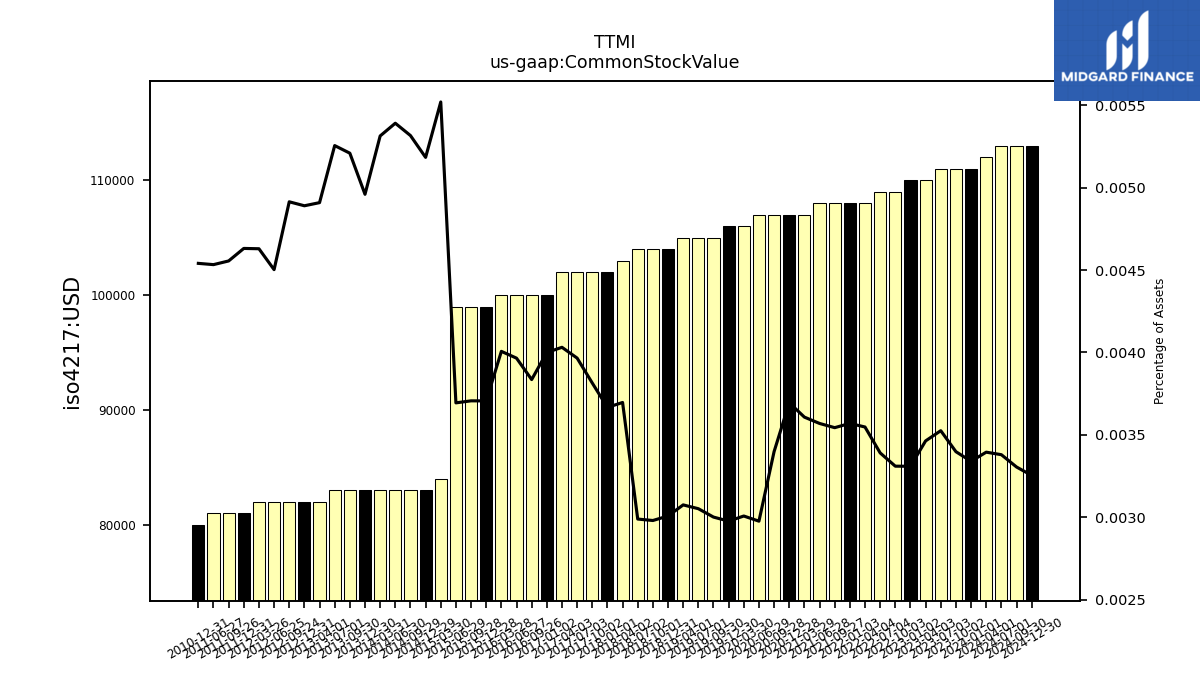
| Common Stock Value | 0.11 | 0.11 | 0.11 | 0.11 | 0.11 | 0.11 | 0.11 | 0.11 | 0.11 | 0.11 | 0.11 | 0.11 | 0.11 | 0.11 | 0.11 | 0.11 | 0.10 | 0.10 | 0.10 | 0.10 | 0.10 | 0.10 | 0.10 | 0.10 | 0.10 | 0.10 | 0.10 | 0.10 | 0.10 | 0.10 | 0.10 | 0.10 | 0.10 | 0.08 | 0.08 | 0.08 | 0.08 | 0.08 | 0.08 | 0.08 | 0.08 | 0.08 | 0.08 | 0.08 | 0.08 | 0.08 | 0.08 | 0.08 | 0.08 | NA | 0.08 | NA | NA | |
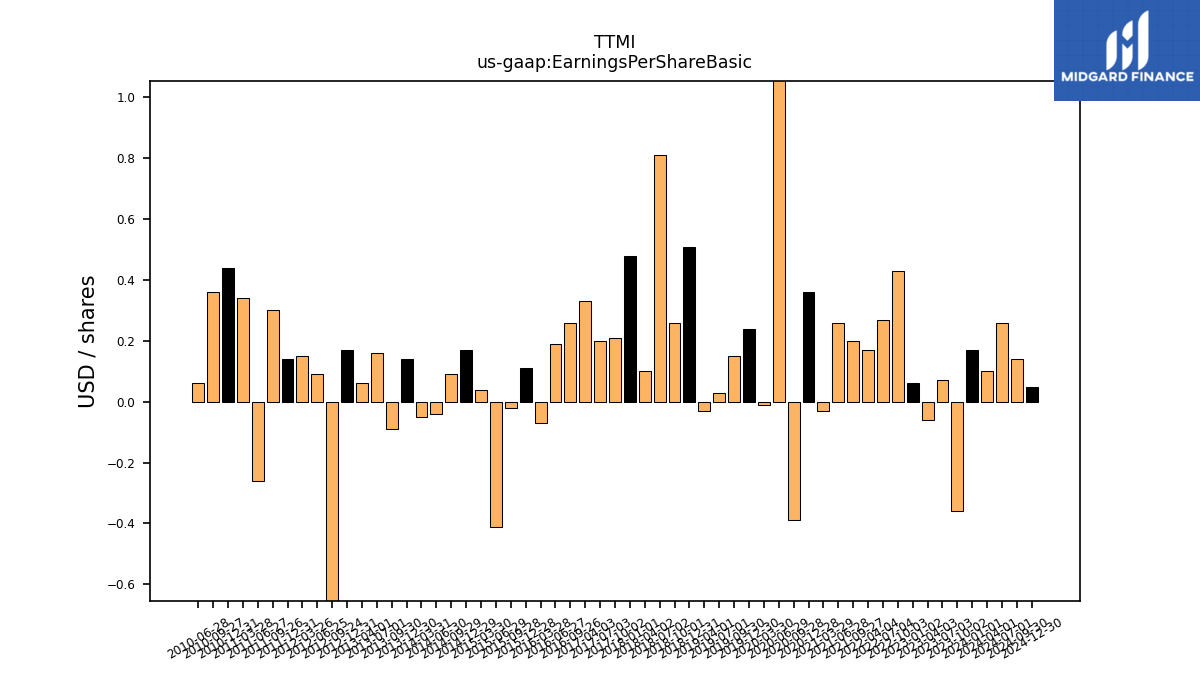
| Earnings Per Share Basic | 0.17 | -0.36 | 0.07 | -0.06 | 0.06 | 0.43 | 0.27 | 0.17 | 0.20 | 0.26 | -0.03 | 0.36 | -0.39 | 1.81 | -0.01 | 0.24 | 0.15 | 0.03 | -0.03 | 0.51 | 0.26 | 0.81 | 0.10 | 0.48 | 0.21 | 0.20 | 0.33 | 0.26 | 0.19 | -0.07 | 0.11 | -0.02 | -0.41 | 0.04 | 0.17 | 0.09 | -0.04 | -0.05 | 0.14 | -0.09 | 0.16 | 0.06 | 0.17 | -2.54 | 0.09 | 0.15 | 0.14 | 0.30 | -0.26 | 0.34 | 0.44 | 0.36 | 0.06 | |
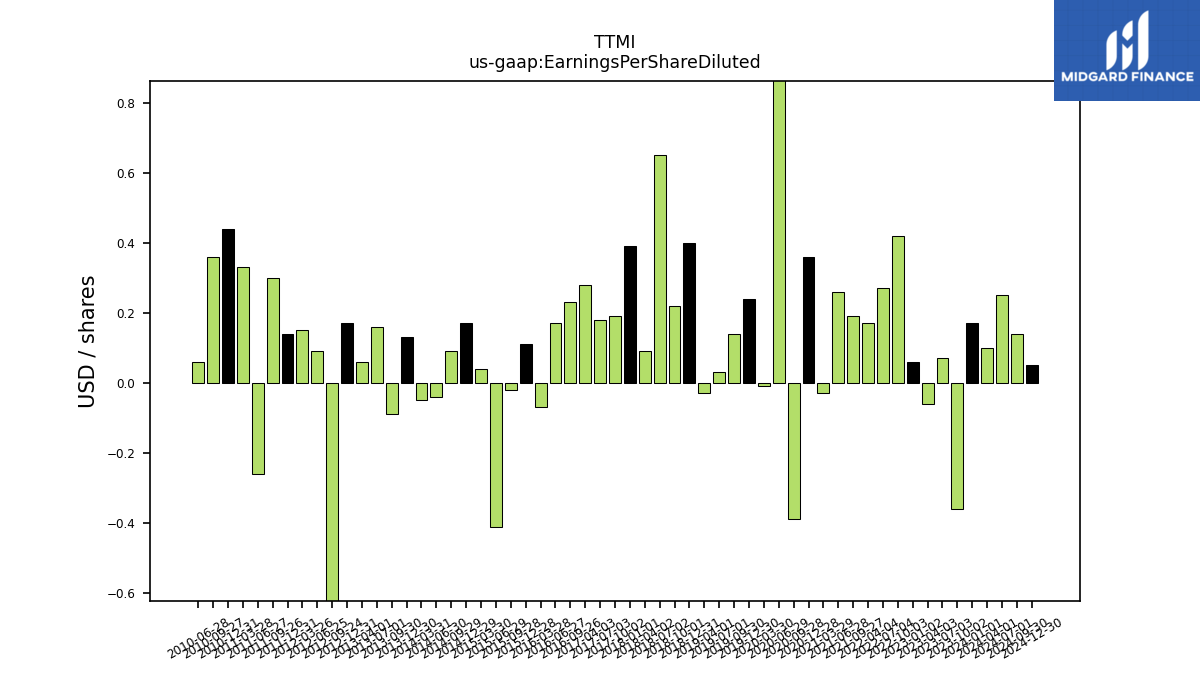
| Earnings Per Share Diluted | 0.17 | -0.36 | 0.07 | -0.06 | 0.06 | 0.42 | 0.27 | 0.17 | 0.19 | 0.26 | -0.03 | 0.36 | -0.39 | 1.79 | -0.01 | 0.24 | 0.14 | 0.03 | -0.03 | 0.40 | 0.22 | 0.65 | 0.09 | 0.39 | 0.19 | 0.18 | 0.28 | 0.23 | 0.17 | -0.07 | 0.11 | -0.02 | -0.41 | 0.04 | 0.17 | 0.09 | -0.04 | -0.05 | 0.13 | -0.09 | 0.16 | 0.06 | 0.17 | -2.54 | 0.09 | 0.15 | 0.14 | 0.30 | -0.26 | 0.33 | 0.44 | 0.36 | 0.06 | |
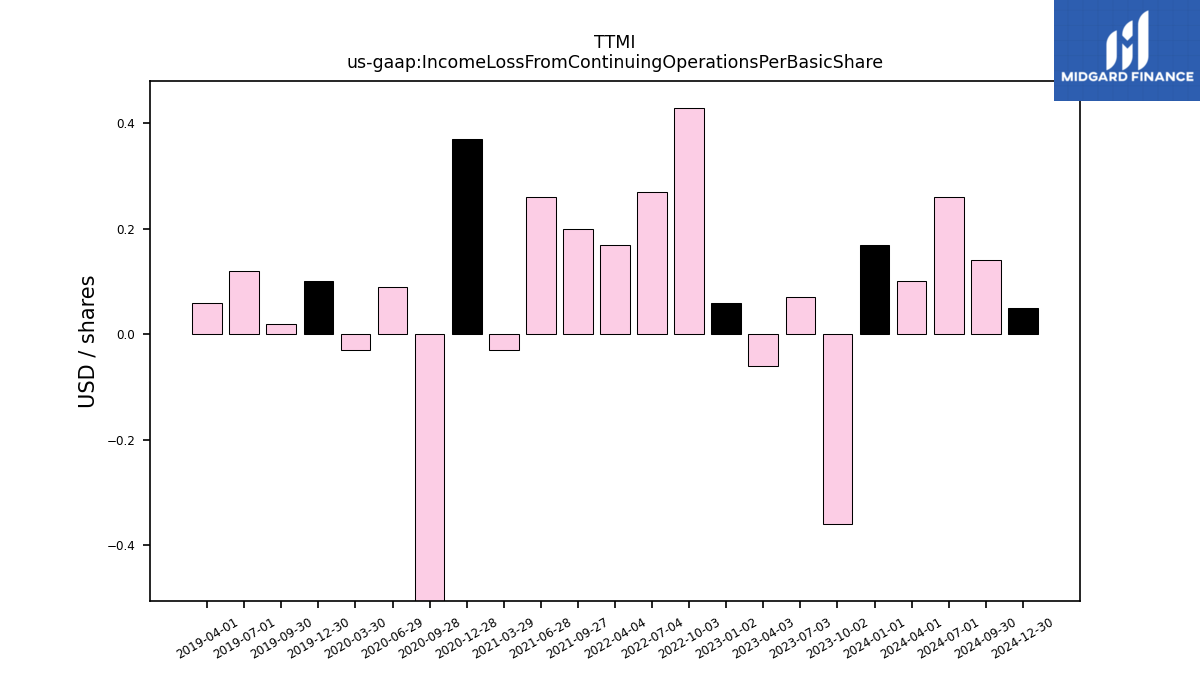
| Income Loss From Continuing Operations Per Basic Share | 0.00 | -0.00 | 0.00 | -0.00 | 0.00 | 0.00 | 0.00 | 0.00 | 0.00 | 0.00 | -0.00 | 0.00 | -0.00 | 0.00 | -0.00 | 0.00 | 0.00 | 0.00 | 0.00 | NA | NA | NA | NA | NA | NA | NA | NA | NA | NA | NA | NA | NA | NA | NA | NA | NA | NA | NA | NA | NA | NA | NA | NA | NA | NA | NA | NA | NA | NA | NA | NA | NA | NA | |
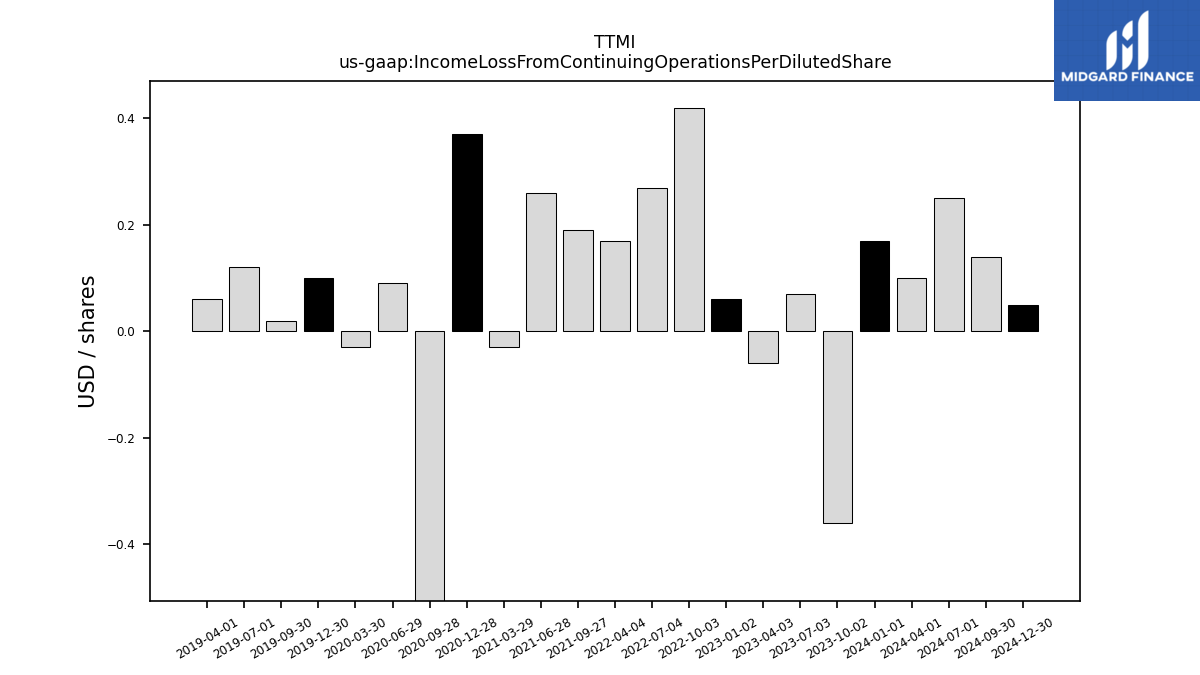
| Income Loss From Continuing Operations Per Diluted Share | 0.00 | -0.00 | 0.00 | -0.00 | 0.00 | 0.00 | 0.00 | 0.00 | 0.00 | 0.00 | -0.00 | 0.00 | -0.00 | 0.00 | -0.00 | 0.00 | 0.00 | 0.00 | 0.00 | NA | NA | NA | NA | NA | NA | NA | NA | NA | NA | NA | NA | NA | NA | NA | NA | NA | NA | NA | NA | NA | NA | NA | NA | NA | NA | NA | NA | NA | NA | NA | NA | NA | NA |
| 2024-01-01 | 2023-10-02 | 2023-07-03 | 2023-04-03 | 2023-01-02 | 2022-10-03 | 2022-07-04 | 2022-04-04 | 2021-09-27 | 2021-06-28 | 2021-03-29 | 2020-12-28 | 2020-09-28 | 2020-06-29 | 2020-03-30 | 2019-12-30 | 2019-09-30 | 2019-07-01 | 2019-04-01 | 2018-12-31 | 2018-10-01 | 2018-07-02 | 2018-04-02 | 2018-01-01 | 2017-10-02 | 2017-07-03 | 2017-04-03 | 2016-09-26 | 2016-06-27 | 2016-03-28 | 2015-12-28 | 2015-09-28 | 2015-06-29 | 2015-03-30 | 2014-12-29 | 2014-09-29 | 2014-06-30 | 2014-03-31 | 2013-12-30 | 2013-09-30 | 2013-07-01 | 2013-04-01 | 2012-12-31 | 2012-09-24 | 2012-06-25 | 2012-03-26 | 2011-12-31 | 2011-09-26 | 2011-06-27 | 2011-03-28 | 2010-12-31 | 2010-09-27 | 2010-06-28 | ||
|---|---|---|---|---|---|---|---|---|---|---|---|---|---|---|---|---|---|---|---|---|---|---|---|---|---|---|---|---|---|---|---|---|---|---|---|---|---|---|---|---|---|---|---|---|---|---|---|---|---|---|---|---|---|---|
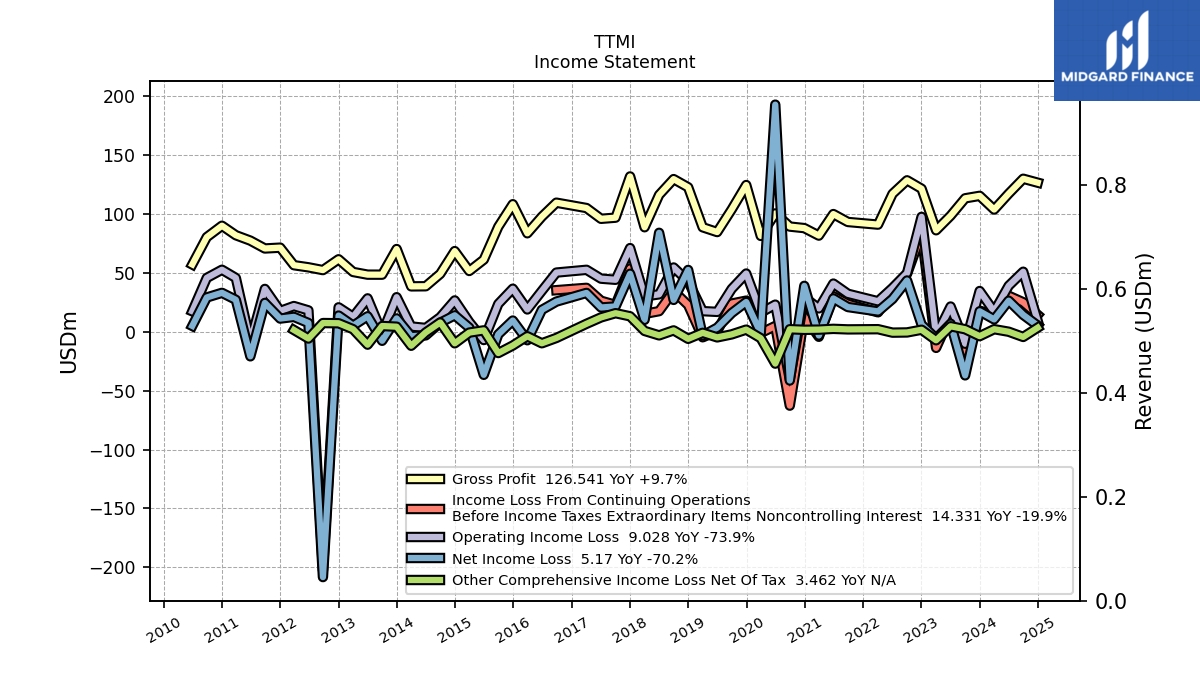
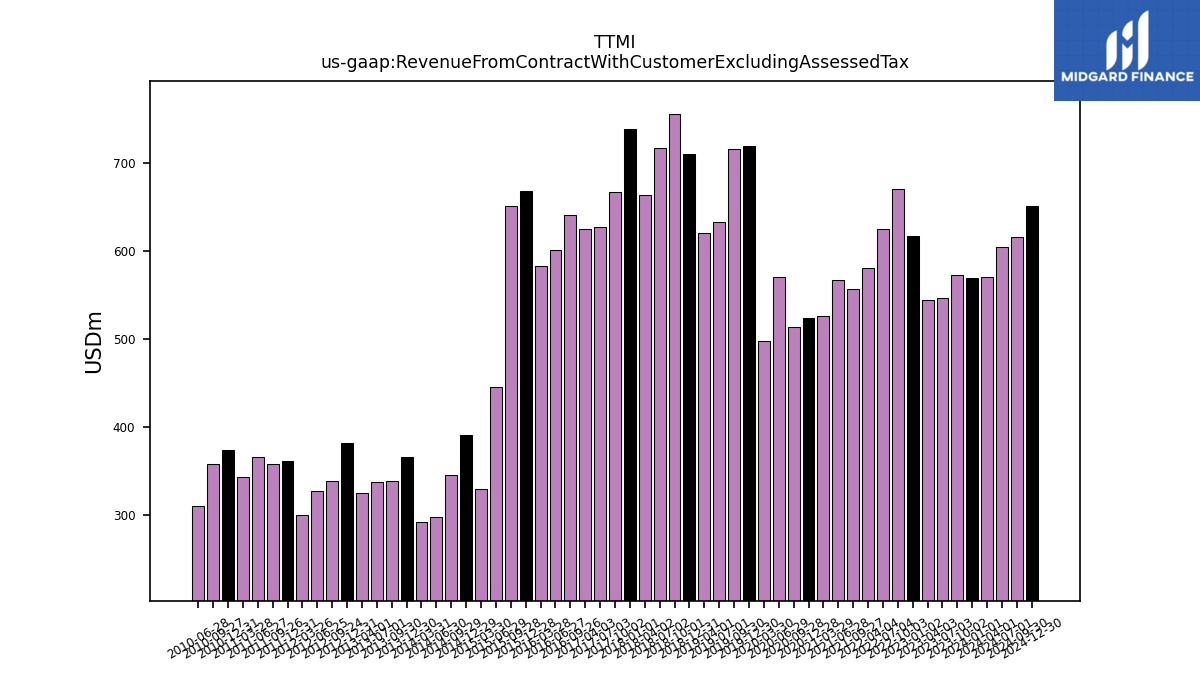
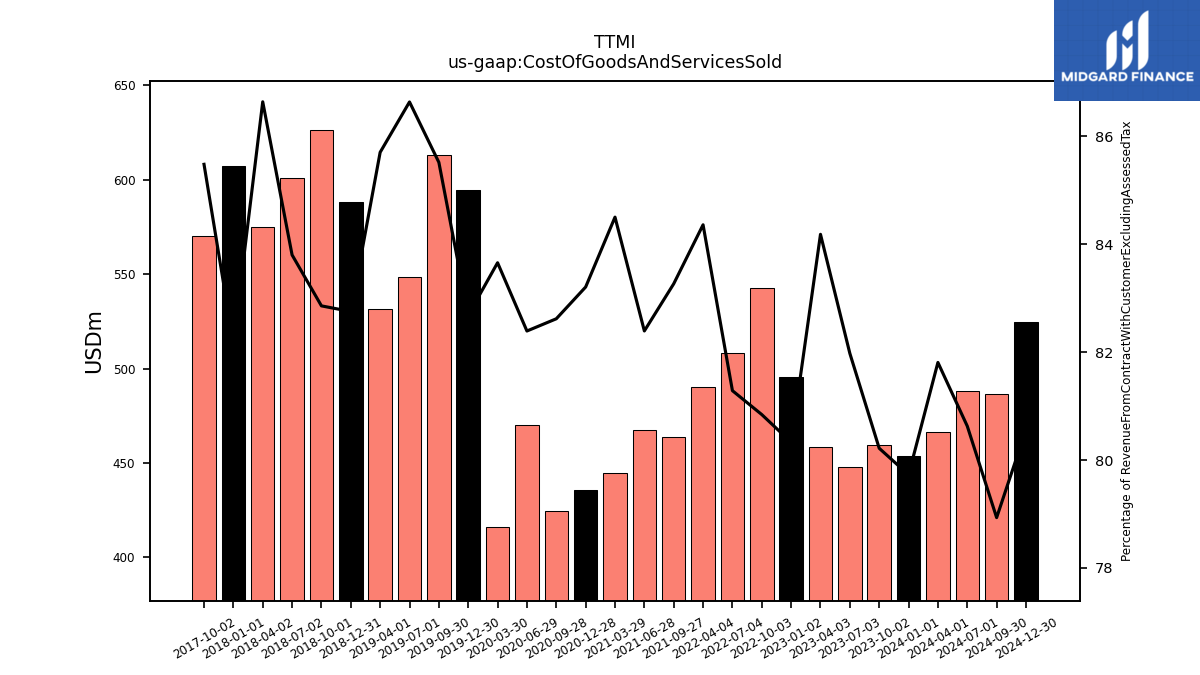
| Revenue From Contract With Customer Excluding Assessed Tax | 569.04 | 572.58 | 546.51 | 544.44 | 617.16 | 671.08 | 625.55 | 581.26 | 556.78 | 567.38 | 526.43 | 523.80 | 513.58 | 570.30 | 497.65 | 719.25 | 716.82 | 633.04 | 620.20 | 710.96 | 755.84 | 716.89 | 663.58 | 739.35 | 666.81 | 627.18 | 625.25 | 641.72 | 601.85 | 583.26 | 668.87 | 652.00 | 445.44 | 329.16 | 390.91 | 345.27 | 297.63 | 291.89 | 366.11 | 338.69 | 338.02 | 325.39 | 381.74 | 339.01 | 327.42 | 300.50 | 361.46 | 358.26 | 366.12 | 342.80 | 373.39 | 357.81 | 310.25 | |
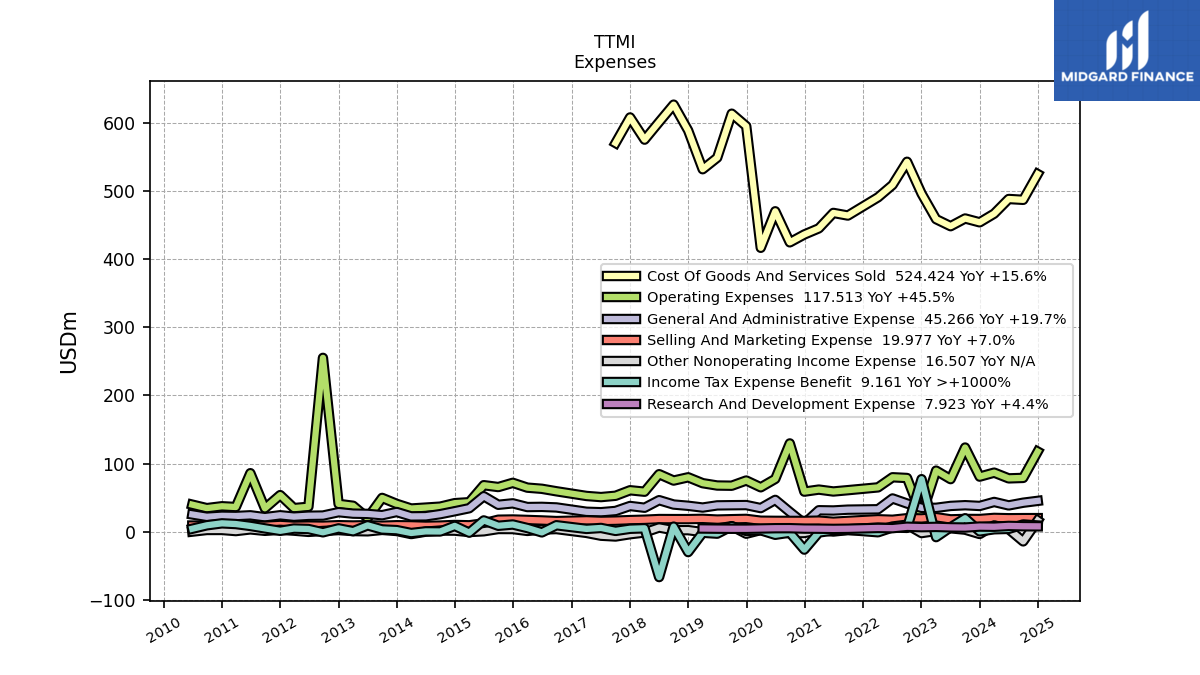
| Cost Of Goods And Services Sold | 453.67 | 459.31 | 448.00 | 458.31 | 495.75 | 542.51 | 508.48 | 490.34 | 463.61 | 467.47 | 444.83 | 435.83 | 424.30 | 469.87 | 416.30 | 594.70 | 612.98 | 548.42 | 531.51 | 588.32 | 626.25 | 600.75 | 574.90 | 607.49 | 569.98 | NA | NA | NA | NA | NA | NA | NA | NA | NA | NA | NA | NA | NA | NA | NA | NA | NA | NA | NA | NA | NA | NA | NA | NA | NA | NA | NA | NA | |
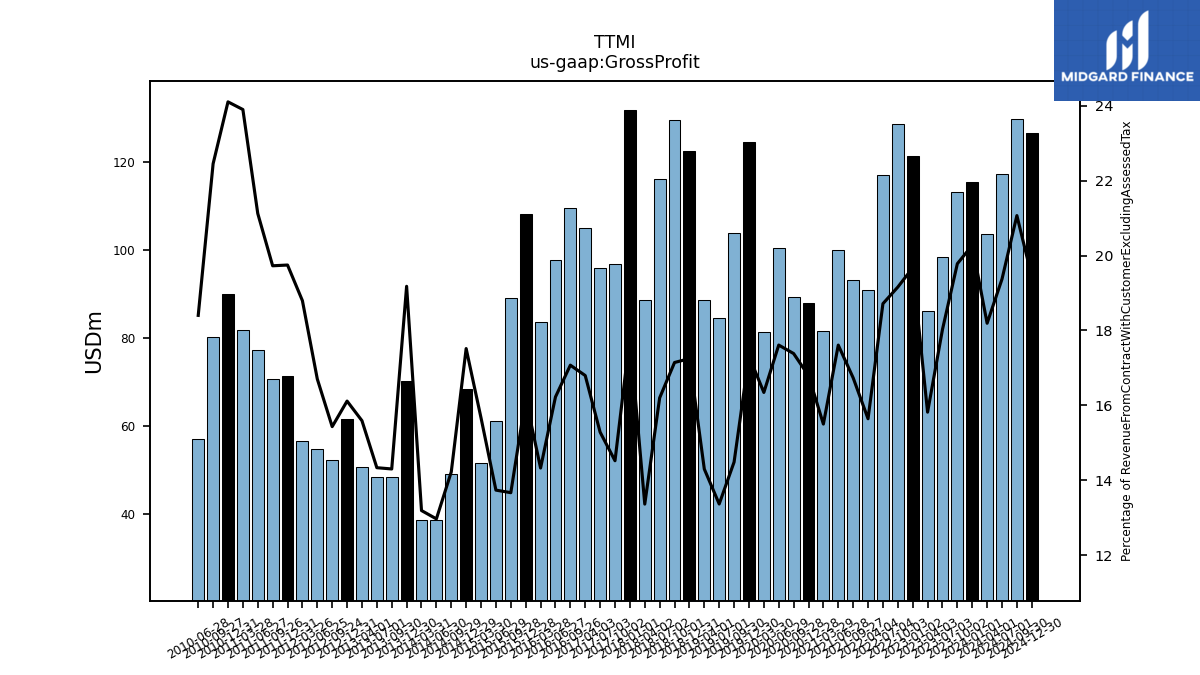
| Gross Profit | 115.37 | 113.27 | 98.51 | 86.12 | 121.40 | 128.57 | 117.07 | 90.92 | 93.18 | 99.91 | 81.60 | 87.97 | 89.28 | 100.43 | 81.34 | 124.55 | 103.83 | 84.61 | 88.69 | 122.63 | 129.58 | 116.14 | 88.68 | 131.86 | 96.83 | 95.87 | 105.02 | 109.56 | 97.64 | 83.56 | 108.27 | 89.12 | 61.19 | 51.56 | 68.47 | 49.11 | 38.60 | 38.51 | 70.22 | 48.44 | 48.46 | 50.73 | 61.51 | 52.32 | 54.69 | 56.48 | 71.38 | 70.67 | 77.33 | 81.93 | 90.00 | 80.33 | 57.09 | |
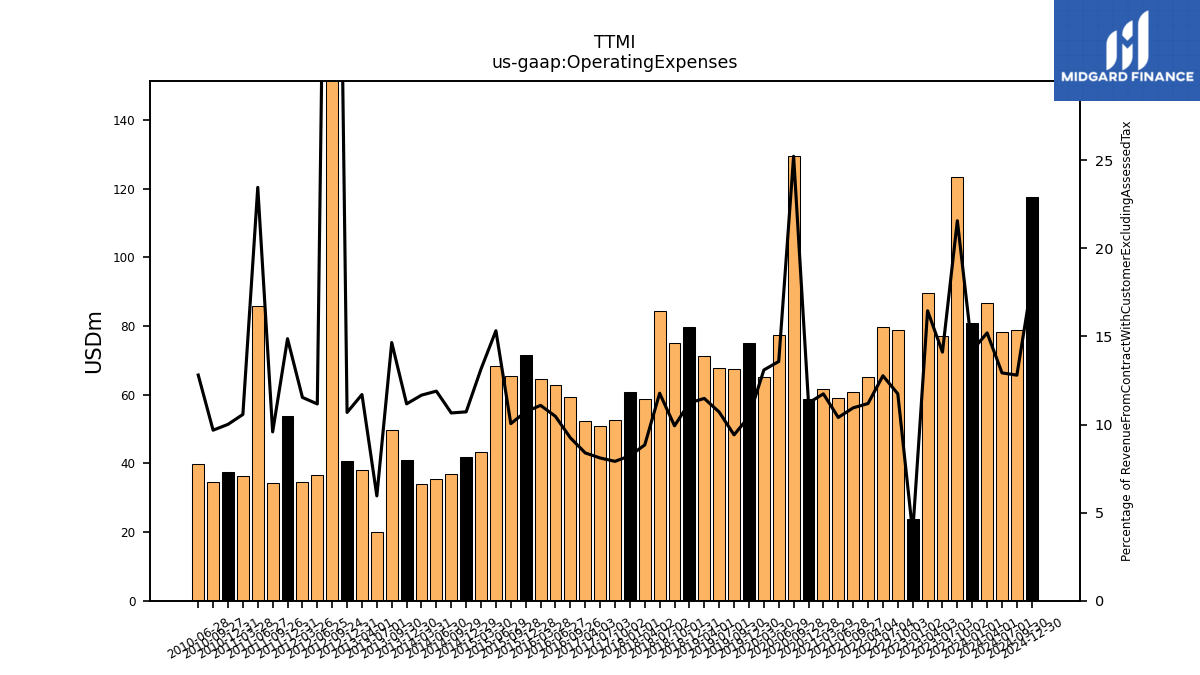
| Operating Expenses | 80.79 | 123.47 | 77.10 | 89.59 | 23.84 | 78.79 | 79.87 | 65.06 | 60.94 | 59.02 | 61.80 | 58.81 | 129.53 | 77.43 | 65.16 | 75.12 | 67.47 | 67.77 | 71.19 | 79.83 | 75.03 | 84.41 | 58.68 | 60.82 | 52.74 | 50.81 | 52.45 | 59.34 | 62.97 | 64.66 | 71.73 | 65.52 | 68.25 | 43.29 | 41.90 | 36.80 | 35.40 | 34.05 | 40.90 | 49.63 | 20.11 | 38.08 | 40.79 | 254.99 | 36.56 | 34.67 | 53.75 | 34.33 | 85.88 | 36.24 | 37.37 | 34.63 | 39.74 | |
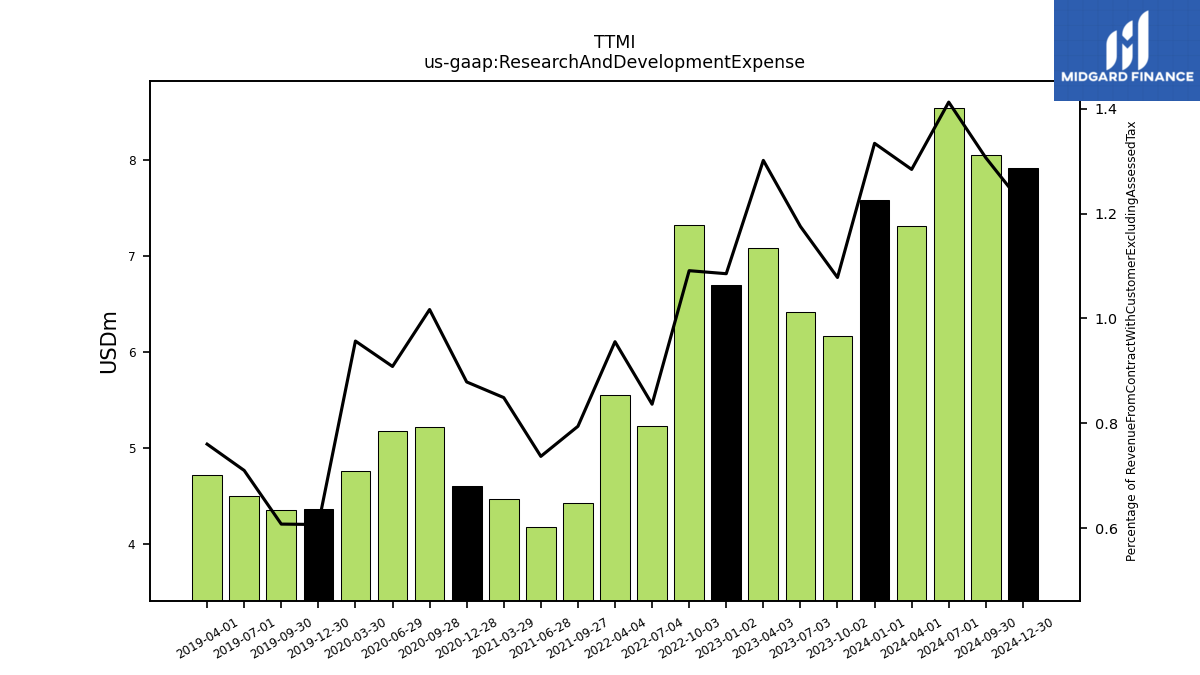
| Research And Development Expense | 7.59 | 6.17 | 6.42 | 7.08 | 6.70 | 7.32 | 5.23 | 5.55 | 4.42 | 4.18 | 4.47 | 4.60 | 5.22 | 5.18 | 4.76 | 4.37 | 4.36 | 4.50 | 4.72 | NA | NA | NA | NA | NA | NA | NA | NA | NA | NA | NA | NA | NA | NA | NA | NA | NA | NA | NA | NA | NA | NA | NA | NA | NA | NA | NA | NA | NA | NA | NA | NA | NA | NA | |
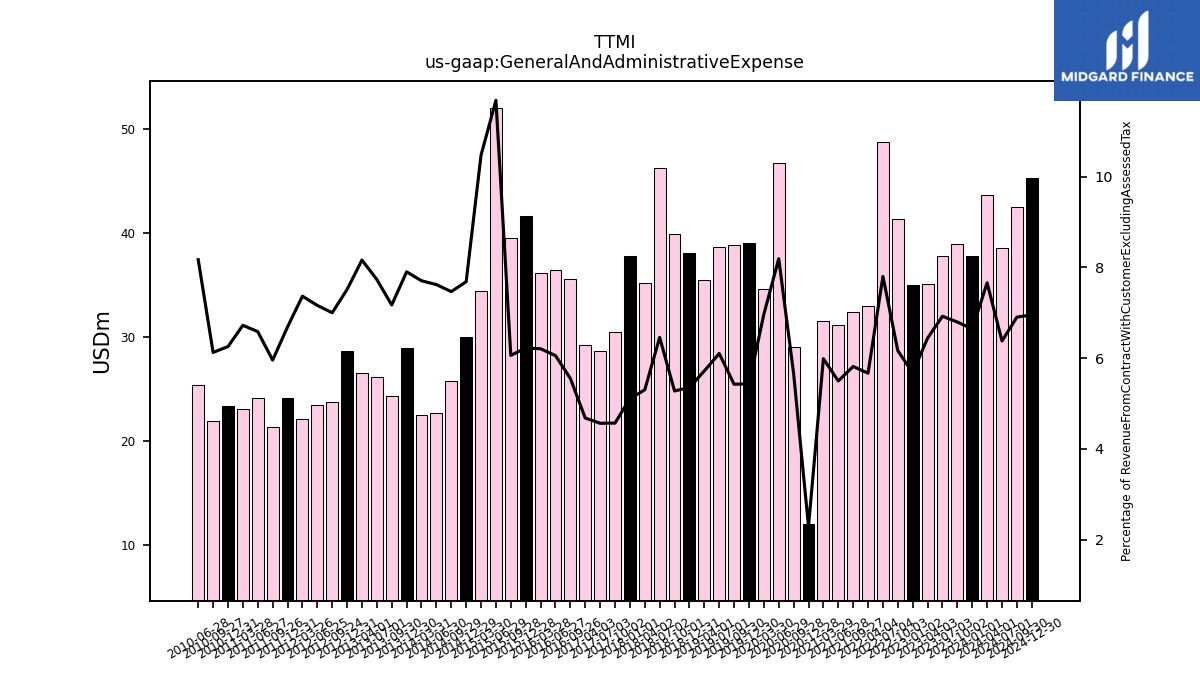
| General And Administrative Expense | 37.80 | 38.92 | 37.84 | 35.07 | 35.05 | 41.37 | 48.81 | 32.95 | 32.39 | 31.19 | 31.53 | 12.00 | 29.09 | 46.72 | 34.67 | 39.09 | 38.90 | 38.64 | 35.47 | 38.06 | 39.89 | 46.30 | 35.19 | 37.76 | 30.47 | 28.63 | 29.27 | 35.64 | 36.46 | 36.21 | 41.64 | 39.52 | 52.04 | 34.47 | 30.04 | 25.78 | 22.68 | 22.49 | 28.93 | 24.29 | 26.14 | 26.56 | 28.68 | 23.73 | 23.45 | 22.14 | 24.18 | 21.34 | 24.11 | 23.05 | 23.36 | 21.92 | 25.35 | |
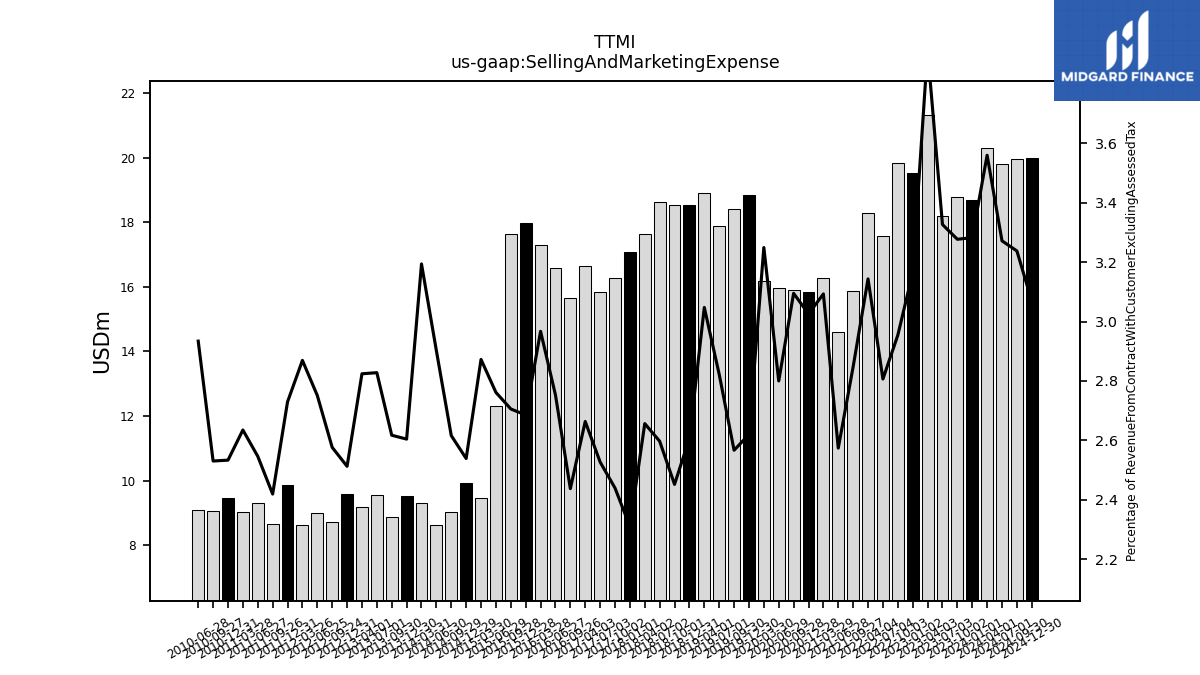
| Selling And Marketing Expense | 18.68 | 18.76 | 18.18 | 21.30 | 19.53 | 19.82 | 17.56 | 18.27 | 15.86 | 14.61 | 16.28 | 15.85 | 15.89 | 15.97 | 16.17 | 18.84 | 18.40 | 17.87 | 18.90 | 18.53 | 18.53 | 18.62 | 17.63 | 17.08 | 16.27 | 15.85 | 16.66 | 15.64 | 16.57 | 17.31 | 17.96 | 17.64 | 12.30 | 9.46 | 9.93 | 9.03 | 8.64 | 9.32 | 9.54 | 8.87 | 9.56 | 9.19 | 9.59 | 8.73 | 9.01 | 8.62 | 9.87 | 8.67 | 9.32 | 9.03 | 9.46 | 9.05 | 9.10 | |
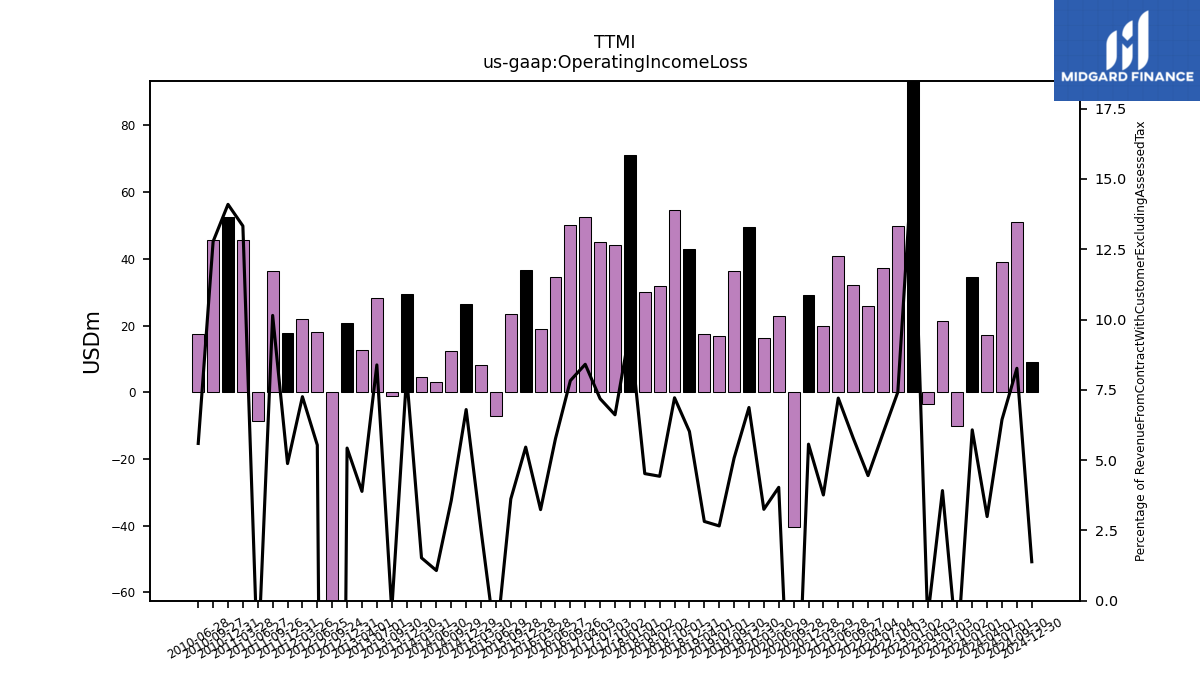
| Operating Income Loss | 34.58 | -10.20 | 21.41 | -3.47 | 97.56 | 49.78 | 37.20 | 25.87 | 32.23 | 40.89 | 19.80 | 29.17 | -40.25 | 23.00 | 16.18 | 49.43 | 36.36 | 16.84 | 17.49 | 42.80 | 54.55 | 31.73 | 30.00 | 71.04 | 44.09 | 45.06 | 52.57 | 50.23 | 34.68 | 18.90 | 36.54 | 23.60 | -7.06 | 8.27 | 26.57 | 12.31 | 3.20 | 4.45 | 29.31 | -1.19 | 28.35 | 12.65 | 20.73 | -202.68 | 18.13 | 21.80 | 17.63 | 36.35 | -8.54 | 45.68 | 52.63 | 45.70 | 17.36 | |
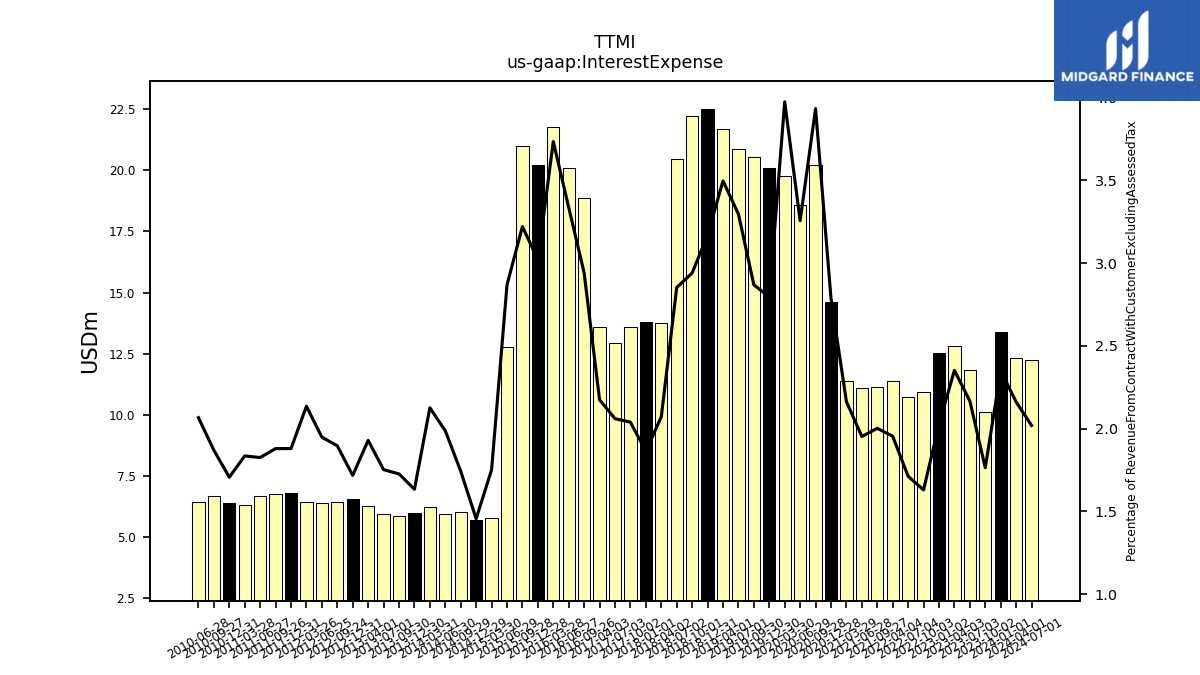
| Interest Expense | 13.37 | 10.10 | 11.84 | 12.81 | 12.51 | 10.94 | 10.71 | 11.36 | 11.15 | 11.08 | 11.39 | 14.60 | 20.20 | 18.57 | 19.78 | 20.11 | 20.57 | 20.87 | 21.69 | 22.53 | 22.23 | 20.45 | 13.75 | 13.78 | 13.60 | 12.92 | 13.60 | 18.87 | 20.08 | 21.78 | 20.21 | 21.00 | 12.78 | 5.76 | 5.69 | 6.02 | 5.92 | 6.21 | 5.98 | 5.85 | 5.92 | 6.28 | 6.56 | 6.43 | 6.38 | 6.42 | 6.79 | 6.73 | 6.68 | 6.29 | 6.37 | 6.69 | 6.41 | |
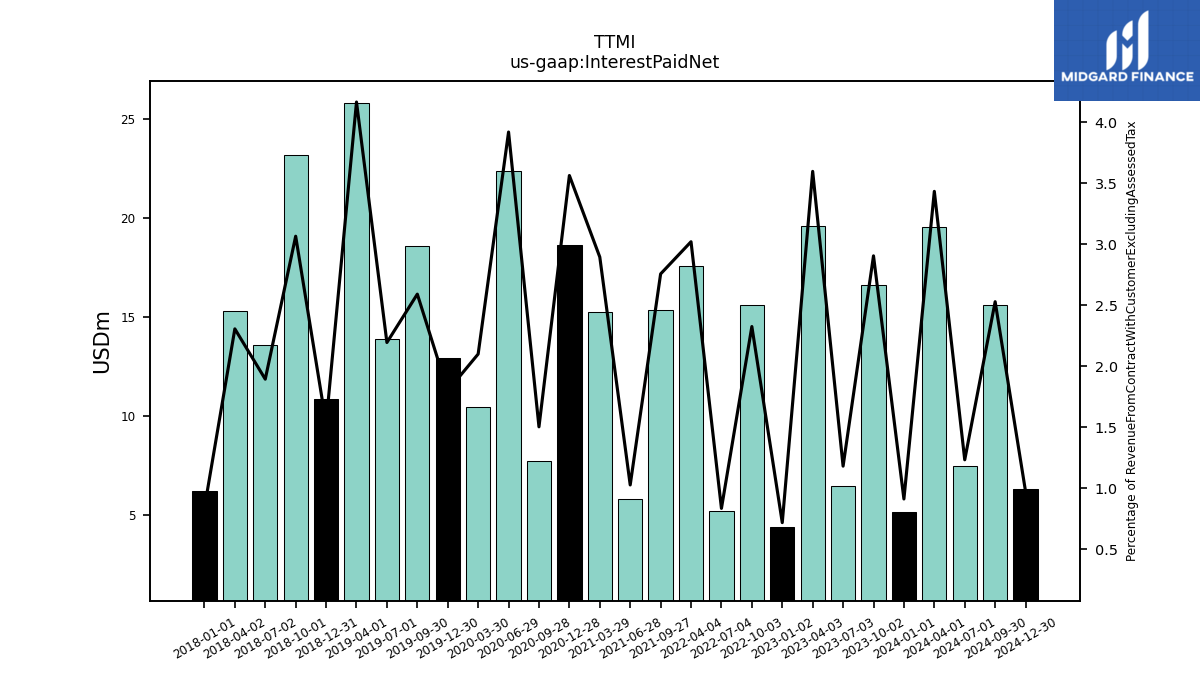
| Interest Paid Net | 5.20 | 16.64 | 6.46 | 19.59 | 4.44 | 15.61 | 5.23 | 17.56 | 15.35 | 5.83 | 15.24 | 18.67 | 7.73 | 22.36 | 10.46 | 12.95 | 18.58 | 13.90 | 25.84 | 10.89 | 23.18 | 13.59 | 15.31 | 6.21 | NA | NA | NA | NA | NA | NA | NA | NA | NA | NA | NA | NA | NA | NA | NA | NA | NA | NA | NA | NA | NA | NA | NA | NA | NA | NA | NA | NA | NA | |
| Gains Losses On Extinguishment Of Debt | 0.00 | 0.00 | -1.15 | NA | NA | NA | NA | NA | 0.00 | 0.00 | -15.22 | NA | NA | NA | NA | NA | NA | NA | NA | NA | NA | NA | NA | 0.00 | -0.77 | NA | NA | NA | NA | NA | 0.00 | 0.00 | -0.80 | NA | 0.00 | 0.00 | 0.00 | -0.51 | NA | NA | NA | NA | 0.00 | -5.53 | NA | NA | NA | NA | NA | NA | NA | NA | NA | |
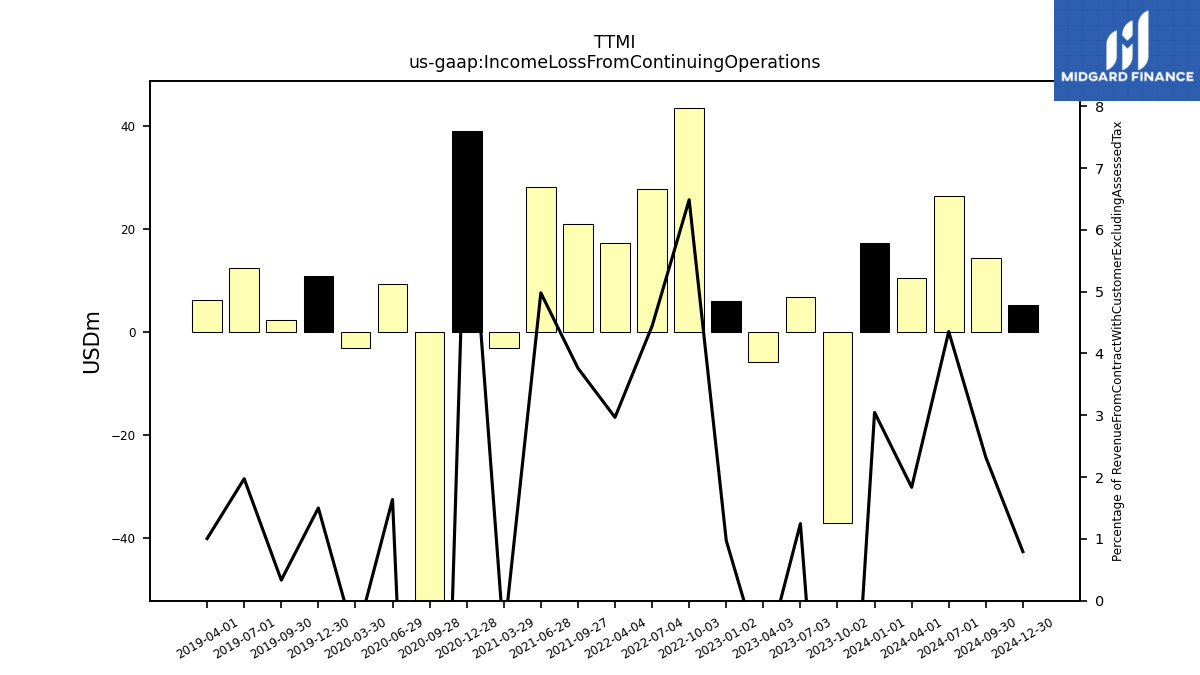
| Income Loss From Continuing Operations | 17.34 | -37.07 | 6.82 | -5.81 | 6.02 | 43.53 | 27.79 | 17.25 | 20.96 | 28.26 | -3.19 | 38.96 | -61.47 | 9.35 | -3.22 | 10.80 | 2.39 | 12.49 | 6.24 | NA | NA | NA | NA | NA | NA | NA | NA | NA | NA | NA | NA | NA | NA | NA | NA | NA | NA | NA | NA | NA | NA | NA | NA | NA | NA | NA | NA | NA | NA | NA | NA | NA | NA | |
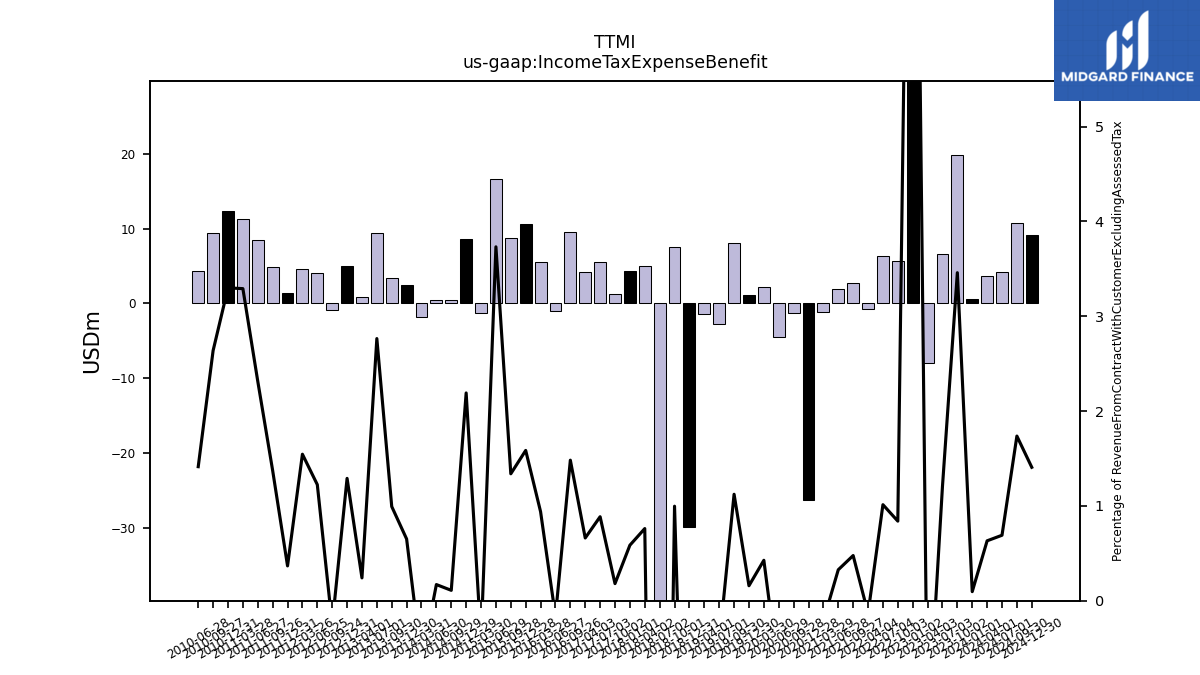
| Income Tax Expense Benefit | 0.55 | 19.81 | 6.59 | -7.92 | 77.08 | 5.63 | 6.34 | -0.77 | 2.65 | 1.85 | -1.11 | -26.25 | -1.30 | -4.47 | 2.12 | 1.14 | 8.05 | -2.83 | -1.48 | -29.86 | 7.54 | -66.55 | 5.05 | 4.33 | 1.21 | 5.56 | 4.14 | 9.51 | -0.98 | 5.48 | 10.60 | 8.73 | 16.62 | -1.36 | 8.57 | 0.38 | 0.51 | -1.85 | 2.38 | 3.37 | 9.35 | 0.78 | 4.93 | -0.85 | 4.01 | 4.64 | 1.33 | 4.92 | 8.47 | 11.28 | 12.32 | 9.44 | 4.39 | |
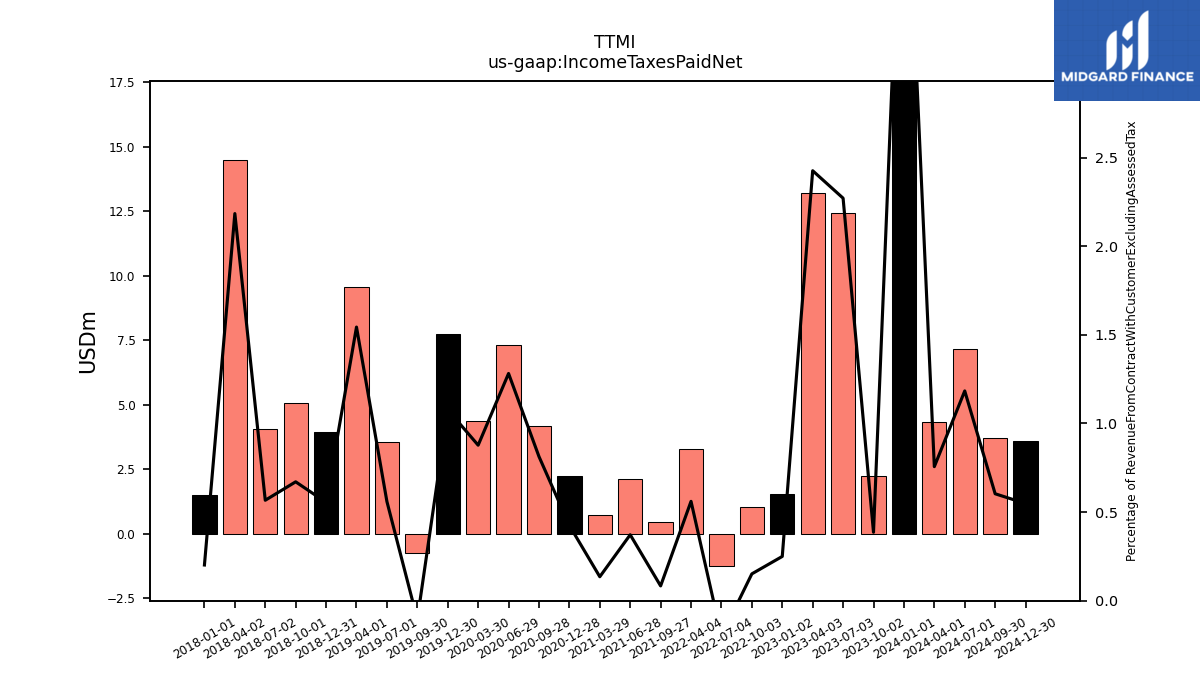
| Income Taxes Paid Net | 25.92 | 2.21 | 12.41 | 13.21 | 1.54 | 1.02 | -1.25 | 3.26 | 0.47 | 2.11 | 0.71 | 2.23 | 4.18 | 7.31 | 4.37 | 7.75 | -0.75 | 3.54 | 9.57 | 3.95 | 5.07 | 4.06 | 14.49 | 1.49 | NA | NA | NA | NA | NA | NA | NA | NA | NA | NA | NA | NA | NA | NA | NA | NA | NA | NA | NA | NA | NA | NA | NA | NA | NA | NA | NA | NA | NA | |
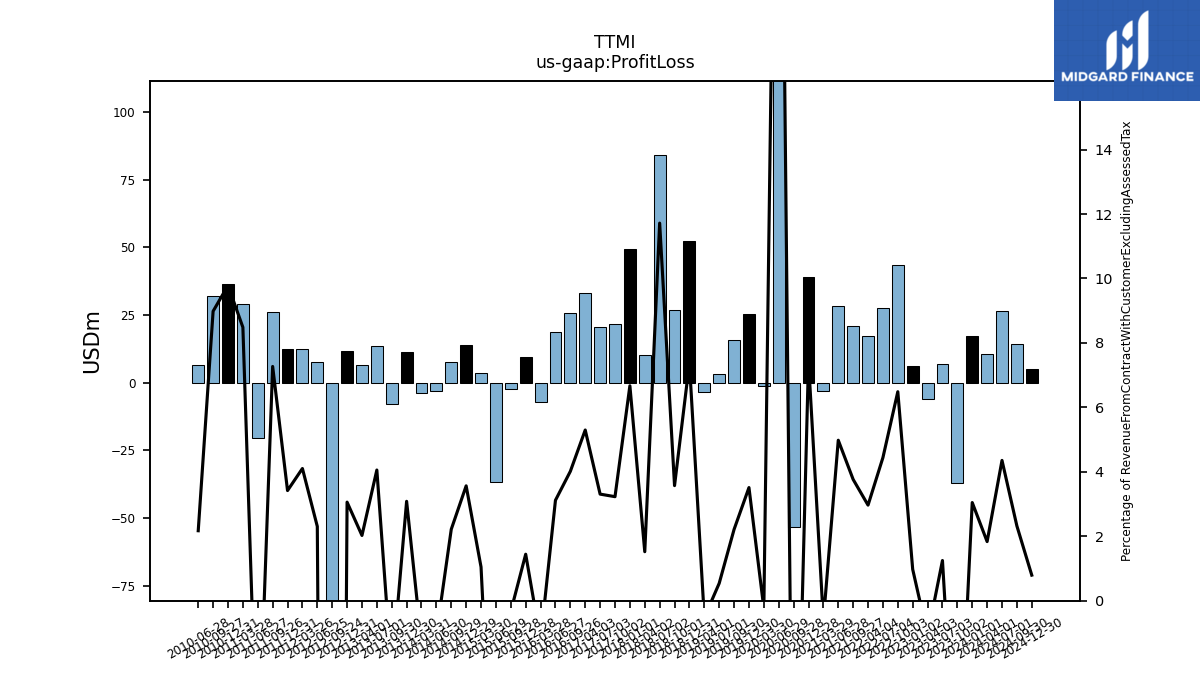
| Profit Loss | 17.34 | -37.07 | 6.82 | -5.81 | 6.02 | 43.53 | 27.79 | 17.25 | 20.96 | 28.26 | -3.19 | 38.96 | -53.06 | 192.81 | -1.17 | 25.26 | 15.87 | 3.42 | -3.25 | 52.48 | 27.00 | 84.00 | 10.10 | 49.32 | 21.54 | 20.75 | 33.12 | 25.77 | 18.77 | -7.15 | 9.66 | -2.14 | -36.58 | 3.45 | 13.94 | 7.66 | -3.10 | -3.80 | 11.30 | -7.71 | 13.71 | 6.59 | 11.68 | -212.66 | 7.55 | 12.33 | 12.36 | 26.05 | -20.27 | 29.09 | 36.53 | 32.15 | 6.74 | |
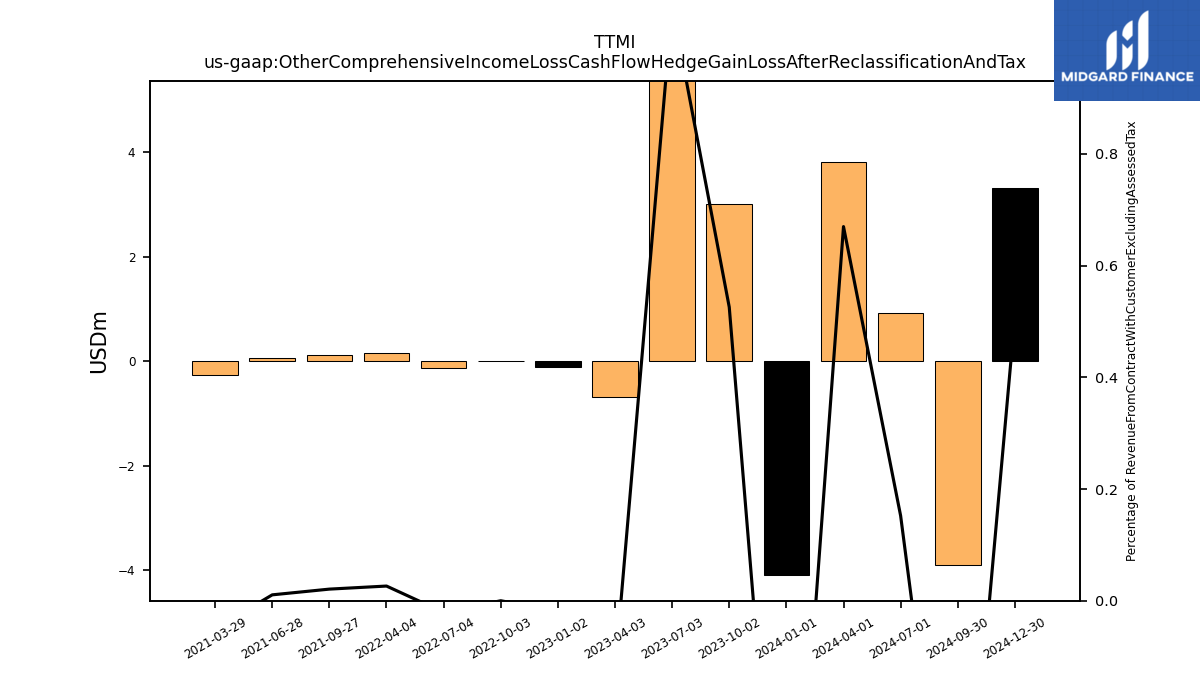
| Other Comprehensive Income Loss Cash Flow Hedge Gain Loss After Reclassification And Tax | -4.09 | 3.01 | 5.82 | -0.68 | -0.12 | 0.00 | -0.13 | 0.15 | 0.12 | 0.06 | -0.26 | NA | NA | NA | NA | NA | NA | NA | NA | NA | NA | NA | NA | NA | NA | NA | NA | NA | NA | NA | NA | NA | NA | NA | NA | NA | NA | NA | NA | NA | NA | NA | NA | NA | NA | NA | NA | NA | NA | NA | NA | NA | NA | |
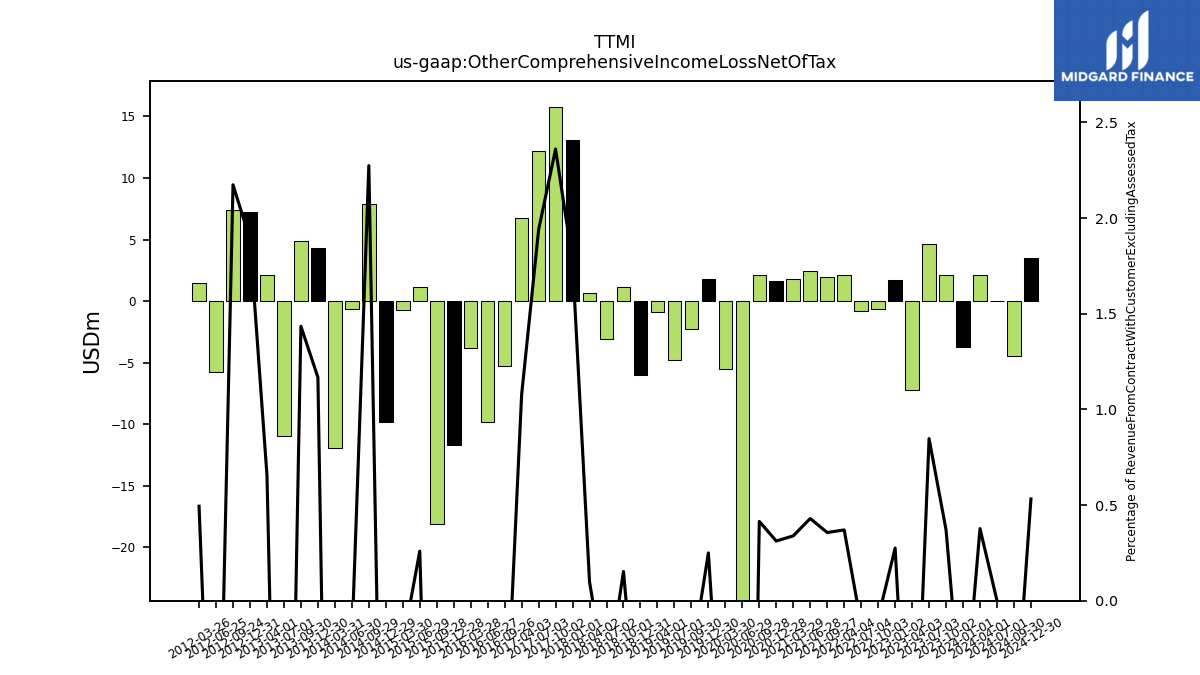
| Other Comprehensive Income Loss Net Of Tax | -3.76 | 2.12 | 4.63 | -7.27 | 1.70 | -0.61 | -0.78 | 2.15 | 1.99 | 2.44 | 1.79 | 1.63 | 2.13 | -27.09 | -5.50 | 1.80 | -2.26 | -4.81 | -0.90 | -6.04 | 1.16 | -3.10 | 0.66 | 13.10 | 15.74 | 12.16 | 6.73 | -5.30 | -9.81 | -3.84 | -11.70 | -18.12 | 1.16 | -0.73 | -9.87 | 7.85 | -0.64 | -11.93 | 4.28 | 4.86 | -11.01 | 2.13 | 7.21 | 7.37 | -5.77 | 1.49 | NA | NA | NA | NA | NA | NA | NA | |
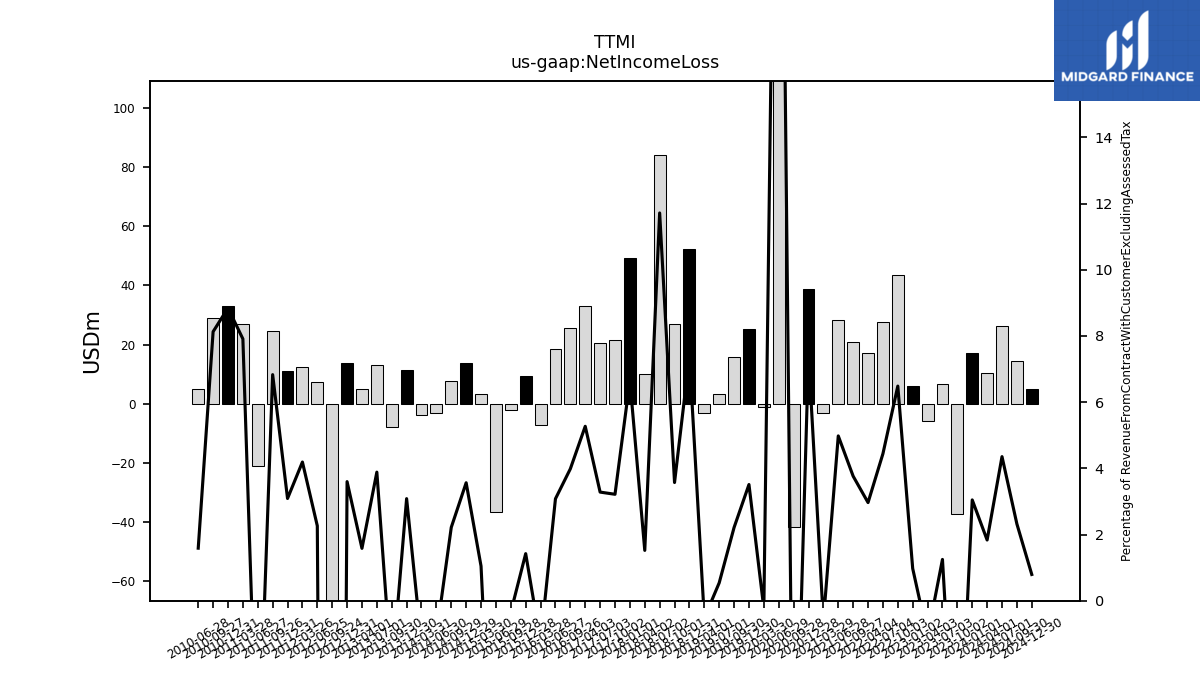
| Net Income Loss | 17.34 | -37.07 | 6.82 | -5.81 | 6.02 | 43.53 | 27.79 | 17.25 | 20.96 | 28.26 | -3.19 | 38.96 | -41.45 | 192.81 | -1.17 | 25.26 | 15.87 | 3.42 | -3.25 | 52.48 | 27.00 | 84.00 | 10.10 | 49.21 | 21.45 | 20.59 | 32.96 | 25.58 | 18.55 | -7.26 | 9.52 | -2.24 | -36.61 | 3.45 | 13.94 | 7.66 | -3.10 | -3.80 | 11.30 | -7.71 | 13.14 | 5.15 | 13.74 | -208.34 | 7.41 | 12.60 | 11.17 | 24.48 | -20.90 | 27.12 | 33.03 | 29.09 | 4.93 | |
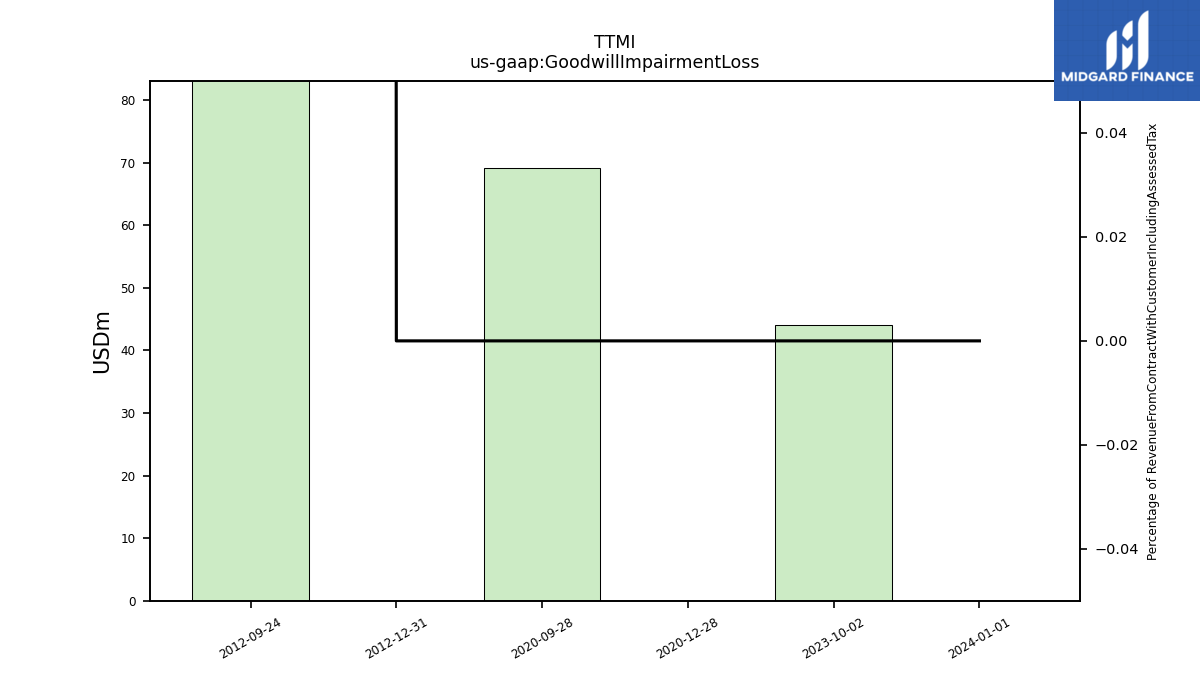
| Goodwill Impairment Loss | 0.00 | 44.10 | NA | NA | NA | NA | NA | NA | NA | NA | NA | 0.00 | 69.20 | NA | NA | NA | NA | NA | NA | NA | NA | NA | NA | NA | NA | NA | NA | NA | NA | NA | NA | NA | NA | NA | NA | NA | NA | NA | NA | NA | NA | NA | 0.00 | 171.40 | NA | NA | NA | NA | NA | NA | NA | NA | NA |
| 2024-01-01 | 2023-10-02 | 2023-07-03 | 2023-04-03 | 2023-01-02 | 2022-10-03 | 2022-07-04 | 2022-04-04 | 2021-09-27 | 2021-06-28 | 2021-03-29 | 2020-12-28 | 2020-09-28 | 2020-06-29 | 2020-03-30 | 2019-12-30 | 2019-09-30 | 2019-07-01 | 2019-04-01 | 2018-12-31 | 2018-10-01 | 2018-07-02 | 2018-04-02 | 2018-01-01 | 2017-10-02 | 2017-07-03 | 2017-04-03 | 2016-09-26 | 2016-06-27 | 2016-03-28 | 2015-12-28 | 2015-09-28 | 2015-06-29 | 2015-03-30 | 2014-12-29 | 2014-09-29 | 2014-06-30 | 2014-03-31 | 2013-12-30 | 2013-09-30 | 2013-07-01 | 2013-04-01 | 2012-12-31 | 2012-09-24 | 2012-06-25 | 2012-03-26 | 2011-12-31 | 2011-09-26 | 2011-06-27 | 2011-03-28 | 2010-12-31 | 2010-09-27 | 2010-06-28 | ||
|---|---|---|---|---|---|---|---|---|---|---|---|---|---|---|---|---|---|---|---|---|---|---|---|---|---|---|---|---|---|---|---|---|---|---|---|---|---|---|---|---|---|---|---|---|---|---|---|---|---|---|---|---|---|---|
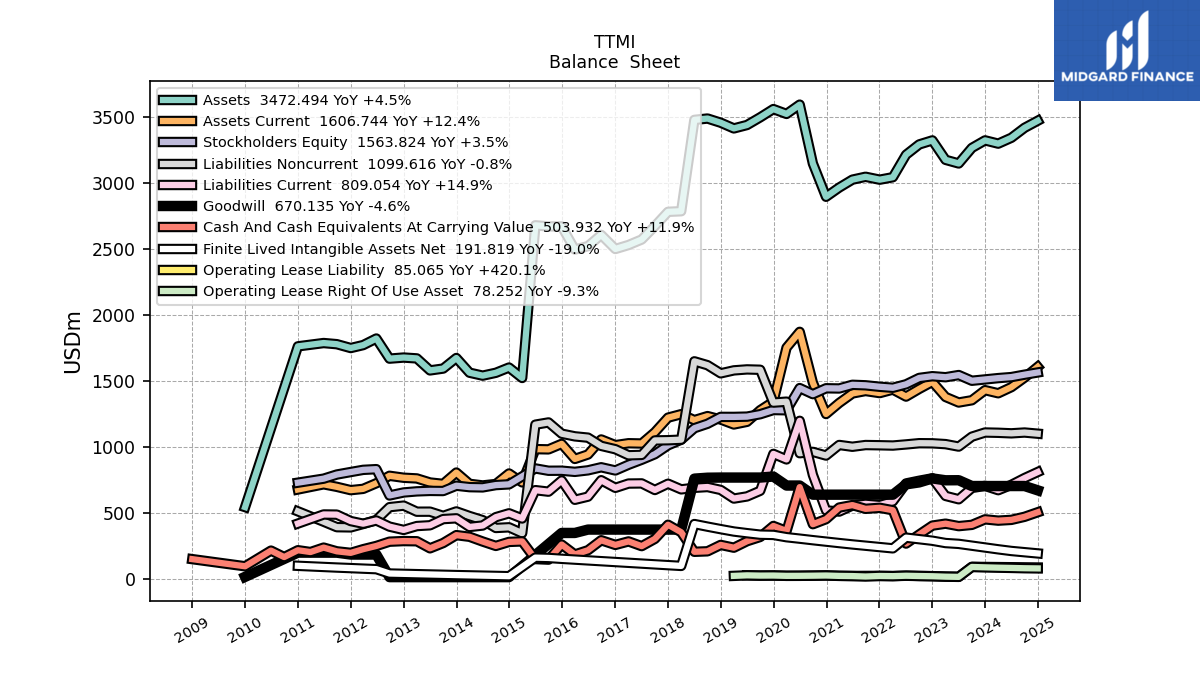
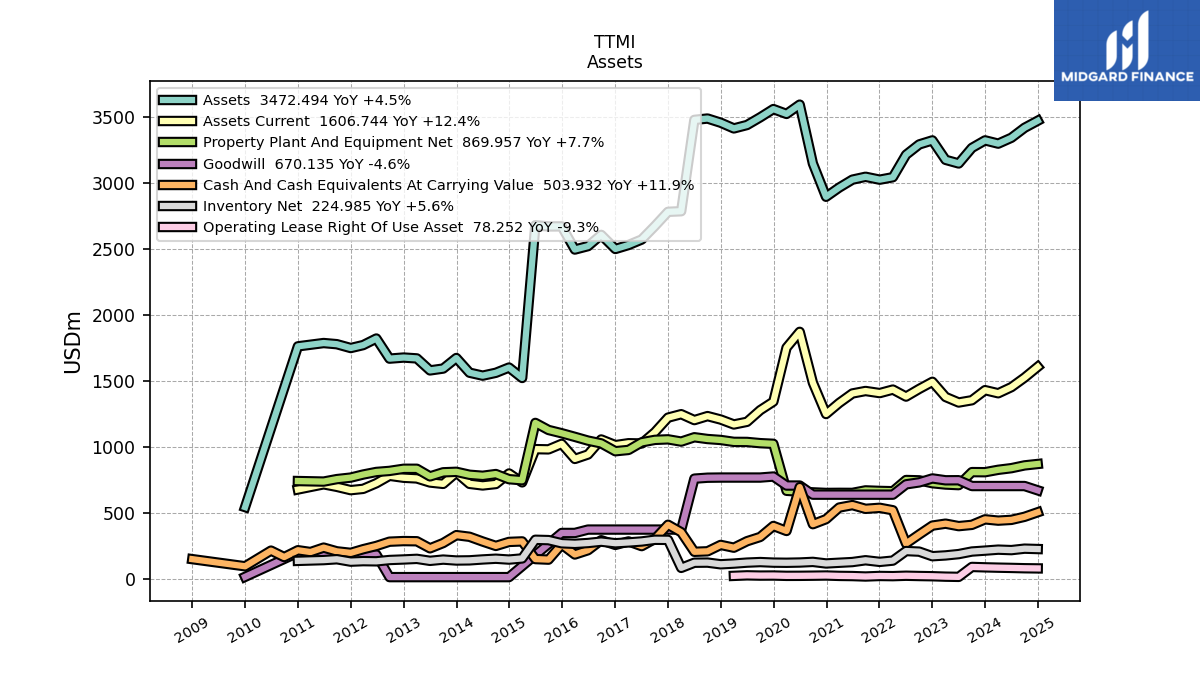
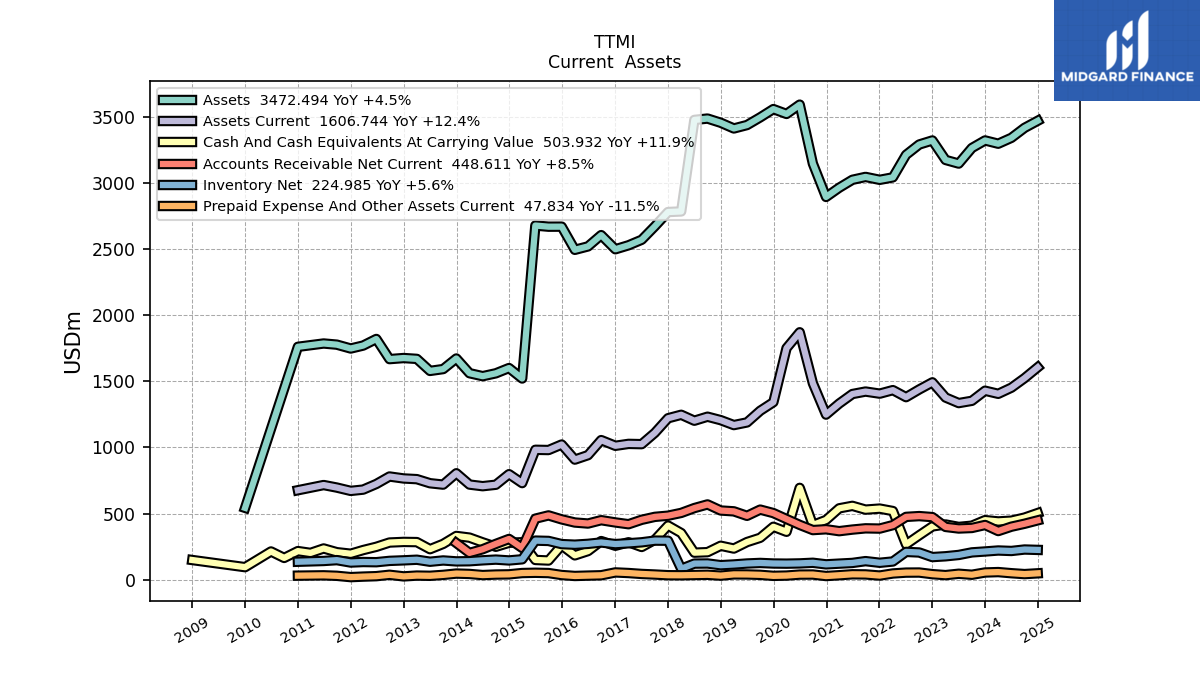
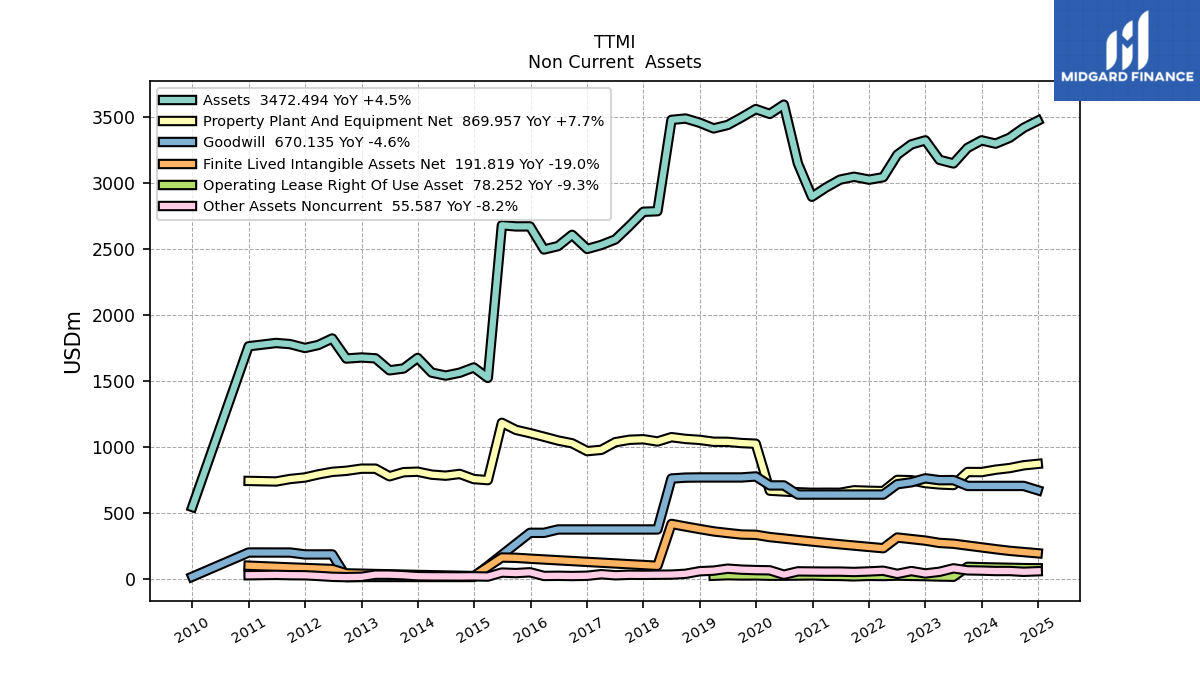
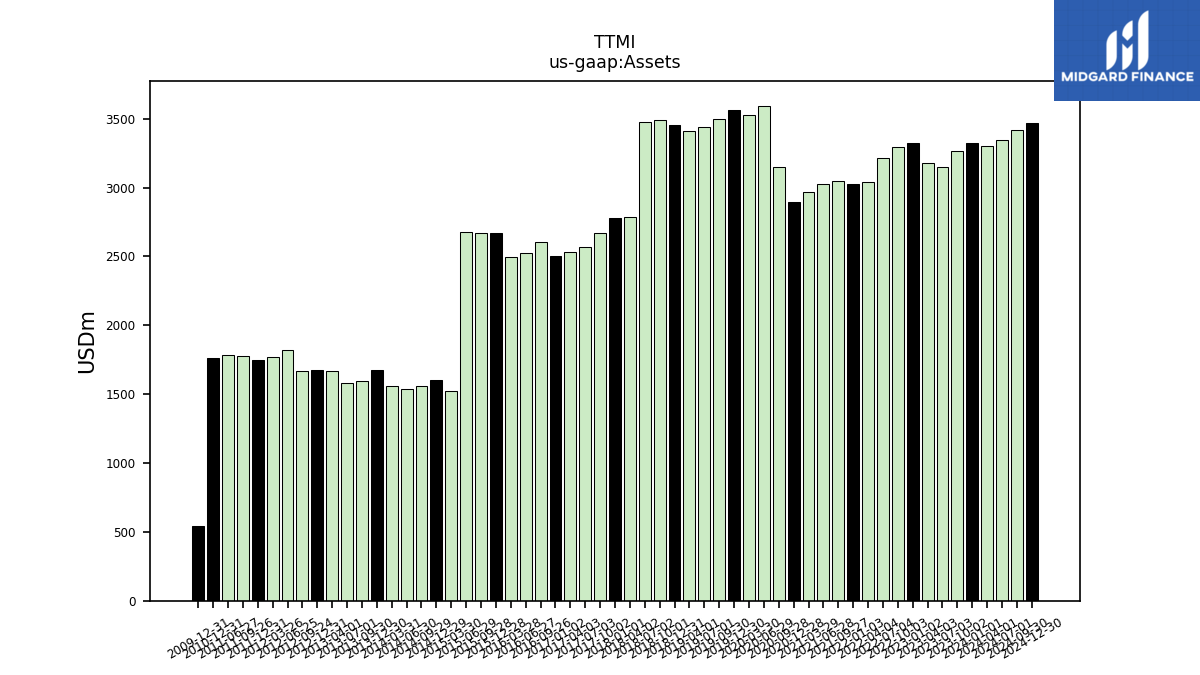
| Assets | 3323.66 | 3266.50 | 3148.49 | 3176.03 | 3323.60 | 3292.89 | 3214.65 | 3044.15 | 3047.63 | 3025.74 | 2965.83 | 2895.94 | 3148.41 | 3594.67 | 3524.12 | 3560.93 | 3498.36 | 3440.11 | 3414.28 | 3457.50 | 3489.23 | 3478.93 | 2786.35 | 2781.88 | 2673.94 | 2571.95 | 2530.24 | 2607.23 | 2521.79 | 2495.83 | 2671.30 | 2670.97 | 2679.84 | 1521.87 | 1601.29 | 1561.40 | 1539.74 | 1562.13 | 1673.58 | 1593.46 | 1579.47 | 1670.47 | 1676.96 | 1668.73 | 1821.29 | 1771.40 | 1749.07 | 1778.25 | 1786.99 | NA | 1761.95 | NA | NA | |
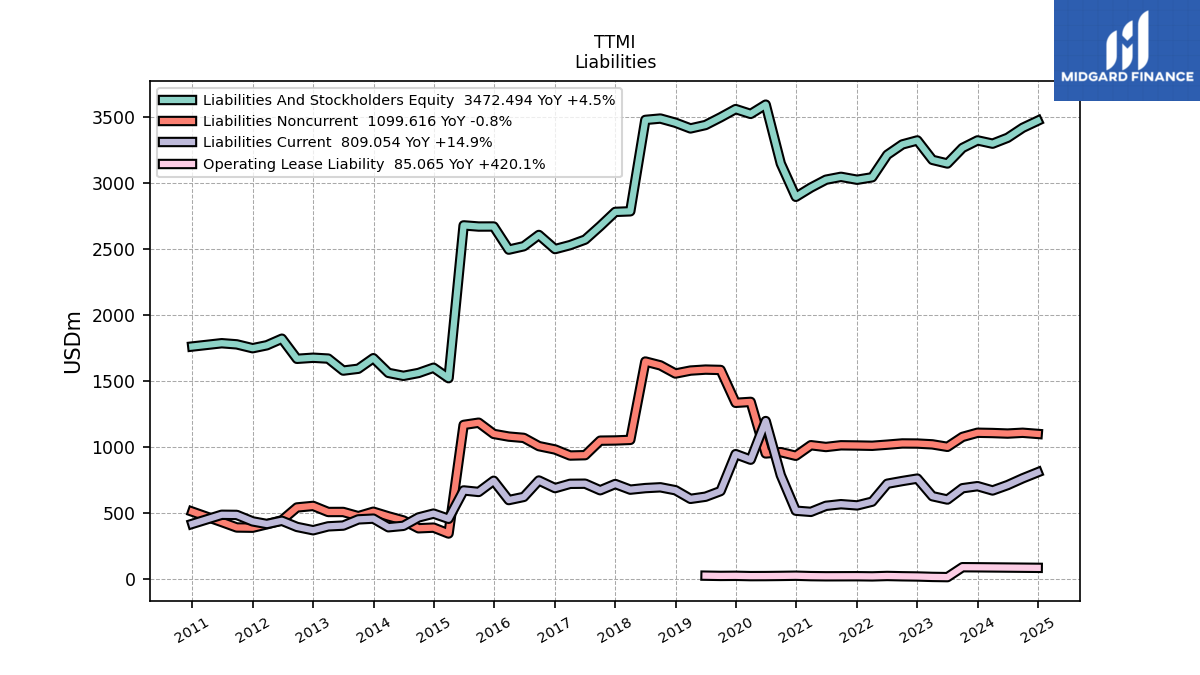
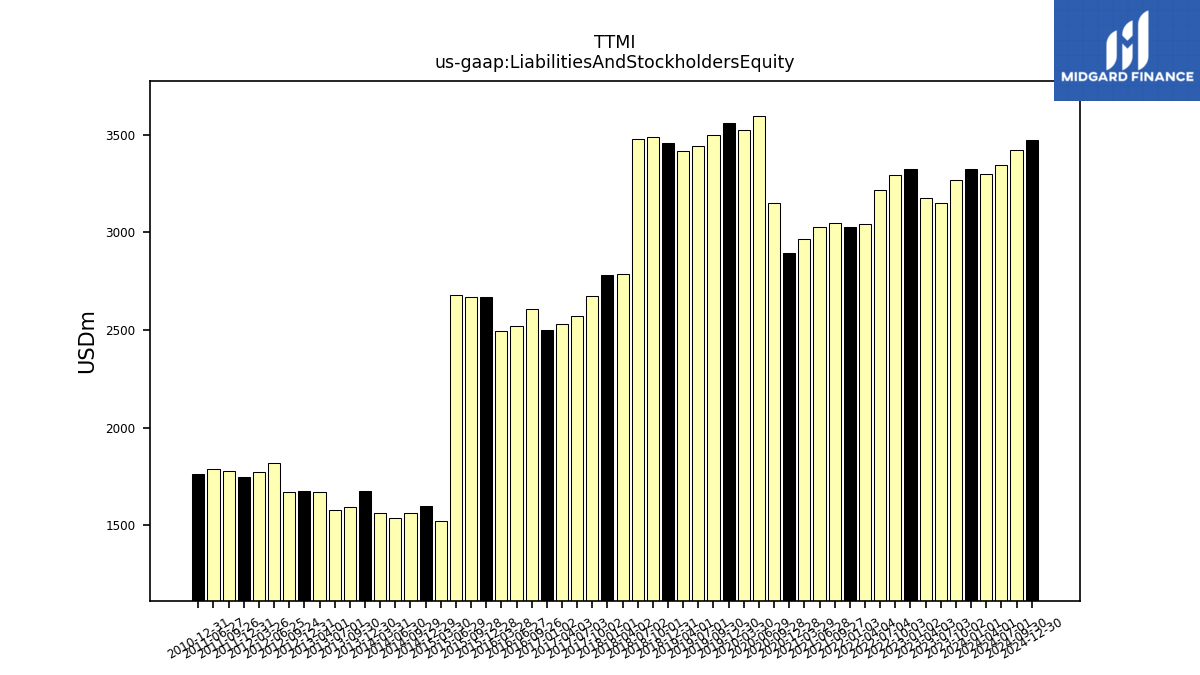
| Liabilities And Stockholders Equity | 3323.66 | 3266.50 | 3148.49 | 3176.03 | 3323.60 | 3292.89 | 3214.65 | 3044.15 | 3047.63 | 3025.74 | 2965.83 | 2895.94 | 3148.41 | 3594.67 | 3524.12 | 3560.93 | 3498.36 | 3440.11 | 3414.28 | 3457.50 | 3489.23 | 3478.93 | 2786.35 | 2781.88 | 2673.94 | 2571.95 | 2530.24 | 2607.23 | 2521.79 | 2495.83 | 2671.30 | 2670.97 | 2679.84 | 1521.87 | 1601.29 | 1561.40 | 1539.74 | 1562.13 | 1673.58 | 1593.46 | 1579.47 | 1670.47 | 1676.96 | 1668.73 | 1821.29 | 1771.40 | 1749.07 | 1778.25 | 1786.99 | NA | 1761.95 | NA | NA | |
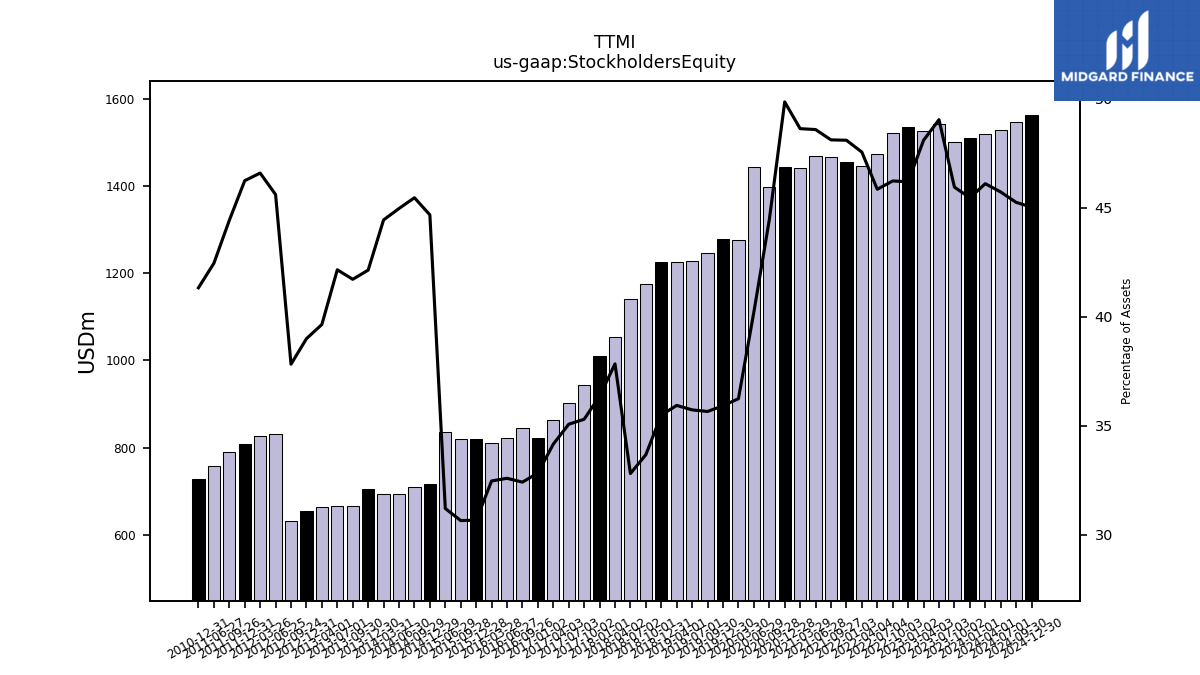
| Stockholders Equity | 1511.04 | 1501.11 | 1544.31 | 1527.73 | 1535.58 | 1522.47 | 1474.08 | 1447.83 | 1466.59 | 1470.37 | 1442.47 | 1444.01 | 1399.30 | 1445.57 | 1277.20 | 1279.04 | 1247.35 | 1229.08 | 1226.86 | 1227.09 | 1174.91 | 1141.29 | 1054.33 | 1011.38 | 943.86 | 901.99 | 864.24 | 845.03 | 821.83 | 810.25 | 819.11 | 818.60 | 836.21 | NA | 715.46 | 709.91 | 692.45 | 694.34 | 705.29 | 664.83 | 665.89 | 662.32 | 653.95 | 631.21 | 830.73 | 825.44 | 808.92 | 790.00 | 758.70 | NA | 728.25 | NA | NA |
| 2024-01-01 | 2023-10-02 | 2023-07-03 | 2023-04-03 | 2023-01-02 | 2022-10-03 | 2022-07-04 | 2022-04-04 | 2021-09-27 | 2021-06-28 | 2021-03-29 | 2020-12-28 | 2020-09-28 | 2020-06-29 | 2020-03-30 | 2019-12-30 | 2019-09-30 | 2019-07-01 | 2019-04-01 | 2018-12-31 | 2018-10-01 | 2018-07-02 | 2018-04-02 | 2018-01-01 | 2017-10-02 | 2017-07-03 | 2017-04-03 | 2016-09-26 | 2016-06-27 | 2016-03-28 | 2015-12-28 | 2015-09-28 | 2015-06-29 | 2015-03-30 | 2014-12-29 | 2014-09-29 | 2014-06-30 | 2014-03-31 | 2013-12-30 | 2013-09-30 | 2013-07-01 | 2013-04-01 | 2012-12-31 | 2012-09-24 | 2012-06-25 | 2012-03-26 | 2011-12-31 | 2011-09-26 | 2011-06-27 | 2011-03-28 | 2010-12-31 | 2010-09-27 | 2010-06-28 | ||
|---|---|---|---|---|---|---|---|---|---|---|---|---|---|---|---|---|---|---|---|---|---|---|---|---|---|---|---|---|---|---|---|---|---|---|---|---|---|---|---|---|---|---|---|---|---|---|---|---|---|---|---|---|---|---|
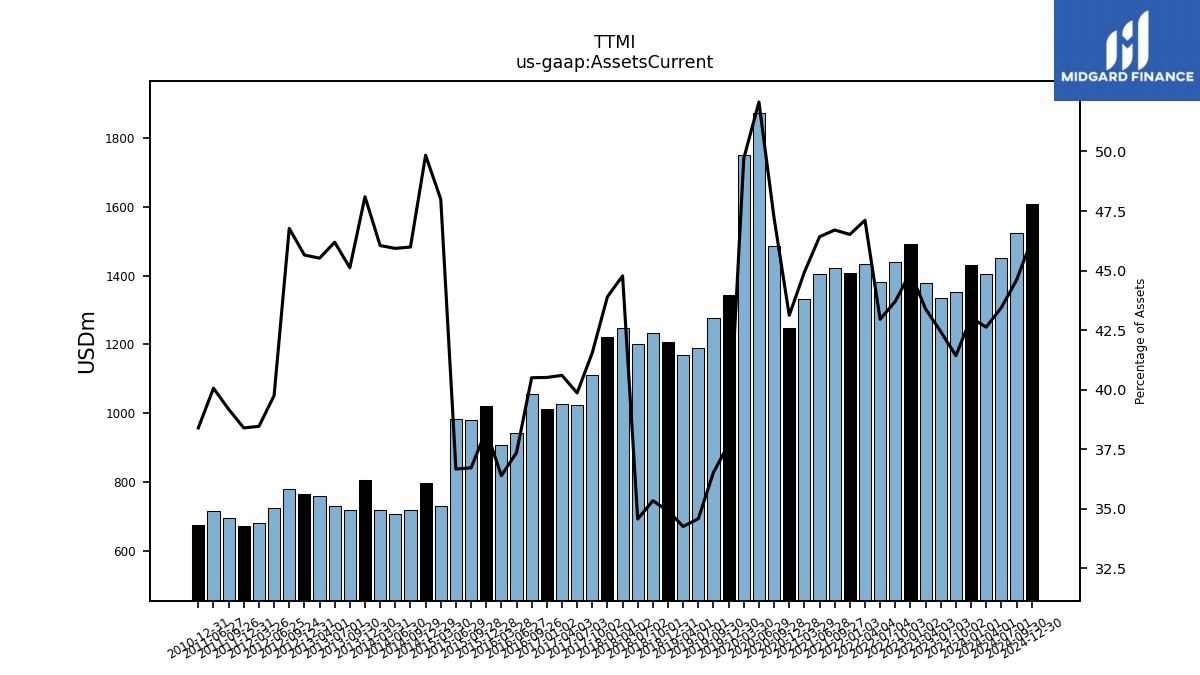
| Assets Current | 1429.69 | 1353.24 | 1336.05 | 1378.10 | 1493.06 | 1439.23 | 1380.88 | 1434.18 | 1423.35 | 1404.52 | 1332.64 | 1248.76 | 1486.18 | 1871.91 | 1751.79 | 1342.68 | 1277.84 | 1189.69 | 1169.55 | 1206.91 | 1233.01 | 1202.64 | 1247.59 | 1221.31 | 1110.96 | 1025.26 | 1027.29 | 1055.99 | 941.98 | 908.21 | 1022.52 | 980.73 | 982.61 | 730.45 | 798.12 | 718.08 | 707.22 | 719.37 | 804.99 | 718.96 | 729.57 | 760.41 | 765.61 | 780.48 | 723.98 | 681.30 | 671.53 | 696.68 | 715.87 | NA | 676.50 | NA | NA | |
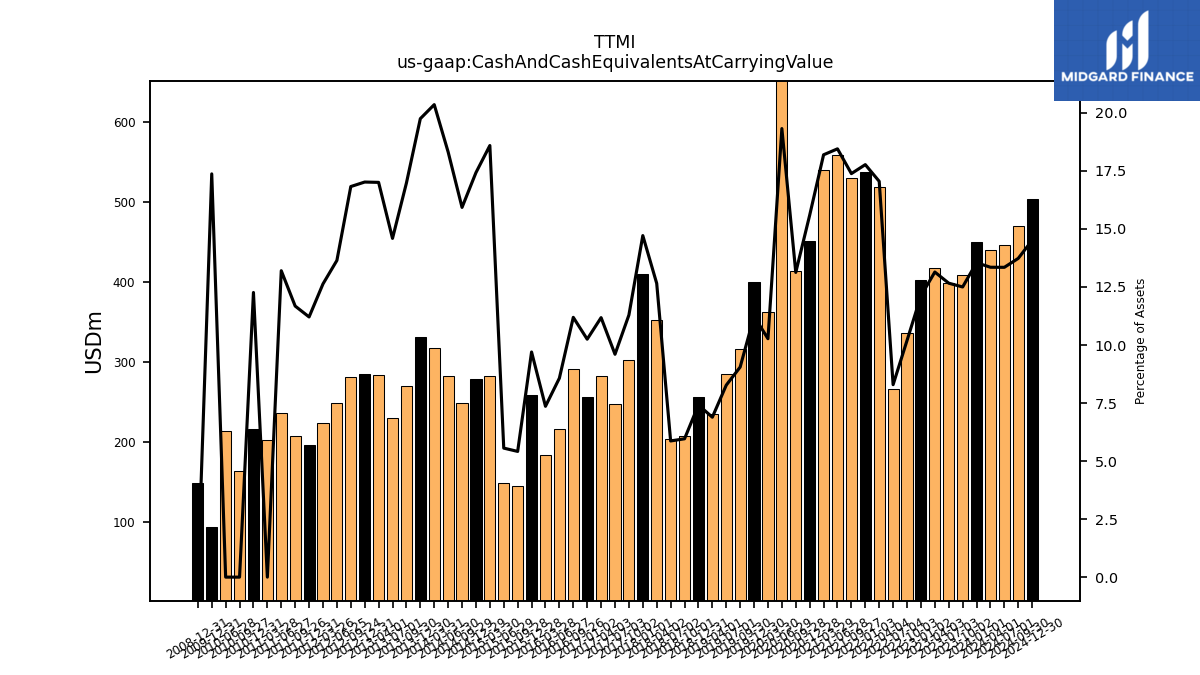
| Cash And Cash Equivalents At Carrying Value | 450.21 | 408.33 | 398.72 | 417.45 | 402.75 | 335.62 | 266.55 | 519.08 | 529.82 | 558.29 | 539.65 | 451.56 | 413.31 | 694.67 | 361.99 | 400.15 | 316.59 | 284.47 | 235.22 | 256.36 | 207.95 | 204.10 | 352.58 | 409.33 | 301.93 | 246.95 | 282.87 | 291.78 | 216.15 | 183.68 | 259.10 | 144.65 | 148.95 | 282.97 | 279.04 | 248.71 | 282.04 | 317.99 | 330.55 | 270.53 | 230.50 | 284.09 | 285.43 | 280.80 | 248.49 | 223.76 | 196.05 | 207.67 | 235.90 | 202.34 | 216.08 | 164.23 | 213.19 | |
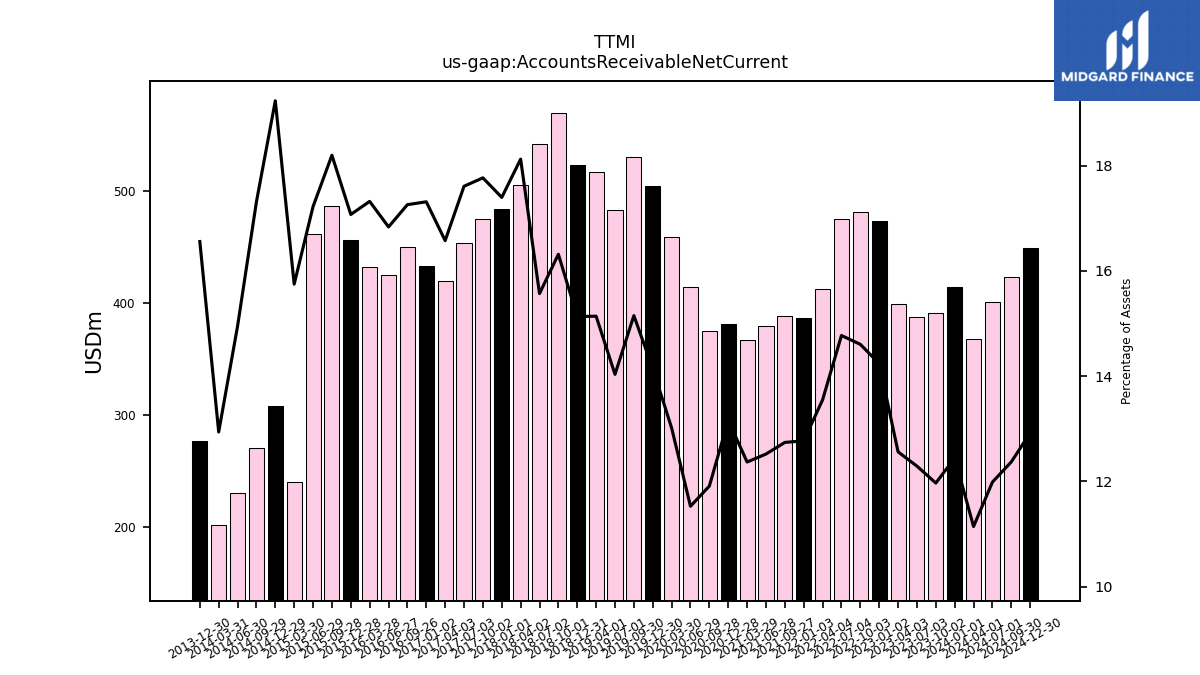
| Accounts Receivable Net Current | 413.56 | 390.90 | 386.90 | 398.90 | 473.23 | 480.84 | 474.83 | 412.43 | 388.23 | 378.76 | 366.77 | 381.11 | 374.97 | 414.33 | 458.64 | 503.66 | 529.94 | 482.74 | 516.83 | 523.16 | 569.22 | 541.59 | 504.91 | 483.90 | 475.06 | 452.83 | 419.34 | 449.92 | 424.51 | 432.25 | 456.00 | 486.00 | 461.48 | 239.65 | 307.93 | 270.30 | 230.16 | 202.09 | 277.07 | NA | NA | NA | NA | NA | NA | NA | NA | NA | NA | NA | NA | NA | NA | |
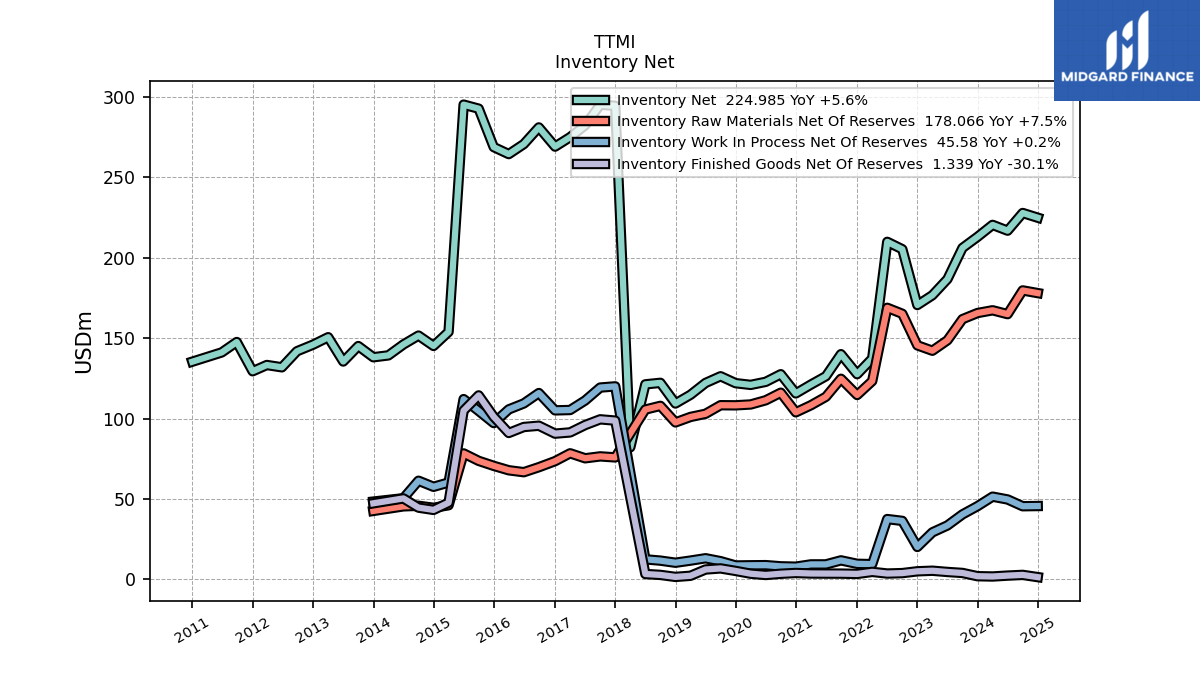
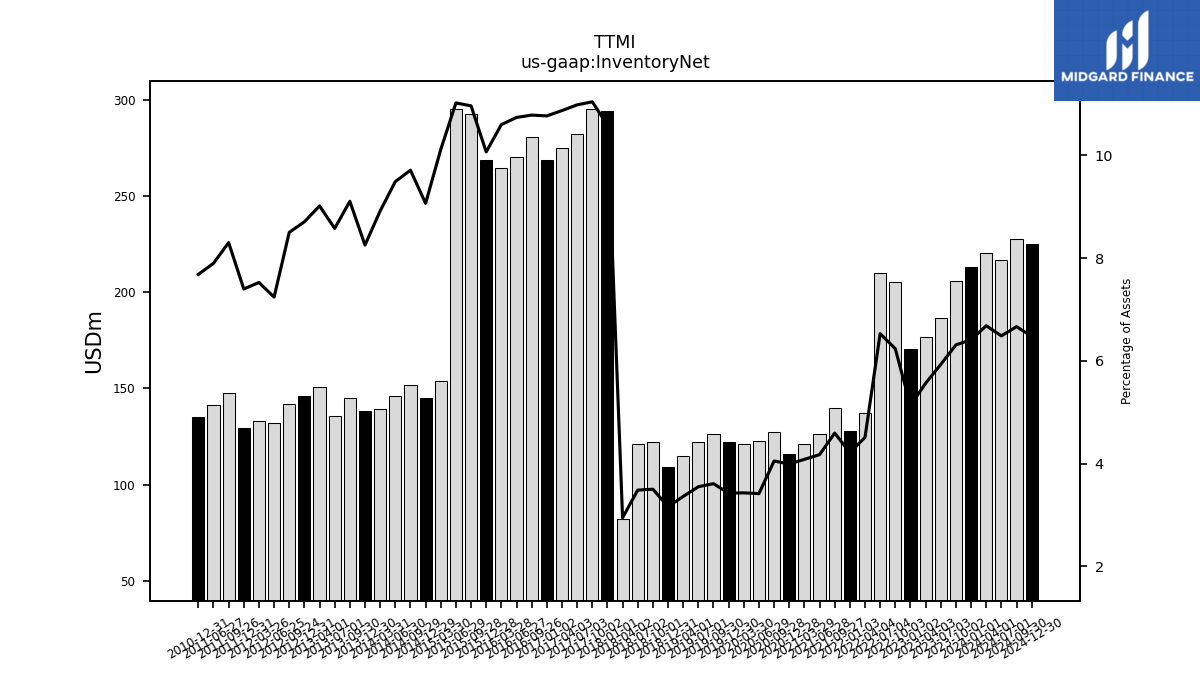
| Inventory Net | 213.07 | 206.18 | 186.76 | 176.73 | 170.64 | 205.37 | 209.96 | 137.34 | 140.06 | 126.36 | 121.12 | 115.65 | 127.59 | 122.85 | 120.95 | 122.02 | 126.32 | 122.15 | 114.80 | 109.38 | 122.23 | 121.28 | 82.12 | 294.59 | 295.28 | 282.49 | 275.09 | 281.17 | 270.79 | 264.56 | 268.92 | 292.83 | 295.34 | 153.92 | 145.19 | 151.64 | 146.11 | 139.31 | 138.15 | 145.11 | 135.50 | 150.62 | 146.01 | 141.88 | 131.89 | 133.32 | 129.43 | 147.64 | 141.15 | NA | 135.38 | NA | NA | |
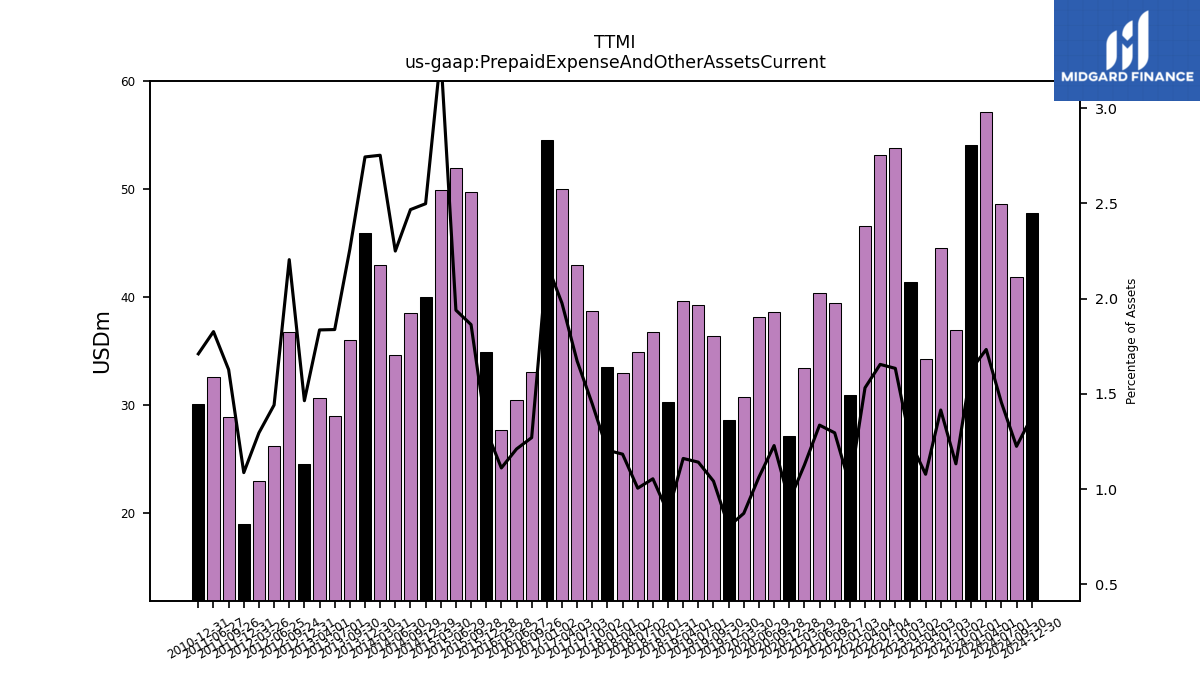
| Prepaid Expense And Other Assets Current | 54.06 | 36.99 | 44.55 | 34.23 | 41.41 | 53.79 | 53.18 | 46.62 | 39.47 | 40.41 | 33.40 | 27.18 | 38.67 | 38.20 | 30.75 | 28.61 | 36.44 | 39.26 | 39.63 | 30.27 | 36.77 | 34.95 | 32.97 | 33.49 | 38.69 | 43.00 | 49.99 | 33.11 | 30.52 | 27.73 | 34.97 | 49.76 | 51.97 | 49.90 | 40.00 | 38.52 | 34.63 | 42.99 | 45.91 | 36.00 | 29.02 | 30.66 | 24.55 | 36.78 | 26.25 | 22.94 | 19.00 | 28.93 | 32.64 | NA | 30.12 | NA | NA | |
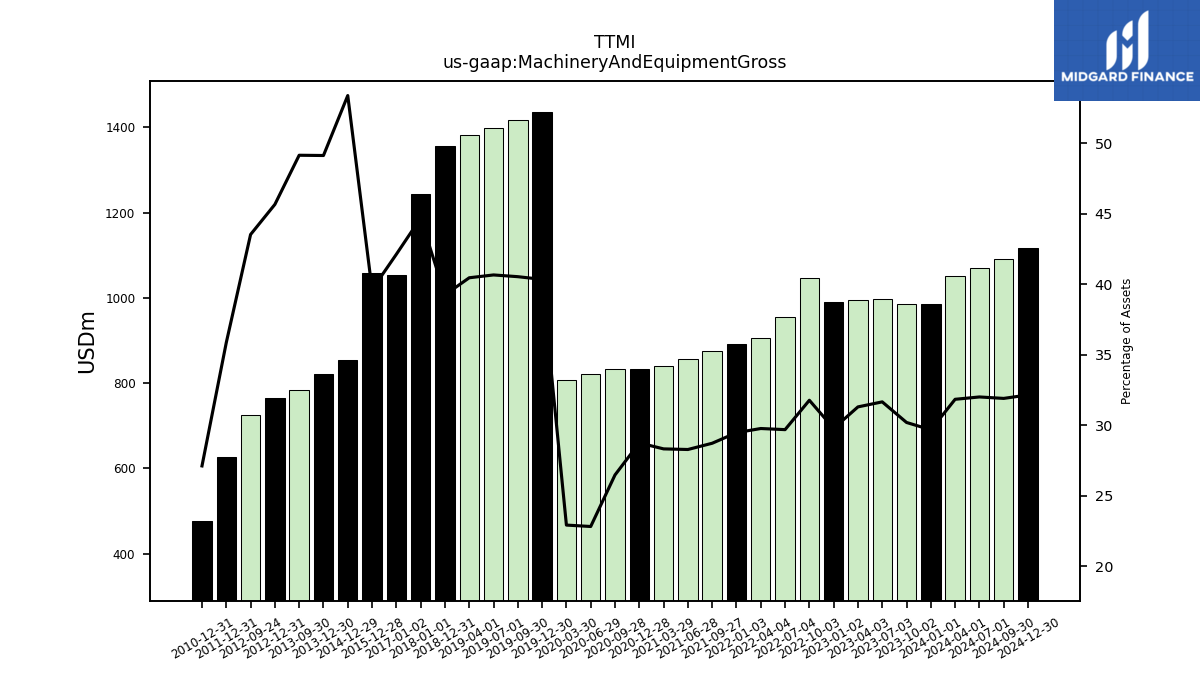
| Machinery And Equipment Gross | 986.53 | 986.62 | 996.94 | 994.37 | 989.93 | 1046.44 | 954.62 | 906.41 | 875.59 | 855.89 | 840.25 | 832.72 | 833.79 | 820.57 | 808.02 | 1436.80 | 1418.27 | 1398.90 | 1381.55 | 1357.04 | NA | NA | NA | 1243.46 | NA | NA | NA | NA | NA | NA | 1058.57 | NA | NA | NA | 854.83 | NA | NA | NA | 822.28 | 783.21 | NA | NA | 765.78 | 726.41 | NA | NA | 627.36 | NA | NA | NA | 477.89 | NA | NA |
| 2024-01-01 | 2023-10-02 | 2023-07-03 | 2023-04-03 | 2023-01-02 | 2022-10-03 | 2022-07-04 | 2022-04-04 | 2021-09-27 | 2021-06-28 | 2021-03-29 | 2020-12-28 | 2020-09-28 | 2020-06-29 | 2020-03-30 | 2019-12-30 | 2019-09-30 | 2019-07-01 | 2019-04-01 | 2018-12-31 | 2018-10-01 | 2018-07-02 | 2018-04-02 | 2018-01-01 | 2017-10-02 | 2017-07-03 | 2017-04-03 | 2016-09-26 | 2016-06-27 | 2016-03-28 | 2015-12-28 | 2015-09-28 | 2015-06-29 | 2015-03-30 | 2014-12-29 | 2014-09-29 | 2014-06-30 | 2014-03-31 | 2013-12-30 | 2013-09-30 | 2013-07-01 | 2013-04-01 | 2012-12-31 | 2012-09-24 | 2012-06-25 | 2012-03-26 | 2011-12-31 | 2011-09-26 | 2011-06-27 | 2011-03-28 | 2010-12-31 | 2010-09-27 | 2010-06-28 | ||
|---|---|---|---|---|---|---|---|---|---|---|---|---|---|---|---|---|---|---|---|---|---|---|---|---|---|---|---|---|---|---|---|---|---|---|---|---|---|---|---|---|---|---|---|---|---|---|---|---|---|---|---|---|---|---|
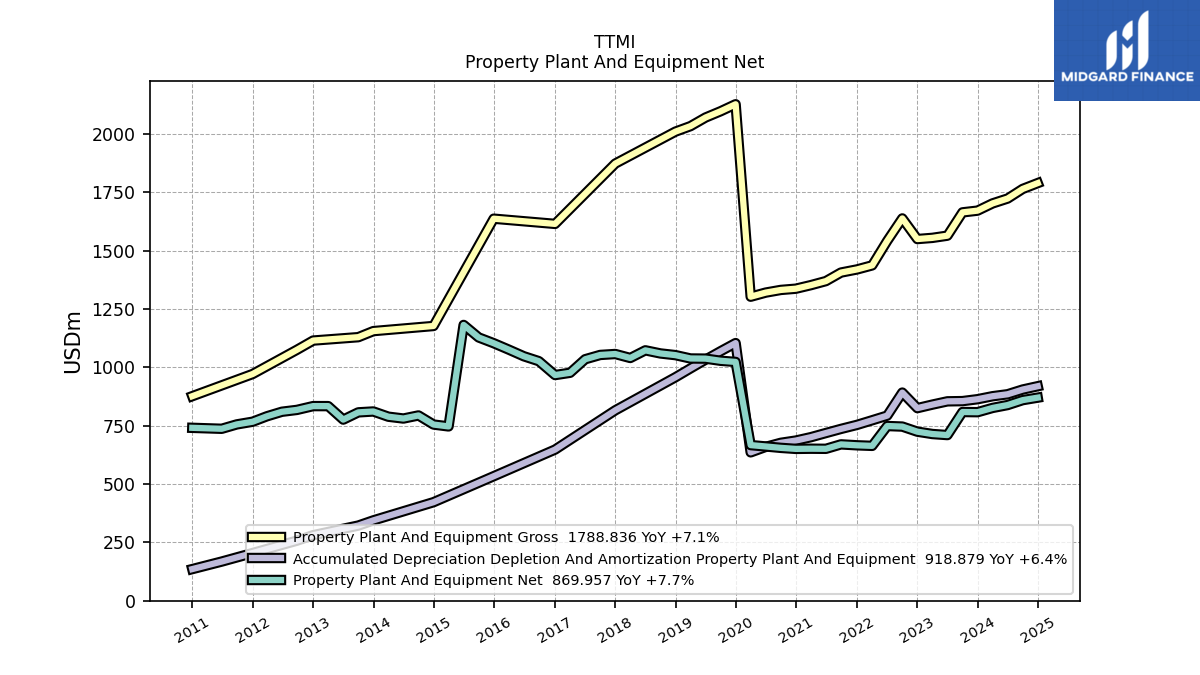
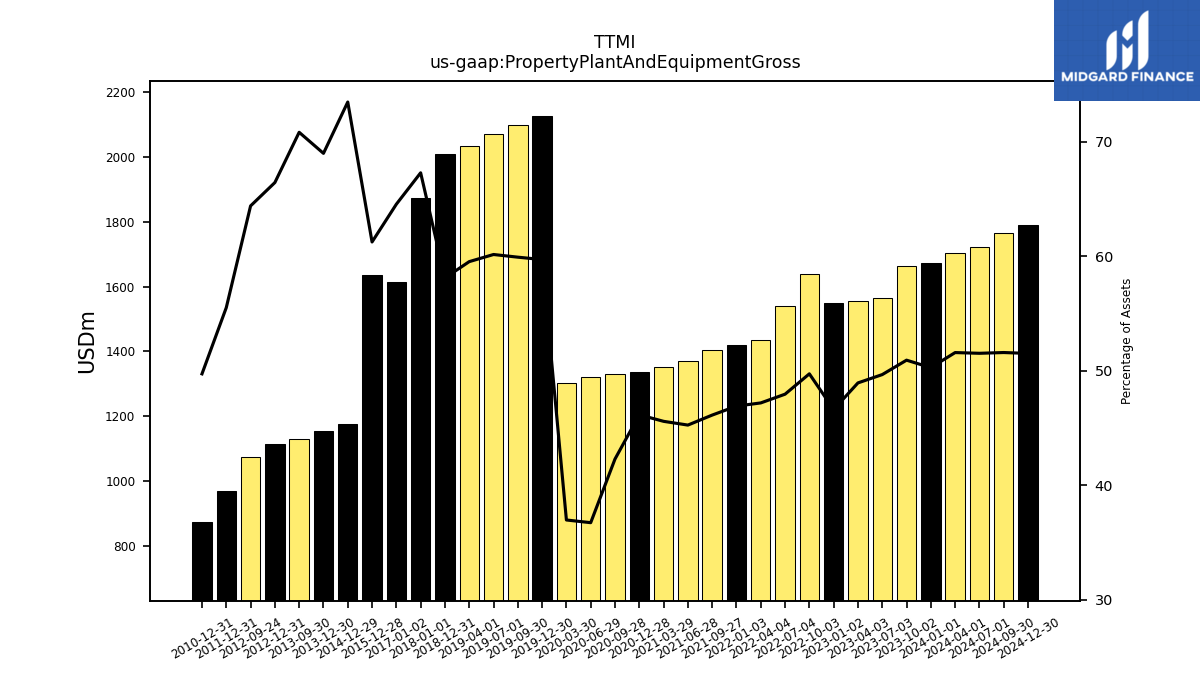
| Property Plant And Equipment Gross | 1670.90 | 1663.47 | 1563.70 | 1554.27 | 1549.20 | 1637.60 | 1541.47 | 1436.48 | 1405.70 | 1369.15 | 1351.78 | 1336.54 | 1331.22 | 1319.89 | 1302.25 | 2126.61 | 2096.58 | 2069.70 | 2032.88 | 2009.30 | NA | NA | NA | 1872.40 | NA | NA | NA | NA | NA | NA | 1636.45 | NA | NA | NA | 1176.85 | NA | NA | NA | 1154.89 | 1128.94 | NA | NA | 1114.42 | 1074.87 | NA | NA | 971.10 | NA | NA | NA | 876.20 | NA | NA | |
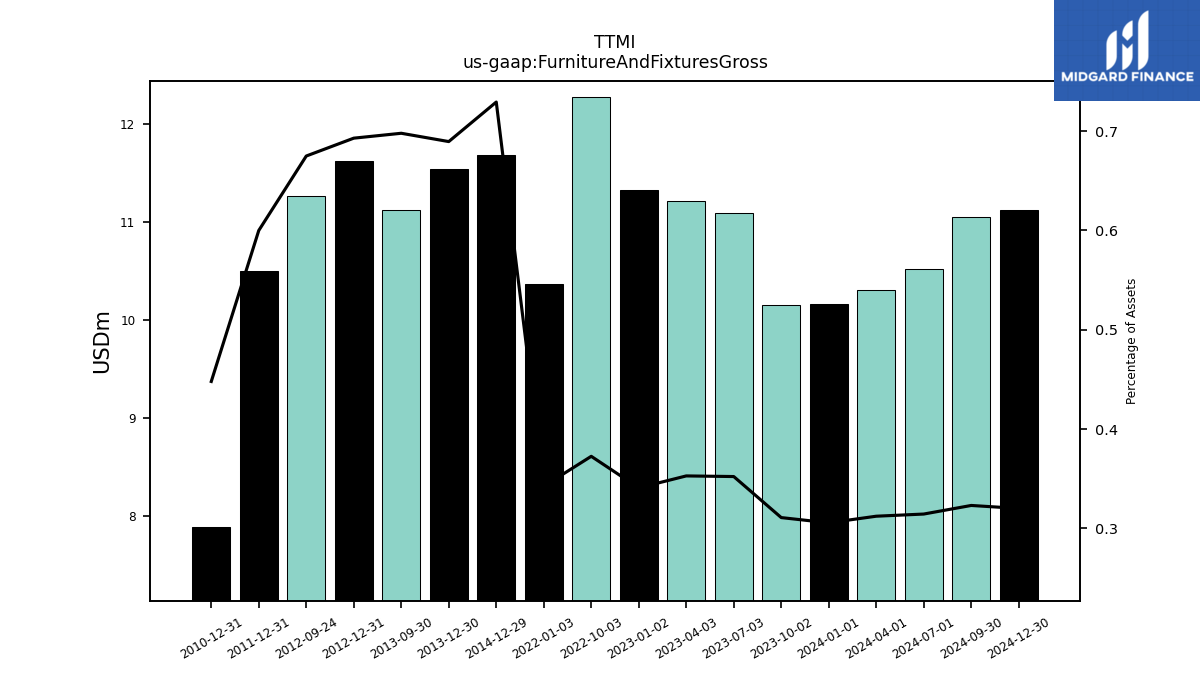
| Furniture And Fixtures Gross | 10.16 | 10.15 | 11.09 | 11.21 | 11.33 | 12.27 | NA | NA | NA | NA | NA | NA | NA | NA | NA | NA | NA | NA | NA | NA | NA | NA | NA | NA | NA | NA | NA | NA | NA | NA | NA | NA | NA | NA | 11.68 | NA | NA | NA | 11.54 | 11.12 | NA | NA | 11.62 | 11.26 | NA | NA | 10.49 | NA | NA | NA | 7.89 | NA | NA | |
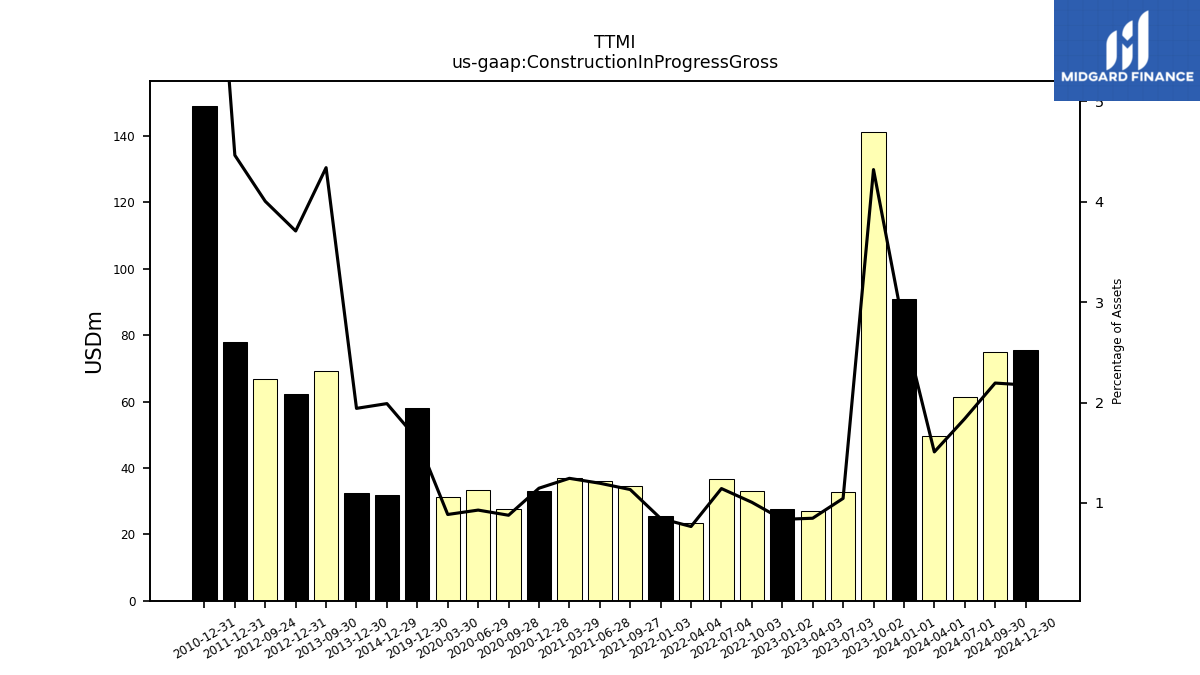
| Construction In Progress Gross | 90.94 | 141.13 | 32.89 | 26.90 | 27.77 | 33.12 | 36.73 | 23.28 | 34.53 | 36.18 | 36.91 | 33.19 | 27.60 | 33.36 | 31.17 | 58.20 | NA | NA | NA | NA | NA | NA | NA | NA | NA | NA | NA | NA | NA | NA | NA | NA | NA | NA | 31.85 | NA | NA | NA | 32.49 | 69.15 | NA | NA | 62.20 | 66.83 | NA | NA | 78.07 | NA | NA | NA | 149.12 | NA | NA | |
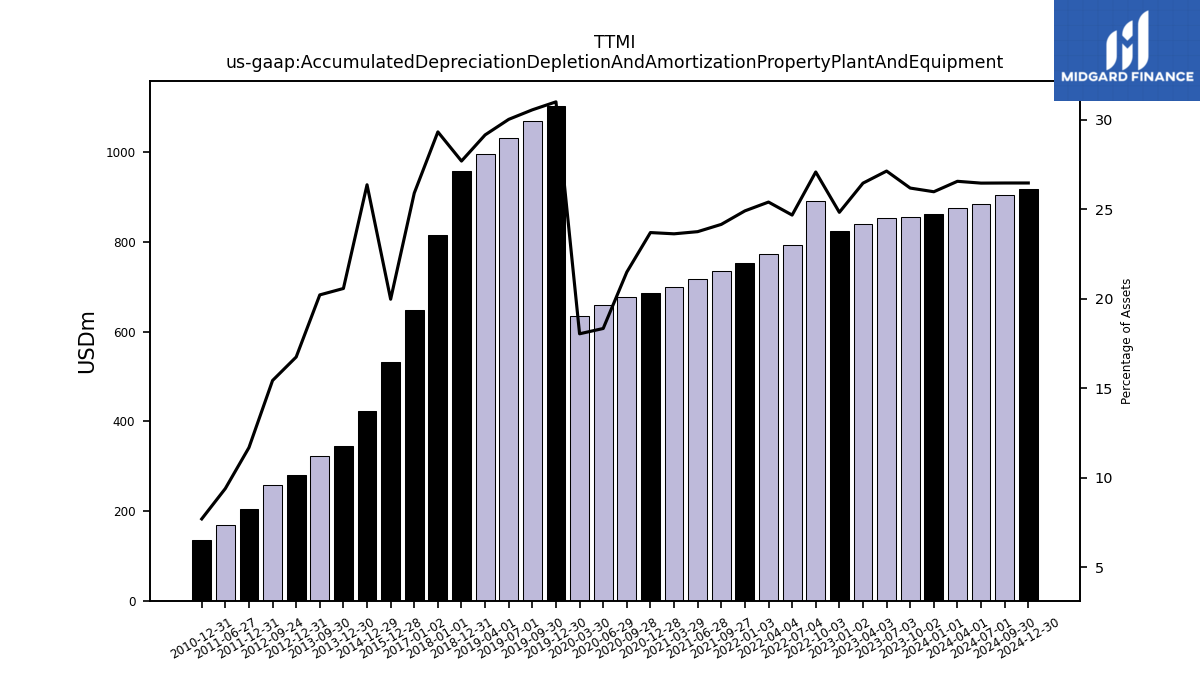
| Accumulated Depreciation Depletion And Amortization Property Plant And Equipment | 863.24 | 855.10 | 854.12 | 840.12 | 825.00 | 891.60 | 793.03 | 773.08 | 735.96 | 718.39 | 700.59 | 686.10 | 676.39 | 659.02 | 635.64 | 1103.68 | 1068.71 | 1032.62 | 995.19 | 957.28 | NA | NA | NA | 815.55 | NA | NA | NA | NA | NA | NA | 533.38 | NA | NA | NA | 422.13 | NA | NA | NA | 344.22 | 322.04 | NA | NA | 280.74 | 257.44 | NA | NA | 204.30 | NA | 167.85 | NA | 135.56 | NA | NA | |
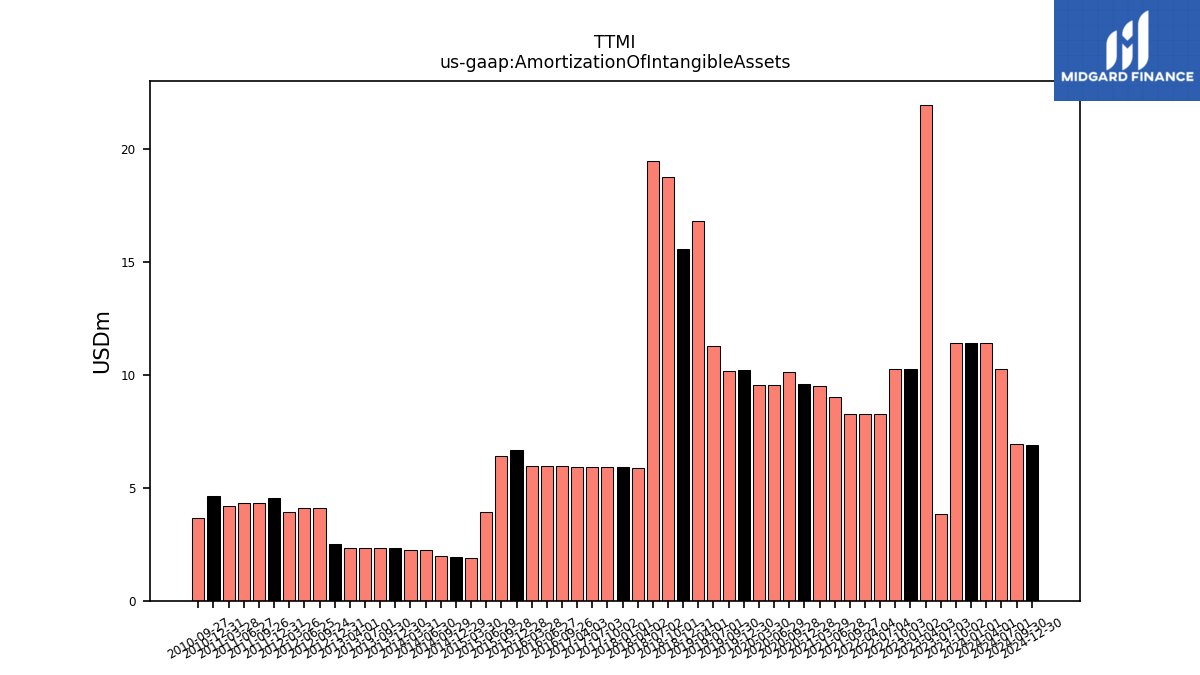
| Amortization Of Intangible Assets | 11.43 | 11.43 | 3.85 | 21.96 | 10.28 | 10.27 | 8.28 | 8.27 | 8.27 | 9.04 | 9.52 | 9.59 | 10.13 | 9.56 | 9.56 | 10.21 | 10.18 | 11.27 | 16.83 | 15.56 | 18.77 | 19.49 | 5.86 | 5.91 | 5.91 | 5.91 | 5.91 | 5.95 | 5.95 | 5.95 | 6.68 | 6.42 | 3.91 | 1.87 | 1.94 | 1.98 | 2.24 | 2.24 | 2.35 | 2.33 | 2.33 | 2.33 | 2.52 | 4.10 | 4.12 | 3.94 | 4.55 | 4.34 | 4.35 | 4.19 | 4.64 | 3.68 | NA | |
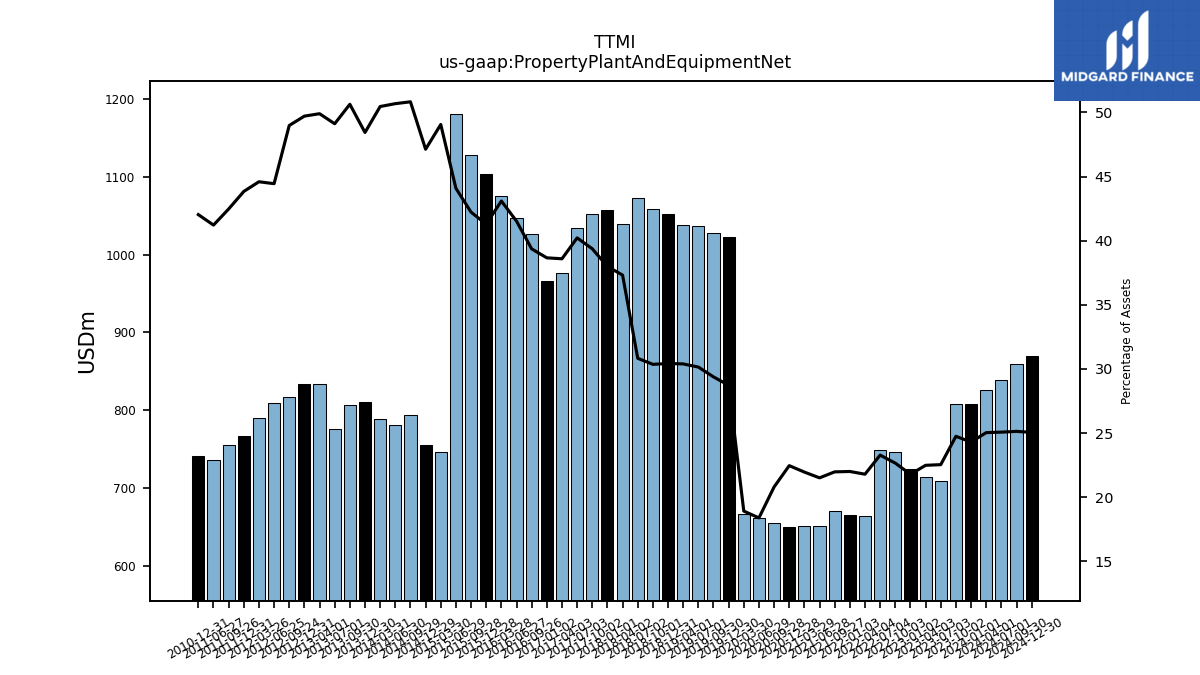
| Property Plant And Equipment Net | 807.67 | 808.37 | 709.58 | 714.15 | 724.20 | 745.99 | 748.44 | 663.39 | 669.74 | 650.76 | 651.19 | 650.43 | 654.84 | 660.87 | 666.61 | 1022.93 | 1027.87 | 1037.09 | 1037.70 | 1052.02 | 1059.25 | 1072.58 | 1039.75 | 1056.85 | 1052.78 | 1034.38 | 976.45 | 1026.21 | 1047.19 | 1075.61 | 1103.07 | 1127.77 | 1181.43 | 746.65 | 754.72 | 793.68 | 780.45 | 788.30 | 810.67 | 806.91 | 775.82 | 833.62 | 833.68 | 817.43 | 809.50 | 789.99 | 766.80 | 755.26 | 736.55 | NA | 740.63 | NA | NA | |
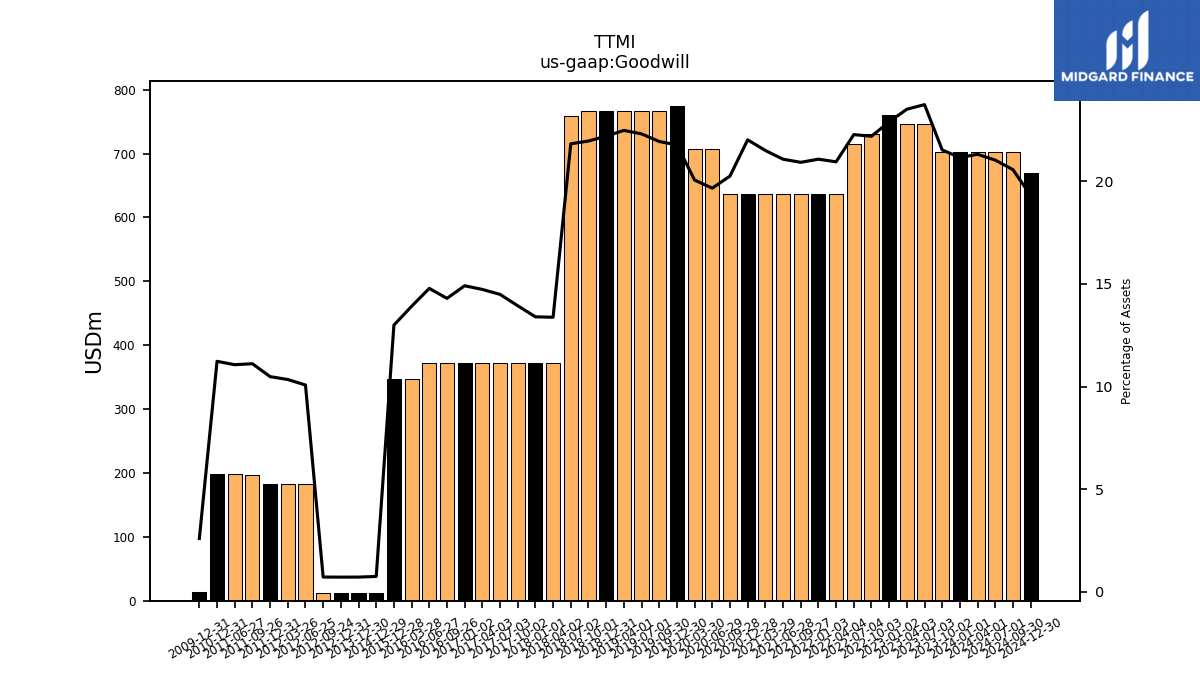
| Goodwill | 702.74 | 702.74 | 746.84 | 746.27 | 760.44 | 730.39 | 715.59 | 637.32 | 637.32 | 637.32 | 637.32 | 637.32 | 637.32 | 706.52 | 706.52 | 774.79 | 767.04 | 767.04 | 767.04 | 767.04 | 765.87 | 758.85 | 372.57 | 372.57 | 372.52 | 372.53 | 372.59 | 372.61 | 372.60 | 347.01 | 346.99 | NA | NA | NA | 12.11 | NA | NA | NA | 12.12 | NA | NA | NA | 12.12 | 12.12 | 183.46 | 183.18 | 183.32 | 197.56 | 197.66 | NA | 197.81 | NA | NA | |
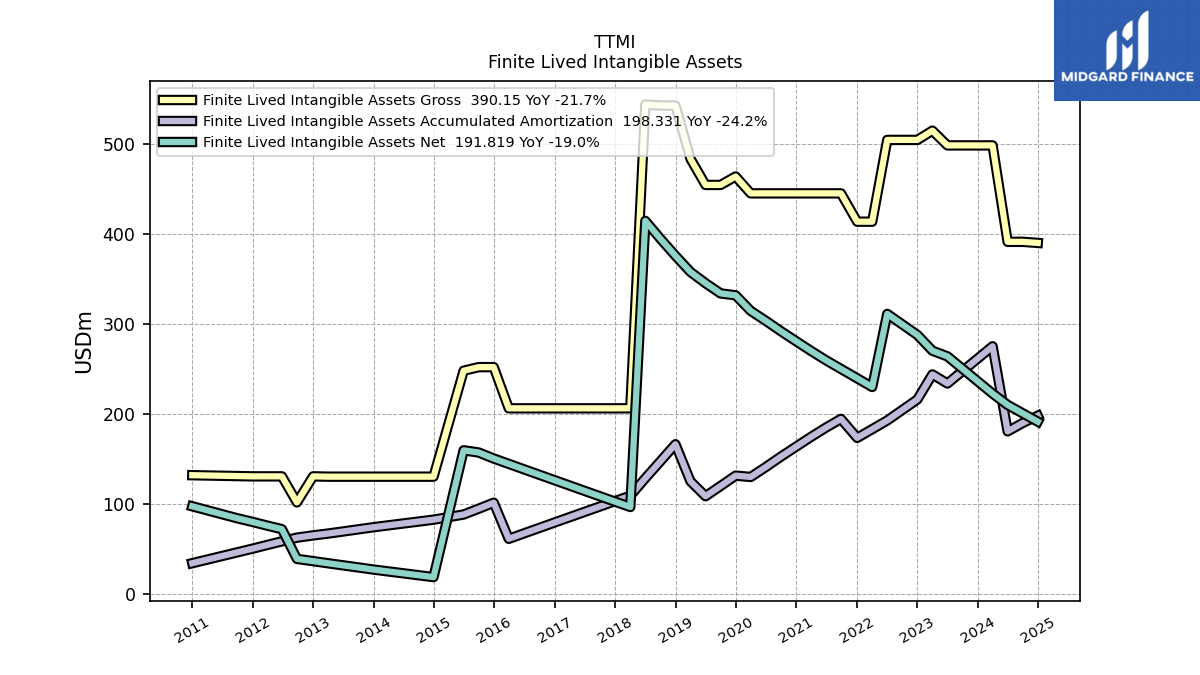
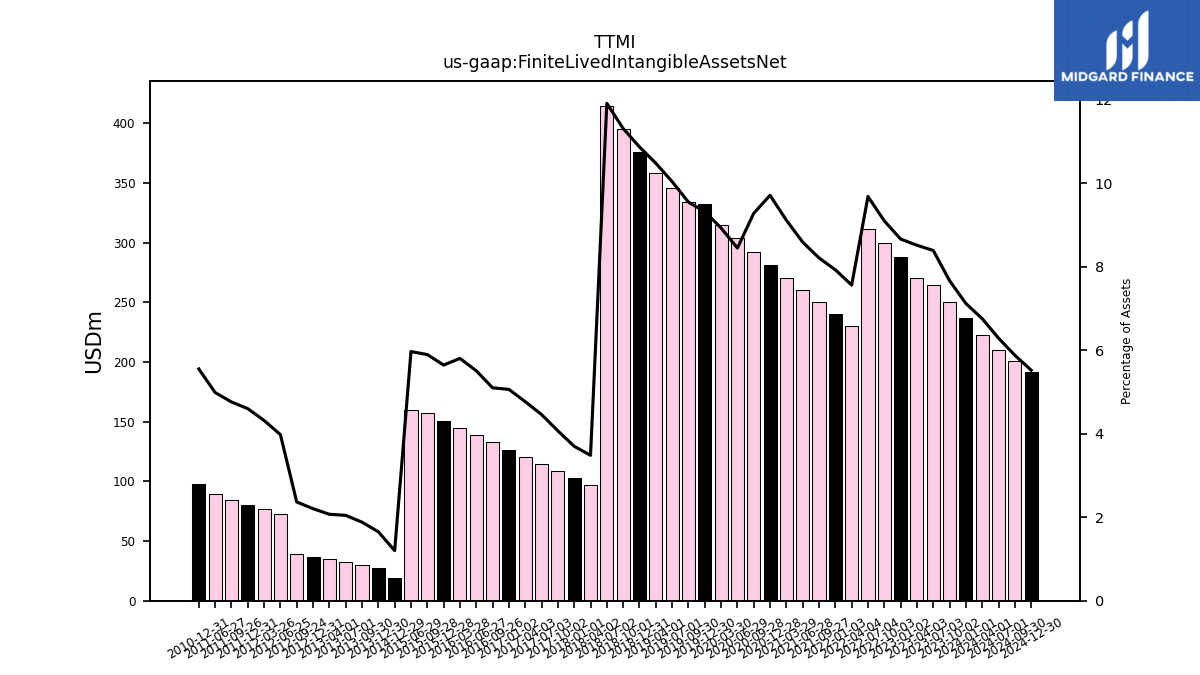
| Finite Lived Intangible Assets Net | 236.71 | 250.48 | 264.24 | 270.51 | 288.04 | 299.69 | 311.35 | 230.26 | 250.32 | 259.98 | 270.40 | 281.31 | 292.28 | 303.79 | 314.74 | 332.01 | 334.12 | 345.47 | 357.92 | 375.92 | 394.82 | 414.60 | 97.09 | 102.95 | 108.84 | 114.75 | 120.69 | 133.02 | 138.96 | 144.92 | 150.87 | 157.56 | 159.98 | NA | 19.25 | NA | NA | NA | 27.66 | 30.00 | 32.31 | 34.61 | 36.98 | 39.49 | 72.49 | 76.51 | 80.51 | 84.70 | 89.16 | NA | 97.87 | NA | NA | |
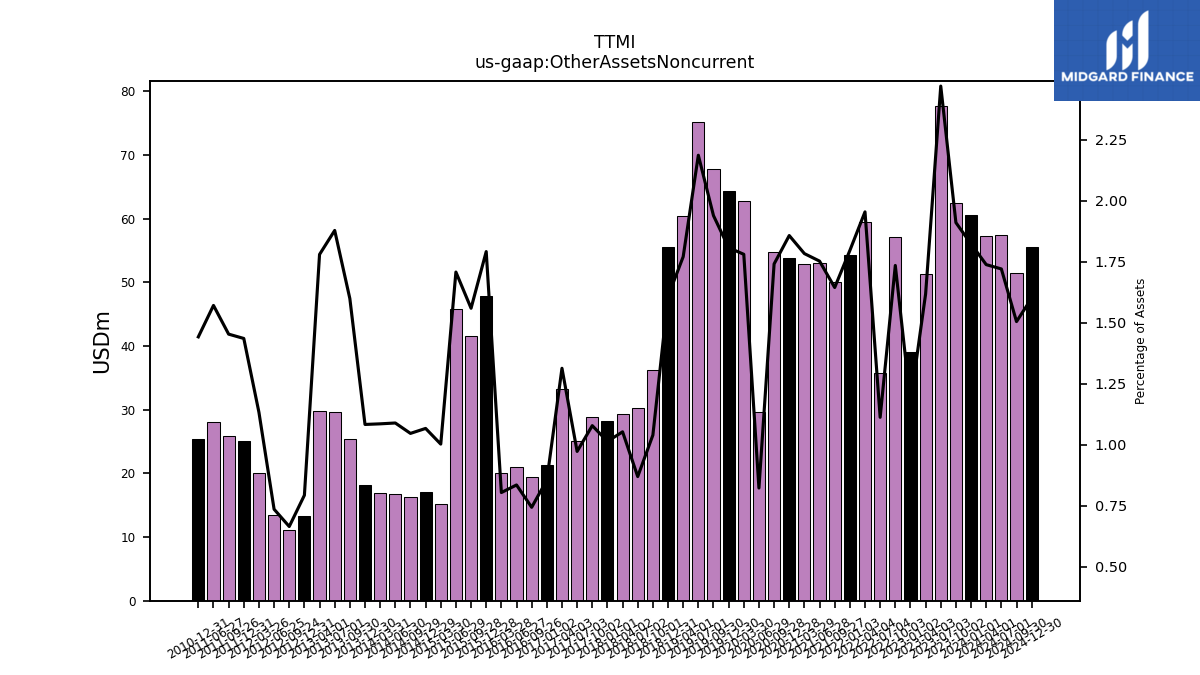
| Other Assets Noncurrent | 60.58 | 62.39 | 77.74 | 51.38 | 39.01 | 57.12 | 35.77 | 59.48 | 50.11 | 53.02 | 52.89 | 53.78 | 54.80 | 29.59 | 62.74 | 64.36 | 67.82 | 75.20 | 60.45 | 55.60 | 36.28 | 30.27 | 29.34 | 28.21 | 28.84 | 25.02 | 33.23 | 19.40 | 21.07 | 20.08 | 47.85 | 41.65 | 45.76 | 15.26 | 17.09 | 16.34 | 16.77 | 16.96 | 18.13 | 25.48 | 29.66 | 29.73 | 13.30 | 11.10 | 13.41 | 20.07 | 25.11 | 25.84 | 28.07 | NA | 25.41 | NA | NA |
| 2024-01-01 | 2023-10-02 | 2023-07-03 | 2023-04-03 | 2023-01-02 | 2022-10-03 | 2022-07-04 | 2022-04-04 | 2021-09-27 | 2021-06-28 | 2021-03-29 | 2020-12-28 | 2020-09-28 | 2020-06-29 | 2020-03-30 | 2019-12-30 | 2019-09-30 | 2019-07-01 | 2019-04-01 | 2018-12-31 | 2018-10-01 | 2018-07-02 | 2018-04-02 | 2018-01-01 | 2017-10-02 | 2017-07-03 | 2017-04-03 | 2016-09-26 | 2016-06-27 | 2016-03-28 | 2015-12-28 | 2015-09-28 | 2015-06-29 | 2015-03-30 | 2014-12-29 | 2014-09-29 | 2014-06-30 | 2014-03-31 | 2013-12-30 | 2013-09-30 | 2013-07-01 | 2013-04-01 | 2012-12-31 | 2012-09-24 | 2012-06-25 | 2012-03-26 | 2011-12-31 | 2011-09-26 | 2011-06-27 | 2011-03-28 | 2010-12-31 | 2010-09-27 | 2010-06-28 | ||
|---|---|---|---|---|---|---|---|---|---|---|---|---|---|---|---|---|---|---|---|---|---|---|---|---|---|---|---|---|---|---|---|---|---|---|---|---|---|---|---|---|---|---|---|---|---|---|---|---|---|---|---|---|---|---|
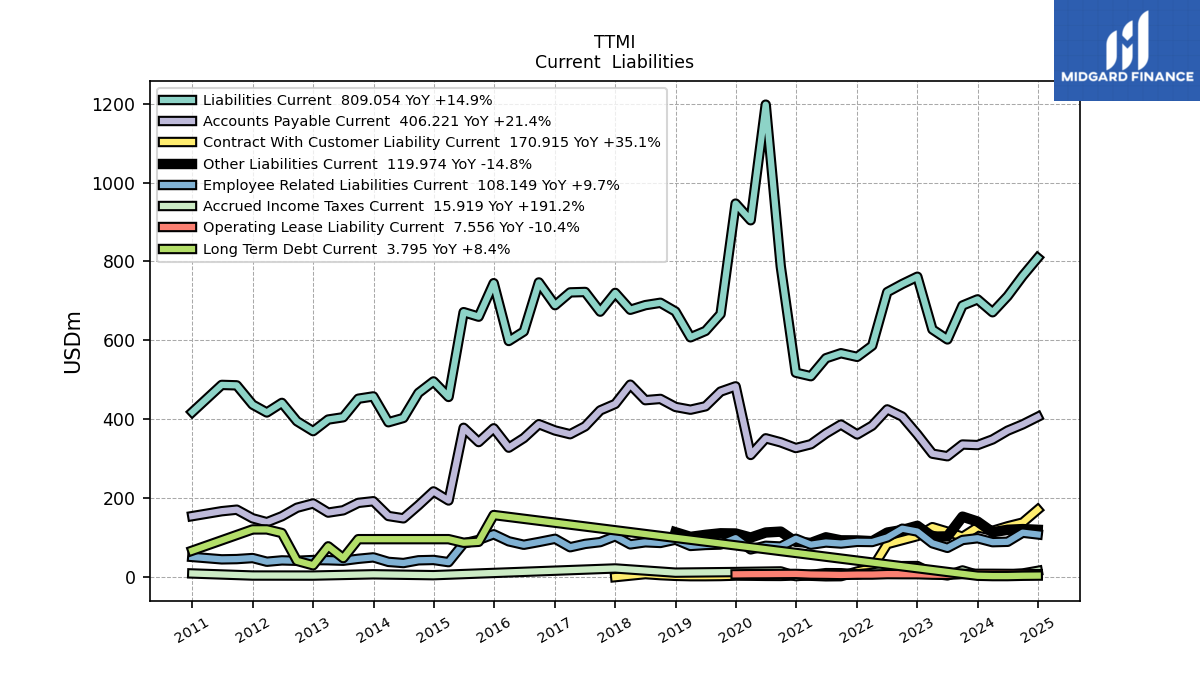
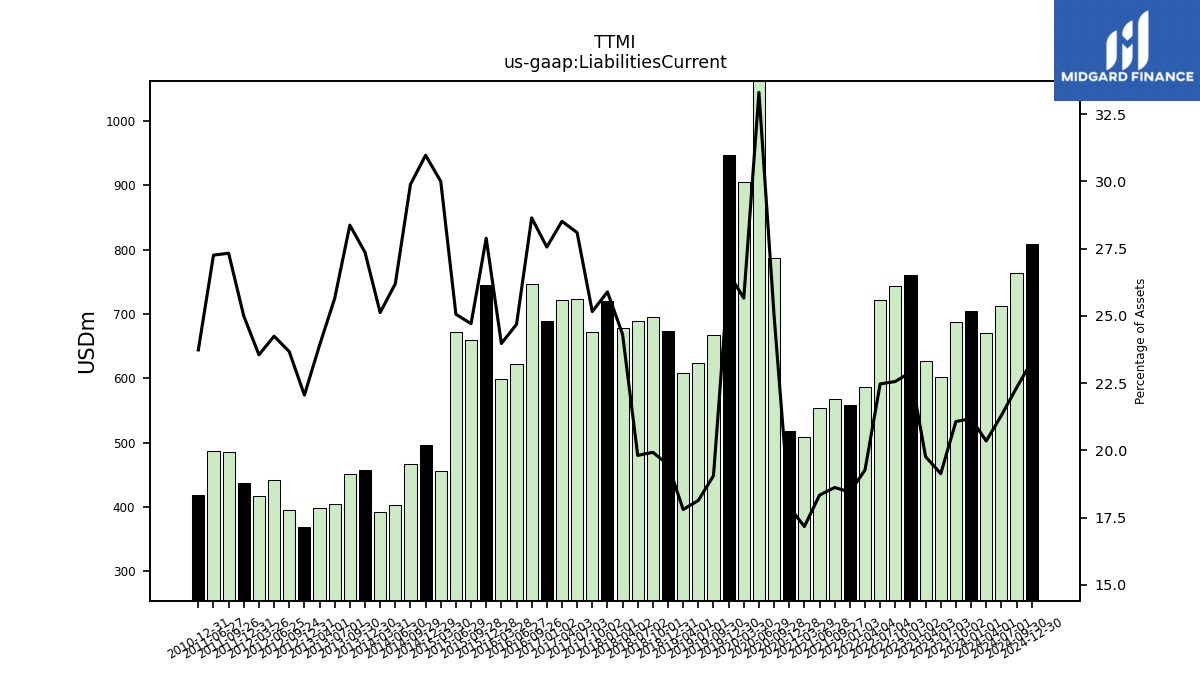
| Liabilities Current | 703.98 | 688.29 | 602.38 | 627.75 | 761.33 | 742.89 | 722.31 | 586.57 | 567.44 | 554.75 | 509.15 | 518.05 | 787.32 | 1197.46 | 904.36 | 946.67 | 666.67 | 623.96 | 607.73 | 673.21 | 695.28 | 689.28 | 677.53 | 720.36 | 672.78 | 722.67 | 721.58 | 746.87 | 622.49 | 598.41 | 744.99 | 660.02 | 671.57 | 456.61 | 496.01 | 466.75 | 403.34 | 392.49 | 458.00 | 452.14 | 405.17 | 399.37 | 369.88 | 395.04 | 441.58 | 417.24 | 437.14 | 486.02 | 487.16 | NA | 418.20 | NA | NA | |
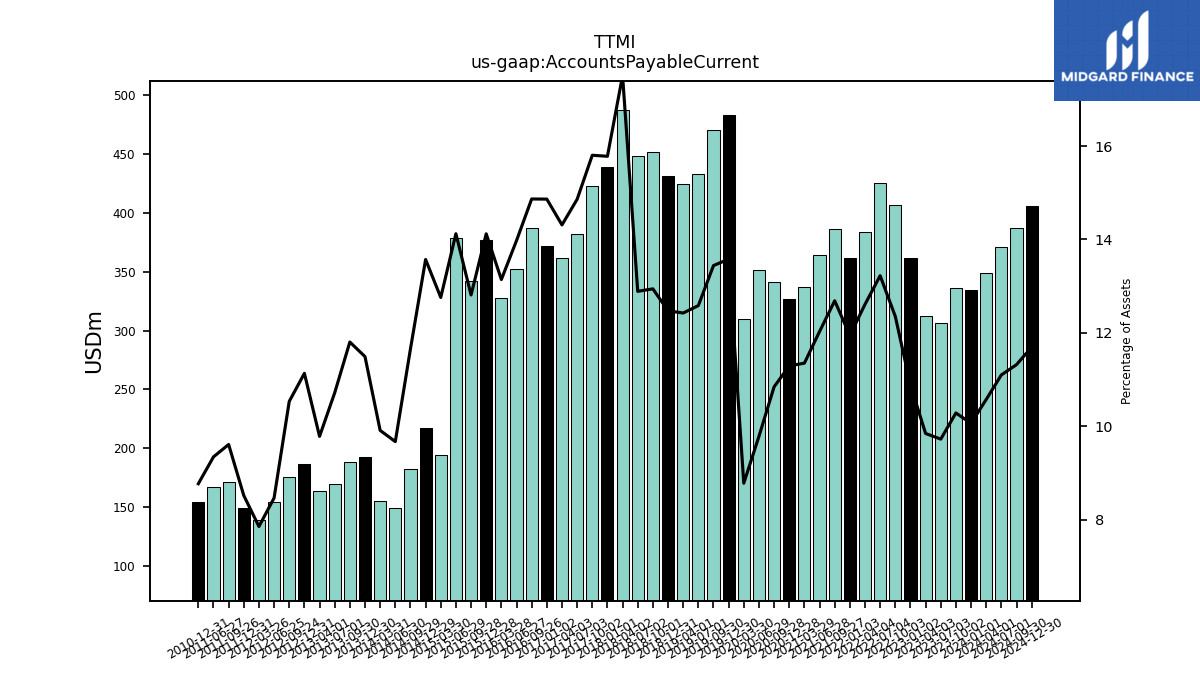
| Accounts Payable Current | 334.61 | 336.07 | 306.30 | 312.82 | 361.79 | 406.82 | 425.13 | 383.93 | 386.70 | 364.00 | 336.74 | 327.10 | 341.50 | 351.82 | 309.58 | 483.57 | 470.23 | 432.94 | 424.29 | 431.29 | 451.64 | 448.45 | 487.82 | 438.99 | 422.55 | 382.19 | 362.14 | 387.61 | 352.45 | 328.04 | 377.22 | 342.23 | 378.49 | 194.19 | 217.33 | 182.04 | 148.97 | 154.89 | 192.36 | 188.12 | 169.31 | 163.50 | 186.75 | 175.81 | 154.26 | 139.21 | 149.06 | 170.96 | 167.06 | NA | 154.60 | NA | NA | |
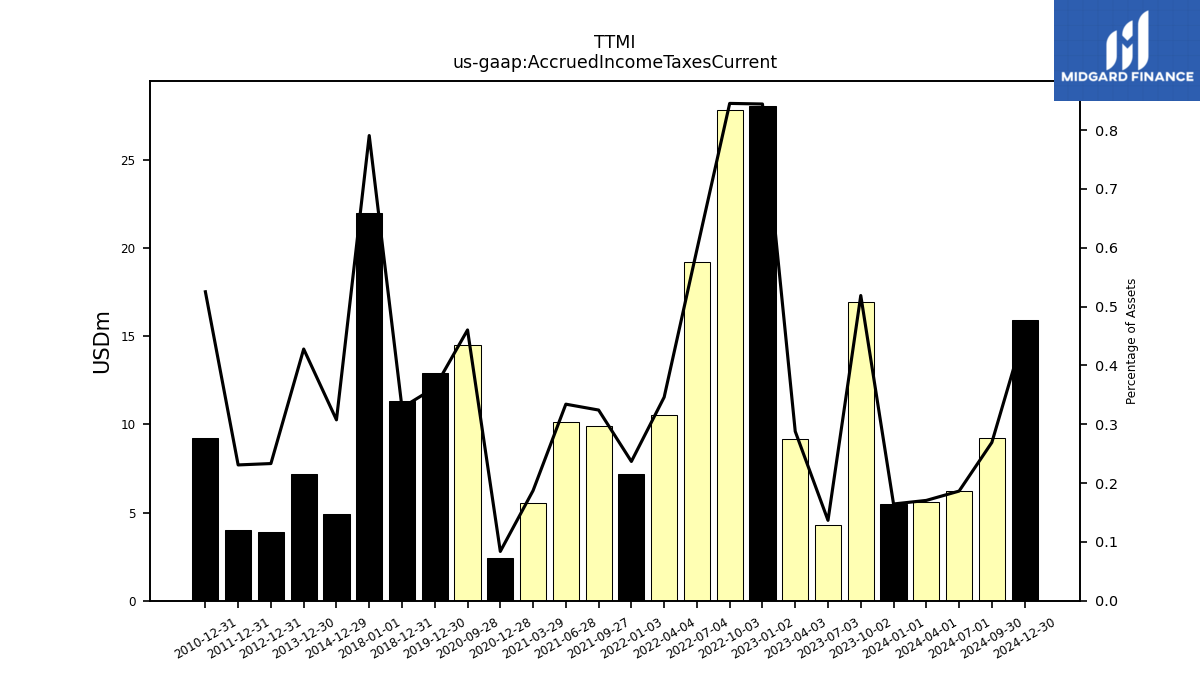
| Accrued Income Taxes Current | 5.47 | 16.94 | 4.30 | 9.14 | 28.06 | 27.83 | 19.18 | 10.53 | 9.88 | 10.11 | 5.55 | 2.43 | 14.49 | NA | NA | 12.90 | NA | NA | NA | 11.35 | NA | NA | NA | 21.99 | NA | NA | NA | NA | NA | NA | NA | NA | NA | NA | 4.92 | NA | NA | NA | 7.16 | NA | NA | NA | 3.91 | NA | NA | NA | 4.04 | NA | NA | NA | 9.25 | NA | NA | |
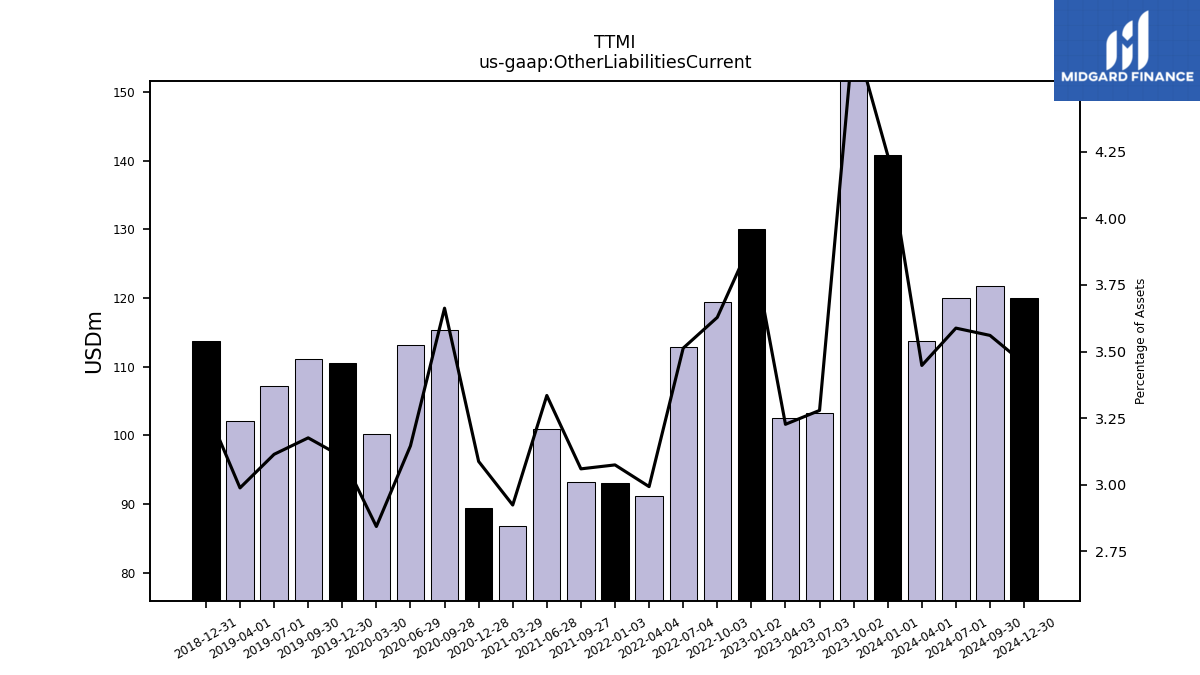
| Other Liabilities Current | 140.81 | 153.30 | 103.24 | 102.49 | 130.03 | 119.47 | 112.92 | 91.12 | 93.26 | 100.92 | 86.73 | 89.42 | 115.32 | 113.10 | 100.22 | 110.57 | 111.12 | 107.14 | 102.04 | 113.76 | NA | NA | NA | NA | NA | NA | NA | NA | NA | NA | NA | NA | NA | NA | NA | NA | NA | NA | NA | NA | NA | NA | NA | NA | NA | NA | NA | NA | NA | NA | NA | NA | NA | |
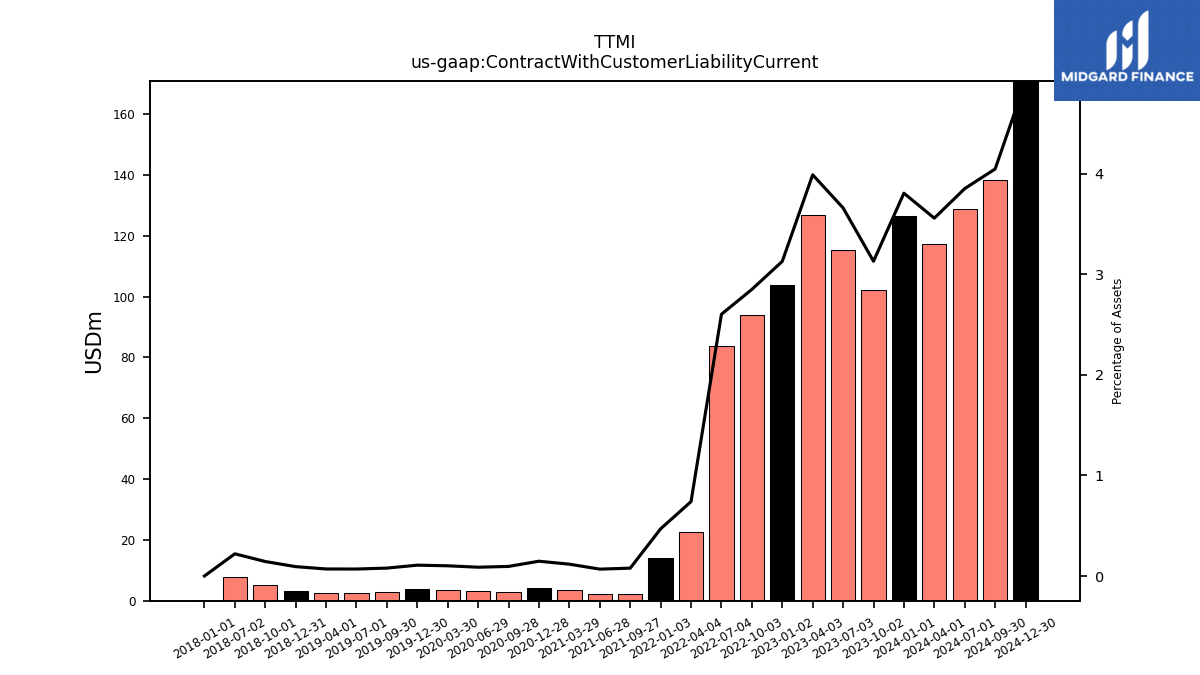
| Contract With Customer Liability Current | 126.51 | 102.24 | 115.25 | 126.70 | 103.98 | 93.84 | 83.67 | 22.52 | 2.38 | 2.07 | 3.49 | 4.25 | 3.00 | 3.14 | 3.58 | 3.84 | 2.75 | 2.39 | 2.39 | 3.22 | 5.03 | 7.68 | NA | 0.00 | NA | NA | NA | NA | NA | NA | NA | NA | NA | NA | NA | NA | NA | NA | NA | NA | NA | NA | NA | NA | NA | NA | NA | NA | NA | NA | NA | NA | NA |
| 2024-01-01 | 2023-10-02 | 2023-07-03 | 2023-04-03 | 2023-01-02 | 2022-10-03 | 2022-07-04 | 2022-04-04 | 2021-09-27 | 2021-06-28 | 2021-03-29 | 2020-12-28 | 2020-09-28 | 2020-06-29 | 2020-03-30 | 2019-12-30 | 2019-09-30 | 2019-07-01 | 2019-04-01 | 2018-12-31 | 2018-10-01 | 2018-07-02 | 2018-04-02 | 2018-01-01 | 2017-10-02 | 2017-07-03 | 2017-04-03 | 2016-09-26 | 2016-06-27 | 2016-03-28 | 2015-12-28 | 2015-09-28 | 2015-06-29 | 2015-03-30 | 2014-12-29 | 2014-09-29 | 2014-06-30 | 2014-03-31 | 2013-12-30 | 2013-09-30 | 2013-07-01 | 2013-04-01 | 2012-12-31 | 2012-09-24 | 2012-06-25 | 2012-03-26 | 2011-12-31 | 2011-09-26 | 2011-06-27 | 2011-03-28 | 2010-12-31 | 2010-09-27 | 2010-06-28 | ||
|---|---|---|---|---|---|---|---|---|---|---|---|---|---|---|---|---|---|---|---|---|---|---|---|---|---|---|---|---|---|---|---|---|---|---|---|---|---|---|---|---|---|---|---|---|---|---|---|---|---|---|---|---|---|---|
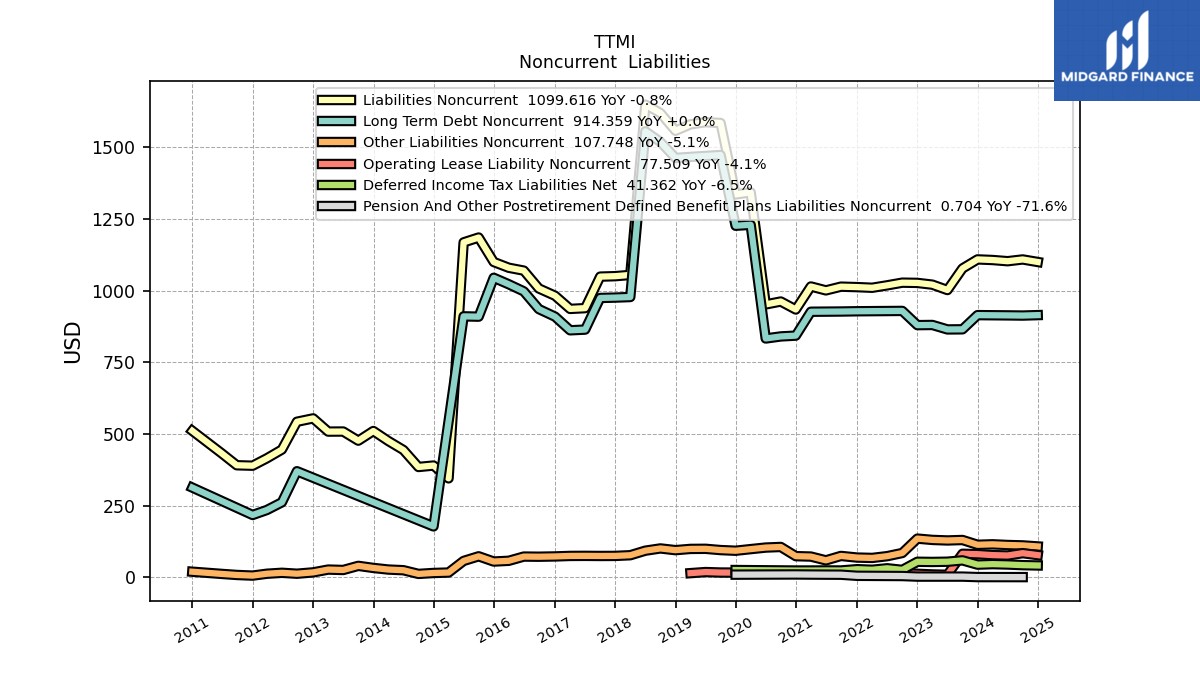
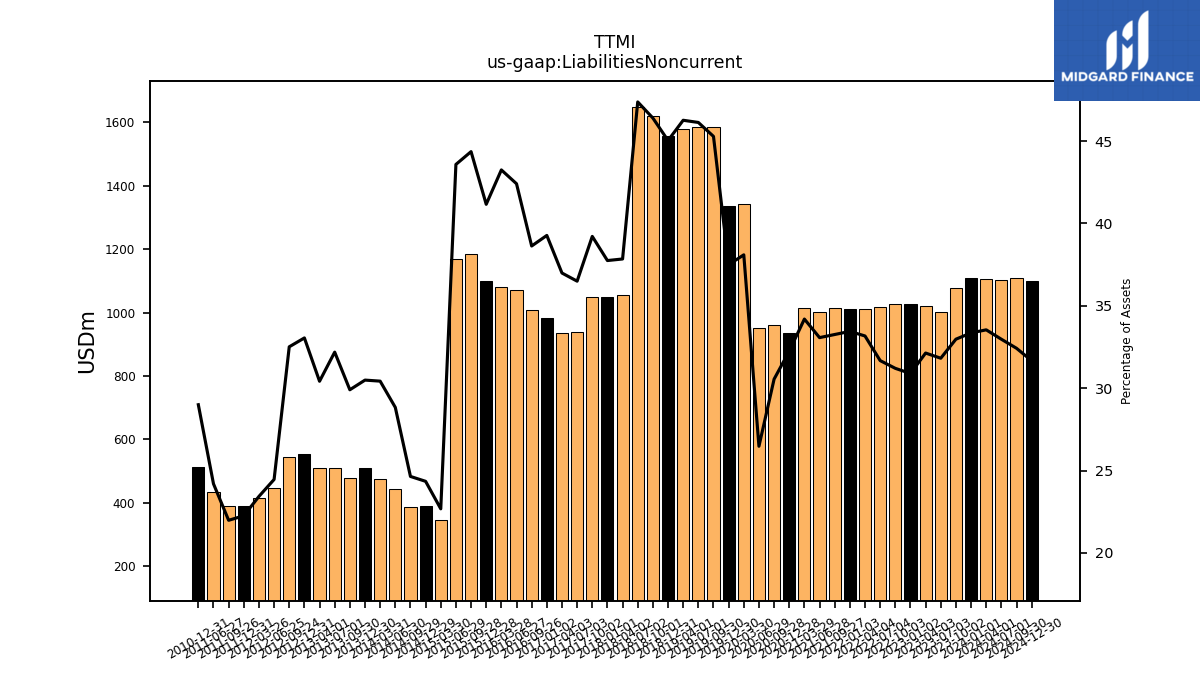
| Liabilities Noncurrent | 1108.64 | 1077.10 | 1001.80 | 1020.55 | 1026.70 | 1027.53 | 1018.26 | 1009.75 | 1013.60 | 1000.62 | 1014.21 | 933.89 | 961.79 | 951.65 | 1342.56 | 1335.23 | 1584.33 | 1587.08 | 1579.69 | 1557.20 | 1619.04 | 1648.36 | 1054.49 | 1050.15 | 1048.61 | 938.68 | 935.98 | 1007.24 | 1069.57 | 1079.50 | 1099.64 | 1184.92 | 1168.01 | 345.07 | 389.81 | 384.75 | 443.95 | 475.31 | 510.28 | 476.50 | 508.41 | 508.17 | 554.25 | 542.53 | 445.45 | 415.01 | 389.26 | 390.81 | 432.33 | NA | 510.89 | NA | NA | |
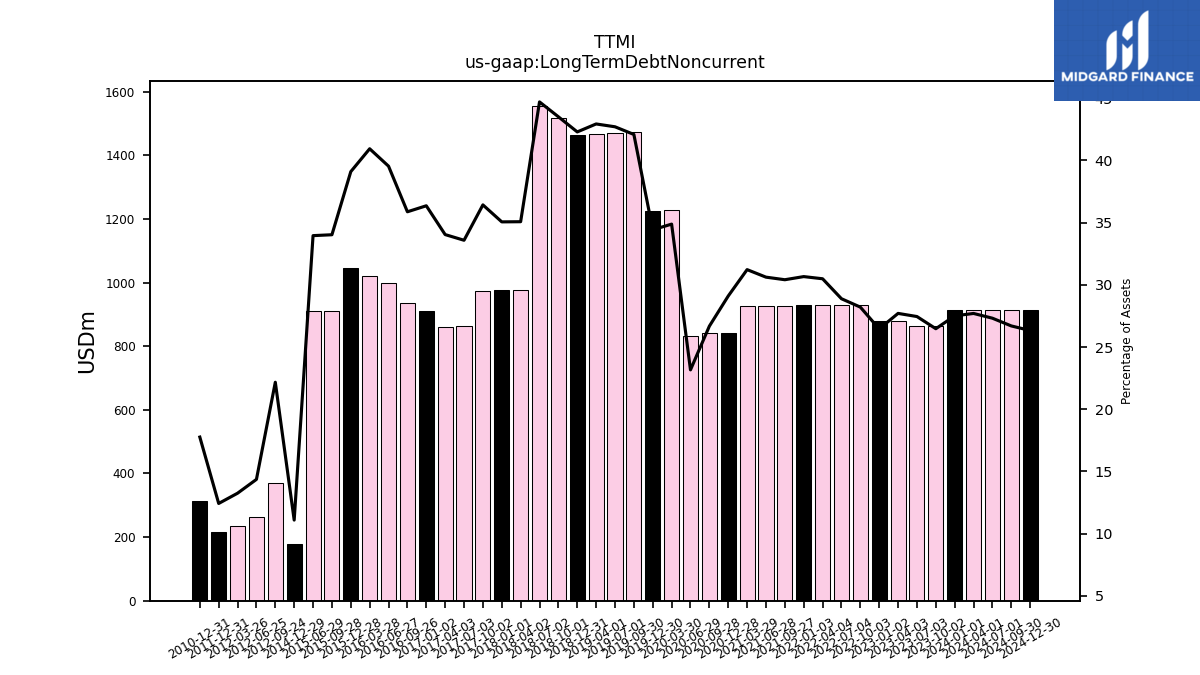
| Long Term Debt Noncurrent | 914.34 | 864.82 | 864.41 | 879.99 | 879.41 | 929.00 | 928.61 | 928.21 | 926.92 | 926.52 | 926.13 | 842.85 | 840.02 | 832.83 | 1229.37 | 1225.96 | 1472.58 | 1469.27 | 1466.01 | 1462.42 | 1518.32 | 1555.42 | 977.41 | 975.48 | 974.16 | 863.85 | 861.39 | 935.38 | 997.21 | 1021.87 | 1044.58 | 908.96 | 910.05 | NA | 177.60 | NA | NA | NA | NA | NA | NA | NA | NA | 370.01 | 261.60 | 234.75 | 217.37 | NA | NA | NA | 313.00 | NA | NA | |
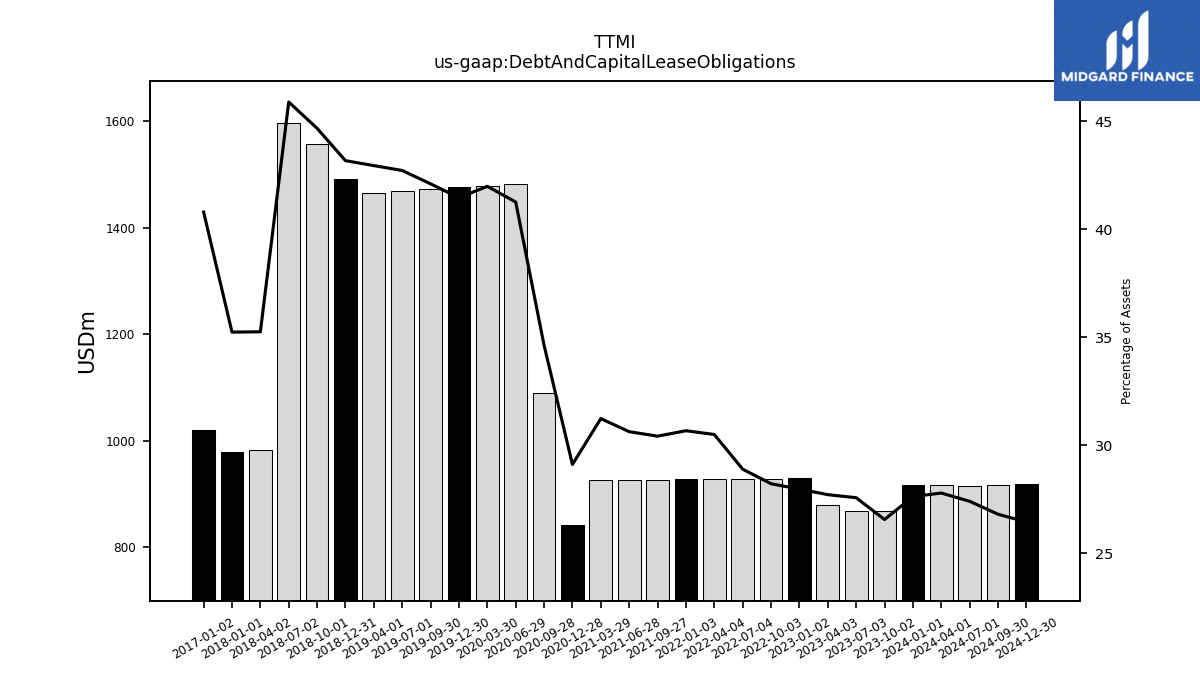
| Debt And Capital Lease Obligations | 917.84 | 867.45 | 867.91 | 879.99 | 929.41 | 929.00 | 928.61 | 928.21 | 926.92 | 926.52 | 926.13 | 842.85 | 1090.00 | 1482.81 | 1479.35 | 1475.94 | 1472.58 | 1469.27 | 1466.01 | 1492.42 | 1558.32 | 1596.15 | 982.03 | 980.06 | NA | NA | NA | NA | NA | NA | NA | NA | NA | NA | NA | NA | NA | NA | NA | NA | NA | NA | NA | NA | NA | NA | NA | NA | NA | NA | NA | NA | NA | |
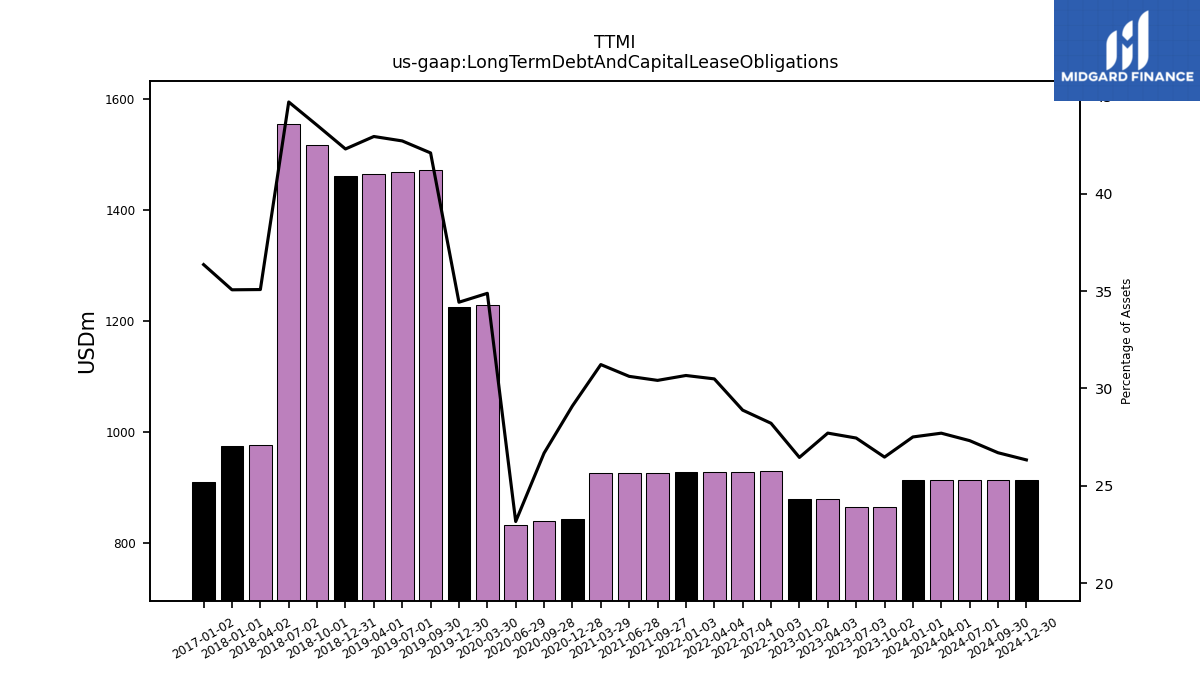
| Long Term Debt And Capital Lease Obligations | 914.34 | 864.82 | 864.41 | 879.99 | 879.41 | 929.00 | 928.61 | 928.21 | 926.92 | 926.52 | 926.13 | 842.85 | 840.02 | 832.83 | 1229.37 | 1225.96 | 1472.58 | 1469.27 | 1466.01 | 1462.42 | 1518.32 | 1555.42 | 977.41 | 975.48 | NA | NA | NA | NA | NA | NA | NA | NA | NA | NA | NA | NA | NA | NA | NA | NA | NA | NA | NA | NA | NA | NA | NA | NA | NA | NA | NA | NA | NA | |
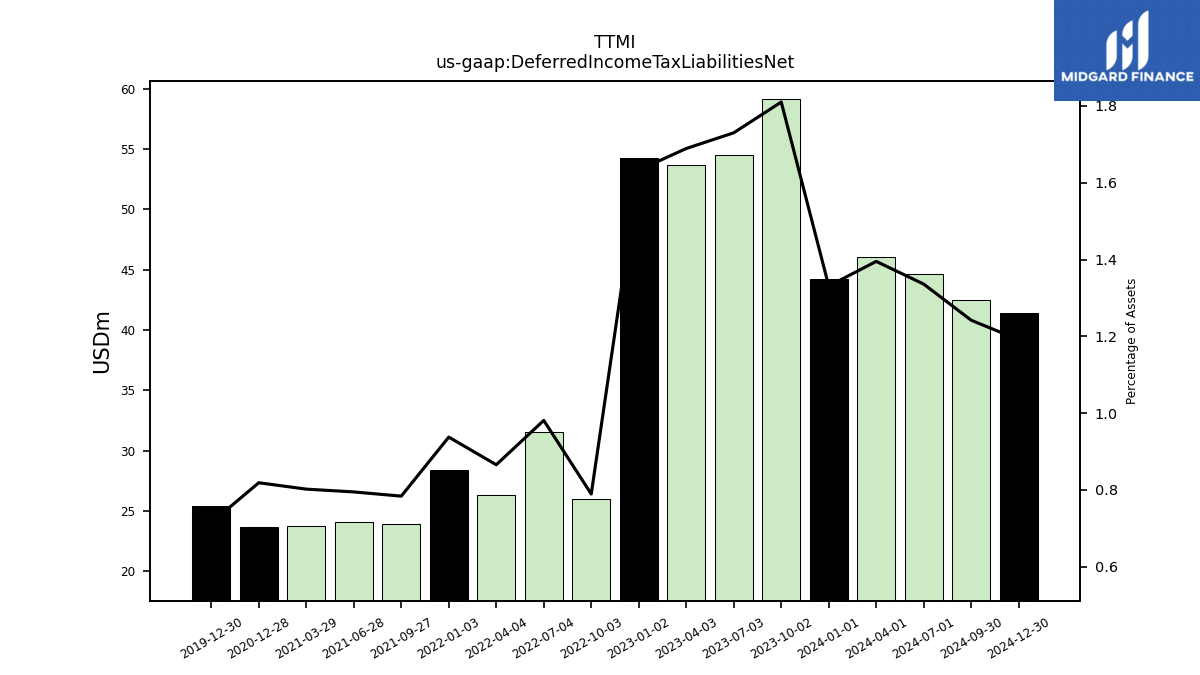
| Deferred Income Tax Liabilities Net | 44.24 | 59.13 | 54.47 | 53.65 | 54.27 | 25.99 | 31.53 | 26.34 | 23.88 | 24.04 | 23.78 | 23.70 | NA | NA | NA | 25.43 | NA | NA | NA | NA | NA | NA | NA | NA | NA | NA | NA | NA | NA | NA | NA | NA | NA | NA | NA | NA | NA | NA | NA | NA | NA | NA | NA | NA | NA | NA | NA | NA | NA | NA | NA | NA | NA | |
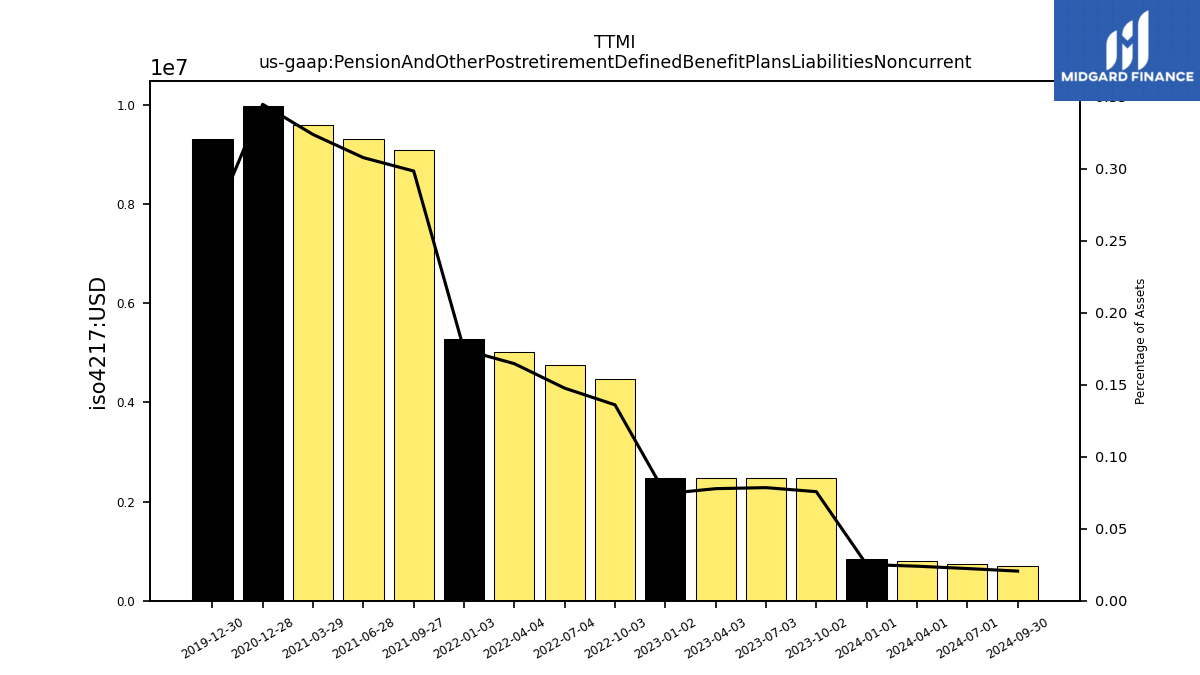
| Pension And Other Postretirement Defined Benefit Plans Liabilities Noncurrent | 0.84 | 2.48 | 2.47 | 2.47 | 2.47 | 4.48 | 4.75 | 5.01 | 9.10 | 9.31 | 9.61 | 9.99 | NA | NA | NA | 9.31 | NA | NA | NA | NA | NA | NA | NA | NA | NA | NA | NA | NA | NA | NA | NA | NA | NA | NA | NA | NA | NA | NA | NA | NA | NA | NA | NA | NA | NA | NA | NA | NA | NA | NA | NA | NA | NA | |
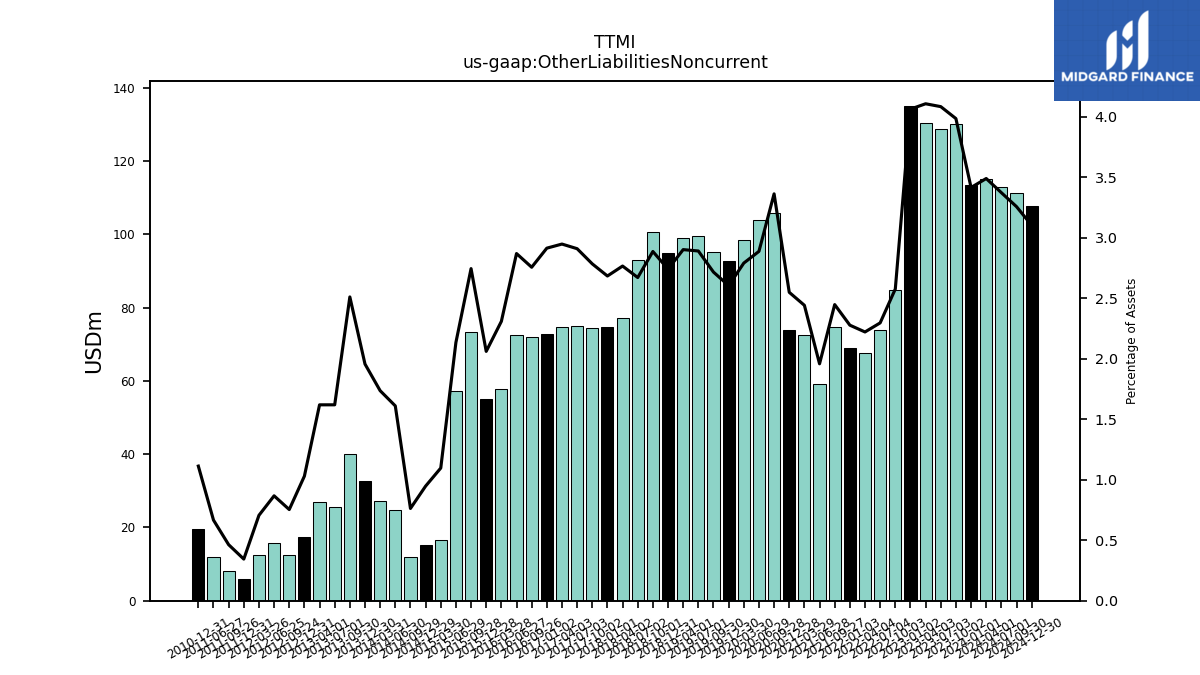
| Other Liabilities Noncurrent | 113.52 | 130.18 | 128.58 | 130.46 | 135.04 | 84.84 | 73.83 | 67.63 | 74.60 | 59.26 | 72.42 | 73.83 | 105.88 | 103.80 | 98.35 | 92.75 | 95.03 | 99.45 | 99.09 | 94.78 | 100.72 | 92.94 | 77.08 | 74.67 | 74.45 | 74.84 | 74.59 | 71.87 | 72.37 | 57.63 | 55.06 | 73.32 | 57.21 | 16.69 | 15.17 | 11.91 | 24.80 | 27.12 | 32.74 | 40.01 | 25.58 | 27.05 | 17.27 | 12.58 | 15.79 | 12.51 | 6.02 | 8.24 | 11.91 | NA | 19.61 | NA | NA | |
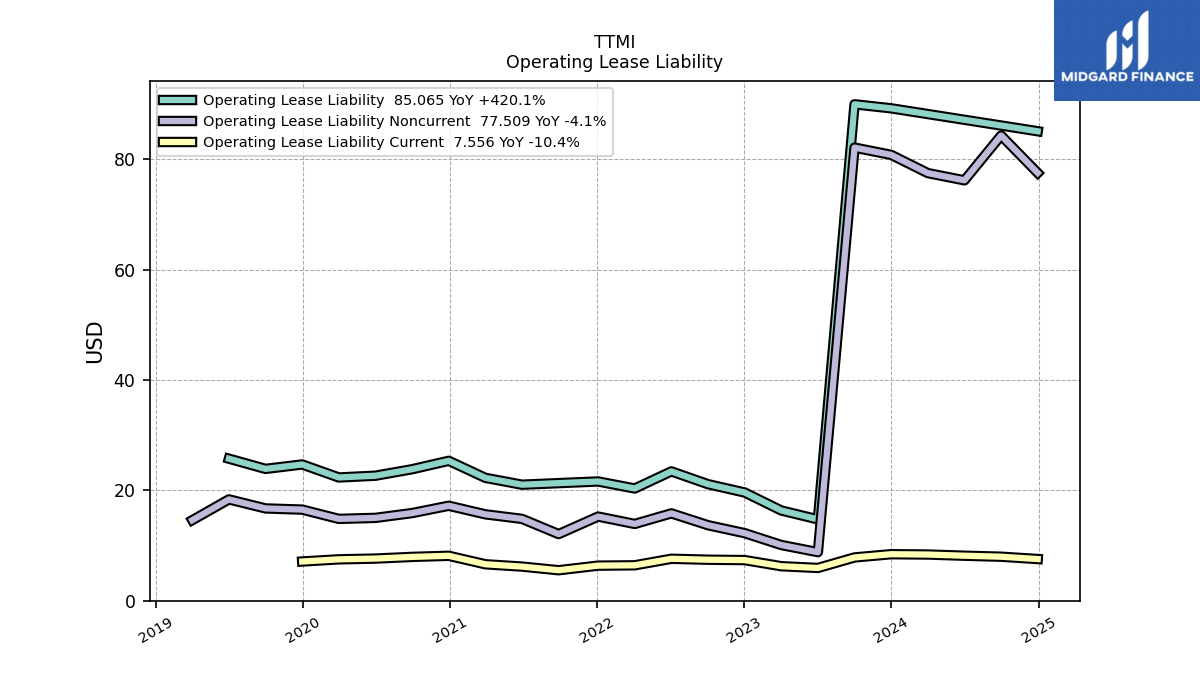
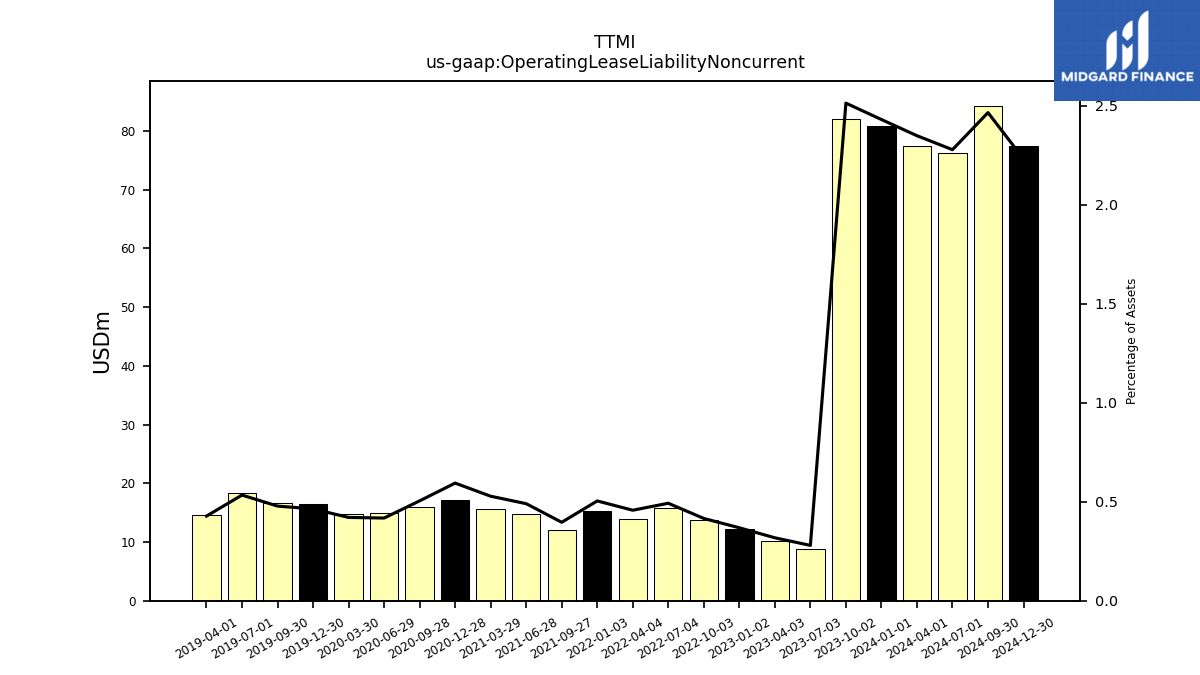
| Operating Lease Liability Noncurrent | 80.79 | 82.10 | 8.80 | 10.10 | 12.25 | 13.69 | 15.83 | 13.92 | 12.08 | 14.84 | 15.66 | 17.21 | 15.88 | 15.02 | 14.83 | 16.52 | 16.73 | 18.36 | 14.60 | NA | NA | NA | NA | NA | NA | NA | NA | NA | NA | NA | NA | NA | NA | NA | NA | NA | NA | NA | NA | NA | NA | NA | NA | NA | NA | NA | NA | NA | NA | NA | NA | NA | NA |
| 2024-01-01 | 2023-10-02 | 2023-07-03 | 2023-04-03 | 2023-01-02 | 2022-10-03 | 2022-07-04 | 2022-04-04 | 2021-09-27 | 2021-06-28 | 2021-03-29 | 2020-12-28 | 2020-09-28 | 2020-06-29 | 2020-03-30 | 2019-12-30 | 2019-09-30 | 2019-07-01 | 2019-04-01 | 2018-12-31 | 2018-10-01 | 2018-07-02 | 2018-04-02 | 2018-01-01 | 2017-10-02 | 2017-07-03 | 2017-04-03 | 2016-09-26 | 2016-06-27 | 2016-03-28 | 2015-12-28 | 2015-09-28 | 2015-06-29 | 2015-03-30 | 2014-12-29 | 2014-09-29 | 2014-06-30 | 2014-03-31 | 2013-12-30 | 2013-09-30 | 2013-07-01 | 2013-04-01 | 2012-12-31 | 2012-09-24 | 2012-06-25 | 2012-03-26 | 2011-12-31 | 2011-09-26 | 2011-06-27 | 2011-03-28 | 2010-12-31 | 2010-09-27 | 2010-06-28 | ||
|---|---|---|---|---|---|---|---|---|---|---|---|---|---|---|---|---|---|---|---|---|---|---|---|---|---|---|---|---|---|---|---|---|---|---|---|---|---|---|---|---|---|---|---|---|---|---|---|---|---|---|---|---|---|---|
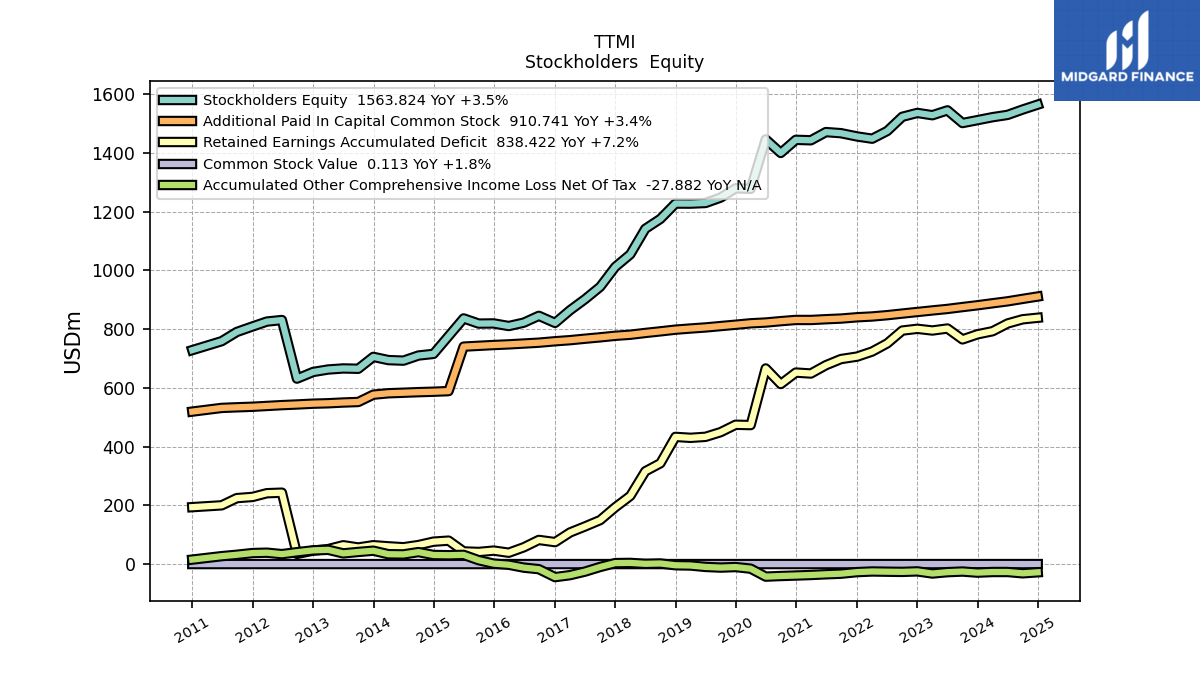
| Stockholders Equity | 1511.04 | 1501.11 | 1544.31 | 1527.73 | 1535.58 | 1522.47 | 1474.08 | 1447.83 | 1466.59 | 1470.37 | 1442.47 | 1444.01 | 1399.30 | 1445.57 | 1277.20 | 1279.04 | 1247.35 | 1229.08 | 1226.86 | 1227.09 | 1174.91 | 1141.29 | 1054.33 | 1011.38 | 943.86 | 901.99 | 864.24 | 845.03 | 821.83 | 810.25 | 819.11 | 818.60 | 836.21 | NA | 715.46 | 709.91 | 692.45 | 694.34 | 705.29 | 664.83 | 665.89 | 662.32 | 653.95 | 631.21 | 830.73 | 825.44 | 808.92 | 790.00 | 758.70 | NA | 728.25 | NA | NA | |
| Common Stock Value | 0.11 | 0.11 | 0.11 | 0.11 | 0.11 | 0.11 | 0.11 | 0.11 | 0.11 | 0.11 | 0.11 | 0.11 | 0.11 | 0.11 | 0.11 | 0.11 | 0.10 | 0.10 | 0.10 | 0.10 | 0.10 | 0.10 | 0.10 | 0.10 | 0.10 | 0.10 | 0.10 | 0.10 | 0.10 | 0.10 | 0.10 | 0.10 | 0.10 | 0.08 | 0.08 | 0.08 | 0.08 | 0.08 | 0.08 | 0.08 | 0.08 | 0.08 | 0.08 | 0.08 | 0.08 | 0.08 | 0.08 | 0.08 | 0.08 | NA | 0.08 | NA | NA | |
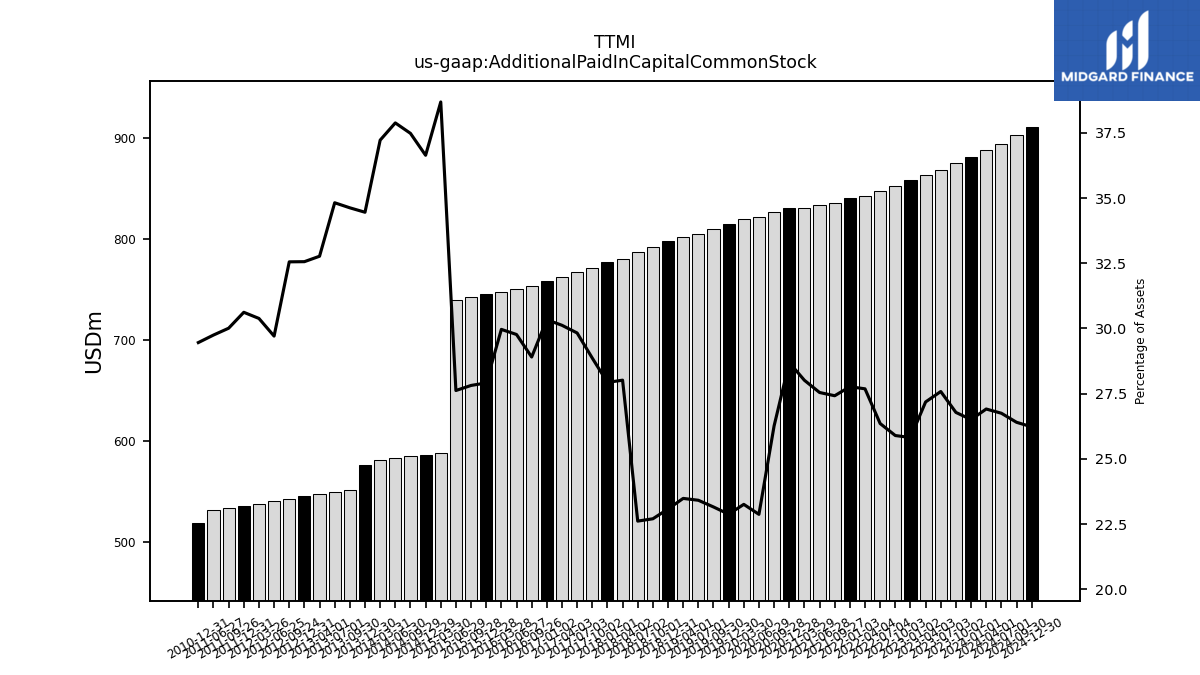
| Additional Paid In Capital Common Stock | 880.96 | 874.80 | 868.44 | 863.32 | 858.08 | 852.68 | 847.21 | 842.79 | 835.66 | 833.44 | 830.84 | 830.97 | 826.86 | 822.19 | 819.54 | 814.71 | 810.08 | 805.42 | 801.82 | 797.89 | 792.16 | 786.70 | 780.65 | 777.02 | 771.82 | 767.14 | 762.14 | 753.62 | 750.70 | 747.85 | 745.61 | 742.93 | 740.19 | 588.73 | 586.71 | 585.22 | 583.27 | 581.42 | 576.64 | 551.74 | 549.96 | 547.40 | 546.03 | 543.24 | 541.04 | 538.22 | 535.56 | 533.64 | 531.58 | NA | 519.05 | NA | NA | |
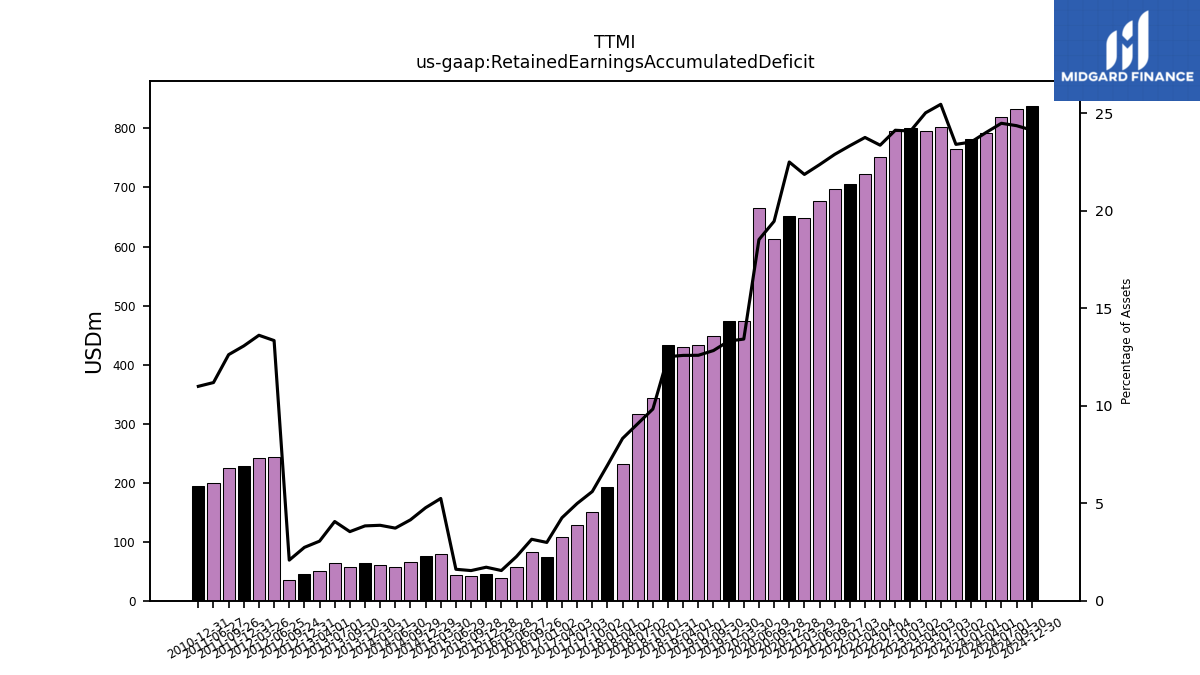
| Retained Earnings Accumulated Deficit | 782.12 | 764.78 | 801.85 | 795.03 | 800.84 | 794.82 | 751.30 | 723.50 | 697.87 | 676.91 | 648.65 | 651.84 | 612.88 | 665.95 | 473.13 | 474.31 | 449.05 | 433.18 | 429.76 | 433.01 | 343.18 | 315.98 | 232.01 | 193.34 | 149.81 | 128.34 | 107.75 | 82.23 | 57.25 | 38.70 | 45.96 | 41.34 | 43.26 | 79.87 | 76.42 | 64.82 | 57.37 | 60.47 | 64.27 | 56.50 | 64.21 | 51.07 | 45.92 | 34.78 | 243.12 | 241.26 | 228.66 | 224.51 | 200.03 | NA | 193.81 | NA | NA | |
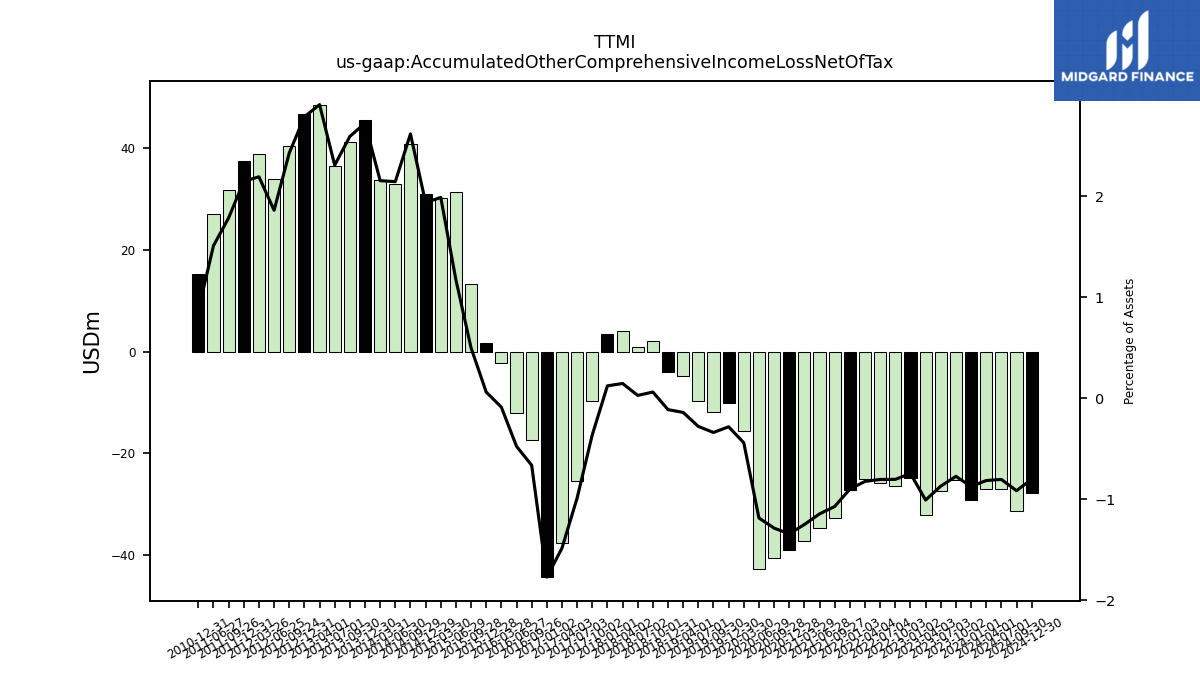
| Accumulated Other Comprehensive Income Loss Net Of Tax | -29.07 | -25.31 | -27.43 | -32.06 | -24.79 | -26.49 | -25.88 | -25.10 | -32.70 | -34.69 | -37.13 | -38.91 | -40.55 | -42.68 | -15.58 | -10.09 | -11.88 | -9.63 | -4.82 | -3.92 | 2.12 | 0.96 | 4.06 | 3.40 | -9.70 | -25.44 | -37.60 | -17.33 | -12.03 | -2.21 | 1.62 | 13.32 | 31.44 | 30.28 | 31.02 | 40.89 | 33.04 | 33.67 | 45.60 | 41.33 | 36.47 | 48.59 | 46.75 | 40.54 | 33.92 | 38.86 | 37.60 | 31.77 | 27.00 | NA | 15.31 | NA | NA |
| 2024-01-01 | 2023-10-02 | 2023-07-03 | 2023-04-03 | 2023-01-02 | 2022-10-03 | 2022-07-04 | 2022-04-04 | 2021-09-27 | 2021-06-28 | 2021-03-29 | 2020-12-28 | 2020-09-28 | 2020-06-29 | 2020-03-30 | 2019-12-30 | 2019-09-30 | 2019-07-01 | 2019-04-01 | 2018-12-31 | 2018-10-01 | 2018-07-02 | 2018-04-02 | 2018-01-01 | 2017-10-02 | 2017-07-03 | 2017-04-03 | 2016-09-26 | 2016-06-27 | 2016-03-28 | 2015-12-28 | 2015-09-28 | 2015-06-29 | 2015-03-30 | 2014-12-29 | 2014-09-29 | 2014-06-30 | 2014-03-31 | 2013-12-30 | 2013-09-30 | 2013-07-01 | 2013-04-01 | 2012-12-31 | 2012-09-24 | 2012-06-25 | 2012-03-26 | 2011-12-31 | 2011-09-26 | 2011-06-27 | 2011-03-28 | 2010-12-31 | 2010-09-27 | 2010-06-28 | ||
|---|---|---|---|---|---|---|---|---|---|---|---|---|---|---|---|---|---|---|---|---|---|---|---|---|---|---|---|---|---|---|---|---|---|---|---|---|---|---|---|---|---|---|---|---|---|---|---|---|---|---|---|---|---|---|
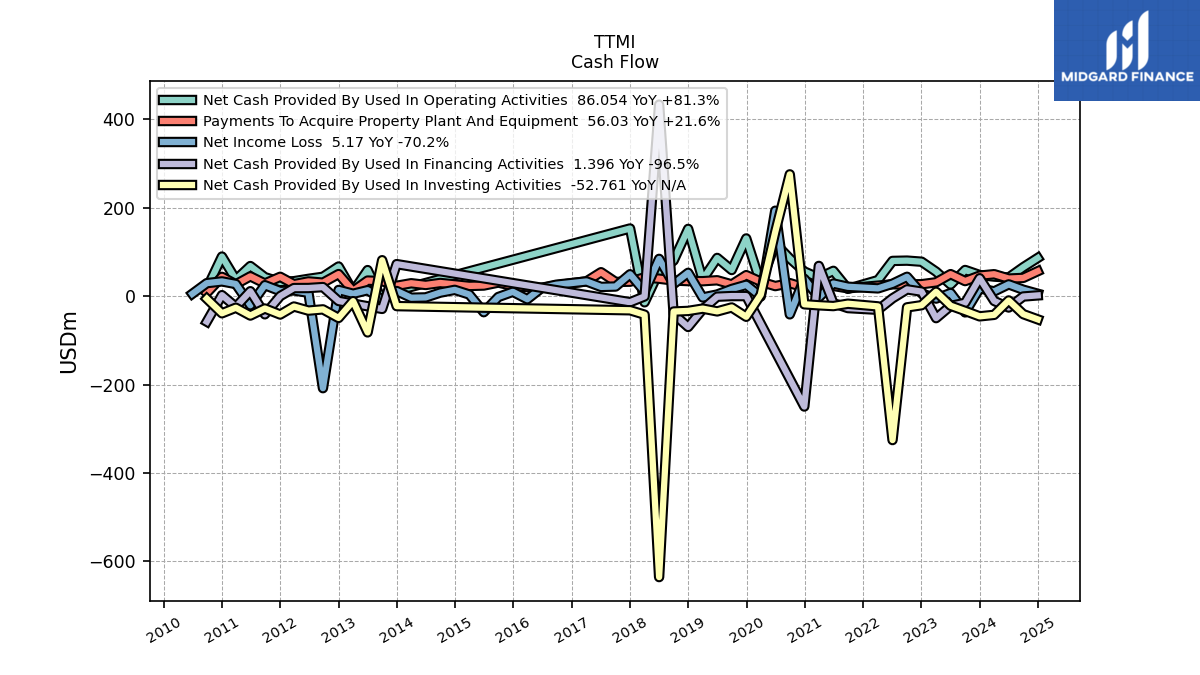
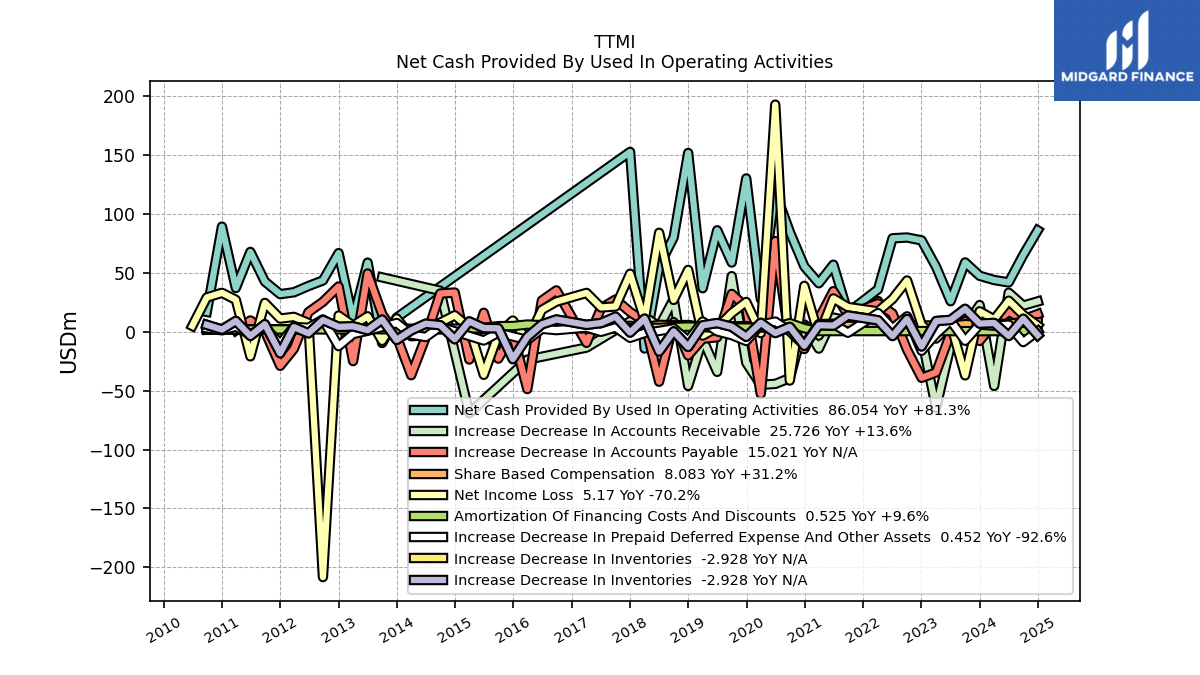
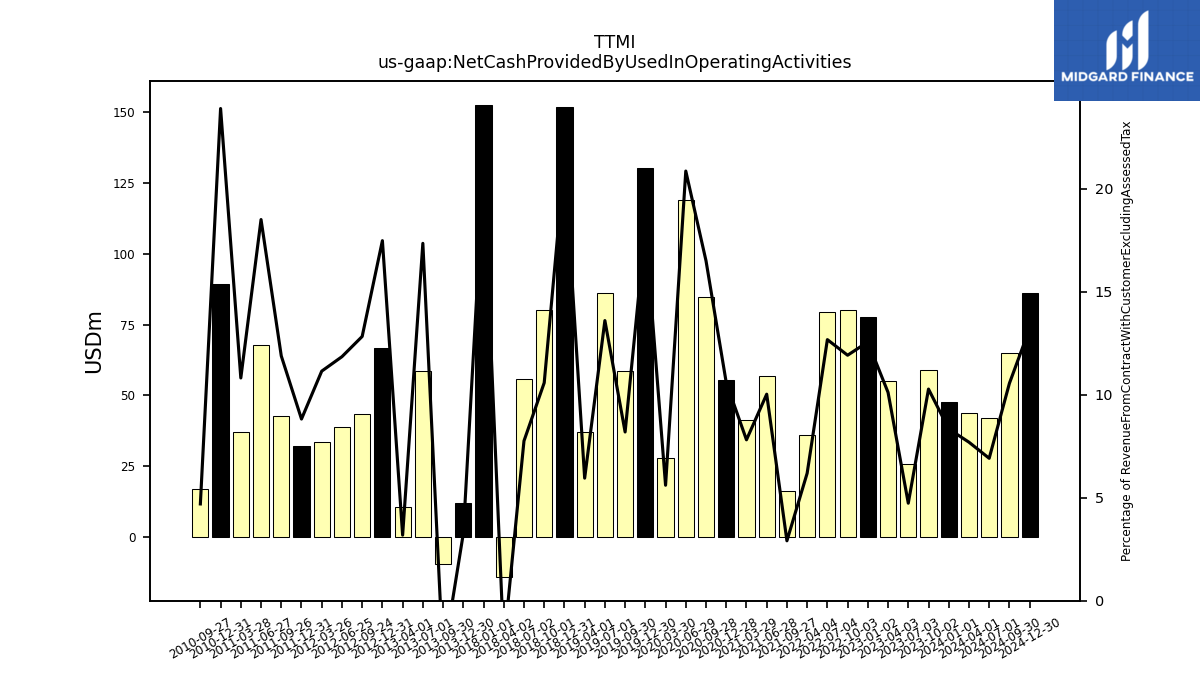
| Net Cash Provided By Used In Operating Activities | 47.47 | 58.85 | 25.88 | 55.08 | 77.56 | 80.01 | 79.32 | 35.99 | 16.21 | 56.91 | 41.15 | 55.49 | 84.78 | 119.00 | 27.91 | 130.15 | 58.74 | 86.12 | 36.92 | 151.77 | 79.99 | 55.64 | -14.26 | 152.69 | NA | NA | NA | NA | NA | NA | NA | NA | NA | NA | NA | NA | NA | NA | 11.94 | -9.58 | 58.66 | 10.37 | 66.75 | 43.51 | 38.80 | 33.50 | 31.90 | 42.59 | 67.77 | 37.09 | 89.25 | 16.82 | NA | |
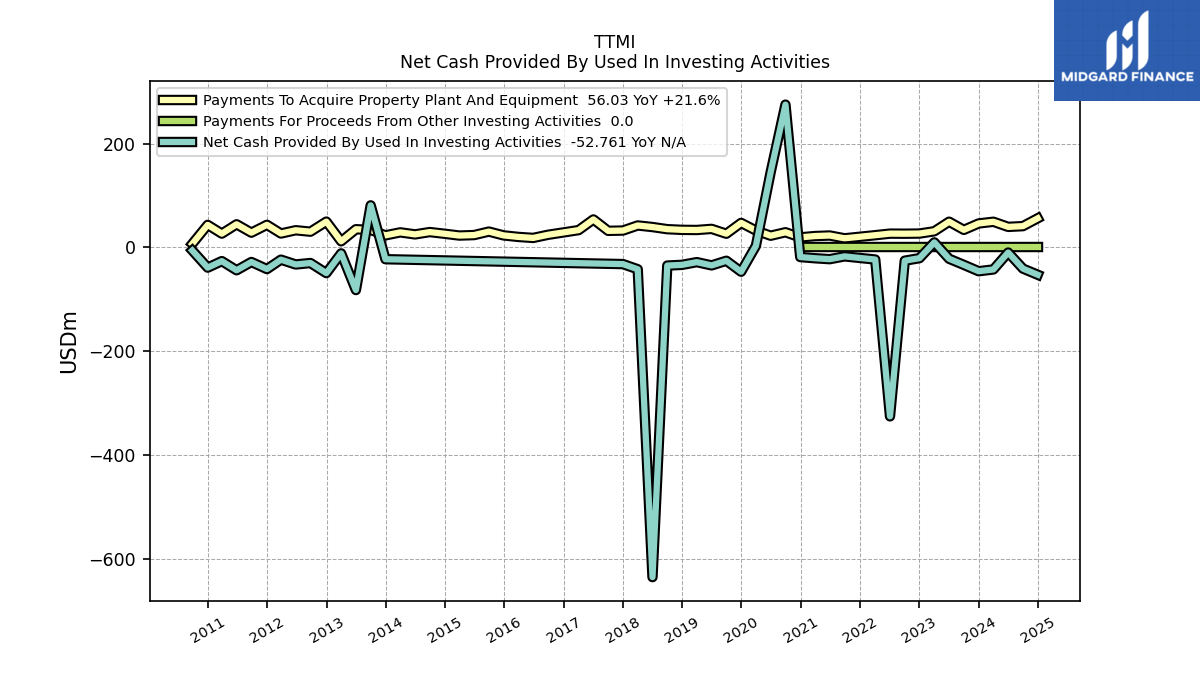
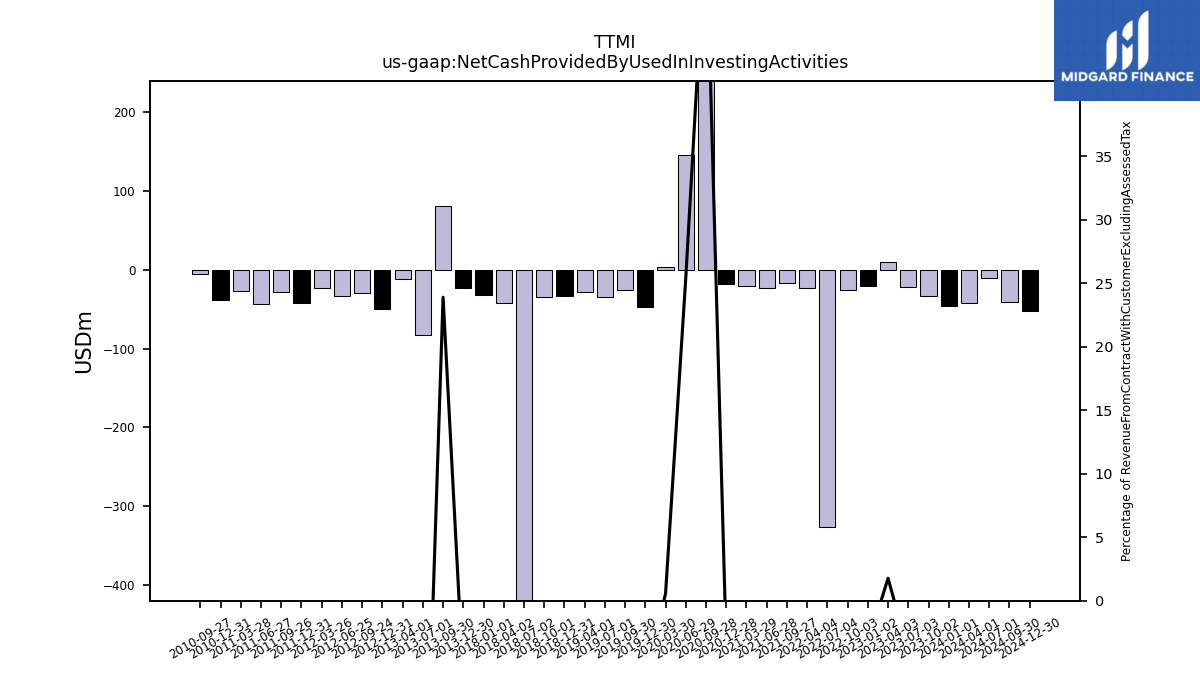
| Net Cash Provided By Used In Investing Activities | -45.95 | -33.76 | -21.94 | 9.63 | -20.78 | -25.65 | -325.61 | -23.42 | -17.38 | -22.73 | -20.97 | -18.66 | 275.02 | 145.04 | 2.89 | -46.98 | -25.80 | -34.74 | -28.45 | -33.67 | -35.04 | -635.34 | -42.14 | -32.21 | NA | NA | NA | NA | NA | NA | NA | NA | NA | NA | NA | NA | NA | NA | -22.83 | 80.95 | -82.27 | -11.54 | -49.63 | -30.16 | -32.96 | -23.69 | -41.83 | -28.19 | -44.13 | -26.47 | -39.04 | -6.01 | NA | |
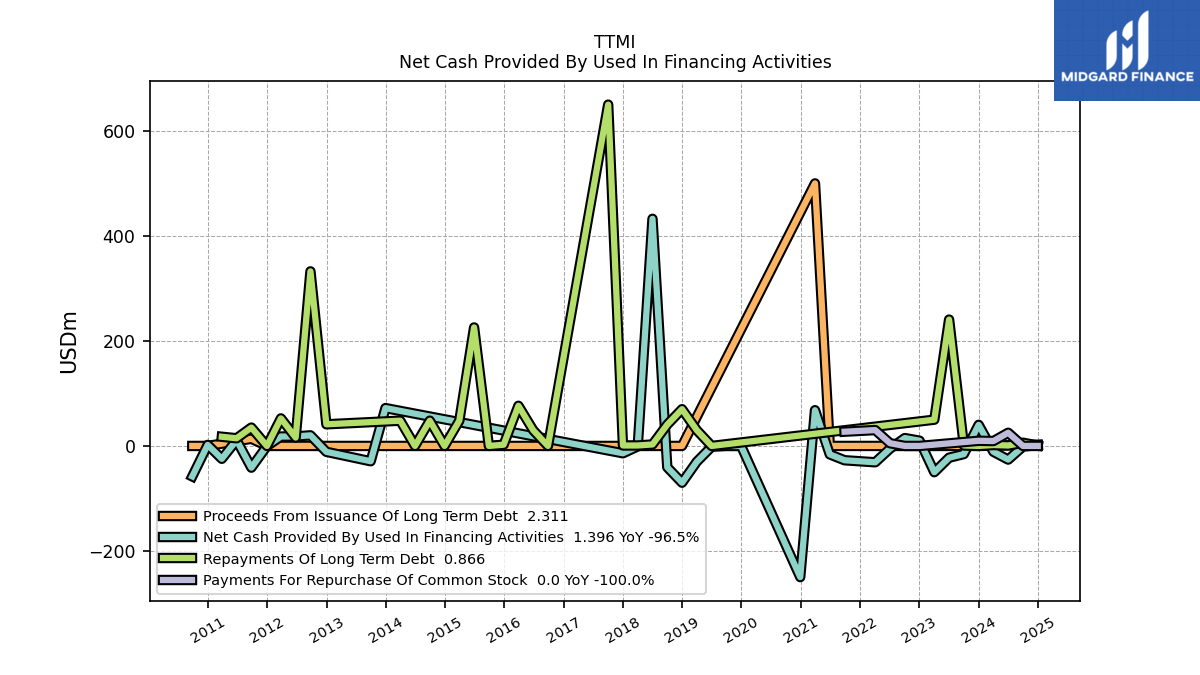
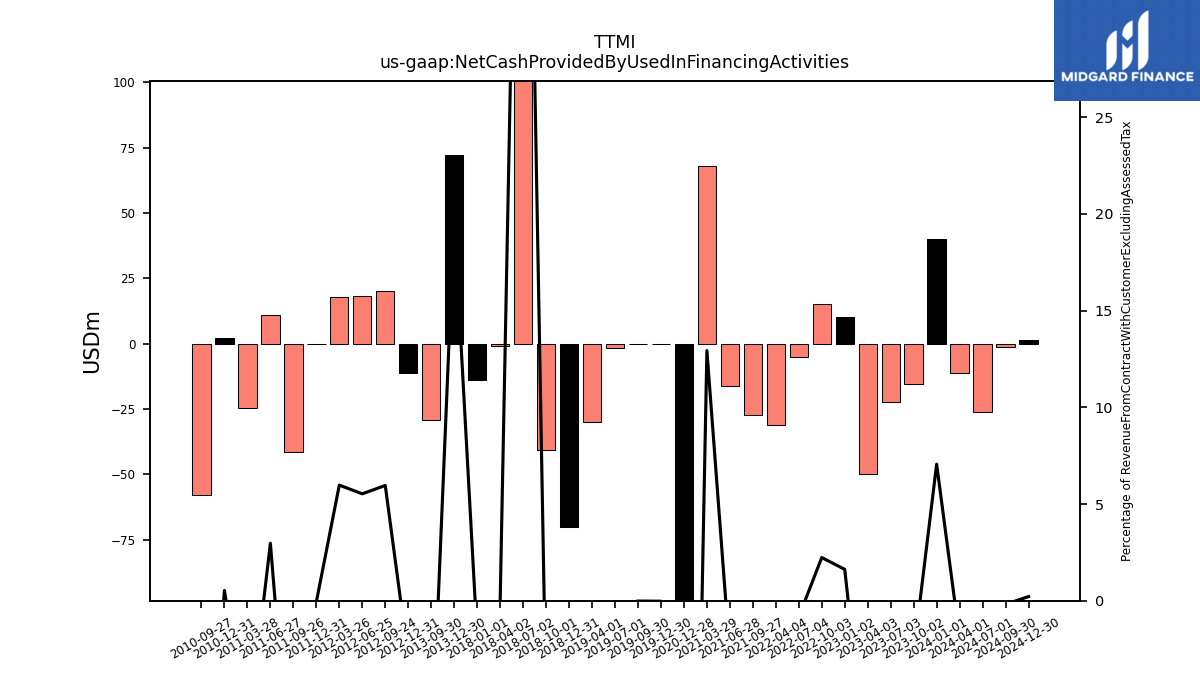
| Net Cash Provided By Used In Financing Activities | 40.19 | -15.49 | -22.37 | -50.00 | 10.00 | 15.00 | -5.19 | -31.12 | -27.25 | -16.05 | 68.08 | -249.82 | NA | NA | NA | -0.16 | -0.11 | -1.53 | -30.01 | -70.00 | -40.66 | 432.59 | -0.88 | -13.96 | NA | NA | NA | NA | NA | NA | NA | NA | NA | NA | NA | NA | NA | NA | 72.10 | -29.15 | NA | NA | -11.21 | 20.21 | 18.10 | 17.96 | -0.23 | -41.38 | 10.88 | -24.49 | 1.99 | -58.00 | NA |
| 2024-01-01 | 2023-10-02 | 2023-07-03 | 2023-04-03 | 2023-01-02 | 2022-10-03 | 2022-07-04 | 2022-04-04 | 2021-09-27 | 2021-06-28 | 2021-03-29 | 2020-12-28 | 2020-09-28 | 2020-06-29 | 2020-03-30 | 2019-12-30 | 2019-09-30 | 2019-07-01 | 2019-04-01 | 2018-12-31 | 2018-10-01 | 2018-07-02 | 2018-04-02 | 2018-01-01 | 2017-10-02 | 2017-07-03 | 2017-04-03 | 2016-09-26 | 2016-06-27 | 2016-03-28 | 2015-12-28 | 2015-09-28 | 2015-06-29 | 2015-03-30 | 2014-12-29 | 2014-09-29 | 2014-06-30 | 2014-03-31 | 2013-12-30 | 2013-09-30 | 2013-07-01 | 2013-04-01 | 2012-12-31 | 2012-09-24 | 2012-06-25 | 2012-03-26 | 2011-12-31 | 2011-09-26 | 2011-06-27 | 2011-03-28 | 2010-12-31 | 2010-09-27 | 2010-06-28 | ||
|---|---|---|---|---|---|---|---|---|---|---|---|---|---|---|---|---|---|---|---|---|---|---|---|---|---|---|---|---|---|---|---|---|---|---|---|---|---|---|---|---|---|---|---|---|---|---|---|---|---|---|---|---|---|---|
| Net Cash Provided By Used In Operating Activities | 47.47 | 58.85 | 25.88 | 55.08 | 77.56 | 80.01 | 79.32 | 35.99 | 16.21 | 56.91 | 41.15 | 55.49 | 84.78 | 119.00 | 27.91 | 130.15 | 58.74 | 86.12 | 36.92 | 151.77 | 79.99 | 55.64 | -14.26 | 152.69 | NA | NA | NA | NA | NA | NA | NA | NA | NA | NA | NA | NA | NA | NA | 11.94 | -9.58 | 58.66 | 10.37 | 66.75 | 43.51 | 38.80 | 33.50 | 31.90 | 42.59 | 67.77 | 37.09 | 89.25 | 16.82 | NA | |
| Net Income Loss | 17.34 | -37.07 | 6.82 | -5.81 | 6.02 | 43.53 | 27.79 | 17.25 | 20.96 | 28.26 | -3.19 | 38.96 | -41.45 | 192.81 | -1.17 | 25.26 | 15.87 | 3.42 | -3.25 | 52.48 | 27.00 | 84.00 | 10.10 | 49.21 | 21.45 | 20.59 | 32.96 | 25.58 | 18.55 | -7.26 | 9.52 | -2.24 | -36.61 | 3.45 | 13.94 | 7.66 | -3.10 | -3.80 | 11.30 | -7.71 | 13.14 | 5.15 | 13.74 | -208.34 | 7.41 | 12.60 | 11.17 | 24.48 | -20.90 | 27.12 | 33.03 | 29.09 | 4.93 | |
| Profit Loss | 17.34 | -37.07 | 6.82 | -5.81 | 6.02 | 43.53 | 27.79 | 17.25 | 20.96 | 28.26 | -3.19 | 38.96 | -53.06 | 192.81 | -1.17 | 25.26 | 15.87 | 3.42 | -3.25 | 52.48 | 27.00 | 84.00 | 10.10 | 49.32 | 21.54 | 20.75 | 33.12 | 25.77 | 18.77 | -7.15 | 9.66 | -2.14 | -36.58 | 3.45 | 13.94 | 7.66 | -3.10 | -3.80 | 11.30 | -7.71 | 13.71 | 6.59 | 11.68 | -212.66 | 7.55 | 12.33 | 12.36 | 26.05 | -20.27 | 29.09 | 36.53 | 32.15 | 6.74 | |
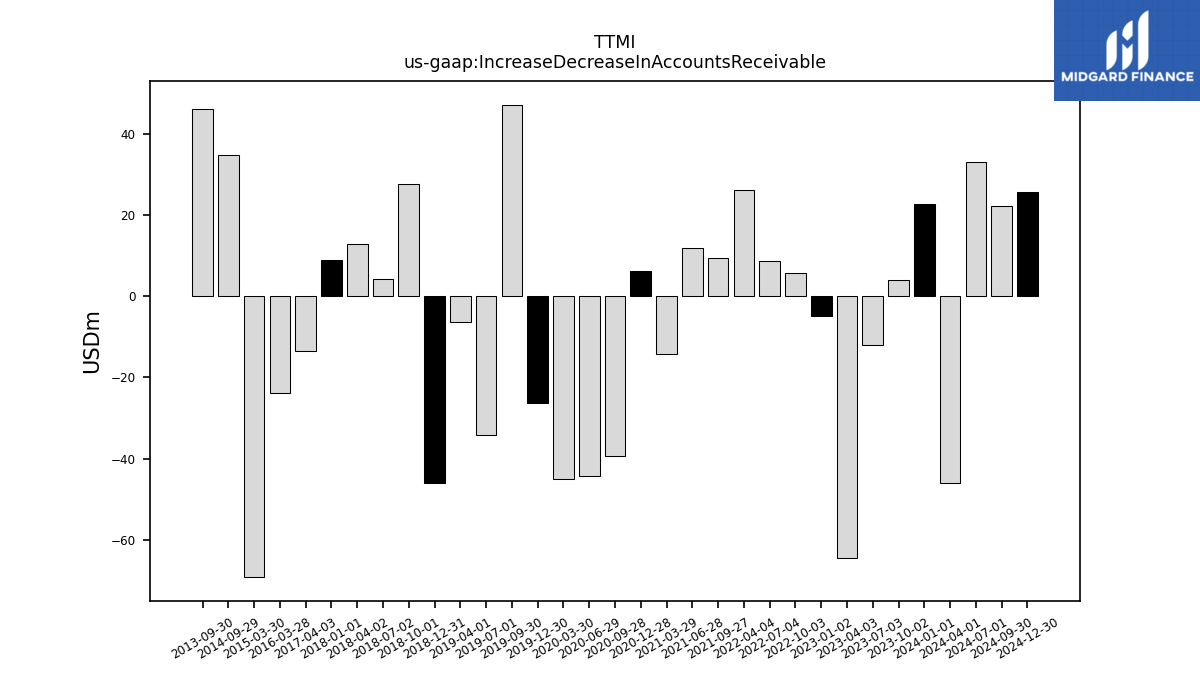
| Increase Decrease In Accounts Receivable | 22.66 | 4.00 | -11.99 | -64.59 | -4.87 | 5.82 | 8.70 | 26.09 | 9.47 | 11.99 | -14.34 | 6.13 | -39.36 | -44.30 | -45.02 | -26.28 | 47.20 | -34.09 | -6.34 | -46.05 | 27.63 | 4.22 | 12.84 | 8.85 | NA | NA | -13.45 | NA | NA | -23.75 | NA | NA | NA | -69.20 | NA | 34.78 | NA | NA | NA | 46.13 | NA | NA | NA | NA | NA | NA | NA | NA | NA | NA | NA | NA | NA | |
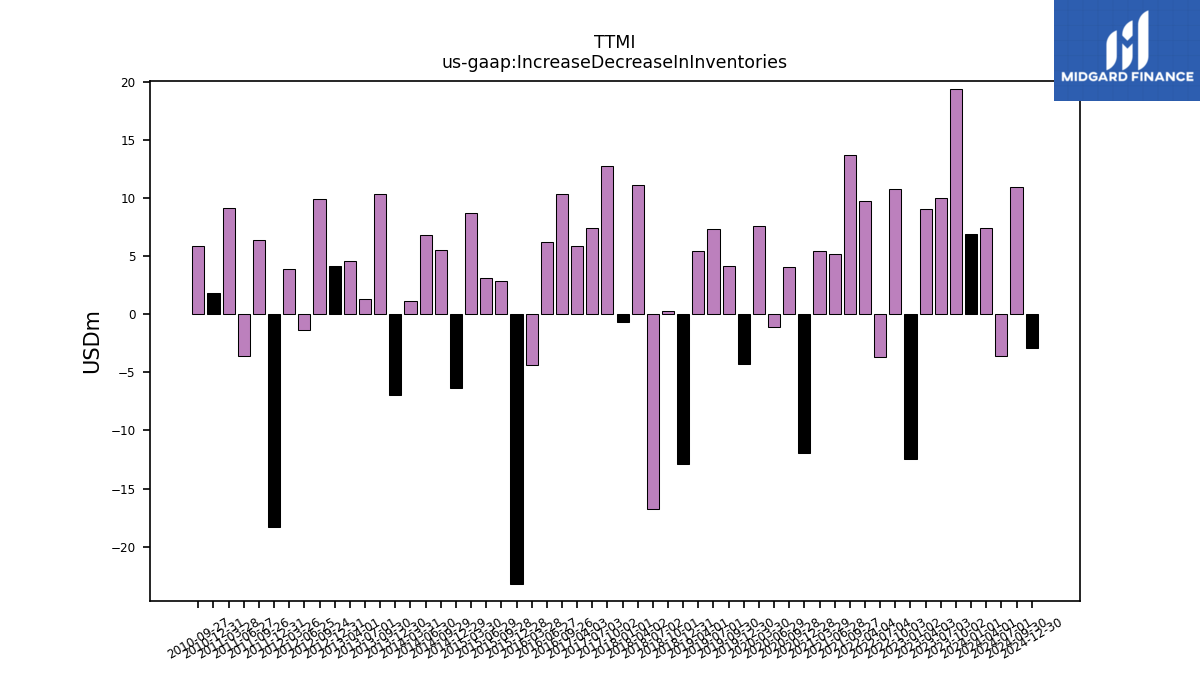
| Increase Decrease In Inventories | 6.90 | 19.41 | 10.04 | 9.04 | -12.49 | 10.81 | -3.64 | 9.73 | 13.70 | 5.23 | 5.47 | -11.94 | 4.09 | -1.10 | 7.57 | -4.30 | 4.17 | 7.35 | 5.42 | -12.86 | 0.29 | -16.79 | 11.10 | -0.69 | 12.79 | 7.39 | 5.88 | 10.38 | 6.24 | -4.37 | -23.25 | 2.89 | 3.14 | 8.73 | -6.38 | 5.52 | 6.80 | 1.17 | -6.96 | 10.34 | 1.35 | 4.61 | 4.14 | 9.92 | -1.35 | 3.87 | -18.27 | 6.38 | -3.56 | 9.17 | 1.87 | 5.85 | NA | |
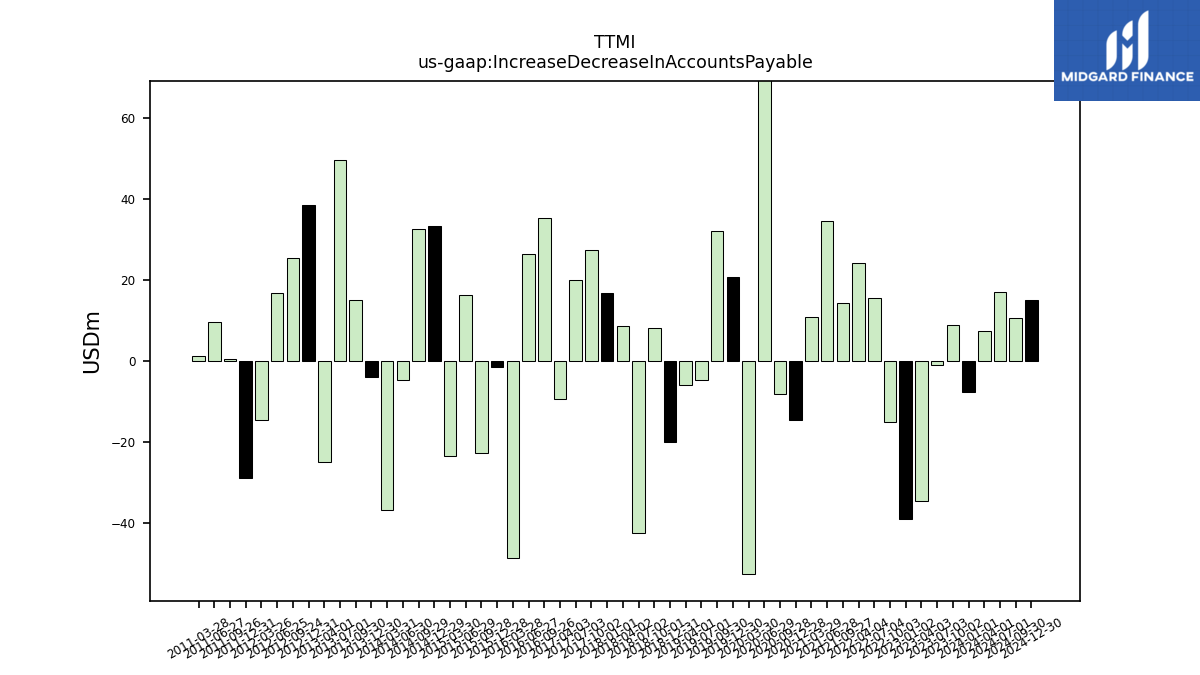
| Increase Decrease In Accounts Payable | -7.79 | 8.89 | -1.10 | -34.58 | -39.14 | -15.22 | 15.44 | 24.11 | 14.34 | 34.46 | 10.88 | -14.69 | -8.28 | 76.97 | -52.79 | 20.61 | 32.09 | -4.68 | -5.98 | -20.14 | 8.18 | -42.44 | 8.66 | 16.75 | 27.35 | 19.98 | -9.47 | 35.12 | 26.45 | -48.69 | -1.55 | -22.85 | 16.11 | -23.63 | 33.26 | 32.46 | -4.87 | -36.92 | -4.11 | 15.00 | 49.45 | -24.97 | 38.45 | 25.39 | 16.60 | -14.52 | -28.96 | 0.42 | 9.60 | 1.10 | NA | NA | NA | |
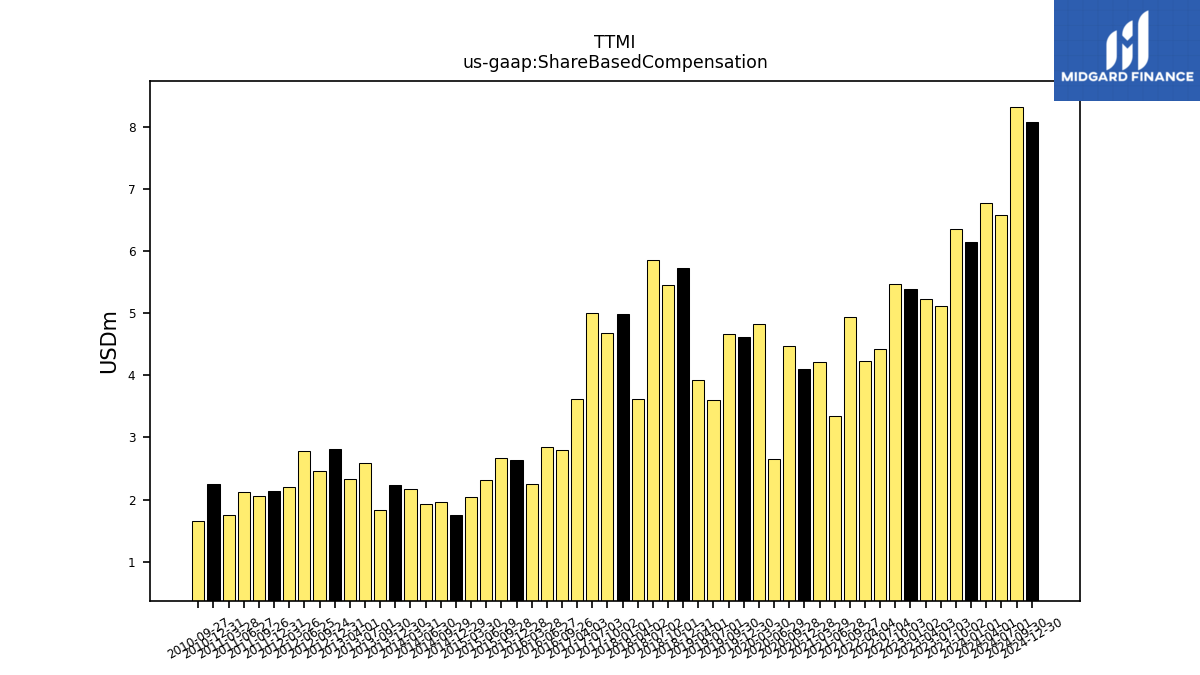
| Share Based Compensation | 6.16 | 6.37 | 5.12 | 5.24 | 5.39 | 5.47 | 4.43 | 4.23 | 4.94 | 3.35 | 4.21 | 4.11 | 4.48 | 2.65 | 4.83 | 4.63 | 4.66 | 3.60 | 3.93 | 5.73 | 5.46 | 5.87 | 3.62 | 4.98 | 4.68 | 5.00 | 3.63 | 2.80 | 2.85 | 2.25 | 2.63 | 2.67 | 2.31 | 2.04 | 1.75 | 1.95 | 1.93 | 2.17 | 2.24 | 1.83 | 2.58 | 2.33 | 2.82 | 2.46 | 2.78 | 2.21 | 2.14 | 2.05 | 2.12 | 1.75 | 2.25 | 1.65 | NA |
| 2024-01-01 | 2023-10-02 | 2023-07-03 | 2023-04-03 | 2023-01-02 | 2022-10-03 | 2022-07-04 | 2022-04-04 | 2021-09-27 | 2021-06-28 | 2021-03-29 | 2020-12-28 | 2020-09-28 | 2020-06-29 | 2020-03-30 | 2019-12-30 | 2019-09-30 | 2019-07-01 | 2019-04-01 | 2018-12-31 | 2018-10-01 | 2018-07-02 | 2018-04-02 | 2018-01-01 | 2017-10-02 | 2017-07-03 | 2017-04-03 | 2016-09-26 | 2016-06-27 | 2016-03-28 | 2015-12-28 | 2015-09-28 | 2015-06-29 | 2015-03-30 | 2014-12-29 | 2014-09-29 | 2014-06-30 | 2014-03-31 | 2013-12-30 | 2013-09-30 | 2013-07-01 | 2013-04-01 | 2012-12-31 | 2012-09-24 | 2012-06-25 | 2012-03-26 | 2011-12-31 | 2011-09-26 | 2011-06-27 | 2011-03-28 | 2010-12-31 | 2010-09-27 | 2010-06-28 | ||
|---|---|---|---|---|---|---|---|---|---|---|---|---|---|---|---|---|---|---|---|---|---|---|---|---|---|---|---|---|---|---|---|---|---|---|---|---|---|---|---|---|---|---|---|---|---|---|---|---|---|---|---|---|---|---|
| Net Cash Provided By Used In Investing Activities | -45.95 | -33.76 | -21.94 | 9.63 | -20.78 | -25.65 | -325.61 | -23.42 | -17.38 | -22.73 | -20.97 | -18.66 | 275.02 | 145.04 | 2.89 | -46.98 | -25.80 | -34.74 | -28.45 | -33.67 | -35.04 | -635.34 | -42.14 | -32.21 | NA | NA | NA | NA | NA | NA | NA | NA | NA | NA | NA | NA | NA | NA | -22.83 | 80.95 | -82.27 | -11.54 | -49.63 | -30.16 | -32.96 | -23.69 | -41.83 | -28.19 | -44.13 | -26.47 | -39.04 | -6.01 | NA | |
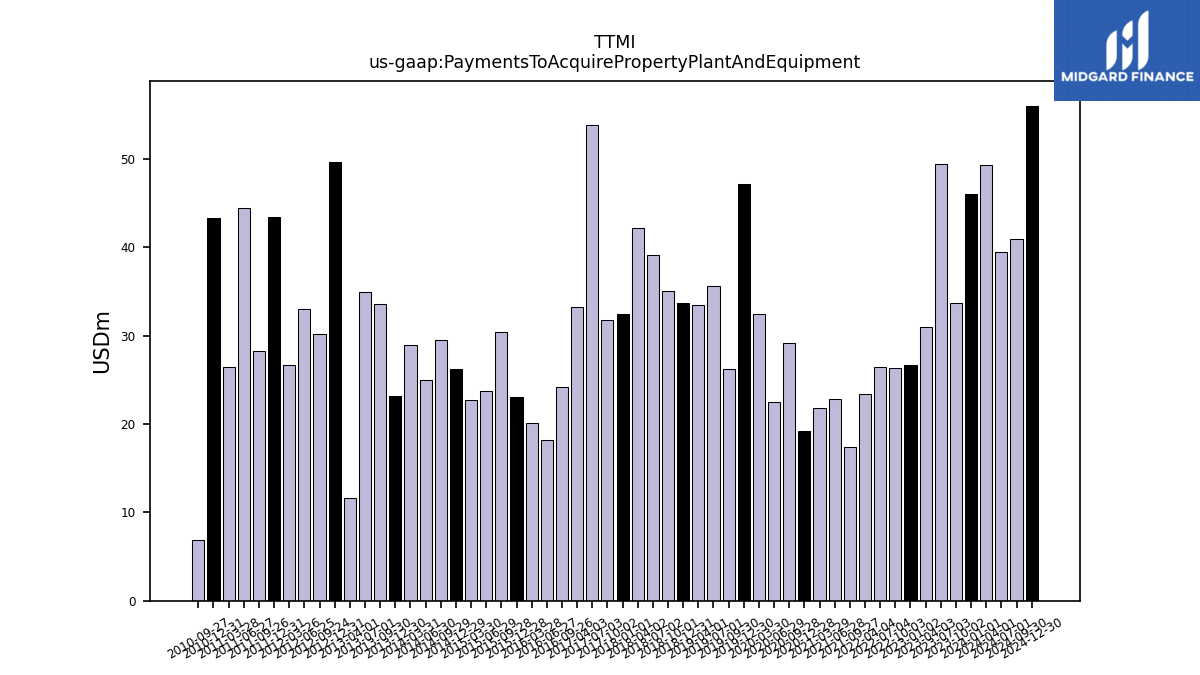
| Payments To Acquire Property Plant And Equipment | 46.08 | 33.70 | 49.47 | 31.00 | 26.64 | 26.32 | 26.48 | 23.45 | 17.45 | 22.84 | 21.80 | 19.25 | 29.14 | 22.45 | 32.45 | 47.20 | 26.27 | 35.62 | 33.48 | 33.74 | 35.05 | 39.15 | 42.19 | 32.41 | 31.83 | 53.85 | 33.26 | 24.22 | 18.18 | 20.12 | 23.05 | 30.41 | 23.69 | 22.78 | 26.23 | 29.48 | 25.00 | 28.91 | 23.14 | 33.60 | 34.94 | 11.67 | 49.64 | 30.21 | 33.00 | 26.70 | 43.47 | 28.32 | 44.48 | 26.48 | 43.31 | 6.88 | NA |
| 2024-01-01 | 2023-10-02 | 2023-07-03 | 2023-04-03 | 2023-01-02 | 2022-10-03 | 2022-07-04 | 2022-04-04 | 2021-09-27 | 2021-06-28 | 2021-03-29 | 2020-12-28 | 2020-09-28 | 2020-06-29 | 2020-03-30 | 2019-12-30 | 2019-09-30 | 2019-07-01 | 2019-04-01 | 2018-12-31 | 2018-10-01 | 2018-07-02 | 2018-04-02 | 2018-01-01 | 2017-10-02 | 2017-07-03 | 2017-04-03 | 2016-09-26 | 2016-06-27 | 2016-03-28 | 2015-12-28 | 2015-09-28 | 2015-06-29 | 2015-03-30 | 2014-12-29 | 2014-09-29 | 2014-06-30 | 2014-03-31 | 2013-12-30 | 2013-09-30 | 2013-07-01 | 2013-04-01 | 2012-12-31 | 2012-09-24 | 2012-06-25 | 2012-03-26 | 2011-12-31 | 2011-09-26 | 2011-06-27 | 2011-03-28 | 2010-12-31 | 2010-09-27 | 2010-06-28 | ||
|---|---|---|---|---|---|---|---|---|---|---|---|---|---|---|---|---|---|---|---|---|---|---|---|---|---|---|---|---|---|---|---|---|---|---|---|---|---|---|---|---|---|---|---|---|---|---|---|---|---|---|---|---|---|---|
| Net Cash Provided By Used In Financing Activities | 40.19 | -15.49 | -22.37 | -50.00 | 10.00 | 15.00 | -5.19 | -31.12 | -27.25 | -16.05 | 68.08 | -249.82 | NA | NA | NA | -0.16 | -0.11 | -1.53 | -30.01 | -70.00 | -40.66 | 432.59 | -0.88 | -13.96 | NA | NA | NA | NA | NA | NA | NA | NA | NA | NA | NA | NA | NA | NA | 72.10 | -29.15 | NA | NA | -11.21 | 20.21 | 18.10 | 17.96 | -0.23 | -41.38 | 10.88 | -24.49 | 1.99 | -58.00 | NA | |
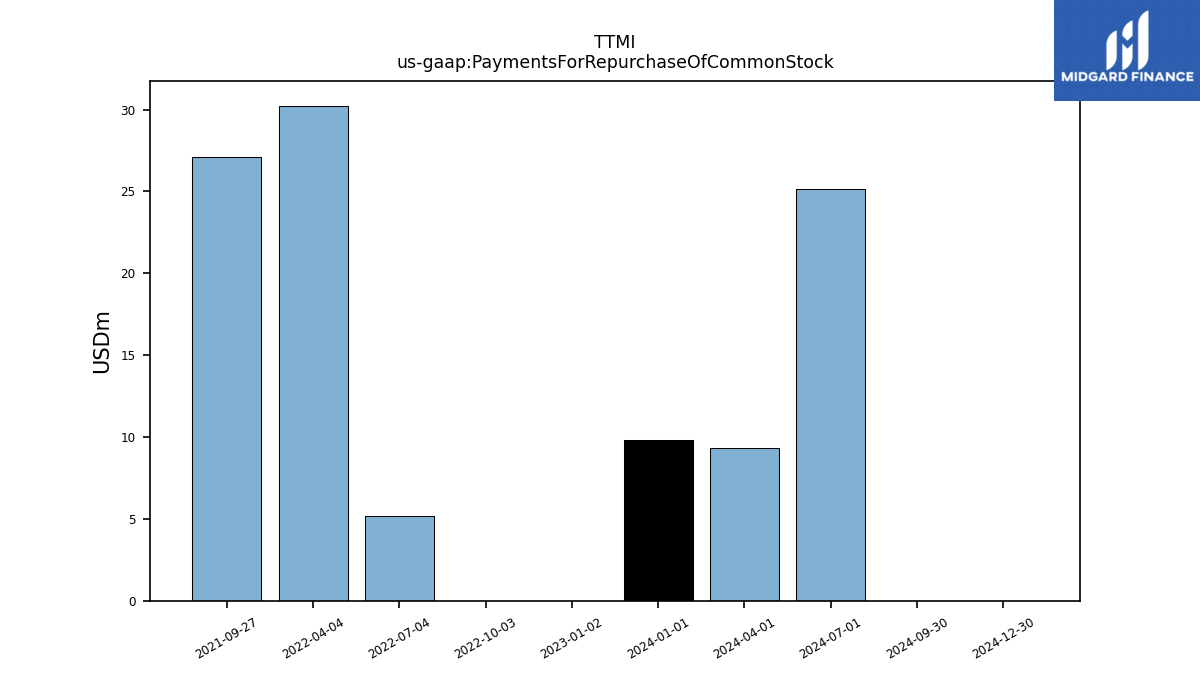
| Payments For Repurchase Of Common Stock | 9.81 | NA | NA | NA | 0.00 | 0.00 | 5.19 | 30.23 | 27.12 | NA | NA | NA | NA | NA | NA | NA | NA | NA | NA | NA | NA | NA | NA | NA | NA | NA | NA | NA | NA | NA | NA | NA | NA | NA | NA | NA | NA | NA | NA | NA | NA | NA | NA | NA | NA | NA | NA | NA | NA | NA | NA | NA | NA |
| 2024-01-01 | 2023-10-02 | 2023-07-03 | 2023-04-03 | 2023-01-02 | 2022-10-03 | 2022-07-04 | 2022-04-04 | 2021-09-27 | 2021-06-28 | 2021-03-29 | 2020-12-28 | 2020-09-28 | 2020-06-29 | 2020-03-30 | 2019-12-30 | 2019-09-30 | 2019-07-01 | 2019-04-01 | 2018-12-31 | 2018-10-01 | 2018-07-02 | 2018-04-02 | 2018-01-01 | 2017-10-02 | 2017-07-03 | 2017-04-03 | 2016-09-26 | 2016-06-27 | 2016-03-28 | 2015-12-28 | 2015-09-28 | 2015-06-29 | 2015-03-30 | 2014-12-29 | 2014-09-29 | 2014-06-30 | 2014-03-31 | 2013-12-30 | 2013-09-30 | 2013-07-01 | 2013-04-01 | 2012-12-31 | 2012-09-24 | 2012-06-25 | 2012-03-26 | 2011-12-31 | 2011-09-26 | 2011-06-27 | 2011-03-28 | 2010-12-31 | 2010-09-27 | 2010-06-28 | ||
|---|---|---|---|---|---|---|---|---|---|---|---|---|---|---|---|---|---|---|---|---|---|---|---|---|---|---|---|---|---|---|---|---|---|---|---|---|---|---|---|---|---|---|---|---|---|---|---|---|---|---|---|---|---|---|
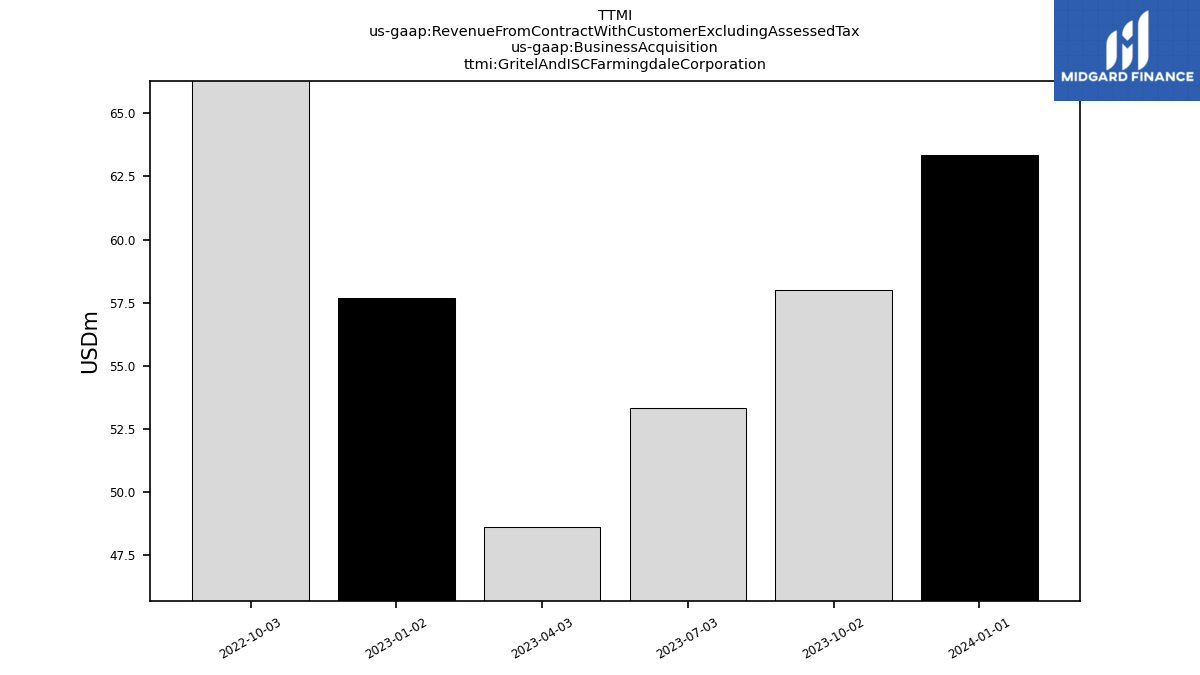
| Revenue From Contract With Customer Excluding Assessed Tax | 569.04 | 572.58 | 546.51 | 544.44 | 617.16 | 671.08 | 625.55 | 581.26 | 556.78 | 567.38 | 526.43 | 523.80 | 513.58 | 570.30 | 497.65 | 719.25 | 716.82 | 633.04 | 620.20 | 710.96 | 755.84 | 716.89 | 663.58 | 739.35 | 666.81 | 627.18 | 625.25 | 641.72 | 601.85 | 583.26 | 668.87 | 652.00 | 445.44 | 329.16 | 390.91 | 345.27 | 297.63 | 291.89 | 366.11 | 338.69 | 338.02 | 325.39 | 381.74 | 339.01 | 327.42 | 300.50 | 361.46 | 358.26 | 366.12 | 342.80 | 373.39 | 357.81 | 310.25 | |
| Gritel And I S C Farmingdale Corporation | 63.34 | 57.98 | 53.33 | 48.64 | 57.68 | 68.25 | NA | NA | NA | NA | NA | NA | NA | NA | NA | NA | NA | NA | NA | NA | NA | NA | NA | NA | NA | NA | NA | NA | NA | NA | NA | NA | NA | NA | NA | NA | NA | NA | NA | NA | NA | NA | NA | NA | NA | NA | NA | NA | NA | NA | NA | NA | NA | |
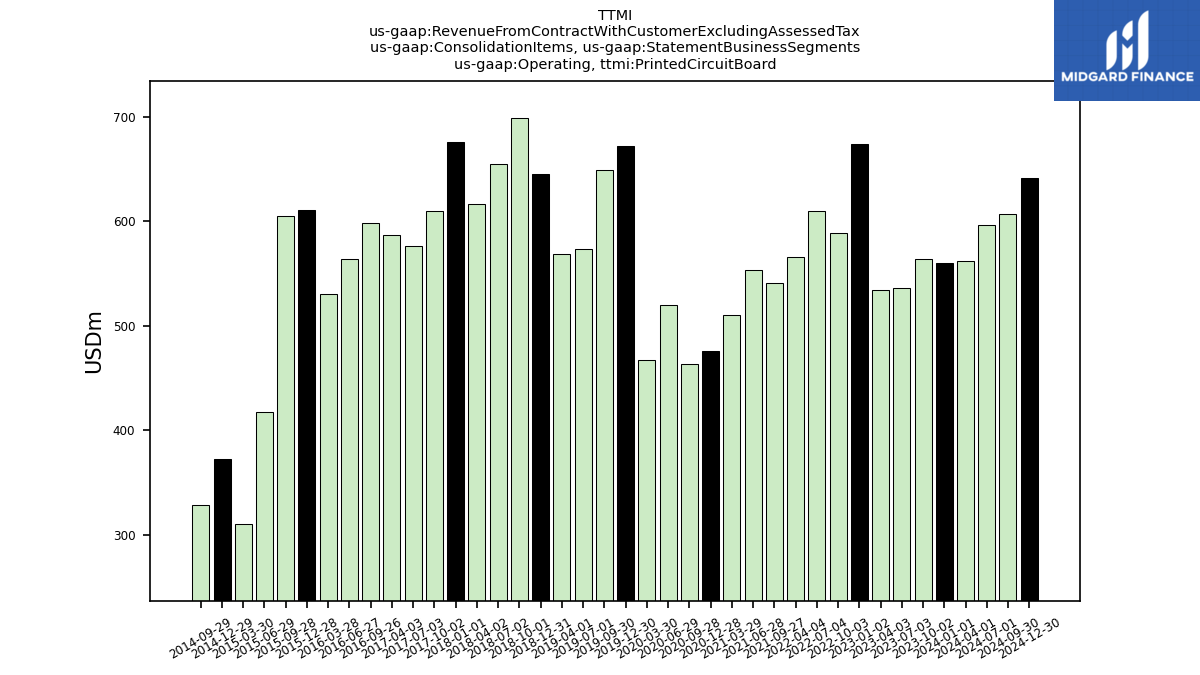
| Operating, Printed Circuit Board | 559.73 | 563.68 | 536.53 | 534.11 | 673.52 | 588.92 | 609.43 | 566.07 | 541.12 | 553.48 | 510.49 | 475.61 | 463.66 | 520.07 | 467.43 | 671.93 | 649.10 | 573.12 | 568.82 | 645.40 | 698.98 | 655.04 | 616.43 | 675.50 | 609.74 | 576.57 | 586.70 | 598.66 | 563.57 | 529.95 | 611.04 | 604.77 | 417.90 | 310.32 | 372.46 | 328.54 | NA | NA | NA | NA | NA | NA | NA | NA | NA | NA | NA | NA | NA | NA | NA | NA | NA | |
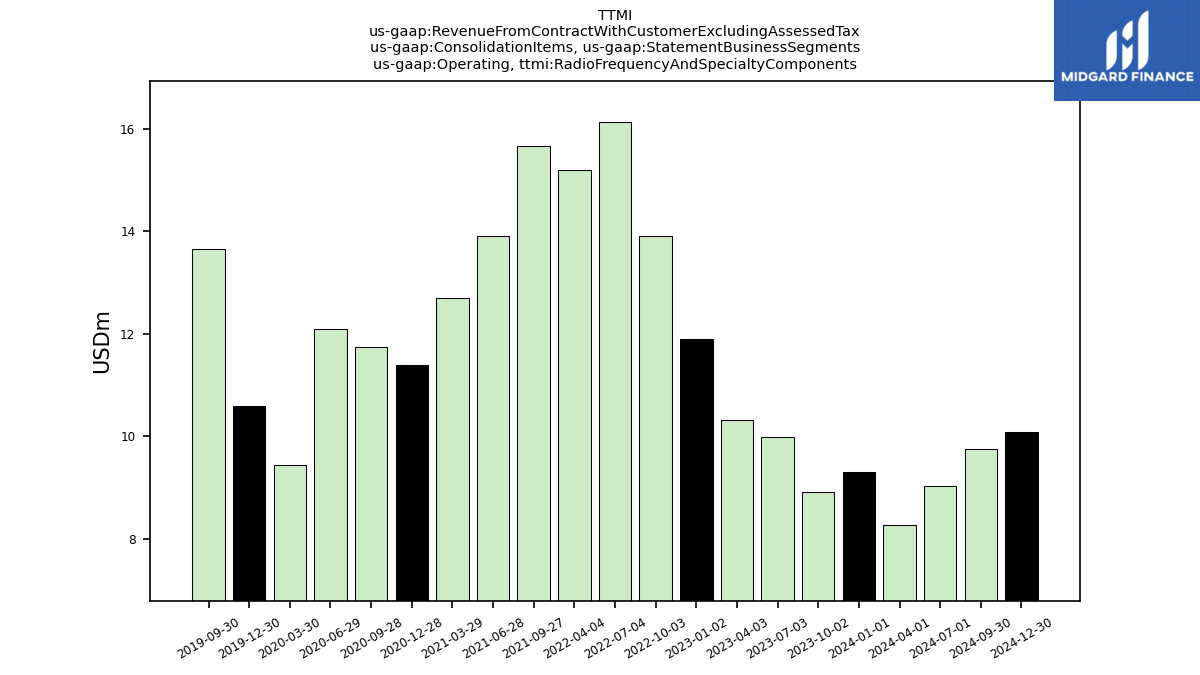
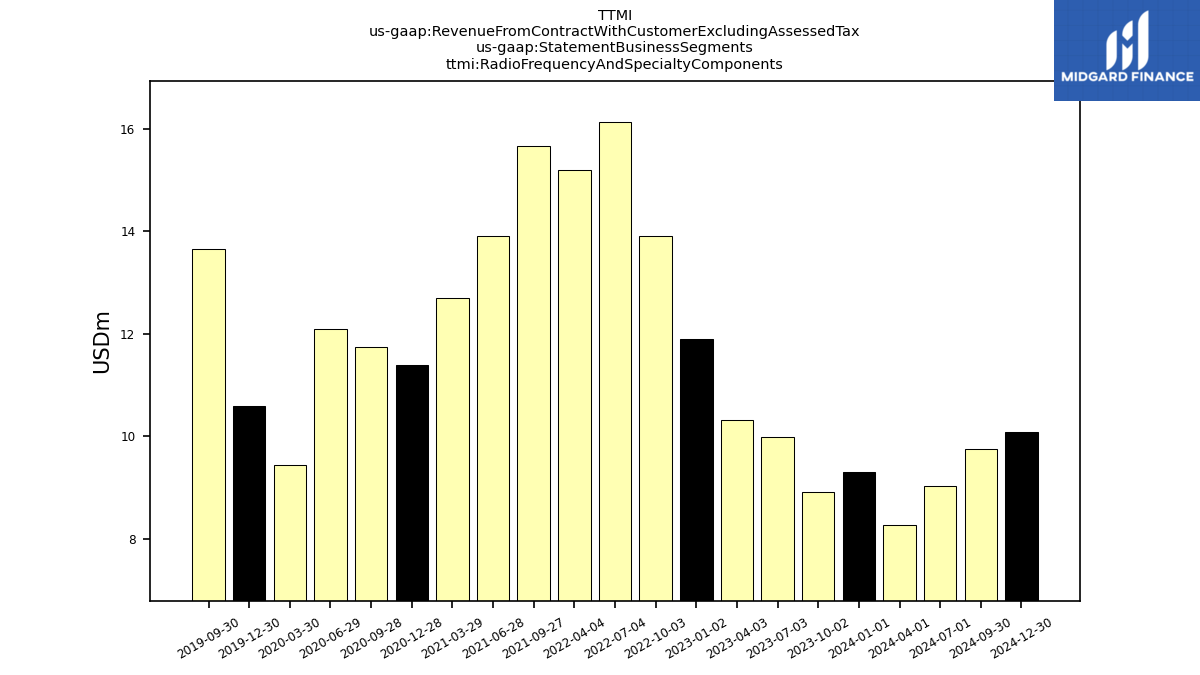
| Operating, Radio Frequency And Specialty Components | 9.31 | 8.91 | 9.98 | 10.33 | 11.89 | 13.90 | 16.12 | 15.19 | 15.67 | 13.90 | 12.69 | 11.38 | 11.74 | 12.09 | 9.44 | 10.59 | 13.64 | NA | NA | NA | NA | NA | NA | NA | NA | NA | NA | NA | NA | NA | NA | NA | NA | NA | NA | NA | NA | NA | NA | NA | NA | NA | NA | NA | NA | NA | NA | NA | NA | NA | NA | NA | NA | |
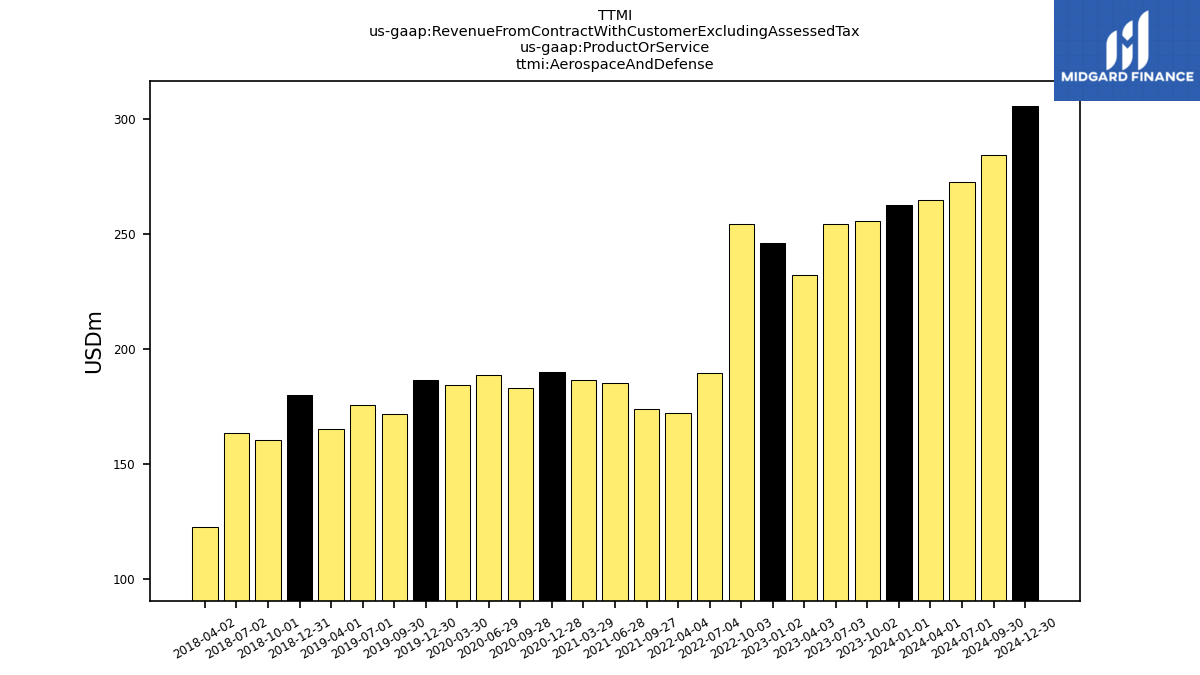
| Aerospace And Defense | 262.69 | 255.62 | 254.28 | 232.29 | 246.23 | 254.28 | 189.68 | 172.18 | 173.91 | 185.16 | 186.54 | 189.89 | 182.91 | 188.64 | 184.45 | 186.65 | 171.90 | 175.66 | 165.07 | 179.99 | 160.19 | 163.41 | 122.77 | NA | NA | NA | NA | NA | NA | NA | NA | NA | NA | NA | NA | NA | NA | NA | NA | NA | NA | NA | NA | NA | NA | NA | NA | NA | NA | NA | NA | NA | NA | |
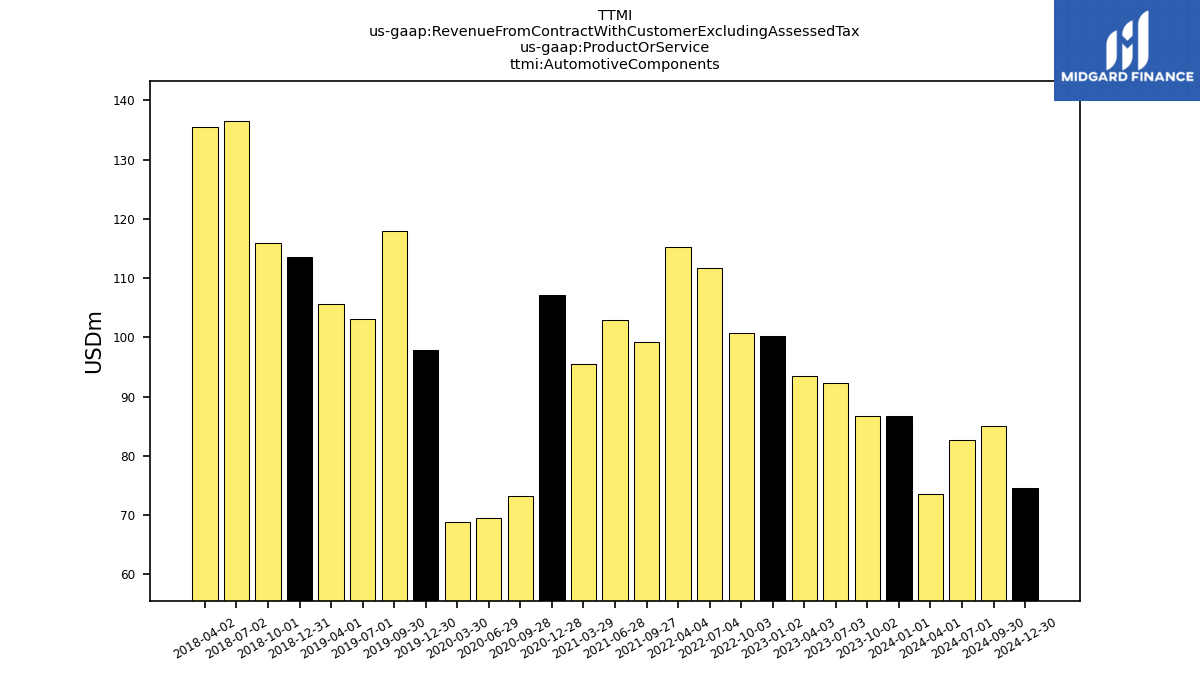
| Automotive Components | 86.81 | 86.80 | 92.37 | 93.47 | 100.20 | 100.81 | 111.78 | 115.24 | 99.20 | 102.89 | 95.43 | 107.14 | 73.27 | 69.56 | 68.88 | 97.81 | 117.95 | 103.04 | 105.58 | 113.59 | 115.96 | 136.46 | 135.60 | NA | NA | NA | NA | NA | NA | NA | NA | NA | NA | NA | NA | NA | NA | NA | NA | NA | NA | NA | NA | NA | NA | NA | NA | NA | NA | NA | NA | NA | NA | |
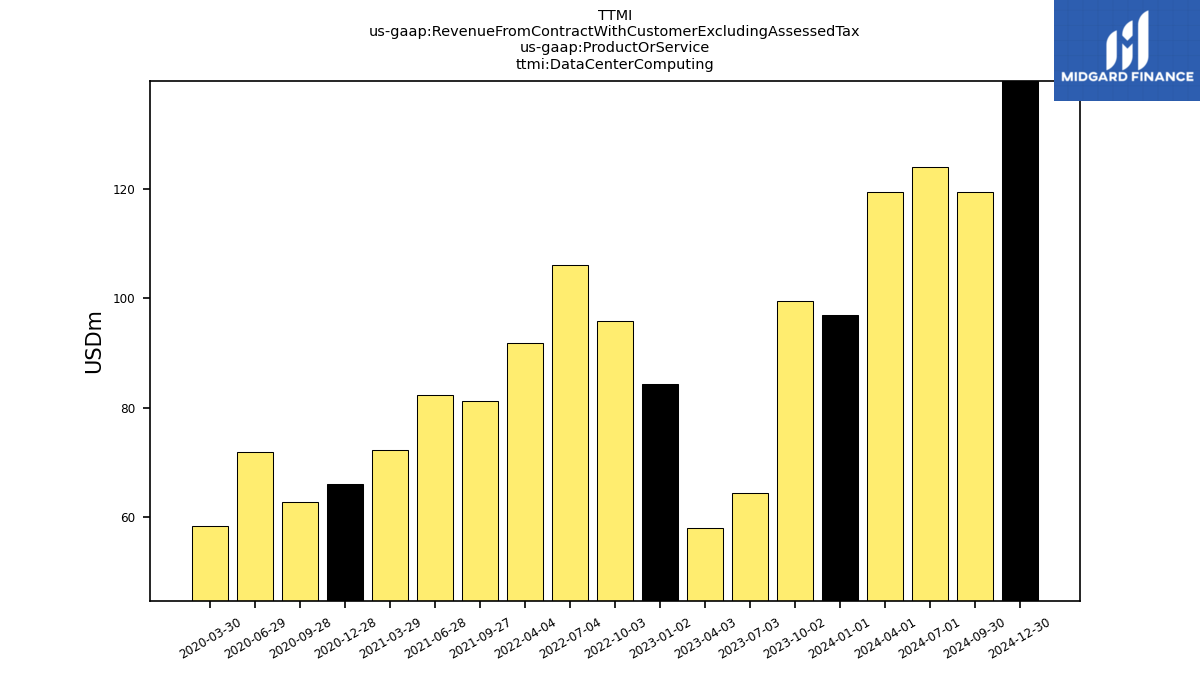
| Data Center Computing | 97.01 | 99.58 | 64.36 | 57.87 | 84.31 | 95.84 | 106.21 | 91.78 | 81.20 | 82.25 | 72.19 | 66.04 | 62.77 | 71.85 | 58.37 | NA | NA | NA | NA | NA | NA | NA | NA | NA | NA | NA | NA | NA | NA | NA | NA | NA | NA | NA | NA | NA | NA | NA | NA | NA | NA | NA | NA | NA | NA | NA | NA | NA | NA | NA | NA | NA | NA | |
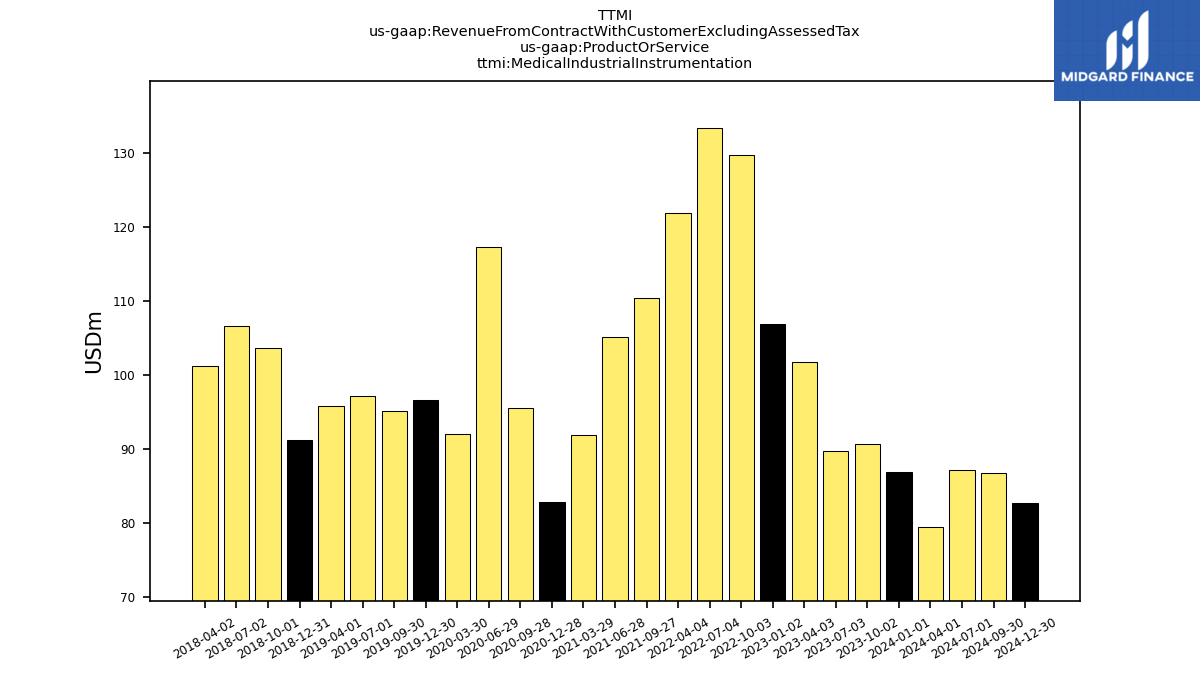
| Medical Industrial Instrumentation | 86.94 | 90.71 | 89.72 | 101.69 | 106.91 | 129.68 | 133.31 | 121.90 | 110.35 | 105.08 | 91.88 | 82.85 | 95.57 | 117.29 | 91.98 | 96.64 | 95.17 | 97.11 | 95.84 | 91.15 | 103.70 | 106.56 | 101.16 | NA | NA | NA | NA | NA | NA | NA | NA | NA | NA | NA | NA | NA | NA | NA | NA | NA | NA | NA | NA | NA | NA | NA | NA | NA | NA | NA | NA | NA | NA | |
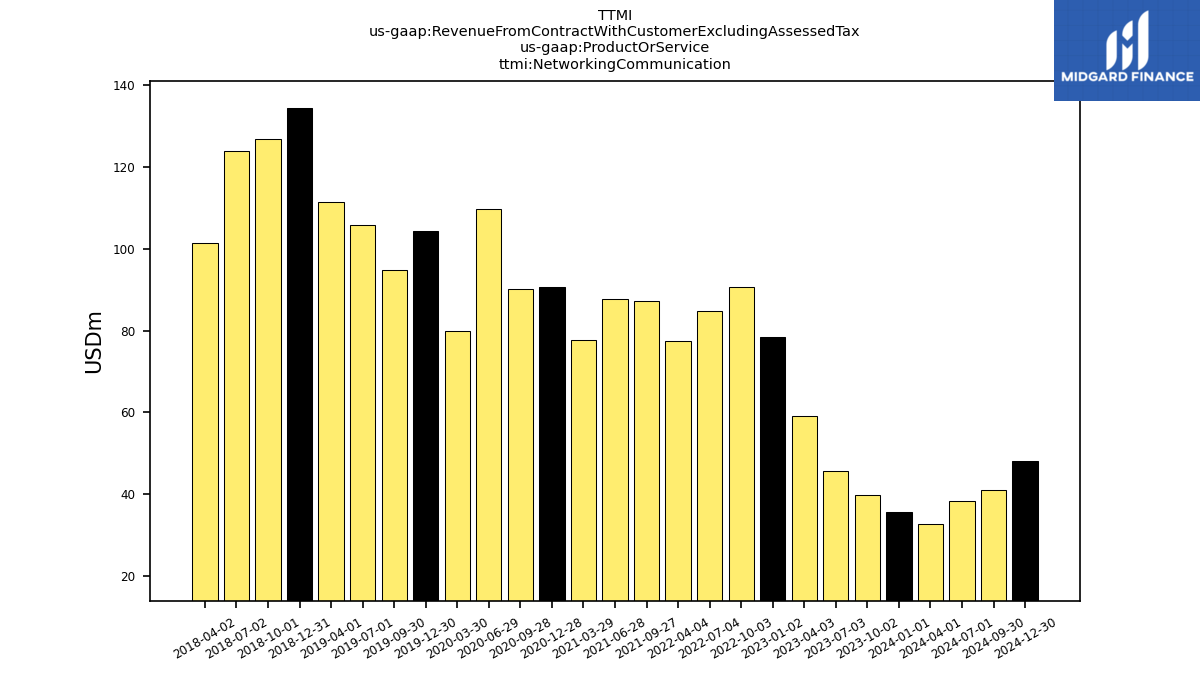
| Networking Communication | 35.59 | 39.86 | 45.77 | 59.12 | 78.38 | 90.67 | 84.88 | 77.40 | 87.16 | 87.68 | 77.59 | 90.55 | 90.29 | 109.86 | 79.88 | 104.33 | 94.79 | 105.86 | 111.40 | 134.34 | 126.91 | 123.95 | 101.41 | NA | NA | NA | NA | NA | NA | NA | NA | NA | NA | NA | NA | NA | NA | NA | NA | NA | NA | NA | NA | NA | NA | NA | NA | NA | NA | NA | NA | NA | NA | |
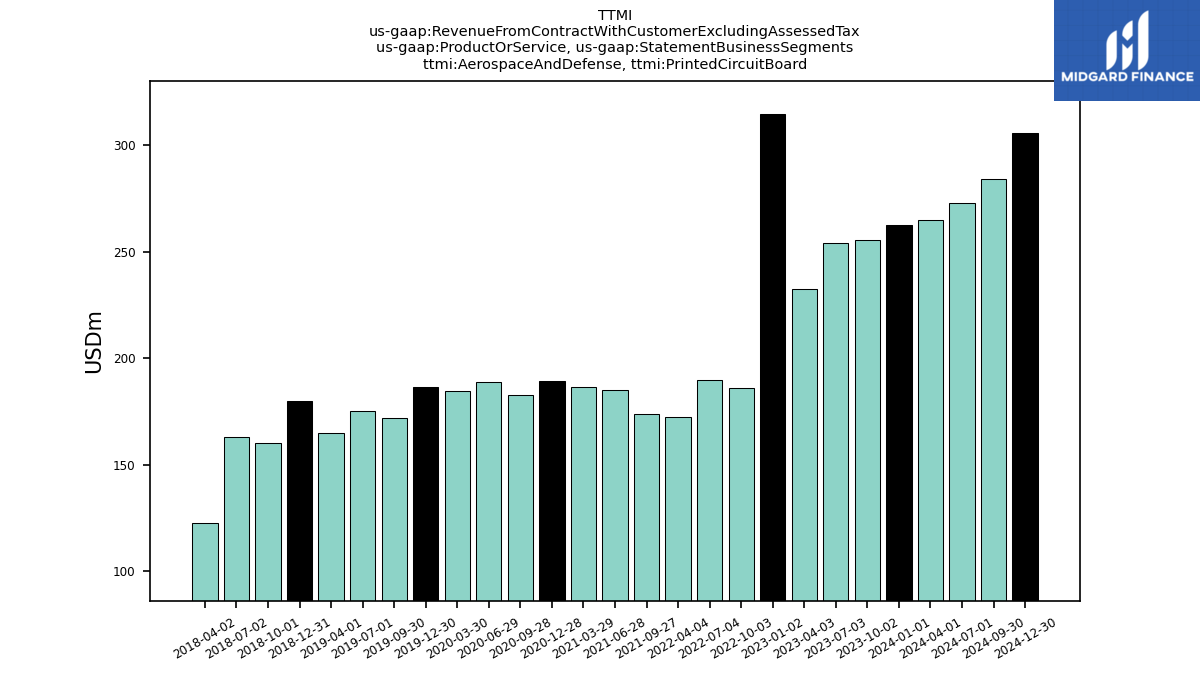
| Aerospace And Defense, Printed Circuit Board | 262.67 | 255.62 | 254.28 | 232.29 | 314.48 | 186.03 | 189.68 | 172.18 | 173.89 | 185.15 | 186.54 | 189.27 | 182.71 | 188.62 | 184.45 | 186.47 | 171.90 | 175.30 | 165.07 | 179.80 | 160.07 | 162.95 | 122.68 | NA | NA | NA | NA | NA | NA | NA | NA | NA | NA | NA | NA | NA | NA | NA | NA | NA | NA | NA | NA | NA | NA | NA | NA | NA | NA | NA | NA | NA | NA | |
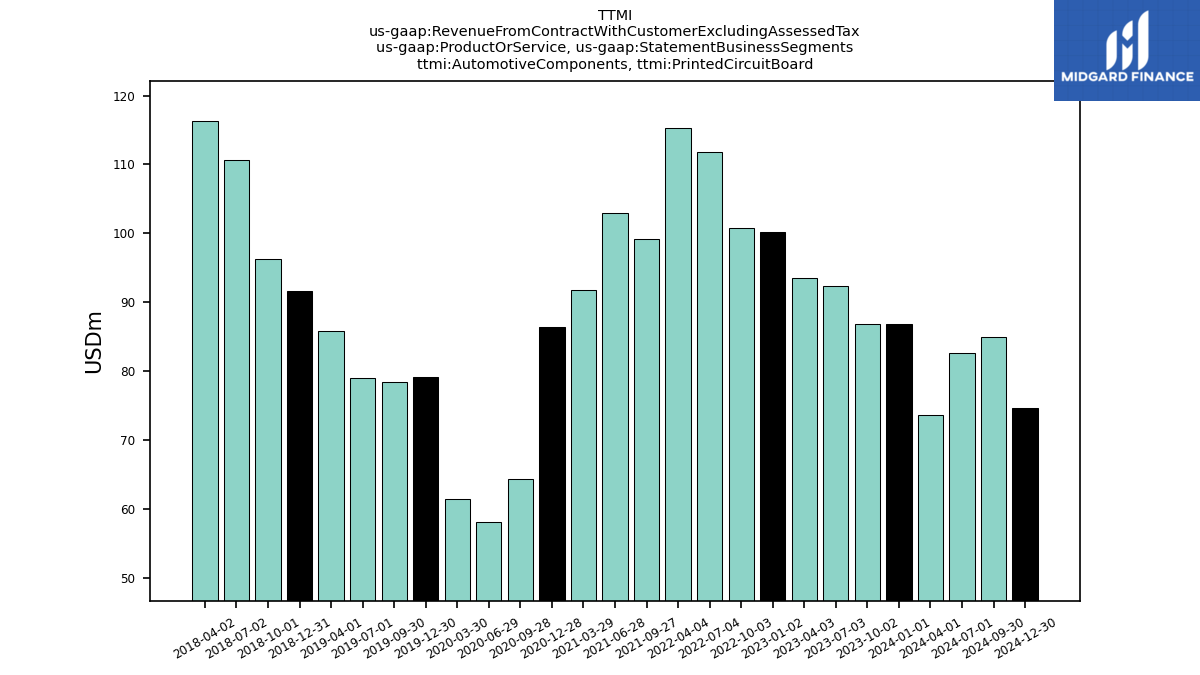
| Automotive Components, Printed Circuit Board | 86.81 | 86.80 | 92.37 | 93.47 | 100.20 | 100.81 | 111.78 | 115.24 | 99.20 | 102.89 | 91.79 | 86.34 | 64.38 | 58.10 | 61.42 | 79.13 | 78.39 | 79.05 | 85.81 | 91.56 | 96.33 | 110.61 | 116.29 | NA | NA | NA | NA | NA | NA | NA | NA | NA | NA | NA | NA | NA | NA | NA | NA | NA | NA | NA | NA | NA | NA | NA | NA | NA | NA | NA | NA | NA | NA | |
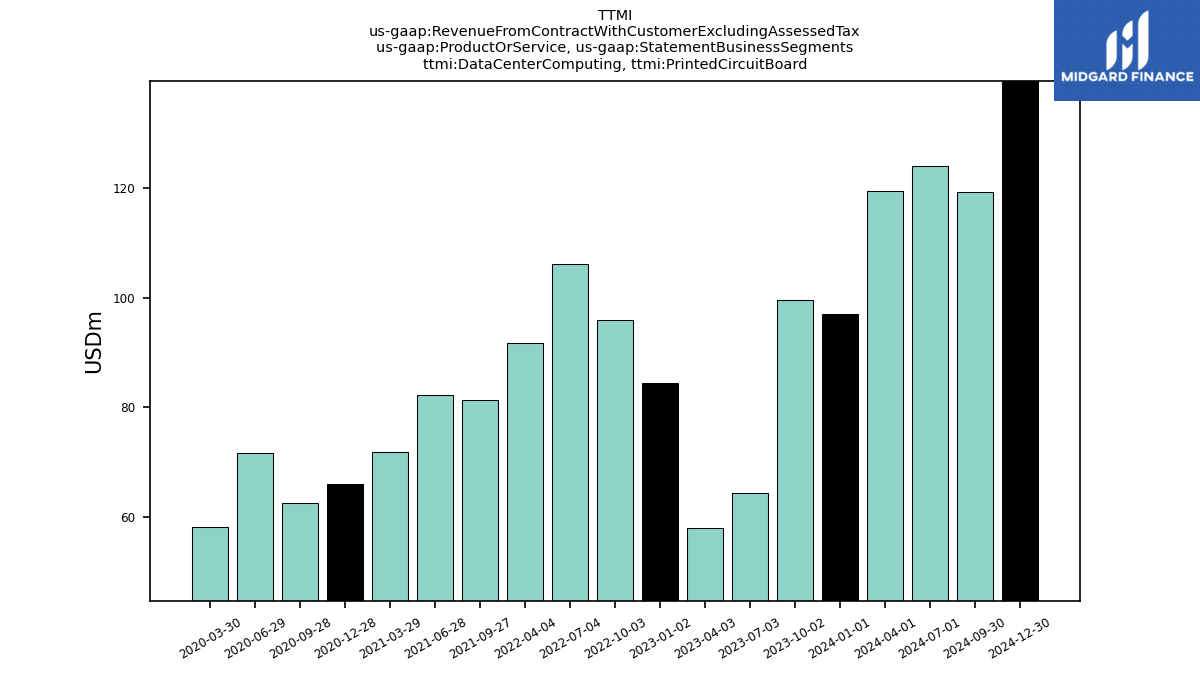
| Data Center Computing, Printed Circuit Board | 97.01 | 99.58 | 64.31 | 57.87 | 84.31 | 95.83 | 106.19 | 91.78 | 81.20 | 82.23 | 71.76 | 65.87 | 62.55 | 71.54 | 58.11 | NA | NA | NA | NA | NA | NA | NA | NA | NA | NA | NA | NA | NA | NA | NA | NA | NA | NA | NA | NA | NA | NA | NA | NA | NA | NA | NA | NA | NA | NA | NA | NA | NA | NA | NA | NA | NA | NA | |
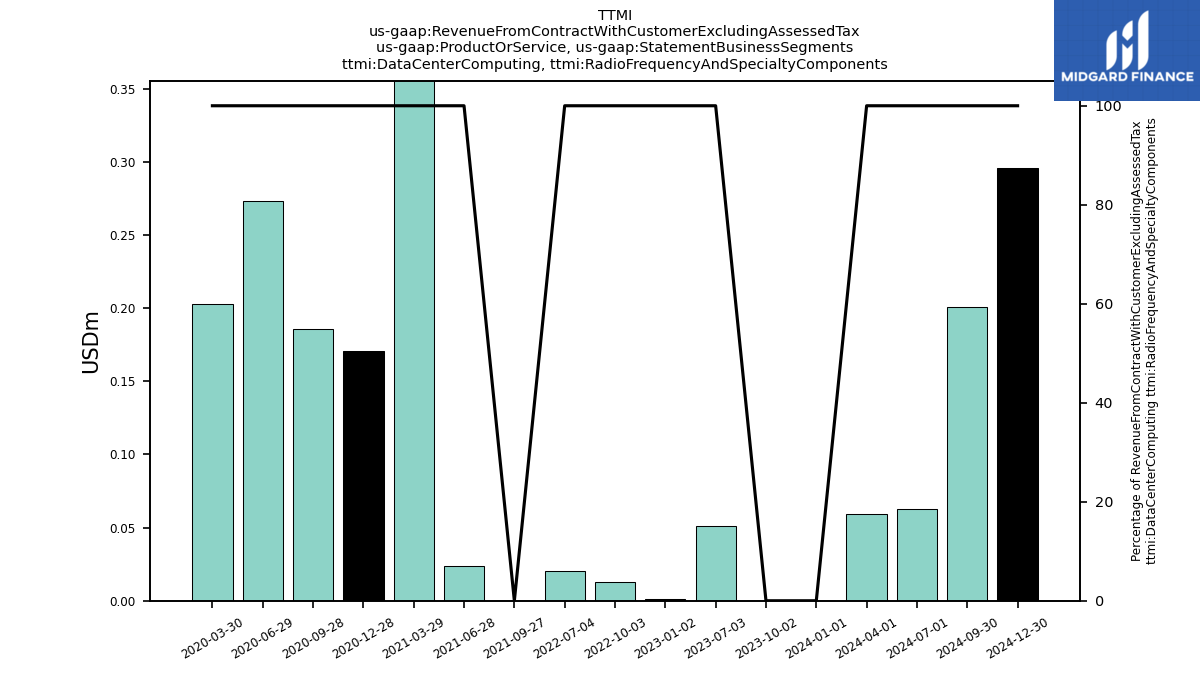
| Data Center Computing, Radio Frequency And Specialty Components | 0.00 | 0.00 | 0.05 | NA | 0.00 | 0.01 | 0.02 | NA | 0.00 | 0.02 | 0.43 | 0.17 | 0.19 | 0.27 | 0.20 | NA | NA | NA | NA | NA | NA | NA | NA | NA | NA | NA | NA | NA | NA | NA | NA | NA | NA | NA | NA | NA | NA | NA | NA | NA | NA | NA | NA | NA | NA | NA | NA | NA | NA | NA | NA | NA | NA | |
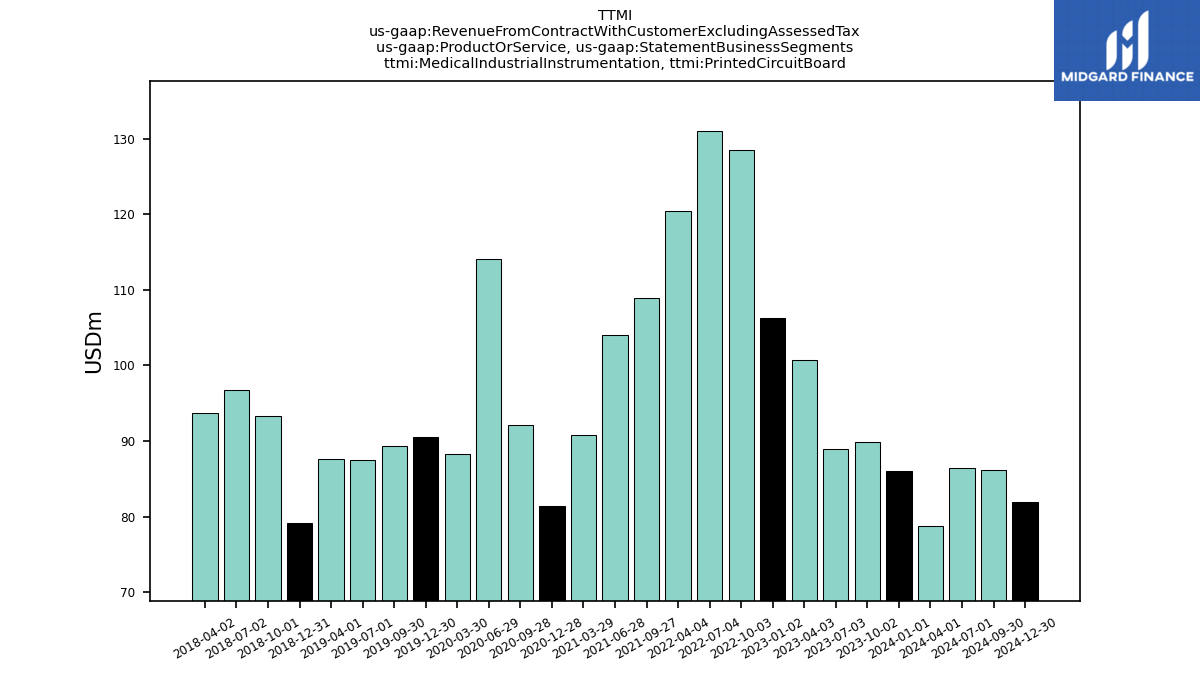
| Medical Industrial Instrumentation, Printed Circuit Board | 86.05 | 89.82 | 88.98 | 100.77 | 106.22 | 128.44 | 131.06 | 120.36 | 108.88 | 104.01 | 90.77 | 81.44 | 92.06 | 114.11 | 88.22 | 90.54 | 89.39 | 87.47 | 87.67 | 79.14 | 93.25 | 96.70 | 93.63 | NA | NA | NA | NA | NA | NA | NA | NA | NA | NA | NA | NA | NA | NA | NA | NA | NA | NA | NA | NA | NA | NA | NA | NA | NA | NA | NA | NA | NA | NA | |
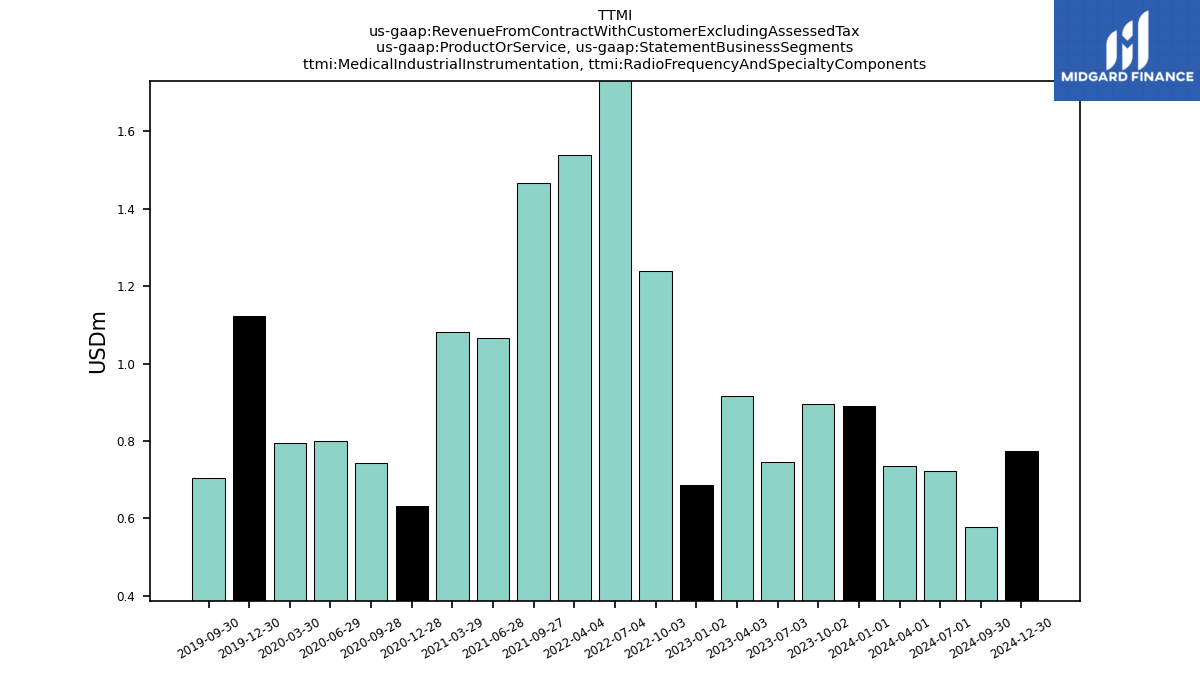
| Medical Industrial Instrumentation, Radio Frequency And Specialty Components | 0.89 | 0.90 | 0.74 | 0.92 | 0.69 | 1.24 | 2.25 | 1.54 | 1.47 | 1.07 | 1.08 | 0.63 | 0.74 | 0.80 | 0.79 | 1.12 | 0.70 | NA | NA | NA | NA | NA | NA | NA | NA | NA | NA | NA | NA | NA | NA | NA | NA | NA | NA | NA | NA | NA | NA | NA | NA | NA | NA | NA | NA | NA | NA | NA | NA | NA | NA | NA | NA | |
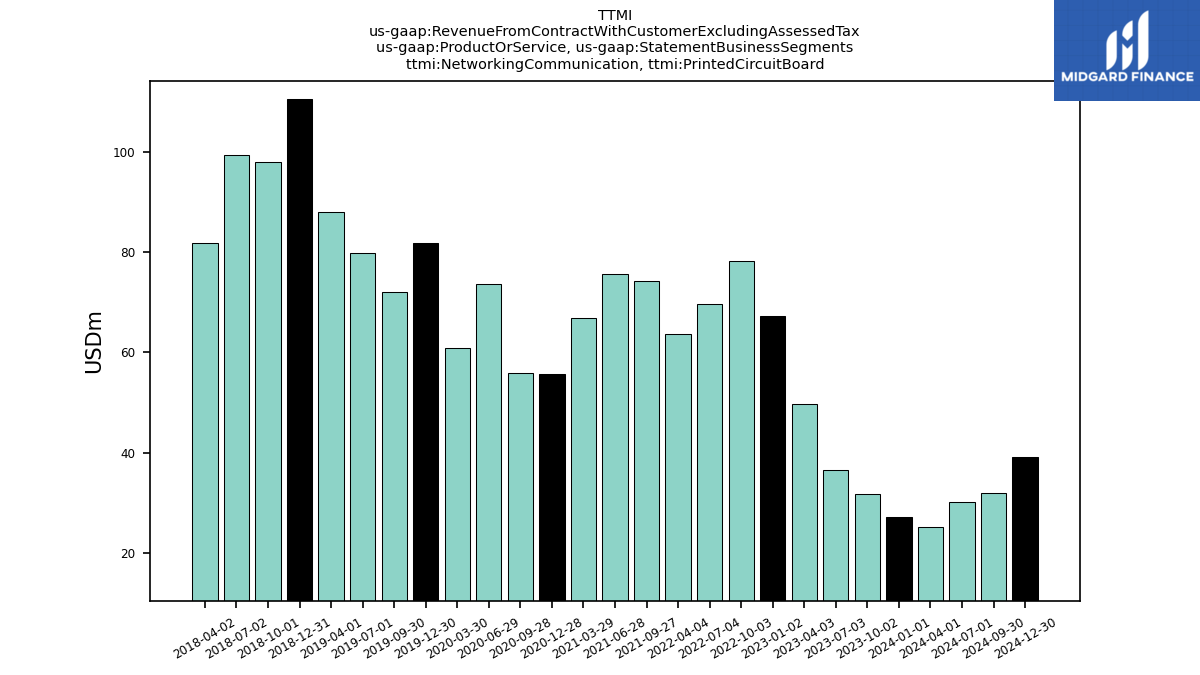
| Networking Communication, Printed Circuit Board | 27.19 | 31.85 | 36.59 | 49.71 | 67.32 | 78.18 | 69.77 | 63.64 | 74.32 | 75.73 | 66.94 | 55.78 | 55.91 | 73.59 | 60.90 | 81.91 | 72.05 | 79.94 | 88.06 | 110.50 | 97.93 | 99.35 | 81.94 | NA | NA | NA | NA | NA | NA | NA | NA | NA | NA | NA | NA | NA | NA | NA | NA | NA | NA | NA | NA | NA | NA | NA | NA | NA | NA | NA | NA | NA | NA | |
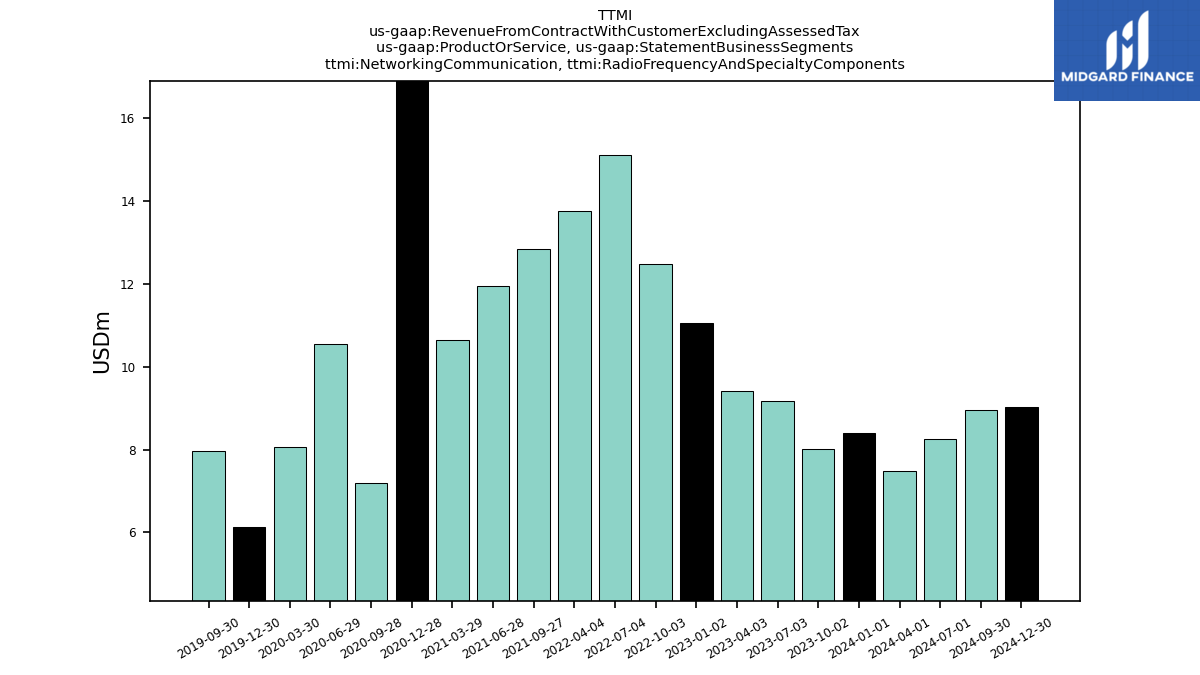
| Networking Communication, Radio Frequency And Specialty Components | 8.40 | 8.01 | 9.18 | 9.41 | 11.05 | 12.49 | 15.11 | 13.76 | 12.85 | 11.95 | 10.65 | 19.99 | 7.20 | 10.56 | 8.07 | 6.14 | 7.97 | NA | NA | NA | NA | NA | NA | NA | NA | NA | NA | NA | NA | NA | NA | NA | NA | NA | NA | NA | NA | NA | NA | NA | NA | NA | NA | NA | NA | NA | NA | NA | NA | NA | NA | NA | NA | |
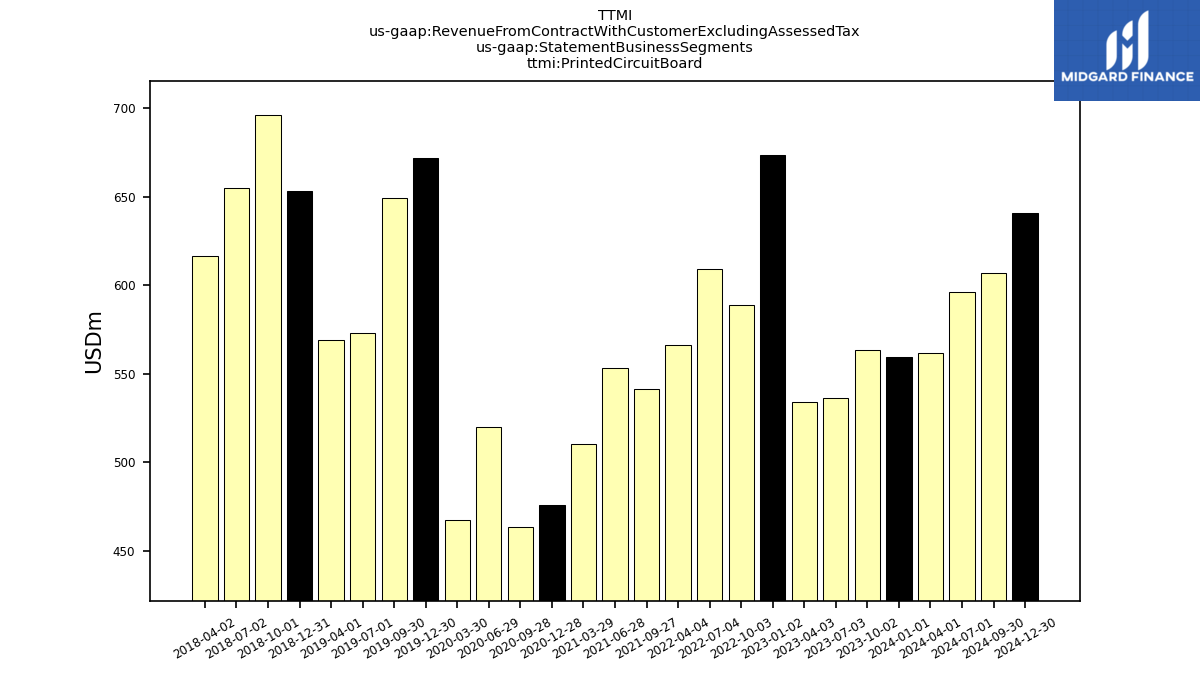
| Printed Circuit Board | 559.73 | 563.68 | 536.53 | 534.11 | 673.52 | 588.92 | 609.43 | 566.07 | 541.12 | 553.48 | 510.49 | 475.61 | 463.66 | 520.07 | 467.43 | 671.93 | 649.10 | 573.12 | 568.82 | 653.48 | 696.36 | 655.04 | 616.43 | NA | NA | NA | NA | NA | NA | NA | NA | NA | NA | NA | NA | NA | NA | NA | NA | NA | NA | NA | NA | NA | NA | NA | NA | NA | NA | NA | NA | NA | NA | |
| Radio Frequency And Specialty Components | 9.31 | 8.91 | 9.98 | 10.33 | 11.89 | 13.90 | 16.12 | 15.19 | 15.67 | 13.90 | 12.69 | 11.38 | 11.74 | 12.09 | 9.44 | 10.59 | 13.64 | NA | NA | NA | NA | NA | NA | NA | NA | NA | NA | NA | NA | NA | NA | NA | NA | NA | NA | NA | NA | NA | NA | NA | NA | NA | NA | NA | NA | NA | NA | NA | NA | NA | NA | NA | NA |