
| 2023-09-30 | 2023-06-30 | 2023-03-31 | 2022-12-31 | 2022-09-30 | 2022-06-30 | 2022-03-31 | 2021-12-31 | 2021-09-30 | 2021-06-30 | 2021-03-31 | 2020-12-31 | 2020-09-30 | 2020-06-30 | 2020-03-31 | 2019-12-31 | 2019-09-30 | 2019-06-30 | 2019-03-31 | 2018-12-31 | 2018-09-30 | 2018-06-30 | 2018-03-31 | 2017-12-31 | 2017-09-30 | 2017-06-30 | 2017-03-31 | 2016-12-31 | 2016-09-30 | 2016-06-30 | 2016-03-31 | 2015-12-31 | 2015-09-30 | 2015-06-30 | 2015-03-31 | 2014-12-31 | 2014-09-30 | 2014-06-30 | 2014-03-31 | 2012-11-30 | 2012-08-31 | 2012-05-31 | 2011-11-30 | 2011-08-31 | 2011-05-31 | 2011-02-28 | 2010-11-30 | 2010-08-31 | ||
|---|---|---|---|---|---|---|---|---|---|---|---|---|---|---|---|---|---|---|---|---|---|---|---|---|---|---|---|---|---|---|---|---|---|---|---|---|---|---|---|---|---|---|---|---|---|---|---|---|---|
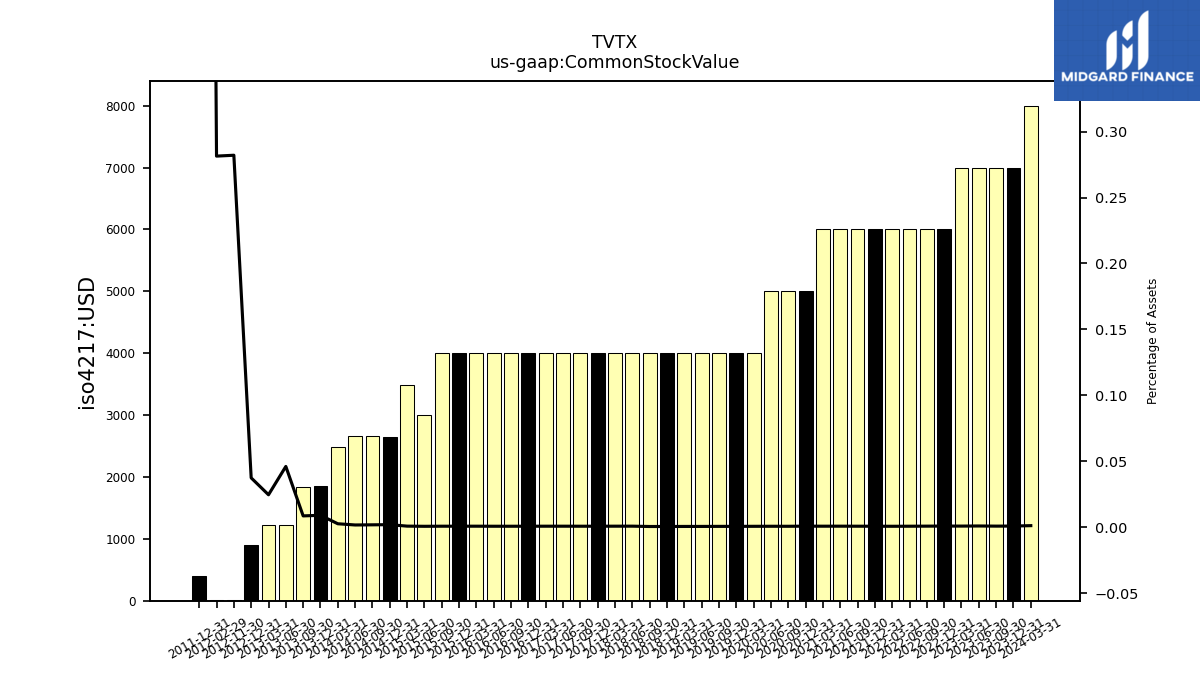
| Common Stock Value | 0.01 | 0.01 | 0.01 | 0.01 | 0.01 | 0.01 | 0.01 | 0.01 | 0.01 | 0.01 | 0.01 | 0.01 | 0.01 | 0.01 | 0.00 | 0.00 | 0.00 | 0.00 | 0.00 | 0.00 | 0.00 | 0.00 | 0.00 | 0.00 | 0.00 | 0.00 | 0.00 | 0.00 | 0.00 | 0.00 | 0.00 | 0.00 | 0.00 | 0.00 | 0.00 | 0.00 | 0.00 | 0.00 | 0.00 | 0.00 | NA | NA | NA | NA | NA | NA | NA | NA | |
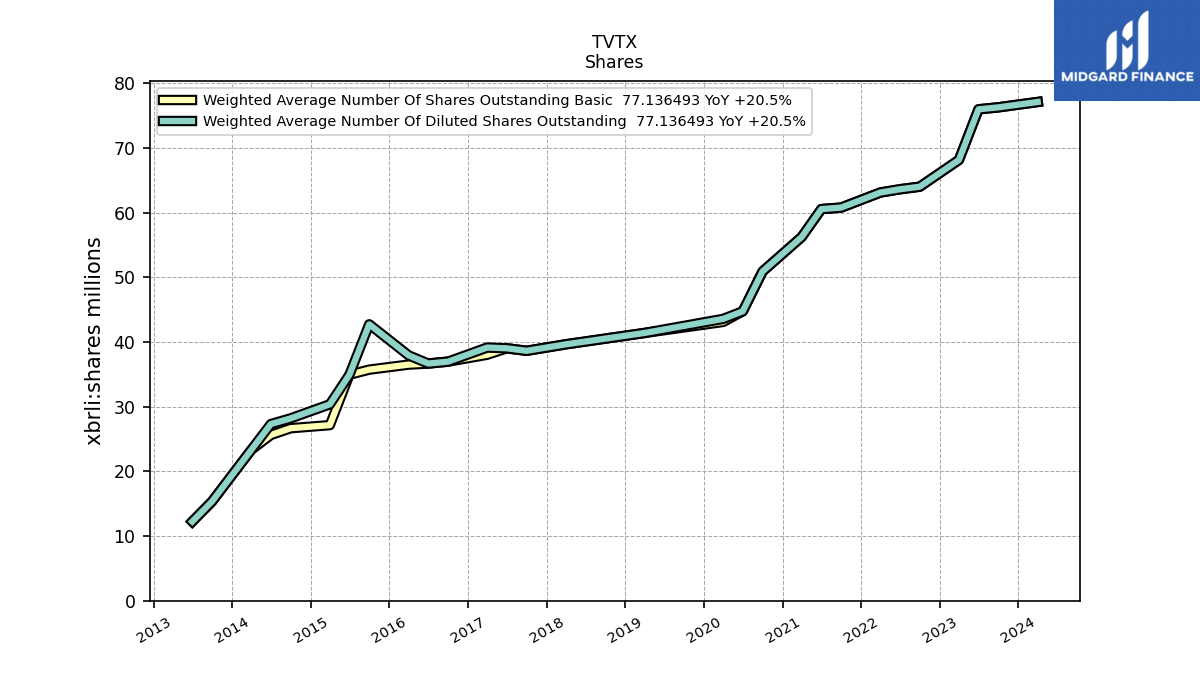
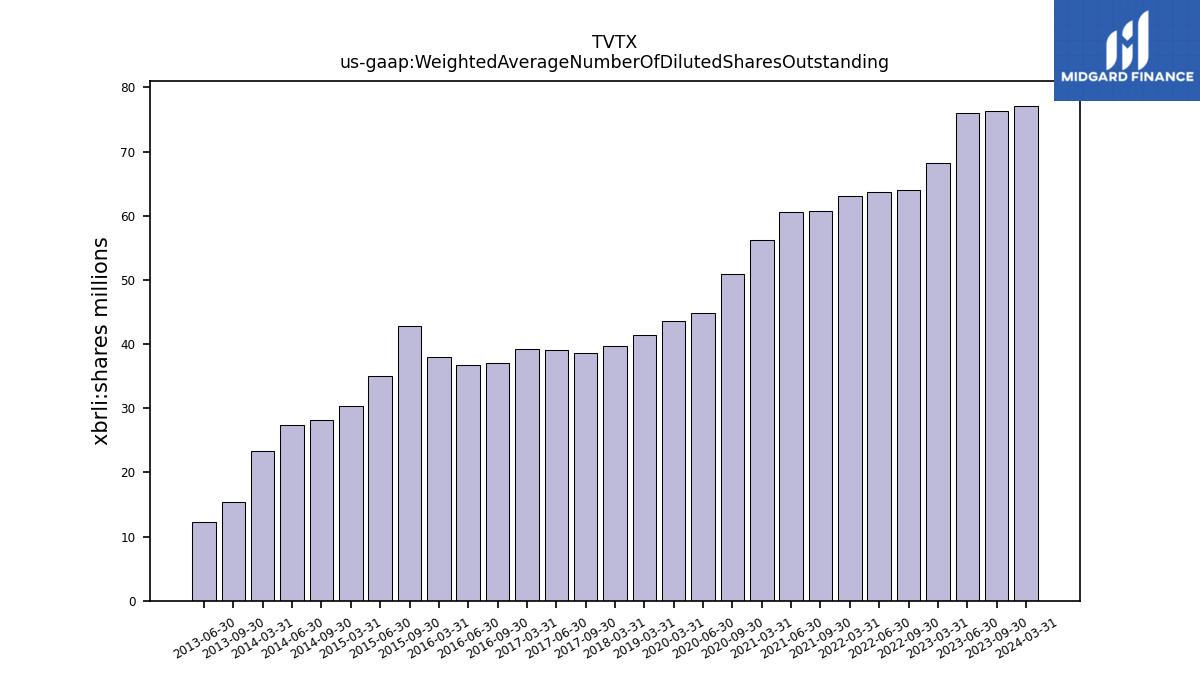
| Weighted Average Number Of Diluted Shares Outstanding | 76.31 | 76.00 | 68.17 | NA | 64.03 | 63.64 | 63.13 | NA | 60.80 | 60.57 | 56.27 | NA | 50.93 | 44.76 | 43.59 | NA | NA | NA | 41.41 | NA | NA | NA | 39.66 | NA | 38.65 | 39.04 | 39.16 | NA | 36.98 | 36.68 | 37.95 | NA | 42.75 | 34.96 | 30.38 | NA | 28.21 | 27.33 | 23.33 | NA | NA | NA | NA | NA | NA | NA | NA | NA | |
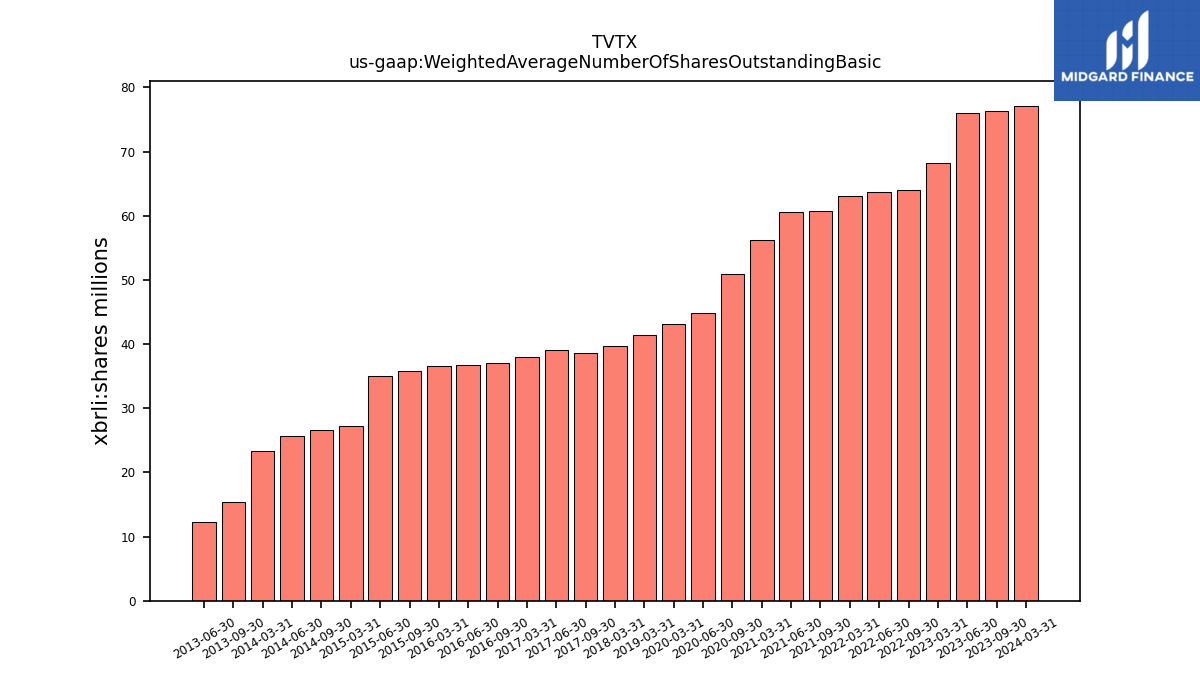
| Weighted Average Number Of Shares Outstanding Basic | 76.31 | 76.00 | 68.17 | NA | 64.03 | 63.64 | 63.13 | NA | 60.80 | 60.57 | 56.27 | NA | 50.93 | 44.76 | 43.12 | NA | NA | NA | 41.41 | NA | NA | NA | 39.66 | NA | 38.65 | 39.04 | 38.05 | NA | 36.98 | 36.68 | 36.52 | NA | 35.74 | 34.96 | 27.16 | NA | 26.68 | 25.64 | 23.33 | NA | NA | NA | NA | NA | NA | NA | NA | NA | |
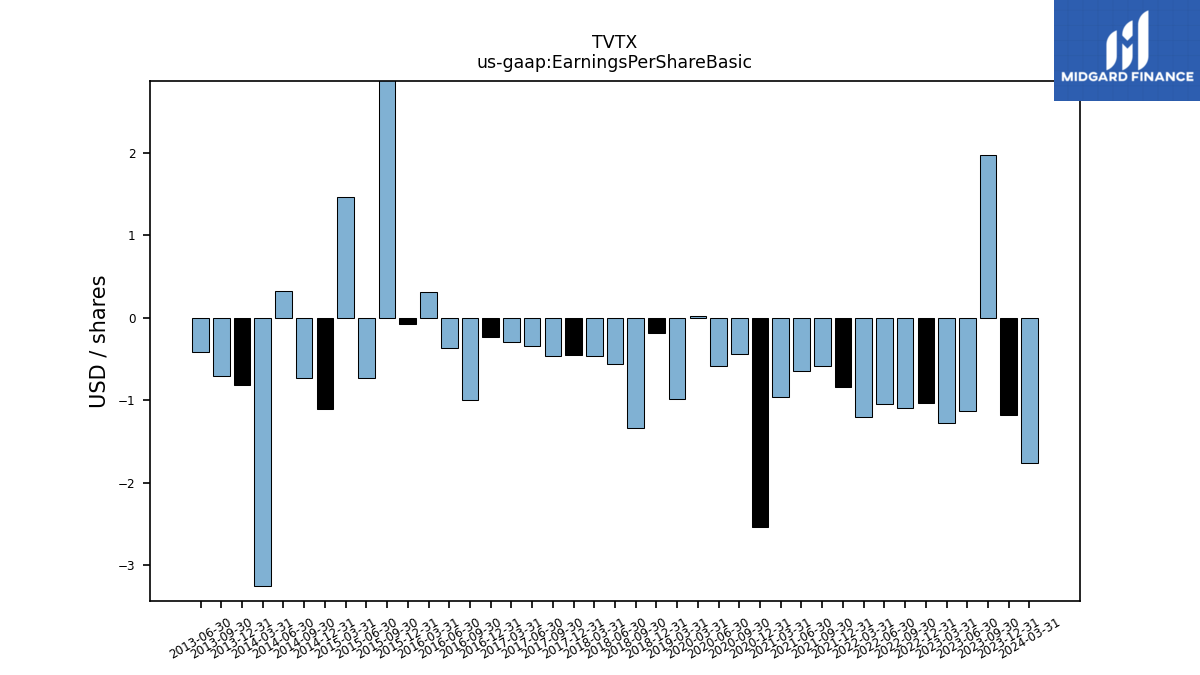
| Earnings Per Share Basic | 1.97 | -1.13 | -1.27 | -1.03 | -1.09 | -1.05 | -1.20 | -0.84 | -0.59 | -0.64 | -0.96 | -2.53 | -0.44 | -0.58 | 0.02 | NA | NA | NA | -0.99 | -0.18 | -1.34 | -0.56 | -0.46 | -0.45 | -0.46 | -0.34 | -0.29 | -0.23 | -1.00 | -0.37 | 0.31 | -0.07 | 2.95 | -0.73 | 1.46 | -1.10 | -0.73 | 0.33 | -3.25 | NA | NA | NA | NA | NA | NA | NA | NA | NA | |
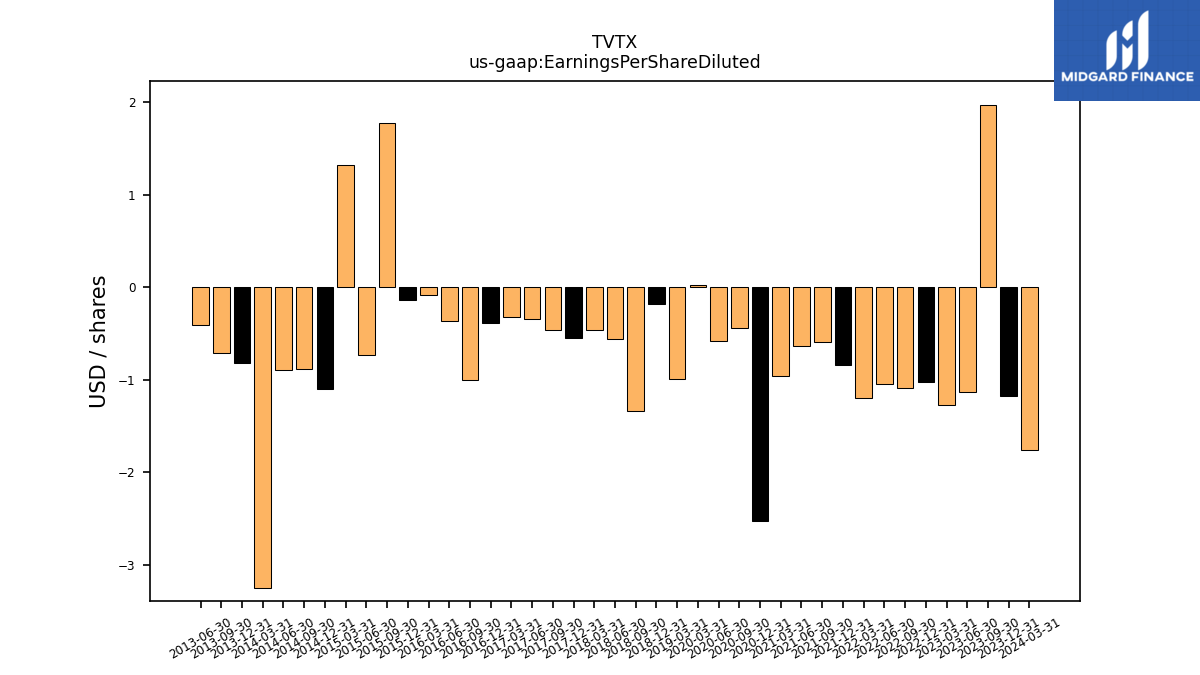
| Earnings Per Share Diluted | 1.97 | -1.13 | -1.27 | -1.03 | -1.09 | -1.05 | -1.20 | -0.84 | -0.59 | -0.64 | -0.96 | -2.53 | -0.44 | -0.58 | 0.02 | NA | NA | NA | -0.99 | -0.18 | -1.34 | -0.56 | -0.46 | -0.55 | -0.46 | -0.34 | -0.32 | -0.39 | -1.00 | -0.37 | -0.08 | -0.14 | 1.78 | -0.73 | 1.32 | -1.10 | -0.89 | -0.90 | -3.25 | NA | NA | NA | NA | NA | NA | NA | NA | NA | |
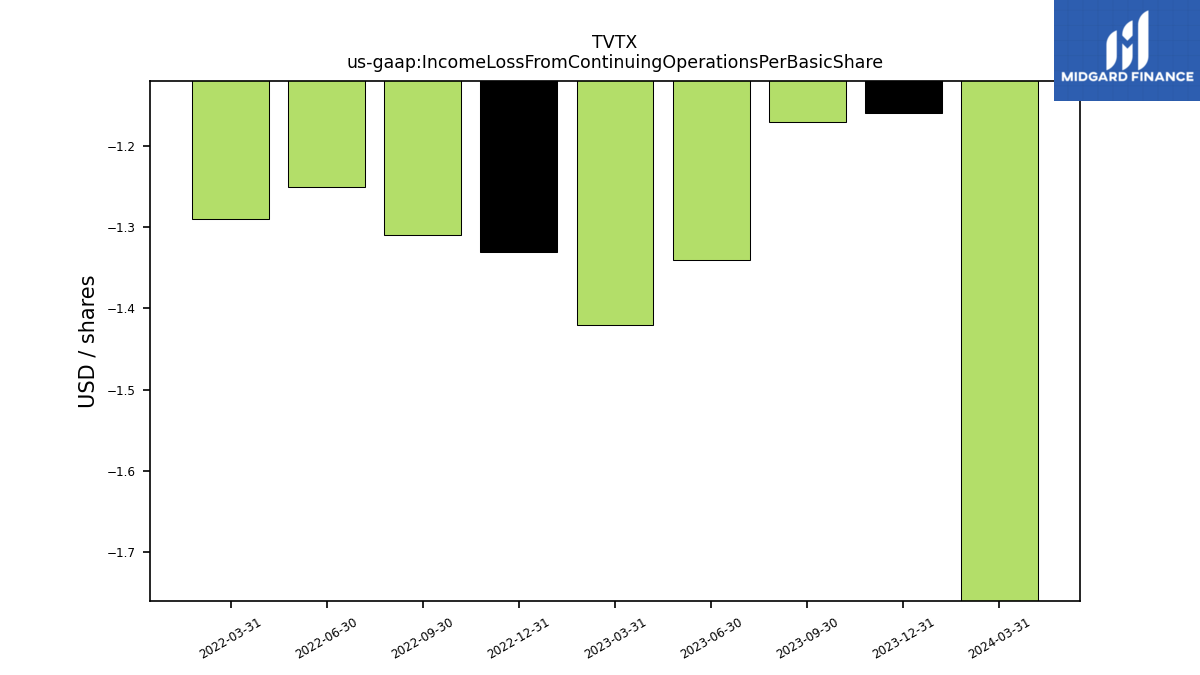
| Income Loss From Continuing Operations Per Basic Share | -0.00 | NA | NA | NA | -0.00 | NA | NA | NA | NA | NA | NA | NA | NA | NA | NA | NA | NA | NA | NA | NA | NA | NA | NA | NA | NA | NA | NA | NA | NA | NA | NA | NA | NA | NA | NA | NA | NA | NA | NA | NA | NA | NA | NA | NA | NA | NA | NA | NA | |
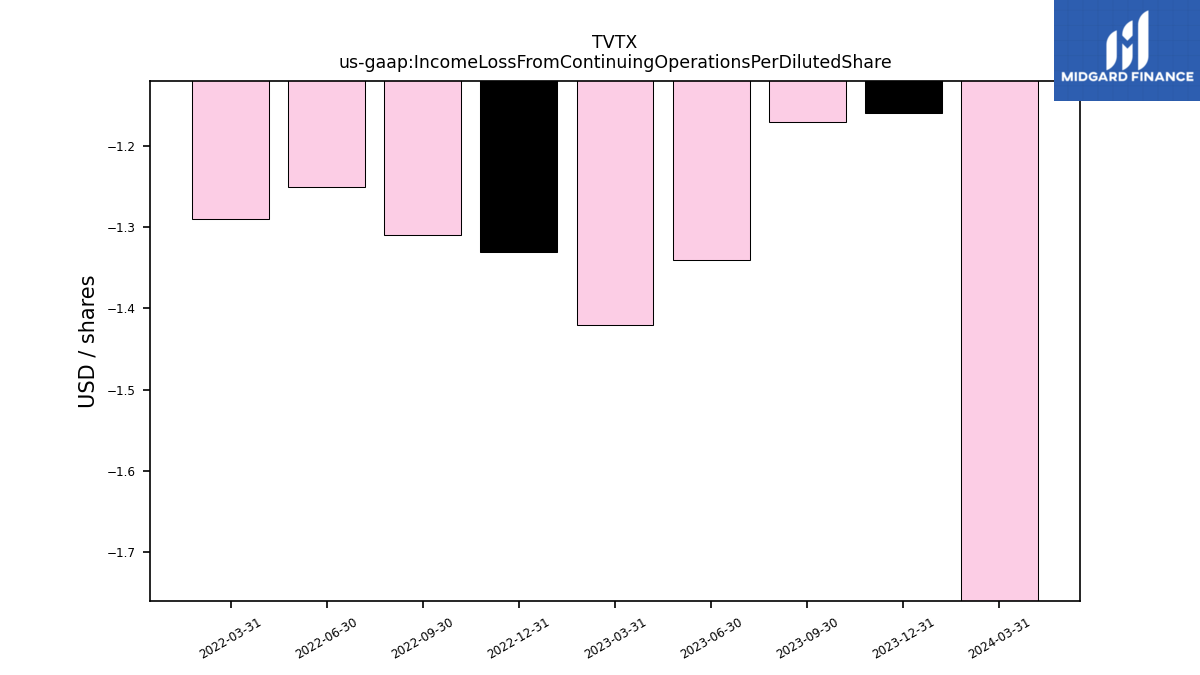
| Income Loss From Continuing Operations Per Diluted Share | -0.00 | NA | NA | NA | -0.00 | NA | NA | NA | NA | NA | NA | NA | NA | NA | NA | NA | NA | NA | NA | NA | NA | NA | NA | NA | NA | NA | NA | NA | NA | NA | NA | NA | NA | NA | NA | NA | NA | NA | NA | NA | NA | NA | NA | NA | NA | NA | NA | NA |
| 2023-09-30 | 2023-06-30 | 2023-03-31 | 2022-12-31 | 2022-09-30 | 2022-06-30 | 2022-03-31 | 2021-12-31 | 2021-09-30 | 2021-06-30 | 2021-03-31 | 2020-12-31 | 2020-09-30 | 2020-06-30 | 2020-03-31 | 2019-12-31 | 2019-09-30 | 2019-06-30 | 2019-03-31 | 2018-12-31 | 2018-09-30 | 2018-06-30 | 2018-03-31 | 2017-12-31 | 2017-09-30 | 2017-06-30 | 2017-03-31 | 2016-12-31 | 2016-09-30 | 2016-06-30 | 2016-03-31 | 2015-12-31 | 2015-09-30 | 2015-06-30 | 2015-03-31 | 2014-12-31 | 2014-09-30 | 2014-06-30 | 2014-03-31 | 2012-11-30 | 2012-08-31 | 2012-05-31 | 2011-11-30 | 2011-08-31 | 2011-05-31 | 2011-02-28 | 2010-11-30 | 2010-08-31 | ||
|---|---|---|---|---|---|---|---|---|---|---|---|---|---|---|---|---|---|---|---|---|---|---|---|---|---|---|---|---|---|---|---|---|---|---|---|---|---|---|---|---|---|---|---|---|---|---|---|---|---|
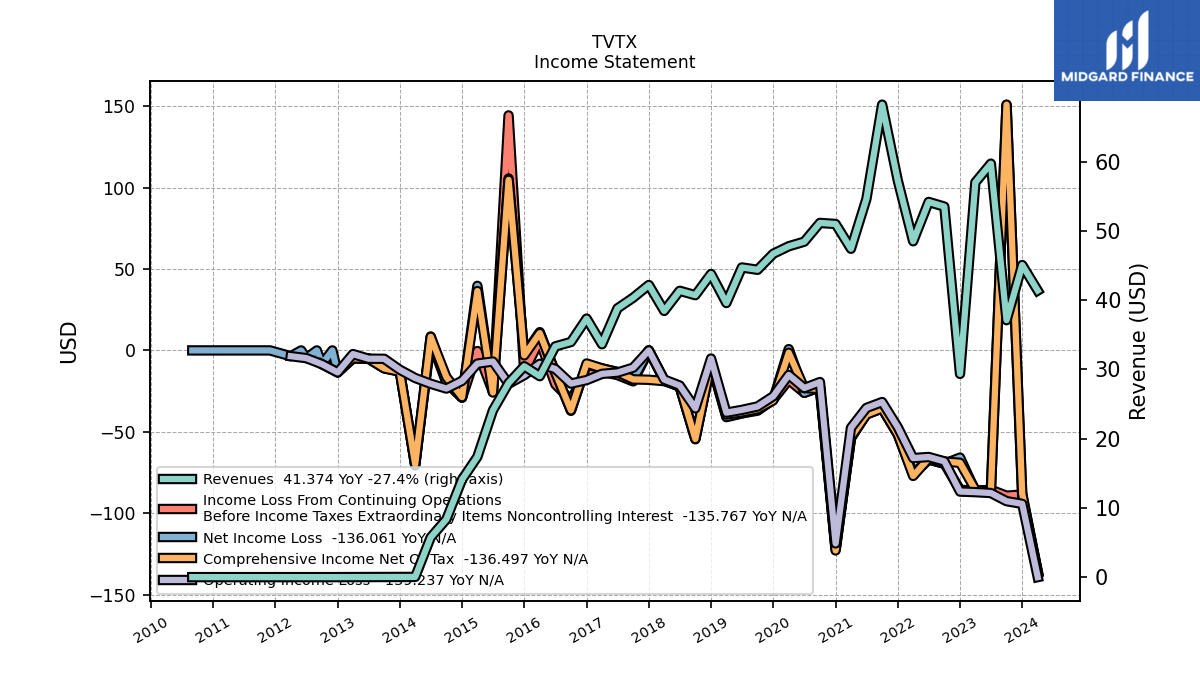
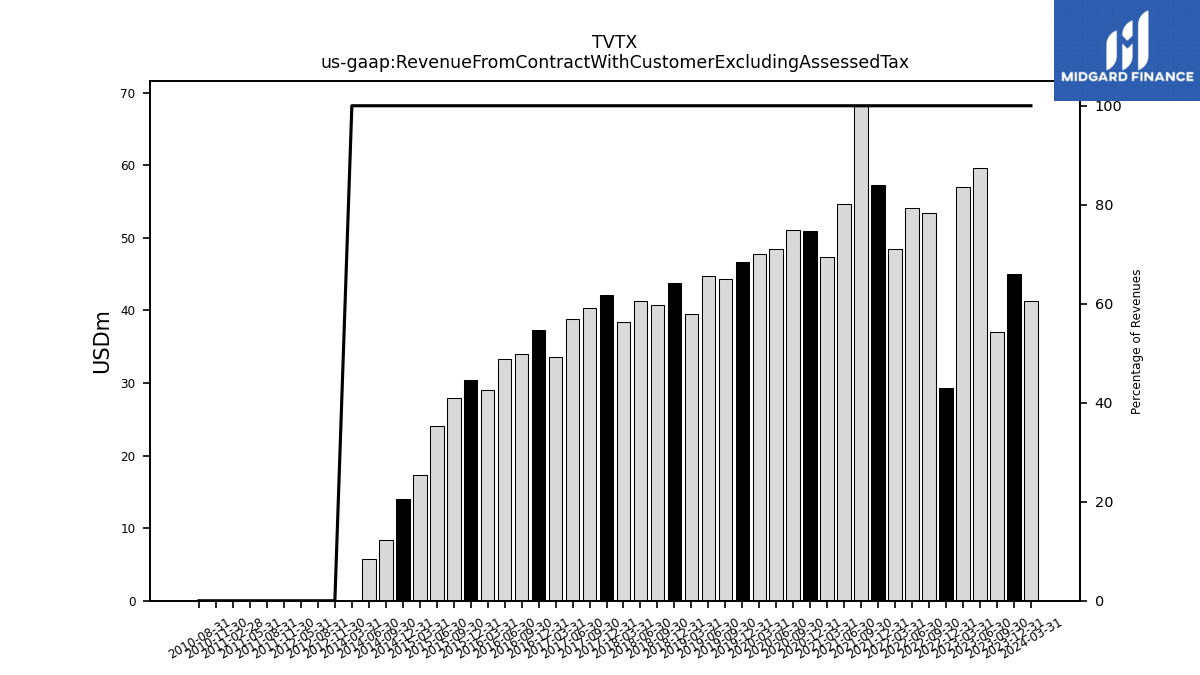
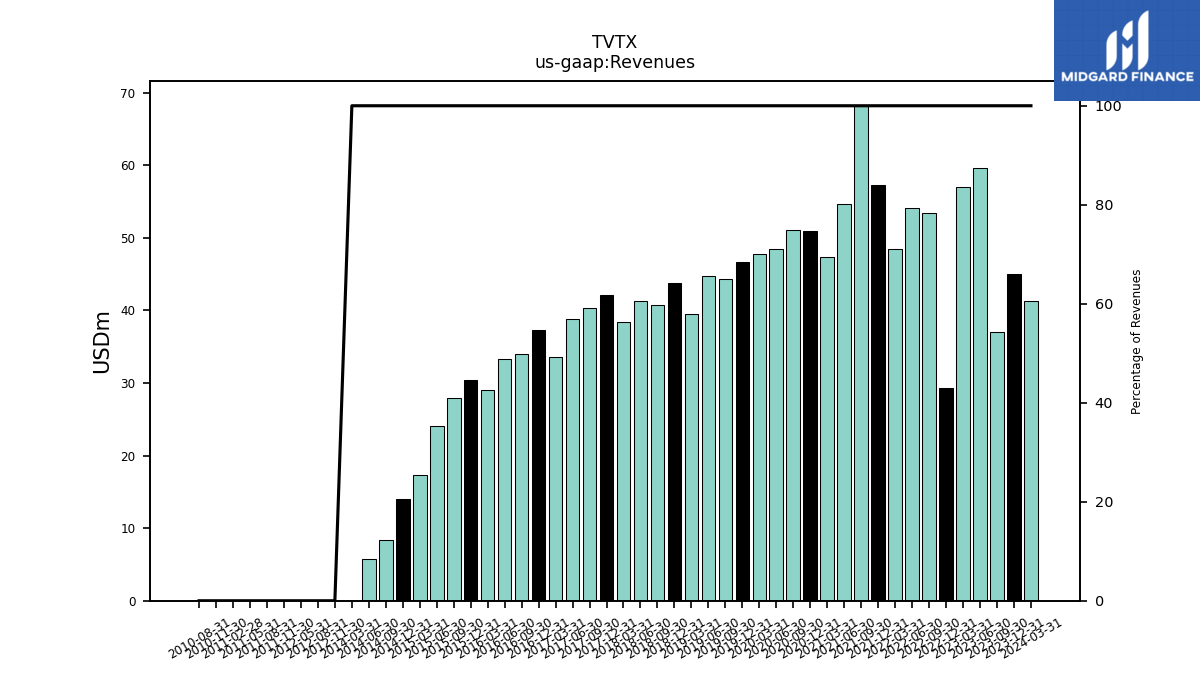
| Revenue From Contract With Customer Excluding Assessed Tax | 37.09 | 59.70 | 56.99 | 55.87 | 53.50 | 54.17 | 48.49 | 57.25 | 68.22 | 54.62 | 47.41 | 50.98 | 51.14 | 48.43 | 47.77 | 46.69 | 44.37 | 44.71 | 39.57 | 43.77 | 40.71 | 41.34 | 38.43 | 42.18 | 40.34 | 38.80 | 33.62 | 37.33 | 33.95 | 33.31 | 29.01 | 30.45 | 28.00 | 24.07 | 17.37 | 14.09 | 8.35 | 5.74 | 0.03 | 0.00 | 0.00 | 0.00 | 0.00 | 0.00 | 0.00 | 0.00 | 0.00 | 0.00 | |
| Revenues | 37.09 | 59.70 | 56.99 | 55.87 | 53.50 | 54.17 | 48.49 | 57.25 | 68.22 | 54.62 | 47.41 | 50.98 | 51.14 | 48.43 | 47.77 | 46.69 | 44.37 | 44.71 | 39.57 | 43.77 | 40.71 | 41.34 | 38.43 | 42.18 | 40.34 | 38.80 | 33.62 | 37.33 | 33.95 | 33.31 | 29.01 | 30.45 | 28.00 | 24.07 | 17.37 | 14.09 | 8.35 | 5.74 | 0.03 | 0.00 | 0.00 | 0.00 | 0.00 | 0.00 | 0.00 | 0.00 | 0.00 | 0.00 | |
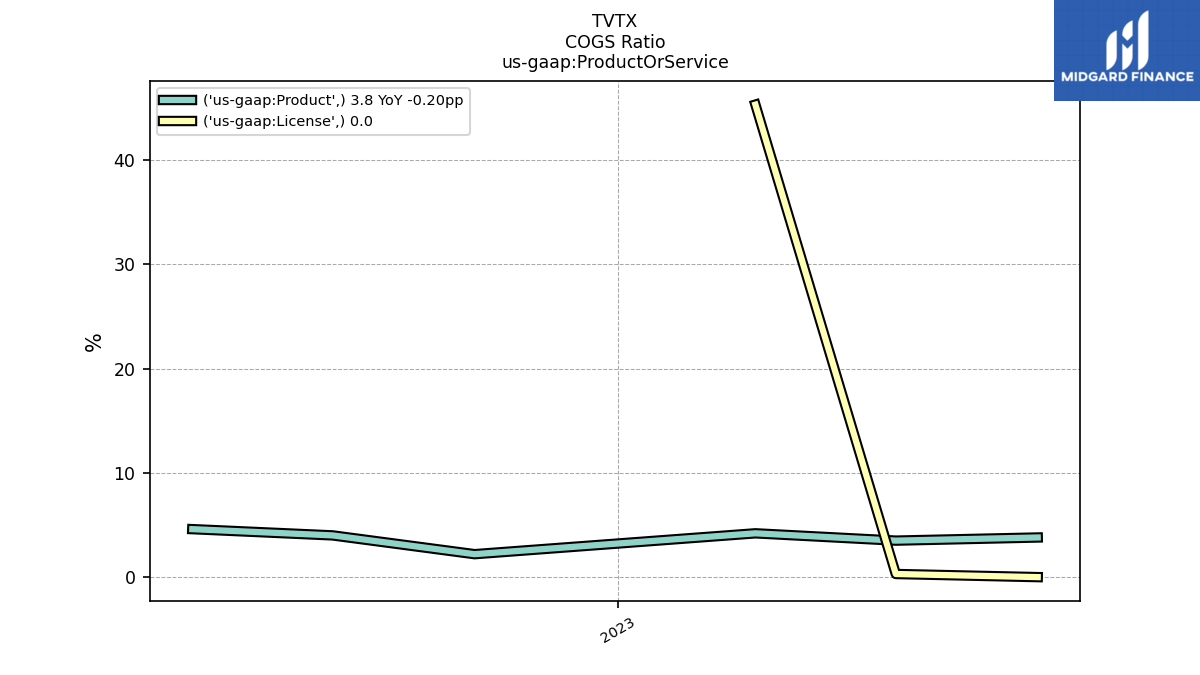
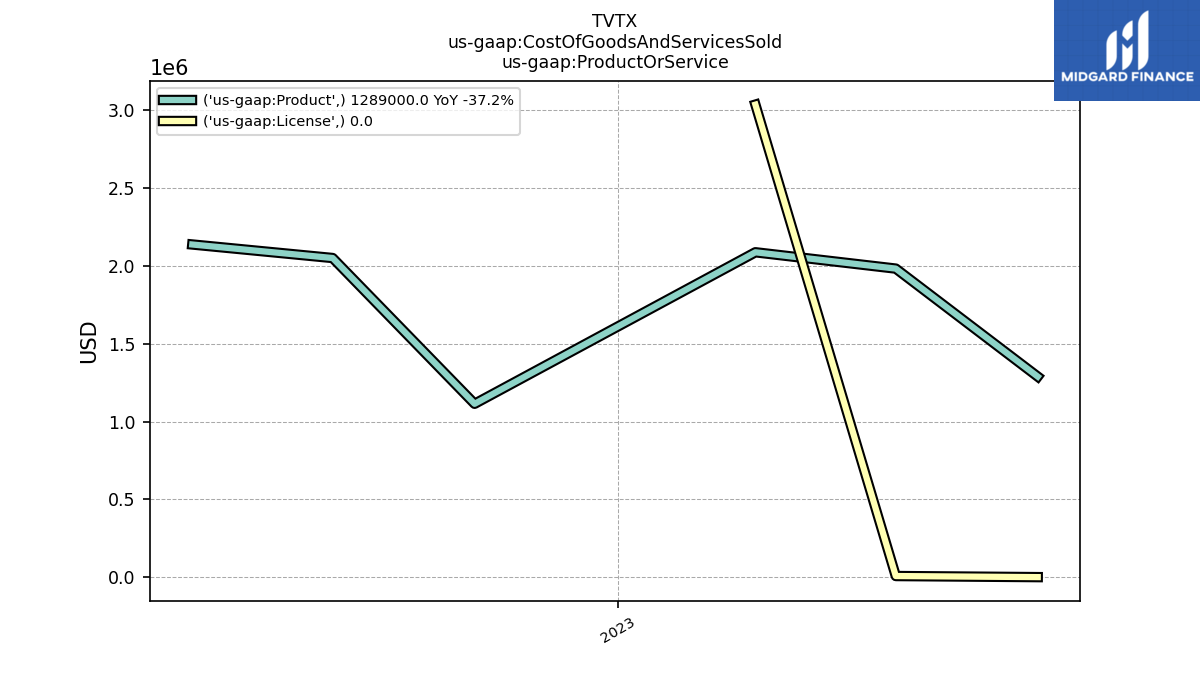
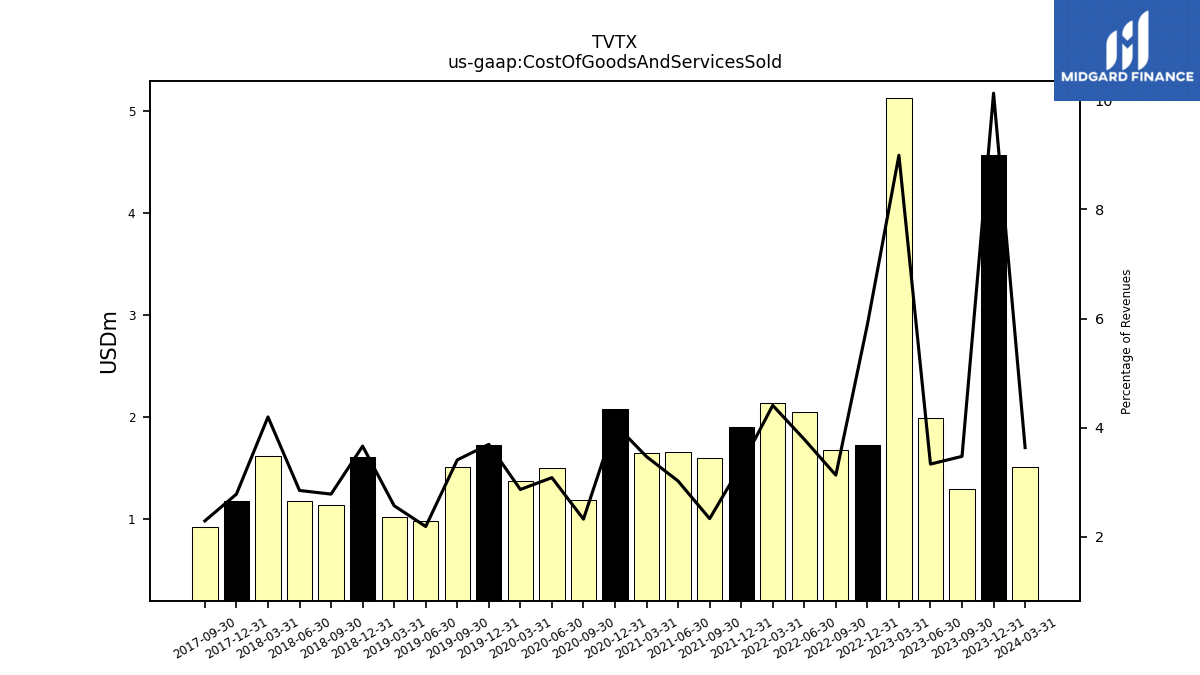
| Cost Of Goods And Services Sold | 1.29 | 1.99 | 5.12 | 1.73 | 1.68 | 2.05 | 2.14 | 1.90 | 1.59 | 1.65 | 1.65 | 2.07 | 1.19 | 1.49 | 1.37 | 1.73 | 1.51 | 0.98 | 1.02 | 1.60 | 1.13 | 1.18 | 1.61 | 1.17 | 0.93 | NA | NA | NA | NA | NA | NA | NA | NA | NA | NA | NA | NA | NA | NA | NA | NA | NA | NA | NA | NA | NA | NA | NA | |
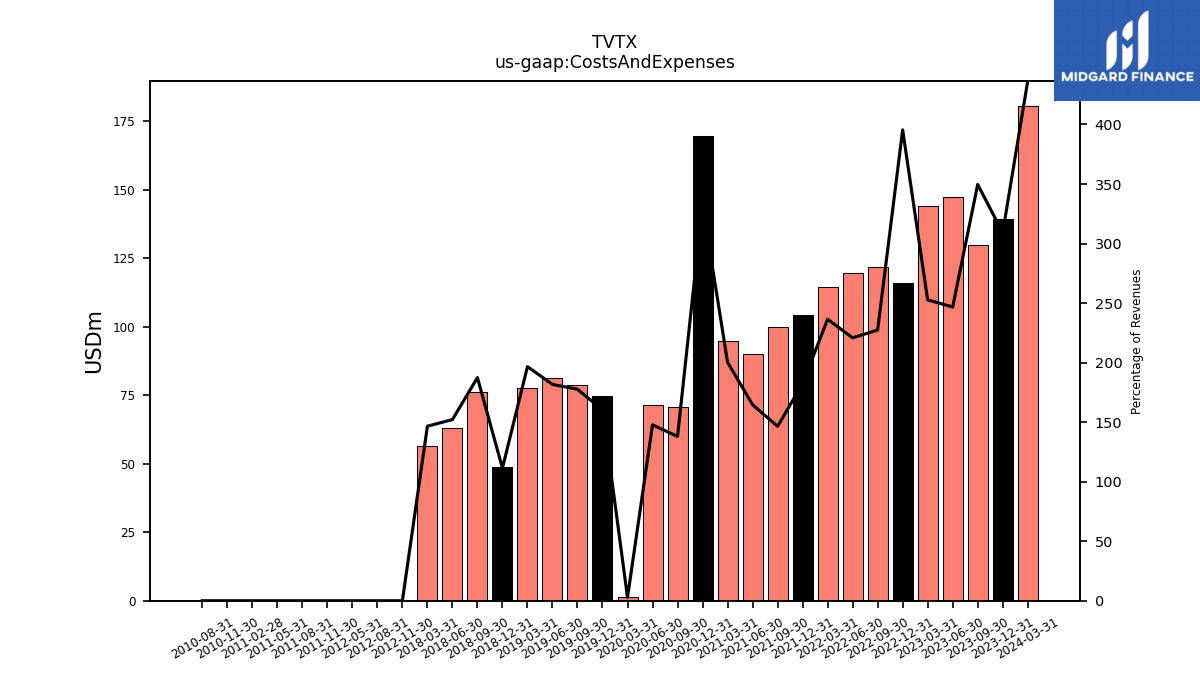
| Costs And Expenses | 129.68 | 147.28 | 144.04 | 122.72 | 121.63 | 119.62 | 114.62 | 104.44 | 99.93 | 89.93 | 94.96 | 169.53 | 70.57 | 71.54 | 1.37 | 74.86 | 78.81 | 81.24 | 77.80 | 48.76 | 76.29 | 62.90 | 56.34 | NA | NA | NA | NA | NA | NA | NA | NA | NA | NA | NA | NA | NA | NA | NA | NA | 0.00 | 0.00 | 0.00 | 0.00 | 0.00 | 0.00 | 0.00 | 0.01 | 0.01 | |
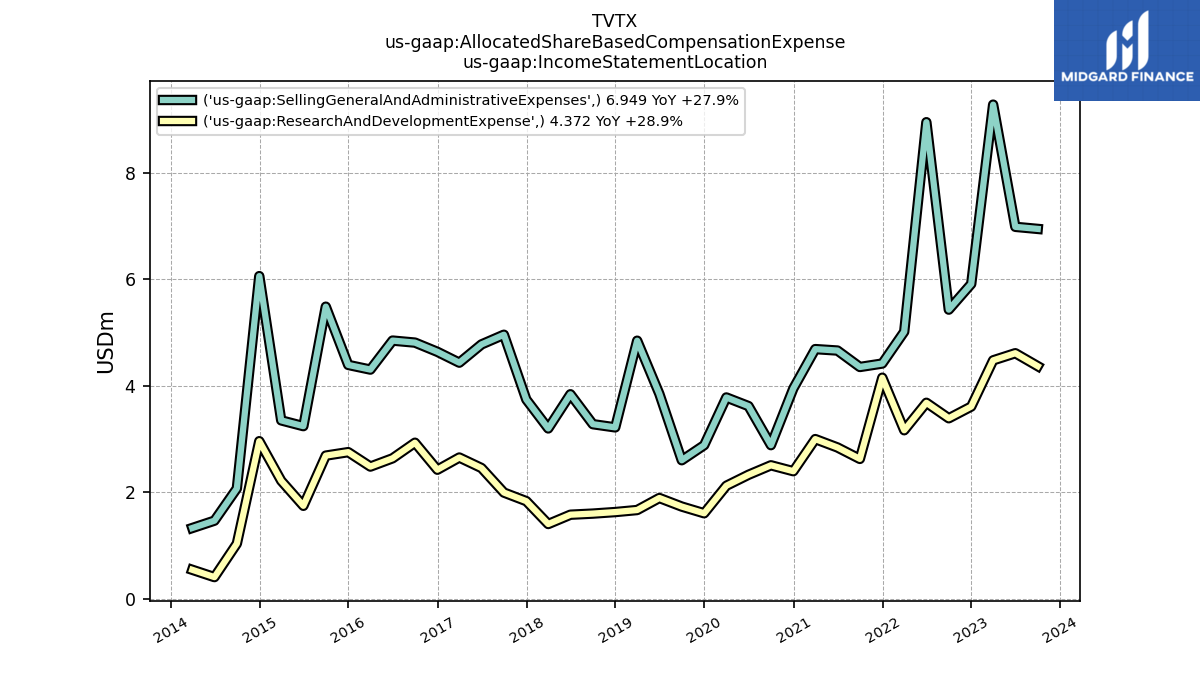
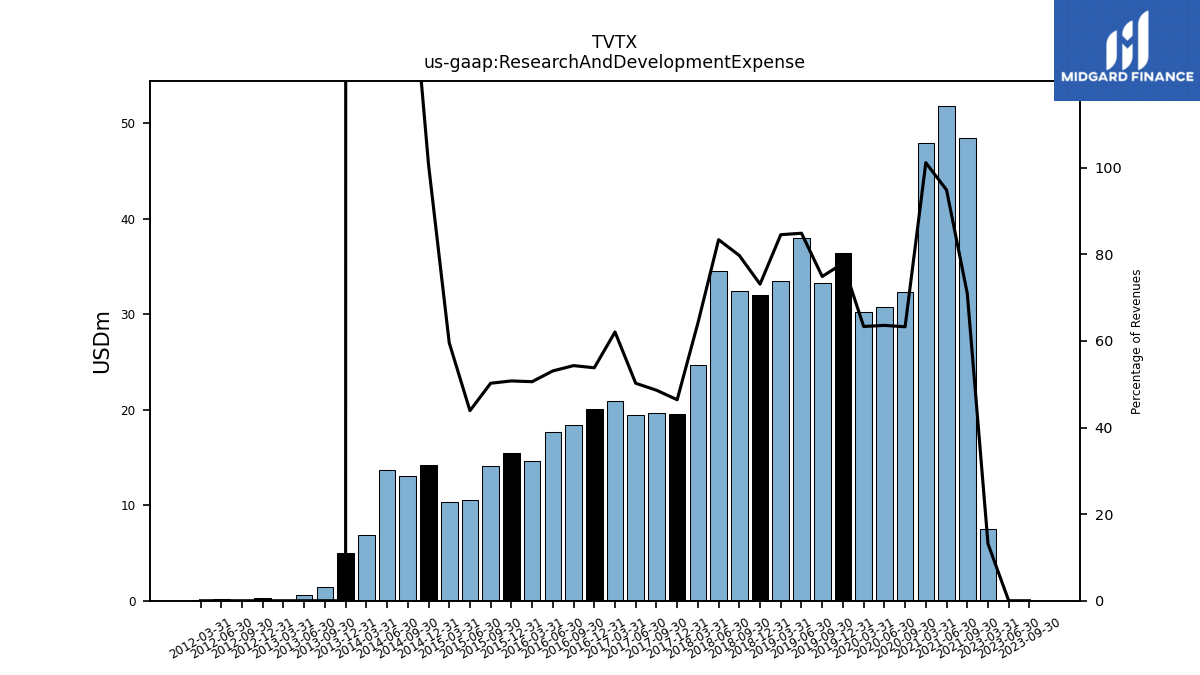
| Research And Development Expense | 0.00 | 0.00 | 7.50 | NA | NA | NA | NA | NA | 48.41 | 51.81 | 47.95 | NA | 32.35 | 30.79 | 30.25 | 36.37 | 33.22 | 37.93 | 33.44 | 32.00 | 32.45 | 34.46 | 24.64 | 19.58 | 19.61 | 19.48 | 20.86 | 20.08 | 18.43 | 17.68 | 14.67 | 15.45 | 14.06 | 10.56 | 10.35 | 14.19 | 13.02 | 13.70 | 6.89 | NA | NA | NA | NA | NA | NA | NA | NA | NA | |
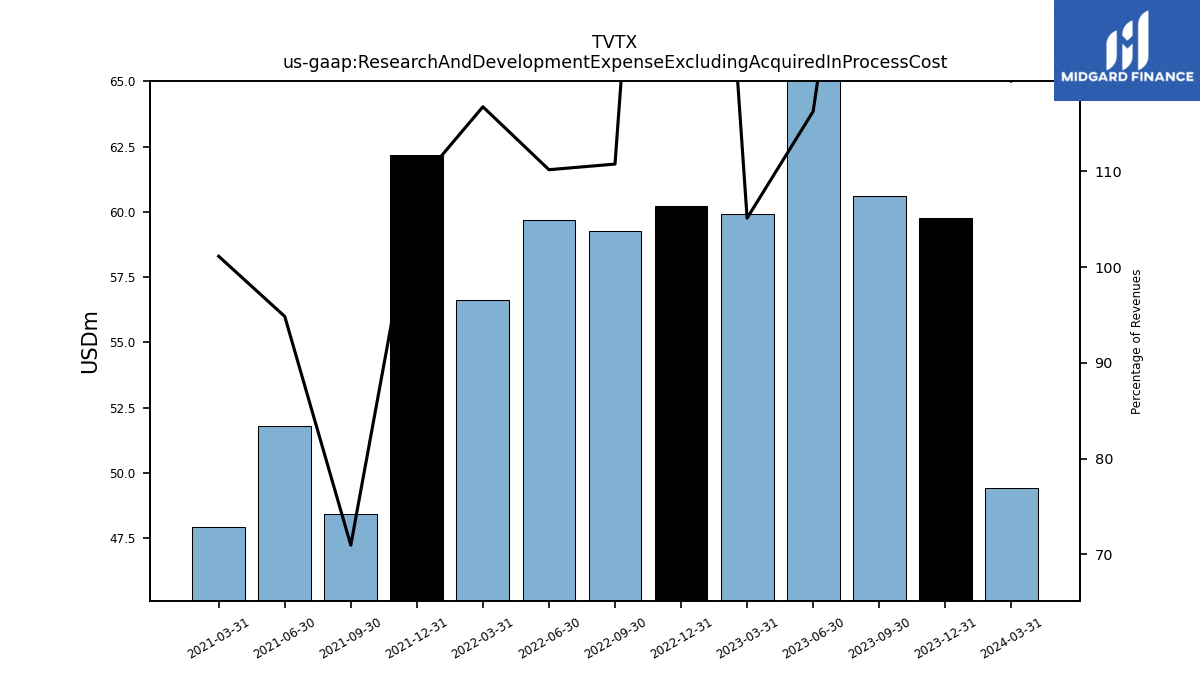
| Research And Development Expense Excluding Acquired In Process Cost | 60.59 | 69.41 | 59.91 | 60.23 | 59.26 | 59.68 | 56.61 | 62.17 | 48.41 | 51.81 | 47.95 | NA | NA | NA | NA | NA | NA | NA | NA | NA | NA | NA | NA | NA | NA | NA | NA | NA | NA | NA | NA | NA | NA | NA | NA | NA | NA | NA | NA | NA | NA | NA | NA | NA | NA | NA | NA | NA | |
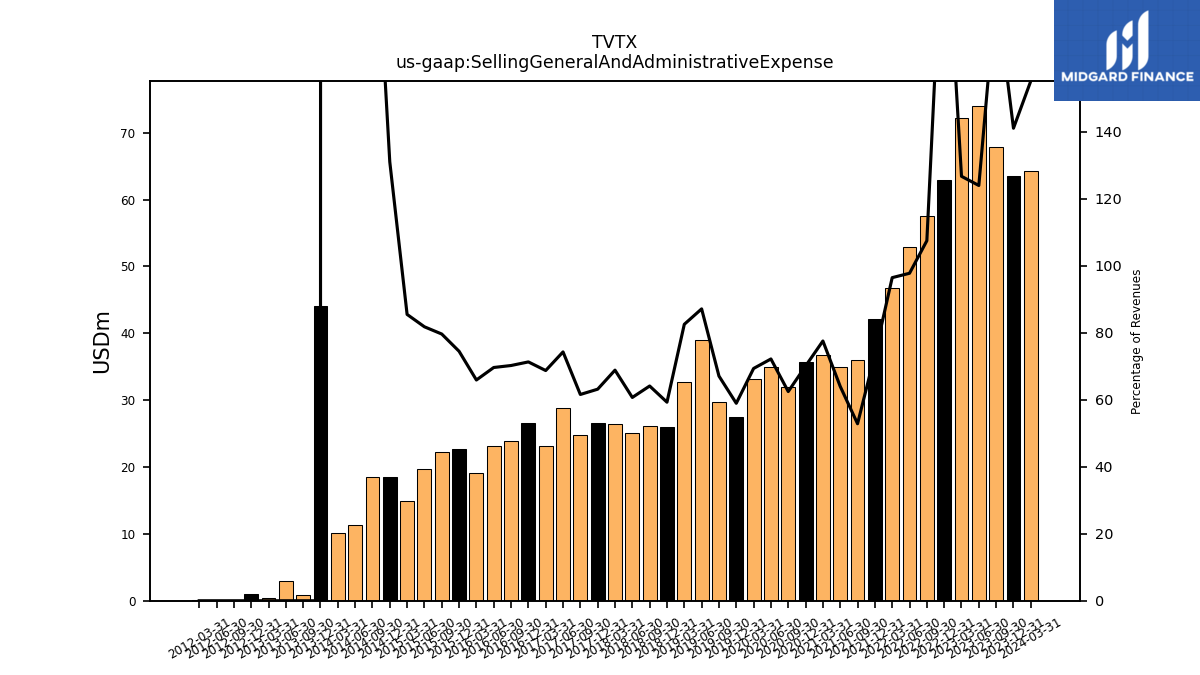
| Selling General And Administrative Expense | 67.80 | 74.04 | 72.25 | 62.92 | 57.52 | 52.98 | 46.79 | 42.08 | 36.06 | 34.97 | 36.78 | 35.74 | 31.95 | 34.97 | 33.14 | 27.53 | 29.78 | 38.97 | 32.67 | 25.95 | 26.11 | 25.10 | 26.47 | 26.65 | 24.85 | 28.84 | 23.11 | 26.62 | 23.85 | 23.20 | 19.12 | 22.68 | 22.31 | 19.69 | 14.86 | 18.46 | 18.58 | 11.34 | 10.09 | NA | NA | NA | NA | NA | NA | NA | NA | NA | |
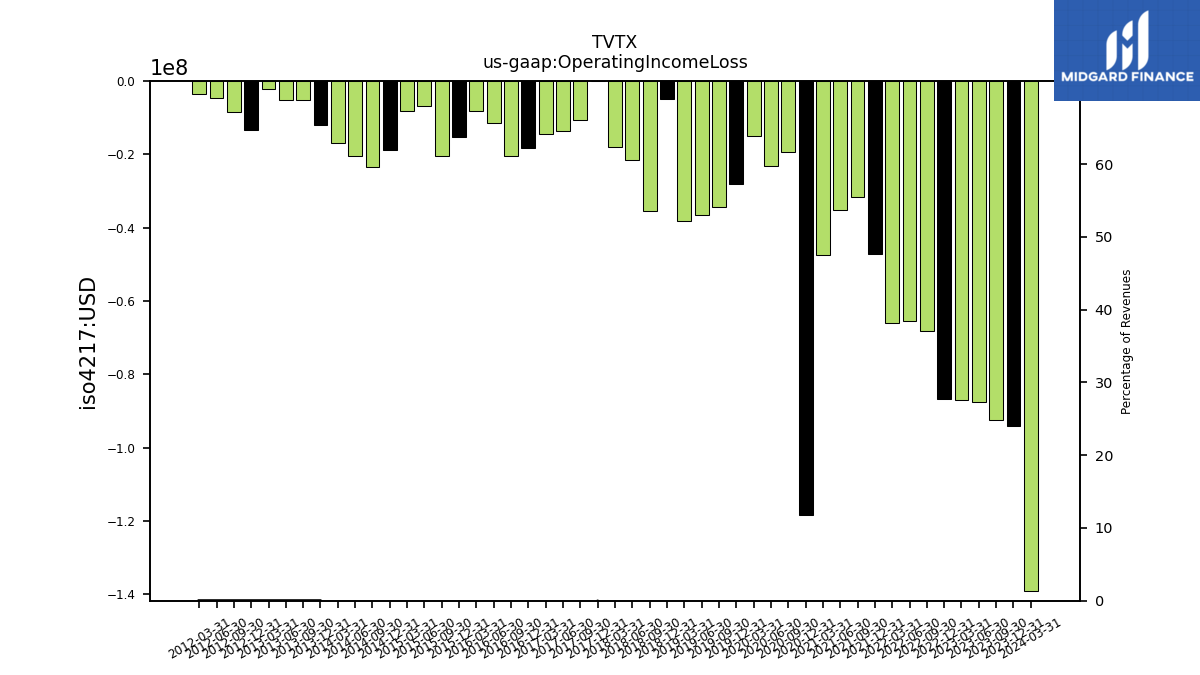
| Operating Income Loss | -92.58 | -87.58 | -87.05 | -66.85 | -68.13 | -65.45 | -66.13 | -47.19 | -31.71 | -35.31 | -47.55 | -118.55 | -19.43 | -23.11 | -15.07 | -28.17 | -34.44 | -36.53 | -38.23 | -4.99 | -35.58 | -21.56 | -17.91 | -0.01 | -10.61 | -13.60 | -14.41 | -18.22 | -20.37 | -11.38 | -8.24 | -15.20 | -20.50 | -6.82 | -8.10 | -18.70 | -23.44 | -20.50 | -16.95 | NA | NA | NA | NA | NA | NA | NA | NA | NA | |
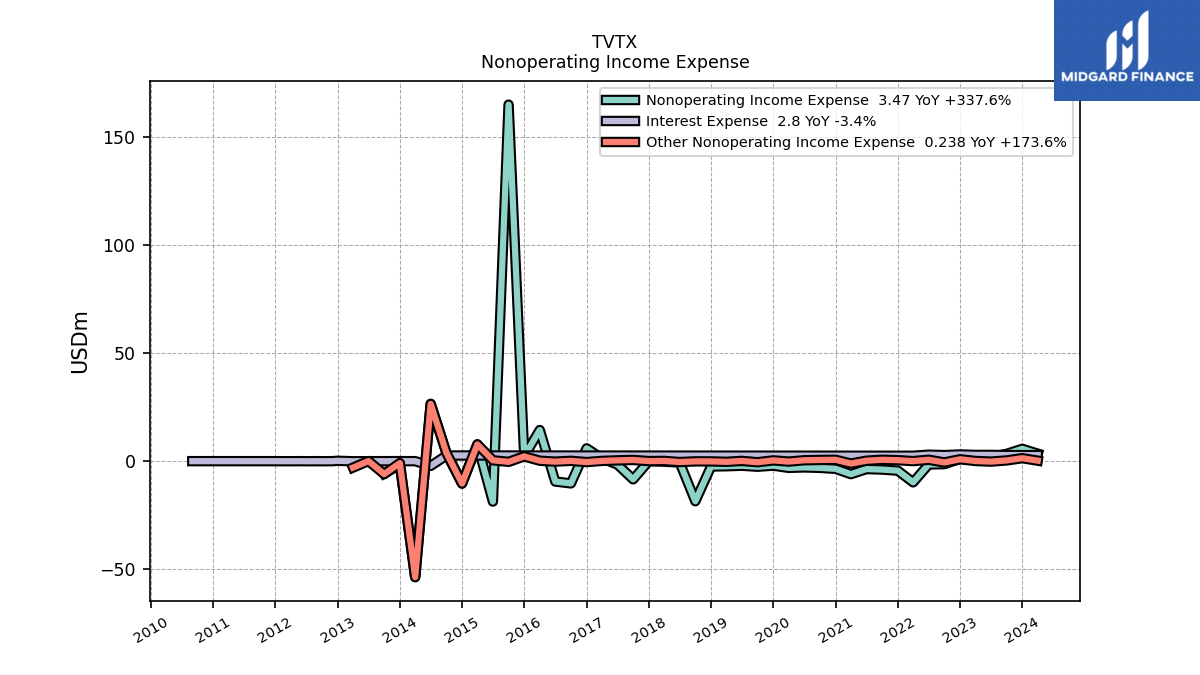
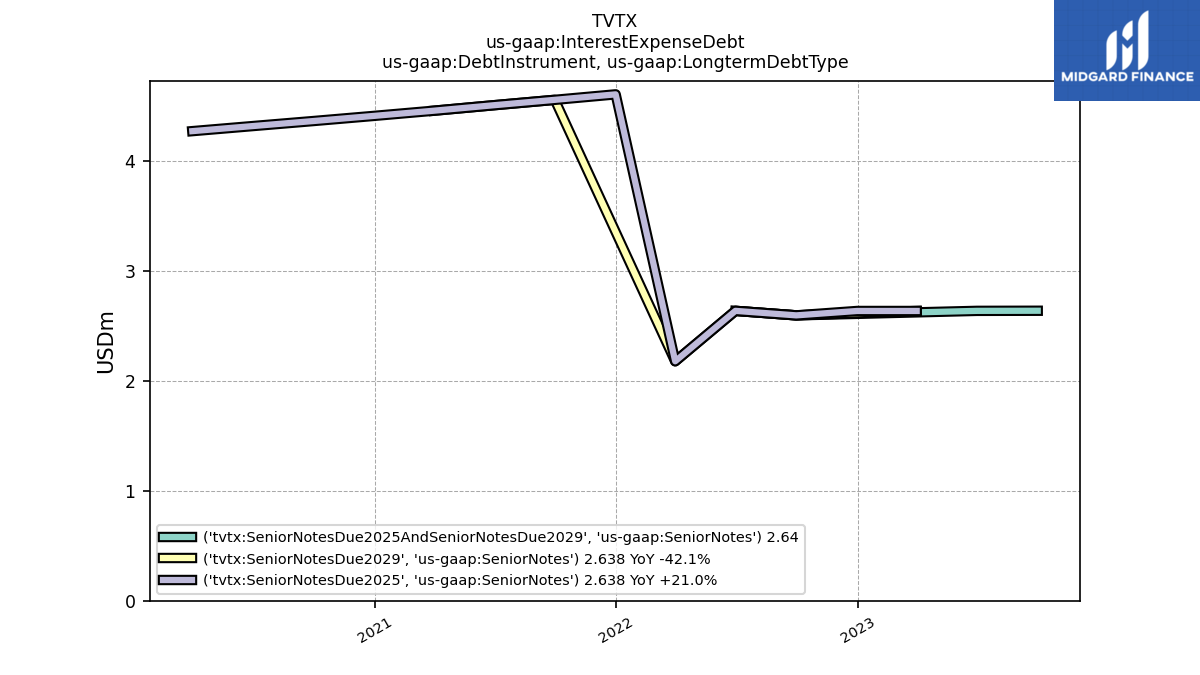
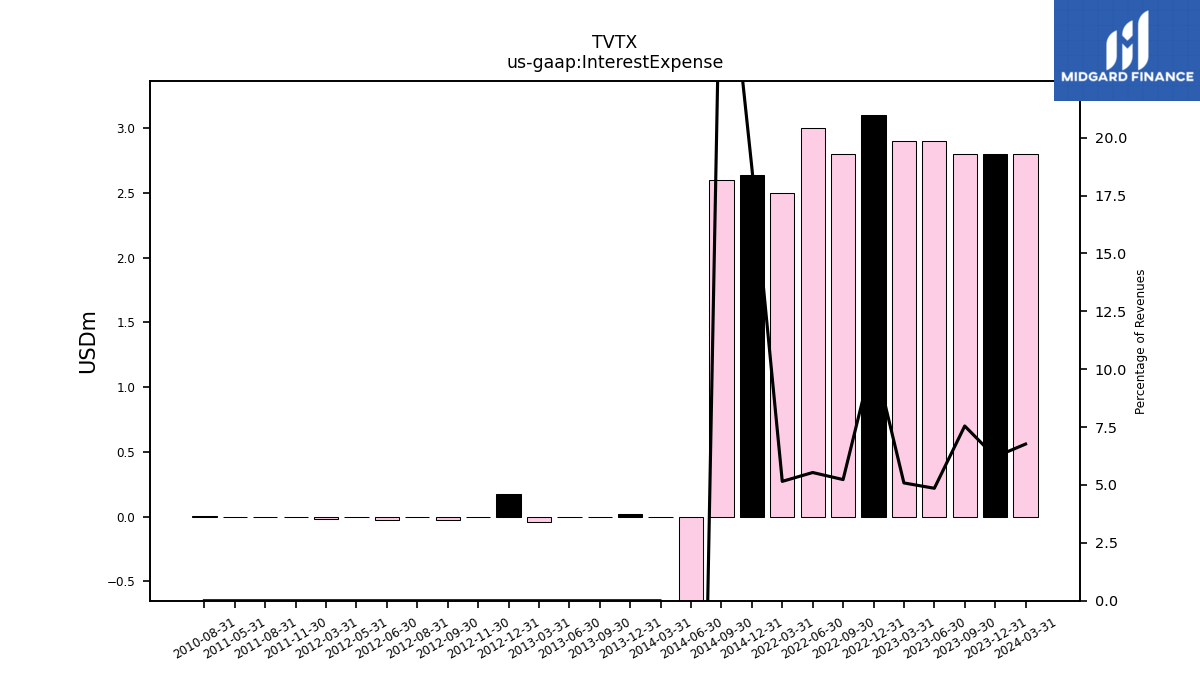
| Interest Expense | 2.80 | 2.90 | 2.90 | 3.10 | 2.80 | 3.00 | 2.50 | NA | NA | NA | NA | NA | NA | NA | NA | NA | NA | NA | NA | NA | NA | NA | NA | NA | NA | NA | NA | NA | NA | NA | NA | NA | NA | NA | NA | 2.63 | 2.60 | -2.18 | 0.00 | 0.00 | 0.00 | 0.00 | 0.00 | 0.00 | 0.00 | NA | NA | 0.00 | |
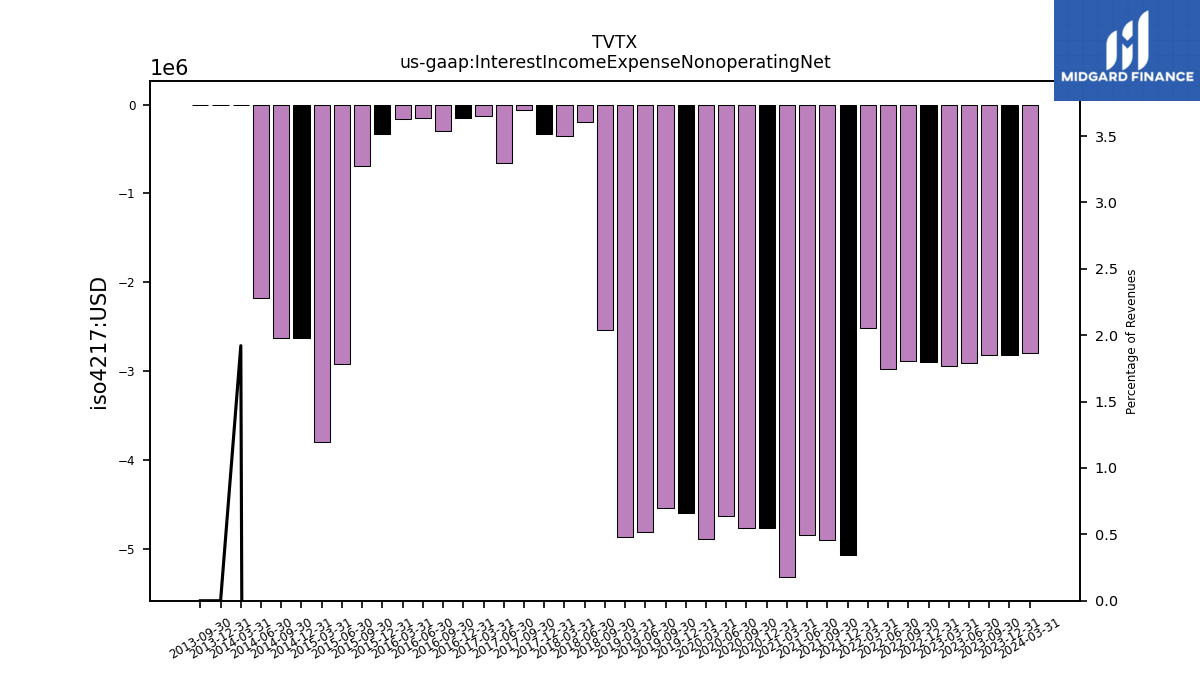
| Interest Income Expense Nonoperating Net | -2.82 | -2.91 | -2.94 | -2.90 | -2.89 | -2.97 | -2.52 | -5.07 | -4.90 | -4.85 | -5.32 | -4.76 | -4.77 | -4.63 | -4.89 | -4.60 | -4.55 | -4.82 | -4.87 | NA | -2.53 | -0.20 | -0.36 | -0.33 | -0.07 | -0.66 | -0.13 | -0.15 | -0.30 | -0.15 | -0.16 | -0.33 | -0.69 | -2.92 | -3.80 | -2.63 | -2.63 | -2.18 | 0.00 | NA | NA | NA | NA | NA | NA | NA | NA | NA | |
| Gains Losses On Extinguishment Of Debt | NA | NA | NA | 0.00 | 0.00 | 0.00 | -7.58 | NA | NA | NA | NA | NA | NA | NA | NA | 0.00 | 0.00 | NA | NA | 0.00 | -17.04 | NA | NA | 0.00 | 0.00 | NA | NA | 0.00 | 0.00 | 0.00 | NA | 0.00 | -4.15 | -2.25 | NA | 0.00 | 0.00 | NA | NA | NA | NA | NA | NA | NA | NA | NA | NA | NA | |
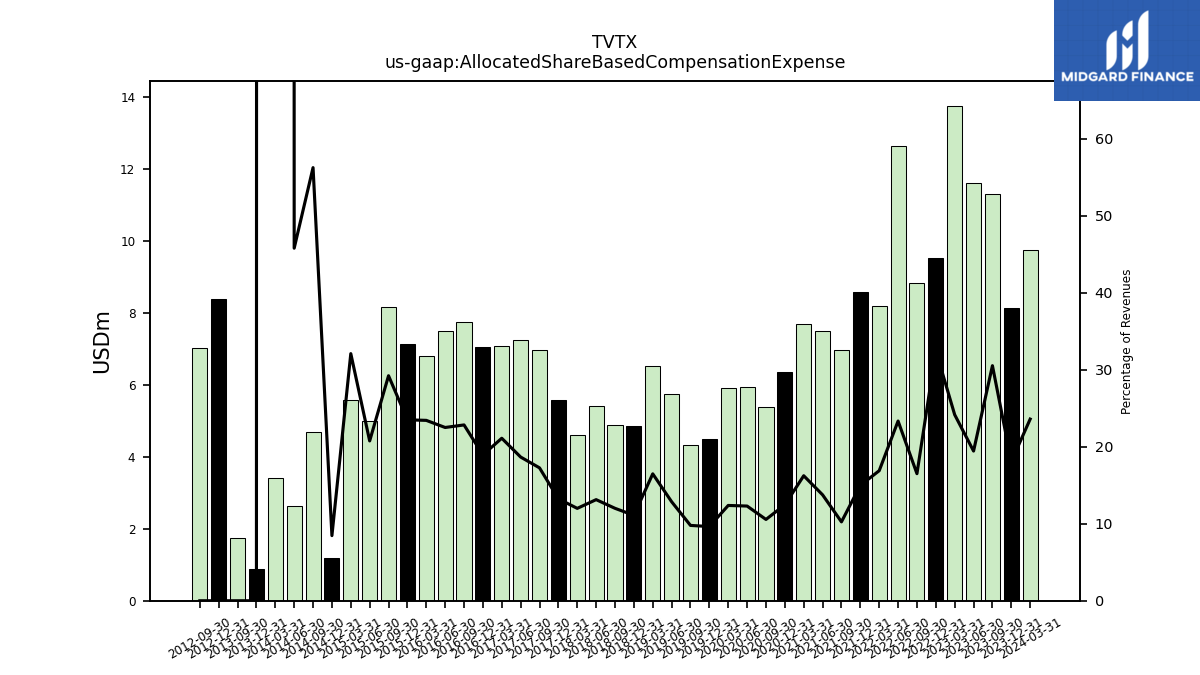
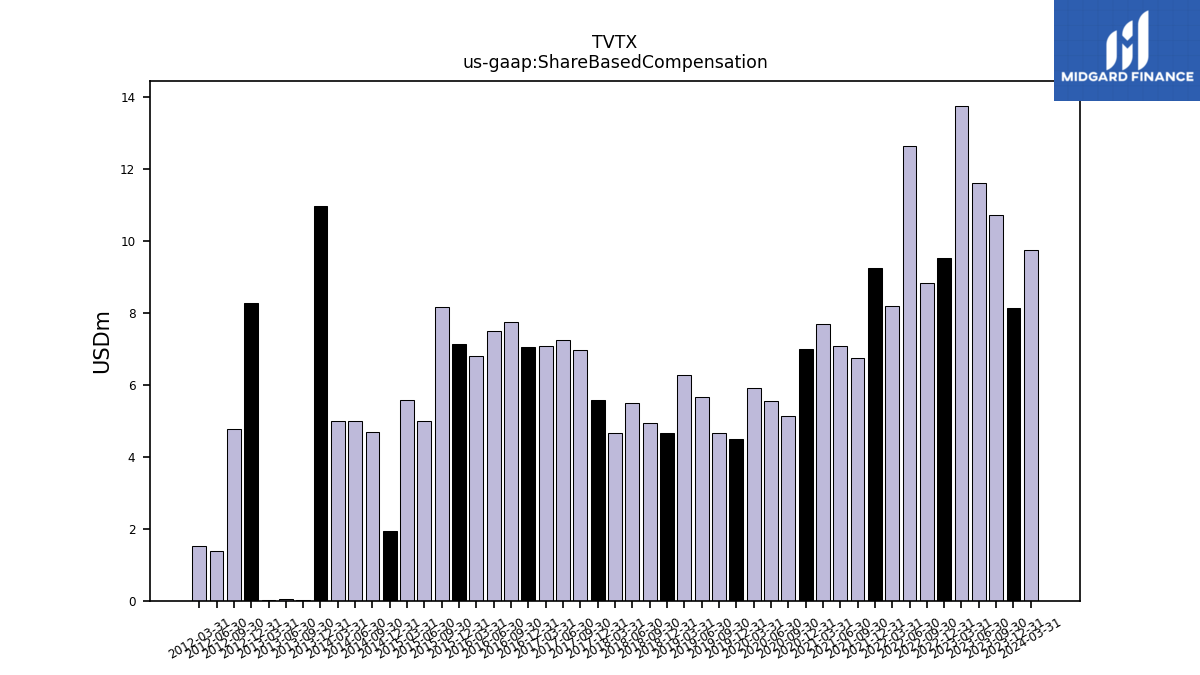
| Allocated Share Based Compensation Expense | 11.32 | 11.60 | 13.76 | 9.53 | 8.83 | 12.64 | 8.19 | 8.58 | 6.99 | 7.51 | 7.69 | 6.35 | 5.40 | 5.95 | 5.91 | 4.50 | 4.34 | 5.75 | 6.52 | 4.85 | 4.88 | 5.43 | 4.61 | 5.58 | 6.96 | 7.24 | 7.09 | 7.07 | 7.75 | 7.49 | 6.79 | 7.15 | 8.18 | 4.99 | 5.57 | 1.19 | 4.69 | 2.63 | 3.40 | NA | NA | NA | NA | NA | NA | NA | NA | NA | |
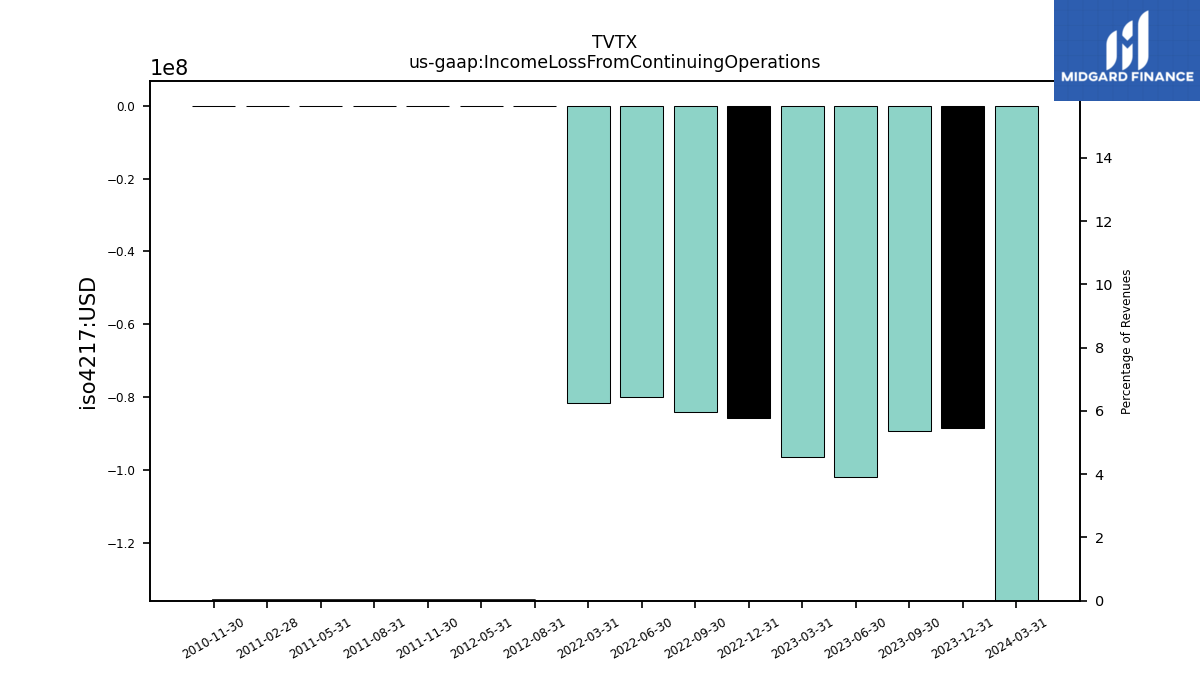
| Income Loss From Continuing Operations | -89.24 | NA | NA | NA | -84.06 | NA | NA | NA | NA | NA | NA | NA | NA | NA | NA | NA | NA | NA | NA | NA | NA | NA | NA | NA | NA | NA | NA | NA | NA | NA | NA | NA | NA | NA | NA | NA | NA | NA | NA | NA | -0.00 | -0.00 | -0.00 | -0.00 | -0.00 | 0.02 | -0.01 | NA | |
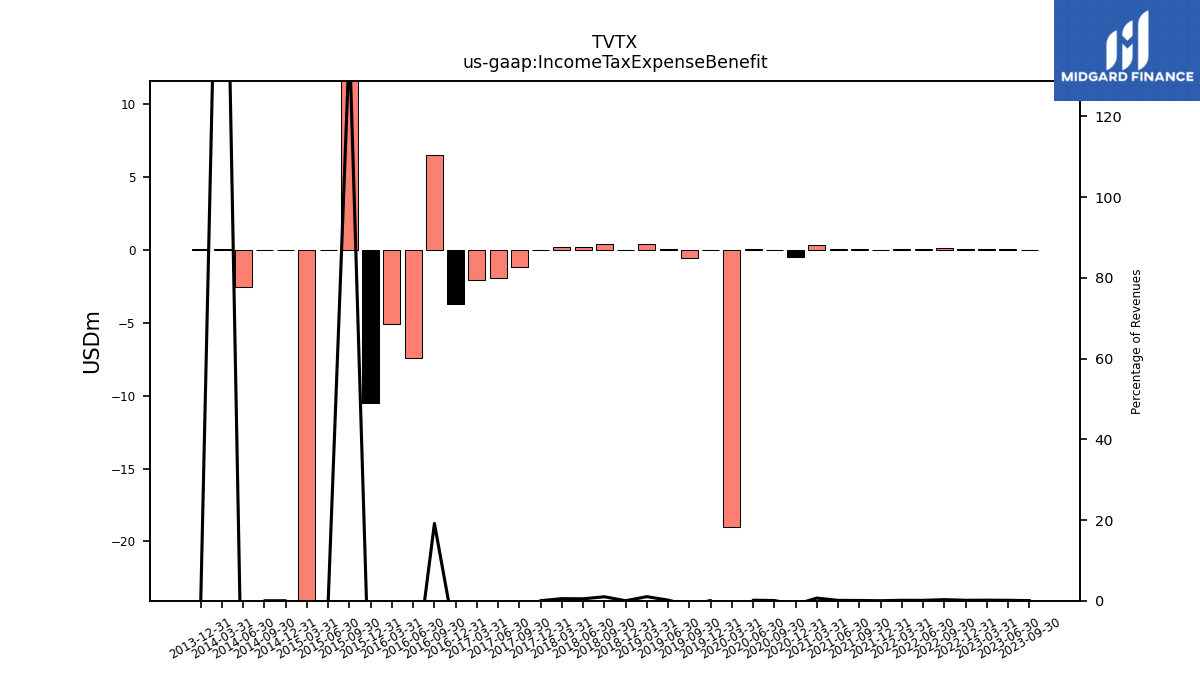
| Income Tax Expense Benefit | 0.01 | 0.07 | 0.08 | 0.06 | 0.14 | 0.05 | 0.05 | 0.00 | 0.04 | 0.05 | 0.31 | -0.47 | 0.02 | 0.07 | -18.98 | 0.03 | -0.52 | 0.07 | 0.40 | 0.00 | 0.40 | 0.20 | 0.20 | 0.01 | -1.20 | -1.93 | -2.06 | -3.68 | 6.50 | -7.39 | -5.10 | -10.53 | 38.76 | 0.01 | -40.02 | 0.00 | 0.00 | -2.53 | 0.07 | NA | NA | NA | NA | NA | NA | NA | NA | NA | |
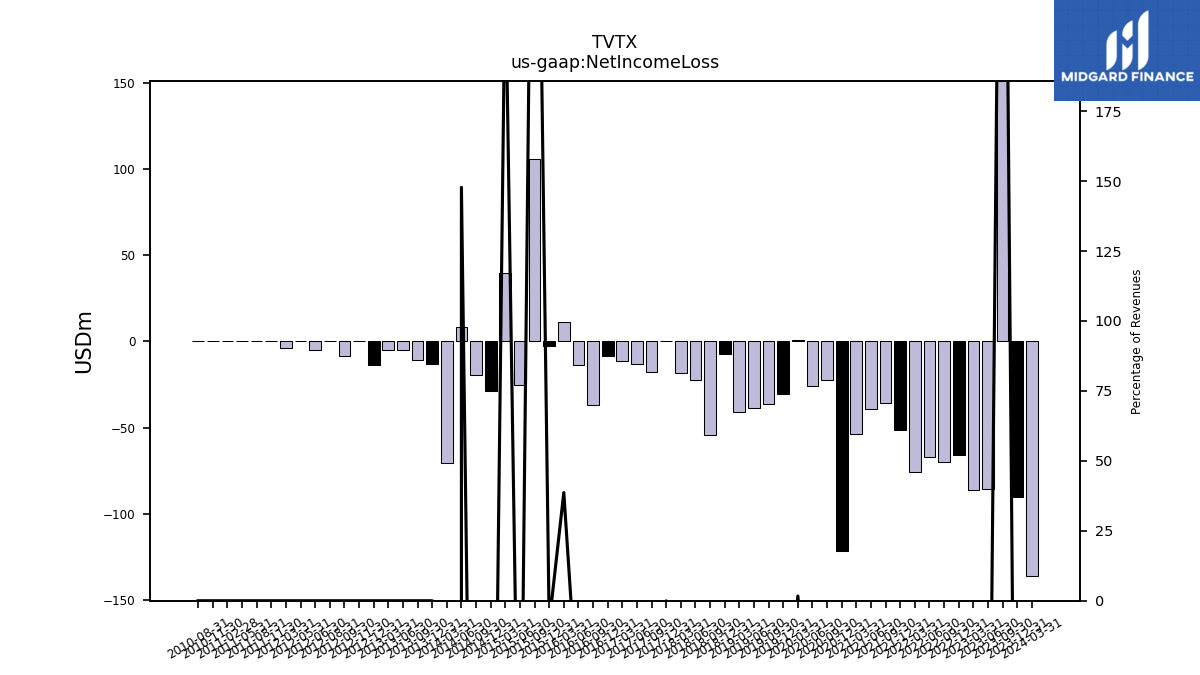
| Net Income Loss | 150.74 | -85.63 | -86.33 | -65.82 | -69.66 | -67.03 | -75.97 | -51.57 | -35.64 | -39.01 | -53.87 | -121.62 | -22.55 | -26.07 | 0.81 | -30.26 | -36.49 | -38.70 | -40.98 | -7.46 | -54.52 | -22.33 | -18.38 | -0.02 | -17.79 | -13.23 | -11.09 | -8.60 | -37.11 | -13.40 | 11.22 | -2.47 | 105.58 | -25.53 | 39.65 | -29.03 | -19.56 | 8.48 | -70.63 | -0.00 | -0.00 | -0.00 | -0.00 | -0.00 | -0.00 | -0.00 | -0.01 | -0.01 | |
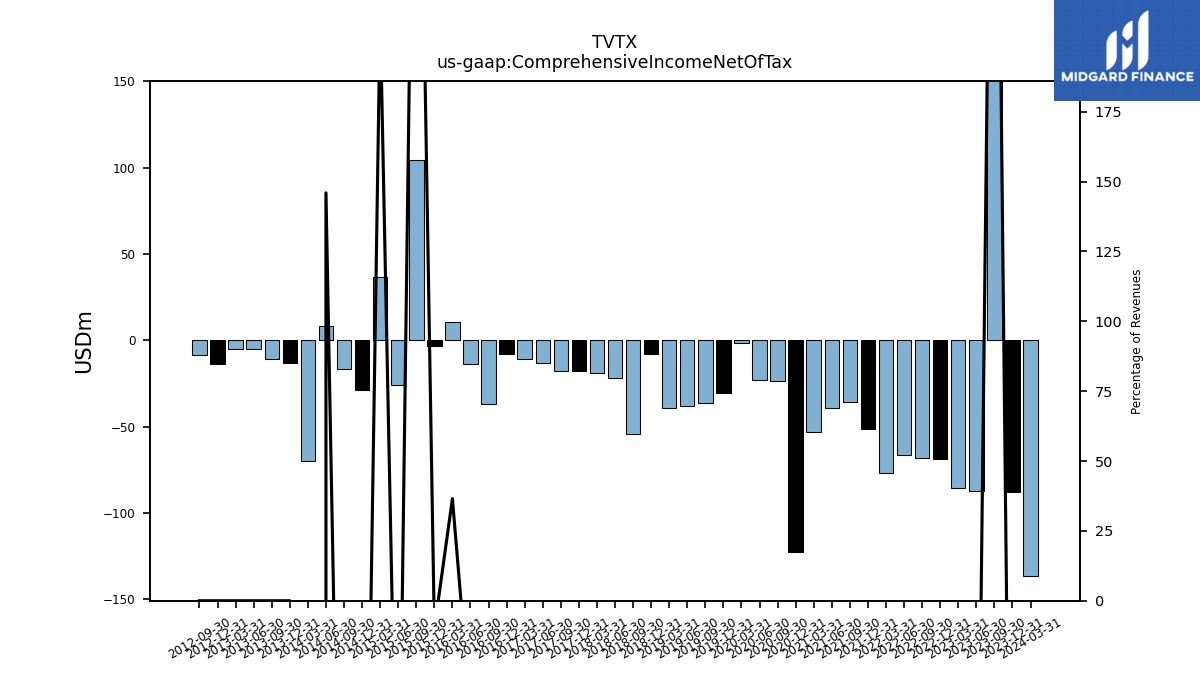
| Comprehensive Income Net Of Tax | 150.94 | -87.31 | -85.60 | -69.03 | -68.27 | -66.42 | -77.10 | -51.61 | -35.52 | -39.39 | -53.23 | -122.88 | -23.59 | -23.17 | -1.42 | -30.70 | -36.10 | -37.98 | -39.39 | -7.90 | -54.45 | -21.95 | -18.89 | -18.04 | -17.81 | -13.38 | -11.02 | -8.03 | -36.79 | -13.49 | 10.60 | -3.05 | 104.72 | -25.86 | 36.46 | -28.70 | -16.32 | 8.38 | -70.00 | NA | NA | NA | NA | NA | NA | NA | NA | NA | |
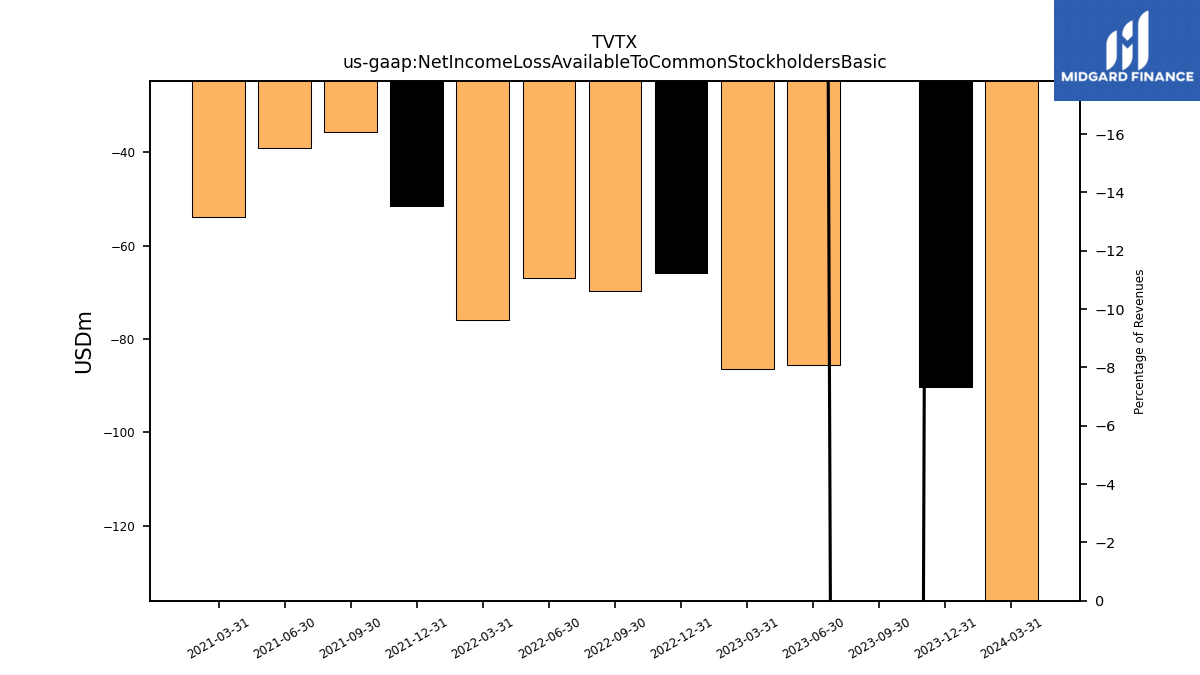
| Net Income Loss Available To Common Stockholders Basic | 150.74 | -85.63 | -86.33 | -65.82 | -69.66 | -67.03 | -75.97 | -51.57 | -35.64 | -39.01 | -53.87 | NA | NA | NA | NA | NA | NA | NA | NA | NA | NA | NA | NA | NA | NA | NA | NA | NA | NA | NA | NA | NA | NA | NA | NA | NA | NA | NA | NA | NA | NA | NA | NA | NA | NA | NA | NA | NA | |
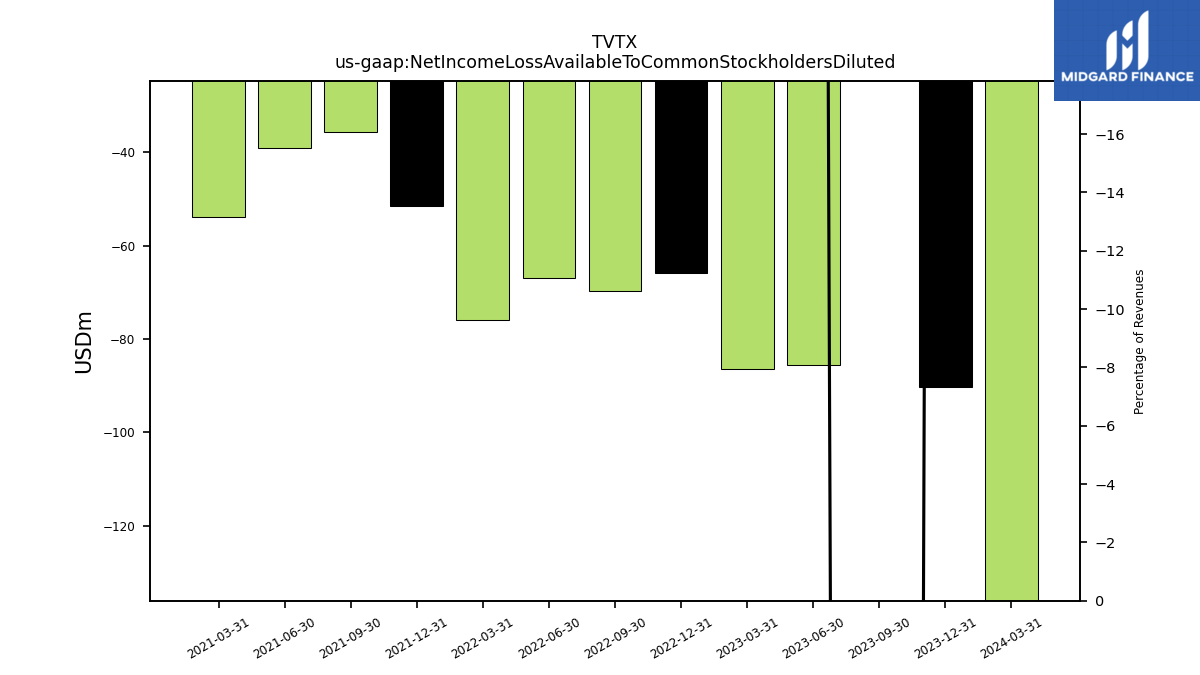
| Net Income Loss Available To Common Stockholders Diluted | 150.74 | -85.63 | -86.33 | -65.82 | -69.66 | -67.03 | -75.97 | -51.57 | -35.64 | -39.01 | -53.87 | NA | NA | NA | NA | NA | NA | NA | NA | NA | NA | NA | NA | NA | NA | NA | NA | NA | NA | NA | NA | NA | NA | NA | NA | NA | NA | NA | NA | NA | NA | NA | NA | NA | NA | NA | NA | NA |
| 2023-09-30 | 2023-06-30 | 2023-03-31 | 2022-12-31 | 2022-09-30 | 2022-06-30 | 2022-03-31 | 2021-12-31 | 2021-09-30 | 2021-06-30 | 2021-03-31 | 2020-12-31 | 2020-09-30 | 2020-06-30 | 2020-03-31 | 2019-12-31 | 2019-09-30 | 2019-06-30 | 2019-03-31 | 2018-12-31 | 2018-09-30 | 2018-06-30 | 2018-03-31 | 2017-12-31 | 2017-09-30 | 2017-06-30 | 2017-03-31 | 2016-12-31 | 2016-09-30 | 2016-06-30 | 2016-03-31 | 2015-12-31 | 2015-09-30 | 2015-06-30 | 2015-03-31 | 2014-12-31 | 2014-09-30 | 2014-06-30 | 2014-03-31 | 2012-11-30 | 2012-08-31 | 2012-05-31 | 2011-11-30 | 2011-08-31 | 2011-05-31 | 2011-02-28 | 2010-11-30 | 2010-08-31 | ||
|---|---|---|---|---|---|---|---|---|---|---|---|---|---|---|---|---|---|---|---|---|---|---|---|---|---|---|---|---|---|---|---|---|---|---|---|---|---|---|---|---|---|---|---|---|---|---|---|---|---|
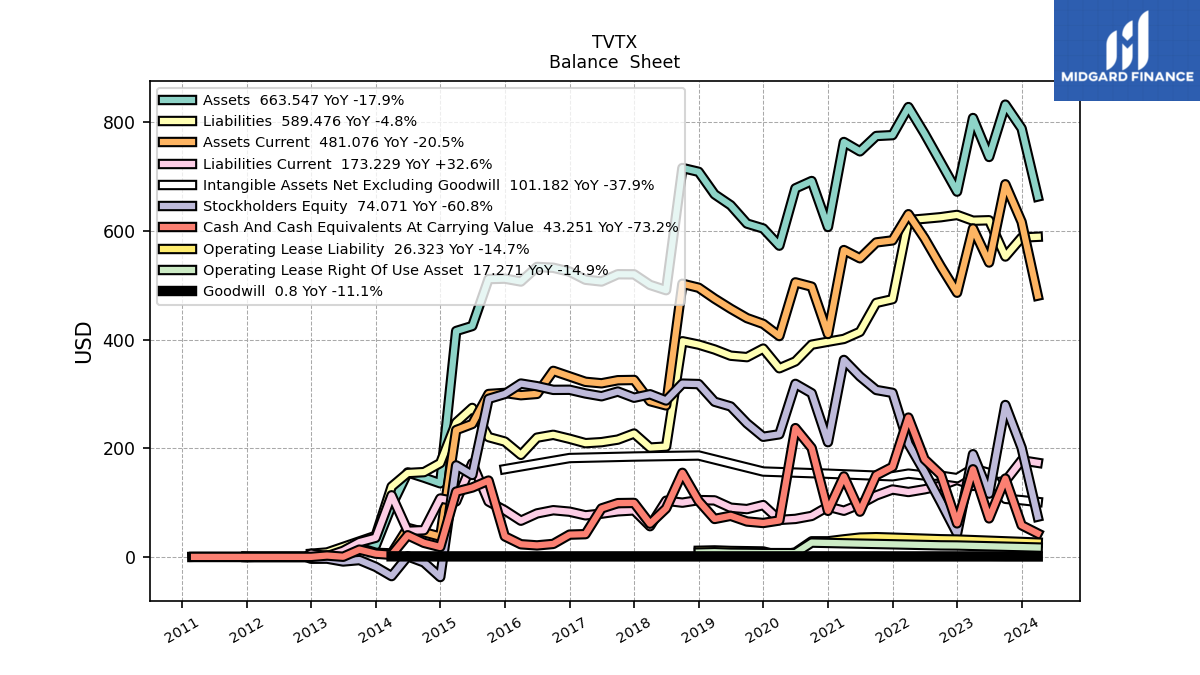
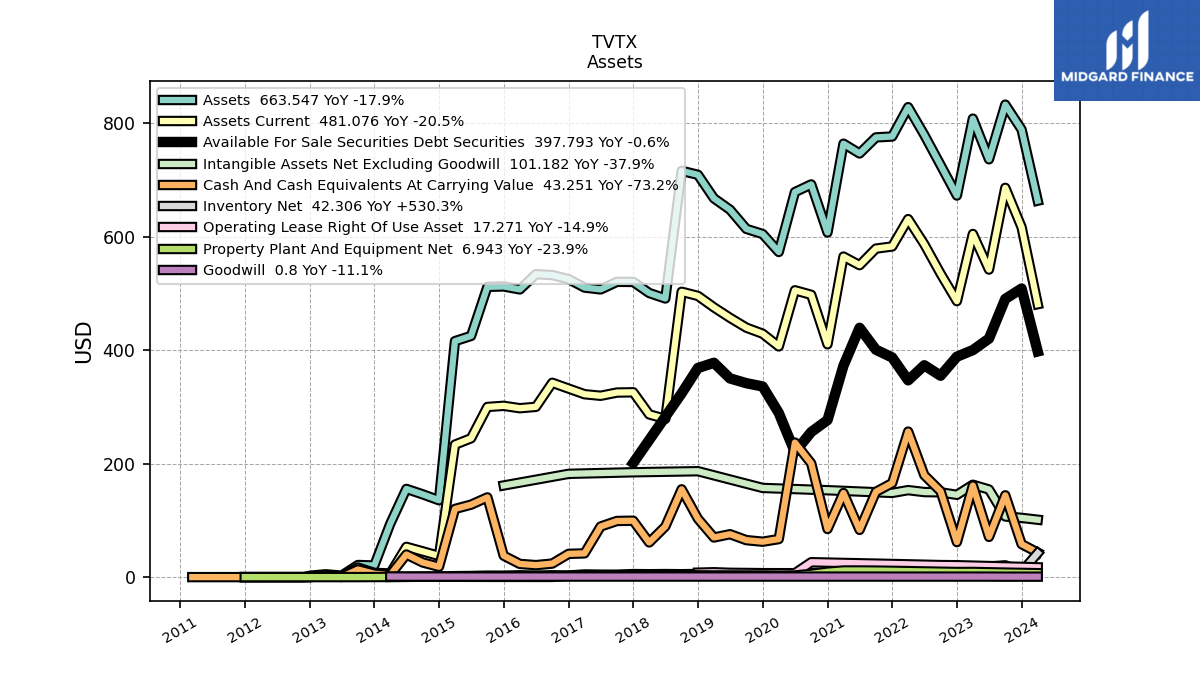
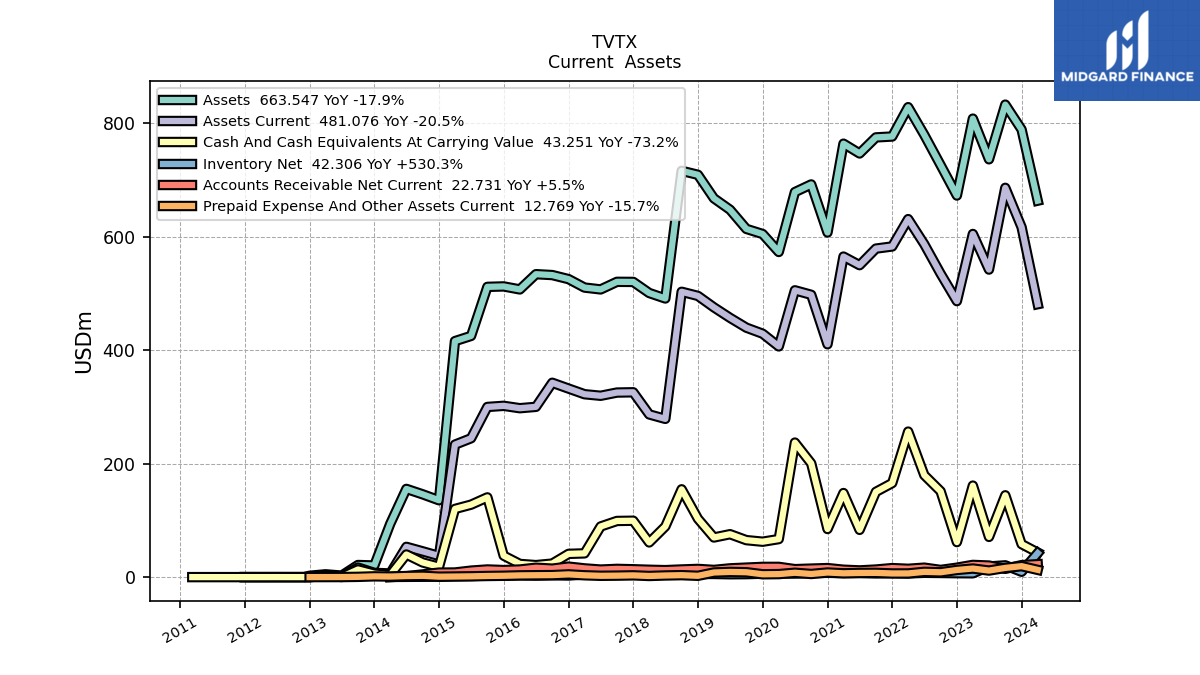
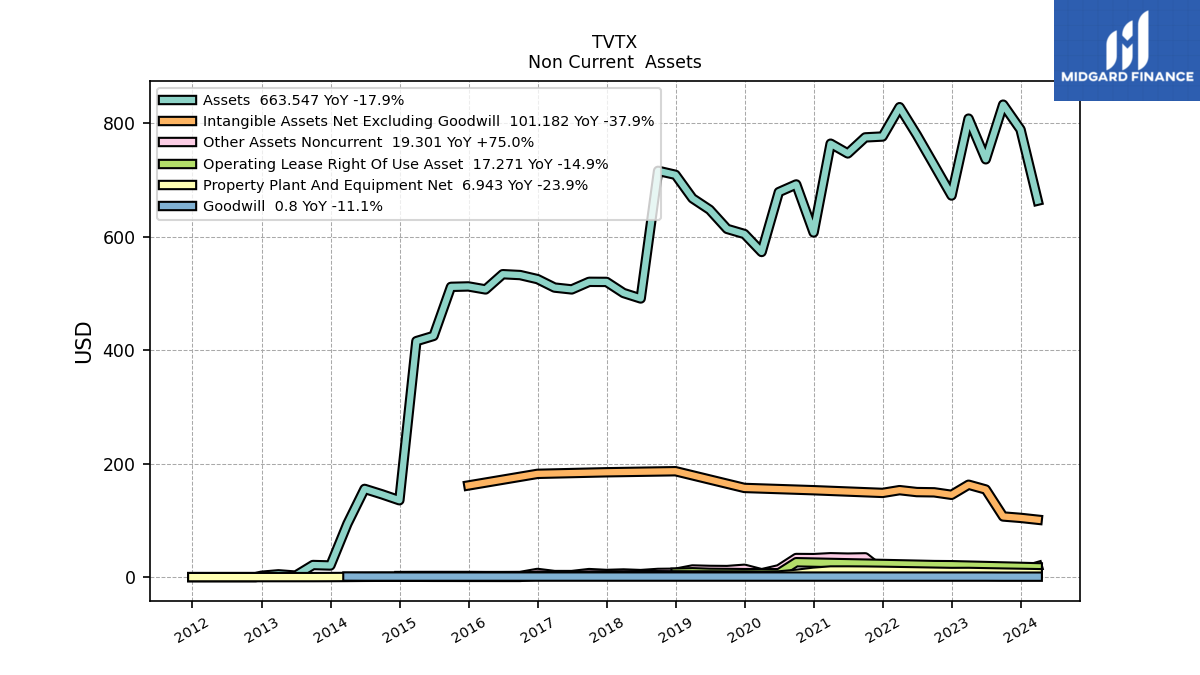
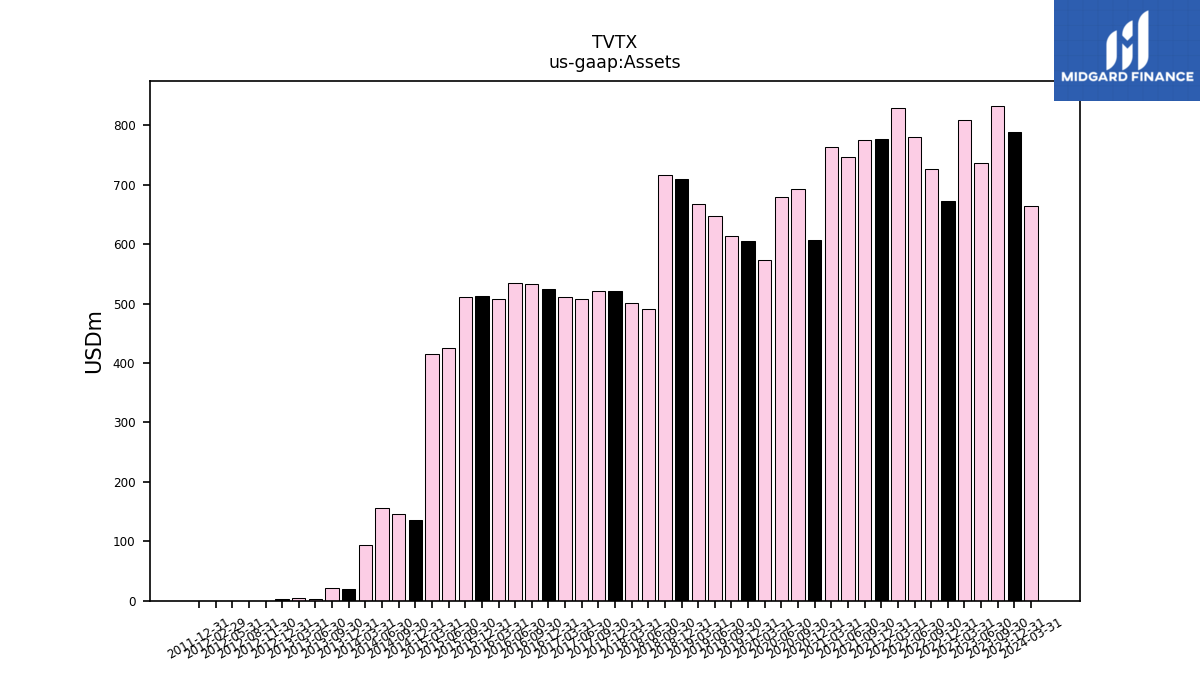
| Assets | 832.85 | 736.43 | 808.23 | 672.59 | 726.22 | 779.49 | 828.40 | 776.63 | 775.08 | 746.77 | 764.04 | 607.44 | 692.22 | 678.69 | 573.06 | 604.80 | 613.82 | 647.57 | 667.67 | 709.16 | 716.19 | 491.14 | 500.79 | 520.35 | 520.51 | 507.13 | 510.38 | 525.28 | 532.42 | 533.97 | 507.10 | 512.40 | 511.63 | 425.14 | 415.99 | 135.47 | 145.93 | 155.54 | 94.05 | 0.00 | 0.00 | 0.00 | NA | NA | NA | NA | NA | NA | |
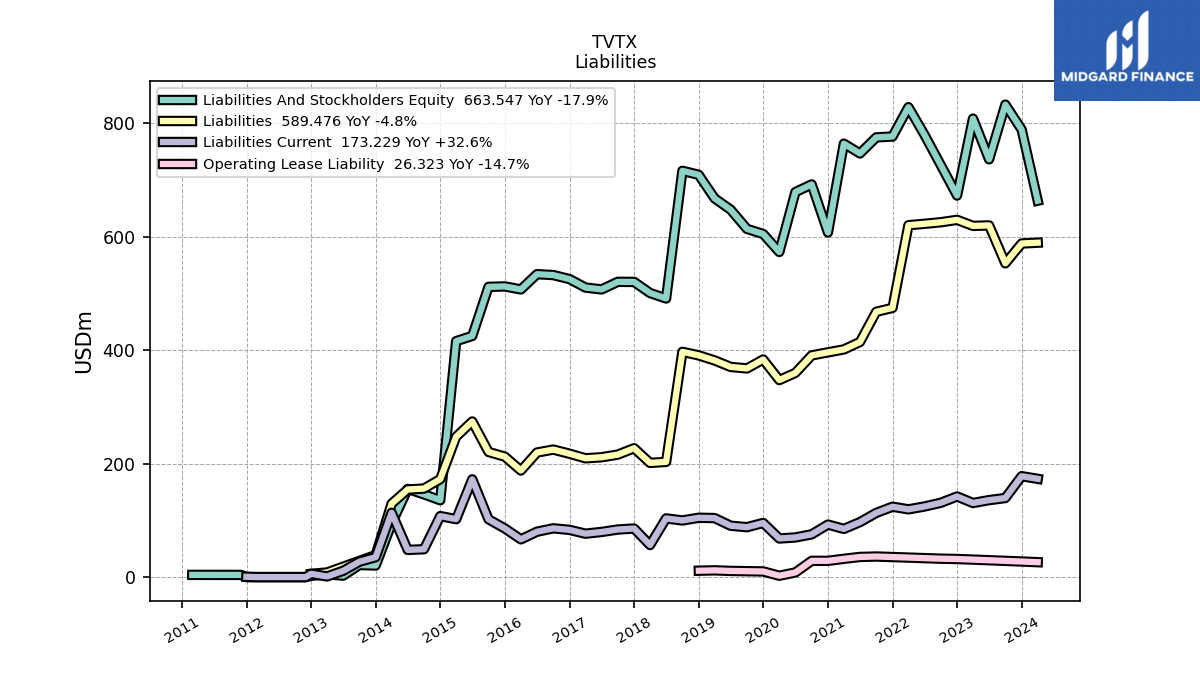
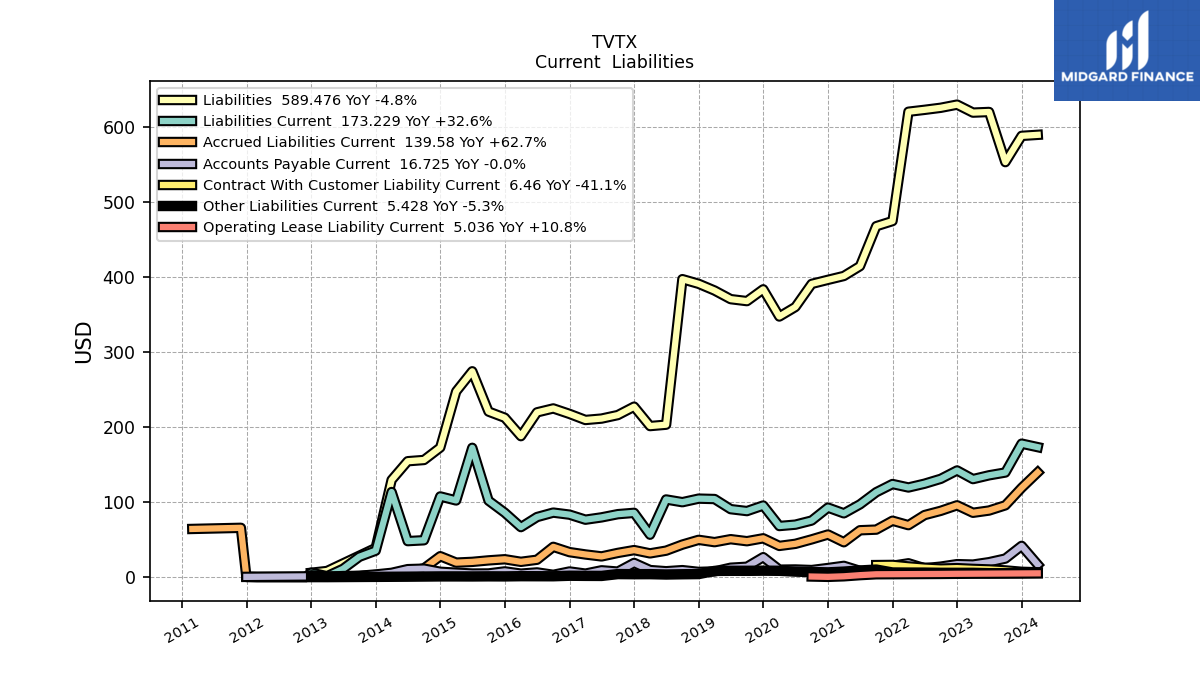
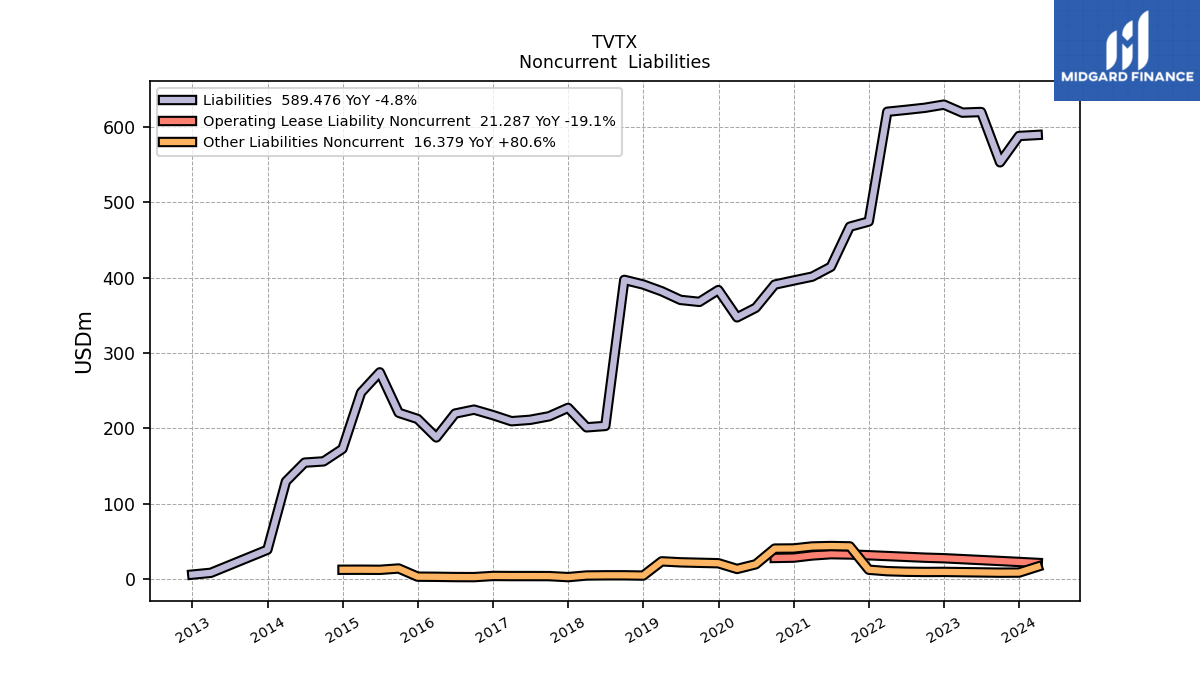
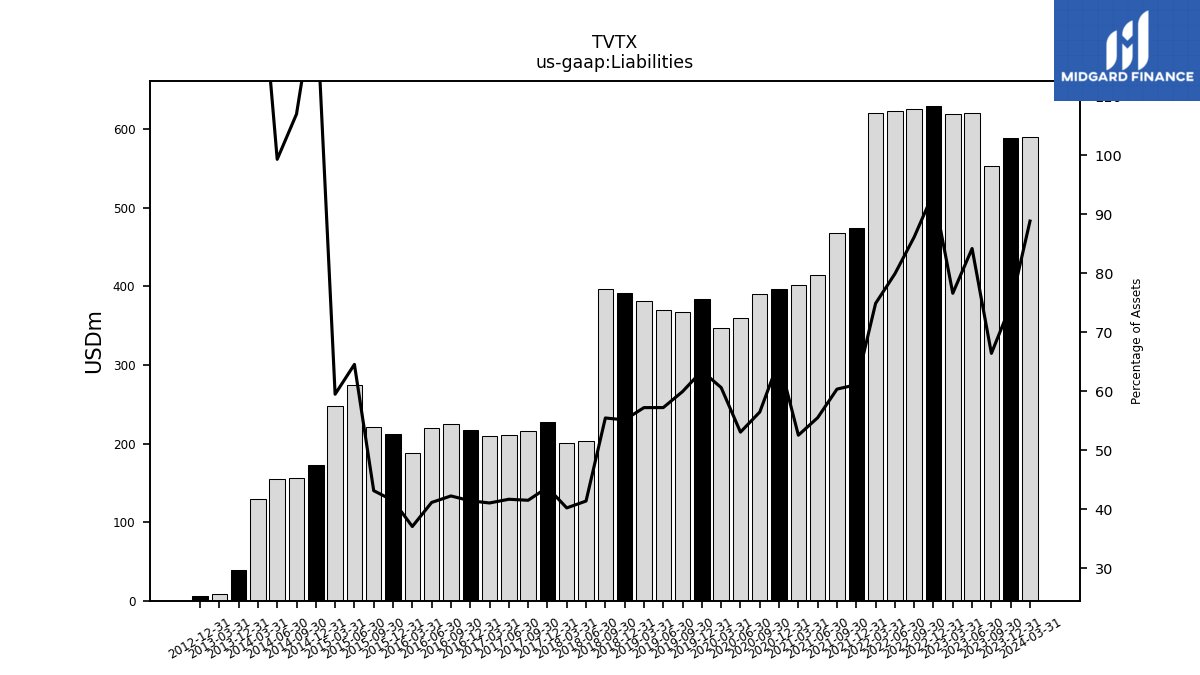
| Liabilities | 553.08 | 619.94 | 619.09 | 629.73 | 625.54 | 622.78 | 620.26 | 474.52 | 467.70 | 414.46 | 401.36 | 396.23 | 390.81 | 360.05 | 347.31 | 383.60 | 367.86 | 370.49 | 381.96 | 390.91 | 397.12 | 203.16 | 201.32 | 227.21 | 215.99 | 211.30 | 209.45 | 217.51 | 224.82 | 219.60 | 187.87 | 212.43 | 220.62 | 274.36 | 247.42 | 172.72 | 156.12 | 154.47 | 129.44 | NA | NA | NA | NA | NA | NA | NA | NA | NA | |
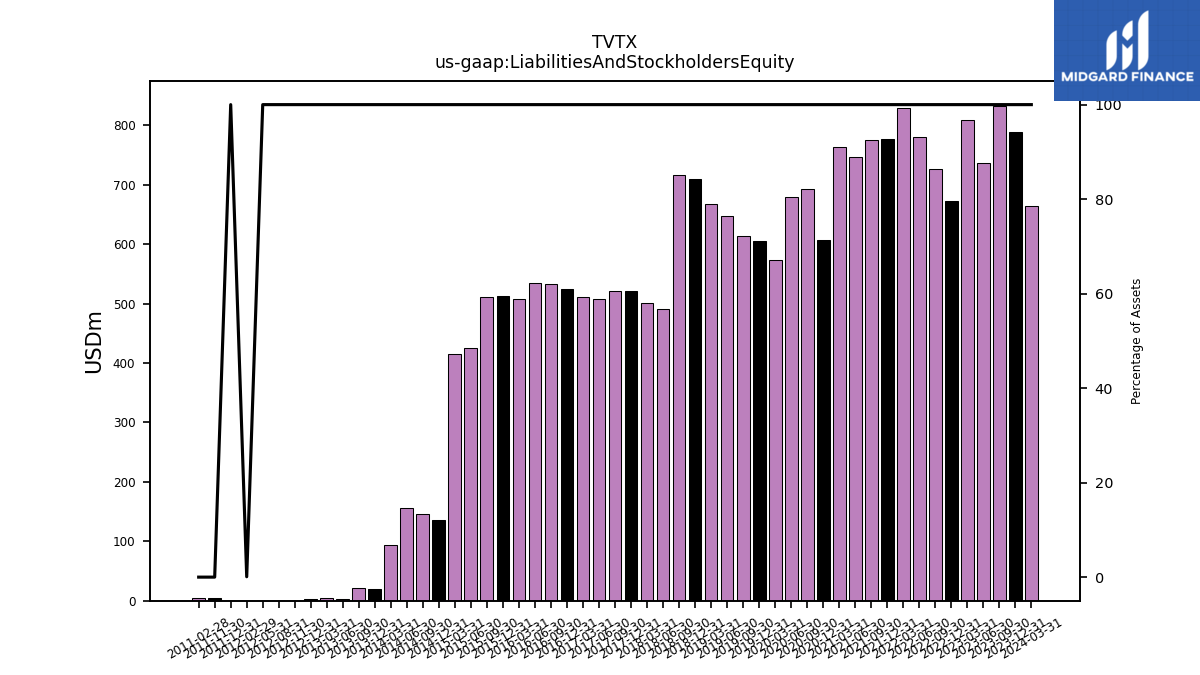
| Liabilities And Stockholders Equity | 832.85 | 736.43 | 808.23 | 672.59 | 726.22 | 779.49 | 828.40 | 776.63 | 775.08 | 746.77 | 764.04 | 607.44 | 692.22 | 678.69 | 573.06 | 604.80 | 613.82 | 647.57 | 667.67 | 709.16 | 716.19 | 491.14 | 500.79 | 520.35 | 520.51 | 507.13 | 510.38 | 525.28 | 532.42 | 533.97 | 507.10 | 512.40 | 511.63 | 425.14 | 415.99 | 135.47 | 145.93 | 155.54 | 94.05 | 0.00 | 0.00 | 0.00 | 3.89 | NA | NA | 3.96 | NA | NA | |
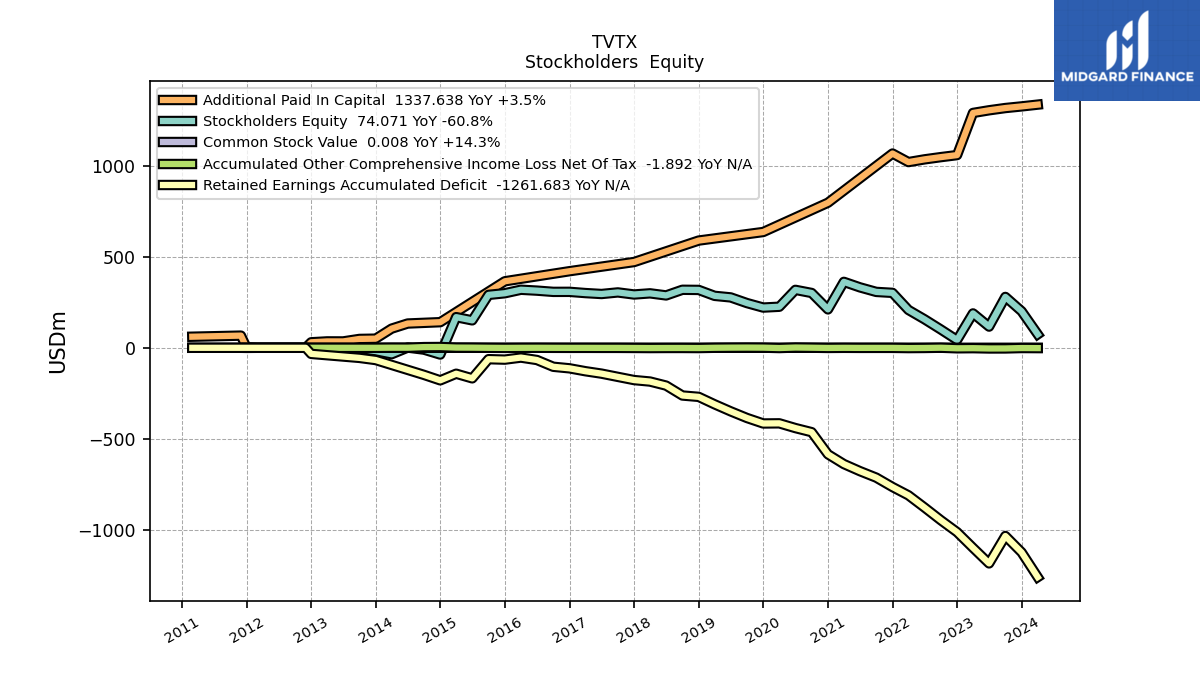
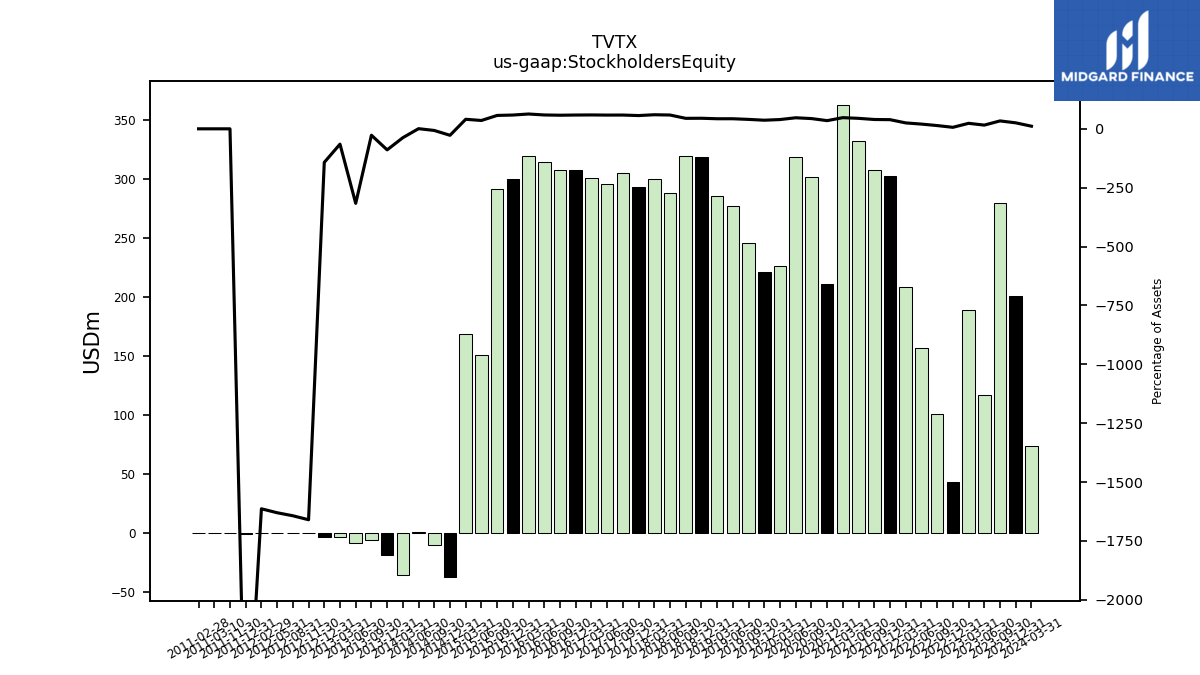
| Stockholders Equity | 279.77 | 116.48 | 189.14 | 42.85 | 100.68 | 156.71 | 208.14 | 302.11 | 307.37 | 332.30 | 362.69 | 211.21 | 301.41 | 318.64 | 225.75 | 221.20 | 245.96 | 277.09 | 285.71 | 318.25 | 319.06 | 287.99 | 299.48 | 293.13 | 304.52 | 295.83 | 300.94 | 307.77 | 307.60 | 314.37 | 319.23 | 299.97 | 291.01 | 150.78 | 168.57 | -37.25 | -10.19 | 1.07 | -35.39 | -0.06 | -0.06 | -0.06 | -0.06 | NA | NA | -0.06 | NA | NA |
| 2023-09-30 | 2023-06-30 | 2023-03-31 | 2022-12-31 | 2022-09-30 | 2022-06-30 | 2022-03-31 | 2021-12-31 | 2021-09-30 | 2021-06-30 | 2021-03-31 | 2020-12-31 | 2020-09-30 | 2020-06-30 | 2020-03-31 | 2019-12-31 | 2019-09-30 | 2019-06-30 | 2019-03-31 | 2018-12-31 | 2018-09-30 | 2018-06-30 | 2018-03-31 | 2017-12-31 | 2017-09-30 | 2017-06-30 | 2017-03-31 | 2016-12-31 | 2016-09-30 | 2016-06-30 | 2016-03-31 | 2015-12-31 | 2015-09-30 | 2015-06-30 | 2015-03-31 | 2014-12-31 | 2014-09-30 | 2014-06-30 | 2014-03-31 | 2012-11-30 | 2012-08-31 | 2012-05-31 | 2011-11-30 | 2011-08-31 | 2011-05-31 | 2011-02-28 | 2010-11-30 | 2010-08-31 | ||
|---|---|---|---|---|---|---|---|---|---|---|---|---|---|---|---|---|---|---|---|---|---|---|---|---|---|---|---|---|---|---|---|---|---|---|---|---|---|---|---|---|---|---|---|---|---|---|---|---|---|
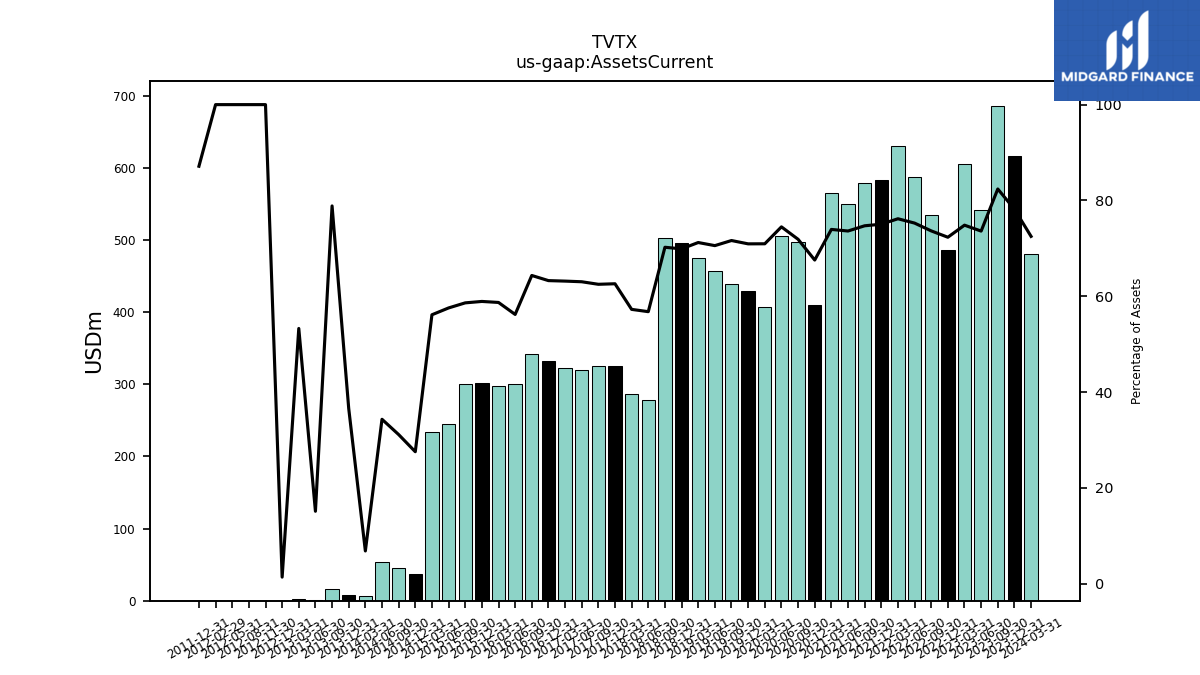
| Assets Current | 686.23 | 542.05 | 604.90 | 486.44 | 534.84 | 586.78 | 631.09 | 582.83 | 579.08 | 549.80 | 565.04 | 410.41 | 497.68 | 505.56 | 406.63 | 429.06 | 439.72 | 457.01 | 475.51 | 495.68 | 502.99 | 278.92 | 286.80 | 325.81 | 325.34 | 319.66 | 322.40 | 332.35 | 342.59 | 300.16 | 297.74 | 301.93 | 299.95 | 244.74 | 233.54 | 37.33 | 45.44 | 53.40 | 6.44 | 0.00 | 0.00 | 0.00 | NA | NA | NA | NA | NA | NA | |
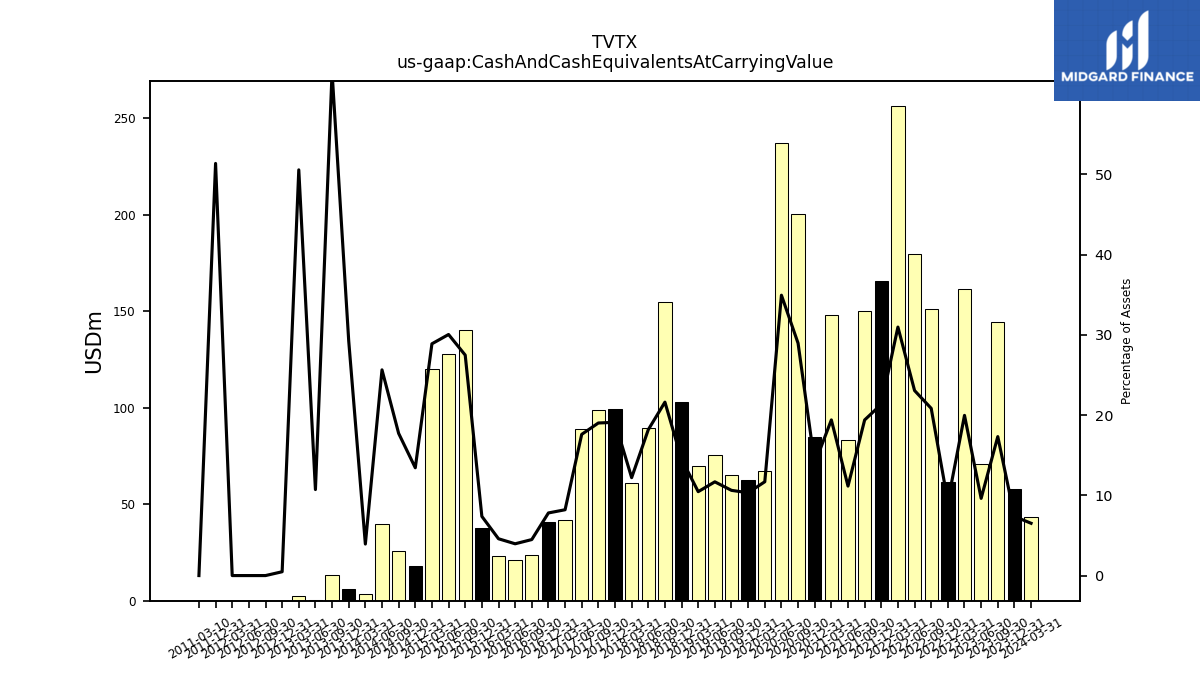
| Cash And Cash Equivalents At Carrying Value | 144.24 | 70.87 | 161.38 | 61.69 | 151.34 | 179.76 | 256.57 | 165.75 | 150.33 | 83.29 | 148.23 | 84.77 | 200.48 | 237.17 | 67.02 | 62.44 | 65.19 | 75.66 | 69.84 | 102.87 | 154.82 | 89.31 | 61.12 | 99.39 | 98.99 | 89.27 | 41.87 | 41.00 | 23.89 | 21.16 | 23.26 | 37.80 | 140.60 | 127.75 | 120.17 | 18.20 | 25.86 | 39.88 | 3.70 | NA | NA | NA | NA | NA | NA | NA | NA | NA | |
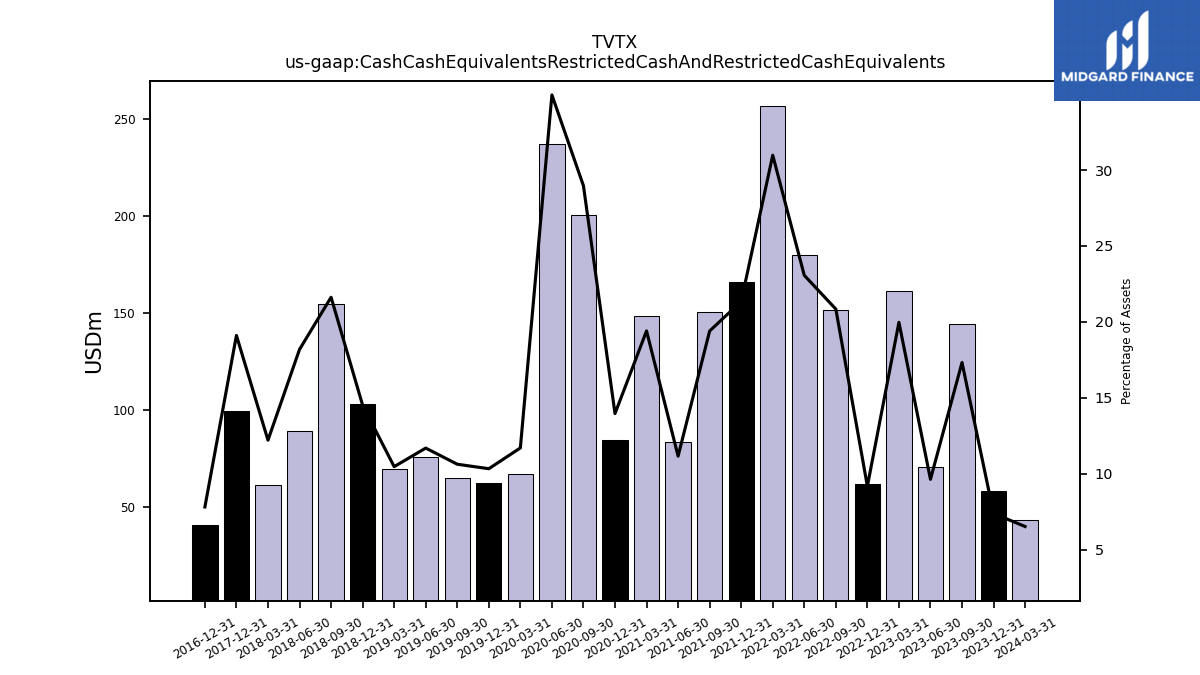
| Cash Cash Equivalents Restricted Cash And Restricted Cash Equivalents | 144.24 | 70.87 | 161.38 | 61.69 | 151.34 | 179.76 | 256.57 | 165.75 | 150.33 | 83.29 | 148.23 | 84.77 | 200.48 | 237.17 | 67.02 | 62.44 | 65.19 | 75.66 | 69.84 | 102.87 | 154.82 | 89.31 | 61.12 | 99.39 | NA | NA | NA | 41.00 | NA | NA | NA | NA | NA | NA | NA | NA | NA | NA | NA | NA | NA | NA | NA | NA | NA | NA | NA | NA | |
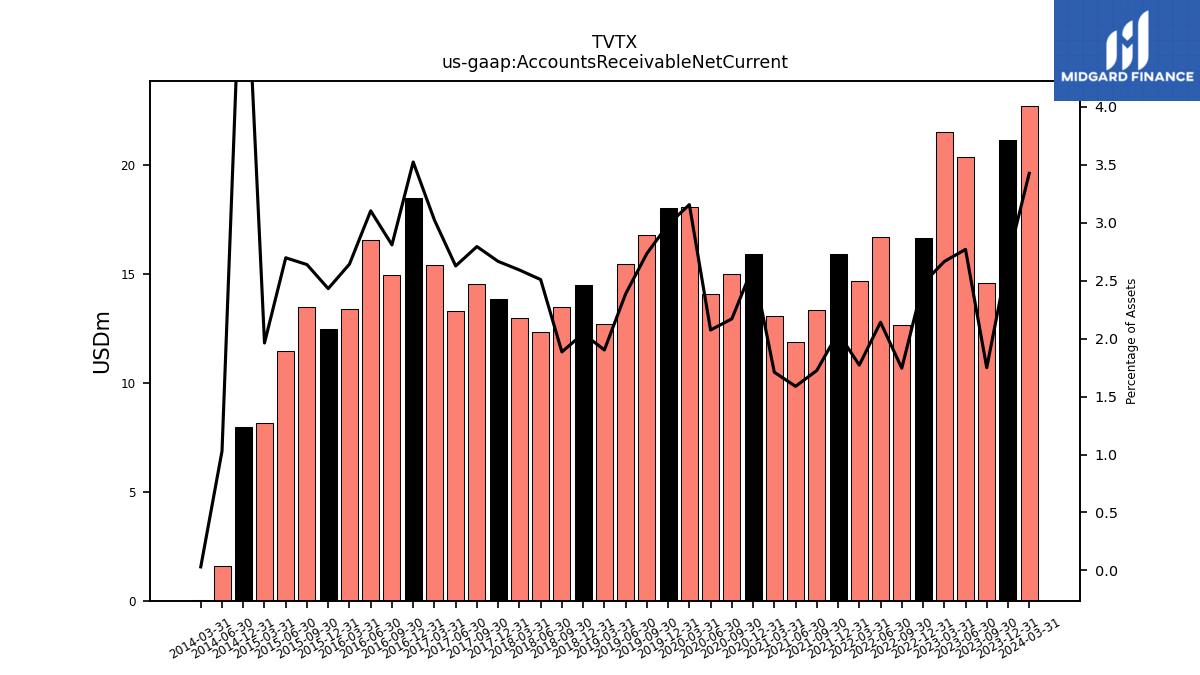
| Accounts Receivable Net Current | 14.57 | 20.40 | 21.54 | 16.65 | 12.67 | 16.69 | 14.68 | 15.91 | 13.37 | 11.86 | 13.07 | 15.93 | 15.03 | 14.08 | 18.09 | 18.05 | 16.78 | 15.45 | 12.70 | 14.49 | 13.50 | 12.32 | 12.98 | 13.87 | 14.54 | 13.32 | 15.43 | 18.51 | 14.96 | 16.57 | 13.40 | 12.46 | 13.50 | 11.47 | 8.16 | 7.96 | NA | 1.60 | 0.03 | NA | NA | NA | NA | NA | NA | NA | NA | NA | |
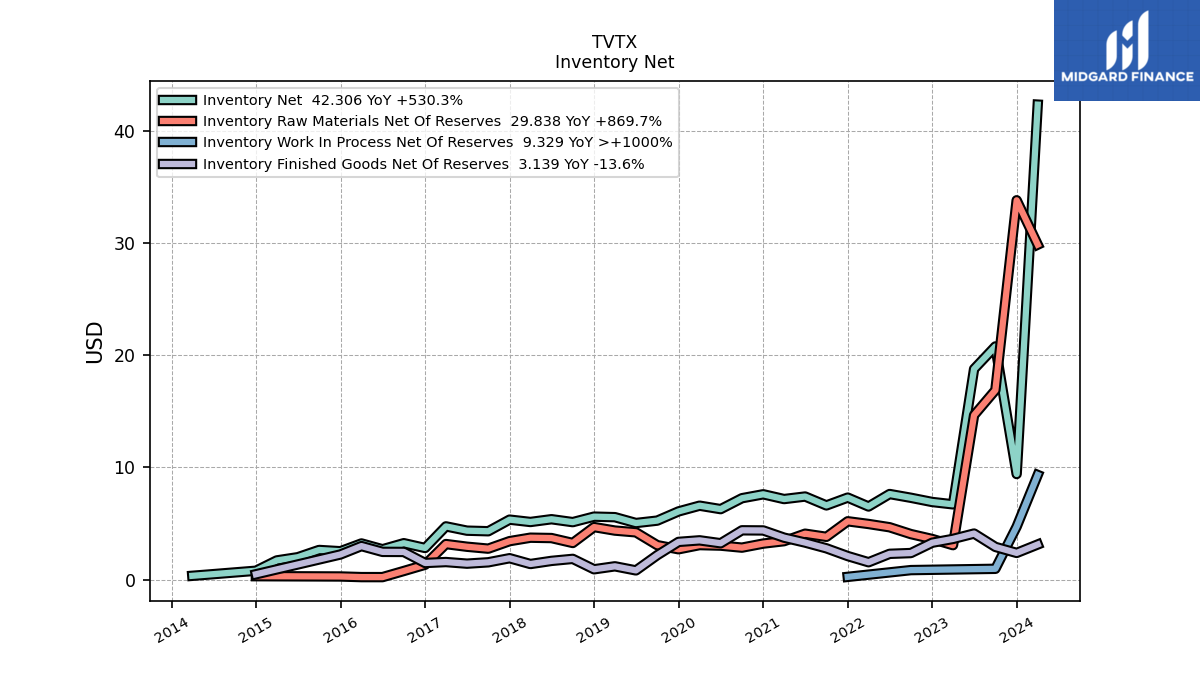
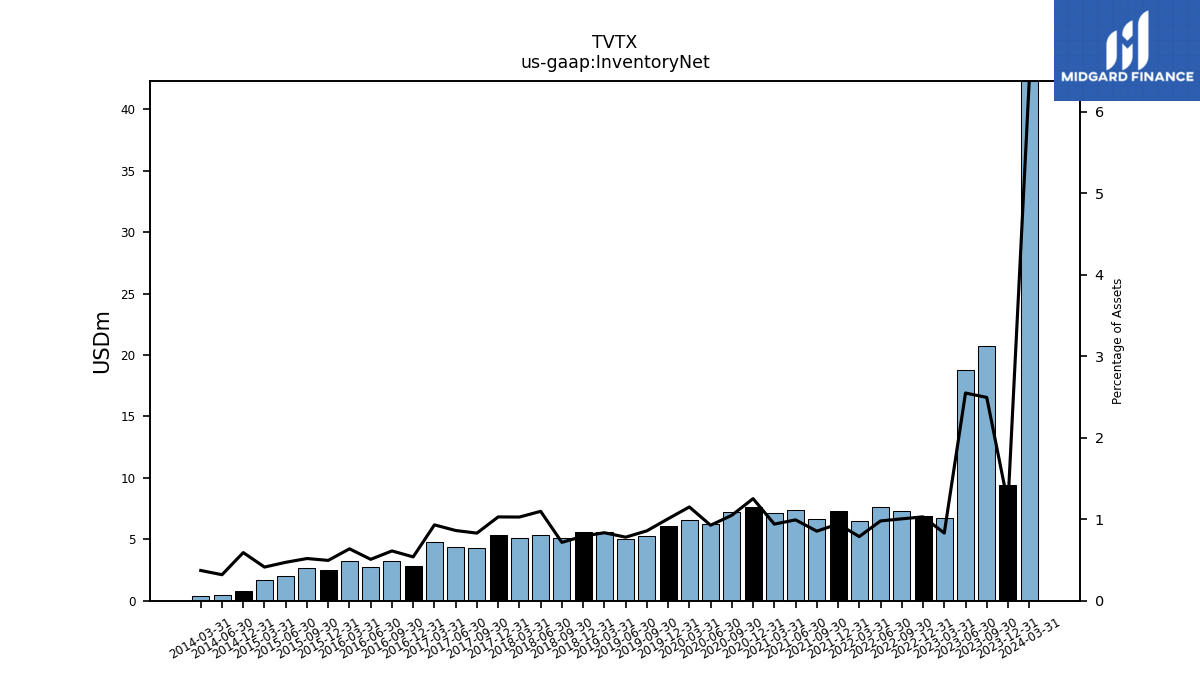
| Inventory Net | 20.77 | 18.77 | 6.71 | 6.92 | 7.30 | 7.63 | 6.52 | 7.31 | 6.62 | 7.41 | 7.18 | 7.61 | 7.26 | 6.29 | 6.59 | 6.08 | 5.26 | 5.05 | 5.57 | 5.62 | 5.13 | 5.39 | 5.14 | 5.35 | 4.32 | 4.37 | 4.75 | 2.83 | 3.25 | 2.71 | 3.23 | 2.54 | 2.65 | 2.00 | 1.72 | 0.80 | NA | 0.50 | 0.35 | NA | NA | NA | NA | NA | NA | NA | NA | NA | |
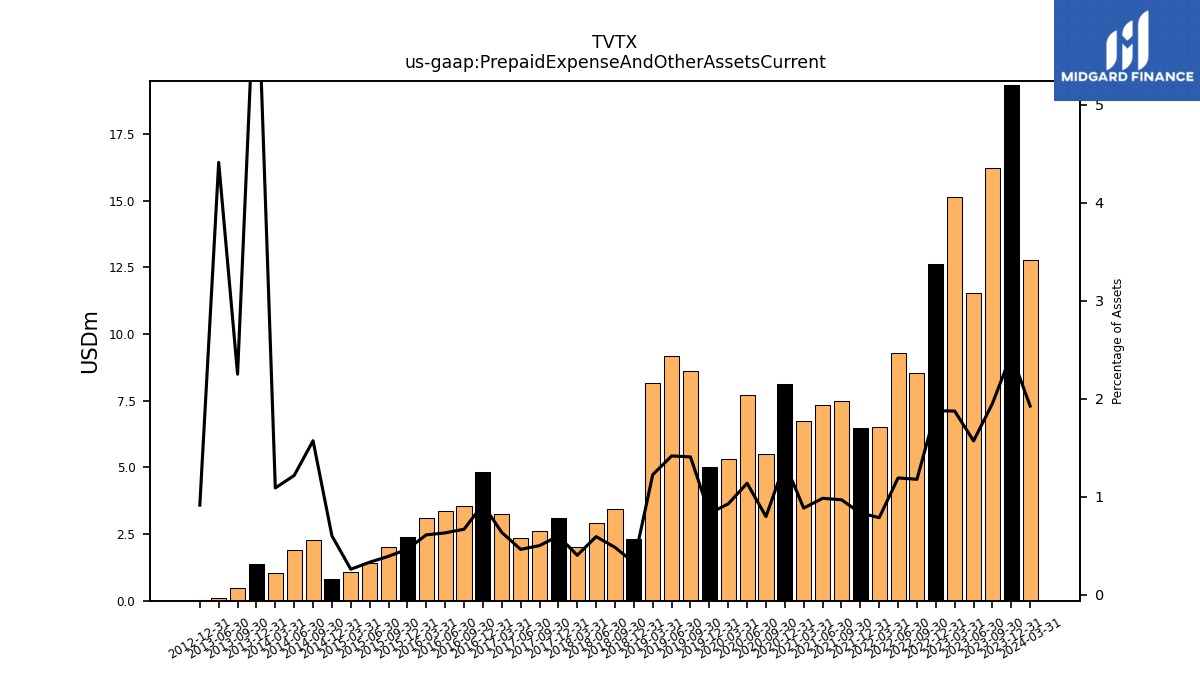
| Prepaid Expense And Other Assets Current | 16.24 | 11.56 | 15.14 | 12.62 | 8.55 | 9.28 | 6.51 | 6.47 | 7.50 | 7.34 | 6.75 | 8.14 | 5.52 | 7.71 | 5.31 | 5.01 | 8.63 | 9.16 | 8.17 | 2.31 | 3.46 | 2.91 | 2.01 | 3.11 | 2.60 | 2.34 | 3.24 | 4.83 | 3.55 | 3.37 | 3.09 | 2.38 | 2.00 | 1.41 | 1.08 | 0.81 | 2.29 | 1.89 | 1.02 | NA | NA | NA | NA | NA | NA | NA | NA | NA | |
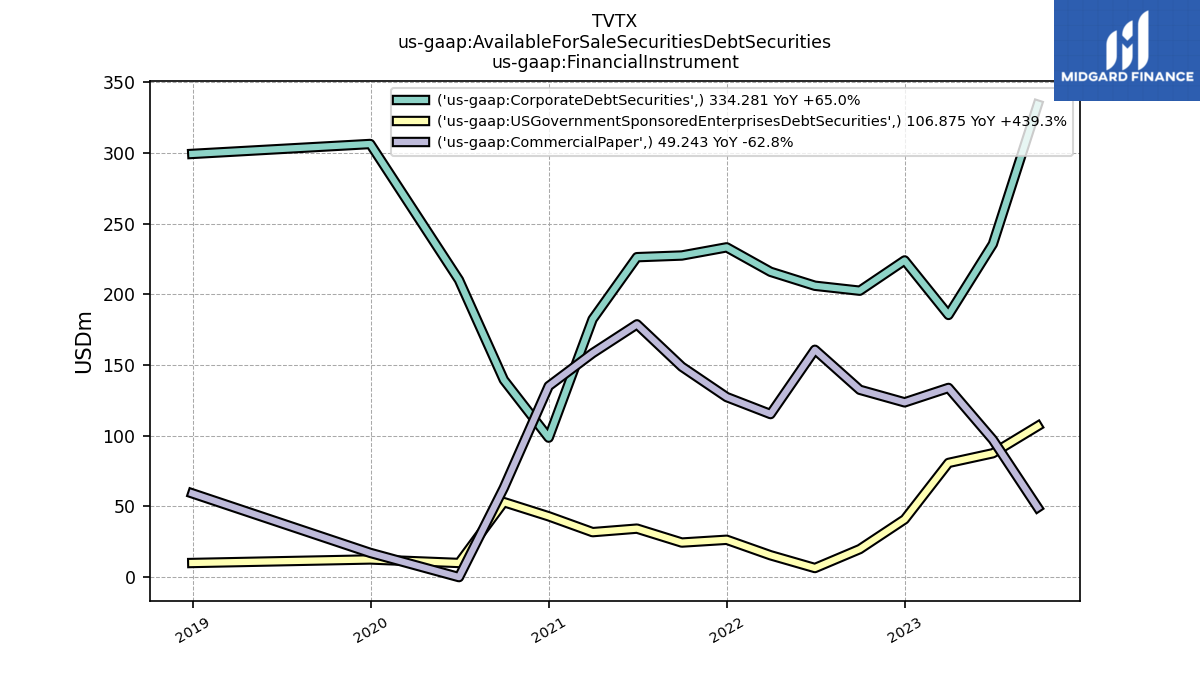
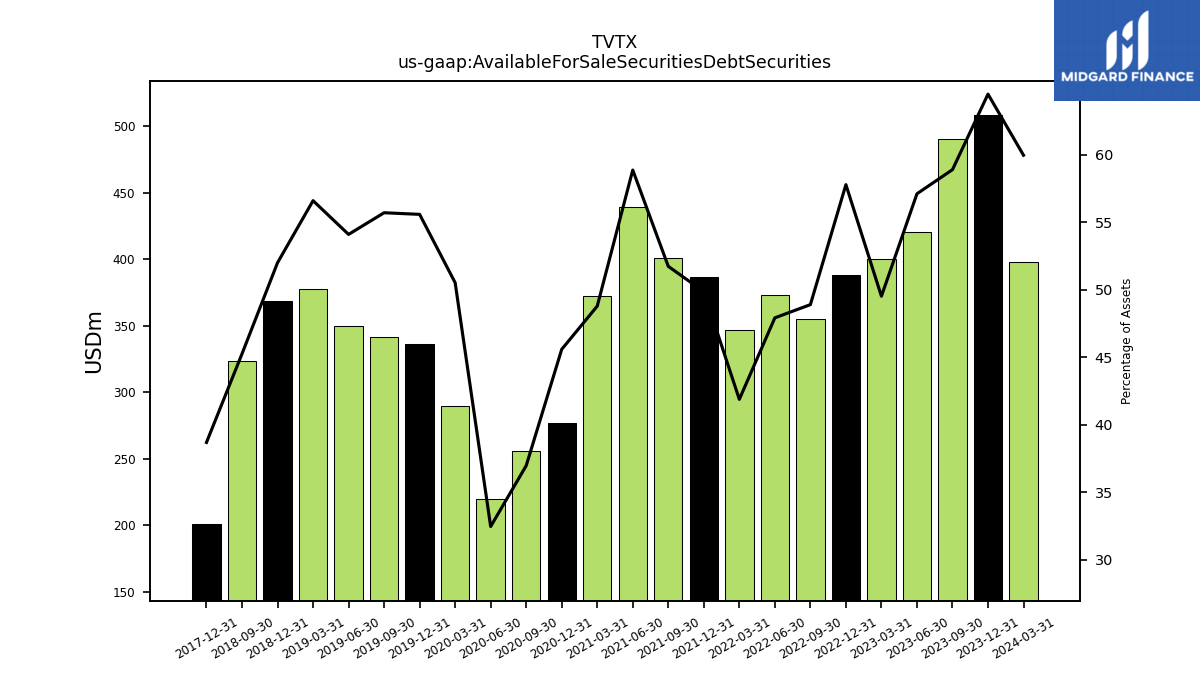
| Available For Sale Securities Debt Securities | 490.40 | 420.46 | 400.14 | 388.56 | 354.99 | 373.41 | 346.82 | 387.13 | 400.86 | 439.50 | 372.64 | 276.82 | 255.79 | 220.21 | 289.44 | 336.09 | 341.83 | 350.24 | 377.80 | 368.67 | 323.99 | NA | NA | 201.24 | NA | NA | NA | NA | NA | NA | NA | NA | NA | NA | NA | NA | NA | NA | NA | NA | NA | NA | NA | NA | NA | NA | NA | NA |
| 2023-09-30 | 2023-06-30 | 2023-03-31 | 2022-12-31 | 2022-09-30 | 2022-06-30 | 2022-03-31 | 2021-12-31 | 2021-09-30 | 2021-06-30 | 2021-03-31 | 2020-12-31 | 2020-09-30 | 2020-06-30 | 2020-03-31 | 2019-12-31 | 2019-09-30 | 2019-06-30 | 2019-03-31 | 2018-12-31 | 2018-09-30 | 2018-06-30 | 2018-03-31 | 2017-12-31 | 2017-09-30 | 2017-06-30 | 2017-03-31 | 2016-12-31 | 2016-09-30 | 2016-06-30 | 2016-03-31 | 2015-12-31 | 2015-09-30 | 2015-06-30 | 2015-03-31 | 2014-12-31 | 2014-09-30 | 2014-06-30 | 2014-03-31 | 2012-11-30 | 2012-08-31 | 2012-05-31 | 2011-11-30 | 2011-08-31 | 2011-05-31 | 2011-02-28 | 2010-11-30 | 2010-08-31 | ||
|---|---|---|---|---|---|---|---|---|---|---|---|---|---|---|---|---|---|---|---|---|---|---|---|---|---|---|---|---|---|---|---|---|---|---|---|---|---|---|---|---|---|---|---|---|---|---|---|---|---|
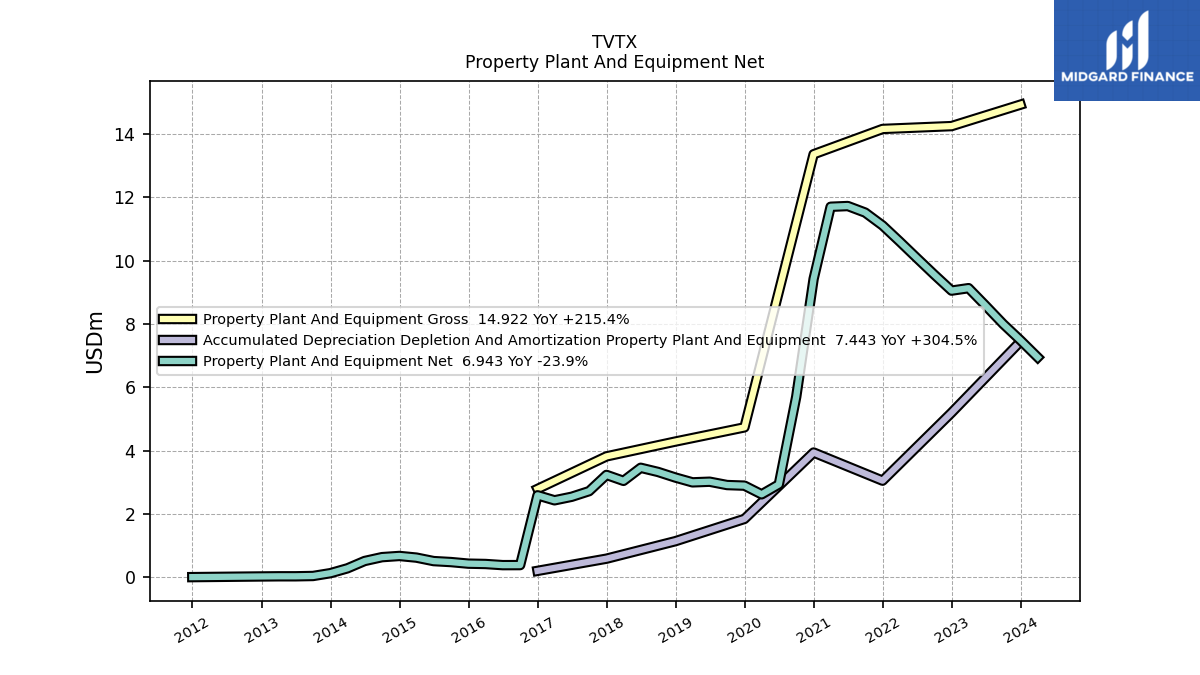
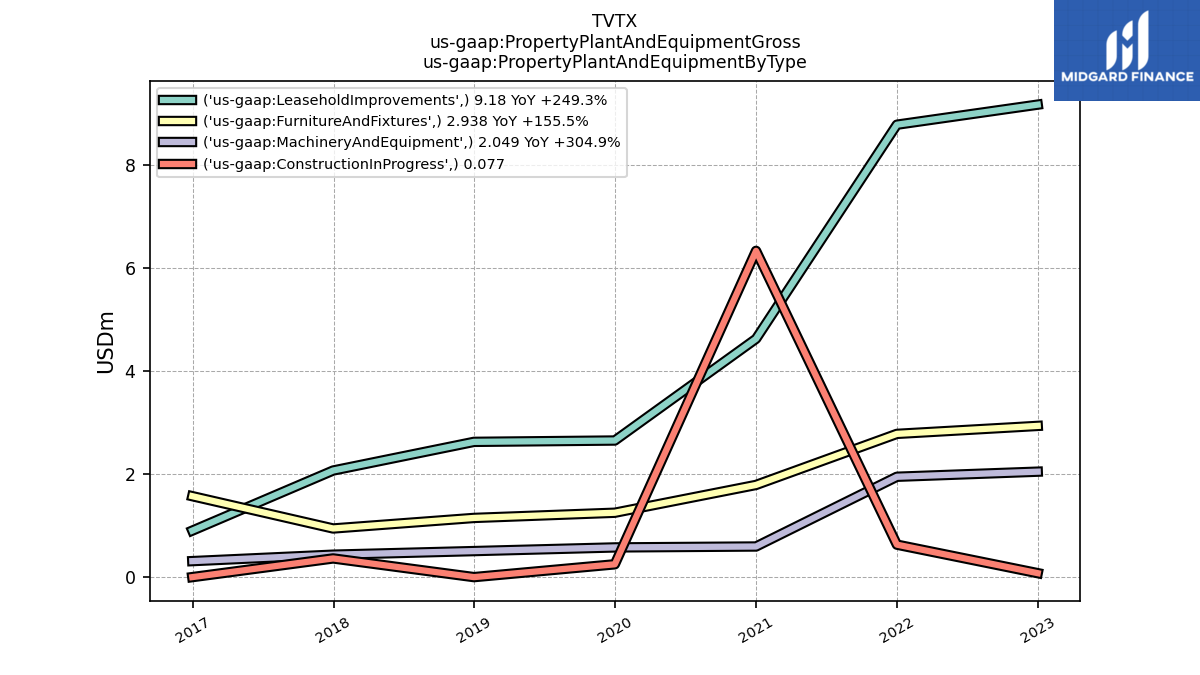
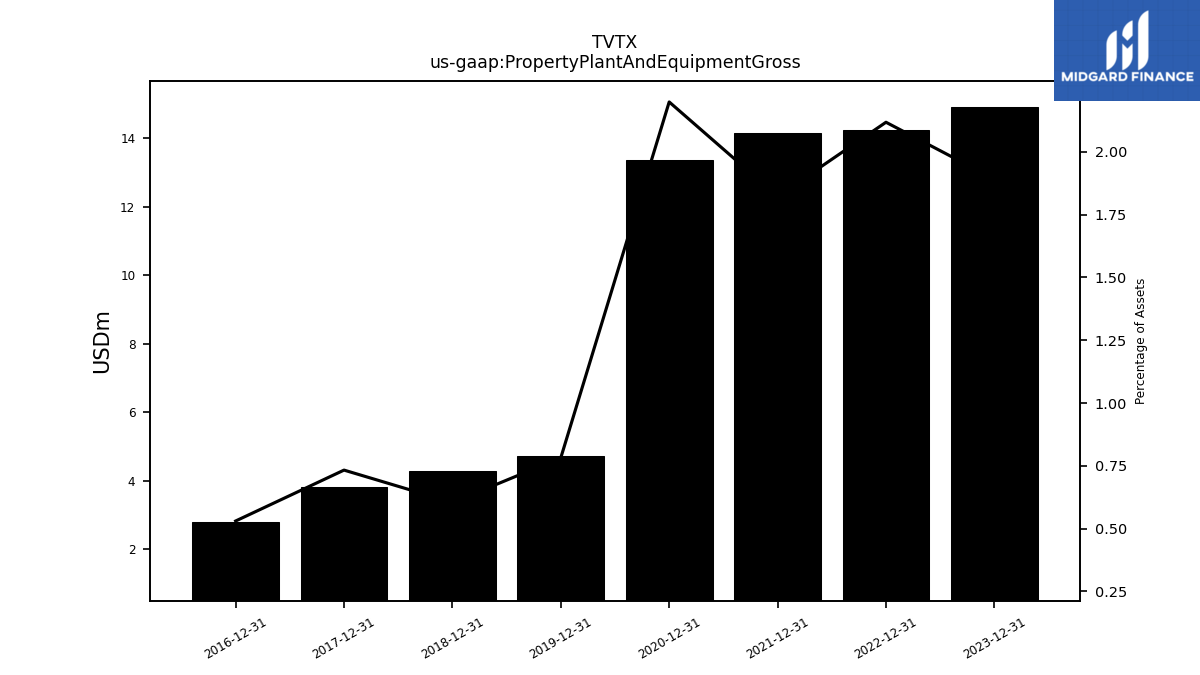
| Property Plant And Equipment Gross | NA | NA | NA | 14.24 | NA | NA | NA | 14.15 | NA | NA | NA | 13.36 | NA | NA | NA | 4.73 | NA | NA | NA | 4.28 | NA | NA | NA | 3.81 | NA | NA | NA | 2.79 | NA | NA | NA | NA | NA | NA | NA | NA | NA | NA | NA | NA | NA | NA | NA | NA | NA | NA | NA | NA | |
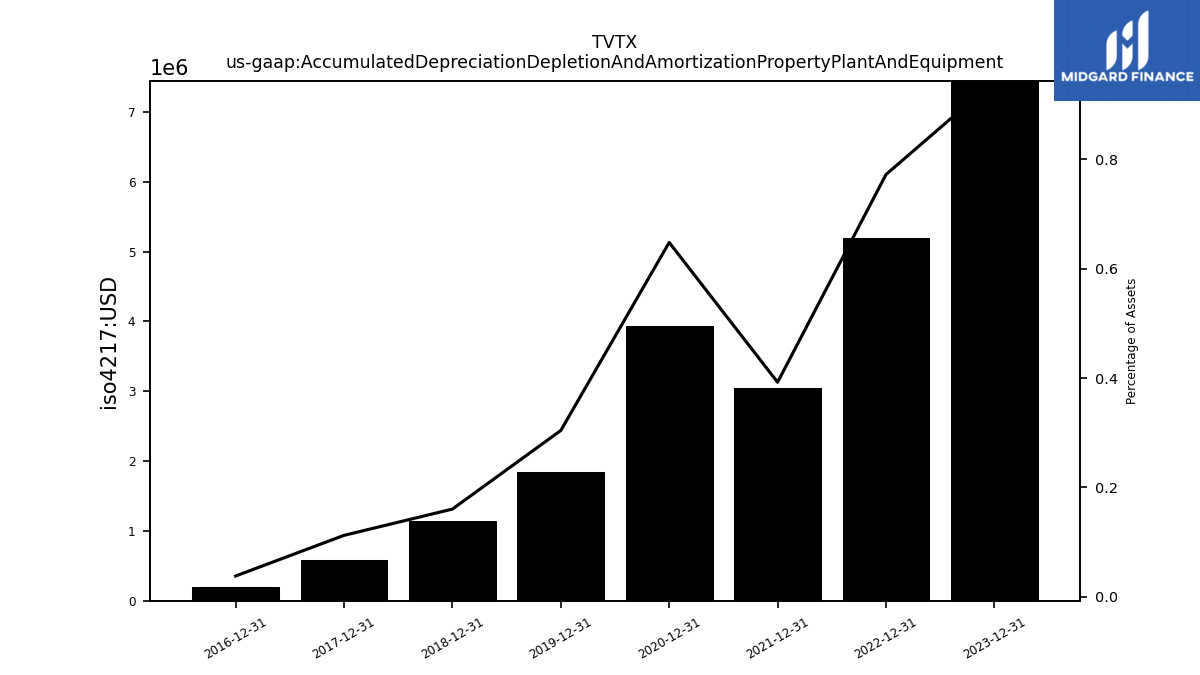
| Accumulated Depreciation Depletion And Amortization Property Plant And Equipment | NA | NA | NA | 5.20 | NA | NA | NA | 3.05 | NA | NA | NA | 3.94 | NA | NA | NA | 1.84 | NA | NA | NA | 1.14 | NA | NA | NA | 0.58 | NA | NA | NA | 0.20 | NA | NA | NA | NA | NA | NA | NA | NA | NA | NA | NA | NA | NA | NA | NA | NA | NA | NA | NA | NA | |
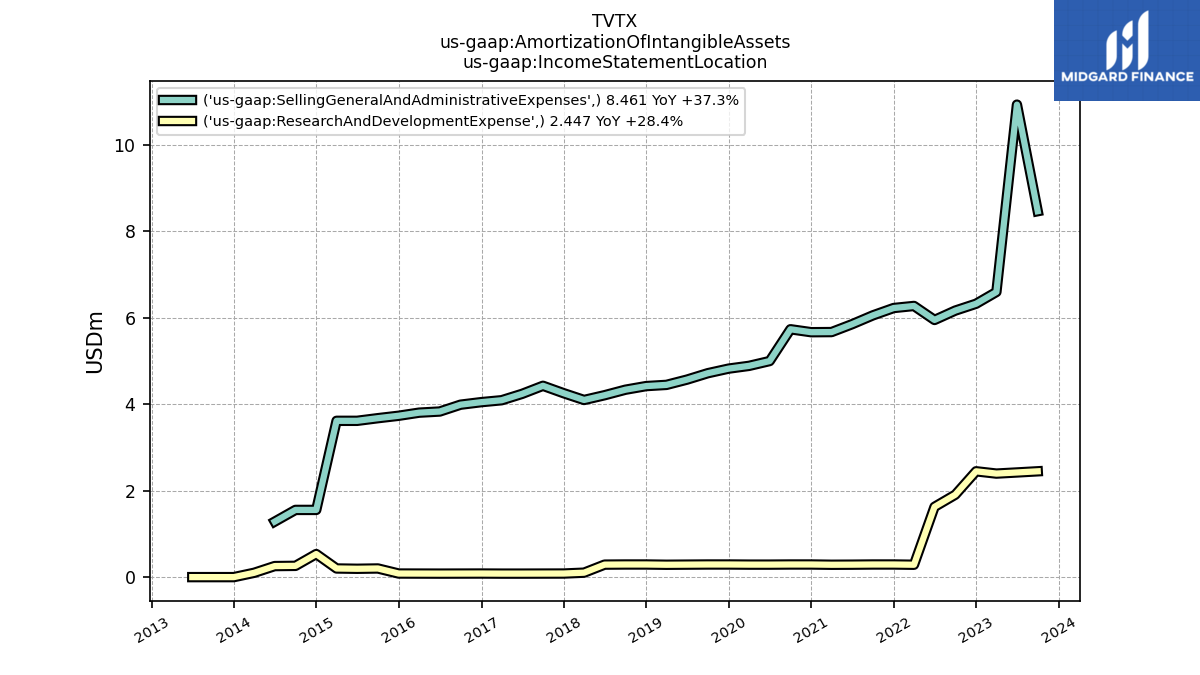
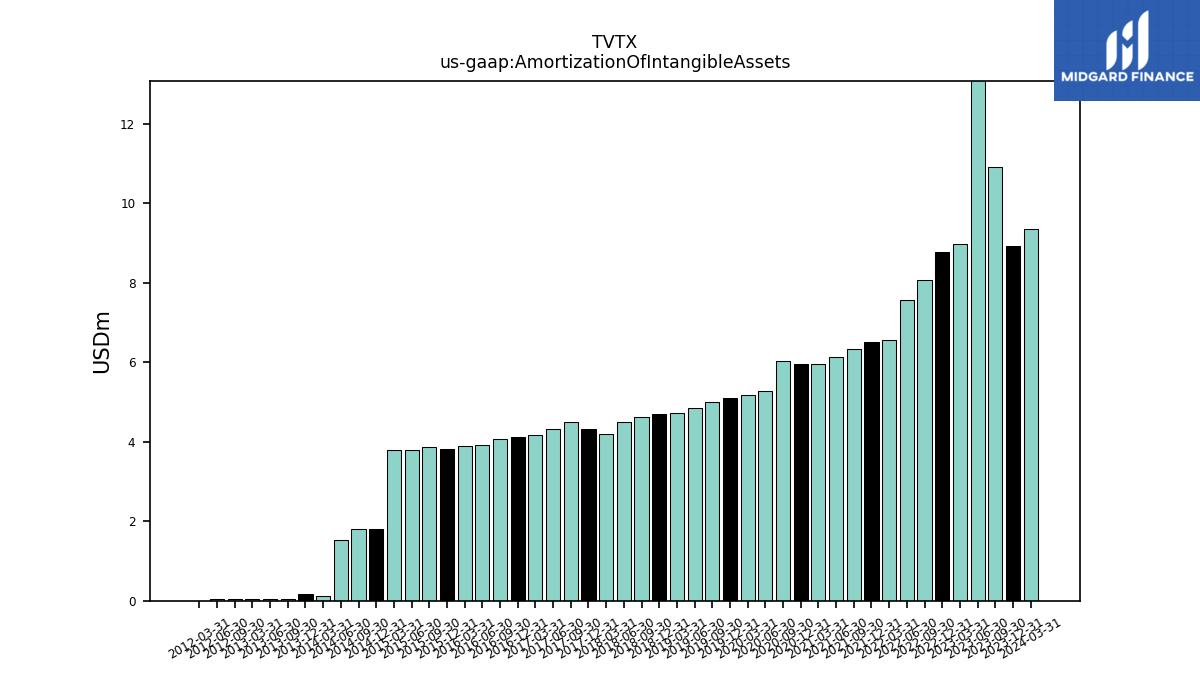
| Amortization Of Intangible Assets | 10.91 | 13.35 | 8.99 | 8.77 | 8.07 | 7.57 | 6.56 | 6.51 | 6.34 | 6.14 | 5.95 | 5.96 | 6.02 | 5.29 | 5.17 | 5.11 | 5.01 | 4.86 | 4.73 | 4.71 | 4.62 | 4.50 | 4.20 | 4.33 | 4.51 | 4.32 | 4.17 | 4.13 | 4.07 | 3.91 | 3.88 | 3.81 | 3.88 | 3.81 | 3.81 | 1.81 | 1.81 | 1.54 | 0.11 | NA | NA | NA | NA | NA | NA | NA | NA | NA | |
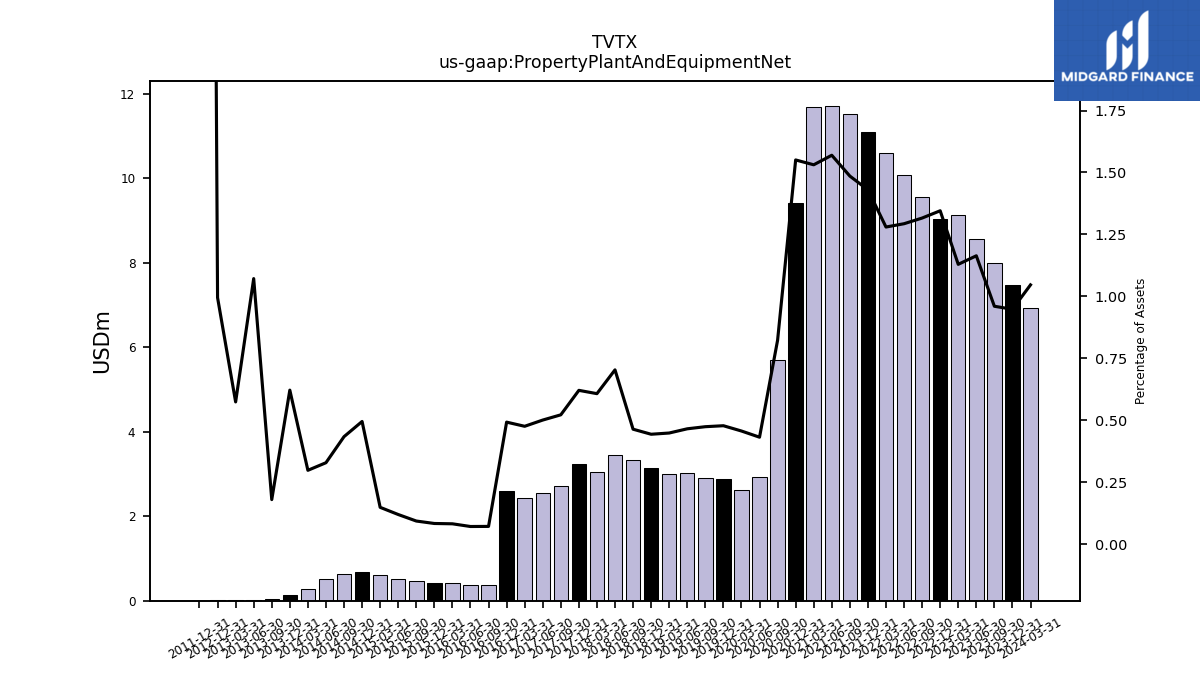
| Property Plant And Equipment Net | 8.00 | 8.57 | 9.13 | 9.05 | 9.56 | 10.08 | 10.60 | 11.11 | 11.51 | 11.72 | 11.70 | 9.42 | 5.70 | 2.93 | 2.62 | 2.89 | 2.91 | 3.02 | 3.00 | 3.15 | 3.32 | 3.46 | 3.04 | 3.23 | 2.72 | 2.54 | 2.43 | 2.59 | 0.38 | 0.38 | 0.42 | 0.43 | 0.48 | 0.51 | 0.62 | 0.67 | 0.63 | 0.51 | 0.28 | NA | NA | NA | NA | NA | NA | NA | NA | NA | |
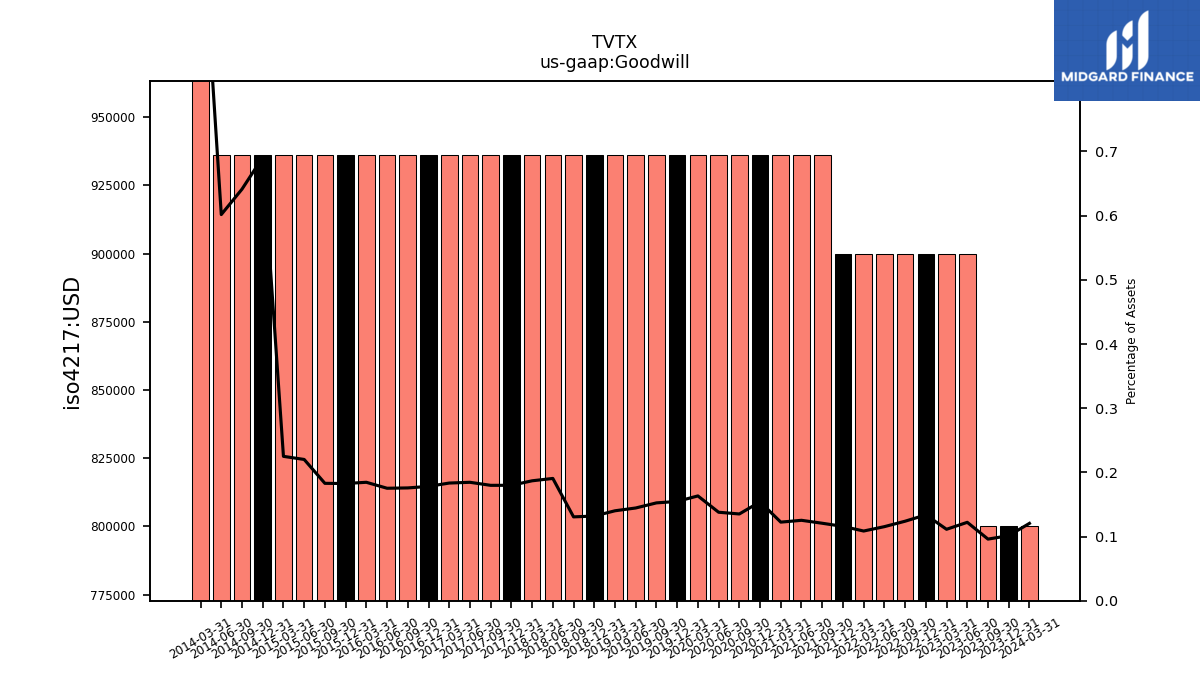
| Goodwill | 0.80 | 0.90 | 0.90 | 0.90 | 0.90 | 0.90 | 0.90 | 0.90 | 0.94 | 0.94 | 0.94 | 0.94 | 0.94 | 0.94 | 0.94 | 0.94 | 0.94 | 0.94 | 0.94 | 0.94 | 0.94 | 0.94 | 0.94 | 0.94 | 0.94 | 0.94 | 0.94 | 0.94 | 0.94 | 0.94 | 0.94 | 0.94 | 0.94 | 0.94 | 0.94 | 0.94 | 0.94 | 0.94 | 1.04 | NA | NA | NA | NA | NA | NA | NA | NA | NA | |
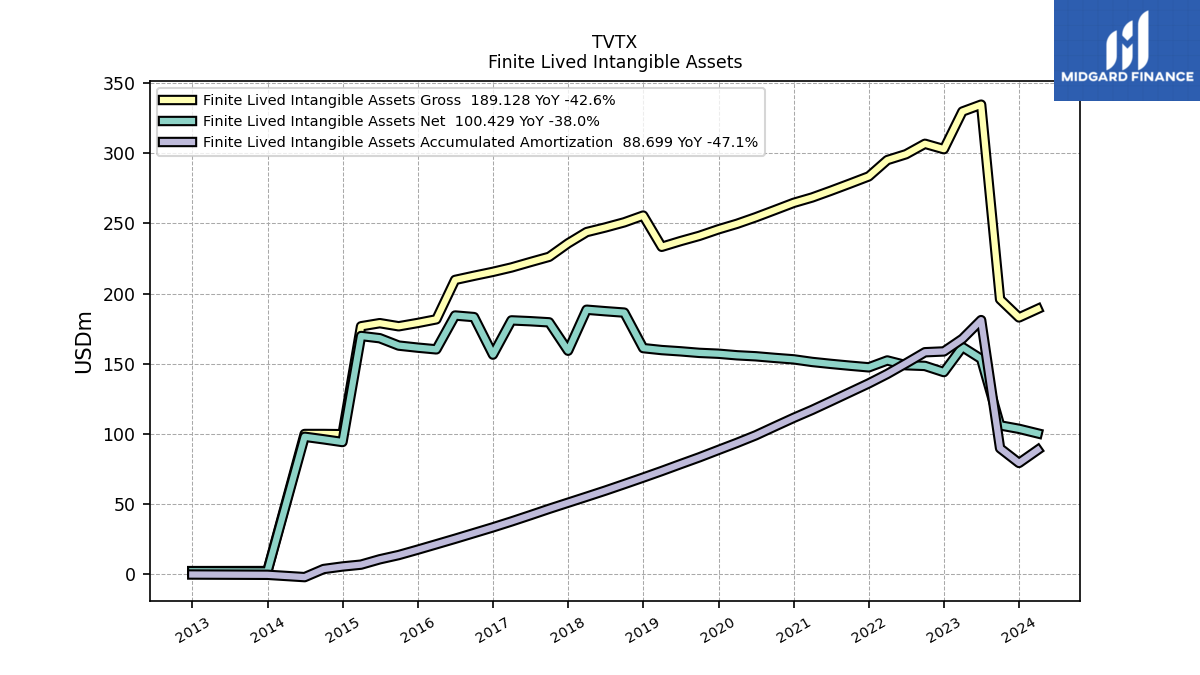
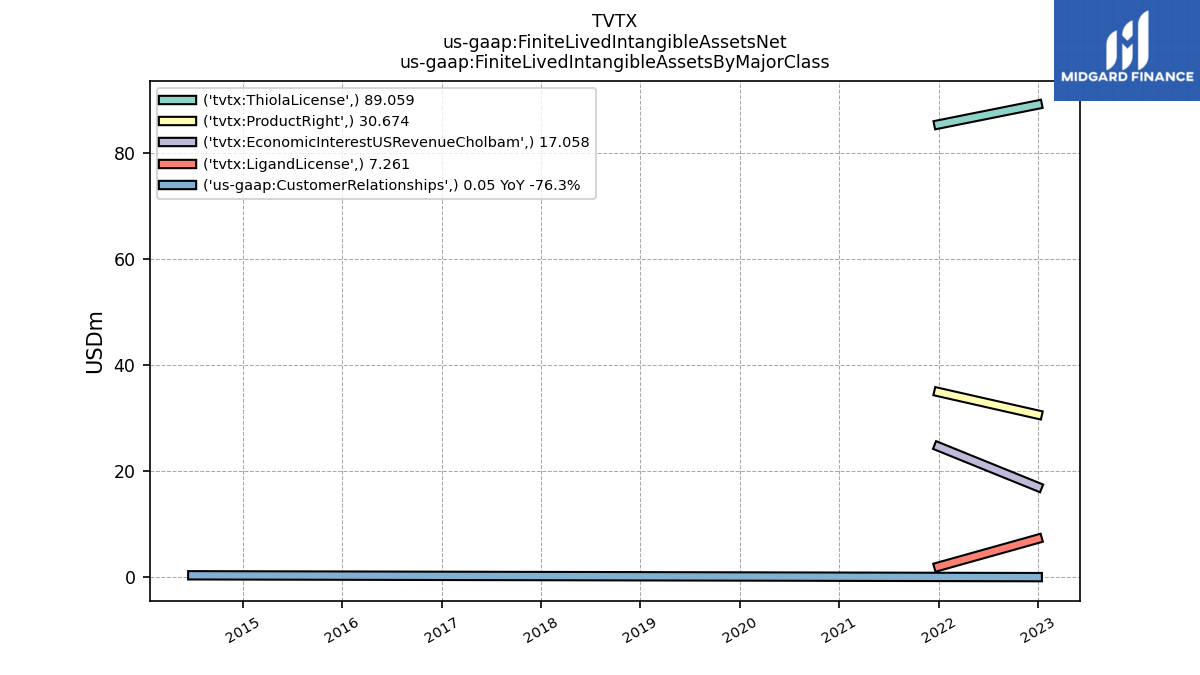
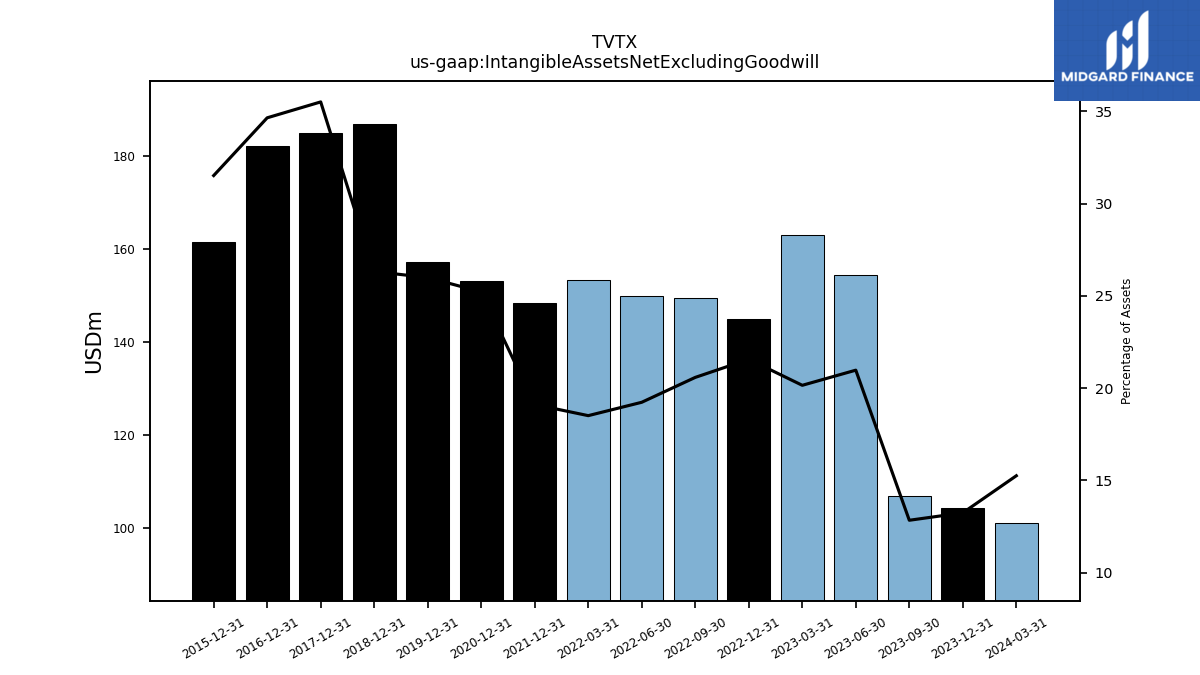
| Intangible Assets Net Excluding Goodwill | 106.90 | 154.46 | 162.88 | 145.04 | 149.47 | 149.92 | 153.32 | 148.44 | NA | NA | NA | 153.19 | NA | NA | NA | 157.20 | NA | NA | NA | 186.69 | NA | NA | NA | 184.82 | NA | NA | NA | 182.04 | NA | NA | NA | 161.54 | NA | NA | NA | NA | NA | NA | NA | NA | NA | NA | NA | NA | NA | NA | NA | NA | |
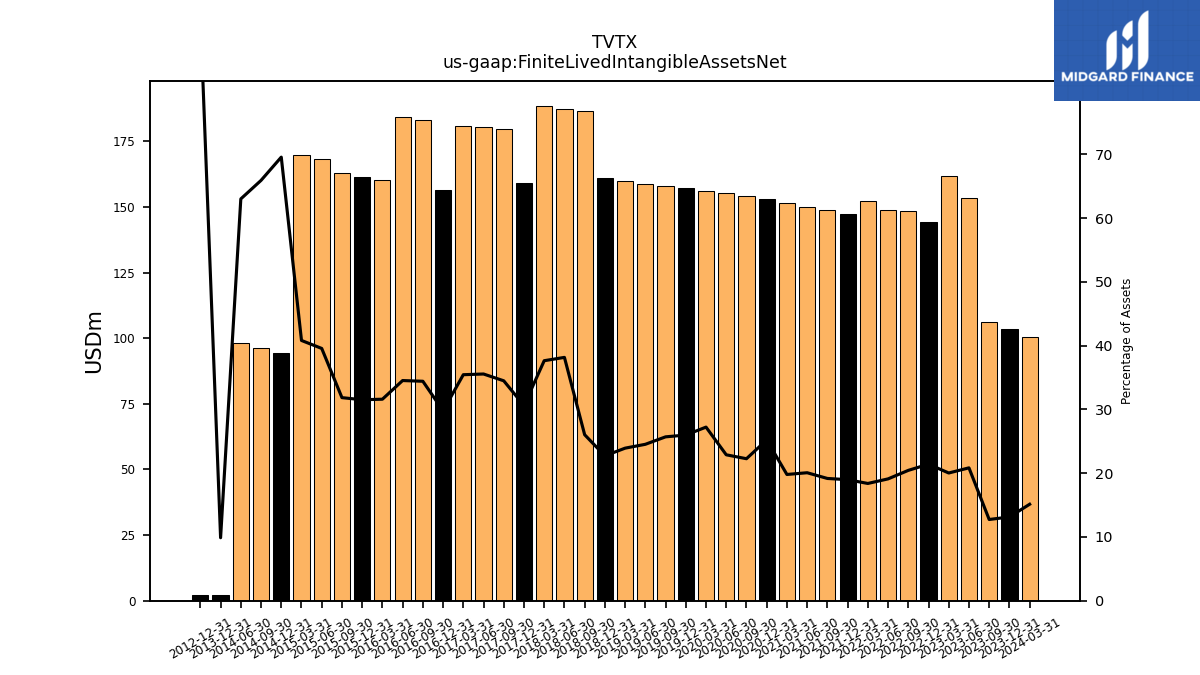
| Finite Lived Intangible Assets Net | 106.15 | 153.52 | 161.95 | 144.10 | 148.50 | 149.00 | 152.40 | 147.50 | 148.68 | 149.95 | 151.34 | 153.19 | 154.22 | 155.37 | 156.08 | 157.20 | 157.80 | 158.91 | 159.80 | 161.19 | 186.50 | 187.49 | 188.56 | 159.32 | 179.57 | 180.37 | 180.96 | 156.54 | 183.30 | 184.43 | 160.30 | 161.54 | 163.00 | 168.25 | 169.84 | 94.27 | 96.22 | 98.03 | NA | NA | NA | NA | NA | NA | NA | NA | NA | NA | |
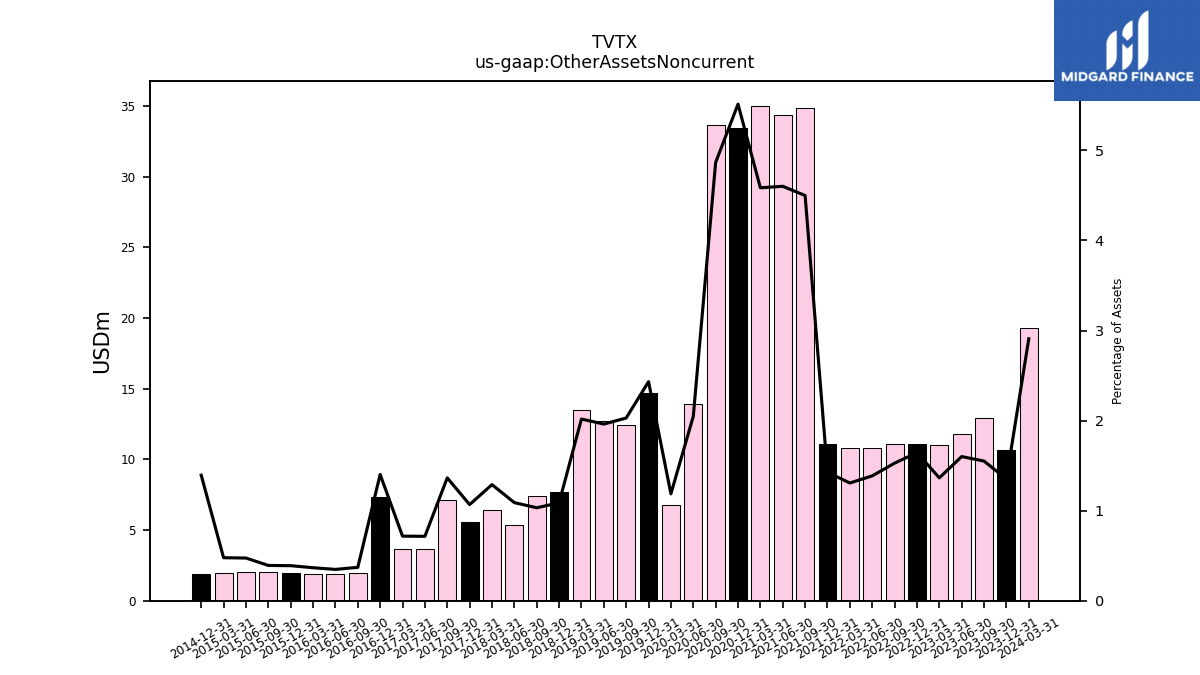
| Other Assets Noncurrent | 12.91 | 11.79 | 11.03 | 11.06 | 11.09 | 10.81 | 10.83 | 11.07 | 34.87 | 34.36 | 35.03 | 33.49 | 33.69 | 13.89 | 6.80 | 14.71 | 12.45 | 12.70 | 13.47 | 7.71 | 7.39 | 5.35 | 6.46 | 5.56 | 7.10 | 3.63 | 3.66 | 7.36 | 1.97 | 1.86 | 1.86 | 2.00 | 2.01 | 2.02 | 1.99 | 1.89 | NA | NA | NA | NA | NA | NA | NA | NA | NA | NA | NA | NA | |
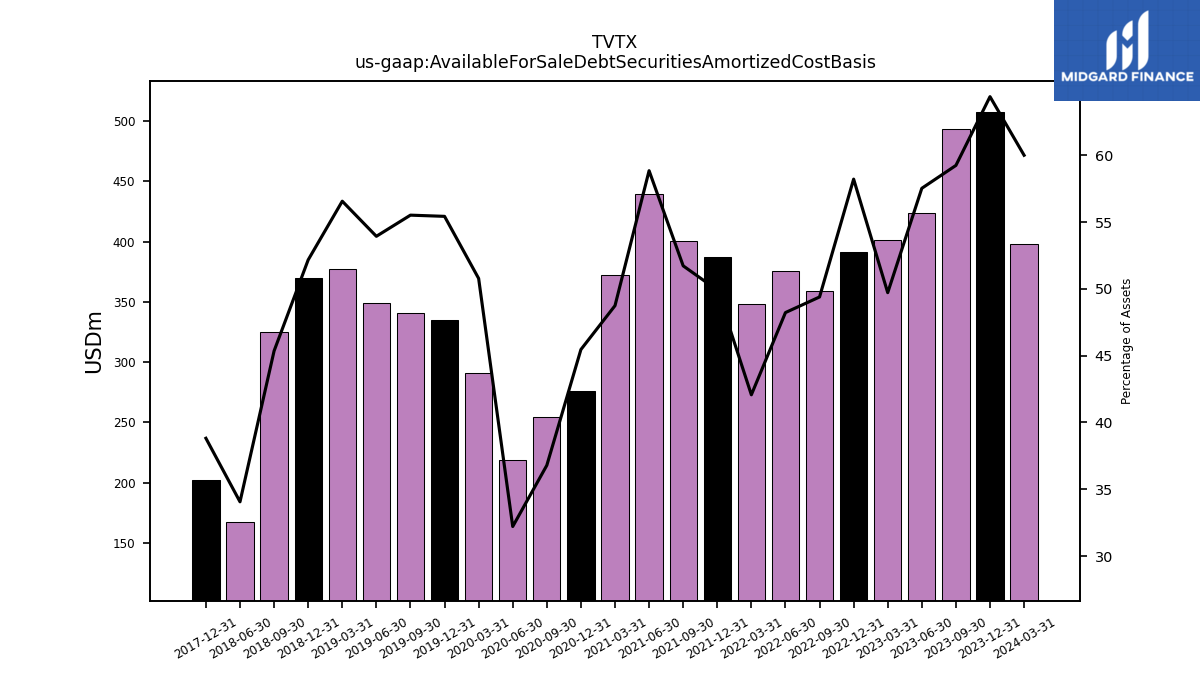
| Available For Sale Debt Securities Amortized Cost Basis | 493.35 | 423.63 | 401.80 | 391.51 | 358.67 | 375.89 | 348.49 | 387.60 | 400.87 | 439.41 | 372.40 | 276.11 | 254.66 | 218.60 | 290.98 | 335.21 | 340.76 | 349.24 | 377.62 | 369.95 | 324.80 | 167.27 | NA | 201.96 | NA | NA | NA | NA | NA | NA | NA | NA | NA | NA | NA | NA | NA | NA | NA | NA | NA | NA | NA | NA | NA | NA | NA | NA |
| 2023-09-30 | 2023-06-30 | 2023-03-31 | 2022-12-31 | 2022-09-30 | 2022-06-30 | 2022-03-31 | 2021-12-31 | 2021-09-30 | 2021-06-30 | 2021-03-31 | 2020-12-31 | 2020-09-30 | 2020-06-30 | 2020-03-31 | 2019-12-31 | 2019-09-30 | 2019-06-30 | 2019-03-31 | 2018-12-31 | 2018-09-30 | 2018-06-30 | 2018-03-31 | 2017-12-31 | 2017-09-30 | 2017-06-30 | 2017-03-31 | 2016-12-31 | 2016-09-30 | 2016-06-30 | 2016-03-31 | 2015-12-31 | 2015-09-30 | 2015-06-30 | 2015-03-31 | 2014-12-31 | 2014-09-30 | 2014-06-30 | 2014-03-31 | 2012-11-30 | 2012-08-31 | 2012-05-31 | 2011-11-30 | 2011-08-31 | 2011-05-31 | 2011-02-28 | 2010-11-30 | 2010-08-31 | ||
|---|---|---|---|---|---|---|---|---|---|---|---|---|---|---|---|---|---|---|---|---|---|---|---|---|---|---|---|---|---|---|---|---|---|---|---|---|---|---|---|---|---|---|---|---|---|---|---|---|---|
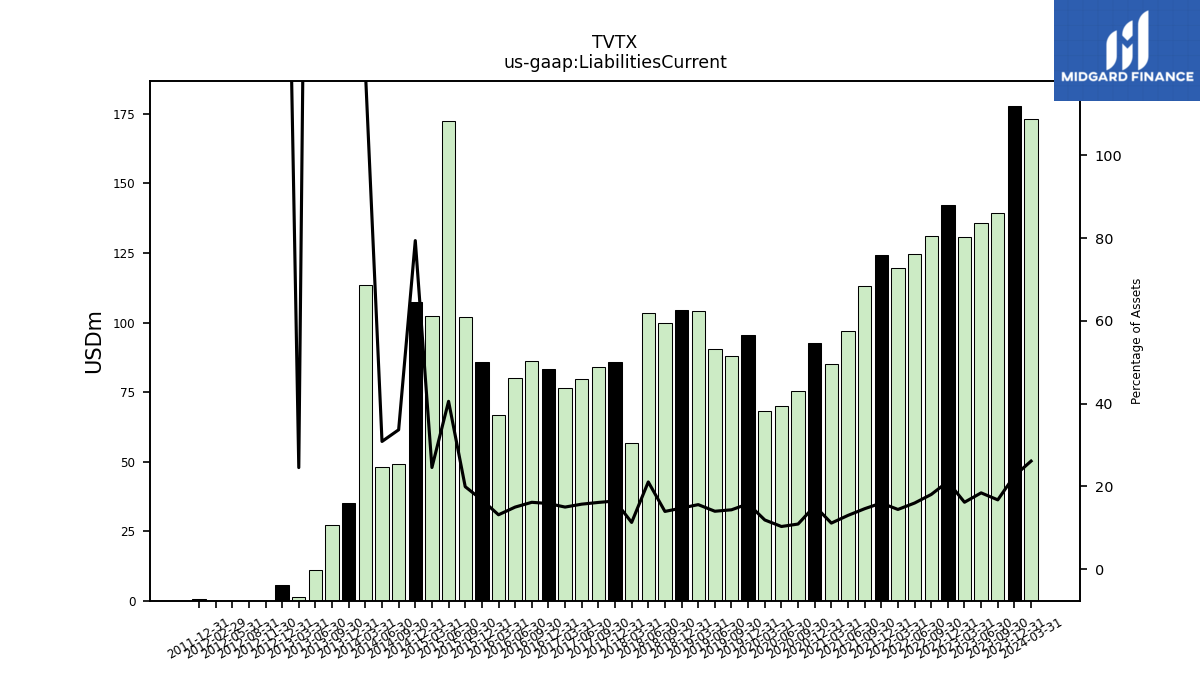
| Liabilities Current | 139.43 | 135.71 | 130.65 | 142.16 | 131.03 | 124.49 | 119.47 | 124.09 | 113.16 | 96.98 | 85.01 | 92.66 | 75.43 | 69.93 | 68.09 | 95.45 | 88.02 | 90.59 | 104.08 | 104.62 | 99.87 | 103.50 | 56.52 | 85.67 | 83.90 | 79.63 | 76.56 | 83.26 | 85.99 | 80.07 | 66.62 | 85.80 | 101.95 | 172.38 | 102.17 | 107.54 | 49.13 | 47.98 | 113.45 | 0.07 | 0.07 | 0.07 | NA | NA | NA | NA | NA | NA | |
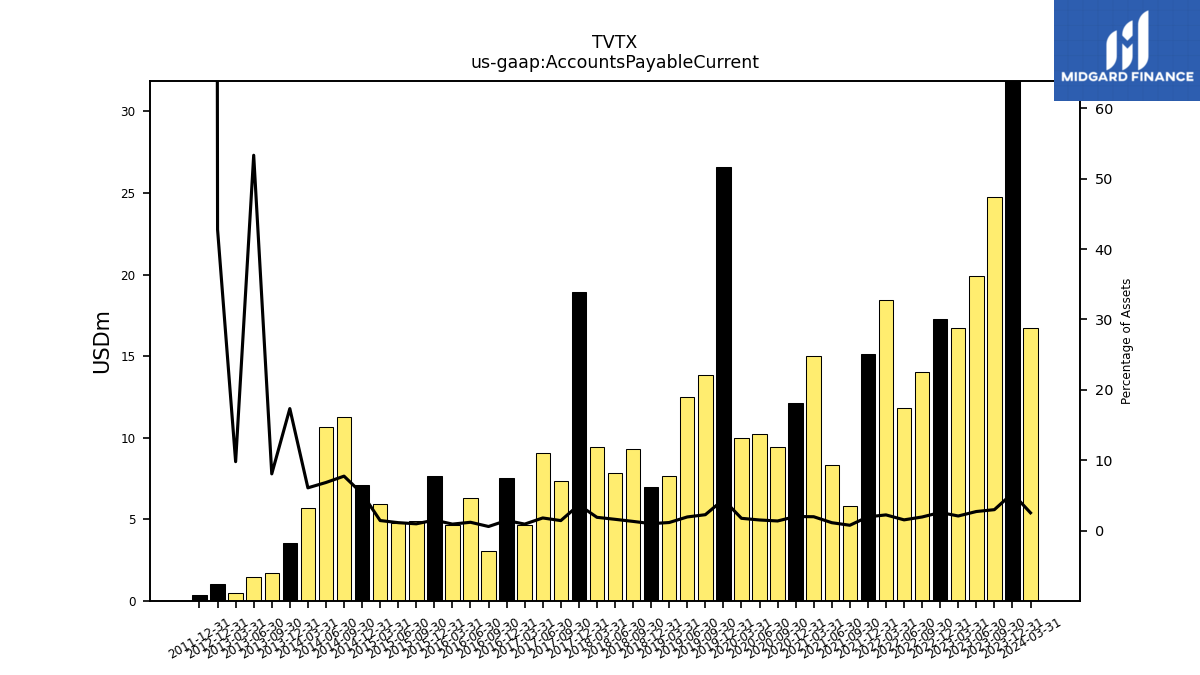
| Accounts Payable Current | 24.74 | 19.91 | 16.73 | 17.29 | 14.01 | 11.85 | 18.43 | 15.14 | 5.83 | 8.34 | 15.01 | 12.13 | 9.43 | 10.20 | 9.97 | 26.61 | 13.83 | 12.52 | 7.63 | 6.95 | 9.31 | 7.85 | 9.42 | 18.94 | 7.37 | 9.08 | 4.67 | 7.52 | 3.07 | 6.29 | 4.65 | 7.64 | 4.89 | 4.78 | 5.91 | 7.12 | 11.29 | 10.63 | 5.71 | NA | NA | NA | NA | NA | NA | NA | NA | NA | |
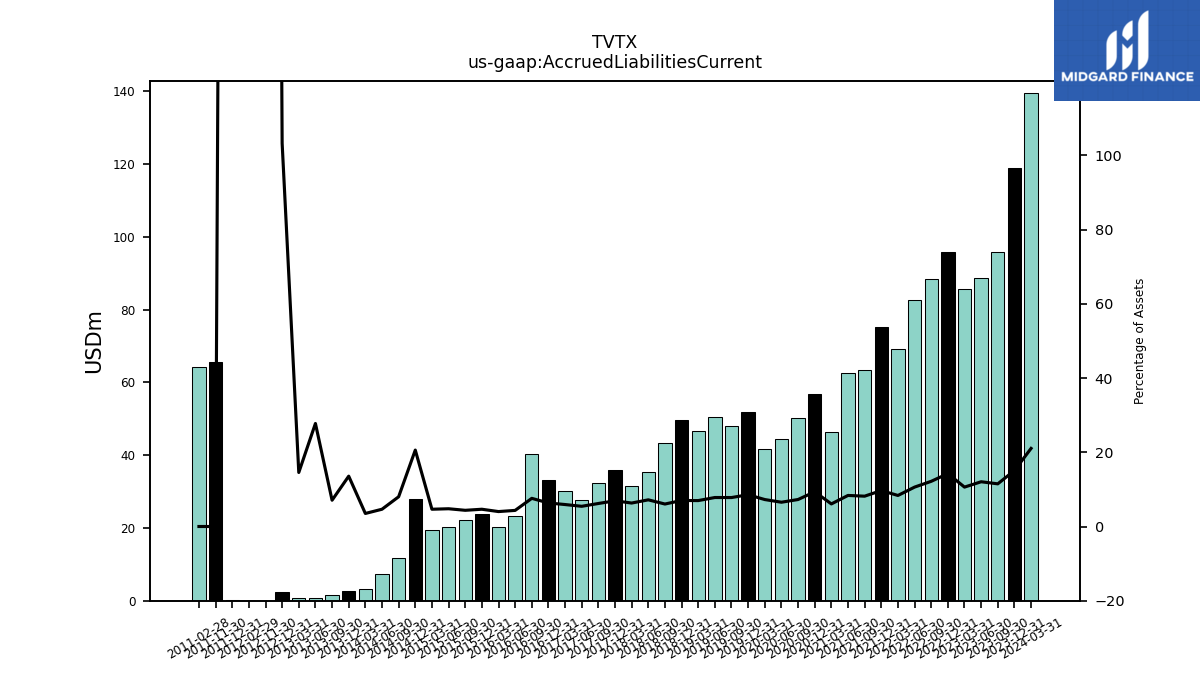
| Accrued Liabilities Current | 95.71 | 88.75 | 85.77 | 95.74 | 88.38 | 82.69 | 69.24 | 75.18 | 63.31 | 62.47 | 46.47 | 56.79 | 50.32 | 44.38 | 41.59 | 51.74 | 47.87 | 50.56 | 46.62 | 49.70 | 43.35 | 35.27 | 31.64 | 36.02 | 32.25 | 27.60 | 30.19 | 33.31 | 40.38 | 23.16 | 20.39 | 23.82 | 22.32 | 20.33 | 19.35 | 27.88 | 11.69 | 7.23 | 3.30 | 0.03 | NA | NA | 65.71 | NA | NA | 64.21 | NA | NA | |
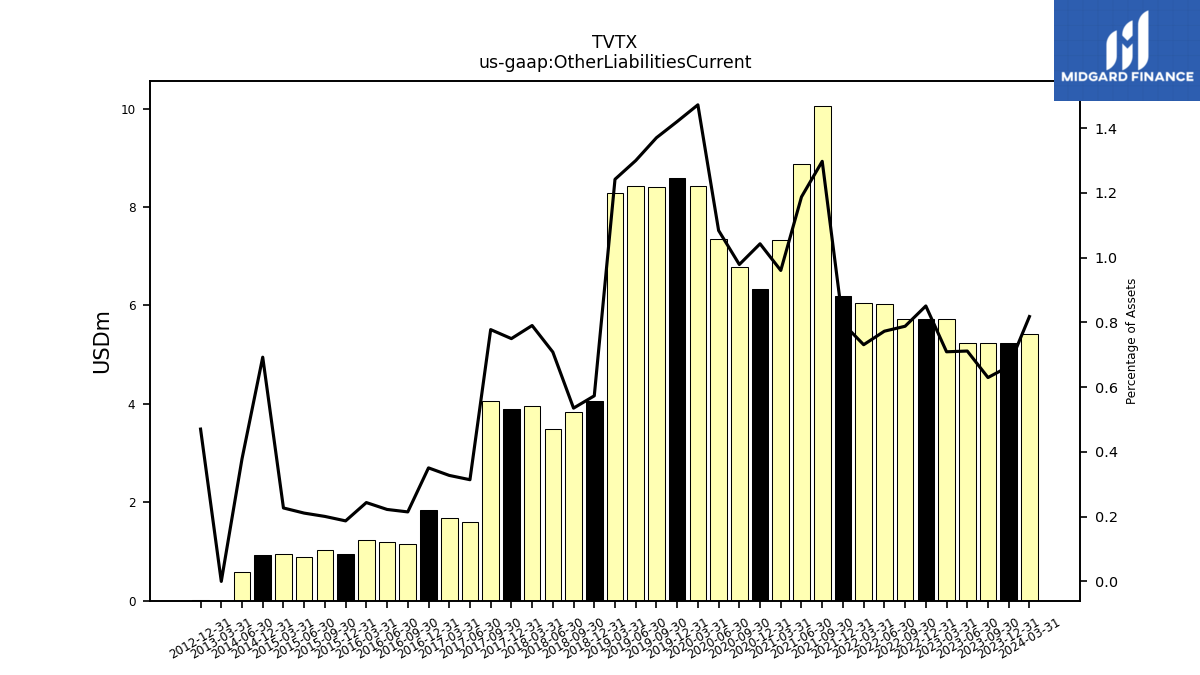
| Other Liabilities Current | 5.24 | 5.24 | 5.73 | 5.72 | 5.72 | 6.02 | 6.06 | 6.19 | 10.06 | 8.87 | 7.34 | 6.33 | 6.78 | 7.36 | 8.44 | 8.59 | 8.41 | 8.42 | 8.29 | 4.07 | 3.83 | 3.48 | 3.96 | 3.90 | 4.05 | 1.59 | 1.67 | 1.84 | 1.14 | 1.19 | 1.24 | 0.96 | 1.03 | 0.90 | 0.94 | 0.94 | NA | 0.59 | NA | NA | NA | NA | NA | NA | NA | NA | NA | NA | |
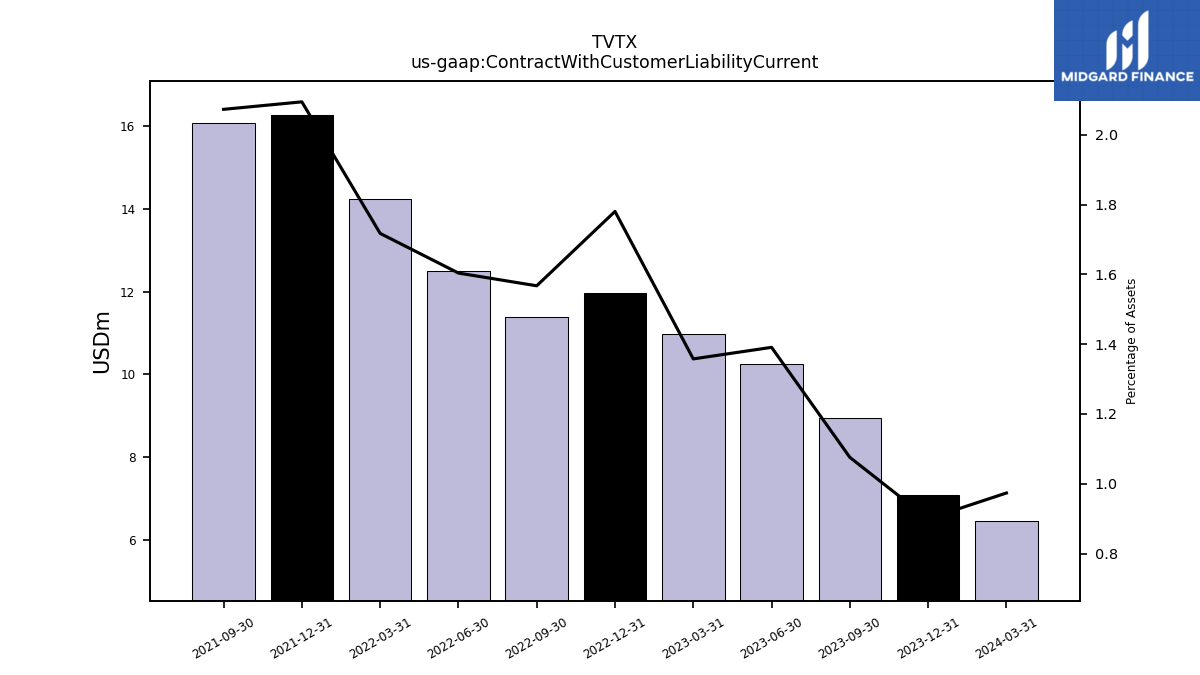
| Contract With Customer Liability Current | 8.96 | 10.24 | 10.97 | 11.98 | 11.38 | 12.50 | 14.23 | 16.27 | 16.07 | NA | NA | NA | NA | NA | NA | NA | NA | NA | NA | NA | NA | NA | NA | NA | NA | NA | NA | NA | NA | NA | NA | NA | NA | NA | NA | NA | NA | NA | NA | NA | NA | NA | NA | NA | NA | NA | NA | NA |
| 2023-09-30 | 2023-06-30 | 2023-03-31 | 2022-12-31 | 2022-09-30 | 2022-06-30 | 2022-03-31 | 2021-12-31 | 2021-09-30 | 2021-06-30 | 2021-03-31 | 2020-12-31 | 2020-09-30 | 2020-06-30 | 2020-03-31 | 2019-12-31 | 2019-09-30 | 2019-06-30 | 2019-03-31 | 2018-12-31 | 2018-09-30 | 2018-06-30 | 2018-03-31 | 2017-12-31 | 2017-09-30 | 2017-06-30 | 2017-03-31 | 2016-12-31 | 2016-09-30 | 2016-06-30 | 2016-03-31 | 2015-12-31 | 2015-09-30 | 2015-06-30 | 2015-03-31 | 2014-12-31 | 2014-09-30 | 2014-06-30 | 2014-03-31 | 2012-11-30 | 2012-08-31 | 2012-05-31 | 2011-11-30 | 2011-08-31 | 2011-05-31 | 2011-02-28 | 2010-11-30 | 2010-08-31 | ||
|---|---|---|---|---|---|---|---|---|---|---|---|---|---|---|---|---|---|---|---|---|---|---|---|---|---|---|---|---|---|---|---|---|---|---|---|---|---|---|---|---|---|---|---|---|---|---|---|---|---|
| Other Liabilities Noncurrent | 8.38 | 8.74 | 9.07 | 9.38 | 9.30 | 9.61 | 10.35 | 12.28 | 43.26 | 43.73 | 43.17 | 40.53 | 40.33 | 19.51 | 13.31 | 20.89 | 21.49 | 22.10 | 23.41 | 4.50 | 4.88 | 4.88 | 4.62 | 2.47 | 3.81 | 3.85 | 3.86 | 4.01 | 2.46 | 2.55 | 2.89 | 3.07 | 13.91 | 12.15 | 12.29 | 12.23 | NA | NA | NA | NA | NA | NA | NA | NA | NA | NA | NA | NA | |
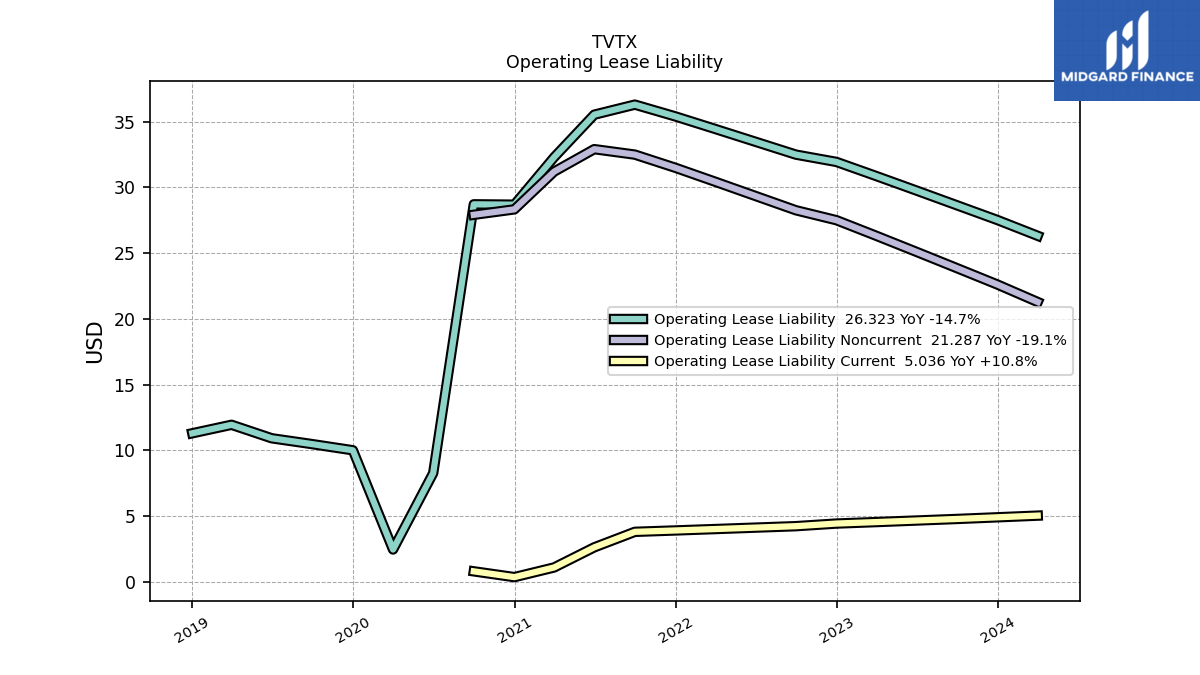
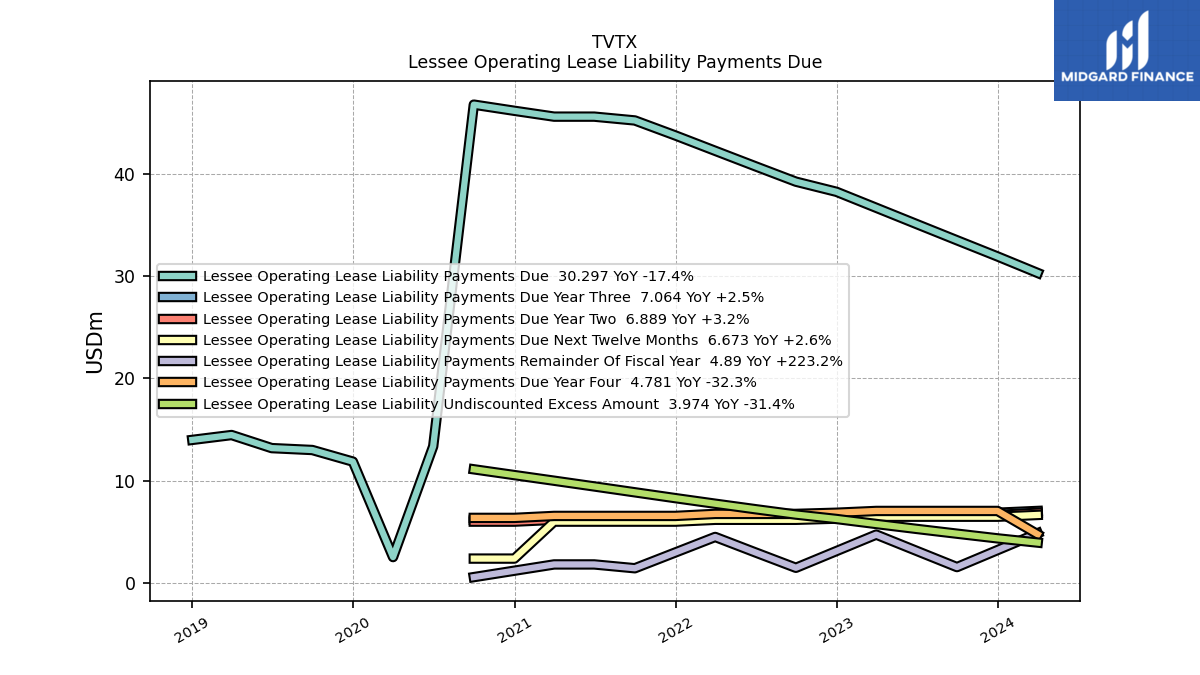
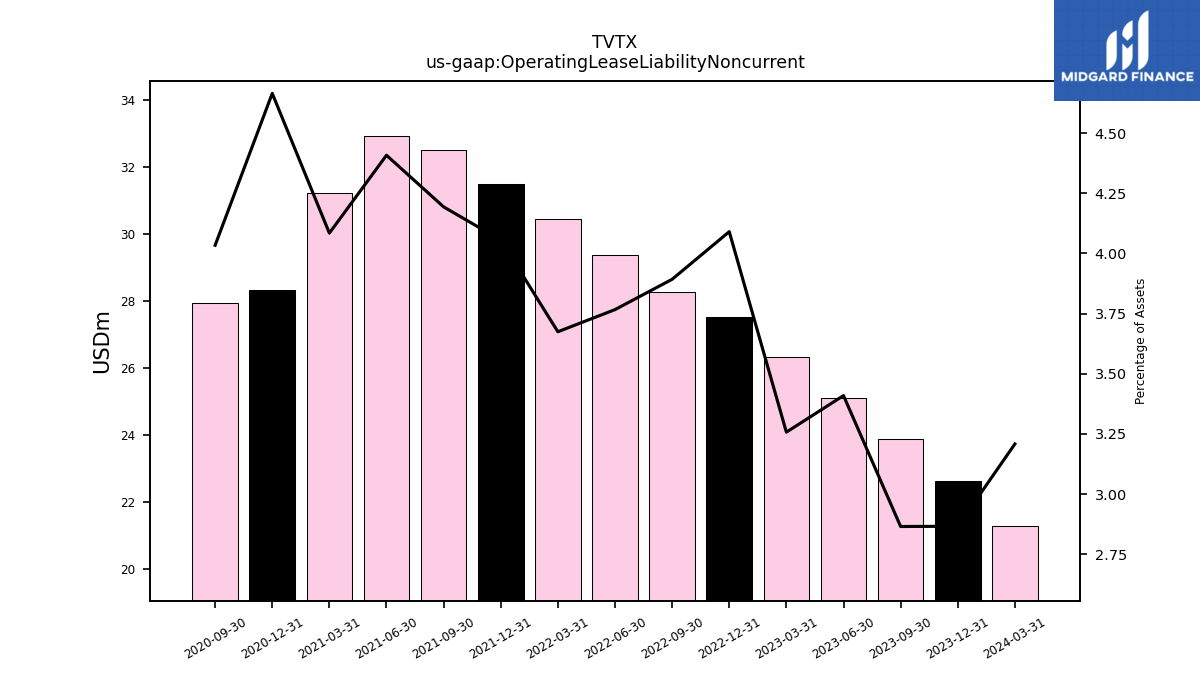
| Operating Lease Liability Noncurrent | 23.86 | 25.11 | 26.33 | 27.51 | 28.27 | 29.36 | 30.44 | 31.50 | 32.50 | 32.92 | 31.21 | 28.34 | 27.92 | NA | NA | NA | NA | NA | NA | NA | NA | NA | NA | NA | NA | NA | NA | NA | NA | NA | NA | NA | NA | NA | NA | NA | NA | NA | NA | NA | NA | NA | NA | NA | NA | NA | NA | NA |
| 2023-09-30 | 2023-06-30 | 2023-03-31 | 2022-12-31 | 2022-09-30 | 2022-06-30 | 2022-03-31 | 2021-12-31 | 2021-09-30 | 2021-06-30 | 2021-03-31 | 2020-12-31 | 2020-09-30 | 2020-06-30 | 2020-03-31 | 2019-12-31 | 2019-09-30 | 2019-06-30 | 2019-03-31 | 2018-12-31 | 2018-09-30 | 2018-06-30 | 2018-03-31 | 2017-12-31 | 2017-09-30 | 2017-06-30 | 2017-03-31 | 2016-12-31 | 2016-09-30 | 2016-06-30 | 2016-03-31 | 2015-12-31 | 2015-09-30 | 2015-06-30 | 2015-03-31 | 2014-12-31 | 2014-09-30 | 2014-06-30 | 2014-03-31 | 2012-11-30 | 2012-08-31 | 2012-05-31 | 2011-11-30 | 2011-08-31 | 2011-05-31 | 2011-02-28 | 2010-11-30 | 2010-08-31 | ||
|---|---|---|---|---|---|---|---|---|---|---|---|---|---|---|---|---|---|---|---|---|---|---|---|---|---|---|---|---|---|---|---|---|---|---|---|---|---|---|---|---|---|---|---|---|---|---|---|---|---|
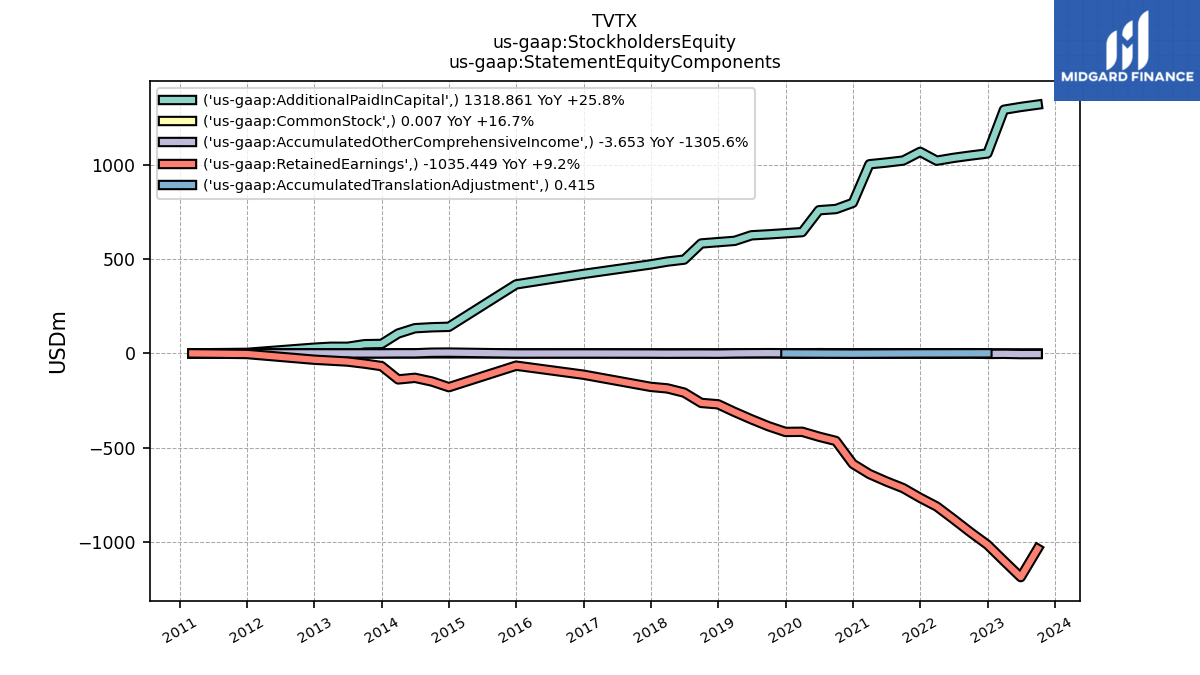
| Stockholders Equity | 279.77 | 116.48 | 189.14 | 42.85 | 100.68 | 156.71 | 208.14 | 302.11 | 307.37 | 332.30 | 362.69 | 211.21 | 301.41 | 318.64 | 225.75 | 221.20 | 245.96 | 277.09 | 285.71 | 318.25 | 319.06 | 287.99 | 299.48 | 293.13 | 304.52 | 295.83 | 300.94 | 307.77 | 307.60 | 314.37 | 319.23 | 299.97 | 291.01 | 150.78 | 168.57 | -37.25 | -10.19 | 1.07 | -35.39 | -0.06 | -0.06 | -0.06 | -0.06 | NA | NA | -0.06 | NA | NA | |
| Common Stock Value | 0.01 | 0.01 | 0.01 | 0.01 | 0.01 | 0.01 | 0.01 | 0.01 | 0.01 | 0.01 | 0.01 | 0.01 | 0.01 | 0.01 | 0.00 | 0.00 | 0.00 | 0.00 | 0.00 | 0.00 | 0.00 | 0.00 | 0.00 | 0.00 | 0.00 | 0.00 | 0.00 | 0.00 | 0.00 | 0.00 | 0.00 | 0.00 | 0.00 | 0.00 | 0.00 | 0.00 | 0.00 | 0.00 | 0.00 | 0.00 | NA | NA | NA | NA | NA | NA | NA | NA | |
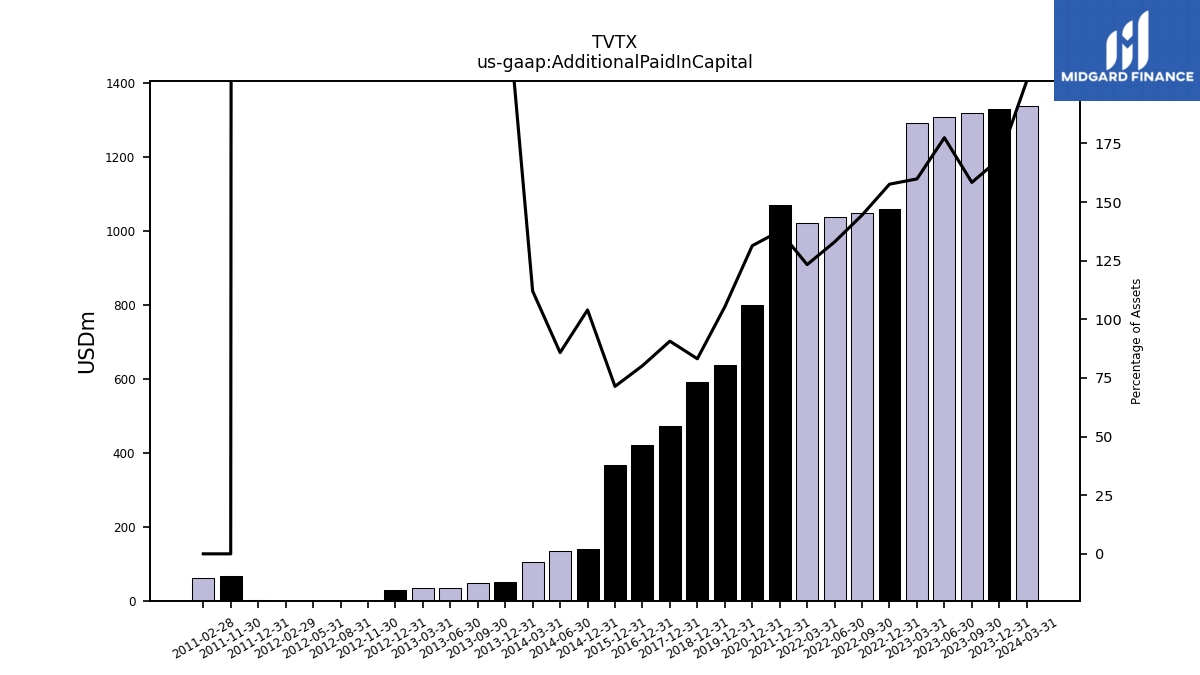
| Additional Paid In Capital | 1318.86 | 1306.52 | 1291.86 | 1059.97 | 1048.77 | 1036.53 | 1021.54 | 1068.63 | NA | NA | NA | 797.99 | NA | NA | NA | 636.91 | NA | NA | NA | 589.79 | NA | NA | NA | 471.80 | NA | NA | NA | 421.31 | NA | NA | NA | 365.80 | NA | NA | NA | 140.85 | NA | 133.45 | 105.37 | 0.08 | 0.08 | 0.08 | 66.90 | NA | NA | 60.90 | NA | NA | |
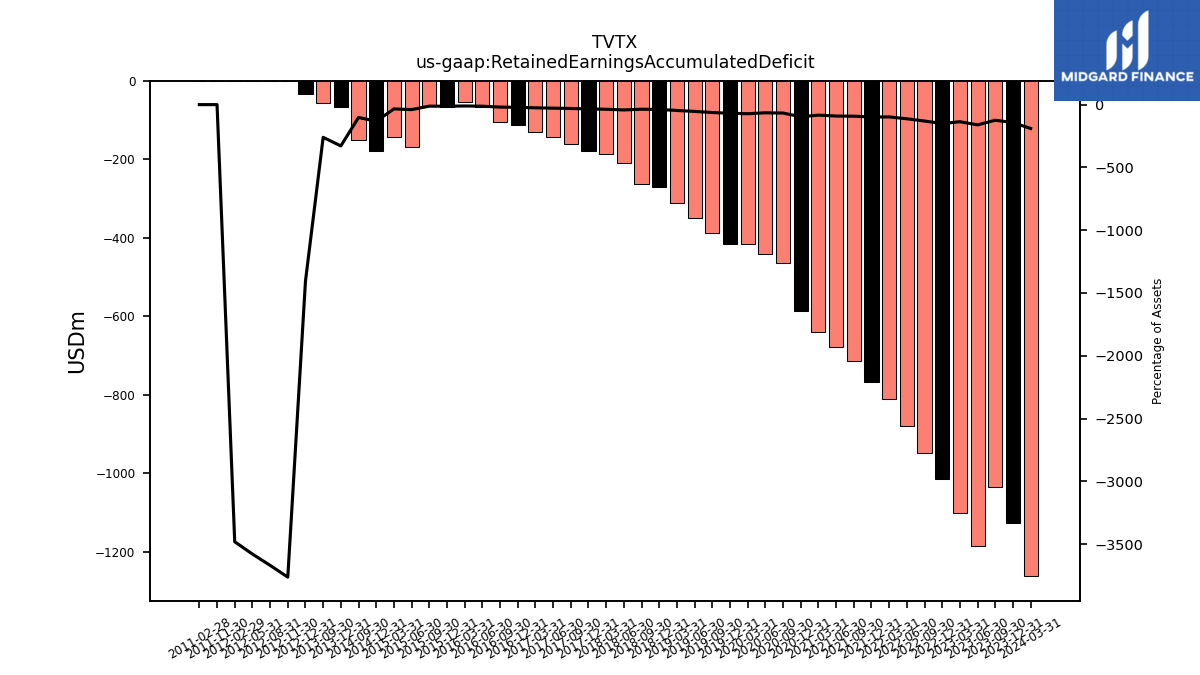
| Retained Earnings Accumulated Deficit | -1035.45 | -1186.18 | -1100.55 | -1014.22 | -948.40 | -878.74 | -811.71 | -765.97 | -714.39 | -678.75 | -639.74 | -585.88 | -464.25 | -441.70 | -415.64 | -416.44 | -386.19 | -349.69 | -310.99 | -270.02 | -262.56 | -208.05 | -185.72 | -177.66 | -160.04 | -142.24 | -129.01 | -113.06 | -104.45 | -67.34 | -53.94 | -65.15 | -62.68 | -168.26 | -142.73 | -179.17 | -149.13 | NA | NA | -0.15 | -0.14 | -0.14 | -0.13 | NA | NA | -0.12 | NA | NA | |
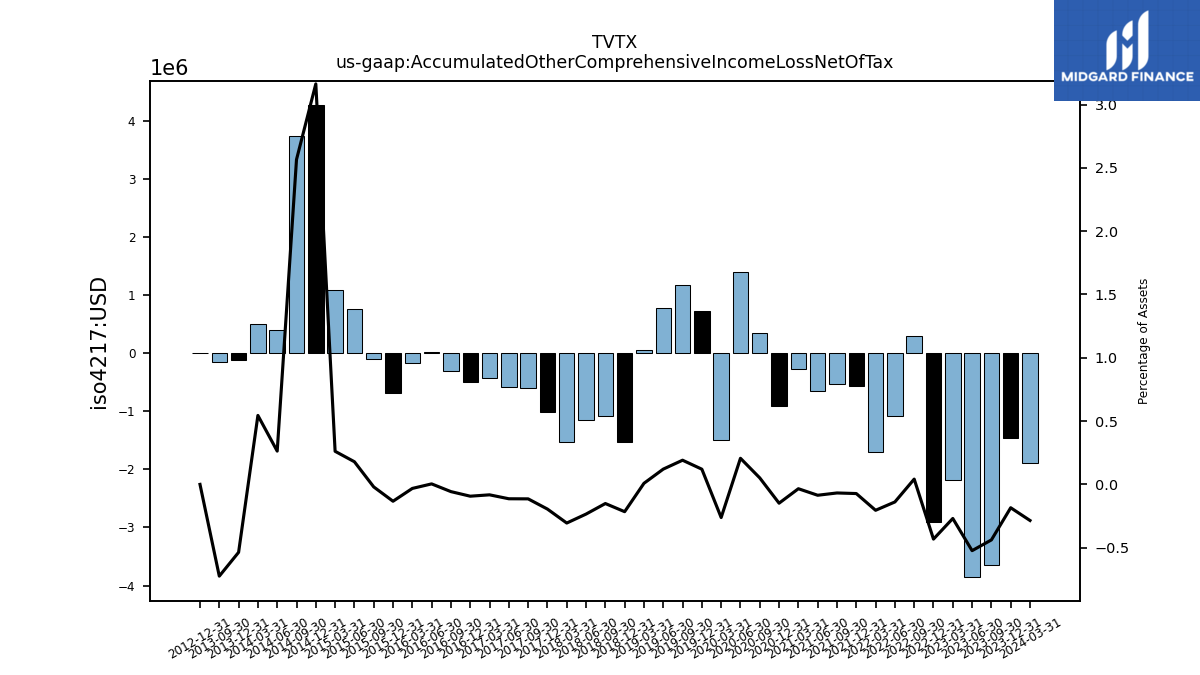
| Accumulated Other Comprehensive Income Loss Net Of Tax | -3.65 | -3.85 | -2.18 | -2.91 | 0.30 | -1.08 | -1.70 | -0.56 | -0.53 | -0.64 | -0.26 | -0.90 | 0.35 | 1.40 | -1.50 | 0.73 | 1.17 | 0.78 | 0.06 | -1.53 | -1.08 | -1.15 | -1.53 | -1.01 | -0.59 | -0.58 | -0.42 | -0.49 | -0.30 | 0.02 | -0.16 | -0.68 | -0.10 | 0.76 | 1.09 | 4.29 | 3.74 | 0.41 | 0.51 | NA | NA | NA | NA | NA | NA | NA | NA | NA |
| 2023-09-30 | 2023-06-30 | 2023-03-31 | 2022-12-31 | 2022-09-30 | 2022-06-30 | 2022-03-31 | 2021-12-31 | 2021-09-30 | 2021-06-30 | 2021-03-31 | 2020-12-31 | 2020-09-30 | 2020-06-30 | 2020-03-31 | 2019-12-31 | 2019-09-30 | 2019-06-30 | 2019-03-31 | 2018-12-31 | 2018-09-30 | 2018-06-30 | 2018-03-31 | 2017-12-31 | 2017-09-30 | 2017-06-30 | 2017-03-31 | 2016-12-31 | 2016-09-30 | 2016-06-30 | 2016-03-31 | 2015-12-31 | 2015-09-30 | 2015-06-30 | 2015-03-31 | 2014-12-31 | 2014-09-30 | 2014-06-30 | 2014-03-31 | 2012-11-30 | 2012-08-31 | 2012-05-31 | 2011-11-30 | 2011-08-31 | 2011-05-31 | 2011-02-28 | 2010-11-30 | 2010-08-31 | ||
|---|---|---|---|---|---|---|---|---|---|---|---|---|---|---|---|---|---|---|---|---|---|---|---|---|---|---|---|---|---|---|---|---|---|---|---|---|---|---|---|---|---|---|---|---|---|---|---|---|---|
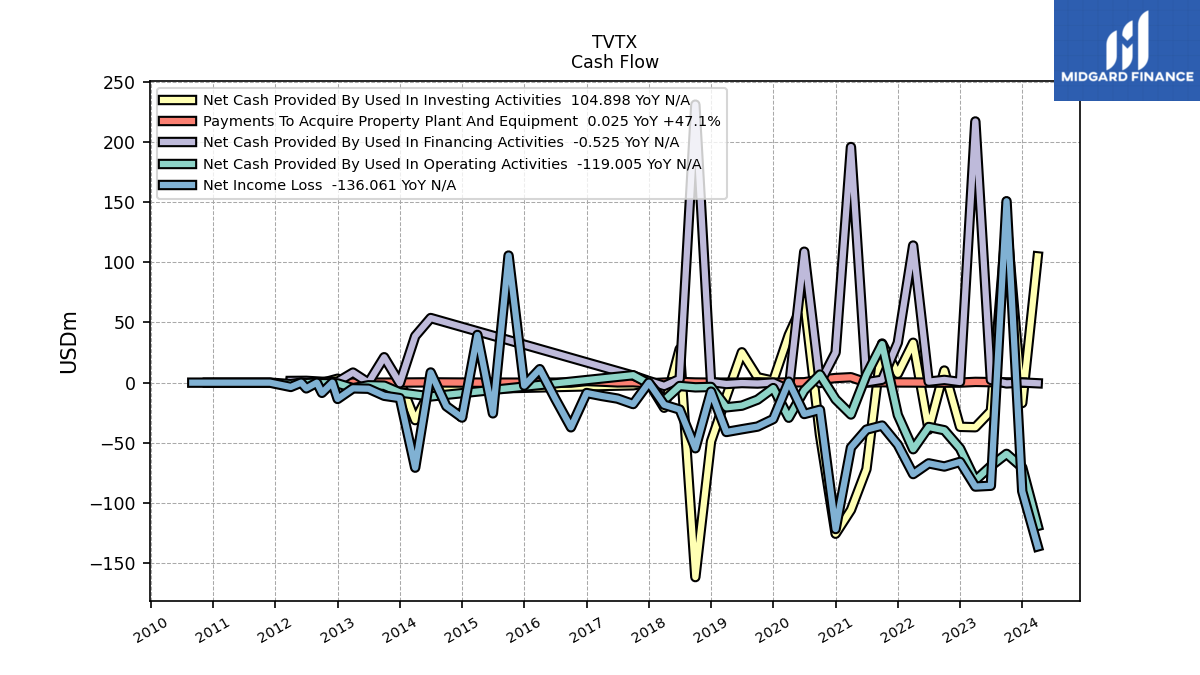
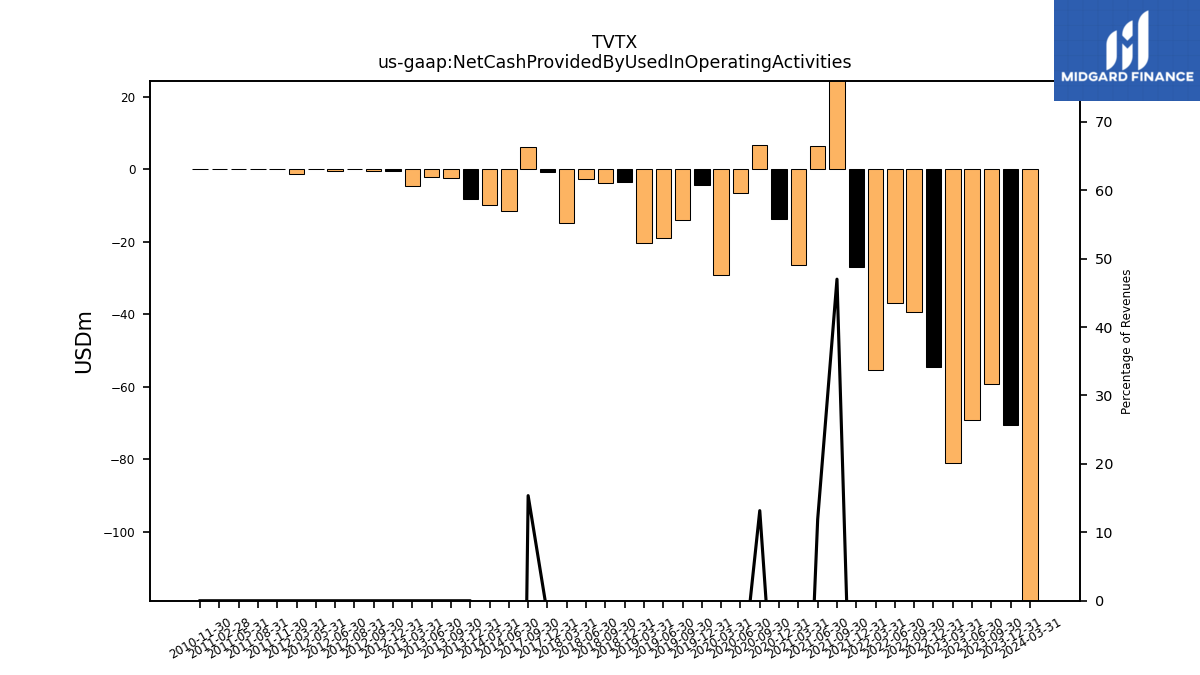
| Net Cash Provided By Used In Operating Activities | -59.13 | -69.30 | -81.12 | -54.64 | -39.52 | -36.81 | -55.32 | -26.88 | 32.06 | 6.50 | -26.47 | -13.87 | 6.74 | -6.45 | -29.16 | -4.49 | -14.12 | -19.11 | -20.49 | -3.56 | -3.90 | -2.76 | -14.73 | -0.85 | 6.20 | NA | NA | NA | NA | NA | NA | NA | NA | NA | NA | NA | NA | -11.45 | -9.81 | NA | 0.00 | -0.00 | -0.00 | -0.00 | -0.00 | -0.00 | -0.00 | NA | |
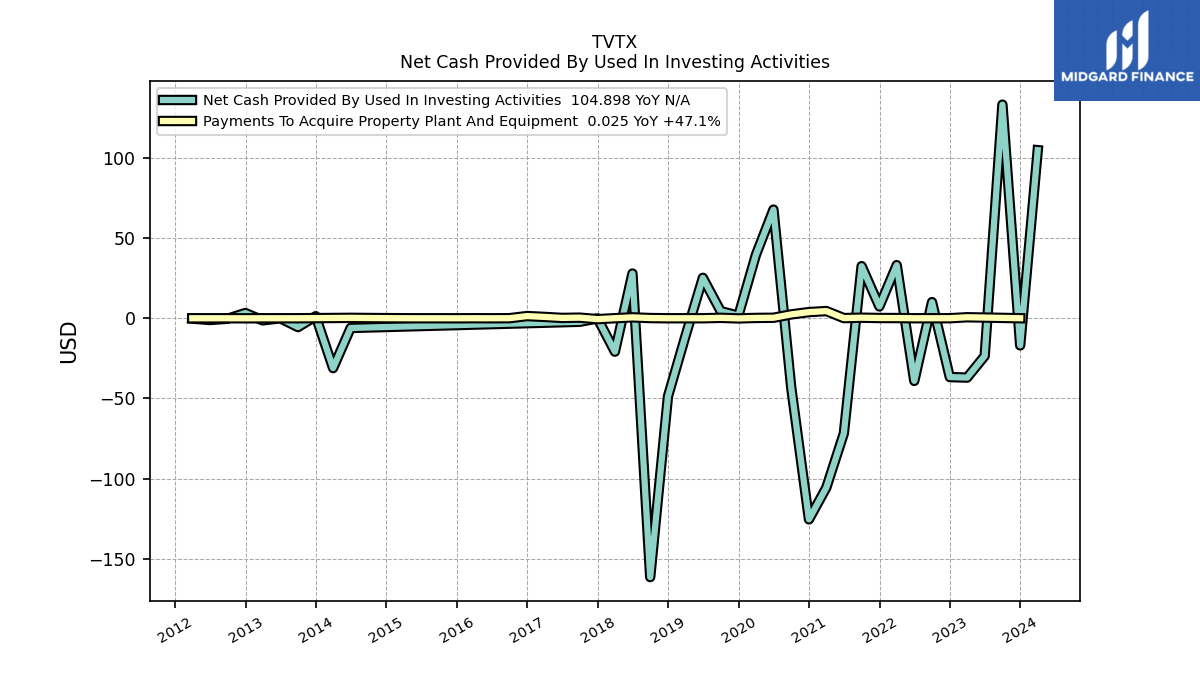
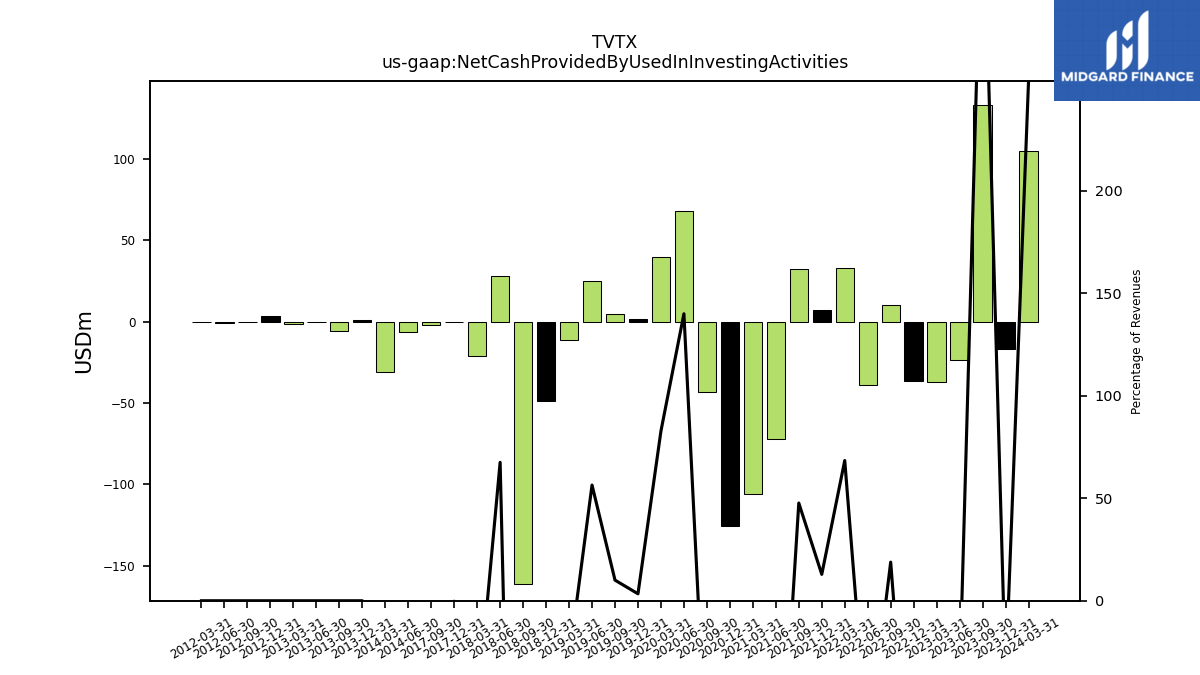
| Net Cash Provided By Used In Investing Activities | 133.32 | -23.55 | -37.04 | -36.70 | 10.08 | -39.10 | 33.16 | 7.37 | 32.52 | -71.81 | -105.71 | -125.51 | -43.17 | 67.80 | 39.55 | 1.58 | 4.46 | 25.23 | -11.41 | -48.80 | -161.54 | 27.91 | -20.85 | -0.10 | -2.19 | NA | NA | NA | NA | NA | NA | NA | NA | NA | NA | NA | NA | -6.06 | -31.11 | NA | NA | NA | NA | NA | NA | NA | NA | NA | |
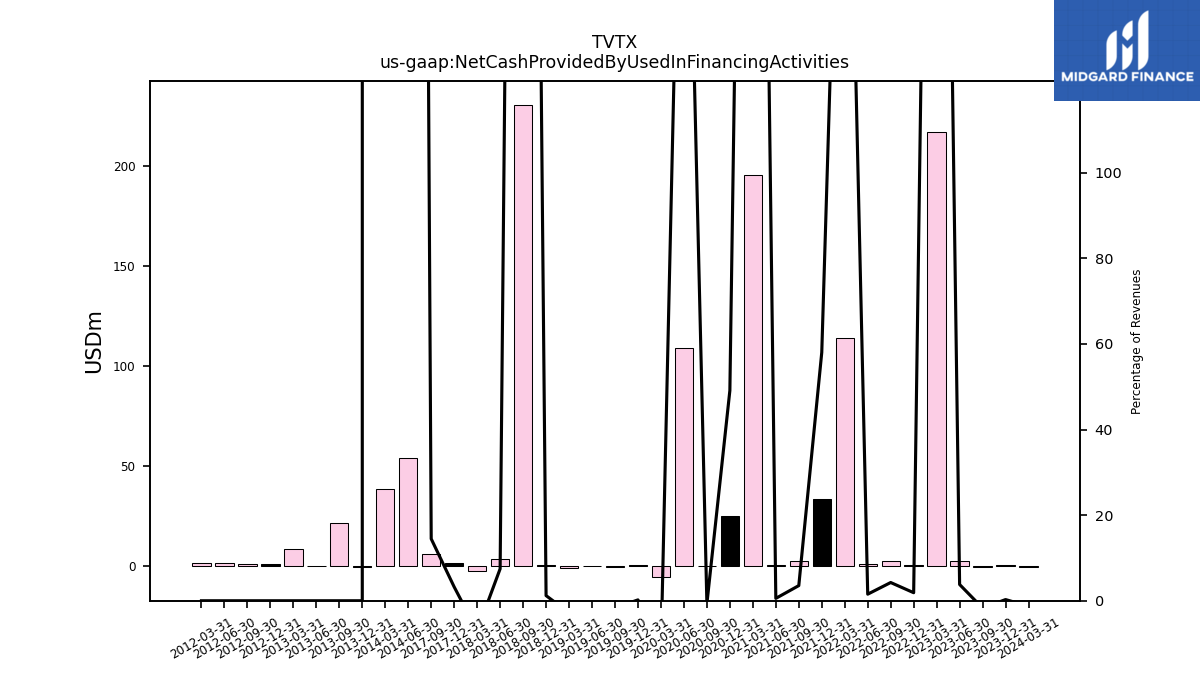
| Net Cash Provided By Used In Financing Activities | -0.63 | 2.27 | 217.00 | 0.55 | 2.28 | 0.83 | 113.91 | 33.21 | 2.41 | 0.30 | 195.75 | 25.04 | -0.35 | 108.80 | -5.77 | 0.10 | -0.74 | -0.32 | -1.11 | 0.53 | 230.96 | 3.08 | -2.70 | 1.36 | 5.83 | NA | NA | NA | NA | NA | NA | NA | NA | NA | NA | NA | NA | 53.69 | 38.62 | NA | NA | NA | NA | NA | NA | NA | NA | NA |
| 2023-09-30 | 2023-06-30 | 2023-03-31 | 2022-12-31 | 2022-09-30 | 2022-06-30 | 2022-03-31 | 2021-12-31 | 2021-09-30 | 2021-06-30 | 2021-03-31 | 2020-12-31 | 2020-09-30 | 2020-06-30 | 2020-03-31 | 2019-12-31 | 2019-09-30 | 2019-06-30 | 2019-03-31 | 2018-12-31 | 2018-09-30 | 2018-06-30 | 2018-03-31 | 2017-12-31 | 2017-09-30 | 2017-06-30 | 2017-03-31 | 2016-12-31 | 2016-09-30 | 2016-06-30 | 2016-03-31 | 2015-12-31 | 2015-09-30 | 2015-06-30 | 2015-03-31 | 2014-12-31 | 2014-09-30 | 2014-06-30 | 2014-03-31 | 2012-11-30 | 2012-08-31 | 2012-05-31 | 2011-11-30 | 2011-08-31 | 2011-05-31 | 2011-02-28 | 2010-11-30 | 2010-08-31 | ||
|---|---|---|---|---|---|---|---|---|---|---|---|---|---|---|---|---|---|---|---|---|---|---|---|---|---|---|---|---|---|---|---|---|---|---|---|---|---|---|---|---|---|---|---|---|---|---|---|---|---|
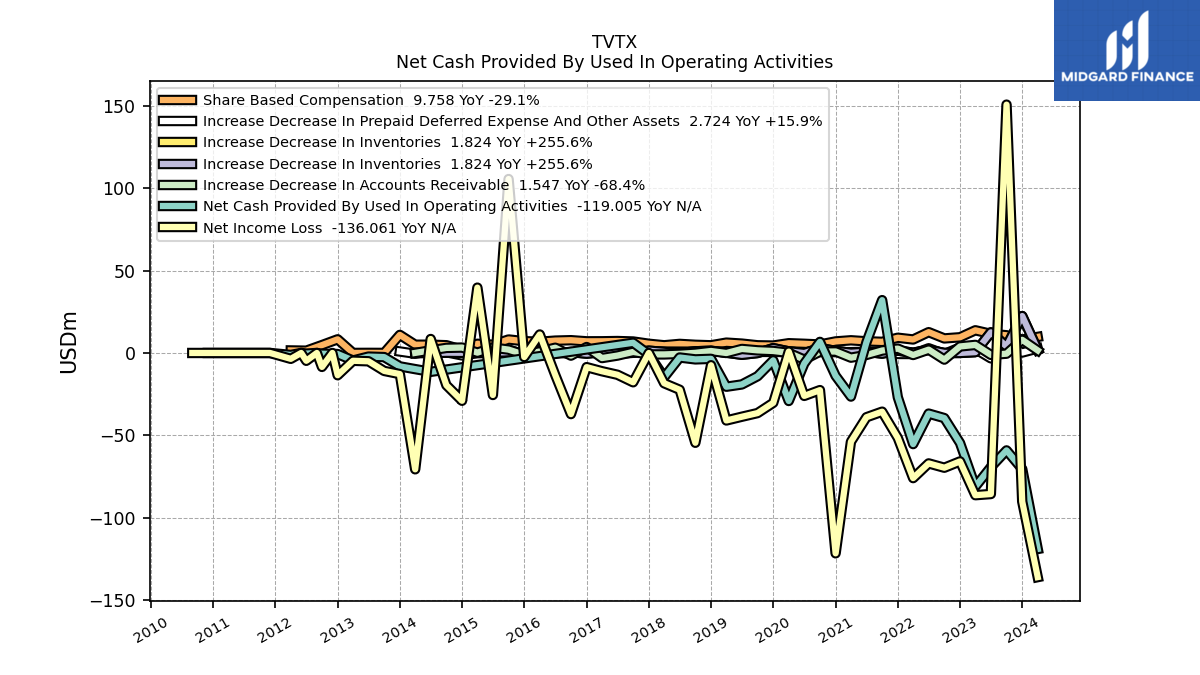
| Net Cash Provided By Used In Operating Activities | -59.13 | -69.30 | -81.12 | -54.64 | -39.52 | -36.81 | -55.32 | -26.88 | 32.06 | 6.50 | -26.47 | -13.87 | 6.74 | -6.45 | -29.16 | -4.49 | -14.12 | -19.11 | -20.49 | -3.56 | -3.90 | -2.76 | -14.73 | -0.85 | 6.20 | NA | NA | NA | NA | NA | NA | NA | NA | NA | NA | NA | NA | -11.45 | -9.81 | NA | 0.00 | -0.00 | -0.00 | -0.00 | -0.00 | -0.00 | -0.00 | NA | |
| Net Income Loss | 150.74 | -85.63 | -86.33 | -65.82 | -69.66 | -67.03 | -75.97 | -51.57 | -35.64 | -39.01 | -53.87 | -121.62 | -22.55 | -26.07 | 0.81 | -30.26 | -36.49 | -38.70 | -40.98 | -7.46 | -54.52 | -22.33 | -18.38 | -0.02 | -17.79 | -13.23 | -11.09 | -8.60 | -37.11 | -13.40 | 11.22 | -2.47 | 105.58 | -25.53 | 39.65 | -29.03 | -19.56 | 8.48 | -70.63 | -0.00 | -0.00 | -0.00 | -0.00 | -0.00 | -0.00 | -0.00 | -0.01 | -0.01 | |
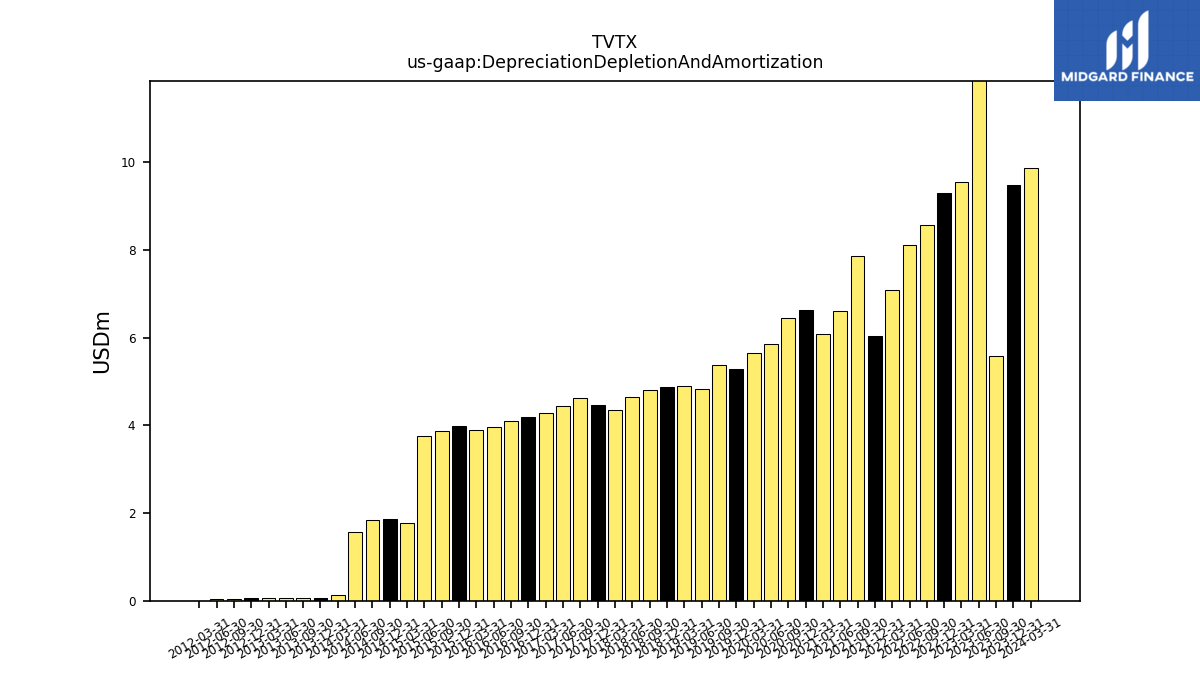
| Depreciation Depletion And Amortization | 5.59 | 13.90 | 9.54 | 9.30 | 8.58 | 8.11 | 7.09 | 6.05 | 7.87 | 6.62 | 6.07 | 6.63 | 6.44 | 5.85 | 5.66 | 5.29 | 5.38 | 4.84 | 4.90 | 4.88 | 4.80 | 4.64 | 4.35 | 4.47 | 4.62 | 4.44 | 4.28 | 4.18 | 4.09 | 3.97 | 3.89 | 3.98 | 3.88 | 3.76 | 1.78 | 1.86 | 1.85 | 1.57 | 0.13 | NA | NA | NA | NA | NA | NA | NA | NA | NA | |
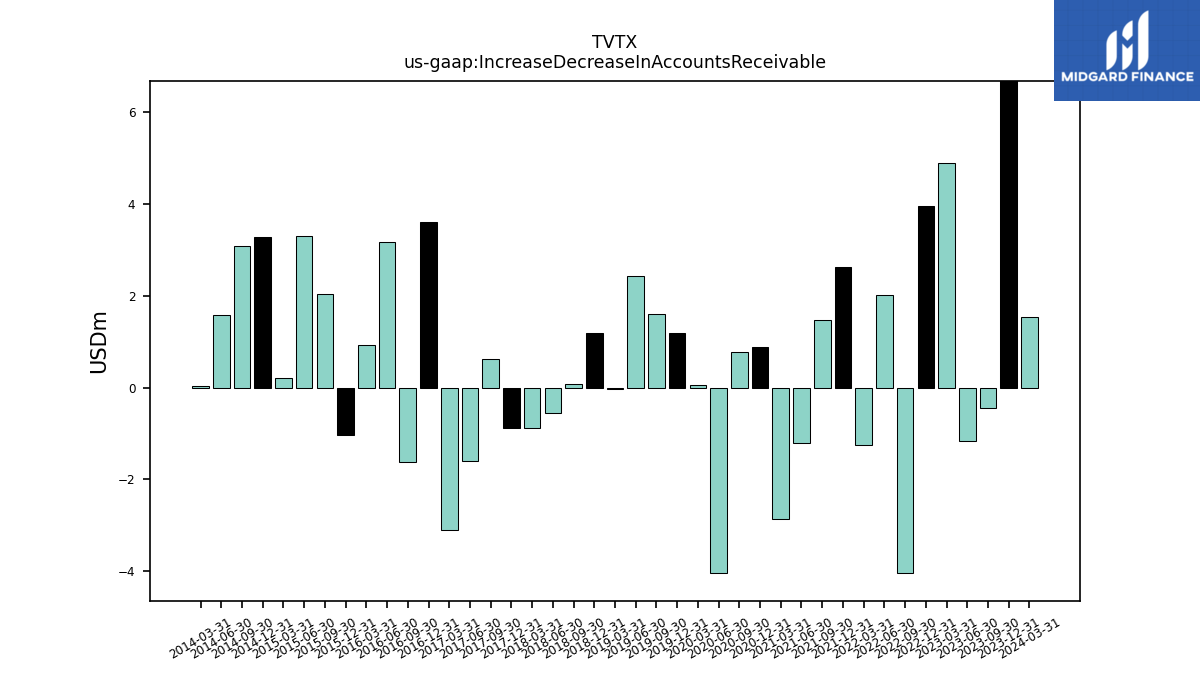
| Increase Decrease In Accounts Receivable | -0.44 | -1.16 | 4.89 | 3.95 | -4.04 | 2.02 | -1.24 | 2.64 | 1.48 | -1.21 | -2.85 | 0.89 | 0.78 | -4.04 | 0.06 | 1.20 | 1.59 | 2.44 | -0.04 | 1.19 | 0.09 | -0.55 | -0.89 | -0.88 | 0.62 | -1.59 | -3.10 | 3.60 | -1.62 | 3.18 | 0.93 | -1.04 | 2.03 | 3.30 | 0.20 | 3.28 | 3.08 | 1.57 | 0.03 | NA | NA | NA | NA | NA | NA | NA | NA | NA | |
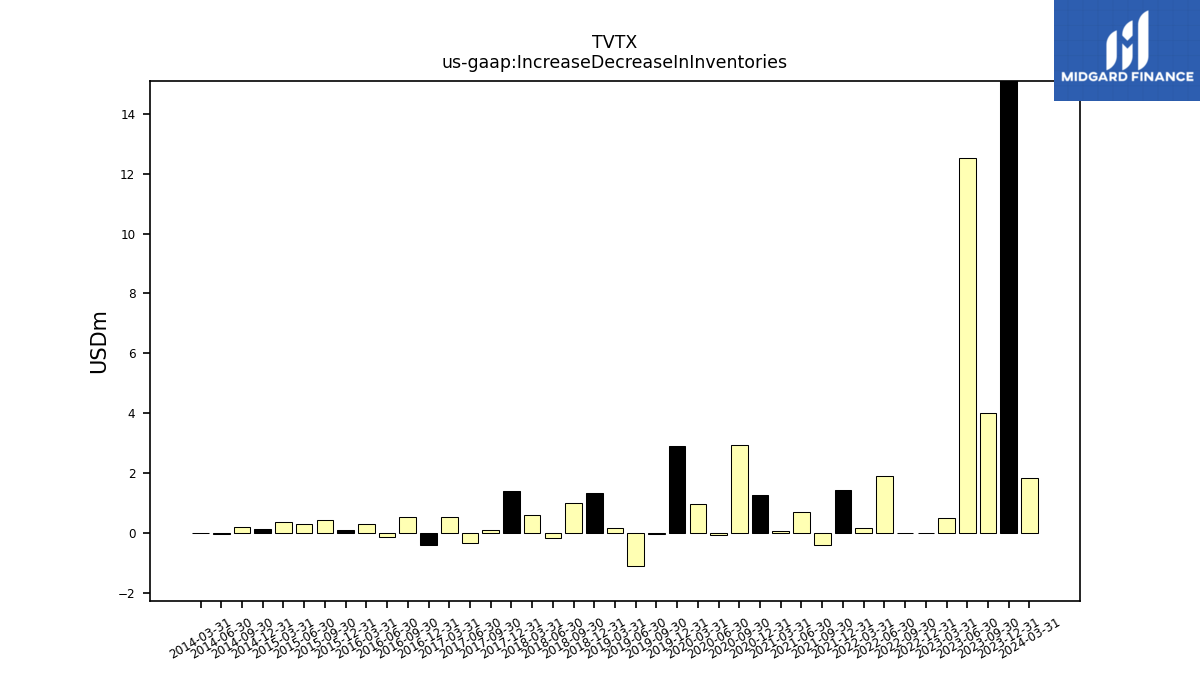
| Increase Decrease In Inventories | 4.00 | 12.51 | 0.51 | 0.01 | -0.01 | 1.90 | 0.16 | 1.44 | -0.38 | 0.70 | 0.06 | 1.25 | 2.94 | -0.08 | 0.96 | 2.90 | -0.03 | -1.09 | 0.17 | 1.34 | 0.99 | -0.16 | 0.59 | 1.39 | 0.11 | -0.34 | 0.55 | -0.41 | 0.54 | -0.13 | 0.30 | 0.10 | 0.43 | 0.29 | 0.35 | 0.12 | 0.19 | -0.02 | -0.00 | NA | NA | NA | NA | NA | NA | NA | NA | NA | |
| Share Based Compensation | 10.73 | 11.60 | 13.76 | 9.53 | 8.83 | 12.64 | 8.19 | 9.24 | 6.76 | 7.07 | 7.69 | 7.00 | 5.14 | 5.56 | 5.91 | 4.50 | 4.66 | 5.68 | 6.27 | 4.66 | 4.95 | 5.50 | 4.66 | 5.58 | 6.96 | 7.24 | 7.09 | 7.07 | 7.75 | 7.49 | 6.79 | 7.15 | 8.18 | 4.99 | 5.57 | 1.93 | 4.69 | 5.01 | 5.01 | NA | NA | NA | NA | NA | NA | NA | NA | NA |
| 2023-09-30 | 2023-06-30 | 2023-03-31 | 2022-12-31 | 2022-09-30 | 2022-06-30 | 2022-03-31 | 2021-12-31 | 2021-09-30 | 2021-06-30 | 2021-03-31 | 2020-12-31 | 2020-09-30 | 2020-06-30 | 2020-03-31 | 2019-12-31 | 2019-09-30 | 2019-06-30 | 2019-03-31 | 2018-12-31 | 2018-09-30 | 2018-06-30 | 2018-03-31 | 2017-12-31 | 2017-09-30 | 2017-06-30 | 2017-03-31 | 2016-12-31 | 2016-09-30 | 2016-06-30 | 2016-03-31 | 2015-12-31 | 2015-09-30 | 2015-06-30 | 2015-03-31 | 2014-12-31 | 2014-09-30 | 2014-06-30 | 2014-03-31 | 2012-11-30 | 2012-08-31 | 2012-05-31 | 2011-11-30 | 2011-08-31 | 2011-05-31 | 2011-02-28 | 2010-11-30 | 2010-08-31 | ||
|---|---|---|---|---|---|---|---|---|---|---|---|---|---|---|---|---|---|---|---|---|---|---|---|---|---|---|---|---|---|---|---|---|---|---|---|---|---|---|---|---|---|---|---|---|---|---|---|---|---|
| Net Cash Provided By Used In Investing Activities | 133.32 | -23.55 | -37.04 | -36.70 | 10.08 | -39.10 | 33.16 | 7.37 | 32.52 | -71.81 | -105.71 | -125.51 | -43.17 | 67.80 | 39.55 | 1.58 | 4.46 | 25.23 | -11.41 | -48.80 | -161.54 | 27.91 | -20.85 | -0.10 | -2.19 | NA | NA | NA | NA | NA | NA | NA | NA | NA | NA | NA | NA | -6.06 | -31.11 | NA | NA | NA | NA | NA | NA | NA | NA | NA | |
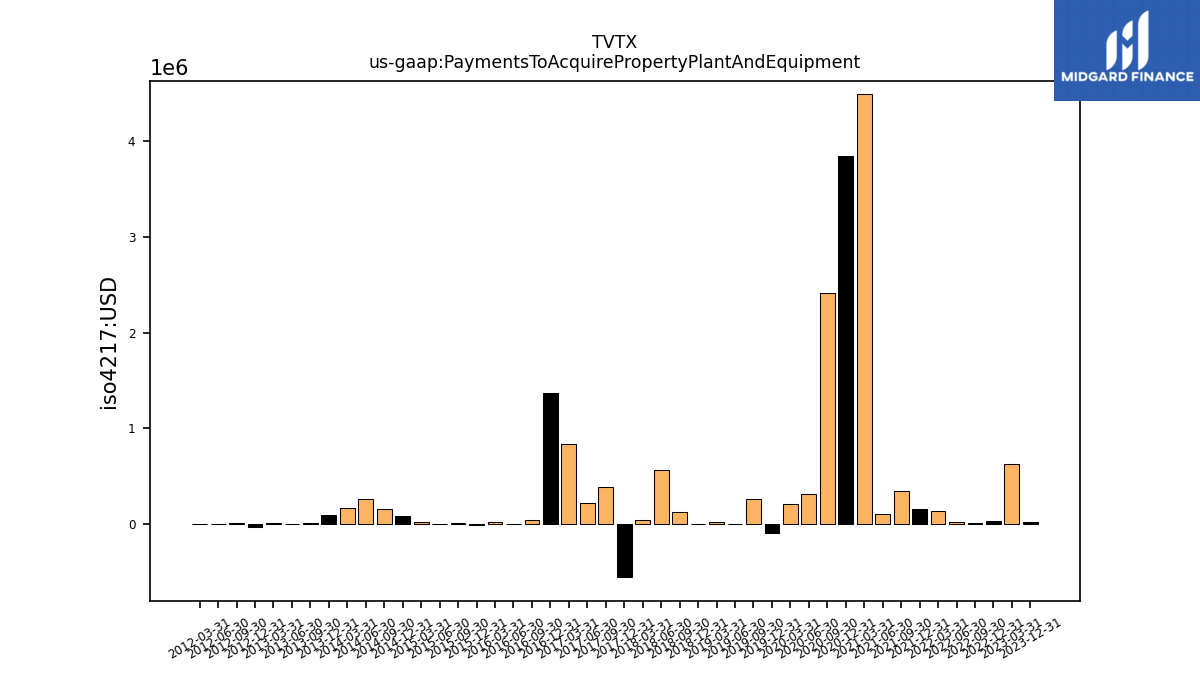
| Payments To Acquire Property Plant And Equipment | NA | NA | 0.63 | 0.03 | 0.01 | 0.02 | 0.13 | 0.15 | 0.35 | 0.10 | 4.50 | 3.84 | 2.41 | 0.31 | 0.21 | -0.09 | 0.27 | 0.00 | 0.02 | 0.00 | 0.13 | 0.56 | 0.04 | -0.55 | 0.38 | 0.22 | 0.84 | 1.37 | 0.04 | 0.00 | 0.02 | -0.01 | 0.01 | 0.00 | 0.02 | 0.08 | 0.16 | 0.26 | 0.17 | NA | NA | NA | NA | NA | NA | NA | NA | NA |
| 2023-09-30 | 2023-06-30 | 2023-03-31 | 2022-12-31 | 2022-09-30 | 2022-06-30 | 2022-03-31 | 2021-12-31 | 2021-09-30 | 2021-06-30 | 2021-03-31 | 2020-12-31 | 2020-09-30 | 2020-06-30 | 2020-03-31 | 2019-12-31 | 2019-09-30 | 2019-06-30 | 2019-03-31 | 2018-12-31 | 2018-09-30 | 2018-06-30 | 2018-03-31 | 2017-12-31 | 2017-09-30 | 2017-06-30 | 2017-03-31 | 2016-12-31 | 2016-09-30 | 2016-06-30 | 2016-03-31 | 2015-12-31 | 2015-09-30 | 2015-06-30 | 2015-03-31 | 2014-12-31 | 2014-09-30 | 2014-06-30 | 2014-03-31 | 2012-11-30 | 2012-08-31 | 2012-05-31 | 2011-11-30 | 2011-08-31 | 2011-05-31 | 2011-02-28 | 2010-11-30 | 2010-08-31 | ||
|---|---|---|---|---|---|---|---|---|---|---|---|---|---|---|---|---|---|---|---|---|---|---|---|---|---|---|---|---|---|---|---|---|---|---|---|---|---|---|---|---|---|---|---|---|---|---|---|---|---|
| Net Cash Provided By Used In Financing Activities | -0.63 | 2.27 | 217.00 | 0.55 | 2.28 | 0.83 | 113.91 | 33.21 | 2.41 | 0.30 | 195.75 | 25.04 | -0.35 | 108.80 | -5.77 | 0.10 | -0.74 | -0.32 | -1.11 | 0.53 | 230.96 | 3.08 | -2.70 | 1.36 | 5.83 | NA | NA | NA | NA | NA | NA | NA | NA | NA | NA | NA | NA | 53.69 | 38.62 | NA | NA | NA | NA | NA | NA | NA | NA | NA |
| 2023-09-30 | 2023-06-30 | 2023-03-31 | 2022-12-31 | 2022-09-30 | 2022-06-30 | 2022-03-31 | 2021-12-31 | 2021-09-30 | 2021-06-30 | 2021-03-31 | 2020-12-31 | 2020-09-30 | 2020-06-30 | 2020-03-31 | 2019-12-31 | 2019-09-30 | 2019-06-30 | 2019-03-31 | 2018-12-31 | 2018-09-30 | 2018-06-30 | 2018-03-31 | 2017-12-31 | 2017-09-30 | 2017-06-30 | 2017-03-31 | 2016-12-31 | 2016-09-30 | 2016-06-30 | 2016-03-31 | 2015-12-31 | 2015-09-30 | 2015-06-30 | 2015-03-31 | 2014-12-31 | 2014-09-30 | 2014-06-30 | 2014-03-31 | 2012-11-30 | 2012-08-31 | 2012-05-31 | 2011-11-30 | 2011-08-31 | 2011-05-31 | 2011-02-28 | 2010-11-30 | 2010-08-31 | ||
|---|---|---|---|---|---|---|---|---|---|---|---|---|---|---|---|---|---|---|---|---|---|---|---|---|---|---|---|---|---|---|---|---|---|---|---|---|---|---|---|---|---|---|---|---|---|---|---|---|---|
| Revenues | 37.09 | 59.70 | 56.99 | 55.87 | 53.50 | 54.17 | 48.49 | 57.25 | 68.22 | 54.62 | 47.41 | 50.98 | 51.14 | 48.43 | 47.77 | 46.69 | 44.37 | 44.71 | 39.57 | 43.77 | 40.71 | 41.34 | 38.43 | 42.18 | 40.34 | 38.80 | 33.62 | 37.33 | 33.95 | 33.31 | 29.01 | 30.45 | 28.00 | 24.07 | 17.37 | 14.09 | 8.35 | 5.74 | 0.03 | 0.00 | 0.00 | 0.00 | 0.00 | 0.00 | 0.00 | 0.00 | 0.00 | 0.00 | |
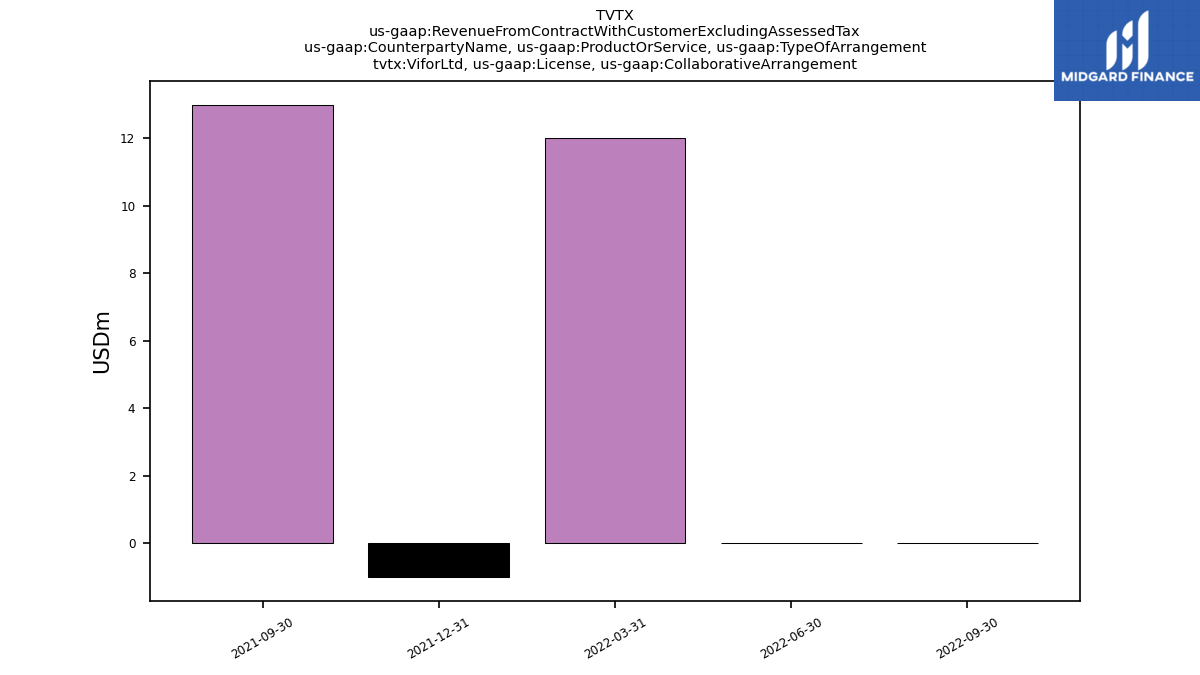
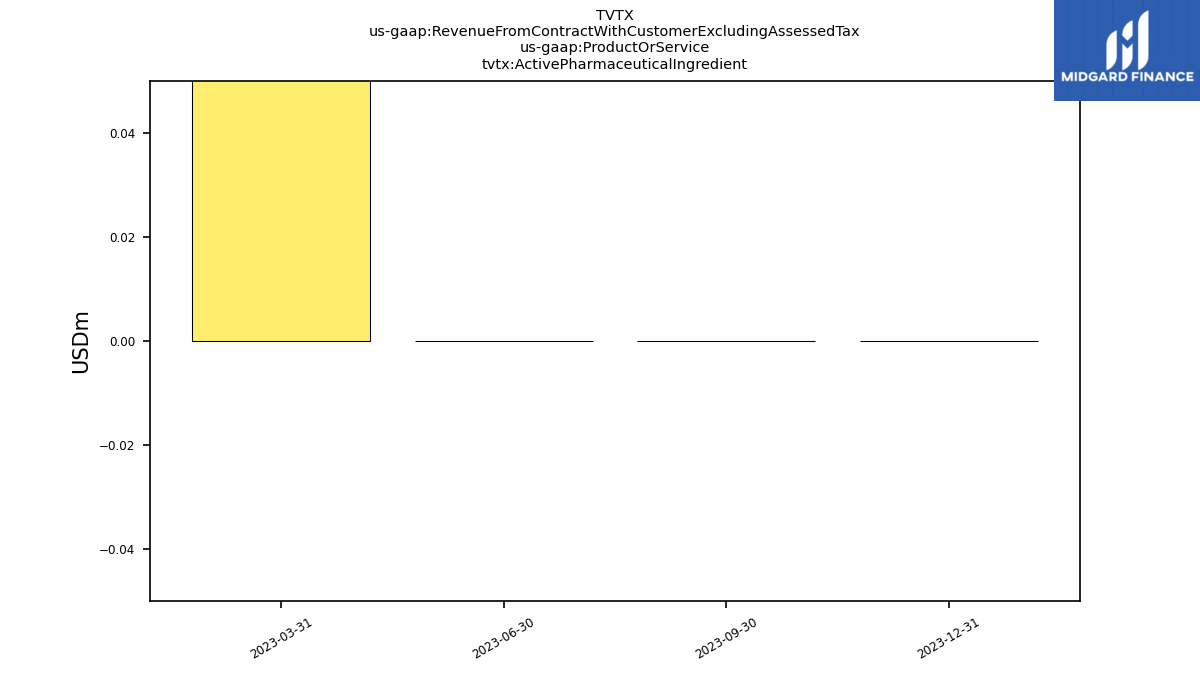
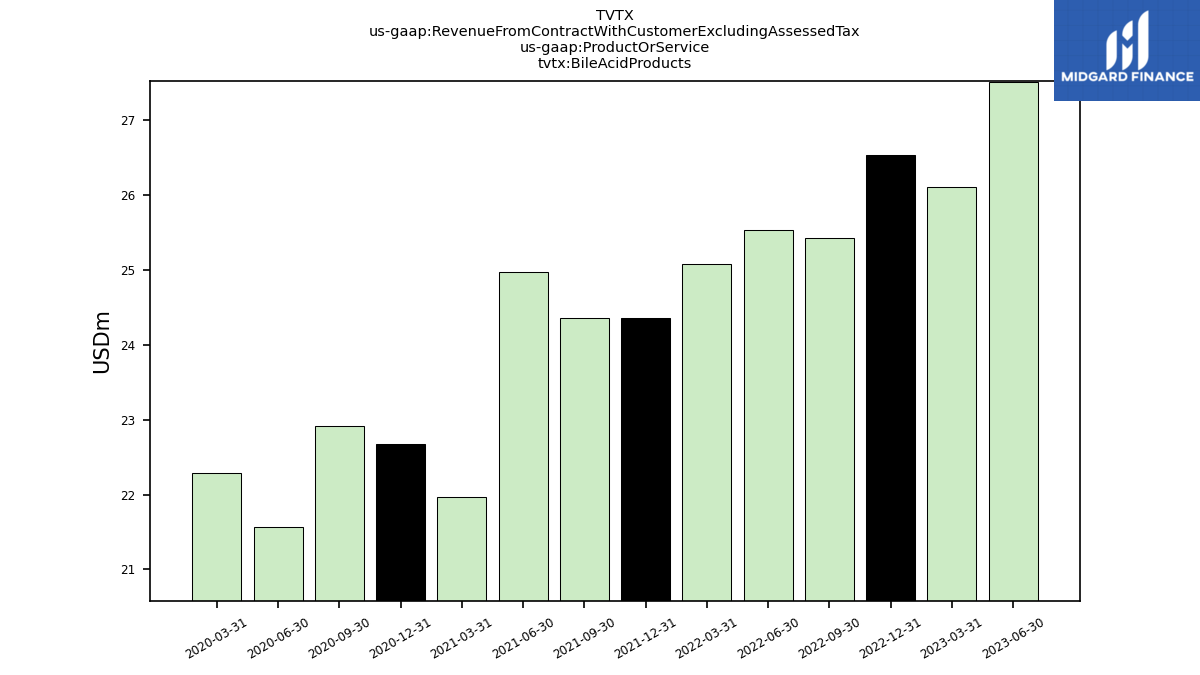
| Revenue From Contract With Customer Excluding Assessed Tax | 37.09 | 59.70 | 56.99 | 55.87 | 53.50 | 54.17 | 48.49 | 57.25 | 68.22 | 54.62 | 47.41 | 50.98 | 51.14 | 48.43 | 47.77 | 46.69 | 44.37 | 44.71 | 39.57 | 43.77 | 40.71 | 41.34 | 38.43 | 42.18 | 40.34 | 38.80 | 33.62 | 37.33 | 33.95 | 33.31 | 29.01 | 30.45 | 28.00 | 24.07 | 17.37 | 14.09 | 8.35 | 5.74 | 0.03 | 0.00 | 0.00 | 0.00 | 0.00 | 0.00 | 0.00 | 0.00 | 0.00 | 0.00 | |
| Vifor Ltd, License, Collaborative Arrangement | NA | NA | NA | NA | 0.00 | 0.00 | 12.00 | -1.00 | 13.00 | NA | NA | NA | NA | NA | NA | NA | NA | NA | NA | NA | NA | NA | NA | NA | NA | NA | NA | NA | NA | NA | NA | NA | NA | NA | NA | NA | NA | NA | NA | NA | NA | NA | NA | NA | NA | NA | NA | NA | |
| Active Pharmaceutical Ingredient | 0.00 | 0.00 | 3.30 | NA | NA | NA | NA | NA | NA | NA | NA | NA | NA | NA | NA | NA | NA | NA | NA | NA | NA | NA | NA | NA | NA | NA | NA | NA | NA | NA | NA | NA | NA | NA | NA | NA | NA | NA | NA | NA | NA | NA | NA | NA | NA | NA | NA | NA | |
| Bile Acid Products | NA | 27.50 | 26.11 | 26.53 | 25.42 | 25.53 | 25.07 | 24.36 | 24.35 | 24.97 | 21.96 | 22.67 | 22.91 | 21.57 | 22.28 | NA | NA | NA | NA | NA | NA | NA | NA | NA | NA | NA | NA | NA | NA | NA | NA | NA | NA | NA | NA | NA | NA | NA | NA | NA | NA | NA | NA | NA | NA | NA | NA | NA | |
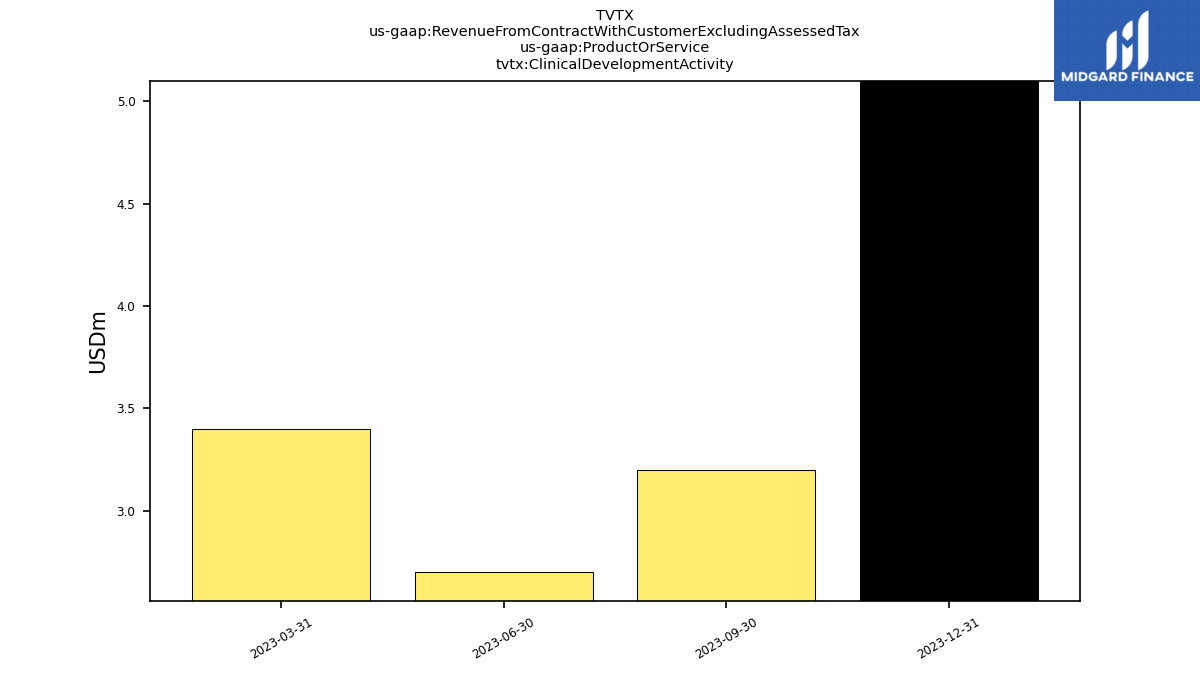
| Clinical Development Activity | 3.20 | 2.70 | 3.40 | NA | NA | NA | NA | NA | NA | NA | NA | NA | NA | NA | NA | NA | NA | NA | NA | NA | NA | NA | NA | NA | NA | NA | NA | NA | NA | NA | NA | NA | NA | NA | NA | NA | NA | NA | NA | NA | NA | NA | NA | NA | NA | NA | NA | NA | |
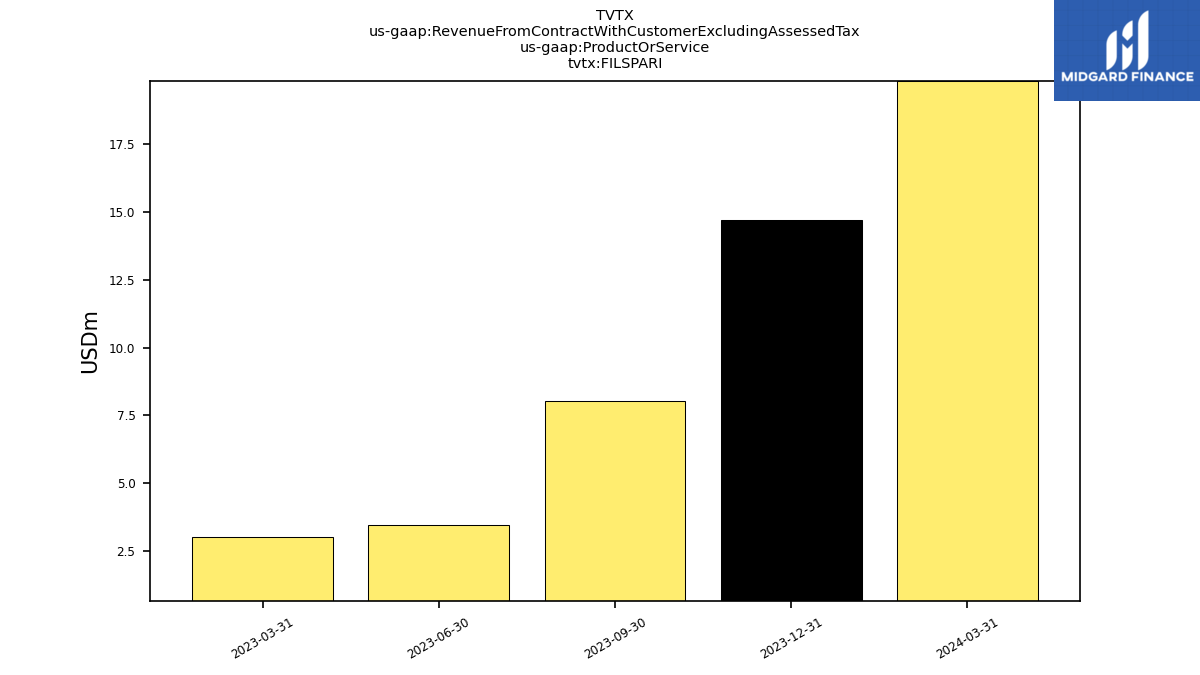
| FILSPARI | 8.04 | 3.46 | 3.00 | NA | NA | NA | NA | NA | NA | NA | NA | NA | NA | NA | NA | NA | NA | NA | NA | NA | NA | NA | NA | NA | NA | NA | NA | NA | NA | NA | NA | NA | NA | NA | NA | NA | NA | NA | NA | NA | NA | NA | NA | NA | NA | NA | NA | NA | |
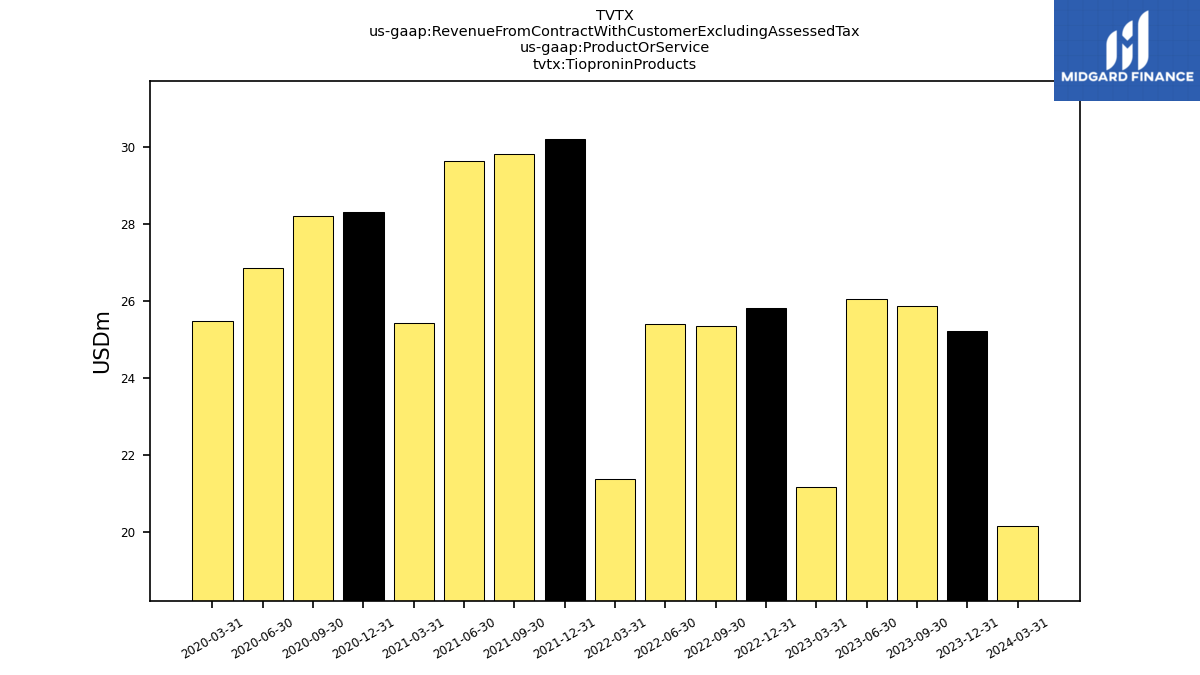
| Tiopronin Products | 25.89 | 26.05 | 21.17 | 25.82 | 25.37 | 25.42 | 21.37 | 30.21 | 29.82 | 29.64 | 25.44 | 28.31 | 28.23 | 26.86 | 25.49 | NA | NA | NA | NA | NA | NA | NA | NA | NA | NA | NA | NA | NA | NA | NA | NA | NA | NA | NA | NA | NA | NA | NA | NA | NA | NA | NA | NA | NA | NA | NA | NA | NA | |
| License | 3.16 | 2.69 | 6.71 | 3.52 | 2.71 | 3.22 | 2.04 | 2.67 | 14.04 | NA | NA | NA | NA | NA | NA | NA | NA | NA | NA | NA | NA | NA | NA | NA | NA | NA | NA | NA | NA | NA | NA | NA | NA | NA | NA | NA | NA | NA | NA | NA | NA | NA | NA | NA | NA | NA | NA | NA | |
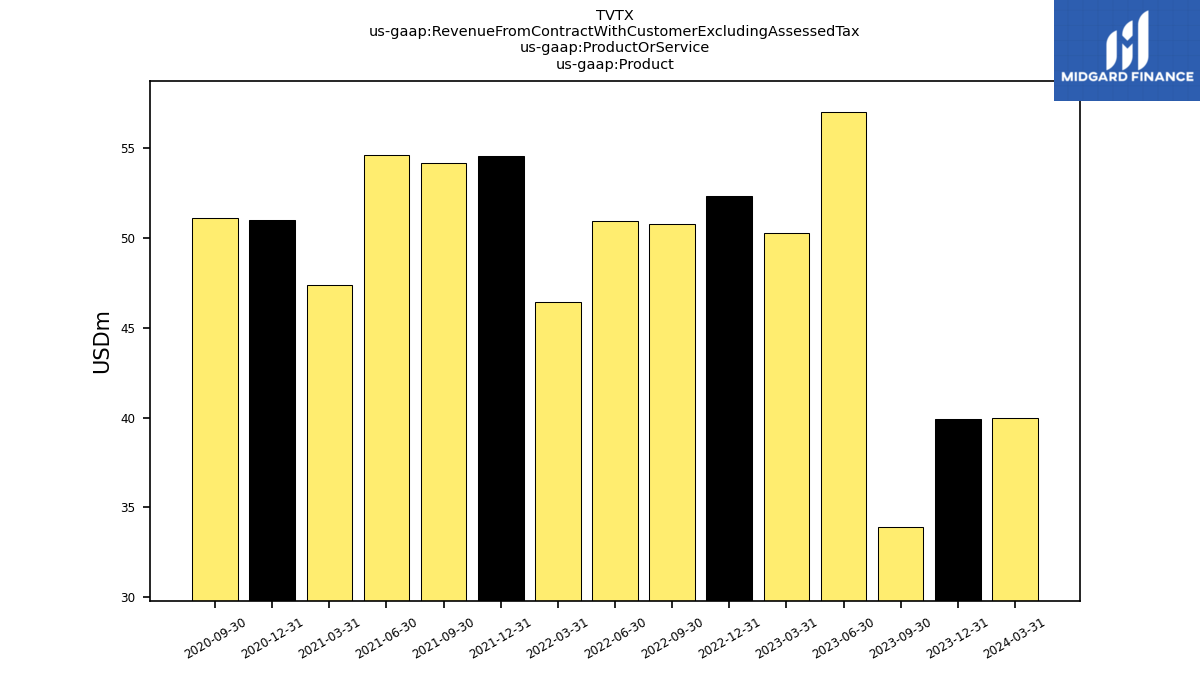
| Product | 33.93 | 57.01 | 50.28 | 52.34 | 50.79 | 50.95 | 46.44 | 54.58 | 54.17 | 54.62 | 47.41 | 50.98 | 51.14 | NA | NA | NA | NA | NA | NA | NA | NA | NA | NA | NA | NA | NA | NA | NA | NA | NA | NA | NA | NA | NA | NA | NA | NA | NA | NA | NA | NA | NA | NA | NA | NA | NA | NA | NA | |
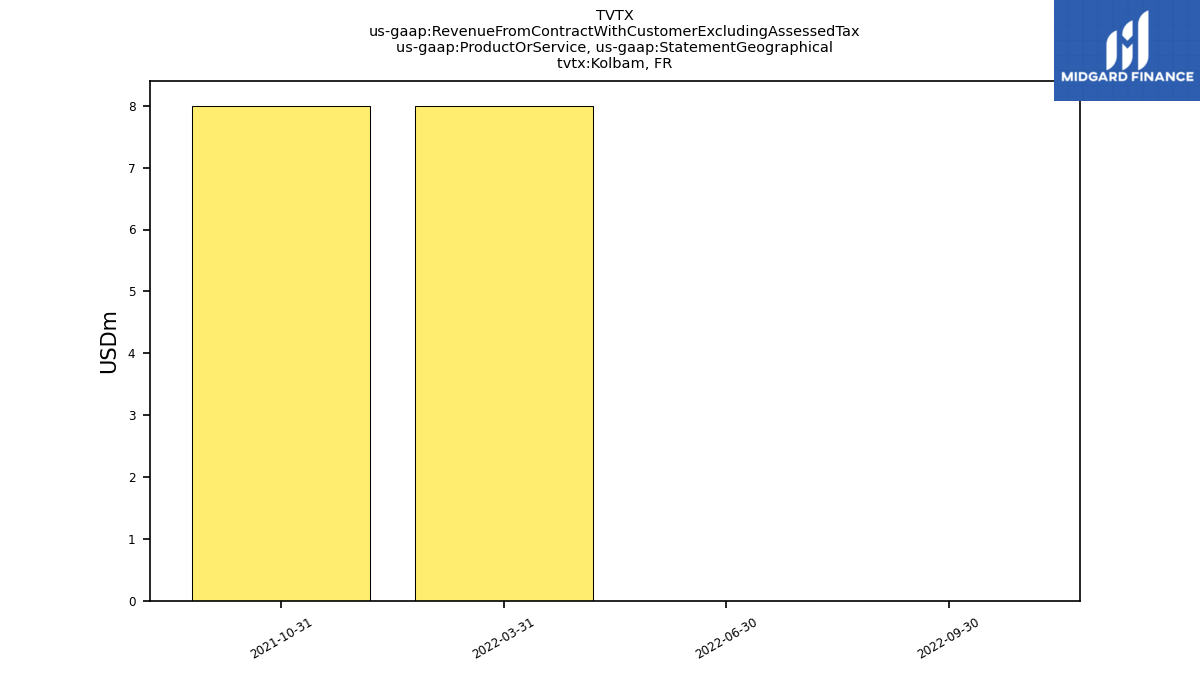
| Kolbam, | NA | NA | NA | NA | 0.00 | 0.00 | 8.00 | NA | NA | NA | NA | NA | NA | NA | NA | NA | NA | NA | NA | NA | NA | NA | NA | NA | NA | NA | NA | NA | NA | NA | NA | NA | NA | NA | NA | NA | NA | NA | NA | NA | NA | NA | NA | NA | NA | NA | NA | NA |

