
| 2023-09-30 | 2023-06-30 | 2023-03-31 | 2022-12-31 | 2022-09-30 | 2022-06-30 | 2022-03-31 | 2021-12-31 | 2021-09-30 | 2021-06-30 | 2021-03-31 | 2020-12-31 | 2020-09-30 | 2020-06-30 | 2020-03-31 | 2019-12-31 | 2019-09-30 | 2019-06-30 | 2019-03-31 | 2018-12-31 | 2018-09-30 | ||
|---|---|---|---|---|---|---|---|---|---|---|---|---|---|---|---|---|---|---|---|---|---|---|
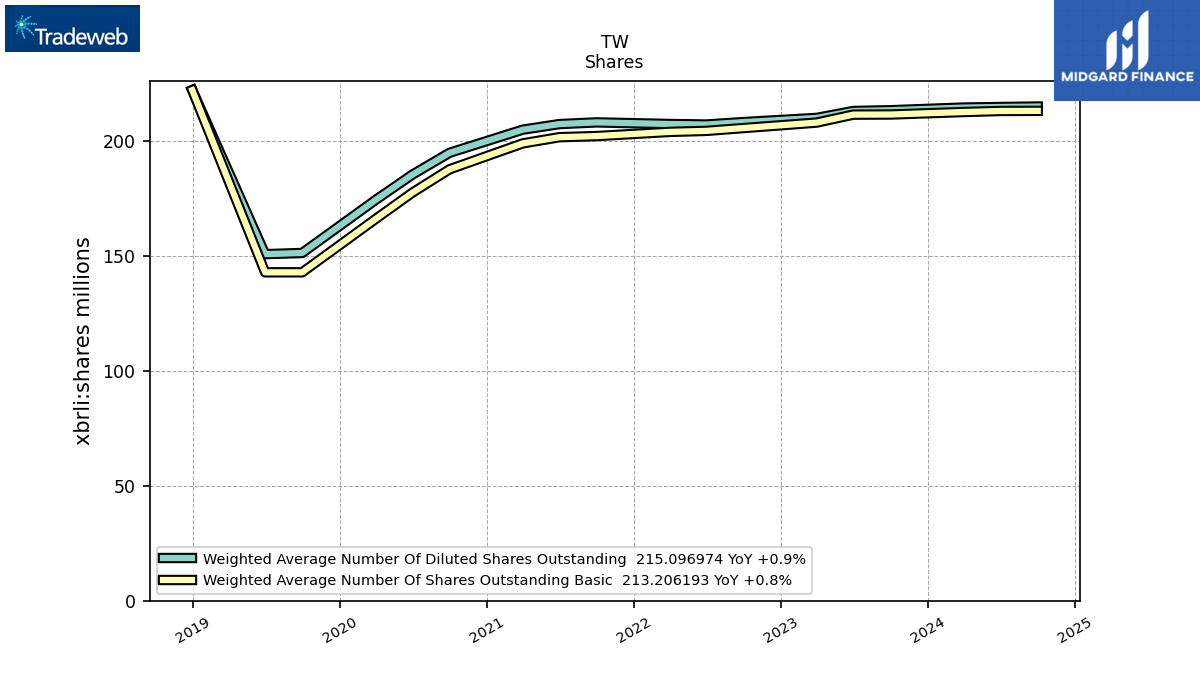
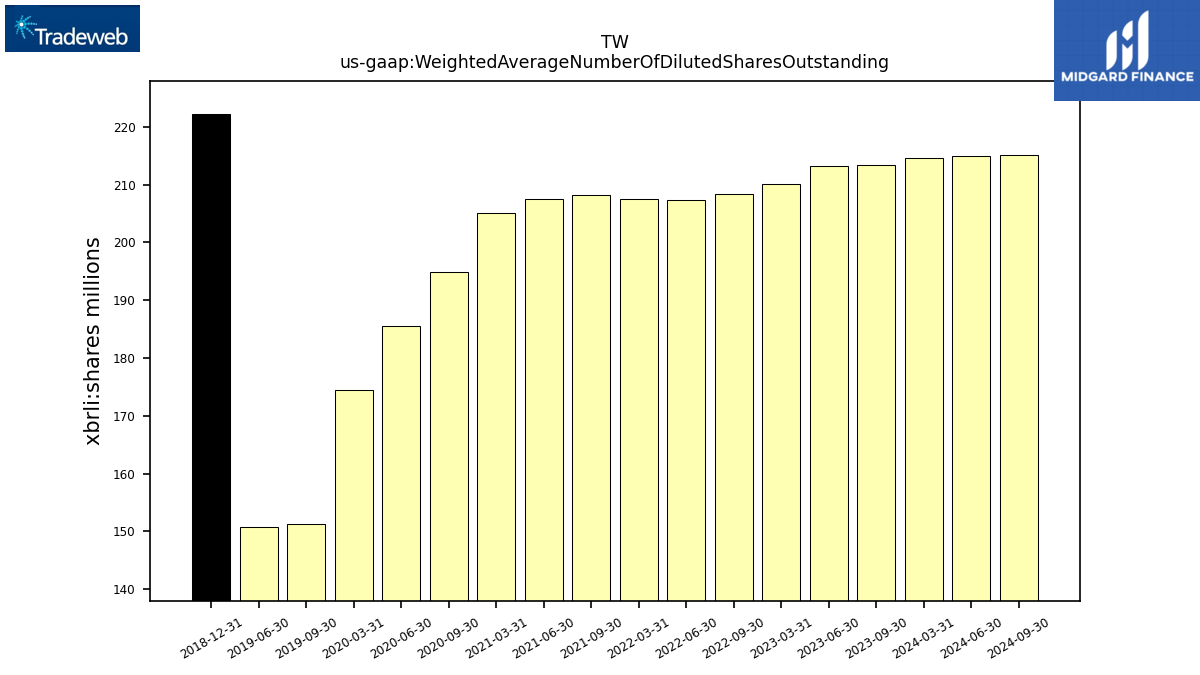
| Weighted Average Number Of Diluted Shares Outstanding | 213.49 | 213.16 | 210.14 | NA | 208.33 | 207.27 | 207.50 | NA | 208.20 | 207.46 | 205.03 | NA | 194.96 | 185.49 | 174.52 | NA | 151.36 | 150.85 | NA | 222.24 | NA | |
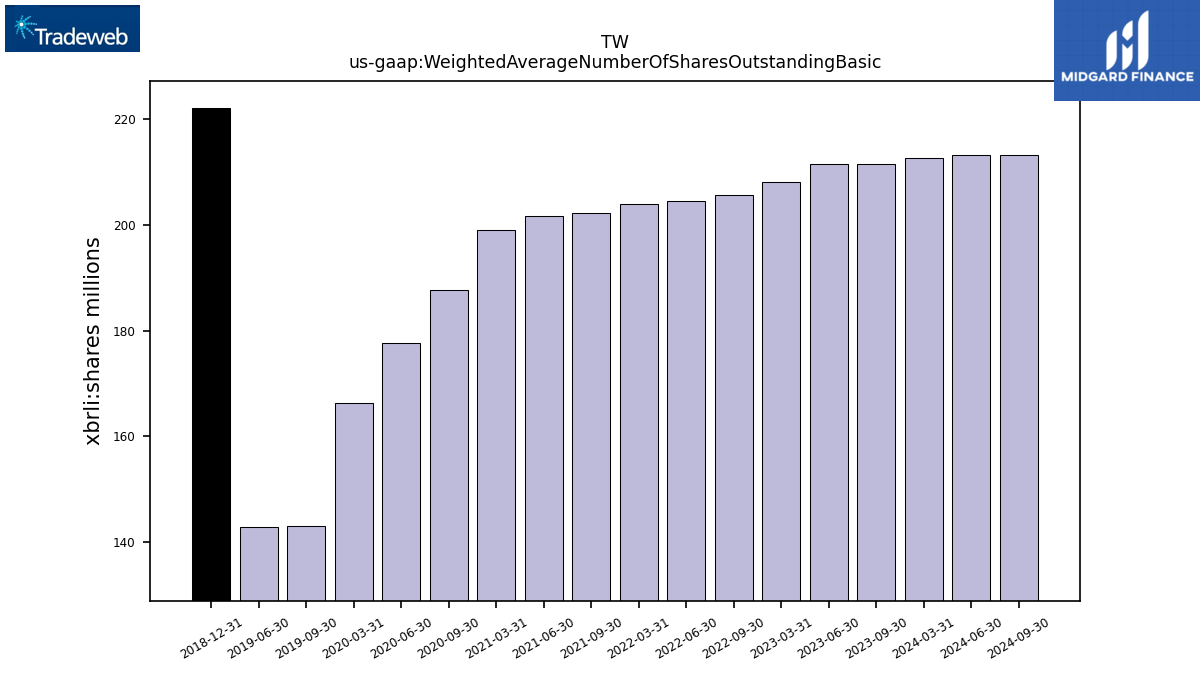
| Weighted Average Number Of Shares Outstanding Basic | 211.62 | 211.57 | 208.11 | NA | 205.72 | 204.50 | 204.06 | NA | 202.24 | 201.75 | 199.06 | NA | 187.77 | 177.65 | 166.23 | NA | 142.94 | 142.93 | NA | 222.22 | NA | |
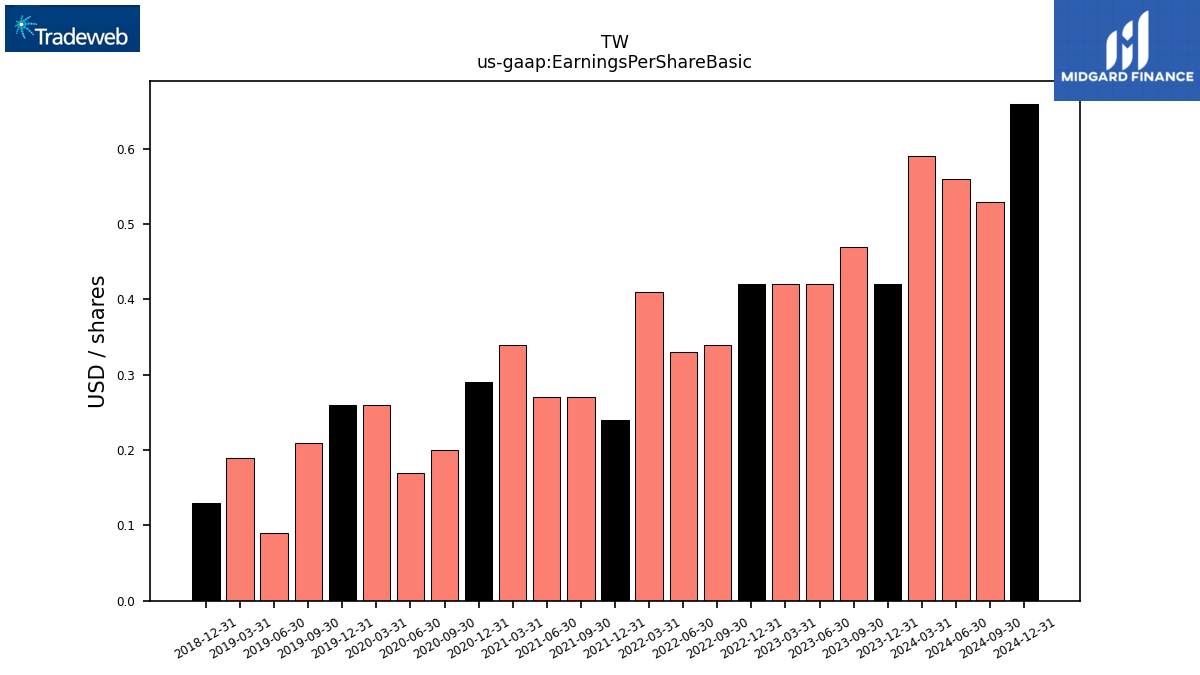
| Earnings Per Share Basic | 0.47 | 0.42 | 0.42 | 0.42 | 0.34 | 0.33 | 0.41 | 0.24 | 0.27 | 0.27 | 0.34 | 0.29 | 0.20 | 0.17 | 0.26 | 0.26 | 0.21 | 0.09 | 0.19 | 0.13 | NA | |
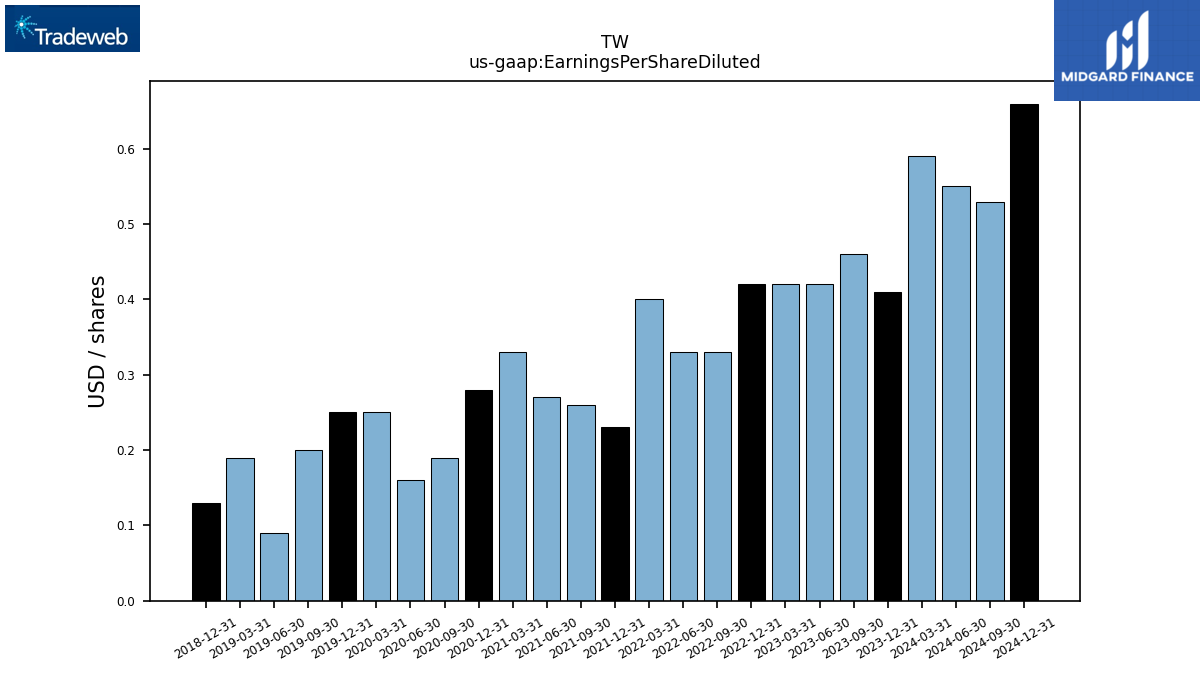
| Earnings Per Share Diluted | 0.46 | 0.42 | 0.42 | 0.42 | 0.33 | 0.33 | 0.40 | 0.23 | 0.26 | 0.27 | 0.33 | 0.28 | 0.19 | 0.16 | 0.25 | 0.25 | 0.20 | 0.09 | 0.19 | 0.13 | NA |
| 2023-09-30 | 2023-06-30 | 2023-03-31 | 2022-12-31 | 2022-09-30 | 2022-06-30 | 2022-03-31 | 2021-12-31 | 2021-09-30 | 2021-06-30 | 2021-03-31 | 2020-12-31 | 2020-09-30 | 2020-06-30 | 2020-03-31 | 2019-12-31 | 2019-09-30 | 2019-06-30 | 2019-03-31 | 2018-12-31 | 2018-09-30 | ||
|---|---|---|---|---|---|---|---|---|---|---|---|---|---|---|---|---|---|---|---|---|---|---|
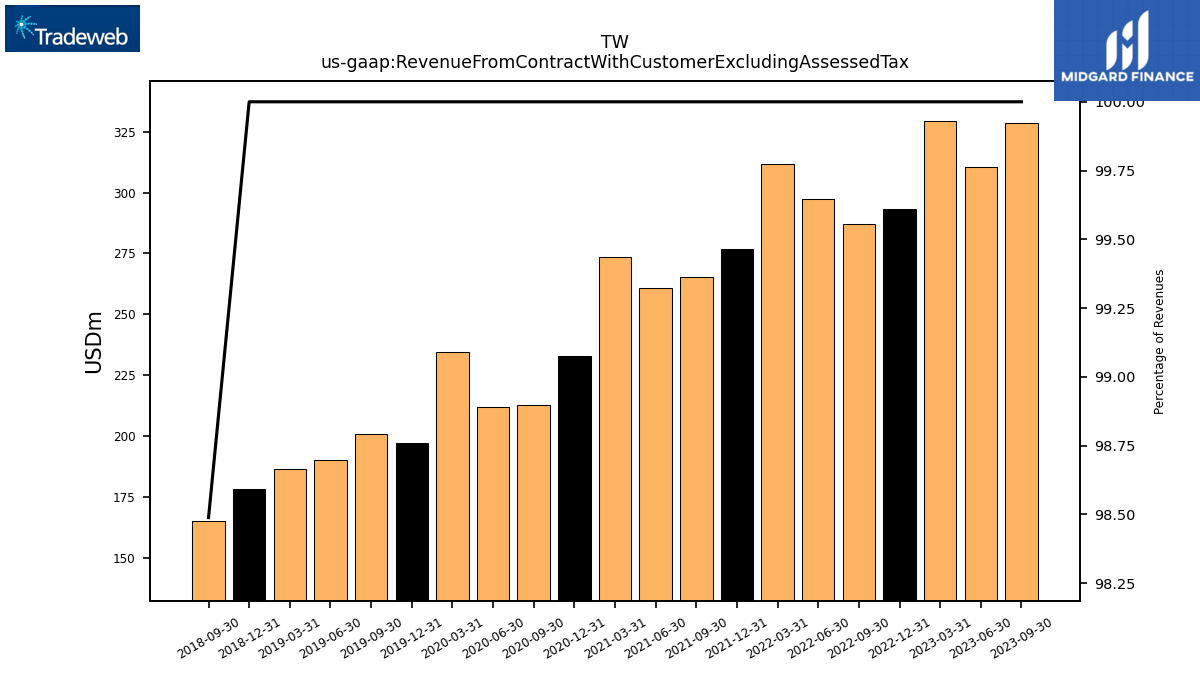
| Revenue From Contract With Customer Excluding Assessed Tax | 328.36 | 310.61 | 329.25 | 293.04 | 287.12 | 297.14 | 311.49 | 276.88 | 265.32 | 260.84 | 273.40 | 233.08 | 212.87 | 212.11 | 234.61 | 197.31 | 200.98 | 190.49 | 186.79 | 178.64 | 165.25 | |
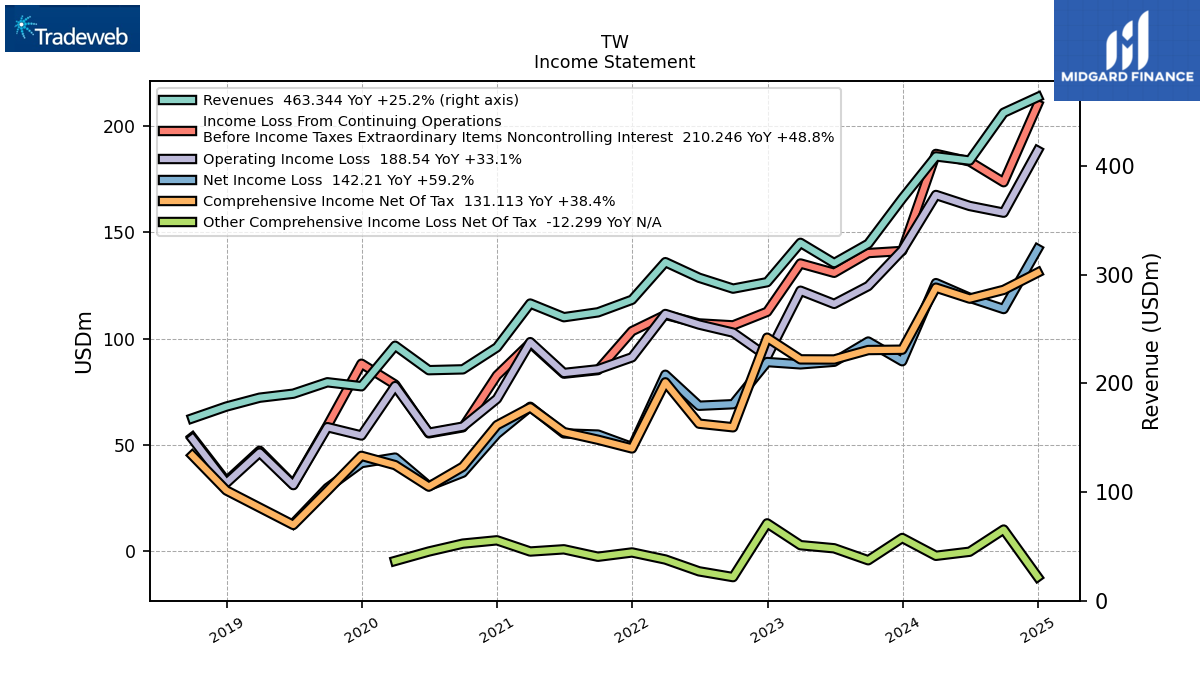
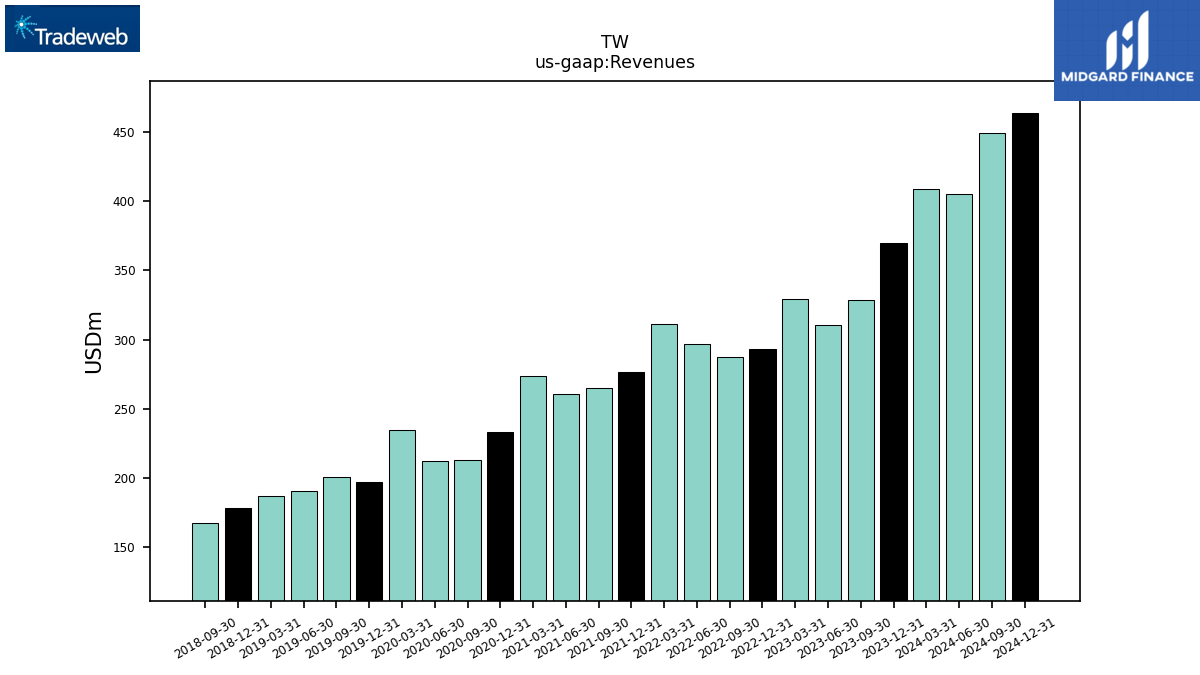
| Revenues | 328.36 | 310.61 | 329.25 | 293.04 | 287.12 | 297.14 | 311.49 | 276.88 | 265.32 | 260.84 | 273.40 | 233.08 | 212.87 | 212.11 | 234.61 | 197.31 | 200.98 | 190.49 | 186.79 | 178.64 | 167.79 | |
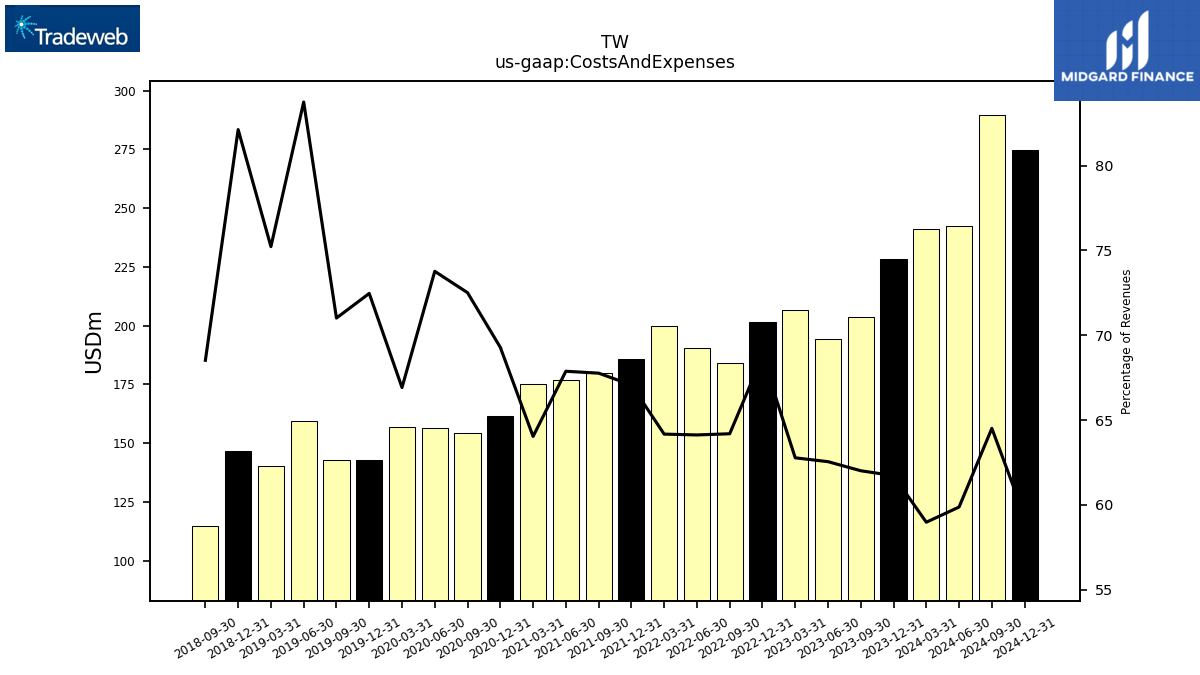
| Costs And Expenses | 203.62 | 194.28 | 206.68 | 201.49 | 184.31 | 190.53 | 199.88 | 185.70 | 179.80 | 177.05 | 175.07 | 161.50 | 154.35 | 156.47 | 156.99 | 142.98 | 142.72 | 159.53 | 140.51 | 146.70 | 114.97 | |
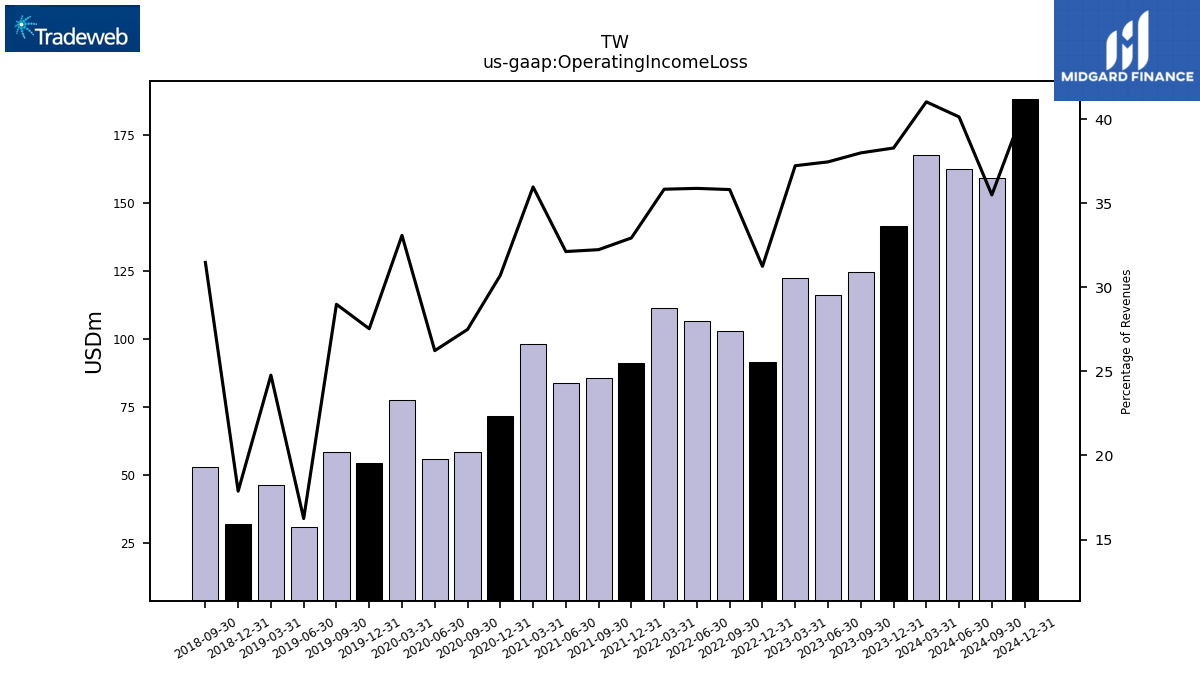
| Operating Income Loss | 124.74 | 116.33 | 122.57 | 91.55 | 102.81 | 106.61 | 111.60 | 91.18 | 85.53 | 83.79 | 98.33 | 71.58 | 58.52 | 55.64 | 77.61 | 54.33 | 58.26 | 30.95 | 46.28 | 31.93 | 52.82 | |
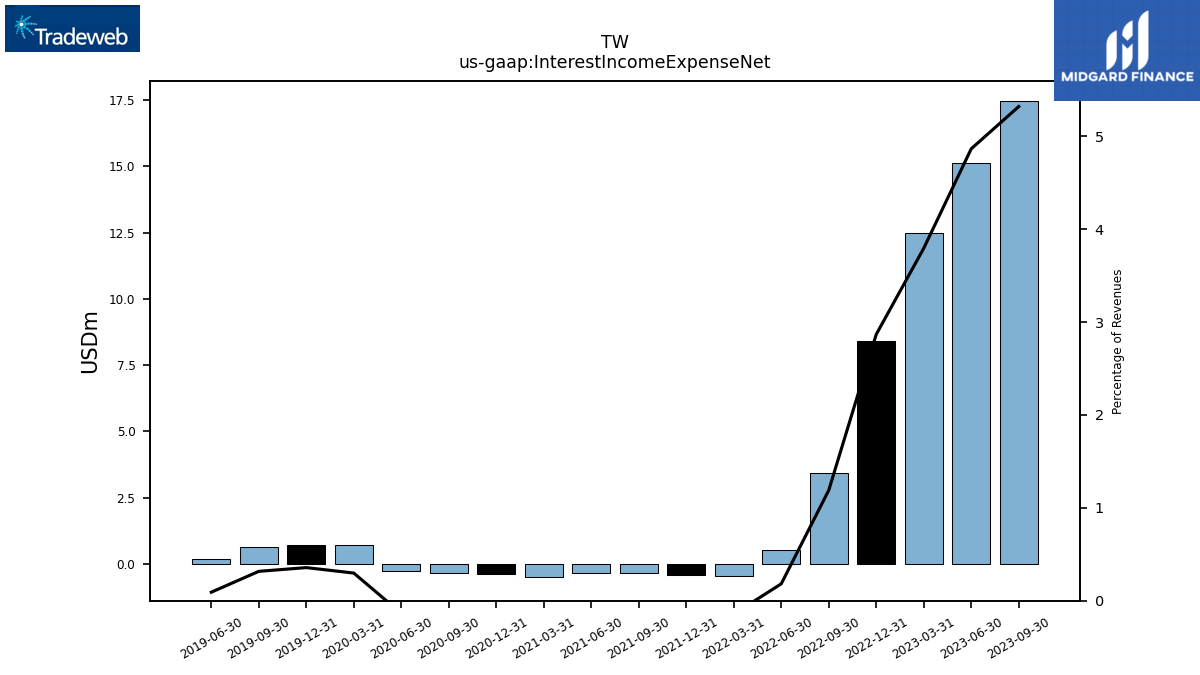
| Interest Income Expense Net | 17.46 | 15.11 | 12.49 | 8.40 | 3.41 | 0.54 | -0.45 | -0.41 | -0.36 | -0.33 | -0.49 | -0.38 | -0.35 | -0.29 | 0.70 | 0.70 | 0.64 | 0.17 | NA | NA | NA | |
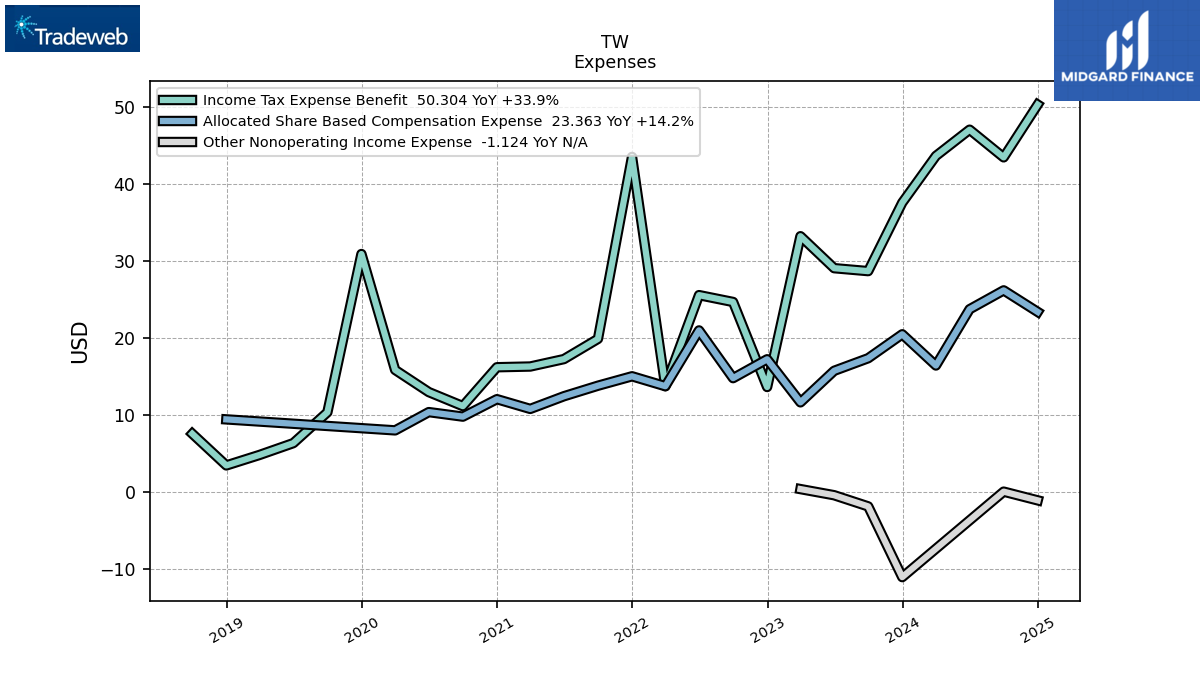
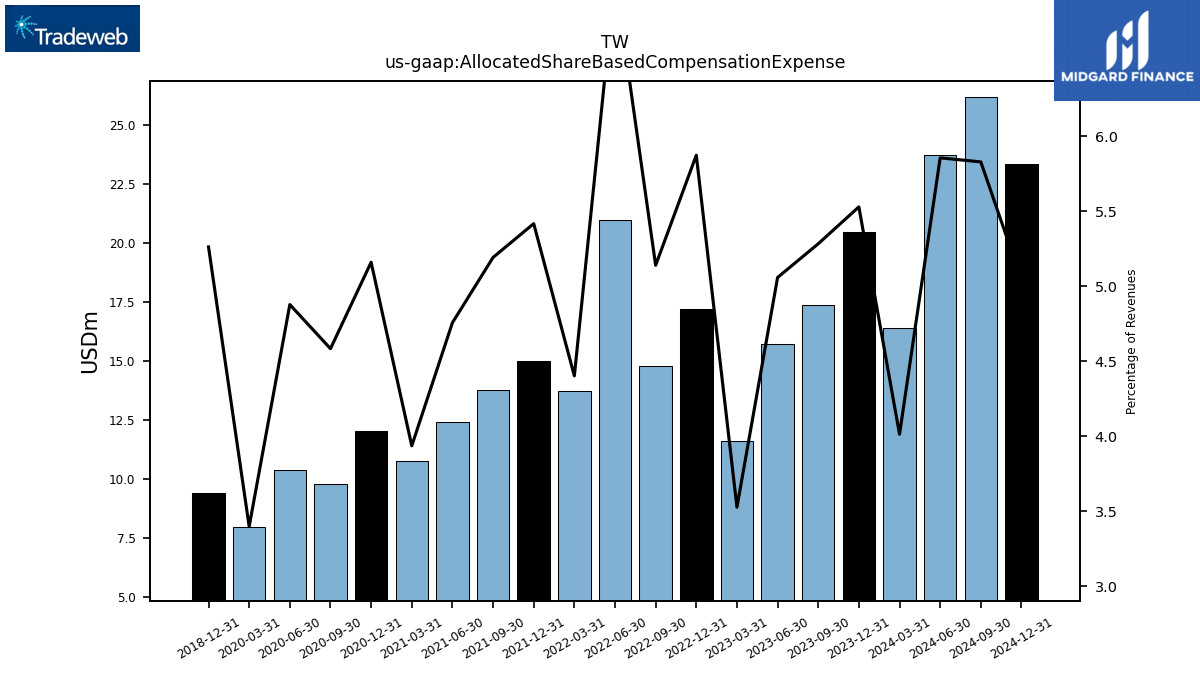
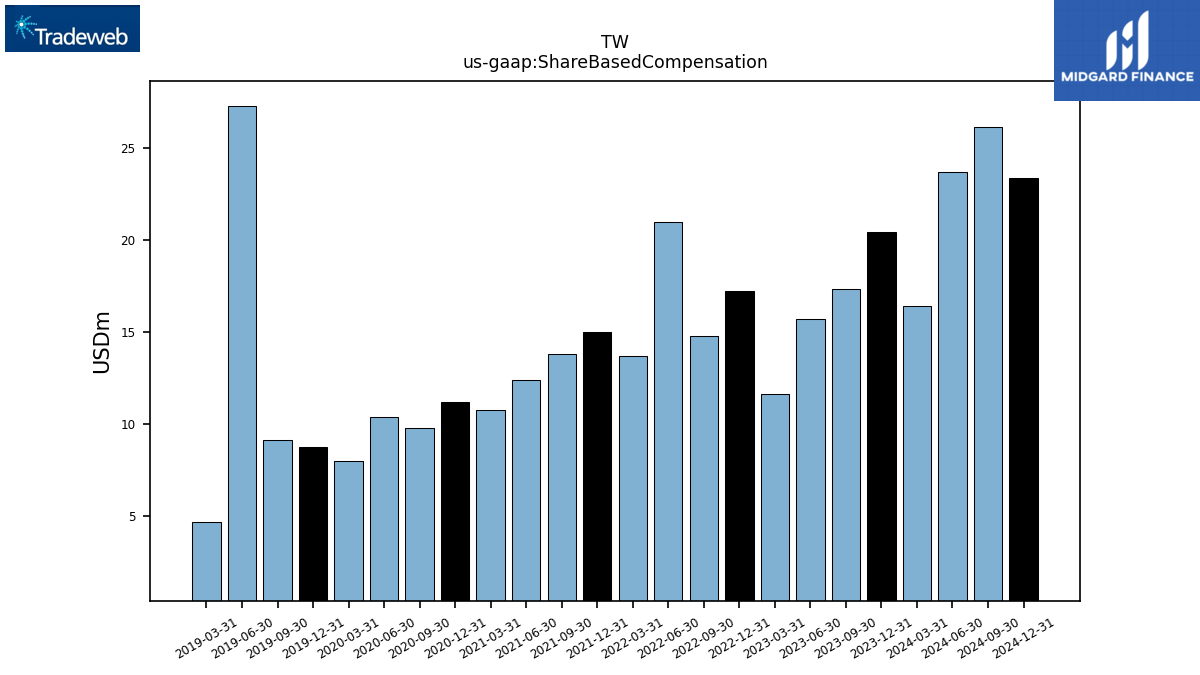
| Allocated Share Based Compensation Expense | 17.35 | 15.71 | 11.61 | 17.21 | 14.76 | 20.96 | 13.71 | 15.00 | 13.78 | 12.41 | 10.76 | 12.03 | 9.76 | 10.35 | 7.97 | NA | NA | NA | NA | 9.40 | NA | |
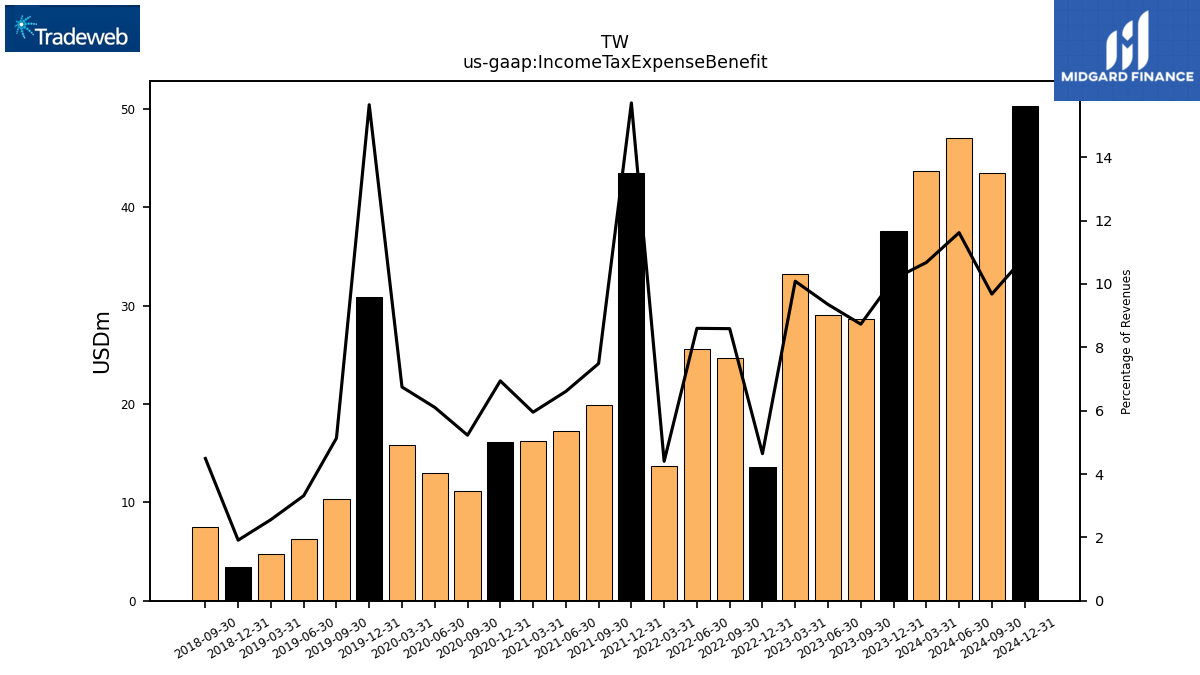
| Income Tax Expense Benefit | 28.67 | 29.05 | 33.20 | 13.61 | 24.66 | 25.55 | 13.71 | 43.51 | 19.86 | 17.23 | 16.27 | 16.18 | 11.12 | 12.95 | 15.83 | 30.89 | 10.32 | 6.31 | 4.78 | 3.42 | 7.54 | |
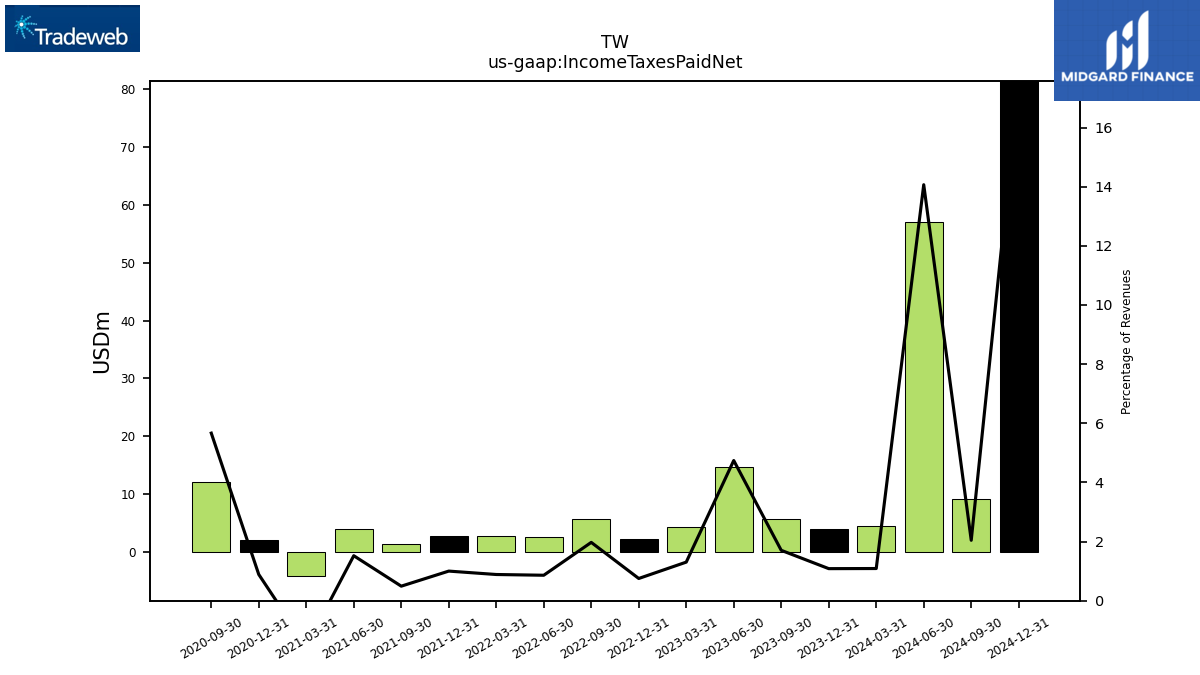
| Income Taxes Paid Net | 5.60 | 14.73 | 4.30 | 2.21 | 5.67 | 2.56 | 2.76 | 2.78 | 1.31 | 3.97 | -4.17 | 2.07 | 12.06 | NA | NA | NA | NA | NA | NA | NA | NA | |
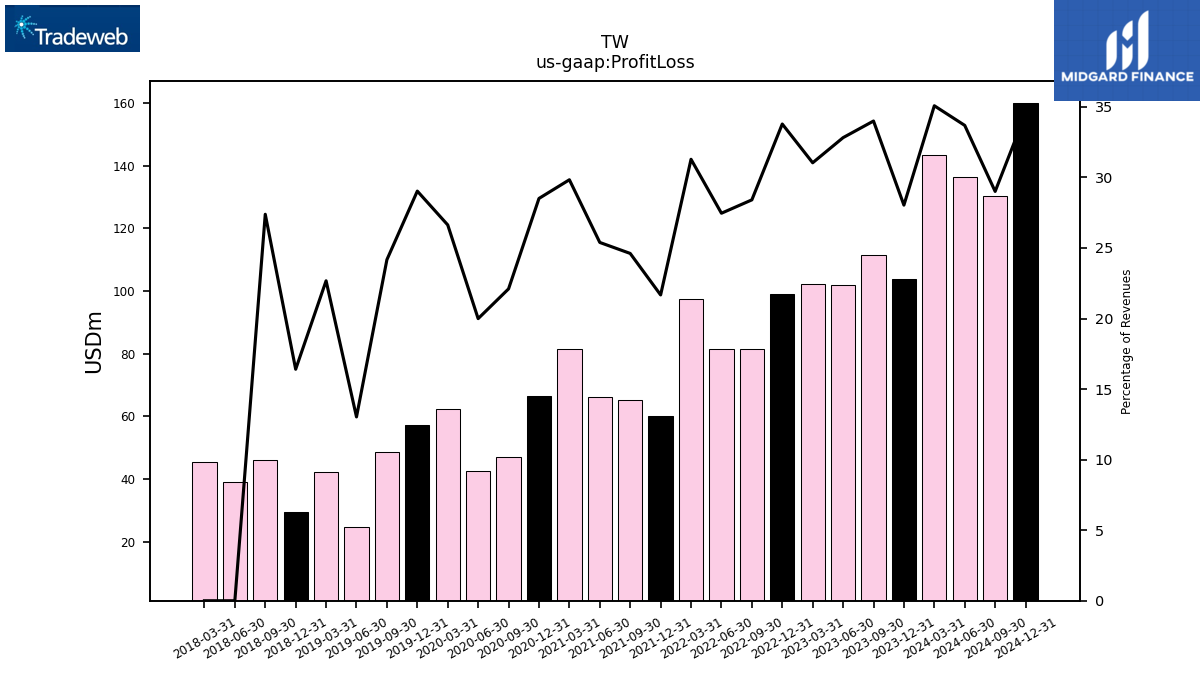
| Profit Loss | 111.63 | 101.94 | 102.19 | 99.00 | 81.57 | 81.60 | 97.44 | 60.01 | 65.31 | 66.23 | 81.56 | 66.45 | 47.05 | 42.41 | 62.48 | 57.28 | 48.58 | 24.82 | 42.35 | 29.31 | 45.95 | |
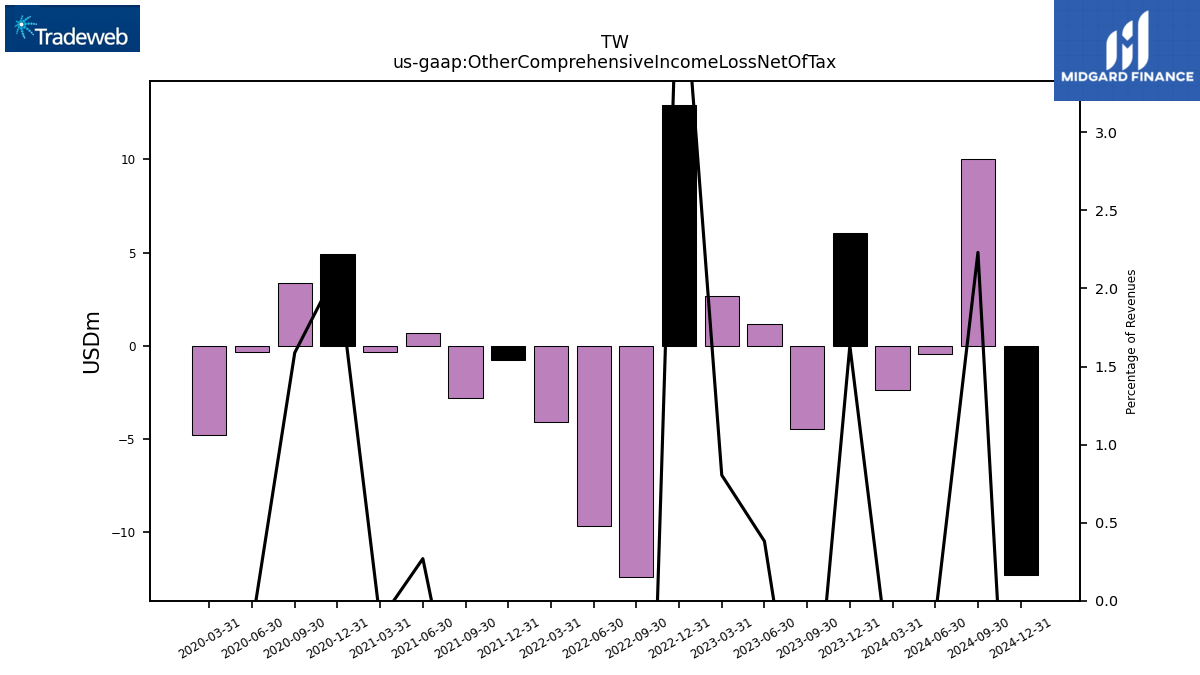
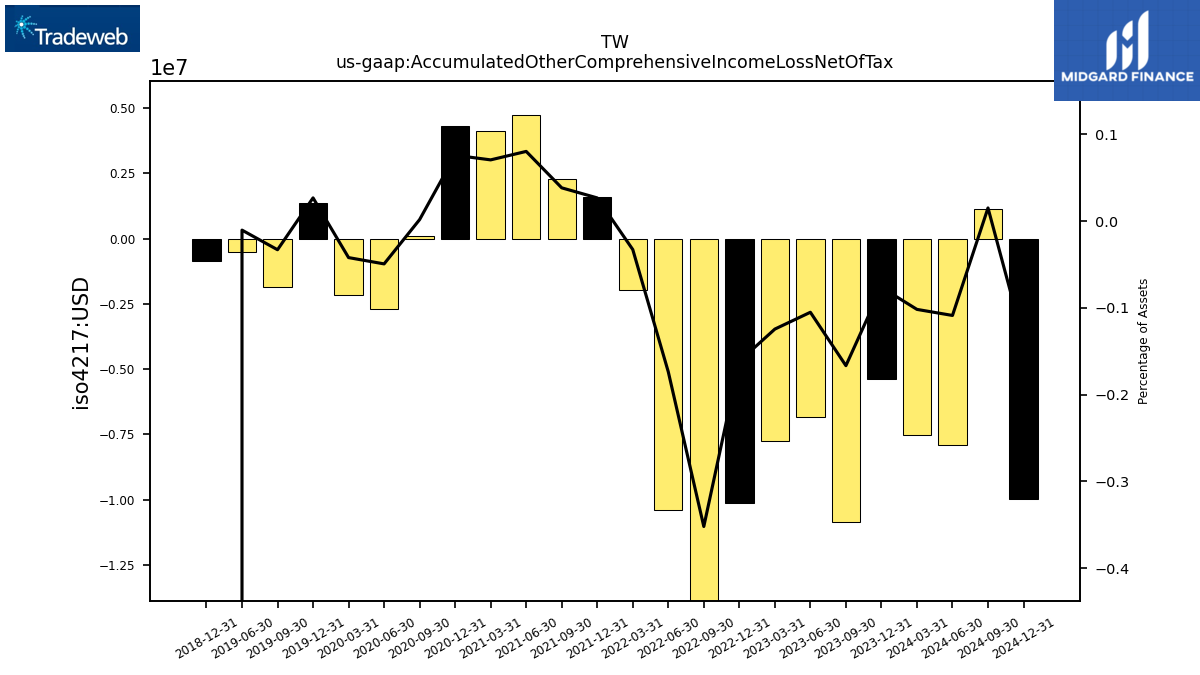
| Other Comprehensive Income Loss Net Of Tax | -4.46 | 1.18 | 2.65 | 12.94 | -12.41 | -9.68 | -4.10 | -0.78 | -2.80 | 0.70 | -0.34 | 4.95 | 3.38 | -0.34 | -4.78 | NA | NA | NA | NA | NA | NA | |
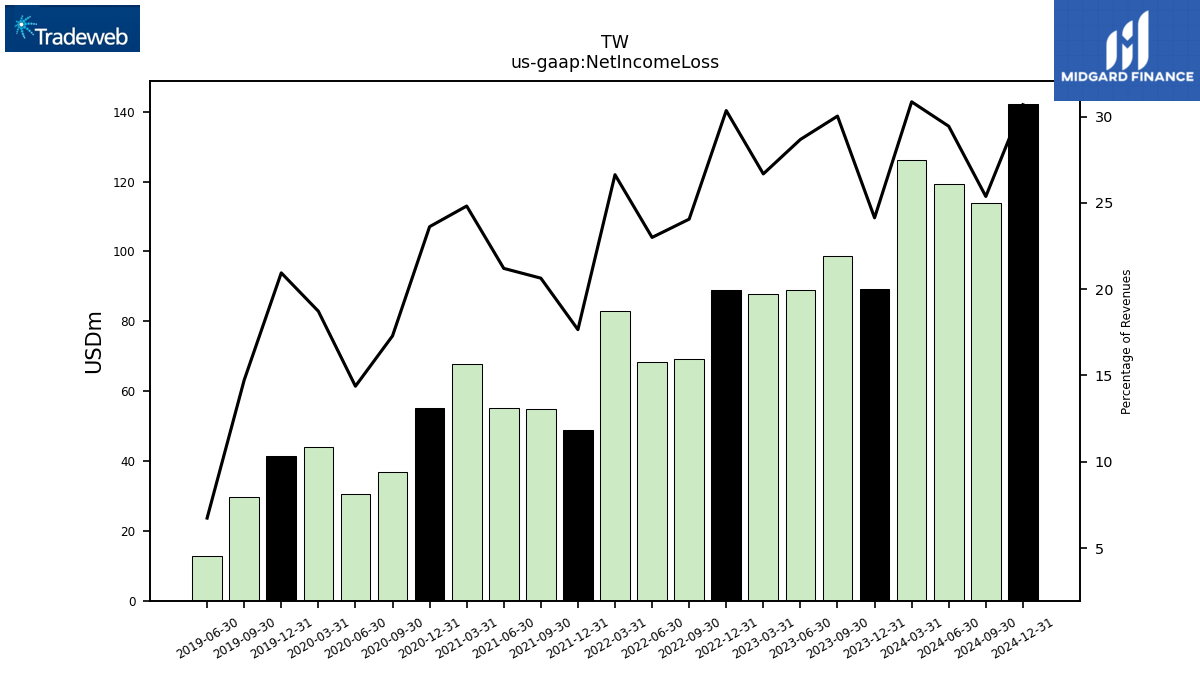
| Net Income Loss | 98.61 | 89.08 | 87.86 | 88.95 | 69.08 | 68.34 | 82.97 | 48.89 | 54.76 | 55.32 | 67.86 | 55.06 | 36.81 | 30.50 | 43.93 | 41.33 | 29.61 | 12.83 | NA | NA | NA | |
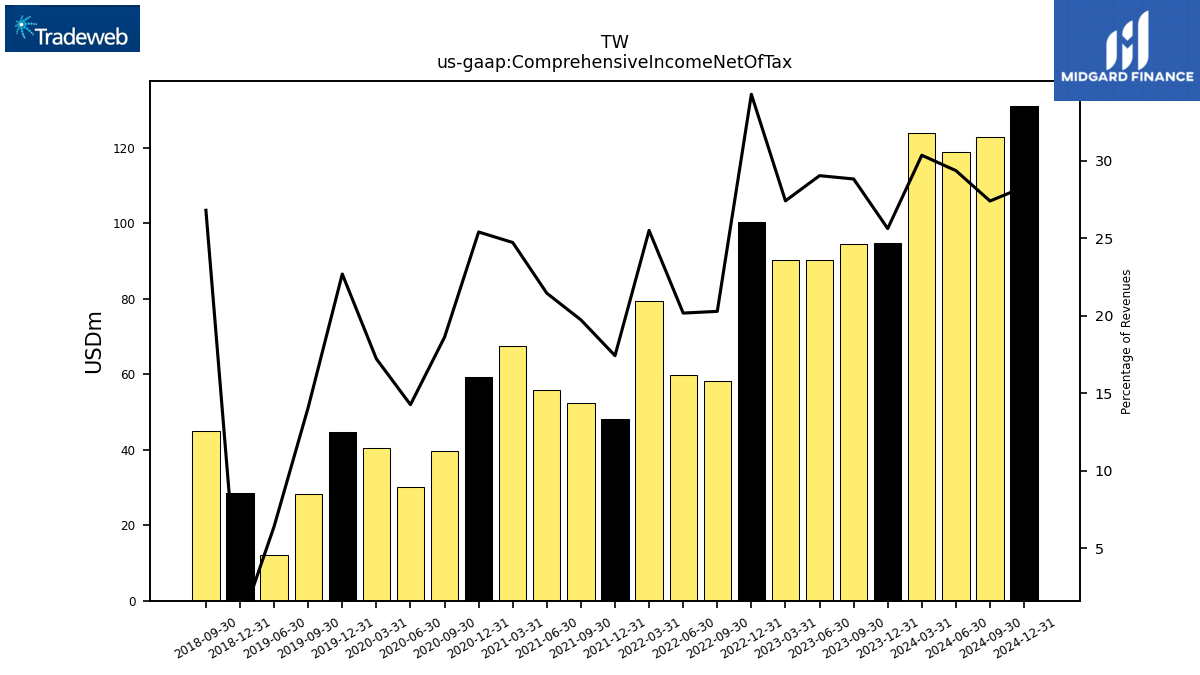
| Comprehensive Income Net Of Tax | 94.60 | 90.15 | 90.21 | 100.43 | 58.20 | 59.90 | 79.40 | 48.22 | 52.33 | 55.93 | 67.56 | 59.18 | 39.60 | 30.23 | 40.38 | 44.75 | 28.28 | 12.18 | NA | 28.44 | 44.95 | |
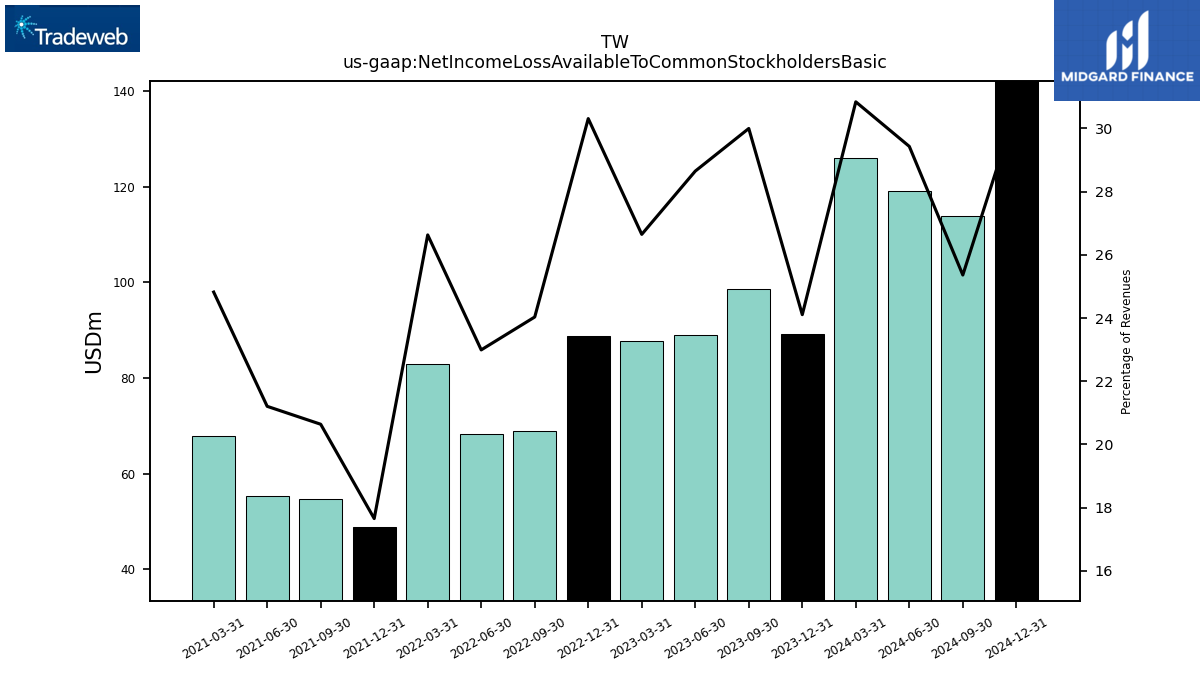
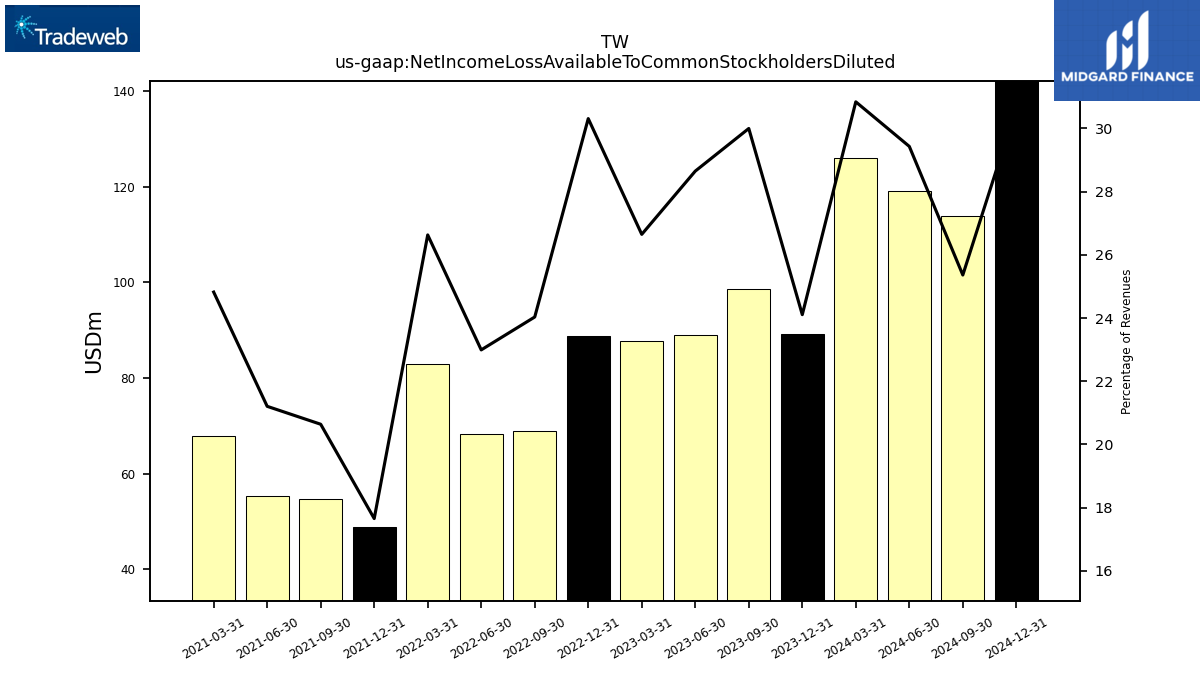
| Net Income Loss Available To Common Stockholders Basic | 98.49 | 88.98 | 87.73 | 88.81 | 69.00 | 68.32 | 82.94 | 48.89 | 54.76 | 55.32 | 67.86 | NA | NA | NA | NA | NA | NA | NA | NA | NA | NA | |
| Net Income Loss Available To Common Stockholders Diluted | 98.49 | 88.98 | 87.73 | 88.81 | 69.00 | 68.32 | 82.94 | 48.89 | 54.76 | 55.32 | 67.86 | NA | NA | NA | NA | NA | NA | NA | NA | NA | NA |
| 2023-09-30 | 2023-06-30 | 2023-03-31 | 2022-12-31 | 2022-09-30 | 2022-06-30 | 2022-03-31 | 2021-12-31 | 2021-09-30 | 2021-06-30 | 2021-03-31 | 2020-12-31 | 2020-09-30 | 2020-06-30 | 2020-03-31 | 2019-12-31 | 2019-09-30 | 2019-06-30 | 2019-03-31 | 2018-12-31 | 2018-09-30 | ||
|---|---|---|---|---|---|---|---|---|---|---|---|---|---|---|---|---|---|---|---|---|---|---|
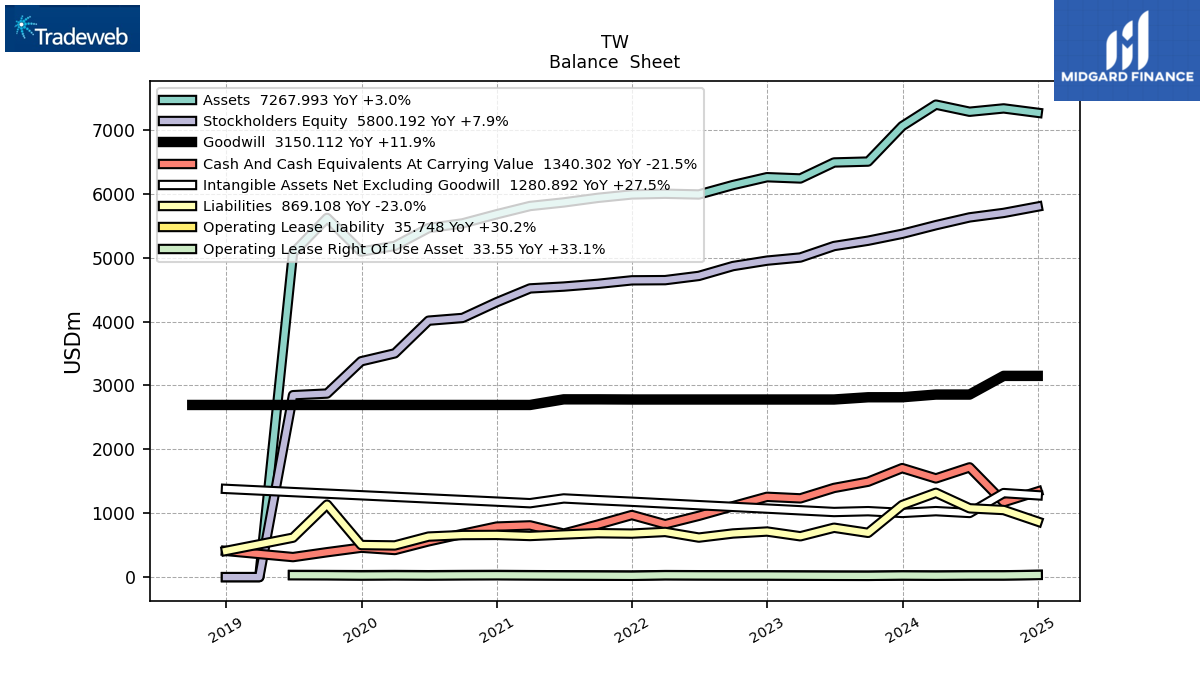
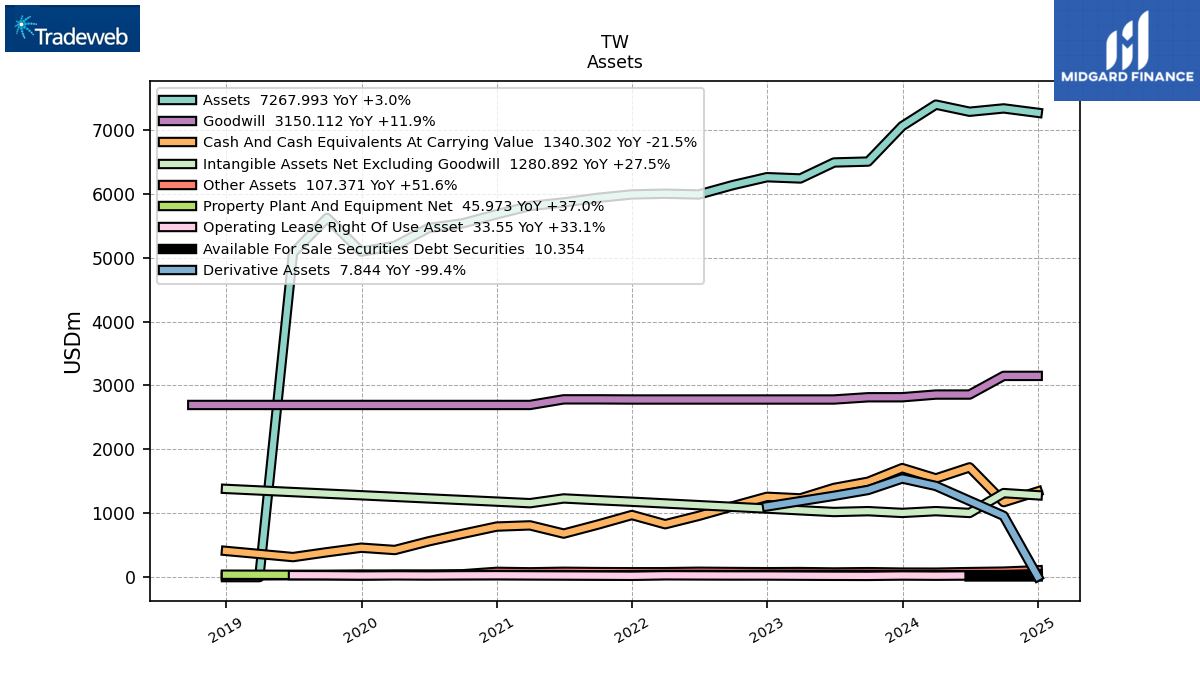
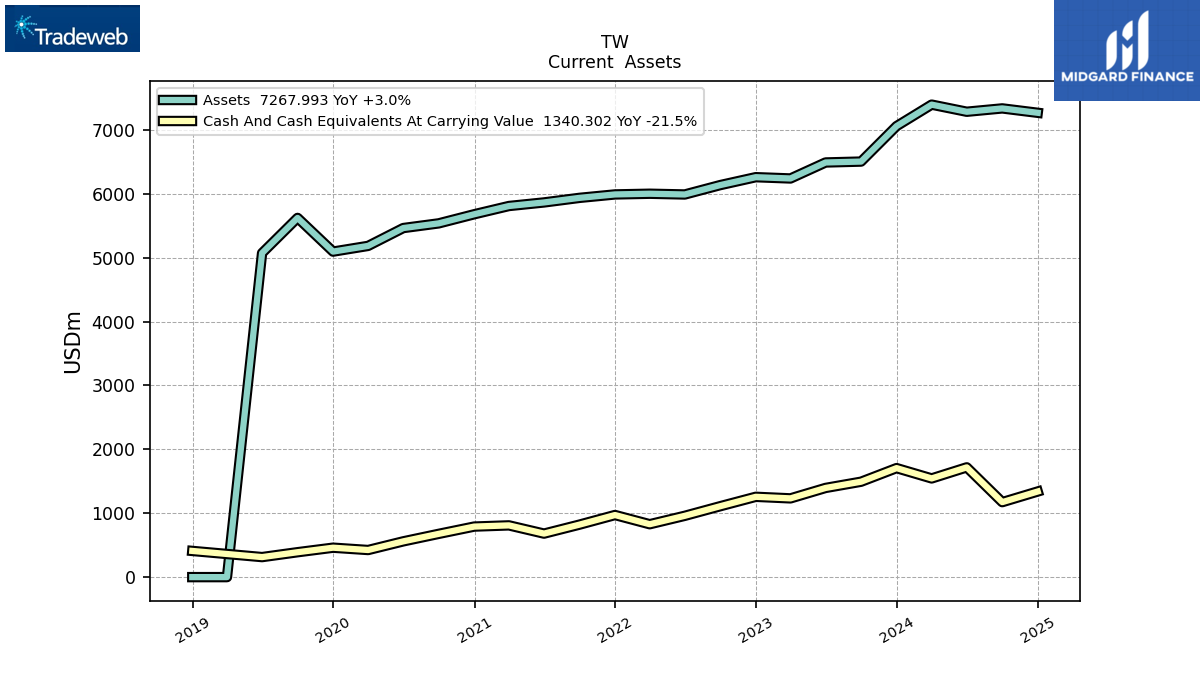
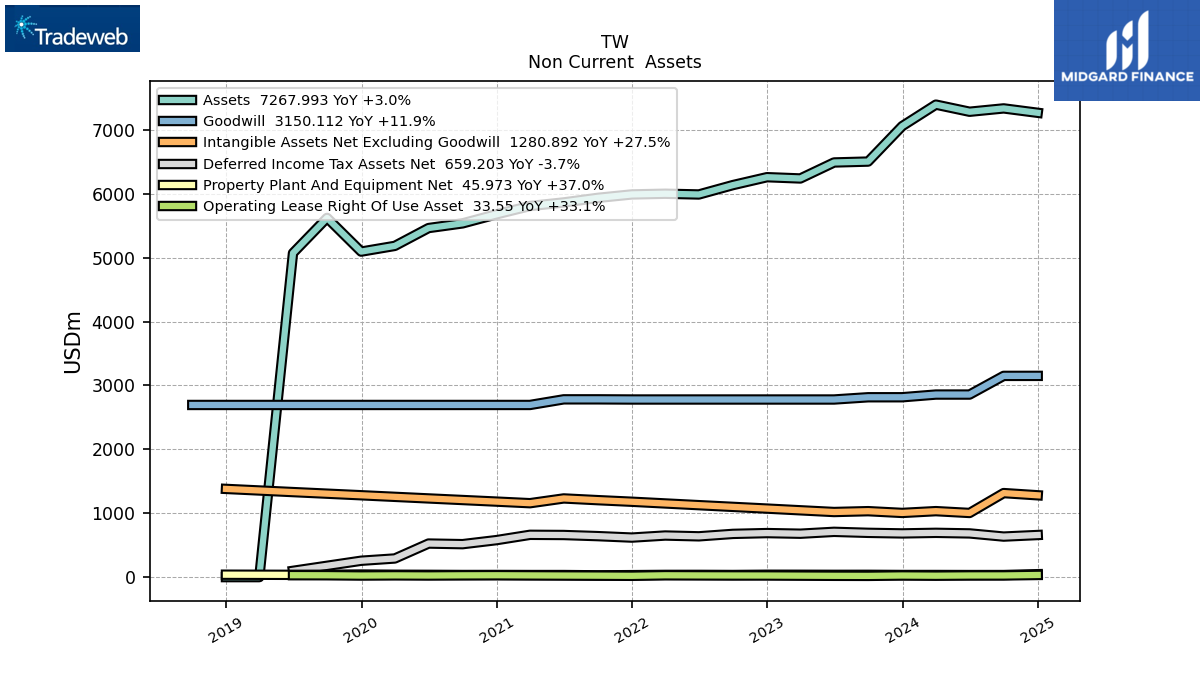
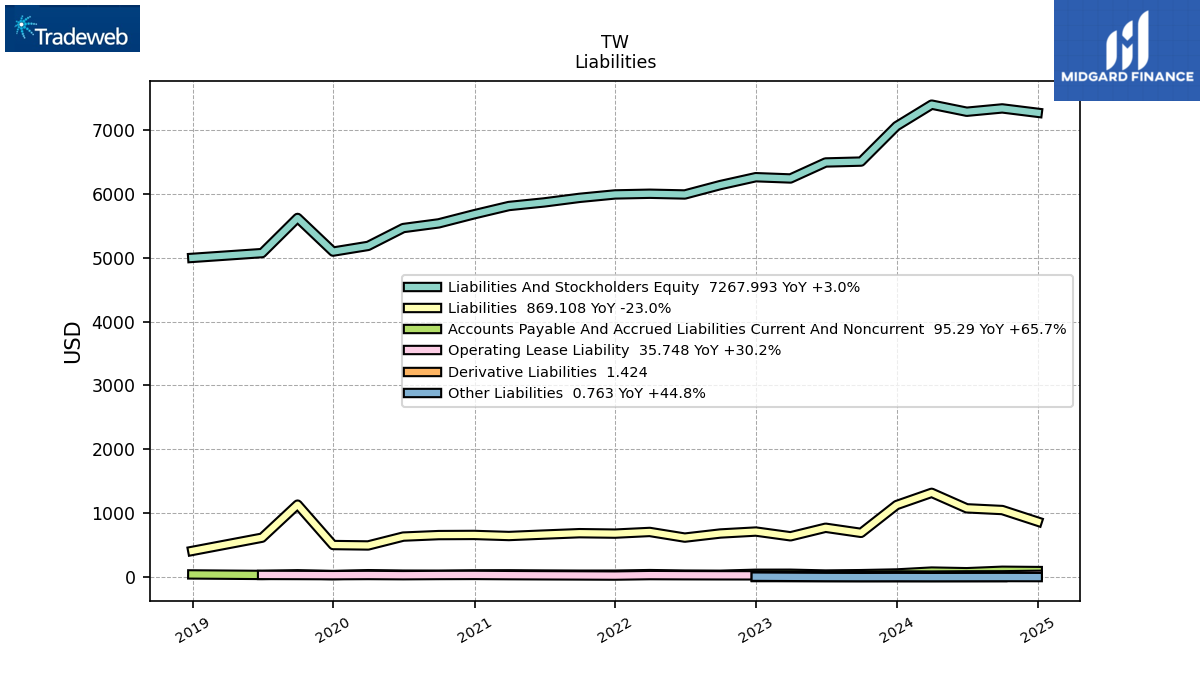
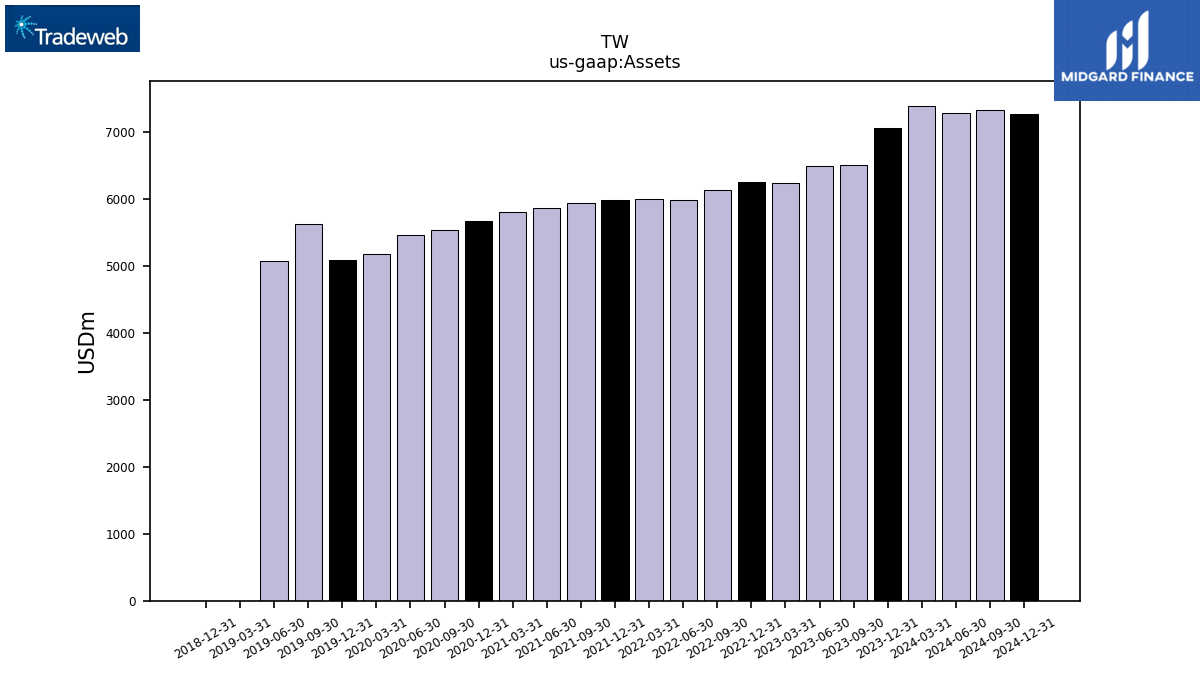
| Assets | 6504.55 | 6490.50 | 6240.07 | 6260.13 | 6136.60 | 5989.54 | 6001.12 | 5990.18 | 5936.50 | 5864.89 | 5808.93 | 5679.85 | 5537.35 | 5463.88 | 5184.72 | 5095.33 | 5622.68 | 5072.35 | 0.00 | 0.00 | NA | |
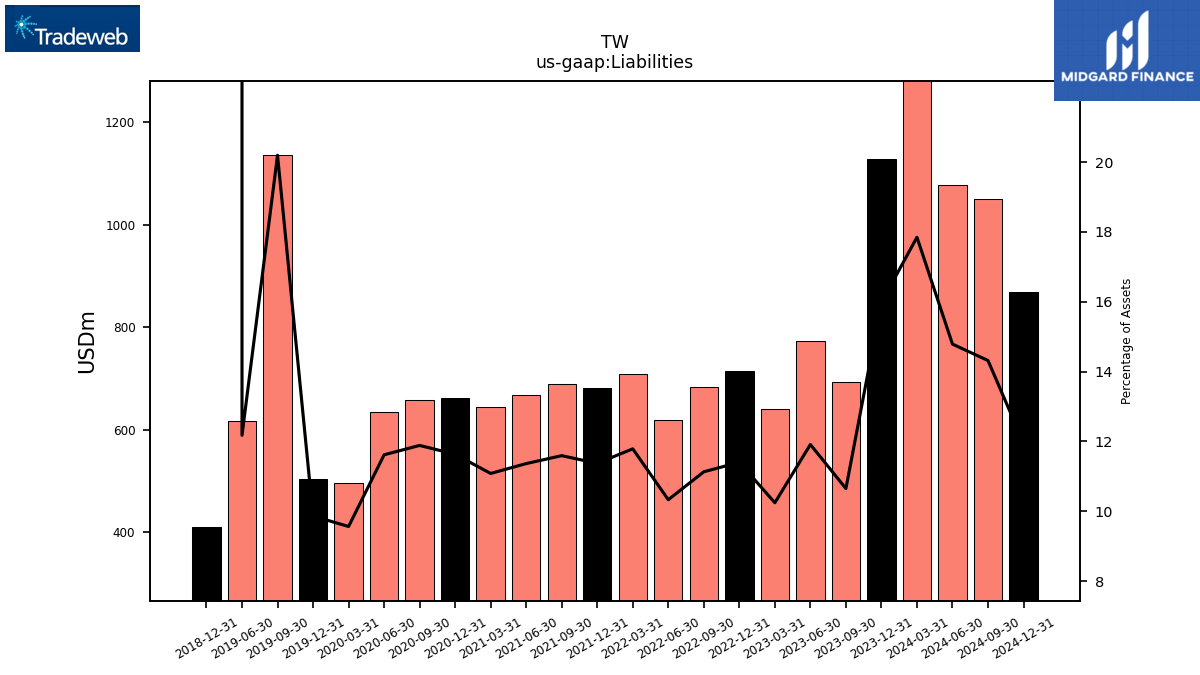
| Liabilities | 692.81 | 773.13 | 639.20 | 713.82 | 683.03 | 618.77 | 707.39 | 681.24 | 688.17 | 666.56 | 643.80 | 660.69 | 658.13 | 634.74 | 495.87 | 502.59 | 1135.44 | 617.55 | NA | 410.63 | NA | |
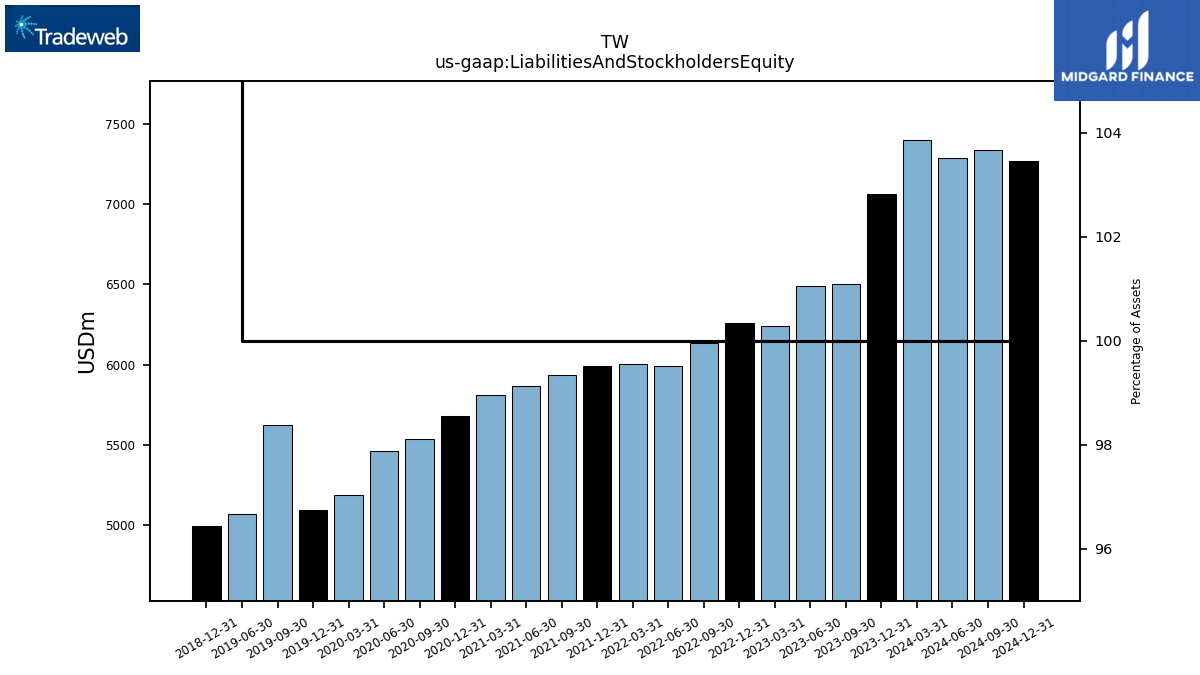
| Liabilities And Stockholders Equity | 6504.55 | 6490.50 | 6240.07 | 6260.13 | 6136.60 | 5989.54 | 6001.12 | 5990.18 | 5936.50 | 5864.89 | 5808.93 | 5679.85 | 5537.35 | 5463.88 | 5184.72 | 5095.33 | 5622.68 | 5072.35 | NA | 4997.14 | NA | |
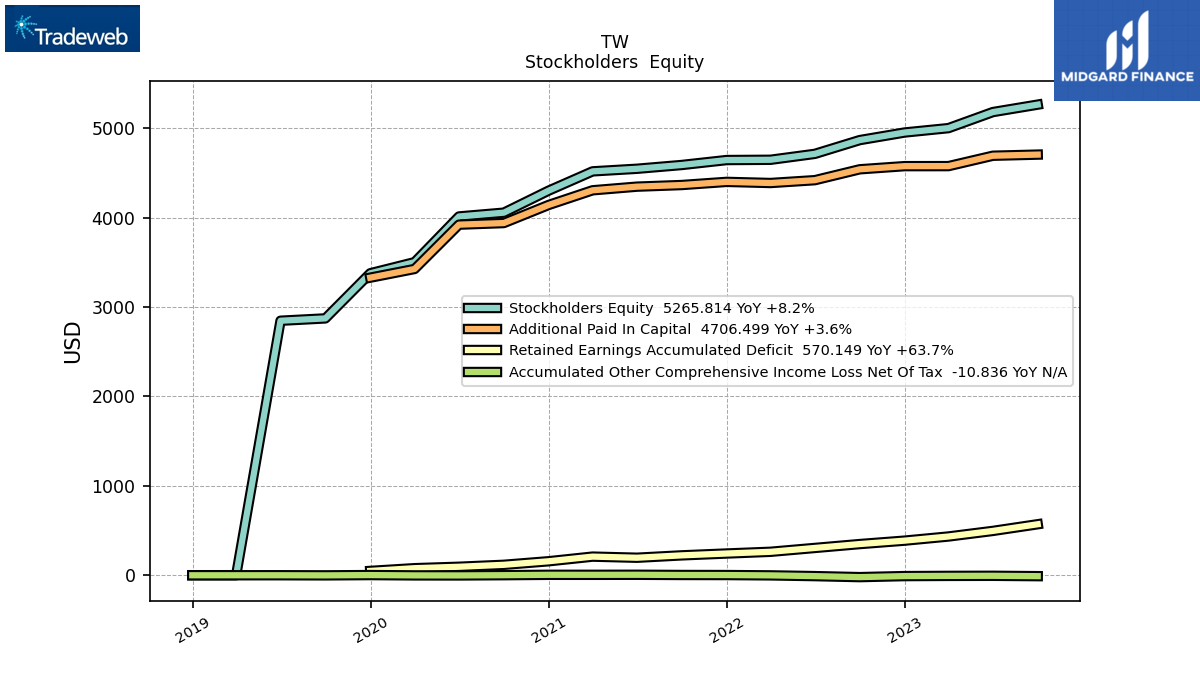
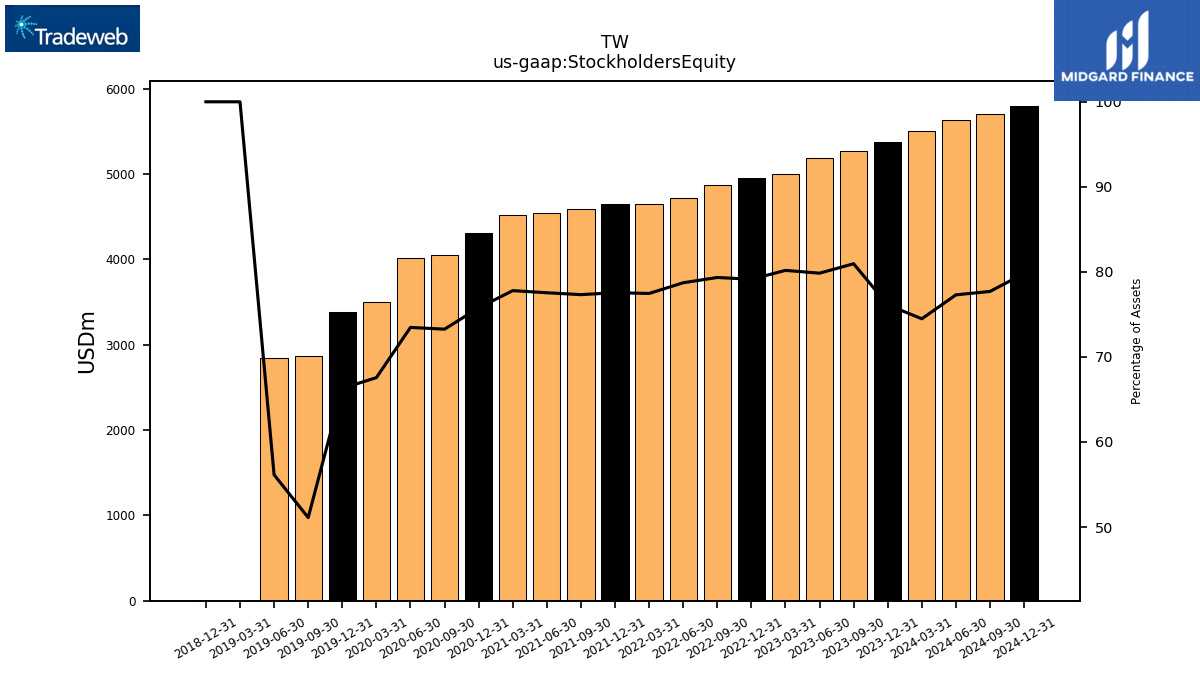
| Stockholders Equity | 5265.81 | 5182.46 | 5002.90 | 4953.79 | 4868.89 | 4714.90 | 4648.62 | 4645.60 | 4590.27 | 4547.97 | 4519.02 | 4303.45 | 4056.86 | 4014.24 | 3502.81 | 3378.59 | 2873.60 | 2847.55 | 0.00 | 0.00 | NA |
| 2023-09-30 | 2023-06-30 | 2023-03-31 | 2022-12-31 | 2022-09-30 | 2022-06-30 | 2022-03-31 | 2021-12-31 | 2021-09-30 | 2021-06-30 | 2021-03-31 | 2020-12-31 | 2020-09-30 | 2020-06-30 | 2020-03-31 | 2019-12-31 | 2019-09-30 | 2019-06-30 | 2019-03-31 | 2018-12-31 | 2018-09-30 | ||
|---|---|---|---|---|---|---|---|---|---|---|---|---|---|---|---|---|---|---|---|---|---|---|
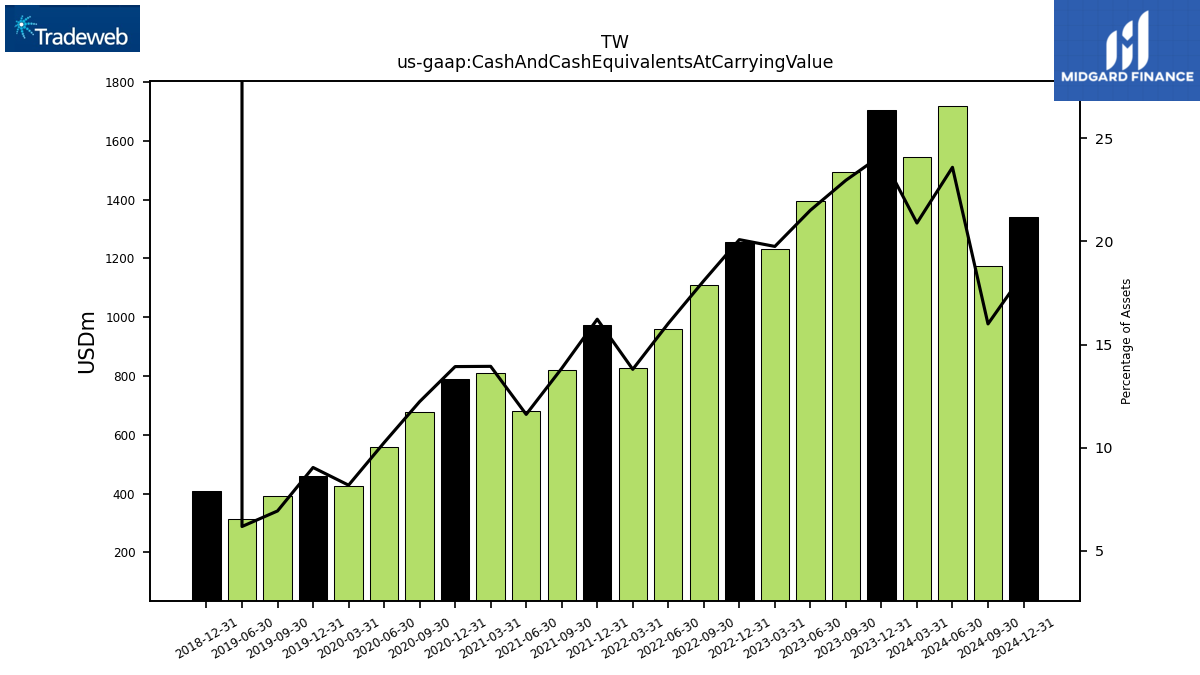
| Cash And Cash Equivalents At Carrying Value | 1493.41 | 1395.90 | 1232.67 | 1257.23 | 1110.23 | 959.72 | 828.06 | 972.05 | 821.90 | 681.23 | 809.94 | 791.28 | 677.35 | 559.89 | 424.36 | 460.71 | 389.93 | 313.58 | NA | 410.10 | NA | |
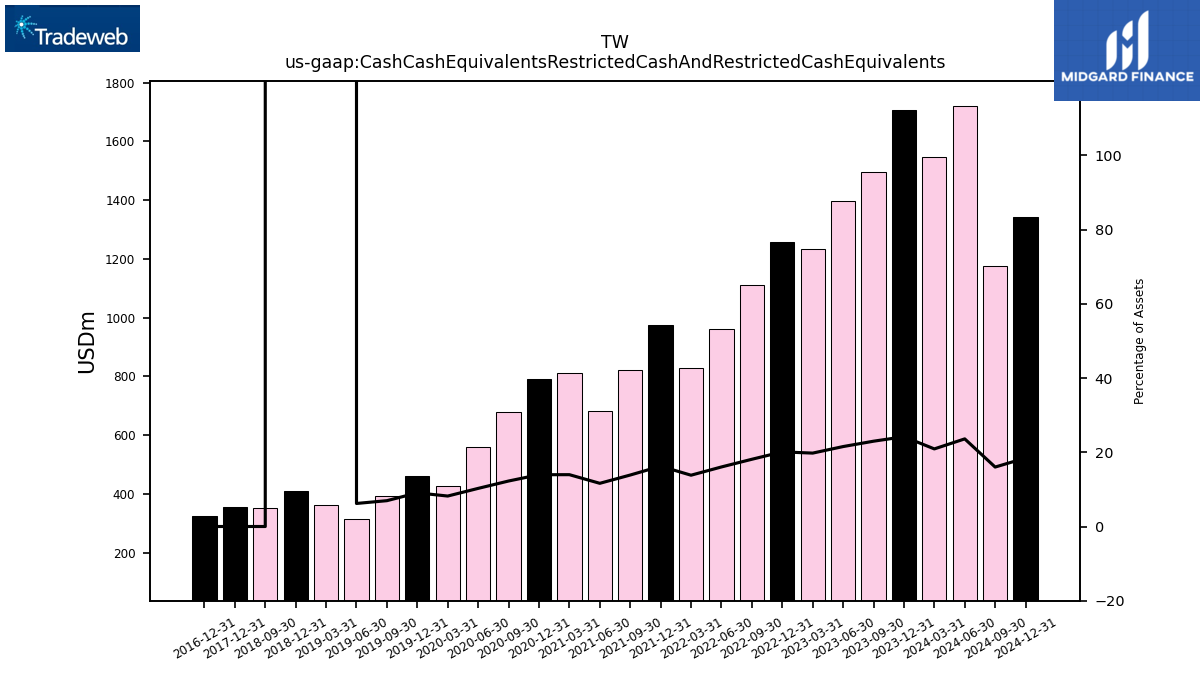
| Cash Cash Equivalents Restricted Cash And Restricted Cash Equivalents | 1494.41 | 1397.40 | 1233.67 | 1258.23 | 1111.23 | 960.72 | 829.06 | 973.05 | 822.90 | 682.23 | 810.94 | 792.28 | 678.35 | 560.89 | 425.36 | 461.71 | 391.13 | 314.78 | 362.81 | 411.30 | 351.38 |
| 2023-09-30 | 2023-06-30 | 2023-03-31 | 2022-12-31 | 2022-09-30 | 2022-06-30 | 2022-03-31 | 2021-12-31 | 2021-09-30 | 2021-06-30 | 2021-03-31 | 2020-12-31 | 2020-09-30 | 2020-06-30 | 2020-03-31 | 2019-12-31 | 2019-09-30 | 2019-06-30 | 2019-03-31 | 2018-12-31 | 2018-09-30 | ||
|---|---|---|---|---|---|---|---|---|---|---|---|---|---|---|---|---|---|---|---|---|---|---|
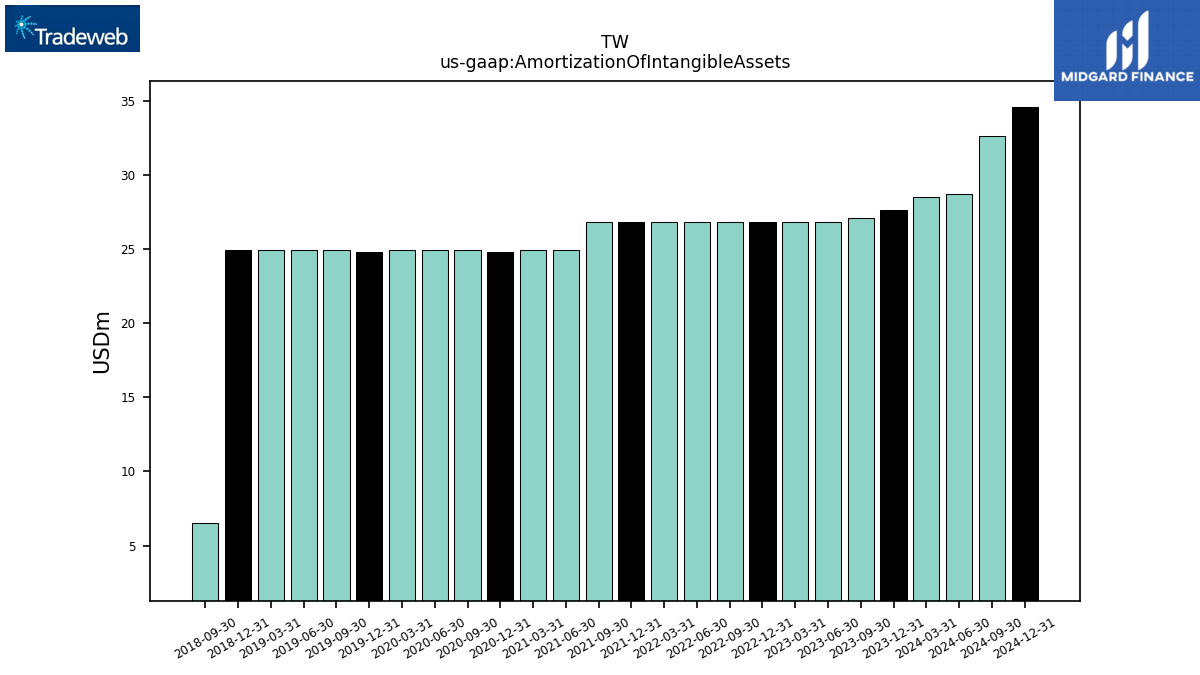
| Amortization Of Intangible Assets | 27.10 | 26.80 | 26.80 | 26.80 | 26.80 | 26.80 | 26.80 | 26.80 | 26.80 | 24.90 | 24.90 | 24.80 | 24.90 | 24.90 | 24.90 | 24.80 | 24.90 | 24.90 | 24.90 | 24.90 | 6.50 | |
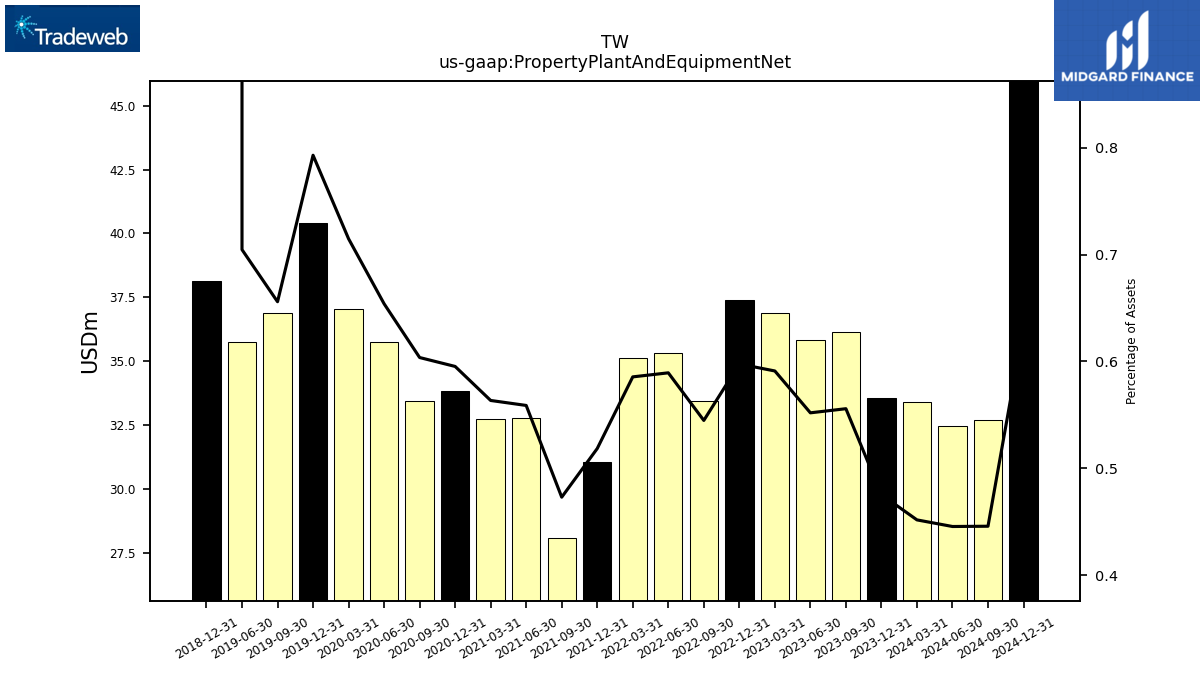
| Property Plant And Equipment Net | 36.15 | 35.82 | 36.88 | 37.41 | 33.43 | 35.30 | 35.14 | 31.06 | 28.08 | 32.77 | 32.73 | 33.81 | 33.43 | 35.73 | 37.06 | 40.41 | 36.88 | 35.74 | NA | 38.13 | NA | |
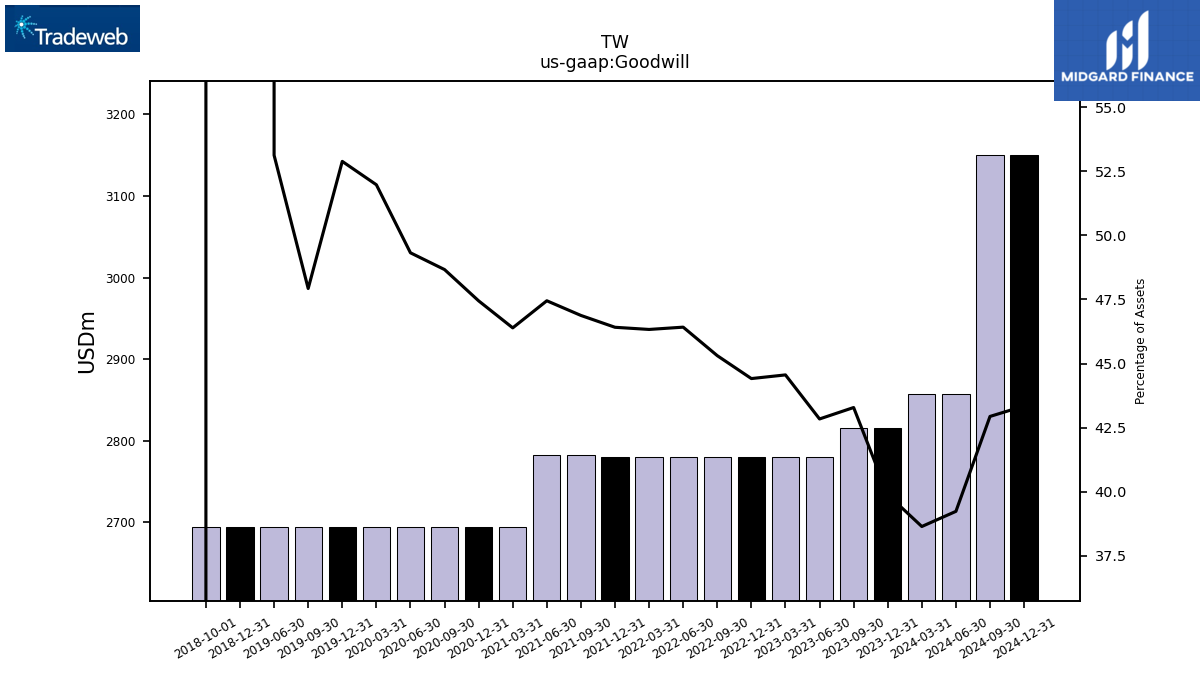
| Goodwill | 2815.32 | 2780.26 | 2780.26 | 2780.26 | 2780.26 | 2780.26 | 2780.26 | 2780.26 | 2782.78 | 2782.78 | 2694.80 | 2694.80 | 2694.80 | 2694.80 | 2694.80 | 2694.80 | 2694.80 | 2694.80 | NA | 2694.80 | NA | |
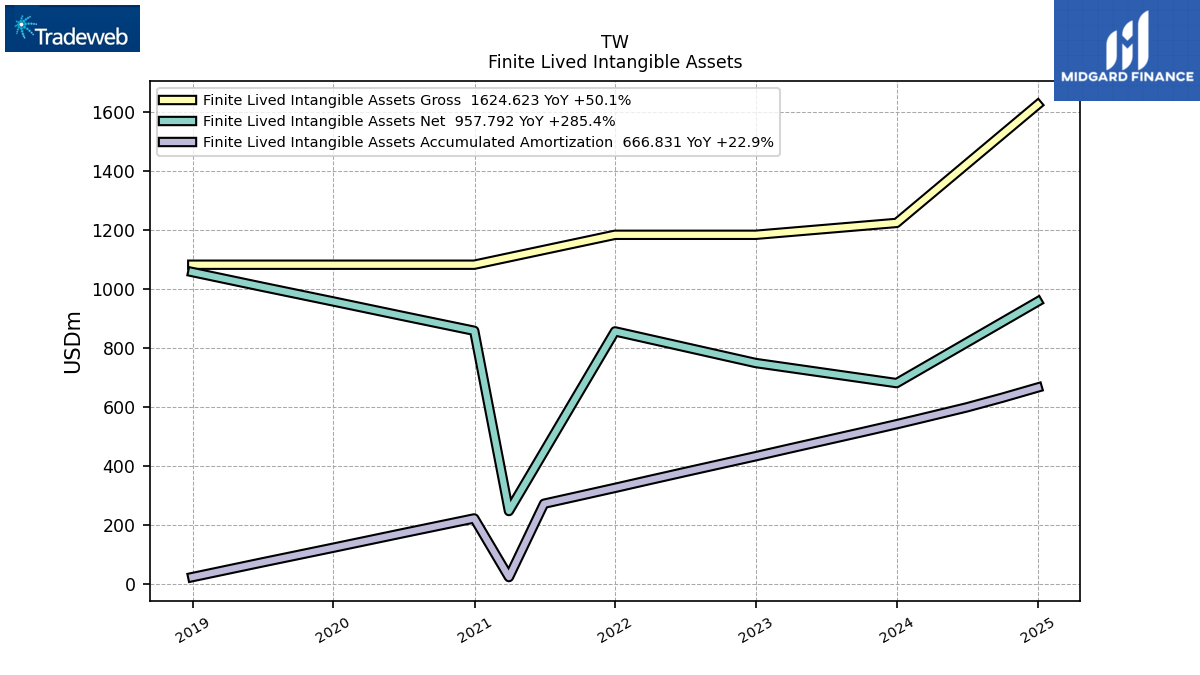
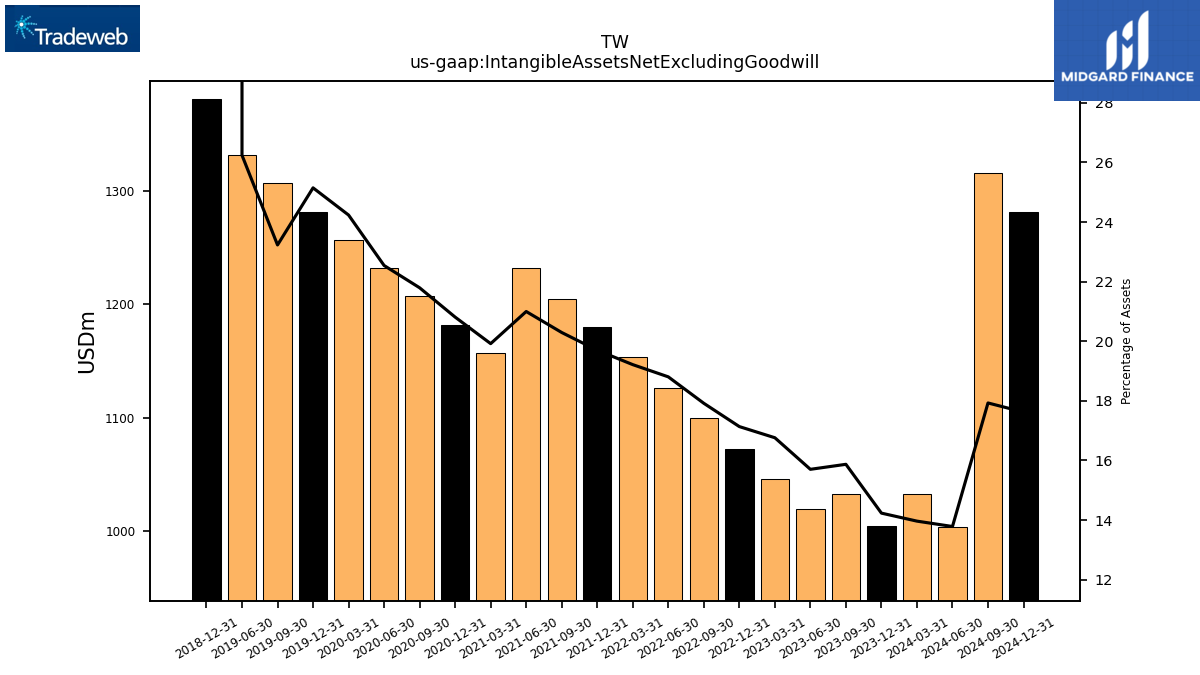
| Intangible Assets Net Excluding Goodwill | 1032.35 | 1019.22 | 1046.02 | 1072.82 | 1099.62 | 1126.42 | 1153.22 | 1180.02 | 1204.81 | 1231.57 | 1157.18 | 1182.03 | 1206.89 | 1231.74 | 1256.59 | 1281.44 | 1306.29 | 1331.14 | NA | 1380.85 | NA | |
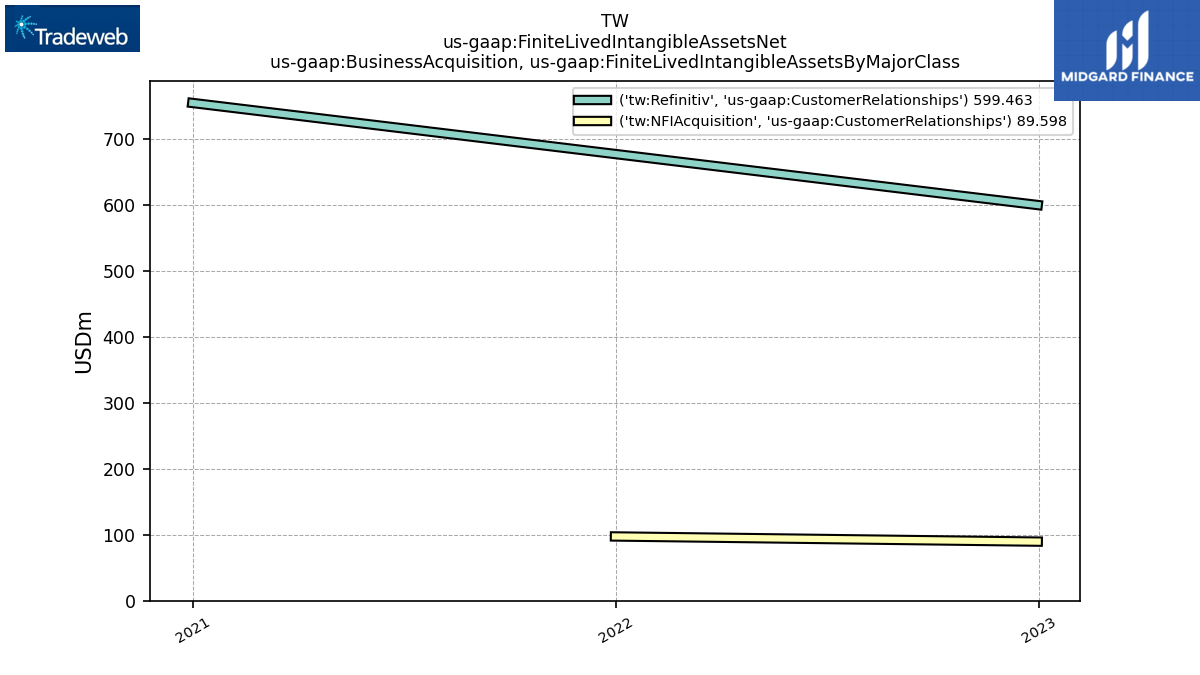
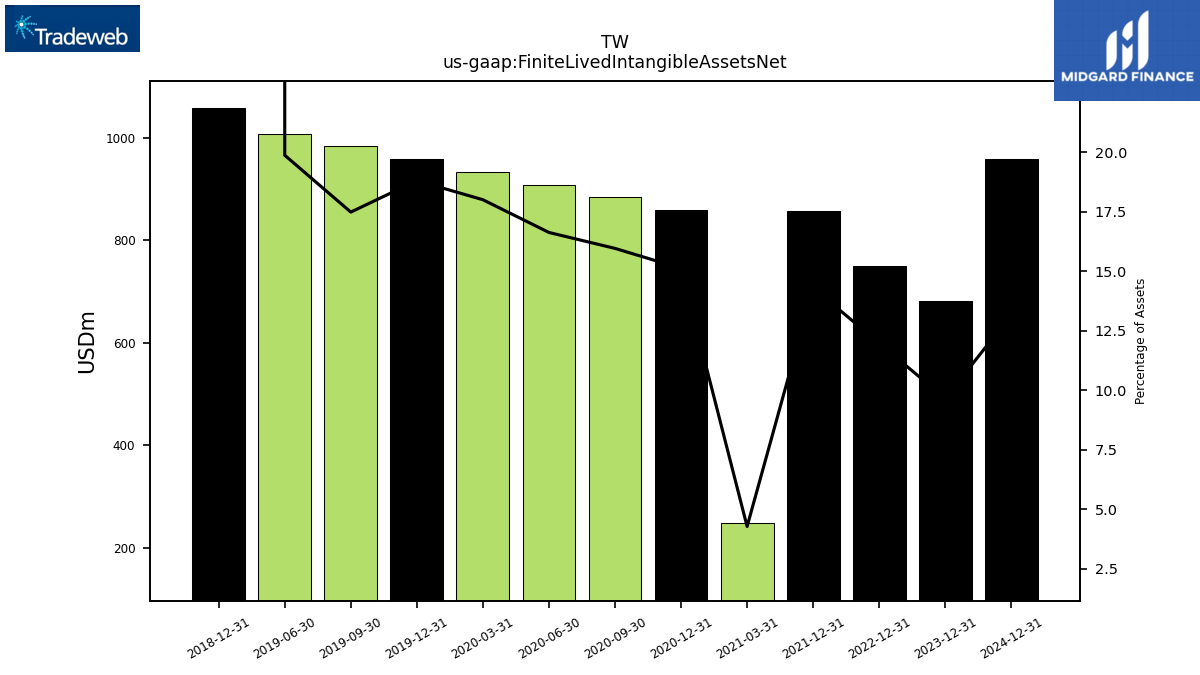
| Finite Lived Intangible Assets Net | NA | NA | NA | 749.72 | NA | NA | NA | 856.92 | NA | NA | 248.50 | 858.93 | 883.79 | 908.64 | 933.49 | 958.34 | 983.19 | 1008.04 | NA | 1057.75 | NA |
| 2023-09-30 | 2023-06-30 | 2023-03-31 | 2022-12-31 | 2022-09-30 | 2022-06-30 | 2022-03-31 | 2021-12-31 | 2021-09-30 | 2021-06-30 | 2021-03-31 | 2020-12-31 | 2020-09-30 | 2020-06-30 | 2020-03-31 | 2019-12-31 | 2019-09-30 | 2019-06-30 | 2019-03-31 | 2018-12-31 | 2018-09-30 | ||
|---|---|---|---|---|---|---|---|---|---|---|---|---|---|---|---|---|---|---|---|---|---|---|
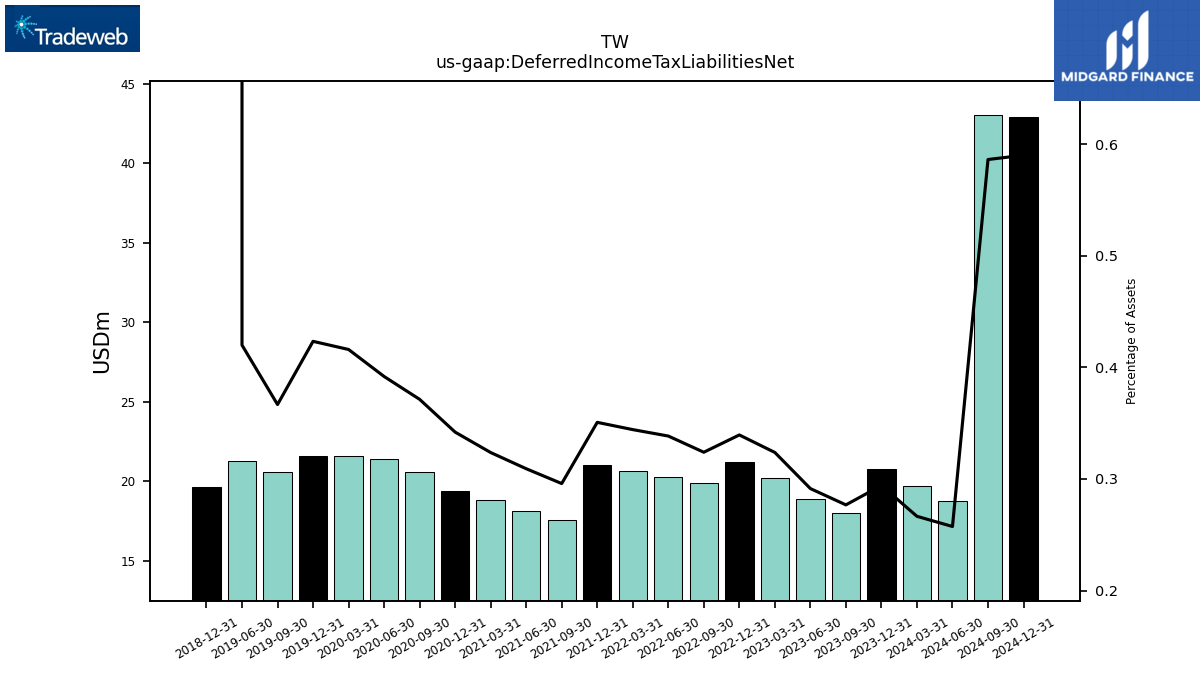
| Deferred Income Tax Liabilities Net | 18.00 | 18.91 | 20.20 | 21.25 | 19.88 | 20.27 | 20.66 | 21.01 | 17.57 | 18.13 | 18.80 | 19.43 | 20.57 | 21.41 | 21.57 | 21.57 | 20.62 | 21.30 | NA | 19.63 | NA | |
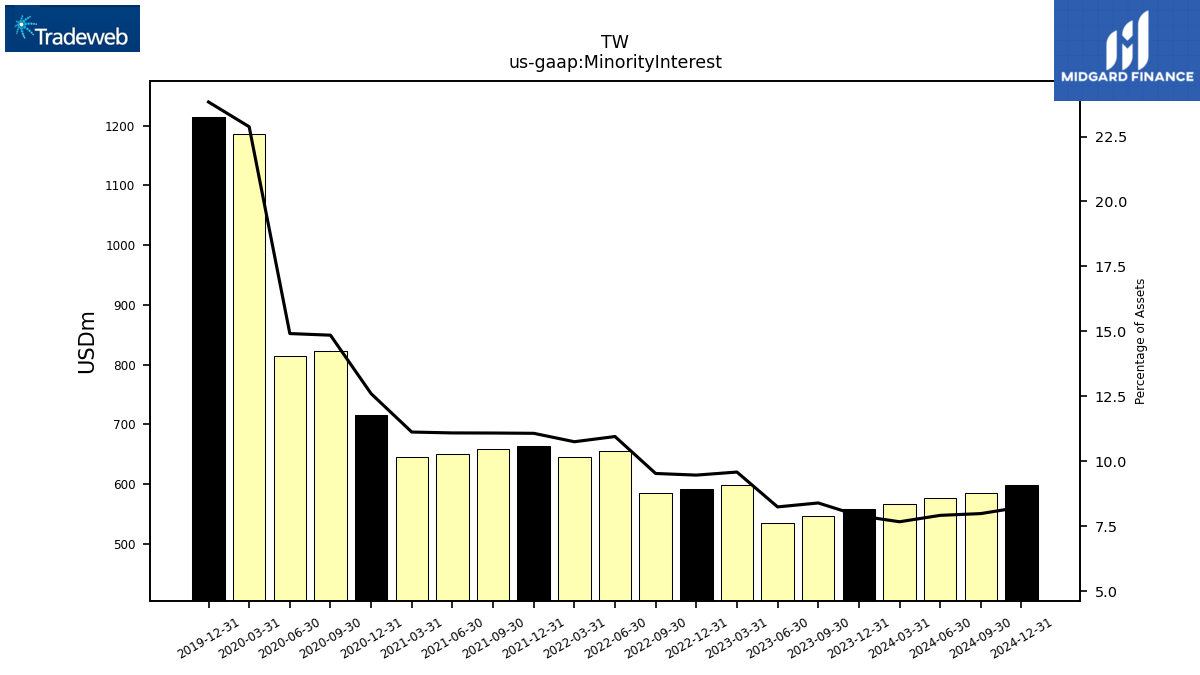
| Minority Interest | 545.93 | 534.91 | 597.97 | 592.52 | 584.68 | 655.87 | 645.12 | 663.35 | 658.06 | 650.36 | 646.12 | 715.71 | 822.36 | 814.90 | 1186.04 | 1214.16 | NA | NA | NA | NA | NA |
| 2023-09-30 | 2023-06-30 | 2023-03-31 | 2022-12-31 | 2022-09-30 | 2022-06-30 | 2022-03-31 | 2021-12-31 | 2021-09-30 | 2021-06-30 | 2021-03-31 | 2020-12-31 | 2020-09-30 | 2020-06-30 | 2020-03-31 | 2019-12-31 | 2019-09-30 | 2019-06-30 | 2019-03-31 | 2018-12-31 | 2018-09-30 | ||
|---|---|---|---|---|---|---|---|---|---|---|---|---|---|---|---|---|---|---|---|---|---|---|
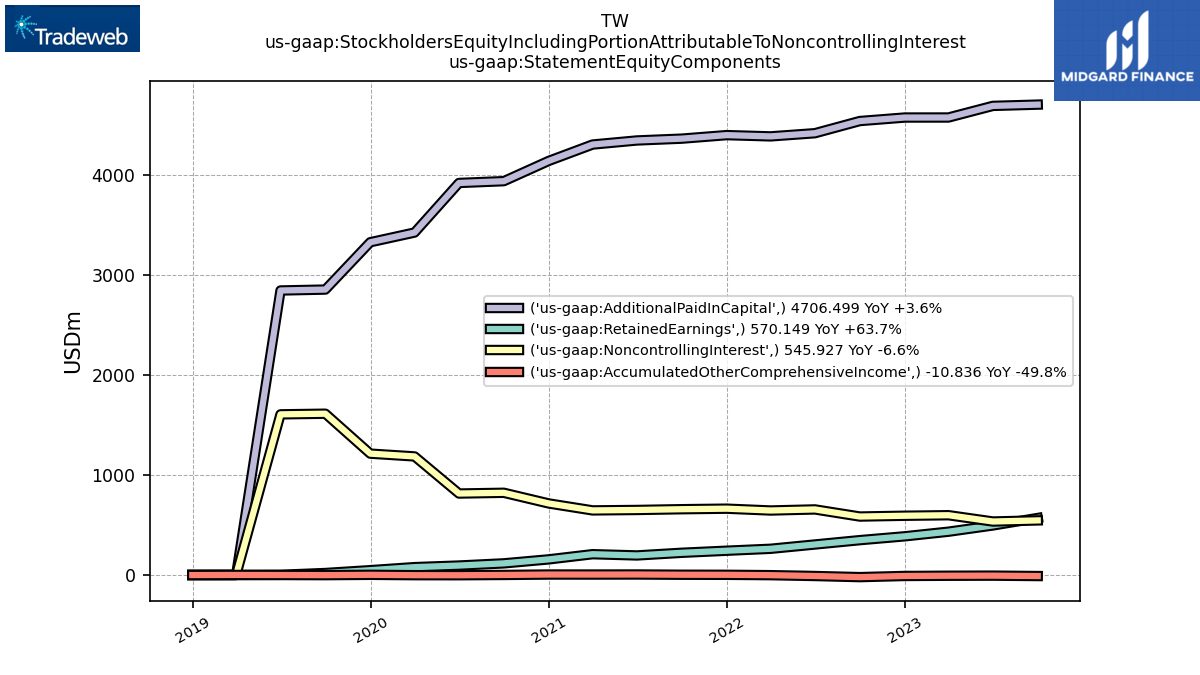
| Stockholders Equity | 5265.81 | 5182.46 | 5002.90 | 4953.79 | 4868.89 | 4714.90 | 4648.62 | 4645.60 | 4590.27 | 4547.97 | 4519.02 | 4303.45 | 4056.86 | 4014.24 | 3502.81 | 3378.59 | 2873.60 | 2847.55 | 0.00 | 0.00 | NA | |
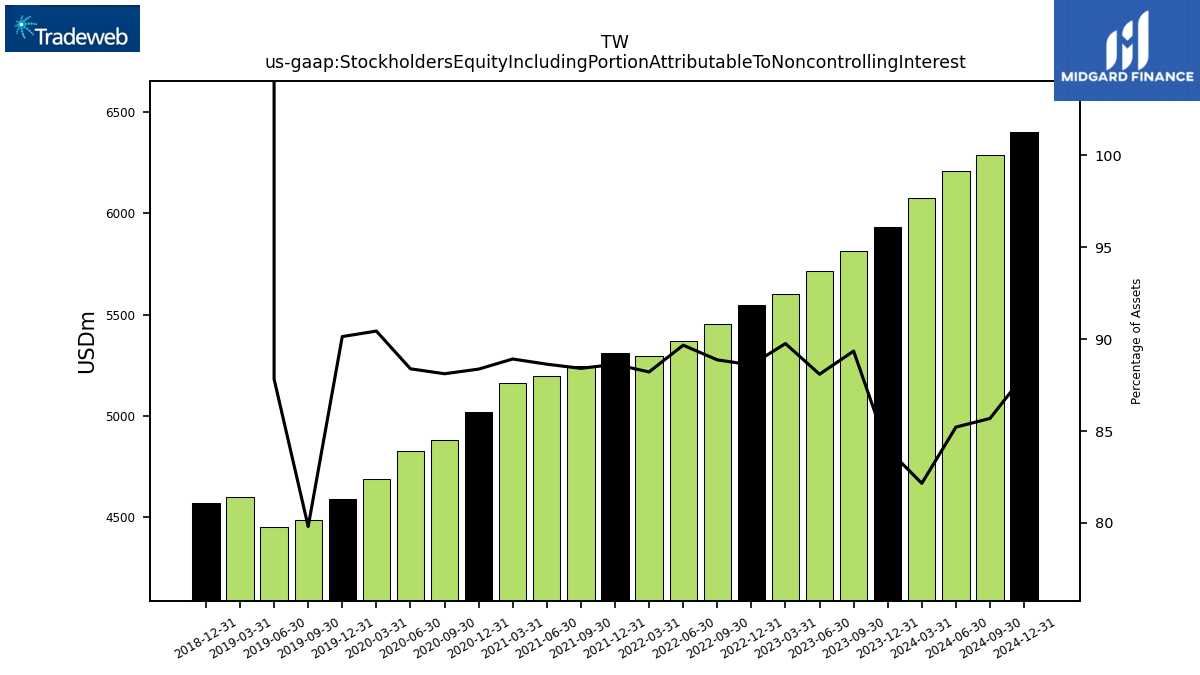
| Stockholders Equity Including Portion Attributable To Noncontrolling Interest | 5811.74 | 5717.37 | 5600.86 | 5546.32 | 5453.57 | 5370.77 | 5293.73 | 5308.94 | 5248.33 | 5198.33 | 5165.14 | 5019.16 | 4879.22 | 4829.14 | 4688.85 | 4592.74 | 4487.24 | 4454.80 | 4597.98 | 4572.33 | NA | |
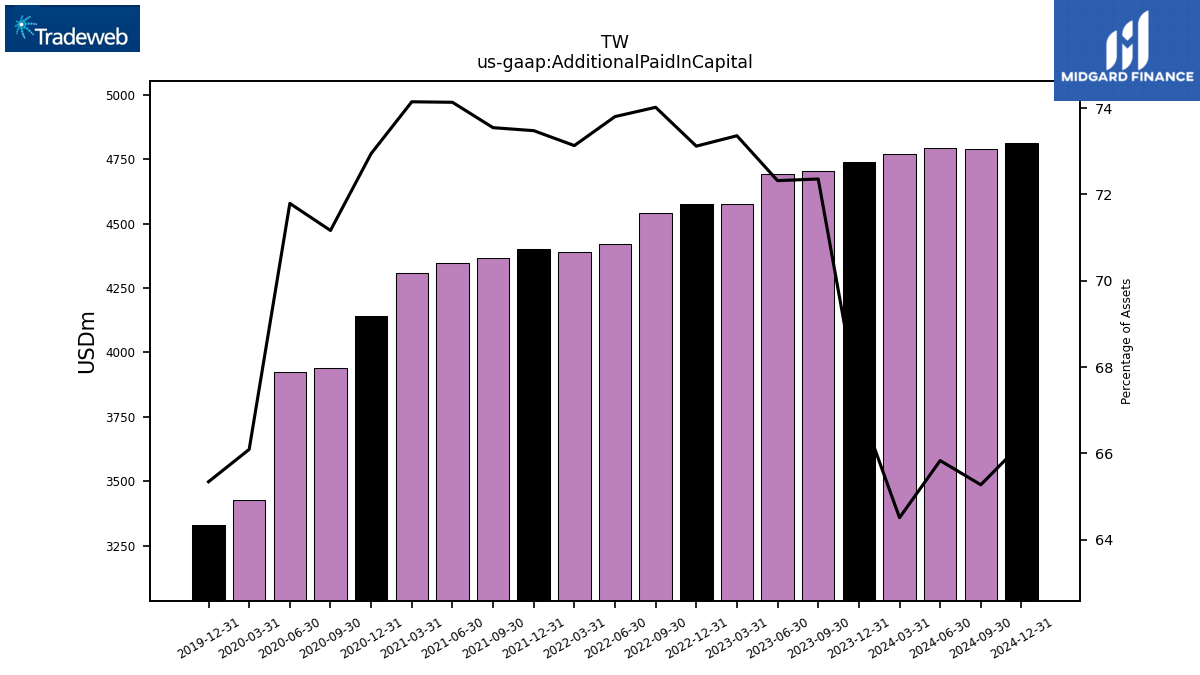
| Additional Paid In Capital | 4706.50 | 4693.80 | 4577.61 | 4577.27 | 4542.16 | 4420.40 | 4388.66 | 4401.37 | 4366.04 | 4347.88 | 4307.05 | 4143.09 | 3940.59 | 3922.56 | 3426.62 | 3329.39 | NA | NA | NA | NA | NA | |
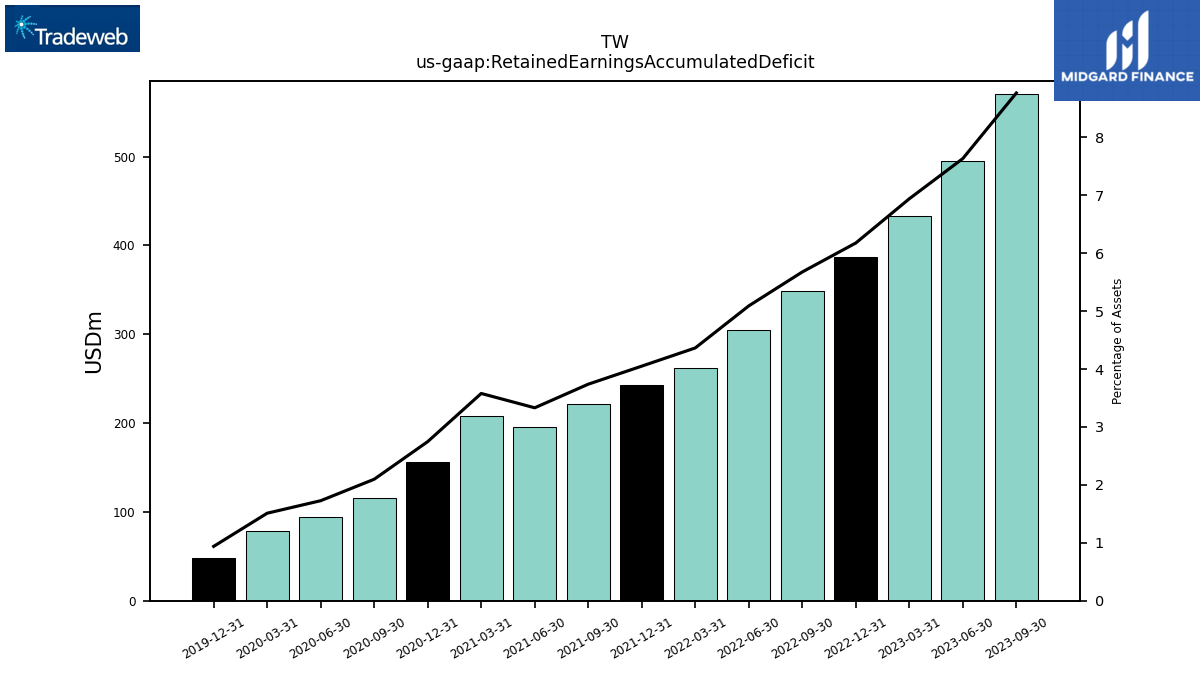
| Retained Earnings Accumulated Deficit | 570.15 | 495.48 | 433.05 | 386.63 | 348.33 | 304.90 | 261.92 | 242.62 | 221.95 | 195.37 | 207.87 | 156.04 | 116.16 | 94.37 | 78.36 | 47.83 | NA | NA | NA | NA | NA | |
| Accumulated Other Comprehensive Income Loss Net Of Tax | -10.84 | -6.82 | -7.76 | -10.11 | -21.60 | -10.40 | -1.96 | 1.60 | 2.28 | 4.71 | 4.10 | 4.31 | 0.10 | -2.69 | -2.18 | 1.37 | -1.85 | -0.53 | NA | -0.87 | NA | |
| Minority Interest | 545.93 | 534.91 | 597.97 | 592.52 | 584.68 | 655.87 | 645.12 | 663.35 | 658.06 | 650.36 | 646.12 | 715.71 | 822.36 | 814.90 | 1186.04 | 1214.16 | NA | NA | NA | NA | NA | |
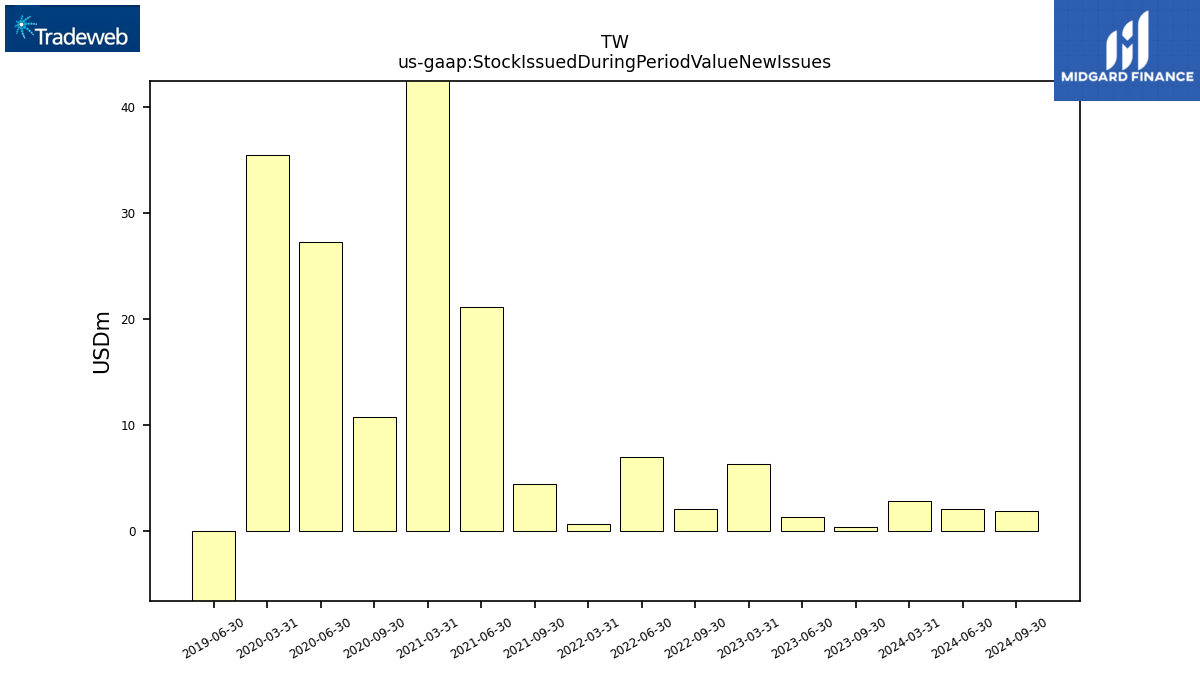
| Stock Issued During Period Value New Issues | 0.41 | 1.26 | 6.32 | NA | 2.06 | 6.92 | 0.69 | NA | 4.44 | 21.14 | 46.40 | NA | 10.70 | 27.20 | 35.42 | NA | NA | -15.85 | NA | NA | NA | |
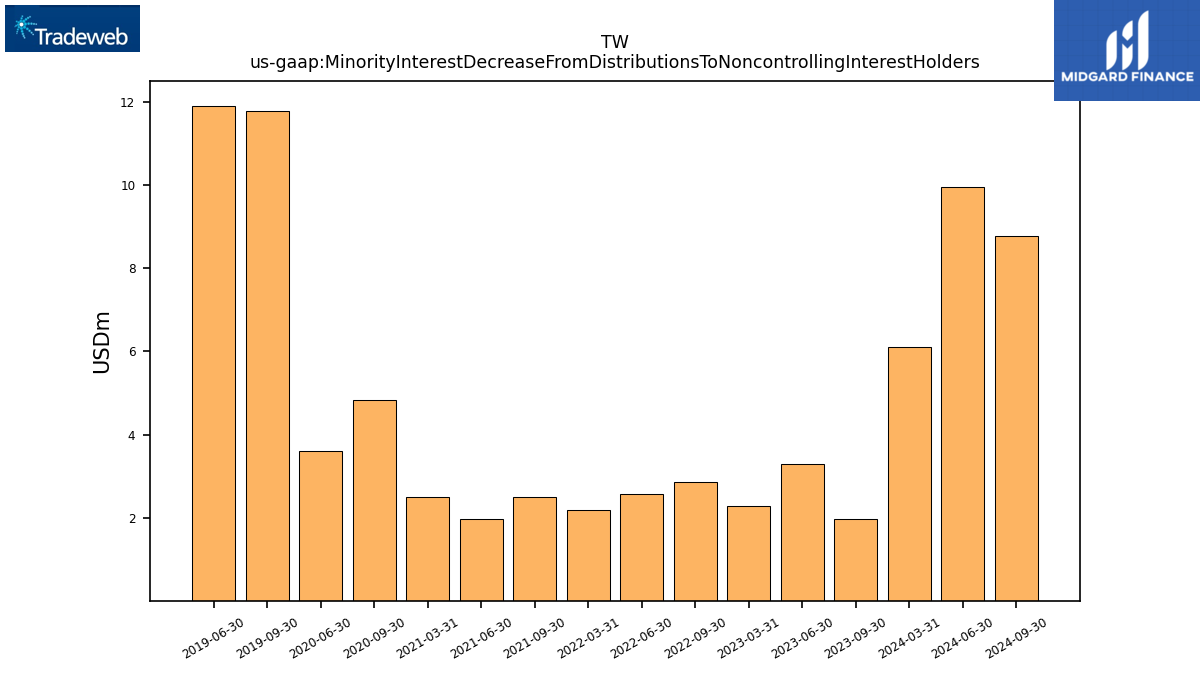
| Minority Interest Decrease From Distributions To Noncontrolling Interest Holders | 1.96 | 3.29 | 2.28 | NA | 2.86 | 2.57 | 2.18 | NA | 2.49 | 1.97 | 2.50 | NA | 4.84 | 3.60 | NA | NA | 11.77 | 11.91 | NA | NA | NA |
| 2023-09-30 | 2023-06-30 | 2023-03-31 | 2022-12-31 | 2022-09-30 | 2022-06-30 | 2022-03-31 | 2021-12-31 | 2021-09-30 | 2021-06-30 | 2021-03-31 | 2020-12-31 | 2020-09-30 | 2020-06-30 | 2020-03-31 | 2019-12-31 | 2019-09-30 | 2019-06-30 | 2019-03-31 | 2018-12-31 | 2018-09-30 | ||
|---|---|---|---|---|---|---|---|---|---|---|---|---|---|---|---|---|---|---|---|---|---|---|
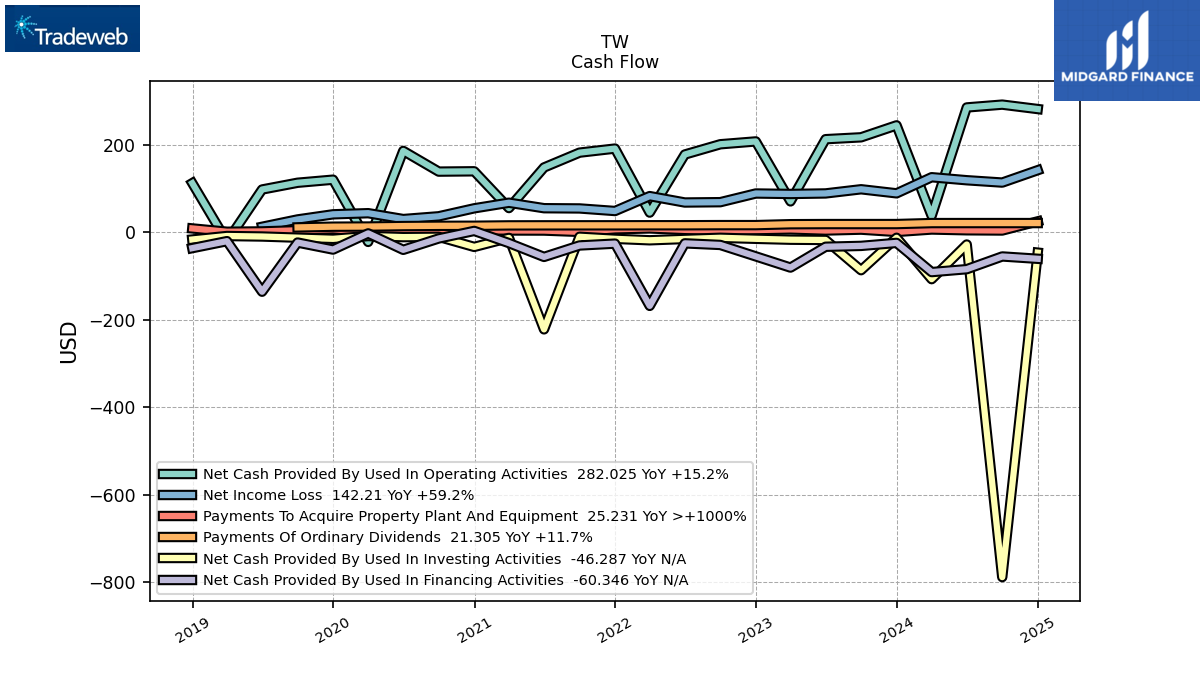
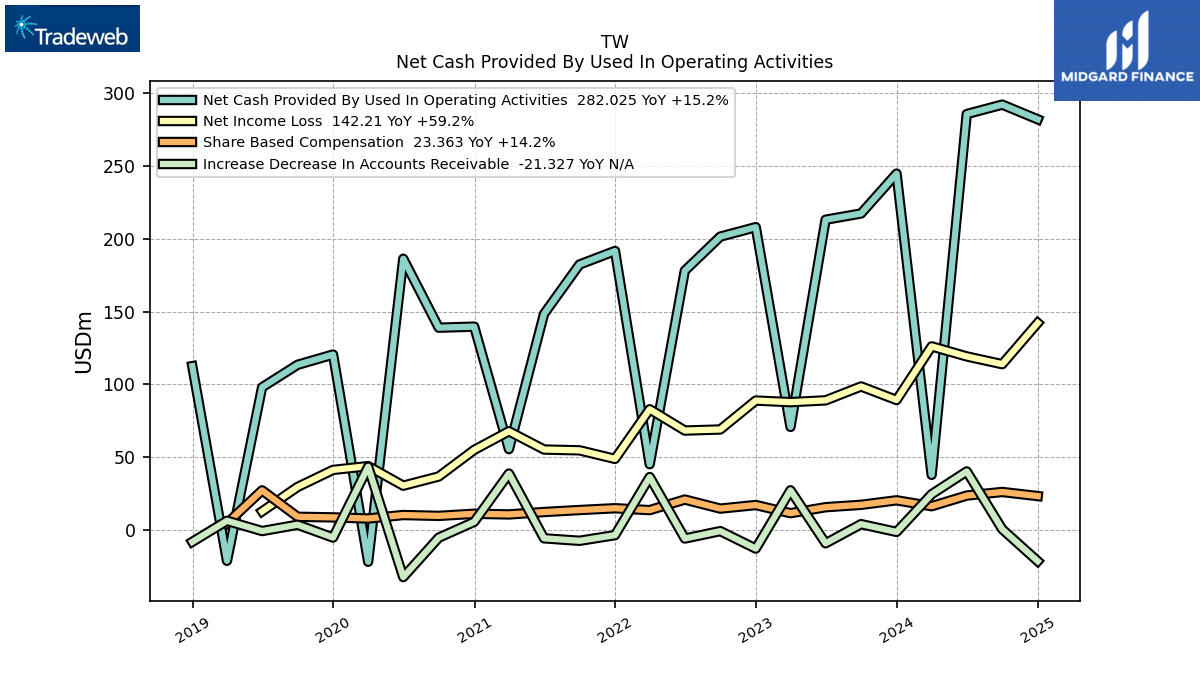
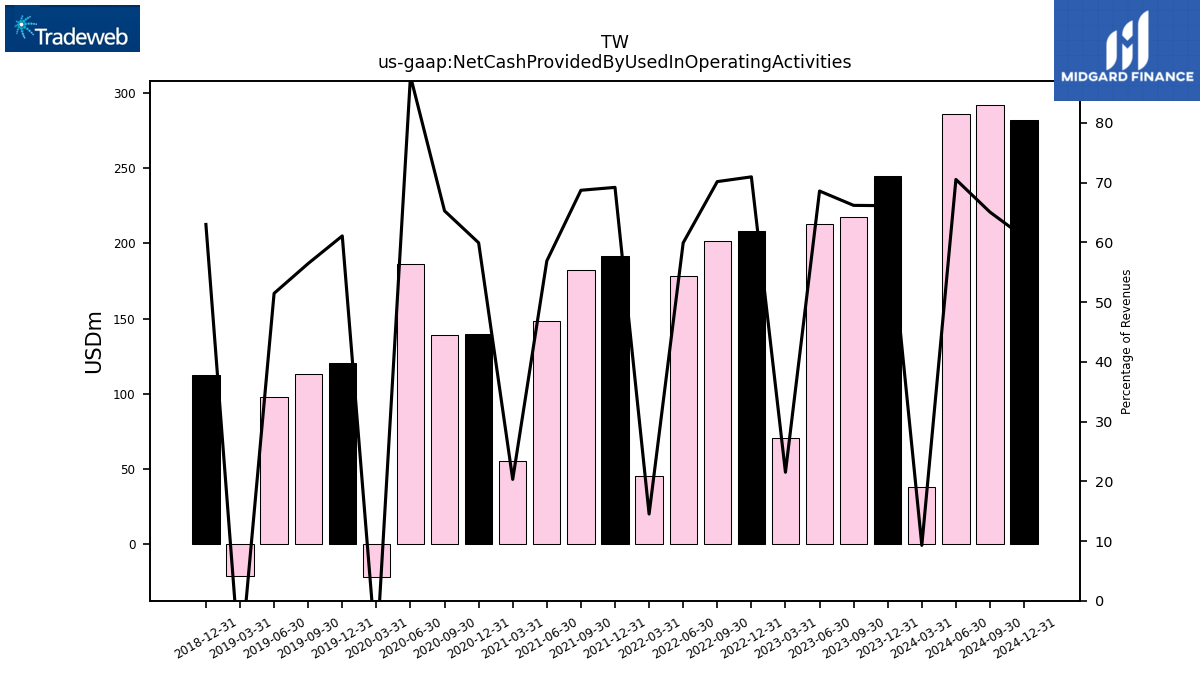
| Net Cash Provided By Used In Operating Activities | 217.39 | 213.10 | 70.84 | 208.00 | 201.51 | 178.07 | 45.24 | 191.65 | 182.36 | 148.43 | 55.57 | 139.70 | 138.98 | 186.31 | -21.76 | 120.54 | 113.49 | 98.05 | -21.08 | 112.56 | NA | |
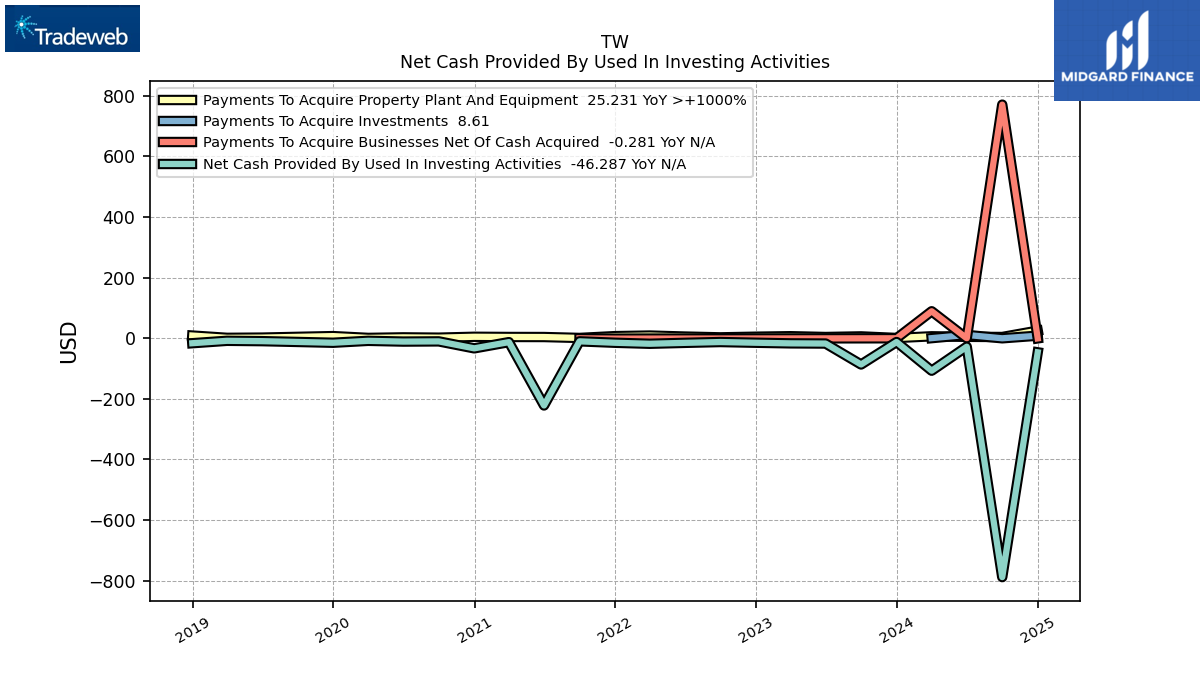
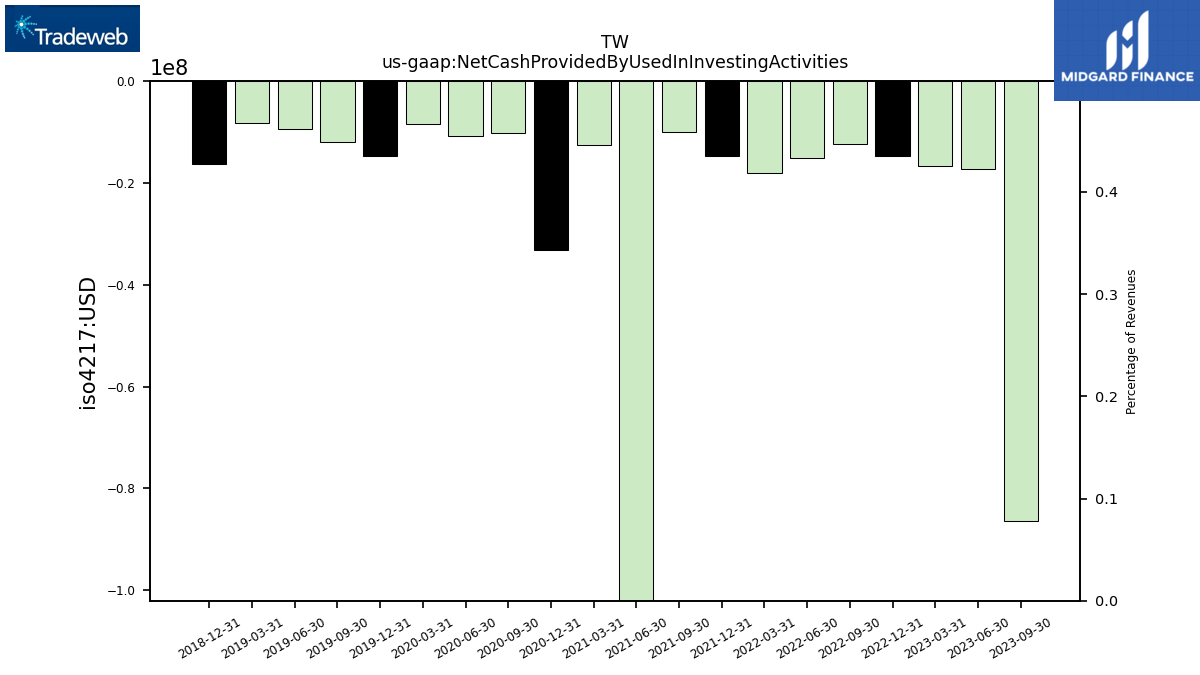
| Net Cash Provided By Used In Investing Activities | -86.45 | -17.35 | -16.71 | -14.67 | -12.34 | -15.05 | -18.04 | -14.73 | -10.02 | -221.74 | -12.62 | -33.19 | -10.17 | -10.82 | -8.36 | -14.70 | -12.06 | -9.42 | -8.28 | -16.25 | NA | |
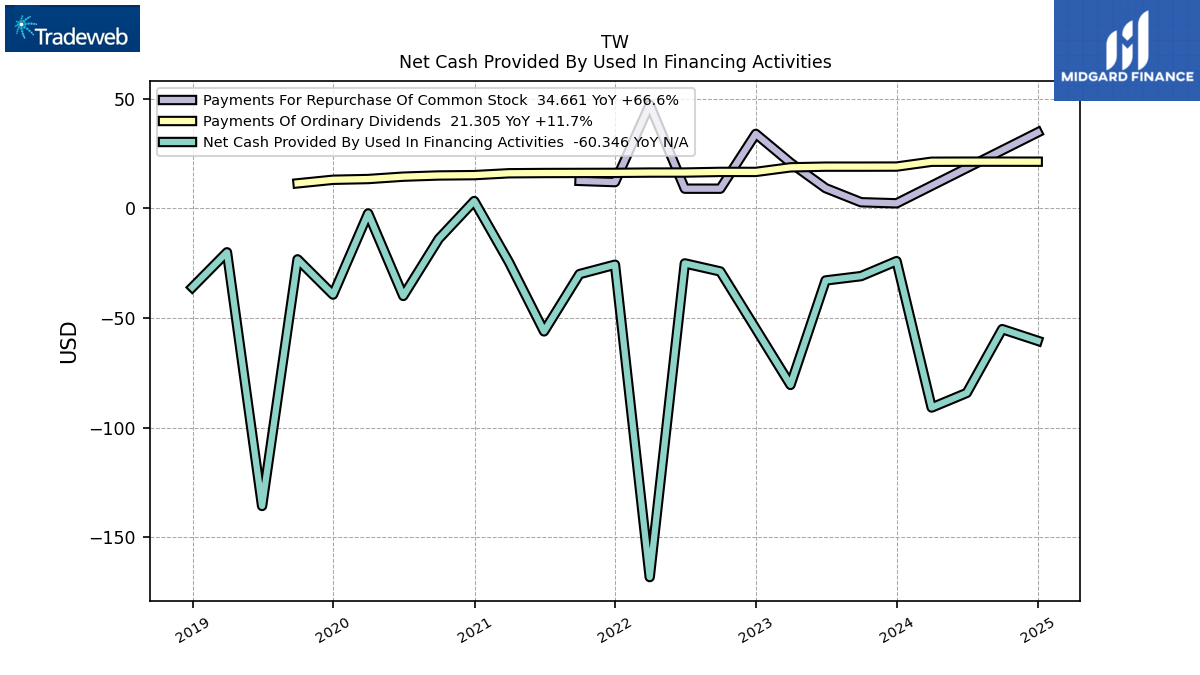
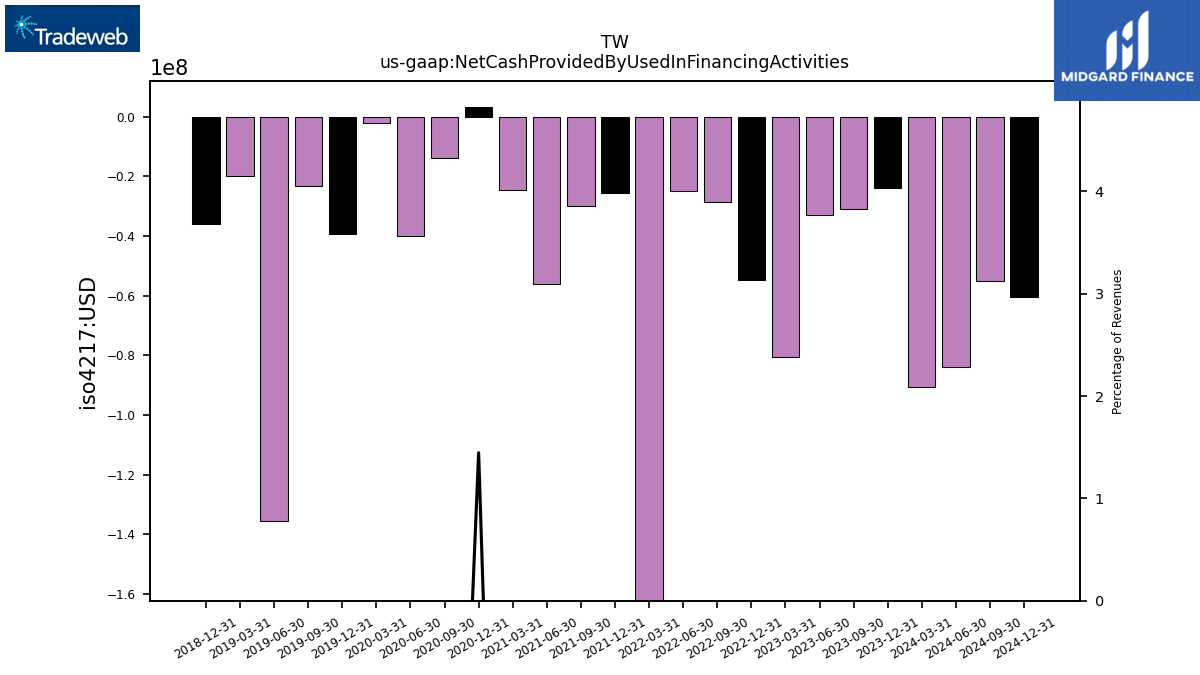
| Net Cash Provided By Used In Financing Activities | -30.85 | -32.84 | -80.46 | -54.85 | -28.72 | -25.05 | -168.08 | -25.66 | -29.93 | -56.06 | -24.45 | 3.37 | -13.89 | -39.89 | -2.28 | -39.29 | -23.21 | -135.65 | -20.00 | -36.00 | NA |
| 2023-09-30 | 2023-06-30 | 2023-03-31 | 2022-12-31 | 2022-09-30 | 2022-06-30 | 2022-03-31 | 2021-12-31 | 2021-09-30 | 2021-06-30 | 2021-03-31 | 2020-12-31 | 2020-09-30 | 2020-06-30 | 2020-03-31 | 2019-12-31 | 2019-09-30 | 2019-06-30 | 2019-03-31 | 2018-12-31 | 2018-09-30 | ||
|---|---|---|---|---|---|---|---|---|---|---|---|---|---|---|---|---|---|---|---|---|---|---|
| Net Cash Provided By Used In Operating Activities | 217.39 | 213.10 | 70.84 | 208.00 | 201.51 | 178.07 | 45.24 | 191.65 | 182.36 | 148.43 | 55.57 | 139.70 | 138.98 | 186.31 | -21.76 | 120.54 | 113.49 | 98.05 | -21.08 | 112.56 | NA | |
| Net Income Loss | 98.61 | 89.08 | 87.86 | 88.95 | 69.08 | 68.34 | 82.97 | 48.89 | 54.76 | 55.32 | 67.86 | 55.06 | 36.81 | 30.50 | 43.93 | 41.33 | 29.61 | 12.83 | NA | NA | NA | |
| Profit Loss | 111.63 | 101.94 | 102.19 | 99.00 | 81.57 | 81.60 | 97.44 | 60.01 | 65.31 | 66.23 | 81.56 | 66.45 | 47.05 | 42.41 | 62.48 | 57.28 | 48.58 | 24.82 | 42.35 | 29.31 | 45.95 | |
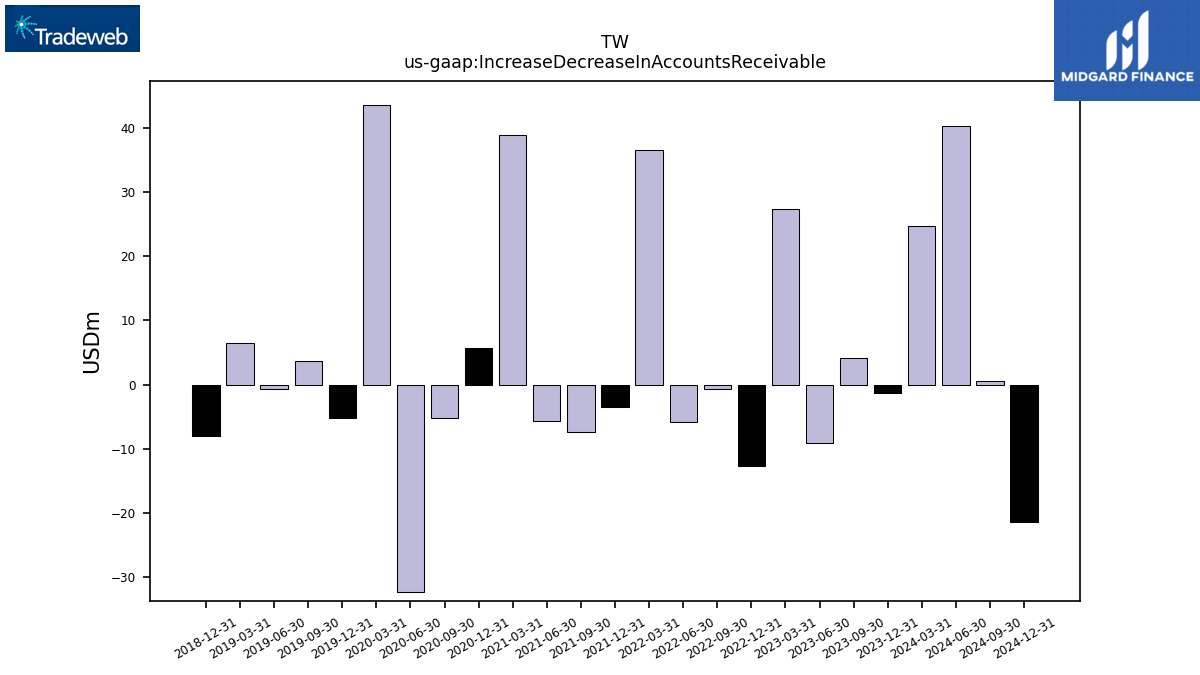
| Increase Decrease In Accounts Receivable | 4.09 | -9.07 | 27.31 | -12.71 | -0.70 | -5.80 | 36.44 | -3.47 | -7.34 | -5.65 | 38.83 | 5.66 | -5.21 | -32.29 | 43.45 | -5.14 | 3.67 | -0.65 | 6.41 | -8.09 | NA | |
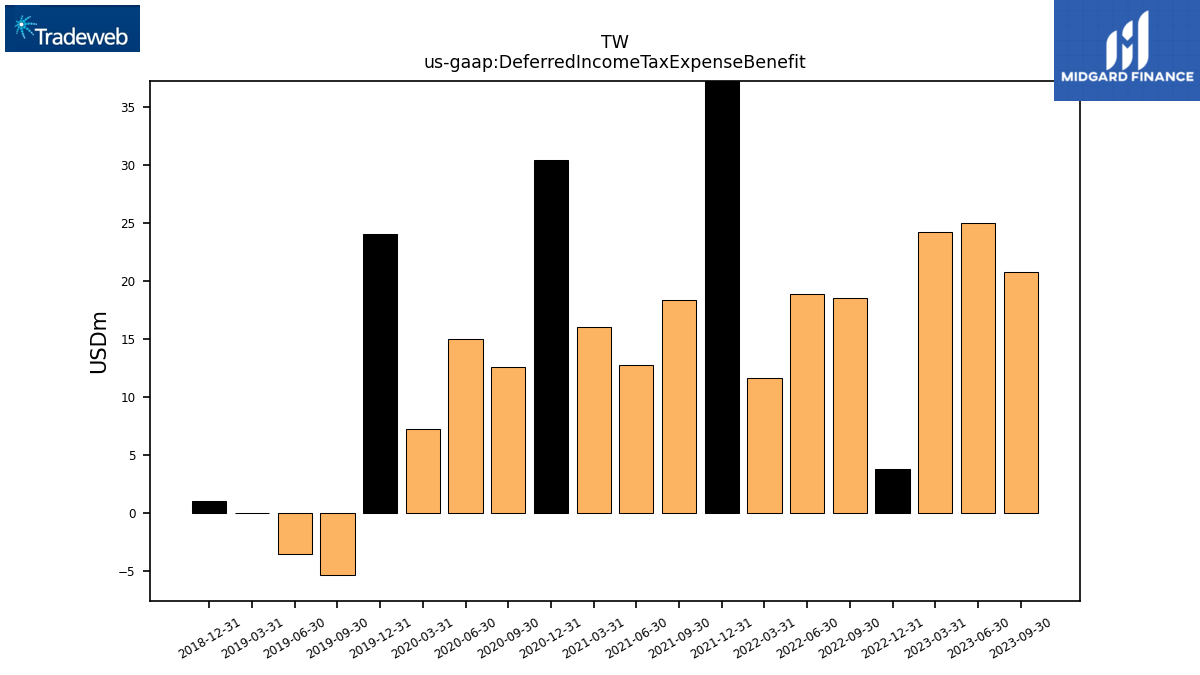
| Deferred Income Tax Expense Benefit | 20.81 | 25.04 | 24.22 | 3.79 | 18.53 | 18.91 | 11.64 | 38.33 | 18.33 | 12.75 | 16.00 | 30.45 | 12.53 | 14.98 | 7.23 | 24.04 | -5.42 | -3.56 | -0.04 | 0.97 | NA | |
| Share Based Compensation | 17.35 | 15.71 | 11.61 | 17.21 | 14.76 | 20.96 | 13.71 | 15.00 | 13.78 | 12.41 | 10.76 | 11.21 | 9.76 | 10.35 | 7.97 | 8.73 | 9.13 | 27.29 | 4.67 | NA | NA |
| 2023-09-30 | 2023-06-30 | 2023-03-31 | 2022-12-31 | 2022-09-30 | 2022-06-30 | 2022-03-31 | 2021-12-31 | 2021-09-30 | 2021-06-30 | 2021-03-31 | 2020-12-31 | 2020-09-30 | 2020-06-30 | 2020-03-31 | 2019-12-31 | 2019-09-30 | 2019-06-30 | 2019-03-31 | 2018-12-31 | 2018-09-30 | ||
|---|---|---|---|---|---|---|---|---|---|---|---|---|---|---|---|---|---|---|---|---|---|---|
| Net Cash Provided By Used In Investing Activities | -86.45 | -17.35 | -16.71 | -14.67 | -12.34 | -15.05 | -18.04 | -14.73 | -10.02 | -221.74 | -12.62 | -33.19 | -10.17 | -10.82 | -8.36 | -14.70 | -12.06 | -9.42 | -8.28 | -16.25 | NA | |
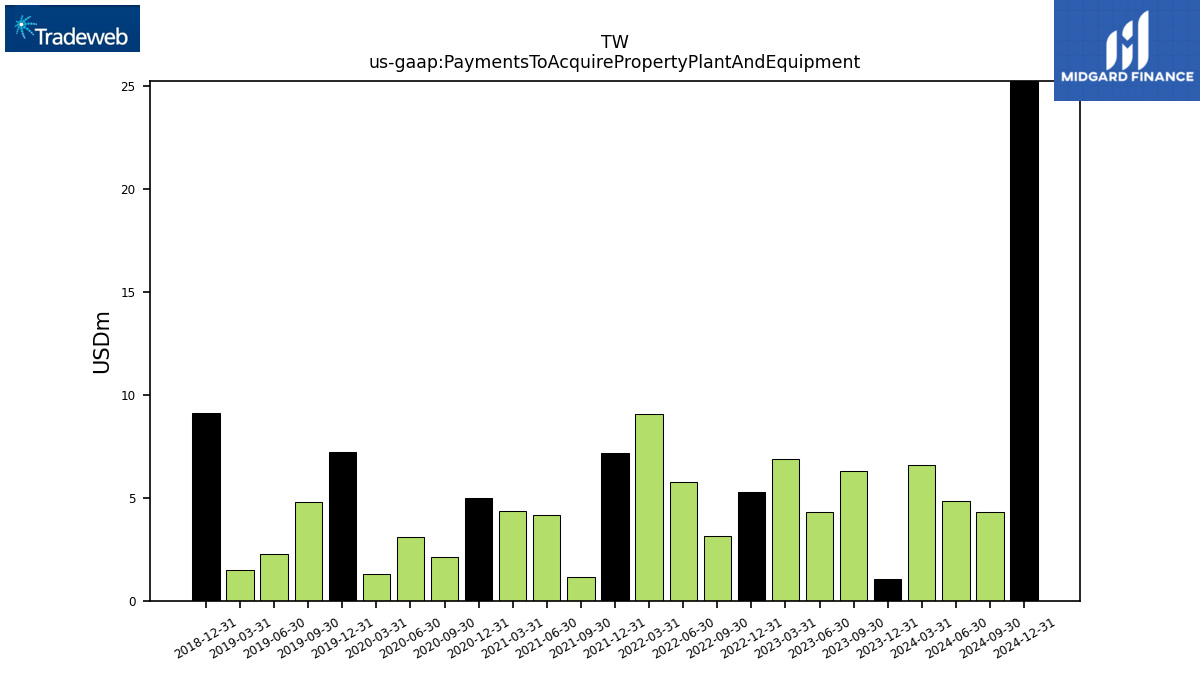
| Payments To Acquire Property Plant And Equipment | 6.30 | 4.29 | 6.88 | 5.25 | 3.14 | 5.76 | 9.06 | 7.16 | 1.17 | 4.18 | 4.36 | 5.01 | 2.10 | 3.08 | 1.30 | 7.21 | 4.77 | 2.28 | 1.52 | 9.09 | NA |
| 2023-09-30 | 2023-06-30 | 2023-03-31 | 2022-12-31 | 2022-09-30 | 2022-06-30 | 2022-03-31 | 2021-12-31 | 2021-09-30 | 2021-06-30 | 2021-03-31 | 2020-12-31 | 2020-09-30 | 2020-06-30 | 2020-03-31 | 2019-12-31 | 2019-09-30 | 2019-06-30 | 2019-03-31 | 2018-12-31 | 2018-09-30 | ||
|---|---|---|---|---|---|---|---|---|---|---|---|---|---|---|---|---|---|---|---|---|---|---|
| Net Cash Provided By Used In Financing Activities | -30.85 | -32.84 | -80.46 | -54.85 | -28.72 | -25.05 | -168.08 | -25.66 | -29.93 | -56.06 | -24.45 | 3.37 | -13.89 | -39.89 | -2.28 | -39.29 | -23.21 | -135.65 | -20.00 | -36.00 | NA | |
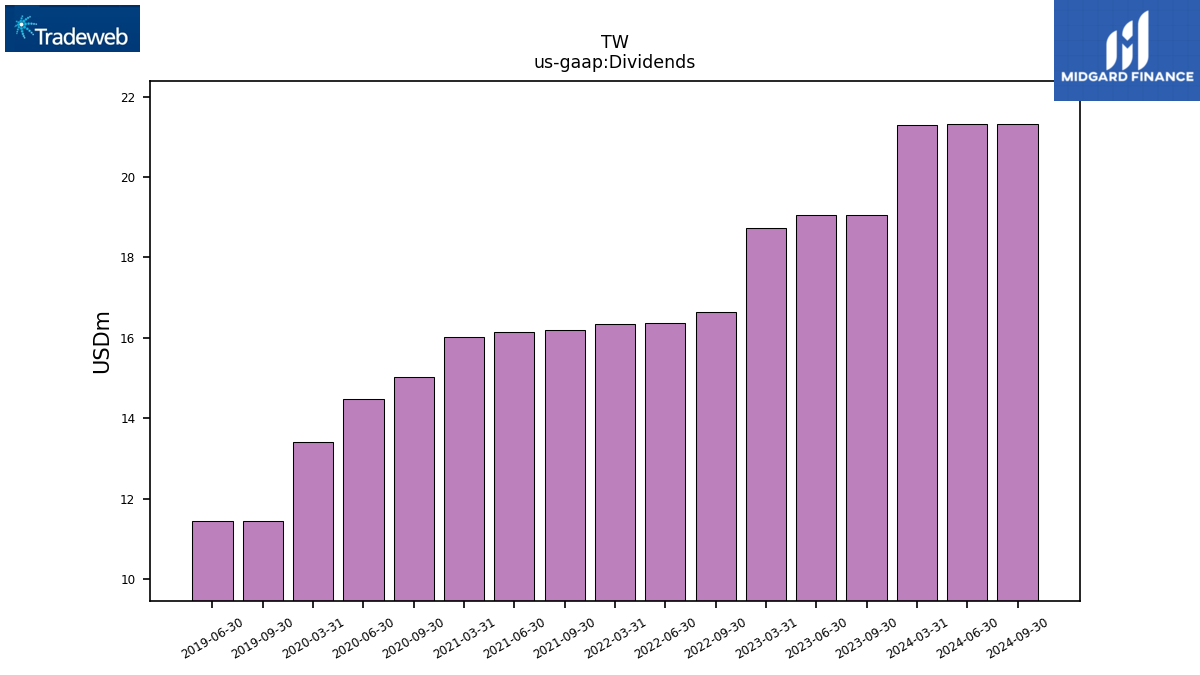
| Dividends | 19.05 | 19.05 | 18.73 | NA | 16.65 | 16.36 | 16.35 | NA | 16.18 | 16.14 | 16.03 | NA | 15.03 | 14.48 | 13.40 | NA | 11.44 | 11.44 | NA | NA | NA | |
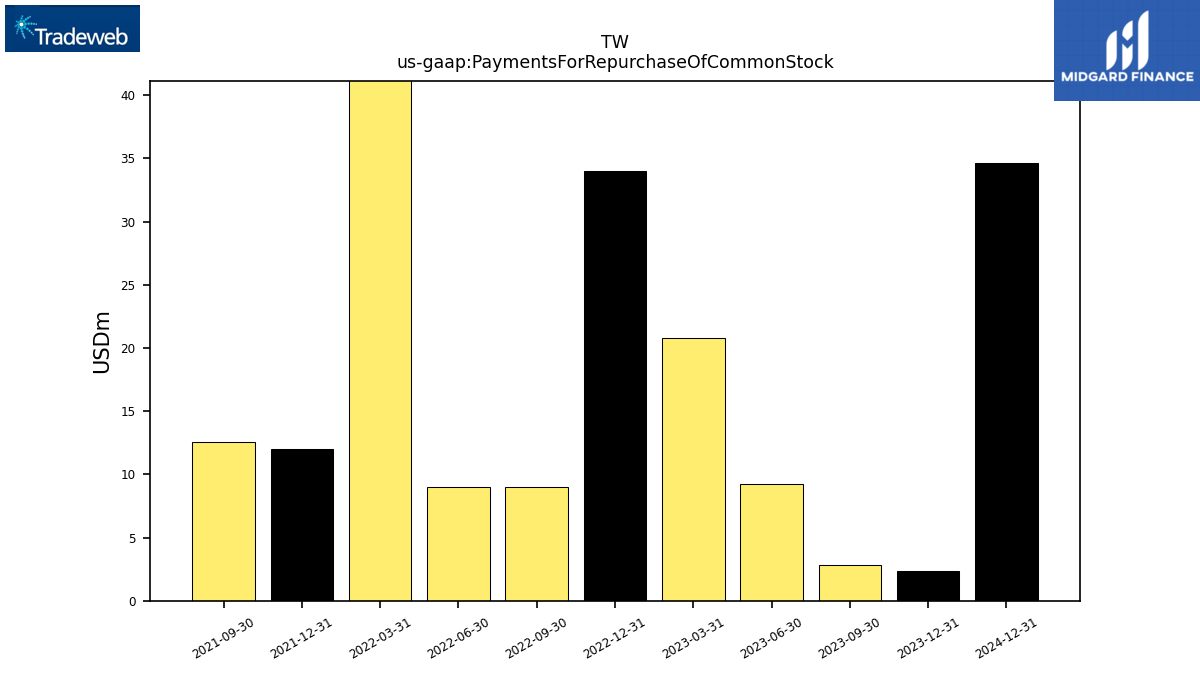
| Payments For Repurchase Of Common Stock | 2.82 | 9.24 | 20.81 | 34.00 | 9.00 | 9.00 | 47.32 | 12.00 | 12.55 | NA | NA | NA | NA | NA | NA | NA | NA | NA | NA | NA | NA |
| 2023-09-30 | 2023-06-30 | 2023-03-31 | 2022-12-31 | 2022-09-30 | 2022-06-30 | 2022-03-31 | 2021-12-31 | 2021-09-30 | 2021-06-30 | 2021-03-31 | 2020-12-31 | 2020-09-30 | 2020-06-30 | 2020-03-31 | 2019-12-31 | 2019-09-30 | 2019-06-30 | 2019-03-31 | 2018-12-31 | 2018-09-30 | ||
|---|---|---|---|---|---|---|---|---|---|---|---|---|---|---|---|---|---|---|---|---|---|---|
| Revenues | 328.36 | 310.61 | 329.25 | 293.04 | 287.12 | 297.14 | 311.49 | 276.88 | 265.32 | 260.84 | 273.40 | 233.08 | 212.87 | 212.11 | 234.61 | 197.31 | 200.98 | 190.49 | 186.79 | 178.64 | 167.79 | |
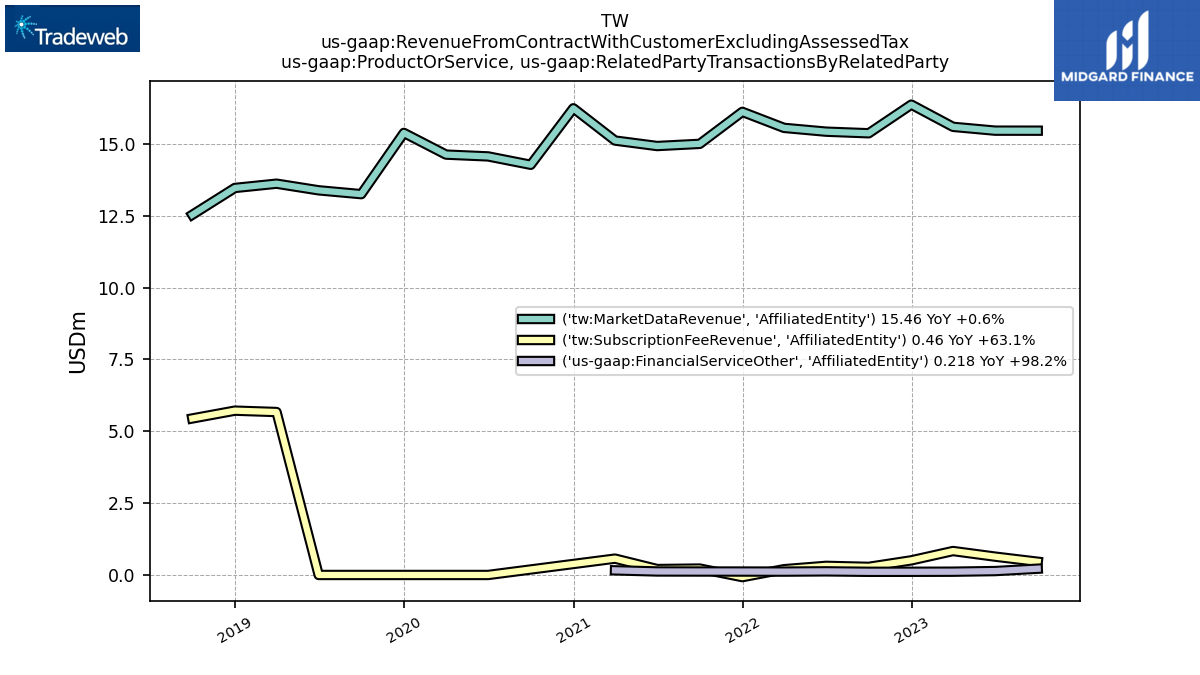
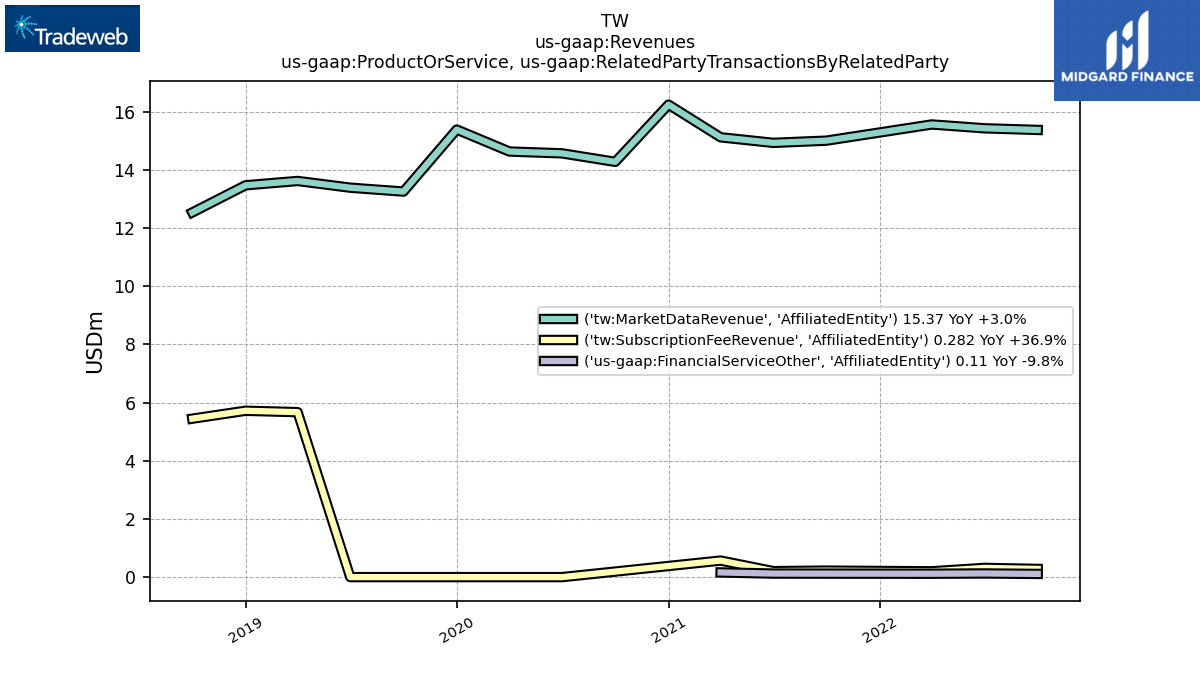
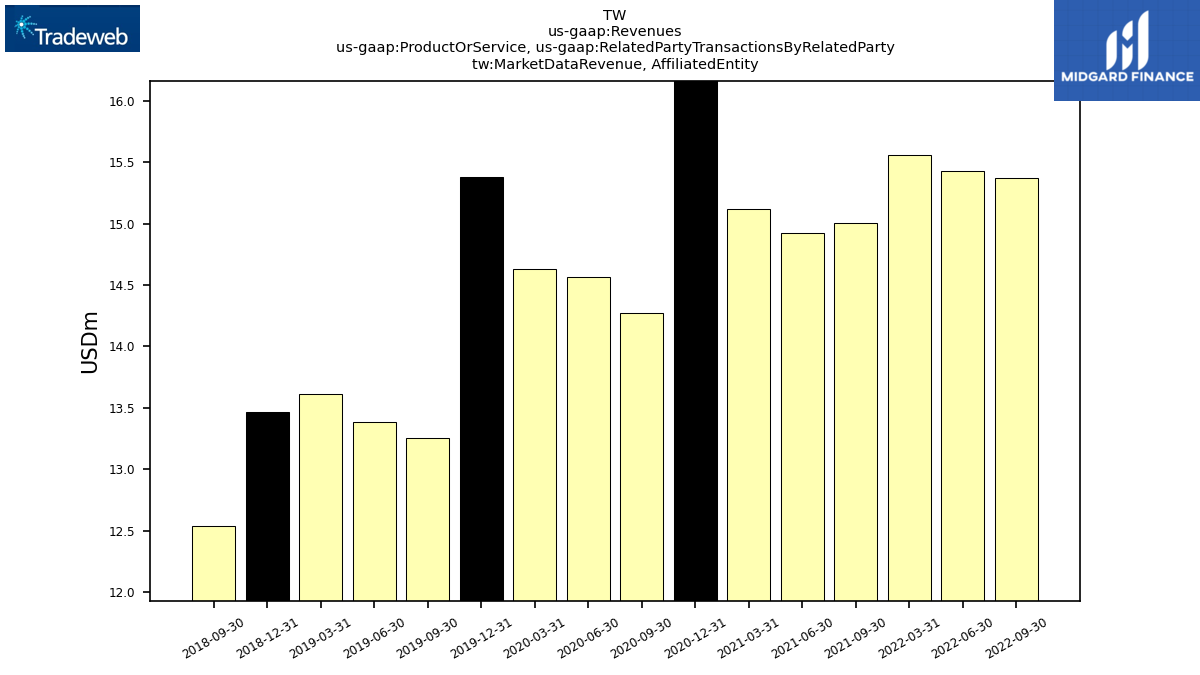
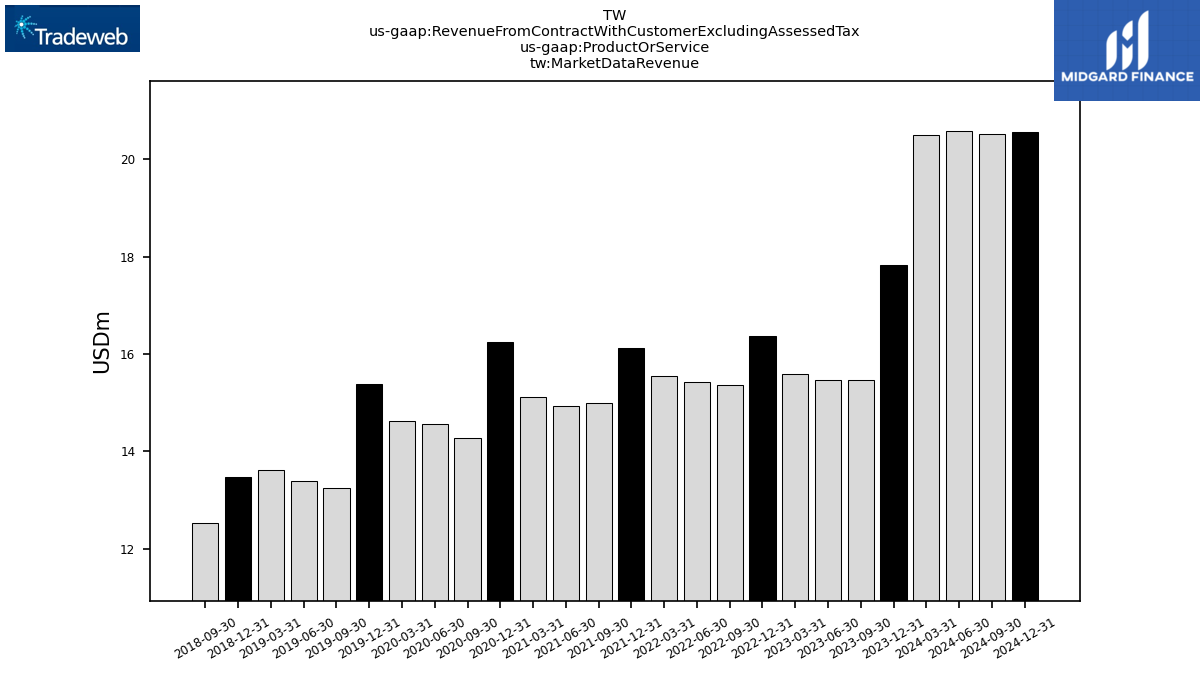
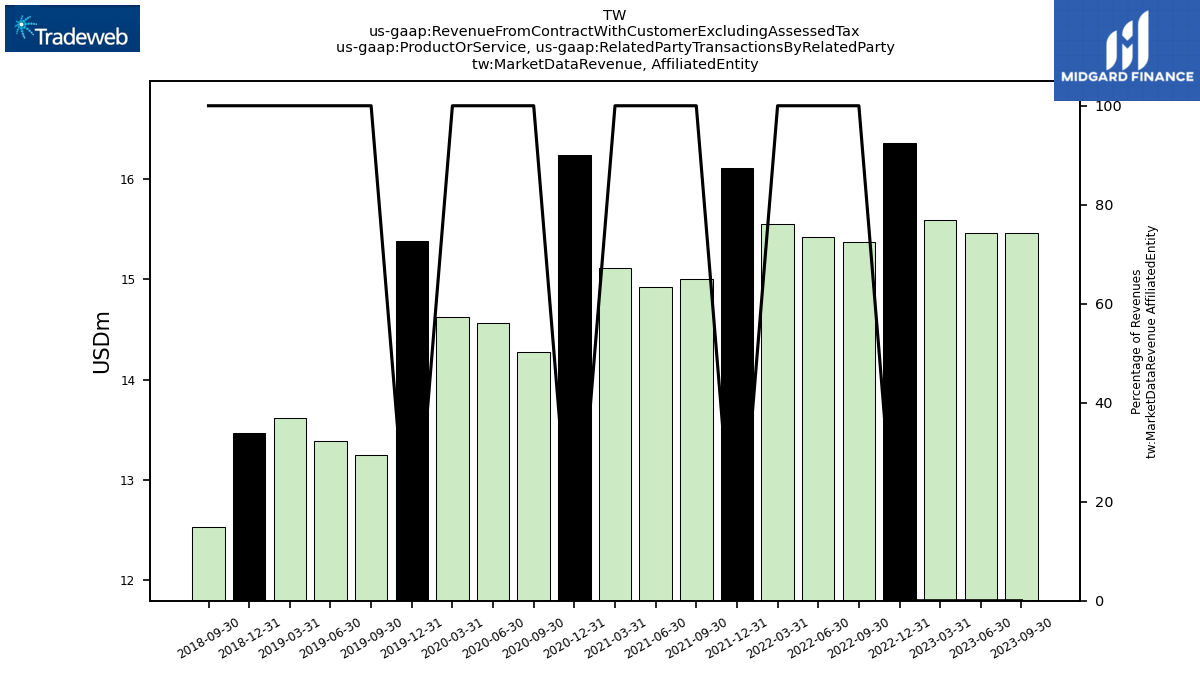
| Market Data Revenue, | NA | NA | NA | NA | 15.37 | 15.43 | 15.56 | NA | 15.00 | 14.93 | 15.12 | 16.24 | 14.27 | 14.56 | 14.63 | 15.38 | 13.25 | 13.38 | 13.62 | 13.47 | 12.53 | |
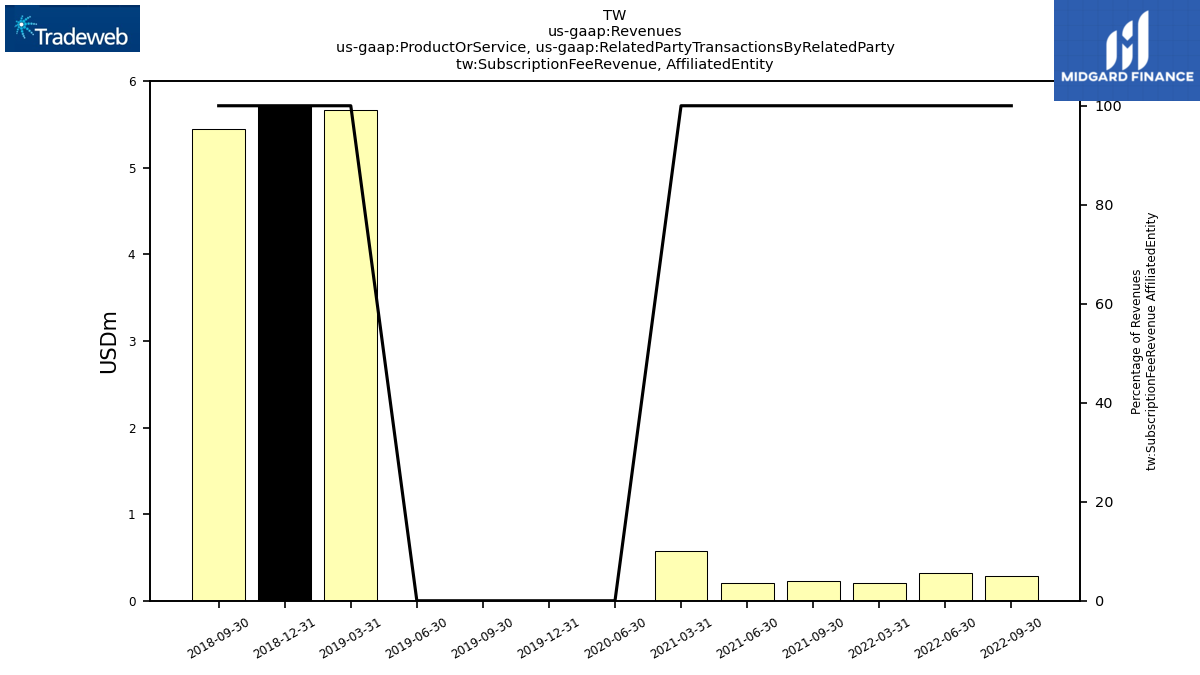
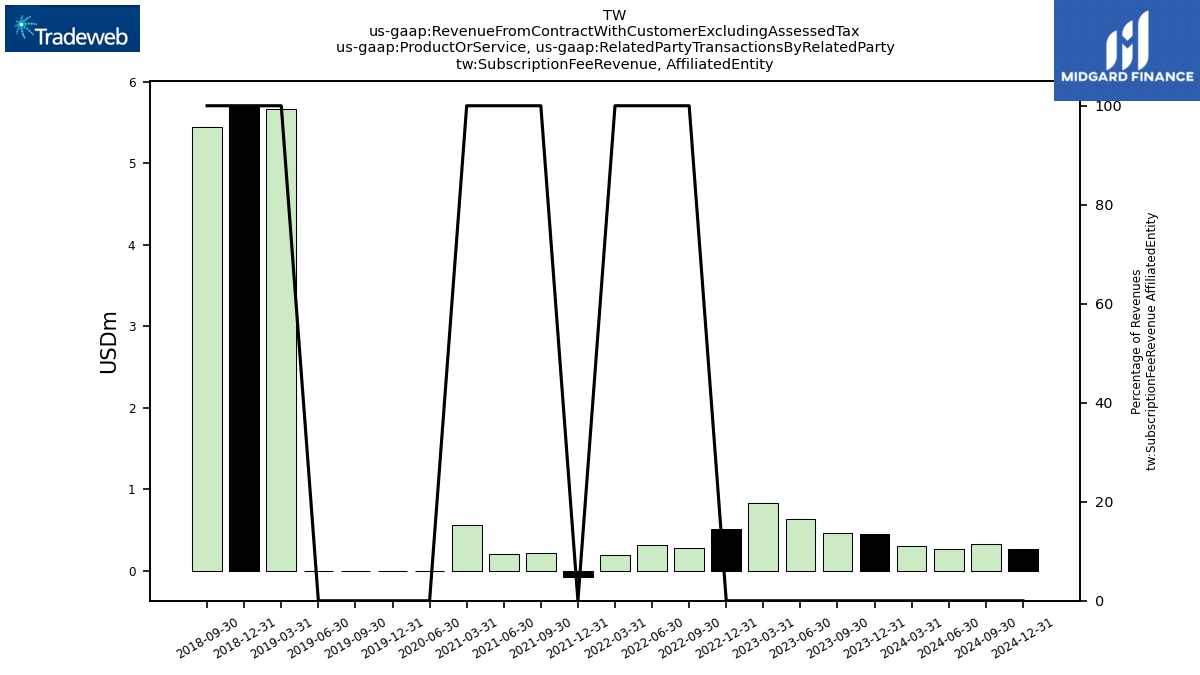
| Subscription Fee Revenue, | NA | NA | NA | NA | 0.28 | 0.32 | 0.20 | NA | 0.22 | 0.21 | 0.57 | NA | NA | 0.00 | NA | 0.00 | 0.00 | 0.00 | 5.67 | 5.72 | 5.45 | |
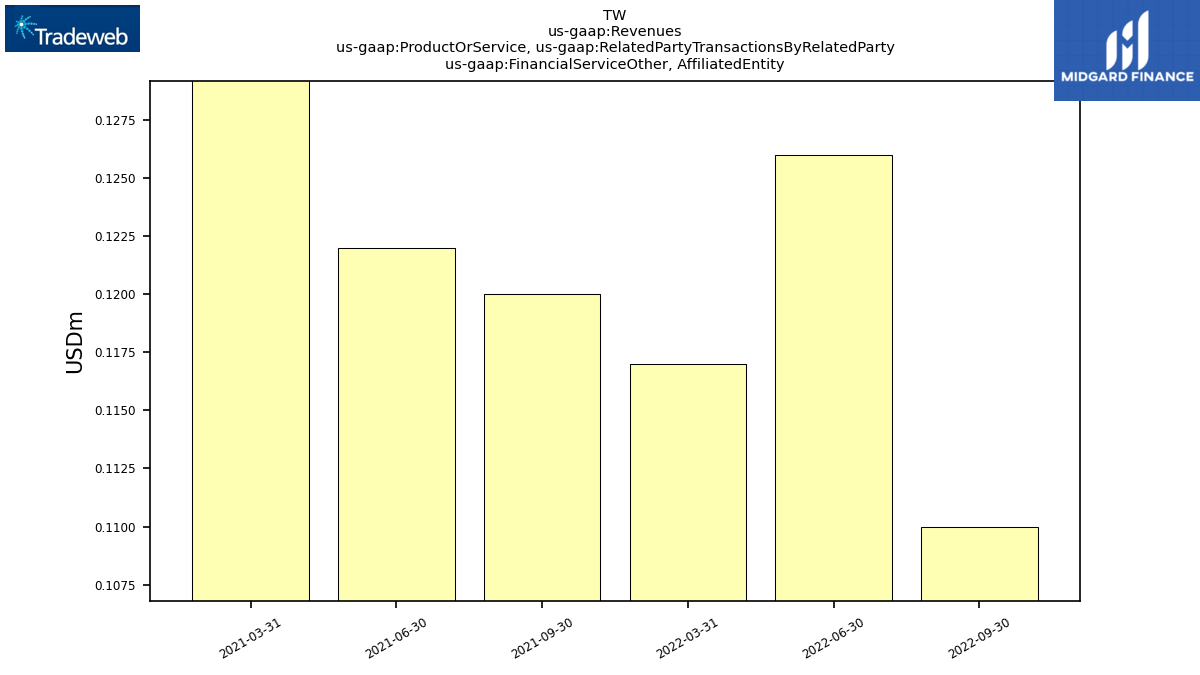
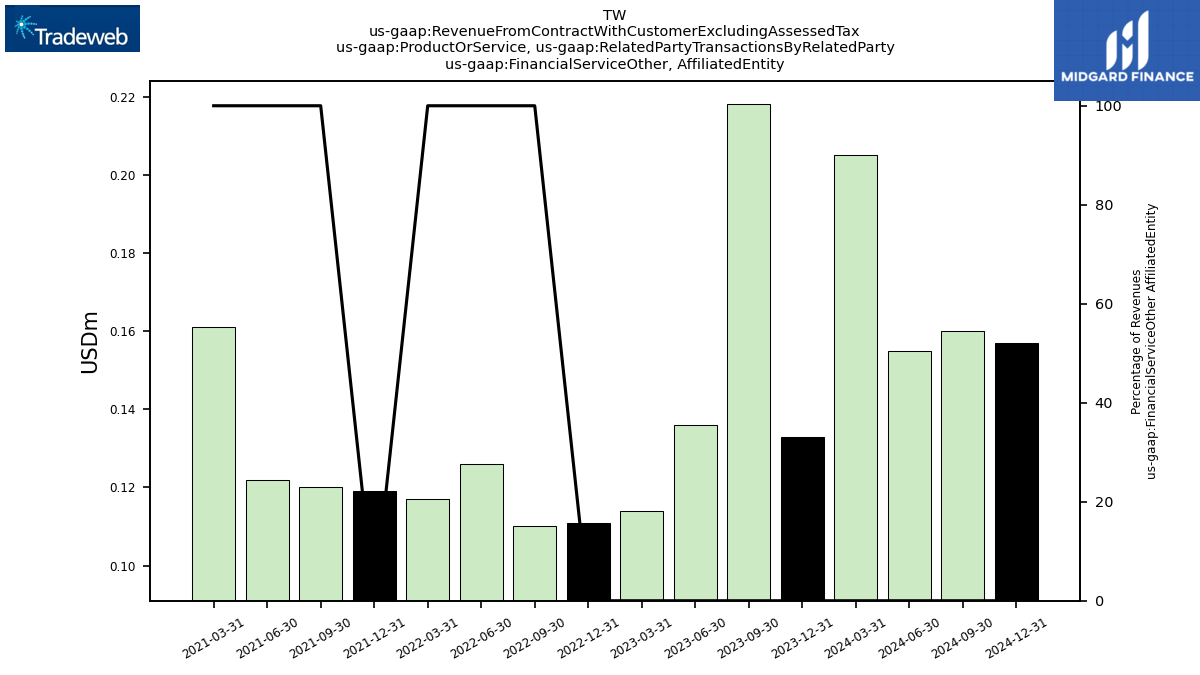
| Financial Service Other, | NA | NA | NA | NA | 0.11 | 0.13 | 0.12 | NA | 0.12 | 0.12 | 0.16 | NA | NA | NA | NA | NA | NA | NA | NA | NA | NA | |
| Revenue From Contract With Customer Excluding Assessed Tax | 328.36 | 310.61 | 329.25 | 293.04 | 287.12 | 297.14 | 311.49 | 276.88 | 265.32 | 260.84 | 273.40 | 233.08 | 212.87 | 212.11 | 234.61 | 197.31 | 200.98 | 190.49 | 186.79 | 178.64 | 165.25 | |
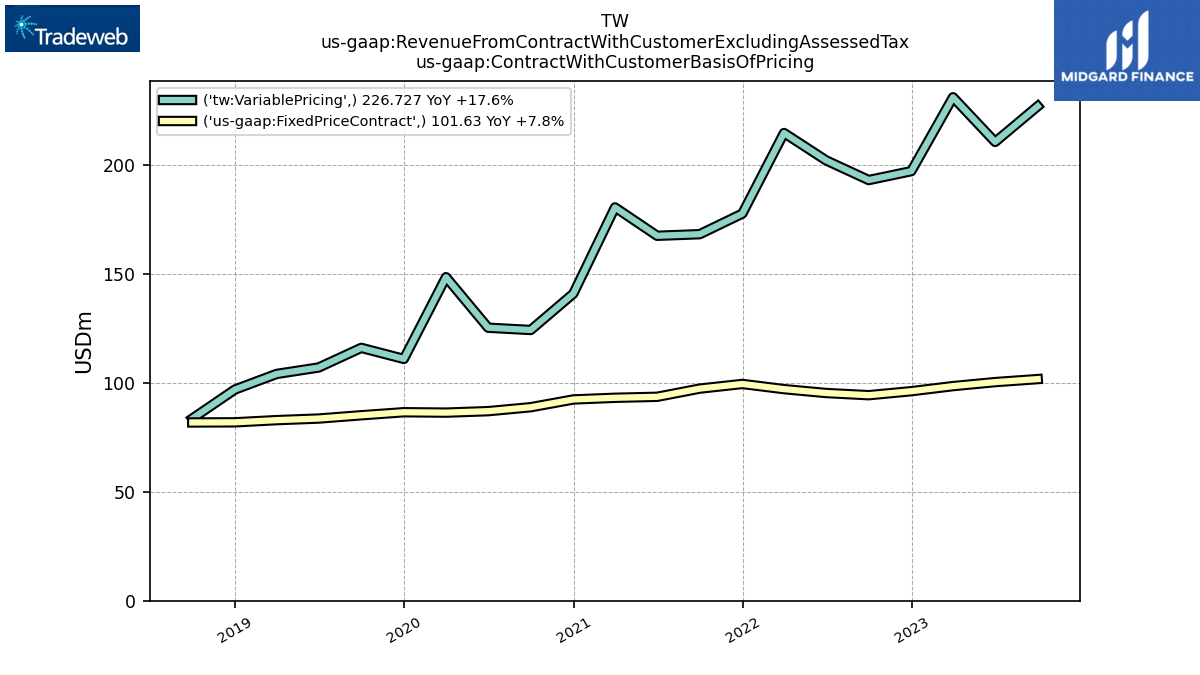
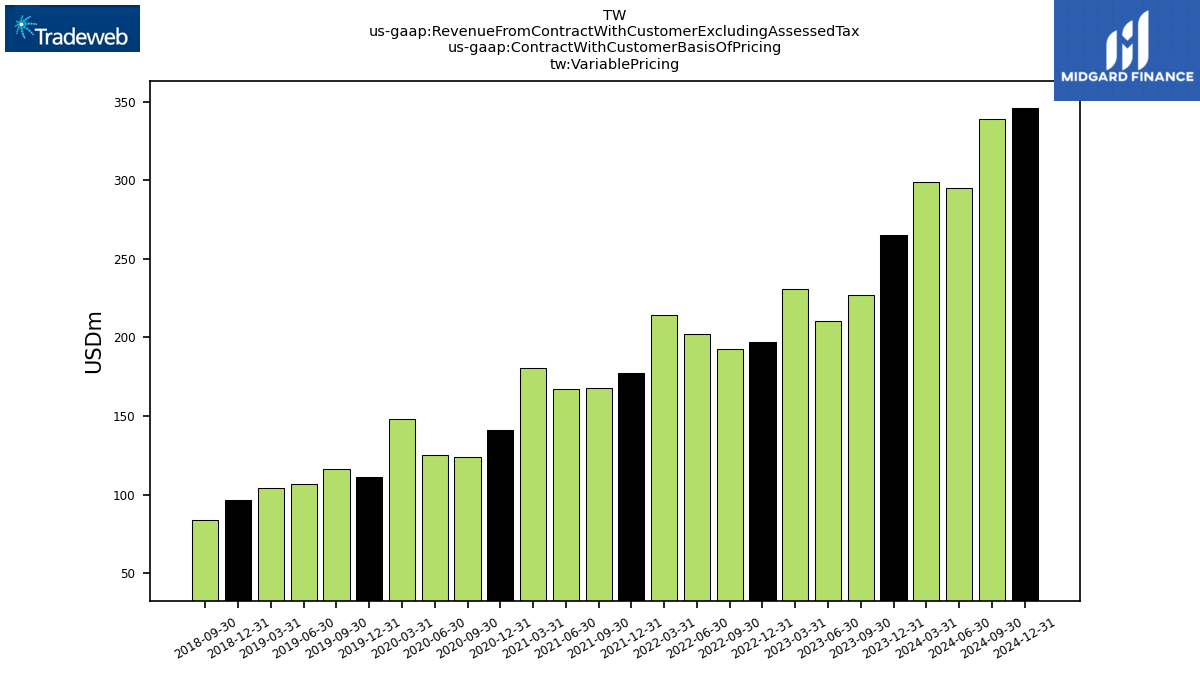
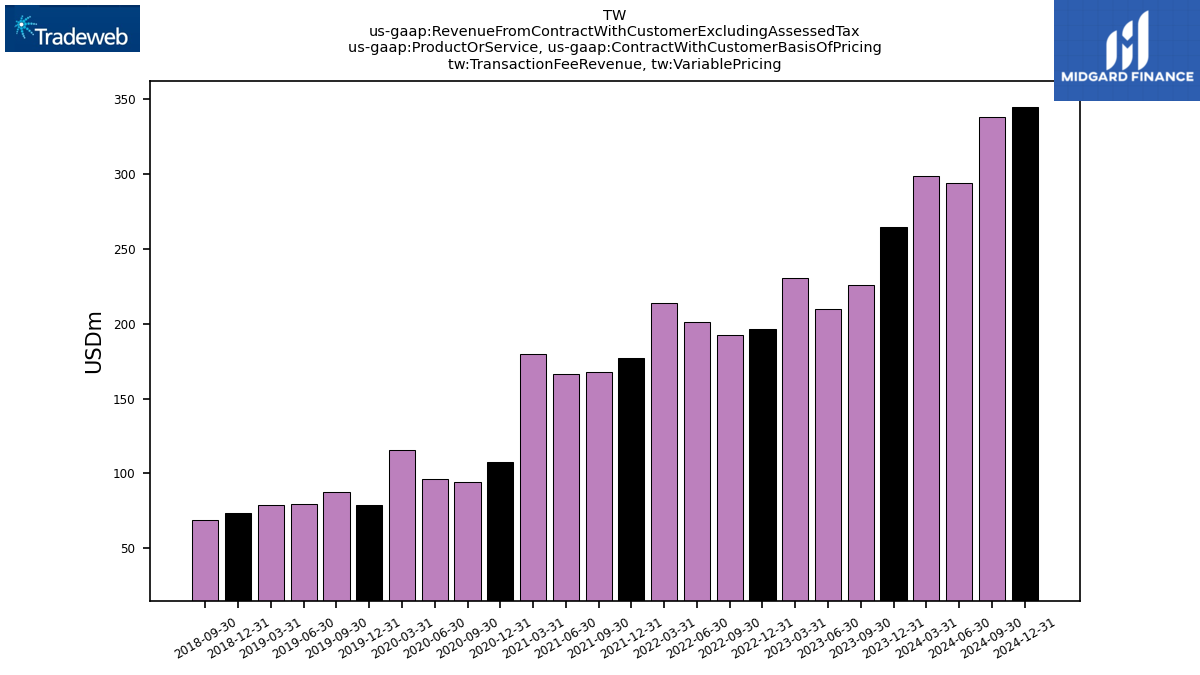
| Variable Pricing | 226.73 | 210.37 | 230.84 | 196.97 | 192.87 | 201.90 | 214.46 | 177.49 | 168.06 | 167.33 | 180.34 | 140.79 | 124.14 | 125.18 | 148.35 | 110.87 | 115.94 | 106.95 | 103.98 | 96.83 | 83.52 | |
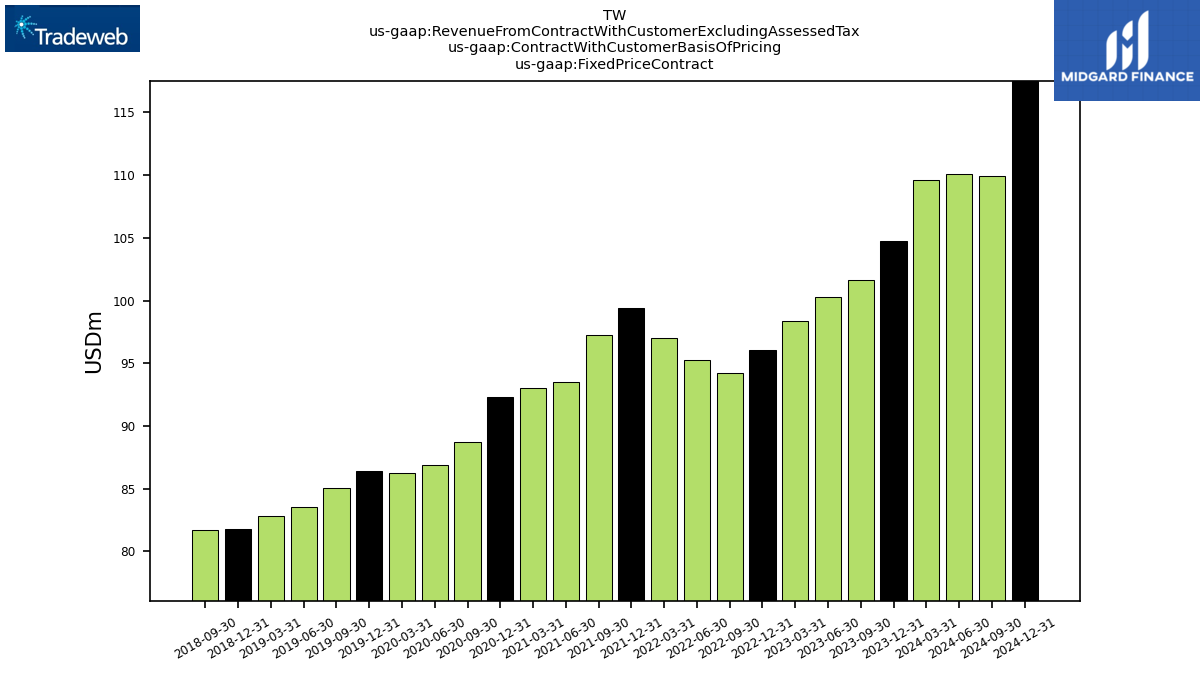
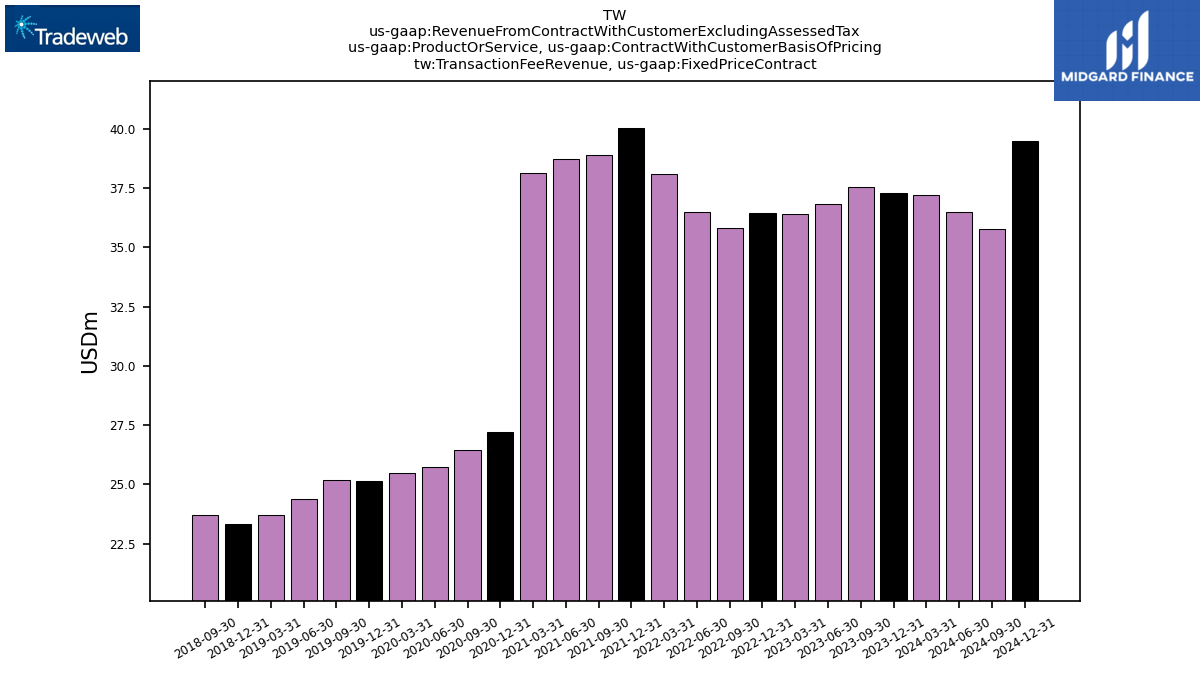
| Fixed Price Contract | 101.63 | 100.25 | 98.41 | 96.08 | 94.24 | 95.24 | 97.02 | 99.39 | 97.26 | 93.51 | 93.06 | 92.29 | 88.73 | 86.92 | 86.25 | 86.44 | 85.04 | 83.54 | 82.81 | 81.80 | 81.74 | |
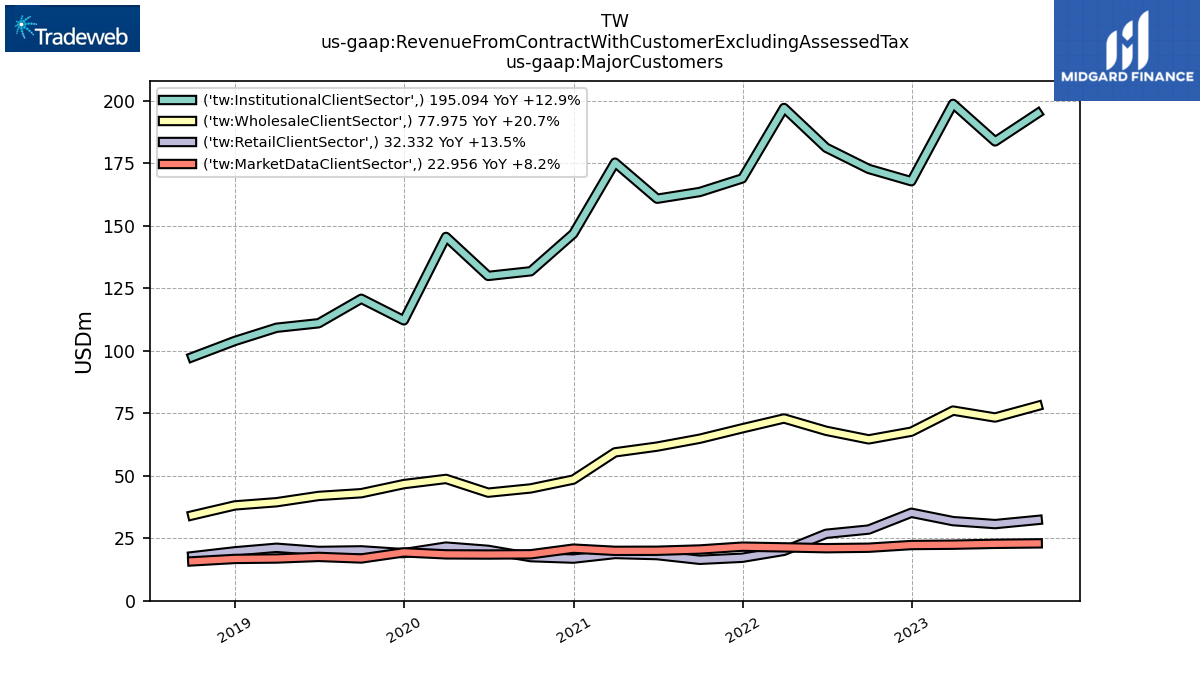
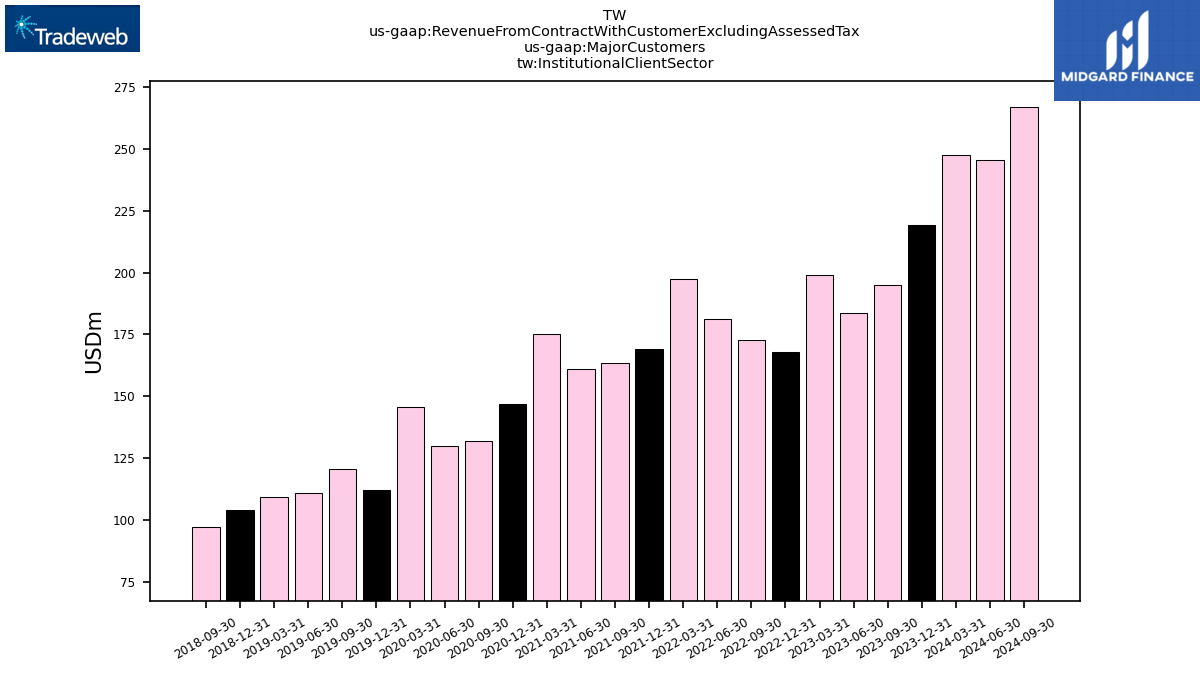
| Institutional Client Sector | 195.09 | 183.83 | 198.85 | 167.89 | 172.81 | 181.30 | 197.21 | 169.02 | 163.59 | 160.88 | 175.32 | 146.87 | 131.86 | 129.99 | 145.61 | 112.21 | 120.86 | 111.06 | 109.25 | 103.97 | 97.50 | |
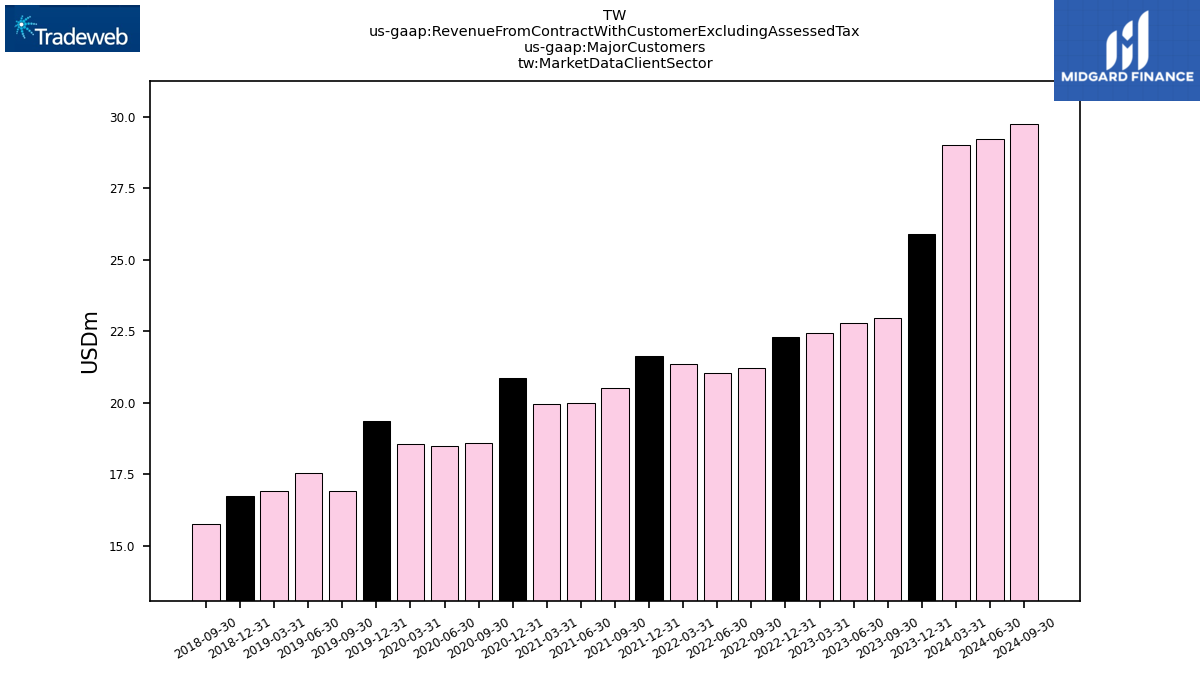
| Market Data Client Sector | 22.96 | 22.78 | 22.43 | 22.30 | 21.22 | 21.03 | 21.37 | 21.65 | 20.52 | 20.01 | 19.97 | 20.86 | 18.60 | 18.50 | 18.56 | 19.36 | 16.91 | 17.54 | 16.90 | 16.73 | 15.77 | |
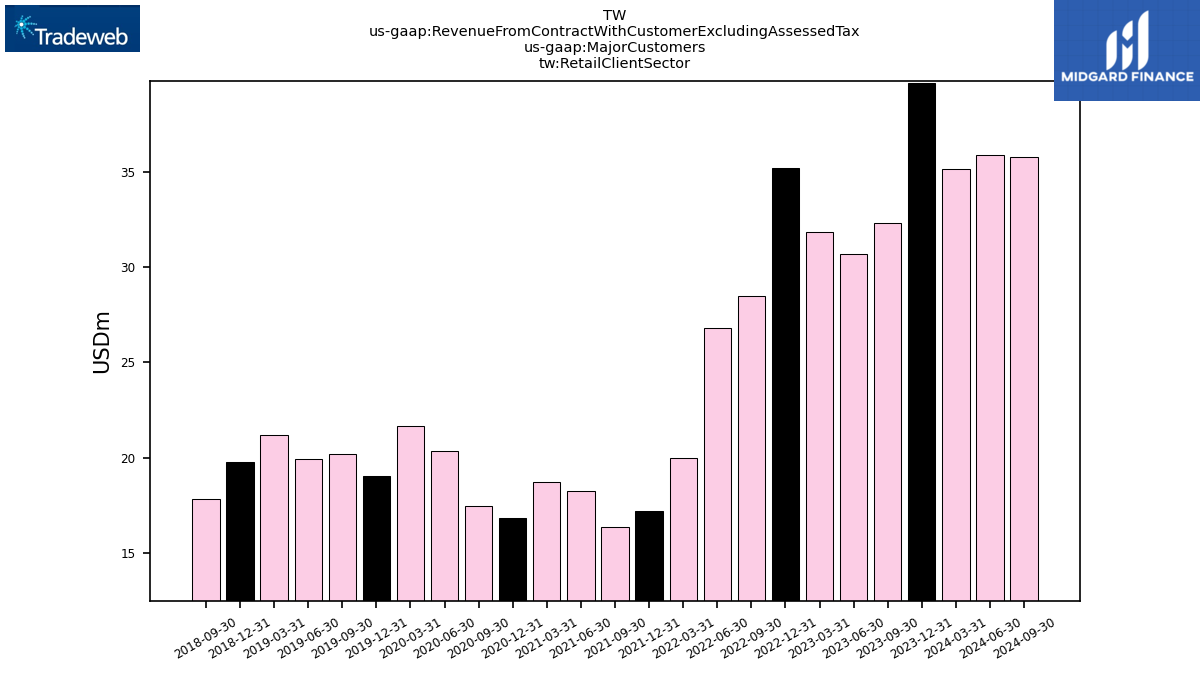
| Retail Client Sector | 32.33 | 30.68 | 31.86 | 35.20 | 28.50 | 26.80 | 19.97 | 17.21 | 16.39 | 18.26 | 18.71 | 16.86 | 17.45 | 20.37 | 21.68 | 19.05 | 20.17 | 19.94 | 21.21 | 19.78 | 17.81 | |
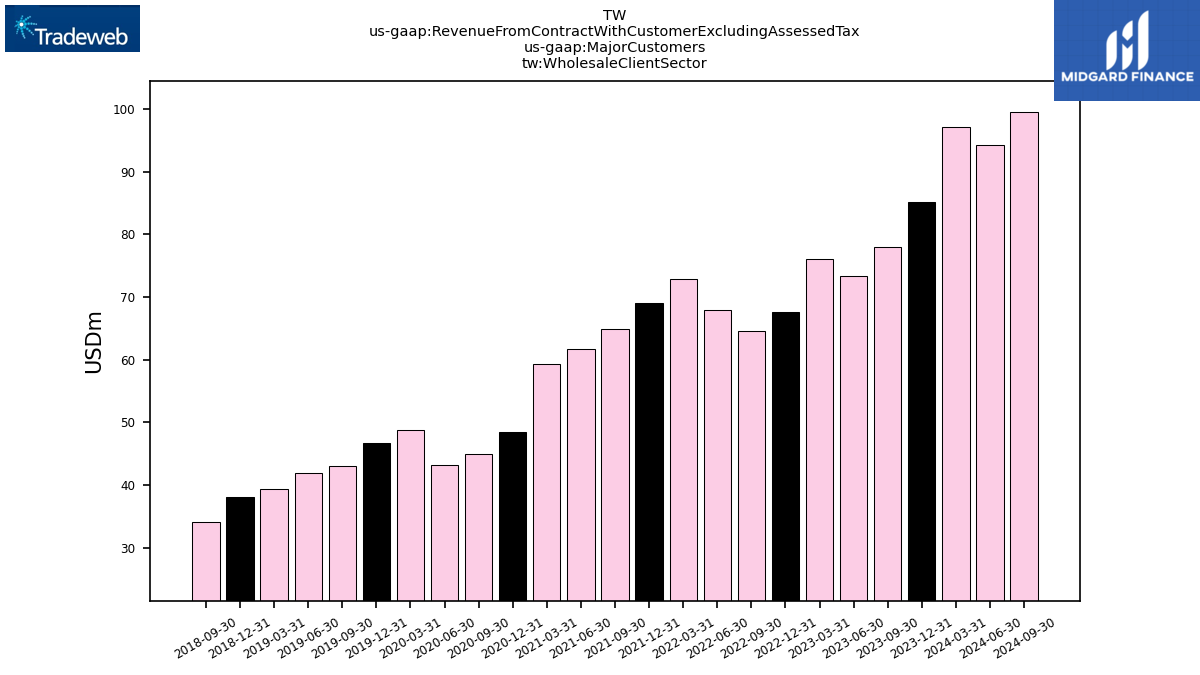
| Wholesale Client Sector | 77.97 | 73.33 | 76.10 | 67.66 | 64.58 | 68.01 | 72.94 | 69.01 | 64.84 | 61.69 | 59.39 | 48.49 | 44.96 | 43.25 | 48.76 | 46.68 | 43.04 | 41.95 | 39.43 | 38.15 | 34.17 | |
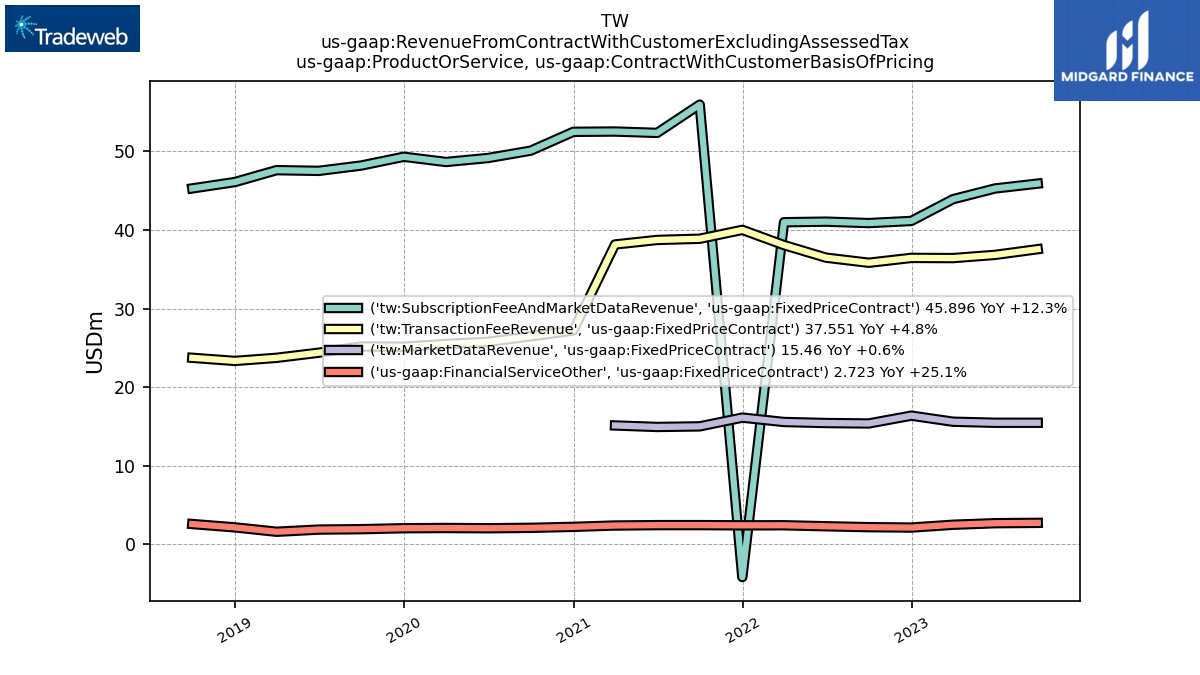
| Market Data Revenue | 15.46 | 15.46 | 15.59 | 16.37 | 15.37 | 15.43 | 15.56 | 16.12 | 15.00 | 14.93 | 15.12 | 16.24 | 14.27 | 14.56 | 14.63 | 15.38 | 13.25 | 13.38 | 13.62 | 13.47 | 12.53 | |
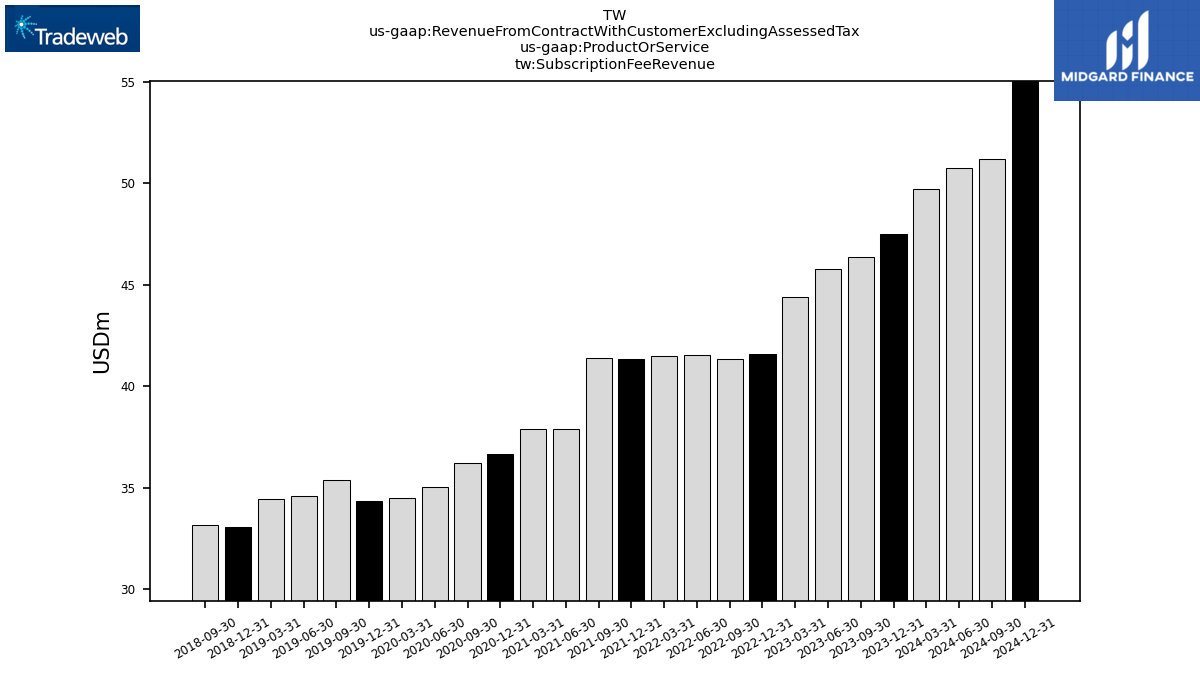
| Subscription Fee Revenue | 46.36 | 45.75 | 44.37 | 41.59 | 41.34 | 41.54 | 41.45 | 41.31 | 41.39 | 37.88 | 37.87 | 36.65 | 36.22 | 35.01 | 34.48 | 34.33 | 35.39 | 34.57 | 34.45 | 33.05 | 33.16 | |
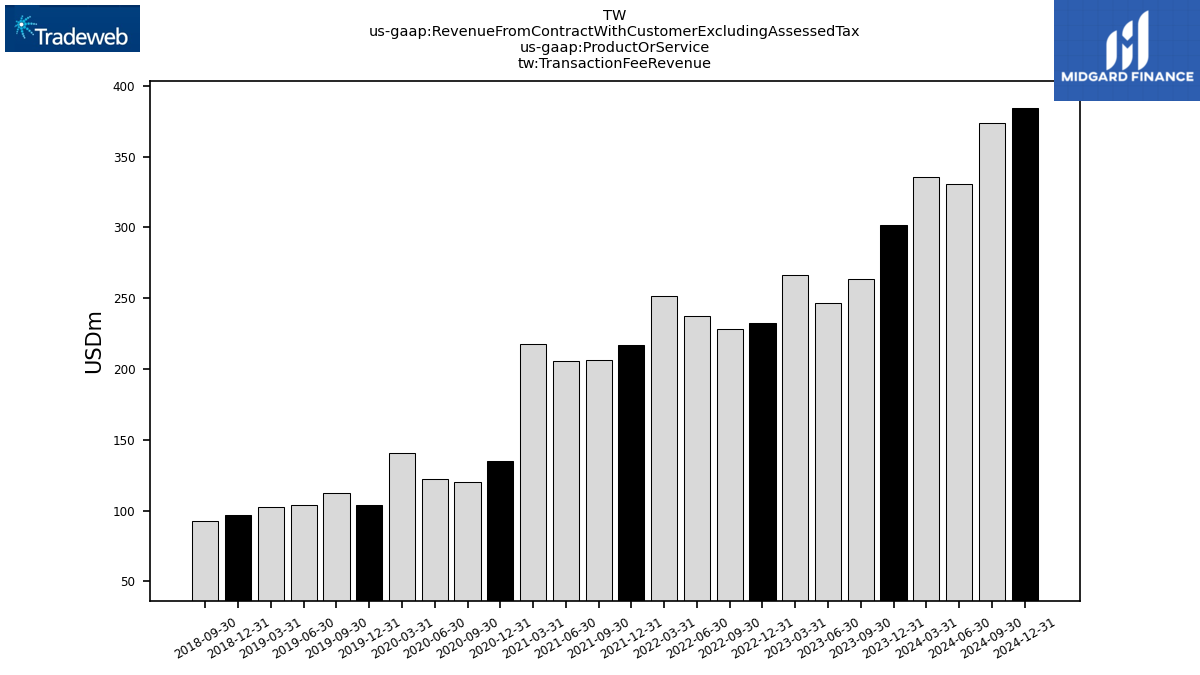
| Transaction Fee Revenue | 263.49 | 246.46 | 266.60 | 232.78 | 228.01 | 237.67 | 251.81 | 216.84 | 206.32 | 205.38 | 217.82 | 134.92 | 120.58 | 122.15 | 140.82 | 104.25 | 112.75 | 103.95 | 102.64 | 97.13 | 92.58 | |
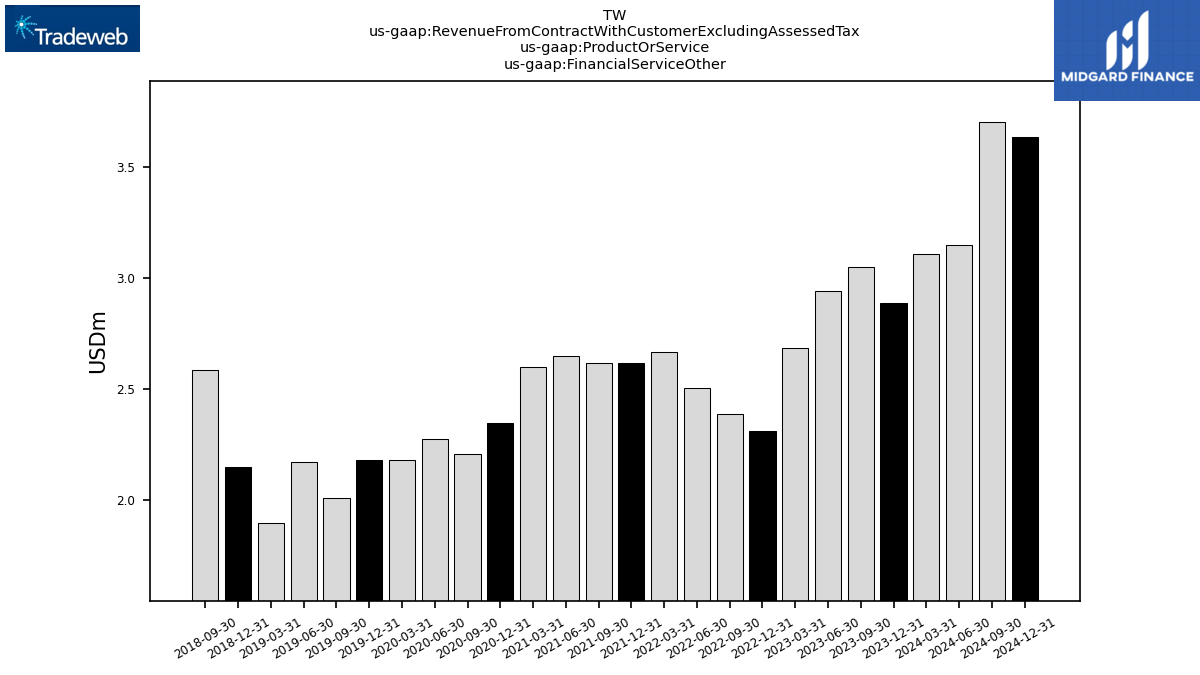
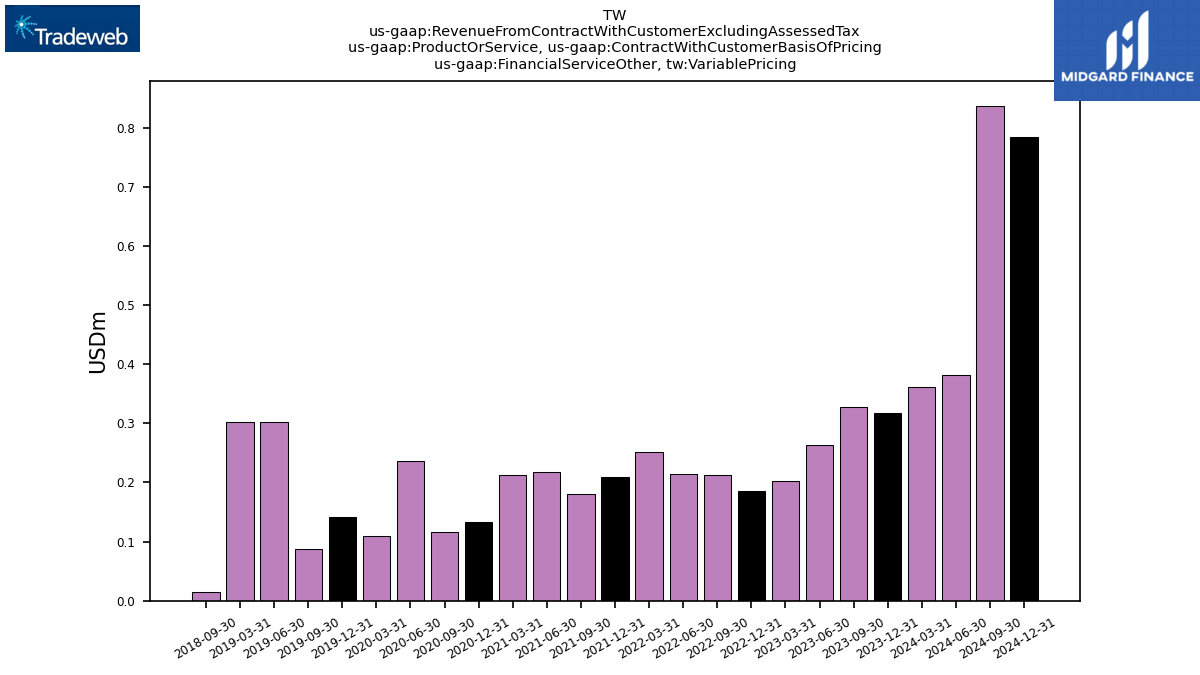
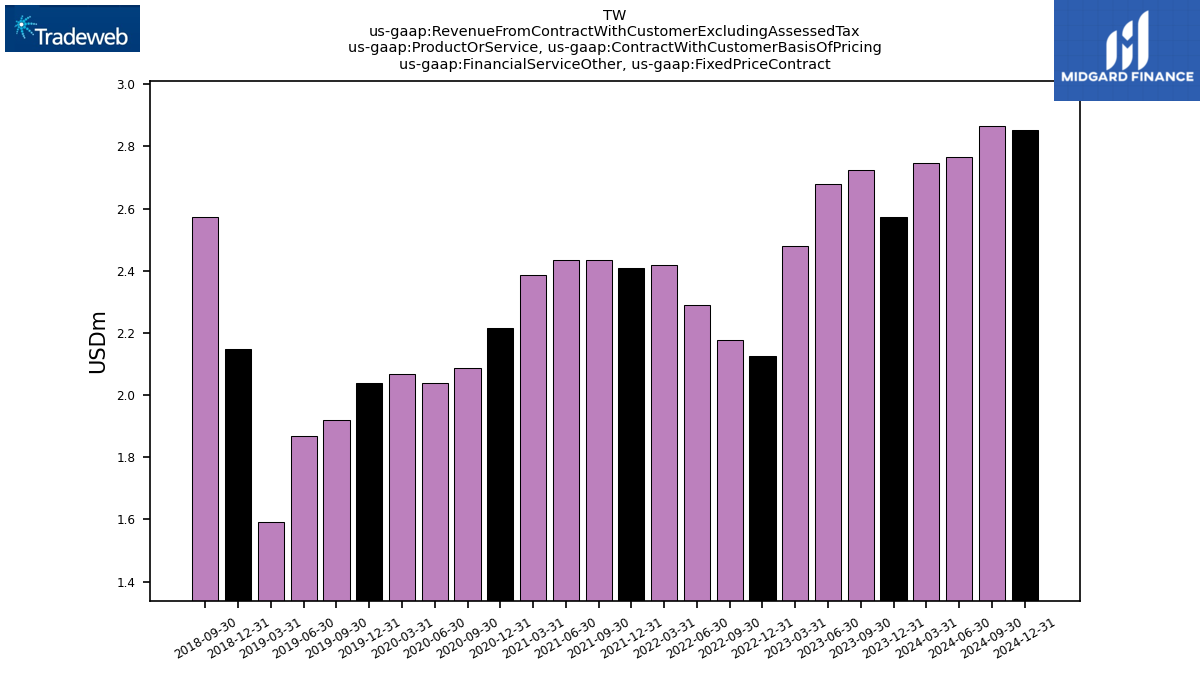
| Financial Service Other | 3.05 | 2.94 | 2.68 | 2.31 | 2.39 | 2.50 | 2.67 | 2.62 | 2.62 | 2.65 | 2.60 | 2.35 | 2.21 | 2.27 | 2.18 | 2.18 | 2.01 | 2.17 | 1.89 | 2.15 | 2.59 | |
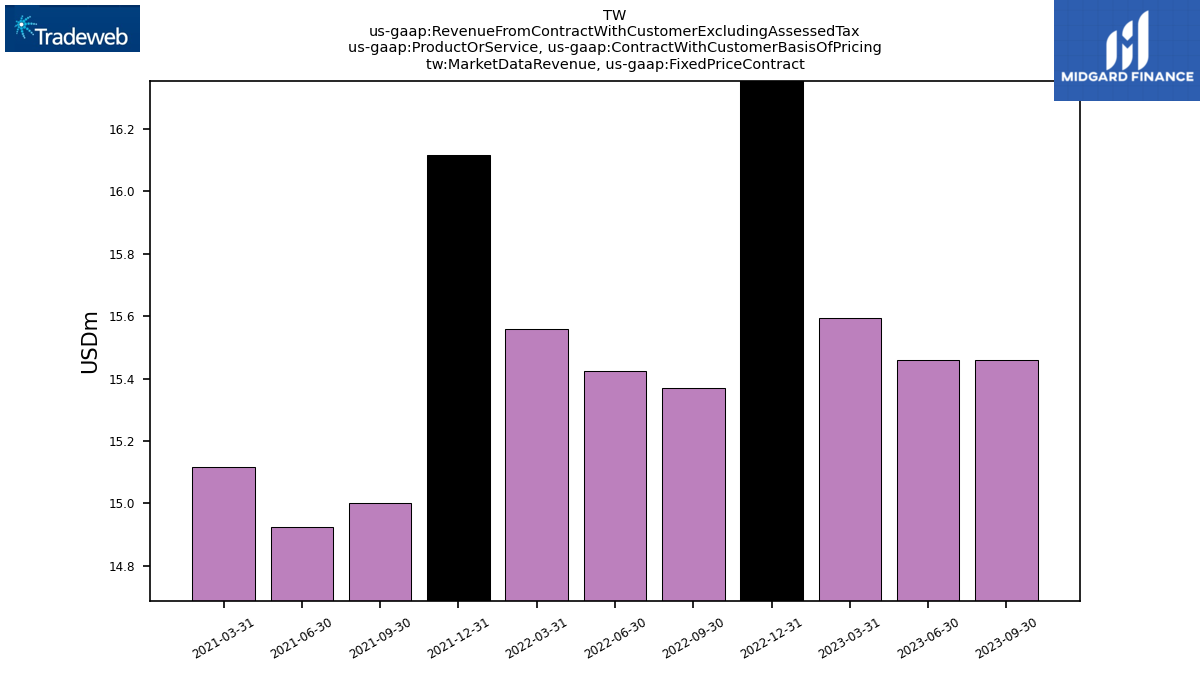
| Market Data Revenue, Fixed Price Contract | 15.46 | 15.46 | 15.59 | 16.37 | 15.37 | 15.43 | 15.56 | 16.12 | 15.00 | 14.93 | 15.12 | NA | NA | NA | NA | NA | NA | NA | NA | NA | NA | |
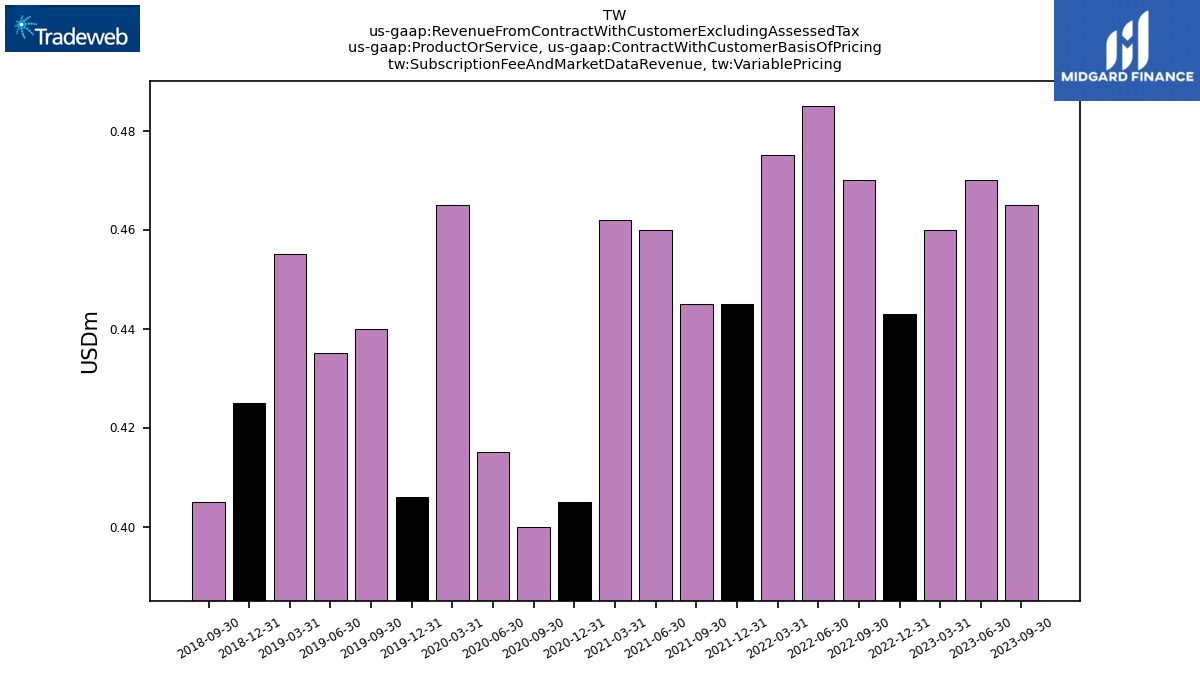
| Subscription Fee And Market Data Revenue, Variable Pricing | 0.47 | 0.47 | 0.46 | 0.44 | 0.47 | 0.48 | 0.47 | 0.45 | 0.45 | 0.46 | 0.46 | 0.41 | 0.40 | 0.41 | 0.47 | 0.41 | 0.44 | 0.43 | 0.46 | 0.42 | 0.41 | |
| Subscription Fee And Market Data Revenue, Fixed Price Contract | 45.90 | 45.28 | 43.91 | 41.14 | 40.87 | 41.05 | 40.98 | -4.18 | 55.95 | 52.35 | 52.52 | 52.49 | 50.09 | 49.16 | 48.65 | 49.31 | 48.20 | 47.52 | 47.61 | 46.09 | 45.28 | |
| Transaction Fee Revenue, Variable Pricing | 225.93 | 209.63 | 230.18 | 196.34 | 192.19 | 201.20 | 213.74 | 176.83 | 167.44 | 166.66 | 179.67 | 107.72 | 94.12 | 96.39 | 115.34 | 79.11 | 87.57 | 79.58 | 78.92 | 73.80 | 68.86 | |
| Transaction Fee Revenue, Fixed Price Contract | 37.55 | 36.83 | 36.42 | 36.44 | 35.82 | 36.47 | 38.07 | 40.01 | 38.88 | 38.73 | 38.15 | 27.20 | 26.46 | 25.76 | 25.49 | 25.13 | 25.17 | 24.38 | 23.73 | 23.33 | 23.73 | |
| Financial Service Other, Variable Pricing | 0.33 | 0.26 | 0.20 | 0.18 | 0.21 | 0.21 | 0.25 | 0.21 | 0.18 | 0.22 | 0.21 | 0.13 | 0.12 | 0.24 | 0.11 | 0.14 | 0.09 | 0.30 | 0.30 | NA | 0.01 | |
| Financial Service Other, Fixed Price Contract | 2.72 | 2.68 | 2.48 | 2.12 | 2.18 | 2.29 | 2.42 | 2.41 | 2.44 | 2.43 | 2.38 | 2.21 | 2.09 | 2.04 | 2.07 | 2.04 | 1.92 | 1.87 | 1.59 | 2.15 | 2.57 | |
| Market Data Revenue, | 15.46 | 15.46 | 15.59 | 16.37 | 15.37 | 15.43 | 15.56 | 16.12 | 15.00 | 14.93 | 15.12 | 16.24 | 14.27 | 14.56 | 14.63 | 15.38 | 13.25 | 13.38 | 13.62 | 13.47 | 12.53 | |
| Subscription Fee Revenue, | 0.46 | 0.64 | 0.83 | 0.51 | 0.28 | 0.32 | 0.20 | -0.07 | 0.22 | 0.21 | 0.57 | NA | NA | 0.00 | NA | 0.00 | 0.00 | 0.00 | 5.67 | 5.72 | 5.45 | |
| Financial Service Other, | 0.22 | 0.14 | 0.11 | 0.11 | 0.11 | 0.13 | 0.12 | 0.12 | 0.12 | 0.12 | 0.16 | NA | NA | NA | NA | NA | NA | NA | NA | NA | NA | |
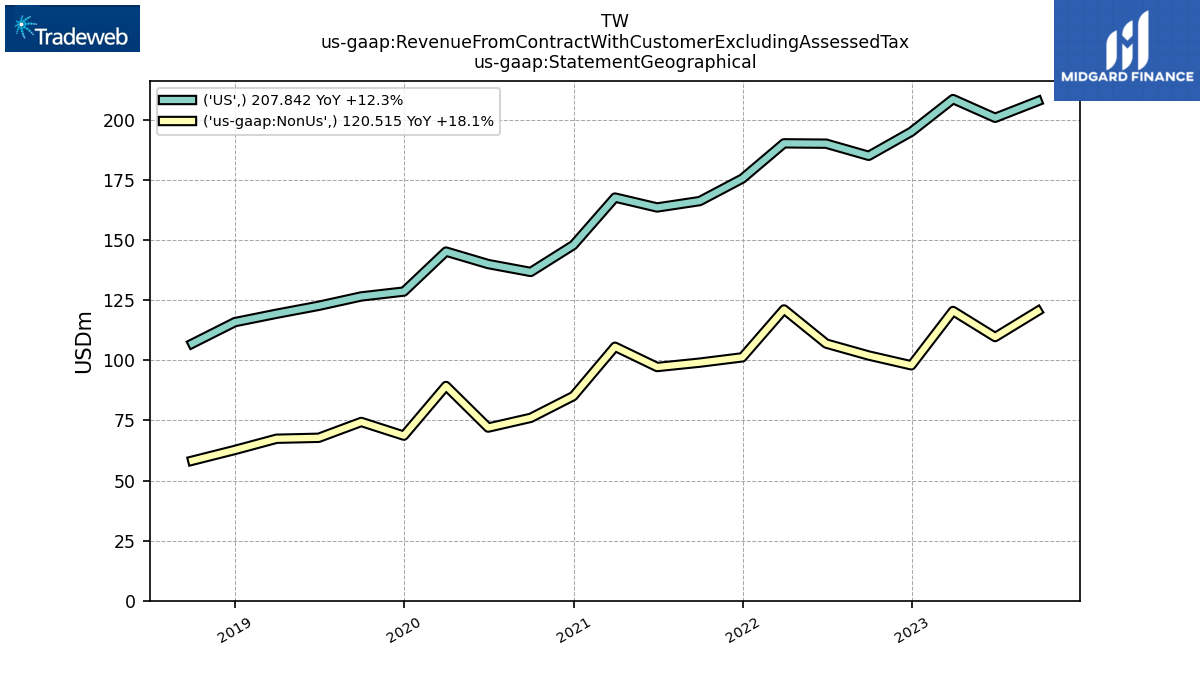
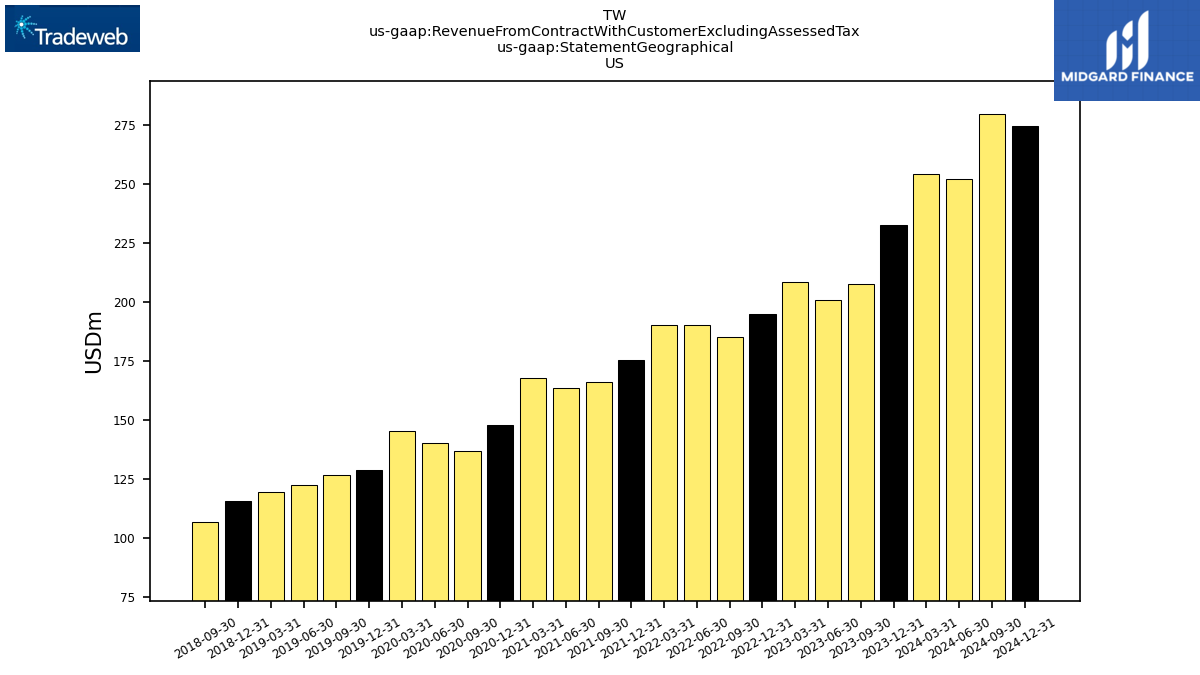
| US | 207.84 | 200.92 | 208.70 | 195.10 | 185.10 | 190.15 | 190.29 | 175.61 | 166.27 | 163.60 | 167.74 | 147.95 | 136.78 | 140.07 | 145.26 | 128.63 | 126.60 | 122.69 | 119.40 | 115.91 | 106.98 | |
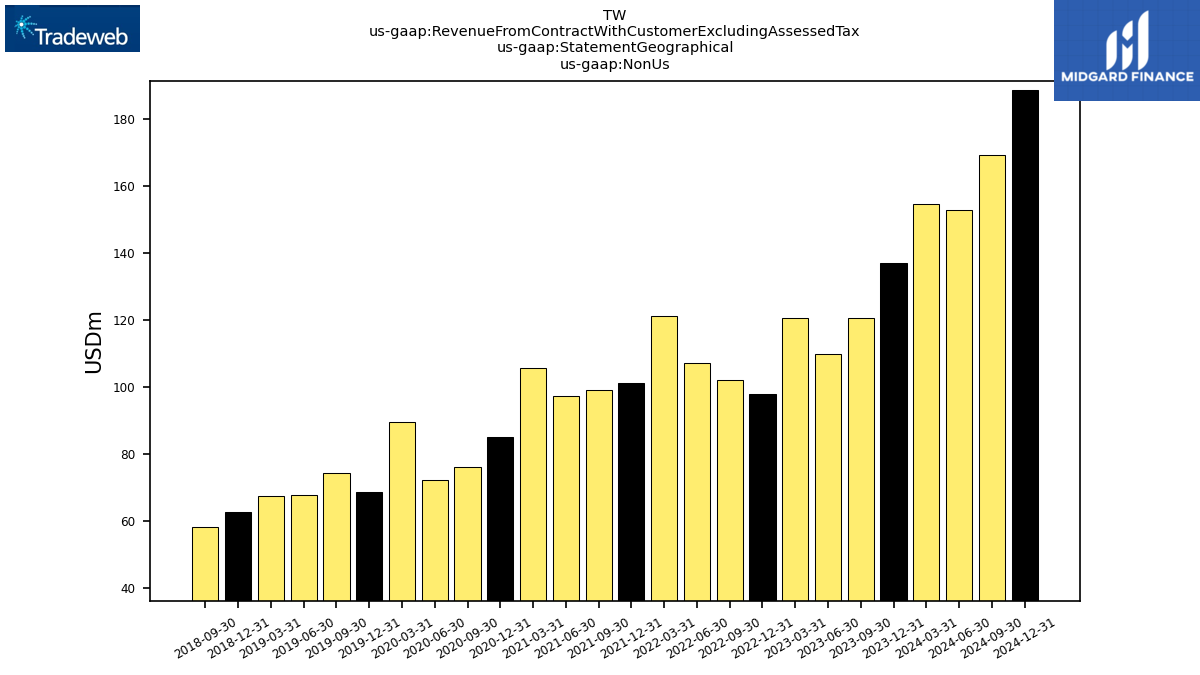
| Non Us | 120.52 | 109.69 | 120.55 | 97.94 | 102.02 | 106.99 | 121.19 | 101.27 | 99.06 | 97.23 | 105.66 | 85.13 | 76.08 | 72.03 | 89.35 | 68.68 | 74.38 | 67.79 | 67.39 | 62.73 | 58.27 |
