
| 2023-09-30 | 2023-06-30 | 2023-03-31 | 2022-12-31 | 2022-09-30 | 2022-06-30 | 2022-03-31 | 2021-12-31 | 2021-09-30 | 2021-06-30 | 2021-03-31 | 2020-12-31 | 2020-09-30 | 2020-06-30 | 2020-03-31 | 2019-12-31 | 2019-09-30 | 2019-06-30 | 2019-03-31 | 2018-12-31 | 2018-09-30 | 2018-06-30 | 2018-03-31 | ||
|---|---|---|---|---|---|---|---|---|---|---|---|---|---|---|---|---|---|---|---|---|---|---|---|---|
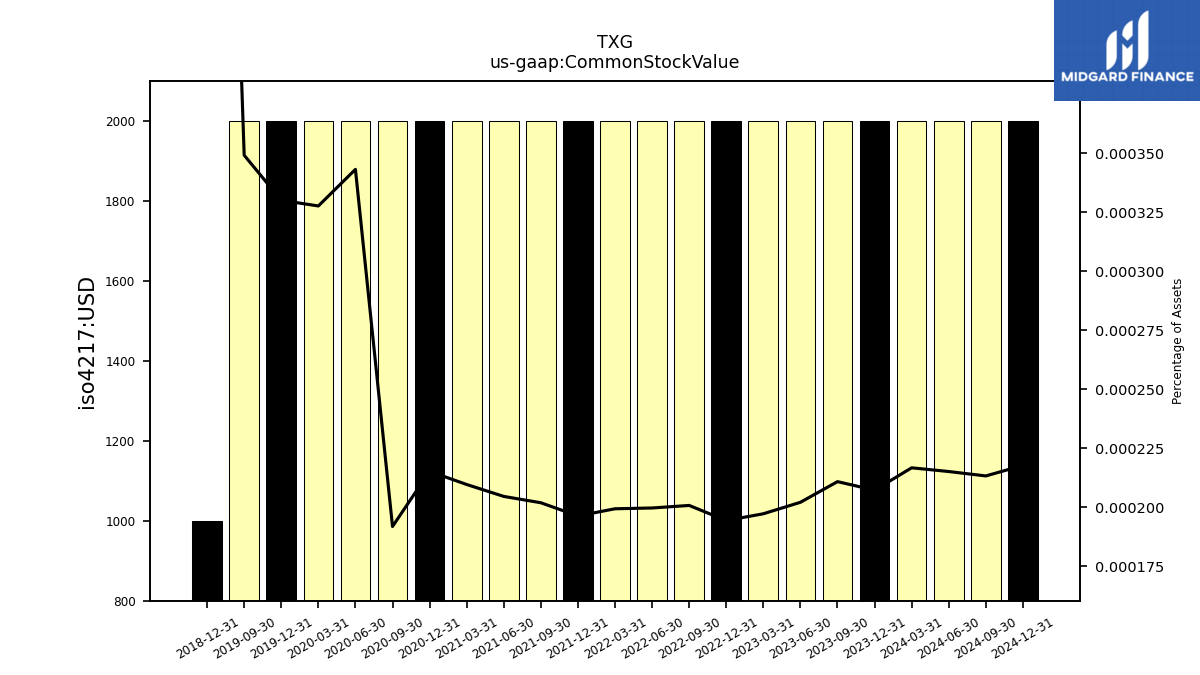
| Common Stock Value | 0.00 | 0.00 | 0.00 | 0.00 | 0.00 | 0.00 | 0.00 | 0.00 | 0.00 | 0.00 | 0.00 | 0.00 | 0.00 | 0.00 | 0.00 | 0.00 | 0.00 | NA | NA | 0.00 | NA | NA | NA | |
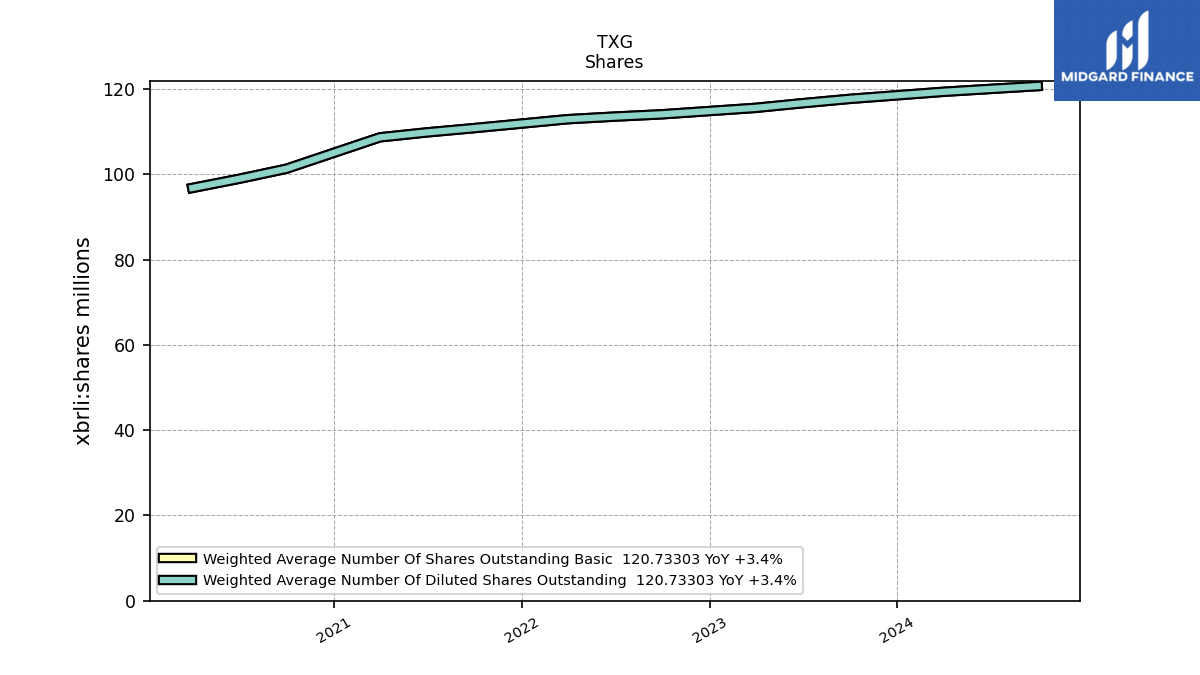
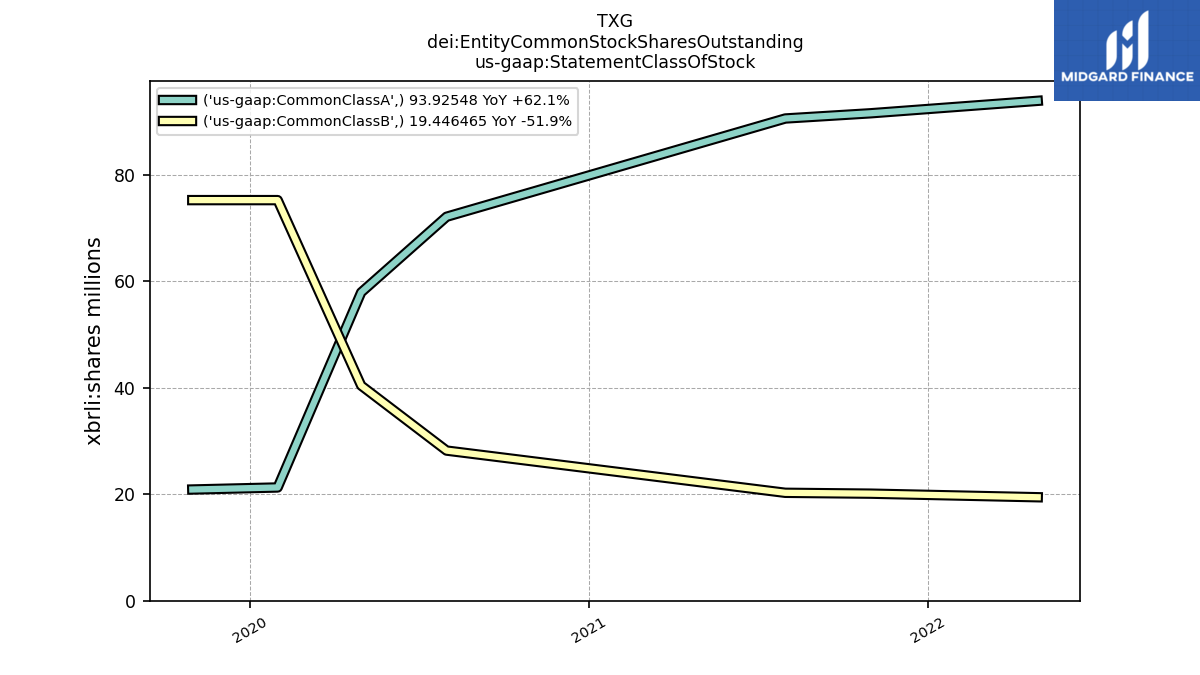
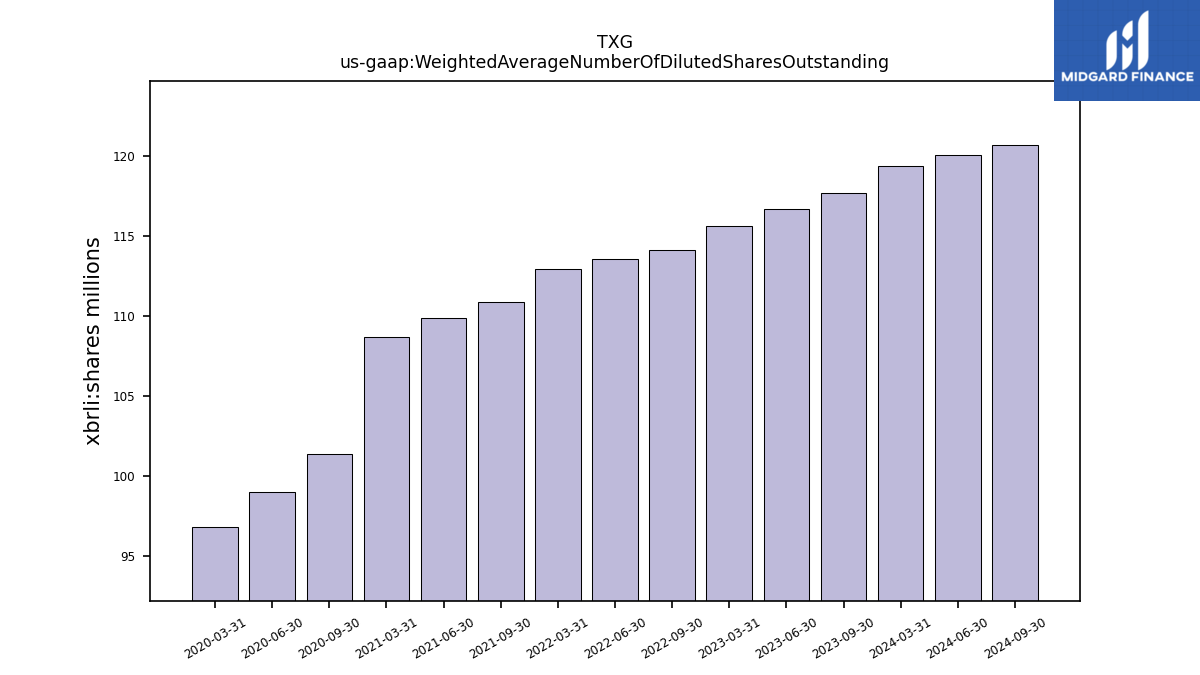
| Weighted Average Number Of Diluted Shares Outstanding | 117.73 | 116.71 | 115.62 | NA | 114.11 | 113.57 | 112.97 | NA | 110.87 | 109.87 | 108.71 | NA | 101.34 | 98.98 | 96.83 | NA | NA | NA | NA | NA | NA | NA | NA | |
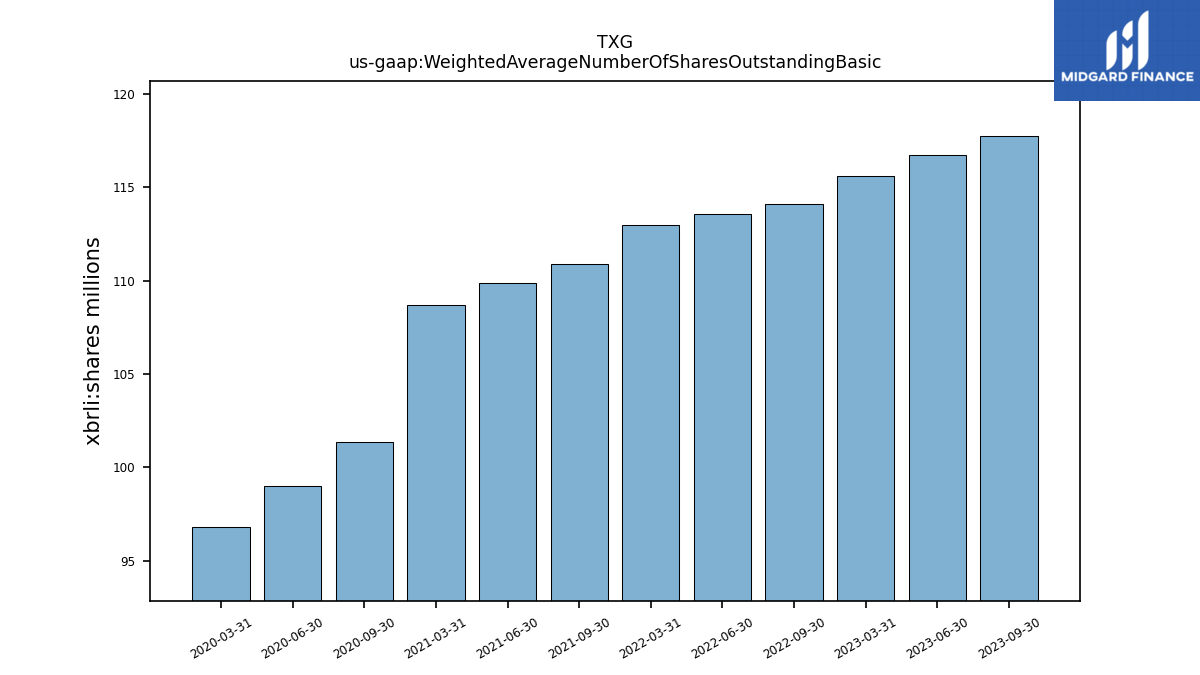
| Weighted Average Number Of Shares Outstanding Basic | 117.73 | 116.71 | 115.62 | NA | 114.11 | 113.57 | 112.97 | NA | 110.87 | 109.87 | 108.71 | NA | 101.34 | 98.98 | 96.83 | NA | NA | NA | NA | NA | NA | NA | NA | |
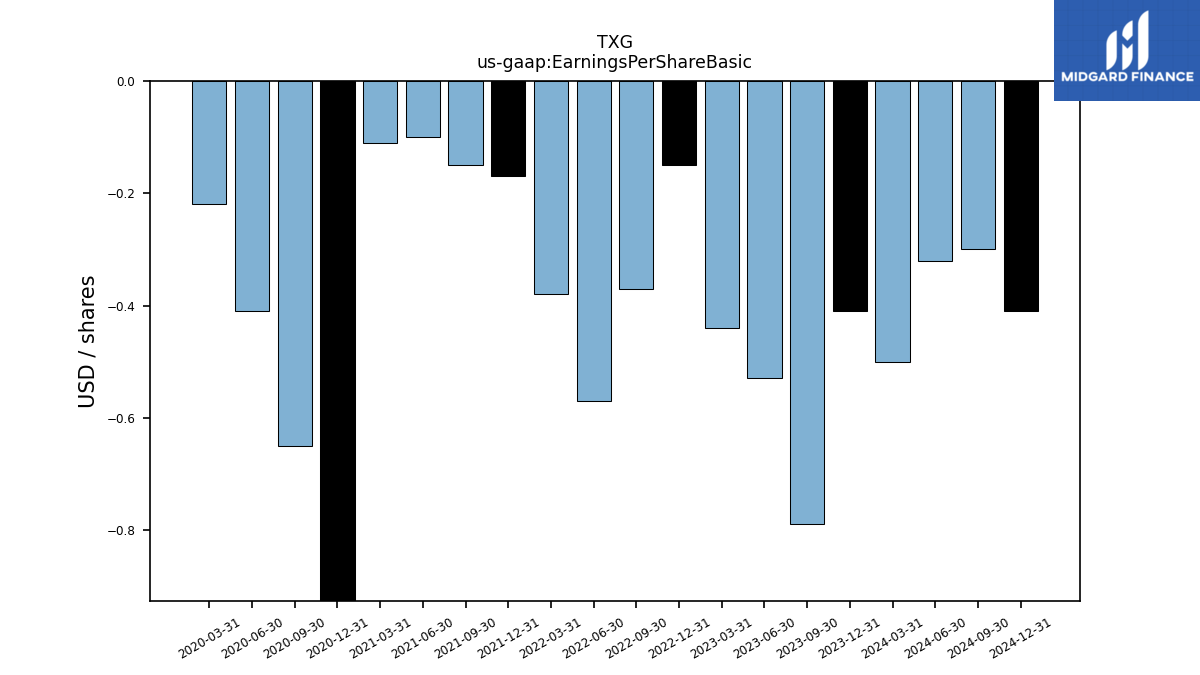
| Earnings Per Share Basic | -0.79 | -0.53 | -0.44 | -0.15 | -0.37 | -0.57 | -0.38 | -0.17 | -0.15 | -0.10 | -0.11 | -4.09 | -0.65 | -0.41 | -0.22 | NA | NA | NA | NA | NA | NA | NA | NA | |
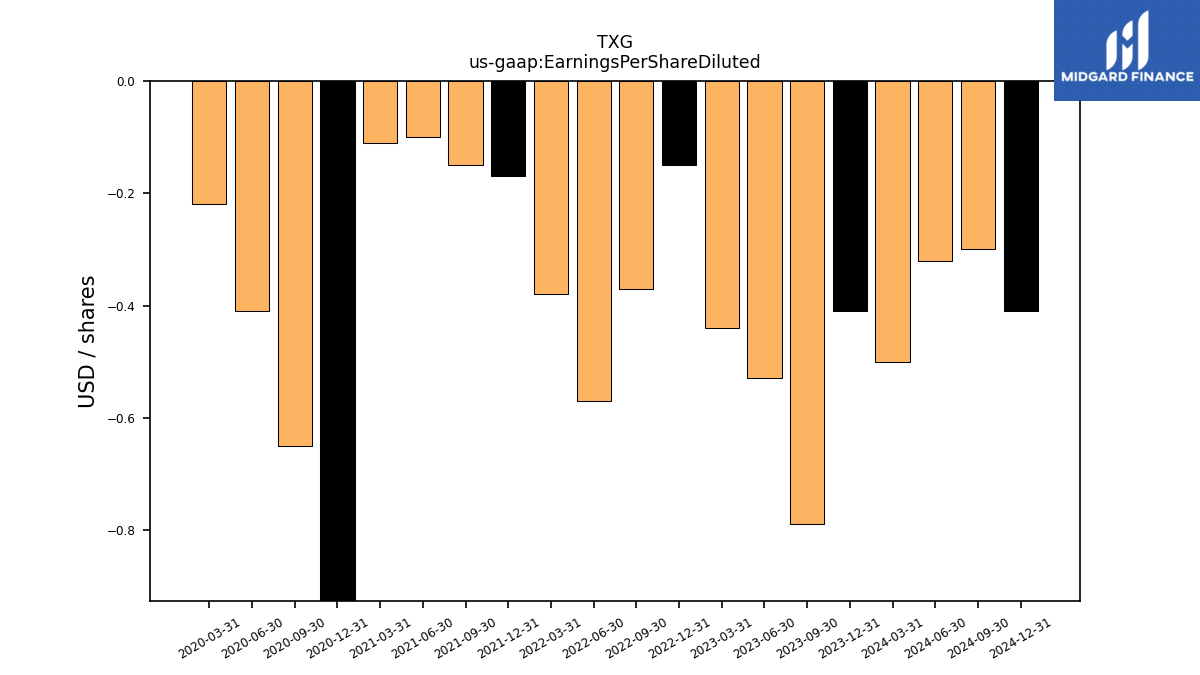
| Earnings Per Share Diluted | -0.79 | -0.53 | -0.44 | -0.15 | -0.37 | -0.57 | -0.38 | -0.17 | -0.15 | -0.10 | -0.11 | -4.09 | -0.65 | -0.41 | -0.22 | NA | NA | NA | NA | NA | NA | NA | NA |
| 2023-09-30 | 2023-06-30 | 2023-03-31 | 2022-12-31 | 2022-09-30 | 2022-06-30 | 2022-03-31 | 2021-12-31 | 2021-09-30 | 2021-06-30 | 2021-03-31 | 2020-12-31 | 2020-09-30 | 2020-06-30 | 2020-03-31 | 2019-12-31 | 2019-09-30 | 2019-06-30 | 2019-03-31 | 2018-12-31 | 2018-09-30 | 2018-06-30 | 2018-03-31 | ||
|---|---|---|---|---|---|---|---|---|---|---|---|---|---|---|---|---|---|---|---|---|---|---|---|---|
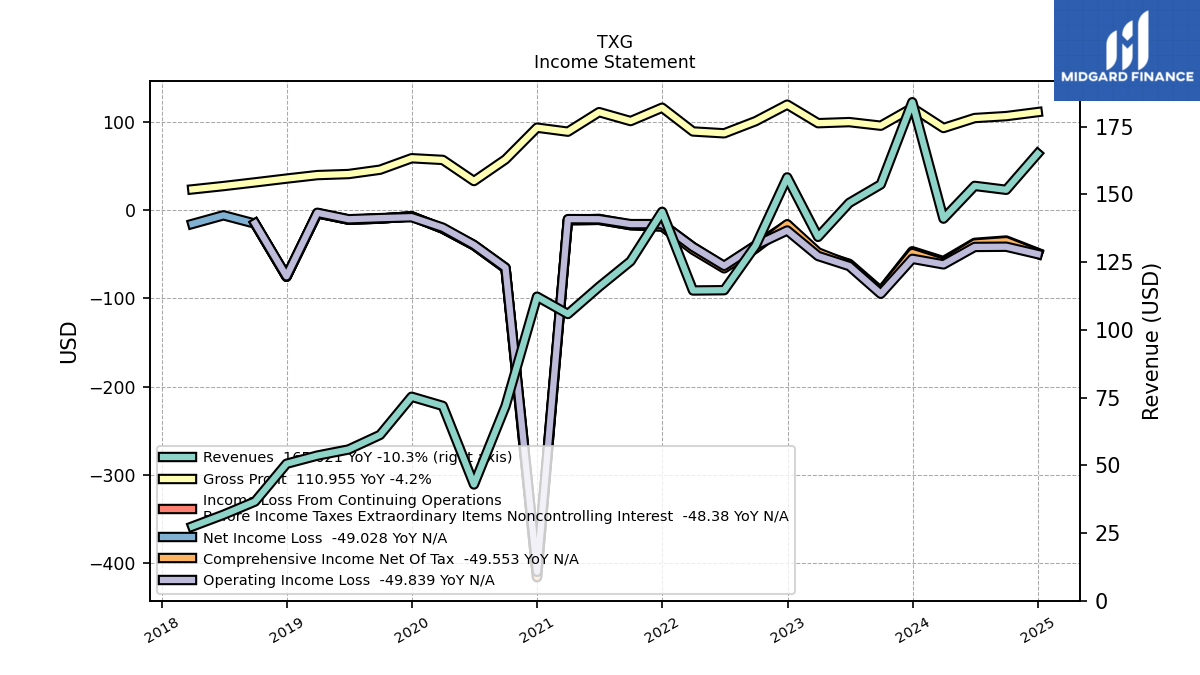
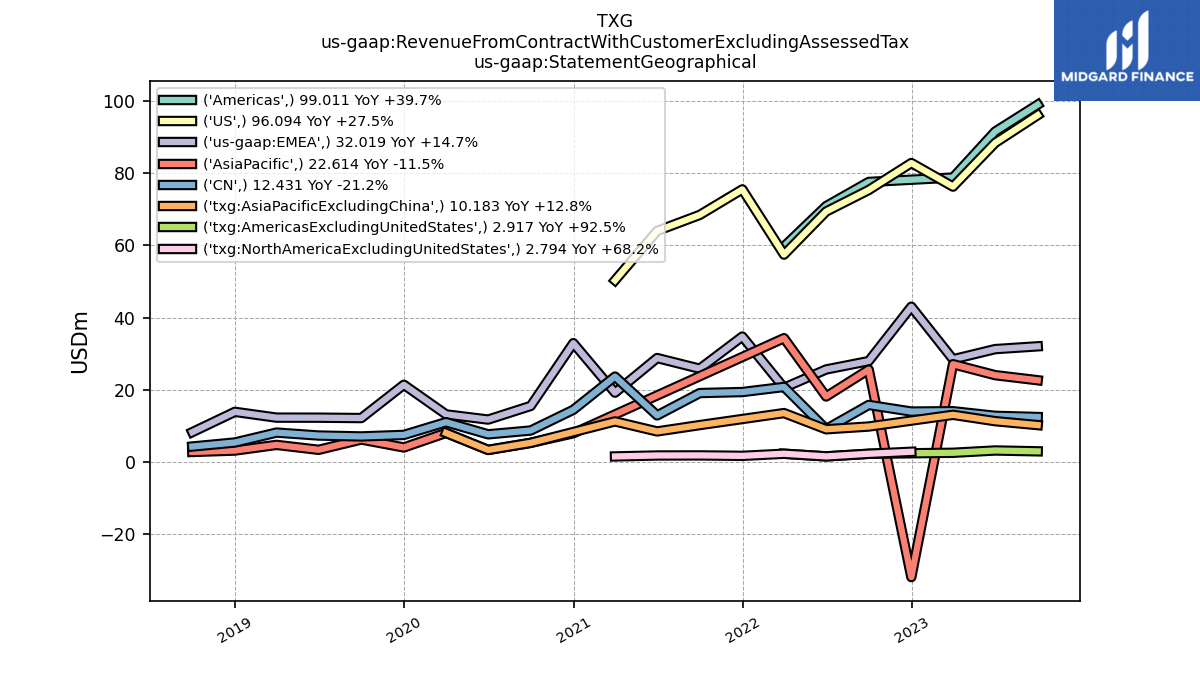
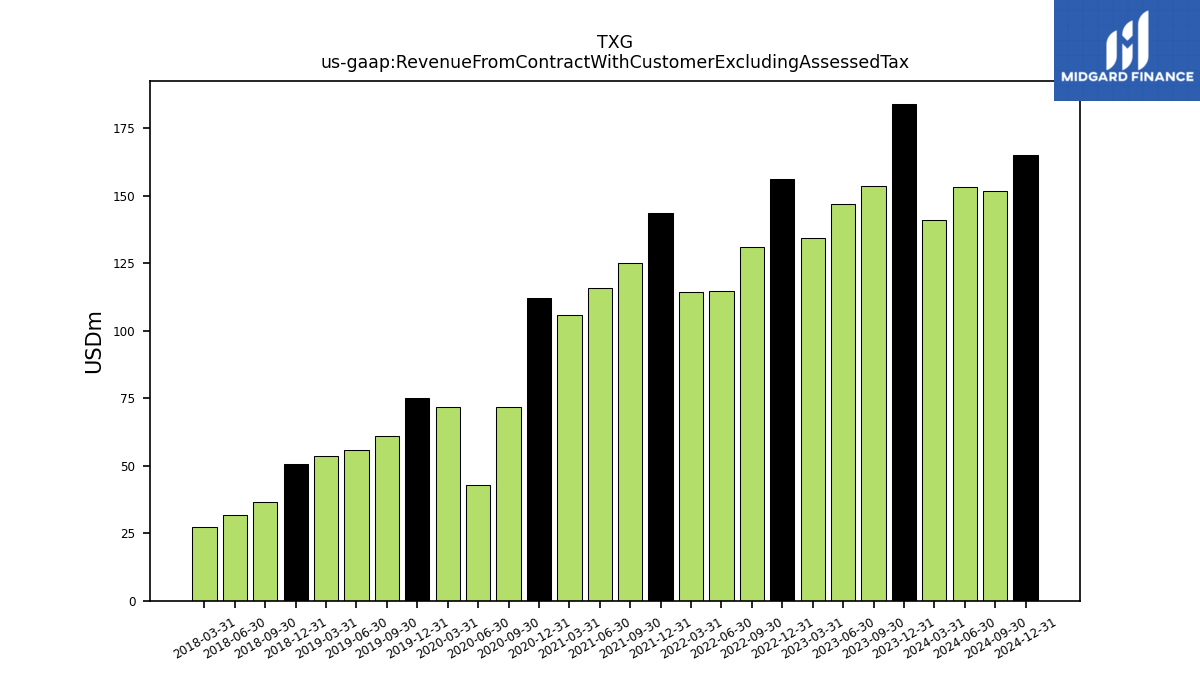
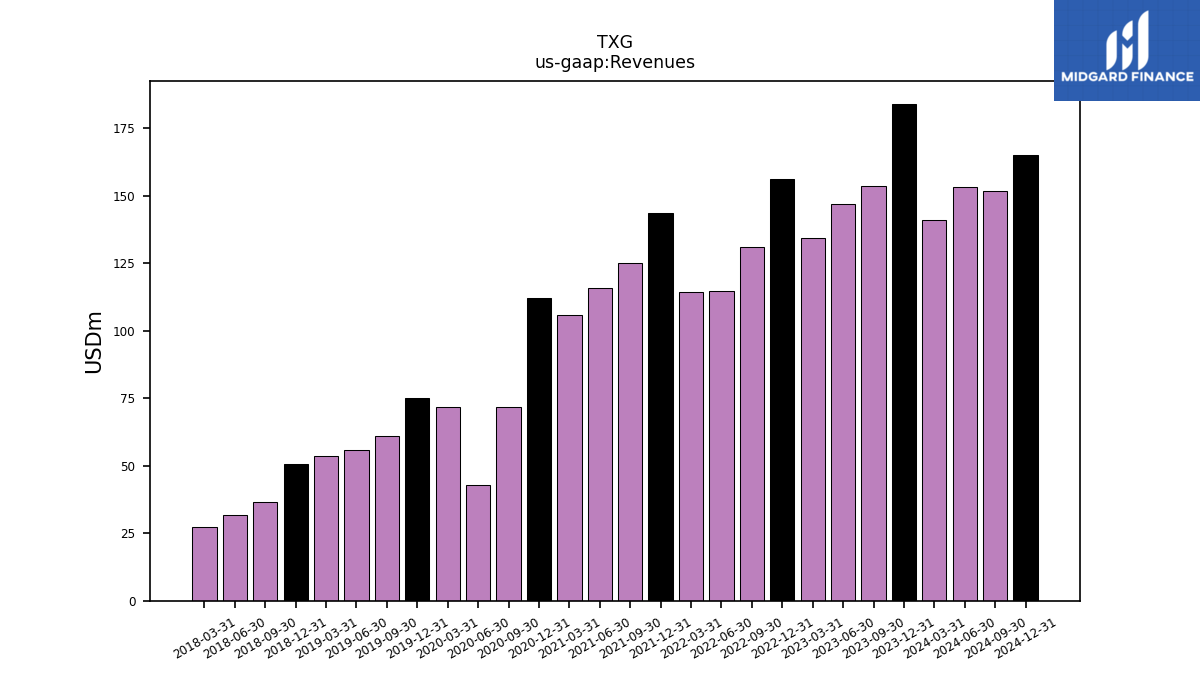
| Revenue From Contract With Customer Excluding Assessed Tax | 153.64 | 146.82 | 134.28 | 156.23 | 131.07 | 114.61 | 114.50 | 143.53 | 125.30 | 115.84 | 105.82 | 112.22 | 71.82 | 42.91 | 71.91 | 75.29 | 61.21 | 55.82 | 53.58 | 50.55 | 36.61 | 31.74 | 27.41 | |
| Revenues | 153.64 | 146.82 | 134.28 | 156.23 | 131.07 | 114.61 | 114.50 | 143.53 | 125.30 | 115.84 | 105.82 | 112.22 | 71.82 | 42.91 | 71.91 | 75.29 | 61.21 | 55.82 | 53.58 | 50.55 | 36.61 | 31.74 | 27.41 | |
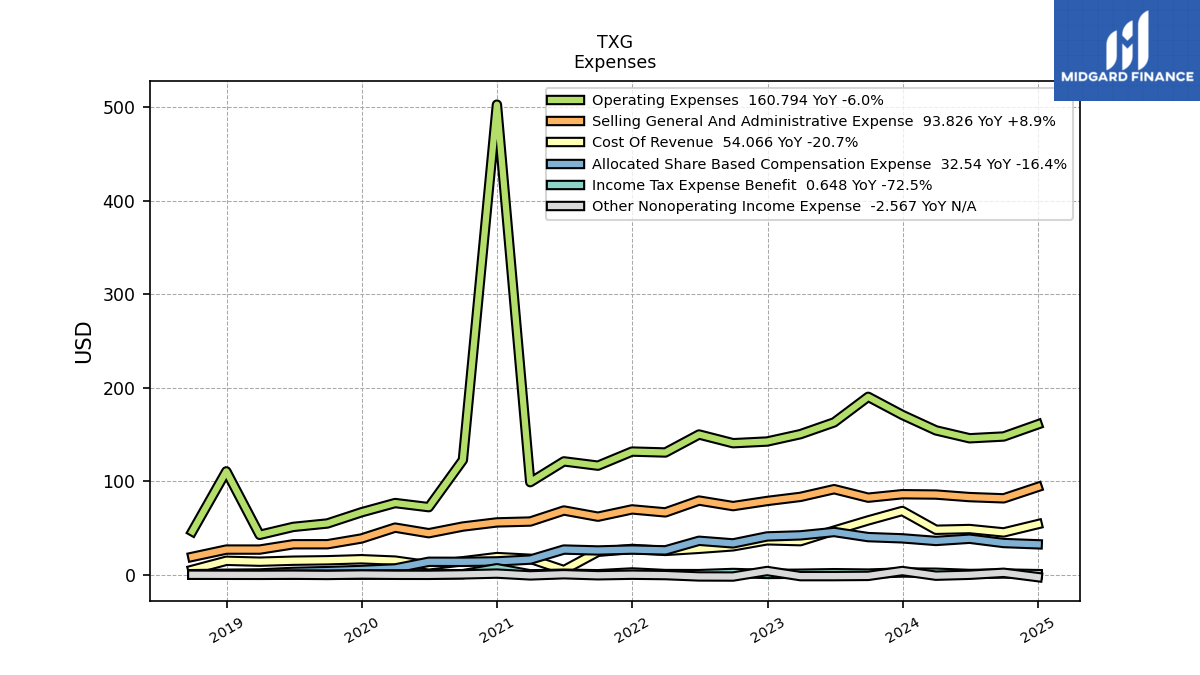
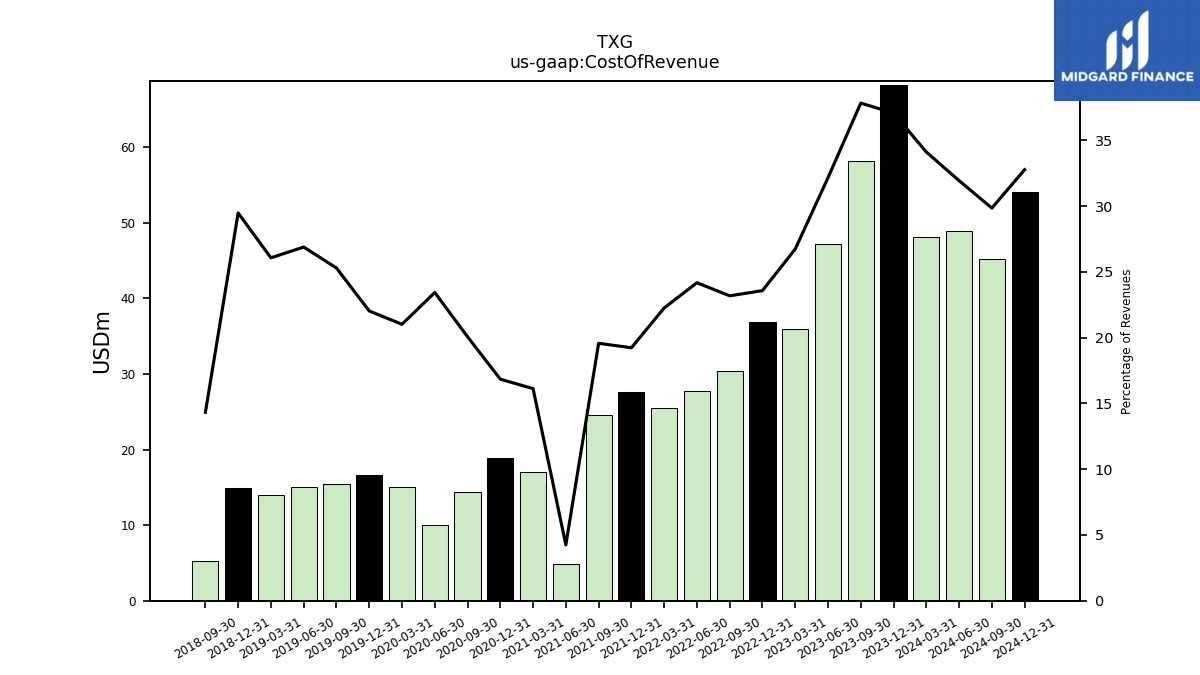
| Cost Of Revenue | 58.12 | 47.21 | 35.90 | 36.83 | 30.38 | 27.70 | 25.48 | 27.60 | 24.52 | 4.92 | 17.06 | 18.90 | 14.41 | 10.05 | 15.11 | 16.58 | 15.48 | 15.01 | 13.96 | 14.90 | 5.24 | NA | NA | |
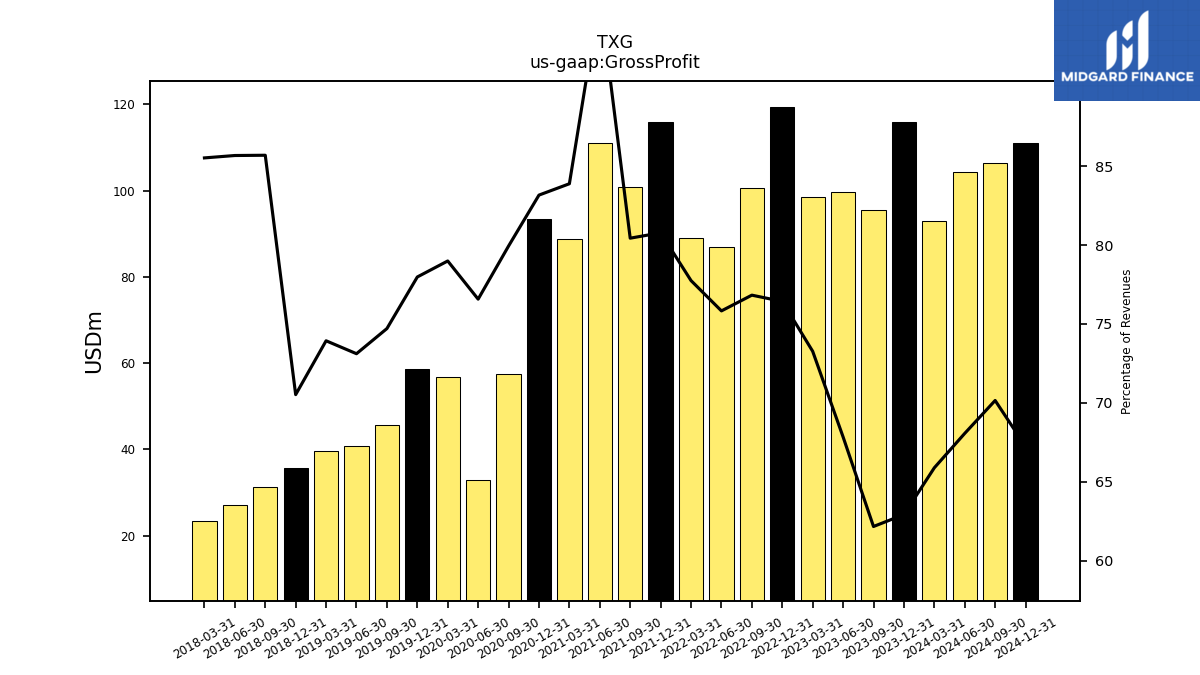
| Gross Profit | 95.53 | 99.61 | 98.39 | 119.41 | 100.69 | 86.91 | 89.02 | 115.93 | 100.78 | 110.93 | 88.76 | 93.32 | 57.41 | 32.85 | 56.80 | 58.71 | 45.73 | 40.81 | 39.61 | 35.65 | 31.37 | 27.19 | 23.44 | |
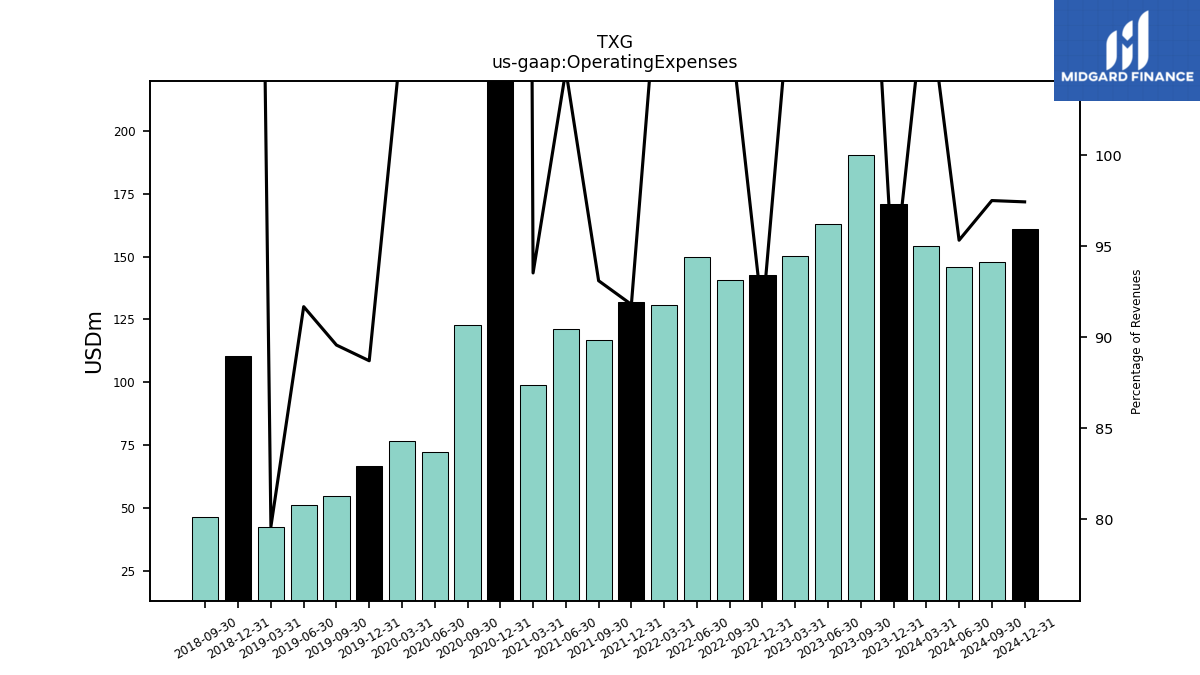
| Operating Expenses | 190.32 | 162.97 | 150.38 | 142.50 | 140.69 | 150.02 | 130.75 | 131.76 | 116.66 | 121.25 | 98.98 | 502.90 | 122.66 | 72.27 | 76.68 | 66.79 | 54.82 | 51.17 | 42.65 | 110.62 | 46.30 | NA | NA | |
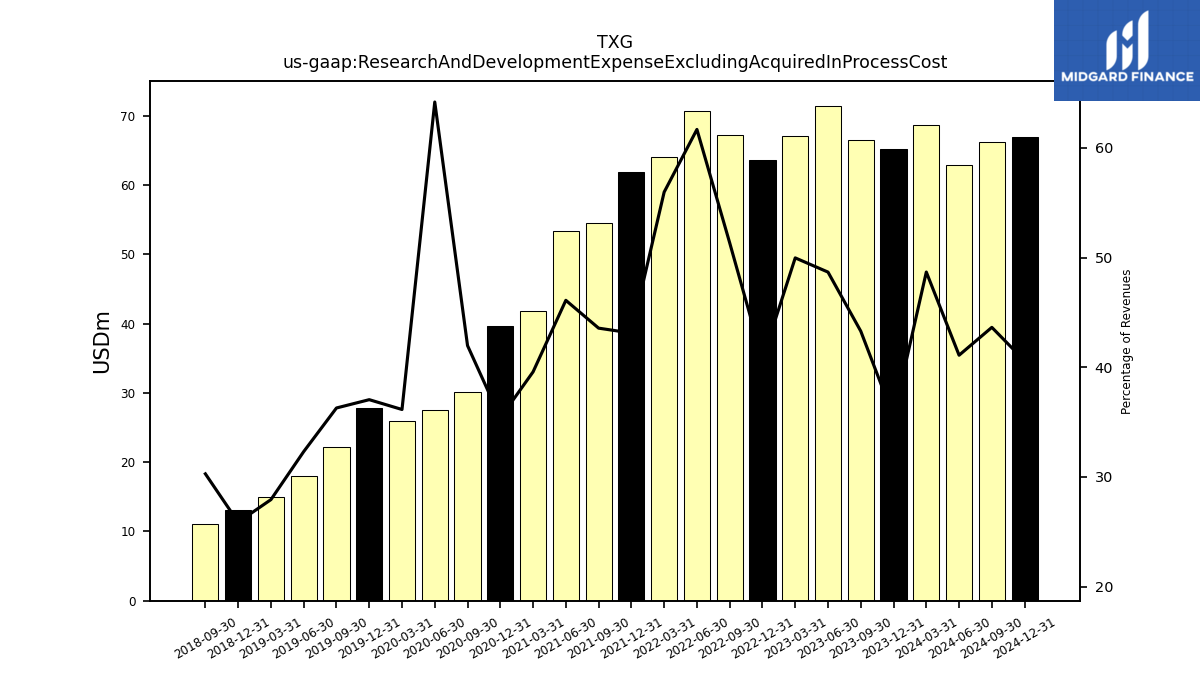
| Research And Development Expense Excluding Acquired In Process Cost | 66.51 | 71.46 | 67.10 | 63.61 | 67.29 | 70.69 | 64.08 | 61.88 | 54.58 | 53.40 | 41.88 | 39.70 | 30.14 | 27.54 | 25.99 | 27.89 | 22.21 | 18.03 | 14.96 | 13.08 | 11.09 | NA | NA | |
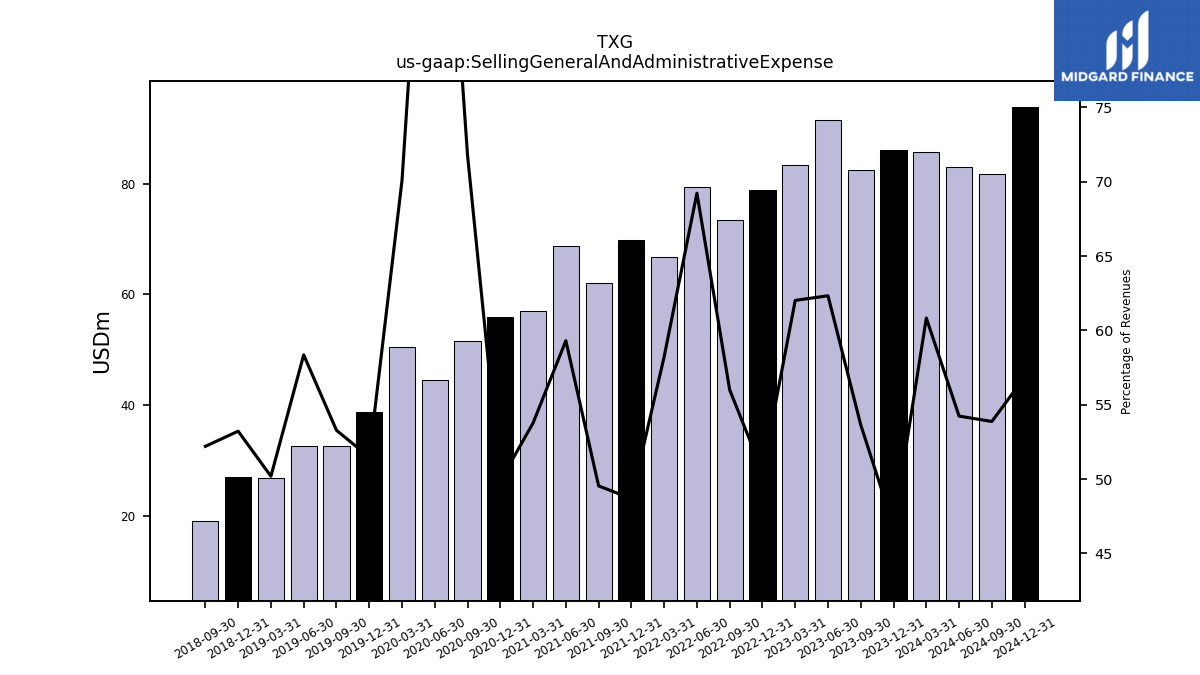
| Selling General And Administrative Expense | 82.42 | 91.51 | 83.28 | 78.89 | 73.40 | 79.34 | 66.67 | 69.88 | 62.08 | 68.70 | 56.90 | 55.97 | 51.55 | 44.42 | 50.39 | 38.76 | 32.61 | 32.57 | 26.89 | 26.91 | 19.11 | NA | NA | |
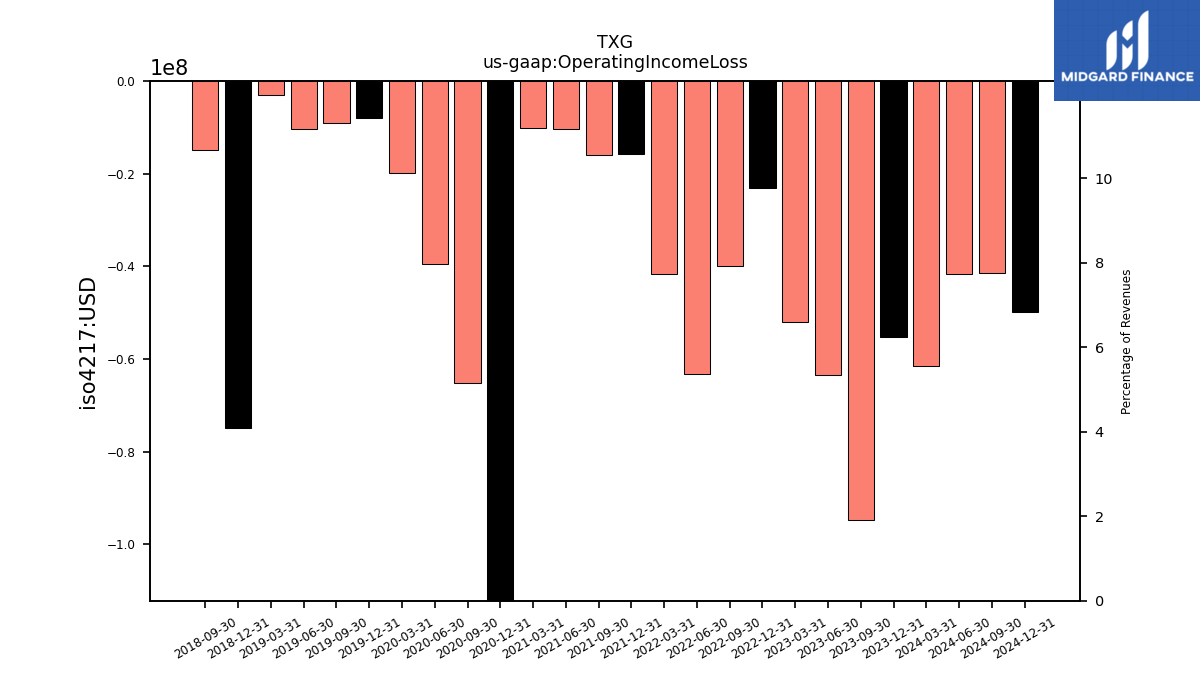
| Operating Income Loss | -94.80 | -63.36 | -51.99 | -23.10 | -40.00 | -63.12 | -41.73 | -15.83 | -15.88 | -10.33 | -10.22 | -409.58 | -65.25 | -39.42 | -19.88 | -8.08 | -9.10 | -10.36 | -3.04 | -74.97 | -14.93 | NA | NA | |
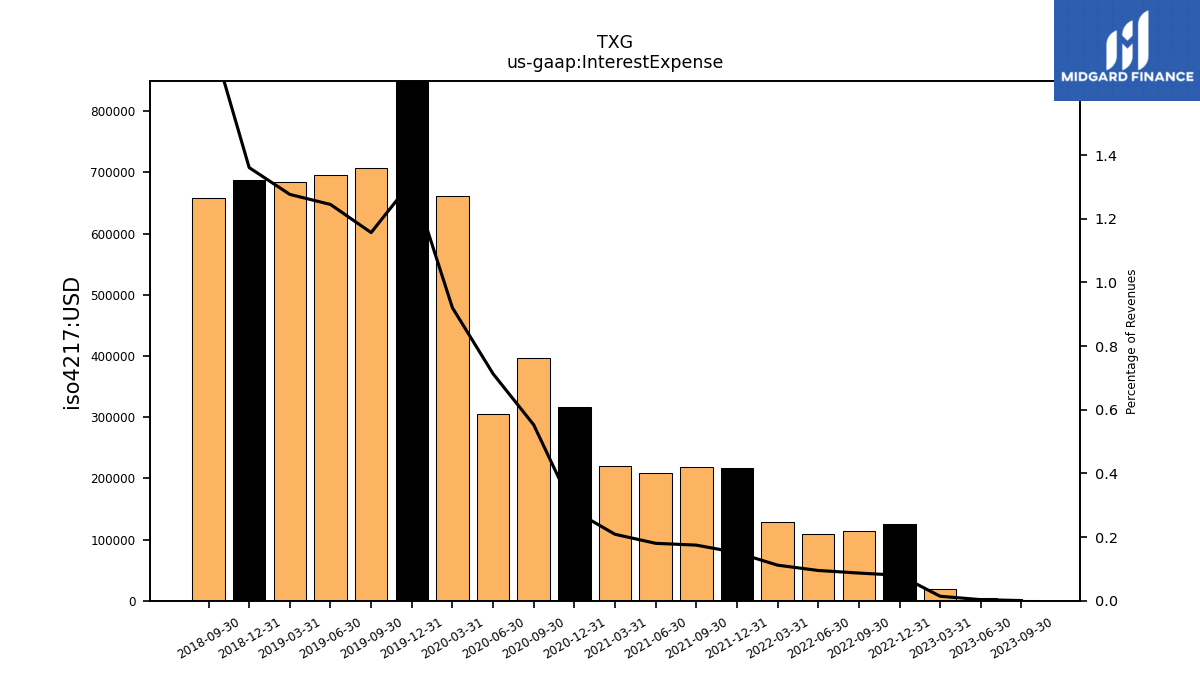
| Interest Expense | 0.00 | 0.01 | 0.02 | 0.12 | 0.11 | 0.11 | 0.13 | 0.22 | 0.22 | 0.21 | 0.22 | 0.32 | 0.40 | 0.31 | 0.66 | 0.99 | 0.71 | 0.69 | 0.68 | 0.69 | 0.66 | NA | NA | |
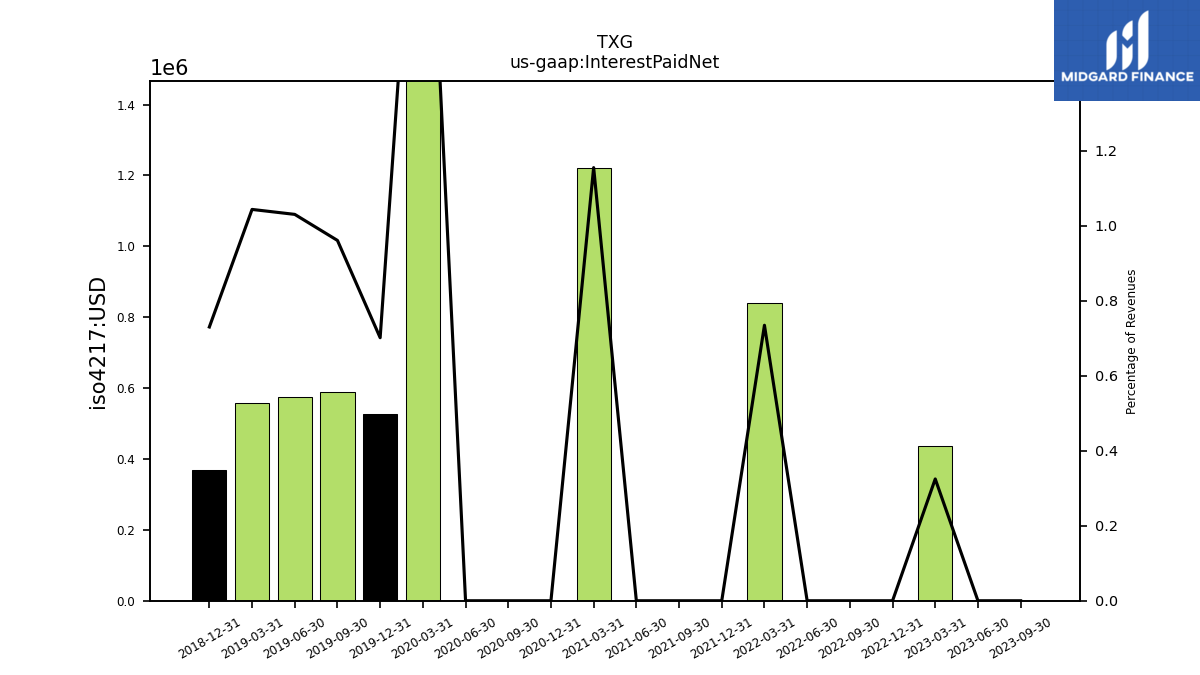
| Interest Paid Net | 0.00 | 0.00 | 0.44 | 0.00 | 0.00 | 0.00 | 0.84 | 0.00 | 0.00 | 0.00 | 1.22 | 0.00 | 0.00 | 0.00 | 1.67 | 0.53 | 0.59 | 0.57 | 0.56 | 0.37 | NA | NA | NA | |
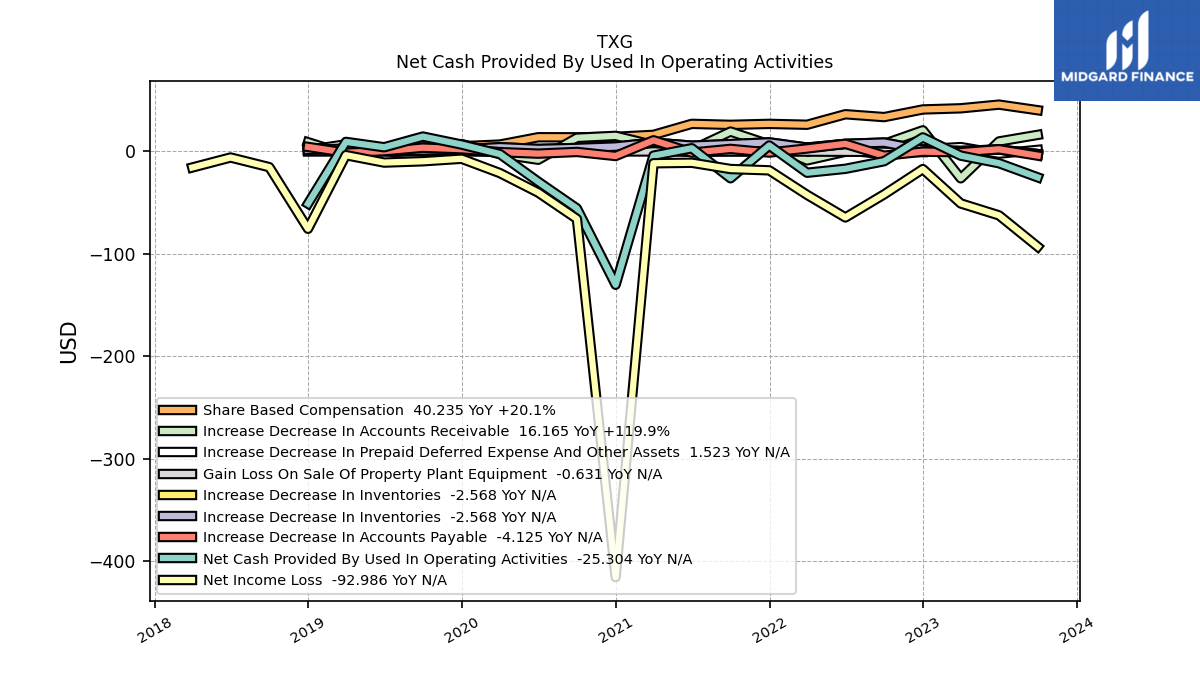
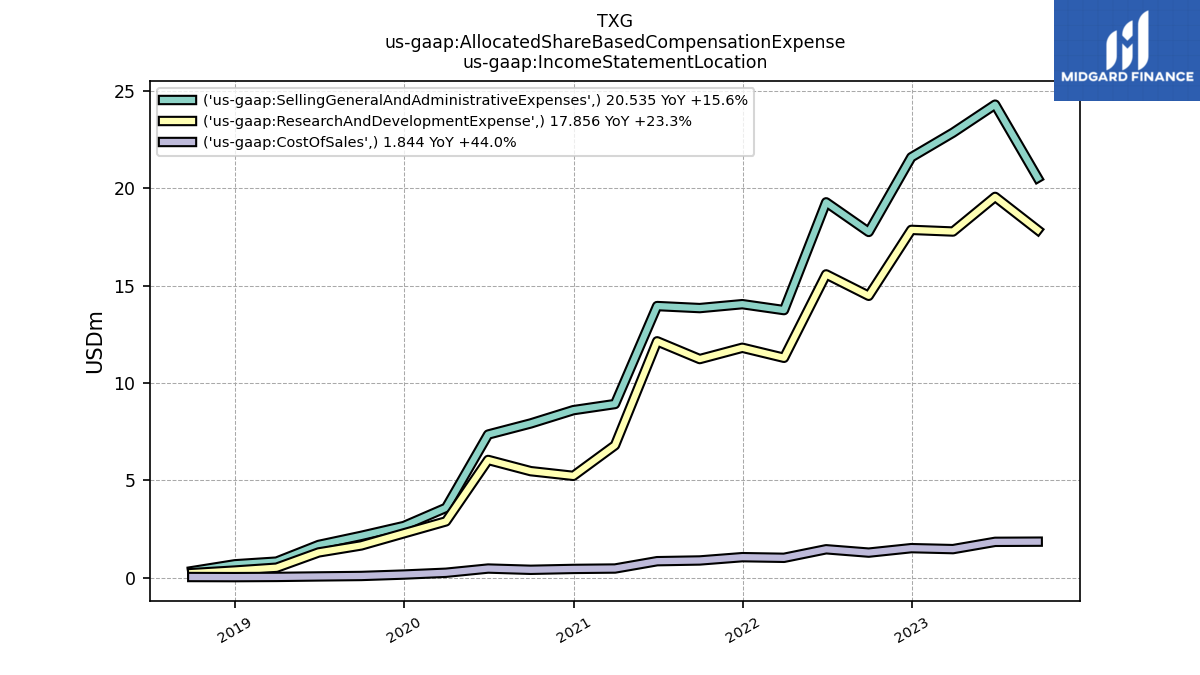
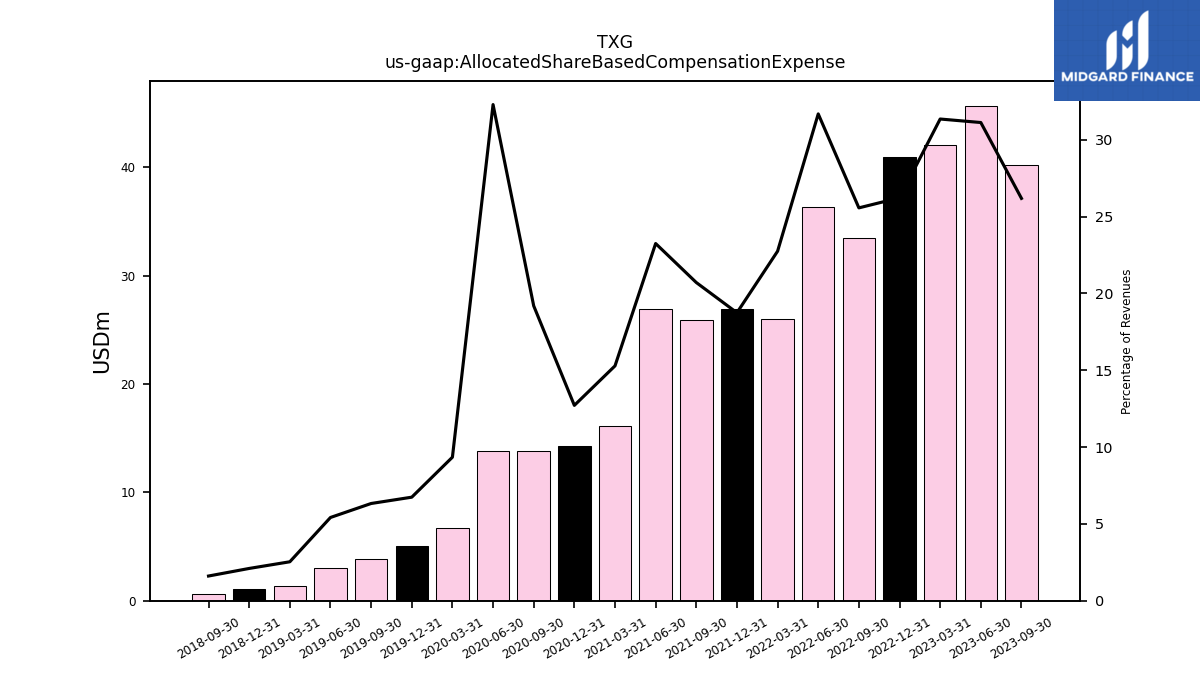
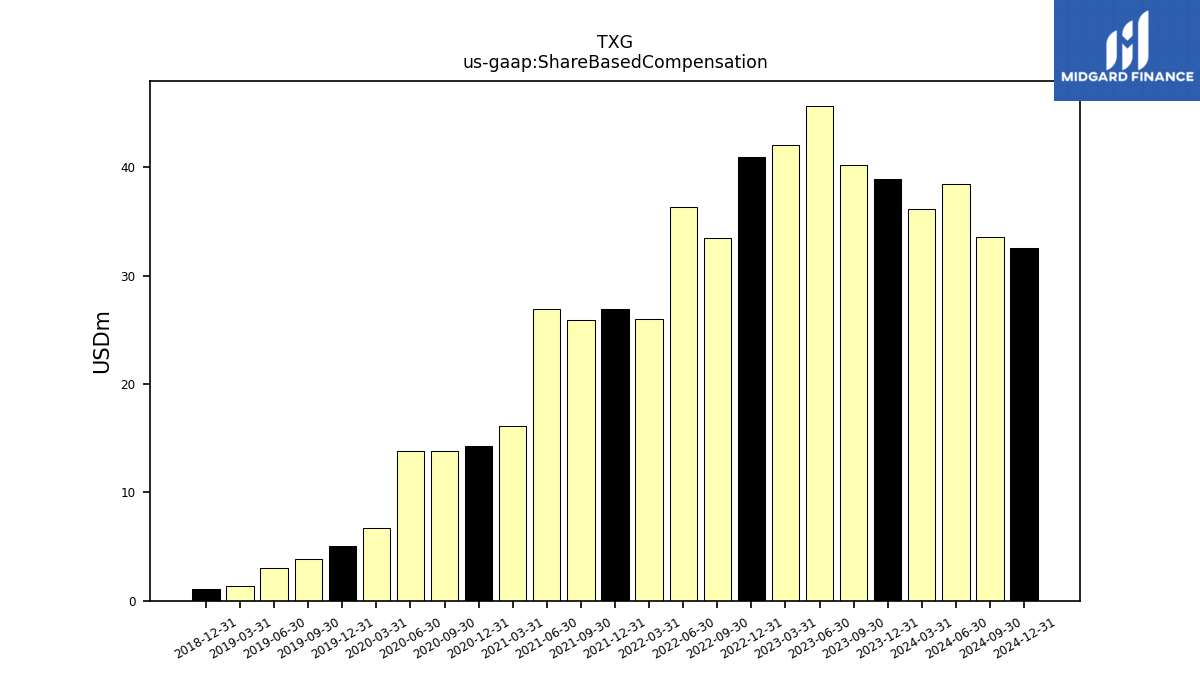
| Allocated Share Based Compensation Expense | 40.23 | 45.70 | 42.10 | 40.97 | 33.51 | 36.31 | 26.05 | 26.90 | 25.95 | 26.93 | 16.18 | 14.27 | 13.78 | 13.86 | 6.72 | 5.08 | 3.87 | 3.02 | 1.36 | 1.06 | 0.59 | NA | NA | |
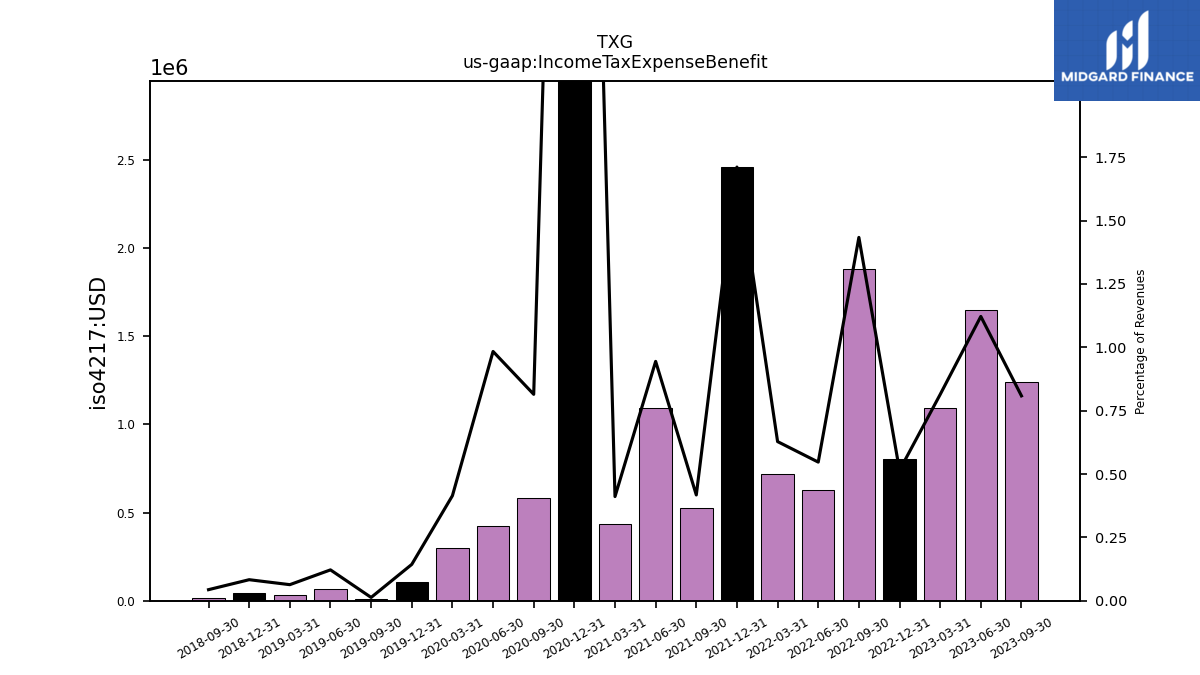
| Income Tax Expense Benefit | 1.24 | 1.65 | 1.09 | 0.80 | 1.88 | 0.63 | 0.72 | 2.46 | 0.52 | 1.09 | 0.43 | 6.95 | 0.58 | 0.42 | 0.30 | 0.11 | 0.01 | 0.07 | 0.03 | 0.04 | 0.02 | NA | NA | |
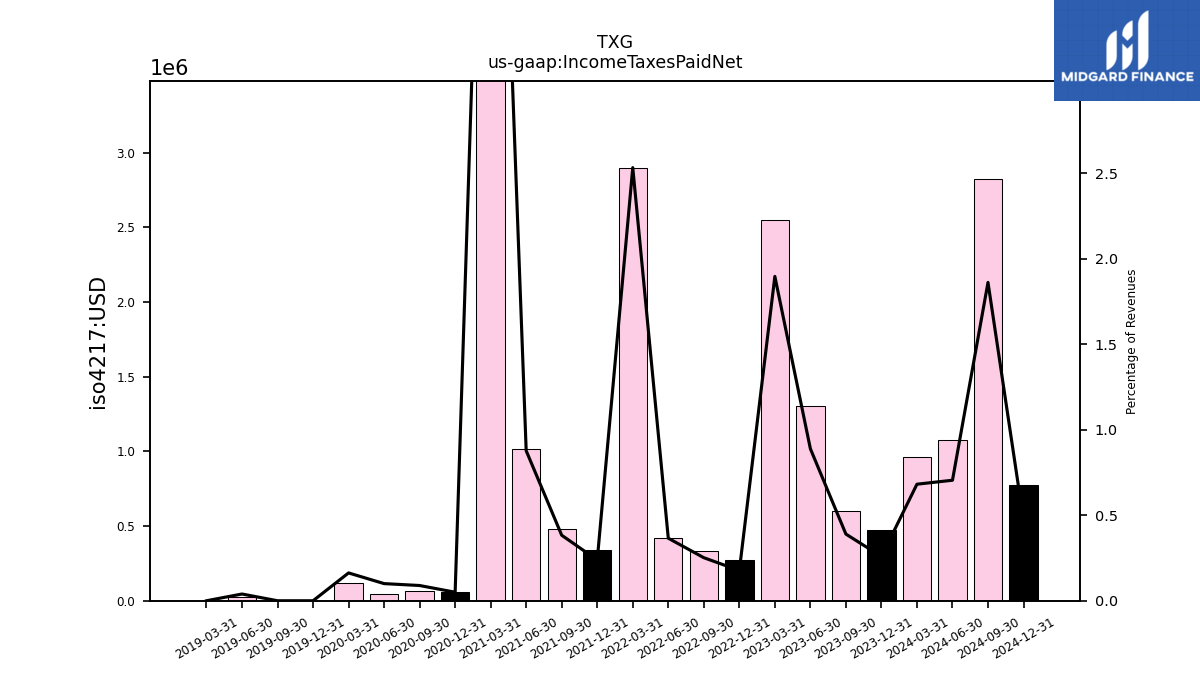
| Income Taxes Paid Net | 0.60 | 1.30 | 2.55 | 0.28 | 0.33 | 0.42 | 2.90 | 0.34 | 0.48 | 1.02 | 6.82 | 0.06 | 0.06 | 0.04 | 0.12 | 0.00 | 0.00 | 0.02 | 0.00 | NA | NA | NA | NA | |
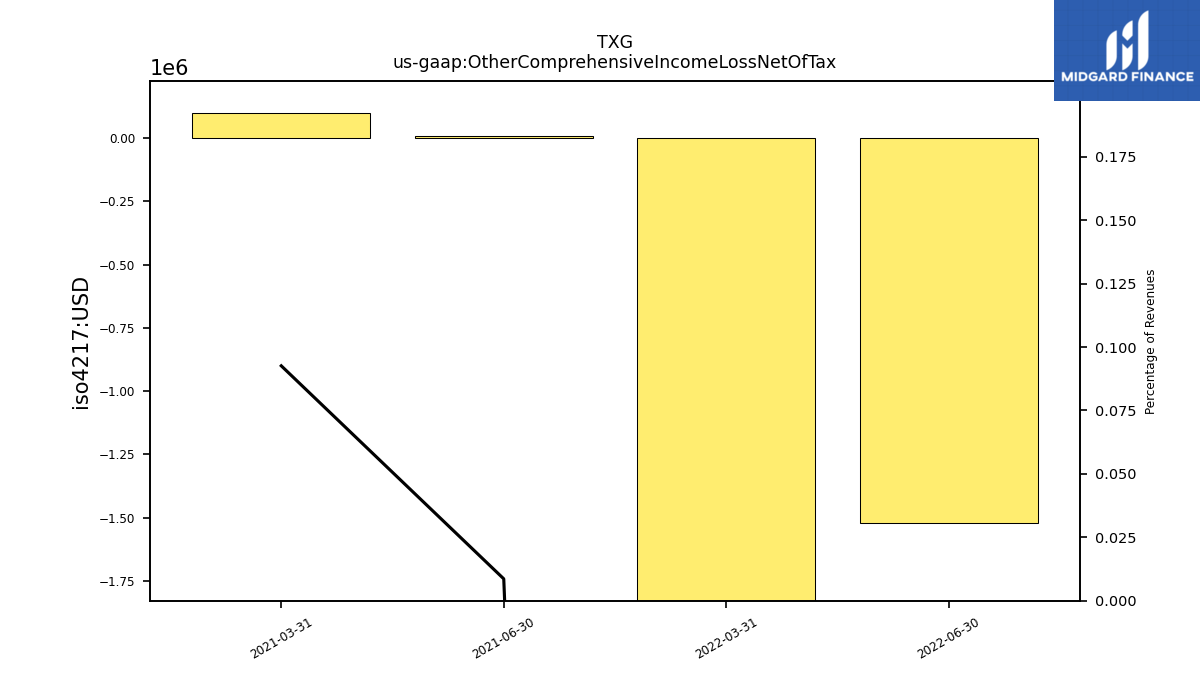
| Other Comprehensive Income Loss Net Of Tax | NA | NA | NA | NA | NA | -1.52 | -2.46 | NA | NA | 0.01 | 0.10 | NA | NA | NA | NA | NA | NA | NA | NA | NA | NA | NA | NA | |
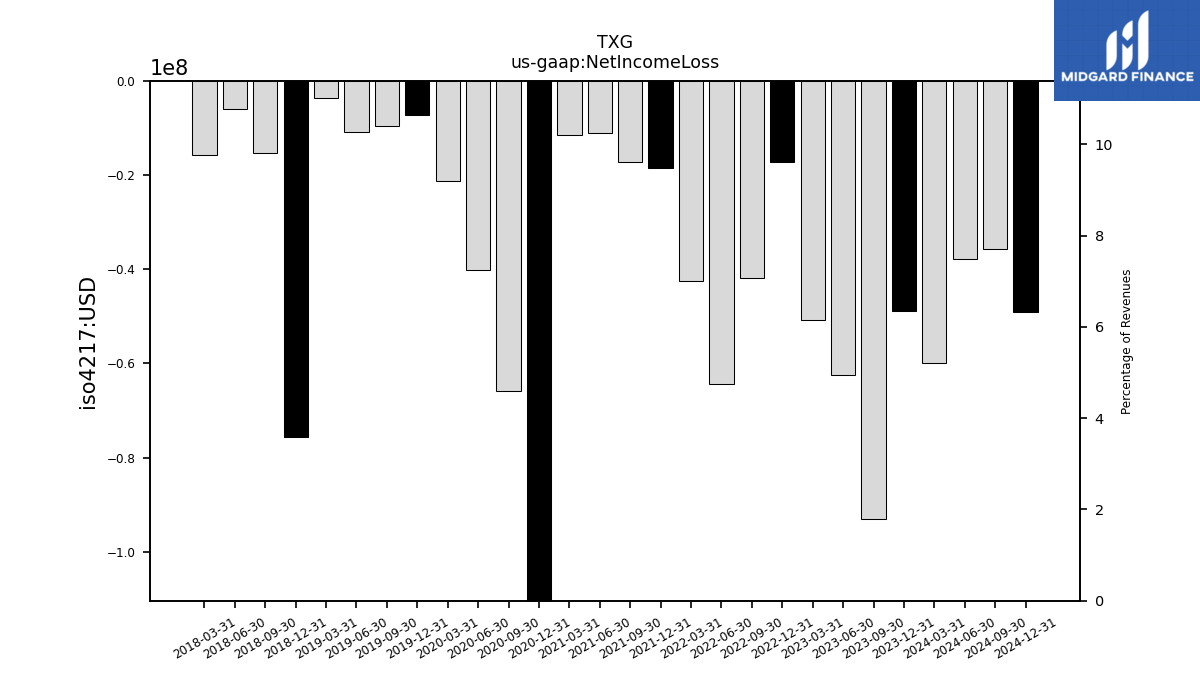
| Net Income Loss | -92.99 | -62.41 | -50.75 | -17.21 | -41.91 | -64.46 | -42.41 | -18.45 | -17.17 | -11.05 | -11.55 | -415.57 | -65.85 | -40.17 | -21.14 | -7.13 | -9.60 | -10.88 | -3.64 | -75.52 | -15.35 | -5.92 | -15.69 | |
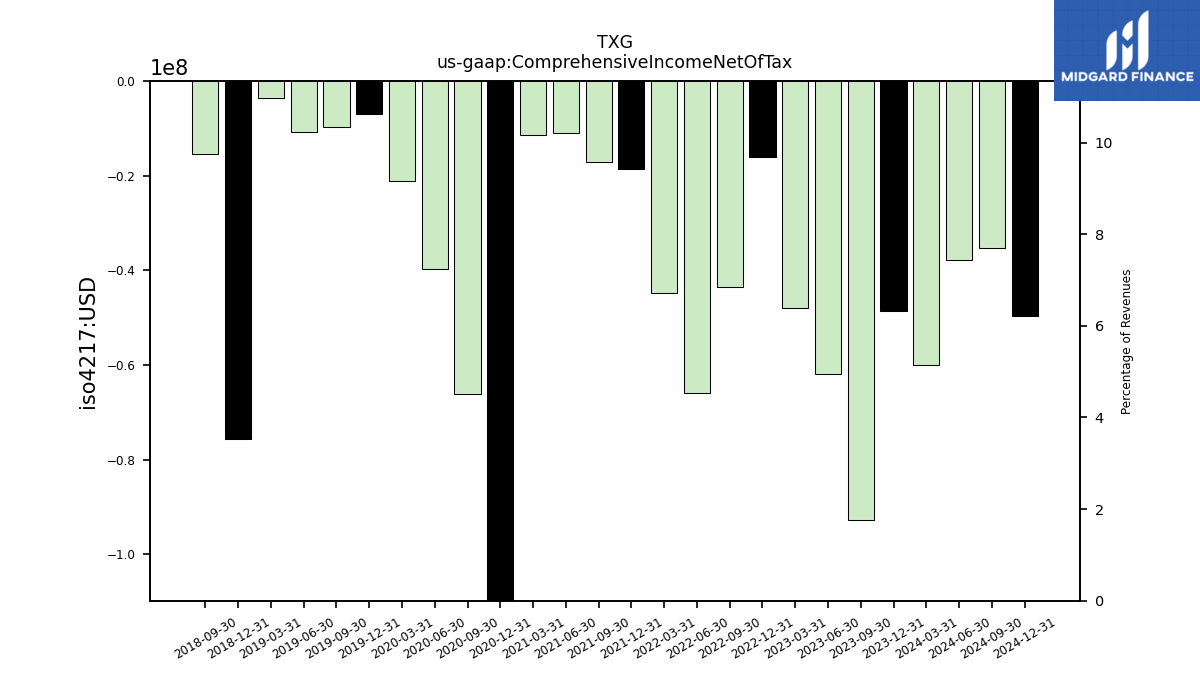
| Comprehensive Income Net Of Tax | -92.69 | -61.90 | -47.89 | -16.06 | -43.44 | -65.98 | -44.88 | -18.62 | -17.04 | -11.04 | -11.45 | -415.57 | -66.21 | -39.81 | -21.14 | -7.02 | -9.73 | -10.85 | -3.66 | -75.56 | -15.34 | NA | NA |
| 2023-09-30 | 2023-06-30 | 2023-03-31 | 2022-12-31 | 2022-09-30 | 2022-06-30 | 2022-03-31 | 2021-12-31 | 2021-09-30 | 2021-06-30 | 2021-03-31 | 2020-12-31 | 2020-09-30 | 2020-06-30 | 2020-03-31 | 2019-12-31 | 2019-09-30 | 2019-06-30 | 2019-03-31 | 2018-12-31 | 2018-09-30 | 2018-06-30 | 2018-03-31 | ||
|---|---|---|---|---|---|---|---|---|---|---|---|---|---|---|---|---|---|---|---|---|---|---|---|---|
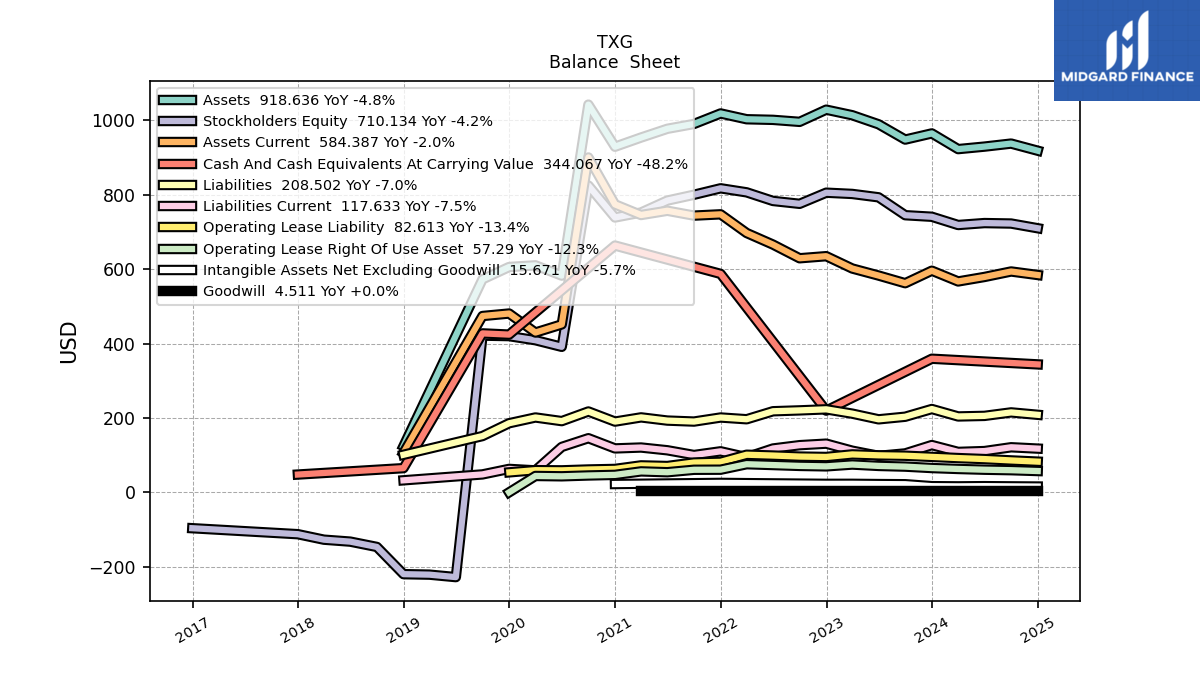
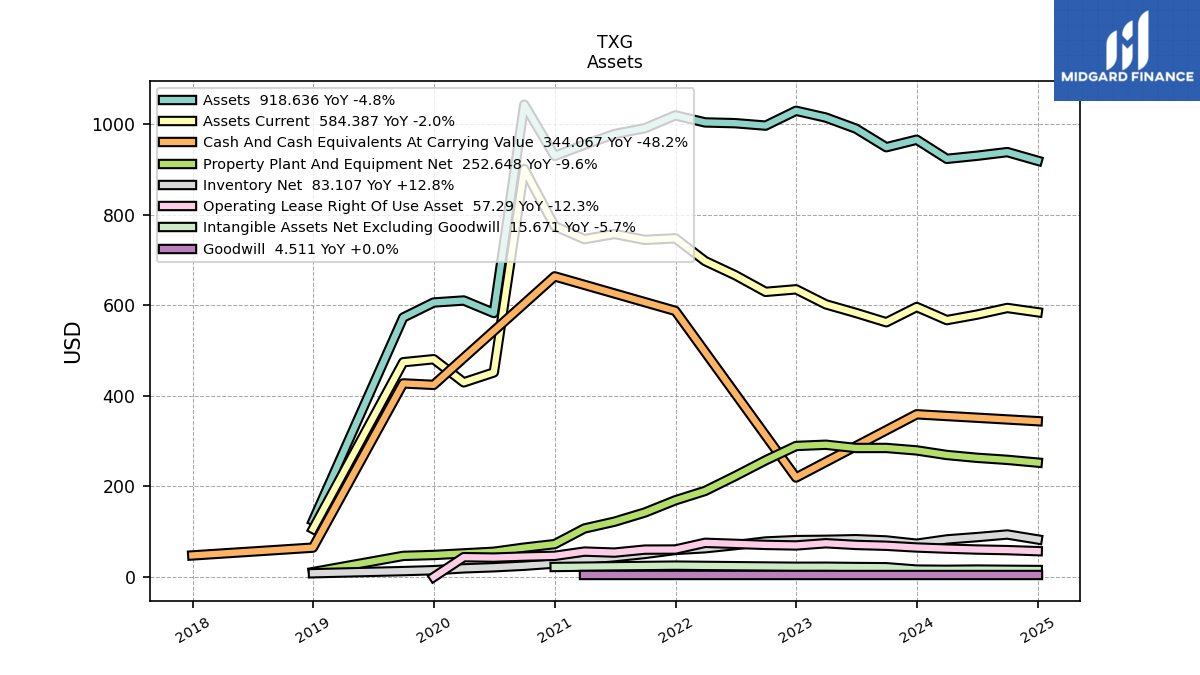
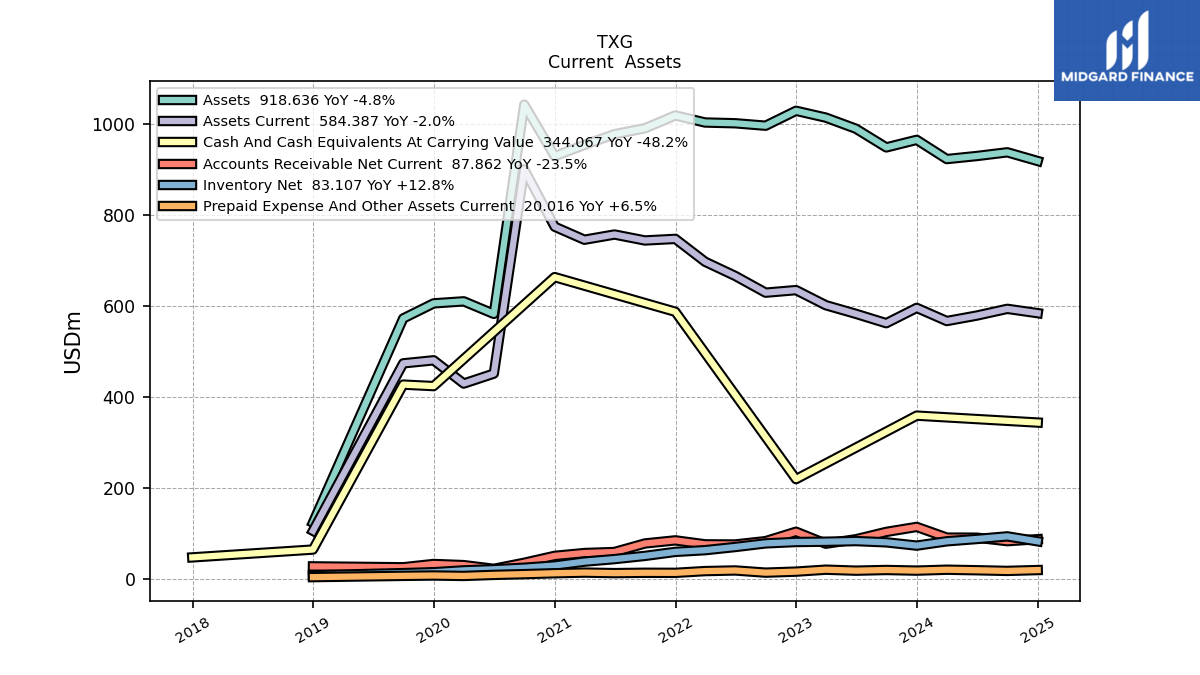
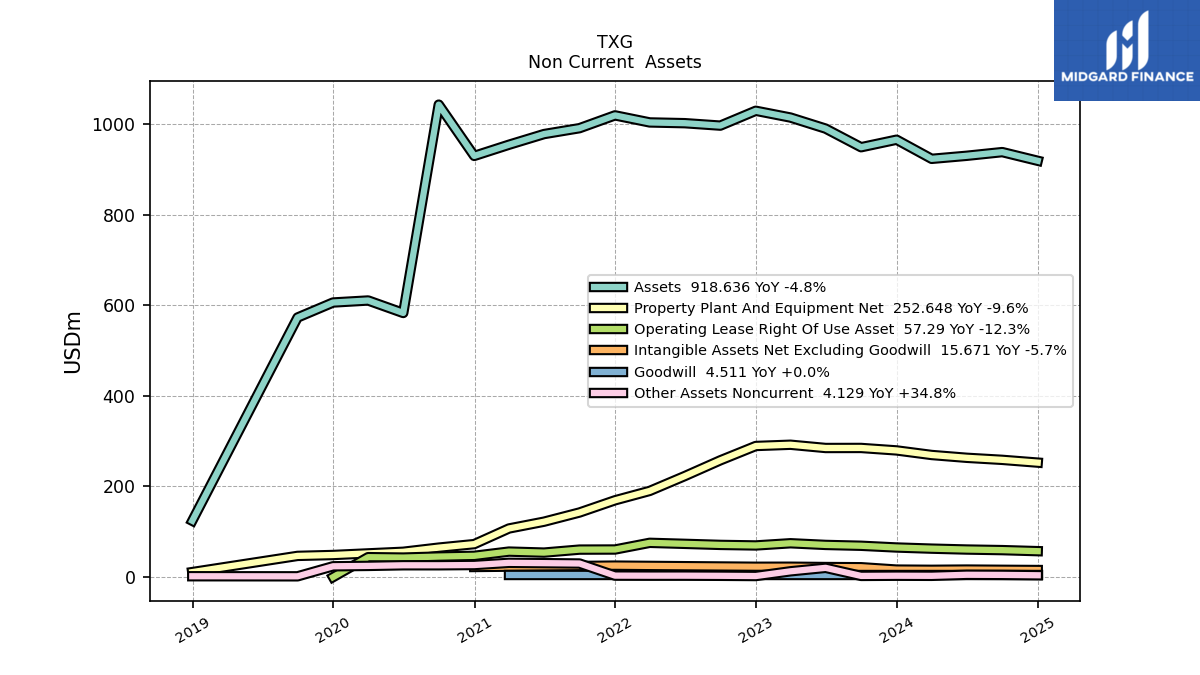
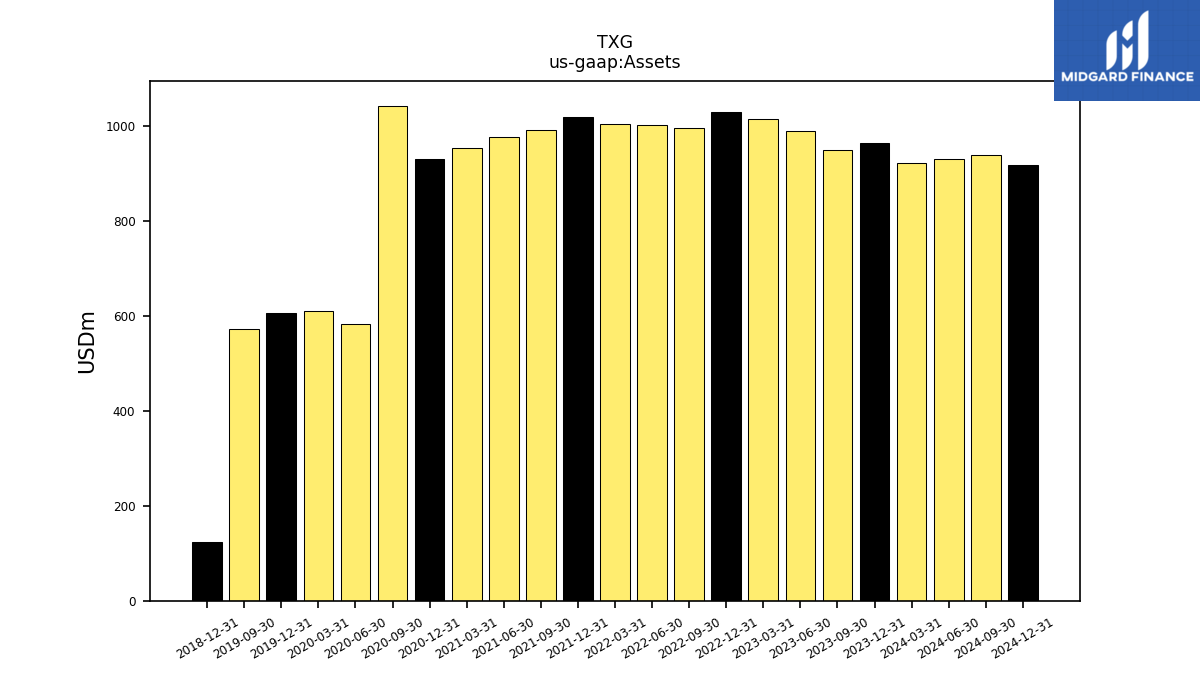
| Assets | 948.54 | 989.64 | 1014.03 | 1028.98 | 996.21 | 1001.59 | 1003.25 | 1018.83 | 990.57 | 977.58 | 954.03 | 929.34 | 1042.54 | 582.80 | 610.38 | 605.92 | 572.82 | NA | NA | 124.31 | NA | NA | NA | |
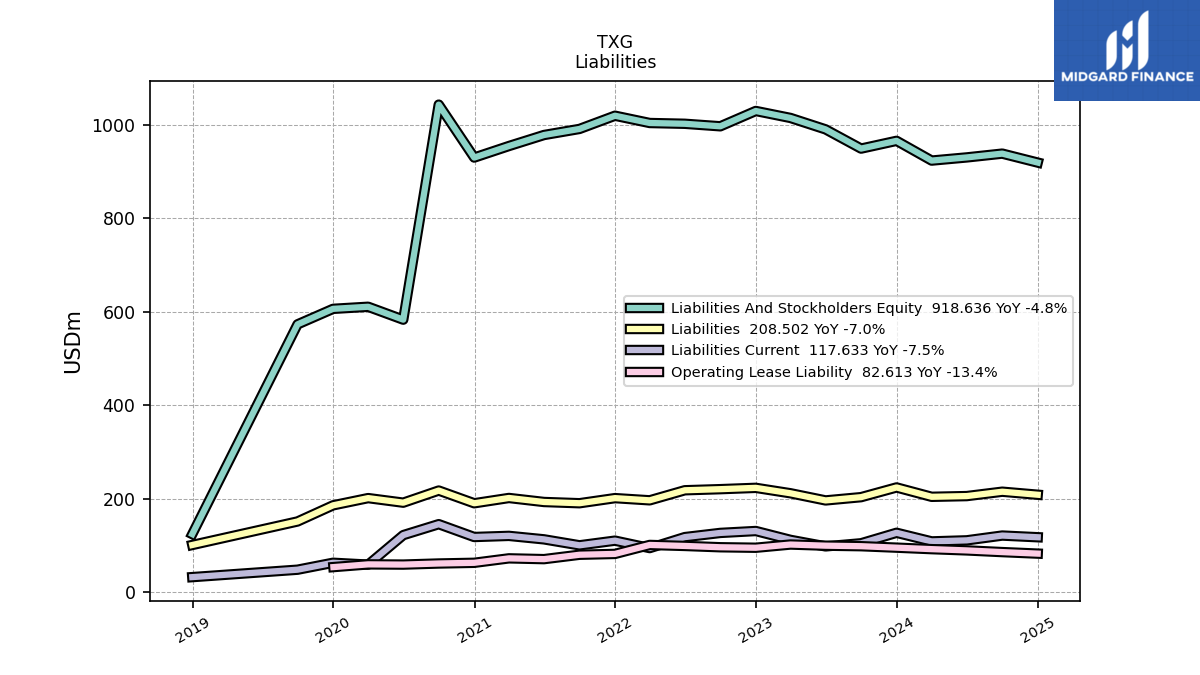
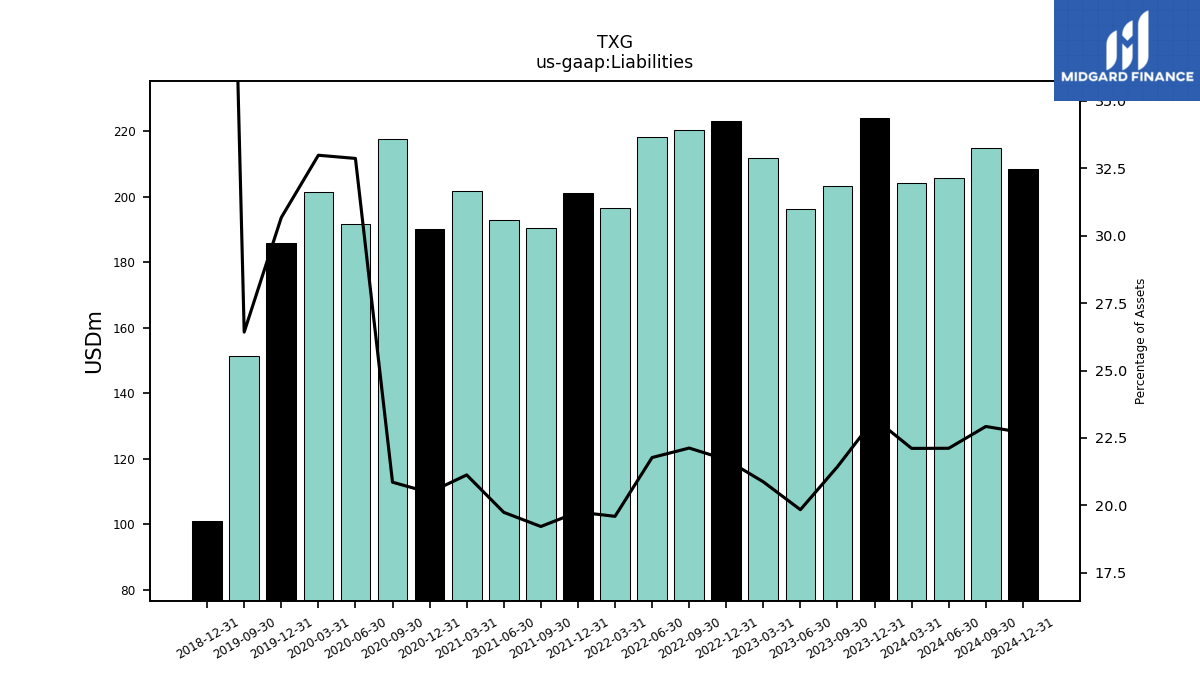
| Liabilities | 203.32 | 196.34 | 211.65 | 223.24 | 220.41 | 218.07 | 196.57 | 201.26 | 190.35 | 192.99 | 201.57 | 190.27 | 217.46 | 191.53 | 201.32 | 185.84 | 151.37 | NA | NA | 101.05 | NA | NA | NA | |
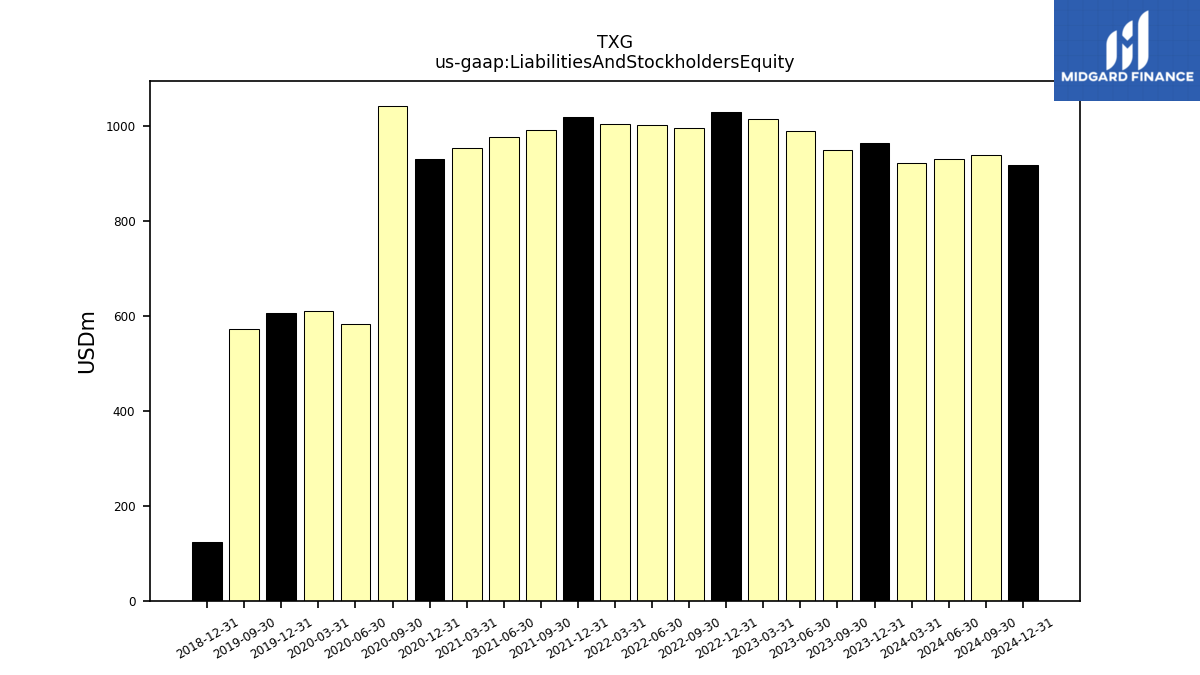
| Liabilities And Stockholders Equity | 948.54 | 989.64 | 1014.03 | 1028.98 | 996.21 | 1001.59 | 1003.25 | 1018.83 | 990.57 | 977.58 | 954.03 | 929.34 | 1042.54 | 582.80 | 610.38 | 605.92 | 572.82 | NA | NA | 124.31 | NA | NA | NA | |
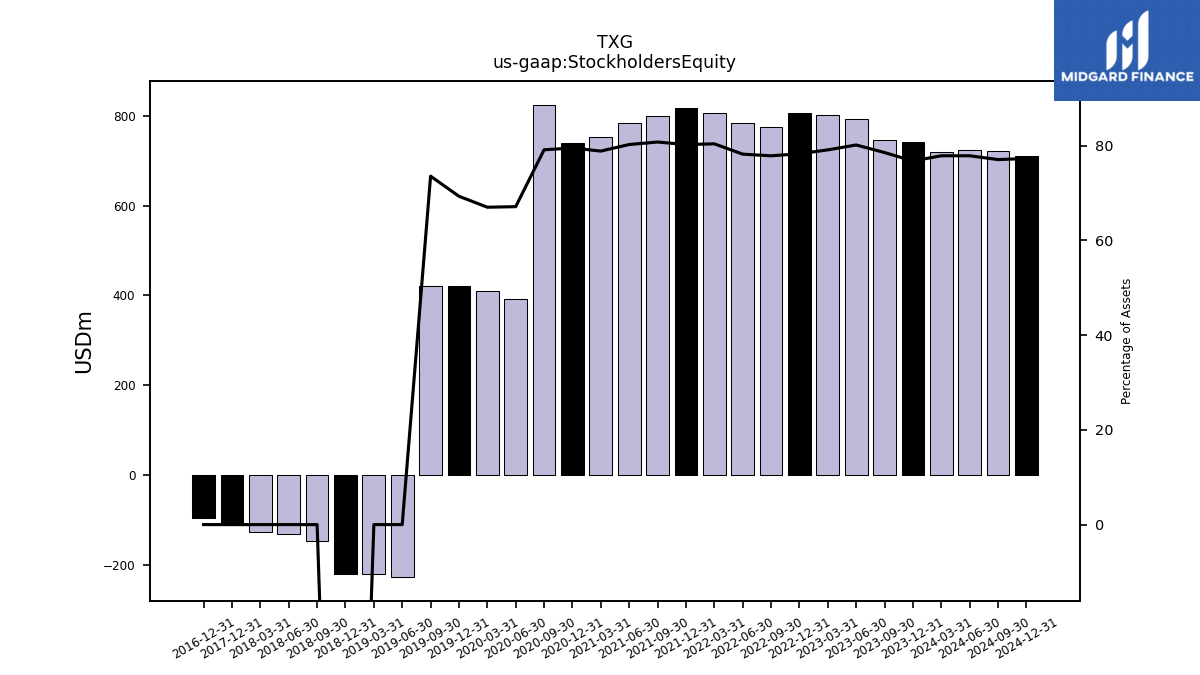
| Stockholders Equity | 745.22 | 793.30 | 802.38 | 805.74 | 775.79 | 783.52 | 806.68 | 817.57 | 800.22 | 784.59 | 752.46 | 739.07 | 825.08 | 391.27 | 409.07 | 420.08 | 421.45 | -227.95 | -221.29 | -219.99 | -146.77 | -132.47 | -127.25 |
| 2023-09-30 | 2023-06-30 | 2023-03-31 | 2022-12-31 | 2022-09-30 | 2022-06-30 | 2022-03-31 | 2021-12-31 | 2021-09-30 | 2021-06-30 | 2021-03-31 | 2020-12-31 | 2020-09-30 | 2020-06-30 | 2020-03-31 | 2019-12-31 | 2019-09-30 | 2019-06-30 | 2019-03-31 | 2018-12-31 | 2018-09-30 | 2018-06-30 | 2018-03-31 | ||
|---|---|---|---|---|---|---|---|---|---|---|---|---|---|---|---|---|---|---|---|---|---|---|---|---|
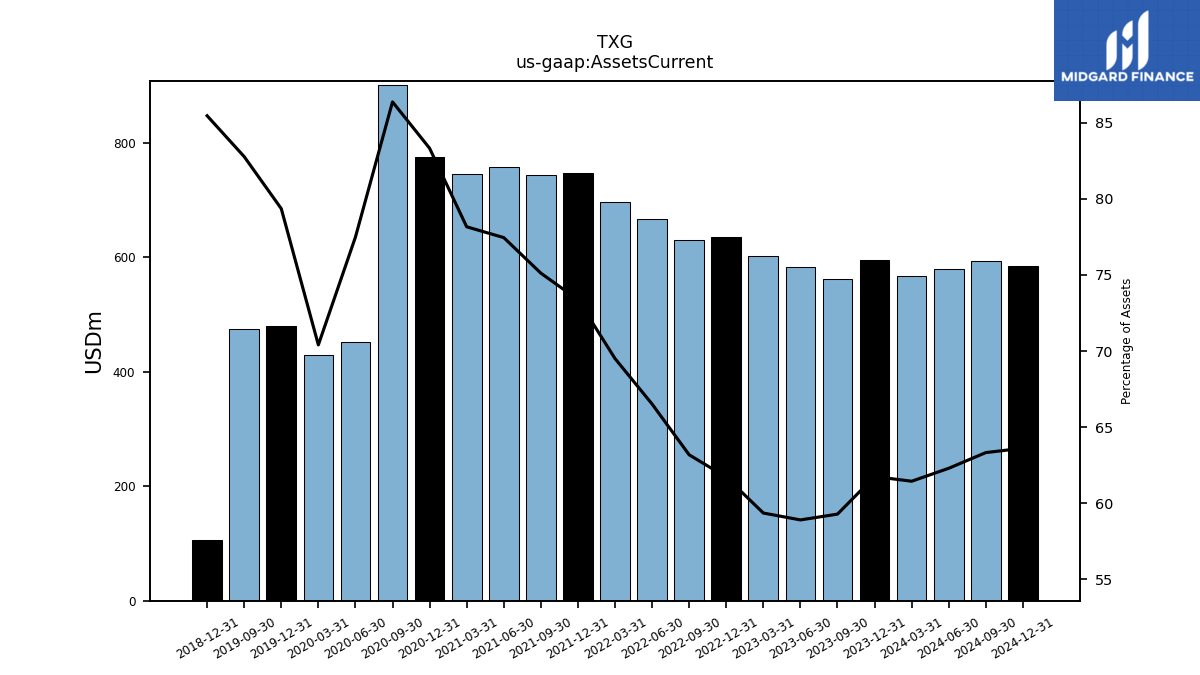
| Assets Current | 562.35 | 582.94 | 601.89 | 635.03 | 629.42 | 666.23 | 697.34 | 747.59 | 744.10 | 757.17 | 745.72 | 774.37 | 900.45 | 451.58 | 429.73 | 480.84 | 474.14 | NA | NA | 106.24 | NA | NA | NA | |
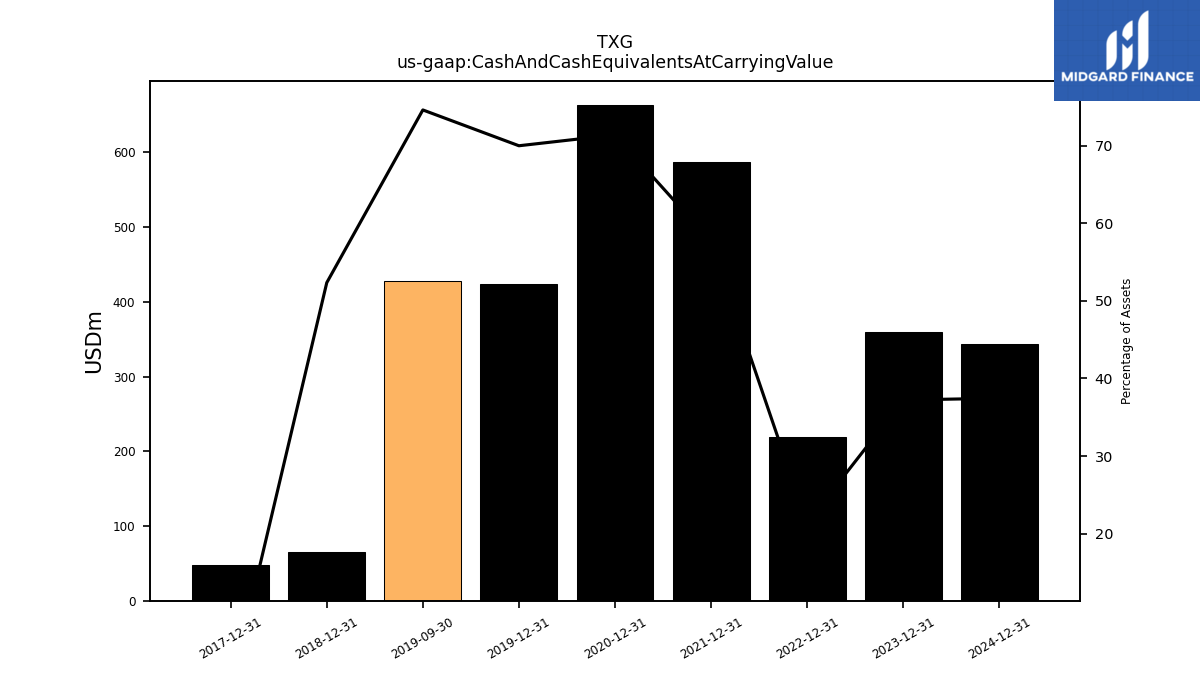
| Cash And Cash Equivalents At Carrying Value | NA | NA | NA | 219.75 | NA | NA | NA | 587.45 | NA | NA | NA | 663.60 | NA | NA | NA | 424.17 | 427.44 | NA | NA | 65.08 | NA | NA | NA | |
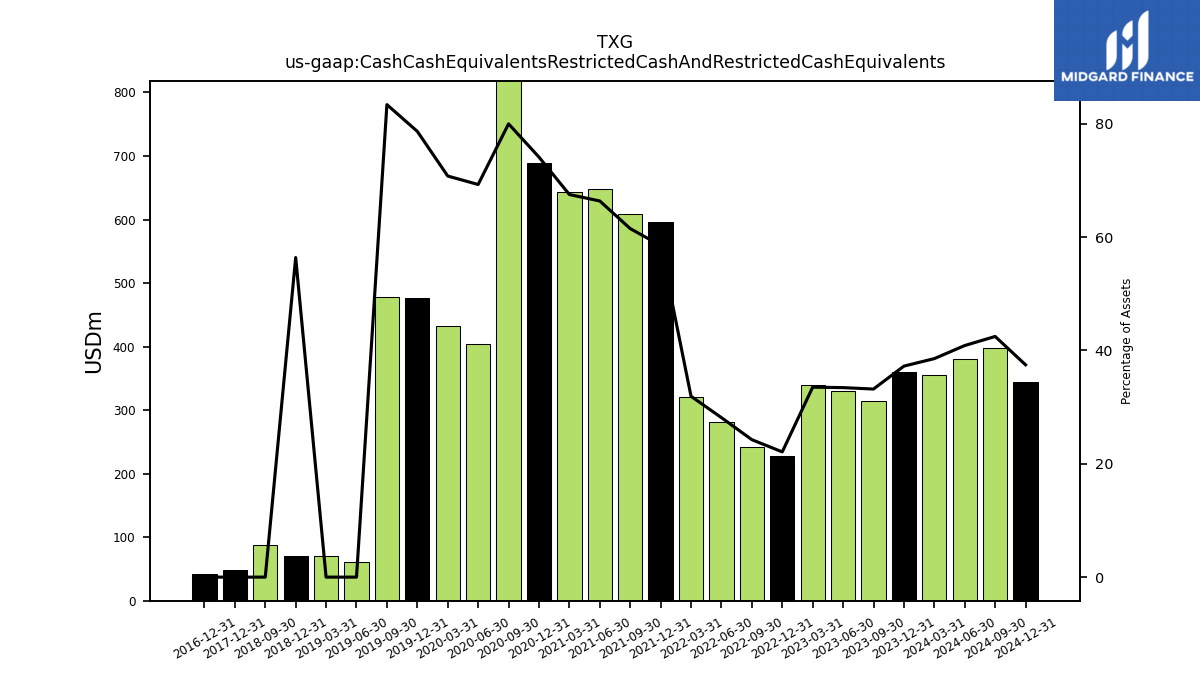
| Cash Cash Equivalents Restricted Cash And Restricted Cash Equivalents | 314.74 | 330.85 | 339.79 | 227.35 | 241.55 | 281.79 | 320.11 | 596.07 | 609.07 | 648.71 | 643.96 | 688.64 | 833.70 | 403.69 | 431.90 | 476.49 | 477.49 | 61.04 | 70.96 | 70.09 | 88.06 | NA | NA | |
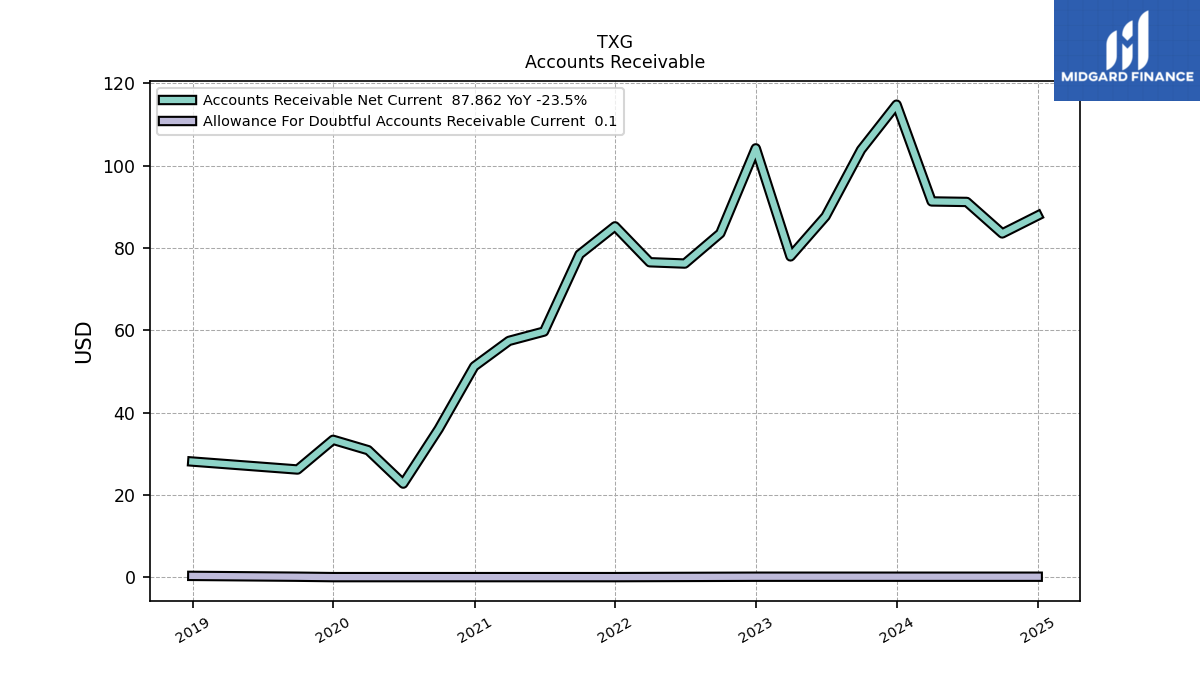
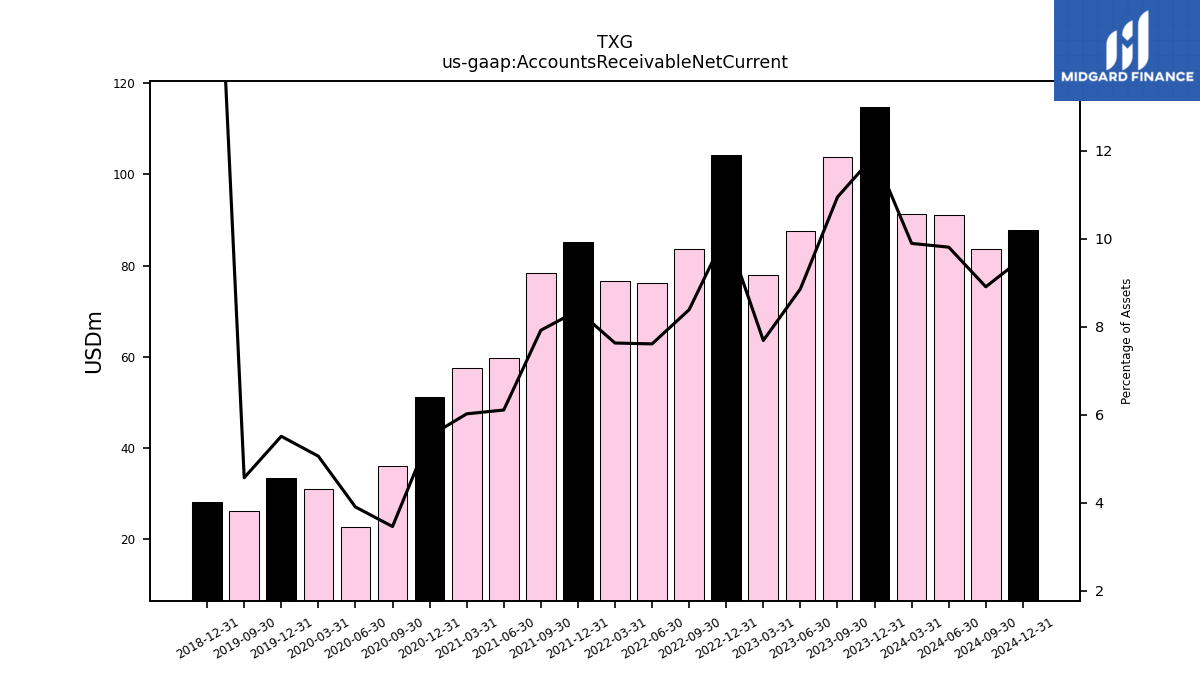
| Accounts Receivable Net Current | 103.85 | 87.69 | 77.94 | 104.21 | 83.55 | 76.20 | 76.53 | 85.25 | 78.43 | 59.68 | 57.41 | 51.21 | 36.03 | 22.73 | 30.85 | 33.37 | 26.15 | NA | NA | 28.09 | NA | NA | NA | |
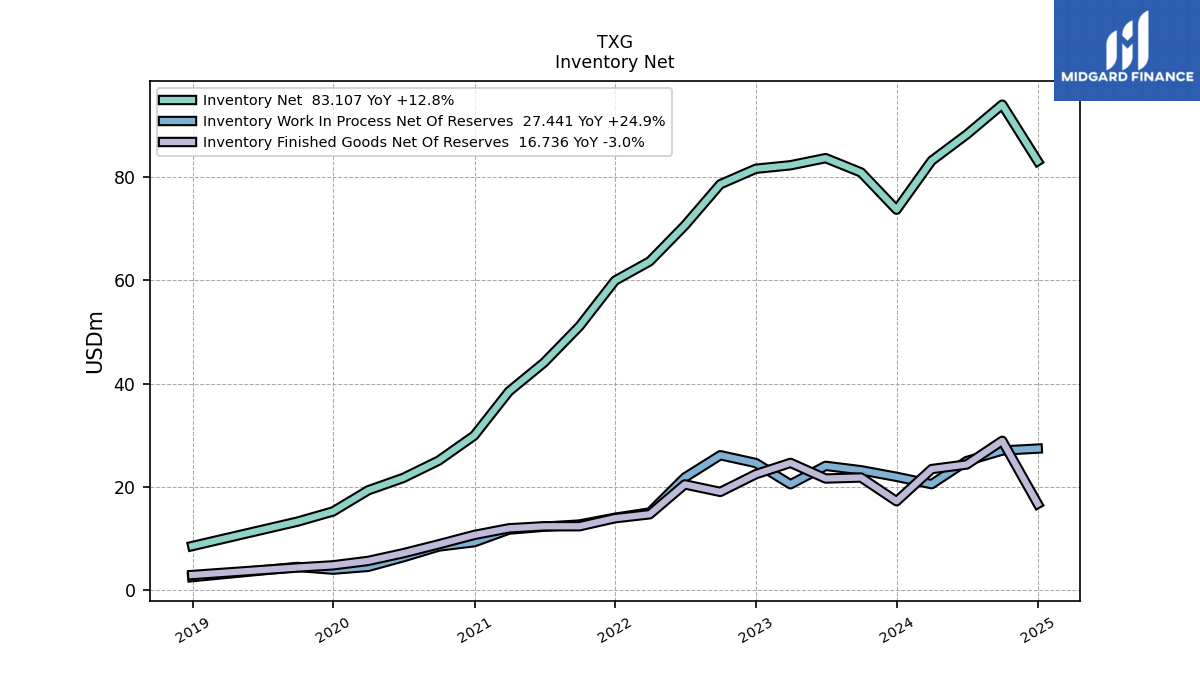
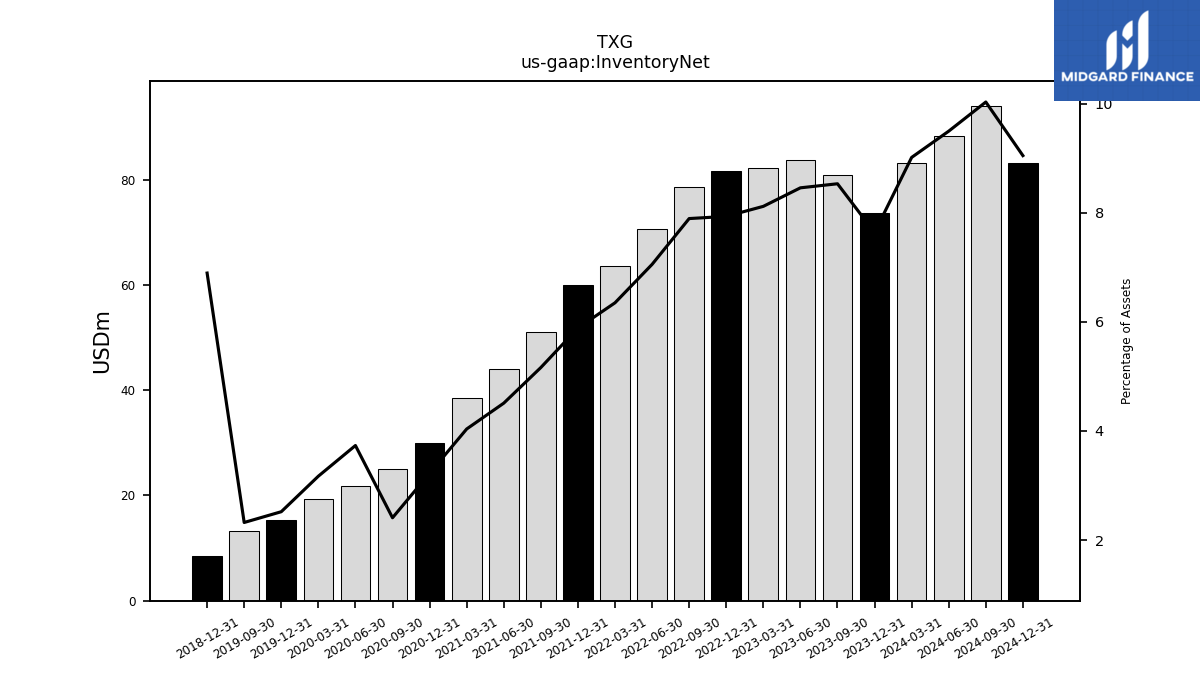
| Inventory Net | 80.92 | 83.69 | 82.31 | 81.63 | 78.63 | 70.65 | 63.70 | 59.97 | 51.14 | 44.09 | 38.51 | 29.96 | 25.12 | 21.76 | 19.36 | 15.27 | 13.30 | NA | NA | 8.57 | NA | NA | NA | |
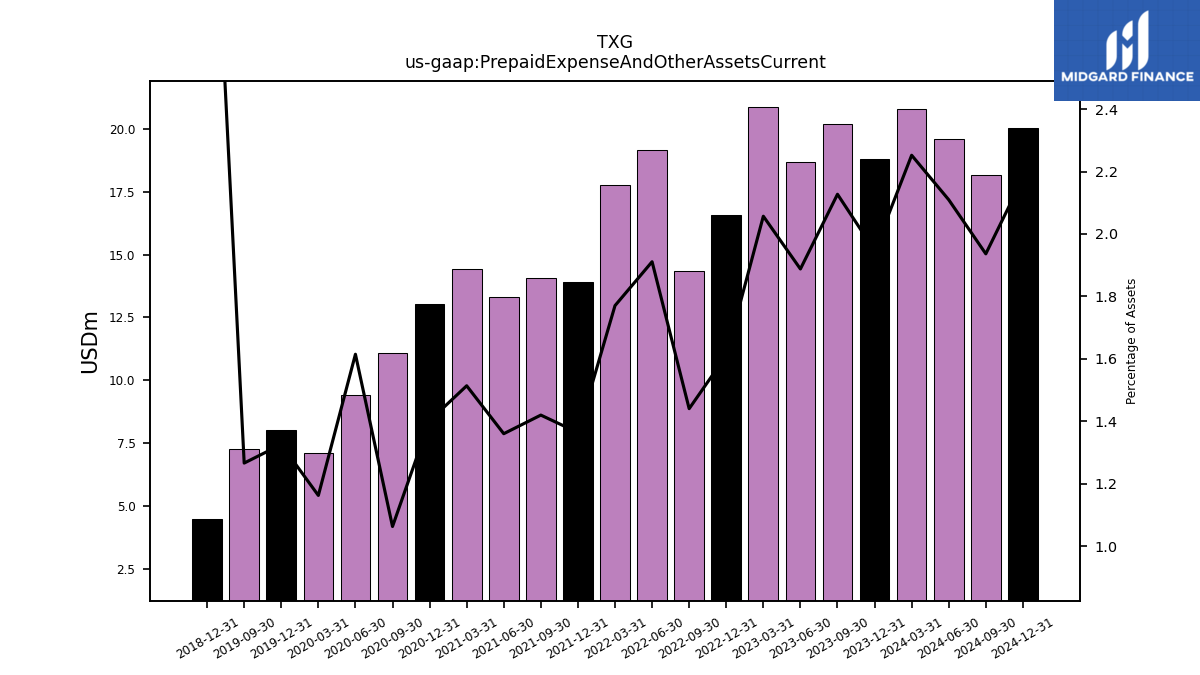
| Prepaid Expense And Other Assets Current | 20.18 | 18.68 | 20.86 | 16.58 | 14.35 | 19.14 | 17.76 | 13.90 | 14.06 | 13.30 | 14.44 | 13.03 | 11.08 | 9.41 | 7.10 | 8.03 | 7.25 | NA | NA | 4.50 | NA | NA | NA | |
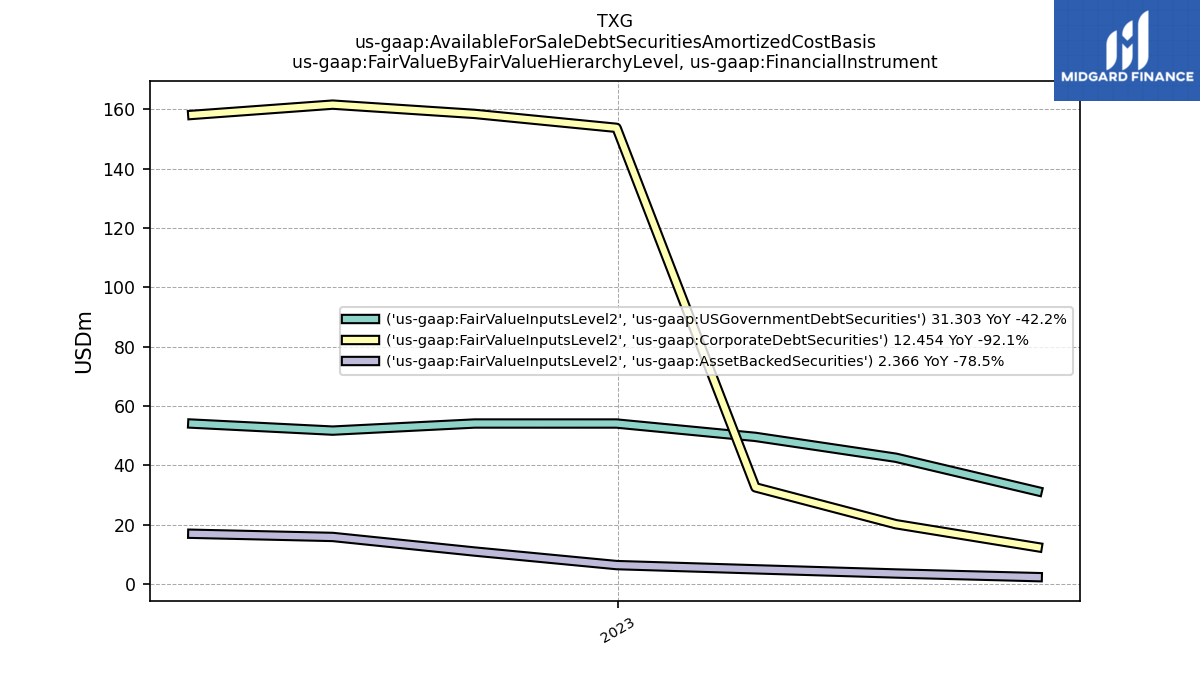
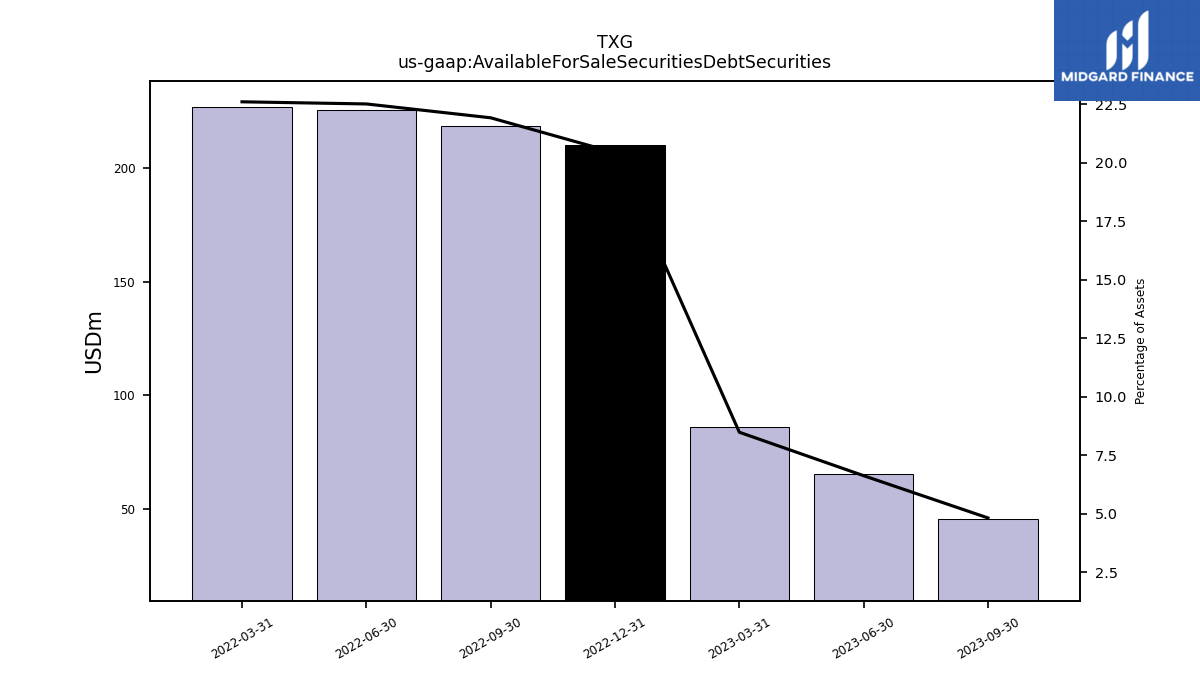
| Available For Sale Securities Debt Securities | 45.64 | 65.51 | 85.97 | 210.24 | 218.44 | 225.55 | 226.84 | NA | NA | NA | NA | NA | NA | NA | NA | NA | NA | NA | NA | NA | NA | NA | NA |
| 2023-09-30 | 2023-06-30 | 2023-03-31 | 2022-12-31 | 2022-09-30 | 2022-06-30 | 2022-03-31 | 2021-12-31 | 2021-09-30 | 2021-06-30 | 2021-03-31 | 2020-12-31 | 2020-09-30 | 2020-06-30 | 2020-03-31 | 2019-12-31 | 2019-09-30 | 2019-06-30 | 2019-03-31 | 2018-12-31 | 2018-09-30 | 2018-06-30 | 2018-03-31 | ||
|---|---|---|---|---|---|---|---|---|---|---|---|---|---|---|---|---|---|---|---|---|---|---|---|---|
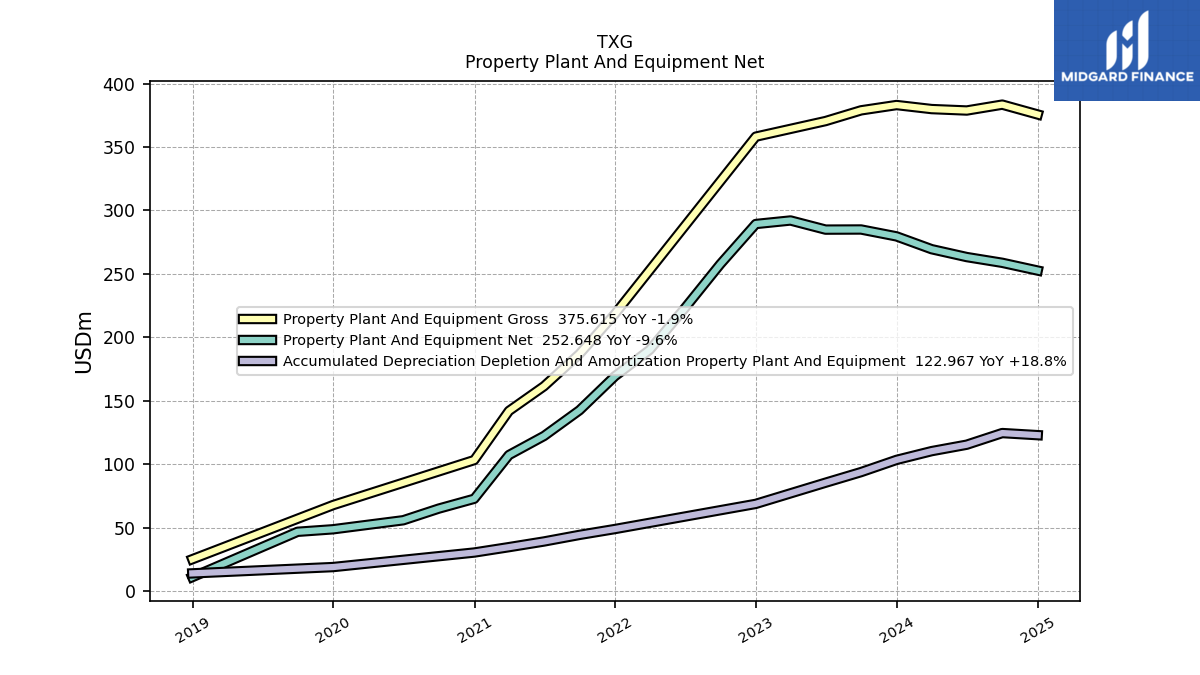
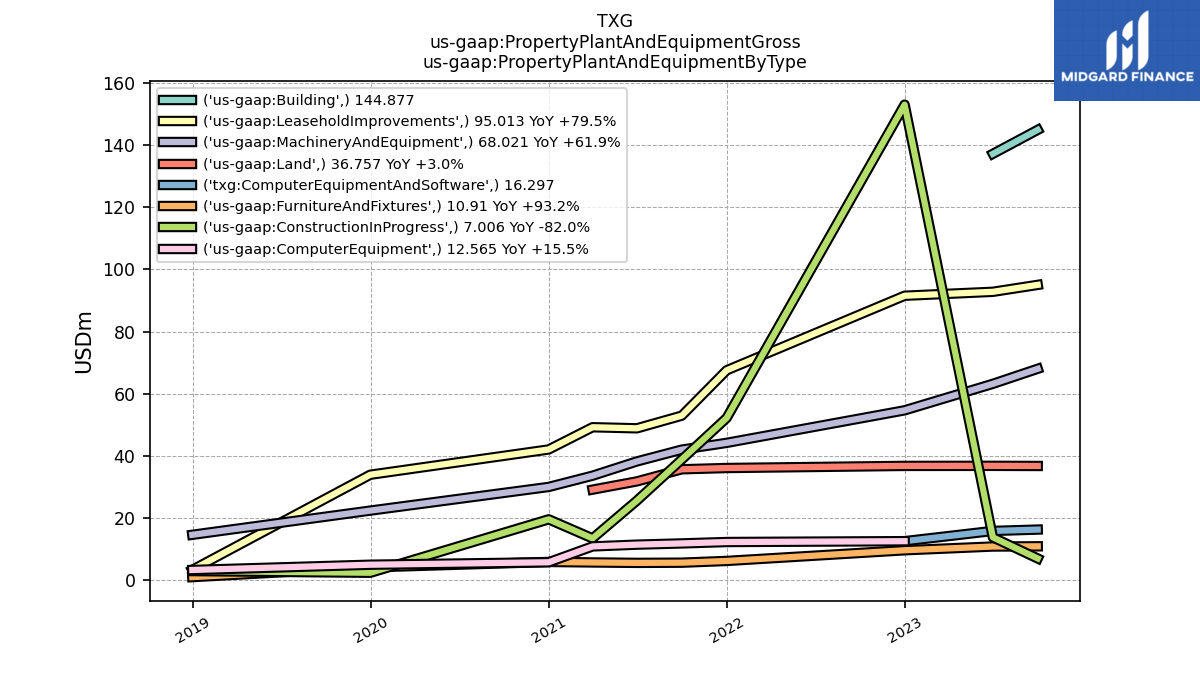
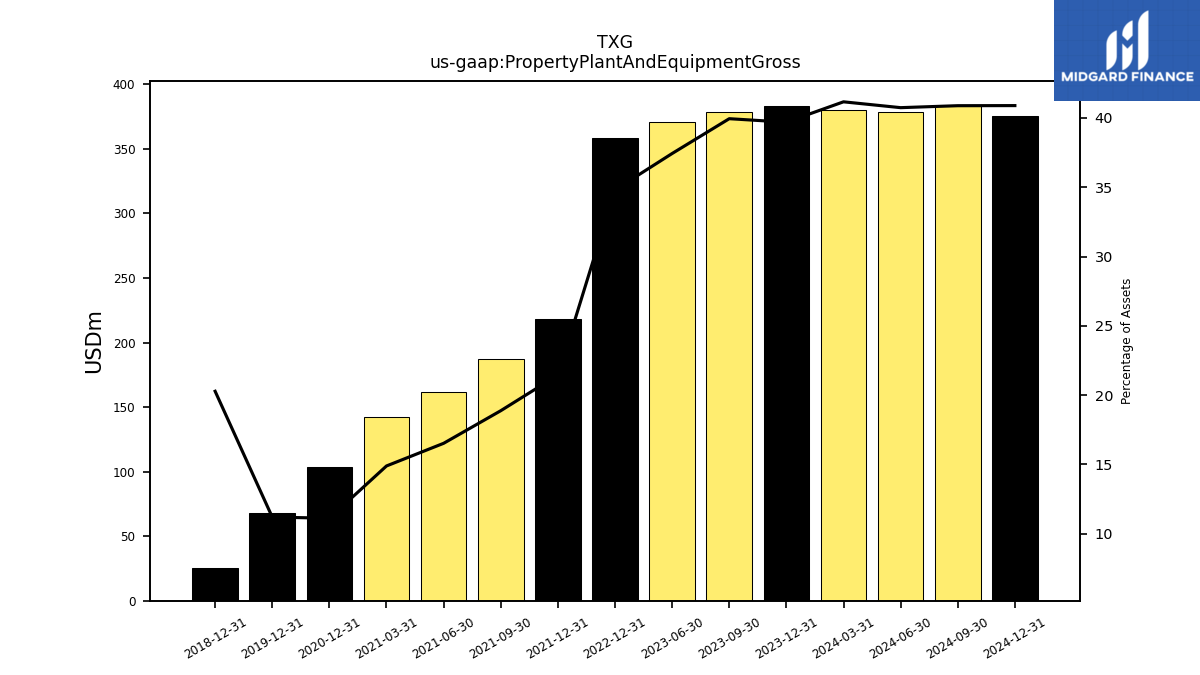
| Property Plant And Equipment Gross | 378.88 | 370.44 | NA | 358.16 | NA | NA | NA | 218.51 | 186.98 | 161.54 | 142.06 | 103.34 | NA | NA | NA | 67.88 | NA | NA | NA | 25.21 | NA | NA | NA | |
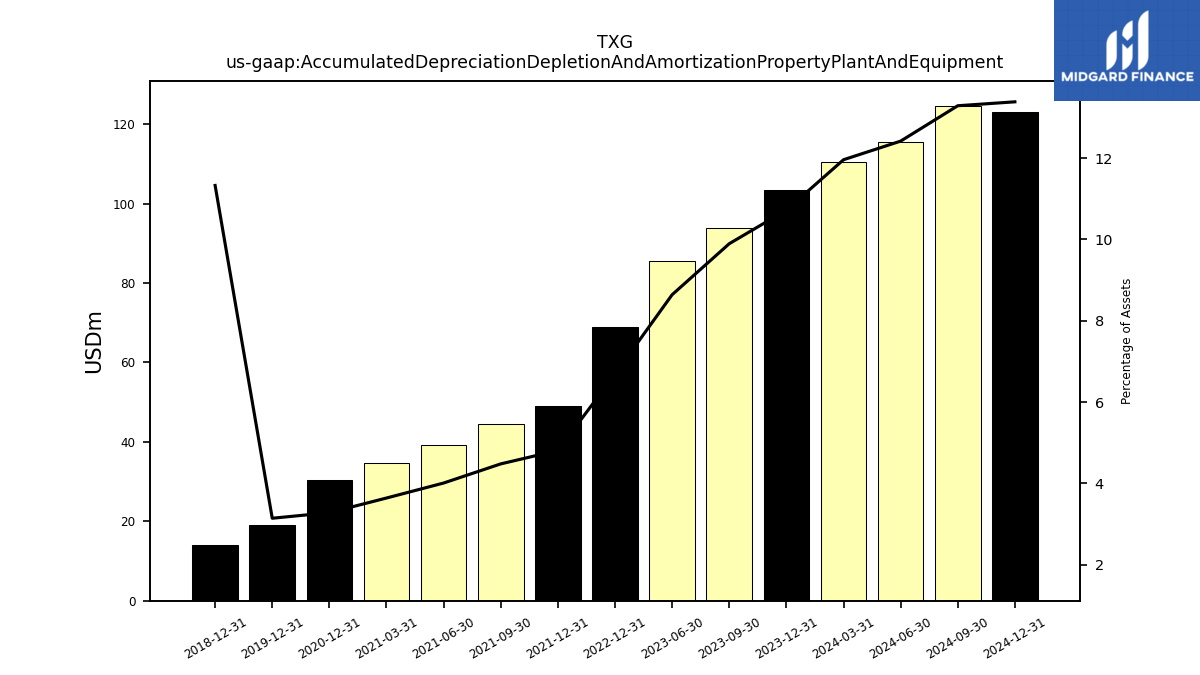
| Accumulated Depreciation Depletion And Amortization Property Plant And Equipment | 93.87 | 85.53 | NA | 68.83 | NA | NA | NA | 49.02 | 44.39 | 39.21 | 34.75 | 30.50 | NA | NA | NA | 19.05 | NA | NA | NA | 14.08 | NA | NA | NA | |
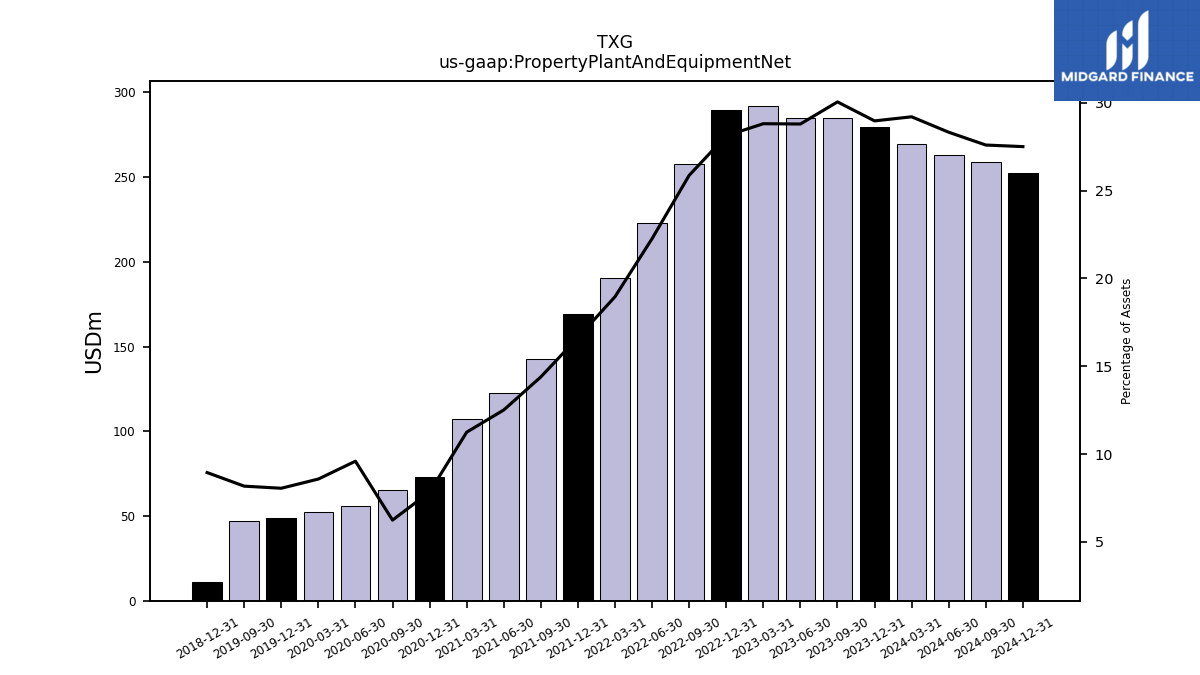
| Property Plant And Equipment Net | 285.01 | 284.91 | 292.11 | 289.33 | 257.69 | 223.00 | 190.20 | 169.49 | 142.59 | 122.33 | 107.31 | 72.84 | 65.11 | 55.93 | 52.38 | 48.82 | 46.84 | NA | NA | 11.13 | NA | NA | NA | |
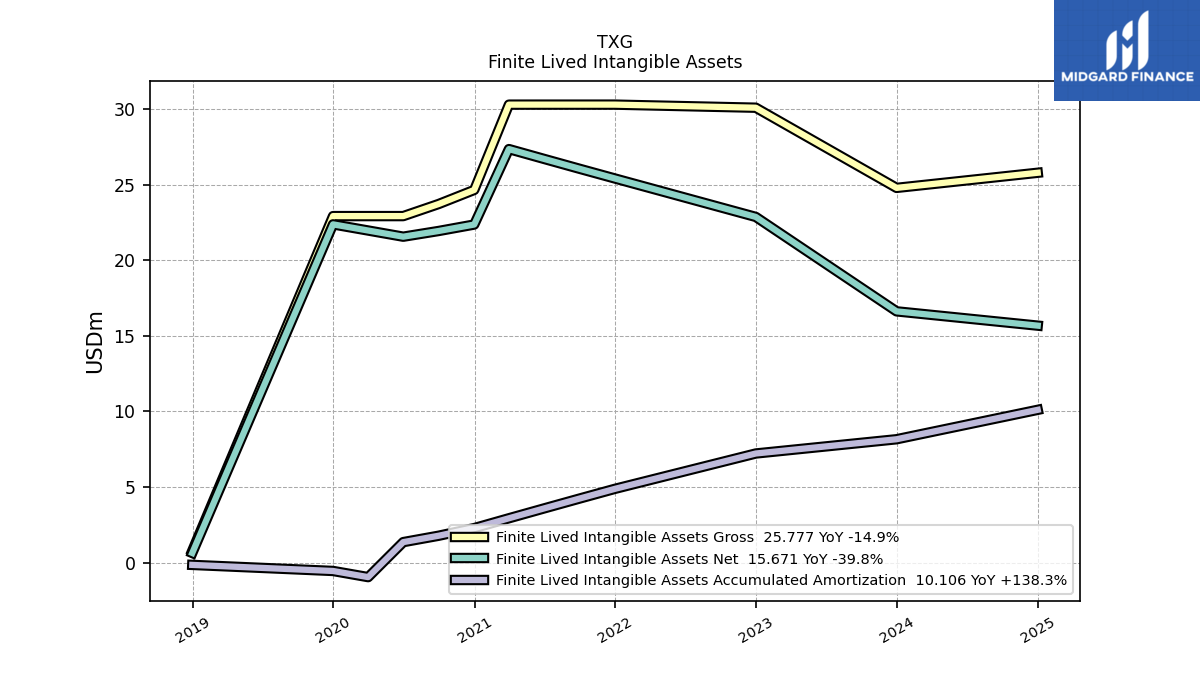
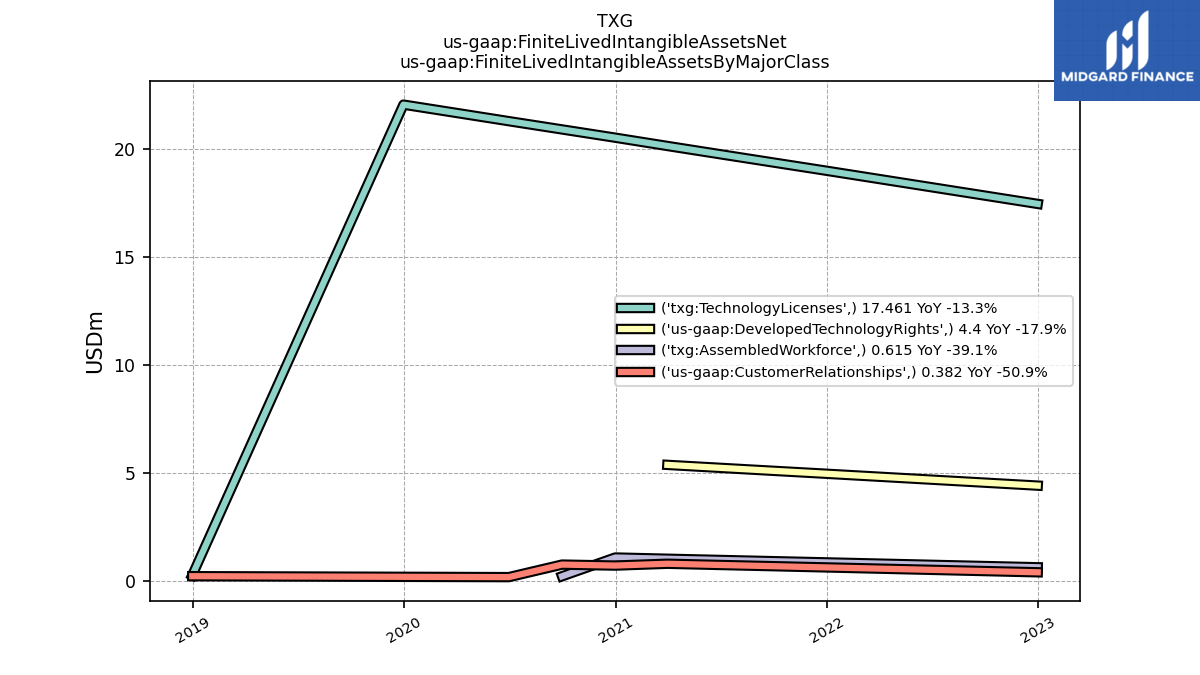
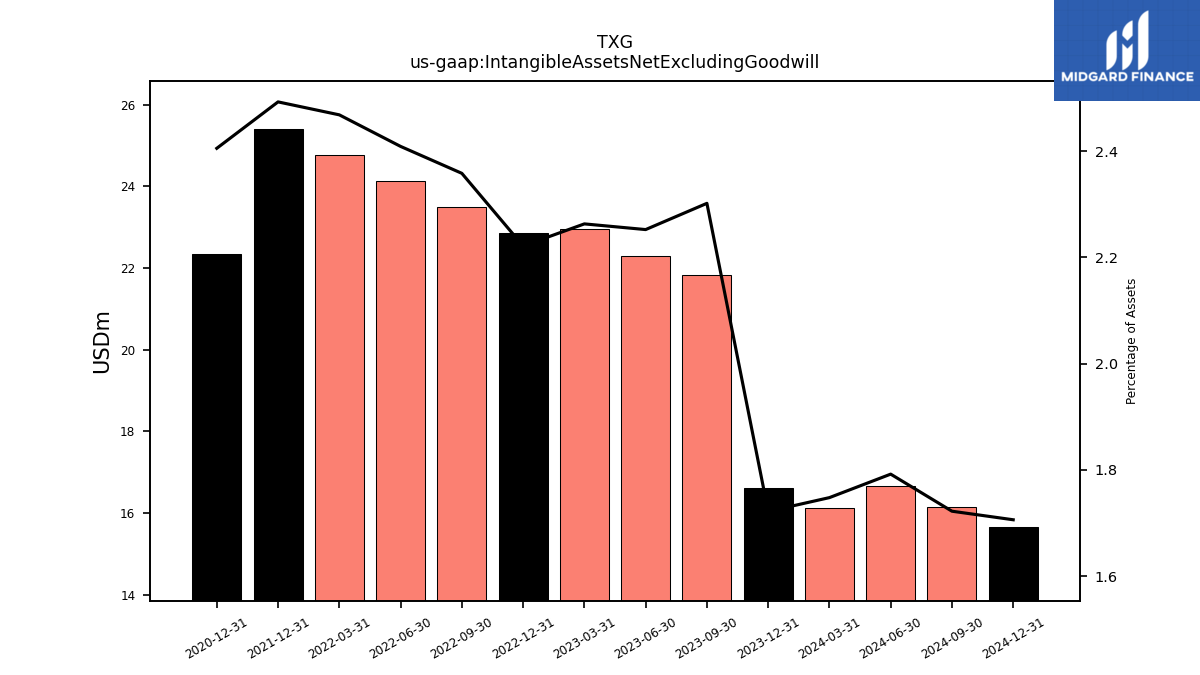
| Intangible Assets Net Excluding Goodwill | 21.83 | 22.29 | 22.95 | 22.86 | 23.49 | 24.13 | 24.76 | 25.40 | NA | NA | NA | 22.35 | NA | NA | NA | NA | NA | NA | NA | NA | NA | NA | NA | |
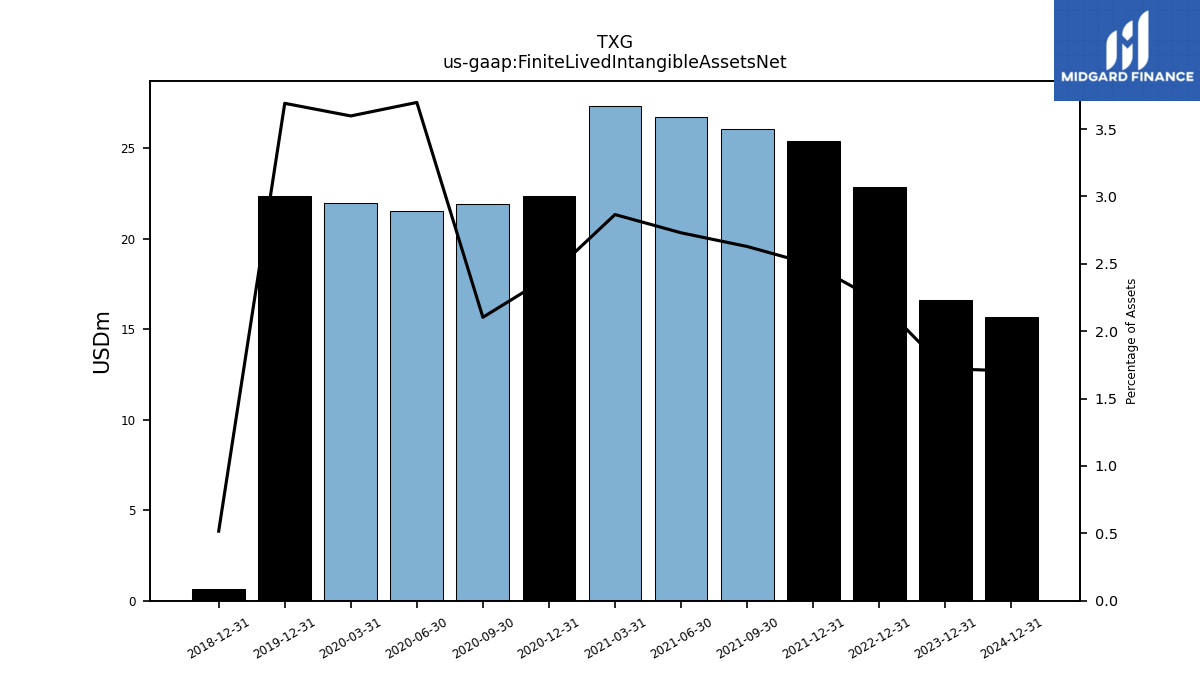
| Finite Lived Intangible Assets Net | NA | NA | NA | 22.86 | NA | NA | NA | 25.40 | 26.04 | 26.69 | 27.34 | 22.35 | 21.93 | 21.55 | 21.96 | 22.37 | NA | NA | NA | 0.64 | NA | NA | NA | |
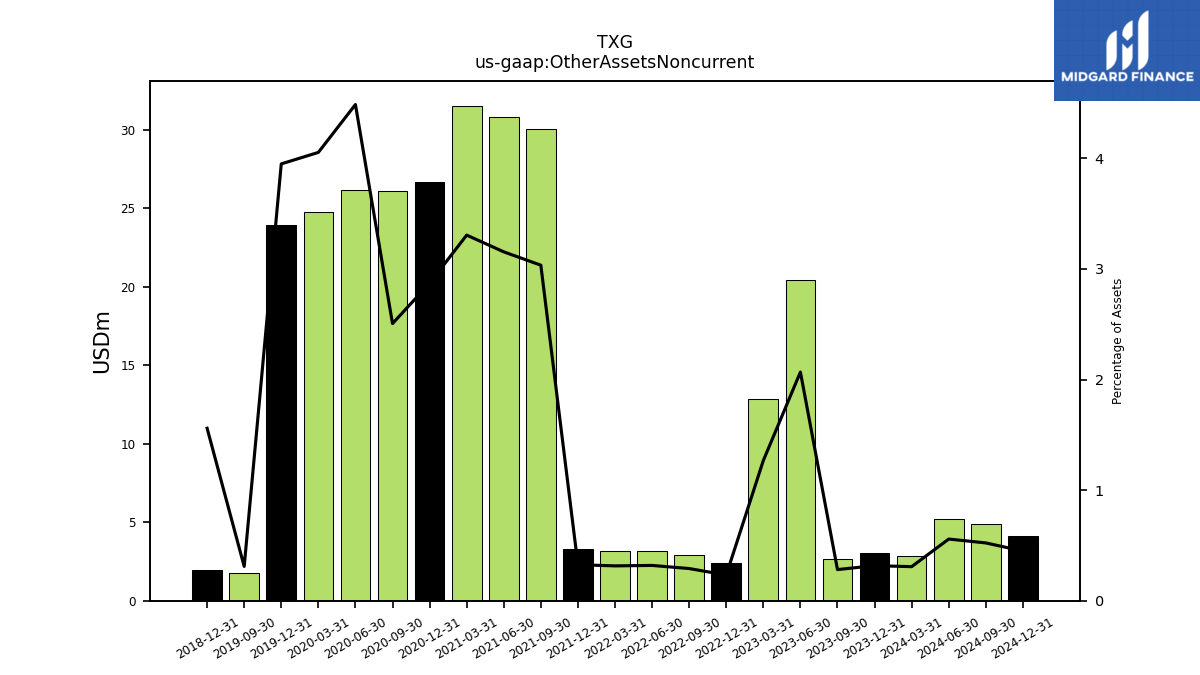
| Other Assets Noncurrent | 2.67 | 20.46 | 12.86 | 2.39 | 2.90 | 3.20 | 3.16 | 3.32 | 30.06 | 30.84 | 31.54 | 26.68 | 26.13 | 26.15 | 24.75 | 23.93 | 1.78 | NA | NA | 1.94 | NA | NA | NA | |
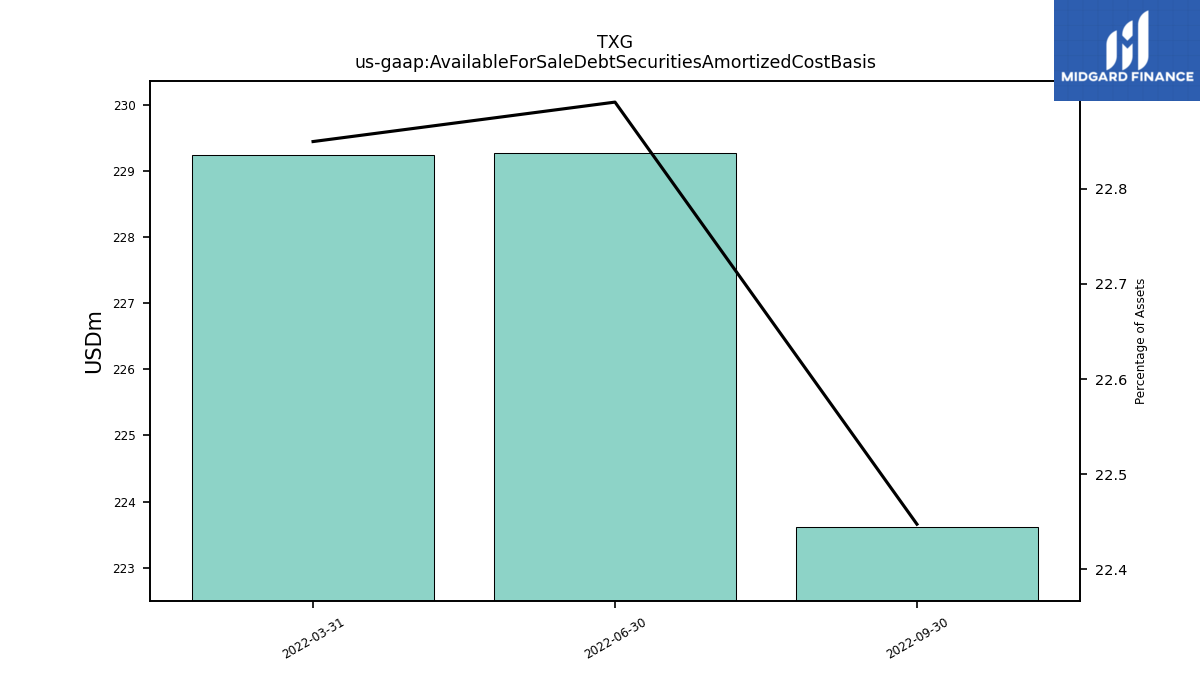
| Available For Sale Debt Securities Amortized Cost Basis | NA | NA | NA | NA | 223.62 | 229.28 | 229.24 | NA | NA | NA | NA | NA | NA | NA | NA | NA | NA | NA | NA | NA | NA | NA | NA |
| 2023-09-30 | 2023-06-30 | 2023-03-31 | 2022-12-31 | 2022-09-30 | 2022-06-30 | 2022-03-31 | 2021-12-31 | 2021-09-30 | 2021-06-30 | 2021-03-31 | 2020-12-31 | 2020-09-30 | 2020-06-30 | 2020-03-31 | 2019-12-31 | 2019-09-30 | 2019-06-30 | 2019-03-31 | 2018-12-31 | 2018-09-30 | 2018-06-30 | 2018-03-31 | ||
|---|---|---|---|---|---|---|---|---|---|---|---|---|---|---|---|---|---|---|---|---|---|---|---|---|
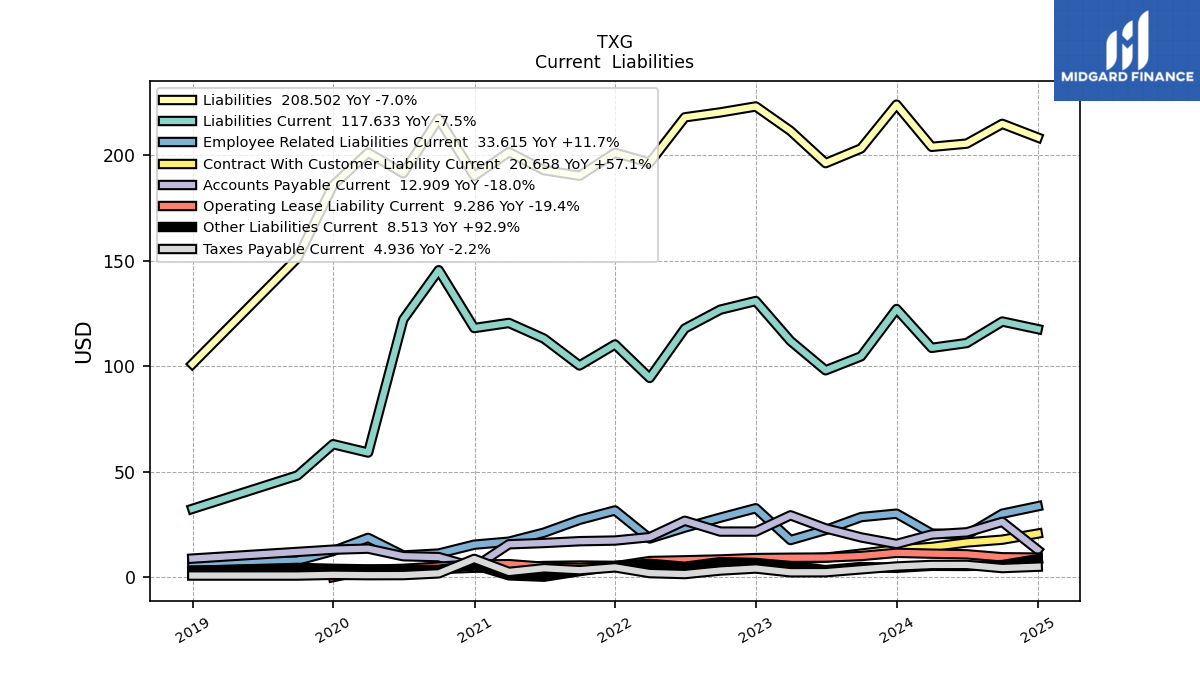
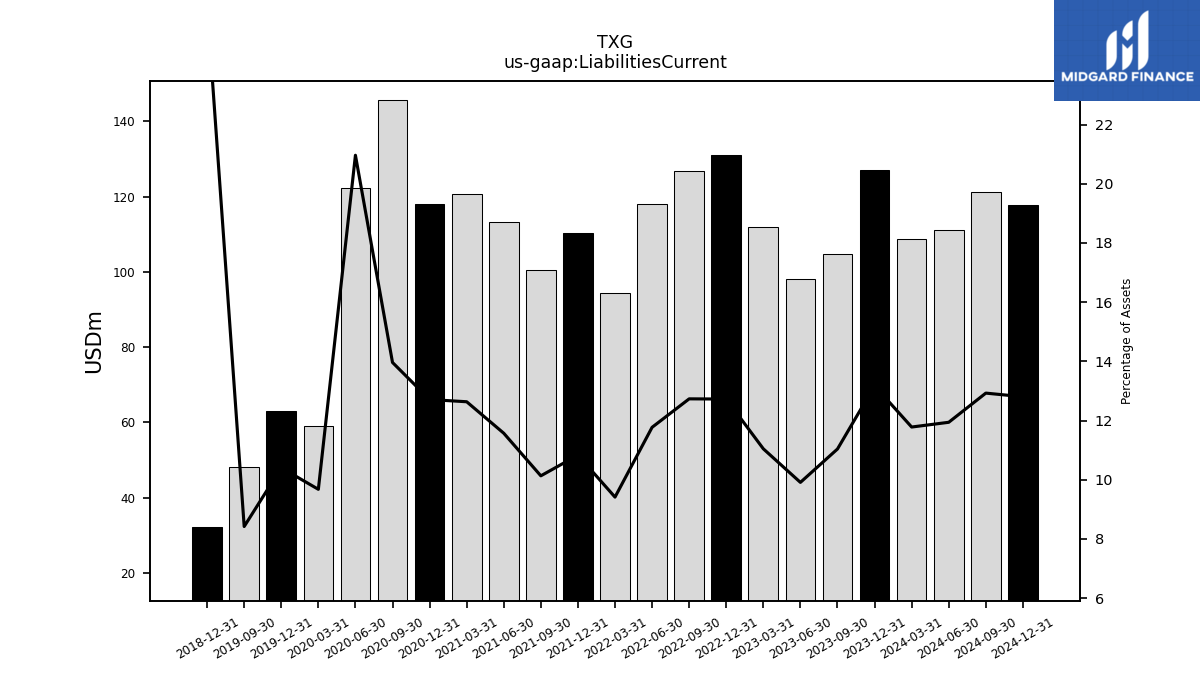
| Liabilities Current | 104.72 | 98.09 | 112.01 | 130.96 | 126.86 | 117.91 | 94.45 | 110.36 | 100.38 | 113.13 | 120.55 | 118.13 | 145.57 | 122.18 | 59.07 | 63.05 | 48.24 | NA | NA | 32.36 | NA | NA | NA | |
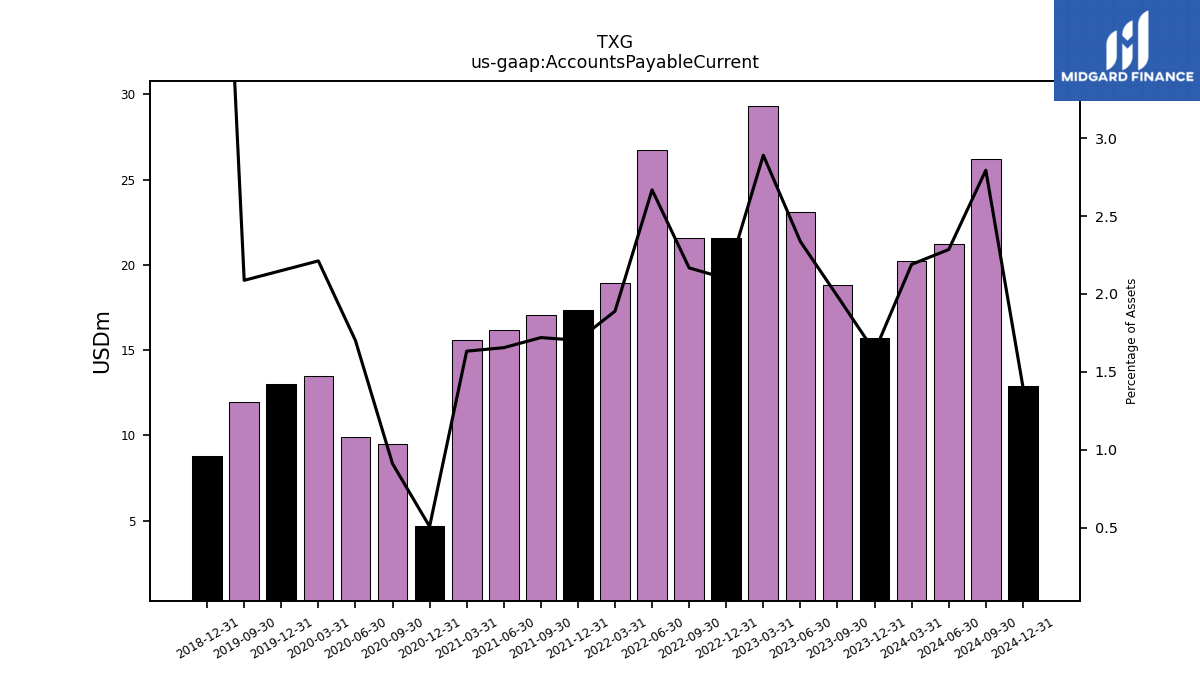
| Accounts Payable Current | 18.84 | 23.12 | 29.32 | 21.60 | 21.59 | 26.73 | 18.96 | 17.35 | 17.04 | 16.18 | 15.58 | 4.71 | 9.49 | 9.92 | 13.51 | 13.03 | 11.96 | NA | NA | 8.79 | NA | NA | NA | |
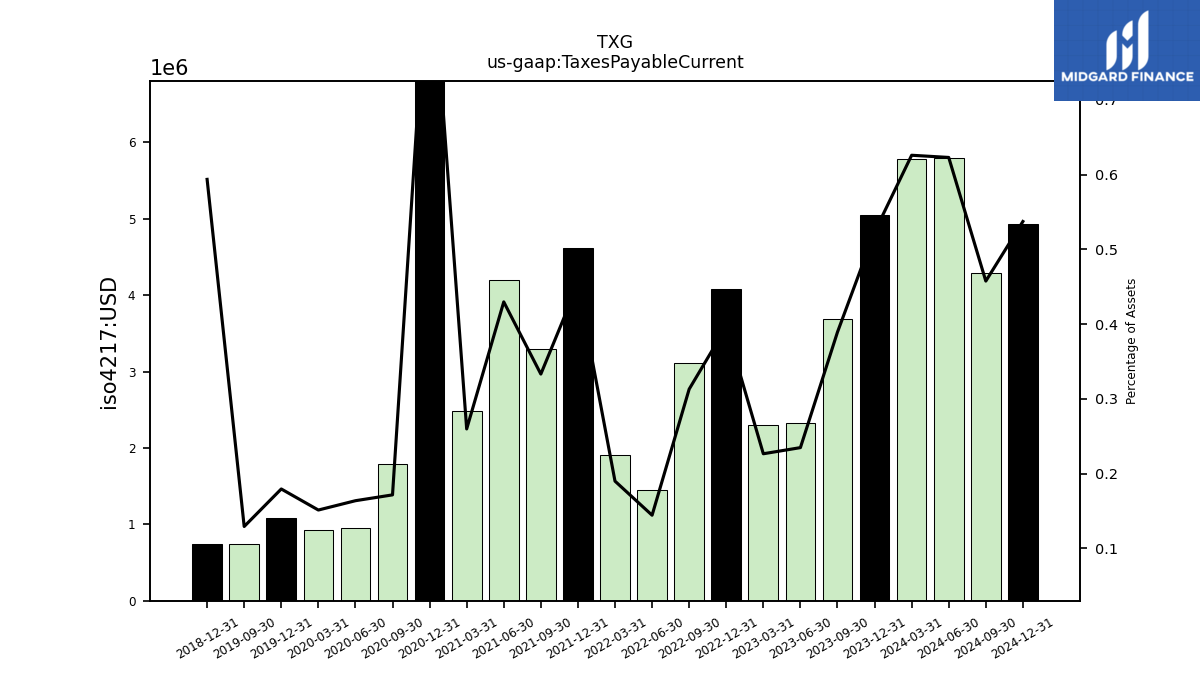
| Taxes Payable Current | 3.69 | 2.32 | 2.30 | 4.08 | 3.12 | 1.45 | 1.91 | 4.62 | 3.30 | 4.20 | 2.48 | 8.65 | 1.79 | 0.95 | 0.92 | 1.09 | 0.74 | NA | NA | 0.74 | NA | NA | NA | |
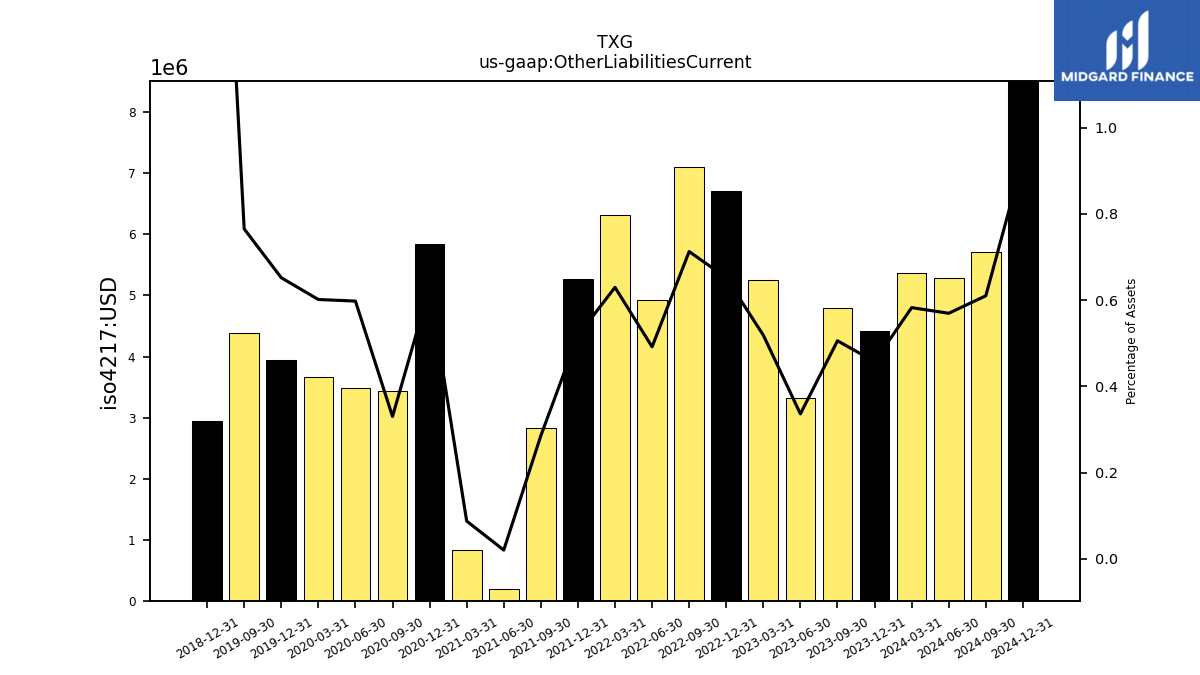
| Other Liabilities Current | 4.79 | 3.33 | 5.26 | 6.71 | 7.10 | 4.92 | 6.32 | 5.28 | 2.83 | 0.20 | 0.83 | 5.84 | 3.44 | 3.48 | 3.67 | 3.95 | 4.38 | NA | NA | 2.95 | NA | NA | NA | |
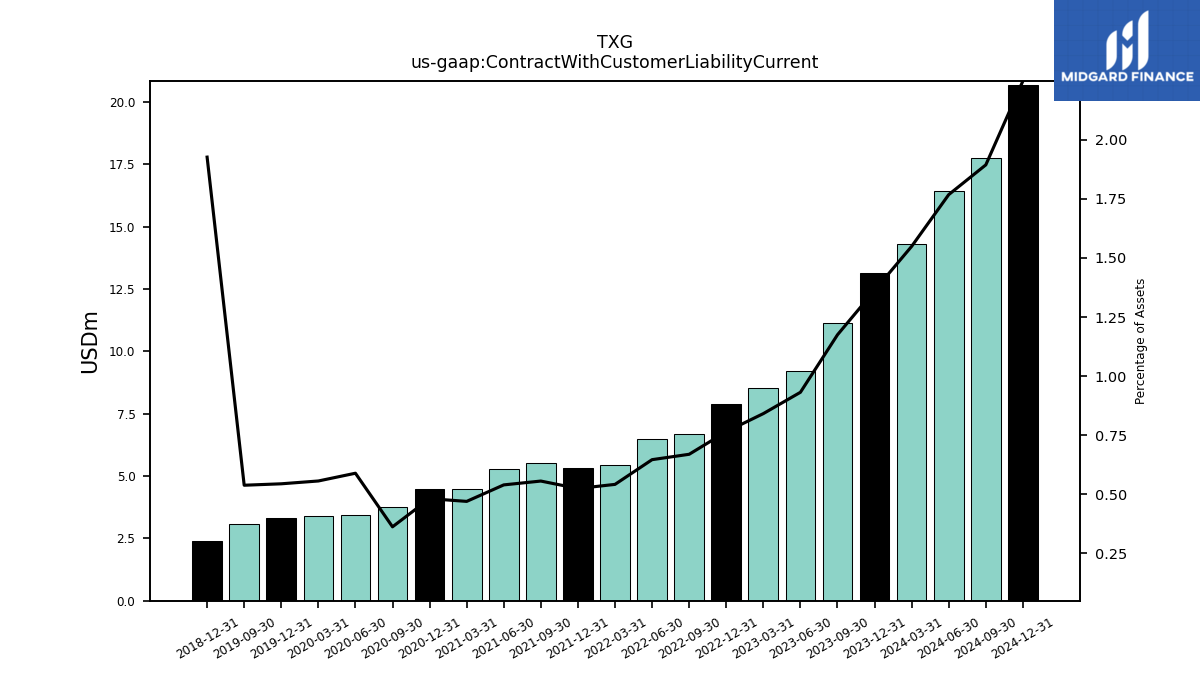
| Contract With Customer Liability Current | 11.14 | 9.22 | 8.53 | 7.87 | 6.67 | 6.47 | 5.43 | 5.34 | 5.50 | 5.27 | 4.48 | 4.47 | 3.77 | 3.43 | 3.39 | 3.30 | 3.08 | NA | NA | 2.40 | NA | NA | NA |
| 2023-09-30 | 2023-06-30 | 2023-03-31 | 2022-12-31 | 2022-09-30 | 2022-06-30 | 2022-03-31 | 2021-12-31 | 2021-09-30 | 2021-06-30 | 2021-03-31 | 2020-12-31 | 2020-09-30 | 2020-06-30 | 2020-03-31 | 2019-12-31 | 2019-09-30 | 2019-06-30 | 2019-03-31 | 2018-12-31 | 2018-09-30 | 2018-06-30 | 2018-03-31 | ||
|---|---|---|---|---|---|---|---|---|---|---|---|---|---|---|---|---|---|---|---|---|---|---|---|---|
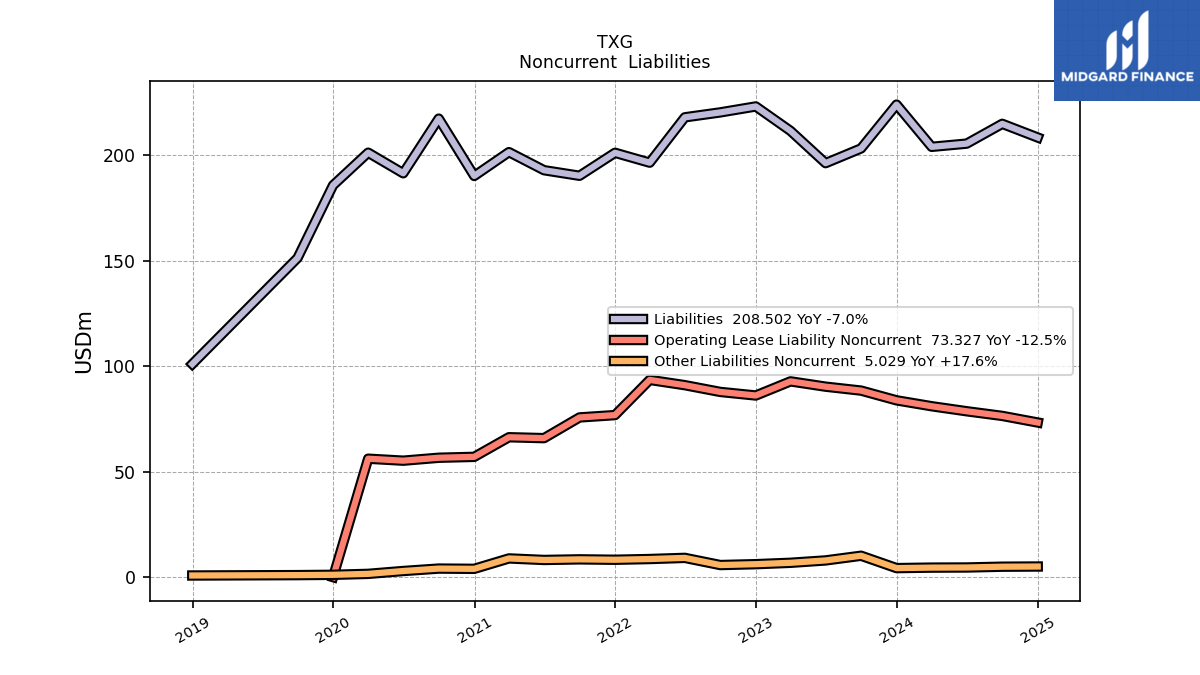
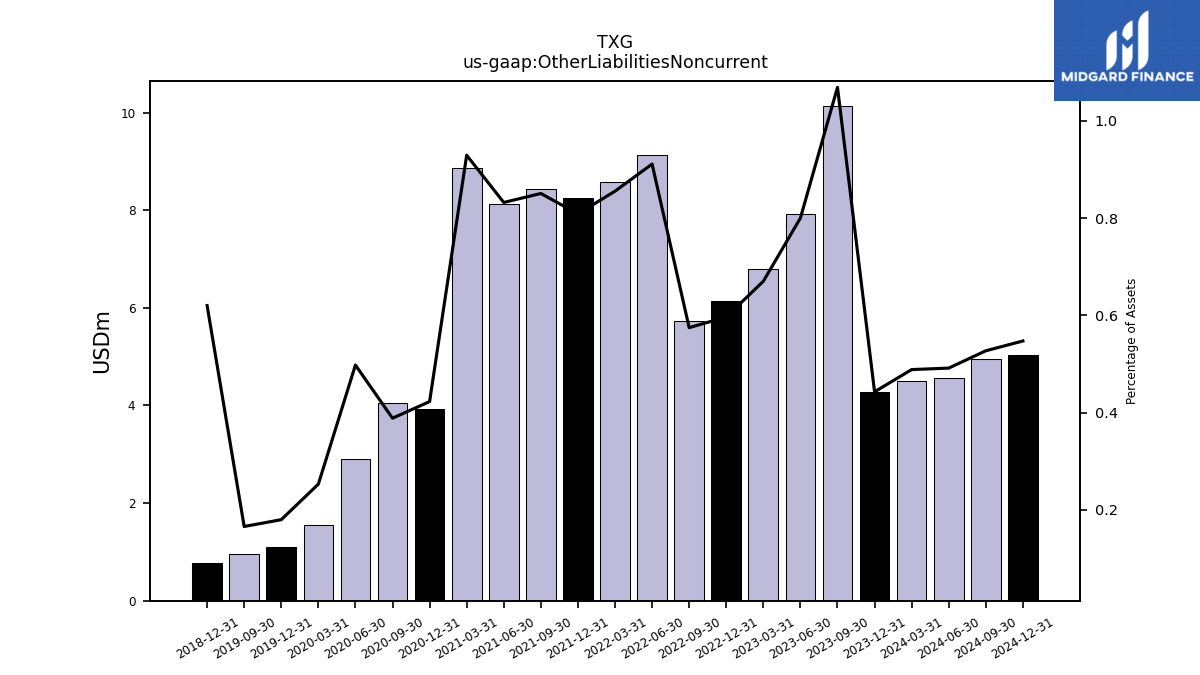
| Other Liabilities Noncurrent | 10.14 | 7.92 | 6.80 | 6.14 | 5.73 | 9.13 | 8.58 | 8.24 | 8.43 | 8.14 | 8.87 | 3.93 | 4.05 | 2.90 | 1.54 | 1.09 | 0.95 | NA | NA | 0.77 | NA | NA | NA | |
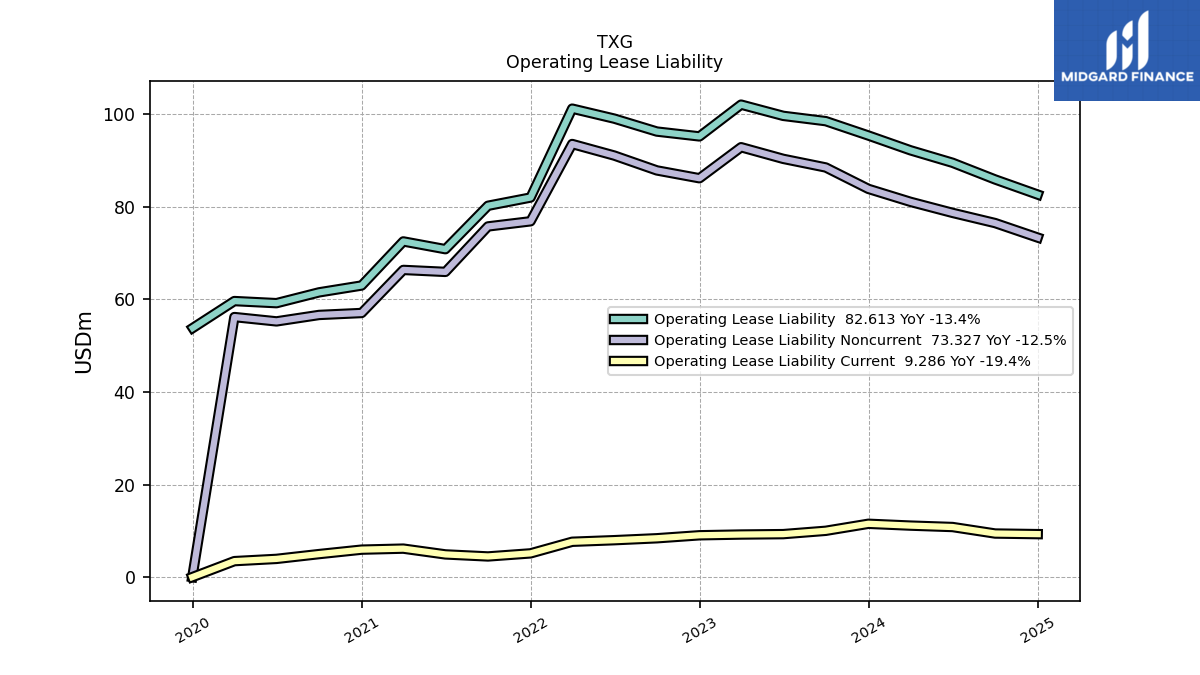
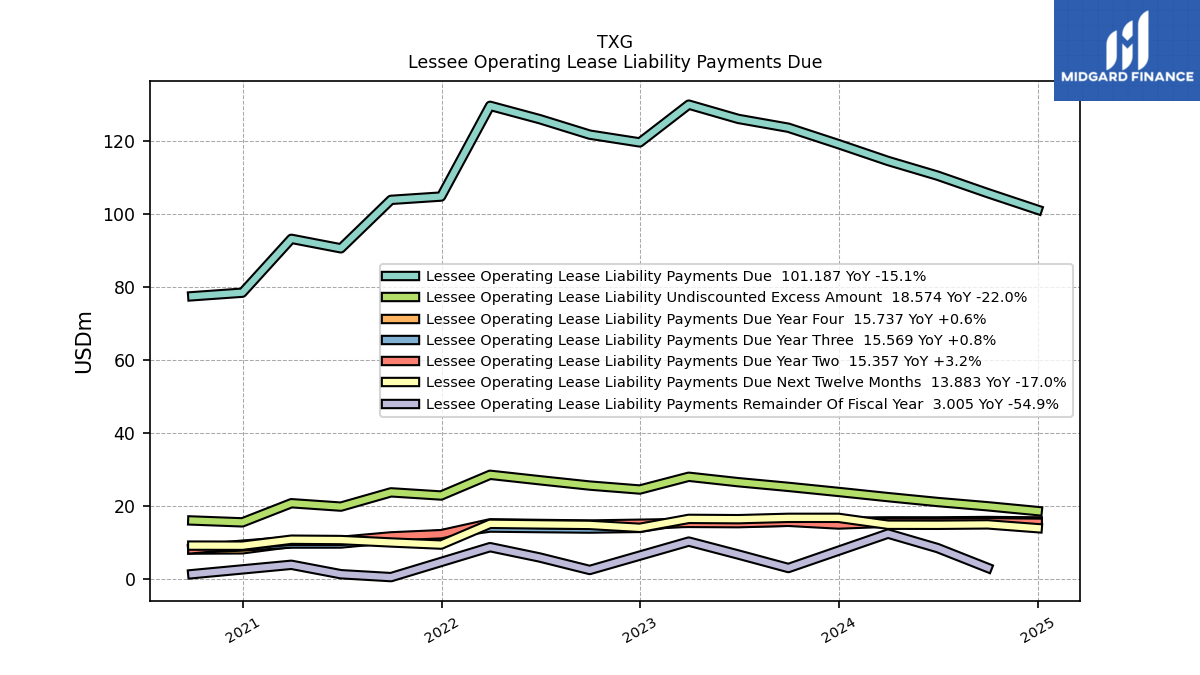
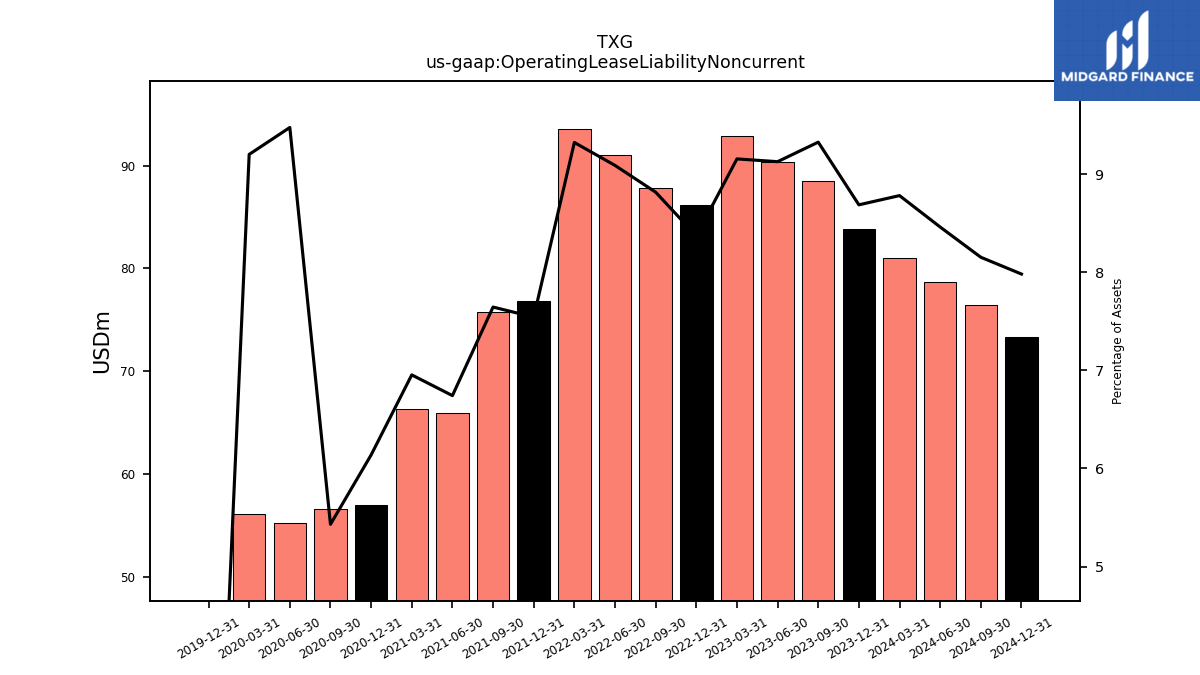
| Operating Lease Liability Noncurrent | 88.47 | 90.33 | 92.84 | 86.14 | 87.83 | 91.04 | 93.54 | 76.85 | 75.73 | 65.92 | 66.34 | 57.04 | 56.62 | 55.23 | 56.17 | 0.00 | NA | NA | NA | NA | NA | NA | NA |
| 2023-09-30 | 2023-06-30 | 2023-03-31 | 2022-12-31 | 2022-09-30 | 2022-06-30 | 2022-03-31 | 2021-12-31 | 2021-09-30 | 2021-06-30 | 2021-03-31 | 2020-12-31 | 2020-09-30 | 2020-06-30 | 2020-03-31 | 2019-12-31 | 2019-09-30 | 2019-06-30 | 2019-03-31 | 2018-12-31 | 2018-09-30 | 2018-06-30 | 2018-03-31 | ||
|---|---|---|---|---|---|---|---|---|---|---|---|---|---|---|---|---|---|---|---|---|---|---|---|---|
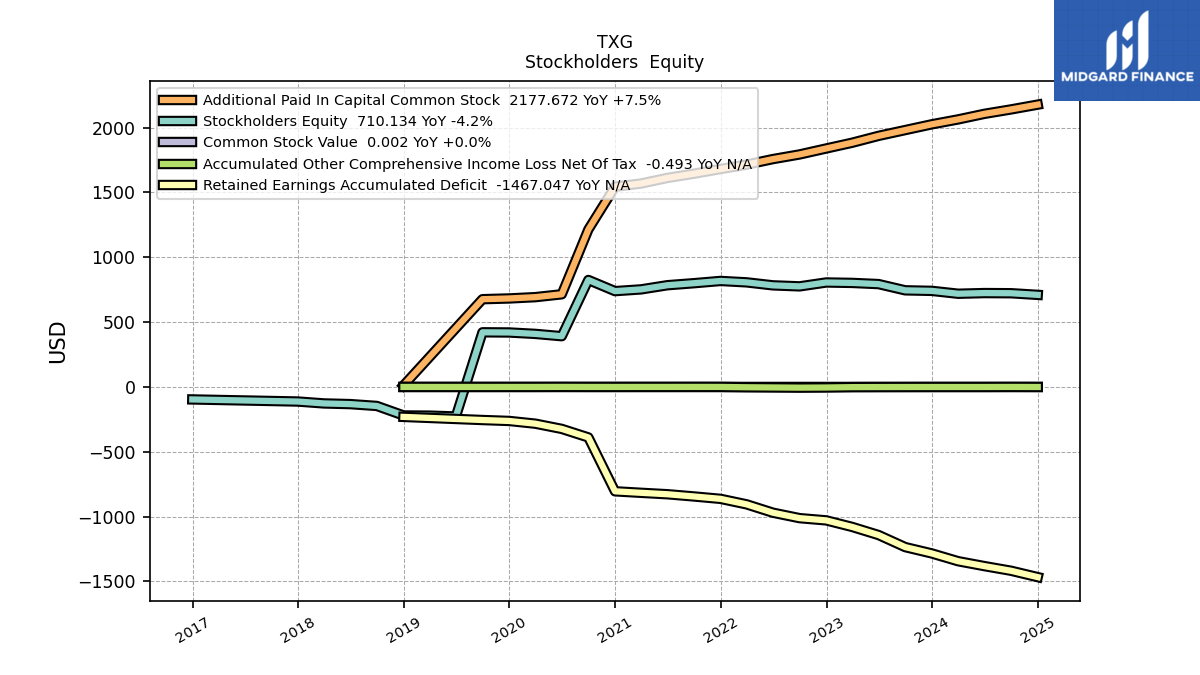
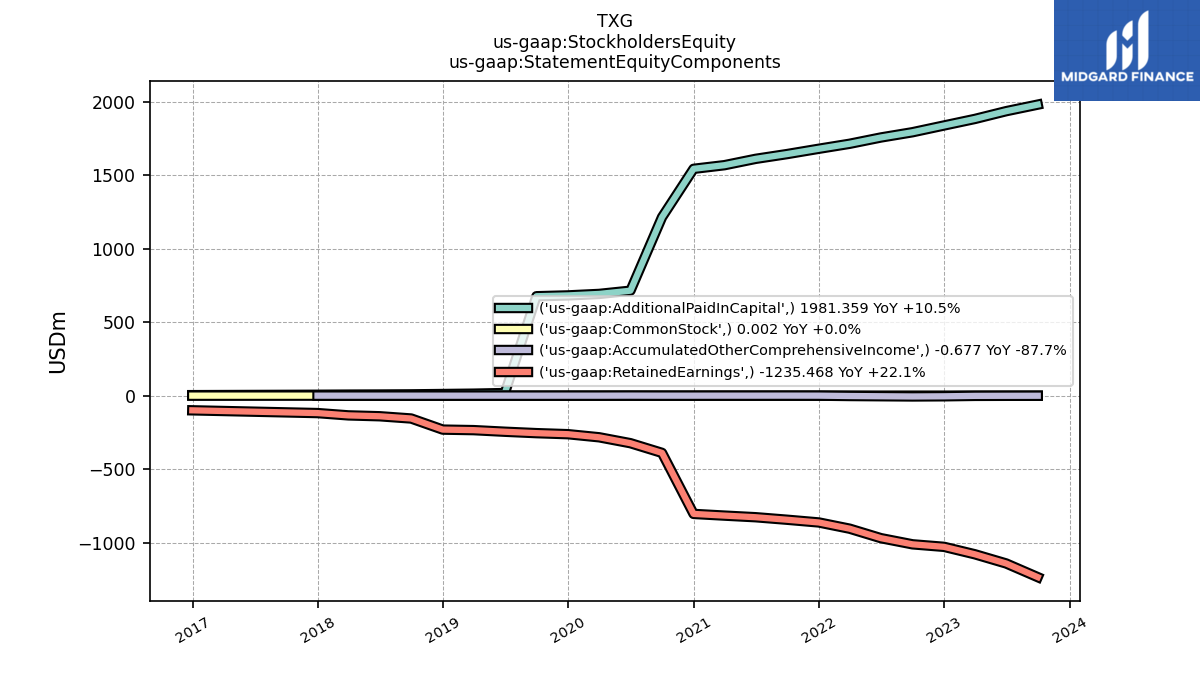
| Stockholders Equity | 745.22 | 793.30 | 802.38 | 805.74 | 775.79 | 783.52 | 806.68 | 817.57 | 800.22 | 784.59 | 752.46 | 739.07 | 825.08 | 391.27 | 409.07 | 420.08 | 421.45 | -227.95 | -221.29 | -219.99 | -146.77 | -132.47 | -127.25 | |
| Common Stock Value | 0.00 | 0.00 | 0.00 | 0.00 | 0.00 | 0.00 | 0.00 | 0.00 | 0.00 | 0.00 | 0.00 | 0.00 | 0.00 | 0.00 | 0.00 | 0.00 | 0.00 | NA | NA | 0.00 | NA | NA | NA | |
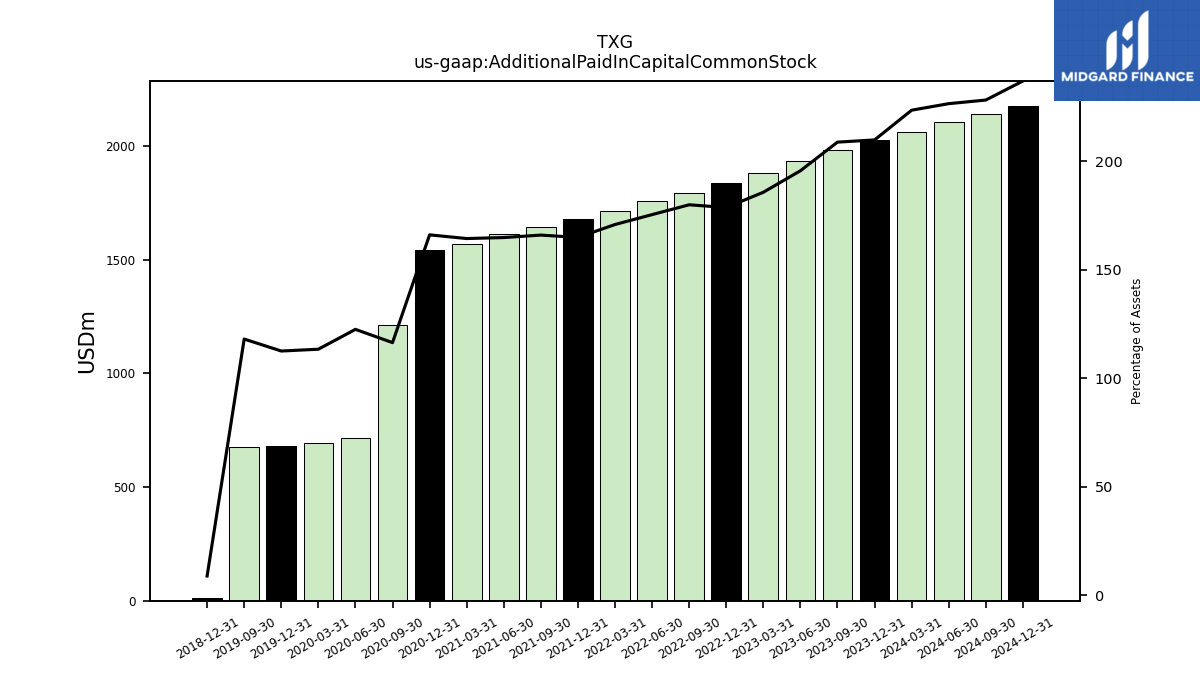
| Additional Paid In Capital Common Stock | 1981.36 | 1936.75 | 1883.93 | 1839.40 | 1793.39 | 1757.67 | 1714.86 | 1680.87 | 1644.90 | 1612.23 | 1569.06 | 1544.22 | 1214.65 | 714.63 | 692.62 | 682.49 | 676.84 | NA | NA | 11.16 | NA | NA | NA | |
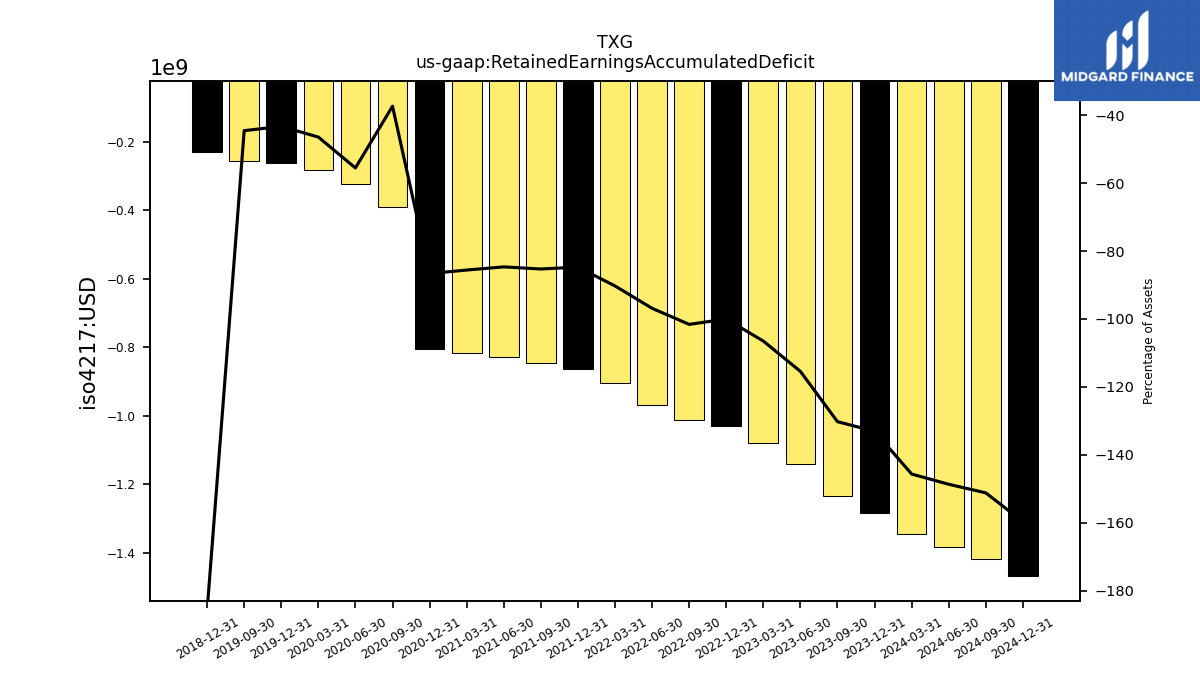
| Retained Earnings Accumulated Deficit | -1235.47 | -1142.48 | -1080.07 | -1029.32 | -1012.11 | -970.19 | -905.73 | -863.32 | -844.87 | -827.70 | -816.65 | -805.10 | -389.52 | -323.68 | -283.51 | -262.37 | -255.23 | NA | NA | -231.12 | NA | NA | NA | |
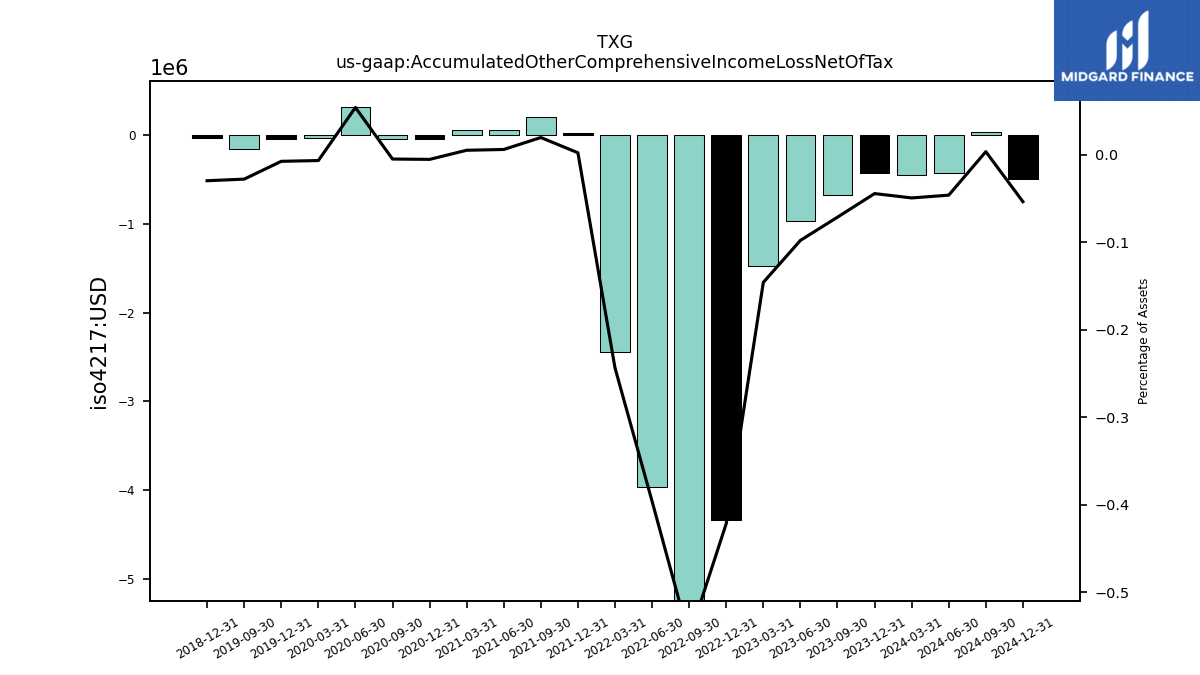
| Accumulated Other Comprehensive Income Loss Net Of Tax | -0.68 | -0.97 | -1.48 | -4.33 | -5.49 | -3.96 | -2.44 | 0.02 | 0.19 | 0.06 | 0.05 | -0.05 | -0.05 | 0.31 | -0.04 | -0.05 | -0.16 | NA | NA | -0.04 | NA | NA | NA | |
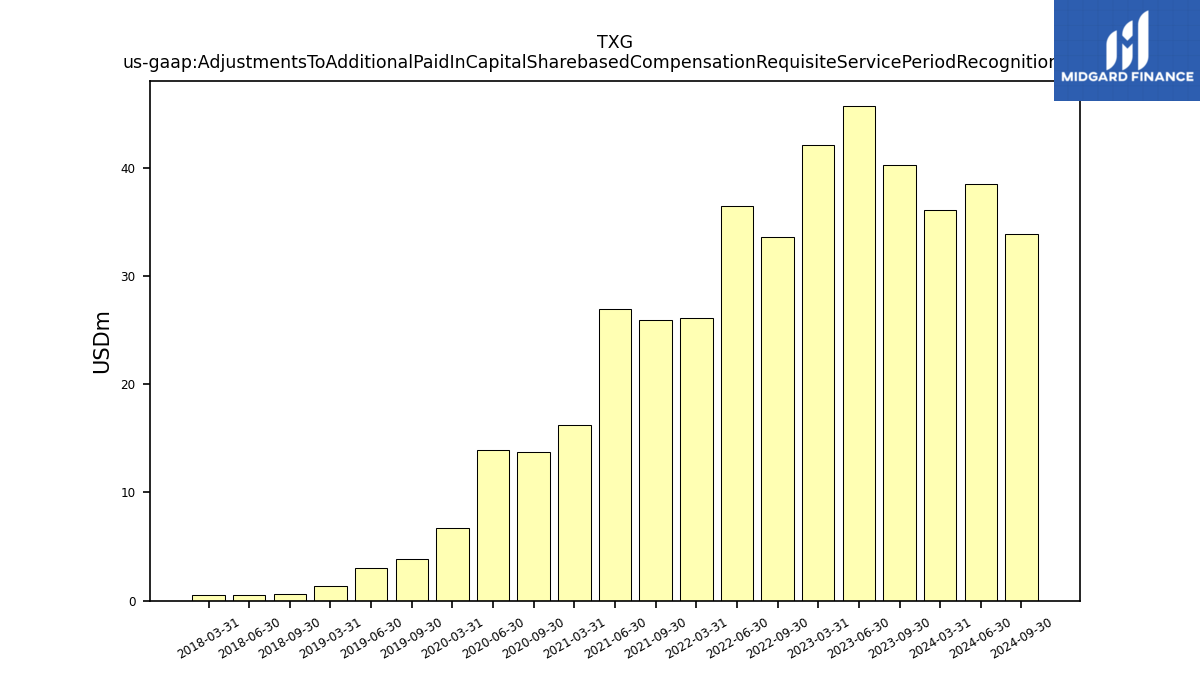
| Adjustments To Additional Paid In Capital Sharebased Compensation Requisite Service Period Recognition Value | 40.23 | 45.72 | 42.13 | NA | 33.65 | 36.42 | 26.14 | NA | 25.95 | 26.93 | 16.25 | NA | 13.78 | 13.92 | 6.72 | NA | 3.87 | 3.02 | 1.36 | NA | 0.59 | 0.52 | 0.49 |
| 2023-09-30 | 2023-06-30 | 2023-03-31 | 2022-12-31 | 2022-09-30 | 2022-06-30 | 2022-03-31 | 2021-12-31 | 2021-09-30 | 2021-06-30 | 2021-03-31 | 2020-12-31 | 2020-09-30 | 2020-06-30 | 2020-03-31 | 2019-12-31 | 2019-09-30 | 2019-06-30 | 2019-03-31 | 2018-12-31 | 2018-09-30 | 2018-06-30 | 2018-03-31 | ||
|---|---|---|---|---|---|---|---|---|---|---|---|---|---|---|---|---|---|---|---|---|---|---|---|---|
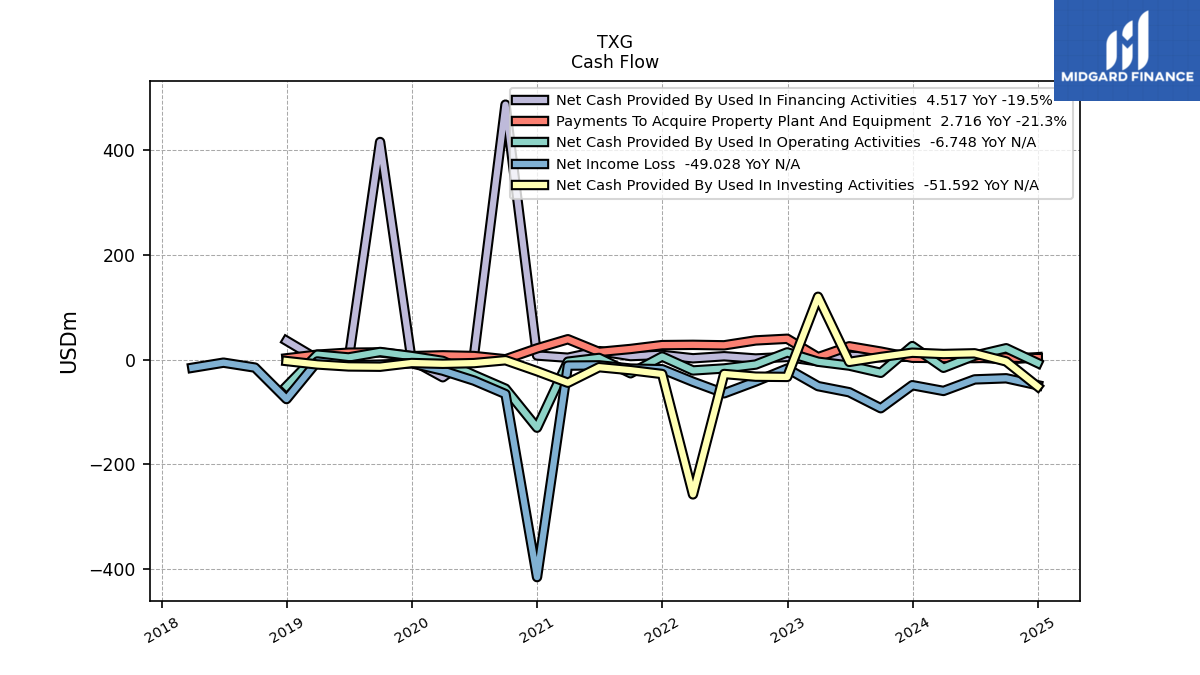
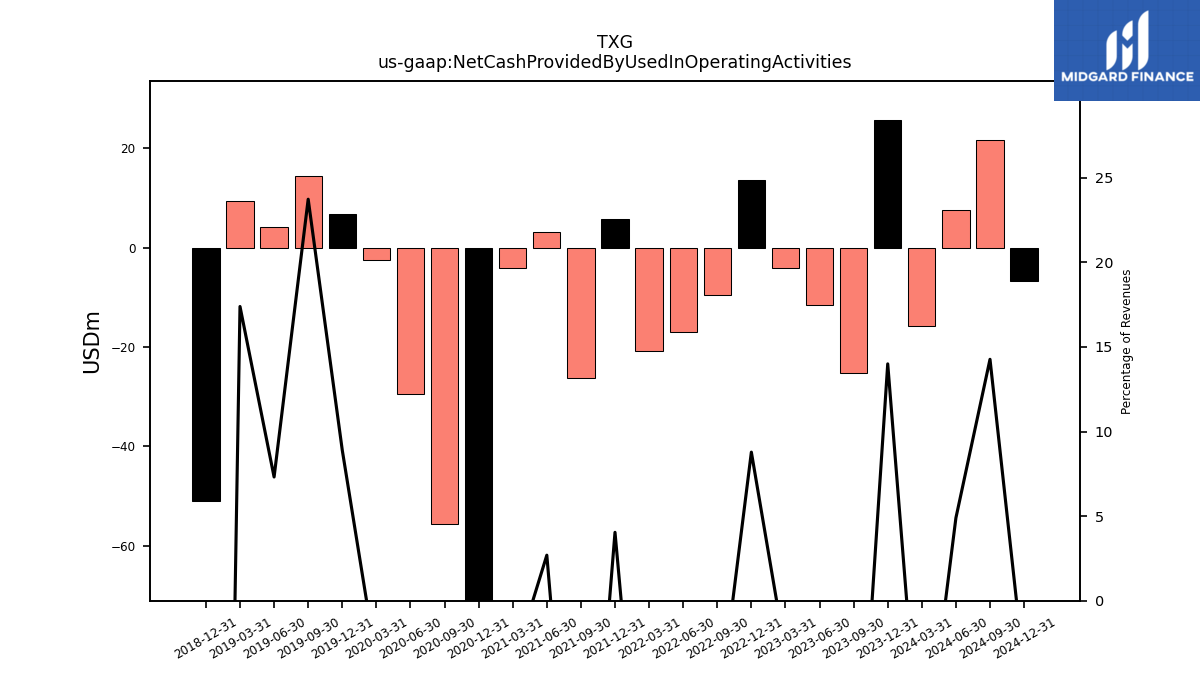
| Net Cash Provided By Used In Operating Activities | -25.30 | -11.53 | -4.12 | 13.72 | -9.56 | -16.96 | -20.80 | 5.80 | -26.22 | 3.12 | -4.08 | -130.18 | -55.63 | -29.52 | -2.58 | 6.70 | 14.53 | 4.08 | 9.32 | -51.00 | NA | NA | NA | |
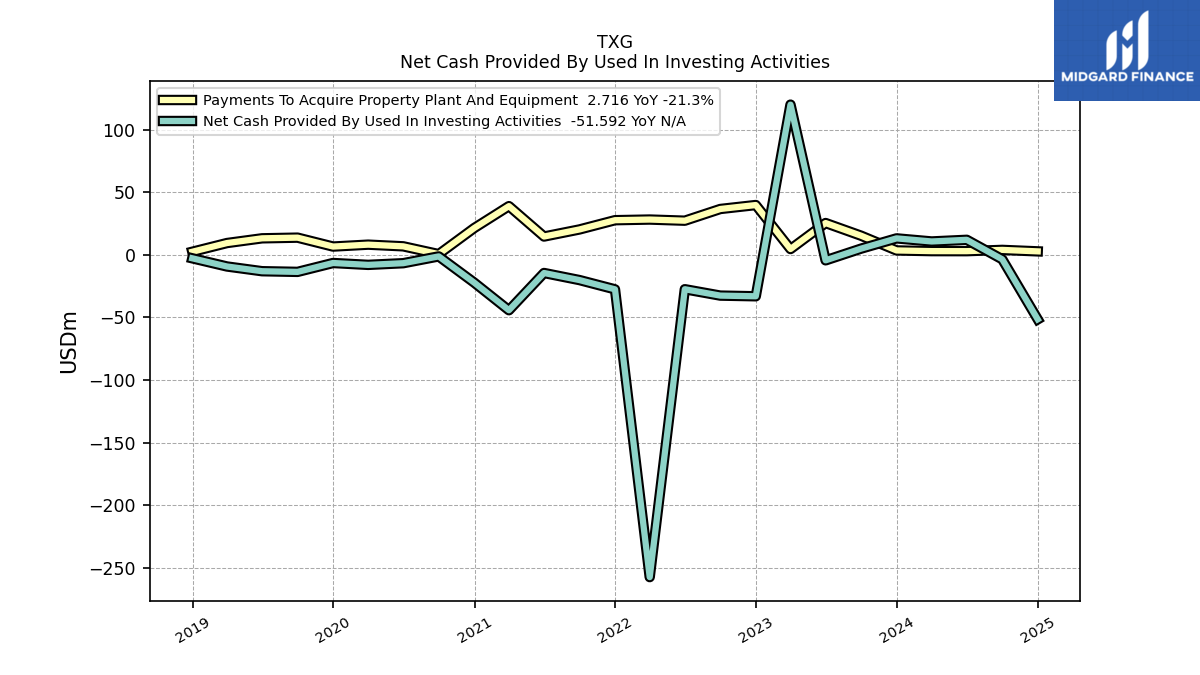
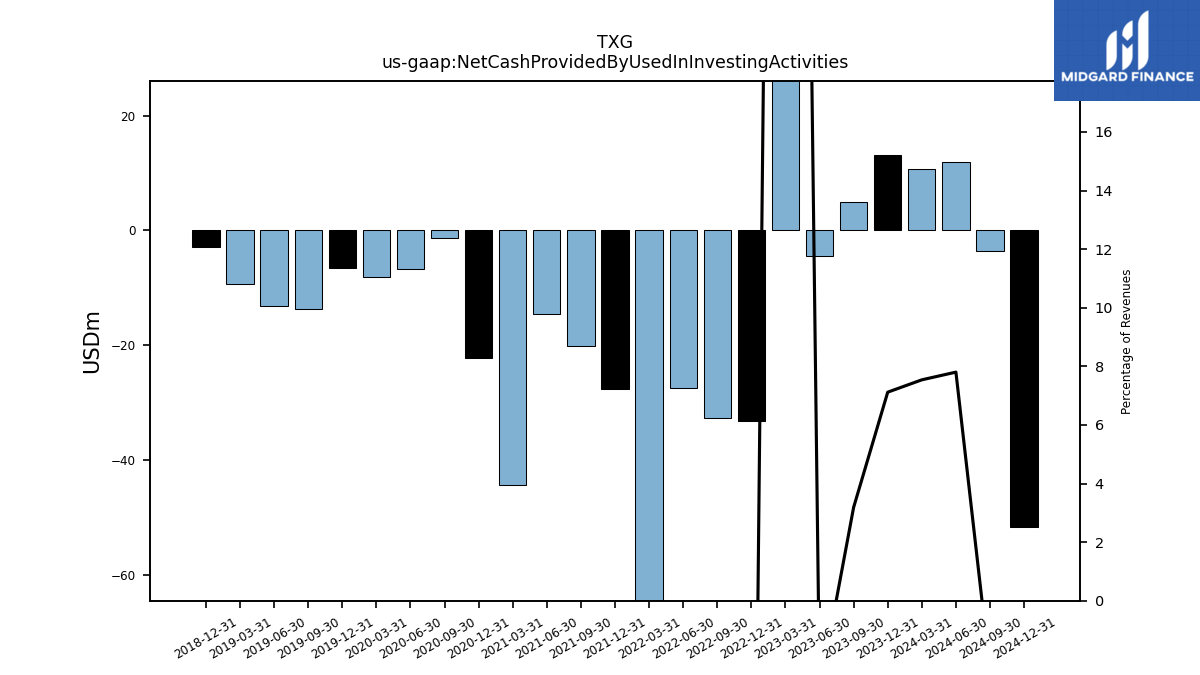
| Net Cash Provided By Used In Investing Activities | 4.90 | -4.46 | 119.96 | -33.17 | -32.63 | -27.53 | -257.56 | -27.62 | -20.23 | -14.57 | -44.32 | -22.27 | -1.31 | -6.74 | -8.08 | -6.58 | -13.68 | -13.14 | -9.37 | -2.83 | NA | NA | NA | |
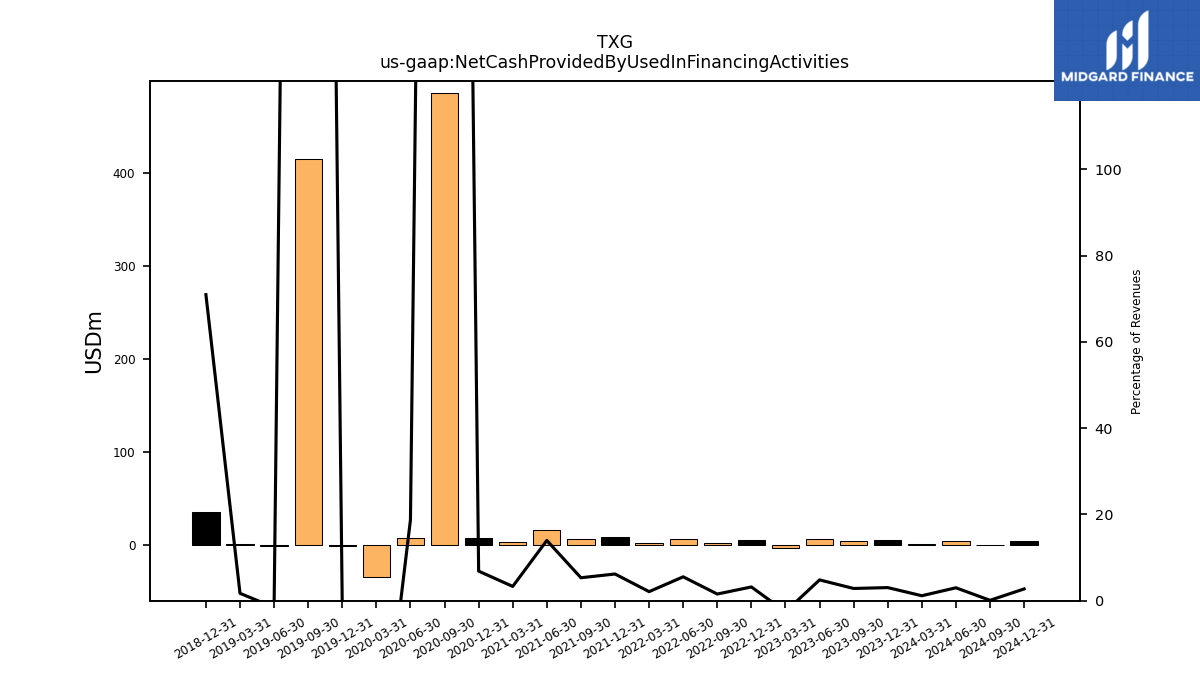
| Net Cash Provided By Used In Financing Activities | 4.37 | 7.10 | -3.41 | 5.00 | 2.04 | 6.36 | 2.42 | 8.90 | 6.68 | 16.19 | 3.52 | 7.71 | 486.97 | 8.05 | -33.82 | -1.11 | 415.64 | -0.86 | 0.92 | 35.88 | NA | NA | NA |
| 2023-09-30 | 2023-06-30 | 2023-03-31 | 2022-12-31 | 2022-09-30 | 2022-06-30 | 2022-03-31 | 2021-12-31 | 2021-09-30 | 2021-06-30 | 2021-03-31 | 2020-12-31 | 2020-09-30 | 2020-06-30 | 2020-03-31 | 2019-12-31 | 2019-09-30 | 2019-06-30 | 2019-03-31 | 2018-12-31 | 2018-09-30 | 2018-06-30 | 2018-03-31 | ||
|---|---|---|---|---|---|---|---|---|---|---|---|---|---|---|---|---|---|---|---|---|---|---|---|---|
| Net Cash Provided By Used In Operating Activities | -25.30 | -11.53 | -4.12 | 13.72 | -9.56 | -16.96 | -20.80 | 5.80 | -26.22 | 3.12 | -4.08 | -130.18 | -55.63 | -29.52 | -2.58 | 6.70 | 14.53 | 4.08 | 9.32 | -51.00 | NA | NA | NA | |
| Net Income Loss | -92.99 | -62.41 | -50.75 | -17.21 | -41.91 | -64.46 | -42.41 | -18.45 | -17.17 | -11.05 | -11.55 | -415.57 | -65.85 | -40.17 | -21.14 | -7.13 | -9.60 | -10.88 | -3.64 | -75.52 | -15.35 | -5.92 | -15.69 | |
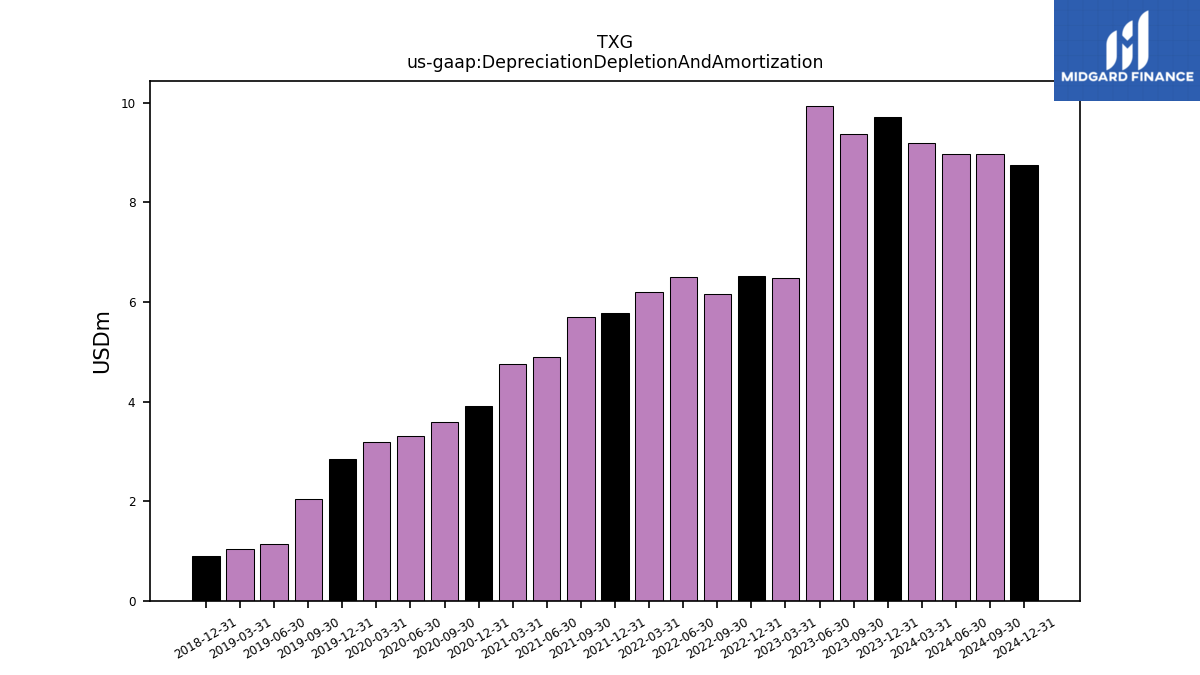
| Depreciation Depletion And Amortization | 9.37 | 9.94 | 6.48 | 6.52 | 6.16 | 6.50 | 6.19 | 5.78 | 5.70 | 4.89 | 4.75 | 3.92 | 3.59 | 3.31 | 3.19 | 2.85 | 2.04 | 1.14 | 1.04 | 0.89 | NA | NA | NA | |
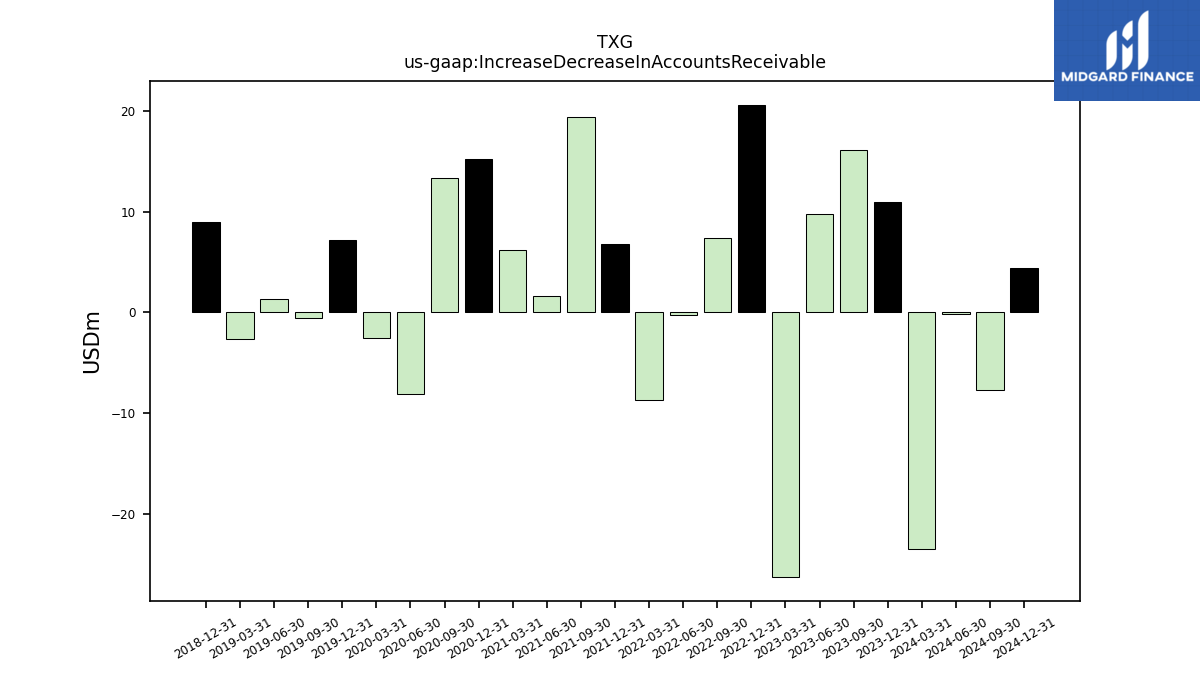
| Increase Decrease In Accounts Receivable | 16.16 | 9.75 | -26.28 | 20.62 | 7.35 | -0.30 | -8.73 | 6.83 | 19.39 | 1.64 | 6.19 | 15.19 | 13.30 | -8.12 | -2.52 | 7.22 | -0.58 | 1.31 | -2.67 | 8.99 | NA | NA | NA | |
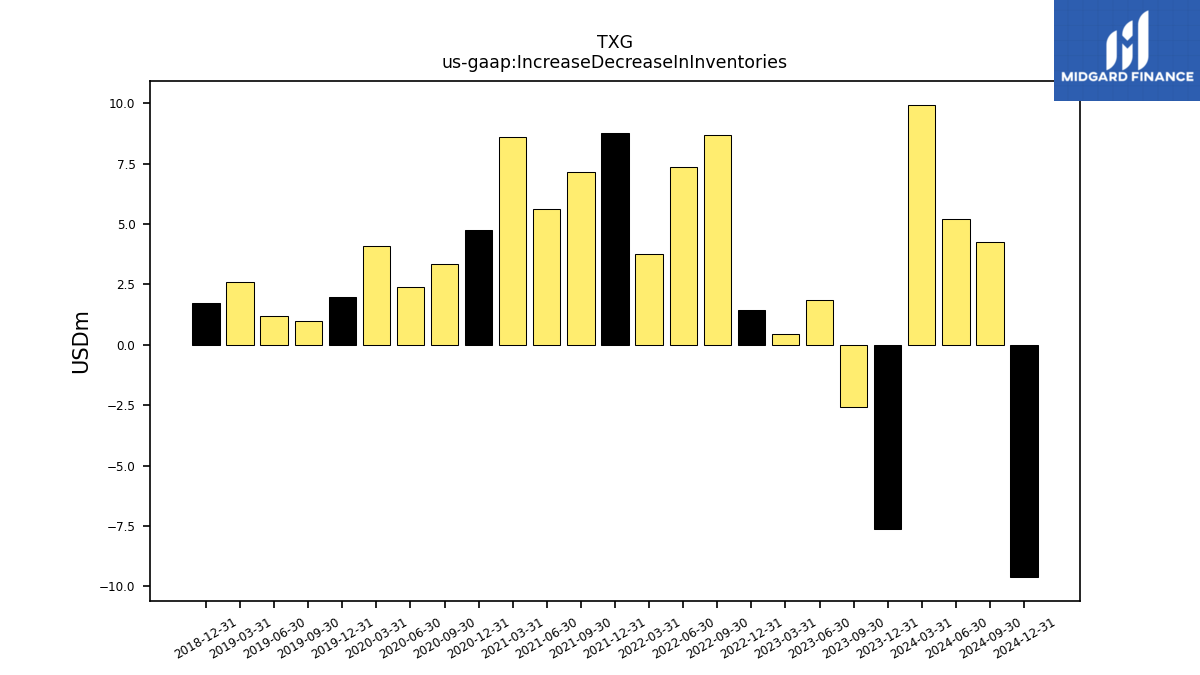
| Increase Decrease In Inventories | -2.57 | 1.86 | 0.45 | 1.43 | 8.66 | 7.37 | 3.74 | 8.78 | 7.13 | 5.60 | 8.61 | 4.75 | 3.36 | 2.40 | 4.09 | 1.96 | 0.98 | 1.17 | 2.59 | 1.72 | NA | NA | NA | |
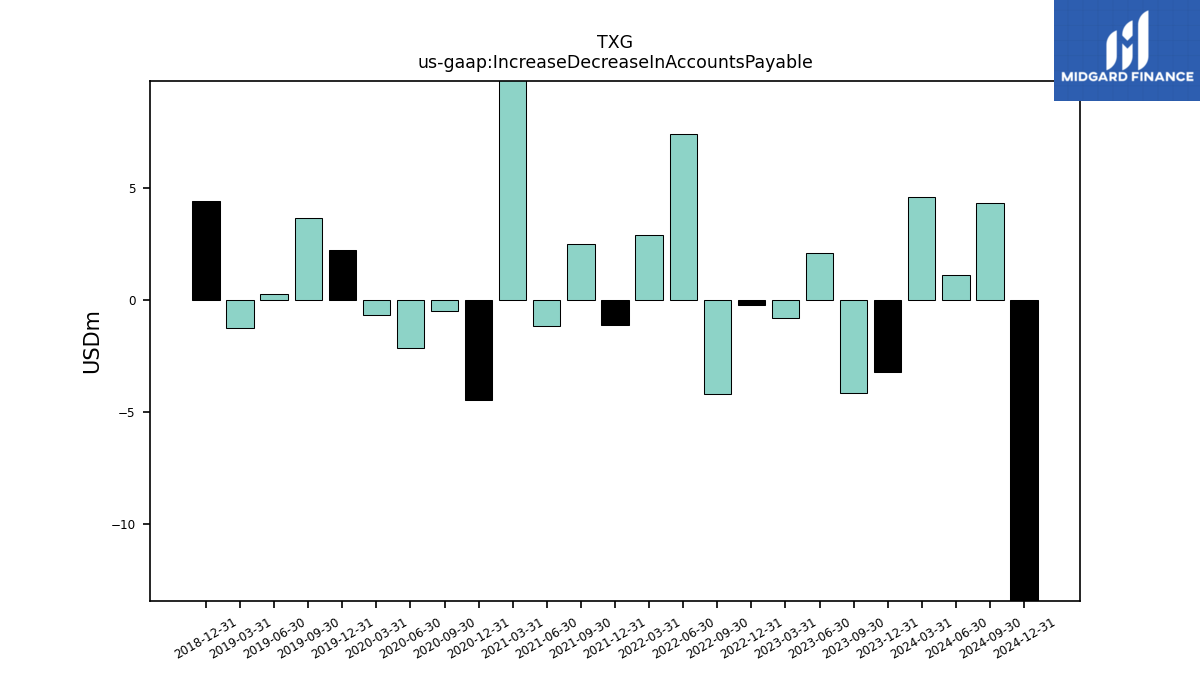
| Increase Decrease In Accounts Payable | -4.12 | 2.10 | -0.78 | -0.22 | -4.18 | 7.39 | 2.88 | -1.11 | 2.48 | -1.17 | 10.88 | -4.46 | -0.50 | -2.16 | -0.65 | 2.21 | 3.67 | 0.28 | -1.27 | 4.41 | NA | NA | NA | |
| Share Based Compensation | 40.23 | 45.70 | 42.10 | 40.97 | 33.51 | 36.31 | 26.05 | 26.90 | 25.95 | 26.93 | 16.18 | 14.27 | 13.78 | 13.86 | 6.72 | 5.08 | 3.87 | 3.02 | 1.36 | 1.06 | NA | NA | NA |
| 2023-09-30 | 2023-06-30 | 2023-03-31 | 2022-12-31 | 2022-09-30 | 2022-06-30 | 2022-03-31 | 2021-12-31 | 2021-09-30 | 2021-06-30 | 2021-03-31 | 2020-12-31 | 2020-09-30 | 2020-06-30 | 2020-03-31 | 2019-12-31 | 2019-09-30 | 2019-06-30 | 2019-03-31 | 2018-12-31 | 2018-09-30 | 2018-06-30 | 2018-03-31 | ||
|---|---|---|---|---|---|---|---|---|---|---|---|---|---|---|---|---|---|---|---|---|---|---|---|---|
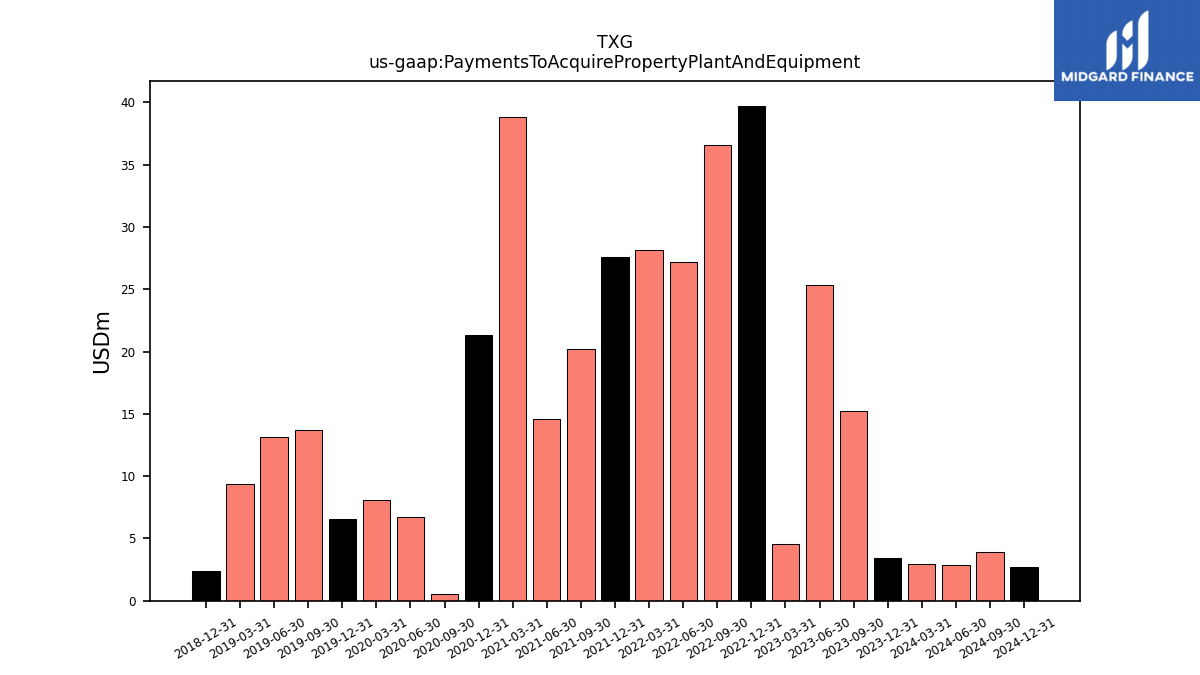
| Net Cash Provided By Used In Investing Activities | 4.90 | -4.46 | 119.96 | -33.17 | -32.63 | -27.53 | -257.56 | -27.62 | -20.23 | -14.57 | -44.32 | -22.27 | -1.31 | -6.74 | -8.08 | -6.58 | -13.68 | -13.14 | -9.37 | -2.83 | NA | NA | NA | |
| Payments To Acquire Property Plant And Equipment | 15.24 | 25.36 | 4.56 | 39.73 | 36.57 | 27.22 | 28.14 | 27.62 | 20.23 | 14.57 | 38.87 | 21.34 | 0.51 | 6.74 | 8.08 | 6.56 | 13.68 | 13.14 | 9.37 | 2.40 | NA | NA | NA |
| 2023-09-30 | 2023-06-30 | 2023-03-31 | 2022-12-31 | 2022-09-30 | 2022-06-30 | 2022-03-31 | 2021-12-31 | 2021-09-30 | 2021-06-30 | 2021-03-31 | 2020-12-31 | 2020-09-30 | 2020-06-30 | 2020-03-31 | 2019-12-31 | 2019-09-30 | 2019-06-30 | 2019-03-31 | 2018-12-31 | 2018-09-30 | 2018-06-30 | 2018-03-31 | ||
|---|---|---|---|---|---|---|---|---|---|---|---|---|---|---|---|---|---|---|---|---|---|---|---|---|
| Net Cash Provided By Used In Financing Activities | 4.37 | 7.10 | -3.41 | 5.00 | 2.04 | 6.36 | 2.42 | 8.90 | 6.68 | 16.19 | 3.52 | 7.71 | 486.97 | 8.05 | -33.82 | -1.11 | 415.64 | -0.86 | 0.92 | 35.88 | NA | NA | NA |
| 2023-09-30 | 2023-06-30 | 2023-03-31 | 2022-12-31 | 2022-09-30 | 2022-06-30 | 2022-03-31 | 2021-12-31 | 2021-09-30 | 2021-06-30 | 2021-03-31 | 2020-12-31 | 2020-09-30 | 2020-06-30 | 2020-03-31 | 2019-12-31 | 2019-09-30 | 2019-06-30 | 2019-03-31 | 2018-12-31 | 2018-09-30 | 2018-06-30 | 2018-03-31 | ||
|---|---|---|---|---|---|---|---|---|---|---|---|---|---|---|---|---|---|---|---|---|---|---|---|---|
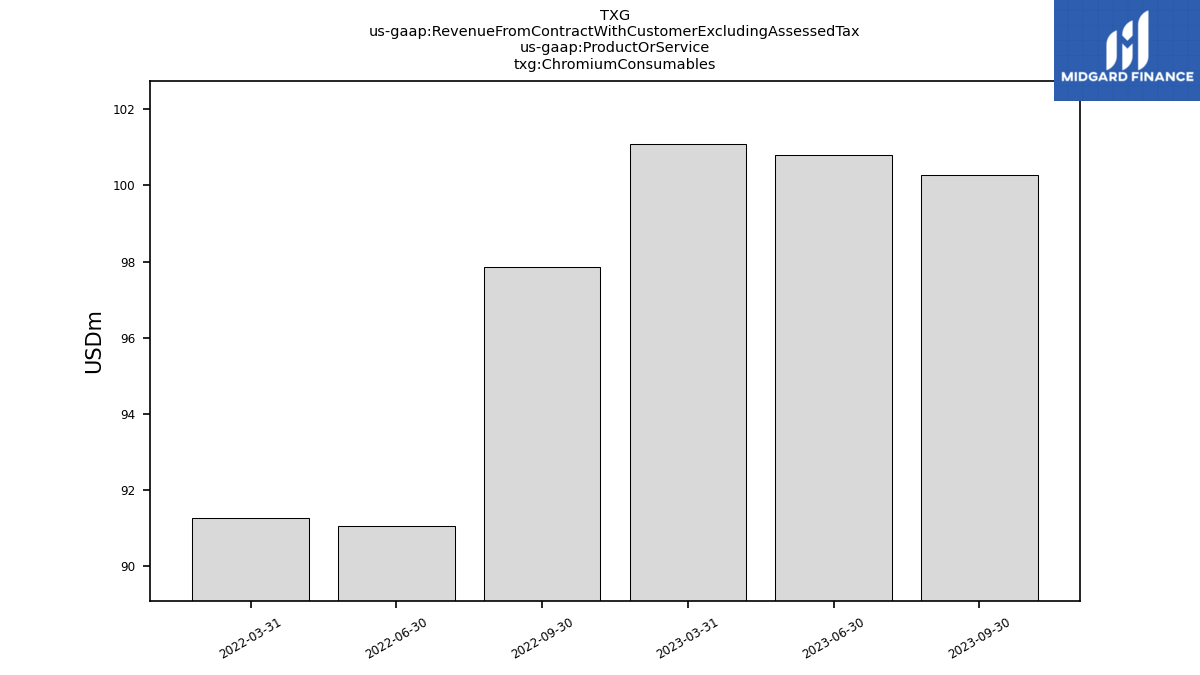
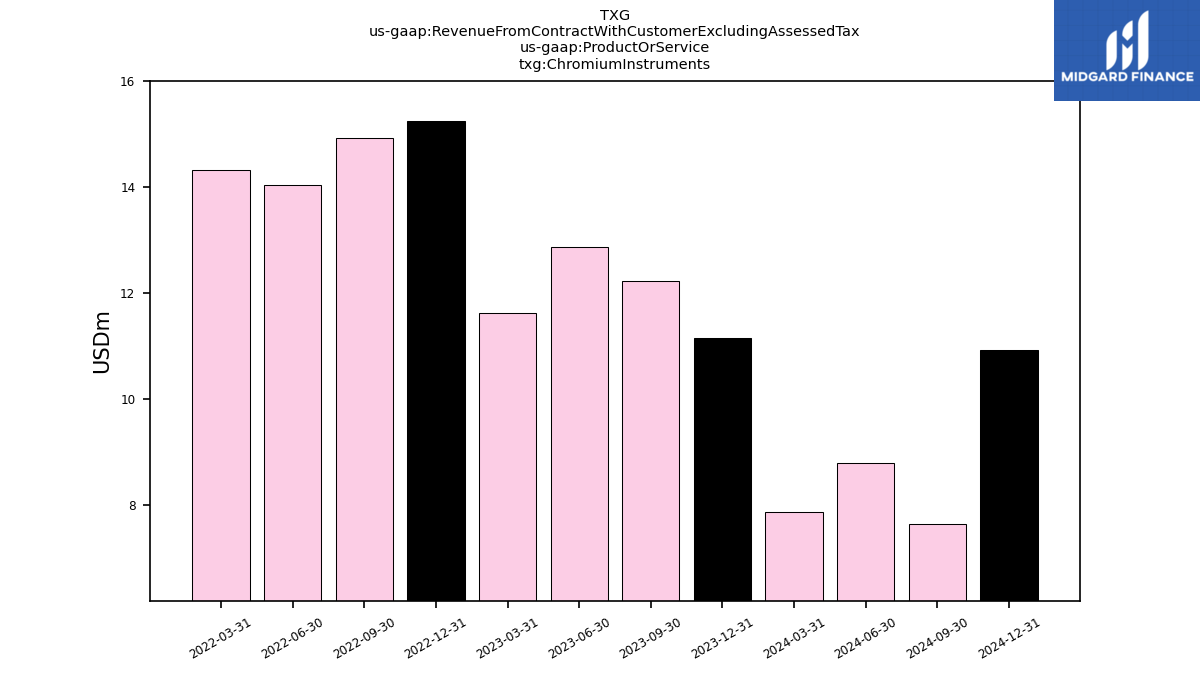
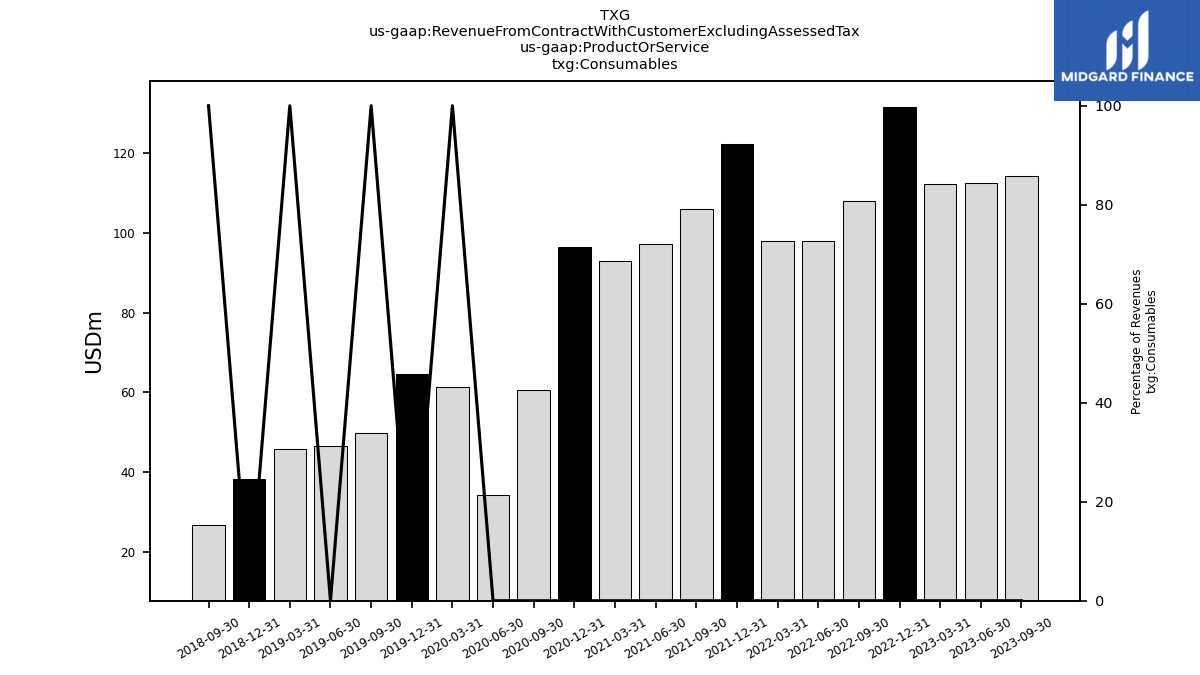
| Revenues | 153.64 | 146.82 | 134.28 | 156.23 | 131.07 | 114.61 | 114.50 | 143.53 | 125.30 | 115.84 | 105.82 | 112.22 | 71.82 | 42.91 | 71.91 | 75.29 | 61.21 | 55.82 | 53.58 | 50.55 | 36.61 | 31.74 | 27.41 | |
| Revenue From Contract With Customer Excluding Assessed Tax | 153.64 | 146.82 | 134.28 | 156.23 | 131.07 | 114.61 | 114.50 | 143.53 | 125.30 | 115.84 | 105.82 | 112.22 | 71.82 | 42.91 | 71.91 | 75.29 | 61.21 | 55.82 | 53.58 | 50.55 | 36.61 | 31.74 | 27.41 | |
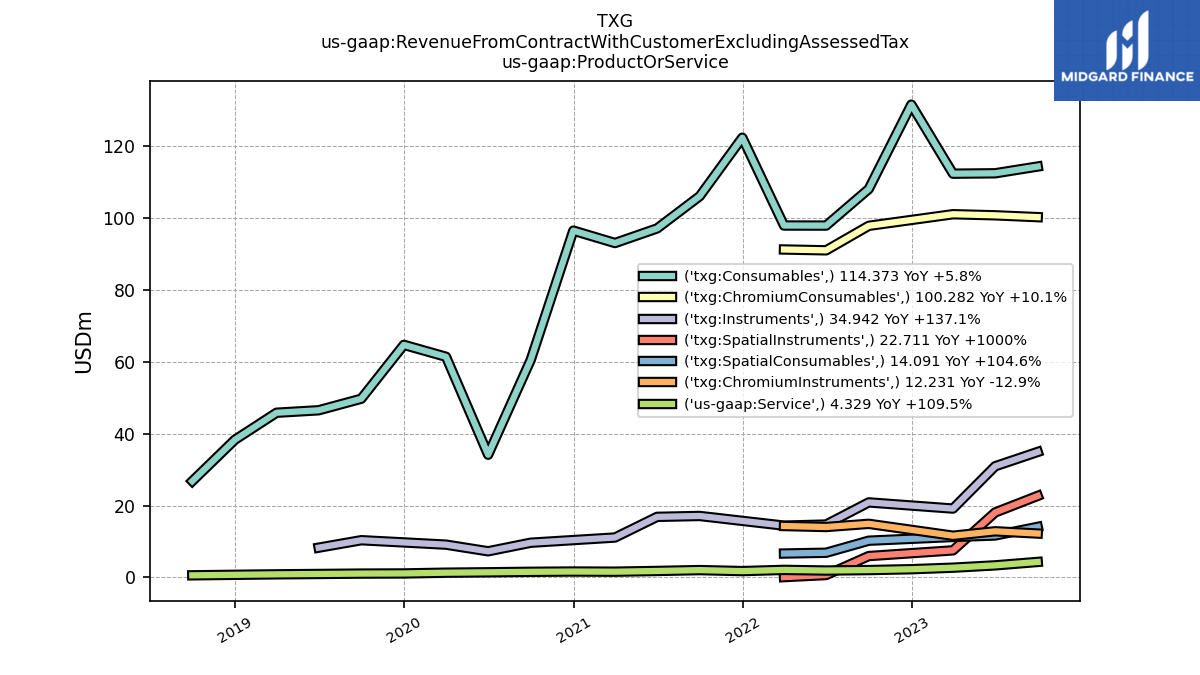
| Chromium Consumables | 100.28 | 100.79 | 101.10 | NA | 97.87 | 91.05 | 91.28 | NA | NA | NA | NA | NA | NA | NA | NA | NA | NA | NA | NA | NA | NA | NA | NA | |
| Chromium Instruments | 12.23 | 12.86 | 11.63 | NA | 14.94 | 14.05 | 14.33 | NA | NA | NA | NA | NA | NA | NA | NA | NA | NA | NA | NA | NA | NA | NA | NA | |
| Consumables | 114.37 | 112.49 | 112.38 | 131.60 | 108.11 | 97.93 | 97.95 | 122.40 | 106.12 | 97.15 | 93.08 | 96.54 | 60.56 | 34.16 | 61.43 | 64.74 | 49.74 | 46.54 | 45.85 | 38.32 | 26.81 | NA | NA | |
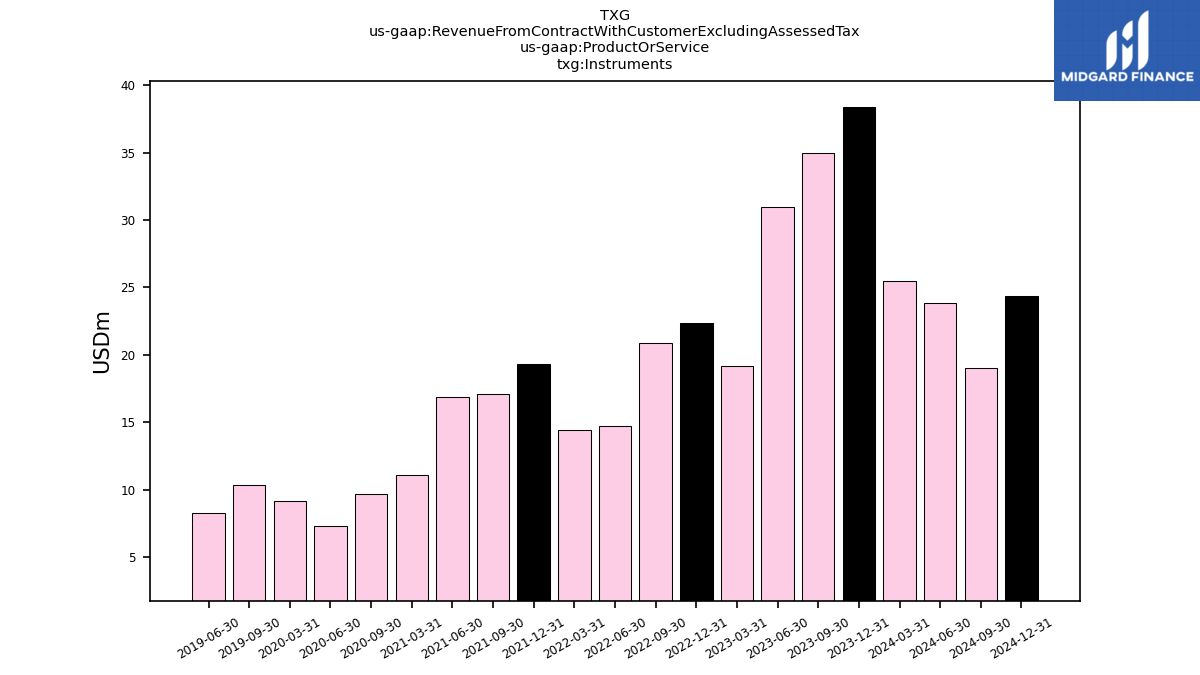
| Instruments | 34.94 | 30.95 | 19.18 | NA | 20.90 | 14.74 | 14.43 | NA | 17.12 | 16.88 | 11.12 | NA | 9.68 | 7.29 | 9.14 | NA | 10.38 | 8.30 | NA | NA | NA | NA | NA | |
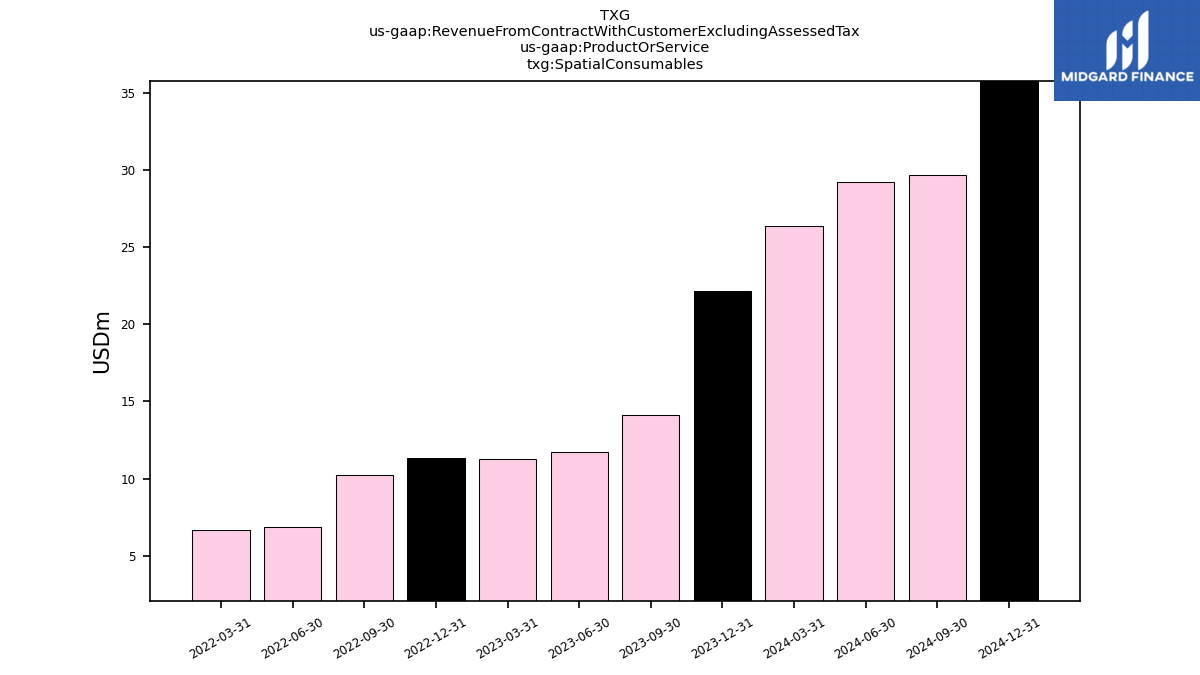
| Spatial Consumables | 14.09 | 11.69 | 11.28 | NA | 10.24 | 6.89 | 6.67 | NA | NA | NA | NA | NA | NA | NA | NA | NA | NA | NA | NA | NA | NA | NA | NA | |
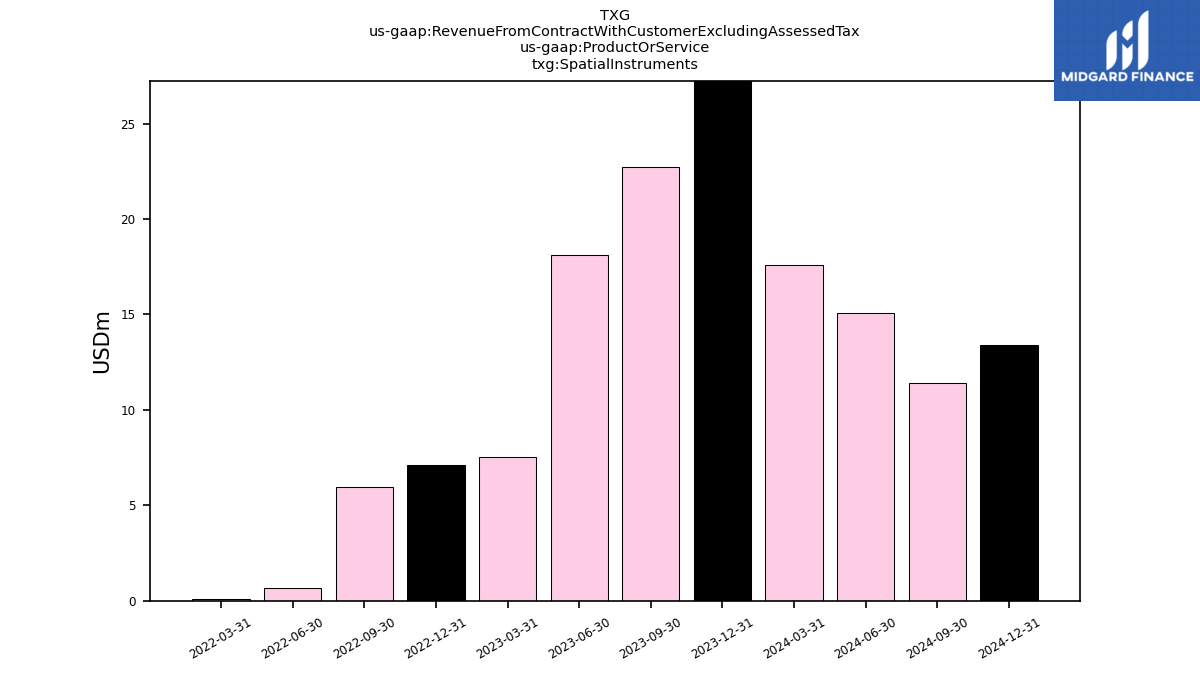
| Spatial Instruments | 22.71 | 18.10 | 7.55 | NA | 5.96 | 0.69 | 0.10 | NA | NA | NA | NA | NA | NA | NA | NA | NA | NA | NA | NA | NA | NA | NA | NA | |
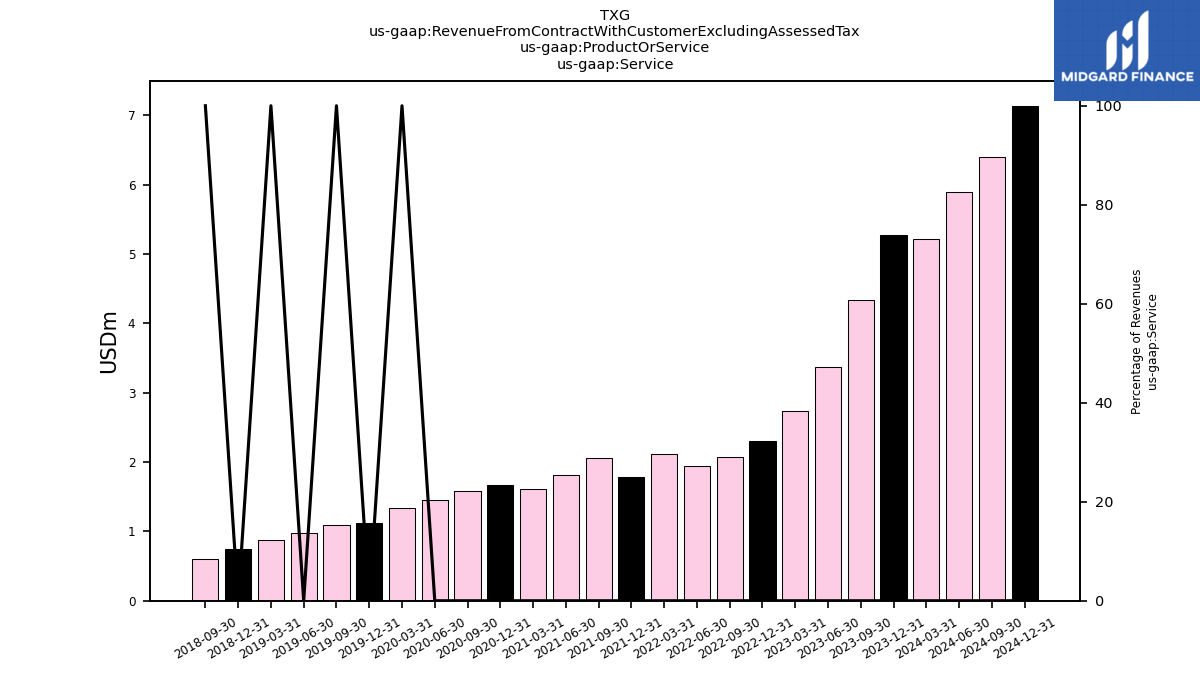
| Service | 4.33 | 3.38 | 2.73 | 2.30 | 2.07 | 1.94 | 2.12 | 1.78 | 2.06 | 1.82 | 1.62 | 1.66 | 1.58 | 1.45 | 1.34 | 1.13 | 1.08 | 0.98 | 0.88 | 0.75 | 0.60 | NA | NA | |
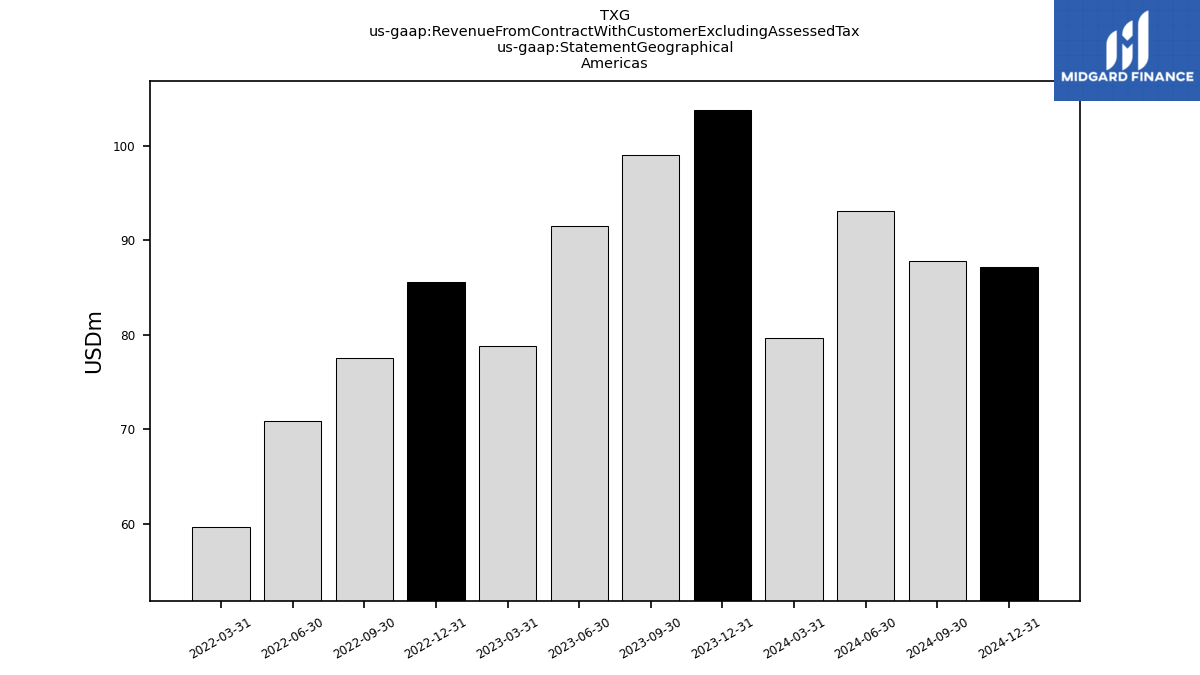
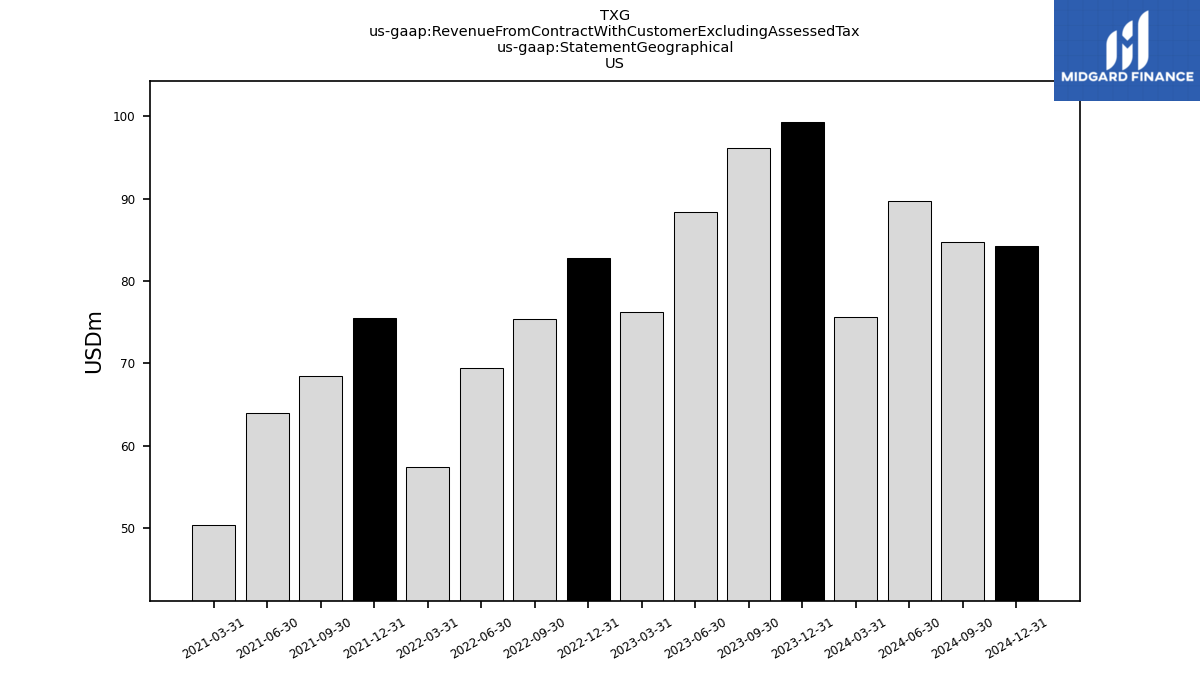
| 99.01 | 91.54 | 78.80 | NA | 77.58 | 70.89 | 59.69 | NA | NA | NA | NA | NA | NA | NA | NA | NA | NA | NA | NA | NA | NA | NA | NA | ||
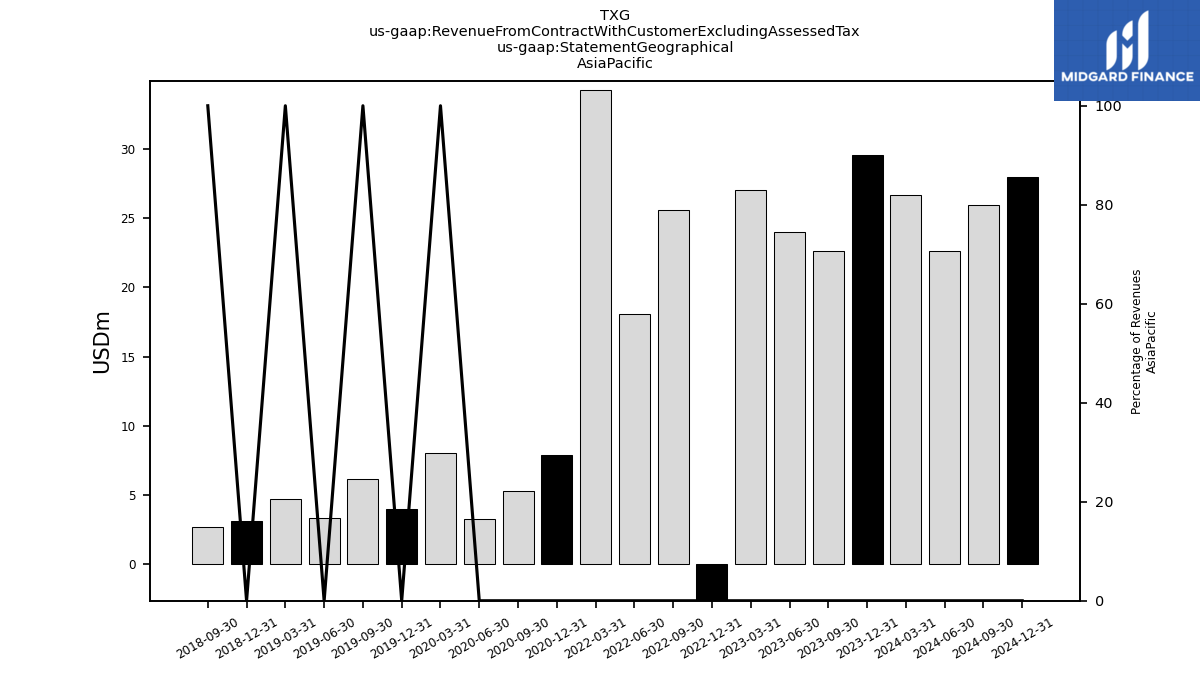
| 22.61 | 24.03 | 27.07 | -31.95 | 25.56 | 18.11 | 34.28 | NA | NA | NA | NA | 7.92 | 5.27 | 3.30 | 8.02 | 3.99 | 6.19 | 3.34 | 4.70 | 3.13 | 2.74 | NA | NA | ||
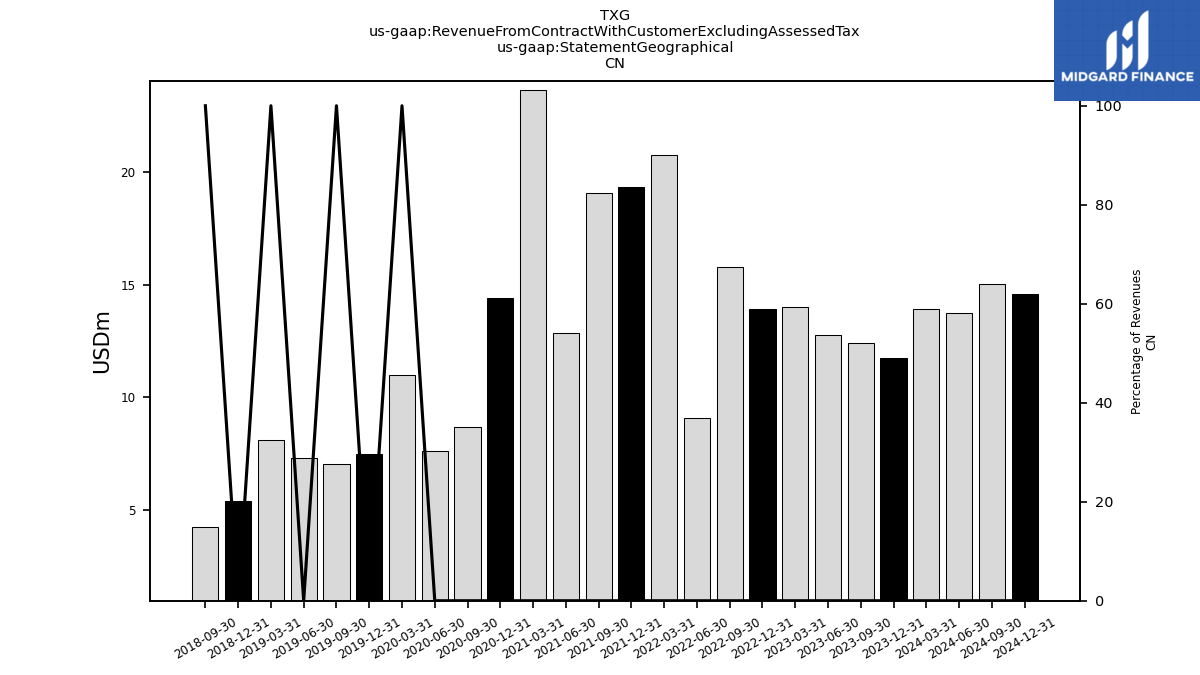
| 12.43 | 12.76 | 14.03 | 13.94 | 15.77 | 9.09 | 20.76 | 19.35 | 19.06 | 12.87 | 23.64 | 14.43 | 8.69 | 7.63 | 11.00 | 7.47 | 7.05 | 7.29 | 8.11 | 5.37 | 4.25 | NA | NA | ||
| US | 96.09 | 88.39 | 76.28 | 82.83 | 75.34 | 69.37 | 57.44 | 75.53 | 68.44 | 64.00 | 50.31 | NA | NA | NA | NA | NA | NA | NA | NA | NA | NA | NA | NA | |
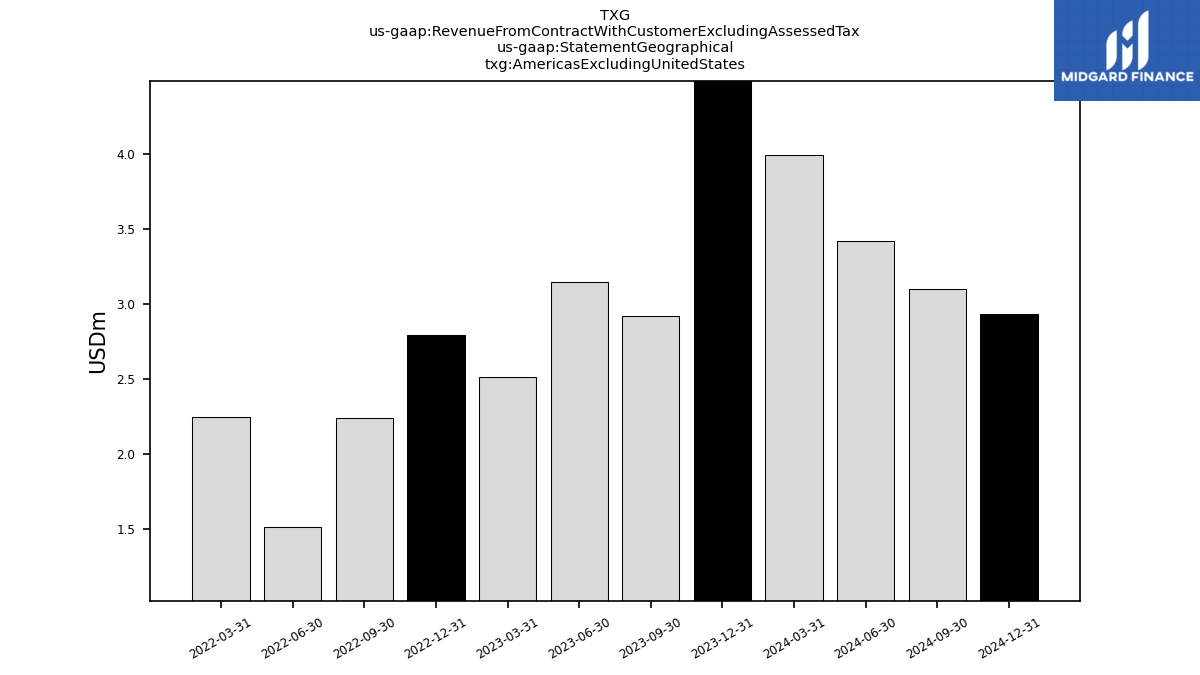
| Americas Excluding United States | 2.92 | 3.15 | 2.52 | NA | 2.24 | 1.51 | 2.25 | NA | NA | NA | NA | NA | NA | NA | NA | NA | NA | NA | NA | NA | NA | NA | NA | |
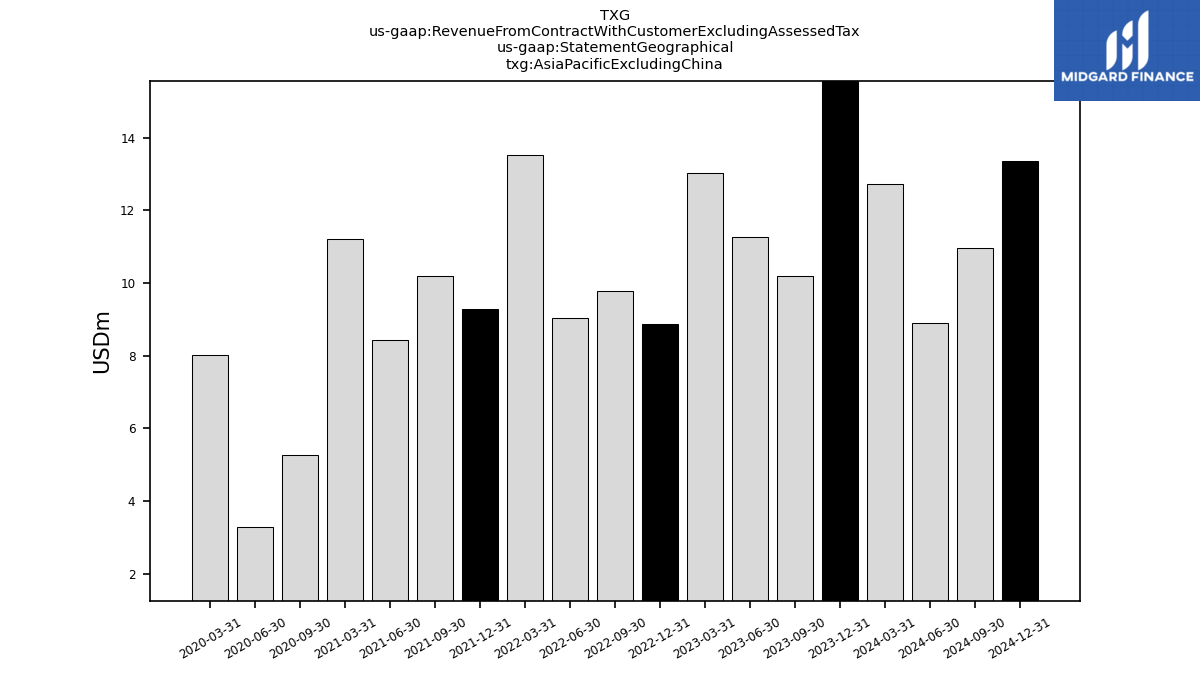
| Asia Pacific Excluding China | 10.18 | 11.28 | 13.04 | NA | 9.79 | 9.03 | 13.52 | NA | 10.19 | 8.43 | 11.20 | NA | 5.27 | 3.30 | 8.02 | NA | NA | NA | NA | NA | NA | NA | NA | |
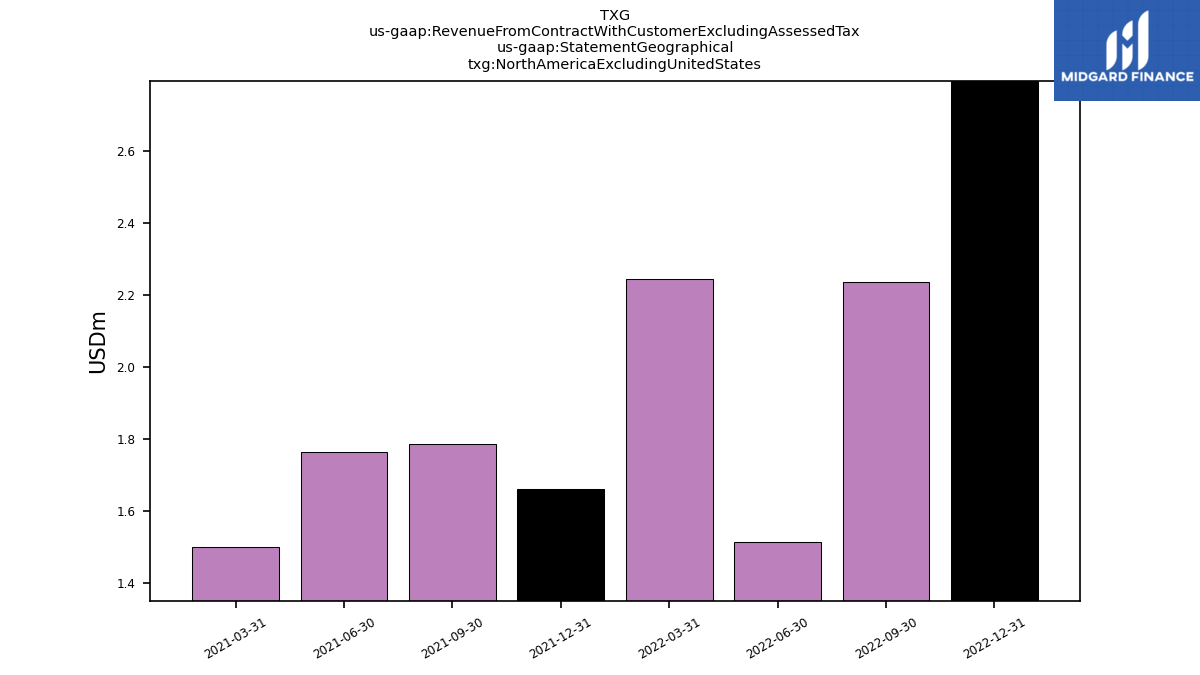
| North America Excluding United States | NA | NA | NA | 2.79 | 2.24 | 1.51 | 2.25 | 1.66 | 1.79 | 1.76 | 1.50 | NA | NA | NA | NA | NA | NA | NA | NA | NA | NA | NA | NA | |
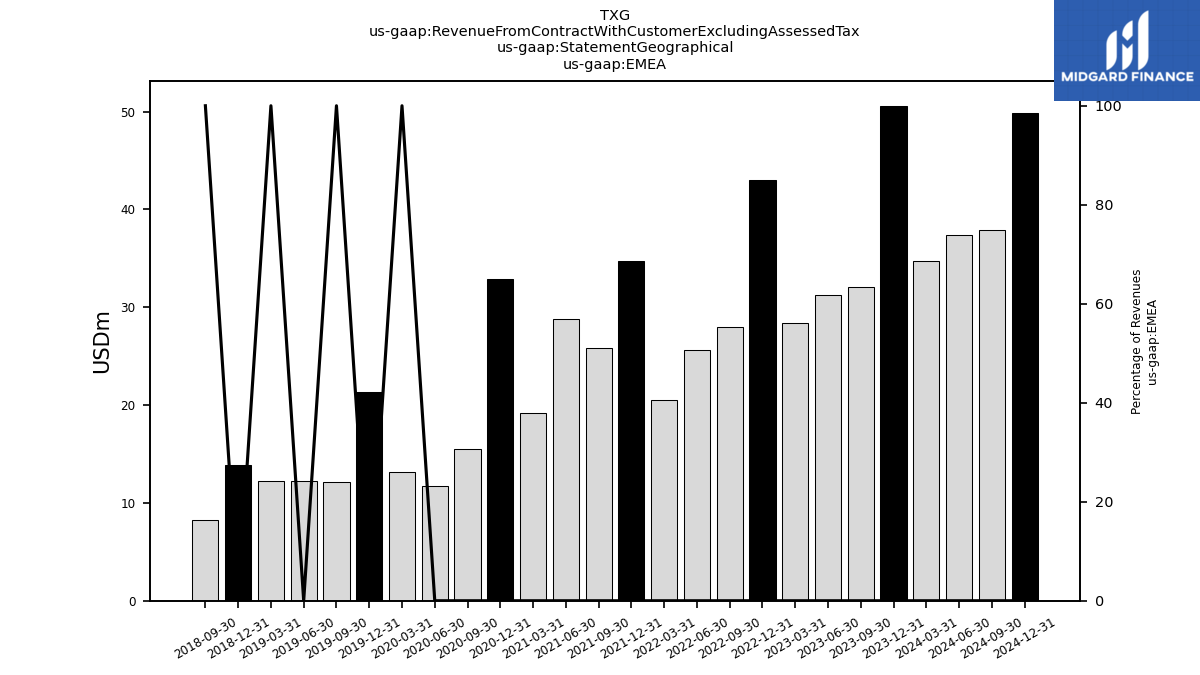
| EMEA | 32.02 | 31.25 | 28.42 | 43.00 | 27.93 | 25.61 | 20.53 | 34.73 | 25.82 | 28.77 | 19.17 | 32.90 | 15.50 | 11.71 | 13.16 | 21.37 | 12.14 | 12.24 | 12.26 | 13.86 | 8.23 | NA | NA |
