
| 2024-02-03 | 2023-10-28 | 2023-07-29 | 2023-04-29 | 2023-01-28 | 2022-10-29 | 2022-07-30 | 2022-04-30 | 2022-01-29 | 2021-10-30 | 2021-07-31 | 2021-05-01 | 2021-01-30 | 2020-10-31 | 2020-08-01 | 2020-05-02 | 2020-02-01 | 2019-11-02 | 2019-08-03 | 2019-05-04 | 2019-02-02 | 2018-11-03 | 2018-08-04 | 2018-05-05 | 2018-02-03 | 2017-10-28 | 2017-07-29 | 2017-04-29 | 2017-01-28 | 2016-10-29 | 2016-07-30 | 2016-04-30 | 2016-01-30 | 2015-10-31 | 2015-08-01 | 2015-05-02 | 2015-01-31 | 2014-11-01 | 2014-08-02 | 2014-05-03 | 2014-02-01 | 2013-11-02 | 2013-08-03 | 2013-05-04 | 2013-02-02 | 2012-10-27 | 2012-07-28 | 2012-04-28 | 2012-01-28 | 2011-10-29 | 2011-07-30 | 2011-04-30 | 2011-01-29 | 2010-10-30 | 2010-07-31 | 2010-05-01 | ||
|---|---|---|---|---|---|---|---|---|---|---|---|---|---|---|---|---|---|---|---|---|---|---|---|---|---|---|---|---|---|---|---|---|---|---|---|---|---|---|---|---|---|---|---|---|---|---|---|---|---|---|---|---|---|---|---|---|---|
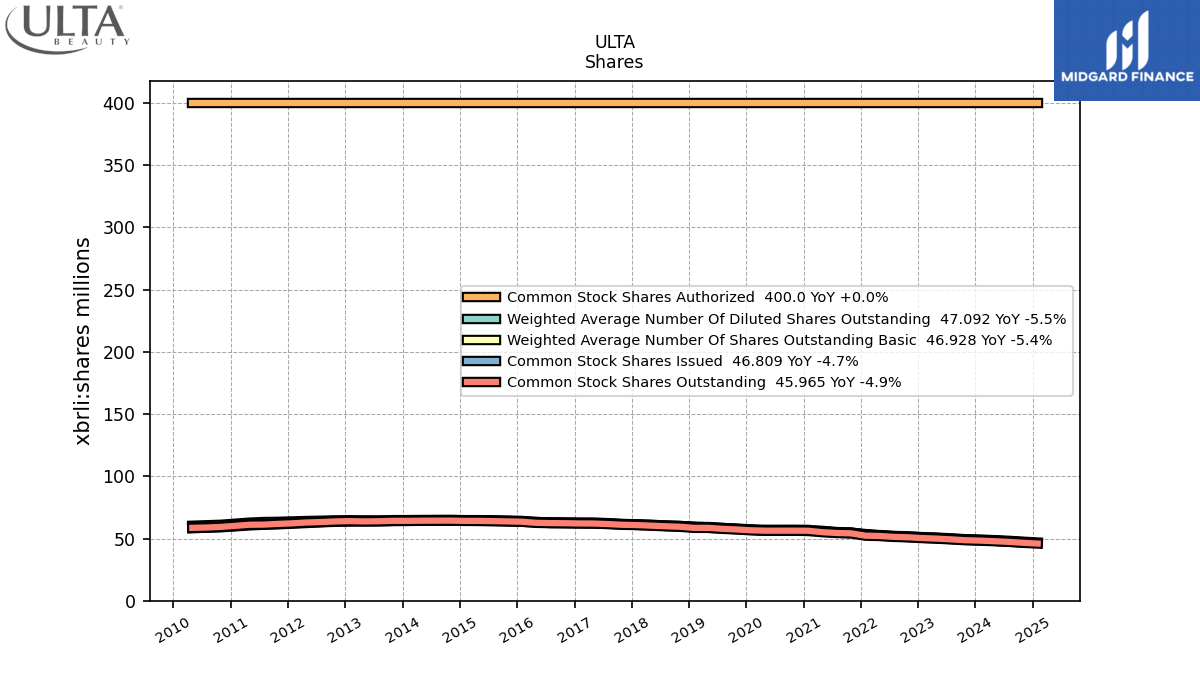
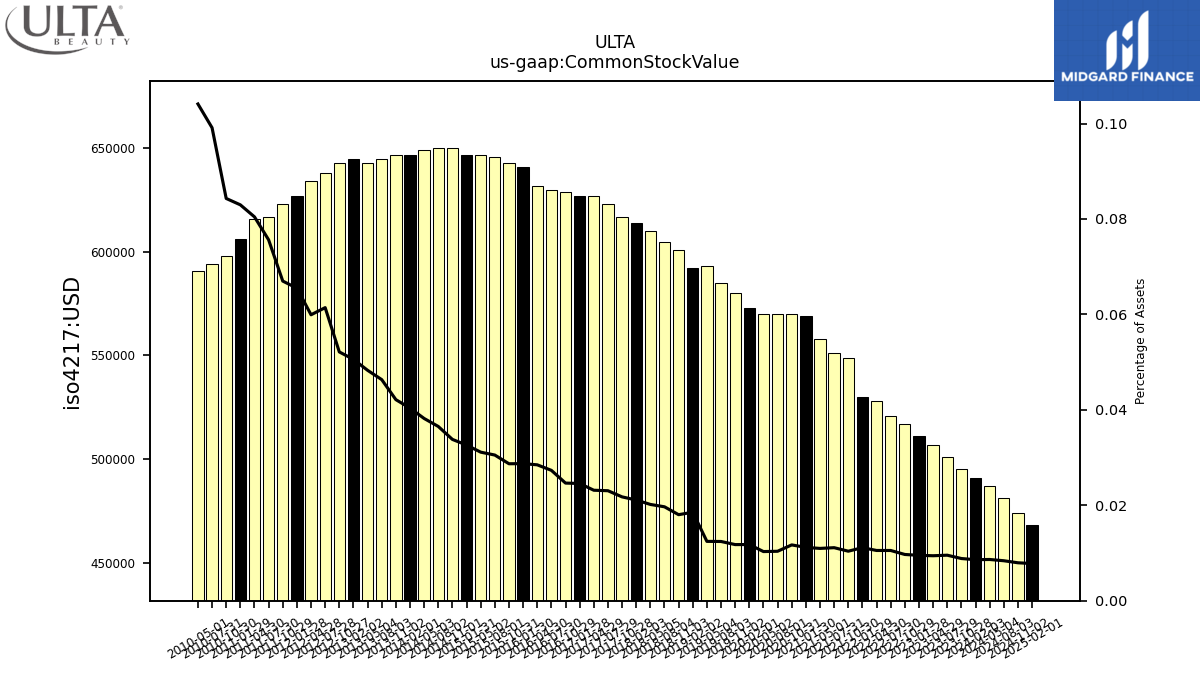
| Common Stock Value | 0.49 | 0.49 | 0.50 | 0.51 | 0.51 | 0.52 | 0.52 | 0.53 | 0.53 | 0.55 | 0.55 | 0.56 | 0.57 | 0.57 | 0.57 | 0.57 | 0.57 | 0.58 | 0.58 | 0.59 | 0.59 | 0.60 | 0.60 | 0.61 | 0.61 | 0.62 | 0.62 | 0.63 | 0.63 | 0.63 | 0.63 | 0.63 | 0.64 | 0.64 | 0.65 | 0.65 | 0.65 | 0.65 | 0.65 | 0.65 | 0.65 | 0.65 | 0.65 | 0.64 | 0.65 | 0.64 | 0.64 | 0.63 | 0.63 | 0.62 | 0.62 | 0.62 | 0.61 | 0.60 | 0.59 | 0.59 |
| 2024-02-03 | 2023-10-28 | 2023-07-29 | 2023-04-29 | 2023-01-28 | 2022-10-29 | 2022-07-30 | 2022-04-30 | 2022-01-29 | 2021-10-30 | 2021-07-31 | 2021-05-01 | 2021-01-30 | 2020-10-31 | 2020-08-01 | 2020-05-02 | 2020-02-01 | 2019-11-02 | 2019-08-03 | 2019-05-04 | 2019-02-02 | 2018-11-03 | 2018-08-04 | 2018-05-05 | 2018-02-03 | 2017-10-28 | 2017-07-29 | 2017-04-29 | 2017-01-28 | 2016-10-29 | 2016-07-30 | 2016-04-30 | 2016-01-30 | 2015-10-31 | 2015-08-01 | 2015-05-02 | 2015-01-31 | 2014-11-01 | 2014-08-02 | 2014-05-03 | 2014-02-01 | 2013-11-02 | 2013-08-03 | 2013-05-04 | 2013-02-02 | 2012-10-27 | 2012-07-28 | 2012-04-28 | 2012-01-28 | 2011-10-29 | 2011-07-30 | 2011-04-30 | 2011-01-29 | 2010-10-30 | 2010-07-31 | 2010-05-01 | ||
|---|---|---|---|---|---|---|---|---|---|---|---|---|---|---|---|---|---|---|---|---|---|---|---|---|---|---|---|---|---|---|---|---|---|---|---|---|---|---|---|---|---|---|---|---|---|---|---|---|---|---|---|---|---|---|---|---|---|
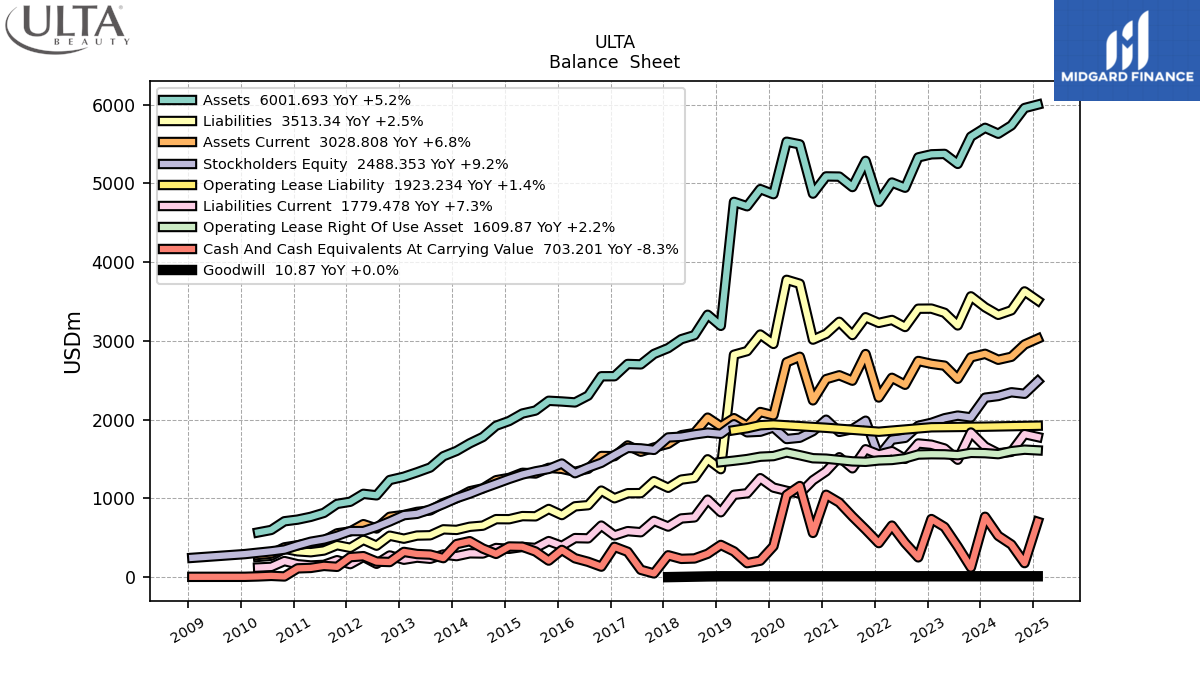
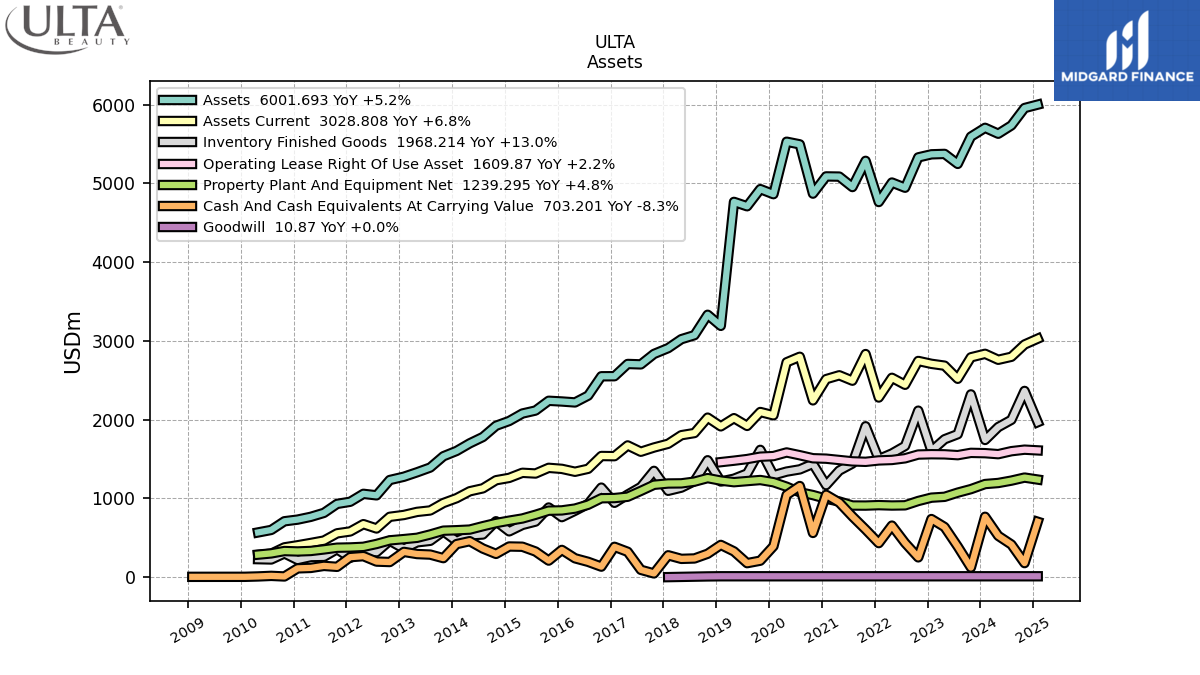
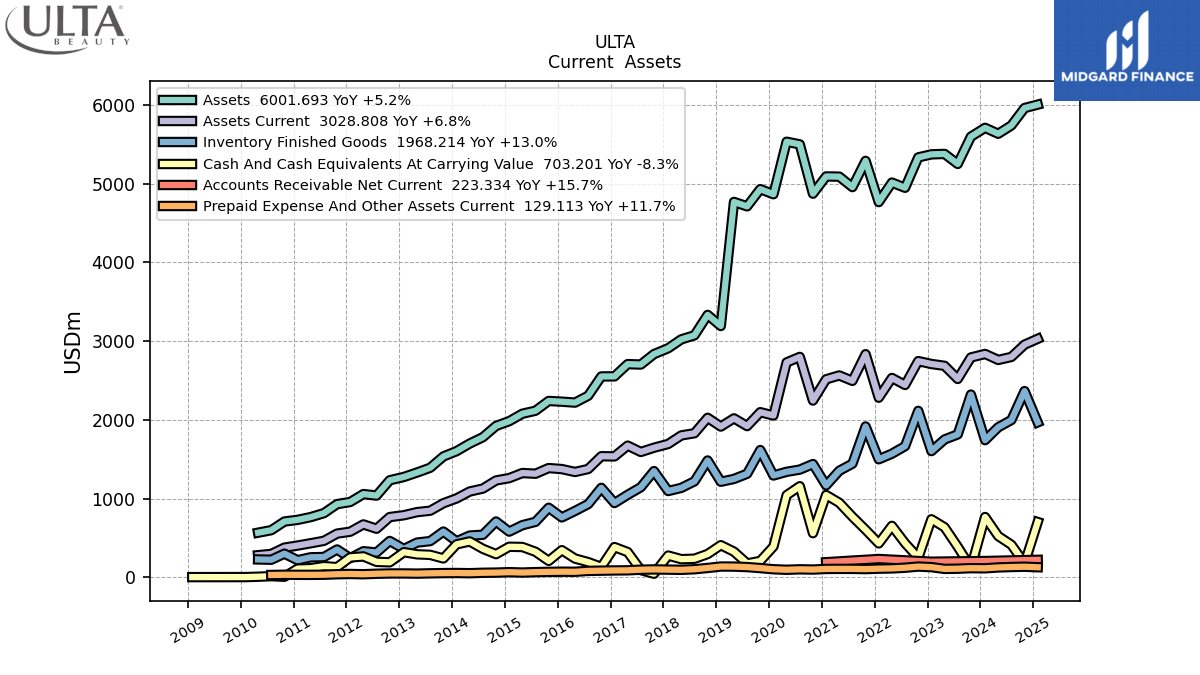
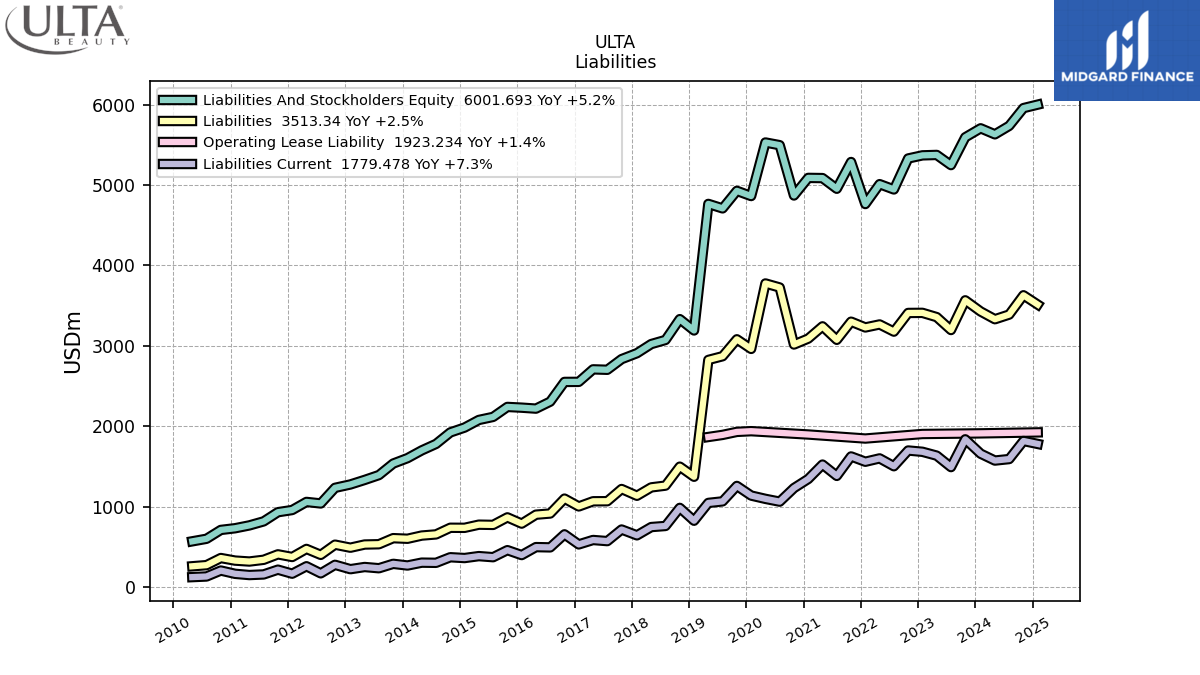
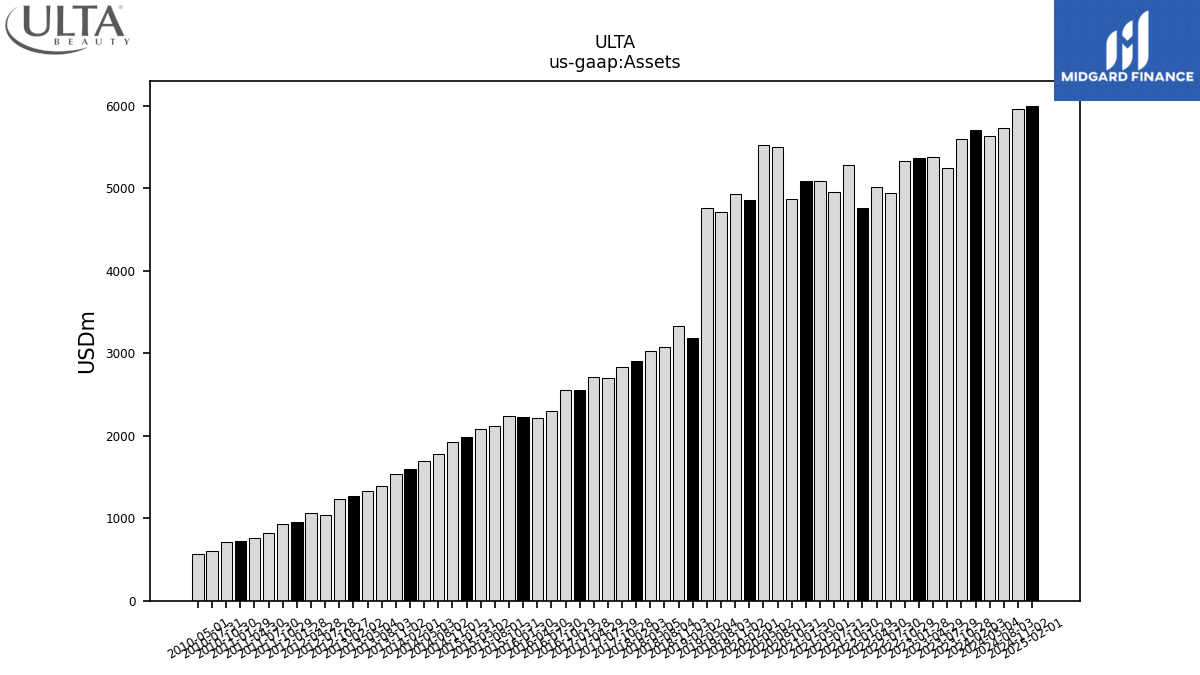
| Assets | 5707.01 | 5595.01 | 5248.76 | 5375.72 | 5370.41 | 5331.55 | 4945.99 | 5012.04 | 4764.38 | 5287.77 | 4954.59 | 5087.54 | 5089.97 | 4870.99 | 5497.12 | 5530.55 | 4863.87 | 4928.85 | 4710.38 | 4766.35 | 3191.17 | 3332.69 | 3073.35 | 3022.25 | 2908.69 | 2834.87 | 2702.22 | 2707.60 | 2551.88 | 2551.20 | 2305.79 | 2218.95 | 2230.92 | 2240.00 | 2115.91 | 2077.95 | 1983.17 | 1922.76 | 1779.81 | 1699.22 | 1602.73 | 1535.35 | 1391.99 | 1331.58 | 1275.25 | 1233.25 | 1038.77 | 1058.00 | 957.22 | 930.07 | 815.85 | 765.81 | 730.49 | 709.42 | 599.33 | 567.76 | |
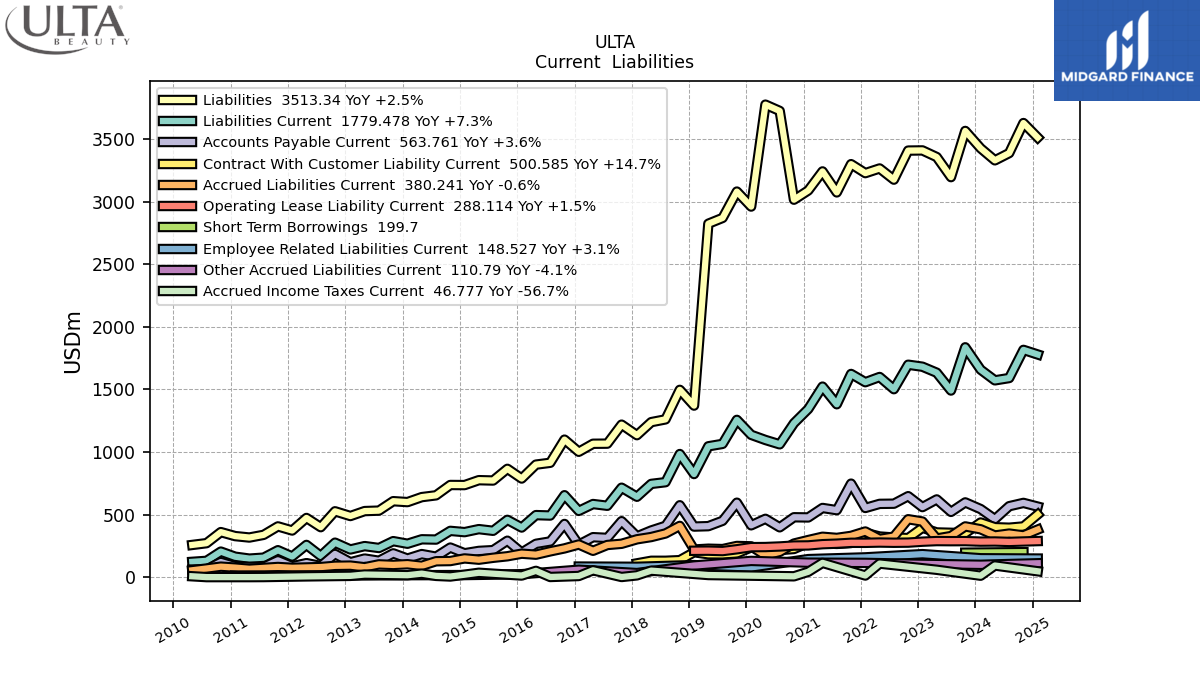
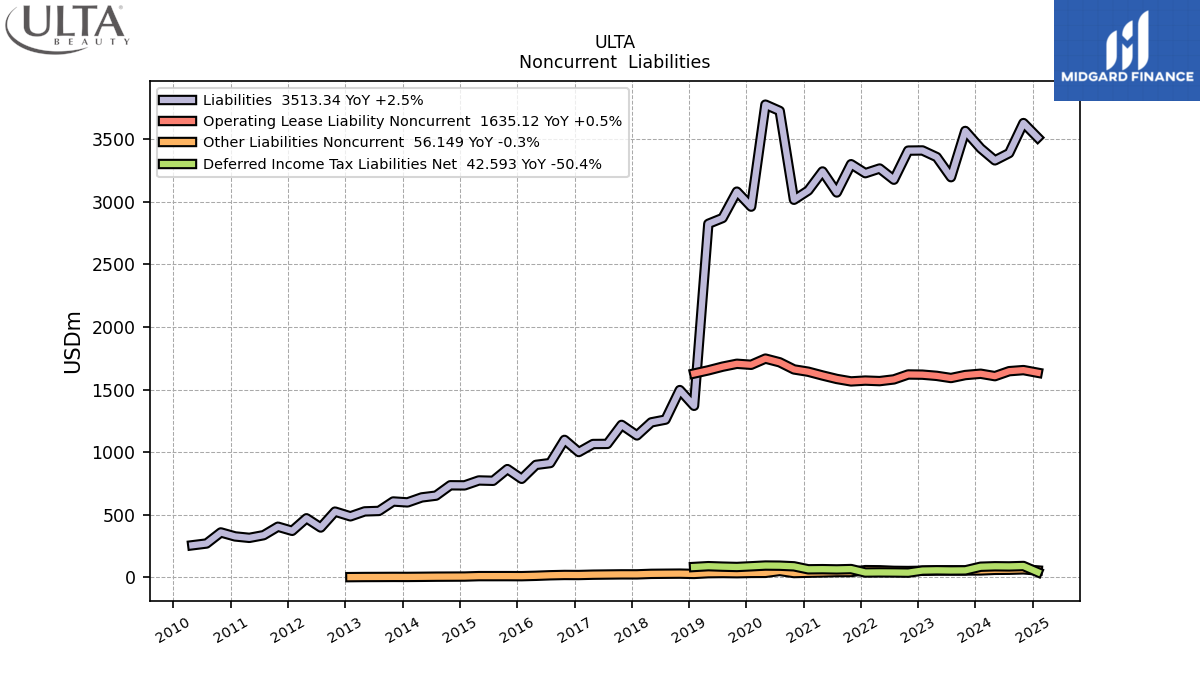
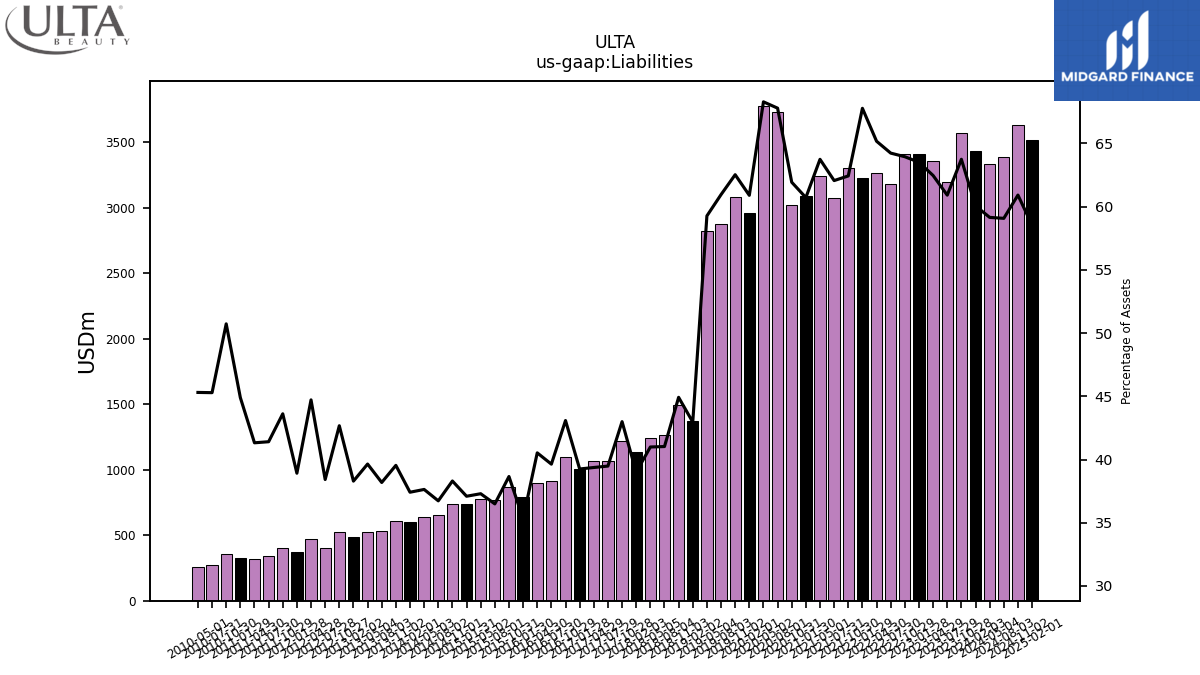
| Liabilities | 3427.68 | 3566.47 | 3196.88 | 3357.65 | 3410.60 | 3409.29 | 3176.93 | 3266.42 | 3229.01 | 3300.97 | 3074.77 | 3242.83 | 3090.42 | 3016.56 | 3726.33 | 3776.59 | 2961.78 | 3081.69 | 2870.92 | 2824.78 | 1370.95 | 1496.95 | 1260.87 | 1238.82 | 1134.47 | 1218.82 | 1066.87 | 1065.94 | 1001.66 | 1099.12 | 913.85 | 899.26 | 788.03 | 865.84 | 772.12 | 774.97 | 735.66 | 736.43 | 653.77 | 639.47 | 599.63 | 607.03 | 531.53 | 527.85 | 488.31 | 526.25 | 399.08 | 473.10 | 372.51 | 405.64 | 337.82 | 316.44 | 327.95 | 359.88 | 271.41 | 257.23 | |
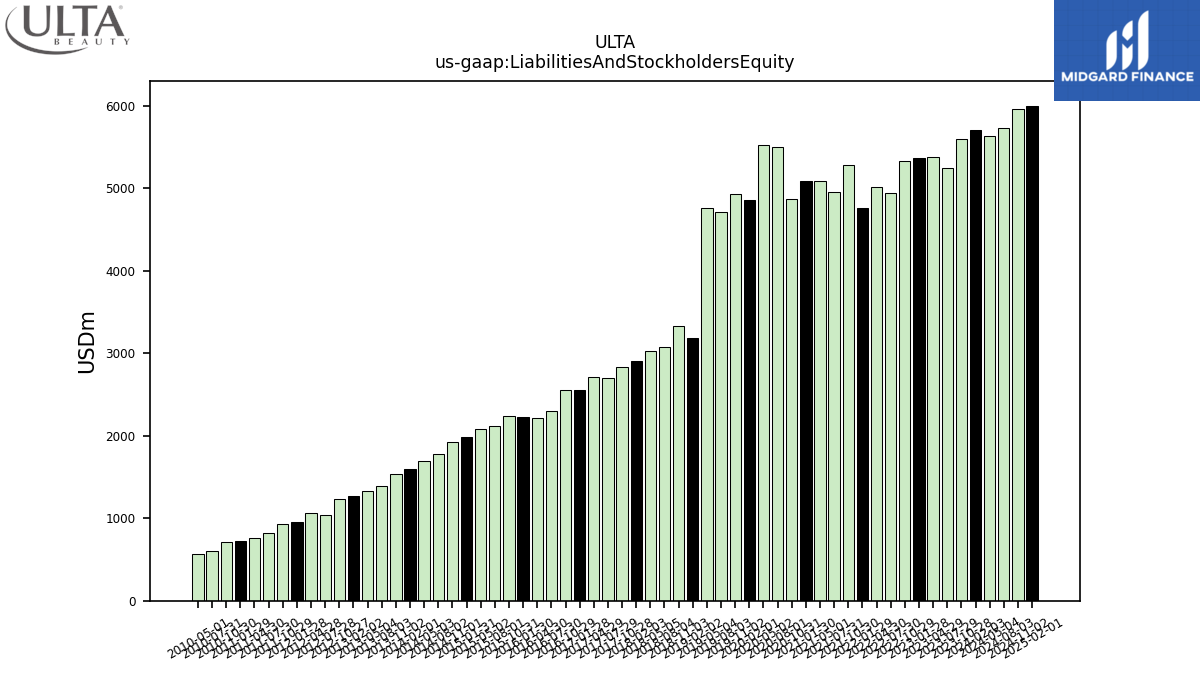
| Liabilities And Stockholders Equity | 5707.01 | 5595.01 | 5248.76 | 5375.72 | 5370.41 | 5331.55 | 4945.99 | 5012.04 | 4764.38 | 5287.77 | 4954.59 | 5087.54 | 5089.97 | 4870.99 | 5497.12 | 5530.55 | 4863.87 | 4928.85 | 4710.38 | 4766.35 | 3191.17 | 3332.69 | 3073.35 | 3022.25 | 2908.69 | 2834.87 | 2702.22 | 2707.60 | 2551.88 | 2551.20 | 2305.79 | 2218.95 | 2230.92 | 2240.00 | 2115.91 | 2077.95 | 1983.17 | 1922.76 | 1779.81 | 1699.22 | 1602.73 | 1535.35 | 1391.99 | 1331.58 | 1275.25 | 1233.25 | 1038.77 | 1058.00 | 957.22 | 930.07 | 815.85 | 765.81 | 730.49 | 709.42 | 599.33 | 567.76 | |
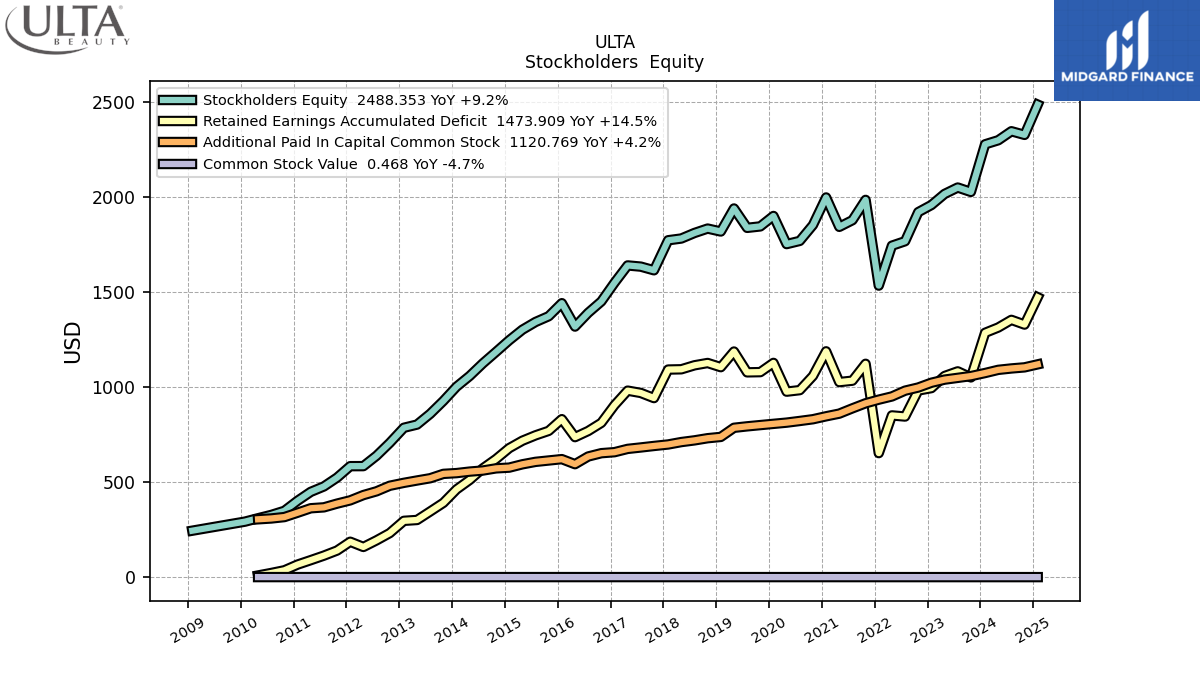
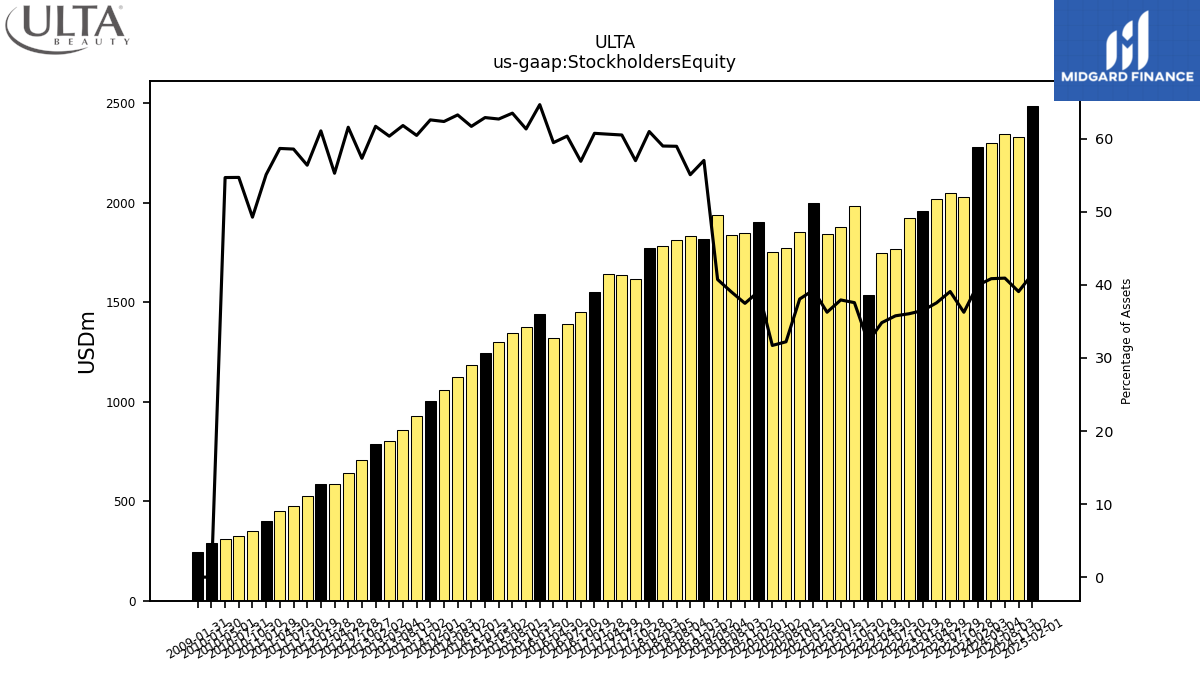
| Stockholders Equity | 2279.33 | 2028.54 | 2051.88 | 2018.07 | 1959.81 | 1922.26 | 1769.07 | 1745.62 | 1535.37 | 1986.80 | 1879.81 | 1844.72 | 1999.55 | 1854.44 | 1770.79 | 1753.96 | 1902.09 | 1847.16 | 1839.45 | 1941.57 | 1820.22 | 1835.74 | 1812.48 | 1783.43 | 1774.22 | 1616.05 | 1635.35 | 1641.66 | 1550.22 | 1452.08 | 1391.94 | 1319.69 | 1442.89 | 1374.16 | 1343.79 | 1302.98 | 1247.51 | 1186.33 | 1126.04 | 1059.76 | 1003.09 | 928.32 | 860.46 | 803.72 | 786.94 | 707.00 | 639.68 | 584.90 | 584.70 | 524.43 | 478.03 | 449.37 | 402.53 | 349.54 | 327.91 | 310.54 |
| 2024-02-03 | 2023-10-28 | 2023-07-29 | 2023-04-29 | 2023-01-28 | 2022-10-29 | 2022-07-30 | 2022-04-30 | 2022-01-29 | 2021-10-30 | 2021-07-31 | 2021-05-01 | 2021-01-30 | 2020-10-31 | 2020-08-01 | 2020-05-02 | 2020-02-01 | 2019-11-02 | 2019-08-03 | 2019-05-04 | 2019-02-02 | 2018-11-03 | 2018-08-04 | 2018-05-05 | 2018-02-03 | 2017-10-28 | 2017-07-29 | 2017-04-29 | 2017-01-28 | 2016-10-29 | 2016-07-30 | 2016-04-30 | 2016-01-30 | 2015-10-31 | 2015-08-01 | 2015-05-02 | 2015-01-31 | 2014-11-01 | 2014-08-02 | 2014-05-03 | 2014-02-01 | 2013-11-02 | 2013-08-03 | 2013-05-04 | 2013-02-02 | 2012-10-27 | 2012-07-28 | 2012-04-28 | 2012-01-28 | 2011-10-29 | 2011-07-30 | 2011-04-30 | 2011-01-29 | 2010-10-30 | 2010-07-31 | 2010-05-01 | ||
|---|---|---|---|---|---|---|---|---|---|---|---|---|---|---|---|---|---|---|---|---|---|---|---|---|---|---|---|---|---|---|---|---|---|---|---|---|---|---|---|---|---|---|---|---|---|---|---|---|---|---|---|---|---|---|---|---|---|
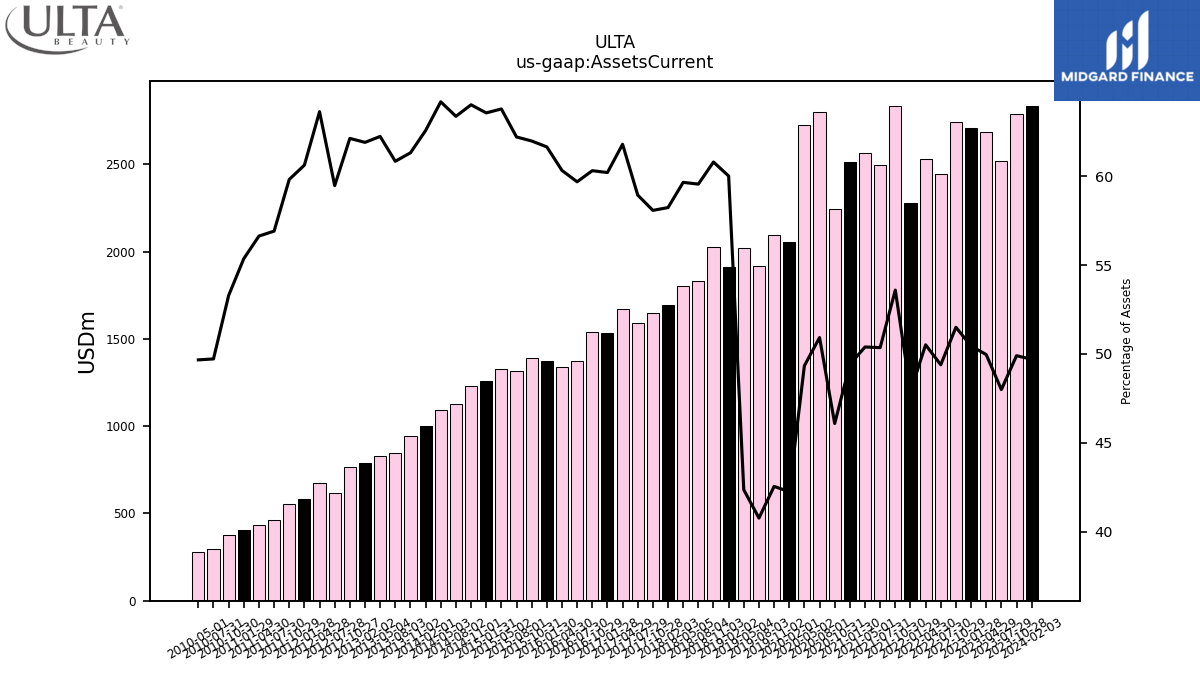
| Assets Current | 2836.52 | 2792.04 | 2519.25 | 2685.98 | 2709.30 | 2745.82 | 2442.91 | 2531.87 | 2281.18 | 2833.69 | 2494.93 | 2563.76 | 2514.78 | 2245.01 | 2799.19 | 2728.82 | 2055.32 | 2097.47 | 1920.60 | 2019.33 | 1914.86 | 2025.97 | 1830.16 | 1802.70 | 1693.74 | 1646.29 | 1592.49 | 1672.97 | 1536.24 | 1538.46 | 1376.08 | 1338.42 | 1375.17 | 1388.19 | 1316.09 | 1325.20 | 1260.36 | 1230.74 | 1127.69 | 1090.49 | 1002.70 | 941.30 | 846.79 | 828.62 | 789.32 | 766.08 | 617.71 | 673.10 | 580.23 | 556.28 | 464.27 | 433.66 | 404.39 | 378.03 | 297.99 | 282.00 | |
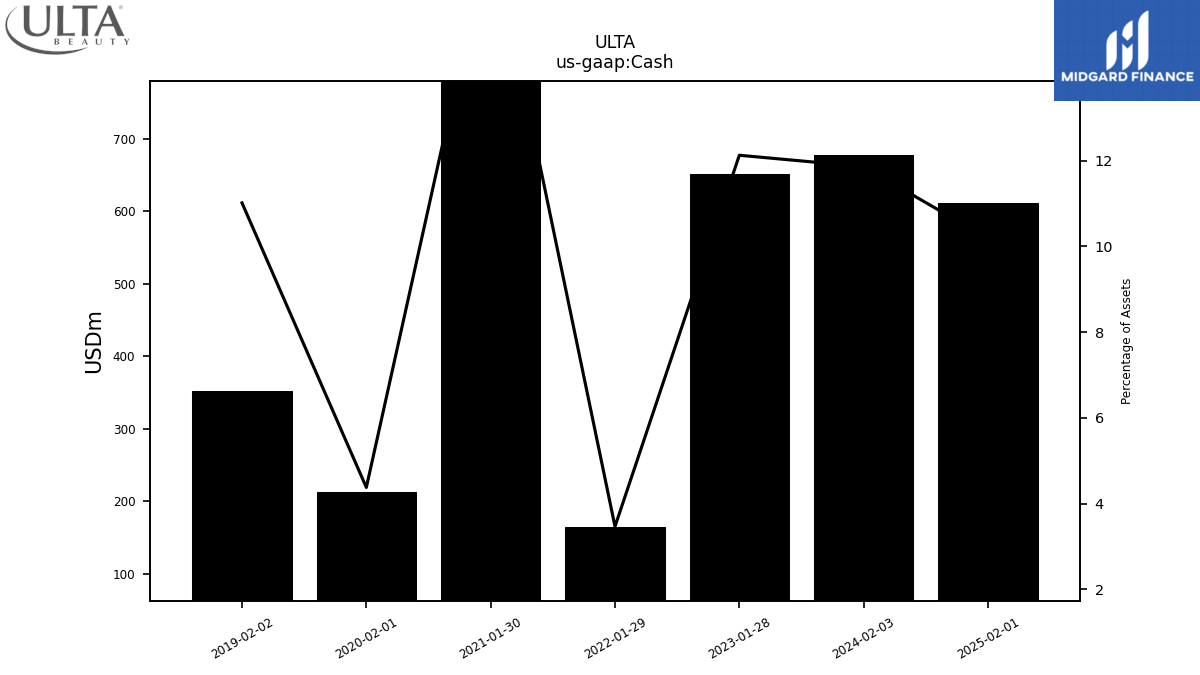
| Cash | 677.00 | NA | NA | NA | 651.37 | NA | NA | NA | 165.12 | NA | NA | NA | 887.30 | NA | NA | NA | 212.88 | NA | NA | NA | 351.55 | NA | NA | NA | NA | NA | NA | NA | NA | NA | NA | NA | NA | NA | NA | NA | NA | NA | NA | NA | NA | NA | NA | NA | NA | NA | NA | NA | NA | NA | NA | NA | NA | NA | NA | NA | |
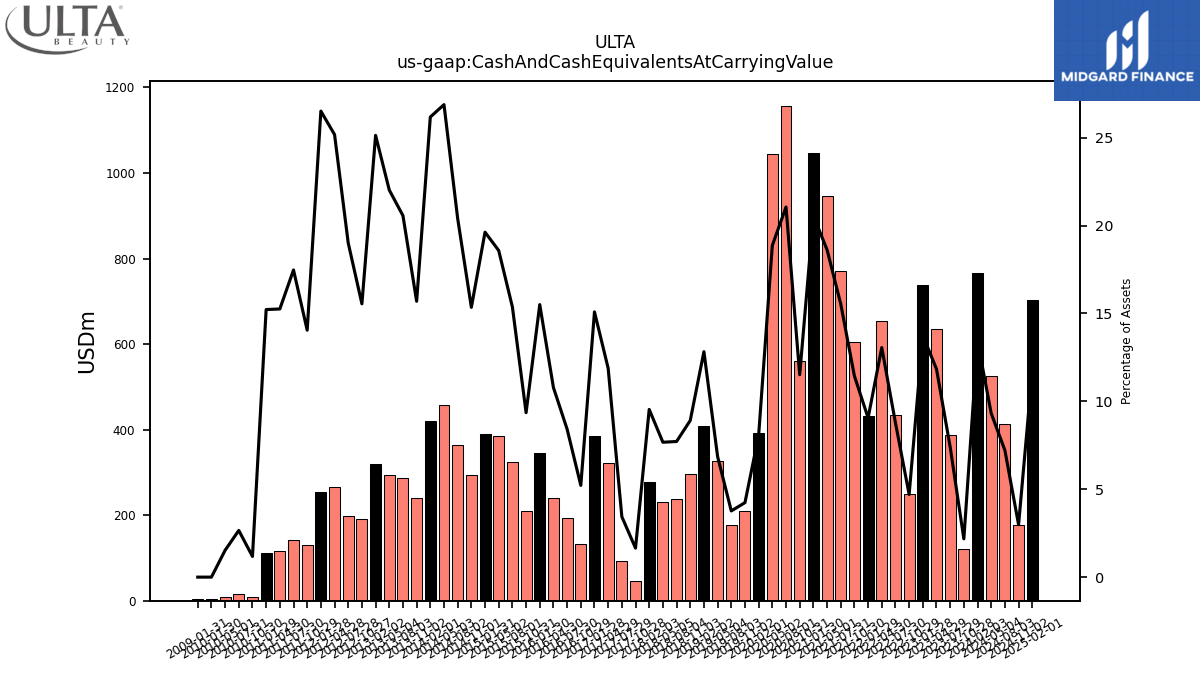
| Cash And Cash Equivalents At Carrying Value | 766.59 | 121.81 | 388.63 | 636.45 | 737.88 | 250.63 | 434.23 | 654.49 | 431.56 | 605.05 | 770.14 | 947.46 | 1046.05 | 560.90 | 1157.32 | 1043.54 | 392.32 | 208.84 | 177.40 | 326.83 | 409.25 | 296.94 | 237.11 | 231.89 | 277.44 | 46.79 | 92.86 | 321.73 | 385.01 | 133.11 | 194.08 | 239.25 | 345.84 | 209.55 | 325.21 | 386.01 | 389.15 | 295.06 | 363.06 | 456.71 | 419.48 | 240.92 | 286.21 | 293.21 | 320.48 | 191.72 | 197.40 | 266.35 | 253.74 | 130.66 | 142.54 | 116.81 | 111.19 | 8.35 | 15.92 | 8.67 | |
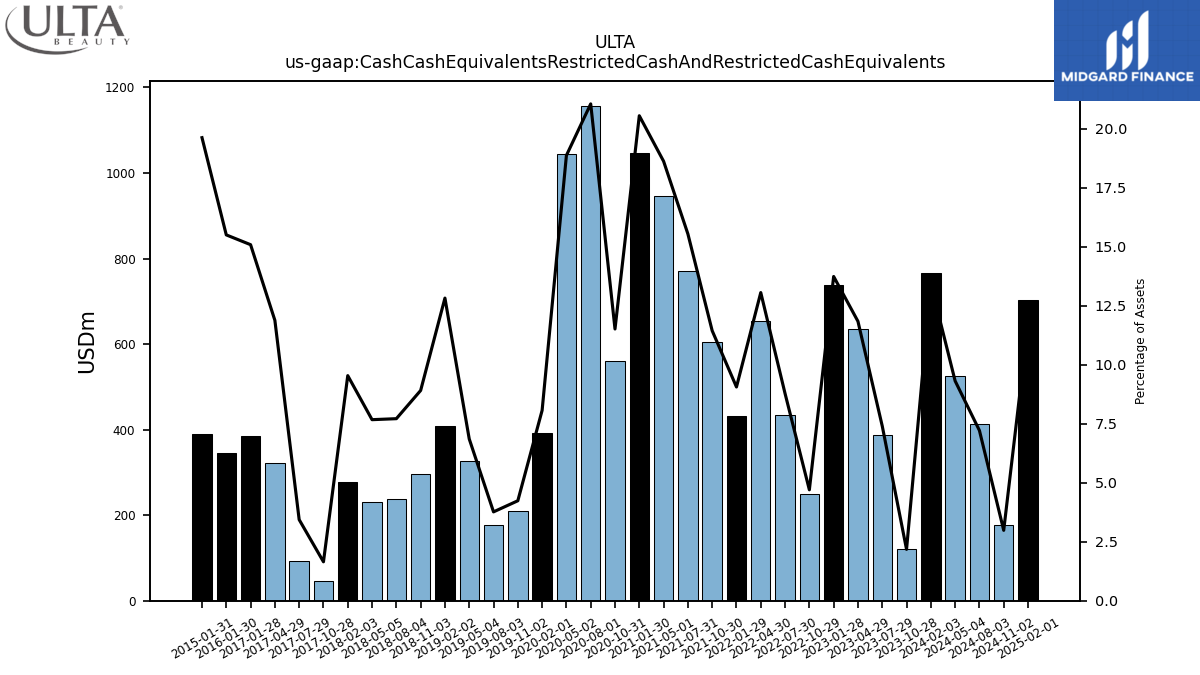
| Cash Cash Equivalents Restricted Cash And Restricted Cash Equivalents | 766.59 | 121.81 | 388.63 | 636.45 | 737.88 | 250.63 | 434.23 | 654.49 | 431.56 | 605.05 | 770.14 | 947.46 | 1046.05 | 560.90 | 1157.32 | 1043.54 | 392.32 | 208.84 | 177.40 | 326.83 | 409.25 | 296.94 | 237.11 | 231.89 | 277.44 | 46.79 | 92.86 | 321.73 | 385.01 | NA | NA | NA | 345.84 | NA | NA | NA | 389.15 | NA | NA | NA | NA | NA | NA | NA | NA | NA | NA | NA | NA | NA | NA | NA | NA | NA | NA | NA | |
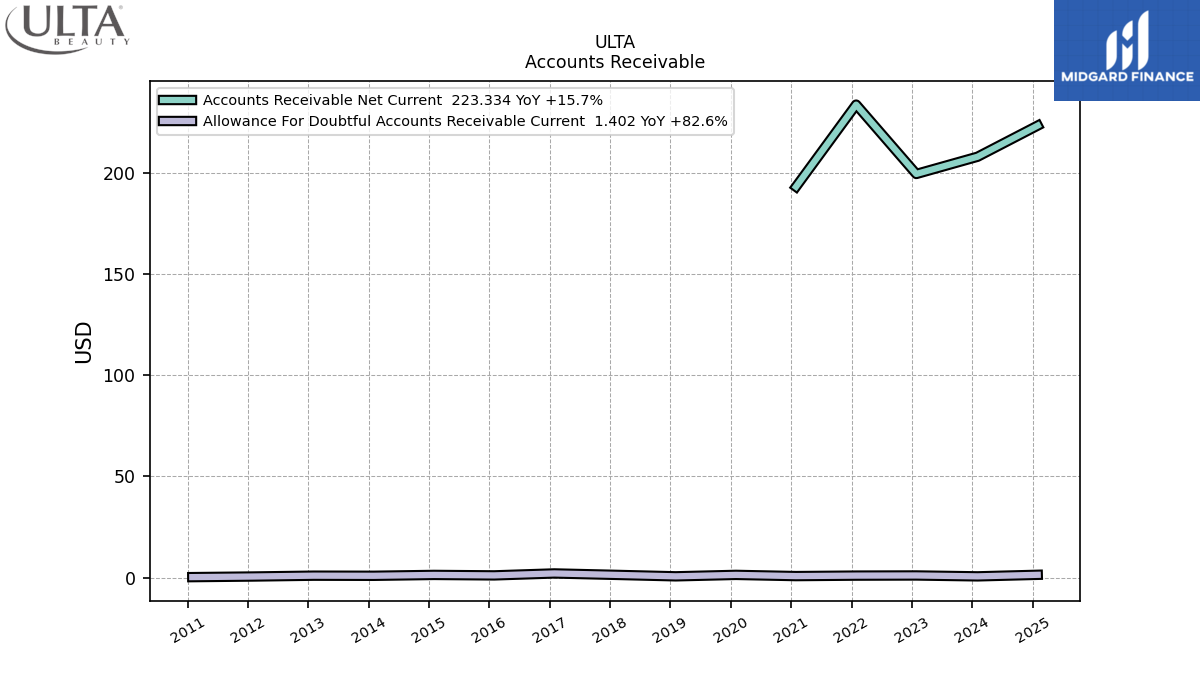
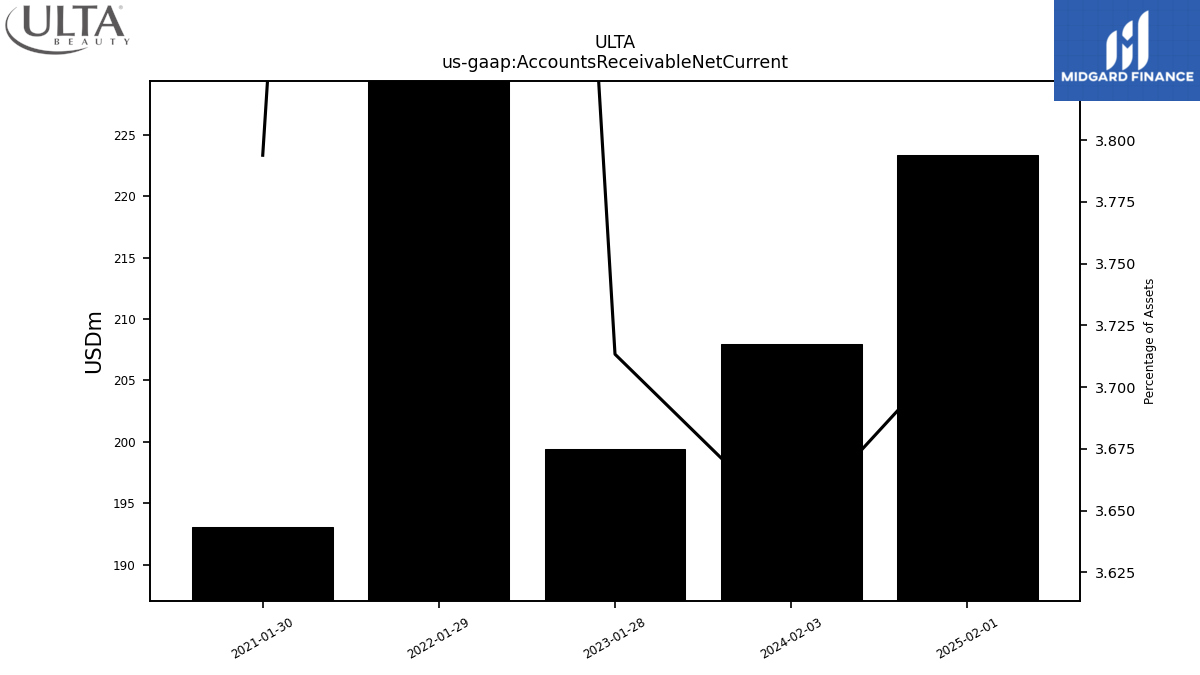
| Accounts Receivable Net Current | 207.94 | NA | NA | NA | 199.42 | NA | NA | NA | 233.68 | NA | NA | NA | 193.11 | NA | NA | NA | NA | NA | NA | NA | NA | NA | NA | NA | NA | NA | NA | NA | NA | NA | NA | NA | NA | NA | NA | NA | NA | NA | NA | NA | NA | NA | NA | NA | NA | NA | NA | NA | NA | NA | NA | NA | NA | NA | NA | NA | |
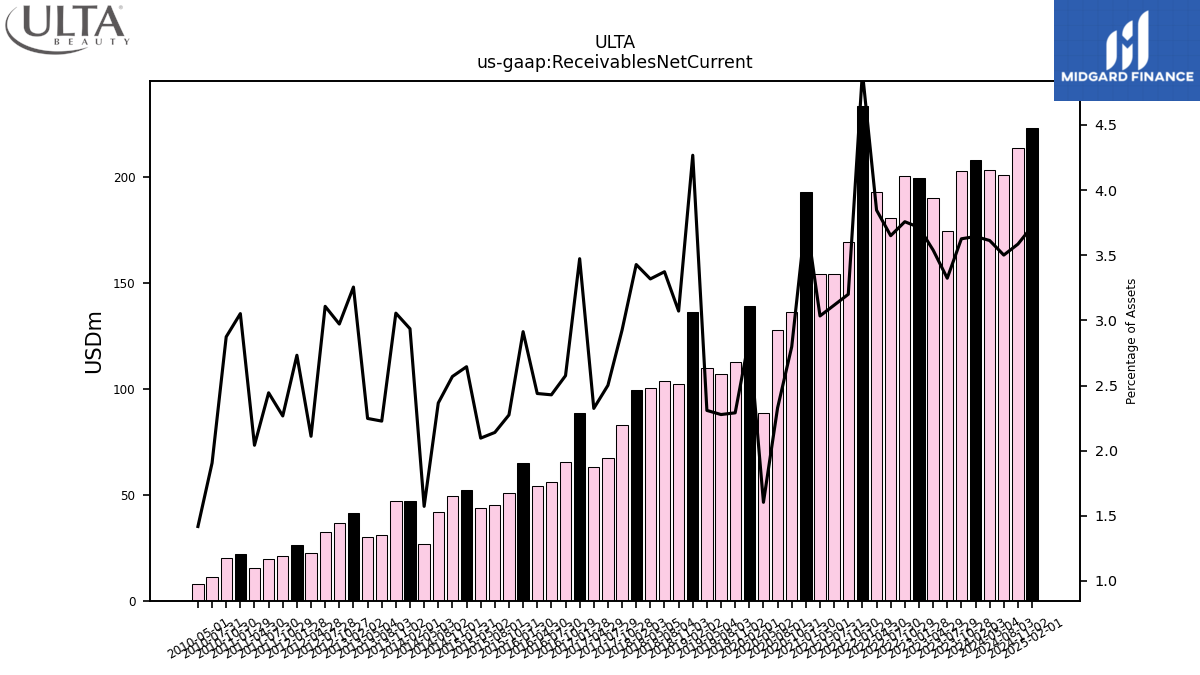
| Receivables Net Current | 207.94 | 202.87 | 174.44 | 190.28 | 199.42 | 200.30 | 180.51 | 192.75 | 233.68 | 169.21 | 154.42 | 154.34 | 193.11 | 136.27 | 127.99 | 88.69 | 139.34 | 112.89 | 107.26 | 110.05 | 136.17 | 102.35 | 103.67 | 100.27 | 99.72 | 82.93 | 67.59 | 62.94 | 88.63 | 65.71 | 56.00 | 54.11 | 64.99 | 50.94 | 45.28 | 43.56 | 52.44 | 49.40 | 42.11 | 26.72 | 47.05 | 46.91 | 31.00 | 29.93 | 41.52 | 36.65 | 32.28 | 22.33 | 26.15 | 21.08 | 19.94 | 15.63 | 22.29 | 20.39 | 11.42 | 8.05 | |
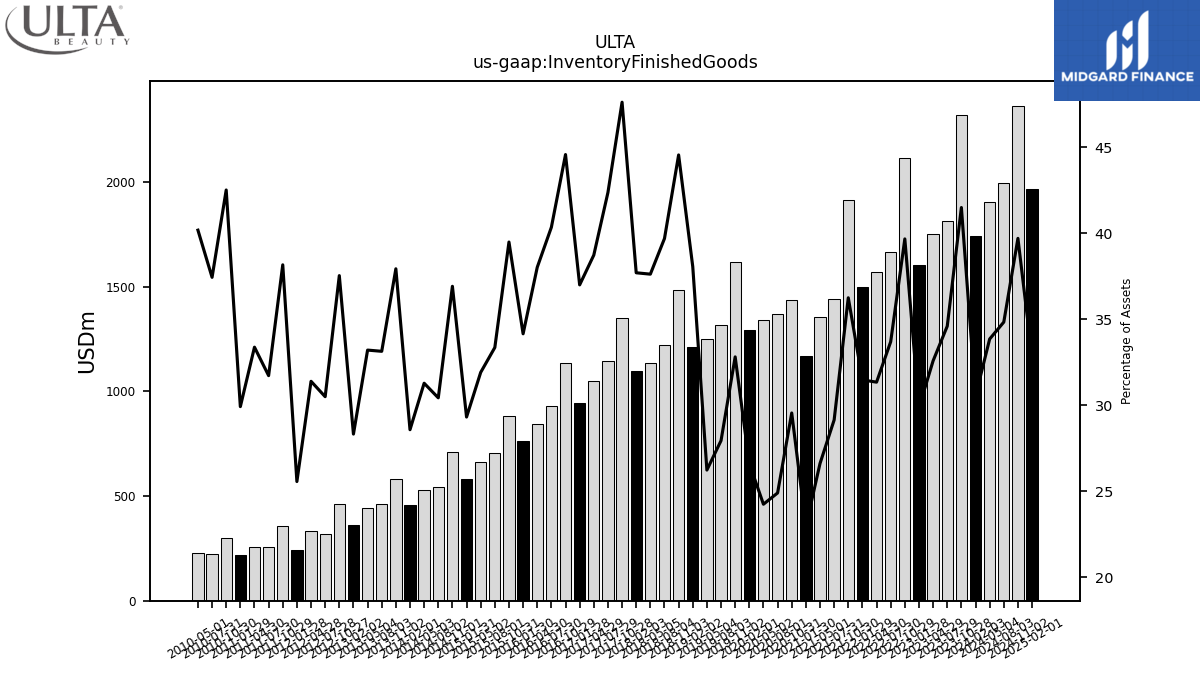
| Inventory Finished Goods | 1742.14 | 2321.31 | 1815.54 | 1751.23 | 1603.45 | 2114.67 | 1666.13 | 1570.55 | 1499.22 | 1916.34 | 1443.68 | 1353.57 | 1168.21 | 1439.10 | 1368.54 | 1340.57 | 1293.70 | 1616.92 | 1316.00 | 1250.04 | 1214.33 | 1484.57 | 1219.68 | 1136.82 | 1096.42 | 1349.71 | 1144.70 | 1048.43 | 943.98 | 1137.02 | 930.21 | 843.49 | 761.79 | 884.41 | 705.66 | 662.94 | 581.23 | 709.67 | 541.51 | 531.43 | 457.93 | 582.30 | 461.16 | 442.08 | 361.12 | 462.83 | 316.73 | 332.06 | 244.65 | 354.89 | 258.75 | 255.55 | 218.52 | 301.56 | 224.33 | 228.08 | |
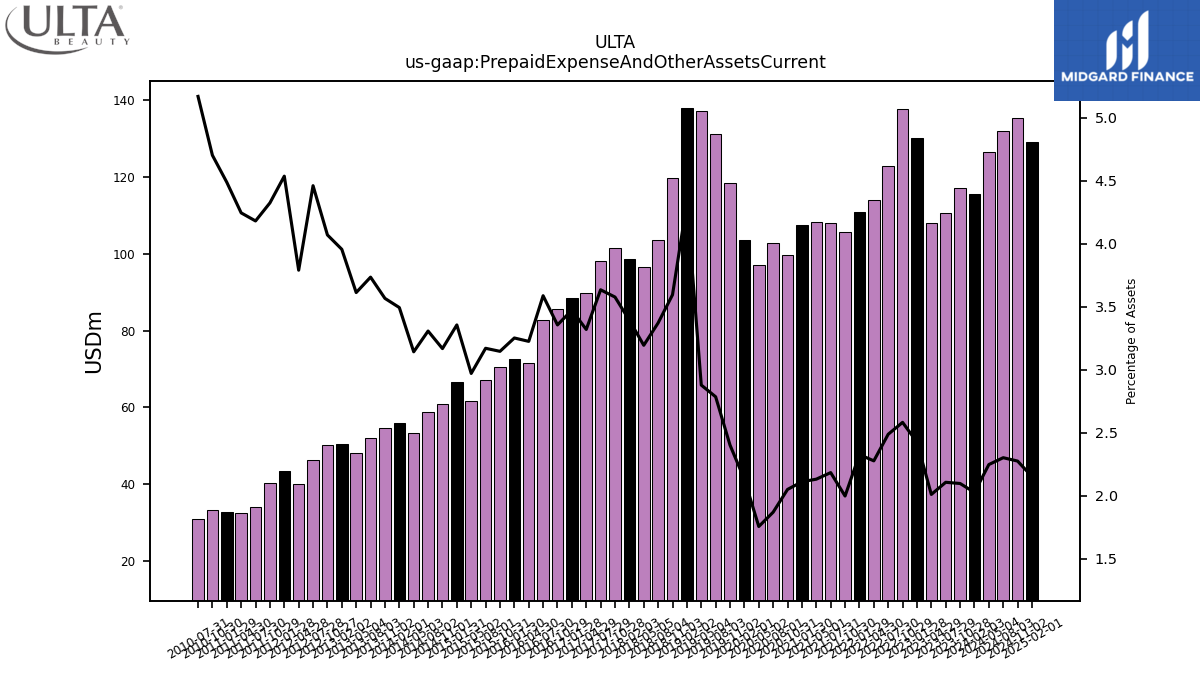
| Prepaid Expense And Other Assets Current | 115.60 | 117.28 | 110.52 | 108.01 | 130.25 | 137.64 | 123.01 | 114.08 | 110.81 | 105.58 | 108.14 | 108.39 | 107.40 | 99.81 | 102.71 | 97.04 | 103.57 | 118.34 | 131.17 | 137.17 | 138.12 | 119.82 | 103.62 | 96.53 | 98.67 | 101.40 | 98.22 | 89.88 | 88.62 | 85.61 | 82.72 | 71.56 | 72.55 | 70.47 | 67.08 | 61.73 | 66.55 | 60.91 | 58.86 | 53.39 | 55.99 | 54.76 | 51.99 | 48.11 | 50.45 | 50.20 | 46.34 | 40.10 | 43.43 | 40.22 | 34.11 | 32.51 | 32.79 | 33.37 | 30.99 | NA |
| 2024-02-03 | 2023-10-28 | 2023-07-29 | 2023-04-29 | 2023-01-28 | 2022-10-29 | 2022-07-30 | 2022-04-30 | 2022-01-29 | 2021-10-30 | 2021-07-31 | 2021-05-01 | 2021-01-30 | 2020-10-31 | 2020-08-01 | 2020-05-02 | 2020-02-01 | 2019-11-02 | 2019-08-03 | 2019-05-04 | 2019-02-02 | 2018-11-03 | 2018-08-04 | 2018-05-05 | 2018-02-03 | 2017-10-28 | 2017-07-29 | 2017-04-29 | 2017-01-28 | 2016-10-29 | 2016-07-30 | 2016-04-30 | 2016-01-30 | 2015-10-31 | 2015-08-01 | 2015-05-02 | 2015-01-31 | 2014-11-01 | 2014-08-02 | 2014-05-03 | 2014-02-01 | 2013-11-02 | 2013-08-03 | 2013-05-04 | 2013-02-02 | 2012-10-27 | 2012-07-28 | 2012-04-28 | 2012-01-28 | 2011-10-29 | 2011-07-30 | 2011-04-30 | 2011-01-29 | 2010-10-30 | 2010-07-31 | 2010-05-01 | ||
|---|---|---|---|---|---|---|---|---|---|---|---|---|---|---|---|---|---|---|---|---|---|---|---|---|---|---|---|---|---|---|---|---|---|---|---|---|---|---|---|---|---|---|---|---|---|---|---|---|---|---|---|---|---|---|---|---|---|
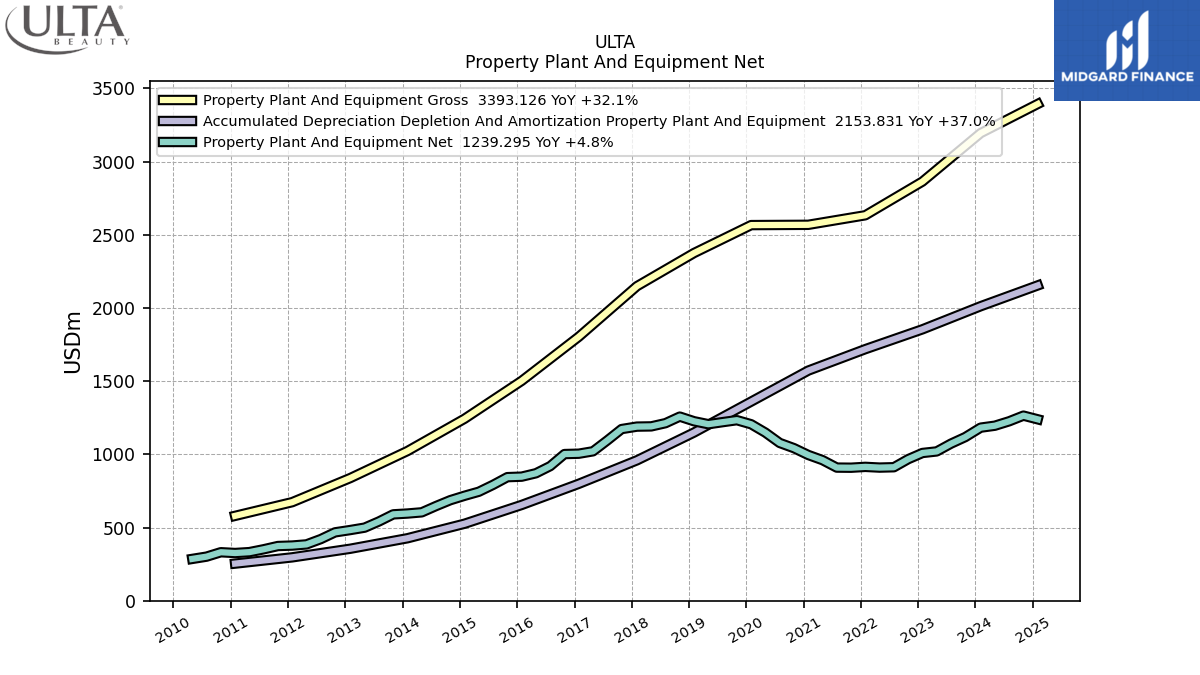
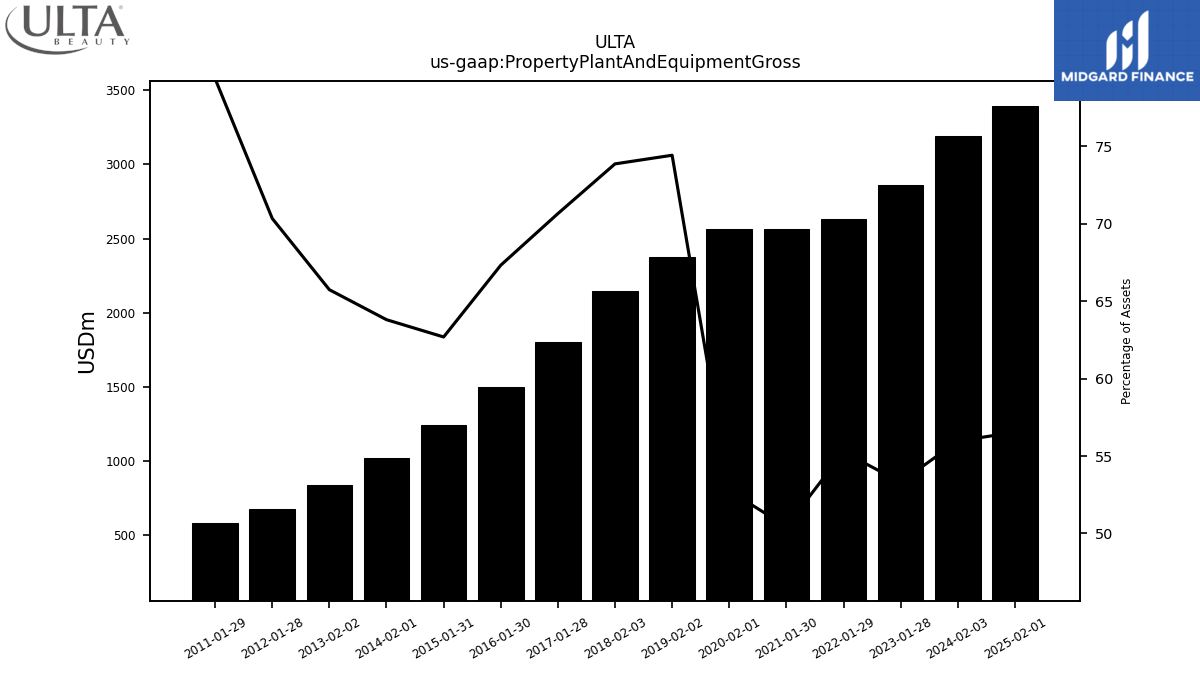
| Property Plant And Equipment Gross | 3194.03 | NA | NA | NA | 2863.18 | NA | NA | NA | 2633.01 | NA | NA | NA | 2567.82 | NA | NA | NA | 2565.84 | NA | NA | NA | 2375.14 | NA | NA | NA | 2148.66 | NA | NA | NA | 1803.12 | NA | NA | NA | 1501.95 | NA | NA | NA | 1243.25 | NA | NA | NA | 1022.66 | NA | NA | NA | 838.39 | NA | NA | NA | 673.35 | NA | NA | NA | 579.80 | NA | NA | NA | |
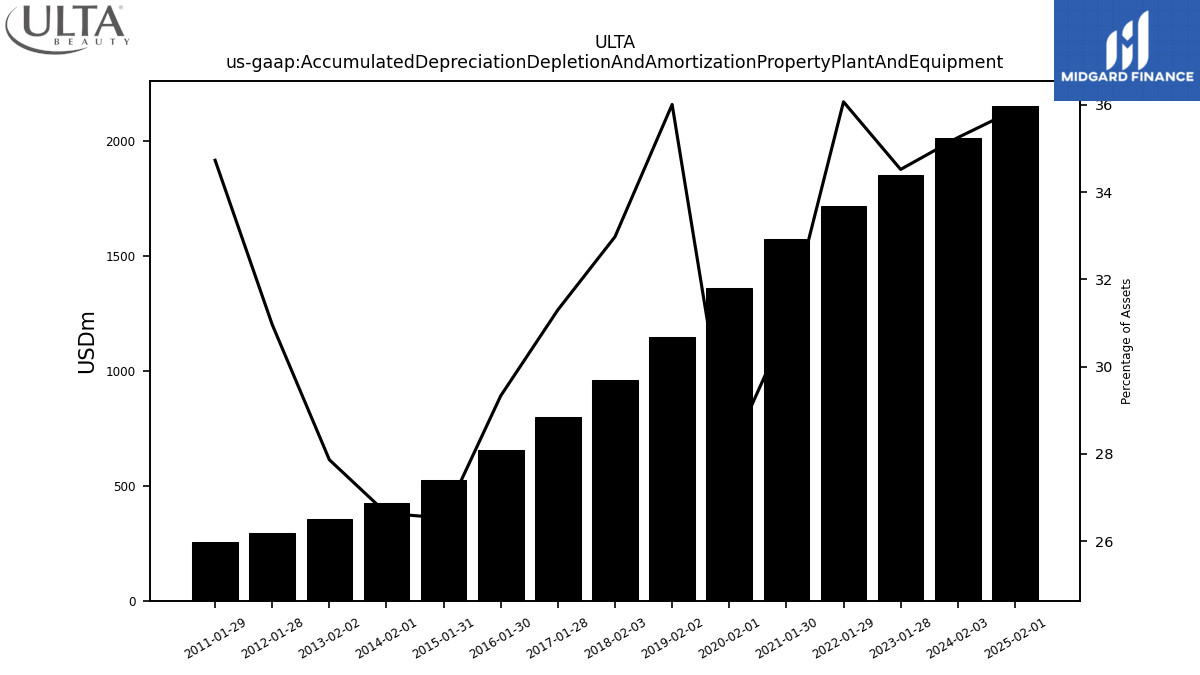
| Accumulated Depreciation Depletion And Amortization Property Plant And Equipment | 2011.69 | NA | NA | NA | 1853.91 | NA | NA | NA | 1718.54 | NA | NA | NA | 1572.02 | NA | NA | NA | 1360.32 | NA | NA | NA | 1149.11 | NA | NA | NA | 959.21 | NA | NA | NA | 798.76 | NA | NA | NA | 654.36 | NA | NA | NA | 526.09 | NA | NA | NA | 426.92 | NA | NA | NA | 355.33 | NA | NA | NA | 296.37 | NA | NA | NA | 253.70 | NA | NA | NA | |
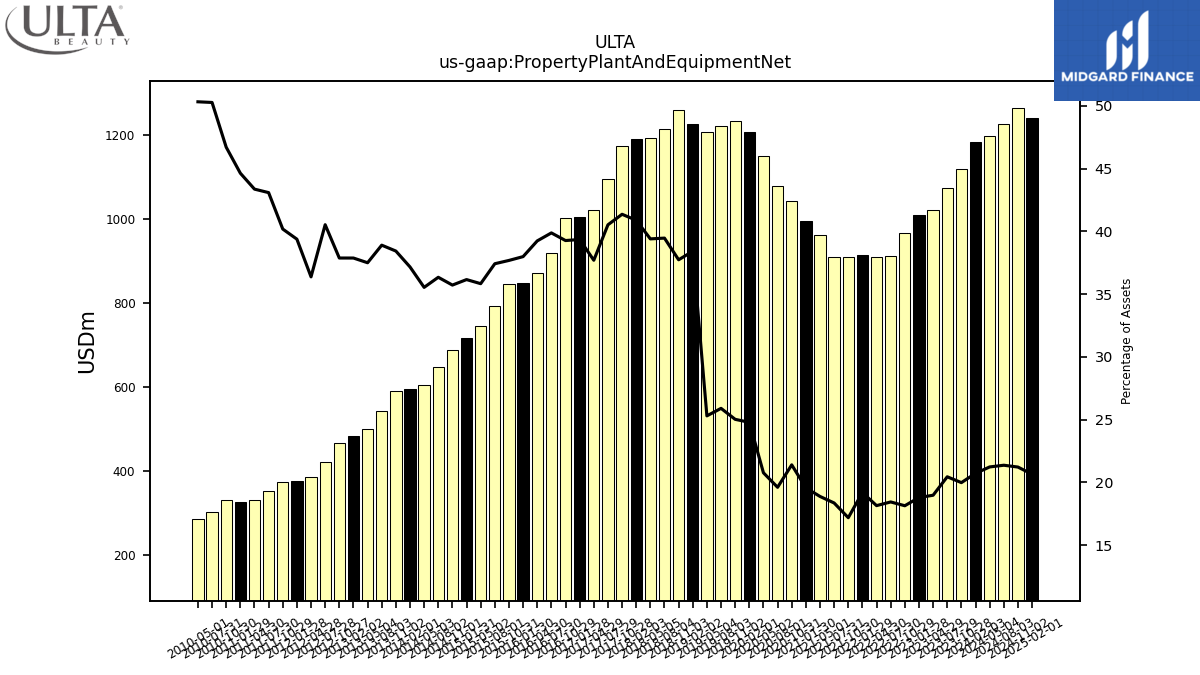
| Property Plant And Equipment Net | 1182.34 | 1117.87 | 1073.14 | 1019.98 | 1009.27 | 967.04 | 912.02 | 909.54 | 914.48 | 908.66 | 909.51 | 960.44 | 995.79 | 1042.26 | 1077.83 | 1148.34 | 1205.52 | 1233.41 | 1219.95 | 1205.92 | 1226.03 | 1257.78 | 1212.98 | 1190.97 | 1189.45 | 1172.68 | 1095.13 | 1020.85 | 1004.36 | 1001.94 | 919.60 | 870.84 | 847.60 | 844.24 | 791.90 | 744.66 | 717.16 | 686.90 | 646.89 | 603.93 | 595.74 | 590.13 | 541.56 | 499.39 | 483.06 | 467.17 | 421.06 | 384.90 | 376.99 | 373.79 | 351.58 | 332.15 | 326.10 | 331.39 | 301.33 | 285.77 | |
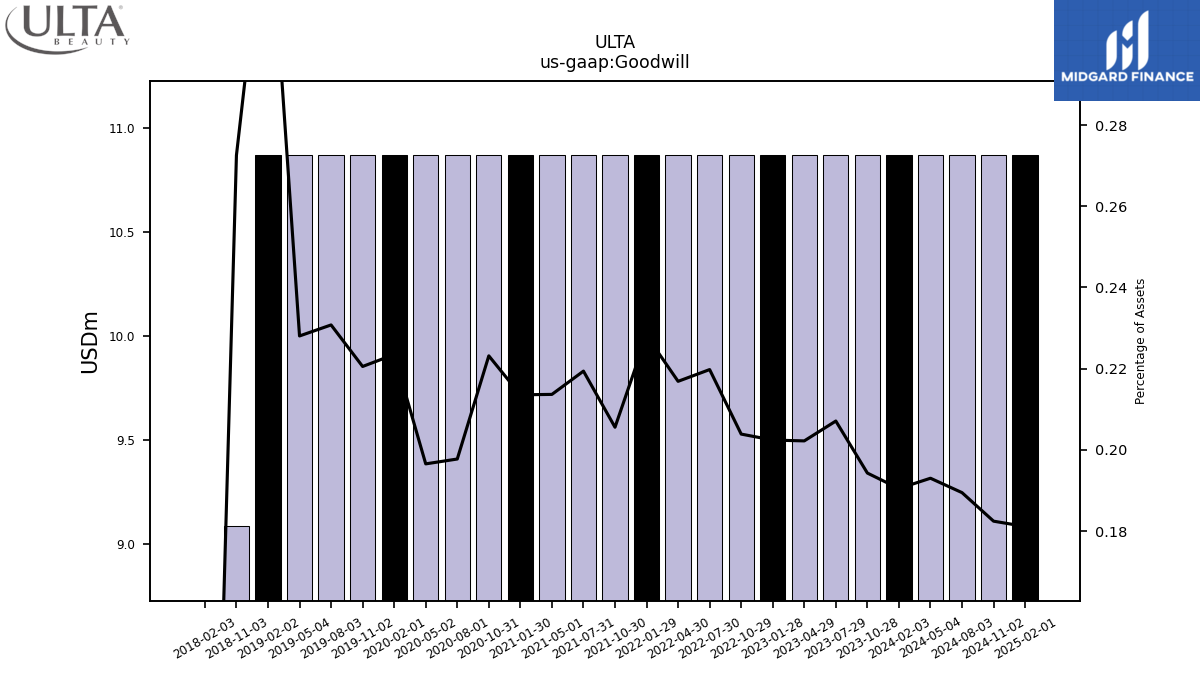
| Goodwill | 10.87 | 10.87 | 10.87 | 10.87 | 10.87 | 10.87 | 10.87 | 10.87 | 10.87 | 10.87 | 10.87 | 10.87 | 10.87 | 10.87 | 10.87 | 10.87 | 10.87 | 10.87 | 10.87 | 10.87 | 10.87 | 9.08 | NA | NA | 0.00 | NA | NA | NA | NA | NA | NA | NA | NA | NA | NA | NA | NA | NA | NA | NA | NA | NA | NA | NA | NA | NA | NA | NA | NA | NA | NA | NA | NA | NA | NA | NA | |
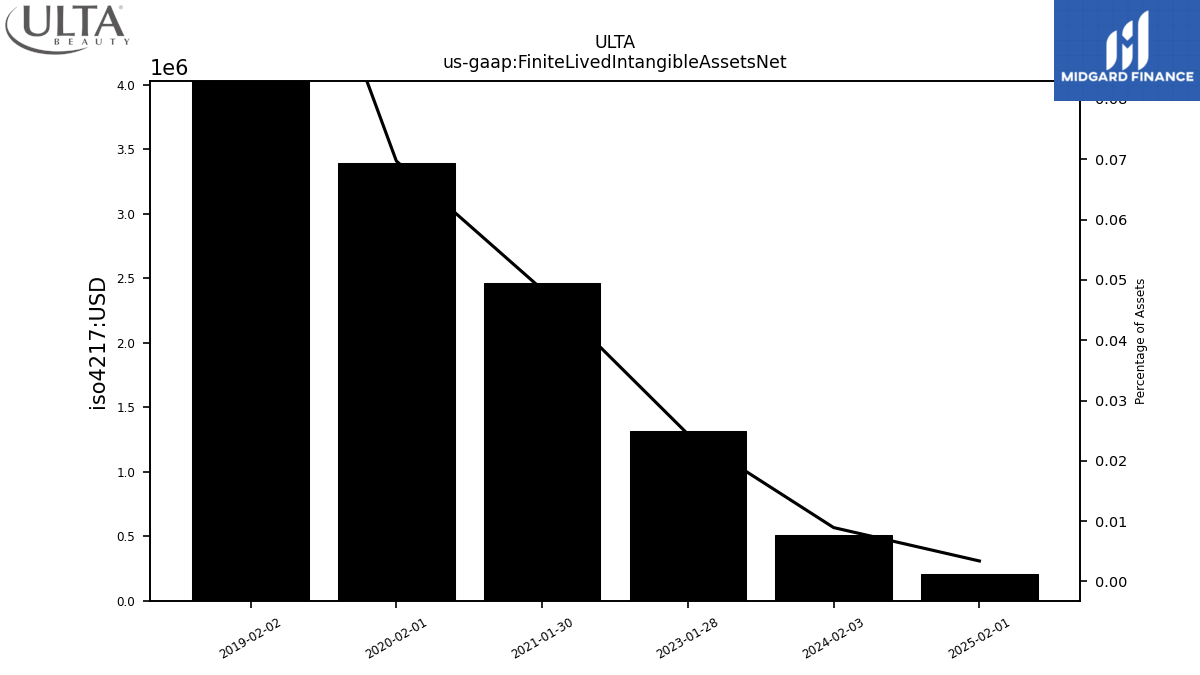
| Finite Lived Intangible Assets Net | 0.51 | NA | NA | NA | 1.31 | NA | NA | NA | NA | NA | NA | NA | 2.46 | NA | NA | NA | 3.39 | NA | NA | NA | 4.32 | NA | NA | NA | NA | NA | NA | NA | NA | NA | NA | NA | NA | NA | NA | NA | NA | NA | NA | NA | NA | NA | NA | NA | NA | NA | NA | NA | NA | NA | NA | NA | NA | NA | NA | NA | |
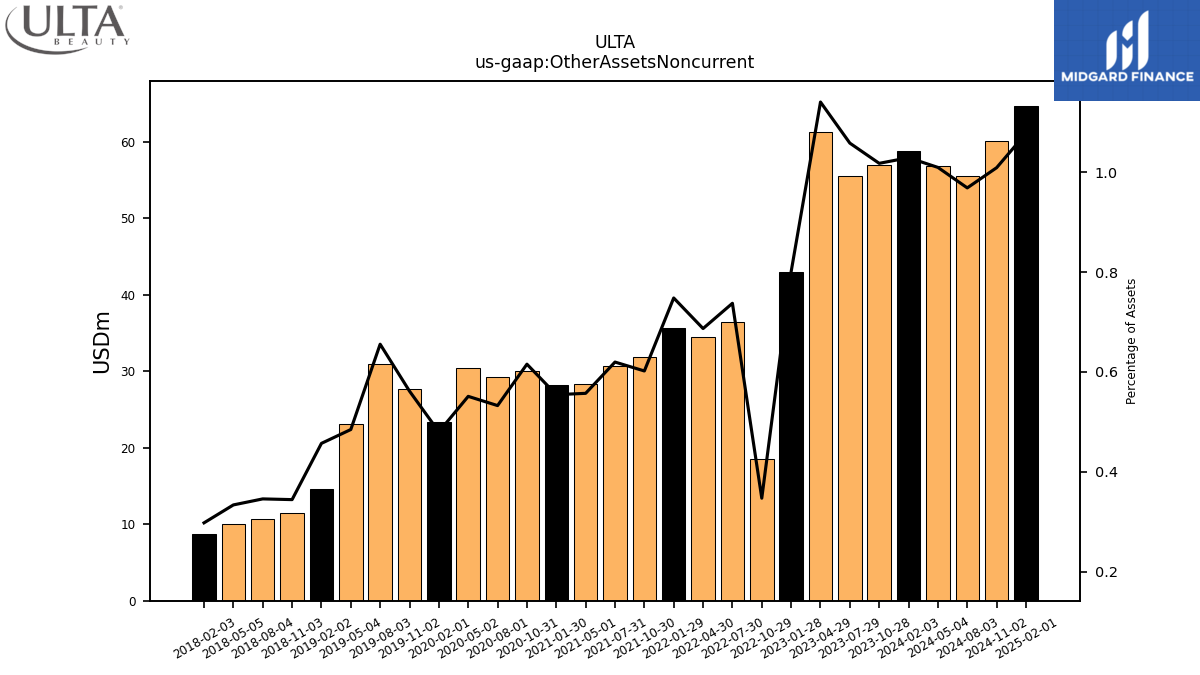
| Other Assets Noncurrent | 58.73 | 56.95 | 55.55 | 61.31 | 43.01 | 18.51 | 36.48 | 34.43 | 35.65 | 31.83 | 30.71 | 28.35 | 28.23 | 29.99 | 29.28 | 30.48 | 23.36 | 27.68 | 30.88 | 23.11 | 14.58 | 11.48 | 10.63 | 10.09 | 8.66 | NA | NA | NA | NA | NA | NA | NA | NA | NA | NA | NA | NA | NA | NA | NA | NA | NA | NA | NA | NA | NA | NA | NA | NA | NA | NA | NA | NA | NA | NA | NA |
| 2024-02-03 | 2023-10-28 | 2023-07-29 | 2023-04-29 | 2023-01-28 | 2022-10-29 | 2022-07-30 | 2022-04-30 | 2022-01-29 | 2021-10-30 | 2021-07-31 | 2021-05-01 | 2021-01-30 | 2020-10-31 | 2020-08-01 | 2020-05-02 | 2020-02-01 | 2019-11-02 | 2019-08-03 | 2019-05-04 | 2019-02-02 | 2018-11-03 | 2018-08-04 | 2018-05-05 | 2018-02-03 | 2017-10-28 | 2017-07-29 | 2017-04-29 | 2017-01-28 | 2016-10-29 | 2016-07-30 | 2016-04-30 | 2016-01-30 | 2015-10-31 | 2015-08-01 | 2015-05-02 | 2015-01-31 | 2014-11-01 | 2014-08-02 | 2014-05-03 | 2014-02-01 | 2013-11-02 | 2013-08-03 | 2013-05-04 | 2013-02-02 | 2012-10-27 | 2012-07-28 | 2012-04-28 | 2012-01-28 | 2011-10-29 | 2011-07-30 | 2011-04-30 | 2011-01-29 | 2010-10-30 | 2010-07-31 | 2010-05-01 | ||
|---|---|---|---|---|---|---|---|---|---|---|---|---|---|---|---|---|---|---|---|---|---|---|---|---|---|---|---|---|---|---|---|---|---|---|---|---|---|---|---|---|---|---|---|---|---|---|---|---|---|---|---|---|---|---|---|---|---|
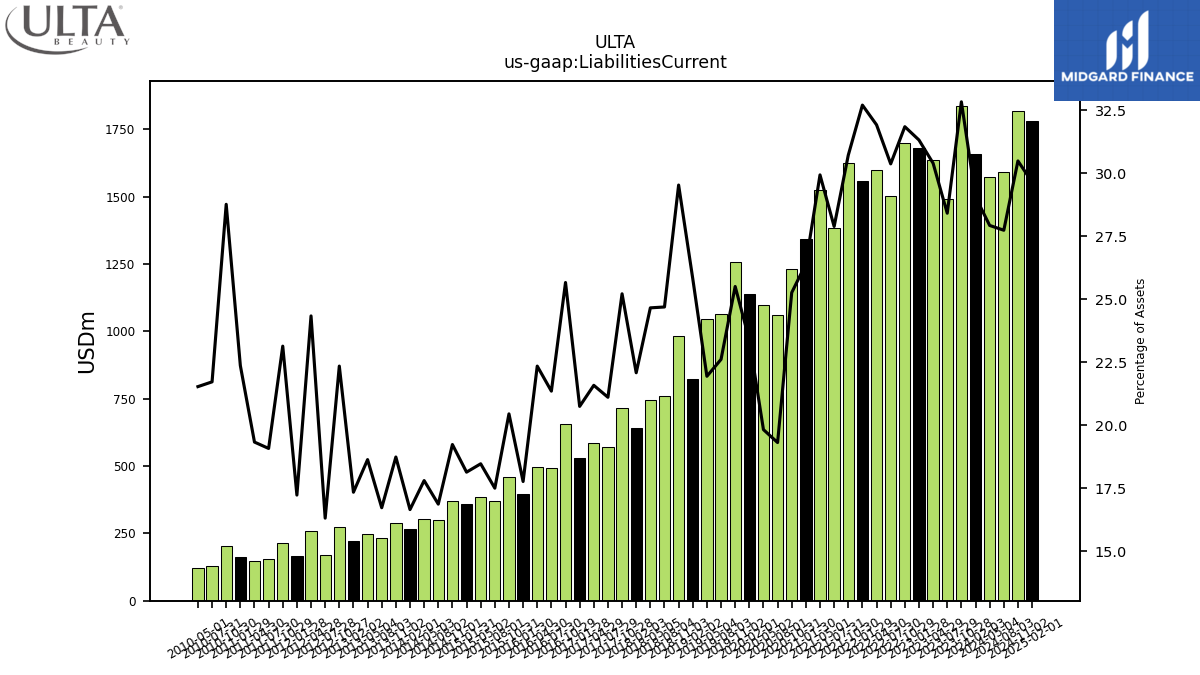
| Liabilities Current | 1658.19 | 1836.94 | 1491.17 | 1633.90 | 1681.78 | 1697.77 | 1502.05 | 1599.75 | 1558.01 | 1624.12 | 1381.53 | 1522.76 | 1343.71 | 1230.34 | 1061.33 | 1096.18 | 1137.26 | 1256.92 | 1064.93 | 1045.61 | 823.74 | 984.08 | 758.75 | 745.09 | 642.17 | 714.71 | 570.28 | 584.25 | 529.34 | 654.64 | 492.25 | 495.73 | 396.23 | 457.98 | 370.21 | 383.66 | 359.59 | 369.71 | 300.14 | 302.42 | 266.81 | 287.61 | 232.75 | 248.07 | 221.07 | 275.53 | 169.39 | 257.45 | 164.85 | 215.16 | 155.61 | 148.00 | 163.36 | 204.05 | 130.15 | 122.22 | |
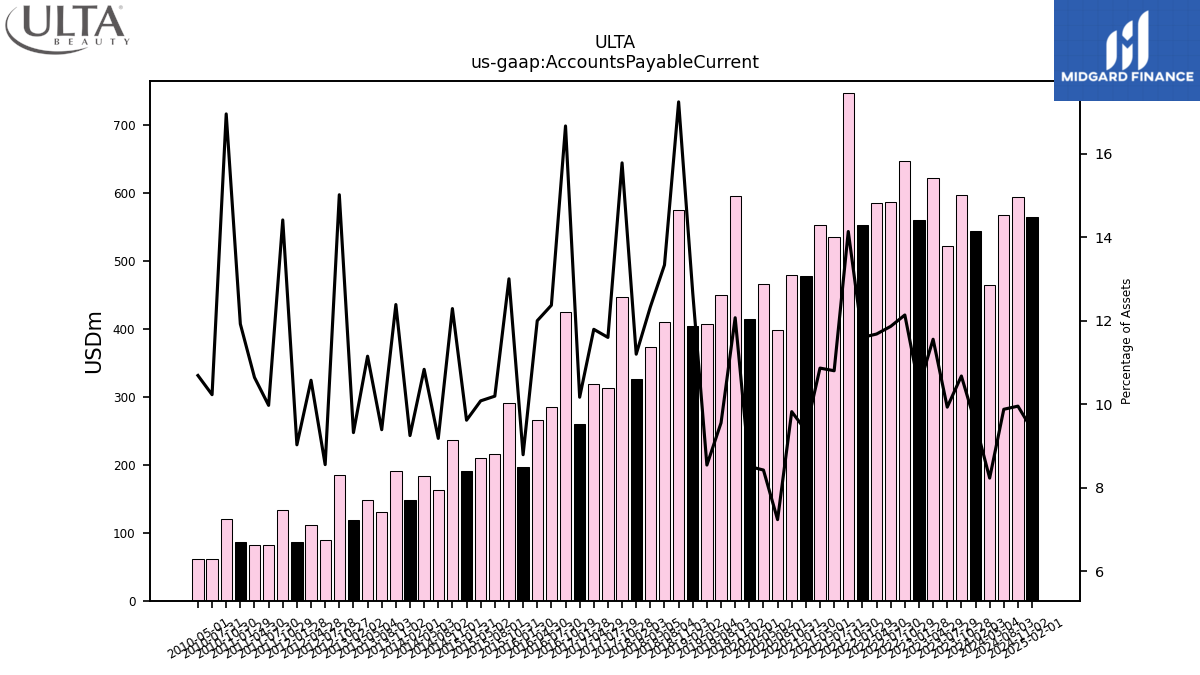
| Accounts Payable Current | 544.00 | 597.37 | 521.32 | 621.27 | 559.53 | 647.12 | 586.85 | 585.50 | 552.73 | 747.45 | 535.26 | 552.84 | 477.05 | 478.50 | 398.01 | 466.04 | 414.01 | 594.99 | 450.12 | 407.35 | 404.02 | 574.48 | 409.85 | 372.66 | 325.76 | 447.29 | 313.48 | 319.35 | 259.52 | 425.07 | 285.24 | 266.28 | 196.17 | 291.27 | 215.72 | 209.51 | 190.78 | 236.33 | 163.46 | 184.15 | 148.28 | 190.19 | 130.74 | 148.49 | 118.89 | 185.18 | 88.88 | 111.89 | 86.44 | 134.04 | 81.38 | 81.51 | 87.09 | 120.25 | 61.32 | 60.69 | |
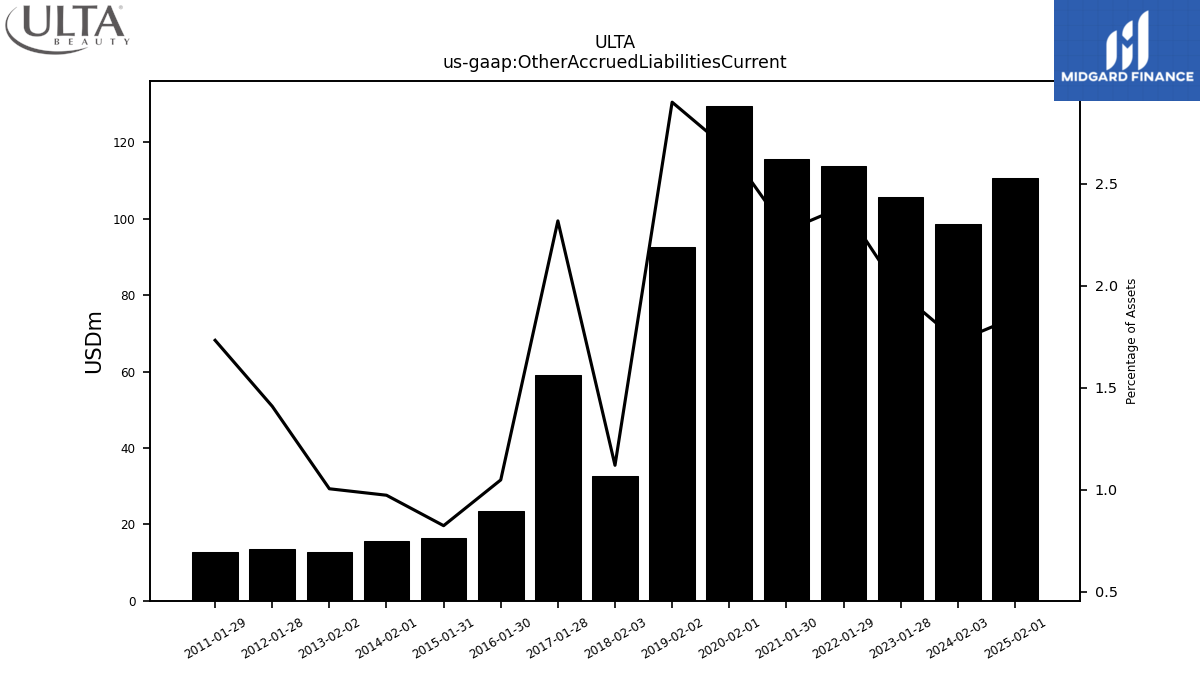
| Other Accrued Liabilities Current | 98.67 | NA | NA | NA | 105.58 | NA | NA | NA | 113.84 | NA | NA | NA | 115.56 | NA | NA | NA | 129.60 | NA | NA | NA | 92.56 | NA | NA | NA | 32.60 | NA | NA | NA | 59.17 | NA | NA | NA | 23.41 | NA | NA | NA | 16.36 | NA | NA | NA | 15.61 | NA | NA | NA | 12.83 | NA | NA | NA | 13.50 | NA | NA | NA | 12.66 | NA | NA | NA | |
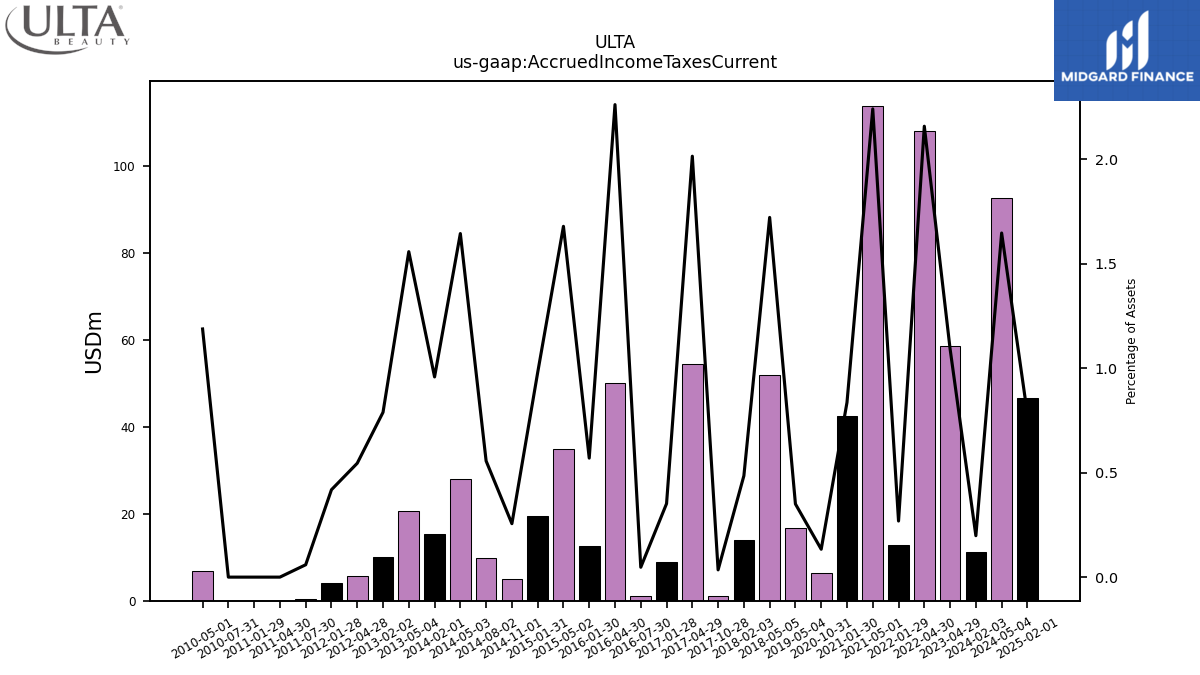
| Accrued Income Taxes Current | 11.31 | NA | NA | 58.70 | NA | NA | NA | 108.11 | 12.79 | NA | NA | 113.96 | 42.53 | 6.50 | NA | NA | NA | NA | NA | 16.68 | NA | NA | NA | 52.01 | 14.10 | 0.98 | NA | 54.52 | 8.97 | NA | 1.09 | 50.16 | 12.70 | NA | NA | 34.87 | 19.40 | 4.92 | 9.89 | 27.93 | 15.35 | NA | NA | 20.73 | 10.05 | NA | NA | 5.76 | 4.00 | NA | 0.48 | 0.00 | 0.00 | NA | 0.00 | 6.74 | |
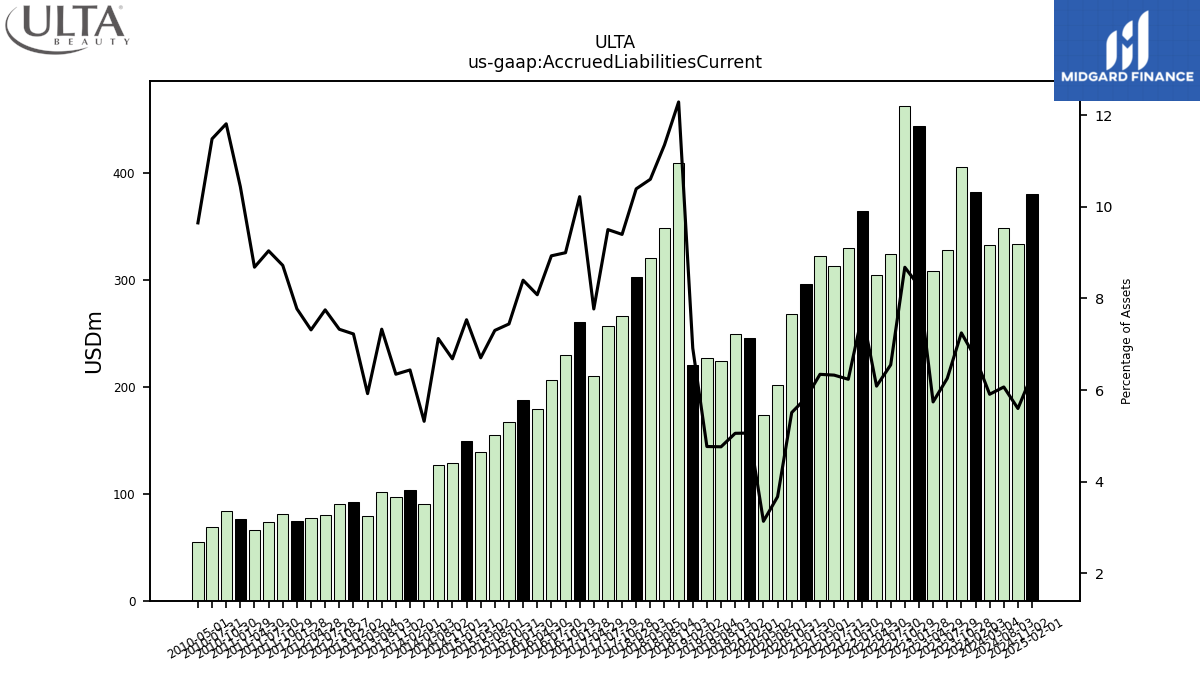
| Accrued Liabilities Current | 382.47 | 405.44 | 328.25 | 308.58 | 444.28 | 462.77 | 323.94 | 305.00 | 364.80 | 329.67 | 313.37 | 322.68 | 296.33 | 268.31 | 201.75 | 173.31 | 246.09 | 249.11 | 224.20 | 227.16 | 220.67 | 409.60 | 348.91 | 320.42 | 302.31 | 266.44 | 256.79 | 210.38 | 260.85 | 229.57 | 205.92 | 179.30 | 187.35 | 166.71 | 154.49 | 139.28 | 149.41 | 128.47 | 126.79 | 90.34 | 103.18 | 97.42 | 102.01 | 78.85 | 92.13 | 90.35 | 80.51 | 77.38 | 74.41 | 81.12 | 73.75 | 66.49 | 76.26 | 83.81 | 68.83 | 54.79 | |
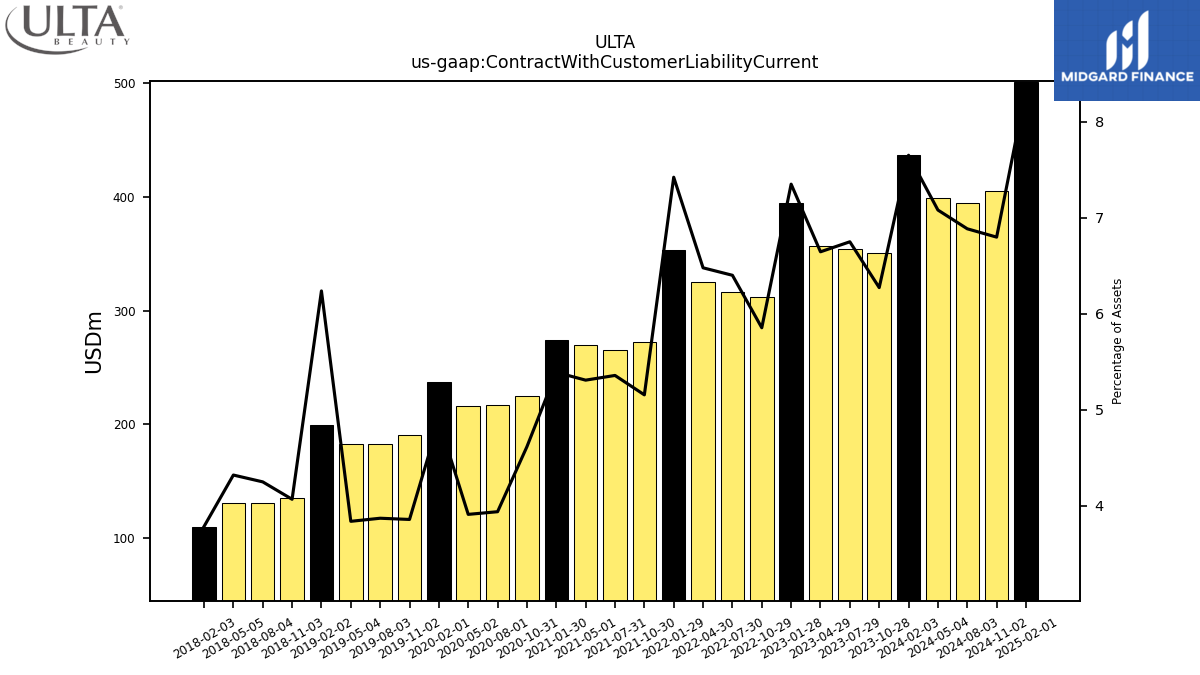
| Contract With Customer Liability Current | 436.59 | 350.94 | 354.25 | 357.22 | 394.68 | 312.13 | 316.57 | 324.69 | 353.58 | 272.63 | 265.46 | 270.09 | 274.38 | 224.86 | 216.54 | 216.33 | 237.53 | 190.19 | 182.35 | 182.99 | 199.05 | 135.60 | 130.62 | 130.59 | 110.10 | NA | NA | NA | NA | NA | NA | NA | NA | NA | NA | NA | NA | NA | NA | NA | NA | NA | NA | NA | NA | NA | NA | NA | NA | NA | NA | NA | NA | NA | NA | NA |
| 2024-02-03 | 2023-10-28 | 2023-07-29 | 2023-04-29 | 2023-01-28 | 2022-10-29 | 2022-07-30 | 2022-04-30 | 2022-01-29 | 2021-10-30 | 2021-07-31 | 2021-05-01 | 2021-01-30 | 2020-10-31 | 2020-08-01 | 2020-05-02 | 2020-02-01 | 2019-11-02 | 2019-08-03 | 2019-05-04 | 2019-02-02 | 2018-11-03 | 2018-08-04 | 2018-05-05 | 2018-02-03 | 2017-10-28 | 2017-07-29 | 2017-04-29 | 2017-01-28 | 2016-10-29 | 2016-07-30 | 2016-04-30 | 2016-01-30 | 2015-10-31 | 2015-08-01 | 2015-05-02 | 2015-01-31 | 2014-11-01 | 2014-08-02 | 2014-05-03 | 2014-02-01 | 2013-11-02 | 2013-08-03 | 2013-05-04 | 2013-02-02 | 2012-10-27 | 2012-07-28 | 2012-04-28 | 2012-01-28 | 2011-10-29 | 2011-07-30 | 2011-04-30 | 2011-01-29 | 2010-10-30 | 2010-07-31 | 2010-05-01 | ||
|---|---|---|---|---|---|---|---|---|---|---|---|---|---|---|---|---|---|---|---|---|---|---|---|---|---|---|---|---|---|---|---|---|---|---|---|---|---|---|---|---|---|---|---|---|---|---|---|---|---|---|---|---|---|---|---|---|---|
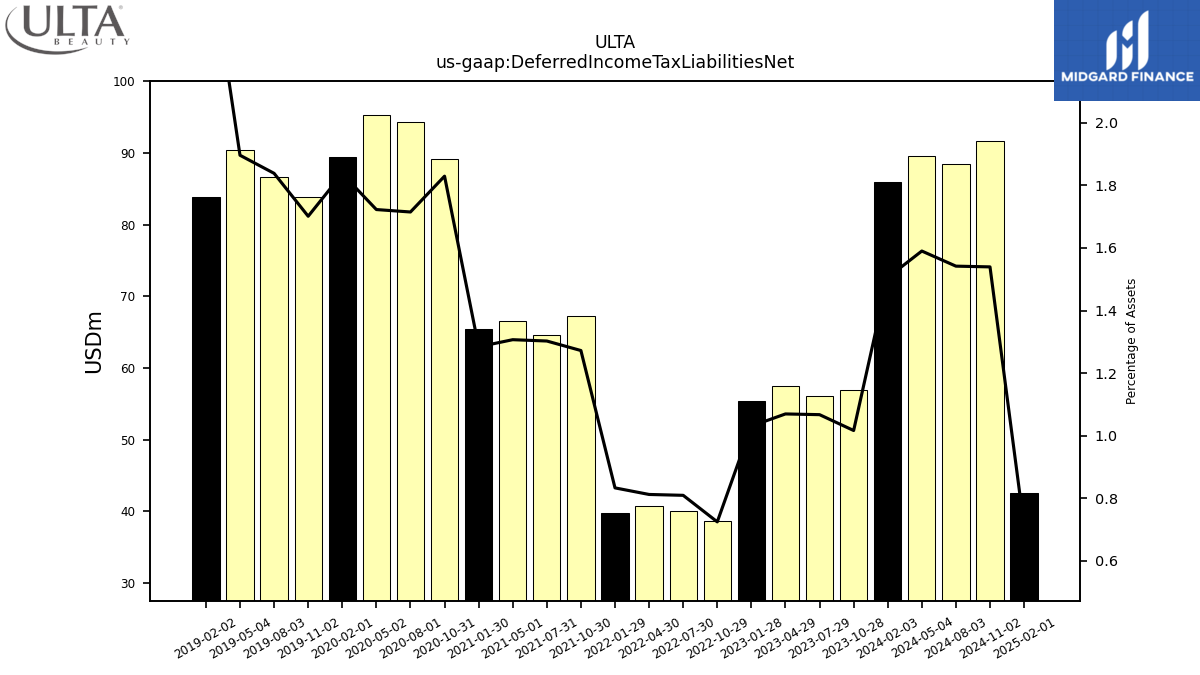
| Deferred Income Tax Liabilities Net | 85.92 | 56.87 | 56.01 | 57.49 | 55.35 | 38.63 | 40.03 | 40.70 | 39.69 | 67.27 | 64.53 | 66.48 | 65.36 | 89.11 | 94.27 | 95.28 | 89.37 | 83.86 | 86.60 | 90.38 | 83.86 | NA | NA | NA | NA | NA | NA | NA | NA | NA | NA | NA | NA | NA | NA | NA | NA | NA | NA | NA | NA | NA | NA | NA | NA | NA | NA | NA | NA | NA | NA | NA | NA | NA | NA | NA | |
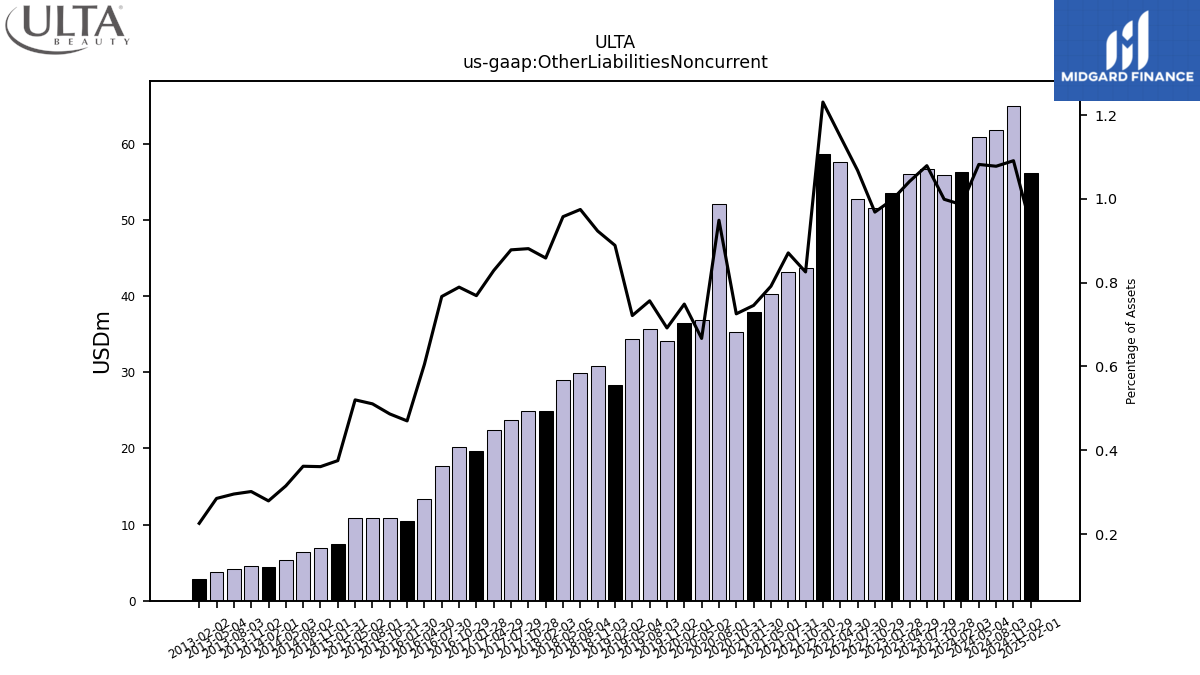
| Other Liabilities Noncurrent | 56.30 | 55.91 | 56.66 | 56.01 | 53.60 | 51.64 | 52.84 | 57.61 | 58.66 | 43.66 | 43.16 | 40.27 | 37.96 | 35.35 | 52.18 | 36.89 | 36.43 | 34.11 | 35.65 | 34.40 | 28.37 | 30.77 | 29.96 | 28.94 | 24.98 | 24.99 | 23.74 | 22.45 | 19.63 | 20.14 | 17.69 | 13.43 | 10.49 | 10.90 | 10.81 | 10.81 | 7.44 | 6.94 | 6.44 | 5.35 | 4.47 | 4.63 | 4.11 | 3.79 | 2.88 | NA | NA | NA | NA | NA | NA | NA | NA | NA | NA | NA | |
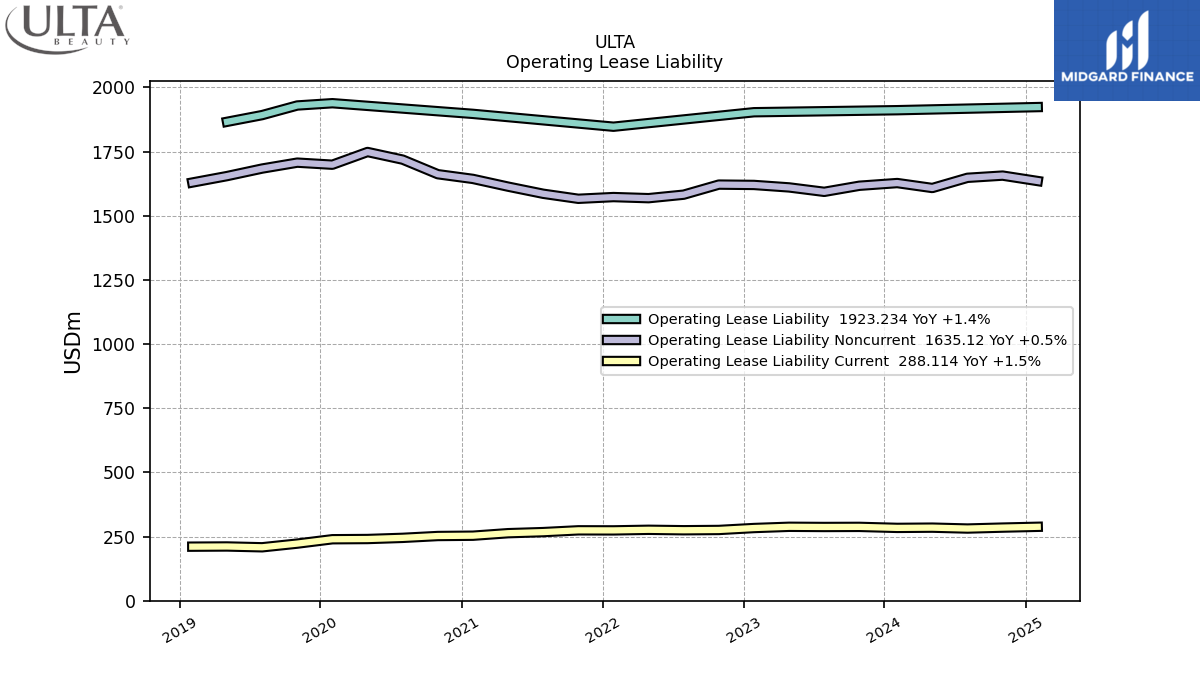
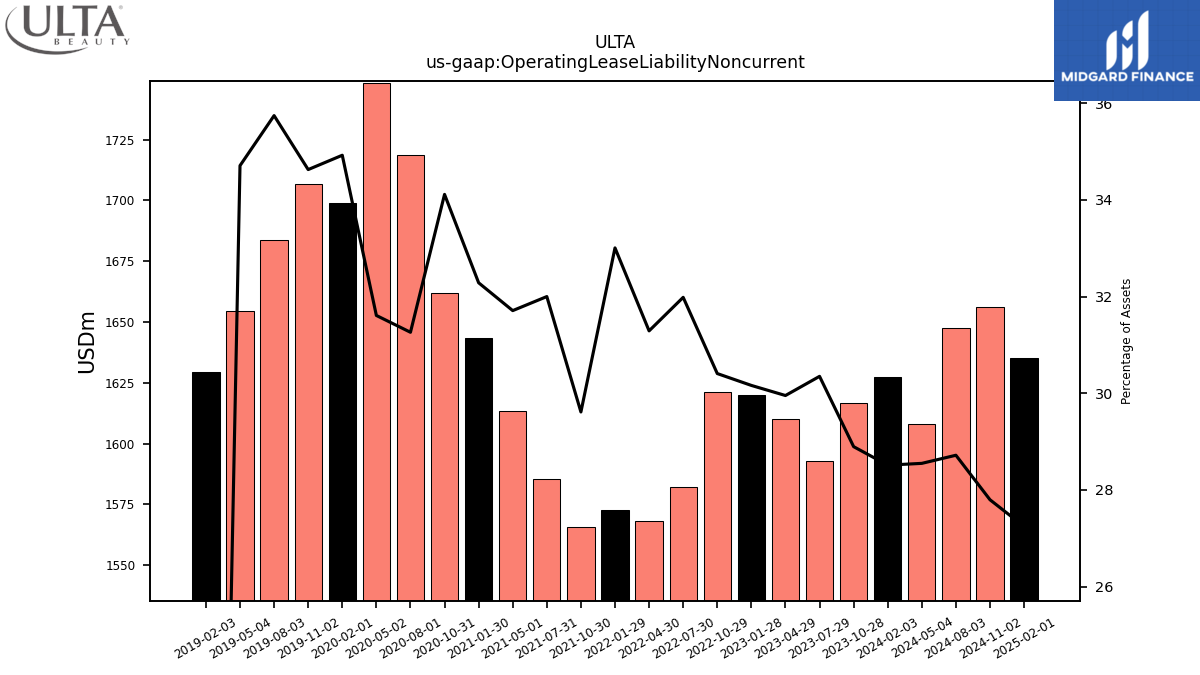
| Operating Lease Liability Noncurrent | 1627.27 | 1616.75 | 1593.04 | 1610.26 | 1619.88 | 1621.25 | 1582.00 | 1568.36 | 1572.64 | 1565.92 | 1585.54 | 1613.31 | 1643.39 | 1661.75 | 1718.55 | 1748.24 | 1698.72 | 1706.81 | 1683.74 | 1654.40 | NA | NA | NA | NA | NA | NA | NA | NA | NA | NA | NA | NA | NA | NA | NA | NA | NA | NA | NA | NA | NA | NA | NA | NA | NA | NA | NA | NA | NA | NA | NA | NA | NA | NA | NA | NA |
| 2024-02-03 | 2023-10-28 | 2023-07-29 | 2023-04-29 | 2023-01-28 | 2022-10-29 | 2022-07-30 | 2022-04-30 | 2022-01-29 | 2021-10-30 | 2021-07-31 | 2021-05-01 | 2021-01-30 | 2020-10-31 | 2020-08-01 | 2020-05-02 | 2020-02-01 | 2019-11-02 | 2019-08-03 | 2019-05-04 | 2019-02-02 | 2018-11-03 | 2018-08-04 | 2018-05-05 | 2018-02-03 | 2017-10-28 | 2017-07-29 | 2017-04-29 | 2017-01-28 | 2016-10-29 | 2016-07-30 | 2016-04-30 | 2016-01-30 | 2015-10-31 | 2015-08-01 | 2015-05-02 | 2015-01-31 | 2014-11-01 | 2014-08-02 | 2014-05-03 | 2014-02-01 | 2013-11-02 | 2013-08-03 | 2013-05-04 | 2013-02-02 | 2012-10-27 | 2012-07-28 | 2012-04-28 | 2012-01-28 | 2011-10-29 | 2011-07-30 | 2011-04-30 | 2011-01-29 | 2010-10-30 | 2010-07-31 | 2010-05-01 | ||
|---|---|---|---|---|---|---|---|---|---|---|---|---|---|---|---|---|---|---|---|---|---|---|---|---|---|---|---|---|---|---|---|---|---|---|---|---|---|---|---|---|---|---|---|---|---|---|---|---|---|---|---|---|---|---|---|---|---|
| Stockholders Equity | 2279.33 | 2028.54 | 2051.88 | 2018.07 | 1959.81 | 1922.26 | 1769.07 | 1745.62 | 1535.37 | 1986.80 | 1879.81 | 1844.72 | 1999.55 | 1854.44 | 1770.79 | 1753.96 | 1902.09 | 1847.16 | 1839.45 | 1941.57 | 1820.22 | 1835.74 | 1812.48 | 1783.43 | 1774.22 | 1616.05 | 1635.35 | 1641.66 | 1550.22 | 1452.08 | 1391.94 | 1319.69 | 1442.89 | 1374.16 | 1343.79 | 1302.98 | 1247.51 | 1186.33 | 1126.04 | 1059.76 | 1003.09 | 928.32 | 860.46 | 803.72 | 786.94 | 707.00 | 639.68 | 584.90 | 584.70 | 524.43 | 478.03 | 449.37 | 402.53 | 349.54 | 327.91 | 310.54 | |
| Common Stock Value | 0.49 | 0.49 | 0.50 | 0.51 | 0.51 | 0.52 | 0.52 | 0.53 | 0.53 | 0.55 | 0.55 | 0.56 | 0.57 | 0.57 | 0.57 | 0.57 | 0.57 | 0.58 | 0.58 | 0.59 | 0.59 | 0.60 | 0.60 | 0.61 | 0.61 | 0.62 | 0.62 | 0.63 | 0.63 | 0.63 | 0.63 | 0.63 | 0.64 | 0.64 | 0.65 | 0.65 | 0.65 | 0.65 | 0.65 | 0.65 | 0.65 | 0.65 | 0.65 | 0.64 | 0.65 | 0.64 | 0.64 | 0.63 | 0.63 | 0.62 | 0.62 | 0.62 | 0.61 | 0.60 | 0.59 | 0.59 | |
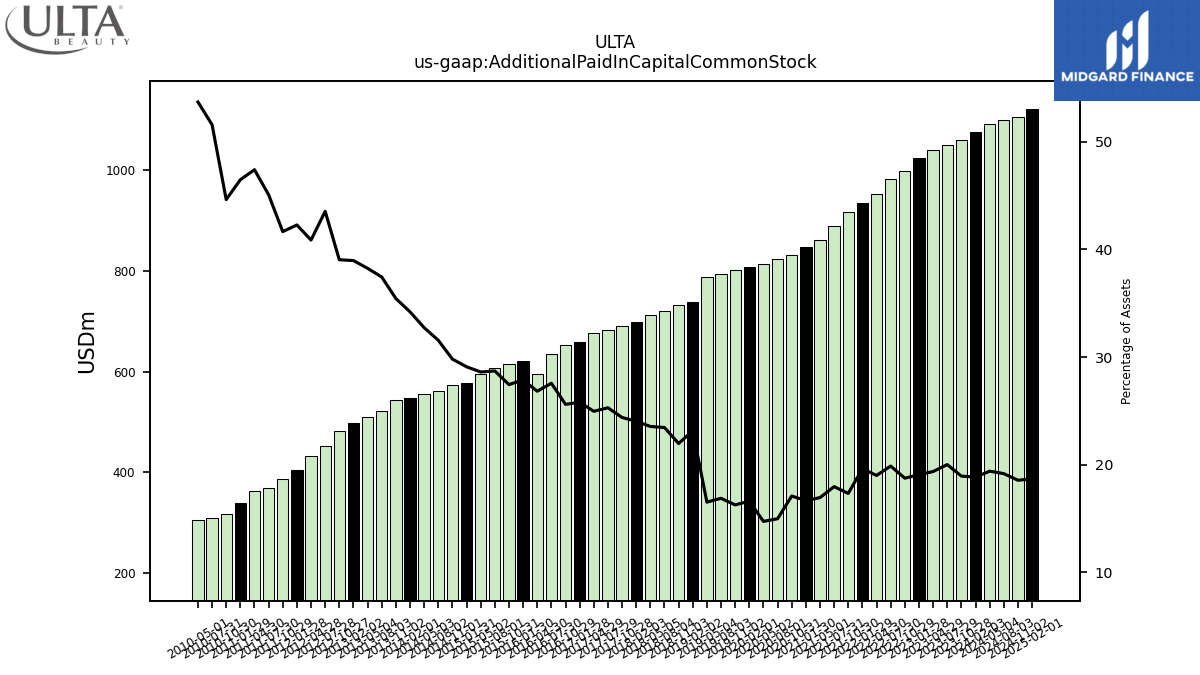
| Additional Paid In Capital Common Stock | 1075.10 | 1058.97 | 1049.68 | 1040.38 | 1024.00 | 998.82 | 982.34 | 951.80 | 934.95 | 915.81 | 889.21 | 861.31 | 847.30 | 831.82 | 822.66 | 813.92 | 807.49 | 800.99 | 794.37 | 786.75 | 738.67 | 731.89 | 720.53 | 711.60 | 698.92 | 691.08 | 683.16 | 675.65 | 658.33 | 653.04 | 635.58 | 595.15 | 621.72 | 614.59 | 607.38 | 594.48 | 576.98 | 573.12 | 561.73 | 556.15 | 548.19 | 544.10 | 521.17 | 509.29 | 496.93 | 481.52 | 452.33 | 432.44 | 404.70 | 387.49 | 367.86 | 363.10 | 339.58 | 316.69 | 309.27 | 304.96 | |
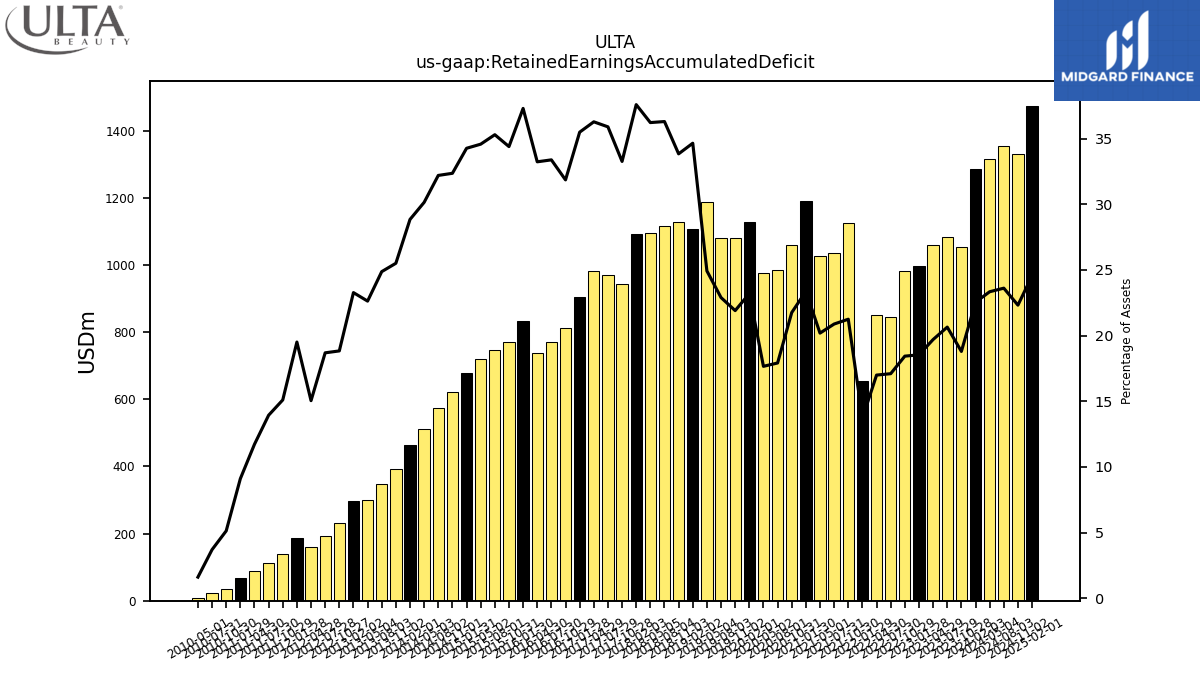
| Retained Earnings Accumulated Deficit | 1286.77 | 1051.88 | 1083.93 | 1059.31 | 995.77 | 983.14 | 846.01 | 851.94 | 653.38 | 1123.75 | 1034.83 | 1027.41 | 1189.42 | 1059.84 | 985.04 | 976.99 | 1128.48 | 1079.86 | 1078.68 | 1188.31 | 1105.86 | 1127.95 | 1115.75 | 1094.82 | 1093.45 | 943.09 | 970.12 | 982.41 | 905.78 | 812.85 | 769.83 | 737.53 | 832.22 | 770.51 | 746.96 | 718.59 | 679.59 | 622.28 | 573.12 | 512.33 | 462.38 | 391.70 | 346.27 | 301.36 | 296.86 | 232.33 | 194.18 | 159.24 | 186.79 | 140.50 | 113.73 | 89.83 | 66.53 | 36.43 | 22.22 | 9.16 |
