
| 2023-12-31 | 2023-09-30 | 2023-06-30 | 2023-03-31 | 2022-12-31 | 2022-09-30 | 2022-06-30 | 2022-03-31 | 2021-12-31 | 2021-09-30 | 2021-06-30 | 2021-03-31 | 2020-12-31 | 2020-09-30 | 2020-06-30 | 2020-03-31 | 2019-12-31 | 2019-09-30 | 2019-06-30 | 2019-03-31 | 2018-12-31 | 2018-09-30 | 2018-06-30 | 2018-03-31 | 2017-12-31 | 2017-09-30 | 2017-06-30 | 2017-03-31 | 2016-12-31 | 2016-09-30 | 2016-06-30 | 2016-03-31 | 2015-12-31 | 2015-09-30 | 2015-06-30 | ||
|---|---|---|---|---|---|---|---|---|---|---|---|---|---|---|---|---|---|---|---|---|---|---|---|---|---|---|---|---|---|---|---|---|---|---|---|---|
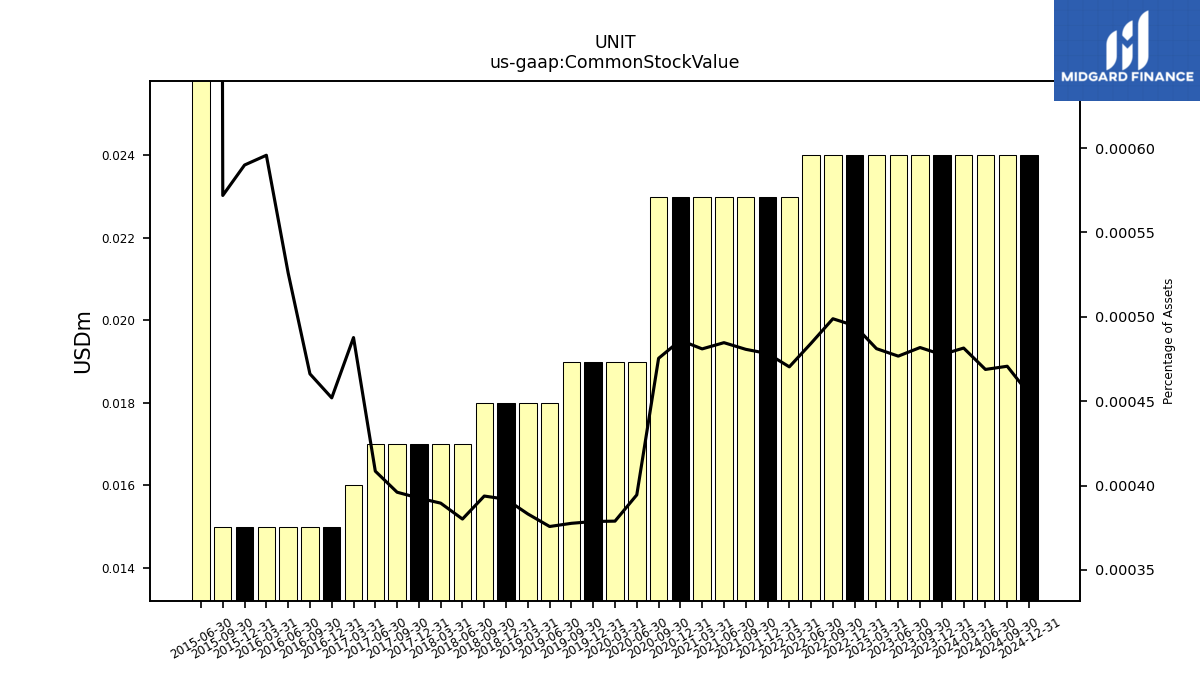
| Common Stock Value | 0.02 | 0.02 | 0.02 | 0.02 | 0.02 | 0.02 | 0.02 | 0.02 | 0.02 | 0.02 | 0.02 | 0.02 | 0.02 | 0.02 | 0.02 | 0.02 | 0.02 | 0.02 | 0.02 | 0.02 | 0.02 | 0.02 | 0.02 | 0.02 | 0.02 | 0.02 | 0.02 | 0.02 | 0.01 | 0.01 | 0.01 | 0.01 | 0.01 | 0.01 | 0.15 | |
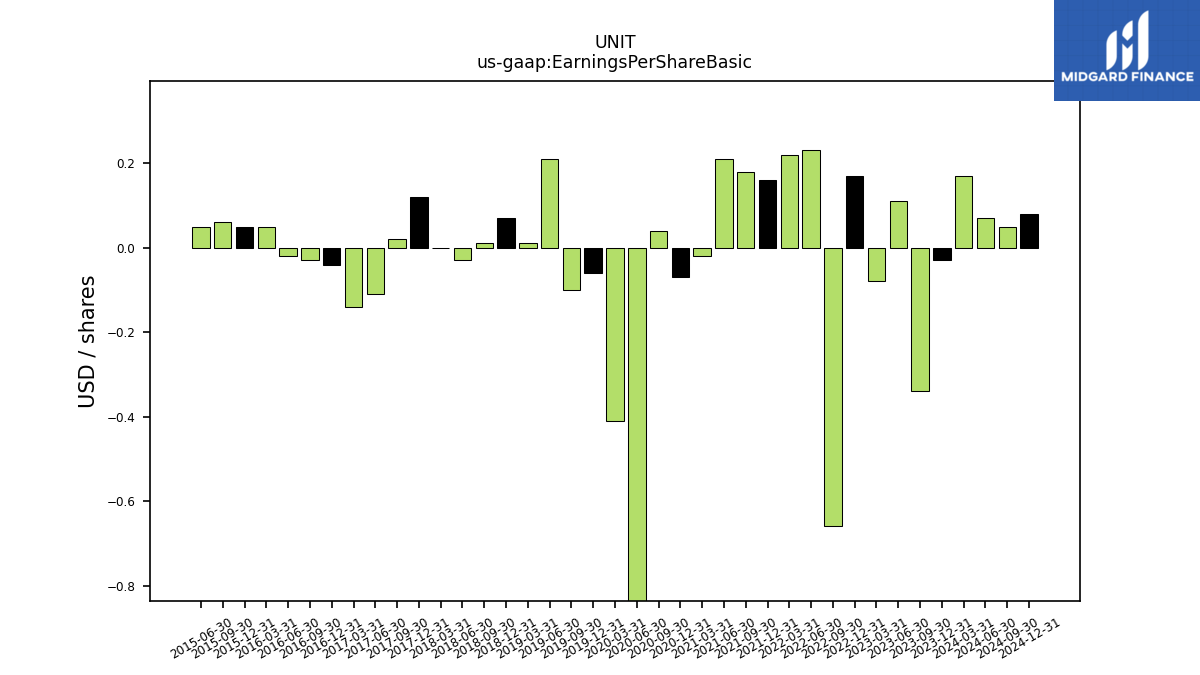
| Earnings Per Share Basic | -0.03 | -0.34 | 0.11 | -0.08 | 0.17 | -0.66 | 0.23 | 0.22 | 0.16 | 0.18 | 0.21 | -0.02 | -0.07 | 0.04 | -3.06 | -0.41 | -0.06 | -0.10 | 0.21 | 0.01 | 0.07 | 0.01 | -0.03 | 0.00 | 0.12 | 0.02 | -0.11 | -0.14 | -0.04 | -0.03 | -0.02 | 0.05 | 0.05 | 0.06 | 0.05 | |
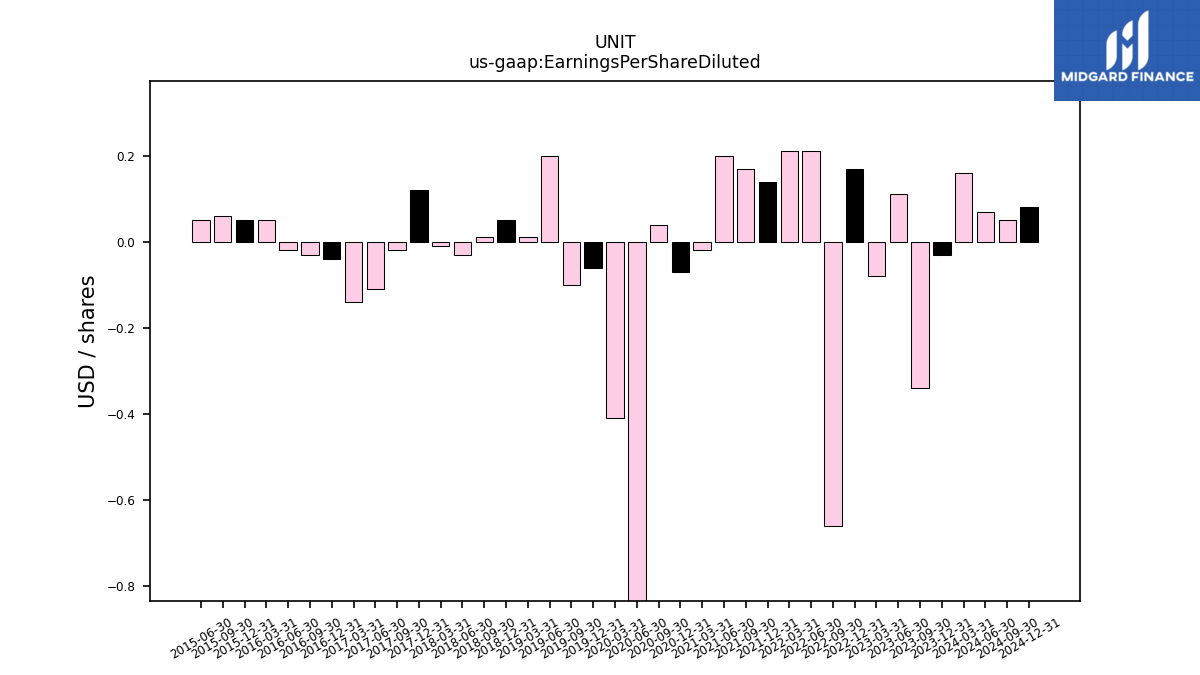
| Earnings Per Share Diluted | -0.03 | -0.34 | 0.11 | -0.08 | 0.17 | -0.66 | 0.21 | 0.21 | 0.14 | 0.17 | 0.20 | -0.02 | -0.07 | 0.04 | -3.06 | -0.41 | -0.06 | -0.10 | 0.20 | 0.01 | 0.05 | 0.01 | -0.03 | -0.01 | 0.12 | -0.02 | -0.11 | -0.14 | -0.04 | -0.03 | -0.02 | 0.05 | 0.05 | 0.06 | 0.05 |
| 2023-12-31 | 2023-09-30 | 2023-06-30 | 2023-03-31 | 2022-12-31 | 2022-09-30 | 2022-06-30 | 2022-03-31 | 2021-12-31 | 2021-09-30 | 2021-06-30 | 2021-03-31 | 2020-12-31 | 2020-09-30 | 2020-06-30 | 2020-03-31 | 2019-12-31 | 2019-09-30 | 2019-06-30 | 2019-03-31 | 2018-12-31 | 2018-09-30 | 2018-06-30 | 2018-03-31 | 2017-12-31 | 2017-09-30 | 2017-06-30 | 2017-03-31 | 2016-12-31 | 2016-09-30 | 2016-06-30 | 2016-03-31 | 2015-12-31 | 2015-09-30 | 2015-06-30 | ||
|---|---|---|---|---|---|---|---|---|---|---|---|---|---|---|---|---|---|---|---|---|---|---|---|---|---|---|---|---|---|---|---|---|---|---|---|---|
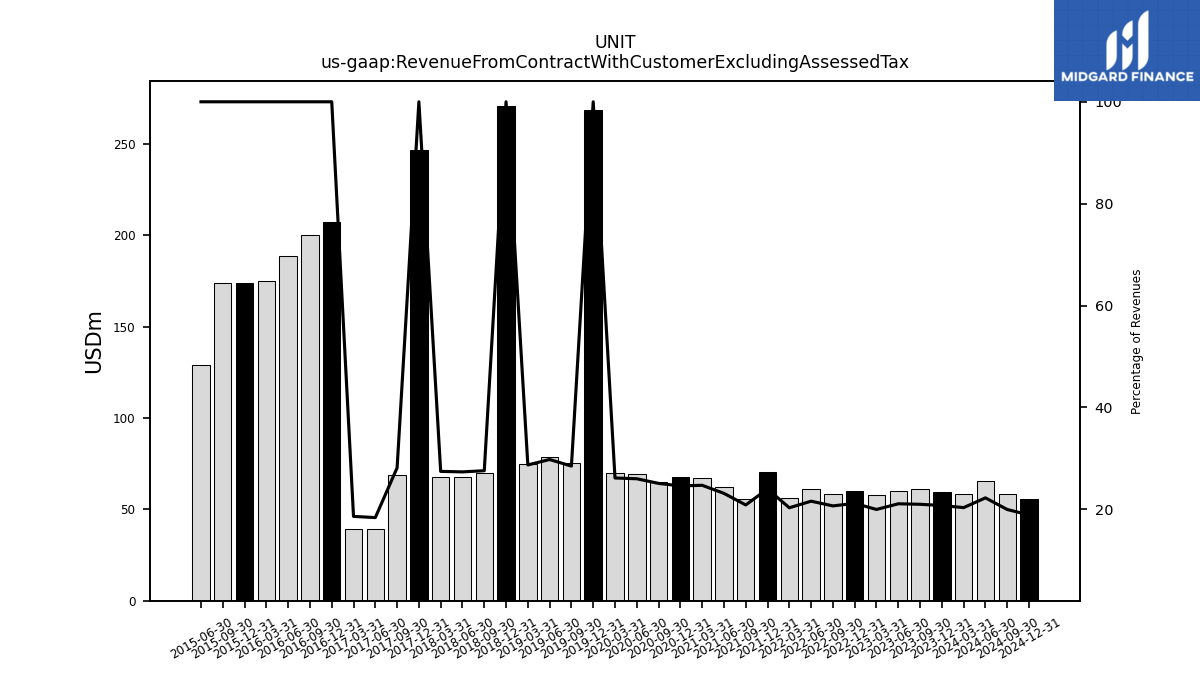
| Revenue From Contract With Customer Excluding Assessed Tax | 59.28 | 61.02 | 59.85 | 57.90 | 60.08 | 58.54 | 61.35 | 56.47 | 70.32 | 55.66 | 62.06 | 67.39 | 67.73 | 64.93 | 69.39 | 69.62 | 268.54 | 75.12 | 78.75 | 74.97 | 270.75 | 69.69 | 67.65 | 67.79 | 246.34 | 69.04 | 39.16 | 39.37 | 206.92 | 200.24 | 188.57 | 174.68 | 173.93 | 173.63 | 128.75 | |
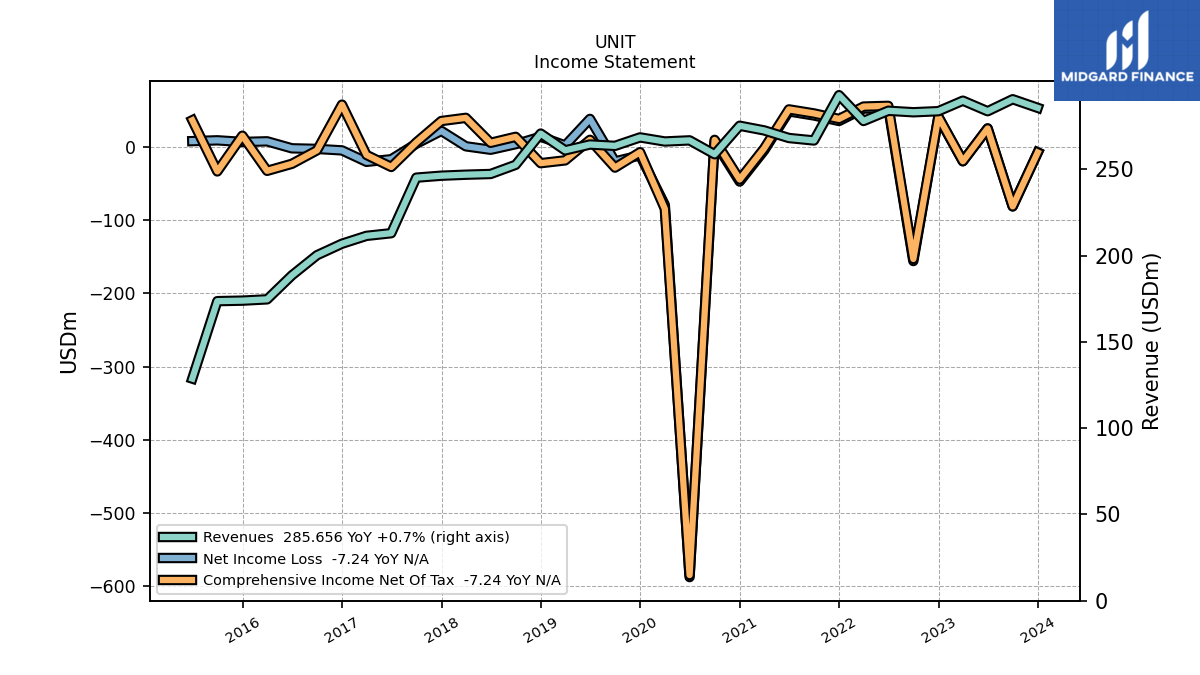
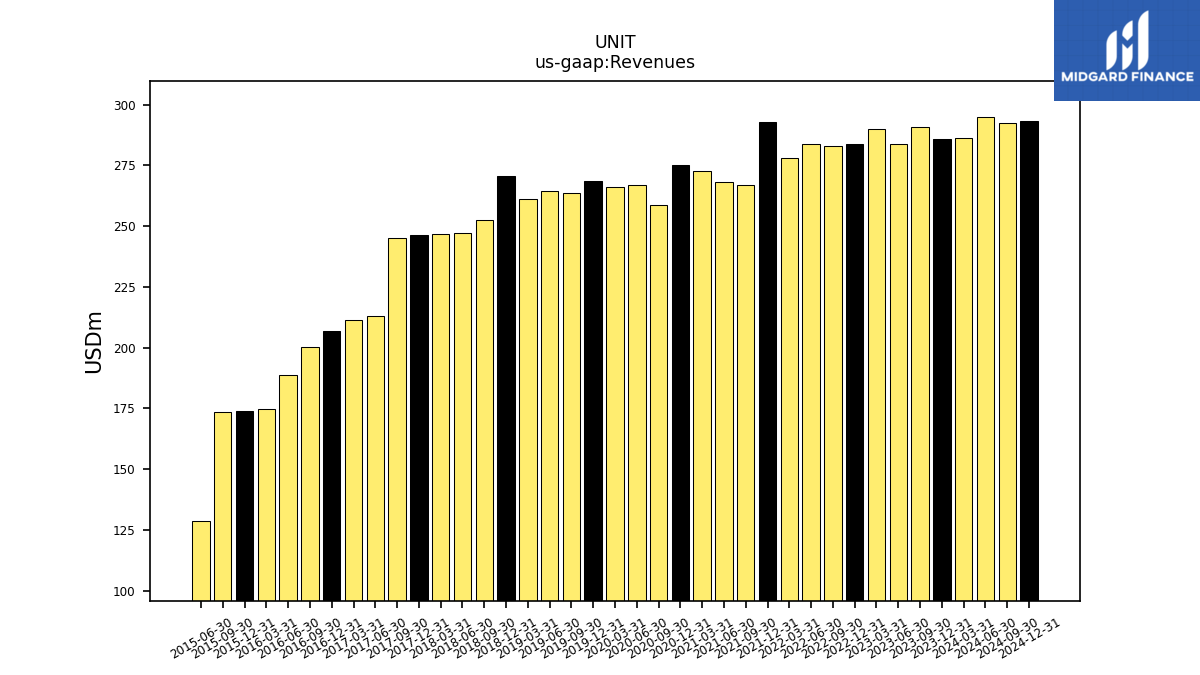
| Revenues | 285.66 | 290.65 | 283.70 | 289.82 | 283.74 | 283.10 | 283.98 | 278.03 | 293.01 | 266.75 | 268.18 | 272.59 | 275.29 | 258.76 | 266.82 | 266.16 | 268.54 | 263.63 | 264.41 | 261.03 | 270.75 | 252.64 | 247.33 | 246.91 | 246.34 | 245.21 | 213.01 | 211.47 | 206.92 | 200.24 | 188.57 | 174.68 | 173.93 | 173.63 | 128.75 | |
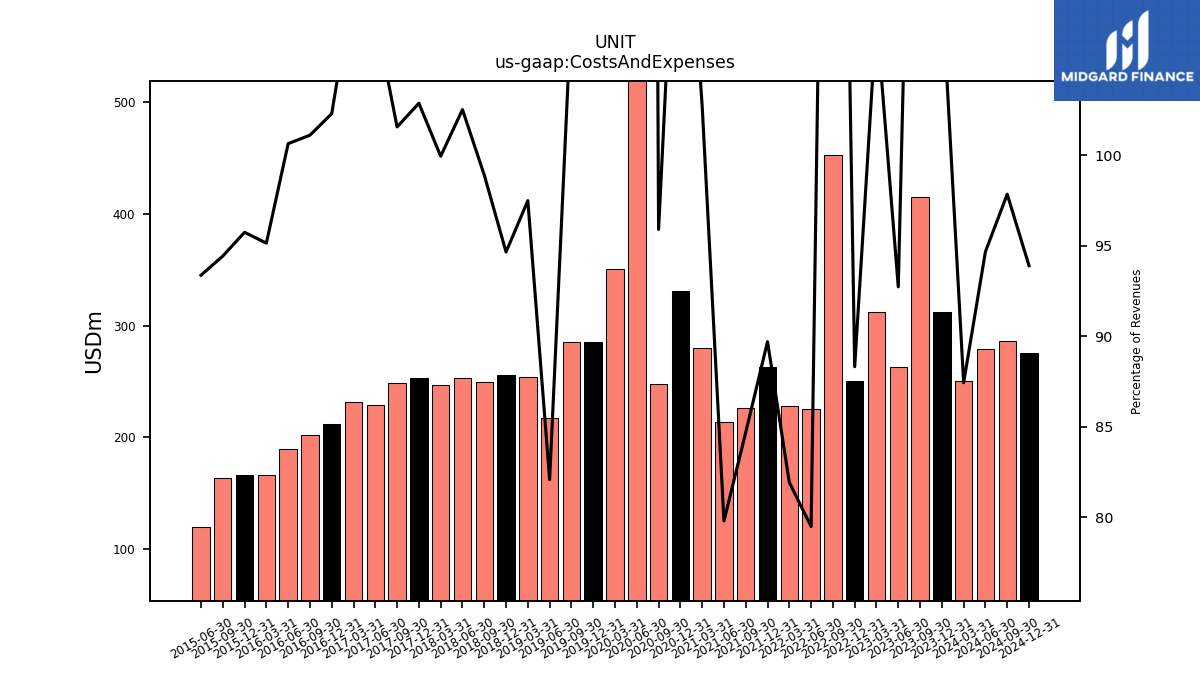
| Costs And Expenses | 312.18 | 415.35 | 263.08 | 312.11 | 250.60 | 452.58 | 225.74 | 227.79 | 262.83 | 225.91 | 214.00 | 280.04 | 330.96 | 248.17 | 871.02 | 351.00 | 285.38 | 285.15 | 217.02 | 254.49 | 256.28 | 249.88 | 253.57 | 246.78 | 253.41 | 249.05 | 229.40 | 231.85 | 211.67 | 202.46 | 189.78 | 166.19 | 166.53 | 163.96 | 120.22 | |
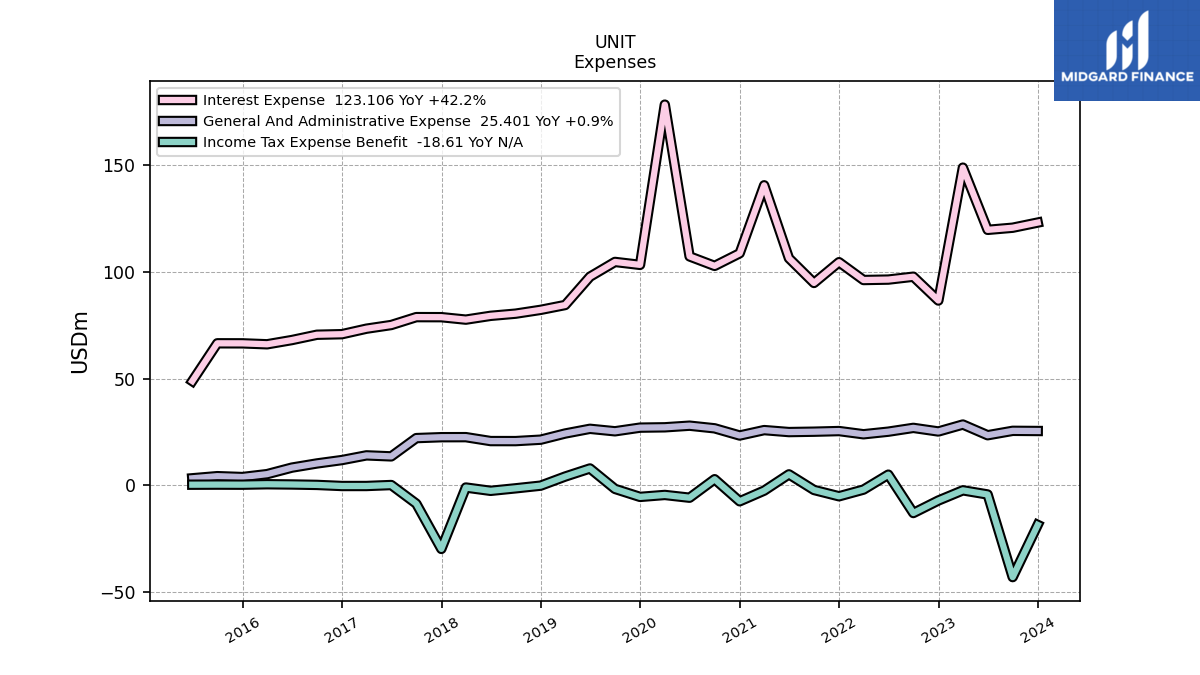
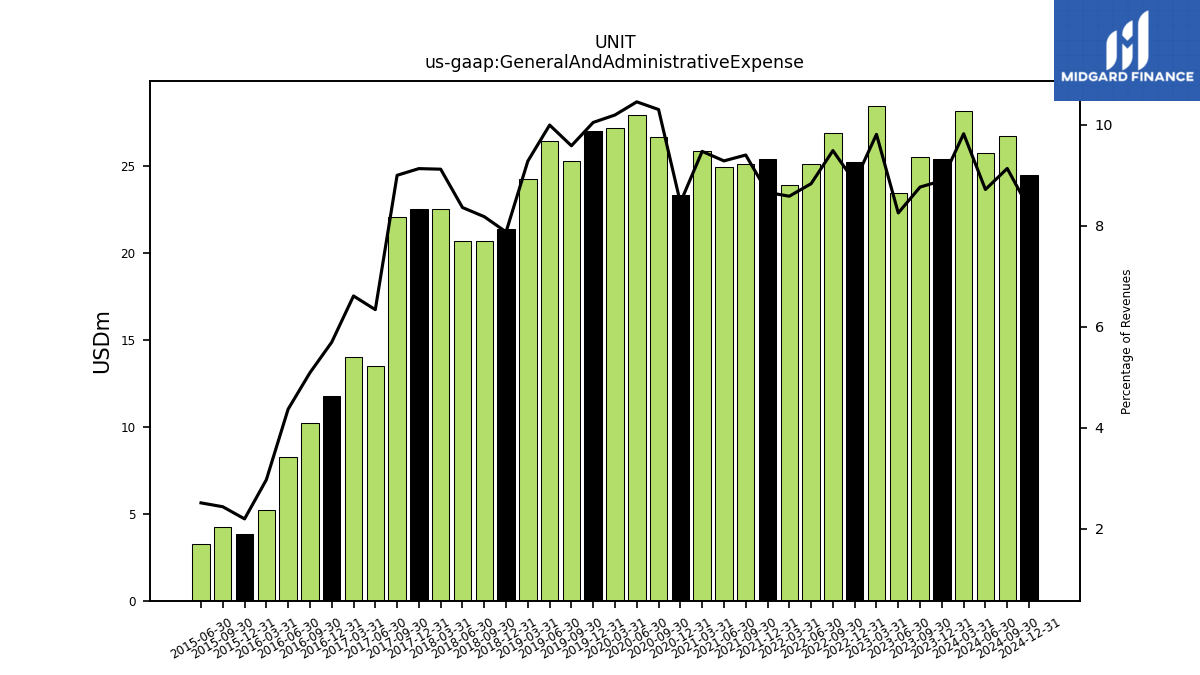
| General And Administrative Expense | 25.40 | 25.48 | 23.42 | 28.43 | 25.17 | 26.86 | 25.09 | 23.87 | 25.38 | 25.08 | 24.90 | 25.82 | 23.29 | 26.66 | 27.89 | 27.13 | 26.98 | 25.27 | 26.43 | 24.23 | 21.33 | 20.67 | 20.68 | 22.52 | 22.50 | 22.07 | 13.50 | 13.98 | 11.78 | 10.19 | 8.24 | 5.19 | 3.82 | 4.23 | 3.23 | |
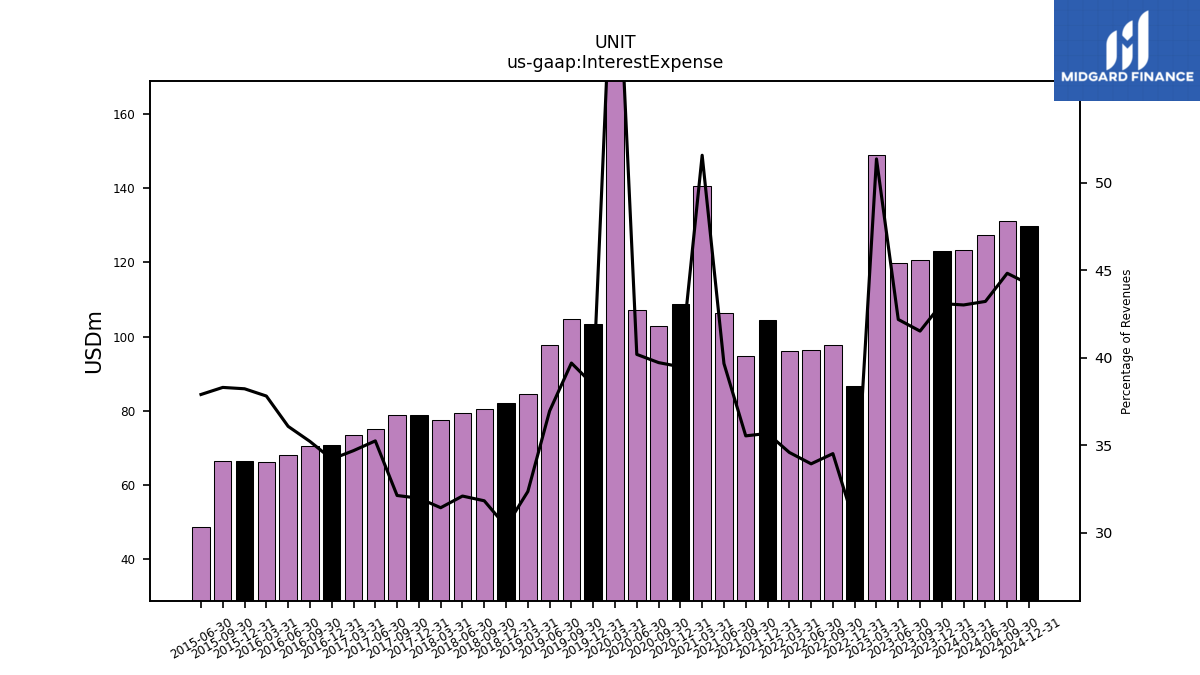
| Interest Expense | 123.11 | 120.69 | 119.69 | 148.86 | 86.55 | 97.73 | 96.38 | 96.17 | 104.53 | 94.79 | 106.39 | 140.58 | 108.70 | 102.79 | 107.24 | 178.39 | 103.27 | 104.66 | 97.73 | 84.46 | 82.19 | 80.41 | 79.39 | 77.61 | 78.76 | 78.78 | 75.09 | 73.36 | 70.79 | 70.52 | 68.04 | 66.05 | 66.49 | 66.51 | 48.80 | |
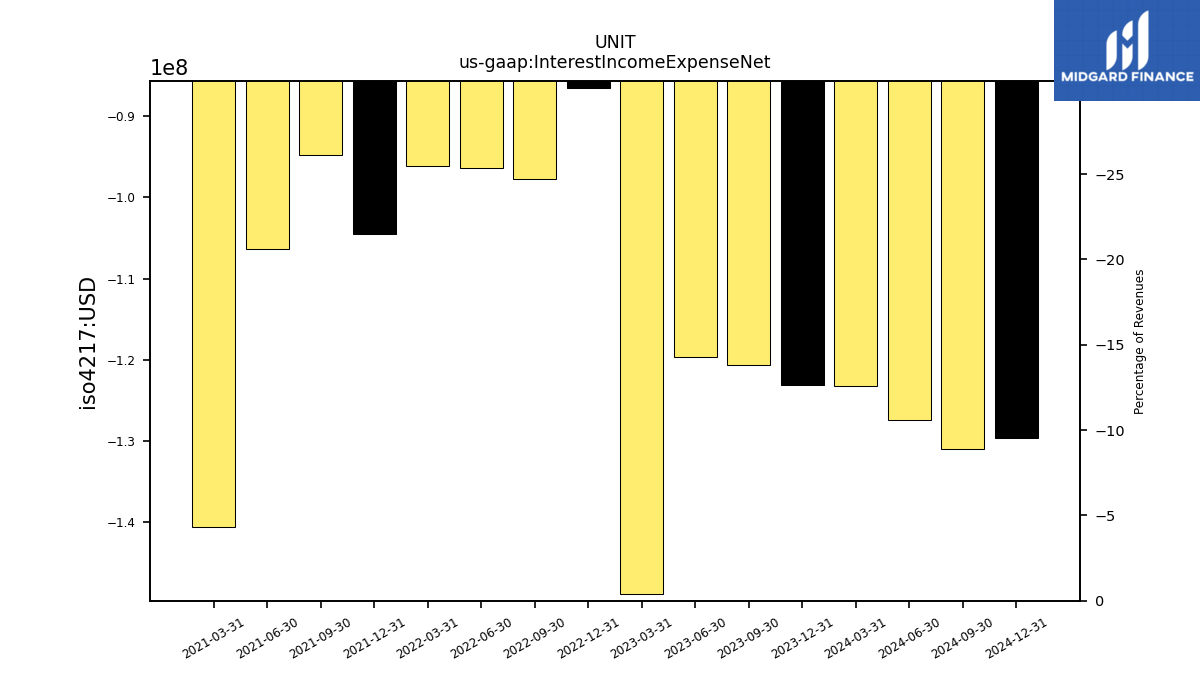
| Interest Income Expense Net | -123.11 | -120.69 | -119.69 | -148.86 | -86.55 | -97.73 | -96.38 | -96.17 | -104.53 | -94.79 | -106.39 | -140.58 | NA | NA | NA | NA | NA | NA | NA | NA | NA | NA | NA | NA | NA | NA | NA | NA | NA | NA | NA | NA | NA | NA | NA | |
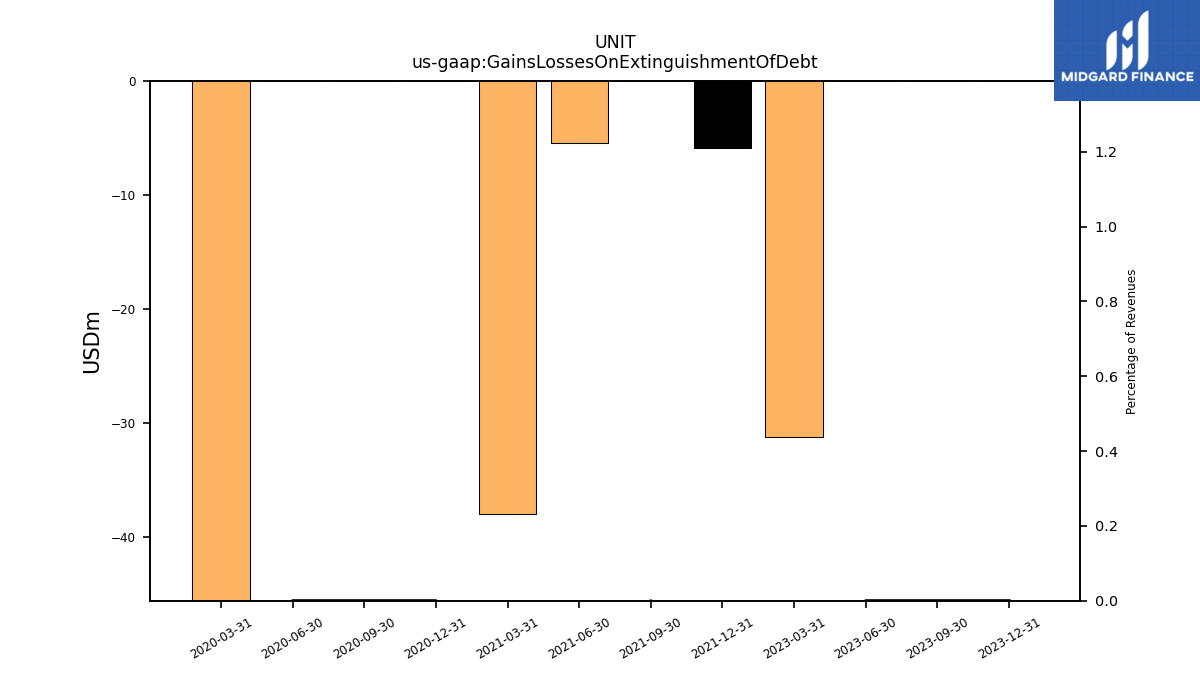
| Gains Losses On Extinguishment Of Debt | 0.00 | 0.00 | 0.00 | -31.19 | NA | NA | NA | NA | -5.91 | 0.00 | -5.40 | -37.97 | 0.00 | 0.00 | 0.00 | -73.95 | NA | NA | NA | NA | NA | NA | NA | NA | NA | NA | NA | NA | NA | NA | NA | NA | NA | NA | NA | |
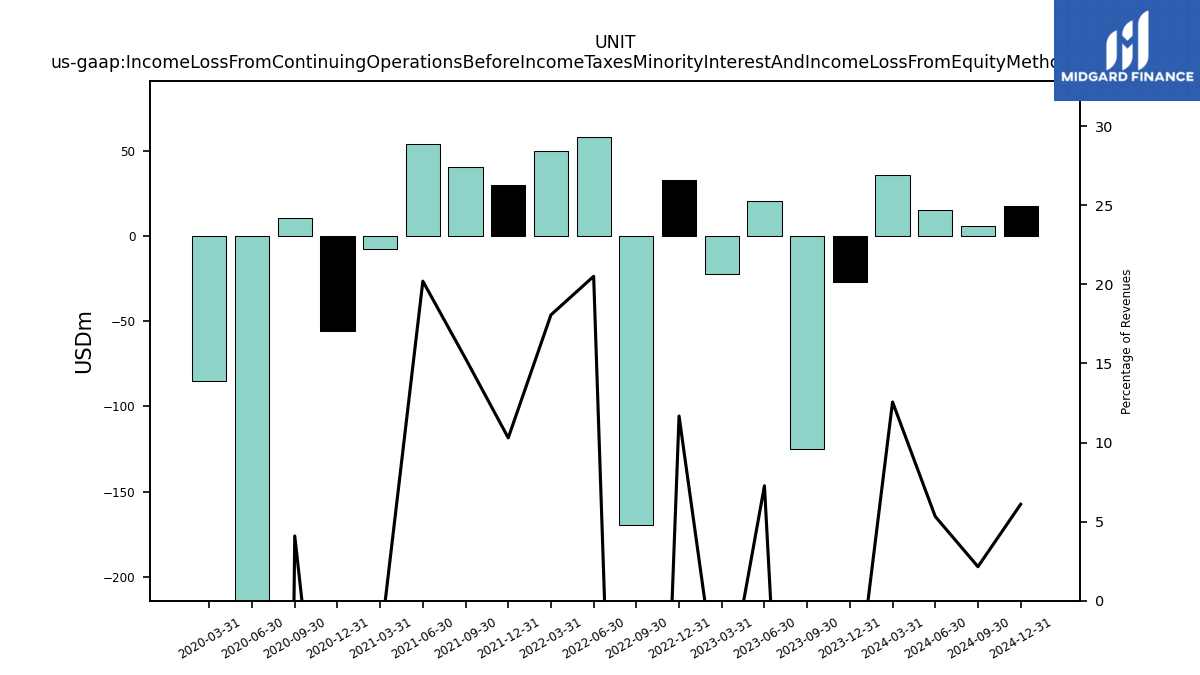
| Income Loss From Continuing Operations Before Income Taxes Minority Interest And Income Loss From Equity Method Investments | -26.52 | -124.70 | 20.62 | -22.28 | 33.14 | -169.48 | 58.24 | 50.24 | 30.17 | 40.83 | 54.18 | -7.46 | -55.66 | 10.60 | -604.20 | -84.84 | NA | NA | NA | NA | NA | NA | NA | NA | NA | NA | NA | NA | NA | NA | NA | NA | NA | NA | NA | |
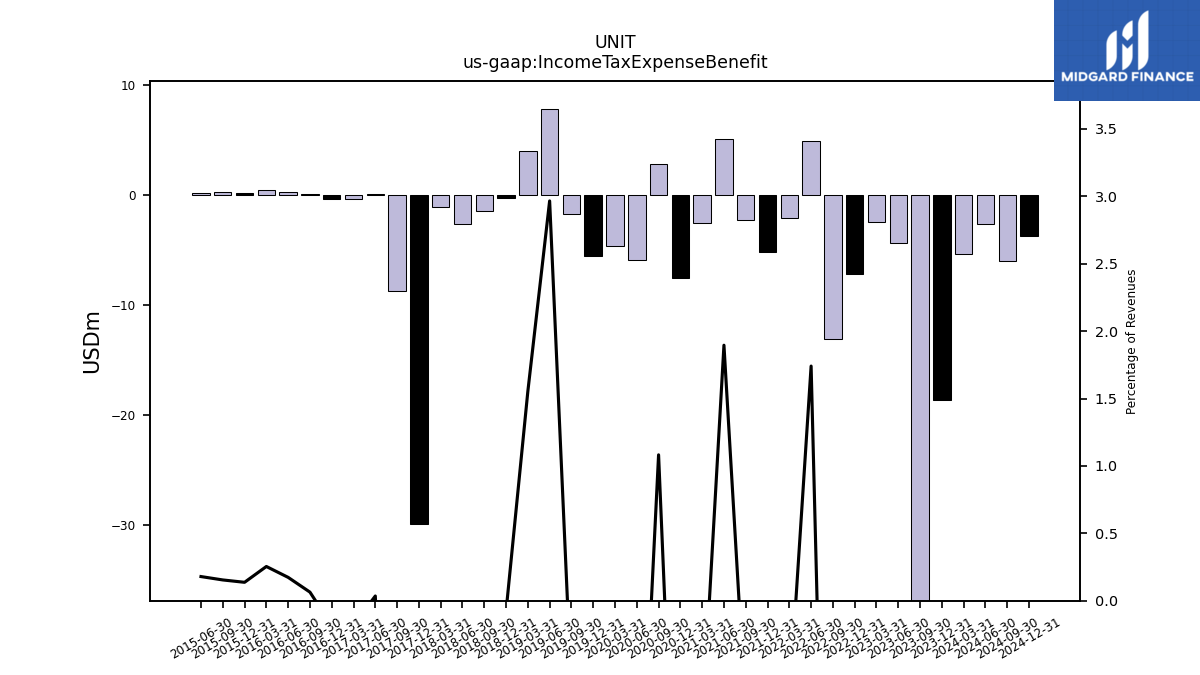
| Income Tax Expense Benefit | -18.61 | -43.09 | -4.36 | -2.41 | -7.18 | -13.06 | 4.94 | -2.07 | -5.20 | -2.24 | 5.08 | -2.56 | -7.55 | 2.80 | -5.88 | -4.58 | -5.49 | -1.75 | 7.84 | 4.05 | -0.21 | -1.47 | -2.65 | -1.10 | -29.87 | -8.67 | 0.07 | -0.38 | -0.38 | 0.13 | 0.33 | 0.44 | 0.24 | 0.27 | 0.23 | |
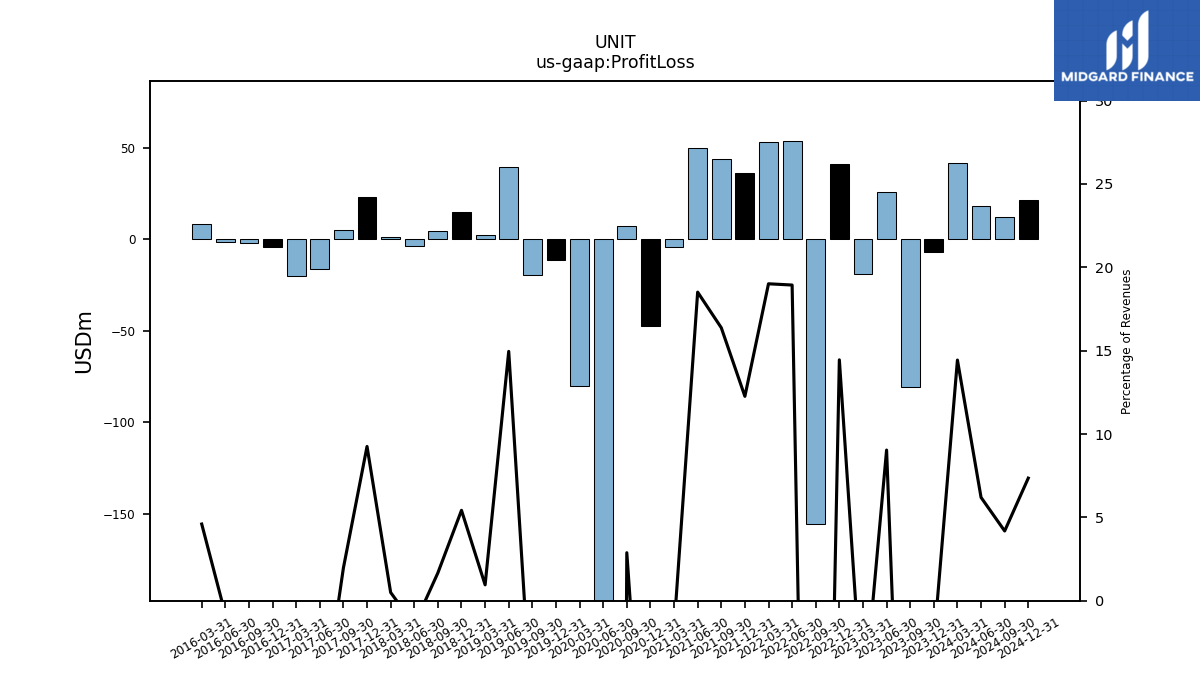
| Profit Loss | -7.24 | -80.93 | 25.64 | -19.21 | 40.99 | -155.75 | 53.77 | 52.86 | 35.93 | 43.68 | 49.64 | -4.50 | -47.67 | 7.46 | -598.33 | -80.27 | -11.35 | -19.78 | 39.55 | 2.49 | 14.68 | 4.22 | -3.59 | 1.23 | 22.80 | 4.83 | -16.46 | -20.00 | -4.37 | -2.34 | -1.53 | 8.04 | NA | NA | NA | |
| Net Income Loss | -7.24 | -80.90 | 25.63 | -19.20 | 40.98 | -155.68 | 53.70 | 52.73 | 35.83 | 43.37 | 48.91 | -4.44 | -46.97 | 7.26 | -587.74 | -78.85 | -11.16 | -19.42 | 38.72 | 2.44 | 14.35 | 4.13 | -3.50 | 1.21 | 22.29 | 4.73 | -16.46 | -20.00 | -4.37 | -2.34 | -1.53 | 8.04 | 7.17 | 9.40 | 8.30 | |
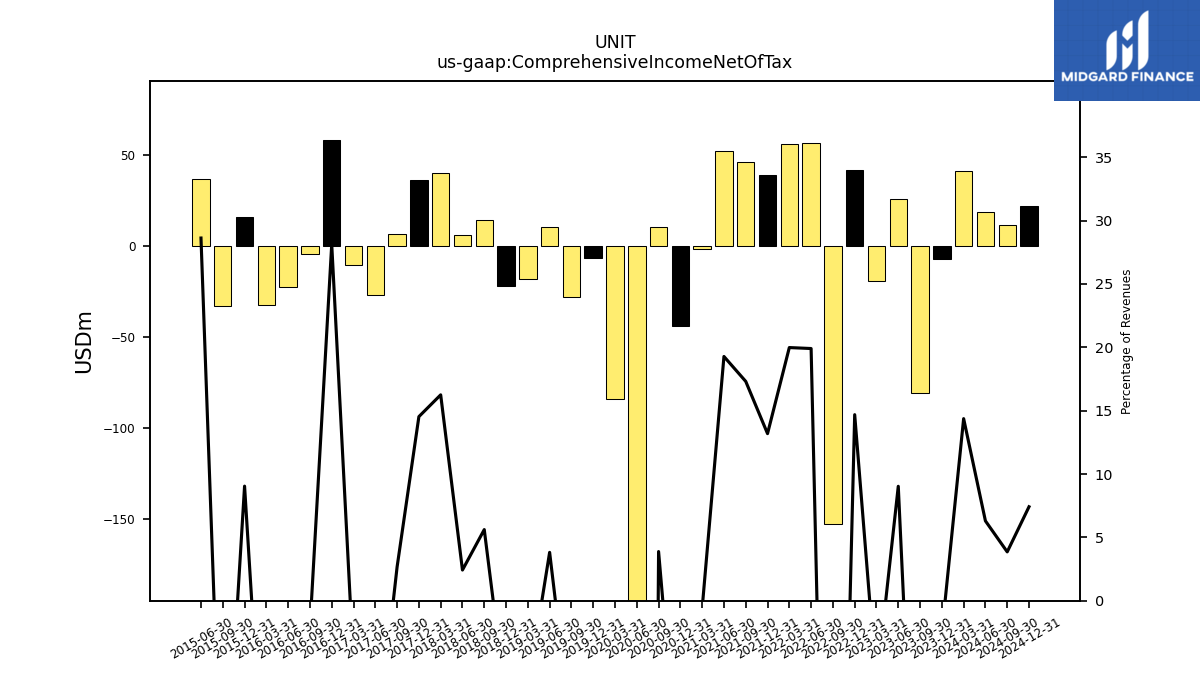
| Comprehensive Income Net Of Tax | -7.24 | -80.90 | 25.63 | -19.20 | 41.66 | -152.85 | 56.52 | 55.55 | 38.65 | 46.17 | 51.70 | -1.65 | -44.18 | 10.05 | -584.96 | -84.13 | -6.82 | -27.91 | 10.10 | -18.00 | -21.84 | 14.19 | 6.00 | 40.12 | 35.79 | 6.55 | -27.03 | -10.56 | 58.20 | -4.31 | -22.71 | -32.33 | 15.73 | -33.14 | 36.85 | |
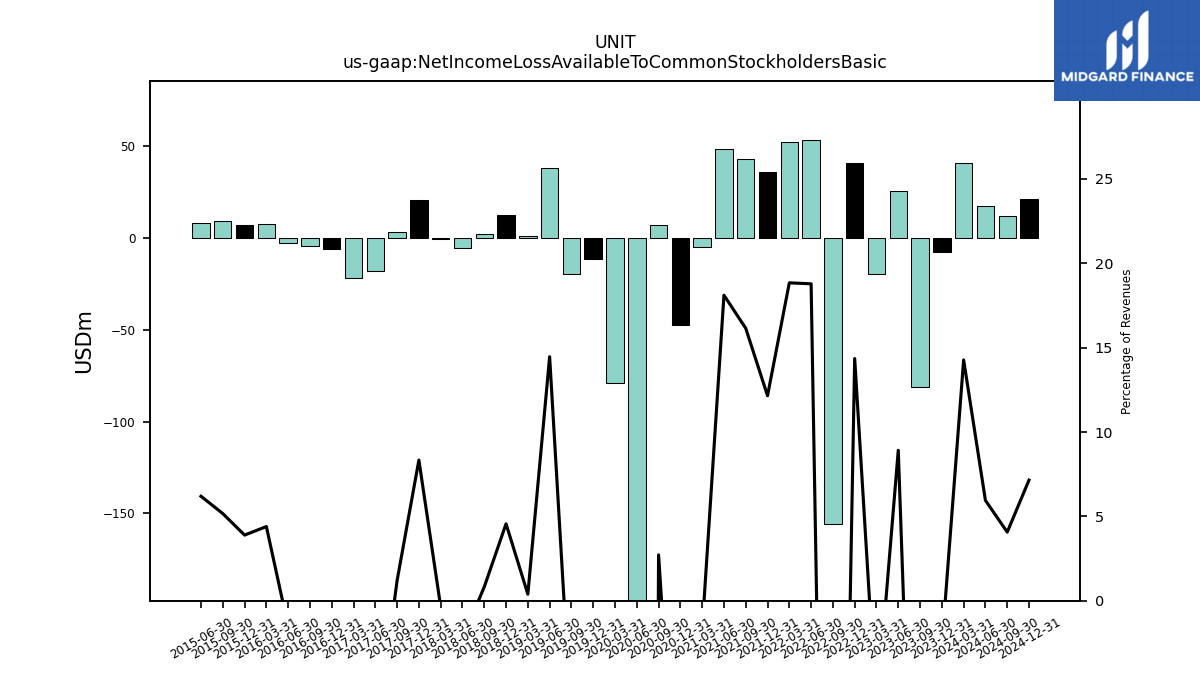
| Net Income Loss Available To Common Stockholders Basic | -7.56 | -81.22 | 25.30 | -19.45 | 40.73 | -155.91 | 53.35 | 52.39 | 35.61 | 43.08 | 48.57 | -4.69 | -47.20 | 7.03 | -588.17 | -79.06 | -11.40 | -19.47 | 38.25 | 1.01 | 12.35 | 2.08 | -5.56 | -0.87 | 20.54 | 2.94 | -18.24 | -21.79 | -6.16 | -4.14 | -2.87 | 7.68 | 6.77 | 8.97 | 7.98 | |
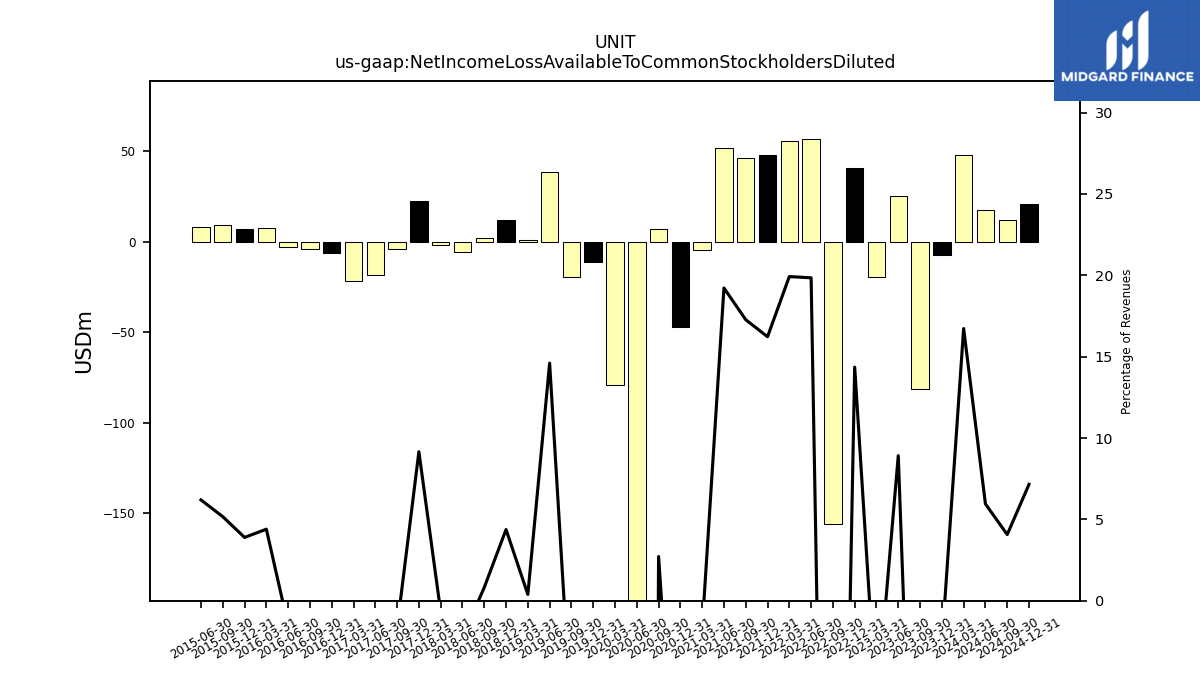
| Net Income Loss Available To Common Stockholders Diluted | -7.56 | -81.22 | 25.30 | -19.45 | 40.73 | -155.91 | 56.35 | 55.39 | 47.54 | 46.06 | 51.55 | -4.69 | -47.20 | 7.03 | -588.17 | -79.06 | -11.40 | -19.47 | 38.61 | 1.01 | 11.84 | 2.08 | -5.56 | -1.65 | 22.56 | -4.03 | -18.24 | -21.79 | -6.16 | -4.14 | -2.87 | 7.68 | 6.77 | 8.97 | 7.98 | |
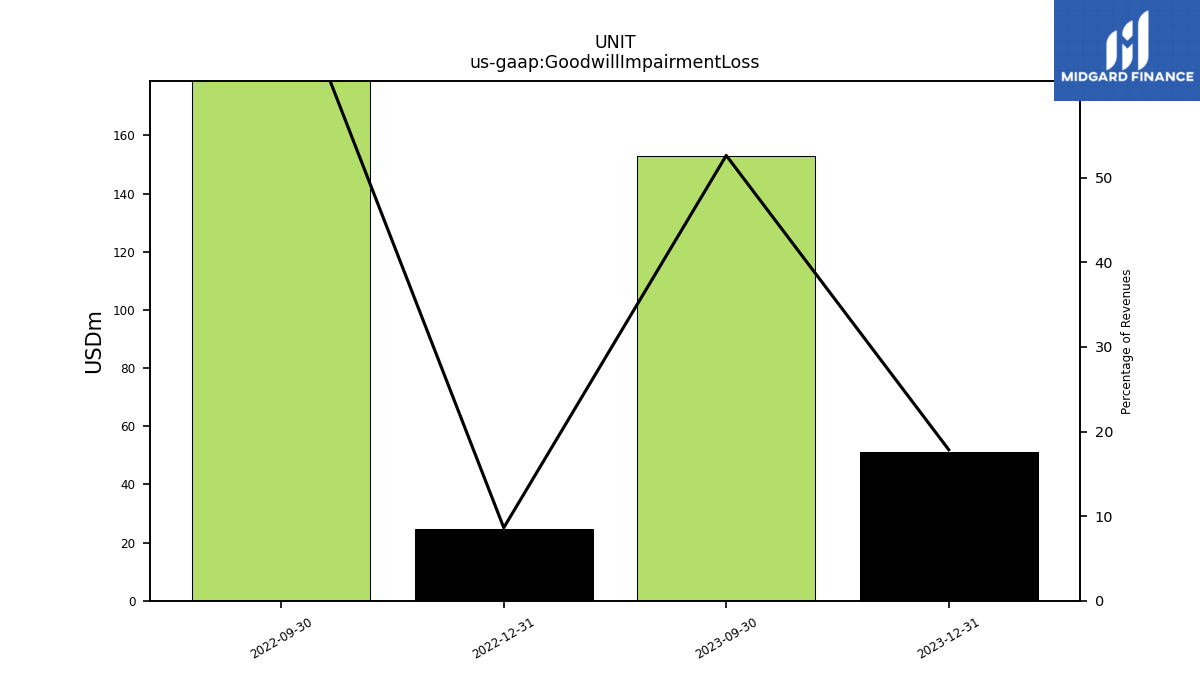
| Goodwill Impairment Loss | 51.00 | 153.00 | NA | NA | 24.50 | 216.00 | NA | NA | NA | NA | NA | NA | NA | NA | NA | NA | NA | NA | NA | NA | NA | NA | NA | NA | NA | NA | NA | NA | NA | NA | NA | NA | NA | NA | NA |
| 2023-12-31 | 2023-09-30 | 2023-06-30 | 2023-03-31 | 2022-12-31 | 2022-09-30 | 2022-06-30 | 2022-03-31 | 2021-12-31 | 2021-09-30 | 2021-06-30 | 2021-03-31 | 2020-12-31 | 2020-09-30 | 2020-06-30 | 2020-03-31 | 2019-12-31 | 2019-09-30 | 2019-06-30 | 2019-03-31 | 2018-12-31 | 2018-09-30 | 2018-06-30 | 2018-03-31 | 2017-12-31 | 2017-09-30 | 2017-06-30 | 2017-03-31 | 2016-12-31 | 2016-09-30 | 2016-06-30 | 2016-03-31 | 2015-12-31 | 2015-09-30 | 2015-06-30 | ||
|---|---|---|---|---|---|---|---|---|---|---|---|---|---|---|---|---|---|---|---|---|---|---|---|---|---|---|---|---|---|---|---|---|---|---|---|---|
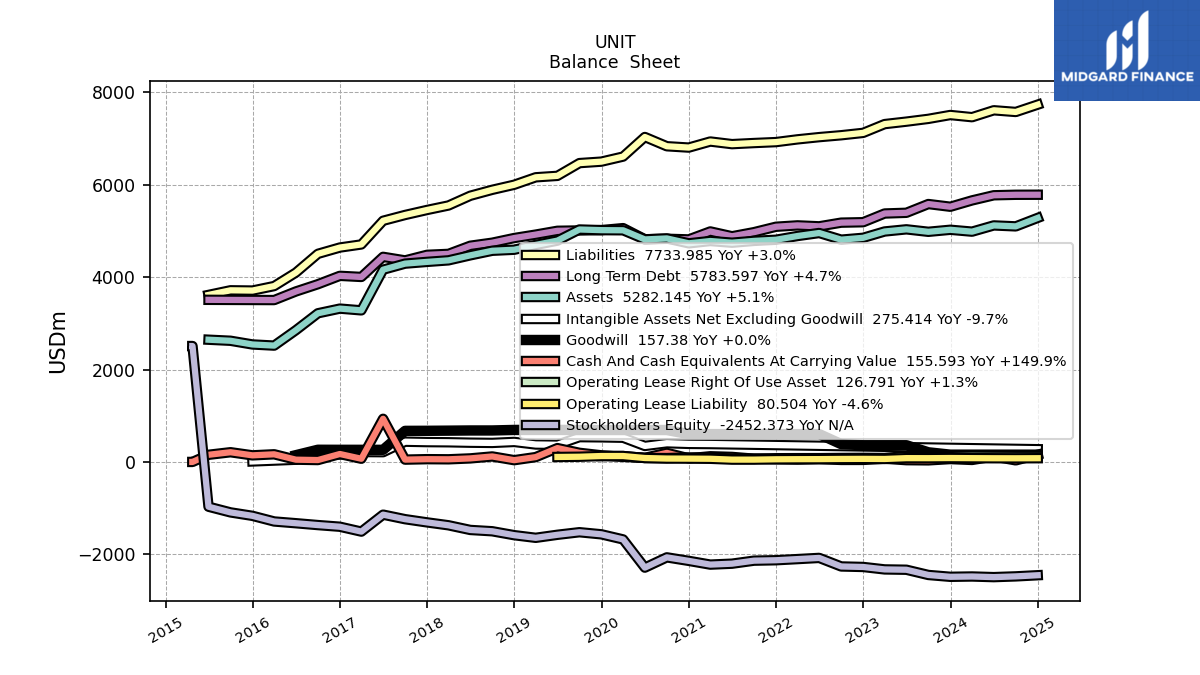
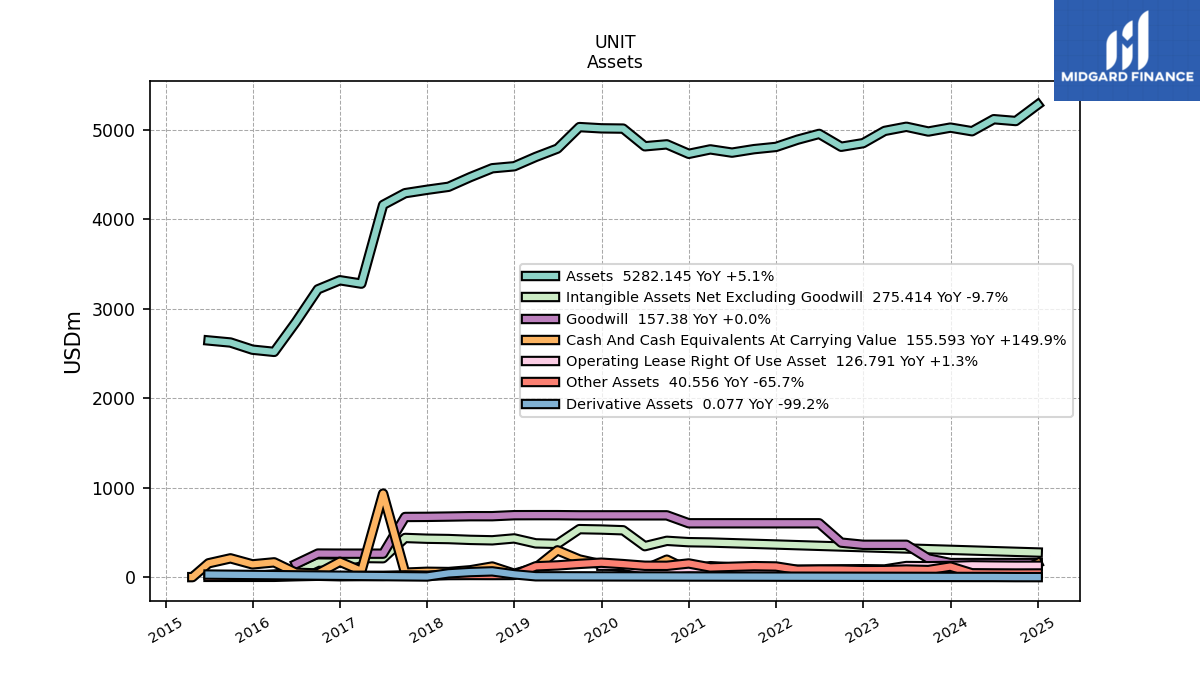
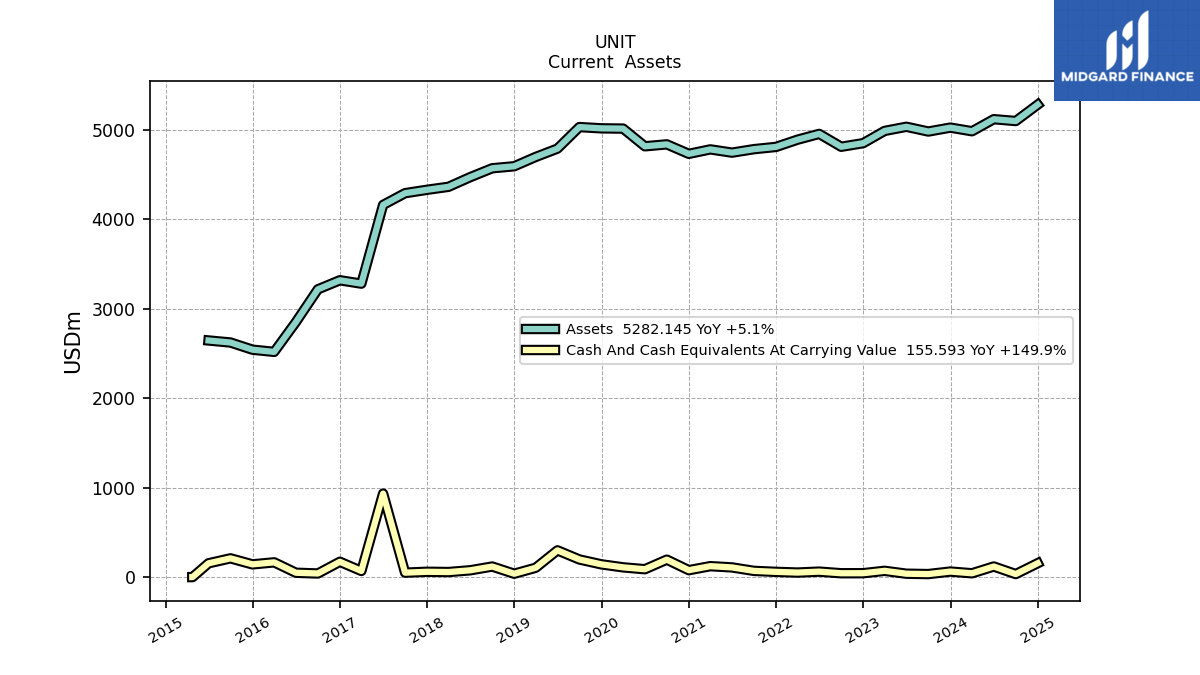
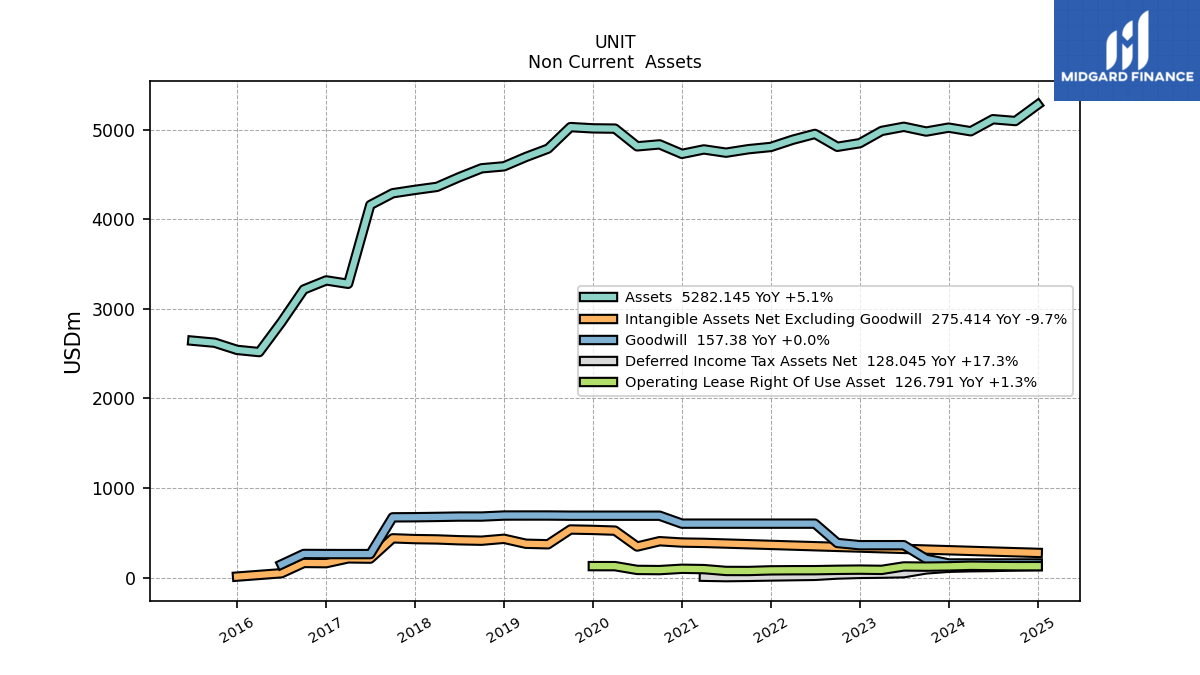
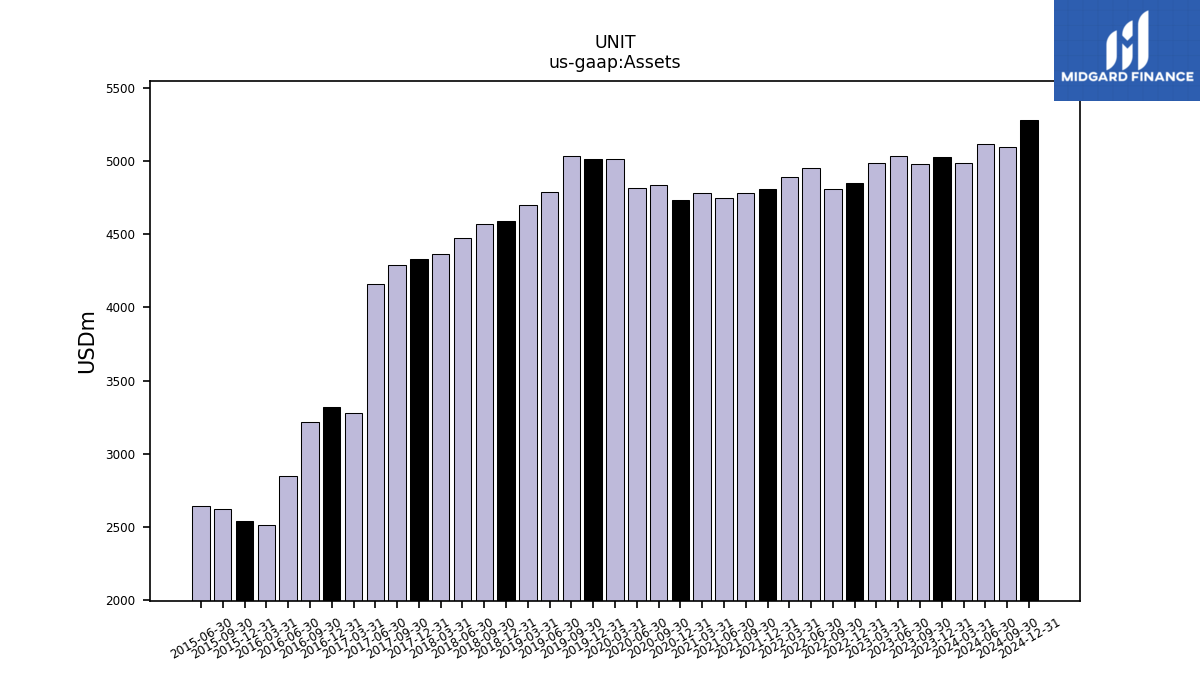
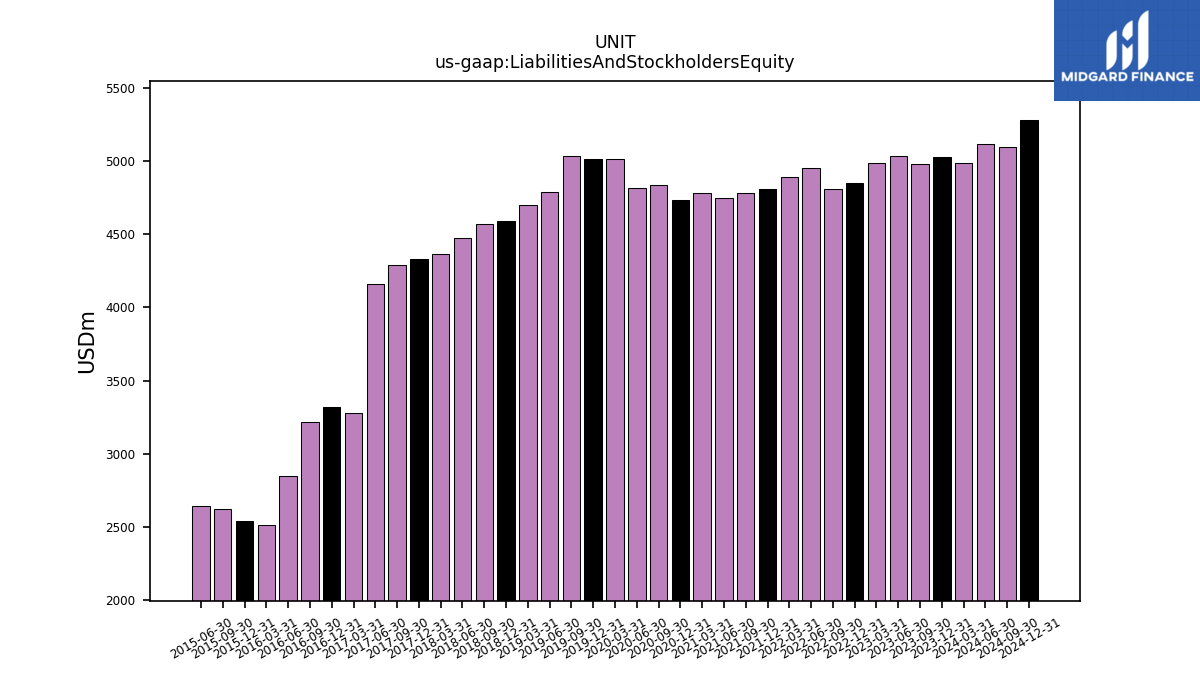
| Assets | 5025.13 | 4981.32 | 5034.57 | 4988.20 | 4851.23 | 4811.01 | 4955.21 | 4889.91 | 4809.24 | 4784.28 | 4745.37 | 4781.76 | 4731.82 | 4837.97 | 4816.19 | 5014.08 | 5017.00 | 5031.23 | 4790.36 | 4697.31 | 4592.94 | 4570.82 | 4471.66 | 4363.51 | 4330.08 | 4292.21 | 4161.16 | 3280.68 | 3318.75 | 3217.53 | 2851.68 | 2517.91 | 2542.64 | 2622.78 | 2645.64 | |
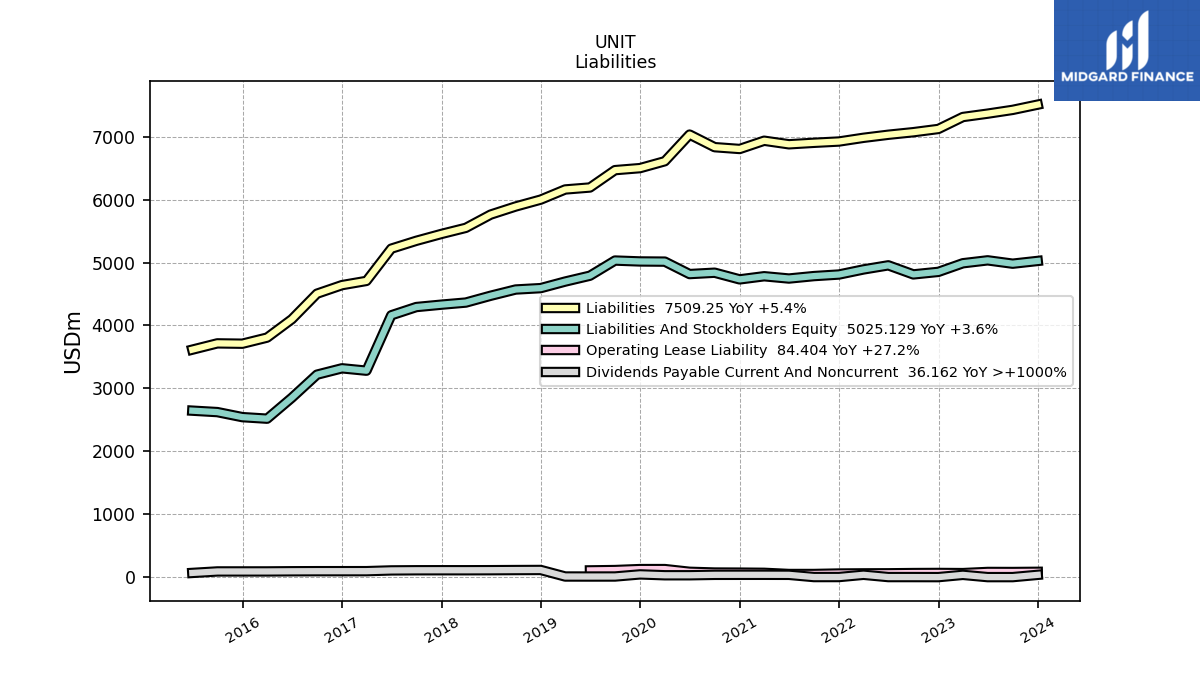
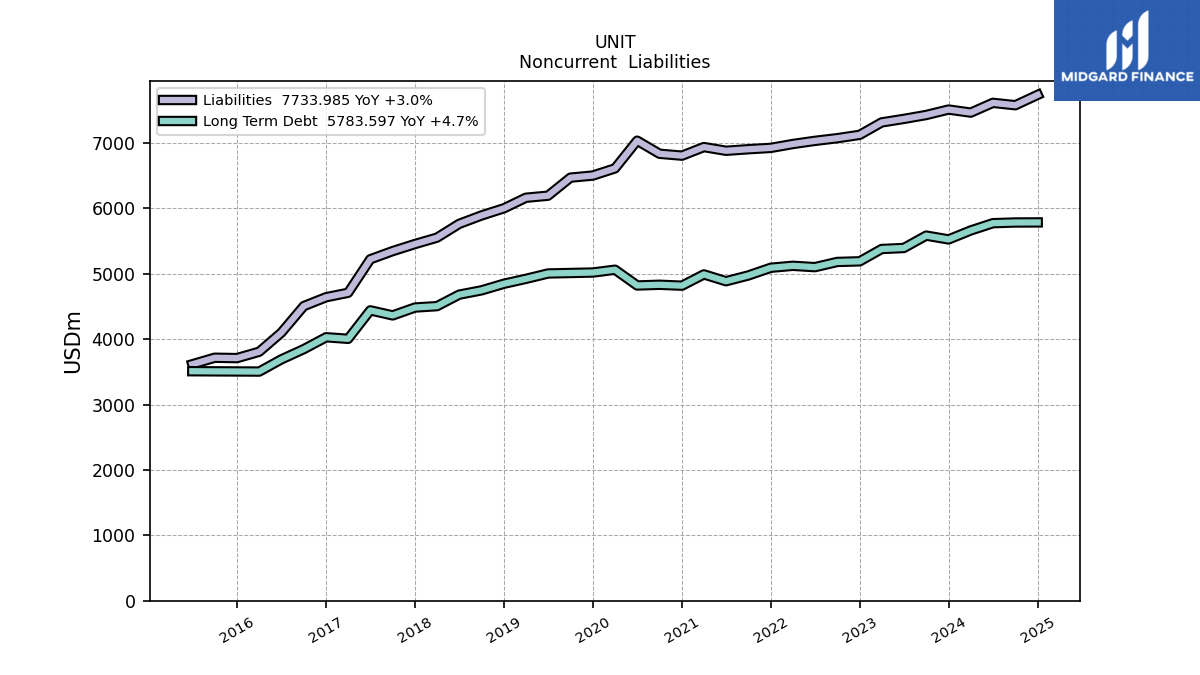
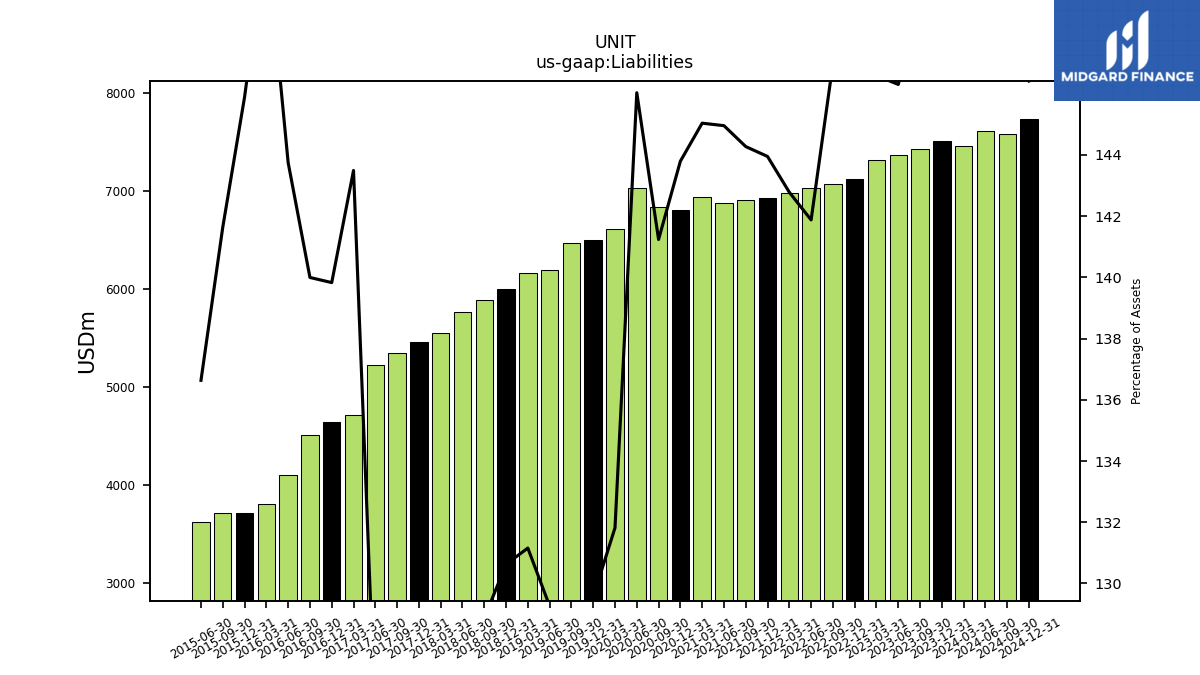
| Liabilities | 7509.25 | 7425.77 | 7365.81 | 7312.37 | 7122.44 | 7071.18 | 7030.40 | 6981.93 | 6923.02 | 6902.52 | 6878.81 | 6935.45 | 6804.19 | 6833.09 | 7033.33 | 6609.53 | 6500.16 | 6468.06 | 6192.15 | 6160.84 | 5999.63 | 5890.23 | 5761.45 | 5550.86 | 5453.69 | 5345.08 | 5220.16 | 4707.59 | 4640.65 | 4504.49 | 4099.31 | 3806.83 | 3709.54 | 3714.97 | 3614.94 | |
| Liabilities And Stockholders Equity | 5025.13 | 4981.32 | 5034.57 | 4988.20 | 4851.23 | 4811.01 | 4955.21 | 4889.91 | 4809.24 | 4784.28 | 4745.37 | 4781.76 | 4731.82 | 4837.97 | 4816.19 | 5014.08 | 5017.00 | 5031.23 | 4790.36 | 4697.31 | 4592.94 | 4570.82 | 4471.66 | 4363.51 | 4330.08 | 4292.21 | 4161.16 | 3280.68 | 3318.75 | 3217.53 | 2851.68 | 2517.91 | 2542.64 | 2622.78 | 2645.64 | |
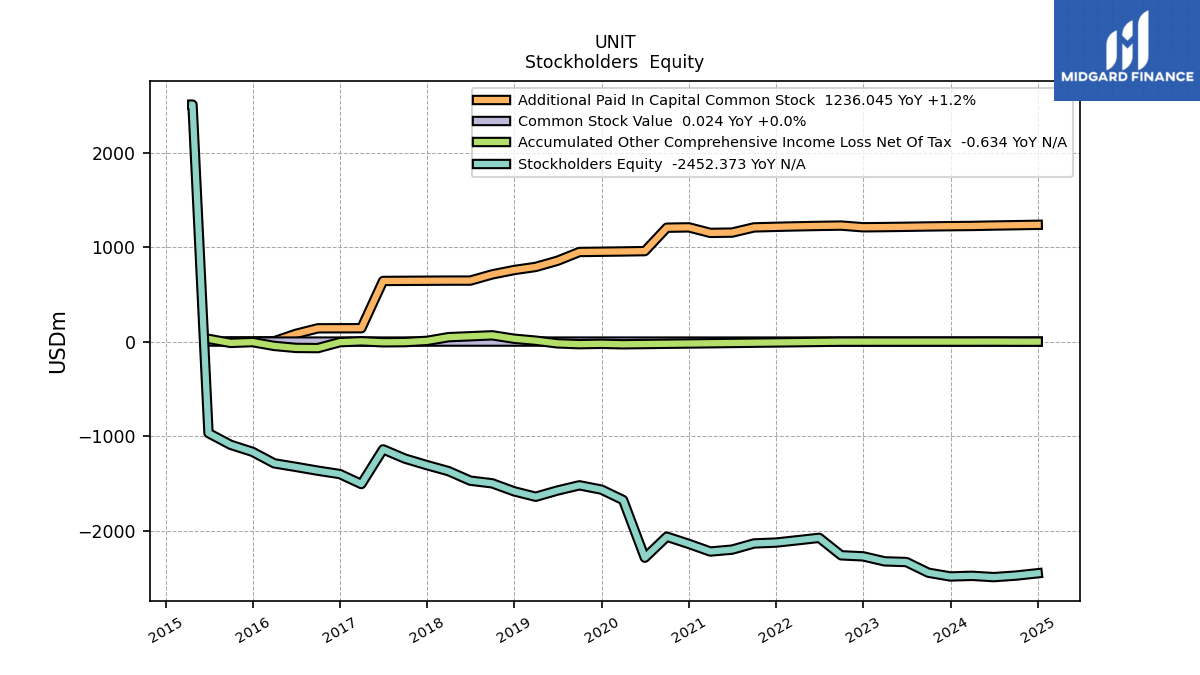
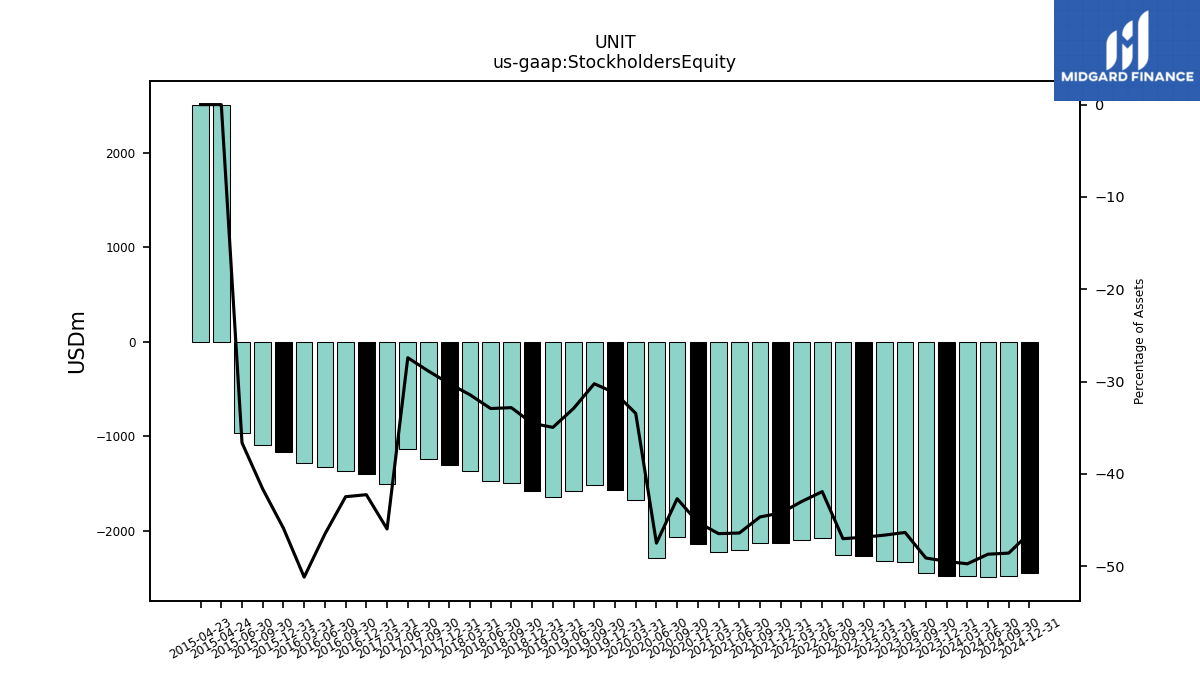
| Stockholders Equity | -2486.39 | -2446.73 | -2333.59 | -2326.52 | -2273.58 | -2262.48 | -2077.52 | -2103.06 | -2127.79 | -2137.04 | -2202.43 | -2222.43 | -2141.66 | -2065.59 | -2287.89 | -1677.25 | -1566.87 | -1521.43 | -1576.84 | -1642.54 | -1585.58 | -1500.54 | -1472.34 | -1371.48 | -1308.55 | -1239.28 | -1141.04 | -1508.21 | -1402.44 | -1366.76 | -1326.70 | -1288.91 | -1166.91 | -1092.19 | -969.30 |
| 2023-12-31 | 2023-09-30 | 2023-06-30 | 2023-03-31 | 2022-12-31 | 2022-09-30 | 2022-06-30 | 2022-03-31 | 2021-12-31 | 2021-09-30 | 2021-06-30 | 2021-03-31 | 2020-12-31 | 2020-09-30 | 2020-06-30 | 2020-03-31 | 2019-12-31 | 2019-09-30 | 2019-06-30 | 2019-03-31 | 2018-12-31 | 2018-09-30 | 2018-06-30 | 2018-03-31 | 2017-12-31 | 2017-09-30 | 2017-06-30 | 2017-03-31 | 2016-12-31 | 2016-09-30 | 2016-06-30 | 2016-03-31 | 2015-12-31 | 2015-09-30 | 2015-06-30 | ||
|---|---|---|---|---|---|---|---|---|---|---|---|---|---|---|---|---|---|---|---|---|---|---|---|---|---|---|---|---|---|---|---|---|---|---|---|---|
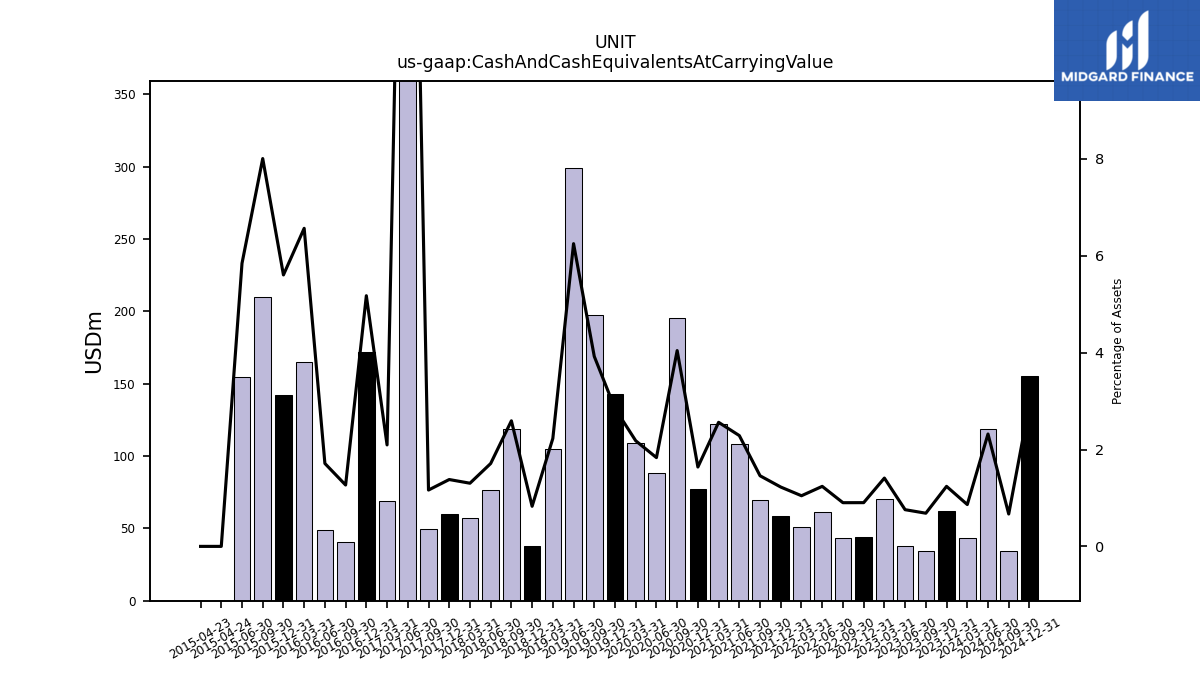
| Cash And Cash Equivalents At Carrying Value | 62.26 | 34.12 | 38.15 | 70.35 | 43.80 | 43.39 | 61.41 | 51.13 | 58.90 | 69.75 | 108.54 | 122.47 | 77.53 | 195.57 | 88.27 | 109.33 | 142.81 | 197.32 | 299.39 | 104.68 | 38.03 | 118.49 | 76.50 | 56.90 | 59.77 | 49.92 | 934.10 | 68.73 | 171.75 | 40.76 | 48.81 | 165.34 | 142.50 | 210.00 | 154.62 | |
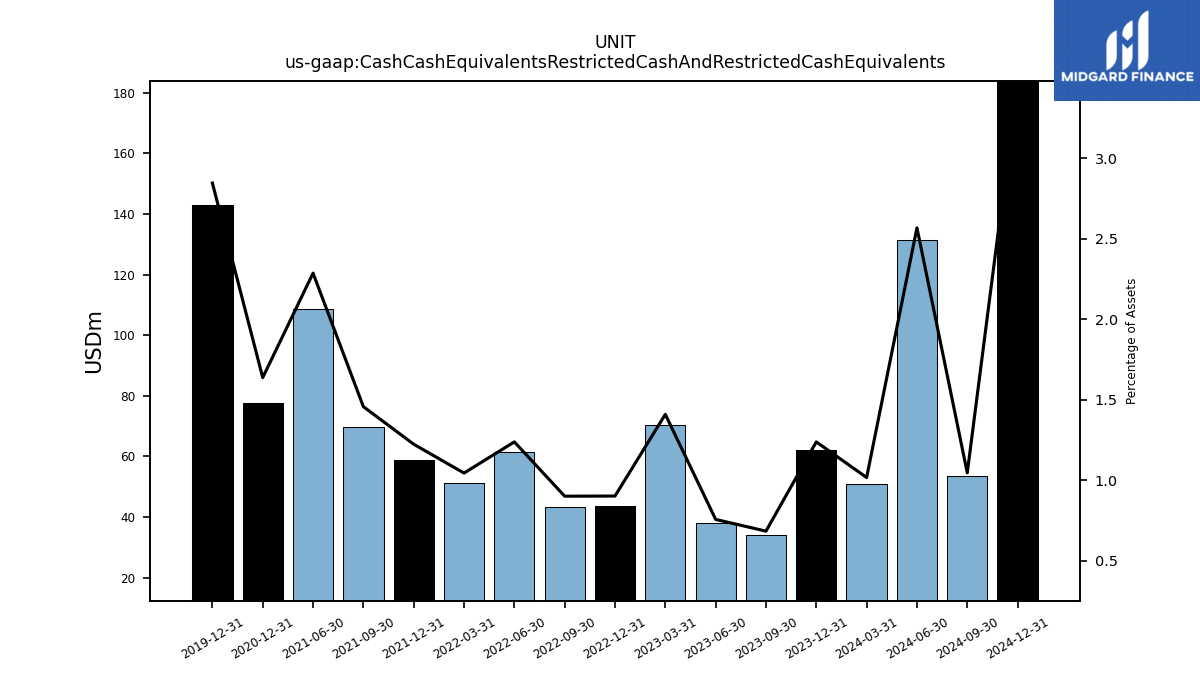
| Cash Cash Equivalents Restricted Cash And Restricted Cash Equivalents | 62.26 | 34.12 | 38.15 | 70.35 | 43.80 | 43.39 | 61.41 | 51.13 | 58.90 | 69.75 | 108.54 | NA | 77.53 | NA | NA | NA | 142.81 | NA | NA | NA | NA | NA | NA | NA | NA | NA | NA | NA | NA | NA | NA | NA | NA | NA | NA |
| 2023-12-31 | 2023-09-30 | 2023-06-30 | 2023-03-31 | 2022-12-31 | 2022-09-30 | 2022-06-30 | 2022-03-31 | 2021-12-31 | 2021-09-30 | 2021-06-30 | 2021-03-31 | 2020-12-31 | 2020-09-30 | 2020-06-30 | 2020-03-31 | 2019-12-31 | 2019-09-30 | 2019-06-30 | 2019-03-31 | 2018-12-31 | 2018-09-30 | 2018-06-30 | 2018-03-31 | 2017-12-31 | 2017-09-30 | 2017-06-30 | 2017-03-31 | 2016-12-31 | 2016-09-30 | 2016-06-30 | 2016-03-31 | 2015-12-31 | 2015-09-30 | 2015-06-30 | ||
|---|---|---|---|---|---|---|---|---|---|---|---|---|---|---|---|---|---|---|---|---|---|---|---|---|---|---|---|---|---|---|---|---|---|---|---|---|
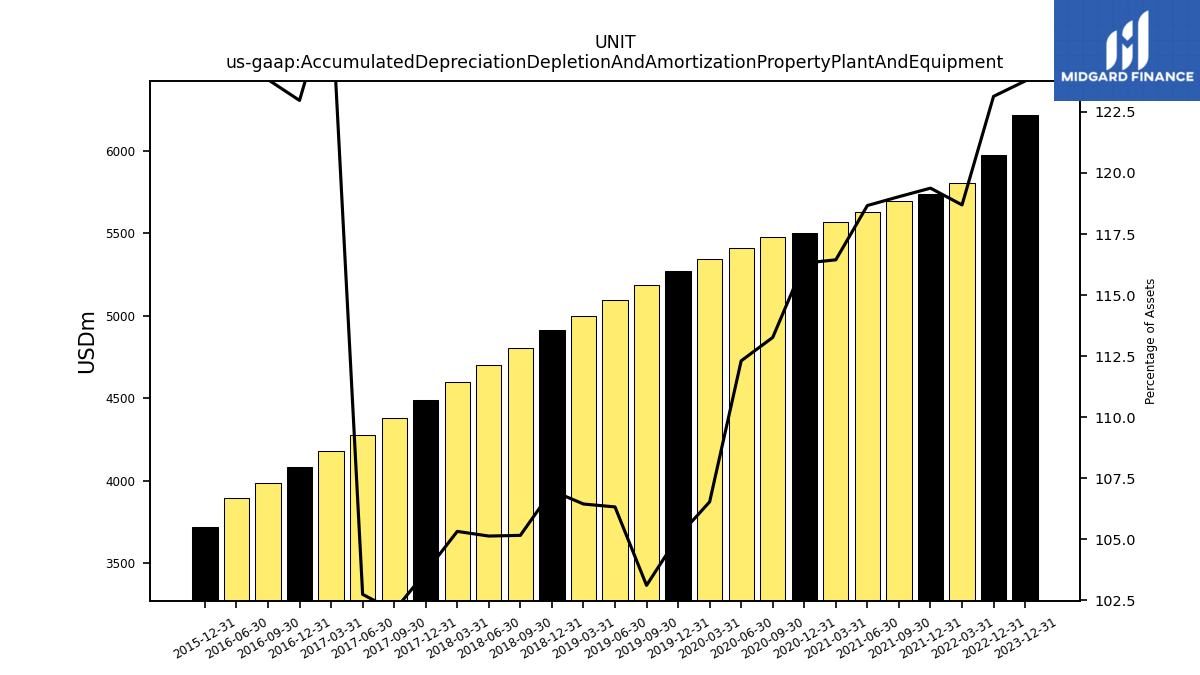
| Accumulated Depreciation Depletion And Amortization Property Plant And Equipment | 6219.34 | NA | NA | NA | 5973.63 | NA | NA | 5803.96 | 5741.21 | 5694.67 | 5631.22 | 5568.12 | 5503.49 | 5479.86 | 5409.10 | 5341.93 | 5273.53 | 5188.21 | 5093.60 | 5000.25 | 4914.30 | 4806.96 | 4701.38 | 4596.01 | 4488.70 | 4381.24 | 4275.63 | 4179.38 | 4081.04 | 3984.04 | 3890.87 | NA | 3720.89 | NA | NA | |
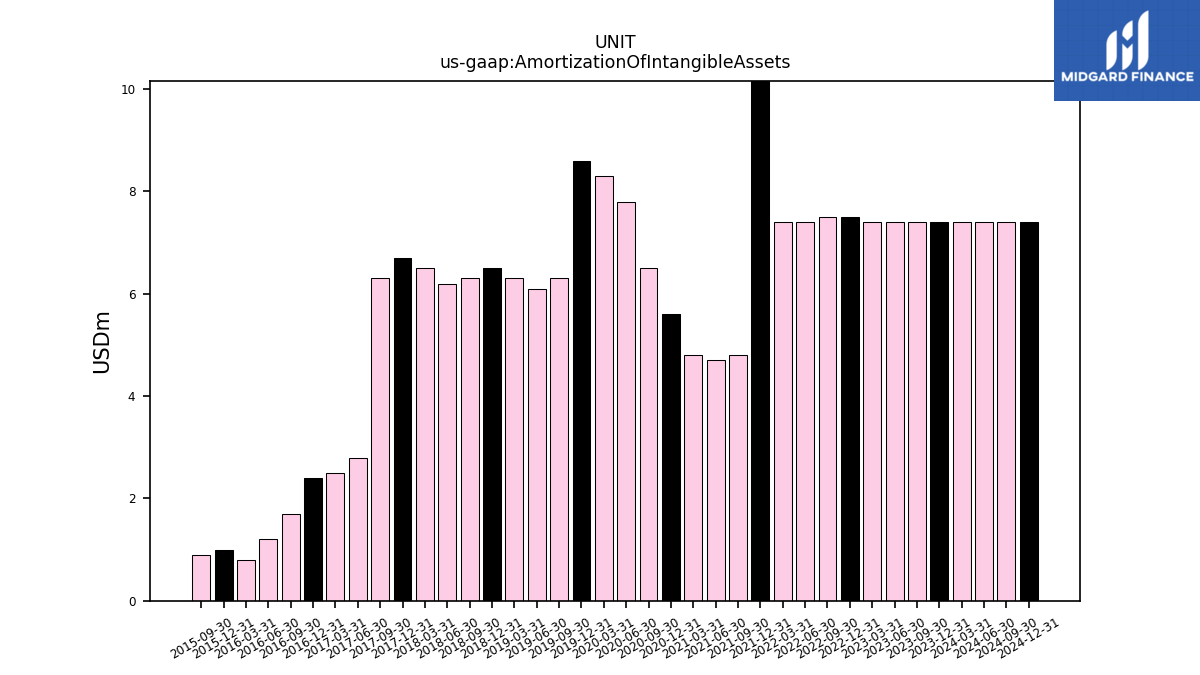
| Amortization Of Intangible Assets | 7.40 | 7.40 | 7.40 | 7.40 | 7.50 | 7.50 | 7.40 | 7.40 | 15.50 | 4.80 | 4.70 | 4.80 | 5.60 | 6.50 | 7.80 | 8.30 | 8.60 | 6.30 | 6.10 | 6.30 | 6.50 | 6.30 | 6.20 | 6.50 | 6.70 | 6.30 | 2.80 | 2.50 | 2.40 | 1.70 | 1.20 | 0.80 | 1.00 | 0.90 | NA | |
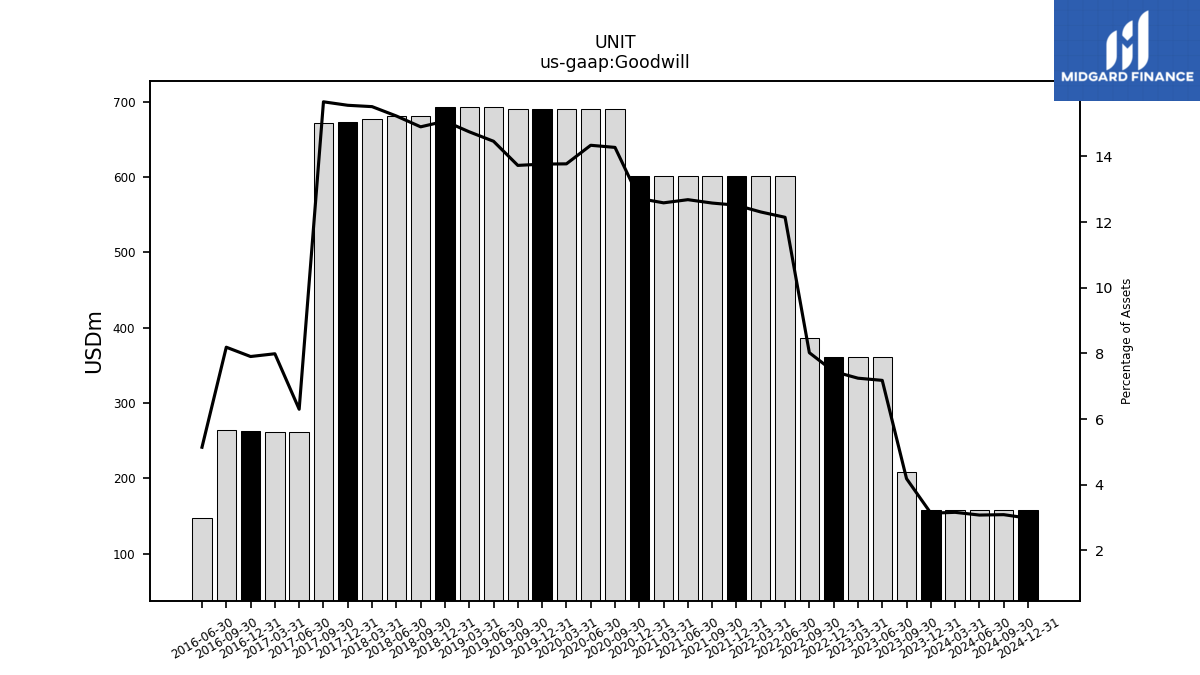
| Goodwill | 157.38 | 208.38 | 361.38 | 361.38 | 361.38 | 385.88 | 601.88 | 601.88 | 601.88 | 601.88 | 601.88 | 601.88 | 601.88 | 690.67 | 690.67 | 690.67 | 690.67 | 690.67 | 692.83 | 692.89 | 692.38 | 681.17 | 681.17 | 677.13 | 673.73 | 672.37 | 262.09 | 262.09 | 262.33 | 263.46 | 146.59 | NA | NA | NA | NA | |
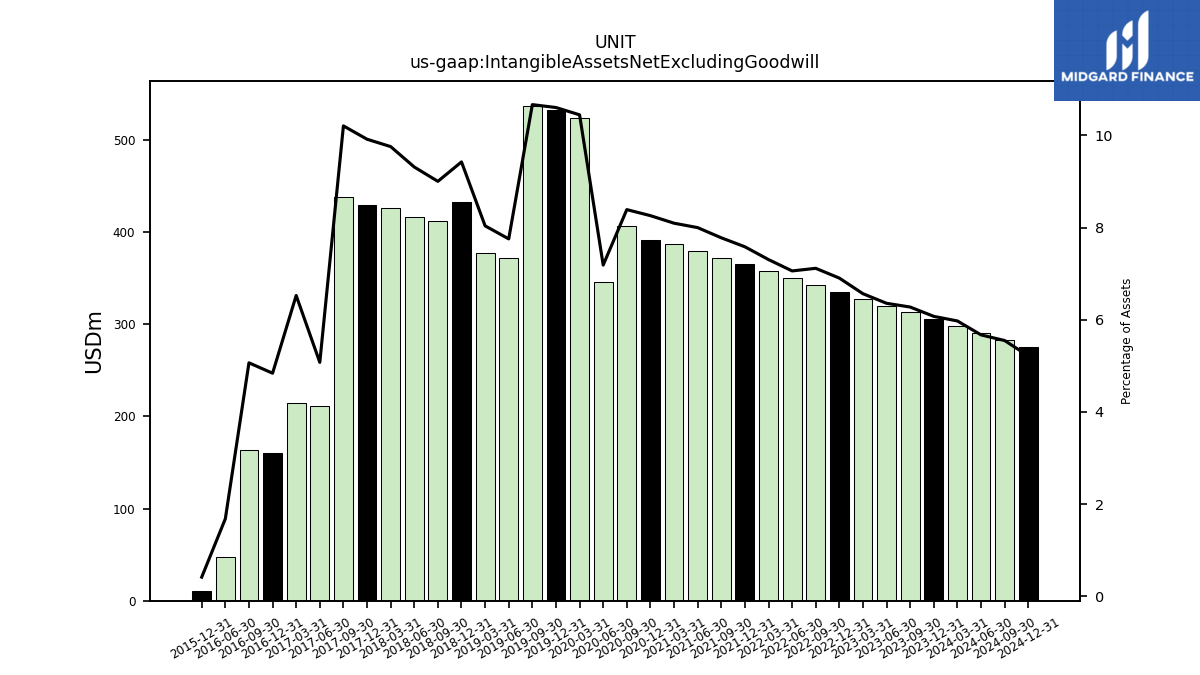
| Intangible Assets Net Excluding Goodwill | 305.12 | 312.54 | 319.97 | 327.40 | 334.85 | 342.29 | 349.74 | 357.18 | 364.63 | 372.08 | 379.52 | 387.01 | 390.73 | 405.83 | 346.05 | 523.72 | 531.98 | 536.65 | 371.41 | 377.48 | 432.82 | 411.45 | 416.43 | 425.69 | 429.36 | 438.02 | 211.16 | 214.06 | 160.58 | 162.94 | 47.92 | NA | 10.53 | NA | NA |
| 2023-12-31 | 2023-09-30 | 2023-06-30 | 2023-03-31 | 2022-12-31 | 2022-09-30 | 2022-06-30 | 2022-03-31 | 2021-12-31 | 2021-09-30 | 2021-06-30 | 2021-03-31 | 2020-12-31 | 2020-09-30 | 2020-06-30 | 2020-03-31 | 2019-12-31 | 2019-09-30 | 2019-06-30 | 2019-03-31 | 2018-12-31 | 2018-09-30 | 2018-06-30 | 2018-03-31 | 2017-12-31 | 2017-09-30 | 2017-06-30 | 2017-03-31 | 2016-12-31 | 2016-09-30 | 2016-06-30 | 2016-03-31 | 2015-12-31 | 2015-09-30 | 2015-06-30 | ||
|---|---|---|---|---|---|---|---|---|---|---|---|---|---|---|---|---|---|---|---|---|---|---|---|---|---|---|---|---|---|---|---|---|---|---|---|---|
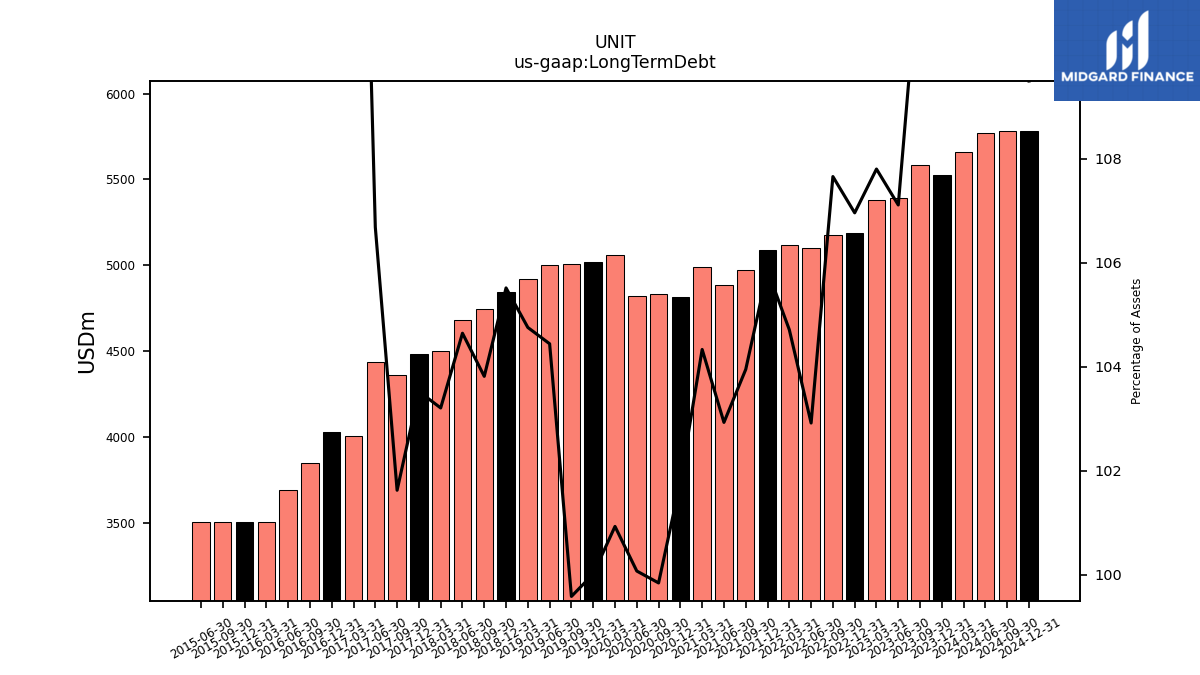
| Long Term Debt | 5523.58 | 5582.06 | 5392.54 | 5377.31 | 5188.81 | 5179.33 | 5099.78 | 5120.28 | 5090.54 | 4973.17 | 4884.41 | 4988.89 | 4816.52 | 4830.37 | 4819.65 | 5060.70 | 5017.68 | 5010.29 | 5003.09 | 4920.65 | 4846.23 | 4745.23 | 4679.30 | 4503.46 | 4482.70 | 4361.96 | 4439.24 | 4003.79 | 4028.21 | 3846.71 | 3690.19 | 3503.64 | 3505.23 | 3506.91 | 3508.68 |
| 2023-12-31 | 2023-09-30 | 2023-06-30 | 2023-03-31 | 2022-12-31 | 2022-09-30 | 2022-06-30 | 2022-03-31 | 2021-12-31 | 2021-09-30 | 2021-06-30 | 2021-03-31 | 2020-12-31 | 2020-09-30 | 2020-06-30 | 2020-03-31 | 2019-12-31 | 2019-09-30 | 2019-06-30 | 2019-03-31 | 2018-12-31 | 2018-09-30 | 2018-06-30 | 2018-03-31 | 2017-12-31 | 2017-09-30 | 2017-06-30 | 2017-03-31 | 2016-12-31 | 2016-09-30 | 2016-06-30 | 2016-03-31 | 2015-12-31 | 2015-09-30 | 2015-06-30 | ||
|---|---|---|---|---|---|---|---|---|---|---|---|---|---|---|---|---|---|---|---|---|---|---|---|---|---|---|---|---|---|---|---|---|---|---|---|---|
| Stockholders Equity | -2486.39 | -2446.73 | -2333.59 | -2326.52 | -2273.58 | -2262.48 | -2077.52 | -2103.06 | -2127.79 | -2137.04 | -2202.43 | -2222.43 | -2141.66 | -2065.59 | -2287.89 | -1677.25 | -1566.87 | -1521.43 | -1576.84 | -1642.54 | -1585.58 | -1500.54 | -1472.34 | -1371.48 | -1308.55 | -1239.28 | -1141.04 | -1508.21 | -1402.44 | -1366.76 | -1326.70 | -1288.91 | -1166.91 | -1092.19 | -969.30 | |
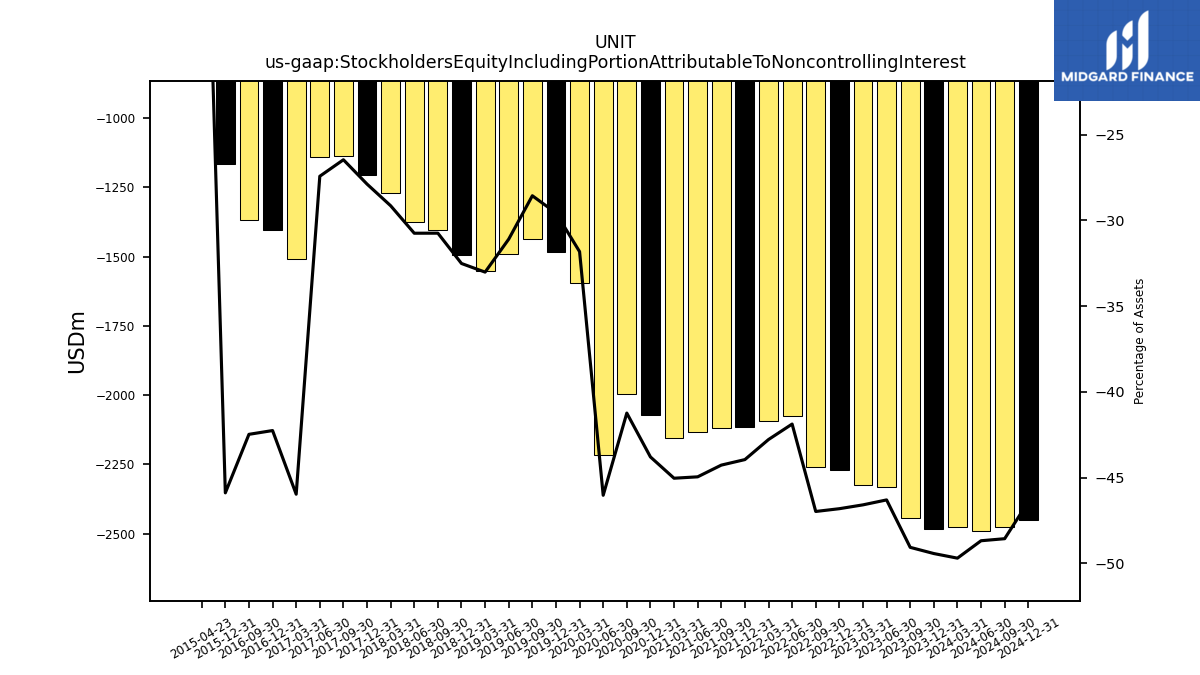
| Stockholders Equity Including Portion Attributable To Noncontrolling Interest | -2484.12 | -2444.44 | -2331.24 | -2324.18 | -2271.21 | -2260.18 | -2075.20 | -2092.02 | -2113.77 | -2118.24 | -2133.44 | -2153.69 | -2072.38 | -1995.13 | -2217.14 | -1595.45 | -1483.16 | -1436.84 | -1489.29 | -1550.78 | -1493.20 | -1405.17 | -1374.81 | -1271.62 | -1207.14 | -1135.66 | -1141.04 | -1508.21 | -1402.44 | -1366.76 | NA | NA | -1166.91 | NA | NA | |
| Common Stock Value | 0.02 | 0.02 | 0.02 | 0.02 | 0.02 | 0.02 | 0.02 | 0.02 | 0.02 | 0.02 | 0.02 | 0.02 | 0.02 | 0.02 | 0.02 | 0.02 | 0.02 | 0.02 | 0.02 | 0.02 | 0.02 | 0.02 | 0.02 | 0.02 | 0.02 | 0.02 | 0.02 | 0.02 | 0.01 | 0.01 | 0.01 | 0.01 | 0.01 | 0.01 | 0.15 | |
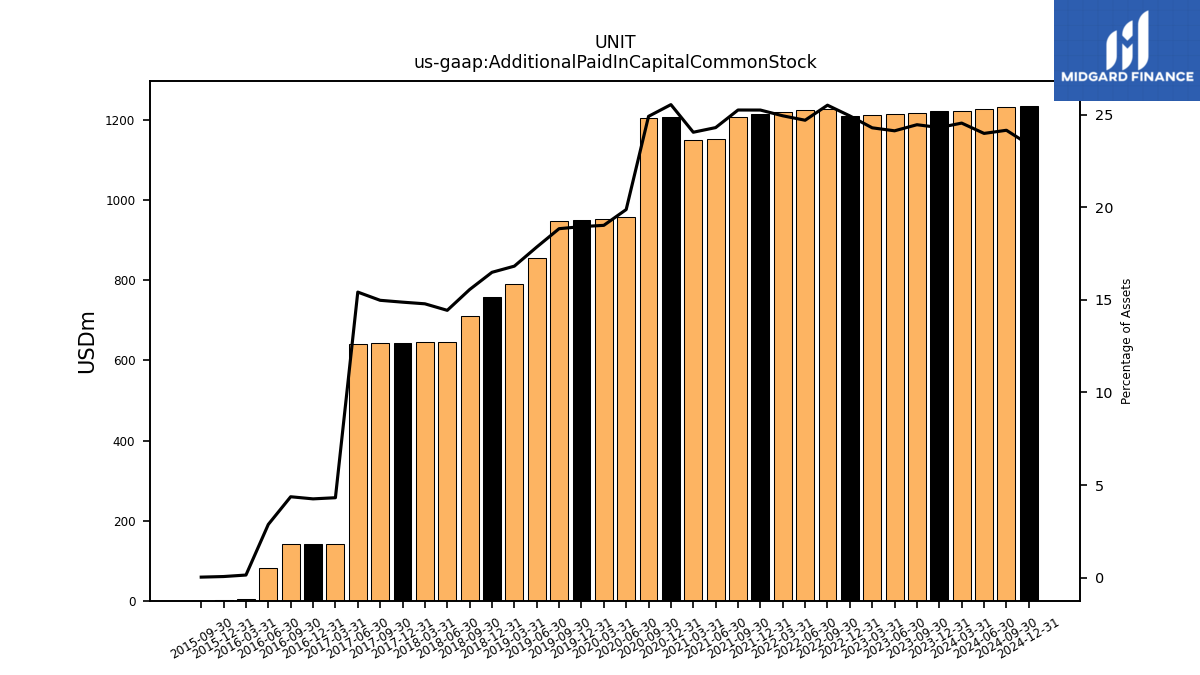
| Additional Paid In Capital Common Stock | 1221.82 | 1218.82 | 1215.26 | 1212.14 | 1210.03 | 1227.90 | 1224.43 | 1220.04 | 1214.83 | 1208.61 | 1153.71 | 1150.55 | 1209.14 | 1205.63 | 957.66 | 954.22 | 951.29 | 948.38 | 855.42 | 790.35 | 757.52 | 711.27 | 645.63 | 645.40 | 644.33 | 642.98 | 641.81 | 141.50 | 141.09 | 140.47 | 81.88 | 3.41 | 1.39 | 0.60 | NA | |
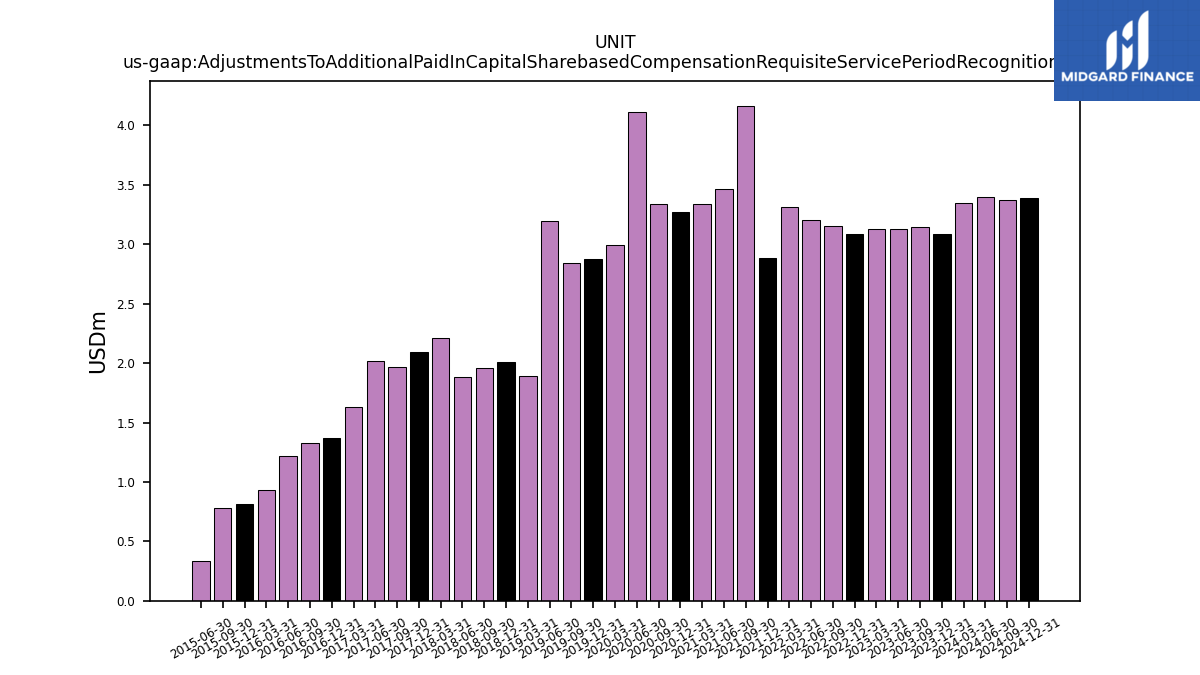
| Adjustments To Additional Paid In Capital Sharebased Compensation Requisite Service Period Recognition Value | 3.08 | 3.15 | 3.13 | 3.13 | 3.09 | 3.15 | 3.20 | 3.31 | 2.88 | 4.17 | 3.46 | 3.33 | 3.27 | 3.34 | 4.11 | 3.00 | 2.88 | 2.85 | 3.20 | 1.89 | 2.01 | 1.96 | 1.89 | 2.21 | 2.09 | 1.97 | 2.02 | 1.63 | 1.37 | 1.33 | 1.22 | 0.93 | 0.82 | 0.78 | 0.34 |
| 2023-12-31 | 2023-09-30 | 2023-06-30 | 2023-03-31 | 2022-12-31 | 2022-09-30 | 2022-06-30 | 2022-03-31 | 2021-12-31 | 2021-09-30 | 2021-06-30 | 2021-03-31 | 2020-12-31 | 2020-09-30 | 2020-06-30 | 2020-03-31 | 2019-12-31 | 2019-09-30 | 2019-06-30 | 2019-03-31 | 2018-12-31 | 2018-09-30 | 2018-06-30 | 2018-03-31 | 2017-12-31 | 2017-09-30 | 2017-06-30 | 2017-03-31 | 2016-12-31 | 2016-09-30 | 2016-06-30 | 2016-03-31 | 2015-12-31 | 2015-09-30 | 2015-06-30 | ||
|---|---|---|---|---|---|---|---|---|---|---|---|---|---|---|---|---|---|---|---|---|---|---|---|---|---|---|---|---|---|---|---|---|---|---|---|---|
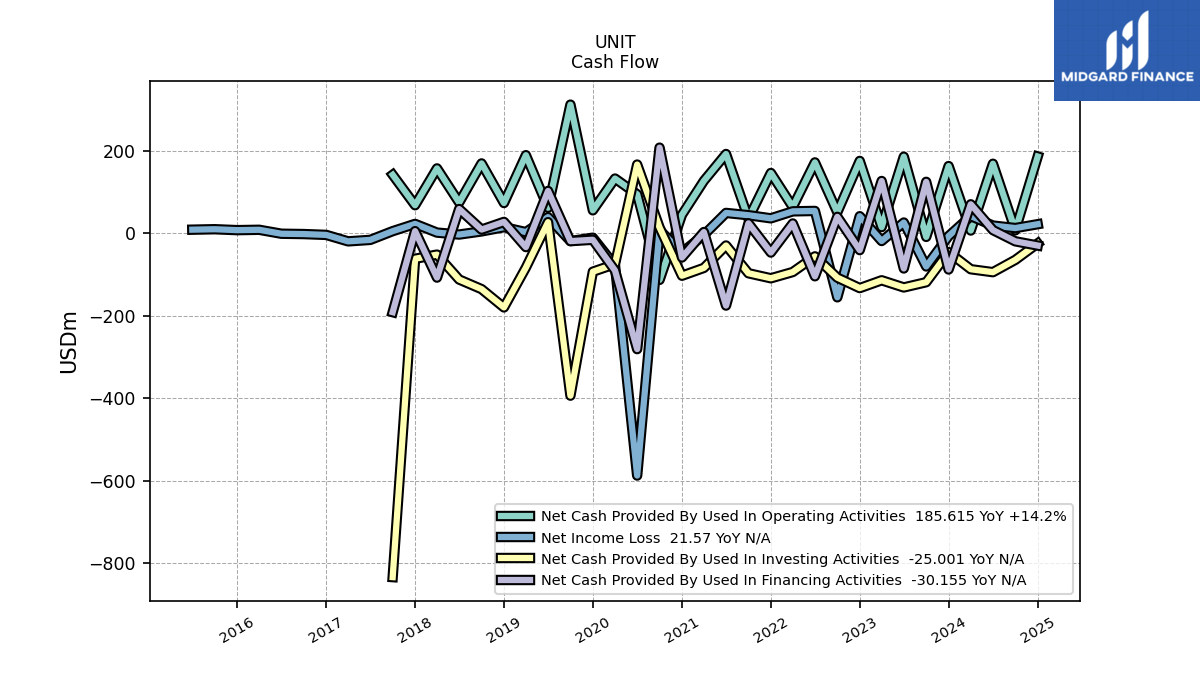
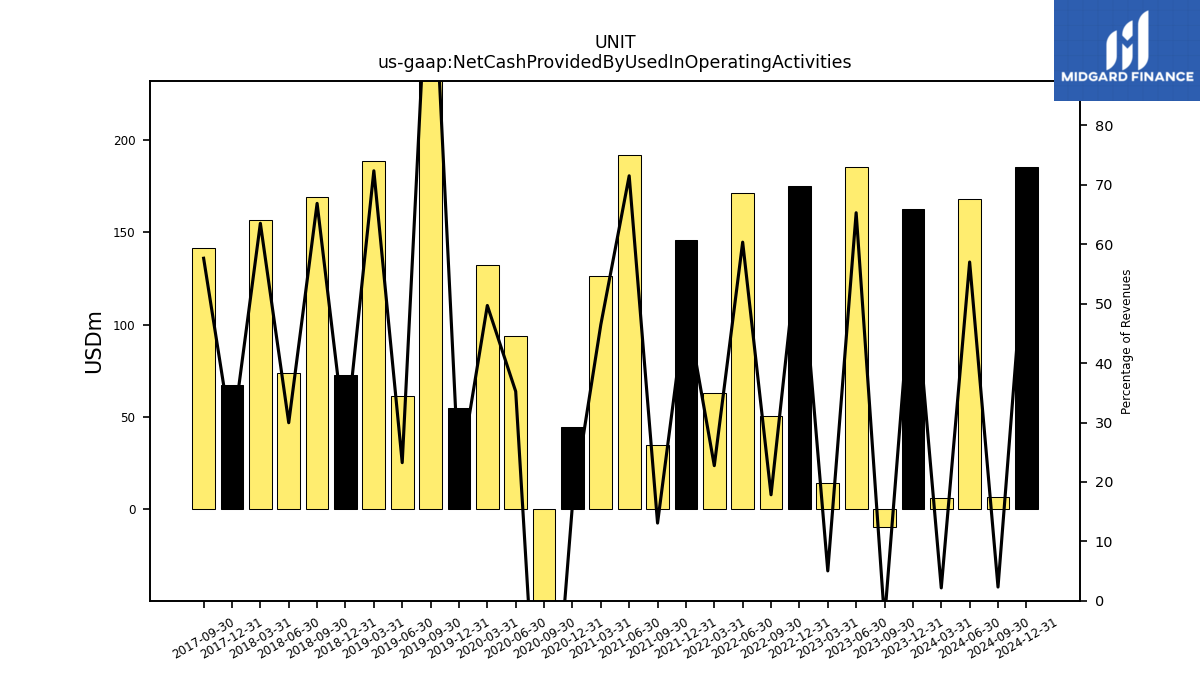
| Net Cash Provided By Used In Operating Activities | 162.55 | -9.26 | 185.27 | 14.56 | 175.01 | 50.50 | 171.39 | 63.22 | 145.80 | 34.88 | 191.81 | 126.66 | 44.42 | -113.47 | 94.01 | 132.27 | 55.19 | 311.43 | 61.46 | 188.90 | 72.88 | 168.96 | 74.11 | 156.87 | 67.51 | 141.35 | NA | NA | NA | NA | NA | NA | NA | NA | NA | |
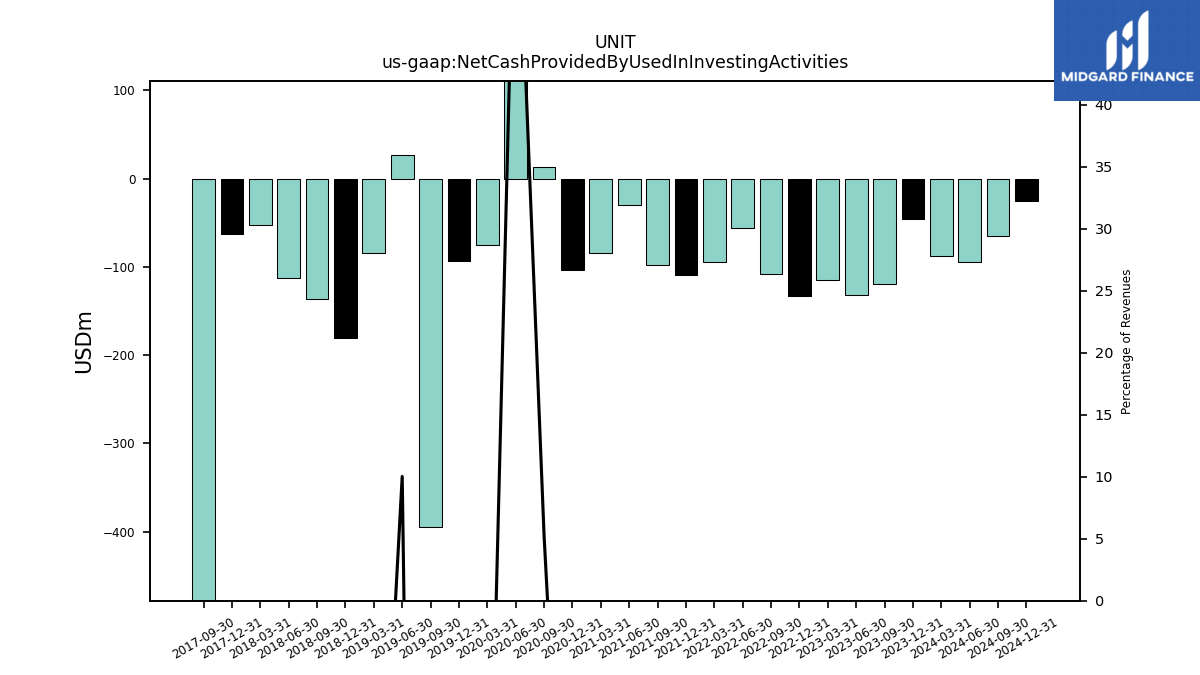
| Net Cash Provided By Used In Investing Activities | -46.16 | -119.05 | -131.73 | -114.37 | -133.33 | -107.93 | -56.41 | -94.35 | -109.50 | -97.33 | -30.01 | -84.38 | -103.34 | 13.62 | 166.21 | -75.09 | -93.55 | -394.07 | 26.50 | -83.67 | -180.14 | -135.79 | -112.52 | -52.10 | -62.22 | -833.93 | NA | NA | NA | NA | NA | NA | NA | NA | NA | |
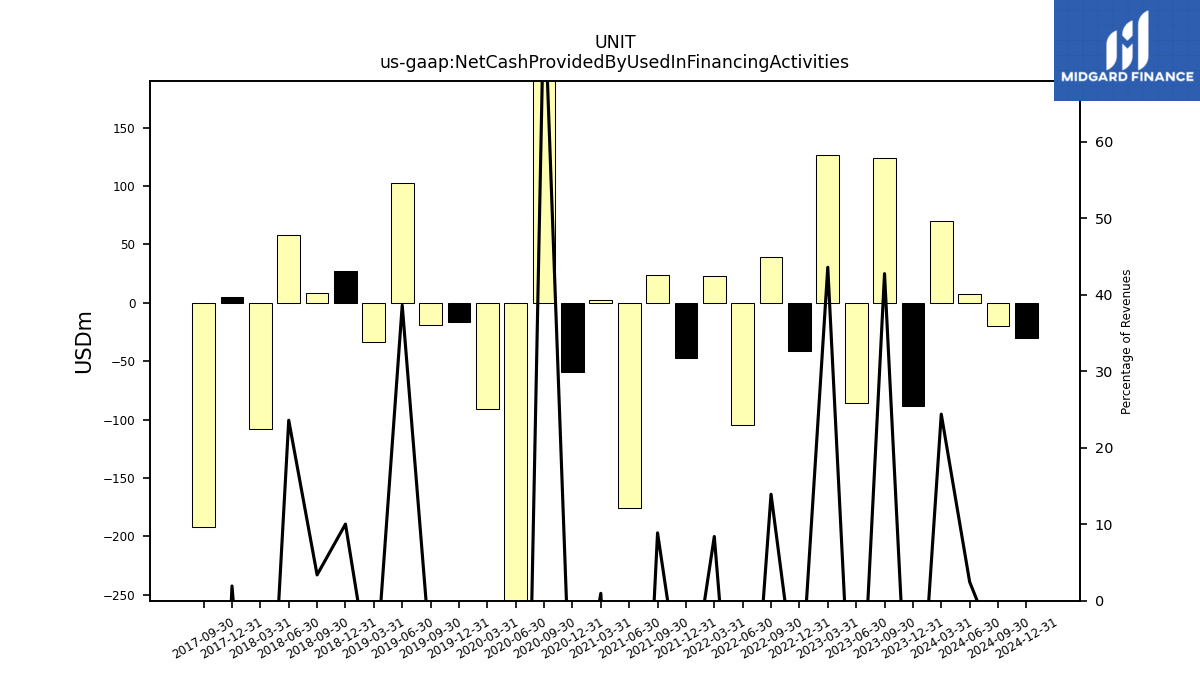
| Net Cash Provided By Used In Financing Activities | -88.25 | 124.28 | -85.74 | 126.36 | -41.27 | 39.42 | -104.70 | 23.35 | -47.15 | 23.67 | -175.73 | 2.65 | -59.11 | 207.15 | -281.28 | -90.66 | -16.14 | -19.44 | 102.17 | -33.96 | 27.13 | 8.54 | 58.37 | -107.89 | 4.76 | -191.64 | NA | NA | NA | NA | NA | NA | NA | NA | NA |
| 2023-12-31 | 2023-09-30 | 2023-06-30 | 2023-03-31 | 2022-12-31 | 2022-09-30 | 2022-06-30 | 2022-03-31 | 2021-12-31 | 2021-09-30 | 2021-06-30 | 2021-03-31 | 2020-12-31 | 2020-09-30 | 2020-06-30 | 2020-03-31 | 2019-12-31 | 2019-09-30 | 2019-06-30 | 2019-03-31 | 2018-12-31 | 2018-09-30 | 2018-06-30 | 2018-03-31 | 2017-12-31 | 2017-09-30 | 2017-06-30 | 2017-03-31 | 2016-12-31 | 2016-09-30 | 2016-06-30 | 2016-03-31 | 2015-12-31 | 2015-09-30 | 2015-06-30 | ||
|---|---|---|---|---|---|---|---|---|---|---|---|---|---|---|---|---|---|---|---|---|---|---|---|---|---|---|---|---|---|---|---|---|---|---|---|---|
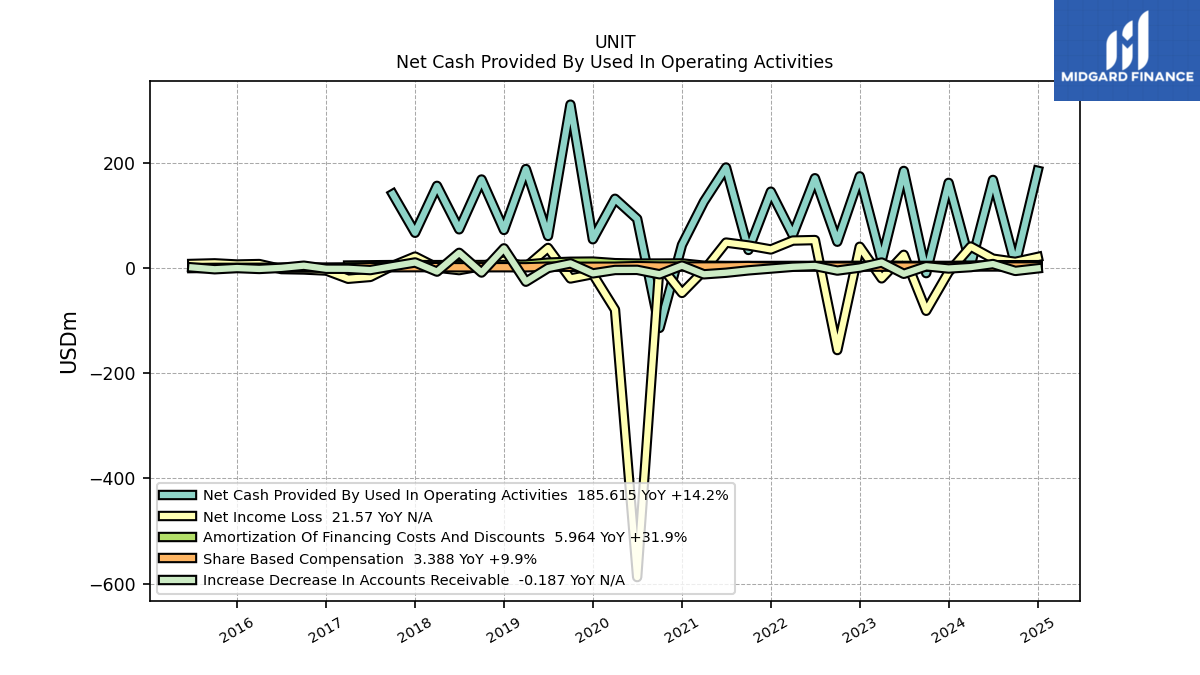
| Net Cash Provided By Used In Operating Activities | 162.55 | -9.26 | 185.27 | 14.56 | 175.01 | 50.50 | 171.39 | 63.22 | 145.80 | 34.88 | 191.81 | 126.66 | 44.42 | -113.47 | 94.01 | 132.27 | 55.19 | 311.43 | 61.46 | 188.90 | 72.88 | 168.96 | 74.11 | 156.87 | 67.51 | 141.35 | NA | NA | NA | NA | NA | NA | NA | NA | NA | |
| Net Income Loss | -7.24 | -80.90 | 25.63 | -19.20 | 40.98 | -155.68 | 53.70 | 52.73 | 35.83 | 43.37 | 48.91 | -4.44 | -46.97 | 7.26 | -587.74 | -78.85 | -11.16 | -19.42 | 38.72 | 2.44 | 14.35 | 4.13 | -3.50 | 1.21 | 22.29 | 4.73 | -16.46 | -20.00 | -4.37 | -2.34 | -1.53 | 8.04 | 7.17 | 9.40 | 8.30 | |
| Profit Loss | -7.24 | -80.93 | 25.64 | -19.21 | 40.99 | -155.75 | 53.77 | 52.86 | 35.93 | 43.68 | 49.64 | -4.50 | -47.67 | 7.46 | -598.33 | -80.27 | -11.35 | -19.78 | 39.55 | 2.49 | 14.68 | 4.22 | -3.59 | 1.23 | 22.80 | 4.83 | -16.46 | -20.00 | -4.37 | -2.34 | -1.53 | 8.04 | NA | NA | NA | |
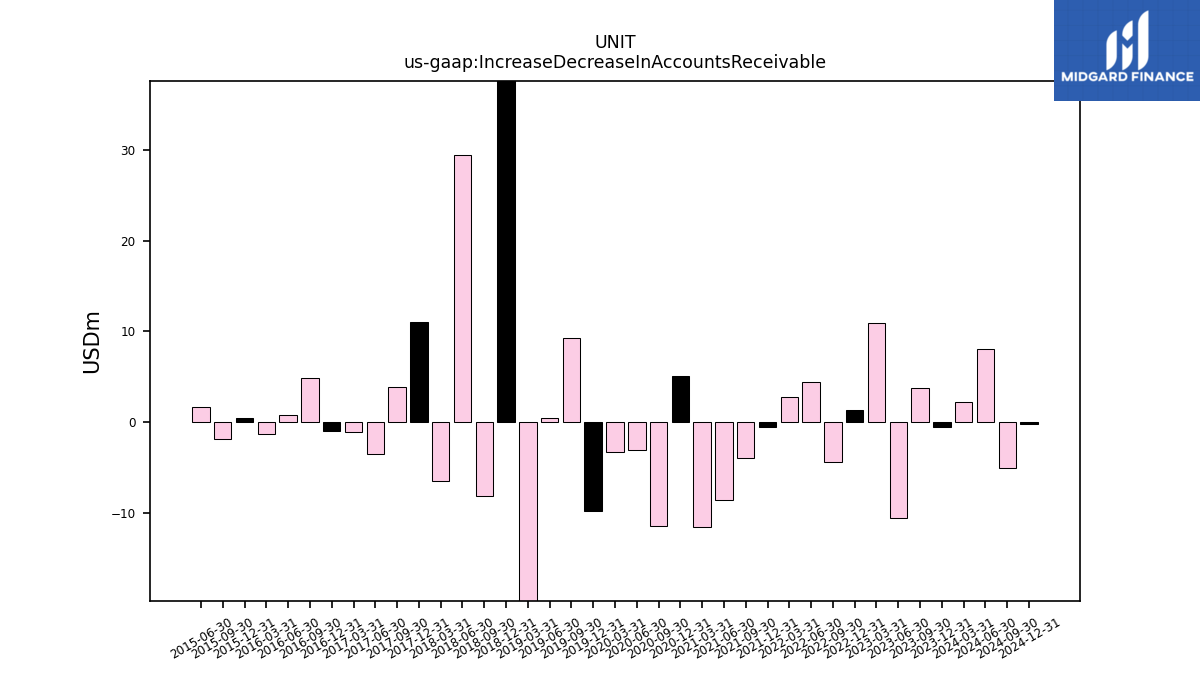
| Increase Decrease In Accounts Receivable | -0.47 | 3.80 | -10.57 | 10.96 | 1.31 | -4.36 | 4.41 | 2.81 | -0.56 | -3.97 | -8.50 | -11.47 | 5.07 | -11.44 | -3.02 | -3.25 | -9.71 | 9.28 | 0.43 | -25.60 | 37.94 | -8.12 | 29.38 | -6.41 | 11.06 | 3.94 | -3.45 | -1.01 | -0.92 | 4.92 | 0.82 | -1.31 | 0.43 | -1.86 | 1.64 | |
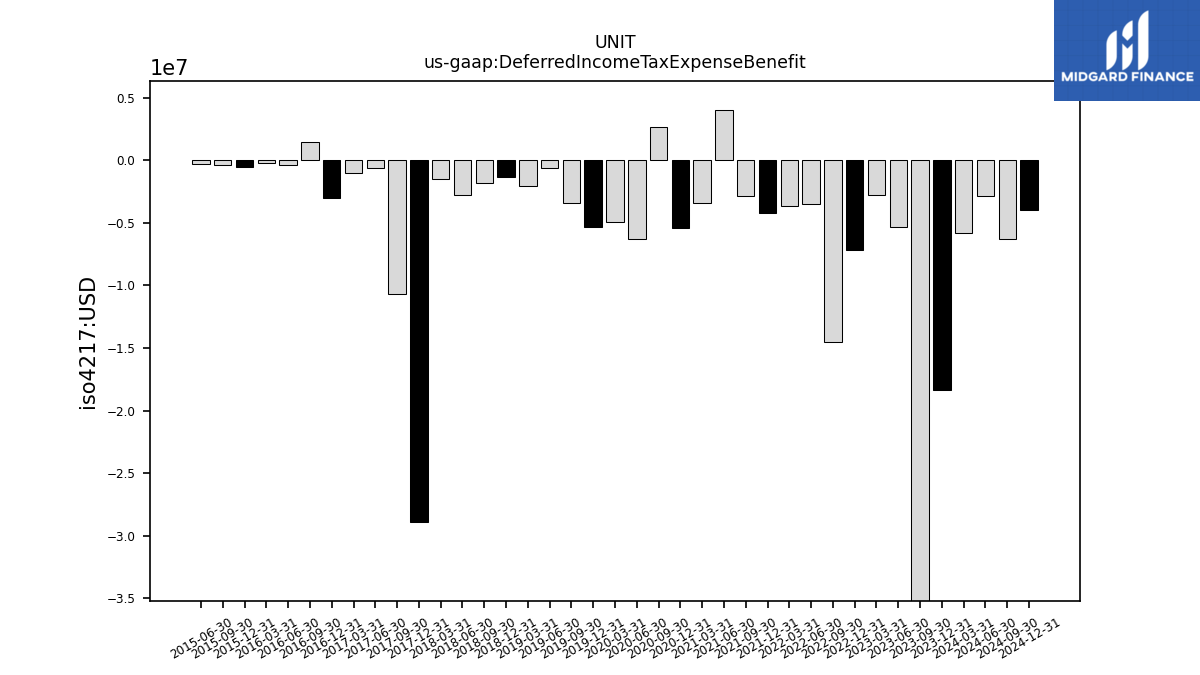
| Deferred Income Tax Expense Benefit | -18.34 | -42.12 | -5.29 | -2.75 | -7.19 | -14.54 | -3.52 | -3.66 | -4.20 | -2.88 | 4.03 | -3.43 | -5.38 | 2.70 | -6.29 | -4.92 | -5.29 | -3.42 | -0.65 | -2.06 | -1.30 | -1.82 | -2.75 | -1.50 | -28.89 | -10.67 | -0.60 | -1.00 | -3.02 | 1.44 | -0.38 | -0.22 | -0.54 | -0.38 | -0.29 | |
| Share Based Compensation | 3.08 | 3.15 | 3.13 | 3.13 | 3.09 | 3.15 | 3.20 | 3.31 | 2.88 | 4.17 | 3.46 | 3.33 | 3.27 | 3.34 | 4.11 | 3.00 | 2.88 | 2.85 | 3.20 | 1.89 | 2.01 | 1.96 | 1.89 | 2.21 | 2.09 | 1.97 | 2.02 | 1.63 | 1.37 | 1.33 | 1.22 | 0.93 | 0.82 | 0.78 | 0.34 | |
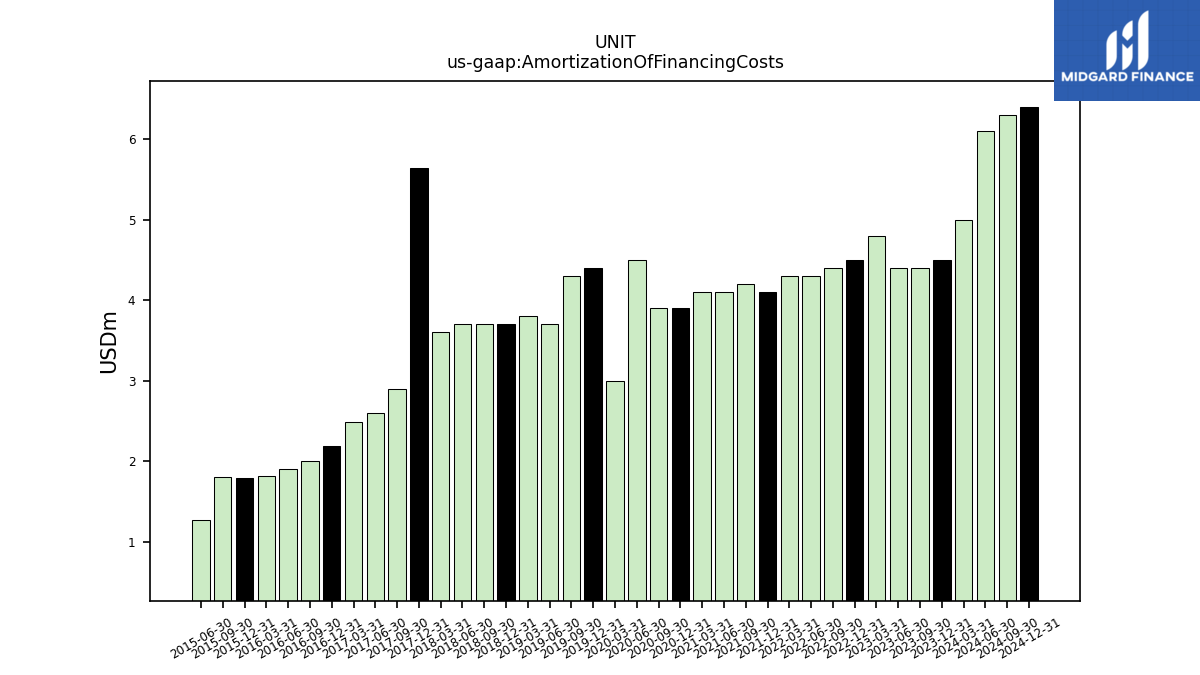
| Amortization Of Financing Costs | 4.50 | 4.40 | 4.40 | 4.80 | 4.50 | 4.40 | 4.30 | 4.30 | 4.10 | 4.20 | 4.10 | 4.10 | 3.90 | 3.90 | 4.50 | 3.00 | 4.40 | 4.30 | 3.70 | 3.80 | 3.70 | 3.70 | 3.70 | 3.60 | 5.64 | 2.90 | 2.60 | 2.49 | 2.18 | 2.00 | 1.90 | 1.82 | 1.79 | 1.80 | 1.27 |
| 2023-12-31 | 2023-09-30 | 2023-06-30 | 2023-03-31 | 2022-12-31 | 2022-09-30 | 2022-06-30 | 2022-03-31 | 2021-12-31 | 2021-09-30 | 2021-06-30 | 2021-03-31 | 2020-12-31 | 2020-09-30 | 2020-06-30 | 2020-03-31 | 2019-12-31 | 2019-09-30 | 2019-06-30 | 2019-03-31 | 2018-12-31 | 2018-09-30 | 2018-06-30 | 2018-03-31 | 2017-12-31 | 2017-09-30 | 2017-06-30 | 2017-03-31 | 2016-12-31 | 2016-09-30 | 2016-06-30 | 2016-03-31 | 2015-12-31 | 2015-09-30 | 2015-06-30 | ||
|---|---|---|---|---|---|---|---|---|---|---|---|---|---|---|---|---|---|---|---|---|---|---|---|---|---|---|---|---|---|---|---|---|---|---|---|---|
| Net Cash Provided By Used In Investing Activities | -46.16 | -119.05 | -131.73 | -114.37 | -133.33 | -107.93 | -56.41 | -94.35 | -109.50 | -97.33 | -30.01 | -84.38 | -103.34 | 13.62 | 166.21 | -75.09 | -93.55 | -394.07 | 26.50 | -83.67 | -180.14 | -135.79 | -112.52 | -52.10 | -62.22 | -833.93 | NA | NA | NA | NA | NA | NA | NA | NA | NA |
| 2023-12-31 | 2023-09-30 | 2023-06-30 | 2023-03-31 | 2022-12-31 | 2022-09-30 | 2022-06-30 | 2022-03-31 | 2021-12-31 | 2021-09-30 | 2021-06-30 | 2021-03-31 | 2020-12-31 | 2020-09-30 | 2020-06-30 | 2020-03-31 | 2019-12-31 | 2019-09-30 | 2019-06-30 | 2019-03-31 | 2018-12-31 | 2018-09-30 | 2018-06-30 | 2018-03-31 | 2017-12-31 | 2017-09-30 | 2017-06-30 | 2017-03-31 | 2016-12-31 | 2016-09-30 | 2016-06-30 | 2016-03-31 | 2015-12-31 | 2015-09-30 | 2015-06-30 | ||
|---|---|---|---|---|---|---|---|---|---|---|---|---|---|---|---|---|---|---|---|---|---|---|---|---|---|---|---|---|---|---|---|---|---|---|---|---|
| Net Cash Provided By Used In Financing Activities | -88.25 | 124.28 | -85.74 | 126.36 | -41.27 | 39.42 | -104.70 | 23.35 | -47.15 | 23.67 | -175.73 | 2.65 | -59.11 | 207.15 | -281.28 | -90.66 | -16.14 | -19.44 | 102.17 | -33.96 | 27.13 | 8.54 | 58.37 | -107.89 | 4.76 | -191.64 | NA | NA | NA | NA | NA | NA | NA | NA | NA | |
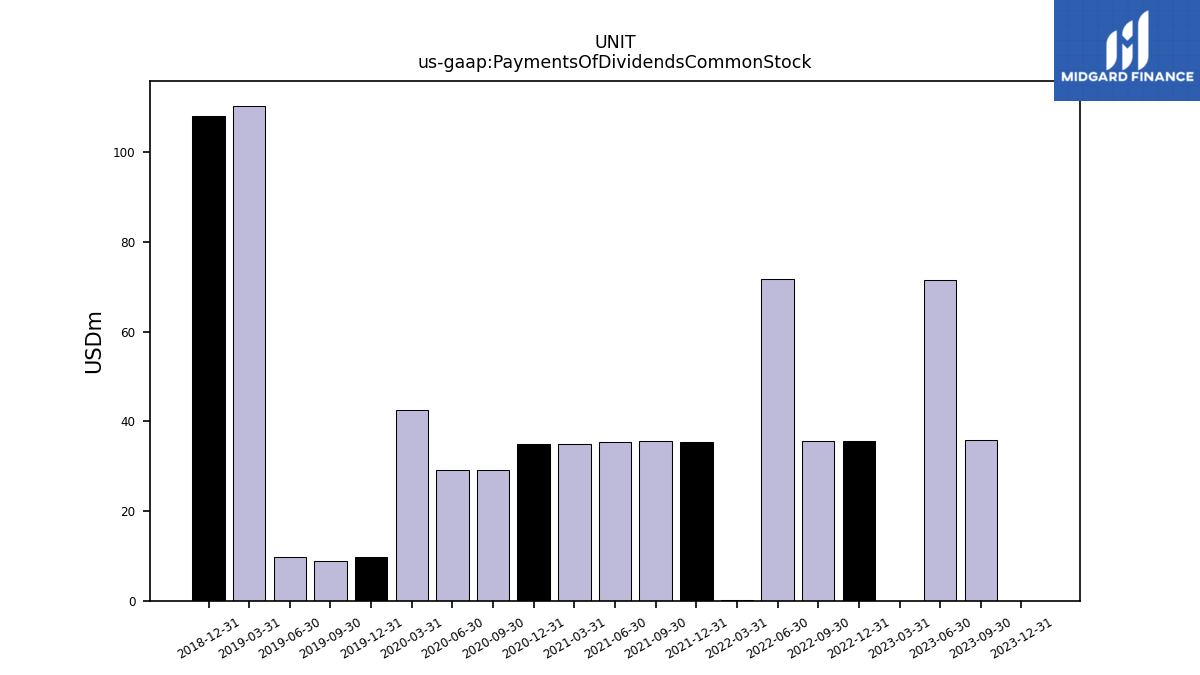
| Payments Of Dividends Common Stock | 0.01 | 35.80 | 71.58 | 0.01 | 35.59 | 35.59 | 71.67 | 0.10 | 35.43 | 35.55 | 35.42 | 34.96 | 34.92 | 29.11 | 29.13 | 42.52 | 9.66 | 8.91 | 9.81 | 110.35 | 107.98 | NA | NA | NA | NA | NA | NA | NA | NA | NA | NA | NA | NA | NA | NA |
| 2023-12-31 | 2023-09-30 | 2023-06-30 | 2023-03-31 | 2022-12-31 | 2022-09-30 | 2022-06-30 | 2022-03-31 | 2021-12-31 | 2021-09-30 | 2021-06-30 | 2021-03-31 | 2020-12-31 | 2020-09-30 | 2020-06-30 | 2020-03-31 | 2019-12-31 | 2019-09-30 | 2019-06-30 | 2019-03-31 | 2018-12-31 | 2018-09-30 | 2018-06-30 | 2018-03-31 | 2017-12-31 | 2017-09-30 | 2017-06-30 | 2017-03-31 | 2016-12-31 | 2016-09-30 | 2016-06-30 | 2016-03-31 | 2015-12-31 | 2015-09-30 | 2015-06-30 | ||
|---|---|---|---|---|---|---|---|---|---|---|---|---|---|---|---|---|---|---|---|---|---|---|---|---|---|---|---|---|---|---|---|---|---|---|---|---|
| Revenues | 285.66 | 290.65 | 283.70 | 289.82 | 283.74 | 283.10 | 283.98 | 278.03 | 293.01 | 266.75 | 268.18 | 272.59 | 275.29 | 258.76 | 266.82 | 266.16 | 268.54 | 263.63 | 264.41 | 261.03 | 270.75 | 252.64 | 247.33 | 246.91 | 246.34 | 245.21 | 213.01 | 211.47 | 206.92 | 200.24 | 188.57 | 174.68 | 173.93 | 173.63 | 128.75 | |
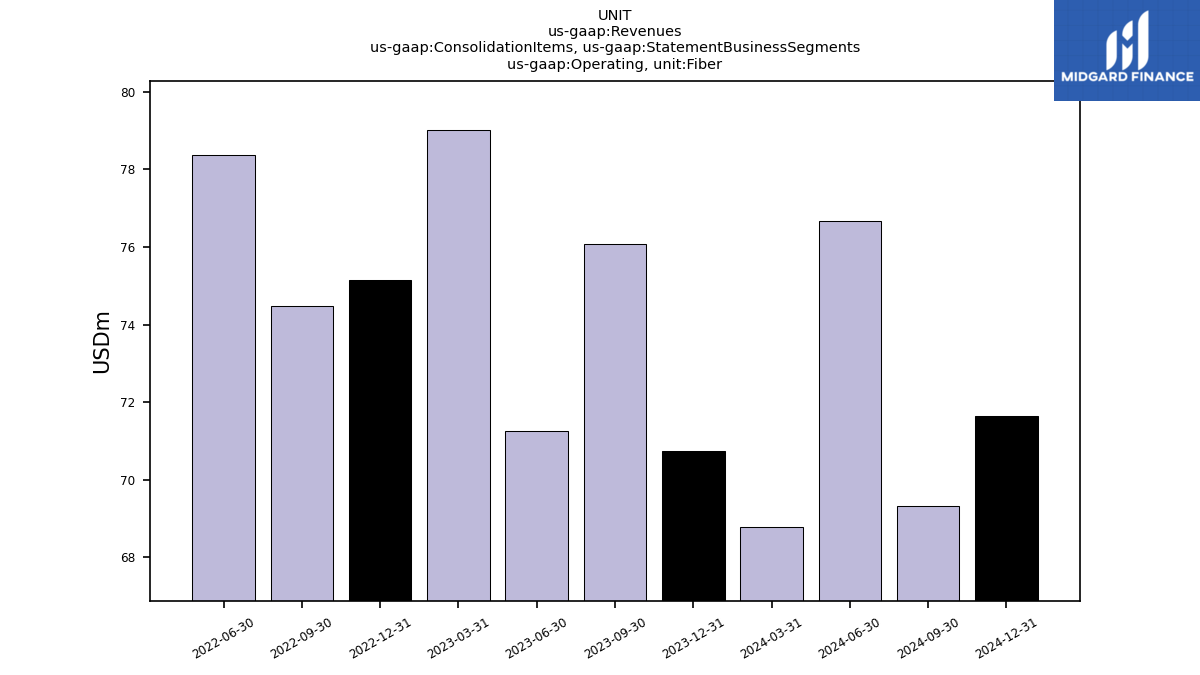
| Operating, Fiber | 70.73 | 76.07 | 71.25 | NA | 75.16 | 74.48 | 78.36 | NA | NA | NA | NA | NA | NA | NA | NA | NA | NA | NA | NA | NA | NA | NA | NA | NA | NA | NA | NA | NA | NA | NA | NA | NA | NA | NA | NA | |
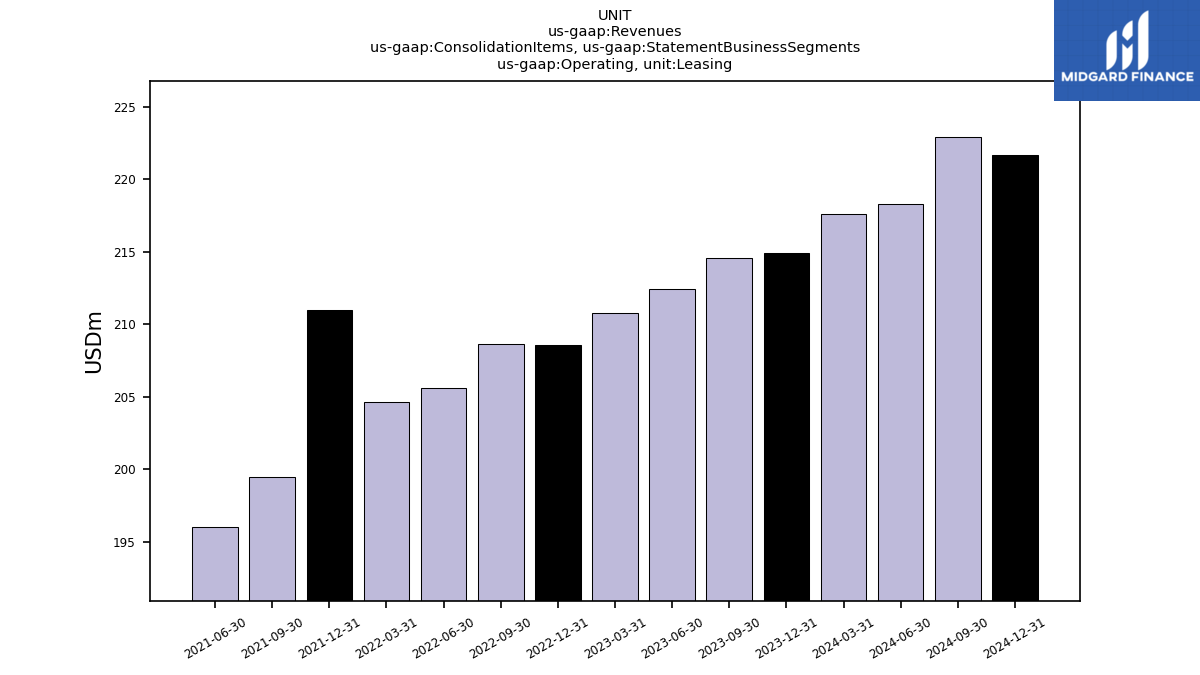
| Operating, Leasing | 214.92 | 214.59 | 212.45 | 210.81 | 208.58 | 208.62 | 205.61 | 204.64 | 211.02 | 199.49 | 196.06 | NA | NA | NA | NA | NA | NA | NA | NA | NA | NA | NA | NA | NA | NA | NA | NA | NA | NA | NA | NA | NA | NA | NA | NA | |
| Revenue From Contract With Customer Excluding Assessed Tax | 59.28 | 61.02 | 59.85 | 57.90 | 60.08 | 58.54 | 61.35 | 56.47 | 70.32 | 55.66 | 62.06 | 67.39 | 67.73 | 64.93 | 69.39 | 69.62 | 268.54 | 75.12 | 78.75 | 74.97 | 270.75 | 69.69 | 67.65 | 67.79 | 246.34 | 69.04 | 39.16 | 39.37 | 206.92 | 200.24 | 188.57 | 174.68 | 173.93 | 173.63 | 128.75 | |
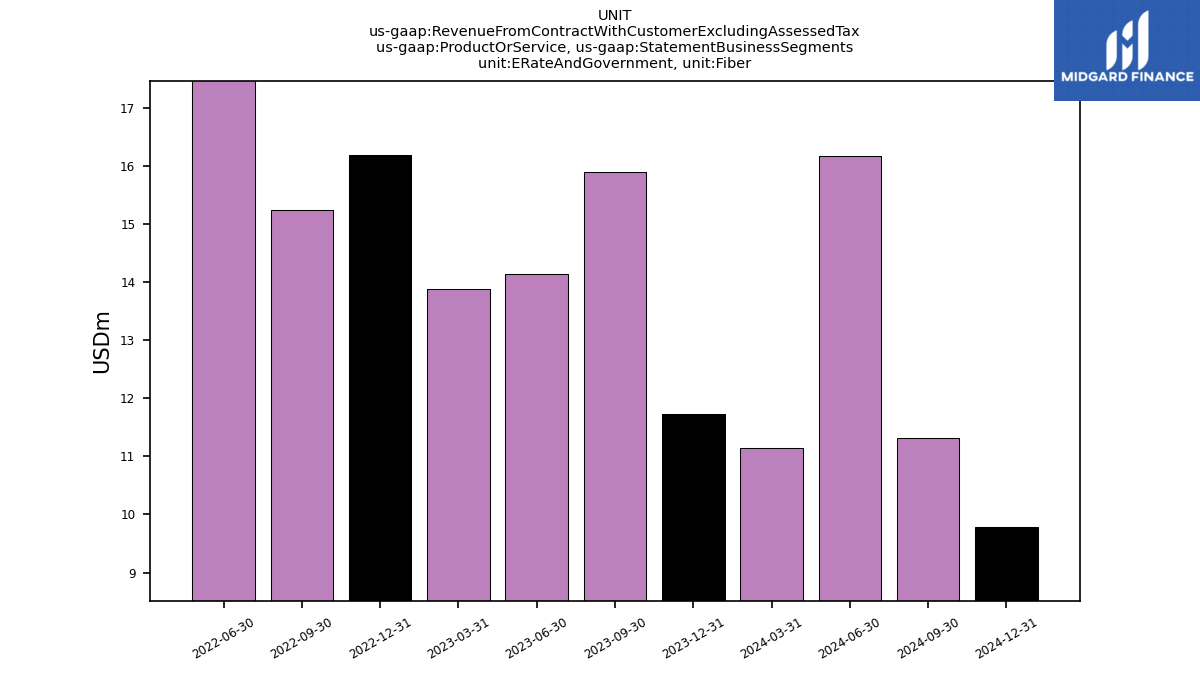
| E Rate And Government, Fiber | 11.73 | 15.91 | 14.14 | NA | 16.19 | 15.24 | 18.50 | NA | NA | NA | NA | NA | NA | NA | NA | NA | NA | NA | NA | NA | NA | NA | NA | NA | NA | NA | NA | NA | NA | NA | NA | NA | NA | NA | NA | |
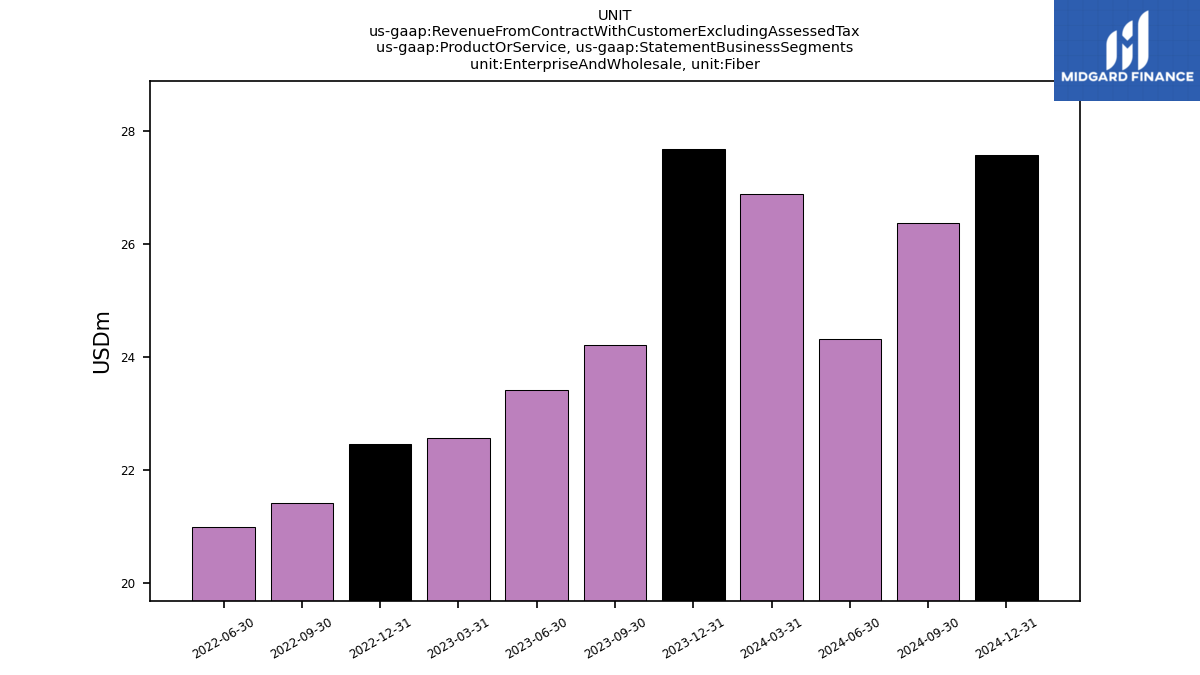
| Enterprise And Wholesale, Fiber | 27.69 | 24.21 | 23.41 | NA | 22.46 | 21.42 | 21.00 | NA | NA | NA | NA | NA | NA | NA | NA | NA | NA | NA | NA | NA | NA | NA | NA | NA | NA | NA | NA | NA | NA | NA | NA | NA | NA | NA | NA | |
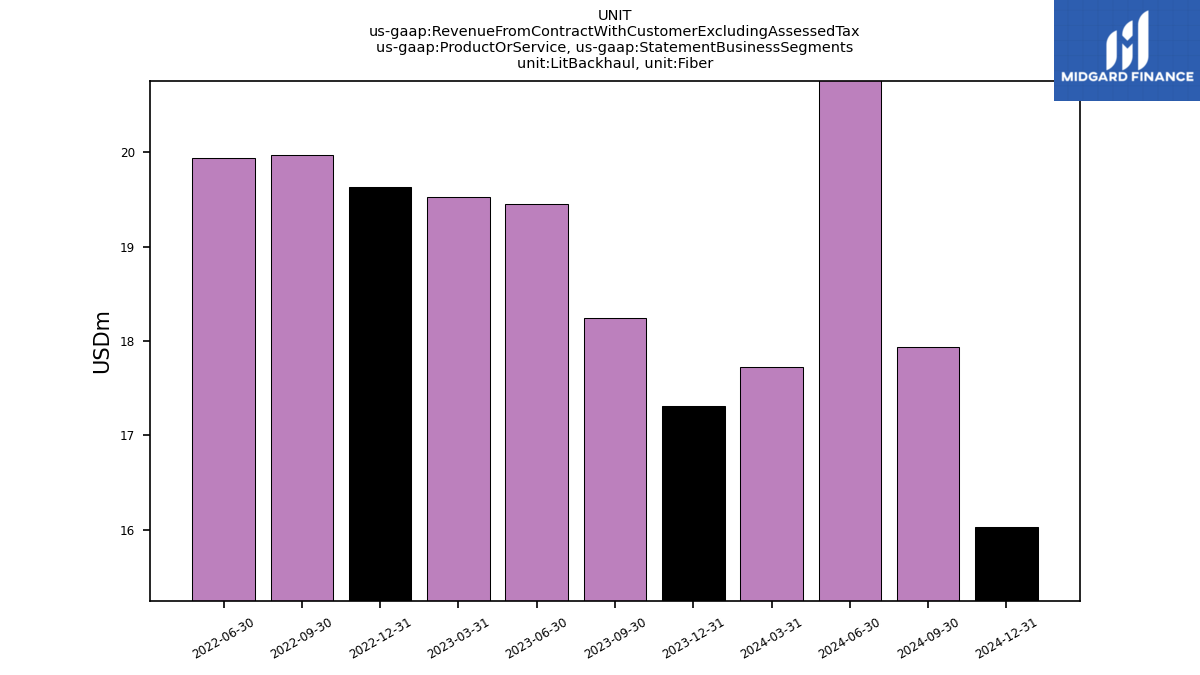
| Lit Backhaul, Fiber | 17.32 | 18.25 | 19.45 | NA | 19.63 | 19.97 | 19.94 | NA | NA | NA | NA | NA | NA | NA | NA | NA | NA | NA | NA | NA | NA | NA | NA | NA | NA | NA | NA | NA | NA | NA | NA | NA | NA | NA | NA | |
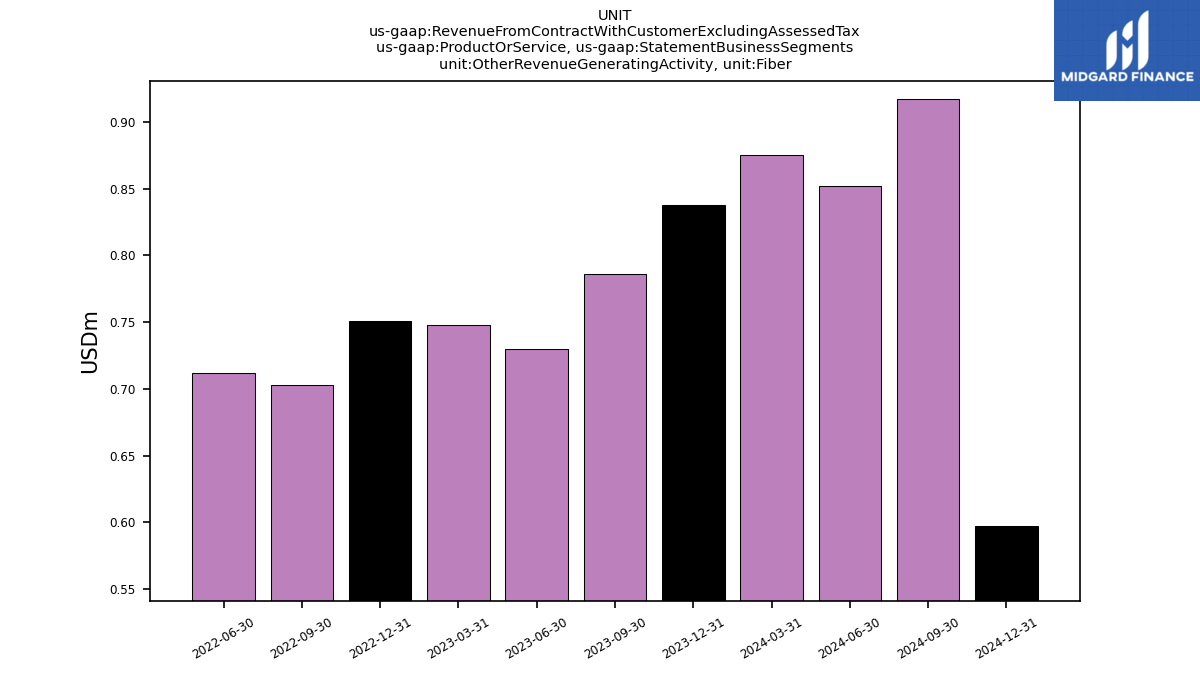
| Other Revenue Generating Activity, Fiber | 0.84 | 0.79 | 0.73 | NA | 0.75 | 0.70 | 0.71 | NA | NA | NA | NA | NA | NA | NA | NA | NA | NA | NA | NA | NA | NA | NA | NA | NA | NA | NA | NA | NA | NA | NA | NA | NA | NA | NA | NA | |
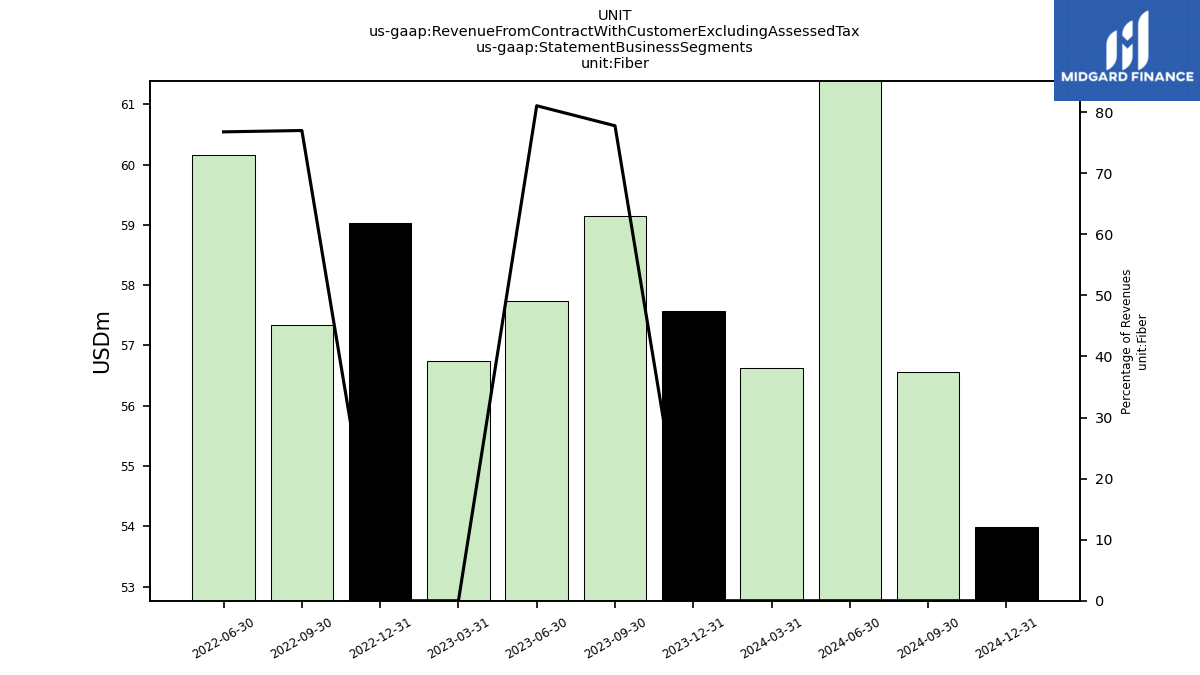
| Fiber | 57.58 | 59.15 | 57.74 | NA | 59.04 | 57.34 | 60.16 | NA | NA | NA | NA | NA | NA | NA | NA | NA | NA | NA | NA | NA | NA | NA | NA | NA | NA | NA | NA | NA | NA | NA | NA | NA | NA | NA | NA | |
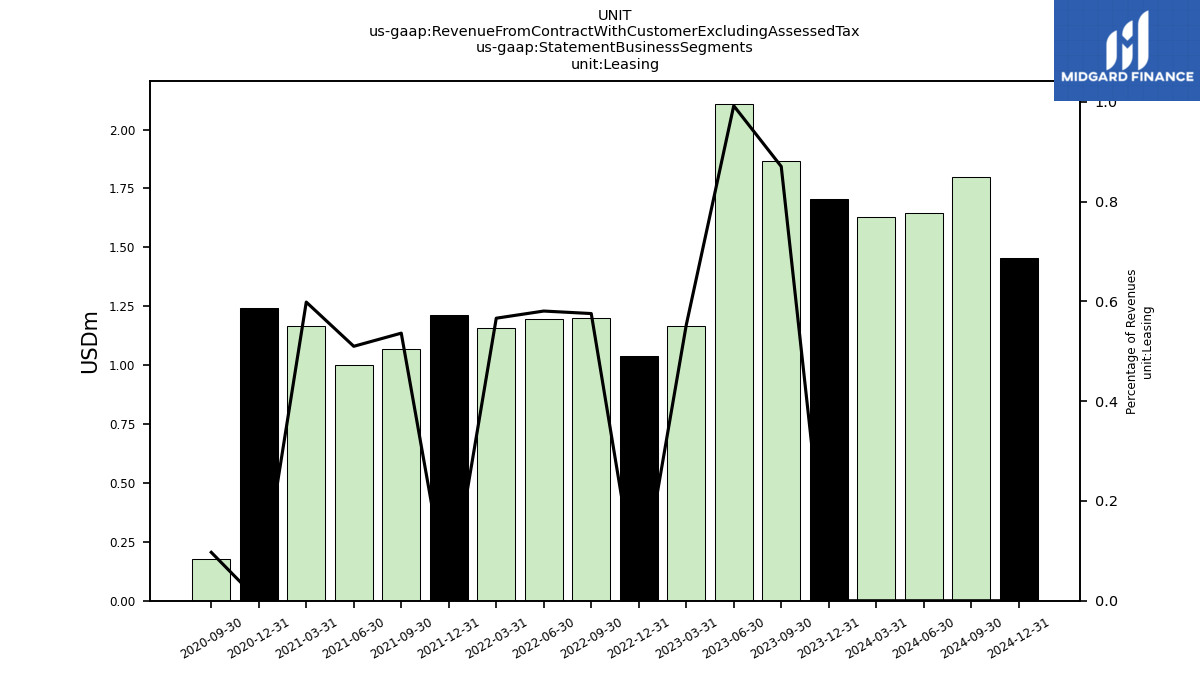
| Leasing | 1.71 | 1.87 | 2.11 | 1.17 | 1.04 | 1.20 | 1.19 | 1.16 | 1.21 | 1.07 | 1.00 | 1.17 | 1.24 | 0.18 | NA | NA | NA | NA | NA | NA | NA | NA | NA | NA | NA | NA | NA | NA | NA | NA | NA | NA | NA | NA | NA |