
| 2023-06-30 | 2023-03-31 | 2022-12-31 | 2022-09-30 | 2022-06-30 | 2022-03-31 | 2021-12-31 | 2021-09-30 | 2021-06-30 | 2021-03-31 | 2020-12-31 | 2020-09-30 | 2020-06-30 | 2020-03-31 | 2019-12-31 | 2019-09-30 | 2019-06-30 | 2019-03-31 | 2018-12-31 | 2018-09-30 | 2018-06-30 | 2018-03-31 | 2017-12-31 | 2017-09-30 | 2017-06-30 | 2017-03-31 | 2016-12-31 | 2016-09-30 | 2016-06-30 | 2016-03-31 | 2015-12-31 | 2015-09-30 | 2015-06-30 | 2015-03-31 | 2014-12-31 | 2014-09-30 | 2014-06-30 | 2014-03-31 | ||
|---|---|---|---|---|---|---|---|---|---|---|---|---|---|---|---|---|---|---|---|---|---|---|---|---|---|---|---|---|---|---|---|---|---|---|---|---|---|---|---|
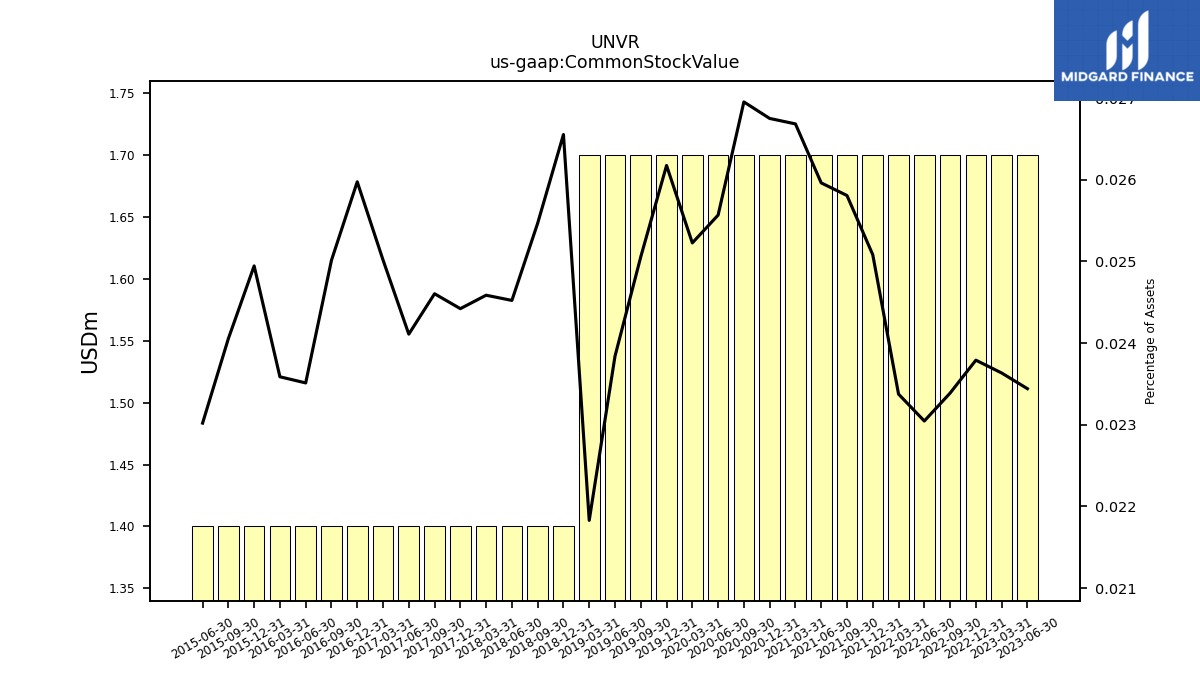
| Common Stock Value | 1.70 | 1.70 | 1.70 | 1.70 | 1.70 | 1.70 | 1.70 | 1.70 | 1.70 | 1.70 | 1.70 | 1.70 | 1.70 | 1.70 | 1.70 | 1.70 | 1.70 | 1.70 | 1.40 | 1.40 | 1.40 | 1.40 | 1.40 | 1.40 | 1.40 | 1.40 | 1.40 | 1.40 | 1.40 | 1.40 | 1.40 | 1.40 | 1.40 | NA | NA | NA | NA | NA | |
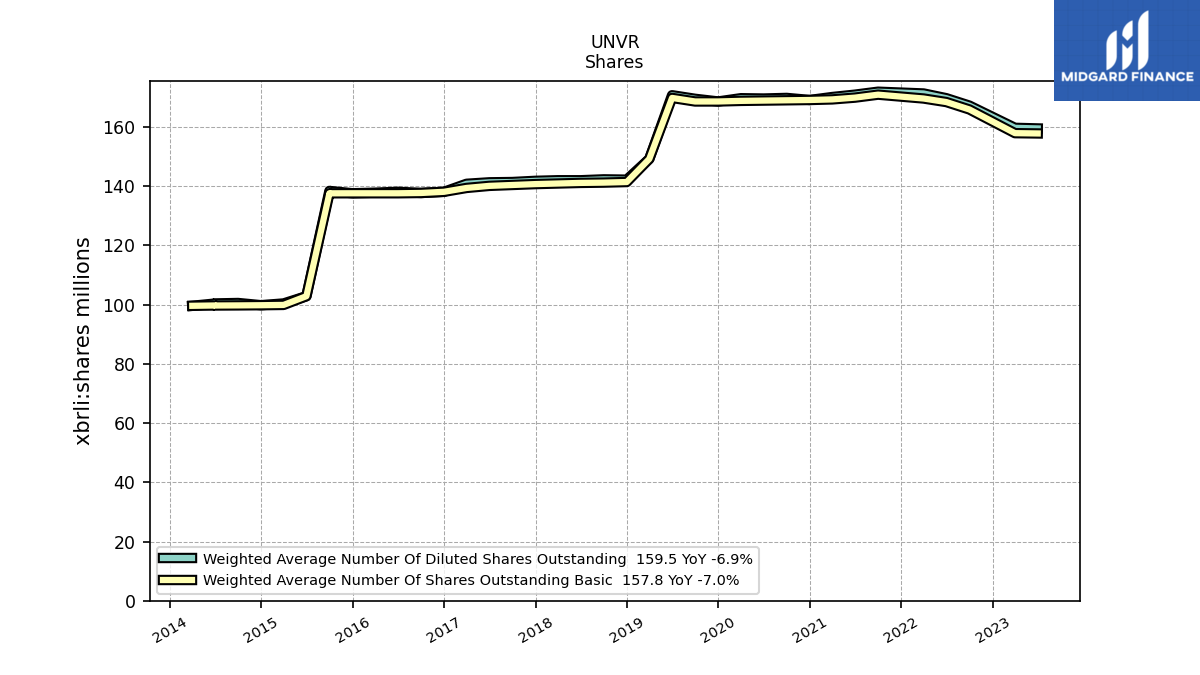
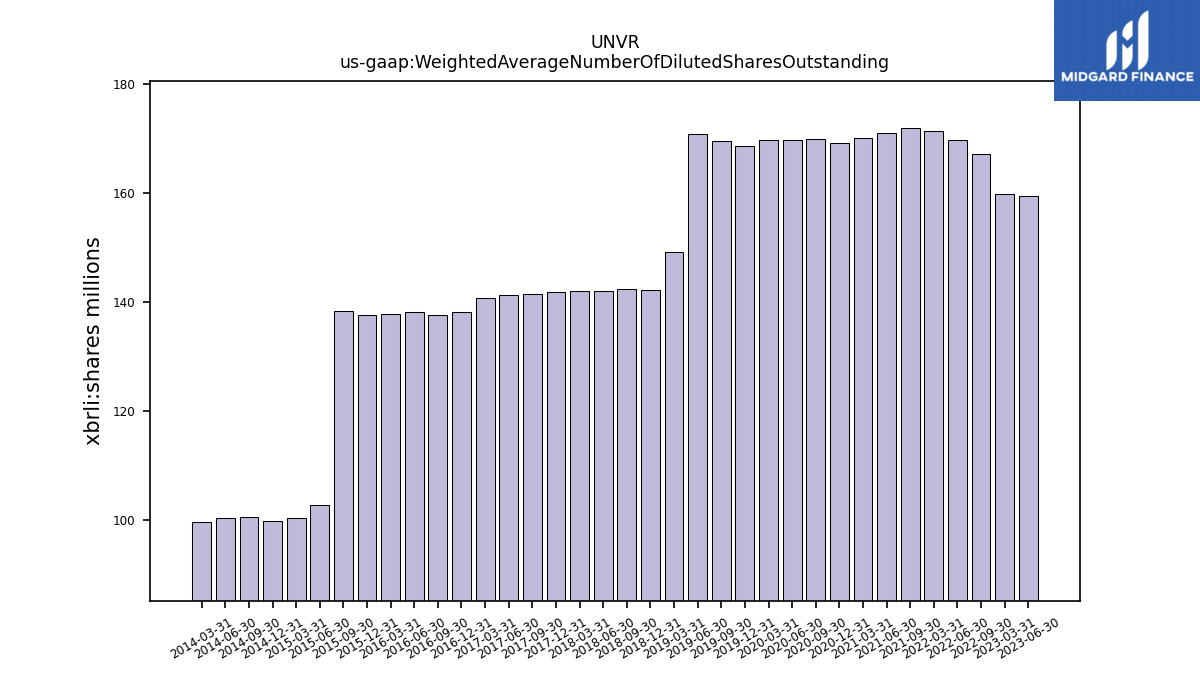
| Weighted Average Number Of Diluted Shares Outstanding | 159.50 | 159.70 | NA | 167.20 | 169.70 | 171.30 | NA | 171.90 | 170.90 | 170.10 | 169.10 | 169.80 | 169.60 | 169.70 | 168.60 | 169.50 | 170.70 | 149.20 | 142.20 | 142.30 | 142.00 | 142.00 | 141.80 | 141.40 | 141.30 | 140.80 | 138.10 | 137.70 | 138.10 | 137.80 | 137.60 | 138.40 | 102.85 | 100.40 | 99.80 | 100.55 | 100.40 | 99.60 | |
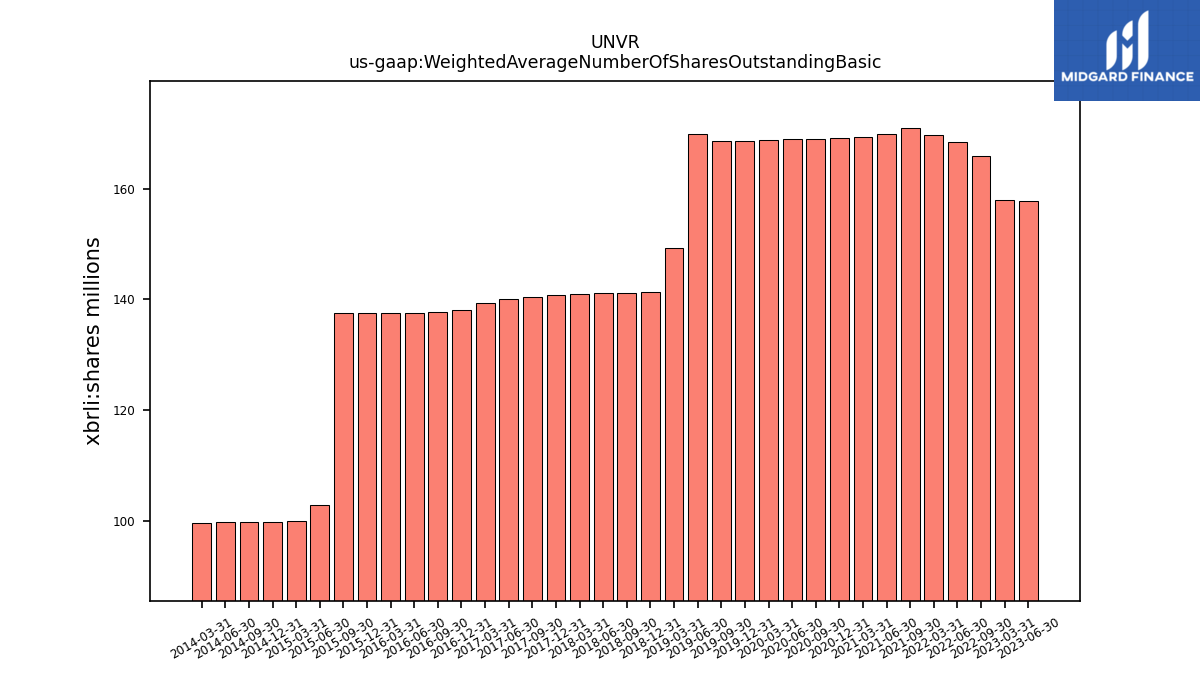
| Weighted Average Number Of Shares Outstanding Basic | 157.80 | 157.90 | NA | 165.90 | 168.40 | 169.60 | NA | 170.90 | 169.90 | 169.30 | 169.10 | 169.00 | 168.90 | 168.80 | 168.60 | 168.60 | 169.80 | 149.20 | 141.40 | 141.20 | 141.10 | 140.90 | 140.70 | 140.40 | 140.10 | 139.40 | 138.10 | 137.70 | 137.60 | 137.60 | 137.60 | 137.60 | 102.85 | 99.90 | 99.80 | 99.74 | 99.70 | 99.60 | |
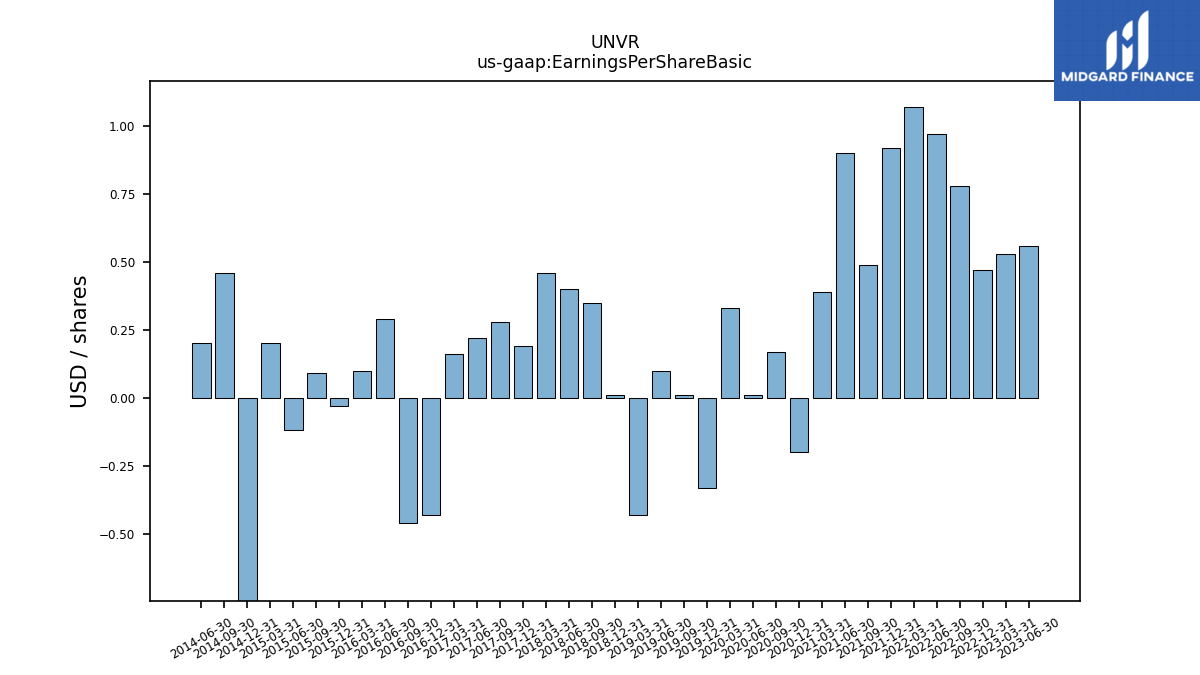
| Earnings Per Share Basic | 0.56 | 0.53 | 0.47 | 0.78 | 0.97 | 1.07 | 0.92 | 0.49 | 0.90 | 0.39 | -0.20 | 0.17 | 0.01 | 0.33 | -0.33 | 0.01 | 0.10 | -0.43 | 0.01 | 0.35 | 0.40 | 0.46 | 0.19 | 0.28 | 0.22 | 0.16 | -0.43 | -0.46 | 0.29 | 0.10 | -0.03 | 0.09 | -0.12 | 0.20 | -0.83 | 0.46 | 0.20 | NA | |
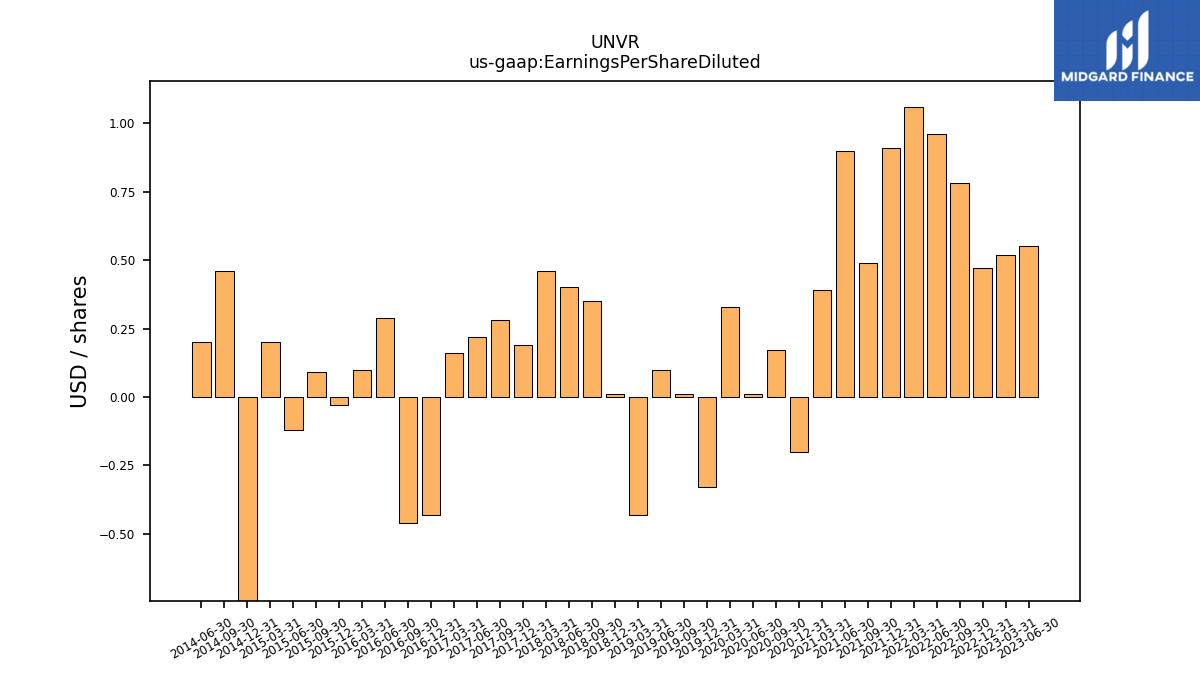
| Earnings Per Share Diluted | 0.55 | 0.52 | 0.47 | 0.78 | 0.96 | 1.06 | 0.91 | 0.49 | 0.90 | 0.39 | -0.20 | 0.17 | 0.01 | 0.33 | -0.33 | 0.01 | 0.10 | -0.43 | 0.01 | 0.35 | 0.40 | 0.46 | 0.19 | 0.28 | 0.22 | 0.16 | -0.43 | -0.46 | 0.29 | 0.10 | -0.03 | 0.09 | -0.12 | 0.20 | -0.82 | 0.46 | 0.20 | NA |
| 2023-06-30 | 2023-03-31 | 2022-12-31 | 2022-09-30 | 2022-06-30 | 2022-03-31 | 2021-12-31 | 2021-09-30 | 2021-06-30 | 2021-03-31 | 2020-12-31 | 2020-09-30 | 2020-06-30 | 2020-03-31 | 2019-12-31 | 2019-09-30 | 2019-06-30 | 2019-03-31 | 2018-12-31 | 2018-09-30 | 2018-06-30 | 2018-03-31 | 2017-12-31 | 2017-09-30 | 2017-06-30 | 2017-03-31 | 2016-12-31 | 2016-09-30 | 2016-06-30 | 2016-03-31 | 2015-12-31 | 2015-09-30 | 2015-06-30 | 2015-03-31 | 2014-12-31 | 2014-09-30 | 2014-06-30 | 2014-03-31 | ||
|---|---|---|---|---|---|---|---|---|---|---|---|---|---|---|---|---|---|---|---|---|---|---|---|---|---|---|---|---|---|---|---|---|---|---|---|---|---|---|---|
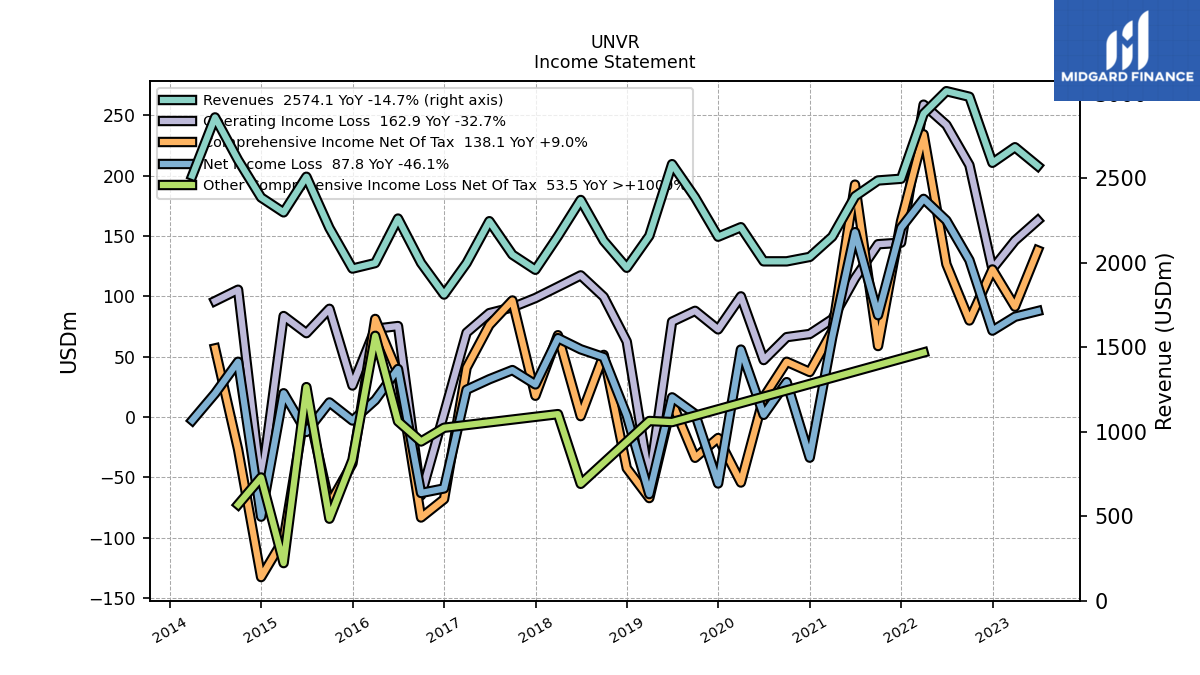
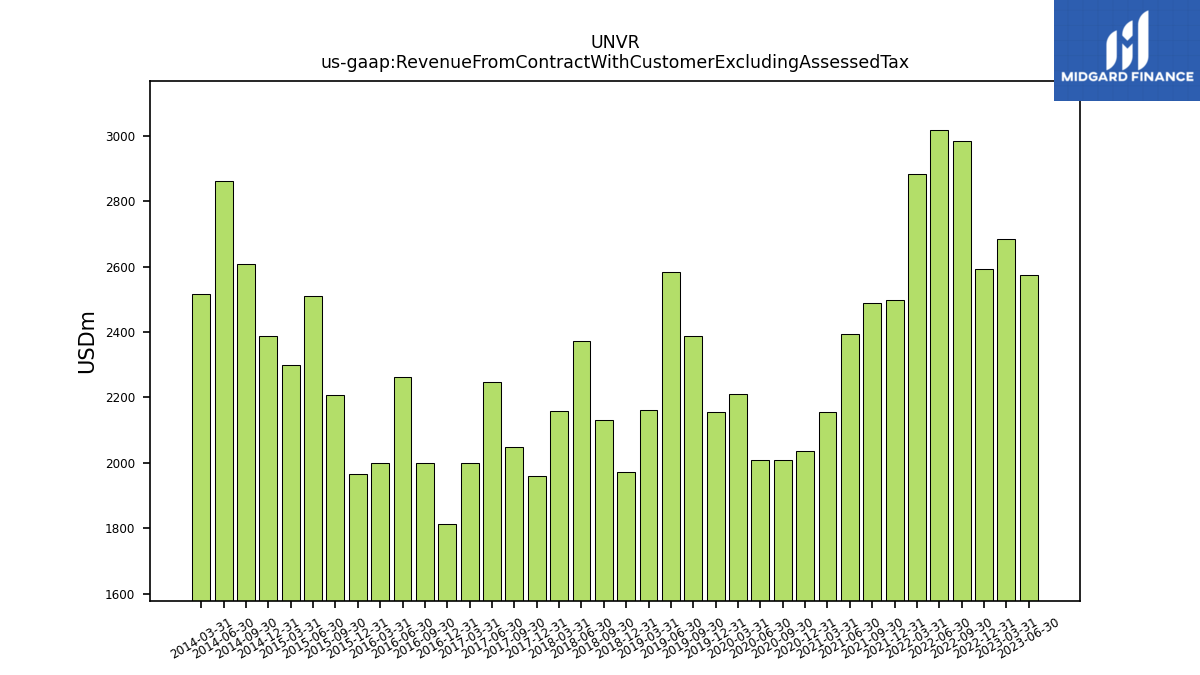
| Revenue From Contract With Customer Excluding Assessed Tax | 2574.10 | 2684.90 | 2592.60 | 2983.50 | 3016.60 | 2882.60 | 2498.10 | 2487.90 | 2394.10 | 2155.40 | 2035.40 | 2009.20 | 2009.20 | 2211.20 | 2155.00 | 2387.30 | 2584.60 | 2160.00 | 1971.20 | 2130.70 | 2372.60 | 2158.00 | 1959.20 | 2048.70 | 2247.00 | 1998.80 | 1812.50 | 1999.70 | 2262.50 | 1999.00 | 1966.30 | 2206.30 | 2510.10 | 2299.10 | 2387.20 | 2608.90 | 2861.40 | 2516.40 | |
| Revenues | 2574.10 | 2684.90 | 2592.60 | 2983.50 | 3016.60 | 2882.60 | 2498.10 | 2487.90 | 2394.10 | 2155.40 | 2035.40 | 2009.20 | 2009.20 | 2211.20 | 2155.00 | 2387.30 | 2584.60 | 2160.00 | 1971.20 | 2130.70 | 2372.60 | 2158.00 | 1959.20 | 2048.70 | 2247.00 | 1998.80 | 1812.50 | 1999.70 | 2262.50 | 1999.00 | 1966.30 | 2206.30 | 2510.10 | 2299.10 | 2387.20 | 2608.90 | 2861.40 | 2516.40 | |
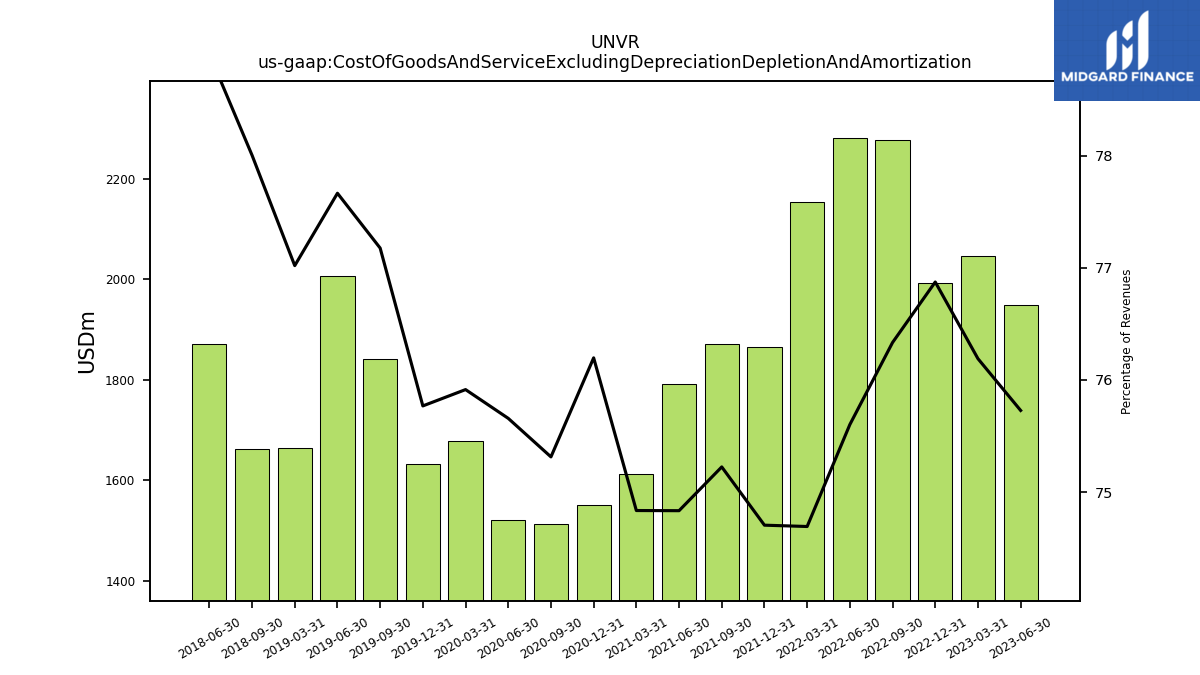
| Cost Of Goods And Service Excluding Depreciation Depletion And Amortization | 1949.30 | 2045.60 | 1993.00 | 2277.40 | 2280.60 | 2153.10 | 1866.20 | 1871.50 | 1791.60 | 1613.00 | 1550.90 | 1513.20 | 1520.10 | 1678.60 | 1632.80 | 1842.40 | 2007.30 | 1663.60 | NA | 1662.00 | 1872.10 | NA | NA | NA | NA | NA | NA | NA | NA | NA | NA | NA | NA | NA | NA | NA | NA | NA | |
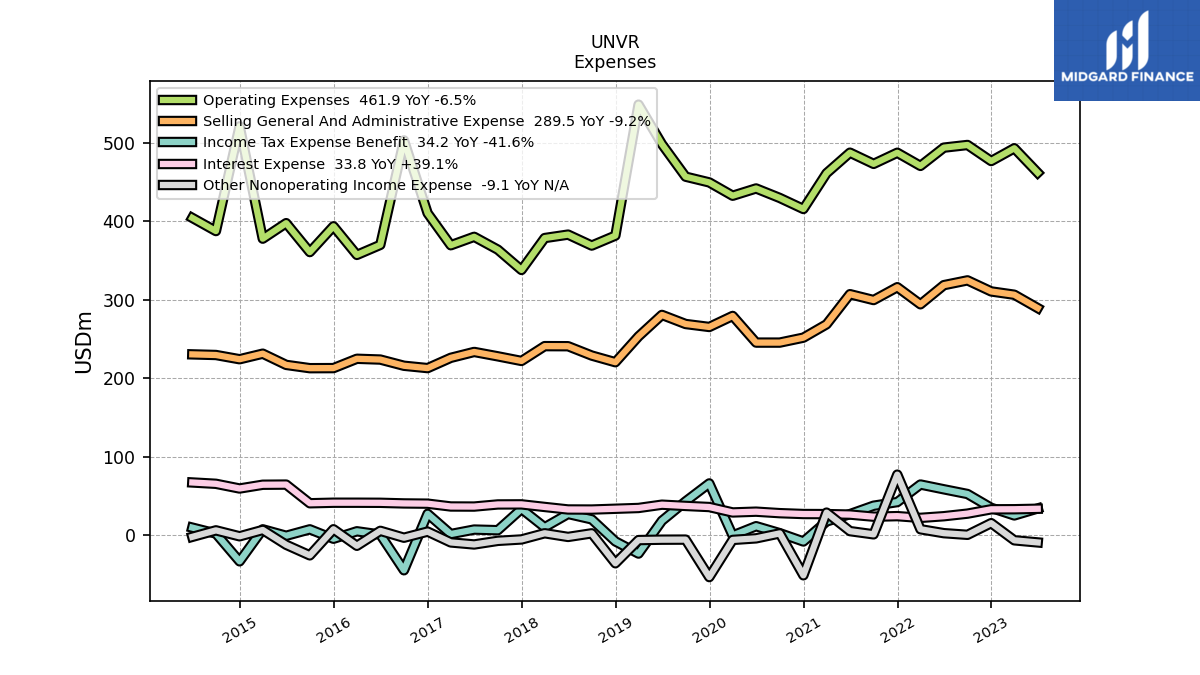
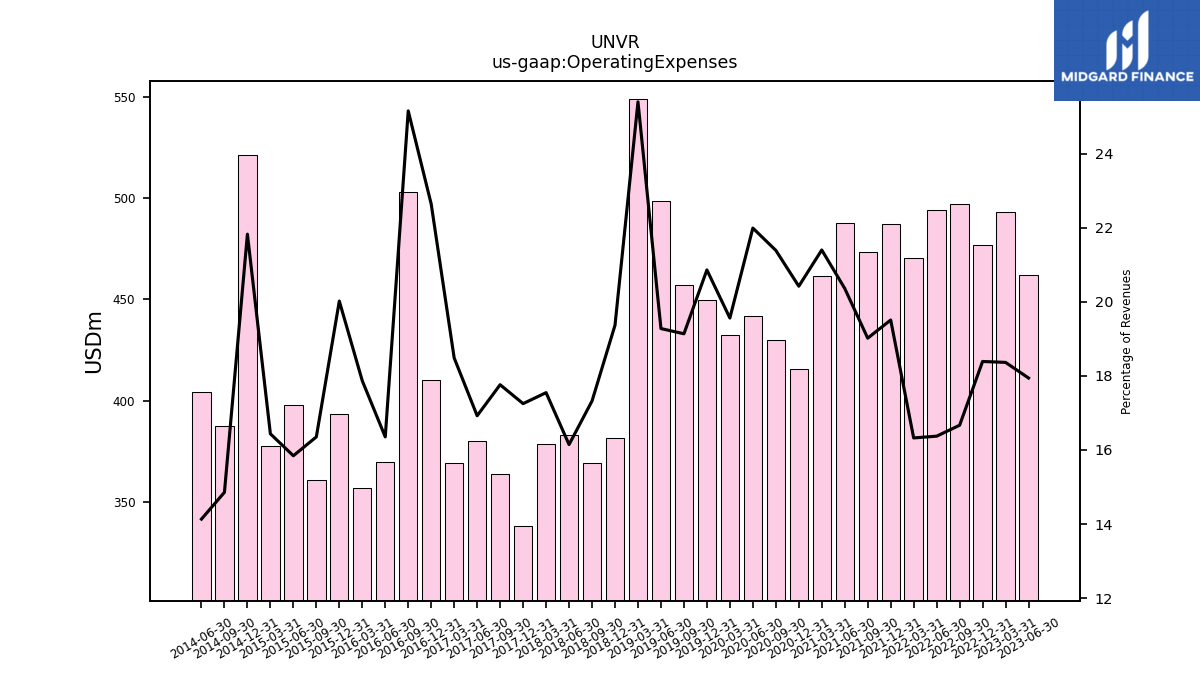
| Operating Expenses | 461.90 | 493.10 | 476.80 | 497.30 | 493.90 | 470.60 | 487.40 | 473.20 | 487.50 | 461.30 | 415.70 | 429.80 | 441.90 | 432.60 | 449.60 | 456.90 | 498.30 | 548.70 | 381.80 | 369.10 | 383.10 | 378.70 | 338.00 | 363.90 | 380.30 | 369.50 | 410.40 | 503.10 | 370.00 | 357.20 | 393.70 | 360.80 | 397.70 | 377.90 | 521.10 | 387.60 | 404.40 | NA | |
| Selling General And Administrative Expense | 289.50 | 306.50 | 310.70 | 324.80 | 318.70 | 294.30 | 316.10 | 299.70 | 307.20 | 268.80 | 251.80 | 245.50 | 245.50 | 279.50 | 265.40 | 269.20 | 280.80 | 253.40 | 220.50 | 229.00 | 240.90 | 241.00 | 222.10 | 228.00 | 233.60 | 226.10 | 213.00 | 216.00 | 223.90 | 224.90 | 213.00 | 212.90 | 217.10 | 231.40 | 224.30 | 229.70 | 230.50 | NA | |
| Operating Income Loss | 162.90 | 146.20 | 122.80 | 208.80 | 242.10 | 258.90 | 144.50 | 143.20 | 115.00 | 81.10 | 68.80 | 66.20 | 47.20 | 100.00 | 72.60 | 88.00 | 79.00 | -52.30 | 62.50 | 99.60 | 117.40 | 107.90 | 98.60 | 90.90 | 86.10 | 69.90 | 2.90 | -65.00 | 75.40 | 73.10 | 26.10 | 89.70 | 69.50 | 83.70 | -56.40 | 105.50 | 96.10 | NA | |
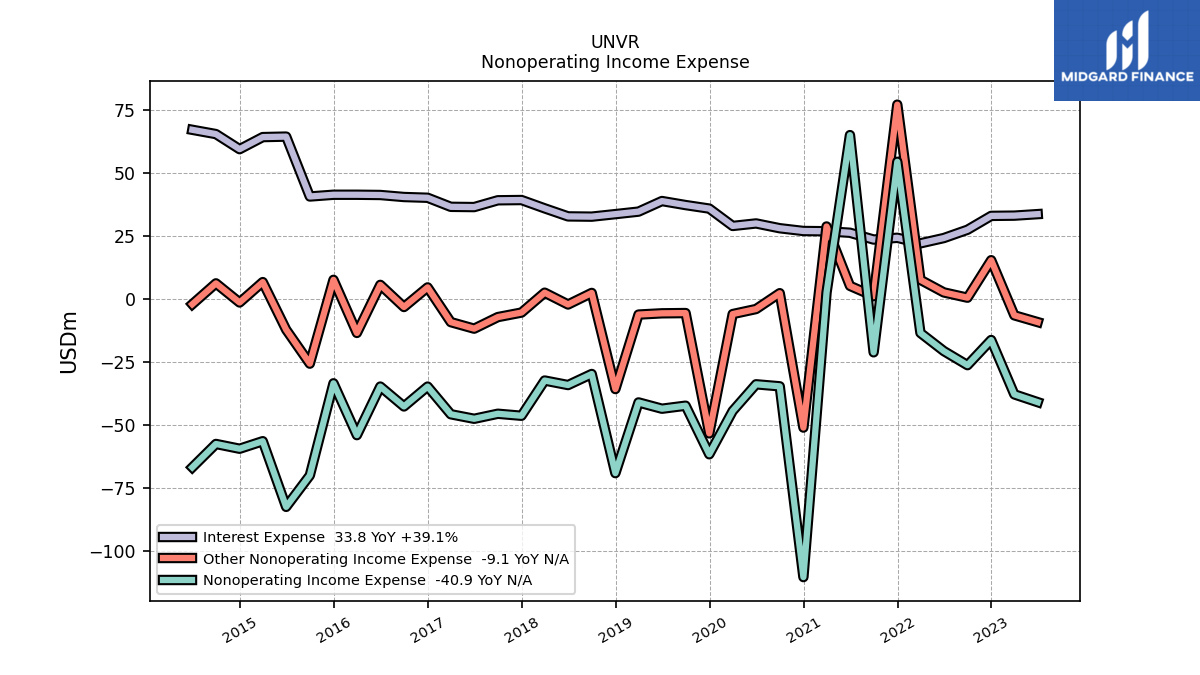
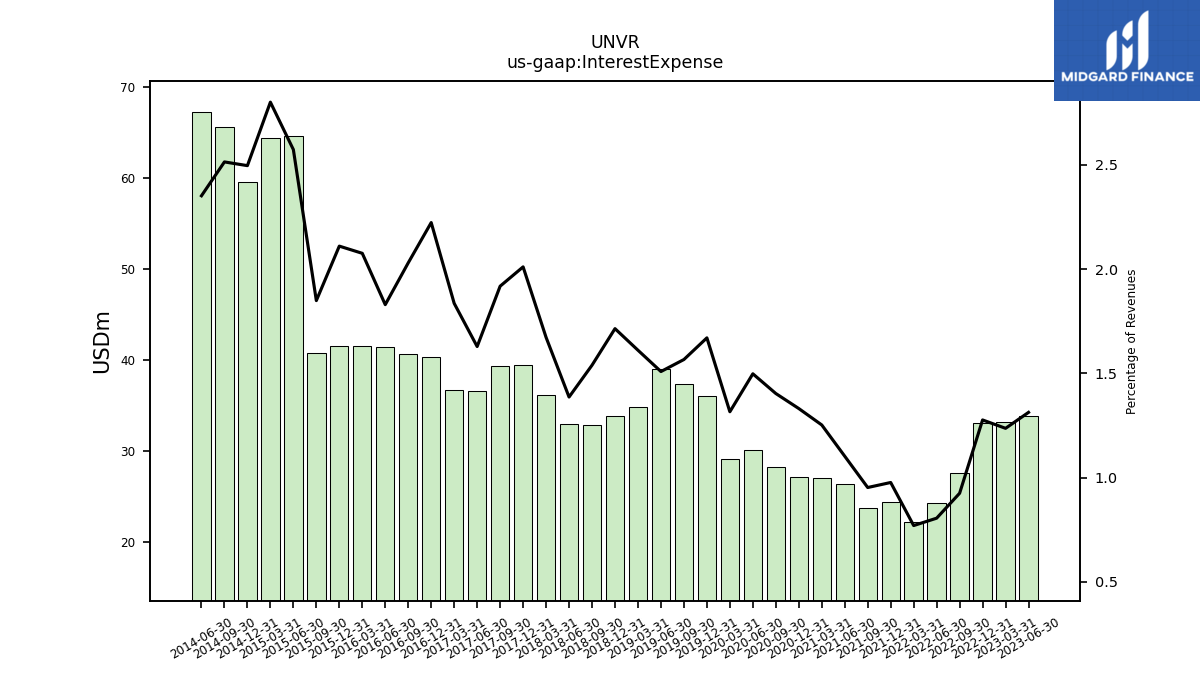
| Interest Expense | 33.80 | 33.20 | 33.10 | 27.60 | 24.30 | 22.20 | 24.40 | 23.70 | 26.40 | 27.00 | 27.10 | 28.20 | 30.10 | 29.10 | 36.00 | 37.40 | 39.00 | 34.80 | 33.80 | 32.80 | 32.90 | 36.10 | 39.40 | 39.30 | 36.60 | 36.70 | 40.30 | 40.60 | 41.40 | 41.50 | 41.50 | 40.80 | 64.60 | 64.40 | 59.60 | 65.60 | 67.30 | NA | |
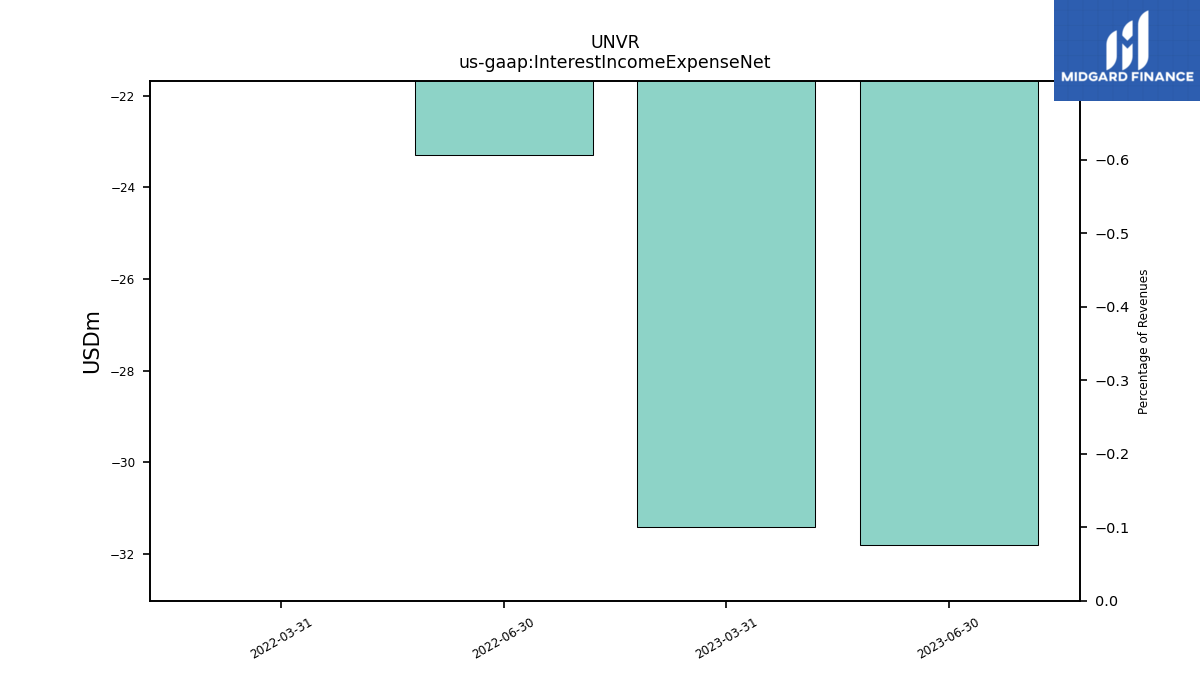
| Interest Income Expense Net | -31.80 | -31.40 | NA | NA | -23.30 | -21.10 | NA | NA | NA | NA | NA | NA | NA | NA | NA | NA | NA | NA | NA | NA | NA | NA | NA | NA | NA | NA | NA | NA | NA | NA | NA | NA | NA | NA | NA | NA | NA | NA | |
| Interest Paid Net | 34.60 | 22.00 | 31.90 | 19.30 | 25.60 | 11.90 | 26.50 | 15.50 | 27.40 | 18.60 | 31.60 | 22.60 | 32.50 | 18.00 | 36.20 | 43.00 | 26.60 | 40.30 | NA | NA | NA | NA | NA | NA | NA | NA | NA | NA | NA | NA | NA | NA | NA | NA | NA | NA | NA | NA | |
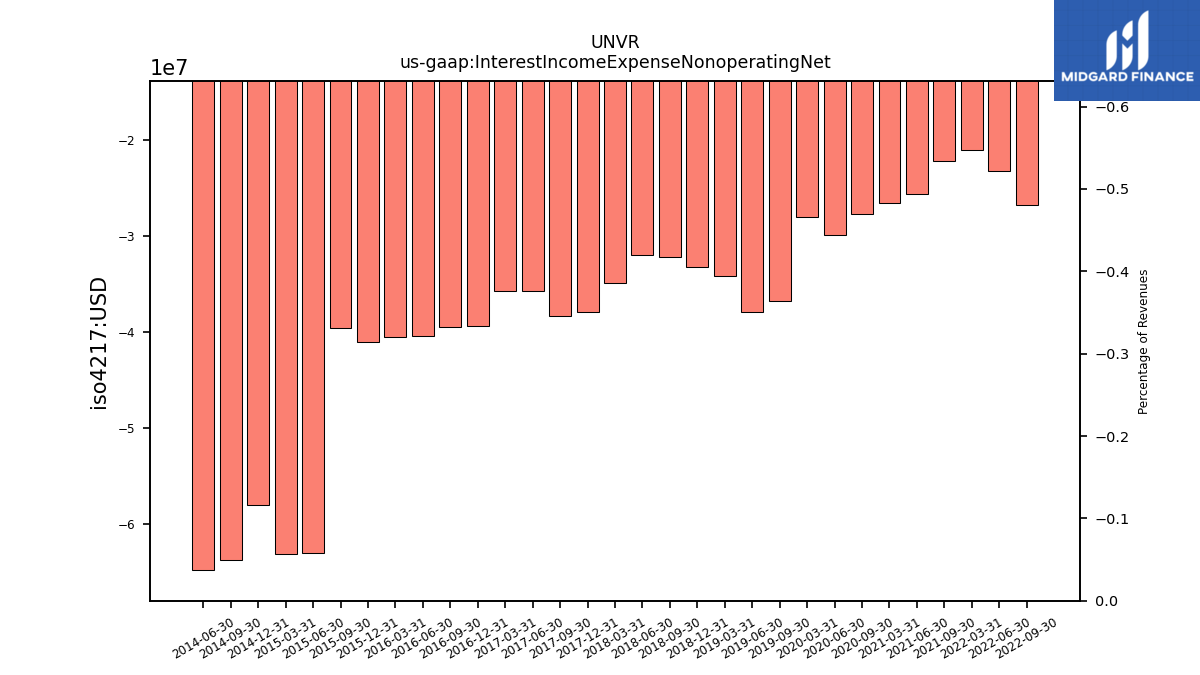
| Interest Income Expense Nonoperating Net | NA | NA | NA | -26.80 | -23.30 | -21.10 | NA | -22.20 | -25.70 | -26.60 | NA | -27.70 | -29.90 | -28.10 | NA | -36.80 | -37.90 | -34.20 | -33.30 | -32.20 | -32.00 | -34.90 | -38.00 | -38.40 | -35.80 | -35.80 | -39.40 | -39.50 | -40.40 | -40.60 | -41.10 | -39.60 | -63.10 | -63.20 | -58.10 | -63.80 | -64.80 | NA | |
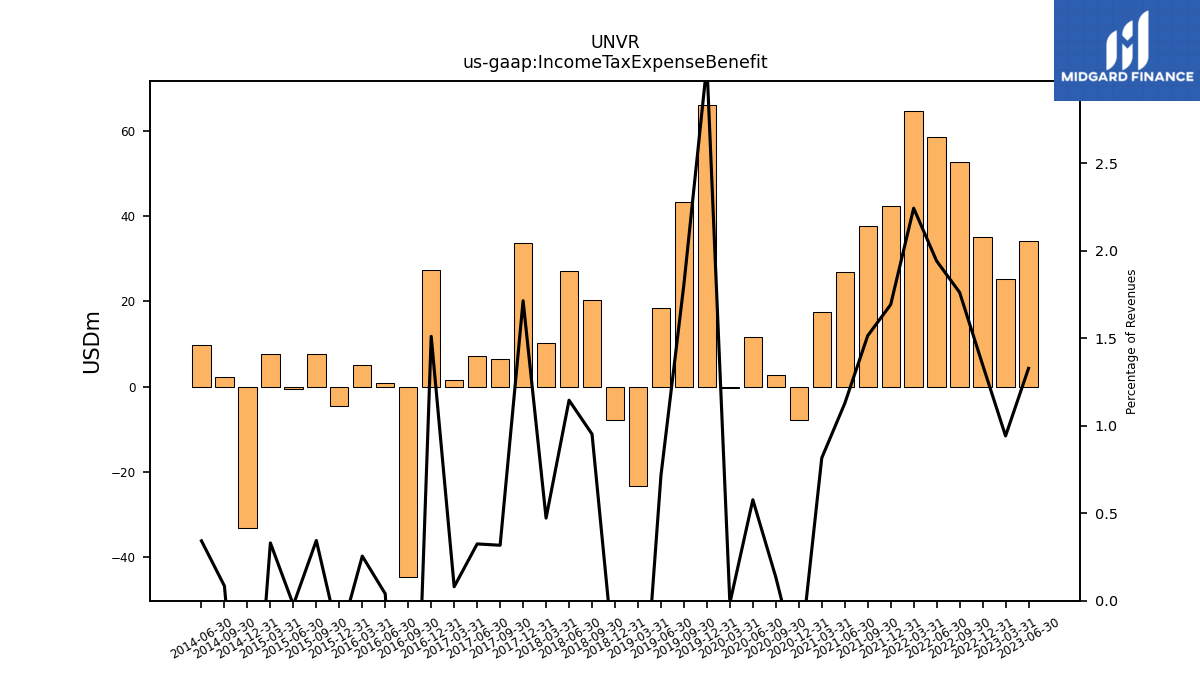
| Income Tax Expense Benefit | 34.20 | 25.30 | 35.00 | 52.60 | 58.60 | 64.70 | 42.30 | 37.70 | 27.00 | 17.60 | -7.90 | 2.70 | 11.60 | -0.30 | 66.10 | 43.20 | 18.50 | -23.30 | -7.80 | 20.30 | 27.20 | 10.20 | 33.60 | 6.50 | 7.30 | 1.60 | 27.40 | -44.60 | 0.90 | 5.10 | -4.40 | 7.60 | -0.60 | 7.60 | -33.20 | 2.20 | 9.80 | NA | |
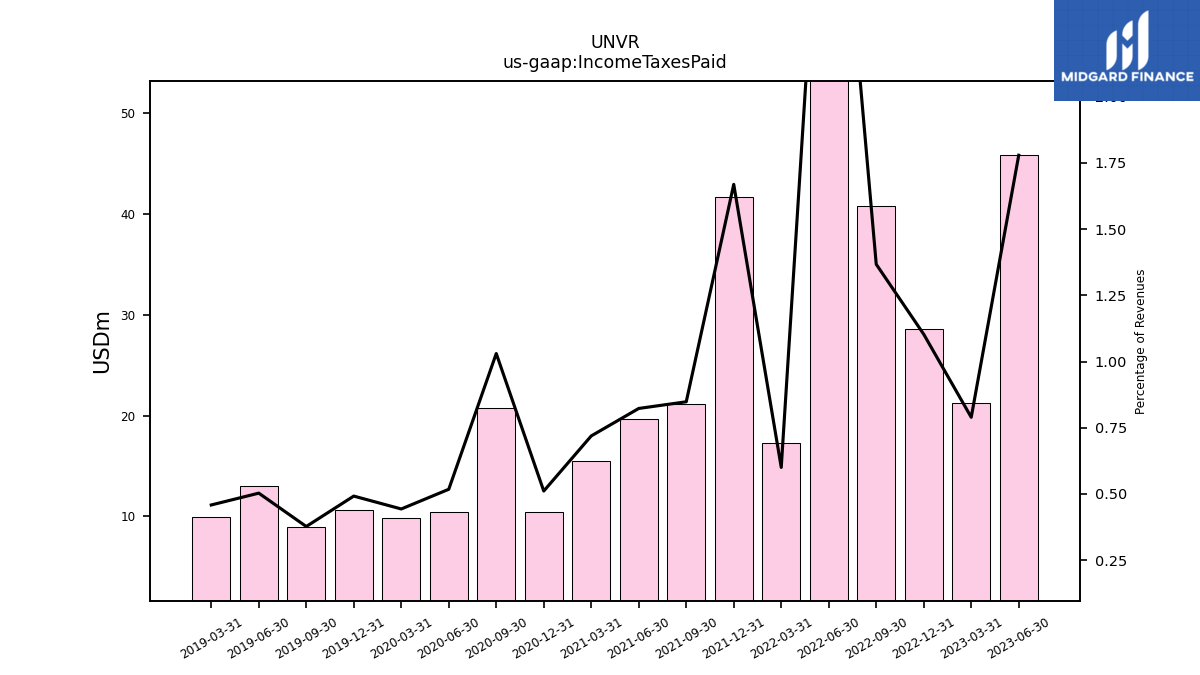
| Income Taxes Paid | 45.80 | 21.20 | 28.60 | 40.80 | 103.00 | 17.30 | 41.70 | 21.10 | 19.70 | 15.50 | 10.40 | 20.70 | 10.40 | 9.80 | 10.60 | 9.00 | 13.00 | 9.90 | NA | NA | NA | NA | NA | NA | NA | NA | NA | NA | NA | NA | NA | NA | NA | NA | NA | NA | NA | NA | |
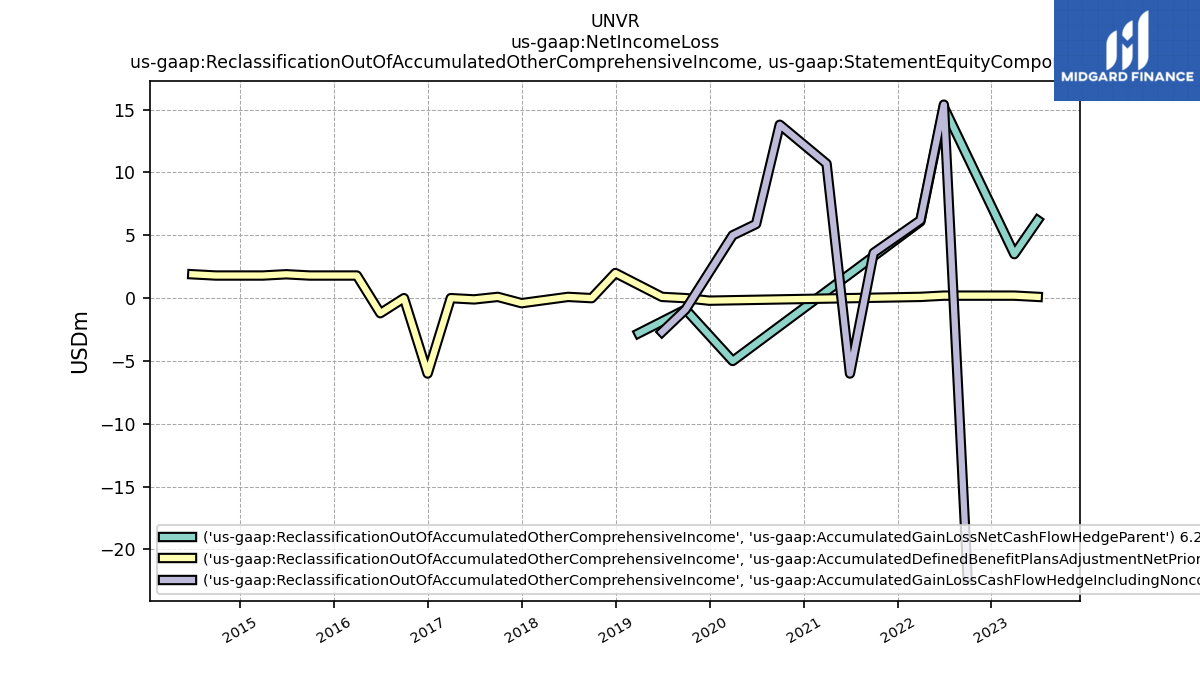
| Other Comprehensive Income Loss Net Of Tax | NA | NA | NA | NA | NA | 53.50 | NA | NA | NA | NA | NA | NA | NA | NA | NA | NA | -4.20 | -3.30 | NA | NA | -55.40 | 2.40 | NA | NA | NA | NA | -8.90 | -20.30 | -3.60 | 67.30 | -35.60 | -84.30 | 24.80 | -121.10 | -50.10 | -72.60 | NA | NA | |
| Net Income Loss | 87.80 | 83.10 | 71.60 | 130.00 | 162.90 | 180.80 | 156.80 | 84.40 | 153.20 | 66.20 | -33.70 | 28.90 | 1.80 | 55.90 | -55.10 | 2.50 | 16.30 | -63.90 | 1.20 | 49.60 | 56.10 | 65.40 | 27.00 | 38.90 | 31.30 | 22.60 | -59.20 | -63.00 | 39.80 | 14.00 | -2.90 | 12.10 | -12.40 | 19.70 | -82.60 | 45.80 | 19.50 | -2.80 | |
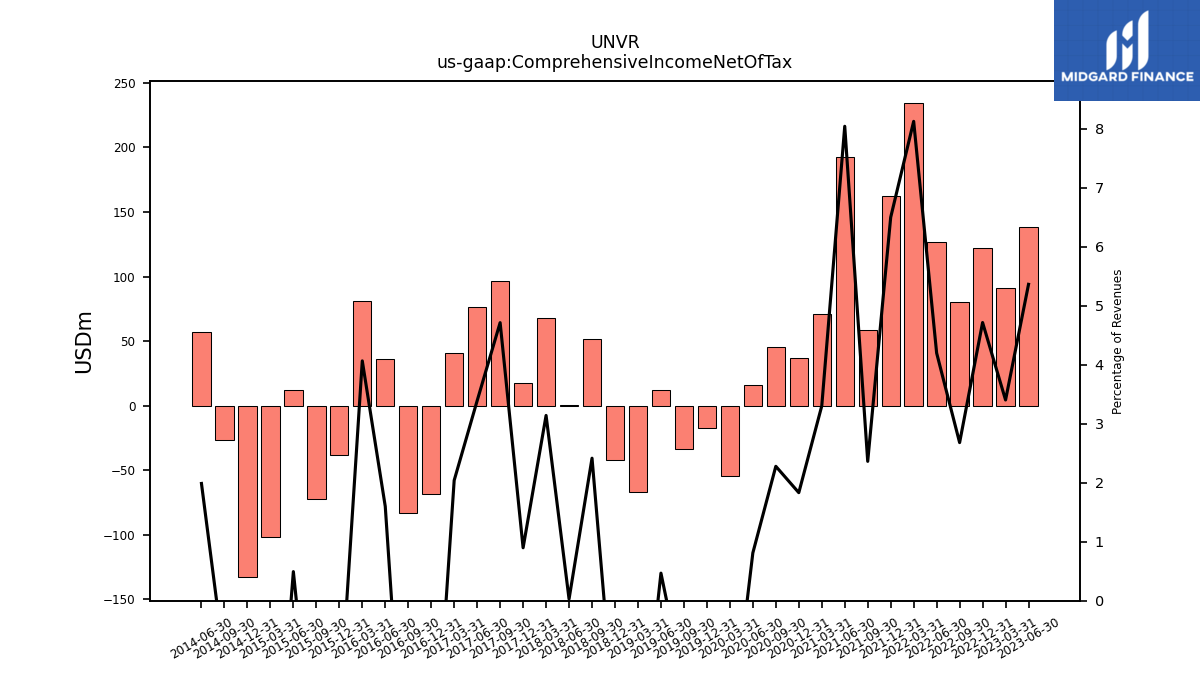
| Comprehensive Income Net Of Tax | 138.10 | 91.40 | 122.30 | 80.00 | 126.70 | 234.30 | 162.40 | 58.80 | 192.60 | 71.20 | 37.30 | 45.80 | 16.30 | -54.30 | -17.40 | -33.80 | 12.10 | -67.20 | -42.40 | 51.50 | 0.70 | 67.80 | 17.60 | 96.60 | 76.20 | 40.80 | -68.10 | -83.30 | 36.20 | 81.30 | -38.50 | -72.20 | 12.40 | -101.40 | -132.70 | -26.80 | 56.90 | NA |
| 2023-06-30 | 2023-03-31 | 2022-12-31 | 2022-09-30 | 2022-06-30 | 2022-03-31 | 2021-12-31 | 2021-09-30 | 2021-06-30 | 2021-03-31 | 2020-12-31 | 2020-09-30 | 2020-06-30 | 2020-03-31 | 2019-12-31 | 2019-09-30 | 2019-06-30 | 2019-03-31 | 2018-12-31 | 2018-09-30 | 2018-06-30 | 2018-03-31 | 2017-12-31 | 2017-09-30 | 2017-06-30 | 2017-03-31 | 2016-12-31 | 2016-09-30 | 2016-06-30 | 2016-03-31 | 2015-12-31 | 2015-09-30 | 2015-06-30 | 2015-03-31 | 2014-12-31 | 2014-09-30 | 2014-06-30 | 2014-03-31 | ||
|---|---|---|---|---|---|---|---|---|---|---|---|---|---|---|---|---|---|---|---|---|---|---|---|---|---|---|---|---|---|---|---|---|---|---|---|---|---|---|---|
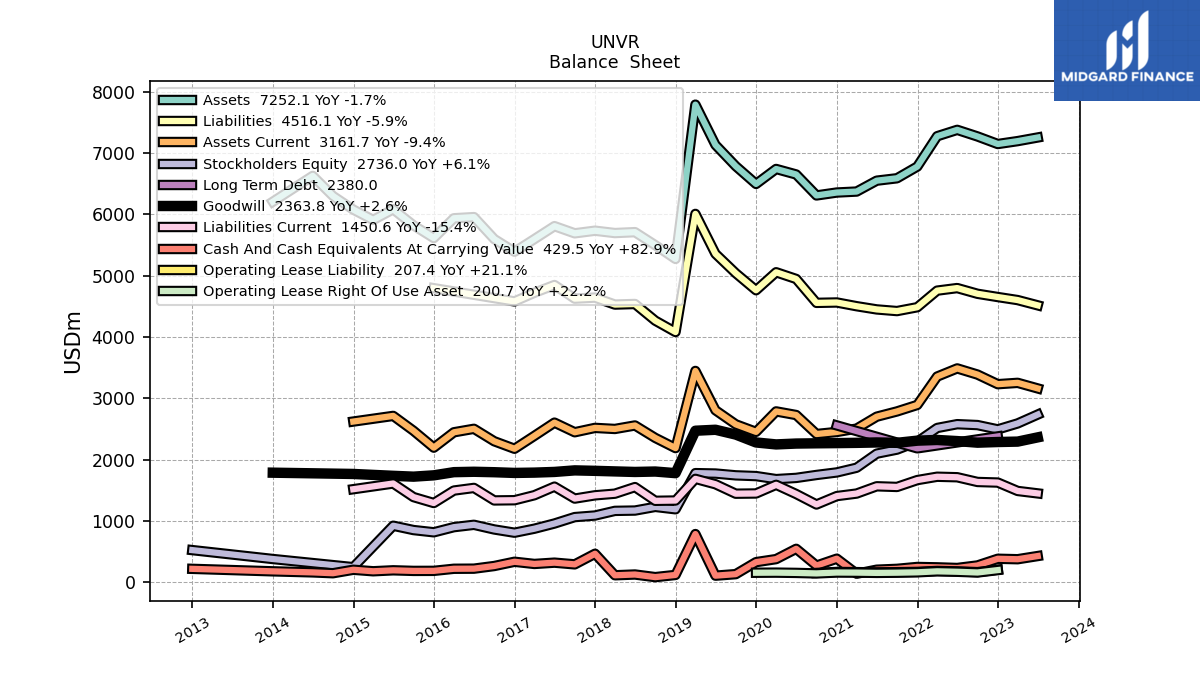
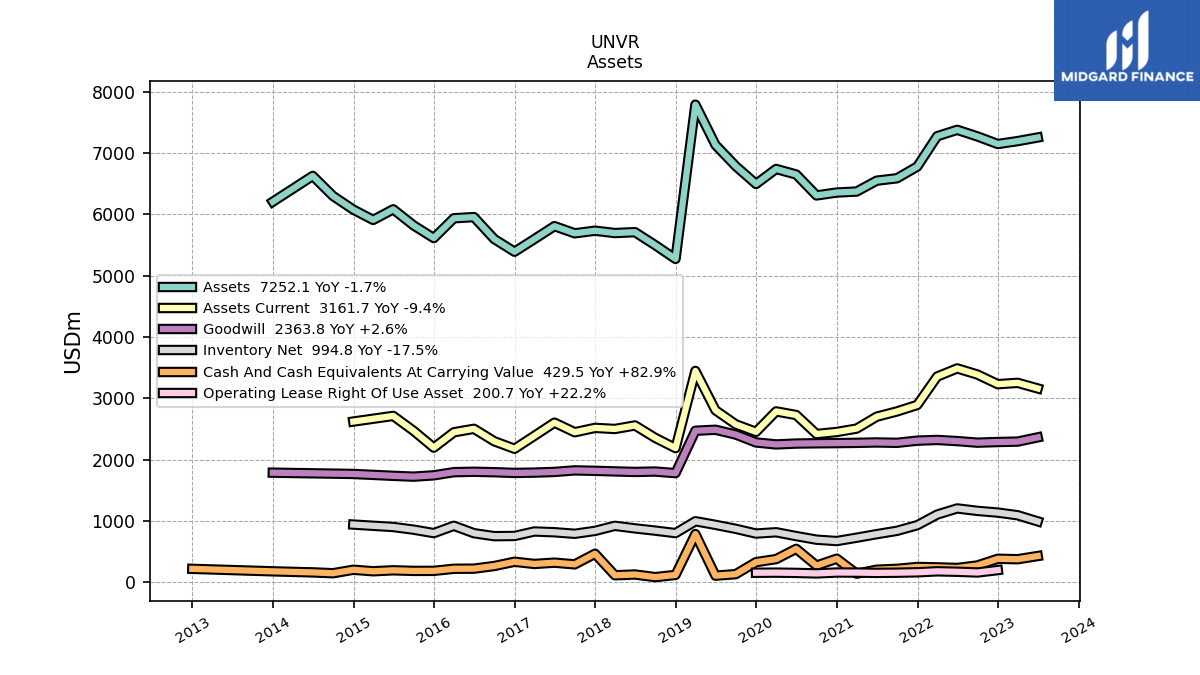
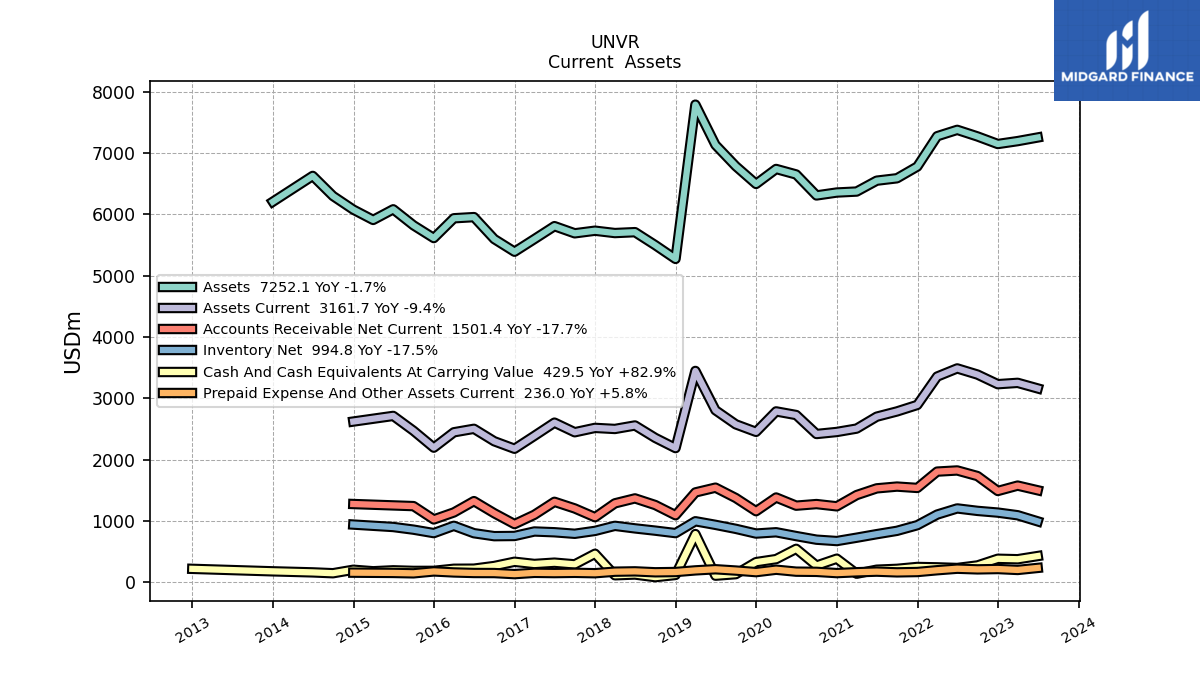
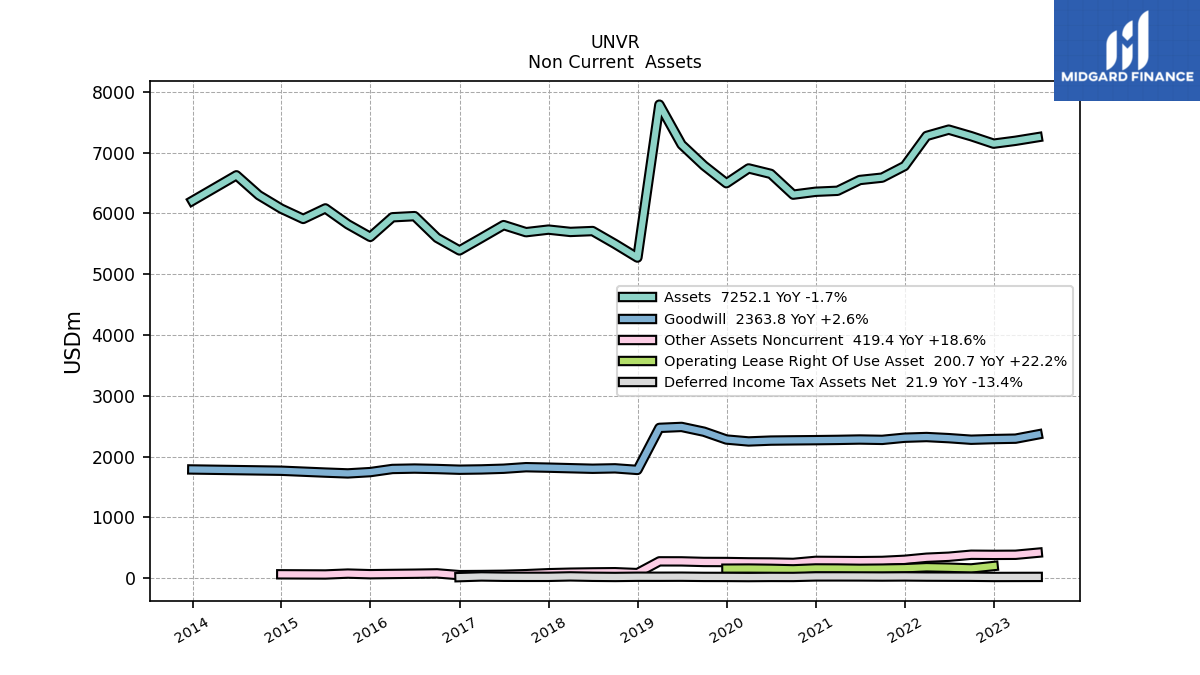
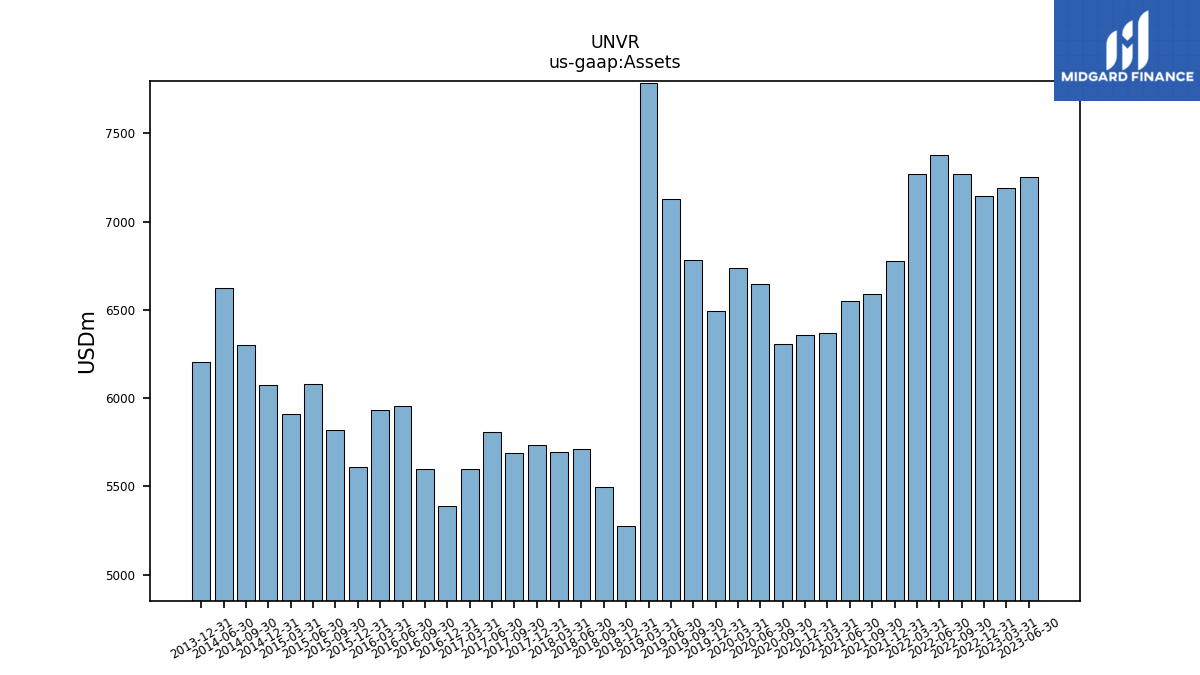
| Assets | 7252.10 | 7193.10 | 7145.70 | 7268.90 | 7376.60 | 7272.70 | 6777.80 | 6587.40 | 6548.20 | 6370.90 | 6355.00 | 6307.30 | 6649.20 | 6739.00 | 6494.80 | 6784.70 | 7131.10 | 7787.80 | 5272.40 | 5497.10 | 5709.10 | 5694.30 | 5732.70 | 5690.10 | 5806.90 | 5596.00 | 5389.90 | 5596.90 | 5954.40 | 5935.40 | 5612.40 | 5820.10 | 6081.70 | 5908.20 | 6076.60 | 6298.30 | 6625.80 | NA | |
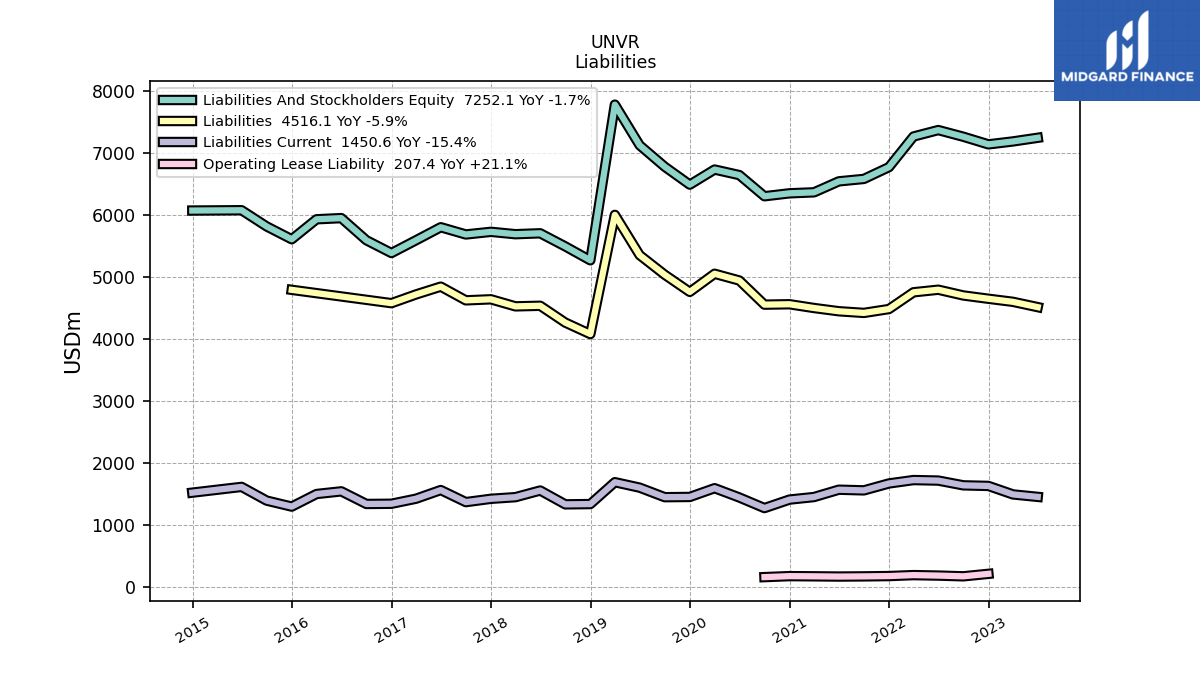
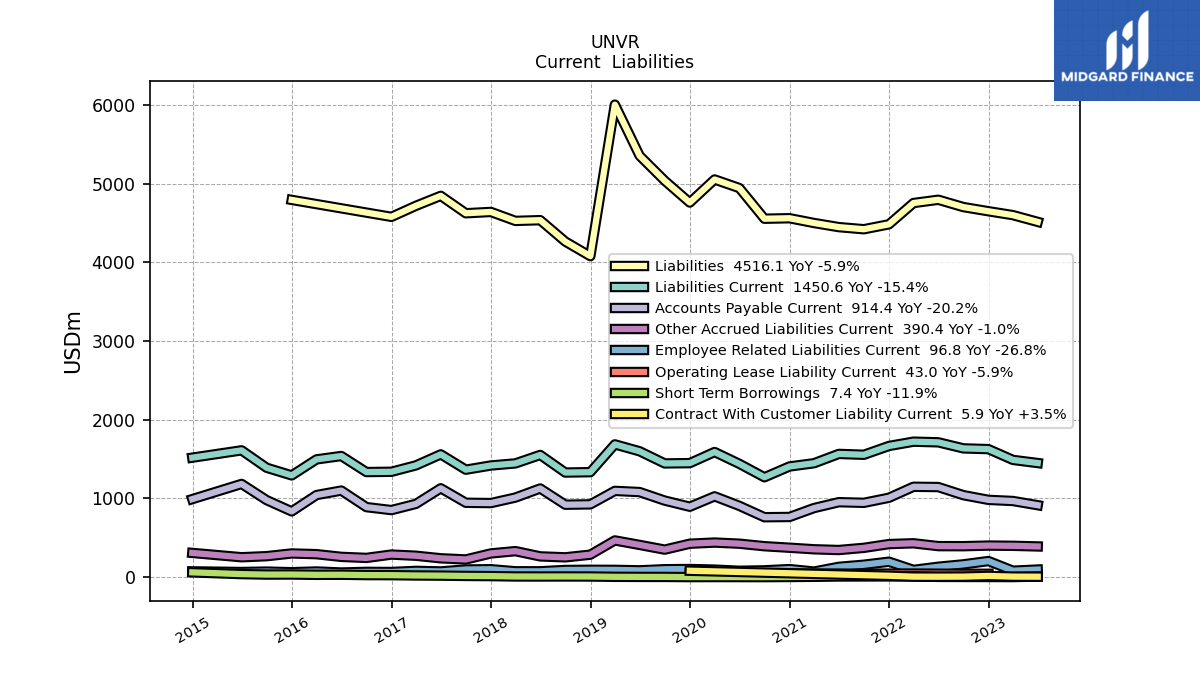
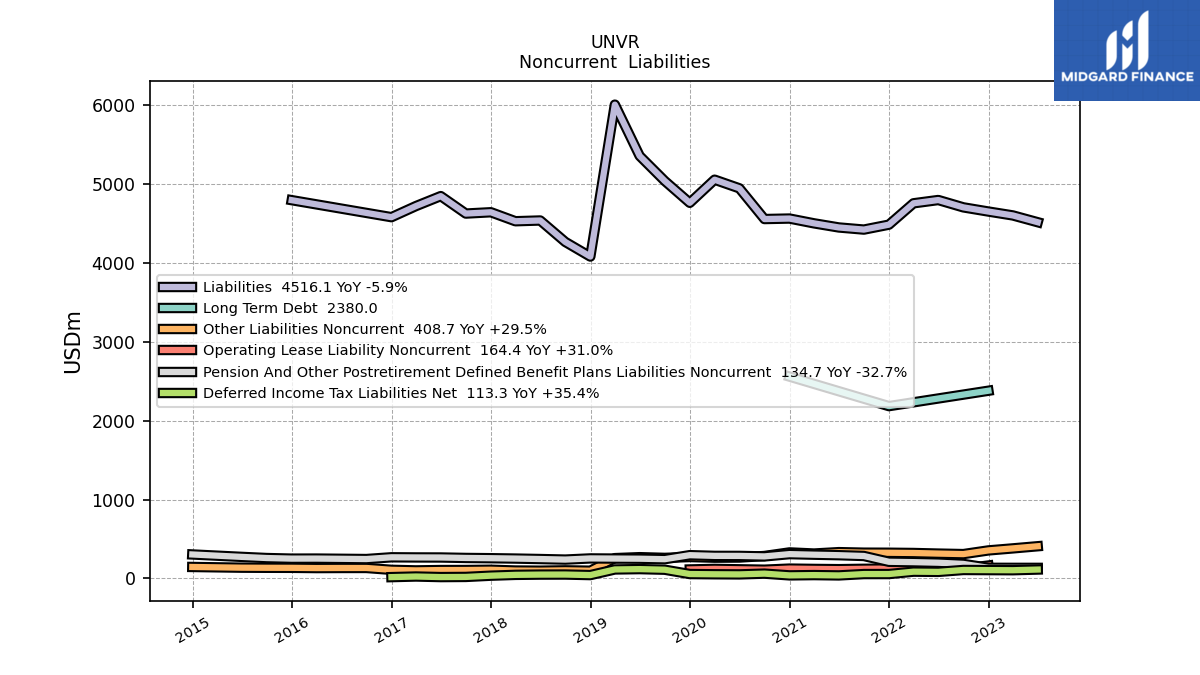
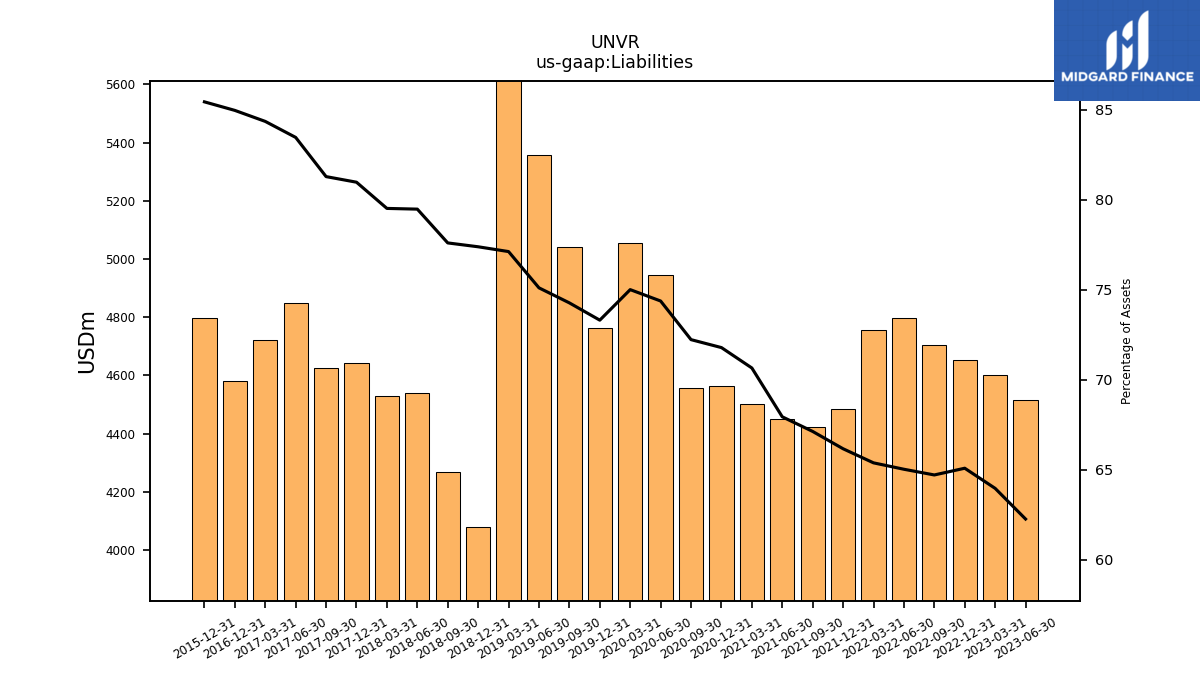
| Liabilities | 4516.10 | 4601.90 | 4651.50 | 4704.50 | 4797.60 | 4755.90 | 4485.30 | 4422.70 | 4449.60 | 4501.90 | 4562.70 | 4556.30 | 4946.00 | 5055.40 | 4762.00 | 5039.70 | 5356.60 | 6006.80 | 4080.70 | 4266.40 | 4538.10 | 4528.60 | 4642.60 | 4625.80 | 4847.20 | 4720.90 | 4580.00 | NA | NA | NA | 4795.70 | NA | NA | NA | NA | NA | NA | NA | |
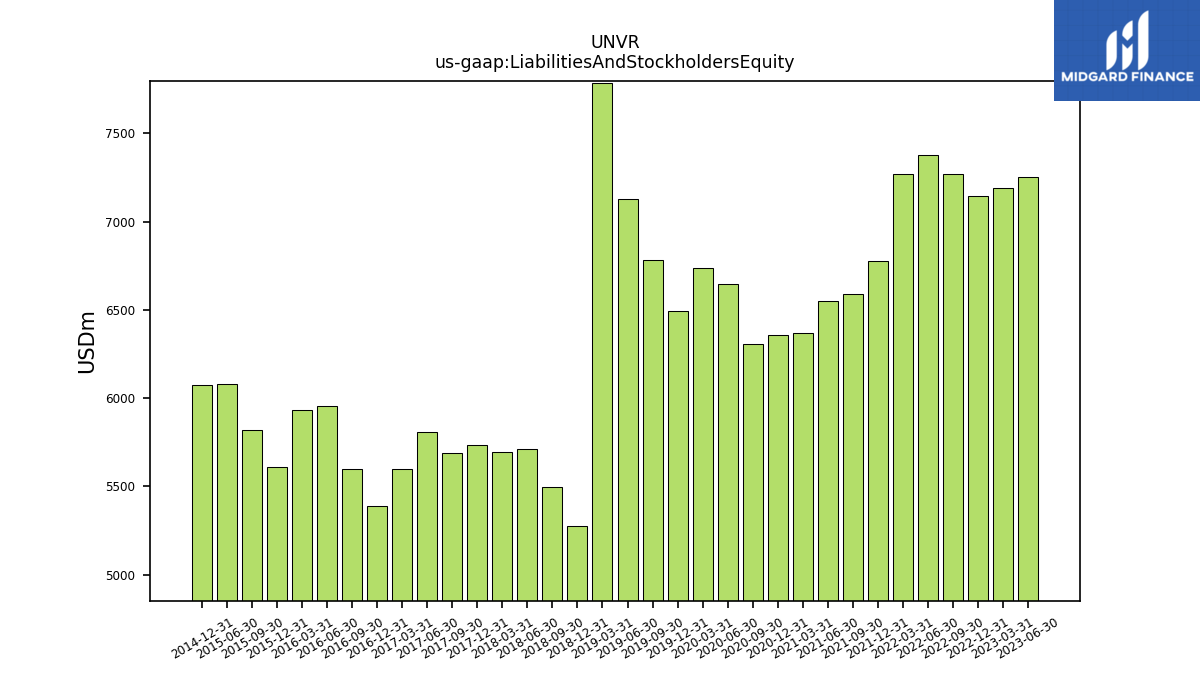
| Liabilities And Stockholders Equity | 7252.10 | 7193.10 | 7145.70 | 7268.90 | 7376.60 | 7272.70 | 6777.80 | 6587.40 | 6548.20 | 6370.90 | 6355.00 | 6307.30 | 6649.20 | 6739.00 | 6494.80 | 6784.70 | 7131.10 | 7787.80 | 5272.40 | 5497.10 | 5709.10 | 5694.30 | 5732.70 | 5690.10 | 5806.90 | 5596.00 | 5389.90 | 5596.90 | 5954.40 | 5935.40 | 5612.40 | 5820.10 | 6081.70 | NA | 6076.60 | NA | NA | NA | |
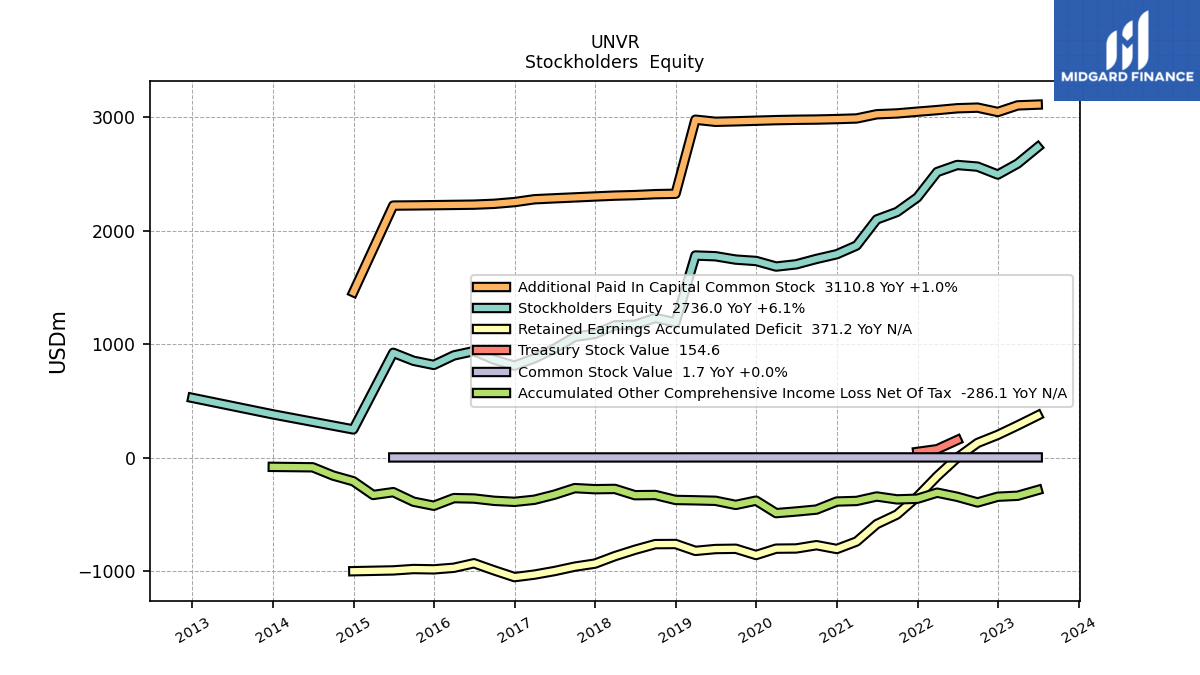
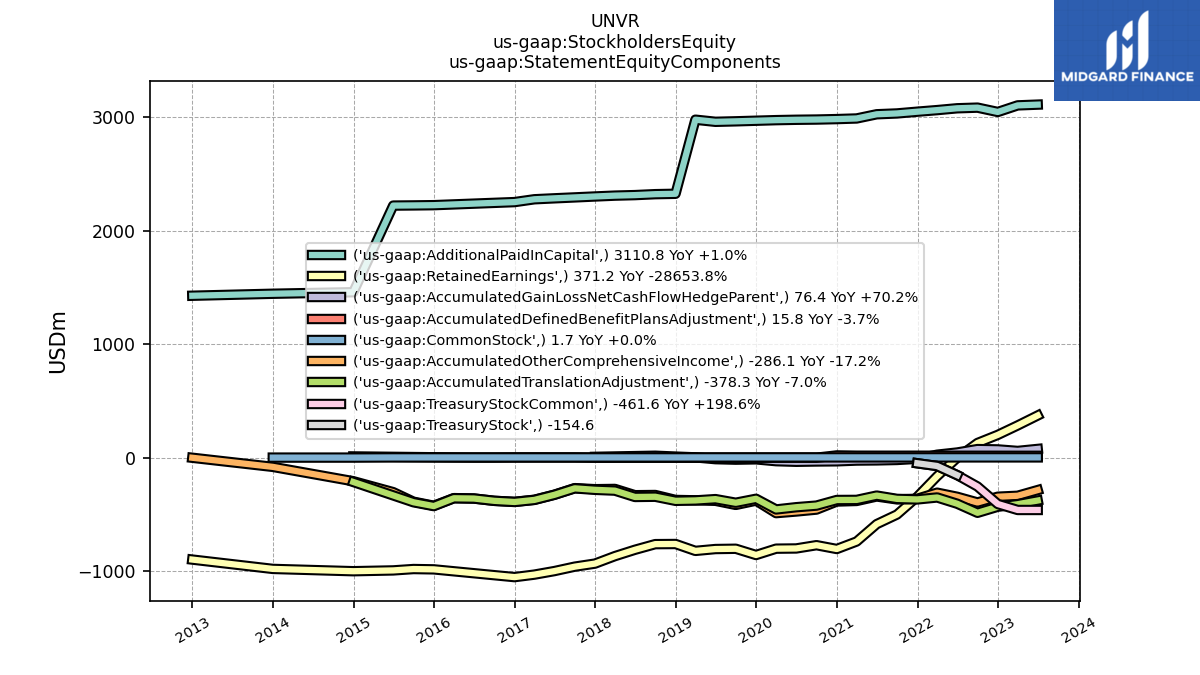
| Stockholders Equity | 2736.00 | 2591.20 | 2494.20 | 2564.40 | 2579.00 | 2516.80 | 2292.50 | 2164.70 | 2098.60 | 1869.00 | 1792.30 | 1751.00 | 1703.20 | 1683.60 | 1732.80 | 1745.00 | 1774.50 | 1781.00 | 1191.70 | 1230.70 | 1171.00 | 1165.70 | 1090.10 | 1064.30 | 959.70 | 875.10 | 809.90 | 862.80 | 938.70 | 900.30 | 816.70 | 853.10 | 923.70 | NA | 248.10 | NA | NA | NA |
| 2023-06-30 | 2023-03-31 | 2022-12-31 | 2022-09-30 | 2022-06-30 | 2022-03-31 | 2021-12-31 | 2021-09-30 | 2021-06-30 | 2021-03-31 | 2020-12-31 | 2020-09-30 | 2020-06-30 | 2020-03-31 | 2019-12-31 | 2019-09-30 | 2019-06-30 | 2019-03-31 | 2018-12-31 | 2018-09-30 | 2018-06-30 | 2018-03-31 | 2017-12-31 | 2017-09-30 | 2017-06-30 | 2017-03-31 | 2016-12-31 | 2016-09-30 | 2016-06-30 | 2016-03-31 | 2015-12-31 | 2015-09-30 | 2015-06-30 | 2015-03-31 | 2014-12-31 | 2014-09-30 | 2014-06-30 | 2014-03-31 | ||
|---|---|---|---|---|---|---|---|---|---|---|---|---|---|---|---|---|---|---|---|---|---|---|---|---|---|---|---|---|---|---|---|---|---|---|---|---|---|---|---|
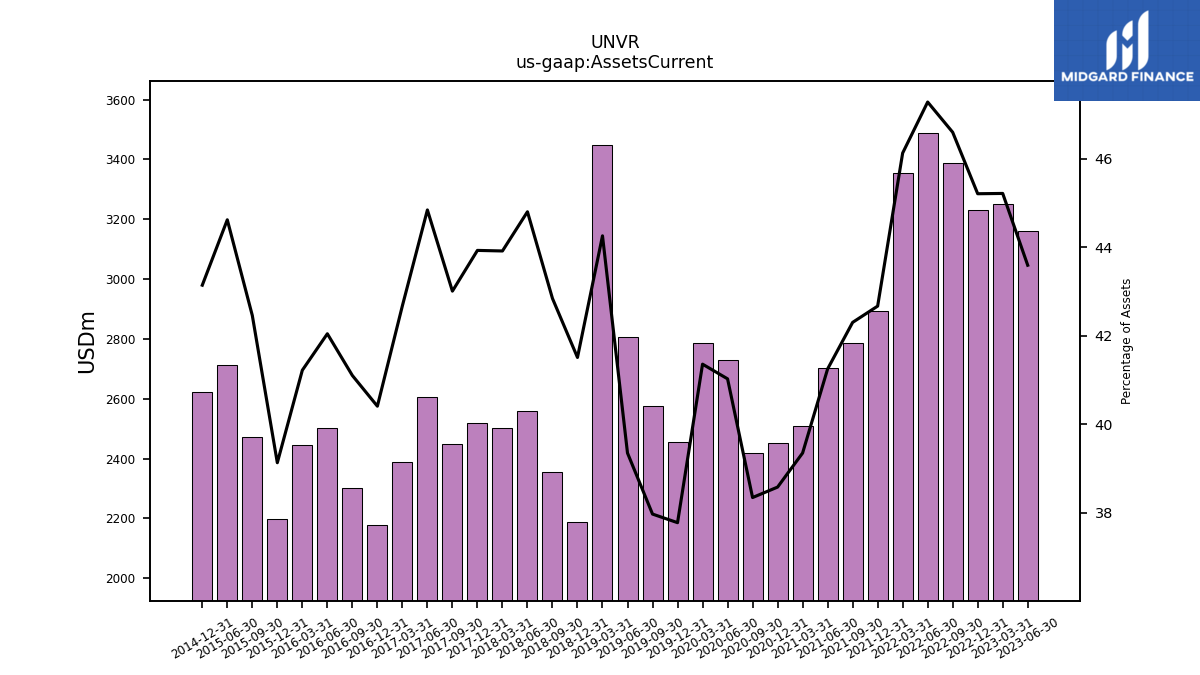
| Assets Current | 3161.70 | 3252.70 | 3230.80 | 3387.50 | 3488.10 | 3355.10 | 2892.30 | 2786.80 | 2701.30 | 2507.10 | 2451.90 | 2418.60 | 2728.10 | 2787.30 | 2453.60 | 2576.30 | 2806.20 | 3447.00 | 2188.70 | 2355.30 | 2558.00 | 2500.90 | 2518.50 | 2447.40 | 2604.20 | 2388.40 | 2178.10 | 2300.60 | 2503.70 | 2446.80 | 2196.30 | 2471.30 | 2713.90 | NA | 2621.80 | NA | NA | NA | |
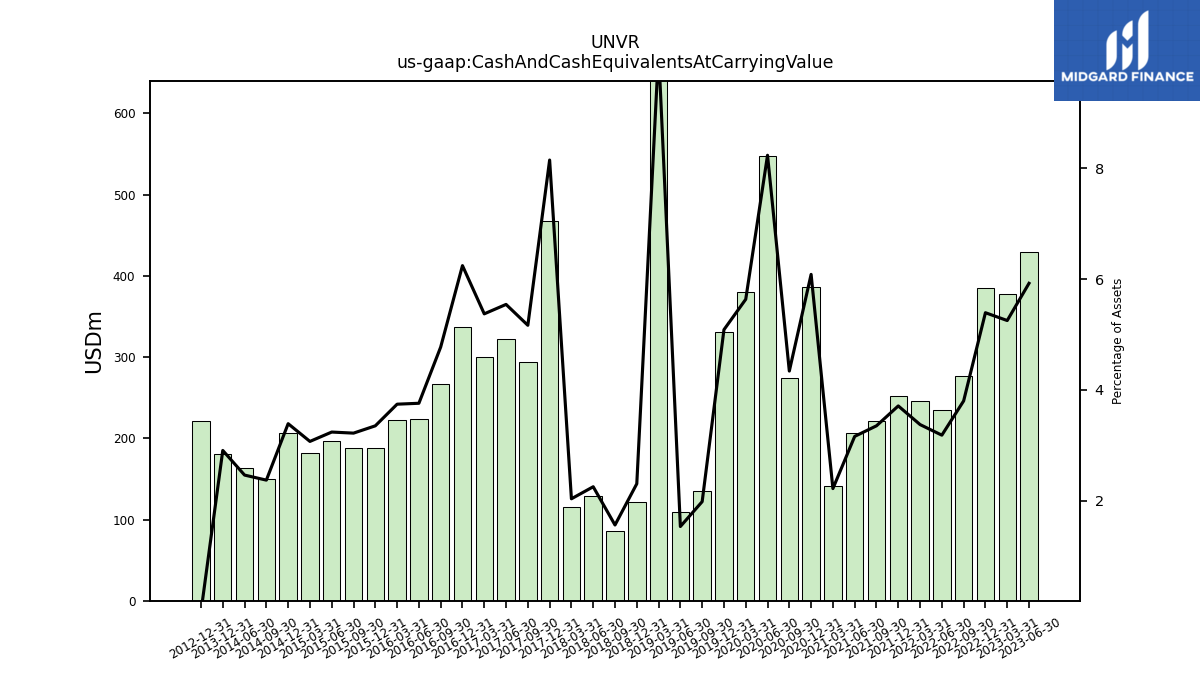
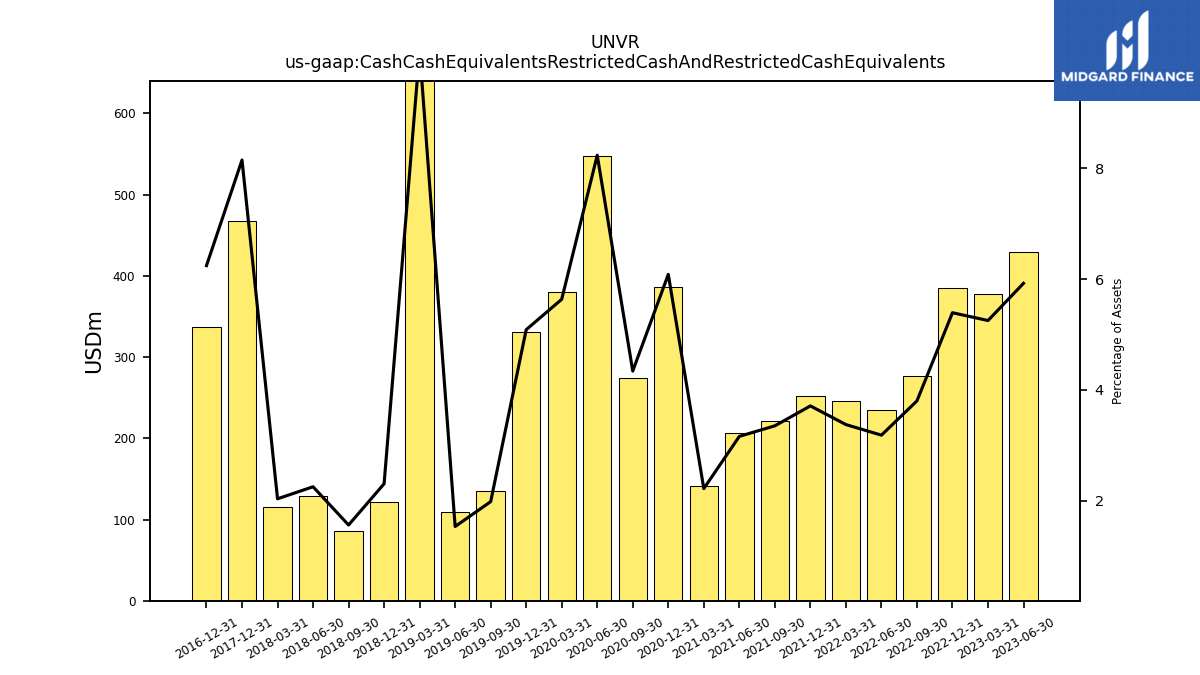
| Cash And Cash Equivalents At Carrying Value | 429.50 | 377.70 | 385.30 | 276.30 | 234.80 | 245.40 | 251.50 | 220.80 | 207.00 | 141.40 | 386.60 | 273.70 | 547.40 | 379.70 | 330.30 | 134.60 | 109.50 | 788.00 | 121.60 | 85.90 | 128.60 | 115.90 | 467.00 | 293.90 | 321.80 | 300.60 | 336.40 | 267.10 | 223.80 | 222.10 | 188.10 | 187.40 | 197.00 | 181.40 | 206.00 | 149.40 | 163.20 | NA | |
| Cash Cash Equivalents Restricted Cash And Restricted Cash Equivalents | 429.50 | 377.70 | 385.30 | 276.30 | 234.80 | 245.40 | 251.50 | 220.80 | 207.00 | 141.40 | 386.60 | 273.70 | 547.40 | 379.70 | 330.30 | 134.60 | 109.50 | 788.00 | 121.60 | 85.90 | 128.60 | 115.90 | 467.00 | NA | NA | NA | 336.40 | NA | NA | NA | NA | NA | NA | NA | NA | NA | NA | NA | |
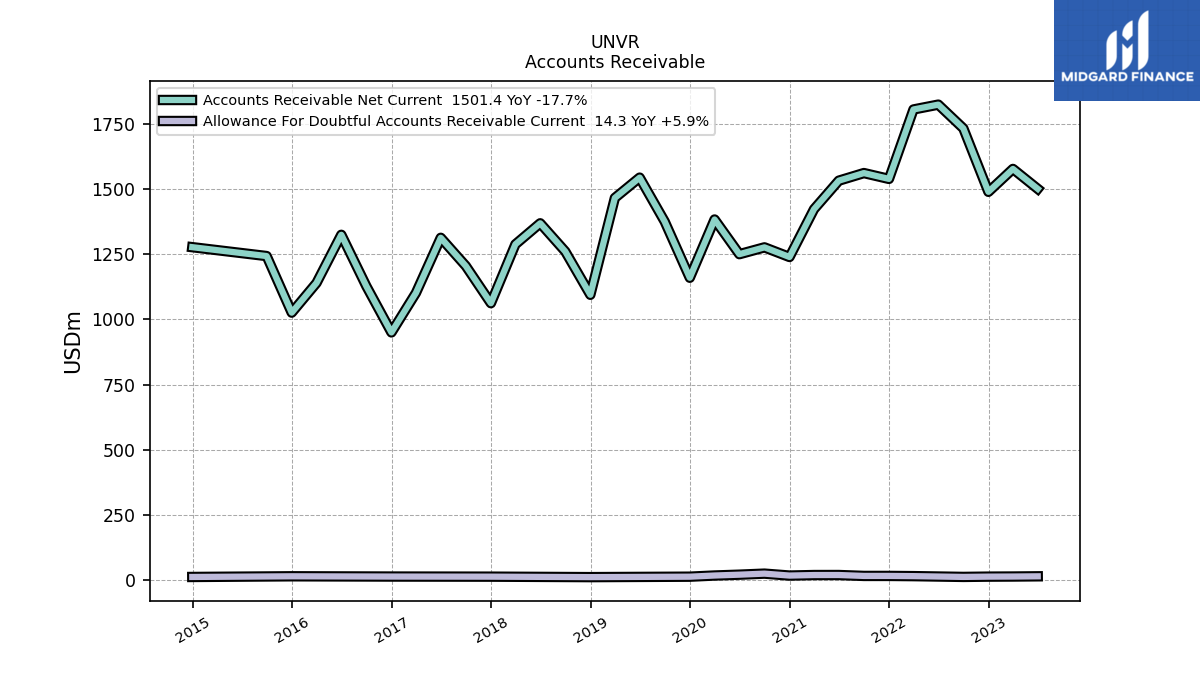
| Accounts Receivable Net Current | 1501.40 | 1577.80 | 1489.90 | 1733.40 | 1824.60 | 1806.00 | 1539.50 | 1561.90 | 1532.80 | 1423.40 | 1239.80 | 1276.80 | 1250.60 | 1383.80 | 1160.10 | 1375.70 | 1544.40 | 1466.50 | 1094.70 | 1261.00 | 1369.20 | 1288.50 | 1062.40 | 1205.30 | 1313.50 | 1102.10 | 950.30 | 1127.60 | 1325.00 | 1140.20 | 1026.20 | 1243.40 | NA | NA | 1277.50 | NA | NA | NA | |
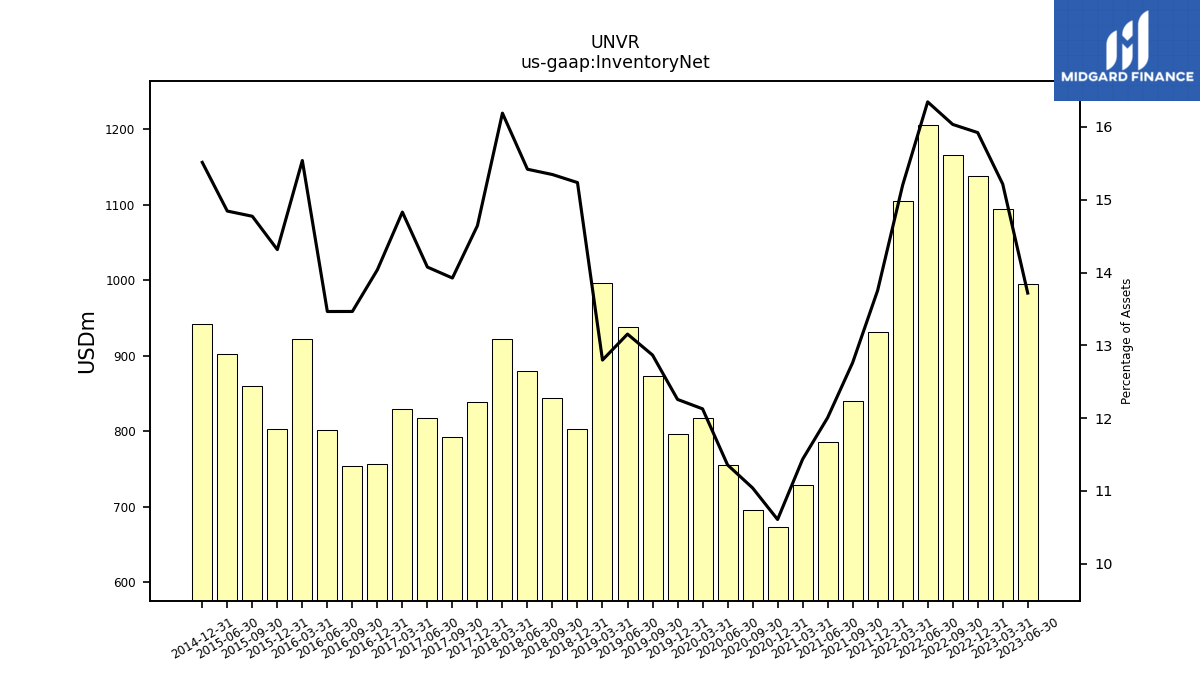
| Inventory Net | 994.80 | 1094.50 | 1137.80 | 1165.60 | 1205.70 | 1105.50 | 932.20 | 840.60 | 786.10 | 728.40 | 674.00 | 696.30 | 755.10 | 817.20 | 796.00 | 872.90 | 938.00 | 996.60 | 803.30 | 843.60 | 880.30 | 921.90 | 839.50 | 792.30 | 817.30 | 829.90 | 756.60 | 753.60 | 801.70 | 922.30 | 803.40 | 859.80 | 902.80 | NA | 942.70 | NA | NA | NA | |
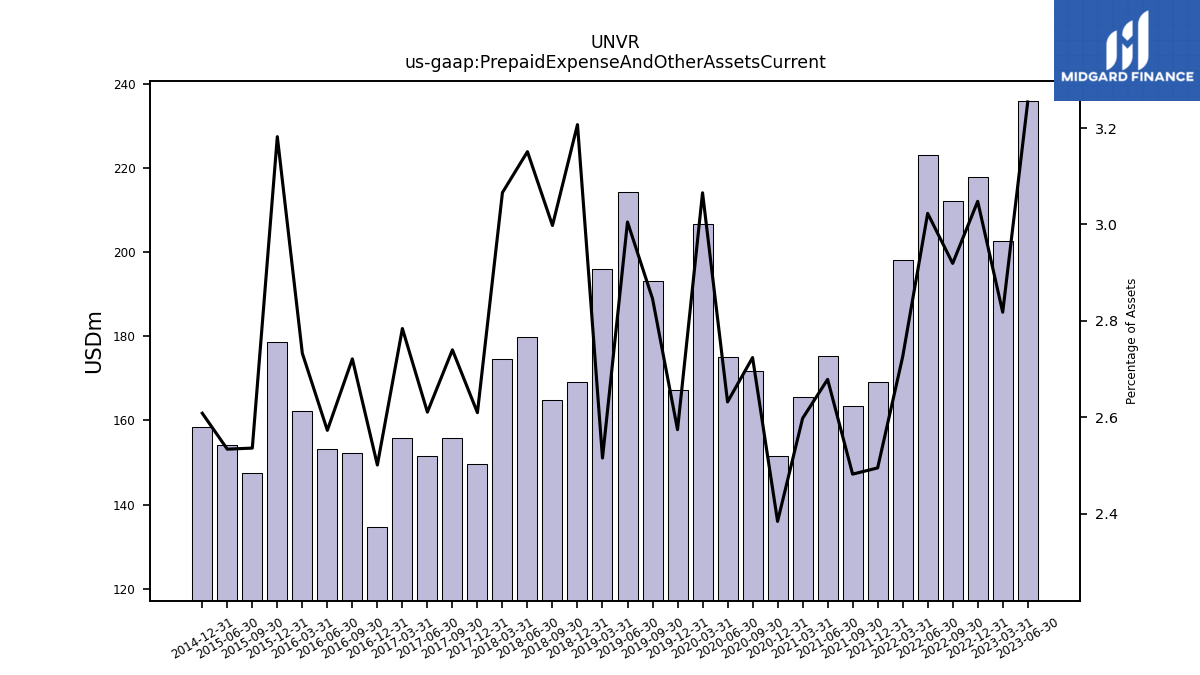
| Prepaid Expense And Other Assets Current | 236.00 | 202.70 | 217.80 | 212.20 | 223.00 | 198.20 | 169.10 | 163.50 | 175.40 | 165.50 | 151.50 | 171.80 | 175.00 | 206.60 | 167.20 | 193.10 | 214.30 | 195.90 | 169.10 | 164.80 | 179.90 | 174.60 | 149.60 | 155.90 | 151.60 | 155.80 | 134.80 | 152.30 | 153.20 | 162.20 | 178.60 | 147.60 | 154.10 | NA | 158.50 | NA | NA | NA |
| 2023-06-30 | 2023-03-31 | 2022-12-31 | 2022-09-30 | 2022-06-30 | 2022-03-31 | 2021-12-31 | 2021-09-30 | 2021-06-30 | 2021-03-31 | 2020-12-31 | 2020-09-30 | 2020-06-30 | 2020-03-31 | 2019-12-31 | 2019-09-30 | 2019-06-30 | 2019-03-31 | 2018-12-31 | 2018-09-30 | 2018-06-30 | 2018-03-31 | 2017-12-31 | 2017-09-30 | 2017-06-30 | 2017-03-31 | 2016-12-31 | 2016-09-30 | 2016-06-30 | 2016-03-31 | 2015-12-31 | 2015-09-30 | 2015-06-30 | 2015-03-31 | 2014-12-31 | 2014-09-30 | 2014-06-30 | 2014-03-31 | ||
|---|---|---|---|---|---|---|---|---|---|---|---|---|---|---|---|---|---|---|---|---|---|---|---|---|---|---|---|---|---|---|---|---|---|---|---|---|---|---|---|
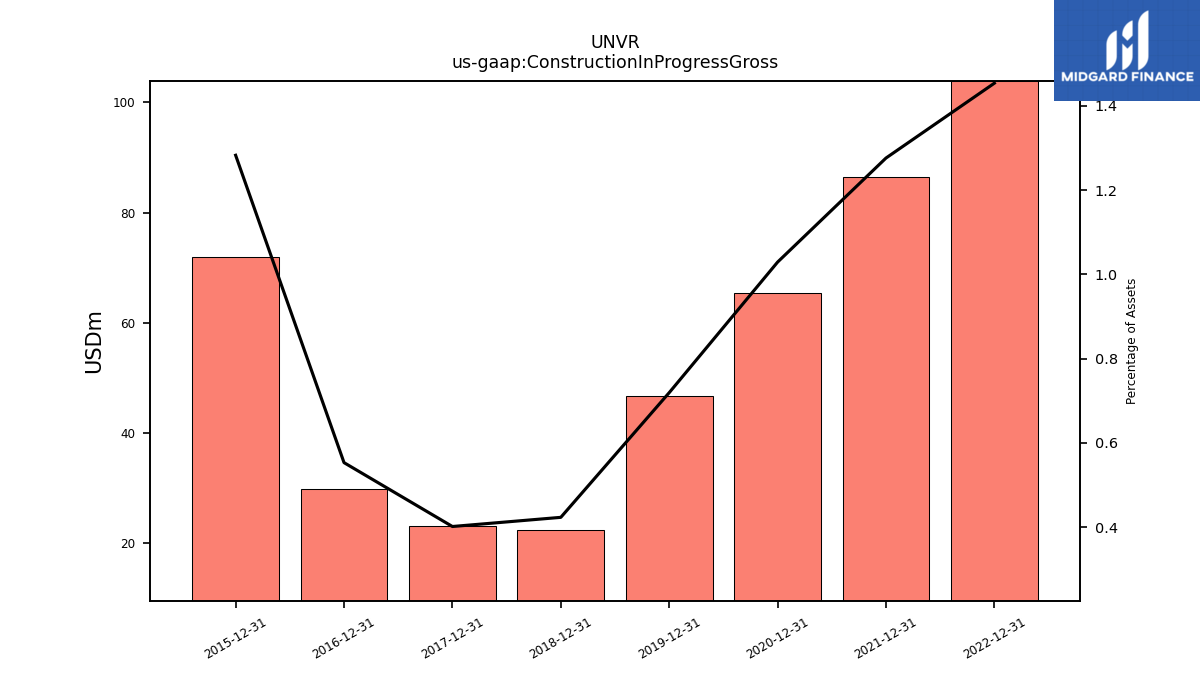
| Construction In Progress Gross | NA | NA | 103.90 | NA | NA | NA | 86.50 | NA | NA | NA | 65.40 | NA | NA | NA | 46.70 | NA | NA | NA | 22.30 | NA | NA | NA | 23.00 | NA | NA | NA | 29.80 | NA | NA | NA | 72.00 | NA | NA | NA | NA | NA | NA | NA | |
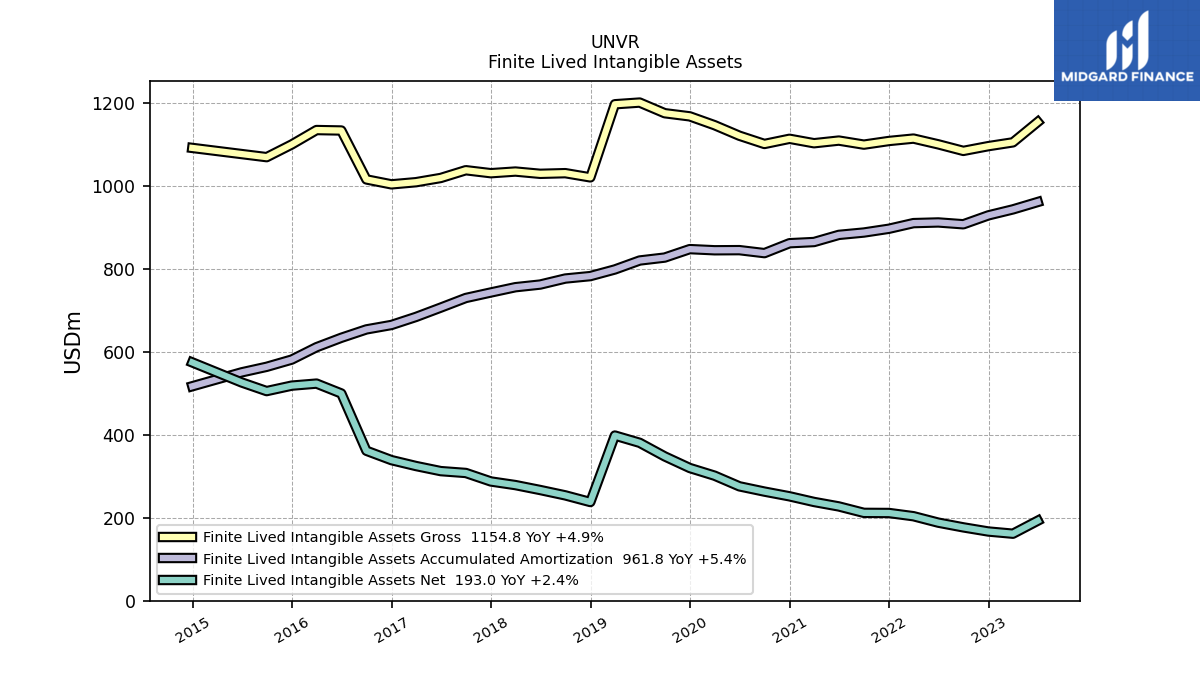
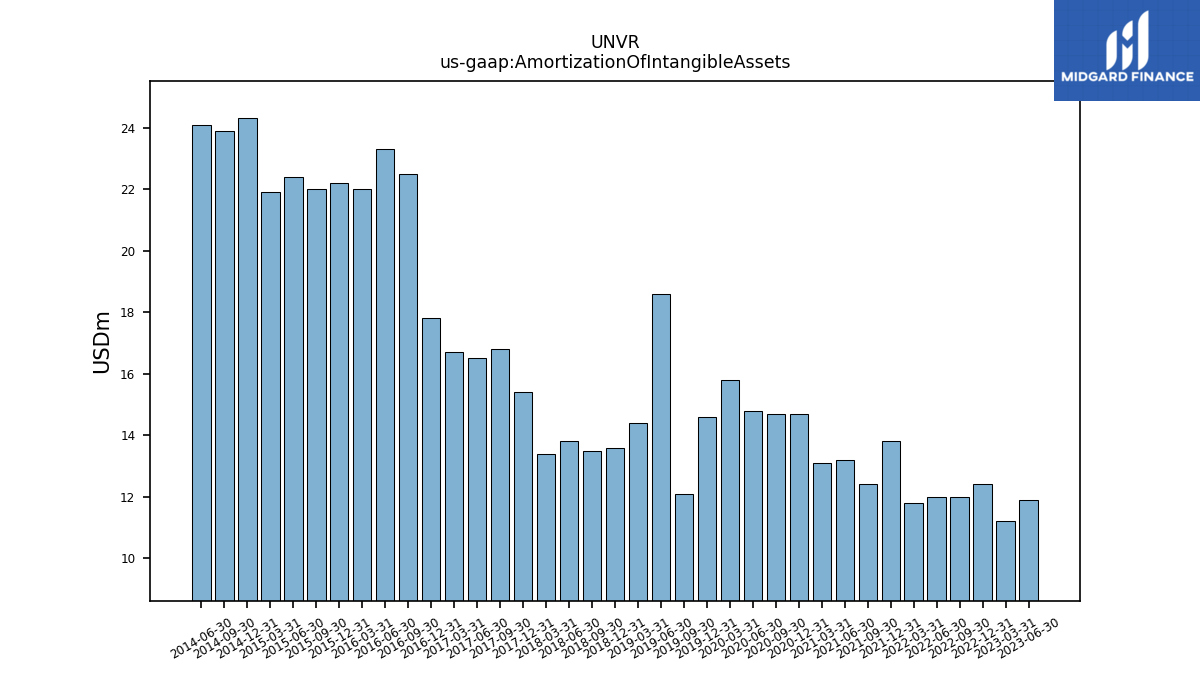
| Amortization Of Intangible Assets | 11.90 | 11.20 | 12.40 | 12.00 | 12.00 | 11.80 | 13.80 | 12.40 | 13.20 | 13.10 | 14.70 | 14.70 | 14.80 | 15.80 | 14.60 | 12.10 | 18.60 | 14.40 | 13.60 | 13.50 | 13.80 | 13.40 | 15.40 | 16.80 | 16.50 | 16.70 | 17.80 | 22.50 | 23.30 | 22.00 | 22.20 | 22.00 | 22.40 | 21.90 | 24.30 | 23.90 | 24.10 | NA | |
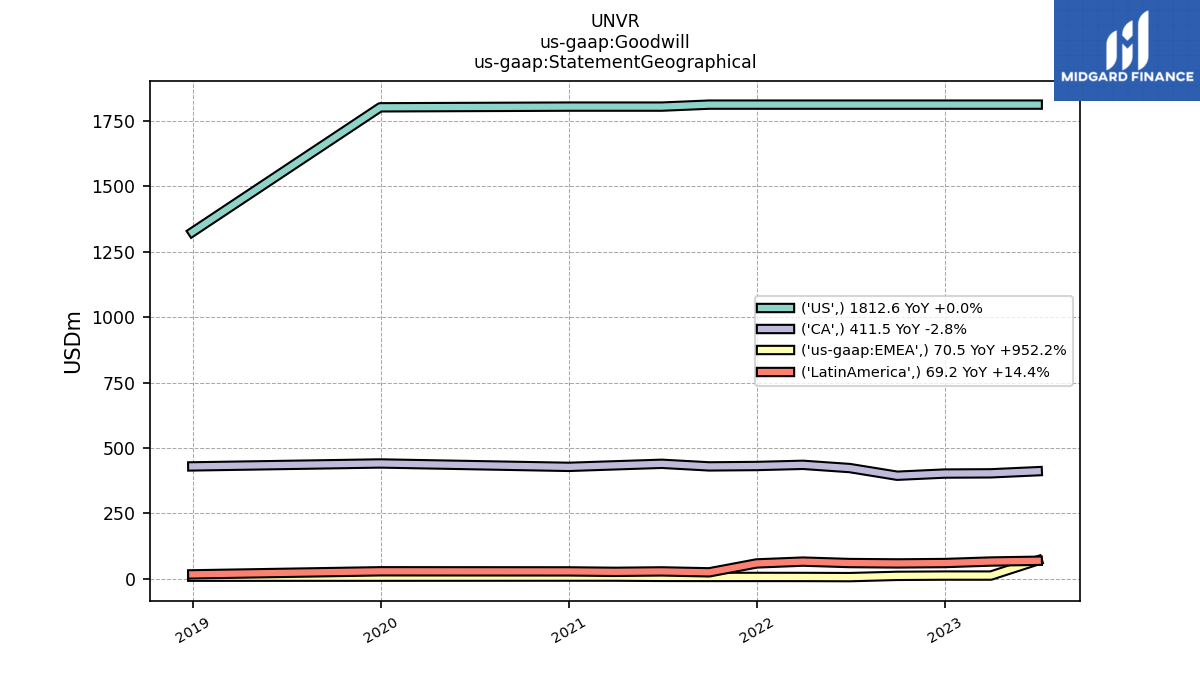
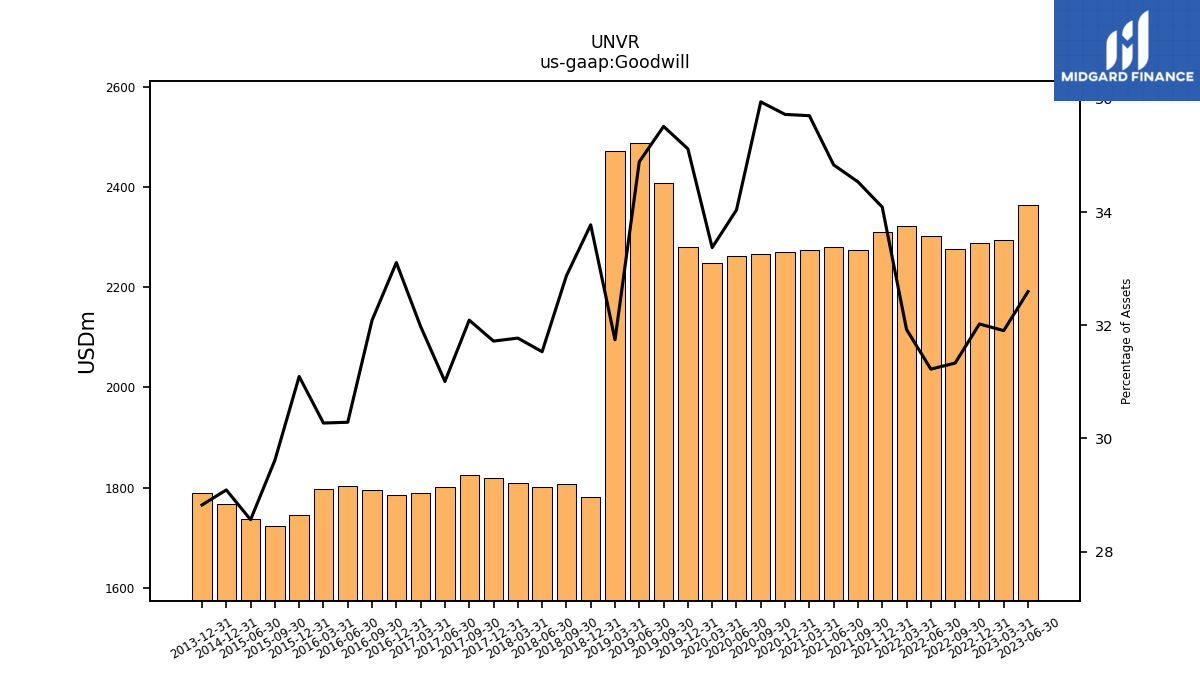
| Goodwill | 2363.80 | 2294.90 | 2288.20 | 2277.40 | 2303.30 | 2321.80 | 2310.40 | 2274.90 | 2281.00 | 2274.60 | 2270.40 | 2267.30 | 2263.20 | 2249.00 | 2280.80 | 2409.50 | 2488.00 | 2472.10 | 1780.70 | 1807.10 | 1800.20 | 1809.20 | 1818.40 | 1825.90 | 1800.50 | 1789.40 | 1784.40 | 1795.90 | 1803.30 | 1796.70 | 1745.10 | 1723.50 | 1737.10 | NA | 1767.60 | NA | NA | NA | |
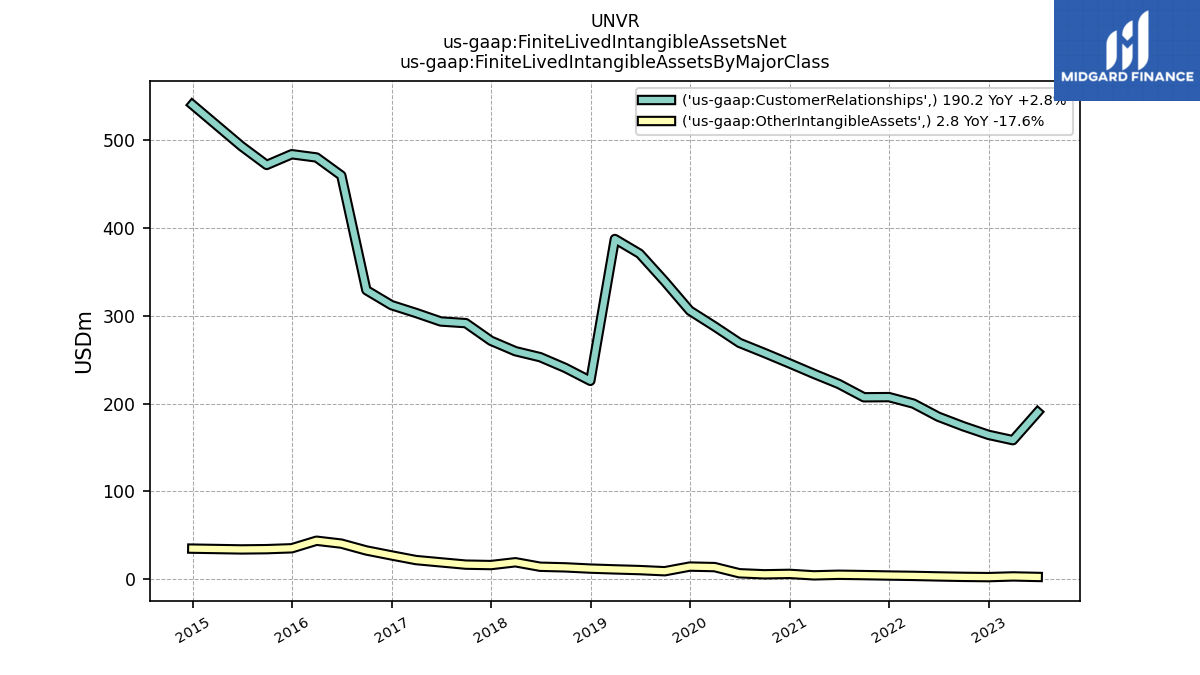
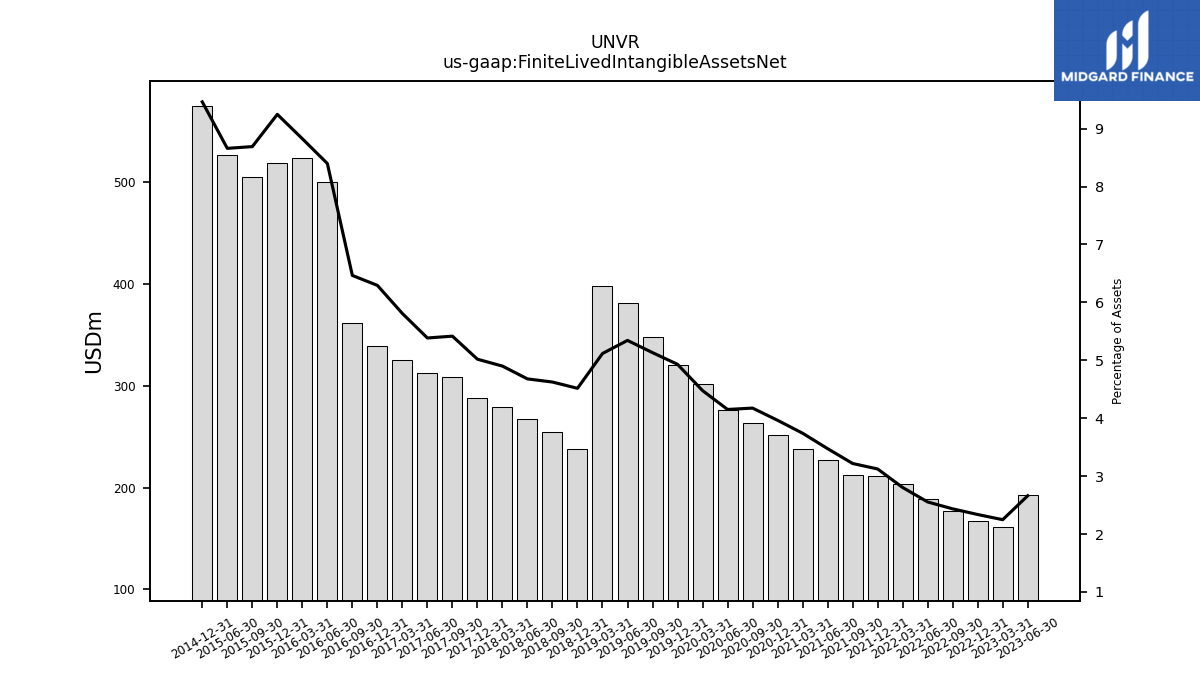
| Finite Lived Intangible Assets Net | 193.00 | 161.70 | 167.00 | 177.00 | 188.40 | 203.90 | 211.70 | 212.00 | 227.50 | 238.30 | 251.90 | 263.30 | 276.00 | 301.70 | 320.20 | 348.20 | 381.00 | 398.50 | 238.10 | 254.20 | 267.10 | 279.00 | 287.70 | 308.20 | 312.70 | 325.00 | 339.20 | 361.80 | 500.00 | 523.80 | 518.90 | 505.70 | 526.60 | NA | 574.90 | NA | NA | NA | |
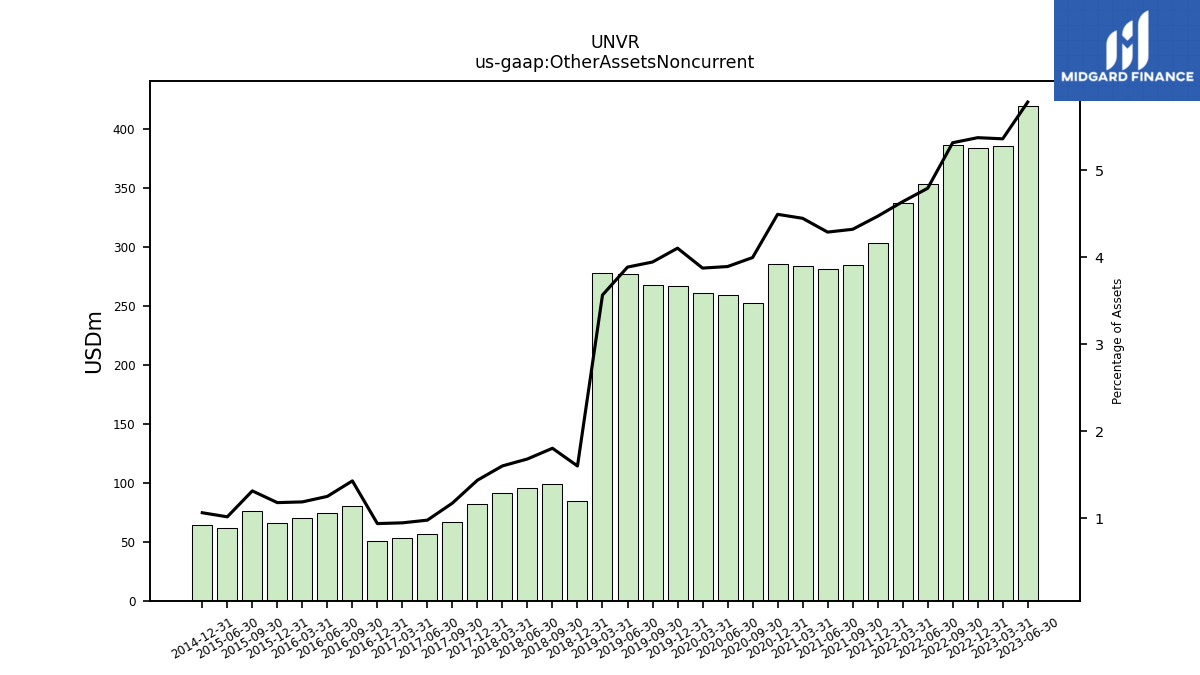
| Other Assets Noncurrent | 419.40 | 385.60 | 384.00 | 386.40 | 353.50 | 337.30 | 303.00 | 284.60 | 280.80 | 283.30 | 285.50 | 252.00 | 258.80 | 261.10 | 266.50 | 267.60 | 277.10 | 277.60 | 84.30 | 99.10 | 95.90 | 91.10 | 82.30 | 66.70 | 56.70 | 52.90 | 50.50 | 79.90 | 74.40 | 70.40 | 66.10 | 76.40 | 61.70 | NA | 64.50 | NA | NA | NA |
| 2023-06-30 | 2023-03-31 | 2022-12-31 | 2022-09-30 | 2022-06-30 | 2022-03-31 | 2021-12-31 | 2021-09-30 | 2021-06-30 | 2021-03-31 | 2020-12-31 | 2020-09-30 | 2020-06-30 | 2020-03-31 | 2019-12-31 | 2019-09-30 | 2019-06-30 | 2019-03-31 | 2018-12-31 | 2018-09-30 | 2018-06-30 | 2018-03-31 | 2017-12-31 | 2017-09-30 | 2017-06-30 | 2017-03-31 | 2016-12-31 | 2016-09-30 | 2016-06-30 | 2016-03-31 | 2015-12-31 | 2015-09-30 | 2015-06-30 | 2015-03-31 | 2014-12-31 | 2014-09-30 | 2014-06-30 | 2014-03-31 | ||
|---|---|---|---|---|---|---|---|---|---|---|---|---|---|---|---|---|---|---|---|---|---|---|---|---|---|---|---|---|---|---|---|---|---|---|---|---|---|---|---|
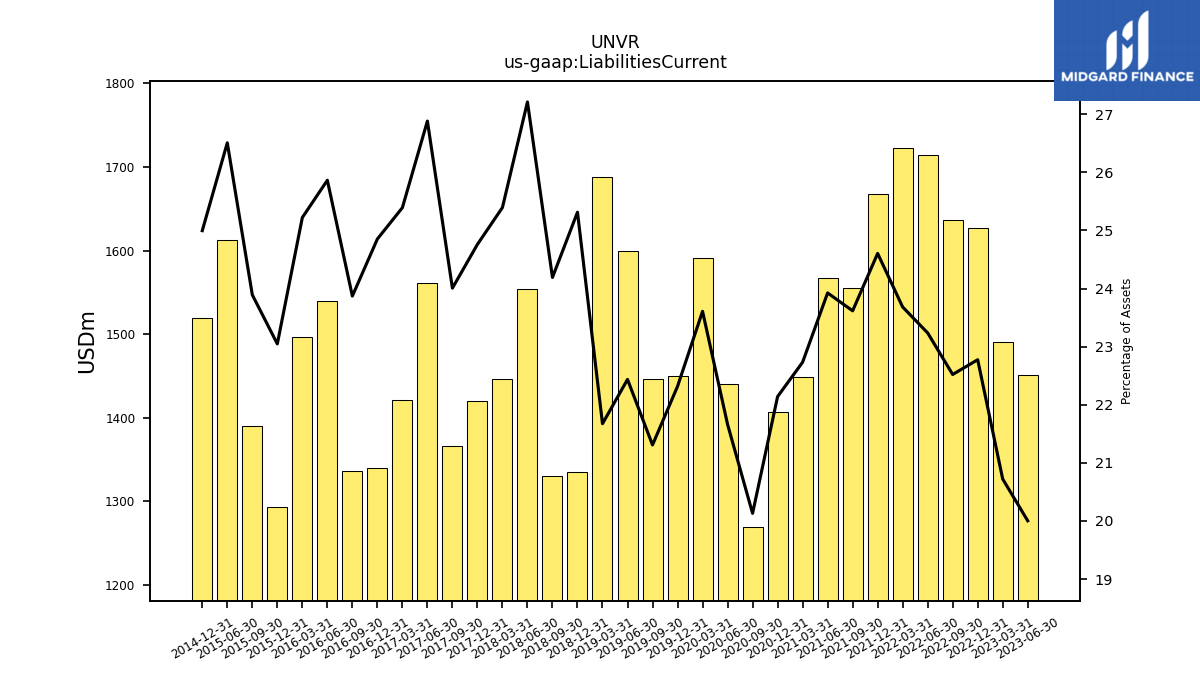
| Liabilities Current | 1450.60 | 1490.50 | 1627.40 | 1637.00 | 1714.00 | 1722.30 | 1667.60 | 1555.70 | 1566.60 | 1448.20 | 1407.00 | 1269.70 | 1440.40 | 1590.90 | 1449.40 | 1445.70 | 1599.90 | 1687.90 | 1334.60 | 1329.80 | 1553.50 | 1446.00 | 1419.40 | 1366.00 | 1561.00 | 1420.90 | 1339.50 | 1336.00 | 1540.00 | 1497.00 | 1293.50 | 1390.50 | 1612.10 | NA | 1518.90 | NA | NA | NA | |
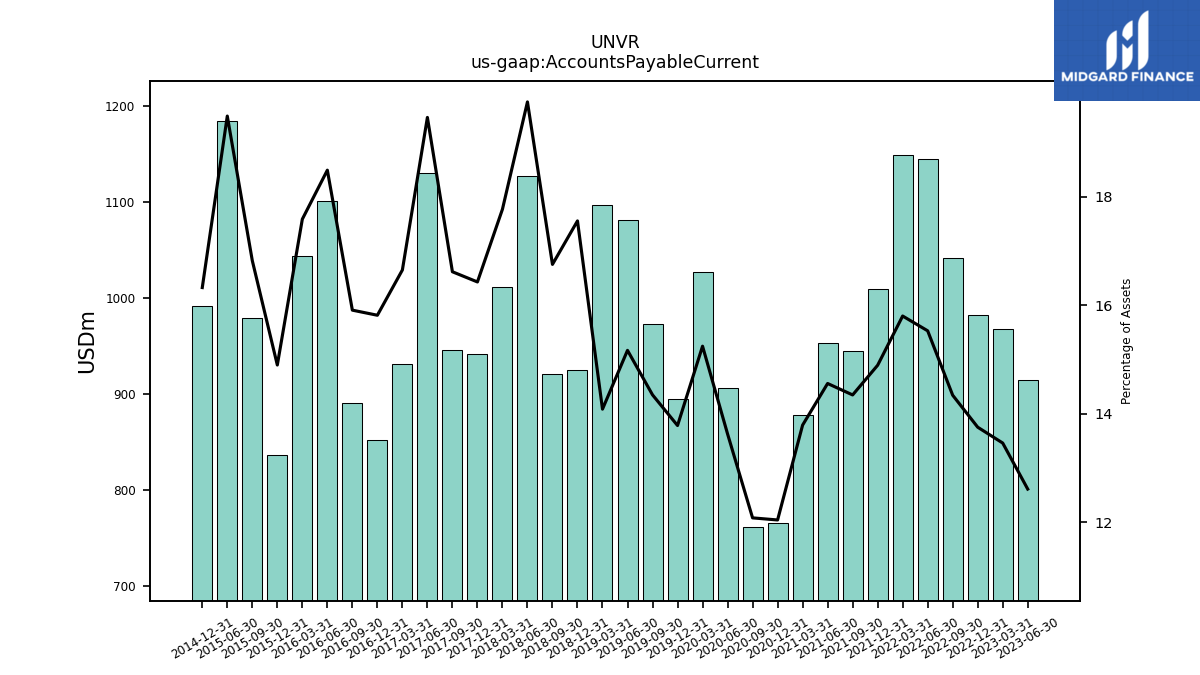
| Accounts Payable Current | 914.40 | 968.00 | 982.50 | 1042.30 | 1145.30 | 1149.00 | 1009.30 | 944.90 | 953.10 | 878.40 | 765.10 | 761.80 | 906.00 | 1027.20 | 895.00 | 973.30 | 1081.50 | 1096.70 | 925.40 | 920.80 | 1127.30 | 1011.70 | 941.70 | 945.40 | 1130.00 | 931.60 | 852.30 | 890.30 | 1100.80 | 1043.70 | 836.00 | 978.90 | 1185.00 | NA | 991.90 | NA | NA | NA | |
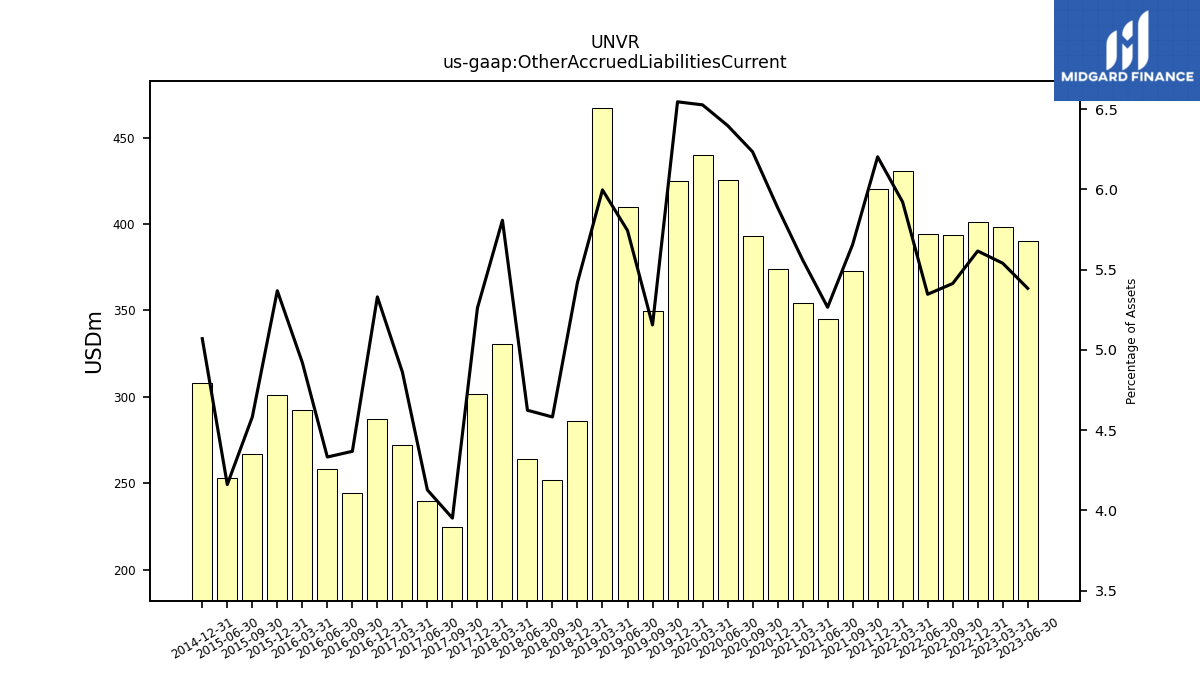
| Other Accrued Liabilities Current | 390.40 | 398.50 | 401.30 | 393.50 | 394.40 | 430.60 | 420.40 | 372.60 | 344.80 | 354.30 | 374.10 | 393.20 | 425.40 | 439.80 | 425.10 | 349.80 | 409.60 | 467.00 | 285.80 | 251.90 | 264.00 | 330.70 | 301.60 | 224.90 | 239.70 | 272.10 | 287.30 | 244.50 | 258.00 | 292.10 | 301.30 | 266.70 | 253.10 | NA | 308.10 | NA | NA | NA | |
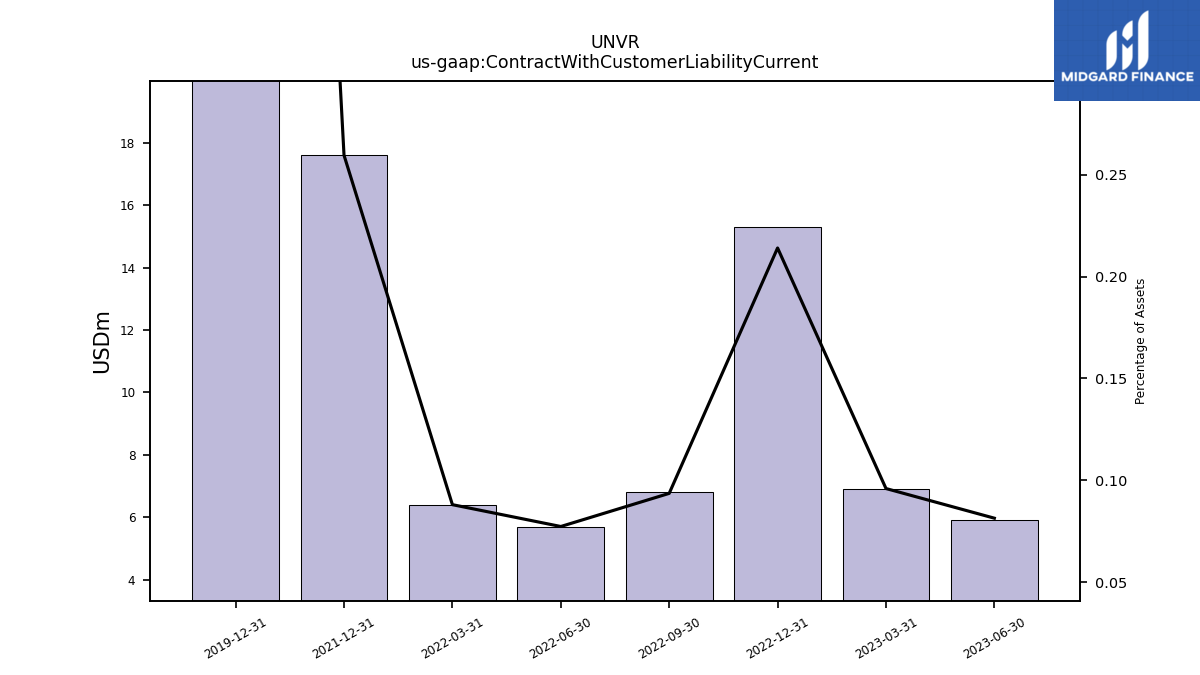
| Contract With Customer Liability Current | 5.90 | 6.90 | 15.30 | 6.80 | 5.70 | 6.40 | 17.60 | NA | NA | NA | NA | NA | NA | NA | 81.50 | NA | NA | NA | NA | NA | NA | NA | NA | NA | NA | NA | NA | NA | NA | NA | NA | NA | NA | NA | NA | NA | NA | NA |
| 2023-06-30 | 2023-03-31 | 2022-12-31 | 2022-09-30 | 2022-06-30 | 2022-03-31 | 2021-12-31 | 2021-09-30 | 2021-06-30 | 2021-03-31 | 2020-12-31 | 2020-09-30 | 2020-06-30 | 2020-03-31 | 2019-12-31 | 2019-09-30 | 2019-06-30 | 2019-03-31 | 2018-12-31 | 2018-09-30 | 2018-06-30 | 2018-03-31 | 2017-12-31 | 2017-09-30 | 2017-06-30 | 2017-03-31 | 2016-12-31 | 2016-09-30 | 2016-06-30 | 2016-03-31 | 2015-12-31 | 2015-09-30 | 2015-06-30 | 2015-03-31 | 2014-12-31 | 2014-09-30 | 2014-06-30 | 2014-03-31 | ||
|---|---|---|---|---|---|---|---|---|---|---|---|---|---|---|---|---|---|---|---|---|---|---|---|---|---|---|---|---|---|---|---|---|---|---|---|---|---|---|---|
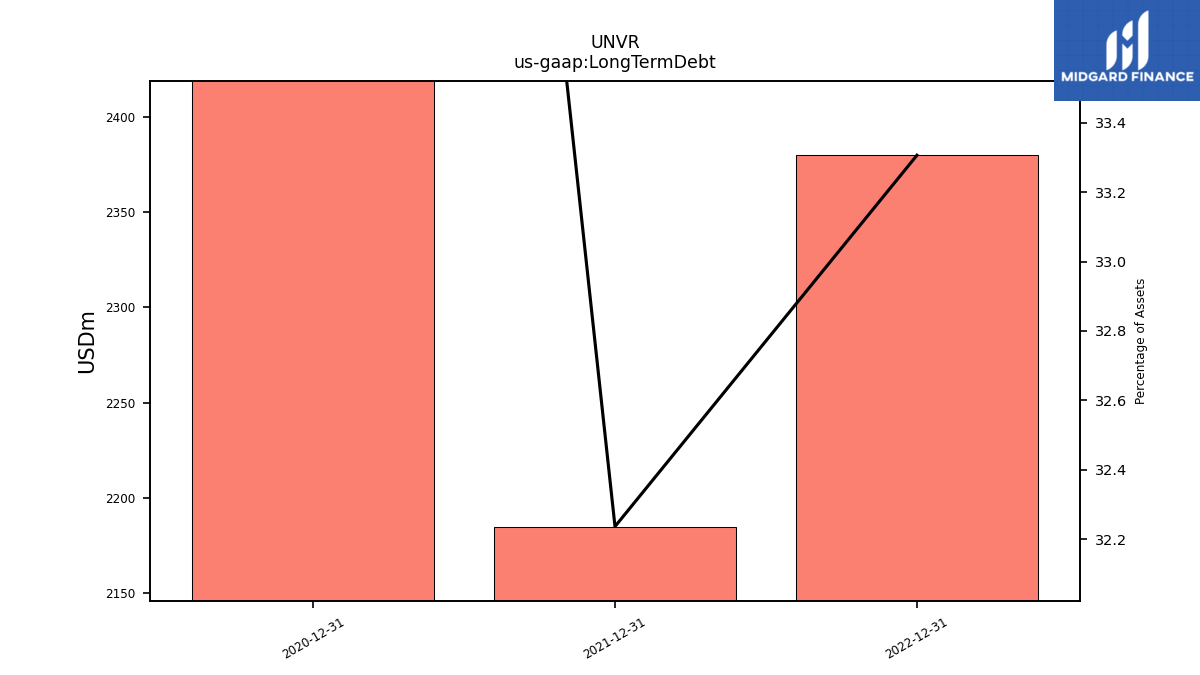
| Long Term Debt | NA | NA | 2380.00 | NA | NA | NA | 2184.90 | NA | NA | NA | 2559.10 | NA | NA | NA | NA | NA | NA | NA | NA | NA | NA | NA | NA | NA | NA | NA | NA | NA | NA | NA | NA | NA | NA | NA | NA | NA | NA | NA | |
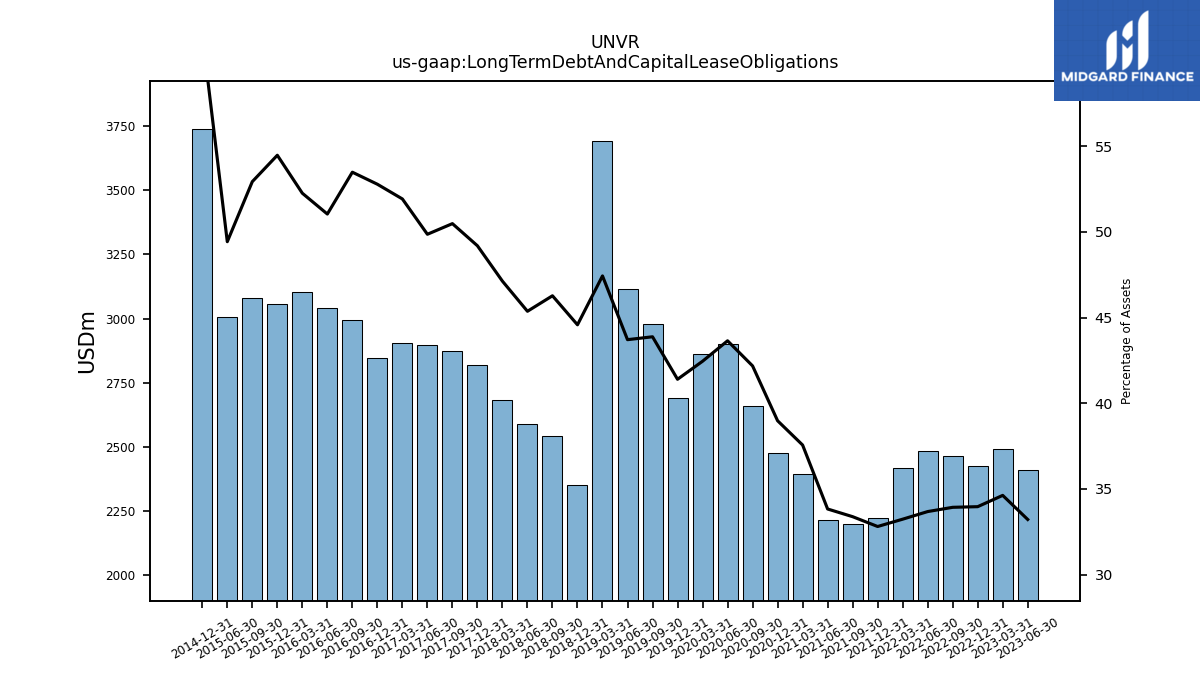
| Long Term Debt And Capital Lease Obligations | 2408.80 | 2490.40 | 2426.90 | 2466.00 | 2484.20 | 2416.90 | 2223.50 | 2198.80 | 2215.10 | 2393.00 | 2477.10 | 2660.40 | 2902.10 | 2860.80 | 2688.80 | 2977.10 | 3117.10 | 3694.00 | 2350.40 | 2543.70 | 2590.10 | 2683.50 | 2820.00 | 2872.60 | 2895.50 | 2905.70 | 2845.00 | 2993.60 | 3039.40 | 3101.80 | 3057.40 | 3080.90 | 3006.20 | NA | 3739.50 | NA | NA | NA | |
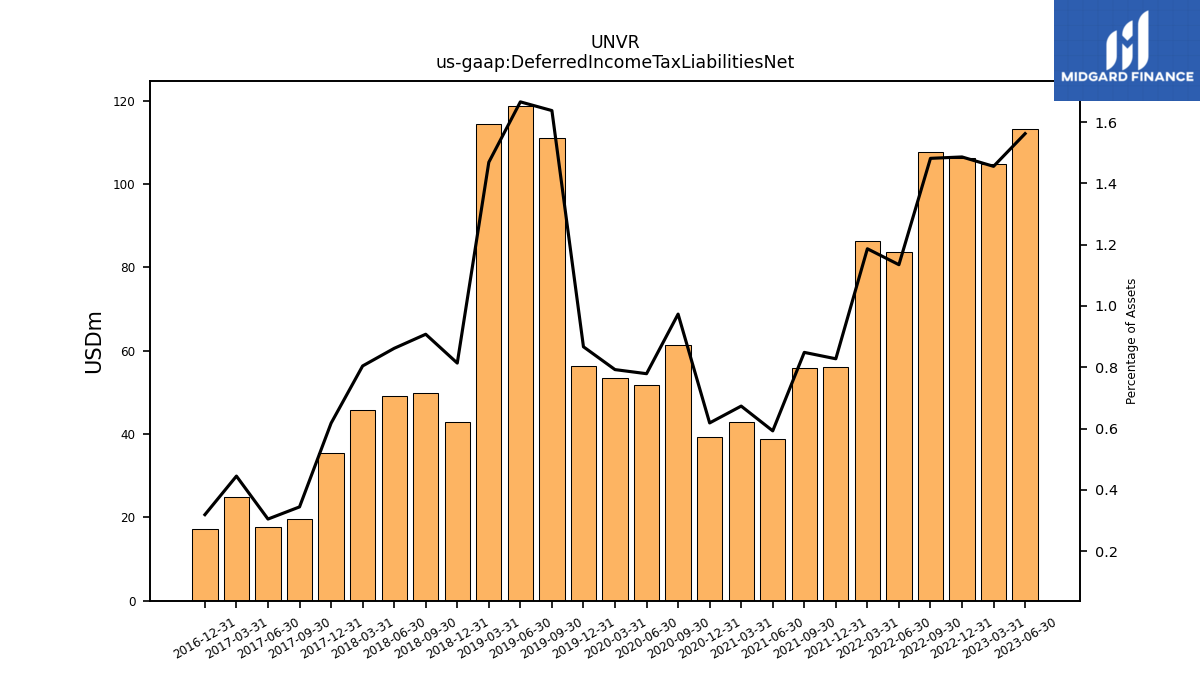
| Deferred Income Tax Liabilities Net | 113.30 | 104.70 | 106.20 | 107.70 | 83.70 | 86.30 | 56.10 | 55.90 | 38.80 | 42.90 | 39.30 | 61.40 | 51.80 | 53.40 | 56.30 | 111.10 | 118.80 | 114.40 | 42.90 | 49.90 | 49.20 | 45.80 | 35.40 | 19.60 | 17.70 | 24.90 | 17.20 | NA | NA | NA | NA | NA | NA | NA | NA | NA | NA | NA | |
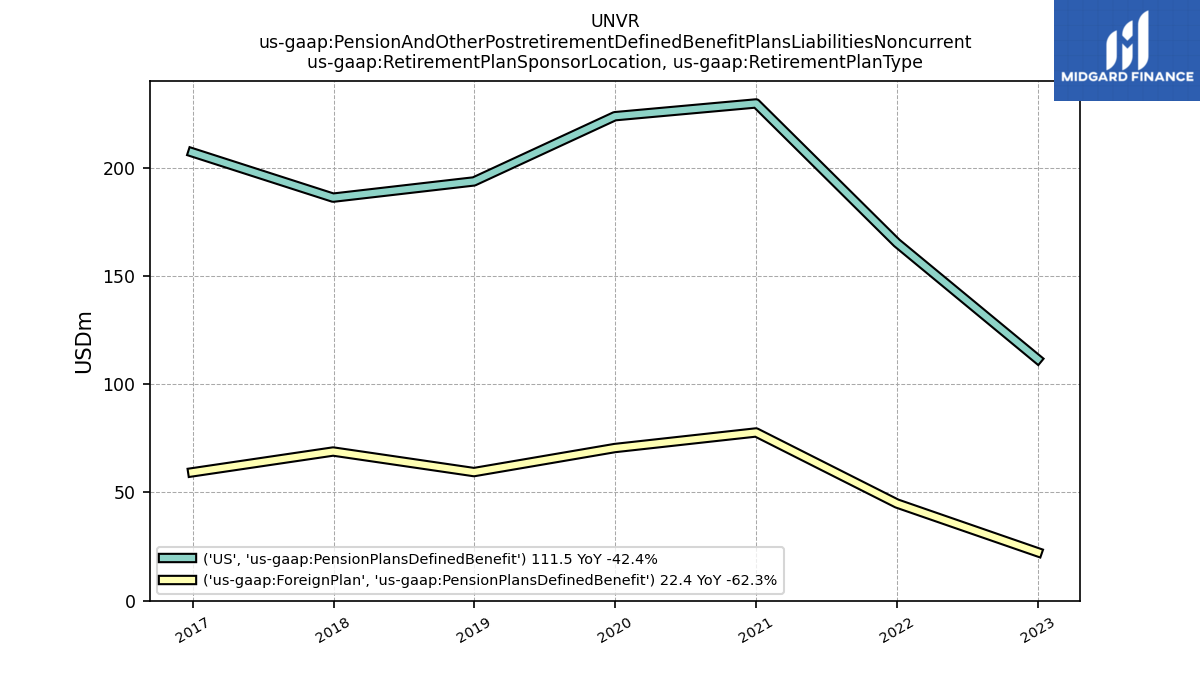
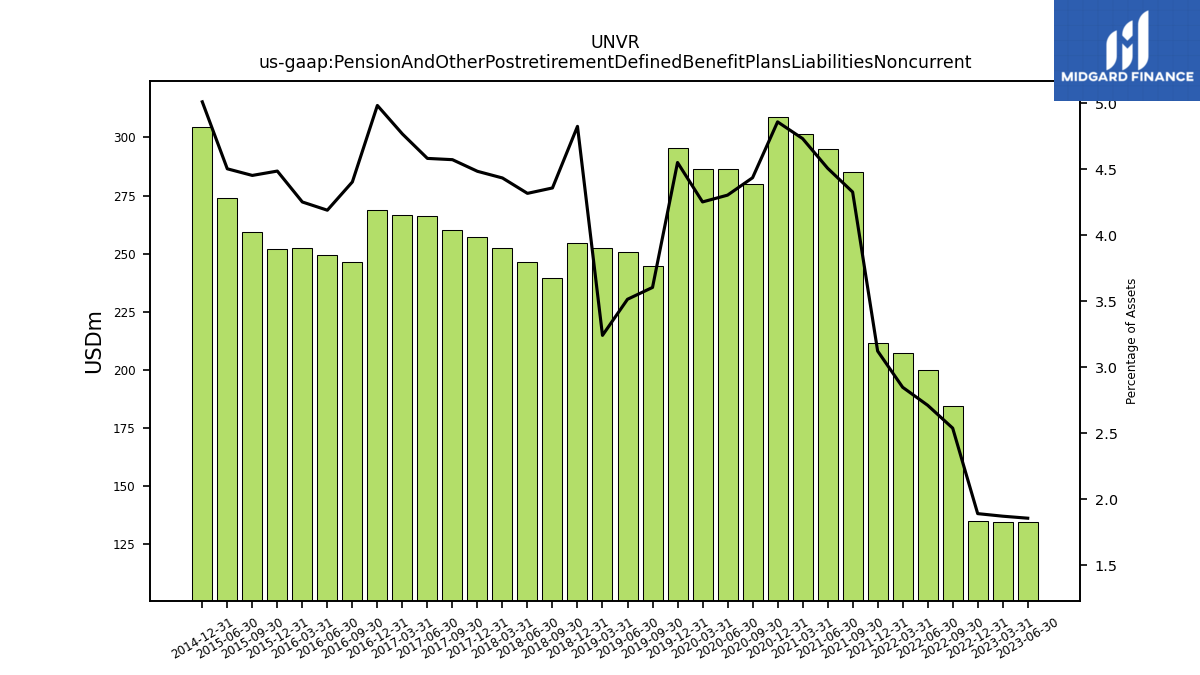
| Pension And Other Postretirement Defined Benefit Plans Liabilities Noncurrent | 134.70 | 134.70 | 135.20 | 184.60 | 200.10 | 207.20 | 211.70 | 285.10 | 295.20 | 301.50 | 308.80 | 279.80 | 286.20 | 286.60 | 295.60 | 244.60 | 250.70 | 252.50 | 254.40 | 239.60 | 246.50 | 252.50 | 257.10 | 260.20 | 266.10 | 266.80 | 268.60 | 246.50 | 249.50 | 252.40 | 251.80 | 259.20 | 273.90 | NA | 304.50 | NA | NA | NA | |
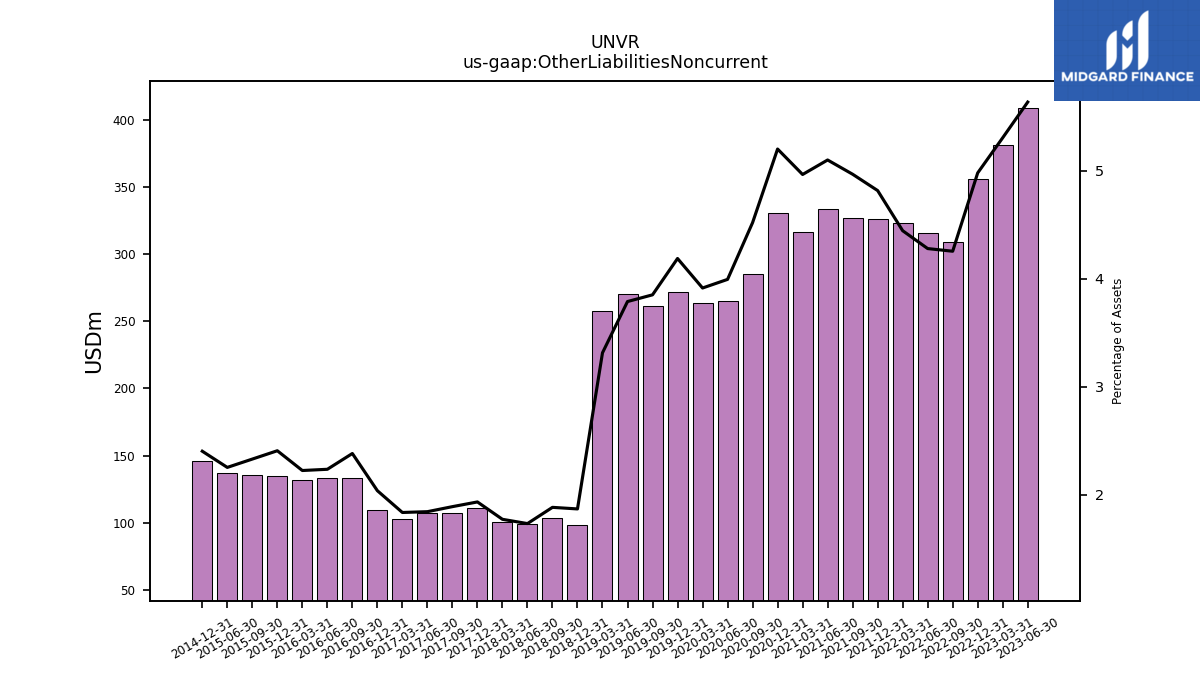
| Other Liabilities Noncurrent | 408.70 | 381.60 | 355.80 | 309.20 | 315.60 | 323.20 | 326.40 | 327.20 | 333.90 | 316.30 | 330.50 | 285.00 | 265.50 | 263.70 | 271.90 | 261.20 | 270.10 | 258.00 | 98.40 | 103.40 | 98.80 | 100.80 | 110.70 | 107.40 | 106.90 | 102.60 | 109.70 | 133.20 | 133.00 | 131.90 | 135.00 | 135.50 | 136.90 | NA | 145.90 | NA | NA | NA | |
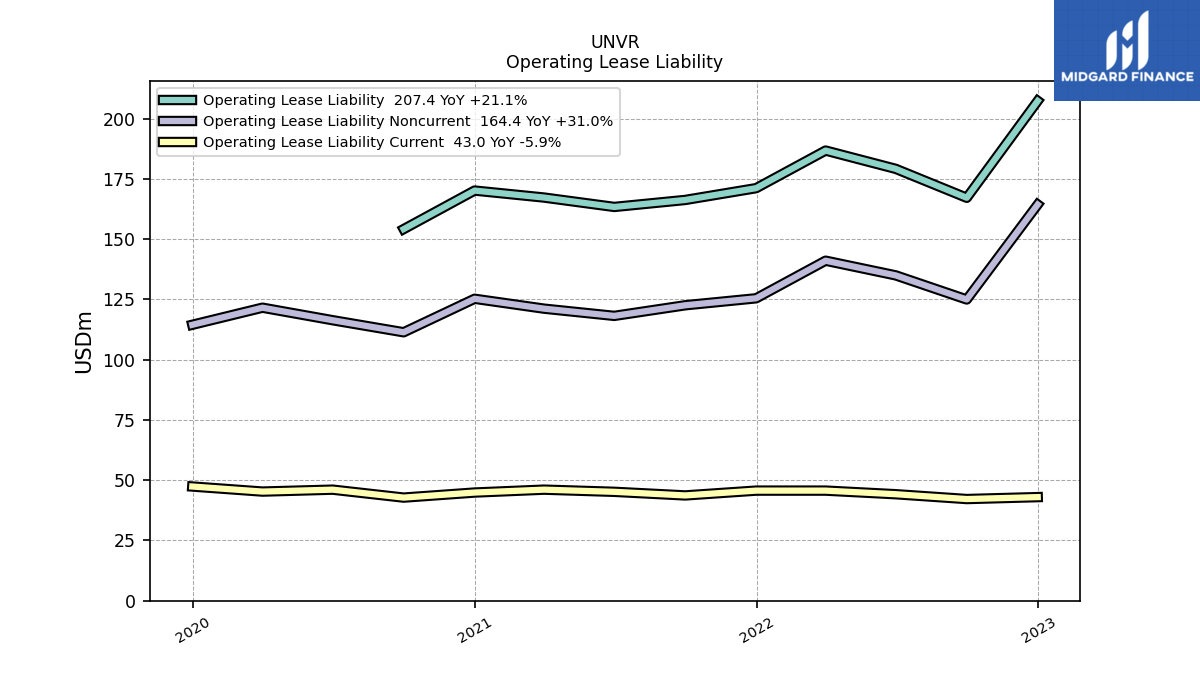
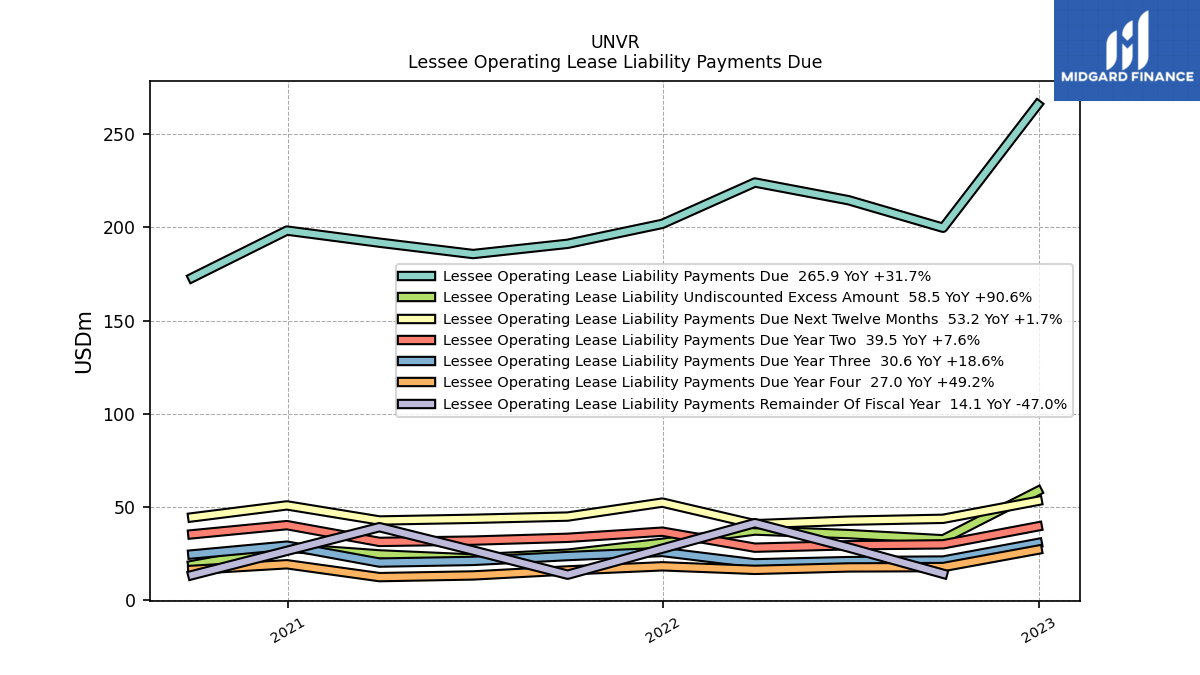
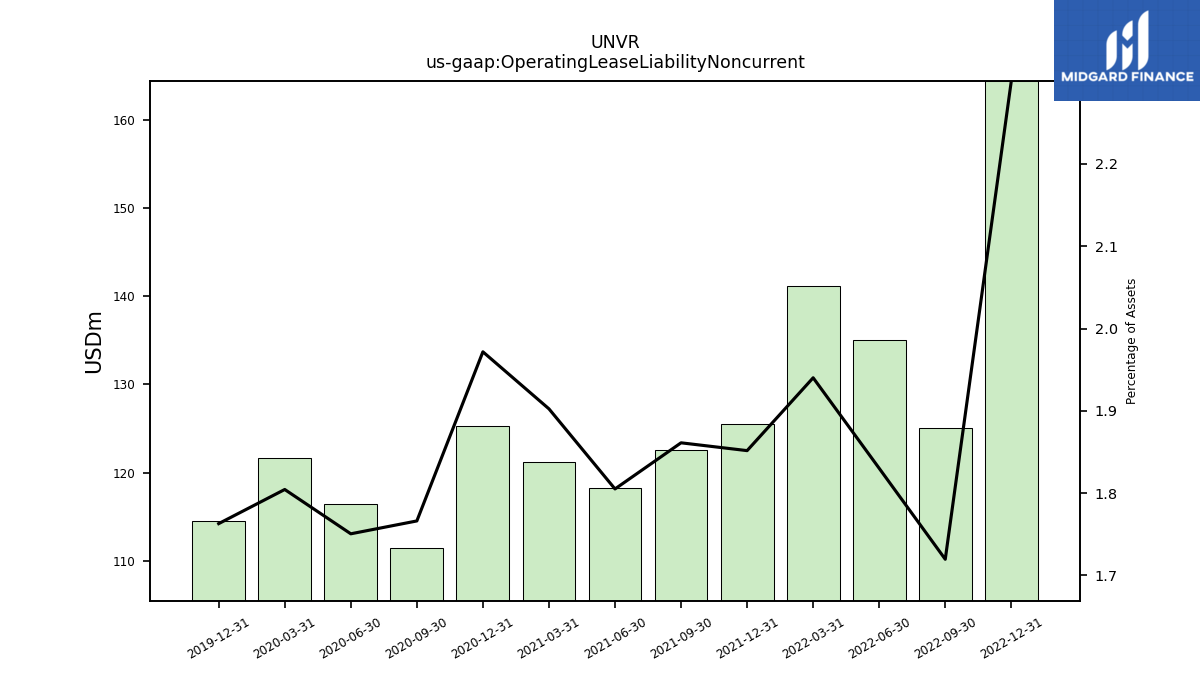
| Operating Lease Liability Noncurrent | NA | NA | 164.40 | 125.00 | 135.00 | 141.10 | 125.50 | 122.60 | 118.20 | 121.20 | 125.30 | 111.40 | 116.40 | 121.60 | 114.50 | NA | NA | NA | NA | NA | NA | NA | NA | NA | NA | NA | NA | NA | NA | NA | NA | NA | NA | NA | NA | NA | NA | NA |
| 2023-06-30 | 2023-03-31 | 2022-12-31 | 2022-09-30 | 2022-06-30 | 2022-03-31 | 2021-12-31 | 2021-09-30 | 2021-06-30 | 2021-03-31 | 2020-12-31 | 2020-09-30 | 2020-06-30 | 2020-03-31 | 2019-12-31 | 2019-09-30 | 2019-06-30 | 2019-03-31 | 2018-12-31 | 2018-09-30 | 2018-06-30 | 2018-03-31 | 2017-12-31 | 2017-09-30 | 2017-06-30 | 2017-03-31 | 2016-12-31 | 2016-09-30 | 2016-06-30 | 2016-03-31 | 2015-12-31 | 2015-09-30 | 2015-06-30 | 2015-03-31 | 2014-12-31 | 2014-09-30 | 2014-06-30 | 2014-03-31 | ||
|---|---|---|---|---|---|---|---|---|---|---|---|---|---|---|---|---|---|---|---|---|---|---|---|---|---|---|---|---|---|---|---|---|---|---|---|---|---|---|---|
| Stockholders Equity | 2736.00 | 2591.20 | 2494.20 | 2564.40 | 2579.00 | 2516.80 | 2292.50 | 2164.70 | 2098.60 | 1869.00 | 1792.30 | 1751.00 | 1703.20 | 1683.60 | 1732.80 | 1745.00 | 1774.50 | 1781.00 | 1191.70 | 1230.70 | 1171.00 | 1165.70 | 1090.10 | 1064.30 | 959.70 | 875.10 | 809.90 | 862.80 | 938.70 | 900.30 | 816.70 | 853.10 | 923.70 | NA | 248.10 | NA | NA | NA | |
| Common Stock Value | 1.70 | 1.70 | 1.70 | 1.70 | 1.70 | 1.70 | 1.70 | 1.70 | 1.70 | 1.70 | 1.70 | 1.70 | 1.70 | 1.70 | 1.70 | 1.70 | 1.70 | 1.70 | 1.40 | 1.40 | 1.40 | 1.40 | 1.40 | 1.40 | 1.40 | 1.40 | 1.40 | 1.40 | 1.40 | 1.40 | 1.40 | 1.40 | 1.40 | NA | NA | NA | NA | NA | |
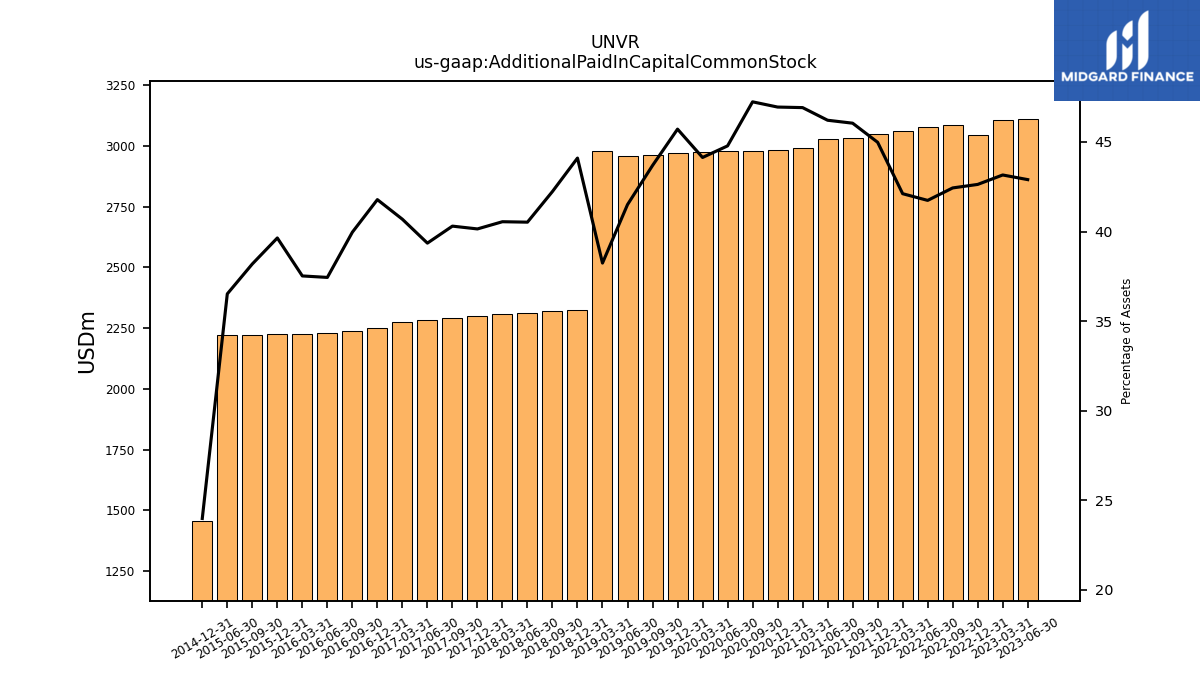
| Additional Paid In Capital Common Stock | 3110.80 | 3104.10 | 3046.00 | 3084.30 | 3078.70 | 3062.50 | 3048.50 | 3033.10 | 3025.80 | 2988.80 | 2983.30 | 2979.30 | 2977.30 | 2974.00 | 2968.90 | 2963.70 | 2959.40 | 2978.00 | 2325.00 | 2321.60 | 2313.40 | 2308.80 | 2301.30 | 2293.10 | 2285.10 | 2276.70 | 2251.80 | 2236.60 | 2229.20 | 2227.00 | 2224.70 | 2222.60 | 2221.00 | NA | 1457.60 | NA | NA | NA | |
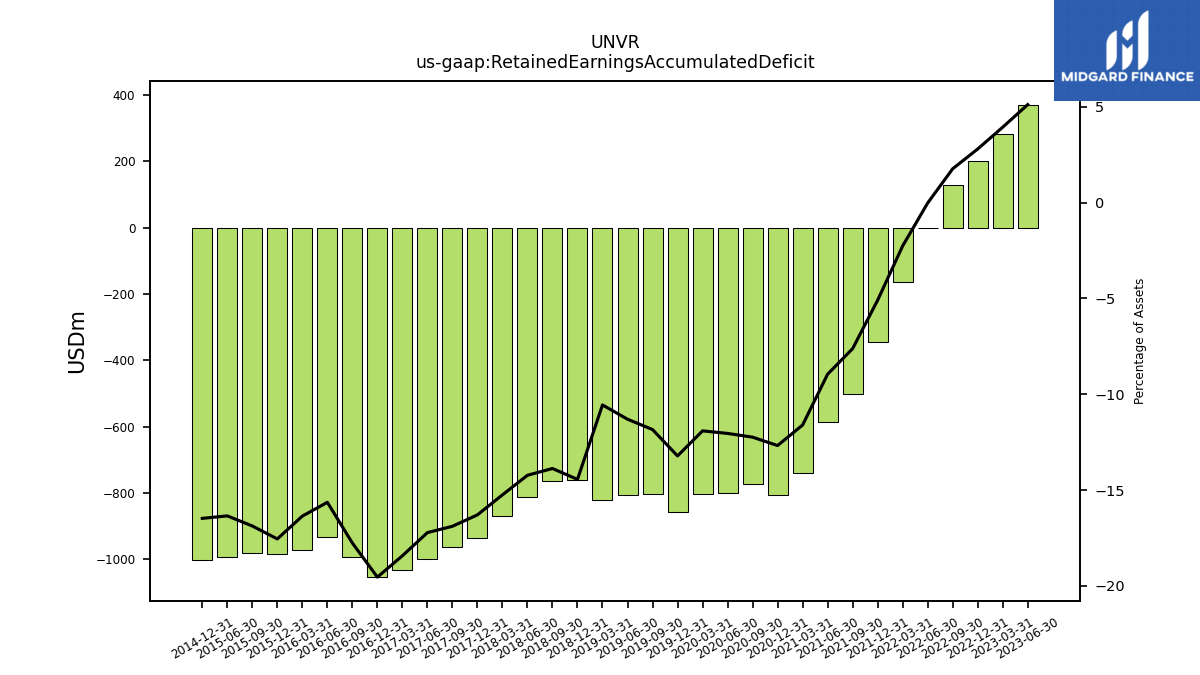
| Retained Earnings Accumulated Deficit | 371.20 | 283.40 | 200.30 | 128.70 | -1.30 | -164.20 | -345.00 | -501.80 | -586.20 | -739.40 | -805.60 | -771.90 | -800.80 | -802.60 | -858.50 | -803.40 | -805.90 | -822.20 | -761.50 | -762.70 | -812.30 | -868.40 | -934.10 | -961.10 | -1000.00 | -1031.30 | -1053.40 | -994.20 | -931.20 | -971.00 | -985.00 | -982.10 | -994.20 | NA | -1001.30 | NA | NA | NA | |
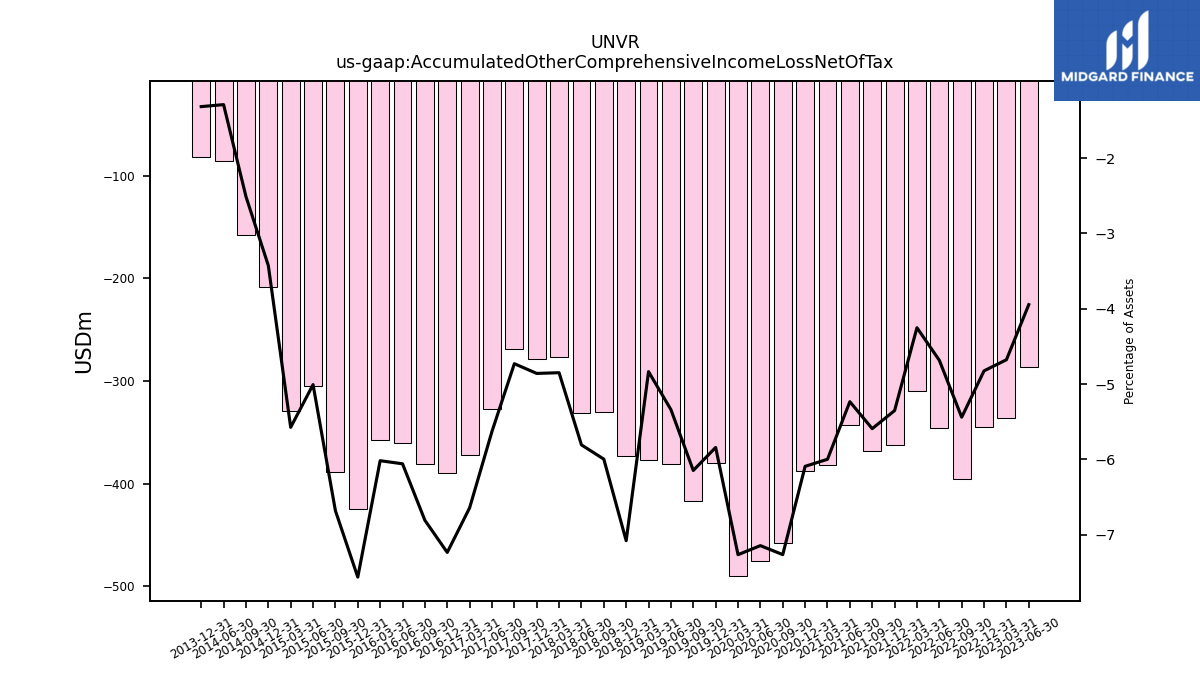
| Accumulated Other Comprehensive Income Loss Net Of Tax | -286.10 | -336.40 | -344.70 | -395.40 | -345.50 | -309.20 | -362.70 | -368.30 | -342.70 | -382.10 | -387.10 | -458.10 | -475.00 | -489.50 | -379.30 | -417.00 | -380.70 | -376.50 | -373.20 | -329.60 | -331.50 | -276.10 | -278.50 | -269.10 | -326.80 | -371.70 | -389.90 | -381.00 | -360.70 | -357.10 | -424.40 | -388.80 | -304.50 | -329.30 | -208.20 | -158.10 | -85.50 | NA | |
| Treasury Stock Value | NA | NA | NA | NA | 154.60 | 74.00 | 50.00 | NA | NA | NA | NA | NA | NA | NA | NA | NA | NA | NA | NA | NA | NA | NA | NA | NA | NA | NA | NA | NA | NA | NA | NA | NA | NA | NA | NA | NA | NA | NA | |
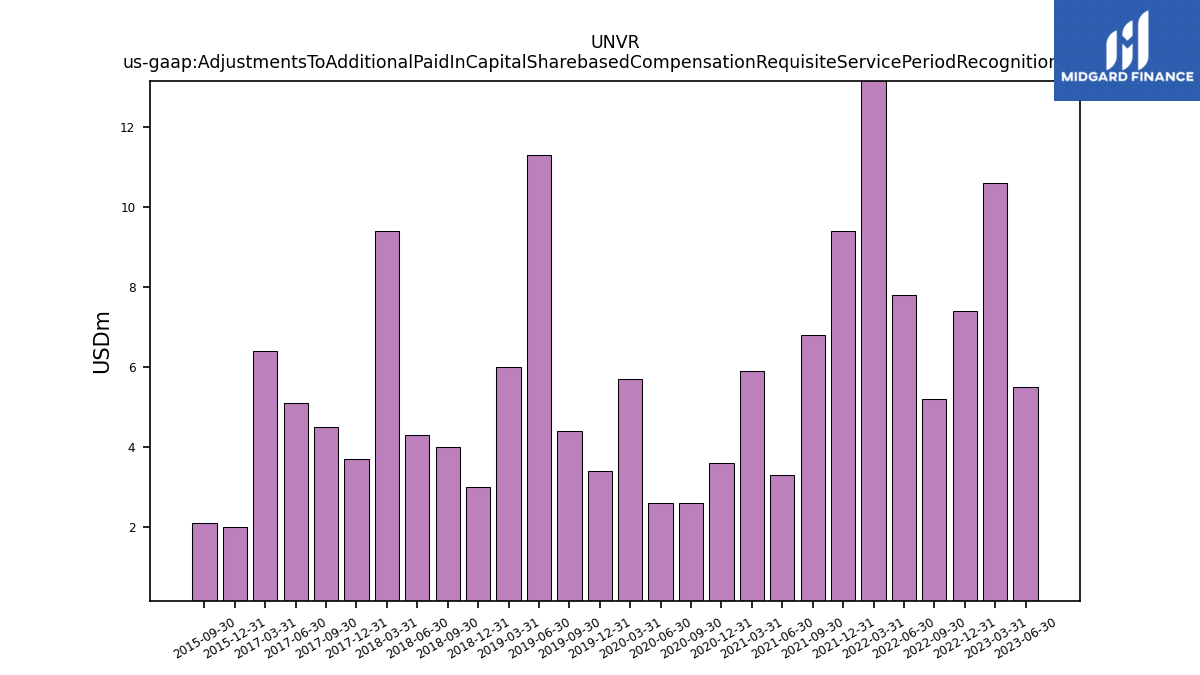
| Adjustments To Additional Paid In Capital Sharebased Compensation Requisite Service Period Recognition Value | 5.50 | 10.60 | 7.40 | 5.20 | 7.80 | 13.90 | 9.40 | 6.80 | 3.30 | 5.90 | 3.60 | 2.60 | 2.60 | 5.70 | 3.40 | 4.40 | 11.30 | 6.00 | 3.00 | 4.00 | 4.30 | 9.40 | 3.70 | 4.50 | 5.10 | 6.40 | NA | NA | NA | NA | 2.00 | 2.10 | NA | NA | NA | NA | NA | NA |
| 2023-06-30 | 2023-03-31 | 2022-12-31 | 2022-09-30 | 2022-06-30 | 2022-03-31 | 2021-12-31 | 2021-09-30 | 2021-06-30 | 2021-03-31 | 2020-12-31 | 2020-09-30 | 2020-06-30 | 2020-03-31 | 2019-12-31 | 2019-09-30 | 2019-06-30 | 2019-03-31 | 2018-12-31 | 2018-09-30 | 2018-06-30 | 2018-03-31 | 2017-12-31 | 2017-09-30 | 2017-06-30 | 2017-03-31 | 2016-12-31 | 2016-09-30 | 2016-06-30 | 2016-03-31 | 2015-12-31 | 2015-09-30 | 2015-06-30 | 2015-03-31 | 2014-12-31 | 2014-09-30 | 2014-06-30 | 2014-03-31 | ||
|---|---|---|---|---|---|---|---|---|---|---|---|---|---|---|---|---|---|---|---|---|---|---|---|---|---|---|---|---|---|---|---|---|---|---|---|---|---|---|---|
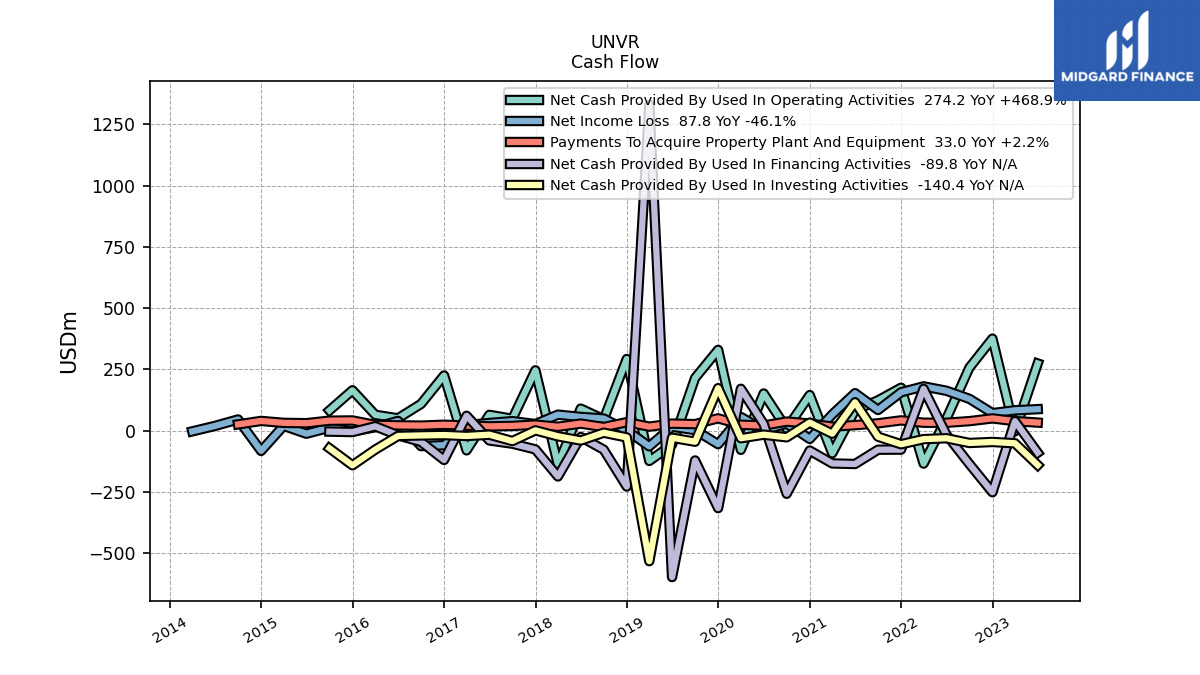
| Net Cash Provided By Used In Operating Activities | 274.20 | -2.90 | 375.60 | 257.00 | 48.20 | -134.40 | 175.20 | 123.70 | 83.70 | -92.30 | 145.30 | 8.10 | 151.70 | -78.20 | 329.70 | 214.70 | -57.00 | -123.50 | 292.50 | 46.40 | 90.00 | -139.00 | 246.30 | 48.30 | 64.60 | -80.30 | 225.40 | 109.10 | 50.40 | 64.70 | 164.80 | 82.60 | NA | NA | NA | NA | NA | NA | |
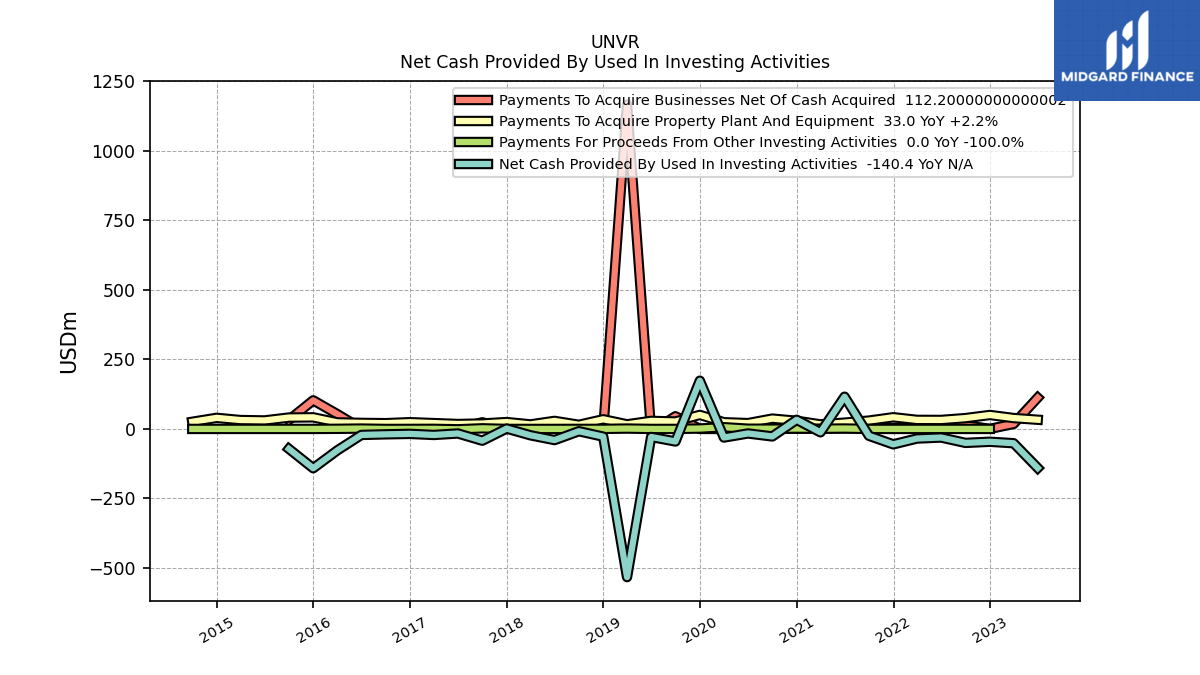
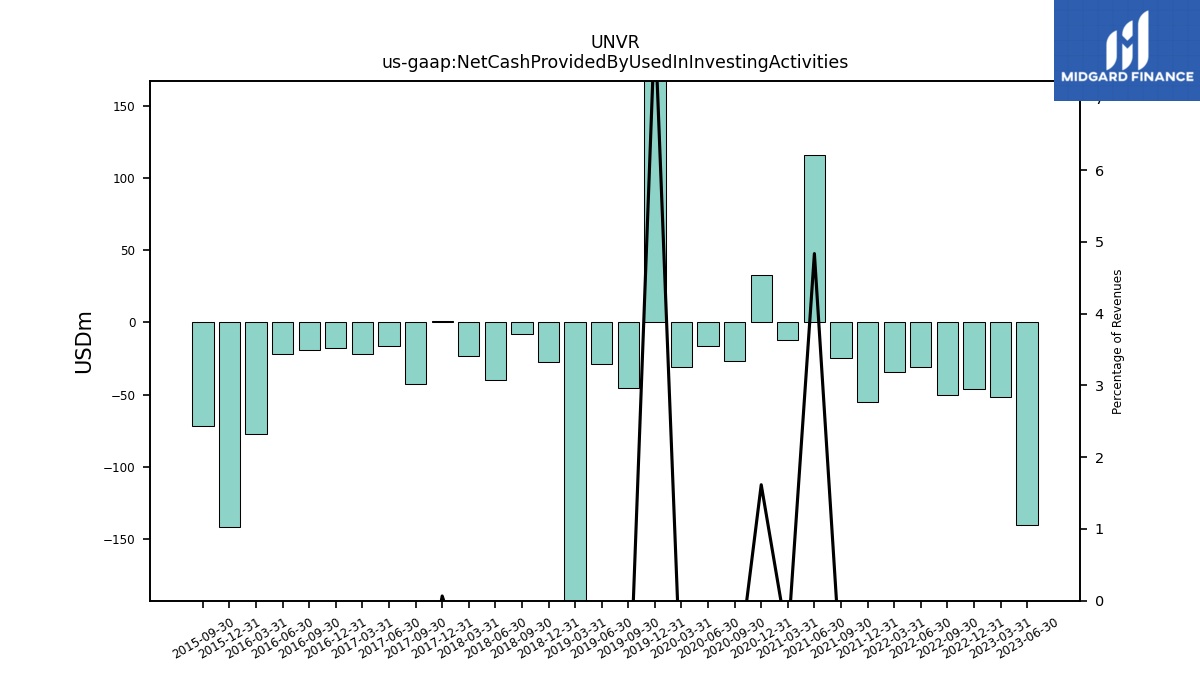
| Net Cash Provided By Used In Investing Activities | -140.40 | -51.40 | -46.10 | -50.20 | -30.90 | -34.50 | -55.40 | -24.60 | 115.80 | -12.20 | 32.90 | -27.00 | -16.30 | -30.90 | 173.40 | -45.10 | -28.80 | -532.60 | -27.70 | -8.30 | -40.10 | -22.90 | 1.30 | -42.30 | -16.40 | -21.70 | -17.80 | -19.40 | -21.60 | -77.20 | -141.30 | -71.60 | NA | NA | NA | NA | NA | NA | |
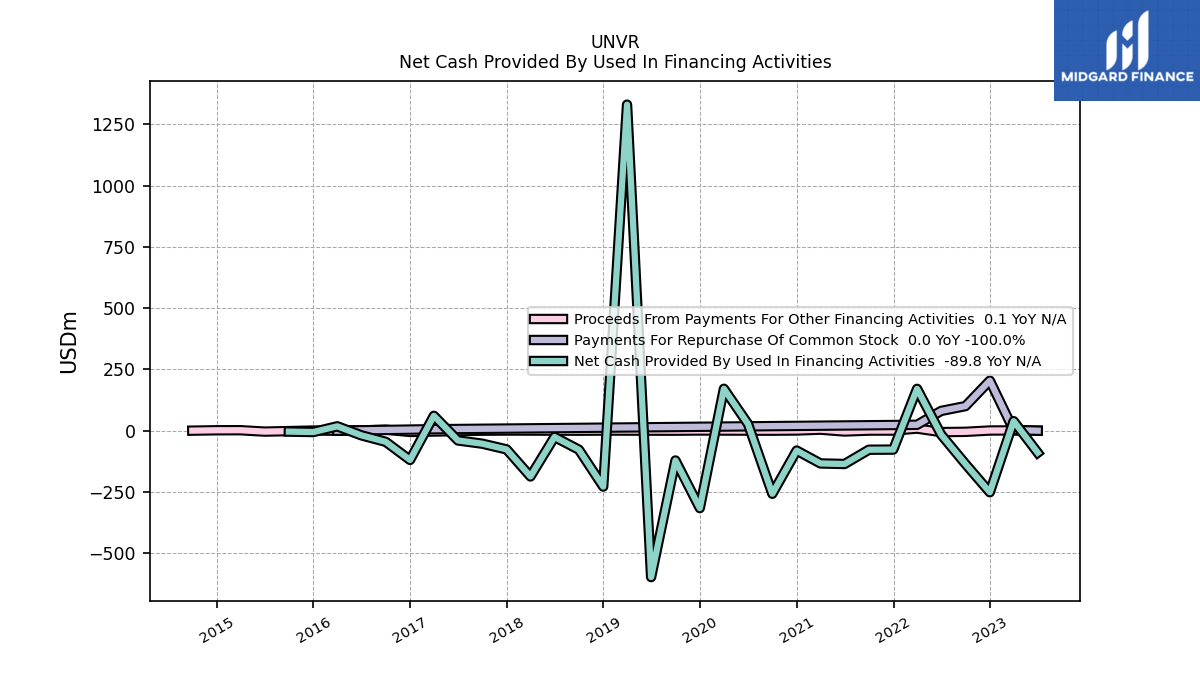
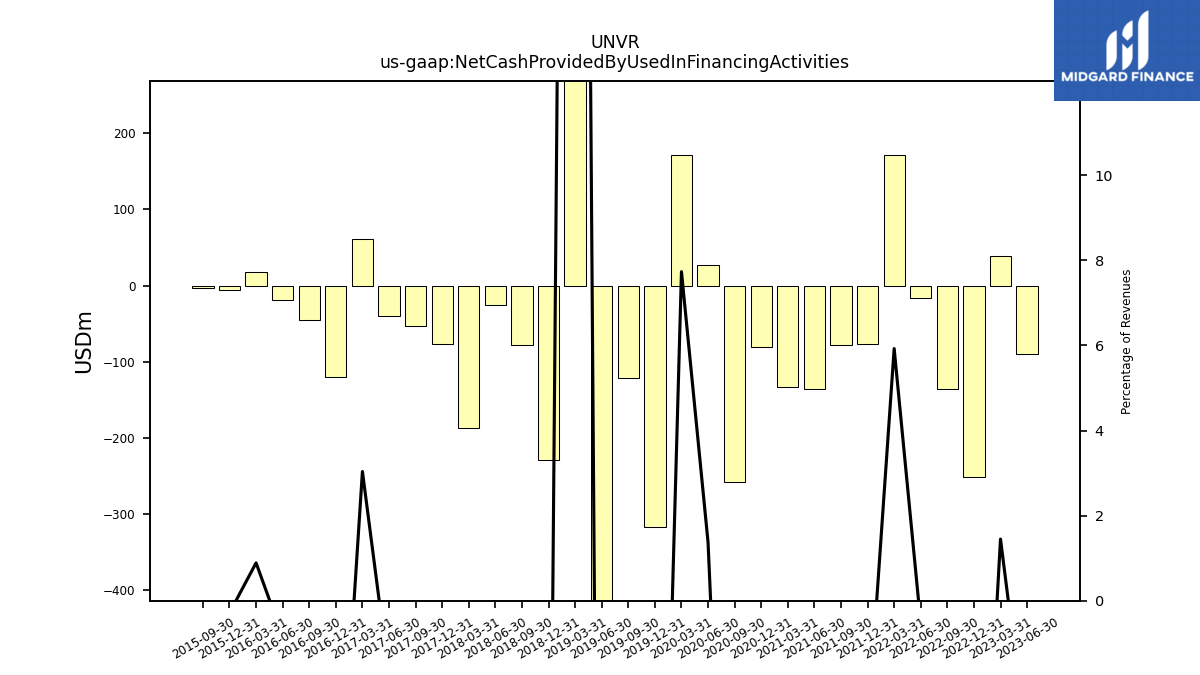
| Net Cash Provided By Used In Financing Activities | -89.80 | 38.90 | -251.40 | -136.00 | -16.10 | 170.80 | -77.20 | -77.70 | -136.00 | -133.70 | -81.10 | -257.50 | 27.60 | 171.00 | -316.10 | -121.60 | -597.60 | 1330.50 | -228.20 | -77.60 | -25.70 | -186.80 | -76.40 | -53.10 | -39.90 | 60.70 | -119.50 | -45.40 | -19.00 | 17.80 | -5.60 | -3.80 | NA | NA | NA | NA | NA | NA |
| 2023-06-30 | 2023-03-31 | 2022-12-31 | 2022-09-30 | 2022-06-30 | 2022-03-31 | 2021-12-31 | 2021-09-30 | 2021-06-30 | 2021-03-31 | 2020-12-31 | 2020-09-30 | 2020-06-30 | 2020-03-31 | 2019-12-31 | 2019-09-30 | 2019-06-30 | 2019-03-31 | 2018-12-31 | 2018-09-30 | 2018-06-30 | 2018-03-31 | 2017-12-31 | 2017-09-30 | 2017-06-30 | 2017-03-31 | 2016-12-31 | 2016-09-30 | 2016-06-30 | 2016-03-31 | 2015-12-31 | 2015-09-30 | 2015-06-30 | 2015-03-31 | 2014-12-31 | 2014-09-30 | 2014-06-30 | 2014-03-31 | ||
|---|---|---|---|---|---|---|---|---|---|---|---|---|---|---|---|---|---|---|---|---|---|---|---|---|---|---|---|---|---|---|---|---|---|---|---|---|---|---|---|
| Net Cash Provided By Used In Operating Activities | 274.20 | -2.90 | 375.60 | 257.00 | 48.20 | -134.40 | 175.20 | 123.70 | 83.70 | -92.30 | 145.30 | 8.10 | 151.70 | -78.20 | 329.70 | 214.70 | -57.00 | -123.50 | 292.50 | 46.40 | 90.00 | -139.00 | 246.30 | 48.30 | 64.60 | -80.30 | 225.40 | 109.10 | 50.40 | 64.70 | 164.80 | 82.60 | NA | NA | NA | NA | NA | NA | |
| Net Income Loss | 87.80 | 83.10 | 71.60 | 130.00 | 162.90 | 180.80 | 156.80 | 84.40 | 153.20 | 66.20 | -33.70 | 28.90 | 1.80 | 55.90 | -55.10 | 2.50 | 16.30 | -63.90 | 1.20 | 49.60 | 56.10 | 65.40 | 27.00 | 38.90 | 31.30 | 22.60 | -59.20 | -63.00 | 39.80 | 14.00 | -2.90 | 12.10 | -12.40 | 19.70 | -82.60 | 45.80 | 19.50 | -2.80 | |
| Depreciation Depletion And Amortization | 45.80 | 43.60 | 46.20 | 44.80 | 44.20 | 44.70 | 46.90 | 49.10 | 50.50 | 56.90 | 53.90 | 56.30 | 55.20 | 57.50 | 55.10 | 53.70 | 58.30 | 47.60 | 45.00 | 45.00 | 44.70 | 44.80 | 47.90 | 49.30 | 50.60 | 52.60 | 56.20 | 64.90 | 61.30 | 55.50 | 54.70 | 56.30 | 60.10 | 53.90 | 62.70 | 57.80 | NA | NA | |
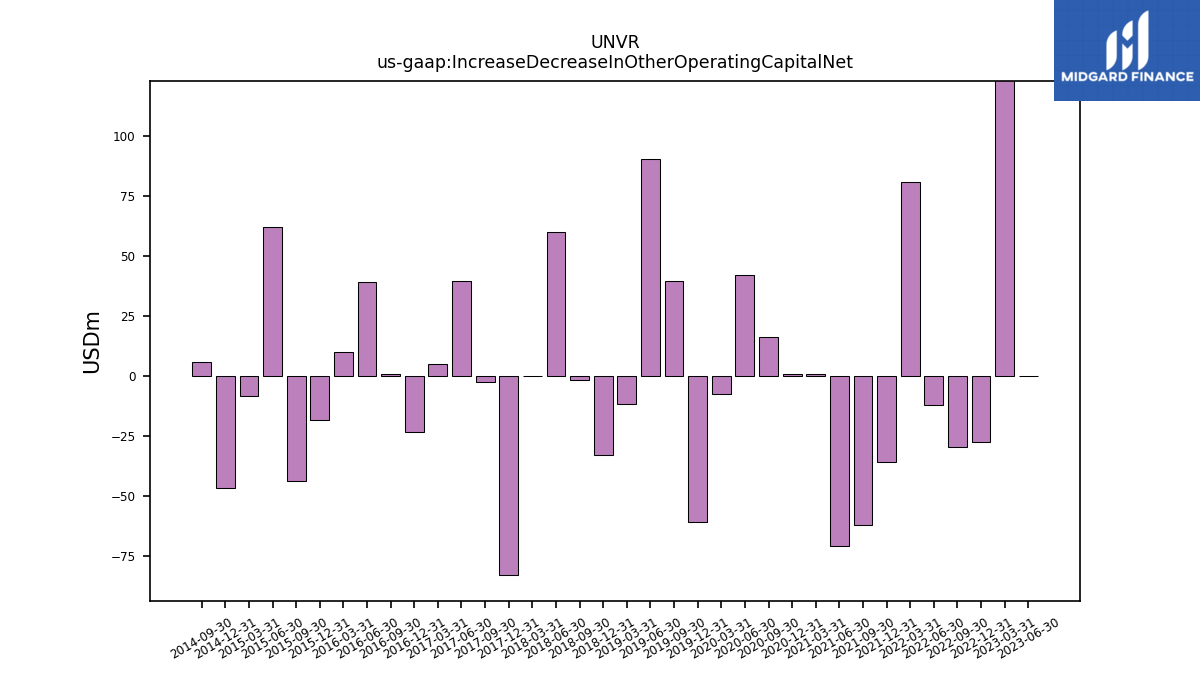
| Increase Decrease In Other Operating Capital Net | -0.30 | 129.80 | -27.50 | -29.70 | -12.20 | 81.00 | -35.80 | -62.30 | -71.10 | 0.60 | 0.80 | 16.30 | 41.90 | -7.70 | -60.90 | 39.40 | 90.60 | -11.70 | -33.10 | -1.60 | 60.00 | 0.10 | -83.20 | -2.50 | 39.70 | 5.10 | -23.50 | 0.80 | 39.20 | 9.80 | -18.50 | -44.10 | 62.20 | -8.30 | -46.70 | 5.60 | NA | NA | |
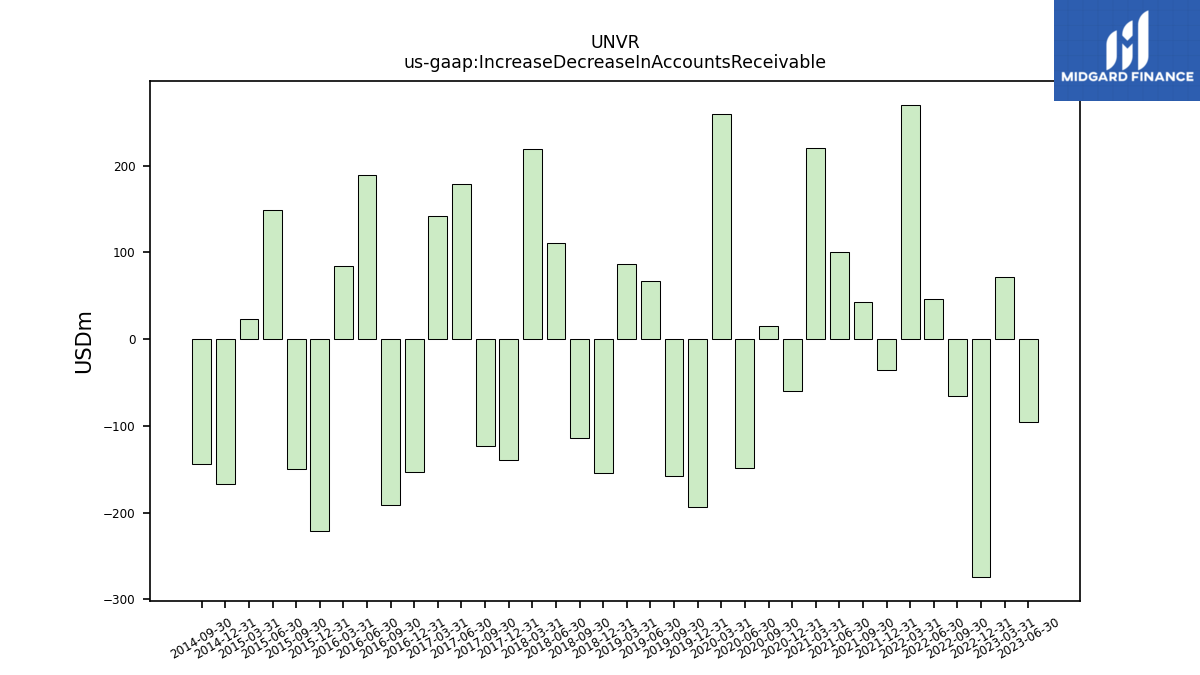
| Increase Decrease In Accounts Receivable | -95.50 | 71.60 | -274.30 | -66.00 | 46.90 | 270.50 | -35.60 | 43.20 | 100.10 | 220.90 | -60.20 | 15.10 | -148.30 | 259.40 | -193.30 | -157.50 | 67.20 | 86.60 | -154.20 | -113.90 | 110.80 | 219.40 | -139.80 | -123.30 | 179.20 | 142.40 | -153.40 | -190.90 | 189.30 | 84.80 | -220.70 | -150.20 | 149.30 | 22.90 | -167.50 | -144.10 | NA | NA | |
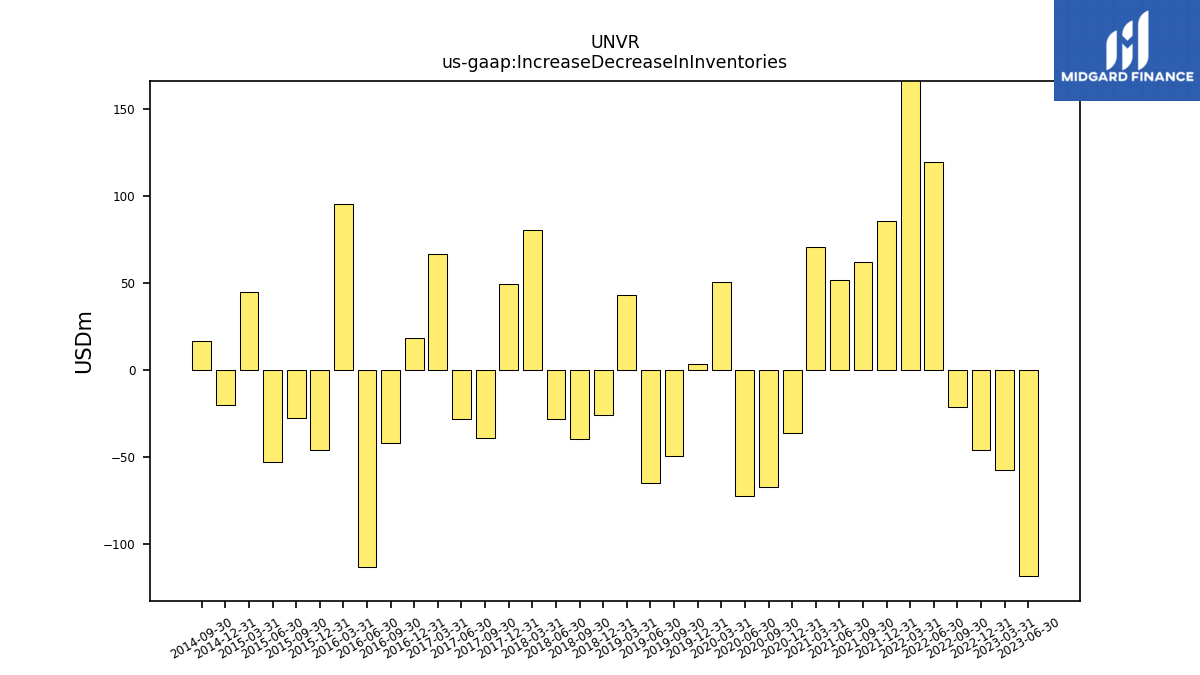
| Increase Decrease In Inventories | -118.50 | -57.60 | -46.20 | -21.70 | 119.50 | 168.90 | 85.40 | 62.20 | 51.80 | 70.80 | -36.40 | -67.60 | -72.50 | 50.50 | 3.10 | -49.70 | -65.30 | 42.90 | -26.30 | -39.70 | -28.50 | 80.10 | 49.20 | -39.40 | -28.50 | 66.40 | 18.20 | -41.90 | -113.40 | 95.10 | -46.40 | -27.60 | -53.00 | 44.70 | -20.40 | 16.80 | NA | NA | |
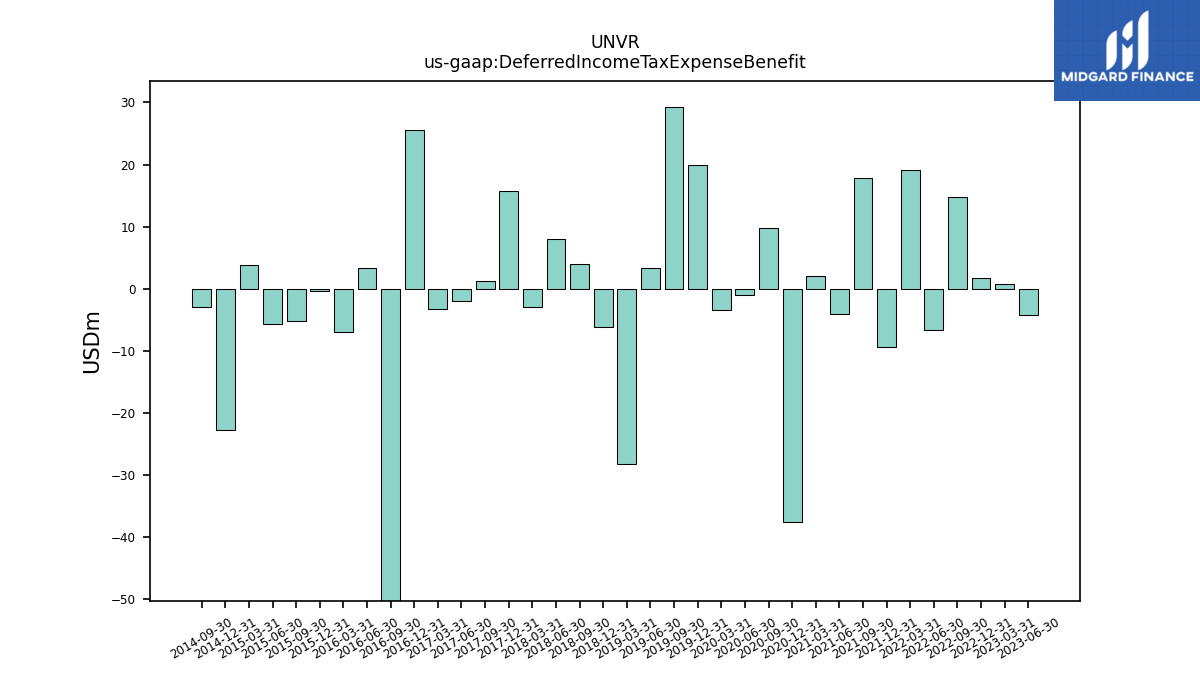
| Deferred Income Tax Expense Benefit | -4.30 | 0.70 | 1.80 | 14.70 | -6.60 | 19.10 | -9.40 | 17.80 | -4.00 | 2.00 | -37.60 | 9.70 | -1.00 | -3.50 | 19.90 | 29.30 | 3.30 | -28.20 | -6.10 | 3.90 | 8.00 | -3.00 | 15.70 | 1.30 | -2.00 | -3.30 | 25.60 | -53.60 | 3.30 | -6.90 | -0.40 | -5.20 | -5.60 | 3.80 | -22.80 | -3.00 | NA | NA | |
| Share Based Compensation | 5.50 | 10.60 | 7.40 | 5.20 | 7.80 | 13.90 | 9.40 | 6.80 | 3.30 | 5.90 | 3.60 | 2.60 | 2.60 | 5.70 | 3.40 | 4.40 | 11.30 | 6.00 | 3.00 | 4.00 | 4.30 | 9.40 | 3.70 | 4.50 | 5.10 | 6.40 | 3.30 | 3.60 | 1.30 | 2.20 | 2.00 | 2.10 | 1.90 | 1.50 | 0.60 | 3.90 | 4.00 | NA |
| 2023-06-30 | 2023-03-31 | 2022-12-31 | 2022-09-30 | 2022-06-30 | 2022-03-31 | 2021-12-31 | 2021-09-30 | 2021-06-30 | 2021-03-31 | 2020-12-31 | 2020-09-30 | 2020-06-30 | 2020-03-31 | 2019-12-31 | 2019-09-30 | 2019-06-30 | 2019-03-31 | 2018-12-31 | 2018-09-30 | 2018-06-30 | 2018-03-31 | 2017-12-31 | 2017-09-30 | 2017-06-30 | 2017-03-31 | 2016-12-31 | 2016-09-30 | 2016-06-30 | 2016-03-31 | 2015-12-31 | 2015-09-30 | 2015-06-30 | 2015-03-31 | 2014-12-31 | 2014-09-30 | 2014-06-30 | 2014-03-31 | ||
|---|---|---|---|---|---|---|---|---|---|---|---|---|---|---|---|---|---|---|---|---|---|---|---|---|---|---|---|---|---|---|---|---|---|---|---|---|---|---|---|
| Net Cash Provided By Used In Investing Activities | -140.40 | -51.40 | -46.10 | -50.20 | -30.90 | -34.50 | -55.40 | -24.60 | 115.80 | -12.20 | 32.90 | -27.00 | -16.30 | -30.90 | 173.40 | -45.10 | -28.80 | -532.60 | -27.70 | -8.30 | -40.10 | -22.90 | 1.30 | -42.30 | -16.40 | -21.70 | -17.80 | -19.40 | -21.60 | -77.20 | -141.30 | -71.60 | NA | NA | NA | NA | NA | NA | |
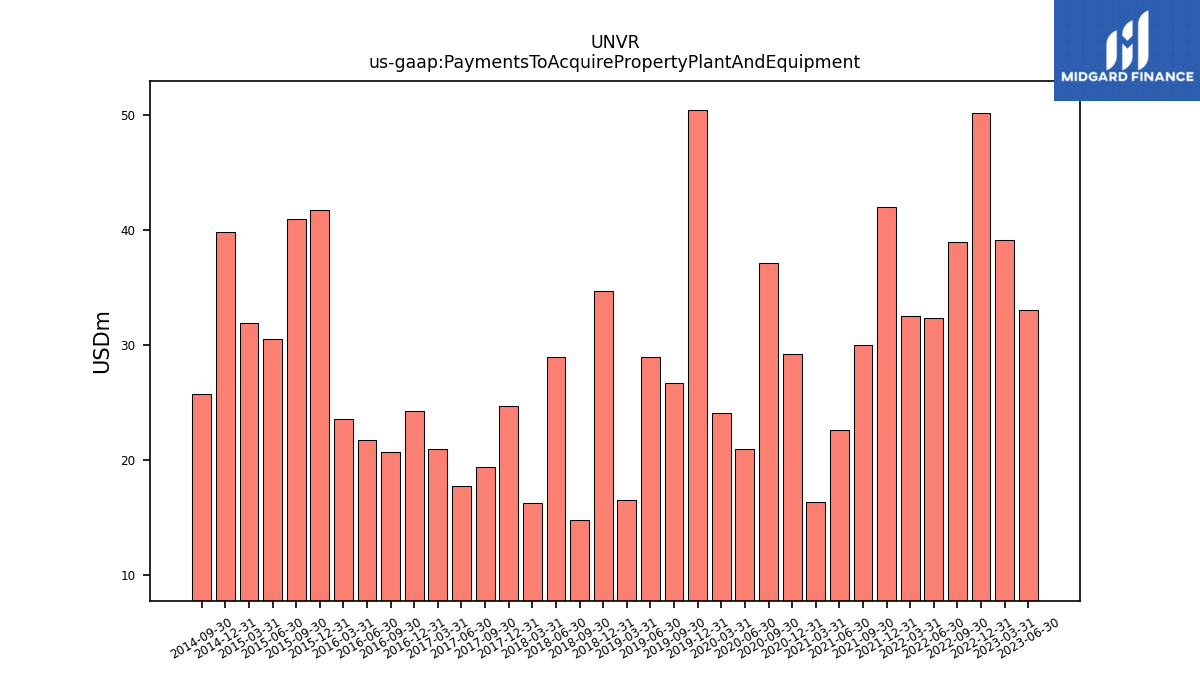
| Payments To Acquire Property Plant And Equipment | 33.00 | 39.10 | 50.10 | 38.90 | 32.30 | 32.50 | 42.00 | 30.00 | 22.60 | 16.30 | 29.20 | 37.10 | 20.90 | 24.10 | 50.40 | 26.70 | 28.90 | 16.50 | 34.70 | 14.80 | 28.90 | 16.20 | 24.70 | 19.40 | 17.70 | 20.90 | 24.20 | 20.70 | 21.70 | 23.50 | 41.70 | 40.90 | 30.50 | 31.90 | 39.80 | 25.70 | NA | NA |
| 2023-06-30 | 2023-03-31 | 2022-12-31 | 2022-09-30 | 2022-06-30 | 2022-03-31 | 2021-12-31 | 2021-09-30 | 2021-06-30 | 2021-03-31 | 2020-12-31 | 2020-09-30 | 2020-06-30 | 2020-03-31 | 2019-12-31 | 2019-09-30 | 2019-06-30 | 2019-03-31 | 2018-12-31 | 2018-09-30 | 2018-06-30 | 2018-03-31 | 2017-12-31 | 2017-09-30 | 2017-06-30 | 2017-03-31 | 2016-12-31 | 2016-09-30 | 2016-06-30 | 2016-03-31 | 2015-12-31 | 2015-09-30 | 2015-06-30 | 2015-03-31 | 2014-12-31 | 2014-09-30 | 2014-06-30 | 2014-03-31 | ||
|---|---|---|---|---|---|---|---|---|---|---|---|---|---|---|---|---|---|---|---|---|---|---|---|---|---|---|---|---|---|---|---|---|---|---|---|---|---|---|---|
| Net Cash Provided By Used In Financing Activities | -89.80 | 38.90 | -251.40 | -136.00 | -16.10 | 170.80 | -77.20 | -77.70 | -136.00 | -133.70 | -81.10 | -257.50 | 27.60 | 171.00 | -316.10 | -121.60 | -597.60 | 1330.50 | -228.20 | -77.60 | -25.70 | -186.80 | -76.40 | -53.10 | -39.90 | 60.70 | -119.50 | -45.40 | -19.00 | 17.80 | -5.60 | -3.80 | NA | NA | NA | NA | NA | NA | |
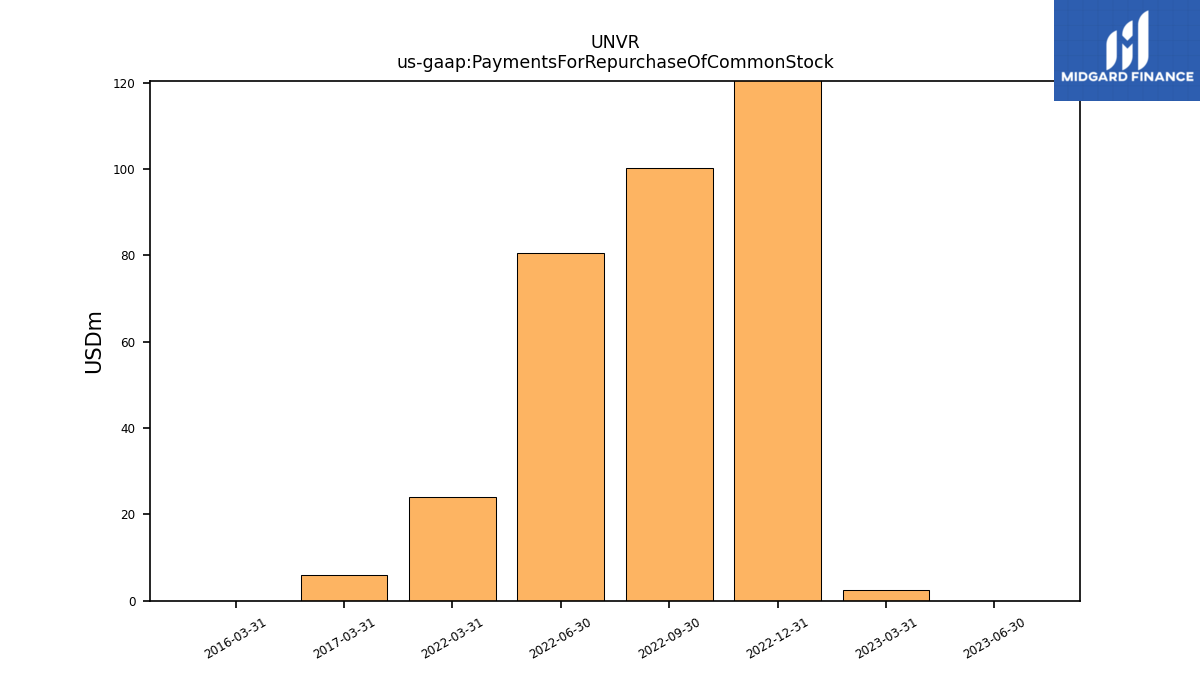
| Payments For Repurchase Of Common Stock | 0.00 | 2.50 | 204.20 | 100.30 | 80.60 | 24.00 | NA | NA | NA | NA | NA | NA | NA | NA | NA | NA | NA | NA | NA | NA | NA | NA | NA | NA | NA | 6.00 | NA | NA | NA | 0.00 | NA | NA | NA | NA | NA | NA | NA | NA |
| 2023-06-30 | 2023-03-31 | 2022-12-31 | 2022-09-30 | 2022-06-30 | 2022-03-31 | 2021-12-31 | 2021-09-30 | 2021-06-30 | 2021-03-31 | 2020-12-31 | 2020-09-30 | 2020-06-30 | 2020-03-31 | 2019-12-31 | 2019-09-30 | 2019-06-30 | 2019-03-31 | 2018-12-31 | 2018-09-30 | 2018-06-30 | 2018-03-31 | 2017-12-31 | 2017-09-30 | 2017-06-30 | 2017-03-31 | 2016-12-31 | 2016-09-30 | 2016-06-30 | 2016-03-31 | 2015-12-31 | 2015-09-30 | 2015-06-30 | 2015-03-31 | 2014-12-31 | 2014-09-30 | 2014-06-30 | 2014-03-31 | ||
|---|---|---|---|---|---|---|---|---|---|---|---|---|---|---|---|---|---|---|---|---|---|---|---|---|---|---|---|---|---|---|---|---|---|---|---|---|---|---|---|
| Revenues | 2574.10 | 2684.90 | 2592.60 | 2983.50 | 3016.60 | 2882.60 | 2498.10 | 2487.90 | 2394.10 | 2155.40 | 2035.40 | 2009.20 | 2009.20 | 2211.20 | 2155.00 | 2387.30 | 2584.60 | 2160.00 | 1971.20 | 2130.70 | 2372.60 | 2158.00 | 1959.20 | 2048.70 | 2247.00 | 1998.80 | 1812.50 | 1999.70 | 2262.50 | 1999.00 | 1966.30 | 2206.30 | 2510.10 | 2299.10 | 2387.20 | 2608.90 | 2861.40 | 2516.40 | |
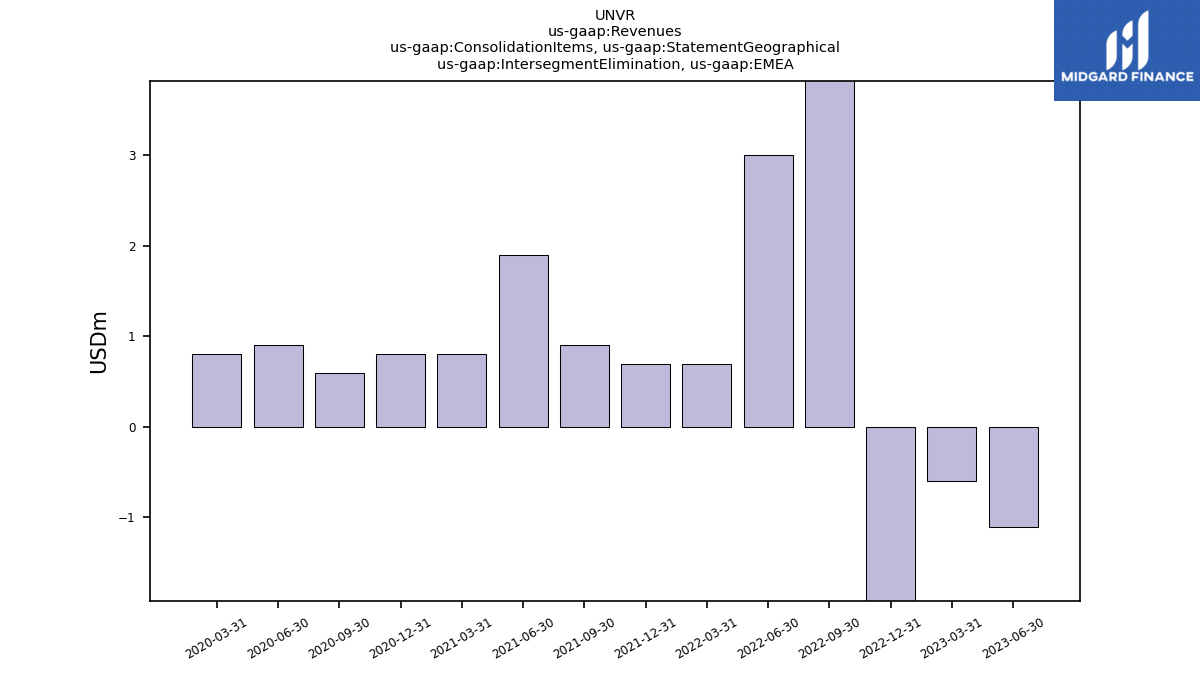
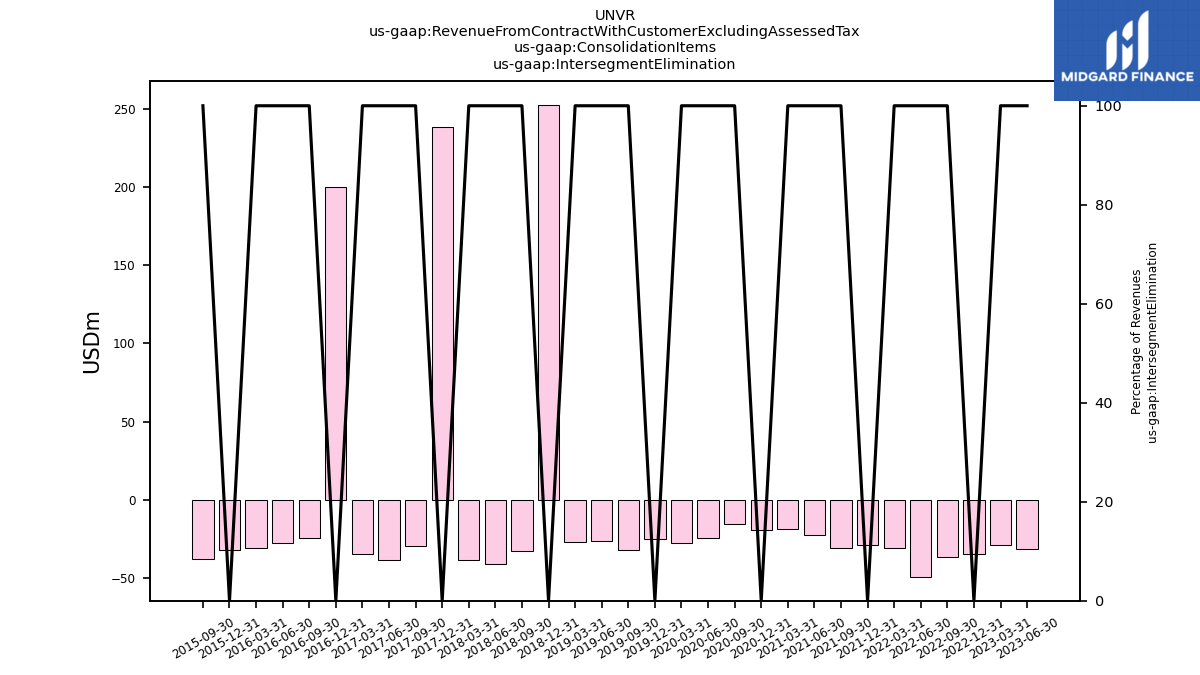
| Intersegment Elimination | -31.70 | -28.70 | -34.40 | -36.30 | -49.40 | -31.00 | -28.80 | -31.10 | -22.70 | -18.90 | -19.20 | -15.70 | -24.60 | -27.30 | -24.80 | -31.80 | -26.10 | -27.00 | 252.60 | -32.60 | -41.30 | -38.60 | 238.60 | -29.50 | -38.70 | -34.40 | 199.90 | -24.40 | -27.70 | -30.60 | -32.20 | -37.80 | NA | NA | NA | NA | NA | NA | |
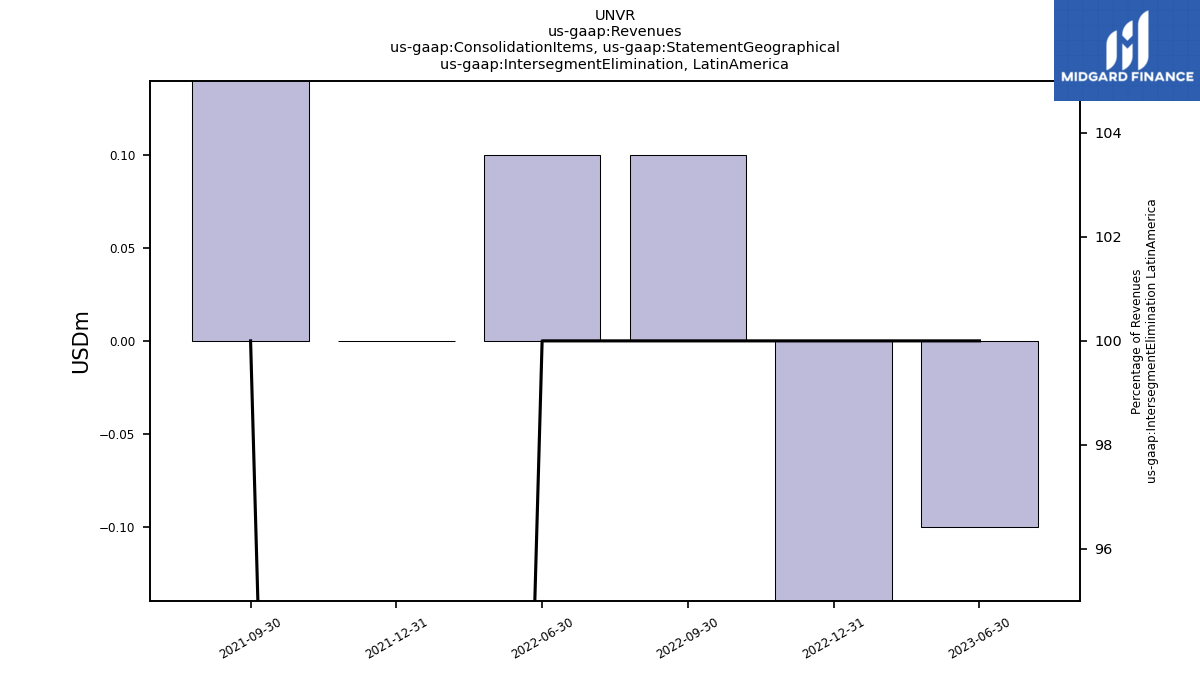
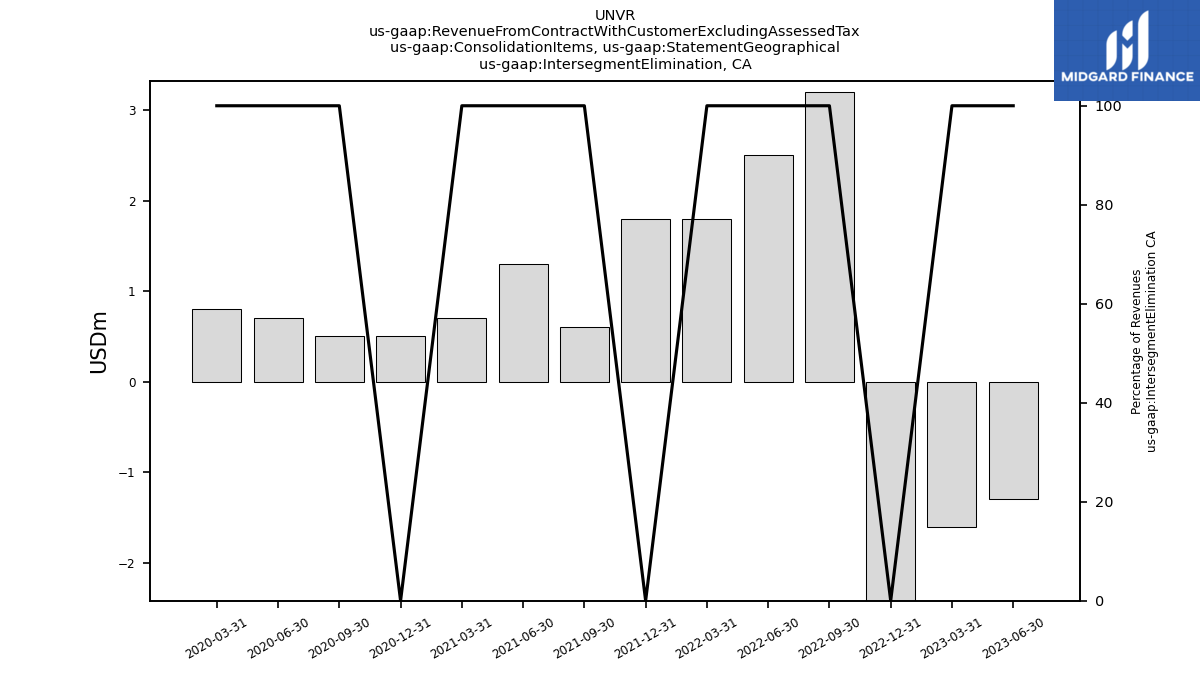
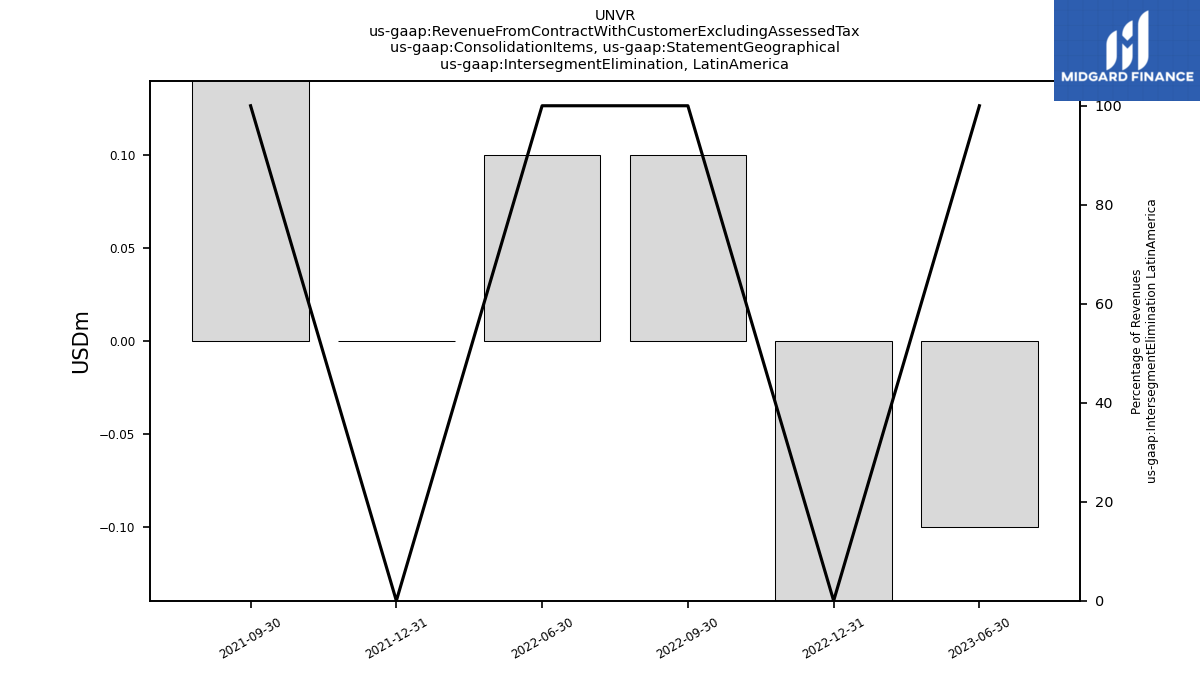
| Intersegment Elimination, | -1.30 | -1.60 | -18.00 | 3.20 | 2.50 | 1.80 | 1.80 | 0.60 | 1.30 | 0.70 | 0.50 | 0.50 | 0.70 | 0.80 | NA | NA | NA | NA | NA | NA | NA | NA | NA | NA | NA | NA | NA | NA | NA | NA | NA | NA | NA | NA | NA | NA | NA | NA | |
| Intersegment Elimination, | -0.10 | NA | -0.70 | 0.10 | 0.10 | NA | 0.00 | 0.70 | NA | NA | NA | NA | NA | NA | NA | NA | NA | NA | NA | NA | NA | NA | NA | NA | NA | NA | NA | NA | NA | NA | NA | NA | NA | NA | NA | NA | NA | NA | |
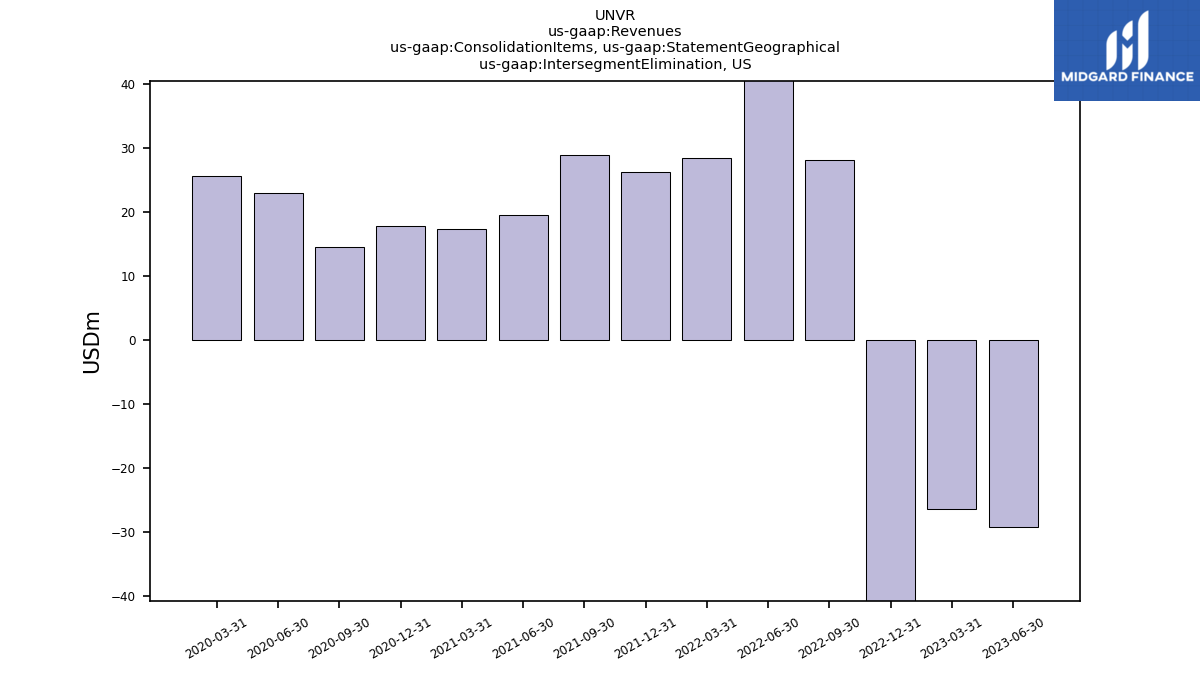
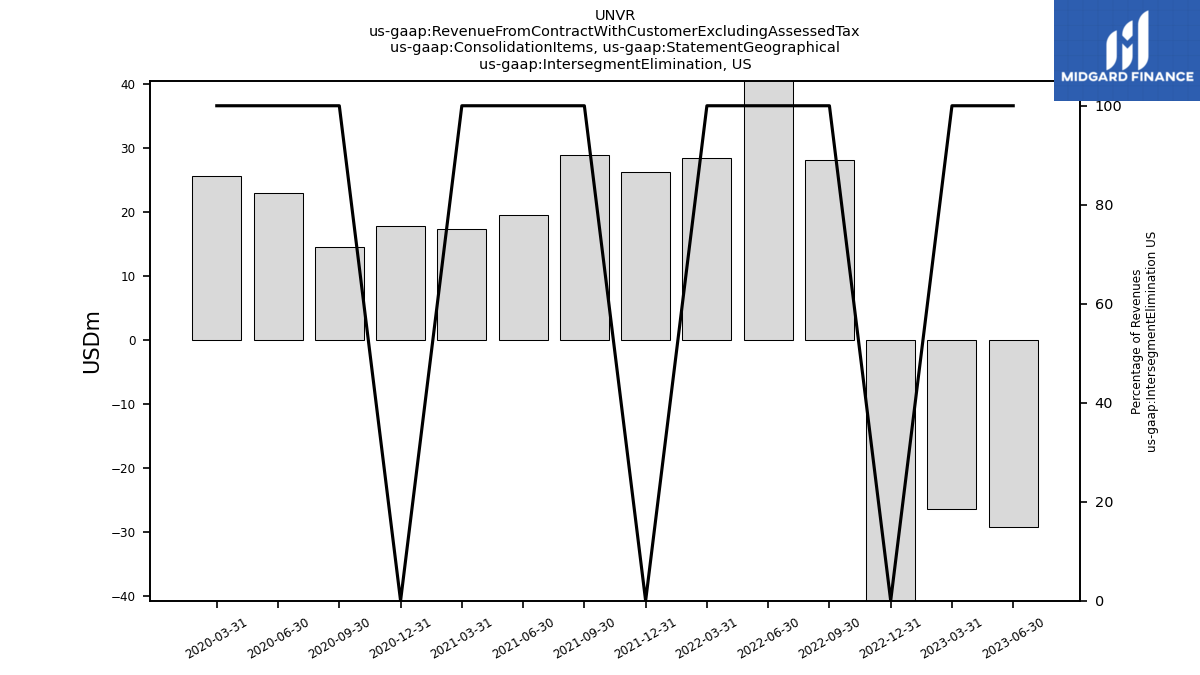
| Intersegment Elimination,US | -29.20 | -26.50 | -230.00 | 28.20 | 43.80 | 28.50 | 26.30 | 28.90 | 19.50 | 17.40 | 17.90 | 14.60 | 23.00 | 25.70 | NA | NA | NA | NA | NA | NA | NA | NA | NA | NA | NA | NA | NA | NA | NA | NA | NA | NA | NA | NA | NA | NA | NA | NA | |
| Intersegment Elimination,EMEA | -1.10 | -0.60 | -19.10 | 4.80 | 3.00 | 0.70 | 0.70 | 0.90 | 1.90 | 0.80 | 0.80 | 0.60 | 0.90 | 0.80 | NA | NA | NA | NA | NA | NA | NA | NA | NA | NA | NA | NA | NA | NA | NA | NA | NA | NA | NA | NA | NA | NA | NA | NA | |
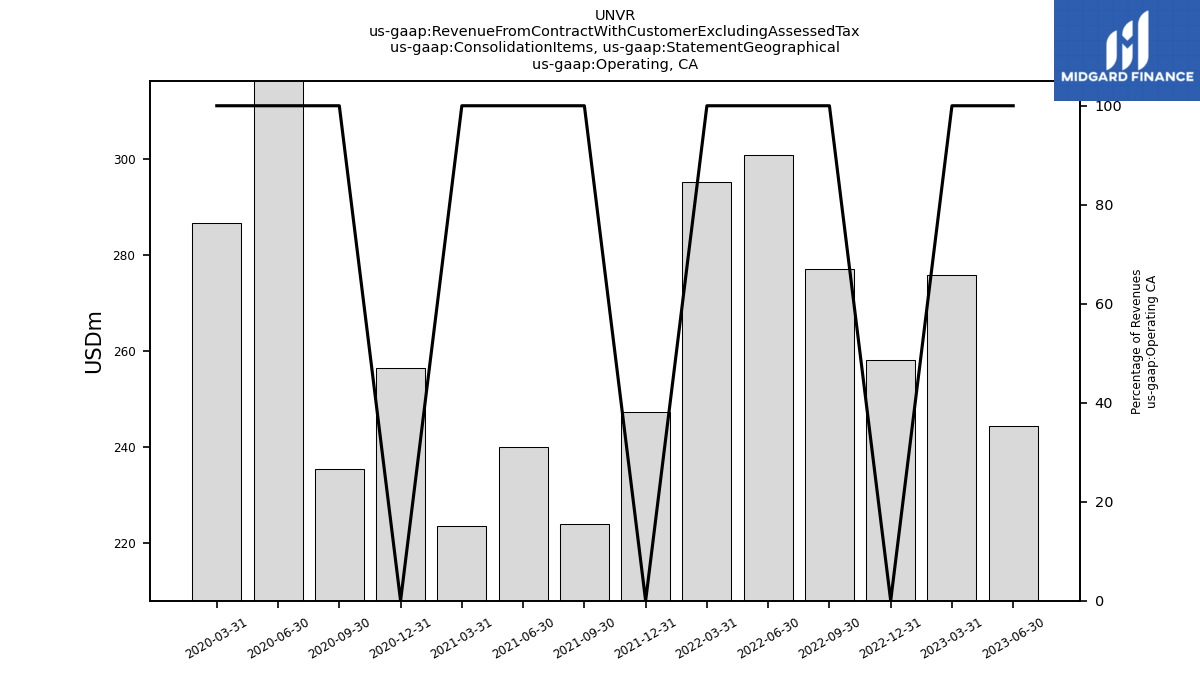
| Operating, | 244.30 | 275.80 | 258.00 | 277.10 | 300.70 | 295.20 | 247.20 | 223.90 | 239.90 | 223.40 | 256.50 | 235.40 | 332.20 | 286.60 | NA | NA | NA | NA | NA | NA | NA | NA | NA | NA | NA | NA | NA | NA | NA | NA | NA | NA | NA | NA | NA | NA | NA | NA | |
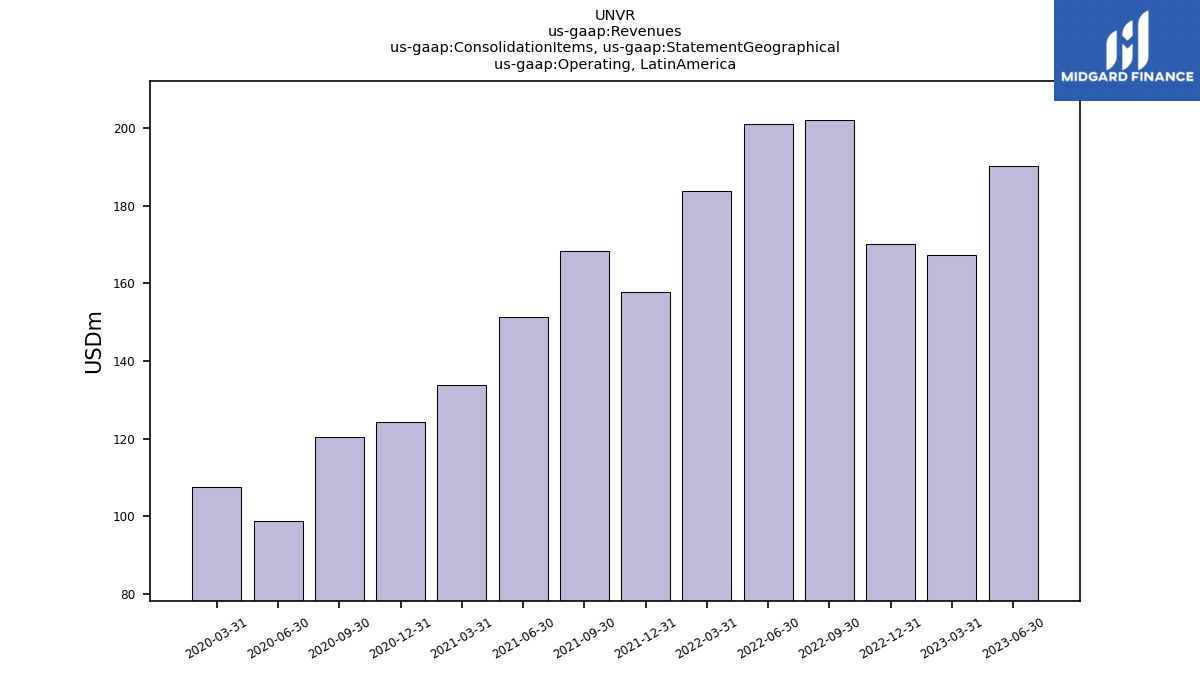
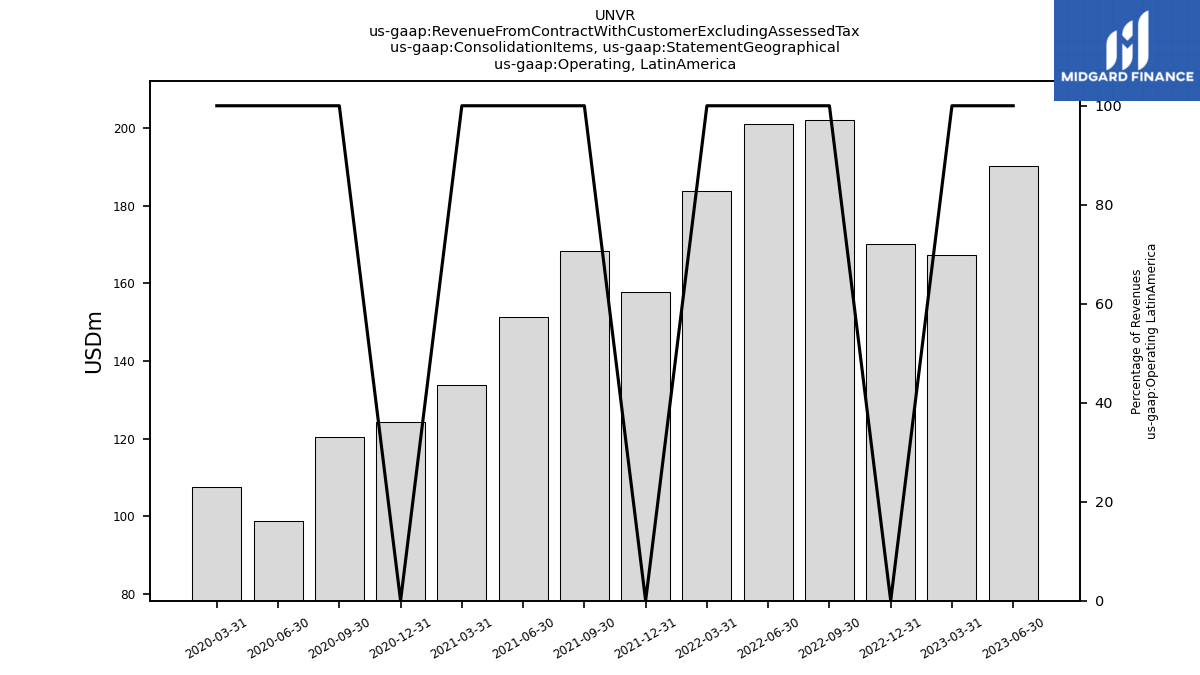
| Operating, | 190.10 | 167.40 | 170.20 | 202.00 | 201.10 | 183.80 | 157.80 | 168.20 | 151.30 | 133.80 | 124.20 | 120.50 | 98.70 | 107.60 | NA | NA | NA | NA | NA | NA | NA | NA | NA | NA | NA | NA | NA | NA | NA | NA | NA | NA | NA | NA | NA | NA | NA | NA | |
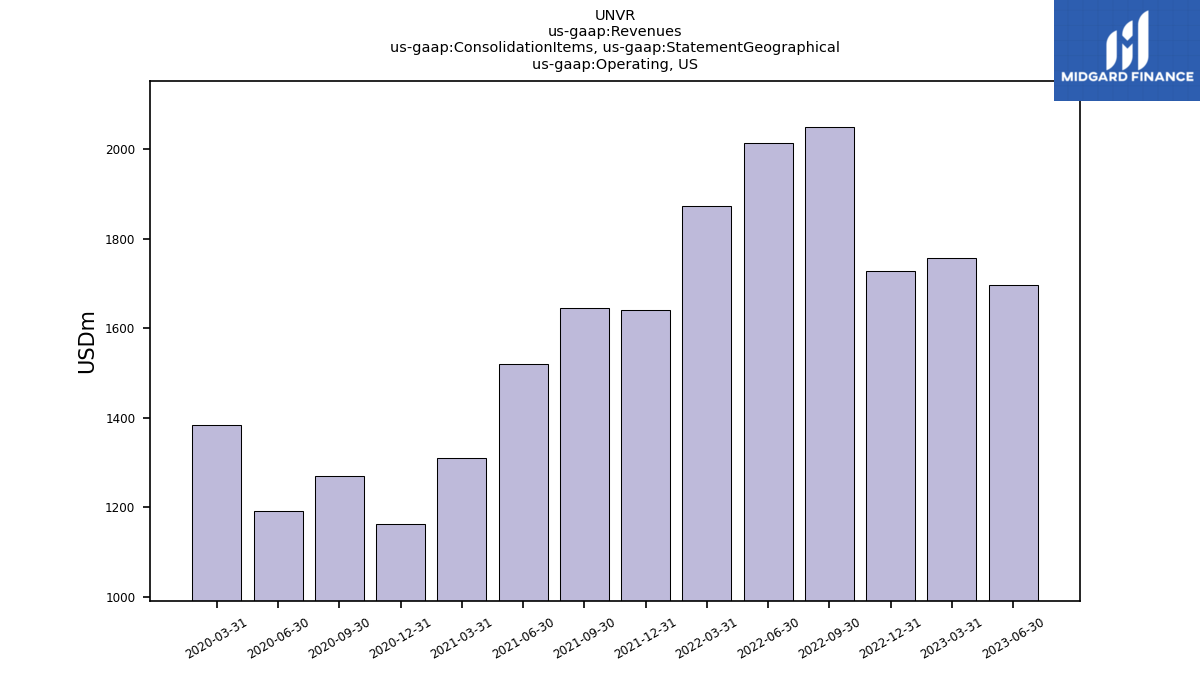
| Operating,US | 1695.40 | 1755.70 | 1727.90 | 2049.40 | 2014.00 | 1871.70 | 1640.30 | 1645.70 | 1519.70 | 1310.40 | 1161.60 | 1269.00 | 1192.40 | 1383.20 | NA | NA | NA | NA | NA | NA | NA | NA | NA | NA | NA | NA | NA | NA | NA | NA | NA | NA | NA | NA | NA | NA | NA | NA | |
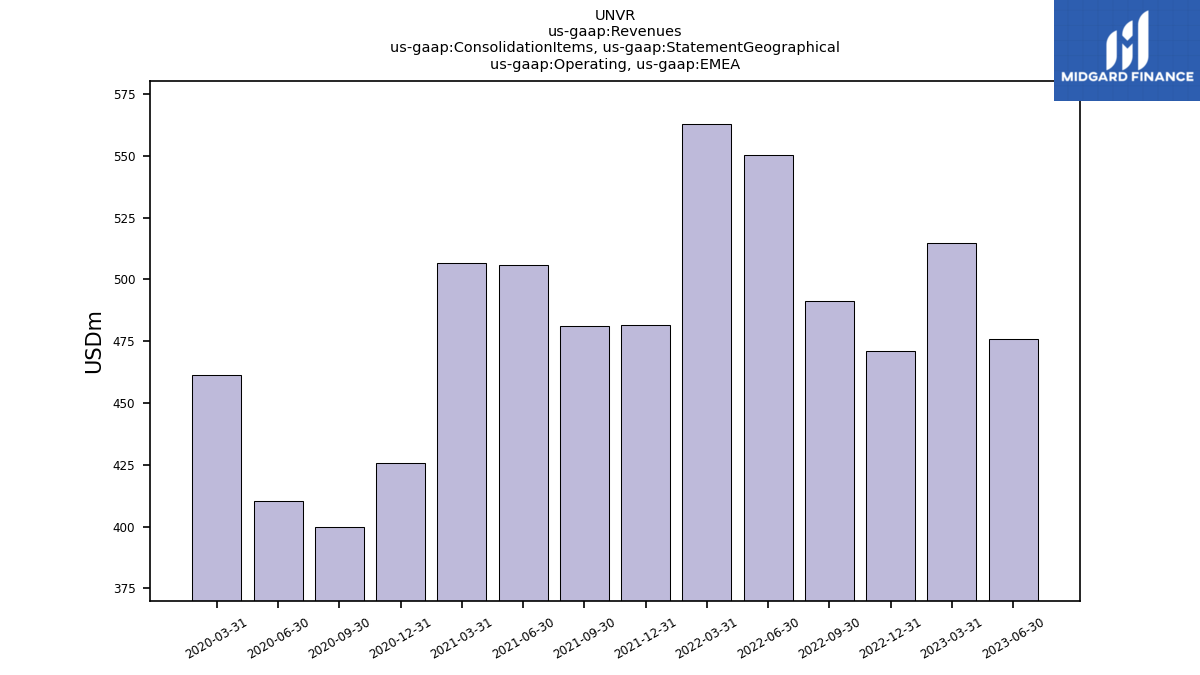
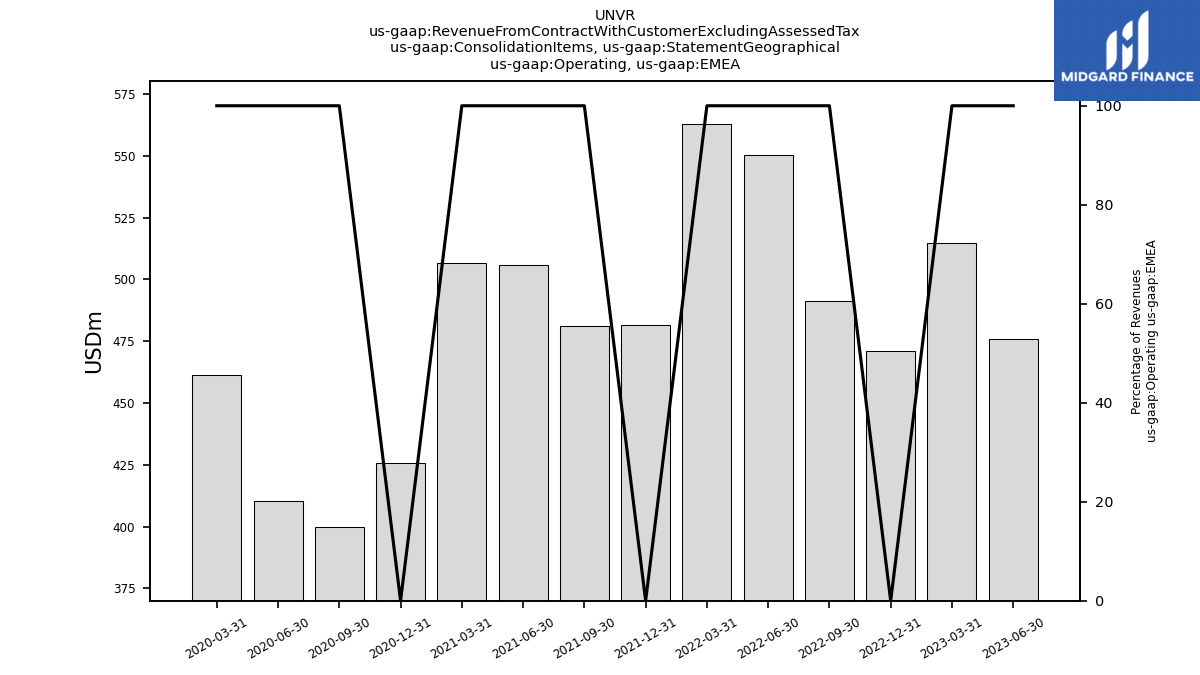
| Operating,EMEA | 476.00 | 514.70 | 470.90 | 491.30 | 550.20 | 562.90 | 481.60 | 481.20 | 505.90 | 506.70 | 425.50 | 400.00 | 410.50 | 461.10 | NA | NA | NA | NA | NA | NA | NA | NA | NA | NA | NA | NA | NA | NA | NA | NA | NA | NA | NA | NA | NA | NA | NA | NA | |
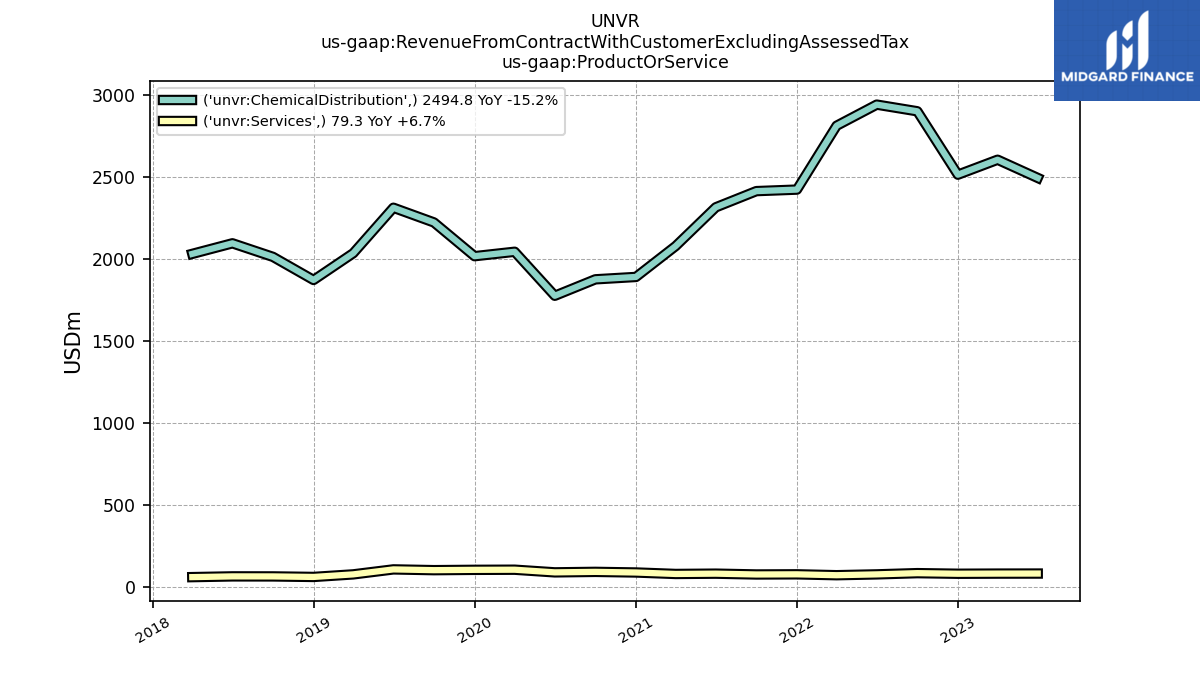
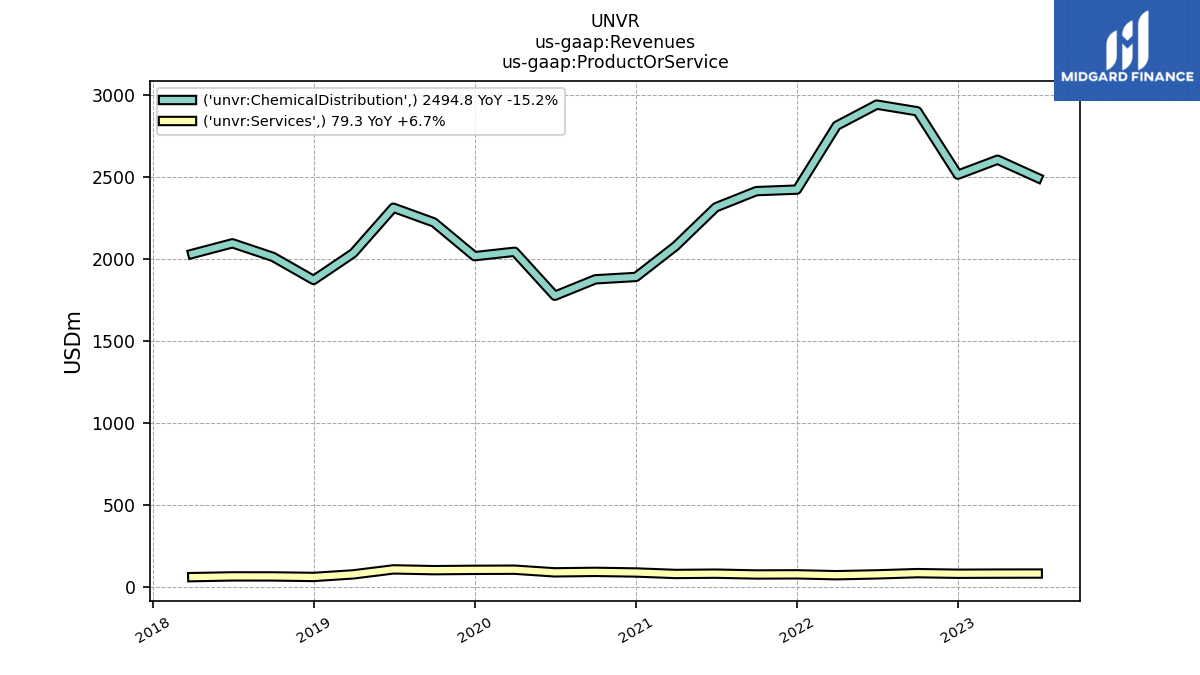
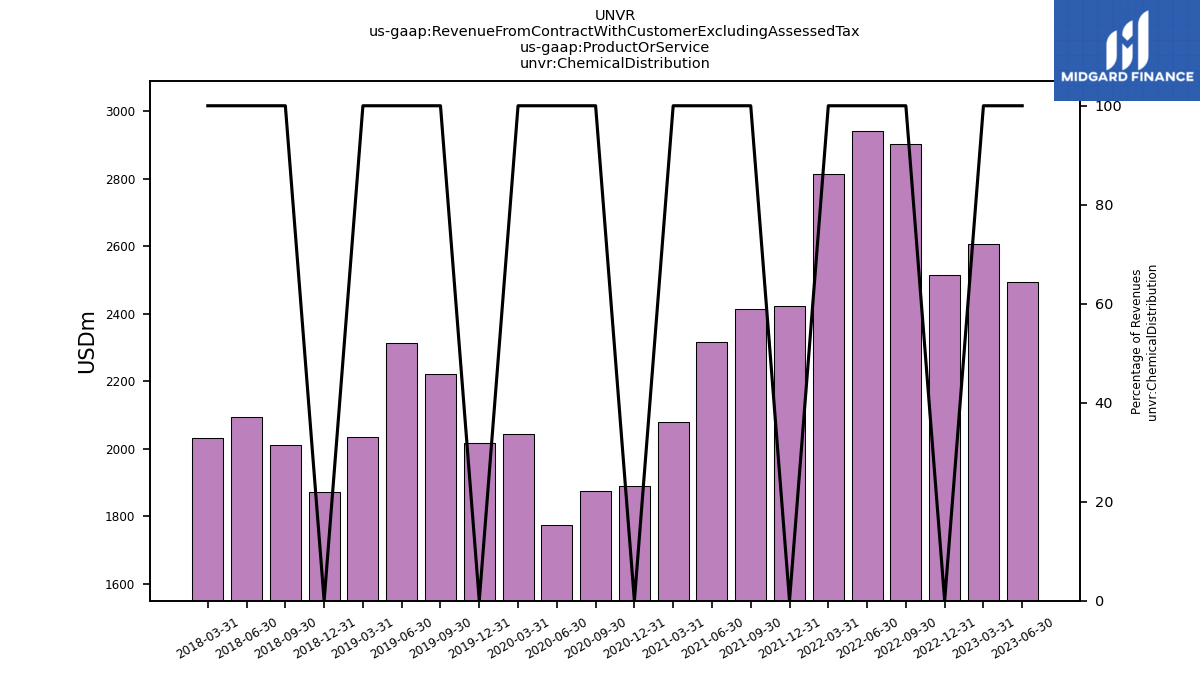
| Chemical Distribution | 2494.80 | 2605.90 | 2514.50 | 2901.70 | 2942.30 | 2813.40 | 2423.50 | 2414.20 | 2315.40 | 2078.60 | 1890.20 | 1875.70 | 1775.20 | 2044.00 | 2016.90 | 2223.00 | 2312.80 | 2035.20 | 1871.60 | 2012.70 | 2095.60 | 2031.10 | NA | NA | NA | NA | NA | NA | NA | NA | NA | NA | NA | NA | NA | NA | NA | NA | |
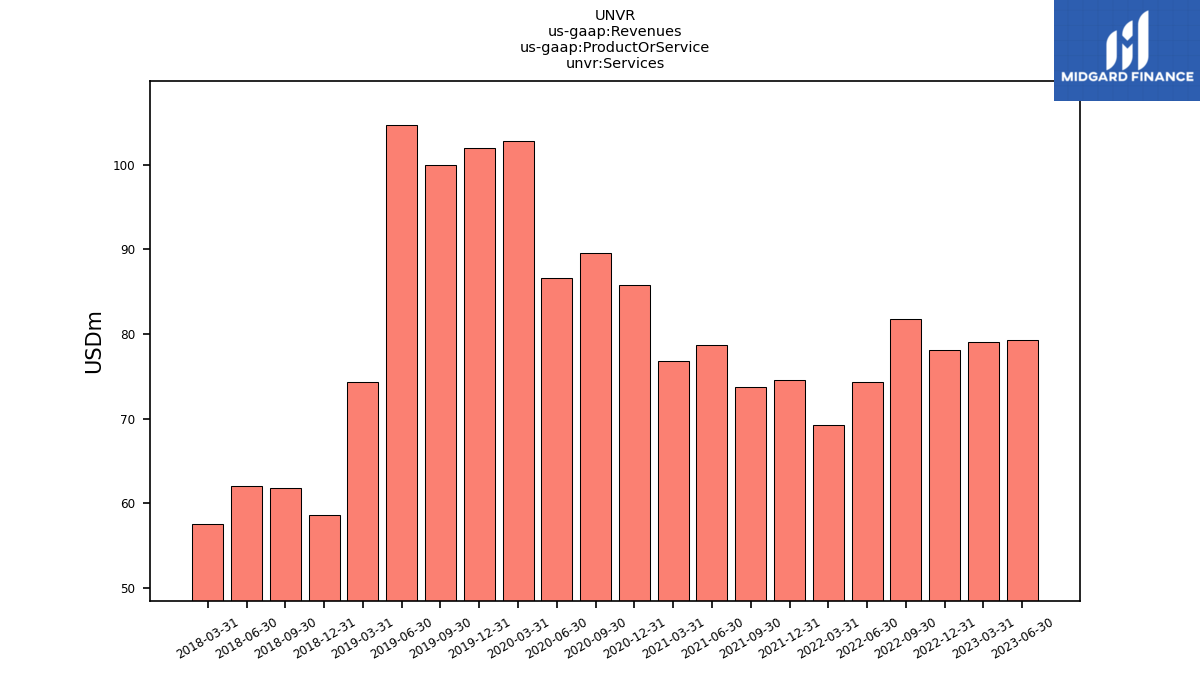
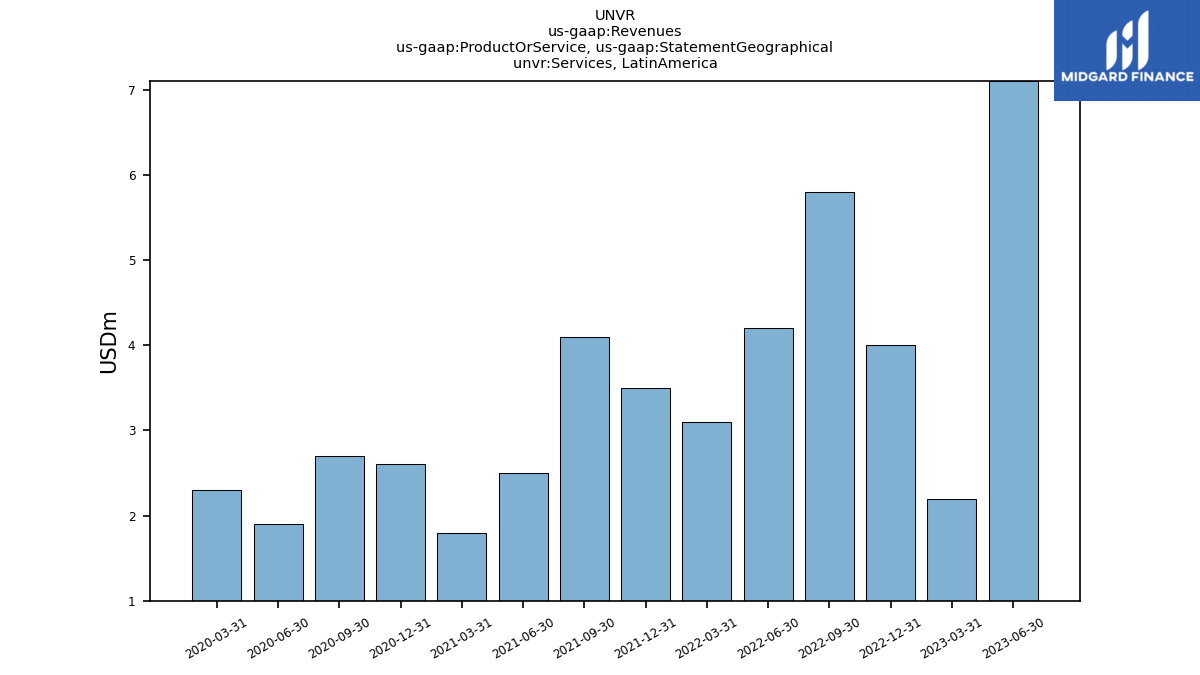
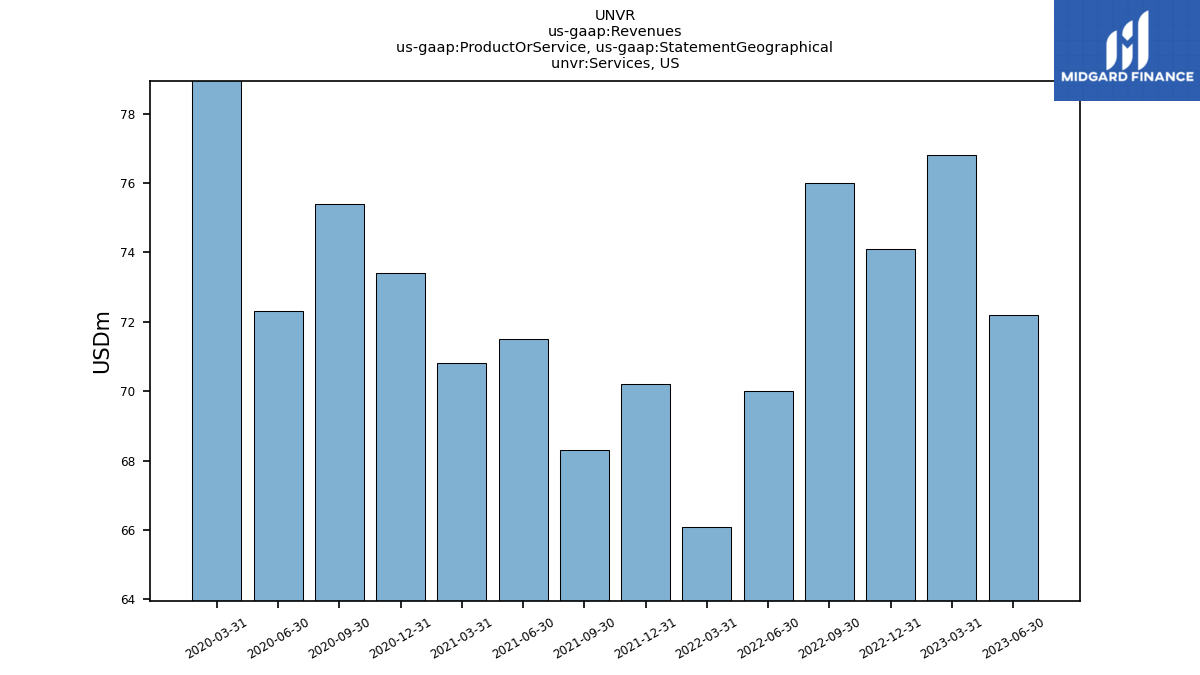
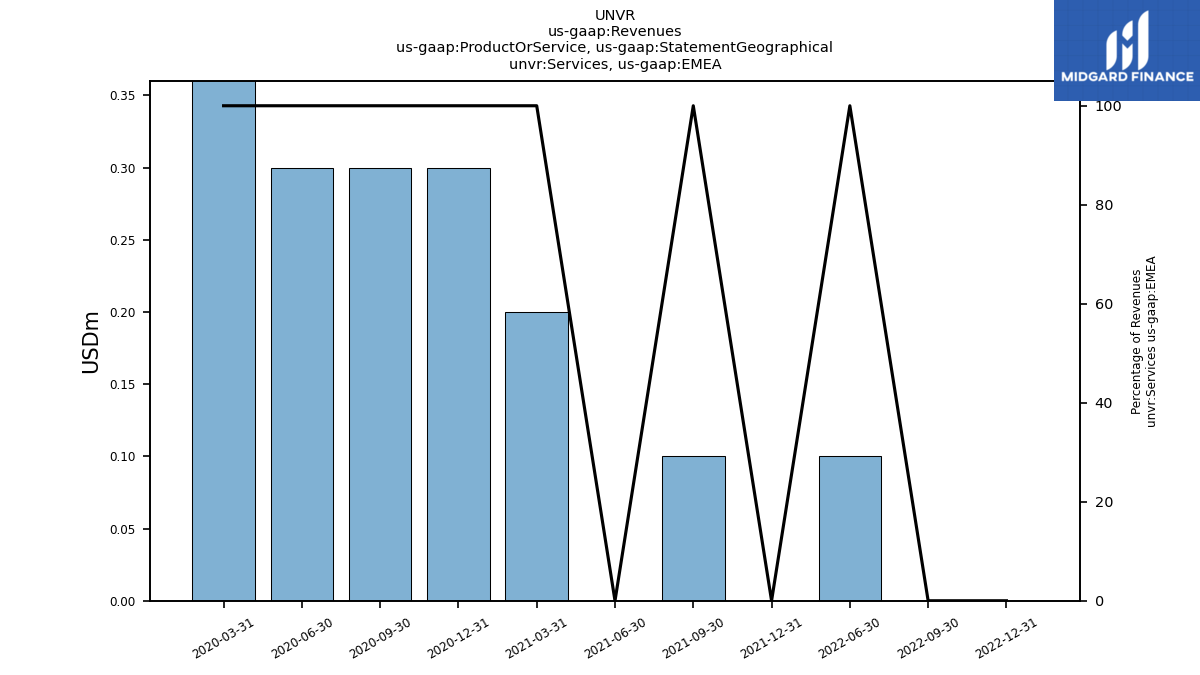
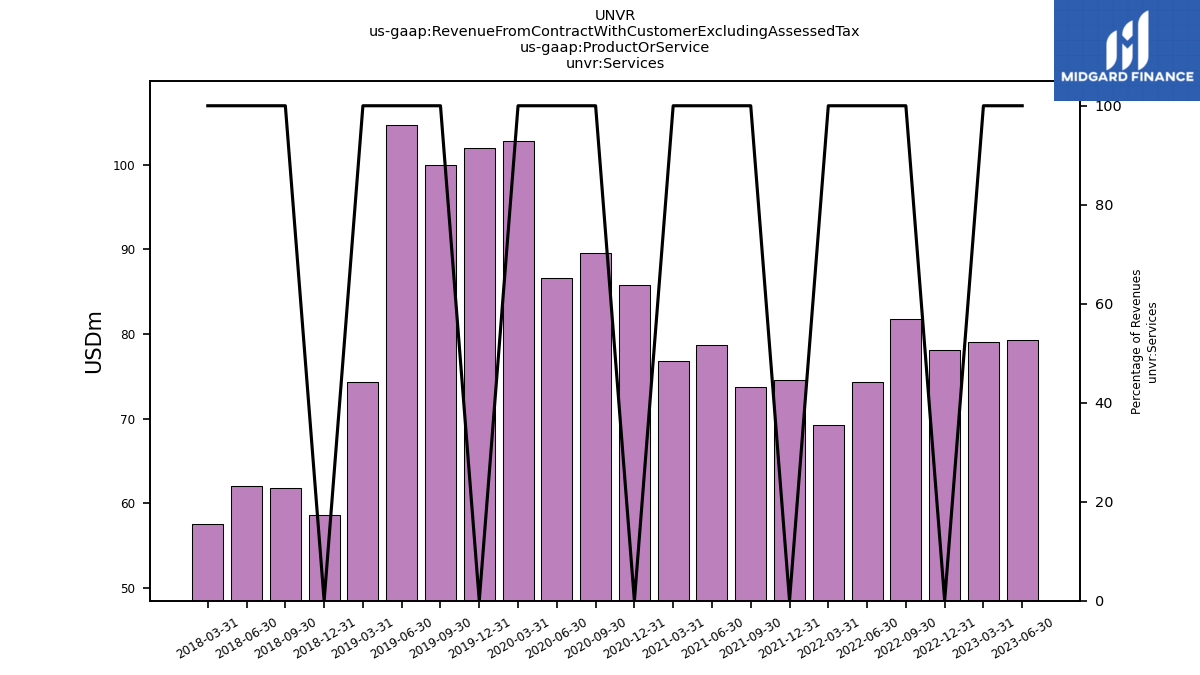
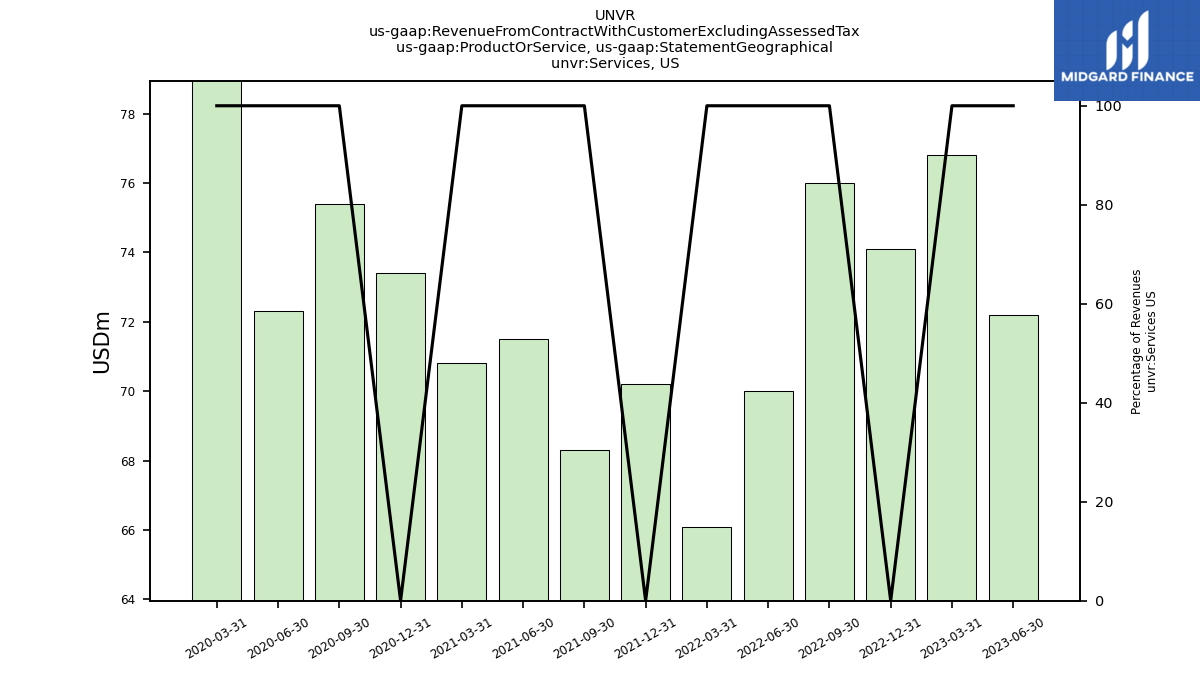
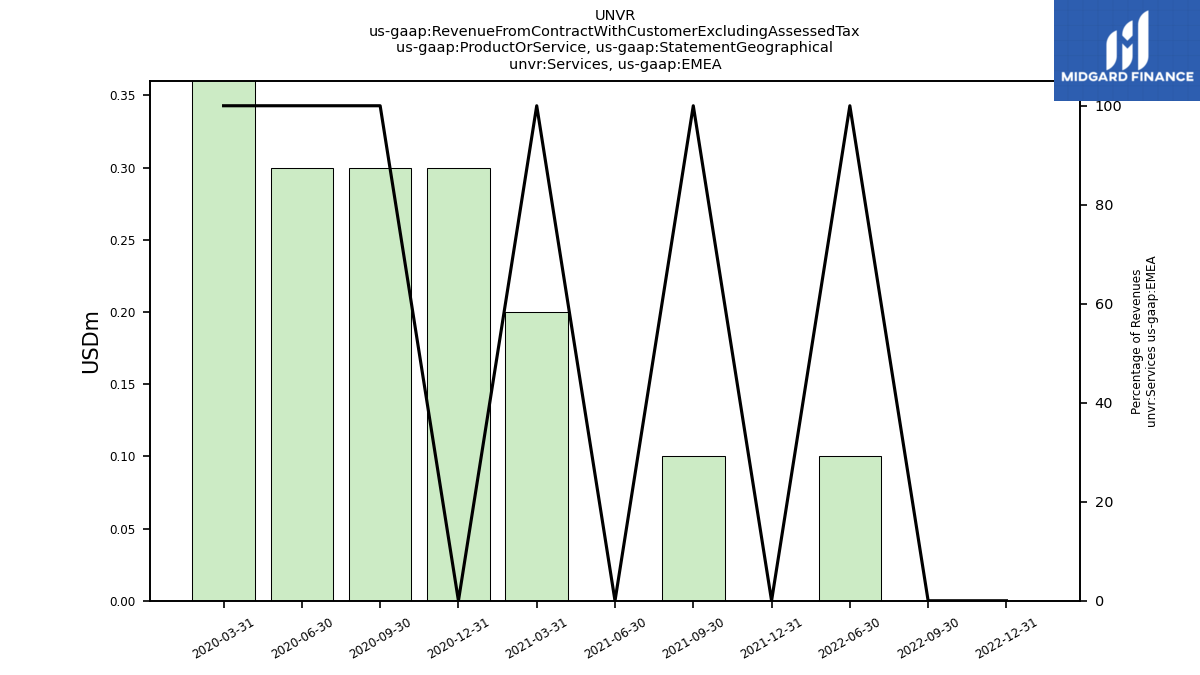
| Services | 79.30 | 79.00 | 78.10 | 81.80 | 74.30 | 69.20 | 74.60 | 73.70 | 78.70 | 76.80 | 85.80 | 89.60 | 86.60 | 102.80 | 102.00 | 100.00 | 104.70 | 74.30 | 58.60 | 61.80 | 62.00 | 57.50 | NA | NA | NA | NA | NA | NA | NA | NA | NA | NA | NA | NA | NA | NA | NA | NA | |
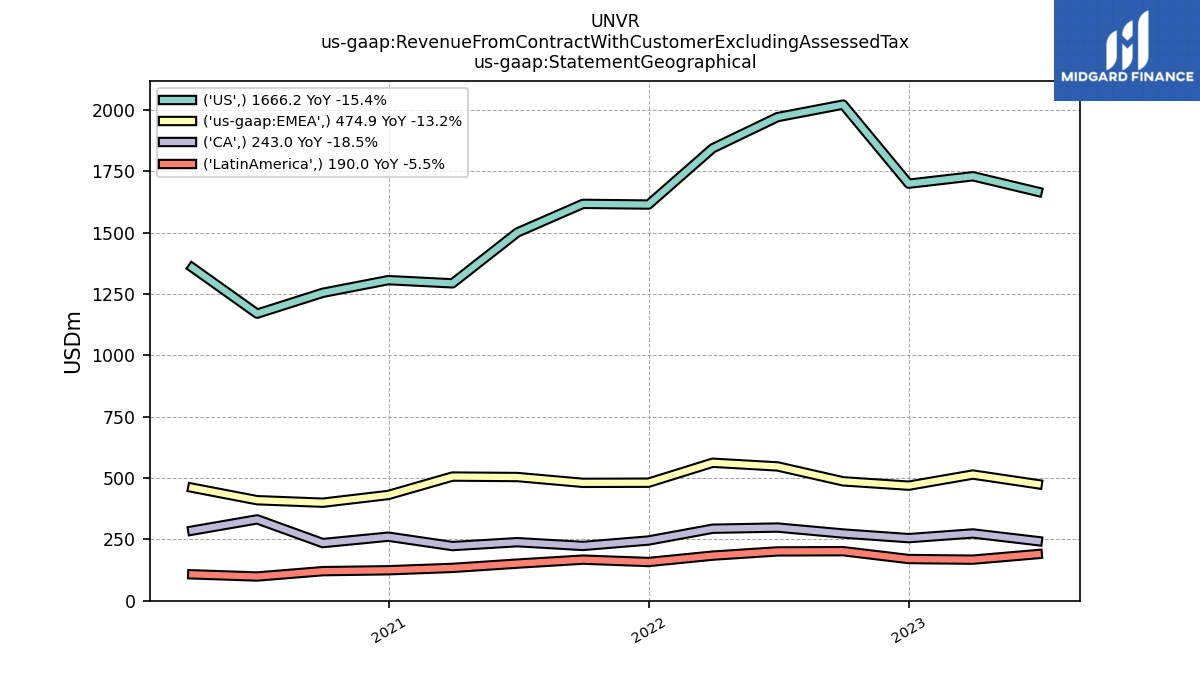
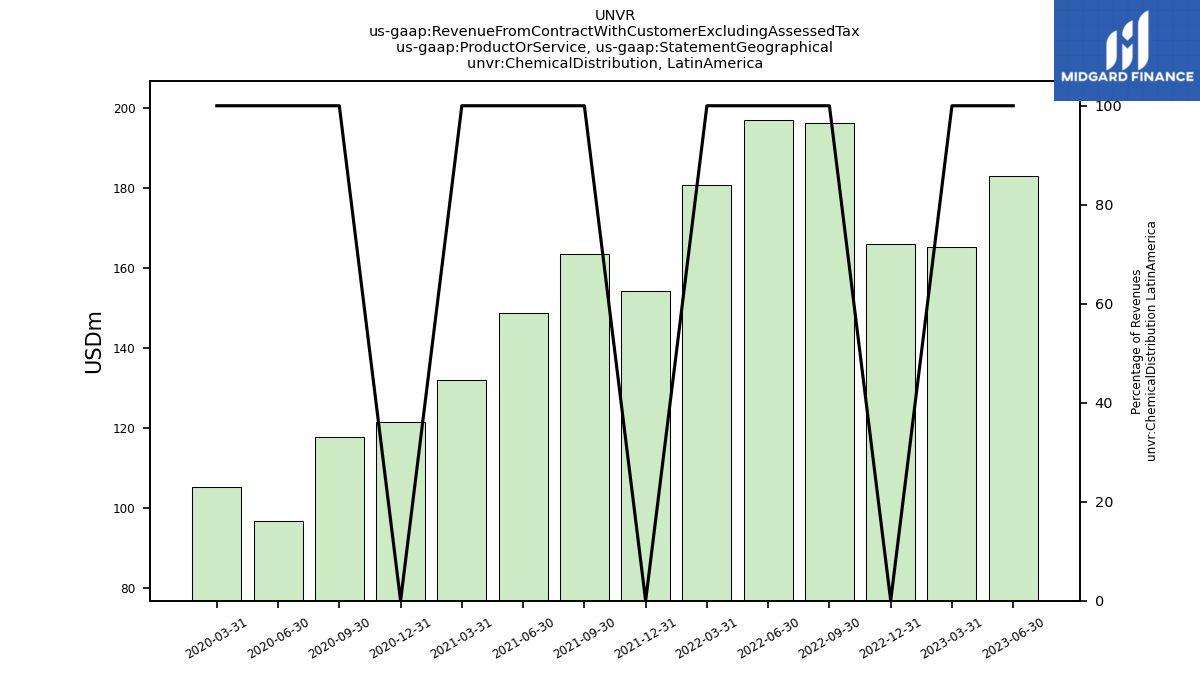
| Chemical Distribution, | 243.00 | 274.20 | 255.00 | 273.90 | 298.20 | 293.40 | 244.50 | 222.10 | 233.90 | 218.70 | 189.60 | 179.80 | 172.00 | 208.30 | NA | NA | NA | NA | NA | NA | NA | NA | NA | NA | NA | NA | NA | NA | NA | NA | NA | NA | NA | NA | NA | NA | NA | NA | |
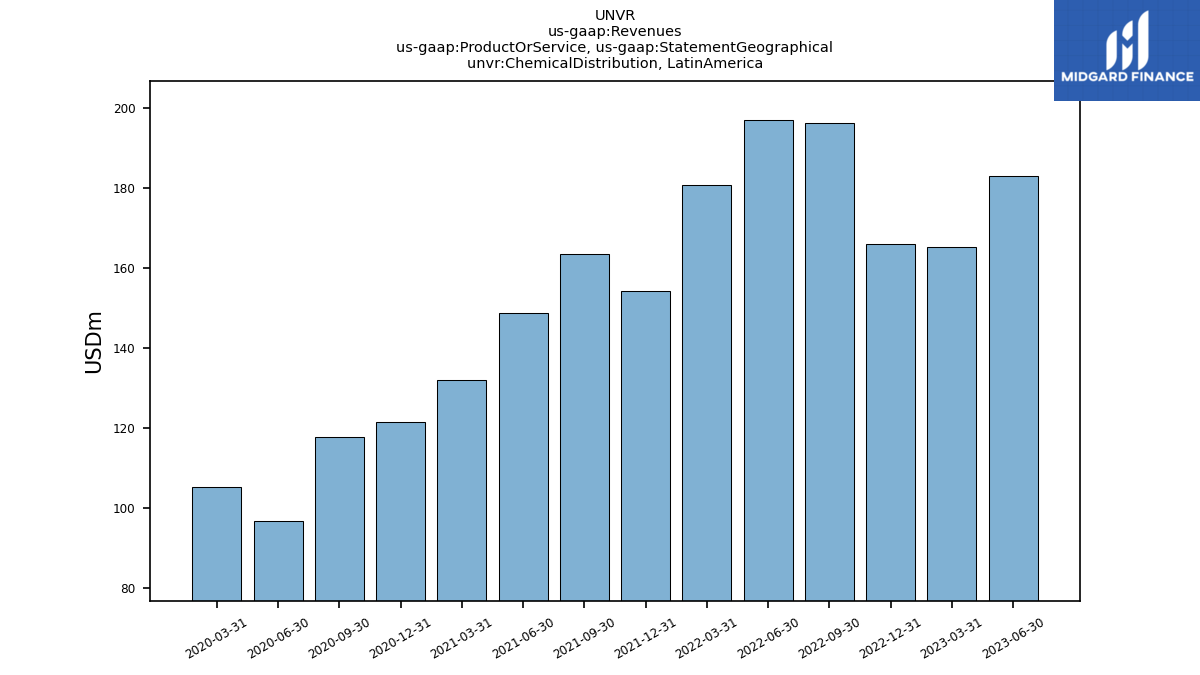
| Chemical Distribution, | 182.90 | 165.20 | 165.90 | 196.10 | 196.80 | 180.70 | 154.30 | 163.40 | 148.80 | 132.00 | 121.60 | 117.80 | 96.80 | 105.30 | NA | NA | NA | NA | NA | NA | NA | NA | NA | NA | NA | NA | NA | NA | NA | NA | NA | NA | NA | NA | NA | NA | NA | NA | |
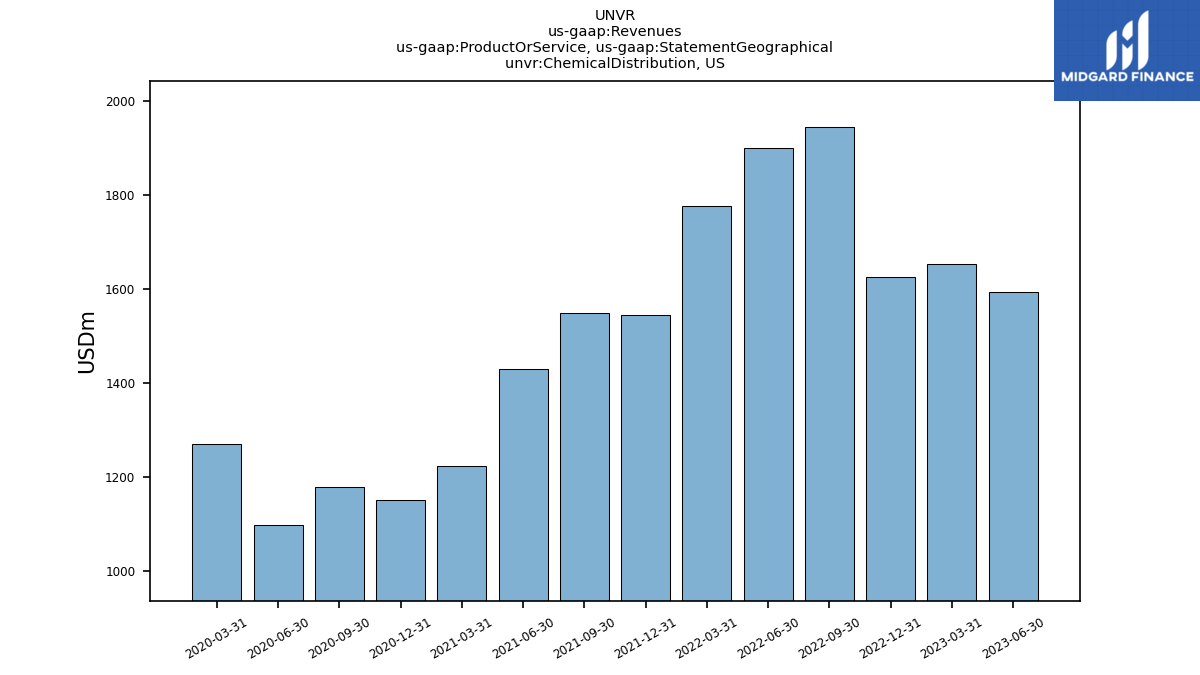
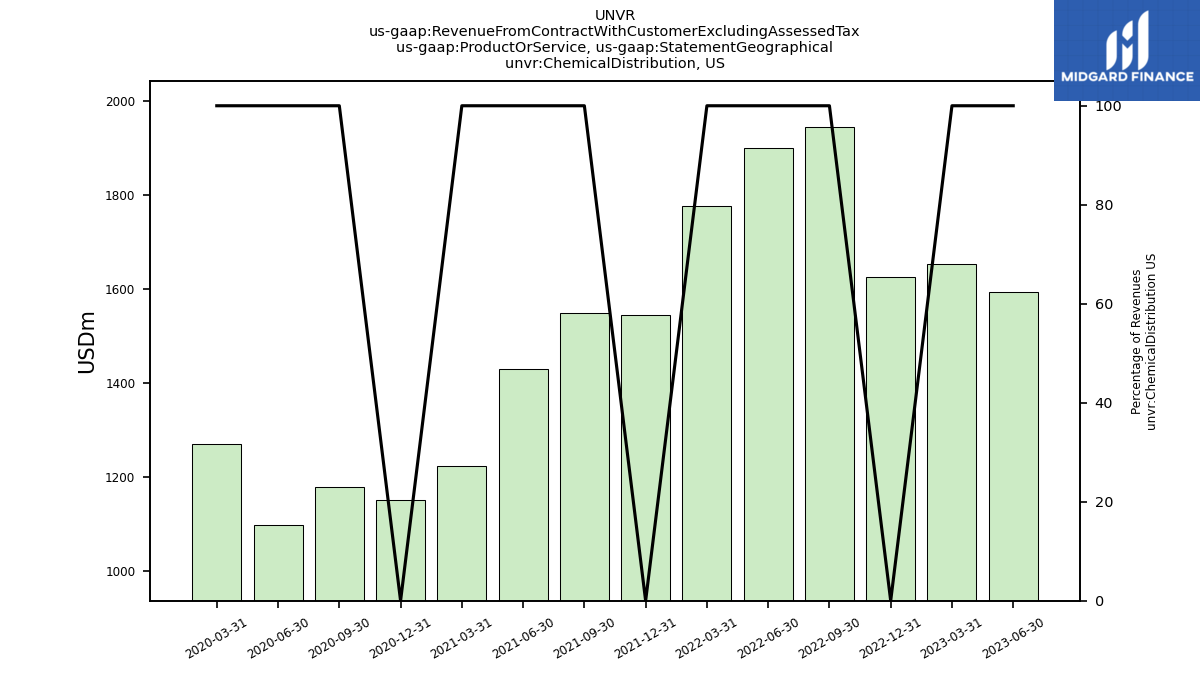
| Chemical Distribution,US | 1594.00 | 1652.40 | 1624.80 | 1945.20 | 1900.20 | 1777.10 | 1543.80 | 1548.50 | 1428.70 | 1222.20 | 1151.50 | 1179.00 | 1097.10 | 1270.50 | NA | NA | NA | NA | NA | NA | NA | NA | NA | NA | NA | NA | NA | NA | NA | NA | NA | NA | NA | NA | NA | NA | NA | NA | |
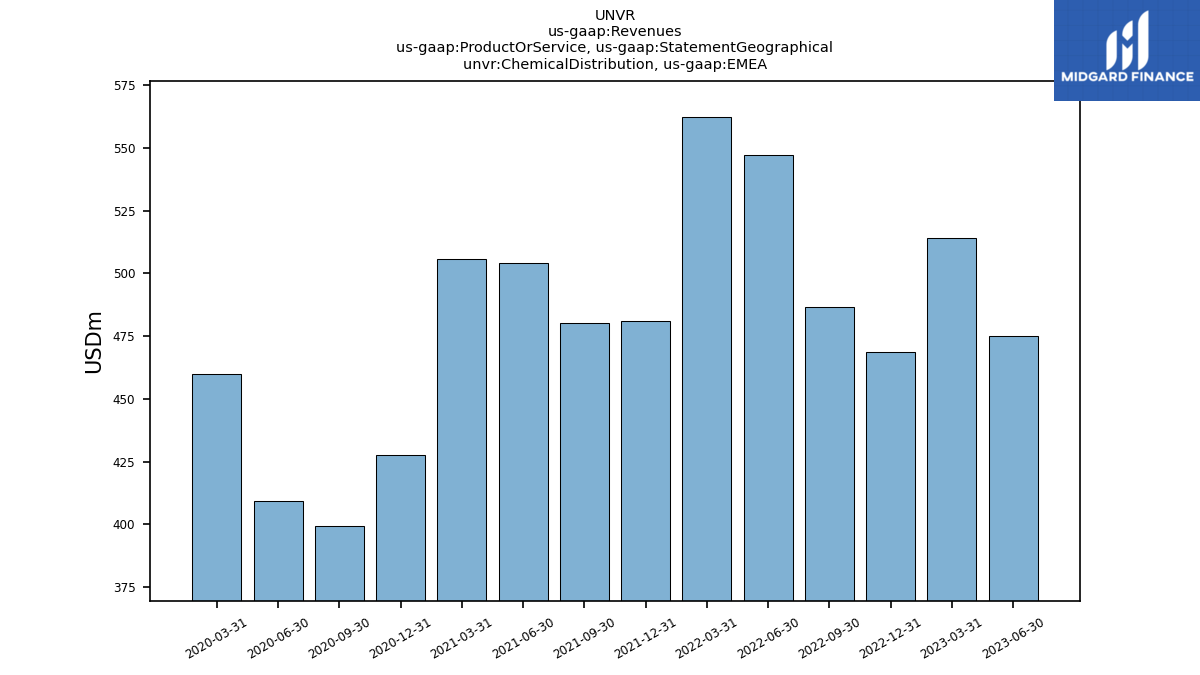
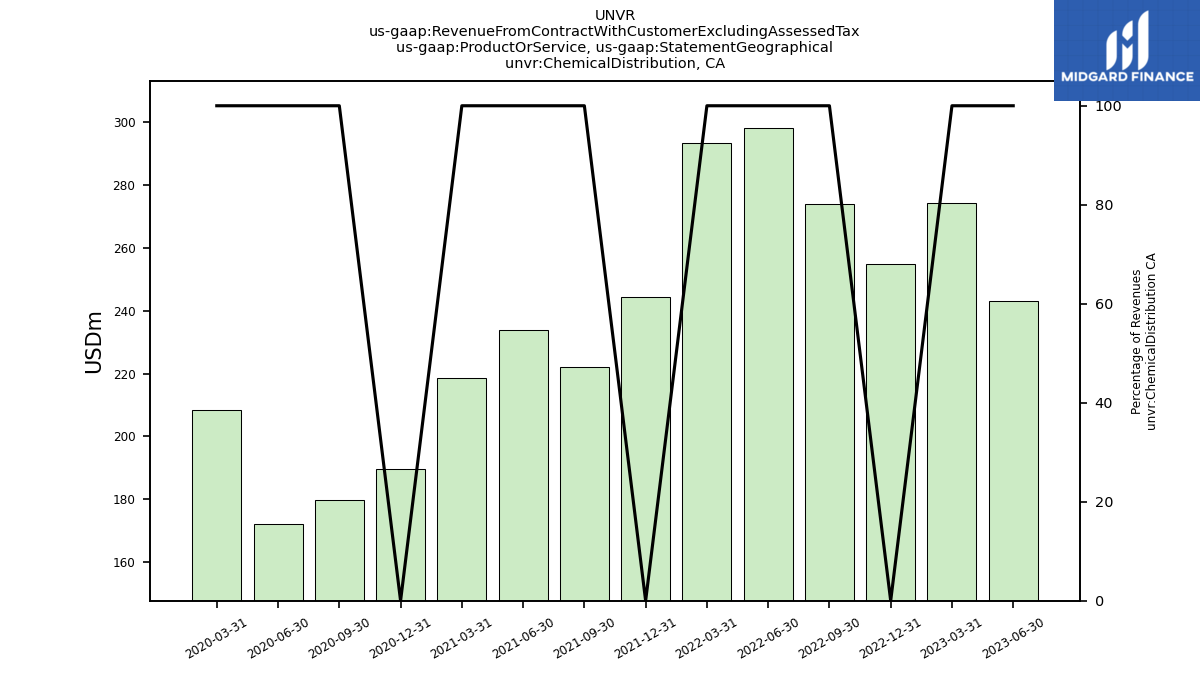
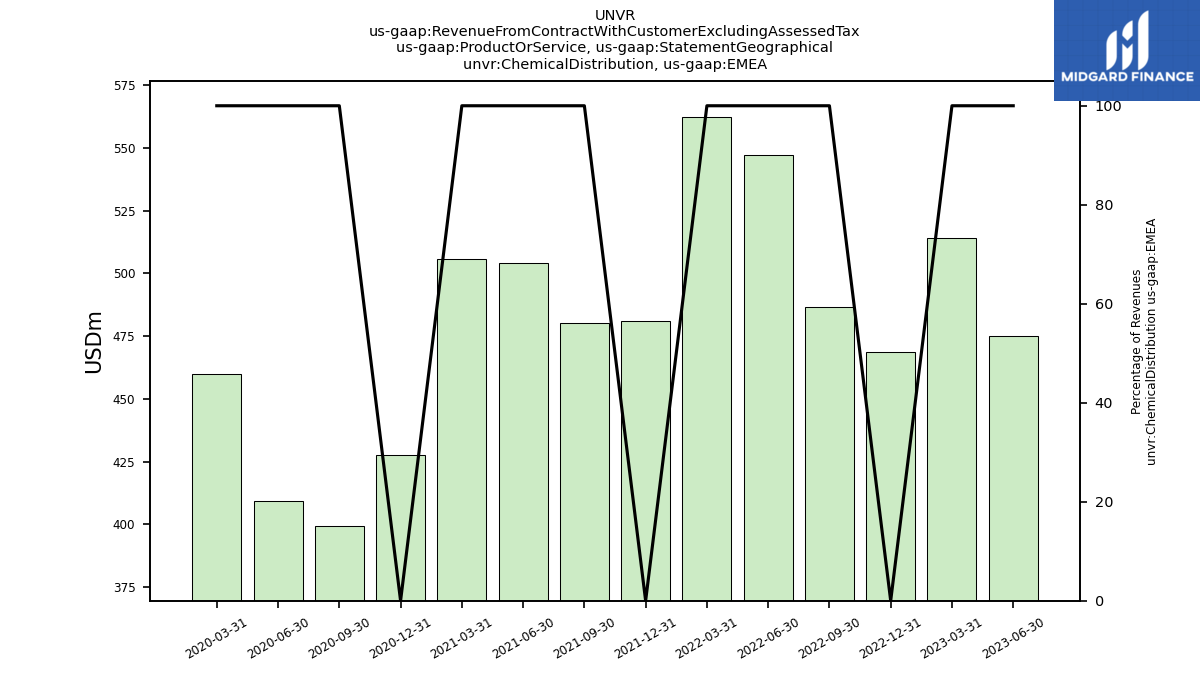
| Chemical Distribution,EMEA | 474.90 | 514.10 | 468.80 | 486.50 | 547.10 | 562.20 | 480.90 | 480.20 | 504.00 | 505.70 | 427.50 | 399.10 | 409.30 | 459.90 | NA | NA | NA | NA | NA | NA | NA | NA | NA | NA | NA | NA | NA | NA | NA | NA | NA | NA | NA | NA | NA | NA | NA | NA | |
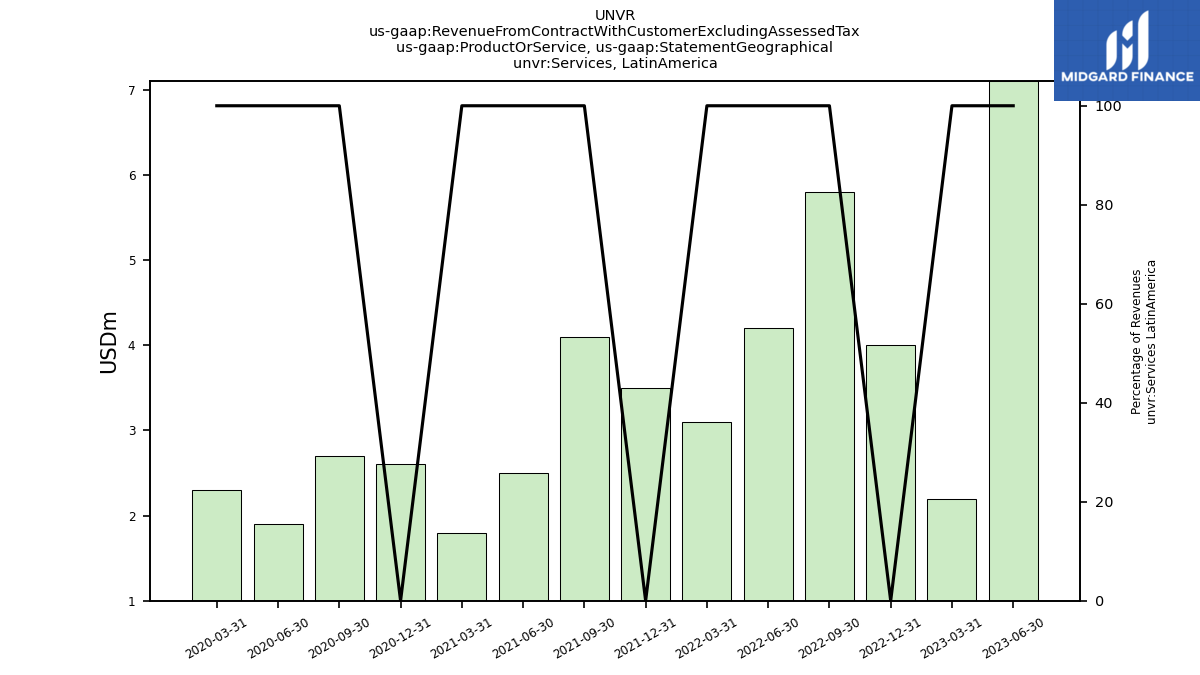
| Services, | 7.10 | 2.20 | 4.00 | 5.80 | 4.20 | 3.10 | 3.50 | 4.10 | 2.50 | 1.80 | 2.60 | 2.70 | 1.90 | 2.30 | NA | NA | NA | NA | NA | NA | NA | NA | NA | NA | NA | NA | NA | NA | NA | NA | NA | NA | NA | NA | NA | NA | NA | NA | |
| Services,US | 72.20 | 76.80 | 74.10 | 76.00 | 70.00 | 66.10 | 70.20 | 68.30 | 71.50 | 70.80 | 73.40 | 75.40 | 72.30 | 87.00 | NA | NA | NA | NA | NA | NA | NA | NA | NA | NA | NA | NA | NA | NA | NA | NA | NA | NA | NA | NA | NA | NA | NA | NA | |
| Services,EMEA | NA | NA | 0.00 | 0.00 | 0.10 | NA | 0.00 | 0.10 | 0.00 | 0.20 | 0.30 | 0.30 | 0.30 | 0.40 | NA | NA | NA | NA | NA | NA | NA | NA | NA | NA | NA | NA | NA | NA | NA | NA | NA | NA | NA | NA | NA | NA | NA | NA | |
| 243.00 | 274.20 | 255.00 | 273.90 | 298.20 | 293.40 | 245.40 | 223.30 | 238.60 | 222.70 | 261.00 | 234.90 | 331.50 | 285.80 | NA | NA | NA | NA | NA | NA | NA | NA | NA | NA | NA | NA | NA | NA | NA | NA | NA | NA | NA | NA | NA | NA | NA | NA | ||
| 190.00 | 167.40 | 169.90 | 201.90 | 201.00 | 183.80 | 157.80 | 167.50 | 151.30 | 133.80 | 124.20 | 120.50 | 98.70 | 107.60 | NA | NA | NA | NA | NA | NA | NA | NA | NA | NA | NA | NA | NA | NA | NA | NA | NA | NA | NA | NA | NA | NA | NA | NA | ||
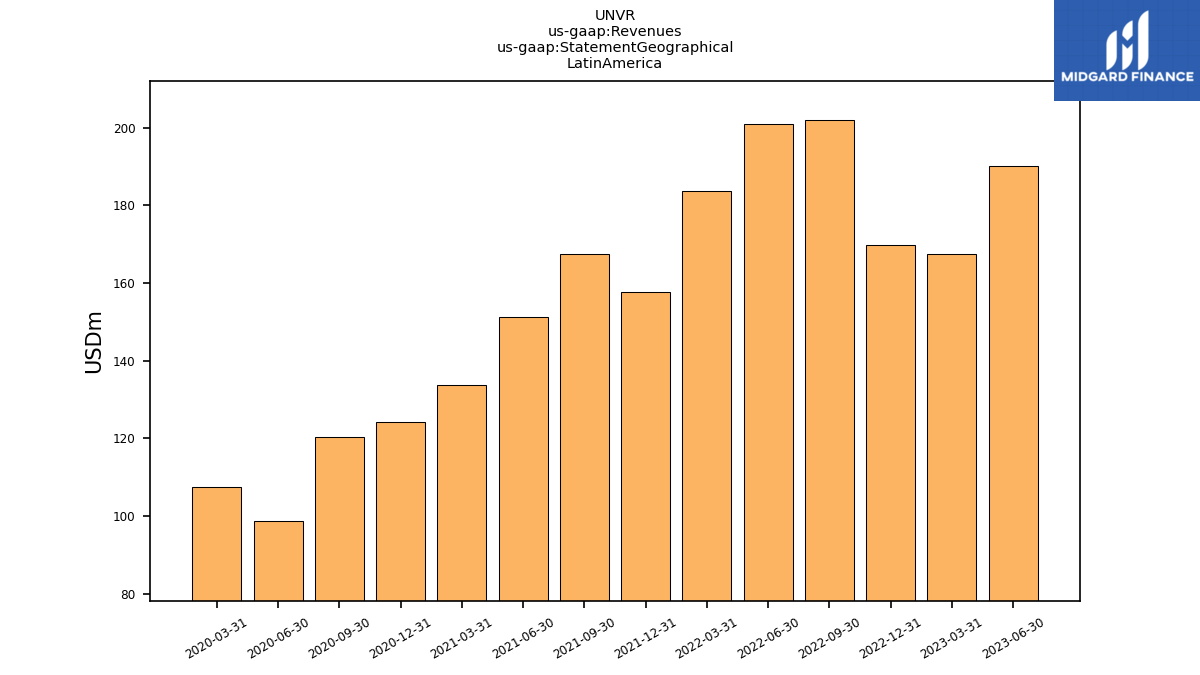
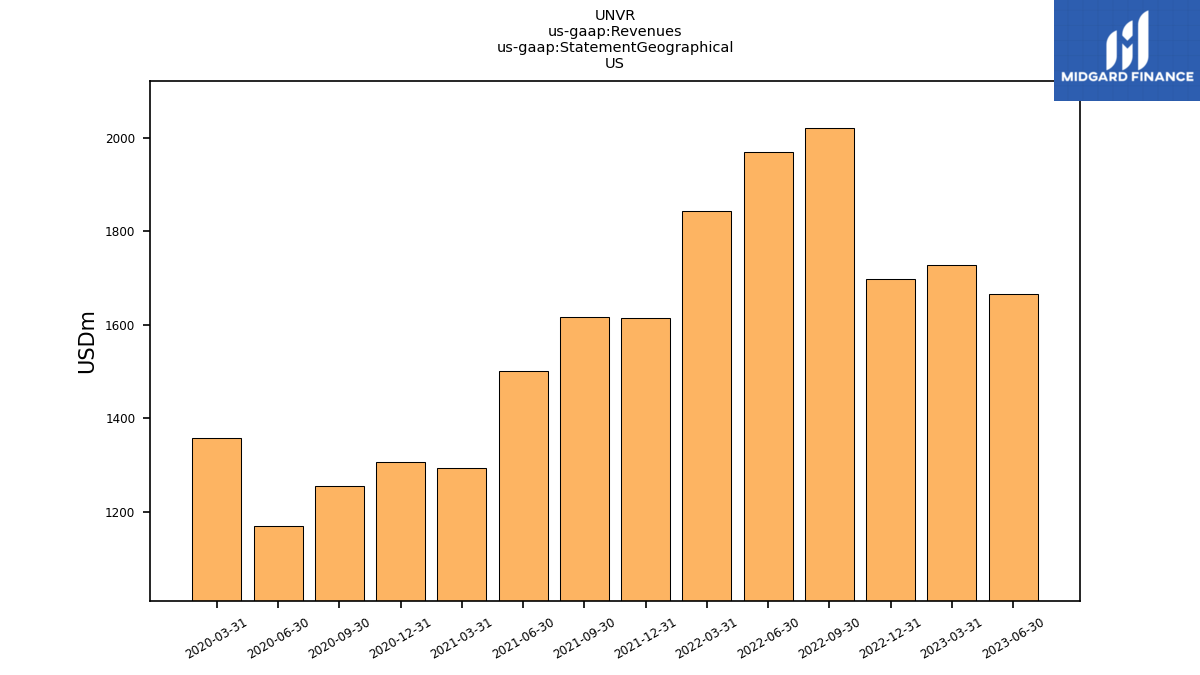
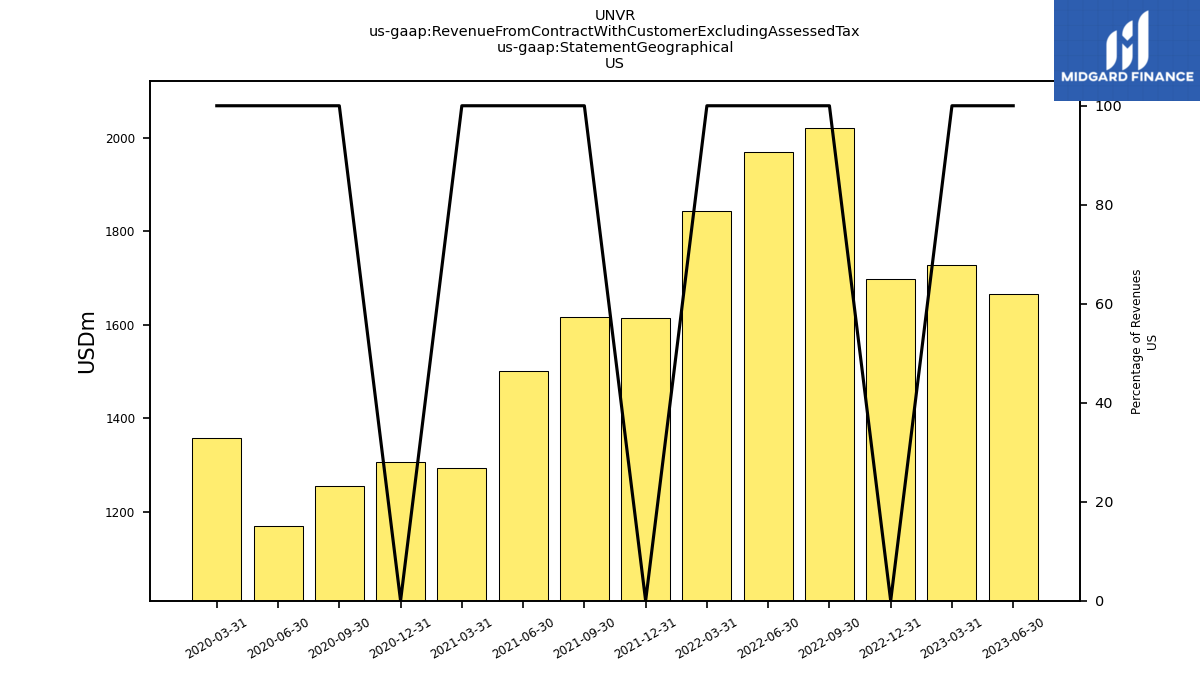
| US | 1666.20 | 1729.20 | 1698.90 | 2021.20 | 1970.20 | 1843.20 | 1614.00 | 1616.80 | 1500.20 | 1293.00 | 1306.10 | 1254.40 | 1169.40 | 1357.50 | NA | NA | NA | NA | NA | NA | NA | NA | NA | NA | NA | NA | NA | NA | NA | NA | NA | NA | NA | NA | NA | NA | NA | NA | |
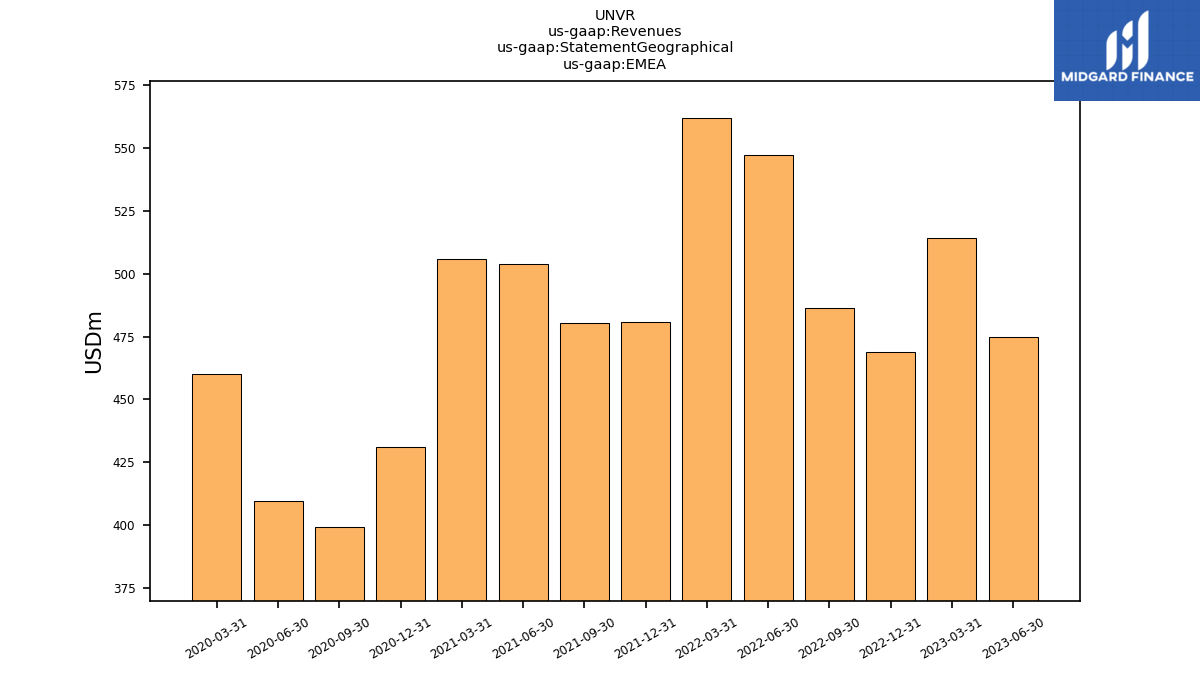
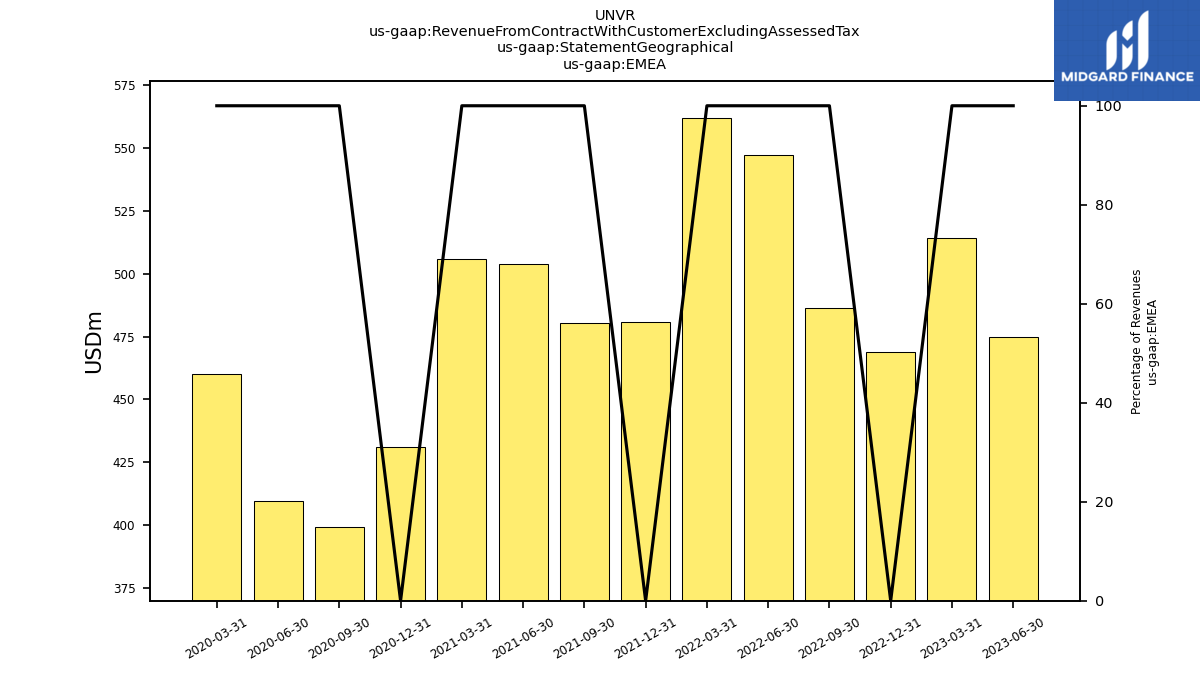
| EMEA | 474.90 | 514.10 | 468.80 | 486.50 | 547.20 | 562.20 | 480.90 | 480.30 | 504.00 | 505.90 | 430.90 | 399.40 | 409.60 | 460.30 | NA | NA | NA | NA | NA | NA | NA | NA | NA | NA | NA | NA | NA | NA | NA | NA | NA | NA | NA | NA | NA | NA | NA | NA | |
| Revenue From Contract With Customer Excluding Assessed Tax | 2574.10 | 2684.90 | 2592.60 | 2983.50 | 3016.60 | 2882.60 | 2498.10 | 2487.90 | 2394.10 | 2155.40 | 2035.40 | 2009.20 | 2009.20 | 2211.20 | 2155.00 | 2387.30 | 2584.60 | 2160.00 | 1971.20 | 2130.70 | 2372.60 | 2158.00 | 1959.20 | 2048.70 | 2247.00 | 1998.80 | 1812.50 | 1999.70 | 2262.50 | 1999.00 | 1966.30 | 2206.30 | 2510.10 | 2299.10 | 2387.20 | 2608.90 | 2861.40 | 2516.40 | |
| Intersegment Elimination | -31.70 | -28.70 | -34.40 | -36.30 | -49.40 | -31.00 | -28.80 | -31.10 | -22.70 | -18.90 | -19.20 | -15.70 | -24.60 | -27.30 | -24.80 | -31.80 | -26.10 | -27.00 | 252.60 | -32.60 | -41.30 | -38.60 | 238.60 | -29.50 | -38.70 | -34.40 | 199.90 | -24.40 | -27.70 | -30.60 | -32.20 | -37.80 | NA | NA | NA | NA | NA | NA | |
| Intersegment Elimination, | -1.30 | -1.60 | -18.00 | 3.20 | 2.50 | 1.80 | 1.80 | 0.60 | 1.30 | 0.70 | 0.50 | 0.50 | 0.70 | 0.80 | NA | NA | NA | NA | NA | NA | NA | NA | NA | NA | NA | NA | NA | NA | NA | NA | NA | NA | NA | NA | NA | NA | NA | NA | |
| Intersegment Elimination, | -0.10 | NA | -0.70 | 0.10 | 0.10 | NA | 0.00 | 0.70 | NA | NA | NA | NA | NA | NA | NA | NA | NA | NA | NA | NA | NA | NA | NA | NA | NA | NA | NA | NA | NA | NA | NA | NA | NA | NA | NA | NA | NA | NA | |
| Intersegment Elimination,US | -29.20 | -26.50 | -230.00 | 28.20 | 43.80 | 28.50 | 26.30 | 28.90 | 19.50 | 17.40 | 17.90 | 14.60 | 23.00 | 25.70 | NA | NA | NA | NA | NA | NA | NA | NA | NA | NA | NA | NA | NA | NA | NA | NA | NA | NA | NA | NA | NA | NA | NA | NA | |
| Intersegment Elimination,EMEA | -1.10 | -0.60 | -19.10 | 4.80 | 3.00 | 0.70 | 0.70 | 0.90 | 1.90 | 0.80 | 0.80 | 0.60 | 0.90 | 0.80 | NA | NA | NA | NA | NA | NA | NA | NA | NA | NA | NA | NA | NA | NA | NA | NA | NA | NA | NA | NA | NA | NA | NA | NA | |
| Operating, | 244.30 | 275.80 | 258.00 | 277.10 | 300.70 | 295.20 | 247.20 | 223.90 | 239.90 | 223.40 | 256.50 | 235.40 | 332.20 | 286.60 | NA | NA | NA | NA | NA | NA | NA | NA | NA | NA | NA | NA | NA | NA | NA | NA | NA | NA | NA | NA | NA | NA | NA | NA | |
| Operating, | 190.10 | 167.40 | 170.20 | 202.00 | 201.10 | 183.80 | 157.80 | 168.20 | 151.30 | 133.80 | 124.20 | 120.50 | 98.70 | 107.60 | NA | NA | NA | NA | NA | NA | NA | NA | NA | NA | NA | NA | NA | NA | NA | NA | NA | NA | NA | NA | NA | NA | NA | NA | |
| Operating,US | 1695.40 | 1755.70 | 1727.90 | 2049.40 | 2014.00 | 1871.70 | 1640.30 | 1645.70 | 1519.70 | 1310.40 | 1161.60 | 1269.00 | 1192.40 | 1383.20 | NA | NA | NA | NA | NA | NA | NA | NA | NA | NA | NA | NA | NA | NA | NA | NA | NA | NA | NA | NA | NA | NA | NA | NA | |
| Operating,EMEA | 476.00 | 514.70 | 470.90 | 491.30 | 550.20 | 562.90 | 481.60 | 481.20 | 505.90 | 506.70 | 425.50 | 400.00 | 410.50 | 461.10 | NA | NA | NA | NA | NA | NA | NA | NA | NA | NA | NA | NA | NA | NA | NA | NA | NA | NA | NA | NA | NA | NA | NA | NA | |
| Chemical Distribution | 2494.80 | 2605.90 | 2514.50 | 2901.70 | 2942.30 | 2813.40 | 2423.50 | 2414.20 | 2315.40 | 2078.60 | 1890.20 | 1875.70 | 1775.20 | 2044.00 | 2016.90 | 2223.00 | 2312.80 | 2035.20 | 1871.60 | 2012.70 | 2095.60 | 2031.10 | NA | NA | NA | NA | NA | NA | NA | NA | NA | NA | NA | NA | NA | NA | NA | NA | |
| Services | 79.30 | 79.00 | 78.10 | 81.80 | 74.30 | 69.20 | 74.60 | 73.70 | 78.70 | 76.80 | 85.80 | 89.60 | 86.60 | 102.80 | 102.00 | 100.00 | 104.70 | 74.30 | 58.60 | 61.80 | 62.00 | 57.50 | NA | NA | NA | NA | NA | NA | NA | NA | NA | NA | NA | NA | NA | NA | NA | NA | |
| Chemical Distribution, | 243.00 | 274.20 | 255.00 | 273.90 | 298.20 | 293.40 | 244.50 | 222.10 | 233.90 | 218.70 | 189.60 | 179.80 | 172.00 | 208.30 | NA | NA | NA | NA | NA | NA | NA | NA | NA | NA | NA | NA | NA | NA | NA | NA | NA | NA | NA | NA | NA | NA | NA | NA | |
| Chemical Distribution, | 182.90 | 165.20 | 165.90 | 196.10 | 196.80 | 180.70 | 154.30 | 163.40 | 148.80 | 132.00 | 121.60 | 117.80 | 96.80 | 105.30 | NA | NA | NA | NA | NA | NA | NA | NA | NA | NA | NA | NA | NA | NA | NA | NA | NA | NA | NA | NA | NA | NA | NA | NA | |
| Chemical Distribution,US | 1594.00 | 1652.40 | 1624.80 | 1945.20 | 1900.20 | 1777.10 | 1543.80 | 1548.50 | 1428.70 | 1222.20 | 1151.50 | 1179.00 | 1097.10 | 1270.50 | NA | NA | NA | NA | NA | NA | NA | NA | NA | NA | NA | NA | NA | NA | NA | NA | NA | NA | NA | NA | NA | NA | NA | NA | |
| Chemical Distribution,EMEA | 474.90 | 514.10 | 468.80 | 486.50 | 547.10 | 562.20 | 480.90 | 480.20 | 504.00 | 505.70 | 427.50 | 399.10 | 409.30 | 459.90 | NA | NA | NA | NA | NA | NA | NA | NA | NA | NA | NA | NA | NA | NA | NA | NA | NA | NA | NA | NA | NA | NA | NA | NA | |
| Services, | 7.10 | 2.20 | 4.00 | 5.80 | 4.20 | 3.10 | 3.50 | 4.10 | 2.50 | 1.80 | 2.60 | 2.70 | 1.90 | 2.30 | NA | NA | NA | NA | NA | NA | NA | NA | NA | NA | NA | NA | NA | NA | NA | NA | NA | NA | NA | NA | NA | NA | NA | NA | |
| Services,US | 72.20 | 76.80 | 74.10 | 76.00 | 70.00 | 66.10 | 70.20 | 68.30 | 71.50 | 70.80 | 73.40 | 75.40 | 72.30 | 87.00 | NA | NA | NA | NA | NA | NA | NA | NA | NA | NA | NA | NA | NA | NA | NA | NA | NA | NA | NA | NA | NA | NA | NA | NA | |
| Services,EMEA | NA | NA | 0.00 | 0.00 | 0.10 | NA | 0.00 | 0.10 | 0.00 | 0.20 | 0.30 | 0.30 | 0.30 | 0.40 | NA | NA | NA | NA | NA | NA | NA | NA | NA | NA | NA | NA | NA | NA | NA | NA | NA | NA | NA | NA | NA | NA | NA | NA | |
| 243.00 | 274.20 | 255.00 | 273.90 | 298.20 | 293.40 | 245.40 | 223.30 | 238.60 | 222.70 | 261.00 | 234.90 | 331.50 | 285.80 | NA | NA | NA | NA | NA | NA | NA | NA | NA | NA | NA | NA | NA | NA | NA | NA | NA | NA | NA | NA | NA | NA | NA | NA | ||
| 190.00 | 167.40 | 169.90 | 201.90 | 201.00 | 183.80 | 157.80 | 167.50 | 151.30 | 133.80 | 124.20 | 120.50 | 98.70 | 107.60 | NA | NA | NA | NA | NA | NA | NA | NA | NA | NA | NA | NA | NA | NA | NA | NA | NA | NA | NA | NA | NA | NA | NA | NA | ||
| US | 1666.20 | 1729.20 | 1698.90 | 2021.20 | 1970.20 | 1843.20 | 1614.00 | 1616.80 | 1500.20 | 1293.00 | 1306.10 | 1254.40 | 1169.40 | 1357.50 | NA | NA | NA | NA | NA | NA | NA | NA | NA | NA | NA | NA | NA | NA | NA | NA | NA | NA | NA | NA | NA | NA | NA | NA | |
| EMEA | 474.90 | 514.10 | 468.80 | 486.50 | 547.20 | 562.20 | 480.90 | 480.30 | 504.00 | 505.90 | 430.90 | 399.40 | 409.60 | 460.30 | NA | NA | NA | NA | NA | NA | NA | NA | NA | NA | NA | NA | NA | NA | NA | NA | NA | NA | NA | NA | NA | NA | NA | NA |

