
| 2023-12-30 | 2023-09-30 | 2023-07-01 | 2023-04-01 | 2022-12-31 | 2022-10-01 | 2022-07-02 | 2022-04-02 | 2022-01-01 | 2021-10-02 | 2021-07-03 | 2021-04-03 | 2020-09-26 | 2020-06-27 | 2020-03-28 | 2019-12-28 | 2019-09-28 | 2019-06-29 | 2019-03-30 | 2018-12-29 | 2018-09-29 | 2018-06-30 | 2018-03-31 | 2017-12-30 | 2017-09-30 | 2017-07-01 | 2017-04-01 | 2016-12-31 | 2016-10-01 | 2016-07-02 | 2016-04-02 | 2016-01-02 | 2015-10-03 | 2015-07-04 | 2015-04-04 | 2015-01-03 | 2014-09-27 | 2014-06-28 | 2014-03-29 | 2013-12-28 | 2013-09-28 | 2013-06-29 | 2013-03-30 | 2012-12-29 | 2012-09-29 | 2012-06-30 | 2012-03-31 | 2011-12-31 | 2011-10-01 | 2011-07-02 | 2011-04-02 | 2011-01-01 | 2010-10-02 | 2010-07-03 | ||
|---|---|---|---|---|---|---|---|---|---|---|---|---|---|---|---|---|---|---|---|---|---|---|---|---|---|---|---|---|---|---|---|---|---|---|---|---|---|---|---|---|---|---|---|---|---|---|---|---|---|---|---|---|---|---|---|
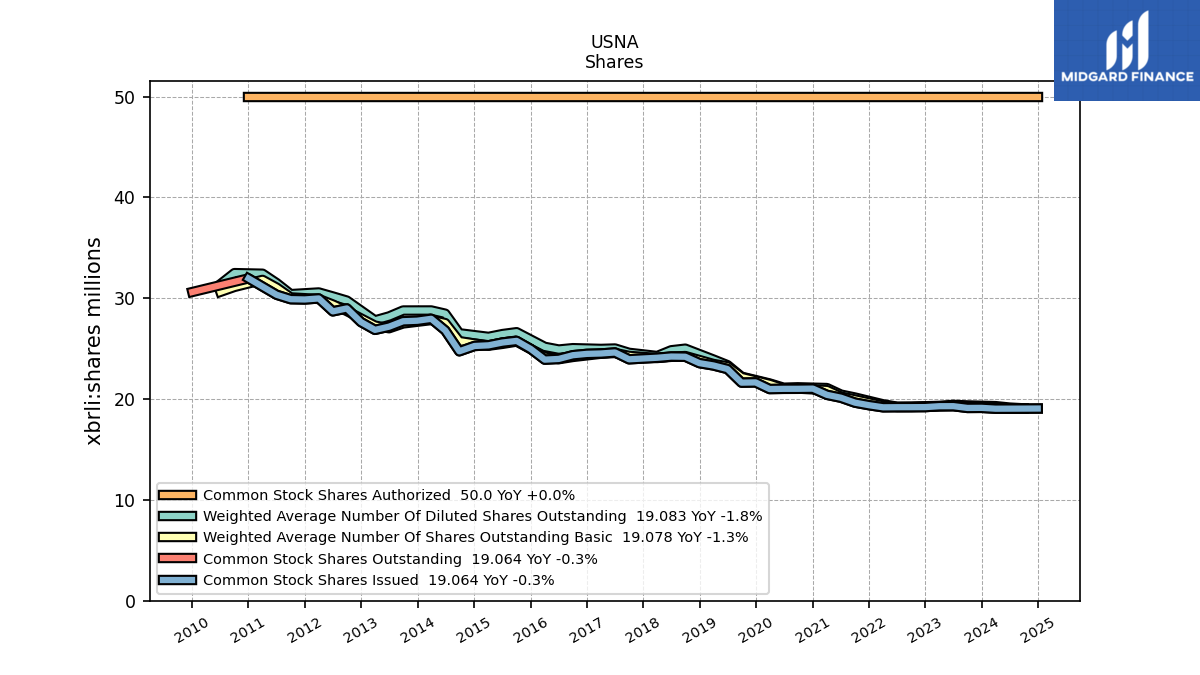
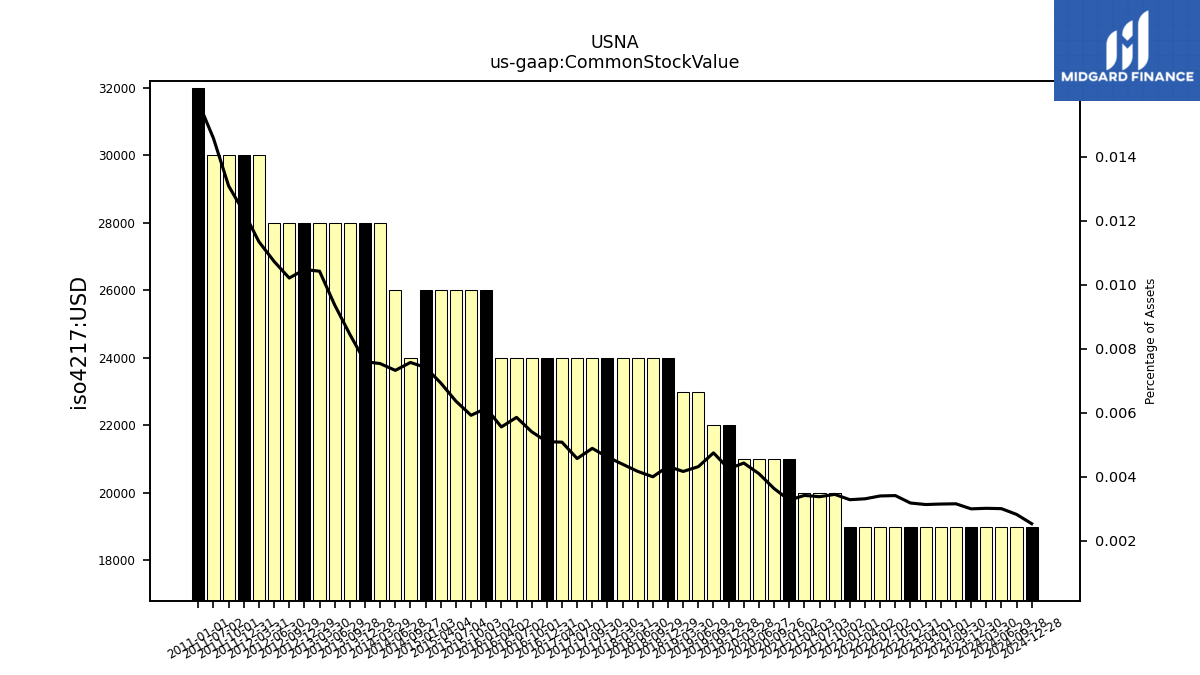
| Common Stock Value | 0.02 | 0.02 | 0.02 | 0.02 | 0.02 | 0.02 | 0.02 | 0.02 | 0.02 | 0.02 | 0.02 | 0.02 | 0.02 | 0.02 | 0.02 | 0.02 | 0.02 | 0.02 | 0.02 | 0.02 | 0.02 | 0.02 | 0.02 | 0.02 | 0.02 | 0.02 | 0.02 | 0.02 | 0.02 | 0.02 | 0.02 | 0.03 | 0.03 | 0.03 | 0.03 | 0.03 | 0.02 | 0.03 | 0.03 | 0.03 | 0.03 | 0.03 | 0.03 | 0.03 | 0.03 | 0.03 | 0.03 | 0.03 | 0.03 | 0.03 | NA | 0.03 | NA | NA | |
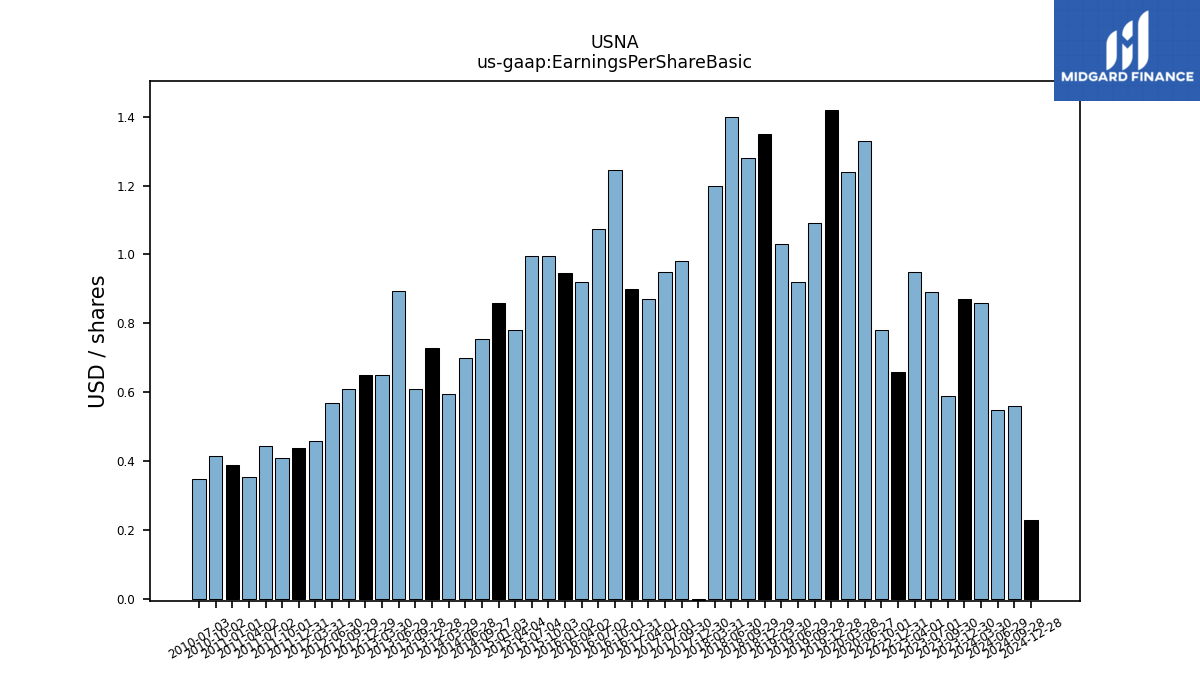
| Earnings Per Share Basic | 0.87 | 0.59 | NA | NA | 0.66 | 0.78 | NA | NA | NA | NA | NA | NA | NA | 1.33 | 1.24 | 1.42 | 1.09 | 0.92 | 1.03 | 1.35 | 1.28 | 1.40 | 1.20 | -0.24 | 0.98 | 0.95 | 0.87 | 0.90 | 1.25 | 1.07 | 0.92 | 0.94 | 0.99 | 0.99 | 0.78 | 0.86 | 0.76 | 0.70 | 0.59 | 0.73 | 0.61 | 0.90 | 0.65 | 0.65 | 0.61 | 0.57 | 0.46 | 0.44 | 0.41 | 0.45 | 0.35 | 0.39 | 0.41 | 0.35 | |
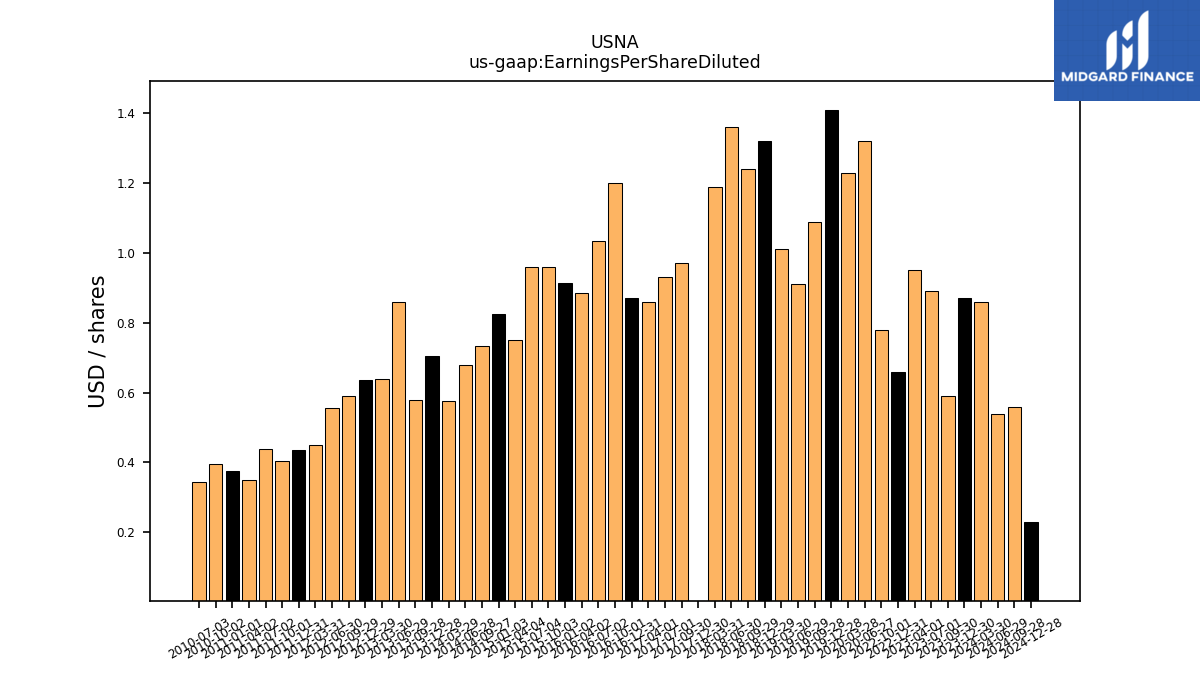
| Earnings Per Share Diluted | 0.87 | 0.59 | NA | NA | 0.66 | 0.78 | NA | NA | NA | NA | NA | NA | NA | 1.32 | 1.23 | 1.41 | 1.09 | 0.91 | 1.01 | 1.32 | 1.24 | 1.36 | 1.19 | -0.24 | 0.97 | 0.93 | 0.86 | 0.87 | 1.20 | 1.03 | 0.89 | 0.92 | 0.96 | 0.96 | 0.75 | 0.82 | 0.73 | 0.68 | 0.57 | 0.70 | 0.58 | 0.86 | 0.64 | 0.64 | 0.59 | 0.56 | 0.45 | 0.43 | 0.41 | 0.44 | 0.35 | 0.38 | 0.40 | 0.34 |
| 2023-12-30 | 2023-09-30 | 2023-07-01 | 2023-04-01 | 2022-12-31 | 2022-10-01 | 2022-07-02 | 2022-04-02 | 2022-01-01 | 2021-10-02 | 2021-07-03 | 2021-04-03 | 2020-09-26 | 2020-06-27 | 2020-03-28 | 2019-12-28 | 2019-09-28 | 2019-06-29 | 2019-03-30 | 2018-12-29 | 2018-09-29 | 2018-06-30 | 2018-03-31 | 2017-12-30 | 2017-09-30 | 2017-07-01 | 2017-04-01 | 2016-12-31 | 2016-10-01 | 2016-07-02 | 2016-04-02 | 2016-01-02 | 2015-10-03 | 2015-07-04 | 2015-04-04 | 2015-01-03 | 2014-09-27 | 2014-06-28 | 2014-03-29 | 2013-12-28 | 2013-09-28 | 2013-06-29 | 2013-03-30 | 2012-12-29 | 2012-09-29 | 2012-06-30 | 2012-03-31 | 2011-12-31 | 2011-10-01 | 2011-07-02 | 2011-04-02 | 2011-01-01 | 2010-10-02 | 2010-07-03 | ||
|---|---|---|---|---|---|---|---|---|---|---|---|---|---|---|---|---|---|---|---|---|---|---|---|---|---|---|---|---|---|---|---|---|---|---|---|---|---|---|---|---|---|---|---|---|---|---|---|---|---|---|---|---|---|---|---|
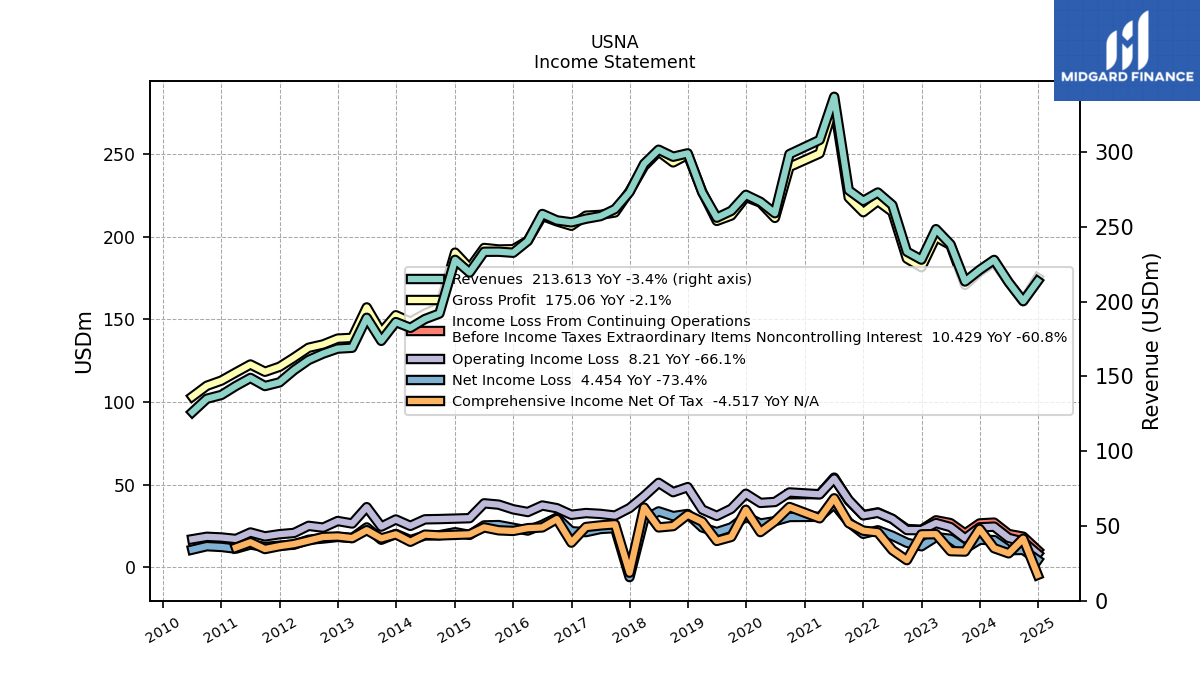
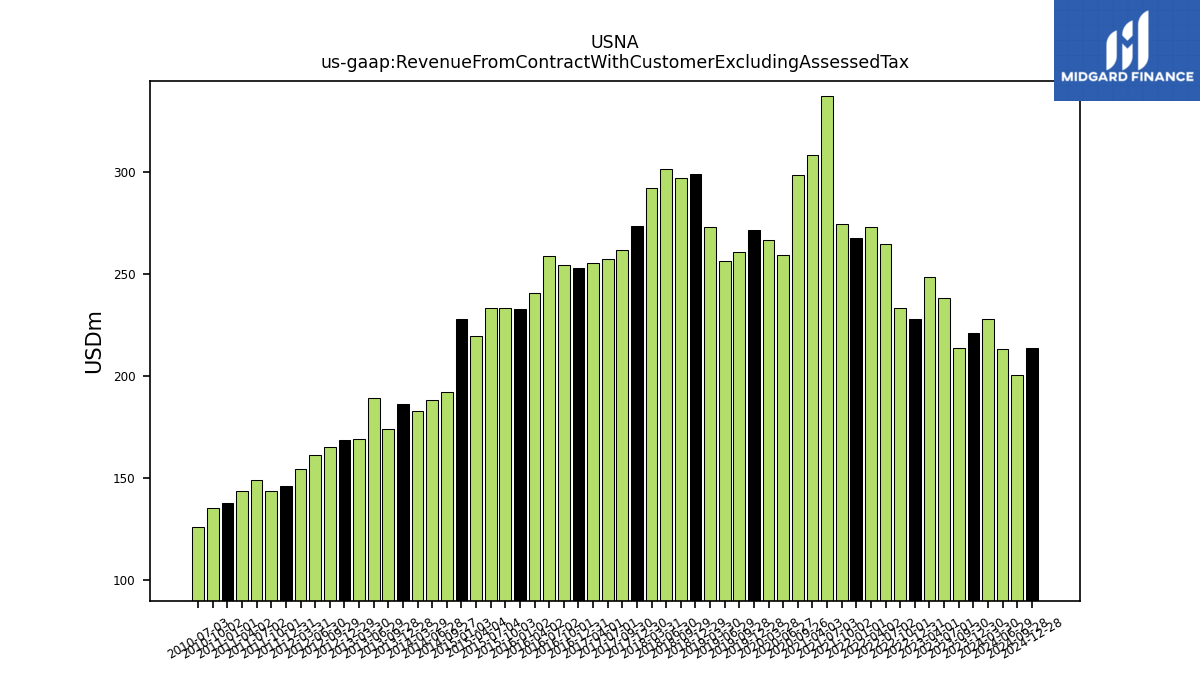
| Revenue From Contract With Customer Excluding Assessed Tax | 221.08 | 213.37 | 238.20 | 248.36 | 227.96 | 233.30 | 264.47 | 272.87 | 267.30 | 274.35 | 336.84 | 307.98 | 298.51 | 258.99 | 266.62 | 271.30 | 260.60 | 256.02 | 272.99 | 299.02 | 296.77 | 301.46 | 292.00 | 273.11 | 261.76 | 257.06 | 255.32 | 252.90 | 254.22 | 258.51 | 240.45 | 232.59 | 233.29 | 233.24 | 219.38 | 227.87 | 191.94 | 188.26 | 182.40 | 186.27 | 173.69 | 189.14 | 169.08 | 168.53 | 165.18 | 160.90 | 154.12 | 145.95 | 143.50 | 148.93 | 143.57 | 137.54 | 135.01 | 126.01 | |
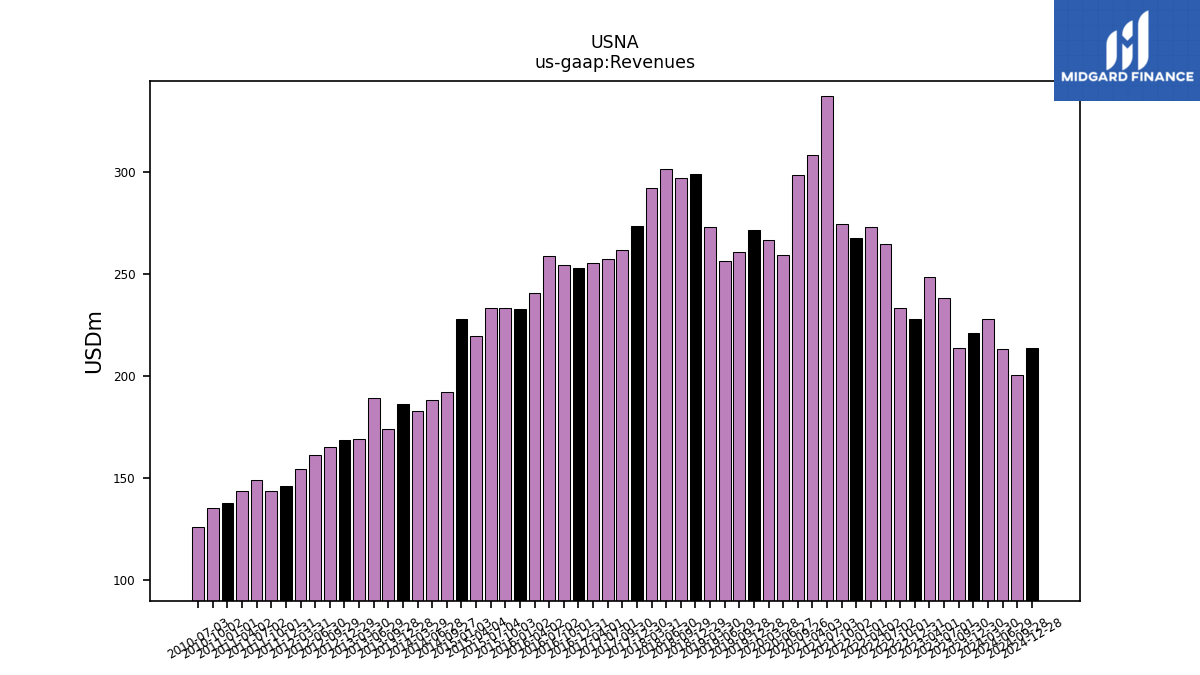
| Revenues | 221.08 | 213.37 | 238.20 | 248.36 | 227.96 | 233.30 | 264.47 | 272.87 | 267.30 | 274.35 | 336.84 | 307.98 | 298.51 | 258.99 | 266.62 | 271.30 | 260.60 | 256.02 | 272.99 | 299.02 | 296.77 | 301.46 | 292.00 | 273.11 | 261.76 | 257.06 | 255.32 | 252.90 | 254.22 | 258.51 | 240.45 | 232.59 | 233.29 | 233.24 | 219.38 | 227.87 | 191.94 | 188.26 | 182.40 | 186.27 | 173.69 | 189.14 | 169.08 | 168.53 | 165.18 | 160.90 | 154.12 | 145.95 | 143.50 | 148.93 | 143.57 | 137.54 | 135.01 | 126.01 | |
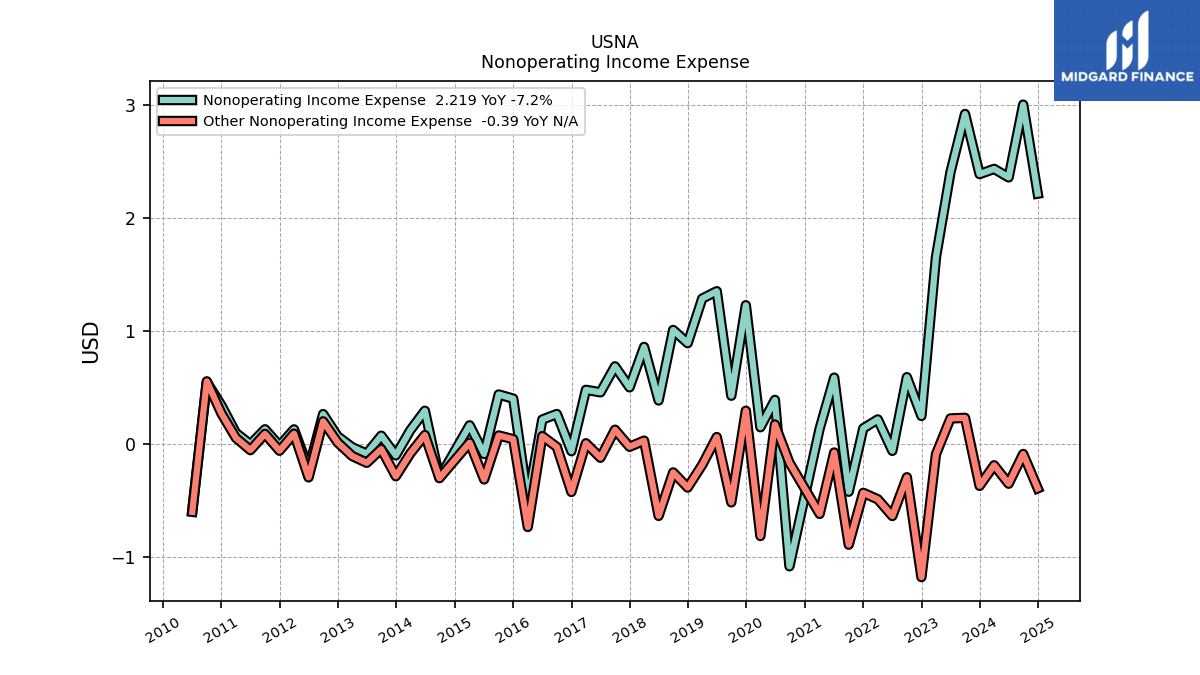
| Other Income | 0.98 | 0.71 | 0.76 | 0.73 | 0.76 | 0.89 | 0.90 | 0.90 | 0.94 | 0.94 | 0.96 | 0.97 | 0.82 | 0.98 | 0.64 | 0.69 | 0.71 | 0.78 | 0.47 | NA | NA | NA | NA | NA | NA | NA | NA | NA | NA | NA | NA | NA | NA | NA | NA | NA | NA | NA | NA | NA | NA | NA | NA | NA | NA | NA | NA | NA | NA | NA | NA | NA | NA | NA | |
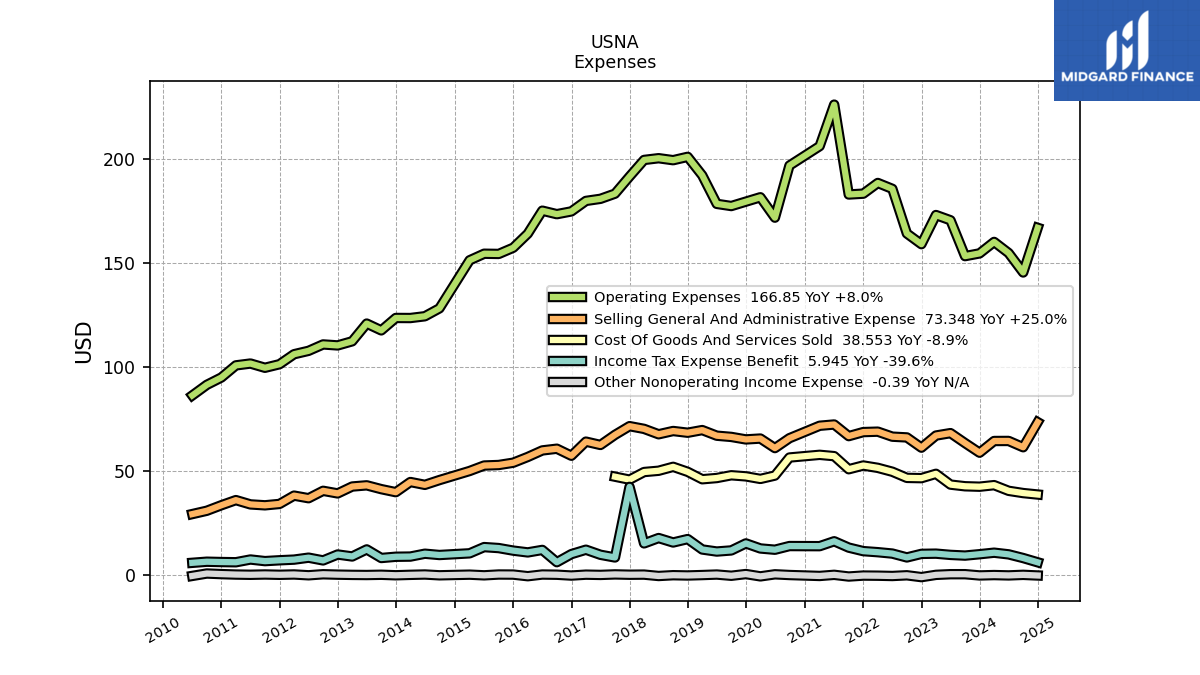
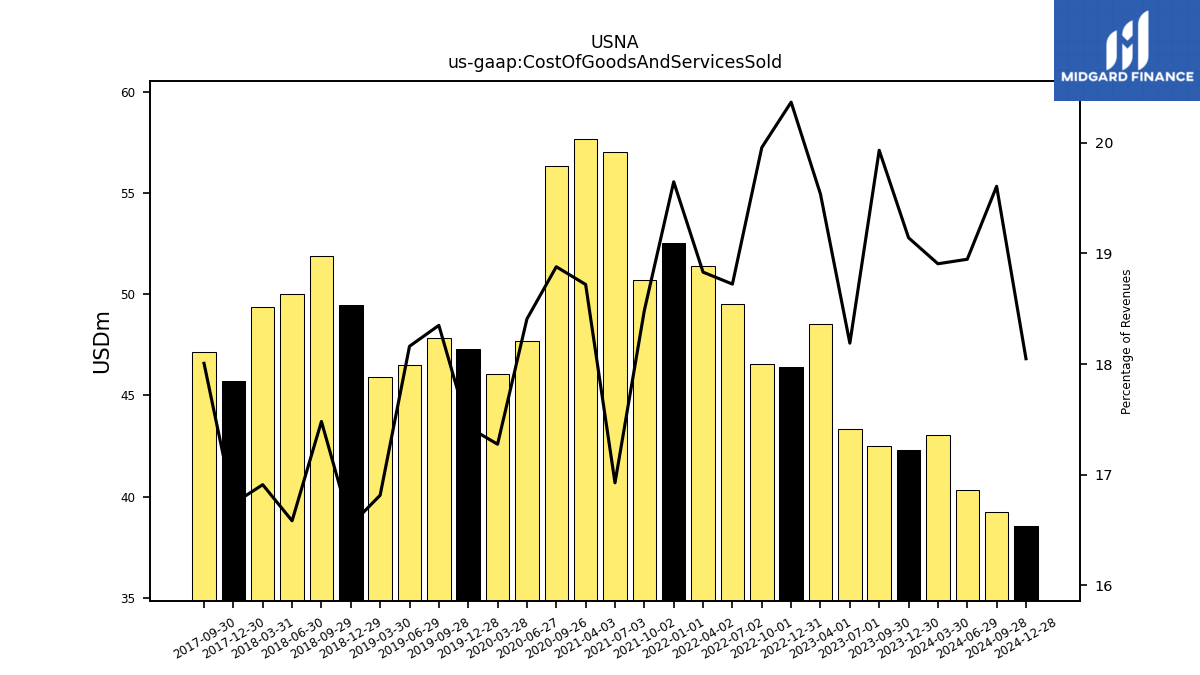
| Cost Of Goods And Services Sold | 42.32 | 42.53 | 43.33 | 48.52 | 46.43 | 46.56 | 49.52 | 51.38 | 52.52 | 50.72 | 57.01 | 57.65 | 56.36 | 47.67 | 46.06 | 47.29 | 47.82 | 46.49 | 45.90 | 49.47 | 51.88 | 49.99 | 49.38 | 45.71 | 47.13 | NA | NA | NA | NA | NA | NA | NA | NA | NA | NA | NA | NA | NA | NA | NA | NA | NA | NA | NA | NA | NA | NA | NA | NA | NA | NA | NA | NA | NA | |
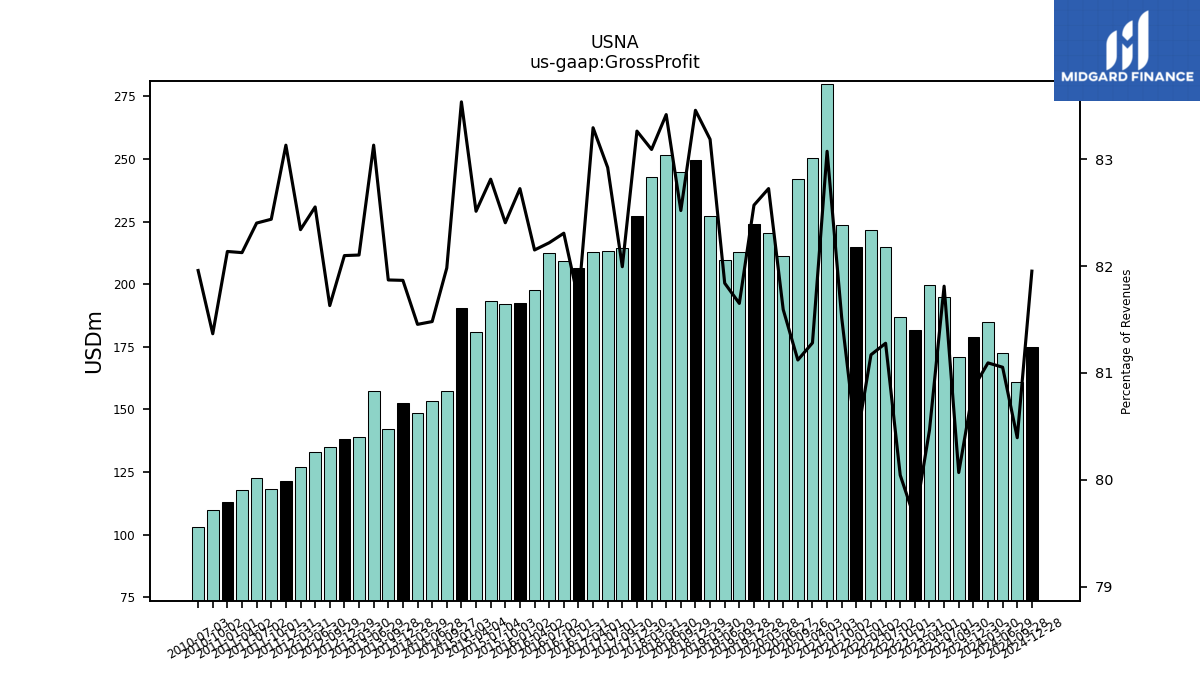
| Gross Profit | 178.76 | 170.84 | 194.88 | 199.84 | 181.53 | 186.74 | 214.96 | 221.48 | 214.78 | 223.64 | 279.82 | 250.32 | 242.16 | 211.32 | 220.56 | 224.01 | 212.78 | 209.52 | 227.09 | 249.56 | 244.89 | 251.47 | 242.62 | 227.40 | 214.63 | 213.16 | 212.67 | 206.58 | 209.24 | 212.54 | 197.53 | 192.40 | 192.24 | 193.16 | 181.01 | 190.35 | 157.36 | 153.39 | 148.57 | 152.49 | 142.20 | 157.23 | 138.82 | 138.36 | 134.83 | 132.83 | 126.90 | 121.33 | 118.30 | 122.72 | 117.90 | 112.97 | 109.85 | 103.28 | |
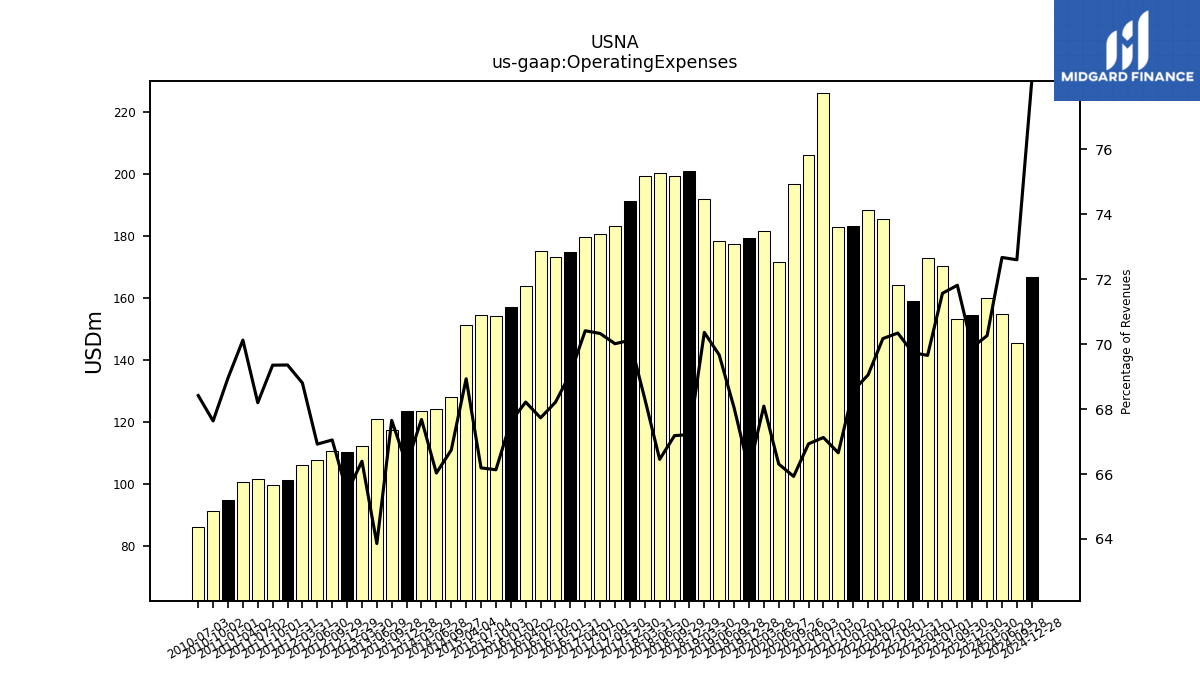
| Operating Expenses | 154.54 | 153.23 | 170.48 | 173.00 | 158.98 | 164.11 | 185.59 | 188.42 | 183.28 | 182.87 | 226.10 | 206.13 | 196.80 | 171.73 | 181.55 | 179.44 | 177.32 | 178.37 | 192.09 | 200.99 | 199.38 | 200.33 | 199.49 | 191.51 | 183.27 | 180.79 | 179.78 | 174.74 | 173.41 | 175.09 | 164.03 | 157.27 | 154.28 | 154.38 | 151.23 | NA | 128.10 | 124.30 | 123.45 | 123.48 | 117.51 | 120.78 | 112.26 | 110.28 | 110.75 | 107.68 | 106.04 | 101.23 | 99.52 | 101.56 | 100.68 | 94.84 | 91.31 | 86.21 | |
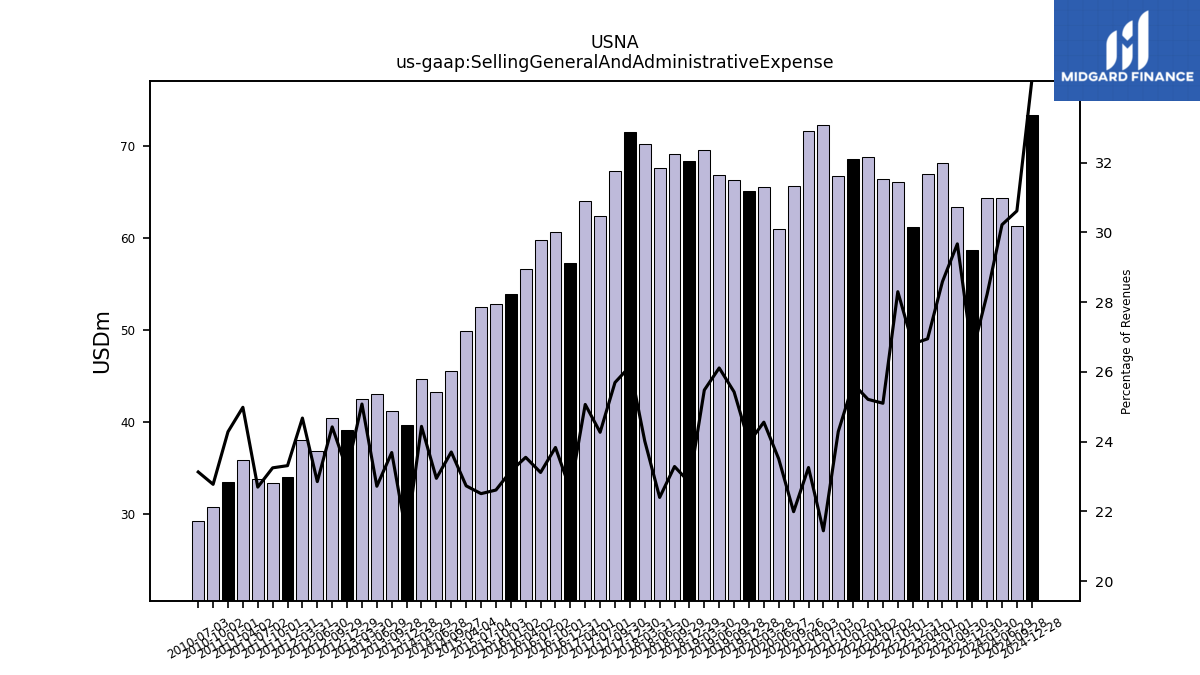
| Selling General And Administrative Expense | 58.66 | 63.30 | 68.10 | 66.93 | 61.10 | 66.02 | 66.39 | 68.80 | 68.59 | 66.64 | 72.24 | 71.63 | 65.66 | 60.88 | 65.48 | 65.06 | 66.26 | 66.85 | 69.56 | 68.28 | 69.11 | 67.54 | 70.13 | 71.44 | 67.26 | 62.39 | 64.00 | 57.21 | 60.59 | 59.76 | 56.63 | 53.86 | 52.76 | 52.51 | 49.88 | NA | 45.50 | 43.21 | 44.58 | 39.68 | 41.15 | 42.98 | 42.40 | 39.09 | 40.34 | 36.78 | 38.03 | 34.02 | 33.37 | 33.80 | 35.87 | 33.40 | 30.75 | 29.15 | |
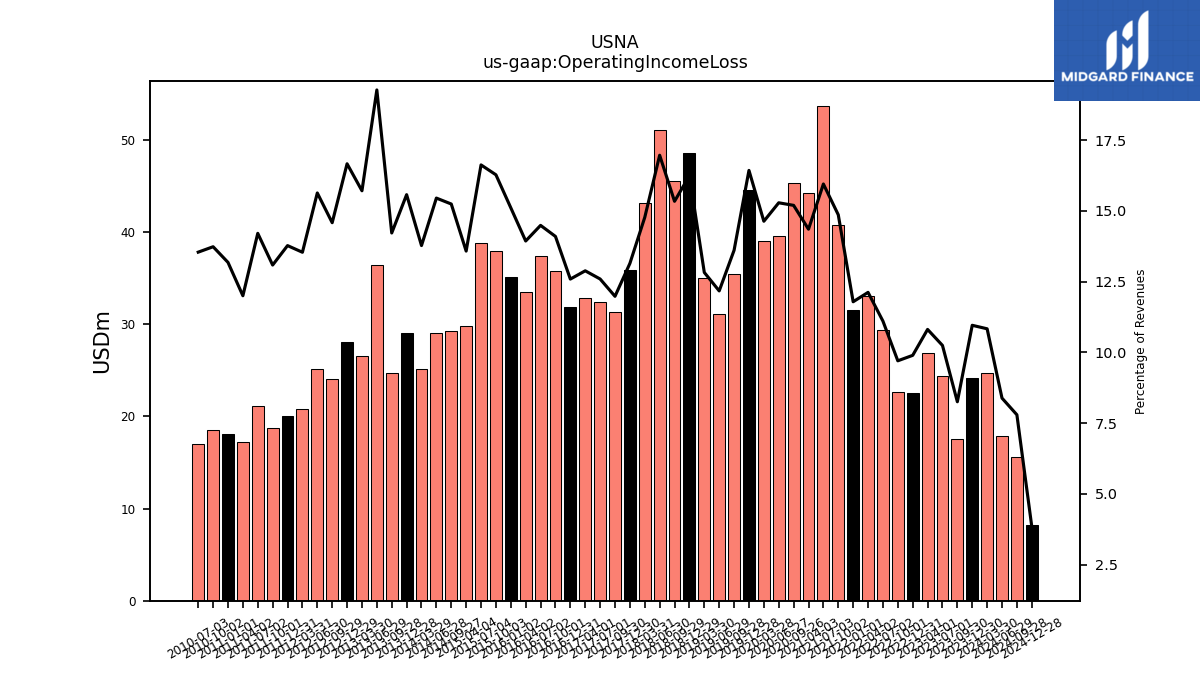
| Operating Income Loss | 24.22 | 17.61 | 24.40 | 26.84 | 22.55 | 22.63 | 29.37 | 33.07 | 31.50 | 40.77 | 53.72 | 44.20 | 45.35 | 39.59 | 39.01 | 44.57 | 35.46 | 31.16 | 35.00 | 48.57 | 45.51 | 51.14 | 43.13 | 35.89 | 31.36 | 32.37 | 32.89 | 31.84 | 35.83 | 37.45 | 33.50 | 35.14 | 37.97 | 38.77 | 29.79 | NA | 29.25 | 29.09 | 25.12 | 29.00 | 24.69 | 36.45 | 26.56 | 28.08 | 24.08 | 25.15 | 20.86 | 20.10 | 18.78 | 21.15 | 17.23 | 18.12 | 18.54 | 17.06 | |
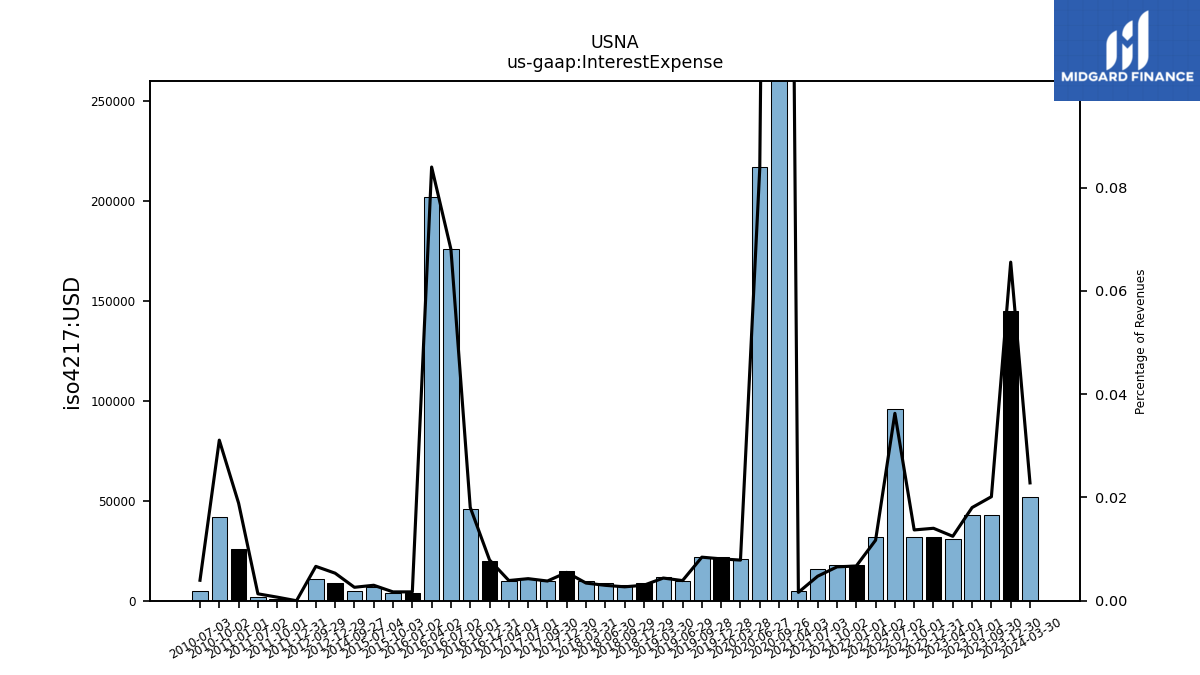
| Interest Expense | 0.14 | 0.04 | 0.04 | 0.03 | 0.03 | 0.03 | 0.10 | 0.03 | 0.02 | 0.02 | 0.02 | 0.01 | 1.38 | 0.22 | 0.02 | 0.02 | 0.02 | 0.01 | 0.01 | 0.01 | 0.01 | 0.01 | 0.01 | 0.01 | 0.01 | 0.01 | 0.01 | 0.02 | 0.05 | 0.18 | 0.20 | 0.00 | 0.00 | 0.01 | NA | NA | 0.01 | NA | NA | NA | NA | NA | NA | 0.01 | 0.01 | NA | NA | 0.00 | 0.00 | 0.00 | NA | 0.03 | 0.04 | 0.01 | |
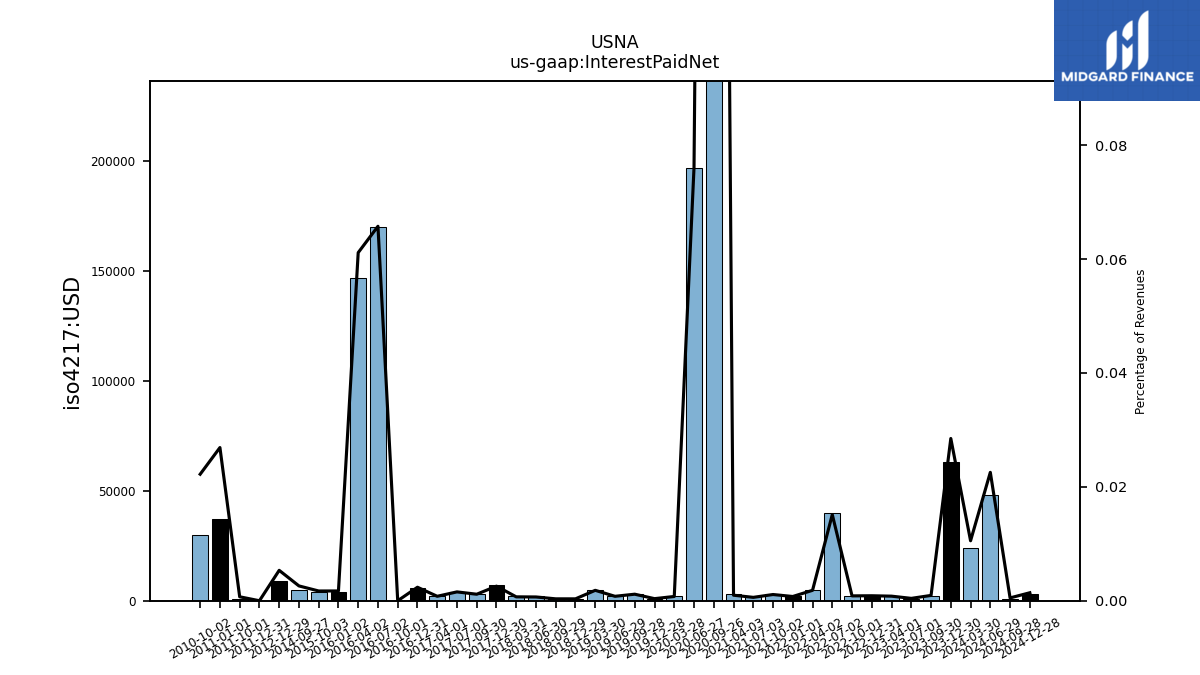
| Interest Paid Net | 0.06 | 0.00 | 0.00 | 0.00 | 0.00 | 0.00 | 0.04 | 0.01 | 0.00 | 0.00 | 0.00 | 0.00 | 1.36 | 0.20 | 0.00 | 0.00 | 0.00 | 0.00 | 0.01 | 0.00 | 0.00 | 0.00 | 0.00 | 0.01 | 0.00 | 0.00 | 0.00 | 0.01 | 0.00 | 0.17 | 0.15 | 0.00 | 0.00 | NA | NA | NA | 0.01 | NA | NA | NA | NA | NA | NA | 0.01 | NA | NA | NA | 0.00 | 0.00 | NA | NA | 0.04 | 0.03 | NA | |
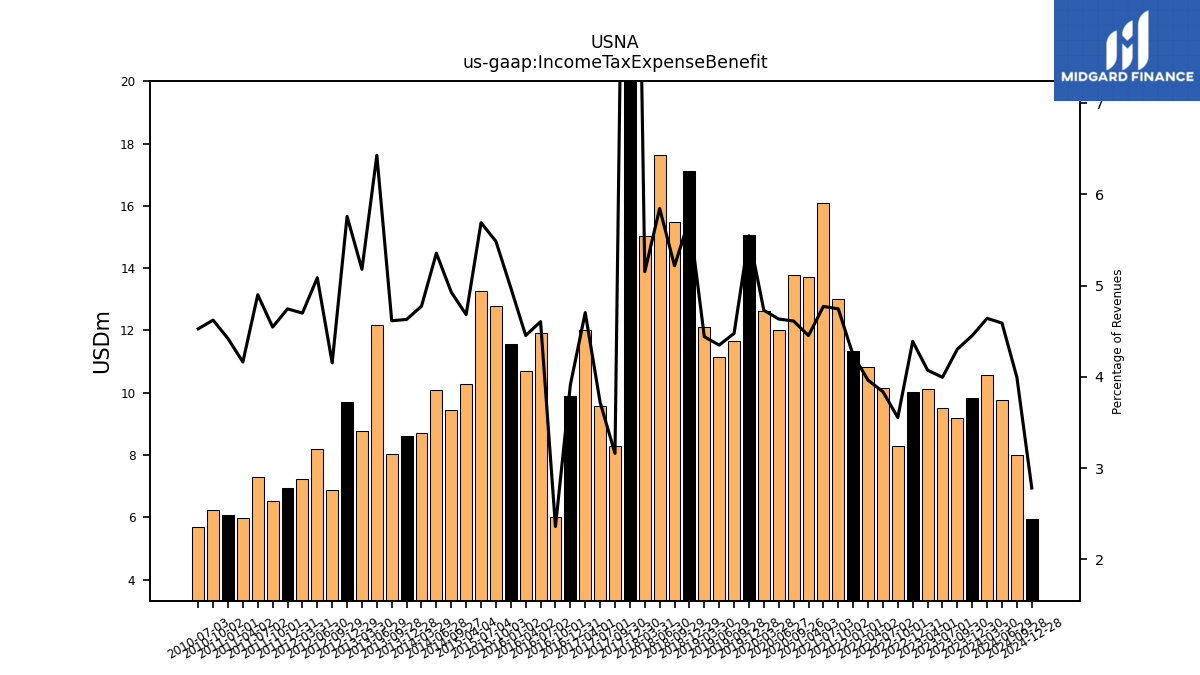
| Income Tax Expense Benefit | 9.85 | 9.18 | 9.52 | 10.12 | 10.01 | 8.29 | 10.15 | 10.82 | 11.33 | 13.02 | 16.08 | 13.71 | 13.77 | 12.00 | 12.61 | 15.05 | 11.67 | 11.13 | 12.12 | 17.13 | 15.49 | 17.62 | 15.04 | 42.25 | 8.28 | 9.57 | 12.01 | 9.89 | 6.00 | 11.91 | 10.71 | 11.57 | 12.80 | 13.27 | 10.27 | NA | 9.46 | 10.08 | 8.71 | 8.62 | 8.02 | 12.16 | 8.76 | 9.71 | 6.86 | 8.18 | 7.24 | 6.93 | 6.52 | 7.30 | 5.98 | 6.08 | 6.24 | 5.71 | |
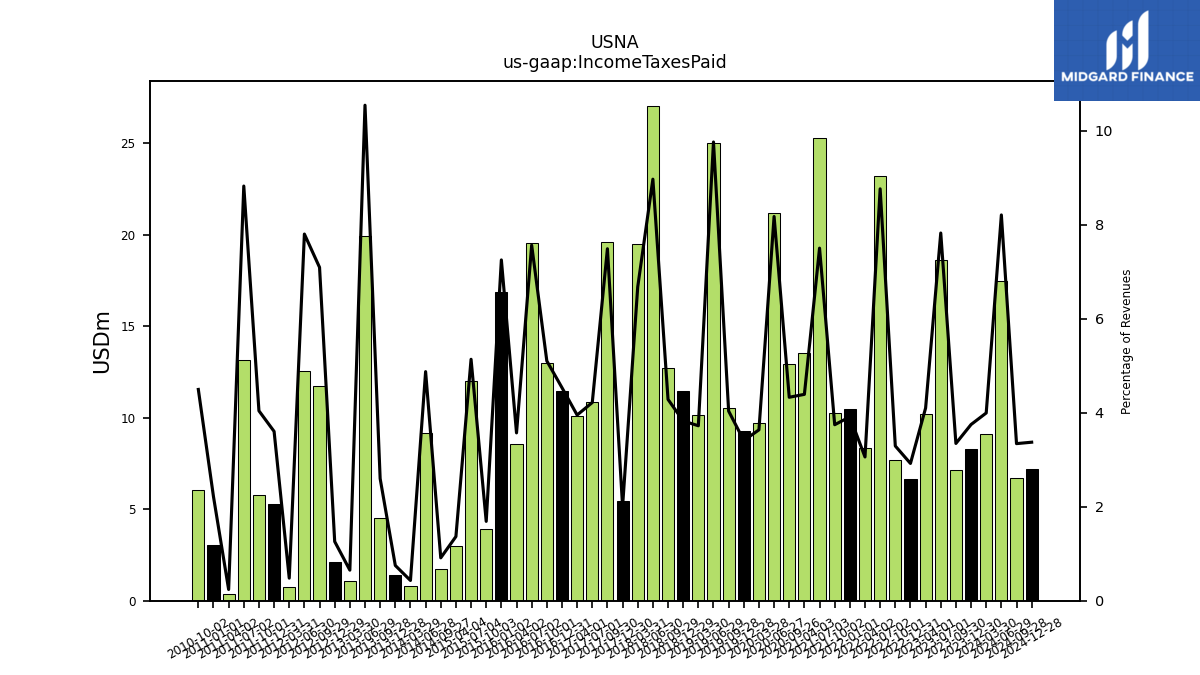
| Income Taxes Paid | 8.29 | 7.14 | 18.64 | 10.18 | 6.66 | 7.68 | 23.18 | 8.35 | 10.46 | 10.27 | 25.27 | 13.52 | 12.92 | 21.17 | 9.69 | 9.25 | 10.52 | 24.99 | 10.16 | 11.44 | 12.71 | 27.04 | 19.50 | 5.47 | 19.60 | 10.84 | 10.09 | 11.46 | 12.97 | 19.56 | 8.59 | 16.86 | 3.94 | 11.98 | 3.00 | NA | 1.75 | 9.18 | 0.79 | 1.40 | 4.51 | 19.94 | 1.10 | 2.12 | 11.71 | 12.55 | 0.74 | 5.26 | 5.80 | 13.14 | 0.34 | 3.05 | 6.07 | NA | |
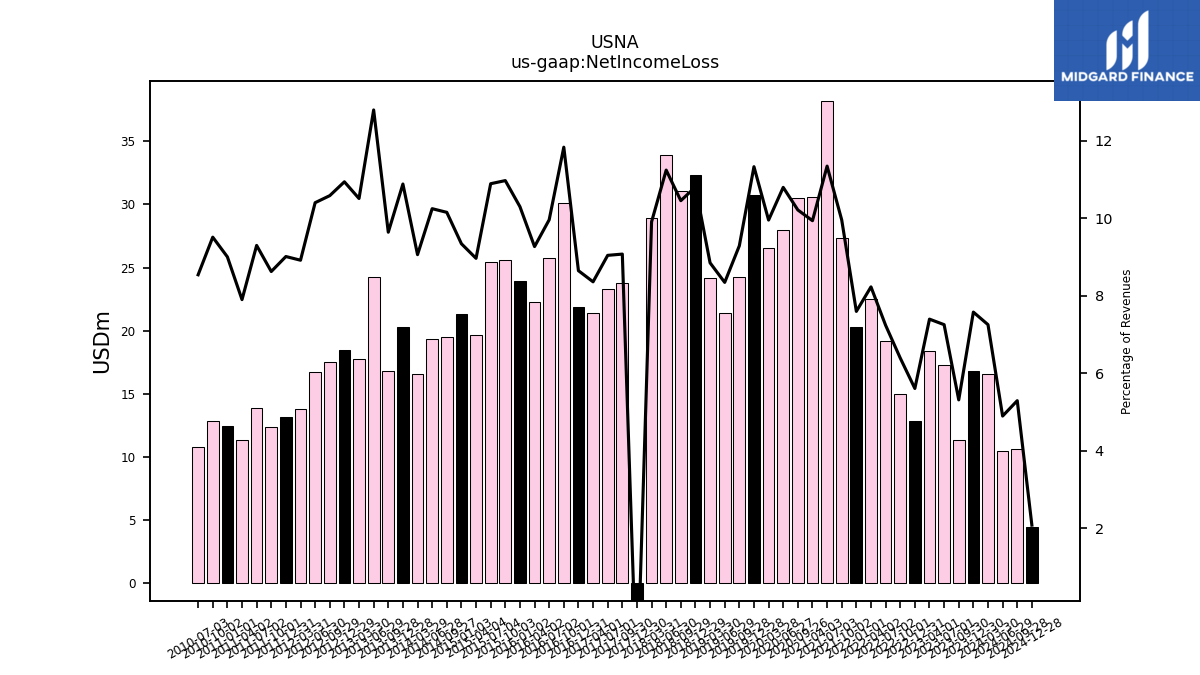
| Net Income Loss | 16.77 | 11.35 | 17.29 | 18.38 | 12.79 | 14.93 | 19.16 | 22.47 | 20.32 | 27.33 | 38.23 | 30.62 | 30.51 | 27.98 | 26.55 | 30.75 | 24.22 | 21.38 | 24.17 | 32.33 | 31.04 | 33.91 | 28.95 | -5.85 | 23.77 | 23.26 | 21.36 | 21.88 | 30.10 | 25.76 | 22.30 | 23.97 | 25.61 | 25.42 | 19.68 | 21.30 | 19.50 | 19.30 | 16.54 | 20.28 | 16.75 | 24.21 | 17.78 | 18.45 | 17.49 | 16.75 | 13.75 | 13.16 | 12.38 | 13.86 | 11.35 | 12.39 | 12.85 | 10.77 | |
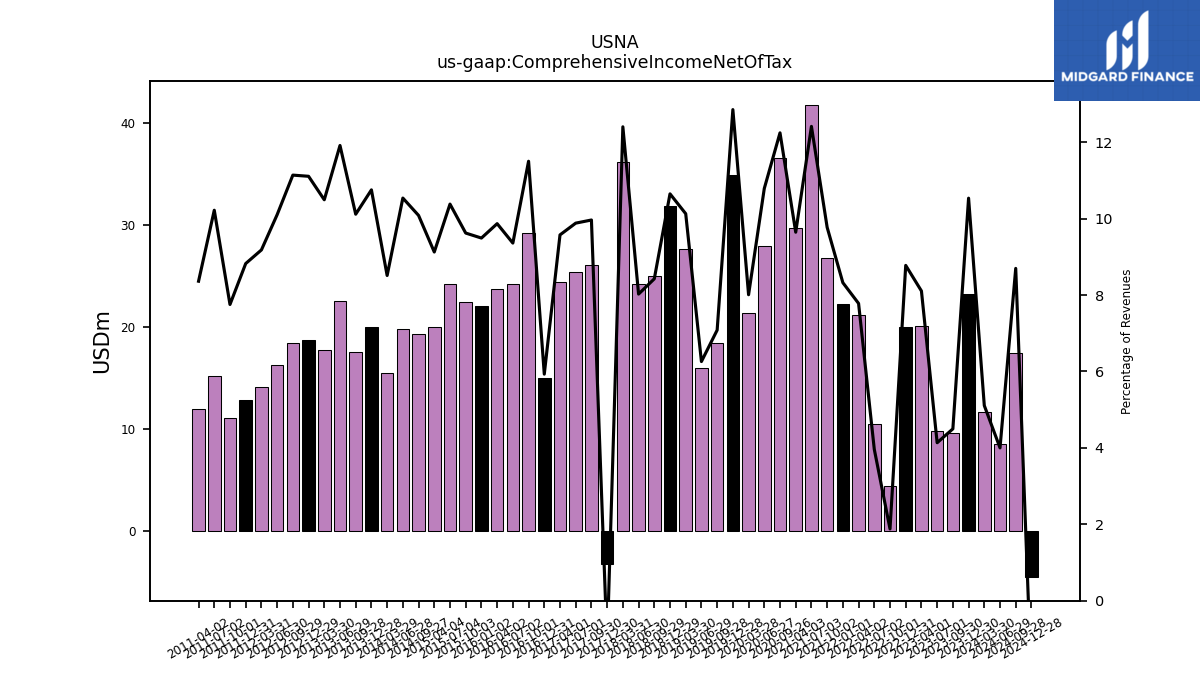
| Comprehensive Income Net Of Tax | 23.30 | 9.60 | 9.85 | 20.14 | 20.01 | 4.39 | 10.48 | 21.23 | 22.25 | 26.81 | 41.82 | 29.71 | 36.56 | 27.95 | 21.35 | 34.87 | 18.46 | 16.03 | 27.65 | 31.84 | 25.00 | 24.20 | 36.22 | -3.18 | 26.09 | 25.41 | 24.45 | 15.00 | 29.24 | 24.20 | 23.73 | 22.08 | 22.45 | 24.21 | 20.02 | NA | 19.36 | 19.84 | 15.53 | 20.03 | 17.57 | 22.54 | 17.74 | 18.72 | 18.40 | 16.26 | 14.15 | 12.88 | 11.13 | 15.22 | 12.01 | NA | NA | NA | |
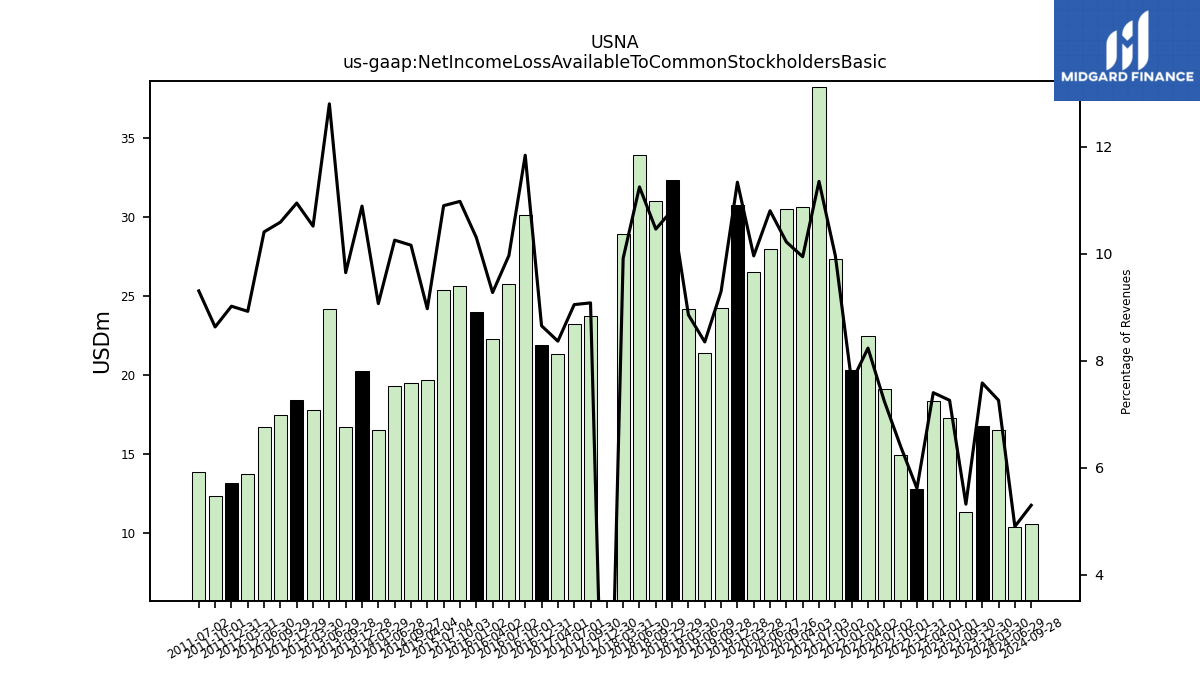
| Net Income Loss Available To Common Stockholders Basic | 16.77 | 11.35 | 17.29 | 18.38 | 12.79 | 14.93 | 19.16 | 22.47 | 20.32 | 27.33 | 38.23 | 30.62 | 30.51 | 27.98 | 26.55 | 30.75 | 24.22 | 21.38 | 24.17 | 32.33 | 31.04 | 33.91 | 28.95 | -5.85 | 23.77 | 23.26 | 21.36 | 21.88 | 30.10 | 25.76 | 22.30 | 23.97 | 25.61 | 25.42 | 19.68 | NA | 19.50 | 19.30 | 16.54 | 20.28 | 16.75 | 24.21 | 17.78 | 18.45 | 17.49 | 16.75 | 13.75 | 13.16 | 12.38 | 13.86 | NA | NA | NA | NA |
| 2023-12-30 | 2023-09-30 | 2023-07-01 | 2023-04-01 | 2022-12-31 | 2022-10-01 | 2022-07-02 | 2022-04-02 | 2022-01-01 | 2021-10-02 | 2021-07-03 | 2021-04-03 | 2020-09-26 | 2020-06-27 | 2020-03-28 | 2019-12-28 | 2019-09-28 | 2019-06-29 | 2019-03-30 | 2018-12-29 | 2018-09-29 | 2018-06-30 | 2018-03-31 | 2017-12-30 | 2017-09-30 | 2017-07-01 | 2017-04-01 | 2016-12-31 | 2016-10-01 | 2016-07-02 | 2016-04-02 | 2016-01-02 | 2015-10-03 | 2015-07-04 | 2015-04-04 | 2015-01-03 | 2014-09-27 | 2014-06-28 | 2014-03-29 | 2013-12-28 | 2013-09-28 | 2013-06-29 | 2013-03-30 | 2012-12-29 | 2012-09-29 | 2012-06-30 | 2012-03-31 | 2011-12-31 | 2011-10-01 | 2011-07-02 | 2011-04-02 | 2011-01-01 | 2010-10-02 | 2010-07-03 | ||
|---|---|---|---|---|---|---|---|---|---|---|---|---|---|---|---|---|---|---|---|---|---|---|---|---|---|---|---|---|---|---|---|---|---|---|---|---|---|---|---|---|---|---|---|---|---|---|---|---|---|---|---|---|---|---|---|
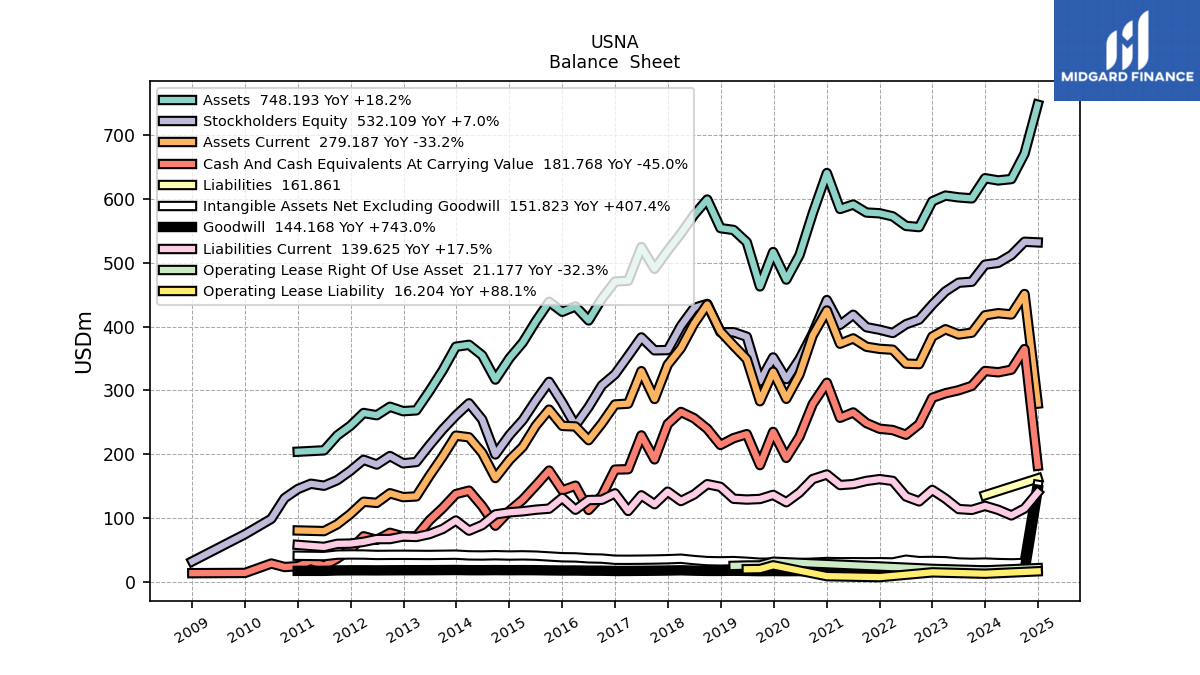
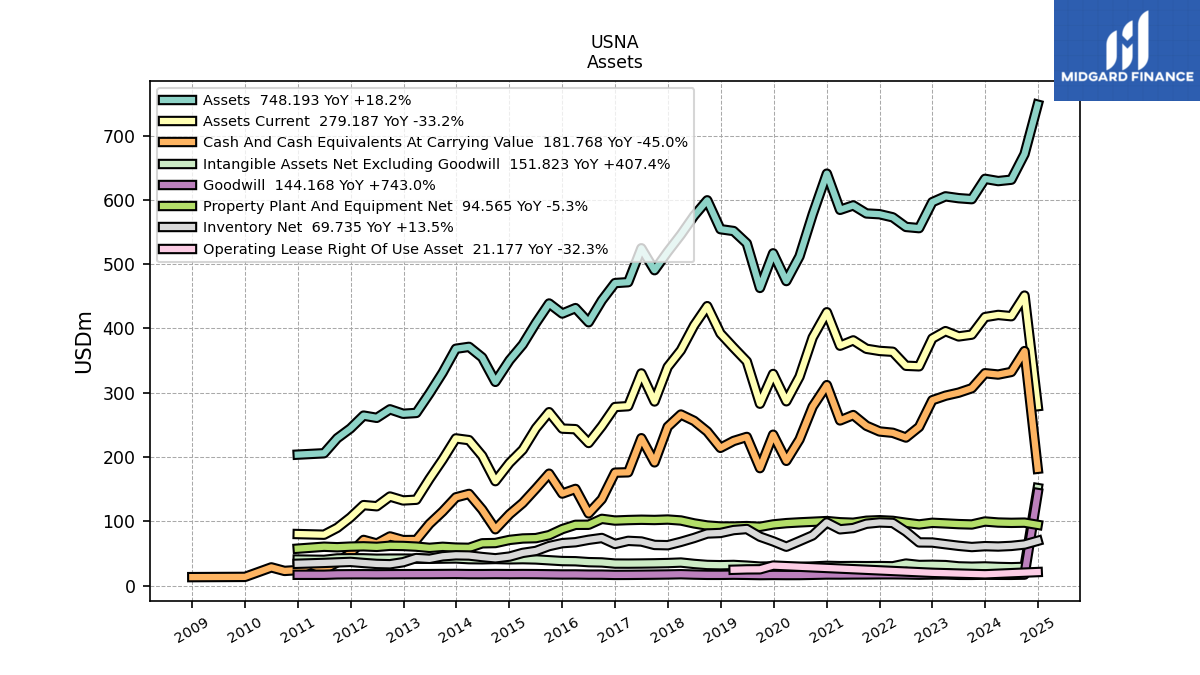
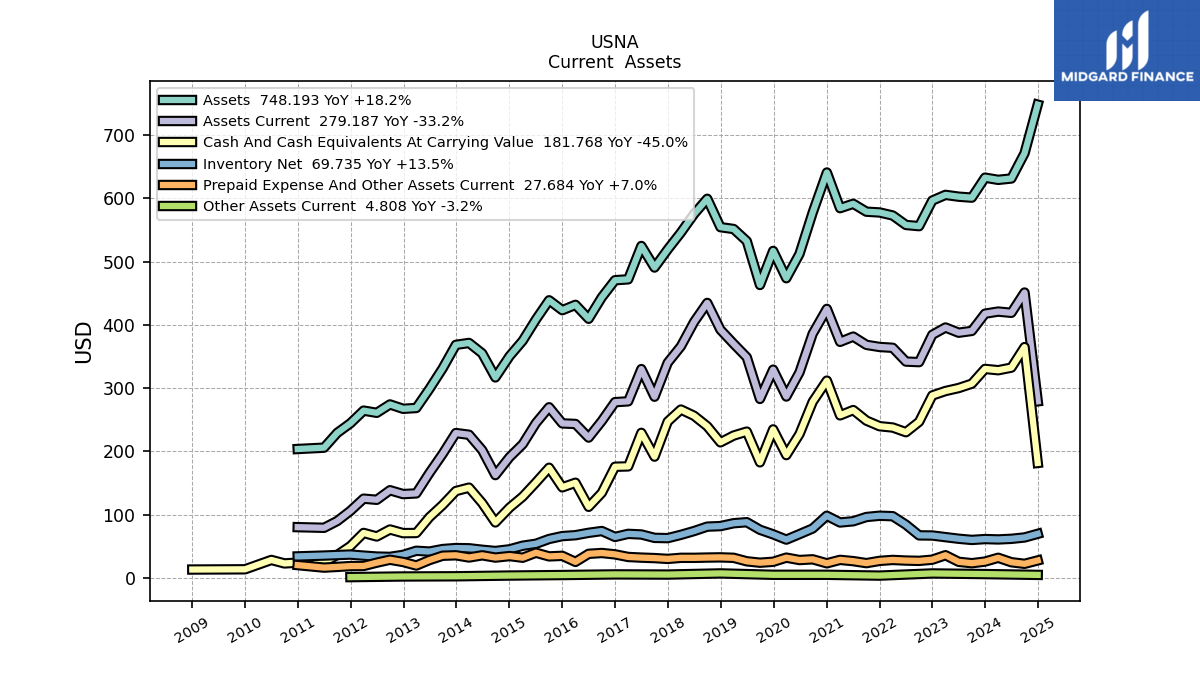
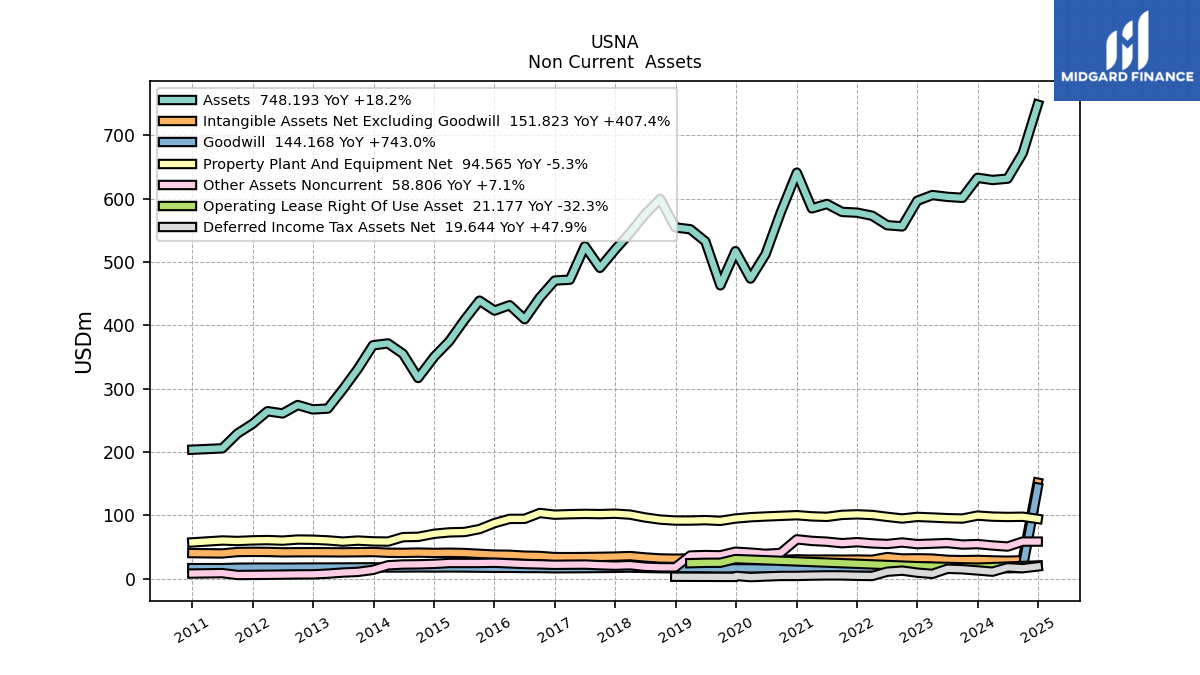
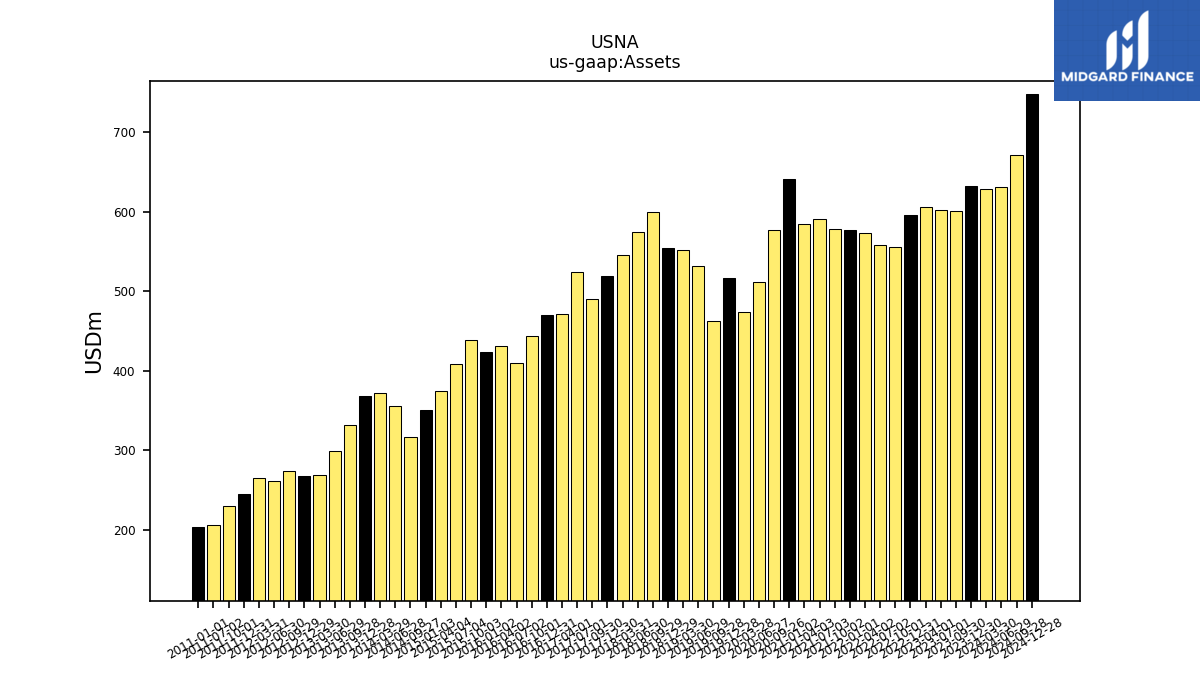
| Assets | 632.76 | 601.15 | 602.68 | 605.53 | 596.55 | 556.06 | 557.96 | 572.92 | 577.74 | 578.95 | 591.45 | 584.51 | 577.53 | 512.15 | 473.75 | 516.93 | 463.04 | 532.40 | 551.58 | 554.46 | 599.38 | 575.28 | 545.95 | 519.27 | 490.65 | 524.78 | 472.01 | 470.64 | 443.61 | 409.66 | 431.73 | 423.24 | 438.93 | 408.51 | 375.05 | 350.58 | 316.93 | 354.92 | 371.47 | 368.47 | 331.33 | 298.92 | 268.66 | 267.36 | 274.28 | 261.01 | 264.51 | 244.50 | 229.29 | 205.93 | NA | 203.80 | NA | NA | |
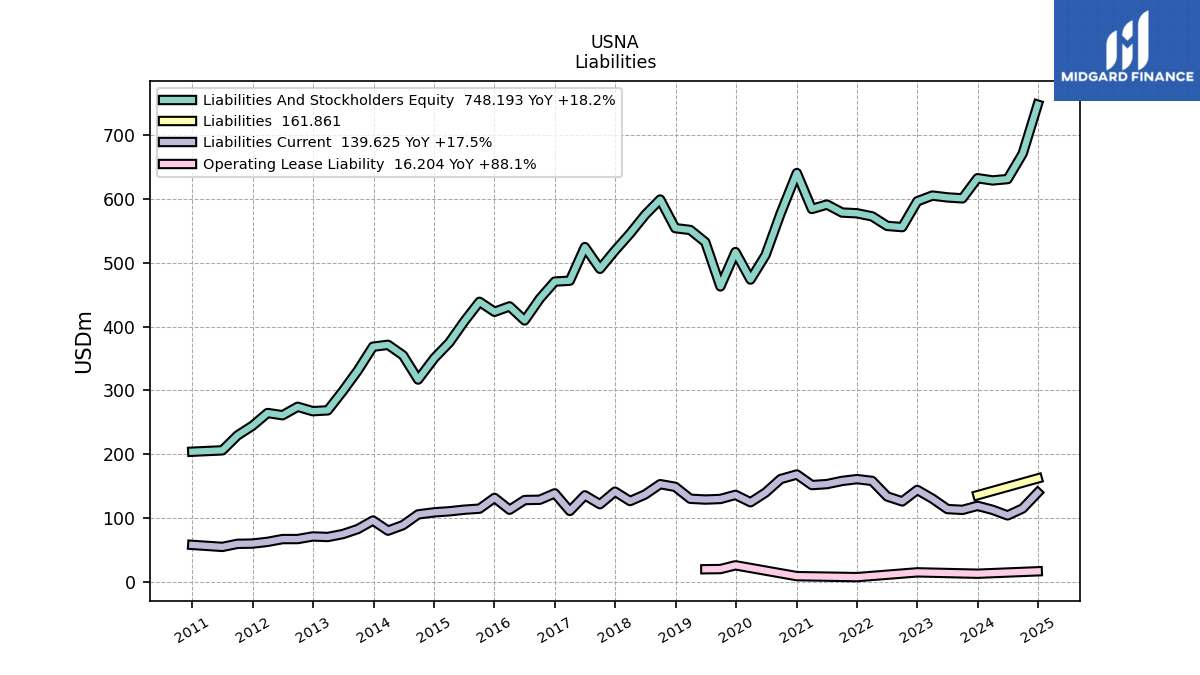
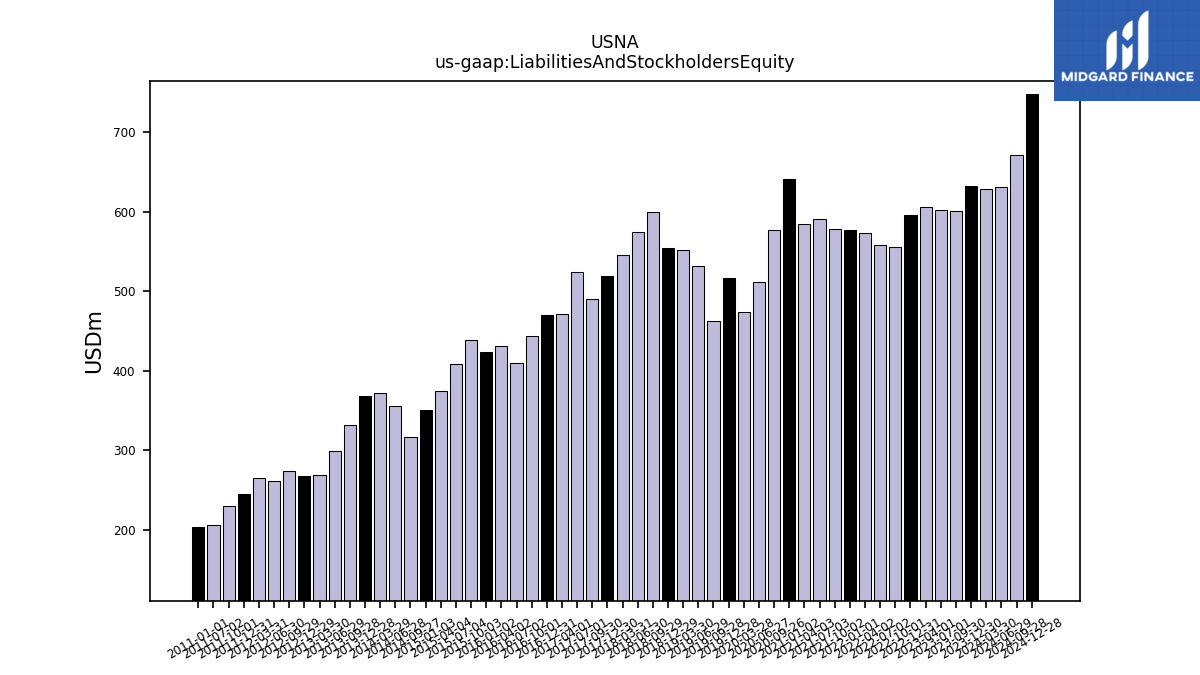
| Liabilities And Stockholders Equity | 632.76 | 601.15 | 602.68 | 605.53 | 596.55 | 556.06 | 557.96 | 572.92 | 577.74 | 578.95 | 591.45 | 584.51 | 577.53 | 512.15 | 473.75 | 516.93 | 463.04 | 532.40 | 551.58 | 554.46 | 599.38 | 575.28 | 545.95 | 519.27 | 490.65 | 524.78 | 472.01 | 470.64 | 443.61 | 409.66 | 431.73 | 423.24 | 438.93 | 408.51 | 375.05 | 350.58 | 316.93 | 354.92 | 371.47 | 368.47 | 331.33 | 298.92 | 268.66 | 267.36 | 274.28 | 261.01 | 264.51 | 244.50 | 229.29 | 205.93 | NA | 203.80 | NA | NA | |
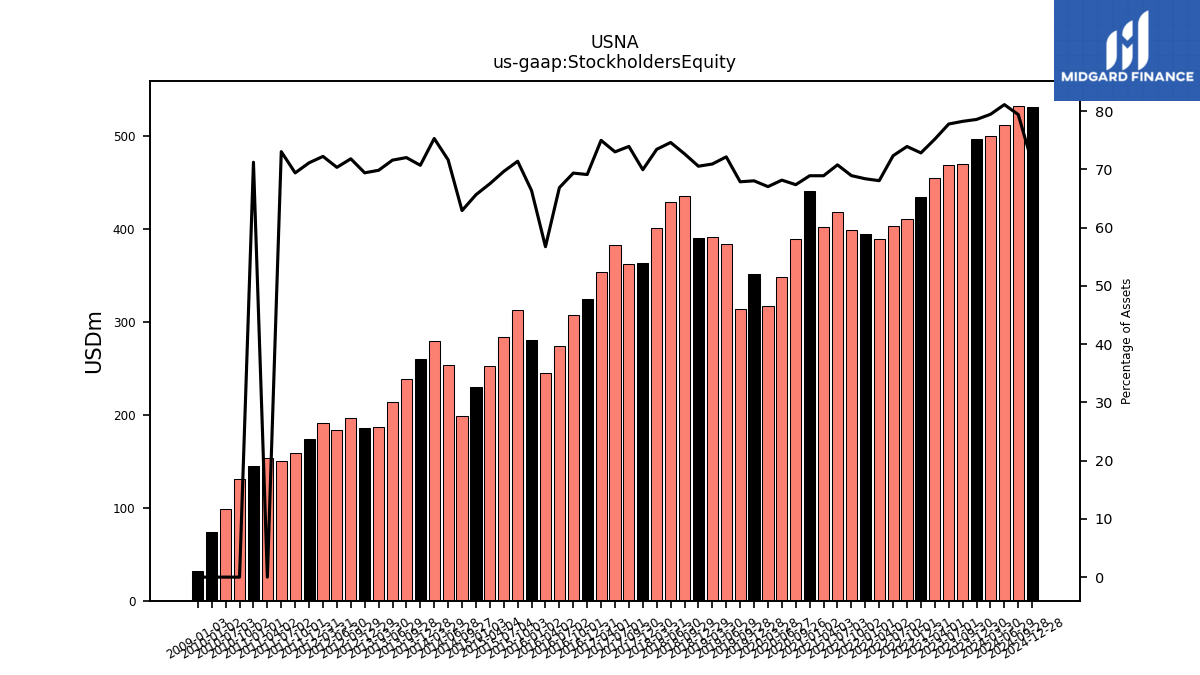
| Stockholders Equity | 497.20 | 470.39 | 468.82 | 455.35 | 434.47 | 411.10 | 403.68 | 389.95 | 395.12 | 399.08 | 418.62 | 402.78 | 389.12 | 349.08 | 317.61 | 351.71 | 314.29 | 384.16 | 391.22 | 391.15 | 435.59 | 429.28 | 400.98 | 363.21 | 362.81 | 383.14 | 353.93 | 325.29 | 307.71 | 273.93 | 244.91 | 280.85 | 313.39 | 284.52 | 253.31 | 230.16 | 199.45 | 254.25 | 279.74 | 260.52 | 238.65 | 214.01 | 187.65 | 185.57 | 196.98 | 183.63 | 191.06 | 173.91 | 159.14 | 150.42 | 153.56 | 145.17 | 130.82 | 98.56 |
| 2023-12-30 | 2023-09-30 | 2023-07-01 | 2023-04-01 | 2022-12-31 | 2022-10-01 | 2022-07-02 | 2022-04-02 | 2022-01-01 | 2021-10-02 | 2021-07-03 | 2021-04-03 | 2020-09-26 | 2020-06-27 | 2020-03-28 | 2019-12-28 | 2019-09-28 | 2019-06-29 | 2019-03-30 | 2018-12-29 | 2018-09-29 | 2018-06-30 | 2018-03-31 | 2017-12-30 | 2017-09-30 | 2017-07-01 | 2017-04-01 | 2016-12-31 | 2016-10-01 | 2016-07-02 | 2016-04-02 | 2016-01-02 | 2015-10-03 | 2015-07-04 | 2015-04-04 | 2015-01-03 | 2014-09-27 | 2014-06-28 | 2014-03-29 | 2013-12-28 | 2013-09-28 | 2013-06-29 | 2013-03-30 | 2012-12-29 | 2012-09-29 | 2012-06-30 | 2012-03-31 | 2011-12-31 | 2011-10-01 | 2011-07-02 | 2011-04-02 | 2011-01-01 | 2010-10-02 | 2010-07-03 | ||
|---|---|---|---|---|---|---|---|---|---|---|---|---|---|---|---|---|---|---|---|---|---|---|---|---|---|---|---|---|---|---|---|---|---|---|---|---|---|---|---|---|---|---|---|---|---|---|---|---|---|---|---|---|---|---|---|
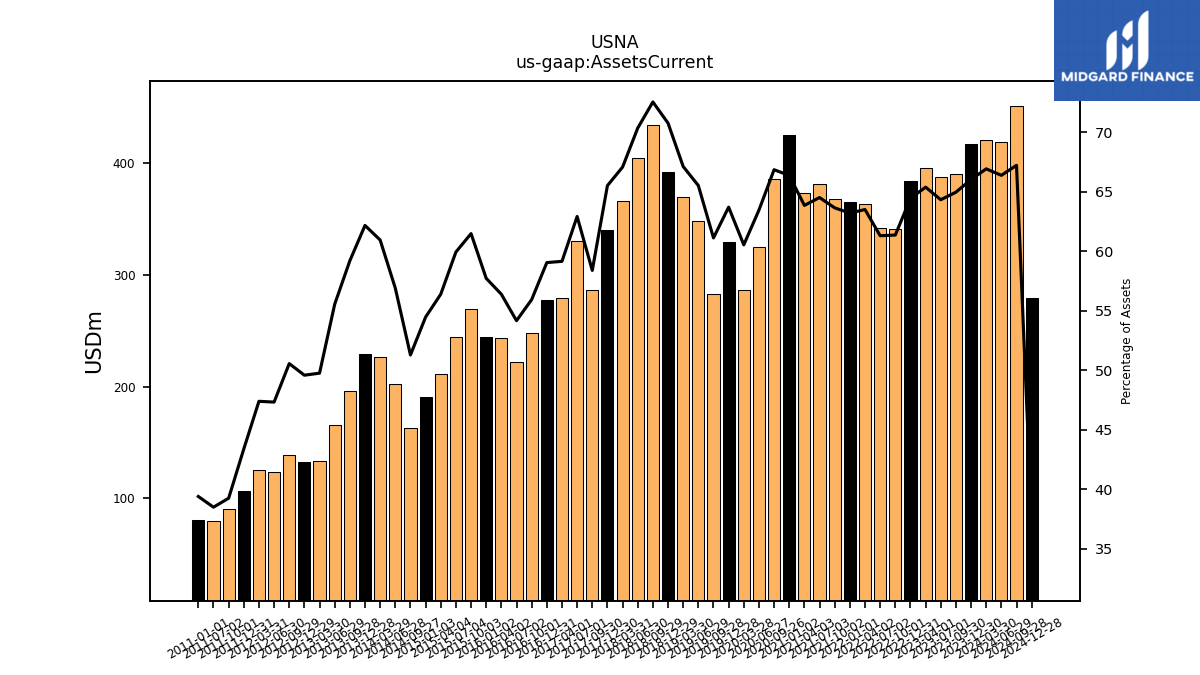
| Assets Current | 417.75 | 390.46 | 387.65 | 395.88 | 384.38 | 341.15 | 342.00 | 363.79 | 365.12 | 368.43 | 381.51 | 373.18 | 386.03 | 324.95 | 286.76 | 329.28 | 282.98 | 348.78 | 370.18 | 392.33 | 434.76 | 404.66 | 366.13 | 340.16 | 286.45 | 330.16 | 279.16 | 277.86 | 248.11 | 221.86 | 243.40 | 244.26 | 269.82 | 244.81 | 211.47 | 190.93 | 162.51 | 201.93 | 226.36 | 229.04 | 196.12 | 166.02 | 133.65 | 132.54 | 138.65 | 123.51 | 125.33 | 106.06 | 89.98 | 79.26 | NA | 80.27 | NA | NA | |
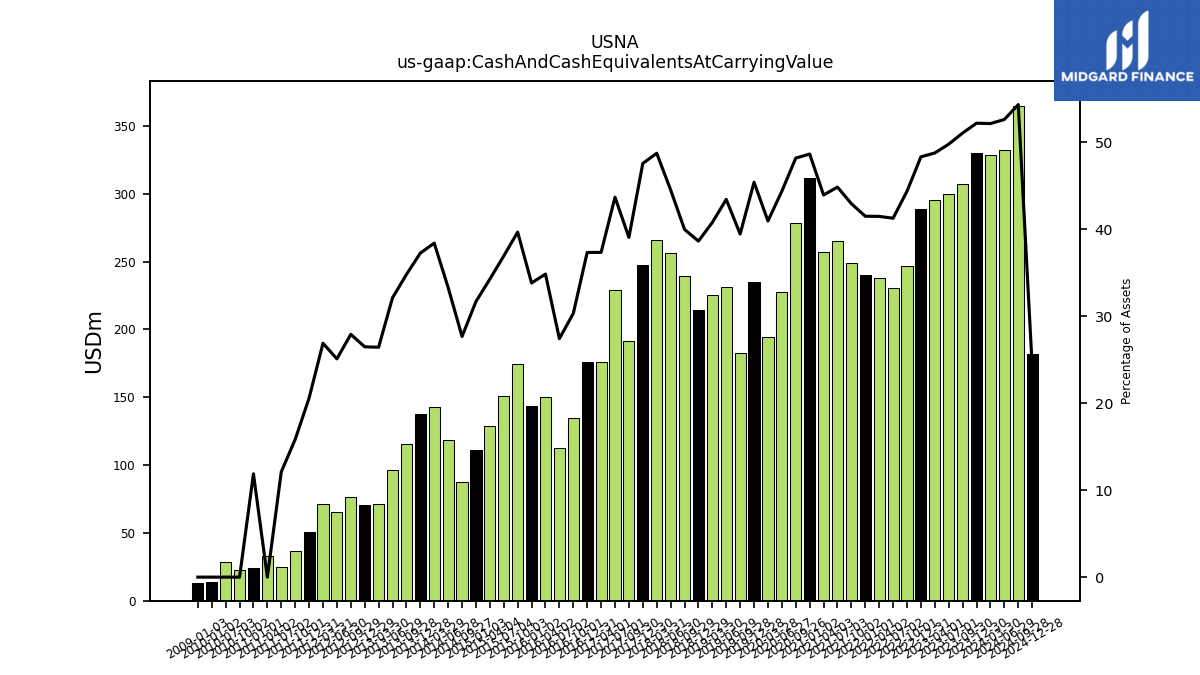
| Cash And Cash Equivalents At Carrying Value | 330.42 | 307.08 | 300.18 | 295.45 | 288.42 | 246.88 | 230.37 | 237.75 | 239.83 | 248.69 | 265.37 | 256.96 | 278.42 | 227.37 | 194.10 | 234.83 | 182.75 | 231.35 | 225.04 | 214.33 | 239.75 | 256.33 | 266.20 | 247.13 | 191.75 | 229.37 | 176.32 | 175.77 | 134.54 | 112.40 | 150.50 | 143.21 | 174.19 | 150.93 | 128.57 | 111.13 | 87.74 | 118.27 | 142.73 | 137.34 | 115.35 | 96.06 | 71.05 | 70.84 | 76.60 | 65.54 | 71.16 | 50.35 | 36.32 | 24.94 | 32.72 | 24.22 | 22.93 | 28.43 | |
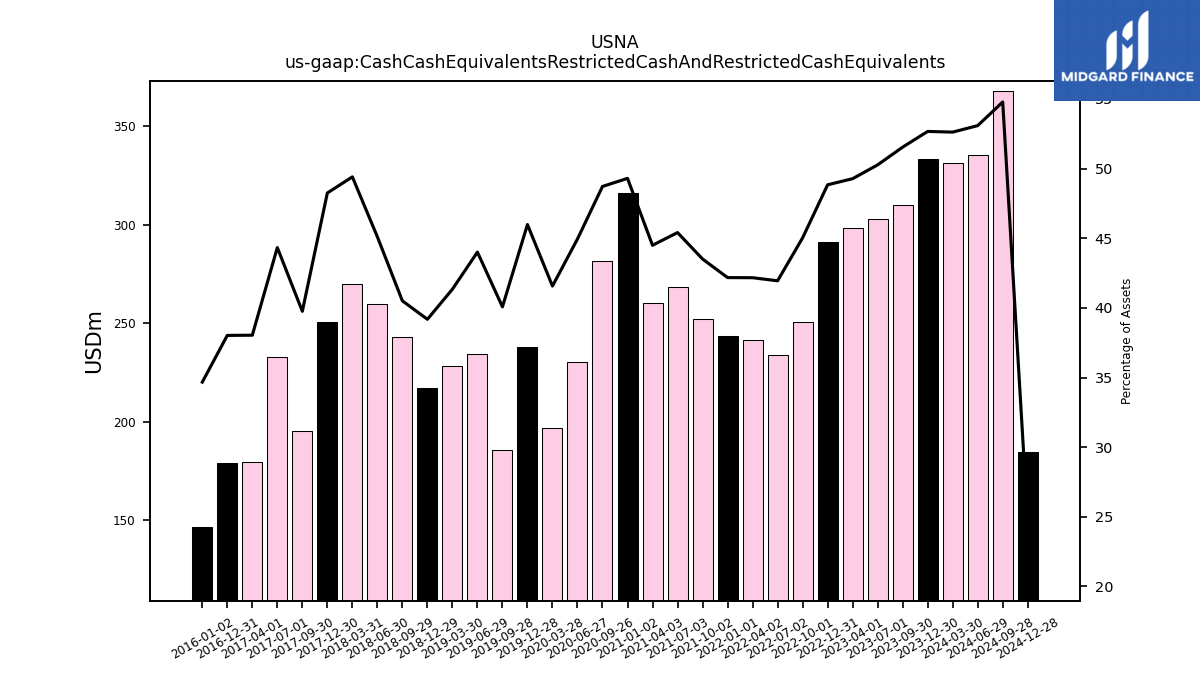
| Cash Cash Equivalents Restricted Cash And Restricted Cash Equivalents | 333.25 | 309.82 | 302.94 | 298.37 | 291.32 | 250.36 | 234.03 | 241.57 | 243.65 | 251.89 | 268.55 | 260.07 | 281.35 | 230.19 | 196.92 | 237.69 | 185.56 | 234.26 | 228.02 | 217.23 | 242.77 | 259.46 | 269.71 | 250.53 | 195.06 | 232.62 | 179.55 | 178.95 | NA | NA | NA | 146.73 | NA | NA | NA | NA | NA | NA | NA | NA | NA | NA | NA | NA | NA | NA | NA | NA | NA | NA | NA | NA | NA | NA | |
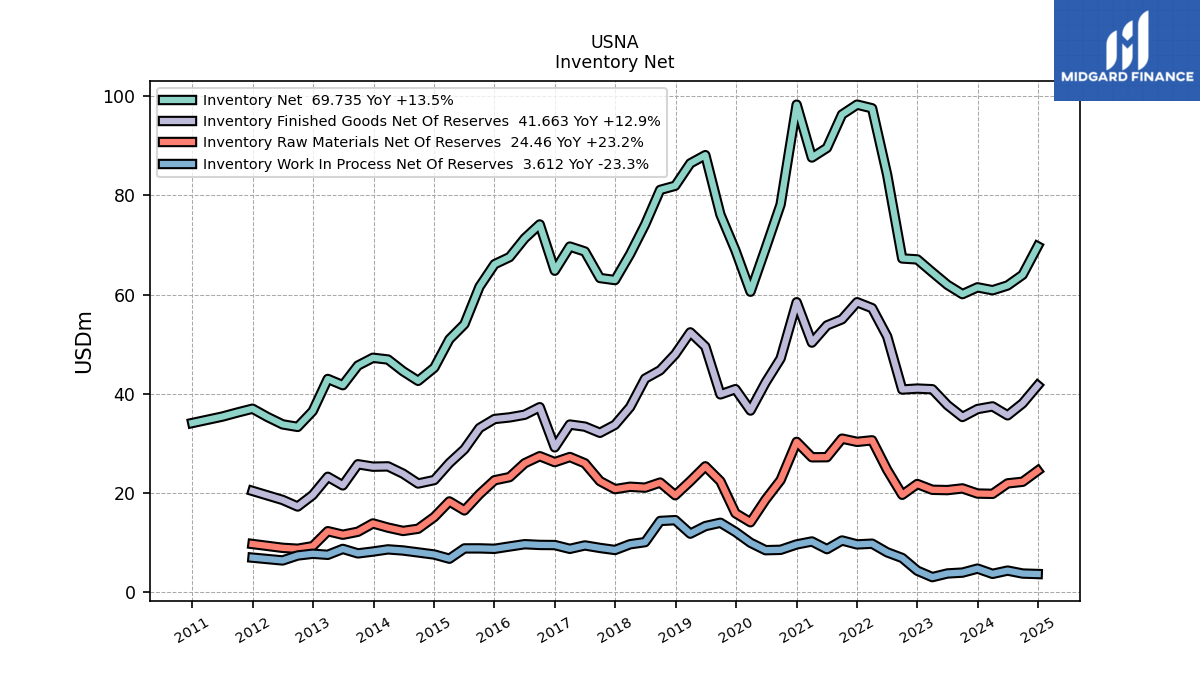
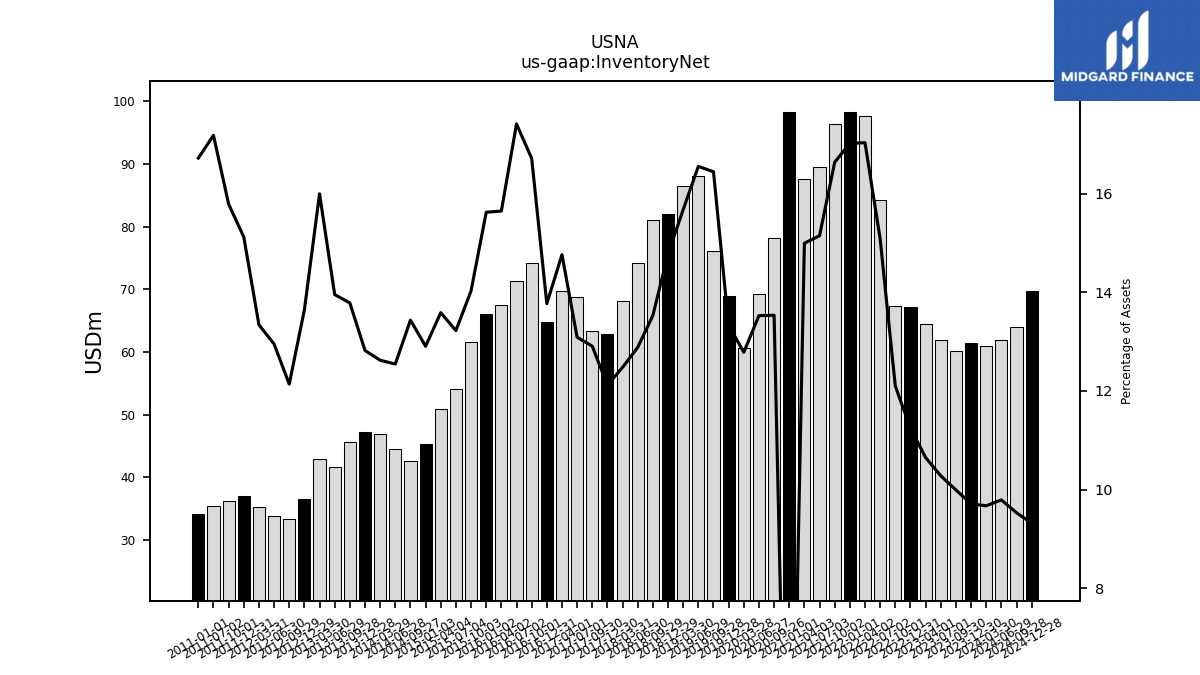
| Inventory Net | 61.45 | 60.08 | 61.96 | 64.49 | 67.09 | 67.28 | 84.16 | 97.58 | 98.32 | 96.32 | 89.59 | 87.65 | 78.17 | 69.28 | 60.57 | 68.91 | 76.14 | 88.13 | 86.47 | 81.95 | 81.11 | 74.12 | 68.13 | 62.92 | 63.33 | 68.69 | 69.68 | 64.81 | 74.15 | 71.33 | 67.55 | 66.12 | 61.58 | 54.02 | 50.96 | 45.25 | 42.58 | 44.53 | 46.89 | 47.24 | 45.67 | 41.71 | 42.97 | 36.48 | 33.30 | 33.80 | 35.29 | 36.97 | 36.20 | 35.38 | NA | 34.08 | NA | NA | |
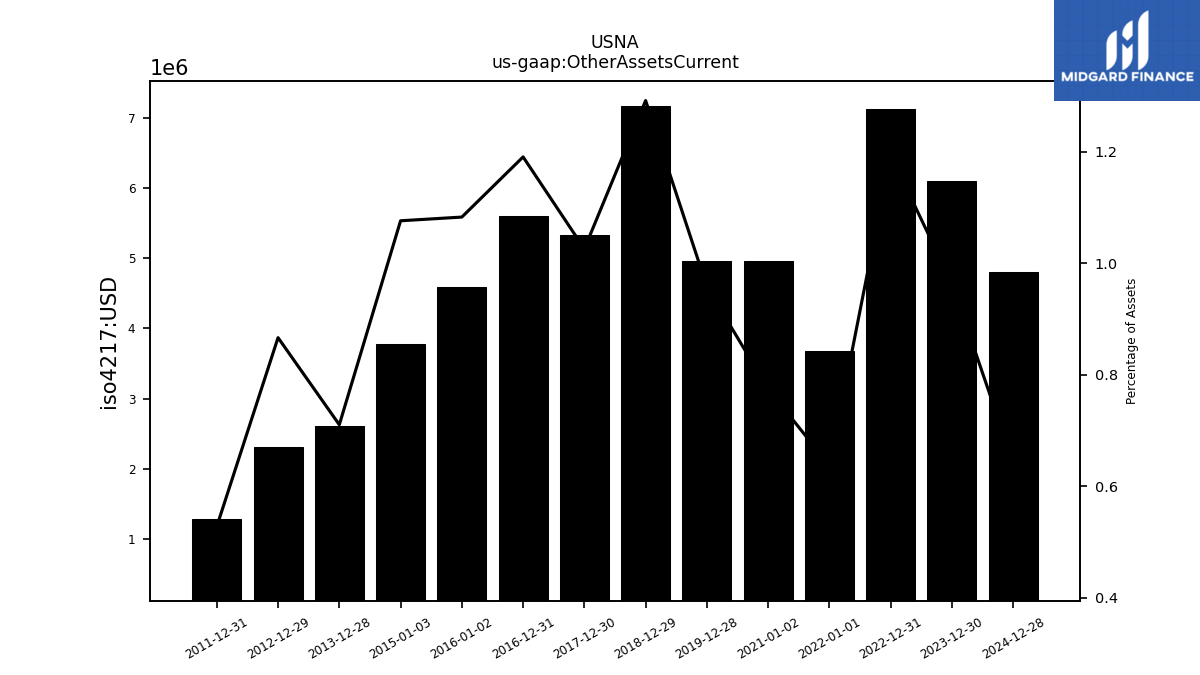
| Other Assets Current | 6.10 | NA | NA | NA | 7.12 | NA | NA | NA | 3.68 | NA | NA | NA | NA | NA | NA | 4.95 | NA | NA | NA | 7.16 | NA | NA | NA | 5.33 | NA | NA | NA | 5.60 | NA | NA | NA | 4.58 | NA | NA | NA | 3.77 | NA | NA | NA | 2.62 | NA | NA | NA | 2.32 | NA | NA | NA | 1.29 | NA | NA | NA | NA | NA | NA | |
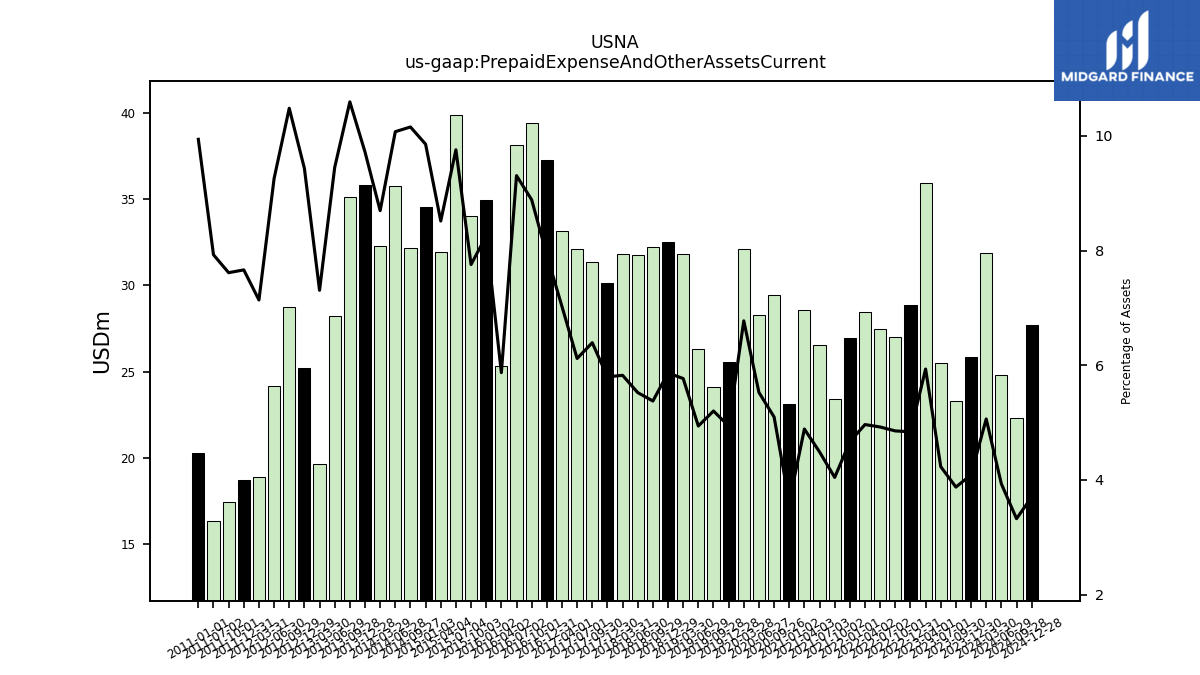
| Prepaid Expense And Other Assets Current | 25.87 | 23.30 | 25.50 | 35.93 | 28.87 | 27.00 | 27.47 | 28.45 | 26.97 | 23.41 | 26.55 | 28.57 | 29.45 | 28.30 | 32.10 | 25.54 | 24.09 | 26.30 | 31.82 | 32.52 | 32.23 | 31.78 | 31.80 | 30.11 | 31.37 | 32.11 | 33.16 | 37.28 | 39.42 | 38.13 | 25.35 | 34.94 | 34.05 | 39.86 | 31.94 | 34.55 | 32.19 | 35.76 | 32.31 | 35.82 | 35.10 | 28.25 | 19.63 | 25.23 | 28.75 | 24.16 | 18.88 | 18.74 | 17.46 | 16.32 | NA | 20.26 | NA | NA |
| 2023-12-30 | 2023-09-30 | 2023-07-01 | 2023-04-01 | 2022-12-31 | 2022-10-01 | 2022-07-02 | 2022-04-02 | 2022-01-01 | 2021-10-02 | 2021-07-03 | 2021-04-03 | 2020-09-26 | 2020-06-27 | 2020-03-28 | 2019-12-28 | 2019-09-28 | 2019-06-29 | 2019-03-30 | 2018-12-29 | 2018-09-29 | 2018-06-30 | 2018-03-31 | 2017-12-30 | 2017-09-30 | 2017-07-01 | 2017-04-01 | 2016-12-31 | 2016-10-01 | 2016-07-02 | 2016-04-02 | 2016-01-02 | 2015-10-03 | 2015-07-04 | 2015-04-04 | 2015-01-03 | 2014-09-27 | 2014-06-28 | 2014-03-29 | 2013-12-28 | 2013-09-28 | 2013-06-29 | 2013-03-30 | 2012-12-29 | 2012-09-29 | 2012-06-30 | 2012-03-31 | 2011-12-31 | 2011-10-01 | 2011-07-02 | 2011-04-02 | 2011-01-01 | 2010-10-02 | 2010-07-03 | ||
|---|---|---|---|---|---|---|---|---|---|---|---|---|---|---|---|---|---|---|---|---|---|---|---|---|---|---|---|---|---|---|---|---|---|---|---|---|---|---|---|---|---|---|---|---|---|---|---|---|---|---|---|---|---|---|---|
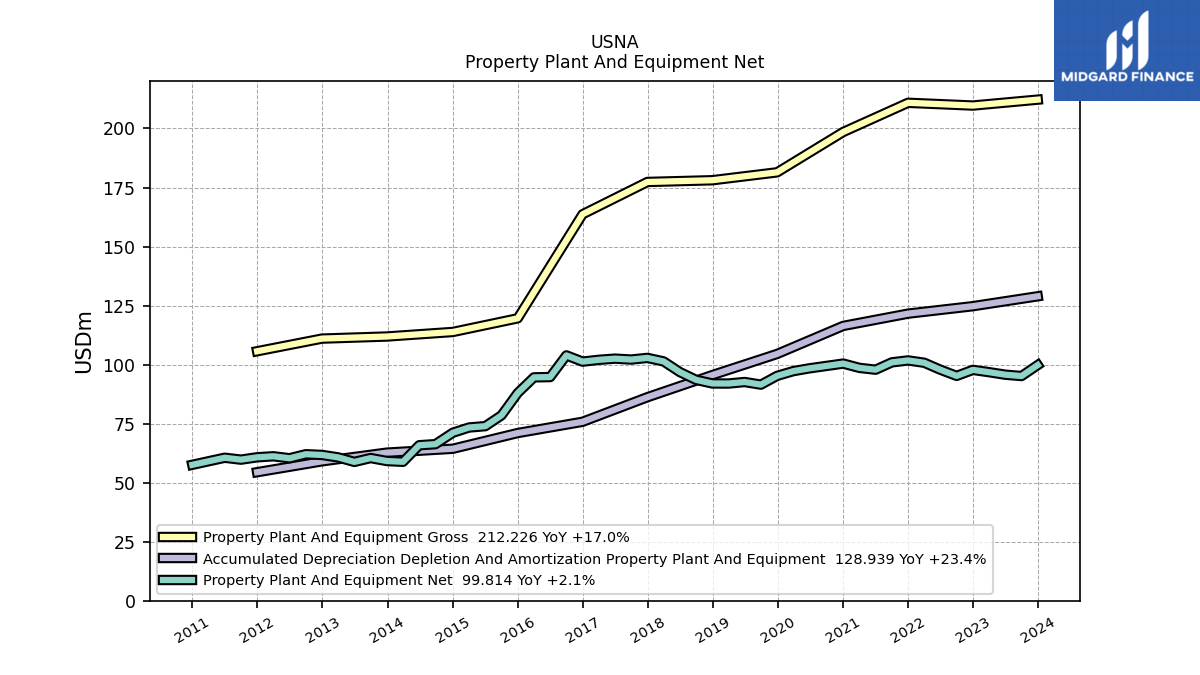
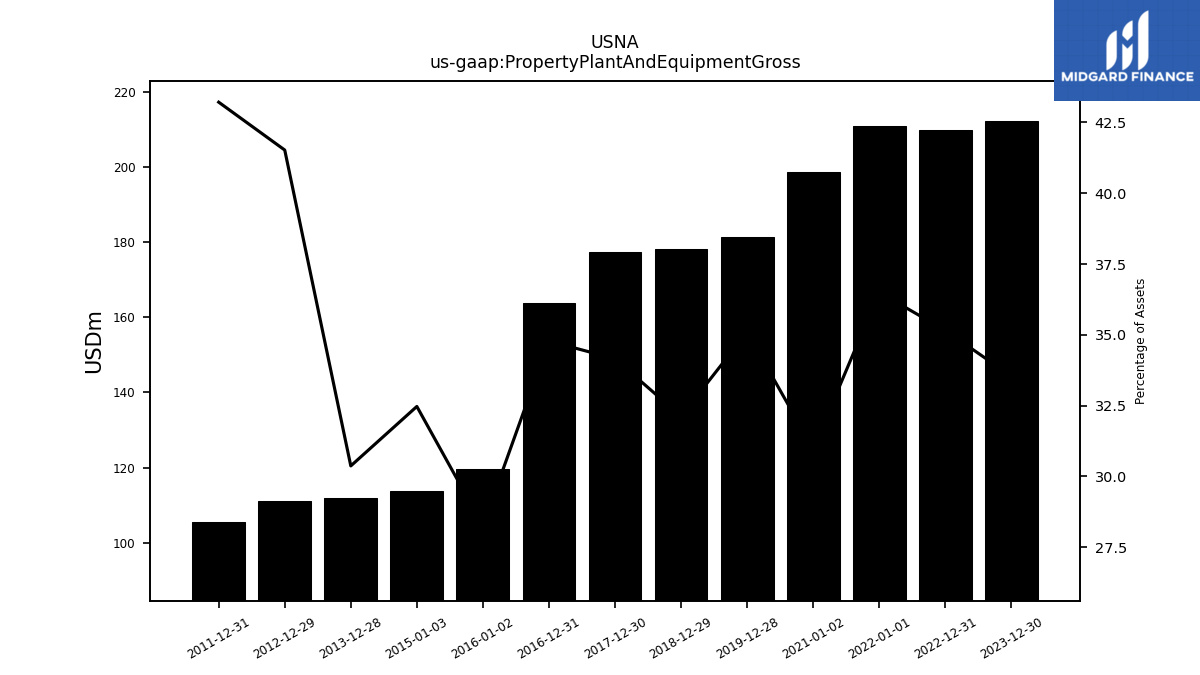
| Property Plant And Equipment Gross | 212.23 | NA | NA | NA | 209.72 | NA | NA | NA | 210.88 | NA | NA | NA | NA | NA | NA | 181.44 | NA | NA | NA | 178.09 | NA | NA | NA | 177.35 | NA | NA | NA | 163.68 | NA | NA | NA | 119.61 | NA | NA | NA | 113.83 | NA | NA | NA | 111.90 | NA | NA | NA | 111.02 | NA | NA | NA | 105.66 | NA | NA | NA | NA | NA | NA | |
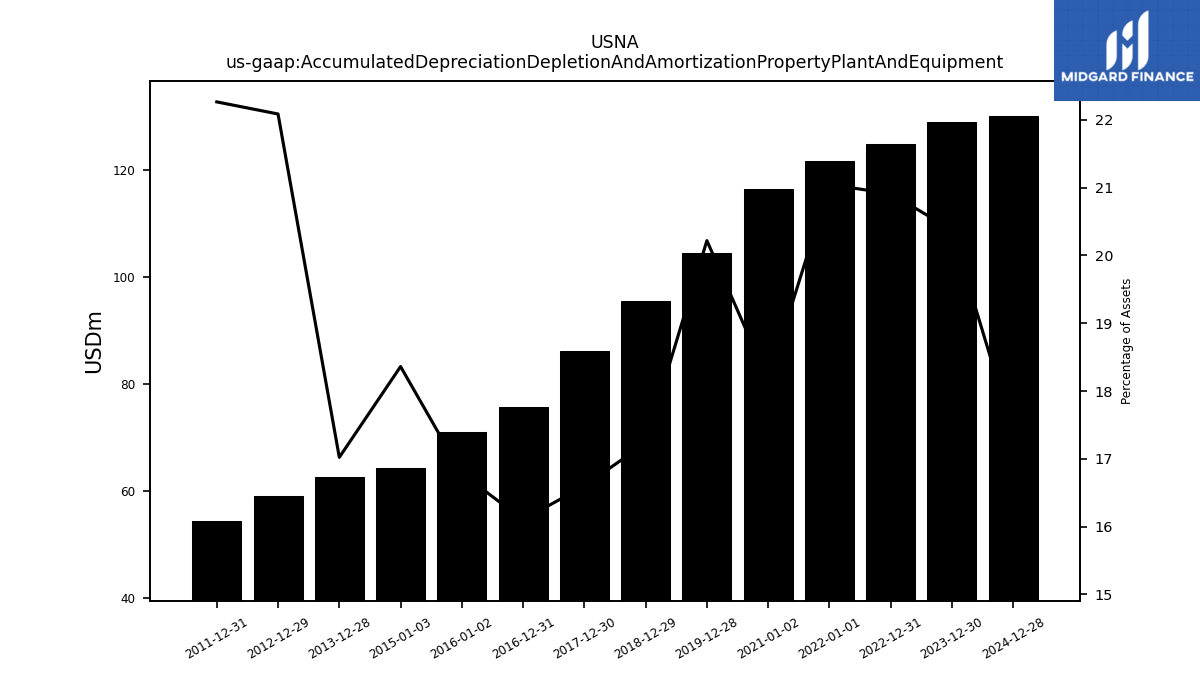
| Accumulated Depreciation Depletion And Amortization Property Plant And Equipment | 128.94 | NA | NA | NA | 124.75 | NA | NA | NA | 121.59 | NA | NA | NA | NA | NA | NA | 104.52 | NA | NA | NA | 95.56 | NA | NA | NA | 86.20 | NA | NA | NA | 75.79 | NA | NA | NA | 71.03 | NA | NA | NA | 64.37 | NA | NA | NA | 62.72 | NA | NA | NA | 59.05 | NA | NA | NA | 54.44 | NA | NA | NA | NA | NA | NA | |
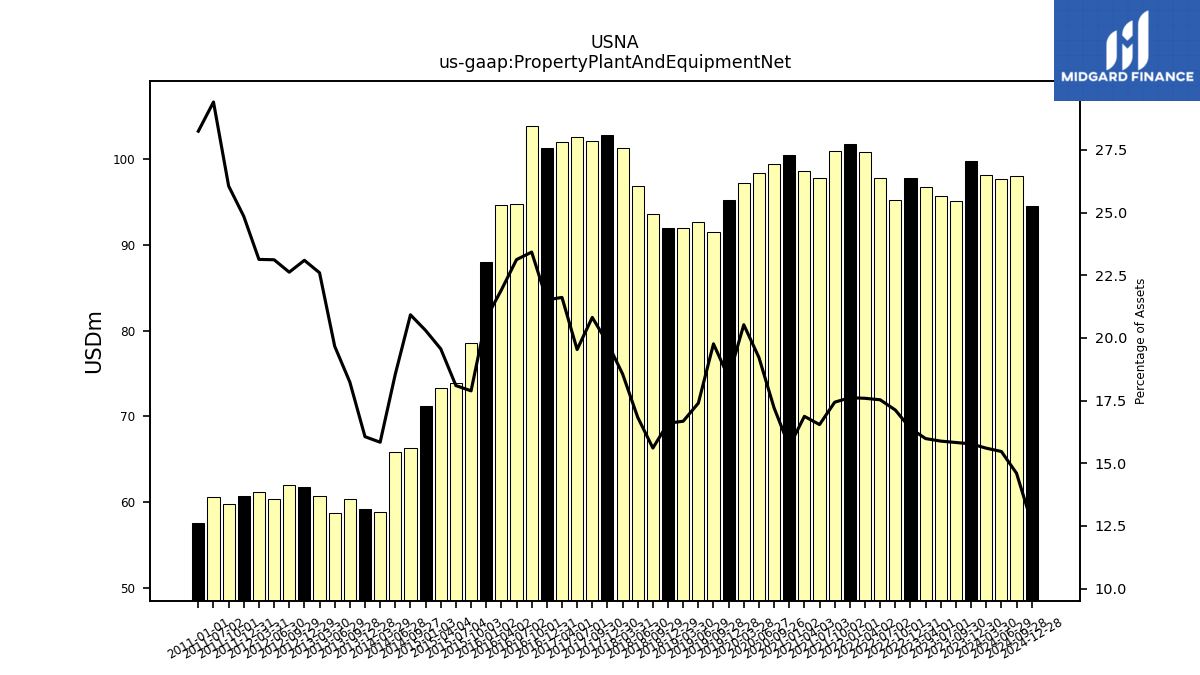
| Property Plant And Equipment Net | 99.81 | 95.16 | 95.74 | 96.80 | 97.77 | 95.23 | 97.83 | 100.79 | 101.78 | 100.96 | 97.85 | 98.62 | 99.40 | 98.44 | 97.25 | 95.23 | 91.52 | 92.64 | 91.99 | 92.03 | 93.56 | 96.84 | 101.36 | 102.85 | 102.15 | 102.53 | 102.03 | 101.27 | 103.92 | 94.73 | 94.61 | 87.98 | 78.53 | 73.94 | 73.37 | 71.16 | 66.31 | 65.86 | 58.84 | 59.18 | 60.43 | 58.80 | 60.72 | 61.75 | 62.05 | 60.34 | 61.19 | 60.75 | 59.76 | 60.56 | NA | 57.57 | NA | NA | |
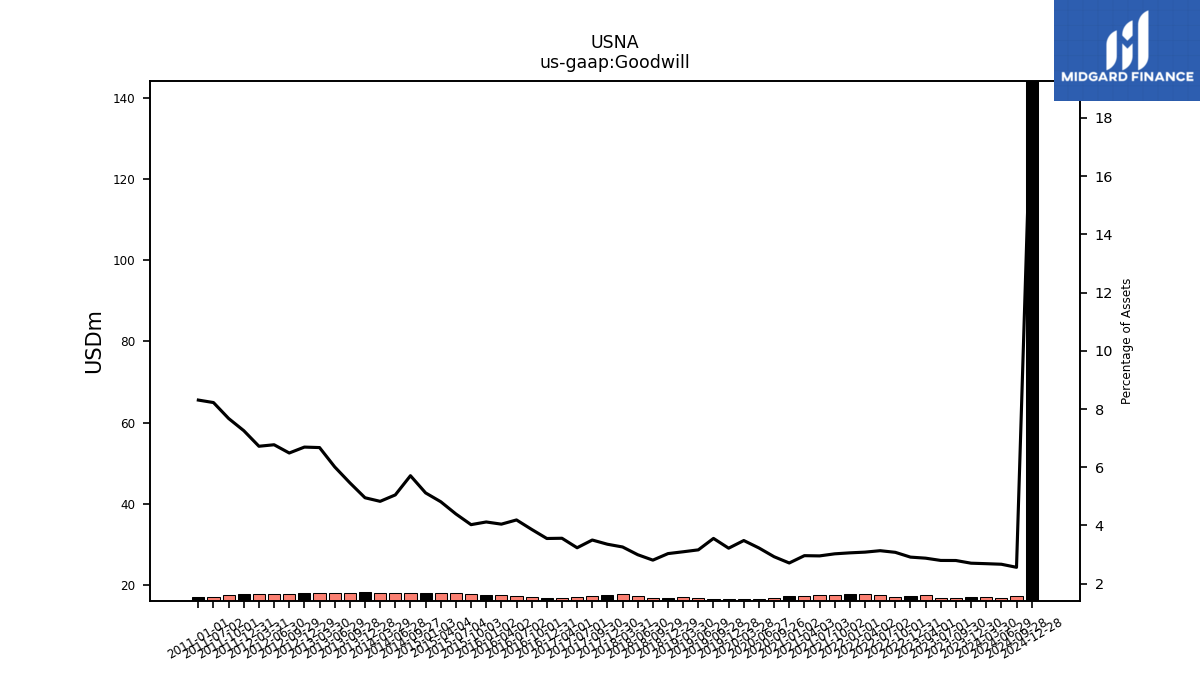
| Goodwill | 17.10 | 16.80 | 16.86 | 17.41 | 17.37 | 17.10 | 17.48 | 17.66 | 17.67 | 17.51 | 17.47 | 17.31 | 16.89 | 16.52 | 16.49 | 16.64 | 16.46 | 16.83 | 17.07 | 16.82 | 16.83 | 17.22 | 17.80 | 17.42 | 17.17 | 16.97 | 16.80 | 16.71 | 17.14 | 17.16 | 17.46 | 17.43 | 17.68 | 17.95 | 18.05 | 17.94 | 18.09 | 17.92 | 17.93 | 18.24 | 18.11 | 17.97 | 17.93 | 17.89 | 17.80 | 17.68 | 17.78 | 17.74 | 17.60 | 16.93 | NA | 16.93 | NA | NA | |
| Intangible Assets Net Excluding Goodwill | 29.92 | 29.46 | 30.00 | 31.97 | 32.43 | 32.16 | 34.37 | 30.12 | 30.44 | 30.31 | 30.49 | 30.34 | 29.75 | 29.01 | 29.07 | 29.84 | 29.67 | 31.13 | 32.23 | 31.81 | 32.22 | 33.81 | 35.97 | 35.15 | 34.73 | 34.45 | 34.27 | 34.35 | 36.13 | 36.58 | 37.98 | 38.27 | 39.51 | 40.76 | 41.25 | 40.95 | 41.48 | 41.02 | 41.21 | 42.33 | 42.08 | 41.81 | 41.96 | 42.09 | 42.02 | 41.85 | 42.49 | 42.64 | 42.37 | 40.10 | NA | 40.62 | NA | NA | |
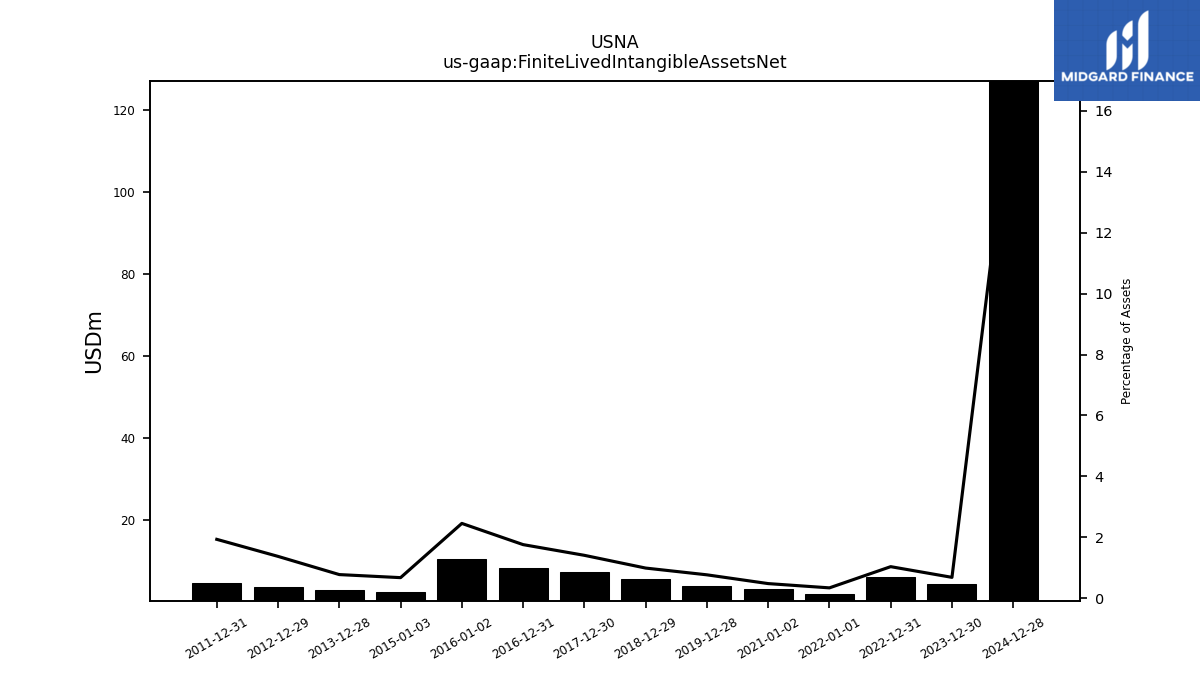
| Finite Lived Intangible Assets Net | 4.35 | NA | NA | NA | 6.19 | NA | NA | NA | 1.98 | NA | NA | NA | NA | NA | NA | 3.98 | NA | NA | NA | 5.50 | NA | NA | NA | 7.32 | NA | NA | NA | 8.29 | NA | NA | NA | 10.40 | NA | NA | NA | 2.38 | NA | NA | NA | 2.87 | NA | NA | NA | 3.68 | NA | NA | NA | 4.73 | NA | NA | NA | NA | NA | NA | |
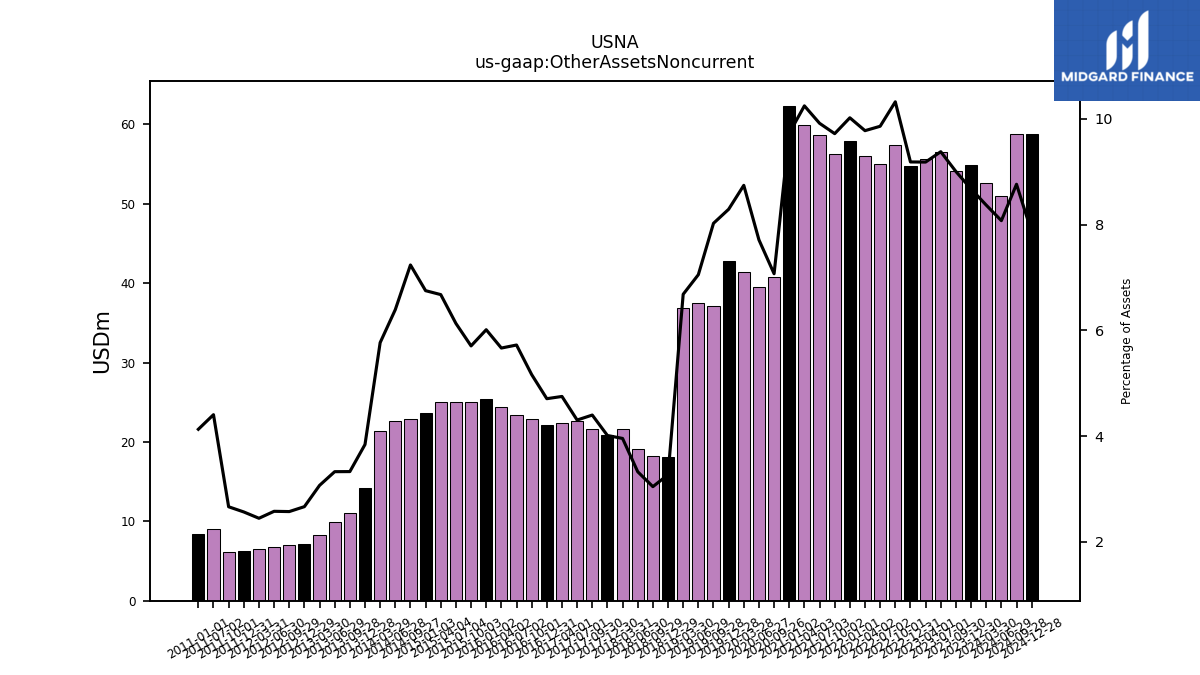
| Other Assets Noncurrent | 54.89 | 54.13 | 56.53 | 55.61 | 54.80 | 57.40 | 55.02 | 56.02 | 57.89 | 56.28 | 58.65 | 59.89 | 40.84 | 39.50 | 41.42 | 42.86 | 37.16 | 37.55 | 36.86 | 18.13 | 18.25 | 19.14 | 21.60 | 20.83 | 21.58 | 22.59 | 22.42 | 22.16 | 22.91 | 23.45 | 24.46 | 25.45 | 25.05 | 25.05 | 25.04 | 23.67 | 22.94 | 22.69 | 21.43 | 14.15 | 11.03 | 9.95 | 8.24 | 7.13 | 7.06 | 6.73 | 6.47 | 6.27 | 6.11 | 9.07 | NA | 8.42 | NA | NA |
| 2023-12-30 | 2023-09-30 | 2023-07-01 | 2023-04-01 | 2022-12-31 | 2022-10-01 | 2022-07-02 | 2022-04-02 | 2022-01-01 | 2021-10-02 | 2021-07-03 | 2021-04-03 | 2020-09-26 | 2020-06-27 | 2020-03-28 | 2019-12-28 | 2019-09-28 | 2019-06-29 | 2019-03-30 | 2018-12-29 | 2018-09-29 | 2018-06-30 | 2018-03-31 | 2017-12-30 | 2017-09-30 | 2017-07-01 | 2017-04-01 | 2016-12-31 | 2016-10-01 | 2016-07-02 | 2016-04-02 | 2016-01-02 | 2015-10-03 | 2015-07-04 | 2015-04-04 | 2015-01-03 | 2014-09-27 | 2014-06-28 | 2014-03-29 | 2013-12-28 | 2013-09-28 | 2013-06-29 | 2013-03-30 | 2012-12-29 | 2012-09-29 | 2012-06-30 | 2012-03-31 | 2011-12-31 | 2011-10-01 | 2011-07-02 | 2011-04-02 | 2011-01-01 | 2010-10-02 | 2010-07-03 | ||
|---|---|---|---|---|---|---|---|---|---|---|---|---|---|---|---|---|---|---|---|---|---|---|---|---|---|---|---|---|---|---|---|---|---|---|---|---|---|---|---|---|---|---|---|---|---|---|---|---|---|---|---|---|---|---|---|
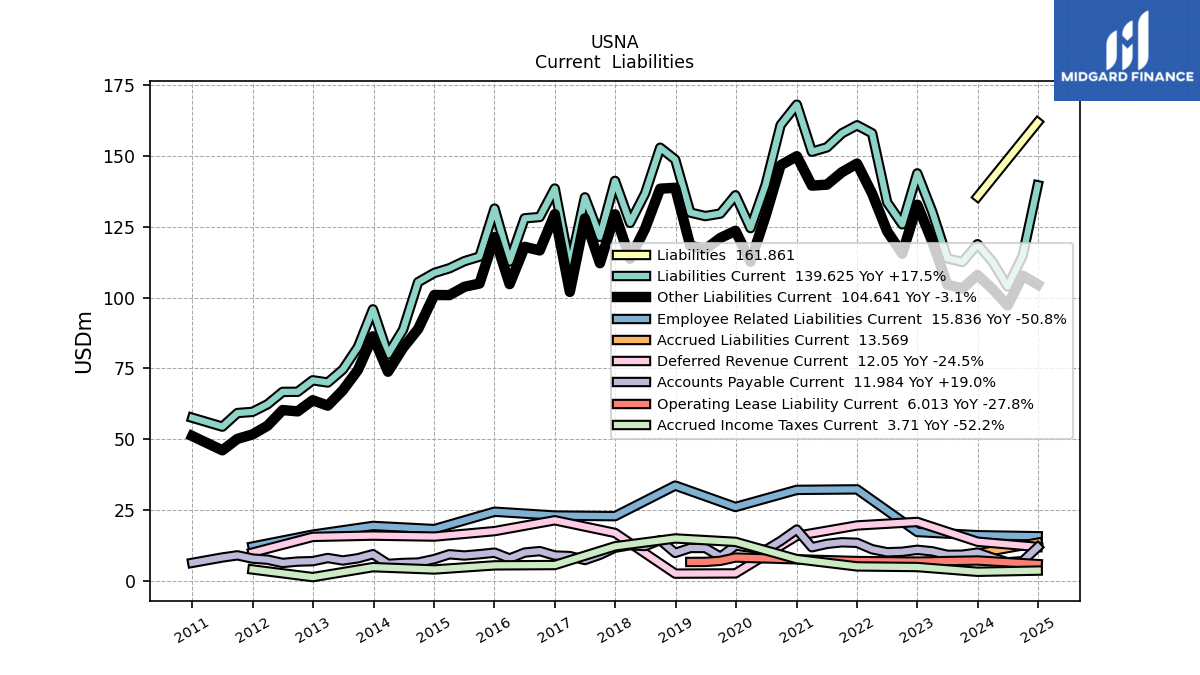
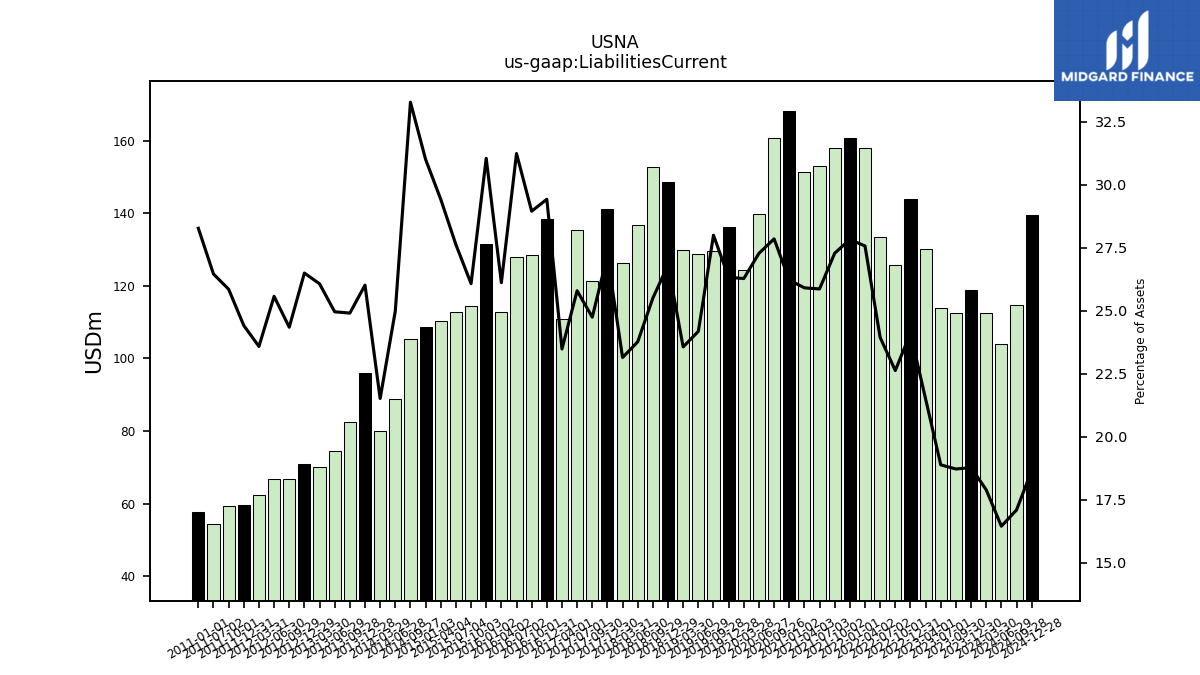
| Liabilities Current | 118.84 | 112.56 | 113.84 | 130.22 | 143.83 | 125.85 | 133.59 | 157.97 | 160.79 | 157.96 | 153.00 | 151.45 | 160.86 | 139.72 | 124.50 | 136.10 | 129.65 | 128.76 | 129.99 | 148.69 | 152.89 | 136.75 | 126.37 | 141.18 | 121.43 | 135.37 | 110.86 | 138.49 | 128.43 | 127.98 | 112.75 | 131.41 | 114.47 | 112.86 | 110.35 | 108.70 | 105.46 | 88.70 | 79.94 | 95.87 | 82.53 | 74.61 | 70.05 | 70.84 | 66.79 | 66.75 | 62.39 | 59.70 | 59.29 | 54.49 | NA | 57.62 | NA | NA | |
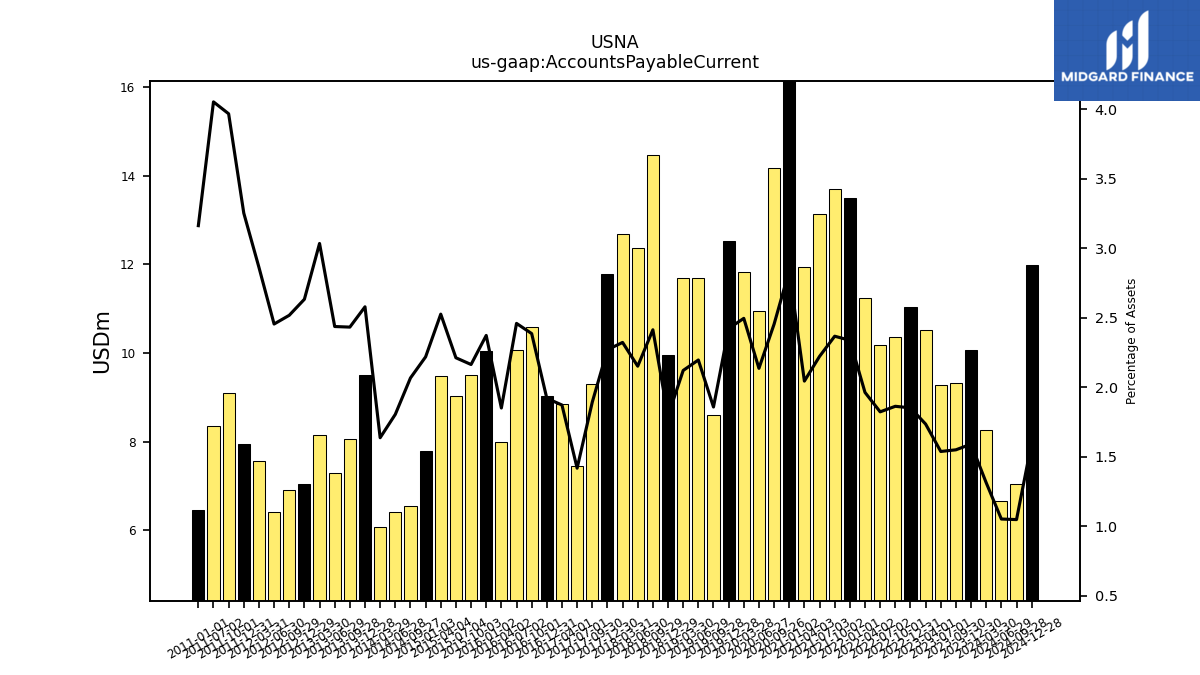
| Accounts Payable Current | 10.07 | 9.32 | 9.27 | 10.51 | 11.05 | 10.36 | 10.18 | 11.25 | 13.51 | 13.71 | 13.14 | 11.95 | 14.17 | 10.94 | 11.82 | 12.53 | 8.61 | 11.69 | 11.70 | 9.95 | 14.47 | 12.38 | 12.68 | 11.79 | 9.29 | 7.44 | 8.84 | 9.04 | 10.59 | 10.08 | 7.99 | 10.04 | 9.50 | 9.04 | 9.47 | 7.78 | 6.55 | 6.41 | 6.08 | 9.50 | 8.06 | 7.29 | 8.15 | 7.04 | 6.91 | 6.41 | 7.57 | 7.95 | 9.10 | 8.35 | NA | 6.45 | NA | NA | |
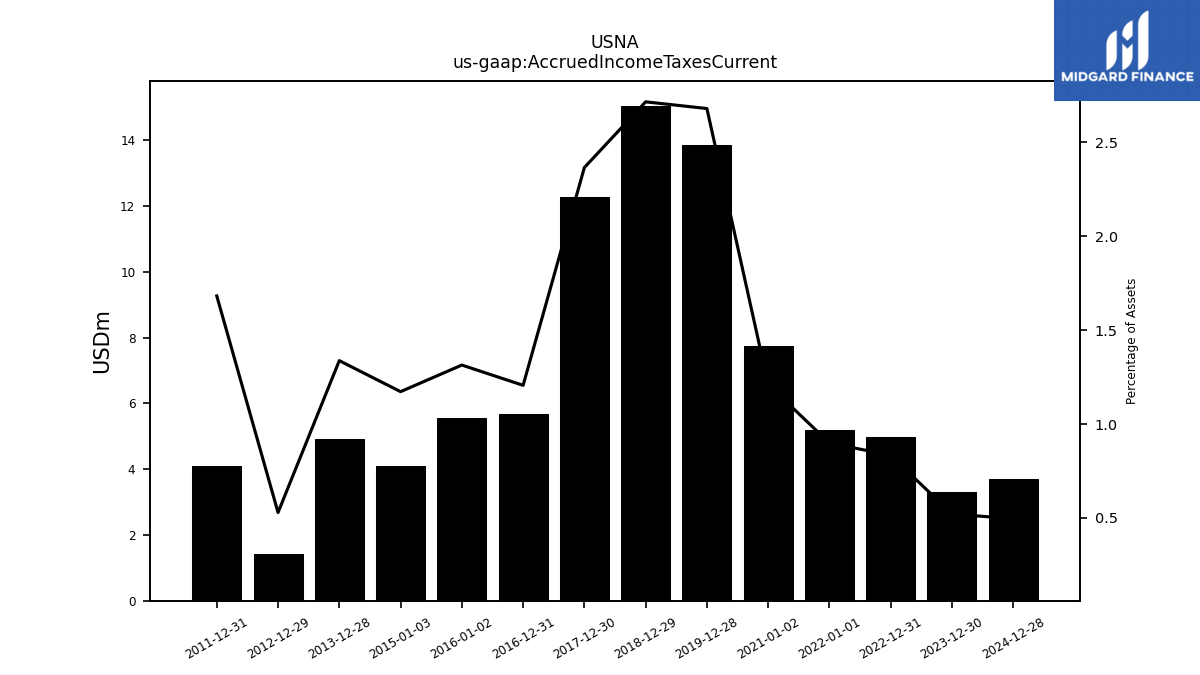
| Accrued Income Taxes Current | 3.30 | NA | NA | NA | 4.97 | NA | NA | NA | 5.19 | NA | NA | NA | NA | NA | NA | 13.85 | NA | NA | NA | 15.05 | NA | NA | NA | 12.28 | NA | NA | NA | 5.68 | NA | NA | NA | 5.56 | NA | NA | NA | 4.11 | NA | NA | NA | 4.93 | NA | NA | NA | 1.41 | NA | NA | NA | 4.11 | NA | NA | NA | NA | NA | NA | |
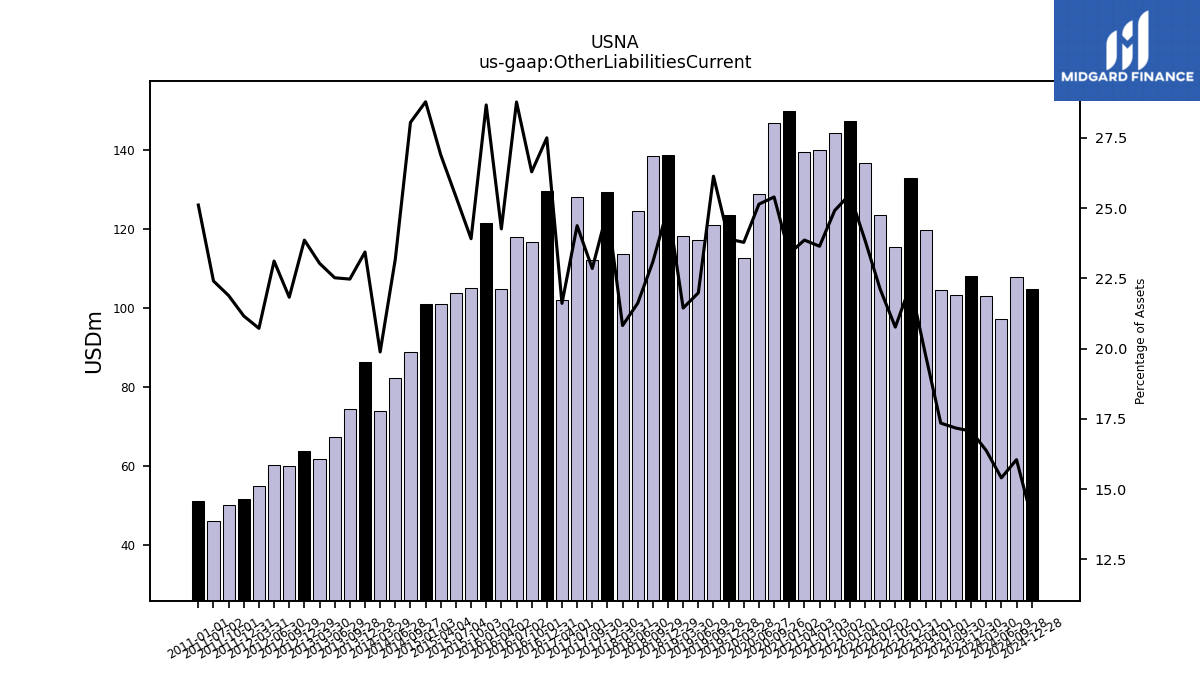
| Other Liabilities Current | 107.99 | 103.24 | 104.57 | 119.71 | 132.78 | 115.48 | 123.42 | 136.72 | 147.28 | 144.26 | 139.86 | 139.50 | 146.69 | 128.78 | 112.68 | 123.57 | 121.04 | 117.06 | 118.29 | 138.74 | 138.42 | 124.37 | 113.69 | 129.40 | 112.14 | 127.93 | 102.02 | 129.45 | 116.65 | 117.90 | 104.76 | 121.37 | 104.97 | 103.82 | 100.88 | 100.93 | 88.91 | 82.30 | 73.86 | 86.37 | 74.47 | 67.33 | 61.89 | 63.80 | 59.88 | 60.34 | 54.82 | 51.74 | 50.19 | 46.14 | NA | 51.18 | NA | NA |
| 2023-12-30 | 2023-09-30 | 2023-07-01 | 2023-04-01 | 2022-12-31 | 2022-10-01 | 2022-07-02 | 2022-04-02 | 2022-01-01 | 2021-10-02 | 2021-07-03 | 2021-04-03 | 2020-09-26 | 2020-06-27 | 2020-03-28 | 2019-12-28 | 2019-09-28 | 2019-06-29 | 2019-03-30 | 2018-12-29 | 2018-09-29 | 2018-06-30 | 2018-03-31 | 2017-12-30 | 2017-09-30 | 2017-07-01 | 2017-04-01 | 2016-12-31 | 2016-10-01 | 2016-07-02 | 2016-04-02 | 2016-01-02 | 2015-10-03 | 2015-07-04 | 2015-04-04 | 2015-01-03 | 2014-09-27 | 2014-06-28 | 2014-03-29 | 2013-12-28 | 2013-09-28 | 2013-06-29 | 2013-03-30 | 2012-12-29 | 2012-09-29 | 2012-06-30 | 2012-03-31 | 2011-12-31 | 2011-10-01 | 2011-07-02 | 2011-04-02 | 2011-01-01 | 2010-10-02 | 2010-07-03 | ||
|---|---|---|---|---|---|---|---|---|---|---|---|---|---|---|---|---|---|---|---|---|---|---|---|---|---|---|---|---|---|---|---|---|---|---|---|---|---|---|---|---|---|---|---|---|---|---|---|---|---|---|---|---|---|---|---|
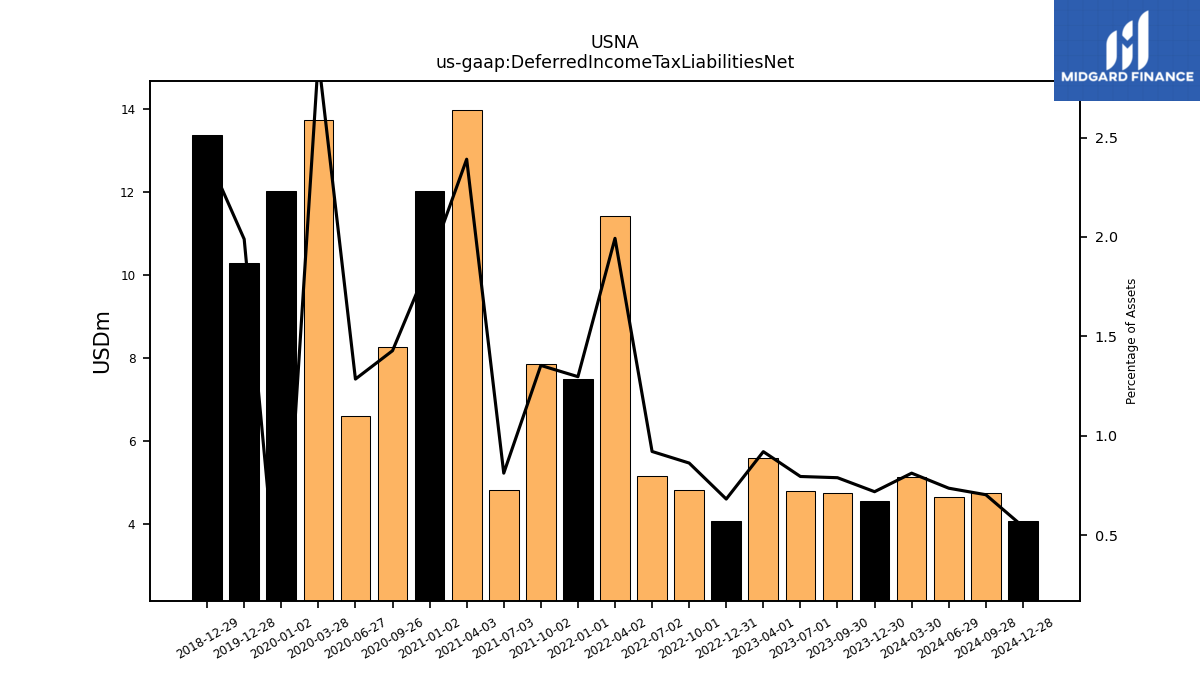
| Deferred Income Tax Liabilities Net | 4.55 | 4.75 | 4.80 | 5.58 | 4.07 | 4.80 | 5.14 | 11.42 | 7.50 | 7.84 | 4.81 | 13.97 | 8.25 | 6.58 | 13.73 | 10.28 | NA | NA | NA | 13.37 | NA | NA | NA | NA | NA | NA | NA | NA | NA | NA | NA | NA | NA | NA | NA | NA | NA | NA | NA | NA | NA | NA | NA | NA | NA | NA | NA | NA | NA | NA | NA | NA | NA | NA | |
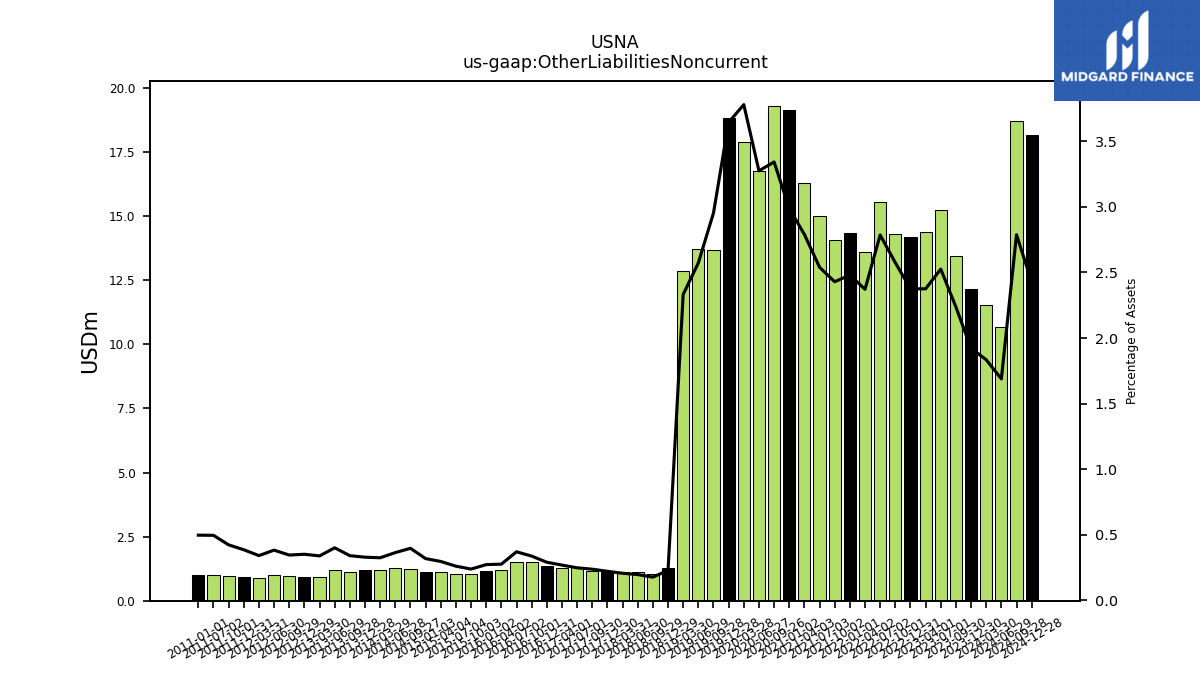
| Other Liabilities Noncurrent | 12.16 | 13.45 | 15.22 | 14.38 | 14.17 | 14.32 | 15.54 | 13.59 | 14.33 | 14.06 | 15.02 | 16.31 | 19.30 | 16.77 | 17.91 | 18.84 | 13.68 | 13.70 | 12.87 | 1.26 | 1.06 | 1.13 | 1.12 | 1.15 | 1.16 | 1.30 | 1.27 | 1.36 | 1.49 | 1.51 | 1.19 | 1.15 | 1.04 | 1.06 | 1.11 | 1.11 | 1.26 | 1.29 | 1.20 | 1.21 | 1.13 | 1.20 | 0.91 | 0.94 | 0.95 | 1.00 | 0.90 | 0.94 | 0.97 | 1.02 | NA | 1.01 | NA | NA | |
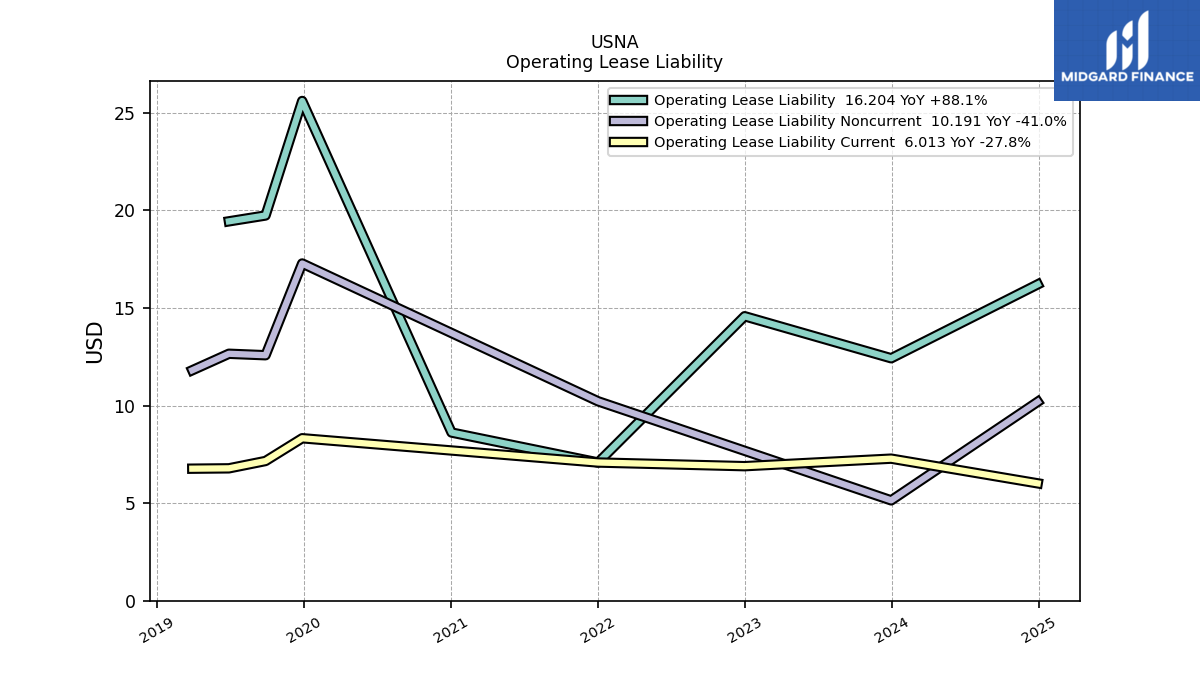
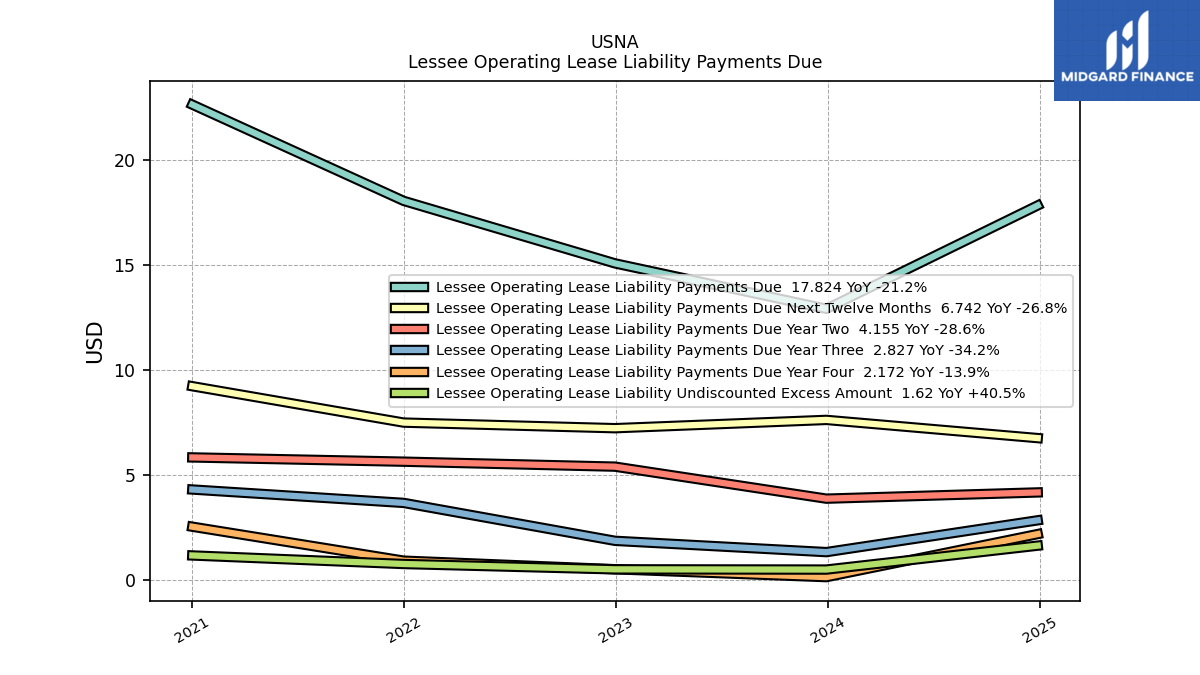
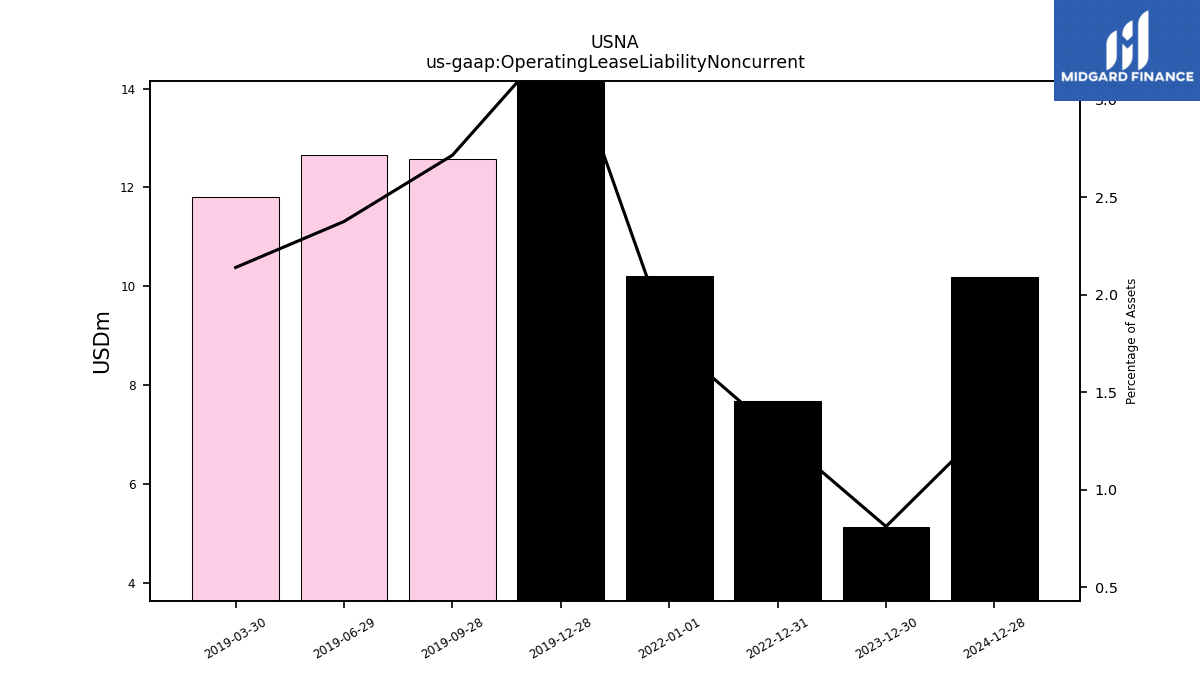
| Operating Lease Liability Noncurrent | 5.14 | NA | NA | NA | 7.68 | NA | NA | NA | 10.21 | NA | NA | NA | NA | NA | NA | 17.27 | 12.57 | 12.65 | 11.80 | NA | NA | NA | NA | NA | NA | NA | NA | NA | NA | NA | NA | NA | NA | NA | NA | NA | NA | NA | NA | NA | NA | NA | NA | NA | NA | NA | NA | NA | NA | NA | NA | NA | NA | NA |
| 2023-12-30 | 2023-09-30 | 2023-07-01 | 2023-04-01 | 2022-12-31 | 2022-10-01 | 2022-07-02 | 2022-04-02 | 2022-01-01 | 2021-10-02 | 2021-07-03 | 2021-04-03 | 2020-09-26 | 2020-06-27 | 2020-03-28 | 2019-12-28 | 2019-09-28 | 2019-06-29 | 2019-03-30 | 2018-12-29 | 2018-09-29 | 2018-06-30 | 2018-03-31 | 2017-12-30 | 2017-09-30 | 2017-07-01 | 2017-04-01 | 2016-12-31 | 2016-10-01 | 2016-07-02 | 2016-04-02 | 2016-01-02 | 2015-10-03 | 2015-07-04 | 2015-04-04 | 2015-01-03 | 2014-09-27 | 2014-06-28 | 2014-03-29 | 2013-12-28 | 2013-09-28 | 2013-06-29 | 2013-03-30 | 2012-12-29 | 2012-09-29 | 2012-06-30 | 2012-03-31 | 2011-12-31 | 2011-10-01 | 2011-07-02 | 2011-04-02 | 2011-01-01 | 2010-10-02 | 2010-07-03 | ||
|---|---|---|---|---|---|---|---|---|---|---|---|---|---|---|---|---|---|---|---|---|---|---|---|---|---|---|---|---|---|---|---|---|---|---|---|---|---|---|---|---|---|---|---|---|---|---|---|---|---|---|---|---|---|---|---|
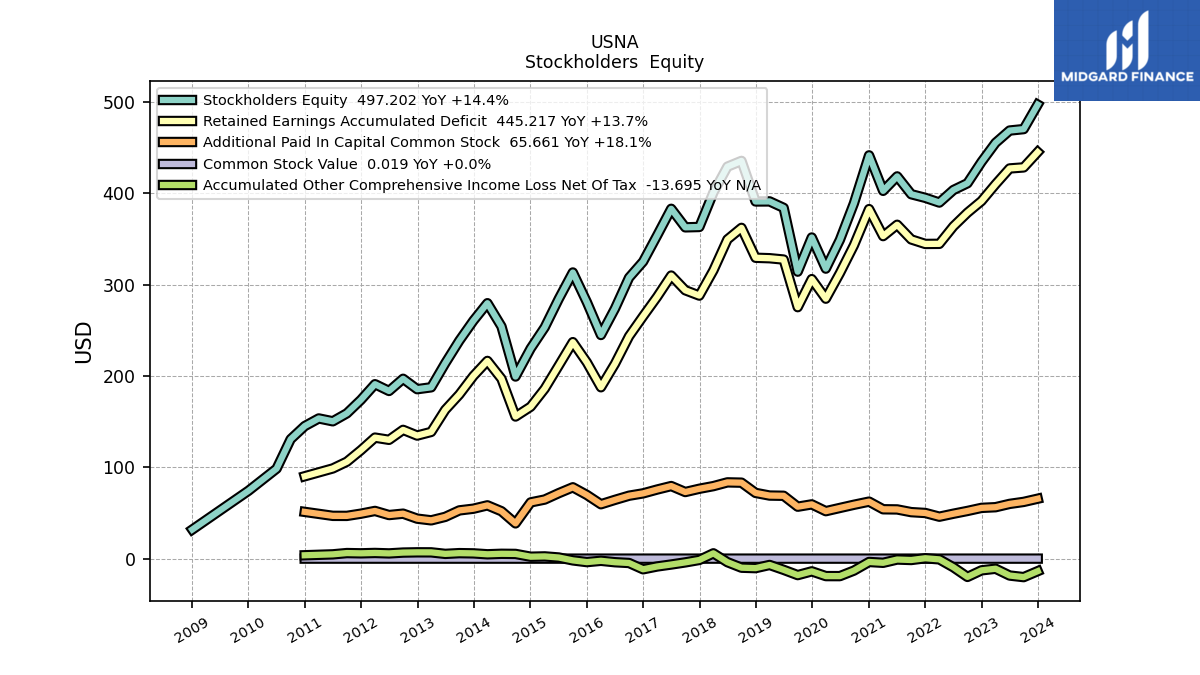
| Stockholders Equity | 497.20 | 470.39 | 468.82 | 455.35 | 434.47 | 411.10 | 403.68 | 389.95 | 395.12 | 399.08 | 418.62 | 402.78 | 389.12 | 349.08 | 317.61 | 351.71 | 314.29 | 384.16 | 391.22 | 391.15 | 435.59 | 429.28 | 400.98 | 363.21 | 362.81 | 383.14 | 353.93 | 325.29 | 307.71 | 273.93 | 244.91 | 280.85 | 313.39 | 284.52 | 253.31 | 230.16 | 199.45 | 254.25 | 279.74 | 260.52 | 238.65 | 214.01 | 187.65 | 185.57 | 196.98 | 183.63 | 191.06 | 173.91 | 159.14 | 150.42 | 153.56 | 145.17 | 130.82 | 98.56 | |
| Common Stock Value | 0.02 | 0.02 | 0.02 | 0.02 | 0.02 | 0.02 | 0.02 | 0.02 | 0.02 | 0.02 | 0.02 | 0.02 | 0.02 | 0.02 | 0.02 | 0.02 | 0.02 | 0.02 | 0.02 | 0.02 | 0.02 | 0.02 | 0.02 | 0.02 | 0.02 | 0.02 | 0.02 | 0.02 | 0.02 | 0.02 | 0.02 | 0.03 | 0.03 | 0.03 | 0.03 | 0.03 | 0.02 | 0.03 | 0.03 | 0.03 | 0.03 | 0.03 | 0.03 | 0.03 | 0.03 | 0.03 | 0.03 | 0.03 | 0.03 | 0.03 | NA | 0.03 | NA | NA | |
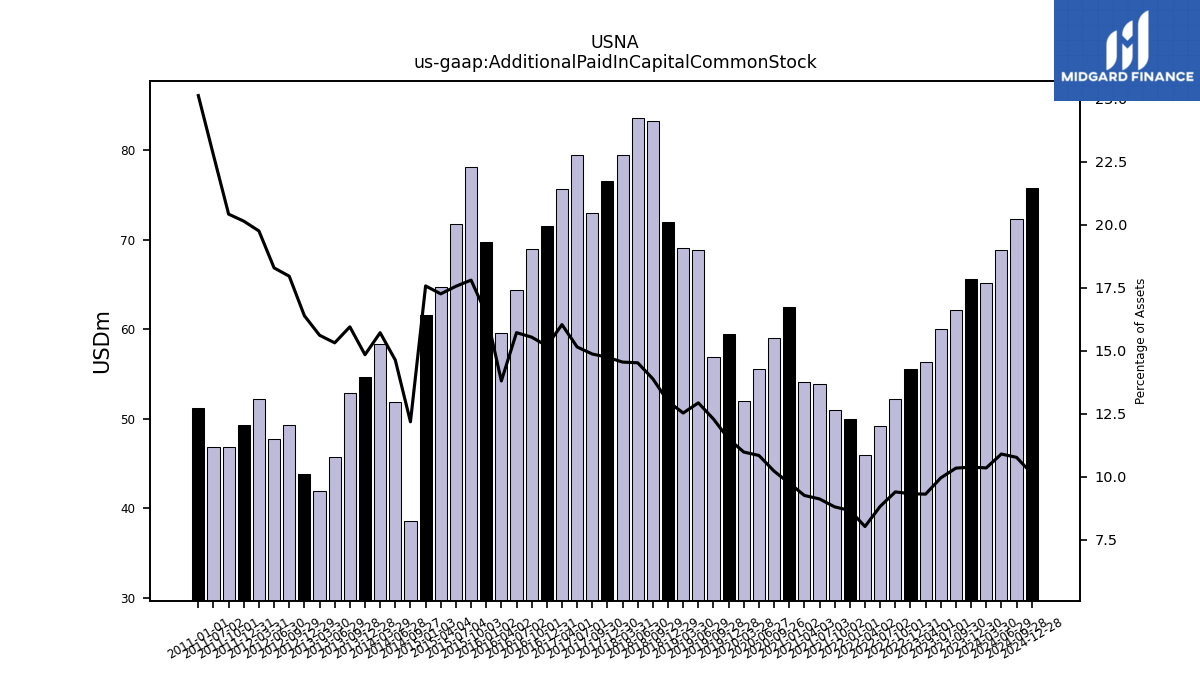
| Additional Paid In Capital Common Stock | 65.66 | 62.15 | 59.97 | 56.35 | 55.60 | 52.24 | 49.21 | 45.95 | 50.01 | 50.95 | 53.91 | 54.08 | 59.01 | 55.53 | 52.00 | 59.45 | 56.89 | 68.85 | 69.10 | 72.01 | 83.22 | 83.54 | 79.43 | 76.54 | 72.96 | 79.51 | 75.70 | 71.50 | 68.94 | 64.40 | 59.58 | 69.74 | 78.15 | 71.74 | 64.73 | 61.61 | 38.60 | 51.92 | 58.38 | 54.69 | 52.85 | 45.78 | 41.95 | 43.82 | 49.26 | 47.74 | 52.26 | 49.26 | 46.83 | 46.88 | NA | 51.22 | NA | NA | |
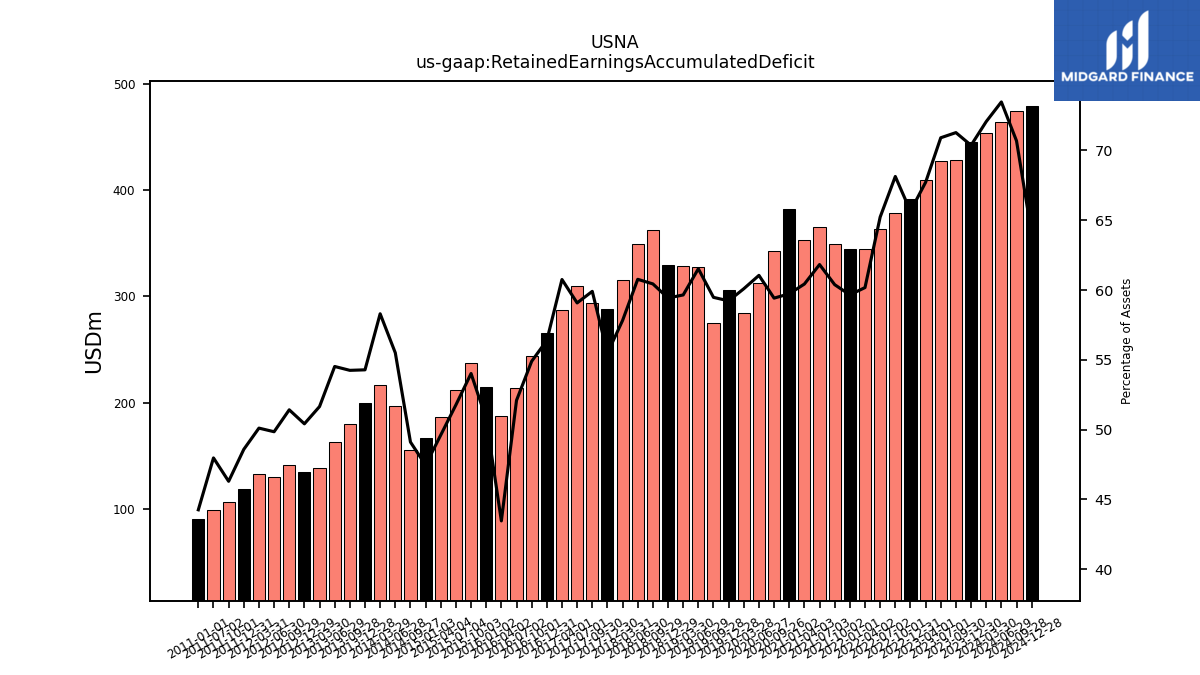
| Retained Earnings Accumulated Deficit | 445.22 | 428.45 | 427.31 | 410.02 | 391.64 | 378.84 | 363.91 | 344.75 | 344.64 | 349.59 | 365.65 | 353.21 | 343.17 | 312.66 | 284.68 | 306.15 | 275.39 | 327.54 | 329.00 | 329.50 | 362.25 | 349.58 | 315.67 | 288.07 | 293.92 | 310.02 | 286.76 | 265.40 | 243.52 | 213.43 | 187.66 | 214.88 | 237.11 | 211.50 | 186.09 | 166.41 | 155.66 | 196.99 | 216.56 | 200.02 | 179.74 | 162.99 | 138.78 | 134.80 | 141.04 | 130.12 | 132.55 | 118.80 | 106.17 | 98.80 | NA | 90.21 | NA | NA | |
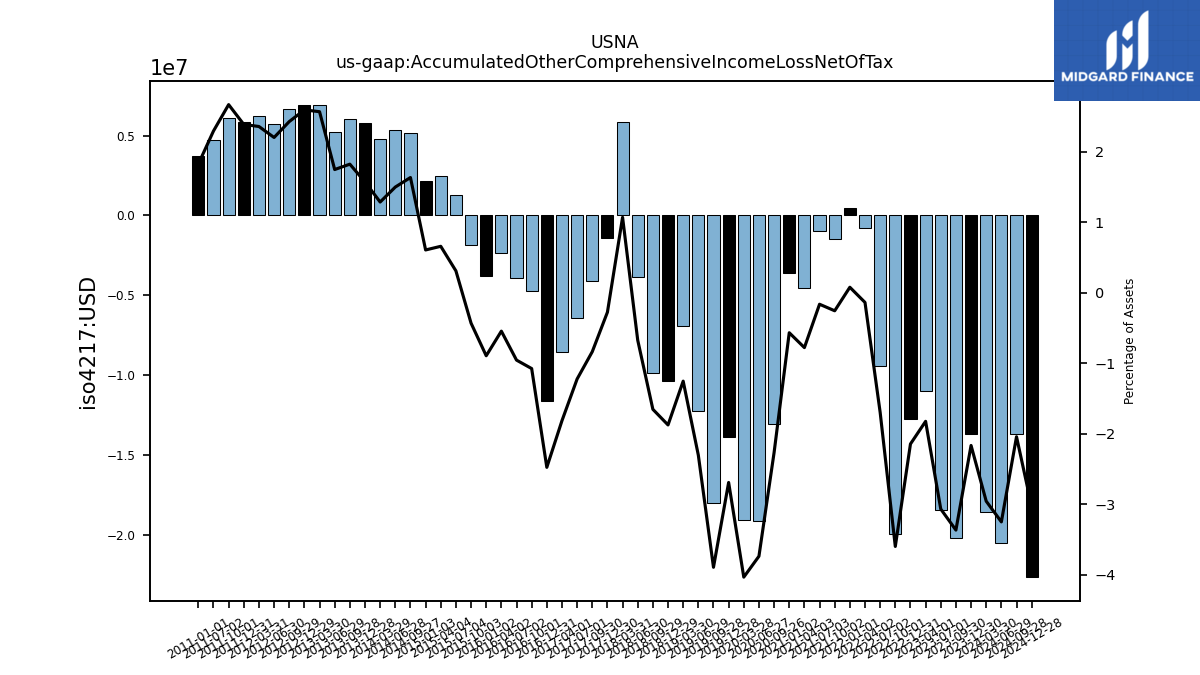
| Accumulated Other Comprehensive Income Loss Net Of Tax | -13.70 | -20.22 | -18.48 | -11.04 | -12.79 | -20.00 | -9.46 | -0.78 | 0.46 | -1.47 | -0.96 | -4.54 | -13.08 | -19.13 | -19.10 | -13.90 | -18.02 | -12.26 | -6.91 | -10.39 | -9.90 | -3.86 | 5.85 | -1.43 | -4.09 | -6.41 | -8.56 | -11.65 | -4.76 | -3.91 | -2.35 | -3.78 | -1.89 | 1.27 | 2.48 | 2.13 | 5.18 | 5.32 | 4.78 | 5.79 | 6.05 | 5.23 | 6.90 | 6.94 | 6.66 | 5.75 | 6.24 | 5.84 | 6.12 | 4.73 | NA | 3.72 | NA | NA | |
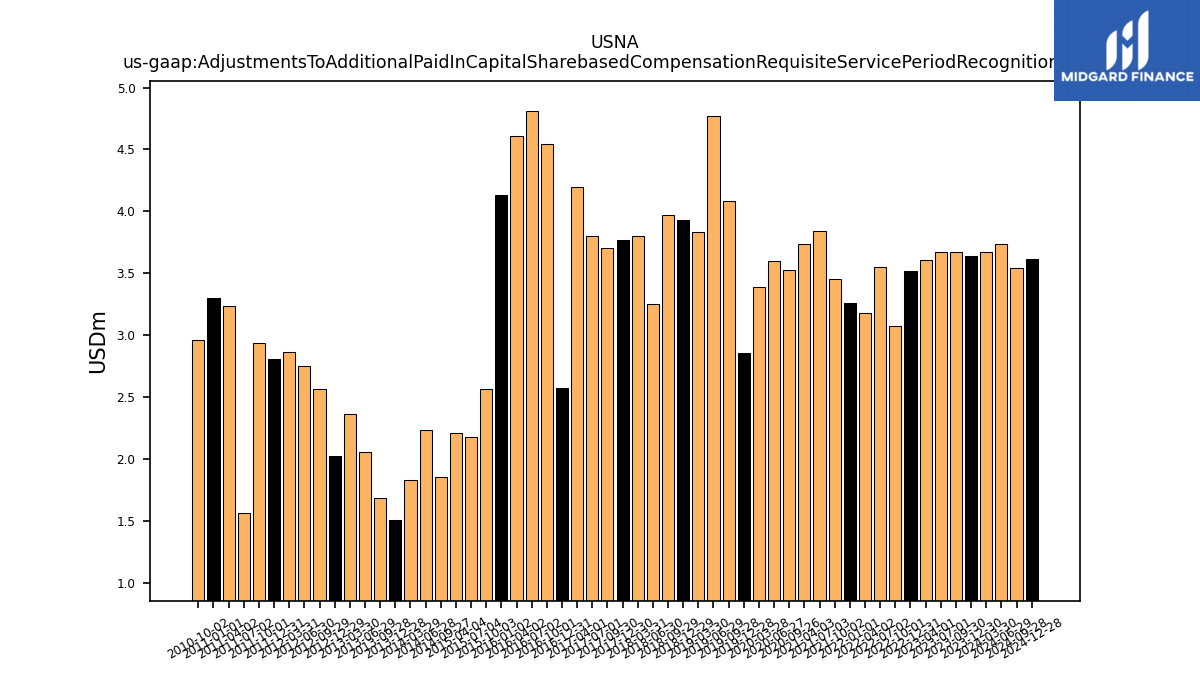
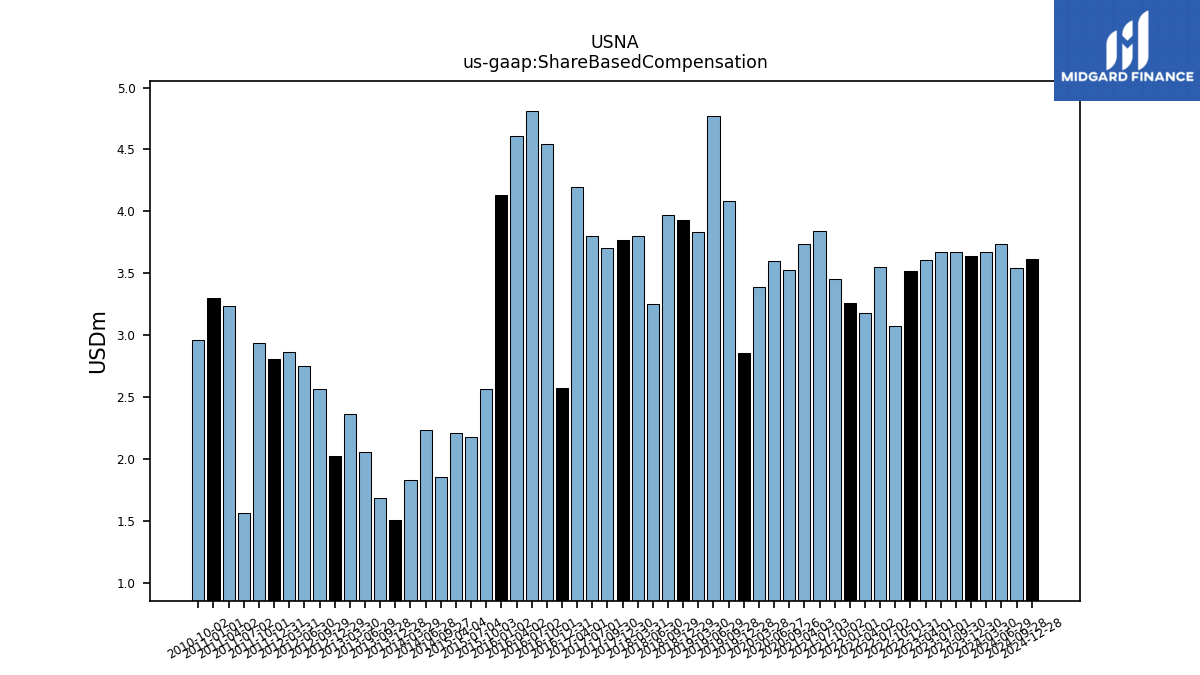
| Adjustments To Additional Paid In Capital Sharebased Compensation Requisite Service Period Recognition Value | 3.64 | 3.67 | 3.67 | 3.61 | 3.52 | 3.08 | 3.56 | 3.18 | 3.26 | 3.45 | 3.85 | 3.74 | 3.53 | 3.60 | 3.39 | 2.86 | 4.08 | 4.77 | 3.83 | 3.93 | 3.97 | 3.25 | 3.81 | 3.77 | 3.71 | 3.80 | 4.20 | 2.58 | 4.54 | 4.81 | 4.61 | 4.13 | 2.56 | 2.18 | 2.21 | NA | 1.86 | 2.23 | 1.84 | 1.51 | 1.69 | 2.06 | 2.37 | 2.03 | 2.57 | 2.75 | 2.87 | 2.81 | 2.94 | 1.57 | 3.23 | 3.30 | 2.97 | NA |
| 2023-12-30 | 2023-09-30 | 2023-07-01 | 2023-04-01 | 2022-12-31 | 2022-10-01 | 2022-07-02 | 2022-04-02 | 2022-01-01 | 2021-10-02 | 2021-07-03 | 2021-04-03 | 2020-09-26 | 2020-06-27 | 2020-03-28 | 2019-12-28 | 2019-09-28 | 2019-06-29 | 2019-03-30 | 2018-12-29 | 2018-09-29 | 2018-06-30 | 2018-03-31 | 2017-12-30 | 2017-09-30 | 2017-07-01 | 2017-04-01 | 2016-12-31 | 2016-10-01 | 2016-07-02 | 2016-04-02 | 2016-01-02 | 2015-10-03 | 2015-07-04 | 2015-04-04 | 2015-01-03 | 2014-09-27 | 2014-06-28 | 2014-03-29 | 2013-12-28 | 2013-09-28 | 2013-06-29 | 2013-03-30 | 2012-12-29 | 2012-09-29 | 2012-06-30 | 2012-03-31 | 2011-12-31 | 2011-10-01 | 2011-07-02 | 2011-04-02 | 2011-01-01 | 2010-10-02 | 2010-07-03 | ||
|---|---|---|---|---|---|---|---|---|---|---|---|---|---|---|---|---|---|---|---|---|---|---|---|---|---|---|---|---|---|---|---|---|---|---|---|---|---|---|---|---|---|---|---|---|---|---|---|---|---|---|---|---|---|---|---|
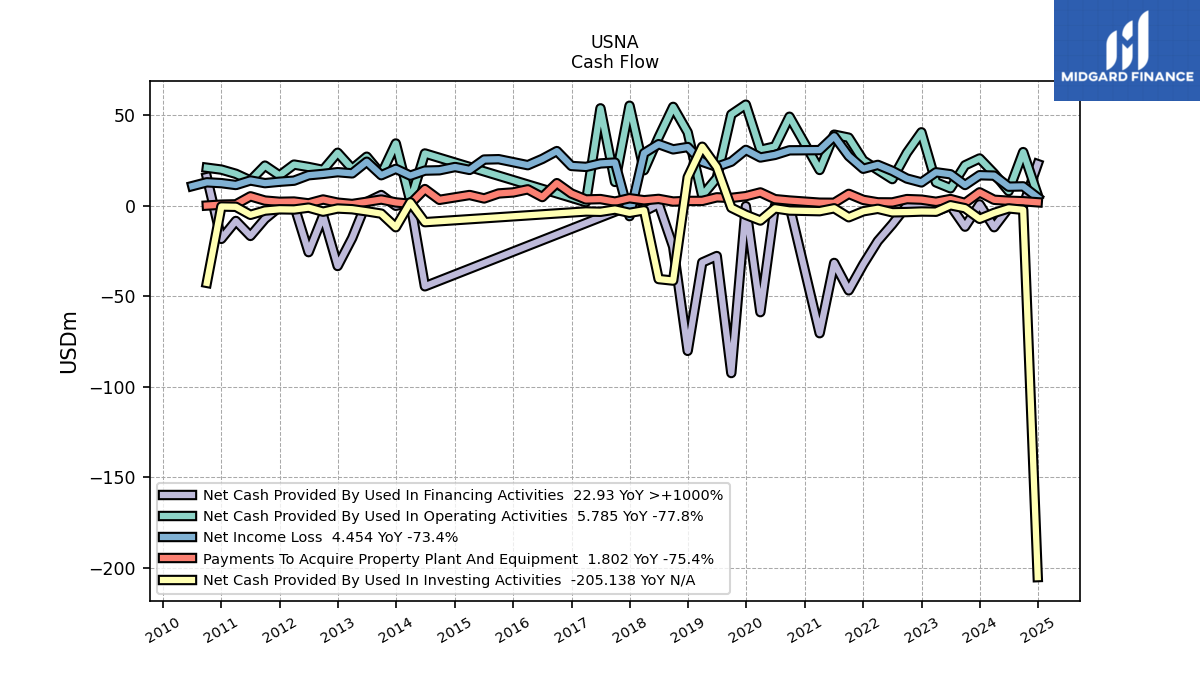
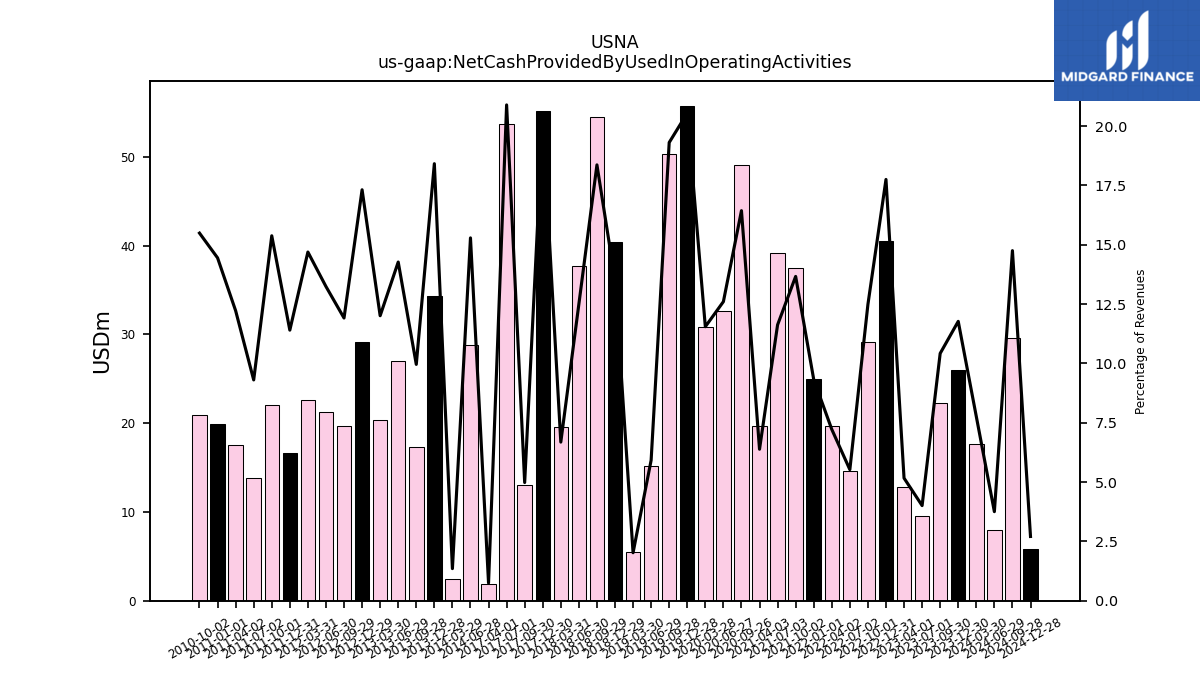
| Net Cash Provided By Used In Operating Activities | 26.02 | 22.23 | 9.55 | 12.83 | 40.46 | 29.12 | 14.61 | 19.70 | 24.92 | 37.49 | 39.16 | 19.66 | 49.06 | 32.64 | 30.79 | 55.74 | 50.31 | 15.16 | 5.52 | 40.43 | 54.50 | 37.67 | 19.52 | 55.14 | 13.04 | 53.70 | 1.90 | NA | NA | NA | NA | NA | NA | NA | NA | NA | NA | 28.78 | 2.47 | 34.30 | 17.30 | 26.99 | 20.30 | 29.18 | 19.68 | 21.30 | 22.64 | 16.64 | 22.07 | 13.86 | 17.55 | 19.87 | 20.91 | NA | |
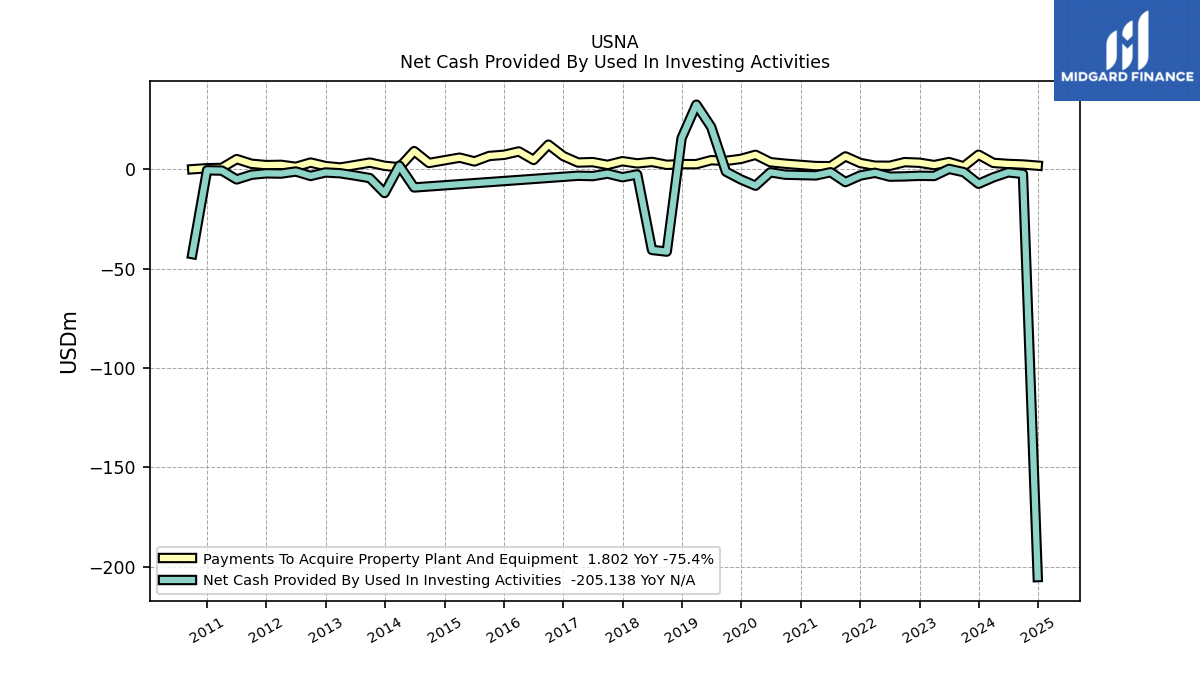
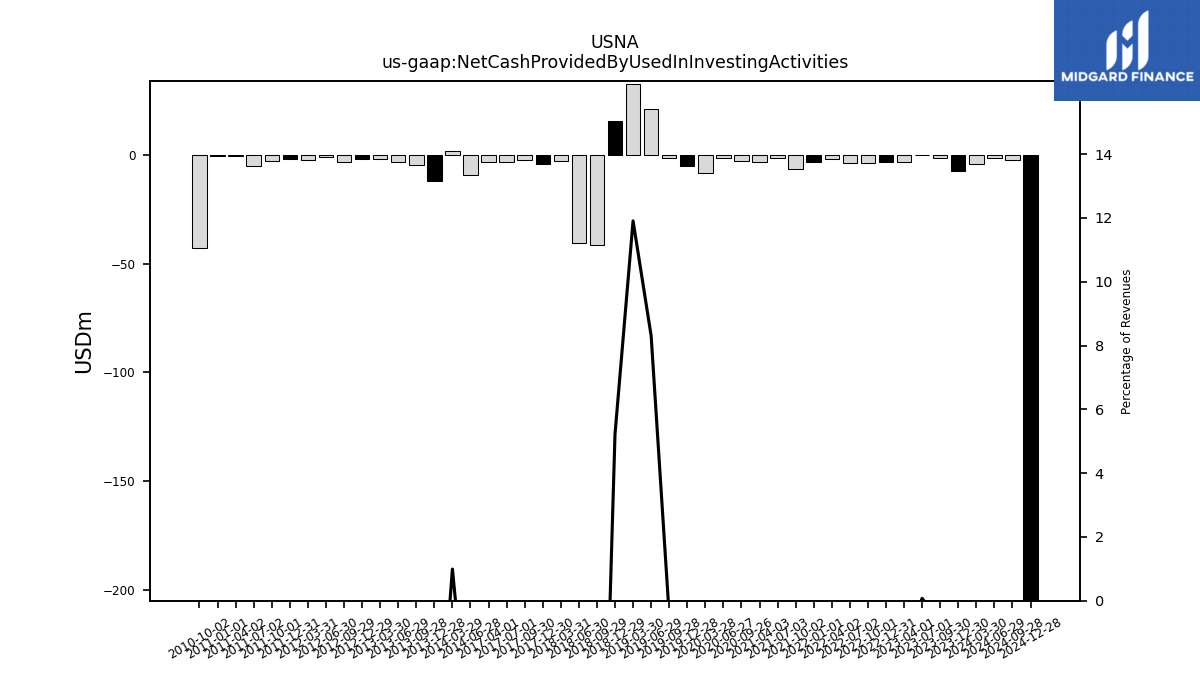
| Net Cash Provided By Used In Investing Activities | -7.32 | -1.45 | 0.18 | -3.38 | -3.28 | -3.58 | -3.72 | -1.79 | -3.15 | -6.45 | -1.49 | -3.09 | -2.73 | -1.53 | -8.27 | -5.11 | -1.19 | 21.27 | 32.51 | 15.61 | -41.42 | -40.58 | -2.61 | -4.01 | -2.19 | -3.44 | -3.26 | NA | NA | NA | NA | NA | NA | NA | NA | NA | NA | -9.16 | 1.81 | -11.97 | -4.44 | -3.17 | -2.01 | -1.61 | -3.36 | -1.12 | -2.18 | -2.05 | -2.76 | -5.12 | -0.68 | -0.52 | -42.68 | NA | |
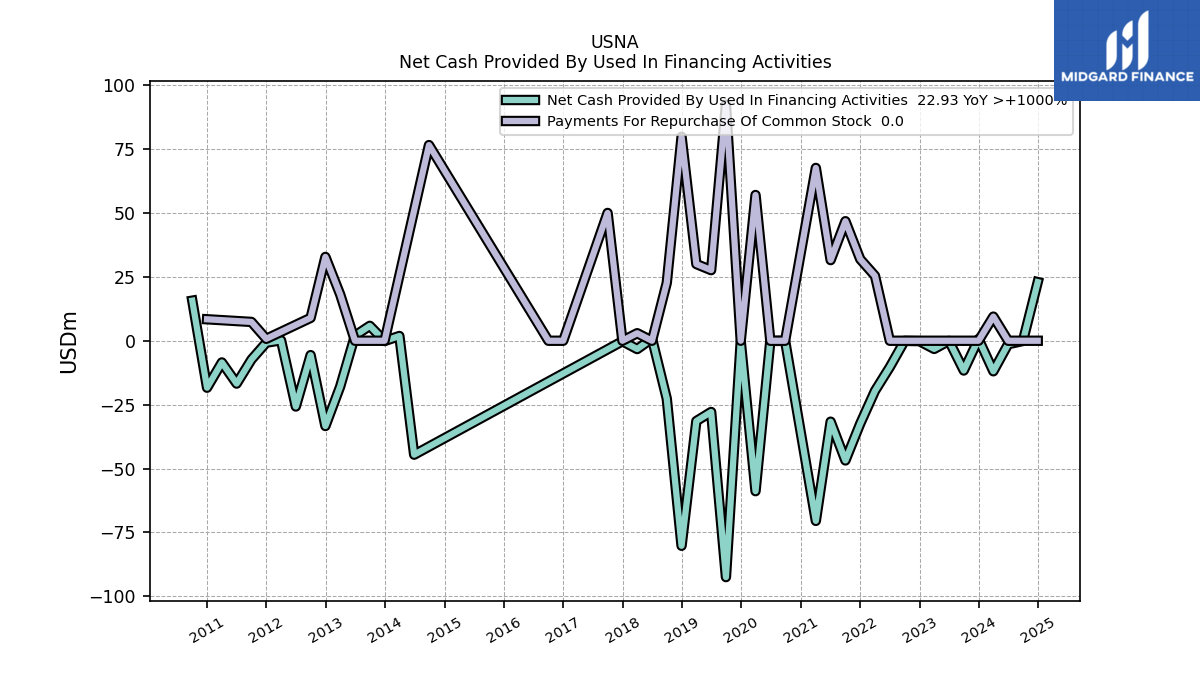
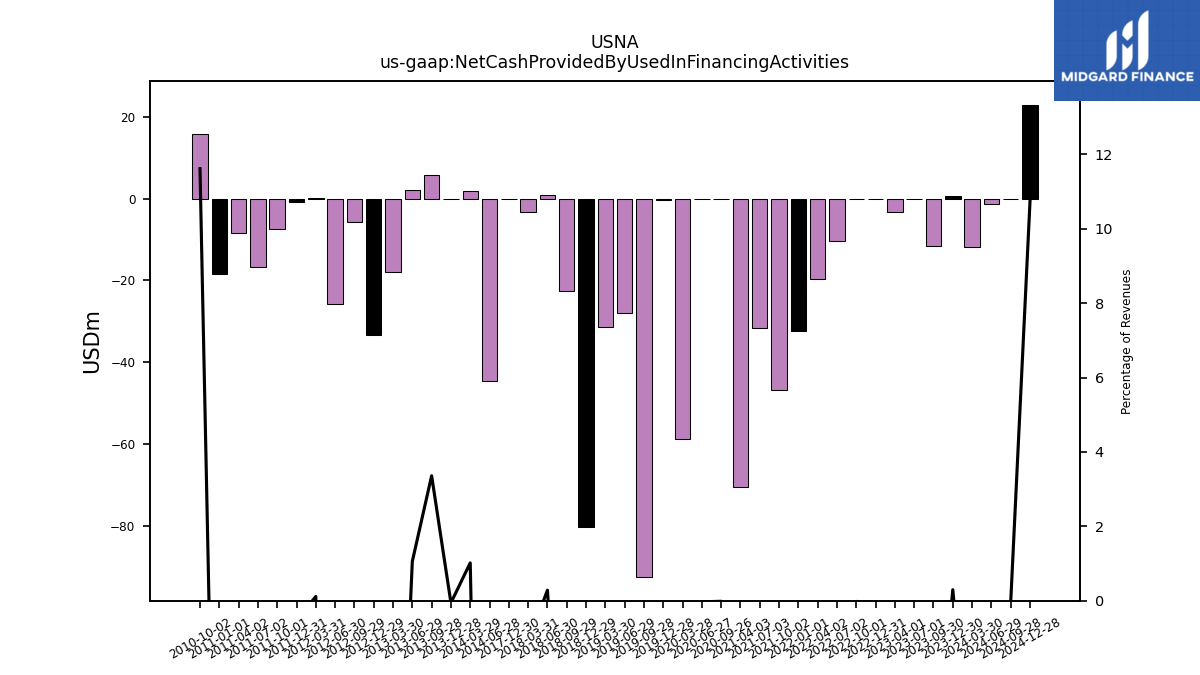
| Net Cash Provided By Used In Financing Activities | 0.66 | -11.64 | -0.06 | -3.20 | -0.15 | -0.04 | -10.30 | -19.59 | -32.45 | -46.83 | -31.66 | -70.47 | -0.04 | -0.07 | -58.85 | -0.30 | -92.48 | -27.86 | -31.41 | -80.22 | -22.66 | 0.85 | -3.25 | -0.19 | NA | NA | NA | NA | NA | NA | NA | NA | NA | NA | NA | NA | NA | -44.58 | 1.86 | -0.10 | 5.84 | 2.00 | -17.90 | -33.37 | -5.62 | -25.73 | 0.18 | -0.76 | -7.36 | -16.77 | -8.49 | -18.38 | 15.68 | NA |
| 2023-12-30 | 2023-09-30 | 2023-07-01 | 2023-04-01 | 2022-12-31 | 2022-10-01 | 2022-07-02 | 2022-04-02 | 2022-01-01 | 2021-10-02 | 2021-07-03 | 2021-04-03 | 2020-09-26 | 2020-06-27 | 2020-03-28 | 2019-12-28 | 2019-09-28 | 2019-06-29 | 2019-03-30 | 2018-12-29 | 2018-09-29 | 2018-06-30 | 2018-03-31 | 2017-12-30 | 2017-09-30 | 2017-07-01 | 2017-04-01 | 2016-12-31 | 2016-10-01 | 2016-07-02 | 2016-04-02 | 2016-01-02 | 2015-10-03 | 2015-07-04 | 2015-04-04 | 2015-01-03 | 2014-09-27 | 2014-06-28 | 2014-03-29 | 2013-12-28 | 2013-09-28 | 2013-06-29 | 2013-03-30 | 2012-12-29 | 2012-09-29 | 2012-06-30 | 2012-03-31 | 2011-12-31 | 2011-10-01 | 2011-07-02 | 2011-04-02 | 2011-01-01 | 2010-10-02 | 2010-07-03 | ||
|---|---|---|---|---|---|---|---|---|---|---|---|---|---|---|---|---|---|---|---|---|---|---|---|---|---|---|---|---|---|---|---|---|---|---|---|---|---|---|---|---|---|---|---|---|---|---|---|---|---|---|---|---|---|---|---|
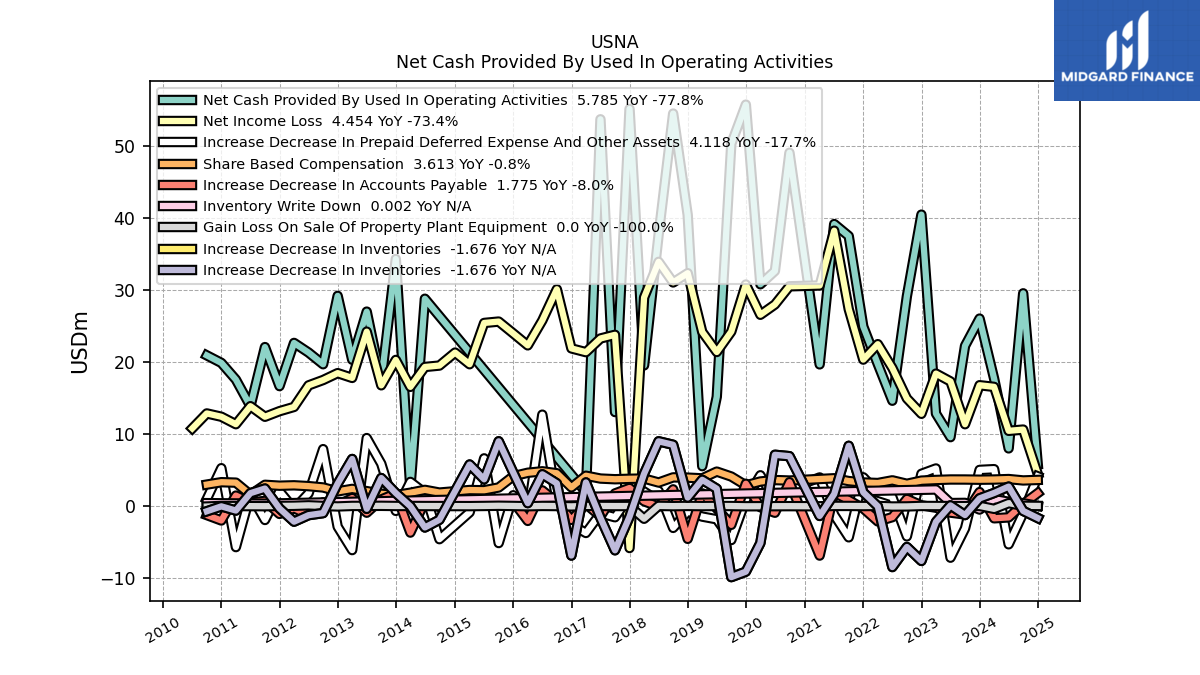
| Net Cash Provided By Used In Operating Activities | 26.02 | 22.23 | 9.55 | 12.83 | 40.46 | 29.12 | 14.61 | 19.70 | 24.92 | 37.49 | 39.16 | 19.66 | 49.06 | 32.64 | 30.79 | 55.74 | 50.31 | 15.16 | 5.52 | 40.43 | 54.50 | 37.67 | 19.52 | 55.14 | 13.04 | 53.70 | 1.90 | NA | NA | NA | NA | NA | NA | NA | NA | NA | NA | 28.78 | 2.47 | 34.30 | 17.30 | 26.99 | 20.30 | 29.18 | 19.68 | 21.30 | 22.64 | 16.64 | 22.07 | 13.86 | 17.55 | 19.87 | 20.91 | NA | |
| Net Income Loss | 16.77 | 11.35 | 17.29 | 18.38 | 12.79 | 14.93 | 19.16 | 22.47 | 20.32 | 27.33 | 38.23 | 30.62 | 30.51 | 27.98 | 26.55 | 30.75 | 24.22 | 21.38 | 24.17 | 32.33 | 31.04 | 33.91 | 28.95 | -5.85 | 23.77 | 23.26 | 21.36 | 21.88 | 30.10 | 25.76 | 22.30 | 23.97 | 25.61 | 25.42 | 19.68 | 21.30 | 19.50 | 19.30 | 16.54 | 20.28 | 16.75 | 24.21 | 17.78 | 18.45 | 17.49 | 16.75 | 13.75 | 13.16 | 12.38 | 13.86 | 11.35 | 12.39 | 12.85 | 10.77 | |
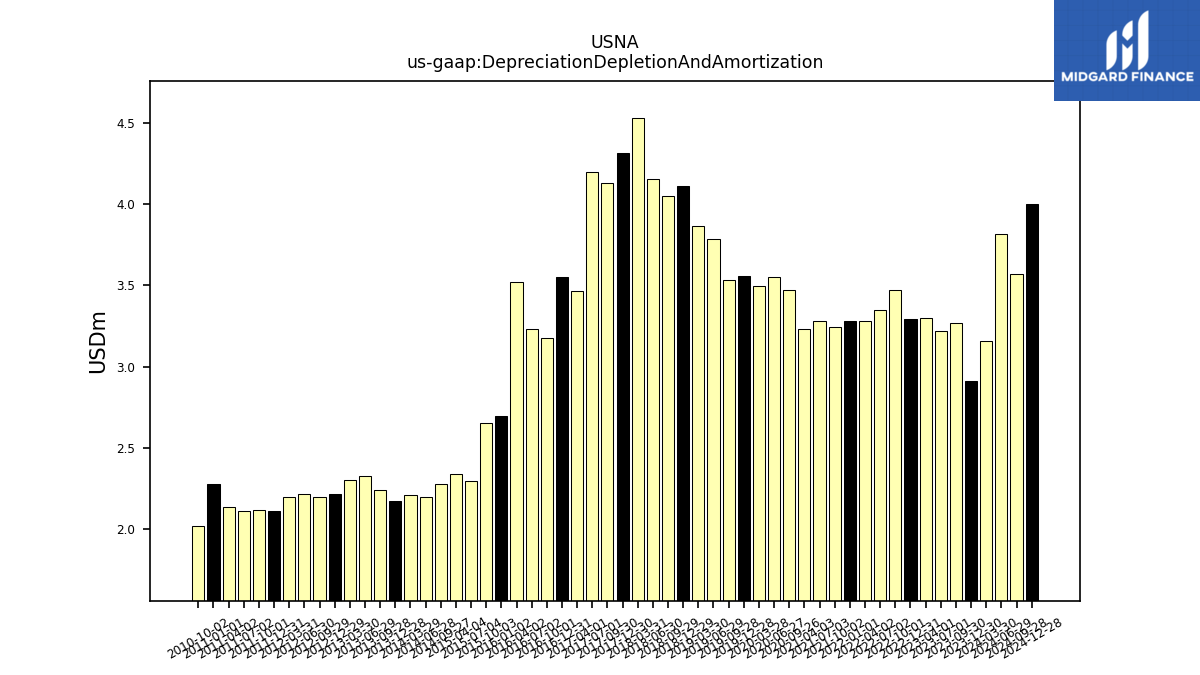
| Depreciation Depletion And Amortization | 2.91 | 3.27 | 3.22 | 3.30 | 3.29 | 3.47 | 3.35 | 3.28 | 3.28 | 3.24 | 3.28 | 3.23 | 3.47 | 3.55 | 3.49 | 3.56 | 3.53 | 3.79 | 3.87 | 4.11 | 4.05 | 4.15 | 4.53 | 4.31 | 4.13 | 4.20 | 3.47 | 3.55 | 3.18 | 3.23 | 3.52 | 2.69 | 2.65 | 2.29 | 2.34 | NA | 2.28 | 2.20 | 2.21 | 2.17 | 2.24 | 2.33 | 2.30 | 2.22 | 2.20 | 2.21 | 2.20 | 2.11 | 2.12 | 2.11 | 2.14 | 2.27 | 2.02 | NA | |
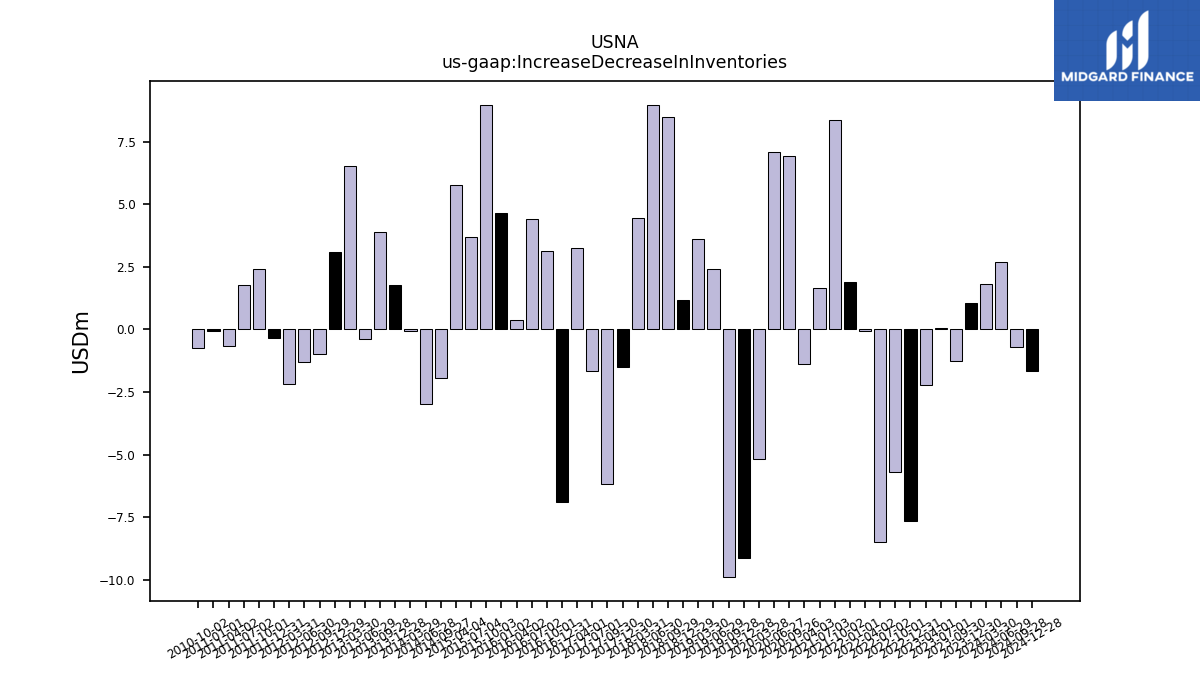
| Increase Decrease In Inventories | 1.05 | -1.27 | 0.07 | -2.21 | -7.64 | -5.70 | -8.49 | -0.05 | 1.89 | 8.35 | 1.65 | -1.39 | 6.91 | 7.10 | -5.15 | -9.13 | -9.89 | 2.40 | 3.63 | 1.16 | 8.49 | 8.97 | 4.47 | -1.50 | -6.16 | -1.66 | 3.27 | -6.89 | 3.13 | 4.40 | 0.39 | 4.64 | 8.98 | 3.70 | 5.75 | NA | -1.92 | -2.99 | -0.04 | 1.78 | 3.88 | -0.40 | 6.52 | 3.09 | -1.00 | -1.28 | -2.19 | -0.34 | 2.42 | 1.78 | -0.64 | -0.06 | -0.74 | NA | |
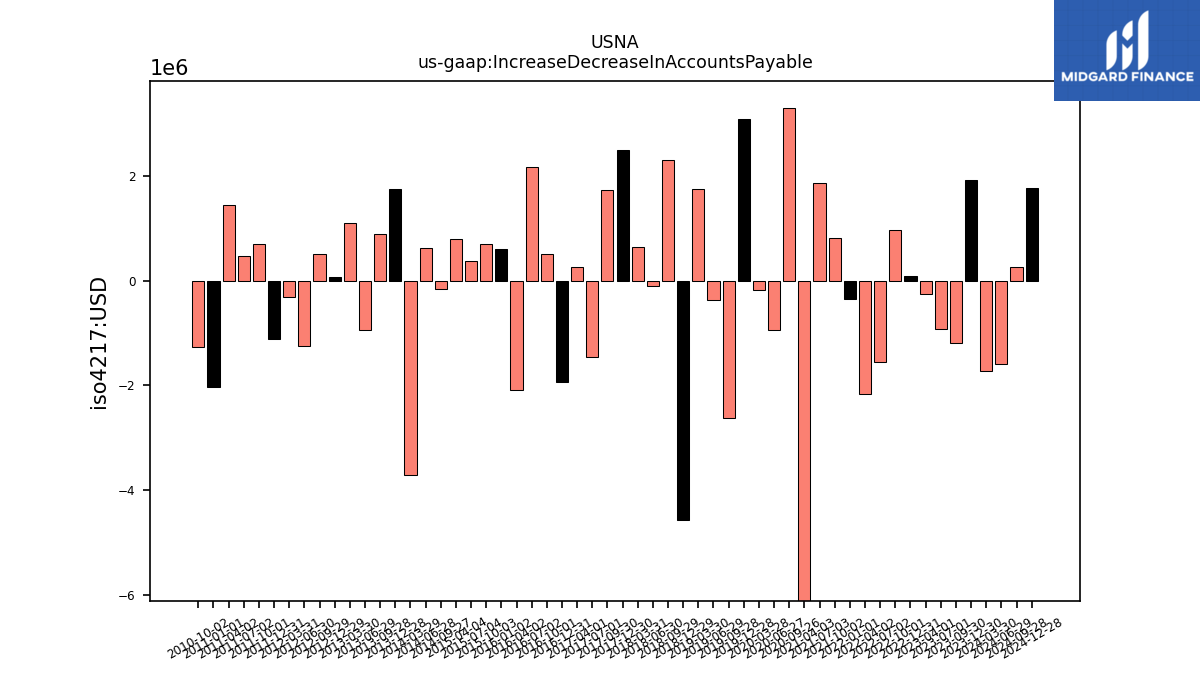
| Increase Decrease In Accounts Payable | 1.93 | -1.19 | -0.93 | -0.25 | 0.09 | 0.97 | -1.56 | -2.15 | -0.35 | 0.81 | 1.87 | -6.90 | 3.30 | -0.95 | -0.17 | 3.08 | -2.63 | -0.37 | 1.75 | -4.58 | 2.31 | -0.10 | 0.65 | 2.49 | 1.74 | -1.45 | 0.26 | -1.94 | 0.52 | 2.16 | -2.08 | 0.61 | 0.70 | 0.38 | 0.79 | NA | -0.16 | 0.62 | -3.70 | 1.74 | 0.89 | -0.94 | 1.10 | 0.08 | 0.50 | -1.25 | -0.31 | -1.11 | 0.70 | 0.47 | 1.44 | -2.02 | -1.27 | NA | |
| Share Based Compensation | 3.64 | 3.67 | 3.67 | 3.61 | 3.52 | 3.08 | 3.56 | 3.18 | 3.26 | 3.45 | 3.85 | 3.74 | 3.53 | 3.60 | 3.39 | 2.86 | 4.08 | 4.77 | 3.83 | 3.93 | 3.97 | 3.25 | 3.81 | 3.77 | 3.71 | 3.80 | 4.20 | 2.58 | 4.54 | 4.81 | 4.61 | 4.13 | 2.56 | 2.18 | 2.21 | NA | 1.86 | 2.23 | 1.84 | 1.51 | 1.69 | 2.06 | 2.37 | 2.03 | 2.57 | 2.75 | 2.87 | 2.81 | 2.94 | 1.57 | 3.23 | 3.30 | 2.97 | NA |
| 2023-12-30 | 2023-09-30 | 2023-07-01 | 2023-04-01 | 2022-12-31 | 2022-10-01 | 2022-07-02 | 2022-04-02 | 2022-01-01 | 2021-10-02 | 2021-07-03 | 2021-04-03 | 2020-09-26 | 2020-06-27 | 2020-03-28 | 2019-12-28 | 2019-09-28 | 2019-06-29 | 2019-03-30 | 2018-12-29 | 2018-09-29 | 2018-06-30 | 2018-03-31 | 2017-12-30 | 2017-09-30 | 2017-07-01 | 2017-04-01 | 2016-12-31 | 2016-10-01 | 2016-07-02 | 2016-04-02 | 2016-01-02 | 2015-10-03 | 2015-07-04 | 2015-04-04 | 2015-01-03 | 2014-09-27 | 2014-06-28 | 2014-03-29 | 2013-12-28 | 2013-09-28 | 2013-06-29 | 2013-03-30 | 2012-12-29 | 2012-09-29 | 2012-06-30 | 2012-03-31 | 2011-12-31 | 2011-10-01 | 2011-07-02 | 2011-04-02 | 2011-01-01 | 2010-10-02 | 2010-07-03 | ||
|---|---|---|---|---|---|---|---|---|---|---|---|---|---|---|---|---|---|---|---|---|---|---|---|---|---|---|---|---|---|---|---|---|---|---|---|---|---|---|---|---|---|---|---|---|---|---|---|---|---|---|---|---|---|---|---|
| Net Cash Provided By Used In Investing Activities | -7.32 | -1.45 | 0.18 | -3.38 | -3.28 | -3.58 | -3.72 | -1.79 | -3.15 | -6.45 | -1.49 | -3.09 | -2.73 | -1.53 | -8.27 | -5.11 | -1.19 | 21.27 | 32.51 | 15.61 | -41.42 | -40.58 | -2.61 | -4.01 | -2.19 | -3.44 | -3.26 | NA | NA | NA | NA | NA | NA | NA | NA | NA | NA | -9.16 | 1.81 | -11.97 | -4.44 | -3.17 | -2.01 | -1.61 | -3.36 | -1.12 | -2.18 | -2.05 | -2.76 | -5.12 | -0.68 | -0.52 | -42.68 | NA | |
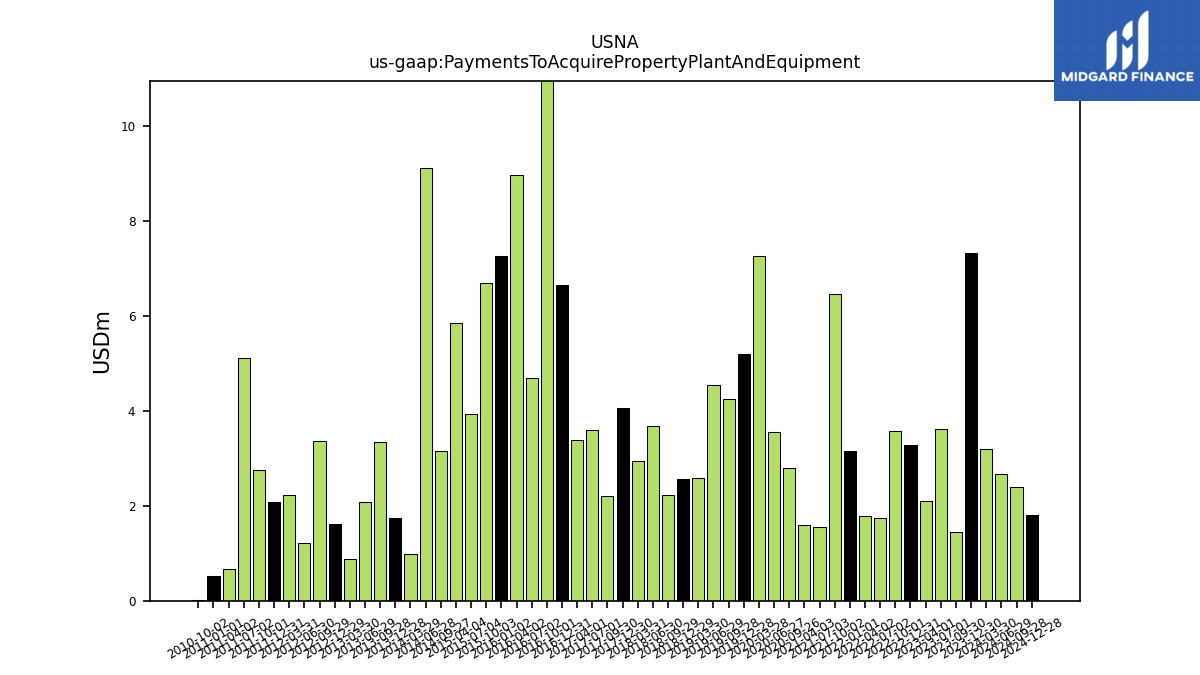
| Payments To Acquire Property Plant And Equipment | 7.32 | 1.45 | 3.61 | 2.11 | 3.29 | 3.58 | 1.75 | 1.79 | 3.15 | 6.46 | 1.55 | 1.60 | 2.79 | 3.56 | 7.27 | 5.20 | 4.24 | 4.55 | 2.58 | 2.57 | 2.23 | 3.69 | 2.95 | 4.05 | 2.20 | 3.59 | 3.38 | 6.65 | 12.38 | 4.69 | 8.97 | 7.26 | 6.69 | 3.94 | 5.84 | NA | 3.16 | 9.12 | 0.98 | 1.75 | 3.35 | 2.09 | 0.87 | 1.62 | 3.36 | 1.22 | 2.23 | 2.08 | 2.76 | 5.12 | 0.68 | 0.52 | 0.01 | NA |
| 2023-12-30 | 2023-09-30 | 2023-07-01 | 2023-04-01 | 2022-12-31 | 2022-10-01 | 2022-07-02 | 2022-04-02 | 2022-01-01 | 2021-10-02 | 2021-07-03 | 2021-04-03 | 2020-09-26 | 2020-06-27 | 2020-03-28 | 2019-12-28 | 2019-09-28 | 2019-06-29 | 2019-03-30 | 2018-12-29 | 2018-09-29 | 2018-06-30 | 2018-03-31 | 2017-12-30 | 2017-09-30 | 2017-07-01 | 2017-04-01 | 2016-12-31 | 2016-10-01 | 2016-07-02 | 2016-04-02 | 2016-01-02 | 2015-10-03 | 2015-07-04 | 2015-04-04 | 2015-01-03 | 2014-09-27 | 2014-06-28 | 2014-03-29 | 2013-12-28 | 2013-09-28 | 2013-06-29 | 2013-03-30 | 2012-12-29 | 2012-09-29 | 2012-06-30 | 2012-03-31 | 2011-12-31 | 2011-10-01 | 2011-07-02 | 2011-04-02 | 2011-01-01 | 2010-10-02 | 2010-07-03 | ||
|---|---|---|---|---|---|---|---|---|---|---|---|---|---|---|---|---|---|---|---|---|---|---|---|---|---|---|---|---|---|---|---|---|---|---|---|---|---|---|---|---|---|---|---|---|---|---|---|---|---|---|---|---|---|---|---|
| Net Cash Provided By Used In Financing Activities | 0.66 | -11.64 | -0.06 | -3.20 | -0.15 | -0.04 | -10.30 | -19.59 | -32.45 | -46.83 | -31.66 | -70.47 | -0.04 | -0.07 | -58.85 | -0.30 | -92.48 | -27.86 | -31.41 | -80.22 | -22.66 | 0.85 | -3.25 | -0.19 | NA | NA | NA | NA | NA | NA | NA | NA | NA | NA | NA | NA | NA | -44.58 | 1.86 | -0.10 | 5.84 | 2.00 | -17.90 | -33.37 | -5.62 | -25.73 | 0.18 | -0.76 | -7.36 | -16.77 | -8.49 | -18.38 | 15.68 | NA | |
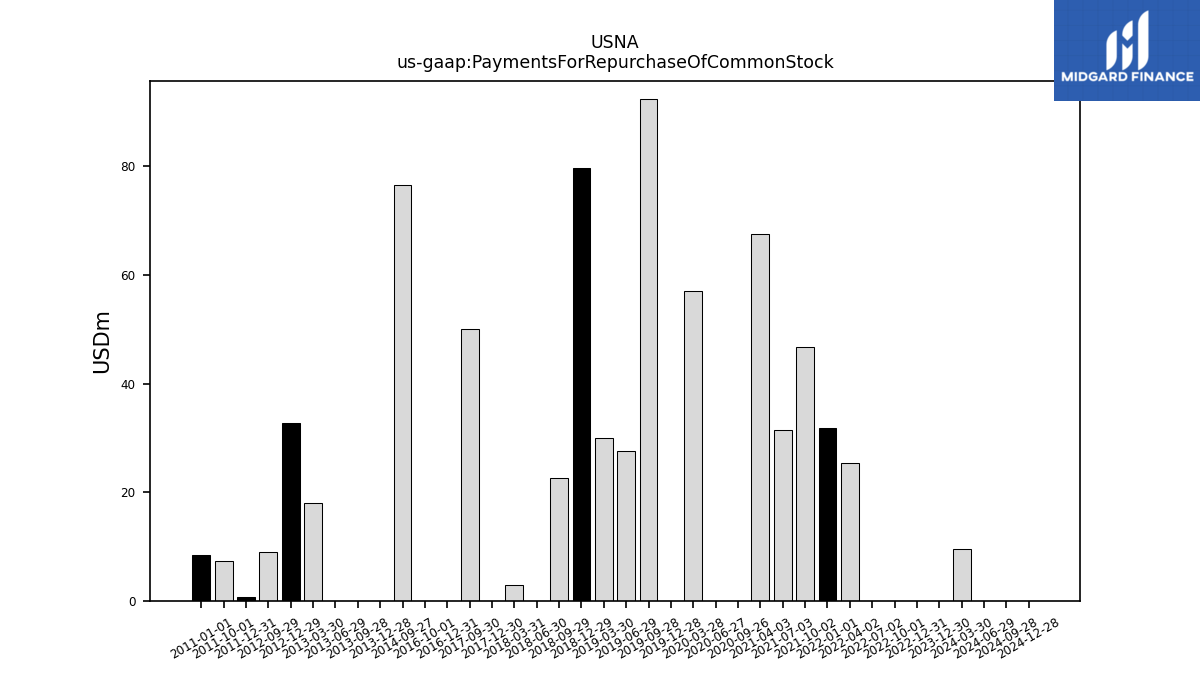
| Payments For Repurchase Of Common Stock | 0.00 | NA | NA | NA | 0.00 | 0.00 | 0.00 | 25.38 | 31.91 | 46.77 | 31.55 | 67.61 | 0.00 | 0.00 | 57.03 | 0.00 | 92.38 | 27.62 | 30.00 | 79.78 | 22.65 | 0.00 | 2.94 | 0.00 | 50.00 | NA | NA | 0.00 | 0.00 | NA | NA | NA | NA | NA | NA | NA | 76.55 | NA | NA | 0.00 | 0.00 | 0.00 | 18.09 | 32.79 | 8.94 | NA | NA | 0.76 | 7.36 | NA | NA | 8.40 | NA | NA |
| 2023-12-30 | 2023-09-30 | 2023-07-01 | 2023-04-01 | 2022-12-31 | 2022-10-01 | 2022-07-02 | 2022-04-02 | 2022-01-01 | 2021-10-02 | 2021-07-03 | 2021-04-03 | 2020-09-26 | 2020-06-27 | 2020-03-28 | 2019-12-28 | 2019-09-28 | 2019-06-29 | 2019-03-30 | 2018-12-29 | 2018-09-29 | 2018-06-30 | 2018-03-31 | 2017-12-30 | 2017-09-30 | 2017-07-01 | 2017-04-01 | 2016-12-31 | 2016-10-01 | 2016-07-02 | 2016-04-02 | 2016-01-02 | 2015-10-03 | 2015-07-04 | 2015-04-04 | 2015-01-03 | 2014-09-27 | 2014-06-28 | 2014-03-29 | 2013-12-28 | 2013-09-28 | 2013-06-29 | 2013-03-30 | 2012-12-29 | 2012-09-29 | 2012-06-30 | 2012-03-31 | 2011-12-31 | 2011-10-01 | 2011-07-02 | 2011-04-02 | 2011-01-01 | 2010-10-02 | 2010-07-03 | ||
|---|---|---|---|---|---|---|---|---|---|---|---|---|---|---|---|---|---|---|---|---|---|---|---|---|---|---|---|---|---|---|---|---|---|---|---|---|---|---|---|---|---|---|---|---|---|---|---|---|---|---|---|---|---|---|---|
| Revenues | 221.08 | 213.37 | 238.20 | 248.36 | 227.96 | 233.30 | 264.47 | 272.87 | 267.30 | 274.35 | 336.84 | 307.98 | 298.51 | 258.99 | 266.62 | 271.30 | 260.60 | 256.02 | 272.99 | 299.02 | 296.77 | 301.46 | 292.00 | 273.11 | 261.76 | 257.06 | 255.32 | 252.90 | 254.22 | 258.51 | 240.45 | 232.59 | 233.29 | 233.24 | 219.38 | 227.87 | 191.94 | 188.26 | 182.40 | 186.27 | 173.69 | 189.14 | 169.08 | 168.53 | 165.18 | 160.90 | 154.12 | 145.95 | 143.50 | 148.93 | 143.57 | 137.54 | 135.01 | 126.01 | |
| Revenue From Contract With Customer Excluding Assessed Tax | 221.08 | 213.37 | 238.20 | 248.36 | 227.96 | 233.30 | 264.47 | 272.87 | 267.30 | 274.35 | 336.84 | 307.98 | 298.51 | 258.99 | 266.62 | 271.30 | 260.60 | 256.02 | 272.99 | 299.02 | 296.77 | 301.46 | 292.00 | 273.11 | 261.76 | 257.06 | 255.32 | 252.90 | 254.22 | 258.51 | 240.45 | 232.59 | 233.29 | 233.24 | 219.38 | 227.87 | 191.94 | 188.26 | 182.40 | 186.27 | 173.69 | 189.14 | 169.08 | 168.53 | 165.18 | 160.90 | 154.12 | 145.95 | 143.50 | 148.93 | 143.57 | 137.54 | 135.01 | 126.01 | |
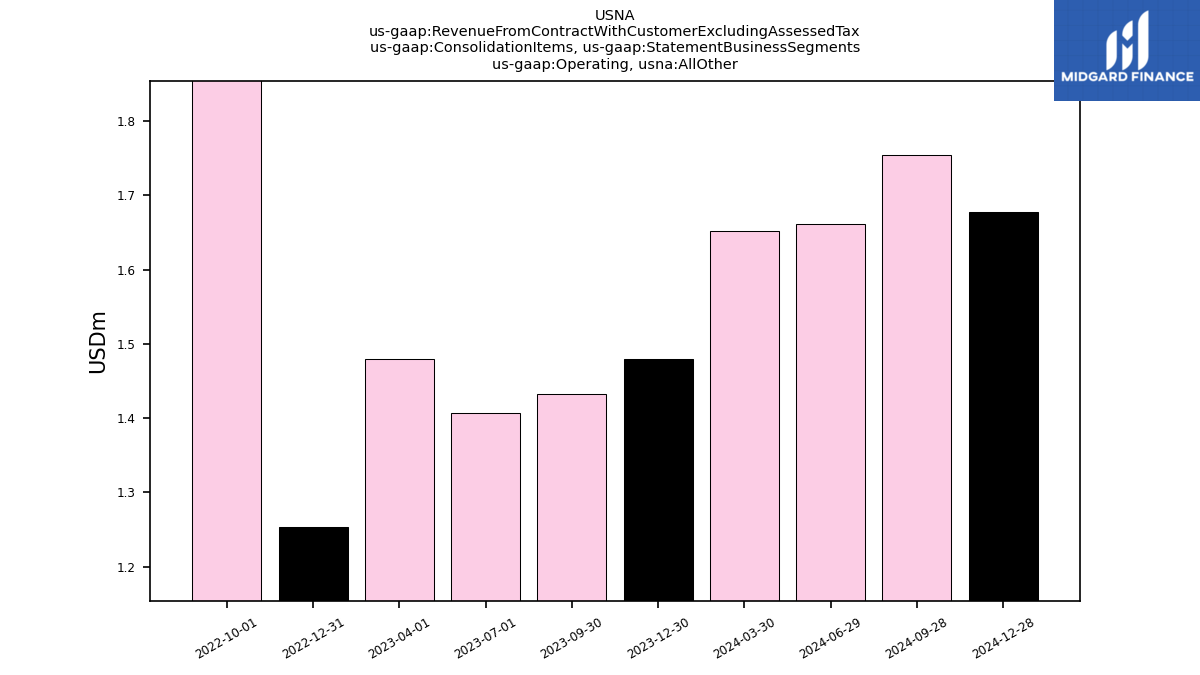
| Operating, All Other | 1.48 | 1.43 | 1.41 | 1.48 | 1.25 | 2.30 | NA | NA | NA | NA | NA | NA | NA | NA | NA | NA | NA | NA | NA | NA | NA | NA | NA | NA | NA | NA | NA | NA | NA | NA | NA | NA | NA | NA | NA | NA | NA | NA | NA | NA | NA | NA | NA | NA | NA | NA | NA | NA | NA | NA | NA | NA | NA | NA | |
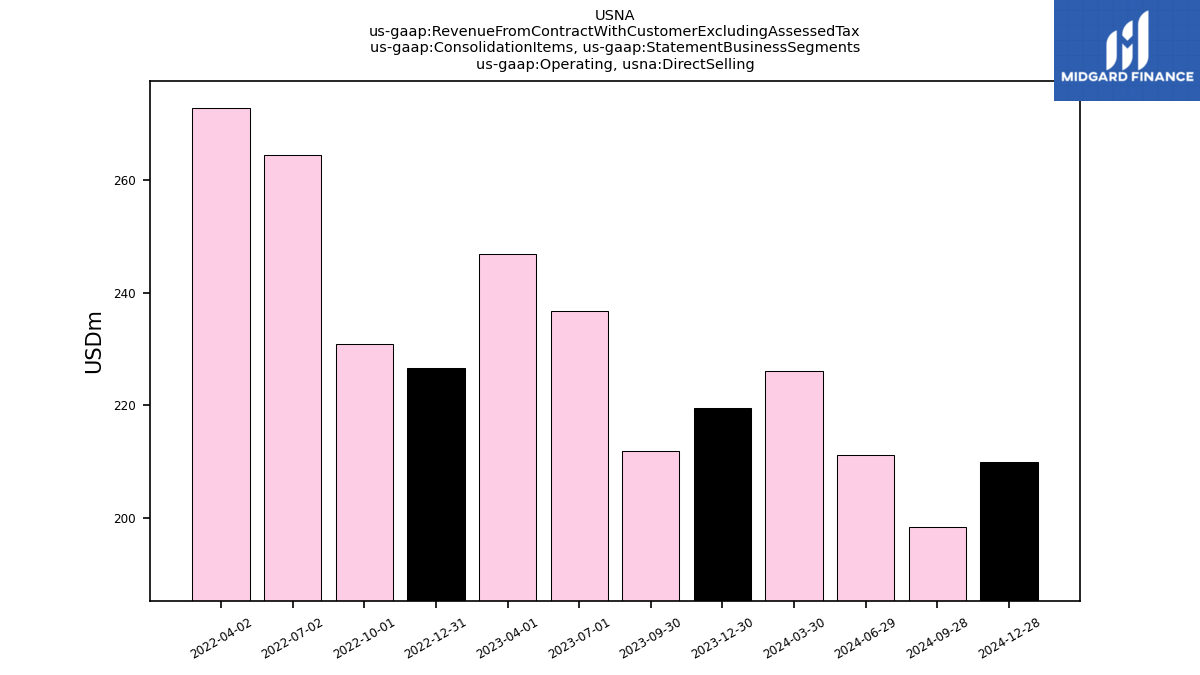
| Operating, Direct Selling | 219.60 | 211.93 | 236.79 | 246.88 | 226.71 | 231.00 | 264.47 | 272.87 | NA | NA | NA | NA | NA | NA | NA | NA | NA | NA | NA | NA | NA | NA | NA | NA | NA | NA | NA | NA | NA | NA | NA | NA | NA | NA | NA | NA | NA | NA | NA | NA | NA | NA | NA | NA | NA | NA | NA | NA | NA | NA | NA | NA | NA | NA | |
| 177.10 | 170.00 | 193.62 | 199.71 | 183.43 | 182.66 | 217.41 | 218.42 | 212.07 | 220.87 | 278.95 | 251.29 | 241.29 | 209.31 | 215.60 | 217.32 | 208.57 | 205.48 | 220.90 | 243.26 | 239.60 | 241.60 | 232.12 | 216.74 | 199.29 | NA | NA | NA | NA | NA | NA | NA | NA | NA | NA | NA | NA | NA | NA | NA | NA | NA | NA | NA | NA | NA | NA | NA | NA | NA | NA | NA | NA | NA | ||
| 104.68 | 94.67 | 117.88 | 110.03 | 107.05 | 97.44 | 128.39 | 120.25 | 111.70 | 109.23 | 150.88 | 134.30 | 120.52 | 110.53 | 115.48 | 115.59 | 115.42 | 112.78 | 127.37 | 150.19 | 144.62 | 151.11 | 140.59 | 130.50 | 116.17 | 120.83 | 115.46 | 112.70 | 108.36 | 115.83 | 100.50 | 98.30 | 95.15 | 94.48 | 83.81 | NA | 50.38 | 51.22 | 38.76 | 39.94 | 29.79 | 23.56 | NA | NA | NA | NA | NA | NA | NA | NA | NA | NA | NA | NA | ||
| 18.37 | 23.75 | 24.91 | 28.89 | 23.95 | 25.10 | 28.15 | 29.19 | 28.36 | 32.12 | 36.34 | 29.02 | 27.79 | 25.00 | NA | NA | NA | NA | NA | NA | NA | NA | NA | NA | NA | NA | NA | NA | NA | NA | NA | NA | NA | NA | NA | NA | NA | NA | NA | NA | NA | NA | NA | NA | NA | NA | NA | NA | NA | NA | NA | NA | NA | NA | ||
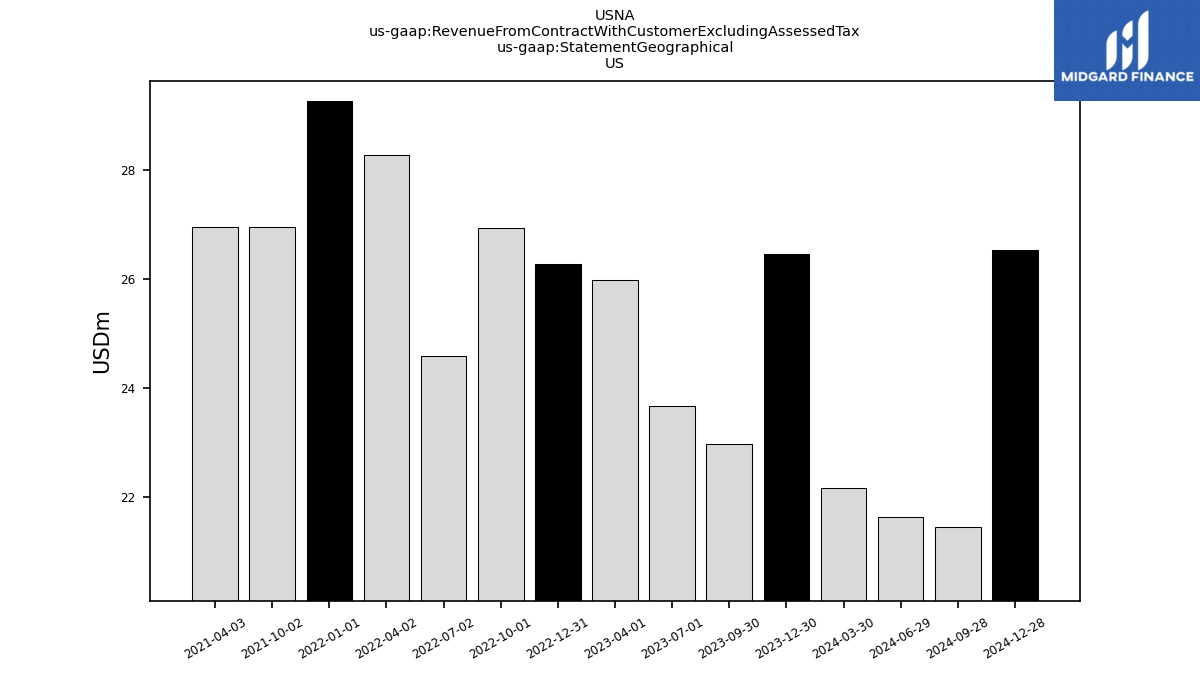
| US | 26.46 | 22.98 | 23.68 | 25.98 | 26.28 | 26.94 | 24.58 | 28.28 | 29.27 | 26.97 | NA | 26.96 | NA | NA | NA | NA | NA | NA | NA | NA | NA | NA | NA | NA | NA | NA | NA | NA | NA | NA | NA | NA | NA | NA | NA | NA | NA | NA | NA | NA | NA | NA | NA | NA | NA | NA | NA | NA | NA | NA | NA | NA | NA | NA | |
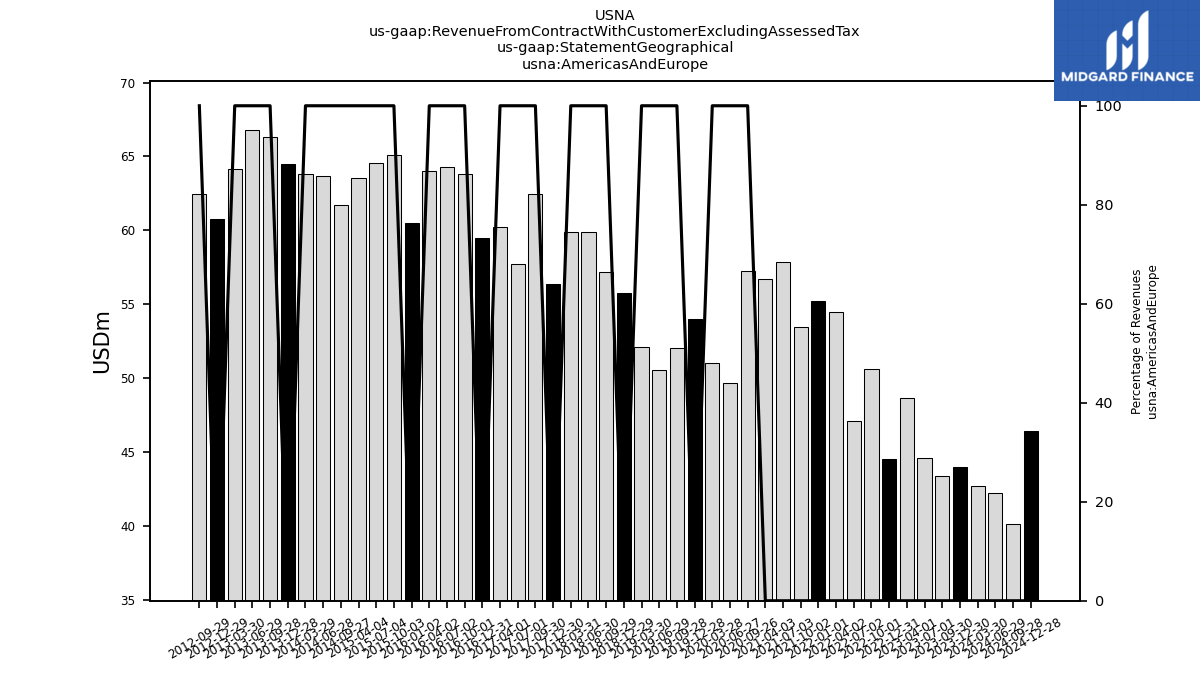
| Americas And Europe | 43.98 | 43.36 | 44.59 | 48.65 | 44.53 | 50.64 | 47.07 | 54.45 | 55.23 | 53.48 | 57.88 | 56.69 | 57.22 | 49.68 | 51.01 | 53.98 | 52.02 | 50.53 | 52.09 | 55.76 | 57.17 | 59.86 | 59.88 | 56.38 | 62.47 | 57.75 | 60.22 | 59.47 | 63.84 | 64.29 | 64.03 | 60.47 | 65.11 | 64.53 | 63.52 | NA | 61.72 | 63.66 | 63.81 | 64.47 | 66.29 | 66.77 | 64.15 | 60.75 | 62.49 | NA | NA | NA | NA | NA | NA | NA | NA | NA | |
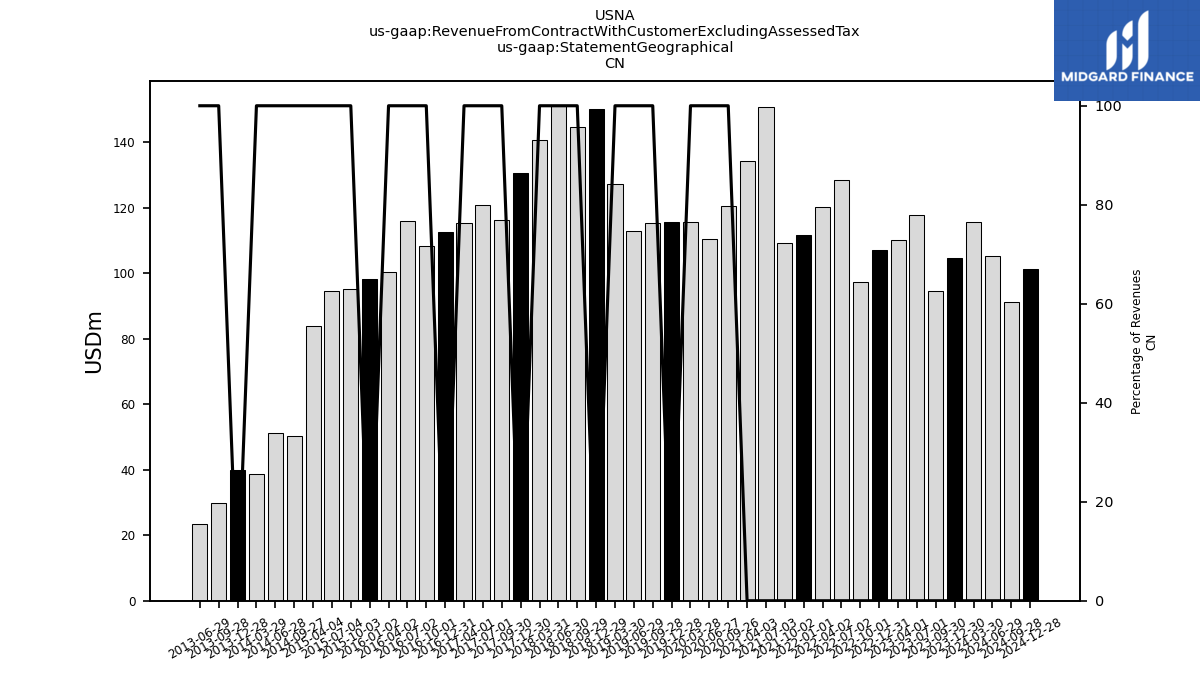
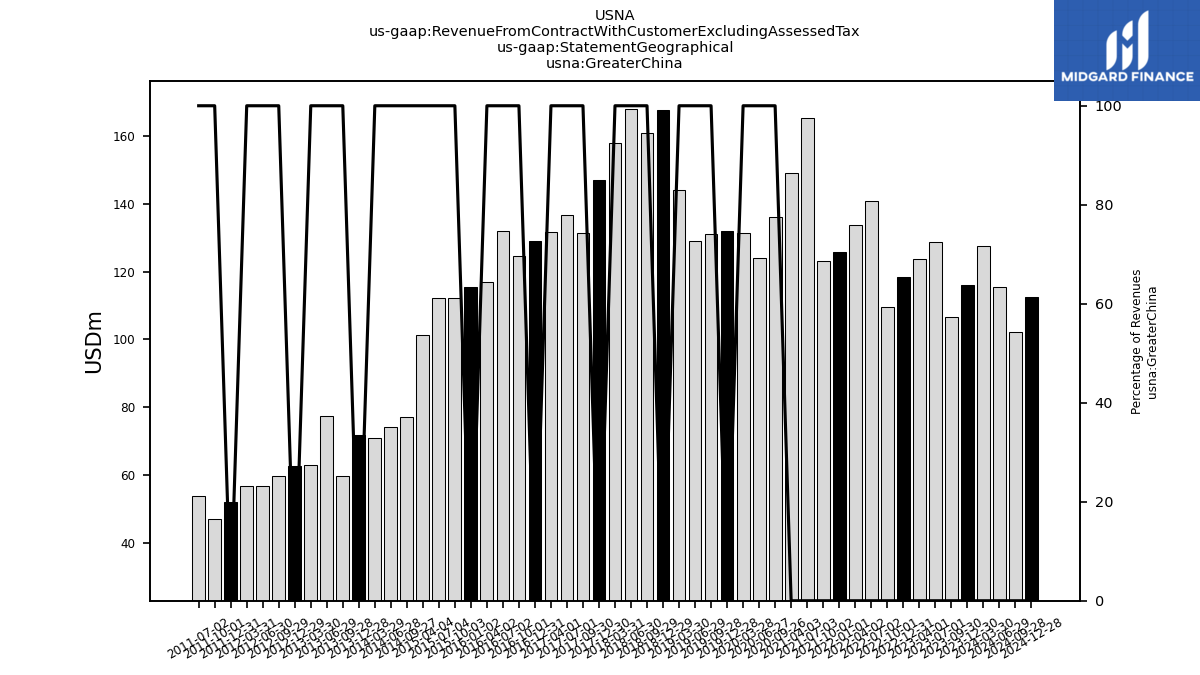
| Greater China | 115.92 | 106.61 | 128.75 | 123.82 | 118.29 | 109.68 | 140.78 | 133.74 | 125.84 | 123.23 | 165.42 | 148.98 | 136.01 | 124.00 | 131.43 | 131.95 | 130.95 | 128.95 | 144.15 | 167.81 | 160.93 | 167.84 | 157.81 | 147.06 | 131.27 | 136.70 | 131.74 | 128.99 | 124.47 | 131.84 | 117.00 | 115.34 | 112.32 | 112.33 | 101.29 | NA | 77.21 | 74.09 | 70.85 | 71.67 | 59.77 | 77.39 | 62.98 | 62.50 | 59.72 | 56.77 | 56.63 | 52.02 | 47.01 | 53.68 | NA | NA | NA | NA | |
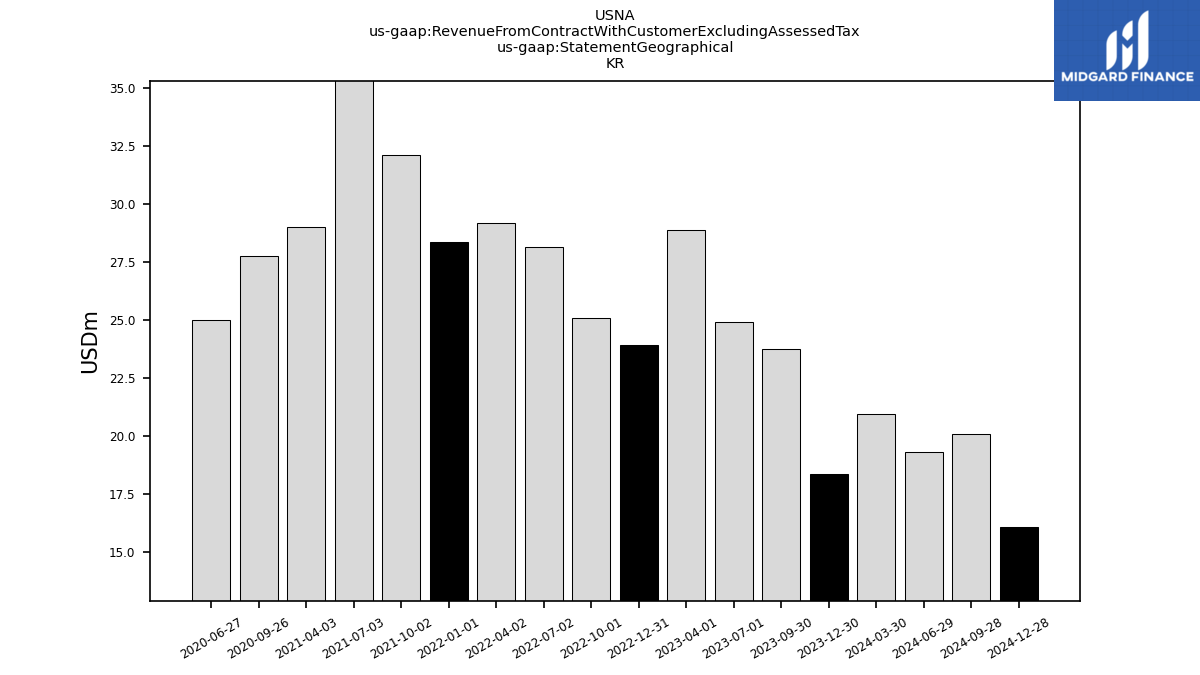
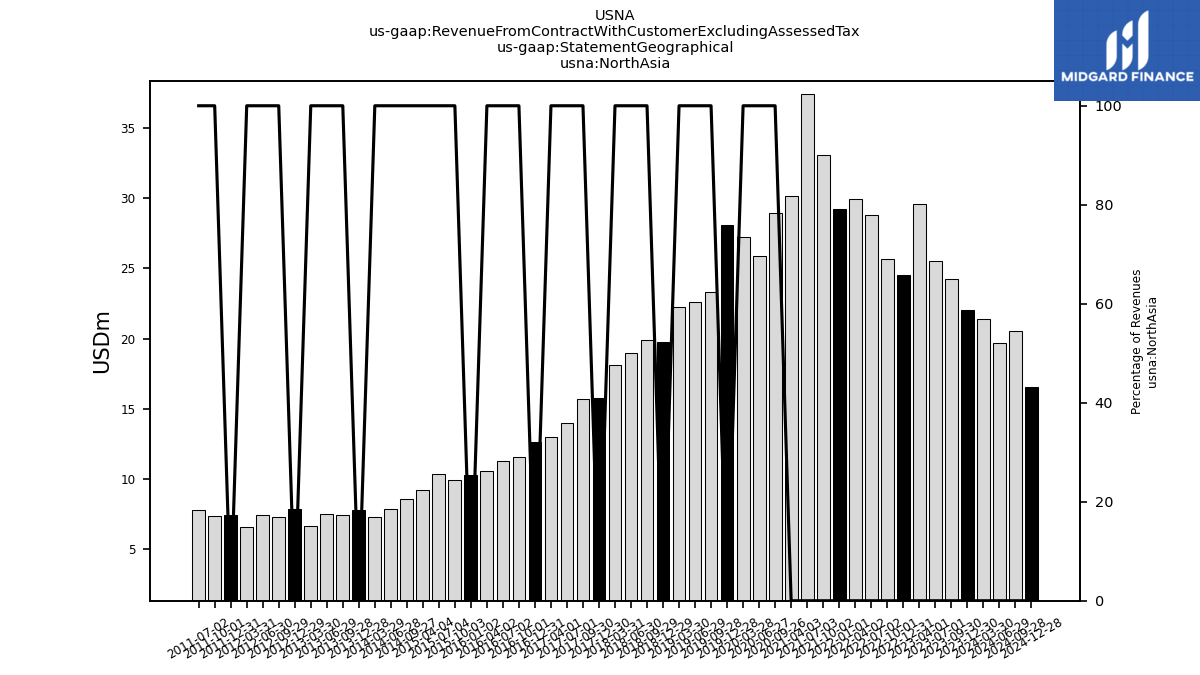
| North Asia | 22.07 | 24.24 | 25.53 | 29.61 | 24.54 | 25.67 | 28.80 | 29.94 | 29.25 | 33.07 | 37.44 | 30.16 | 28.97 | 25.85 | 27.25 | 28.09 | 23.30 | 22.57 | 22.23 | 19.75 | 19.90 | 18.99 | 18.08 | 15.76 | 15.71 | 13.95 | 12.96 | 12.65 | 11.55 | 11.26 | 10.56 | 10.26 | 9.92 | 10.35 | 9.23 | NA | 8.53 | 7.82 | 7.29 | 7.78 | 7.40 | 7.50 | 6.64 | 7.87 | 7.25 | 7.40 | 6.60 | 7.45 | 7.34 | 7.75 | NA | NA | NA | NA | |
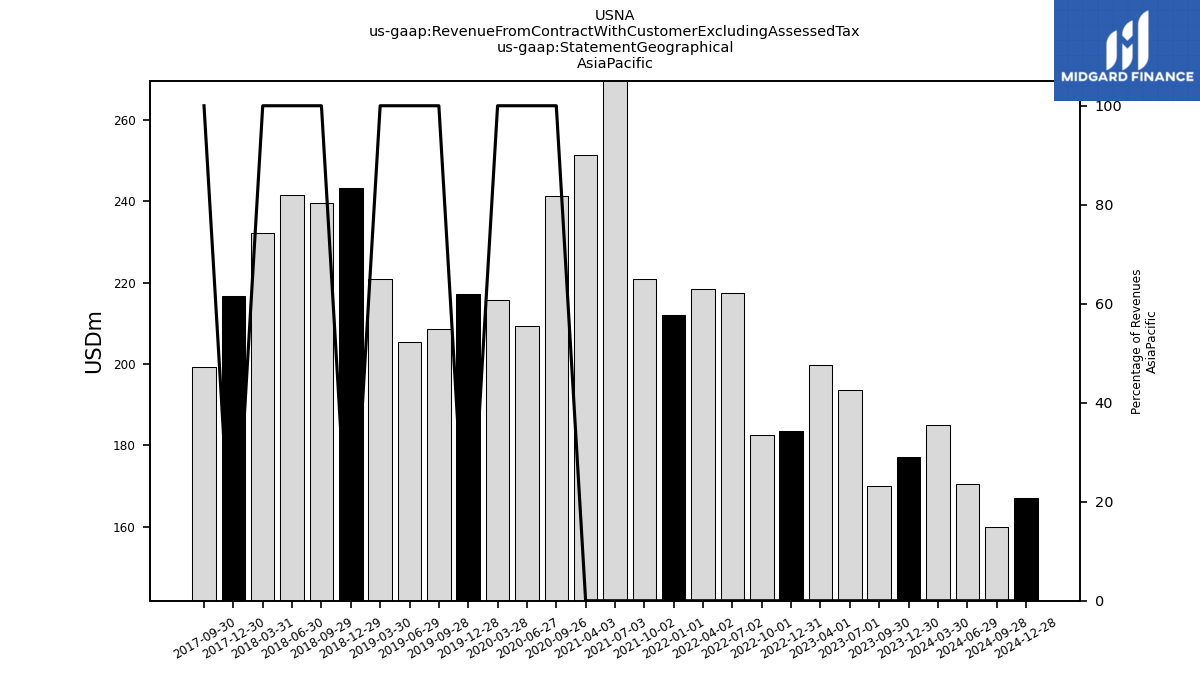
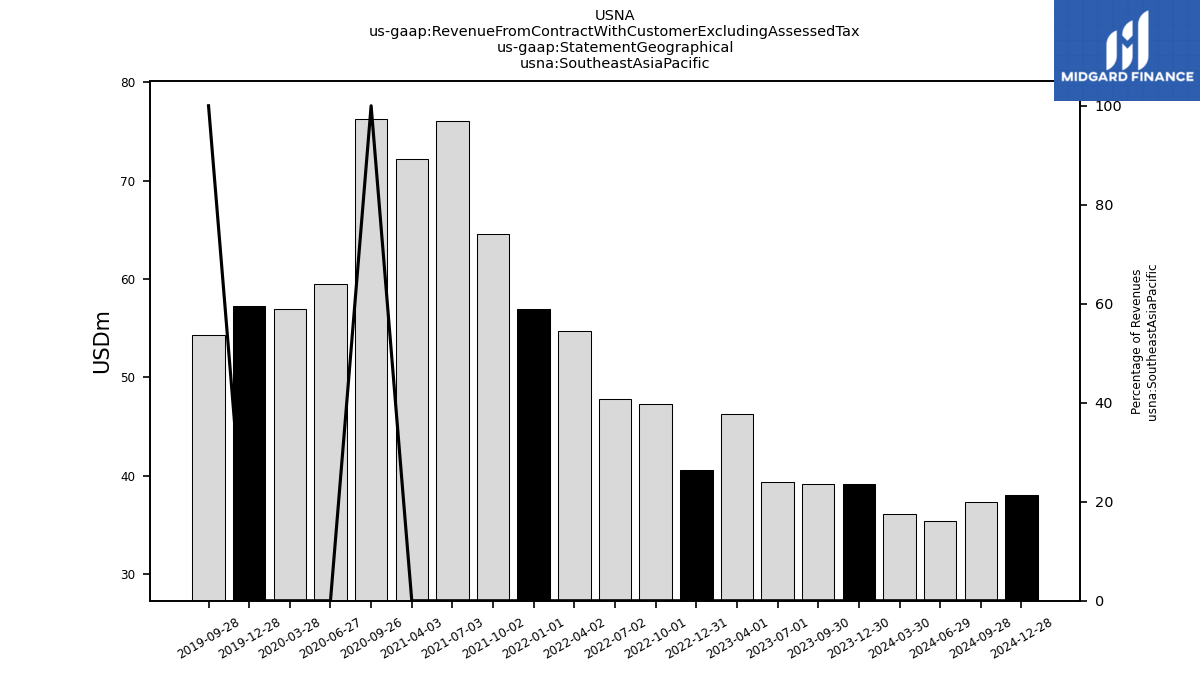
| Southeast Asia Pacific | 39.12 | 39.15 | 39.34 | 46.29 | 40.60 | 47.31 | 47.83 | 54.74 | 56.98 | 64.57 | 76.10 | 72.15 | 76.31 | 59.46 | 56.92 | 57.28 | 54.33 | NA | NA | NA | NA | NA | NA | NA | NA | NA | NA | NA | NA | NA | NA | NA | NA | NA | NA | NA | NA | NA | NA | NA | NA | NA | NA | NA | NA | NA | NA | NA | NA | NA | NA | NA | NA | NA |