
| 2023-10-31 | 2023-07-31 | 2023-04-30 | 2023-01-31 | 2022-10-31 | 2022-07-31 | 2022-04-30 | 2022-01-31 | 2021-10-31 | 2021-07-31 | 2021-04-30 | 2021-01-31 | 2020-10-31 | 2020-07-31 | 2020-04-30 | 2020-01-31 | 2019-10-31 | 2019-07-31 | 2019-04-30 | 2019-01-31 | 2018-10-31 | 2018-07-31 | 2018-04-30 | 2018-01-31 | 2017-10-31 | 2017-07-31 | 2017-04-30 | 2017-01-31 | 2016-10-31 | 2016-07-31 | 2016-04-30 | 2016-01-31 | 2015-10-31 | 2015-07-31 | 2015-04-30 | 2015-01-31 | 2014-10-31 | 2014-07-31 | 2014-04-30 | 2014-01-31 | 2013-10-31 | 2013-07-31 | 2013-04-30 | 2013-01-31 | 2012-10-31 | 2012-07-31 | 2012-04-30 | ||
|---|---|---|---|---|---|---|---|---|---|---|---|---|---|---|---|---|---|---|---|---|---|---|---|---|---|---|---|---|---|---|---|---|---|---|---|---|---|---|---|---|---|---|---|---|---|---|---|---|
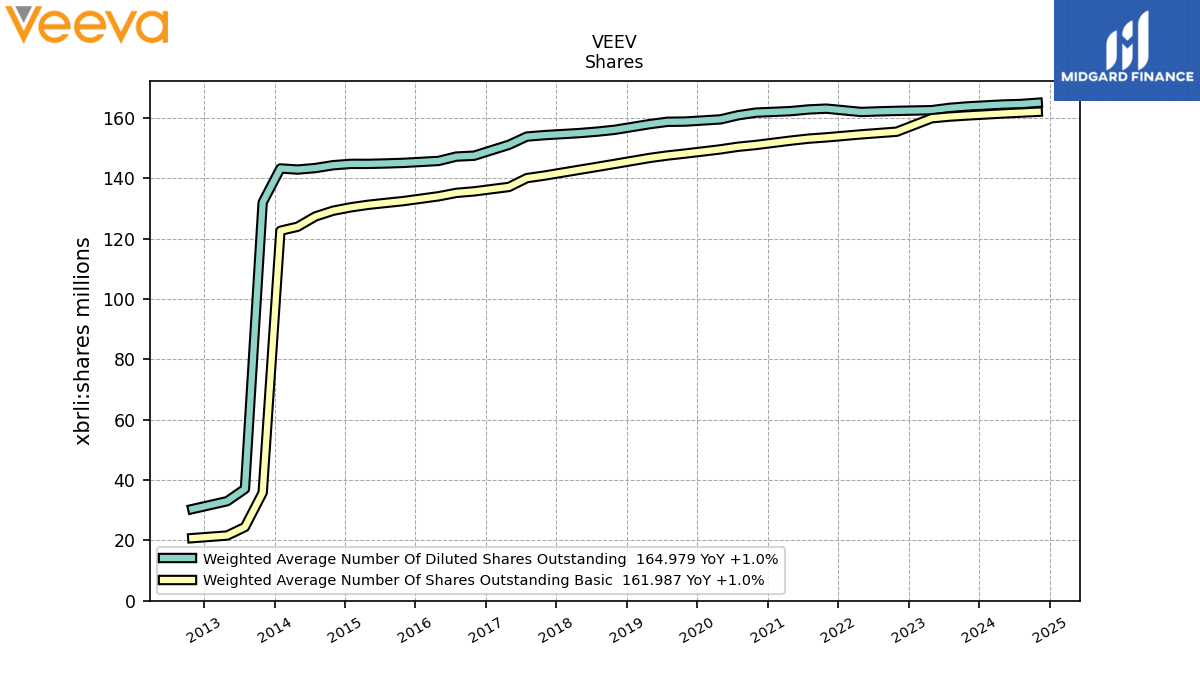
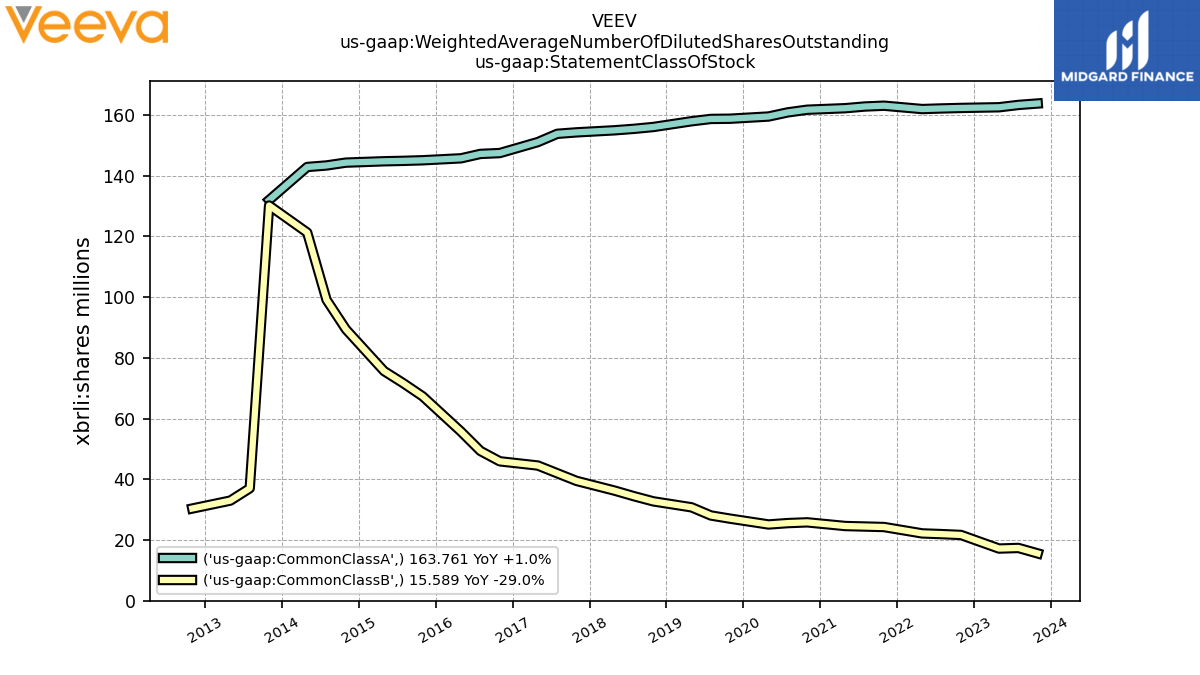
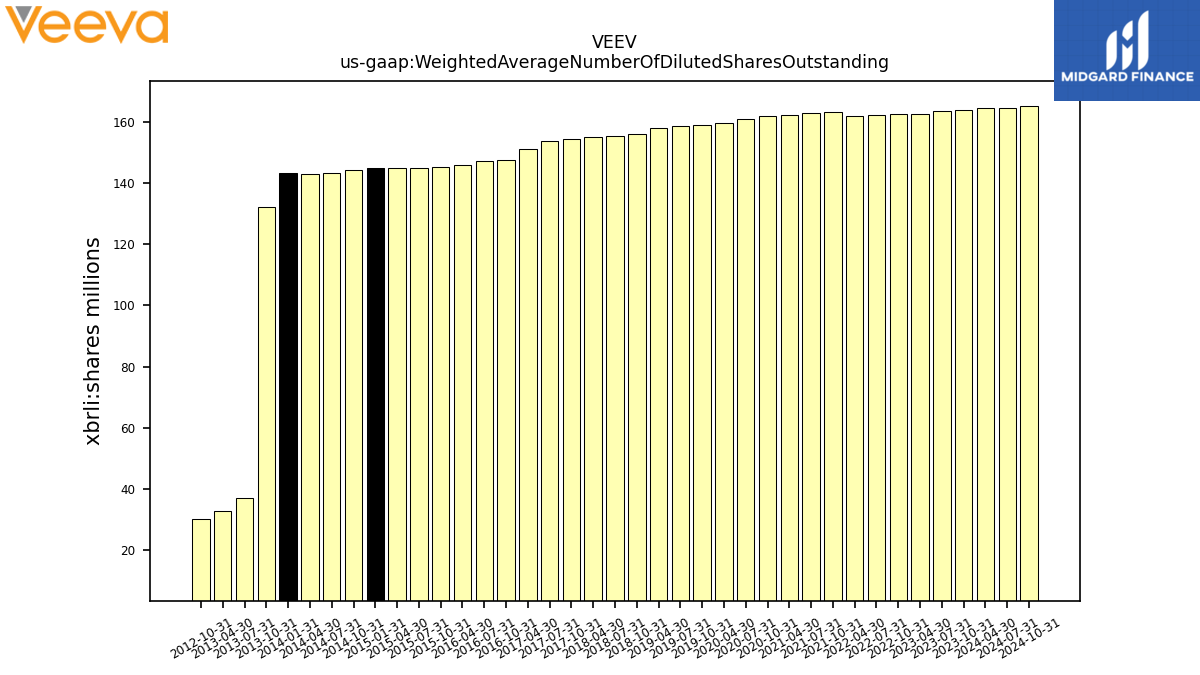
| Weighted Average Number Of Diluted Shares Outstanding | 163.76 | 163.28 | 162.52 | NA | 162.29 | 162.13 | 161.93 | NA | 163.03 | 162.76 | 162.21 | NA | 161.71 | 160.84 | 159.47 | NA | 158.75 | 158.68 | 157.91 | NA | 156.03 | 155.42 | 154.94 | NA | 154.26 | 153.78 | 151.06 | NA | 147.44 | 147.16 | 145.71 | NA | 145.06 | 144.87 | 144.73 | 144.74 | 144.29 | 143.35 | 142.85 | 143.22 | 131.96 | 37.04 | 32.99 | NA | 30.37 | NA | NA | |
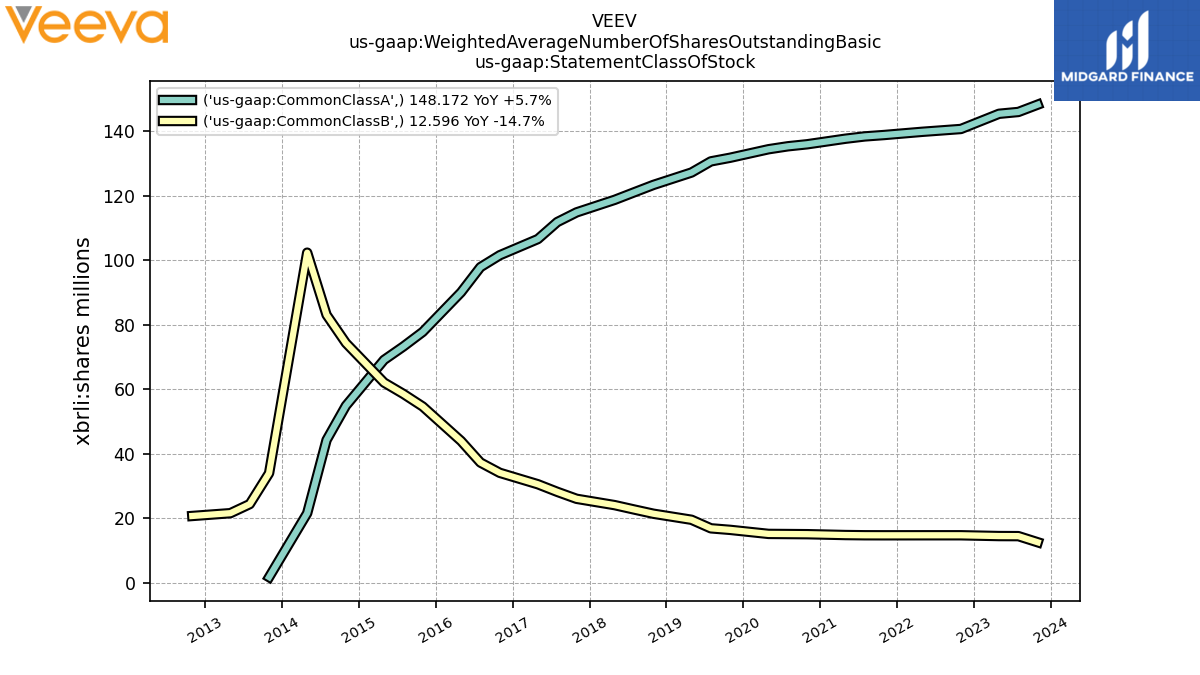
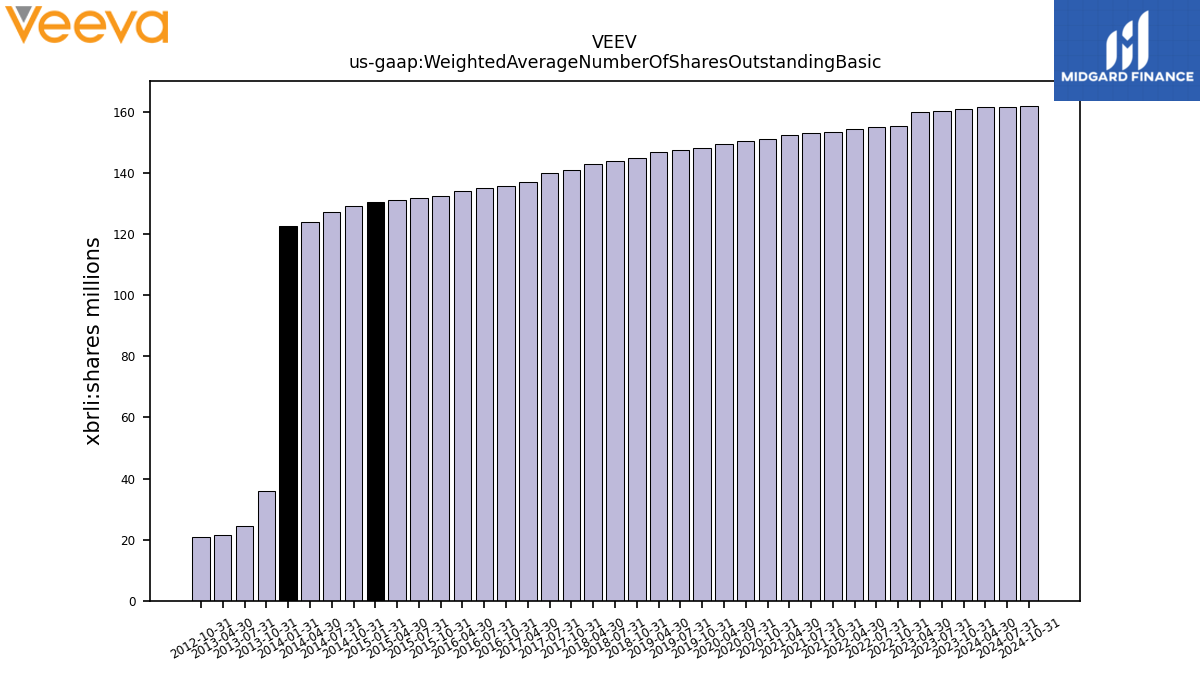
| Weighted Average Number Of Shares Outstanding Basic | 160.77 | 160.40 | 159.85 | NA | 155.39 | 154.95 | 154.51 | NA | 153.51 | 153.09 | 152.44 | NA | 150.99 | 150.41 | 149.54 | NA | 148.16 | 147.51 | 146.71 | NA | 144.74 | 143.75 | 142.78 | NA | 140.86 | 140.01 | 137.10 | NA | 135.62 | 135.13 | 134.00 | NA | 132.41 | 131.80 | 131.16 | 130.34 | 129.21 | 127.31 | 123.90 | 122.58 | 35.80 | 24.42 | 21.61 | NA | 20.74 | NA | NA | |
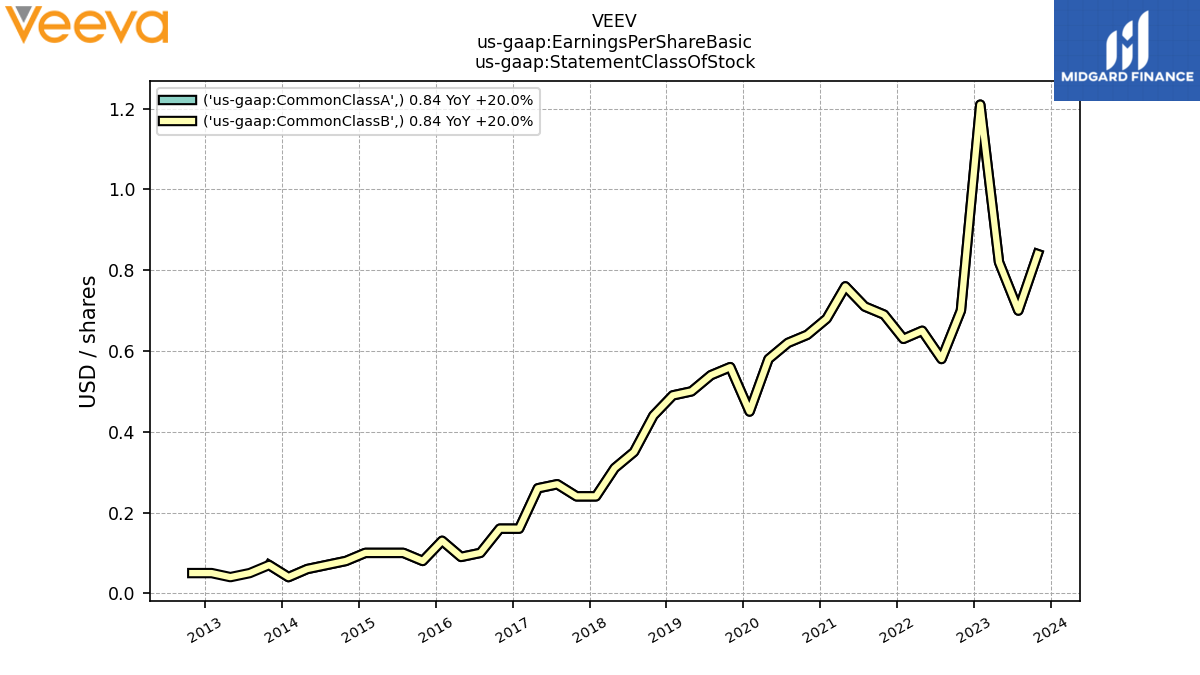
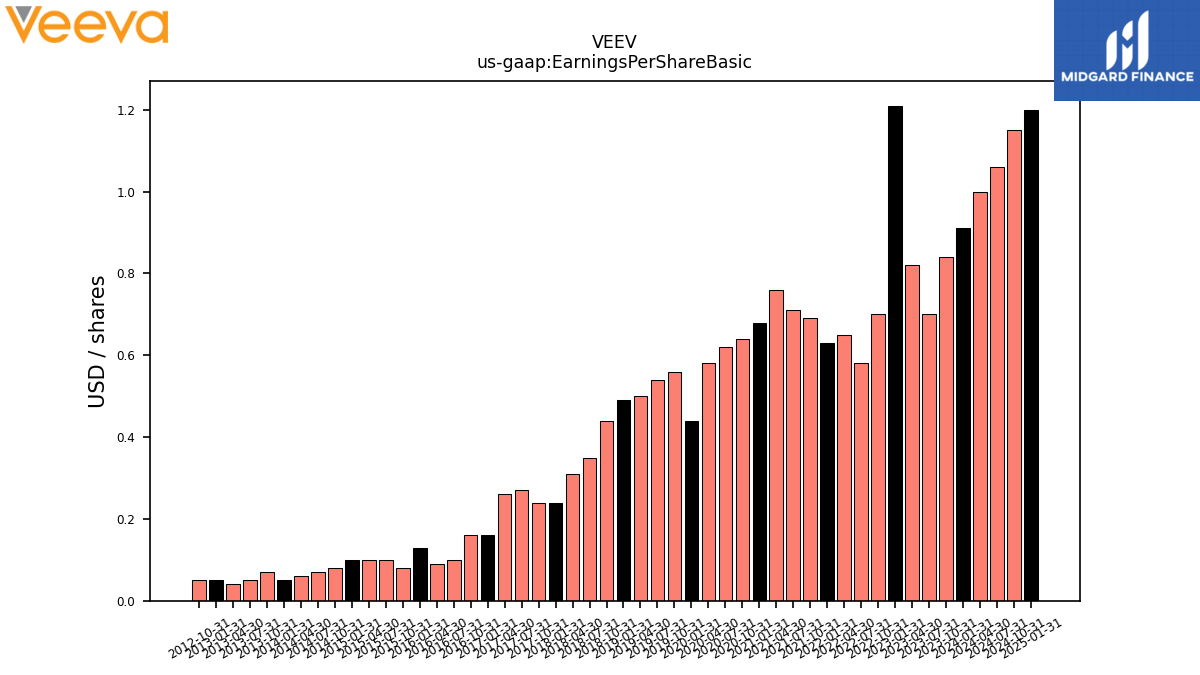
| Earnings Per Share Basic | 0.84 | 0.70 | 0.82 | 1.21 | 0.70 | 0.58 | 0.65 | 0.63 | 0.69 | 0.71 | 0.76 | 0.68 | 0.64 | 0.62 | 0.58 | 0.44 | 0.56 | 0.54 | 0.50 | 0.49 | 0.44 | 0.35 | 0.31 | 0.24 | 0.24 | 0.27 | 0.26 | 0.16 | 0.16 | 0.10 | 0.09 | 0.13 | 0.08 | 0.10 | 0.10 | 0.10 | 0.08 | 0.07 | 0.06 | 0.05 | 0.07 | 0.05 | 0.04 | 0.05 | 0.05 | NA | NA | |
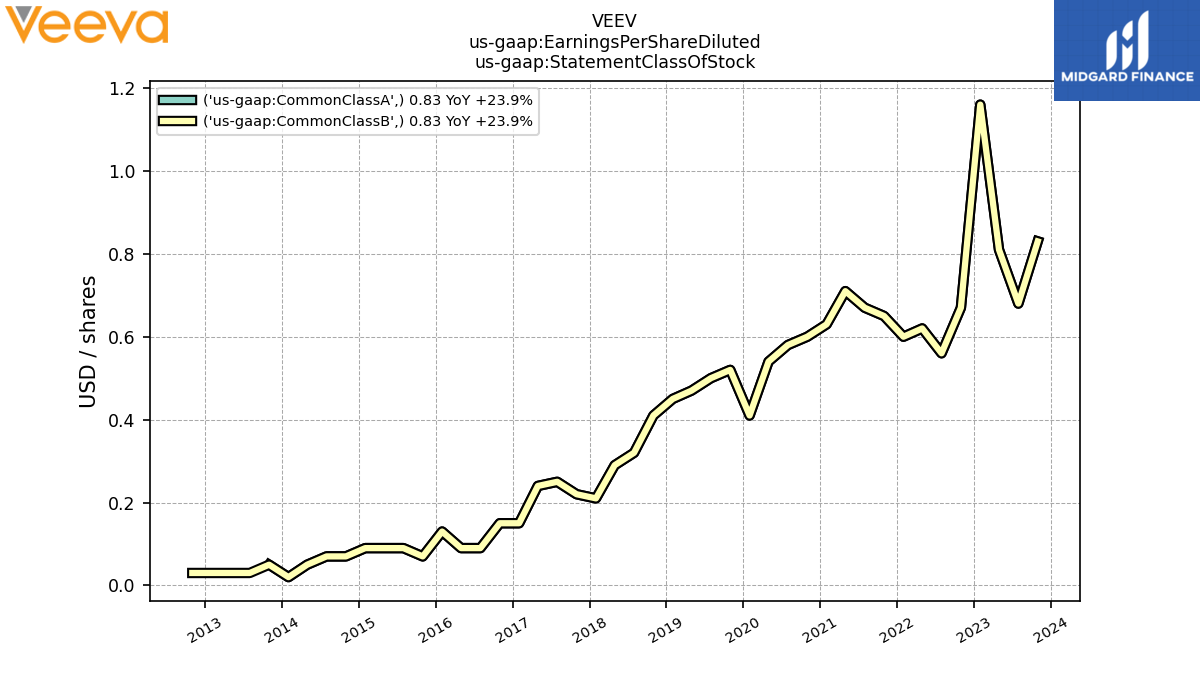
| Earnings Per Share Diluted | 0.83 | 0.68 | 0.81 | 1.16 | 0.67 | 0.56 | 0.62 | 0.60 | 0.65 | 0.67 | 0.71 | 0.64 | 0.60 | 0.58 | 0.54 | 0.42 | 0.52 | 0.50 | 0.47 | 0.45 | 0.41 | 0.32 | 0.29 | 0.22 | 0.22 | 0.25 | 0.24 | 0.15 | 0.15 | 0.09 | 0.09 | 0.12 | 0.07 | 0.09 | 0.09 | 0.09 | 0.07 | 0.07 | 0.05 | 0.04 | 0.05 | 0.03 | 0.03 | 0.03 | 0.03 | NA | NA |
| 2023-10-31 | 2023-07-31 | 2023-04-30 | 2023-01-31 | 2022-10-31 | 2022-07-31 | 2022-04-30 | 2022-01-31 | 2021-10-31 | 2021-07-31 | 2021-04-30 | 2021-01-31 | 2020-10-31 | 2020-07-31 | 2020-04-30 | 2020-01-31 | 2019-10-31 | 2019-07-31 | 2019-04-30 | 2019-01-31 | 2018-10-31 | 2018-07-31 | 2018-04-30 | 2018-01-31 | 2017-10-31 | 2017-07-31 | 2017-04-30 | 2017-01-31 | 2016-10-31 | 2016-07-31 | 2016-04-30 | 2016-01-31 | 2015-10-31 | 2015-07-31 | 2015-04-30 | 2015-01-31 | 2014-10-31 | 2014-07-31 | 2014-04-30 | 2014-01-31 | 2013-10-31 | 2013-07-31 | 2013-04-30 | 2013-01-31 | 2012-10-31 | 2012-07-31 | 2012-04-30 | ||
|---|---|---|---|---|---|---|---|---|---|---|---|---|---|---|---|---|---|---|---|---|---|---|---|---|---|---|---|---|---|---|---|---|---|---|---|---|---|---|---|---|---|---|---|---|---|---|---|---|
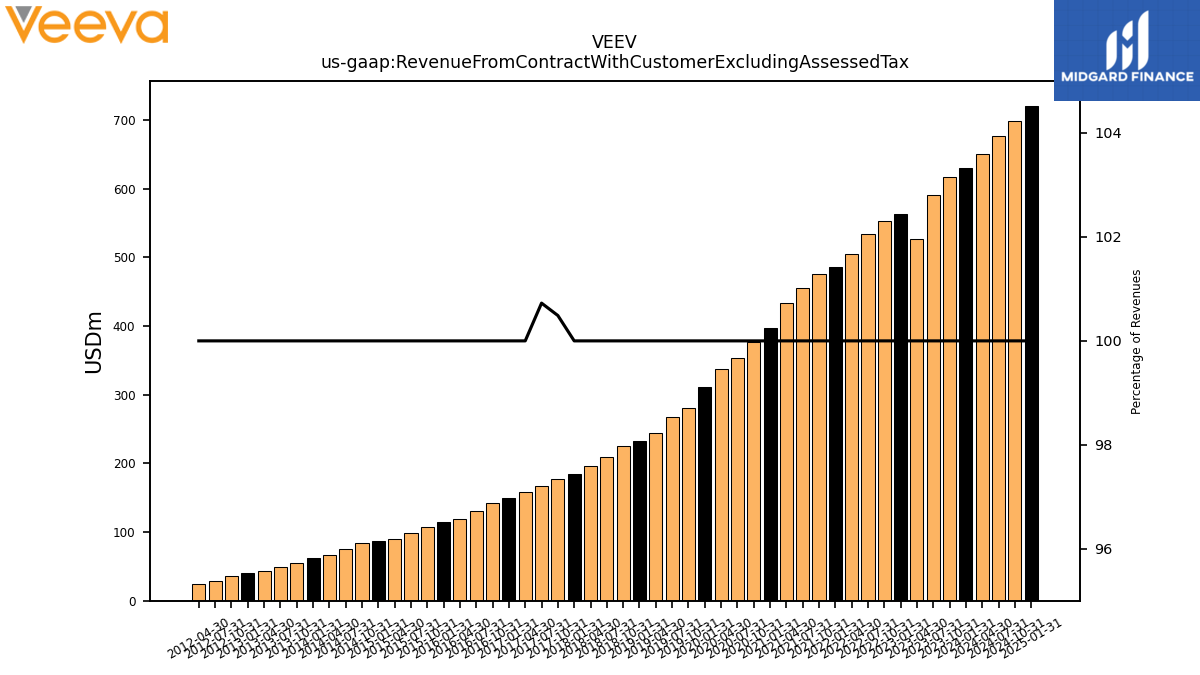
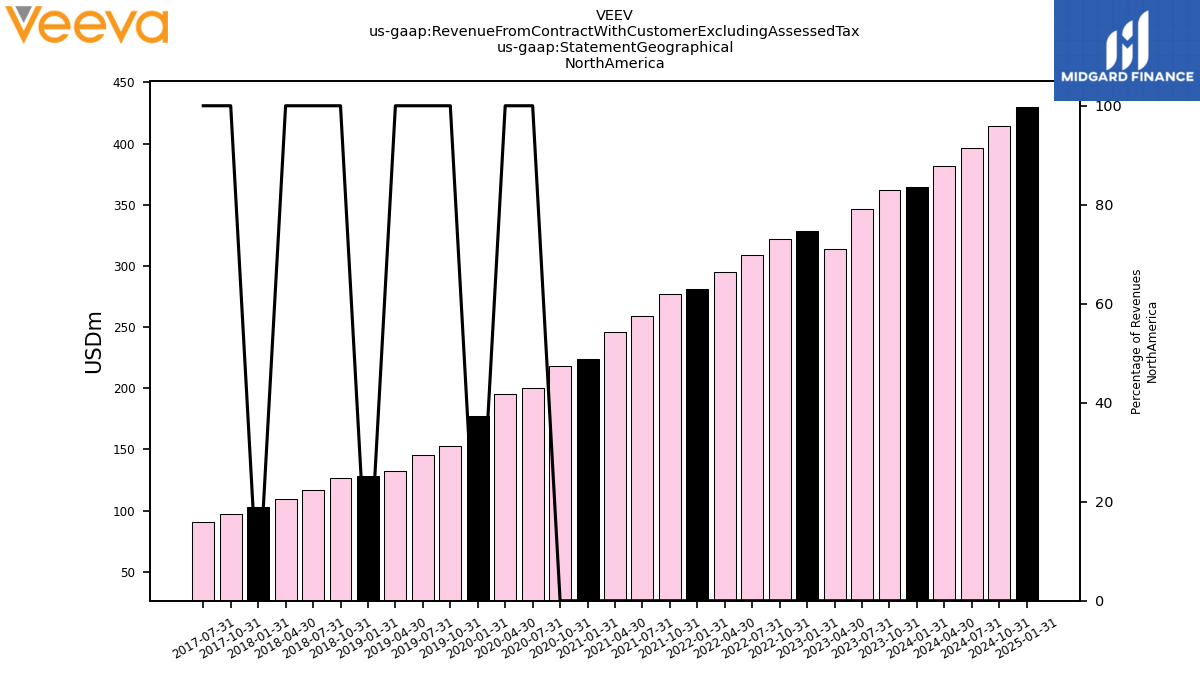
| Revenue From Contract With Customer Excluding Assessed Tax | 616.50 | 590.23 | 526.33 | 563.39 | 552.35 | 534.22 | 505.10 | 485.50 | 476.11 | 455.59 | 433.57 | 396.76 | 377.52 | 353.68 | 337.11 | 311.51 | 280.92 | 266.90 | 244.75 | 232.32 | 224.73 | 209.61 | 195.55 | 184.92 | 177.01 | 167.79 | 157.92 | 150.15 | 142.78 | 131.35 | 119.76 | 114.27 | 106.92 | 98.11 | 89.92 | 87.01 | 83.83 | 75.66 | 66.72 | 62.80 | 54.98 | 49.58 | 42.79 | 39.79 | 35.80 | 29.45 | 24.51 | |
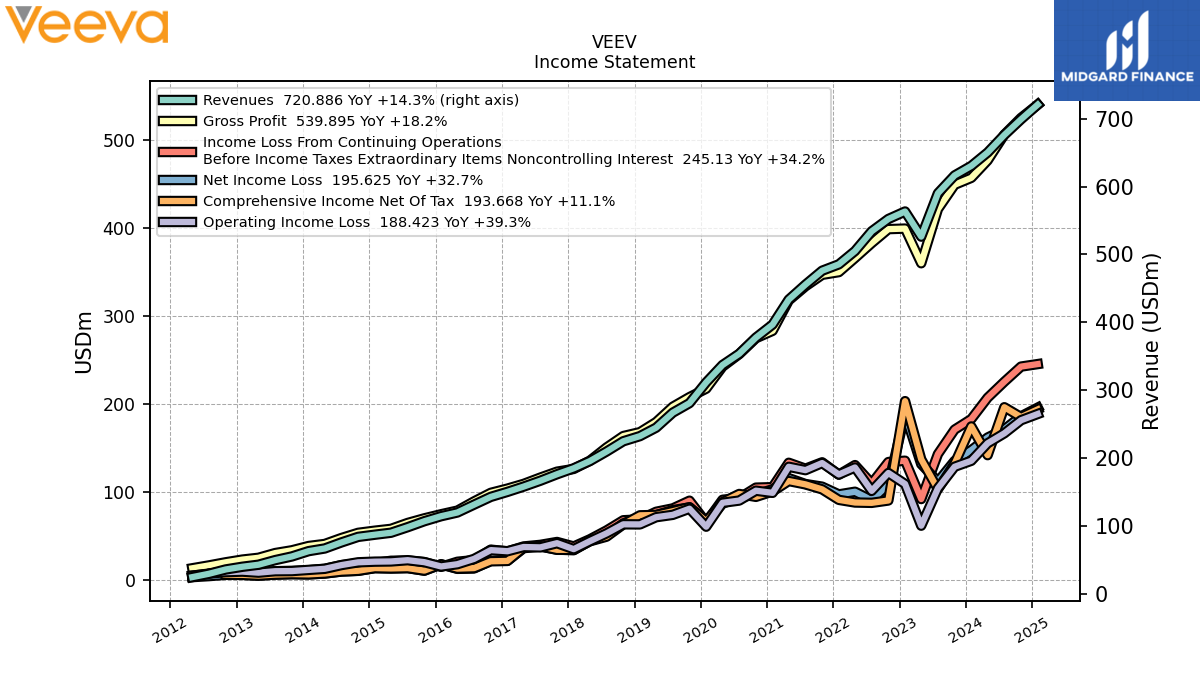
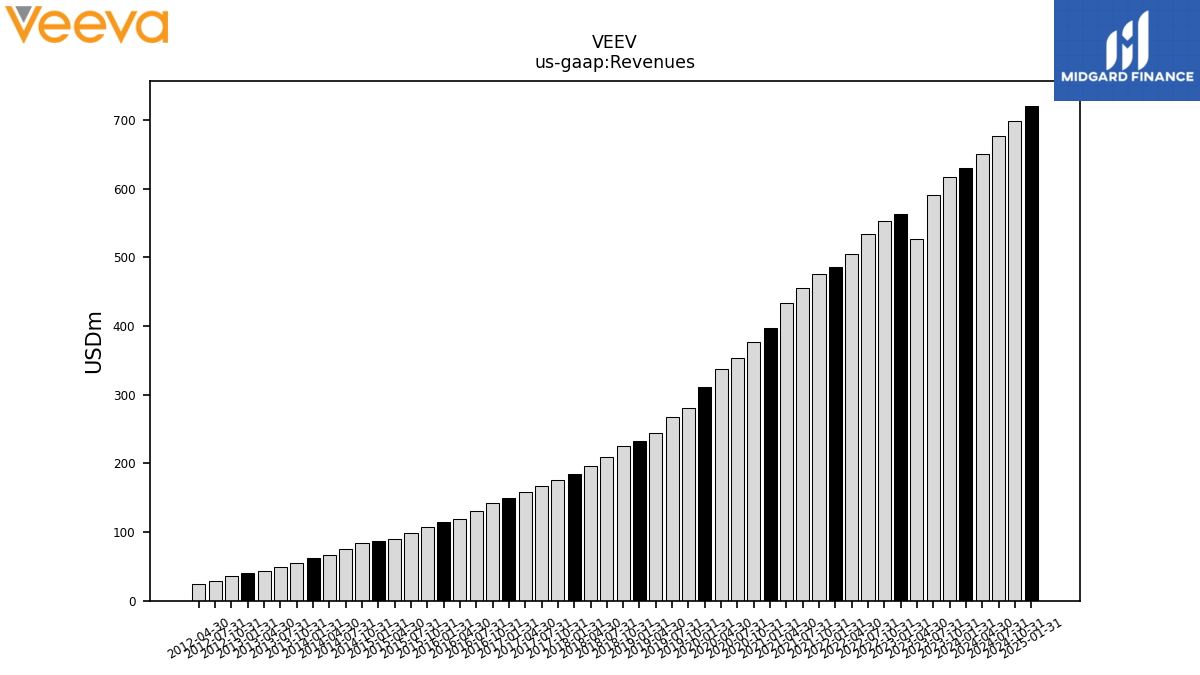
| Revenues | 616.50 | 590.23 | 526.33 | 563.39 | 552.35 | 534.22 | 505.10 | 485.50 | 476.11 | 455.59 | 433.57 | 396.76 | 377.52 | 353.68 | 337.11 | 311.51 | 280.92 | 266.90 | 244.75 | 232.32 | 224.73 | 209.61 | 195.55 | 184.92 | 176.15 | 166.59 | 157.92 | 150.15 | 142.78 | 131.35 | 119.76 | 114.27 | 106.92 | 98.11 | 89.92 | 87.01 | 83.83 | 75.66 | 66.72 | 62.80 | 54.98 | 49.58 | 42.79 | 39.79 | 35.80 | 29.45 | 24.51 | |
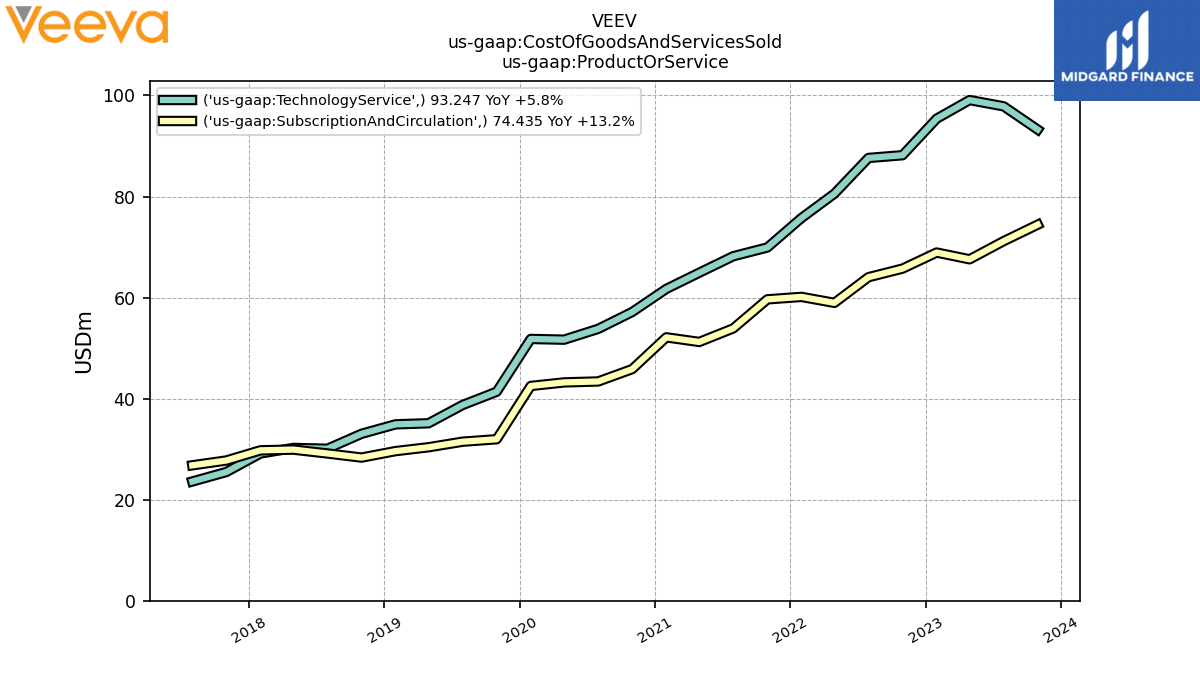
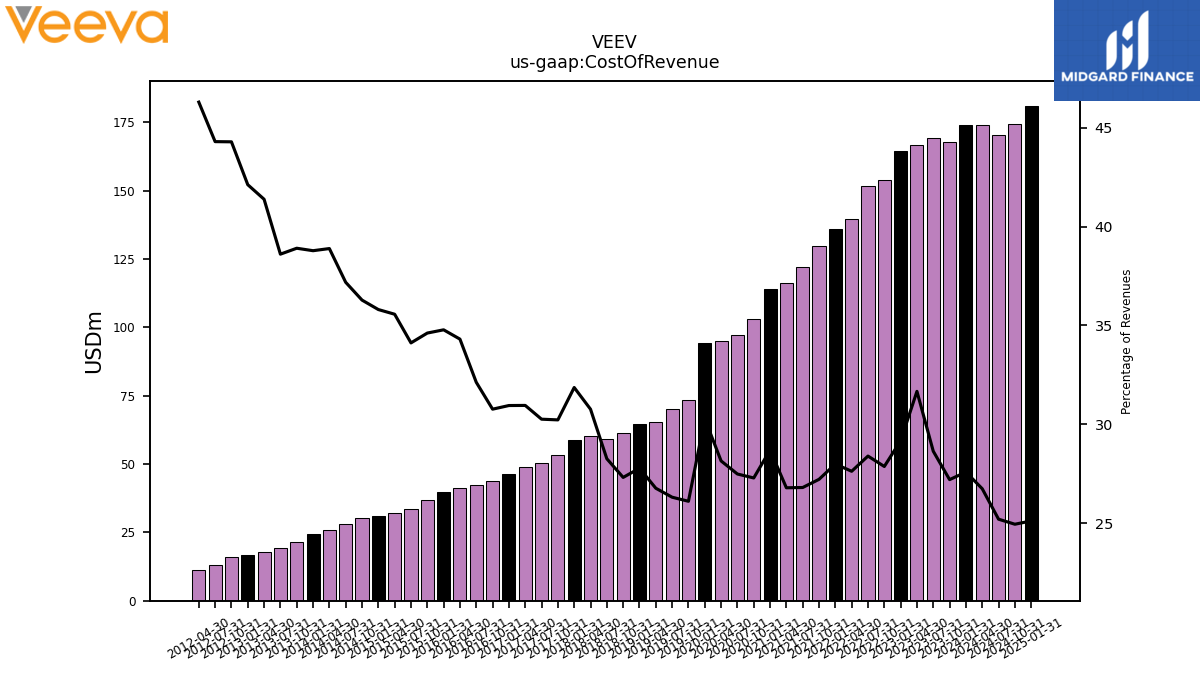
| Cost Of Revenue | 167.68 | 169.02 | 166.66 | 164.31 | 153.91 | 151.67 | 139.51 | 135.88 | 129.56 | 122.10 | 116.14 | 113.85 | 103.00 | 97.20 | 94.88 | 94.32 | 73.33 | 70.22 | 65.50 | 64.53 | 61.37 | 59.23 | 60.16 | 58.92 | 53.24 | 50.40 | 48.88 | 46.47 | 43.92 | 42.20 | 41.09 | 39.74 | 37.01 | 33.47 | 31.98 | 31.16 | 30.42 | 28.14 | 25.95 | 24.36 | 21.39 | 19.14 | 17.71 | 16.76 | 15.86 | 13.05 | 11.35 | |
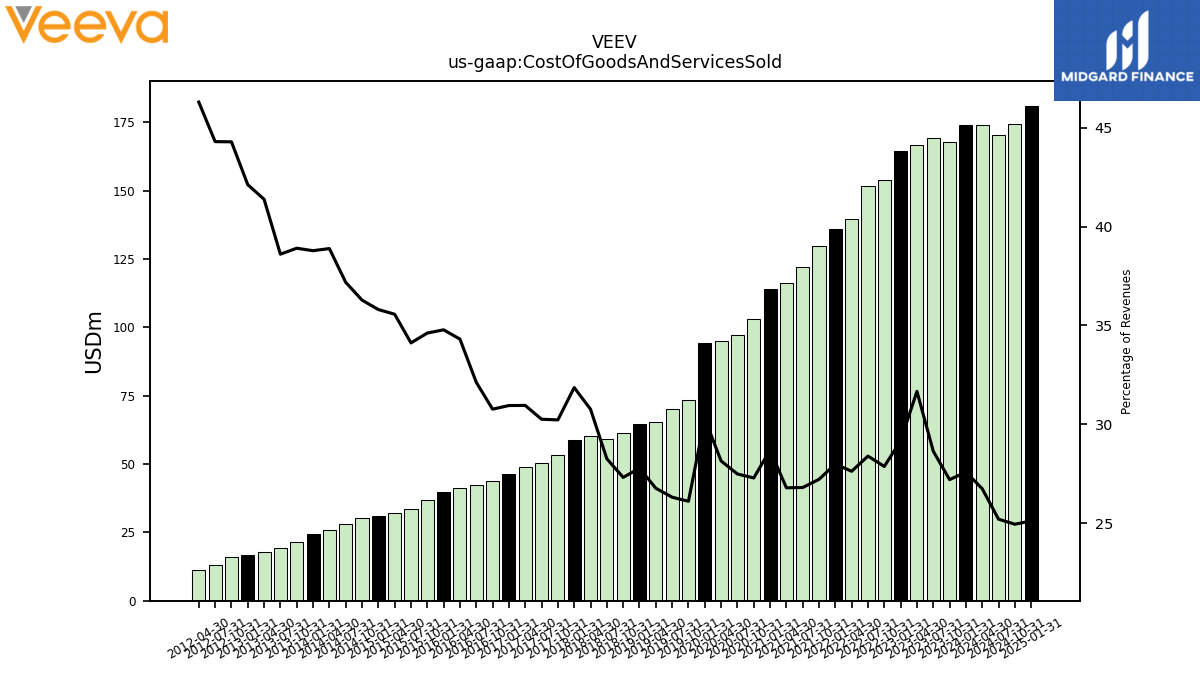
| Cost Of Goods And Services Sold | 167.68 | 169.02 | 166.66 | 164.31 | 153.91 | 151.67 | 139.51 | 135.88 | 129.56 | 122.10 | 116.14 | 113.85 | 103.00 | 97.20 | 94.88 | 94.32 | 73.33 | 70.22 | 65.50 | 64.53 | 61.37 | 59.23 | 60.16 | 58.91 | 53.23 | 50.40 | 48.88 | 46.47 | 43.92 | 42.20 | 41.09 | 39.74 | 37.01 | 33.47 | 31.98 | 31.16 | 30.42 | 28.14 | 25.95 | 24.36 | 21.39 | 19.14 | 17.71 | 16.76 | 15.86 | 13.05 | 11.35 | |
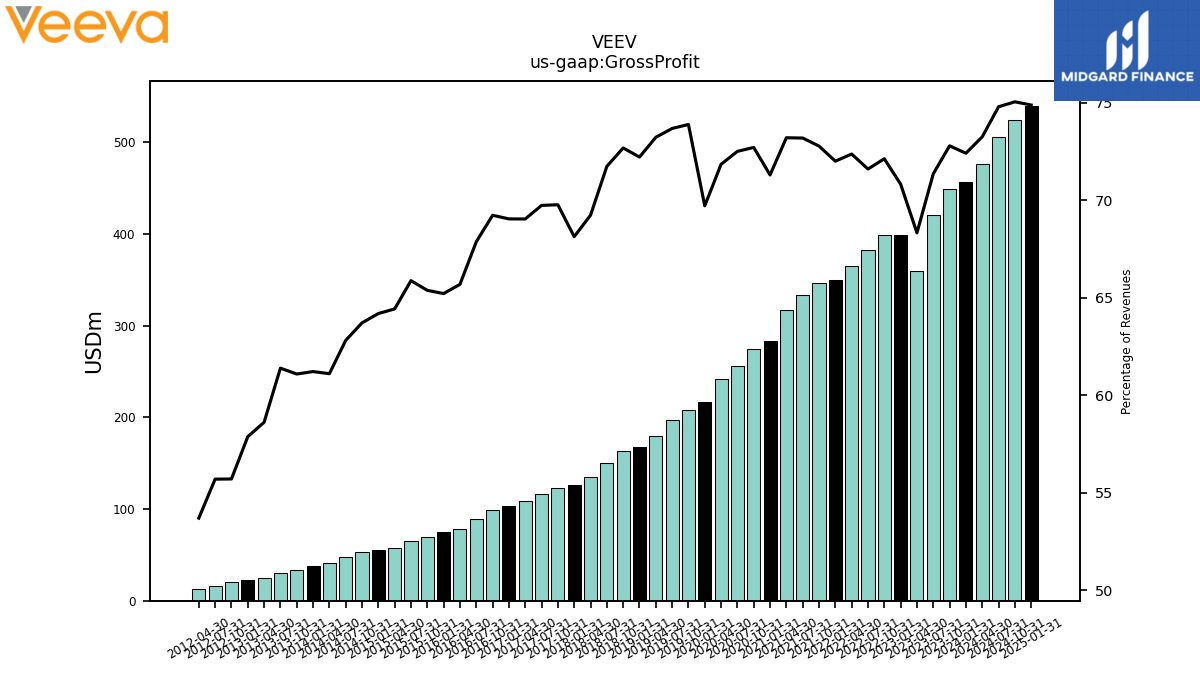
| Gross Profit | 448.82 | 421.21 | 359.66 | 399.07 | 398.44 | 382.55 | 365.59 | 349.62 | 346.55 | 333.50 | 317.44 | 282.91 | 274.52 | 256.48 | 242.23 | 217.19 | 207.59 | 196.68 | 179.25 | 167.80 | 163.36 | 150.38 | 135.39 | 126.00 | 122.91 | 116.18 | 109.04 | 103.68 | 98.85 | 89.15 | 78.67 | 74.53 | 69.91 | 64.63 | 57.94 | 55.86 | 53.41 | 47.53 | 40.77 | 38.45 | 33.59 | 30.44 | 25.08 | 23.03 | 19.94 | 16.41 | 13.16 | |
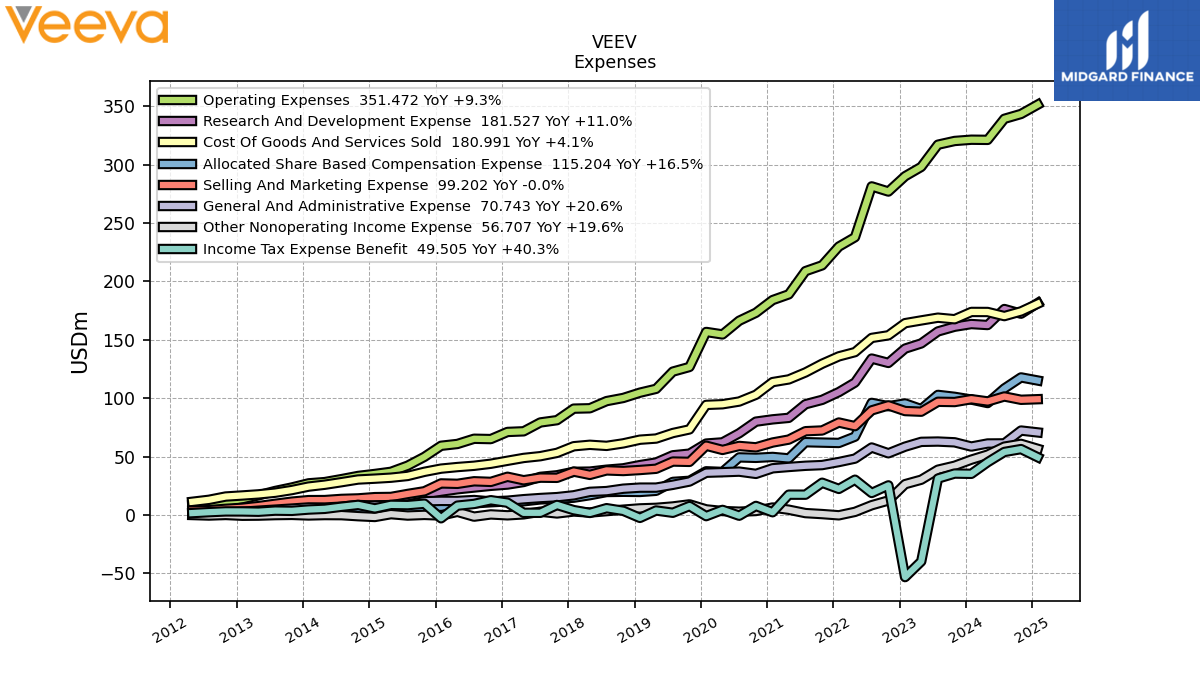
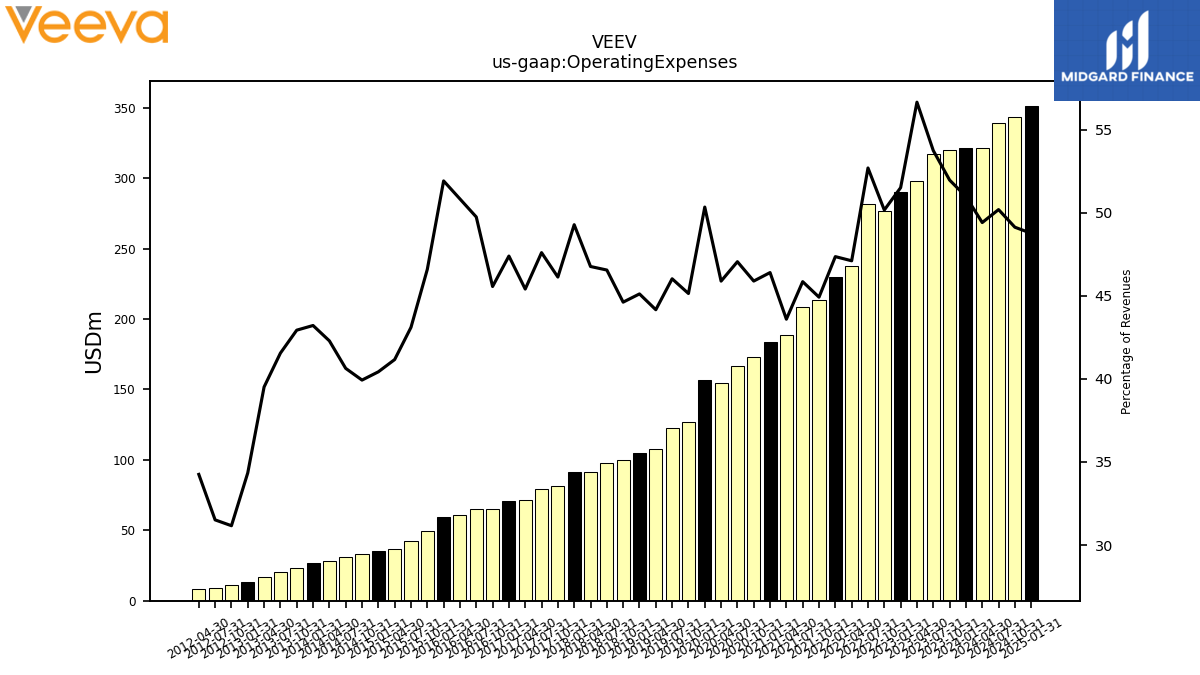
| Operating Expenses | 320.33 | 317.16 | 298.13 | 290.15 | 277.04 | 281.46 | 237.91 | 229.90 | 213.84 | 208.87 | 188.99 | 184.07 | 173.22 | 166.40 | 154.66 | 156.79 | 126.79 | 122.83 | 108.08 | 104.80 | 100.26 | 97.56 | 91.44 | 91.11 | 81.25 | 79.28 | 71.70 | 71.15 | 65.04 | 65.33 | 60.87 | 59.31 | 49.81 | 42.28 | 37.01 | 35.17 | 33.47 | 30.74 | 28.21 | 27.14 | 23.60 | 20.60 | 16.91 | 13.66 | 11.16 | 9.28 | 8.39 | |
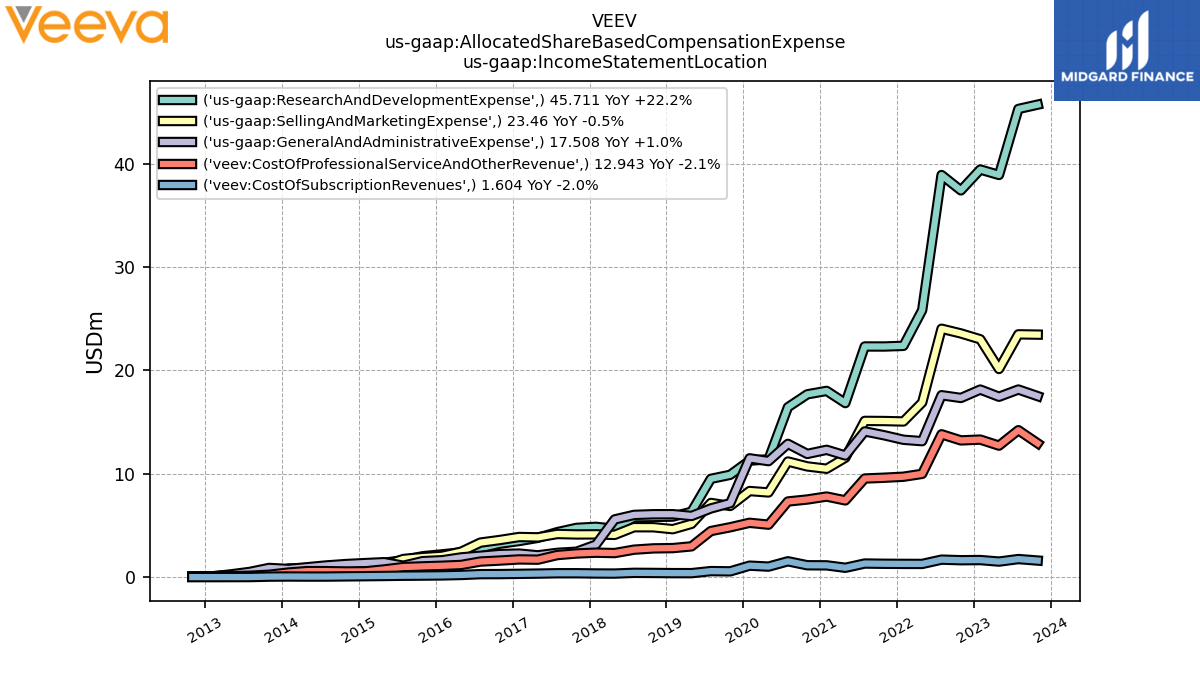
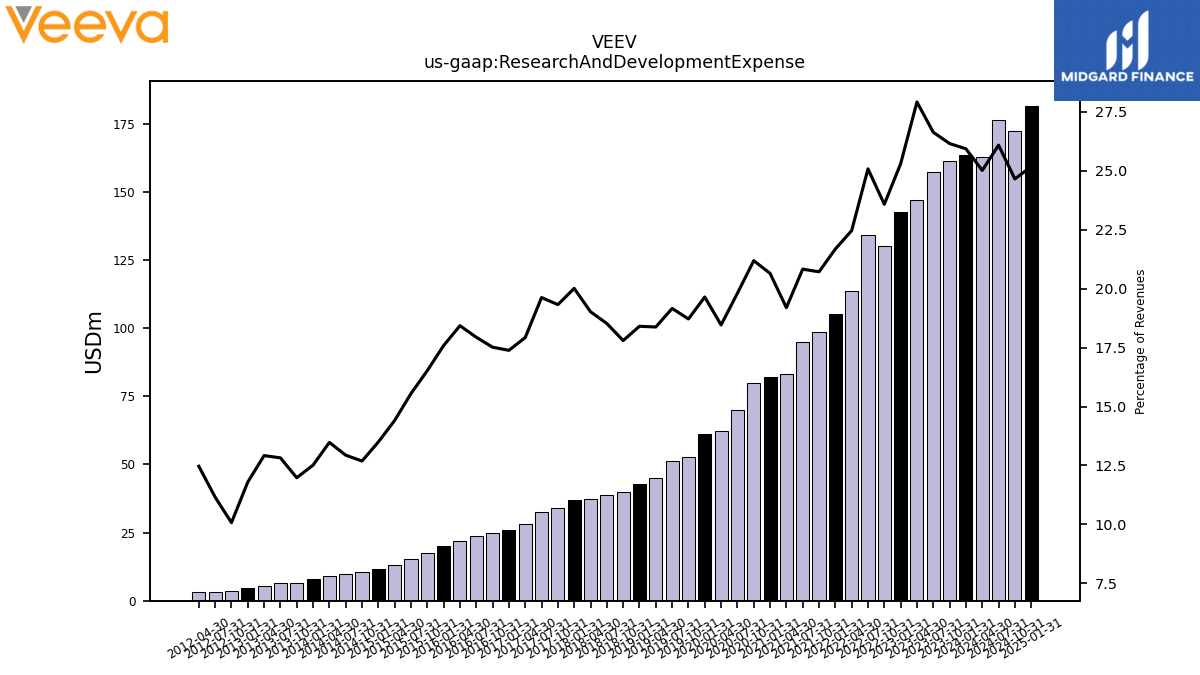
| Research And Development Expense | 161.28 | 157.23 | 146.96 | 142.54 | 130.26 | 134.01 | 113.47 | 105.28 | 98.64 | 94.90 | 83.23 | 81.94 | 79.99 | 70.05 | 62.24 | 61.20 | 52.58 | 51.15 | 44.97 | 42.76 | 40.00 | 38.83 | 37.20 | 37.01 | 34.04 | 32.69 | 28.31 | 26.10 | 25.01 | 23.56 | 22.07 | 20.10 | 17.67 | 15.26 | 12.96 | 11.74 | 10.63 | 9.79 | 8.99 | 7.86 | 6.58 | 6.36 | 5.53 | 4.69 | 3.60 | 3.29 | 3.06 | |
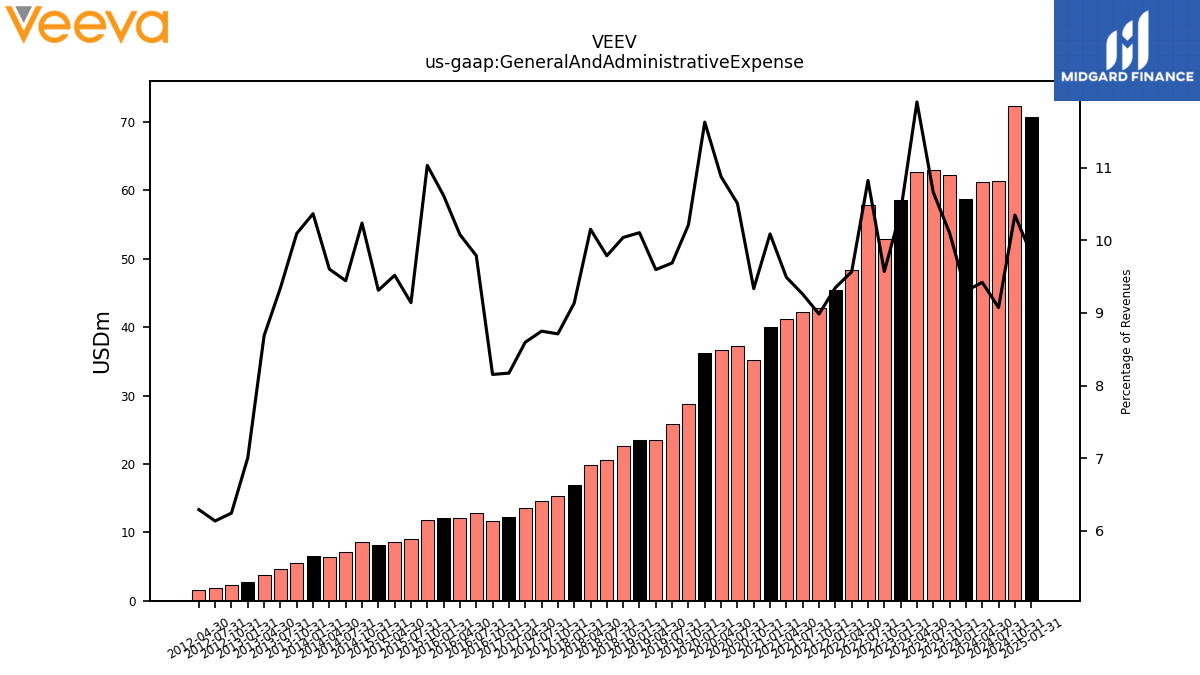
| General And Administrative Expense | 62.28 | 62.94 | 62.67 | 58.56 | 52.87 | 57.83 | 48.33 | 45.39 | 42.78 | 42.19 | 41.16 | 40.03 | 35.24 | 37.17 | 36.67 | 36.23 | 28.69 | 25.86 | 23.49 | 23.48 | 22.56 | 20.52 | 19.85 | 16.89 | 15.35 | 14.57 | 13.58 | 12.27 | 11.64 | 12.86 | 12.07 | 12.13 | 11.80 | 8.97 | 8.56 | 8.10 | 8.58 | 7.15 | 6.41 | 6.51 | 5.55 | 4.63 | 3.72 | 2.79 | 2.23 | 1.81 | 1.54 | |
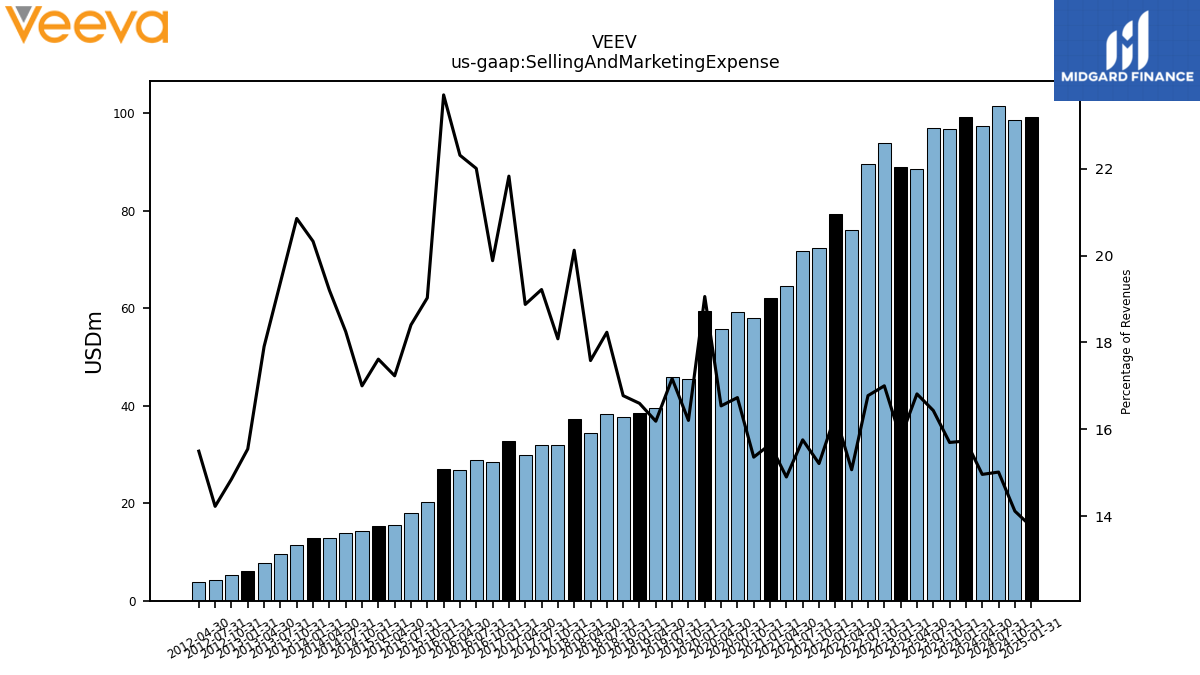
| Selling And Marketing Expense | 96.77 | 97.00 | 88.50 | 89.05 | 93.91 | 89.62 | 76.11 | 79.24 | 72.42 | 71.79 | 64.61 | 62.10 | 57.98 | 59.17 | 55.76 | 59.37 | 45.52 | 45.82 | 39.62 | 38.56 | 37.70 | 38.22 | 34.38 | 37.22 | 31.86 | 32.02 | 29.81 | 32.78 | 28.39 | 28.91 | 26.72 | 27.09 | 20.34 | 18.06 | 15.50 | 15.33 | 14.25 | 13.81 | 12.81 | 12.77 | 11.47 | 9.61 | 7.66 | 6.19 | 5.32 | 4.19 | 3.80 | |
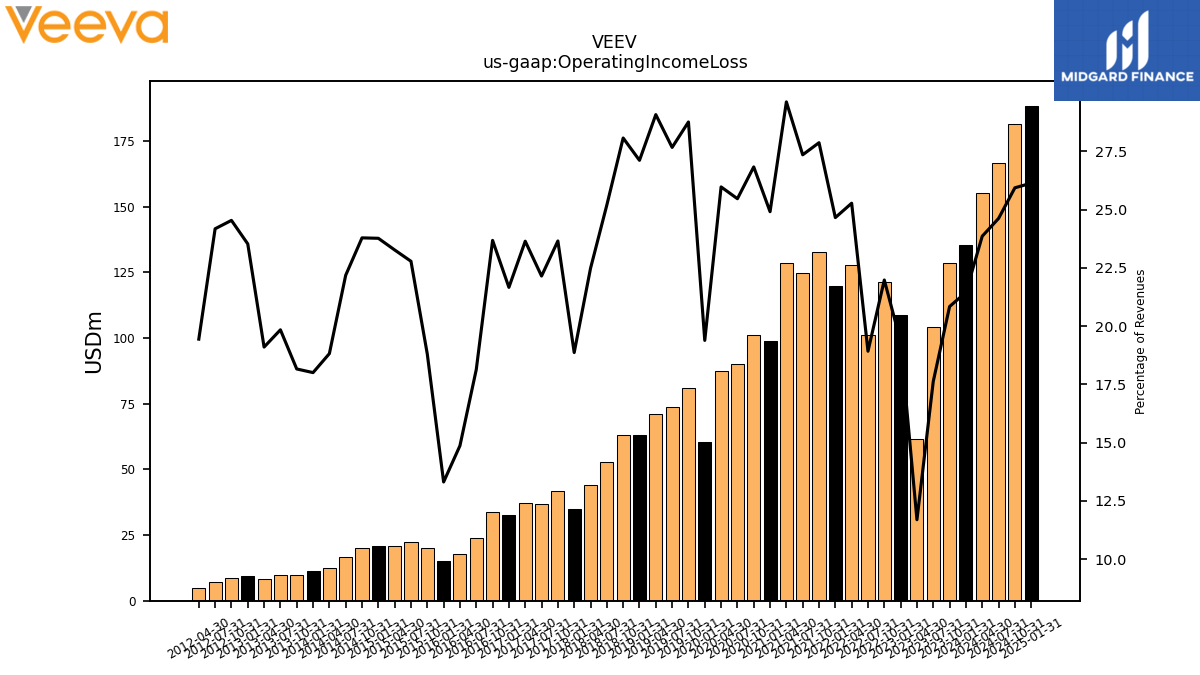
| Operating Income Loss | 128.49 | 104.05 | 61.53 | 108.92 | 121.40 | 101.09 | 127.67 | 119.72 | 132.71 | 124.62 | 128.45 | 98.84 | 101.31 | 90.08 | 87.56 | 60.39 | 80.80 | 73.86 | 71.17 | 63.00 | 63.09 | 52.82 | 43.96 | 34.89 | 41.67 | 36.90 | 37.34 | 32.53 | 33.81 | 23.82 | 17.81 | 15.21 | 20.10 | 22.35 | 20.93 | 20.68 | 19.94 | 16.79 | 12.56 | 11.31 | 9.98 | 9.84 | 8.17 | 9.36 | 8.78 | 7.12 | 4.76 | |
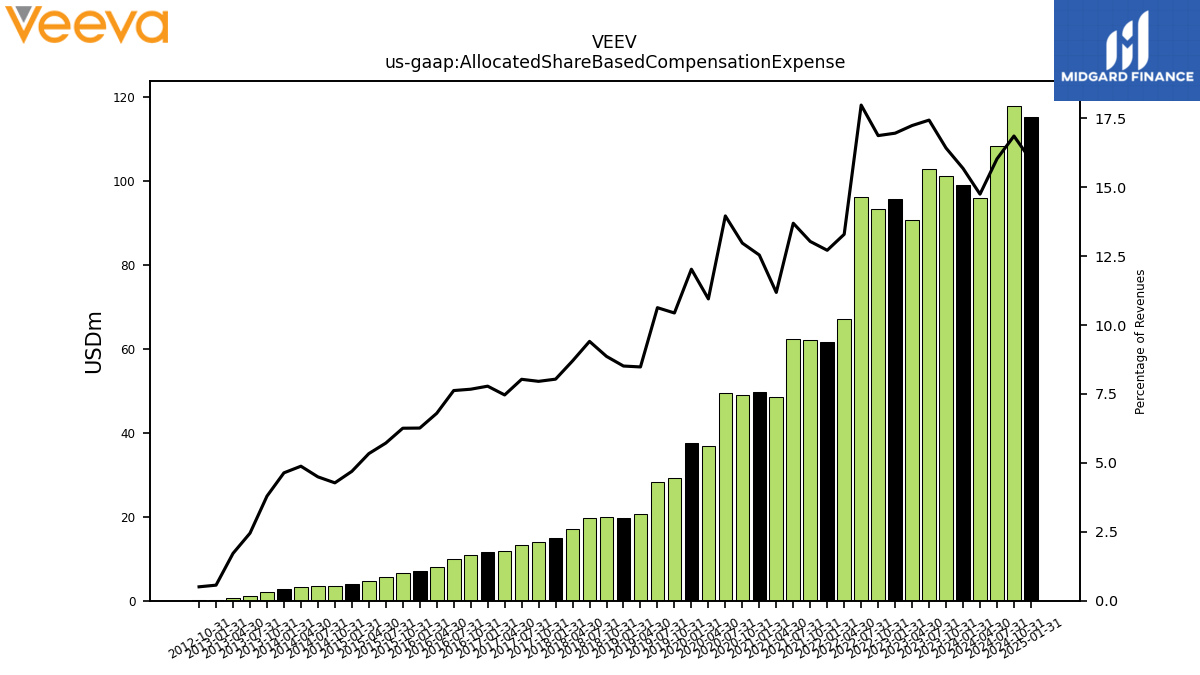
| Allocated Share Based Compensation Expense | 101.23 | 102.89 | 90.72 | 95.54 | 93.19 | 96.04 | 67.13 | 61.72 | 62.05 | 62.38 | 48.49 | 49.76 | 48.97 | 49.37 | 36.91 | 37.46 | 29.32 | 28.37 | 20.76 | 19.78 | 19.92 | 19.72 | 17.01 | 14.86 | 14.02 | 13.38 | 11.79 | 11.69 | 10.96 | 10.01 | 8.14 | 7.16 | 6.69 | 5.61 | 4.80 | 4.08 | 3.58 | 3.40 | 3.26 | 2.91 | 2.09 | 1.22 | 0.73 | 0.23 | 0.18 | NA | NA | |
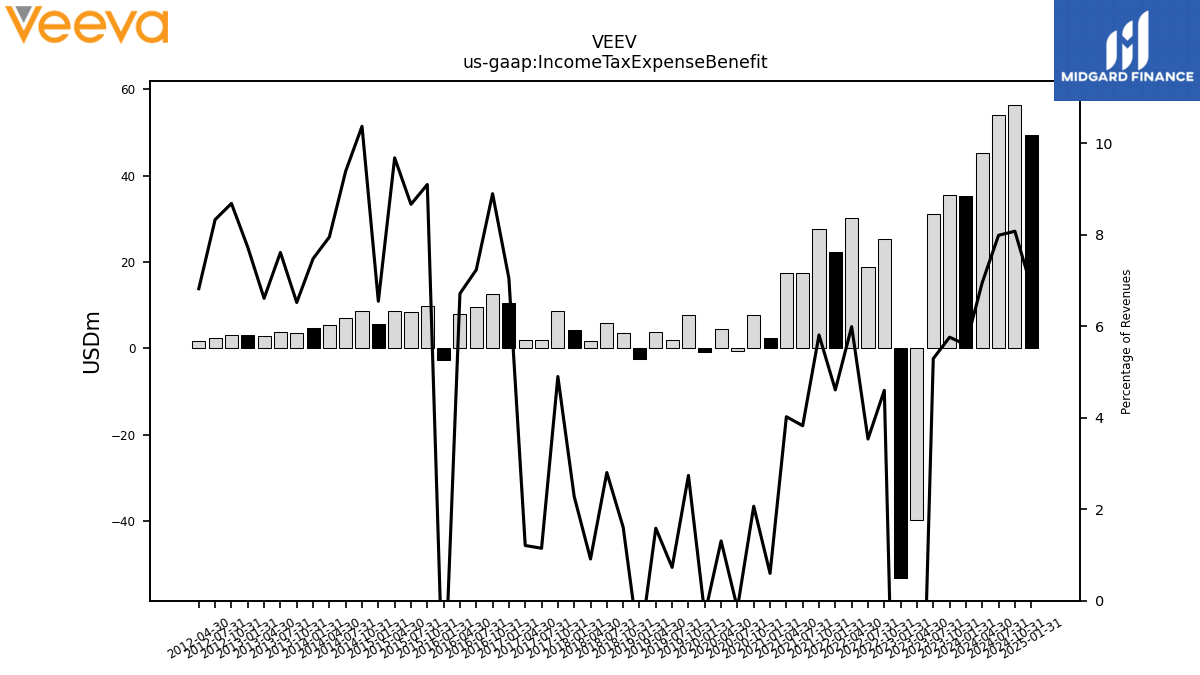
| Income Tax Expense Benefit | 35.52 | 31.25 | -39.74 | -53.17 | 25.41 | 18.89 | 30.27 | 22.38 | 27.66 | 17.43 | 17.44 | 2.37 | 7.80 | -0.59 | 4.41 | -0.94 | 7.70 | 1.95 | 3.88 | -2.46 | 3.62 | 5.87 | 1.78 | 4.21 | 8.63 | 1.91 | 1.91 | 10.58 | 12.71 | 9.50 | 8.04 | -2.78 | 9.73 | 8.50 | 8.71 | 5.70 | 8.69 | 7.11 | 5.31 | 4.70 | 3.58 | 3.77 | 2.83 | 3.08 | 3.11 | 2.45 | 1.67 | |
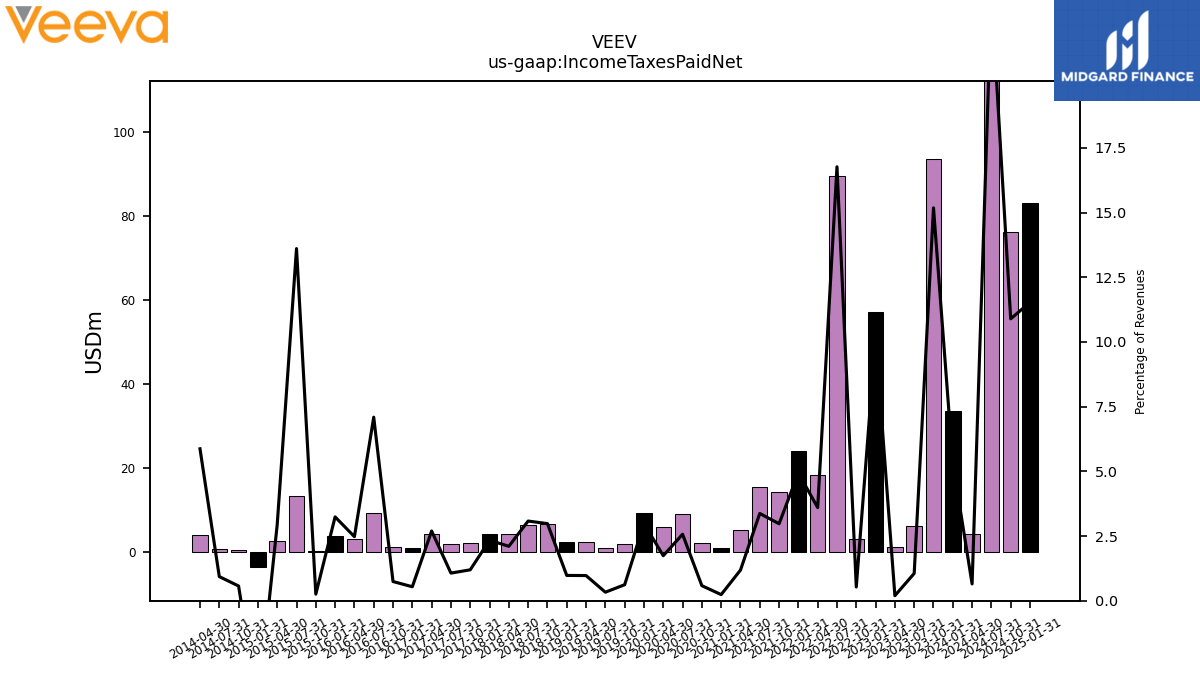
| Income Taxes Paid Net | 93.59 | 6.23 | 1.03 | 57.24 | 2.94 | 89.58 | 18.19 | 23.96 | 14.17 | 15.37 | 5.13 | 0.94 | 2.20 | 9.09 | 5.87 | 9.29 | 1.74 | 0.88 | 2.38 | 2.27 | 6.70 | 6.46 | 4.12 | 4.32 | 2.11 | 1.78 | 4.26 | 0.81 | 1.06 | 9.32 | 2.96 | 3.70 | 0.27 | 13.35 | 2.64 | -3.59 | 0.48 | 0.71 | 3.92 | NA | NA | NA | NA | NA | NA | NA | NA | |
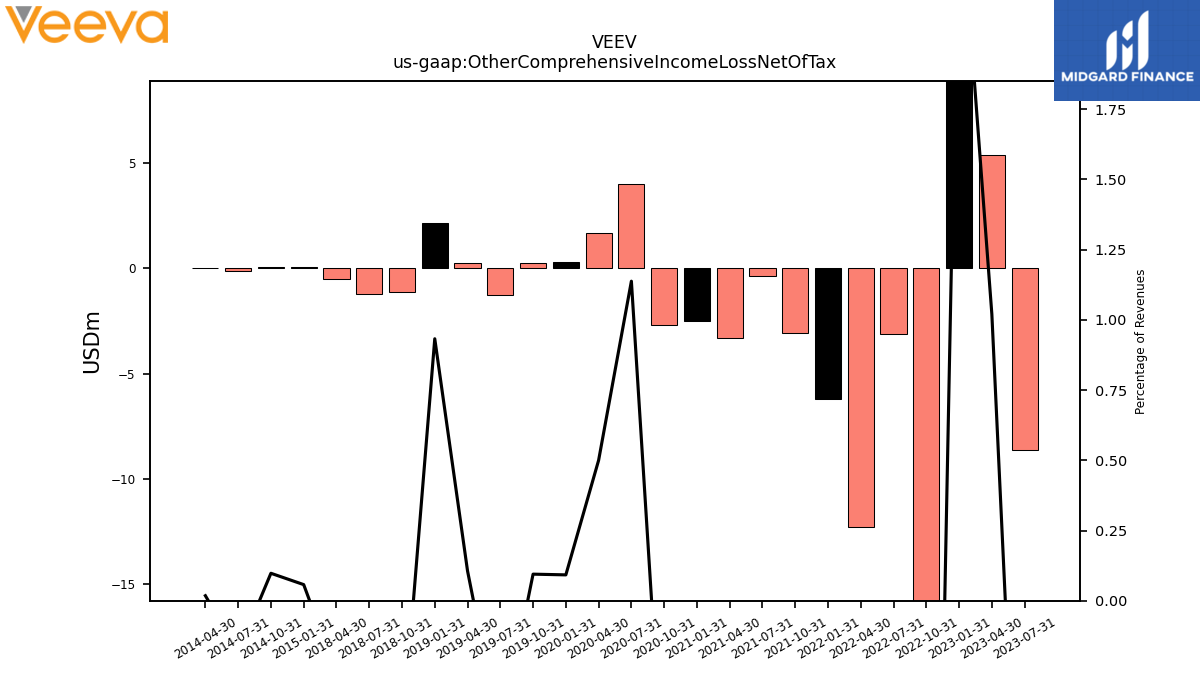
| Other Comprehensive Income Loss Net Of Tax | NA | -8.62 | 5.37 | 14.51 | -18.31 | -3.12 | -12.25 | -6.22 | -3.05 | -0.39 | -3.30 | -2.51 | -2.67 | 4.02 | 1.69 | 0.29 | 0.27 | -1.28 | 0.26 | 2.17 | -1.12 | -1.22 | -0.50 | NA | NA | NA | NA | NA | NA | NA | NA | NA | NA | NA | NA | 0.05 | 0.08 | -0.14 | 0.01 | NA | NA | NA | NA | NA | NA | NA | NA | |
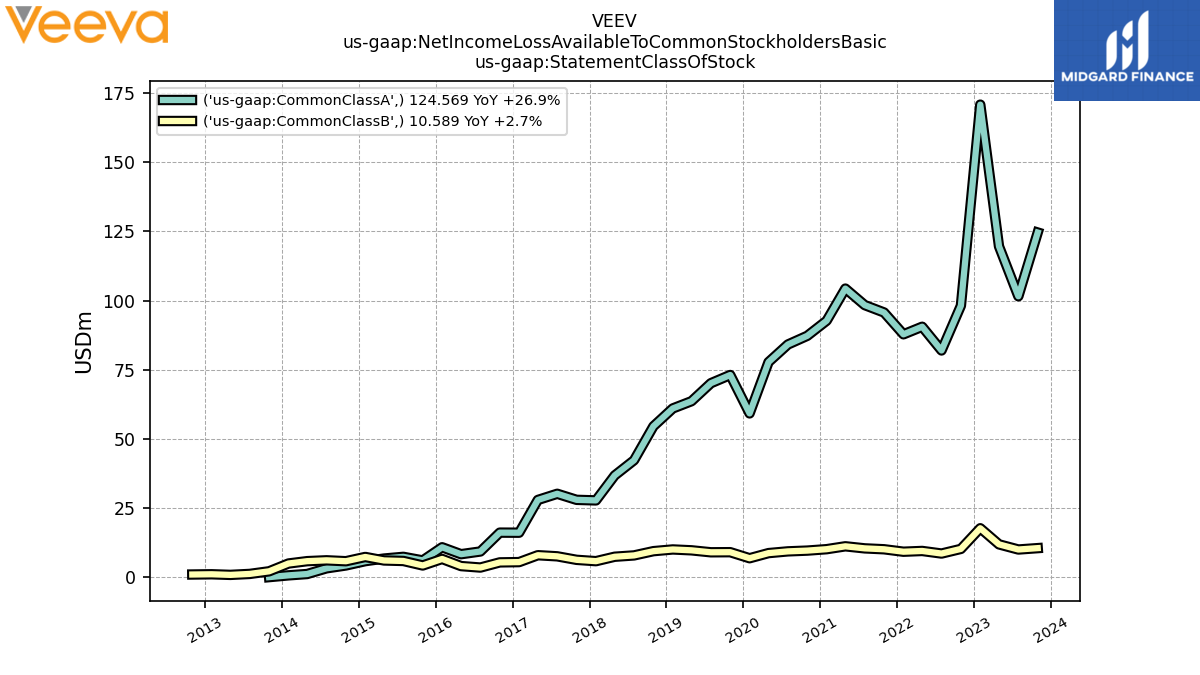
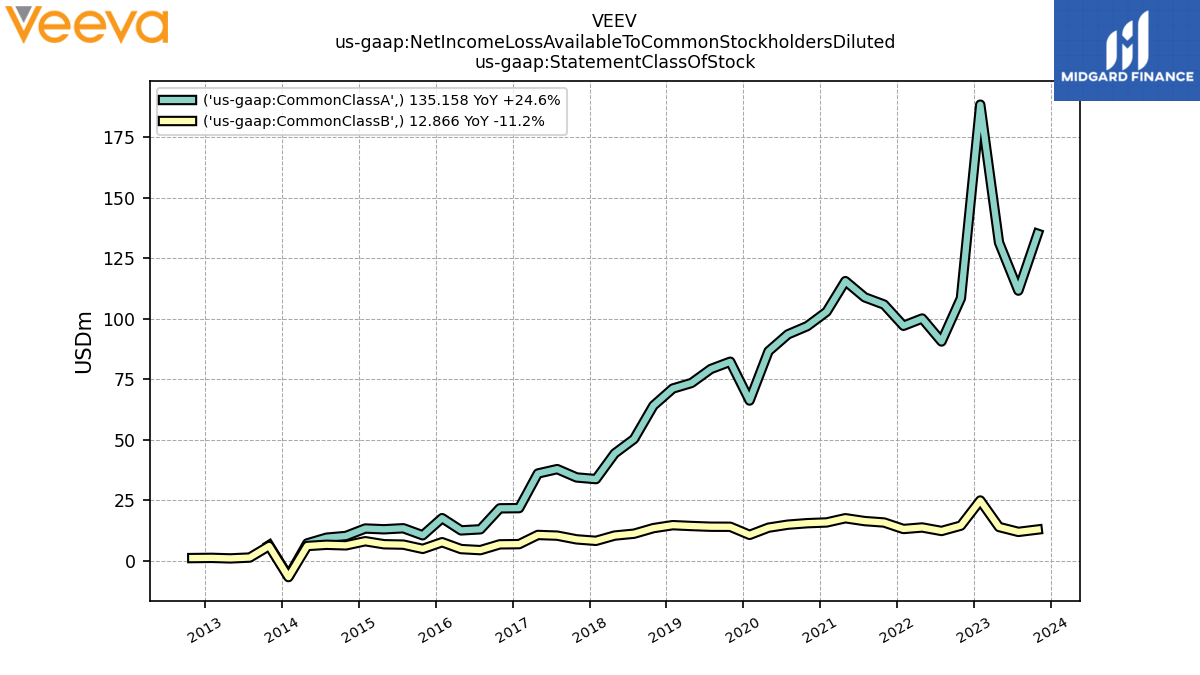
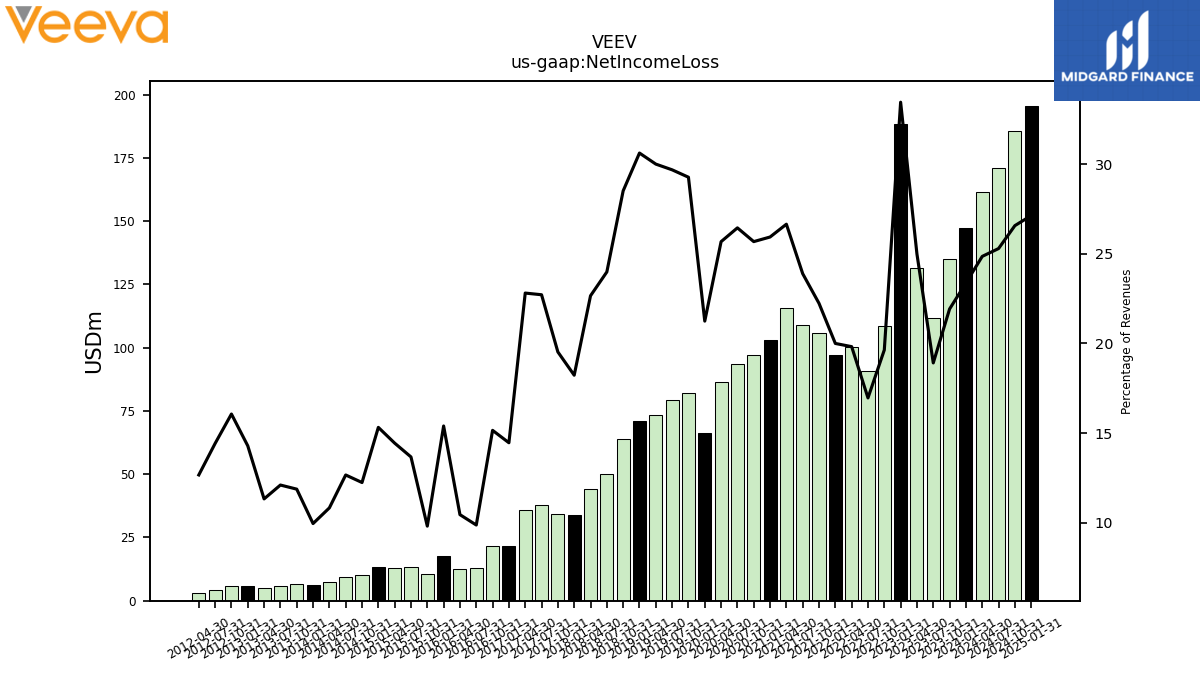
| Net Income Loss | 135.16 | 111.63 | 131.52 | 188.53 | 108.46 | 90.60 | 100.11 | 97.10 | 105.87 | 108.86 | 115.57 | 102.92 | 96.96 | 93.55 | 86.57 | 66.18 | 82.25 | 79.24 | 73.45 | 71.15 | 64.08 | 50.29 | 44.31 | 33.71 | 34.39 | 37.84 | 36.02 | 21.71 | 21.63 | 12.96 | 12.51 | 17.59 | 10.48 | 13.41 | 12.98 | 13.33 | 10.26 | 9.58 | 7.22 | 6.25 | 6.53 | 6.00 | 4.84 | 5.68 | 5.75 | 4.25 | 3.10 | |
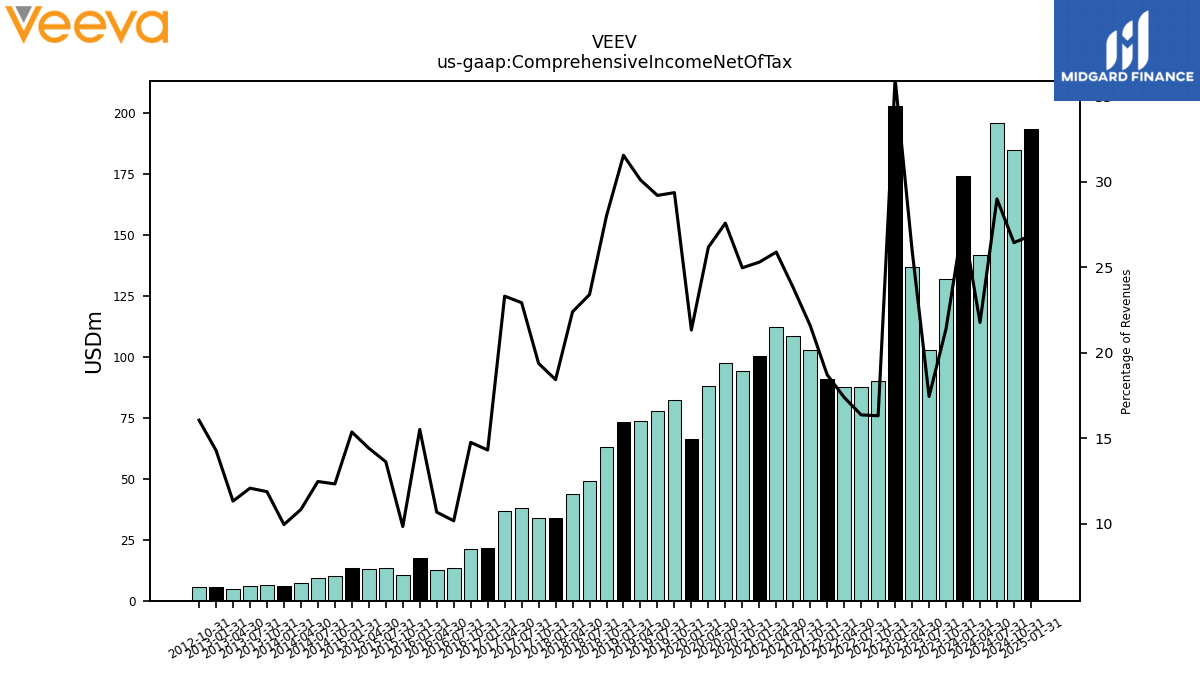
| Comprehensive Income Net Of Tax | 132.00 | 103.00 | 136.89 | 203.05 | 90.15 | 87.48 | 87.86 | 90.88 | 102.82 | 108.48 | 112.27 | 100.41 | 94.29 | 97.58 | 88.26 | 66.47 | 82.51 | 77.96 | 73.71 | 73.32 | 62.97 | 49.07 | 43.81 | 34.09 | 34.14 | 38.20 | 36.82 | 21.50 | 21.08 | 13.37 | 12.80 | 17.74 | 10.53 | 13.37 | 12.97 | 13.38 | 10.34 | 9.44 | 7.23 | 6.25 | 6.53 | 5.99 | 4.85 | 5.69 | 5.75 | NA | NA |
| 2023-10-31 | 2023-07-31 | 2023-04-30 | 2023-01-31 | 2022-10-31 | 2022-07-31 | 2022-04-30 | 2022-01-31 | 2021-10-31 | 2021-07-31 | 2021-04-30 | 2021-01-31 | 2020-10-31 | 2020-07-31 | 2020-04-30 | 2020-01-31 | 2019-10-31 | 2019-07-31 | 2019-04-30 | 2019-01-31 | 2018-10-31 | 2018-07-31 | 2018-04-30 | 2018-01-31 | 2017-10-31 | 2017-07-31 | 2017-04-30 | 2017-01-31 | 2016-10-31 | 2016-07-31 | 2016-04-30 | 2016-01-31 | 2015-10-31 | 2015-07-31 | 2015-04-30 | 2015-01-31 | 2014-10-31 | 2014-07-31 | 2014-04-30 | 2014-01-31 | 2013-10-31 | 2013-07-31 | 2013-04-30 | 2013-01-31 | 2012-10-31 | 2012-07-31 | 2012-04-30 | ||
|---|---|---|---|---|---|---|---|---|---|---|---|---|---|---|---|---|---|---|---|---|---|---|---|---|---|---|---|---|---|---|---|---|---|---|---|---|---|---|---|---|---|---|---|---|---|---|---|---|
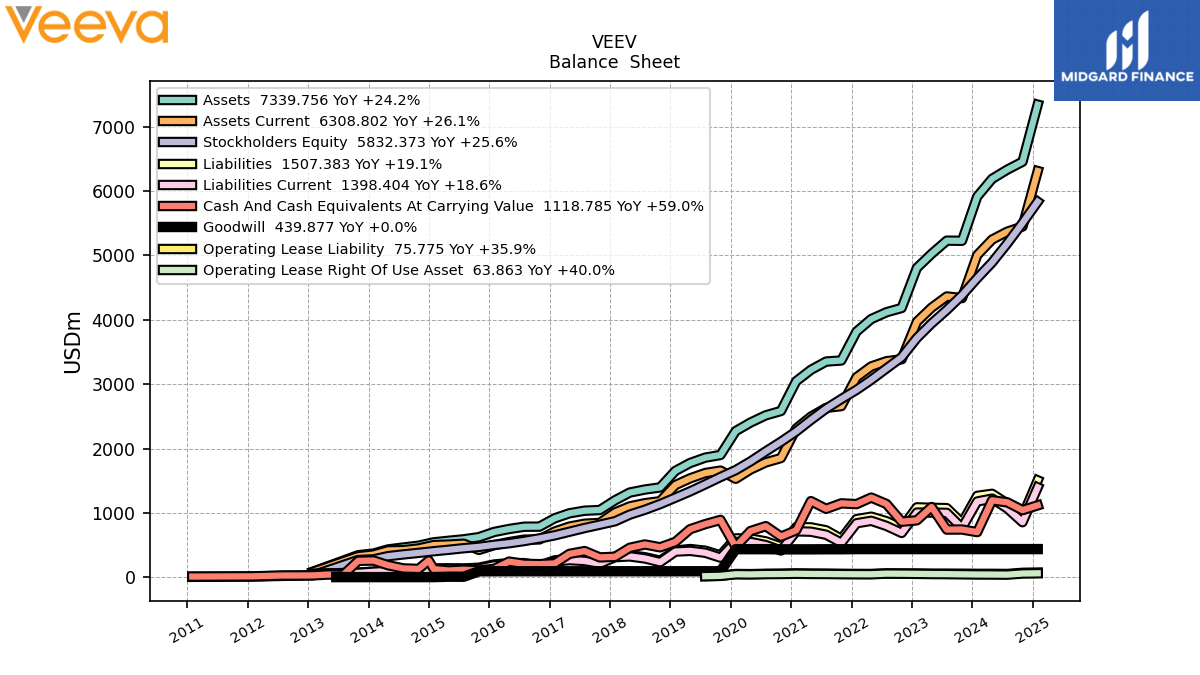
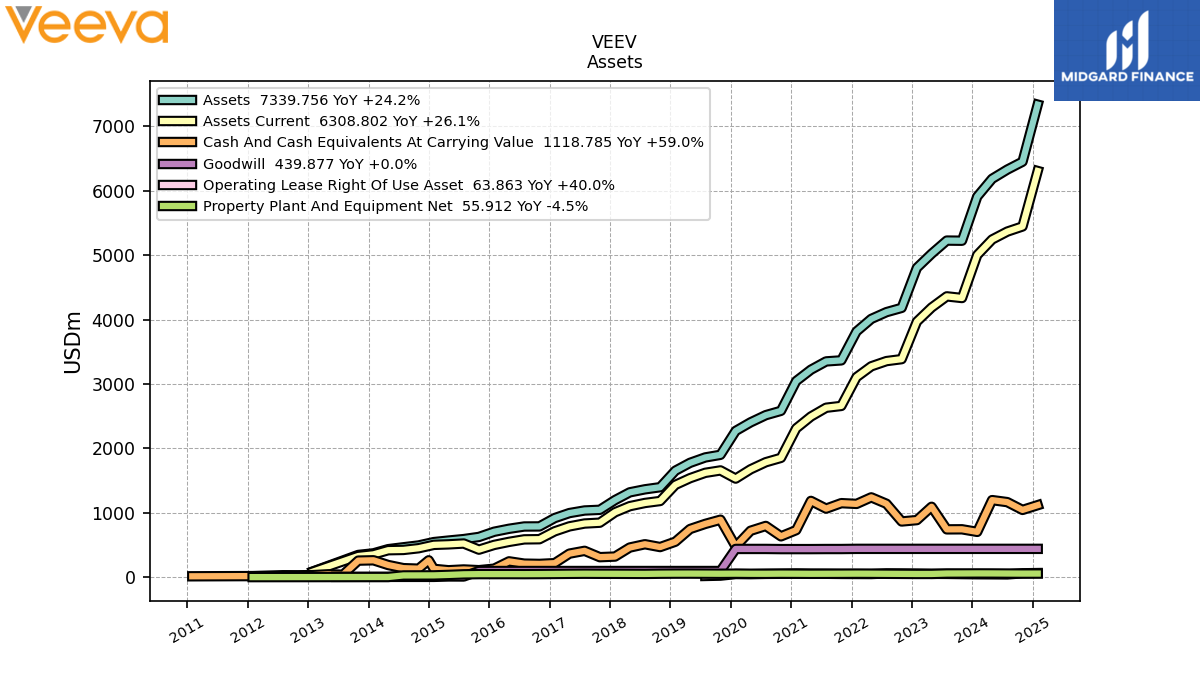
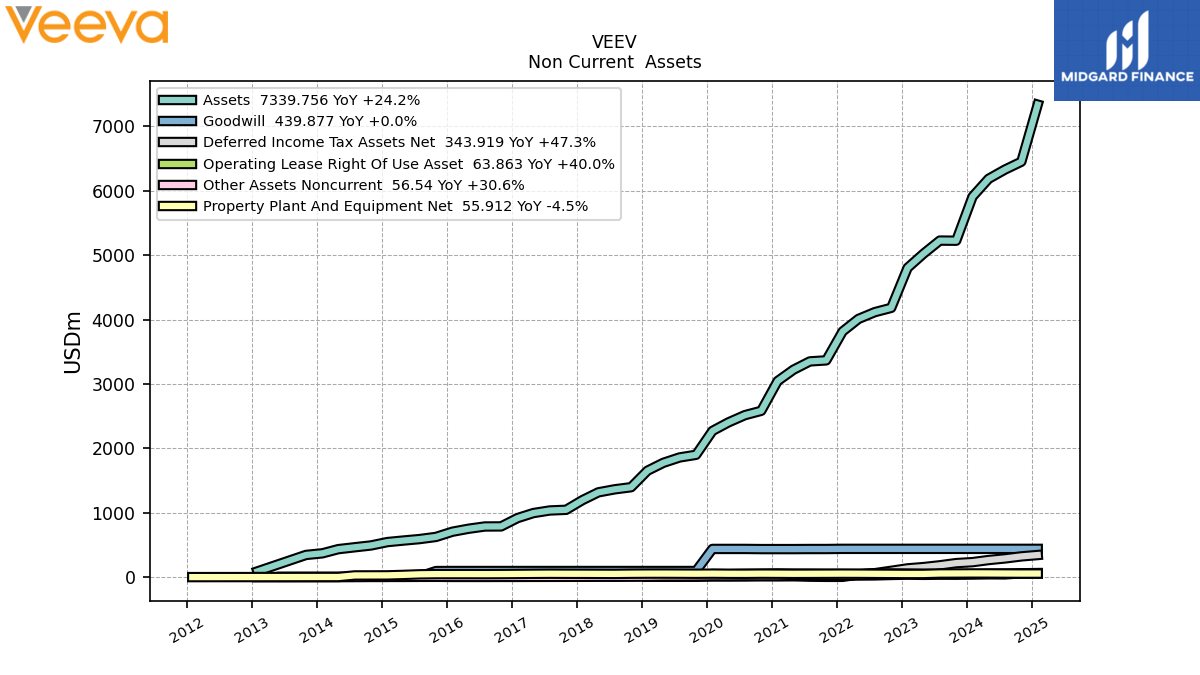
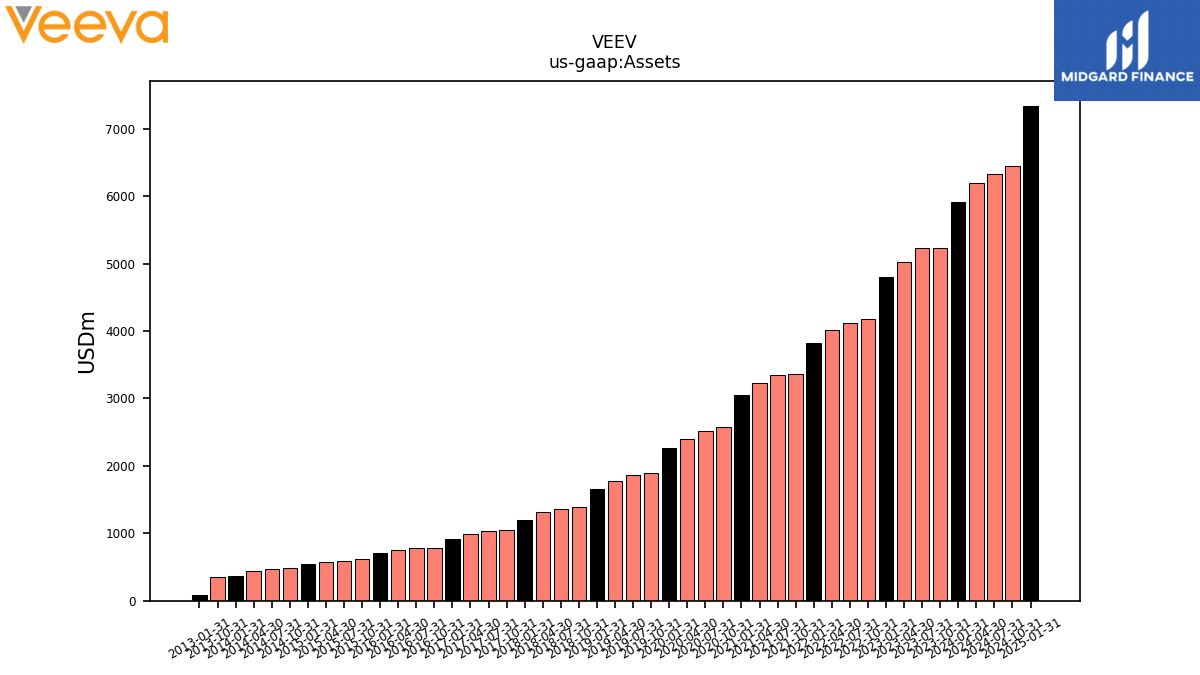
| Assets | 5225.77 | 5228.14 | 5023.37 | 4804.30 | 4182.72 | 4116.58 | 4011.22 | 3816.47 | 3367.49 | 3351.38 | 3222.15 | 3046.07 | 2583.64 | 2516.41 | 2404.62 | 2271.78 | 1900.44 | 1859.85 | 1776.10 | 1653.77 | 1397.28 | 1364.59 | 1317.65 | 1197.01 | 1046.22 | 1035.87 | 995.66 | 917.70 | 788.47 | 787.23 | 751.79 | 705.80 | 625.03 | 591.63 | 568.66 | 544.89 | 492.55 | 464.24 | 435.12 | 370.31 | 345.29 | NA | NA | 89.82 | NA | NA | NA | |
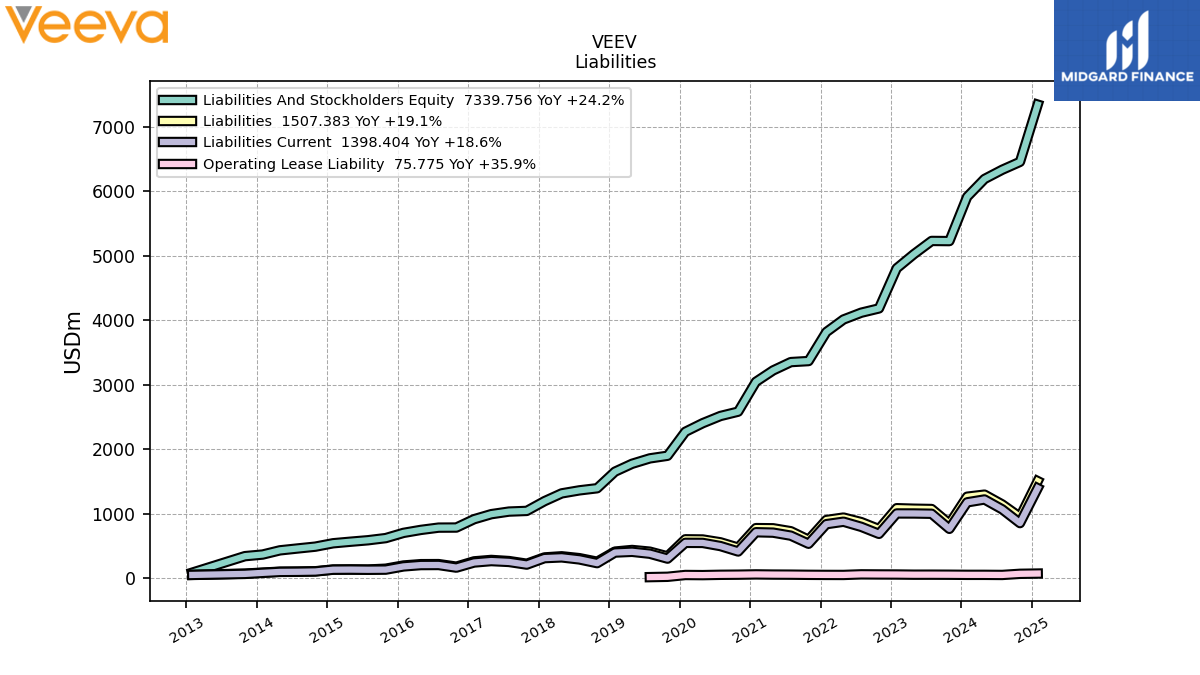
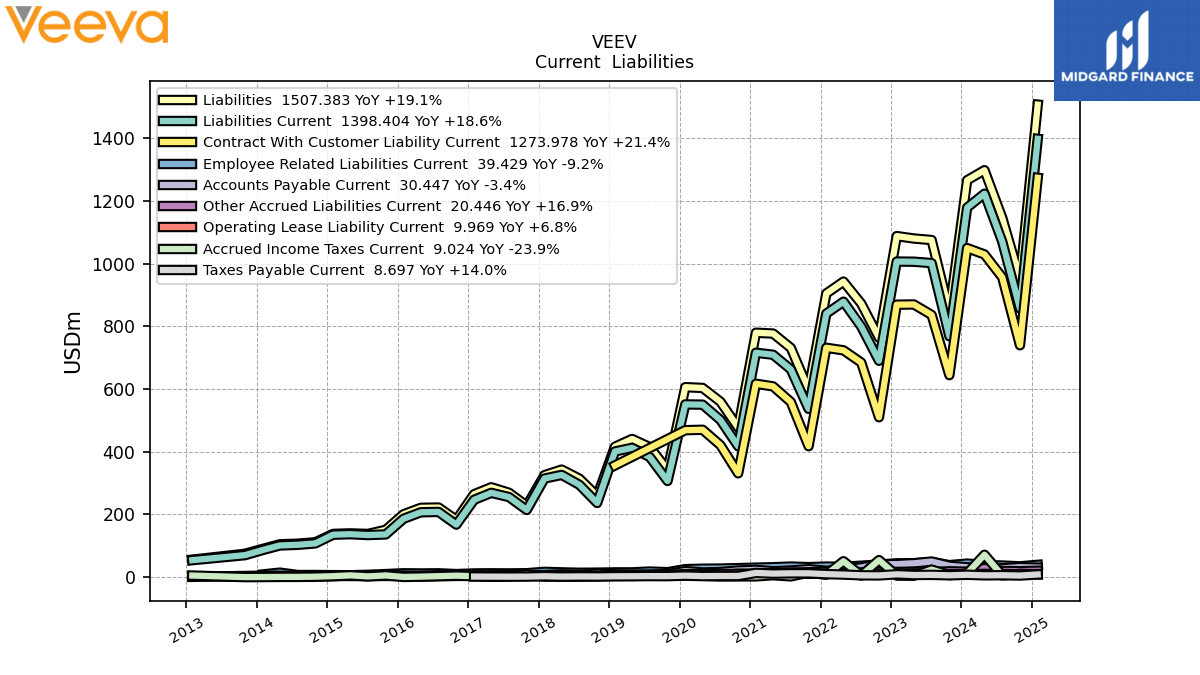
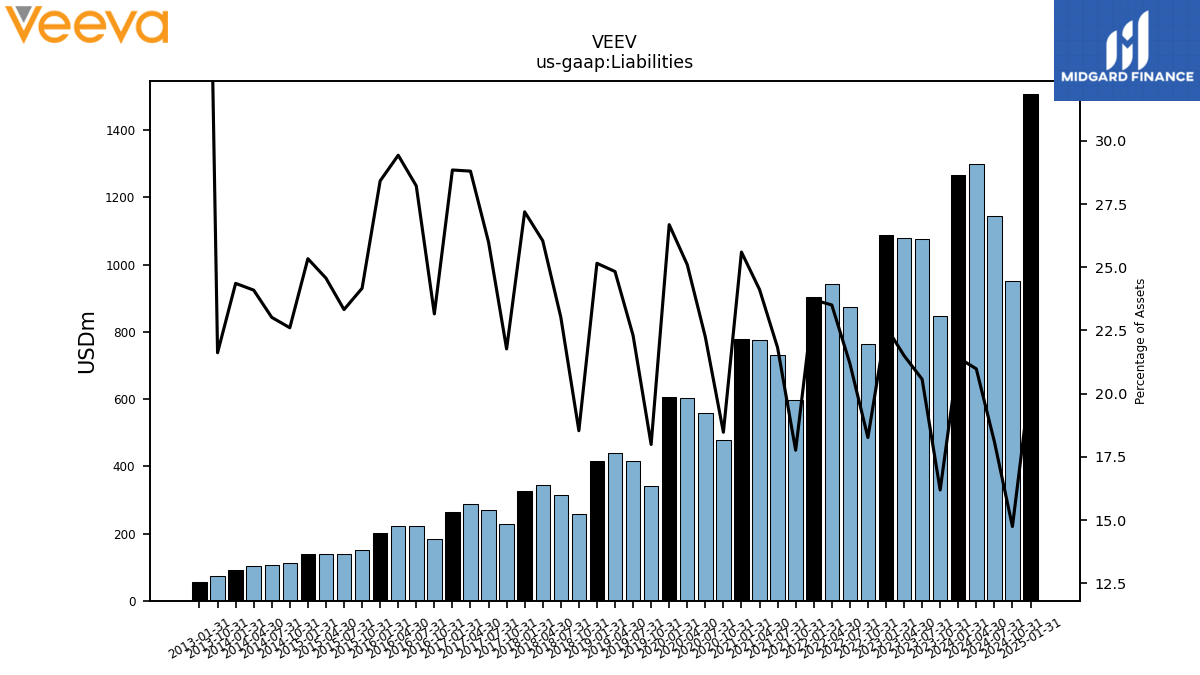
| Liabilities | 846.00 | 1075.50 | 1080.31 | 1088.04 | 763.92 | 872.65 | 942.95 | 904.83 | 598.12 | 731.29 | 777.16 | 779.75 | 477.26 | 559.68 | 603.58 | 606.18 | 341.88 | 414.84 | 441.00 | 416.02 | 258.98 | 314.22 | 343.22 | 325.48 | 227.75 | 269.27 | 286.76 | 264.72 | 182.57 | 222.12 | 221.25 | 200.55 | 151.06 | 138.00 | 139.71 | 138.06 | 111.35 | 106.85 | 104.84 | 90.21 | 74.64 | NA | NA | 55.85 | NA | NA | NA | |
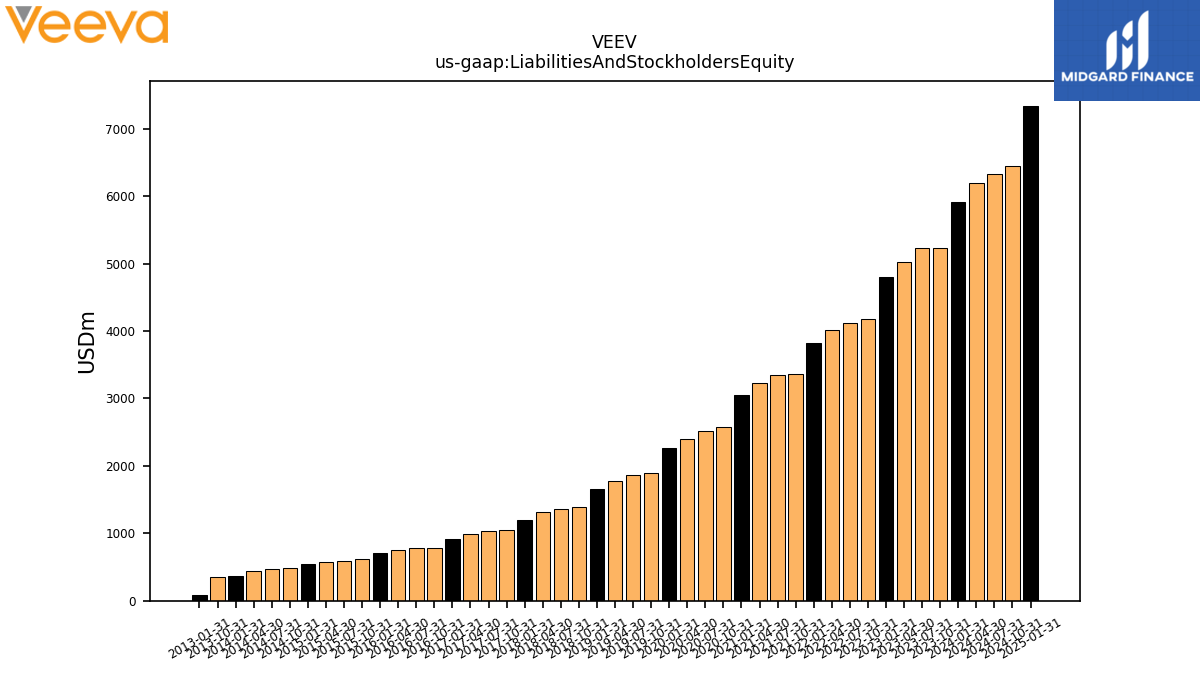
| Liabilities And Stockholders Equity | 5225.77 | 5228.14 | 5023.37 | 4804.30 | 4182.72 | 4116.58 | 4011.22 | 3816.47 | 3367.49 | 3351.38 | 3222.15 | 3046.07 | 2583.64 | 2516.41 | 2404.62 | 2271.78 | 1900.44 | 1859.85 | 1776.10 | 1653.77 | 1397.28 | 1364.59 | 1317.65 | 1197.01 | 1046.22 | 1035.87 | 995.66 | 917.70 | 788.47 | 787.23 | 751.79 | 705.80 | 625.03 | 591.63 | 568.66 | 544.89 | 492.55 | 464.24 | 435.12 | 370.31 | 345.29 | NA | NA | 89.82 | NA | NA | NA | |
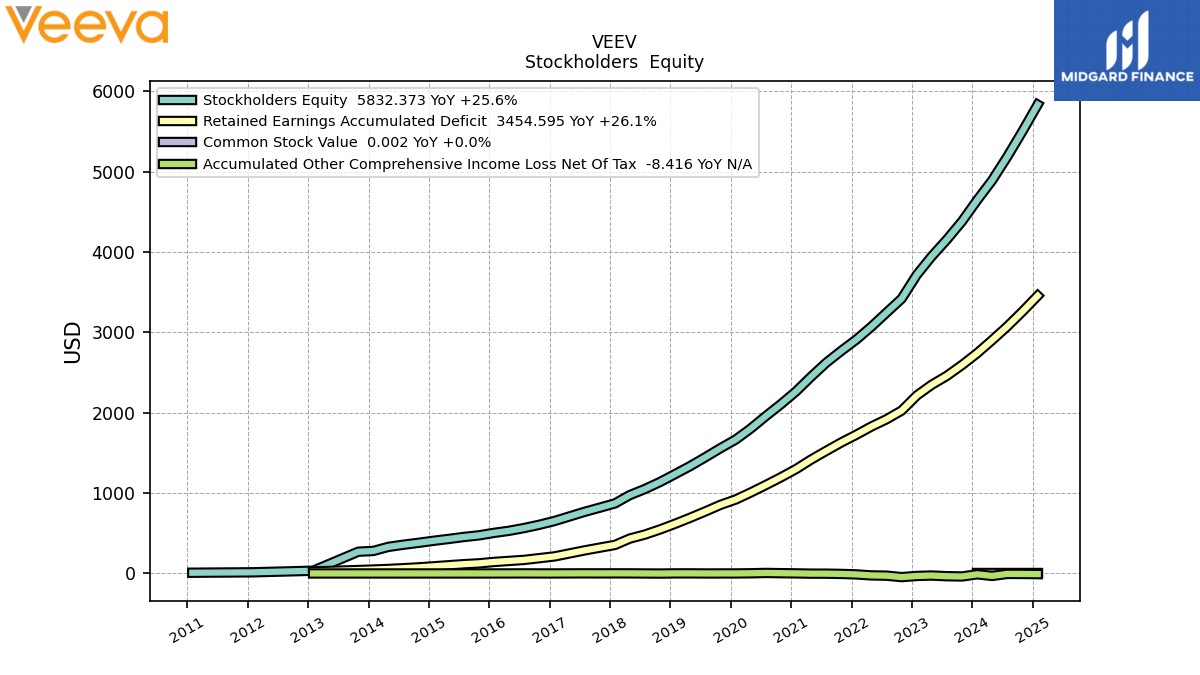
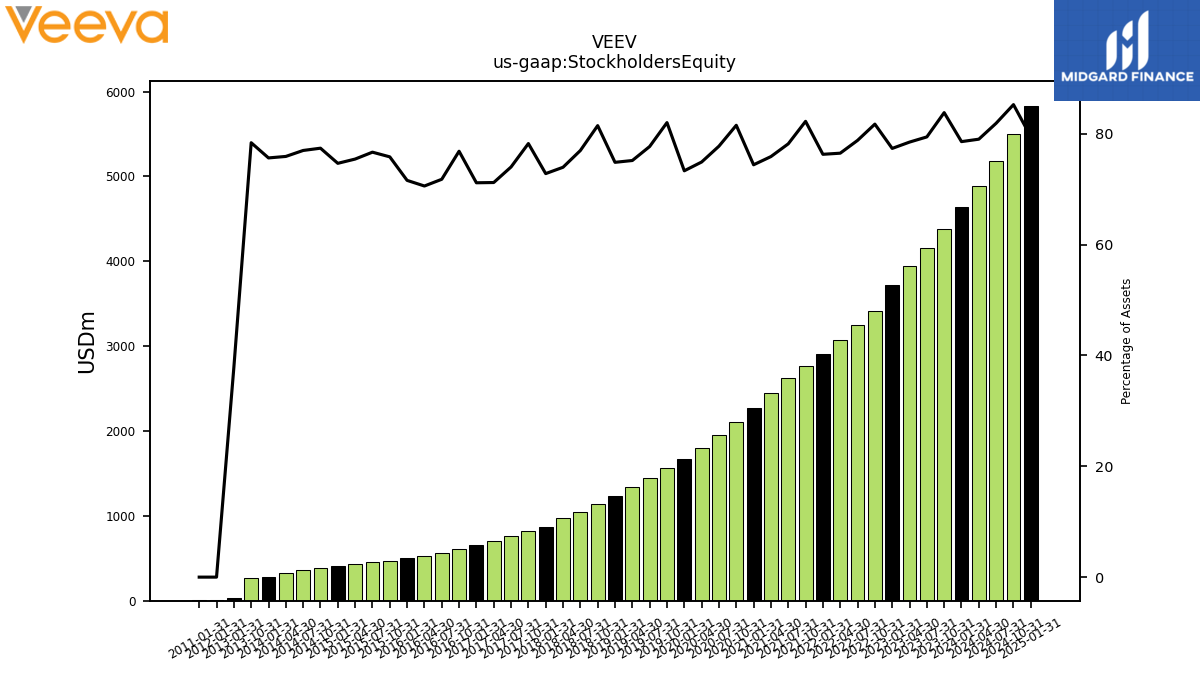
| Stockholders Equity | 4379.77 | 4152.64 | 3943.06 | 3716.25 | 3418.79 | 3243.93 | 3068.28 | 2911.64 | 2769.36 | 2620.10 | 2444.98 | 2266.32 | 2106.38 | 1956.73 | 1801.04 | 1665.59 | 1558.57 | 1445.02 | 1335.10 | 1237.75 | 1138.31 | 1050.38 | 974.44 | 871.53 | 818.47 | 766.60 | 708.90 | 652.98 | 605.90 | 565.11 | 530.55 | 505.25 | 473.98 | 453.64 | 428.95 | 406.83 | 381.21 | 357.39 | 330.29 | 280.10 | 270.65 | NA | NA | 33.97 | NA | NA | NA |
| 2023-10-31 | 2023-07-31 | 2023-04-30 | 2023-01-31 | 2022-10-31 | 2022-07-31 | 2022-04-30 | 2022-01-31 | 2021-10-31 | 2021-07-31 | 2021-04-30 | 2021-01-31 | 2020-10-31 | 2020-07-31 | 2020-04-30 | 2020-01-31 | 2019-10-31 | 2019-07-31 | 2019-04-30 | 2019-01-31 | 2018-10-31 | 2018-07-31 | 2018-04-30 | 2018-01-31 | 2017-10-31 | 2017-07-31 | 2017-04-30 | 2017-01-31 | 2016-10-31 | 2016-07-31 | 2016-04-30 | 2016-01-31 | 2015-10-31 | 2015-07-31 | 2015-04-30 | 2015-01-31 | 2014-10-31 | 2014-07-31 | 2014-04-30 | 2014-01-31 | 2013-10-31 | 2013-07-31 | 2013-04-30 | 2013-01-31 | 2012-10-31 | 2012-07-31 | 2012-04-30 | ||
|---|---|---|---|---|---|---|---|---|---|---|---|---|---|---|---|---|---|---|---|---|---|---|---|---|---|---|---|---|---|---|---|---|---|---|---|---|---|---|---|---|---|---|---|---|---|---|---|---|
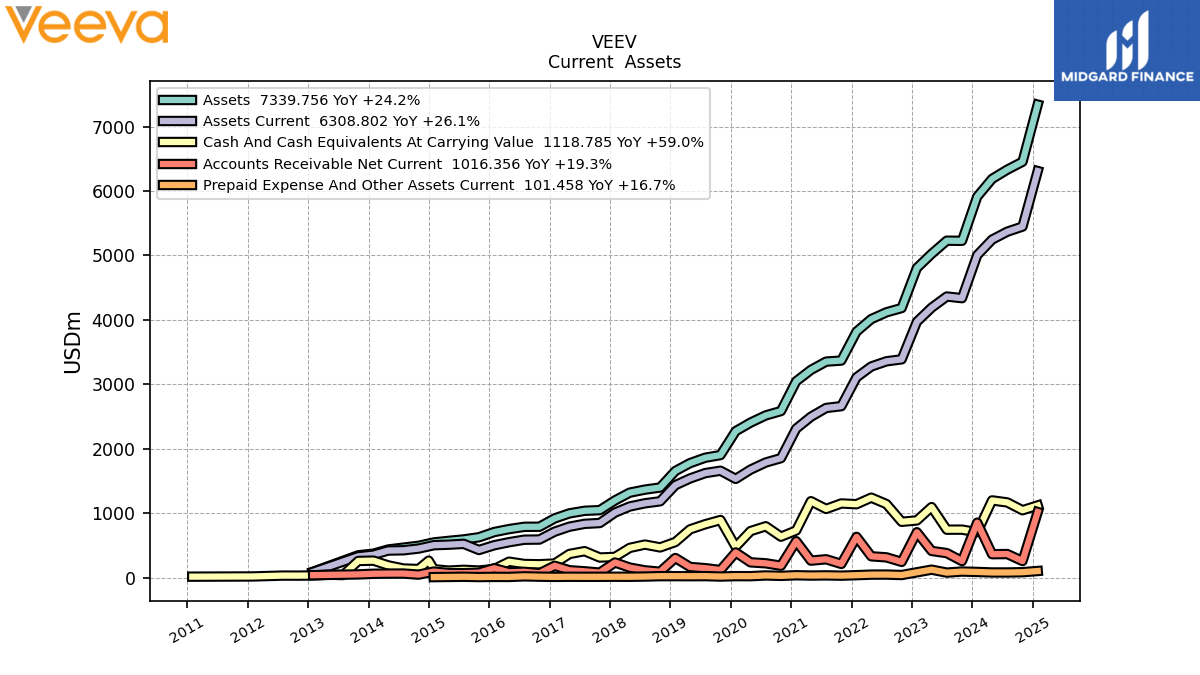
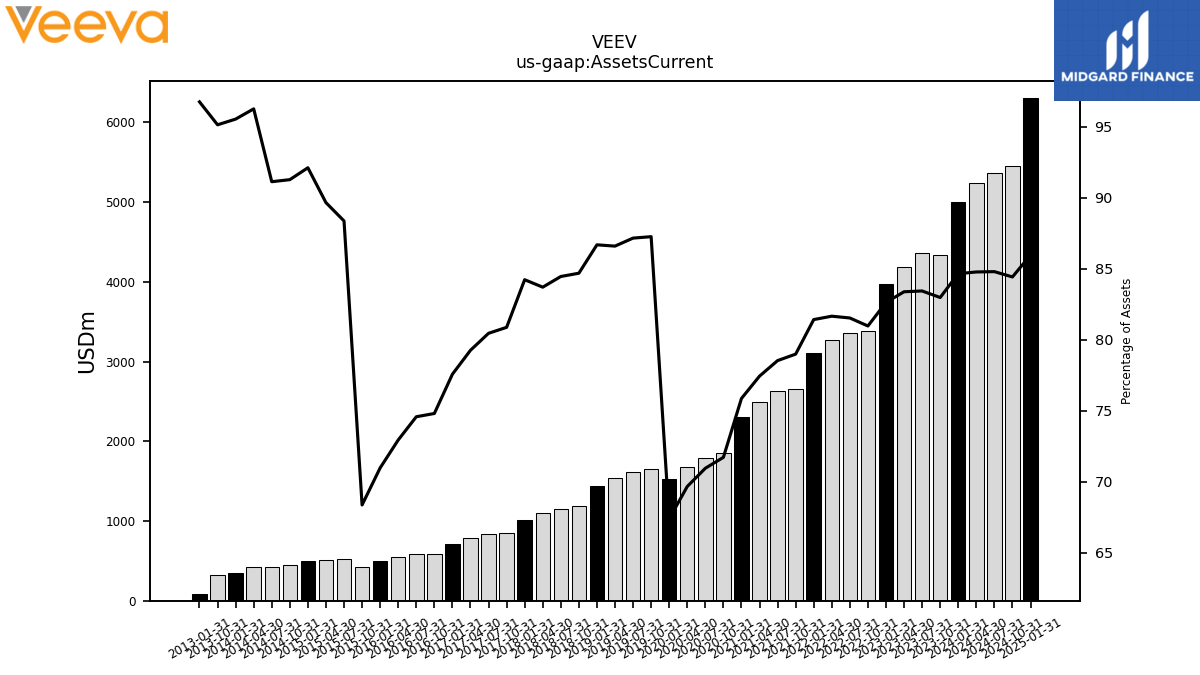
| Assets Current | 4335.76 | 4361.75 | 4188.13 | 3969.31 | 3386.49 | 3356.14 | 3275.30 | 3107.18 | 2659.80 | 2631.79 | 2495.07 | 2310.83 | 1853.00 | 1785.43 | 1675.27 | 1531.12 | 1658.12 | 1620.84 | 1537.85 | 1433.41 | 1183.19 | 1152.36 | 1102.83 | 1008.14 | 846.07 | 833.36 | 789.11 | 711.87 | 589.83 | 587.09 | 548.37 | 500.96 | 427.34 | 522.75 | 509.77 | 501.84 | 449.52 | 423.00 | 418.78 | 353.73 | 328.45 | NA | NA | 86.89 | NA | NA | NA | |
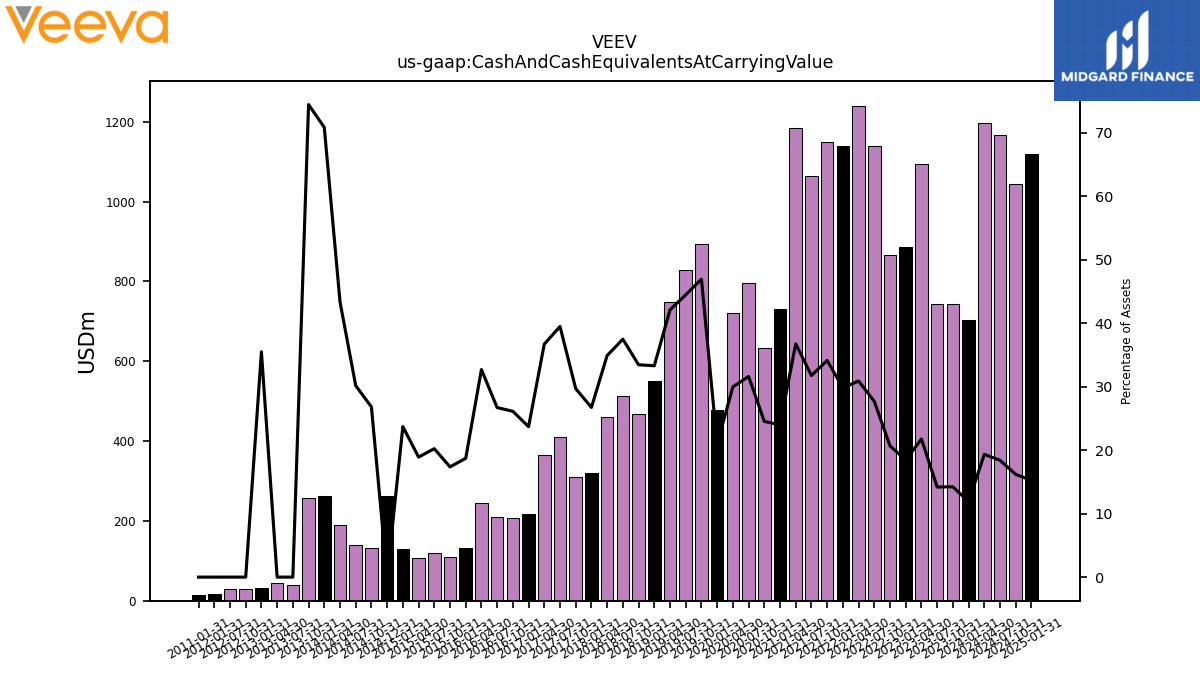
| Cash And Cash Equivalents At Carrying Value | 743.71 | 742.61 | 1093.63 | 886.47 | 865.16 | 1140.25 | 1240.00 | 1138.04 | 1149.95 | 1064.73 | 1184.98 | 730.50 | 634.26 | 795.78 | 720.78 | 476.73 | 892.58 | 827.47 | 748.16 | 550.97 | 467.64 | 511.74 | 460.24 | 320.18 | 310.80 | 409.23 | 365.66 | 217.61 | 206.08 | 210.37 | 245.94 | 132.18 | 108.59 | 119.78 | 107.56 | 129.25 | 132.13 | 140.12 | 188.89 | 262.51 | 257.14 | 38.61 | 44.35 | 31.89 | 29.64 | 30.16 | NA | |
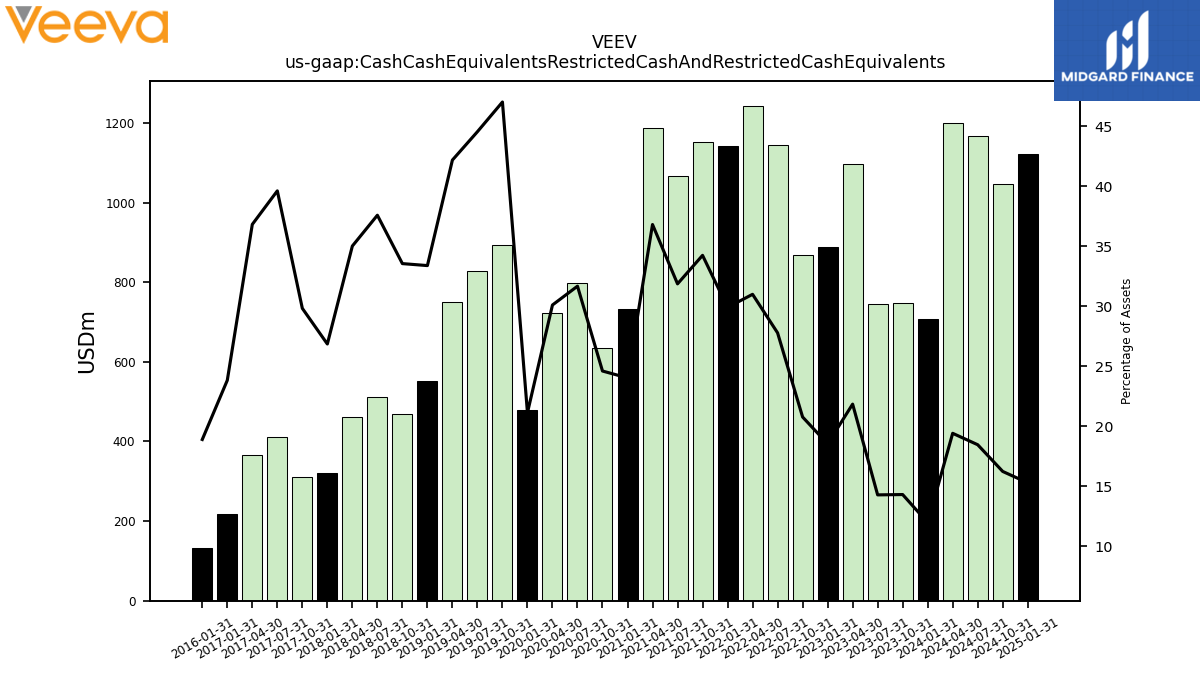
| Cash Cash Equivalents Restricted Cash And Restricted Cash Equivalents | 746.89 | 745.79 | 1096.82 | 889.65 | 868.34 | 1143.43 | 1243.18 | 1141.22 | 1153.13 | 1067.92 | 1186.19 | 731.71 | 635.47 | 796.99 | 723.84 | 479.80 | 893.79 | 828.68 | 749.37 | 552.18 | 468.85 | 512.94 | 461.44 | 321.39 | 312.00 | 410.43 | 366.66 | 218.61 | NA | NA | NA | 133.28 | NA | NA | NA | NA | NA | NA | NA | NA | NA | NA | NA | NA | NA | NA | NA | |
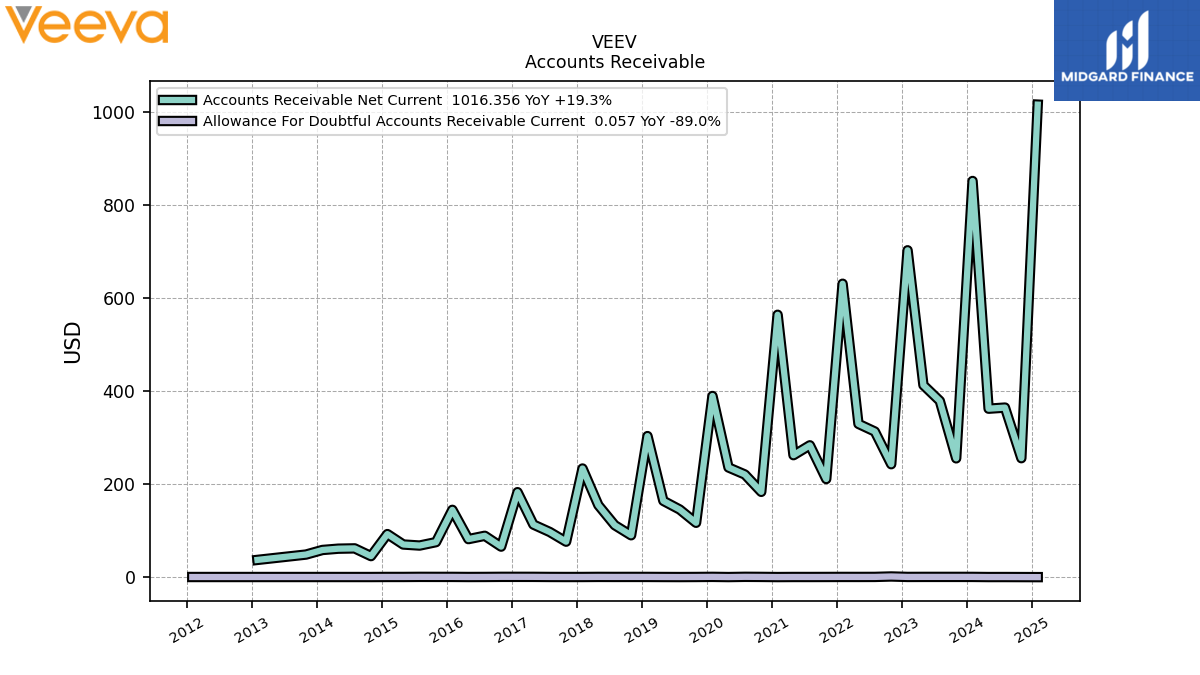
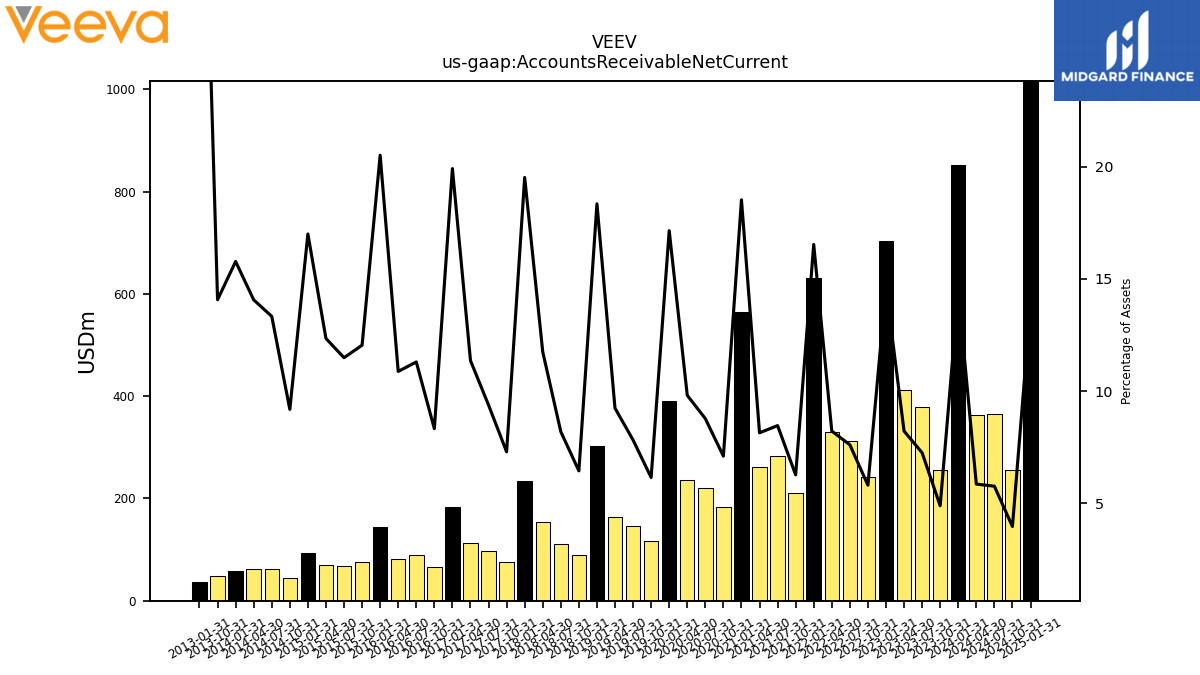
| Accounts Receivable Net Current | 255.50 | 379.07 | 412.94 | 703.05 | 242.86 | 313.22 | 329.68 | 631.13 | 211.05 | 283.62 | 262.33 | 564.39 | 183.44 | 220.80 | 235.92 | 389.69 | 116.87 | 145.46 | 164.11 | 303.46 | 90.05 | 111.80 | 154.84 | 233.73 | 76.29 | 97.15 | 113.12 | 182.82 | 65.65 | 88.96 | 81.78 | 144.80 | 75.30 | 67.98 | 70.22 | 92.66 | 45.24 | 61.90 | 61.22 | 58.43 | 48.60 | NA | NA | 37.09 | NA | NA | NA | |
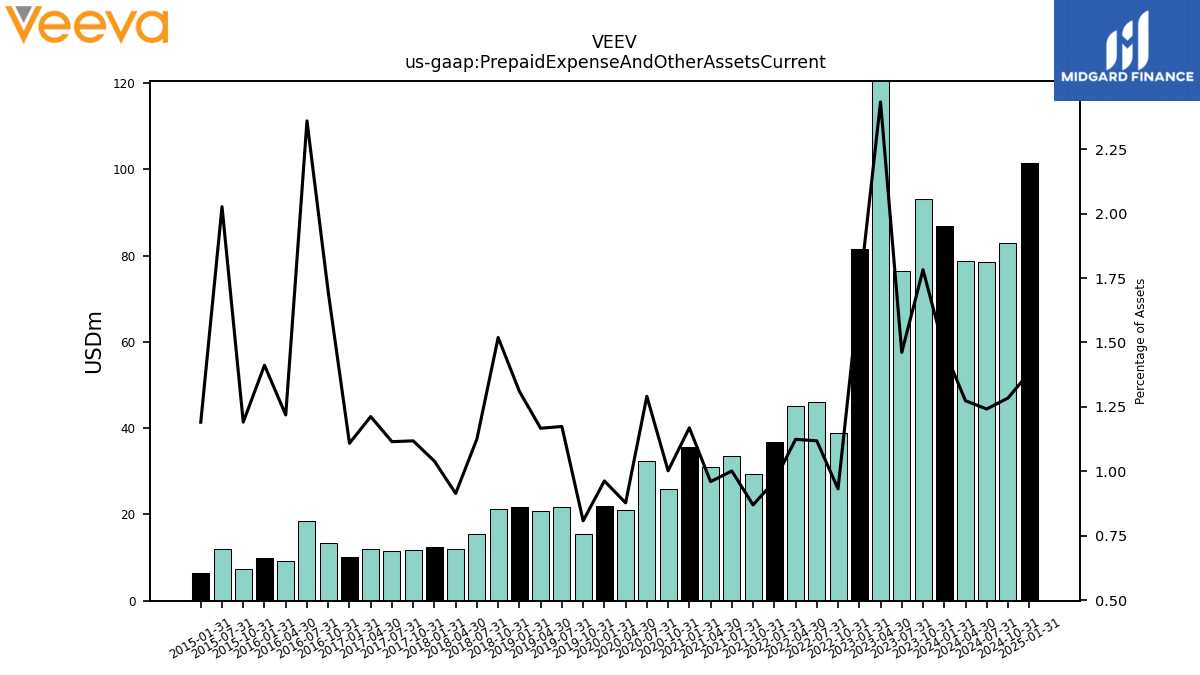
| Prepaid Expense And Other Assets Current | 93.14 | 76.41 | 122.22 | 81.46 | 38.99 | 46.04 | 45.09 | 36.68 | 29.29 | 33.56 | 30.94 | 35.61 | 25.89 | 32.49 | 21.11 | 21.87 | 15.36 | 21.84 | 20.73 | 21.67 | 21.23 | 15.36 | 12.04 | 12.44 | 11.70 | 11.55 | 12.07 | 10.18 | 13.37 | 18.57 | 9.16 | 9.96 | 7.45 | 11.99 | NA | 6.49 | NA | NA | NA | NA | NA | NA | NA | NA | NA | NA | NA |
| 2023-10-31 | 2023-07-31 | 2023-04-30 | 2023-01-31 | 2022-10-31 | 2022-07-31 | 2022-04-30 | 2022-01-31 | 2021-10-31 | 2021-07-31 | 2021-04-30 | 2021-01-31 | 2020-10-31 | 2020-07-31 | 2020-04-30 | 2020-01-31 | 2019-10-31 | 2019-07-31 | 2019-04-30 | 2019-01-31 | 2018-10-31 | 2018-07-31 | 2018-04-30 | 2018-01-31 | 2017-10-31 | 2017-07-31 | 2017-04-30 | 2017-01-31 | 2016-10-31 | 2016-07-31 | 2016-04-30 | 2016-01-31 | 2015-10-31 | 2015-07-31 | 2015-04-30 | 2015-01-31 | 2014-10-31 | 2014-07-31 | 2014-04-30 | 2014-01-31 | 2013-10-31 | 2013-07-31 | 2013-04-30 | 2013-01-31 | 2012-10-31 | 2012-07-31 | 2012-04-30 | ||
|---|---|---|---|---|---|---|---|---|---|---|---|---|---|---|---|---|---|---|---|---|---|---|---|---|---|---|---|---|---|---|---|---|---|---|---|---|---|---|---|---|---|---|---|---|---|---|---|---|
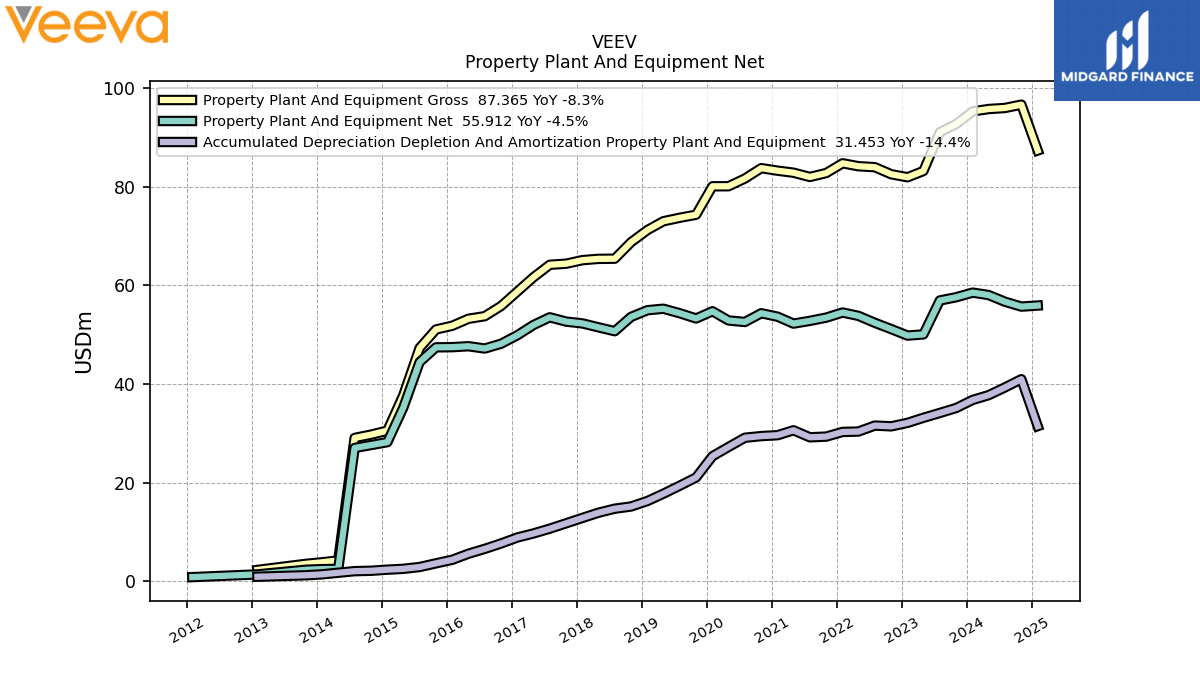
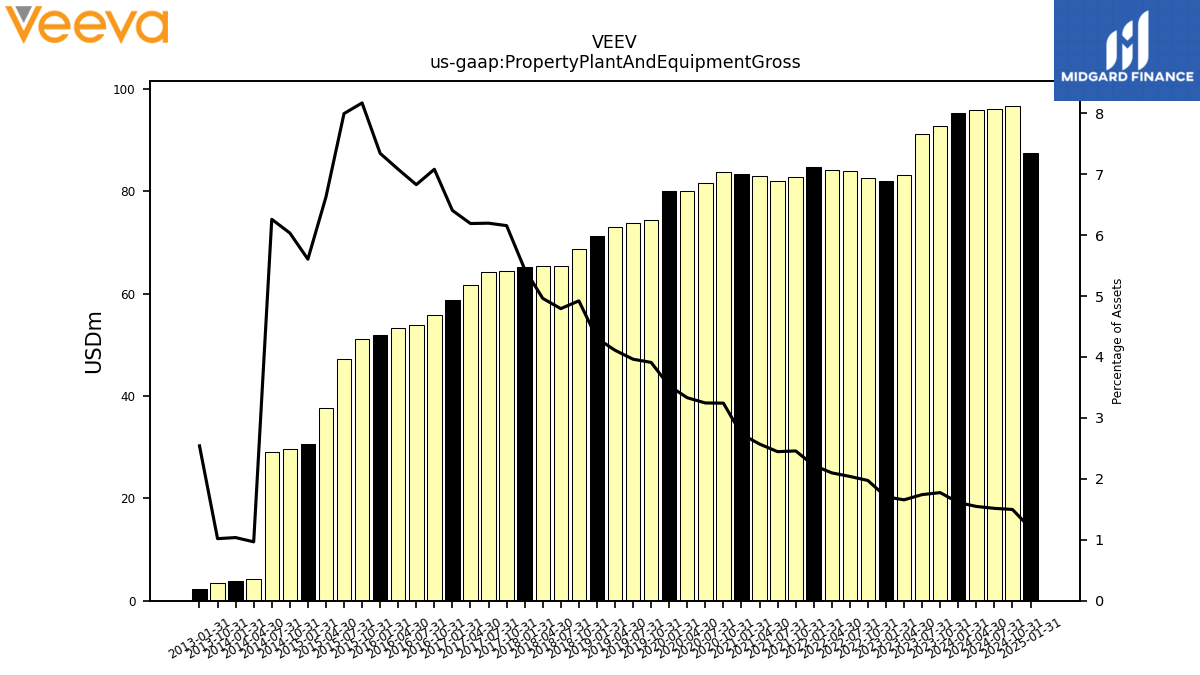
| Property Plant And Equipment Gross | 92.73 | 91.06 | 83.20 | 81.93 | 82.55 | 83.98 | 84.17 | 84.77 | 82.79 | 81.99 | 82.86 | 83.27 | 83.78 | 81.67 | 80.11 | 80.10 | 74.33 | 73.72 | 73.01 | 71.23 | 68.77 | 65.41 | 65.38 | 65.12 | 64.40 | 64.18 | 61.63 | 58.78 | 55.82 | 53.75 | 53.23 | 51.82 | 51.06 | 47.30 | 37.68 | 30.54 | 29.73 | 29.06 | 4.21 | 3.84 | 3.52 | NA | NA | 2.28 | NA | NA | NA | |
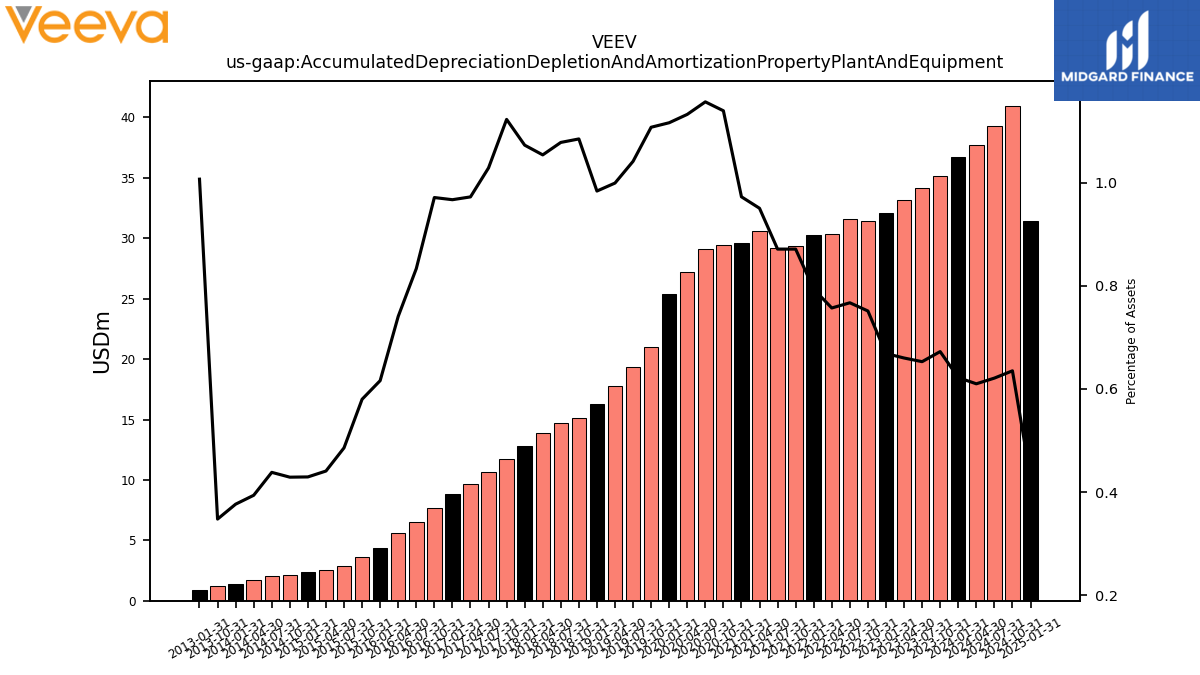
| Accumulated Depreciation Depletion And Amortization Property Plant And Equipment | 35.13 | 34.12 | 33.14 | 32.12 | 31.41 | 31.57 | 30.36 | 30.27 | 29.33 | 29.19 | 30.61 | 29.62 | 29.43 | 29.10 | 27.22 | 25.35 | 21.04 | 19.36 | 17.74 | 16.26 | 15.15 | 14.71 | 13.88 | 12.84 | 11.74 | 10.65 | 9.68 | 8.87 | 7.66 | 6.56 | 5.57 | 4.35 | 3.62 | 2.87 | 2.51 | 2.34 | 2.11 | 2.03 | 1.71 | 1.39 | 1.20 | NA | NA | 0.90 | NA | NA | NA | |
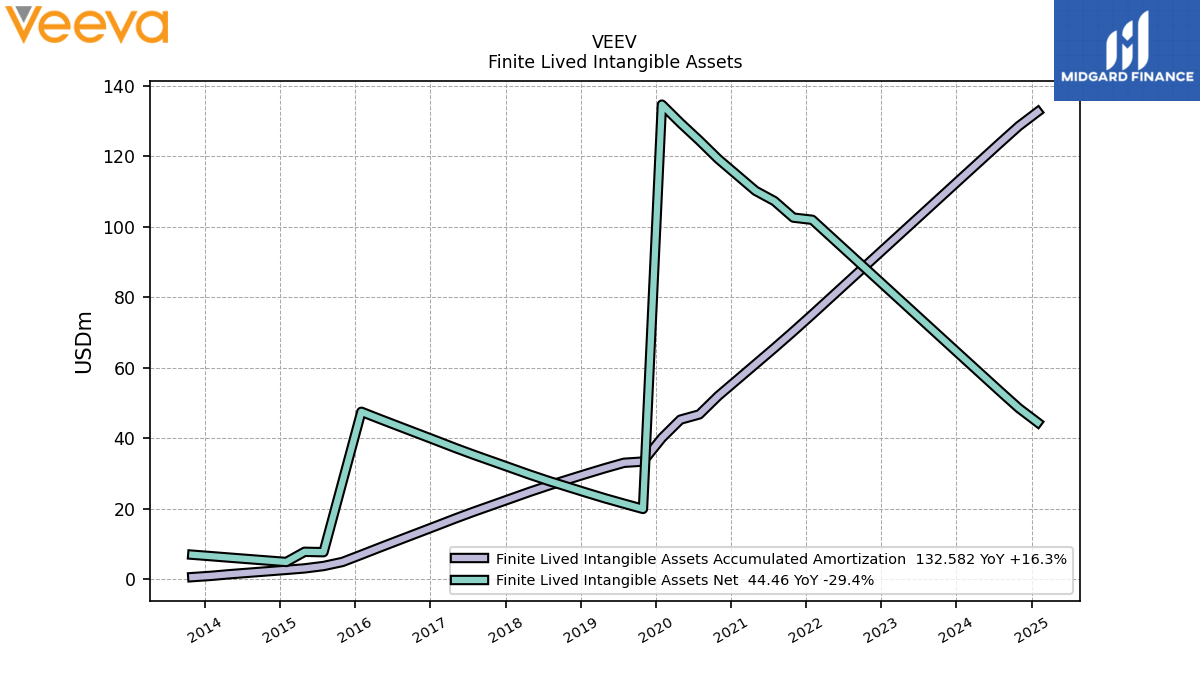
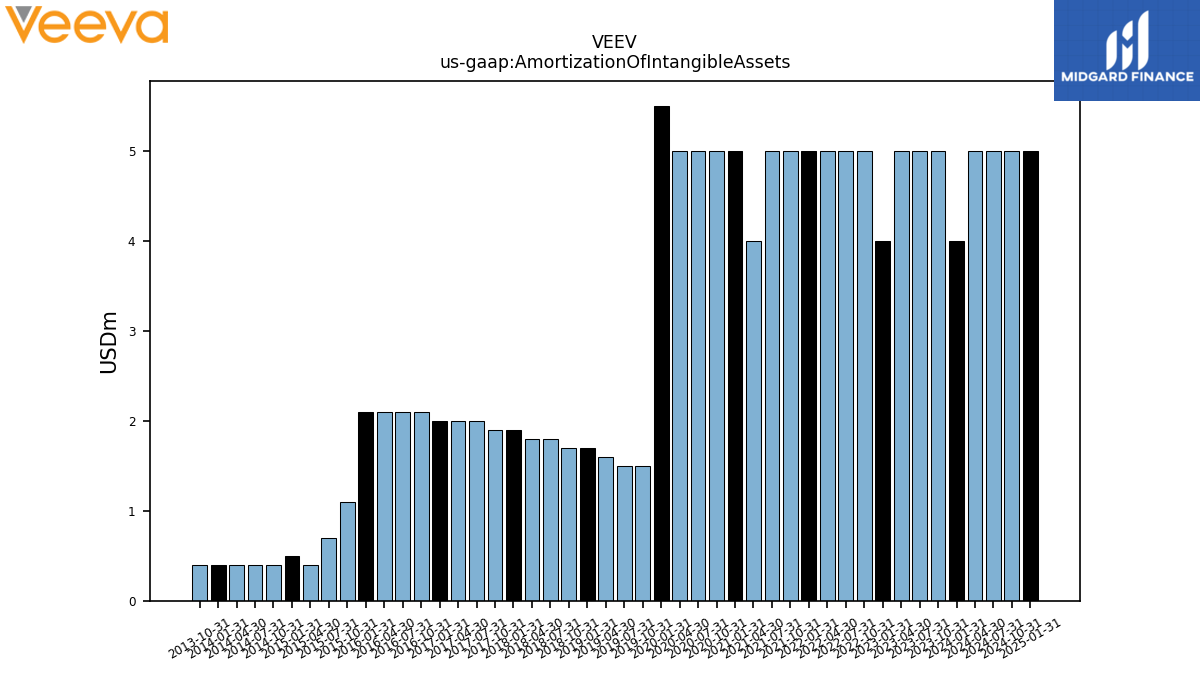
| Amortization Of Intangible Assets | 5.00 | 5.00 | 5.00 | 4.00 | 5.00 | 5.00 | 5.00 | 5.00 | 5.00 | 5.00 | 4.00 | 5.00 | 5.00 | 5.00 | 5.00 | 5.50 | 1.50 | 1.50 | 1.60 | 1.70 | 1.70 | 1.80 | 1.80 | 1.90 | 1.90 | 2.00 | 2.00 | 2.00 | 2.10 | 2.10 | 2.10 | 2.10 | 1.10 | 0.70 | 0.40 | 0.50 | 0.40 | 0.40 | 0.40 | 0.40 | 0.40 | NA | NA | NA | NA | NA | NA | |
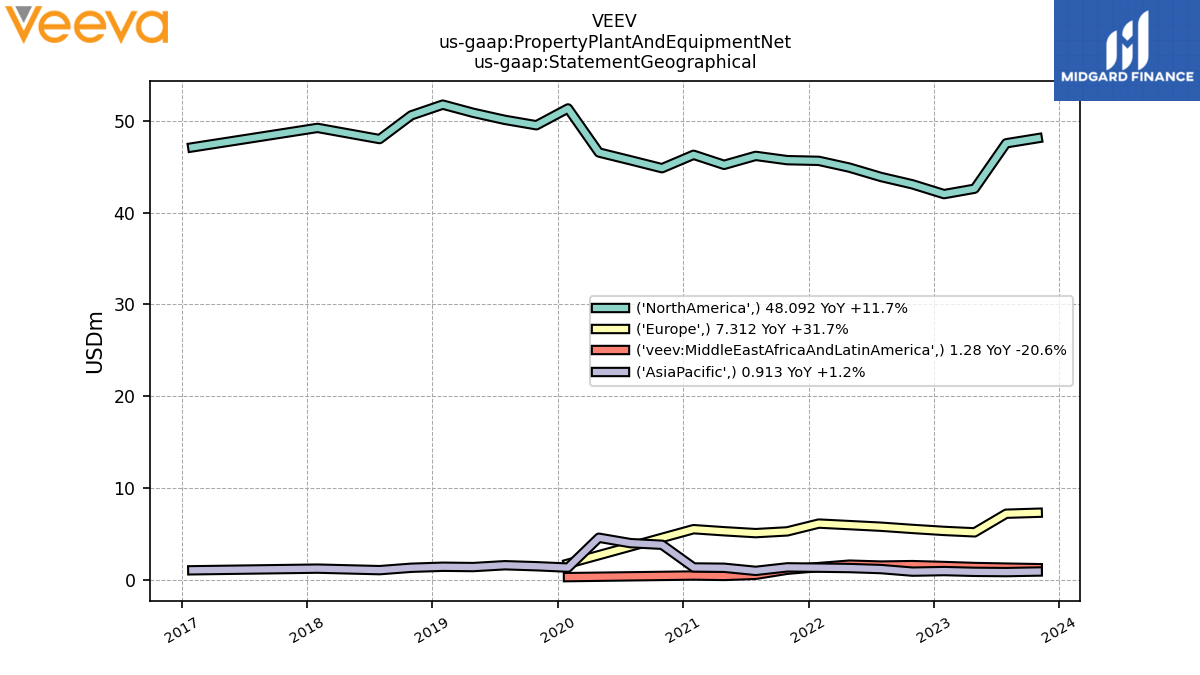
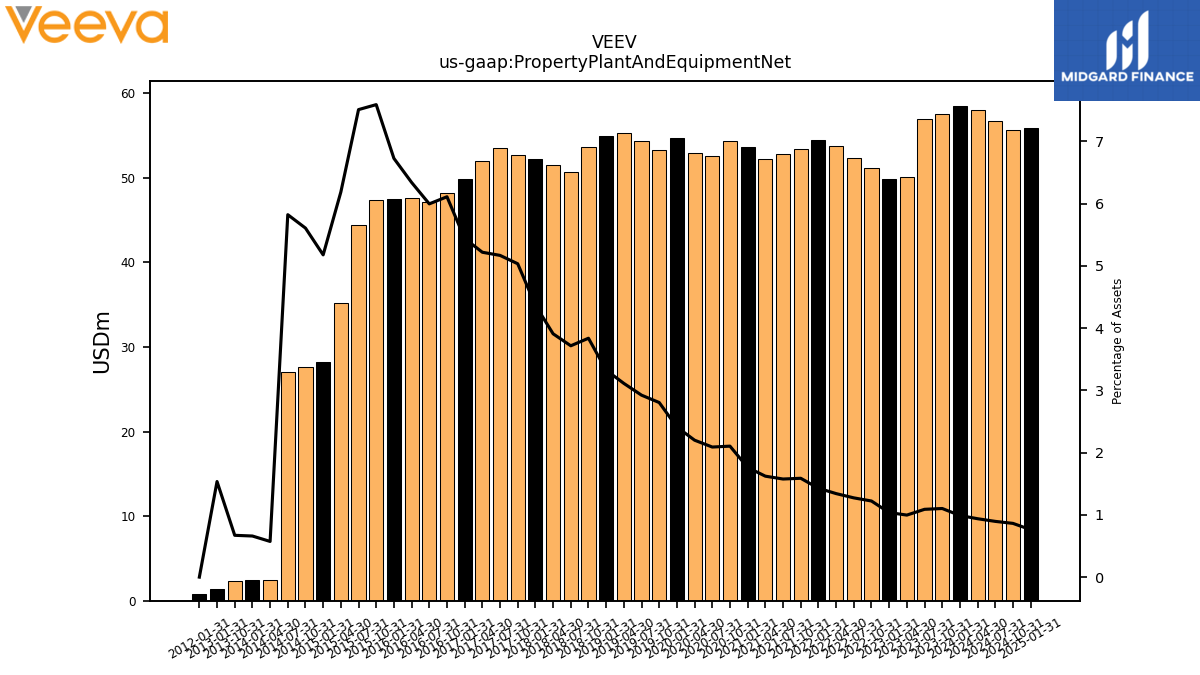
| Property Plant And Equipment Net | 57.60 | 56.94 | 50.06 | 49.82 | 51.13 | 52.41 | 53.82 | 54.49 | 53.46 | 52.80 | 52.25 | 53.65 | 54.35 | 52.58 | 52.89 | 54.75 | 53.29 | 54.35 | 55.27 | 54.97 | 53.61 | 50.70 | 51.50 | 52.28 | 52.66 | 53.53 | 51.95 | 49.91 | 48.17 | 47.20 | 47.66 | 47.47 | 47.43 | 44.42 | 35.17 | 28.20 | 27.61 | 27.02 | 2.49 | 2.44 | 2.32 | NA | NA | 1.38 | NA | NA | NA | |
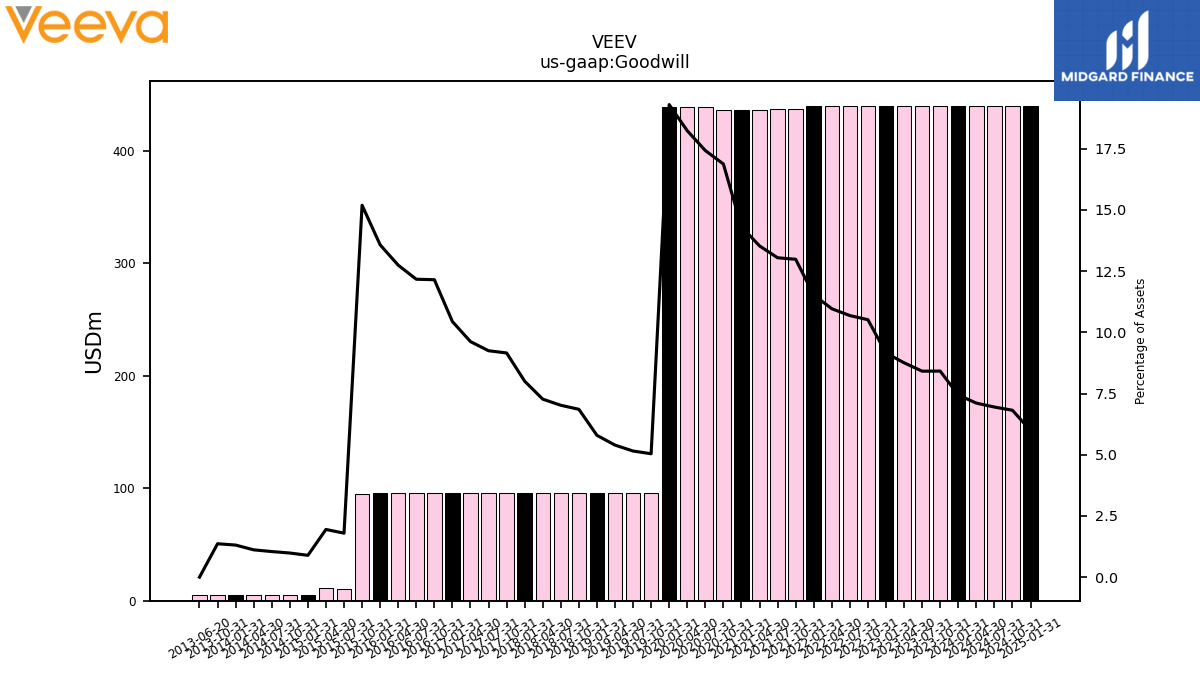
| Goodwill | 439.88 | 439.88 | 439.88 | 439.88 | 439.88 | 439.88 | 439.88 | 439.88 | 437.26 | 437.26 | 436.03 | 436.03 | 436.03 | 438.53 | 438.53 | 438.53 | 95.80 | 95.80 | 95.80 | 95.80 | 95.80 | 95.80 | 95.80 | 95.80 | 95.80 | 95.80 | 95.80 | 95.80 | 95.80 | 95.80 | 95.80 | 95.80 | 94.96 | 10.62 | 11.07 | 4.85 | 4.85 | 4.85 | 4.85 | 4.85 | 4.71 | NA | NA | NA | NA | NA | NA | |
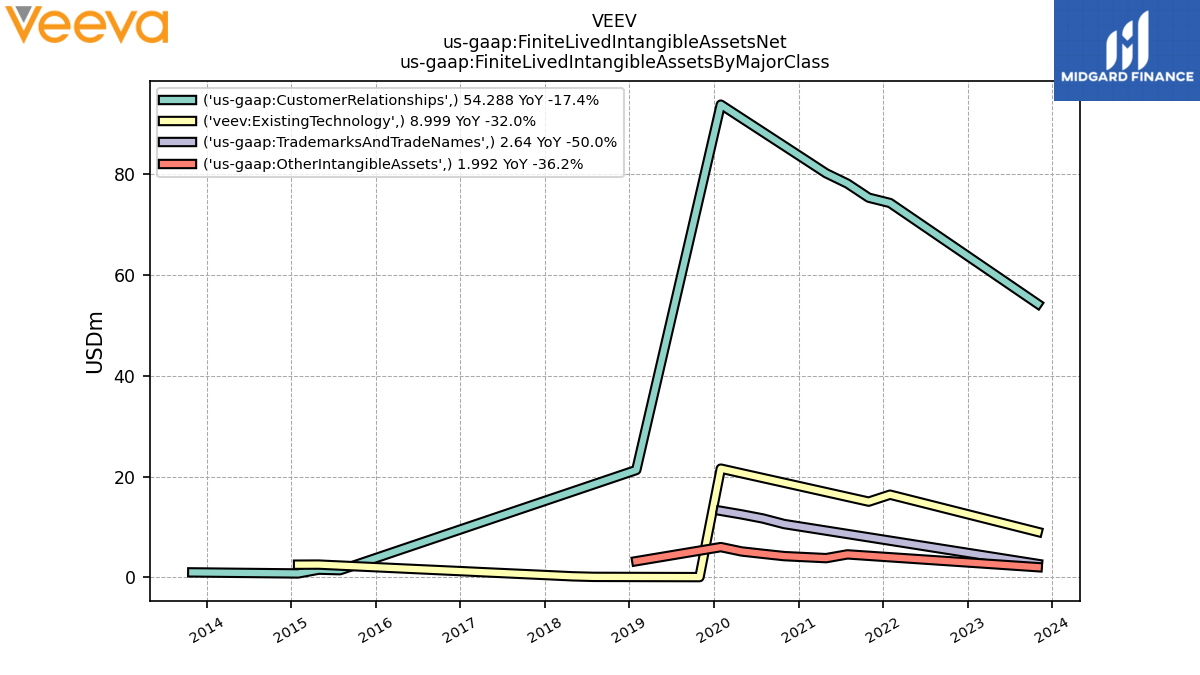
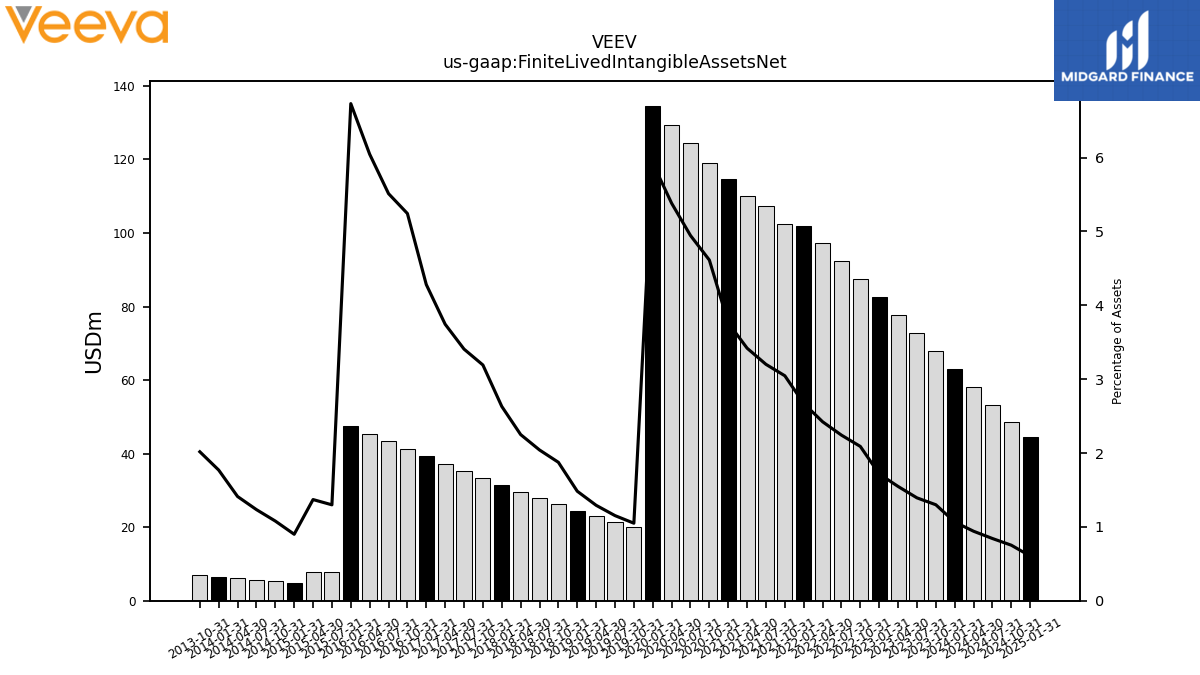
| Finite Lived Intangible Assets Net | 67.92 | 72.83 | 77.73 | 82.48 | 87.38 | 92.29 | 97.19 | 101.94 | 102.56 | 107.25 | 110.17 | 114.59 | 119.17 | 124.42 | 129.40 | 134.60 | 19.95 | 21.44 | 22.95 | 24.52 | 26.19 | 27.85 | 29.64 | 31.49 | 33.39 | 35.29 | 37.27 | 39.28 | 41.33 | 43.39 | 45.45 | 47.50 | NA | 7.68 | 7.79 | 4.90 | 5.31 | 5.73 | 6.14 | 6.55 | 6.96 | NA | NA | NA | NA | NA | NA | |
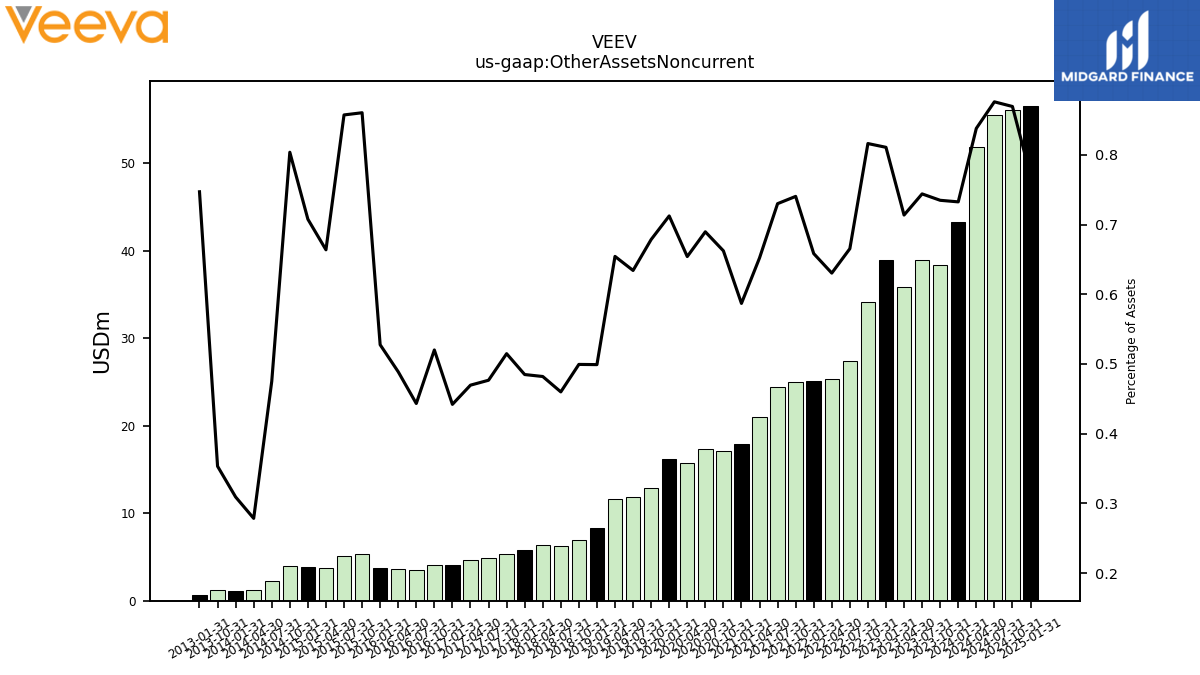
| Other Assets Noncurrent | 38.40 | 38.90 | 35.85 | 38.95 | 34.14 | 27.39 | 25.29 | 25.13 | 24.93 | 24.46 | 21.01 | 17.88 | 17.11 | 17.35 | 15.73 | 16.18 | 12.89 | 11.79 | 11.62 | 8.25 | 6.98 | 6.28 | 6.35 | 5.80 | 5.39 | 4.94 | 4.68 | 4.06 | 4.10 | 3.49 | 3.67 | 3.72 | 5.38 | 5.07 | 3.77 | 3.86 | 3.96 | 2.21 | 1.21 | 1.15 | 1.22 | NA | NA | 0.67 | NA | NA | NA | |
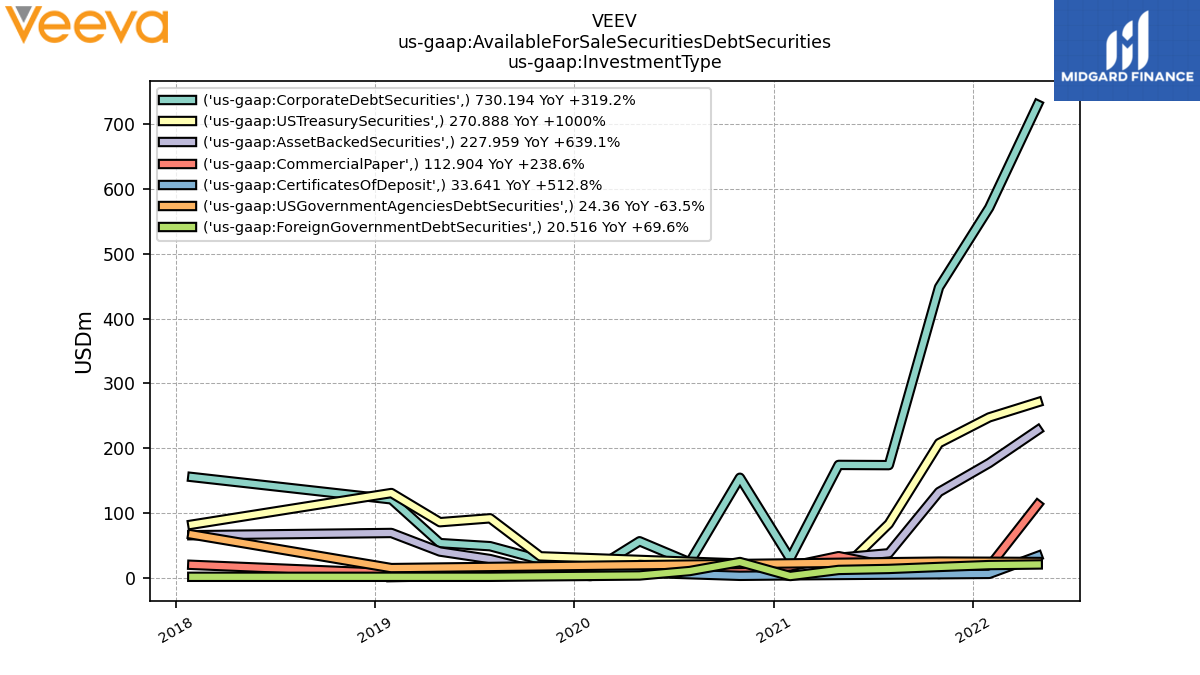
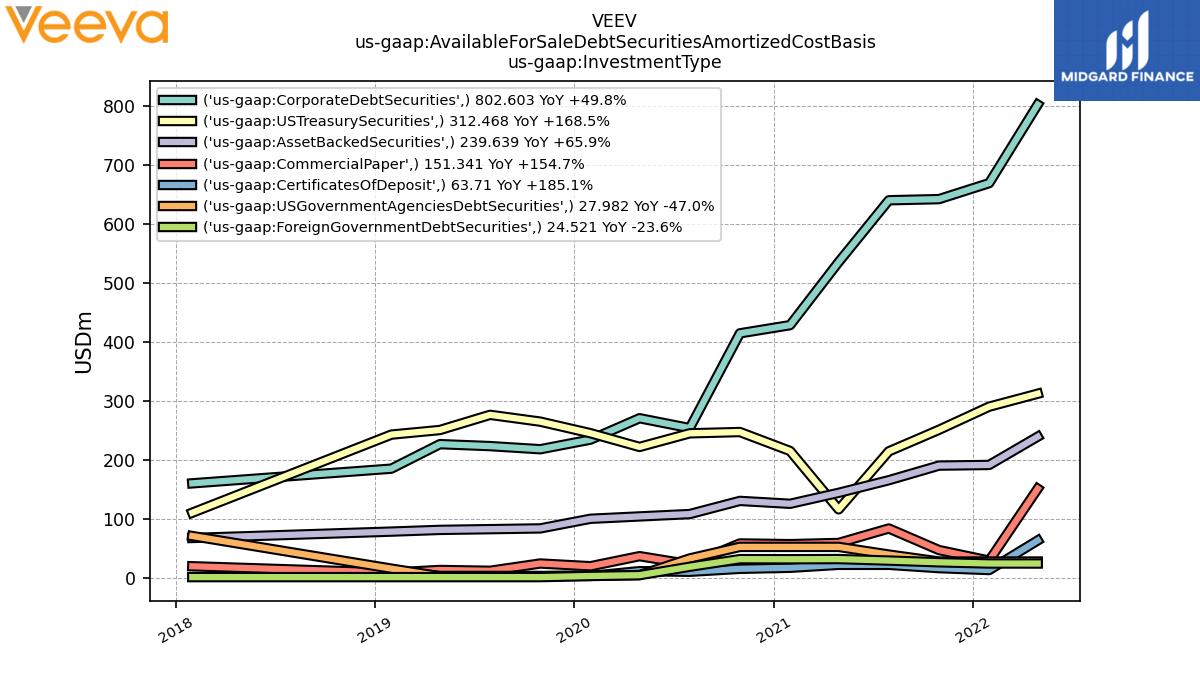
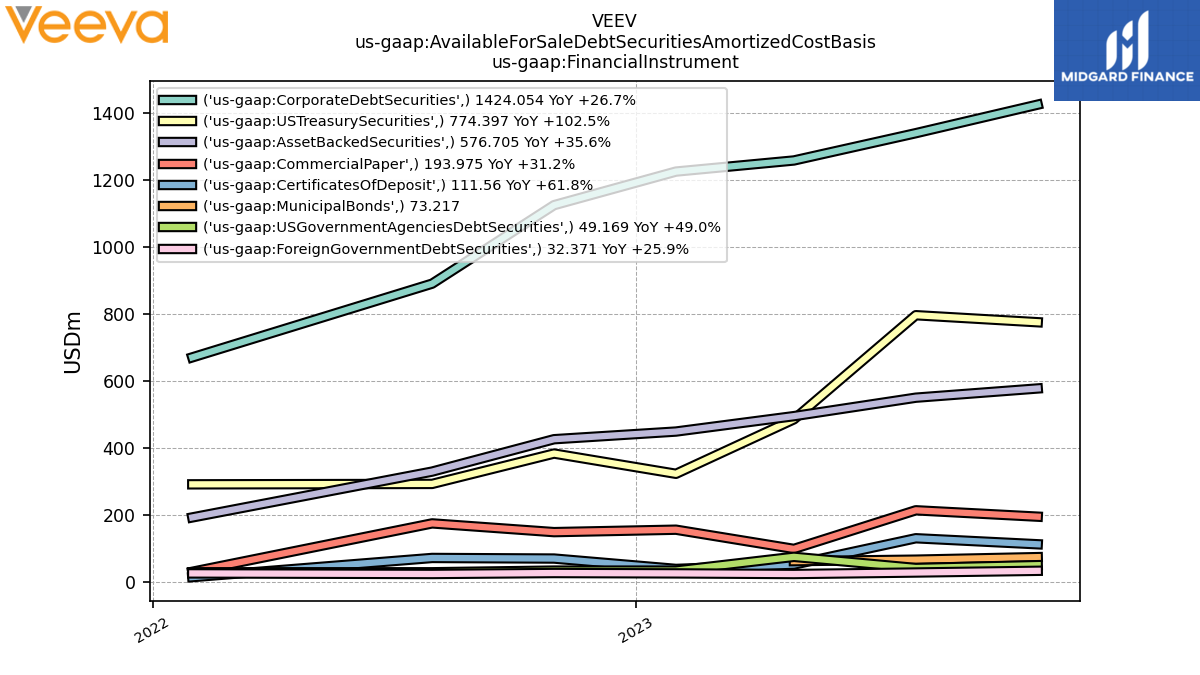
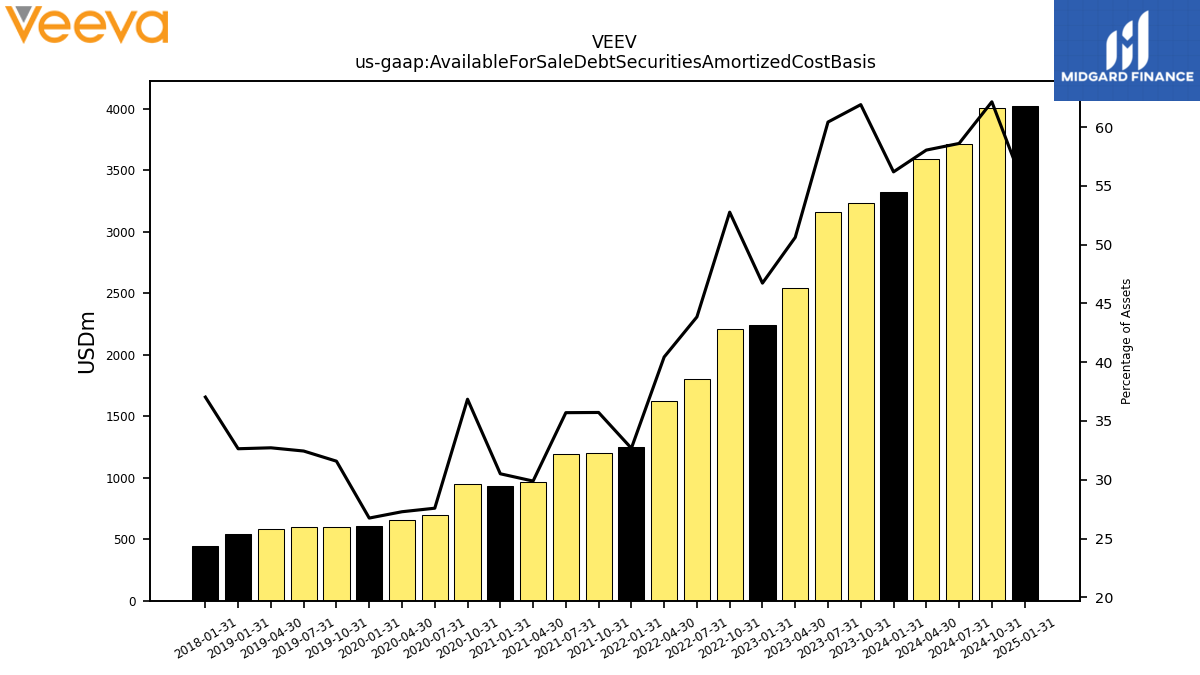
| Available For Sale Debt Securities Amortized Cost Basis | 3235.45 | 3159.52 | 2542.81 | 2244.97 | 2207.00 | 1805.31 | 1622.26 | 1247.16 | 1202.98 | 1196.64 | 963.02 | 929.27 | 952.04 | 693.97 | 655.93 | 607.45 | 600.13 | 603.38 | 581.09 | 539.74 | NA | NA | NA | 443.27 | NA | NA | NA | NA | NA | NA | NA | NA | NA | NA | NA | NA | NA | NA | NA | NA | NA | NA | NA | NA | NA | NA | NA |
| 2023-10-31 | 2023-07-31 | 2023-04-30 | 2023-01-31 | 2022-10-31 | 2022-07-31 | 2022-04-30 | 2022-01-31 | 2021-10-31 | 2021-07-31 | 2021-04-30 | 2021-01-31 | 2020-10-31 | 2020-07-31 | 2020-04-30 | 2020-01-31 | 2019-10-31 | 2019-07-31 | 2019-04-30 | 2019-01-31 | 2018-10-31 | 2018-07-31 | 2018-04-30 | 2018-01-31 | 2017-10-31 | 2017-07-31 | 2017-04-30 | 2017-01-31 | 2016-10-31 | 2016-07-31 | 2016-04-30 | 2016-01-31 | 2015-10-31 | 2015-07-31 | 2015-04-30 | 2015-01-31 | 2014-10-31 | 2014-07-31 | 2014-04-30 | 2014-01-31 | 2013-10-31 | 2013-07-31 | 2013-04-30 | 2013-01-31 | 2012-10-31 | 2012-07-31 | 2012-04-30 | ||
|---|---|---|---|---|---|---|---|---|---|---|---|---|---|---|---|---|---|---|---|---|---|---|---|---|---|---|---|---|---|---|---|---|---|---|---|---|---|---|---|---|---|---|---|---|---|---|---|---|
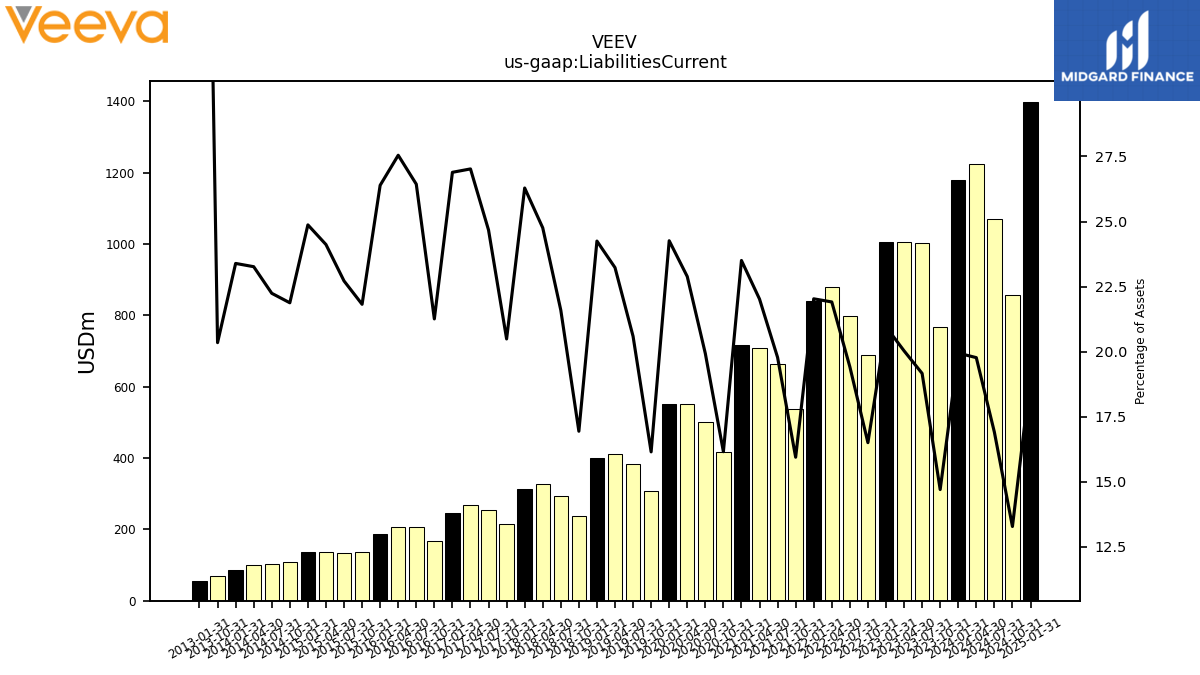
| Liabilities Current | 768.25 | 1001.95 | 1006.30 | 1006.80 | 690.28 | 799.39 | 878.86 | 840.78 | 536.89 | 662.84 | 709.55 | 715.95 | 417.39 | 501.48 | 550.34 | 551.17 | 306.90 | 382.94 | 412.59 | 401.02 | 236.72 | 294.66 | 326.23 | 314.68 | 214.35 | 255.58 | 269.05 | 246.78 | 167.62 | 208.12 | 207.10 | 186.28 | 136.38 | 134.40 | 137.14 | 135.52 | 107.76 | 103.26 | 101.23 | 86.62 | 70.25 | NA | NA | 54.29 | NA | NA | NA | |
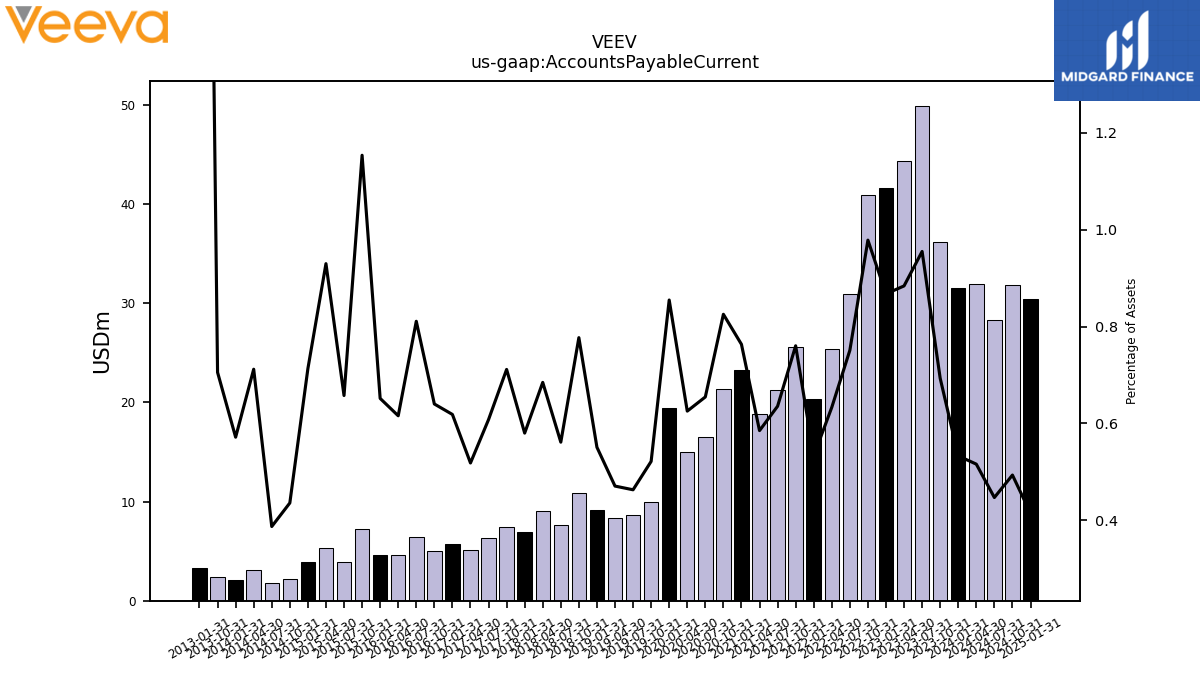
| Accounts Payable Current | 36.24 | 49.93 | 44.40 | 41.68 | 40.93 | 30.91 | 25.40 | 20.35 | 25.61 | 21.30 | 18.86 | 23.25 | 21.32 | 16.48 | 15.04 | 19.42 | 9.91 | 8.61 | 8.36 | 9.11 | 10.86 | 7.66 | 9.02 | 6.94 | 7.44 | 6.30 | 5.16 | 5.68 | 5.05 | 6.38 | 4.63 | 4.60 | 7.21 | 3.89 | 5.29 | 3.89 | 2.15 | 1.80 | 3.10 | 2.12 | 2.44 | NA | NA | 3.34 | NA | NA | NA | |
| Other Accrued Liabilities Current | 18.80 | 16.73 | 16.91 | 16.86 | 18.13 | 15.35 | 16.68 | 17.88 | 15.57 | 15.02 | 13.13 | 9.49 | 10.73 | 7.44 | 8.52 | 9.58 | 5.33 | 5.27 | 5.28 | 6.48 | 3.49 | 3.57 | 4.35 | 3.60 | 4.82 | 4.98 | 5.51 | 4.82 | 3.92 | 3.44 | 2.09 | 4.09 | 3.96 | 3.58 | 3.76 | 3.79 | NA | NA | NA | 4.87 | NA | NA | NA | 1.07 | NA | NA | NA | |
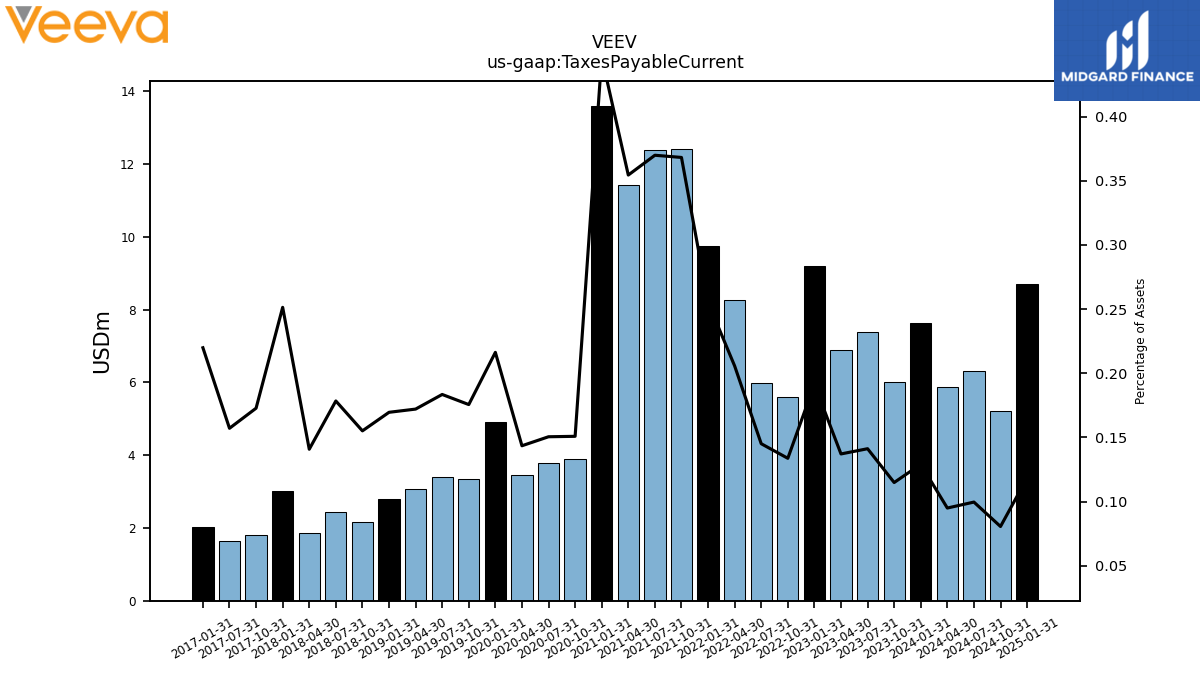
| Taxes Payable Current | 6.00 | 7.38 | 6.89 | 9.20 | 5.60 | 5.97 | 8.25 | 9.74 | 12.40 | 12.39 | 11.42 | 13.60 | 3.90 | 3.79 | 3.45 | 4.91 | 3.34 | 3.41 | 3.06 | 2.81 | 2.17 | 2.44 | 1.86 | 3.01 | 1.81 | 1.63 | NA | 2.02 | NA | NA | NA | NA | NA | NA | NA | NA | NA | NA | NA | NA | NA | NA | NA | NA | NA | NA | NA | |
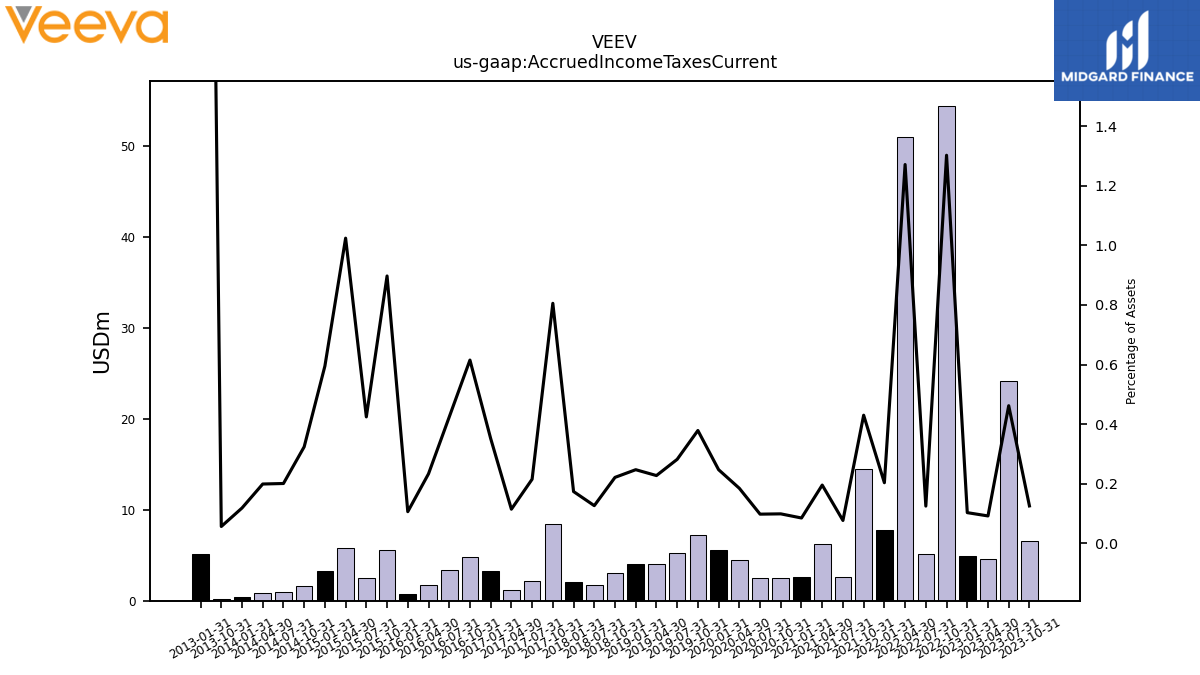
| Accrued Income Taxes Current | 6.56 | 24.14 | 4.62 | 4.95 | 54.47 | 5.14 | 50.98 | 7.76 | 14.48 | 2.57 | 6.30 | 2.59 | 2.56 | 2.46 | 4.44 | 5.61 | 7.20 | 5.24 | 4.04 | 4.09 | 3.09 | 1.73 | NA | 2.08 | 8.43 | 2.23 | 1.14 | 3.23 | 4.85 | 3.34 | 1.75 | 0.75 | 5.61 | 2.51 | 5.82 | 3.24 | 1.59 | 0.93 | 0.87 | 0.44 | 0.20 | NA | NA | 5.18 | NA | NA | NA | |
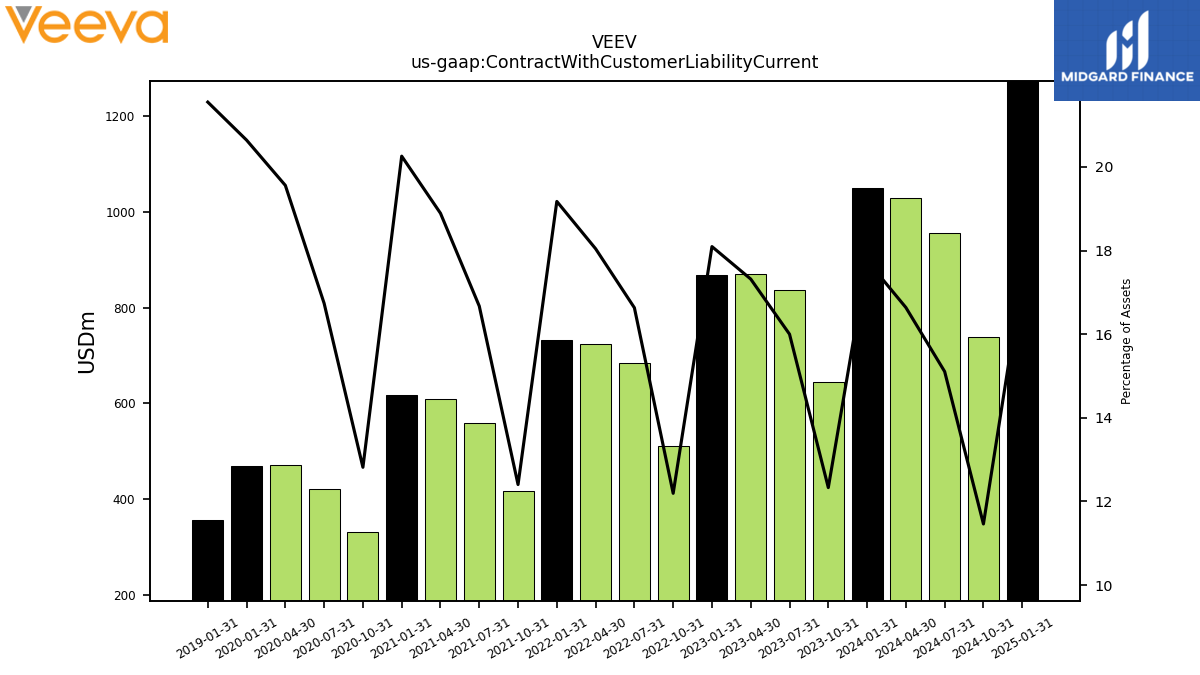
| Contract With Customer Liability Current | 644.46 | 836.50 | 869.92 | 869.28 | 510.10 | 684.64 | 723.72 | 731.75 | 417.75 | 558.72 | 608.67 | 616.99 | 331.17 | 421.17 | 470.26 | 468.89 | NA | NA | NA | 356.36 | NA | NA | NA | NA | NA | NA | NA | NA | NA | NA | NA | NA | NA | NA | NA | NA | NA | NA | NA | NA | NA | NA | NA | NA | NA | NA | NA |
| 2023-10-31 | 2023-07-31 | 2023-04-30 | 2023-01-31 | 2022-10-31 | 2022-07-31 | 2022-04-30 | 2022-01-31 | 2021-10-31 | 2021-07-31 | 2021-04-30 | 2021-01-31 | 2020-10-31 | 2020-07-31 | 2020-04-30 | 2020-01-31 | 2019-10-31 | 2019-07-31 | 2019-04-30 | 2019-01-31 | 2018-10-31 | 2018-07-31 | 2018-04-30 | 2018-01-31 | 2017-10-31 | 2017-07-31 | 2017-04-30 | 2017-01-31 | 2016-10-31 | 2016-07-31 | 2016-04-30 | 2016-01-31 | 2015-10-31 | 2015-07-31 | 2015-04-30 | 2015-01-31 | 2014-10-31 | 2014-07-31 | 2014-04-30 | 2014-01-31 | 2013-10-31 | 2013-07-31 | 2013-04-30 | 2013-01-31 | 2012-10-31 | 2012-07-31 | 2012-04-30 | ||
|---|---|---|---|---|---|---|---|---|---|---|---|---|---|---|---|---|---|---|---|---|---|---|---|---|---|---|---|---|---|---|---|---|---|---|---|---|---|---|---|---|---|---|---|---|---|---|---|---|
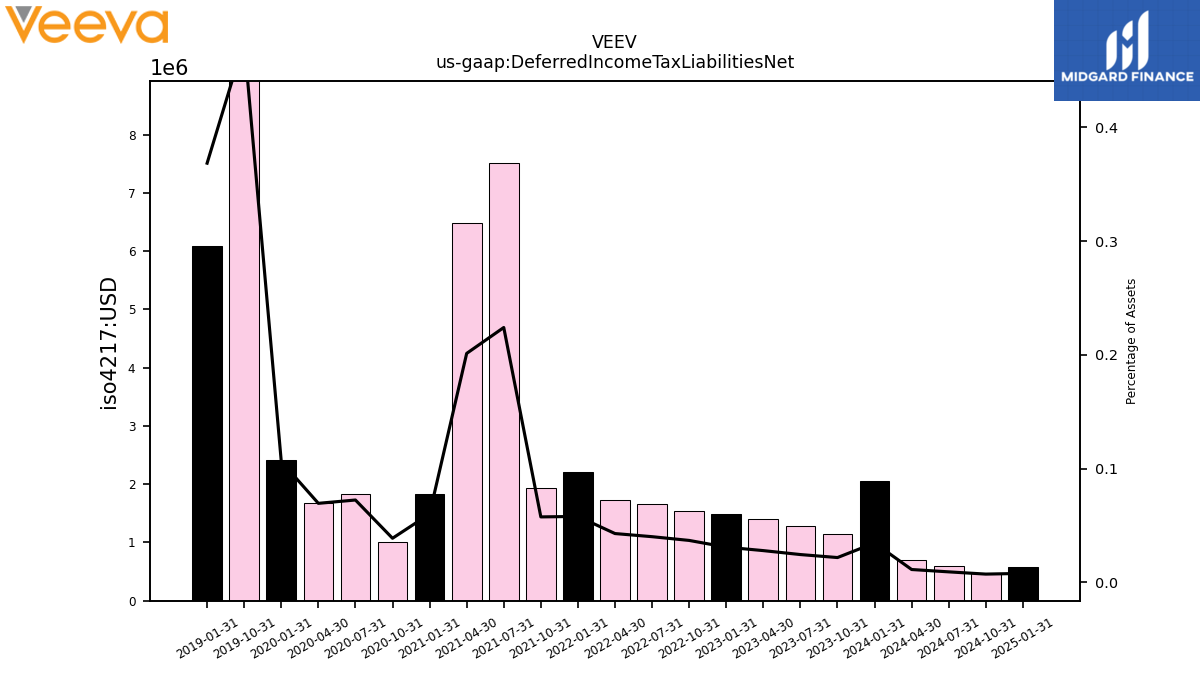
| Deferred Income Tax Liabilities Net | 1.15 | 1.28 | 1.41 | 1.49 | 1.55 | 1.66 | 1.73 | 2.22 | 1.94 | 7.51 | 6.49 | 1.83 | 1.00 | 1.82 | 1.67 | 2.42 | 9.04 | NA | NA | 6.09 | NA | NA | NA | NA | NA | NA | NA | NA | NA | NA | NA | NA | NA | NA | NA | NA | NA | NA | NA | NA | NA | NA | NA | NA | NA | NA | NA | |
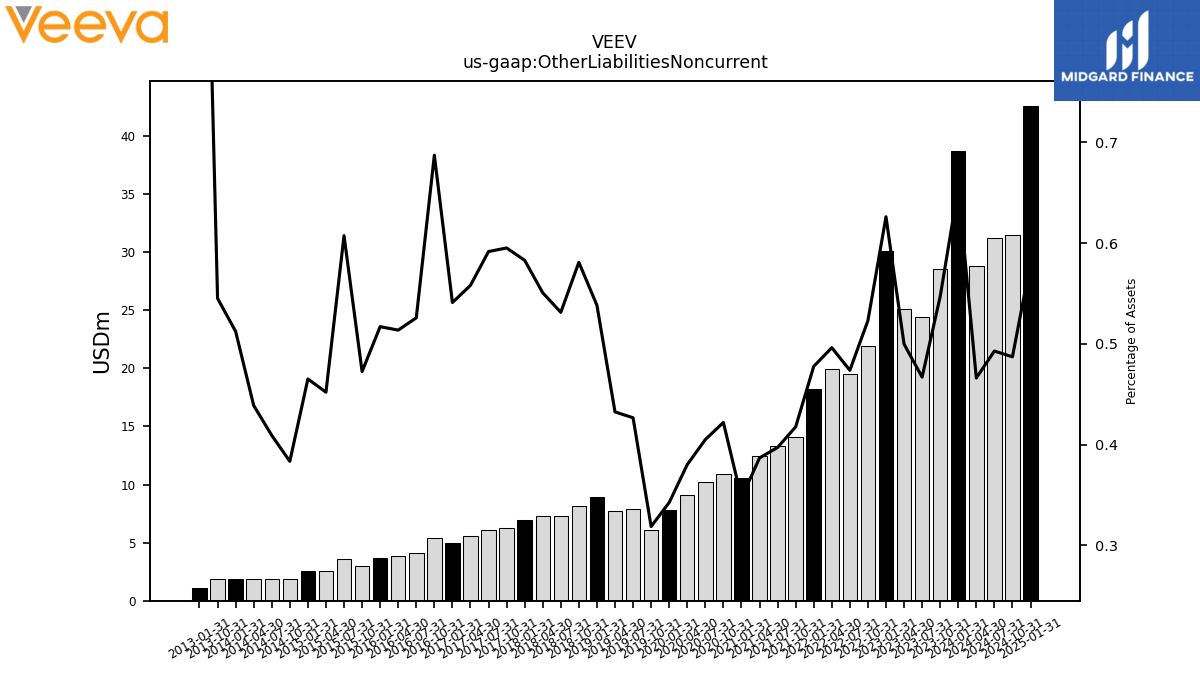
| Other Liabilities Noncurrent | 28.58 | 24.41 | 25.10 | 30.08 | 21.87 | 19.50 | 19.90 | 18.23 | 14.06 | 13.31 | 12.46 | 10.57 | 10.90 | 10.19 | 9.14 | 7.78 | 6.05 | 7.93 | 7.68 | 8.90 | 8.12 | 7.25 | 7.25 | 6.98 | 6.23 | 6.13 | 5.56 | 4.96 | 5.42 | 4.14 | 3.86 | 3.65 | 2.95 | 3.59 | 2.57 | 2.53 | 1.89 | 1.90 | 1.91 | 1.90 | 1.88 | NA | NA | 1.12 | NA | NA | NA | |
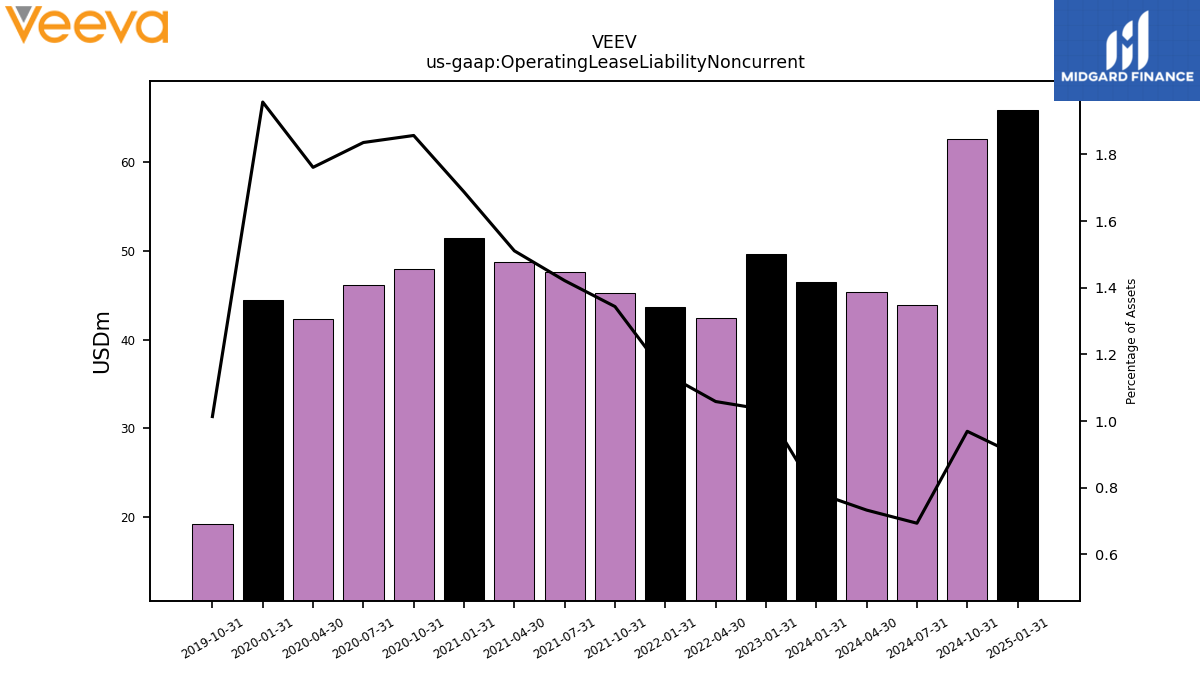
| Operating Lease Liability Noncurrent | NA | NA | NA | 49.67 | NA | NA | 42.46 | 43.61 | 45.24 | 47.63 | 48.67 | 51.39 | 47.97 | 46.19 | 42.34 | 44.45 | 19.26 | NA | NA | NA | NA | NA | NA | NA | NA | NA | NA | NA | NA | NA | NA | NA | NA | NA | NA | NA | NA | NA | NA | NA | NA | NA | NA | NA | NA | NA | NA |
| 2023-10-31 | 2023-07-31 | 2023-04-30 | 2023-01-31 | 2022-10-31 | 2022-07-31 | 2022-04-30 | 2022-01-31 | 2021-10-31 | 2021-07-31 | 2021-04-30 | 2021-01-31 | 2020-10-31 | 2020-07-31 | 2020-04-30 | 2020-01-31 | 2019-10-31 | 2019-07-31 | 2019-04-30 | 2019-01-31 | 2018-10-31 | 2018-07-31 | 2018-04-30 | 2018-01-31 | 2017-10-31 | 2017-07-31 | 2017-04-30 | 2017-01-31 | 2016-10-31 | 2016-07-31 | 2016-04-30 | 2016-01-31 | 2015-10-31 | 2015-07-31 | 2015-04-30 | 2015-01-31 | 2014-10-31 | 2014-07-31 | 2014-04-30 | 2014-01-31 | 2013-10-31 | 2013-07-31 | 2013-04-30 | 2013-01-31 | 2012-10-31 | 2012-07-31 | 2012-04-30 | ||
|---|---|---|---|---|---|---|---|---|---|---|---|---|---|---|---|---|---|---|---|---|---|---|---|---|---|---|---|---|---|---|---|---|---|---|---|---|---|---|---|---|---|---|---|---|---|---|---|---|
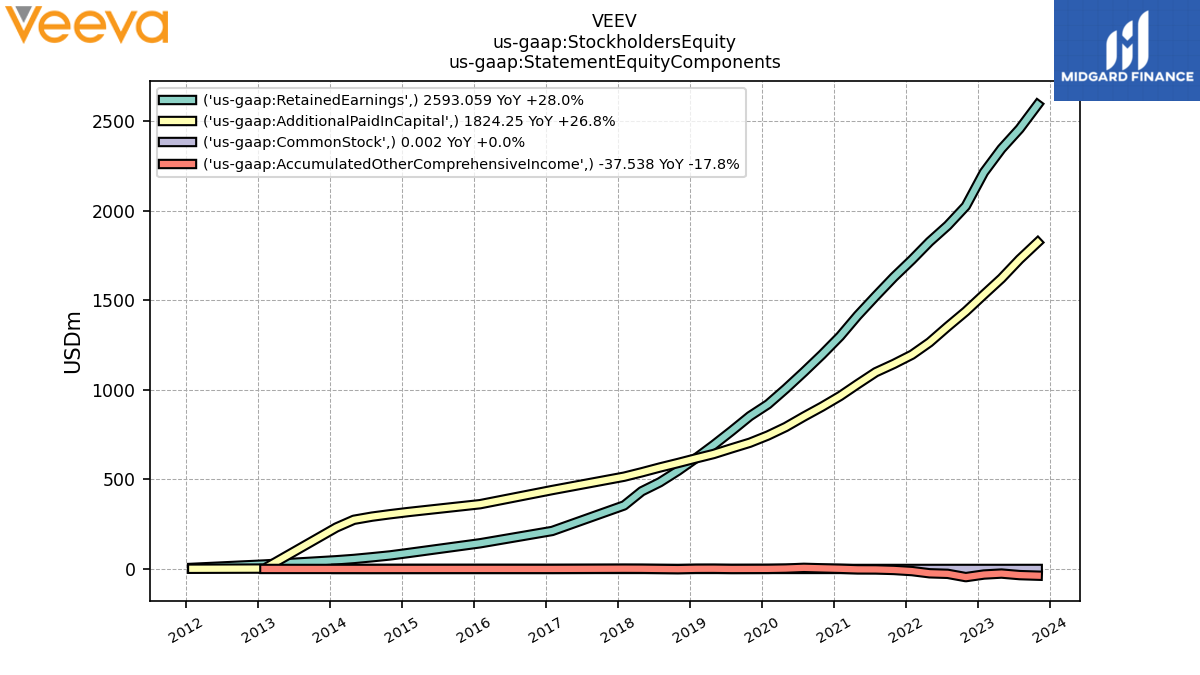
| Stockholders Equity | 4379.77 | 4152.64 | 3943.06 | 3716.25 | 3418.79 | 3243.93 | 3068.28 | 2911.64 | 2769.36 | 2620.10 | 2444.98 | 2266.32 | 2106.38 | 1956.73 | 1801.04 | 1665.59 | 1558.57 | 1445.02 | 1335.10 | 1237.75 | 1138.31 | 1050.38 | 974.44 | 871.53 | 818.47 | 766.60 | 708.90 | 652.98 | 605.90 | 565.11 | 530.55 | 505.25 | 473.98 | 453.64 | 428.95 | 406.83 | 381.21 | 357.39 | 330.29 | 280.10 | 270.65 | NA | NA | 33.97 | NA | NA | NA | |
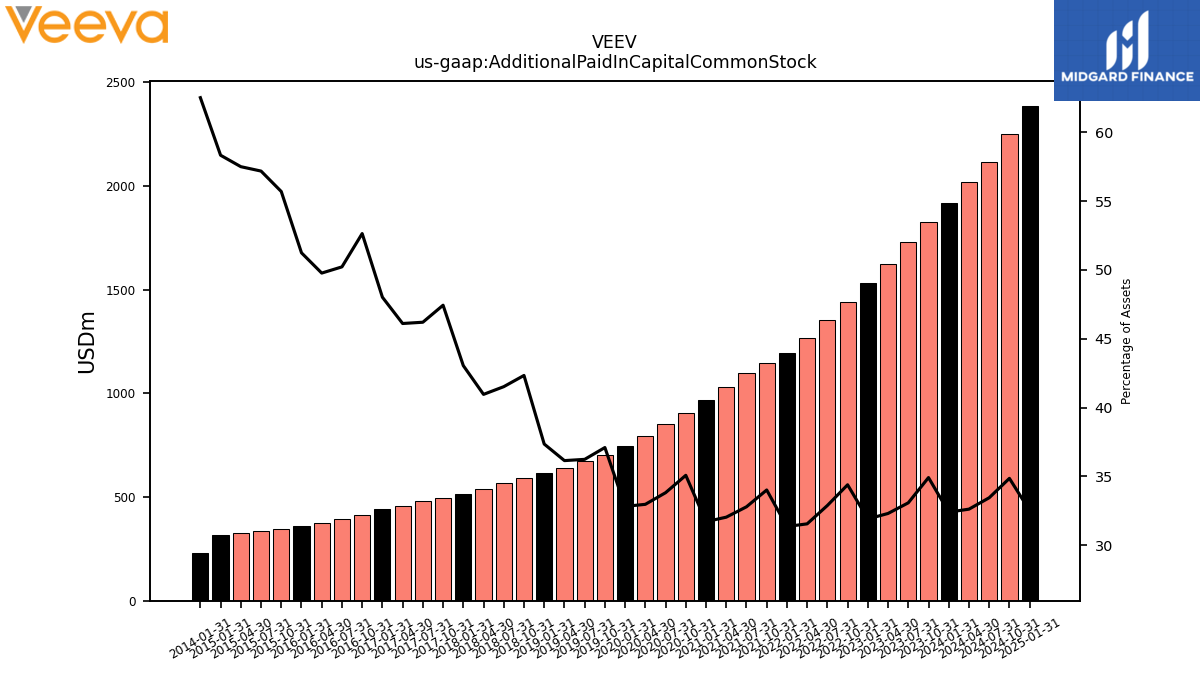
| Additional Paid In Capital Common Stock | 1824.25 | 1729.12 | 1622.55 | 1532.63 | 1438.21 | 1353.50 | 1265.32 | 1196.55 | 1145.15 | 1098.70 | 1032.06 | 965.67 | 906.14 | 850.78 | 792.66 | 745.48 | 704.91 | 673.88 | 641.92 | 617.62 | 591.50 | 566.53 | 539.66 | 515.27 | 496.30 | 478.58 | 459.09 | 440.68 | 415.10 | 395.39 | 374.19 | 361.69 | 348.16 | 338.34 | 327.03 | 317.88 | NA | NA | NA | 231.53 | NA | NA | NA | NA | NA | NA | NA | |
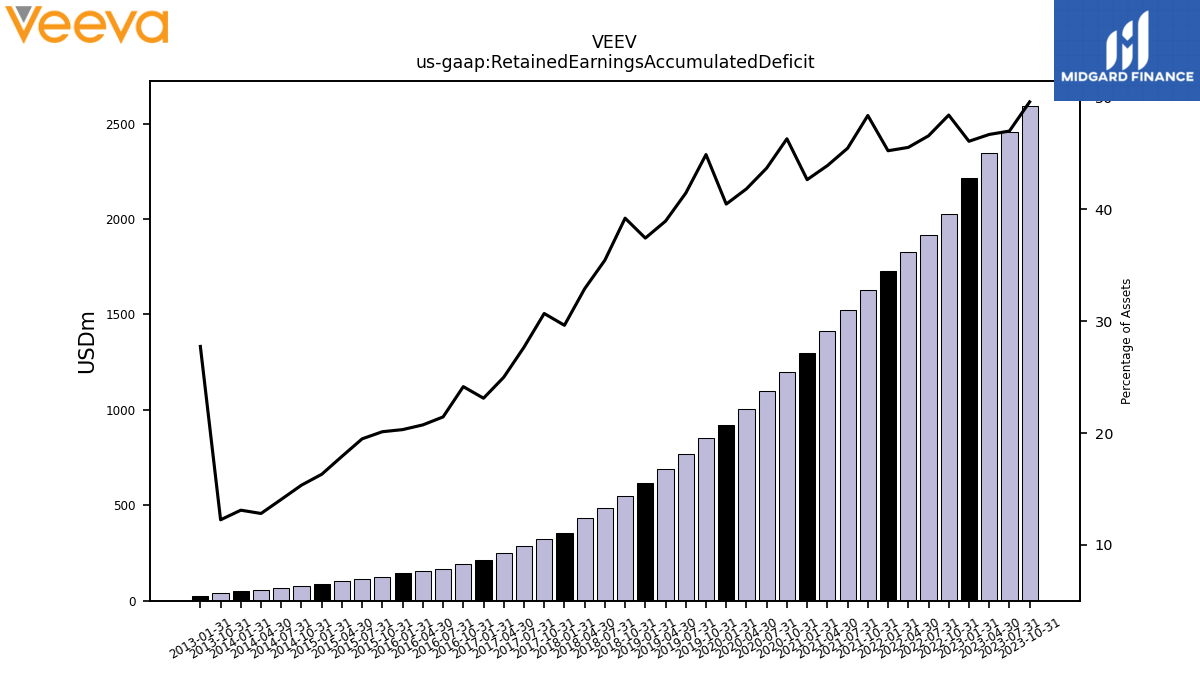
| Retained Earnings Accumulated Deficit | 2593.06 | 2457.90 | 2346.27 | 2214.75 | 2026.22 | 1917.76 | 1827.16 | 1727.05 | 1629.95 | 1524.08 | 1415.22 | 1299.66 | 1196.74 | 1099.78 | 1006.23 | 919.66 | 853.48 | 771.23 | 691.99 | 619.20 | 548.05 | 483.96 | 433.68 | 354.85 | 321.14 | 286.75 | 248.91 | 212.19 | 190.48 | 168.85 | 155.89 | 143.38 | 125.80 | 115.31 | 101.91 | 88.92 | 75.60 | 65.34 | 55.76 | 48.54 | 42.30 | NA | NA | 24.93 | NA | NA | NA | |
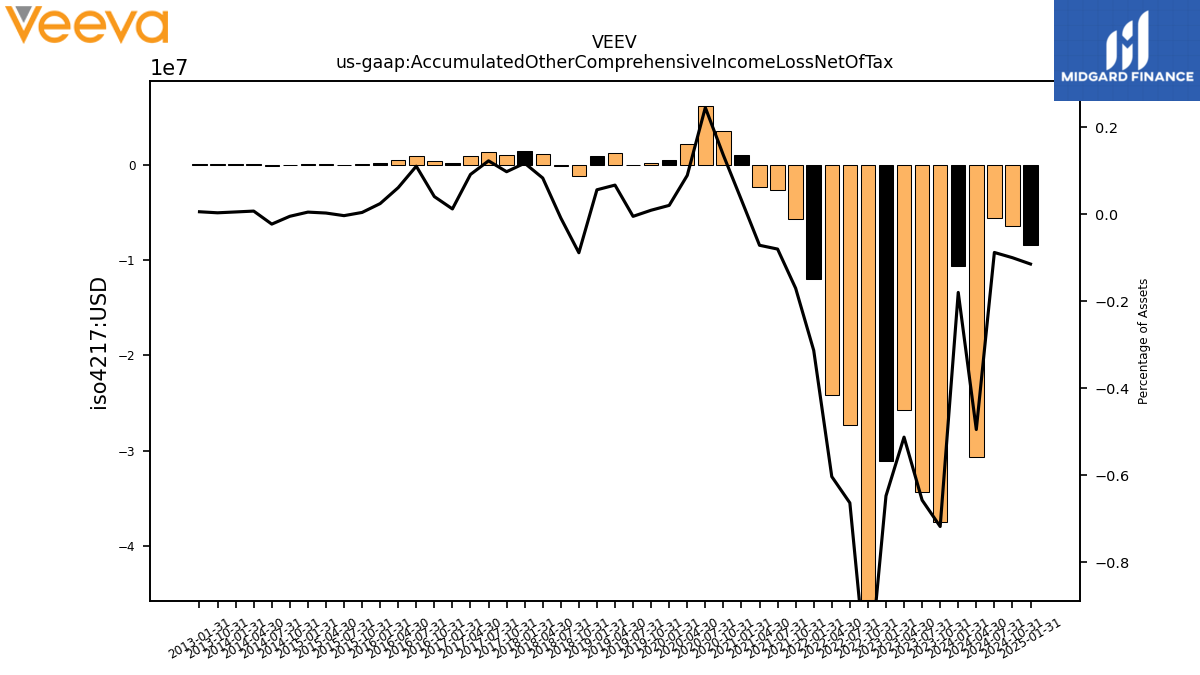
| Accumulated Other Comprehensive Income Loss Net Of Tax | -37.54 | -34.38 | -25.76 | -31.13 | -45.64 | -27.34 | -24.21 | -11.96 | -5.74 | -2.69 | -2.30 | 0.99 | 3.50 | 6.17 | 2.15 | 0.46 | 0.17 | -0.09 | 1.19 | 0.93 | -1.24 | -0.12 | 1.10 | 1.40 | 1.02 | 1.27 | 0.91 | 0.11 | 0.32 | 0.87 | 0.46 | 0.17 | 0.03 | -0.02 | 0.01 | 0.03 | -0.02 | -0.11 | 0.03 | 0.02 | 0.01 | NA | NA | 0.01 | NA | NA | NA | |
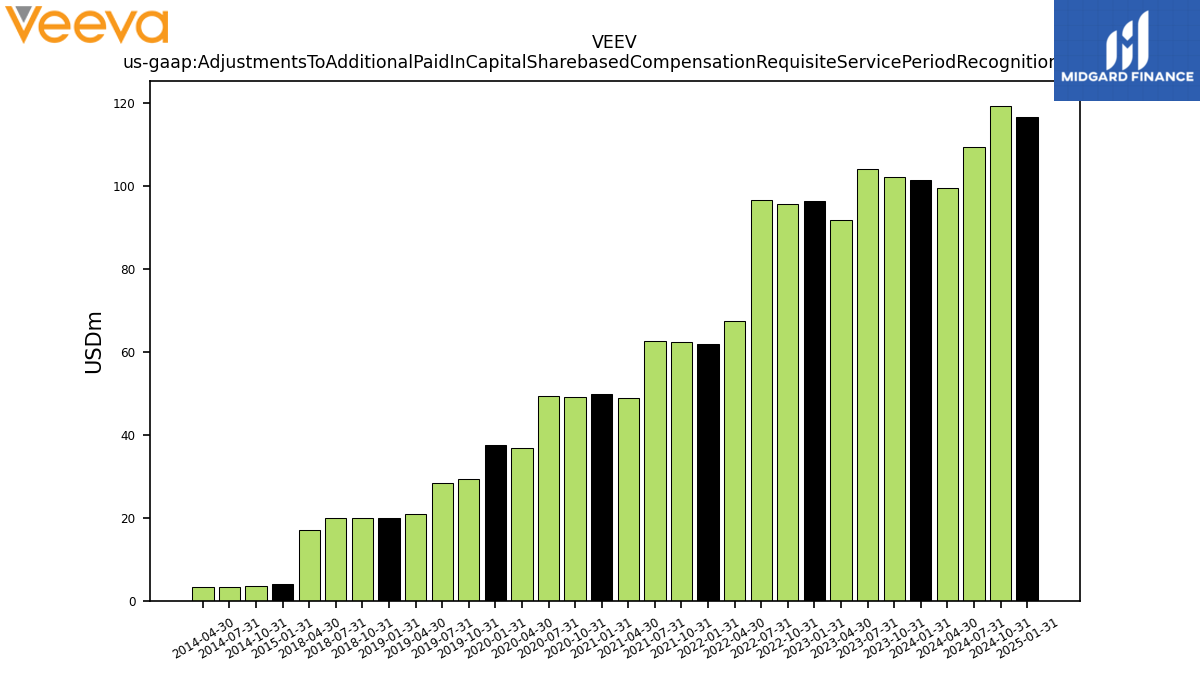
| Adjustments To Additional Paid In Capital Sharebased Compensation Requisite Service Period Recognition Value | 102.17 | 104.17 | 91.67 | 96.38 | 95.62 | 96.69 | 67.39 | 61.95 | 62.31 | 62.68 | 48.79 | 49.93 | 49.18 | 49.37 | 36.91 | 37.51 | 29.45 | 28.48 | 20.86 | 19.86 | 20.04 | 19.83 | 17.06 | NA | NA | NA | NA | NA | NA | NA | NA | NA | NA | NA | NA | 4.10 | 3.59 | 3.40 | 3.29 | NA | NA | NA | NA | NA | NA | NA | NA |
| 2023-10-31 | 2023-07-31 | 2023-04-30 | 2023-01-31 | 2022-10-31 | 2022-07-31 | 2022-04-30 | 2022-01-31 | 2021-10-31 | 2021-07-31 | 2021-04-30 | 2021-01-31 | 2020-10-31 | 2020-07-31 | 2020-04-30 | 2020-01-31 | 2019-10-31 | 2019-07-31 | 2019-04-30 | 2019-01-31 | 2018-10-31 | 2018-07-31 | 2018-04-30 | 2018-01-31 | 2017-10-31 | 2017-07-31 | 2017-04-30 | 2017-01-31 | 2016-10-31 | 2016-07-31 | 2016-04-30 | 2016-01-31 | 2015-10-31 | 2015-07-31 | 2015-04-30 | 2015-01-31 | 2014-10-31 | 2014-07-31 | 2014-04-30 | 2014-01-31 | 2013-10-31 | 2013-07-31 | 2013-04-30 | 2013-01-31 | 2012-10-31 | 2012-07-31 | 2012-04-30 | ||
|---|---|---|---|---|---|---|---|---|---|---|---|---|---|---|---|---|---|---|---|---|---|---|---|---|---|---|---|---|---|---|---|---|---|---|---|---|---|---|---|---|---|---|---|---|---|---|---|---|
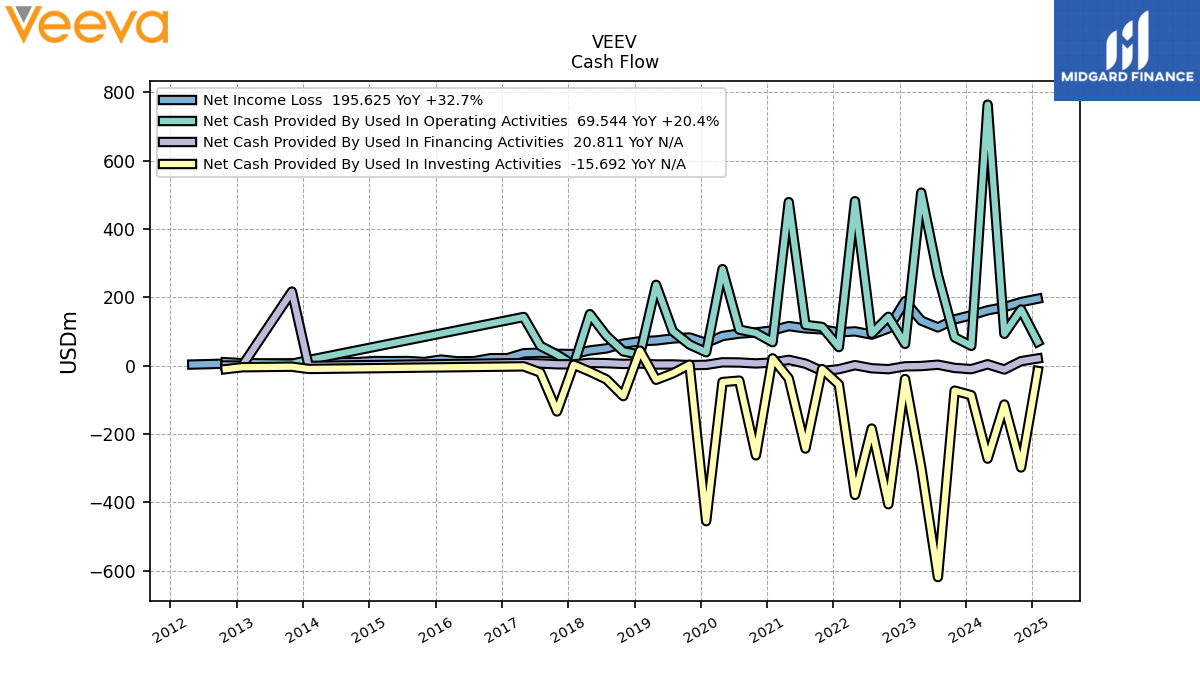
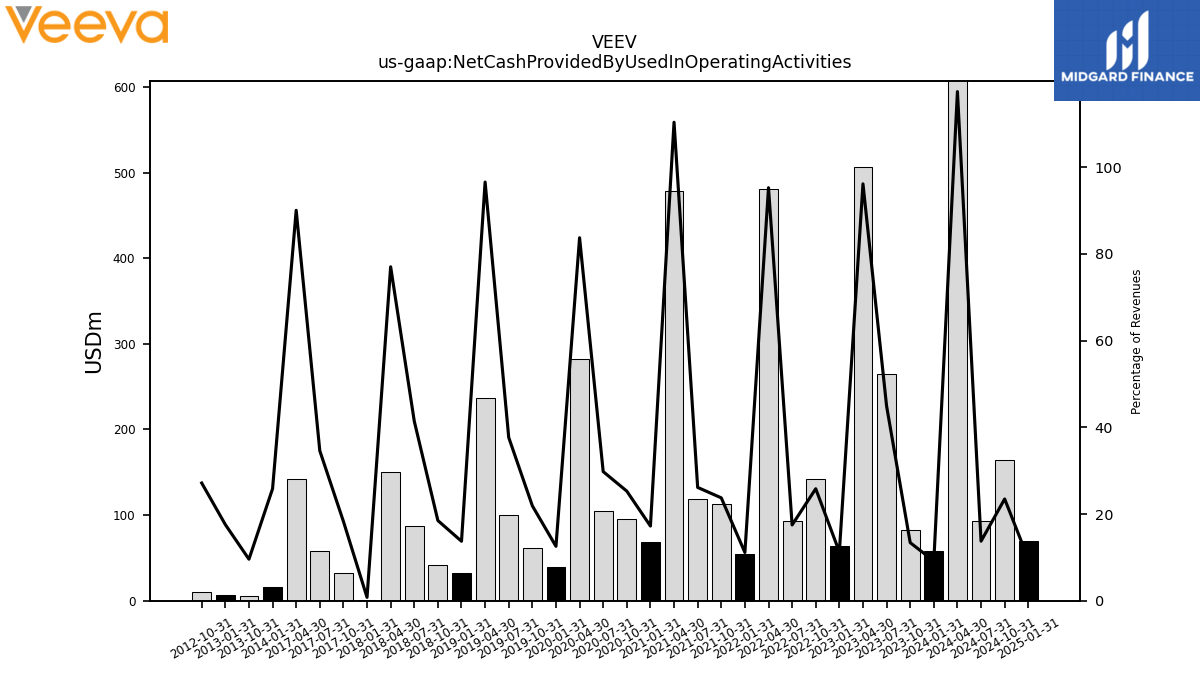
| Net Cash Provided By Used In Operating Activities | 82.60 | 265.04 | 505.94 | 63.40 | 142.66 | 93.39 | 481.03 | 54.05 | 112.96 | 119.06 | 478.38 | 68.35 | 95.40 | 105.32 | 282.17 | 39.11 | 61.50 | 100.47 | 236.29 | 31.87 | 41.56 | 86.81 | 150.59 | 1.44 | 32.23 | 57.61 | 142.16 | NA | NA | NA | NA | NA | NA | NA | NA | NA | NA | NA | NA | 16.23 | 5.27 | NA | NA | 6.99 | 9.72 | NA | NA | |
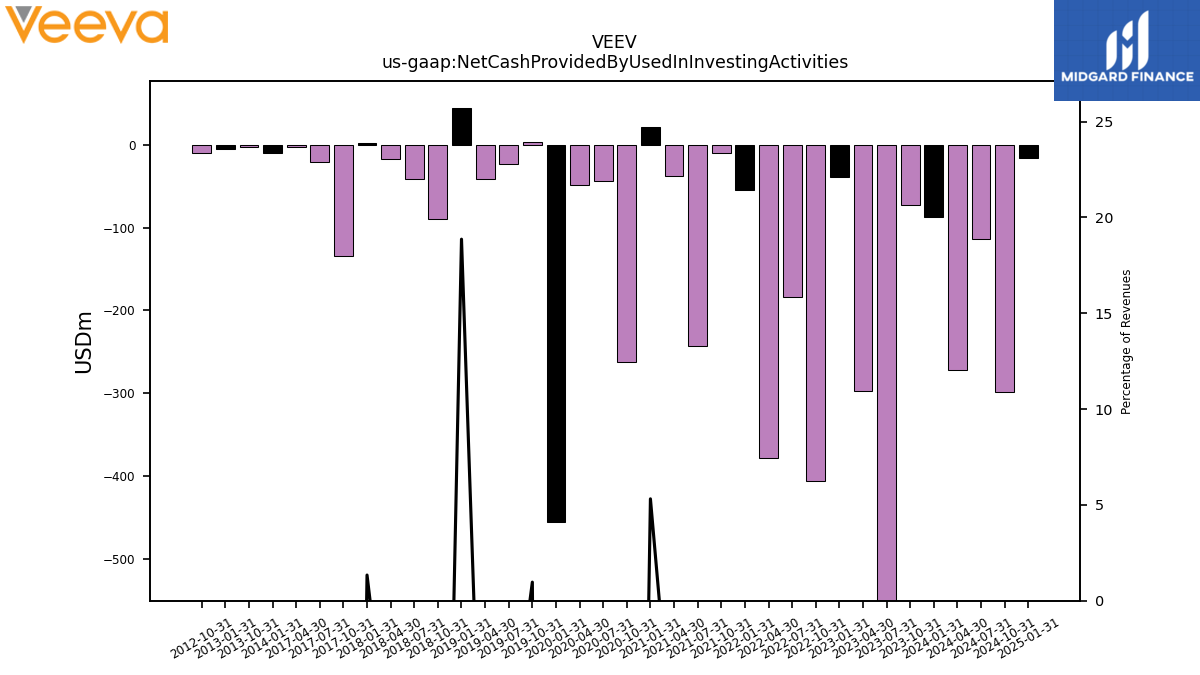
| Net Cash Provided By Used In Investing Activities | -73.32 | -618.93 | -297.39 | -39.26 | -405.73 | -184.21 | -378.49 | -55.16 | -10.23 | -242.81 | -37.95 | 21.09 | -262.59 | -43.93 | -48.21 | -455.30 | 2.73 | -22.80 | -41.54 | 43.82 | -89.36 | -40.77 | -17.56 | 2.48 | -134.40 | -20.30 | -2.30 | NA | NA | NA | NA | NA | NA | NA | NA | NA | NA | NA | NA | -9.87 | -3.25 | NA | NA | -4.81 | -10.47 | NA | NA | |
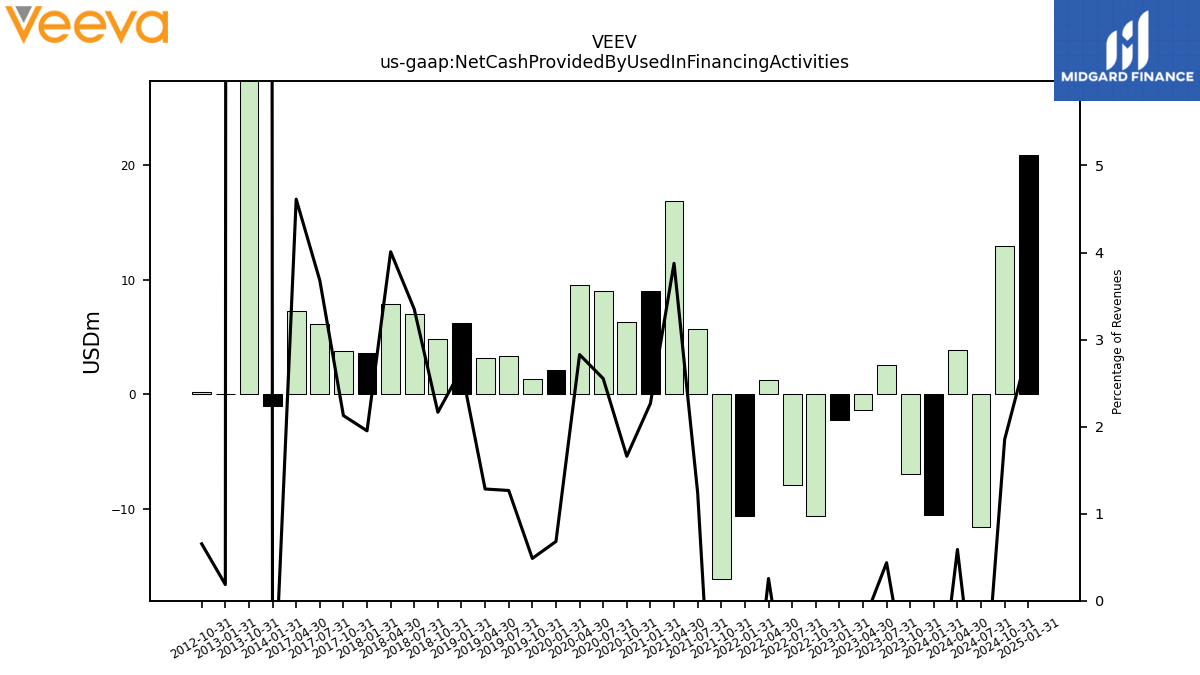
| Net Cash Provided By Used In Financing Activities | -6.89 | 2.58 | -1.39 | -2.24 | -10.54 | -7.88 | 1.29 | -10.56 | -16.05 | 5.66 | 16.80 | 8.99 | 6.26 | 9.03 | 9.53 | 2.12 | 1.37 | 3.38 | 3.14 | 6.18 | 4.87 | 7.02 | 7.84 | 3.61 | 3.75 | 6.13 | 7.29 | NA | NA | NA | NA | NA | NA | NA | NA | NA | NA | NA | NA | -0.99 | 216.52 | NA | NA | 0.07 | 0.23 | NA | NA |
| 2023-10-31 | 2023-07-31 | 2023-04-30 | 2023-01-31 | 2022-10-31 | 2022-07-31 | 2022-04-30 | 2022-01-31 | 2021-10-31 | 2021-07-31 | 2021-04-30 | 2021-01-31 | 2020-10-31 | 2020-07-31 | 2020-04-30 | 2020-01-31 | 2019-10-31 | 2019-07-31 | 2019-04-30 | 2019-01-31 | 2018-10-31 | 2018-07-31 | 2018-04-30 | 2018-01-31 | 2017-10-31 | 2017-07-31 | 2017-04-30 | 2017-01-31 | 2016-10-31 | 2016-07-31 | 2016-04-30 | 2016-01-31 | 2015-10-31 | 2015-07-31 | 2015-04-30 | 2015-01-31 | 2014-10-31 | 2014-07-31 | 2014-04-30 | 2014-01-31 | 2013-10-31 | 2013-07-31 | 2013-04-30 | 2013-01-31 | 2012-10-31 | 2012-07-31 | 2012-04-30 | ||
|---|---|---|---|---|---|---|---|---|---|---|---|---|---|---|---|---|---|---|---|---|---|---|---|---|---|---|---|---|---|---|---|---|---|---|---|---|---|---|---|---|---|---|---|---|---|---|---|---|
| Net Cash Provided By Used In Operating Activities | 82.60 | 265.04 | 505.94 | 63.40 | 142.66 | 93.39 | 481.03 | 54.05 | 112.96 | 119.06 | 478.38 | 68.35 | 95.40 | 105.32 | 282.17 | 39.11 | 61.50 | 100.47 | 236.29 | 31.87 | 41.56 | 86.81 | 150.59 | 1.44 | 32.23 | 57.61 | 142.16 | NA | NA | NA | NA | NA | NA | NA | NA | NA | NA | NA | NA | 16.23 | 5.27 | NA | NA | 6.99 | 9.72 | NA | NA | |
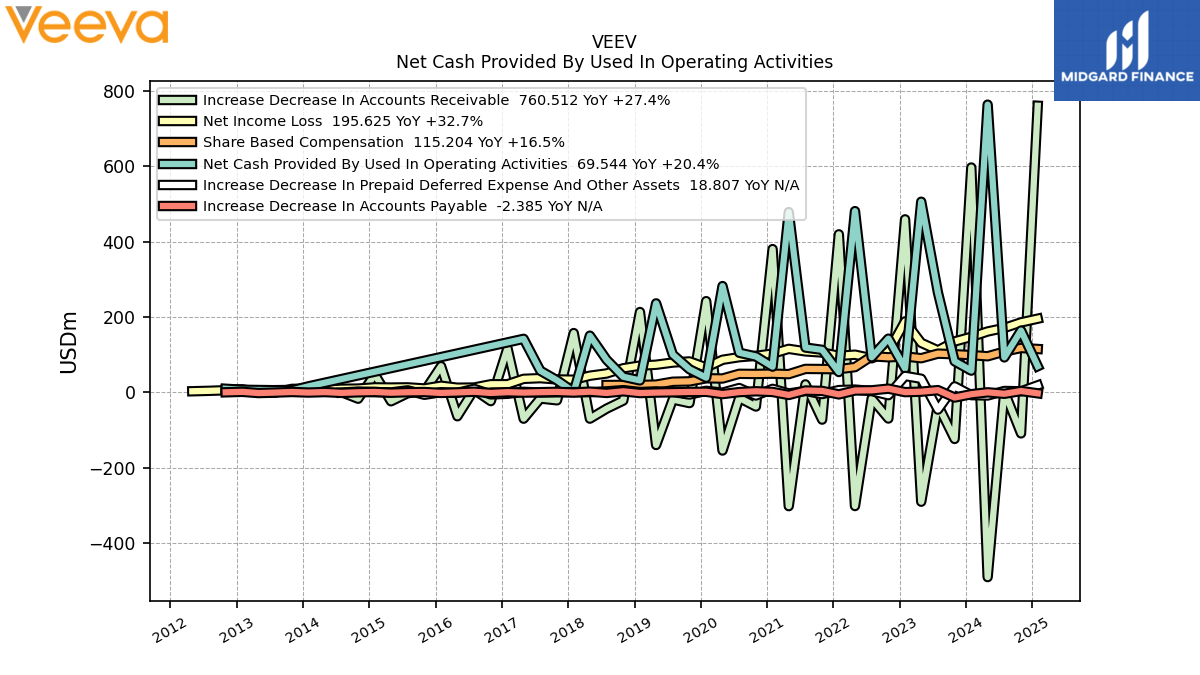
| Net Income Loss | 135.16 | 111.63 | 131.52 | 188.53 | 108.46 | 90.60 | 100.11 | 97.10 | 105.87 | 108.86 | 115.57 | 102.92 | 96.96 | 93.55 | 86.57 | 66.18 | 82.25 | 79.24 | 73.45 | 71.15 | 64.08 | 50.29 | 44.31 | 33.71 | 34.39 | 37.84 | 36.02 | 21.71 | 21.63 | 12.96 | 12.51 | 17.59 | 10.48 | 13.41 | 12.98 | 13.33 | 10.26 | 9.58 | 7.22 | 6.25 | 6.53 | 6.00 | 4.84 | 5.68 | 5.75 | 4.25 | 3.10 | |
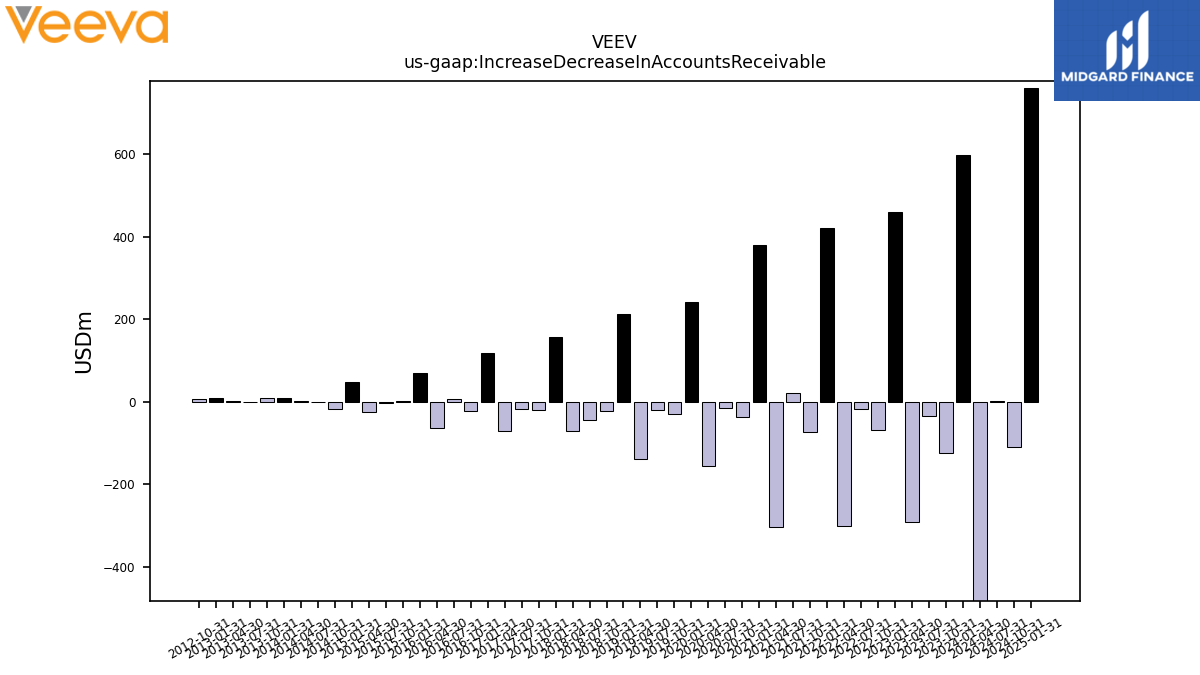
| Increase Decrease In Accounts Receivable | -123.43 | -33.53 | -289.96 | 459.24 | -69.27 | -16.31 | -301.48 | 419.49 | -72.15 | 21.41 | -301.73 | 380.28 | -37.45 | -14.61 | -154.16 | 242.16 | -28.32 | -18.80 | -139.51 | 213.35 | -21.66 | -43.10 | -69.59 | 157.46 | -20.92 | -16.17 | -69.70 | 117.18 | -23.08 | 7.28 | -63.23 | 69.50 | 2.69 | -2.00 | -23.54 | 47.61 | -16.68 | 0.72 | 2.81 | 9.89 | 9.42 | -0.45 | 0.89 | 8.22 | 7.20 | NA | NA | |
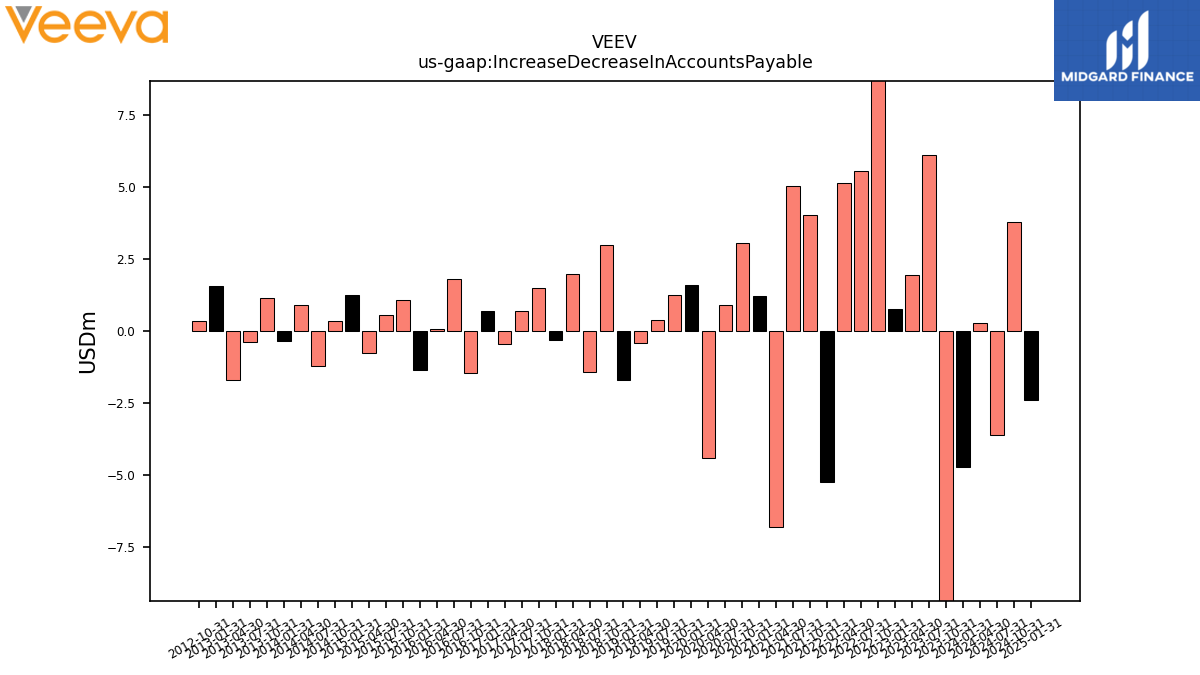
| Increase Decrease In Accounts Payable | -13.56 | 6.10 | 1.96 | 0.77 | 10.00 | 5.54 | 5.12 | -5.26 | 4.03 | 5.03 | -6.79 | 1.21 | 3.06 | 0.91 | -4.43 | 1.60 | 1.25 | 0.38 | -0.42 | -1.70 | 2.98 | -1.44 | 1.98 | -0.32 | 1.47 | 0.70 | -0.46 | 0.70 | -1.46 | 1.80 | 0.07 | -1.37 | 1.07 | 0.56 | -0.76 | 1.23 | 0.35 | -1.21 | 0.91 | -0.36 | 1.16 | -0.40 | -1.70 | 1.57 | 0.33 | NA | NA | |
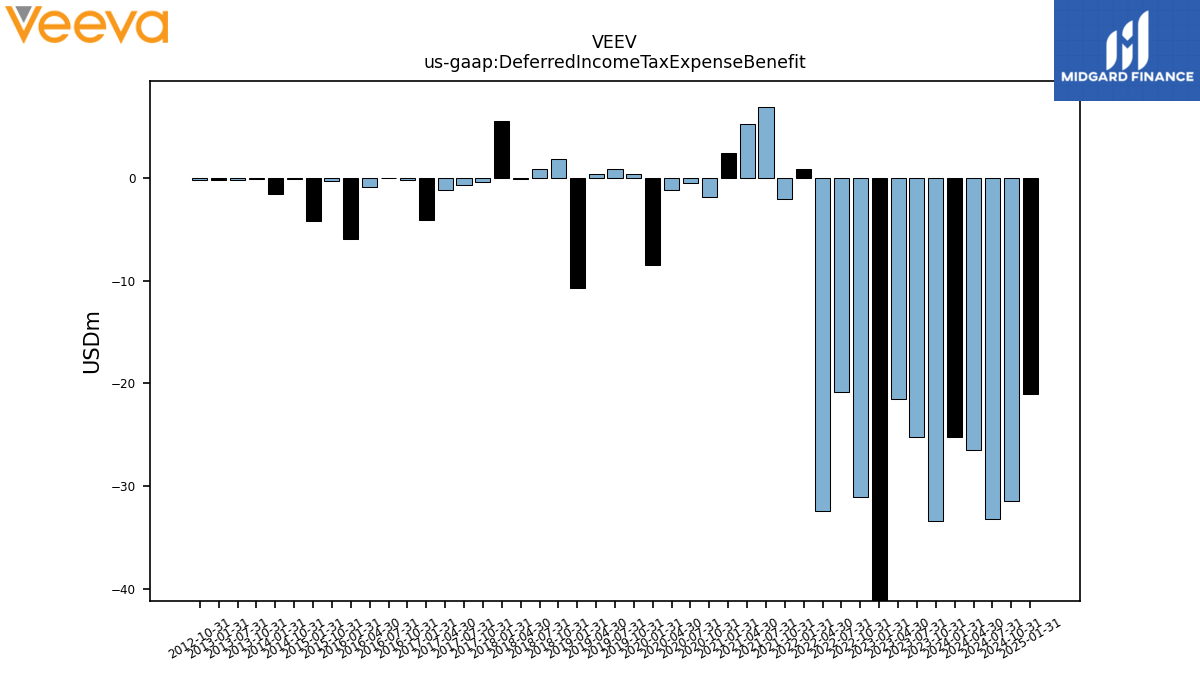
| Deferred Income Tax Expense Benefit | -33.41 | -25.21 | -21.51 | -43.13 | -31.06 | -20.88 | -32.43 | 0.91 | -2.02 | 6.95 | 5.24 | 2.48 | -1.89 | -0.50 | -1.13 | -8.43 | 0.43 | 0.92 | 0.42 | -10.73 | 1.82 | 0.87 | -0.05 | 5.52 | -0.34 | -0.71 | -1.20 | -4.11 | -0.16 | 0.04 | -0.84 | -5.96 | -0.31 | NA | NA | -4.19 | -0.08 | NA | NA | -1.52 | -0.09 | -0.17 | NA | -0.19 | -0.19 | NA | NA | |
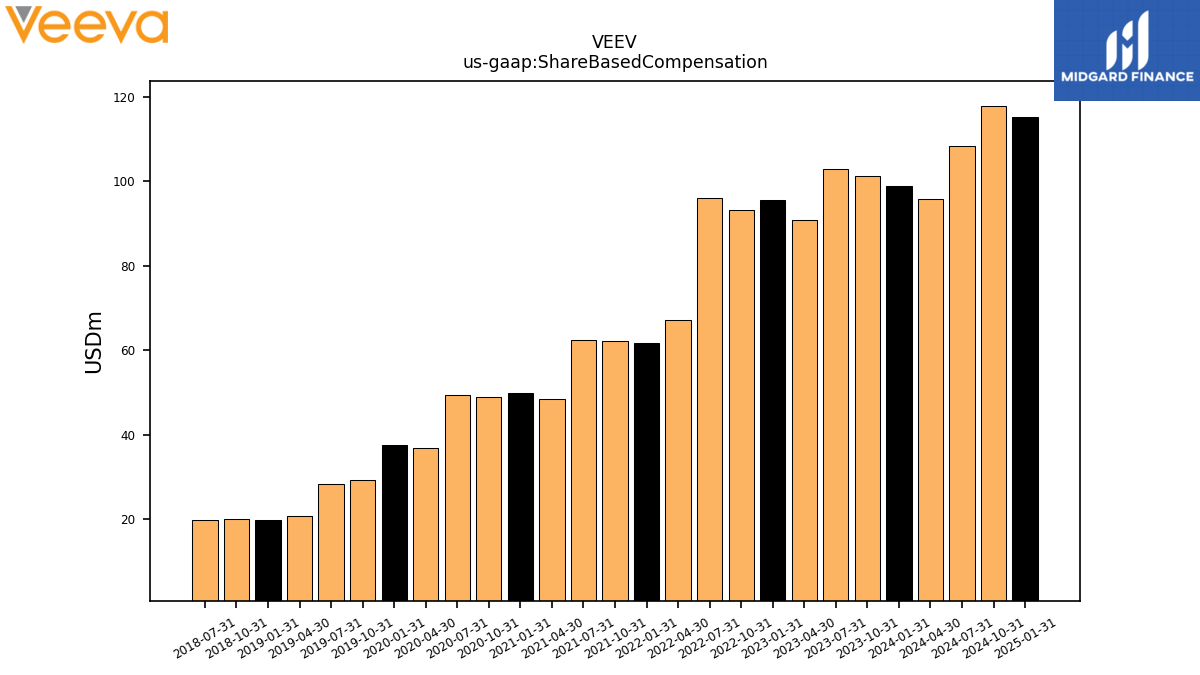
| Share Based Compensation | 101.23 | 102.89 | 90.72 | 95.54 | 93.19 | 96.04 | 67.13 | 61.72 | 62.05 | 62.38 | 48.49 | 49.76 | 48.97 | 49.37 | 36.91 | 37.46 | 29.32 | 28.37 | 20.76 | 19.78 | 19.92 | 19.72 | NA | NA | NA | NA | NA | NA | NA | NA | NA | NA | NA | NA | NA | NA | NA | NA | NA | NA | NA | NA | NA | NA | NA | NA | NA |
| 2023-10-31 | 2023-07-31 | 2023-04-30 | 2023-01-31 | 2022-10-31 | 2022-07-31 | 2022-04-30 | 2022-01-31 | 2021-10-31 | 2021-07-31 | 2021-04-30 | 2021-01-31 | 2020-10-31 | 2020-07-31 | 2020-04-30 | 2020-01-31 | 2019-10-31 | 2019-07-31 | 2019-04-30 | 2019-01-31 | 2018-10-31 | 2018-07-31 | 2018-04-30 | 2018-01-31 | 2017-10-31 | 2017-07-31 | 2017-04-30 | 2017-01-31 | 2016-10-31 | 2016-07-31 | 2016-04-30 | 2016-01-31 | 2015-10-31 | 2015-07-31 | 2015-04-30 | 2015-01-31 | 2014-10-31 | 2014-07-31 | 2014-04-30 | 2014-01-31 | 2013-10-31 | 2013-07-31 | 2013-04-30 | 2013-01-31 | 2012-10-31 | 2012-07-31 | 2012-04-30 | ||
|---|---|---|---|---|---|---|---|---|---|---|---|---|---|---|---|---|---|---|---|---|---|---|---|---|---|---|---|---|---|---|---|---|---|---|---|---|---|---|---|---|---|---|---|---|---|---|---|---|
| Net Cash Provided By Used In Investing Activities | -73.32 | -618.93 | -297.39 | -39.26 | -405.73 | -184.21 | -378.49 | -55.16 | -10.23 | -242.81 | -37.95 | 21.09 | -262.59 | -43.93 | -48.21 | -455.30 | 2.73 | -22.80 | -41.54 | 43.82 | -89.36 | -40.77 | -17.56 | 2.48 | -134.40 | -20.30 | -2.30 | NA | NA | NA | NA | NA | NA | NA | NA | NA | NA | NA | NA | -9.87 | -3.25 | NA | NA | -4.81 | -10.47 | NA | NA |
| 2023-10-31 | 2023-07-31 | 2023-04-30 | 2023-01-31 | 2022-10-31 | 2022-07-31 | 2022-04-30 | 2022-01-31 | 2021-10-31 | 2021-07-31 | 2021-04-30 | 2021-01-31 | 2020-10-31 | 2020-07-31 | 2020-04-30 | 2020-01-31 | 2019-10-31 | 2019-07-31 | 2019-04-30 | 2019-01-31 | 2018-10-31 | 2018-07-31 | 2018-04-30 | 2018-01-31 | 2017-10-31 | 2017-07-31 | 2017-04-30 | 2017-01-31 | 2016-10-31 | 2016-07-31 | 2016-04-30 | 2016-01-31 | 2015-10-31 | 2015-07-31 | 2015-04-30 | 2015-01-31 | 2014-10-31 | 2014-07-31 | 2014-04-30 | 2014-01-31 | 2013-10-31 | 2013-07-31 | 2013-04-30 | 2013-01-31 | 2012-10-31 | 2012-07-31 | 2012-04-30 | ||
|---|---|---|---|---|---|---|---|---|---|---|---|---|---|---|---|---|---|---|---|---|---|---|---|---|---|---|---|---|---|---|---|---|---|---|---|---|---|---|---|---|---|---|---|---|---|---|---|---|
| Net Cash Provided By Used In Financing Activities | -6.89 | 2.58 | -1.39 | -2.24 | -10.54 | -7.88 | 1.29 | -10.56 | -16.05 | 5.66 | 16.80 | 8.99 | 6.26 | 9.03 | 9.53 | 2.12 | 1.37 | 3.38 | 3.14 | 6.18 | 4.87 | 7.02 | 7.84 | 3.61 | 3.75 | 6.13 | 7.29 | NA | NA | NA | NA | NA | NA | NA | NA | NA | NA | NA | NA | -0.99 | 216.52 | NA | NA | 0.07 | 0.23 | NA | NA |
| 2023-10-31 | 2023-07-31 | 2023-04-30 | 2023-01-31 | 2022-10-31 | 2022-07-31 | 2022-04-30 | 2022-01-31 | 2021-10-31 | 2021-07-31 | 2021-04-30 | 2021-01-31 | 2020-10-31 | 2020-07-31 | 2020-04-30 | 2020-01-31 | 2019-10-31 | 2019-07-31 | 2019-04-30 | 2019-01-31 | 2018-10-31 | 2018-07-31 | 2018-04-30 | 2018-01-31 | 2017-10-31 | 2017-07-31 | 2017-04-30 | 2017-01-31 | 2016-10-31 | 2016-07-31 | 2016-04-30 | 2016-01-31 | 2015-10-31 | 2015-07-31 | 2015-04-30 | 2015-01-31 | 2014-10-31 | 2014-07-31 | 2014-04-30 | 2014-01-31 | 2013-10-31 | 2013-07-31 | 2013-04-30 | 2013-01-31 | 2012-10-31 | 2012-07-31 | 2012-04-30 | ||
|---|---|---|---|---|---|---|---|---|---|---|---|---|---|---|---|---|---|---|---|---|---|---|---|---|---|---|---|---|---|---|---|---|---|---|---|---|---|---|---|---|---|---|---|---|---|---|---|---|
| Revenues | 616.50 | 590.23 | 526.33 | 563.39 | 552.35 | 534.22 | 505.10 | 485.50 | 476.11 | 455.59 | 433.57 | 396.76 | 377.52 | 353.68 | 337.11 | 311.51 | 280.92 | 266.90 | 244.75 | 232.32 | 224.73 | 209.61 | 195.55 | 184.92 | 176.15 | 166.59 | 157.92 | 150.15 | 142.78 | 131.35 | 119.76 | 114.27 | 106.92 | 98.11 | 89.92 | 87.01 | 83.83 | 75.66 | 66.72 | 62.80 | 54.98 | 49.58 | 42.79 | 39.79 | 35.80 | 29.45 | 24.51 | |
| Revenue From Contract With Customer Excluding Assessed Tax | 616.50 | 590.23 | 526.33 | 563.39 | 552.35 | 534.22 | 505.10 | 485.50 | 476.11 | 455.59 | 433.57 | 396.76 | 377.52 | 353.68 | 337.11 | 311.51 | 280.92 | 266.90 | 244.75 | 232.32 | 224.73 | 209.61 | 195.55 | 184.92 | 177.01 | 167.79 | 157.92 | 150.15 | 142.78 | 131.35 | 119.76 | 114.27 | 106.92 | 98.11 | 89.92 | 87.01 | 83.83 | 75.66 | 66.72 | 62.80 | 54.98 | 49.58 | 42.79 | 39.79 | 35.80 | 29.45 | 24.51 | |
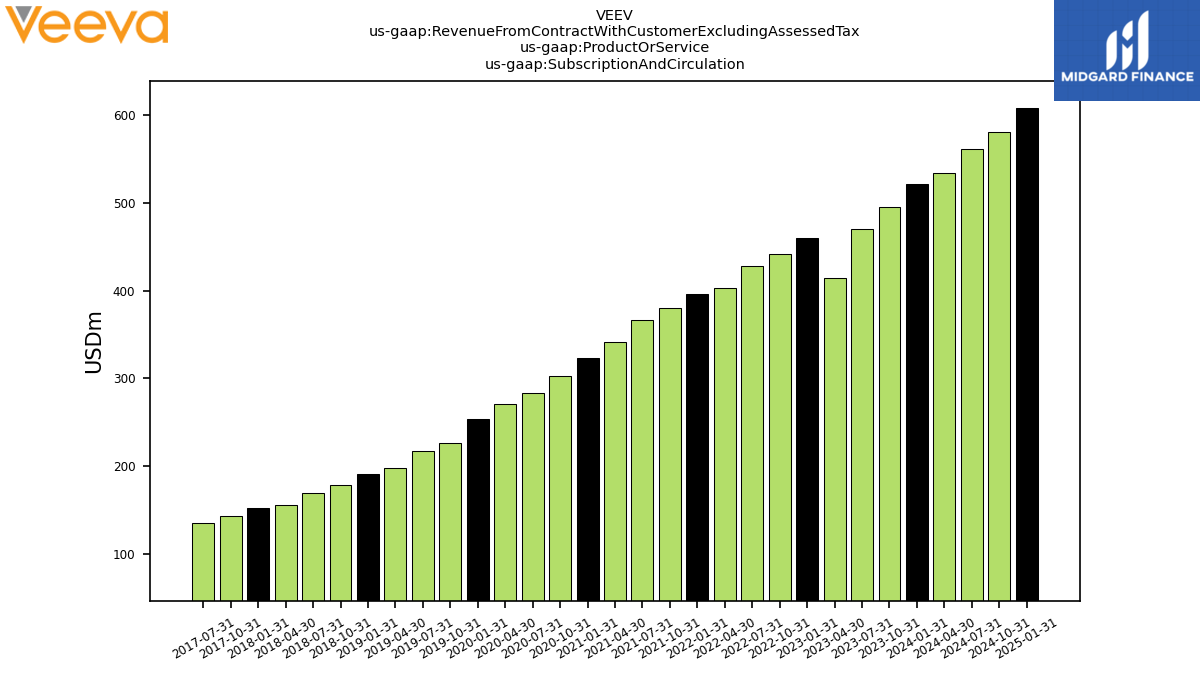
| Subscription And Circulation | 494.91 | 470.64 | 414.55 | 460.15 | 441.57 | 428.65 | 402.63 | 395.68 | 380.74 | 366.44 | 341.12 | 322.81 | 302.94 | 283.50 | 270.24 | 254.11 | 226.76 | 217.31 | 198.12 | 190.66 | 178.21 | 169.59 | 156.00 | 151.95 | 142.80 | 135.55 | NA | NA | NA | NA | NA | NA | NA | NA | NA | NA | NA | NA | NA | NA | NA | NA | NA | NA | NA | NA | NA | |
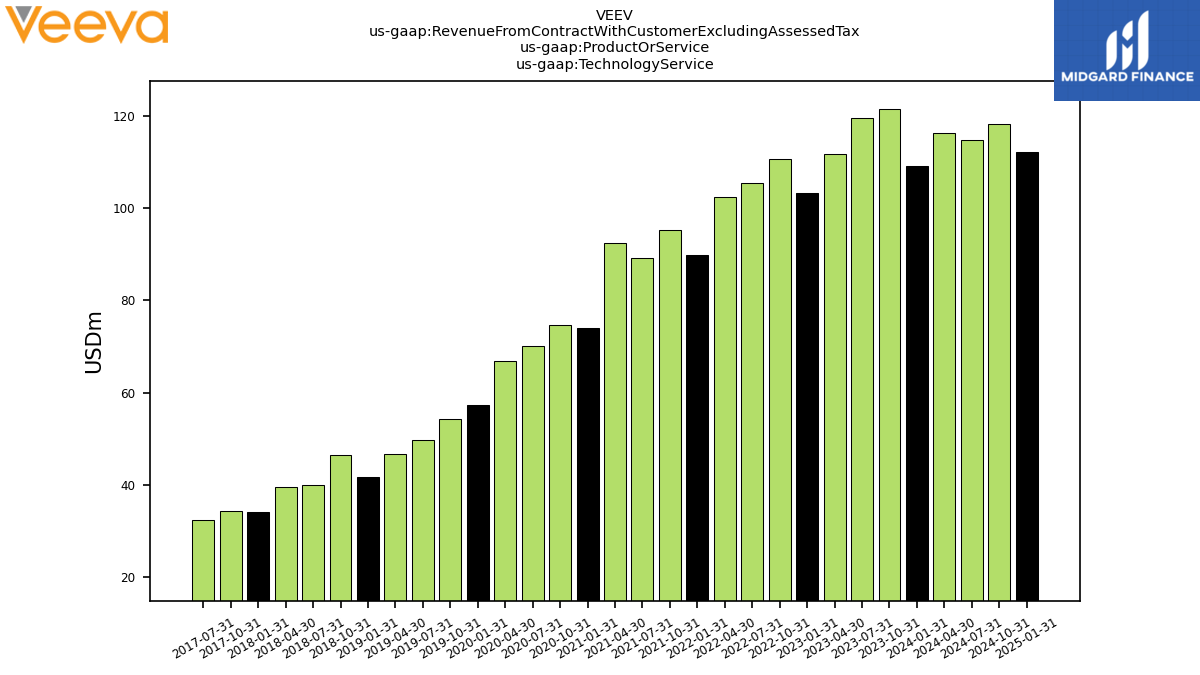
| Technology Service | 121.59 | 119.59 | 111.78 | 103.24 | 110.78 | 105.57 | 102.47 | 89.82 | 95.37 | 89.16 | 92.45 | 73.95 | 74.58 | 70.18 | 66.87 | 57.40 | 54.16 | 49.59 | 46.64 | 41.66 | 46.52 | 40.02 | 39.54 | 34.03 | 34.21 | 32.24 | NA | NA | NA | NA | NA | NA | NA | NA | NA | NA | NA | NA | NA | NA | NA | NA | NA | NA | NA | NA | NA | |
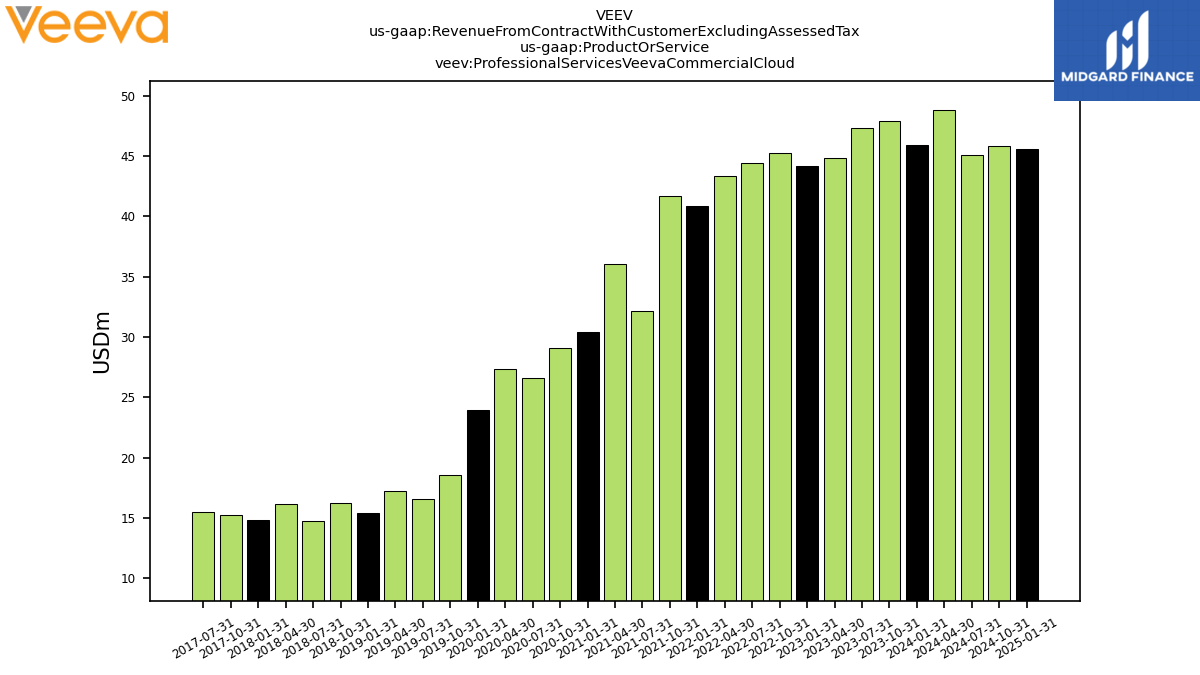
| Professional Services Veeva Commercial Cloud | 47.90 | 47.32 | 44.86 | NA | 45.28 | 44.42 | 43.32 | NA | 41.67 | 32.16 | 36.03 | 30.39 | 29.11 | 26.62 | 27.38 | 23.97 | 18.59 | 16.57 | 17.22 | 15.41 | 16.21 | 14.77 | 16.16 | 14.80 | 15.28 | 15.47 | NA | NA | NA | NA | NA | NA | NA | NA | NA | NA | NA | NA | NA | NA | NA | NA | NA | NA | NA | NA | NA | |
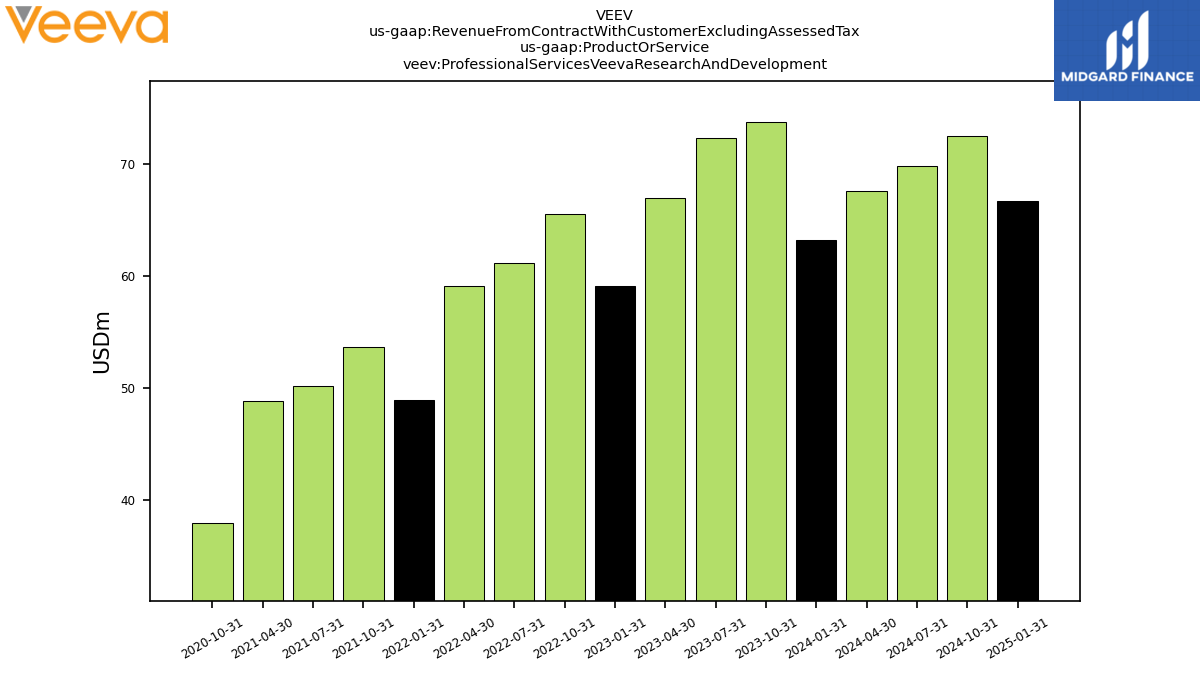
| Professional Services Veeva Research And Development | 73.69 | 72.27 | 66.92 | NA | 65.50 | 61.15 | 59.15 | NA | 53.70 | 50.19 | 48.86 | NA | 37.97 | NA | NA | NA | NA | NA | NA | NA | NA | NA | NA | NA | NA | NA | NA | NA | NA | NA | NA | NA | NA | NA | NA | NA | NA | NA | NA | NA | NA | NA | NA | NA | NA | NA | NA | |
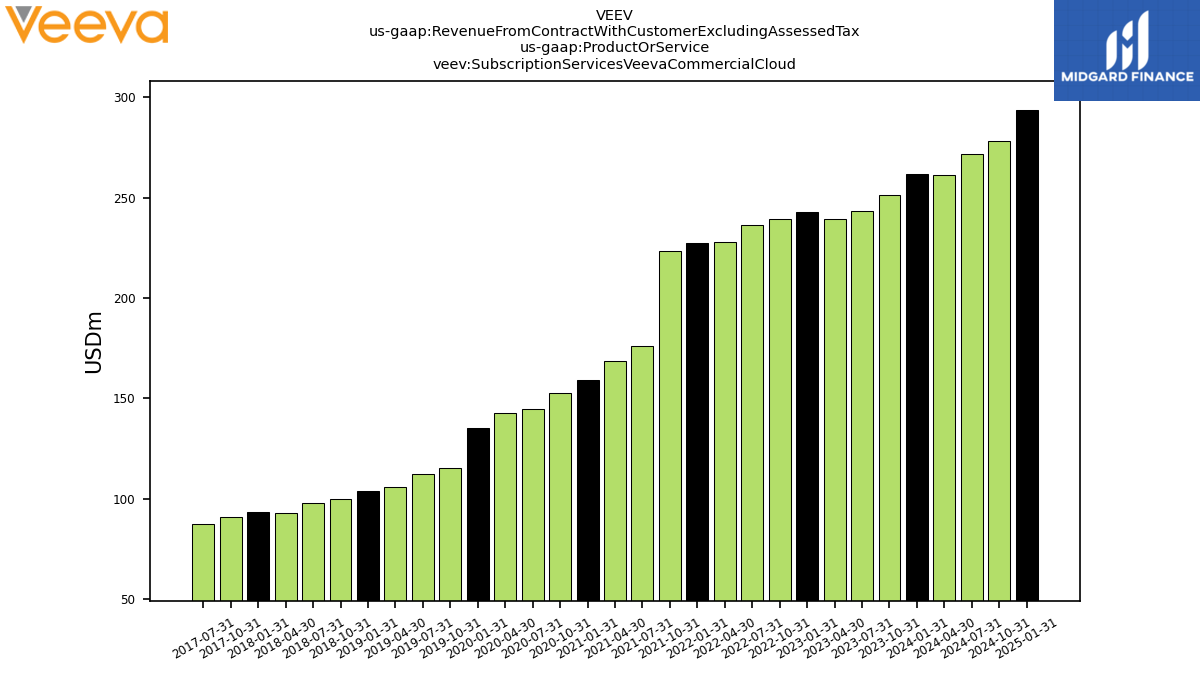
| Subscription Services Veeva Commercial Cloud | 251.17 | 243.43 | 239.32 | NA | 239.28 | 236.36 | 227.72 | NA | 223.18 | 176.05 | 168.46 | 159.38 | 152.47 | 144.81 | 142.58 | 135.02 | 115.20 | 112.59 | 105.80 | 104.09 | 99.91 | 97.93 | 93.11 | 93.19 | 90.85 | 87.42 | NA | NA | NA | NA | NA | NA | NA | NA | NA | NA | NA | NA | NA | NA | NA | NA | NA | NA | NA | NA | NA | |
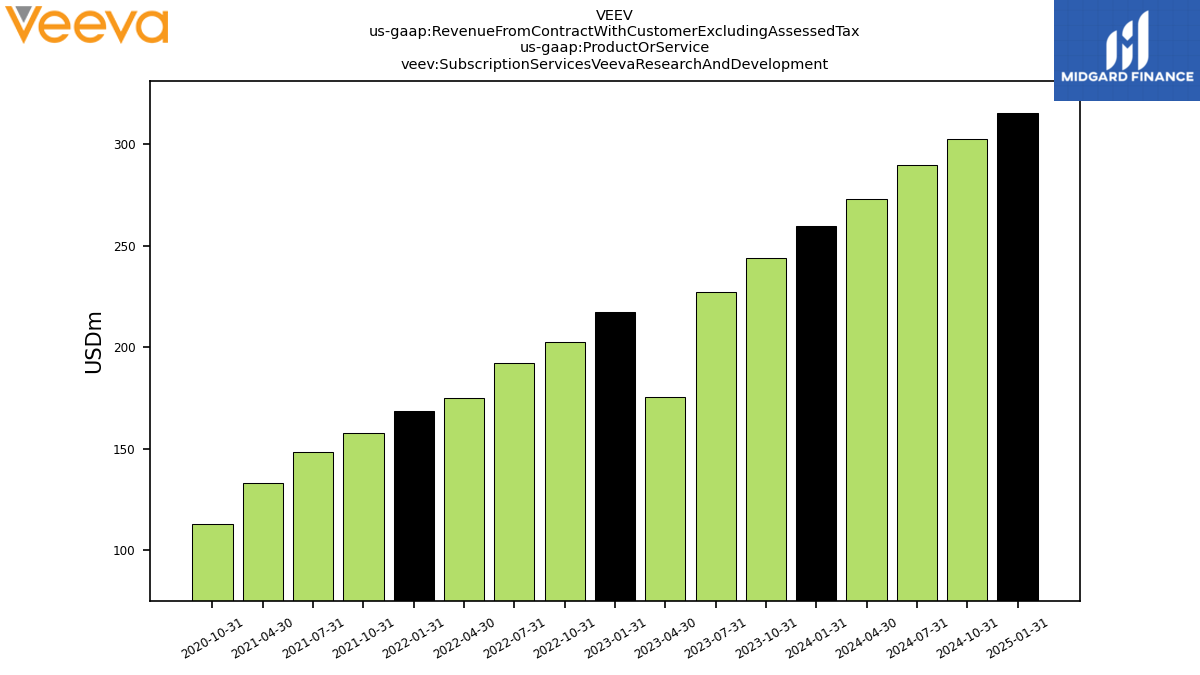
| Subscription Services Veeva Research And Development | 243.75 | 227.21 | 175.22 | NA | 202.29 | 192.29 | 174.91 | NA | 157.56 | 148.31 | 133.27 | NA | 113.06 | NA | NA | NA | NA | NA | NA | NA | NA | NA | NA | NA | NA | NA | NA | NA | NA | NA | NA | NA | NA | NA | NA | NA | NA | NA | NA | NA | NA | NA | NA | NA | NA | NA | NA | |
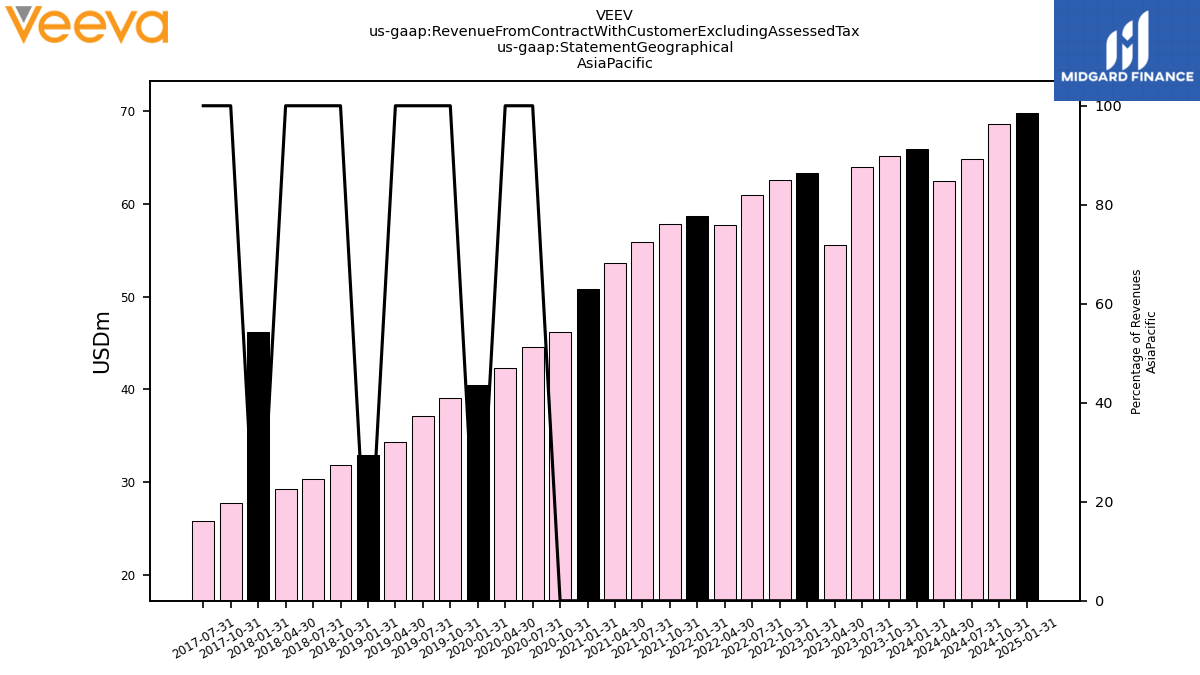
| 65.18 | 63.96 | 55.58 | 63.37 | 62.62 | 60.95 | 57.71 | 58.65 | 57.84 | 55.85 | 53.63 | 50.81 | 46.18 | 44.57 | 42.29 | 40.49 | 39.06 | 37.13 | 34.37 | 32.90 | 31.88 | 30.36 | 29.29 | 46.23 | 27.72 | 25.79 | NA | NA | NA | NA | NA | NA | NA | NA | NA | NA | NA | NA | NA | NA | NA | NA | NA | NA | NA | NA | NA | ||
| 172.47 | 164.53 | 142.42 | 157.11 | 152.95 | 149.81 | 138.96 | 132.24 | 128.03 | 127.55 | 121.30 | 110.53 | 102.44 | 98.39 | 89.42 | 84.19 | 79.83 | 75.82 | 70.37 | 63.84 | 59.37 | NA | NA | NA | NA | NA | NA | NA | NA | NA | NA | NA | NA | NA | NA | NA | NA | NA | NA | NA | NA | NA | NA | NA | NA | NA | NA | ||
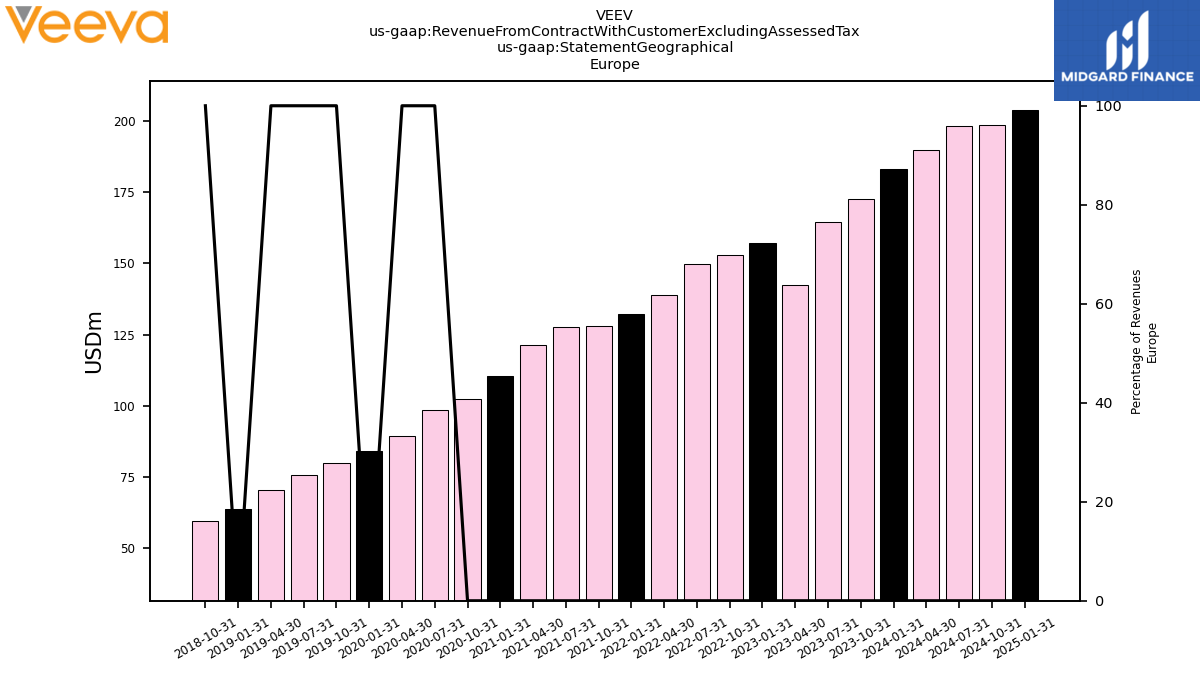
| 362.38 | 346.33 | 313.98 | 328.17 | 321.86 | 308.96 | 294.77 | 281.18 | 277.17 | 259.12 | 246.30 | 224.09 | 218.11 | 200.33 | 195.66 | 177.26 | 153.00 | 145.31 | 132.13 | 128.02 | 126.26 | 117.16 | 109.28 | 102.95 | 96.94 | 91.01 | NA | NA | NA | NA | NA | NA | NA | NA | NA | NA | NA | NA | NA | NA | NA | NA | NA | NA | NA | NA | NA | ||
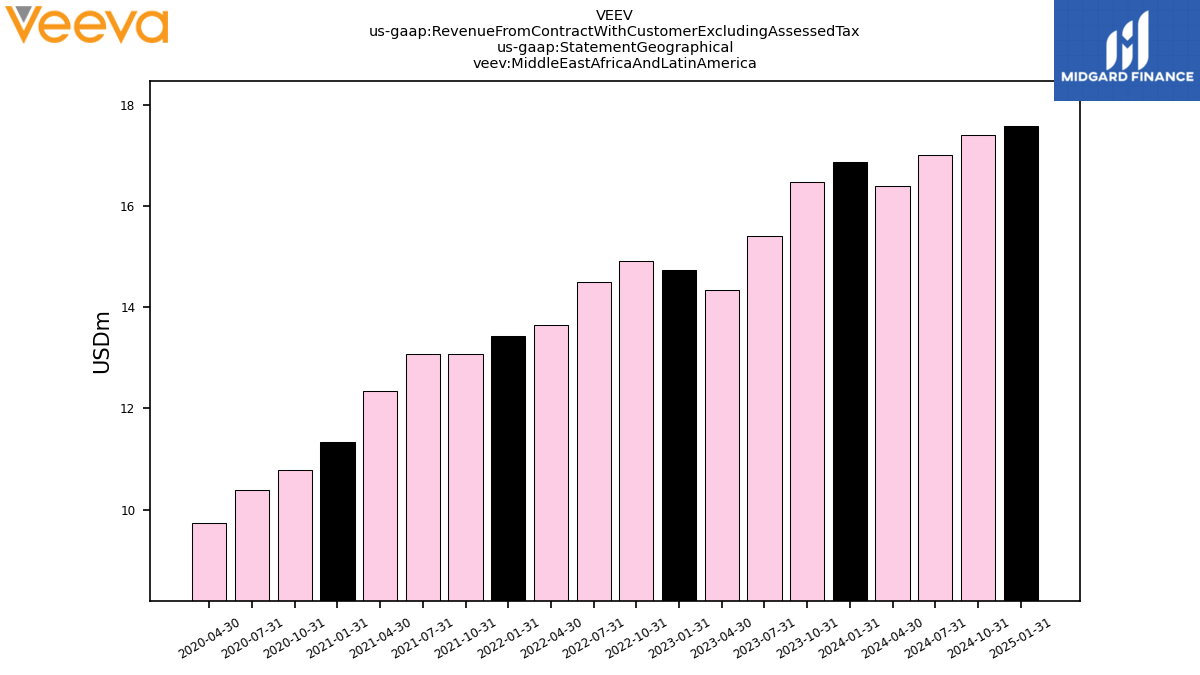
| Middle East Africa And Latin America | 16.47 | 15.40 | 14.35 | 14.74 | 14.92 | 14.50 | 13.66 | 13.43 | 13.08 | 13.07 | 12.34 | 11.33 | 10.79 | 10.38 | 9.73 | NA | NA | NA | NA | NA | NA | NA | NA | NA | NA | NA | NA | NA | NA | NA | NA | NA | NA | NA | NA | NA | NA | NA | NA | NA | NA | NA | NA | NA | NA | NA | NA |


