
| 2023-12-31 | 2023-09-30 | 2023-06-30 | 2023-03-31 | 2022-12-31 | 2022-09-30 | 2022-06-30 | 2022-03-31 | 2021-12-31 | 2021-09-30 | 2021-06-30 | 2021-03-31 | 2020-12-31 | 2020-09-30 | 2020-06-30 | 2020-03-31 | 2019-12-31 | 2019-09-30 | 2019-06-30 | 2019-03-31 | 2018-12-31 | 2018-09-30 | 2018-06-30 | 2018-03-31 | ||
|---|---|---|---|---|---|---|---|---|---|---|---|---|---|---|---|---|---|---|---|---|---|---|---|---|---|
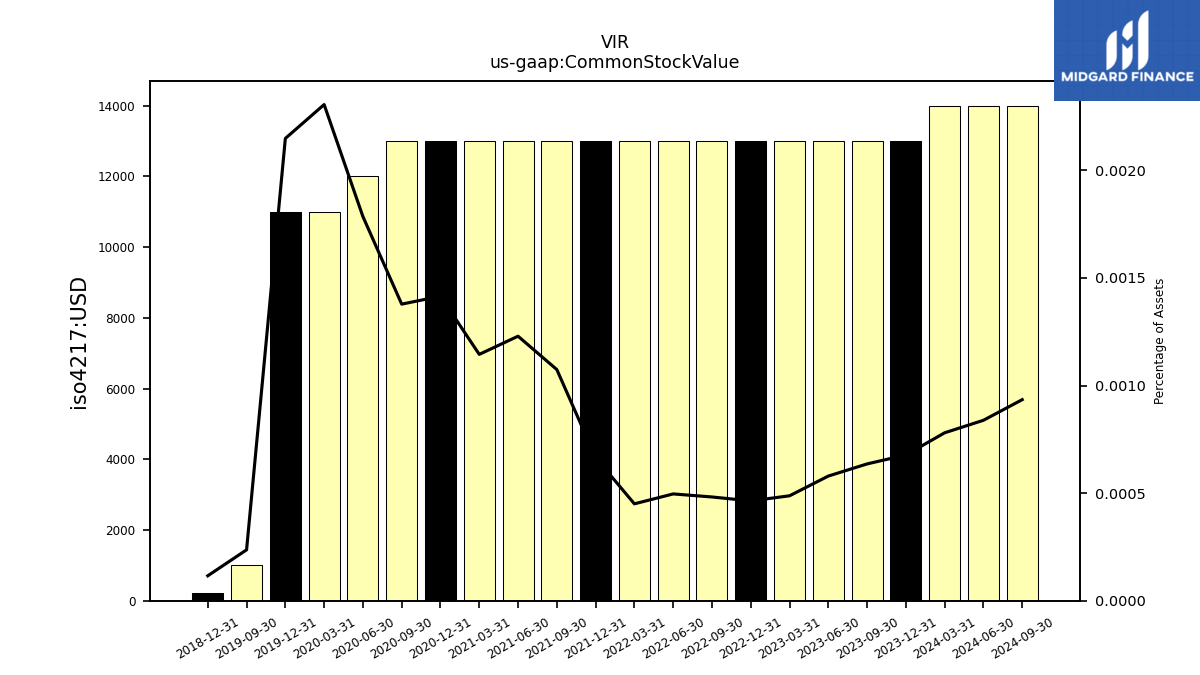
| Common Stock Value | 0.01 | 0.01 | 0.01 | 0.01 | 0.01 | 0.01 | 0.01 | 0.01 | 0.01 | 0.01 | 0.01 | 0.01 | 0.01 | 0.01 | 0.01 | 0.01 | 0.01 | 0.00 | NA | NA | 0.00 | NA | NA | NA | |
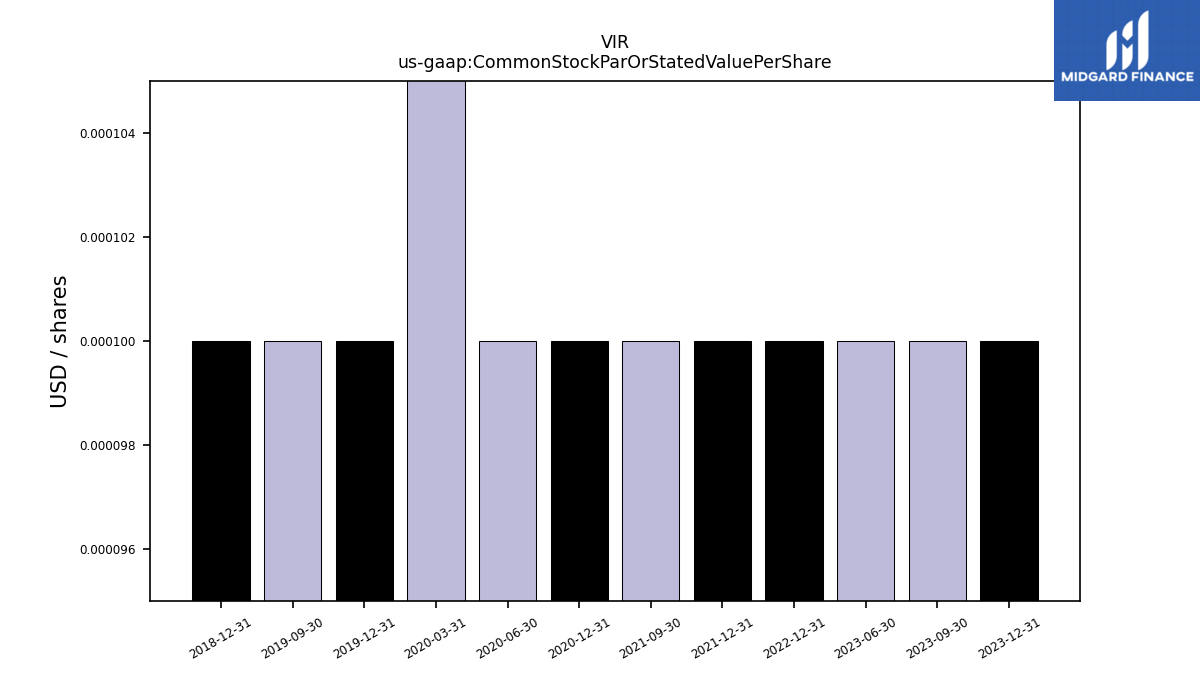
| Common Stock Par Or Stated Value Per Share | 0.00 | 0.00 | 0.00 | NA | 0.00 | NA | NA | NA | 0.00 | 0.00 | NA | NA | 0.00 | NA | 0.00 | 0.00 | 0.00 | 0.00 | NA | NA | 0.00 | NA | NA | NA | |
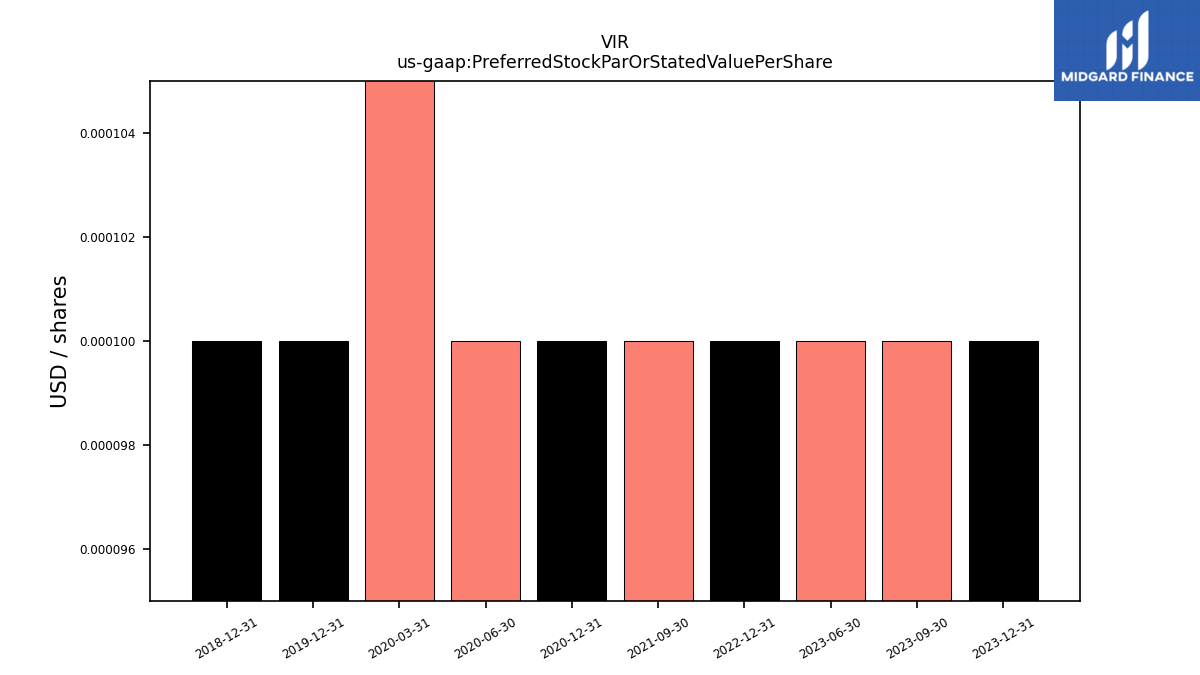
| Preferred Stock Par Or Stated Value Per Share | 0.00 | 0.00 | 0.00 | NA | 0.00 | NA | NA | NA | NA | 0.00 | NA | NA | 0.00 | NA | 0.00 | 0.00 | 0.00 | NA | NA | NA | 0.00 | NA | NA | NA | |
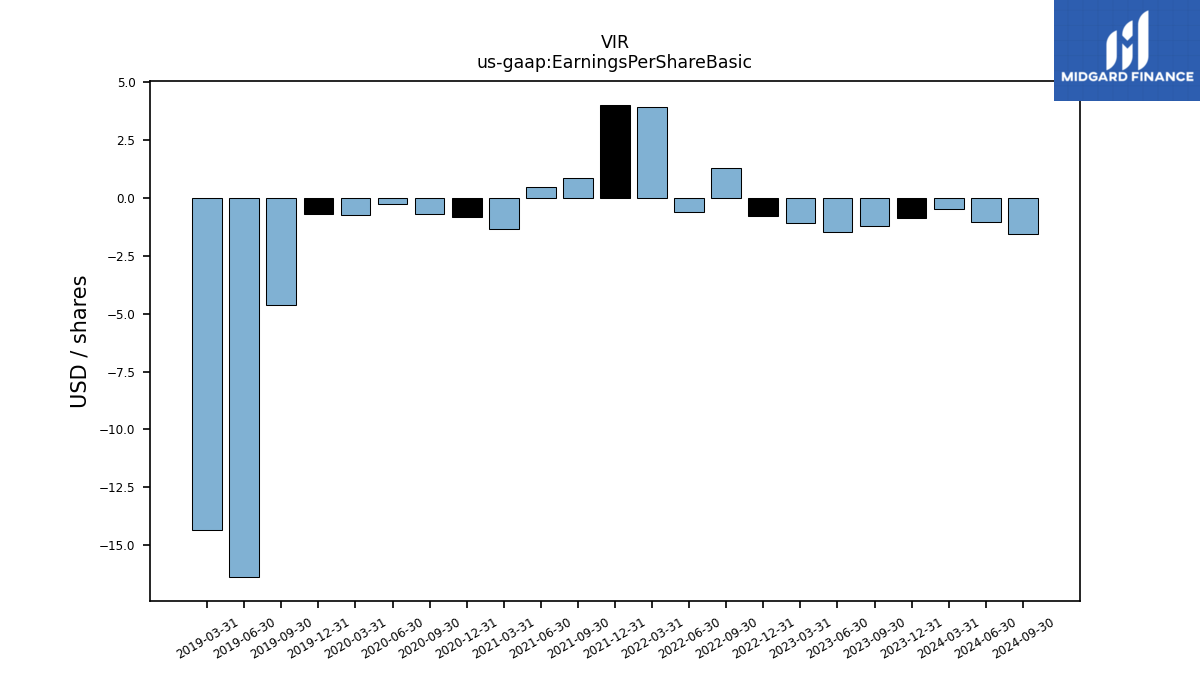
| Earnings Per Share Basic | -0.86 | -1.22 | -1.45 | -1.06 | -0.77 | 1.32 | -0.58 | 3.93 | 4.04 | 0.85 | 0.48 | -1.32 | -0.83 | -0.67 | -0.27 | -0.71 | -0.69 | -4.60 | -16.38 | -14.36 | NA | NA | NA | NA | |
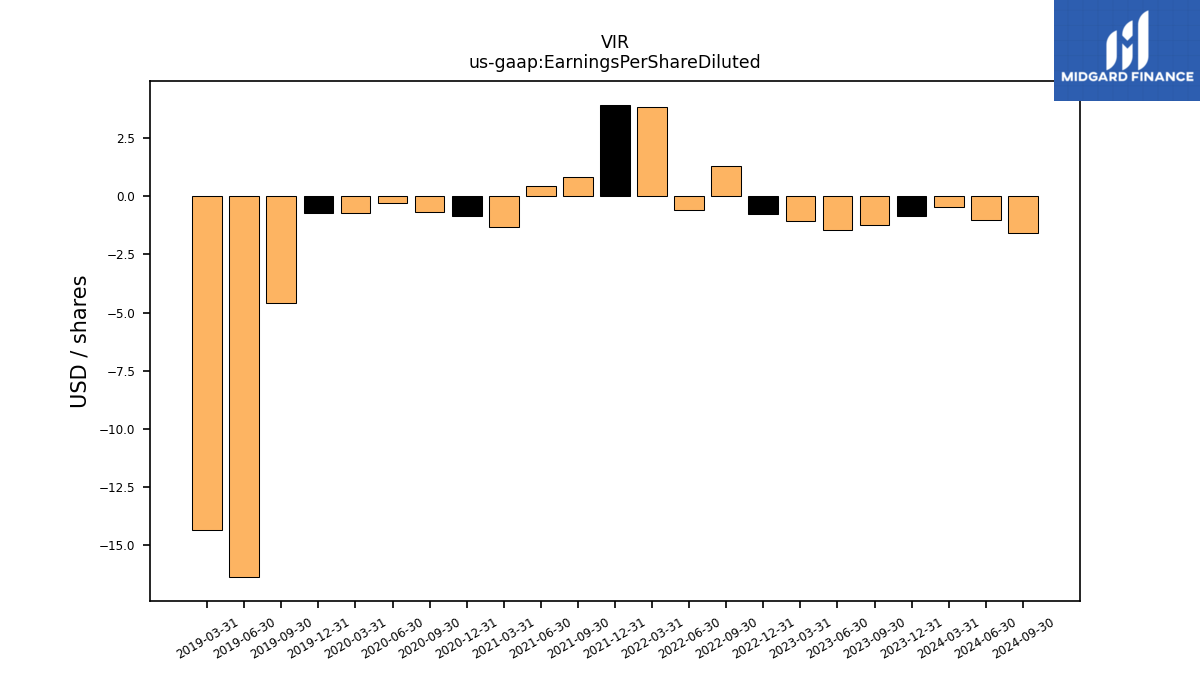
| Earnings Per Share Diluted | -0.86 | -1.22 | -1.45 | -1.06 | -0.75 | 1.30 | -0.58 | 3.85 | 3.94 | 0.82 | 0.46 | -1.32 | -0.83 | -0.67 | -0.27 | -0.71 | -0.71 | -4.60 | -16.38 | -14.36 | NA | NA | NA | NA |
| 2023-12-31 | 2023-09-30 | 2023-06-30 | 2023-03-31 | 2022-12-31 | 2022-09-30 | 2022-06-30 | 2022-03-31 | 2021-12-31 | 2021-09-30 | 2021-06-30 | 2021-03-31 | 2020-12-31 | 2020-09-30 | 2020-06-30 | 2020-03-31 | 2019-12-31 | 2019-09-30 | 2019-06-30 | 2019-03-31 | 2018-12-31 | 2018-09-30 | 2018-06-30 | 2018-03-31 | ||
|---|---|---|---|---|---|---|---|---|---|---|---|---|---|---|---|---|---|---|---|---|---|---|---|---|---|
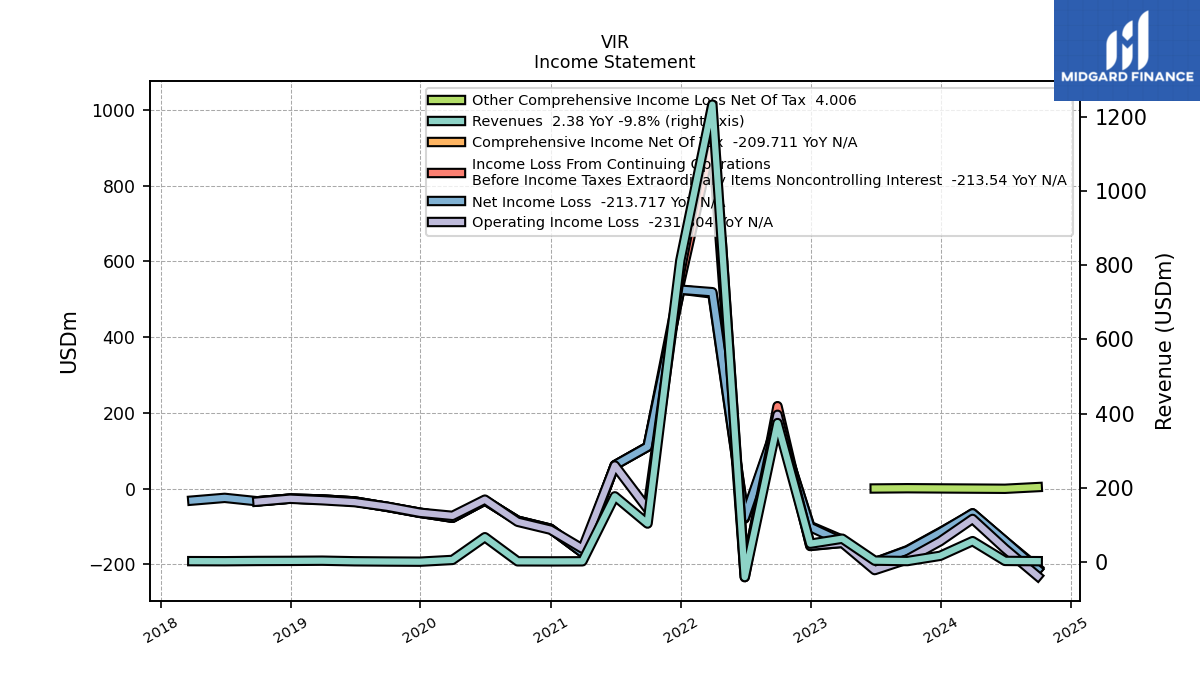
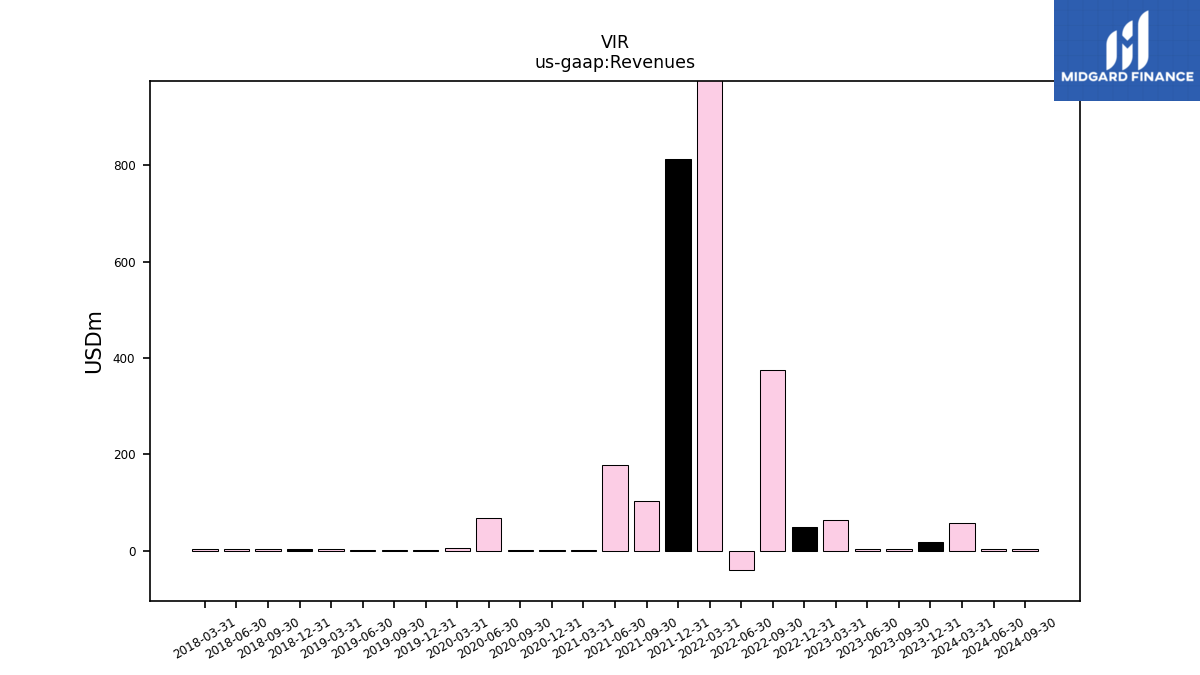
| Revenues | 16.79 | 2.64 | 3.80 | 62.96 | 49.41 | 374.56 | -40.63 | 1232.46 | 812.75 | 103.62 | 177.07 | 1.98 | 1.73 | 1.93 | 66.99 | 5.72 | 0.98 | 1.40 | 2.05 | 3.66 | 3.13 | 2.88 | 2.22 | 2.43 | |
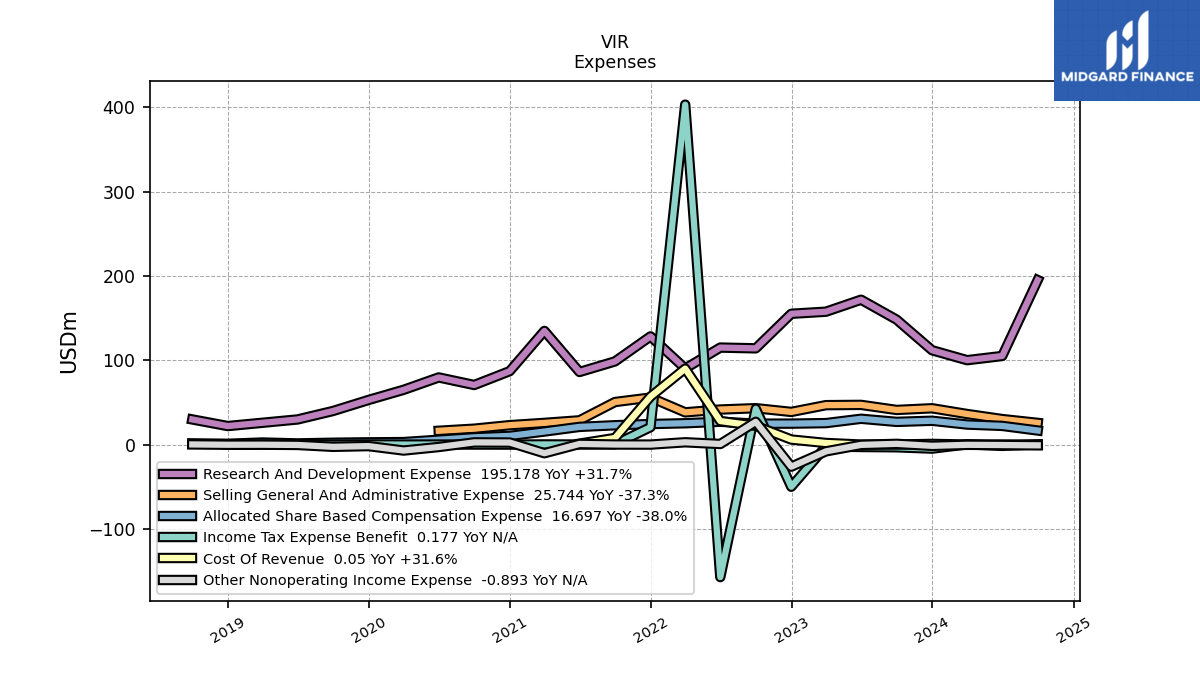
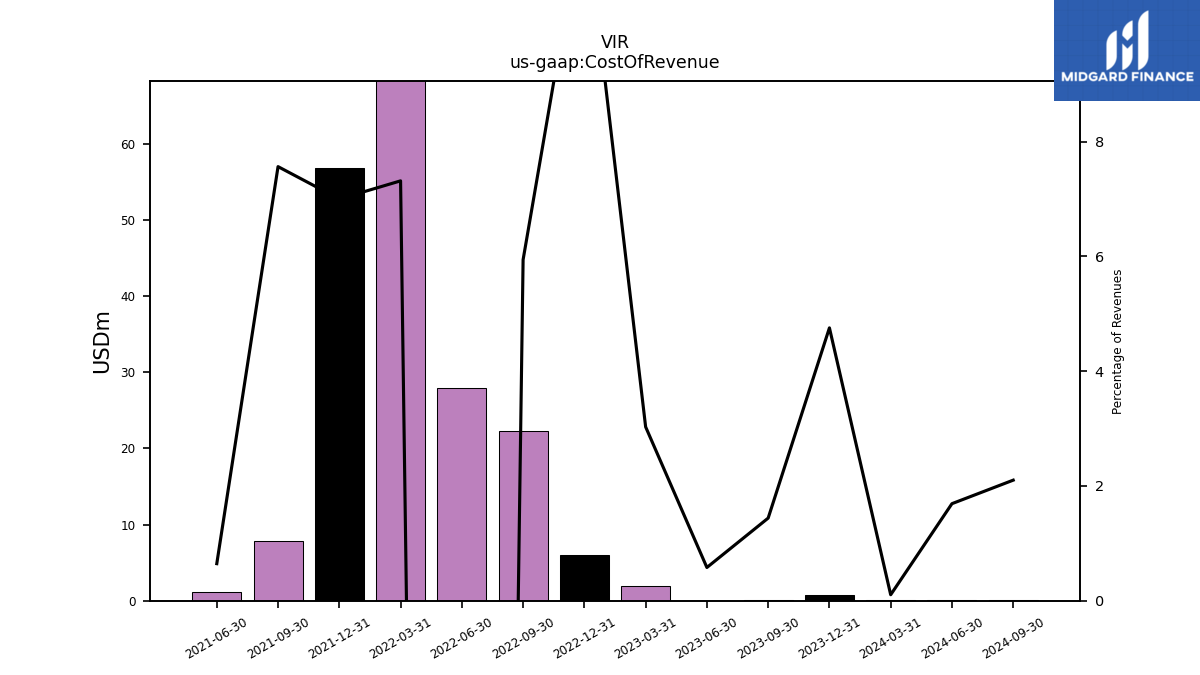
| Cost Of Revenue | 0.80 | 0.04 | 0.02 | 1.91 | 6.00 | 22.25 | 27.92 | 90.15 | 56.88 | 7.84 | 1.14 | NA | NA | NA | NA | NA | NA | NA | NA | NA | NA | NA | NA | NA | |
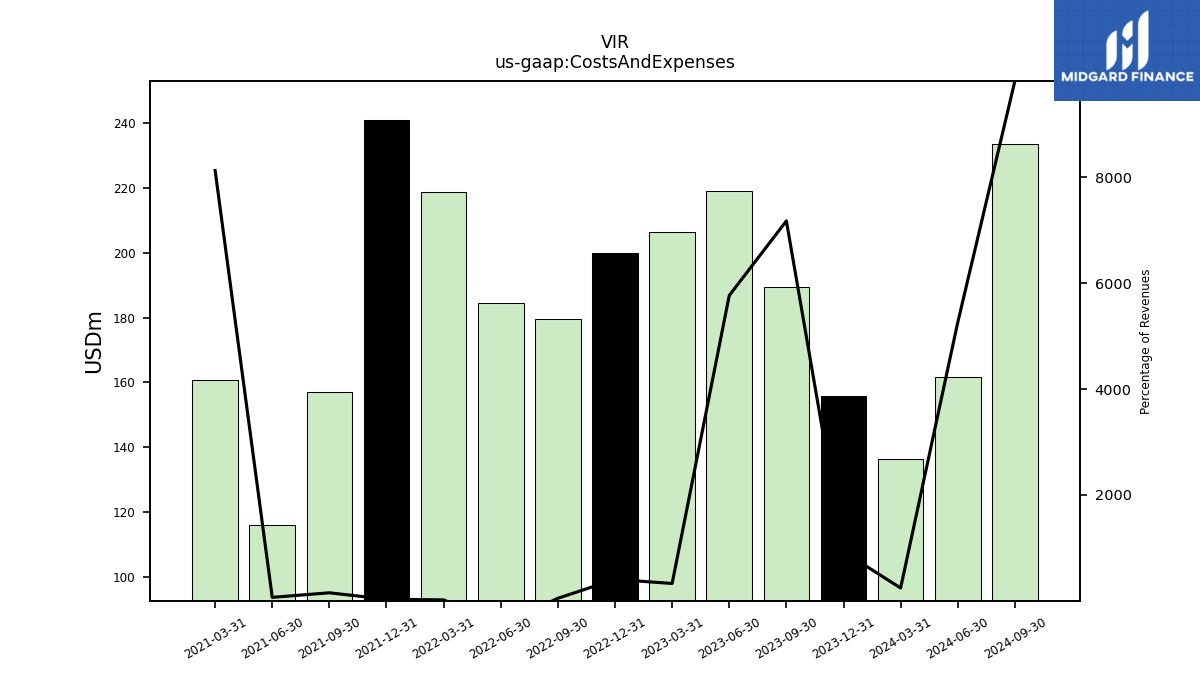
| Costs And Expenses | 155.80 | 189.37 | 218.98 | 206.33 | 199.91 | 179.59 | 184.59 | 218.63 | 241.00 | 157.00 | 116.05 | 160.61 | NA | NA | NA | NA | NA | NA | NA | NA | NA | NA | NA | NA | |
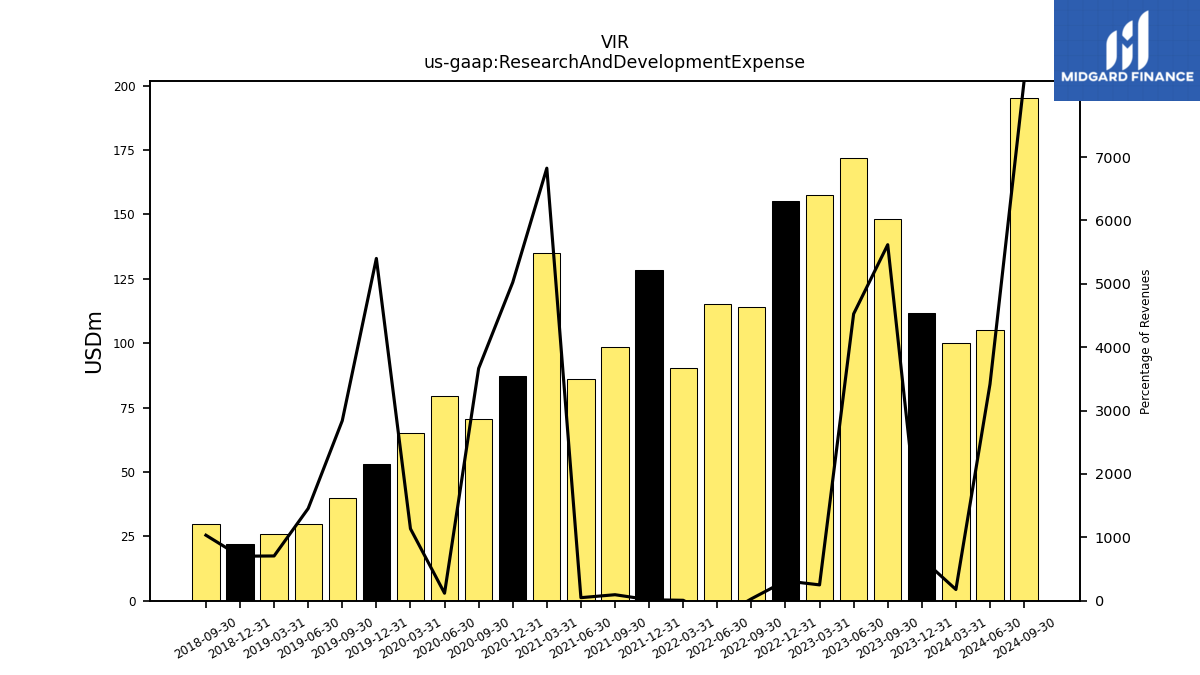
| Research And Development Expense | 111.92 | 148.25 | 171.86 | 157.64 | 155.17 | 114.17 | 115.08 | 90.23 | 128.34 | 98.67 | 86.13 | 134.87 | 87.09 | 70.68 | 79.65 | 64.98 | 52.93 | 39.86 | 29.80 | 25.87 | 21.97 | 29.84 | NA | NA | |
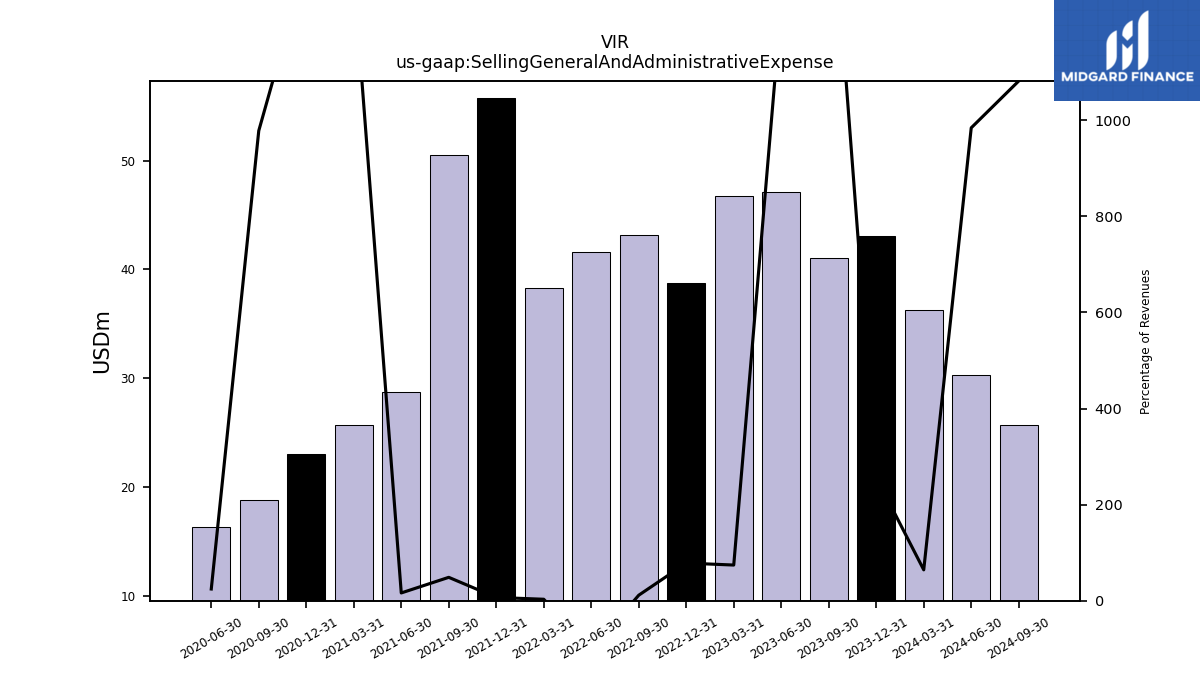
| Selling General And Administrative Expense | 43.09 | 41.08 | 47.10 | 46.78 | 38.74 | 43.17 | 41.59 | 38.26 | 55.78 | 50.50 | 28.78 | 25.74 | 23.04 | 18.86 | 16.39 | NA | NA | NA | NA | NA | NA | NA | NA | NA | |
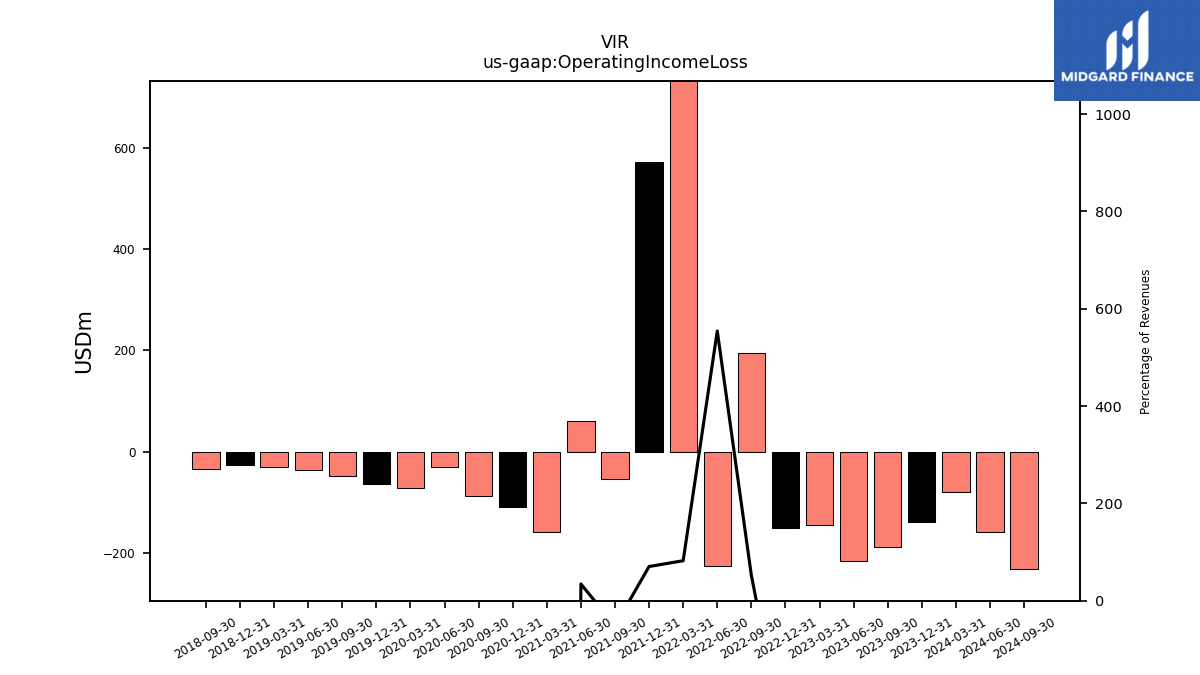
| Operating Income Loss | -139.02 | -186.73 | -215.19 | -143.37 | -150.50 | 194.96 | -225.22 | 1013.83 | 571.75 | -53.38 | 61.02 | -158.63 | -108.40 | -87.61 | -29.05 | -71.91 | -63.76 | -47.68 | -35.77 | -30.77 | -26.80 | -34.35 | NA | NA | |
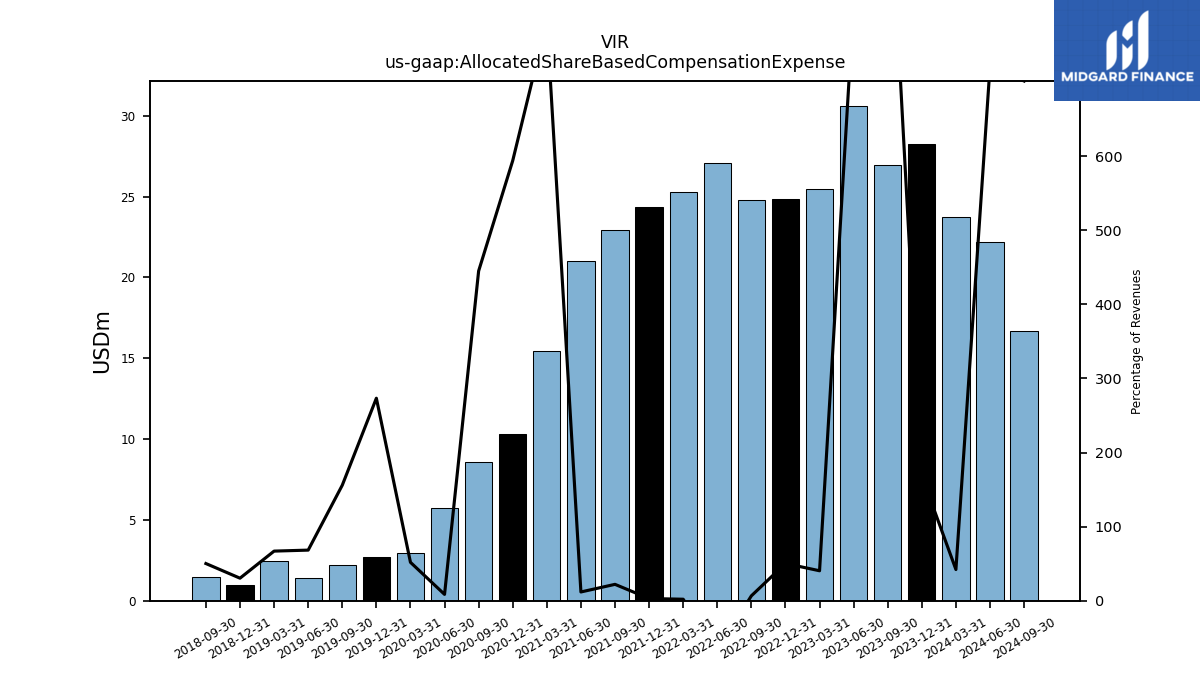
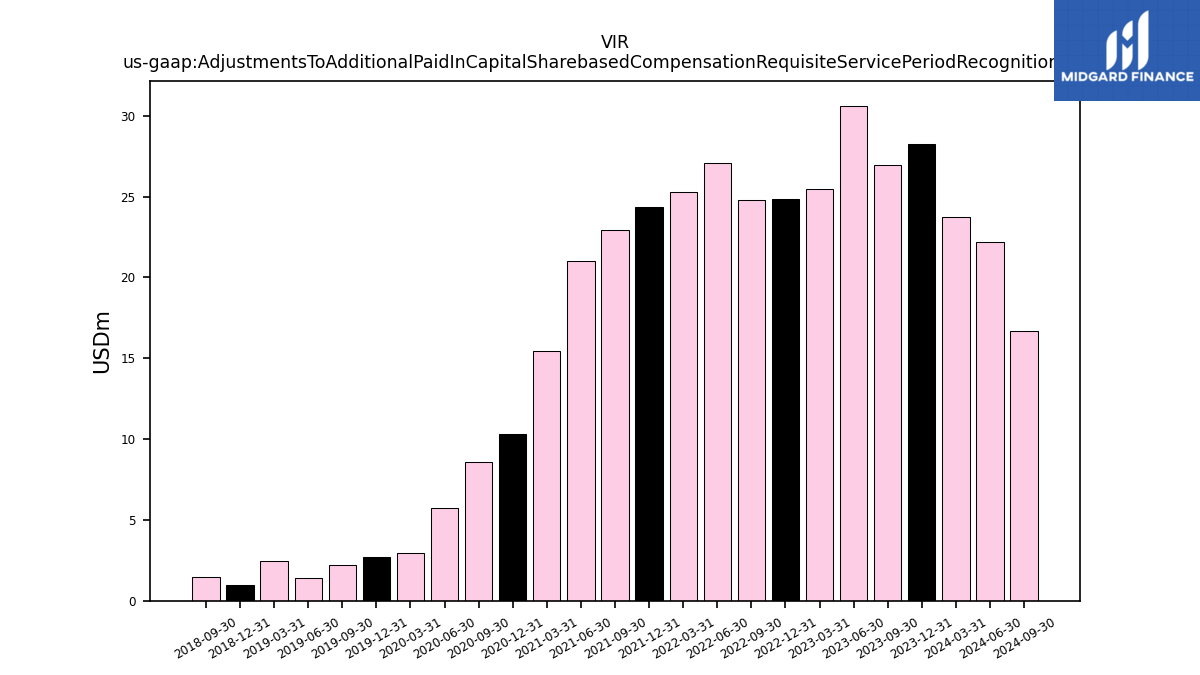
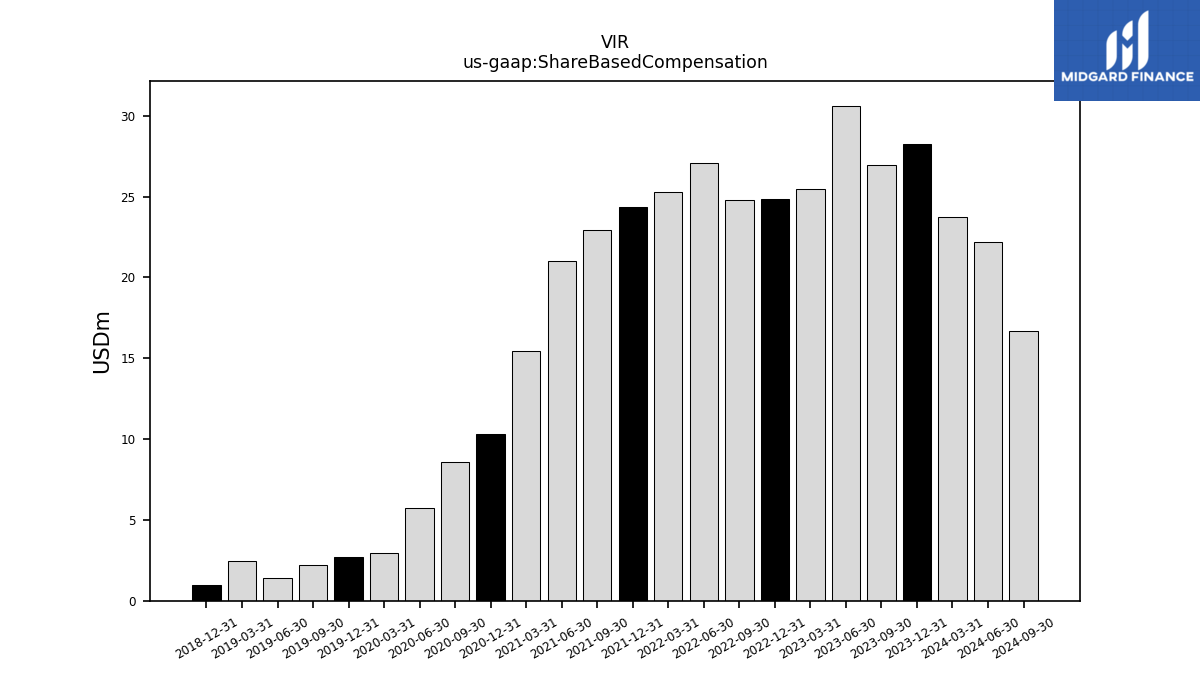
| Allocated Share Based Compensation Expense | 28.27 | 26.94 | 30.62 | 25.48 | 24.86 | 24.81 | 27.10 | 25.30 | 24.37 | 22.94 | 21.00 | 15.47 | 10.30 | 8.58 | 5.75 | 2.97 | 2.68 | 2.19 | 1.40 | 2.45 | 0.95 | 1.45 | NA | NA | |
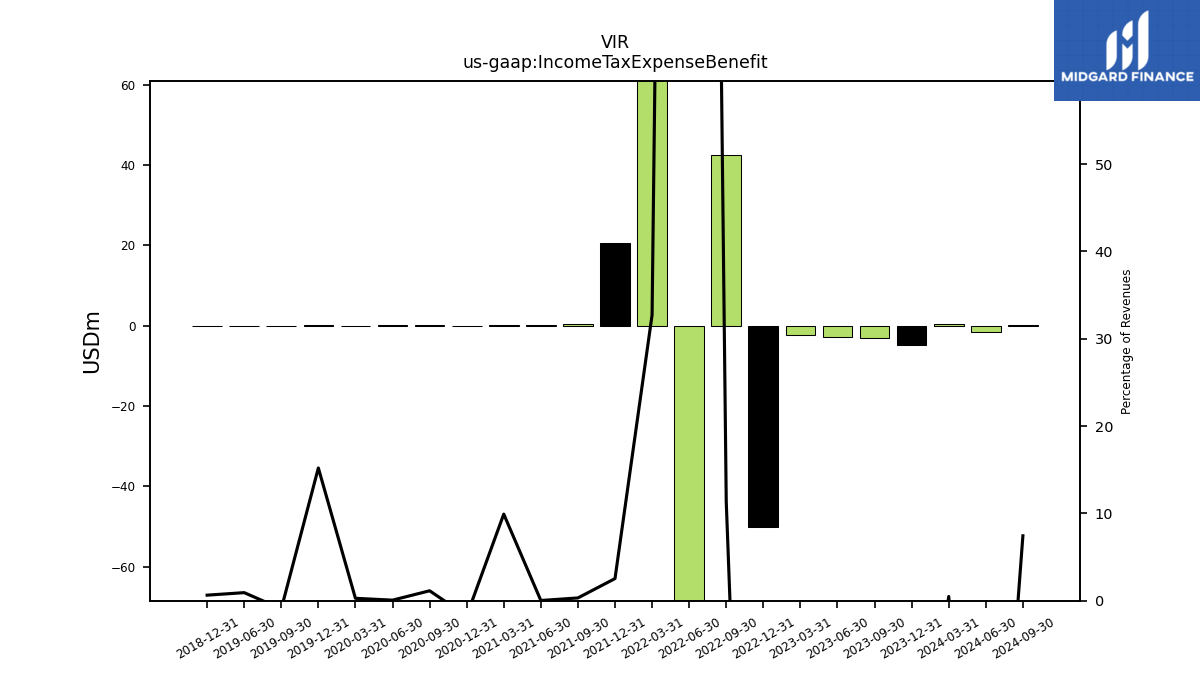
| Income Tax Expense Benefit | -4.78 | -3.21 | -2.85 | -2.23 | -50.03 | 42.42 | -157.23 | 403.29 | 20.64 | 0.33 | 0.05 | 0.20 | -0.03 | 0.02 | 0.05 | 0.02 | 0.15 | -0.01 | 0.02 | NA | 0.02 | NA | NA | NA | |
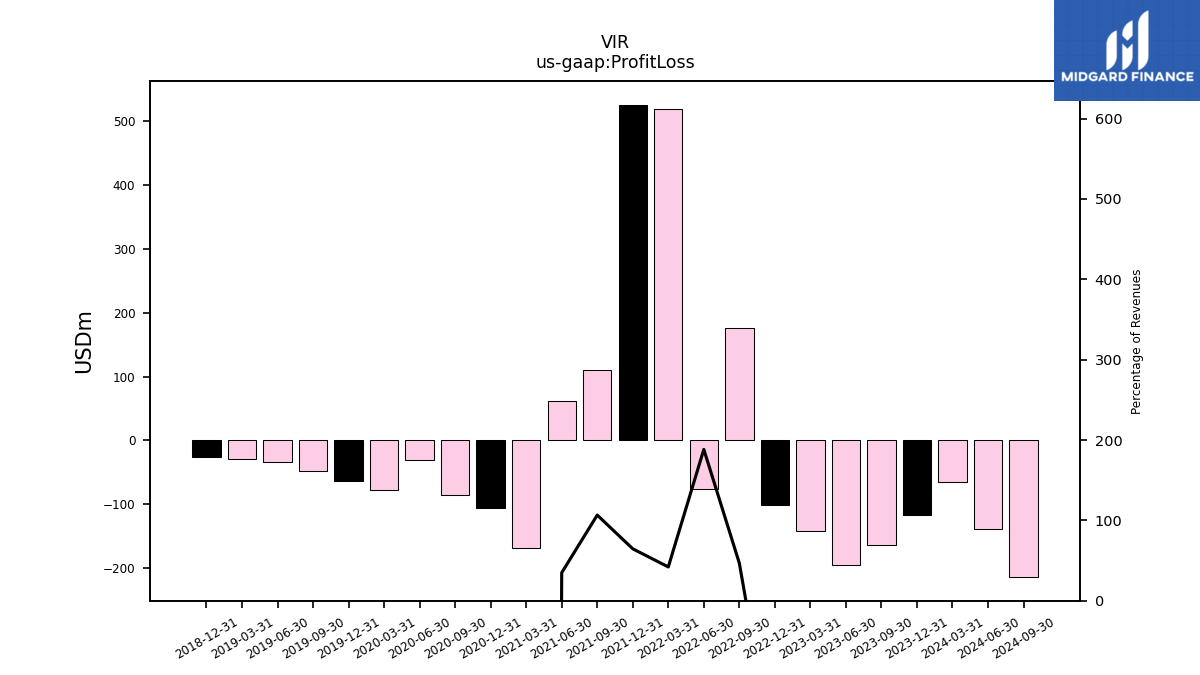
| Profit Loss | -115.97 | -163.41 | -194.78 | -140.96 | -101.60 | 175.31 | -76.49 | 518.62 | 525.25 | 110.43 | 61.81 | -168.91 | -105.65 | -84.61 | -31.17 | -77.24 | -63.77 | -48.31 | -33.93 | -28.67 | -26.39 | NA | NA | NA | |
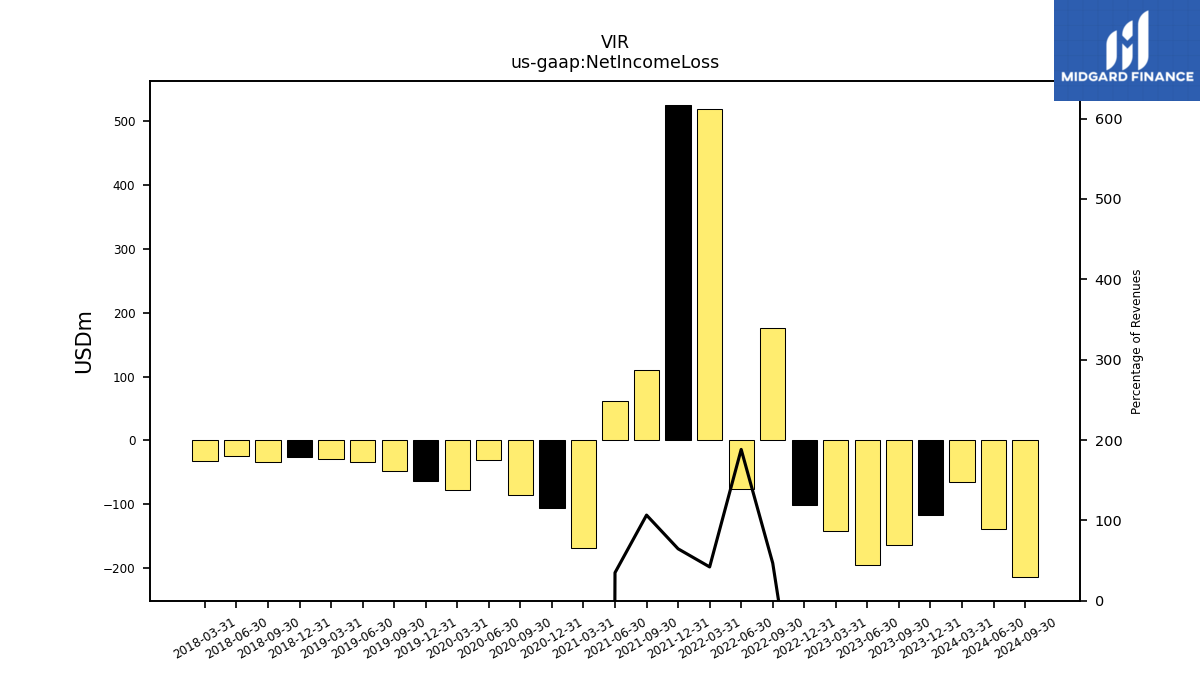
| Net Income Loss | -115.97 | -163.41 | -194.78 | -140.96 | -101.60 | 175.31 | -76.49 | 518.62 | 525.25 | 110.43 | 61.81 | -168.91 | -105.65 | -84.61 | -31.17 | -77.24 | -63.77 | -48.31 | -33.93 | -28.67 | -26.39 | -33.46 | -24.45 | -31.59 | |
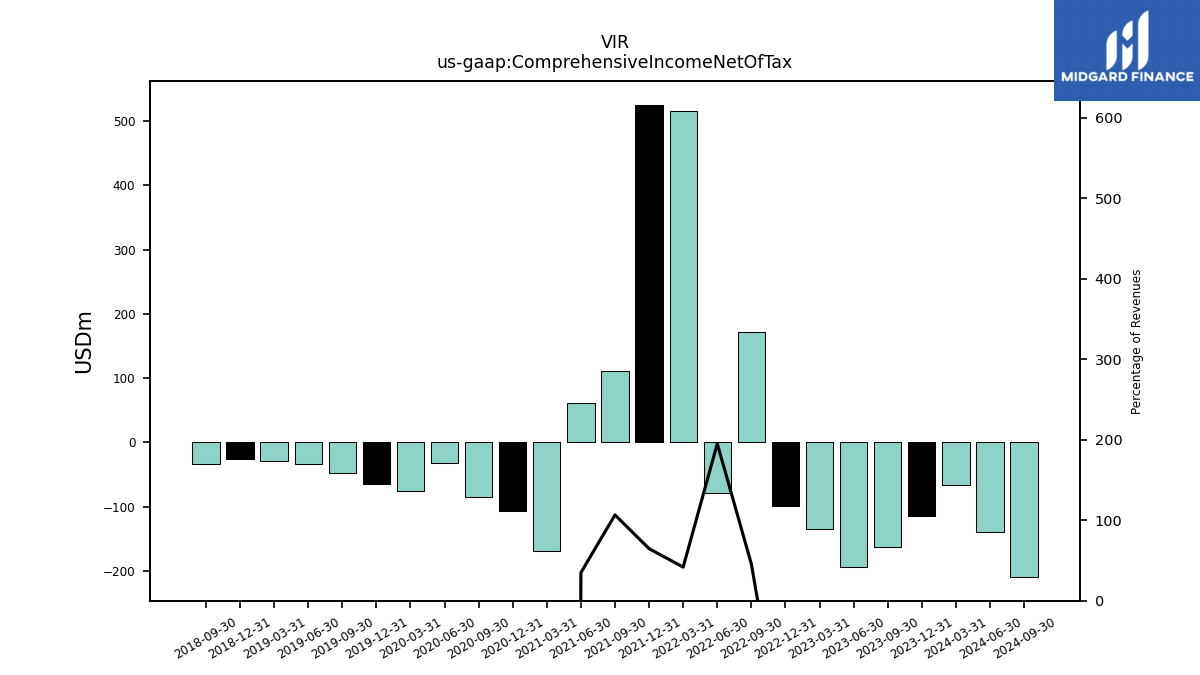
| Comprehensive Income Net Of Tax | -114.89 | -162.41 | -194.46 | -135.05 | -98.84 | 170.99 | -79.24 | 514.91 | 525.46 | 110.45 | 61.78 | -168.94 | -106.44 | -84.80 | -31.71 | -76.39 | -64.45 | -48.47 | -33.78 | -28.56 | -26.37 | -33.48 | NA | NA | |
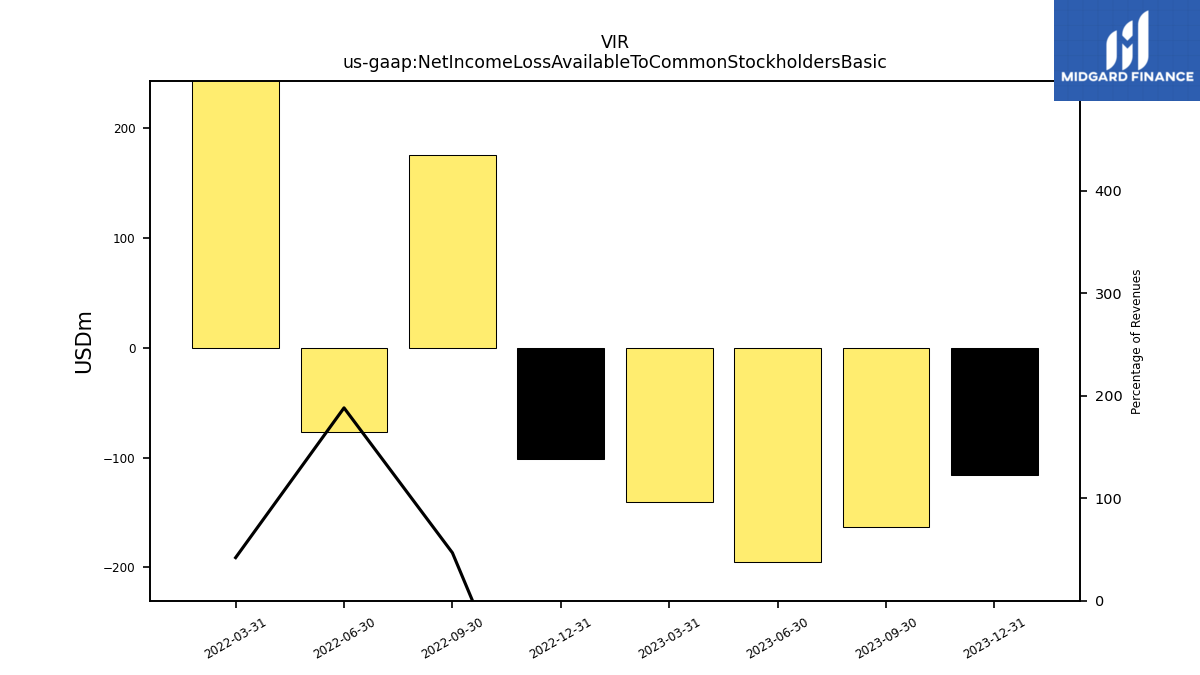
| Net Income Loss Available To Common Stockholders Basic | -115.97 | -163.41 | -194.78 | -140.90 | -101.60 | 175.31 | -76.49 | 518.62 | NA | NA | NA | NA | NA | NA | NA | NA | NA | NA | NA | NA | NA | NA | NA | NA |
| 2023-12-31 | 2023-09-30 | 2023-06-30 | 2023-03-31 | 2022-12-31 | 2022-09-30 | 2022-06-30 | 2022-03-31 | 2021-12-31 | 2021-09-30 | 2021-06-30 | 2021-03-31 | 2020-12-31 | 2020-09-30 | 2020-06-30 | 2020-03-31 | 2019-12-31 | 2019-09-30 | 2019-06-30 | 2019-03-31 | 2018-12-31 | 2018-09-30 | 2018-06-30 | 2018-03-31 | ||
|---|---|---|---|---|---|---|---|---|---|---|---|---|---|---|---|---|---|---|---|---|---|---|---|---|---|
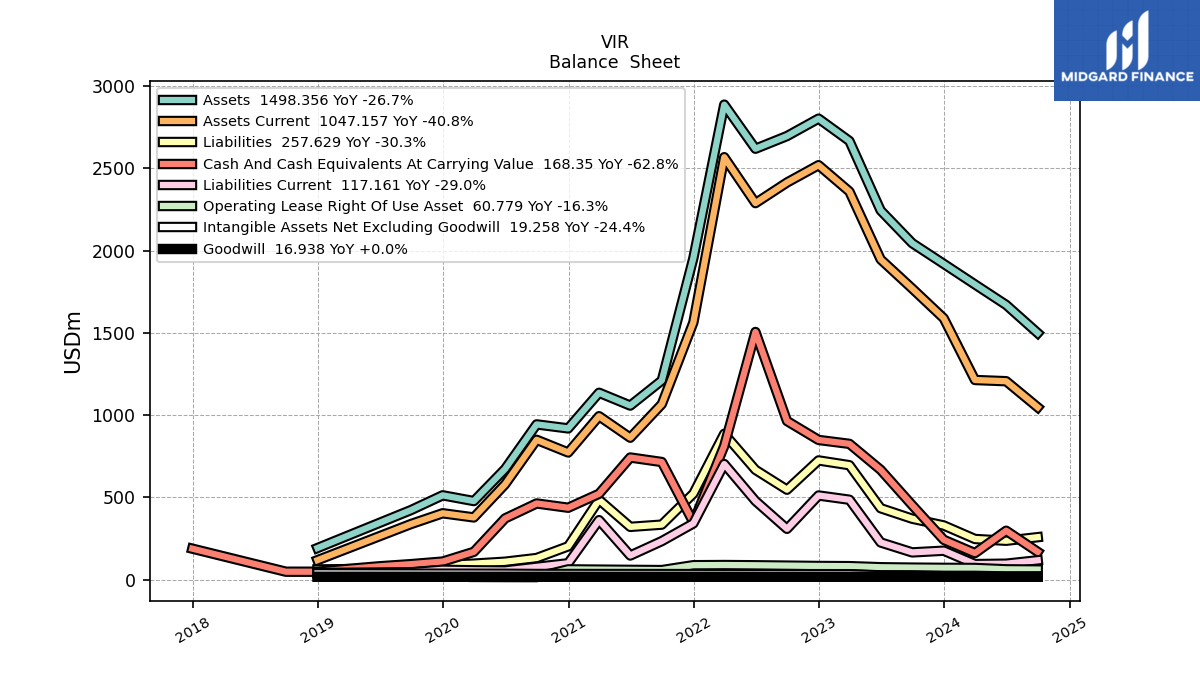
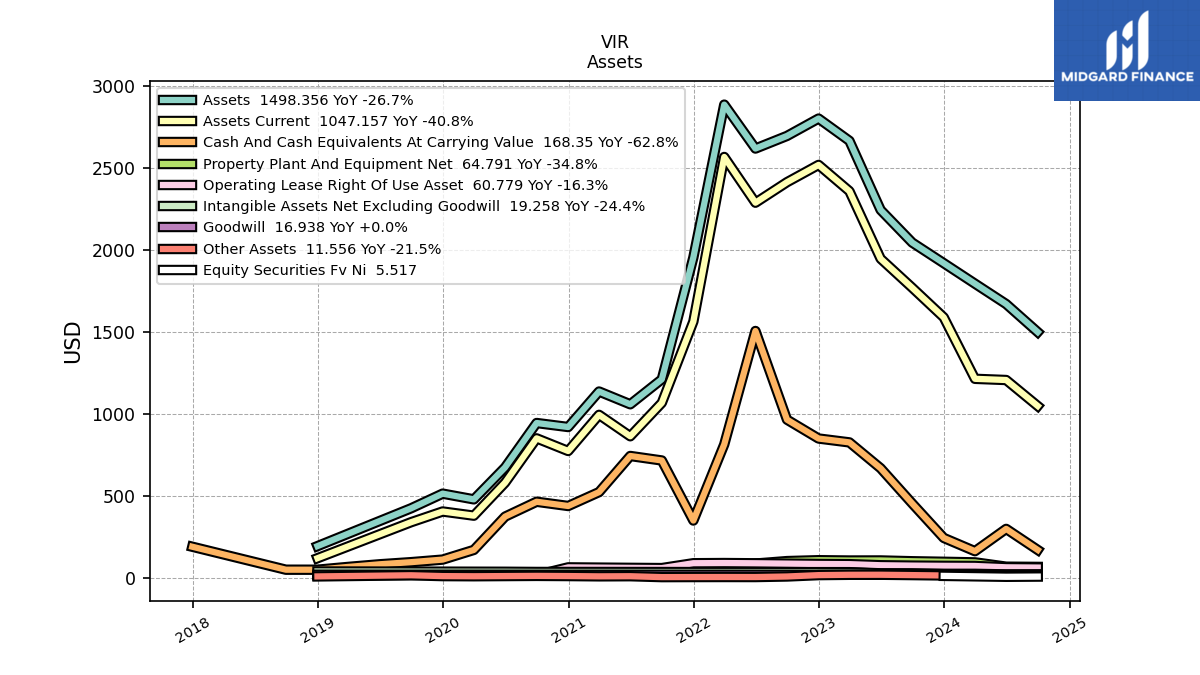
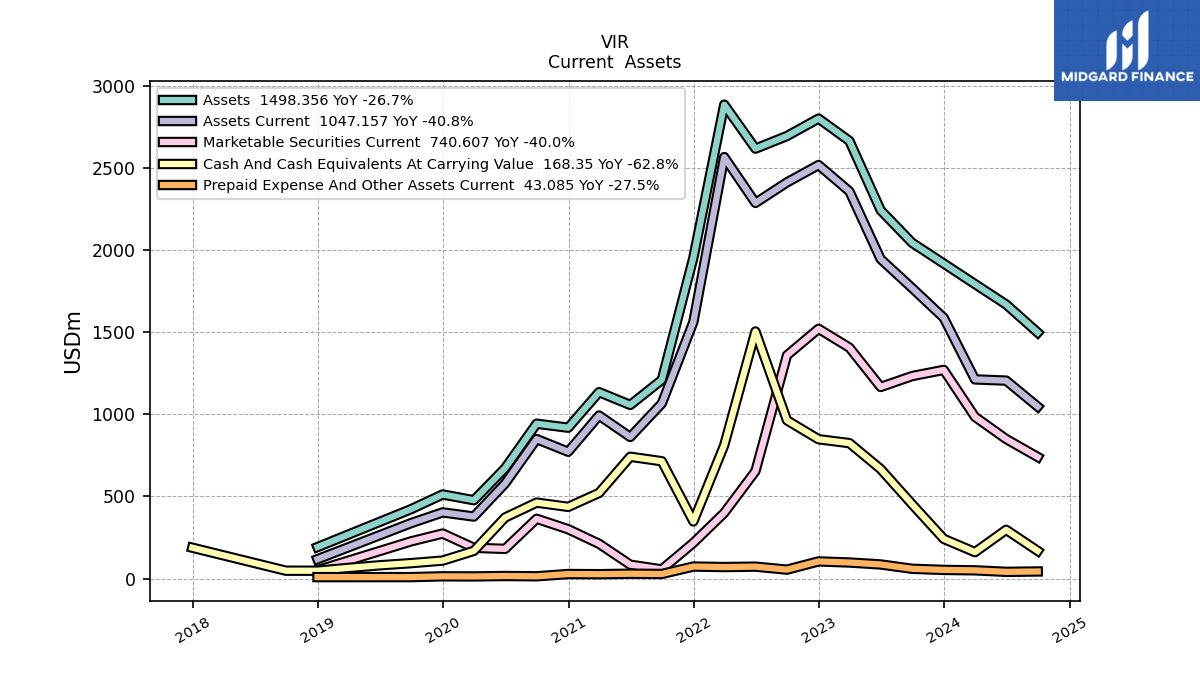
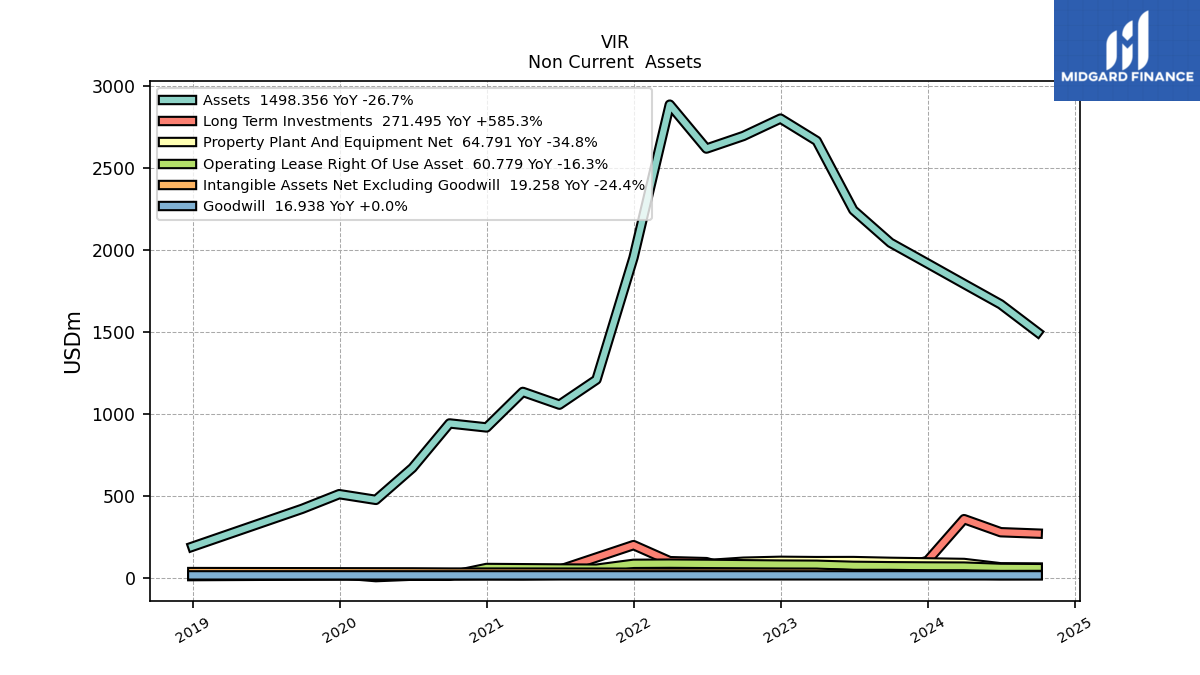
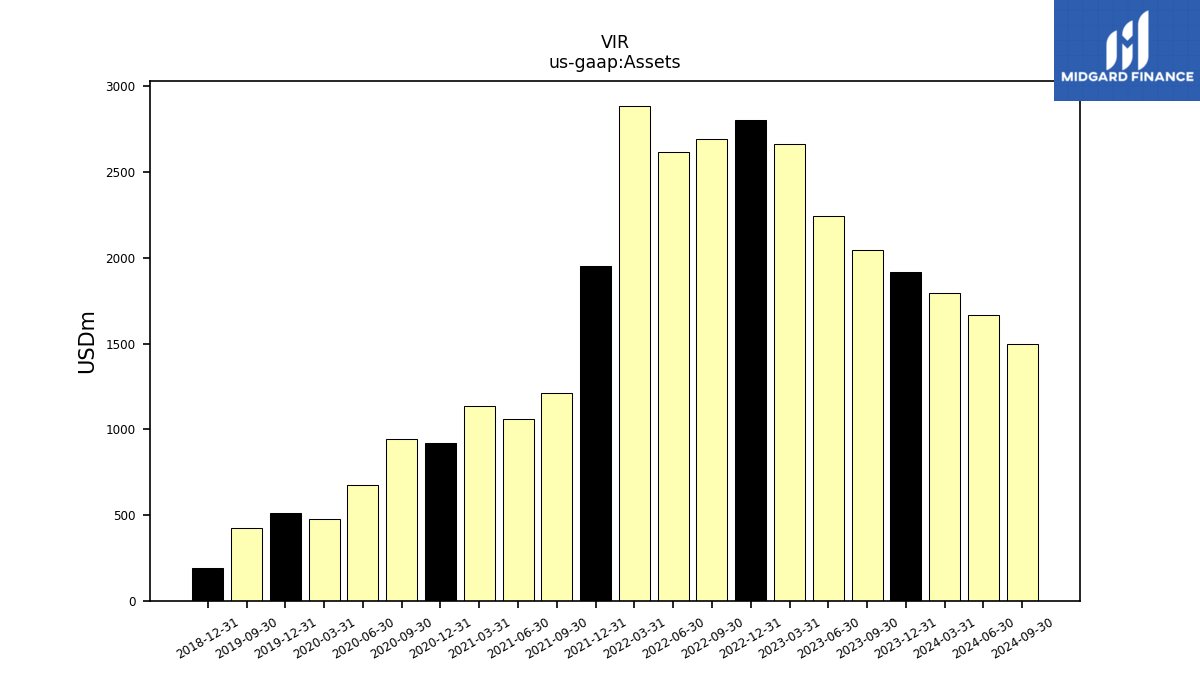
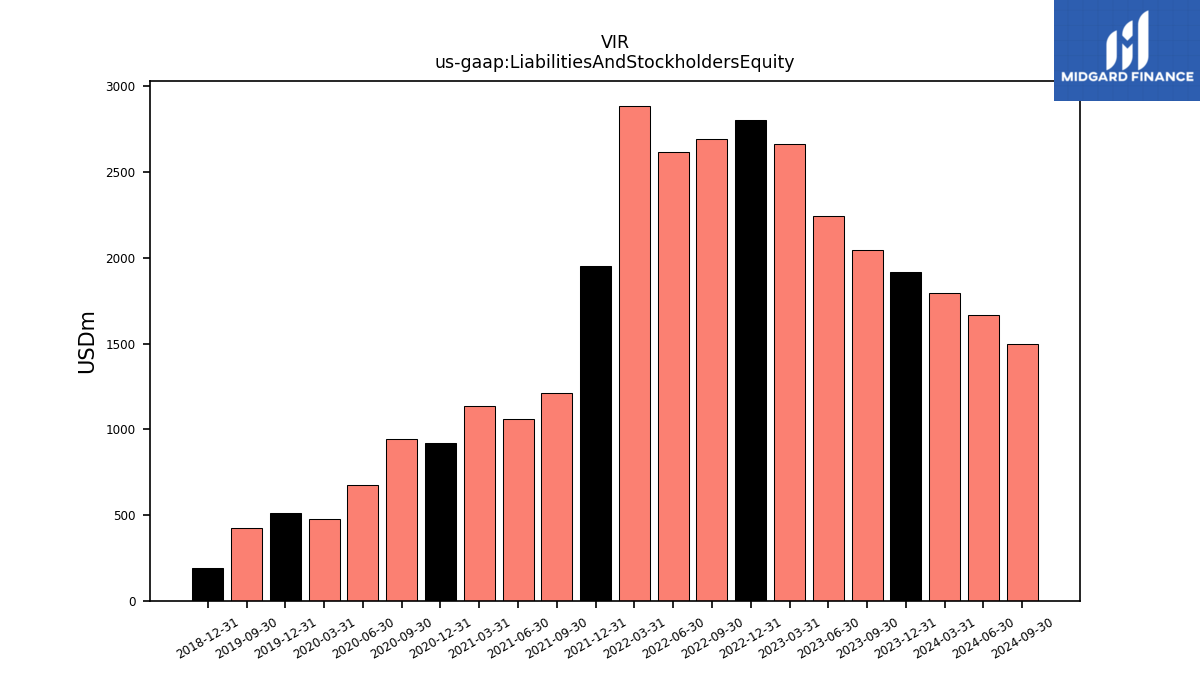
| Assets | 1919.06 | 2044.89 | 2243.87 | 2665.94 | 2802.09 | 2695.97 | 2618.99 | 2887.13 | 1954.27 | 1210.21 | 1057.58 | 1135.58 | 918.76 | 943.26 | 672.24 | 477.11 | 512.07 | 422.64 | NA | NA | 191.60 | NA | NA | NA | |
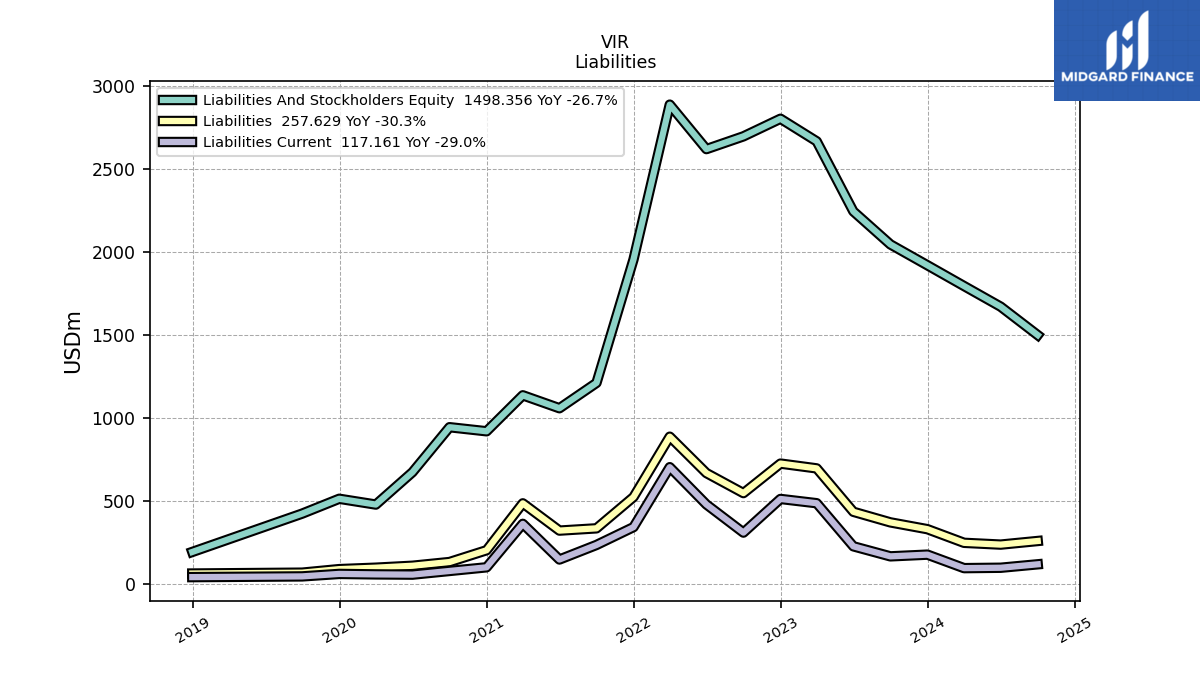
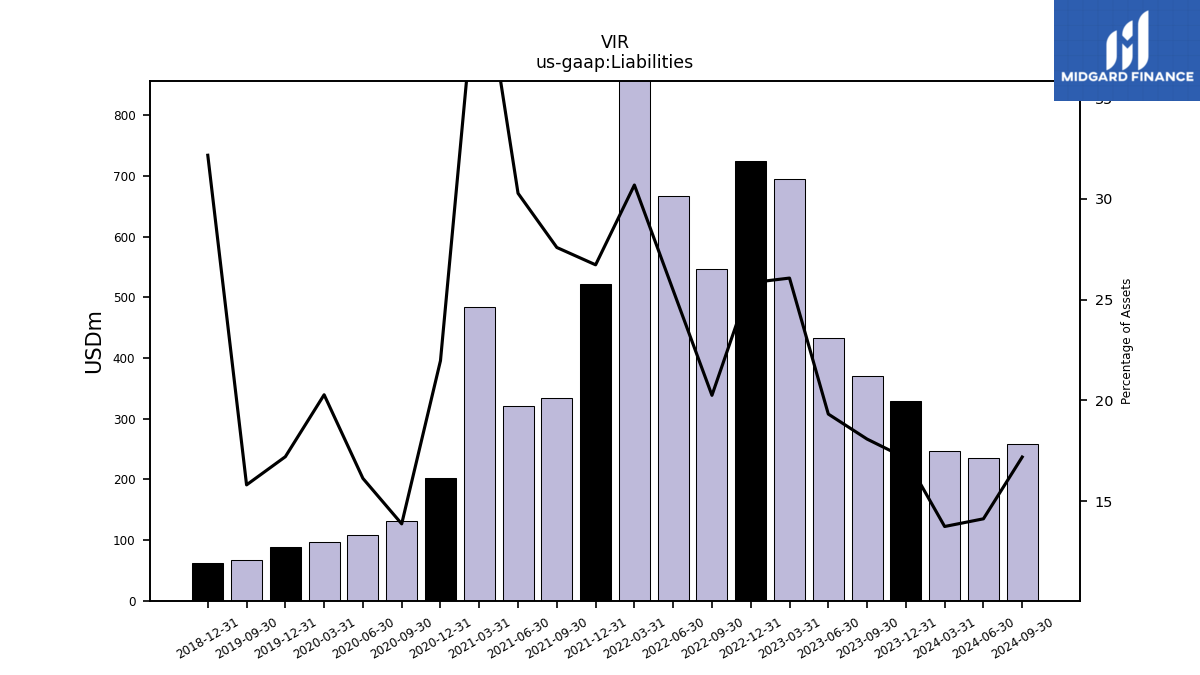
| Liabilities | 328.82 | 369.81 | 433.67 | 695.13 | 724.12 | 546.12 | 666.98 | 886.12 | 522.42 | 333.94 | 320.26 | 484.63 | 201.91 | 130.90 | 108.46 | 96.78 | 88.13 | 66.83 | NA | NA | 61.64 | NA | NA | NA | |
| Liabilities And Stockholders Equity | 1919.06 | 2044.89 | 2243.87 | 2665.94 | 2802.09 | 2695.97 | 2618.99 | 2887.13 | 1954.27 | 1210.21 | 1057.58 | 1135.58 | 918.76 | 943.26 | 672.24 | 477.11 | 512.07 | 422.64 | NA | NA | 191.60 | NA | NA | NA |
| 2023-12-31 | 2023-09-30 | 2023-06-30 | 2023-03-31 | 2022-12-31 | 2022-09-30 | 2022-06-30 | 2022-03-31 | 2021-12-31 | 2021-09-30 | 2021-06-30 | 2021-03-31 | 2020-12-31 | 2020-09-30 | 2020-06-30 | 2020-03-31 | 2019-12-31 | 2019-09-30 | 2019-06-30 | 2019-03-31 | 2018-12-31 | 2018-09-30 | 2018-06-30 | 2018-03-31 | ||
|---|---|---|---|---|---|---|---|---|---|---|---|---|---|---|---|---|---|---|---|---|---|---|---|---|---|
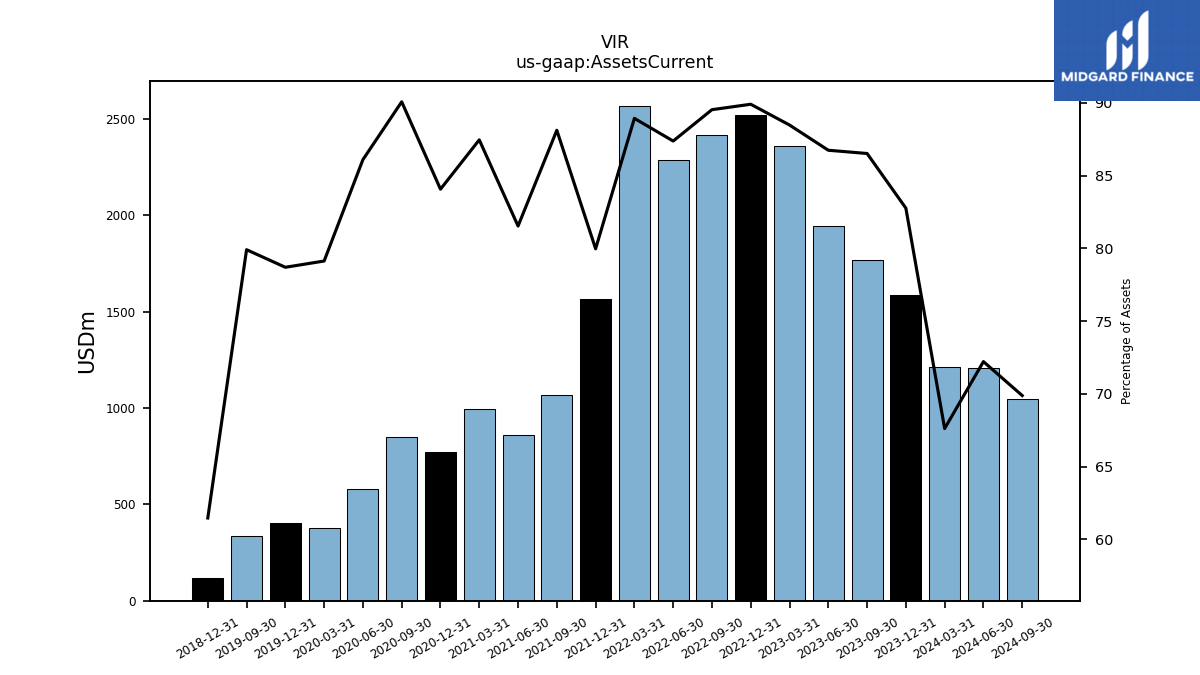
| Assets Current | 1588.23 | 1769.18 | 1946.33 | 2358.63 | 2519.08 | 2413.62 | 2288.27 | 2567.55 | 1562.82 | 1066.34 | 862.29 | 993.11 | 772.37 | 849.57 | 578.76 | 377.54 | 403.00 | 337.72 | NA | NA | 117.78 | NA | NA | NA | |
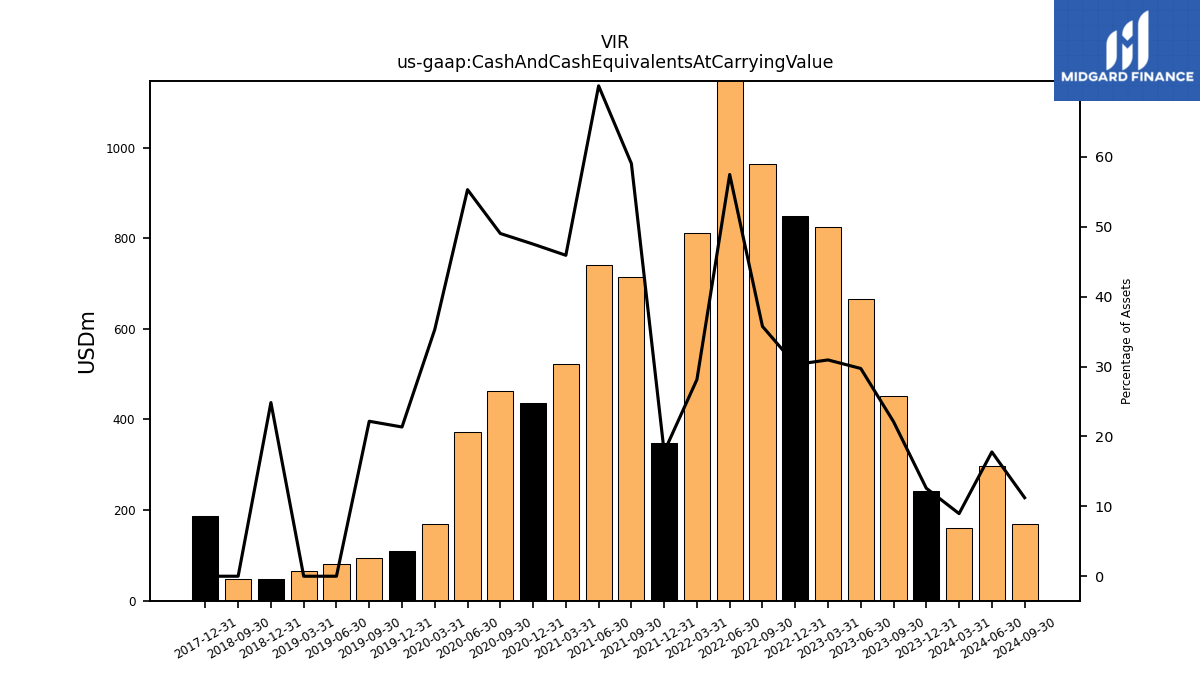
| Cash And Cash Equivalents At Carrying Value | 241.58 | 452.10 | 666.95 | 824.91 | 848.63 | 963.74 | 1505.18 | 812.36 | 347.81 | 714.52 | 741.95 | 521.40 | 436.57 | 462.52 | 371.78 | 168.42 | 109.33 | 93.70 | 80.68 | 64.72 | 47.60 | 47.67 | NA | NA | |
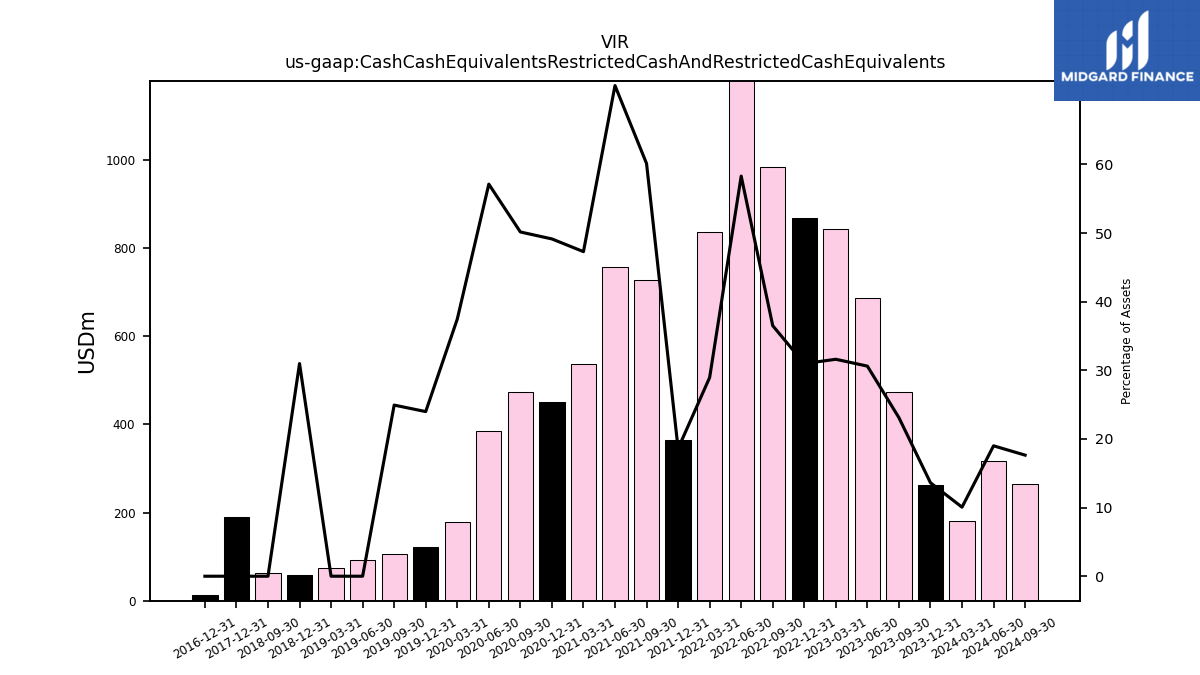
| Cash Cash Equivalents Restricted Cash And Restricted Cash Equivalents | 261.29 | 472.35 | 686.86 | 842.61 | 867.97 | 983.97 | 1526.68 | 835.80 | 363.42 | 727.63 | 755.96 | 537.00 | 451.49 | 473.08 | 384.00 | 178.71 | 122.82 | 105.37 | 93.30 | 73.12 | 59.36 | 62.33 | NA | NA | |
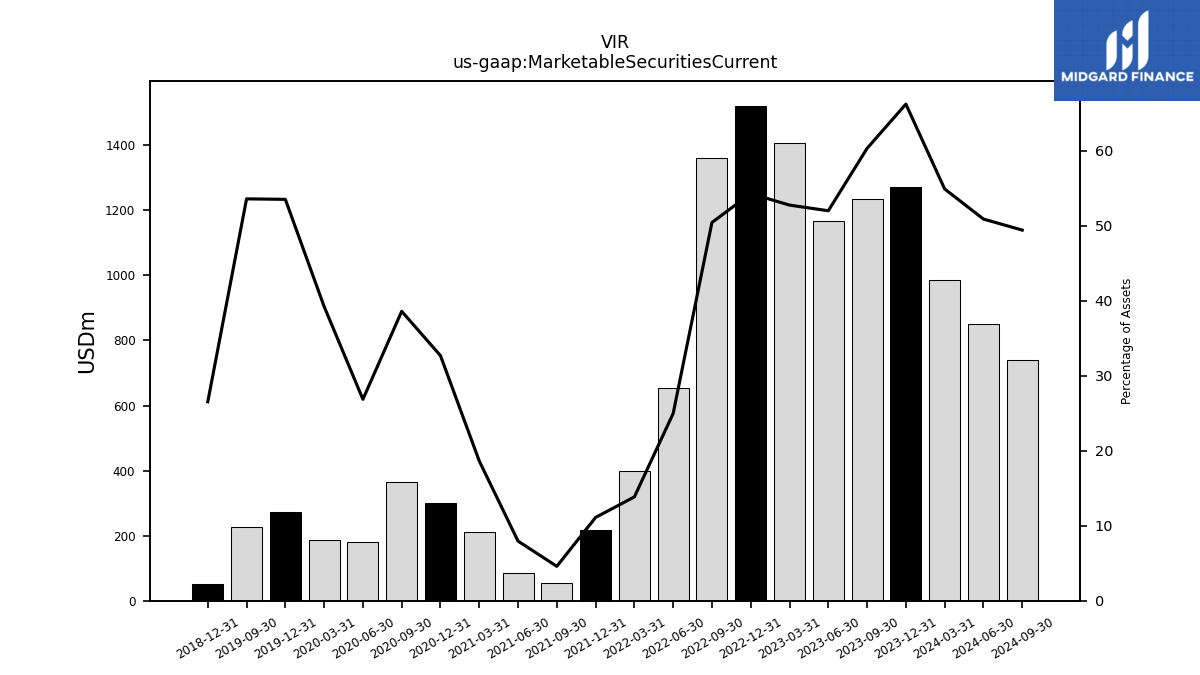
| Marketable Securities Current | 1270.98 | 1233.63 | 1166.95 | 1406.58 | 1521.52 | 1359.94 | 654.11 | 399.83 | 217.18 | 55.56 | 84.11 | 211.64 | 300.29 | 364.07 | 180.60 | 187.19 | 274.10 | 226.51 | NA | NA | 50.84 | NA | NA | NA | |
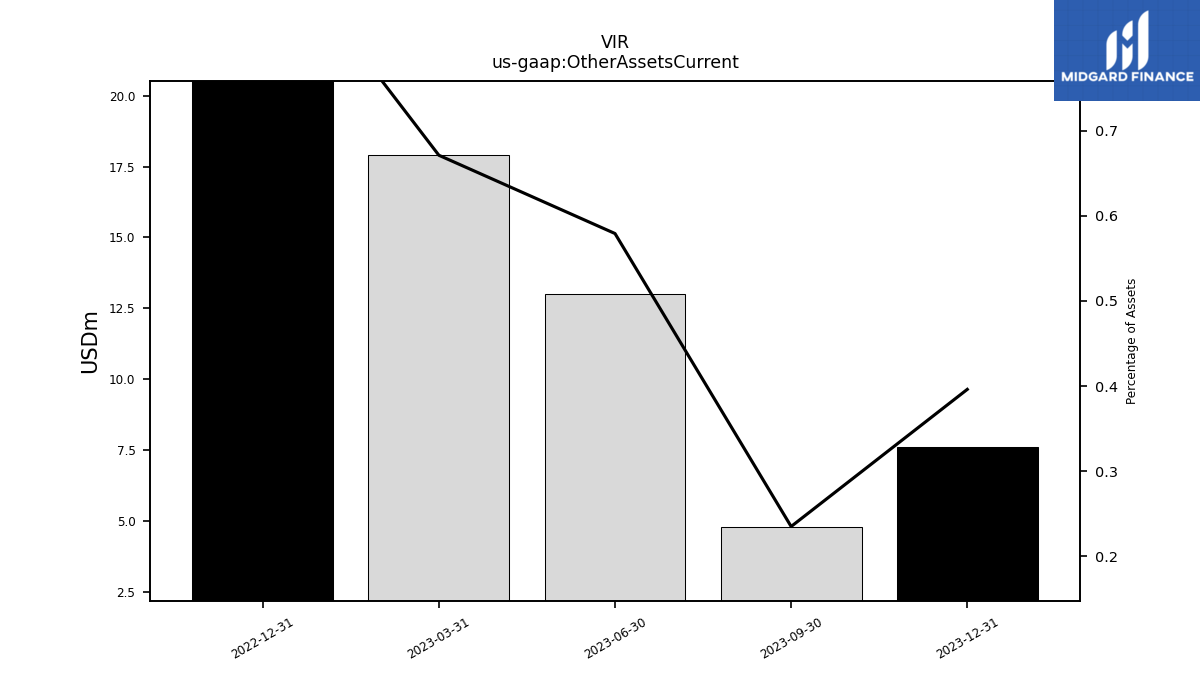
| Other Assets Current | 7.60 | 4.80 | 13.00 | 17.90 | 26.40 | NA | NA | NA | NA | NA | NA | NA | NA | NA | NA | NA | NA | NA | NA | NA | NA | NA | NA | NA | |
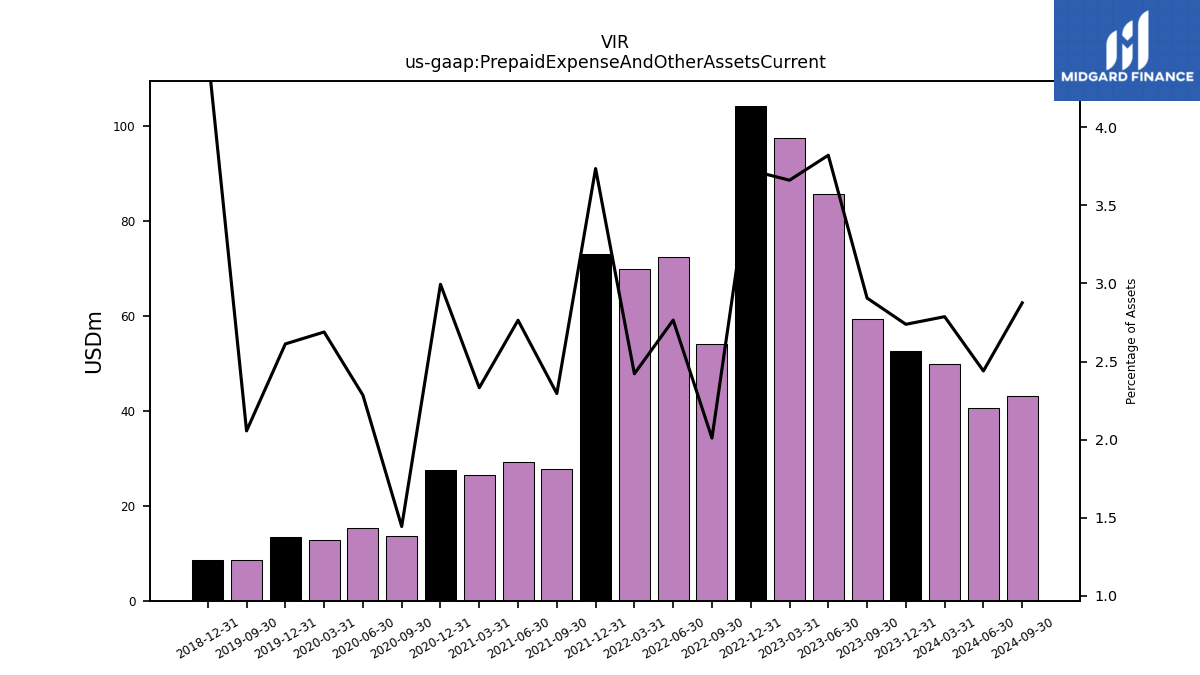
| Prepaid Expense And Other Assets Current | 52.55 | 59.43 | 85.74 | 97.60 | 104.36 | 54.18 | 72.42 | 69.91 | 73.00 | 27.77 | 29.23 | 26.48 | 27.51 | 13.61 | 15.36 | 12.83 | 13.38 | 8.69 | NA | NA | 8.58 | NA | NA | NA |
| 2023-12-31 | 2023-09-30 | 2023-06-30 | 2023-03-31 | 2022-12-31 | 2022-09-30 | 2022-06-30 | 2022-03-31 | 2021-12-31 | 2021-09-30 | 2021-06-30 | 2021-03-31 | 2020-12-31 | 2020-09-30 | 2020-06-30 | 2020-03-31 | 2019-12-31 | 2019-09-30 | 2019-06-30 | 2019-03-31 | 2018-12-31 | 2018-09-30 | 2018-06-30 | 2018-03-31 | ||
|---|---|---|---|---|---|---|---|---|---|---|---|---|---|---|---|---|---|---|---|---|---|---|---|---|---|
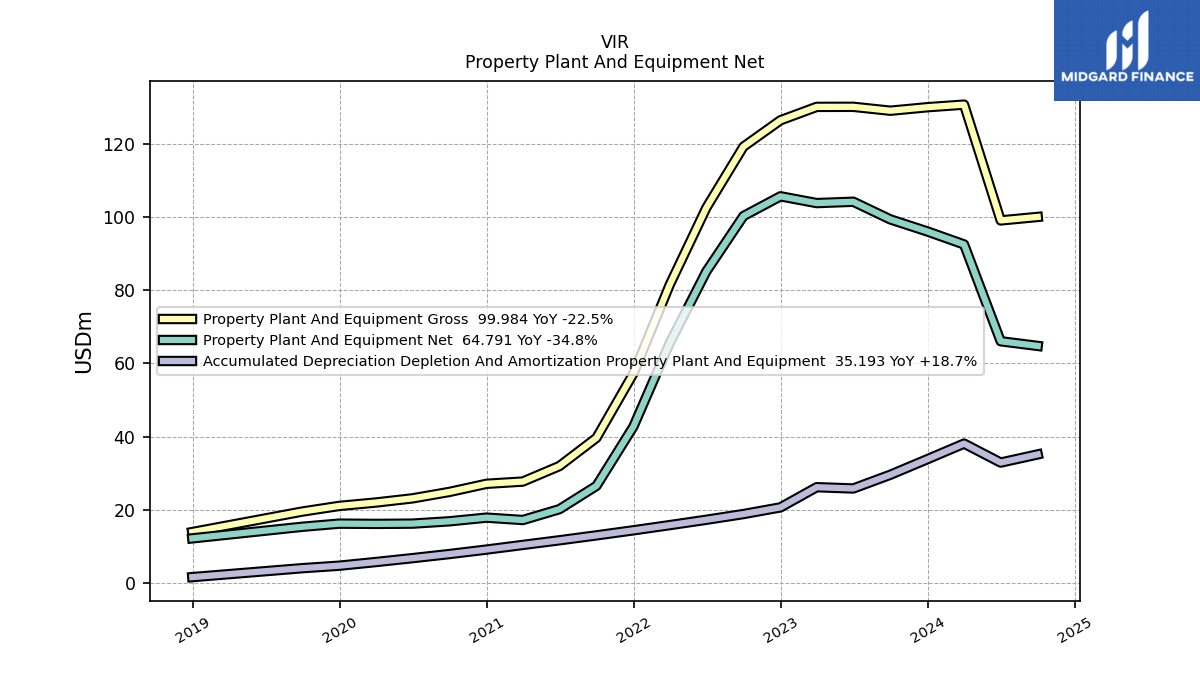
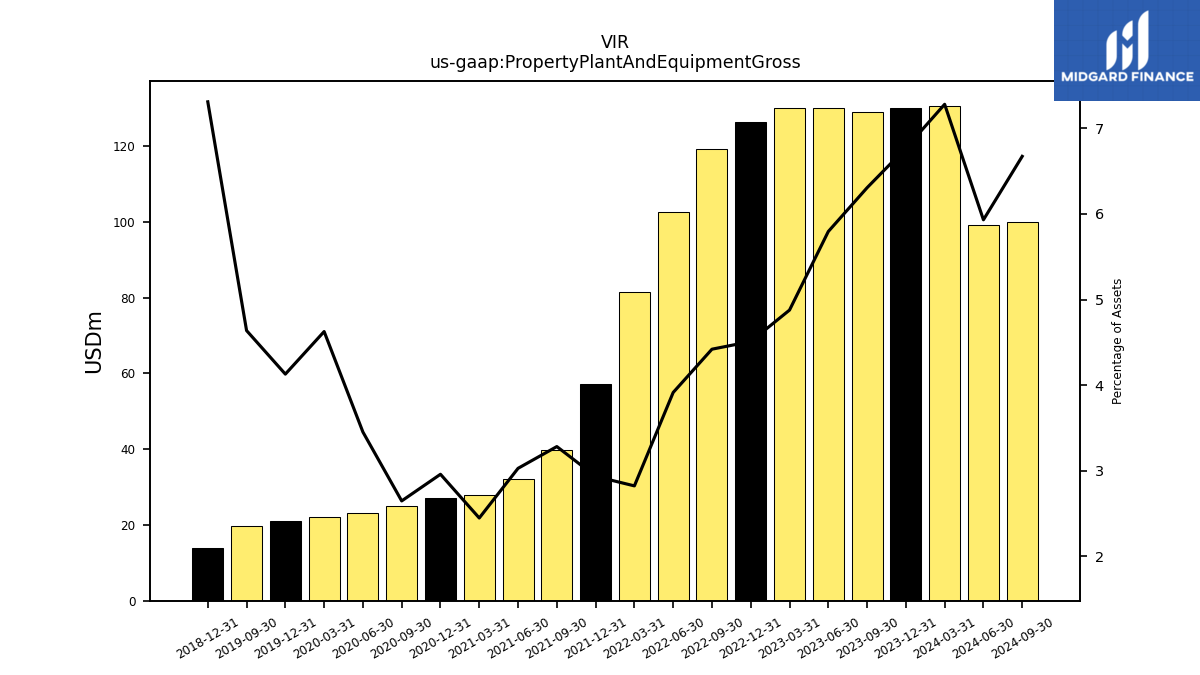
| Property Plant And Equipment Gross | 129.91 | 128.96 | 130.03 | 130.01 | 126.35 | 119.15 | 102.50 | 81.49 | 57.33 | 39.72 | 32.02 | 27.79 | 27.18 | 24.96 | 23.20 | 22.07 | 21.14 | 19.60 | NA | NA | 14.01 | NA | NA | NA | |
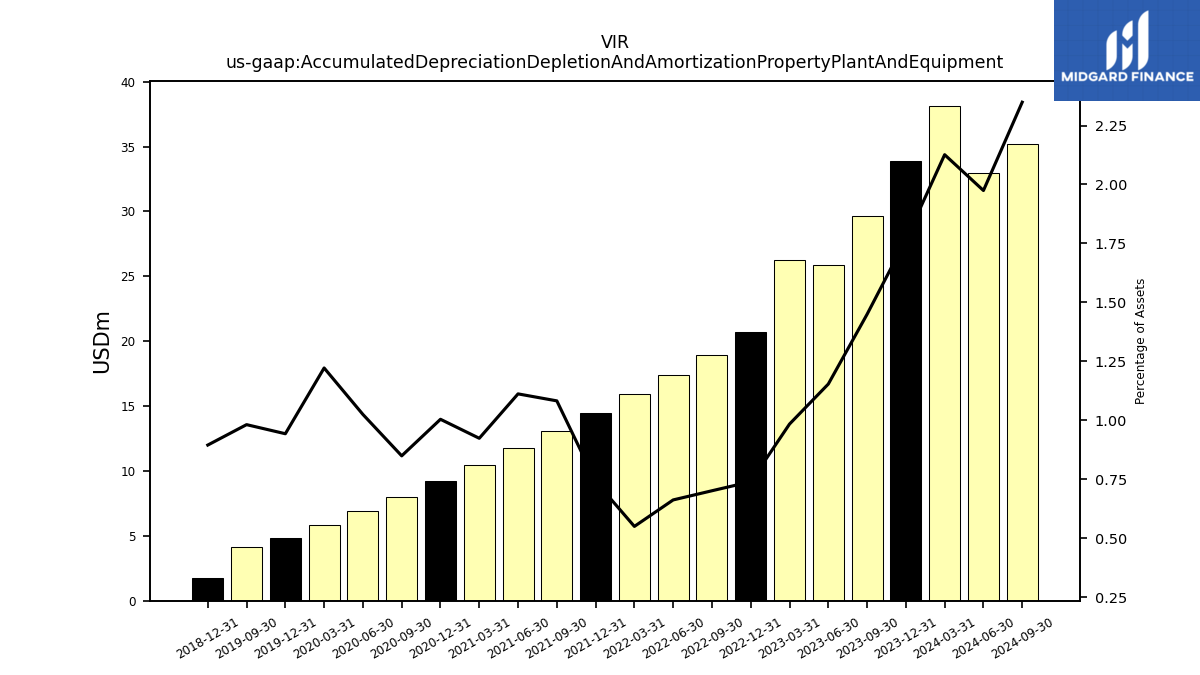
| Accumulated Depreciation Depletion And Amortization Property Plant And Equipment | 33.90 | 29.65 | 25.90 | 26.25 | 20.74 | 18.92 | 17.37 | 15.90 | 14.49 | 13.11 | 11.77 | 10.50 | 9.23 | 8.02 | 6.89 | 5.83 | 4.83 | 4.15 | NA | NA | 1.72 | NA | NA | NA | |
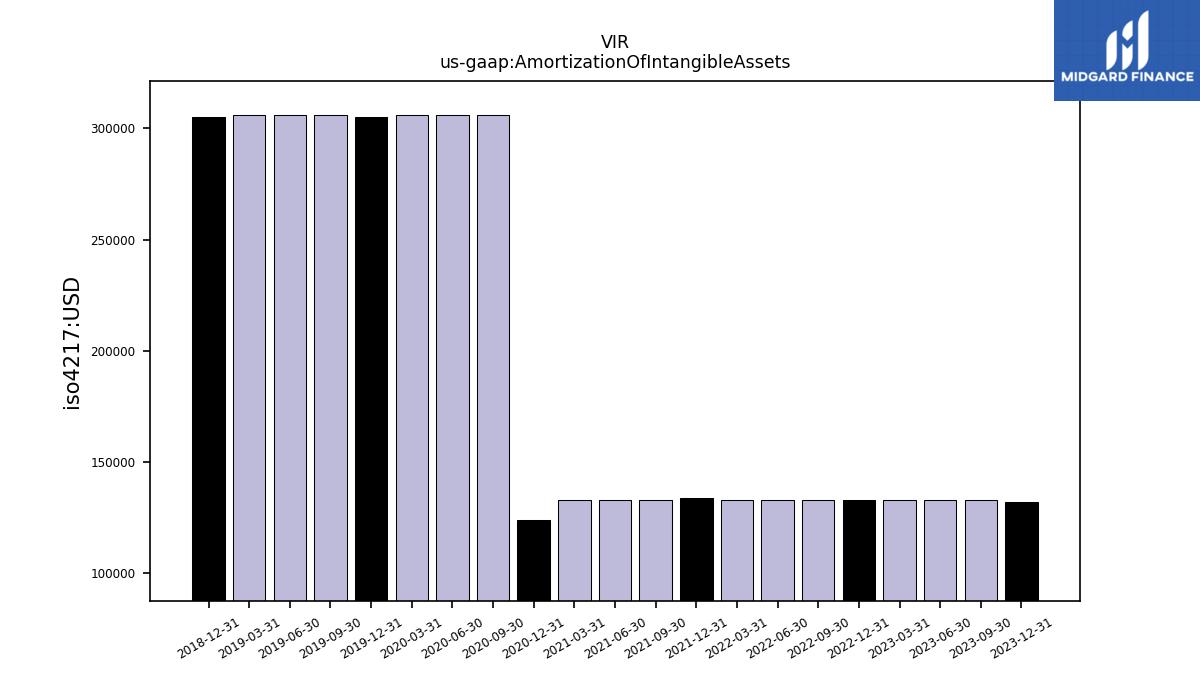
| Amortization Of Intangible Assets | 0.13 | 0.13 | 0.13 | 0.13 | 0.13 | 0.13 | 0.13 | 0.13 | 0.13 | 0.13 | 0.13 | 0.13 | 0.12 | 0.31 | 0.31 | 0.31 | 0.30 | 0.31 | 0.31 | 0.31 | 0.30 | NA | NA | NA | |
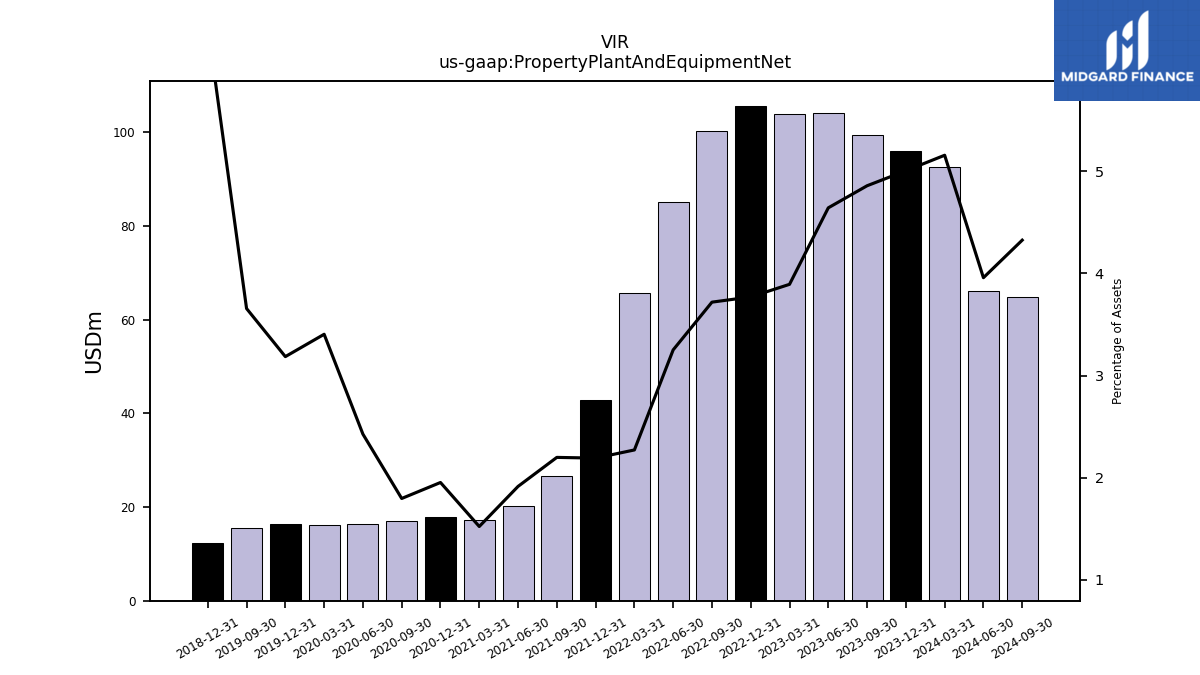
| Property Plant And Equipment Net | 96.02 | 99.31 | 104.13 | 103.76 | 105.61 | 100.23 | 85.14 | 65.58 | 42.83 | 26.61 | 20.25 | 17.29 | 17.95 | 16.95 | 16.31 | 16.24 | 16.31 | 15.45 | NA | NA | 12.29 | NA | NA | NA | |
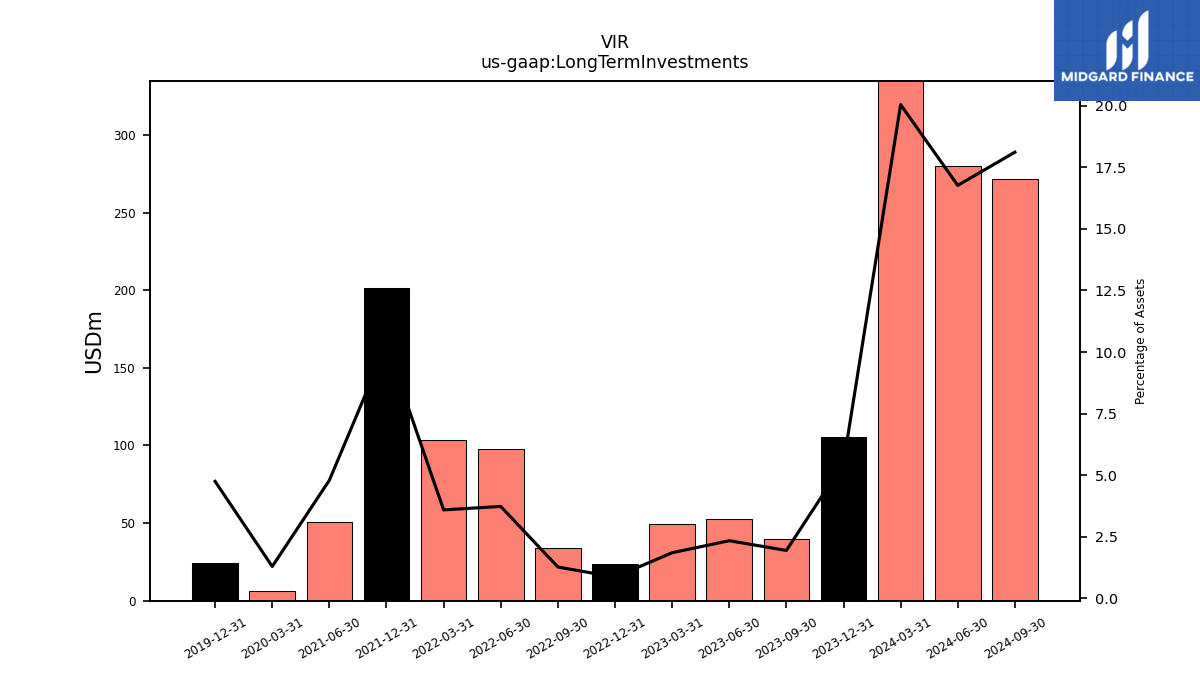
| Long Term Investments | 105.28 | 39.62 | 52.36 | 49.19 | 23.93 | 34.10 | 97.58 | 103.53 | 201.39 | NA | 50.68 | NA | NA | NA | NA | 6.14 | 24.29 | NA | NA | NA | NA | NA | NA | NA | |
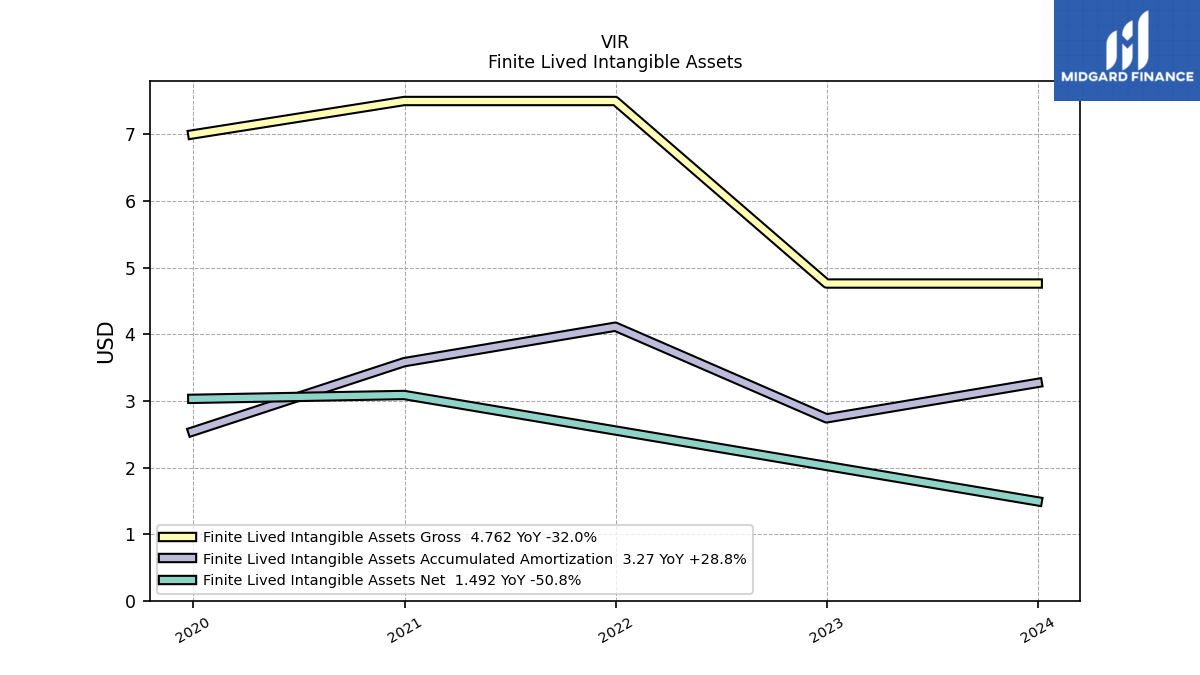
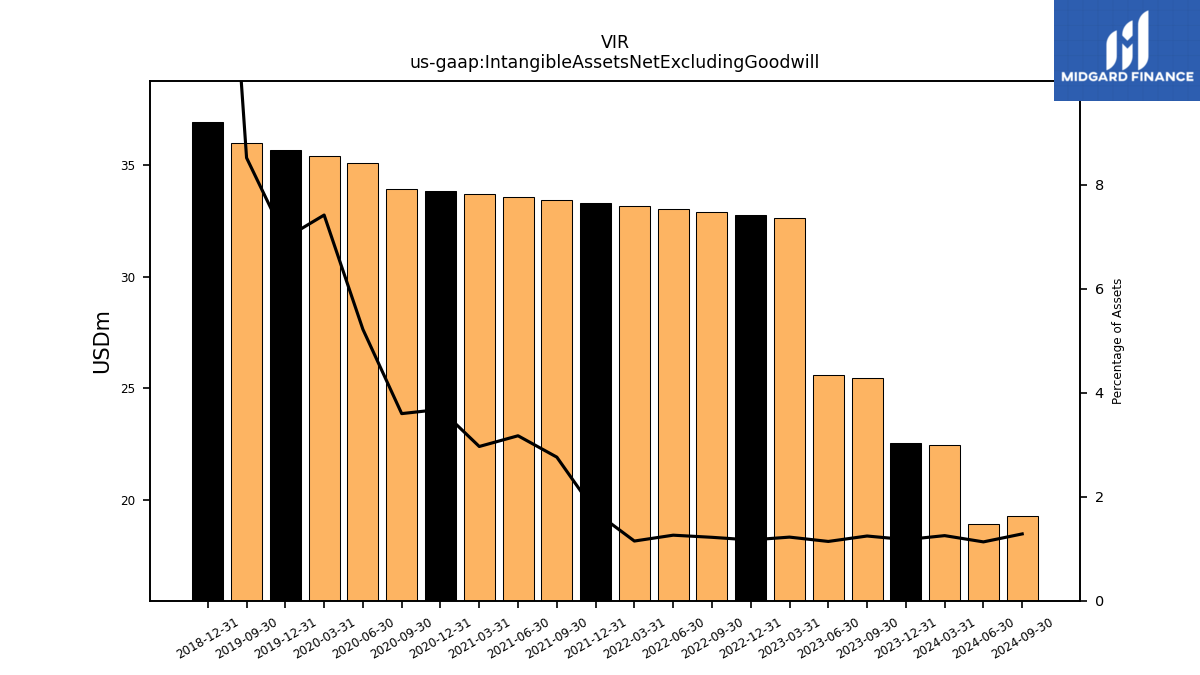
| Intangible Assets Net Excluding Goodwill | 22.57 | 25.46 | 25.59 | 32.62 | 32.76 | 32.89 | 33.02 | 33.15 | 33.29 | 33.42 | 33.55 | 33.69 | 33.82 | 33.94 | 35.08 | 35.39 | 35.69 | 36.00 | NA | NA | 36.92 | NA | NA | NA | |
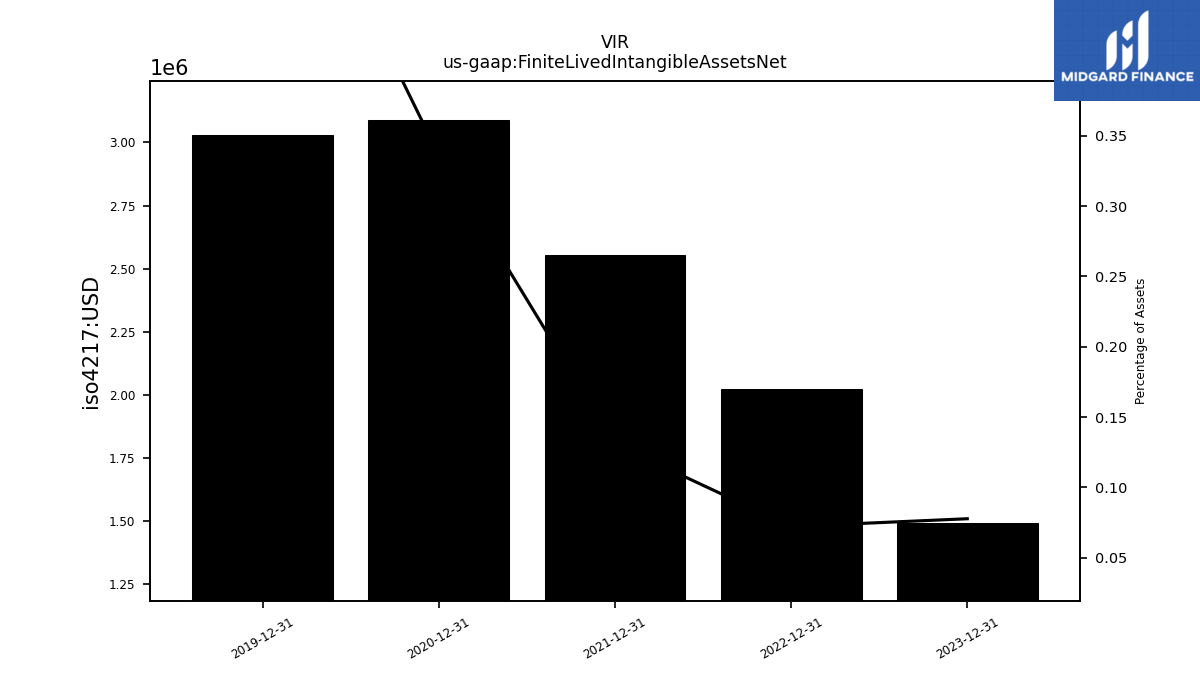
| Finite Lived Intangible Assets Net | 1.49 | NA | NA | NA | 2.02 | NA | NA | NA | 2.56 | NA | NA | NA | 3.09 | NA | NA | NA | 3.03 | NA | NA | NA | NA | NA | NA | NA |
| 2023-12-31 | 2023-09-30 | 2023-06-30 | 2023-03-31 | 2022-12-31 | 2022-09-30 | 2022-06-30 | 2022-03-31 | 2021-12-31 | 2021-09-30 | 2021-06-30 | 2021-03-31 | 2020-12-31 | 2020-09-30 | 2020-06-30 | 2020-03-31 | 2019-12-31 | 2019-09-30 | 2019-06-30 | 2019-03-31 | 2018-12-31 | 2018-09-30 | 2018-06-30 | 2018-03-31 | ||
|---|---|---|---|---|---|---|---|---|---|---|---|---|---|---|---|---|---|---|---|---|---|---|---|---|---|
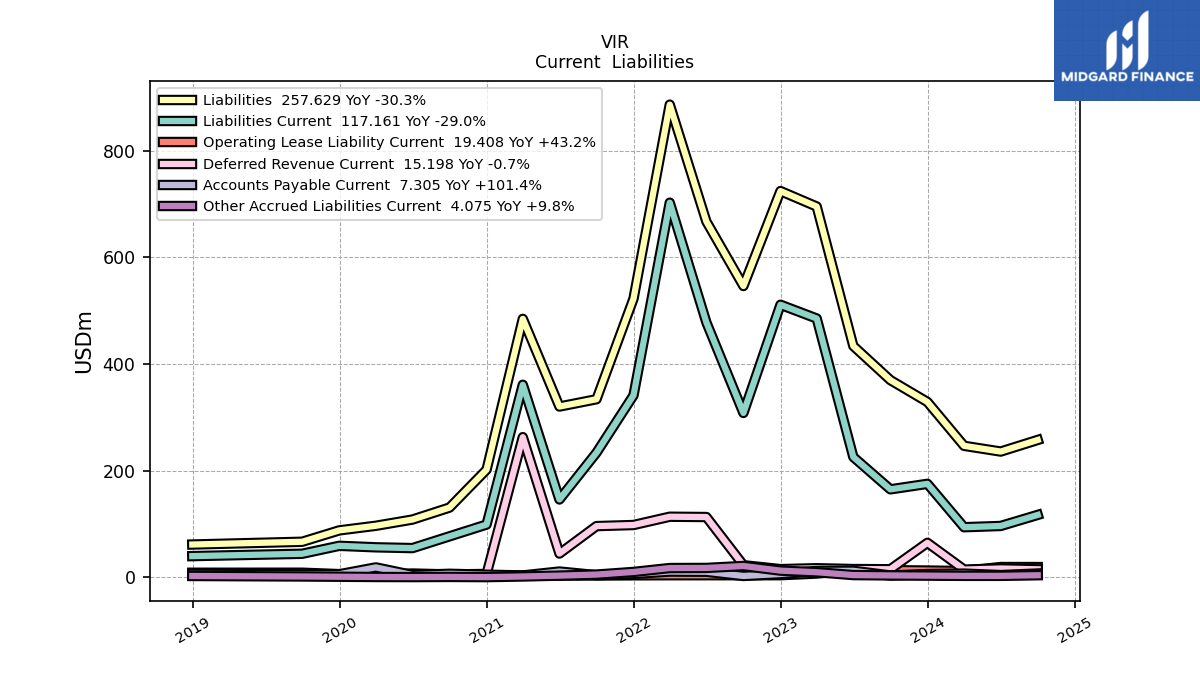
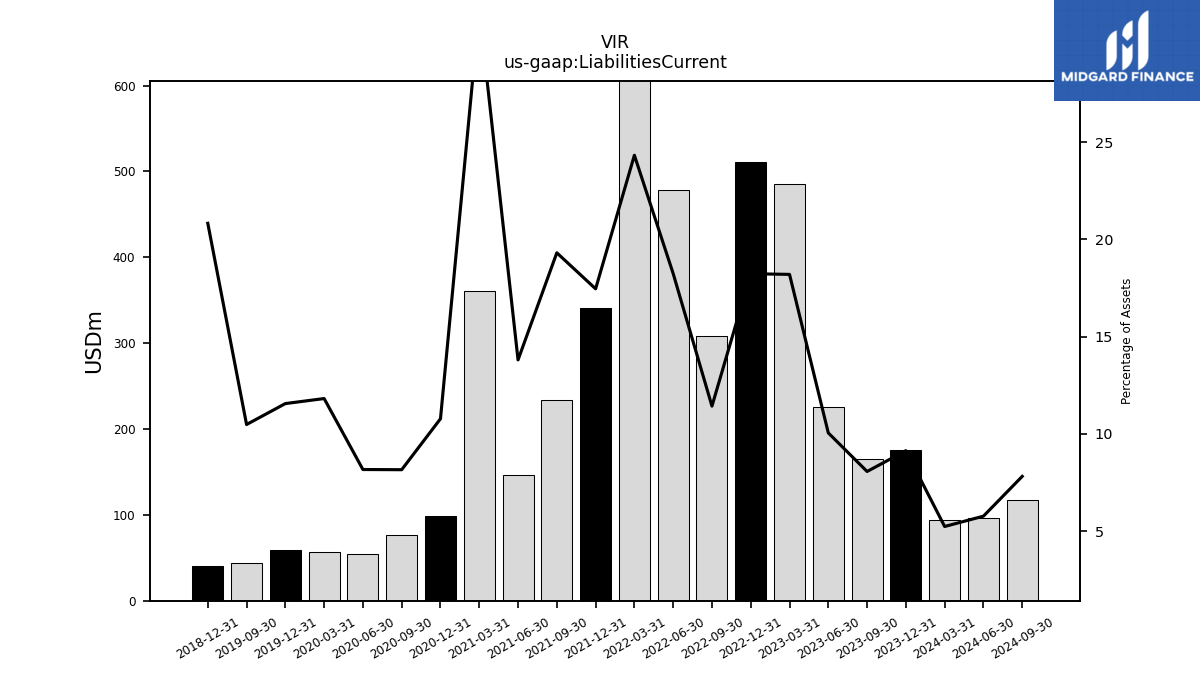
| Liabilities Current | 175.41 | 165.05 | 225.62 | 485.29 | 511.03 | 308.20 | 477.87 | 702.36 | 341.24 | 233.72 | 146.02 | 361.10 | 99.06 | 77.00 | 54.94 | 56.40 | 59.21 | 44.32 | NA | NA | 39.91 | NA | NA | NA | |
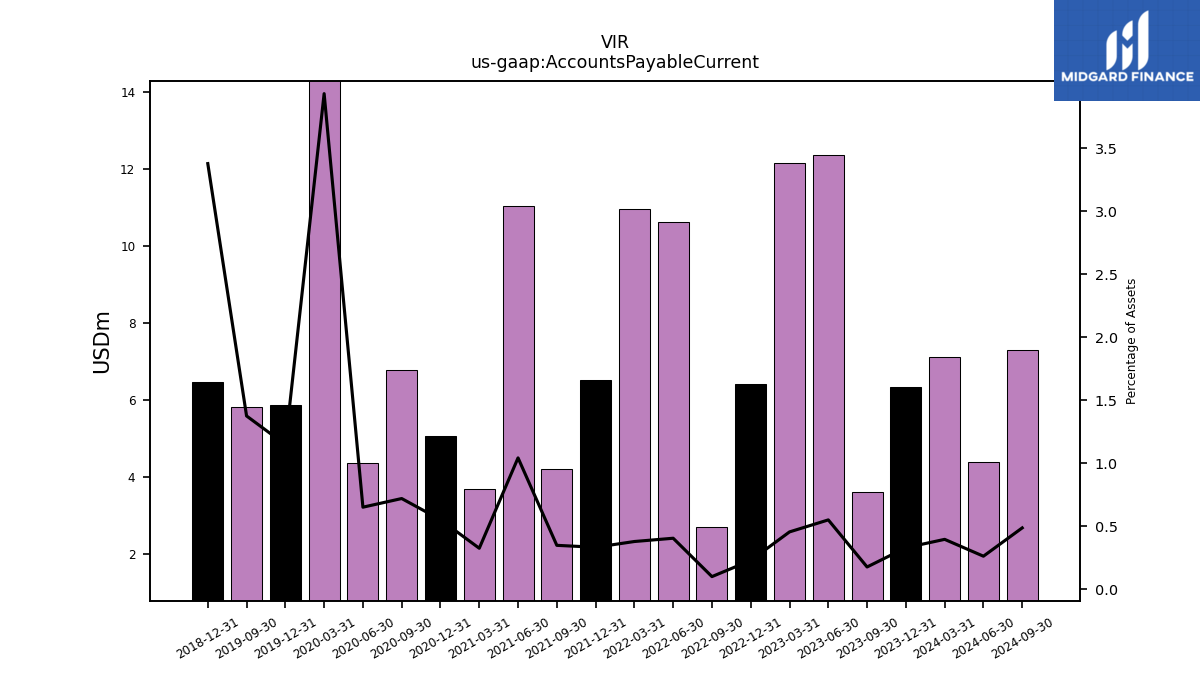
| Accounts Payable Current | 6.33 | 3.63 | 12.36 | 12.15 | 6.42 | 2.72 | 10.62 | 10.96 | 6.52 | 4.22 | 11.03 | 3.70 | 5.08 | 6.80 | 4.38 | 18.77 | 5.88 | 5.82 | NA | NA | 6.47 | NA | NA | NA | |
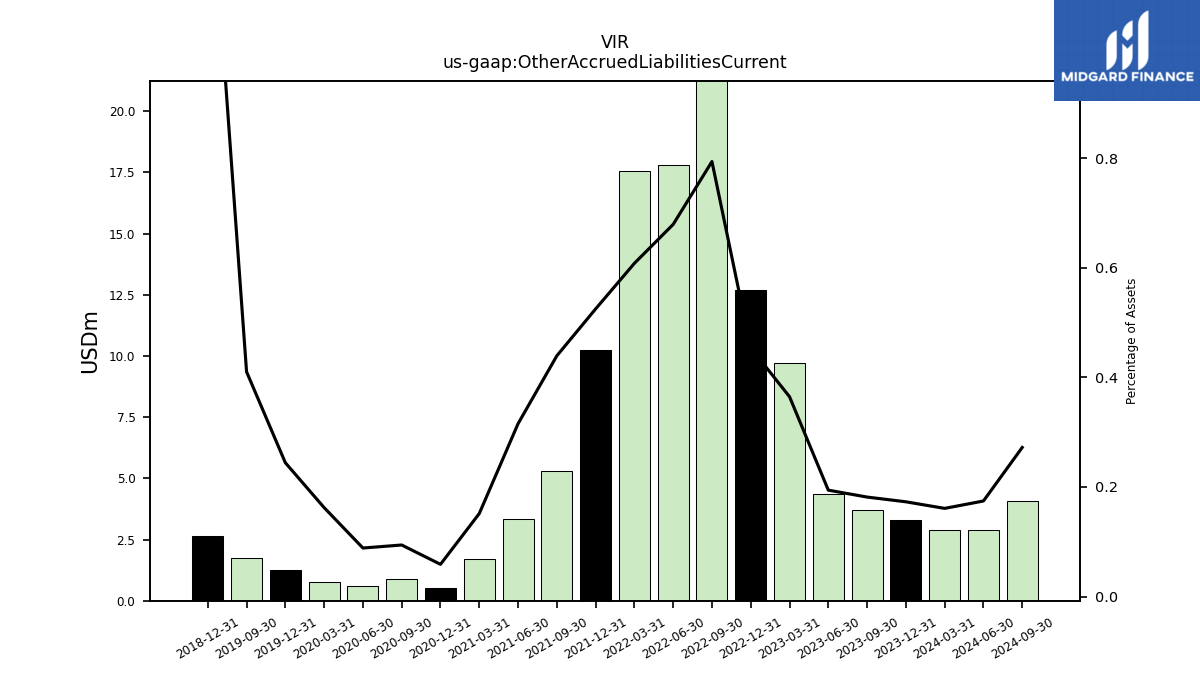
| Other Accrued Liabilities Current | 3.32 | 3.71 | 4.36 | 9.72 | 12.71 | 21.39 | 17.78 | 17.55 | 10.25 | 5.32 | 3.33 | 1.72 | 0.54 | 0.89 | 0.59 | 0.77 | 1.25 | 1.73 | NA | NA | 2.66 | NA | NA | NA | |
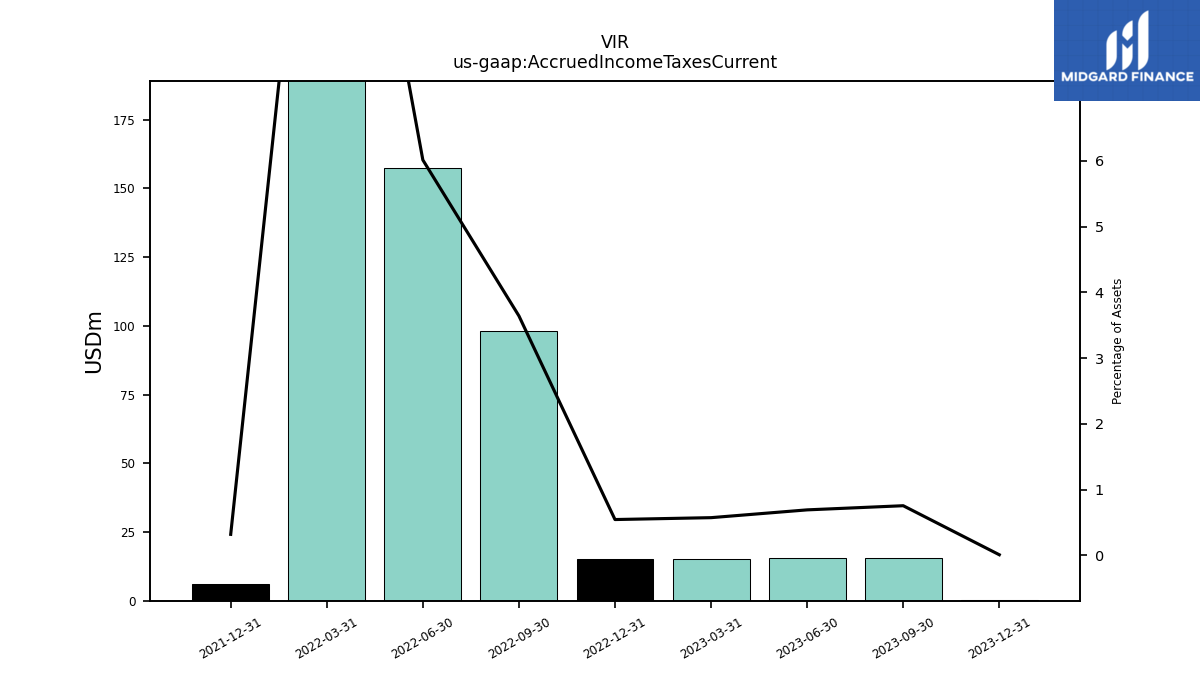
| Accrued Income Taxes Current | 0.15 | 15.41 | 15.50 | 15.25 | 15.23 | 98.19 | 157.54 | 404.43 | 6.22 | NA | NA | NA | NA | NA | NA | NA | NA | NA | NA | NA | NA | NA | NA | NA |
| 2023-12-31 | 2023-09-30 | 2023-06-30 | 2023-03-31 | 2022-12-31 | 2022-09-30 | 2022-06-30 | 2022-03-31 | 2021-12-31 | 2021-09-30 | 2021-06-30 | 2021-03-31 | 2020-12-31 | 2020-09-30 | 2020-06-30 | 2020-03-31 | 2019-12-31 | 2019-09-30 | 2019-06-30 | 2019-03-31 | 2018-12-31 | 2018-09-30 | 2018-06-30 | 2018-03-31 | ||
|---|---|---|---|---|---|---|---|---|---|---|---|---|---|---|---|---|---|---|---|---|---|---|---|---|---|
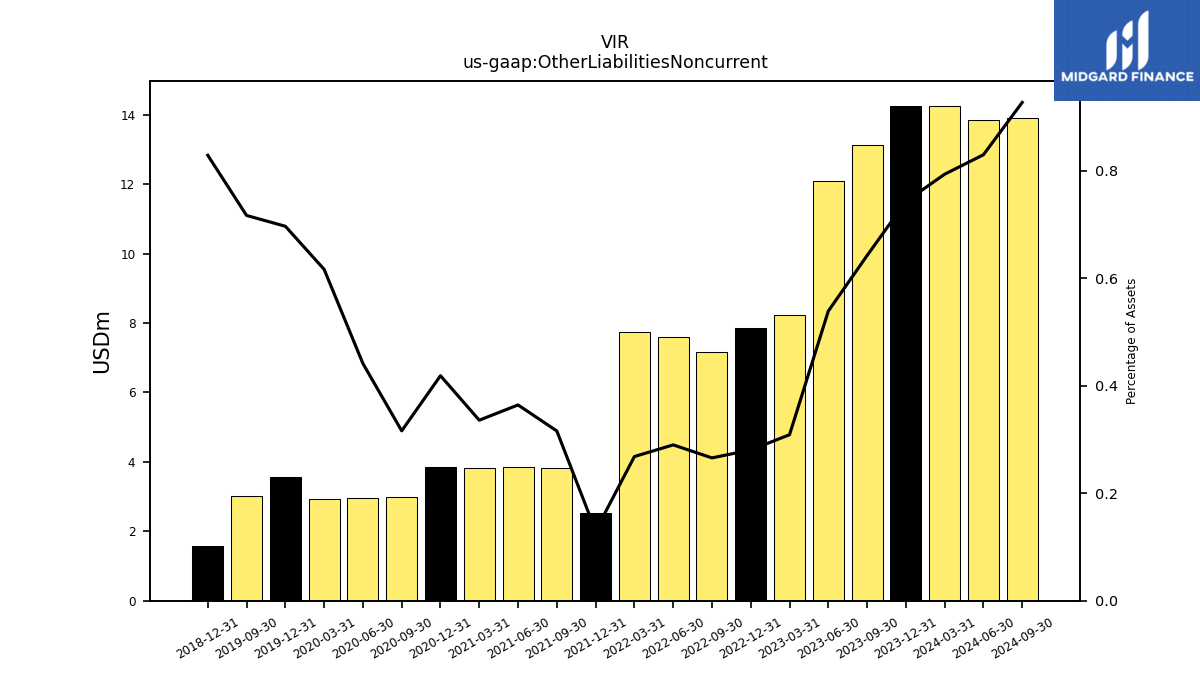
| Other Liabilities Noncurrent | 14.26 | 13.13 | 12.09 | 8.23 | 7.86 | 7.17 | 7.60 | 7.75 | 2.54 | 3.82 | 3.85 | 3.81 | 3.85 | 2.98 | 2.97 | 2.94 | 3.57 | 3.03 | NA | NA | 1.59 | NA | NA | NA | |
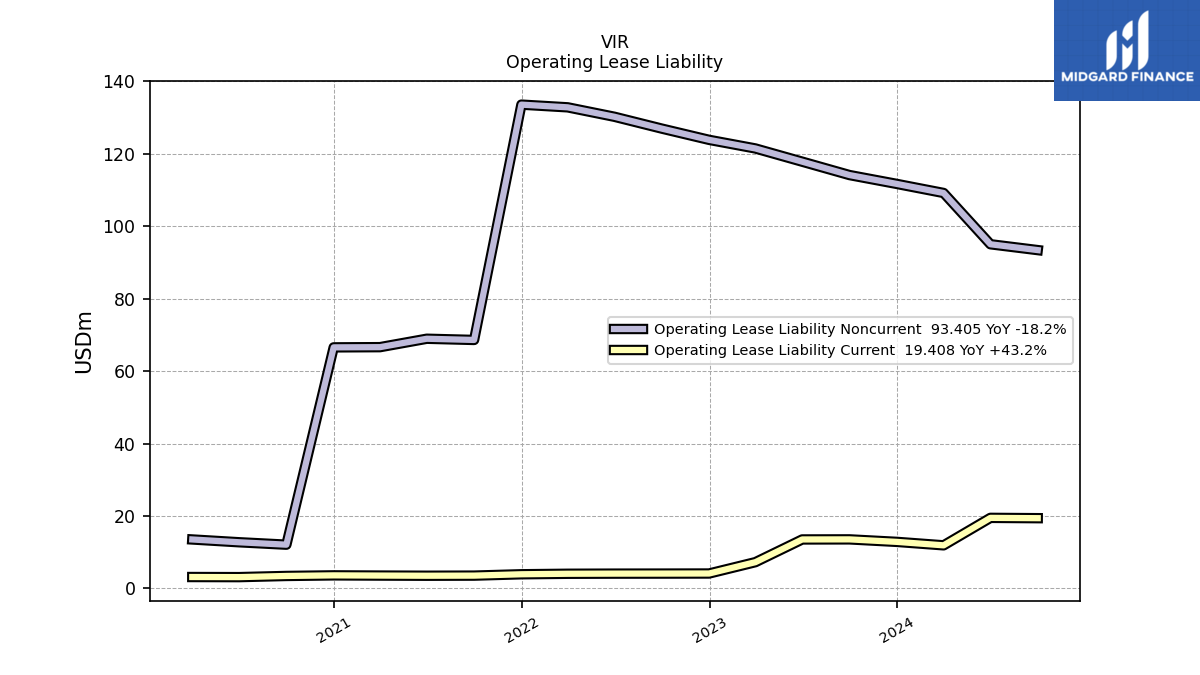
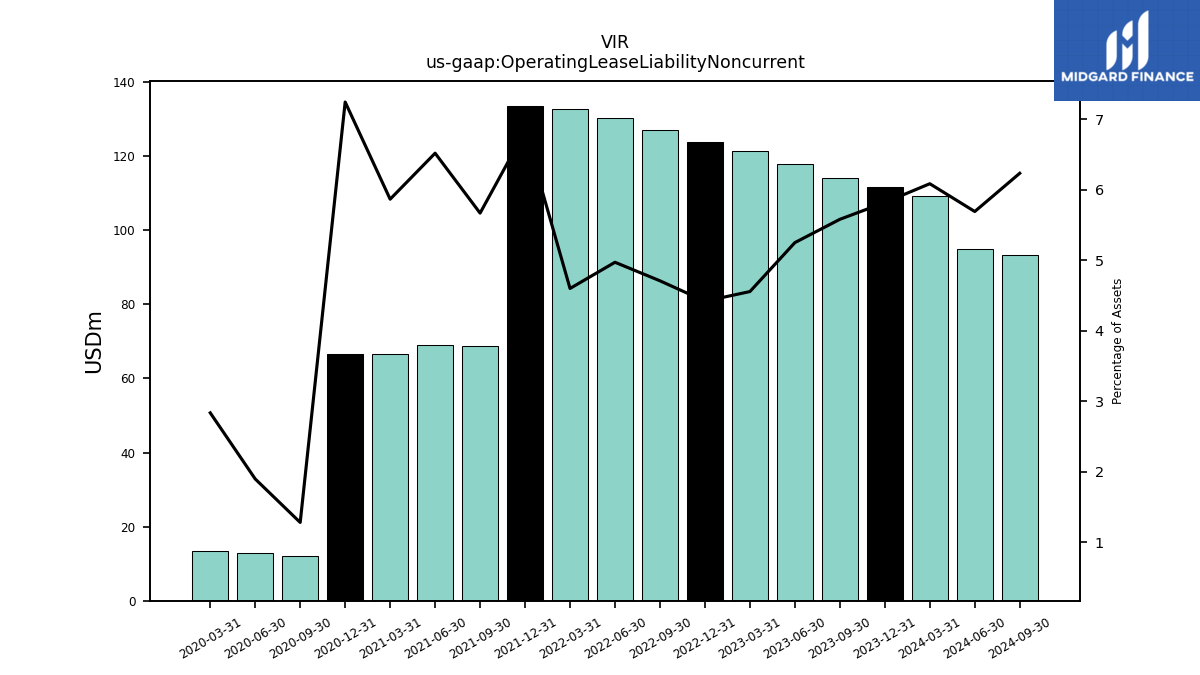
| Operating Lease Liability Noncurrent | 111.67 | 114.12 | 117.81 | 121.46 | 123.84 | 126.94 | 130.21 | 132.81 | 133.56 | 68.60 | 68.94 | 66.61 | 66.56 | 12.09 | 12.76 | 13.53 | NA | NA | NA | NA | NA | NA | NA | NA |
| 2023-12-31 | 2023-09-30 | 2023-06-30 | 2023-03-31 | 2022-12-31 | 2022-09-30 | 2022-06-30 | 2022-03-31 | 2021-12-31 | 2021-09-30 | 2021-06-30 | 2021-03-31 | 2020-12-31 | 2020-09-30 | 2020-06-30 | 2020-03-31 | 2019-12-31 | 2019-09-30 | 2019-06-30 | 2019-03-31 | 2018-12-31 | 2018-09-30 | 2018-06-30 | 2018-03-31 | ||
|---|---|---|---|---|---|---|---|---|---|---|---|---|---|---|---|---|---|---|---|---|---|---|---|---|---|
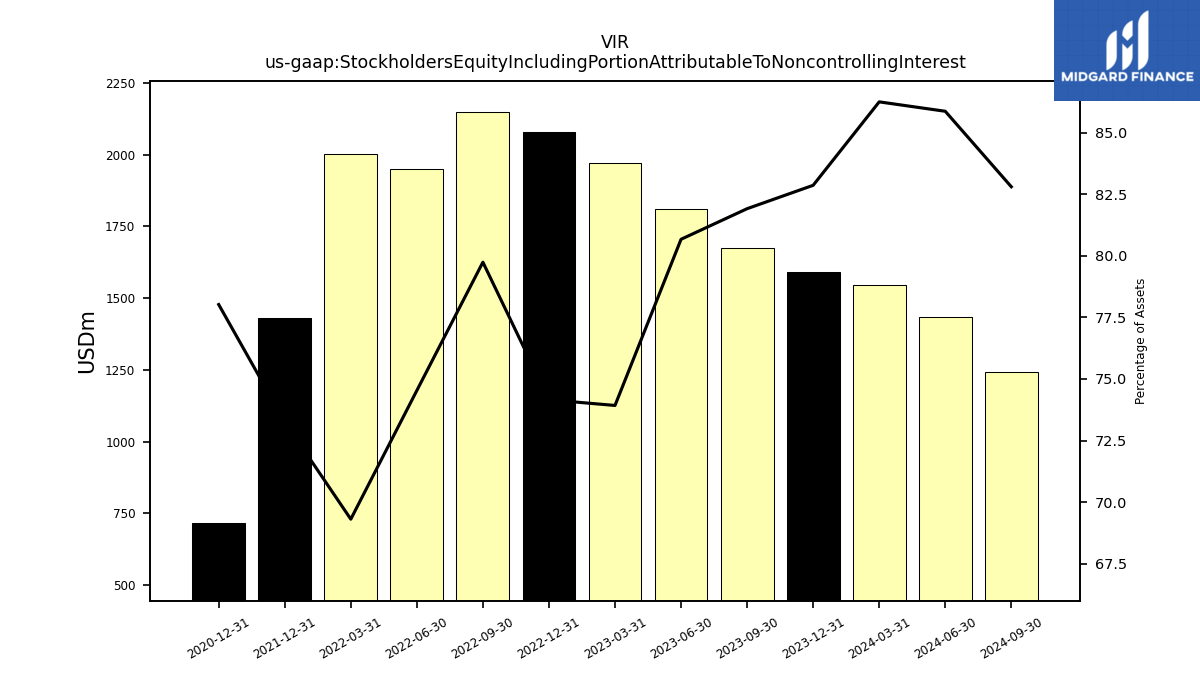
| Stockholders Equity Including Portion Attributable To Noncontrolling Interest | 1590.24 | 1675.09 | 1810.21 | 1970.80 | 2077.96 | 2149.86 | 1952.01 | 2001.01 | 1431.85 | NA | NA | NA | 716.85 | NA | NA | NA | NA | NA | NA | NA | NA | NA | NA | NA | |
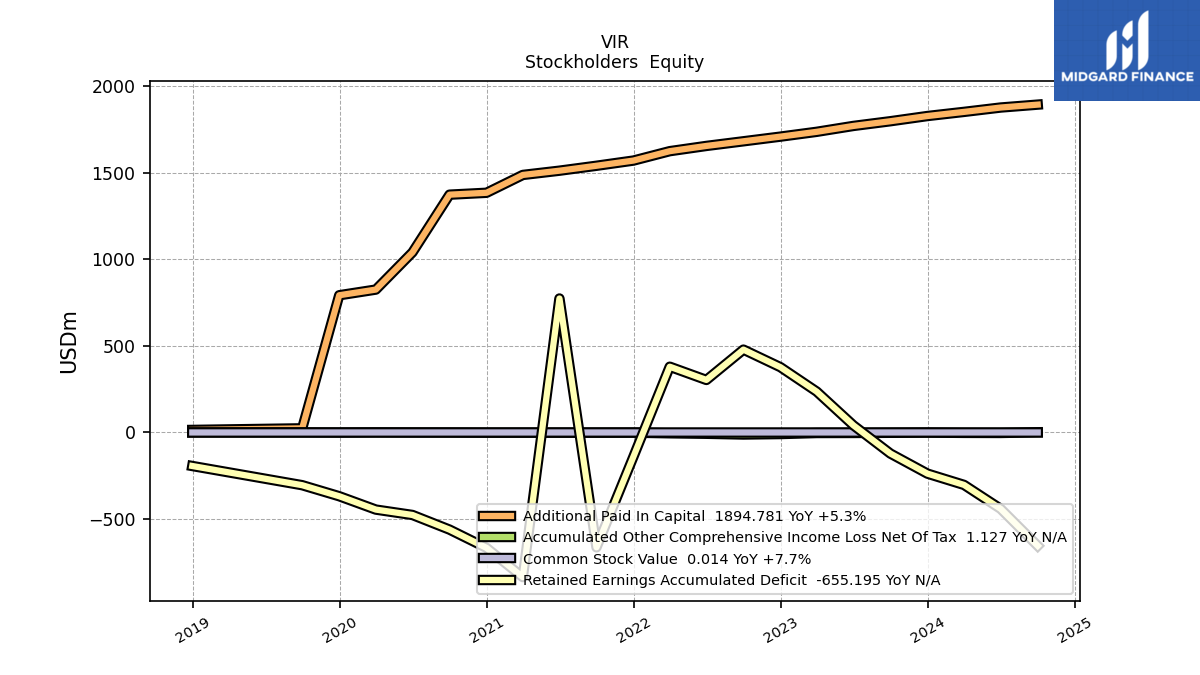
| Common Stock Value | 0.01 | 0.01 | 0.01 | 0.01 | 0.01 | 0.01 | 0.01 | 0.01 | 0.01 | 0.01 | 0.01 | 0.01 | 0.01 | 0.01 | 0.01 | 0.01 | 0.01 | 0.00 | NA | NA | 0.00 | NA | NA | NA | |
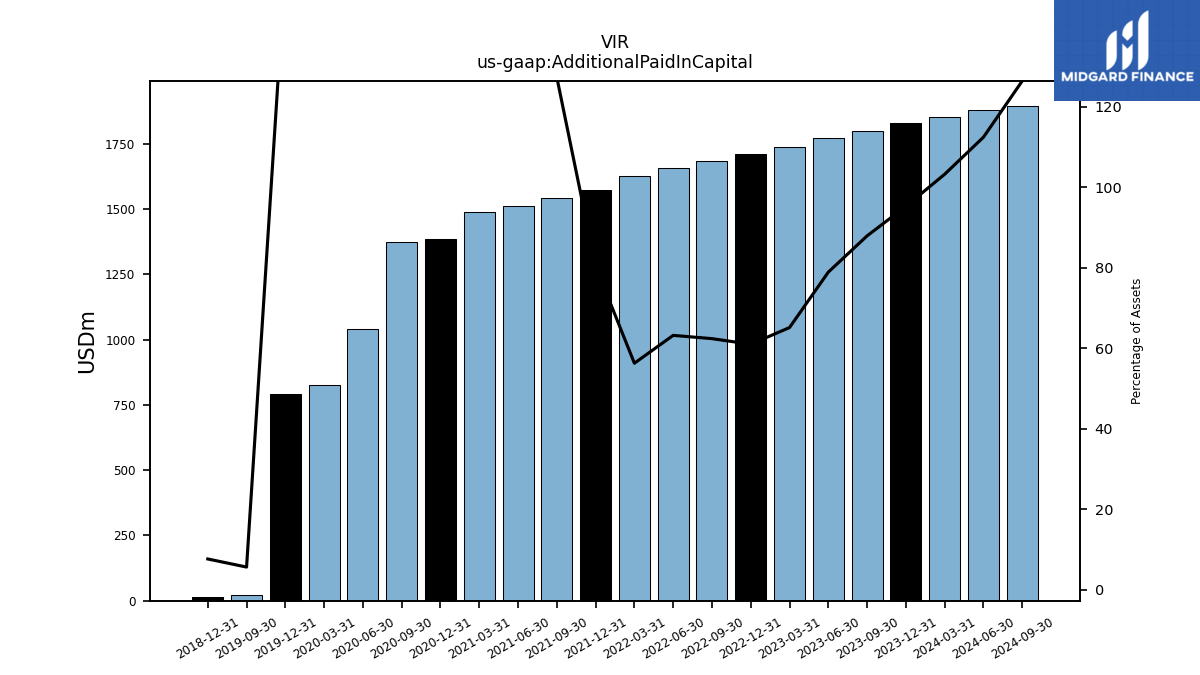
| Additional Paid In Capital | 1828.86 | 1798.82 | 1771.54 | 1737.63 | 1709.84 | 1682.88 | 1656.02 | 1625.79 | 1571.54 | 1541.42 | 1512.93 | 1488.34 | 1385.30 | 1374.36 | 1040.99 | 825.83 | 793.05 | 23.87 | NA | NA | 14.67 | NA | NA | NA | |
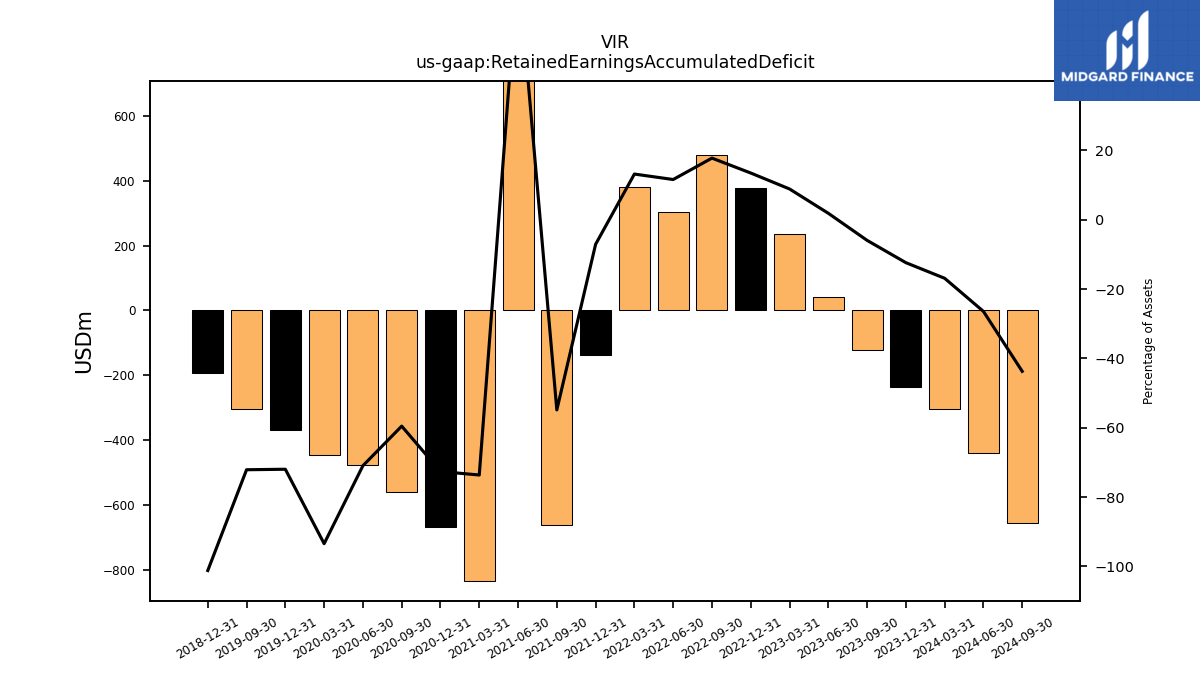
| Retained Earnings Accumulated Deficit | -237.82 | -121.85 | 41.56 | 236.34 | 377.24 | 478.84 | 303.53 | 380.02 | -138.60 | -663.85 | 774.28 | -836.10 | -667.18 | -561.53 | -476.93 | -445.76 | -368.52 | -304.75 | NA | NA | -193.84 | NA | NA | NA | |
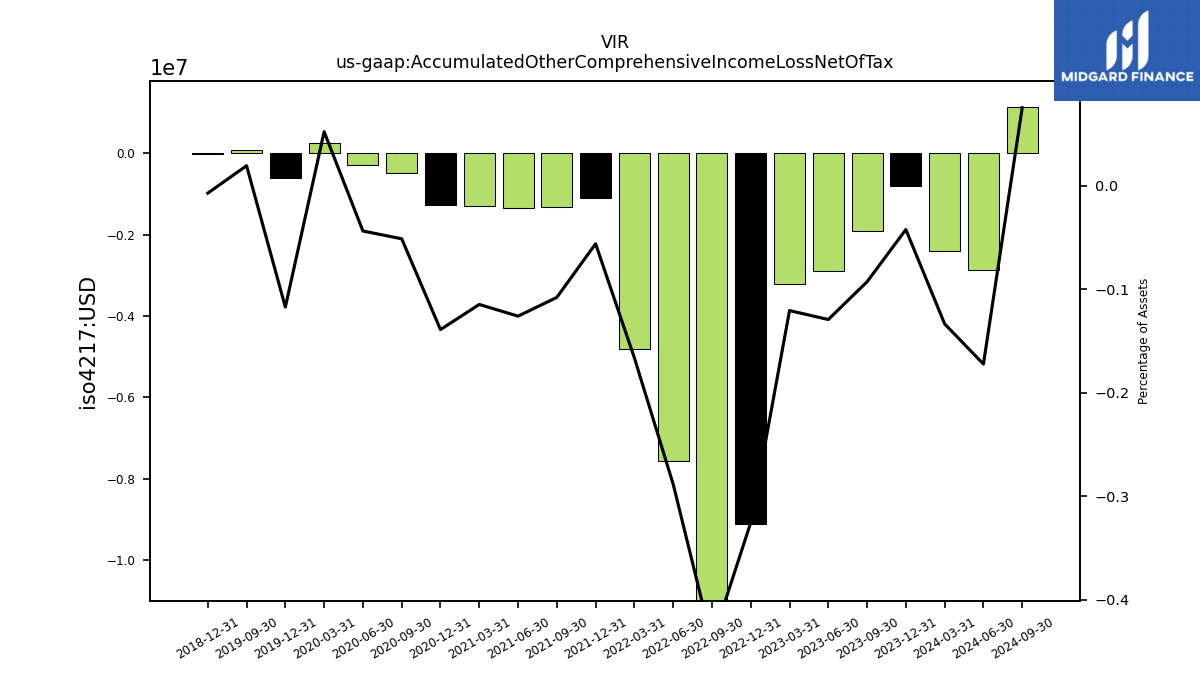
| Accumulated Other Comprehensive Income Loss Net Of Tax | -0.81 | -1.90 | -2.90 | -3.22 | -9.12 | -11.88 | -7.55 | -4.80 | -1.10 | -1.31 | -1.33 | -1.30 | -1.28 | -0.48 | -0.29 | 0.25 | -0.60 | 0.08 | NA | NA | -0.01 | NA | NA | NA | |
| Adjustments To Additional Paid In Capital Sharebased Compensation Requisite Service Period Recognition Value | 28.27 | 26.94 | 30.62 | 25.48 | 24.86 | 24.81 | 27.10 | 25.30 | 24.37 | 22.94 | 21.00 | 15.47 | 10.30 | 8.58 | 5.75 | 2.97 | 2.68 | 2.19 | 1.40 | 2.45 | 0.95 | 1.45 | NA | NA |
| 2023-12-31 | 2023-09-30 | 2023-06-30 | 2023-03-31 | 2022-12-31 | 2022-09-30 | 2022-06-30 | 2022-03-31 | 2021-12-31 | 2021-09-30 | 2021-06-30 | 2021-03-31 | 2020-12-31 | 2020-09-30 | 2020-06-30 | 2020-03-31 | 2019-12-31 | 2019-09-30 | 2019-06-30 | 2019-03-31 | 2018-12-31 | 2018-09-30 | 2018-06-30 | 2018-03-31 | ||
|---|---|---|---|---|---|---|---|---|---|---|---|---|---|---|---|---|---|---|---|---|---|---|---|---|---|
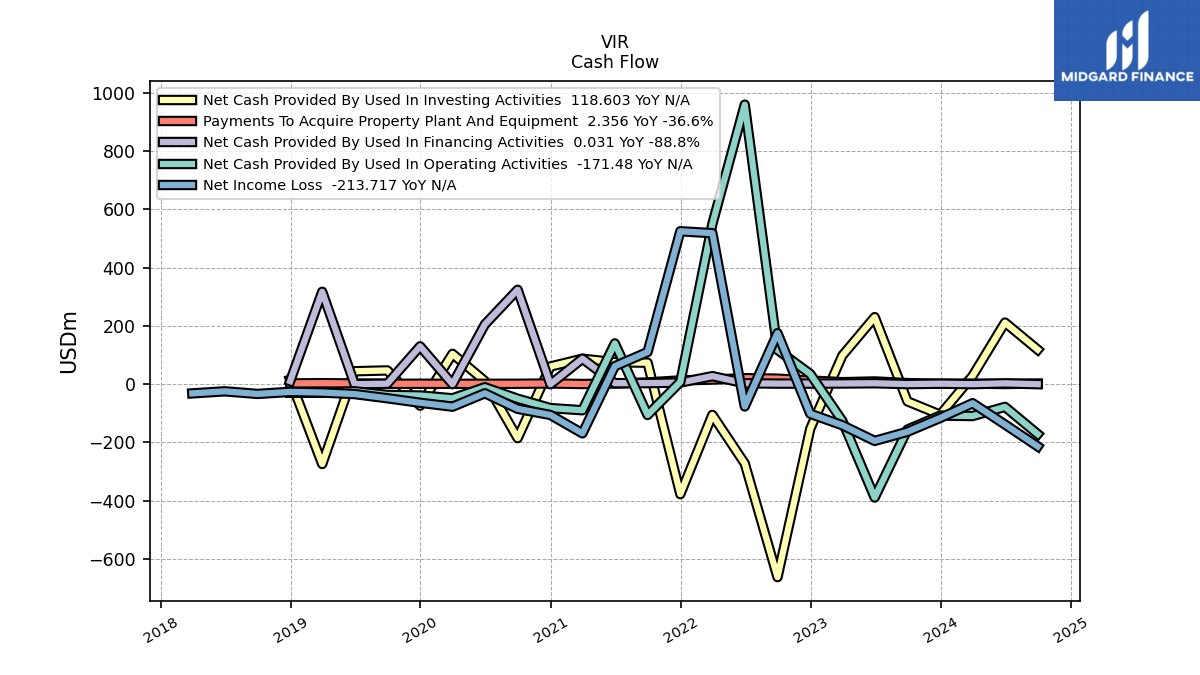
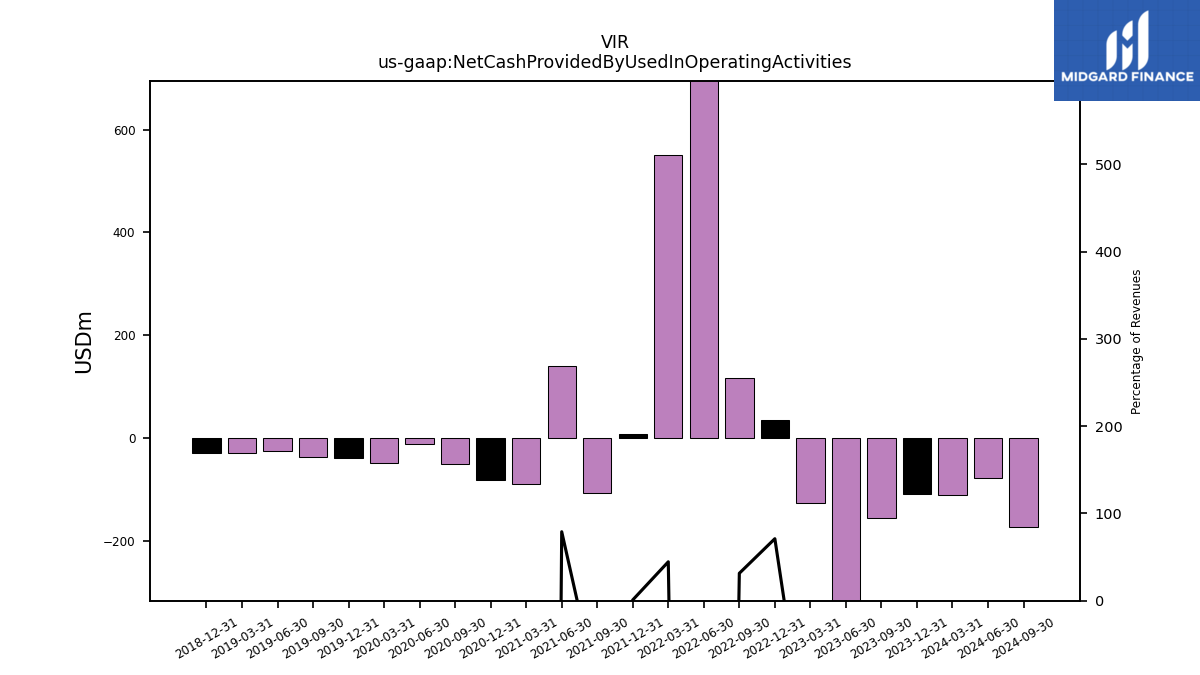
| Net Cash Provided By Used In Operating Activities | -107.93 | -155.83 | -389.25 | -125.78 | 35.13 | 117.90 | 960.14 | 550.09 | 7.70 | -105.81 | 140.06 | -89.53 | -82.05 | -49.84 | -10.64 | -48.41 | -38.88 | -36.95 | -24.30 | -29.49 | -29.51 | NA | NA | NA | |
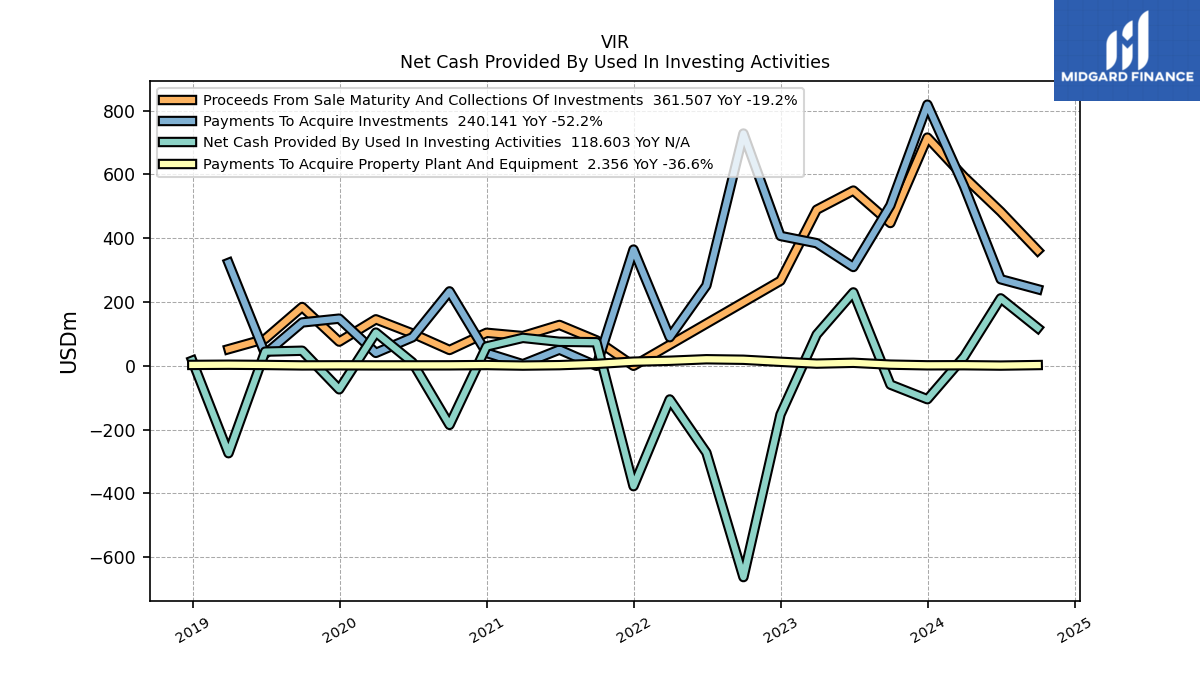
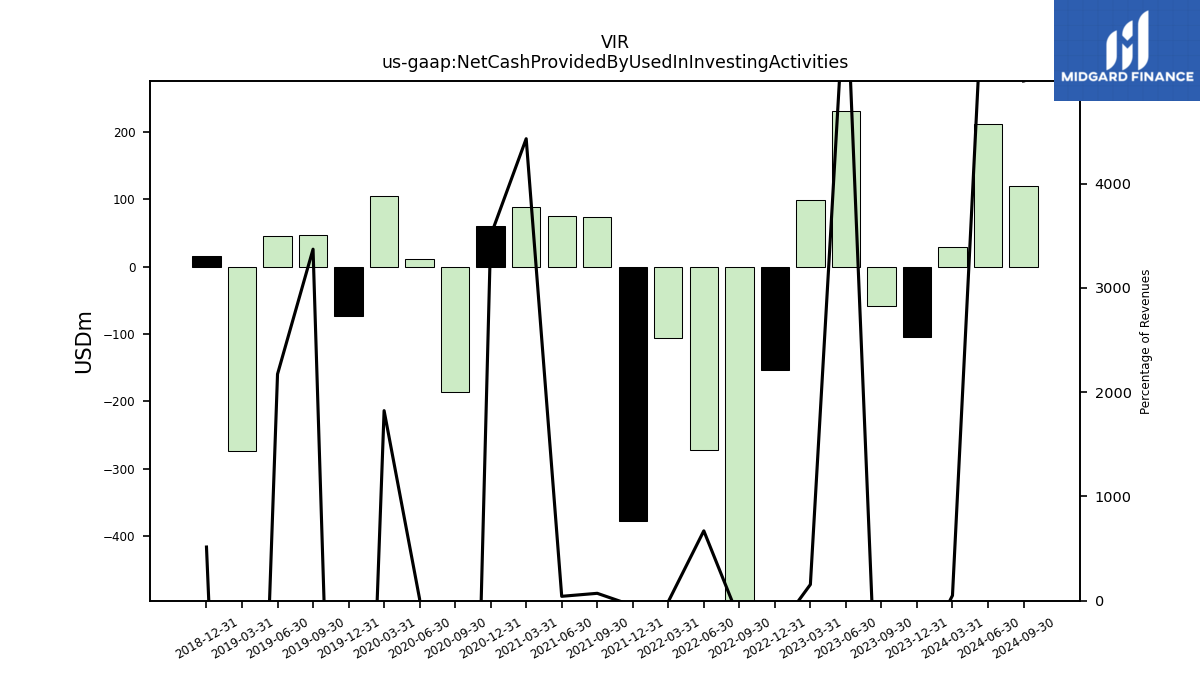
| Net Cash Provided By Used In Investing Activities | -104.81 | -58.95 | 230.31 | 98.08 | -153.13 | -662.61 | -272.33 | -105.39 | -377.58 | 73.86 | 75.38 | 87.53 | 60.71 | -185.38 | 10.59 | 104.22 | -73.77 | 47.29 | 44.48 | -274.16 | 16.10 | NA | NA | NA | |
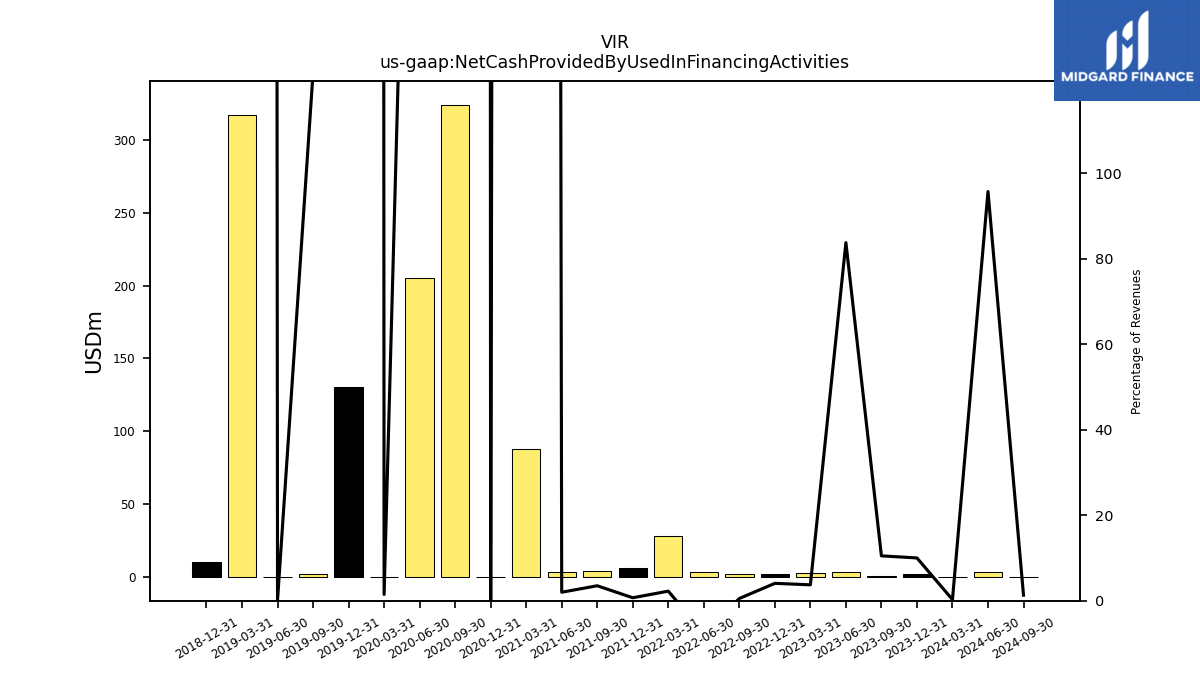
| Net Cash Provided By Used In Financing Activities | 1.68 | 0.28 | 3.18 | 2.34 | 2.01 | 1.99 | 3.08 | 27.68 | 5.67 | 3.63 | 3.53 | 87.50 | -0.26 | 324.31 | 205.34 | 0.09 | 130.10 | 1.73 | 0.00 | 317.41 | 10.44 | NA | NA | NA |
| 2023-12-31 | 2023-09-30 | 2023-06-30 | 2023-03-31 | 2022-12-31 | 2022-09-30 | 2022-06-30 | 2022-03-31 | 2021-12-31 | 2021-09-30 | 2021-06-30 | 2021-03-31 | 2020-12-31 | 2020-09-30 | 2020-06-30 | 2020-03-31 | 2019-12-31 | 2019-09-30 | 2019-06-30 | 2019-03-31 | 2018-12-31 | 2018-09-30 | 2018-06-30 | 2018-03-31 | ||
|---|---|---|---|---|---|---|---|---|---|---|---|---|---|---|---|---|---|---|---|---|---|---|---|---|---|
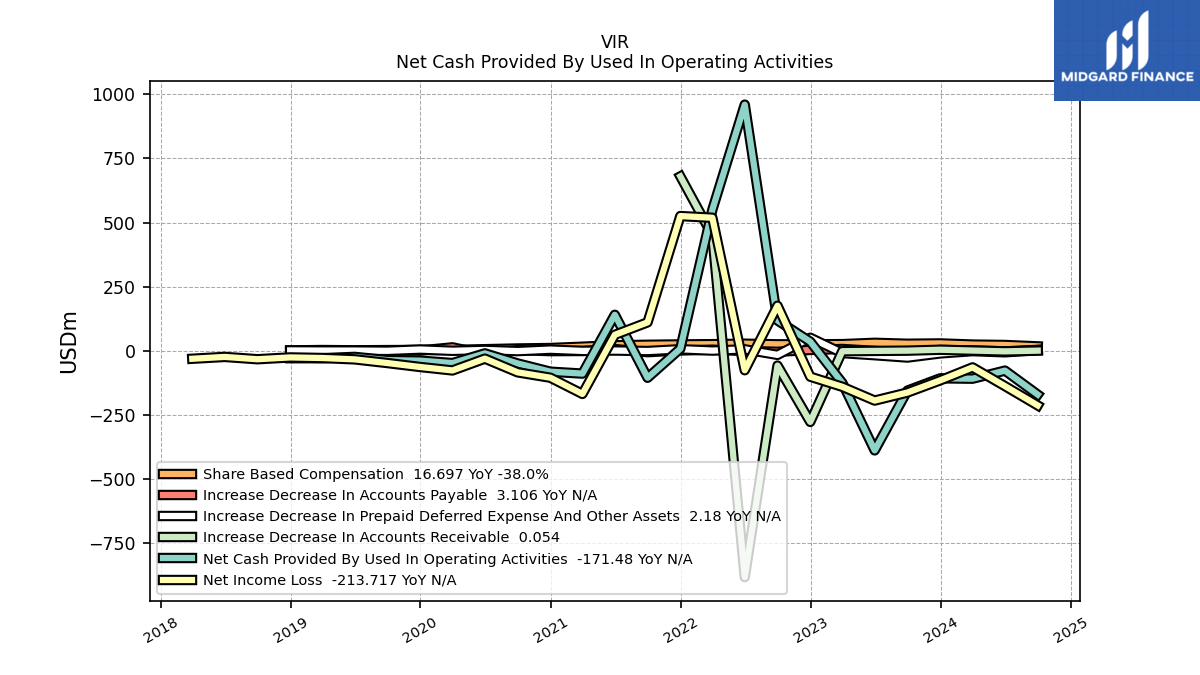
| Net Cash Provided By Used In Operating Activities | -107.93 | -155.83 | -389.25 | -125.78 | 35.13 | 117.90 | 960.14 | 550.09 | 7.70 | -105.81 | 140.06 | -89.53 | -82.05 | -49.84 | -10.64 | -48.41 | -38.88 | -36.95 | -24.30 | -29.49 | -29.51 | NA | NA | NA | |
| Net Income Loss | -115.97 | -163.41 | -194.78 | -140.96 | -101.60 | 175.31 | -76.49 | 518.62 | 525.25 | 110.43 | 61.81 | -168.91 | -105.65 | -84.61 | -31.17 | -77.24 | -63.77 | -48.31 | -33.93 | -28.67 | -26.39 | -33.46 | -24.45 | -31.59 | |
| Profit Loss | -115.97 | -163.41 | -194.78 | -140.96 | -101.60 | 175.31 | -76.49 | 518.62 | 525.25 | 110.43 | 61.81 | -168.91 | -105.65 | -84.61 | -31.17 | -77.24 | -63.77 | -48.31 | -33.93 | -28.67 | -26.39 | NA | NA | NA | |
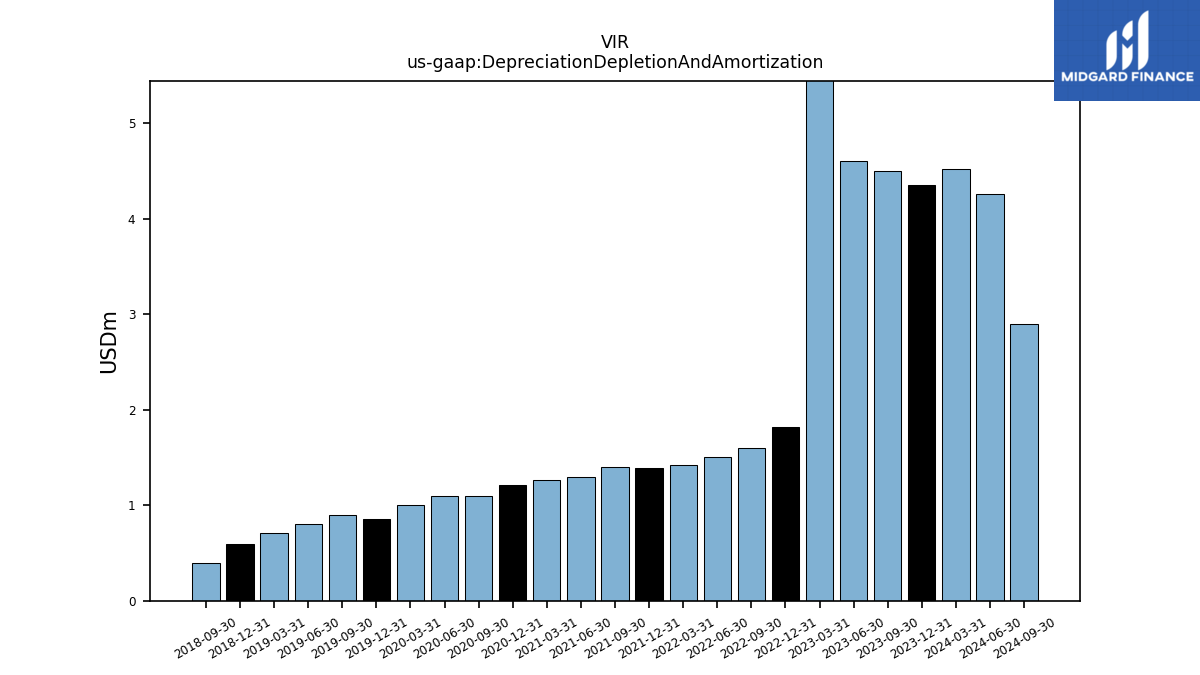
| Depreciation Depletion And Amortization | 4.35 | 4.50 | 4.60 | 5.50 | 1.82 | 1.60 | 1.50 | 1.42 | 1.39 | 1.40 | 1.30 | 1.27 | 1.22 | 1.10 | 1.10 | 1.00 | 0.86 | 0.90 | 0.80 | 0.71 | 0.59 | 0.40 | NA | NA | |
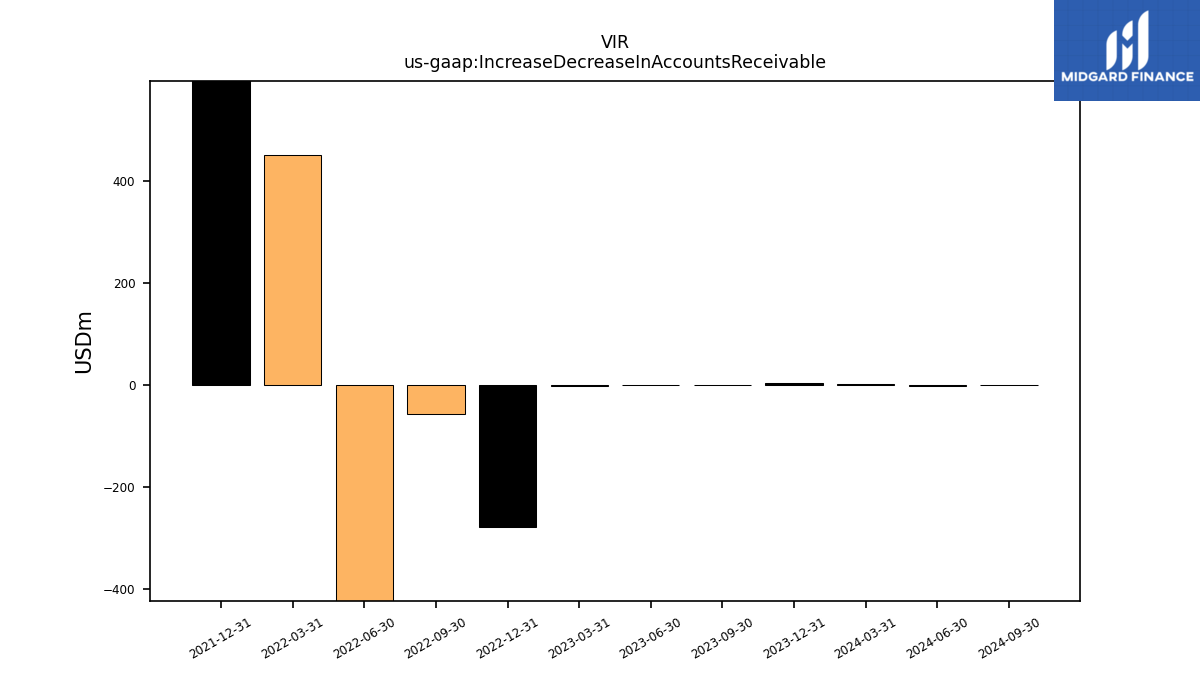
| Increase Decrease In Accounts Receivable | 3.61 | 0.00 | -0.95 | -2.09 | -278.17 | -58.18 | -883.77 | 450.08 | 680.08 | NA | NA | NA | NA | NA | NA | NA | NA | NA | NA | NA | NA | NA | NA | NA | |
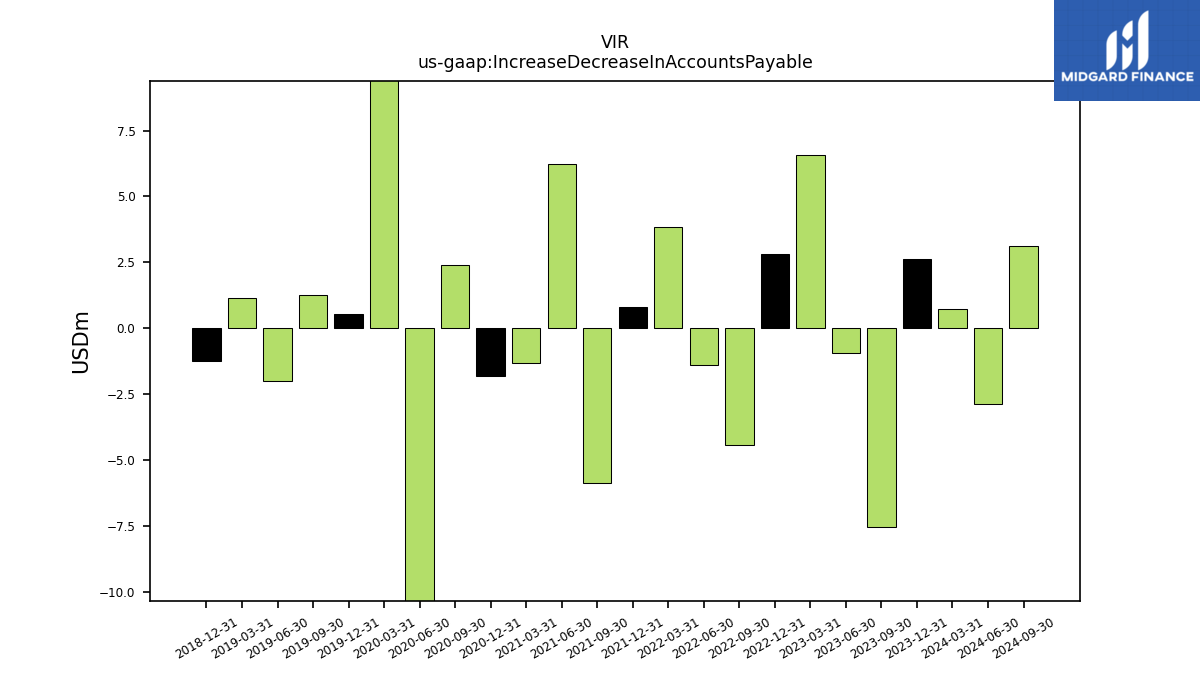
| Increase Decrease In Accounts Payable | 2.63 | -7.53 | -0.93 | 6.56 | 2.80 | -4.45 | -1.39 | 3.83 | 0.79 | -5.89 | 6.25 | -1.32 | -1.83 | 2.38 | -14.29 | 12.94 | 0.54 | 1.26 | -2.00 | 1.16 | -1.23 | NA | NA | NA | |
| Share Based Compensation | 28.27 | 26.94 | 30.62 | 25.48 | 24.86 | 24.81 | 27.10 | 25.30 | 24.37 | 22.94 | 21.00 | 15.47 | 10.30 | 8.58 | 5.75 | 2.97 | 2.68 | 2.19 | 1.40 | 2.45 | 0.95 | NA | NA | NA |
| 2023-12-31 | 2023-09-30 | 2023-06-30 | 2023-03-31 | 2022-12-31 | 2022-09-30 | 2022-06-30 | 2022-03-31 | 2021-12-31 | 2021-09-30 | 2021-06-30 | 2021-03-31 | 2020-12-31 | 2020-09-30 | 2020-06-30 | 2020-03-31 | 2019-12-31 | 2019-09-30 | 2019-06-30 | 2019-03-31 | 2018-12-31 | 2018-09-30 | 2018-06-30 | 2018-03-31 | ||
|---|---|---|---|---|---|---|---|---|---|---|---|---|---|---|---|---|---|---|---|---|---|---|---|---|---|
| Net Cash Provided By Used In Investing Activities | -104.81 | -58.95 | 230.31 | 98.08 | -153.13 | -662.61 | -272.33 | -105.39 | -377.58 | 73.86 | 75.38 | 87.53 | 60.71 | -185.38 | 10.59 | 104.22 | -73.77 | 47.29 | 44.48 | -274.16 | 16.10 | NA | NA | NA | |
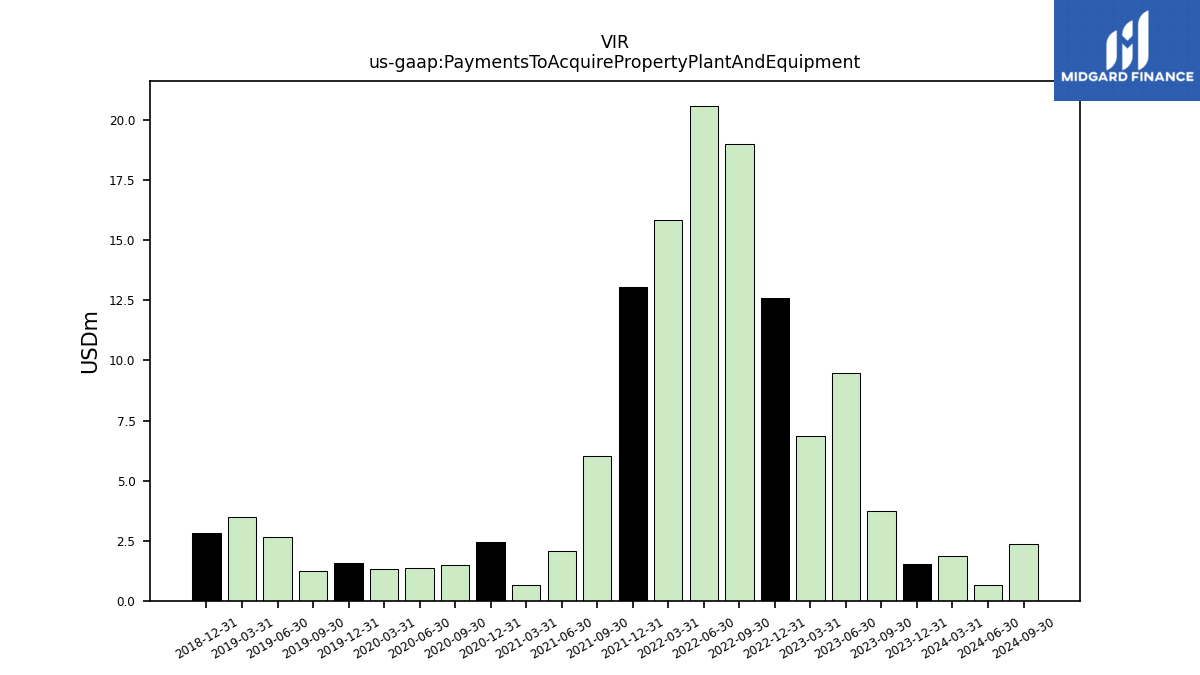
| Payments To Acquire Property Plant And Equipment | 1.53 | 3.71 | 9.46 | 6.87 | 12.60 | 18.99 | 20.60 | 15.84 | 13.07 | 6.01 | 2.08 | 0.67 | 2.43 | 1.47 | 1.34 | 1.30 | 1.55 | 1.26 | 2.65 | 3.48 | 2.80 | NA | NA | NA | |
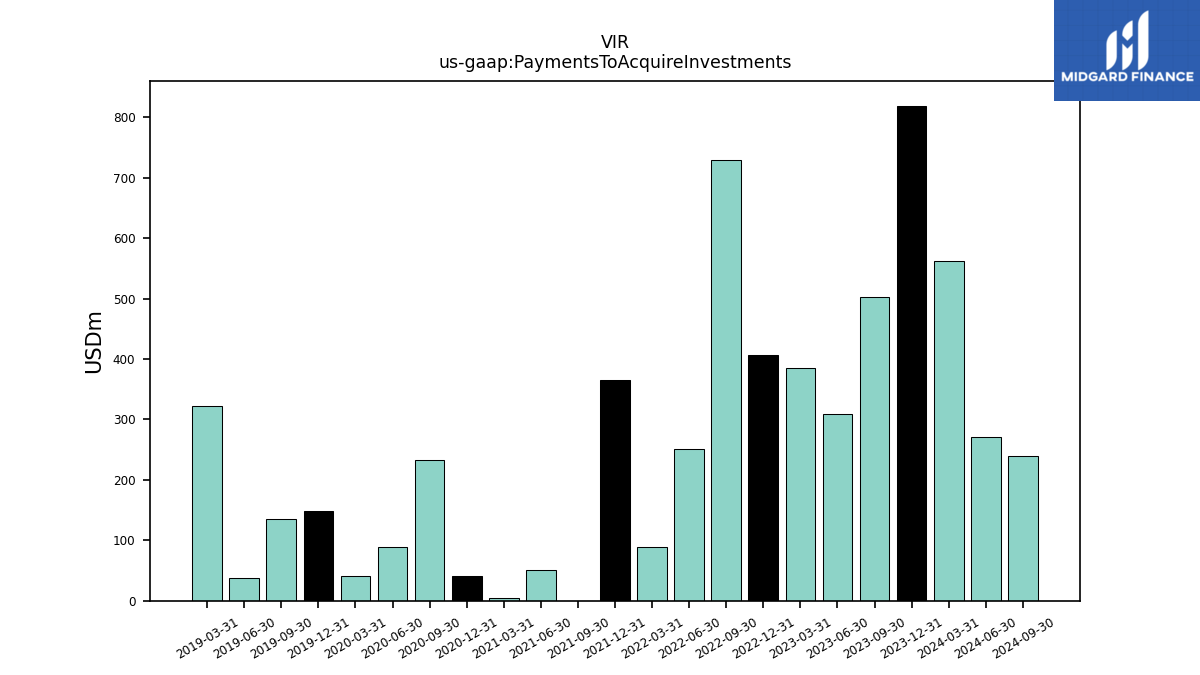
| Payments To Acquire Investments | 818.99 | 502.91 | 309.78 | 384.51 | 407.21 | 728.46 | 251.73 | 89.56 | 364.51 | 0.00 | 50.73 | 5.00 | 40.44 | 233.50 | 89.43 | 40.47 | 147.96 | 135.91 | 37.19 | 322.83 | NA | NA | NA | NA |
| 2023-12-31 | 2023-09-30 | 2023-06-30 | 2023-03-31 | 2022-12-31 | 2022-09-30 | 2022-06-30 | 2022-03-31 | 2021-12-31 | 2021-09-30 | 2021-06-30 | 2021-03-31 | 2020-12-31 | 2020-09-30 | 2020-06-30 | 2020-03-31 | 2019-12-31 | 2019-09-30 | 2019-06-30 | 2019-03-31 | 2018-12-31 | 2018-09-30 | 2018-06-30 | 2018-03-31 | ||
|---|---|---|---|---|---|---|---|---|---|---|---|---|---|---|---|---|---|---|---|---|---|---|---|---|---|
| Net Cash Provided By Used In Financing Activities | 1.68 | 0.28 | 3.18 | 2.34 | 2.01 | 1.99 | 3.08 | 27.68 | 5.67 | 3.63 | 3.53 | 87.50 | -0.26 | 324.31 | 205.34 | 0.09 | 130.10 | 1.73 | 0.00 | 317.41 | 10.44 | NA | NA | NA |
| 2023-12-31 | 2023-09-30 | 2023-06-30 | 2023-03-31 | 2022-12-31 | 2022-09-30 | 2022-06-30 | 2022-03-31 | 2021-12-31 | 2021-09-30 | 2021-06-30 | 2021-03-31 | 2020-12-31 | 2020-09-30 | 2020-06-30 | 2020-03-31 | 2019-12-31 | 2019-09-30 | 2019-06-30 | 2019-03-31 | 2018-12-31 | 2018-09-30 | 2018-06-30 | 2018-03-31 | ||
|---|---|---|---|---|---|---|---|---|---|---|---|---|---|---|---|---|---|---|---|---|---|---|---|---|---|
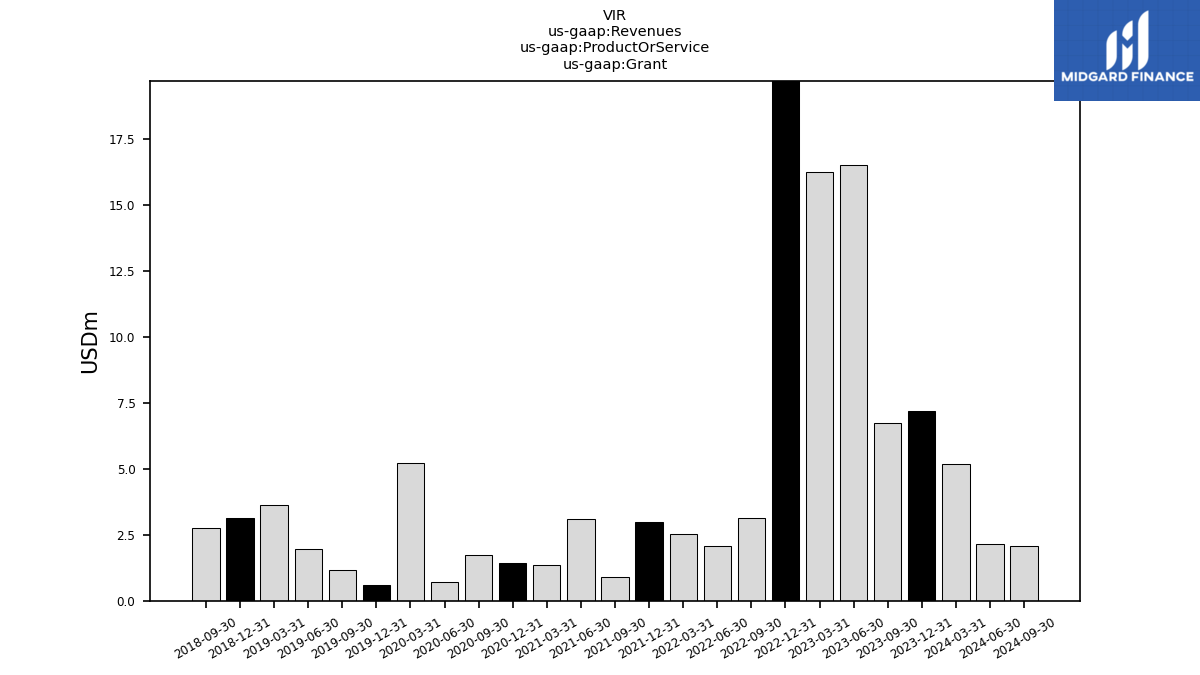
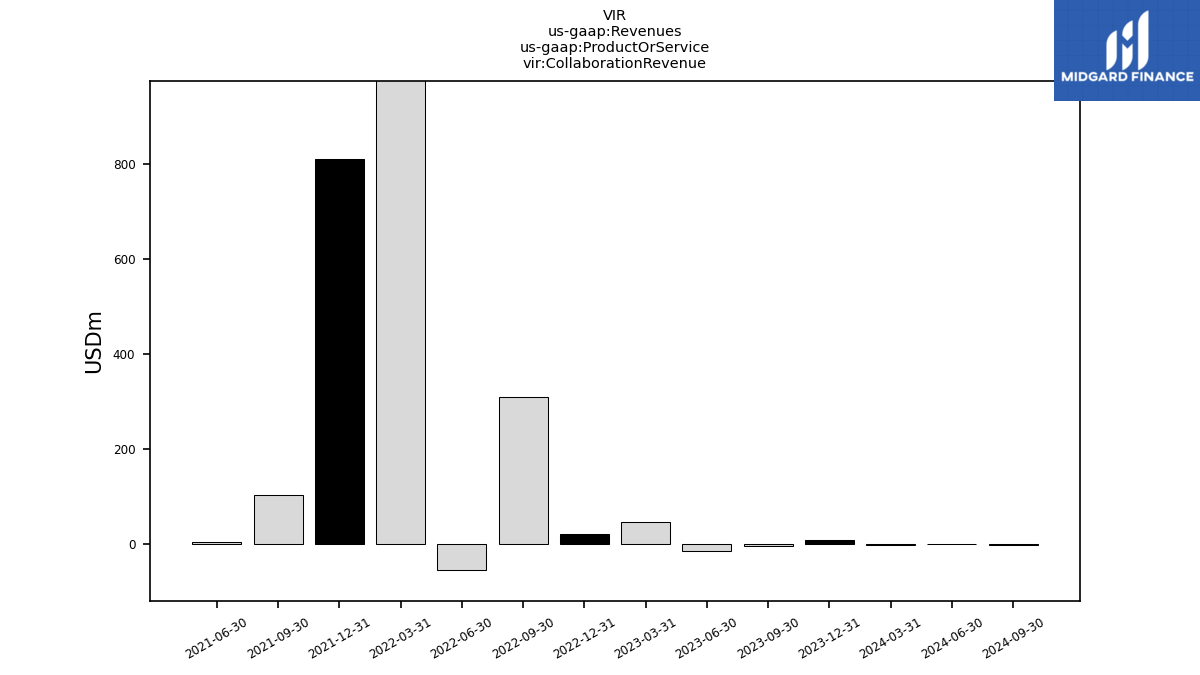
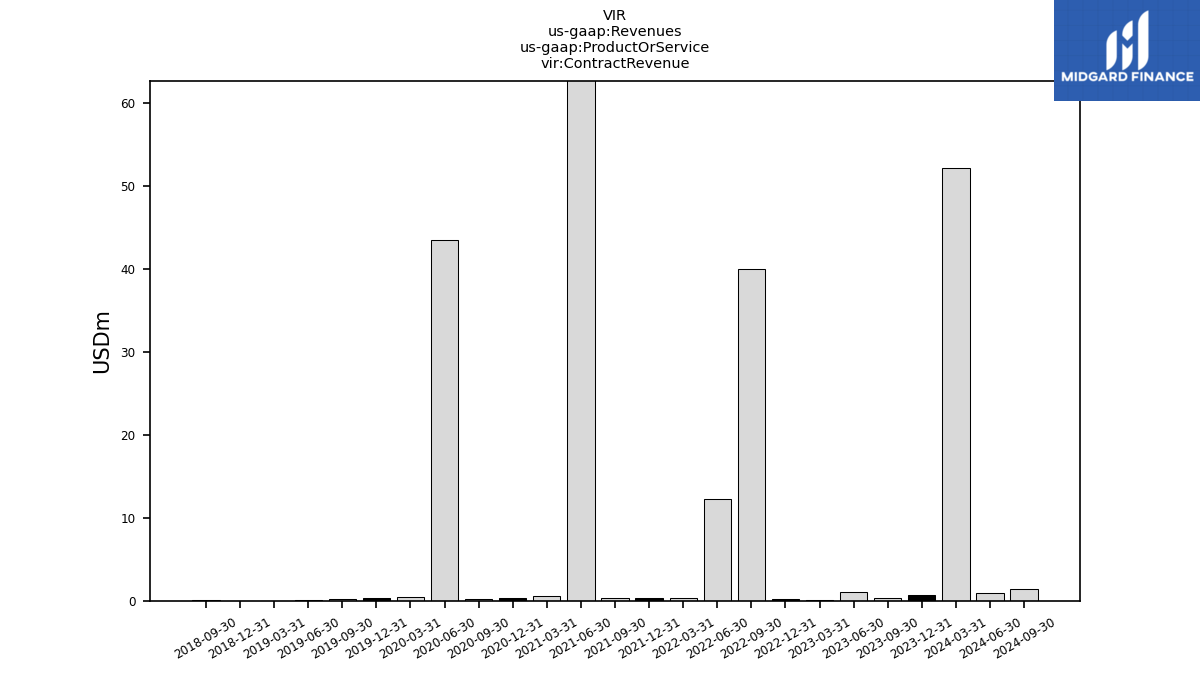
| Revenues | 16.79 | 2.64 | 3.80 | 62.96 | 49.41 | 374.56 | -40.63 | 1232.46 | 812.75 | 103.62 | 177.07 | 1.98 | 1.73 | 1.93 | 66.99 | 5.72 | 0.98 | 1.40 | 2.05 | 3.66 | 3.13 | 2.88 | 2.22 | 2.43 | |
| Grant | 7.18 | 6.74 | 16.52 | 16.25 | 27.62 | 3.12 | 2.06 | 2.52 | 2.99 | 0.90 | 3.08 | 1.37 | 1.43 | 1.74 | 0.72 | 5.23 | 0.61 | 1.17 | 1.96 | 3.64 | 3.12 | 2.77 | NA | NA | |
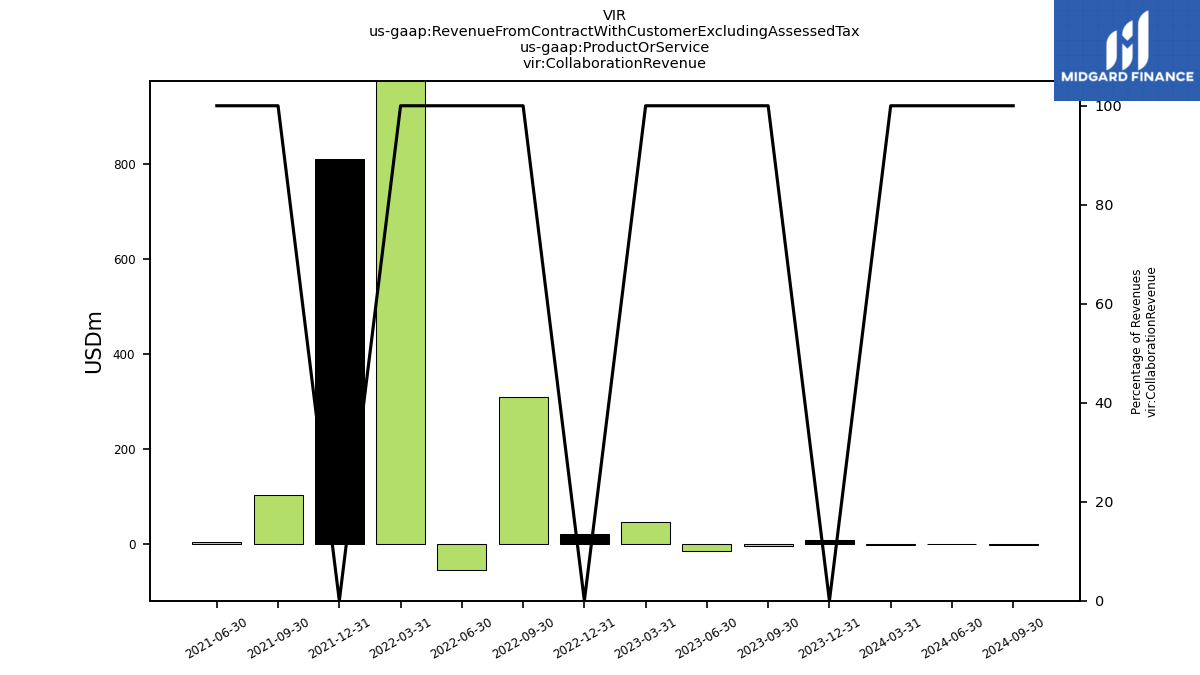
| Collaboration Revenue | 8.86 | -4.39 | -13.78 | 46.57 | 21.61 | 309.14 | -54.94 | 1229.66 | 809.46 | 102.40 | 5.33 | NA | NA | NA | NA | NA | NA | NA | NA | NA | NA | NA | NA | NA | |
| Contract Revenue | 0.74 | 0.29 | 1.06 | 0.14 | 0.18 | 40.00 | 12.25 | 0.28 | 0.29 | 0.32 | 168.65 | 0.60 | 0.30 | 0.19 | 43.52 | 0.49 | 0.37 | 0.24 | 0.09 | 0.02 | 0.01 | 0.11 | NA | NA | |
| Collaboration Revenue | 8.86 | -4.39 | -13.78 | 46.57 | 21.61 | 309.14 | -54.94 | 1229.66 | 809.46 | 102.40 | 5.33 | NA | NA | NA | NA | NA | NA | NA | NA | NA | NA | NA | NA | NA | |
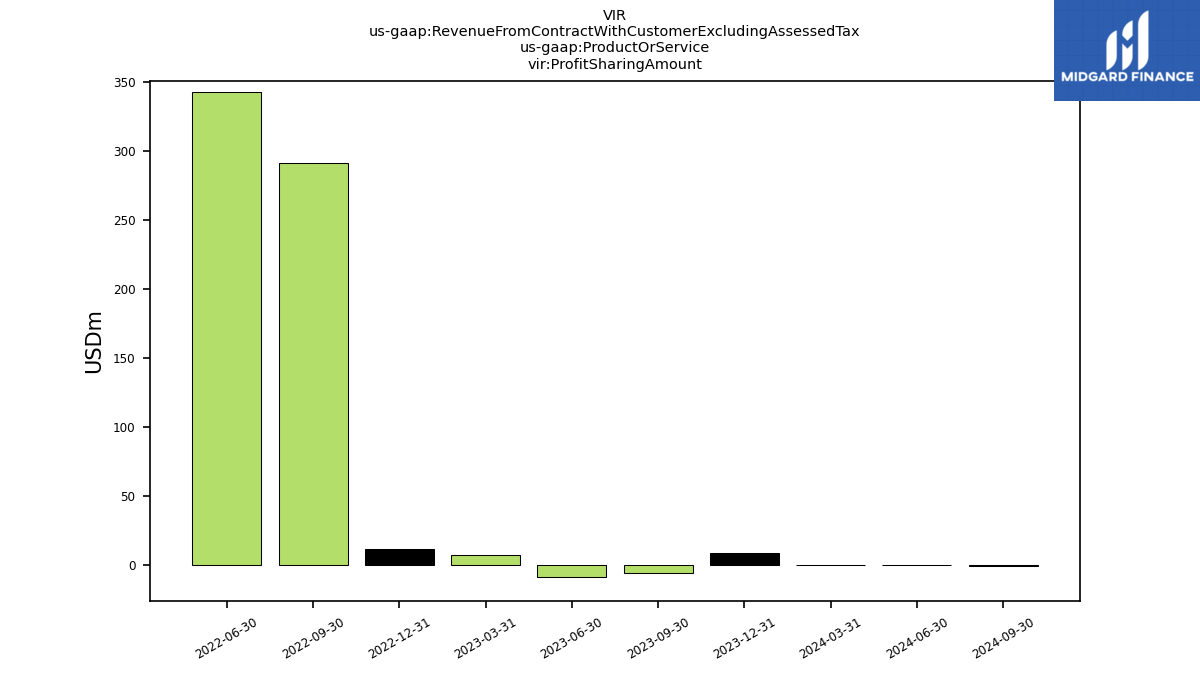
| Profit Sharing Amount | 8.73 | -6.04 | -8.40 | NA | 11.77 | 291.23 | 342.49 | NA | NA | NA | NA | NA | NA | NA | NA | NA | NA | NA | NA | NA | NA | NA | NA | NA | |
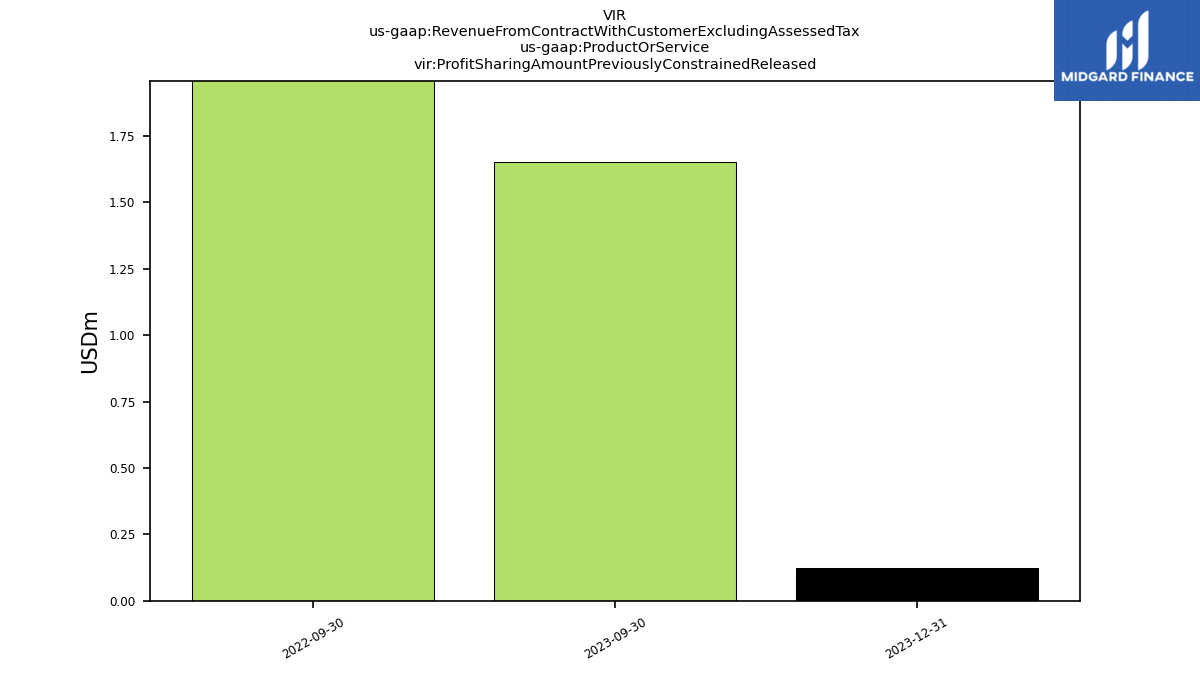
| Profit Sharing Amount Previously Constrained Released | 0.12 | 1.65 | NA | NA | NA | 20.35 | NA | NA | NA | NA | NA | NA | NA | NA | NA | NA | NA | NA | NA | NA | NA | NA | NA | NA |