
| 2023-12-31 | 2023-09-30 | 2023-06-30 | 2023-03-31 | 2022-12-31 | 2022-09-30 | 2022-06-30 | 2022-03-31 | 2021-12-31 | 2021-09-30 | 2021-06-30 | 2021-03-31 | 2020-12-31 | 2020-09-30 | 2020-06-30 | 2020-03-31 | 2019-12-31 | 2019-09-30 | 2019-06-30 | 2019-03-31 | 2018-12-31 | 2018-09-30 | 2018-06-30 | 2018-03-31 | 2017-12-31 | 2017-09-30 | 2017-06-30 | 2017-03-31 | 2016-12-31 | ||
|---|---|---|---|---|---|---|---|---|---|---|---|---|---|---|---|---|---|---|---|---|---|---|---|---|---|---|---|---|---|---|
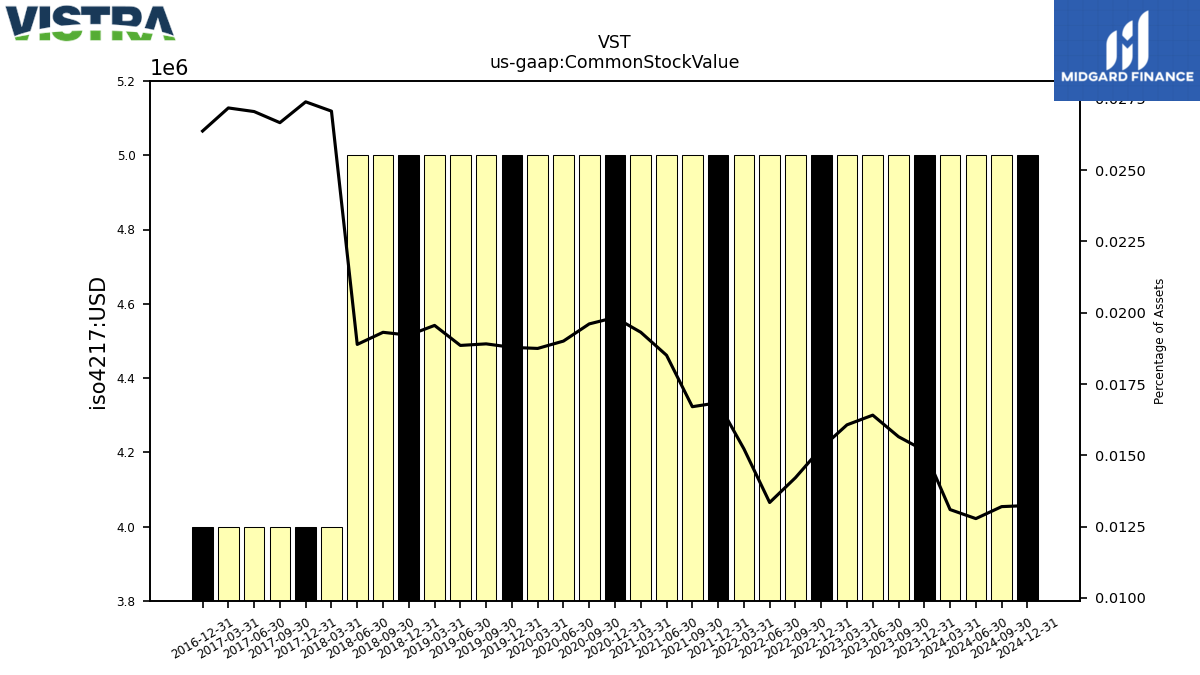
| Common Stock Value | 5.00 | 5.00 | 5.00 | 5.00 | 5.00 | 5.00 | 5.00 | 5.00 | 5.00 | 5.00 | 5.00 | 5.00 | 5.00 | 5.00 | 5.00 | 5.00 | 5.00 | 5.00 | 5.00 | 5.00 | 5.00 | 5.00 | 5.00 | 4.00 | 4.00 | 4.00 | 4.00 | 4.00 | 4.00 | |
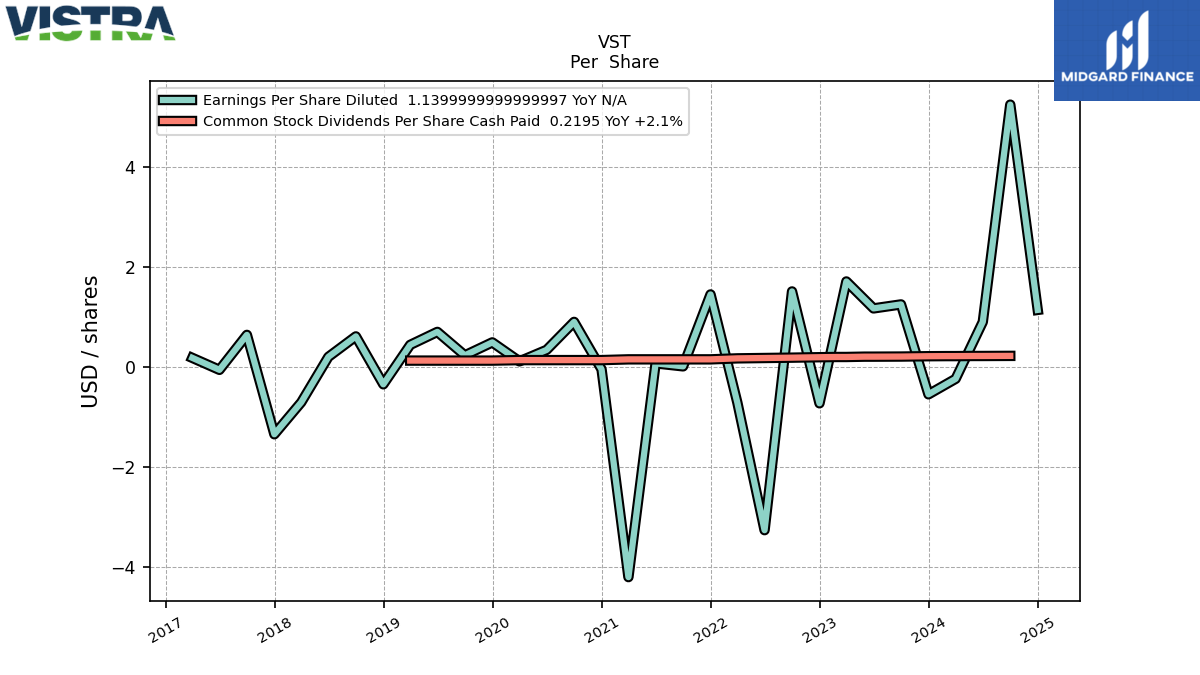
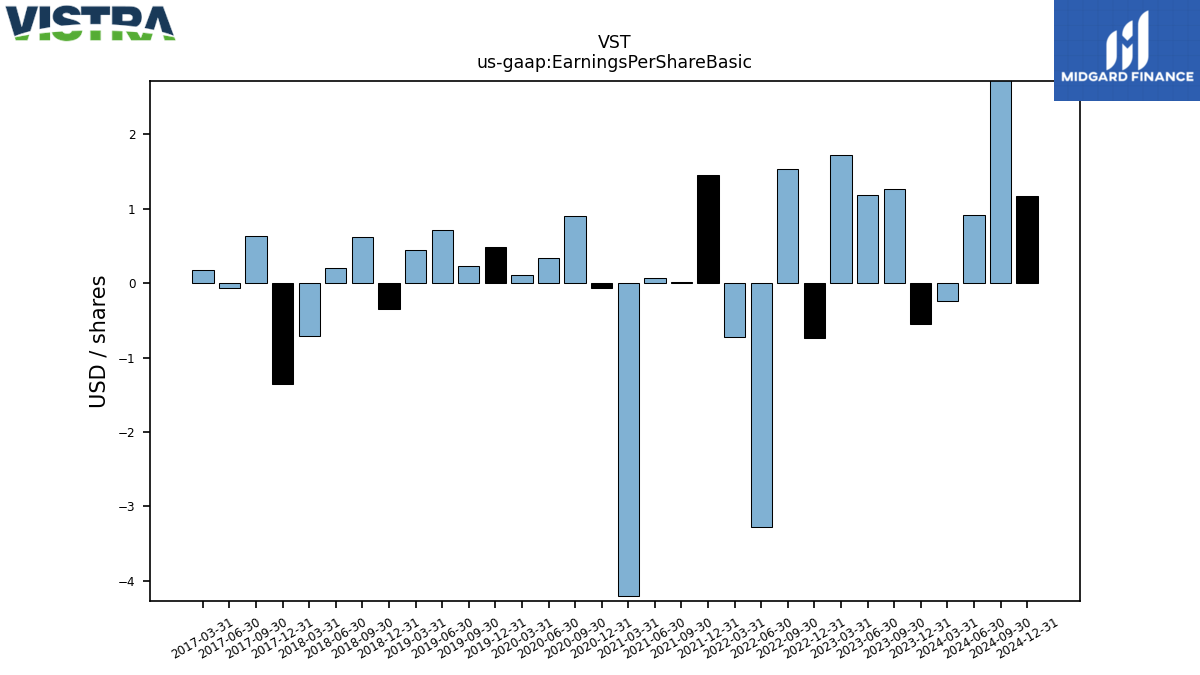
| Earnings Per Share Basic | -0.55 | 1.27 | 1.18 | 1.72 | -0.73 | 1.53 | -3.27 | -0.72 | 1.45 | 0.01 | 0.07 | -4.21 | -0.06 | 0.91 | 0.34 | 0.11 | 0.49 | 0.23 | 0.71 | 0.45 | -0.35 | 0.62 | 0.21 | -0.71 | -1.35 | 0.64 | -0.06 | 0.18 | NA | |
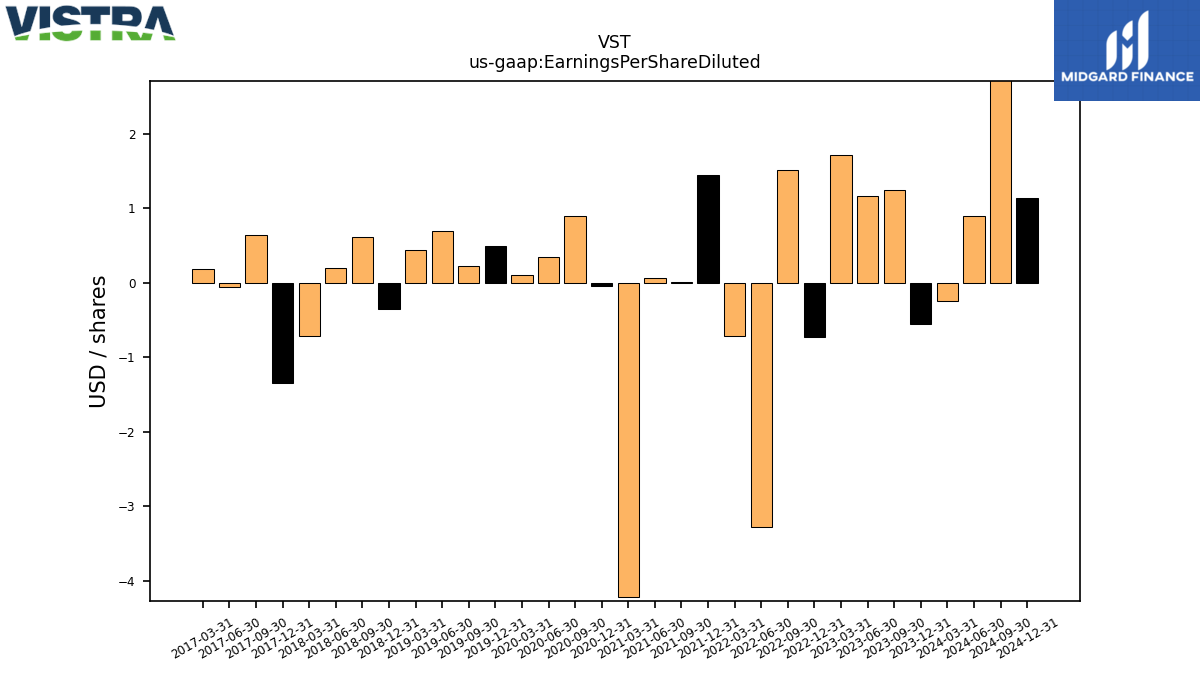
| Earnings Per Share Diluted | -0.55 | 1.25 | 1.17 | 1.71 | -0.73 | 1.51 | -3.27 | -0.72 | 1.45 | 0.01 | 0.07 | -4.21 | -0.05 | 0.90 | 0.34 | 0.11 | 0.49 | 0.23 | 0.70 | 0.44 | -0.35 | 0.61 | 0.20 | -0.71 | -1.35 | 0.64 | -0.06 | 0.18 | NA |
| 2023-12-31 | 2023-09-30 | 2023-06-30 | 2023-03-31 | 2022-12-31 | 2022-09-30 | 2022-06-30 | 2022-03-31 | 2021-12-31 | 2021-09-30 | 2021-06-30 | 2021-03-31 | 2020-12-31 | 2020-09-30 | 2020-06-30 | 2020-03-31 | 2019-12-31 | 2019-09-30 | 2019-06-30 | 2019-03-31 | 2018-12-31 | 2018-09-30 | 2018-06-30 | 2018-03-31 | 2017-12-31 | 2017-09-30 | 2017-06-30 | 2017-03-31 | 2016-12-31 | ||
|---|---|---|---|---|---|---|---|---|---|---|---|---|---|---|---|---|---|---|---|---|---|---|---|---|---|---|---|---|---|---|
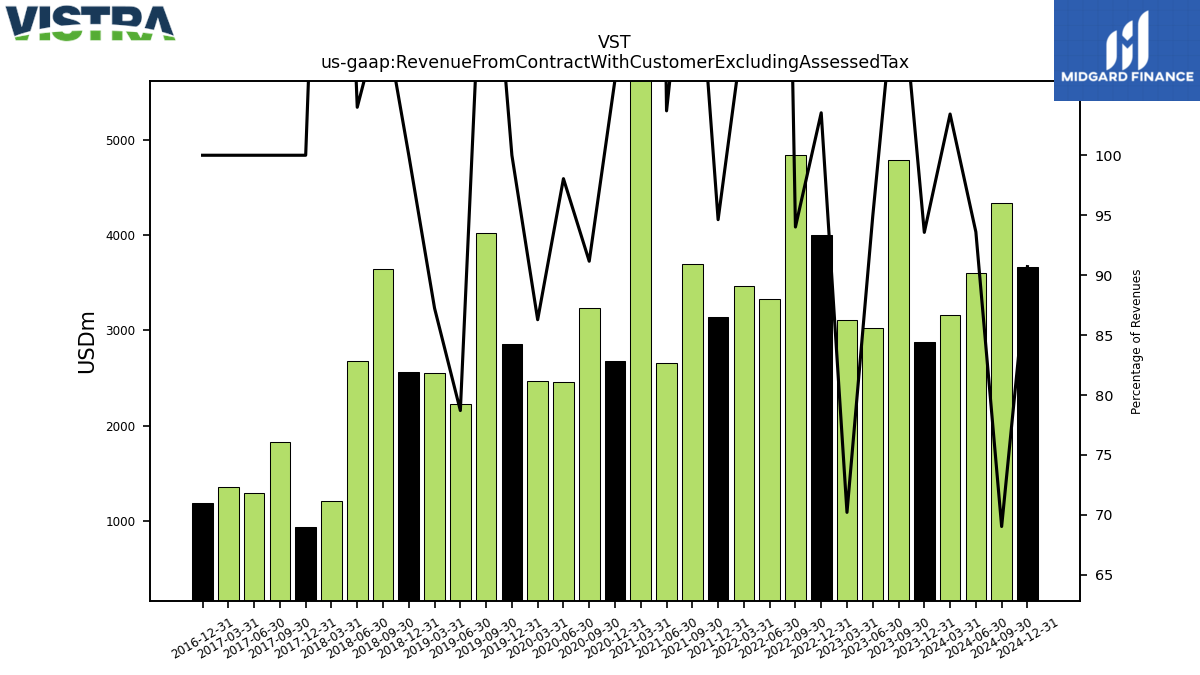
| Revenue From Contract With Customer Excluding Assessed Tax | 2880.00 | 4789.00 | 3027.00 | 3107.00 | 4006.00 | 4838.00 | 3326.00 | 3461.00 | 3136.00 | 3702.00 | 2660.00 | 8203.00 | 2683.00 | 3238.00 | 2460.00 | 2466.00 | 2860.00 | 4026.00 | 2229.00 | 2550.00 | 2562.00 | 3641.00 | 2677.00 | 1212.00 | 943.00 | 1833.00 | 1296.00 | 1357.00 | 1191.00 | |
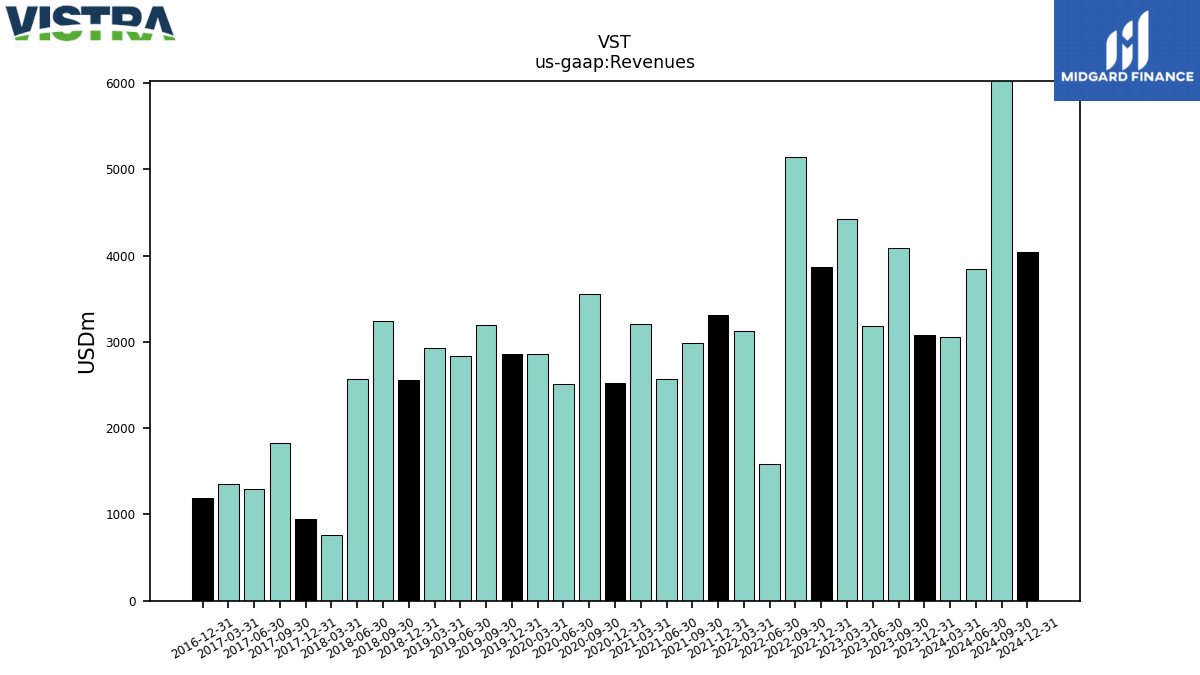
| Revenues | 3078.00 | 4086.00 | 3189.00 | 4425.00 | 3869.00 | 5146.00 | 1588.00 | 3125.00 | 3314.00 | 2991.00 | 2565.00 | 3207.00 | 2524.00 | 3552.00 | 2509.00 | 2858.00 | 2860.00 | 3194.00 | 2832.00 | 2923.00 | 2562.00 | 3243.00 | 2574.00 | 765.00 | 943.00 | 1833.00 | 1296.00 | 1357.00 | 1191.00 | |
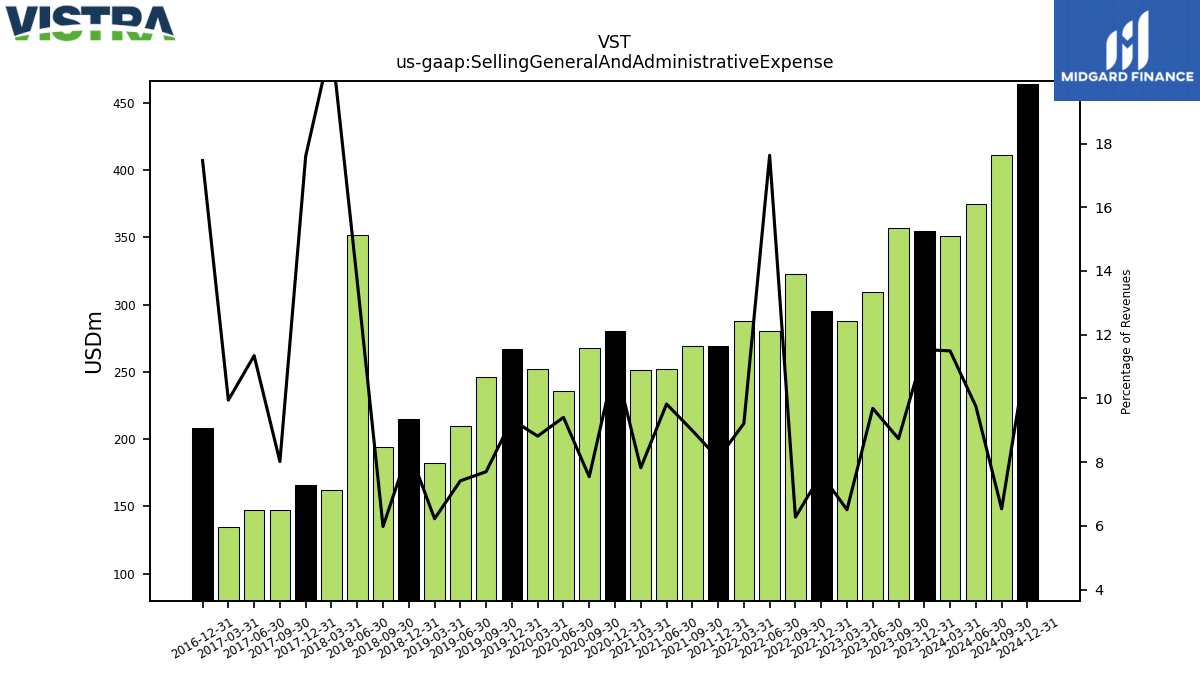
| Selling General And Administrative Expense | 355.00 | 357.00 | 309.00 | 288.00 | 295.00 | 323.00 | 280.00 | 288.00 | 269.00 | 269.00 | 252.00 | 251.00 | 280.00 | 268.00 | 236.00 | 252.00 | 267.00 | 246.00 | 210.00 | 182.00 | 215.00 | 194.00 | 352.00 | 162.00 | 166.00 | 147.00 | 147.00 | 135.00 | 208.00 | |
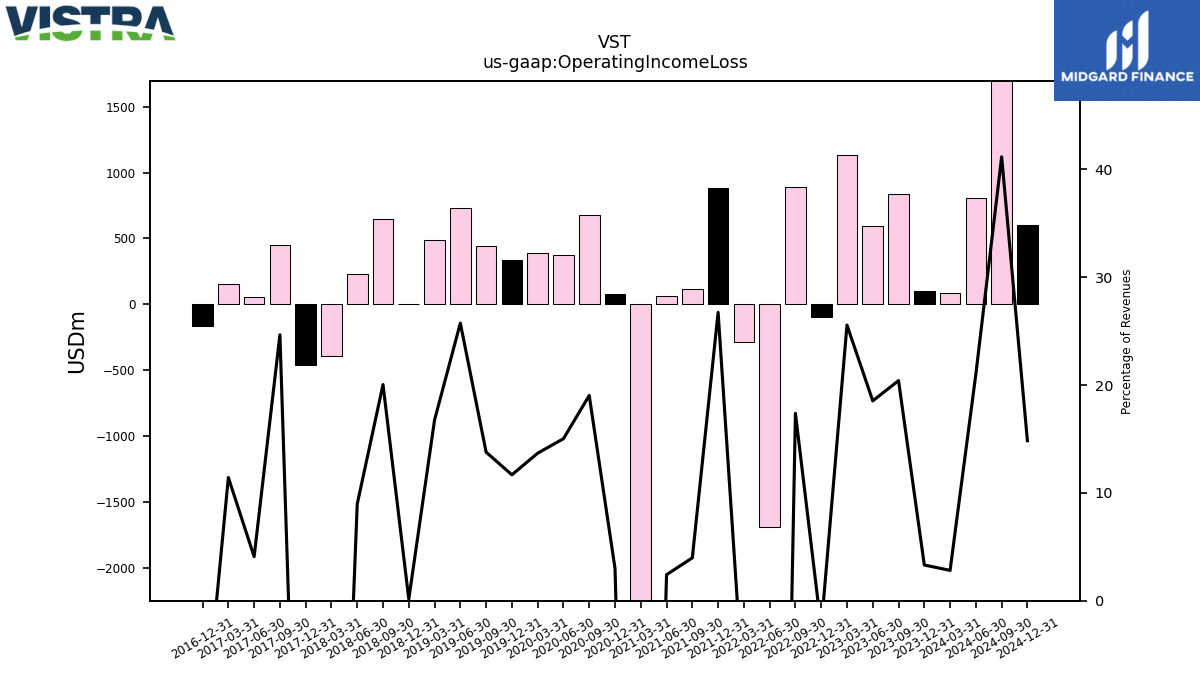
| Operating Income Loss | 102.00 | 834.00 | 591.00 | 1131.00 | -98.00 | 894.00 | -1683.00 | -288.00 | 886.00 | 119.00 | 62.00 | -2583.00 | 76.00 | 676.00 | 377.00 | 391.00 | 334.00 | 440.00 | 729.00 | 490.00 | 4.00 | 650.00 | 231.00 | -394.00 | -460.00 | 452.00 | 53.00 | 155.00 | -161.00 | |
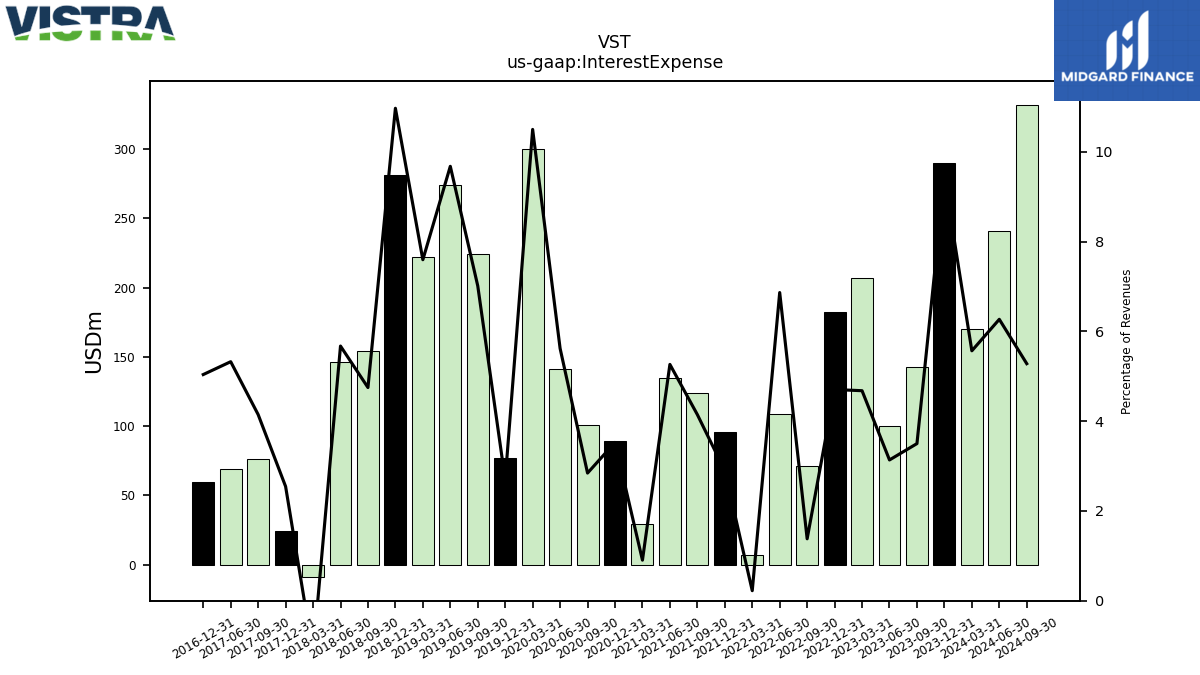
| Interest Expense | 290.00 | 143.00 | 100.00 | 207.00 | 182.00 | 71.00 | 109.00 | 7.00 | 96.00 | 124.00 | 135.00 | 29.00 | 89.00 | 101.00 | 141.00 | 300.00 | 77.00 | 224.00 | 274.00 | 222.00 | 281.00 | 154.00 | 146.00 | -9.00 | 24.00 | 76.00 | 69.00 | NA | 60.00 | |
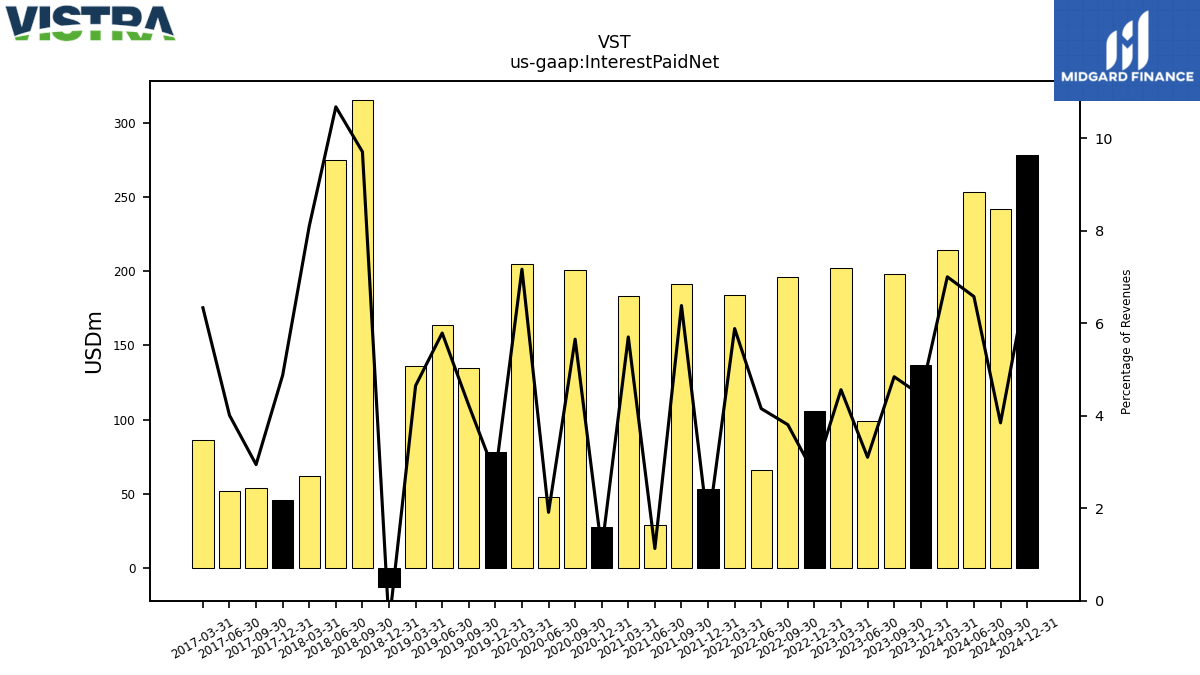
| Interest Paid Net | 137.00 | 198.00 | 99.00 | 202.00 | 106.00 | 196.00 | 66.00 | 184.00 | 53.00 | 191.00 | 29.00 | 183.00 | 28.00 | 201.00 | 48.00 | 205.00 | 78.00 | 135.00 | 164.00 | 136.00 | -13.00 | 315.00 | 275.00 | 62.00 | 46.00 | 54.00 | 52.00 | 86.00 | NA | |
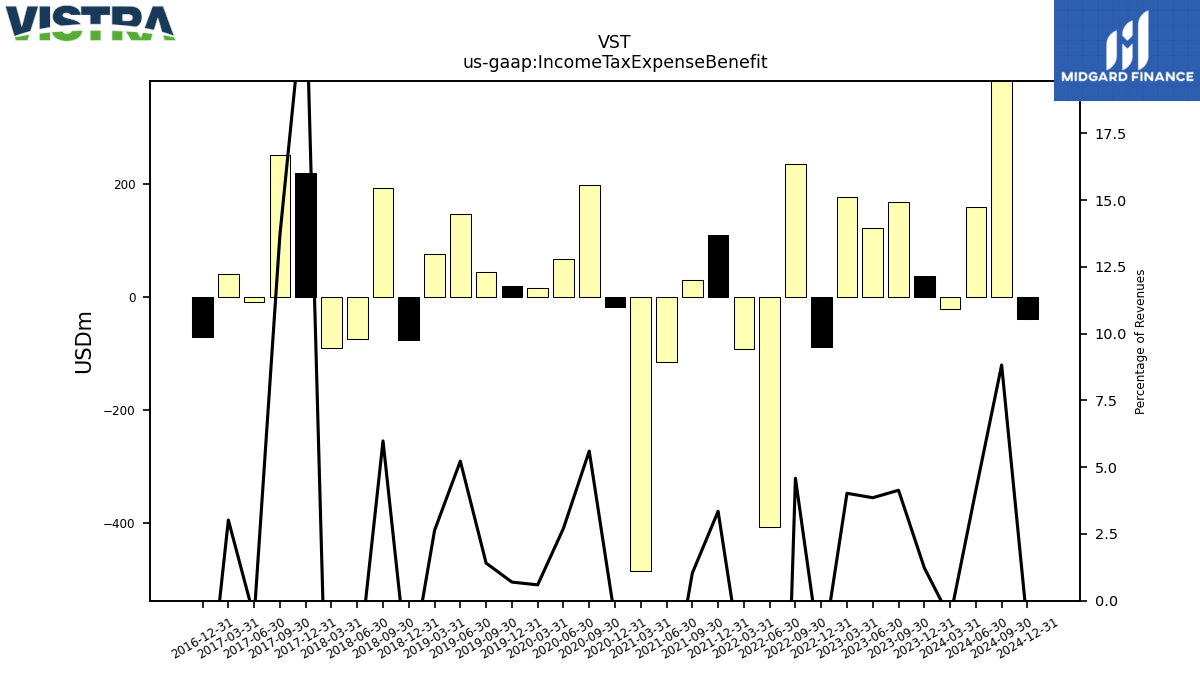
| Income Tax Expense Benefit | 38.00 | 169.00 | 123.00 | 178.00 | -88.00 | 236.00 | -407.00 | -91.00 | 111.00 | 31.00 | -115.00 | -485.00 | -17.00 | 199.00 | 68.00 | 17.00 | 20.00 | 45.00 | 148.00 | 77.00 | -76.00 | 194.00 | -74.00 | -89.00 | 220.00 | 251.00 | -8.00 | 41.00 | -70.00 | |
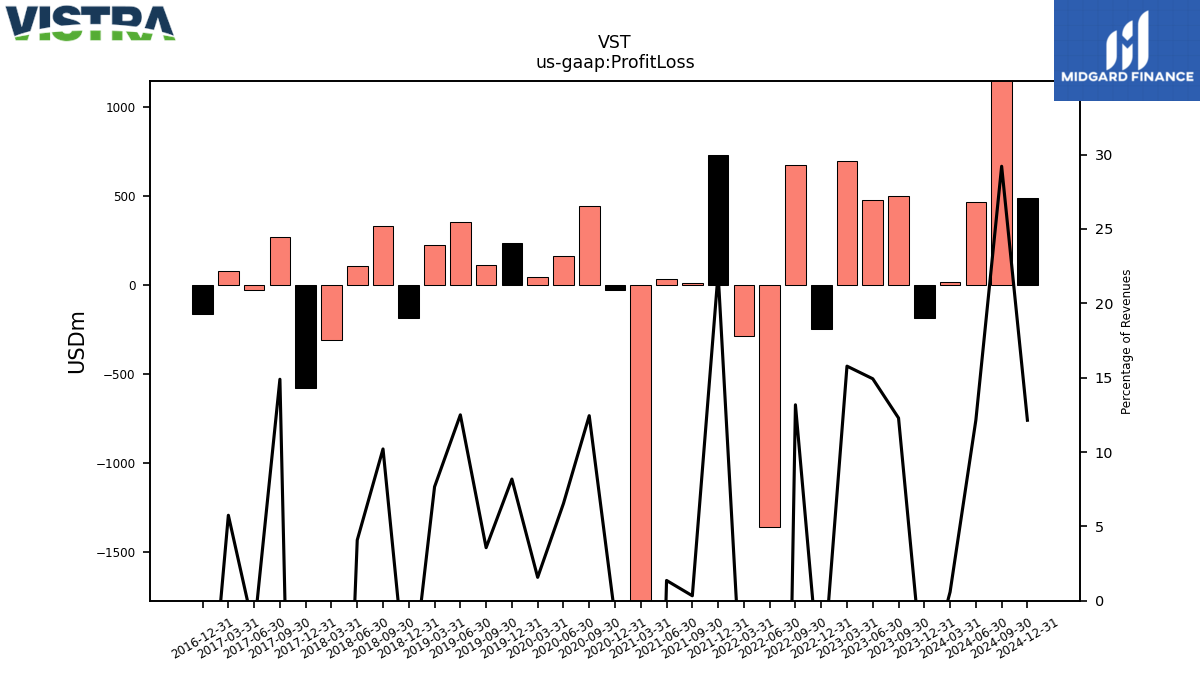
| Profit Loss | -184.00 | 502.00 | 476.00 | 698.00 | -248.00 | 678.00 | -1357.00 | -284.00 | 730.00 | 10.00 | 35.00 | -2040.00 | -27.00 | 442.00 | 164.00 | 45.00 | 234.00 | 114.00 | 354.00 | 224.00 | -186.00 | 331.00 | 105.00 | -306.00 | -579.00 | 273.00 | -26.00 | 78.00 | -163.00 | |
| Other Comprehensive Income Loss Net Of Tax | -4.00 | -2.00 | 4.00 | 1.00 | 17.00 | 6.00 | NA | NA | 15.00 | 14.00 | 1.00 | 2.00 | 8.00 | -4.00 | 1.00 | -23.00 | 4.00 | -13.00 | 0.00 | 1.00 | -7.00 | 1.00 | 0.00 | 1.00 | -23.00 | 0.00 | 0.00 | 0.00 | 6.00 | |
| Net Income Loss | -184.00 | 502.00 | 476.00 | 699.00 | -246.00 | 668.00 | -1365.00 | -285.00 | 726.00 | 7.00 | 36.00 | -2043.00 | -29.00 | 443.00 | 166.00 | 56.00 | 234.00 | 113.00 | 356.00 | 225.00 | -186.00 | 330.00 | 108.00 | -306.00 | -579.00 | 273.00 | -26.00 | NA | NA | |
| Preferred Stock Dividends Income Statement Impact | 38.00 | 37.00 | 37.00 | 38.00 | 38.00 | 37.00 | 37.00 | 38.00 | NA | NA | NA | NA | NA | NA | NA | NA | NA | NA | NA | NA | NA | NA | NA | NA | NA | NA | NA | NA | NA | |
| Net Income Loss Available To Common Stockholders Basic | -222.00 | 465.00 | 439.00 | 661.00 | -284.00 | 631.00 | -1402.00 | -323.00 | 705.00 | 7.00 | 36.00 | -2043.00 | NA | NA | NA | NA | NA | NA | NA | NA | NA | 330.00 | 108.00 | -306.00 | NA | 273.00 | -26.00 | 78.00 | NA |
| 2023-12-31 | 2023-09-30 | 2023-06-30 | 2023-03-31 | 2022-12-31 | 2022-09-30 | 2022-06-30 | 2022-03-31 | 2021-12-31 | 2021-09-30 | 2021-06-30 | 2021-03-31 | 2020-12-31 | 2020-09-30 | 2020-06-30 | 2020-03-31 | 2019-12-31 | 2019-09-30 | 2019-06-30 | 2019-03-31 | 2018-12-31 | 2018-09-30 | 2018-06-30 | 2018-03-31 | 2017-12-31 | 2017-09-30 | 2017-06-30 | 2017-03-31 | 2016-12-31 | ||
|---|---|---|---|---|---|---|---|---|---|---|---|---|---|---|---|---|---|---|---|---|---|---|---|---|---|---|---|---|---|---|
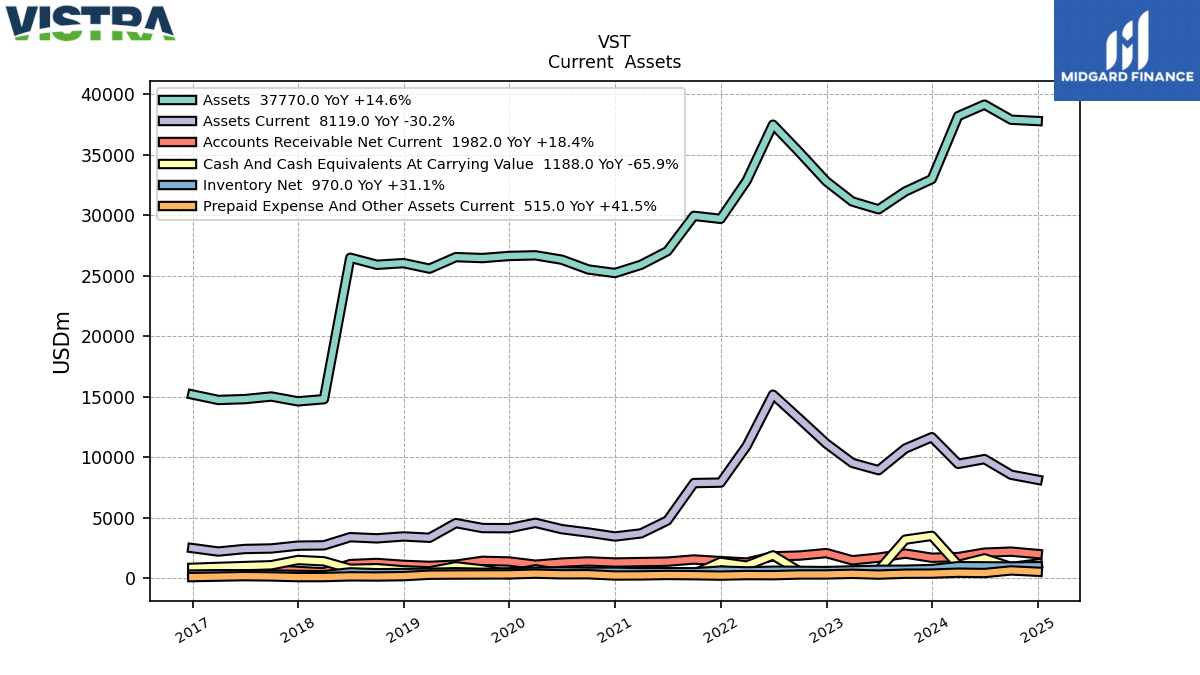
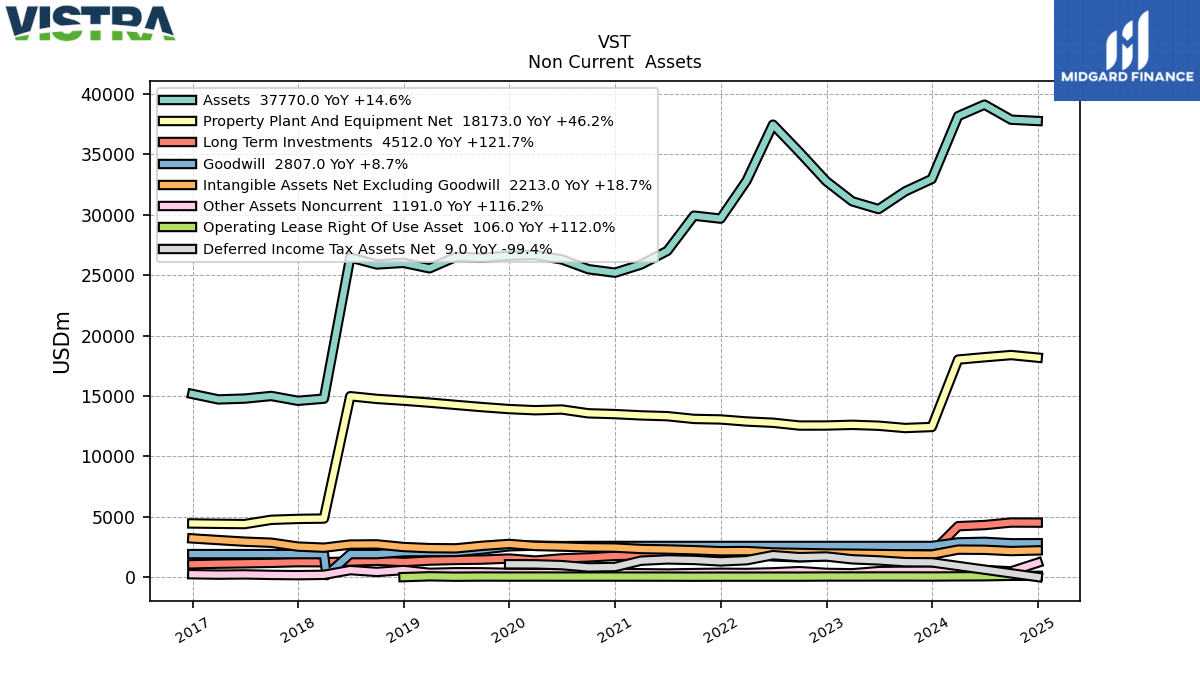
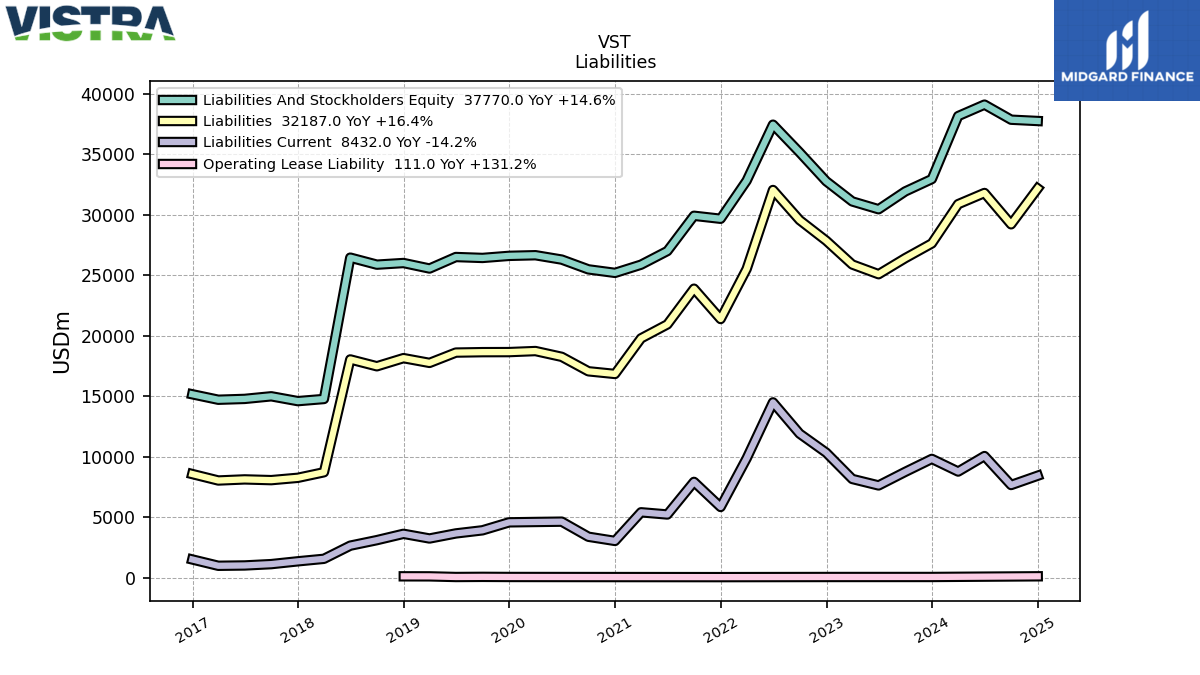
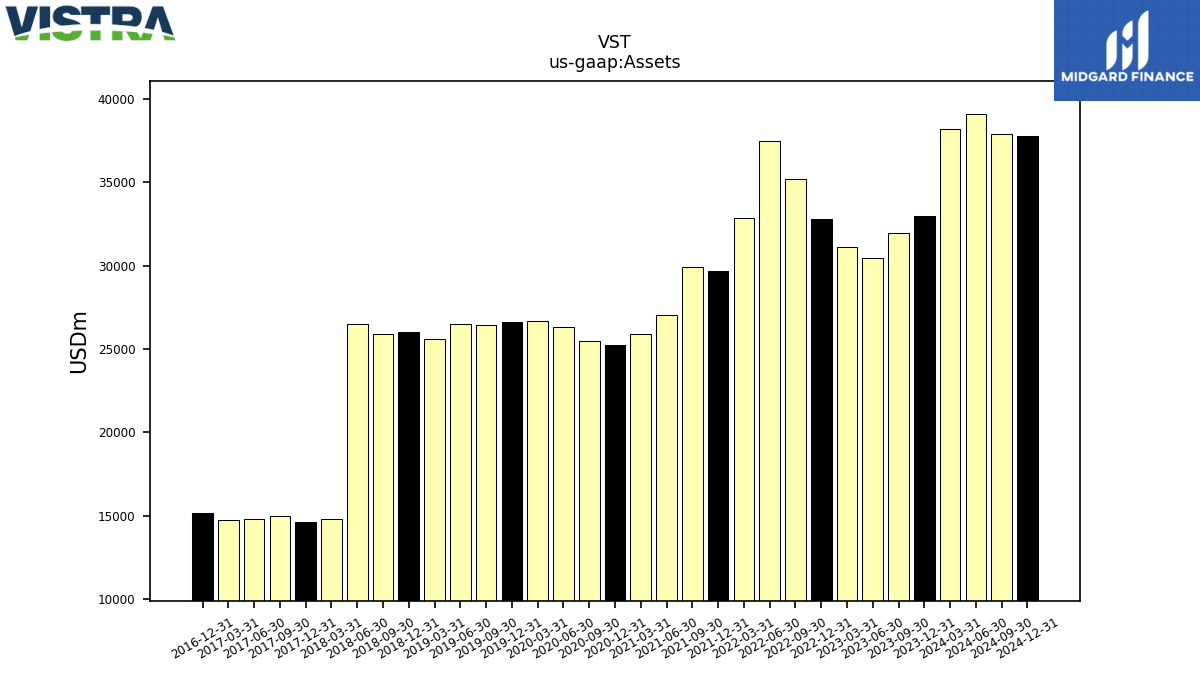
| Assets | 32966.00 | 31945.00 | 30472.00 | 31117.00 | 32787.00 | 35175.00 | 37468.00 | 32833.00 | 29683.00 | 29932.00 | 27015.00 | 25886.00 | 25208.00 | 25499.00 | 26307.00 | 26669.00 | 26616.00 | 26443.00 | 26520.00 | 25568.00 | 26024.00 | 25888.00 | 26470.00 | 14776.00 | 14600.00 | 15000.00 | 14784.00 | 14715.00 | 15167.00 | |
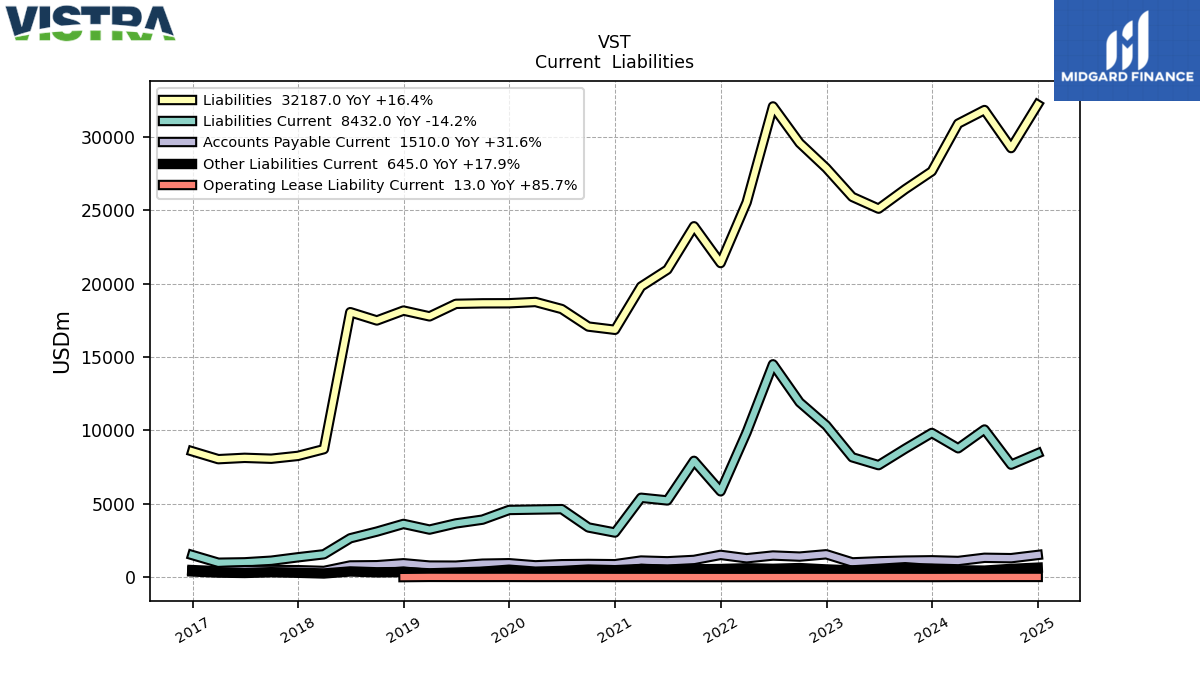
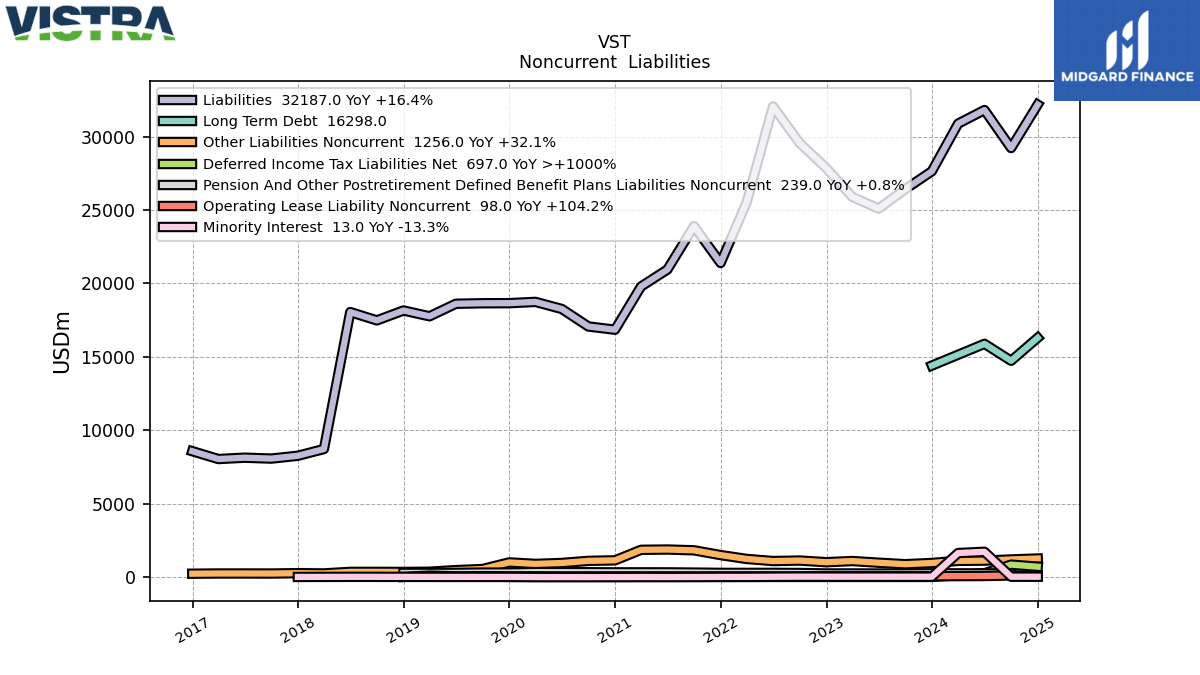
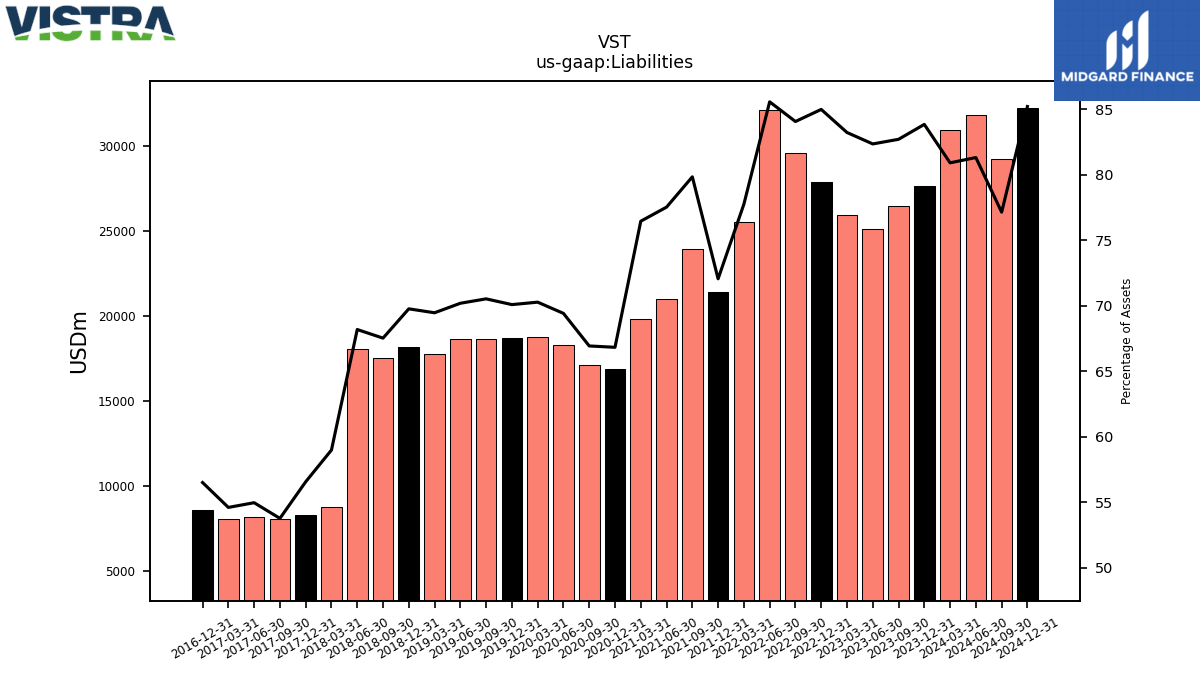
| Liabilities | 27644.00 | 26424.00 | 25098.00 | 25901.00 | 27869.00 | 29574.00 | 32065.00 | 25531.00 | 21391.00 | 23901.00 | 20947.00 | 19793.00 | 16847.00 | 17068.00 | 18263.00 | 18743.00 | 18656.00 | 18651.00 | 18616.00 | 17762.00 | 18157.00 | 17483.00 | 18050.00 | 8716.00 | 8258.00 | 8065.00 | 8126.00 | 8035.00 | 8570.00 | |
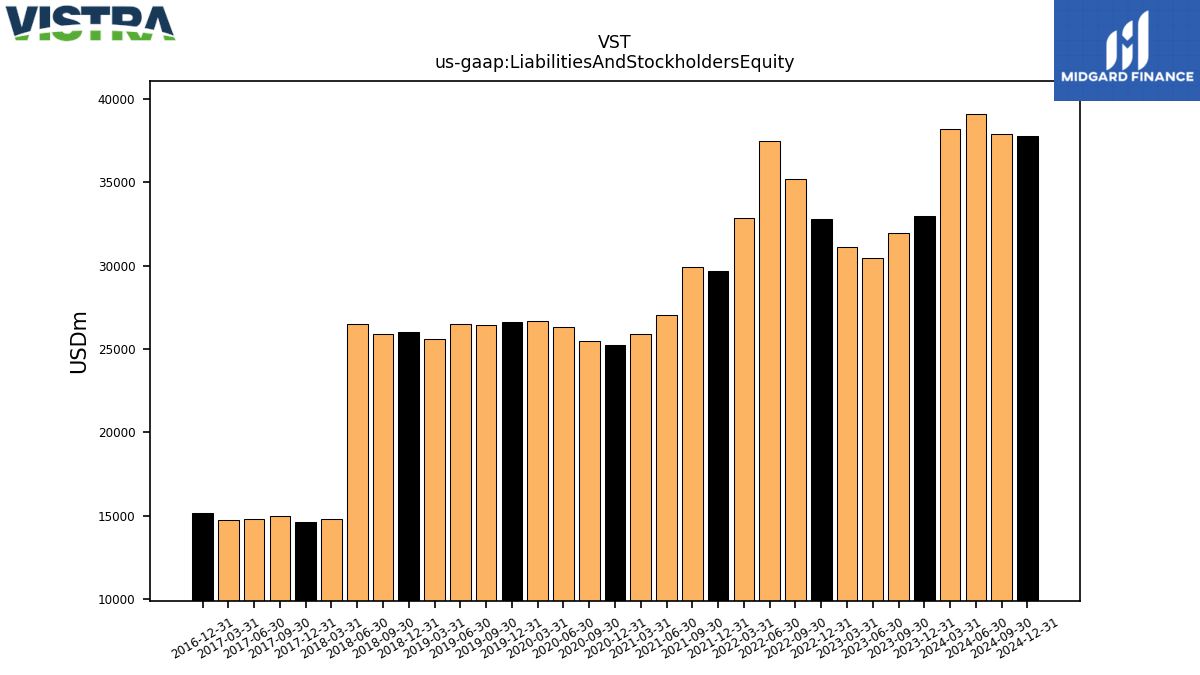
| Liabilities And Stockholders Equity | 32966.00 | 31945.00 | 30472.00 | 31117.00 | 32787.00 | 35175.00 | 37468.00 | 32833.00 | 29683.00 | 29932.00 | 27015.00 | 25886.00 | 25208.00 | 25499.00 | 26307.00 | 26669.00 | 26616.00 | 26443.00 | 26520.00 | 25568.00 | 26024.00 | 25888.00 | 26470.00 | 14776.00 | 14600.00 | 15000.00 | 14784.00 | 14715.00 | 15167.00 | |
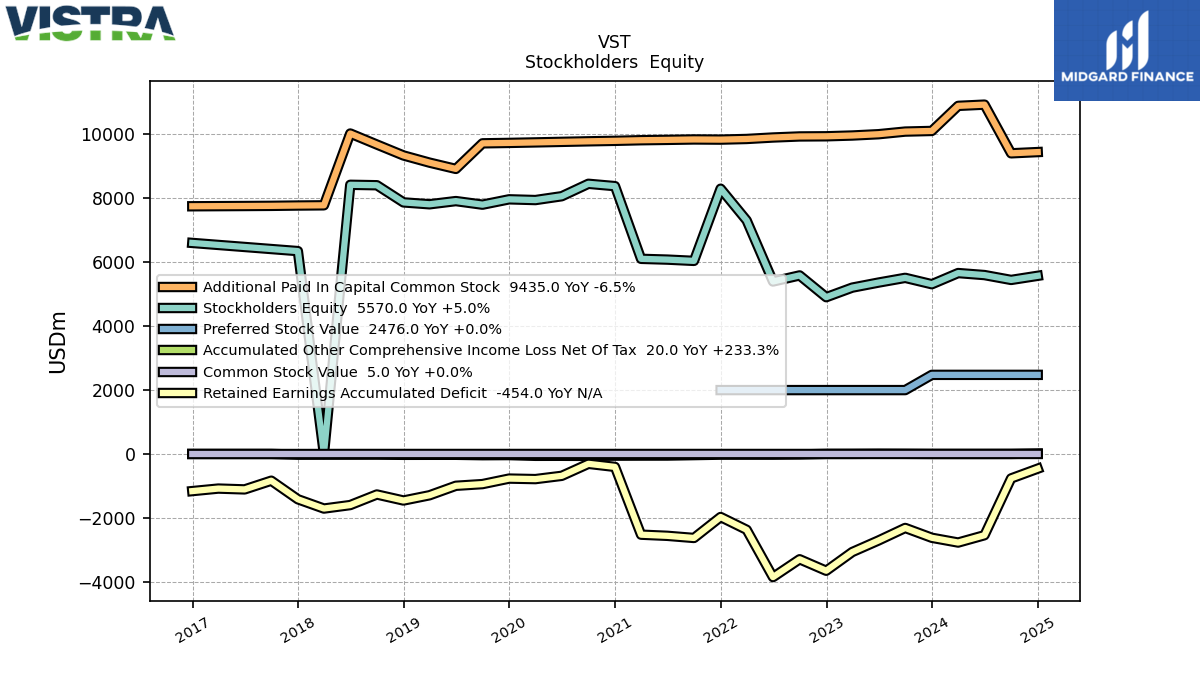
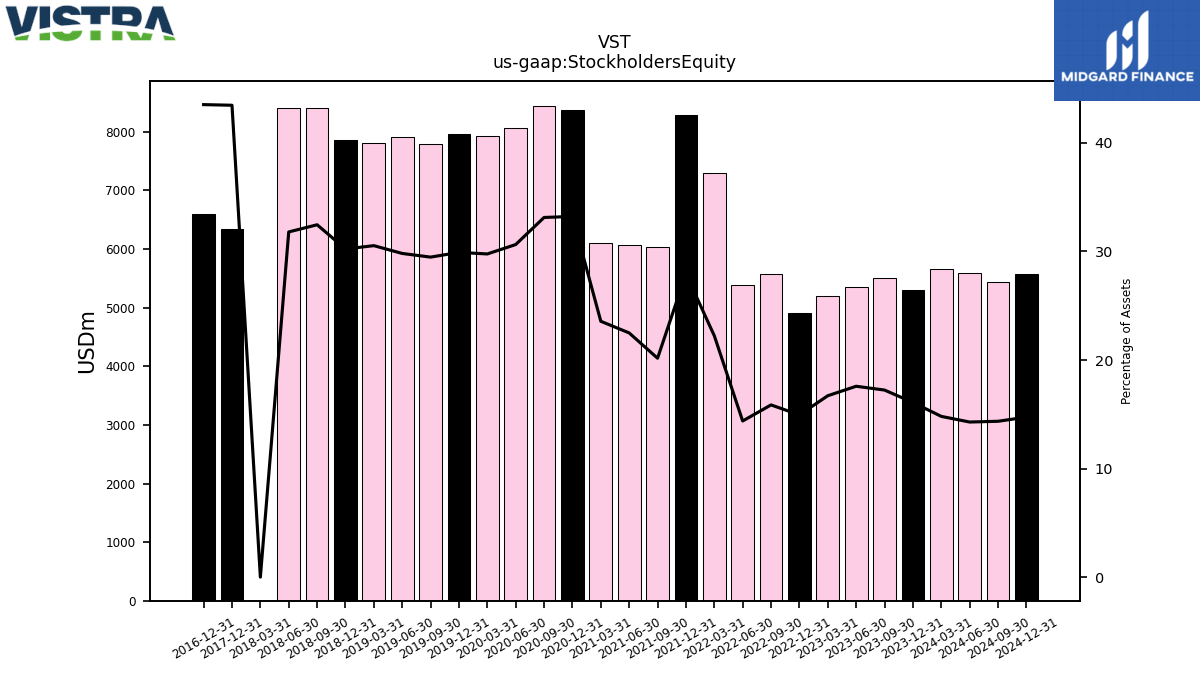
| Stockholders Equity | 5307.00 | 5506.00 | 5359.00 | 5201.00 | 4902.00 | 5582.00 | 5392.00 | 7300.00 | 8291.00 | 6036.00 | 6076.00 | 6100.00 | 8371.00 | 8444.00 | 8056.00 | 7936.00 | 7959.00 | 7792.00 | 7904.00 | 7804.00 | 7863.00 | 8399.00 | 8413.00 | 4.00 | 6342.00 | NA | NA | NA | 6597.00 |
| 2023-12-31 | 2023-09-30 | 2023-06-30 | 2023-03-31 | 2022-12-31 | 2022-09-30 | 2022-06-30 | 2022-03-31 | 2021-12-31 | 2021-09-30 | 2021-06-30 | 2021-03-31 | 2020-12-31 | 2020-09-30 | 2020-06-30 | 2020-03-31 | 2019-12-31 | 2019-09-30 | 2019-06-30 | 2019-03-31 | 2018-12-31 | 2018-09-30 | 2018-06-30 | 2018-03-31 | 2017-12-31 | 2017-09-30 | 2017-06-30 | 2017-03-31 | 2016-12-31 | ||
|---|---|---|---|---|---|---|---|---|---|---|---|---|---|---|---|---|---|---|---|---|---|---|---|---|---|---|---|---|---|---|
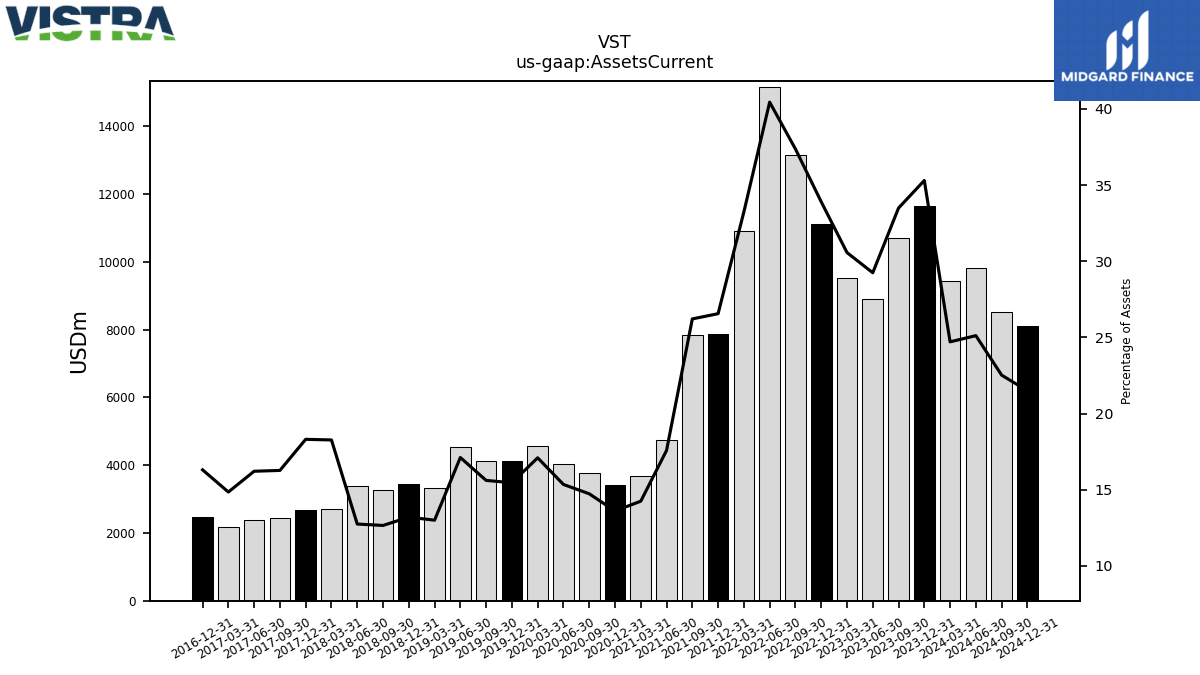
| Assets Current | 11637.00 | 10699.00 | 8911.00 | 9512.00 | 11116.00 | 13145.00 | 15153.00 | 10913.00 | 7883.00 | 7846.00 | 4749.00 | 3688.00 | 3429.00 | 3757.00 | 4037.00 | 4559.00 | 4114.00 | 4128.00 | 4539.00 | 3324.00 | 3435.00 | 3276.00 | 3374.00 | 2699.00 | 2673.00 | 2440.00 | 2397.00 | 2185.00 | 2473.00 | |
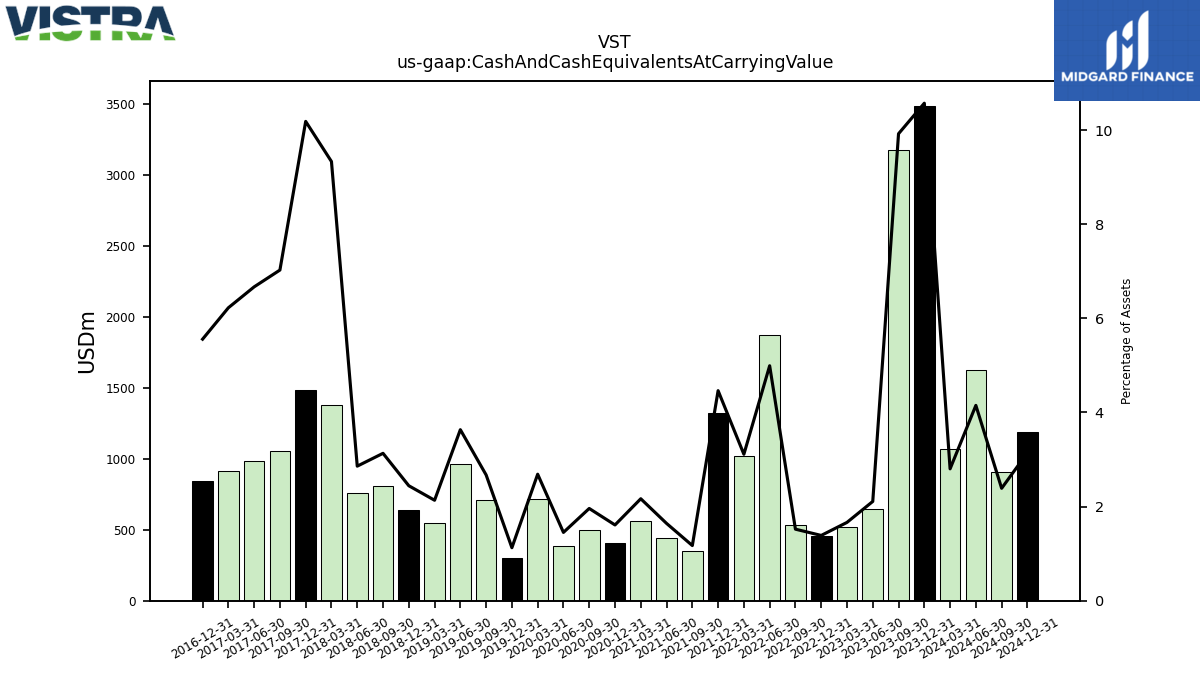
| Cash And Cash Equivalents At Carrying Value | 3485.00 | 3170.00 | 643.00 | 518.00 | 455.00 | 535.00 | 1871.00 | 1022.00 | 1325.00 | 351.00 | 444.00 | 561.00 | 406.00 | 500.00 | 382.00 | 717.00 | 300.00 | 707.00 | 964.00 | 546.00 | 636.00 | 811.00 | 757.00 | 1379.00 | 1487.00 | 1054.00 | 986.00 | 916.00 | 843.00 | |
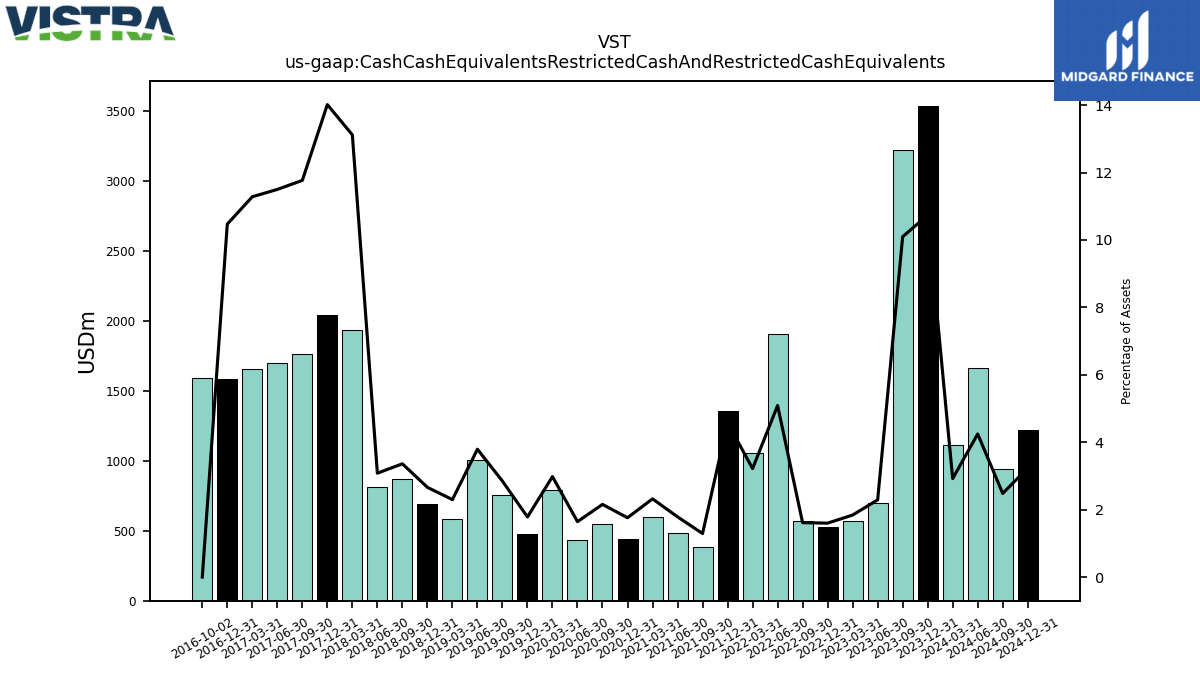
| Cash Cash Equivalents Restricted Cash And Restricted Cash Equivalents | 3539.00 | 3225.00 | 698.00 | 573.00 | 525.00 | 568.00 | 1907.00 | 1057.00 | 1359.00 | 387.00 | 483.00 | 601.00 | 444.00 | 550.00 | 433.00 | 795.00 | 475.00 | 753.00 | 1006.00 | 588.00 | 693.00 | 870.00 | 816.00 | 1938.00 | 2046.00 | 1765.00 | 1700.00 | 1660.00 | 1588.00 | |
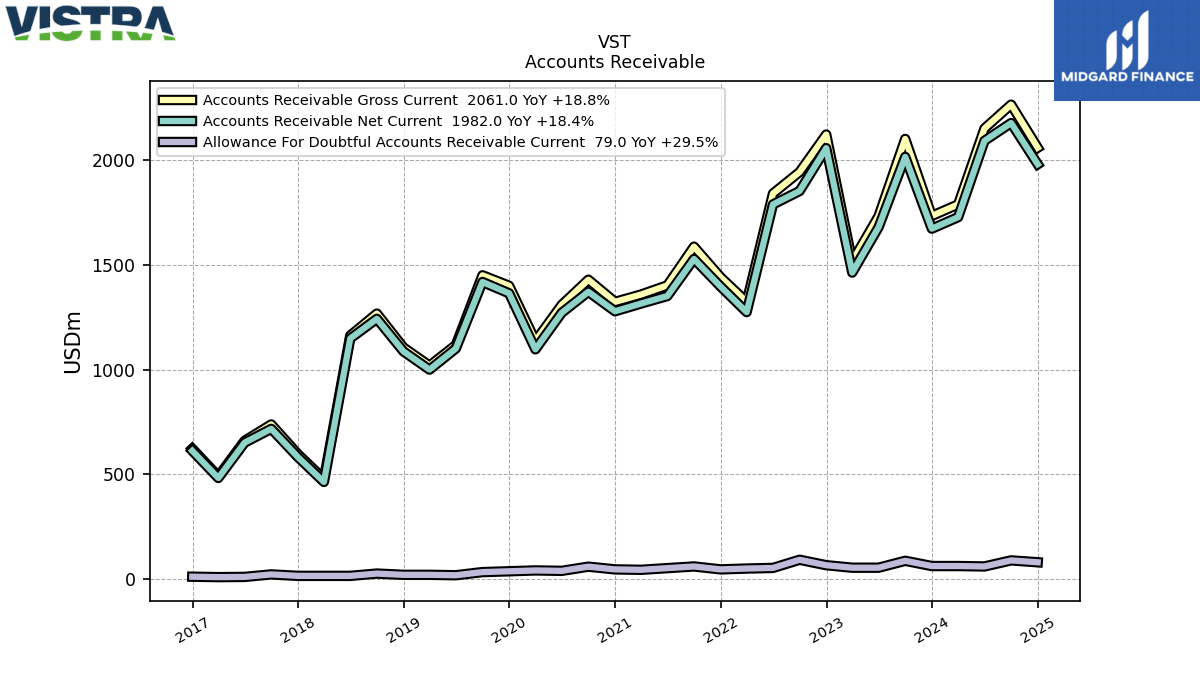
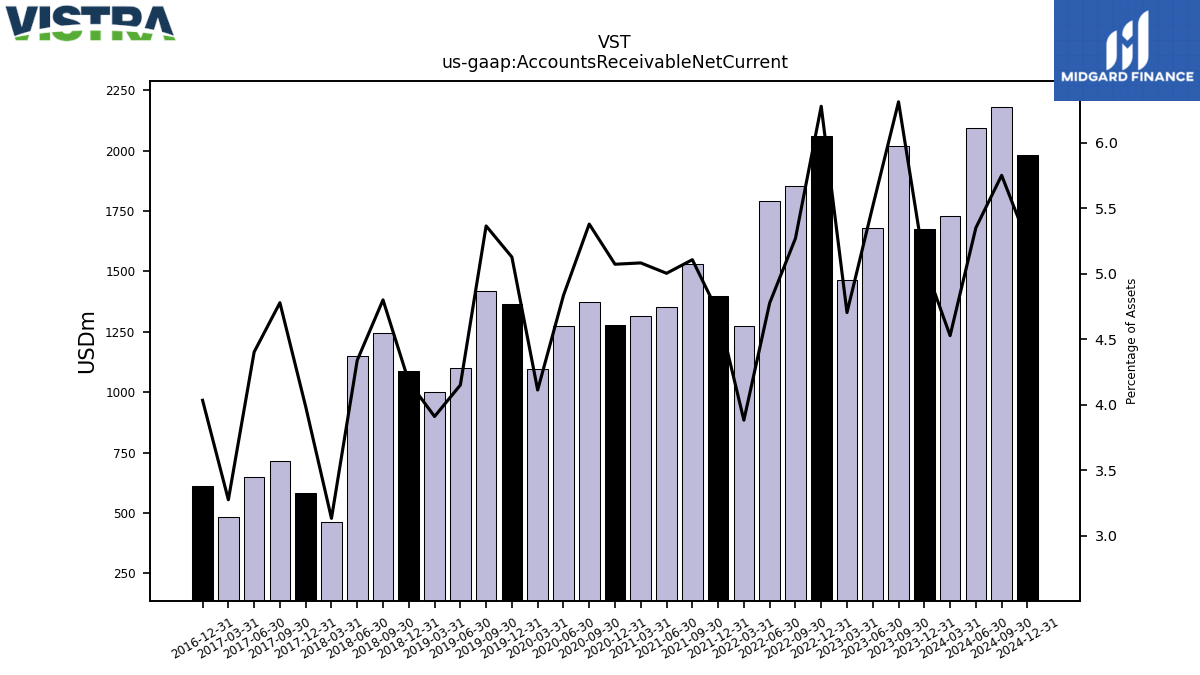
| Accounts Receivable Net Current | 1674.00 | 2017.00 | 1681.00 | 1464.00 | 2059.00 | 1854.00 | 1790.00 | 1275.00 | 1397.00 | 1529.00 | 1352.00 | 1316.00 | 1279.00 | 1372.00 | 1272.00 | 1097.00 | 1365.00 | 1419.00 | 1101.00 | 1000.00 | 1087.00 | 1243.00 | 1149.00 | 463.00 | 582.00 | 717.00 | 651.00 | 482.00 | 612.00 | |
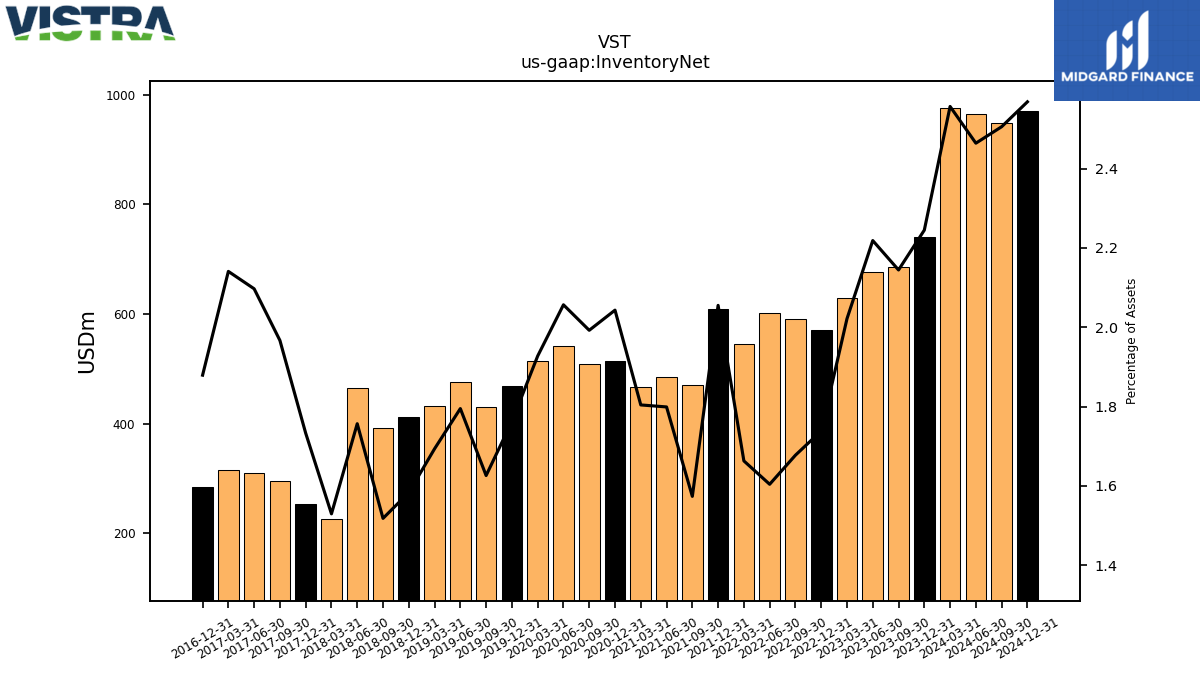
| Inventory Net | 740.00 | 685.00 | 676.00 | 629.00 | 570.00 | 590.00 | 601.00 | 546.00 | 610.00 | 471.00 | 486.00 | 467.00 | 515.00 | 508.00 | 541.00 | 514.00 | 469.00 | 430.00 | 476.00 | 433.00 | 412.00 | 393.00 | 465.00 | 226.00 | 253.00 | 295.00 | 310.00 | 315.00 | 285.00 | |
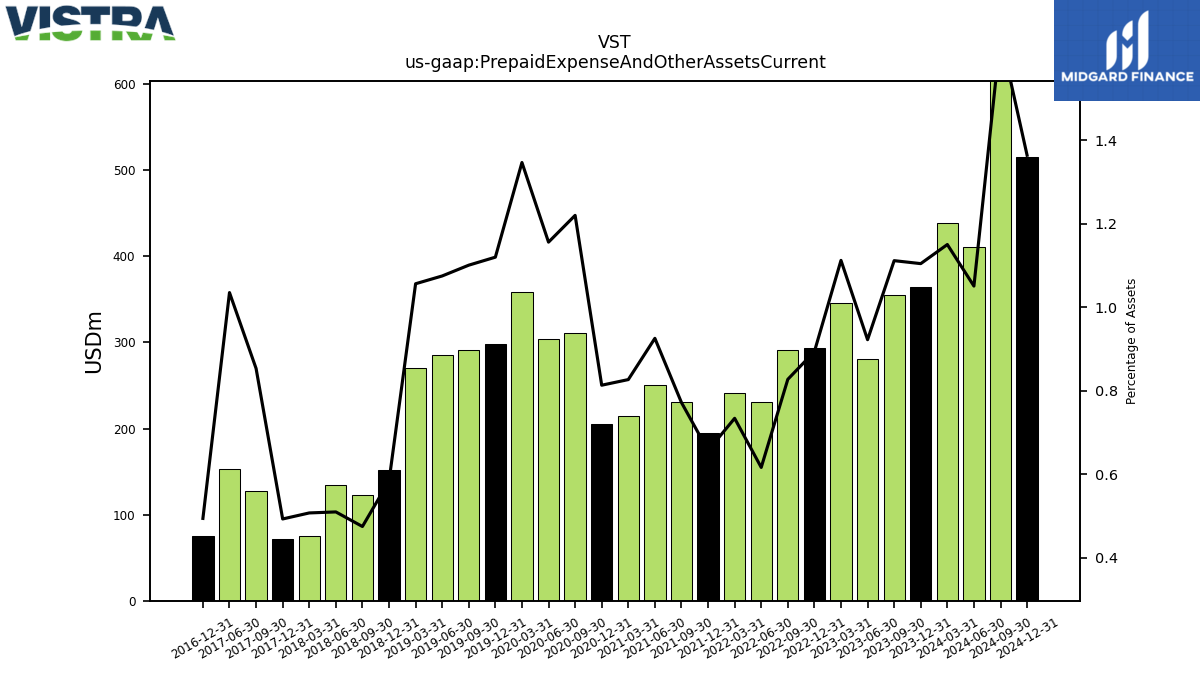
| Prepaid Expense And Other Assets Current | 364.00 | 355.00 | 281.00 | 346.00 | 293.00 | 291.00 | 231.00 | 241.00 | 195.00 | 231.00 | 250.00 | 214.00 | 205.00 | 311.00 | 304.00 | 359.00 | 298.00 | 291.00 | 285.00 | 270.00 | 152.00 | 123.00 | 135.00 | 75.00 | 72.00 | 128.00 | 153.00 | NA | 75.00 | |
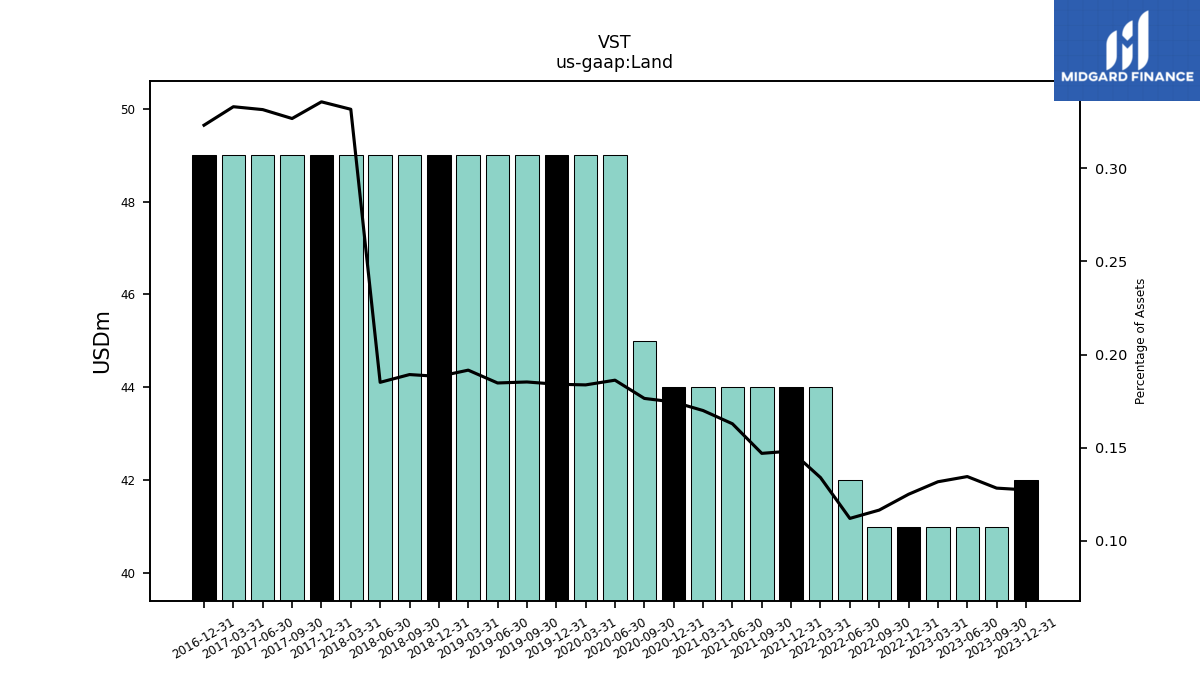
| Land | 42.00 | 41.00 | 41.00 | 41.00 | 41.00 | 41.00 | 42.00 | 44.00 | 44.00 | 44.00 | 44.00 | 44.00 | 44.00 | 45.00 | 49.00 | 49.00 | 49.00 | 49.00 | 49.00 | 49.00 | 49.00 | 49.00 | 49.00 | 49.00 | 49.00 | 49.00 | 49.00 | 49.00 | 49.00 |
| 2023-12-31 | 2023-09-30 | 2023-06-30 | 2023-03-31 | 2022-12-31 | 2022-09-30 | 2022-06-30 | 2022-03-31 | 2021-12-31 | 2021-09-30 | 2021-06-30 | 2021-03-31 | 2020-12-31 | 2020-09-30 | 2020-06-30 | 2020-03-31 | 2019-12-31 | 2019-09-30 | 2019-06-30 | 2019-03-31 | 2018-12-31 | 2018-09-30 | 2018-06-30 | 2018-03-31 | 2017-12-31 | 2017-09-30 | 2017-06-30 | 2017-03-31 | 2016-12-31 | ||
|---|---|---|---|---|---|---|---|---|---|---|---|---|---|---|---|---|---|---|---|---|---|---|---|---|---|---|---|---|---|---|
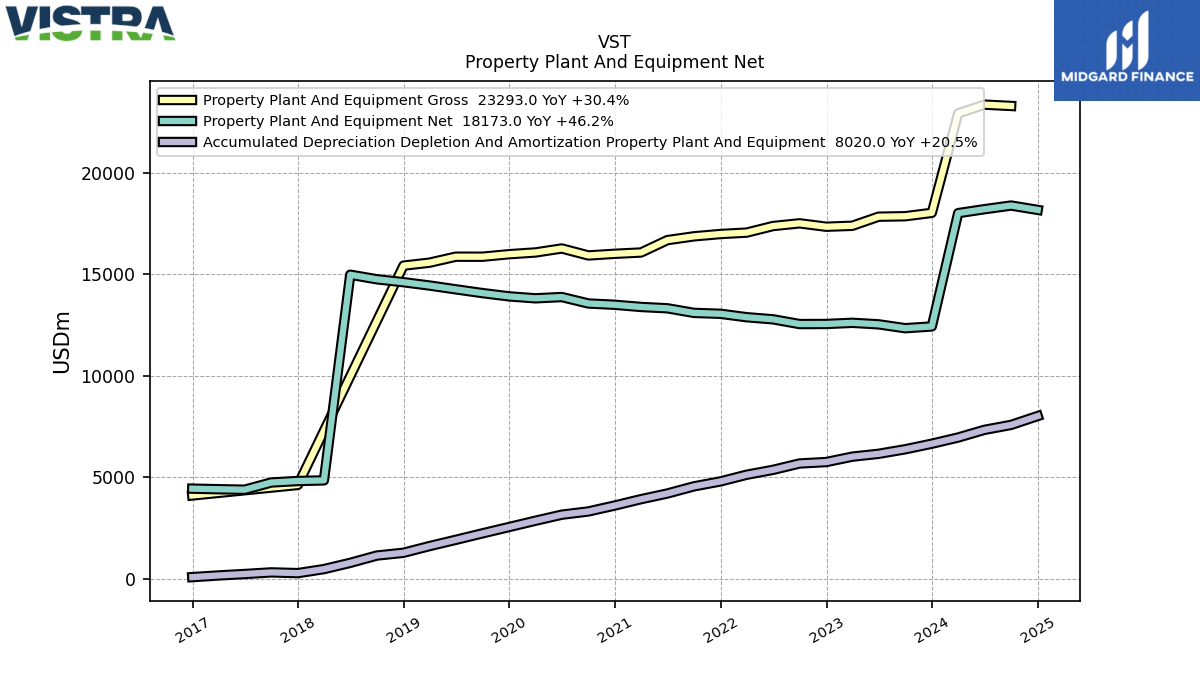
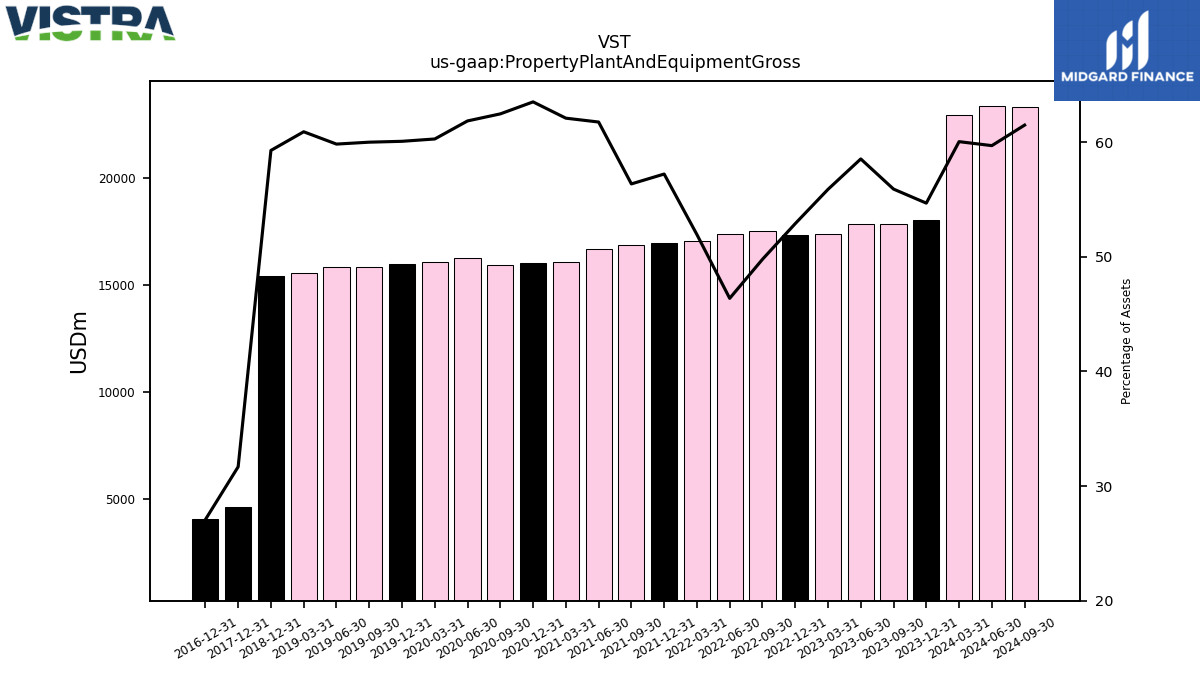
| Property Plant And Equipment Gross | 18028.00 | 17861.00 | 17839.00 | 17391.00 | 17344.00 | 17512.00 | 17378.00 | 17055.00 | 16986.00 | 16871.00 | 16685.00 | 16075.00 | 16012.00 | 15930.00 | 16273.00 | 16077.00 | 15991.00 | 15867.00 | 15869.00 | 15574.00 | 15428.00 | NA | NA | NA | 4626.00 | NA | NA | NA | 4107.00 | |
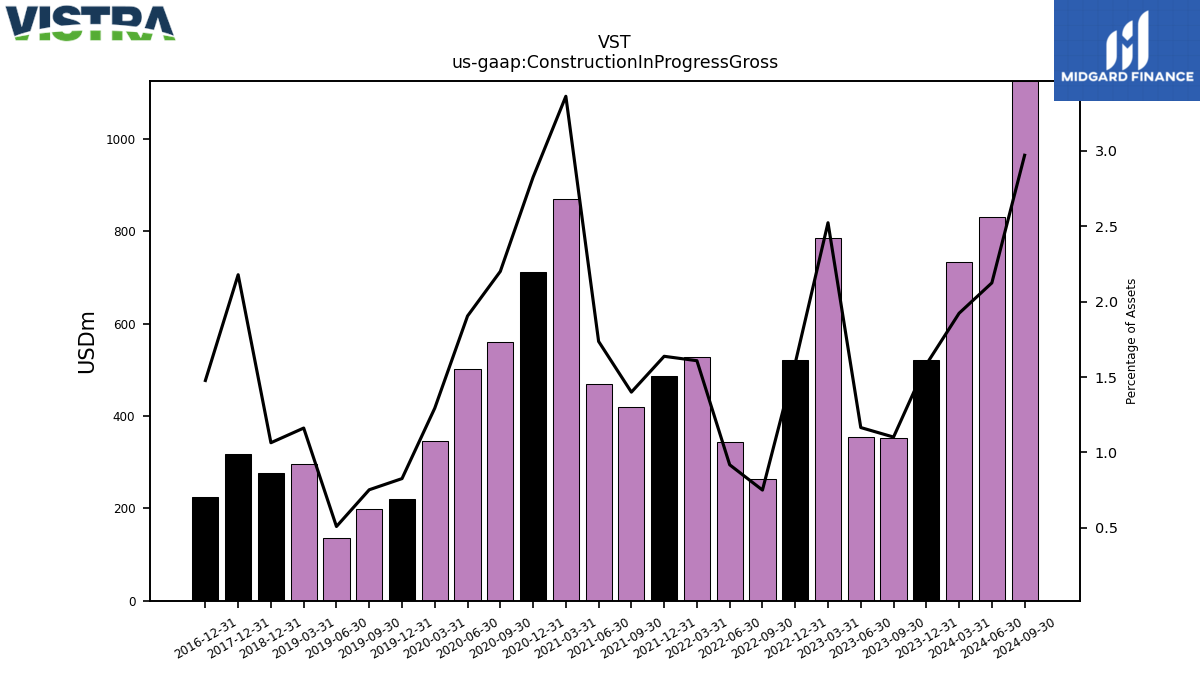
| Construction In Progress Gross | 522.00 | 352.00 | 355.00 | 785.00 | 522.00 | 264.00 | 344.00 | 528.00 | 486.00 | 419.00 | 469.00 | 870.00 | 712.00 | 561.00 | 501.00 | 345.00 | 220.00 | 199.00 | 135.00 | 297.00 | 277.00 | NA | NA | NA | 318.00 | NA | NA | NA | 224.00 | |
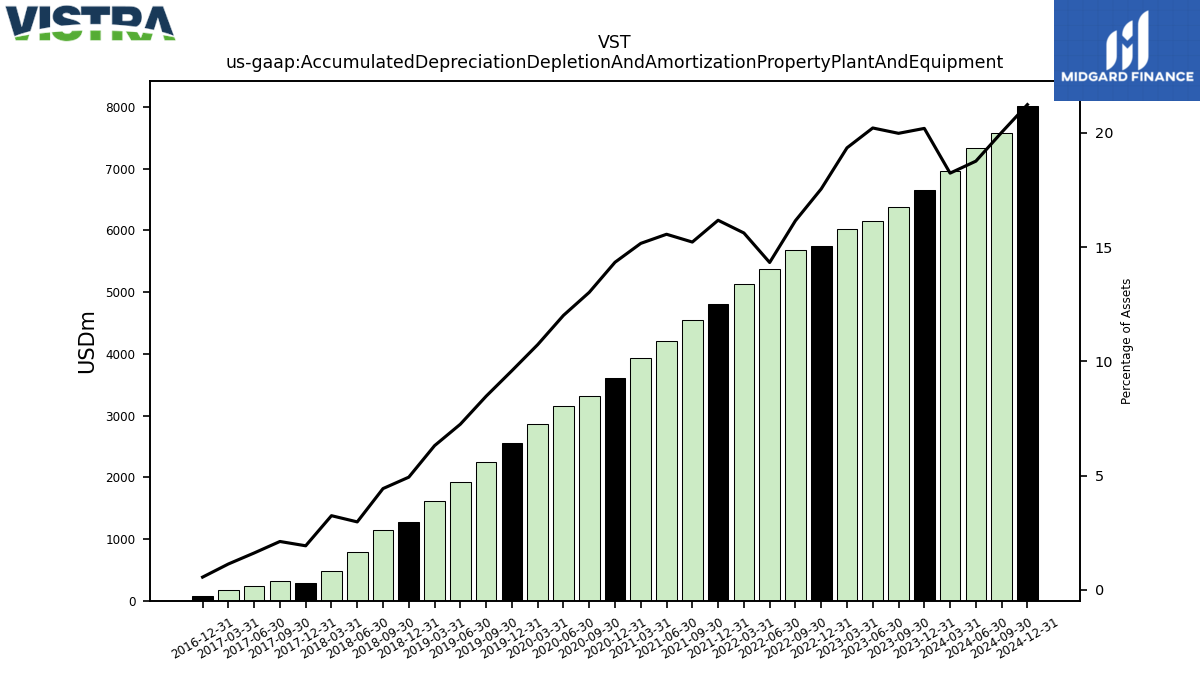
| Accumulated Depreciation Depletion And Amortization Property Plant And Equipment | 6657.00 | 6382.00 | 6159.00 | 6019.00 | 5753.00 | 5683.00 | 5368.00 | 5128.00 | 4801.00 | 4556.00 | 4204.00 | 3925.00 | 3614.00 | 3320.00 | 3160.00 | 2862.00 | 2553.00 | 2241.00 | 1923.00 | 1614.00 | 1284.00 | 1148.00 | 788.00 | 480.00 | 282.00 | 318.00 | 239.00 | 167.00 | 85.00 | |
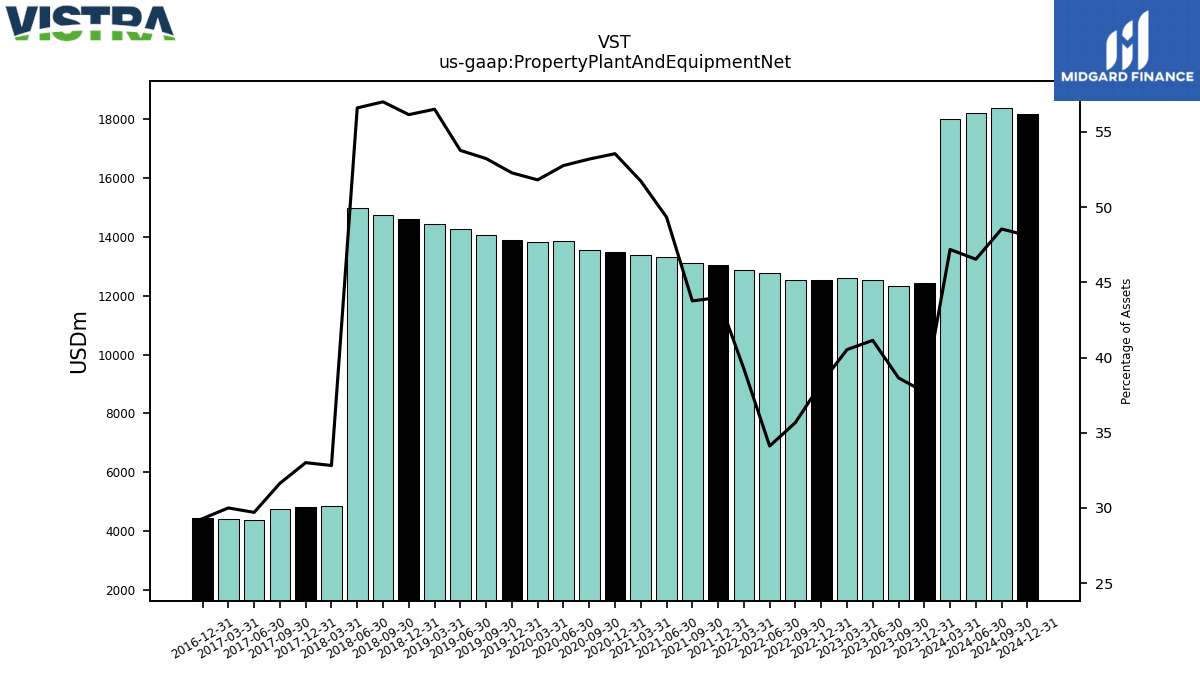
| Property Plant And Equipment Net | 12432.00 | 12346.00 | 12537.00 | 12611.00 | 12554.00 | 12550.00 | 12784.00 | 12887.00 | 13056.00 | 13100.00 | 13327.00 | 13392.00 | 13499.00 | 13564.00 | 13881.00 | 13818.00 | 13914.00 | 14075.00 | 14260.00 | 14448.00 | 14612.00 | 14756.00 | 14981.00 | 4850.00 | 4820.00 | 4746.00 | 4392.00 | 4415.00 | 4443.00 | |
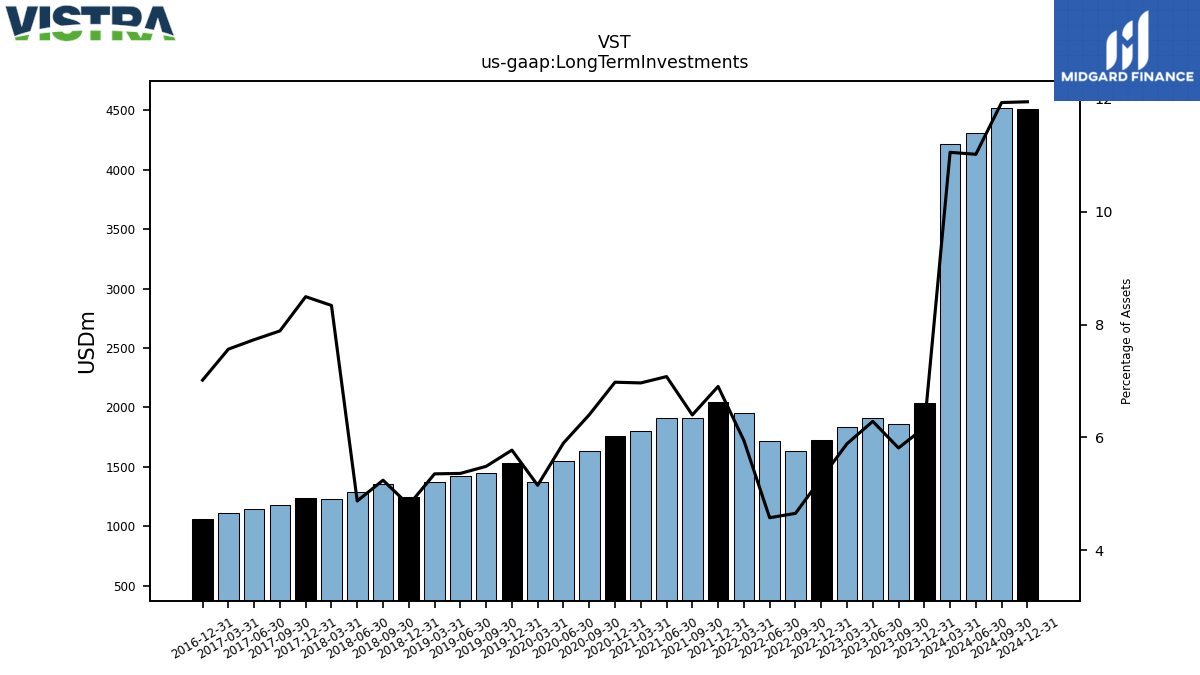
| Long Term Investments | 2035.00 | 1857.00 | 1915.00 | 1832.00 | 1729.00 | 1637.00 | 1715.00 | 1952.00 | 2049.00 | 1915.00 | 1912.00 | 1803.00 | 1759.00 | 1632.00 | 1552.00 | 1374.00 | 1537.00 | 1451.00 | 1422.00 | 1369.00 | 1250.00 | 1357.00 | 1290.00 | 1232.00 | 1240.00 | 1183.00 | 1143.00 | 1113.00 | 1064.00 | |
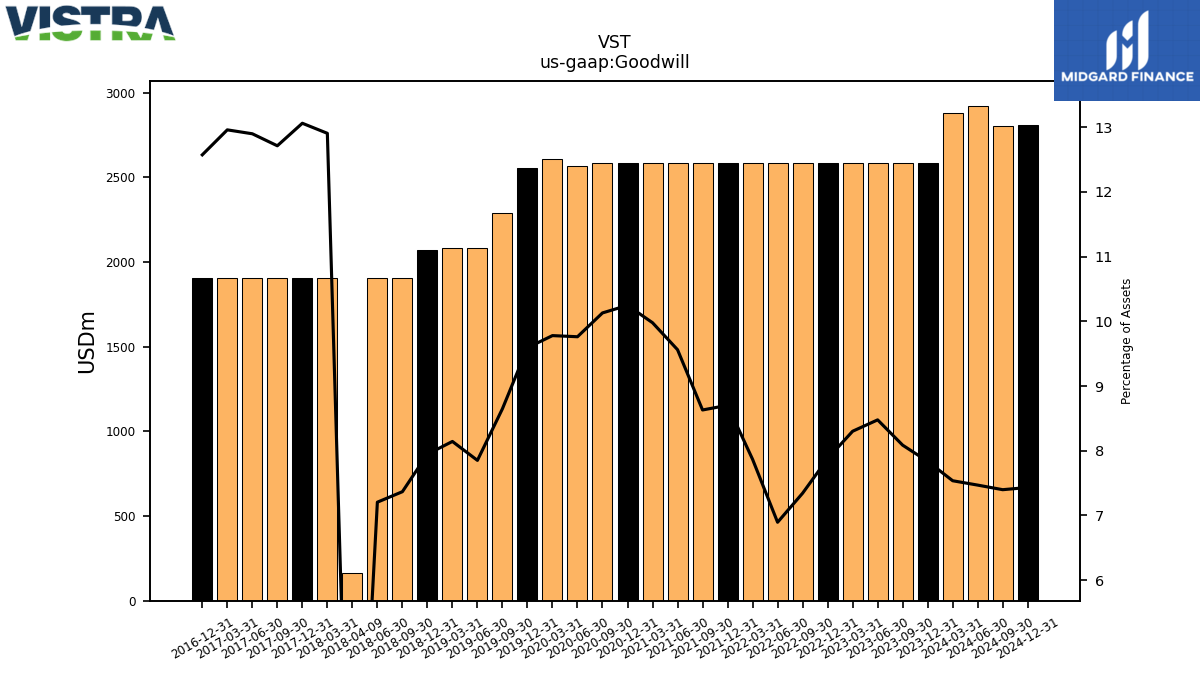
| Goodwill | 2583.00 | 2583.00 | 2583.00 | 2583.00 | 2583.00 | 2583.00 | 2583.00 | 2583.00 | 2583.00 | 2583.00 | 2583.00 | 2583.00 | 2583.00 | 2583.00 | 2568.00 | 2608.00 | 2553.00 | 2287.00 | 2082.00 | 2082.00 | 2068.00 | 1907.00 | 1907.00 | 1907.00 | 1907.00 | 1907.00 | 1907.00 | 1907.00 | 1907.00 | |
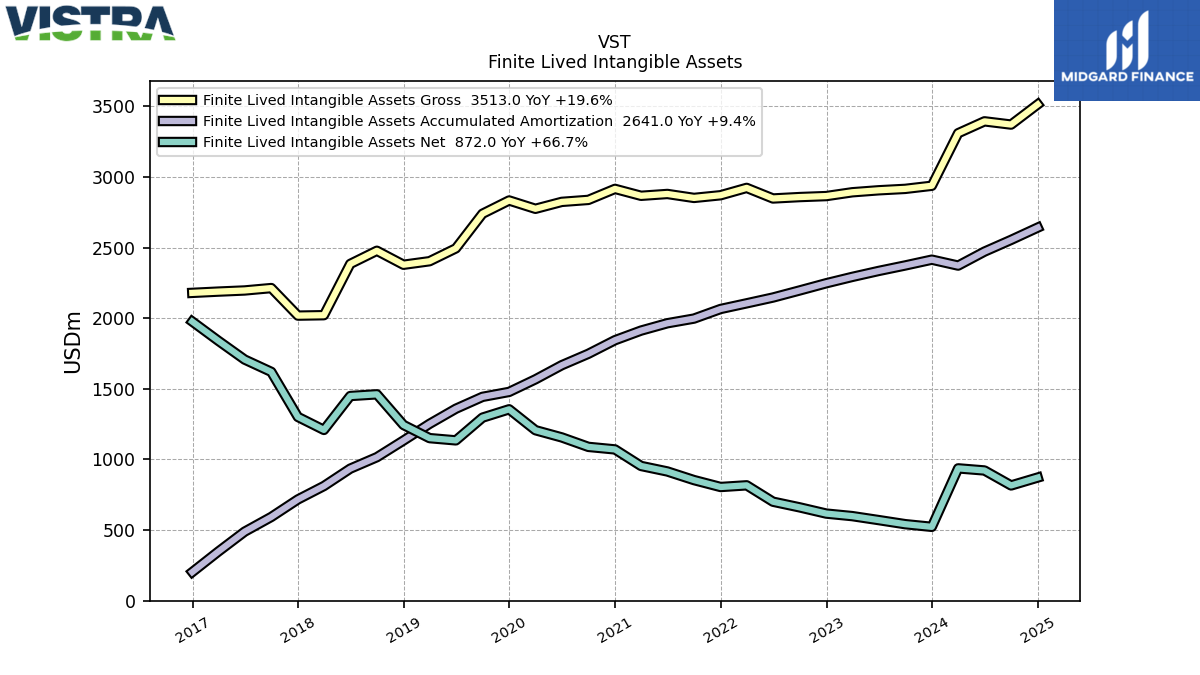
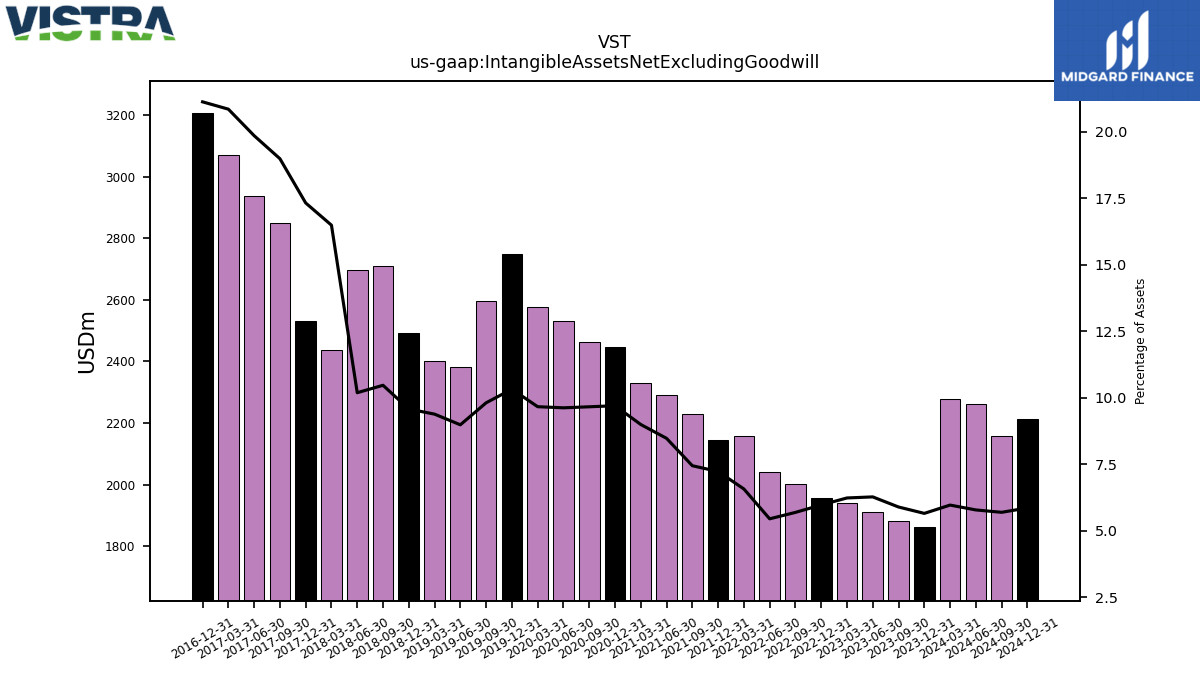
| Intangible Assets Net Excluding Goodwill | 1864.00 | 1883.00 | 1912.00 | 1940.00 | 1958.00 | 2002.00 | 2042.00 | 2158.00 | 2146.00 | 2229.00 | 2290.00 | 2329.00 | 2446.00 | 2464.00 | 2532.00 | 2578.00 | 2748.00 | 2595.00 | 2383.00 | 2400.00 | 2493.00 | 2711.00 | 2698.00 | 2437.00 | 2530.00 | 2849.00 | 2936.00 | 3069.00 | 3205.00 | |
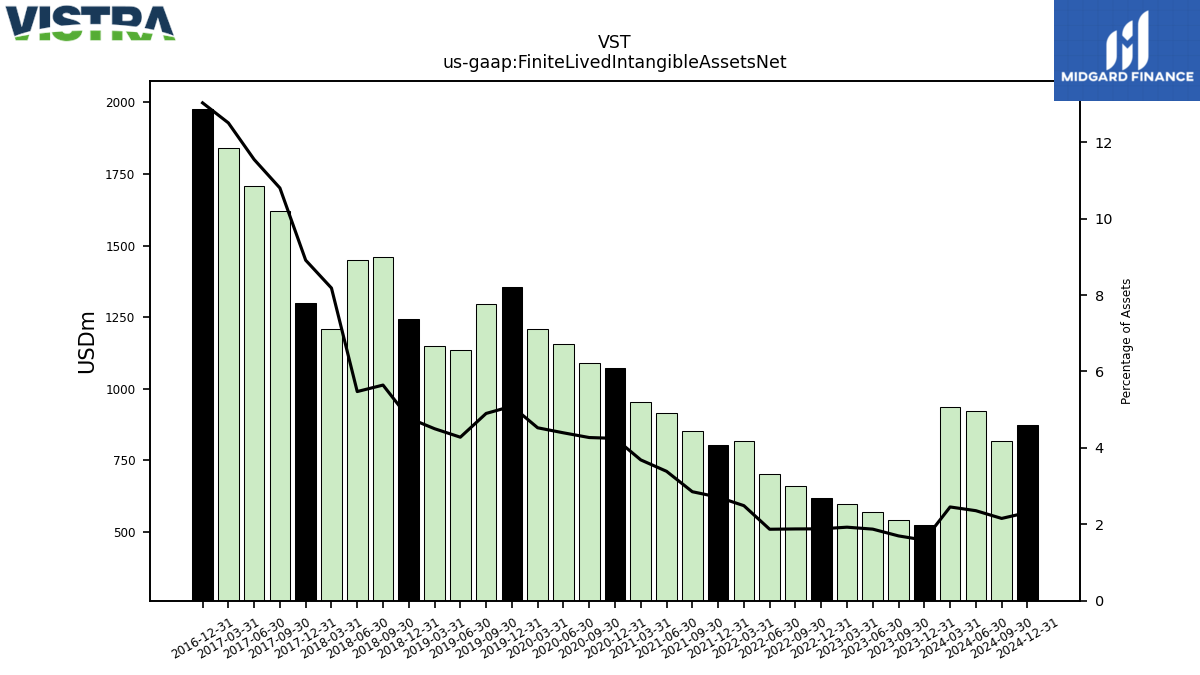
| Finite Lived Intangible Assets Net | 523.00 | 542.00 | 571.00 | 599.00 | 617.00 | 661.00 | 701.00 | 817.00 | 805.00 | 854.00 | 915.00 | 954.00 | 1071.00 | 1089.00 | 1156.00 | 1207.00 | 1355.00 | 1296.00 | 1135.00 | 1151.00 | 1244.00 | 1461.00 | 1449.00 | 1209.00 | 1301.00 | 1620.00 | 1707.00 | 1840.00 | 1976.00 | |
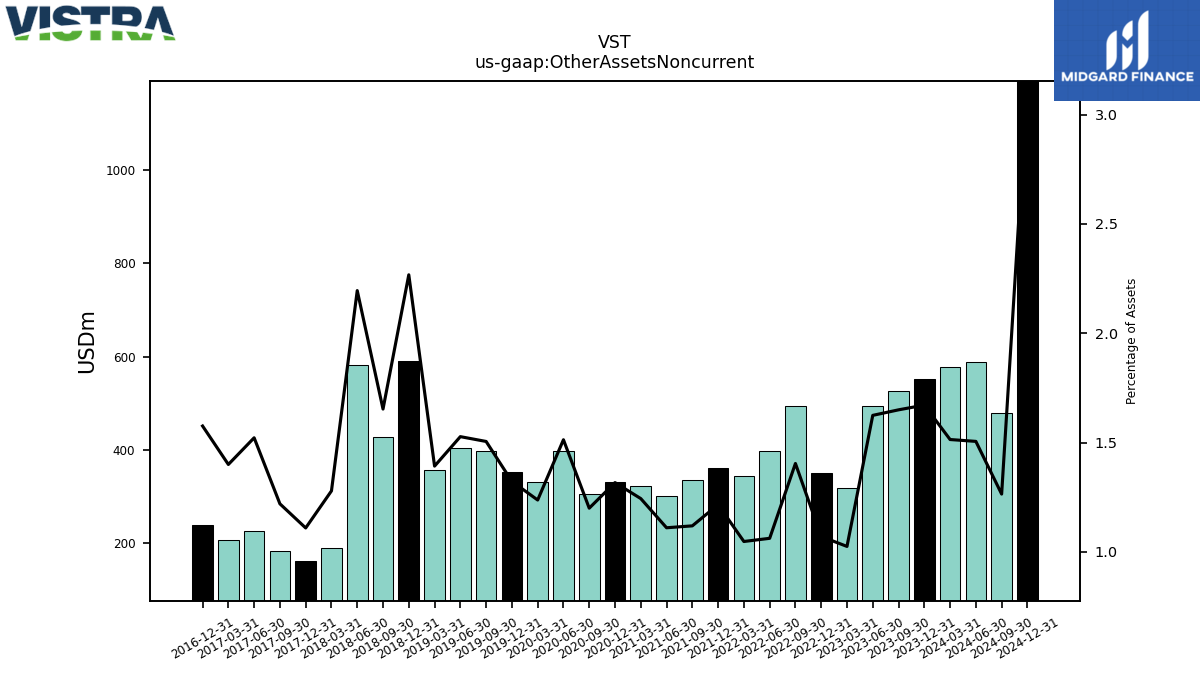
| Other Assets Noncurrent | 551.00 | 527.00 | 495.00 | 319.00 | 351.00 | 494.00 | 398.00 | 344.00 | 361.00 | 335.00 | 300.00 | 322.00 | 332.00 | 306.00 | 398.00 | 330.00 | 352.00 | 398.00 | 405.00 | 356.00 | 590.00 | 428.00 | 581.00 | 189.00 | 162.00 | 183.00 | 225.00 | 206.00 | 239.00 |
| 2023-12-31 | 2023-09-30 | 2023-06-30 | 2023-03-31 | 2022-12-31 | 2022-09-30 | 2022-06-30 | 2022-03-31 | 2021-12-31 | 2021-09-30 | 2021-06-30 | 2021-03-31 | 2020-12-31 | 2020-09-30 | 2020-06-30 | 2020-03-31 | 2019-12-31 | 2019-09-30 | 2019-06-30 | 2019-03-31 | 2018-12-31 | 2018-09-30 | 2018-06-30 | 2018-03-31 | 2017-12-31 | 2017-09-30 | 2017-06-30 | 2017-03-31 | 2016-12-31 | ||
|---|---|---|---|---|---|---|---|---|---|---|---|---|---|---|---|---|---|---|---|---|---|---|---|---|---|---|---|---|---|---|
| Liabilities Current | 9823.00 | 8748.00 | 7626.00 | 8162.00 | 10337.00 | 11911.00 | 14499.00 | 9865.00 | 5843.00 | 7922.00 | 5223.00 | 5406.00 | 3036.00 | 3383.00 | 4631.00 | 4604.00 | 4574.00 | 3915.00 | 3657.00 | 3238.00 | 3625.00 | 3102.00 | 2646.00 | 1557.00 | 1351.00 | 1119.00 | 1008.00 | 981.00 | 1504.00 | |
| Accounts Payable Current | 1147.00 | 1124.00 | 1076.00 | 1005.00 | 1556.00 | 1398.00 | 1472.00 | 1284.00 | 1515.00 | 1172.00 | 1078.00 | 1129.00 | 880.00 | 897.00 | 879.00 | 804.00 | 947.00 | 916.00 | 782.00 | 787.00 | 945.00 | 812.00 | 795.00 | 421.00 | 473.00 | 487.00 | 474.00 | 402.00 | 479.00 | |
| Other Liabilities Current | 547.00 | 674.00 | 563.00 | 458.00 | 524.00 | 616.00 | 565.00 | 600.00 | 553.00 | 534.00 | 487.00 | 554.00 | 471.00 | 516.00 | 418.00 | 371.00 | 506.00 | 370.00 | 308.00 | 258.00 | 345.00 | 329.00 | 387.00 | 248.00 | 297.00 | 336.00 | 283.00 | 310.00 | 387.00 |
| 2023-12-31 | 2023-09-30 | 2023-06-30 | 2023-03-31 | 2022-12-31 | 2022-09-30 | 2022-06-30 | 2022-03-31 | 2021-12-31 | 2021-09-30 | 2021-06-30 | 2021-03-31 | 2020-12-31 | 2020-09-30 | 2020-06-30 | 2020-03-31 | 2019-12-31 | 2019-09-30 | 2019-06-30 | 2019-03-31 | 2018-12-31 | 2018-09-30 | 2018-06-30 | 2018-03-31 | 2017-12-31 | 2017-09-30 | 2017-06-30 | 2017-03-31 | 2016-12-31 | ||
|---|---|---|---|---|---|---|---|---|---|---|---|---|---|---|---|---|---|---|---|---|---|---|---|---|---|---|---|---|---|---|
| Long Term Debt | 14402.00 | NA | NA | NA | NA | NA | NA | NA | NA | NA | NA | NA | NA | NA | NA | NA | NA | NA | NA | NA | NA | NA | NA | NA | NA | NA | NA | NA | NA | |
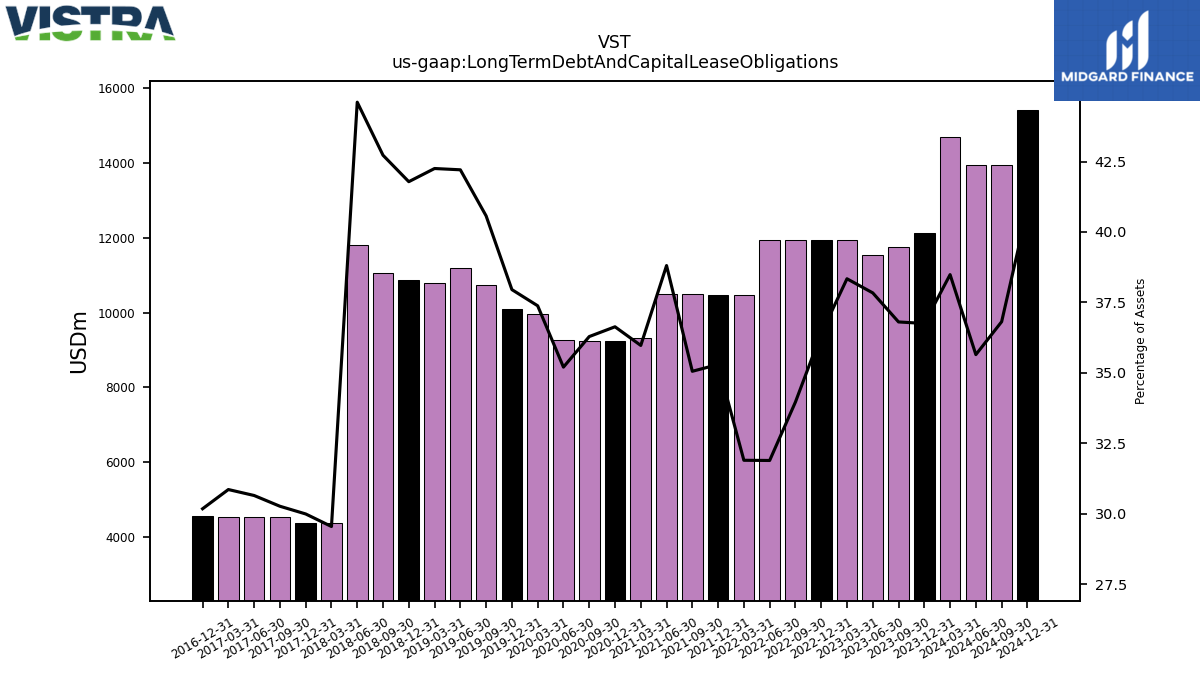
| Long Term Debt And Capital Lease Obligations | 12116.00 | 11758.00 | 11530.00 | 11930.00 | 11933.00 | 11947.00 | 11949.00 | 10473.00 | 10477.00 | 10493.00 | 10484.00 | 9312.00 | 9235.00 | 9253.00 | 9261.00 | 9969.00 | 10102.00 | 10728.00 | 11193.00 | 10803.00 | 10874.00 | 11060.00 | 11807.00 | 4366.00 | 4379.00 | 4540.00 | 4531.00 | 4541.00 | 4577.00 | |
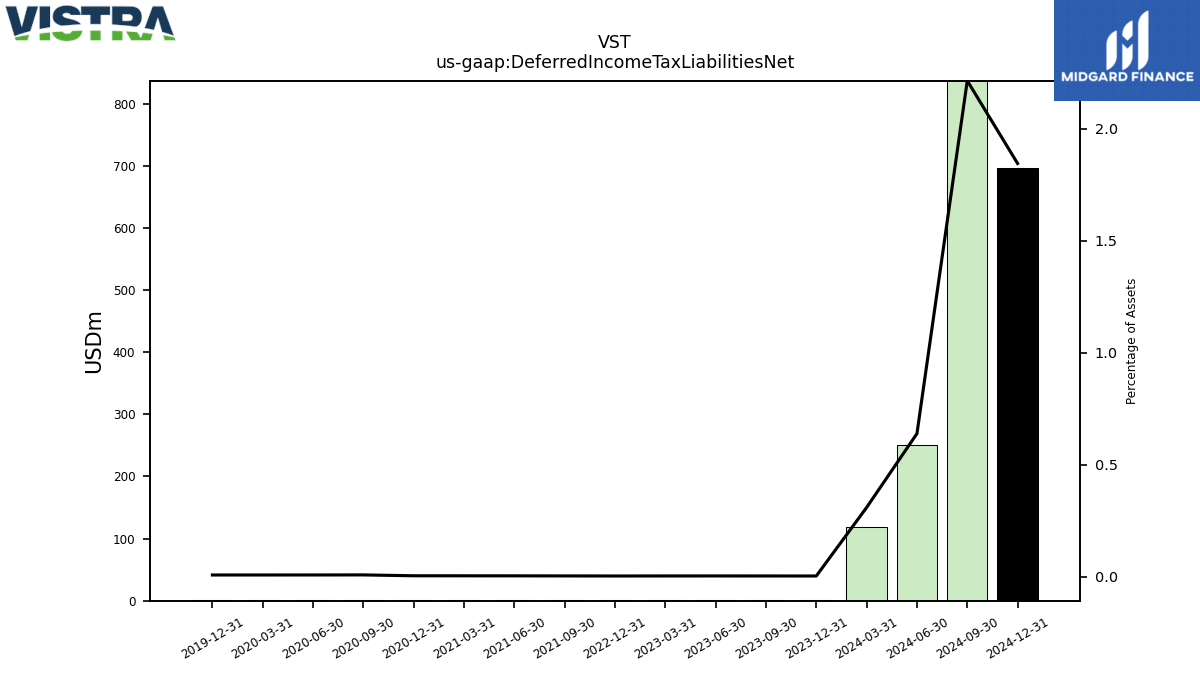
| Deferred Income Tax Liabilities Net | 1.00 | 1.00 | 1.00 | 1.00 | 1.00 | NA | NA | NA | NA | 1.00 | 1.00 | 1.00 | 1.00 | 2.00 | 2.00 | 2.00 | 2.00 | NA | NA | NA | NA | NA | NA | NA | NA | NA | NA | NA | NA | |
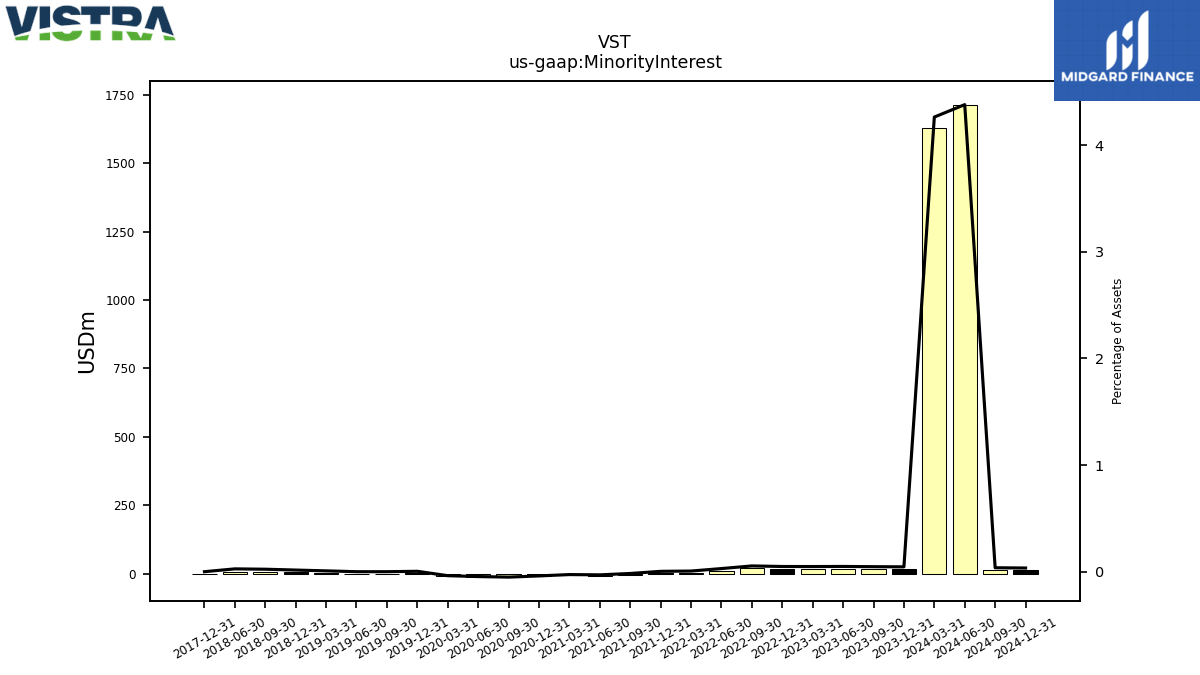
| Minority Interest | 15.00 | 15.00 | 15.00 | 15.00 | 16.00 | 19.00 | 11.00 | 2.00 | 1.00 | -5.00 | -8.00 | -7.00 | -10.00 | -13.00 | -12.00 | -10.00 | 1.00 | 0.00 | 0.00 | 2.00 | 4.00 | 6.00 | 7.00 | NA | 0.00 | NA | NA | NA | NA | |
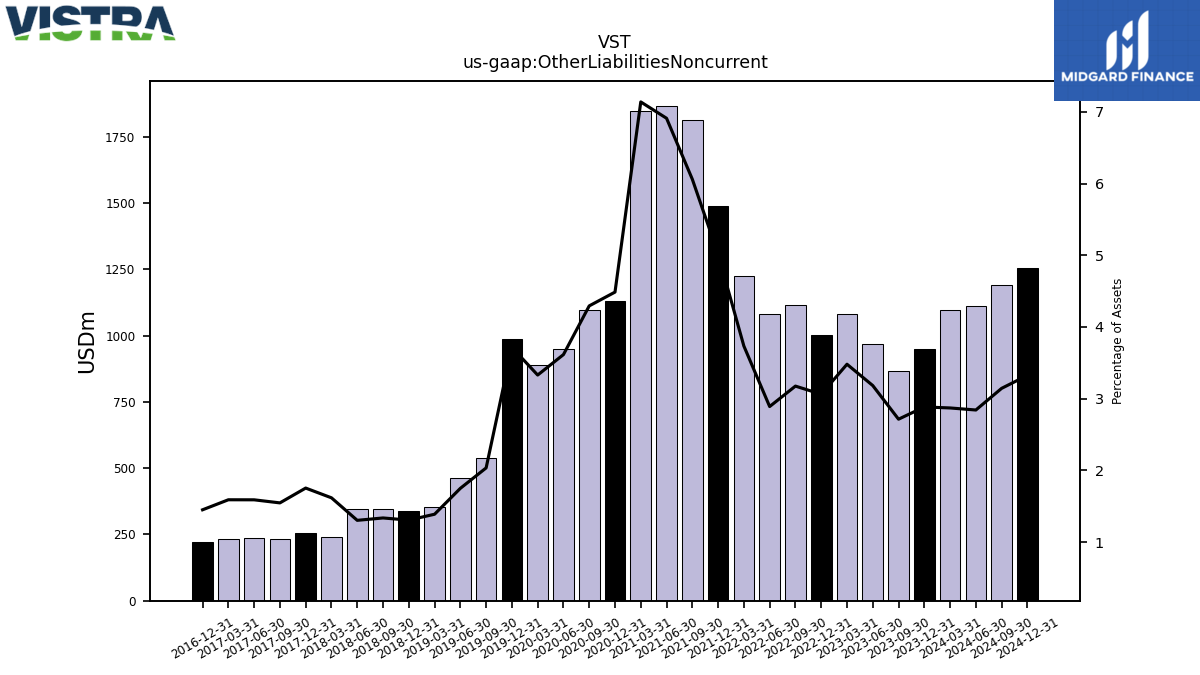
| Other Liabilities Noncurrent | 951.00 | 867.00 | 970.00 | 1083.00 | 1004.00 | 1117.00 | 1083.00 | 1226.00 | 1489.00 | 1814.00 | 1867.00 | 1848.00 | 1131.00 | 1095.00 | 951.00 | 888.00 | 989.00 | 538.00 | 464.00 | 355.00 | 340.00 | 346.00 | 345.00 | 239.00 | 256.00 | 232.00 | 235.00 | 234.00 | 220.00 | |
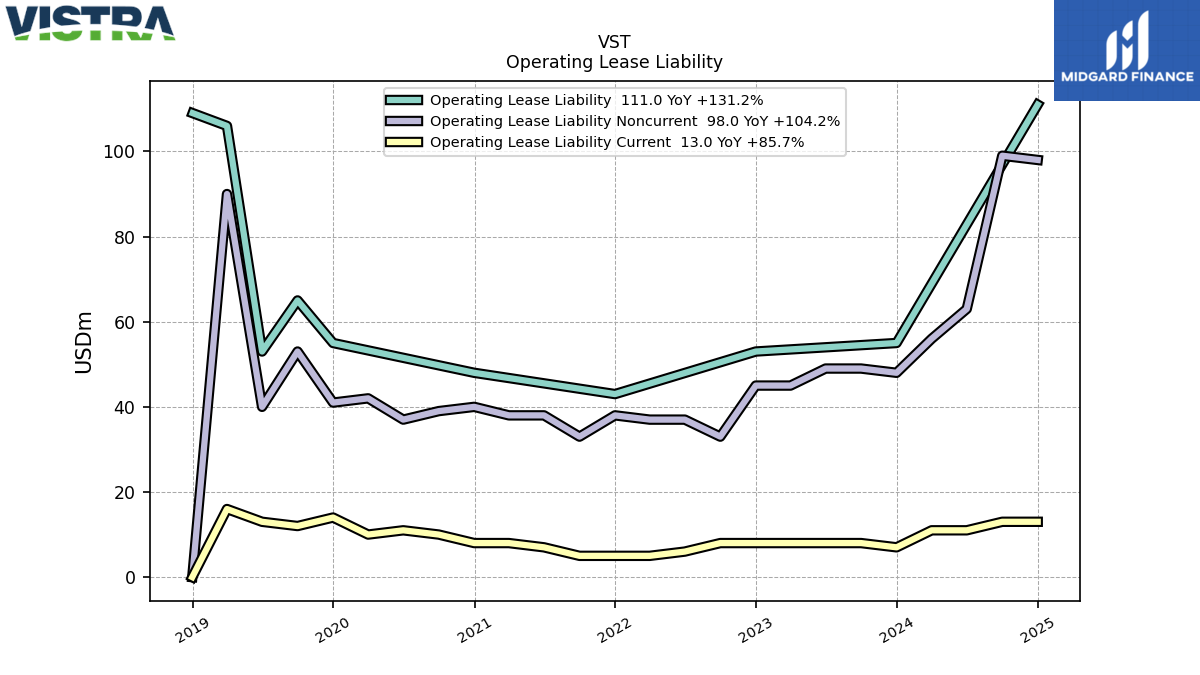
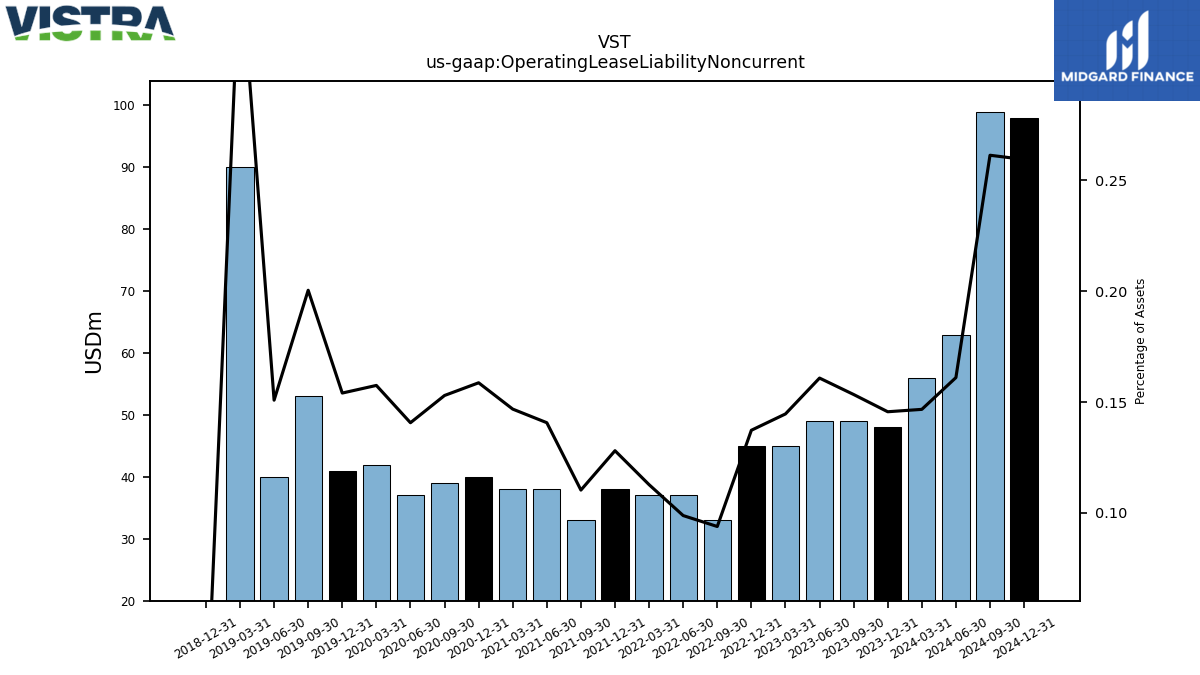
| Operating Lease Liability Noncurrent | 48.00 | 49.00 | 49.00 | 45.00 | 45.00 | 33.00 | 37.00 | 37.00 | 38.00 | 33.00 | 38.00 | 38.00 | 40.00 | 39.00 | 37.00 | 42.00 | 41.00 | 53.00 | 40.00 | 90.00 | 0.00 | NA | NA | NA | NA | NA | NA | NA | NA |
| 2023-12-31 | 2023-09-30 | 2023-06-30 | 2023-03-31 | 2022-12-31 | 2022-09-30 | 2022-06-30 | 2022-03-31 | 2021-12-31 | 2021-09-30 | 2021-06-30 | 2021-03-31 | 2020-12-31 | 2020-09-30 | 2020-06-30 | 2020-03-31 | 2019-12-31 | 2019-09-30 | 2019-06-30 | 2019-03-31 | 2018-12-31 | 2018-09-30 | 2018-06-30 | 2018-03-31 | 2017-12-31 | 2017-09-30 | 2017-06-30 | 2017-03-31 | 2016-12-31 | ||
|---|---|---|---|---|---|---|---|---|---|---|---|---|---|---|---|---|---|---|---|---|---|---|---|---|---|---|---|---|---|---|
| Stockholders Equity | 5307.00 | 5506.00 | 5359.00 | 5201.00 | 4902.00 | 5582.00 | 5392.00 | 7300.00 | 8291.00 | 6036.00 | 6076.00 | 6100.00 | 8371.00 | 8444.00 | 8056.00 | 7936.00 | 7959.00 | 7792.00 | 7904.00 | 7804.00 | 7863.00 | 8399.00 | 8413.00 | 4.00 | 6342.00 | NA | NA | NA | 6597.00 | |
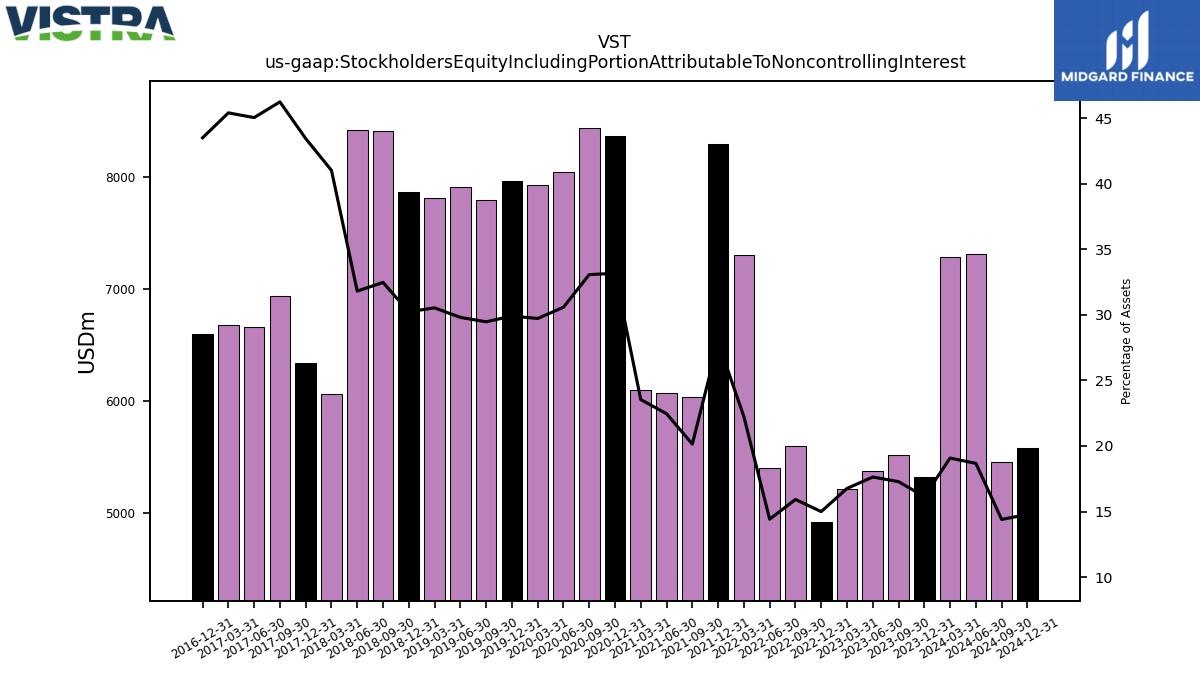
| Stockholders Equity Including Portion Attributable To Noncontrolling Interest | 5322.00 | 5521.00 | 5374.00 | 5216.00 | 4918.00 | 5601.00 | 5403.00 | 7302.00 | 8292.00 | 6031.00 | 6068.00 | 6093.00 | 8361.00 | 8431.00 | 8044.00 | 7926.00 | 7960.00 | 7792.00 | 7904.00 | 7806.00 | 7867.00 | 8405.00 | 8420.00 | 6060.00 | 6342.00 | 6935.00 | 6658.00 | 6680.00 | 6597.00 | |
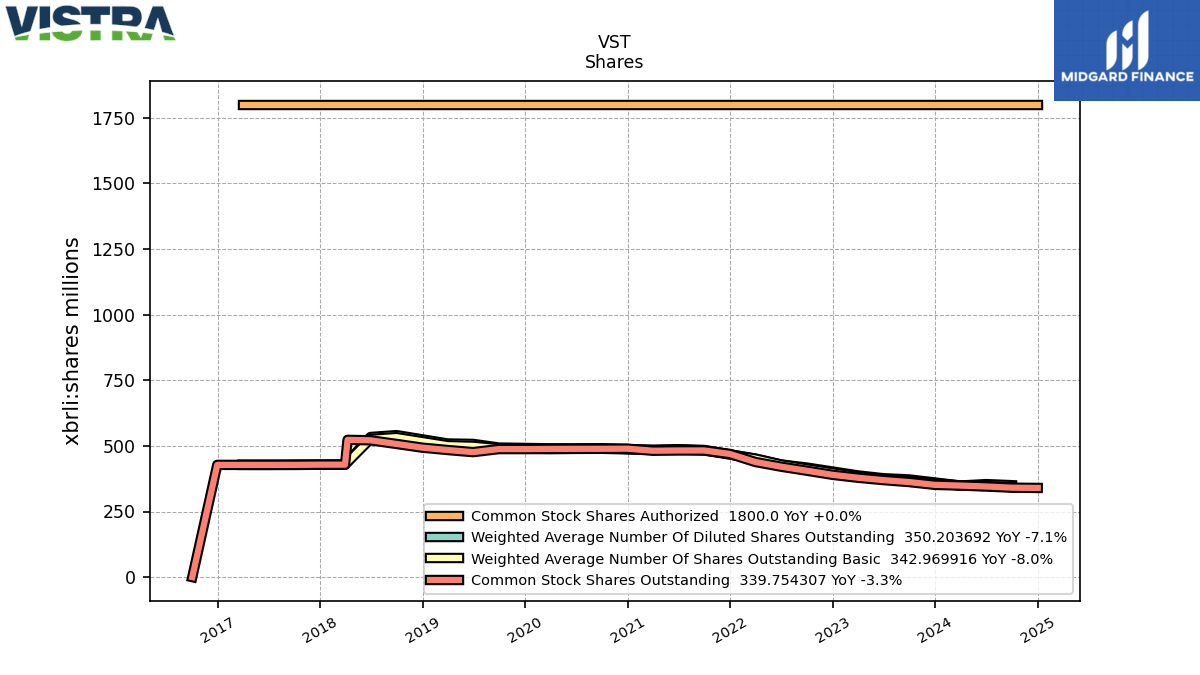
| Common Stock Value | 5.00 | 5.00 | 5.00 | 5.00 | 5.00 | 5.00 | 5.00 | 5.00 | 5.00 | 5.00 | 5.00 | 5.00 | 5.00 | 5.00 | 5.00 | 5.00 | 5.00 | 5.00 | 5.00 | 5.00 | 5.00 | 5.00 | 5.00 | 4.00 | 4.00 | 4.00 | 4.00 | 4.00 | 4.00 | |
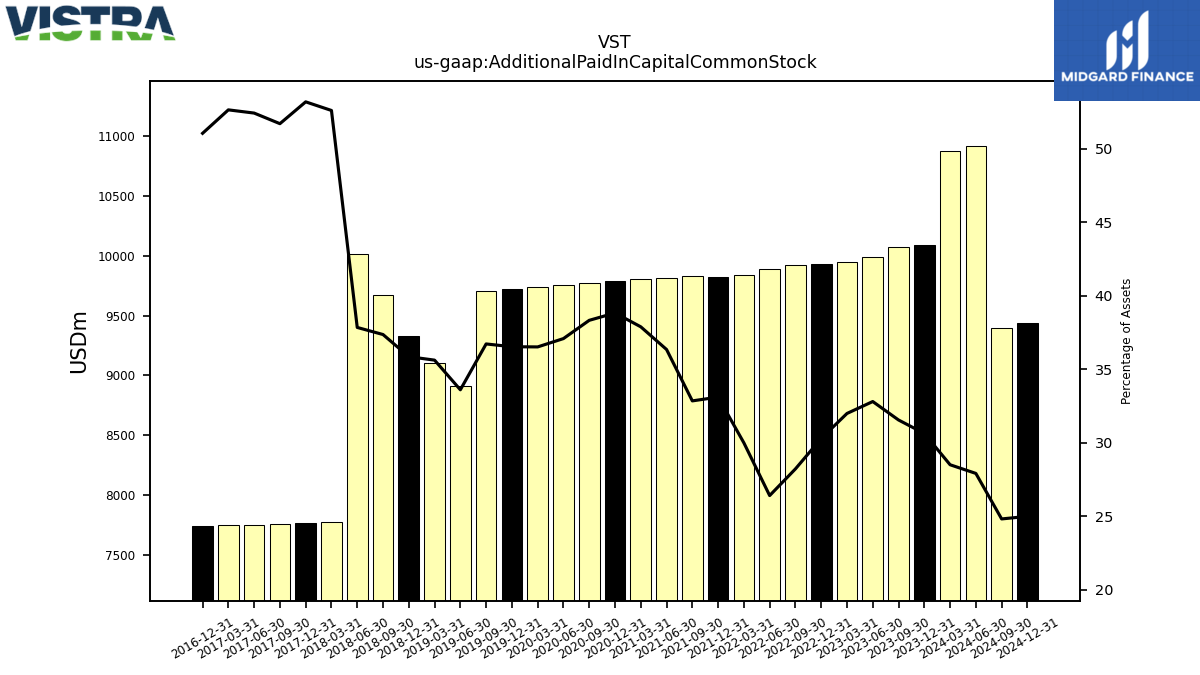
| Additional Paid In Capital Common Stock | 10095.00 | 10075.00 | 9993.00 | 9952.00 | 9928.00 | 9923.00 | 9890.00 | 9844.00 | 9824.00 | 9829.00 | 9816.00 | 9805.00 | 9786.00 | 9771.00 | 9754.00 | 9737.00 | 9721.00 | 9708.00 | 8909.00 | 9105.00 | 9329.00 | 9670.00 | 10015.00 | 7772.00 | 7765.00 | 7755.00 | 7750.00 | 7746.00 | 7742.00 | |
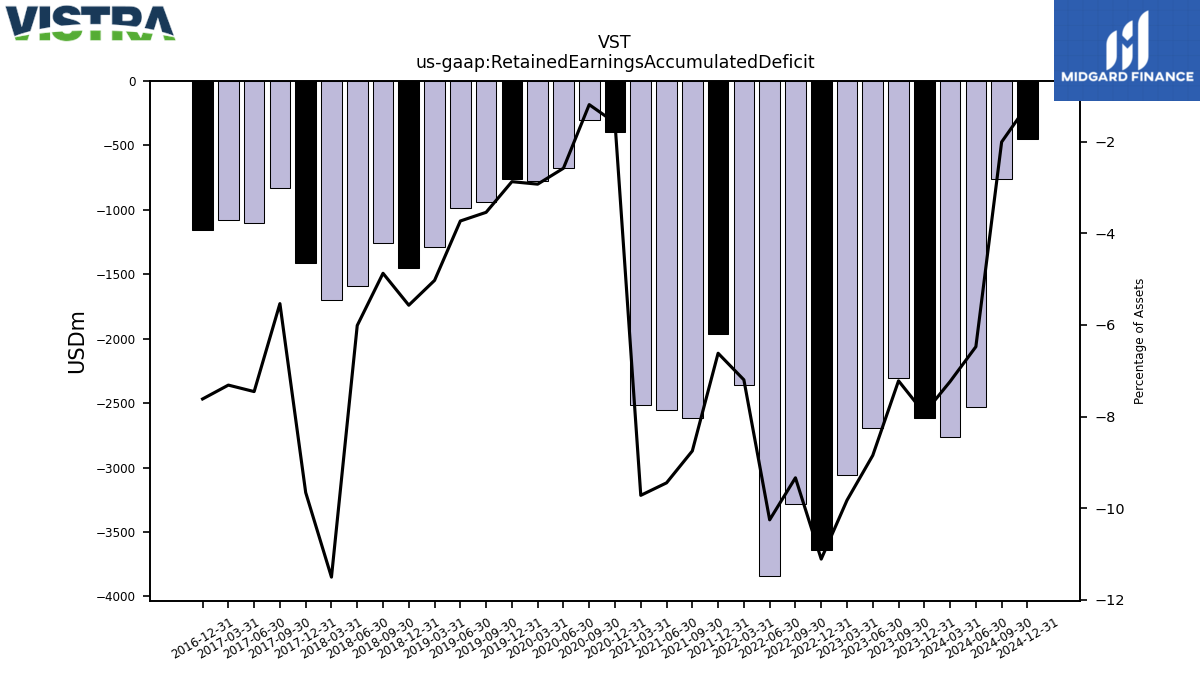
| Retained Earnings Accumulated Deficit | -2613.00 | -2306.00 | -2696.00 | -3058.00 | -3643.00 | -3284.00 | -3842.00 | -2363.00 | -1964.00 | -2619.00 | -2552.00 | -2516.00 | -399.00 | -303.00 | -678.00 | -780.00 | -764.00 | -936.00 | -989.00 | -1285.00 | -1449.00 | -1261.00 | -1591.00 | -1700.00 | -1410.00 | -830.00 | -1102.00 | -1076.00 | -1155.00 | |
| Accumulated Other Comprehensive Income Loss Net Of Tax | 6.00 | 10.00 | 12.00 | 8.00 | 7.00 | -10.00 | -16.00 | -16.00 | -16.00 | -31.00 | -45.00 | -46.00 | -48.00 | -56.00 | -52.00 | -53.00 | -30.00 | -34.00 | -21.00 | -21.00 | -22.00 | -15.00 | -16.00 | -16.00 | -17.00 | 6.00 | 6.00 | 6.00 | 6.00 | |
| Minority Interest | 15.00 | 15.00 | 15.00 | 15.00 | 16.00 | 19.00 | 11.00 | 2.00 | 1.00 | -5.00 | -8.00 | -7.00 | -10.00 | -13.00 | -12.00 | -10.00 | 1.00 | 0.00 | 0.00 | 2.00 | 4.00 | 6.00 | 7.00 | NA | 0.00 | NA | NA | NA | NA | |
| Adjustments To Additional Paid In Capital Sharebased Compensation Requisite Service Period Recognition Value | 21.00 | 81.00 | 42.00 | 24.00 | 16.00 | 29.00 | 40.00 | 18.00 | 21.00 | 12.00 | 10.00 | 17.00 | 17.00 | 18.00 | 16.00 | 14.00 | 17.00 | 17.00 | 16.00 | 12.00 | 3.00 | 6.00 | 56.00 | 7.00 | 10.00 | 5.00 | 4.00 | 4.00 | NA |
| 2023-12-31 | 2023-09-30 | 2023-06-30 | 2023-03-31 | 2022-12-31 | 2022-09-30 | 2022-06-30 | 2022-03-31 | 2021-12-31 | 2021-09-30 | 2021-06-30 | 2021-03-31 | 2020-12-31 | 2020-09-30 | 2020-06-30 | 2020-03-31 | 2019-12-31 | 2019-09-30 | 2019-06-30 | 2019-03-31 | 2018-12-31 | 2018-09-30 | 2018-06-30 | 2018-03-31 | 2017-12-31 | 2017-09-30 | 2017-06-30 | 2017-03-31 | 2016-12-31 | ||
|---|---|---|---|---|---|---|---|---|---|---|---|---|---|---|---|---|---|---|---|---|---|---|---|---|---|---|---|---|---|---|
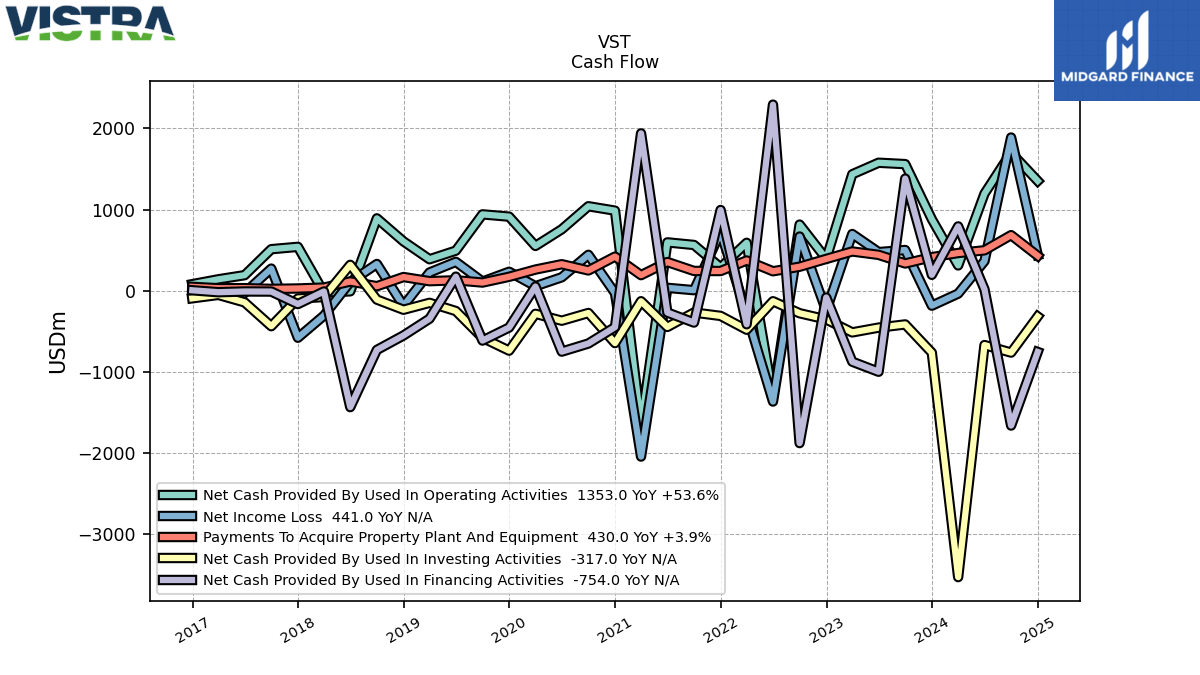
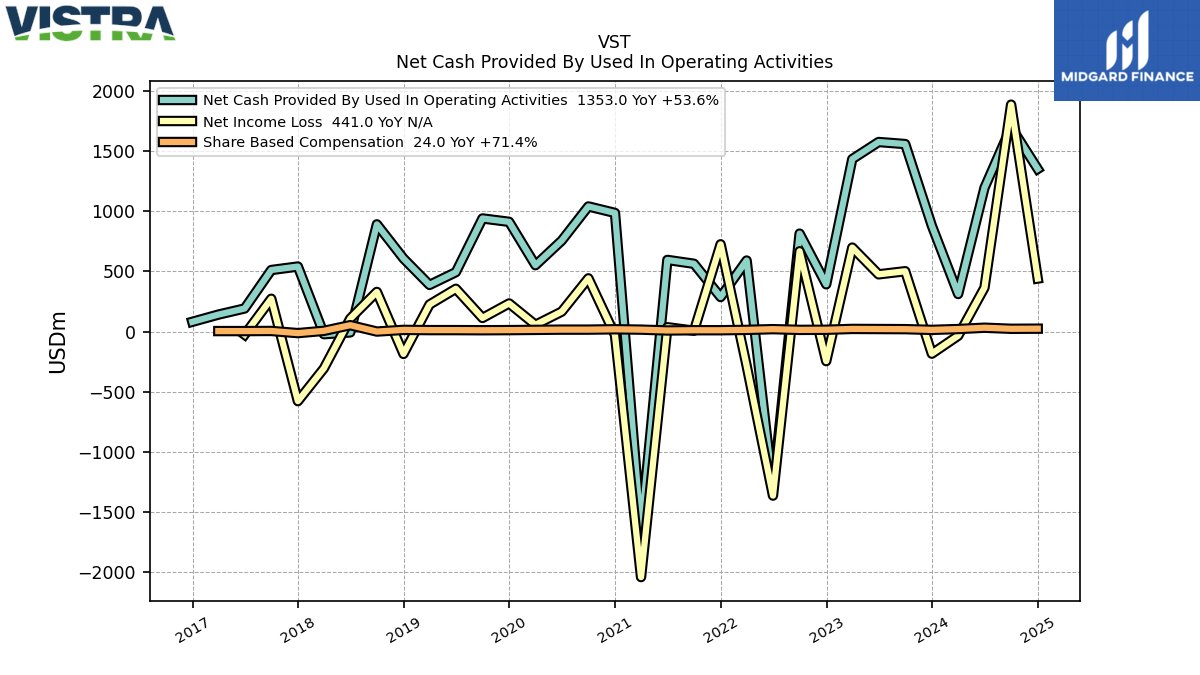
| Net Cash Provided By Used In Operating Activities | 881.00 | 1560.00 | 1577.00 | 1435.00 | 393.00 | 815.00 | -1314.00 | 591.00 | 287.00 | 564.00 | 596.00 | -1653.00 | 987.00 | 1041.00 | 757.00 | 552.00 | 913.00 | 941.00 | 494.00 | 388.00 | 608.00 | 892.00 | -7.00 | -22.00 | 541.00 | 512.00 | 192.00 | 141.00 | 81.00 | |
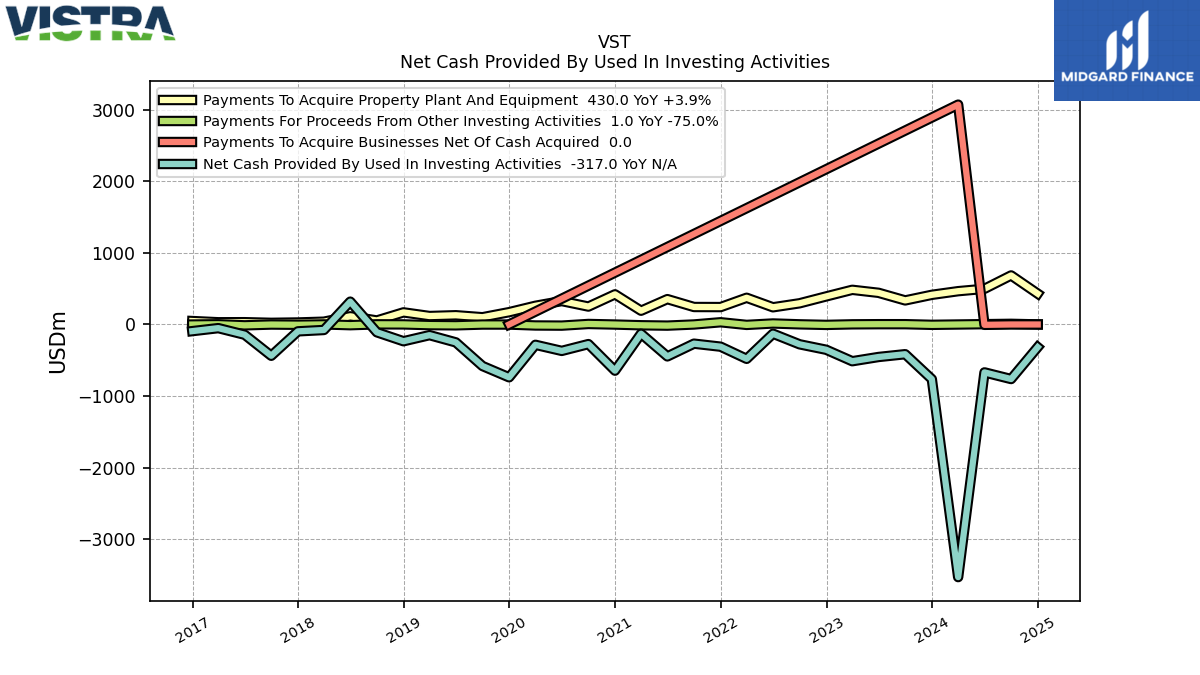
| Net Cash Provided By Used In Investing Activities | -763.00 | -415.00 | -454.00 | -513.00 | -353.00 | -277.00 | -129.00 | -480.00 | -310.00 | -268.00 | -446.00 | -129.00 | -645.00 | -274.00 | -369.00 | -284.00 | -738.00 | -580.00 | -250.00 | -149.00 | -234.00 | -109.00 | 319.00 | -77.00 | -96.00 | -437.00 | -143.00 | -51.00 | -93.00 | |
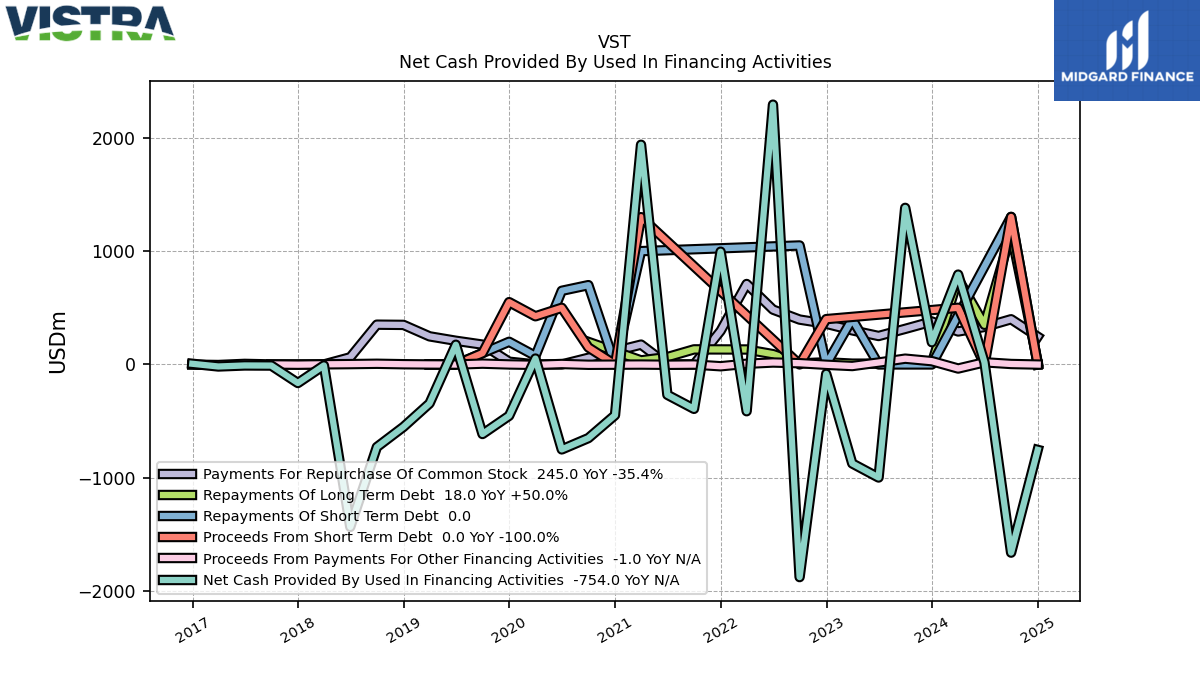
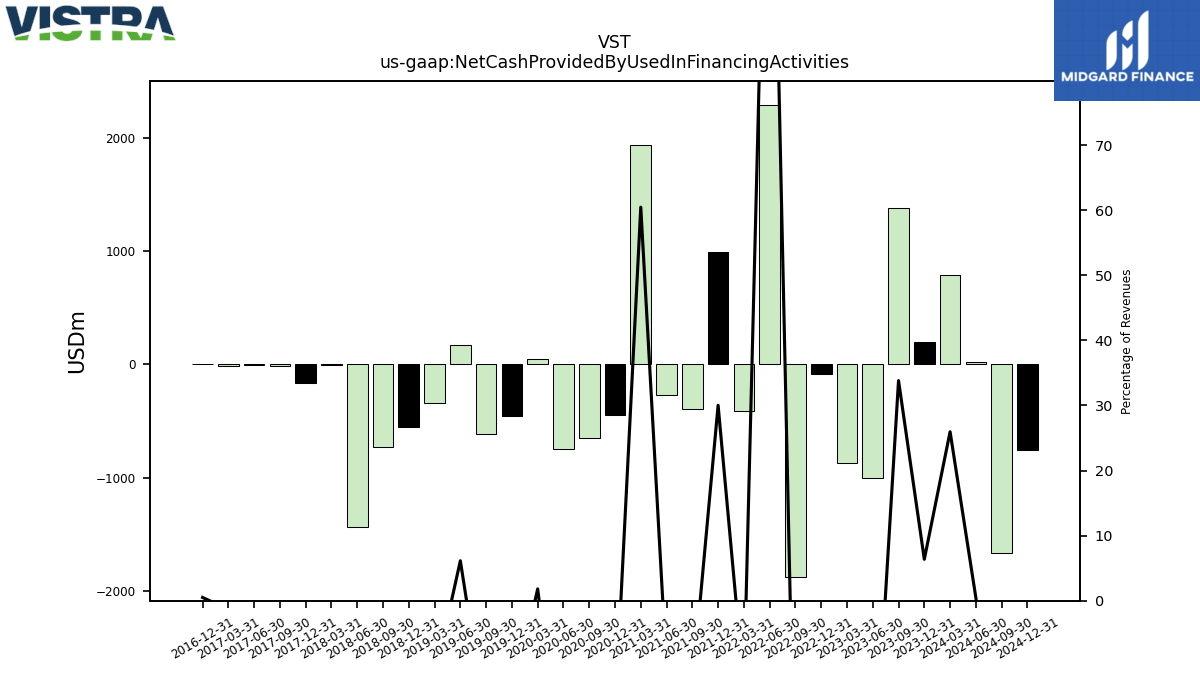
| Net Cash Provided By Used In Financing Activities | 196.00 | 1382.00 | -998.00 | -874.00 | -83.00 | -1877.00 | 2293.00 | -413.00 | 995.00 | -392.00 | -268.00 | 1939.00 | -448.00 | -650.00 | -750.00 | 52.00 | -453.00 | -614.00 | 174.00 | -344.00 | -551.00 | -729.00 | -1434.00 | -9.00 | -164.00 | -10.00 | -9.00 | -18.00 | 6.00 |
| 2023-12-31 | 2023-09-30 | 2023-06-30 | 2023-03-31 | 2022-12-31 | 2022-09-30 | 2022-06-30 | 2022-03-31 | 2021-12-31 | 2021-09-30 | 2021-06-30 | 2021-03-31 | 2020-12-31 | 2020-09-30 | 2020-06-30 | 2020-03-31 | 2019-12-31 | 2019-09-30 | 2019-06-30 | 2019-03-31 | 2018-12-31 | 2018-09-30 | 2018-06-30 | 2018-03-31 | 2017-12-31 | 2017-09-30 | 2017-06-30 | 2017-03-31 | 2016-12-31 | ||
|---|---|---|---|---|---|---|---|---|---|---|---|---|---|---|---|---|---|---|---|---|---|---|---|---|---|---|---|---|---|---|
| Net Cash Provided By Used In Operating Activities | 881.00 | 1560.00 | 1577.00 | 1435.00 | 393.00 | 815.00 | -1314.00 | 591.00 | 287.00 | 564.00 | 596.00 | -1653.00 | 987.00 | 1041.00 | 757.00 | 552.00 | 913.00 | 941.00 | 494.00 | 388.00 | 608.00 | 892.00 | -7.00 | -22.00 | 541.00 | 512.00 | 192.00 | 141.00 | 81.00 | |
| Net Income Loss | -184.00 | 502.00 | 476.00 | 699.00 | -246.00 | 668.00 | -1365.00 | -285.00 | 726.00 | 7.00 | 36.00 | -2043.00 | -29.00 | 443.00 | 166.00 | 56.00 | 234.00 | 113.00 | 356.00 | 225.00 | -186.00 | 330.00 | 108.00 | -306.00 | -579.00 | 273.00 | -26.00 | NA | NA | |
| Profit Loss | -184.00 | 502.00 | 476.00 | 698.00 | -248.00 | 678.00 | -1357.00 | -284.00 | 730.00 | 10.00 | 35.00 | -2040.00 | -27.00 | 442.00 | 164.00 | 45.00 | 234.00 | 114.00 | 354.00 | 224.00 | -186.00 | 331.00 | 105.00 | -306.00 | -579.00 | 273.00 | -26.00 | 78.00 | -163.00 | |
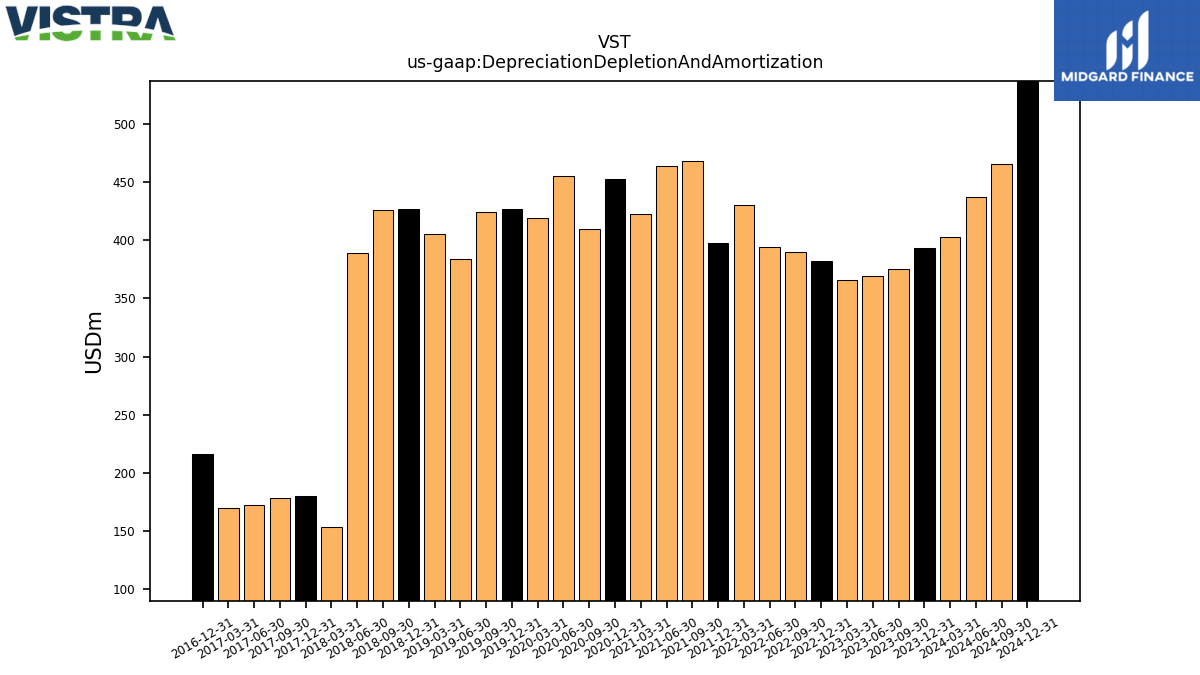
| Depreciation Depletion And Amortization | 393.00 | 375.00 | 369.00 | 366.00 | 382.00 | 390.00 | 394.00 | 430.00 | 398.00 | 468.00 | 464.00 | 423.00 | 453.00 | 410.00 | 455.00 | 419.00 | 427.00 | 424.00 | 384.00 | 405.00 | 427.00 | 426.00 | 389.00 | 153.00 | 180.00 | 178.00 | 172.00 | 170.00 | 216.00 | |
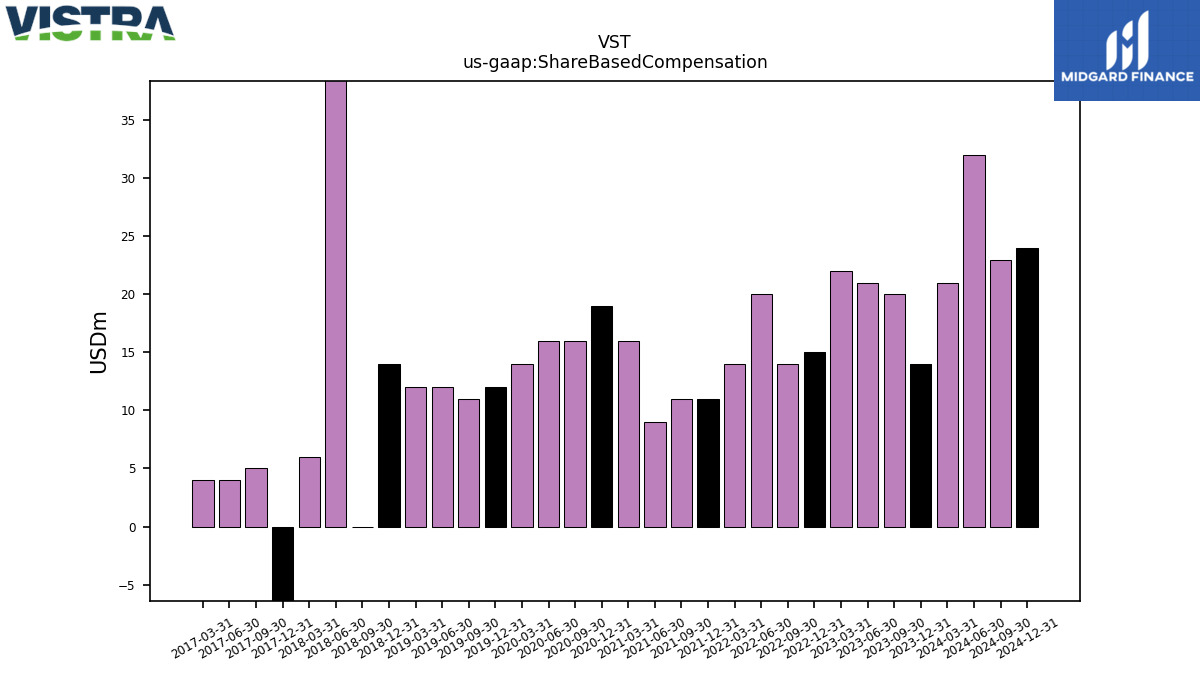
| Share Based Compensation | 14.00 | 20.00 | 21.00 | 22.00 | 15.00 | 14.00 | 20.00 | 14.00 | 11.00 | 11.00 | 9.00 | 16.00 | 19.00 | 16.00 | 16.00 | 14.00 | 12.00 | 11.00 | 12.00 | 12.00 | 14.00 | 0.00 | 53.00 | 6.00 | -13.00 | 5.00 | 4.00 | 4.00 | NA |
| 2023-12-31 | 2023-09-30 | 2023-06-30 | 2023-03-31 | 2022-12-31 | 2022-09-30 | 2022-06-30 | 2022-03-31 | 2021-12-31 | 2021-09-30 | 2021-06-30 | 2021-03-31 | 2020-12-31 | 2020-09-30 | 2020-06-30 | 2020-03-31 | 2019-12-31 | 2019-09-30 | 2019-06-30 | 2019-03-31 | 2018-12-31 | 2018-09-30 | 2018-06-30 | 2018-03-31 | 2017-12-31 | 2017-09-30 | 2017-06-30 | 2017-03-31 | 2016-12-31 | ||
|---|---|---|---|---|---|---|---|---|---|---|---|---|---|---|---|---|---|---|---|---|---|---|---|---|---|---|---|---|---|---|
| Net Cash Provided By Used In Investing Activities | -763.00 | -415.00 | -454.00 | -513.00 | -353.00 | -277.00 | -129.00 | -480.00 | -310.00 | -268.00 | -446.00 | -129.00 | -645.00 | -274.00 | -369.00 | -284.00 | -738.00 | -580.00 | -250.00 | -149.00 | -234.00 | -109.00 | 319.00 | -77.00 | -96.00 | -437.00 | -143.00 | -51.00 | -93.00 | |
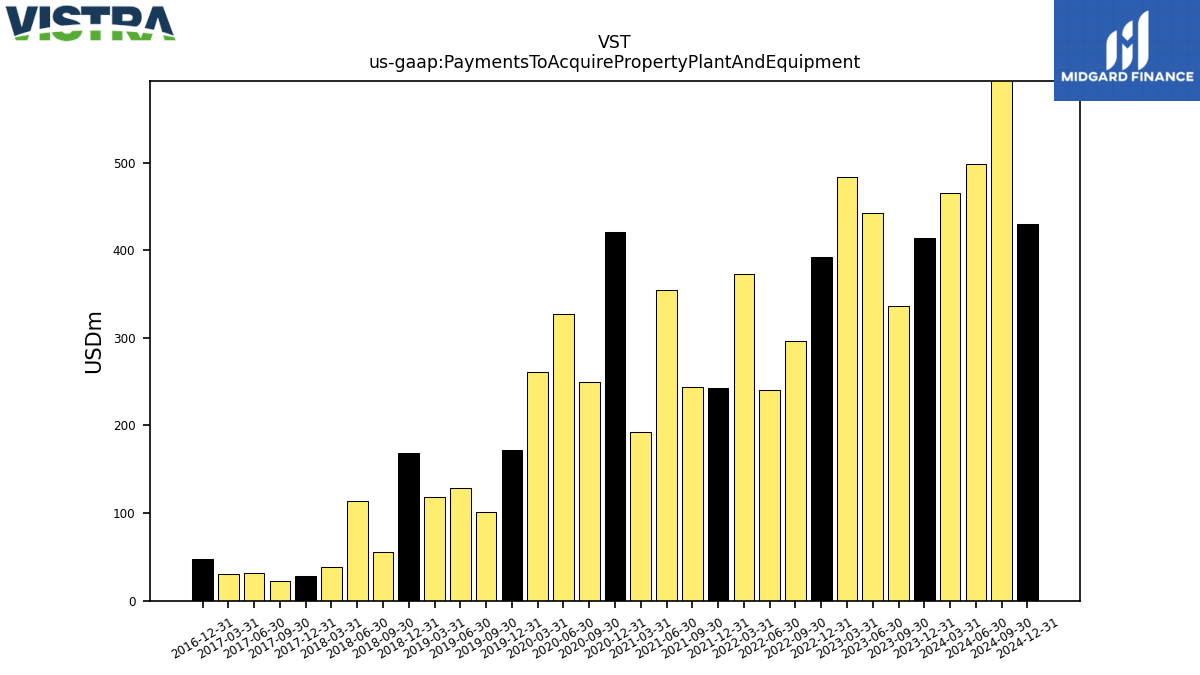
| Payments To Acquire Property Plant And Equipment | 414.00 | 336.00 | 442.00 | 484.00 | 392.00 | 296.00 | 240.00 | 373.00 | 243.00 | 244.00 | 354.00 | 192.00 | 421.00 | 250.00 | 327.00 | 261.00 | 172.00 | 101.00 | 129.00 | 118.00 | 169.00 | 56.00 | 114.00 | 39.00 | 28.00 | 23.00 | 32.00 | 31.00 | 48.00 |
| 2023-12-31 | 2023-09-30 | 2023-06-30 | 2023-03-31 | 2022-12-31 | 2022-09-30 | 2022-06-30 | 2022-03-31 | 2021-12-31 | 2021-09-30 | 2021-06-30 | 2021-03-31 | 2020-12-31 | 2020-09-30 | 2020-06-30 | 2020-03-31 | 2019-12-31 | 2019-09-30 | 2019-06-30 | 2019-03-31 | 2018-12-31 | 2018-09-30 | 2018-06-30 | 2018-03-31 | 2017-12-31 | 2017-09-30 | 2017-06-30 | 2017-03-31 | 2016-12-31 | ||
|---|---|---|---|---|---|---|---|---|---|---|---|---|---|---|---|---|---|---|---|---|---|---|---|---|---|---|---|---|---|---|
| Net Cash Provided By Used In Financing Activities | 196.00 | 1382.00 | -998.00 | -874.00 | -83.00 | -1877.00 | 2293.00 | -413.00 | 995.00 | -392.00 | -268.00 | 1939.00 | -448.00 | -650.00 | -750.00 | 52.00 | -453.00 | -614.00 | 174.00 | -344.00 | -551.00 | -729.00 | -1434.00 | -9.00 | -164.00 | -10.00 | -9.00 | -18.00 | 6.00 | |
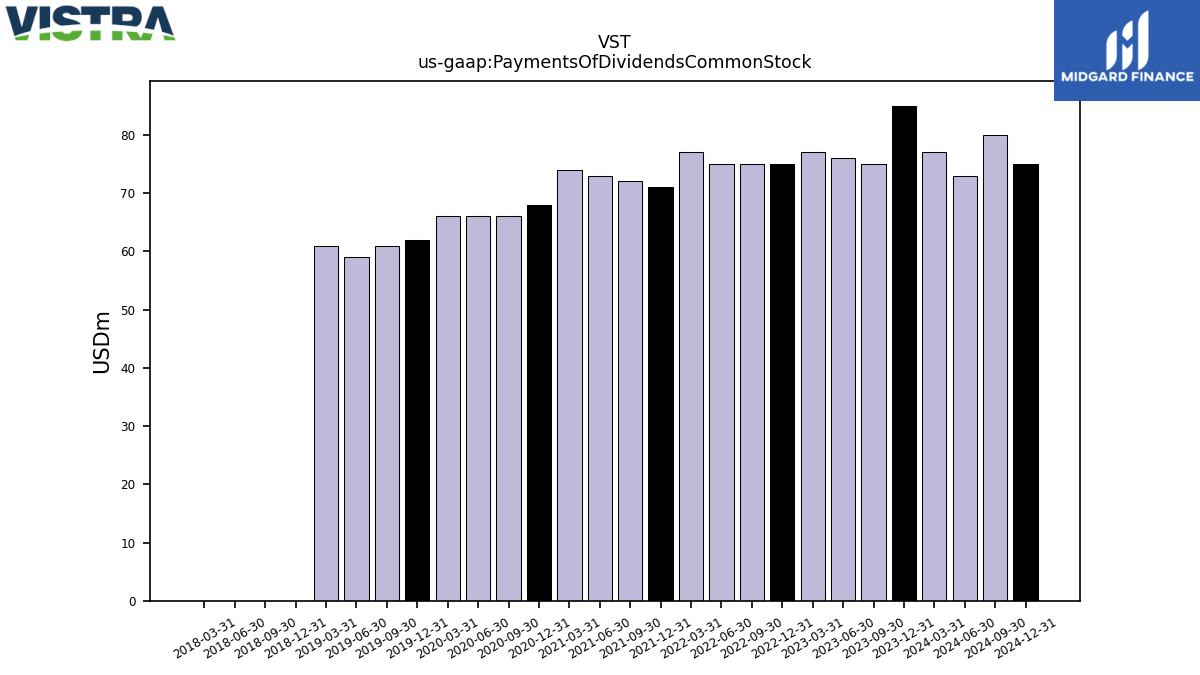
| Payments Of Dividends Common Stock | 85.00 | 75.00 | 76.00 | 77.00 | 75.00 | 75.00 | 75.00 | 77.00 | 71.00 | 72.00 | 73.00 | 74.00 | 68.00 | 66.00 | 66.00 | 66.00 | 62.00 | 61.00 | 59.00 | 61.00 | 0.00 | 0.00 | 0.00 | 0.00 | NA | NA | NA | NA | NA | |
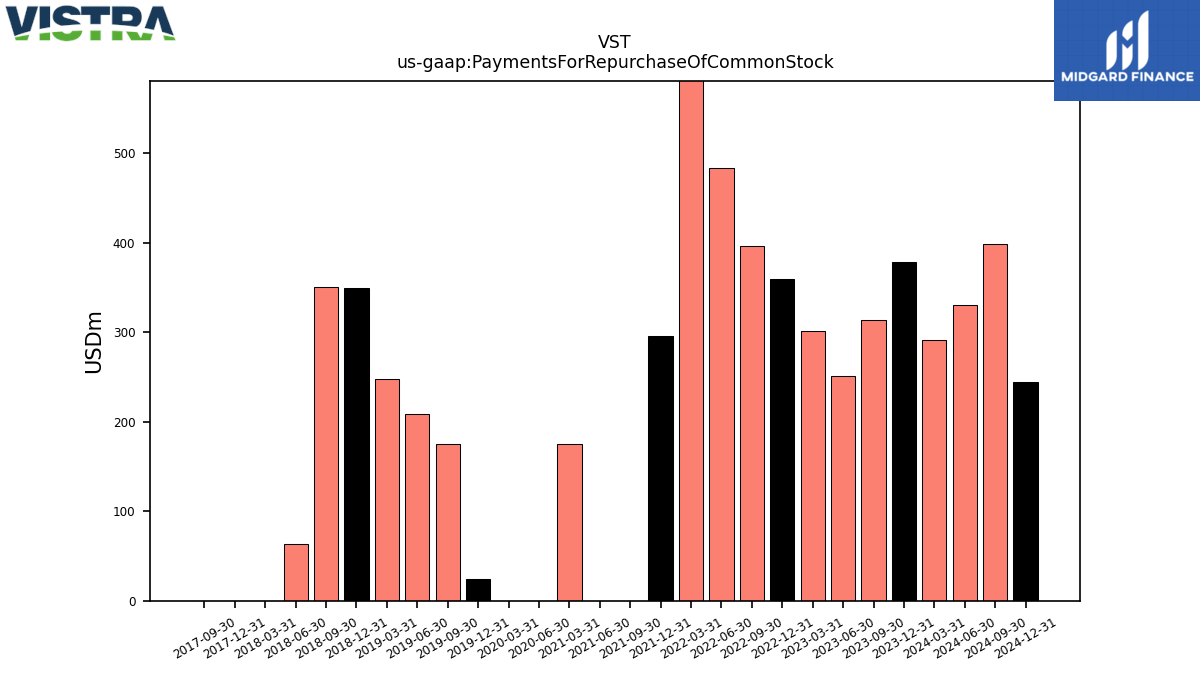
| Payments For Repurchase Of Common Stock | 379.00 | 314.00 | 251.00 | 301.00 | 359.00 | 396.00 | 484.00 | 710.00 | 296.00 | 0.00 | 0.00 | 175.00 | NA | NA | 0.00 | 0.00 | 24.00 | 175.00 | 209.00 | 248.00 | 349.00 | 351.00 | 63.00 | 0.00 | 0.00 | 0.00 | NA | NA | NA |
| 2023-12-31 | 2023-09-30 | 2023-06-30 | 2023-03-31 | 2022-12-31 | 2022-09-30 | 2022-06-30 | 2022-03-31 | 2021-12-31 | 2021-09-30 | 2021-06-30 | 2021-03-31 | 2020-12-31 | 2020-09-30 | 2020-06-30 | 2020-03-31 | 2019-12-31 | 2019-09-30 | 2019-06-30 | 2019-03-31 | 2018-12-31 | 2018-09-30 | 2018-06-30 | 2018-03-31 | 2017-12-31 | 2017-09-30 | 2017-06-30 | 2017-03-31 | 2016-12-31 | ||
|---|---|---|---|---|---|---|---|---|---|---|---|---|---|---|---|---|---|---|---|---|---|---|---|---|---|---|---|---|---|---|
| Revenues | 3078.00 | 4086.00 | 3189.00 | 4425.00 | 3869.00 | 5146.00 | 1588.00 | 3125.00 | 3314.00 | 2991.00 | 2565.00 | 3207.00 | 2524.00 | 3552.00 | 2509.00 | 2858.00 | 2860.00 | 3194.00 | 2832.00 | 2923.00 | 2562.00 | 3243.00 | 2574.00 | 765.00 | 943.00 | 1833.00 | 1296.00 | 1357.00 | 1191.00 | |
| -1585.00 | -2033.00 | -813.00 | -2146.00 | -2689.00 | -3449.00 | -17.00 | 1401.00 | -1742.00 | -488.00 | 609.00 | -662.00 | -1262.00 | -1538.00 | -1021.00 | -1073.00 | -33.00 | -142.00 | -56.00 | -82.00 | -48.00 | -24.00 | -2.00 | 0.00 | NA | NA | NA | NA | 0.00 | ||
| Corporate Non | 1.00 | 1.00 | NA | NA | 0.00 | 1.00 | NA | NA | NA | NA | NA | NA | NA | NA | 46.00 | 82.00 | 79.00 | 95.00 | 47.00 | 118.00 | 85.00 | 91.00 | 31.00 | 0.00 | 0.00 | 0.00 | 0.00 | -1.00 | NA | |
| Intersegment Elimination | -1586.00 | -2034.00 | -813.00 | -2146.00 | -2689.00 | -3450.00 | -17.00 | 1401.00 | -1742.00 | -488.00 | 609.00 | -662.00 | -1262.00 | -1538.00 | -1022.00 | -1073.00 | -1206.00 | -598.00 | -1446.00 | -720.00 | -424.00 | -1116.00 | -1157.00 | 298.00 | NA | NA | NA | -478.00 | NA | |
| , Affiliate Sales | -1586.00 | -2034.00 | -813.00 | -2146.00 | -2689.00 | -3450.00 | -17.00 | 1401.00 | -1742.00 | -488.00 | 609.00 | -662.00 | -1262.00 | -1538.00 | -1021.00 | -1073.00 | -947.00 | -693.00 | NA | NA | NA | NA | NA | NA | NA | NA | NA | NA | NA | |
| , Hedging And Other Revenues | 1.00 | 1.00 | NA | NA | 0.00 | 1.00 | NA | NA | NA | NA | NA | NA | NA | NA | NA | NA | NA | NA | NA | NA | NA | NA | NA | NA | NA | NA | NA | NA | NA | |
| , Total Other Revenues | -1585.00 | -2033.00 | -813.00 | -2146.00 | -2689.00 | -3449.00 | -17.00 | 1401.00 | -1742.00 | -488.00 | 609.00 | -662.00 | -1262.00 | -1538.00 | -1021.00 | -1073.00 | -947.00 | -693.00 | NA | NA | NA | NA | NA | NA | NA | NA | NA | NA | NA | |
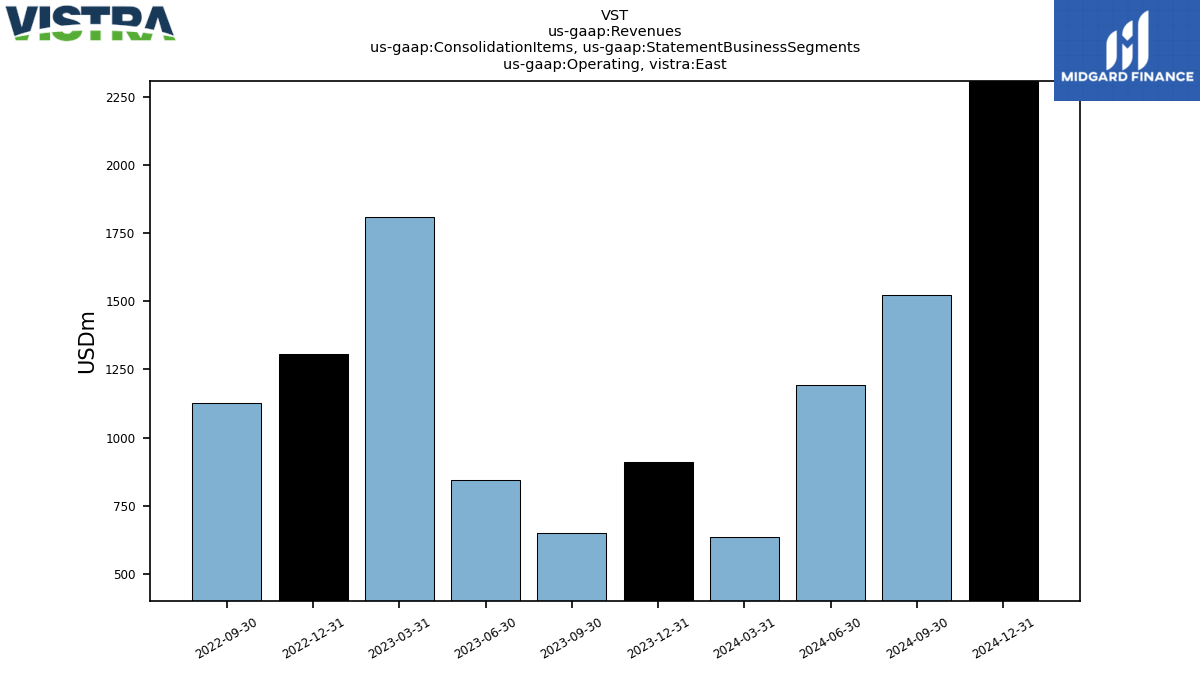
| Operating, Affiliate Sales, East | 556.00 | 345.00 | NA | NA | 895.00 | 538.00 | NA | NA | NA | NA | NA | NA | NA | NA | NA | NA | NA | NA | NA | NA | NA | NA | NA | NA | NA | NA | NA | NA | NA | |
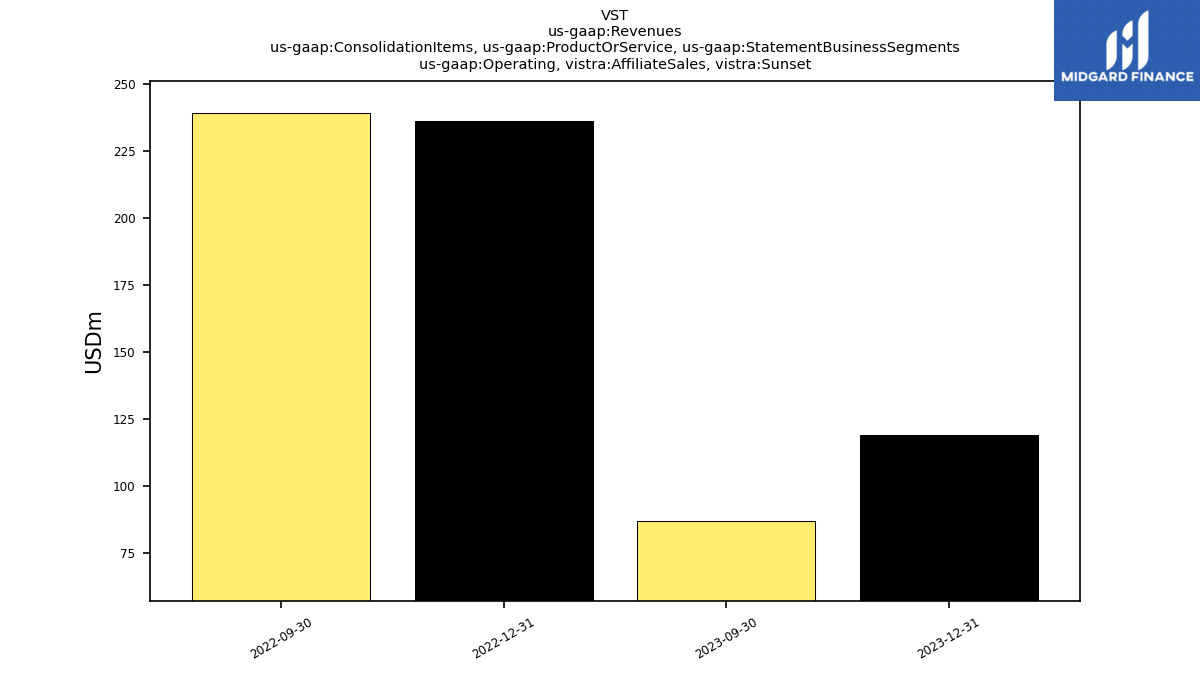
| Operating, Affiliate Sales, Sunset | 119.00 | 87.00 | NA | NA | 236.00 | 239.00 | NA | NA | NA | NA | NA | NA | NA | NA | NA | NA | NA | NA | NA | NA | NA | NA | NA | NA | NA | NA | NA | NA | NA | |
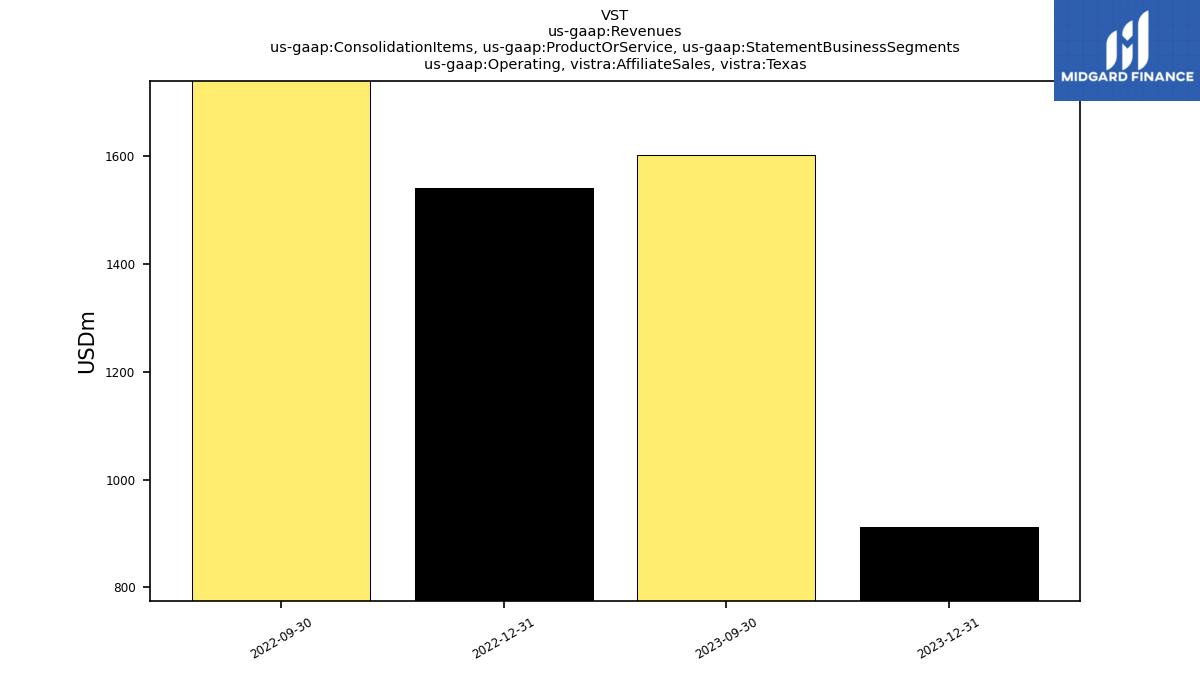
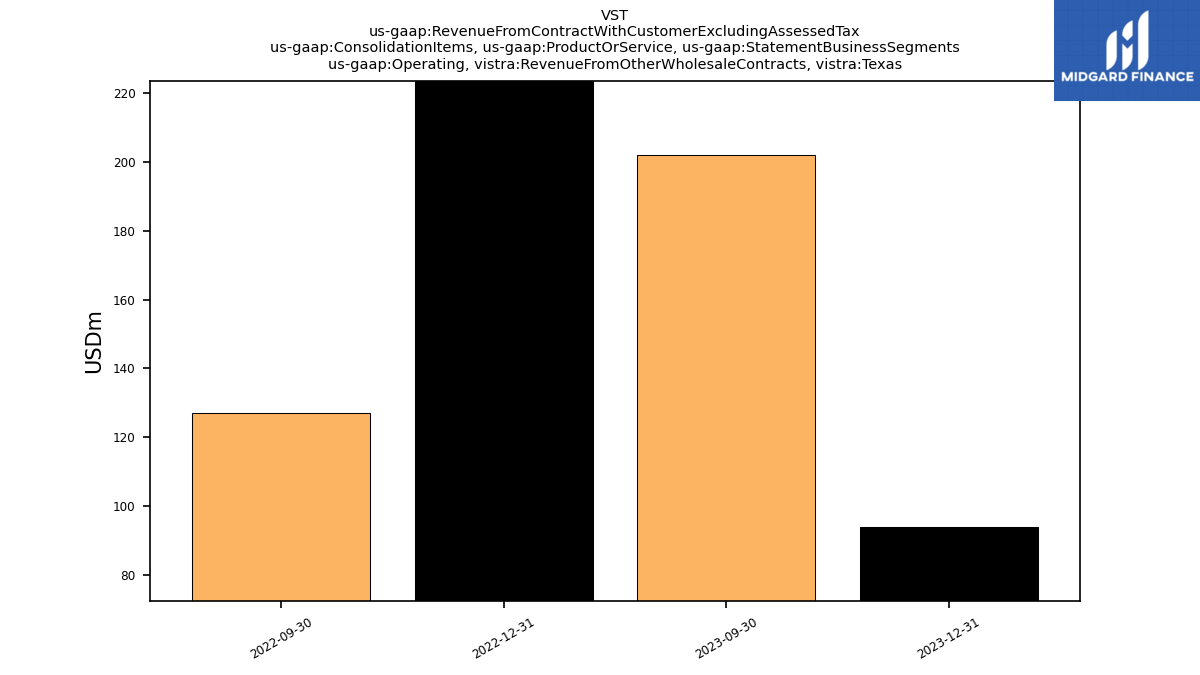
| Operating, Affiliate Sales, Texas | 913.00 | 1602.00 | NA | NA | 1541.00 | 2655.00 | NA | NA | NA | NA | NA | NA | NA | NA | NA | NA | NA | NA | NA | NA | NA | NA | NA | NA | NA | NA | NA | NA | NA | |
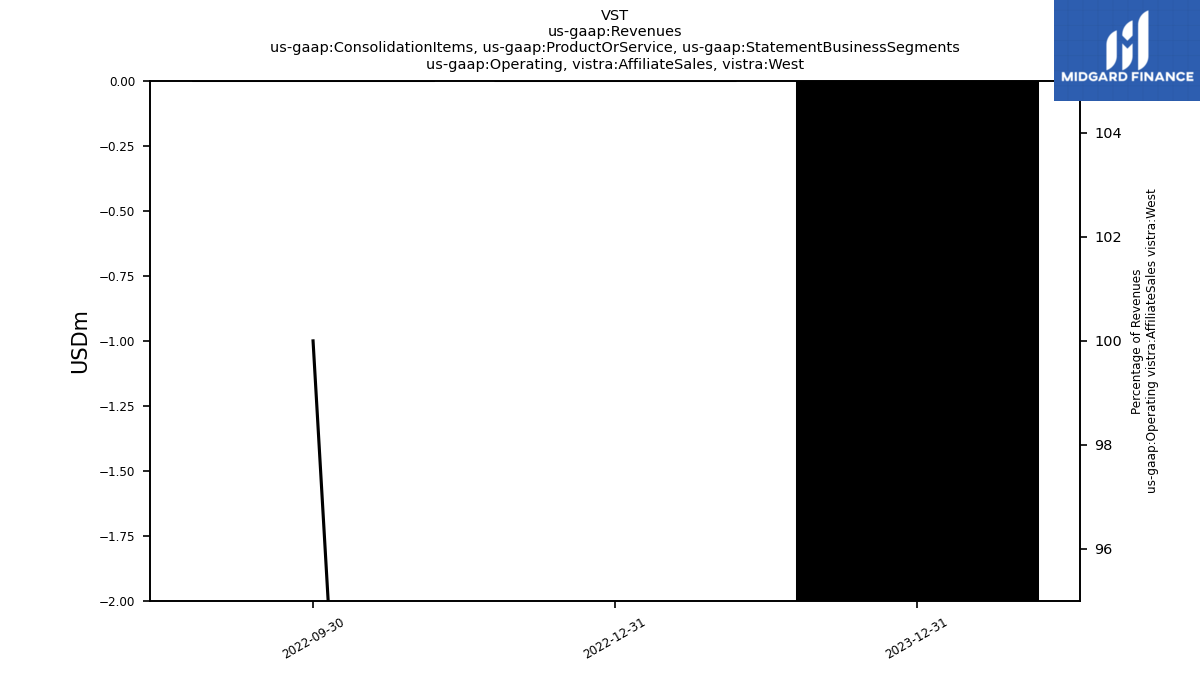
| Operating, Affiliate Sales, West | -2.00 | NA | NA | NA | 0.00 | 3.00 | NA | NA | NA | NA | NA | NA | NA | NA | NA | NA | NA | NA | NA | NA | NA | NA | NA | NA | NA | NA | NA | NA | NA | |
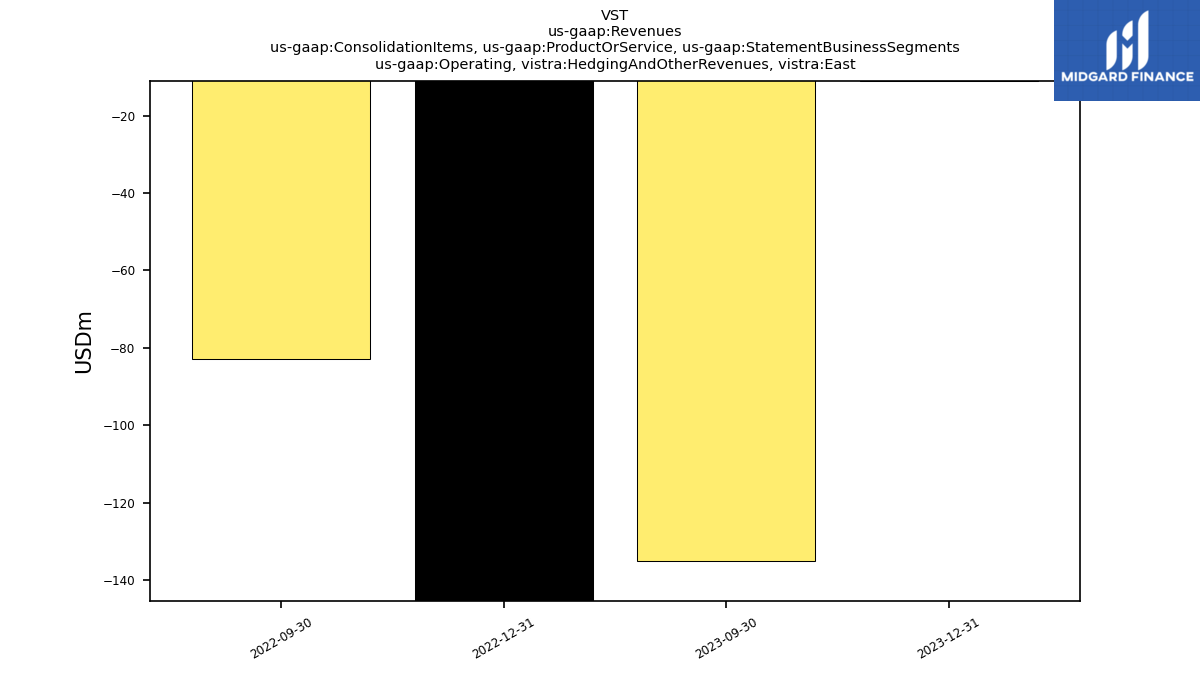
| Operating, Hedging And Other Revenues, East | -11.00 | -135.00 | NA | NA | -246.00 | -83.00 | NA | NA | NA | NA | NA | NA | NA | NA | NA | NA | NA | NA | NA | NA | NA | NA | NA | NA | NA | NA | NA | NA | NA | |
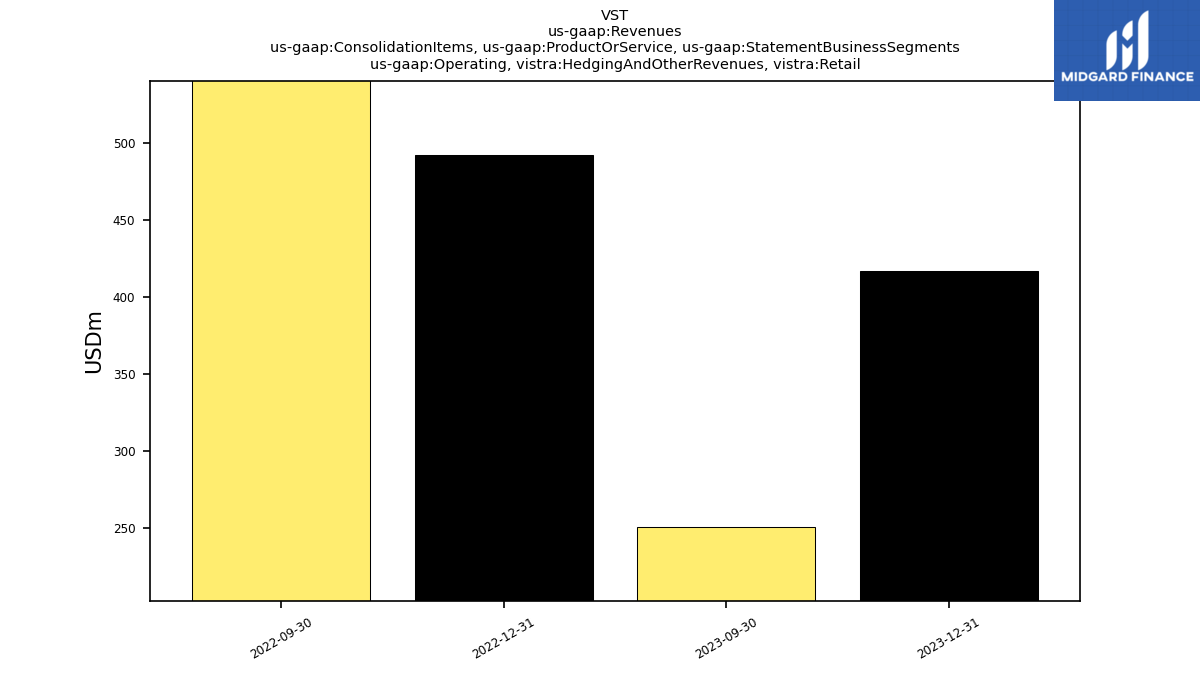
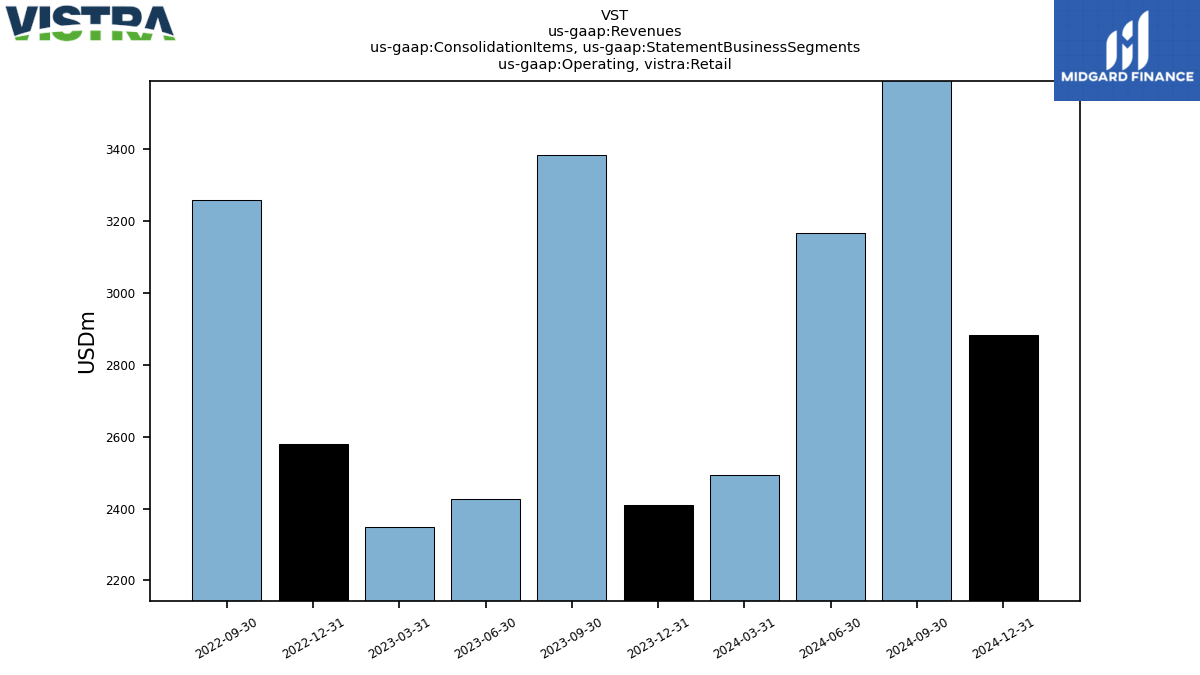
| Operating, Hedging And Other Revenues, Retail | 417.00 | 251.00 | NA | NA | 492.00 | 579.00 | NA | NA | NA | NA | NA | NA | NA | NA | NA | NA | NA | NA | NA | NA | NA | NA | NA | NA | NA | NA | NA | NA | NA | |
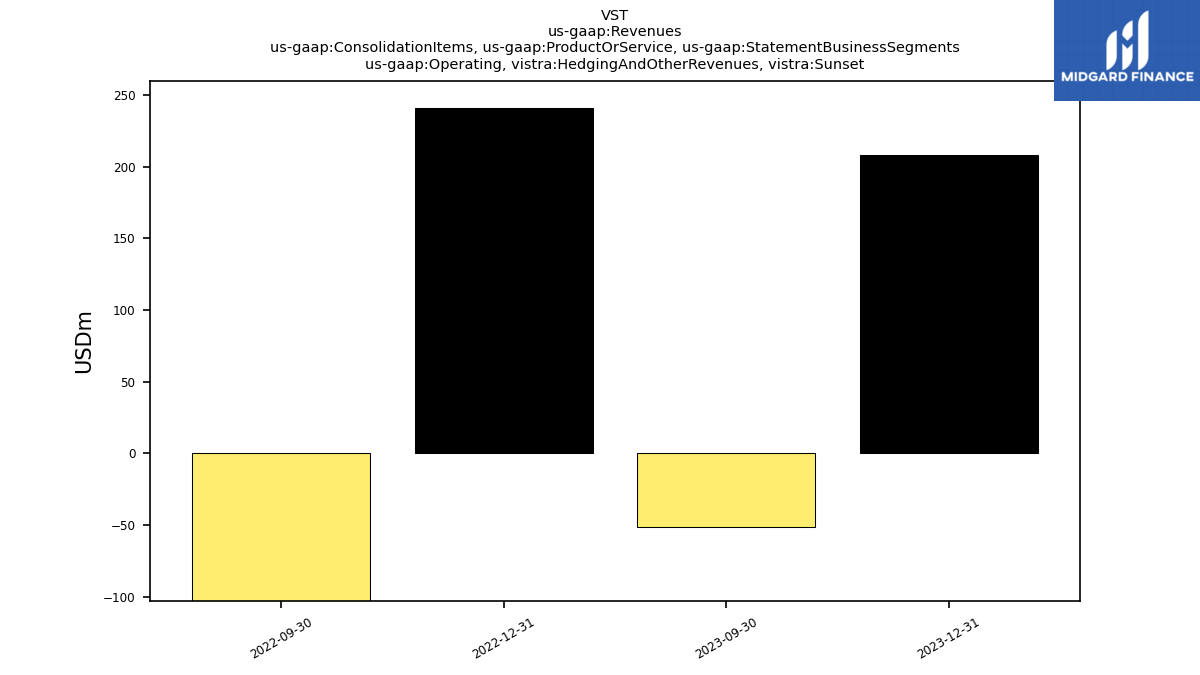
| Operating, Hedging And Other Revenues, Sunset | 208.00 | -51.00 | NA | NA | 241.00 | -353.00 | NA | NA | NA | NA | NA | NA | NA | NA | NA | NA | NA | NA | NA | NA | NA | NA | NA | NA | NA | NA | NA | NA | NA | |
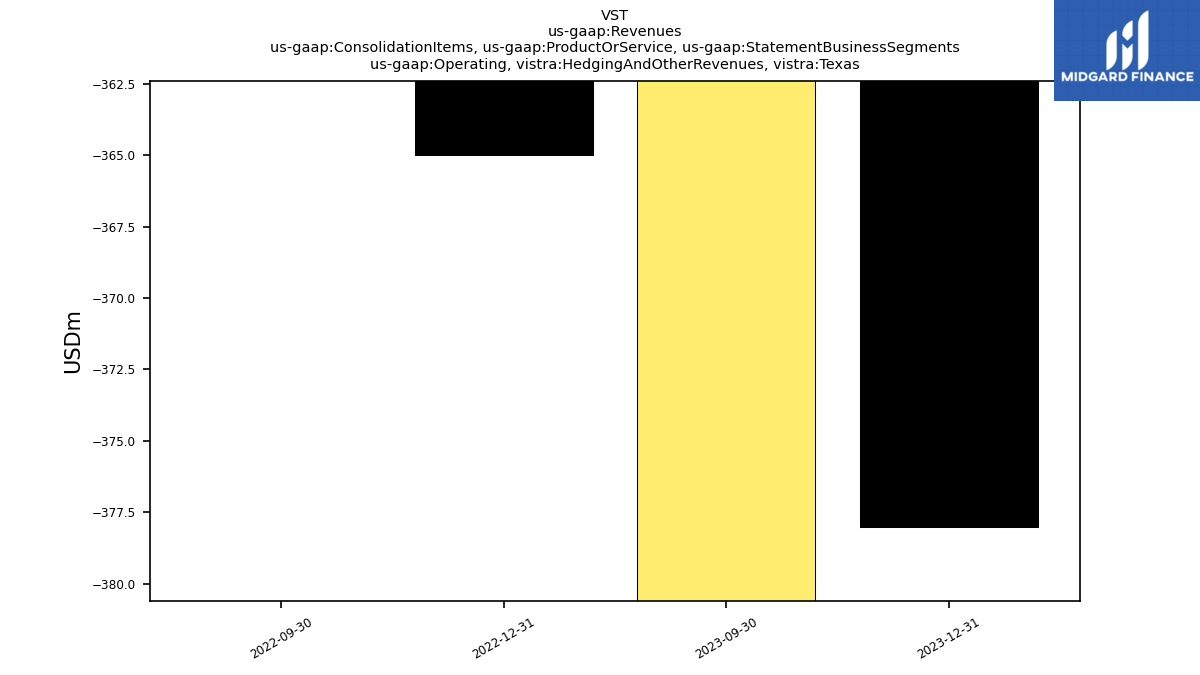
| Operating, Hedging And Other Revenues, Texas | -378.00 | -987.00 | NA | NA | -365.00 | 176.00 | NA | NA | NA | NA | NA | NA | NA | NA | NA | NA | NA | NA | NA | NA | NA | NA | NA | NA | NA | NA | NA | NA | NA | |
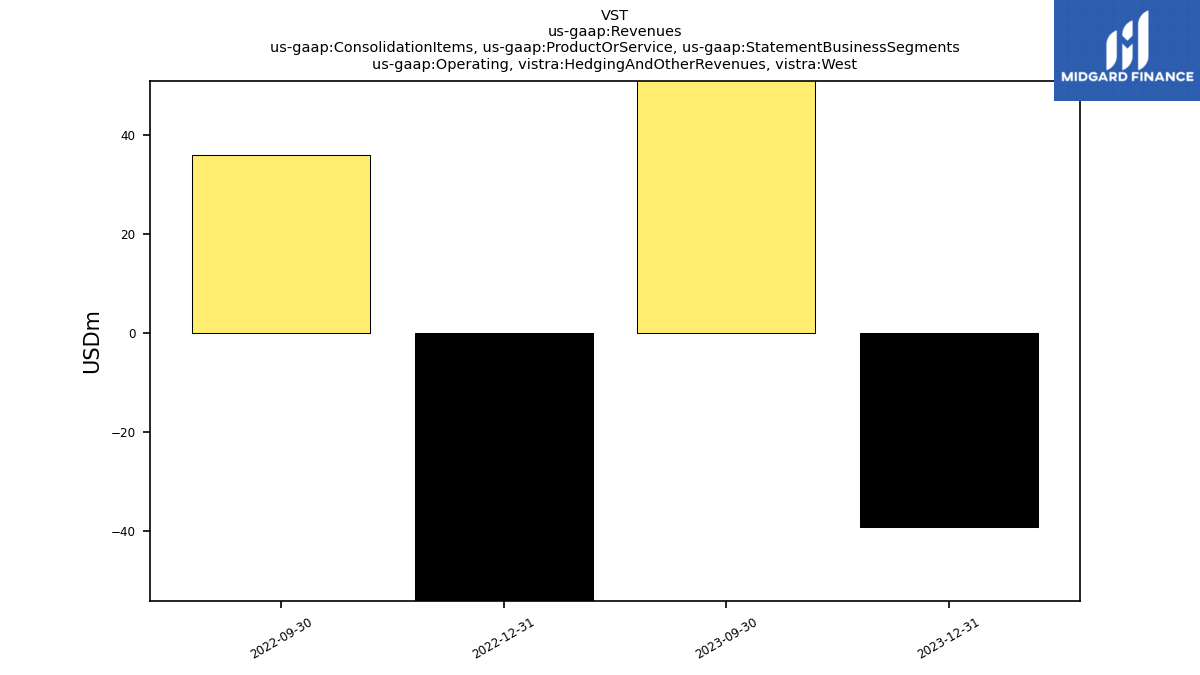
| Operating, Hedging And Other Revenues, West | -39.00 | 215.00 | NA | NA | -287.00 | 36.00 | NA | NA | NA | NA | NA | NA | NA | NA | NA | NA | NA | NA | NA | NA | NA | NA | NA | NA | NA | NA | NA | NA | NA | |
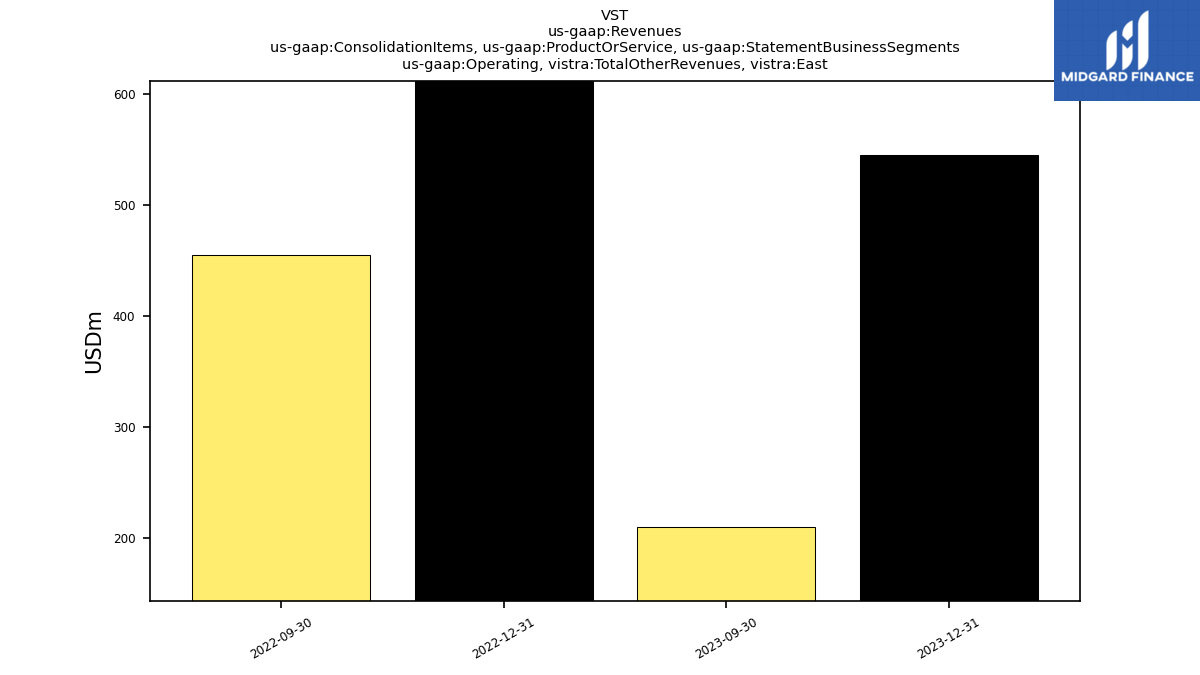
| Operating, Total Other Revenues, East | 545.00 | 210.00 | NA | NA | 649.00 | 455.00 | NA | NA | NA | NA | NA | NA | NA | NA | NA | NA | NA | NA | NA | NA | NA | NA | NA | NA | NA | NA | NA | NA | NA | |
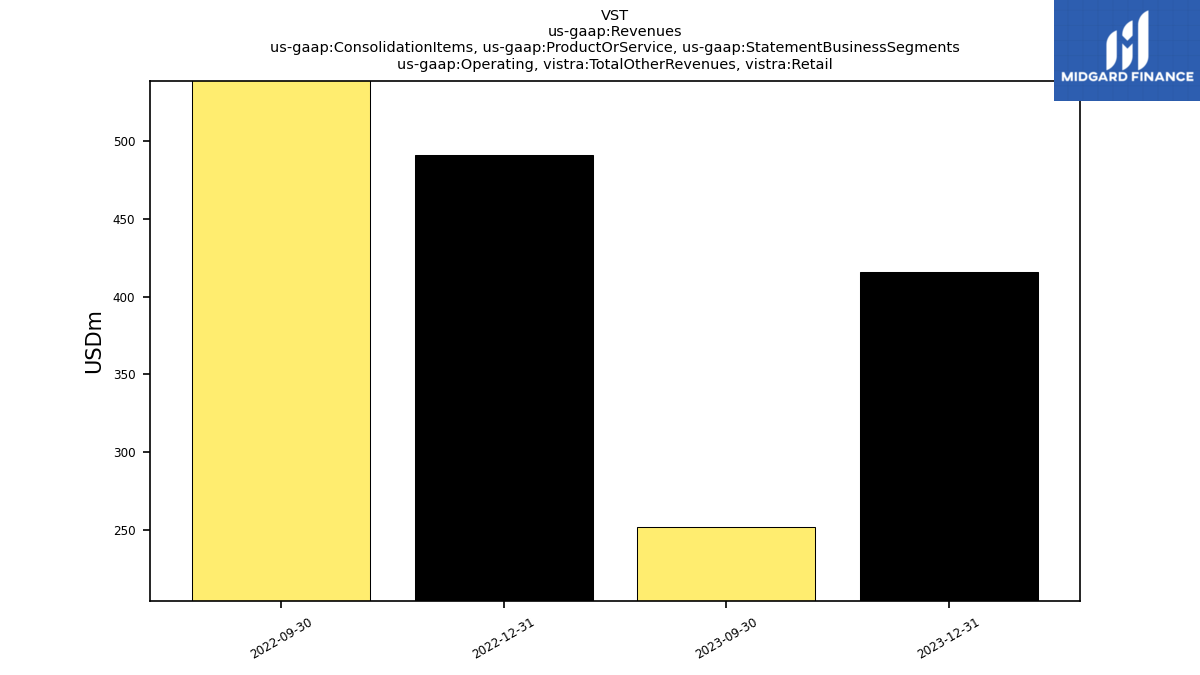
| Operating, Total Other Revenues, Retail | 416.00 | 252.00 | NA | NA | 491.00 | 581.00 | NA | NA | NA | NA | NA | NA | NA | NA | NA | NA | NA | NA | NA | NA | NA | NA | NA | NA | NA | NA | NA | NA | NA | |
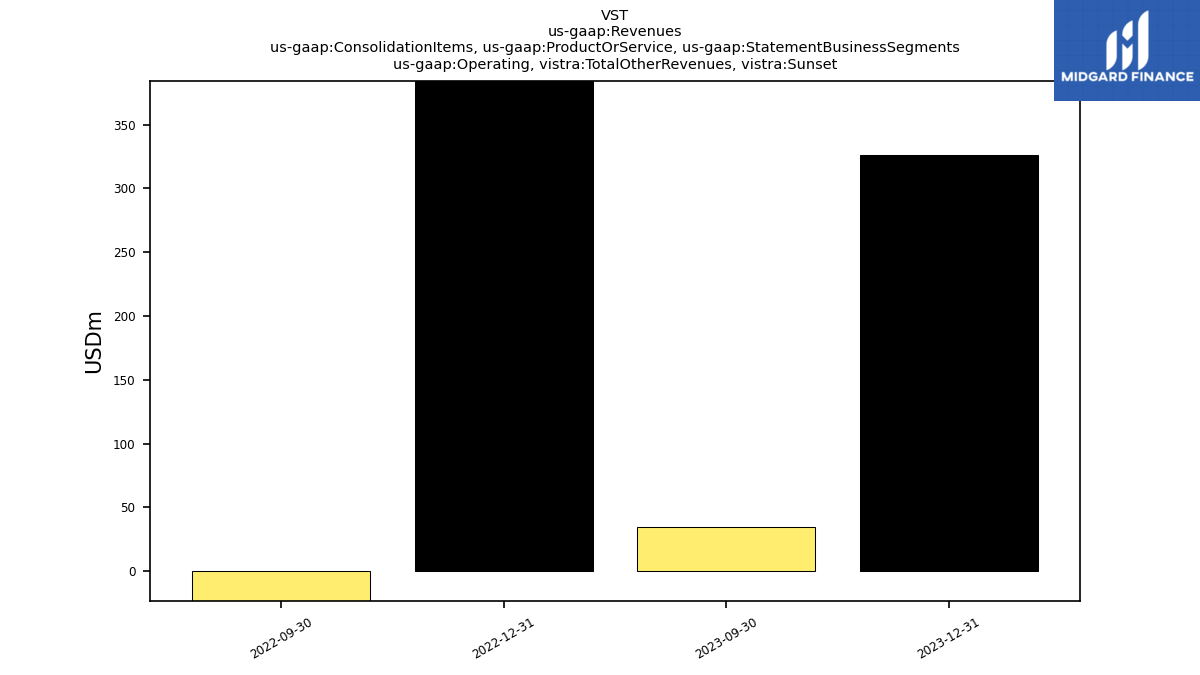
| Operating, Total Other Revenues, Sunset | 326.00 | 35.00 | NA | NA | 476.00 | -115.00 | NA | NA | NA | NA | NA | NA | NA | NA | NA | NA | NA | NA | NA | NA | NA | NA | NA | NA | NA | NA | NA | NA | NA | |
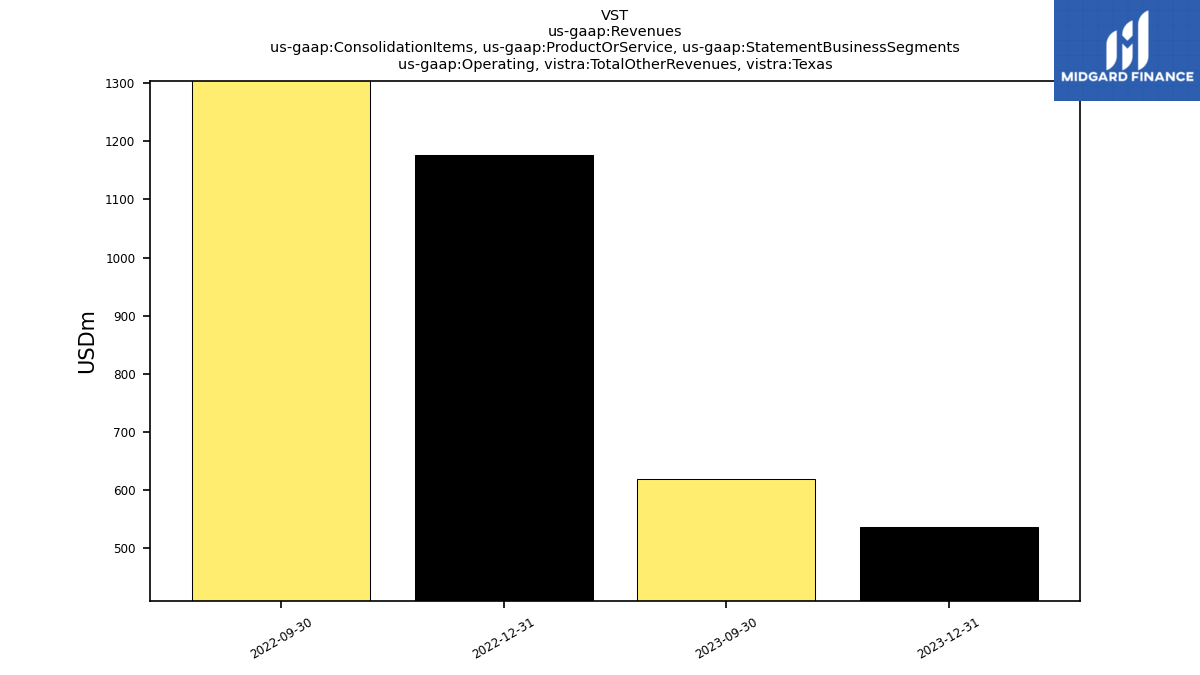
| Operating, Total Other Revenues, Texas | 537.00 | 618.00 | NA | NA | 1176.00 | 2831.00 | NA | NA | NA | NA | NA | NA | NA | NA | NA | NA | NA | NA | NA | NA | NA | NA | NA | NA | NA | NA | NA | NA | NA | |
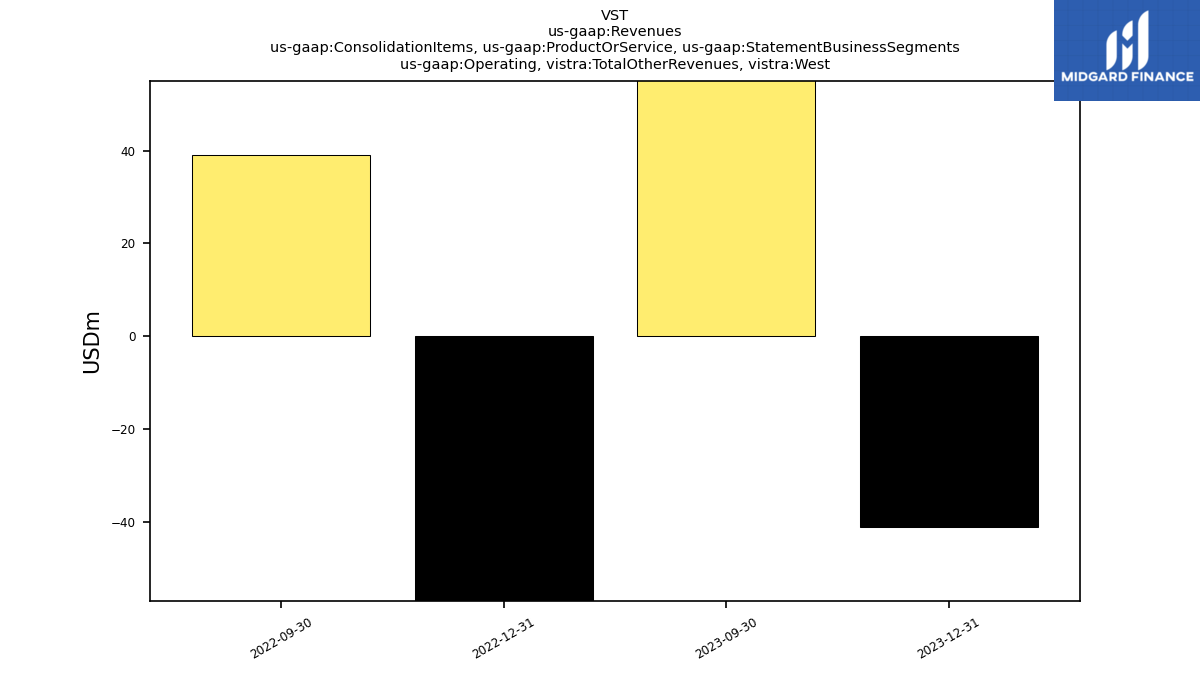
| Operating, Total Other Revenues, West | -41.00 | 215.00 | NA | NA | -287.00 | 39.00 | NA | NA | NA | NA | NA | NA | NA | NA | NA | NA | NA | NA | NA | NA | NA | NA | NA | NA | NA | NA | NA | NA | NA | |
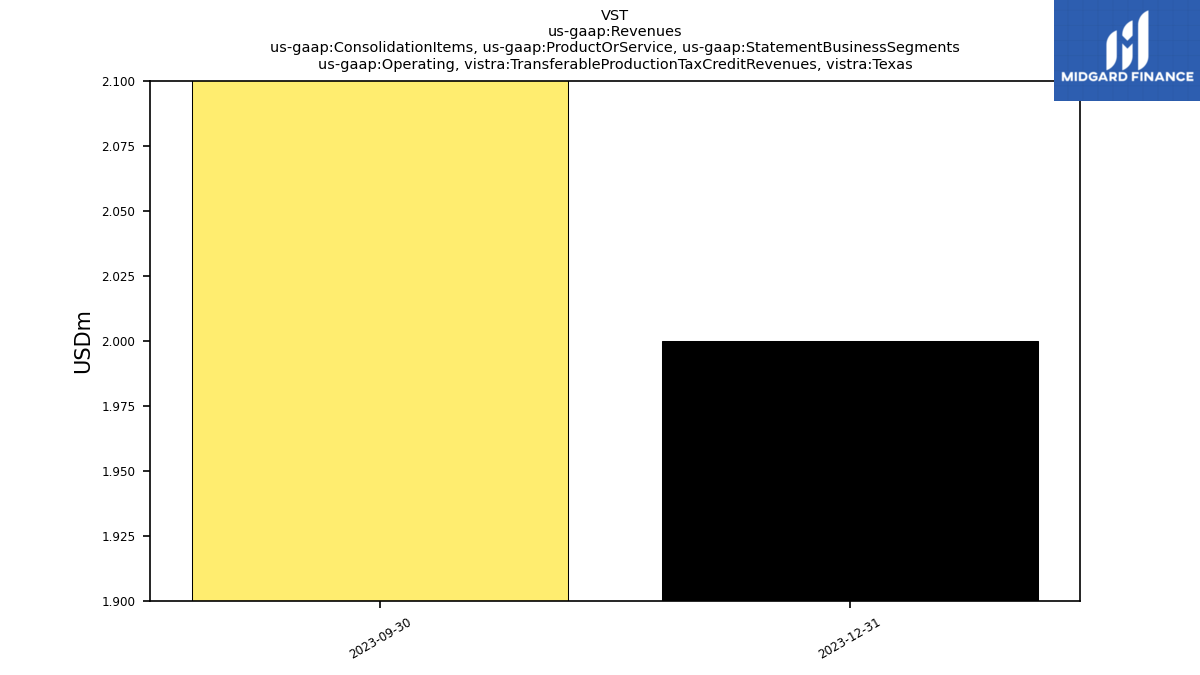
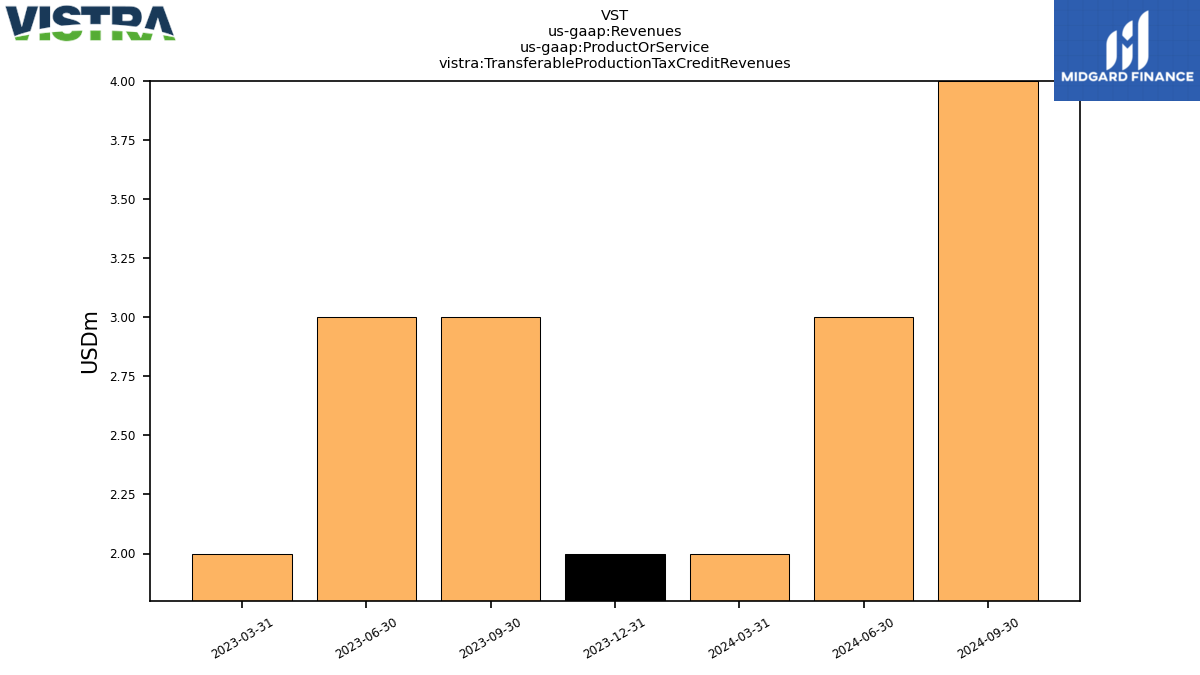
| Operating, Transferable Production Tax Credit Revenues, Texas | 2.00 | 3.00 | NA | NA | NA | NA | NA | NA | NA | NA | NA | NA | NA | NA | NA | NA | NA | NA | NA | NA | NA | NA | NA | NA | NA | NA | NA | NA | NA | |
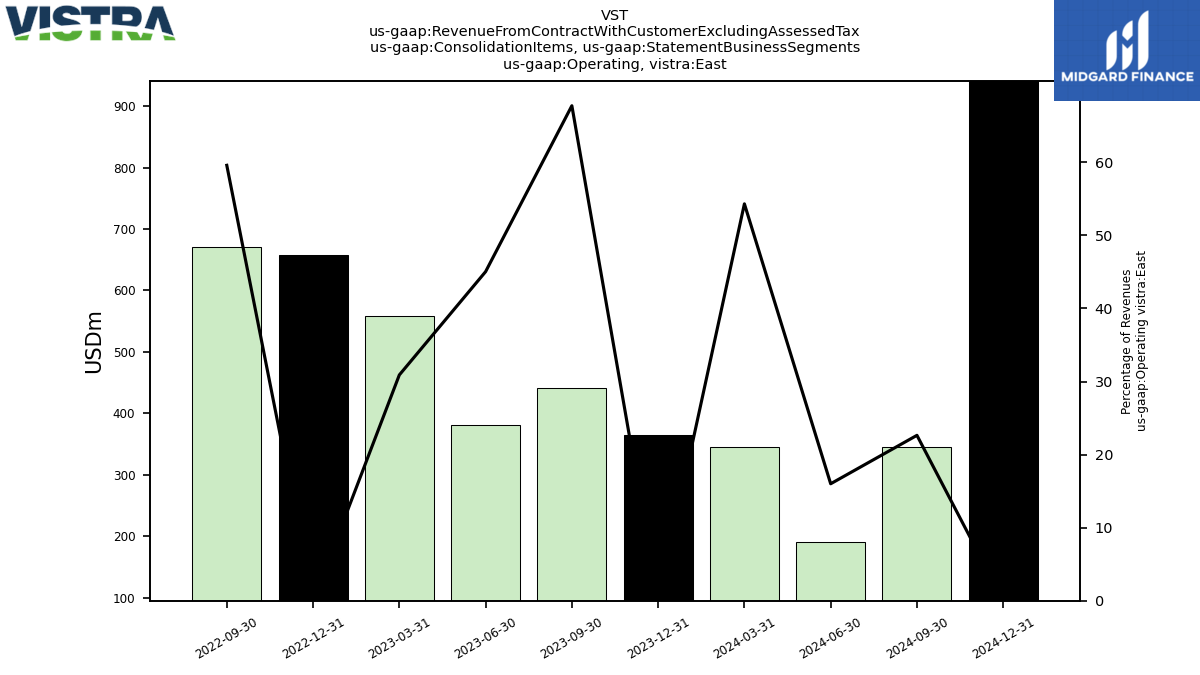
| Operating, East | 910.00 | 651.00 | NA | NA | 1306.00 | 1126.00 | NA | NA | NA | NA | NA | NA | NA | NA | NA | NA | NA | NA | NA | NA | NA | NA | NA | NA | NA | NA | NA | NA | NA | |
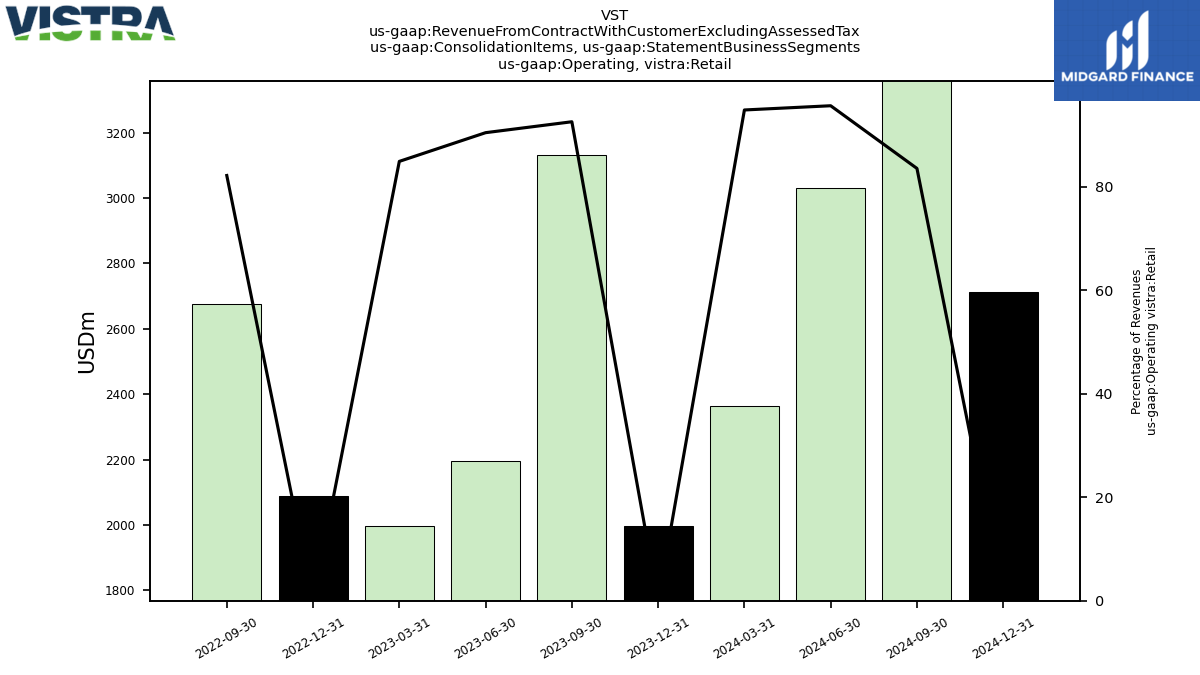
| Operating, Retail | 2411.00 | 3383.00 | NA | NA | 2579.00 | 3258.00 | NA | NA | NA | NA | NA | NA | NA | NA | NA | NA | NA | NA | NA | NA | NA | NA | NA | NA | NA | NA | NA | NA | NA | |
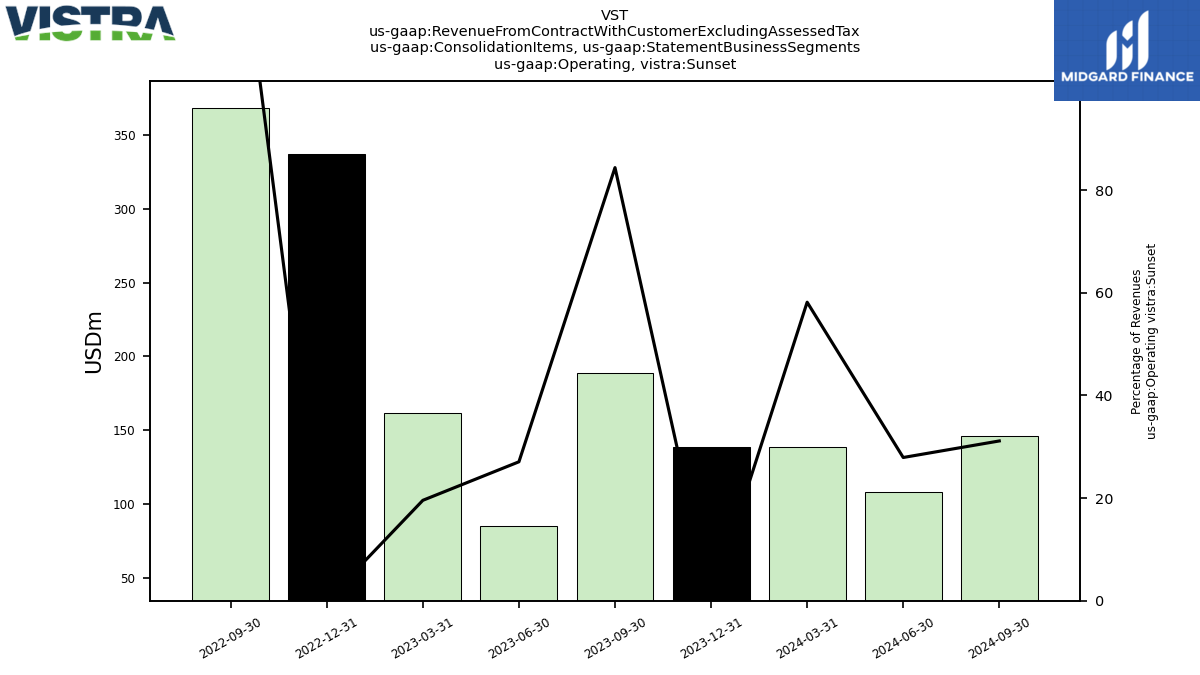
| Operating, Sunset | 465.00 | 224.00 | NA | NA | 813.00 | 253.00 | NA | NA | NA | NA | NA | NA | NA | NA | NA | NA | NA | NA | NA | NA | NA | NA | NA | NA | NA | NA | NA | NA | NA | |
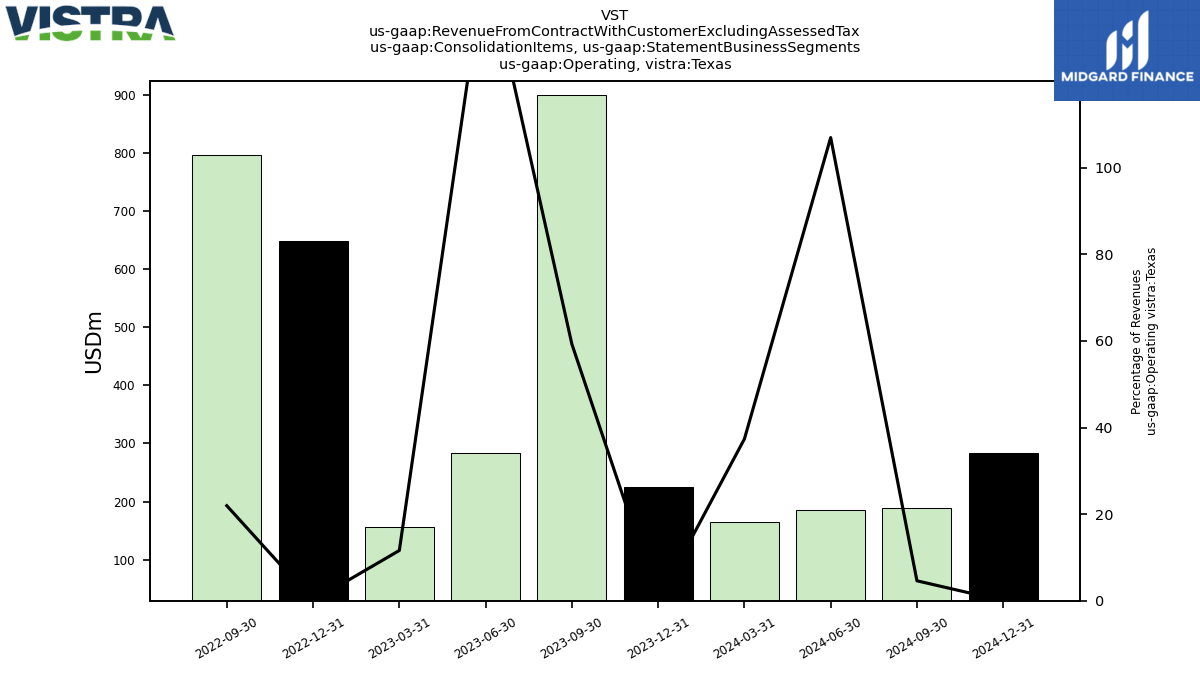
| Operating, Texas | 762.00 | 1517.00 | NA | NA | 1824.00 | 3627.00 | NA | NA | NA | NA | NA | NA | NA | NA | NA | NA | NA | NA | NA | NA | NA | NA | NA | NA | NA | NA | NA | NA | NA | |
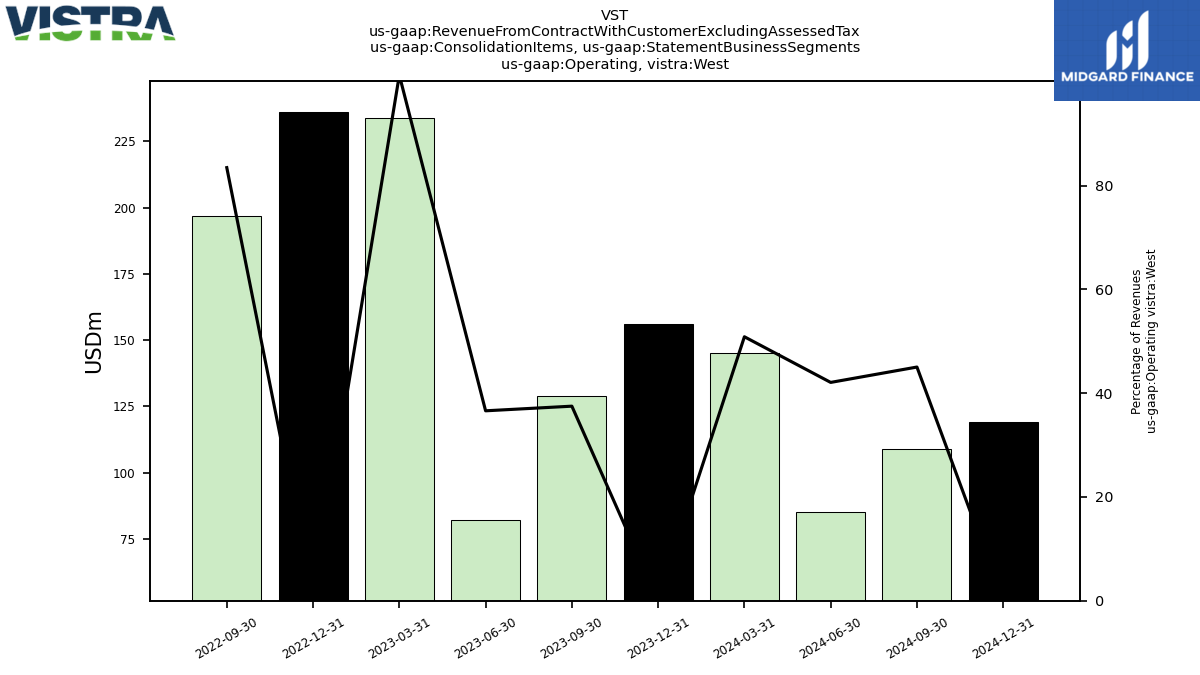
| Operating, West | 115.00 | 344.00 | NA | NA | -51.00 | 236.00 | NA | NA | NA | NA | NA | NA | NA | NA | NA | NA | NA | NA | NA | NA | NA | NA | NA | NA | NA | NA | NA | NA | NA | |
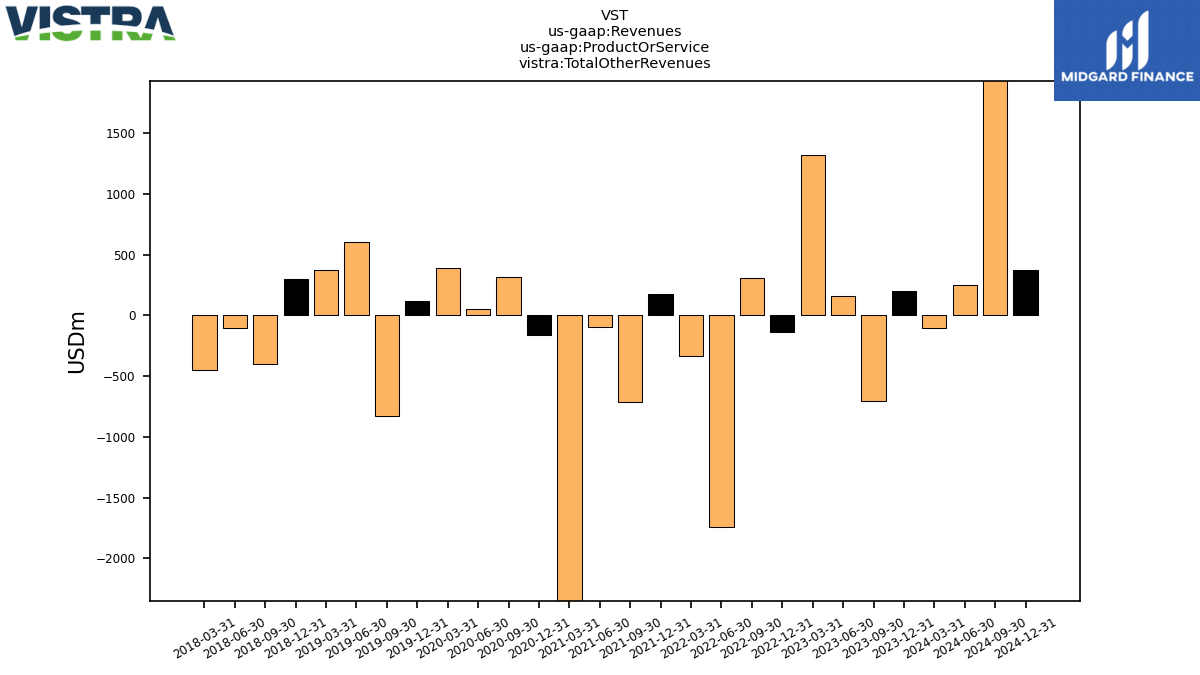
| Hedging And Other Revenues | 198.00 | -706.00 | 162.00 | 1319.00 | -135.00 | 307.00 | -1735.00 | -334.00 | 181.00 | -711.00 | -164.00 | -4990.00 | -151.00 | 310.00 | 61.00 | 400.00 | 132.00 | -840.00 | 617.00 | 388.00 | 309.00 | -404.00 | -80.00 | -435.00 | NA | NA | NA | NA | NA | |
| Total Other Revenues | 198.00 | -703.00 | 162.00 | 1318.00 | -137.00 | 308.00 | -1738.00 | -336.00 | 178.00 | -711.00 | -95.00 | -4996.00 | -159.00 | 314.00 | 49.00 | 392.00 | 120.00 | -832.00 | 603.00 | 373.00 | 297.00 | -398.00 | -103.00 | -447.00 | NA | NA | NA | NA | NA | |
| Transferable Production Tax Credit Revenues | 2.00 | 3.00 | 3.00 | 2.00 | NA | NA | NA | NA | NA | NA | NA | NA | NA | NA | NA | NA | NA | NA | NA | NA | NA | NA | NA | NA | NA | NA | NA | NA | NA | |
| Revenue From Contract With Customer Excluding Assessed Tax | 2880.00 | 4789.00 | 3027.00 | 3107.00 | 4006.00 | 4838.00 | 3326.00 | 3461.00 | 3136.00 | 3702.00 | 2660.00 | 8203.00 | 2683.00 | 3238.00 | 2460.00 | 2466.00 | 2860.00 | 4026.00 | 2229.00 | 2550.00 | 2562.00 | 3641.00 | 2677.00 | 1212.00 | 943.00 | 1833.00 | 1296.00 | 1357.00 | 1191.00 | |
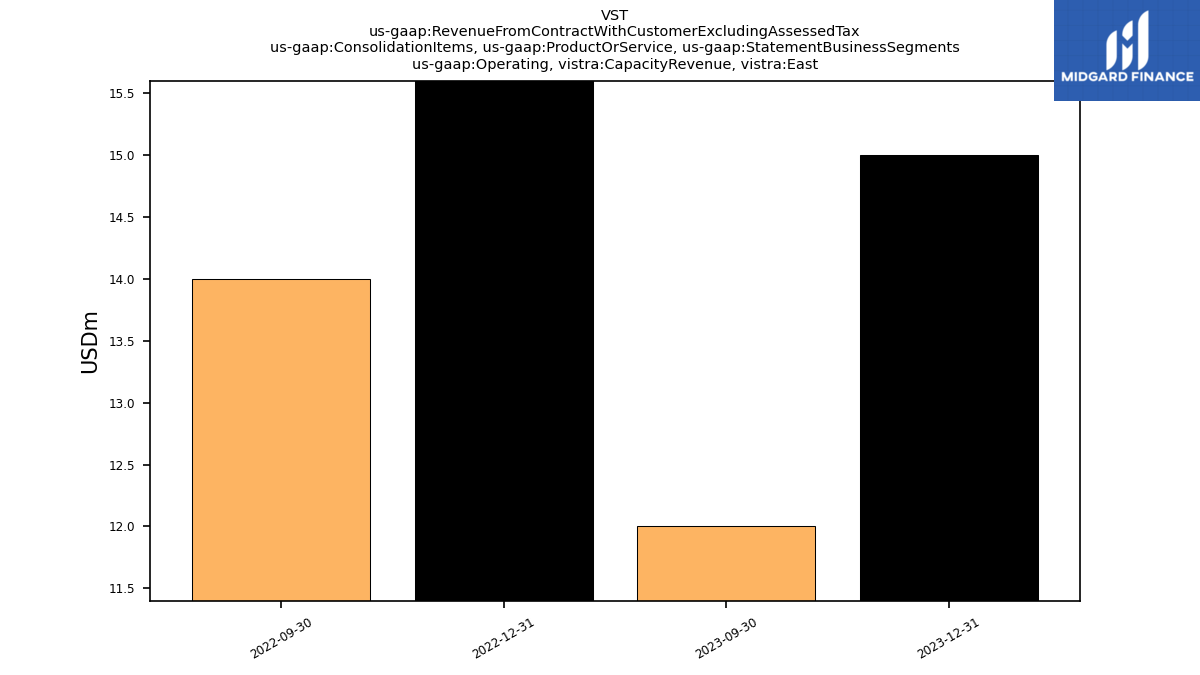
| Operating, Capacity Revenue, East | 15.00 | 12.00 | NA | NA | 16.00 | 14.00 | NA | NA | NA | NA | NA | NA | NA | NA | NA | NA | NA | NA | NA | NA | NA | NA | NA | NA | NA | NA | NA | NA | NA | |
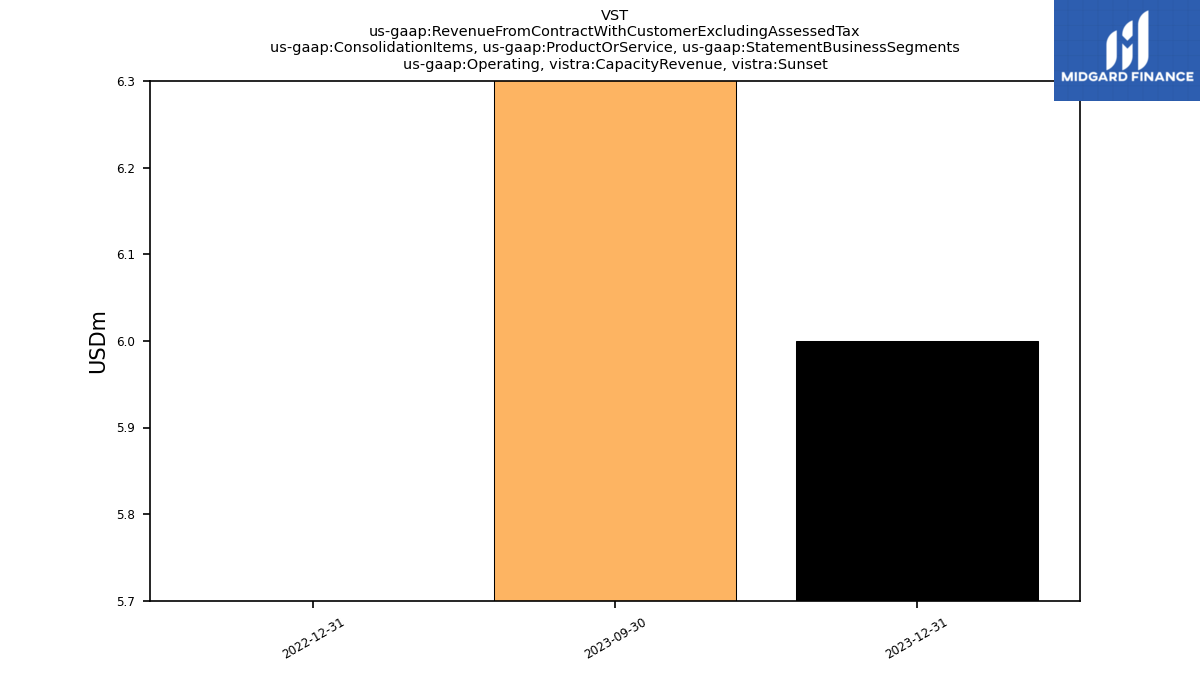
| Operating, Capacity Revenue, Sunset | 6.00 | 8.00 | NA | NA | 0.00 | NA | NA | NA | NA | NA | NA | NA | NA | NA | NA | NA | NA | NA | NA | NA | NA | NA | NA | NA | NA | NA | NA | NA | NA | |
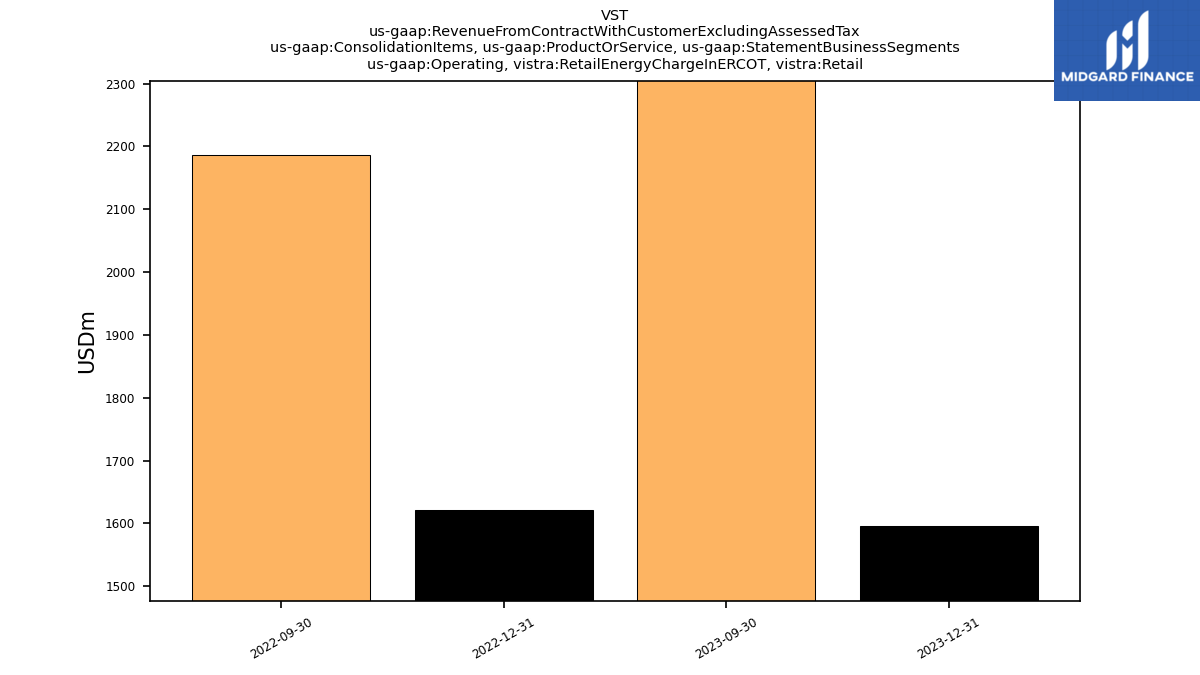
| Operating, Retail Energy Charge In E R C O T, Retail | 1595.00 | 2667.00 | NA | NA | 1622.00 | 2186.00 | NA | NA | NA | NA | NA | NA | NA | NA | NA | NA | NA | NA | NA | NA | NA | NA | NA | NA | NA | NA | NA | NA | NA | |
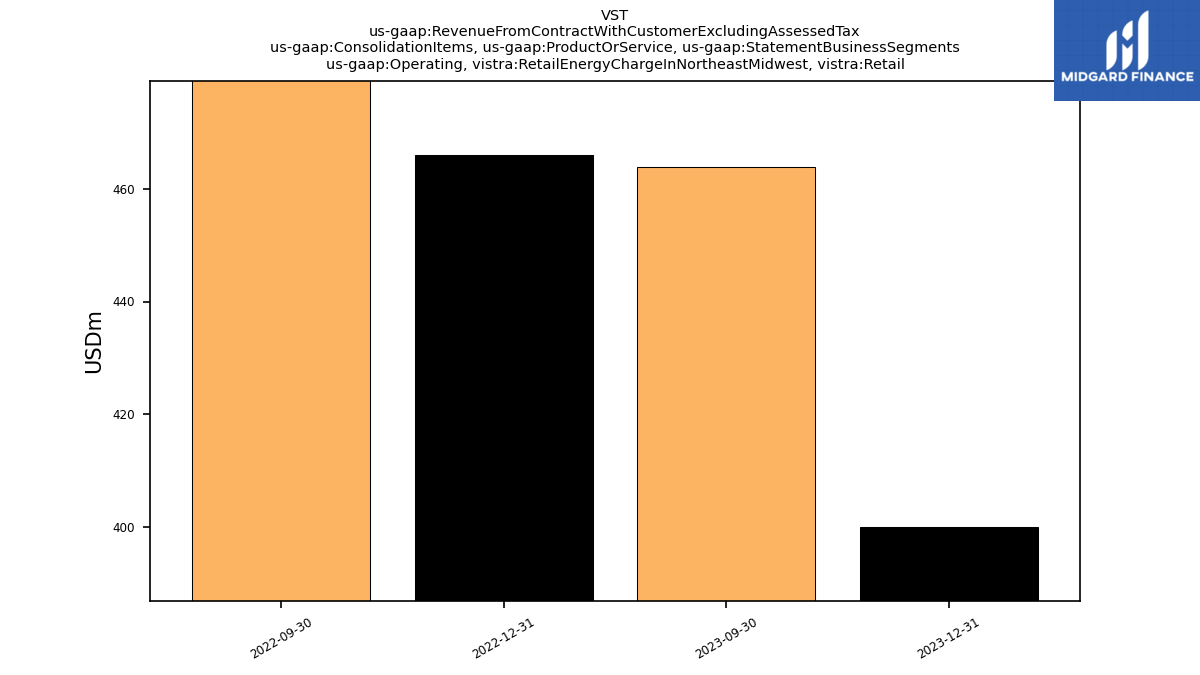
| Operating, Retail Energy Charge In Northeast Midwest, Retail | 400.00 | 464.00 | NA | NA | 466.00 | 491.00 | NA | NA | NA | NA | NA | NA | NA | NA | NA | NA | NA | NA | NA | NA | NA | NA | NA | NA | NA | NA | NA | NA | NA | |
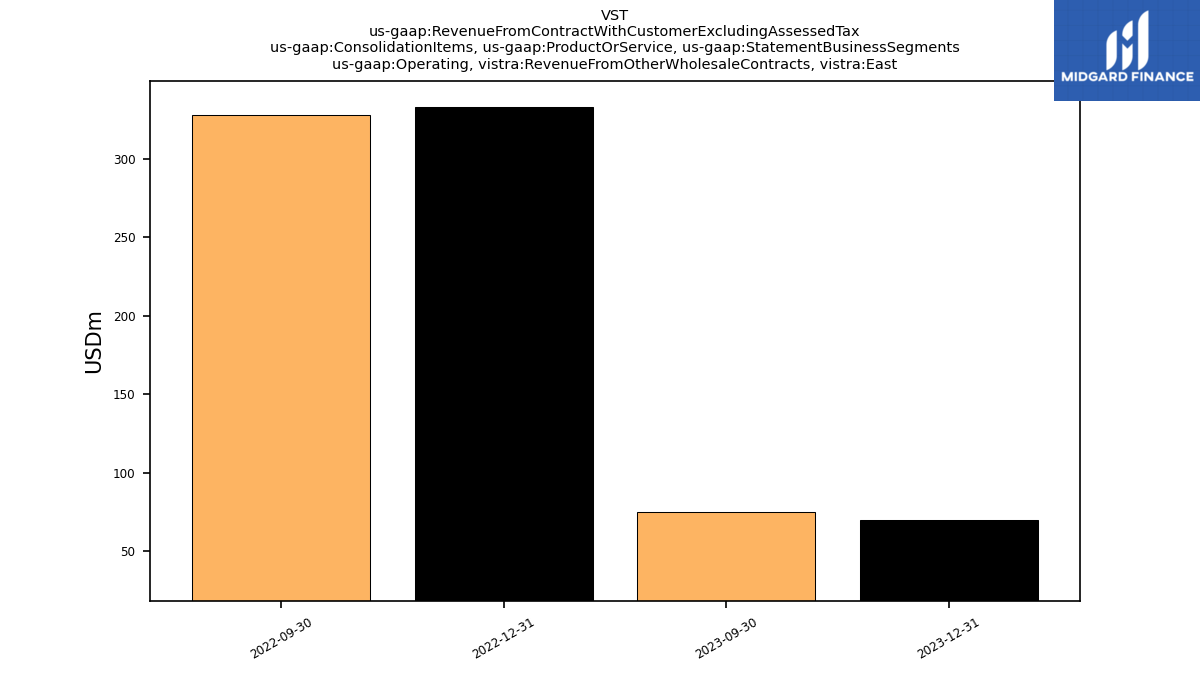
| Operating, Revenue From Other Wholesale Contracts, East | 70.00 | 75.00 | NA | NA | 333.00 | 328.00 | NA | NA | NA | NA | NA | NA | NA | NA | NA | NA | NA | NA | NA | NA | NA | NA | NA | NA | NA | NA | NA | NA | NA | |
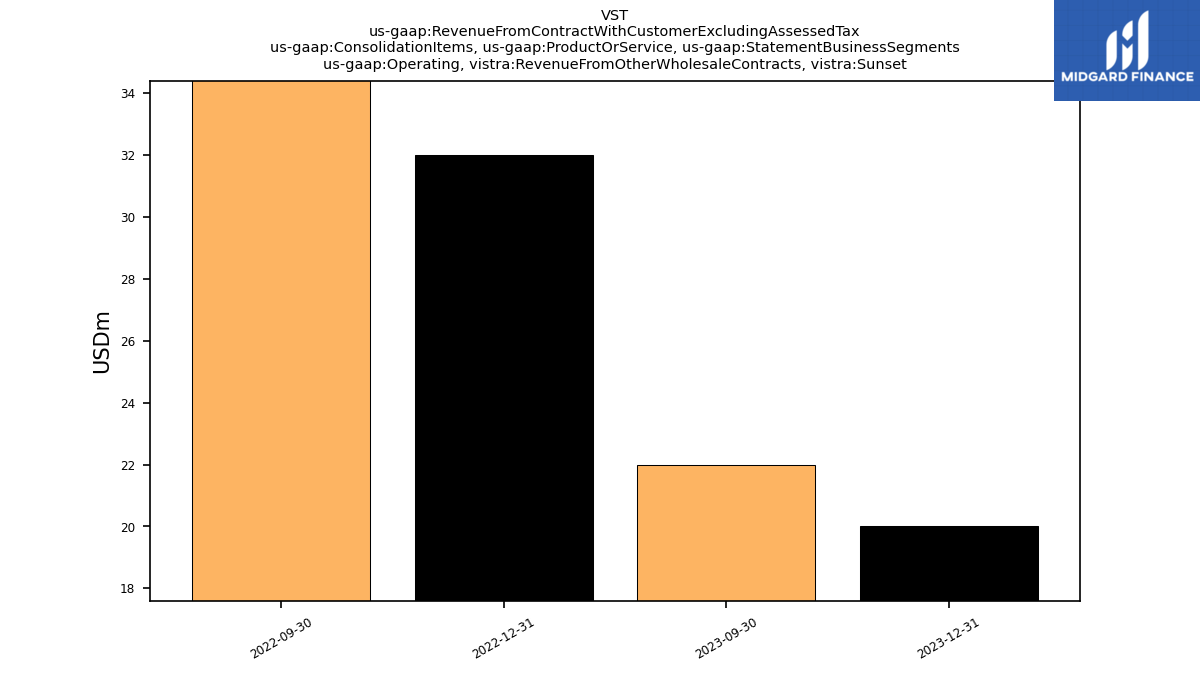
| Operating, Revenue From Other Wholesale Contracts, Sunset | 20.00 | 22.00 | NA | NA | 32.00 | 38.00 | NA | NA | NA | NA | NA | NA | NA | NA | NA | NA | NA | NA | NA | NA | NA | NA | NA | NA | NA | NA | NA | NA | NA | |
| Operating, Revenue From Other Wholesale Contracts, Texas | 94.00 | 202.00 | NA | NA | 304.00 | 127.00 | NA | NA | NA | NA | NA | NA | NA | NA | NA | NA | NA | NA | NA | NA | NA | NA | NA | NA | NA | NA | NA | NA | NA | |
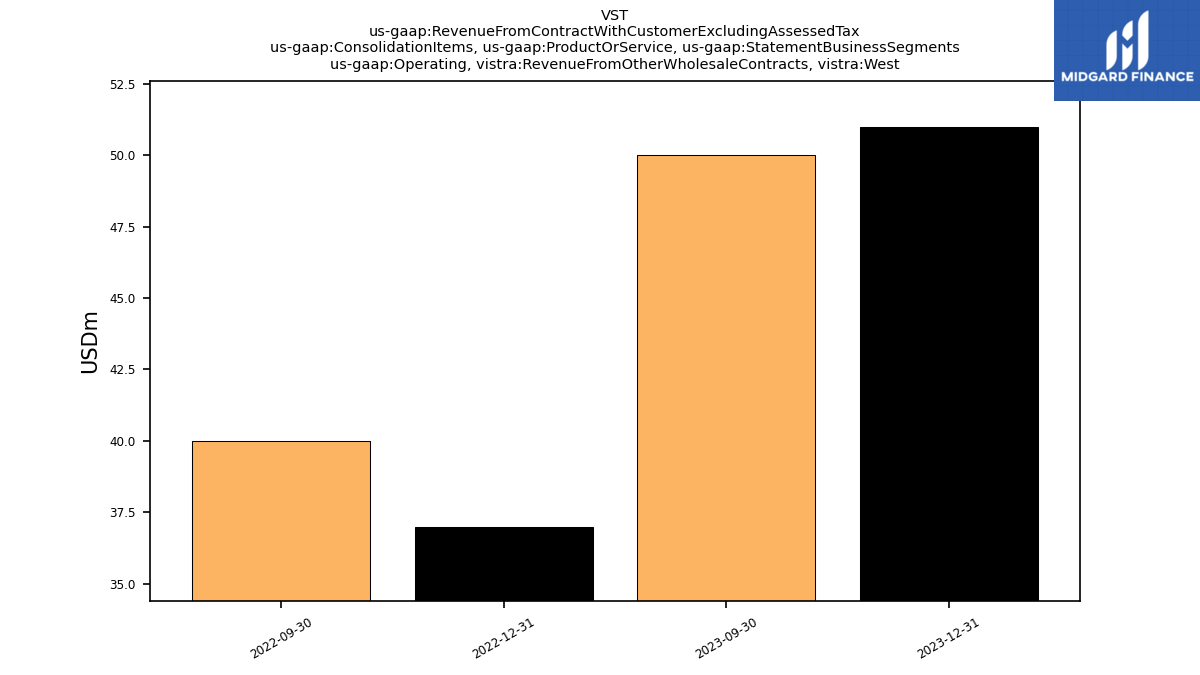
| Operating, Revenue From Other Wholesale Contracts, West | 51.00 | 50.00 | NA | NA | 37.00 | 40.00 | NA | NA | NA | NA | NA | NA | NA | NA | NA | NA | NA | NA | NA | NA | NA | NA | NA | NA | NA | NA | NA | NA | NA | |
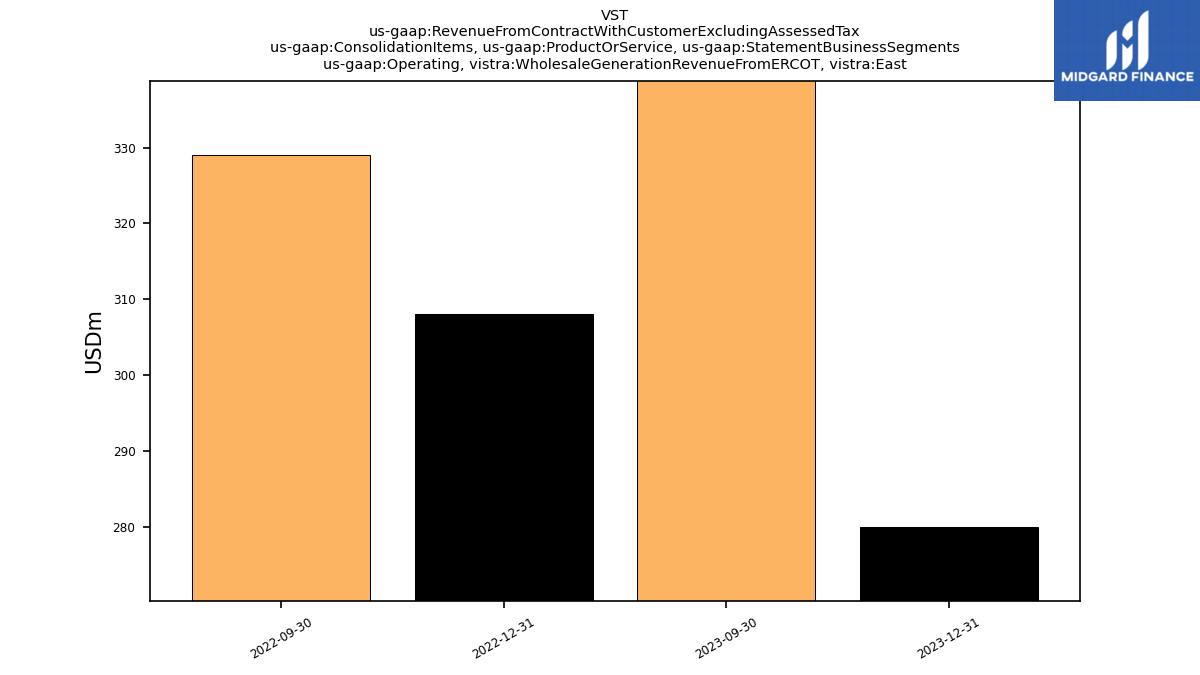
| Operating, Wholesale Generation Revenue From E R C O T, East | 280.00 | 354.00 | NA | NA | 308.00 | 329.00 | NA | NA | NA | NA | NA | NA | NA | NA | NA | NA | NA | NA | NA | NA | NA | NA | NA | NA | NA | NA | NA | NA | NA | |
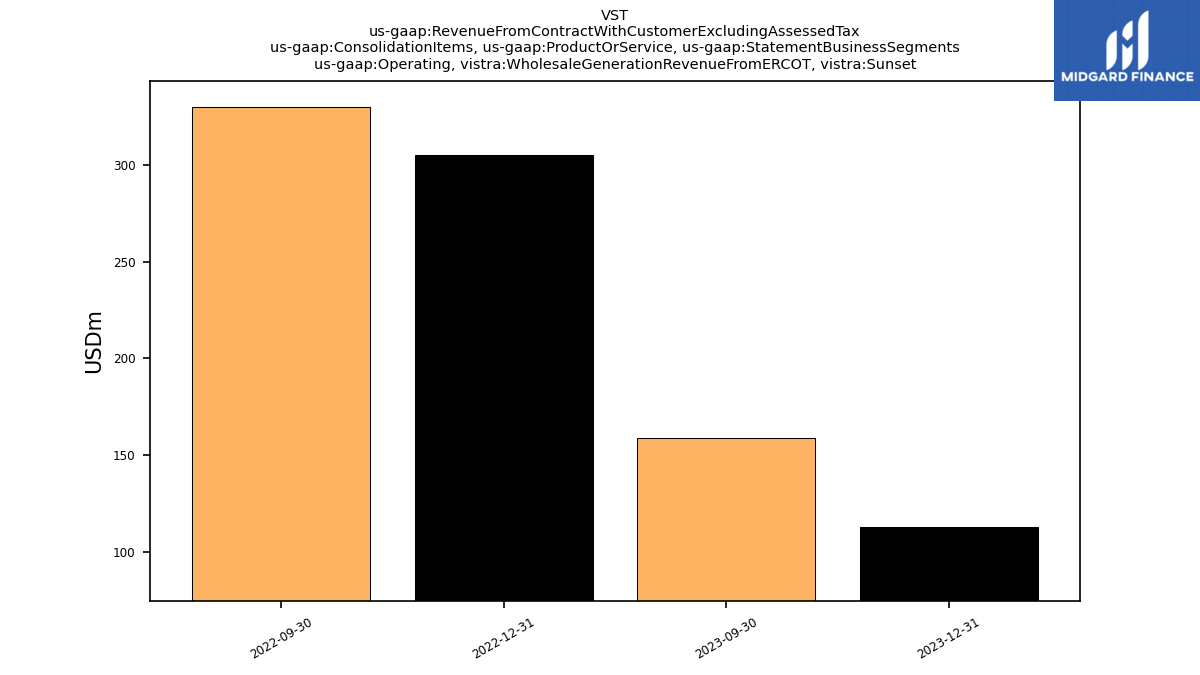
| Operating, Wholesale Generation Revenue From E R C O T, Sunset | 113.00 | 159.00 | NA | NA | 305.00 | 330.00 | NA | NA | NA | NA | NA | NA | NA | NA | NA | NA | NA | NA | NA | NA | NA | NA | NA | NA | NA | NA | NA | NA | NA | |
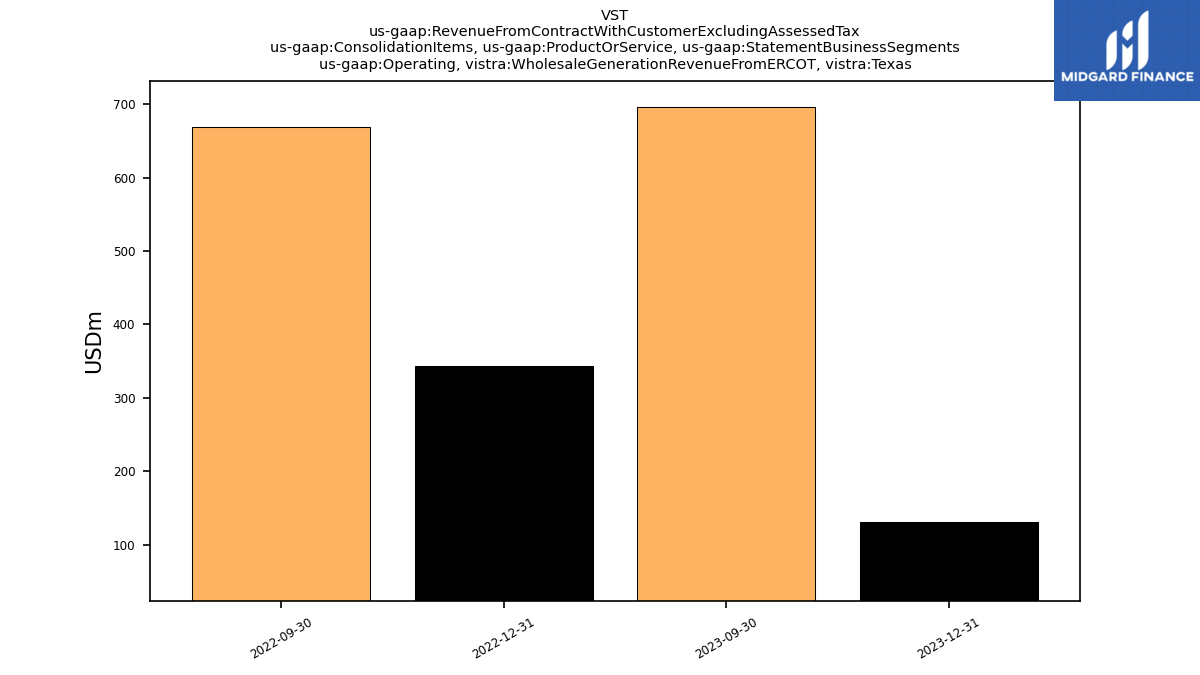
| Operating, Wholesale Generation Revenue From E R C O T, Texas | 131.00 | 697.00 | NA | NA | 344.00 | 669.00 | NA | NA | NA | NA | NA | NA | NA | NA | NA | NA | NA | NA | NA | NA | NA | NA | NA | NA | NA | NA | NA | NA | NA | |
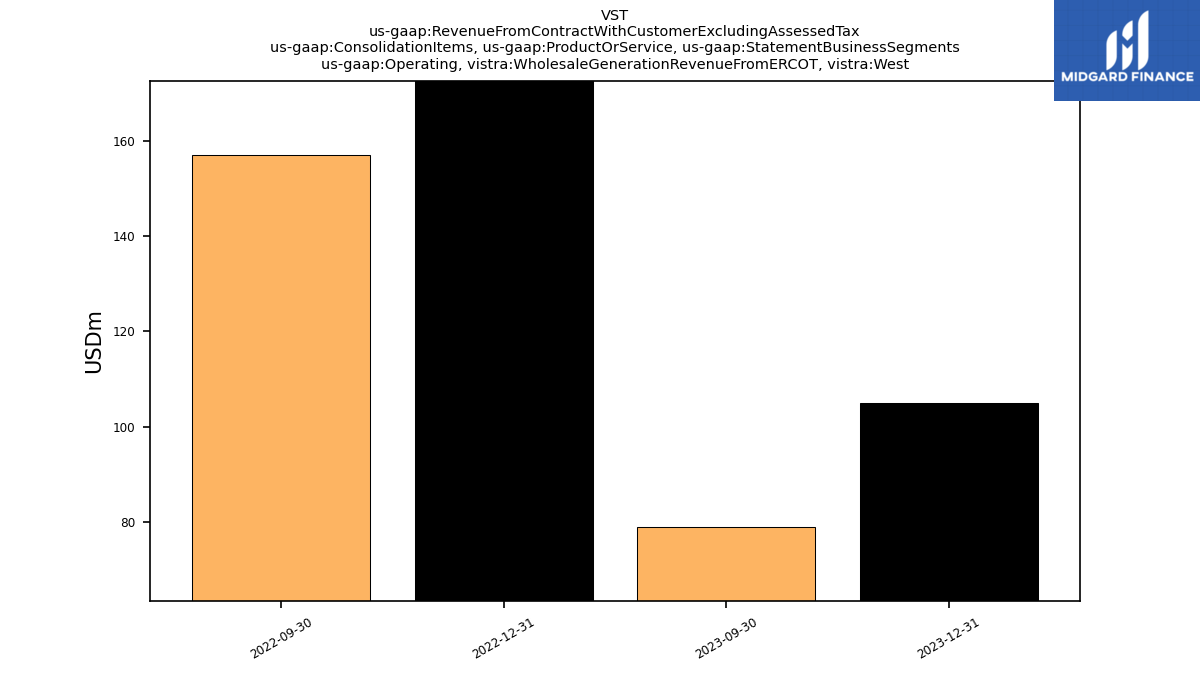
| Operating, Wholesale Generation Revenue From E R C O T, West | 105.00 | 79.00 | NA | NA | 199.00 | 157.00 | NA | NA | NA | NA | NA | NA | NA | NA | NA | NA | NA | NA | NA | NA | NA | NA | NA | NA | NA | NA | NA | NA | NA | |
| Operating, East | 365.00 | 441.00 | NA | NA | 657.00 | 671.00 | NA | NA | NA | NA | NA | NA | NA | NA | NA | NA | NA | NA | NA | NA | NA | NA | NA | NA | NA | NA | NA | NA | NA | |
| Operating, Retail | 1995.00 | 3131.00 | NA | NA | 2088.00 | 2677.00 | NA | NA | NA | NA | NA | NA | NA | NA | NA | NA | NA | NA | NA | NA | NA | NA | NA | NA | NA | NA | NA | NA | NA | |
| Operating, Sunset | 139.00 | 189.00 | NA | NA | 337.00 | 368.00 | NA | NA | NA | NA | NA | NA | NA | NA | NA | NA | NA | NA | NA | NA | NA | NA | NA | NA | NA | NA | NA | NA | NA | |
| Operating, Texas | 225.00 | 899.00 | NA | NA | 648.00 | 796.00 | NA | NA | NA | NA | NA | NA | NA | NA | NA | NA | NA | NA | NA | NA | NA | NA | NA | NA | NA | NA | NA | NA | NA | |
| Operating, West | 156.00 | 129.00 | NA | NA | 236.00 | 197.00 | NA | NA | NA | NA | NA | NA | NA | NA | NA | NA | NA | NA | NA | NA | NA | NA | NA | NA | NA | NA | NA | NA | NA | |
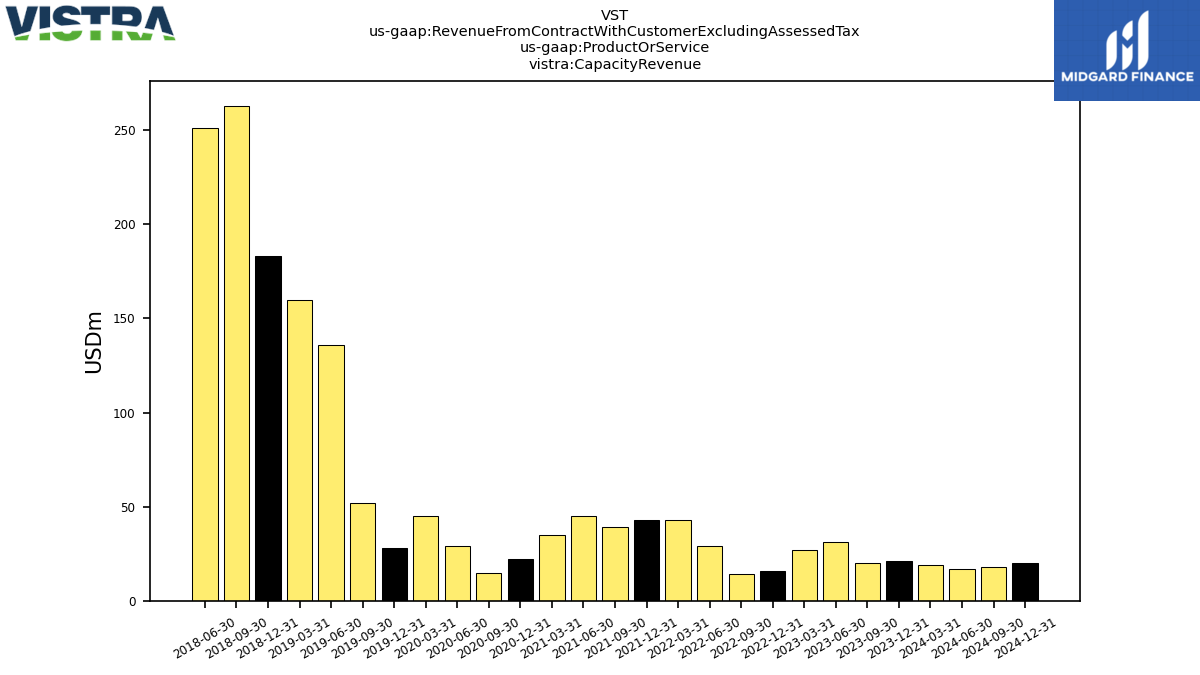
| Capacity Revenue | 21.00 | 20.00 | 31.00 | 27.00 | 16.00 | 14.00 | 29.00 | 43.00 | 43.00 | 39.00 | 45.00 | 35.00 | 22.00 | 15.00 | 29.00 | 45.00 | 28.00 | 52.00 | 136.00 | 160.00 | 183.00 | 263.00 | 251.00 | NA | NA | NA | NA | NA | NA | |
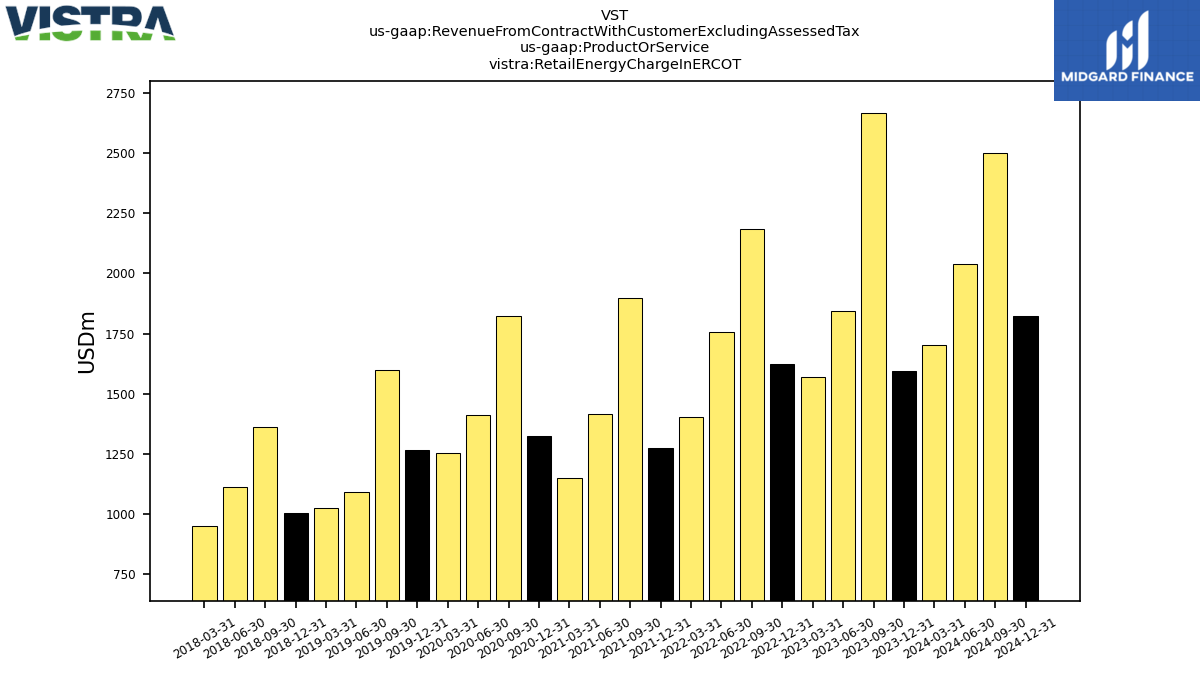
| Retail Energy Charge In E R C O T | 1595.00 | 2667.00 | 1843.00 | 1568.00 | 1622.00 | 2186.00 | 1757.00 | 1405.00 | 1273.00 | 1896.00 | 1417.00 | 1149.00 | 1324.00 | 1824.00 | 1411.00 | 1253.00 | 1267.00 | 1600.00 | 1091.00 | 1025.00 | 1003.00 | 1362.00 | 1111.00 | 949.00 | NA | NA | NA | NA | NA | |
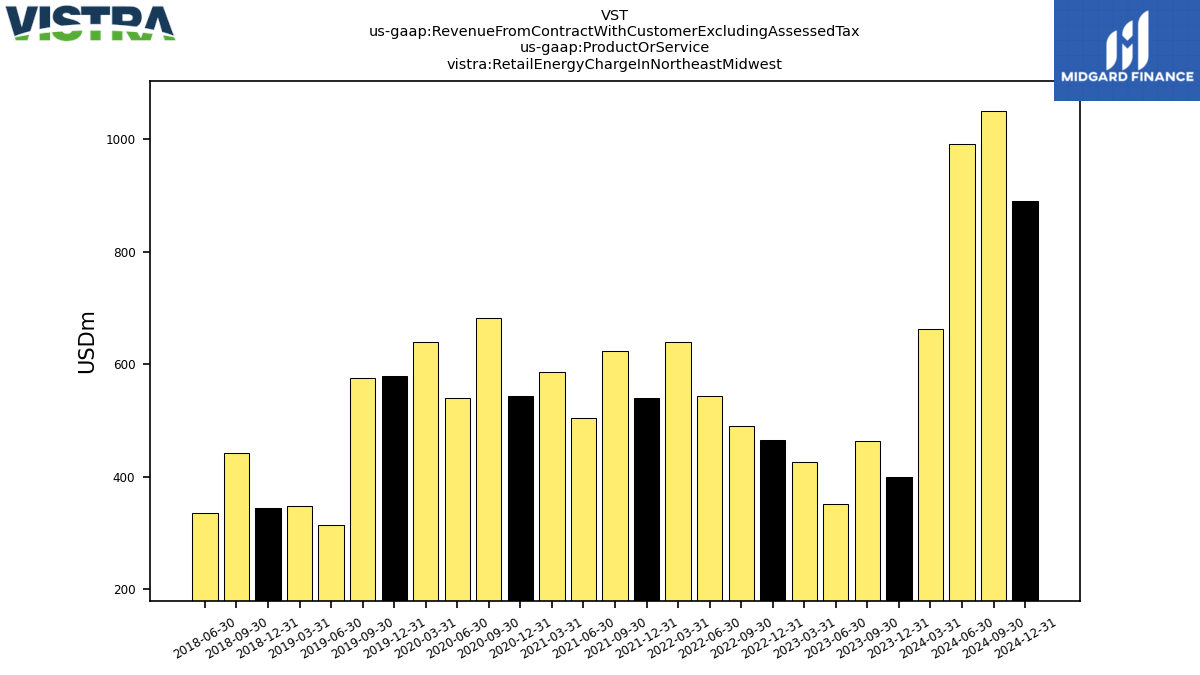
| Retail Energy Charge In Northeast Midwest | 400.00 | 464.00 | 352.00 | 427.00 | 466.00 | 491.00 | 543.00 | 639.00 | 540.00 | 624.00 | 504.00 | 586.00 | 544.00 | 683.00 | 540.00 | 640.00 | 579.00 | 576.00 | 315.00 | 348.00 | 345.00 | 442.00 | 336.00 | NA | NA | NA | NA | NA | NA | |
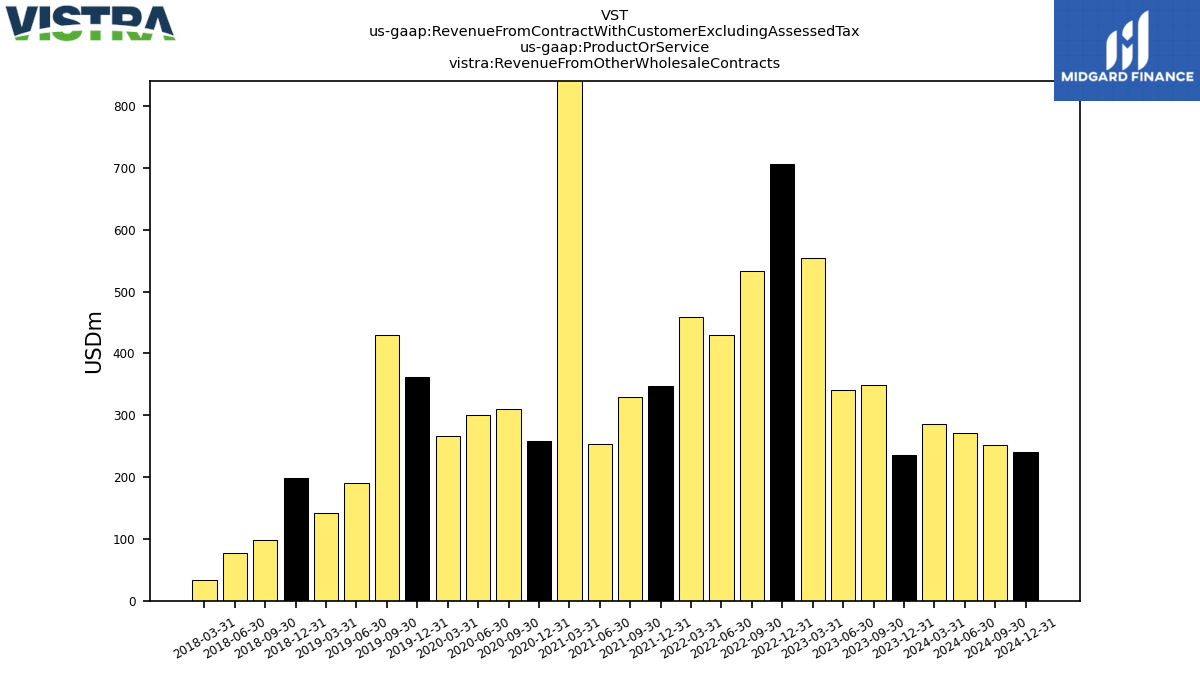
| Revenue From Other Wholesale Contracts | 235.00 | 349.00 | 341.00 | 555.00 | 706.00 | 533.00 | 430.00 | 458.00 | 347.00 | 330.00 | 254.00 | 2270.00 | 259.00 | 310.00 | 301.00 | 267.00 | 361.00 | 430.00 | 190.00 | 142.00 | 198.00 | 98.00 | 78.00 | 34.00 | NA | NA | NA | NA | NA | |
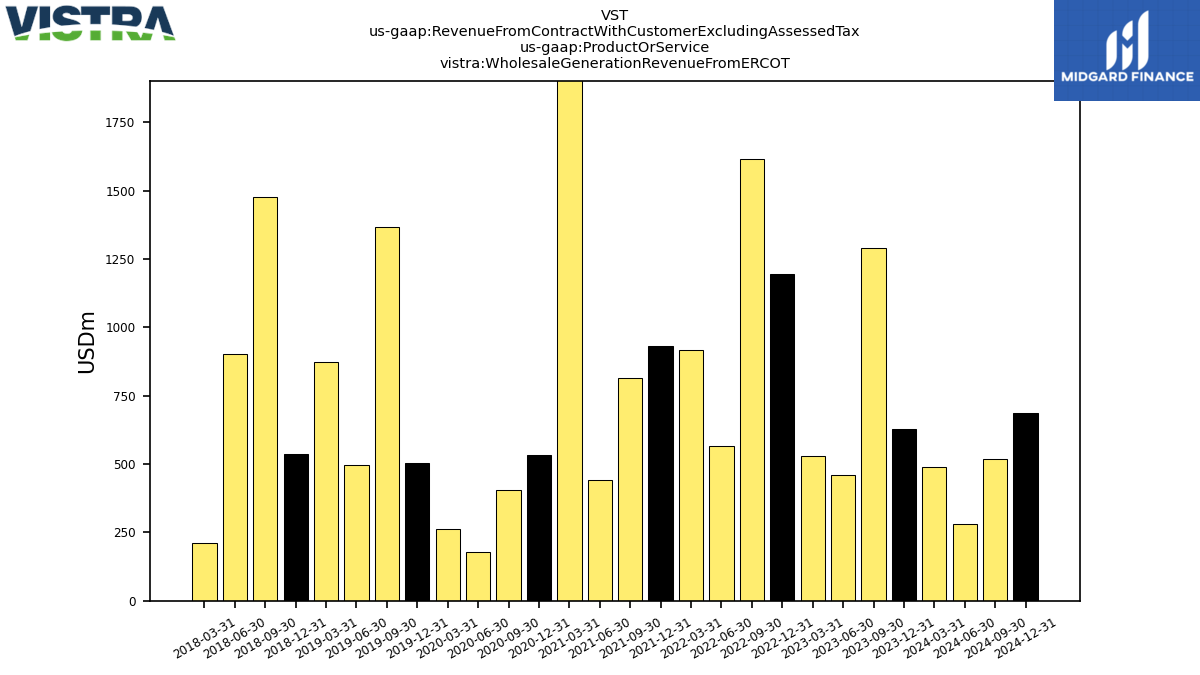
| Wholesale Generation Revenue From E R C O T | 629.00 | 1289.00 | 460.00 | 530.00 | 1196.00 | 1614.00 | 567.00 | 916.00 | 933.00 | 813.00 | 440.00 | 4163.00 | 534.00 | 406.00 | 179.00 | 261.00 | 505.00 | 1368.00 | 497.00 | 875.00 | 537.00 | 1476.00 | 901.00 | 210.00 | NA | NA | NA | NA | NA |